UNITED STATES
SECURITIES AND EXCHANGE COMMISSION
Washington, D.C. 20549
FORM N-CSR
CERTIFIED SHAREHOLDER REPORT OF REGISTERED MANAGEMENT
INVESTMENT COMPANIES
Investment Company Act file number 811-08200
Bridgeway Funds, Inc.
(Exact name of registrant as specified in charter)
20 Greenway Plaza, Suite 450
Houston, Texas 77046
(Address of principal executive offices) (Zip code)
Michael D. Mulcahy, President
Bridgeway Funds, Inc.
20 Greenway Plaza, Suite 450
Houston, Texas 77046
(Name and address of agent for service)
Registrant’s telephone number, including area code: (713) 661-3500
Date of fiscal year end: June 30
Date of reporting period: July 1, 2012 through December 31, 2012
Form N-CSR is to be used by management investment companies to file reports with the Commission not later than 10 days after the transmission to stockholders of any report that is required to be transmitted to stockholders under Rule 30e-1 under the Investment Company Act of 1940 (17 CFR 270.30e-1). The Commission may use the information provided on Form N-CSR in its regulatory, disclosure review, inspection, and policymaking roles.
A registrant is required to disclose the information specified by Form N-CSR, and the Commission will make this information public. A registrant is not required to respond to the collection of information contained in Form N-CSR unless the Form displays a currently valid Office of Management and Budget (“OMB”) control number. Please direct comments concerning the accuracy of the information collection burden estimate and any suggestions for reducing the burden to Secretary, Securities and Exchange Commission, 100 F Street, NE, Washington, DC 20549. The OMB has reviewed this collection of information under the clearance requirements of 44 U.S.C. § 3507.
| Item 1. | Reports to Stockholders. |
The Report to Shareholders is attached herewith.

A no-load mutual fund family of domestic funds
| ||||||
Semi-Annual Report
December 31, 2012 (Unaudited)
| ||||||
| AGGRESSIVE INVESTORS 1 | BRAGX | |||||
| ULTRA-SMALL COMPANY | BRUSX | |||||
| (Open to Existing Investors — Direct Only) | ||||||
| ULTRA-SMALL COMPANY MARKET | BRSIX | |||||
| SMALL-CAP MOMENTUM | BRSMX | |||||
| SMALL-CAP GROWTH | BRSGX | |||||
| SMALL-CAP VALUE | BRSVX | |||||
| LARGE-CAP GROWTH | BRLGX | |||||
| BLUE CHIP 35 INDEX | BRLIX | |||||
| MANAGED VOLATILITY | BRBPX | |||||
www.bridgeway.com
| ||||||
TABLE OF CONTENTS
|  |
| Letter from the Investment Management Team | 1 | |||||||
AGGRESSIVE INVESTORS 1 FUND | ||||||||
| 8 | ||||||||
| 12 | ||||||||
ULTRA-SMALL COMPANY FUND | ||||||||
| 15 | ||||||||
| 19 | ||||||||
ULTRA-SMALL COMPANY MARKET FUND | ||||||||
| 25 | ||||||||
| 29 | ||||||||
SMALL-CAP MOMENTUM FUND | ||||||||
| 41 | ||||||||
| 45 | ||||||||
SMALL-CAP GROWTH FUND | ||||||||
| 52 | ||||||||
| 56 | ||||||||
SMALL-CAP VALUE FUND | ||||||||
| 59 | ||||||||
| 63 | ||||||||
LARGE-CAP GROWTH FUND | ||||||||
| 66 | ||||||||
| 69 | ||||||||
BLUE CHIP 35 INDEX FUND | ||||||||
| 72 | ||||||||
| 76 | ||||||||
MANAGED VOLATILITY FUND | ||||||||
| 78 | ||||||||
| 82 | ||||||||
| 86 | ||||||||
| 89 | ||||||||
| 91 | ||||||||
| 93 | ||||||||
| 97 | ||||||||
| Notes to Financial Statements | 103 | |||||||
| Other Information | 117 | |||||||
| Disclosure of Fund Expenses | 118 | |||||||
|
Bridgeway Funds Standardized Returns as of December 31, 2012* (Unaudited)
| Annualized | ||||||||||||||||||||||||||||||||||||
| Fund | Quarter | Six Months | 1 Year | 5 Years | 10 Years | Inception to Date | Inception Date | Gross Expense Ratio2 | Net Expense Ratio2 | |||||||||||||||||||||||||||
Aggressive Investors 1 | 2.60% | 11.92% | 21.58% | -6.93% | 6.45% | 12.53% | 8/5/1994 | 1.33% | 3 | NA | 3 | |||||||||||||||||||||||||
Ultra-Small Company | 2.91% | 10.11% | 24.49% | 1.00% | 11.52% | 14.91% | 8/5/1994 | 1.25% | 1.25% | |||||||||||||||||||||||||||
Ultra-Small Co Market | -0.49% | 5.21% | 19.83% | 1.00% | 9.53% | 9.73% | 7/31/1997 | 0.95% | 1 | 0.87% | 1 | |||||||||||||||||||||||||
Small-Cap Momentum | 0.47% | 6.36% | 14.18% | NA | NA | 12.11% | 5/28/2010 | 5.76% | 1 | 0.93% | 1 | |||||||||||||||||||||||||
Small-Cap Growth | -2.33% | 4.56% | 11.05% | -4.31% | NA | 2.22% | 10/31/2003 | 1.08% | 1 | 0.94% | 1 | |||||||||||||||||||||||||
Small-Cap Value | 2.66% | 11.11% | 20.99% | -0.30% | NA | 5.97% | 10/31/2003 | 0.99% | 1 | 0.94% | 1 | |||||||||||||||||||||||||
Large-Cap Growth | 0.95% | 6.71% | 16.21% | -0.50% | NA | 4.30% | 10/31/2003 | 0.92% | 1 | 0.84% | 1 | |||||||||||||||||||||||||
Blue Chip 35 Index | -1.41% | 4.76% | 15.20% | 2.11% | 6.26% | 4.95% | 7/31/1997 | 0.29% | 1 | 0.15% | 1 | |||||||||||||||||||||||||
Managed Volatility | -0.40% | 2.18% | 6.46% | 0.72% | 4.80% | 3.63% | 6/30/2001 | 1.44% | 1 | 0.95% | 1 | |||||||||||||||||||||||||
Bridgeway Funds Returns for Calendar Years 1999 through 2012* (Unaudited)
| 1999 | 2000 | 2001 | 2002 | 2003 | 2004 | 2005 | 2006 | 2007 | 2008 | 2009 | 2010 | 2011 | 2012 | |||||||||||||||||||||||||||||||||||||||||||
Aggressive Investors 1 | 120.62 | % | 13.58 | % | -11.20 | % | -18.01 | % | 53.97 | % | 12.21 | % | 14.93 | % | 7.11 | % | 25.80 | % | -56.16 | % | 23.98 | % | 17.82 | % | -10.31 | % | 21.58 | % | ||||||||||||||||||||||||||||
Ultra-Small Company | 40.41 | % | 4.75 | % | 34.00 | % | 3.98 | % | 88.57 | % | 23.33 | % | 2.99 | % | 21.55 | % | -2.77 | % | -46.24 | % | 48.93 | % | 23.55 | % | -14.64 | % | 24.49 | % | ||||||||||||||||||||||||||||
Ultra-Small Co Market | 31.49 | % | 0.67 | % | 23.98 | % | 4.90 | % | 79.43 | % | 20.12 | % | 4.08 | % | 11.48 | % | -5.40 | % | -39.49 | % | 25.95 | % | 24.86 | % | -7.86 | % | 19.83 | % | ||||||||||||||||||||||||||||
Small-Cap Momentum | -0.92 | % | 14.18 | % | ||||||||||||||||||||||||||||||||||||||||||||||||||||
Small-Cap Growth | 11.59 | % | 18.24 | % | 5.31 | % | 6.87 | % | -43.48 | % | 15.04 | % | 11.77 | % | -0.63 | % | 11.05 | % | ||||||||||||||||||||||||||||||||||||||
Small-Cap Value | 17.33 | % | 18.92 | % | 12.77 | % | 6.93 | % | -45.57 | % | 26.98 | % | 16.55 | % | 1.05 | % | 20.99 | % | ||||||||||||||||||||||||||||||||||||||
Large-Cap Growth | 6.77 | % | 9.33 | % | 4.99 | % | 19.01 | % | -45.42 | % | 36.66 | % | 13.34 | % | -0.71 | % | 16.21 | % | ||||||||||||||||||||||||||||||||||||||
Blue Chip 35 Index | 30.34 | % | -15.12 | % | -9.06 | % | -18.02 | % | 28.87 | % | 4.79 | % | 0.05 | % | 15.42 | % | 6.07 | % | -33.30 | % | 26.61 | % | 10.60 | % | 3.17 | % | 15.20 | % | ||||||||||||||||||||||||||||
Managed Volatility | -3.51 | % | 17.82 | % | 7.61 | % | 6.96 | % | 6.65 | % | 6.58 | % | -19.38 | % | 12.39 | % | 5.41 | % | 1.94 | % | 6.46 | % | ||||||||||||||||||||||||||||||||||
Performance figures quoted represent past performance and are no guarantee of future results. Current performance may be lower or higher than the performance data quoted. Investment return and principal value will fluctuate, so that an investor’s shares, when redeemed, may be worth more or less than original cost. To obtain performance current to the most recent month- end, please visit our website at www.bridgeway.com or call 1-800-661-3550. Total return figures include the reinvestment of dividends and capital gains.
1 Some of the Funds’ fees were waived or expenses reimbursed; otherwise, returns would have been lower. The Adviser has contractually agreed to waive fees and/or reimburse expenses. Any material change to this Fund policy would require a vote by shareholders.
2 Expense ratios are as stated in the current prospectus. Please see financial highlights for expense ratios as of December 31, 2012.
3 The management fee included in the gross expense ratio for the Aggressive Investors 1 Fund has been restated to reflect only the base management fee payable under the Fund’s performance-based management fee structure. The total actual management fee for the fiscal year ended June 30, 2012 was -0.47%. The actual total management fee for the prior fiscal year was negative due to the negative performance adjustment of the investment management fee under the Fund’s performance-based management fee structure.
| * | Numbers highlighted in green indicate periods when the Fund outperformed its primary benchmark. |
This report is submitted for the general information of the shareholders of each Fund. It is not authorized for distribution to prospective investors unless preceded or accompanied by an effective prospectus, which includes information regarding a Fund’s risks, objectives, fees and expenses, experience of its management, and other information. Investors should read the prospectus carefully before investing in a Fund. For questions or other Fund information, call 1-800-661-3550 or visit the Funds’ website at www.bridgeway.com. Funds are available for purchase by residents of the United States, Puerto Rico, U.S. Virgin Islands and Guam only. Foreside Fund Services, LLC, Distributor.
The views expressed here are exclusively those of Fund management. These views, including those relating to the market, sectors or individual stocks are not meant as investment advice and should not be considered predictive in nature.
i |
www.bridgeway.com |
THIS PAGE INTENTIONALLY LEFT BLANK
LETTER FROM THE INVESTMENT MANAGEMENT TEAM
| |
December 31, 2012
Dear Fellow Shareholders,
Uncertainty ruled the equity market for the last quarter of 2012. The outcome of the U.S. presidential election, the effects of Superstorm Sandy, and the drama of the potential fiscal cliff caused continued volatility. Before staging an impressive recovery from mid-November to close the quarter almost flat, the S&P 500 Index had been down almost 5%. The smaller and more value style parts of the U.S. markets were the only segments in positive territory. Stock correlations continued to fall from the June spike, an environment generally favorable to our Select Funds and especially to our growth Funds, as discussed in previous letters. Details appear on page 2. Individual Fund performance appears on the previous page, with Fund by Fund details starting on page 8.
As documented in earlier shareholder letters, Bridgeway continues to believe that bond investors face the extraordinary risk of rising interest rates and inflation. Our research team recently looked at a popular fixed income alternative, high yield stocks. See page 3 for an eye-popping statistical development that we have not seen in the last four decades.
Each calendar year we have a friendly competition with Morningstar’s “Fund picks.” In spite of the macro driven market of the June quarter, this year our Funds led Morningstar’s picks 8 to 3. See details on page 4.
Bridgeway continues to field questions about our very unusual policy of capping the compensation of our highest paid people at seven times the lowest compensated ones. On page 5, our president discusses the reasons, implications, and benefits of this policy, which dates back to our founding nearly two decades ago.
One of the strongest parts of our culture is a commitment to community and world change. We believe this gives us a broader world view, which helps every aspect of our organization, including managing your money. Or, as one Partner recently said, “It is engrained in the fabric of who we are – as individuals and as a corporation; and how we work - providing service and returns to our shareholders and our world. We can’t divorce one from the other.” On page 5, Dick Cancelmo, our Managed Volatility portfolio manager and head of Trading, and Bill Baumeyer, a marketing and client service team member, paint a word picture of transformational change from their vantage points.
As always, we appreciate your feedback. We take your comments very seriously and regularly discuss them internally to help in managing our Funds and this company. Please keep your ideas coming — both favorable and critical. They provide us with a vital tool, helping us serve you better.
Sincerely,
Your Investment Management Team
 |  |  | ||
| John Montgomery | Christine L. Wang | Michael Whipple | ||
 |  |  | ||
| Elena Khoziaeva | Dick Cancelmo | Rasool Shaik | ||
1 | Semi-Annual Report | December 31, 2012 (Unaudited) |
| LETTER FROM THE INVESTMENT MANAGEMENT TEAM (continued) |
|
Market Review
The Short Version: In a volatile climate, and as measured by the S&P 500 Index, the market declined during the quarter almost 5%, but recovered a majority of that to close down only a fraction of a percent.
The fourth quarter of 2012 experienced volatility across the domestic equity markets with the uncertainty of the outcome of the U.S. presidential election, the effects of Superstorm Sandy, and the drama of the approaching fiscal cliff. Despite the volatility, the quarter ended with the S&P 500 Index down 0.38% and the Dow down 1.74%.
October started the quarter on a sour note with domestic equity markets turning negative. Despite improvement in some economic indicators, such as a drop in the unemployment rate to the lowest rate since the beginning of 2009, the highest level of housing starts in over four years, and an increase in consumer confidence, markets still reacted with uncertainty ahead of the U.S. presidential election. The S&P 500 Index lost almost two percent, the Dow was down two and one-half percent, and the Nasdaq Composite Index fell by more than four percent.
All of this uncertainty led to large daily moves for the Dow, averaging +/-0.7%. For the month, the Dow ranged 819 points from high to low – the widest range since June. By mid-month, broad domestic equity markets were off about 5% before an impressive rally, resulting in the S&P 500 Index and Nasdaq Composite closing fractionally higher and the Dow finishing slightly negative for the month.
While most markets posted mixed returns through the end of November, December provided some much needed positive performance, pulling segments of the market (the smaller and more value segments) in the black for the quarter. With the uncertainty of the fiscal cliff and the possibility of tax increases, 483 companies declared special dividends versus 142 a year ago and many companies sped up the payment of regular dividends to secure the 2012 tax rate. Towards the end of December, dismal fiscal cliff negotiations rankled the markets, but on the last day of the month when it appeared that a deal would be struck, the markets turned positive.
Additionally, the Federal Reserve held its last monetary policy meeting of the year in December. For the first time, the Fed tied its monetary policy to a specific economic indicator instead of a time period. The Fed announced they will continue with easy monetary policy until the unemployment rate hits 6.5% or lower as long as inflation forecasts remain near its 2% target. In addition, the Fed will make purchases totaling $85 billion per month: $40 billion in mortgage backed securities and $45 billion in long-term Treasuries which is a slight modification from Operation Twist (selling $45 billion a month of short-term Treasuries to fund the long-term purchases).
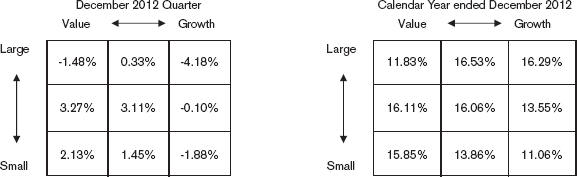
Returns across U.S equity style boxes, as defined by Morningstar, were mixed for the quarter. Value outperformed growth, and small- and mid-cap stocks were favored over large-cap stocks. Small-cap value posted a 2.13% gain while large-cap growth was down 4.18% for the quarter.
Sector performance for the S&P 500 Index was mixed with half of the sectors positive and half negative leaving the Index essentially flat. Financials led the way gaining approximately six percent followed by Industrials up four percent and consumer discretionary up two percent. Telecommunication Services and Information Technology suffered the most, falling approximately six percent each, while Utilities and Energy were down nearly three percent each.
Following are the stock market “style box” returns from Morningstar for the quarter and year:
www.bridgeway.com | 2 |
| LETTER FROM THE INVESTMENT MANAGEMENT TEAM (continued) |
|
Using High Dividend Stocks to Reduce Risk (by Bridgeway’s research team)
The Short Version: For the same reasons that many investors have sold stock funds to buy bond funds, many investors have turned to high yield stocks as an alternative to produce current income. Bridgeway’s research indicates that high yield stocks are somewhat expensive relative to history and the overall stock market and thus represent their own (rather eye popping) risks.
Previously, we discussed the unusual risk of bonds and other fixed income instruments in the current environment. [See letters from March, June, and September 2012.] As many investors see money market rates near zero, or wonder what to do with the proceeds from maturing bonds, they look desperately for some extra yield, even a moderate amount. One place they have turned is high yield dividend paying stocks. While these stocks do provide some potential reduction of inflation risk, benefits from diversification (if owned along with fixed income and other asset classes), and the benefit of current income, Bridgeway’s investment team recently asked the question, “How cheap or expensive are these stocks?”
The graph below provides an eye opening answer: On the basis of one measure of valuation, “price to book value”, they are the most expensive, relative to other stocks, we have seen at any time in our data history going back to 1972. On this measure, the price of these stocks has already been bid up on a relative basis. For the first time in at least four decades, high yield large cap stocks are actually more expensive than the broader market. Buyer beware.
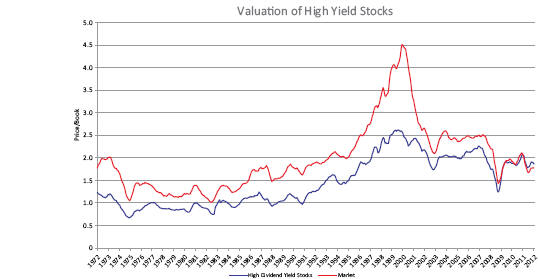
Source: Bridgeway analysis.
3 | Semi-Annual Report | December 31, 2012 (Unaudited) |
| LETTER FROM THE INVESTMENT MANAGEMENT TEAM (continued) |
|
What’s an investor to do? We believe that creating, writing down, and implementing a disciplined asset allocation plan is the best answer. Right now that might guard against an overreliance on bonds and also high dividend paying stocks, particularly because they’ve done so well over the last one and two decades.
Performance Versus Morningstar Analyst Picks or Gold Rated Funds
The Short Version: The final tally: Bridgeway 8, Morningstar 3. Overall, calendar year 2012 was a good one for our Select Funds. Four (Aggressive Investors 1, Ultra-Small Company, Large-Cap Growth, and Small-Cap Value) of Bridgeway’s eleven Funds outperformed their respective market benchmarks. Four more performed in line with their design, (see details below on Small-Cap Momentum, Ultra-Small Company Market, Blue Chip 35 Index, and Managed Volatility). Bridgeway outperformed Morningstar’s Analyst picks (Gold rated funds) by a solid margin.
Morningstar, the Chicago-based independent research firm, publishes a list of “analysts picks” or “Gold rated Funds” every year for each asset class, as determined by its analysts. Each year in January when the final tallies are in, we compare the performance of each of our Funds to the average returns of Morningstar’s top picks for the comparable asset class. How did we do in 2012?
In a market year that included a high-correlation spike — unfavorable to some of our growth models and Funds — 2012 was still a decent year in our “contest” with Morningstar’s fund “top picks.”
The table below depicts the results by Morningstar category and relevant Bridgeway Fund.
| Bridgeway Funds | Morningstar Analyst “Picks” | |||||||
| Name | 2012 Return | Morningstar Category | 2012 Return | |||||
* Aggressive Investors 1 | 21.58% | Mid-cap blend | 17.92% | |||||
* Ultra-Small Company2 | 24.49% | Small growth | 17.21% | |||||
* Ultra-Small Company Market | 19.83% | Small blend | 19.12% | |||||
Small-Cap Momentum | 14.18% | * Small growth | 17.21% | |||||
Small-Cap Growth | 11.05% | * Small growth | 17.21% | |||||
* Small-Cap Value | 20.99% | Small value | 10.93% | |||||
* Omni Small-Cap Value1 | 17.74% | Small value | 10.93% | |||||
* Omni Tax-Managed | 16.62% | Small value | 10.93% | |||||
* Large-Cap Growth | 16.21% | Large-cap growth | 15.01% | |||||
Blue Chip 35 Index | 15.20% | * Large-cap blend | 15.81% | |||||
* Managed Volatility | 6.46% | Long-Short Equity | 4.51% | |||||
| 1These funds are offered in a separate prospectus and their semi-annual reports are also in a separate report. | ||||||||
| 2Ultra-Small Company Fund moved from small growth to small value during the quarter ended June 30, 2012. | ||||||||
An “*” means a “win” for that contest. Past performance is not an indicator of future results. The Bridgeway Funds’ adviser, Bridgeway Capital Management, Inc., does not have any influence on the selection of the funds chosen by Morningstar’s analysts. The number and specific funds used in the comparison are in the control and discretion of Morningstar and their analysts and are subject to change. Morningstar’s criteria for choosing Analyst Picks includes, but is not limited to, factors such as performance, expenses, and quality of fund management. In addition, the comparison of Bridgeway Funds to the Morningstar Analyst Picks is limited to performance only and does not take into consideration other factors that are considered by Morningstar when compiling their list of Analyst Picks.
Each Bridgeway Fund is compared to the average total return of the group of funds selected by Morningstar at the beginning of 2012 for the one-year period ended December 31, 2012. These averages in the table are comprised of between one and fifteen funds from within each category. In an effort to provide a complete and balanced assessment, all of the Bridgeway Funds are used in the comparison table shown above, such that no attempt is made to cull out unfavorable results. The purpose of this comparison is to “raise the bar” on performance comparison, as this analysis uses an arguably higher benchmark by comparing the Bridgeway Funds to other funds chosen by an independent source that specializes in investment research.
www.bridgeway.com | 4 |
| LETTER FROM THE INVESTMENT MANAGEMENT TEAM (continued) |
|
Bridgeway’s 7 to 1 Salary Cap Ratio (by Bridgeway’s President)
The Short Version: At Bridgeway, we have a salary-cap policy that limits total compensation of any Partner (full-time staff member) to seven times that of the total compensation of the lowest paid Partner.
On a recent Sunday, a headline in our local paper caught my attention: “Utilities reduced their workforce but greatly increased CEO pay.” A study of investor-owned utilities conducted by Longnecker & Associates showed CEO salaries growing by over 150% over the last 10 years to an average annual pay in excess of $9 million even while workforce numbers were being reduced. A 2012 Economic Policy Institute analysis of CEO pay across 350 of the largest companies showed the average CEO earned over 220 times more than the typical worker (down from over 400x a few years ago). This large disparity in pay has been confirmed by other studies as well. One problem that has been picked up by the media is that this ratio has risen dramatically over the last few decades. In fact, in 1980 – when the CEO to average worker pay was around 30 to 1 - management guru Peter Drucker proposed capping CEO salary at 20 to 1 in order to help ensure that workers are motivated by a sense of purpose rather than money.
For me, I can’t imagine working at a company with such income disparity when I know it takes everyone for a company to be successful. A 2010 joint study by Northeastern University’s business school and Bentley University was one of the first studies to show a negative correlation between employee productivity and CEO to worker pay ratio. Apparently, other people don’t believe that creates a great work environment either.
One unusual part of Bridgeway’s culture that helps us focus on purpose over money is our salary cap policy. Since the founding of Bridgeway in 1993, we have maintained a commitment that no full-time Partner (that is, any full-time staff member) at Bridgeway can make total compensation greater than seven times the total compensation (salary, bonus, retirement) of the lowest paid Partner. What does this mean? Well, it really means what it says: No one - not even the founder, John Montgomery - can make more than 7x the lowest paid Partner.
Why do we do this? Our intent with this policy is multifold:
1) It serves to create a more equitable and amiable workplace by better recognizing the value that all Partners play in the company’s success.
2) It helps to keep our costs low so that we can have more operational flexibility in challenging economic environments (like most of us have faced in the past few years) to continue to invest in our business and Partners.
3) It allows us to create a work environment that attracts, challenges, excites and fulfills in ways that money cannot buy.
4) It serves to protect us from the greed that too often and too easily creeps into a company’s culture.
In 2010, Bridgeway was named as the #4 best medium/small company to work for by Great Place to Work Institute. We believe our bigger focus on mission, value and purpose is a major part of this, and that the salary cap policy is one way to keep our rudder pointed in the right direction.
Transformative Change
The Short Version: This quarter, we are highlighting two of our Partners and their passion and pursuit of transformative change. Dick Cancelmo and Bill Baumeyer have each written a section about their pursuits.
5 | Semi-Annual Report | December 31, 2012 (Unaudited) |
| LETTER FROM THE INVESTMENT MANAGEMENT TEAM (continued) |
|
Dick Cancelmo
Bridgeway has enabled me to transform my work life into my life’s work. I love what I do in leading our trading team and managing the Bridgeway Managed Volatility Fund. I also stay active with a few, select non-profit ventures that I believe are quite impactful.
One commitment is to my alma mater – Washington and Lee University and our Shepherd Poverty Program. The program integrates rigorous academic study and focused direct service to disadvantaged communities and persons, and supplements and enriches the education of undergraduate and law students in all majors and career paths. The intent of this program is to prepare students for lives aimed at diminishing poverty and enhancing human capability through professional and civic efforts. Bridgeway thought so highly of this program that we helped start similar programs at Rice University, Baylor University, and Furman University. In addition, a consortium of schools has been established in an effort to create a national movement to expand poverty studies across the country. We now have 20 colleges and universities as members of The Shepherd Higher Education Consortium on Poverty and I am very excited to serve as a founding board member. The students and graduates of this program continually amaze me with their knowledge, dedication and attitude to live a life with meaning and purpose; it brings me great joy to see their lives unfold.
Here in Houston I have a great relationship with ProVision, a local charter school founded by Roy Young, a former NFL player. ProVision serves young men who are underserved by society and are at risk of dropping out of school and an eventual life of poverty or much worse. The teachers and administration of ProVision are an extremely dedicated and capable group of men and women who are devoting their lives to helping these young men. There are strict rules and lots of tough love and I have seen the results first hand. For the last three years I have hosted a group of 7 young men and 2 teachers at a property my wife Martha and I have in rural South Texas. The group comes down on a Friday afternoon and stays all weekend. The teachers have a set program and there are also lots of activities such as hiking, games, wild life viewing plus lots of laughs and plenty of great food. This last year one of the young men came up with a great variation on the favorite camp fire dessert called Smores, he added an Oreo to the mix and created what we now call Smoreos! These young men have the time of their lives and for one short weekend get away from all of their problems and see a completely different world of nature and beauty. They are incredibly well behaved and gracious and while I know they have a great time, I don’t know if they have a better time than me. If it wasn’t for ProVision where would these young men be?
Bill Baumeyer
Bridgeway has created the opportunity that allows us to participate in the world in a big way. We not only get to assist investors in reaching their financial goals, but we get to impact our communities and the world as well.
I have had the honor of serving on the Bridgeway Foundation board for the past eight years and have had the privilege of being a catalyst for hope and reconciliation throughout the world by working towards the prevention of oppression, genocide, and human rights violations. One of our recent grants went towards creating a network of radio towers in Eastern Congo, CAR, and South Sudan to help prevent killings, child abductions, rape, and disruption of life imposed by the Lord’s Resistance Army (LRA). The towers have been effective in tracking the LRA movements and warning communities in advance, allowing them to prepare and not be as impacted as in the past. You can see the results of this system by visiting http://lracrisistracker.theresolve.org and http://invisiblechildren.com/program/fm-radios. There are numerous other projects in which we have been involved to pursue our mission.
I also serve on the Board of Cherish our Children International (COCI). COCI’s mission is to create and fund programs that provide a brighter future for the world’s most vulnerable children. We currently have programs in Serbia, Africa, Mexico and the United States. This past year I have participated with Team COCI, a group of athletes committed to making a difference for children. We had 70 team members participate in 28 different events. The events ranged from Ironman triathlons and marathons to sprint triathlons and 5k runs. The team has two purposes, to support athletes in reaching their athletic goals and to make a difference in the community. This season, we even had the privilege of participating in various athletic events with the children for our U.S. program in a partnership with No More Victims, Inc. (NMVI).
NMVI supports children that have incarcerated parent(s) or family member(s). Nationally, 7.3 million children have at least one parent in jail or prison. Sadly, 60 to 90 percent of these kids are doomed to follow in the same footsteps as their parents,
www.bridgeway.com | 6 |
| LETTER FROM THE INVESTMENT MANAGEMENT TEAM (continued) |
|
becoming imprisoned at some point in their lives. NMVI has been able to flip this statistic with 95% of the children in the program staying out of jail and graduating from high school. I have been able to work with and hear the everyday obstacles they have to overcome. The NMVI program provides a safe place for these children to share their experiences so they don’t feel alone. It provides a structure that is not present in their current family setting which encourages them to do the right things every day.
We created triathlon relay teams with the children and competed in two different sprint triathlons. This was the first time for the kids to participate in an event like this. They trained, competed, and had a great time. They are already talking about what event they want to do this year. The great thing is that the kids motivate us, the Team COCI members, to train harder and meet our athletic goals. It’s a win/win partnership for us all. If you have been looking for a reason to get off the couch or reach for that new “personal record,” consider joining our team this year. If you are interested in learning more about COCI or Team COCI, please visit www.cherishourchildern.org.
7 | Semi-Annual Report | December 31, 2012 (Unaudited) |
Aggressive Investors 1 Fund | |
December 31, 2012
Dear Fellow Aggressive Investors 1 Fund Shareholder,
For the quarter ended December 31, 2012, Aggressive Investors 1 Fund returned 2.60%, outperforming our primary market benchmark, the S&P 500 Index (-0.38%), our peer benchmark, the Lipper Capital Appreciation Funds Index (+1.42%), and the Russell 2000 Index (+1.85%). It was a quarter without high correlation spikes, the prevailing historical market environment, and also one generally favorable to our Select funds. We are pleased with the results.
For the six-month “semi-annual” period ending December 31, 2012, our Fund returned 11.92%, easily outpacing our primary market benchmark, the S&P 500 Index (+5.95%), our peer benchmark, the Lipper Capital Appreciation Funds Index (+7.19%), and the Russell 2000 Index (+7.20%). It was a solid six months of low correlation markets, and we performed well on an absolute and relative basis.
For the calendar year, our Fund returned 21.58%, outperforming our primary market benchmark, the S&P 500 Index (+16.00%), our peer benchmark, the Lipper Capital Appreciation Funds Index (+15.87%), and the Russell 2000 Index (+16.35%). In spite of the fact that we did underperform during the unfavorable high correlation quarter ended June 30, 2012 as expected, we are pleased to have made up the difference in the other three calendar quarters. Looking at the last five year period and as indicated on the graph on the following page, we still have ground to make up to return to our all- time high in 2007. This is due to the extraordinary and unprecedented high correlation spikes of 2008, 2010, and 2011, as described in our previous shareholder letters Looking forward, we would expect a return to more favorable periods without high correlation spikes, or lacking that, periods with relatively little negative effect, since our model calibration period includes a number of these spikes.
The table below presents our December quarter, six-month, one-year, five-year, ten-year and inception-to-date financial results. See the next page for a graph of performance since inception.
| Standardized Returns as of December 31, 2012 | ||||||||||||||||||||||
Annualized | ||||||||||||||||||||||
| Quarter | 6 Months | 1 Year | 5 Years | 10 Years | Since Inception (8/5/94) | |||||||||||||||||
Aggressive Investors 1 Fund | 2.60% | 11.92% | 21.58 | % | -6.93% | 6.45% | 12.53% | |||||||||||||||
S&P 500 Index | -0.38% | 5.95% | 16.00 | % | 1.66% | 7.10% | 8.40% | |||||||||||||||
Russell 2000 Index | 1.85% | 7.20% | 16.35 | % | 3.56% | 9.72% | 8.46% | |||||||||||||||
Lipper Capital Appreciation Funds Index | 1.42% | 7.19% | 15.87 | % | 1.14% | 7.93% | 7.40% | |||||||||||||||
Performance figures quoted in the table above and the graph on the next page represent past performance and are no guarantee of future results. Total return figures in the table above and the graph on the next page include the reinvestment of dividends and capital gains. The table above and the graph on the next page do not reflect the deduction of taxes that a shareholder would pay on Fund distributions or on the redemption of Fund shares.
The S&P 500 Index is a broad-based, unmanaged measurement of changes in stock market conditions, based on the average of 500 widely held common stocks with dividends reinvested. The Russell 2000 Index is an unmanaged, market value weighted index that measures performance of the 2,000 companies that are between the 1,000th and 3,000th largest in the market with dividends reinvested. The Lipper Capital Appreciation Funds Index reflects the record of the 30 largest funds in the category of more aggressive domestic growth mutual funds, as reported by Lipper, Inc. It is not possible to invest directly in an index. Periods longer than one year are annualized.
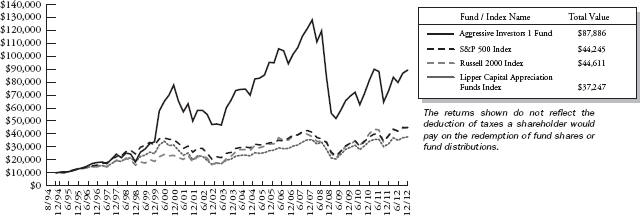
According to data from Lipper, Inc. as of December 31, 2012, Aggressive Investors 1 Fund ranked 31st of 279 capital appreciation funds for the twelve months ending December 31, 2012, 215th of 223 over the last five years, 107th of 160 over the
www.bridgeway.com | 8 |
Aggressive Investors 1 Fund MANAGER’S COMMENTARY (Unaudited) (continued) | |
last ten years, and 2nd of 51 since inception in August, 1994. These long-term numbers and the graph below give two snapshots of our long-term success. Lipper, Inc. is an independent mutual fund rating service that ranks funds in various fund categories by making comparative calculations using total returns.
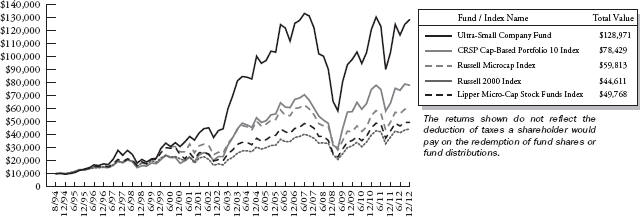
Aggressive Investors 1 Fund vs. S&P 500 Index, Russell 2000 Index & Lipper Capital Appreciation Funds Index
from Inception 8/5/94 to 12/31/12
Detailed Explanation of Quarterly Performance
The Short Version: The low correlation market was favorable to a majority of our stock selection models.
Three of our four categories of models (Growth, GARP and Value) outperformed our primary market benchmark by more than one percent each. Approximately ninety percent of our assets are invested in these model categories. The strongest performing individual model was in the mid-cap growth market segment, returning almost eight percent for the quarter. Only our Momentum model category underperformed our market benchmark, as the highest momentum stocks underperformed the most. As a refreshing change from some of the recent high stock correlation years (2008, 2010, 2011, and early 2012), stocks were generally rewarded for surprising Wall Street expectations on the upside — yet another sign we are no longer in a macro driven market.
Company size played a large role in our outperformance for the quarter. Almost sixty percent of Fund assets were in companies with market caps of less than $11 billion. This small-cap bias helped our relative returns. Of the four ultra-large names (Apple, Exxon Mobil, Microsoft and Wal-Mart) that all performed poorly, we only had exposure to Apple, and that exposure was less than a quarter of the S&P 500 Index exposure. Our underweighting in those four companies saved us more than one percent in relative return.
The Fund was overweighted in the Consumer Discretionary and Materials sectors, both of which had positive returns, adding almost one percent of relative returns. Our underweighting in the negatively performing Information Technology and Consumer Staples sectors also helped.
Detailed Explanation of Calendar Year Performance
The Short Version: We were able to overcome our underperformance in the second quarter’s high-correlation spike through strong model performance in the other three quarters.
9 | Semi-Annual Report | December 31, 2012 (Unaudited) |
Aggressive Investors 1 Fund MANAGER’S COMMENTARY (Unaudited) (continued) | |
The quarter ended June 30, 2012 contained a high-correlation spike, an environment unfavorable to our growth models. Even though we fared better than during previous spikes, we still underperformed the S&P 500 Index by more than two percent, an amount within our design parameters. The other three quarters had historically normal market correlation and as a result, we outperformed for the year by more than five and one-half percent.
We had a small-cap bias compared to the S&P 500 Index throughout the year which proved negative in the second quarter, but was more than made up for in the fourth quarter. Our models performed well, especially in the second half of the year. Our momentum models’ performance was mixed.
Top Ten Holdings as of December 31, 2012
| Rank | Description | Industry | % of Net Assets | ||||||
1 | Regeneron Pharmaceuticals, Inc. | Biotechnology | 2.4 | % | |||||
2 | Westlake Chemical Corp. | Chemicals | 2.3 | % | |||||
3 | Seagate Technology PLC | Computers & Peripherals | 2.2 | % | |||||
4 | Discover Financial Services | Consumer Finance | 2.1 | % | |||||
5 | Gap, Inc. (The) | Specialty Retail | 1.9 | % | |||||
6 | OfficeMax, Inc. | Specialty Retail | 1.7 | % | |||||
7 | Lumber Liquidators Holdings, Inc. | Specialty Retail | 1.6 | % | |||||
8 | HollyFrontier Corp. | Oil, Gas & Consumable Fuels | 1.5 | % | |||||
9 | Delphi Automotive PLC | Auto Components | 1.5 | % | |||||
10 | Ryland Group, Inc. (The) | Household Durables | 1.5 | % | |||||
| Total | 18.7 | % | |||||||
Industry Sector Representation as of December 31, 2012
| % of Net Assets | % of S&P 500 Index | Difference | |||||||||||||
Consumer Discretionary | 21.3 | % | 11.4 | % | 9.9 | % | |||||||||
Consumer Staples | 6.1 | % | 10.6 | % | -4.5 | % | |||||||||
Energy | 9.9 | % | 11.0 | % | -1.1 | % | |||||||||
Financials | 16.0 | % | 15.6 | % | 0.4 | % | |||||||||
Health Care | 13.6 | % | 12.1 | % | 1.5 | % | |||||||||
Industrials | 8.5 | % | 10.2 | % | -1.7 | % | |||||||||
Information Technology | 15.9 | % | 19.0 | % | -3.1 | % | |||||||||
Materials | 8.5 | % | 3.6 | % | 4.9 | % | |||||||||
Telecommunication Services | 0.0 | % | 3.1 | % | -3.1 | % | |||||||||
Utilities | 0.0 | % | 3.4 | % | -3.4 | % | |||||||||
Cash & Other Assets | 0.2 | % | 0.0 | % | 0.2 | % | |||||||||
Total | 100.0 | % | 100.0 | % | |||||||||||
Disclaimer
The views expressed here are exclusively those of Fund management. These views, including those related to market sectors or individual stocks, are not meant as investment advice and should not be considered predictive in nature. Any favorable (or unfavorable) description of a holding applies only as of the quarter end, December 31, 2012, unless otherwise stated. Security positions can and do change thereafter. Discussions of historical performance do not guarantee and may not be indicative of future performance.
Market volatility can significantly affect short-term performance. The Fund is not an appropriate investment for short-term investors. Investments in the small companies within this multi-cap fund generally carry greater risk than is customarily associated with larger companies. This additional risk is attributable to a number of factors, including the relatively limited financial
www.bridgeway.com | 10 |
Aggressive Investors 1 Fund MANAGER’S COMMENTARY (Unaudited) (continued) | |
resources that are typically available to small companies, and the fact that small companies often have comparatively limited product lines. In addition, the stock of small companies tends to be more volatile than the stock of large companies, particularly in the short term and particularly in the early stages of an economic or market downturn. The Fund’s use of options, futures, and leverage can magnify the risk of loss in an unfavorable market, and the Fund’s use of short-sale positions can, in theory, expose shareholders to unlimited loss. Finally, the Fund exposes shareholders to “focus risk,” which may add to Fund volatility through the possibility that a single company could significantly affect total return. Shareholders of the Fund, therefore, are taking on more risk than they would if they invested in the stock market as a whole.
Conclusion
Thank you for your continued investment in Aggressive Investors 1 Fund. We encourage your feedback; your reactions and concerns are extremely important to us.
Sincerely,
The Investment Management Team
11 | Semi-Annual Report | December 31, 2012 (Unaudited) |
Bridgeway Aggressive Investors 1 Fund | |
Showing percentage of net assets as of December 31, 2012 (Unaudited)
| Industry Company | Shares | Value | ||||||||||
COMMON STOCKS - 100.26% |
| |||||||||||
Aerospace & Defense - 2.30% |
| |||||||||||
AAR Corp. | 129,800 | $ | 2,424,664 | |||||||||
Textron, Inc. | 92,100 | 2,283,159 | ||||||||||
|
| |||||||||||
| 4,707,823 | ||||||||||||
Airlines - 1.27% | ||||||||||||
SkyWest, Inc. | 207,700 | 2,587,942 | ||||||||||
Auto Components - 1.50% | ||||||||||||
Delphi Automotive PLC* | 80,300 | 3,071,475 | ||||||||||
Beverages - 1.56% | ||||||||||||
Brown-Forman Corp., Class B | 32,300 | 2,042,975 | ||||||||||
Cott Corp. | 142,000 | 1,140,260 | ||||||||||
|
| |||||||||||
| 3,183,235 | ||||||||||||
Biotechnology - 3.59% |
| |||||||||||
Amgen, Inc. | 27,100 | 2,339,272 | ||||||||||
Regeneron Pharmaceuticals, Inc.* | 29,200 | 4,995,244 | ||||||||||
|
| |||||||||||
| 7,334,516 | ||||||||||||
Building Products - 1.78% |
| |||||||||||
Nortek, Inc.* | 21,000 | 1,391,250 | ||||||||||
USG Corp.*+ | 80,300 | 2,254,021 | ||||||||||
|
| |||||||||||
| 3,645,271 | ||||||||||||
Chemicals - 5.82% |
| |||||||||||
CF Industries Holdings, Inc. | 12,800 | 2,600,448 | ||||||||||
PolyOne Corp. | 105,400 | 2,152,268 | ||||||||||
Sherwin-Williams Co. (The) | 16,000 | 2,461,120 | ||||||||||
Westlake Chemical Corp.+ | 59,100 | 4,686,630 | ||||||||||
|
| |||||||||||
| 11,900,466 | ||||||||||||
Commercial Banks - 1.94% |
| |||||||||||
Bank of Montreal+ | 37,300 | 2,286,490 | ||||||||||
KeyCorp | 198,600 | 1,672,212 | ||||||||||
|
| |||||||||||
| 3,958,702 | ||||||||||||
Commercial Services & Supplies - 1.75% |
| |||||||||||
Cintas Corp. | 51,000 | 2,085,900 | ||||||||||
Quad/Graphics, Inc.+ | 73,700 | 1,502,743 | ||||||||||
|
| |||||||||||
| 3,588,643 | ||||||||||||
Computers & Peripherals - 5.55% |
| |||||||||||
Apple, Inc. | 3,600 | 1,918,908 | ||||||||||
EMC Corp.* | 84,800 | 2,145,440 | ||||||||||
Seagate Technology PLC | 150,400 | 4,584,192 | ||||||||||
Western Digital Corp. | 63,500 | 2,698,115 | ||||||||||
|
| |||||||||||
| 11,346,655 | ||||||||||||
| Industry Company | Shares | Value | ||||||
| ||||||||
Consumer Finance - 3.15% |
| |||||||
Discover Financial Services# | 111,400 | $ | 4,294,470 | |||||
SLM Corp. | 125,000 | 2,141,250 | ||||||
|
| |||||||
| 6,435,720 | ||||||||
Diversified Financial Services - 1.08% |
| |||||||
Moody’s Corp. | 44,000 | 2,214,080 | ||||||
Electronic Equipment, Instruments & Components - 1.04% |
| |||||||
Corning, Inc. | 167,900 | 2,118,898 | ||||||
Energy Equipment & Services - 2.19% |
| |||||||
Atwood Oceanics, Inc.* | 45,900 | 2,101,761 | ||||||
Exterran Holdings, Inc.* | 108,700 | 2,382,704 | ||||||
|
| |||||||
| 4,484,465 | ||||||||
Food & Staples Retailing - 2.09% |
| |||||||
Kroger Co. (The) | 80,800 | 2,102,416 | ||||||
Susser Holdings Corp.* | 62,700 | 2,162,523 | ||||||
|
| |||||||
| 4,264,939 | ||||||||
Food Products - 1.03% |
| |||||||
HJ Heinz Co. | 36,500 | 2,105,320 | ||||||
Health Care Equipment & Supplies - 2.23% |
| |||||||
Integra LifeSciences Holdings Corp.* | 55,500 | 2,162,835 | ||||||
West Pharmaceutical Services, Inc. | 43,700 | 2,392,575 | ||||||
|
| |||||||
| 4,555,410 | ||||||||
Health Care Providers & Services - 7.21% |
| |||||||
Aetna, Inc. | 49,000 | 2,268,700 | ||||||
AmerisourceBergen Corp. | 49,500 | 2,137,410 | ||||||
Bio-Reference Labs, Inc.*+ | 39,000 | 1,118,910 | ||||||
Cigna Corp. | 38,100 | 2,036,826 | ||||||
DaVita HealthCare Partners, Inc.* | 20,700 | 2,287,971 | ||||||
HCA Holdings, Inc. | 76,800 | 2,317,056 | ||||||
McKesson Corp. | 26,700 | 2,588,832 | ||||||
|
| |||||||
| 14,755,705 | ||||||||
Hotels, Restaurants & Leisure - 3.10% |
| |||||||
Cracker Barrel Old Country Store, Inc. | 28,300 | 1,818,558 | ||||||
Jack in the Box, Inc.* | 79,700 | 2,279,420 | ||||||
Wynn Resorts, Ltd. | 20,000 | 2,249,800 | ||||||
|
| |||||||
| 6,347,778 | ||||||||
Household Durables - 4.63% |
| |||||||
Meritage Homes Corp.* | 62,000 | 2,315,700 | ||||||
PulteGroup, Inc.* | 124,700 | 2,264,552 | ||||||
www.bridgeway.com | 12 |
Bridgeway Aggressive Investors 1 Fund SCHEDULE OF INVESTMENTS (continued) | |
Showing percentage of net assets as of December 31, 2012 (Unaudited)
| Industry Company | Shares | Value | ||||||||||
Common Stocks (continued) |
| |||||||||||
Household Durables (continued) |
| |||||||||||
Ryland Group, Inc. (The) | 83,200 | $ | 3,036,800 | |||||||||
Toll Brothers, Inc.* | 57,200 | 1,849,276 | ||||||||||
|
| |||||||||||
| 9,466,328 | ||||||||||||
Household Products - 1.45% |
| |||||||||||
Central Garden & Pet Co., Class A* | 98,200 | 1,026,190 | ||||||||||
Church & Dwight Co., Inc. | 36,400 | 1,949,948 | ||||||||||
|
| |||||||||||
| 2,976,138 | ||||||||||||
Insurance - 5.84% |
| |||||||||||
Arch Capital Group, Ltd.* | 49,900 | 2,196,598 | ||||||||||
Axis Capital Holdings, Ltd. | 59,200 | 2,050,688 | ||||||||||
First American | 99,200 | 2,389,728 | ||||||||||
MetLife, Inc. | 66,000 | 2,174,040 | ||||||||||
Prudential Financial, Inc. | 39,400 | 2,101,202 | ||||||||||
Stewart Information Services Corp. | 39,700 | 1,032,200 | ||||||||||
|
| |||||||||||
| 11,944,456 | ||||||||||||
Internet & Catalog Retail - 0.54% | ||||||||||||
HSN, Inc. | 20,000 | 1,101,600 | ||||||||||
Internet Software & Services - 2.15% |
| |||||||||||
Equinix, Inc.* | 11,200 | 2,309,440 | ||||||||||
Rackspace Hosting, Inc.* | 28,100 | 2,086,987 | ||||||||||
|
| |||||||||||
| 4,396,427 | ||||||||||||
IT Services - 2.66% |
| |||||||||||
Accenture PLC, Class A | 35,900 | 2,387,350 | ||||||||||
International Business Machines Corp. | 5,400 | 1,034,370 | ||||||||||
Western Union Co. (The) | 148,500 | 2,021,085 | ||||||||||
|
| |||||||||||
| 5,442,805 | ||||||||||||
Media - 2.41% |
| |||||||||||
New York Times Co., | 58,900 | 502,417 | ||||||||||
Sinclair Broadcast Group, Inc., Class A | 164,900 | 2,081,038 | ||||||||||
Time Warner Cable, Inc. | 24,200 | 2,351,998 | ||||||||||
|
| |||||||||||
| 4,935,453 | ||||||||||||
Office Electronics - 1.07% |
| |||||||||||
Xerox Corp. | 320,700 | 2,187,174 | ||||||||||
| Industry Company | Shares | Value | ||||||
| ||||||||
Oil, Gas & Consumable Fuels - 7.76% |
| |||||||
Chevron Corp. | 19,700 | $ | 2,130,358 | |||||
Crosstex Energy, Inc. | 81,900 | 1,174,446 | ||||||
Delek US Holdings, Inc. | 94,000 | 2,380,080 | ||||||
HollyFrontier Corp. | 67,600 | 3,146,780 | ||||||
Marathon Petroleum Corp. | 40,000 | 2,520,000 | ||||||
Suncor Energy, Inc. | 62,000 | 2,044,760 | ||||||
Tesoro Corp. | 56,300 | 2,480,015 | ||||||
|
| |||||||
| 15,876,439 | ||||||||
Paper & Forest Products - 2.69% |
| |||||||
Louisiana-Pacific Corp.* | 137,400 | 2,654,568 | ||||||
PH Glatfelter Co. | 163,400 | 2,856,232 | ||||||
|
| |||||||
| 5,510,800 | ||||||||
Pharmaceuticals - 0.66% |
| |||||||
Warner Chilcott PLC, | 112,200 | 1,350,888 | ||||||
Real Estate Investment Trusts (REITs) - 4.03% |
| |||||||
American Tower Corp. | 28,600 | 2,209,922 | ||||||
BioMed Realty Trust, Inc. | 92,500 | 1,788,025 | ||||||
Weingarten Realty Investors | 76,600 | 2,050,582 | ||||||
Weyerhaeuser Co. | 78,800 | 2,192,216 | ||||||
|
| |||||||
| 8,240,745 | ||||||||
Semiconductors & Semiconductor Equipment - 0.96% |
| |||||||
Cirrus Logic, Inc.* | 68,000 | 1,969,960 | ||||||
Software - 2.56% |
| |||||||
NetSuite, Inc.* | 34,800 | 2,342,040 | ||||||
Oracle Corp. | 86,600 | 2,885,512 | ||||||
|
| |||||||
| 5,227,552 | ||||||||
Specialty Retail - 9.22% |
| |||||||
Gap, Inc. (The) | 127,000 | 3,942,080 | ||||||
Home Depot, Inc. (The) | 32,900 | 2,034,865 | ||||||
Limited Brands, Inc. | 47,300 | 2,225,938 | ||||||
Lumber Liquidators Holdings, Inc.*+ | 61,200 | 3,233,196 | ||||||
OfficeMax, Inc. | 361,900 | 3,532,144 | ||||||
O’Reilly Automotive, Inc.* | 22,500 | 2,011,950 | ||||||
Pep Boys-Manny, Moe & Jack (The) | 192,000 | 1,887,360 | ||||||
|
| |||||||
| 18,867,533 | ||||||||
13 | Semi-Annual Report | December 31, 2012 (Unaudited) |
Bridgeway Aggressive Investors 1 Fund SCHEDULE OF INVESTMENTS (continued) | |
Showing percentage of net assets as of December 31, 2012 (Unaudited)
| Industry Company | Shares | Value | ||||||||||||
Common Stocks (continued) |
| |||||||||||||
Trading Companies & Distributors - 1.45% |
| |||||||||||||
United Rentals, Inc.* | 64,959 | $ | 2,956,933 | |||||||||||
|
| |||||||||||||
TOTAL COMMON STOCKS - 100.26% |
| 205,058,274 | ||||||||||||
|
| |||||||||||||
(Cost $ 184,142,146) | ||||||||||||||
| Rate^ | Shares | Value | ||||||||||||
|
| |||||||||||||
MONEY MARKET FUND - 0.00% |
| |||||||||||||
BlackRock FedFund | 0.01 | % | 895 | 895 | ||||||||||
|
| |||||||||||||
TOTAL MONEY MARKET FUND - 0.00% |
| 895 | ||||||||||||
|
| |||||||||||||
(Cost $ 895) | ||||||||||||||
TOTAL INVESTMENTS - 100.26% |
| $ | 205,059,169 | |||||||||||
(Cost $ 184,143,041) | ||||||||||||||
Liabilities in Excess of Other Assets - (0.26%) |
| (527,034 | ) | |||||||||||
|
| |||||||||||||
NET ASSETS - 100.00% | $ | 204,532,135 | ||||||||||||
|
| |||||||||||||
| * | Non-income producing security. |
| # | Securities, or a portion thereof, segregated to cover the Fund’s potential obligation under swap agreements. The total value of segregated assets is $1,156,500. |
| ^ | Rate disclosed as of December 31, 2012. |
| + | This security or a portion of the security is out on loan at December 31, 2012. Total loaned securities had a value of $14,052,360 at December 31, 2012. |
PLC - Public Limited Company
Summary of inputs used to value the Fund’s investments as of 12/31/2012 is as follows (See Note 2 in Notes to Financial Statements):
| Valuation Inputs | ||||||||||||||||||||
| Investment in Securities (Value) | ||||||||||||||||||||
Level 1 Quoted Prices | Level 2 Significant Observable Inputs | Level 3 Significant Unobservable Inputs | Total | |||||||||||||||||
Common Stocks | $ | 205,058,274 | $ | — | $ | — | $ | 205,058,274 | ||||||||||||
Money Market Fund | — | 895 | — | 895 | ||||||||||||||||
|
|
|
|
|
|
|
| |||||||||||||
TOTAL | $ | 205,058,274 | $ | 895 | $ | — | $ | 205,059,169 | ||||||||||||
|
|
|
|
|
|
|
| |||||||||||||
See Notes to Financial Statements.
www.bridgeway.com | 14 |
Ultra-Small Company Fund | |
(Unaudited)
December 31, 2012
Dear Fellow Ultra-Small Company Fund Shareholder,
For the quarter ended December 31, 2012, our Fund was up 2.91%, outperforming our primary market benchmark, the CRSP Cap-Based Portfolio 10 Index (-1.08%), our peer benchmark, the Lipper Micro-Cap Stock Funds Index (+0.47%), the Russell Microcap Index (+0.04%) and the Russell 2000 Index (+1.85%), It was a good quarter on a relative basis and we are pleased.
For the six-month “semi-annual” period ending December 31, 2012, our Fund returned 10.11%, outperforming our primary market benchmark, the CRSP Cap-Based Portfolio 10 Index (+5.28%), our peer benchmark, the Lipper Micro-Cap Stock Funds Index (+5.97%), the Russell Microcap Index (+5.96%) and the Russell 2000 Index (+7.20%), Most of our models performed very well in the second half of 2012 as market correlations returned to a historically normal range.
For the 2012 calendar year, our Fund was up 24.49%, outperforming all of our benchmarks as we did for the quarter and the last six months. It feels good to have a clean sweep for these shorter time periods and since inception. We still have some ground to make up relative to our performance benchmarks in the five and ten year periods, primarily due to the “penny stock” and “junk rally” effects of 2009.
The table below presents our December quarter, six-month, one-year, five-year, ten-year and inception-to-date financial results. See the next page for a graph of performance since inception.
Standardized Returns as of December 31, 2012
Annualized | ||||||||||||||||||||||||||||||
| Quarter | 6 Months | 1 Year | 5 Years | 10 Years | Since Inception (8/5/94) | |||||||||||||||||||||||||
Ultra-Small Company Fund | 2.91% | 10.11% | 24.49% | 1.00% | 11.52% | 14.91% | ||||||||||||||||||||||||
CRSP Cap-Based Portfolio 10 Index | -1.08% | 5.28% | 21.47% | 5.25% | 12.90% | 11.83% | ||||||||||||||||||||||||
Russell Microcap Index | 0.04% | 5.96% | 19.75% | 1.46% | 8.42% | N/A | ||||||||||||||||||||||||
Russell 2000 Index | 1.85% | 7.20% | 16.35% | 3.56% | 9.72% | 8.46% | ||||||||||||||||||||||||
Lipper Micro-Cap Stock Funds Index | 0.47% | 5.97% | 15.69% | 1.95% | 9.05% | N/A | ||||||||||||||||||||||||
Performance figures quoted in the table above and the graph on the next page represent past performance and are no guarantee of future results. Total return figures in the table above and the graph on the next page include the reinvestment of dividends and capital gains. The table above and the graph on the next page do not reflect the deduction of taxes that a shareholder would pay on Fund distributions or on the redemption of Fund shares.
The CRSP Cap-Based Portfolio 10 Index is an unmanaged index of 1,055 of the smallest publicly traded U.S. stocks (with dividends reinvested), as reported by the Center for Research on Security Prices. The Lipper Micro-Cap Stock Funds Index is an index of small-company funds compiled by Lipper, Inc. The Russell Microcap Index is an unmanaged, market value weighted index that measures performance of 1,000 of the smallest securities in the Russell 2000 Index. The Russell 2000 Index is an unmanaged, market value weighted index that measures performance of the 2,000 companies that are between the 1,000th and 3,000th largest in the market with dividends reinvested. It is not possible to invest directly in an index. Periods longer than one year are annualized.
According to data from Lipper, Inc. as of December 31, 2012, Ultra-Small Company Fund ranked 3rd of 68 micro-cap funds for the twelve months ending December 31, 2012, 35th of 48 over the last five years, 2nd of 34 over the last ten years, and 1st of 8 since inception in August, 1994. These long-term numbers and the graph below give two snapshots of our long-term success. Lipper, Inc. is an independent mutual fund rating service that ranks funds in various fund categories by making comparative calculations using total returns.
15 | Semi-Annual Report | December 31, 2012 (Unaudited) |
Ultra-Small Company Fund MANAGER’S COMMENTARY (Unaudited) (continued) | |
(Unaudited)
Ultra-Small Company Fund vs. CRSP Cap-Based Portfolio 10 Index, Russell Microcap Index**, Russell 2000 Index & Lipper Micro-Cap Stock Funds Index* from Inception 8/5/94 to 12/31/12
| * | The Lipper Micro-Cap Stock Funds Index began on 12/31/1995, and the line graph for the Index begins at the same value as the Fund on that date. |
| ** | The Russell Microcap Index began on 6/30/2000, and the line graph for the Index begins at the same value as the Fund on that date. |
Detailed Explanation of Quarterly Performance
The Short Version: Our value models were the best-performing models for the quarter.
Our value models shined for the quarter. They represented 29% of our net assets and averaged more than an eight percent return for the three-month period.
Stock picks in the Energy and Industrial sectors produced our best relative returns, adding about two percent of outperformance for the quarter. Being underweighted in the poorly performing Health Care sector aided our relative performance as well. Companies in the Fund that surprised Wall Street to the upside were relatively well rewarded this quarter, a welcome reversal of the trend during some of the macro-driven years from 2008 to 2011.
From a company size standpoint, the table on the next page, which shows data as of December 31, 2012, indicates that the largest (CRSP 1) and the smallest (CRSP 10) stocks were the only stocks that had negative performance for the quarter. This gave us a strong headwind relative to the Russell 2000 Index of small companies, but a relative tailwind relative to our primary market index, which is rebalanced quarterly and comprised only of CRSP 10 ultra-small companies.
www.bridgeway.com | 16 |
Ultra-Small Company Fund MANAGER’S COMMENTARY (Unaudited) (continued) | |
(Unaudited)
| CRSP Decile1 | Quarter | 6 Months | 1 Year | 5 Years | 10 Years | 87 Years | ||||||||||||||||||
1 (ultra-large) | -1.13% | 5.31% | 15.95 | % | 1.30% | 6.40% | 9.10% | |||||||||||||||||
2 | 1.81% | 7.80% | 15.97 | % | 2.68% | 10.16% | 10.42% | |||||||||||||||||
3 | 3.60% | 9.08% | 16.73 | % | 4.04% | 10.35% | 10.81% | |||||||||||||||||
4 | 3.70% | 10.27% | 16.29 | % | 5.64% | 11.32% | 10.79% | |||||||||||||||||
5 | 3.88% | 10.98% | 15.82 | % | 6.69% | 12.11% | 11.33% | |||||||||||||||||
6 | 3.78% | 9.06% | 18.13 | % | 4.65% | 10.91% | 11.29% | |||||||||||||||||
7 | 1.16% | 6.62% | 18.05 | % | 6.26% | 11.91% | 11.27% | |||||||||||||||||
8 | 2.27% | 8.96% | 18.30 | % | 7.13% | 12.57% | 11.49% | |||||||||||||||||
9 | 1.12% | 6.17% | 14.57 | % | 5.42% | 10.90% | 11.47% | |||||||||||||||||
10 (ultra-small) | -1.08% | 5.28% | 21.47 | % | 5.25% | 12.90% | 13.01% | |||||||||||||||||
| 1 | The CRSP Cap-Based Portfolio Indexes are unmanaged indexes of the publicly traded U.S. stocks with dividends reinvested, grouped by market capitalization, as reported by the Center for Research in Security Prices. Past performance is no guarantee of future results. |
Detailed Explanation of Calender Year Performance
The Short Version: The strong fourth quarter brought our relative returns for the year from negative to positive.
As it did for the quarter, our value tilt added almost two percent to our relative returns for the year. Most of that outperformance occurred during the fourth quarter, when our value models really stood out. Our overweighting combined with solid stock picks in the Consumer Discretionary sector produced more than four percent of outperformance versus the CRSP 10 Index.
Top Ten Holdings as of December 31, 2012
| Rank | Description | Industry | % of Net Assets | |||||
1 | Green Plains Renewable Energy, Inc. | Oil, Gas & Consumable Fuels | 2.0% | |||||
2 | Conn’s, Inc. | Specialty Retail | 1.8% | |||||
3 | Homeowners Choice, Inc. | Insurance | 1.5% | |||||
4 | Barrett Business Services, Inc. | Professional Services | 1.4% | |||||
5 | CalAmp Corp. | Communications Equipment | 1.4% | |||||
6 | Bon-Ton Stores, Inc. (The) | Multiline Retail | 1.4% | |||||
7 | Fairpoint Communications, Inc. | Diversified Telecommunication Services | 1.3% | |||||
8 | Cenveo, Inc. | Commercial Services & Supplies | 1.3% | |||||
9 | James River Coal Co. | Oil, Gas & Consumable Fuels | 1.3% | |||||
10 | Smith & Wesson Holding Corp. | Leisure Equipment & Products | 1.2% | |||||
| Total | 14.6% | |||||||
17 | Semi-Annual Report | December 31, 2012 (Unaudited) |
Ultra-Small Company Fund MANAGER’S COMMENTARY (Unaudited) (continued) | |
(Unaudited)
Industry Sector Representation as of December 31, 2012
| % of Net Assets | % of CRSP 10 Index | Difference | |||||||||||||
Consumer Discretionary | 21.5% | 16.5% | 5.0% | ||||||||||||
Consumer Staples | 5.8% | 3.1% | 2.7% | ||||||||||||
Energy | 5.9% | 7.8% | -1.9% | ||||||||||||
Financials | 23.3% | 24.6% | -1.3% | ||||||||||||
Health Care | 7.5% | 15.0% | -7.5% | ||||||||||||
Industrials | 15.6% | 12.3% | 3.3% | ||||||||||||
Information Technology | 11.7% | 15.5% | -3.8% | ||||||||||||
Materials | 3.9% | 2.7% | 1.2% | ||||||||||||
Telecommunication Services | 3.4% | 1.4% | 2.0% | ||||||||||||
Utilities | 0.4% | 1.1% | -0.7% | ||||||||||||
Cash & Other Assets | 1.0% | 0.0% | 1.0% | ||||||||||||
Total | 100.0% | 100.0% | |||||||||||||
Disclaimer
The views expressed here are exclusively those of Fund management. These views, including those related to market sectors or individual stocks, are not meant as investment advice and should not be considered predictive in nature. Any favorable (or unfavorable) description of a holding applies only as of December 31, 2012, unless otherwise stated. Security positions can and do change thereafter. Discussions of historical performance do not guarantee and are not indicative of future performance.
The Fund is subject to very high, above market risk (volatility) and is not an appropriate investment for short-term investors. Investments in ultra-small companies generally carry greater risk than is customarily associated with larger companies and even “small companies” for various reasons, such as narrower markets (fewer investors), limited financial resources and greater trading difficulty.
Conclusion
Because of capacity limitations, Ultra-Small Company Fund is open to current investors only through Bridgeway. We encourage your feedback; your reactions and concerns are important to us.
Sincerely,
The Investment Management Team
www.bridgeway.com | 18 |
Bridgeway Ultra-Small Company Fund | |
Showing percentage of net assets as of December 31, 2012 (Unaudited)
| Industry Company | Shares | Value | ||||||||||
COMMON STOCKS - 99.14% |
| |||||||||||
Aerospace & Defense - 1.64% |
| |||||||||||
Astronics Corp., Class B*+ | 3,047 | $ | 66,120 | |||||||||
Ducommun, Inc.* | 57,900 | 936,243 | ||||||||||
EDAC Technologies Corp.*+ | 18,600 | 229,524 | ||||||||||
LMI Aerospace, Inc.* | 24,900 | 481,566 | ||||||||||
|
| |||||||||||
| 1,713,453 | ||||||||||||
Air Freight & Logistics - 1.00% |
| |||||||||||
Park-Ohio Holdings Corp.* | 49,000 | 1,044,190 | ||||||||||
Airlines - 1.03% |
| |||||||||||
Hawaiian Holdings, Inc.* | 19,900 | 130,743 | ||||||||||
Republic Airways Holdings, Inc.* | 166,300 | 944,584 | ||||||||||
|
| |||||||||||
| 1,075,327 | ||||||||||||
Auto Components - 1.27% |
| |||||||||||
Exide Technologies* | 262,100 | 896,382 | ||||||||||
Shiloh Industries, Inc. | 9,300 | 95,790 | ||||||||||
Strattec Security Corp. | 2,137 | 55,156 | ||||||||||
Tower International, Inc.* | 34,600 | 278,530 | ||||||||||
|
| |||||||||||
| 1,325,858 | ||||||||||||
Beverages - 0.18% |
| |||||||||||
Reed’s, Inc.*+ | 33,500 | 191,285 | ||||||||||
Biotechnology - 1.59% |
| |||||||||||
Anacor Pharmaceuticals, Inc.* | 47,700 | 248,040 | ||||||||||
China Biologic Products, Inc.*+ | 6,900 | 112,539 | ||||||||||
Maxygen, Inc. | 120,700 | 296,922 | ||||||||||
Oncothyreon, Inc.* | 279,300 | 536,256 | ||||||||||
Vanda Pharmaceuticals, Inc.* | 126,500 | 468,050 | ||||||||||
|
| |||||||||||
| 1,661,807 | ||||||||||||
Building Products - 2.15% |
| |||||||||||
NCI Building Systems, Inc.* | 54,600 | 758,940 | ||||||||||
Patrick Industries, Inc.* | 67,100 | 1,044,076 | ||||||||||
PGT, Inc.* | 100,000 | 450,000 | ||||||||||
|
| |||||||||||
| 2,253,016 | ||||||||||||
Capital Markets - 3.27% |
| |||||||||||
Calamos Asset | ||||||||||||
Management, Inc., Class A | 80,100 | 846,657 | ||||||||||
FBR & Co.* | 50,000 | 193,500 | ||||||||||
Fidus Investment Corp. | 63,600 | 1,046,220 | ||||||||||
Gladstone Investment Corp. | 30,000 | 208,800 | ||||||||||
KCAP Financial, Inc.+ | 50,000 | 459,500 | ||||||||||
| Industry Company | Shares | Value | ||||||
| ||||||||
Capital Markets (continued) | ||||||||
New Mountain Finance Corp. | 44,800 | $ | 667,520 | |||||
|
| |||||||
| 3,422,197 | ||||||||
Chemicals - 1.44% | ||||||||
American Vanguard Corp. | 11,000 | 341,770 | ||||||
Chase Corp. | 9,700 | 180,420 | ||||||
Gulf Resources, Inc.*+ | 195,100 | 226,316 | ||||||
Landec Corp.* | 79,800 | 757,302 | ||||||
|
| |||||||
| 1,505,808 | ||||||||
Commercial Banks - 5.73% | ||||||||
Access National Corp. | 9,800 | 127,400 | ||||||
American National Bankshares, Inc. | 19,000 | 383,610 | ||||||
C&F Financial Corp.+ | 6,700 | 260,898 | ||||||
Center Bancorp, Inc. | 18,300 | 211,914 | ||||||
Citizens & Northern Corp. | 16,400 | 309,960 | ||||||
Enterprise Bancorp, Inc.+ | 15,400 | 254,408 | ||||||
Enterprise Financial Services Corp. | 6,600 | 86,262 | ||||||
Farmers Capital Bank Corp.* | 20,000 | 245,000 | ||||||
Fidelity Southern Corp.*+ | 28,094 | 268,298 | ||||||
First M&F Corp. | 15,000 | 104,550 | ||||||
German American Bancorp, Inc.+ | 18,600 | 403,992 | ||||||
Heritage Financial Corp. | 30,200 | 443,638 | ||||||
Independent Bank Corp.*+ | 47,300 | 165,550 | ||||||
MainSource Financial Group, Inc. | 26,600 | 337,022 | ||||||
Metro Bancorp, Inc.* | 38,700 | 511,614 | ||||||
MetroCorp Bancshares, Inc.* | 16,000 | 175,840 | ||||||
OmniAmerican Bancorp, Inc.* | 20,670 | 478,097 | ||||||
Pacific Mercantile Bancorp*+ | 25,000 | 157,250 | ||||||
Park Sterling Corp.* | 75,000 | 392,250 | ||||||
Premier Financial Bancorp, Inc. | 10,200 | 110,466 | ||||||
Renasant Corp. | 13,700 | 262,218 | ||||||
Taylor Capital Group, Inc.*+ | 17,500 | 315,875 | ||||||
|
| |||||||
| 6,006,112 | ||||||||
Commercial Services & Supplies - 2.42% |
| |||||||
Casella Waste Systems, Inc., Class A* | 159,000 | 696,420 | ||||||
Ceco Environmental Corp. | 35,700 | 355,215 | ||||||
19 | Semi-Annual Report | December 31, 2012 (Unaudited) |
Bridgeway Ultra-Small Company Fund SCHEDULE OF INVESTMENTS (continued) | |
Showing percentage of net assets as of December 31, 2012 (Unaudited)
| Industry Company | Shares | Value | ||||||||
Common Stocks (continued) | ||||||||||
Commercial Services & Supplies (continued) |
| |||||||||
Cenveo, Inc.*+ | 502,800 | $ | 1,357,560 | |||||||
Versar, Inc.* | 31,800 | 122,748 | ||||||||
|
| |||||||||
| 2,531,943 | ||||||||||
Communications Equipment - 3.73% |
| |||||||||
CalAmp Corp.* | 176,900 | 1,471,808 | ||||||||
Ituran Location & Control, Ltd.+ | 14,500 | 196,765 | ||||||||
Mitel Networks Corp.* | 34,800 | 109,272 | ||||||||
Sierra Wireless, Inc.* | 87,600 | 695,544 | ||||||||
Tessco Technologies, Inc. | 49,100 | 1,087,074 | ||||||||
UTStarcom Holdings Corp.* | 331,400 | 344,656 | ||||||||
|
| |||||||||
| 3,905,119 | ||||||||||
Computers & Peripherals - 0.31% |
| |||||||||
Concurrent Computer Corp. | 20,700 | 117,783 | ||||||||
Novatel Wireless, Inc.* | 153,900 | 206,226 | ||||||||
|
| |||||||||
| 324,009 | ||||||||||
Construction & Engineering - 0.97% |
| |||||||||
Argan, Inc. | 22,800 | 410,400 | ||||||||
Goldfield Corp. (The)*+ | 273,400 | 513,992 | ||||||||
UniTek Global Services, Inc.* | 25,000 | 90,500 | ||||||||
|
| |||||||||
| 1,014,892 | ||||||||||
Consumer Finance - 0.40% |
| |||||||||
Atlanticus Holdings Corp.* | 55,100 | 184,585 | ||||||||
Consumer Portfolio Services, Inc.* | 43,600 | 233,696 | ||||||||
|
| |||||||||
| 418,281 | ||||||||||
Containers & Packaging - 0.12% |
| |||||||||
Myers Industries, Inc. | 8,200 | 124,230 | ||||||||
Diversified Consumer Services - 1.15% |
| |||||||||
Carriage Services, Inc. | 36,100 | 428,507 | ||||||||
Corinthian Colleges, Inc.* | 316,700 | 772,748 | ||||||||
|
| |||||||||
| 1,201,255 | ||||||||||
Diversified Financial Services - 0.36% |
| |||||||||
Gain Capital Holdings, Inc. | 57,000 | 233,130 | ||||||||
MicroFinancial, Inc. | 19,100 | 139,048 | ||||||||
|
| |||||||||
| 372,178 | ||||||||||
Diversified Telecommunication Services - 3.26% |
| |||||||||
Fairpoint Communications, Inc.*+ | 175,000 | 1,389,500 | ||||||||
HickoryTech Corp. | 24,900 | 242,277 | ||||||||
inContact, Inc.* | 147,900 | 766,122 | ||||||||
Neutral Tandem, Inc. | 306,300 | 787,191 | ||||||||
| Industry Company | Shares | Value | ||||||
| ||||||||
Diversified Telecommunication Services (continued) |
| |||||||
Primus Telecommunications Group, Inc. | 21,546 | $ | 234,205 | |||||
|
| |||||||
| 3,419,295 | ||||||||
Electrical Equipment - 0.85% |
| |||||||
Coleman Cable, Inc. | 27,800 | 257,706 | ||||||
Lihua International, Inc.+ | 115,800 | 508,362 | ||||||
Magnetek, Inc.* | 11,700 | 120,510 | ||||||
|
| |||||||
| 886,578 | ||||||||
Electronic Equipment, Instruments & Components - 1.81% |
| |||||||
Key Tronic Corp.* | 88,500 | 906,240 | ||||||
PAR Technology Corp.* | 18,400 | 90,160 | ||||||
PC Connection, Inc. | 48,500 | 557,750 | ||||||
SMTC Corp.* | 84,200 | 202,922 | ||||||
Viasystems Group, Inc.* | 11,200 | 136,640 | ||||||
|
| |||||||
| 1,893,712 | ||||||||
Energy Equipment & Services - 0.89% |
| |||||||
Forbes Energy Services, Ltd.* | 46,700 | 118,151 | ||||||
Global Geophysical Services, Inc.* | 24,000 | 92,400 | ||||||
North American Energy Partners, Inc.* | 105,100 | 357,340 | ||||||
PHI, Inc.* | 5,400 | 180,846 | ||||||
Pioneer Energy Services Corp.* | 25,800 | 187,308 | ||||||
|
| |||||||
| 936,045 | ||||||||
Food & Staples Retailing - 1.93% |
| |||||||
Ingles Markets, Inc., Class A | 6,200 | 107,012 | ||||||
Nash Finch Co. | 53,400 | 1,136,352 | ||||||
Pantry, Inc. (The)* | 7,000 | 84,910 | ||||||
Susser Holdings Corp.* | 20,100 | 693,249 | ||||||
|
| |||||||
| 2,021,523 | ||||||||
Food Products - 2.99% |
| |||||||
Alico, Inc. | 15,400 | 564,102 | ||||||
Farmer Bros. Co.* | 46,600 | 672,438 | ||||||
Inventure Foods, Inc.* | 139,600 | 906,004 | ||||||
John B. Sanfilippo & Son, Inc. | 44,600 | 810,828 | ||||||
Rocky Mountain Chocolate Factory, Inc. | 17,300 | 182,688 | ||||||
|
| |||||||
| 3,136,060 | ||||||||
Health Care Equipment & Supplies - 2.43% |
| |||||||
CryoLife, Inc. | 105,300 | 656,019 | ||||||
Delcath Systems, Inc.* | 305,000 | 375,150 | ||||||
www.bridgeway.com | 20 |
Bridgeway Ultra-Small Company Fund SCHEDULE OF INVESTMENTS (continued) | |
Showing percentage of net assets as of December 31, 2012 (Unaudited)
| Industry Company | Shares | Value | ||||||||||
Common Stocks (continued) | ||||||||||||
Health Care Equipment & Supplies (continued) |
| |||||||||||
Fonar Corp.* | 56,500 | $ | 244,645 | |||||||||
Kewaunee Scientific Corp. | 10,000 | 121,500 | ||||||||||
Orthofix International N.V.* | 2,700 | 106,191 | ||||||||||
PhotoMedex, Inc.*+ | 72,000 | 1,044,720 | ||||||||||
|
| |||||||||||
| 2,548,225 | ||||||||||||
Health Care Providers & Services - 2.53% |
| |||||||||||
Addus HomeCare Corp.* | 23,700 | 168,744 | ||||||||||
Alliance HealthCare Services, Inc.* | 25,160 | 160,521 | ||||||||||
Five Star Quality Care, Inc.* | 205,400 | 1,029,054 | ||||||||||
Providence Service Corp. (The)* | 62,700 | 1,065,273 | ||||||||||
Psychemedics Corp. | 9,700 | 104,275 | ||||||||||
Triple-S Management Corp., Class B* | 6,800 | 125,596 | ||||||||||
|
| |||||||||||
| 2,653,463 | ||||||||||||
Hotels, Restaurants & Leisure - 4.21% |
| |||||||||||
Carrols Restaurant Group, Inc.* | 188,000 | 1,124,240 | ||||||||||
Einstein Noah Restaurant Group, Inc. | 14,100 | 172,161 | ||||||||||
Frisch’s Restaurants, Inc. | 10,700 | 197,950 | ||||||||||
Isle of Capri Casinos, Inc.* | 94,400 | 528,640 | ||||||||||
Kona Grill, Inc.* | 48,700 | 422,229 | ||||||||||
Monarch Casino & Resort, Inc.* | 22,423 | 244,635 | ||||||||||
MTR Gaming Group, Inc.* | 63,900 | 266,463 | ||||||||||
Papa John’s International, Inc.* | 3,300 | 181,302 | ||||||||||
Ruth’s Hospitality Group, Inc.* | 134,100 | 974,907 | ||||||||||
Sonic Corp.* | 28,500 | 296,685 | ||||||||||
|
| |||||||||||
| 4,409,212 | ||||||||||||
Household Durables - 1.03% |
| |||||||||||
Bassett Furniture Industries, Inc. | 46,100 | 574,867 | ||||||||||
Flexsteel Industries, Inc. | 14,000 | 300,300 | ||||||||||
Libbey, Inc.* | 10,600 | 205,110 | ||||||||||
|
| |||||||||||
| 1,080,277 | ||||||||||||
Household Products - 0.29% |
| |||||||||||
Oil-Dri Corp. of America | 4,600 | 126,960 | ||||||||||
Orchids Paper Products Co. | 8,800 | 177,936 | ||||||||||
|
| |||||||||||
| 304,896 | ||||||||||||
Insurance - 3.38% |
| |||||||||||
Crawford & Co., Class B | 38,800 | 309,624 | ||||||||||
Eastern Insurance Holdings, Inc. | 18,700 | 319,396 | ||||||||||
| Industry Company | Shares | Value | ||||||
| ||||||||
Insurance (continued) |
| |||||||
Homeowners Choice, Inc.+ | 78,200 | $ | 1,625,778 | |||||
Independence Holding Co. | 9,200 | 87,584 | ||||||
Investors Title Co. | 4,100 | 246,000 | ||||||
Maiden Holdings, Ltd. | 16,400 | 150,716 | ||||||
United Fire Group, Inc. | 10,700 | 233,688 | ||||||
Universal Insurance Holdings, Inc. | 130,000 | 569,400 | ||||||
|
| |||||||
| 3,542,186 | ||||||||
Internet & Catalog Retail - 0.64% |
| |||||||
1-800-Flowers.com, Inc., Class A* | 183,500 | 673,445 | ||||||
Internet Software & Services - 0.70% |
| |||||||
BroadVision, Inc.*+ | 49,049 | 437,517 | ||||||
Internet Initiative Japan, Inc. - Sponsored ADR+ | 9,100 | 104,559 | ||||||
TheStreet, Inc. | 113,700 | 189,879 | ||||||
|
| |||||||
| 731,955 | ||||||||
IT Services - 2.04% |
| |||||||
Heartland Payment Systems, Inc. | 7,500 | 221,250 | ||||||
Lionbridge Technologies, Inc.* | 227,400 | 914,148 | ||||||
NCI, Inc., Class A* | 85,000 | 398,650 | ||||||
Pfsweb, Inc.* | 60,200 | 170,968 | ||||||
PRGX Global, Inc.* | 67,200 | 433,440 | ||||||
|
| |||||||
| 2,138,456 | ||||||||
Leisure Equipment & Products - 2.18% |
| |||||||
Arctic Cat, Inc.* | 3,900 | 130,221 | ||||||
LeapFrog Enterprises, Inc.* | 29,600 | 255,448 | ||||||
Nautilus, Inc.* | 188,800 | 662,688 | ||||||
Smith & Wesson Holding Corp.*+ | 146,800 | 1,238,992 | ||||||
|
| |||||||
| 2,287,349 | ||||||||
Life Sciences Tools & Services - 0.89% |
| |||||||
Albany Molecular Research, Inc.* | 86,700 | 457,776 | ||||||
Pacific Biosciences of California, Inc.* | 280,000 | 476,000 | ||||||
|
| |||||||
| 933,776 | ||||||||
Machinery - 0.95% |
| |||||||
Cleantech Solutions | ||||||||
International, Inc.*+ | 69,000 | 272,550 | ||||||
Manitex International, Inc.* | 73,300 | 523,362 | ||||||
Supreme Industries, Inc., Class A* | 26,900 | 91,729 | ||||||
21 | Semi-Annual Report | December 31, 2012 (Unaudited) |
Bridgeway Ultra-Small Company Fund SCHEDULE OF INVESTMENTS (continued) | |
Showing percentage of net assets as of December 31, 2012 (Unaudited)
| Industry Company | Shares | Value | ||||||||||
Common Stocks (continued) | ||||||||||||
Machinery (continued) |
| |||||||||||
Xerium Technologies, Inc.* | 36,500 | $ | 111,325 | |||||||||
|
| |||||||||||
| 998,966 | ||||||||||||
Marine - 0.44% |
| |||||||||||
Eagle Bulk Shipping, Inc.* | 83,426 | 125,139 | ||||||||||
Global Ship Lease, Inc., Class A*+ | 51,500 | 151,410 | ||||||||||
Ultrapetrol Bahamas, Ltd.*+ | 110,000 | 181,500 | ||||||||||
|
| |||||||||||
| 458,049 | ||||||||||||
Media - 5.02% |
| |||||||||||
Beasley Broadcasting Group, Inc., Class A+ | 18,900 | 92,421 | ||||||||||
Emmis Communications Corp., Class A* | 163,900 | 322,883 | ||||||||||
Entercom Communications Corp., Class A* | 4,622 | 32,262 | ||||||||||
Fisher Communications, Inc. | 41,000 | 1,106,590 | ||||||||||
Gray Television, Inc.* | 193,500 | 425,700 | ||||||||||
Lee Enterprises, Inc.* | 354,800 | 404,472 | ||||||||||
LIN TV Corp., Class A* | 137,200 | 1,033,116 | ||||||||||
McClatchy Co., Class A (The)*# | 204,300 | 668,061 | ||||||||||
Saga Communications, Inc., Class A | 5,100 | 237,150 | ||||||||||
Salem Communications Corp., Class A | 78,700 | 429,702 | ||||||||||
Sinclair Broadcast Group, Inc., Class A | 18,800 | 237,256 | ||||||||||
Spanish Broadcasting System, Inc., Class A* | 109,500 | 270,465 | ||||||||||
|
| |||||||||||
| 5,260,078 | ||||||||||||
Metals & Mining - 0.79% |
| |||||||||||
Handy & Harman, Ltd.* | 55,000 | 828,850 | ||||||||||
Multiline Retail - 1.39% |
| |||||||||||
Bon-Ton Stores, Inc. (The) | 120,500 | 1,460,460 | ||||||||||
Oil, Gas & Consumable Fuels - 4.98% |
| |||||||||||
Adams Resources & Energy, Inc. | 12,600 | 441,882 | ||||||||||
Alon USA Energy, Inc. | 20,000 | 361,800 | ||||||||||
BioFuel Energy Corp.*+ | 49,000 | 180,320 | ||||||||||
Crimson Exploration, Inc.* | 80,400 | 220,296 | ||||||||||
Double Eagle Petroleum Co.* | 28,142 | 110,879 | ||||||||||
Green Plains Renewable Energy, Inc.* | 268,100 | 2,120,671 | ||||||||||
James River Coal Co.*+ | 423,900 | 1,356,480 | ||||||||||
Verenium Corp.*+ | 57,600 | 124,992 | ||||||||||
Westmoreland Coal Co.* | 32,600 | 304,484 | ||||||||||
|
| |||||||||||
| 5,221,804 | ||||||||||||
| Industry Company | Shares | Value | ||||||
| ||||||||
Paper & Forest Products - 0.21% |
| |||||||
Neenah Paper, Inc. | 7,900 | $ | 224,913 | |||||
Personal Products - 0.45% |
| |||||||
Cyanotech Corp.* | 40,100 | 185,663 | ||||||
Nutraceutical International Corp. | 17,200 | 284,488 | ||||||
|
| |||||||
| 470,151 | ||||||||
Pharmaceuticals - 0.54% |
| |||||||
Pozen, Inc.* | 112,600 | 564,126 | ||||||
Professional Services - 2.93% |
| |||||||
Barrett Business Services, Inc. | 39,300 | 1,496,937 | ||||||
CDI Corp. | 11,400 | 195,282 | ||||||
Franklin Covey Co.* | 22,400 | 288,960 | ||||||
ICF International, Inc.* | 8,600 | 201,584 | ||||||
On Assignment, Inc.* | 31,300 | 634,764 | ||||||
VSE Corp. | 10,100 | 247,551 | ||||||
|
| |||||||
| 3,065,078 | ||||||||
Real Estate Investment Trusts (REITs) - 4.71% |
| |||||||
Agree Realty Corp. | 26,160 | 700,826 | ||||||
Capital Trust, Inc., Class A | 110,300 | 231,630 | ||||||
Gramercy Capital Corp.* | 268,600 | 789,684 | ||||||
MPG Office Trust, Inc.*+ | 283,700 | 873,796 | ||||||
One Liberty Properties, Inc. | 41,700 | 846,093 | ||||||
Retail Opportunity Investments Corp.+ | 21,700 | 279,062 | ||||||
Sabra Health Care REIT, Inc. | 6,700 | 145,524 | ||||||
Terreno Realty Corp. | 20,700 | 319,608 | ||||||
Winthrop Realty Trust | 67,900 | 750,295 | ||||||
|
| |||||||
| 4,936,518 | ||||||||
Real Estate Management & Development - 0.11% |
| |||||||
ZipRealty, Inc.* | 40,000 | 112,000 | ||||||
Road & Rail - 1.48% |
| |||||||
Celadon Group, Inc. | 15,200 | 274,664 | ||||||
Covenant Transportation Group, Inc., Class A* | 74,700 | 413,091 | ||||||
Saia, Inc.* | 37,300 | 862,376 | ||||||
|
| |||||||
| 1,550,131 | ||||||||
Semiconductors & Semiconductor Equipment - 0.70% |
| |||||||
Actions Semiconductor Co., Ltd. - ADR*+ | 58,000 | 95,120 | ||||||
Alpha & Omega Semiconductor, Ltd.* | 50,000 | 420,000 | ||||||
Amtech Systems, Inc.*+ | 31,800 | 102,396 | ||||||
www.bridgeway.com | 22 |
Bridgeway Ultra-Small Company Fund SCHEDULE OF INVESTMENTS (continued) | |
Showing percentage of net assets as of December 31, 2012 (Unaudited)
| Industry Company | Shares | Value | ||||||||||
Common Stocks (continued) | ||||||||||||
Semiconductors & Semiconductor Equipment (continued) |
| |||||||||||
Cascade Microtech, Inc.* | 20,000 | $ | 112,000 | |||||||||
|
| |||||||||||
| 729,516 | ||||||||||||
Software - 1.74% |
| |||||||||||
ePlus, Inc. | 15,700 | 649,038 | ||||||||||
Evolving Systems, Inc. | 23,300 | 138,868 | ||||||||||
NetSol Technologies, Inc.*+ | 44,400 | 264,180 | ||||||||||
TeleCommunication Systems, Inc., Class A* | 314,100 | 775,827 | ||||||||||
|
| |||||||||||
| 1,827,913 | ||||||||||||
Specialty Retail - 3.69% |
| |||||||||||
Citi Trends, Inc.* | 36,600 | 503,616 | ||||||||||
Conn’s, Inc.*+ | 62,000 | 1,902,160 | ||||||||||
Haverty Furniture Cos., Inc. | 17,400 | 283,794 | ||||||||||
Pacific Sunwear of California, Inc.* | 296,600 | 471,594 | ||||||||||
TravelCenters of America LLC* | 150,200 | 705,940 | ||||||||||
|
| |||||||||||
| 3,867,104 | ||||||||||||
Textiles, Apparel & Luxury Goods - 0.90% |
| |||||||||||
Culp, Inc. | 10,400 | 156,104 | ||||||||||
Delta Apparel, Inc.* | 14,900 | 208,302 | ||||||||||
Movado Group, Inc. | 8,300 | 254,644 | ||||||||||
R.G. Barry Corp. | 23,100 | 327,327 | ||||||||||
|
| |||||||||||
| 946,377 | ||||||||||||
Thrifts & Mortgage Finance - 5.40% |
| |||||||||||
Bank Mutual Corp. | 118,800 | 510,840 | ||||||||||
BofI Holding, Inc.* | 29,300 | 816,591 | ||||||||||
First Financial Holdings, Inc. | 67,700 | 885,516 | ||||||||||
First Pactrust Bancorp, Inc. | 24,400 | 299,388 | ||||||||||
Heritage Financial Group, Inc. | 20,000 | 275,800 | ||||||||||
Hingham Institution for Savings | 2,500 | 156,500 | ||||||||||
IMPAC Mortgage Holdings, Inc.*+ | 46,000 | 648,600 | ||||||||||
Meta Financial Group, Inc. | 4,200 | 95,760 | ||||||||||
NASB Financial, Inc.*+ | 5,200 | 111,124 | ||||||||||
Peoples Federal Bancshares, Inc.+ | 17,900 | 311,281 | ||||||||||
Provident Financial Holdings, Inc. | 24,100 | 421,750 | ||||||||||
Pulaski Financial Corp. | 16,600 | 148,570 | ||||||||||
Security National Financial Corp., Class A*+ | 47,910 | 420,650 | ||||||||||
Simplicity Bancorp, Inc. | 30,000 | 448,500 | ||||||||||
United Community Financial Corp.* | 36,300 | 104,907 | ||||||||||
|
| |||||||||||
| 5,655,777 | ||||||||||||
| Industry Company | Shares | Value | ||||||
| ||||||||
Trading Companies & Distributors - 0.67% |
| |||||||
BlueLinx Holdings, Inc.* | 49,100 | $ | 137,971 | |||||
DXP Enterprises, Inc.* | 11,400 | 559,398 | ||||||
|
| |||||||
| 697,369 | ||||||||
Transportation Infrastructure - 0.86% |
| |||||||
Aegean Marine Petroleum | ||||||||
Network, Inc. | 171,100 | 903,408 | ||||||
Water Utilities - 0.37% |
| |||||||
Artesian Resources Corp., Class A | 17,300 | 388,039 | ||||||
|
| |||||||
TOTAL COMMON STOCKS - 99.14% | 103,854,040 | |||||||
|
| |||||||
(Cost $ 89,424,403) |
| |||||||
| Rate^ | Shares | Value | ||||||||||
MONEY MARKET FUND - 0.26% |
| |||||||||||
BlackRock FedFund | 0.01 | % | 269,622 | 269,622 | ||||||||
|
| |||||||||||
TOTAL MONEY MARKET FUND - 0.26% |
| 269,622 | ||||||||||
|
| |||||||||||
(Cost $ 269,622) |
| |||||||||||
TOTAL INVESTMENTS - 99.40% |
| $ | 104,123,662 | |||||||||
|
| |||||||||||
(Cost $ 89,694,025) |
| |||||||||||
Other Assets in Excess of Liabilities - 0.60% |
| 625,585 | ||||||||||
|
| |||||||||||
NET ASSETS - 100.00% | $ | 104,749,247 | ||||||||||
|
| |||||||||||
| * | Non-income producing security. |
| # | Securities, or a portion thereof, segregated to cover the Fund’s potential obligation under swap agreements. The total value of segregated assets is $668,061. |
| ^ | Rate disclosed as of December 31, 2012. |
| + | This security or a portion of the security is out on loan at December 31, 2012. Total loaned securities had a value of $14,406,673 at December 31, 2012. |
| ADR | - American Depositary Receipt |
| LLC | - Limited Liability Company |
23 | Semi-Annual Report | December 31, 2012 (Unaudited) |
Bridgeway Ultra-Small Company Fund SCHEDULE OF INVESTMENTS (continued) | |
Summary of inputs used to value the Fund’s investments as of 12/31/2012 is as follows (See Note 2 in Notes to Financial Statements):
|
| |||||||||||||||
| Valuation Inputs | ||||||||||||||||
| Investment in Securities (Value) | ||||||||||||||||
| Level 1 Quoted Prices | Level 2 Significant Observable Inputs | Level 3 Significant Unobservable Inputs | Total | |||||||||||||
Common Stocks | $ | 103,854,040 | $ | — | $ | — | $ | 103,854,040 | ||||||||
Money Market Fund | — | 269,622 | — | 269,622 | ||||||||||||
|
|
|
|
|
|
|
| |||||||||
TOTAL | $ | 103,854,040 | $ | 269,622 | $ | — | $ | 104,123,662 | ||||||||
|
|
|
|
|
|
|
| |||||||||
Other Financial Instruments** | ||||||||||||||||
Swaps | $ | — | $ | 6,186 | $ | — | $ | 6,186 | ||||||||
|
|
|
|
|
|
|
| |||||||||
TOTAL | $ | — | $ | 6,186 | $ | — | $ | 6,186 | ||||||||
|
|
|
|
|
|
|
| |||||||||
** Other financial instruments are derivative instruments not reflected in the Schedule of Investments, such as swap contracts, which are valued at the unrealized appreciation/depreciation on the investment.
|
| |||||||||||||||
Following is a reconciliation of Level 3 investments for which significant unobservable inputs were used to determine fair value:
|
| |||||||||||
| Investment in Securities (Value) | ||||||||||||
| Common Stocks | Total | |||||||||||
| Balance as of 06/30/2012 | $ | 65,173 | $ | 65,173 | |||||||
Purchases | — | — | ||||||||||
Sales | — | — | ||||||||||
Realized gain/(loss) | — | — | ||||||||||
Change in unrealized appreciation/ (depreciation) | — | — | ||||||||||
Transfers in | — | — | ||||||||||
Transfers out1,2 | (65,173 | ) | (65,173 | ) | ||||||||
|
|
|
| |||||||||
Balance as of 12/31/12 | $ | — | $ | — | ||||||||
|
|
|
| |||||||||
Net change in unrealized appreciation (depreciation) from investments held as of 12/31/12 | $ | — | $ | — | ||||||||
|
|
|
| |||||||||
1Transfer out represents the value as of the beginning of the reporting period, for any investment security where significant transfers in the pricing level occurred during the period.
2Transfer took place as a result of trading resuming.
See Notes to Financial Statements. |
| |||||||||||
www.bridgeway.com | 24 |
Ultra-Small Company Market Fund | |
(Unaudited)
December 31, 2012
Dear Fellow Ultra-Small Company Market Fund Shareholder,
In the December quarter our Fund was down 0.49%, outperforming our primary market benchmark, the CRSP Cap-Based Portfolio 10 Index (-1.08%). Since ultra-small stocks as a group “took a breather” in the quarter, we trailed our peer benchmark, the Lipper Micro-Cap Stock Funds Index (+0.47%), the Russell Microcap Index (+0.04%) and the Russell 2000 Index (+1.85%). All three of these indexes had exposure to considerably larger stocks, which performed better as a whole.
For the six-month “semi-annual” period ending December 31, 2012 our Fund returned 5.21%, trailing all of our benchmarks, the CRSP Cap-Based Portfolio 10 Index (+5.28%), the Lipper Micro-Cap Stock Funds Index (+5.97%), the Russell Microcap Index (+5.96%) and the Russell 2000 Index (+7.20%).
For the calendar year, our Fund returned 19.83%, trailing our primary market benchmark, the CRSP Cap-Based Portfolio 10 Index (+21.47%), but outperforming our peer benchmark, the Lipper Micro-Cap Stock Funds Index (+15.69%), the Russell Microcap Index (+19.75%) and the Russell 2000 Index (+16.35%). Ultra-small stocks as a group performed very well in the March quarter, giving our Fund a boost in relative performance for the full calendar year.
The table below presents our December quarter, six-month, one-year, five-year, ten-year and inception-to-date financial results. See the next page for a graph of performance since inception.
Standardized Returns as of December 31, 2012
| Annualized | ||||||||||||||||||||||||||||||
| Since Inception | ||||||||||||||||||||||||||||||
| Quarter | 6 Months | 1 Year | 5 Years | 10 Years | (7/31/97) | |||||||||||||||||||||||||
Ultra-Small Company Market Fund | -0.49% | 5.21% | 19.83 | % | 1.00% | 9.53% | 9.73% | |||||||||||||||||||||||
CRSP Cap-Based Portfolio 10 Index | -1.08% | 5.28% | 21.47 | % | 5.25% | 12.90% | 10.29% | |||||||||||||||||||||||
Russell Microcap Index | 0.04% | 5.96% | 19.75 | % | 1.46% | 8.42% | N/A | |||||||||||||||||||||||
Russell 2000 Index | 1.85% | 7.20% | 16.35 | % | 3.56% | 9.72% | 6.14% | |||||||||||||||||||||||
Lipper Micro-Cap Stock Funds Index | 0.47% | 5.97% | 15.69 | % | 1.95% | 9.05% | 6.53% | |||||||||||||||||||||||
Performance figures quoted in the table above and the graph on the next page represent past performance and are no guarantee of future results. Total return figures in the table above and the graph on the next page include the reinvestment of dividends and capital gains. The table above and the graph on the next page do not reflect the deduction of taxes that a shareholder would pay on Fund distributions or on the redemption of Fund shares.
The CRSP Cap-Based Portfolio 10 Index is an unmanaged index of 1,055 of the smallest publicly traded U.S. stocks (with dividends reinvested), as reported by the Center for Research on Security Prices. The Lipper Micro-Cap Stock Funds Index is an index of small-company funds compiled by Lipper, Inc. The Russell Microcap Index is an unmanaged, market value weighted index that measures performance of 1,000 of the smallest securities in the Russell 2000 Index. The Russell 2000 Index is an unmanaged, market value weighted index that measures performance of the 2,000 companies that are between the 1,000th and 3,000th largest in the market with dividends reinvested. It is not possible to invest directly in an index. Periods longer than one year are annualized.
According to data from Lipper, Inc. as of December 31, 2012, Ultra-Small Company Market Fund ranked 17th of 68 micro-cap funds for the twelve months ending December 31, 2012, 35th of 48 over the last five years, 22nd of 34 over the last ten years, and 5th of 19 since inception in July, 1997. Lipper, Inc. is an independent mutual fund rating service that ranks funds in various fund categories by making comparative calculations using total returns.
25 | Semi-Annual Report | December 31, 2012 (Unaudited) |
Ultra-Small Company Market Fund MANAGER’S COMMENTARY (Unaudited) (continued) (Unaudited) | |
Ultra-Small Company Market Fund vs. CRSP Cap-Based Portfolio 10 Index, Russell Microcap Index*, Russell 2000 Index & Lipper Micro-Cap Stock Funds Index from Inception 7/31/97 to 12/31/12
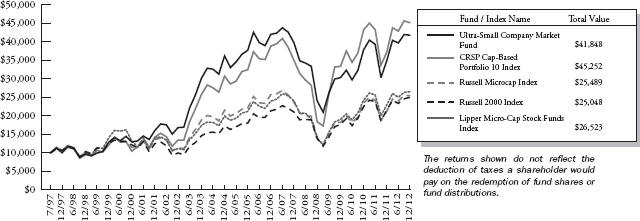
| * | The Russell Microcap Index began on 6/30/2000, and the line graph for the Index begins at the same value as the Fund on that date. |
Detailed Explanation of Quarterly Performance:
The Short Version: Our exposure to some larger and more liquid (still very small) stocks helped our performance relative to our primary market benchmark. Though more than 80% of our Fund is comprised of ultra-small stocks, we don’t automatically sell them immediately as they appreciate to a higher size range.
The Industrials and Consumer Staples sectors were the best performers for the quarter, while Energy, Health Care and Utilities were the worst performing sectors.
Company size was the main driver of the Fund’s outperformance for the quarter. The table on the next page, which shows data as of December 31, 2012, indicates that CRSP 10 stocks were one of two negative performing deciles for the quarter. Since we are committed to investing in this size of stocks for the long term, size is a major determinant of our performance. The Fund is designed to approximate the returns of the CRSP Cap-Based Portfolio 10 Index by investing in a representative sample of these ultra-small companies. We currently have over 80% of net assets in CRSP 10 stocks and only 18% in CRSP 9 stocks. We do use sidestepping models that help us avoid very negative stocks in order to provide some “cushion” in a down “ultra-small market” such as we had this quarter. This strategy worked for the quarter, as we were able to provide more than half a percent of cushion.
www.bridgeway.com | 26 |
Ultra-Small Company Market Fund MANAGER’S COMMENTARY (Unaudited) (continued) | |
(Unaudited)
| CRSP Decile1 | Quarter | 6 Months | 1 Year | 5 Years | 10 Years | 87 Years | ||||||||||||||||||
1 (ultra-large) | -1.13% | 5.31% | 15.95 | % | 1.30% | 6.40% | 9.10% | |||||||||||||||||
2 | 1.81% | 7.80% | 15.97 | % | 2.68% | 10.16% | 10.42% | |||||||||||||||||
3 | 3.60% | 9.08% | 16.73 | % | 4.04% | 10.35% | 10.81% | |||||||||||||||||
4 | 3.70% | 10.27% | 16.29 | % | 5.64% | 11.32% | 10.79% | |||||||||||||||||
5 | 3.88% | 10.98% | 15.82 | % | 6.69% | 12.11% | 11.33% | |||||||||||||||||
6 | 3.78% | 9.06% | 18.13 | % | 4.65% | 10.91% | 11.29% | |||||||||||||||||
7 | 1.16% | 6.62% | 18.05 | % | 6.26% | 11.91% | 11.27% | |||||||||||||||||
8 | 2.27% | 8.96% | 18.30 | % | 7.13% | 12.57% | 11.49% | |||||||||||||||||
9 | 1.12% | 6.17% | 14.57 | % | 5.42% | 10.90% | 11.47% | |||||||||||||||||
10 (ultra-small) | -1.08% | 5.28% | 21.47 | % | 5.25% | 12.90% | 13.01% | |||||||||||||||||
| 1 | The CRSP Cap-Based Portfolio Indexes are unmanaged indexes of the publicly traded U.S. stocks with dividends reinvested, grouped by market capitalization, as reported by the Center for Research in Security Prices. Past performance is no guarantee of future results. |
Detailed Explanation of Calendar Year Performance
The Short Version: Company size was the major determinant of Fund underperformance for the calendar year.
Most of the underperformance for the calendar year came early as CRSP 10 stocks had a very strong run for the year overall. Historically, we have outperformed our primary market benchmark in all down years, but in only half of the up market years. Our strategy of avoiding a relatively small percentage of stocks that can be very damaging in downturns, as well as our strategy of not immediately selling stocks that outgrow the CRSP 10 size limitation hurt our performance this calendar year.
Energy was the only sector in the CRSP 10 universe that had overall negative returns for the calendar year.
Top Ten Holdings as of December 31, 2012
| Rank | Description | Industry | % of Net Assets | ||||||
1 | Utah Medical Products, Inc. | Health Care Equipment & Supplies | 0.5% | ||||||
2 | Provident Financial Holdings, Inc. | Thrifts & Mortgage Finance | 0.5% | ||||||
3 | Lifeway Foods, Inc. | Food Products | 0.5% | ||||||
4 | Spartan Motors, Inc. | Auto Components | 0.5% | ||||||
5 | Providence Service Corp. (The) | Health Care Providers & Services | 0.5% | ||||||
6 | REX American Resources Corp. | Oil, Gas & Consumable Fuels | 0.5% | ||||||
7 | Federal Agricultural Mortgage Corp. | Thrifts & Mortgage Finance | 0.5% | ||||||
8 | Hurco Cos., Inc. | Machinery | 0.4% | ||||||
9 | Barrett Business Services, Inc. | Professional Services | 0.4% | ||||||
10 | York Water Co. | Water Utilities | 0.4% | ||||||
| Total | 4.7% | ||||||||
27 | Semi-Annual Report | December 31, 2012 (Unaudited) |
Ultra-Small Company Market Fund MANAGER’S COMMENTARY (Unaudited) (continued) | |
(Unaudited)
Industry Sector Representation as of December 31, 2012
| % of Net Assets | % of CRSP 10 Index | Difference | |||||||||||||
Consumer Discretionary | 16.8 | % | 16.5 | % | 0.3 | % | |||||||||
Consumer Staples | 3.2 | % | 3.1 | % | 0.1 | % | |||||||||
Energy | 7.4 | % | 7.8 | % | -0.4 | % | |||||||||
Financials | 26.0 | % | 24.6 | % | 1.4 | % | |||||||||
Health Care | 13.1 | % | 15.0 | % | -1.9 | % | |||||||||
Industrials | 13.2 | % | 12.3 | % | 0.9 | % | |||||||||
Information Technology | 14.7 | % | 15.5 | % | -0.8 | % | |||||||||
Materials | 2.9 | % | 2.7 | % | 0.2 | % | |||||||||
Telecommunication Services | 1.4 | % | 1.4 | % | 0.0 | % | |||||||||
Utilities | 1.0 | % | 1.1 | % | -0.1 | % | |||||||||
Cash & Other Assets | 0.3 | % | 0.0 | % | 0.3 | % | |||||||||
Total | 100.0 | % | 100.0 | % | |||||||||||
Disclaimer
The views expressed here are exclusively those of Fund management. These views, including those related to market sectors or individual stocks, are not meant as investment advice and should not be considered predictive in nature. Any favorable (or unfavorable) description of a holding applies only as of December 31, 2012, unless otherwise stated. Security positions can and do change thereafter. Discussions of historical performance do not guarantee and are not indicative of future performance.
The Fund is subject to very high, above market risk (volatility) and is not an appropriate investment for short-term investors. Investments in ultra-small companies generally carry greater risk than is customarily associated with larger companies and even “small companies” for various reasons, such as narrower markets (fewer investors), limited financial resources and greater trading difficulty.
Conclusion
Thank you for your continued investment in Ultra-Small Company Market Fund. We encourage your feedback; your reactions and concerns are important to us.
Sincerely,
The Investment Management Team
www.bridgeway.com | 28 |
Bridgeway Ultra-Small Company Market Fund | |
Showing percentage of net assets as of December 31, 2012 (Unaudited)
| Industry Company | Shares | Value | ||||||||
COMMON STOCKS - 99.45% | ||||||||||
Aerospace & Defense - 0.98% | ||||||||||
Astronics Corp.* | 22,700 | $ | 519,376 | |||||||
Astronics Corp., Class B*+ | 6,015 | 130,525 | ||||||||
Ducommun, Inc.* | 25,300 | 409,101 | ||||||||
Innovative Solutions & Support, Inc. | 63,454 | 218,282 | ||||||||
KEYW Holding Corp. | 9,782 | 124,134 | ||||||||
LMI Aerospace, Inc.* | 1,400 | 27,076 | ||||||||
Sparton Corp.* | 63,300 | 877,971 | ||||||||
Sypris Solutions, Inc. | 90,000 | 356,400 | ||||||||
Tel-Instrument Electronics Corp.*+ | 15,000 | 53,100 | ||||||||
|
| |||||||||
| 2,715,965 | ||||||||||
Air Freight & Logistics - 0.65% | ||||||||||
Pacer International, Inc.* | 3,000 | 11,700 | ||||||||
Park-Ohio Holdings Corp.* | 47,500 | 1,012,225 | ||||||||
XPO Logistics, Inc.*+ | 44,800 | 778,624 | ||||||||
|
| |||||||||
| 1,802,549 | ||||||||||
Airlines - 0.25% | ||||||||||
Republic Airways Holdings, Inc.* | 119,691 | 679,845 | ||||||||
Auto Components - 1.23% | ||||||||||
China XD Plastics Co., Ltd.* | 106,000 | 407,040 | ||||||||
Shiloh Industries, Inc. | 39,600 | 407,880 | ||||||||
SORL Auto Parts, Inc.*+ | 109,900 | 271,453 | ||||||||
Spartan Motors, Inc. | 268,087 | 1,321,669 | ||||||||
Stoneridge, Inc.* | 75,000 | 384,000 | ||||||||
Strattec Security Corp. | 24,100 | 622,021 | ||||||||
UQM Technologies, Inc.* | 9,600 | 7,296 | ||||||||
|
| |||||||||
| 3,421,359 | ||||||||||
Automobiles - 0.15% | ||||||||||
Kandi Technolgies Group, Inc.*+ | 103,000 | 410,970 | ||||||||
Beverages - 0.27% | ||||||||||
Craft Brew Alliance, Inc.* | 92,200 | 597,456 | ||||||||
MGP Ingredients, Inc. | 2,600 | 8,892 | ||||||||
Primo Water Corp.* | 112,930 | 134,387 | ||||||||
|
| |||||||||
| 740,735 | ||||||||||
Biotechnology - 4.03% | ||||||||||
ACADIA Pharmaceuticals, Inc.*+ | 188,000 | 874,200 | ||||||||
Amicus Therapeutics, Inc.*+ | 115,991 | 310,856 | ||||||||
Anacor Pharmaceuticals, Inc.*+ | 85,300 | 443,560 | ||||||||
Astex Pharmaceuticals* | 274,600 | 799,086 | ||||||||
BioCryst Pharmaceuticals, Inc.* | 160,000 | 227,200 | ||||||||
| Industry Company | Shares | Value | ||||||
| ||||||||
Biotechnology (continued) | ||||||||
BioSpecifics Technologies Corp.*+ | 23,300 | $ | 348,335 | |||||
Biota Pharmaceuticals, Inc.+ | 17,899 | 71,417 | ||||||
BioTime, Inc.*+ | 123,800 | 388,732 | ||||||
Codexis, Inc.*+ | 148,264 | 327,663 | ||||||
Curis, Inc.*+ | 120,000 | 411,600 | ||||||
Cytokinetics, Inc.* | 321,800 | 212,388 | ||||||
Cytori Therapeutics, Inc.*+ | 86,503 | 243,939 | ||||||
Durata Therapeutics, Inc.* | 47,500 | 362,900 | ||||||
Geron Corp.* | 423,900 | 597,699 | ||||||
ImmunoCellular Therapeutics, Ltd.*+ | 105,000 | 201,600 | ||||||
Maxygen, Inc. | 52,850 | 130,011 | ||||||
Medgenics, Inc.*+ | 29,400 | 218,736 | ||||||
Metabolix, Inc.*+ | 95,000 | 140,600 | ||||||
Nanosphere, Inc.* | 162,300 | 467,424 | ||||||
Novavax, Inc.*+ | 161,200 | 304,668 | ||||||
Osiris Therapeutics, Inc.*+ | 11,100 | 99,678 | ||||||
PharmAthene, Inc.*+ | 178,826 | 200,285 | ||||||
Progenics Pharmaceuticals, Inc.* | 72,400 | 215,752 | ||||||
Repligen Corp.* | 104,500 | 657,305 | ||||||
Savient Pharmaceuticals, Inc.*+ | 246,800 | 259,140 | ||||||
SIGA Technologies, Inc.*+ | 148,700 | 389,594 | ||||||
Synthetic Biologics, Inc.*+ | 40,000 | 70,400 | ||||||
Targacept, Inc.* | 103,900 | 455,082 | ||||||
Trius Therapeutics, Inc.*+ | 126,700 | 605,626 | ||||||
Vanda Pharmaceuticals, Inc.* | 174,300 | 644,910 | ||||||
XOMA Corp.*+ | 120,000 | 287,400 | ||||||
Zalicus, Inc.* | 326,321 | 212,109 | ||||||
|
| |||||||
| 11,179,895 | ||||||||
Building Products - 0.70% | ||||||||
Alpha PRO Tech, Ltd.* | 106,700 | 153,648 | ||||||
American Woodmark Corp.* | 19,500 | 542,490 | ||||||
Insteel Industries, Inc. | 25,700 | 320,736 | ||||||
NCI Building Systems, Inc.* | 51,608 | 717,351 | ||||||
Patrick Industries, Inc.* | 10,239 | 159,319 | ||||||
PGT, Inc.* | 9,500 | 42,750 | ||||||
|
| |||||||
| 1,936,294 | ||||||||
Capital Markets - 3.79% | ||||||||
Arlington Asset Investment Corp., Class A | 27,400 | 569,098 | ||||||
Artio Global Investors, Inc. | 141,600 | 269,040 | ||||||
Calamos Asset Management, Inc., Class A | 23,000 | 243,110 | ||||||
Diamond Hill Investment Group, Inc. | 5,600 | 380,016 | ||||||
29 | Semi-Annual Report | December 31, 2012 (Unaudited) |
Bridgeway Ultra-Small Company Market Fund SCHEDULE OF INVESTMENTS (continued) | |
Showing percentage of net assets as of December 31, 2012 (Unaudited)
| Industry Company | Shares | Value | ||||||||
Common Stocks (continued) | ||||||||||
Capital Markets (continued) | ||||||||||
FBR & Co.*+ | 172,700 | $ | 668,349 | |||||||
Gladstone Capital Corp. | 78,700 | 642,192 | ||||||||
Gladstone Investment Corp. | 56,400 | 392,544 | ||||||||
Harris & Harris Group, Inc.* | 100,300 | 330,990 | ||||||||
JMP Group, Inc. | 51,851 | 314,736 | ||||||||
KCAP Financial, Inc.+ | 93,900 | 862,941 | ||||||||
Ladenburg Thalmann Financial Services, Inc.* | 493,000 | 690,200 | ||||||||
Manning & Napier, Inc. | 33,100 | 417,060 | ||||||||
Medallion Financial Corp. | 86,711 | 1,017,987 | ||||||||
Medley Capital Corp. | 56,800 | 827,008 | ||||||||
NGP Capital Resources Co. | 72,500 | 523,450 | ||||||||
Oppenheimer Holdings, Inc., Class A | 39,100 | 675,257 | ||||||||
Pzena Investment Management, Inc., Class A | 52,800 | 285,120 | ||||||||
Solar Senior Capital, Ltd. | 27,200 | 507,552 | ||||||||
SWS Group, Inc.* | 86,000 | 454,940 | ||||||||
Westwood Holdings Group, Inc. | 11,025 | 450,922 | ||||||||
|
| |||||||||
| 10,522,512 | ||||||||||
Chemicals - 1.26% | ||||||||||
American Pacific Corp.* | 11,900 | 183,855 | ||||||||
Arabian American Development Co.*+ | 51,100 | 424,641 | ||||||||
Chase Corp.+ | 27,800 | 517,080 | ||||||||
Core Molding Technologies, Inc.* | 20,600 | 135,960 | ||||||||
GSE Holding, Inc.* | 2,300 | 14,260 | ||||||||
Gulf Resources, Inc.* | 7,800 | 9,048 | ||||||||
KMG Chemicals, Inc. | 60,100 | 1,055,957 | ||||||||
Landec Corp.* | 93,064 | 883,177 | ||||||||
Penford Corp.* | 35,000 | 258,300 | ||||||||
|
| |||||||||
| 3,482,278 | ||||||||||
Commercial Banks - 11.48% | ||||||||||
1st Constitution Bancorp* | 11,000 | 98,010 | ||||||||
1st United Bancorp, Inc. | 104,600 | 653,750 | ||||||||
Access National Corp.+ | 33,500 | 435,500 | ||||||||
American National Bankshares, Inc. | 30,600 | 617,814 | ||||||||
American River Bankshares* | 39,500 | 279,660 | ||||||||
Anchor Bancorp, Inc.* | 10,000 | 129,200 | ||||||||
Bank of Commerce Holdings | 48,700 | 224,020 | ||||||||
Bank of Kentucky Financial Corp. | 10,200 | 252,246 | ||||||||
Bar Harbor Bankshares | 12,000 | 403,800 | ||||||||
BCB Bancorp, Inc.+ | 23,500 | 219,490 | ||||||||
| Industry Company | Shares | Value | ||||||
| ||||||||
Commercial Banks (continued) | ||||||||
Berkshire Bancorp, Inc. | 35,000 | $ | 287,000 | |||||
Bridge Bancorp, Inc. | 8,100 | 164,754 | ||||||
Bridge Capital Holdings*+ | 36,800 | 572,608 | ||||||
C&F Financial Corp.+ | 10,800 | 420,552 | ||||||
Camden National Corp. | 11,800 | 400,846 | ||||||
Capital City Bank Group, Inc.* | 50,390 | 572,934 | ||||||
Center Bancorp, Inc.+ | 72,217 | 836,273 | ||||||
Centerstate Banks, Inc. | 40,866 | 348,587 | ||||||
Century Bancorp, Inc., Class A | 23,272 | 766,812 | ||||||
Citizens Holding Co. | 20,670 | 399,345 | ||||||
CNB Financial Corp. | 42,200 | 691,236 | ||||||
CoBiz Financial, Inc. | 40,400 | 301,788 | ||||||
Colony Bankcorp, Inc.* | 16,668 | 60,838 | ||||||
Enterprise Bancorp, Inc.+ | 102 | 1,685 | ||||||
Enterprise Financial Services Corp. | 29,800 | 389,486 | ||||||
Evans Bancorp, Inc.+ | 11,000 | 170,500 | ||||||
Farmers Capital Bank Corp.* | 67,149 | 822,575 | ||||||
Fidelity Southern Corp.*+ | 23,029 | 219,927 | ||||||
Financial Institutions, Inc. | 18,700 | 348,381 | ||||||
First Bancorp | 32,000 | 410,240 | ||||||
First Bancorp, Inc. | 33,300 | 548,451 | ||||||
First Bancshares, Inc.+ | 4,494 | 41,570 | ||||||
First Business Financial Services, Inc. | 1,200 | 27,540 | ||||||
First California Financial Group, Inc.* | 49,100 | 379,052 | ||||||
First Connecticut Bancorp, Inc.+ | 36,400 | 500,500 | ||||||
First South Bancorp, Inc.* | 14,300 | 68,640 | ||||||
German American Bancorp, Inc.+ | 24,500 | 532,140 | ||||||
Guaranty Bancorp* | 228,200 | 444,990 | ||||||
Hampton Roads Bankshares, Inc.*+ | 50,725 | 60,363 | ||||||
Heritage Commerce Corp.*+ | 74,300 | 518,614 | ||||||
Heritage Financial Corp. | 40,560 | 595,826 | ||||||
Horizon Bancorp+ | 16,500 | 324,225 | ||||||
Independent Bank Corp.*+ | 20,000 | 70,000 | ||||||
Intervest Bancshares Corp., | 78,212 | 304,245 | ||||||
Landmark Bancorp, Inc. | 6,867 | 136,653 | ||||||
LNB Bancorp, Inc. | 23,700 | 141,489 | ||||||
Macatawa Bank Corp.* | 51,500 | 148,835 | ||||||
Mercantile Bank Corp. | 26,700 | 440,550 | ||||||
Merchants Bancshares, Inc. | 28,700 | 768,299 | ||||||
Metro Bancorp, Inc.* | 40,600 | 536,732 | ||||||
www.bridgeway.com | 30 |
Bridgeway Ultra-Small Company Market Fund SCHEDULE OF INVESTMENTS (continued) | |
Showing percentage of net assets as of December 31, 2012 (Unaudited)
| Industry Company | Shares | Value | ||||||||
Common Stocks (continued) | ||||||||||
Commercial Banks (continued) | ||||||||||
MetroCorp Bancshares, Inc.* | 50,057 | $ | 550,127 | |||||||
MidSouth Bancorp, Inc. | 35,900 | 586,965 | ||||||||
MidWestOne Financial Group, Inc. | 43,300 | 888,083 | ||||||||
National Bankshares, Inc.+ | 14,300 | 463,177 | ||||||||
New Century Bancorp, Inc.*+ | 10,076 | 55,418 | ||||||||
NewBridge Bancorp* | 43,806 | 202,822 | ||||||||
North Valley Bancorp* | 15,900 | 225,621 | ||||||||
Northrim BanCorp, Inc. | 34,700 | 785,955 | ||||||||
Ohio Valley Banc Corp. | 19,500 | 366,600 | ||||||||
Old Second Bancorp, Inc.*+ | 15,000 | 18,300 | ||||||||
OmniAmerican Bancorp, Inc.* | 26,300 | 608,319 | ||||||||
Pacific Continental Corp. | 53,611 | 521,635 | ||||||||
Pacific Mercantile Bancorp*+ | 49,000 | 308,210 | ||||||||
Pacific Premier Bancorp, Inc.* | 23,500 | 240,640 | ||||||||
Park Sterling Corp.* | 120,700 | 631,261 | ||||||||
Peapack Gladstone Financial Corp. | 39,130 | 550,950 | ||||||||
Penns Woods Bancorp, Inc.+ | 16,400 | 613,524 | ||||||||
Peoples Bancorp of North Carolina, Inc. | 5,801 | 53,717 | ||||||||
Peoples Bancorp, Inc. | 28,400 | 580,212 | ||||||||
Preferred Bank* | 33,680 | 478,256 | ||||||||
Premier Financial Bancorp, Inc. | 29,337 | 317,720 | ||||||||
QCR Holdings, Inc. | 13,200 | 176,616 | ||||||||
Republic First Bancorp, Inc.* | 83,000 | 171,810 | ||||||||
Salisbury Bancorp, Inc.+ | 2,366 | 55,364 | ||||||||
Seacoast Banking Corp. of Florida* | 212,364 | 341,906 | ||||||||
Shore Bancshares, Inc. | 22,600 | 121,588 | ||||||||
Sierra Bancorp | 42,900 | 490,347 | ||||||||
Southern National Bancorp of Virginia, Inc. | 30,200 | 241,600 | ||||||||
Southwest Bancorp, Inc.* | 73,100 | 818,720 | ||||||||
Suffolk Bancorp* | 27,000 | 353,700 | ||||||||
Taylor Capital Group, Inc.*+ | 3,708 | 66,929 | ||||||||
Virginia Commerce Bancorp, Inc.* | 42,059 | 376,428 | ||||||||
Washington Banking Co. | 74,300 | 1,011,966 | ||||||||
West Bancorporation, Inc. | 28,200 | 303,996 | ||||||||
Yadkin Valley Financial Corp.* | 64,200 | 188,748 | ||||||||
|
| |||||||||
| 31,855,801 | ||||||||||
| Industry Company | Shares | Value | ||||||
Commercial Services & Supplies - 2.49% |
| |||||||
A.T. Cross Co., Class A* | 46,000 | $ | 495,880 | |||||
American Reprographics Co.* | 144,600 | 370,176 | ||||||
AMREP Corp.*+ | 22,500 | 338,400 | ||||||
Asset Acceptance Capital Corp.* | 100,000 | 450,000 | ||||||
Asta Funding, Inc. | 122,300 | 1,163,073 | ||||||
Casella Waste Systems, Inc., Class A* | 118,100 | 517,278 | ||||||
Ceco Environmental Corp. | 42,600 | 423,870 | ||||||
Cenveo, Inc.*+ | 168,503 | 454,958 | ||||||
Courier Corp. | 51,100 | 562,100 | ||||||
Fuel Tech, Inc.* | 65,000 | 273,000 | ||||||
Intersections, Inc. | 108,184 | 1,025,584 | ||||||
Metalico, Inc.* | 184,802 | 362,212 | ||||||
TRC Cos., Inc.* | 65,600 | 381,792 | ||||||
Versar, Inc.* | 22,000 | 84,920 | ||||||
|
| |||||||
| 6,903,243 | ||||||||
Communications Equipment - 2.67% |
| |||||||
Aviat Networks, Inc.* | 228,000 | 750,120 | ||||||
Bel Fuse, Inc., Class B | 25,100 | 490,705 | ||||||
CalAmp Corp.* | 101,200 | 841,984 | ||||||
Clearfield, Inc.* | 69,916 | 313,923 | ||||||
Communications Systems, Inc. | 28,900 | 300,560 | ||||||
Emcore Corp.*+ | 23,052 | 99,124 | ||||||
Globecomm Systems, Inc.* | 67,400 | 761,620 | ||||||
KVH Industries, Inc.* | 60,410 | 844,532 | ||||||
Meru Networks, Inc.*+ | 4,950 | 13,117 | ||||||
Numerex Corp., Class A*+ | 30,000 | 394,200 | ||||||
Oclaro, Inc.* | 25,200 | 39,564 | ||||||
PC-Tel, Inc. | 87,800 | 632,160 | ||||||
Symmetricom, Inc.* | 56,300 | 324,851 | ||||||
Telestone Technologies Corp.*+ | 94,100 | 123,271 | ||||||
Telular Corp. | 57,900 | 548,313 | ||||||
Tessco Technologies, Inc. | 24,500 | 542,430 | ||||||
Westell Technologies, Inc., | 205,000 | 379,250 | ||||||
|
| |||||||
| 7,399,724 | ||||||||
Computers & Peripherals - 0.78% |
| |||||||
Concurrent Computer Corp. | 55,600 | 316,364 | ||||||
Datalink Corp.* | 57,700 | 493,335 | ||||||
Dot Hill Systems Corp.* | 269,400 | 252,562 | ||||||
Hutchinson Technology, Inc.*+ | 75,000 | 150,000 | ||||||
Immersion Corp.* | 62,900 | 432,123 | ||||||
31 | Semi-Annual Report | December 31, 2012 (Unaudited) |
Bridgeway Ultra-Small Company Market Fund SCHEDULE OF INVESTMENTS (continued) | |
Showing percentage of net assets as of December 31, 2012 (Unaudited)
| Industry Company | Shares | Value | ||||||||
Common Stocks (continued) | ||||||||||
Computers & Peripherals (continued) |
| |||||||||
Novatel Wireless, Inc.* | 78,800 | $ | 105,592 | |||||||
Rimage Corp. | 5,000 | 33,400 | ||||||||
Transact Technologies, Inc. | 25,800 | 186,276 | ||||||||
USA Technologies, Inc.*+ | 111,400 | 193,836 | ||||||||
|
| |||||||||
| 2,163,488 | ||||||||||
Construction & Engineering - 1.39% |
| |||||||||
Argan, Inc. | 44,700 | 804,600 | ||||||||
Furmanite Corp.* | 160,500 | 861,885 | ||||||||
Michael Baker Corp. | 24,900 | 620,757 | ||||||||
Northwest Pipe Co.* | 19,100 | 455,726 | ||||||||
Orion Marine Group, Inc.* | 65,900 | 481,729 | ||||||||
Sterling Construction Co., Inc.* | 44,900 | 446,306 | ||||||||
UniTek Global Services, Inc.* | 53,200 | 192,584 | ||||||||
|
| |||||||||
| 3,863,587 | ||||||||||
Construction Materials - 0.09% |
| |||||||||
United States Lime & Minerals, Inc.* | 5,300 | 249,736 | ||||||||
Consumer Finance - 0.24% | ||||||||||
Atlanticus Holdings Corp.*+ | 41,347 | 138,512 | ||||||||
First Marblehead Corp. (The)* | 375,600 | 291,804 | ||||||||
White River Capital, Inc. | 11,662 | 247,818 | ||||||||
|
| |||||||||
| 678,134 | ||||||||||
Containers & Packaging - 0.36% |
| |||||||||
AEP Industries, Inc.* | 16,700 | 989,141 | ||||||||
Distributors - 0.28% | ||||||||||
Amcon Distributing Co.+ | 2,300 | 147,246 | ||||||||
VOXX International Corp.* | 94,001 | 632,627 | ||||||||
|
| |||||||||
| 779,873 | ||||||||||
Diversified Consumer Services - 1.10% |
| |||||||||
Cambium Learning Group, Inc.* | 58,715 | 65,173 | ||||||||
Carriage Services, Inc. | 85,200 | 1,011,324 | ||||||||
Collectors Universe+ | 56,360 | 565,291 | ||||||||
Corinthian Colleges, Inc.* | 105,000 | 256,200 | ||||||||
Learning Tree International, Inc.* | 40,000 | 218,000 | ||||||||
Lincoln Educational Services Corp. | 78,400 | 438,256 | ||||||||
Mac-Gray Corp. | 35,000 | 439,250 | ||||||||
School Specialty, Inc.* | 60,000 | 57,000 | ||||||||
|
| |||||||||
| 3,050,494 | ||||||||||
| Industry Company | Shares | Value | ||||||
Diversified Financial Services - 0.58% |
| |||||||
California First National Bancorp | 1,800 | $ | 26,910 | |||||
Gain Capital Holdings, Inc. | 94,400 | 386,096 | ||||||
Marlin Business Services Corp. | 29,500 | 591,770 | ||||||
Resource America, Inc., Class A | 91,770 | 612,106 | ||||||
|
| |||||||
| 1,616,882 | ||||||||
Diversified Telecommunication Services - 1.19% |
| |||||||
Alaska Communications Systems Group, Inc.+ | 130,000 | 252,200 | ||||||
Cbeyond, Inc.* | 2,600 | 23,504 | ||||||
Elephant Talk Communications, Inc.*+ | 165,400 | 165,400 | ||||||
Hawaiian Telcom Holdco, Inc.* | 24,686 | 481,377 | ||||||
HickoryTech Corp. | 44,995 | 437,802 | ||||||
IDT Corp., Class B | 50,567 | 482,409 | ||||||
ORBCOMM, Inc.* | 171,000 | 670,320 | ||||||
Otelco, Inc. | 65,100 | 84,630 | ||||||
Primus Telecommunications Group, Inc.+ | 35,000 | 380,450 | ||||||
Warwick Valley Telephone Co.+ | 30,200 | 312,570 | ||||||
|
| |||||||
| 3,290,662 | ||||||||
Electrical Equipment - 0.88% | ||||||||
Coleman Cable, Inc. | 78,900 | 731,403 | ||||||
Enphase Energy, Inc.* | 16,823 | 61,404 | ||||||
LSI Industries, Inc. | 70,500 | 494,205 | ||||||
Magnetek, Inc.* | 10,000 | 103,000 | ||||||
Ocean Power Technologies, Inc.*+ | 38,000 | 82,080 | ||||||
PowerSecure International, Inc.* | 92,600 | 723,206 | ||||||
SL Industries, Inc.+ | 13,200 | 237,600 | ||||||
|
| |||||||
| 2,432,898 | ||||||||
Electronic Equipment, Instruments & Components - 2.61% |
| |||||||
Agilysys, Inc.* | 62,200 | 520,614 | ||||||
Document Security Systems, Inc.*+ | 51,700 | 112,189 | ||||||
Echelon Corp.* | 128,000 | 313,600 | ||||||
eMagin Corp.+ | 56,300 | 200,991 | ||||||
ID Systems, Inc.* | 48,000 | 279,360 | ||||||
Identive Group, Inc.* | 236,697 | 355,045 | ||||||
IEC Electronics Corp.*+ | 64,500 | 436,020 | ||||||
Iteris, Inc.* | 172,520 | 293,284 | ||||||
Key Tronic Corp.* | 24,200 | 247,808 | ||||||
www.bridgeway.com | 32 |
Bridgeway Ultra-Small Company Market Fund SCHEDULE OF INVESTMENTS (continued) | |
Showing percentage of net assets as of December 31, 2012 (Unaudited)
| Industry Company | Shares | Value | ||||||||
Common Stocks (continued) | ||||||||||
Electronic Equipment, Instruments & Components (continued) | ||||||||||
LoJack Corp.* | 65,500 | $ | 182,745 | |||||||
Maxwell Technologies, Inc.*+ | 2,700 | 22,383 | ||||||||
Mesa Laboratories, Inc. | 6,200 | 310,682 | ||||||||
Netlist, Inc.* | 63,100 | 46,694 | ||||||||
PAR Technology Corp.* | 17,800 | 87,220 | ||||||||
PC Connection, Inc. | 30,000 | 345,000 | ||||||||
PC Mall, Inc.* | 74,200 | 460,782 | ||||||||
Pulse Electronics Corp.* | 100,000 | 31,050 | ||||||||
Radisys Corp.* | 144,700 | 431,206 | ||||||||
Richardson Electronics, Ltd. | 54,211 | 613,669 | ||||||||
SMTC Corp.*+ | 184,300 | 444,163 | ||||||||
Vishay Precision Group, Inc.* | 67,467 | 891,914 | ||||||||
Zygo Corp.* | 39,200 | 615,440 | ||||||||
|
| |||||||||
| 7,241,859 | ||||||||||
Energy Equipment & Services - 2.19% |
| |||||||||
Bolt Technology Corp. | 65,663 | 937,011 | ||||||||
Cal Dive International, Inc.* | 345,300 | 597,369 | ||||||||
Dawson Geophysical Co.* | 30,800 | 812,504 | ||||||||
ENGlobal Corp.* | 118,761 | 62,943 | ||||||||
Forbes Energy Services, Ltd.* | 104,700 | 264,891 | ||||||||
Global Geophysical Services, Inc.* | 197,000 | 758,450 | ||||||||
GreenHunter Energy, Inc.* | 74,000 | 119,880 | ||||||||
Mitcham Industries, Inc.* | 80,700 | 1,099,941 | ||||||||
Natural Gas Services Group, Inc.* | 37,600 | 617,392 | ||||||||
TGC Industries, Inc. | 99,750 | 816,953 | ||||||||
|
| |||||||||
| 6,087,334 | ||||||||||
Food & Staples Retailing - 0.35% |
| |||||||||
Arden Group, Inc., Class A | 5,500 | 494,835 | ||||||||
Ingles Markets, Inc., Class A | 21,200 | 365,912 | ||||||||
Village Super Market, Inc., Class A | 3,580 | 117,639 | ||||||||
|
| |||||||||
| 978,386 | ||||||||||
Food Products - 1.94% | ||||||||||
Alico, Inc. | 21,700 | 794,871 | ||||||||
American Lorain Corp.* | 13,300 | 16,891 | ||||||||
Farmer Bros. Co.* | 42,500 | 613,275 | ||||||||
Griffin Land & Nurseries, Inc. | 13,300 | 359,100 | ||||||||
Inventure Foods, Inc.* | 44,000 | 285,560 | ||||||||
John B. Sanfilippo & Son, Inc. | 33,900 | 616,302 | ||||||||
Lifeway Foods, Inc.+ | 156,302 | 1,366,079 | ||||||||
Limoneira Co.+ | 20,000 | 387,800 | ||||||||
| Industry Company | Shares | Value | ||||||
| ||||||||
Food Products (continued) | ||||||||
Omega Protein Corp.* | 69,800 | $ | 427,176 | |||||
Overhill Farms, Inc.* | 116,750 | 505,528 | ||||||
|
| |||||||
| 5,372,582 | ||||||||
Gas Utilities - 0.06% | ||||||||
Gas Natural, Inc.+ | 16,900 | 157,677 | ||||||
Health Care Equipment & Supplies - 3.87% |
| |||||||
Alphatec Holdings, Inc.* | 84,888 | 140,065 | ||||||
Anika Therapeutics, Inc.* | 87,439 | 869,144 | ||||||
AtriCure, Inc.* | 133,200 | 919,080 | ||||||
Bacterin International Holdings, Inc.*+ | 25,601 | 32,001 | ||||||
Cardiovascular Systems, Inc.*+ | 52,500 | 658,875 | ||||||
Cerus Corp.*+ | 193,304 | 610,841 | ||||||
CryoLife, Inc. | 107,270 | 668,292 | ||||||
Cutera, Inc.* | 45,200 | 406,800 | ||||||
DynaVox, Inc., Class A* | 28,330 | 10,482 | ||||||
Hansen Medical, Inc.*+ | 195,657 | 406,967 | ||||||
Kewaunee Scientific Corp. | 7,700 | 93,555 | ||||||
LeMaitre Vascular, Inc.+ | 50,000 | 287,000 | ||||||
Medical Action Industries, Inc.* | 65,815 | 177,042 | ||||||
Palomar Medical Technologies, Inc.* | 72,400 | 666,804 | ||||||
Rochester Medical Corp.* | 31,700 | 319,536 | ||||||
Rockwell Medical Technologies, Inc.*+ | 72,100 | 580,405 | ||||||
RTI Biologics, Inc.* | 125,000 | 533,750 | ||||||
Solta Medical, Inc.* | 166,400 | 444,288 | ||||||
Theragenics Corp.* | 86,675 | 137,813 | ||||||
TranS1, Inc.* | 129,500 | 321,160 | ||||||
Utah Medical Products, Inc. | 40,100 | 1,445,605 | ||||||
Vascular Solutions, Inc.* | 49,300 | 778,940 | ||||||
Zeltiq Aesthetics, Inc.*+ | 48,900 | 226,407 | ||||||
|
| |||||||
| 10,734,852 | ||||||||
Health Care Providers & Services - 1.96% |
| |||||||
Almost Family, Inc. | 24,400 | 494,344 | ||||||
AMN Healthcare Services, Inc.* | 6,300 | 72,765 | ||||||
CardioNet, Inc.* | 137,700 | 313,956 | ||||||
Chindex International, Inc.* | 72,700 | 763,350 | ||||||
Cross Country Healthcare, Inc.* | 71,000 | 340,800 | ||||||
Five Star Quality Care, Inc.* | 125,400 | 628,254 | ||||||
LCA-Vision, Inc.* | 84,000 | 239,400 | ||||||
PDI, Inc.* | 30,000 | 228,000 | ||||||
Providence Service Corp. (The)* | 77,100 | 1,309,929 | ||||||
RadNet, Inc.* | 220,700 | 558,371 | ||||||
33 | Semi-Annual Report | December 31, 2012 (Unaudited) |
Bridgeway Ultra-Small Company Market Fund SCHEDULE OF INVESTMENTS (continued) | |
Showing percentage of net assets as of December 31, 2012 (Unaudited)
| Industry Company | Shares | Value | ||||||||
Common Stocks (continued) | ||||||||||
Health Care Providers & Services (continued) |
| |||||||||
Skilled Healthcare Group, Inc., | 78,500 | $ | 500,045 | |||||||
|
|
| ||||||||
| 5,449,214 | ||||||||||
Hotels, Restaurants & Leisure - 2.86% |
| |||||||||
Ark Restaurants Corp. | 8,100 | 136,485 | ||||||||
Carrols Restaurant Group, Inc.* | 43,100 | 257,738 | ||||||||
Dover Downs Gaming & Entertainment, Inc. | 152,580 | 335,676 | ||||||||
Einstein Noah Restaurant Group, Inc. | 18,581 | 226,874 | ||||||||
Famous Dave’s of America, Inc.* | 128,800 | 1,183,672 | ||||||||
Frisch’s Restaurants, Inc.+ | 16,000 | 296,000 | ||||||||
Full House Resorts, Inc.* | 60,700 | 209,415 | ||||||||
Gaming Partners International Corp.+ | 56,300 | 391,285 | ||||||||
Isle of Capri Casinos, Inc.* | 62,500 | 350,000 | ||||||||
Jamba, Inc.* | 153,314 | 343,423 | ||||||||
Kona Grill, Inc.* | 67,500 | 585,225 | ||||||||
Lakes Entertainment, Inc.* | 84,600 | 253,800 | ||||||||
Luby’s, Inc.* | 77,100 | 515,799 | ||||||||
Monarch Casino & Resort, Inc.* | 42,877 | 467,788 | ||||||||
Morgans Hotel Group Co.* | 84,300 | 467,022 | ||||||||
MTR Gaming Group, Inc.* | 90,700 | 378,219 | ||||||||
Nathan’s Famous, Inc.* | 12,000 | 404,400 | ||||||||
Nevada Gold & Casinos, Inc.* | 120,000 | 92,400 | ||||||||
Premier Exhibitions, Inc.* | 142,500 | 386,175 | ||||||||
Town Sports International Holdings, Inc. | 61,087 | 650,577 | ||||||||
| 7,931,973 | ||||||||||
Household Durables - 2.10% |
| |||||||||
Bassett Furniture Industries, Inc. | 74,200 | 925,274 | ||||||||
Cobra Electronics Corp.* | 30,000 | 112,800 | ||||||||
CSS Industries, Inc. | 15,700 | 343,673 | ||||||||
Emerson Radio Corp.* | 124,800 | 215,904 | ||||||||
Flexsteel Industries, Inc. | 22,000 | 471,900 | ||||||||
Furniture Brands International, Inc.* | 284,100 | 301,146 | ||||||||
Hooker Furniture Corp. | 53,300 | 774,449 | ||||||||
Kid Brands, Inc.* | 36,400 | 56,420 | ||||||||
Lifetime Brands, Inc. | 65,000 | 689,650 | ||||||||
P & F Industries, Inc., Class A* | 10,500 | 65,100 | ||||||||
Sealy Corp.*+ | 288,500 | 626,045 | ||||||||
Stanley Furniture Co., Inc.* | 40,000 | 180,000 | ||||||||
Universal Electronics, Inc.* | 35,000 | 677,250 | ||||||||
| Industry Company | Shares | Value | ||||||
| ||||||||
Household Durables (continued) | ||||||||
Zagg, Inc.*+ | 54,300 | $ 399,648 | ||||||
| 5,839,259 | ||||||||
Household Products - 0.21% | ||||||||
Oil-Dri Corp. of America | 20,800 | 574,080 | ||||||
Independent Power Producers & Energy Traders - 0.32% |
| |||||||
American DG Energy, Inc.*+ | 109,000 | 251,790 | ||||||
Genie Energy, Ltd., Class B | 48,667 | 345,536 | ||||||
Synthesis Energy Systems, Inc.* | 272,471 | 291,544 | ||||||
| 888,870 | ||||||||
Insurance - 1.69% | ||||||||
Atlantic American Corp. | 14,056 | 42,449 | ||||||
Crawford & Co., Class B | 84,600 | 675,108 | ||||||
Eastern Insurance Holdings, Inc. | 25,600 | 437,248 | ||||||
Federated National Holding Co. | 23,000 | 124,660 | ||||||
First Acceptance Corp.* | 111,700 | 139,625 | ||||||
Fortegra Financial Corp.* | 50,000 | 444,500 | ||||||
Hallmark Financial Services, Inc.* | 80,400 | 754,956 | ||||||
Homeowners Choice, Inc.+ | 12,000 | 249,480 | ||||||
Independence Holding Co. | 69,190 | 658,689 | ||||||
Investors Title Co. | 3,500 | 210,000 | ||||||
Phoenix Cos., Inc. (The)*+ | 14,200 | 351,166 | ||||||
Universal Insurance Holdings, Inc. | 136,400 | 597,432 | ||||||
|
| |||||||
| 4,685,313 | ||||||||
Internet & Catalog Retail - 1.22% | ||||||||
1-800-Flowers.com, Inc., | 170,000 | 623,900 | ||||||
CafePress, Inc.*+ | 49,800 | 287,346 | ||||||
dELiA*s, Inc.* | 213,100 | 249,327 | ||||||
Gaiam, Inc., Class A* | 45,000 | 142,200 | ||||||
Overstock.com, Inc.*+ | 55,000 | 787,050 | ||||||
PetMed Express, Inc.+ | 19,647 | 218,081 | ||||||
US Auto Parts Network, Inc.* | 125,900 | 230,397 | ||||||
ValueVision Media, Inc., Class A* | 176,286 | 317,315 | ||||||
Vitacost.com, Inc.*+ | 77,000 | 522,060 | ||||||
| 3,377,676 | ||||||||
Internet Software & Services - 2.33% | ||||||||
Carbonite, Inc.*+ | 72,400 | 669,700 | ||||||
Ipass, Inc.* | 171,200 | 313,296 | ||||||
Keynote Systems, Inc. | 44,400 | 625,596 | ||||||
Limelight Networks, Inc.* | 170,736 | 379,034 | ||||||
www.bridgeway.com | 34 |
Bridgeway Ultra-Small Company Market Fund SCHEDULE OF INVESTMENTS (continued) | |
Showing percentage of net assets as of December 31, 2012 (Unaudited)
| Industry Company | Shares | Value | ||||||||
Common Stocks (continued) | ||||||||||
Internet Software & Services (continued) |
| |||||||||
Marchex, Inc., | 163,600 | $ | 672,396 | |||||||
Spark Networks, Inc.*+ | 64,800 | 505,440 | ||||||||
Support.com, Inc.* | 136,745 | 571,594 | ||||||||
TechTarget, Inc.* | 145,900 | 809,745 | ||||||||
TheStreet, Inc. | 236,900 | 395,623 | ||||||||
Tucows, Inc.* | 150,000 | 216,000 | ||||||||
Unwired Planet, Inc.* | 234,600 | 281,520 | ||||||||
XO Group, Inc.* | 54,813 | 509,761 | ||||||||
Zix Corp.* | 187,582 | 525,230 | ||||||||
| 6,474,935 | ||||||||||
IT Services - 1.63% |
| |||||||||
Analysts International Corp.* | 18,500 | 58,460 | ||||||||
CIBER, Inc.* | 185,000 | 617,900 | ||||||||
Computer Task Group, Inc.* | 25,000 | 455,750 | ||||||||
Dynamics Research Corp.* | 41,558 | 243,114 | ||||||||
Edgewater Technology, Inc.* | 39,200 | 148,960 | ||||||||
Hackett Group, Inc. (The) | 119,928 | 513,292 | ||||||||
Information Services Group, Inc.*+ | 96,600 | 111,090 | ||||||||
Innodata, Inc.* | 54,500 | 206,010 | ||||||||
Lionbridge Technologies, Inc.* | 122,795 | 493,636 | ||||||||
Mattersight Corp.*+ | 66,503 | 330,520 | ||||||||
ModusLink Global Solutions, Inc.* | 115,700 | 335,530 | ||||||||
NCI, Inc., Class A* | 2,630 | 12,335 | ||||||||
Official Payments Holdings, Inc.* | 44,500 | 250,980 | ||||||||
Online Resources Corp.* | 133,028 | 301,973 | ||||||||
PRGX Global, Inc.* | 68,500 | 441,825 | ||||||||
| 4,521,375 | ||||||||||
Leisure Equipment & Products - 0.19% |
| |||||||||
Johnson Outdoors, Inc., | 25,800 | 513,936 | ||||||||
Marine Products Corp. | 2,400 | 13,728 | ||||||||
| 527,664 | ||||||||||
Life Sciences Tools & Services - 1.16% |
| |||||||||
Accelerate Diagnostics, Inc.* | 19,800 | 79,794 | ||||||||
Albany Molecular Research, Inc.* | 103,100 | 544,368 | ||||||||
BioClinica, Inc.* | 80,900 | 462,748 | ||||||||
Enzo Biochem, Inc.* | 201,300 | 543,510 | ||||||||
Furiex Pharmaceuticals, Inc.* | 21,200 | 408,312 | ||||||||
Harvard Bioscience, Inc.* | 167,017 | 731,534 | ||||||||
Pacific Biosciences of California, Inc.* | 222,400 | 378,080 | ||||||||
pSivida Corp.* | 50,000 | 60,500 | ||||||||
| 3,208,846 | ||||||||||
| Industry Company | Shares | Value | ||||||
Machinery - 3.92% | ||||||||
Accuride Corp.* | 264,200 | $ | 848,082 | |||||
Alamo Group, Inc. | 11,060 | 360,998 | ||||||
Ampco-Pittsburgh Corp. | 24,400 | 487,512 | ||||||
Dynamic Materials Corp. | 1,300 | 18,070 | ||||||
Eastern Co. (The) | 1,600 | 25,312 | ||||||
Energy Recovery, Inc.*+ | 66,700 | 226,780 | ||||||
Flow International Corp.* | 192,751 | 674,629 | ||||||
FreightCar America, Inc. | 29,675 | 665,314 | ||||||
Gencor Industries, Inc.* | 18,500 | 139,490 | ||||||
Graham Corp. | 60,900 | 1,187,550 | ||||||
Hardinge, Inc. | 33,300 | 331,002 | ||||||
Hurco Cos., Inc.* | 54,331 | 1,249,613 | ||||||
Key Technology, Inc.* | 20,000 | 208,800 | ||||||
L.S. Starrett Co., | 34,200 | 331,740 | ||||||
Lydall, Inc.* | 74,200 | 1,064,028 | ||||||
Met-Pro Corp. | 40,200 | 389,538 | ||||||
Miller Industries, Inc. | 29,400 | 448,350 | ||||||
NN, Inc.* | 86,100 | 788,676 | ||||||
PMFG, Inc.*+ | 33,671 | 306,069 | ||||||
Tecumseh Products Co., Class A* | 57,700 | 266,574 | ||||||
Twin Disc, Inc.+ | 29,600 | 515,928 | ||||||
Xerium Technologies, Inc.* | 107,050 | 326,502 | ||||||
|
| |||||||
| 10,860,557 | ||||||||
Marine - 0.11% | ||||||||
International Shipholding Corp. | 19,203 | 316,465 | ||||||
Media - 3.17% | ||||||||
AH Belo Corp., Class A | 66,700 | 310,155 | ||||||
Ballantyne Strong, Inc.* | 45,500 | 150,150 | ||||||
Beasley Broadcasting Group, Inc., Class A+ | 16,000 | 78,240 | ||||||
Carmike Cinemas, Inc.* | 51,800 | 777,000 | ||||||
Dex One Corp.*+ | 222,700 | 351,866 | ||||||
Emmis Communications Corp., Class A* | 159,500 | 314,215 | ||||||
Entercom Communications Corp., Class A*+ | 80,000 | 558,400 | ||||||
Entravision Communications Corp., Class A | 96,200 | 159,692 | ||||||
Gray Television, Inc.* | 232,200 | 510,840 | ||||||
Harris Interactive, Inc.* | 40,000 | 48,000 | ||||||
Journal Communications, Inc., Class A* | 127,200 | 688,152 | ||||||
LIN TV Corp., Class A* | 47,500 | 357,675 | ||||||
Martha Stewart Living Omnimedia, Class A* | 90,200 | 220,990 | ||||||
McClatchy Co., Class A (The)*+ | 211,150 | 690,461 | ||||||
35 | Semi-Annual Report | December 31, 2012 (Unaudited) |
Bridgeway Ultra-Small Company Market Fund SCHEDULE OF INVESTMENTS (continued) | |
Showing percentage of net assets as of December 31, 2012 (Unaudited)
| Industry Company | Shares | Value | ||||||||
Common Stocks (continued) | ||||||||||
Media (continued) | ||||||||||
Media General, Inc., Class A*+ | 135,311 | $ | 581,837 | |||||||
Navarre Corp.* | 230,600 | 410,468 | ||||||||
Nexstar Broadcasting Group, Inc., Class A* | 70,800 | 749,772 | ||||||||
Radio One, Inc., Class D* | 100,000 | 76,000 | ||||||||
ReachLocal, Inc.* | 34,069 | 439,831 | ||||||||
Rentrak Corp.* | 22,800 | 444,372 | ||||||||
Saga Communications, Inc., Class A | 15,004 | 697,686 | ||||||||
Salem Communications Corp., Class A | 3,500 | 19,110 | ||||||||
SuperMedia, Inc.*+ | 49,000 | 167,580 | ||||||||
|
| |||||||||
| 8,802,492 | ||||||||||
Metals & Mining - 1.02% | ||||||||||
Comstock Mining, Inc.* | 15,850 | 36,138 | ||||||||
Friedman Industries, Inc. | 68,300 | 691,196 | ||||||||
Golden Minerals Co.*+ | 106,700 | 489,753 | ||||||||
Great Northern Iron Ore Properties+ | 7,700 | 517,440 | ||||||||
Olympic Steel, Inc. | 26,100 | 577,854 | ||||||||
Synalloy Corp. | 19,400 | 254,528 | ||||||||
Universal Stainless & Alloy* | 7,428 | 273,128 | ||||||||
|
| |||||||||
| 2,840,037 | ||||||||||
Multiline Retail - 0.47% | ||||||||||
ALCO Stores, Inc.*+ | 7,000 | 61,460 | ||||||||
Bon-Ton Stores, Inc. (The) | 45,950 | 556,914 | ||||||||
Tuesday Morning Corp.* | 110,500 | 690,625 | ||||||||
|
| |||||||||
| 1,308,999 | ||||||||||
Oil, Gas & Consumable Fuels - 4.64% |
| |||||||||
Adams Resources & Energy, Inc. | 22,300 | 782,061 | ||||||||
Amyris, Inc.*+ | 160,000 | 499,200 | ||||||||
Callon Petroleum Co.* | 182,800 | 859,160 | ||||||||
Ceres, Inc.* | 20,000 | 90,800 | ||||||||
Crimson Exploration, Inc.* | 161,320 | 442,017 | ||||||||
Double Eagle Petroleum Co.* | 79,800 | 314,412 | ||||||||
Emerald Oil, Inc.* | 80,157 | 420,023 | ||||||||
Evolution Petroleum Corp.* | 36,300 | 295,119 | ||||||||
Green Plains Renewable Energy, Inc.*+ | 126,800 | 1,002,988 | ||||||||
HKN, Inc.* | 1,103 | 83,277 | ||||||||
James River Coal Co.*+ | 118,500 | 379,200 | ||||||||
L&L Energy, Inc.* | 120,100 | 228,190 | ||||||||
Lone Pine Resources, Inc.* | 226,300 | 278,349 | ||||||||
Miller Energy Resources, Inc.*+ | 120,000 | 475,200 | ||||||||
| Industry Company | Shares | Value | ||||||
Oil, Gas & Consumable Fuels (continued) |
| |||||||
Panhandle Oil & Gas, Inc., Class A | 23,797 | $ | 671,789 | |||||
PostRock Energy Corp.* | 73,500 | 108,780 | ||||||
Pyramid Oil Co.* | 69,800 | 272,220 | ||||||
Renewable Energy Group, Inc.*+ | 20,000 | 117,200 | ||||||
REX American Resources Corp.* | 67,249 | 1,297,233 | ||||||
Saratoga Resources, Inc.* | 160,100 | 566,754 | ||||||
Synergy Resources Corp.* | 160,000 | 862,400 | ||||||
Uranerz Energy Corp.*+ | 264,800 | 368,072 | ||||||
Uranium Energy Corp.* | 220,800 | 565,248 | ||||||
Verenium Corp.* | 78,800 | 170,996 | ||||||
Warren Resources, Inc.* | 352,900 | 991,649 | ||||||
Westmoreland Coal Co.*+ | 61,375 | 573,242 | ||||||
Zion Oil & Gas, Inc.*+ | 81,200 | 143,724 | ||||||
|
| |||||||
| 12,859,303 | ||||||||
Paper & Forest Products - 0.07% |
| |||||||
Neenah Paper, Inc. | 333 | 9,481 | ||||||
Orient Paper, Inc.+ | 97,061 | 173,739 | ||||||
|
| |||||||
| 183,220 | ||||||||
Personal Products - 0.39% | ||||||||
CCA Industries, Inc. | 14,100 | 61,053 | ||||||
Female Health Co. (The)+ | 43,200 | 310,176 | ||||||
Natural Alternatives International, Inc.* | 17,500 | 85,925 | ||||||
Nutraceutical International Corp. | 37,000 | 611,980 | ||||||
|
| |||||||
| 1,069,134 | ||||||||
Pharmaceuticals - 2.07% | ||||||||
Alimera Sciences, Inc.* | 81,600 | 128,112 | ||||||
Biosante Pharmaceuticals, Inc.*+ | 70,500 | 87,420 | ||||||
Cempra, Inc.* | 22,749 | 145,594 | ||||||
Cumberland Pharmaceuticals, Inc.*+ | 53,600 | 225,120 | ||||||
Durect Corp.* | 218,600 | 201,112 | ||||||
Horizon Pharma, Inc.*+ | 218,300 | 508,639 | ||||||
Lannett Co., Inc.* | 83,020 | 411,779 | ||||||
Novabay Pharmaceuticals, Inc.*+ | 121,500 | 138,510 | ||||||
NuPathe, Inc.*+ | 37,500 | 126,750 | ||||||
Obagi Medical Products, Inc.* | 57,600 | 782,784 | ||||||
Omeros Corp.*+ | 77,400 | 401,706 | ||||||
Pain Therapeutics, Inc.+ | 125,699 | 340,644 | ||||||
Pernix Therapeutics Holdings*+ | 40,000 | 310,000 | ||||||
www.bridgeway.com | 36 |
Bridgeway Ultra-Small Company Market Fund SCHEDULE OF INVESTMENTS (continued) | |
Showing percentage of net assets as of December 31, 2012 (Unaudited)
| Industry Company | Shares | Value | ||||||||||
Common Stocks (continued) | ||||||||||||
Pharmaceuticals (continued) | ||||||||||||
Pozen, Inc.* | 80,400 | $ | 402,804 | |||||||||
Sucampo Pharmaceuticals, Inc., Class A* | 104,000 | 509,600 | ||||||||||
Transcept Pharmaceuticals, Inc.*+ | 68,000 | 302,600 | ||||||||||
XenoPort, Inc.* | 65,100 | 505,827 | ||||||||||
Zogenix, Inc.* | 161,300 | 214,529 | ||||||||||
|
| |||||||||||
| 5,743,530 | ||||||||||||
Professional Services - 1.49% | ||||||||||||
Barrett Business Services, Inc. | 32,600 | 1,241,734 | ||||||||||
CRA International, Inc.* | 30,000 | 593,100 | ||||||||||
CTPartners Executive Search, Inc.* | 27,400 | 126,040 | ||||||||||
Dolan Co. (The)* | 148,100 | 576,109 | ||||||||||
Heidrick & Struggles International, Inc. | 50,000 | 763,000 | ||||||||||
Hill International, Inc.* | 30,971 | 113,354 | ||||||||||
Hudson Global, Inc.* | 69,204 | 310,034 | ||||||||||
RCM Technologies, Inc. | 26,200 | 132,310 | ||||||||||
VSE Corp. | 11,700 | 286,767 | ||||||||||
|
| |||||||||||
| 4,142,448 | ||||||||||||
Real Estate Management & Development - 0.82% |
| |||||||||||
AV Homes, Inc.* | 54,600 | 776,412 | ||||||||||
Consolidated-Tomoka | 16,249 | 503,882 | ||||||||||
Stratus Properties, Inc.* | 37,150 | 321,719 | ||||||||||
Thomas Properties | 123,719 | 669,320 | ||||||||||
|
| |||||||||||
| 2,271,333 | ||||||||||||
Road & Rail - 0.45% | ||||||||||||
Covenant Transportation Group, Inc., Class A* | 30,000 | 165,900 | ||||||||||
P.A.M. Transportation Services, Inc. | 9,750 | 99,742 | ||||||||||
Universal Truckload Services, Inc. | 30,700 | 560,275 | ||||||||||
USA Truck, Inc.* | 54,271 | 186,150 | ||||||||||
YRC Worldwide, Inc.*+ | 36,800 | 248,400 | ||||||||||
|
| |||||||||||
| 1,260,467 | ||||||||||||
Semiconductors & Semiconductor Equipment - 2.59% |
| |||||||||||
Amtech Systems, Inc.*+ | 57,500 | 185,150 | ||||||||||
AXT, Inc.* | 124,716 | 350,452 | ||||||||||
Cohu, Inc. | 50,000 | 542,000 | ||||||||||
DSP Group, Inc.* | 81,300 | 468,288 | ||||||||||
GigOptix, Inc.* | 14,000 | 26,880 | ||||||||||
| Industry Company | Shares | Value | ||||||
Semiconductors & Semiconductor Equipment (continued) |
| |||||||
GSI Technology, Inc.* | 161,417 | $ | 1,012,085 | |||||
Integrated Silicon | 77,641 | 698,769 | ||||||
Mattson Technology, Inc.* | 131,300 | 110,292 | ||||||
MaxLinear, Inc., Class A* | 65,100 | 326,802 | ||||||
Mindspeed Technologies, Inc.*+ | 16,000 | 74,880 | ||||||
NeoPhotonics Corp.* | 85,000 | 487,900 | ||||||
PDF Solutions, Inc.* | 6,130 | 84,471 | ||||||
Pericom Semiconductor Corp.* | 72,372 | 581,147 | ||||||
Pixelworks, Inc.* | 58,900 | 131,936 | ||||||
PLX Technology, Inc.*+ | 78,900 | 286,407 | ||||||
QuickLogic Corp.*+ | 134,800 | 292,516 | ||||||
Rubicon Technology, Inc.*+ | 67,000 | 409,370 | ||||||
Sigma Designs, Inc.* | 90,000 | 463,500 | ||||||
Ultra Clean Holdings* | 108,600 | 533,226 | ||||||
Vitesse Semiconductor Corp.* | 50,000 | 111,500 | ||||||
|
| |||||||
| 7,177,571 | ||||||||
Software - 2.04% | ||||||||
American Software, Inc., Class A | 60,700 | 471,032 | ||||||
Bsquare Corp.* | 9,500 | 28,025 | ||||||
Callidus Software, Inc.*+ | 113,100 | 513,474 | ||||||
Cinedigm Digital Cinema Corp., Class A* | 100,000 | 140,000 | ||||||
Digimarc Corp. | 23,100 | 478,170 | ||||||
ePlus, Inc. | 13,451 | 556,064 | ||||||
FalconStor Software, Inc.* | 132,700 | 309,191 | ||||||
Globalscape, Inc. | 66,700 | 95,381 | ||||||
Glu Mobile, Inc.*# | 140,500 | 321,745 | ||||||
GSE Systems, Inc.* | 45,000 | 97,200 | ||||||
Guidance Software, Inc.* | 63,000 | 747,810 | ||||||
Pervasive Software, Inc.* | 43,798 | 390,240 | ||||||
QAD, Inc., Class A | 33,000 | 475,200 | ||||||
QAD, Inc., Class B | 8,250 | 107,003 | ||||||
Rosetta Stone, Inc.* | 41,400 | 510,876 | ||||||
Smith Micro Software, Inc.* | 124,300 | 187,693 | ||||||
TeleCommunication Systems, Inc., Class A* | 91,734 | 226,583 | ||||||
|
| |||||||
| 5,655,687 | ||||||||
Specialty Retail - 2.78% | ||||||||
America’s Car-Mart, Inc.* | 12,500 | 506,500 | ||||||
Big 5 Sporting Goods Corp. | 43,400 | 568,540 | ||||||
Body Central Corp.* | 74,600 | 743,016 | ||||||
Books-A-Million, Inc.* | 40,000 | 106,400 | ||||||
37 | Semi-Annual Report | December 31, 2012 (Unaudited) |
Bridgeway Ultra-Small Company Market Fund SCHEDULE OF INVESTMENTS (continued) | |
Showing percentage of net assets as of December 31, 2012 (Unaudited)
| Industry Company | Shares | Value | ||||||||
Common Stocks (continued) | ||||||||||
Specialty Retail (continued) | ||||||||||
Build-A-Bear Workshop, Inc.*+ | 59,500 | $ | 227,290 | |||||||
Cache, Inc.* | 43,000 | 104,060 | ||||||||
Casual Male Retail Group, Inc.* | 169,600 | 712,320 | ||||||||
Citi Trends, Inc.* | 37,100 | 510,496 | ||||||||
Kirkland’s, Inc.* | 46,551 | 492,975 | ||||||||
MarineMax, Inc.* | 76,600 | 684,804 | ||||||||
New York & Co., Inc.* | 156,100 | 594,741 | ||||||||
Pacific Sunwear of California, Inc.* | 218,749 | 347,811 | ||||||||
TravelCenters of America LLC* | 120,200 | 564,940 | ||||||||
West Marine, Inc.* | 72,200 | 776,150 | ||||||||
Zale Corp.* | 190,200 | 781,722 | ||||||||
|
| |||||||||
| 7,721,765 | ||||||||||
Textiles, Apparel & Luxury Goods - 1.29% |
| |||||||||
Charles & Colvard, Ltd.*+ | 120,900 | 473,928 | ||||||||
Cherokee, Inc. | 21,200 | 290,652 | ||||||||
Culp, Inc. | 51,016 | 765,750 | ||||||||
Delta Apparel, Inc.* | 23,000 | 321,540 | ||||||||
DGSE Cos., Inc.*+ | 28,800 | 154,944 | ||||||||
K-Swiss, Inc., Class A*+ | 45,000 | 151,200 | ||||||||
Lakeland Industries, Inc.* | 10,000 | 49,700 | ||||||||
R.G. Barry Corp. | 27,600 | 391,092 | ||||||||
Rocky Brands, Inc.* | 52,200 | 679,644 | ||||||||
Unifi, Inc.* | 23,689 | 308,194 | ||||||||
|
| |||||||||
| 3,586,644 | ||||||||||
Thrifts & Mortgage Finance - 7.26% |
| |||||||||
Alliance Bancorp, Inc. of Pennsylvania | 22,000 | 279,400 | ||||||||
Bank Mutual Corp. | 129,000 | 554,700 | ||||||||
BankFinancial Corp. | 76,279 | 565,990 | ||||||||
Camco Financial Corp.* | 58,554 | 119,450 | ||||||||
Cape Bancorp, Inc. | 42,102 | 365,866 | ||||||||
Chicopee Bancorp, Inc.* | 26,500 | 421,085 | ||||||||
ESB Financial Corp.+ | 54,000 | 748,980 | ||||||||
ESSA Bancorp, Inc. | 37,400 | 407,286 | ||||||||
Federal Agricultural Mortgage Corp., Class C | 39,200 | 1,274,000 | ||||||||
First Advantage Bancorp | 25,000 | 315,750 | ||||||||
First Defiance Financial Corp. | 44,900 | 861,631 | ||||||||
First Financial Holdings, Inc. | 56,000 | 732,480 | ||||||||
First Financial Northwest, Inc.* | 61,600 | 465,080 | ||||||||
First Pactrust Bancorp, Inc.+ | 36,200 | 444,174 | ||||||||
| Industry Company | Shares | Value | ||||||
Thrifts & Mortgage Finance (continued) |
| |||||||
Fox Chase Bancorp, Inc. | 57,932 | $ | 964,568 | |||||
Franklin Financial Corp. | 32,800 | 543,824 | ||||||
Guaranty Federal Bancshares, Inc.*+ | 20,856 | 143,698 | ||||||
Hampden Bancorp, Inc. | 33,000 | 495,330 | ||||||
Heritage Financial Group, Inc. | 26,900 | 370,951 | ||||||
Home Bancorp, Inc.* | 48,000 | 876,000 | ||||||
Home Federal Bancorp, Inc. | 34,800 | 432,564 | ||||||
Louisiana Bancorp, Inc.*+ | 19,000 | 301,720 | ||||||
Meta Financial Group, Inc.+ | 12,100 | 275,880 | ||||||
MutualFirst Financial, Inc. | 4,404 | 51,263 | ||||||
Naugatuck Valley Financial Corp. | 28,501 | 189,532 | ||||||
New Hampshire Thrift Bancshares, Inc.+ | 18,100 | 231,680 | ||||||
Ocean Shore Holding Co. | 32,100 | 475,080 | ||||||
OceanFirst Financial Corp. | 29,200 | 401,500 | ||||||
Provident Financial Holdings, Inc. | 78,617 | 1,375,798 | ||||||
Pulaski Financial Corp.+ | 43,500 | 389,325 | ||||||
Riverview Bancorp, Inc.* | 17,406 | 29,416 | ||||||
SI Financial Group, Inc. | 34,276 | 394,174 | ||||||
Simplicity Bancorp, Inc. | 55,114 | 823,954 | ||||||
Teche Holding Co.+ | 14,440 | 545,543 | ||||||
Territorial Bancorp, Inc. | 22,300 | 509,555 | ||||||
Timberland Bancorp, Inc.*+ | 24,222 | 168,101 | ||||||
Tree.com, Inc. | 22,100 | 398,463 | ||||||
United Community Financial Corp.* | 130,000 | 375,700 | ||||||
United Financial Bancorp, Inc. | 48,009 | 754,701 | ||||||
Waterstone Financial, Inc.*+ | 43,355 | 338,169 | ||||||
Wayne Savings Bancshares, Inc.+ | 7,800 | 72,228 | ||||||
Westfield Financial, Inc. | 91,679 | 662,839 | ||||||
|
| |||||||
| 20,147,428 | ||||||||
Trading Companies & Distributors - 0.72% |
| |||||||
Aceto Corp. | 8,500 | 85,340 | ||||||
BlueLinx Holdings, Inc.* | 115,000 | 323,150 | ||||||
General Finance Corp.* | 60,000 | 257,400 | ||||||
Houston Wire & Cable Co. | 52,900 | 649,083 | ||||||
Lawson Products, Inc. | 32,400 | 320,760 | ||||||
Willis Lease Finance Corp.* | 24,400 | 349,164 | ||||||
|
| |||||||
| 1,984,897 | ||||||||
Water Utilities - 0.62% | ||||||||
Artesian Resources Corp., Class A | 10,500 | 235,515 | ||||||
www.bridgeway.com | 38 |
Bridgeway Ultra-Small Company Market Fund SCHEDULE OF INVESTMENTS (continued) | |
Showing percentage of net assets as of December 31, 2012 (Unaudited)
| Industry Company | Shares | Value | ||||||||||||||
Common Stocks (continued) |
| |||||||||||||||
Water Utilities (continued) |
| |||||||||||||||
Cadiz, Inc.*+ |
| 31,400 | $ | 248,688 | ||||||||||||
York Water Co. |
| 69,850 | 1,227,264 | |||||||||||||
|
| |||||||||||||||
TOTAL COMMON STOCKS -99.45% |
| 1,711,467 | ||||||||||||||
|
| |||||||||||||||
(Cost $227,368,030) | 275,861,404 | |||||||||||||||
|
| |||||||||||||||
EXCHANGE TRADED FUND - 0.35% |
| |||||||||||||||
iShares Russell Microcap Index Fund+ |
| 18,865 | 985,696 | |||||||||||||
|
| |||||||||||||||
TOTAL EXCHANGE TRADED FUND - 0.35% |
| 985,696 | ||||||||||||||
|
| |||||||||||||||
(Cost $507,389) |
| |||||||||||||||
| Rate^ | Shares | Value | ||||||||||||||
MONEY MARKET FUND - 0.00% |
| |||||||||||||||
BlackRock FedFund | 0.01 | % | 2,101 | 2,101 | ||||||||||||
|
| |||||||||||||||
TOTAL MONEY MARKET FUND - 0.00% (Cost $2,101) |
| 2,101 | ||||||||||||||
|
| |||||||||||||||
TOTAL INVESTMENTS - 99.80% (Cost $227,877,520) |
| $ | 276,849,201 | |||||||||||||
Other Assets in Excess of Liabilities - 0.20% |
| 546,198 | ||||||||||||||
|
| |||||||||||||||
NET ASSETS - 100.00% |
| $ | 277,395,399 | |||||||||||||
|
| |||||||||||||||
| * | Non-income producing security. |
| # | Securities, or a portion thereof, segregated to cover the Fund’s potential obligation under swap agreements. The total value of segregated assets is $321,745. |
| ^ | Rate disclosed as of December 31, 2012. |
| + | This security or a portion of the security is out on loan at December 31, 2012. Total loaned securities had a value of $31,076,493 at December 31, 2012. |
LLC- Limited Liability Company
Summary of inputs used to value the Fund’s investments as of 12/31/2012 is as follows (See Note 2 in Notes to Financial Statements):
|
| ||||||||||||||||||||||
| Valuation Inputs | |||||||||||||||||||||||
| Investment in Securities (Value) | |||||||||||||||||||||||
| Level 1 Quoted Prices | Level 2 Significant Observable Inputs | Level 3 Significant Unobservable Inputs | Total | ||||||||||||||||||||
Common Stocks | $ | 275,861,404 | $ | — | $ — | $ | 275,861,404 | ||||||||||||||||
Exchange-Traded Fund | 985,696 | — | — | 985,696 | |||||||||||||||||||
Money Market Fund | — | 2,101 | — | 2,101 | |||||||||||||||||||
|
|
|
|
|
|
|
| ||||||||||||||||
TOTAL | $ | 276,847,100 | $ | 2,101 | $ — | $ | 276,849,201 | ||||||||||||||||
|
|
|
|
|
|
|
| ||||||||||||||||
| |||||||||||||||||||||||
39 | Semi-Annual Report | December 31, 2012 (Unaudited) |
Bridgeway Ultra-Small Company Market Fund SCHEDULE OF INVESTMENTS (continued) | |
Following is a reconciliation of Level 3 investments for which significant unobservable inputs were used to determine fair value:
| Investment in Securities (Value) | ||||||||||||||
| Common Stocks | Rights | Total | |||||||||||
Balance as of 06/30/2012 | $ | 125,971 | $ | 61,843 | $ | 187,814 | ||||||||
Purchases | — | — | — | |||||||||||
Sales1 | — | (132,736 | ) | (132,736 | ) | |||||||||
Realized gain/(loss) | — | — | — | |||||||||||
Change in unrealized appreciation/ (depreciation)2 | — | 70,893 | 70,893 | |||||||||||
Transfers in | — | — | — | |||||||||||
Transfers out3,4 | (125,971) | — | (125,971 | ) | ||||||||||
|
|
|
|
|
| |||||||||
Balance as of 12/31/2012 | $ | — | $ | — | $ | — | ||||||||
|
|
|
|
|
| |||||||||
Net change in unrealized appreciation (depreciation) from investments held as of 12/31/2012 | $ | — | $ | — | $ | — | ||||||||
|
|
|
|
|
| |||||||||
| 1Sales include expiration of rights. | ||||||||||||||
| 2Change in unrealized appreciation/(depreciation) for Level 3 securities is included on Statement of Operations in the Change in Unrealized Appreciation (Depreciation) on Investments. | ||||||||||||||
| 3Transfers out represent the value as of the beginning of the reporting period, for any investment security where significant transfers in the pricing level occurred during the period. | ||||||||||||||
| 4Transfer took place as a result of trading resuming. | ||||||||||||||
| See Notes to Financial Statements. | ||||||||||||||
www.bridgeway.com | 40 |
Small-Cap Momentum Fund | |
(Unaudited)
December 31, 2012
Dear Fellow Small-Cap Momentum Fund Shareholder,
For the quarter ended December 31, 2012, our Fund returned 0.47%, trailing our primary market benchmark, the Russell 2000 Index (+1.85%). Our risk adjustment strategy hurt our returns for the quarter and we are not pleased with the results.
For the six-month “semi-annual” period, our Fund was up 6.36%, trailing the Russell 2000 Index (+7.20%). While it was a good six months in absolute terms, we are disappointed with our relative returns.
For the calendar year ended December 31, 2012, our Fund appreciated 14.18%, underperforming the Russell 2000 Index (+16.35%).
The table below presents our December quarter, six-month, one-year, and inception-to-date financial results. See the next page for a graph of performance since inception.
Standardized Returns as of December 31, 2012
| Annualized | ||||||||||||||
| Quarter | 6 Months | 1 Year | Since Inception (5/28/10) | |||||||||||
Small-Cap Momentum Fund | 0.47% | 6.36% | 14.18 | % | 12.11% | |||||||||
Russell 2000 Index | 1.85% | 7.20% | 16.35 | % | 11.63% | |||||||||
Performance figures quoted in the table above and the graph on the next page represent past performance and are no guarantee of future results. Total return figures in the table above and the graph on the next page include the reinvestment of dividends and capital gains. The table above and the graph on the next page do not reflect the deduction of taxes that a shareholder would pay on Fund distributions or on the redemption of Fund shares.
The Russell 2000 Index is an unmanaged, market value weighted index that measures performance of the 2,000 companies that are between the 1,000th and 3,000th largest in the market with dividends reinvested. It is not possible to invest directly in an index. Periods longer than one year are annualized.
According to data from Lipper, Inc. as of December 31, 2012, Small-Cap Momentum Fund ranked 378th of 705 small-cap core funds for the twelve-month period ended December 31, 2012 and 200th of 634 such funds since inception in May, 2010. Lipper, Inc. is an independent mutual fund rating service that ranks funds in various fund categories by making comparative calculations using total returns.
41 | Semi-Annual Report | December 31, 2012 (Unaudited) |
Small-Cap Momentum Fund MANAGER’S COMMENTARY (Unaudited) (continued) | |
(Unaudited)
Small-Cap Momentum Fund vs. Russell 2000 Index from Inception 5/28/10 to 12/31/12
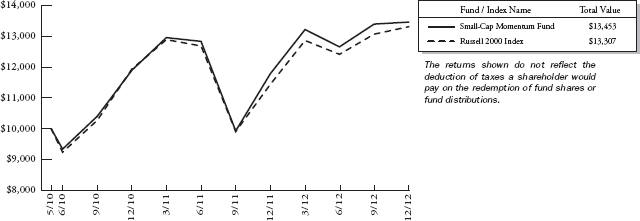
Detailed Explanation of Quarterly Performance
The Short Version: While price momentum had little positive effect in the quarter, the Fund’s risk-adjustment overlay positioned the Fund in lower risk stocks, which did not perform as well in the current environment.
The Fund performed in line with its design objective for the quarter ended December 31, 2012. Our exposure to price momentum had a neutral effect during the somewhat flat quarter. The risk-adjustment overlay led the fund into safer (less volatile) stocks in the volatile periods of the quarter and they underperformed in the market turn around after the presidential election. Higher weighting and strong stock picking in the Financials sector helped our relative return. Poor stock selection in the Health Care and Information Technology sectors hurt the Fund’s relative performance.
Detailed Explanation of Calendar Year Performance
The Short Version: Price momentum was a plus in the 2012 calendar year. However, the lower-risk stocks associated with our risk-adjustment overlay had a negative impact in a year that favored high risk.
The Fund performed in line with its design objective for the calendar year ended December 31, 2012. Our exposure to price momentum helped us during the calendar year. By design, the risk-adjustment overlay, which leads the Fund into less volatile stocks during volatile periods of the market, dampened the volatility and upside returns of the Fund in the fast moving up market of the calendar year. Lower weighting and strong stock picking in the poor-performing Energy sector helped our relative return. Poor stock selection in the Financials and Health Care sectors hurt the Fund’s relative performance for the year.
www.bridgeway.com | 42 |
Small-Cap Momentum Fund MANAGER’S COMMENTARY (Unaudited) (continued) | |
(Unaudited)
Top Ten Holdings as of December 31, 2012
| Rank | Description | Industry | % of Net Assets | |||
| 1 | TCF Financial Corp. | Commercial Banks | 0.8% | |||
| 2 | Pool Corp. | Distributors | 0.8% | |||
| 3 | Investors Bancorp, Inc. | Commercial Banks | 0.8% | |||
| 4 | West Pharmaceutical Services, Inc. | Health Care Equipment & Supplies | 0.7% | |||
| 5 | MasTec, Inc. | Construction & Engineering | 0.7% | |||
| 6 | SS&C Technologies Holdings, Inc. | Software | 0.7% | |||
| 7 | Synovus Financial Corp. | Commercial Banks | 0.7% | |||
| 8 | Portfolio Recovery Associates, Inc. | Commercial Services & Supplies | 0.7% | |||
| 9 | Team Health Holdings, Inc. | Health Care Providers & Services | 0.7% | |||
| 10 | Texas Capital Bancshares, Inc. | Commercial Banks | 0.7% | |||
| Total | 7.3% |
Industry Sector Representation as of December 31, 2012
| % of Net Assets | % of Russell 2000 Index | Difference | ||||
Consumer Discretionary | 17.6% | 14.0% | 3.6% | |||
Consumer Staples | 4.9% | 3.5% | 1.4% | |||
Energy | 3.4% | 6.0% | -2.6% | |||
Financials | 30.8% | 22.9% | 7.9% | |||
Health Care | 13.3% | 12.1% | 1.2% | |||
Industrials | 12.2% | 15.5% | -3.3% | |||
Information Technology | 8.3% | 16.6% | -8.3% | |||
Materials | 5.7% | 5.3% | 0.4% | |||
Telecommunication Services | 1.5% | 0.7% | 0.8% | |||
Utilities | 2.3% | 3.4% | -1.1% | |||
Cash & Other Assets | 0.0% | 0.0% | 0.0% | |||
Total | 100.0% | 100.0% |
Disclaimer
The views expressed here are exclusively those of Fund management. These views, including those related to market sectors or individual stocks, are not meant as investment advice and should not be considered predictive in nature. Any favorable (or unfavorable) description of a holding applies only as of December 31, 2012, unless otherwise stated. Security positions can and do change thereafter. Discussions of historical performance do not guarantee and are not indicative of future performance.
Market volatility can significantly impact short-term performance. The Fund is not an appropriate investment for short-term investors. Investments in small companies generally carry greater risk than is customarily associated with larger companies. This additional risk is attributable to a number of factors, including the relatively limited financial resources that are typically available to small companies, and the fact that small companies often have comparatively limited product lines. In addition, the stock of small companies tends to be more volatile than the stock of large companies, particularly in the short term and particularly in the early stages of an economic or market downturn. Shareholders of the Fund, therefore, are taking on more risk than they would if they invested in the stock market as a whole.
43 | Semi-Annual Report | December 31, 2012 (Unaudited) |
Small-Cap Momentum Fund MANAGER’S COMMENTARY (Unaudited) (continued) | |
(Unaudited)
Conclusion
Thank you for your continued investment in Small-Cap Momentum Fund. We encourage your feedback; your reactions and concerns are important to us.
Sincerely,
The Investment Management Team
www.bridgeway.com | 44 |
Bridgeway Small-Cap Momentum Fund | |
Showing percentage of net assets as of December 31, 2012 (Unaudited)
| Industry Company | Shares | Value | ||||||||
COMMON STOCKS - 99.31% | ||||||||||
Aerospace & Defense - 0.86% |
| |||||||||
DigitalGlobe, Inc.*+ | 400 | $ | 9,776 | |||||||
KEYW Holding Corp. (The)* | 300 | 3,807 | ||||||||
Sparton Corp.* | 100 | 1,387 | ||||||||
Taser International, Inc.* | 450 | 4,023 | ||||||||
| 18,993 | ||||||||||
Airlines - 0.55% |
| |||||||||
Allegiant Travel Co. | 165 | 12,113 | ||||||||
Auto Components - 1.40% |
| |||||||||
Cooper Tire & Rubber Co. | 550 | 13,948 | ||||||||
Dorman Products, Inc. | 300 | 10,602 | ||||||||
Drew Industries, Inc. | 200 | 6,450 | ||||||||
| 31,000 | ||||||||||
Automobiles - 0.19% |
| |||||||||
Winnebago Industries, Inc.* | 250 | 4,282 | ||||||||
Beverages - 0.31% |
| |||||||||
Cott Corp. | 800 | 6,424 | ||||||||
Reed’s, Inc.*+ | 100 | 571 | ||||||||
| 6,995 | ||||||||||
Biotechnology - 2.02% |
| |||||||||
Aegerion Pharmaceuticals, Inc.*+ | 200 | 5,078 | ||||||||
Affymax, Inc.* | 300 | 5,700 | ||||||||
Dyax Corp.* | 950 | 3,306 | ||||||||
Infinity Pharmaceuticals, Inc.*+ | 350 | 12,250 | ||||||||
Medgenics, Inc.* | 100 | 744 | ||||||||
NewLink Genetics Corp.* | 200 | 2,500 | ||||||||
NPS Pharmaceuticals, Inc.* | 750 | 6,825 | ||||||||
PDL BioPharma, Inc.+ | 1,200 | 8,460 | ||||||||
| 44,863 | ||||||||||
Building Products - 2.45% |
| |||||||||
American Woodmark Corp.* | 100 | 2,782 | ||||||||
Apogee Enterprises, Inc. | 250 | 5,993 | ||||||||
Builders FirstSource, Inc.* | 800 | 4,464 | ||||||||
Nortek, Inc.* | 125 | 8,281 | ||||||||
PGT, Inc.* | 500 | 2,250 | ||||||||
Quanex Building Products Corp. | 300 | 6,123 | ||||||||
Simpson Manufacturing Co., Inc. | 400 | 13,116 | ||||||||
Trex Co., Inc.* | 150 | 5,584 | ||||||||
Universal Forest Products, Inc. | 150 | 5,706 | ||||||||
| 54,299 | ||||||||||
| Industry Company | Shares | Value | ||||||
Capital Markets - 3.92% | ||||||||
Apollo Investment Corp. | 1,700 | $ | 14,212 | |||||
Capital Southwest Corp. | 35 | 3,487 | ||||||
FBR & Co.* | 450 | 1,741 | ||||||
Fidus Investment Corp. | 100 | 1,645 | ||||||
Fifth Street Finance Corp. | 750 | 7,815 | ||||||
Financial Engines, Inc.*+ | 400 | 11,100 | ||||||
ICG Group, Inc.* | 300 | 3,429 | ||||||
Main Street Capital Corp. | 250 | 7,628 | ||||||
MCG Capital Corp. | 600 | 2,760 | ||||||
Medley Capital Corp. | 250 | 3,640 | ||||||
New Mountain Finance Corp. | 200 | 2,980 | ||||||
Saratoga Investment Corp. | 50 | 756 | ||||||
THL Credit, Inc. | 200 | 2,958 | ||||||
TICC Capital Corp. | 350 | 3,542 | ||||||
Triangle Capital Corp.+ | 250 | 6,372 | ||||||
Walter Investment Management Corp.* | 300 | 12,906 | ||||||
|
| |||||||
| 86,971 | ||||||||
Chemicals - 2.08% | ||||||||
American Pacific Corp.* | 75 | 1,159 | ||||||
American Vanguard Corp. | 250 | 7,768 | ||||||
FutureFuel Corp. | 350 | 4,144 | ||||||
Landec Corp.* | 250 | 2,372 | ||||||
PolyOne Corp. | 750 | 15,315 | ||||||
Quaker Chemical Corp. | 100 | 5,386 | ||||||
Stepan Co. | 180 | 9,997 | ||||||
|
| |||||||
| 46,141 | ||||||||
Commercial Banks - 10.92% | ||||||||
Access National Corp. | 100 | 1,300 | ||||||
Banco Latinoamericano de | ||||||||
Comercio Exterior SA | 300 | 6,468 | ||||||
Bancorp, Inc. (The)* | 300 | 3,291 | ||||||
BancorpSouth, Inc. | 800 | 11,632 | ||||||
Bank of Kentucky Financial Corp. | 50 | 1,236 | ||||||
Banner Corp. | 150 | 4,610 | ||||||
Bar Harbor Bankshares | 50 | 1,682 | ||||||
Bridge Capital Holdings* | 150 | 2,334 | ||||||
BSB Bancorp, Inc.* | 100 | 1,223 | ||||||
C&F Financial Corp. | 25 | 974 | ||||||
CapitalSource, Inc. | 1,800 | 13,644 | ||||||
Cardinal Financial Corp. | 250 | 4,067 | ||||||
Center Bancorp, Inc. | 150 | 1,737 | ||||||
Community Trust Bancorp, Inc. | 150 | 4,917 | ||||||
45 | Semi-Annual Report | December 31, 2012 (Unaudited) |
Bridgeway Small-Cap Momentum Fund SCHEDULE OF INVESTMENTS (continued) | |
Showing percentage of net assets as of December 31, 2012 (Unaudited)
| Industry Company | Shares | Value | ||||||||
Common Stocks (continued) | ||||||||||
Commercial Banks (continued) | ||||||||||
Farmers Capital Bank Corp.* | 75 | $ | 919 | |||||||
Fidelity Southern Corp.* | 100 | 955 | ||||||||
Financial Institutions, Inc. | 100 | 1,863 | ||||||||
First Community Bancshares, Inc. | 150 | 2,396 | ||||||||
First Merchants Corp. | 250 | 3,710 | ||||||||
First of Long Island Corp. (The) | 100 | 2,832 | ||||||||
German American Bancorp, Inc. | 100 | 2,172 | ||||||||
Hanmi Financial Corp.* | 250 | 3,398 | ||||||||
Heartland Financial USA, Inc. | 150 | 3,922 | ||||||||
Heritage Commerce Corp.* | 200 | 1,396 | ||||||||
Heritage Financial Corp. | 150 | 2,204 | ||||||||
Heritage Oaks Bancorp*+ | 250 | 1,450 | ||||||||
Home BancShares, Inc. | 250 | 8,255 | ||||||||
Horizon Bancorp | 75 | 1,474 | ||||||||
Investors Bancorp, Inc. | 950 | 16,891 | ||||||||
MainSource Financial Group, Inc. | 150 | 1,900 | ||||||||
Mercantile Bank Corp. | 50 | 825 | ||||||||
MetroCorp Bancshares, Inc.* | 150 | 1,648 | ||||||||
Middleburg Financial Corp. | 50 | 883 | ||||||||
MidWestOne Financial Group, Inc. | 50 | 1,026 | ||||||||
Monarch Financial Holdings, Inc. | 75 | 616 | ||||||||
National Bankshares, Inc. | 50 | 1,620 | ||||||||
North Valley Bancorp* | 50 | 710 | ||||||||
Northrim BanCorp, Inc. | 50 | 1,132 | ||||||||
OmniAmerican Bancorp, Inc.* | 100 | 2,313 | ||||||||
Pacific Mercantile Bancorp* | 150 | 944 | ||||||||
Pacific Premier Bancorp, Inc.* | 100 | 1,024 | ||||||||
Peapack Gladstone Financial Corp. | 50 | 704 | ||||||||
Peoples Bancorp, Inc. | 100 | 2,043 | ||||||||
Preferred Bank* | 100 | 1,420 | ||||||||
Premier Financial Bancorp, Inc. | 75 | 812 | ||||||||
SCBT Financial Corp. | 125 | 5,022 | ||||||||
Sierra Bancorp | 100 | 1,143 | ||||||||
Southside Bancshares, Inc.+ | 150 | 3,159 | ||||||||
Southwest Bancorp, Inc.* | 150 | 1,680 | ||||||||
Suffolk Bancorp* | 100 | 1,310 | ||||||||
Synovus Financial Corp. | 6,600 | 16,170 | ||||||||
Taylor Capital Group, Inc.*+ | 250 | 4,512 | ||||||||
| Industry Company | Shares | Value | ||||||
Commercial Banks (continued) | ||||||||
TCF Financial Corp. | 1,400 | $ | 17,010 | |||||
Texas Capital Bancshares, Inc.* | 350 | 15,687 | ||||||
TowneBank | 250 | 3,872 | ||||||
UMB Financial Corp. | 350 | 15,344 | ||||||
Univest Corp. of Pennsylvania | 150 | 2,565 | ||||||
Virginia Commerce Bancorp, Inc.* | 250 | 2,238 | ||||||
Washington Trust Bancorp, Inc. | 150 | 3,946 | ||||||
WesBanco, Inc. | 200 | 4,444 | ||||||
Western Alliance Bancorp* | 750 | 7,898 | ||||||
Wilshire Bancorp, Inc.* | 650 | 3,816 | ||||||
|
| |||||||
| 242,388 | ||||||||
Commercial Services & Supplies - 4.37% | ||||||||
Asset Acceptance Capital Corp.* | 300 | 1,350 | ||||||
Asta Funding, Inc. | 100 | 951 | ||||||
Ceco Environmental Corp. | 150 | 1,493 | ||||||
Deluxe Corp. | 420 | 13,541 | ||||||
Encore Capital Group, Inc.* | 200 | 6,124 | ||||||
Geo Group, Inc. (The) | 500 | 14,100 | ||||||
Hudson Technologies, Inc.* | 250 | 910 | ||||||
InnerWorkings, Inc.*+ | 400 | 5,512 | ||||||
Kimball International, Inc., | 300 | 3,483 | ||||||
Multi-Color Corp. | 150 | 3,598 | ||||||
Portfolio Recovery Associates, Inc.* | 150 | 16,029 | ||||||
Quad/Graphics, Inc.+ | 400 | 8,156 | ||||||
Standard Parking Corp.* | 200 | 4,398 | ||||||
Steelcase, Inc., Class A | 1,050 | 13,377 | ||||||
Viad Corp. | 150 | 4,074 | ||||||
|
| |||||||
| 97,096 | ||||||||
Communications Equipment - 0.23% | ||||||||
CalAmp Corp.* | 200 | 1,664 | ||||||
Numerex Corp., Class A* | 150 | 1,971 | ||||||
Parkervision, Inc.* | 750 | 1,522 | ||||||
|
| |||||||
| 5,157 | ||||||||
Construction & Engineering - 0.73% | ||||||||
MasTec, Inc.* | 650 | 16,204 | ||||||
Construction Materials - 0.77% | ||||||||
Headwaters, Inc.* | 550 | 4,708 | ||||||
Texas Industries, Inc.*+ | 225 | 11,477 | ||||||
www.bridgeway.com | 46 |
Bridgeway Small-Cap Momentum Fund SCHEDULE OF INVESTMENTS (continued) | |
Showing percentage of net assets as of December 31, 2012 (Unaudited)
| Industry Company | Shares | Value | ||||||||
Common Stocks (continued) | ||||||||||
Construction Materials (continued) |
| |||||||||
US Concrete, Inc.* | 100 | $ | 905 | |||||||
|
| |||||||||
| 17,090 | ||||||||||
Consumer Finance - 0.04% |
| |||||||||
Consumer Portfolio Services, Inc.* | 150 | 804 | ||||||||
Containers & Packaging - 0.13% |
| |||||||||
AEP Industries, Inc.* | 50 | 2,962 | ||||||||
Distributors - 0.98% |
| |||||||||
Core-Mark Holding Co., Inc. | 100 | 4,735 | ||||||||
Pool Corp. | 400 | 16,928 | ||||||||
|
| |||||||||
| 21,663 | ||||||||||
Diversified Consumer Services - 1.29% |
| |||||||||
Ascent Capital Group, Inc., Class A* | 150 | 9,291 | ||||||||
Carriage Services, Inc. | 150 | 1,781 | ||||||||
Grand Canyon Education, Inc.* | 400 | 9,388 | ||||||||
Stewart Enterprises, Inc., Class A | 800 | 6,112 | ||||||||
Universal Technical Institute, Inc. | 200 | 2,008 | ||||||||
|
|
| ||||||||
| 28,580 | ||||||||||
Diversified Financial Services - 1.01% |
| |||||||||
California First National Bancorp | 100 | 1,495 | ||||||||
Marlin Business Services Corp. | 100 | 2,006 | ||||||||
NewStar Financial, Inc.* | 450 | 6,304 | ||||||||
PHH Corp.*+ | 500 | 11,375 | ||||||||
Resource America, Inc., Class A | 200 | 1,334 | ||||||||
|
| |||||||||
| 22,514 | ||||||||||
Diversified Telecommunication Services - 0.92% |
| |||||||||
Cincinnati Bell, Inc.* | 1,700 | 9,316 | ||||||||
Cogent Communications Group, Inc. | 400 | 9,056 | ||||||||
Fairpoint Communications, Inc.*+ | 250 | 1,985 | ||||||||
|
| |||||||||
| 20,357 | ||||||||||
Electric Utilities - 1.77% |
| |||||||||
MGE Energy, Inc. | 200 | 10,190 | ||||||||
PNM Resources, Inc. | 700 | 14,357 | ||||||||
UNS Energy Corp. | 350 | 14,847 | ||||||||
|
| |||||||||
| 39,394 | ||||||||||
| Industry Company | Shares | Value | ||||||
Electrical Equipment - 0.79% |
| |||||||
AZZ, Inc. | 200 | $ | 7,686 | |||||
Powell Industries, Inc.* | 100 | 4,153 | ||||||
Thermon Group Holdings, Inc.* | 250 | 5,633 | ||||||
|
| |||||||
| 17,472 | ||||||||
Electronic Equipment, Instruments & Components - 1.17% |
| |||||||
Badger Meter, Inc. | 125 | 5,926 | ||||||
OSI Systems, Inc.* | 175 | 11,207 | ||||||
Rogers Corp.* | 150 | 7,449 | ||||||
Uni-Pixel, Inc.* | 100 | 1,369 | ||||||
|
| |||||||
| 25,951 | ||||||||
Energy Equipment & Services - 0.81% |
| |||||||
Exterran Holdings, Inc.* | 550 | 12,056 | ||||||
Natural Gas Services | ||||||||
Group, Inc.* | 100 | 1,642 | ||||||
Vantage Drilling Co.* | 2,350 | 4,300 | ||||||
|
| |||||||
| 17,998 | ||||||||
Food & Staples Retailing - 0.42% |
| |||||||
Pantry, Inc. (The)* | 200 | 2,426 | ||||||
Susser Holdings Corp.* | 200 | 6,898 | ||||||
|
| |||||||
| 9,324 | ||||||||
Food Products - 2.40% |
| |||||||
Alico, Inc. | 50 | 1,832 | ||||||
B&G Foods, Inc. | 450 | 12,739 | ||||||
Cal-Maine Foods, Inc. | 200 | 8,044 | ||||||
J&J Snack Foods Corp. | 150 | 9,591 | ||||||
Rocky Mountain Chocolate Factory, Inc. | 75 | 792 | ||||||
S&W Seed Co.* | 75 | 579 | ||||||
Smart Balance, Inc.* | 500 | 6,450 | ||||||
Snyders-Lance, Inc. | 550 | 13,260 | ||||||
|
| |||||||
| 53,287 | ||||||||
Gas Utilities - 0.15% |
| |||||||
Chesapeake Utilities Corp. | 75 | 3,405 | ||||||
Health Care Equipment & Supplies - 5.96% |
| |||||||
Analogic Corp. | 100 | 7,430 | ||||||
Cardiovascular Systems, Inc.*+ | 200 | 2,510 | ||||||
Conceptus, Inc.*+ | 250 | 5,252 | ||||||
Cyberonics, Inc.* | 250 | 13,133 | ||||||
Cynosure, Inc., Class A* | 150 | 3,616 | ||||||
EnteroMedics, Inc.* | 350 | 980 | ||||||
Exactech, Inc.* | 100 | 1,695 | ||||||
47 | Semi-Annual Report | December 31, 2012 (Unaudited) |
Bridgeway Small-Cap Momentum Fund SCHEDULE OF INVESTMENTS (continued) | |
Showing percentage of net assets as of December 31, 2012 (Unaudited)
| Industry Company | Shares | Value | ||||||||
Common Stocks (continued) | ||||||||||
Health Care Equipment & Supplies (continued) |
| |||||||||
HeartWare International, Inc.*+ | 125 | $ | 10,494 | |||||||
ICU Medical, Inc.* | 125 | 7,616 | ||||||||
Insulet Corp.* | 400 | 8,488 | ||||||||
Integra LifeSciences Holdings Corp.* | 225 | 8,768 | ||||||||
Meridian Bioscience, Inc. | 350 | 7,088 | ||||||||
Merit Medical Systems, Inc.* | 350 | 4,865 | ||||||||
Neogen Corp.* | 200 | 9,064 | ||||||||
Rochester Medical Corp.* | 100 | 1,008 | ||||||||
RTI Biologics, Inc.* | 500 | 2,135 | ||||||||
Spectranetics Corp.* | 300 | 4,431 | ||||||||
SurModics, Inc.* | 150 | 3,354 | ||||||||
Symmetry Medical, Inc.* | 300 | 3,156 | ||||||||
Utah Medical Products, Inc. | 30 | 1,082 | ||||||||
Vascular Solutions, Inc.* | 150 | 2,370 | ||||||||
West Pharmaceutical Services, Inc. | 300 | 16,425 | ||||||||
Wright Medical Group, Inc.*+ | 350 | 7,346 | ||||||||
|
| |||||||||
| 132,306 | ||||||||||
Health Care Providers & Services - 4.54% |
| |||||||||
Acadia Healthcare Co., Inc.* | 350 | 8,166 | ||||||||
Air Methods Corp. | 300 | 11,067 | ||||||||
AMN Healthcare Services, Inc.* | 350 | 4,043 | ||||||||
Bio-Reference Labs, Inc.* | 250 | 7,172 | ||||||||
BioScrip, Inc.* | 500 | 5,385 | ||||||||
Capital Senior Living Corp.* | 250 | 4,672 | ||||||||
Emeritus Corp.* | 400 | 9,888 | ||||||||
Hanger, Inc.* | 300 | 8,208 | ||||||||
MWI Veterinary Supply, Inc.* | 100 | 11,000 | ||||||||
Select Medical Holdings Corp. | 1,350 | 12,730 | ||||||||
Team Health Holdings, Inc.* | 550 | 15,824 | ||||||||
U.S. Physical Therapy, Inc. | 100 | 2,754 | ||||||||
|
| |||||||||
| 100,909 | ||||||||||
Health Care Technology - 0.64% | ||||||||||
HealthStream, Inc.* | 200 | 4,862 | ||||||||
Medidata Solutions, Inc.* | 225 | 8,818 | ||||||||
Streamline Health Solutions, Inc.* | 100 | 569 | ||||||||
|
| |||||||||
| 14,249 | ||||||||||
Hotels, Restaurants & Leisure - 5.38% |
| |||||||||
AFC Enterprises, Inc.* | 200 | 5,226 | ||||||||
Bally Technologies, Inc.* | 350 | 15,648 | ||||||||
Bob Evans Farms, Inc. | 250 | 10,050 | ||||||||
Carrols Restaurant Group, Inc.* | 200 | 1,196 | ||||||||
| Industry Company | Shares | Value | ||||||
|
| |||||||
Hotels, Restaurants & Leisure (continued) |
| |||||||
Cheesecake Factory, Inc. (The) | 450 | $ | 14,724 | |||||
Churchill Downs, Inc. | 150 | 9,968 | ||||||
Cracker Barrel Old Country Store, Inc. | 200 | 12,852 | ||||||
Denny’s Corp.* | 800 | 3,904 | ||||||
Kona Grill, Inc.* | 75 | 650 | ||||||
Marriott Vacations Worldwide Corp.* | 300 | 12,501 | ||||||
Multimedia Games Holding Co., Inc.* | 250 | 3,678 | ||||||
Nathan’s Famous, Inc.* | 50 | 1,685 | ||||||
Papa John’s International, Inc.* | 200 | 10,988 | ||||||
Ryman Hospitality Properties | 375 | 14,422 | ||||||
Town Sports International Holdings, Inc. | 175 | 1,864 | ||||||
|
| |||||||
| 119,356 | ||||||||
Household Durables - 2.75% | ||||||||
Bassett Furniture Industries, Inc. | 100 | 1,247 | ||||||
Beazer Homes USA, Inc.*+ | 200 | 3,378 | ||||||
CSS Industries, Inc. | 100 | 2,189 | ||||||
Flexsteel Industries, Inc. | 50 | 1,073 | ||||||
Libbey, Inc.* | 150 | 2,902 | ||||||
M/I Homes, Inc.* | 200 | 5,300 | ||||||
MDC Holdings, Inc. | 400 | 14,704 | ||||||
Meritage Homes Corp.* | 300 | 11,205 | ||||||
NACCO Industries, Inc., Class A | 75 | 4,552 | ||||||
Ryland Group, Inc. (The) | 400 | 14,600 | ||||||
|
| |||||||
| 61,150 | ||||||||
Household Products - 0.26% | ||||||||
WD-40 Co. | 125 | 5,889 | ||||||
Industrial Conglomerates - 0.23% | ||||||||
Standex International Corp. | 100 | 5,129 | ||||||
Insurance - 3.76% | ||||||||
AMERISAFE, Inc.* | 150 | 4,088 | ||||||
Baldwin & Lyons, Inc., | 150 | 3,579 | ||||||
Eastern Insurance Holdings, Inc. | 50 | 854 | ||||||
Global Indemnity PLC* | 200 | 4,426 | ||||||
Greenlight Capital Re, Ltd. Class A* | 300 | 6,924 | ||||||
Hilltop Holdings, Inc.* | 450 | 6,093 | ||||||
Homeowners Choice, Inc.+ | 100 | 2,079 | ||||||
Investors Title Co. | 25 | 1,500 | ||||||
www.bridgeway.com | 48 |
Bridgeway Small-Cap Momentum Fund SCHEDULE OF INVESTMENTS (continued) | |
Showing percentage of net assets as of December 31, 2012 (Unaudited)
| Industry Company | Shares | Value | ||||||||
Common Stocks (continued) | ||||||||||
Insurance (continued) | ||||||||||
Kansas City Life Insurance Co. | 100 | $ | 3,816 | |||||||
Montpelier Re Holdings, Ltd. | 450 | 10,287 | ||||||||
Navigators Group, Inc. (The)* | 100 | 5,107 | ||||||||
Platinum Underwriters Holdings, Ltd. | 275 | 12,650 | ||||||||
State Auto Financial Corp. | 350 | 5,229 | ||||||||
Stewart Information Services Corp. | 150 | 3,900 | ||||||||
Symetra Financial Corp. | 1,000 | 12,980 | ||||||||
|
| |||||||||
| 83,512 | ||||||||||
Internet & Catalog Retail - 0.23% | ||||||||||
1-800-Flowers.com, Inc., | 600 | 2,202 | ||||||||
Overstock.com, Inc.* | 200 | 2,862 | ||||||||
|
| |||||||||
| 5,064 | ||||||||||
Internet Software & Services - 1.59% | ||||||||||
Cornerstone OnDemand, Inc.* | 400 | 11,812 | ||||||||
Demand Media, Inc.*+ | 750 | 6,967 | ||||||||
Market Leader, Inc.* | 250 | 1,638 | ||||||||
NIC, Inc. | 550 | 8,987 | ||||||||
Spark Networks, Inc.* | 150 | 1,170 | ||||||||
SPS Commerce, Inc.* | 125 | 4,659 | ||||||||
|
| |||||||||
| 35,233 | ||||||||||
IT Services - 1.35% | ||||||||||
Acxiom Corp.* | 625 | 10,912 | ||||||||
Computer Task Group, Inc.* | 150 | 2,734 | ||||||||
Convergys Corp. | 900 | 14,769 | ||||||||
PRGX Global, Inc.* | 250 | 1,613 | ||||||||
|
| |||||||||
| 30,028 | ||||||||||
Leisure Equipment & Products - 0.25% | ||||||||||
LeapFrog Enterprises, Inc.* | 650 | 5,610 | ||||||||
Life Sciences Tools & Services - 0.80% | ||||||||||
Fluidigm Corp.* | 200 | 2,862 | ||||||||
PAREXEL International Corp.* | 500 | 14,795 | ||||||||
|
| |||||||||
| 17,657 | ||||||||||
Machinery - 1.09% | ||||||||||
CIRCOR International, Inc. | 150 | 5,938 | ||||||||
Douglas Dynamics, Inc. | 200 | 2,878 | ||||||||
Energy Recovery, Inc.* | 450 | 1,530 | ||||||||
Federal Signal Corp.* | 550 | 4,185 | ||||||||
| Industry Company | Shares | Value | ||||||
| ||||||||
Machinery (continued) | ||||||||
Lydall, Inc.* | 150 | $ | 2,151 | |||||
Mueller Water Products, Inc., Class A | 1,350 | 7,574 | ||||||
|
| |||||||
| 24,256 | ||||||||
Media - 0.40% | ||||||||
E.W. Scripps Co., Class A (The)* | 450 | 4,864 | ||||||
Emmis Communications Corp., Class A* | 350 | 690 | ||||||
ReachLocal, Inc.* | 250 | 3,228 | ||||||
|
| |||||||
| 8,782 | ||||||||
Metals & Mining - 1.39% | ||||||||
Gold Resource Corp. | 450 | 6,934 | ||||||
Hecla Mining Co. | 2,500 | 14,575 | ||||||
Kaiser Aluminum Corp. | 150 | 9,254 | ||||||
|
| |||||||
| 30,763 | ||||||||
Multiline Retail - 0.10% | ||||||||
Tuesday Morning Corp.* | 350 | 2,188 | ||||||
Oil, Gas & Consumable Fuels - 2.27% | ||||||||
Cloud Peak Energy, Inc.* | 500 | 9,665 | ||||||
Delek US Holdings, Inc. | 500 | 12,660 | ||||||
EPL Oil & Gas, Inc.* | 350 | 7,892 | ||||||
Longwei Petroleum Investment Holding, Ltd.* | 750 | 1,583 | ||||||
Rentech, Inc. | 1,850 | 4,866 | ||||||
SemGroup Corp., Class A* | 350 | 13,678 | ||||||
|
| |||||||
| 50,344 | ||||||||
Paper & Forest Products - 0.63% | ||||||||
Clearwater Paper Corp.* | 200 | 7,832 | ||||||
PH Glatfelter Co. | 350 | 6,118 | ||||||
|
| |||||||
| 13,950 | ||||||||
Personal Products - 0.86% | ||||||||
Elizabeth Arden, Inc.* | 250 | 11,253 | ||||||
Female Health Co. (The) | 200 | 1,436 | ||||||
Inter Parfums, Inc. | 250 | 4,865 | ||||||
Nutraceutical International Corp. | 100 | 1,654 | ||||||
|
| |||||||
| 19,208 | ||||||||
Pharmaceuticals - 0.64% | ||||||||
BioDelivery Sciences International, Inc.*+ | 300 | 1,293 | ||||||
Endocyte, Inc.* | 300 | 2,694 | ||||||
49 | Semi-Annual Report | December 31, 2012 (Unaudited) |
Bridgeway Small-Cap Momentum Fund SCHEDULE OF INVESTMENTS (continued) | |
Showing percentage of net assets as of December 31, 2012 (Unaudited)
| Industry Company | Shares | Value | | |||||||
Common Stocks (continued) | ||||||||||
Pharmaceuticals (continued) | ||||||||||
Nektar Therapeutics* | 1,050 | $ | 7,781 | |||||||
Repros Therapeutics, Inc.*+ | 150 | 2,362 | ||||||||
|
| |||||||||
| 14,130 | ||||||||||
Professional Services - 1.61% | ||||||||||
Advisory Board Co. (The)* | 300 | 14,037 | ||||||||
Barrett Business Services, Inc. | 50 | 1,904 | ||||||||
Exponent, Inc.* | 100 | 5,583 | ||||||||
Franklin Covey Co.* | 150 | 1,935 | ||||||||
GP Strategies Corp.* | 150 | 3,098 | ||||||||
On Assignment, Inc.* | 450 | 9,126 | ||||||||
|
| |||||||||
| 35,683 | ||||||||||
Real Estate Investment Trusts (REITs) - 6.64% |
| |||||||||
Acadia Realty Trust | 450 | 11,286 | ||||||||
American Assets Trust, Inc. | 500 | 13,965 | ||||||||
American Realty Capital | ||||||||||
Properties, Inc.+ | 100 | 1,324 | ||||||||
CapLease, Inc. | 550 | 3,064 | ||||||||
Chatham Lodging Trust | 100 | 1,538 | ||||||||
Chesapeake Lodging Trust | 350 | 7,308 | ||||||||
DCT Industrial Trust, Inc. | 2,250 | 14,603 | ||||||||
Hudson Pacific Properties, Inc. | 400 | 8,424 | ||||||||
Medical Properties Trust, Inc. | 1,150 | 13,754 | ||||||||
Monmouth Real Estate | ||||||||||
Investment Corp., Class A | 350 | 3,626 | ||||||||
Parkway Properties, Inc. | 350 | 4,896 | ||||||||
Pennsylvania Real Estate | ||||||||||
Investment Trust | 450 | 7,938 | ||||||||
Potlatch Corp. | 350 | 13,716 | ||||||||
Ramco-Gershenson | ||||||||||
Properties Trust | 400 | 5,324 | ||||||||
Sabra Health Care REIT, Inc. | 300 | 6,516 | ||||||||
Saul Centers, Inc. | 150 | 6,419 | ||||||||
STAG Industrial, Inc. | 350 | 6,290 | ||||||||
Sunstone Hotel Investors, Inc.* | 1,150 | 12,316 | ||||||||
Universal Health Realty | ||||||||||
Income Trust | 100 | 5,061 | ||||||||
|
| |||||||||
| 147,368 | ||||||||||
Real Estate Management & Development - 0.57% |
| |||||||||
AV Homes, Inc.* | 100 | 1,422 | ||||||||
Thomas Properties Group, Inc. | 550 | 2,975 | ||||||||
Zillow, Inc., Class A*+ | 300 | 8,325 | ||||||||
|
| |||||||||
| 12,722 | ||||||||||
| Industry Company | Shares | Value | ||||||
| ||||||||
Road & Rail - 0.45% | ||||||||
Celadon Group, Inc. | 200 | $ | 3,614 | |||||
Patriot Transportation | ||||||||
Holding, Inc.* | 100 | 2,843 | ||||||
Saia, Inc.* | 150 | 3,468 | ||||||
|
| |||||||
| 9,925 | ||||||||
Semiconductors & Semiconductor Equipment - 0.85% |
| |||||||
Exar Corp.* | 400 | 3,560 | ||||||
PDF Solutions, Inc.* | 250 | 3,445 | ||||||
Pericom Semiconductor Corp.* | 200 | 1,606 | ||||||
Veeco Instruments, Inc.*+ | 350 | 10,332 | ||||||
|
| |||||||
| 18,943 | ||||||||
Software - 2.19% | ||||||||
Ellie Mae, Inc.* | 200 | 5,550 | ||||||
EPIQ Systems, Inc. | 300 | 3,834 | ||||||
Evolving Systems, Inc. | 100 | 596 | ||||||
Manhattan Associates, Inc.* | 150 | 9,051 | ||||||
Pervasive Software, Inc.* | 150 | 1,337 | ||||||
SS&C Technologies | ||||||||
Holdings, Inc.* | 700 | 16,184 | ||||||
Tyler Technologies, Inc.* | 250 | 12,110 | ||||||
|
| |||||||
| 48,662 | ||||||||
Specialty Retail - 3.50% | ||||||||
Big 5 Sporting Goods Corp. | 200 | 2,620 | ||||||
Brown Shoe Co., Inc. | 350 | 6,430 | ||||||
Casual Male Retail Group, Inc.* | 400 | 1,680 | ||||||
Cato Corp., Class A (The) | 250 | 6,857 | ||||||
Children’s Place Retail Stores, Inc. (The)* | 200 | 8,858 | ||||||
Conn’s, Inc.*+ | 300 | 9,204 | ||||||
Destination Maternity Corp. | 100 | 2,156 | ||||||
Lithia Motors, Inc., Class A | 200 | 7,484 | ||||||
Lumber Liquidators | ||||||||
Holdings, Inc.*+ | 225 | 11,887 | ||||||
Stage Stores, Inc. | 250 | 6,195 | ||||||
Vitamin Shoppe, Inc.* | 250 | 14,340 | ||||||
|
| |||||||
| 77,711 | ||||||||
Textiles, Apparel & Luxury Goods - 1.18% |
| |||||||
Cherokee, Inc. | 50 | 686 | ||||||
Columbia Sportswear Co.+ | 290 | 15,474 | ||||||
Crown Crafts, Inc. | 100 | 500 | ||||||
Culp, Inc. | 100 | 1,501 | ||||||
G-III Apparel Group, Ltd.* | 150 | 5,134 | ||||||
Perry Ellis International, Inc. | 150 | 2,985 | ||||||
|
| |||||||
| 26,280 | ||||||||
www.bridgeway.com | 50 |
Bridgeway Small-Cap Momentum Fund SCHEDULE OF INVESTMENTS (continued) | |
Showing percentage of net assets as of December 31, 2012 (Unaudited)
| Industry Company | Shares | Value | | |||||||
Common Stocks (continued) | ||||||||||
Thrifts & Mortgage Finance - 2.97% |
| |||||||||
ASB Bancorp, Inc.* | 50 | $ | 766 | |||||||
BankFinancial Corp. | 200 | 1,484 | ||||||||
BofI Holding, Inc.* | 100 | 2,787 | ||||||||
Federal Agricultural Mortgage Corp., Class C | 100 | 3,250 | ||||||||
First Financial Holdings, Inc. | 150 | 1,962 | ||||||||
Flagstar Bancorp, Inc.* | 450 | 8,730 | ||||||||
Flushing Financial Corp. | 250 | 3,835 | ||||||||
Fox Chase Bancorp, Inc. | 100 | 1,665 | ||||||||
Franklin Financial Corp. | 100 | 1,658 | ||||||||
Hingham Institution for Savings | 20 | 1,252 | ||||||||
Home Federal Bancorp, Inc. | 100 | 1,243 | ||||||||
IF Bancorp, Inc.* | 50 | 690 | ||||||||
Laporte Bancorp, Inc. | 75 | 647 | ||||||||
Malvern Bancorp, Inc.* | 75 | 834 | ||||||||
Meridian Interstate Bancorp, Inc.* | 200 | 3,356 | ||||||||
NASB Financial, Inc.* | 50 | 1,068 | ||||||||
Oritani Financial Corp. | 400 | 6,128 | ||||||||
Provident Financial Holdings, Inc. | 100 | 1,750 | ||||||||
Radian Group, Inc.+ | 1,100 | 6,721 | ||||||||
Security National Financial Corp., Class A* | 150 | 1,317 | ||||||||
Simplicity Bancorp, Inc. | 50 | 748 | ||||||||
Tree.com, Inc. | 100 | 1,803 | ||||||||
ViewPoint Financial Group, Inc. | 350 | 7,329 | ||||||||
Walker & Dunlop, Inc.* | 300 | 4,998 | ||||||||
|
| |||||||||
| 66,021 | ||||||||||
Trading Companies & Distributors - 1.04% |
| |||||||||
Aceto Corp. | 200 | 2,008 | ||||||||
Beacon Roofing Supply, Inc.* | 400 | 13,312 | ||||||||
DXP Enterprises, Inc.* | 100 | 4,907 | ||||||||
SeaCube Container Leasing, Ltd. | 150 | 2,827 | ||||||||
|
| |||||||||
| 23,054 | ||||||||||
Water Utilities - 0.37% | ||||||||||
American States Water Co. | 150 | 7,197 | ||||||||
Artesian Resources Corp., Class A | 50 | 1,121 | ||||||||
|
| |||||||||
| 8,318 | ||||||||||
Wireless Telecommunication Services - 0.14% |
| |||||||||
Shenandoah Telecommunications Co. | 200 | 3,062 | ||||||||
|
| |||||||||
TOTAL COMMON STOCKS - 99.31% |
| 2,204,765 | ||||||||
|
| |||||||||
(Cost $2,069,575) | ||||||||||
Industry Company | Shares | Value | ||||||
EXCHANGE TRADED FUND - 1.10% |
| |||||||
iShares Russell 2000 Index Fund | 290 | $24,444 | ||||||
|
| |||||||
TOTAL EXCHANGE TRADED FUND - 1.10% |
| 24,444 | ||||||
|
| |||||||
(Cost $23,471) | ||||||||
WARRANTS - 0.00% | ||||||||
Magnum Hunter Resources Corp.*D | 115 | — | ||||||
|
| |||||||
TOTAL WARRANTS - 0.00% | — | |||||||
|
| |||||||
(Cost $ — ) | ||||||||
| Rate^ | Shares | Value | ||||||||||
MONEY MARKET FUND - 0.24% |
| |||||||||||
BlackRock FedFund | 0.01 | % | 5,323 | 5,323 | ||||||||
|
| |||||||||||
TOTAL MONEY MARKET FUND - 0.24% |
| 5,323 | ||||||||||
|
| |||||||||||
(Cost $5,323) | ||||||||||||
TOTAL INVESTMENTS - 100.65% |
| $2,234,532 | ||||||||||
(Cost $2,098,369) | ||||||||||||
Liabilities in Excess of Other Assets - (0.65%) |
| (14,365 | ) | |||||||||
|
| |||||||||||
NET ASSETS - 100.00% | $2,220,167 | |||||||||||
|
| |||||||||||
| * | Non-income producing security. |
| ^ | Rate disclosed as of December 31, 2012. |
| D | Security was fair valued under procedures adopted by the Board of Directors (see Note 2). |
| + | This security or a portion of the security is out on loan at December 31, 2012. Total loaned securities had a value of $201,502 at December 31, 2012. |
PLC - Public Limited Company
Summary of inputs used to value the Fund’s investments as of 12/31/2012 is as follows (See Note 2 in Notes to Financial Statements):
| Valuation Inputs | |||||||||||||
| Investment in Securities (Value) | |||||||||||||
| Level 1 Quoted Prices | Level 2 Significant Observable Inputs | Level 3 Significant Unobservable Inputs | Total | ||||||||||
Common Stocks | $2,204,765 | $ — | $ — | $2,204,765 | ||||||||||
Exchange Traded Fund | 24,444 | — | — | 24,444 | ||||||||||
Warrants | — | — | — | — | ||||||||||
Money Market Fund | — | 5,323 | — | 5,323 | ||||||||||
|
|
|
|
|
|
| ||||||||
TOTAL | $2,229,209 | $5,323 | $ — | $2,234,532 | ||||||||||
|
|
|
|
|
|
| ||||||||
See Notes to Financial Statements.
51 | Semi-Annual Report | December 31, 2012 (Unaudited) |
Small-Cap Growth Fund | |
(Unaudited)
December 31, 2012
Dear Fellow Small-Cap Growth Fund Shareholder,
For the quarter ended December 31, 2012, our Fund was down 2.33%, trailing our primary market benchmark, the Russell 2000 Growth Index (+0.45%), and our peer benchmark, the Lipper Small-Cap Growth Funds Index (+0.12%). It was a poor quarter on an absolute and relative basis, and we are not pleased.
For the six-month “semi-annual” period ending December 31, 2012, our Fund was up 4.56%, trailing our primary market benchmark, the Russell 2000 Growth Index (+5.31%), and our peer benchmark, the Lipper Small-Cap Growth Funds Index (+5.51%).
For the calendar year, our Fund was up 11.05%, trailing both of our benchmarks.
The table below presents our December quarter, six-month, one-year, five-year, and inception-to-date financial results. See the next page for a graph of performance since inception.
Standardized Returns as of December 31, 2012
| Annualized | ||||||||||||||||||
| Quarter | 6 Months | 1 Year | 5 Years | Since Inception (10/31/03) | ||||||||||||||
Small-Cap Growth Fund | -2.33% | 4.56% | 11.05 | % | -4.31% | 2.22% | ||||||||||||
Russell 2000 Growth Index | 0.45% | 5.31% | 14.59 | % | 3.49% | 6.48% | ||||||||||||
Lipper Small-Cap Growth Funds Index | 0.12% | 5.51% | 14.95 | % | 2.09% | 5.37% | ||||||||||||
Performance figures quoted in the table above and the graph on the next page represent past performance and are no guarantee of future results. Total return figures in the table above and the graph on the next page include the reinvestment of dividends and capital gains. The table above and the graph on the next page do not reflect the deduction of taxes that a shareholder would pay on Fund distributions or on the redemption of Fund shares.
The Russell 2000 Growth Index is an unmanaged index that consists of stocks in the Russell 2000 Index with higher price-to-book ratios and higher forecasted growth values with dividends reinvested. The Lipper Small-Cap Growth Funds Index is an index of small-company, growth-oriented funds compiled by Lipper, Inc. It is not possible to invest directly in an index. Periods longer than one year are annualized.
According to data from Lipper, Inc. as of December 31, 2012, Small-Cap Growth Fund ranked 384th of 526 small-cap growth funds for the twelve-month period ended December 31, 2012, 409th of 412 over the last five years and 282nd of 286 such funds since inception in October, 2003. Lipper, Inc. is an independent mutual fund rating service that ranks funds in various fund categories by making comparative calculations using total returns.
www.bridgeway.com | 52 |
Small-Cap Growth Fund MANAGER’S COMMENTARY (Unaudited) (continued) | |
(Unaudited)
Small-Cap Growth Fund vs. Russell 2000 Growth Index & Lipper Small-Cap Growth Funds Index
from Inception 10/31/03 to 12/31/12
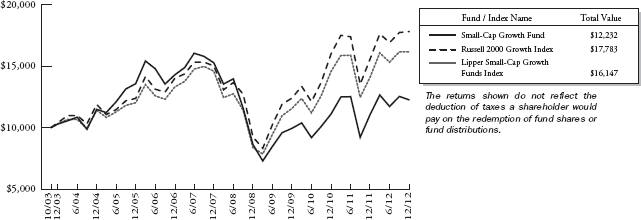
Detailed Explanation of Quarterly Performance
The Short Version: Almost all of our models performed poorly for the quarter, led by our growth models. Stock selection in the Consumer Discretionary and Information Technology sectors hurt our returns the most.
All categories of our models underperformed for the quarter ended December 31, 2012. Our growth models comprised 39% of our net assets and those stocks returned an average of -3.75%. Seven of the ten worst contributors came from the Consumer Discretionary and Information Technology sectors, most of which were picked by the growth models, costing us almost three percent in absolute returns.
Detailed Explanation of Calendar Year Performance
The Short Version: Most of our underperformance for the year came in the fourth quarter.
As described above, two and three-fourths percent of our roughly three and one-half percent of underperformance came during the fourth quarter. For the calendar year, four sectors — Health Care, Industrials, Financials and Information Technology — hurt our relative returns to the tune of three and one-half percent.
53 | Semi-Annual Report | December 31, 2012 (Unaudited) |
Small-Cap Growth Fund MANAGER’S COMMENTARY (Unaudited) (continued) | |
(Unaudited)
Top Ten Holdings as of December 31, 2012
| Rank | Description | Industry | % of Net Assets | ||||||
1 | DXP Enterprises, Inc. | Trading Companies & Distributors | 2.6 | % | |||||
2 | United Rentals, Inc. | Trading Companies & Distributors | 2.5 | % | |||||
3 | OSI Systems, Inc. | Electronic Equipment, Instruments & Components | 2.4 | % | |||||
4 | Credit Acceptance Corp. | Consumer Finance | 2.3 | % | |||||
5 | Computer Task Group, Inc. | IT Services | 2.3 | % | |||||
6 | American Vanguard Corp. | Chemicals | 2.2 | % | |||||
7 | Trimas Corp. | Machinery | 2.2 | % | |||||
8 | Lumber Liquidators Holdings, Inc. | Specialty Retail | 2.1 | % | |||||
9 | Smart Balance, Inc. | Food Products | 2.0 | % | |||||
10 | Cirrus Logic, Inc. | Semiconductors & Semiconductor Equipment | 2.0 | % | |||||
| Total | 22.6 | % | |||||||
Industry Sector Representation as of December 31, 2012
| % of Net Assets | % of Russell 2000 Growth Index | Difference | |||||||||||||
Consumer Discretionary | 23.2 | % | 16.2 | % | 7.0 | % | |||||||||
Consumer Staples | 8.2 | % | 4.6 | % | 3.6 | % | |||||||||
Energy | 3.3 | % | 5.7 | % | -2.4 | % | |||||||||
Financials | 4.8 | % | 7.8 | % | -3.0 | % | |||||||||
Health Care | 12.1 | % | 20.3 | % | -8.2 | % | |||||||||
Industrials | 25.9 | % | 18.0 | % | 7.9 | % | |||||||||
Information Technology | 18.4 | % | 21.5 | % | -3.1 | % | |||||||||
Materials | 3.6 | % | 4.8 | % | -1.2 | % | |||||||||
Telecommunication Services | 0.0 | % | 0.8 | % | -0.8 | % | |||||||||
Utilities | 0.0 | % | 0.3 | % | -0.3 | % | |||||||||
Cash & Other Assets | 0.5 | % | 0.0 | % | 0.5 | % | |||||||||
Total | 100.0 | % | 100.0 | % | |||||||||||
Disclaimer
The views expressed here are exclusively those of Fund management. These views, including those related to market sectors or individual stocks, are not meant as investment advice and should not be considered predictive in nature. Any favorable (or unfavorable) description of a holding applies only as of December 31, 2012, unless otherwise stated. Security positions can and do change thereafter. Discussions of historical performance do not guarantee and are not indicative of future performance.
Market volatility can significantly impact short-term performance. The Fund is not an appropriate investment for short-term investors. Investments in small companies generally carry greater risk than is customarily associated with larger companies. This additional risk is attributable to a number of factors, including the relatively limited financial resources that are typically available to small companies, and the fact that small companies often have comparatively limited product lines. In addition, the stock of small companies tends to be more volatile than the stock of large companies, particularly in the short term and particularly in the early stages of an economic or market downturn. Shareholders of the Fund, therefore, are taking on more risk than they would if they invested in the stock market as a whole.
www.bridgeway.com | 54 |
Small-Cap Growth Fund MANAGER’S COMMENTARY (Unaudited) (continued) | |
(Unaudited)
Conclusion
Thank you for your continued investment in Small-Cap Growth Fund. We encourage your feedback; your reactions and concerns are important to us.
Sincerely,
The Investment Management Team
55 | Semi-Annual Report | December 31, 2012 (Unaudited) |
Bridgeway Small-Cap Growth Fund | |
Showing percentage of net assets as of December 31, 2012 (Unaudited)
| Industry Company | Shares | Value | ||||||||
COMMON STOCKS - 99.86% | ||||||||||
Aerospace & Defense - 3.73% | ||||||||||
Astronics Corp.* | 9,800 | $ | 224,224 | |||||||
Astronics Corp., Class B* | 1,470 | 31,899 | ||||||||
GenCorp, Inc.*+ | 39,200 | 358,680 | ||||||||
Triumph Group, Inc. | 6,400 | 417,920 | ||||||||
|
| |||||||||
| 1,032,723 | ||||||||||
Air Freight & Logistics - 3.17% |
| |||||||||
Echo Global Logistics, Inc.* | 19,700 | 354,009 | ||||||||
Park-Ohio Holdings Corp.* | 24,600 | 524,226 | ||||||||
|
| |||||||||
| 878,235 | ||||||||||
Airlines - 2.64% |
| |||||||||
Hawaiian Holdings, Inc.*# | 51,000 | 335,070 | ||||||||
US Airways Group, Inc.* | 29,200 | 394,200 | ||||||||
|
| |||||||||
| 729,270 | ||||||||||
Building Products - 1.07% |
| |||||||||
American Woodmark Corp.* | 10,600 | 294,892 | ||||||||
Chemicals - 3.29% | ||||||||||
American Vanguard Corp. | 19,300 | 599,651 | ||||||||
Landec Corp.* | 32,600 | 309,374 | ||||||||
|
| |||||||||
| 909,025 | ||||||||||
Commercial Banks - 1.44% |
| |||||||||
Taylor Capital Group, Inc.*+ | 22,100 | 398,905 | ||||||||
Commercial Services & Supplies - 2.39% |
| |||||||||
Ceco Environmental Corp. | 36,100 | 359,195 | ||||||||
EnergySolutions, Inc.* | 96,600 | 301,392 | ||||||||
|
| |||||||||
| 660,587 | ||||||||||
Computers & Peripherals - 1.48% | ||||||||||
Cray, Inc.* | 25,700 | 409,915 | ||||||||
Consumer Finance - 2.35% |
| |||||||||
Credit Acceptance Corp.* | 6,400 | 650,752 | ||||||||
Containers & Packaging - 1.13% | ||||||||||
AEP Industries, Inc.* | 5,300 | 313,919 | ||||||||
Diversified Consumer Services - 1.38% |
| |||||||||
Grand Canyon Education, Inc.* | 16,300 | 382,561 | ||||||||
Electronic Equipment, Instruments & Components - 4.64% |
| |||||||||
Insight Enterprises, Inc.* | 23,600 | 409,932 | ||||||||
OSI Systems, Inc.* | 10,600 | 678,824 | ||||||||
| Industry Company | Shares | Value | ||||||
| ||||||||
Electronic Equipment, Instruments & Components (continued) |
| |||||||
Viasystems Group, Inc.* | 15,900 | $ | 193,980 | |||||
|
| |||||||
| 1,282,736 | ||||||||
Energy Equipment & Services - 1.58% |
| |||||||
Global Geophysical Services, Inc.* | 41,900 | 161,315 | ||||||
Pioneer Energy Services Corp.* | 38,100 | 276,606 | ||||||
|
| |||||||
| 437,921 | ||||||||
Food & Staples Retailing - 1.16% | ||||||||
Susser Holdings Corp.* | 9,300 | 320,757 | ||||||
Food Products - 3.95% | ||||||||
Hain Celestial Group, Inc. (The)* | 10,000 | 542,200 | ||||||
Smart Balance, Inc.* | 42,700 | 550,830 | ||||||
|
| |||||||
| 1,093,030 | ||||||||
Health Care Equipment & Supplies - 2.82% |
| |||||||
Integra LifeSciences Holdings Corp.* | 8,900 | 346,833 | ||||||
Orthofix International N.V.* | 11,000 | 432,630 | ||||||
|
| |||||||
| 779,463 | ||||||||
Health Care Providers & Services - 7.72% |
| |||||||
AMN Healthcare Services, Inc.* | 32,700 | 377,685 | ||||||
Bio-Reference Labs, Inc.*+ | 15,500 | 444,695 | ||||||
Ensign Group, Inc. (The) | 14,300 | 388,817 | ||||||
HealthSouth Corp.* | 13,900 | 293,429 | ||||||
MWI Veterinary Supply, Inc.* | 2,800 | 308,000 | ||||||
Team Health Holdings, Inc.* | 11,300 | 325,101 | ||||||
|
| |||||||
| 2,137,727 | ||||||||
Hotels, Restaurants & Leisure - 5.00% |
| |||||||
Cheesecake Factory, Inc. (The) | 12,600 | 412,272 | ||||||
Cracker Barrel Old Country Store, Inc. | 5,100 | 327,726 | ||||||
Krispy Kreme Doughnuts, Inc.* | 31,700 | 297,346 | ||||||
Papa John’s International, Inc.* | 6,300 | 346,122 | ||||||
|
| |||||||
| 1,383,466 | ||||||||
www.bridgeway.com | 56 |
Bridgeway Small-Cap Growth Fund SCHEDULE OF INVESTMENTS (continued) | |
Showing percentage of net assets as of December 31, 2012 (Unaudited)
| Industry Company | Shares | Value | ||||||||
Common Stocks (continued) |
| |||||||||
Industrial Conglomerates - 1.59% |
| |||||||||
Standex International Corp. | 8,600 | $ | 441,094 | |||||||
Insurance - 1.07% |
| |||||||||
First American Financial Corp. | 12,300 | 296,307 | ||||||||
Internet & Catalog Retail - 1.01% |
| |||||||||
Overstock.com, Inc.*+ | 19,600 | 280,476 | ||||||||
Internet Software & Services - 1.45% |
| |||||||||
j2 Global, Inc. | 13,100 | 400,598 | ||||||||
IT Services - 7.55% |
| |||||||||
CACI International, Inc., | 7,700 | 423,731 | ||||||||
Computer Task Group, Inc.* | 34,600 | 630,758 | ||||||||
Hackett Group, Inc. (The) | 66,100 | 282,908 | ||||||||
Heartland Payment Systems, Inc. | 16,100 | 474,950 | ||||||||
PRGX Global, Inc.* | 43,000 | 277,350 | ||||||||
|
| |||||||||
| 2,089,697 | ||||||||||
Leisure Equipment & Products - 5.33% |
| |||||||||
Arctic Cat, Inc.* | 7,300 | 243,747 | ||||||||
LeapFrog Enterprises, Inc.* | 38,200 | 329,666 | ||||||||
Smith & Wesson Holding Corp.*+ | 49,100 | 414,404 | ||||||||
Sturm Ruger & Co., Inc.+ | 10,700 | 485,780 | ||||||||
|
| |||||||||
| 1,473,597 | ||||||||||
Life Sciences Tools & Services - 1.60% |
| |||||||||
Cambrex Corp.* | 39,000 | 443,820 | ||||||||
Machinery - 2.16% |
| |||||||||
Trimas Corp.* | 21,400 | 598,344 | ||||||||
Media - 1.24% |
| |||||||||
Sinclair Broadcast Group, Inc., Class A | 27,100 | 342,002 | ||||||||
Oil, Gas & Consumable Fuels - 1.73% |
| |||||||||
Adams Resources & Energy, Inc. | 9,800 | 343,686 | ||||||||
Westmoreland Coal Co.* | 14,400 | 134,496 | ||||||||
|
| |||||||||
| 478,182 | ||||||||||
Paper & Forest Products - 1.32% |
| |||||||||
Neenah Paper, Inc. | 12,800 | 364,416 | ||||||||
Personal Products - 0.98% |
| |||||||||
USANA Health Sciences, Inc.*+ | 8,200 | 270,026 | ||||||||
Professional Services - 3.12% |
| |||||||||
GP Strategies Corp.* | 20,800 | 429,520 | ||||||||
| Industry Company | Shares | Value | ||||||
Professional Services (continued) |
| |||||||
On Assignment, Inc.* | 21,400 | $ | 433,992 | |||||
|
| |||||||
| 863,512 | ||||||||
Semiconductors & Semiconductor Equipment - 1.99% |
| |||||||
Cirrus Logic, Inc.* | 19,000 | 550,430 | ||||||
Software - 1.33% |
| |||||||
ePlus, Inc. | 8,900 | 367,926 | ||||||
Specialty Retail - 8.22% | ||||||||
Cabela’s, Inc.* | 6,700 | 279,725 | ||||||
Genesco, Inc.* | 6,200 | 341,000 | ||||||
Lumber Liquidators Holdings, Inc.* | 11,000 | 581,130 | ||||||
Pier 1 Imports, Inc. | 19,200 | 384,000 | ||||||
Sally Beauty Holdings, Inc.* | 12,100 | 285,197 | ||||||
Select Comfort Corp.* | 11,400 | 298,338 | ||||||
Zumiez, Inc.*+ | 5,500 | 106,755 | ||||||
|
| |||||||
| 2,276,145 | ||||||||
Textiles, Apparel & Luxury Goods - 1.06% |
| |||||||
Movado Group, Inc. | 9,600 | 294,528 | ||||||
Trading Companies & Distributors - 6.17% |
| |||||||
DXP Enterprises, Inc.* | 14,900 | 731,143 | ||||||
H&E Equipment Services, Inc. | 18,300 | 275,781 | ||||||
United Rentals, Inc.* | 15,400 | 701,008 | ||||||
|
| |||||||
| 1,707,932 | ||||||||
|
| |||||||
TOTAL COMMON STOCKS - 99.86% | 27,634,916 | |||||||
|
| |||||||
(Cost $ 24,747,382) | ||||||||
| Rate^ | Shares | Value | ||||||||||
MONEY MARKET FUND - 0.28% |
| |||||||||||
BlackRock FedFund | 0.01 | % | 77,543 | 77,543 | ||||||||
|
| |||||||||||
TOTAL MONEY MARKET FUND - 0.28% |
| 77,543 | ||||||||||
|
| |||||||||||
(Cost $ 77,543) | ||||||||||||
TOTAL INVESTMENTS - 100.14% |
| $ | 27,712,459 | |||||||||
(Cost $ 24,824,925) | ||||||||||||
Liabilities in Excess of Other Assets - (0.14%) |
| (37,846 | ) | |||||||||
|
| |||||||||||
NET ASSETS - 100.00% |
| $ | 27,674,613 | |||||||||
|
| |||||||||||
| * | Non-income producing security. |
| # | Securities, or a portion thereof, segregated to cover the Fund’s potential obligation under swap agreements. The total value of segregated assets is $335,070. |
| ^ | Rate disclosed as of December 31, 2012. |
| + | This security or a portion of the security is out on loan at December 31, 2012. Total loaned securities had a value of $2,737,291 at December 31, 2012. |
57 | Semi-Annual Report | December 31, 2012 (Unaudited) |
Bridgeway Small-Cap Growth Fund SCHEDULE OF INVESTMENTS (continued) | |
Summary of inputs used to value the Fund’s investments as of 12/31/2012 is as follows (See Note 2 in Notes to Financial Statements):
| Valuation Inputs | | |||||||||||||||||
| Investment in Securities (Value) | ||||||||||||||||||
Level 1 Quoted Prices | Level 2 Significant Observable Inputs | Level 3 Significant Unobservable Inputs | Total | |||||||||||||||
Common | $27,634,916 | $ — | $ — | $27,634,916 | ||||||||||||||
Money | — | 77,543 | — | 77,543 | ||||||||||||||
|
|
|
|
|
|
|
| |||||||||||
TOTAL | $27,634,916 | $77,543 | $ — | $27,712,459 | ||||||||||||||
|
|
|
|
|
|
|
| |||||||||||
Other | ||||||||||||||||||
Swaps | $ — | $ 794 | $ — | $ 794 | ||||||||||||||
|
|
|
|
|
|
|
| |||||||||||
TOTAL | $ — | $ 794 | $ — | $ 794 | ||||||||||||||
|
|
|
|
|
|
|
| |||||||||||
** Other financial instruments are derivative instruments not reflected in the Schedule of Investments, such as swap contracts, which are valued at the unrealized appreciation/depreciation on the investment. |
| |||||||||||||||||
| See Notes to Financial Statements. | ||||||||||||||||||
|
www.bridgeway.com | 58 |
Small-Cap Value Fund | |
(Unaudited)
December 31, 2012
Dear Fellow Small-Cap Value Fund Shareholder,
For the quarter ended December 31, 2012, our Fund was up 2.66%, trailing our primary market benchmark, the Russell 2000 Value Index (+3.22%), and our peer benchmark, the Lipper Small-Cap Value Funds Index (+4.01%). It was a poor quarter on a relative basis, and we are not pleased.
For the six-month “semi-annual” period ending December 31, 2012, our Fund returned 11.11%, beating our primary market benchmark, the Russell 2000 Value Index (+9.07%), and our peer benchmark, the Lipper Small-Cap Value Funds Index (+8.93%). The third quarter returns more than made up for our poor performing fourth quarter.
For the calendar year, our Fund appreciated 20.99%, beating the Russell 2000 Value Index (+18.05%), and the Lipper Small-Cap Value Funds Index (+15.56%). It was a good year for the Fund, but we are still making up ground in the longer five-year and inception-to-date periods for particularly poor performance in 2008.
The table below presents our December quarter, six-month, one-year, five-year, and inception-to-date financial results. See the next page for a graph of performance since inception.
Standardized Returns as of December 31, 2012
| Annualized | ||||||||||||||||||
| Quarter | 6 Months | 1 Year | 5 Years | Since Inception (10/31/03) | ||||||||||||||
Small-Cap Value Fund | 2.66% | 11.11% | 20.99 | % | -0.30 | % | 5.97% | |||||||||||
Russell 2000 Value Index | 3.22% | 9.07% | 18.05 | % | 3.55 | % | 6.79% | |||||||||||
Lipper Small-Cap Value Funds Index | 4.01% | 8.93% | 15.56 | % | 4.33 | % | 7.48% | |||||||||||
Performance figures quoted in the table above and the graph on the next page represent past performance and are no guarantee of future results. Total return figures in the table above and the graph on the next page include the reinvestment of dividends and capital gains. The table above and the graph on the next page do not reflect the deduction of taxes that a shareholder would pay on Fund distributions or on the redemption of Fund shares.
The Russell 2000 Value Index is an unmanaged index that consists of stocks in the Russell 2000 Index with lower price-to-book ratios and lower forecasted growth values with dividends reinvested. The Lipper Small-Cap Value Funds Index is an index of small-company, value-oriented funds compiled by Lipper, Inc. It is not possible to invest directly in an index. Periods longer than one year are annualized.
According to data from Lipper, Inc. as of December 31, 2012, Small-Cap Value Fund ranked 32nd of 293 small-cap value funds for the twelve-month period ended December 31, 2012, 200th of 202 over the last five years and 106th of 122 such funds since inception in October, 2003. Lipper, Inc. is an independent mutual fund rating service that ranks funds in various fund categories by making comparative calculations using total returns.
59 | Semi-Annual Report | December 31, 2012 (Unaudited) |
Small-Cap Value Fund MANAGER’S COMMENTARY (Unaudited) (continued) | |
(Unaudited)
Small-Cap Value Fund vs. Russell 2000 Value Index & Lipper Small-Cap Value Funds Index
from Inception 10/31/03 to 12/31/12
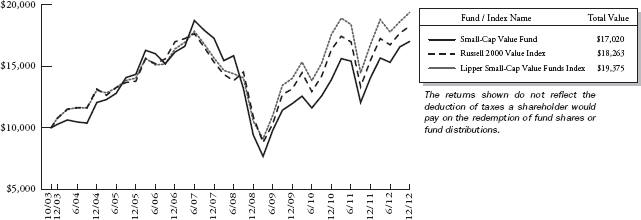
Detailed Explanation of Quarterly Performance
The Short Version: December was a bad month for most of our models in relative performance.
While our diversifying models that look at company financial health fared very well for the quarter, our value and our other diversifying models performed poorly. The sectors that were affected most by model stock selection were Materials, Information Technology and Financials. Our best stock picks came in the Consumer Discretionary sector.
Detailed Explanation of Calendar Year Performance
The Short Version: Consumer Discretionary stocks provided most of our outperformance for the calendar year, while the Financials and Industrials were a drag on our relative returns.
Stock selection in the Consumer Discretionary and Materials sectors provided over three and three-fourths percent of relative outperformance for the calendar year. Six of the Fund’s ten best contributing stocks came from those two sectors; they provided almost six and one-half percent of absolute returns. The six worst contributing stocks came from the Financials and Industrials sectors, costing the Fund two percent of absolute returns. Our diversifying models performed particularly well for the overall calendar year.
www.bridgeway.com | 60 |
Small-Cap Value Fund MANAGER’S COMMENTARY (Unaudited) (continued) | |
(Unaudited)
Top Ten Holdings as of December 31, 2012
| Rank | Description | Industry | % of Net Assets | |||
1 | PH Glatfelter Co. | Paper & Forest Products | 1.9% | |||
2 | First Industrial Realty Trust, Inc. | Real Estate Investment Trusts (REITs) | 1.6% | |||
3 | Insight Enterprises, Inc. | Electronic Equipment, Instruments & Components | 1.5% | |||
4 | Retail Opportunity Investments Corp. | Real Estate Investment Trusts (REITs) | 1.5% | |||
5 | American Vanguard Corp. | Chemicals | 1.5% | |||
6 | Sinclair Broadcast Group, Inc. | Media | 1.4% | |||
7 | M/I Homes, Inc. | Household Durables | 1.4% | |||
8 | NACCO Industries, Inc. | Household Durables | 1.3% | |||
9 | Conn’s, Inc. | Specialty Retail | 1.3% | |||
10 | BioMed Realty Trust, Inc. | Real Estate Investment Trusts (REITs) | 1.3% | |||
| Total | 14.7% |
Industry Sector Representation as of December 31, 2012
| % of Net Assets | % of Russell 2000 Value Index | Difference | |||||||||||||
Consumer Discretionary | 17.6 | % | 11.9 | % | 5.7 | % | |||||||||
Consumer Staples | 4.4 | % | 2.5 | % | 1.9 | % | |||||||||
Energy | 7.6 | % | 6.4 | % | 1.2 | % | |||||||||
Financials | 33.6 | % | 37.0 | % | -3.4 | % | |||||||||
Health Care | 5.9 | % | 4.4 | % | 1.5 | % | |||||||||
Industrials | 15.5 | % | 13.1 | % | 2.4 | % | |||||||||
Information Technology | 5.5 | % | 12.1 | % | -6.6 | % | |||||||||
Materials | 5.7 | % | 5.8 | % | -0.1 | % | |||||||||
Telecommunication Services | 0.8 | % | 0.6 | % | 0.2 | % | |||||||||
Utilities | 3.4 | % | 6.2 | % | -2.8 | % | |||||||||
Cash & Other Assets | 0.0 | % | 0.0 | % | 0.0 | % | |||||||||
Total | 100.0 | % | 100.0 | % | |||||||||||
Disclaimer
The views expressed here are exclusively those of Fund management. These views, including those related to market sectors or individual stocks, are not meant as investment advice and should not be considered predictive in nature. Any favorable (or unfavorable) description of a holding applies only as of December 31, 2012, unless otherwise stated. Security positions can and do change thereafter. Discussions of historical performance do not guarantee and are not indicative of future performance.
Market volatility can significantly impact short-term performance. The Fund is not an appropriate investment for short-term investors. Investments in small companies generally carry greater risk than is customarily associated with larger companies. This additional risk is attributable to a number of factors, including the relatively limited financial resources that are typically available to small companies, and the fact that small companies often have comparatively limited product lines. In addition, the stock of small companies tends to be more volatile than the stock of large companies, particularly in the short term and particularly in the early stages of an economic or market downturn. Shareholders of the Fund, therefore, are taking on more risk than they would if they invested in the stock market as a whole.
61 | Semi-Annual Report | December 31, 2012 (Unaudited) |
Small-Cap Value Fund MANAGER’S COMMENTARY (Unaudited) (continued) | |
(Unaudited)
Conclusion
Thank you for your continued investment in Small-Cap Value Fund. We encourage your feedback; your reactions and concerns are important to us.
Sincerely,
The Investment Management Team
www.bridgeway.com | 62 |
Bridgeway Small-Cap Value Fund | |
Showing percentage of net assets as of December 31, 2012 (Unaudited)
| Industry Company | Shares | Value | ||||||||
COMMON STOCKS - 100.92% | ||||||||||
Aerospace & Defense - 2.94% | ||||||||||
Cubic Corp. | 14,500 | $ | 695,565 | |||||||
GenCorp, Inc.*+ | 85,900 | 785,985 | ||||||||
Triumph Group, Inc. | 12,500 | 816,250 | ||||||||
|
| |||||||||
| 2,297,800 | ||||||||||
Airlines - 2.57% | ||||||||||
Hawaiian Holdings, Inc.* | 122,000 | 801,540 | ||||||||
Republic Airways Holdings, Inc.* | 93,200 | 529,376 | ||||||||
US Airways Group, Inc.* | 50,200 | 677,700 | ||||||||
|
| |||||||||
| 2,008,616 | ||||||||||
Auto Components - 0.52% | ||||||||||
Standard Motor Products, Inc. | 18,200 | 404,404 | ||||||||
Biotechnology - 1.00% | ||||||||||
Maxygen, Inc. | 45,600 | 112,176 | ||||||||
PDL BioPharma, Inc.+ | 94,400 | 665,520 | ||||||||
|
| |||||||||
| 777,696 | ||||||||||
Building Products - 1.92% | ||||||||||
American Woodmark Corp.* | 28,900 | 803,998 | ||||||||
NCI Building Systems, Inc.* | 50,000 | 695,000 | ||||||||
|
| |||||||||
| 1,498,998 | ||||||||||
Capital Markets - 2.81% | ||||||||||
Arlington Asset Investment Corp., Class A | 32,700 | 679,179 | ||||||||
Calamos Asset Management, Inc., Class A | 34,100 | 360,437 | ||||||||
Fidus Investment Corp. | 17,900 | 294,455 | ||||||||
Fifth Street Finance Corp. | 82,700 | 861,734 | ||||||||
|
| |||||||||
| 2,195,805 | ||||||||||
Chemicals - 2.32% | ||||||||||
American Vanguard Corp. | 37,100 | 1,152,697 | ||||||||
Landec Corp.* | 69,400 | 658,606 | ||||||||
|
| |||||||||
| 1,811,303 | ||||||||||
Commercial Banks - 5.67% | ||||||||||
Bancorp, Inc. (The)* | 47,200 | 517,784 | ||||||||
City Holding Co.+ | 16,900 | 588,965 | ||||||||
Community Bank System, Inc. | 30,500 | 834,480 | ||||||||
FNB Corp. | 33,300 | 353,646 | ||||||||
Heritage Financial Corp. | 13,900 | 204,191 | ||||||||
Merchants Bancshares, Inc. | 11,500 | 307,855 | ||||||||
OmniAmerican Bancorp, Inc.* | 9,500 | 219,735 | ||||||||
| Industry Company | Shares | Value | ||||||
Commercial Banks (continued) | ||||||||
Renasant Corp. | 20,300 | $ | 388,542 | |||||
Taylor Capital Group, Inc.*+ | 30,000 | 541,500 | ||||||
Wintrust Financial Corp. | 12,800 | 469,760 | ||||||
|
| |||||||
| 4,426,458 | ||||||||
Commercial Services & Supplies - 1.59% |
| |||||||
Cenveo, Inc.*+ | 163,400 | 441,180 | ||||||
EnergySolutions, Inc.* | 257,700 | 804,024 | ||||||
|
| |||||||
| 1,245,204 | ||||||||
Communications Equipment - 0.42% |
| |||||||
Symmetricom, Inc.* | 57,200 | 330,044 | ||||||
Containers & Packaging - 0.83% | ||||||||
Myers Industries, Inc. | 43,000 | 651,450 | ||||||
Diversified Financial Services - 0.64% |
| |||||||
Interactive Brokers Group, Inc., Class A | 36,400 | 497,952 | ||||||
Diversified Telecommunication Services - 0.84% |
| |||||||
Vonage Holdings Corp.* | 277,700 | 658,149 | ||||||
Electric Utilities - 3.78% | ||||||||
El Paso Electric Co. | 31,500 | 1,005,165 | ||||||
MGE Energy, Inc. | 14,900 | 759,155 | ||||||
Otter Tail Corp. | 33,100 | 827,500 | ||||||
Unitil Corp. | 13,900 | 360,288 | ||||||
|
| |||||||
| 2,952,108 | ||||||||
Electronic Equipment, Instruments & Components - 1.50% |
| |||||||
Insight Enterprises, Inc.* | 67,400 | 1,170,738 | ||||||
Energy Equipment & Services - 2.91% |
| |||||||
Bristow Group, Inc. | 15,700 | 842,462 | ||||||
Helix Energy Solutions Group, Inc.* | 42,900 | 885,456 | ||||||
Pioneer Energy Services Corp.* | 75,100 | 545,226 | ||||||
|
| |||||||
| 2,273,144 | ||||||||
Food & Staples Retailing - 2.63% |
| |||||||
Nash Finch Co. | 23,100 | 491,568 | ||||||
Pantry, Inc. (The)* | 31,900 | 386,947 | ||||||
Susser Holdings Corp.* | 16,300 | 562,187 | ||||||
Weis Markets, Inc. | 15,600 | 611,052 | ||||||
|
| |||||||
| 2,051,754 | ||||||||
Food Products - 1.83% | ||||||||
Cal-Maine Foods, Inc. | 16,200 | 651,564 | ||||||
63 | Semi-Annual Report | December 31, 2012 (Unaudited) |
Bridgeway Small-Cap Value Fund SCHEDULE OF INVESTMENTS (continued) | |
Showing percentage of net assets as of December 31, 2012 (Unaudited)
| Industry Company | Shares | Value | ||||||||
Common Stocks (continued) | ||||||||||
Food Products (continued) | ||||||||||
Smart Balance, Inc.* | 60,500 | $ | 780,450 | |||||||
|
| |||||||||
| 1,432,014 | ||||||||||
Gas Utilities - 0.85% | ||||||||||
Laclede Group, Inc. (The) | 17,100 | 660,231 | ||||||||
Health Care Providers & Services - 4.04% | ||||||||||
AMN Healthcare Services, Inc.* | 79,500 | 918,225 | ||||||||
Kindred Healthcare, Inc.* | 67,100 | 726,022 | ||||||||
Select Medical Holdings Corp. | 47,700 | 449,811 | ||||||||
Skilled Healthcare Group, Inc., Class A* | 90,300 | 575,211 | ||||||||
Triple-S Management Corp., Class B* | 26,100 | 482,067 | ||||||||
|
| |||||||||
| 3,151,336 | ||||||||||
Hotels, Restaurants & Leisure - 0.71% | ||||||||||
Town Sports International Holdings, Inc. | 51,900 | 552,735 | ||||||||
Household Durables - 5.81% | ||||||||||
Hovnanian Enterprises, Inc., Class A*+ | 134,900 | 944,300 | ||||||||
M/I Homes, Inc.* | 40,800 | 1,081,200 | ||||||||
Meritage Homes Corp.* | 18,800 | 702,180 | ||||||||
NACCO Industries, Inc., Class A | 17,500 | 1,062,075 | ||||||||
Ryland Group, Inc. (The) | 20,400 | 744,600 | ||||||||
|
| |||||||||
| 4,534,355 | ||||||||||
Industrial Conglomerates - 0.77% | ||||||||||
Standex International Corp. | 11,800 | 605,222 | ||||||||
Insurance - 9.41% | ||||||||||
Argo Group International Holdings, Ltd. | 23,200 | 779,288 | ||||||||
First American Financial Corp. | 32,500 | 782,925 | ||||||||
Homeowners Choice, Inc.+ | 32,500 | 675,675 | ||||||||
Platinum Underwriters Holdings, Ltd. | 17,200 | 791,200 | ||||||||
Primerica, Inc. | 30,100 | 903,301 | ||||||||
ProAssurance Corp. | 15,200 | 641,288 | ||||||||
RLI Corp. | 10,300 | 665,998 | ||||||||
Stewart Information Services Corp. | 18,500 | 481,000 | ||||||||
Symetra Financial Corp. | 61,800 | 802,164 | ||||||||
United Fire Group, Inc. | 20,200 | 441,168 | ||||||||
Universal Insurance Holdings, Inc. | 87,491 | 383,210 | ||||||||
|
| |||||||||
| 7,347,217 | ||||||||||
| Industry Company | Shares | Value | ||||||
Internet Software & Services - 1.05% |
| |||||||
j2 Global, Inc. | 26,800 | $ | 819,544 | |||||
IT Services - 1.76% |
| |||||||
CACI International, Inc., Class A* | 15,800 | 869,474 | ||||||
Unisys Corp.* | 29,000 | 501,700 | ||||||
|
| |||||||
| 1,371,174 | ||||||||
Leisure Equipment & Products - 0.55% |
| |||||||
Arctic Cat, Inc.* | 12,800 | 427,392 | ||||||
Life Sciences Tools & Services - 0.91% |
| |||||||
Cambrex Corp.* | 62,600 | 712,388 | ||||||
Media - 2.50% |
| |||||||
LIN TV Corp., Class A* | 112,300 | 845,619 | ||||||
Sinclair Broadcast Group, Inc., Class A# | 87,600 | 1,105,512 | ||||||
|
| |||||||
| 1,951,131 | ||||||||
Multiline Retail - 1.03% |
| |||||||
Dillard’s, Inc., Class A | 9,600 | 804,192 | ||||||
Oil, Gas & Consumable Fuels - 2.71% |
| |||||||
Cloud Peak Energy, Inc.* | 45,100 | 871,783 | ||||||
Swift Energy Co.* | 13,500 | 207,765 | ||||||
Western Refining, Inc. | 27,000 | 761,130 | ||||||
Westmoreland Coal Co.* | 29,300 | 273,662 | ||||||
|
| |||||||
| 2,114,340 | ||||||||
Paper & Forest Products - 2.60% |
| |||||||
Neenah Paper, Inc. | 18,800 | 535,236 | ||||||
PH Glatfelter Co. | 85,600 | 1,496,288 | ||||||
|
| |||||||
| 2,031,524 | ||||||||
Professional Services - 0.36% |
| |||||||
CBIZ, Inc.* | 47,900 | 283,089 | ||||||
Real Estate Investment Trusts (REITs) - 11.93% |
| |||||||
Agree Realty Corp. | 21,400 | 573,306 | ||||||
ARMOUR Residential REIT, Inc. | 59,300 | 383,671 | ||||||
BioMed Realty Trust, Inc. | 53,900 | 1,041,887 | ||||||
Education Realty Trust, Inc. | 59,000 | 627,760 | ||||||
First Industrial Realty Trust, Inc.* | 89,100 | 1,254,528 | ||||||
Gramercy Capital Corp.* | 225,300 | 662,382 | ||||||
iStar Financial, Inc.*+ | 81,300 | 662,595 | ||||||
MPG Office Trust, Inc.* | 172,700 | 531,916 | ||||||
National Retail Properties, Inc. | 25,600 | 798,720 | ||||||
One Liberty Properties, Inc. | 11,800 | 239,422 | ||||||
www.bridgeway.com | 64 |
Bridgeway Small-Cap Value Fund SCHEDULE OF INVESTMENTS (continued) | |
Showing percentage of net assets as of December 31, 2012 (Unaudited)
| Industry Company | Shares | Value | ||||||||
Common Stocks (continued) | ||||||||||
Real Estate Investment Trusts (REITs) (continued) | ||||||||||
Retail Opportunity Investments Corp.+ | 91,000 | $ | 1,170,260 | |||||||
Sabra Health Care REIT, Inc. | 27,400 | 595,128 | ||||||||
Weingarten Realty Investors | 28,840 | 772,047 | ||||||||
|
| |||||||||
| 9,313,622 | ||||||||||
Road & Rail - 3.08% | ||||||||||
Amerco, Inc. | 7,200 | 913,032 | ||||||||
Heartland Express, Inc. | 48,900 | 639,123 | ||||||||
Saia, Inc.* | 36,900 | 853,128 | ||||||||
|
| |||||||||
| 2,405,283 | ||||||||||
Semiconductors & Semiconductor Equipment - 0.78% | ||||||||||
Amkor Technology, Inc.*+ | 143,000 | 607,750 | ||||||||
Specialty Retail - 8.00% | ||||||||||
Brown Shoe Co., Inc. | 51,500 | 946,055 | ||||||||
Cabela’s, Inc.* | 19,600 | 818,300 | ||||||||
Conn’s, Inc.*+ | 34,200 | 1,049,256 | ||||||||
Genesco, Inc.* | 14,700 | 808,500 | ||||||||
Men’s Wearhouse, Inc. (The) | 24,700 | 769,652 | ||||||||
OfficeMax, Inc. | 104,800 | 1,022,848 | ||||||||
Penske Automotive Group, Inc. | 27,500 | 827,475 | ||||||||
|
| |||||||||
| 6,242,086 | ||||||||||
Thrifts & Mortgage Finance - 3.44% | ||||||||||
Brookline Bancorp, Inc. | 81,000 | 688,500 | ||||||||
Franklin Financial Corp. | 12,800 | 212,224 | ||||||||
Northwest Bancshares, Inc. | 74,600 | 905,644 | ||||||||
Oritani Financial Corp. | 30,900 | 473,388 | ||||||||
Rockville Financial, Inc. | 31,500 | 406,350 | ||||||||
|
| |||||||||
| 2,686,106 | ||||||||||
Trading Companies & Distributors - 1.06% | ||||||||||
United Rentals, Inc.* | 18,100 | 823,912 | ||||||||
Water Utilities - 0.85% | ||||||||||
American States Water Co. | 13,800 | 662,124 | ||||||||
|
| |||||||||
TOTAL COMMON STOCKS - 100.92% |
| 78,790,390 | ||||||||
|
| |||||||||
(Cost $70,288,051) | ||||||||||
| Rate^ | Shares | Value | ||||||||||
MONEY MARKET FUND - 0.01% |
| |||||||||||
BlackRock FedFund | 0.01 | % | 6,537 | $6,537 | ||||||||
|
| |||||||||||
TOTAL MONEY MARKET FUND - 0.01% |
| 6,537 | ||||||||||
|
| |||||||||||
(Cost $6,537) | ||||||||||||
Total Investments - 100.93% |
| $78,796,927 | ||||||||||
(Cost $70,294,588) | ||||||||||||
Liabilities in Excess of Other Assets - (0.93%) |
| (726,388 | ) | |||||||||
|
| |||||||||||
NET ASSETS - 100.00% | $78,070,539 | |||||||||||
|
| |||||||||||
| * | Non-income producing security. |
| # | Securities, or a portion thereof, segregated to cover the Fund’s potential obligation under swap agreements. The total value of segregated assets is $378,600. |
| ^ | Rate disclosed as of December 31, 2012. |
| + | This security or a portion of the security is out on loan at December 31, 2012. Total loaned securities had a value of $7,322,072 at December 31, 2012. |
Summary of inputs used to value the Fund’s investments as of 12/31/2012 is as follows (See Note 2 in Notes to Financial Statements):
| Valuation Inputs | ||||||||||||||||||||
| Investment in Securities (Value) | ||||||||||||||||||||
| Level 1 Quoted Prices | Level 2 Significant Observable Inputs | Level 3 Significant Unobservable Inputs | Total | |||||||||||||||||
Common Stocks | $ | 78,790,390 | $ | — | $ | — | $ | 78,790,390 | ||||||||||||
Money Market Fund | — | 6,537 | — | 6,537 | ||||||||||||||||
|
|
|
|
|
|
|
| |||||||||||||
TOTAL | $ | 78,790,390 | $ | 6,537 | $ | — | $ | 78,796,927 | ||||||||||||
|
|
|
|
|
|
|
| |||||||||||||
See Notes to Financial Statements
65 | Semi-Annual Report | December 31, 2012 (Unaudited) |
MANAGER’S COMMENTARY (Unaudited) | |
(Unaudited)
December 31, 2012
Dear Fellow Large-Cap Growth Fund Shareholder,
For the quarter ended December 31, 2012, our Fund returned 0.95%, beating our primary market benchmark, the Russell 1000 Growth Index (-1.32%), and our peer benchmark, the Lipper Large-Cap Growth Funds Index (-0.79%).
For the six-month “semi-annual” period ending December 31, 2012, our Fund was up 6.71%, outperforming our primary market benchmark, the Russell 1000 Growth Index (+4.71%), and our peer benchmark, the Lipper Large-Cap Growth Funds Index (+5.62%).
For the calendar year, our Fund was up 16.21%, beating our primary market benchmark, the Russell 1000 Growth Index (+15.26%), and our peer benchmark, the Lipper Large-Cap Growth Funds Index (+15.92%). It was a good year for the Fund on an absolute and relative basis, but we are still making up ground in the longer five year and inception-to-date periods for particularly poor performance in 2008.
The table below presents our December quarter, six-month, one-year, five-year and inception-to-date financial results. See the next page for a graph of performance since inception.
Standardized Returns as of December 31, 2012 | ||||||||||||||||
| Annualized | ||||||||||||||||
| Quarter | 6 Months | 1 Year | 5 Years | Since Inception (10/31/03) | ||||||||||||
Large-Cap Growth Fund | 0.95% | 6.71% | 16.21% | -0.50% | 4.30% | |||||||||||
Russell 1000 Growth Index | -1.32% | 4.71% | 15.26% | 3.12% | 5.71% | |||||||||||
Lipper Large-Cap Growth Funds Index | -0.79% | 5.62% | 15.92% | 1.01% | 4.67% | |||||||||||
Performance figures quoted in the table above and the graph on the next page represent past performance and are no guarantee of future results. Total return figures in the table above and the graph on the next page include the reinvestment of dividends and capital gains. The table above and the graph on the next page do not reflect the deduction of taxes that a shareholder would pay on Fund distributions or on the redemption of Fund shares.
The Russell 1000 Growth Index is an unmanaged index that consists of stocks in the Russell 1000 Index with higher price-to-book ratios and higher forecasted growth values with dividends reinvested. The Lipper Large-Cap Growth Funds Index is an index of large-company, growth-oriented funds compiled by Lipper, Inc. It is not possible to invest directly in an index. Periods longer than one year are annualized.
According to data from Lipper, Inc. as of December 31, 2012, Large-Cap Growth Fund ranked 213th of 531 large-cap growth funds for the twelve-month period ended December 31, 2012, 267th of 387 over the last five years and 215th of 268 such funds since inception in October, 2003. Lipper, Inc. is an independent mutual fund rating service that ranks funds in various fund categories by making comparative calculations using total returns.
www.bridgeway.com | 66 |
Large-Cap Growth Fund MANAGER’S COMMENTARY (Unaudited) (continued) | |
(Unaudited)
Large-Cap Growth Fund vs. Russell 1000 Growth Index & Lipper Large-Cap Growth Funds Index
from Inception 10/31/03 to 12/31/12
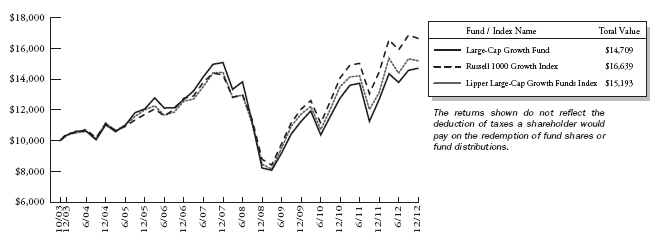
Detailed Explanation of Quarterly Performance
The Short Version: Less exposure to mega-cap stocks worked in our favor for the quarter.
The non market-cap weighting design of the Fund, which gives it less exposure to the largest stocks that were the poorest performers, helped our relative returns by one and three-fourths percent. Our growth and value models, which made up 64% of assets in the Fund, had positive returns for the quarter, going against the grain of our market benchmark. We were underweighted in the Information Technology sector and, combined with solid stock selection in that sector, added almost one and one-half percent to our relative returns versus the Russell 1000 Growth Index. Our best returns came from the Energy sector, which made up less than four and one-half percent of the Fund, but still added one-half percent to the relative returns.
Detailed Explanation of Calender Year Performance
The Short Version: The fourth quarter provided all of our outperformance for the calendar year.
The strong performance in the fourth quarter brought us from negative to positive in relative returns for the calendar year. More exposure to mid-cap stocks and less exposure to mega-cap stocks helped somewhat, as mid-caps performed slightly better as a whole. Information Technology and Consumer Discretionary stocks added the most to our returns (eight percent) for the calendar year. Industrial stocks were our worst performers and cost us one and one-fourth percent in relative returns.
67 | Semi-Annual Report | December 31, 2012 (Unaudited) |
Large-Cap Growth Fund MANAGER’S COMMENTARY (Unaudited) (continued) | |
(Unaudited)
Top Ten Holdings as of December 31, 2012
| Rank Description | Industry | % of Net Assets | ||||||||
| 1 | Apple, Inc. | Computers & Peripherals | 3.3% | |||||||
| 2 | Regeneron Pharmaceuticals, Inc. | Biotechnology | 2.6% | |||||||
| 3 | International Business Machines Corp. | IT Services | 2.3% | |||||||
| 4 | tw telecom, inc. | Diversified Telecommunication Services | 2.2% | |||||||
| 5 | Mastercard, Inc. | IT Services | 2.1% | |||||||
| 6 | Amgen, Inc. | Biotechnology | 2.0% | |||||||
| 7 | Sherwin-Williams Co. (The) | Chemicals | 2.0% | |||||||
| 8 | Western Digital Corp. | Computers & Peripherals | 1.8% | |||||||
| 9 | Alliance Data Systems Corp. | IT Services | 1.7% | |||||||
| 10 | Accenture PLC | IT Services | 1.7% | |||||||
Total | 21.7% | |||||||||
| Industry Sector Representation as of December 31, 2012 | ||||||||
| % of Net Assets | % of Russell 1000 Growth Index | Difference | ||||||
Consumer Discretionary | 22.0% | 16.7% | 5.3% | |||||
Consumer Staples | 11.1% | 12.5% | -1.4% | |||||
Energy | 4.0% | 4.0% | 0.0% | |||||
Financials | 5.3% | 4.6% | 0.7% | |||||
Health Care | 12.2% | 12.0% | 0.2% | |||||
Industrials | 10.0% | 12.7% | -2.7% | |||||
Information Technology | 24.5% | 30.9% | -6.4% | |||||
Materials | 7.8% | 4.1% | 3.7% | |||||
Telecommunication Services | 3.1% | 2.3% | 0.8% | |||||
Utilities | 0.0% | 0.2% | -0.2% | |||||
Cash & Other Assets | 0.0% | 0.0% | 0.0% | |||||
Total | 100.0% | 100.0% | ||||||
Disclaimer
The views expressed here are exclusively those of Fund management. These views, including those related to market sectors or individual stocks, are not meant as investment advice and should not be considered predictive in nature. Any favorable (or unfavorable) description of a holding applies only as of December 31, 2012, unless otherwise stated. Security positions can and do change thereafter. Discussions of historical performance do not guarantee and are not indicative of future performance.
The Fund is subject to market risk (volatility) and is not an appropriate investment for short-term investors.
Conclusion
Thank you for your continued investment in Large-Cap Growth Fund. We encourage your feedback; your reactions and concerns are important to us.
Sincerely,
The Investment Management Team
www.bridgeway.com | 68 |
Bridgeway Large-Cap Growth Fund SCHEDULE OF INVESTMENTS | |
Showing percentage of net assets as of December 31, 2012 (Unaudited)
| Industry Company | Shares | Value | ||||||||
COMMON STOCKS - 100.17% | ||||||||||
Aerospace & Defense - 2.85% | ||||||||||
Boeing Co. (The) | 5,900 | $ | 444,624 | |||||||
Precision Castparts Corp. | 2,300 | 435,666 | ||||||||
Textron, Inc. | 15,900 | 394,161 | ||||||||
|
| |||||||||
| 1,274,451 | ||||||||||
Airlines - 2.16% |
| |||||||||
Southwest Airlines Co. | 43,300 | 443,392 | ||||||||
United Continental Holdings, Inc.* | 22,300 | 521,374 | ||||||||
|
| |||||||||
| 964,766 | ||||||||||
Auto Components - 1.23% | ||||||||||
Delphi Automotive PLC* | 14,400 | 550,800 | ||||||||
Automobiles - 1.22% | ||||||||||
Ford Motor Co. | 42,100 | 545,195 | ||||||||
Beverages - 2.60% | ||||||||||
Brown-Forman Corp., Class B | 4,500 | 284,625 | ||||||||
Coca-Cola Co. (The) | 13,200 | 478,500 | ||||||||
Monster Beverage Corp.* | 7,500 | 396,600 | ||||||||
|
| |||||||||
| 1,159,725 | ||||||||||
Biotechnology - 6.85% | ||||||||||
Amgen, Inc. | 10,600 | 914,992 | ||||||||
Celgene Corp.* | 6,400 | 503,808 | ||||||||
Regeneron Pharmaceuticals, Inc.* | 6,700 | 1,146,169 | ||||||||
United Therapeutics Corp.* | 9,200 | 491,464 | ||||||||
|
| |||||||||
| 3,056,433 | ||||||||||
Chemicals - 6.61% | ||||||||||
CF Industries Holdings, Inc. | 2,200 | 446,952 | ||||||||
Rockwood Holdings, Inc. | 10,200 | 504,492 | ||||||||
Sherwin-Williams Co. (The) | 5,800 | 892,156 | ||||||||
Valspar Corp. | 8,700 | 542,880 | ||||||||
Westlake Chemical Corp.+ | 7,100 | 563,030 | ||||||||
|
| |||||||||
| 2,949,510 | ||||||||||
Commercial Services & Supplies - 0.76% | ||||||||||
Cintas Corp. | 8,300 | 339,470 | ||||||||
Computers & Peripherals - 6.96% | ||||||||||
Apple, Inc.# | 2,800 | 1,492,484 | ||||||||
Dell, Inc. | 21,600 | 218,808 | ||||||||
Seagate Technology PLC | 18,800 | 573,024 | ||||||||
Western Digital Corp. | 19,400 | 824,306 | ||||||||
|
| |||||||||
| 3,108,622 | ||||||||||
Consumer Finance - 0.98% | ||||||||||
Discover Financial Services | 11,300 | 435,615 | ||||||||
| Industry Company | Shares | Value | ||||||
Diversified Consumer Services - 0.67% |
| |||||||
H&R Block, Inc. | 16,100 | $ | 298,977 | |||||
Diversified Financial Services - 1.05% |
| |||||||
Moody’s Corp. | 9,300 | 467,976 | ||||||
Diversified Telecommunication Services - 3.07% |
| |||||||
tw telecom, inc.* | 38,100 | 970,407 | ||||||
Verizon Communications, Inc. | 9,300 | 402,411 | ||||||
|
| |||||||
| 1,372,818 | ||||||||
Food & Staples Retailing - 3.16% |
| |||||||
Costco Wholesale Corp. | 4,700 | 464,219 | ||||||
Wal-Mart Stores, Inc. | 6,800 | 463,964 | ||||||
Whole Foods Market, Inc. | 5,300 | 484,049 | ||||||
|
| |||||||
| 1,412,232 | ||||||||
Food Products - 0.89% |
| |||||||
General Mills, Inc. | 9,800 | 396,018 | ||||||
Health Care Providers & Services - 3.35% |
| |||||||
DaVita HealthCare Partners, Inc.* | 4,200 | 464,226 | ||||||
HCA Holdings, Inc. | 17,200 | 518,924 | ||||||
McKesson Corp. | 5,300 | 513,888 | ||||||
|
| |||||||
| 1,497,038 | ||||||||
Hotels, Restaurants & Leisure - 3.89% |
| |||||||
Chipotle Mexican Grill, Inc.* | 1,200 | 356,952 | ||||||
McDonald’s Corp. | 5,000 | 441,050 | ||||||
Starbucks Corp. | 8,900 | 477,218 | ||||||
Wynn Resorts, Ltd. | 4,100 | 461,209 | ||||||
|
| |||||||
| 1,736,429 | ||||||||
Household Products - 4.11% |
| |||||||
Church & Dwight Co., Inc. | 9,400 | 503,558 | ||||||
Colgate-Palmolive Co. | 4,300 | 449,522 | ||||||
Kimberly-Clark Corp. | 5,300 | 447,479 | ||||||
Procter & Gamble Co. (The) | 6,400 | 434,496 | ||||||
|
| |||||||
| 1,835,055 | ||||||||
Insurance - 1.05% |
| |||||||
Arch Capital Group, Ltd.* | 10,700 | 471,014 | ||||||
Internet Software & Services - 1.50% | ||||||||
Google, Inc., Class A* | 200 | 141,874 | ||||||
Rackspace Hosting, Inc.* | 7,100 | 527,317 | ||||||
|
| |||||||
| 669,191 | ||||||||
IT Services - 11.26% |
| |||||||
Accenture PLC, Class A | 11,400 | 758,100 | ||||||
69 | Semi-Annual Report | December 31, 2012 (Unaudited) |
Bridgeway Large-Cap Growth Fund SCHEDULE OF INVESTMENTS (continued) | |
Showing percentage of net assets as of December 31, 2012 (Unaudited)
| Industry Company | Shares | Value | ||||||||
Common Stocks (continued) | ||||||||||
IT Services (continued) | ||||||||||
Alliance Data Systems Corp.* | 5,300 | $ | 767,228 | |||||||
International Business Machines Corp. | 5,400 | 1,034,370 | ||||||||
Mastercard, Inc., Class A | 1,900 | 933,432 | ||||||||
NeuStar, Inc., Class A* | 10,300 | 431,879 | ||||||||
Visa, Inc., Class A | 4,100 | 621,478 | ||||||||
Western Union Co. (The) | 35,400 | 481,794 | ||||||||
|
| |||||||||
| 5,028,281 | ||||||||||
Leisure Equipment & Products - 0.83% | ||||||||||
Polaris Industries, Inc. | 4,400 | 370,260 | ||||||||
Machinery - 1.01% | ||||||||||
Snap-on, Inc. | 5,700 | 450,243 | ||||||||
Media - 1.67% | ||||||||||
Comcast Corp., Class A | 20,000 | 747,600 | ||||||||
Metals & Mining - 0.44% | ||||||||||
Cliffs Natural Resources, Inc.+ | 5,100 | 196,656 | ||||||||
Multiline Retail - 2.53% | ||||||||||
Dollar General Corp.* | 8,300 | 365,947 | ||||||||
Dollar Tree, Inc.* | 6,400 | 259,584 | ||||||||
Macy’s, Inc. | 12,900 | 503,358 | ||||||||
|
| |||||||||
| 1,128,889 | ||||||||||
Oil, Gas & Consumable Fuels - 4.00% | ||||||||||
Chevron Corp. | 3,400 | 367,676 | ||||||||
Denbury Resources, Inc.* | 24,300 | 393,660 | ||||||||
HollyFrontier Corp. | 10,600 | 493,430 | ||||||||
Marathon Petroleum Corp. | 8,400 | 529,200 | ||||||||
|
| |||||||||
| 1,783,966 | ||||||||||
Personal Products - 0.40% | ||||||||||
Herbalife, Ltd.+ | 5,400 | 177,876 | ||||||||
Pharmaceuticals - 2.08% | ||||||||||
Abbott Laboratories | 6,900 | 451,950 | ||||||||
Allergan, Inc. | 5,200 | 476,996 | ||||||||
|
| |||||||||
| 928,946 | ||||||||||
Real Estate Investment Trusts (REITs) - 2.20% | ||||||||||
American Tower Corp. | 6,800 | 525,436 | ||||||||
Weyerhaeuser Co. | 16,500 | 459,030 | ||||||||
|
| |||||||||
| 984,466 | ||||||||||
Road & Rail - 0.98% | ||||||||||
CSX Corp. | 22,200 | 438,006 | ||||||||
| Industry Company | Shares | Value | ||||
Semiconductors & Semiconductor Equipment - 1.62% | ||||||
Intel Corp. | 9,100 | $ 187,733 | ||||
Xilinx, Inc. | 14,900 | 534,910 | ||||
| ||||||
| 722,643 | ||||||
Software - 3.20% | ||||||
Microsoft Corp. | 7,700 | 205,821 | ||||
NetSuite, Inc.* | 7,000 | 471,100 | ||||
Oracle Corp. | 22,600 | 753,032 | ||||
| ||||||
| 1,429,953 | ||||||
Specialty Retail - 9.31% | ||||||
AutoZone, Inc.* | 1,100 | 389,873 | ||||
Gap, Inc. (The) | 14,200 | 440,768 | ||||
Home Depot, Inc. (The) | 11,000 | 680,350 | ||||
Limited Brands, Inc. | 6,900 | 324,714 | ||||
PetSmart, Inc. | 3,700 | 252,858 | ||||
Ross Stores, Inc. | 7,800 | 422,370 | ||||
Sally Beauty Holdings, Inc.* | 15,900 | 374,763 | ||||
TJX Cos., Inc. | 11,400 | 483,930 | ||||
Tractor Supply Co. | 3,800 | 335,768 | ||||
Ulta Salon Cosmetics & Fragrance, Inc. | 4,600 | 451,996 | ||||
| ||||||
| 4,157,390 | ||||||
Textiles, Apparel & Luxury Goods - 1.88% | ||||||
Hanesbrands, Inc.* | 9,800 | 351,036 | ||||
PVH Corp. | 4,400 | 488,444 | ||||
| ||||||
| 839,480 | ||||||
Trading Companies & Distributors - 1.80% | ||||||
Fastenal Co. | 7,200 | 336,168 | ||||
W.W. Grainger, Inc. | 2,300 | 465,451 | ||||
| ||||||
| 801,619 | ||||||
| ||||||
TOTAL COMMON STOCKS - 100.17% |
| 44,727,609 | ||||
| ||||||
(Cost $37,867,578) | ||||||
| Rate^ | Shares | Value | ||||||||
MONEY MARKET FUND - 0.02% |
| |||||||||
BlackRock FedFund | 0.01 | % | 7,396 | 7,396 | ||||||
| ||||||||||
TOTAL MONEY MARKET FUND - 0.02% |
| 7,396 | ||||||||
| ||||||||||
(Cost $7,396) | ||||||||||
www.bridgeway.com | 70 |
Bridgeway Large-Cap Growth Fund SCHEDULE OF INVESTMENTS (continued) | |
Showing percentage of net assets as of December 31, 2012 (Unaudited)
| Value | ||||||
TOTAL INVESTMENTS - 100.19% | $ | 44,735,005 | ||||
(Cost $37,874,974) | ||||||
Liabilities in Excess of Other Assets - (0.19%) | (83,638 | ) | ||||
|
| |||||
NET ASSETS - 100.00% | $ | 44,651,367 | ||||
|
| |||||
* Non-income producing security. # Securities, or a portion thereof, segregated to cover the Fund’s potential obligation under swap agreements. The total value of segregated assets is $426,424. ^ Rate disclosed as of December 31, 2012. + This security or a portion of the security is out on loan at December 31, 2012. Total loaned securities had a value of $937,562 at December 31, 2012. PLC - Public Limited Company
Summary of inputs used to value the Fund’s investments as of 12/31/2012 is as follows (See Note 2 in Notes to Financial Statements): |
| |||||
| Valuation Inputs | ||||||||||||||||||||||
| Investment in Securities (Value) | ||||||||||||||||||||||
| Level 1 Quoted Prices | Level 2 Significant Observable Inputs | Level 3 Significant Unobservable Inputs | Total | |||||||||||||||||||
Common Stocks | $ | 44,727,609 | $ | — | $ | — | $ | 44,727,609 | ||||||||||||||
Money Market Fund | — | 7,396 | — | 7,396 | ||||||||||||||||||
|
|
|
|
|
|
|
| |||||||||||||||
TOTAL | $ | 44,727,609 | $ | 7,396 | $ | — | $ | 44,735,005 | ||||||||||||||
|
|
|
|
|
|
|
| |||||||||||||||
See Notes to Financial Statements.
71 | Semi-Annual Report | December 31, 2012 (Unaudited) |
MANAGER’S COMMENTARY (Unaudited) | |
(Unaudited)
December 31, 2012
Dear Fellow Blue Chip 35 Index Fund Shareholder,
For the December quarter, our Fund was down 1.41%, trailing our primary market benchmark, the S&P 500 Index
(-0.38%), our peer benchmark, the Lipper Large-Cap Core Funds Index (+0.82%), and the Bridgeway Ultra-Large 35 Index (-1.31%). We did outperform the Russell Top 50 Mega Cap Index (-3.16%). We performed exactly as expected in a market where the largest companies were the worst performers among all large-cap companies.
For the six-month “semi-annual” period ending December 31, 2012, our Fund returned 4.76%, trailing our primary market benchmark, the S&P 500 Index (+5.95%), and our peer benchmark, the Lipper Large-Cap Core Funds Index (+6.74%). We had a virtual tie with the Bridgeway Ultra-Large 35 Index (+4.76%), but we did outperform the Russell Top 50 Mega Cap Index (+3.82%). The market for the six-month period was the same as for the quarter, the largest caps underperformed, and the results were the same.
For the calendar year, our Fund was up 15.20%, slightly trailing all of our benchmarks, the S&P 500 Index (+16.00%), the Lipper Large-Cap Core Funds Index (+15.32%), the Bridgeway Ultra-Large 35 Index (+15.47%) and the Russell Top 50 Mega Cap Index (+15.65%).
The table below presents our December quarter, six-month, one-year, five-year, ten-year and inception-to-date financial results. See the next page for a graph of performance since inception.
Standardized Returns as of December 31, 2012
| Annualized | ||||||||||||||||||||||
| Quarter | 6 Months | 1 Year | 5 Years | 10 Years | Since Inception (7/31/97) | |||||||||||||||||
Blue Chip 35 Index Fund | -1.41% | 4.76% | 15.20% | 2.11% | 6.26% | 4.95% | ||||||||||||||||
S&P 500 Index | -0.38% | 5.95% | 16.00% | 1.66% | 7.10% | 4.51% | ||||||||||||||||
Russell Top 50 Mega Cap Index | -3.16% | 3.82% | 15.65% | 1.03% | 5.55% | 3.36% | ||||||||||||||||
Bridgeway Ultra-Large 35 Index | -1.31% | 4.76% | 15.47% | 2.41% | 6.45% | 5.13% | ||||||||||||||||
Lipper Large-Cap Core Funds Index | 0.82% | 6.74% | 15.32% | 0.97% | 6.13% | 3.80% | ||||||||||||||||
Performance figures quoted in the table above and the graph on the next page represent past performance and are no guarantee of future results. Total return figures in the table above and the graph on the next page include the reinvestment of dividends and capital gains. The table above and the graph on the next page do not reflect the deduction of taxes that a shareholder would pay on Fund distributions or on the redemption of Fund shares.
The S&P 500 Index is a broad-based, unmanaged measurement of changes in stock market conditions based on the average of 500 widely held common stocks with dividends reinvested. The Russell Top 50 Mega Cap Index measures the performance of the largest companies in the Russell 3000 Index. It includes 50 of the largest securities, based on a combination of their market cap and current index membership, and represents approximately 40% of the total market capitalization of the Russell 3000 Index. The Bridgeway Ultra-Large 35 Index is an index comprised of very large, “blue chip” U.S. stocks, excluding tobacco; it is compiled by the adviser of the Fund. The Lipper Large-Cap Core Funds Index reflects the aggregate record of domestic large-cap core mutual funds as reported by Lipper, Inc. It is not possible to invest directly in an index. Periods longer than one year are annualized.
According to data from Lipper, Inc. as of December 31, 2012, Blue Chip 35 Index Fund ranked 489th of 941 large-cap core funds for the twelve months ending December 31, 2012, 133rd of 753 over the last five years, 278th of 491 over the last ten years, and 53rd of 219 since inception in July, 1997. Lipper, Inc. is an independent mutual fund rating service that ranks funds in various fund categories by making comparative calculations using total returns.
www.bridgeway.com | 72 |
Blue Chip 35 Index Fund MANAGER’S COMMENTARY (Unaudited) (continued) | |
(Unaudited)
Blue Chip 35 Index Fund vs. S&P 500 Index, Russell Top 50 Mega Cap Index*, Bridgeway Ultra-Large 35 Index & Lipper Large-Cap Core Funds Index from Inception 7/31/97 to 12/31/12
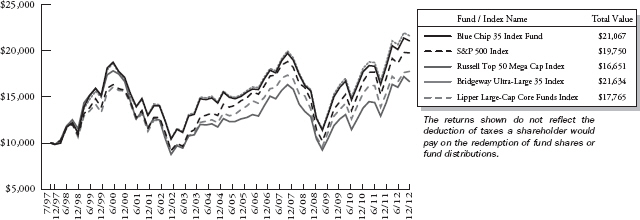
| * | The Russell Top 50 Mega Cap Index began on12/31/2001, and the line graph for the Index begins at the same value as the Fund on that date. |
Quarterly and Calender Year Performance by Company Size:
The Short Version: For both the quarter and the calendar year, the ultra-large stock focus of our Fund hurt our relative performance. As measured by market beta, the lower risk of these ultra-large stocks also hurt our relative performance in a strong “up” year.
The table on the next page indicates that ultra-large stocks, those that make up this Fund, performed the worst of all large-cap stocks for the quarter ended December 31, 2012. This put our Fund at a severe disadvantage versus the smaller cap S&P 500 Index. The half of the S&P 500 Index with lower market caps returned an average of two and
one-half percent while the larger market cap stocks returned an average of -3.1%. Most of the Blue Chip 35 Index Fund stocks reside in the upper half of market cap size.
During the quarter, our “roughly equal weighting” strategy did help to dampen some of the underperformance. Owning smaller than market-cap weightings in the largest stocks kept the Fund from losing more ground to the S&P 500 Index and allowed us to beat the market-cap weighted Russell Top 50 Mega-Cap Index significantly. Limiting our exposure to Apple alone (still 3.5% of Fund net assets) saved us over one percent for the quarter versus the market-cap weighted exposure of the Russell Top 50 Index (8.5% of the Index).
For calendar year 2012, ultra-large (CRSP decile 1 in the table on the next page, which shows data as of December 31, 2012) stocks also appreciated less than the smaller size ranges of the S&P 500 Index. Our “roughly equal weighting” strategy did not help Fund returns for the calendar year. The higher risk (market beta) stocks of the S&P 500 Index also added to the Fund’s underperformance for this period.
73 | Semi-Annual Report | December 31, 2012 (Unaudited) |
Blue Chip 35 Index Fund MANAGER’S COMMENTARY (Unaudited) (continued) | |
(Unaudited)
| Annualized | ||||||||||||||||||||||||
| CRSP Decile1 | Quarter | 6 Months | 1 Year | 5 Years | 10 Years | 87 Years | ||||||||||||||||||
1 (ultra-large) | -1.13% | 5.31% | 15.95% | 1.30% | 6.40% | 9.10% | ||||||||||||||||||
2 | 1.81% | 7.80% | 15.97% | 2.68% | 10.16% | 10.42% | ||||||||||||||||||
3 | 3.60% | 9.08% | 16.73% | 4.04% | 10.35% | 10.81% | ||||||||||||||||||
4 | 3.70% | 10.27% | 16.29% | 5.64% | 11.32% | 10.79% | ||||||||||||||||||
5 | 3.88% | 10.98% | 15.82% | 6.69% | 12.11% | 11.33% | ||||||||||||||||||
6 | 3.78% | 9.06% | 18.13% | 4.65% | 10.91% | 11.29% | ||||||||||||||||||
7 | 1.16% | 6.62% | 18.05% | 6.26% | 11.91% | 11.27% | ||||||||||||||||||
8 | 2.27% | 8.96% | 18.30% | 7.13% | 12.57% | 11.49% | ||||||||||||||||||
9 | 1.12% | 6.17% | 14.57% | 5.42% | 10.90% | 11.47% | ||||||||||||||||||
10 (ultra-small) | -1.08% | 5.28% | 21.47% | 5.25% | 12.90% | 13.01% | ||||||||||||||||||
| 1 | The CRSP Cap-Based Portfolio Indexes are unmanaged indexes of the publicly traded U.S. stocks with dividends reinvested, grouped by market capitalization, as reported by the Center for Research in Security Prices. Past performance is no guarantee of future results. |
Contribution to Returns for Blue Chip 35 Index Fund Stocks for the Calender Year Ended December 31, 2012:
| Rank Company | Industry | % Contribution to Return | ||||||
| 1 | Bank of America Corp. | Diversified Financial Services | 2.4% | |||||
| 2 | Visa, Inc. | IT Services | 1.7% | |||||
| 3 | Apple, Inc. | Computers & Peripherals | 1.4% | |||||
| 4 | Goldman Sachs Group, Inc. (The) | Capital Markets | 1.1% | |||||
| 5 | Monsanto Co. | Chemicals | 0.9% | |||||
| 6 | JPMorgan Chase & Co. | Diversified Financial Services | 0.8% | |||||
| 7 | Oracle Corp. | Software | 0.8% | |||||
| 8 | Wells Fargo & Co. | Commercial Banks | 0.7% | |||||
| 9 | General Electric Co. | Industrial Conglomerates | 0.6% | |||||
| 10 | CVS Caremark Corp. | Food & Staples Retailing | 0.5% | |||||
| 11 | Abbott Laboratories | Pharmaceuticals | 0.5% | |||||
| 12 | Pfizer, Inc. | Pharmaceuticals | 0.5% | |||||
| 13 | Wal-Mart Stores, Inc. | Food & Staples Retailing | 0.5% | |||||
| 14 | AT&T, Inc. | Diversified Telecommunication Services | 0.5% | |||||
| 15 | Berkshire Hathaway, Inc. | Insurance | 0.4% | |||||
| 16 | 3M Co. | Industrial Conglomerates | 0.4% | |||||
| 17 | United Technologies Corp. | Aerospace & Defense | 0.4% | |||||
| 18 | Phillips 66* | Oil, Gas & Consumable Fuels | 0.4% | |||||
| 19 | Cisco Systems, Inc. | Communications Equipment | 0.4% | |||||
| 20 | Merck & Co., Inc | Pharmaceuticals | 0.4% | |||||
| 21 | Verizon Communications, Inc. | Diversified Telecommunication Services | 0.4% | |||||
| 22 | Johnson & Johnson | Pharmaceuticals | 0.3% | |||||
| 23 | Google, Inc. | Internet Software & Services | 0.2% | |||||
| 24 | ConocoPhillips | Oil, Gas & Consumable Fuels | 0.2% | |||||
| 25 | PepsiCo, Inc. | Beverages | 0.2% | |||||
| 26 | Coca-Cola Co. (The) | Beverages | 0.2% | |||||
| 27 | Microsoft Corp. | Software | 0.2% | |||||
| 28 | International Business Machines Corp. | IT Services | 0.2% | |||||
| 29 | Procter & Gamble Co. (The) | Household Products | 0.2% | |||||
www.bridgeway.com | 74 |
Blue Chip 35 Index Fund MANAGER’S COMMENTARY (Unaudited) (continued) | |
(Unaudited)
| Rank Company | Industry | % Contribution to Return | ||||||
| 31 | Schlumberger, Ltd. | Energy Equipment & Services | 0.1% | |||||
| 32 | Exxon Mobil Corp. | Oil, Gas & Consumable Fuels | 0.1% | |||||
| 33 | United Parcel Service, Inc. | Air Freight & Logistics | 0.1% | |||||
| 34 | McDonald’s Corp. | Hotels, Restaurants & Leisure | -0.3% | |||||
| 35 | Intel Corp. | Semiconductors & Semiconductor Equipment | -0.4% | |||||
| 36 | Occidental Petroleum Corp. | Oil, Gas & Consumable Fuels | -0.4% | |||||
| 37 | Hewlett-Packard Co. | Computers & Peripherals | -1.3% | |||||
*Spinoff from ConocoPhillips. Security was sold during the period ended December 31, 2012.
| Industry Sector Representation as of December 31, 2012 | ||||||||
| % of Net Assets | % of S&P 500 Index | Difference | ||||||
Consumer Discretionary | 3.2% | 11.4% | -8.2% | |||||
Consumer Staples | 13.3% | 10.6% | 2.7% | |||||
Energy | 12.9% | 11.0% | 1.9% | |||||
Financials | 14.1% | 15.6% | -1.5% | |||||
Health Care | 10.3% | 12.1% | -1.8% | |||||
Industrials | 10.4% | 10.2% | 0.2% | |||||
Information Technology | 26.9% | 19.0% | 7.9% | |||||
Materials | 2.7% | 3.6% | -0.9% | |||||
Telecommunication Services | 6.1% | 3.1% | 3.0% | |||||
Utilities | 0.0% | 3.4% | -3.4% | |||||
Cash & Other Assets | 0.1% | 0.0% | 0.1% | |||||
Total | 100.0% | 100.0% | ||||||
Disclaimer
The views expressed here are exclusively those of Fund management. These views, including those related to market sectors or individual stocks, are not meant as investment advice and should not be considered predictive in nature. Any favorable (or unfavorable) description of a holding applies only as of December 31, 2012, unless otherwise stated. Security positions can and do change thereafter. Discussions of historical performance do not guarantee and are not indicative of future performance.
The Fund is subject to significant market risk (volatility) and is not an appropriate investment for short-term investors.
Conclusion
Thank you for your continued investment in Blue Chip 35 Index Fund. We encourage your feedback; your reactions and concerns are important to us.
Sincerely,
The Investment Management Team
75 | Semi-Annual Report | December 31, 2012 (Unaudited) |
Bridgeway Blue Chip 35 Index Fund SCHEDULE OF INVESTMENTS | |
Showing percentage of net assets as of December 31, 2012 (Unaudited)
| Industry Company | Shares | Value | ||||||||
COMMON STOCKS - 99.97% | ||||||||||
Aerospace & Defense - 2.61% | ||||||||||
United Technologies Corp. | 77,180 | $ | 6,329,532 | |||||||
Air Freight & Logistics - 2.57% | ||||||||||
United Parcel Service, Inc., Class B | 84,563 | 6,234,830 | ||||||||
Beverages - 5.08% | ||||||||||
Coca-Cola Co. (The) | 169,914 | 6,159,382 | ||||||||
PepsiCo, Inc. | 89,850 | 6,148,436 | ||||||||
|
| |||||||||
| 12,307,818 | ||||||||||
Capital Markets - 2.99% | ||||||||||
Goldman Sachs Group, Inc. (The) | 56,800 | 7,245,408 | ||||||||
Chemicals - 2.70% | ||||||||||
Monsanto Co. | 69,050 | 6,535,582 | ||||||||
Commercial Banks - 2.57% | ||||||||||
Wells Fargo & Co. | 181,859 | 6,215,941 | ||||||||
Communications Equipment - 2.54% | ||||||||||
Cisco Systems, Inc. | 313,108 | 6,152,572 | ||||||||
Computers & Peripherals - 5.87% | ||||||||||
Apple, Inc. | 15,000 | 7,995,450 | ||||||||
Hewlett-Packard Co. | 437,300 | 6,231,525 | ||||||||
|
| |||||||||
| 14,226,975 | ||||||||||
Diversified Financial Services - 5.99% | ||||||||||
Bank of America Corp. | 698,808 | 8,106,173 | ||||||||
JPMorgan Chase & Co. | 145,295 | 6,388,621 | ||||||||
|
| |||||||||
| 14,494,794 | ||||||||||
Diversified Telecommunication Services - 6.09% | ||||||||||
AT&T, Inc. | 214,125 | 7,218,154 | ||||||||
Verizon Communications, Inc. | 174,189 | 7,537,158 | ||||||||
|
| |||||||||
| 14,755,312 | ||||||||||
Energy Equipment & Services - 2.55% | ||||||||||
Schlumberger, Ltd. | 89,100 | 6,173,739 | ||||||||
Food & Staples Retailing - 5.69% | ||||||||||
CVS Caremark Corp. | 129,800 | 6,275,830 | ||||||||
Wal-Mart Stores, Inc. | 109,919 | 7,499,773 | ||||||||
|
| |||||||||
| 13,775,603 | ||||||||||
Hotels, Restaurants & Leisure - 3.25% | ||||||||||
McDonald’s Corp. | 89,100 | 7,859,511 | ||||||||
| Industry Company | Shares | Value | ||||||
Household Products - 2.54% |
| |||||||
Procter & Gamble Co. (The) | 90,726 | $ | 6,159,388 | |||||
Industrial Conglomerates - 5.18% |
| |||||||
3M Co. | 67,550 | 6,272,017 | ||||||
General Electric Co. | 298,943 | 6,274,814 | ||||||
|
| |||||||
| 12,546,831 | ||||||||
Insurance - 2.60% |
| |||||||
Berkshire Hathaway, Inc., Class B* | 70,250 | 6,301,425 | ||||||
Internet Software & Services - 3.10% |
| |||||||
Google, Inc., Class A* | 10,580 | 7,505,135 | ||||||
IT Services - 7.44% |
| |||||||
International Business Machines Corp. | 41,667 | 7,981,314 | ||||||
Visa, Inc., Class A | 66,250 | 10,042,175 | ||||||
|
| |||||||
| 18,023,489 | ||||||||
Oil, Gas & Consumable Fuels - 10.33% |
| |||||||
Chevron Corp. | 57,195 | 6,185,067 | ||||||
ConocoPhillips | 107,435 | 6,230,156 | ||||||
Exxon Mobil Corp. | 72,787 | 6,299,715 | ||||||
Occidental Petroleum Corp. | 82,350 | 6,308,833 | ||||||
|
| |||||||
| 25,023,771 | ||||||||
Pharmaceuticals - 10.33% |
| |||||||
Abbott Laboratories | 96,500 | 6,320,750 | ||||||
Johnson & Johnson | 88,952 | 6,235,535 | ||||||
Merck & Co., Inc. | 153,835 | 6,298,005 | ||||||
Pfizer, Inc. | 246,144 | 6,173,292 | ||||||
|
| |||||||
| 25,027,582 | ||||||||
Semiconductors & Semiconductor Equipment - 2.71% |
| |||||||
Intel Corp. | 318,043 | 6,561,227 | ||||||
Software - 5.24% |
| |||||||
Microsoft Corp. | 234,145 | 6,258,696 | ||||||
Oracle Corp. | 193,113 | 6,434,525 | ||||||
|
| |||||||
| 12,693,221 | ||||||||
|
| |||||||
TOTAL COMMON STOCKS - 99.97% | 242,149,686 | |||||||
|
| |||||||
(Cost $164,627,485) | ||||||||
www.bridgeway.com | 76 |
Bridgeway Blue Chip 35 Index Fund SCHEDULE OF INVESTMENTS (continued) | |
Showing percentage of net assets as of December 31, 2012 (Unaudited)
| Rate^ | Shares | Value | ||||||||||||
MONEY MARKET FUND - 0.06% |
| |||||||||||||
BlackRock FedFund | 0.01 | % | 144,927 | $144,927 | ||||||||||
|
| |||||||||||||
TOTAL MONEY MARKET FUND - 0.06% |
| 144,927 | ||||||||||||
|
| |||||||||||||
(Cost $144,927) |
| |||||||||||||
TOTAL INVESTMENTS - 100.03% |
| $242,294,613 | ||||||||||||
(Cost $164,772,412) |
| |||||||||||||
Liabilities in Excess of Other Assets - (0.03%) |
| (71,724 | ) | |||||||||||
|
| |||||||||||||
NET ASSETS - 100.00% |
| $242,222,889 | ||||||||||||
|
| |||||||||||||
* Non-income producing security. ^ Rate disclosed as of December 31, 2012. |
| |||||||||||||
Summary of inputs used to value the Fund’s investments as of 12/31/2012 is as follows (See Note 2 in Notes to Financial Statements):
| Valuation Inputs | ||||||||||||||||||||
| Investment in Securities (Value) | ||||||||||||||||||||
| Level 1 Quoted Prices | Level 2 Significant Observable Inputs | Level 3 Significant Unobservable Inputs | Total | |||||||||||||||||
Common Stocks | $ | 242,149,686 | $ | — | $ | — | $ | 242,149,686 | ||||||||||||
Money Market Fund | — | 144,927 | — | 144,927 | ||||||||||||||||
|
|
|
|
|
|
|
| |||||||||||||
TOTAL | $ | 242,149,686 | $ | 144,927 | $ | — | $ | 242,294,613 | ||||||||||||
|
|
|
|
|
|
|
| |||||||||||||
See Notes to Financial Statements.
77 | Semi-Annual Report | December 31, 2012 (Unaudited) |
MANAGER’S COMMENTARY (Unaudited) | |
(Unaudited)
December 31, 2012
Dear Fellow Managed Volatility Fund Shareholder:
For the quarter ended December 31, 2012, our Fund declined 0.40%, trailing our primary market benchmark, the S&P 500 Index (-0.38%), our peer benchmark, the Lipper Balanced Funds Index (+1.22%), and the fixed-income only Bloomberg/ EFFAS U.S. Government 1-3 Year Total Return Bond Index (+0.07).
For the six-month “semi-annual” period ending December 31, 2012, our Fund was up 2.18%, trailing our primary market benchmark, the S&P 500 Index (+5.95%), our peer benchmark, the Lipper Balanced Funds Index (+5.87%), but beating the fixed-income only Bloomberg/ EFFAS U.S. Government 1-3 Year Total Return Bond Index (+0.46%).
For the calendar year, our Fund returned 6.46%, trailing the S&P 500 Index (+16.00%) but right on target with the Fund’s design of returning 40% of the benchmark return with 40% or less of the risk in up markets. We also trailed the Lipper Balanced Funds Index (+11.94%), but beat the fixed-income only Bloomberg/ EFFAS U.S. Government 1-3 Year Total Return Bond Index (+0.58%). We are pleased to be ahead of the Fund’s design goal over the five- and ten-year periods and especially for leading the S&P 500 Index since the Fund’s inception.
Everything we do at Bridgeway is based on research and design. Managed Volatility is a very precise mix of equities, short-term fixed income, options and futures that is designed to produce a significantly lower level of volatility than the market, as defined by the S&P 500 Index, and to capture market-like returns over longer periods of time. Inherent to the design, there will be monthly, quarterly and occasionally even annual returns that follow the typical expectation of return versus risk. However, we would expect to capture more than 40% of the market returns with 40% or less of the market risk over longer periods of time.
The table below presents our December quarter, six-month, one-year, five-year, ten-year and inception-to-date financial results. A graph of quarterly performance since inception appears on the following page.
Standardized Returns as of December 31, 2012
| Annualized | ||||||||||||||||||||
| Quarter | 6 Months | 1 Year | 5 Years | 10 Years | Since Inception (6/30/01) | |||||||||||||||
Managed Volatility Fund | -0.40 | % | 2.18% | 6.46 | % | 0.72 | % | 4.80 | % | 3.63% | ||||||||||
S&P 500 Index | -0.38 | % | 5.95% | 16.00 | % | 1.66 | % | 7.10 | % | 3.35% | ||||||||||
Bloomberg/EFFAS U.S. Government 1-3 Year Total Return Bond Index | 0.07 | % | 0.46% | 0.58 | % | 2.42 | % | 2.78 | % | 3.29% | ||||||||||
Lipper Balanced Funds Index | 1.22 | % | 5.87% | 11.94 | % | 2.82 | % | 6.51 | % | 4.46% | ||||||||||
Performance figures quoted in the table above and the graph on the next page represent past performance and are no guarantee of future results. Total return figures in the table above and the graph on the next page include the reinvestment of dividends and capital gains. The table above and the graph on the next page do not reflect the deduction of taxes that a shareholder would pay on Fund distributions or on the redemption of Fund shares.
The S&P 500 Index is a broad-based, unmanaged measurement of changes in stock market conditions, based on the average of 500 widely held common stocks with dividends reinvested. The Bloomberg/ EFFAS U.S. Government 1-3 year Total Return Bond Index is a transparent benchmark for the total return of the 1-3 year U.S. Government bond market. The Lipper Balanced Funds Index is an index of balanced funds compiled by Lipper, Inc. It is not possible to invest directly in an index. Periods longer than one year are annualized.
According to data from Lipper, Inc. as of December 31, 2012, the Managed Volatility Fund ranked 461st of 469 mixed-asset target allocation moderate funds for the calendar year ended December 31, 2012, 346th of 382 for the past five years, 191st of 210 for the past ten years and 132nd of 167 funds since inception in June, 2001. Lipper, Inc. is an independent mutual fund rating service that ranks funds in various fund categories by making comparative calculations using total returns.
www.bridgeway.com | 78 |
Managed Volatility Fund MANAGER’S COMMENTARY (Unaudited) (continued) | |
(Unaudited)
According to data from Morningstar as of December 31, 2012, the Managed Volatility Fund ranked 82nd of 191 Long/Short Equity funds for the calendar year ended December 31, 2012, 19th out of 56 funds for the past five years and 11th of 23 funds for the past ten years. Morningstar ranks funds in various fund categories by making comparative calculations using total returns.
Managed Volatility Fund vs. S&P 500 Index, Bloomberg/EFFAS Bond Index & Lipper Balanced Funds Index
from Inception 6/30/01 to 12/31/12
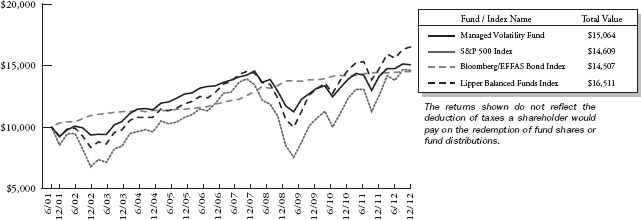
Detailed Explanation of Quarterly Performance
The Short Version: Our fixed income and options premiums gave us a slight edge for the quarter.
We performed pretty much in line with the design of the Fund for the quarter. We were slightly hurt by our holdings in the Consumer Discretionary and Industrials sectors, but our holdings in the Materials and Consumer Staples sectors made up for most of that underperformance. In the flat to slightly down market of the quarter, our fixed income and options strategy really helped our relative returns versus the S&P 500 Index.
Detailed Explanation of Calendar Year Performance
The Short Version: We performed right in line with the Fund’s design for the calendar year.
It was a solid calendar year for the S&P 500 Index and we performed exactly as expected for the period. Our stock portfolio gave us a very slight edge, mostly in the Materials and Financials sectors. Like the quarter, our Consumer Discretionary stocks slightly underperformed the Consumer Discretionary stocks in the S&P 500 Index. Our fixed-income strategy created a bit of a drag on our performance as is expected in such a market up year.
79 | Semi-Annual Report | December 31, 2012 (Unaudited) |
Managed Volatility Fund MANAGER’S COMMENTARY (Unaudited) (continued) | |
(Unaudited)
Top Ten Holdings as of December 31, 2012
| Rank | Description | Industry | % of Net Assets | |||
1 | Gap, Inc. (The) | Specialty Retail | 1.5% | |||
2 | Exxon Mobil Corp. | Oil, Gas & Consumable Fuels | 1.5% | |||
3 | Travelers Cos., Inc. (The) | Insurance | 1.4% | |||
4 | Apple, Inc. | Computers & Peripherals | 1.3% | |||
5 | AutoZone, Inc. | Specialty Retail | 1.3% | |||
6 | Halliburton Co. | Energy Equipment & Services | 1.3% | |||
7 | Chevron Corp. | Oil, Gas & Consumable Fuels | 1.3% | |||
8 | Cabela’s, Inc. | Specialty Retail | 1.3% | |||
9 | Brown-Forman Corp. | Beverages | 1.2% | |||
10 | Northrop Grumman Corp. | Aerospace & Defense | 1.1% | |||
| 13.2% |
Industry Sector Representation as of December 31, 2012
| Asset Type | % of Net Assets | |
Common Stock | 56.1% | |
Consumer Discretionary | 8.7% | |
Consumer Staples | 5.5% | |
Energy | 6.2% | |
Financials | 6.9% | |
Health Care | 5.8% | |
Industrials | 7.4% | |
Information Technology | 10.3% | |
Materials | 1.9% | |
Telecommunication Services | 1.6% | |
Utilities | 1.8% | |
U.S. Government Obligations | 40.3% | |
Covered Call Options Written | -0.7% | |
Put Options Written | -0.6% | |
Money Market Funds | 5.7% | |
Other Assets in Excess of Liabilities | -0.8% | |
Total | 100.0% |
Disclaimer
The views expressed here are exclusively those of Fund management. These views, including those related to market sectors or individual stocks, are not meant as investment advice and should not be considered predictive in nature. Any favorable (or unfavorable) description of a holding applies only as of December 31, 2012, unless otherwise stated. Security positions can and do change thereafter. Discussions of historical performance do not guarantee and are not indicative of future performance.
Market volatility can significantly affect short-term performance. The Fund is not an appropriate investment for short-term investors. Investments in the small companies within this multi-cap fund generally carry greater risk than is customarily associated with larger companies. This additional risk is attributable to a number of factors, including the relatively limited financial resources that are typically available to small companies, and the fact that small companies often have comparatively limited product lines. In addition, the stock of small companies tends to be more volatile than the stock of large companies, particularly in the short term and particularly in the early stages of an economic or market downturn. The Fund’s use of options, futures, and leverage can magnify the risk of loss in an unfavorable market, and the Fund’s use of short-sale positions can, in
www.bridgeway.com | 80 |
Managed Volatility Fund MANAGER’S COMMENTARY (Unaudited) (continued) | |
(Unaudited)
theory, expose shareholders to unlimited loss. Shareholders of the Fund, therefore, are taking on more risk than they would if they invested in the stock market as a whole. The Fund uses an option writing strategy in which the Fund may sell covered calls or secured put options. Up to 75% of Fund assets may be invested in options. Options are subject to special risks and may not fully protect the Fund against declines in the value of its stocks. In addition, an option writing strategy limits the upside profit potential normally associated with stocks. Finally, the Fund’s fixed-income holdings are subject to three types of risk. Interest rate risk is the chance that bond prices overall will decline as interest rates rise. Credit risk is the chance a bond issuer will fail to pay interest and principal. Prepayment risk is the chance a mortgage-backed bond issuer will repay a higher yielding bond, resulting in a lower paying yield.
Conclusion
In closing, we would like to thank you for your continued investment in the Managed Volatility Fund. We encourage your feedback; your reactions and concerns are important to us.
Sincerely,
The Investment Management Team
81 | Semi-Annual Report | December 31, 2012 (Unaudited) |
Bridgeway Managed Volatility Fund SCHEDULE OF INVESTMENTS | |
Showing percentage of net assets as of December 31, 2012 (Unaudited)
| Industry Company | Shares | Value | ||||||||
COMMON STOCKS - 56.10% | ||||||||||
Aerospace & Defense - 1.98% | ||||||||||
Honeywell International, Inc. | 800 | $ | 50,776 | |||||||
Lockheed Martin Corp. | 870 | 80,292 | ||||||||
Northrop Grumman Corp.# | 3,900 | 263,562 | ||||||||
United Technologies Corp. | 940 | 77,090 | ||||||||
|
| |||||||||
| 471,720 | ||||||||||
Air Freight & Logistics - 0.46% | ||||||||||
FedEx Corp.# | 1,200 | 110,064 | ||||||||
Beverages - 1.86% | ||||||||||
Brown-Forman Corp., Class B | 4,425 | 279,881 | ||||||||
Coca-Cola Co. (The) | 4,500 | 163,125 | ||||||||
|
| |||||||||
| 443,006 | ||||||||||
Biotechnology - 0.83% | ||||||||||
Biogen Idec, Inc.*# | 900 | 132,003 | ||||||||
Gilead Sciences, Inc.* | 900 | 66,105 | ||||||||
|
| |||||||||
| 198,108 | ||||||||||
Capital Markets - 0.87% | ||||||||||
Ameriprise Financial, Inc.# | 1,080 | 67,640 | ||||||||
Bank of New York Mellon Corp. (The) | 532 | 13,673 | ||||||||
Charles Schwab Corp. (The) | 3,500 | 50,260 | ||||||||
Morgan Stanley | 800 | 15,296 | ||||||||
State Street Corp.# | 1,300 | 61,113 | ||||||||
|
| |||||||||
| 207,982 | ||||||||||
Chemicals - 1.51% | ||||||||||
CF Industries Holdings, Inc.# | 500 | 101,580 | ||||||||
Dow Chemical Co. (The) | 2,100 | 67,872 | ||||||||
Monsanto Co. | 500 | 47,325 | ||||||||
Sherwin-Williams Co. (The) | 600 | 92,292 | ||||||||
Sigma-Aldrich Corp. | 700 | 51,506 | ||||||||
|
| |||||||||
| 360,575 | ||||||||||
Commercial Banks - 1.28% | ||||||||||
Comerica, Inc. | 1,600 | 48,544 | ||||||||
KeyCorp | 3,700 | 31,154 | ||||||||
US Bancorp# | 2,200 | 70,268 | ||||||||
Wells Fargo & Co.# | 4,571 | 156,237 | ||||||||
|
| |||||||||
| 306,203 | ||||||||||
Communications Equipment - 1.01% | ||||||||||
Cisco Systems, Inc.# | 11,600 | 227,940 | ||||||||
Juniper Networks, Inc.* | 700 | 13,769 | ||||||||
|
| |||||||||
| 241,709 | ||||||||||
| Industry Company | Shares | Value | ||||||
Computers & Peripherals - 2.50% | ||||||||
Apple, Inc.# | 600 | $ | 319,818 | |||||
Hewlett-Packard Co.# | 9,000 | 128,250 | ||||||
Lexmark International, Inc., Class A | 800 | 18,552 | ||||||
SanDisk Corp.* | 900 | 39,204 | ||||||
Seagate Technology PLC# | 3,000 | 91,440 | ||||||
|
| |||||||
| 597,264 | ||||||||
Consumer Finance - 0.85% | ||||||||
American Express Co. | 1,500 | 86,220 | ||||||
Capital One Financial Corp. | 2,000 | 115,860 | ||||||
|
| |||||||
| 202,080 | ||||||||
Diversified Financial Services - 1.41% |
| |||||||
Bank of America Corp.# | 9,100 | 105,560 | ||||||
Citigroup, Inc. | 510 | 20,176 | ||||||
JPMorgan Chase & Co.# | 4,800 | 211,056 | ||||||
|
| |||||||
| 336,792 | ||||||||
Diversified Telecommunication Services - 1.13% |
| |||||||
AT&T, Inc. | 2,400 | 80,904 | ||||||
CenturyLink, Inc. | 3,200 | 125,184 | ||||||
Frontier Communications Corp.+ | 672 | 2,876 | ||||||
Verizon Communications, Inc. | 1,400 | 60,578 | ||||||
|
| |||||||
| 269,542 | ||||||||
Electric Utilities - 0.63% | ||||||||
American Electric Power Co., Inc. | 1,600 | 68,288 | ||||||
Duke Energy Corp. | 783 | 49,956 | ||||||
Exelon Corp. | 1,100 | 32,714 | ||||||
|
| |||||||
| 150,958 | ||||||||
Electrical Equipment - 0.41% | ||||||||
Eaton Corp. PLC# | 1,200 | 65,040 | ||||||
Emerson Electric Co. | 600 | 31,776 | ||||||
|
| |||||||
| 96,816 | ||||||||
Electronic Equipment, Instruments & Components - 0.06% |
| |||||||
FLIR Systems, Inc. | 600 | 13,386 | ||||||
Energy Equipment & Services - 1.54% |
| |||||||
Halliburton Co.# | 9,000 | 312,210 | ||||||
National Oilwell Varco, Inc. | 800 | 54,680 | ||||||
|
| |||||||
| 366,890 | ||||||||
Food & Staples Retailing - 1.69% | ||||||||
CVS Caremark Corp.# | 1,400 | 67,690 | ||||||
www.bridgeway.com | 82 |
Bridgeway Managed Volatility Fund SCHEDULE OF INVESTMENTS (continued) | |
Showing percentage of net assets as of December 31, 2012 (Unaudited)
| Industry Company | Shares | Value | ||||||||
Common Stocks (continued) | ||||||||||
Food & Staples Retailing (continued) | ||||||||||
Kroger Co. (The) | 1,000 | $ | 26,020 | |||||||
Safeway, Inc.# | 11,400 | 206,226 | ||||||||
Wal-Mart Stores, Inc.# | 1,500 | 102,345 | ||||||||
|
| |||||||||
| 402,281 | ||||||||||
Food Products - 0.63% | ||||||||||
Archer-Daniels-Midland Co. | 1,000 | 27,390 | ||||||||
General Mills, Inc. | 1,400 | 56,574 | ||||||||
Mead Johnson Nutrition Co.# | 1,016 | 66,944 | ||||||||
|
| |||||||||
| 150,908 | ||||||||||
Health Care Equipment & Supplies - 0.93% | ||||||||||
Baxter International, Inc. | 1,300 | 86,658 | ||||||||
Becton Dickinson & Co.# | 220 | 17,202 | ||||||||
CR Bard, Inc. | 500 | 48,870 | ||||||||
Stryker Corp.# | 1,260 | 69,073 | ||||||||
|
| |||||||||
| 221,803 | ||||||||||
Health Care Providers & Services - 0.87% | ||||||||||
Express Scripts Holding Co.* | 1,634 | 88,236 | ||||||||
Laboratory Corp. of America Holdings* | 300 | 25,986 | ||||||||
Quest Diagnostics, Inc. | 400 | 23,308 | ||||||||
UnitedHealth Group, Inc.# | 1,300 | 70,512 | ||||||||
|
| |||||||||
| 208,042 | ||||||||||
Hotels, Restaurants & Leisure - 0.81% |
| |||||||||
McDonald’s Corp. | 900 | 79,389 | ||||||||
Yum! Brands, Inc.# | 1,700 | 112,880 | ||||||||
|
| |||||||||
| 192,269 | ||||||||||
Household Products - 1.32% | ||||||||||
Colgate-Palmolive Co. | 1,500 | 156,810 | ||||||||
Kimberly-Clark Corp. | 1,000 | 84,430 | ||||||||
Procter & Gamble Co. (The) | 1,100 | 74,679 | ||||||||
|
| |||||||||
| 315,919 | ||||||||||
Independent Power Producers & Energy Traders - 0.18% | ||||||||||
AES Corp. | 4,100 | 43,870 | ||||||||
Industrial Conglomerates - 0.87% | ||||||||||
3M Co. | 500 | 46,425 | ||||||||
Danaher Corp. | 500 | 27,950 | ||||||||
General Electric Co.# | 6,300 | 132,237 | ||||||||
|
| |||||||||
| 206,612 | ||||||||||
Insurance - 2.24% | ||||||||||
Aflac, Inc. | 300 | 15,936 | ||||||||
Aon PLC | 1,700 | 94,520 | ||||||||
| Industry Company | Shares | Value | ||||||
Insurance (continued) | ||||||||
Chubb Corp. (The)# | 1,100 | $ | 82,852 | |||||
Progressive Corp. (The) | 820 | 17,302 | ||||||
Travelers Cos, Inc. (The)# | 4,500 | 323,190 | ||||||
|
| |||||||
| 533,800 | ||||||||
Internet & Catalog Retail - 0.53% |
| |||||||
Amazon.com, Inc.* | 500 | 125,570 | ||||||
Internet Software & Services - 1.02% |
| |||||||
eBay, Inc.*# | 2,000 | 102,040 | ||||||
Google, Inc., Class A* | 200 | 141,874 | ||||||
|
| |||||||
| 243,914 | ||||||||
IT Services - 2.47% | ||||||||
International Business Machines Corp.# | 1,200 | 229,860 | ||||||
Teradata Corp.*# | 2,300 | 142,347 | ||||||
Visa, Inc., Class A# | 1,300 | 197,054 | ||||||
Western Union Co. (The) | 1,500 | 20,415 | ||||||
|
| |||||||
| 589,676 | ||||||||
Leisure Equipment & Products - 0.22% |
| |||||||
Hasbro, Inc.#+ | 1,500 | 53,850 | ||||||
Life Sciences Tools & Services - 0.19% |
| |||||||
Thermo Fisher Scientific, Inc. | 700 | 44,646 | ||||||
Machinery - 0.98% | ||||||||
Deere & Co.# | 2,700 | 233,334 | ||||||
Media - 1.70% | ||||||||
Comcast Corp., Class A | 2,950 | 110,271 | ||||||
News Corp.# | 3,400 | 86,836 | ||||||
Omnicom Group, Inc.# | 1,000 | 49,960 | ||||||
Time Warner, Inc. | 1,333 | 63,757 | ||||||
Walt Disney Co. (The)# | 1,900 | 94,601 | ||||||
|
| |||||||
| 405,425 | ||||||||
Metals & Mining - 0.08% |
| |||||||
United States Steel Corp.+ | 800 | 19,096 | ||||||
Multiline Retail - 0.98% |
| |||||||
Big Lots, Inc.*# | 1,400 | 39,844 | ||||||
Kohl’s Corp.# | 4,500 | 193,410 | ||||||
|
| |||||||
| 233,254 | ||||||||
Multi-Utilities - 0.98% | ||||||||
Dominion Resources, Inc. | 1,920 | 99,456 | ||||||
Sempra Energy# | 1,900 | 134,786 | ||||||
|
| |||||||
| 234,242 | ||||||||
83 | Semi-Annual Report | December 31, 2012 (Unaudited) |
Bridgeway Managed Volatility Fund SCHEDULE OF INVESTMENTS (continued) | |
Showing percentage of net assets as of December 31, 2012 (Unaudited)
| Industry Company | Shares | Value | ||||||||
Common Stocks (continued) | ||||||||||
Oil, Gas & Consumable Fuels - 4.68% | ||||||||||
Anadarko Petroleum Corp. | 1,000 | $ | 74,310 | |||||||
Apache Corp. | 500 | 39,250 | ||||||||
Chesapeake Energy Corp.+ | 500 | 8,310 | ||||||||
Chevron Corp. | 2,878 | 311,227 | ||||||||
ConocoPhillips# | 1,187 | 68,834 | ||||||||
Exxon Mobil Corp.# | 4,000 | 346,200 | ||||||||
Marathon Petroleum Corp. | 2,300 | 144,900 | ||||||||
Occidental Petroleum Corp.# | 1,200 | 91,932 | ||||||||
Phillips 66 | 593 | 31,488 | ||||||||
|
| |||||||||
| 1,116,451 | ||||||||||
Paper & Forest Products - 0.33% | ||||||||||
International Paper Co.# | 2,000 | 79,680 | ||||||||
Pharmaceuticals - 2.95% | ||||||||||
Abbott Laboratories | 1,800 | 117,900 | ||||||||
Allergan, Inc.# | 1,200 | 110,076 | ||||||||
Bristol-Myers Squibb Co. | 3,079 | 100,345 | ||||||||
Johnson & Johnson# | 1,700 | 119,170 | ||||||||
Merck & Co., Inc. | 1,600 | 65,504 | ||||||||
Pfizer, Inc.# | 7,600 | 190,608 | ||||||||
|
| |||||||||
| 703,603 | ||||||||||
Real Estate Investment Trusts (REITs) - 0.26% | ||||||||||
American Tower Corp. | 800 | 61,816 | ||||||||
Road & Rail - 2.26% | ||||||||||
CSX Corp.# | 10,000 | 197,300 | ||||||||
Norfolk Southern Corp.# | 3,500 | 216,440 | ||||||||
Union Pacific Corp.# | 1,000 | 125,720 | ||||||||
|
| |||||||||
| 539,460 | ||||||||||
Semiconductors & Semiconductor Equipment - 1.47% | ||||||||||
Broadcom Corp., Class A | 1,400 | 46,494 | ||||||||
Cirrus Logic, Inc.*# | 7,000 | 202,790 | ||||||||
Intel Corp.# | 1,800 | 37,134 | ||||||||
Texas Instruments, Inc.# | 2,070 | 64,046 | ||||||||
|
| |||||||||
| 350,464 | ||||||||||
Software - 1.77% | ||||||||||
Citrix Systems, Inc.* | 1,400 | 92,050 | ||||||||
Intuit, Inc. | 500 | 29,750 | ||||||||
Microsoft Corp.# | 5,200 | 138,996 | ||||||||
Oracle Corp.# | 4,860 | 161,935 | ||||||||
|
| |||||||||
| 422,731 | ||||||||||
Specialty Retail - 4.21% | ||||||||||
AutoZone, Inc.*# | 900 | 318,987 | ||||||||
Cabela’s, Inc.*# | 7,400 | 308,950 | ||||||||
Gap, Inc. (The)# | 11,700 | 363,168 | ||||||||
| Industry Company | Shares | Value | ||||||
Specialty Retail (continued) |
| |||||||
Staples, Inc. | 1,250 | $ | 14,250 | |||||
|
| |||||||
| 1,005,355 | ||||||||
Textiles, Apparel & Luxury Goods - 0.22% |
| |||||||
NIKE, Inc., Class B | 1,000 | 51,600 | ||||||
Trading Companies & Distributors - 0.42% |
| |||||||
W.W. Grainger, Inc. | 500 | 101,185 | ||||||
Wireless Telecommunication Services - 0.51% |
| |||||||
Crown Castle International Corp.* | 1,700 | 122,672 | ||||||
|
| |||||||
TOTAL COMMON STOCKS - 56.10% |
| 13,386,623 | ||||||
|
| |||||||
(Cost $9,864,470) | ||||||||
| Due Date | Discount Rate or Coupon Rate | Principal Amount | Value | |||||||||
U.S. GOVERNMENT OBLIGATIONS - 40.33% |
| |||||||||||
U.S. Treasury Bills - 37.71% |
| |||||||||||
01/17/2013 | 0.105 | %(a) | $ | 2,000,000 | 1,999,907 | |||||||
01/31/2013 | 0.125 | %(a) | 2,000,000 | 1,999,791 | ||||||||
02/28/2013 | 0.100 | %(a) | 3,000,000 | 2,999,977 | ||||||||
03/28/2013 | 0.089 | %(a) | 2,000,000 | 1,999,834 | ||||||||
|
| |||||||||||
| 8,999,509 | ||||||||||||
U.S. Treasury Notes - 2.62% |
| |||||||||||
01/31/2013 | 0.625 | % | 100,000 | 100,039 | ||||||||
11/15/2013 | 4.250 | % | 200,000 | 207,047 | ||||||||
03/15/2014 | 1.250 | % | 100,000 | 101,242 | ||||||||
02/15/2015 | 4.000 | % | 200,000 | 215,688 | ||||||||
|
| |||||||||||
| 624,016 | ||||||||||||
|
| |||||||||||
TOTAL U.S. GOVERNMENT OBLIGATIONS - 40.33% |
| 9,623,525 | ||||||||||
|
| |||||||||||
(Cost $9,598,385) |
| |||||||||||
www.bridgeway.com | 84 |
Bridgeway Managed Volatility Fund SCHEDULE OF INVESTMENTS (continued) | |
Showing percentage of net assets as of December 31, 2012 (Unaudited)
| Rate^ | Shares | Value | ||||||||||||
MONEY MARKET FUND - 5.71% |
| |||||||||||||
BlackRock FedFund | 0.01 | % | 1,362,792 | $ | 1,362,792 | |||||||||
| �� |
|
| ||||||||||||
TOTAL MONEY MARKET FUND — 5.71% |
| 1,362,792 | ||||||||||||
|
| |||||||||||||
(Cost $ 1,362,792) | ||||||||||||||
TOTAL INVESTMENTS - 102.14% |
| $ | 24,372,940 | |||||||||||
(Cost $ 20,825,647) | ||||||||||||||
Liabilities in Excess of Other Assets - (2.14%) |
| (509,564 | ) | |||||||||||
|
| |||||||||||||
NET ASSETS - 100.00% |
| $ | 23,863,376 | |||||||||||
|
| |||||||||||||
* Non-income producing security. # Security subject to call or put option written by the Fund. |
| |||||||||||||
^ Rate disclosed as of December 31, 2012. + This security or a portion of the security is out on loan at December 31, 2012. Total loaned securities had a value of $62,592 at December 31, 2012. (a) Rate represents the effective yield at purchase. LLC - Limited Liability Company PLC - Public Limited Company
See Notes to Financial Statements. |
| |||||||||||||
85 | Semi-Annual Report | December 31, 2012 (Unaudited) |
Bridgeway Managed Volatility Fund SCHEDULE OF OPTIONS WRITTEN | |
Showing percentage of net assets as of December 31, 2012 (Unaudited)
| Company | Number of Contracts | Value | ||||||||||
CALL OPTIONS WRITTEN - (0.73%) |
| |||||||||||
Allergan, Inc. | ||||||||||||
Expiring January, 2013 at $100.00 | 6 | $ | (30 | ) | ||||||||
Apple, Inc. | ||||||||||||
Expiring January, 2013 at $710.00 | 2 | (20 | ) | |||||||||
Expiring January, 2013 at $720.00 | 2 | (22 | ) | |||||||||
|
| |||||||||||
| (42 | ) | |||||||||||
AutoZone, Inc. | ||||||||||||
Expiring March, 2013 at $400.00 | 3 | (600 | ) | |||||||||
Bank of America Corp. | ||||||||||||
Expiring January, 2013 at $10.00 | 25 | (4,100 | ) | |||||||||
Big Lots, Inc. | ||||||||||||
Expiring April, 2013 at $30.00 | 10 | (1,700 | ) | |||||||||
Biogen Idec, Inc. | ||||||||||||
Expiring January, 2013 at $160.00 | 4 | (340 | ) | |||||||||
Cabela’s, Inc. | ||||||||||||
Expiring March, 2013 at $40.00 | 64 | (26,240 | ) | |||||||||
CF Industries Holdings, Inc. | ||||||||||||
Expiring February, 2013 at $205.00 | 5 | (4,250 | ) | |||||||||
Cirrus Logic, Inc. | ||||||||||||
Expiring March, 2013 at $29.00 | 60 | (19,800 | ) | |||||||||
Cisco Systems, Inc. | ||||||||||||
Expiring February, 2013 at $18.00 | 25 | (4,875 | ) | |||||||||
CSX Corp. | ||||||||||||
Expiring February, 2013 at $20.00 | 100 | (5,600 | ) | |||||||||
CVS Caremark Corp. | ||||||||||||
Expiring January, 2013 at $48.00 | 5 | (430 | ) | |||||||||
Deere & Co. | ||||||||||||
Expiring March, 2013 at $90.00 | 7 | (1,232 | ) | |||||||||
Eaton Corp. PLC | ||||||||||||
Expiring April, 2013 at $52.50 | 8 | (3,040 | ) | |||||||||
eBay, Inc. | ||||||||||||
Expiring January, 2013 at $49.00 | 7 | (2,009 | ) | |||||||||
Exxon Mobil Corp. | ||||||||||||
Expiring January, 2013 at $95.00 | 10 | (20 | ) | |||||||||
FedEx Corp. | ||||||||||||
Expiring January, 2013 at $95.00 | 4 | (236 | ) | |||||||||
Gap, Inc. (The) | ||||||||||||
Expiring March, 2013 at $32.00 | 80 | (12,320 | ) | |||||||||
Expiring March, 2013 at $35.00 | 10 | (600 | ) | |||||||||
|
| |||||||||||
| (12,920 | ) | |||||||||||
General Electric Co. | ||||||||||||
Expiring March, 2013 at $22.00 | 20 | (720 | ) | |||||||||
Halliburton Co. | ||||||||||||
Expiring January, 2013 at $36.00 | 12 | (420 | ) | |||||||||
| Company | Number of Contracts | Value | ||||||
Expiring April, 2013 at $33.00 | 55 | $ | (18,150 | ) | ||||
|
| |||||||
| (18,570 | ) | |||||||
Hasbro, Inc. | ||||||||
Expiring April, 2013 at $40.00 | 6 | (330 | ) | |||||
Hewlett-Packard Co. | ||||||||
Expiring January, 2013 at $16.00 | 90 | (450 | ) | |||||
Intel Corp. | ||||||||
Expiring February, 2013 at $20.00 | 6 | (618 | ) | |||||
International Business Machines Corp. | ||||||||
Expiring January, 2013 at $200.00 | 4 | (184 | ) | |||||
International Paper Co. | ||||||||
Expiring January, 2013 at $39.00 | 5 | (660 | ) | |||||
Johnson & Johnson | ||||||||
Expiring January, 2013 at $72.50 | 5 | (25 | ) | |||||
JPMorgan Chase & Co. | ||||||||
Expiring January, 2013 at $42.00 | 15 | (3,570 | ) | |||||
Kohl’s Corp. | ||||||||
Expiring January, 2013 at $52.50 | 15 | (75 | ) | |||||
Expiring January, 2013 at $55.00 | 30 | (150 | ) | |||||
|
| |||||||
| (225 | ) | |||||||
Mead Johnson Nutrition Co. | ||||||||
Expiring February, 2013 at $70.00 | 5 | (415 | ) | |||||
Microsoft Corp. | ||||||||
Expiring January, 2013 at $30.00 | 15 | (45 | ) | |||||
News Corp. | ||||||||
Expiring January, 2013 at $26.00 | 10 | (230 | ) | |||||
Norfolk Southern Corp. | ||||||||
Expiring January, 2013 at $57.50 | 16 | (6,720 | ) | |||||
Expiring March, 2013 at $62.50 | 19 | (3,515 | ) | |||||
|
| |||||||
| (10,235 | ) | |||||||
Northrop Grumman Corp. | ||||||||
Expiring February, 2013 at $65.00 | 35 | (14,350 | ) | |||||
Occidental Petroleum Corp. | ||||||||
Expiring February, 2013 at $77.50 | 5 | (1,070 | ) | |||||
Omnicom Group, Inc. | ||||||||
Expiring January, 2013 at $55.00 | 5 | (50 | ) | |||||
Oracle Corp. | ||||||||
Expiring January, 2013 at $33.00 | 15 | (1,230 | ) | |||||
Pfizer, Inc. | ||||||||
Expiring February, 2013 at $25.00 | 20 | (1,100 | ) | |||||
Safeway, Inc. | ||||||||
Expiring March, 2013 at $18.00 | 105 | (10,500 | ) | |||||
Seagate Technology PLC | ||||||||
Expiring March, 2013 at $31.00 | 30 | (6,450 | ) | |||||
www.bridgeway.com | 86 |
Bridgeway Managed Volatility Fund SCHEDULE OF OPTIONS WRITTEN (continued) | |
Showing percentage of net assets as of December 31, 2012 (Unaudited)
| Company | Number of Contracts | Value | ||||||||||
Call Options Written (continued) |
| |||||||||||
Sempra Energy | ||||||||||||
Expiring January, 2013 at $70.00 | 5 | $ | (550 | ) | ||||||||
State Street Corp. | ||||||||||||
Expiring February, 2013 at $45.00 | 5 | (1,525 | ) | |||||||||
Stryker Corp. | ||||||||||||
Expiring March, | 6 | (990 | ) | |||||||||
Teradata Corp. | ||||||||||||
Expiring January, 2013 at $75.00 | 10 | (100 | ) | |||||||||
Texas Instruments, Inc. | ||||||||||||
Expiring January, 2013 at $29.00 | 5 | (1,065 | ) | |||||||||
Travelers Cos., Inc. (The) | ||||||||||||
Expiring January, 2013 at $72.50 | 20 | (1,620 | ) | |||||||||
Union Pacific Corp. | ||||||||||||
Expiring January, 2013 at $125.00 | 4 | (1,072 | ) | |||||||||
UnitedHealth Group, Inc. | ||||||||||||
Expiring January, 2013 at $55.00 | 5 | (425 | ) | |||||||||
US Bancorp | ||||||||||||
Expiring January, 2013 at $35.00 | 7 | (28 | ) | |||||||||
Visa, Inc., Class A | ||||||||||||
Expiring January, 2013 at $140.00 | 5 | (5,750 | ) | |||||||||
Wal-Mart Stores, Inc. | ||||||||||||
Expiring January, 2013 at $75.00 | 5 | (15 | ) | |||||||||
Walt Disney Co. (The) | ||||||||||||
Expiring January, 2013 at $55.00 | 5 | (5 | ) | |||||||||
Wells Fargo & Co. | ||||||||||||
Expiring January, 2013 at $35.00 | 10 | (450 | ) | |||||||||
Expiring April, | 10 | (1,310 | ) | |||||||||
|
| |||||||||||
| (1,760 | ) | |||||||||||
Yum! Brands, Inc. | ||||||||||||
Expiring April, | 6 | (1,248 | ) | |||||||||
|
| |||||||||||
TOTAL CALL OPTIONS WRITTEN — (0.73%) | (174,644 | ) | ||||||||||
|
| |||||||||||
(Premiums received $(201,924)) | ||||||||||||
PUT OPTIONS WRITTEN - (0.55%) |
| |||||||||||
American Vanguard Corp. | ||||||||||||
Expiring February, 2013 at $30.00 | 20 | (2,300 | ) | |||||||||
Ameriprise Financial, Inc. | ||||||||||||
Expiring March, | 40 | (8,000 | ) | |||||||||
AmerisourceBergen Corp. | ||||||||||||
Expiring February, | 45 | (1,665 | ) | |||||||||
Becton Dickinson & Co. | ||||||||||||
Expiring March, | 20 | (2,380 | ) | |||||||||
Boeing Co. (The) | ||||||||||||
Expiring January, 2013 at $72.50 | 30 | (1,770 | ) | |||||||||
| Company | Number of Contracts | Value | ||||||
Chubb Corp. (The) | ||||||||
Expiring January, | 20 | $ | (11,340 | ) | ||||
CME Group, Inc. | ||||||||
Expiring January, | 42 | (20,580 | ) | |||||
ConocoPhillips | ||||||||
Expiring January, | 45 | (1,350 | ) | |||||
Copa Holdings SA, Class A | ||||||||
Expiring February, | 10 | (1,200 | ) | |||||
Darden Restaurants, Inc. | ||||||||
Expiring January, | 30 | (24,300 | ) | |||||
Energizer Holdings, Inc. | ||||||||
Expiring February, | 20 | (1,300 | ) | |||||
Exxon Mobil Corp. | ||||||||
Expiring January, | 30 | (2,850 | ) | |||||
Flowserve Corp. | ||||||||
Expiring January, | 16 | (720 | ) | |||||
General Dynamics Corp. | ||||||||
Expiring February, | 35 | (11,900 | ) | |||||
Hewlett-Packard Co. | ||||||||
Expiring January, | 90 | (3,600 | ) | |||||
Home Depot, Inc. (The) | ||||||||
Expiring February, | 40 | (5,280 | ) | |||||
Iron Mountain, Inc. | ||||||||
Expiring January, | 20 | (700 | ) | |||||
Expiring January, | 20 | (2,600 | ) | |||||
|
| |||||||
| (3,300 | ) | |||||||
Jarden Corp. | ||||||||
Expiring January, | 50 | (3,250 | ) | |||||
L-3 Communications Holdings, Inc. | ||||||||
Expiring January, | 10 | (300 | ) | |||||
Macquarie Infrastructure Co. LLC | ||||||||
Expiring January, | 60 | (600 | ) | |||||
PartnerRe, Ltd. | ||||||||
Expiring February, | 30 | (6,750 | ) | |||||
Regeneron Pharmaceuticals, Inc. | ||||||||
Expiring January, | 15 | (825 | ) | |||||
Expiring February, | 15 | (10,650 | ) | |||||
|
| |||||||
| (11,475 | ) | |||||||
Time Warner Cable, Inc. | ||||||||
Expiring January, | 25 | (500 | ) | |||||
87 | Semi-Annual Report | December 31, 2012 (Unaudited) |
Bridgeway Managed Volatility Fund SCHEDULE OF OPTIONS WRITTEN (continued) | |
Showing percentage of net assets as of December 31, 2012 (Unaudited)
| Company | Number of Contracts | Value | ||||||||||||
Put Options Written (continued) | ||||||||||||||
Westlake Chemical Corp. | ||||||||||||||
Expiring January, 2013 at $66.25 | 45 | $ | (1,575 | ) | ||||||||||
Weyerhaeuser Co. | ||||||||||||||
Expiring April, 2013 at $28.00 | 15 | (2,700 | ) | |||||||||||
|
| |||||||||||||
TOTAL PUT OPTIONS | (130,985 | ) | ||||||||||||
|
| |||||||||||||
(Premiums received $(176,458)) | ||||||||||||||
TOTAL OPTIONS WRITTEN — (1.28%) | $ | (305,629 | ) | |||||||||||
|
| |||||||||||||
(Premiums received $(378,382)) | ||||||||||||||
| Summary of inputs used to value the Fund’s investments as of 12/31/2012 is as follows (See Note 2 in Notes to Financial Statements): | ||||||||||||||
| Assets Table | ||||||||||||||||||
| Valuation Inputs | ||||||||||||||||||
| Investment in Securities (Value) | ||||||||||||||||||
Level 1 Quoted Prices | Level 2 Significant Observable Inputs | Level 3 Significant Unobservable Inputs | Total | |||||||||||||||
Common Stocks | $ | 13,386,623 | $ | — | $ | — | $ | 13,386,623 | ||||||||||
U.S. Government Obligations | — | 9,623,525 | — | 9,623,525 | ||||||||||||||
Money Market Fund | — | 1,362,792 | — | 1,362,792 | ||||||||||||||
|
|
|
|
|
|
|
| |||||||||||
TOTAL | $ | 13,386,623 | $ | 10,986,317 | $ | — | $ | 24,372,940 | ||||||||||
|
|
|
|
|
|
|
| |||||||||||
| Liabilities Table | ||||||||||||||||||
| Valuation Inputs | ||||||||||||||||||
| Investment in Securities (Value) | ||||||||||||||||||
| Level 1 Quoted Prices | Level 2 Significant Observable Inputs | Level 3 Significant Unobservable Inputs | Total | |||||||||||||||
Written Options | $ | (305,629 | ) | $ | — | $ | — | $ | (305,629 | ) | ||||||||
|
|
|
|
|
|
|
| |||||||||||
TOTAL | $ | (305,629 | ) | $ | — | $ | — | $ | (305,629 | ) | ||||||||
|
|
|
|
|
|
|
| |||||||||||
| See Notes to Financial Statements. | ||||||||||||||||||
| ||||||||||
www.bridgeway.com | 88 |
December 31, 2012 (Unaudited) | ||
| ASSETS | Aggressive Investors 1 | Ultra-Small Company | Ultra-Small Company Market | Small-Cap Momentum | ||||||||||||
Investments at value | $ | 205,059,169 | $ | 104,123,662 | $ | 276,849,201 | $ | 2,234,532 | ||||||||
Receivables: | ||||||||||||||||
Portfolio securities sold | 7,623,970 | 1,650,226 | 7,094,267 | 19,787 | ||||||||||||
Fund shares sold | 15,052 | 250 | 250,120 | - | ||||||||||||
Dividends and interest | 110,001 | 178,662 | 242,640 | 1,761 | ||||||||||||
Receivable from investment adviser | - | - | - | 9,528 | ||||||||||||
Total return swap | 1,927 | 6,186 | - | - | ||||||||||||
Prepaid expenses | 24,414 | 12,685 | 35,632 | 6,883 | ||||||||||||
Total assets | 212,834,533 | 105,971,671 | 284,471,860 | 2,272,491 | ||||||||||||
LIABILITIES | ||||||||||||||||
Payables: | ||||||||||||||||
Portfolio securities purchased | 5,600,882 | 897,828 | 381,185 | 25,527 | ||||||||||||
Fund shares redeemed | 666,205 | 191,975 | 697,485 | 2,865 | ||||||||||||
Total return swap | - | - | 47,298 | - | ||||||||||||
Due to broker | - | - | - | - | ||||||||||||
Loan payable | 1,808,000 | - | 5,661,000 | - | ||||||||||||
Accrued Liabilities: | ||||||||||||||||
Investment adviser fees | 54,842 | 79,298 | 102,501 | - | ||||||||||||
Administration fees | 6,508 | 3,295 | 8,924 | 70 | ||||||||||||
Directors’ fees | 3,853 | 1,943 | 6,307 | 43 | ||||||||||||
Other | 162,108 | 48,085 | 171,761 | 23,819 | ||||||||||||
Call options written at value | - | - | - | - | ||||||||||||
Put options written at value | - | - | - | - | ||||||||||||
Total liabilities | 8,302,398 | 1,222,424 | 7,076,461 | 52,324 | ||||||||||||
NET ASSETS | $ | 204,532,135 | $ | 104,749,247 | $ | 277,395,399 | $ | 2,220,167 | ||||||||
NET ASSETS REPRESENT | ||||||||||||||||
Paid-in capital | $ | 384,882,595 | $ | 91,534,476 | $ | 210,399,953 | $ | 2,094,529 | ||||||||
Undistributed (distributions in excess of) net investment income | 421,698 | 1,249,643 | (1,704,110 | ) | 72 | |||||||||||
Accumulated net realized gain (loss) on investments | (201,688,286 | ) | (2,470,695 | ) | 19,727,875 | (10,597 | ) | |||||||||
Net unrealized appreciation on investments | 20,916,128 | 14,435,823 | 48,971,681 | 136,163 | ||||||||||||
NET ASSETS | $ | 204,532,135 | $ | 104,749,247 | $ | 277,395,399 | $ | 2,220,167 | ||||||||
Shares of common stock outstanding of $.001 par value* | 5,578,820 | 3,452,898 | 22,187,998 | 209,490 | ||||||||||||
Net asset value, offering price and redemption price per share | $ | 36.66 | $ | 30.34 | $ | 12.50(a | ) | $ | 10.60(a | ) | ||||||
Total investments at cost | $ | 184,143,041 | $ | 89,694,025 | $ | 227,877,520 | $ | 2,098,369 | ||||||||
Premiums received on call options written | $ | - | $ | - | $ | - | $ | - | ||||||||
Premiums received on put options written | $ | - | $ | - | $ | - | $ | - | ||||||||
| * | See Note1 - Organization in the Notes to Financial Statements for shares authorized for each Fund. |
| (a) | Redemption of shares held less than six months may be charged a 2% redemption fee. See Note 8. |
See Notes to Financial Statements.
89 | Semi-Annual Report | December 31, 2012 (Unaudited) |
|
Small-Cap Growth | Small-Cap Value | Large-Cap Growth | Blue Chip 35 Index | Managed Volatility | ||||||||||||||
| $ | 27,712,459 | $ | 78,796,927 | $ | 44,735,005 | $ | 242,294,613 | $ | 24,372,940 | |||||||||
| 327,880 | - | - | 908,128 | 16,044 | ||||||||||||||
| 265 | 49,494 | 300 | 109,577 | 15,487 | ||||||||||||||
| 10,228 | 49,954 | 19,991 | 255,842 | 16,502 | ||||||||||||||
| - | - | - | 10,383 | - | ||||||||||||||
| 794 | - | - | - | - | ||||||||||||||
| 12,579 | 16,949 | 14,203 | 26,229 | 10,628 | ||||||||||||||
| 28,064,205 | 78,913,324 | 44,769,499 | 243,604,772 | 24,431,601 | ||||||||||||||
| - | - | - | 1,042,041 | 25,050 | ||||||||||||||
| 109,724 | 753,621 | 60,826 | 261,042 | - | ||||||||||||||
| - | 454 | 2,603 | - | - | ||||||||||||||
| - | - | - | - | 192,820 | ||||||||||||||
| 236,000 | - | - | - | - | ||||||||||||||
| 5,959 | 33,653 | 12,078 | - | 5,537 | ||||||||||||||
| 901 | 2,514 | 1,430 | 8,070 | 781 | ||||||||||||||
| 682 | 1,236 | 1,062 | 5,761 | 504 | ||||||||||||||
| 36,326 | 51,307 | 40,133 | 64,969 | 37,904 | ||||||||||||||
| - | - | - | - | 174,644 | ||||||||||||||
| - | - | - | - | 130,985 | ||||||||||||||
| 389,592 | 842,785 | 118,132 | 1,381,883 | 568,225 | ||||||||||||||
| $ | 27,674,613 | $ | 78,070,539 | $ | 44,651,367 | $ | 242,222,889 | $ | 23,863,376 | |||||||||
| $ | 52,998,591 | $ | 121,173,353 | $ | 70,297,088 | $ | 215,887,034 | $ | 25,739,203 | |||||||||
| 223,623 | 100,696 | (48,864 | ) | 483 | 65,097 | |||||||||||||
| (28,435,929 | ) | (51,705,849 | ) | (32,456,888 | ) | (51,186,829 | ) | (5,560,970 | ) | |||||||||
| 2,888,328 | 8,502,339 | 6,860,031 | 77,522,201 | 3,620,046 | ||||||||||||||
| $ | 27,674,613 | $ | 78,070,539 | $ | 44,651,367 | $ | 242,222,889 | $ | 23,863,376 | |||||||||
| 2,275,634 | 4,846,416 | 3,183,464 | 29,131,875 | 1,965,999 | ||||||||||||||
| $ | 12.16 | $ | 16.11 | $ | 14.03 | $ | 8.31 | $ | 12.14 | |||||||||
| $ | 24,824,925 | $ | 70,294,588 | $ | 37,874,974 | $ | 164,772,412 | $ | 20,825,647 | |||||||||
| $ | - | $ | - | $ | - | $ | - | $ | 201,924 | |||||||||
| $ | - | $ | - | $ | - | $ | - | $ | 176,458 | |||||||||
www.bridgeway.com | 90 |
Six Months Ended December 31, 2012 (Unaudited) | ||
| Aggressive Investors 1 | Ultra-Small Company | Ultra-Small Company Market | Small-Cap Momentum | |||||||||||||
INVESTMENT INCOME | ||||||||||||||||
Dividends | $ | 3,359,019 | $ | 1,426,863 | $ | 3,843,828 | $ | 32,427 | ||||||||
Less: foreign taxes withheld | (9,147 | ) | (1,399 | ) | - | - | ||||||||||
Interest | - | - | - | - | ||||||||||||
Securities lending | 17,313 | 448,103 | 818,473 | 2,510 | ||||||||||||
Total Investment Income | 3,367,185 | 1,873,567 | 4,662,301 | 34,937 | ||||||||||||
EXPENSES | ||||||||||||||||
Investment advisory fees - Base fees | 947,937 | 468,647 | 736,077 | 5,930 | ||||||||||||
Investment advisory fees - Performance adjustment | (562,723 | ) | - | - | - | |||||||||||
Administration fees | 40,272 | 19,914 | 56,305 | 412 | ||||||||||||
Accounting fees | 36,909 | 32,960 | 53,816 | 28,228 | ||||||||||||
Transfer agent fees | 119,526 | 33,123 | 73,238 | 16,145 | ||||||||||||
Audit fees | 16,268 | 10,264 | 21,284 | 4,678 | ||||||||||||
Legal fees | 23,663 | 11,729 | 34,115 | 236 | ||||||||||||
Custody fees | 4,205 | 9,088 | 14,307 | 7,220 | ||||||||||||
Blue sky fees | 10,689 | 5,280 | 12,073 | 9,875 | ||||||||||||
Directors’ and officers’ fees | 18,535 | 8,959 | 26,110 | 185 | ||||||||||||
Shareholder servicing fees | 90,809 | 10,717 | 127,484 | 130 | ||||||||||||
Reports to shareholders | 30,066 | 5,541 | 27,183 | 145 | ||||||||||||
Miscellaneous expenses | 32,210 | 15,235 | 47,553 | 310 | ||||||||||||
Total Expenses | 808,366 | 631,457 | 1,229,545 | 73,494 | ||||||||||||
Less investment advisory fees waived | - | - | (125,430 | ) | (5,930 | ) | ||||||||||
Less expense reimbursed by investment adviser | - | - | - | (57,860 | ) | |||||||||||
Net Expenses | 808,366 | 631,457 | 1,104,115 | 9,704 | ||||||||||||
NET INVESTMENT INCOME | 2,558,819 | 1,242,110 | 3,558,186 | 25,233 | ||||||||||||
NET REALIZED AND UNREALIZED GAIN (LOSS) ON INVESTMENTS | ||||||||||||||||
Realized Gain (Loss) on: | ||||||||||||||||
Investments | 8,485,553 | 4,155,096 | 41,409,323 | 131,093 | ||||||||||||
Written options | - | - | - | - | ||||||||||||
Futures contracts | - | - | - | - | ||||||||||||
Swaps | 284,361 | 199,573 | (61,471 | ) | - | |||||||||||
Net Realized Gain | 8,769,914 | 4,354,669 | 41,347,852 | 131,093 | ||||||||||||
Change in Unrealized Appreciation (Depreciation) on: | ||||||||||||||||
Investments | 12,157,783 | 4,305,492 | (30,124,686 | ) | (20,886 | ) | ||||||||||
Written options | - | - | - | - | ||||||||||||
Swaps | - | 6,186 | (11,563 | ) | - | |||||||||||
Net Change in Unrealized Appreciation (Depreciation) | 12,157,783 | 4,311,678 | (30,136,249 | ) | (20,886 | ) | ||||||||||
Net Realized and Unrealized Gain on Investments | 20,927,697 | 8,666,347 | 11,211,603 | 110,207 | ||||||||||||
INCREASE IN NET ASSETS RESULTING FROM OPERATIONS | $ | 23,486,516 | $ | 9,908,457 | $ | 14,769,789 | $ | 135,440 | ||||||||
See Notes to Financial Statements.
91 | Semi-Annual Report | December 31, 2012 (Unaudited) |
|
Small-Cap Growth | Small-Cap Value | Large-Cap Growth | Blue Chip 35 Index | Managed Volatility | ||||||||||||||
| $ | 393,365 | $ | 1,527,795 | $ | 610,471 | $ | 3,455,663 | $ | 153,479 | |||||||||
| - | - | - | - | - | ||||||||||||||
| - | - | - | - | 22,143 | ||||||||||||||
| 32,053 | 39,511 | 441 | - | 326 | ||||||||||||||
| 425,418 | 1,567,306 | 610,912 | 3,455,663 | 175,948 | ||||||||||||||
| 93,261 | 221,977 | 118,512 | 106,718 | 70,747 | ||||||||||||||
| (18,055 | ) | (36,426 | ) | (21,190 | ) | - | - | |||||||||||
| 5,944 | 14,141 | 9,065 | 51,016 | 4,512 | ||||||||||||||
| 23,552 | 27,023 | 24,937 | 38,990 | 26,636 | ||||||||||||||
| 27,378 | 35,724 | 28,398 | 24,877 | 19,349 | ||||||||||||||
| 6,336 | 8,457 | 7,277 | 19,795 | 8,388 | ||||||||||||||
| 3,614 | 7,854 | 5,615 | 30,788 | 12,297 | ||||||||||||||
| 1,505 | 2,233 | 1,422 | 2,780 | 3,365 | ||||||||||||||
| 10,670 | 11,158 | 10,945 | 12,666 | 10,609 | ||||||||||||||
| 2,778 | 6,075 | 4,261 | 23,745 | 2,038 | ||||||||||||||
| 12,066 | 24,302 | 17,445 | 16,385 | 6,456 | ||||||||||||||
| 5,324 | 9,628 | 6,653 | 8,670 | 1,872 | ||||||||||||||
| 5,194 | 10,346 | 7,678 | 44,501 | 3,539 | ||||||||||||||
| 179,567 | 342,492 | 221,018 | 380,931 | 169,808 | ||||||||||||||
| (33,498 | ) | - | (21,971 | ) | (106,718 | ) | (58,971 | ) | ||||||||||
| - | - | - | (74,116 | ) | - | |||||||||||||
| 146,069 | 342,492 | 199,047 | 200,097 | 110,837 | ||||||||||||||
| 279,349 | 1,224,814 | 411,865 | 3,255,566 | 65,111 | ||||||||||||||
| 1,029,318 | 3,878,084 | 1,007,349 | 8,507,486 | 918,306 | ||||||||||||||
| - | - | - | - | (47,606 | ) | |||||||||||||
| - | - | - | - | (315,192 | ) | |||||||||||||
| 5,318 | 195,693 | 30,381 | - | - | ||||||||||||||
| 1,034,636 | 4,073,777 | 1,037,730 | 8,507,486 | 555,508 | ||||||||||||||
| 88,428 | 2,160,193 | 1,710,273 | 705,881 | (62,456 | ) | |||||||||||||
| - | - | - | - | (79,443 | ) | |||||||||||||
| 794 | (33,837 | ) | (17,951 | ) | - | - | ||||||||||||
| 89,222 | 2,126,356 | 1,692,322 | 705,881 | (141,899 | ) | |||||||||||||
| 1,123,858 | 6,200,133 | 2,730,052 | 9,213,367 | 413,609 | ||||||||||||||
| $ | 1,403,207 | $ | 7,424,947 | $ | 3,141,917 | $ | 12,468,933 | $ | 478,720 | |||||||||
www.bridgeway.com | 92 |
Aggressive Investors 1 | Ultra-Small Company | |||||||||||||||
| Six Months Ended December 31, 2012 | Year Ended June 30, 2012 | Six Months Ended December 31, 2012 | Year Ended June 30, 2012 | |||||||||||||
| (Unaudited) | (Unaudited) | |||||||||||||||
OPERATIONS | ||||||||||||||||
Net investment income | $ | 2,558,819 | $ | 1,789,938 | $ | 1,242,110 | $ | 397,016 | ||||||||
Net realized gain (loss) on investments | 8,769,914 | (792,928 | ) | 4,354,669 | (76,958 | ) | ||||||||||
Net change in unrealized appreciation (depreciation) on | 12,157,783 | (2,850,409 | ) | 4,311,678 | (3,883,528 | ) | ||||||||||
Net increase (decrease) in net assets resulting from | 23,486,516 | (1,853,399 | ) | 9,908,457 | (3,563,470 | ) | ||||||||||
DISTRIBUTIONS: | ||||||||||||||||
From net investment income | (2,292,186 | ) | (3,284,990 | ) | (62,868 | ) | (1,269,925 | ) | ||||||||
From net realized gains | - | - | - | - | ||||||||||||
Net decrease in net assets from distributions | (2,292,186 | ) | (3,284,990 | ) | (62,868 | ) | (1,269,925 | ) | ||||||||
SHARE TRANSACTIONS: | ||||||||||||||||
Proceeds from sale of shares | 2,398,500 | 3,496,461 | 680,411 | 1,268,349 | ||||||||||||
Proceeds from conversion of shares* | - | 118,655,804 | - | 18,444,305 | ||||||||||||
Reinvestment of distributions | 2,181,600 | 3,097,726 | 59,092 | 1,200,763 | ||||||||||||
Cost of shares redeemed | (27,252,180 | ) | (20,858,925 | ) | (7,945,456 | ) | (8,403,947 | ) | ||||||||
Redemption fees | - | - | - | - | ||||||||||||
Net increase (decrease) in net assets resulting from share | (22,672,080 | ) | 104,391,066 | (7,205,953 | ) | 12,509,470 | ||||||||||
Net increase (decrease) in net assets | (1,477,750 | ) | 99,252,677 | 2,639,636 | 7,676,075 | |||||||||||
NET ASSETS: | ||||||||||||||||
Beginning of period | 206,009,885 | 106,757,208 | 102,109,611 | 94,433,536 | ||||||||||||
End of period** | $ | 204,532,135 | $ | 206,009,885 | $ | 104,749,247 | $ | 102,109,611 | ||||||||
SHARES ISSUED & REDEEMED | ||||||||||||||||
Issued | 67,673 | 106,700 | 23,608 | 47,559 | ||||||||||||
Share conversions | - | 3,846,030 | - | 734,641 | ||||||||||||
Distributions reinvested | 59,607 | 99,645 | 1,946 | 49,214 | ||||||||||||
Redeemed | (767,564 | ) | (628,812 | ) | (276,017 | ) | (312,634 | ) | ||||||||
Net increase (decrease) | (640,284 | ) | 3,423,563 | (250,463 | ) | 518,780 | ||||||||||
Outstanding at beginning of period | 6,219,104 | 2,795,541 | 3,703,361 | 3,184,581 | ||||||||||||
Outstanding at end of period | 5,578,820 | 6,219,104 | 3,452,898 | 3,703,361 | ||||||||||||
** Including undistributed (distributions in excess of) net investment income of: | $ | 421,698 | $ | 155,065 | $ | 1,249,643 | $ | 70,401 | ||||||||
| * | See Note 1 - Organization in the Notes to Financial Statements. |
See Notes to Financial Statements.
93 | Semi-Annual Report | December 31, 2012 (Unaudited) |
|
Ultra-Small Company Market | Small-Cap Momentum | |||||||||||||
| Six Months Ended December 31, 2012 | Year Ended June 30, 2012 | Six Months Ended December 31, 2012 | Year Ended June 30, 2012 | |||||||||||
| (Unaudited) | (Unaudited) | |||||||||||||
| $ | 3,558,186 | $ | 2,745,731 | $ | 25,233 | $ | 9,979 | |||||||
| 41,347,852 | 33,820,067 | 131,093 | 78,352 | |||||||||||
| | (30,136,249 | ) | (38,783,336 | ) | (20,886 | ) | (135,060 | ) | ||||||
|
| 14,769,789 |
| (2,217,538 | ) | 135,440 | (46,729 | ) | |||||||
| (7,601,593 | ) | (3,451,142 | ) | (35,238 | ) | (1,843 | ) | |||||||
| (48,273,139 | ) | (13,433,187 | ) | (217,605 | ) | (287,704 | ) | |||||||
| (55,874,732 | ) | (16,884,329 | ) | (252,843 | ) | (289,547 | ) | |||||||
| 20,489,106 | 33,789,669 | 600,817 | 358,332 | |||||||||||
| - | - | - | - | |||||||||||
| 49,916,712 | 15,234,587 | 252,588 | 289,325 | |||||||||||
| (54,361,211 | ) | (121,461,084 | ) | (586,029 | ) | (1,245,596 | ) | |||||||
| 23,697 | 87,977 | - | 2,022 | |||||||||||
| | 16,068,304 | | (72,348,851 | ) | 267,376 | (595,917 | ) | |||||||
| (25,036,639 | ) | (91,450,718 | ) | 149,973 | (932,193 | ) | ||||||||
| 302,432,038 | 393,882,756 | 2,070,194 | 3,002,387 | |||||||||||
| $ | 277,395,399 | $ | 302,432,038 | $ | 2,220,167 | $ | 2,070,194 | |||||||
| 1,391,688 | 2,508,563 | 52,119 | 32,696 | |||||||||||
| - | - | - | - | |||||||||||
| 3,990,145 | 1,217,793 | 23,965 | 28,505 | |||||||||||
| (3,808,468 | ) | (8,780,831 | ) | (50,599 | ) | (112,849 | ) | |||||||
| 1,573,365 | (5,054,475 | ) | 25,485 | (51,648 | ) | |||||||||
| 20,614,633 | 25,669,108 | 184,005 | 235,653 | |||||||||||
| 22,187,998 | 20,614,633 | 209,490 | 184,005 | |||||||||||
| $ | (1,704,110 | ) | $ | 2,339,297 | $ | 72 | $ | 10,077 | ||||||
www.bridgeway.com | 94 |
STATEMENTS OF CHANGES IN NET ASSETS (continued) | ||
Small-Cap Growth | Small-Cap Value | |||||||||||||||
| Six Months Ended December 31, 2012 | Year Ended June 30, 2012 | Six Months Ended December 31, 2012 | Year Ended June 30, 2012 | |||||||||||||
| (Unaudited) | (Unaudited) | |||||||||||||||
OPERATIONS | ||||||||||||||||
Net investment income (loss) | $ | 279,349 | $ | (49,714 | ) | $ | 1,224,814 | $ | 827,026 | |||||||
Net realized gain on investments | 1,034,636 | 3,903,999 | 4,073,777 | 9,541,977 | ||||||||||||
Net change in unrealized appreciation (depreciation) on | 89,222 | (7,041,109 | ) | 2,126,356 | (12,240,156 | ) | ||||||||||
Net increase (decrease) in net assets resulting from | 1,403,207 | (3,186,824 | ) | 7,424,947 | (1,871,153 | ) | ||||||||||
DISTRIBUTIONS: | ||||||||||||||||
From net investment income | - | (3,204 | ) | (1,722,036 | ) | (989,896 | ) | |||||||||
Net decrease in net assets from distributions | - | (3,204 | ) | (1,722,036 | ) | (989,896 | ) | |||||||||
SHARE TRANSACTIONS: | ||||||||||||||||
Proceeds from sale of shares | 291,029 | 1,921,059 | 15,117,867 | 5,706,702 | ||||||||||||
Reinvestment of distributions | - | 3,057 | 1,624,584 | 932,539 | ||||||||||||
Cost of shares redeemed | (5,797,884 | ) | (13,672,329 | ) | (11,984,669 | ) | (29,882,098 | ) | ||||||||
Net increase (decrease) in net assets resulting from | (5,506,855 | ) | (11,748,213 | ) | 4,757,782 | (23,242,857 | ) | |||||||||
Net increase (decrease) in net assets | (4,103,648 | ) | (14,938,241 | ) | 10,460,693 | (26,103,906 | ) | |||||||||
NET ASSETS: | ||||||||||||||||
Beginning of period | 31,778,261 | 46,716,502 | 67,609,846 | 93,713,752 | ||||||||||||
End of period* | $ | 27,674,613 | $ | 31,778,261 | $ | 78,070,539 | $ | 67,609,846 | ||||||||
SHARES ISSUED & REDEEMED | ||||||||||||||||
Issued | 24,112 | 167,955 | 941,778 | 411,311 | ||||||||||||
Distributions reinvested | - | 289 | 100,780 | 71,404 | ||||||||||||
Redeemed | (481,302 | ) | (1,198,273 | ) | (756,703 | ) | (2,121,083 | ) | ||||||||
Net increase (decrease) | (457,190 | ) | (1,030,029 | ) | 285,855 | (1,638,368 | ) | |||||||||
Outstanding at beginning of period | 2,732,824 | 3,762,853 | 4,560,561 | 6,198,929 | ||||||||||||
Outstanding at end of period | 2,275,634 | 2,732,824 | 4,846,416 | 4,560,561 | ||||||||||||
* Including undistributed (distributions in excess of) net investment income of: | $ | 223,623 | $ | (55,726 | ) | $ | 100,696 | $ | 597,918 | |||||||
See Notes to Financial Statements.
95 | Semi-Annual Report | December 31, 2012 (Unaudited) |
|
Large-Cap Growth | Blue Chip 35 Index | Managed Volatility | ||||||||||||||||||||
| Six Months Ended December 31, 2012 | Year Ended June 30, 2012 | Six Months Ended December 31, 2012 | Year Ended June 30, 2012 | Six Months Ended December 31, 2012 | Year Ended June 30, 2012 | |||||||||||||||||
| (Unaudited) | (Unaudited) | (Unaudited) | ||||||||||||||||||||
| $ | 411,865 | $ | 364,465 | $ | 3,255,566 | $ | 7,242,042 | $ | 65,111 | $ | 99,886 | |||||||||||
| 1,037,730 | 4,576,504 | 8,507,486 | 12,676,449 | 555,508 | 947,143 | |||||||||||||||||
| | 1,692,322 | | (5,366,090 | ) | 705,881 | 11,937,364 | (141,899 | ) | (258,665 | ) | ||||||||||||
| | 3,141,917 | | (425,121 | ) | 12,468,933 | 31,855,855 | 478,720 | 788,364 | ||||||||||||||
| (610,529 | ) | (342,838 | ) | (6,835,196 | ) | (7,110,502 | ) | (99,887 | ) | (151,314 | ) | |||||||||||
| (610,529 | ) | (342,838 | ) | (6,835,196 | ) | (7,110,502 | ) | (99,887 | ) | (151,314 | ) | |||||||||||
| 673,453 | 2,710,341 | 18,030,579 | 115,003,984 | 4,476,416 | 4,643,420 | |||||||||||||||||
| 577,615 | 323,763 | 6,403,524 | 6,478,915 | 93,246 | 147,905 | |||||||||||||||||
| (7,574,604 | ) | (12,300,164 | ) | (52,005,557 | ) | (213,632,698 | ) | (4,790,364 | ) | (10,969,395 | ) | |||||||||||
| | (6,323,536 | ) | (9,266,060 | ) | (27,571,454 | ) | (92,149,799 | ) | (220,702 | ) | (6,178,070 | ) | ||||||||||
| (3,792,148 | ) | (10,034,019 | ) | (21,937,717 | ) | (67,404,446 | ) | 158,131 | (5,541,020 | ) | ||||||||||||
| 48,443,515 | 58,477,534 | 264,160,606 | 331,565,052 | 23,705,245 | 29,246,265 | |||||||||||||||||
| $ | 44,651,367 | $ | 48,443,515 | $ | 242,222,889 | $ | 264,160,606 | $ | 23,863,376 | $ | 23,705,245 | |||||||||||
| 48,850 | 211,030 | 2,121,087 | 15,067,275 | 367,772 | 408,226 | |||||||||||||||||
| 41,258 | 27,230 | 765,972 | 902,356 | 7,600 | 13,229 | |||||||||||||||||
| (541,813 | ) | (972,552 | ) | (6,111,793 | ) | (27,262,476 | ) | (395,137 | ) | (960,731 | ) | |||||||||||
| (451,705 | ) | (734,292 | ) | (3,224,734 | ) | (11,292,845 | ) | (19,765 | ) | (539,276 | ) | |||||||||||
| 3,635,169 | 4,369,461 | 32,356,609 | 43,649,454 | 1,985,764 | 2,525,040 | |||||||||||||||||
| 3,183,464 | 3,635,169 | 29,131,875 | 32,356,609 | 1,965,999 | 1,985,764 | |||||||||||||||||
| $ | (48,864 | ) | $ | 149,800 | $ | 483 | $ | 3,580,113 | $ | 65,097 | $ | 99,873 | ||||||||||
www.bridgeway.com | 96 |
| (for a share outstanding throughout the period indicated) | ||
Income from Investment Operations | ||||||||||||||||
Value, of Period | Net Investment | Net Realized and Unrealized Gain\(Loss) | Total from Investment Operations | |||||||||||||
AGGRESSIVE INVESTORS 1 | ||||||||||||||||
Period Ended December 31, 2012 (Unaudited) | $ | 33.13 | $ | 0.43 | $ | 3.51 | $ | 3.94 | ||||||||
Year Ended June 30, 2012 | 38.19 | 0.62 | (4.37 | ) | (3.75 | ) | ||||||||||
Year Ended June 30, 2011 | 27.67 | 0.51 | 10.72 | 11.23 | ||||||||||||
Year Ended June 30, 2010 | 25.93 | 0.58 | 1.40 | 1.98 | ||||||||||||
Year Ended June 30, 2009 | 53.96 | 0.30 | (28.00 | ) | (27.70 | ) | ||||||||||
Year Ended June 30, 2008 | 61.90 | (0.59 | ) | 3.14 | 2.55 | |||||||||||
ULTRA-SMALL COMPANY | ||||||||||||||||
Period Ended December 31, 2012 (Unaudited) | 27.57 | 0.35 | 2.44 | 2.79 | ||||||||||||
Year Ended June 30, 2012 | 29.65 | 0.13 | (1.79 | ) | (1.66 | ) | ||||||||||
Year Ended June 30, 2011 | 22.94 | 0.07 | 6.83 | 6.90 | ||||||||||||
Year Ended June 30, 2010 | 19.76 | 0.19 | 3.22 | 3.41 | ||||||||||||
Year Ended June 30, 2009 | 24.59 | 0.23 | (5.03 | ) | (4.80 | ) | ||||||||||
Year Ended June 30, 2008 | 37.65 | 0.03 | (8.67 | ) | (8.64 | ) | ||||||||||
ULTRA-SMALL COMPANY MARKET | ||||||||||||||||
Period Ended December 31, 2012 (Unaudited) | 14.67 | 0.18 | 0.59 | 0.77 | ||||||||||||
Year Ended June 30, 2012 | 15.34 | 0.12 | (0.09 | ) | 0.03 | |||||||||||
Year Ended June 30, 2011 | 11.72 | 0.12 | 3.65 | 3.77 | ||||||||||||
Year Ended June 30, 2010 | 10.50 | 0.14 | 1.25 | 1.39 | ||||||||||||
Year Ended June 30, 2009 | 15.33 | 0.14 | (3.88 | ) | (3.74 | ) | ||||||||||
Year Ended June 30, 2008 | 20.36 | 0.14 | (4.49 | ) | (4.35 | ) | ||||||||||
SMALL-CAP MOMENTUM | ||||||||||||||||
Period Ended December 31, 2012 (Unaudited) | 11.25 | 0.14 | 0.57 | 0.71 | ||||||||||||
Year Ended June 30, 2012 | 12.74 | 0.04 | (0.35 | ) | (0.31 | ) | ||||||||||
Year Ended June 30, 2011 | 9.33 | 0.09 | 3.40 | 3.49 | ||||||||||||
Period Ended June 30, 2010(f) | 10.00 | -(e) | (0.67 | ) | (0.67 | ) | ||||||||||
| (a) | Per share amounts calculated based on the average daily shares outstanding during the period. |
| (b) | Annualized for periods less than one year. |
| (c) | For the years ended June 30, 2009, June 30, 2010, June 30, 2011 and June 30, 2012 and the period ended December 31, 2012, the expense ratio was significantly lower than past years due to a negative performance adjustment to the investment advisory fee. Please refer to the Statements of Operations and Note 3 of the Notes to Financial Statements for further information. The rate shown may not be indicative of the rate going forward. |
| (d) | Total return may have been lower had various fees not been waived during the period. |
| (e) | Amount represents less than $0.005. |
| (f) | Commenced operations on May 28, 2010. |
See Notes to Financial Statements.
97 | Semi-Annual Report | December 31, 2012 (Unaudited) |
|
Less Distributions to Shareholders from: | Ratios & Supplemental Data | |||||||||||||||||||||||||||||||||||||||||
| Net Realized Gain | Net Investment Income | Total Distributions | Paid in Capital from Redemption Fees(a) | Net Asset Value, End of Period | Total Return | Net Assets (000’s) | Expenses Waivers Reimburse- | Expenses After Waivers and Reimburse- ments(b) | Net Investment Income (Loss) After Waivers and Reimburse- ment(b) | Portfolio Turnover Rate | ||||||||||||||||||||||||||||||||
| $ | - | $ | (0.41 | ) | $ | (0.41 | ) | $ | - | $ | 36.66 | 11.92 | % | $ | 204,532 | 0.77 | %(c) | 0.77 | % | 2.43 | % | 83 | % | |||||||||||||||||||
| - | (1.31 | ) | (1.31 | ) | - | 33.13 | (9.57 | %) | 206,010 | (0.04 | %)(c) | (0.04 | %) | 1.86 | % | 125 | % | |||||||||||||||||||||||||
| - | (0.71 | ) | (0.71 | ) | - | 38.19 | 40.81 | % | 106,757 | (0.41 | %)(c) | (0.41 | %) | 1.49 | % | 107 | % | |||||||||||||||||||||||||
| - | (0.24 | ) | (0.24 | ) | - | 27.67 | 7.56 | % | 93,008 | (0.51 | %)(c) | (0.51 | %) | 1.94 | % | 118 | % | |||||||||||||||||||||||||
| (0.33 | ) | - | (0.33 | ) | - | 25.93 | (51.31 | %) | 115,835 | 0.34 | %(c) | 0.34 | % | 0.97 | % | 134 | % | |||||||||||||||||||||||||
| (10.49 | ) | - | (10.49 | ) | - | 53.96 | 3.54 | %(d) | 338,715 | 1.78 | % | 1.78 | % | (1.03 | %) | 142 | % | |||||||||||||||||||||||||
| - | (0.02 | ) | (0.02 | ) | - | 30.34 | 10.11 | % | 104,749 | 1.21 | % | 1.21 | % | 2.39 | % | 47 | % | |||||||||||||||||||||||||
| - | (0.42 | ) | (0.42 | ) | - | 27.57 | (5.41 | %) | 102,110 | 1.22 | % | 1.22 | % | 0.49 | % | 93 | % | |||||||||||||||||||||||||
| - | (0.19 | ) | (0.19 | ) | - | 29.65 | 30.12 | % | 94,434 | 1.18 | % | 1.18 | % | 0.27 | % | 110 | % | |||||||||||||||||||||||||
| - | (0.23 | ) | (0.23 | ) | - | 22.94 | 17.26 | % | 81,582 | 1.17 | % | 1.17 | % | 0.83 | % | 133 | % | |||||||||||||||||||||||||
| - | (0.03 | ) | (0.03 | ) | - | 19.76 | (19.48 | %) | 73,708 | 1.16 | % | 1.16 | % | 1.23 | % | 90 | % | |||||||||||||||||||||||||
| (4.31 | ) | (0.11 | ) | (4.42 | ) | - | 24.59 | (24.59 | %)(d) | 94,933 | 1.07 | % | 1.07 | % | 0.10 | % | 102 | % | ||||||||||||||||||||||||
| (2.54 | ) | (0.40 | ) | (2.94 | ) | - | (e) | 12.50 | 5.21 | %(d) | 277,395 | 0.84 | % | 0.75 | % | 2.42 | % | 24 | % | |||||||||||||||||||||||
| (0.56 | ) | (0.14 | ) | (0.70 | ) | - | (e) | 14.67 | 1.05 | %(d) | 302,432 | 0.83 | % | 0.75 | % | 0.86 | % | 31 | % | |||||||||||||||||||||||
| - | (0.15 | ) | (0.15 | ) | - | (e) | 15.34 | 32.22 | %(d) | 393,883 | 0.79 | % | 0.75 | % | 0.82 | % | 42 | % | ||||||||||||||||||||||||
| - | (0.17 | ) | (0.17 | ) | - | (e) | 11.72 | 13.30 | %(d) | 343,668 | 0.77 | % | 0.75 | % | 1.18 | % | 48 | % | ||||||||||||||||||||||||
| (0.89 | ) | (0.21 | ) | (1.10 | ) | 0.01 | 10.50 | (23.47 | %)(d) | 342,923 | 0.79 | % | 0.75 | % | 1.27 | % | 42 | % | ||||||||||||||||||||||||
| (0.65 | ) | (0.04 | ) | (0.69 | ) | 0.01 | 15.33 | (21.72 | %)(d) | 721,412 | 0.66 | % | 0.66 | % | 0.79 | % | 29 | % | ||||||||||||||||||||||||
| (1.17 | ) | (0.19 | ) | (1.36 | ) | - | 10.60 | 6.36 | %(d) | 2,220 | 6.82 | % | 0.90 | % | 2.34 | % | 153 | % | ||||||||||||||||||||||||
| (1.18 | ) | (0.01 | ) | (1.19 | ) | 0.01 | 11.25 | (1.40 | %)(d) | 2,070 | 5.73 | % | 0.90 | % | 0.38 | % | 230 | % | ||||||||||||||||||||||||
| - | (0.08 | ) | (0.08 | ) | - | (e) | 12.74 | 37.49 | %(d) | 3,002 | 5.43 | % | 0.90 | % | 0.79 | % | 272 | % | ||||||||||||||||||||||||
| - | - | - | - | 9.33 | (6.70 | %)(d) | 1,888 | 11.24 | % | 0.90 | % | 0.50 | % | 3 | % | |||||||||||||||||||||||||||
www.bridgeway.com | 98 |
| FINANCIAL HIGHLIGHTS (continued) |
(for a share outstanding throughout the period indicated)
| Income from Investment Operations | ||||||||||||||||
Value, Beginning of Period | Net Investment Income (Loss)(a) | Net Realized and Unrealized Gain\(Loss) | Total from Investment Operations | |||||||||||||
SMALL-CAP GROWTH | ||||||||||||||||
Period Ended December 31, 2012 (Unaudited) | $ | 11.63 | $ | 0.11 | $ | 0.42 | $ | 0.53 | ||||||||
Year Ended June 30, 2012 | 12.42 | (0.02 | ) | (0.77 | ) | (0.79 | ) | |||||||||
Year Ended June 30, 2011 | 9.14 | (0.01 | ) | 3.31 | 3.30 | |||||||||||
Year Ended June 30, 2010 | 8.46 | 0.02 | 0.70 | 0.72 | ||||||||||||
Year Ended June 30, 2009 | 13.95 | 0.03 | (5.52 | ) | (5.49 | ) | ||||||||||
Year Ended June 30, 2008 | 16.01 | (0.03 | ) | (2.03 | ) | (2.06 | ) | |||||||||
SMALL-CAP VALUE | ||||||||||||||||
Period Ended December 31, 2012 (Unaudited) | 14.82 | 0.26 | 1.39 | 1.65 | ||||||||||||
Year Ended June 30, 2012 | 15.12 | 0.15 | (0.26 | ) | (0.11 | ) | ||||||||||
Year Ended June 30, 2011 | 11.45 | 0.14 | 3.60 | 3.74 | ||||||||||||
Year Ended June 30, 2010 | 9.73 | 0.07 | 1.72 | 1.79 | ||||||||||||
Year Ended June 30, 2009 | 15.86 | 0.08 | (6.14 | ) | (6.06 | ) | ||||||||||
Year Ended June 30, 2008 | 18.74 | 0.03 | (2.91 | ) | (2.88 | ) | ||||||||||
LARGE-CAP GROWTH | ||||||||||||||||
Period Ended December 31, 2012 (Unaudited) | 13.33 | 0.12 | 0.77 | 0.89 | ||||||||||||
Year Ended June 30, 2012 | 13.38 | 0.09 | (0.05 | ) | 0.04 | |||||||||||
Year Ended June 30, 2011 | 10.17 | 0.06 | 3.22 | 3.28 | ||||||||||||
Year Ended June 30, 2010 | 9.06 | 0.06 | 1.11 | 1.17 | ||||||||||||
Year Ended June 30, 2009 | 13.73 | 0.06 | (4.66 | ) | (4.60 | ) | ||||||||||
Year Ended June 30, 2008 | 14.12 | 0.06 | (0.41 | ) | (0.35 | ) | ||||||||||
BLUE CHIP 35 INDEX | ||||||||||||||||
Period Ended December 31, 2012 (Unaudited) | 8.16 | 0.10 | 0.29 | 0.39 | ||||||||||||
Year Ended June 30, 2012 | 7.60 | 0.17 | 0.55 | 0.72 | ||||||||||||
Year Ended June 30, 2011 | 6.18 | 0.15 | 1.39 | 1.54 | ||||||||||||
Year Ended June 30, 2010 | 5.66 | 0.13 | 0.52 | 0.65 | ||||||||||||
Year Ended June 30, 2009 | 7.21 | 0.15 | (1.51 | ) | (1.36 | ) | ||||||||||
Year Ended June 30, 2008 | 8.52 | 0.19 | (1.39 | ) | (1.20 | ) | ||||||||||
| (a) | Per share amounts calculated based on the average daily shares outstanding during the period. |
| (b) | Annualized for periods less than one year. |
| (c) | Total return may have been lower had various fees not been waived during the period. |
| (d) | Amount represents less than $0.005. |
| (e) | Total return includes the effect of a reimbursement by the Adviser and the accounting agent due to a trading error. |
See Notes to Financial Statements.
99 | Semi-Annual Report | December 31, 2012 (Unaudited) |
|
Less Distributions to Shareholders from: | Ratios & Supplemental Data | |||||||||||||||||||||||||||||||||||||
| Net Realized Gain | Net Investment Income | Total Distributions | Net Asset Value, End of Period | Total Return | Net Assets End of Year (000’s) | Expenses Before Waivers and Reimburse- ments(b) | Expenses After Waivers and Reimburse- ments(b) | Net After | Portfolio Turnover Rate | |||||||||||||||||||||||||||||
| $ | - | $ | - | $ | - | $ | 12.16 | 4.56 | %(c) | $ | 27,675 | 1.16 | % | 0.94 | % | 1.80 | % | 32 | % | |||||||||||||||||||
| - | - | (d) | - | (d) | 11.63 | (6.35 | %)(c) | 31,778 | 1.08 | % | 0.94 | % | (0.14 | %) | 63 | % | ||||||||||||||||||||||
| - | (0.02 | ) | (0.02 | ) | 12.42 | 36.17 | %(c) | �� | 46,717 | 0.98 | % | 0.94 | % | (0.12 | %) | 87 | % | |||||||||||||||||||||
| - | (0.04 | ) | (0.04 | ) | 9.14 | 8.44 | % | 57,011 | 0.93 | % | 0.93 | % | 0.21 | % | 87 | % | ||||||||||||||||||||||
| - | - | - | 8.46 | (39.35 | %) | 71,697 | 0.94 | % | 0.94 | % | 0.29 | % | 75 | % | ||||||||||||||||||||||||
| - | - | - | 13.95 | (12.87 | %)(c) | 144,668 | 0.87 | % | 0.87 | % | (0.20 | %) | 63 | % | ||||||||||||||||||||||||
| - | (0.36 | ) | (0.36 | ) | 16.11 | 11.11 | % | 78,071 | 0.93 | % | 0.93 | % | 3.31 | % | 31 | % | ||||||||||||||||||||||
| - | (0.19 | ) | (0.19 | ) | 14.82 | (0.59 | %)(c) | 67,610 | 0.99 | % | 0.94 | % | 1.10 | % | 49 | % | ||||||||||||||||||||||
| - | (0.07 | ) | (0.07 | ) | 15.12 | 32.73 | % | 93,714 | 0.87 | % | 0.87 | % | 1.03 | % | 84 | % | ||||||||||||||||||||||
| - | (0.07 | ) | (0.07 | ) | 11.45 | 18.35 | % | 108,701 | 0.91 | % | 0.91 | % | 0.64 | % | 81 | % | ||||||||||||||||||||||
| - | (0.07 | ) | (0.07 | ) | 9.73 | (38.15 | %) | 132,229 | 0.92 | % | 0.92 | % | 0.75 | % | 83 | % | ||||||||||||||||||||||
| - | - | - | 15.86 | (15.37 | %)(c) | 331,648 | 0.83 | % | 0.83 | % | 0.18 | % | 73 | % | ||||||||||||||||||||||||
| - | (0.19 | ) | (0.19 | ) | 14.03 | 6.71 | %(c) | 44,651 | 0.93 | % | 0.84 | % | 1.74 | % | 30 | % | ||||||||||||||||||||||
| - | (0.09 | ) | (0.09 | ) | 13.33 | 0.37 | %(c) | 48,444 | 0.92 | % | 0.84 | % | 0.74 | % | 55 | % | ||||||||||||||||||||||
| - | (0.07 | ) | (0.07 | ) | 13.38 | 32.31 | %(c) | 58,478 | 0.86 | % | 0.84 | % | 0.47 | % | 65 | % | ||||||||||||||||||||||
| - | (0.06 | ) | (0.06 | ) | 10.17 | 12.89 | %(c) | 58,409 | 0.86 | % | 0.84 | % | 0.55 | % | 40 | % | ||||||||||||||||||||||
| - | (0.07 | ) | (0.07 | ) | 9.06 | (33.43 | %) | 70,534 | 0.82 | % | 0.82 | % | 0.63 | % | 49 | % | ||||||||||||||||||||||
| - | (0.04 | ) | (0.04 | ) | 13.73 | (2.50 | %)(c) | 174,813 | 0.71 | % | 0.71 | % | 0.39 | % | 37 | % | ||||||||||||||||||||||
| - | (0.24 | ) | (0.24 | ) | 8.31 | 4.76 | %(c) | 242,223 | 0.29 | % | 0.15 | % | 2.44 | % | 7 | % | ||||||||||||||||||||||
| - | (0.16 | ) | (0.16 | ) | 8.16 | 9.72 | %(c) | 264,161 | 0.29 | % | 0.15 | % | 2.28 | % | 33 | % | ||||||||||||||||||||||
| - | (0.12 | ) | (0.12 | ) | 7.60 | 25.10 | %(c) | 331,565 | 0.27 | % | 0.15 | % | 2.09 | % | 19 | % | ||||||||||||||||||||||
| - | (0.13 | ) | (0.13 | ) | 6.18 | 11.25 | %(c)(e) | 222,586 | 0.27 | % | 0.15 | % | 1.99 | % | 28 | % | ||||||||||||||||||||||
| - | (0.19 | ) | (0.19 | ) | 5.66 | (18.77 | %)(c) | 188,012 | 0.25 | % | 0.15 | % | 2.58 | % | 86 | % | ||||||||||||||||||||||
| - | (0.11 | ) | (0.11 | ) | 7.21 | (14.28 | %)(c) | 250,988 | 0.22 | % | 0.15 | % | 2.35 | % | 12 | % | ||||||||||||||||||||||
www.bridgeway.com | 100 |
| FINANCIAL HIGHLIGHTS (continued) | |
(for a share outstanding throughout the period indicated)
| Income from Investment Operations | ||||||||||||||||
Net Asset Beginning of Period | Net Investment Income(a) | Net Realized and Unrealized Gain\(Loss) | Total from Investment Operations | |||||||||||||
MANAGED VOLATILITY | ||||||||||||||||
Period Ended December 31, 2012 (Unaudited) | $11.94 | $0.03 | $0.22 | $0.25 | ||||||||||||
Year Ended June 30, 2012 | 11.58 | 0.04 | 0.39 | 0.43 | ||||||||||||
Year Ended June 30, 2011 | 10.23 | 0.07 | 1.37 | 1.44 | ||||||||||||
Year Ended June 30, 2010 | 10.19 | 0.10 | 0.08 | 0.18 | ||||||||||||
Year Ended June 30, 2009 | 12.58 | 0.18 | (1.69 | ) | (1.51 | ) | ||||||||||
Year Ended June 30, 2008 | 12.95 | 0.29 | (0.49 | ) | (0.20 | ) | ||||||||||
| (a) | Per share amounts calculated based on the average daily shares outstanding during the period. |
| (b) | Annualized for periods less than one year. |
| (c) | Total return may have been lower had various fees not been waived during the period. |
See Notes to Financial Statements.
101 | Semi-Annual Report | December 31, 2012 (Unaudited) |
|
Less Distributions to Shareholders from | Ratios & Supplemental Data | |||||||||||||||||||||||||||||||||||
Net Realized Gain | Net Investment Income | Total Distributions | Net Asset End of | Total Return | Net Assets End of Year (000’s) | Expenses Before ments(b) | Expenses After ments(b) | Net Investment After Waivers and ments(b) | Portfolio Turnover Rate | |||||||||||||||||||||||||||
| ||||||||||||||||||||||||||||||||||||
$ - | $ | (0.05 | ) | $ | (0.05 | ) | $ | 12.14 | 2.10 | %(c) | $ | 23,863 | 1.44 | % | 0.94 | % | 0.55 | % | 24 | % | ||||||||||||||||
- | (0.07 | ) | (0.07 | ) | 11.94 | 3.74 | %(c) | 23,705 | 1.43 | % | 0.94 | % | 0.39 | % | 41 | % | ||||||||||||||||||||
- | (0.09 | ) | (0.09 | ) | 11.58 | 14.15 | %(c) | 29,246 | 1.22 | % | 0.94 | % | 0.63 | % | 34 | % | ||||||||||||||||||||
- | (0.14 | ) | (0.14 | ) | 10.23 | 1.67 | %(c) | 33,684 | 1.05 | % | 0.94 | % | 0.91 | % | 33 | % | ||||||||||||||||||||
(0.52) | (0.36 | ) | (0.88 | ) | 10.19 | (11.66 | %)(c) | 47,299 | 1.01 | % | 0.94 | % | 1.72 | % | 51 | % | ||||||||||||||||||||
- | (0.17 | ) | (0.17 | ) | 12.58 | (1.57 | %)(c) | 75,417 | 0.88 | % | 0.88 | % | 2.23 | % | 44 | % | ||||||||||||||||||||
www.bridgeway.com | 102 |
| NOTES TO FINANCIAL STATEMENTS | |
December 31, 2012 (Unaudited)
1. Organization:
Bridgeway Funds, Inc. (“Bridgeway” or the “Company”) was organized as a Maryland corporation on October 19, 1993, and is registered under the Investment Company Act of 1940, as amended (the “1940 Act”), as an open-end management investment company.
Bridgeway is organized as a series fund, with 11 investment funds as of December 31, 2012 (each, a “Fund” and collectively, the “Funds”): Aggressive Investors 1, Ultra-Small Company, Ultra-Small Company Market, Small-Cap Momentum, Small-Cap Growth, Small-Cap Value, Large-Cap Growth, Blue Chip 35 Index and Managed Volatility Funds are presented in this report. The Omni Tax-Managed Small-Cap Value Fund and the Omni Small-Cap Value Fund are included in a separate report.
Bridgeway is authorized to issue 1,915,000,000 shares of common stock at $0.001 per share. As of December 31, 2012, 100,000,000 shares have been classified into the Aggressive Investors 1 Fund. 130,000,000 shares have been classified into the Blue Chip 35 Index Fund. 15,000,000 shares have been classified into the Ultra-Small Company Fund. 100,000,000 shares each have been classified into the Ultra-Small Company Market, Omni Tax-Managed Small-Cap Value, Omni Small-Cap Value, Small-Cap Momentum, Small-Cap Growth, Small-Cap Value and Large-Cap Growth Funds. 50,000,000 shares have been classified into the Managed Volatility Fund.
The Ultra-Small Company Fund is open to existing investors (direct only).
All of the Funds are no-load, diversified funds.
The Aggressive Investors 1 Fund seeks to exceed the stock market total return (primarily through capital appreciation) at a level of total risk roughly equal to that of the stock market over longer periods of time (three year intervals or more).
The Ultra-Small Company, Ultra-Small Company Market, Small-Cap Momentum, Small-Cap Growth, Small-Cap Value and Large-Cap Growth Funds seek to provide a long-term total return on capital, primarily through capital appreciation.
The Blue Chip 35 Index Fund seeks to provide long-term total return on capital, primarily through capital appreciation, but also some income.
The Managed Volatility Fund seeks to provide a high current return with short-term risk less than or equal to 40% of the stock market.
Bridgeway Capital Management, Inc. (the “Adviser”) is the investment adviser for all of the Funds.
On May 30, 2012, the shareholders of the Aggressive Investors 2 Fund and the Micro-Cap Limited Fund (the “Merged Funds”) approved an Agreement and Plan of Reorganization (the “Plan”) which provided for the transfer of all of the assets of the Merged Funds, listed in the table below, for shares of the respective acquiring funds, listed in the table below, and assumption of the liabilities of the Merged Funds. The acquisition was accomplished by a tax-free exchange of shares on June 4, 2012. For financial reporting purposes, assets received and shares issued by the Aggressive Investors 1 Fund and the Ultra-Small Company Fund were recorded at fair value; however, the cost basis of the investments received from the Aggressive Investors 2 Fund and the Micro-Cap Limited Fund was carried forward to align ongoing reporting of the Aggressive Investors 1 Fund’s and the Ultra-Small Company Fund’s realized and unrealized gains and losses with amounts distributable to shareholders for tax purposes.
| Merged Fund | Shares | Acquiring Fund | Shares | Value | ||||||||||
Aggressive Investors 2 | 9,545,121 | Aggressive Investors 1 | 3,846,030 | $ | 118,655,804 | |||||||||
Micro-Cap Limited | 3,111,172 | Ultra-Small Company | 734,641 | 18,444,305 | ||||||||||
103 | Semi-Annual Report | December 31, 2012 (Unaudited) |
| NOTES TO FINANCIAL STATEMENTS (continued) | |
December 31, 2012 (Unaudited)
2. Significant Accounting Policies:
The following summary of significant accounting policies, followed in the preparation of the financial statements of the Funds, are in conformity with accounting principles generally accepted in the United States of America (“GAAP”).
Securities, Options, Futures and Other Investments Valuation Other than options, portfolio securities that are principally traded on a national securities exchange are valued at their last sale price on the principal exchange on which they are traded prior to the close of the New York Stock Exchange (“NYSE”), on each day the NYSE is open for business. If there is no closing price on the NYSE, the portfolio security will be valued using a composite price, which is defined as the last price for the security on any exchange. Portfolio securities other than options that are principally traded on the National Association of Securities Dealers Automated Quotation System (“NASDAQ”) are valued at the NASDAQ Official Closing Price (“NOCP”). In the absence of recorded sales on their home exchange, or NOCP, in the case of NASDAQ traded securities, the security will be valued as follows: bid prices for long positions and ask prices for short positions.
Short-term fixed income securities having a remaining maturity of 60 days or less are valued at amortized cost, which approximates market value. Options are valued at the close if there is trading volume and if there is no trading volume, the bid on long positions and ask on the short positions. Other investments for which no sales are reported are valued at the latest bid price in accordance with the pricing policy established by the Board of Directors.
Investments in open-end registered investment companies and closed-end registered investment companies that do not trade on an exchange are valued at the end of day net asset value (“NAV”) per share.
Investments in closed-end registered investment companies that trade on an exchange are valued at the last sales price as of the close of the customary trading session on the exchange where the security is principally traded.
When market quotations are not readily available or when events occur that make established valuation methods unreliable, securities of the Funds may be valued at fair value as determined in good faith by or under the direction of the Board of Directors. The valuation assigned to fair valued securities for purposes of calculating the Funds’ NAVs may differ from the security’s most recent closing market price and from the prices used by other mutual funds to calculate their NAVs.
The inputs and valuation techniques used to determine the value of a Fund’s investments are summarized into three levels as described in the hierarchy below:
| • | Level 1 — quoted prices in active markets for identical assets |
Investments whose values are based on quoted market prices in active markets, and whose values are therefore classified as Level 1 prices, include active listed equity securities. The Funds do not adjust the quoted price for such investments, even in situations where the Funds hold a large position and a sale could reasonably impact the quoted price.
| • | Level 2 — other significant observable inputs (including quoted prices for similar securities, interest rates, prepayments speeds, credit risk, etc.) |
Investments that trade in markets that are not considered to be active, but whose values are based on quoted market prices, dealer quotations or valuations provided by alternative pricing sources supported by observable inputs are classified as Level 2 prices. These generally include certain U.S. government and sovereign obligations, most government agency securities, investment-grade corporate bonds and less liquid listed equity securities. As investments whose values are classified as Level 2 prices include positions that are not traded in active markets and/or are subject to transfer restrictions, valuations may be adjusted to reflect illiquidity and/or non-transferability, which are generally based on available market information.
Money market fund investments consist of mutual funds which invest primarily in securities that are valued at amortized cost, a Level 2 investment. Therefore, the money market funds are classified as Level 2 investments. The Funds’ total return swap values are derived by applying observable inputs to the outstanding notional values and are therefore classified as Level 2 investments also.
www.bridgeway.com | 104 |
| NOTES TO FINANCIAL STATEMENTS (continued) | |
December 31, 2012 (Unaudited)
| • | Level 3 — significant unobservable inputs (including a Fund’s own assumptions in determining the fair value of investments) |
Investments whose values are classified as Level 3 prices have significant unobservable inputs, as they may trade infrequently or not at all. When observable prices are not available for these securities, the Funds use one or more valuation techniques for which sufficient and reliable data is available. The inputs used by the Funds in estimating the value of Level 3 prices may include the original transaction price, quoted prices for similar securities or assets in active markets, completed or pending third-party transactions in the underlying investment or comparable issuers, and changes in financial ratios or cash flows. Level 3 prices may also be adjusted to reflect illiquidity and/or non-transferability, with the amount of such discount estimated by the Funds in the absence of market information. Assumptions used by the Funds due to the lack of observable inputs may significantly impact the resulting value and therefore the Funds’ results of operations.
The inputs or methodology used for valuing investments are not necessarily an indication of the risk associated with investing in those investments. A summary of the inputs used to value the Funds’ investments as of December 31, 2012 is included with each Fund’s Schedule of Investments.
The Funds’ policy is to recognize transfers into, and transfers out of, each level of hierarchy as of the beginning of the reporting period. For the period ended December 31, 2012, there were no transfers between Level 1 and Level 2 in any of the Funds. Details regarding transfers into, and transfers out of, Level 3 can be found at the end of each Schedule of Investments for Funds that hold Level 3 securities.
In December 2011, the Financial Accounting Standards Board issued Accounting Standards Update (“ASU”) No. 2011-11 “Disclosures about Offsetting Assets and Liabilities” requiring disclosure of both gross and net information related to offsetting and related arrangements enabling users of its financial statements to understand the effect of those arrangements on the entity’s financial position. The objective of this disclosure is to facilitate comparison between those entities that prepare their financial statements on the basis of U.S. GAAP and those entities that prepare their financial statements on the basis of International Financial Reporting Standards. ASU No. 2011-11 is effective for interim and annual periods beginning on or after January 1, 2013. Management is evaluating any impact ASU No. 2011-11 may have on the Fund’s financial statements.
Securities Lending Upon lending its securities to third parties, each Fund receives compensation in the form of fees. A Fund also continues to receive dividends on the securities loaned. The loans are secured by collateral at least equal to the fair value of the securities loaned plus accrued interest. Gain or loss in the fair value of the securities loaned that may occur during the term of the loan will be for the account of a Fund. Each Fund has the right under the lending agreement to recover the securities from the borrower on demand. Additionally, a Fund does not have the right to sell or re-pledge collateral received in the form of securities unless the borrower goes into default. The risks to a Fund of securities lending are that the borrower may not provide additional collateral when required or return the securities when due.
As of December 31, 2012, the Funds had securities on loan and related collateral with values shown below:
| Bridgeway Fund | Securities on Loan Value | Value of Collateral | ||||||
Aggressive Investors 1 | $14,052,360 | $14,017,246 | ||||||
Ultra-Small Company | 14,406,673 | 14,540,688 | ||||||
Ultra-Small Company Market | 31,076,493 | 31,683,008 | ||||||
Small-Cap Momentum | 201,502 | 202,506 | ||||||
Small-Cap Growth | 2,737,291 | 2,759,681 | ||||||
Small-Cap Value | 7,322,072 | 7,390,895 | ||||||
Large-Cap Growth | 937,562 | 908,030 | ||||||
Managed Volatility | 62,592 | 62,949 | ||||||
It is each Fund’s policy to obtain additional collateral from, or return excess collateral to, the borrower by the end of the next business day, following the valuation date of the securities loaned. Therefore, the value of the collateral held may be temporarily less than that required under the lending contract. Aggressive Investors 1, Ultra-Small Company, Small-Cap Momentum, Small-Cap Growth, Small-Cap Value, Large-Cap Growth and Managed Volatility Funds obtained additional collateral on the following business day after the period end to ensure the securities on loan were adequately collateralized. As of December 31, 2012 the collateral consisted of an institutional money market fund.
105 | Semi-Annual Report | December 31, 2012 (Unaudited) |
| NOTES TO FINANCIAL STATEMENTS (continued) | |
December 31, 2012 (Unaudited)
Use of Estimates in Financial Statements In preparing financial statements in conformity with GAAP, management makes estimates and assumptions that affect the reported amounts of assets and liabilities at the date of the financial statements and the disclosure of contingent assets and liabilities at the date of the financial statements as well as the reported amounts of revenue and expenses during the reporting period. Actual results could differ from those estimates.
Risks and Uncertainties The Funds provide for various investment options, including stocks and call and put options. Such investments are exposed to various risks, such as interest rate, market and credit risks. Due to the risks involved, it is at least reasonably possible that changes in risks in the near term would materially affect shareholders’ account values and the amounts reported in the financial statements.
Security Transactions, Investment Income and Expenses Security transactions are accounted for as of the trade date, the date the order to buy or sell is executed. Realized gains and losses are computed on the identified cost basis. Dividend income is recorded on the ex-dividend date, and interest income is recorded on the accrual basis from settlement date. Particularly related to the Managed Volatility Fund, discounts and premiums are accreted/amortized on the effective interest method.
Fund expenses that are not series-specific are allocated to each series based upon its relative proportion of net assets to the Funds’ total net assets or other appropriate basis.
Distributions to Shareholders The Funds pay dividends from net investment income and distribute realized capital gains annually, usually in December.
Derivatives
The Funds’ use of derivatives for the period ended December 31, 2012 was limited to futures contracts, total return swaps and written options. The following is a summary of how these derivatives are treated in the financial statements and their impact on the Funds.
| Asset Derivatives | Liability Derivatives | |||||||||||||||
Fund/Financial Instrument Type | Type of Derivative | Location on Statement of Assets and Liabilities | Value | Location on Statement of Assets and Liabilities | Value | |||||||||||
Ultra-Small Company | ||||||||||||||||
Other | Swap | Receivable, Total return | ||||||||||||||
| swap | $ | 6,186 | $ | - | ||||||||||||
Small-Cap Growth | ||||||||||||||||
Other | Swap | Receivable, Total return | ||||||||||||||
| swap | 794 | - | ||||||||||||||
Managed Volatility | ||||||||||||||||
Equity Contracts | Written | |||||||||||||||
Option | - | Call Options Written at value | 174,644 | |||||||||||||
| Put Options Written at value | 130,985 | |||||||||||||||
www.bridgeway.com | 106 |
| NOTES TO FINANCIAL STATEMENTS (continued) | |
December 31, 2012 (Unaudited)
Fund/Financial Instrument Type | Type of Derivative | Location of Gain (Loss) on Derivatives Recognized in Income | Amount of (Loss) | Amount of Unrealized Gain (Loss) | ||||||||
Aggressive Investors 1 | ||||||||||||
Other | Swap | Realized Gain (Loss) on Swaps | $ | 284,361 | ||||||||
Change in Unrealized Appreciation (Depreciation)on Swaps | $ | - | ||||||||||
Ultra-Small Company | ||||||||||||
Other | Swap | Realized Gain (Loss) on Swaps | $ | 199,573 | ||||||||
Change in Unrealized Appreciation (Depreciation)on Swaps | $ | 6,186 | ||||||||||
Ultra-Small Company Market | ||||||||||||
Other | Swap | Realized Gain (Loss) on Swaps | (61,471 | ) | ||||||||
Change in Unrealized Appreciation (Depreciation)on Swaps | (11,563 | ) | ||||||||||
Small-Cap Growth | ||||||||||||
Other | Swap | Realized Gain (Loss) on Swaps | 5,318 | |||||||||
Change in Unrealized Appreciation (Depreciation)on Swaps | 794 | |||||||||||
Small-Cap Value | ||||||||||||
Other | Swap | Realized Gain (Loss) on Swaps | 195,693 | |||||||||
Change in Unrealized Appreciation (Depreciation)on Swaps | (33,837 | ) | ||||||||||
Large-Cap Growth | ||||||||||||
Other | Swap | Realized Gain (Loss) on Swaps | 30,381 | |||||||||
Change in Unrealized Appreciation (Depreciation)on Swaps | (17,951 | ) | ||||||||||
Managed Volatility | ||||||||||||
Equity Contracts | Written | |||||||||||
| Option | Realized Gain (Loss) on Written Options | (47,606 | ) | |||||||||
Change in Unrealized Appreciation (Depreciation)on Written Options | (79,443 | ) | ||||||||||
| Futures Contract | Realized Gain (Loss) on Futures Contracts | (315,192 | ) | |||||||||
The derivative instruments outstanding as of December 31, 2012, as disclosed in the Notes to the Financial Statements, and the amounts of realized and changes in unrealized gains and losses on derivative instruments during the period, as disclosed in the Statement of Operations, serve as indicators of the volume of derivative activity for the Funds.
Futures Contracts The Funds may purchase or sell financial futures contracts to hedge cash positions, manage market risk, and to dampen volatility in line with investment objectives. A futures contract is an agreement between two parties to buy or sell a financial instrument at a set price on a future date. Upon entering into such a contract, a Fund is required to pledge to the broker an amount of cash or U.S. government securities equal to the minimum “initial margin” requirements of the exchange on which the futures contract is traded. The contract amount reflects the extent of a Fund’s exposure in these financial instruments. A Fund’s participation in the futures markets involves certain risks, including imperfect correlation between movements in the price of futures contracts and movements in the price of the securities hedged or used for cover. Pursuant to a contract, such Fund agrees to receive from, or pay to, the broker an amount of cash equal to the fluctuation in value of the contract. Such receipts or payments are known as “variation margin” and are recorded by a Fund as unrealized appreciation or depreciation. When a contract is closed, a Fund records a realized gain or loss equal to the difference between the value of
107 | Semi-Annual Report | December 31, 2012 (Unaudited) |
| NOTES TO FINANCIAL STATEMENTS (continued) | |
December 31, 2012 (Unaudited)
the contract at the time it was opened and the value at the time it was closed. With futures, there is minimal counterparty risk to the Funds since futures are exchange traded and the exchange’s clearinghouse, as counterparty to all exchange traded futures, guarantees the futures against default. As of December 31, 2012, the Funds had no open futures contracts.
Options The Aggressive Investors 1 Fund may buy and sell calls and puts to increase or decrease the Fund’s exposure to stock market risk or for purposes of diversification of risk. The Managed Volatility Fund may buy and sell calls and puts to reduce the Fund’s volatility and provide some cash flow. An option is a contract conveying a right to buy or sell a financial instrument at a specified price during a stipulated period. The premium paid by a Fund for the purchase of a call or a put option is included in such Fund’s Schedule of Investments as an investment and subsequently marked-to-market to reflect the current market value of the option. When a Fund writes a call or a put option, an amount equal to the premium received by such Fund is included in its Statement of Assets and Liabilities as a liability and is subsequently marked-to-market to reflect the current market value of the option written. If an option which a Fund has written either expires on its stipulated expiration date, or if such Fund enters into a closing purchase transaction, that Fund realizes a gain (or a loss if the cost of a closing purchase transaction exceeds the premium received when the option was written) without regard to any unrealized gain or loss on the underlying security, and the liability related to such options is extinguished. If a call option that a Fund has written is assigned, such Fund realizes a gain or loss from the sale of the underlying security and the proceeds from such sale are increased by the premium originally received. If a put option that a Fund has written is assigned, the amount of the premium originally received reduces the cost of the security that such Fund purchased upon exercise of the option. Buying calls increases a Fund’s exposure to the underlying security to the extent of any premium paid. Buying puts on a stock market index tends to limit a Fund’s exposure to a stock market decline. All options purchased by the Funds were listed on exchanges and considered liquid positions with readily available market quotes.
Covered Call Options and Secured Puts The Aggressive Investors 1 and Managed Volatility Funds may write call options on a covered basis, that is, a Fund will own the underlying security, or a Fund may write secured puts. The principal reason for writing covered calls and secured puts on a security is to attempt to realize income through the receipt of premiums. The option writer has, in return for the premium, given up the opportunity for profit from a substantial price increase in the underlying security so long as the obligation as a writer continues, but has retained the risk of loss should the price of the security decline. All options were listed on exchanges and considered liquid positions with readily available market quotes. Transactions in options written during the period ended December 31, 2012 are as follows:
| Managed Volatility Fund Written Call Options | Managed Volatility Fund Written Put Options | |||||||||||||||
| Contracts | Premiums | Contracts | Premiums | |||||||||||||
| ||||||||||||||||
Outstanding, June 30, 2012 | 1,541 | $ | 322,393 | 1,020 | $ | 190,504 | ||||||||||
Positions Opened | 2,444 | 413,875 | 1,869 | 392,457 | ||||||||||||
Exercised | (1,300 | ) | (238,398 | ) | (800 | ) | (137,687 | ) | ||||||||
Expired | (857 | ) | (158,623 | ) | (636 | ) | (164,723 | ) | ||||||||
Closed | (740 | ) | (137,323 | ) | (615 | ) | (104,093 | ) | ||||||||
Outstanding, December 31, 2012 | 1,088 | $ | 201,924 | 838 | $ | 176,458 | ||||||||||
Market Value, December 31, 2012 | $ | 174,644 | $ | 130,985 | ||||||||||||
The Aggressive Investors 1 Fund had no transactions in written options during the period ended December 31, 2012.
Swaps. Each Fund may enter into total return swaps. Total return swaps are agreements that provide a Fund with a return based on the performance of an underlying asset, in exchange for fee payments to a counterparty based on a specified rate. The difference in the value of these income streams is recorded daily by the Funds and is settled in cash monthly.
The fee paid by a Fund will typically be determined by multiplying the face value of the swap agreement by an agreed upon interest rate. In addition, if the underlying asset declines in value over the term of the swap, a Fund would also be required to pay the dollar value of that decline to the counterparty. Total return swaps could result in losses if the underlying asset does not perform as anticipated by the Adviser. A Fund may use its own NAV as the underlying asset in a total return swap. This
www.bridgeway.com | 108 |
| NOTES TO FINANCIAL STATEMENTS (continued) | |
December 31, 2012 (Unaudited)
strategy serves to reduce cash drag (the impact of cash on a Fund’s overall return) by replacing it with the impact of market exposure based upon a Fund’s own investment holdings. The following total return swaps were open as of December 31, 2012:
Bridgeway Fund | Swap Counterparty | Description | Notional Principal | Maturity Date | Net Unrealized Gain\(Loss) | |||||||||||
| Ultra-Small Company | ReFlow Management Co. | Fund receives the total return of the reference entity, which is this Fund’s NAV. Fund pays a floating rate of 1-month LIBOR plus 2.39%. | $ | 640,723 | January 2, 2013 | $ | 6,186 | |||||||||
| Small-Cap Growth | ReFlow Management Co. | Fund receives the total return of the reference entity, which is this Fund’s NAV. Fund pays a floating rate of 1-month LIBOR plus 2.39%. | 131,815 | January 2, 2013 | 794 | |||||||||||
Indemnification Under the Company’s organizational documents, the Funds’ officers, directors, employees and agents are indemnified against certain liabilities that may arise out of the performance of their duties to the Funds. Additionally, in the normal course of business, the Funds enter into contracts that contain a variety of indemnification clauses. The Funds’ maximum exposure under these arrangements is unknown as this would involve future claims that may be made against the Funds that have not yet occurred. However, the Funds have not had prior claims or losses pursuant to these contracts.
3. Management Fees, Other Related Party Transactions and Contingencies:
The Funds have entered into management agreements with the Adviser. As compensation for the advisory services rendered, facilities furnished, and expenses borne by the Adviser, the Funds pay the Adviser a fee pursuant to each Fund’s management agreement, as described below.
Aggressive Investors 1: A total advisory fee is paid by the Fund to the Adviser that is comprised of a Base Fee and a Performance Adjustment. The Base Fee equals the Base Fee Rate times the average daily net assets of the Fund. The Base Fee Rate is based on the following annual rates: 0.90% of the first $250 million of the Fund’s average daily net assets, 0.875% of the next $250 million, 0.85% of the next $500 million and 0.80% of any excess over $1 billion.
The Performance Adjustment equals 4.67% times the difference in cumulative total return between the Fund and the Standard and Poor’s 500 Composite Stock Price Index with dividends reinvested (hereinafter “Index”) over a rolling five-year performance period. The Performance Adjustment Rate varies from a minimum of –0.70% to a maximum of +0.70%. However, the Performance Adjustment Rate is zero if the difference between the cumulative Fund performance and the Index performance is less than or equal to 2%.
Ultra-Small Company: The Fund pays management fees based on the following annual rates: 0.90% of the first $250 million of the Fund’s average daily net assets, 0.875% of the next $250 million and 0.85% of any excess over $500 million. The management fees are computed daily and are payable monthly. However, during any period that the Fund’s net assets range from $27,500,000 to $55,000,000, the advisory fee will be determined as if the Fund had $55,000,000 under management. This is limited to a maximum annualized expense ratio of 1.49% of average net assets.
Ultra-Small Company Market: The Fund’s management fee is a flat 0.50% of the value of the Fund’s average daily net assets, computed daily and payable monthly.
Small-Cap Momentum: The Fund’s management fee is a flat 0.55% of the value of the Fund’s average daily net assets, computed daily and payable monthly.
Small-Cap Growth and Small-Cap Value: A total advisory fee is paid by each Fund to the Adviser that is comprised of a Base Fee and a Performance Adjustment. The Base Fee equals the Base Fee Rate times the average daily net assets of the Fund. The Base Fee Rate is based on the annual rate of 0.60% of the value of the Fund’s average daily net assets.
109 | Semi-Annual Report | December 31, 2012 (Unaudited) |
| NOTES TO FINANCIAL STATEMENTS (continued) | |
December 31, 2012 (Unaudited)
The Performance Adjustment equals 0.33% times the difference in cumulative total return between the Fund and the Russell 2000 Growth Index for Small-Cap Growth Fund and the Russell 2000 Value Index for Small-Cap Value Fund, with dividends reinvested (hereinafter “Index”) over a rolling five-year performance period. The Performance Adjustment Rate varies from a minimum of -0.05% to a maximum of +0.05%. However, the Performance Adjustment Rate is zero if the difference between the cumulative Fund’s performance and the Index performance is less than or equal to 2%.
Large-Cap Growth: A total advisory fee is paid by the Fund to the Adviser that is comprised of a Base Fee and a Performance Adjustment. The Base Fee equals the Base Fee Rate times the average daily net assets of the Fund. The Base Fee Rate is based on the annual rate of 0.50% of the value of the Fund’s average daily net assets.
The Performance Adjustment equals 0.33% times the difference in cumulative total return between the Fund and the Russell 1000 Growth Index, with dividends reinvested (hereinafter “Index”) over a rolling five-year performance period. The Performance Adjustment Rate varies from a minimum of -0.05% to a maximum of +0.05%. However, the Performance Adjustment Rate is zero if the difference between the cumulative Fund’s performance and the Index performance is less than or equal to 2%.
Blue Chip 35 Index: The Fund’s management fee is a flat 0.08% of the value of the Fund’s average daily net assets, computed daily and payable monthly.
Managed Volatility: The Fund’s management fee is a flat 0.60% of the value of the Fund’s average daily net assets, computed daily and payable monthly.
Expense limitations: The Adviser has agreed to reimburse the Funds for operating expenses and management fees above the expense limitations shown in the table below, which are shown as a ratio of net expenses to average net assets, for each Fund, for the period ended December 31, 2012. Any material change to the expense limitation would require a vote by shareholders of the applicable Fund.
| Bridgeway Fund | Expense Limitation | Total Waivers and Reimbursements for Period Ending 12/31/12 | ||||
| ||||||
Aggressive Investors 1 | 1.75% | $ | - | |||
Ultra-Small Company | 1.85% | - | ||||
Ultra-Small Company Market | 0.75% | 125,430 | ||||
Small-Cap Momentum* | 0.90% | 63,790 | ||||
Small-Cap Growth | 0.94% | 33,498 | ||||
Small-Cap Value | 0.94% | - | ||||
Large-Cap Growth | 0.84% | 21,971 | ||||
Blue Chip 35 Index | 0.15% | 180,834 | ||||
Managed Volatility | 0.94% | 58,971 | ||||
*The Fund is authorized to reimburse the Adviser for management fees previously waived and/or for expenses previously paid by the Adviser, provided, however, that any reimbursements must be paid at a date not more than three years after the fiscal year in which the Adviser waived the fees or reimbursed the expenses and the reimbursements do not cause the Fund to exceed the expense limitation in the agreement. The Fund has recoupable expenses of $11,221, $101,196, $127,045 and $63,790, which expire June 30, 2013, June 30, 2014, June 30, 2015 and June 30, 2016, respectively.
Other Related Party Transactions: The Funds will engage in inter-portfolio trades when it is to the benefit of both parties. The Board of Directors reviews these trades quarterly. Inter-portfolio purchases and sales during the period ended December 31, 2012 were as follows:
www.bridgeway.com | 110 |
| NOTES TO FINANCIAL STATEMENTS (continued) | |
December 31, 2012 (Unaudited)
| Bridgeway Fund | Inter-portfolio Purchases | Inter-portfolio Sales | ||||||
Aggressive Investors 1 | $1,812,765 | $ 363,500 | ||||||
Ultra-Small Company | 65,288 | 1,909,317 | ||||||
Ultra-Small Company Market | 2,330,745 | 11,588,033 | ||||||
Small-Cap Momentum | 6,914 | 35,793 | ||||||
Small-Cap Growth | 448,349 | 1,837 | ||||||
Small-Cap Value | 56,131 | - | ||||||
The Adviser entered into an Administrative Services Agreement with Bridgeway, pursuant to which the Adviser provides various administrative services to the Funds including, but not limited to: (i) supervising and managing various aspects of the Funds’ business and affairs; (ii) selecting, overseeing and/or coordinating activities with other service providers to the Funds; (iii) providing reports to the Board of Directors as requested from time to time; (iv) assisting and/or reviewing amendments and updates to the Funds’ registration statement and other filings with the Securities and Exchange Commission (“SEC”); (v) providing certain shareholder services; (vi) providing administrative support in connection with meetings of the Board of Directors; and (vii) providing certain record-keeping services. For its services to all of the Funds, the Adviser is paid an aggregate annual fee of $535,000 payable in equal monthly installments.
One director of Bridgeway, John Montgomery, is an owner and director of the Adviser. Another director of Bridgeway, Michael Mulcahy, is an executive and director of the Adviser. Under the 1940 Act definitions, each is considered to be an “affiliated person” of the Adviser and an “interested person” of the Adviser and of Bridgeway. Compensation for Mr. Montgomery and Mr. Mulcahy is borne by the Adviser rather than the Funds.
Board of Directors Compensation Independent Directors are paid an annual retainer of $14,000 with an additional retainer of $2,500 paid to the Independent Chairman of the Board and an additional retainer of $1,000 paid to the Nominating and Corporate Governance Committee Chair. The retainer is paid in quarterly installments. Independent Directors are paid $6,000 per meeting for meeting fees. Such compensation is the total compensation from all Funds and is allocated among the Funds.
The Independent Directors receive this compensation in the form of shares of the Funds, credited to his or her account. Such Directors are reimbursed for any expenses incurred in attending meetings and conferences and expenses for subscriptions or printed materials. The amount of directors’ fees attributable to each Fund is disclosed in the Statements of Operations.
4. Distribution and Shareholder Servicing Fees:
Foreside Fund Services, LLC acts as distributor of the Funds’ shares pursuant to a Distribution Agreement dated November 12, 2010. The Adviser pays all costs and expenses associated with distribution of the Funds’ shares pursuant to a protective plan adopted by shareholders pursuant to Rule 12b-1.
5. Purchases and Sales of Investment Securities:
Purchases and sales of investments, other than short-term securities, for each Fund for the period ended December 31, 2012 were as follows:
111 | Semi-Annual Report | December 31, 2012 (Unaudited) |
| NOTES TO FINANCIAL STATEMENTS (continued) | |
December 31, 2012 (Unaudited)
| Purchases | Sales | |||||||||||
| Bridgeway Fund | U.S. Government | Other | U.S. Government | Other | ||||||||
Aggressive Investors 1 | $ - | $171,158,795 | $ - | $191,494,035 | ||||||||
Ultra-Small Company | - | 47,514,613 | - | 49,862,494 | ||||||||
Ultra-Small Company Market | - | 68,449,643 | 104,926,721 | |||||||||
Small-Cap Momentum | - | 3,324,934 | - | 3,272,393 | ||||||||
Small-Cap Growth | - | 9,799,330 | - | 15,012,028 | ||||||||
Small-Cap Value | - | 28,639,427 | - | 22,095,016 | ||||||||
Large-Cap Growth | - | 14,107,250 | - | 19,836,887 | ||||||||
Blue Chip 35 Index | - | 17,303,742 | - | 48,721,089 | ||||||||
Managed Volatility | - | 3,462,063 | - | 4,861,403 | ||||||||
6. Federal Income Taxes
It is the Funds’ policy to continue to comply with the provisions of the Internal Revenue Code of 1986, as amended, applicable to regulated investment companies and distribute income to the extent necessary so that the Funds are not subject to federal income tax. Therefore, no federal income tax provision is required.
Unrealized Appreciation and Depreciation on Investments (Tax Basis) The amount of net unrealized appreciation/ depreciation and the cost of investment securities for tax purposes, including short-term securities at December 31, 2012, were as follows:
| Aggressive Investors 1 | Ultra-Small Company | Ultra-Small Company Market | ||||||||||
Gross appreciation (excess of value over tax cost) | $ 24,830,446 | $19,393,341 | $ 64,690,551 | |||||||||
Gross depreciation (excess of tax cost over value) | (3,970,448 | ) | (4,963,705 | ) | (15,869,270 | ) | ||||||
Net unrealized appreciation (depreciation) | $ 20,859,998 | $14,429,636 | $ 48,821,281 | |||||||||
Cost of investments for income tax purposes | $184,199,171 | $89,694,026 | $228,027,920 | |||||||||
| Small-Cap Momentum | Small-Cap Growth | Small-Cap Value | ||||||||||
Gross appreciation (excess of value over tax cost) | $ 162,750 | $ 4,594,512 | $12,418,066 | |||||||||
Gross depreciation (excess of tax cost over value) | (27,773 | ) | (1,706,978 | ) | (3,915,727 | ) | ||||||
Net unrealized appreciation (depreciation) | $ 134,977 | $ 2,887,534 | $ 8,502,339 | |||||||||
Cost of investments for income tax purposes | $2,099,555 | $24,824,925 | $70,294,588 | |||||||||
| Large-Cap Growth | Blue Chip 35 Index | Managed Volatility | ||||||||||
Gross appreciation (excess of value over tax cost) | $ 8,431,027 | $ 83,373,834 | $ 4,266,444 | |||||||||
Gross depreciation (excess of tax cost over value) | (1,570,996 | ) | (10,247,178 | ) | (660,164 | ) | ||||||
Net unrealized appreciation (depreciation) | $ 6,860,031 | $ 73,126,656 | $ 3,606,280 | |||||||||
Cost of investments for income tax purposes | $37,874,974 | $169,167,957 | $20,461,031 | |||||||||
The differences between book and tax net unrealized appreciation (depreciation) are primarily due to wash sale loss deferrals.
Classifications of Distributions Net investment income (loss) and net realized gain (loss) may differ for financial statement and tax purposes. The character of distributions made during the year from net investment income or net realized gains may differ from its ultimate characterization for federal income tax purposes.
The tax character of the distributions paid by the Funds during the last two fiscal years ended June 30, 2012 and June 30, 2011, respectively, are as follows:
www.bridgeway.com | 112 |
| NOTES TO FINANCIAL STATEMENTS (continued) | |
December 31, 2012 (Unaudited)
| Aggressive Investors 1 | Ultra-Small Company | |||||||||||||||
Year Ended June 30, 2012 | Year Ended June 30, 2011 | Year Ended June 30, 2012 | Year Ended June 30, 2011 | |||||||||||||
Distributions paid from: | ||||||||||||||||
Ordinary income | $3,284,990 | $2,167,451 | $1,269,925 | $632,748 | ||||||||||||
Total | $3,284,990 | $2,167,451 | $1,269,925 | $632,748 | ||||||||||||
| Ultra-Small Company Market | Small-Cap Momentum | |||||||||||||||
Year Ended June 30, 2012 | Year Ended | Year Ended | Year Ended June 30, 2011 | |||||||||||||
Distributions paid from: | ||||||||||||||||
Ordinary income | $ 3,451,142 | $4,111,396 | $280,424 | $ 16,889 | ||||||||||||
Long Term Capital Gain | 13,433,187 | - | 9,123 | - | ||||||||||||
Total | $16,884,329 | $4,111,396 | $289,547 | $ 16,889 | ||||||||||||
| Small-Cap Growth | Small-Cap Value | |||||||||||||||
Year Ended June 30, 2012 | Year Ended June 30, 2011 | Year Ended June 30, 2012 | Year Ended June 30, 2011 | |||||||||||||
Distributions paid from: | ||||||||||||||||
Ordinary income | $ 3,204 | $ 107,719 | $ 989,896 | $ 557,827 | ||||||||||||
Total | $ 3,204 | $ 107,719 | $ 989,896 | $ 557,827 | ||||||||||||
| Large-Cap Growth | Blue Chip 35 Index | |||||||||||||||
Year Ended June 30, 2012 | Year Ended June 30, 2011 | Year Ended June 30, 2012 | Year Ended June 30, 2011 | |||||||||||||
Distributions paid from: | ||||||||||||||||
Ordinary income | $ 342,838 | $ 342,087 | $ 7,110,502 | $ 4,877,457 | ||||||||||||
Total | $ 342,838 | $ 342,087 | $ 7,110,502 | $ 4,877,457 | ||||||||||||
| Managed Volatility | ||||||||||||||||
Year Ended June 30, 2012 | Year Ended | |||||||||||||||
Distributions paid from: | ||||||||||||||||
Ordinary income | $ 151,314 | $ 266,935 | ||||||||||||||
Total | $ 151,314 | $ 266,935 | ||||||||||||||
At June 30, 2012, the Funds had available for tax purposes, capital loss carryovers as follows:
| Aggressive Investor 1 | Ultra-Small Company | |||||||
Expiring 6/30/2016 | $ 9,342,674 | $1,346,595 | ||||||
6/30/2017 | 177,345,455 | 1,662,540 | ||||||
6/30/2018 | 16,094,317 | - | ||||||
| Small-Cap Growth | Small-Cap Value | |||||||
Expiring 6/30/2017 | $ 6,410,906 | $ 4,037,798 | ||||||
6/30/2018 | 22,793,119 | 50,552,993 | ||||||
113 | Semi-Annual Report | December 31, 2012 (Unaudited) |
| NOTES TO FINANCIAL STATEMENTS (continued) | |
December 31, 2012 (Unaudited)
| Large-Cap Growth | Blue Chip 35 Index | Managed Volatility | ||||||||||
Expiring | 6/30/2017 | $ | - | $17,847,189 | $ | - | ||||||
| 6/30/2018 | 33,176,486 | 34,451,339 | 6,090,159 | |||||||||
| 6/30/2019 | - | 2,656,190 | - | |||||||||
Under the Regulated Investment Company Modernization Act of 2010, capital losses incurred by these Funds after June 30, 2011 will not be subject to expiration and will retain their character as either short-term or long-term capital losses. In addition, such losses must be utilized prior to the losses incurred in the years preceding enactment. As a result of the mergers described in Note 1, pre-merger capital loss carryovers are subject to limitations under Internal Revenue Code Sections 381-384. As of the date of the merger the Aggressive Investors 1 Fund had accumulated capital losses of $62,647,229 which are subject to limitation and the Micro-Cap Limited Fund had accumulated losses of $8,287,942 which are subject to limitation.
There are no capital loss carryovers for Ultra-Small Company Market Fund and Small-Cap Momentum Fund as of June 30, 2012.
Capital loss carryovers utilized during the period June 30, 2012 were as follows:
| Bridgeway Fund | Capital Loss Carryover Utilized | |||
Aggressive Investors 1 | $ | 6,940,180 | ||
Ultra-Small Company | 3,714,932 | |||
Small-Cap Growth | 4,272,992 | |||
Small-Cap Value | 10,710,699 | |||
Large-Cap Growth | 4,888,439 | |||
Blue Chip 35 Index | 12,220,024 | |||
Managed Volatility | 953,714 | |||
Components of Accumulated Earnings (Deficit) As of June 30, 2012, the components of accumulated earnings (deficit) on a tax basis were:
| Aggressive Investors 1 | Ultra-Small Company | Ultra-Small Company Market | ||||||||||
Accumulated Net Investment Income (Loss) | $ | 100,737 | $ | 62,838 | $ | 2,314,302 | ||||||
Accumulated Net Realized Gain (Loss) on Investments* | (210,458,200 | ) | (6,825,363 | ) | 26,718,152 | |||||||
Net Unrealized Appreciation/Depreciation of Investments | 8,812,673 | 10,131,707 | 79,067,935 | |||||||||
Total | $ | (201,544,790 | ) | $ | 3,369,182 | $ | 108,100,389 | |||||
| Small-Cap Momentum | Small-Cap Growth | Small-Cap Value | ||||||||||
Accumulated Net Investment Income (Loss) | $ | 10,077 | $ | - | $ | 606,513 | ||||||
Accumulated Net Realized Gain (Loss) on Investments* | 77,406 | (29,526,291 | ) | (55,779,626 | ) | |||||||
Net Unrealized Appreciation/Depreciation of Investments | 155,558 | 2,799,106 | 6,367,388 | |||||||||
Total | $ | 243,041 | $ | (26,727,185 | ) | $ | (48,805,725 | ) | ||||
www.bridgeway.com | 114 |
| NOTES TO FINANCIAL STATEMENTS (continued) | |
December 31, 2012 (Unaudited)
| Large-Cap Growth | Blue Chip 35 Index | Managed Volatility | ||||||||||
Accumulated Net Investment Income (Loss) | $ | 167,751 | $ | 3,580,113 | $ | 99,873 | ||||||
Accumulated Net Realized Gain (Loss) on Investments* | (33,494,618 | ) | (55,403,139 | ) | (6,101,076 | ) | ||||||
Net Unrealized Appreciation/Depreciation of Investments | 5,149,758 | 72,525,144 | 3,746,543 | |||||||||
Total | $ | (28,177,109 | ) | $ | 20,702,118 | $ | (2,254,660 | ) | ||||
| * | Includes qualified late-year losses that the Funds have elected to defer to the beginning of their next fiscal year ending June 30, 2013. The Aggressive Investors 1, Ultra-Small Company, Ultra-Small Company Market, Small-Cap Growth, Small-Cap Value, Large-Cap Growth, Blue Chip 35 Index and Managed Volatility Funds have deferred qualified late-year losses of $7,675,754, $3,816,228, $1,992,931, $322,266, $1,188,835, $318,132, $448,421 and $10,917, respectively. |
Accounting for Uncertainty in Income Taxes sets forth a minimum threshold for financial statement recognition of the benefit of a tax position taken or expected to be taken in a tax return. Management has analyzed each Fund’s tax positions and has concluded that no provision for income tax is required in each Fund’s financial statements. The Funds are not aware of any tax position for which it is reasonably possible that the total amounts of unrecognized tax benefits will significantly change in the next twelve months. Each Fund’s federal tax returns for the prior three fiscal years remains subject to examination by the Internal Revenue Service.
7. Line of Credit
Bridgeway established a line of credit agreement (“Facility”) with The Bank of New York Mellon effective November 5, 2010. The Facility is for temporary or emergency purposes, such as to provide liquidity for shareholder redemptions, and is cancellable by either party. Unless cancelled earlier, the Facility shall be held available until September 19, 2013. Advances under the Facility are limited to $10,000,000 in total for all Funds and advances to each Fund shall not exceed certain limits set forth in the credit agreement, including but not limited to, the maximum amount a Fund is permitted to borrow under the 1940 Act.
The Funds incur a commitment fee of 0.05% per annum on the unused portion of the Facility and interest expense to the extent of amounts borrowed under the Facility. Interest is based on the “Overnight Rate” plus 1.25%. The Overnight Rate means the higher of (a) the Federal Funds rate, (b) the Overnight Eurodollar Rate, or (c) the One-month Eurodollar Rate. The commitment fees are payable quarterly in arrears and are allocated to all participating Funds. Interest expense is charged directly to a Fund based upon actual amounts borrowed by such Fund.
For the period ended December 31, 2012, borrowings by the Funds under this line of credit were as follows:
| Bridgeway Fund | Weighted Average Interest Rate | Weighted Average Loan Balance | Number of Days Outstanding | Interest Expense Incurred1 | Maximum Amount Borrowed During the Period | |||||
Aggressive Investors 1 | 1.47% | $1,045,179 | 28 | $1,179 | $2,343,000 | |||||
Ultra-Small Company | 1.49% | 614,000 | 9 | 226 | 944,000 | |||||
Ultra-Small Company Market | 1.46% | 2,172,622 | 37 | 3,218 | 8,719,000 | |||||
Small-Cap Growth | 1.46% | 286,738 | 42 | 483 | 821,000 | |||||
Small-Cap Value | 1.48% | 243,850 | 20 | 197 | 524,000 | |||||
Large-Cap Growth | 1.47% | 375,111 | 27 | 407 | 2,599,000 | |||||
Blue Chip 35 Index | 1.48% | 1,011,886 | 70 | 2,867 | 9,826,000 |
1Interest expense is included on the Statements of Operations in Miscellaneous expenses.
At December 31, 2012, Aggressive Investors 1, Ultra-Small Company Market, and Small-Cap Growth Funds had loans outstanding in the amounts of $1,808,000, $5,661,000, and $236,000, respectively.
115 | Semi-Annual Report | December 31, 2012 (Unaudited) |
| NOTES TO FINANCIAL STATEMENTS (continued) | |
December 31, 2012 (Unaudited)
8. Redemption Fees
In Ultra-Small Company Market and Small-Cap Momentum Funds, a 2% redemption fee may be charged on shares held less than six months. The fee is charged for the benefit of the remaining shareholders and will be paid to the appropriate Fund to help offset transaction costs. The fee is accounted for as an addition to paid-in capital.
9. Subsequent Events
Management has evaluated the impact of all subsequent events on the Funds and has determined that there were no subsequent events requiring recognition or disclosure in the financial statements.
www.bridgeway.com | 116 |
| OTHER INFORMATION | |
December 31, 2012 (Unaudited)
1. Proxy Voting
Fund policies and procedures used in determining how to vote proxies relating to the Funds’ securities and a summary of proxies voted by the Funds for the period ended June 30, 2012 are available without a charge, upon request, by contacting Bridgeway Funds at 1-800-661-3550 and on the SEC’s website at http://www.sec.gov.
2. Fund Holdings
The complete schedules of the Funds’ holdings for the second and fourth quarters of each fiscal year are contained in the Funds’ Semi-Annual and Annual shareholder reports, respectively.
The Bridgeway Funds file complete schedules of the Funds’ holdings with the SEC for the first and third quarters of each fiscal year on Form N-Q within 60 days after the end of the period. Copies of the Funds’ Form N-Q are available without charge, upon request, by contacting Bridgeway Funds at 1-800-661-3550 and on the SEC’s website at http://www.sec.gov. You may also review and copy Form N-Q at the SEC’s Public Reference Room in Washington, D.C. For more information about the operation of the Public Reference Room, please call 1-800-SEC-0330.
117 | Semi-Annual Report | December 31, 2012 (Unaudited) |
| DISCLOSURE OF FUND EXPENSES | |
December 31, 2012 (Unaudited)
As a shareholder of a Fund, you will incur no transaction costs from such Fund, including sales charges (loads) on purchases, on reinvested dividends or on other distributions. There are no exchange fees. Shareholders are subject to redemption fees on the Ultra-Small Company Market and Small-Cap Momentum Funds under certain circumstances. However, as a shareholder of a Fund, you will incur ongoing costs, including management fees and other Fund expenses. The following examples are intended to help you understand your ongoing costs (in dollars) of investing in a Fund and to compare these costs with ongoing costs of investing in other mutual funds. The examples are based on an investment of $1,000 invested on July 1, 2012 and held until December 31, 2012.
Actual Expenses. The first line of the table below provides information about actual account values and actual expenses. You may use the information in this line, together with the amount you invested, to estimate the expenses that you paid over the period. Simply divide your account value by $1,000 (for example, an $8,600 account value divided by $1,000 = 8.6), then multiply the result by the number in the first line under the heading “Expenses Paid During Period” to estimate the expenses you paid on your account during the period.
Hypothetical Example for Comparison Purposes. The second line of the table below provides information about hypothetical account values and hypothetical expenses based on the Fund’s actual expense ratio and an assumed rate of return of 5% per year before expenses, which is not the Fund’s actual return. The hypothetical account values and expenses may not be used to estimate the actual ending account balance or expenses you paid for the period. You may use this information to compare the ongoing costs of investing in a Fund and other mutual funds. To do so, compare this 5% hypothetical example with the 5% hypothetical examples that appear in the shareholder reports of other funds.
The expenses shown in the table are meant to highlight ongoing Fund costs only. Therefore, the second line of the table is useful in comparing ongoing costs only and will not help you determine the relative total costs of owning different funds, because other funds may also have transaction costs, such as sales charges, redemption fees or exchange fees.
| Beginning Account Value at 7/1/12 | Ending Account Value at 12/31/12 | Expense Ratio | Expenses Paid During Period* 7/1/12 - 12/31/12 | |||||
Bridgeway Aggressive Investors 1 | ||||||||
Actual Fund Return | $1,000.00 | $1,119.20 | 0.77% | $4.11 | ||||
Hypothetical Fund Return | $1,000.00 | $1,021.32 | 0.77% | $3.92 | ||||
Bridgeway Ultra-Small Company Fund | ||||||||
Actual Fund Return | $1,000.00 | $1,101.10 | 1.21% | $6.41 | ||||
Hypothetical Fund Return | $1,000.00 | $1,019.11 | 1.21% | $6.16 | ||||
Bridgeway Ultra-Small Company Market Fund | ||||||||
Actual Fund Return | $1,000.00 | $1,052.10 | 0.75% | $3.88 | ||||
Hypothetical Fund Return | $1,000.00 | $1,021.42 | 0.75% | $3.82 | ||||
Bridgeway Small-Cap Momentum Fund | ||||||||
Actual Fund Return | $1,000.00 | $1,063.60 | 0.90% | $4.68 | ||||
Hypothetical Fund Return | $1,000.00 | $1,020.67 | 0.90% | $4.58 | ||||
Bridgeway Small-Cap Growth Fund | ||||||||
Actual Fund Return | $1,000.00 | $1,045.60 | 0.94% | $4.85 | ||||
Hypothetical Fund Return | $1,000.00 | $1,020.47 | 0.94% | $4.79 | ||||
Bridgeway Small-Cap Value Fund | ||||||||
Actual Fund Return | $1,000.00 | $1,111.10 | 0.93% | $4.95 | ||||
Hypothetical Fund Return | $1,000.00 | $1,020.52 | 0.93% | $4.74 | ||||
www.bridgeway.com | 118 |
| DISCLOSURE OF FUND EXPENSES (continued) | |
December 31, 2012 (Unaudited)
| Beginning Account Value at 7/1/12 | Ending Account Value at 12/31/12 | Expense Ratio | Expenses Paid During Period* 7/1/12 - 12/31/12 | |||||
Bridgeway Large-Cap Growth Fund | ||||||||
Actual Fund Return | $1,000.00 | $1,067.10 | 0.84% | $4.38 | ||||
Hypothetical Fund Return | $1,000.00 | $1,020.97 | 0.84% | $4.28 | ||||
Bridgeway Blue Chip 35 Index Fund | ||||||||
Actual Fund Return | $1,000.00 | $1,047.60 | 0.15% | $0.77 | ||||
Hypothetical Fund Return | $1,000.00 | $1,024.45 | 0.15% | $0.77 | ||||
Bridgeway Managed Volatility | ||||||||
Actual Fund Return | $1,000.00 | $1,021.00 | 0.94% | $4.79 | ||||
Hypothetical Fund Return | $1,000.00 | $1,020.47 | 0.94% | $4.79 | ||||
| * | Expenses are equal to the average account value times the Fund’s annualized expense ratio multiplied by the number of days in the most recent six- month period (184) divided by the number of days in the fiscal year (365). |
119 | Semi-Annual Report | December 31, 2012 (Unaudited) |
THIS PAGE INTENTIONALLY LEFT BLANK
THIS PAGE INTENTIONALLY LEFT BLANK
|
|
BRIDGEWAY FUNDS, INC.
BNY Mellon Investment Servicing (US) Inc.
P.O. Box 9860
Providence, RI 02940-8060
CUSTODIAN
The Bank of New York Mellon
One Wall Street
New York, NY 10286
DISTRIBUTOR
Foreside Fund Services, LLC
Three Canal Plaza, Suite 100
Portland, ME 04101
You can review and copy information about our Funds (including the SAIs) at the SEC’s Public Reference Room in Washington, D.C. To find out more about this public service, call the SEC at 800-SEC-0330. Reports and other information about the Funds is also available on the SEC’s website at www.sec.gov. You can receive copies of this information, for a fee, by writing the Public Reference Section, Securities and Exchange Commission, Washington, D.C. 20549-1520 or by sending an electronic request to the following email address: publicinfo@sec.gov.
|

| Semi-Annual Report | ||||
December 31, 2012 (Unaudited)
| ||||
OMNI SMALL-CAP VALUE | BOSVX | |||
OMNI TAX-MANAGED SMALL-CAP VALUE | BOTSX | |||
www.bridgewayomni.com
| ||||
|
|
| Letter from the Investment Management Team | 1 | |||||||
| 2 | ||||||||
| 5 | ||||||||
| 15 | ||||||||
| 18 | ||||||||
| 29 | ||||||||
| 30 | ||||||||
| 31 | ||||||||
| 32 | ||||||||
| 34 | ||||||||
| 41 | ||||||||
| 42 | ||||||||

Bridgeway Funds Standardized Returns as of December 31, 2012 (Unaudited)
| Annualized | ||||||||||||||||||||||||
| Fund | Quarter | Six Months | 1 Year | 5 Years | 10 Years | Inception to Date | Inception Date | Gross Expense Ratio2 | Net Expense Ratio2 | |||||||||||||||
Omni Small-Cap Value | 3.11% | 9.80% | 17.74% | NA | NA | 16.31% | 8/31/2011 | 0.84%1 | 0.60%1 | |||||||||||||||
Omni Tax-Managed Small-Cap Value | 3.23% | 9.19% | 16.62% | NA | NA | 5.03% | 12/31/2010 | 0.90%1 | 0.60%1 | |||||||||||||||
1 Some of the Funds’ fees were waived or expenses reimbursed; otherwise, returns would have been lower. The Adviser has contractually agreed to waive fees and/or reimburse expenses. Any material change to this Fund policy would require a vote by shareholders.
2 Expense ratios are as stated in the current prospectus. Please see financial highlights for expense ratios as of December 31, 2012.
Performance figures quoted represent past performance and are no guarantee of future results. Current performance may be lower or higher than the performance data quoted. Investment return and principal value will fluctuate, so that an investor’s shares, when redeemed, may be worth more or less than original cost. To obtain performance current to the most recent month-end, please visit our website at www.bridgeway.com or call 1-800-661-3550. Total return figures include the reinvestment of dividends and capital gains.
This report is submitted for the general information of the shareholders of each Fund. It is not authorized for distribution to prospective investors unless preceded or accompanied by an effective prospectus, which includes information regarding a Fund’s risks, objectives, fees and expenses, experience of its management, and other information. Investors should read the prospectus carefully before investing in a Fund. For questions or other Fund information, call 1-800-661-3550 or visit the Funds’ website at www.bridgewayomni.com. Funds are available for purchase by residents of the United States, Puerto Rico, U.S. Virgin Islands and Guam only. Foreside Fund Services, LLC, Distributor.
The views expressed here are exclusively those of Fund management. These views, including those relating to the market, sectors or individual stocks are not meant as investment advice and should not be considered predictive in nature.
i | www.bridgewayomni.com |
| LETTER FROM THE INVESTMENT MANAGEMENT TEAM | |
December 31, 2012
Dear Fellow Shareholders,
At Bridgeway, we have a shared passion for applying logic, data, and evidence to develop investment solutions. Our Omni Small-Cap Value and Omni Tax-Managed Small-Cap Value Funds are constructed based on fundamental academic research that relies on market efficiency to better capture risk premiums. We manage these Funds to provide broad diversification within the small-cap value universe and to keep transaction fees and expenses low. Bridgeway offers the Omni Small-Cap Value and Omni Tax-Managed Small-Cap Value Funds through a select group of advisers. We are committed to advisers and their clients who take a long-term perspective and whose investment goals fit our unique expertise: delivering investment solutions that are statistically driven and grounded in academic theory.
Thank you for your investment in Bridgeway’s Omni Small-Cap Value and Omni Tax-Managed Small-Cap Value Funds.
Sincerely,
Your Investment Management Team
 |  |  | ||
| John Montgomery | Rasool Shaik | Christine L. Wang |
Market Review
The domestic equity market experienced volatility during the fourth quarter of 2012. October started with negative returns, but rallied to end the month nearly unchanged. November was mixed, but December provided positive performance, pulling segments of the market (the smaller and more value segments) in the black for the quarter. Broad market returns for the quarter were up 0.25% as represented by the Russell 3000 Index. Value stocks generally outperformed growth stocks with mid-cap value stocks leading the way as represented by the Russell Mid-Cap Value Index, up 3.93%.
For the calendar year ended December 31, 2012, broad market stocks were up 16.42% as represented by the Russell 3000 Index. Returns among value stocks outperformed growth stocks across the market cap spectrum. Mid-cap value stocks led the way, up 18.51% as represented by the Russell Mid-Cap Value Index, followed closely by small-cap value stocks, up 18.05% as represented by the Russell 2000 Value Index.
The following table presents returns for broad market, small-cap, mid-cap, and large-cap stocks as represented by various style-based Russell Indexes. Size (market capitalization) and style (value/growth) are among the key factors that drive differences in returns among U.S. stocks.
Russell Style-Based Indexes Ranked by Performance for the Quarter and Calendar Year Ended December 31, 2012
| Quarter | Calendar Year | |||||||
| Best Performing | Russell Mid-Cap Value Index +3.93% | Russell Mid-Cap Value Index +18.51% | ||||||
Russell 2000 Value Index +3.22% | Russell 2000 Value Index +18.05% | |||||||
Russell Mid-Cap Growth Index +1.69% | Russell 3000 Value Index +17.55% | |||||||
Russell 3000 Value Index +1.65% | Russell 1000 Value Index +17.51% | |||||||
Russell 1000 Value Index +1.52% | Russell Mid-Cap Growth Index +15.81% | |||||||
Russell 2000 Growth Index +0.45% | Russell 1000 Growth Index +15.26% | |||||||
Russell 3000 Growth Index -1.19% | Russell 3000 Growth Index +15.21% | |||||||
| Worst Performing | Russell 1000 Growth Index -1.32%
| Russell 2000 Growth Index +14.59%
|
The Bridgeway Omni Funds in this semi-annual report are asset class exposure strategies that seek broad diversification and risk premium exposure with low tracking error. These Funds were designed to capture the size and style benefits within a specific asset class.
www.bridgewayomni.com | 1 |
|
December 31, 2012
Dear Fellow Omni Small-Cap Value Fund Shareholder,
For the quarter ended December 31, 2012, total returns were 3.11% for the Fund and 3.22% for the Russell 2000 Value Index.
For the six-month “semi-annual” period ended December 31, 2012, total returns were 9.80% for the Fund and 9.07% for the Russell 2000 Value Index.
For the calendar year ended December 31, 2012, total returns were 17.74% for the Fund and 18.05% for the Russell 2000 Value Index.
The table below presents our quarter, six-month, one-year and inception-to-date financial results. See below for a graph of performance since inception.
Standardized Returns as of December 31, 2012
| Annualized | ||||||||
| Quarter | 6 Months | 1 Year | Since Inception (8/31/11) | |||||
Omni Small-Cap Value Fund | 3.11% | 9.80% | 17.74% | 16.31% | ||||
Russell 2000 Value Index | 3.22% | 9.07% | 18.05% | 16.05% | ||||
Performance figures quoted in the table above and the graph below represent past performance and are no guarantee of future results. Total return figures in the table above and the graph below include the reinvestment of dividends and capital gains. The table above and the graph below do not reflect the deduction of taxes that a shareholder would pay on Fund distributions or on the redemption of Fund shares.
The Russell 2000 Value Index is an unmanaged index that consists of stocks in the Russell 2000 Index with lower price-to-book ratios and lower forecasted growth values with dividends reinvested. It is not possible to invest directly in an index. Periods longer than one year are annualized.
Omni Small-Cap Value Fund vs. Russell 2000 Value Index from Inception 8/31/11 to 12/31/12
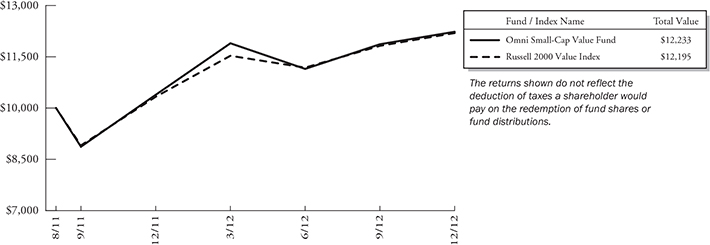
2 | Semi-Annual Report | December 31, 2012 (Unaudited) |
Omni Small-Cap Value Fund MANAGER’S COMMENTARY (Unaudited) (continued) | |
Detailed Explanation of Quarterly Performance
The Omni Small-Cap Value Fund is designed to capture the returns of the small-cap value asset class through broad diversification of small company and value stocks. This approach is sometimes referred to as “passive, asset class investing.” As of December 31, 2012, we held 594 such stocks in a market cap weighted style. We make no attempt to track any particular index in either performance or statistics.
The Fund returns were driven by the fact that returns for small value stocks were positive and outperformed small growth stocks as well as large stocks. Our design tilt toward deeper value and smaller stocks hurt our performance. Sector performance varied greatly and our underweighting in the poor performing Utilities sector helped our performance for the quarter.
Detailed Explanation of Calender Year Performance
Our smaller cap dominance and deeper value tilt hurt the performance for the fiscal year. We were overweighted in the Consumer Discretionary sector, the best performing sector, which helped the Fund’s return. That was offset by our underweighting in the Financials sector which also performed well for the year.
Top Ten Holdings as of December 31, 2012
| Rank Description | Industry | % of Net Assets | ||||
| 1 | Worthington Industries, Inc. | Metals & Mining | 0.9% | |||
| 2 | ANN, Inc. | Specialty Retail | 0.9% | |||
| 3 | Group 1 Automotive, Inc. | Specialty Retail | 0.9% | |||
| 4 | Cooper Tire & Rubber Co. | Auto Components | 0.8% | |||
| 5 | Exterran Holdings, Inc. | Energy Equipment & Services | 0.8% | |||
| 6 | Cloud Peak Energy, Inc. | Oil, Gas & Consumable Fuels | 0.7% | |||
| 7 | KapStone Paper & Packaging Corp. | Paper & Forest Products | 0.7% | |||
| 8 | Alon USA Energy, Inc. | Oil, Gas & Consumable Fuels | 0.7% | |||
| 9 | Avis Budget Group, Inc. | Road & Rail | 0.7% | |||
| 10 | Brink’s Co. (The) | Commercial Services & Supplies | 0.7% | |||
| Total | 7.8% | |||||
Industry Sector Representation as of December 31, 2012
| % of Portfolio | % of Russell 2000 Value Index | Difference | ||||||||||
Consumer Discretionary | 22.3% | 11.9% | 10.4% | |||||||||
Consumer Staples | 4.6% | 2.5% | 2.1% | |||||||||
Energy | 8.8% | 6.4% | 2.4% | |||||||||
Financials | 23.1% | 37.0% | -13.9% | |||||||||
Health Care | 4.2% | 4.4% | -0.2% | |||||||||
Industrials | 15.5% | 13.1% | 2.4% | |||||||||
Information Technology | 9.9% | 12.1% | -2.2% | |||||||||
Materials | 9.2% | 5.8% | 3.4% | |||||||||
Telecommunication Services | 1.6% | 0.6% | 1.0% | |||||||||
Utilities | 0.0% | 6.2% | -6.2% | |||||||||
Cash & Other Assets | 0.8% | 0.0% | 0.8% | |||||||||
Total | 100.0% | 100.0% | ||||||||||
www.bridgewayomni.com | 3 |
Omni Small-Cap Value Fund MANAGER’S COMMENTARY (Unaudited) (continued) | |
Disclaimer
The views expressed here are exclusively those of Fund management. These views, including those related to market sectors or individual stocks, are not meant as investment advice and should not be considered predictive in nature. Any favorable (or unfavorable) description of a holding applies only as of the quarter-end, December 31, 2012, unless otherwise stated. Security positions can and do change thereafter. Discussions of historical performance do not guarantee and may not be indicative of future performance.
Market volatility can significantly impact short-term performance. The Fund is not an appropriate investment for short-term investors. Investments in small companies generally carry greater risk than is customarily associated with larger companies. This additional risk is attributable to a number of factors, including the relatively limited financial resources that are typically available to small companies and the fact that small companies often have comparatively limited product lines. In addition, the stock of small companies tends to be more volatile than the stock of large companies, particularly in the short term and particularly in the early stages of an economic or market downturn. Shareholders of the Fund, therefore, are taking on more risk than they would if they invested in the stock market as a whole.
Conclusion
Thank you for your continued investment in Omni Small-Cap Value Fund. We encourage your feedback; your reactions and concerns are important to us.
Sincerely,
The Investment Management Team
4 | Semi-Annual Report | December 31, 2012 (Unaudited) |
Bridgeway Omni Small-Cap Value Fund SCHEDULE OF INVESTMENTS | |
Showing percentage of net assets as of December 31, 2012 (Unaudited)
| Industry Company | Shares | Value | ||||||
COMMON STOCKS - 98.99% | ||||||||
Aerospace & Defense - 0.68% | ||||||||
AAR Corp. | 32,000 | $ 597,760 | ||||||
Astrotech Corp.* | 30,000 | 26,700 | ||||||
Ducommun, Inc.* | 16,300 | 263,571 | ||||||
EDAC Technologies Corp.* | 6,900 | 85,146 | ||||||
Orbital Sciences Corp.* | 28,150 | 387,625 | ||||||
Sypris Solutions, Inc. | 26,100 | 103,356 | ||||||
|
| |||||||
|
1,464,158 |
| ||||||
Air Freight & Logistics - 0.37% | ||||||||
Air Transport Services Group, Inc.* | 64,600 | 259,046 | ||||||
Atlas Air Worldwide Holdings, Inc.* | 5,300 | 234,843 | ||||||
Pacer International, Inc.* | 28,400 | 110,760 | ||||||
Park-Ohio Holdings Corp.* | 8,700 | 185,397 | ||||||
|
| |||||||
|
790,046 |
| ||||||
Airlines - 1.52% | ||||||||
Hawaiian Holdings, Inc.* | 41,334 | 271,564 | ||||||
JetBlue Airways Corp.*+ | 184,950 | 1,056,065 | ||||||
Republic Airways Holdings, Inc.* | 34,000 | 193,120 | ||||||
SkyWest, Inc. | 33,800 | 421,148 | ||||||
US Airways Group, Inc.* | 97,900 | 1,321,650 | ||||||
|
| |||||||
|
3,263,547 |
| ||||||
Auto Components - 2.12% | ||||||||
China Automotive Systems, Inc.*+ | 22,400 | 107,296 | ||||||
China XD Plastics Co., Ltd.* | 50,900 | 195,456 | ||||||
Cooper Tire & Rubber Co. | 70,100 | 1,777,736 | ||||||
Exide Technologies* | 35,000 | 119,700 | ||||||
Federal-Mogul Corp.* | 54,000 | 433,080 | ||||||
Modine Manufacturing Co.* | 10,000 | 81,300 | ||||||
Shiloh Industries, Inc. | 4,700 | 48,410 | ||||||
SORL Auto Parts, Inc.* | 29,900 | 73,853 | ||||||
Spartan Motors, Inc. | 14,950 | 73,703 | ||||||
Standard Motor Products, Inc. | 38,000 | 844,360 | ||||||
Stoneridge, Inc.* | 55,900 | 286,208 | ||||||
Strattec Security Corp. | 1,300 | 33,553 | ||||||
Superior Industries International, Inc. | 12,200 | 248,880 | ||||||
Tower International, Inc.* | 28,900 | 232,645 | ||||||
|
| |||||||
|
4,556,180 |
| ||||||
Beverages - 0.22% | ||||||||
Coca-Cola Bottling Co. Consolidated | 7,200 | 478,800 | ||||||
Building Products - 0.69% | ||||||||
Ameresco, Inc., Class A* | 27,000 | 264,870 | ||||||
| Industry Company | Shares | Value | ||||||
| ||||||||
Building Products (continued) | ||||||||
Gibraltar Industries, Inc.* | 11,250 | $ 179,100 | ||||||
Griffon Corp. | 28,800 | 330,048 | ||||||
Nortek, Inc.* | 4,800 | 318,000 | ||||||
Patrick Industries, Inc.* | 10,300 | 160,268 | ||||||
Universal Forest Products, Inc. | 5,800 | 220,632 | ||||||
|
| |||||||
|
1,472,918 |
| ||||||
Capital Markets - 1.92% | ||||||||
Calamos Asset Management, Inc., Class A | 43,500 | 459,795 | ||||||
Capital Southwest Corp. | 5,600 | 557,928 | ||||||
CIFC Corp.* | 35,400 | 283,200 | ||||||
Cowen Group, Inc., Class A* | 67,700 | 165,865 | ||||||
FBR & Co.* | 86,400 | 334,368 | ||||||
INTL. FCStone, Inc.* | 12,500 | 217,625 | ||||||
Investment Technology Group, Inc.* | 57,050 | 513,450 | ||||||
NGP Capital Resources Co. | 100 | 722 | ||||||
Oppenheimer Holdings, Inc., Class A | 15,300 | 264,231 | ||||||
Piper Jaffray Cos.* | 11,400 | 366,282 | ||||||
SWS Group, Inc.* | 41,200 | 217,948 | ||||||
Walter Investment Management Corp.* | 17,200 | 739,944 | ||||||
|
| |||||||
|
4,121,358 |
| ||||||
Chemicals - 3.37% | ||||||||
China Green Agriculture, Inc.*+ | 36,800 | 121,072 | ||||||
Core Molding Technologies, Inc.* | 6,200 | 40,920 | ||||||
Georgia Gulf Corp.+ | 31,950 | 1,318,896 | ||||||
Gulf Resources, Inc.*+ | 42,400 | 49,184 | ||||||
Koppers Holdings, Inc. | 10,700 | 408,205 | ||||||
Kraton Performance Polymers, Inc.* | 48,350 | 1,161,851 | ||||||
Material Sciences Corp.* | 5,200 | 46,956 | ||||||
OM Group, Inc.* | 52,800 | 1,172,160 | ||||||
OMNOVA Solutions, Inc.* | 45,650 | 320,006 | ||||||
Penford Corp.* | 18,400 | 135,792 | ||||||
Schulman (A.), Inc. | 30,900 | 893,937 | ||||||
Stepan Co. | 6,000 | 333,240 | ||||||
Tredegar Corp. | 28,800 | 588,096 | ||||||
Yongye International, Inc.*+ | 62,400 | 363,792 | ||||||
Zep, Inc. | 19,400 | 280,136 | ||||||
|
| |||||||
|
7,234,243 |
| ||||||
Commercial Banks - 11.85% | ||||||||
1st Source Corp. | 17,252 | 381,097 | ||||||
www.bridgewayomni.com | 5 |
Bridgeway Omni Small-Cap Value Fund SCHEDULE OF INVESTMENTS (continued) | |
Showing percentage of net assets as of December 31, 2012 (Unaudited)
| Industry Company | Shares | Value | ||||||
Common Stocks (continued) | ||||||||
Commercial Banks (continued) | ||||||||
Access National Corp. | 2,700 | $ | 35,100 | |||||
Ameris Bancorp* | 41,900 | 523,331 | ||||||
BancorpSouth, Inc. | 64,850 | 942,919 | ||||||
Banner Corp. | 11,450 | 351,858 | ||||||
BCB Bancorp, Inc. | 10,400 | 97,136 | ||||||
BNC Bancorp+ | 6,000 | 48,060 | ||||||
C&F Financial Corp.+ | 1,200 | 46,728 | ||||||
Capital City Bank Group, Inc.* | 28,150 | 320,065 | ||||||
Central Valley Community Bancorp | 20,000 | 155,200 | ||||||
Chemical Financial Corp. | 12,500 | 297,000 | ||||||
CoBiz Financial, Inc. | 16,600 | 124,002 | ||||||
Columbia Banking System, Inc. | 37,318 | 669,485 | ||||||
Enterprise Financial Services Corp. | 33,500 | 437,845 | ||||||
Farmers Capital Bank Corp.* | 7,300 | 89,425 | ||||||
Fidelity Southern Corp.*+ | 17,249 | 164,728 | ||||||
First Bancorp | 7,600 | 97,432 | ||||||
First Bancorp, Inc. | 1,295 | 21,329 | ||||||
First BanCorp. (Puerto Rico)*+ | 262,800 | 1,203,624 | ||||||
First Busey Corp. | 25,300 | 117,645 | ||||||
First Business Financial Services, Inc. | 1,200 | 27,540 | ||||||
First Commonwealth Financial Corp. | 158,300 | 1,079,606 | ||||||
First Community Bancshares, Inc. | 35,000 | 558,950 | ||||||
First Financial Bancorp | 38,600 | 564,332 | ||||||
First Interstate Bancsystem, Inc. | 20,200 | 311,686 | ||||||
First M&F Corp. | 2,700 | 18,819 | ||||||
First Merchants Corp. | 44,311 | 657,575 | ||||||
First Midwest Bancorp, Inc. | 78,000 | 976,560 | ||||||
First United Corp.* | 9,200 | 65,964 | ||||||
Firstbank Corp. | 14,800 | 153,772 | ||||||
Glacier Bancorp, Inc. | 55,200 | 811,992 | ||||||
Great Southern Bancorp, Inc. | 6,000 | 152,700 | ||||||
Hanmi Financial Corp.* | 50,050 | 680,180 | ||||||
Heartland Financial USA, Inc. | 7,350 | 192,202 | ||||||
Horizon Bancorp | 3,150 | 61,898 | ||||||
Hudson Valley Holding Corp. | 22,800 | 354,996 | ||||||
Independent Bank Corp.* | 3,800 | 13,300 | ||||||
International Bancshares Corp. | 65,687 | 1,185,650 | ||||||
Intervest Bancshares Corp., Class A* | 32,800 | 127,592 | ||||||
| Industry Company | Shares | Value | ||||||
| ||||||||
Commercial Banks (continued) | ||||||||
Lakeland Bancorp, Inc. | 32,600 | $ | 331,868 | |||||
Macatawa Bank Corp.* | 13,200 | 38,148 | ||||||
MainSource Financial Group, Inc. | 41,750 | 528,972 | ||||||
MB Financial, Inc. | 17,400 | 343,650 | ||||||
MBT Financial Corp.* | 24,300 | 57,591 | ||||||
Mercantile Bank Corp. | 16,800 | 277,200 | ||||||
Metro Bancorp, Inc.* | 27,300 | 360,906 | ||||||
MidWestOne Financial Group, Inc. | 15,000 | 307,650 | ||||||
NewBridge Bancorp* | 7,000 | 32,410 | ||||||
Orrstown Financial Services, Inc.* | 5,600 | 54,936 | ||||||
Peapack Gladstone Financial Corp. | 5,420 | 76,314 | ||||||
Peoples Bancorp, Inc. | 19,700 | 402,471 | ||||||
Pinnacle Financial Partners, Inc.* | 18,700 | 352,308 | ||||||
Premier Financial Bancorp, Inc. | 4,200 | 45,486 | ||||||
PrivateBancorp, Inc. | 74,750 | 1,145,170 | ||||||
Renasant Corp. | 32,512 | 622,280 | ||||||
Republic Bancorp, Inc., Class A | 20,950 | 442,674 | ||||||
S&T Bancorp, Inc. | 22,000 | 397,540 | ||||||
SCBT Financial Corp. | 14,506 | 582,851 | ||||||
Sierra Bancorp | 9,300 | 106,299 | ||||||
Southwest Bancorp, Inc.* | 32,900 | 368,480 | ||||||
State Bank Financial Corp. | 36,500 | 579,620 | ||||||
StellarOne Corp. | 8,100 | 114,534 | ||||||
Suffolk Bancorp* | 24,396 | 319,588 | ||||||
Sun Bancorp, Inc.* | 123,400 | 436,836 | ||||||
Taylor Capital Group, Inc.*+ | 641 | 11,570 | ||||||
Trico Bancshares | 21,600 | 361,800 | ||||||
Union First Market Bankshares Corp. | 11,700 | 184,509 | ||||||
United Community Banks, Inc.* | 35,650 | 335,823 | ||||||
Univest Corp. of Pennsylvania | 14,300 | 244,530 | ||||||
Virginia Commerce Bancorp, Inc.* | 60,350 | 540,132 | ||||||
WesBanco, Inc. | 18,900 | 419,958 | ||||||
Wilshire Bancorp, Inc.* | 57,300 | 336,351 | ||||||
Wintrust Financial Corp. | 12,800 | 469,760 | ||||||
Yadkin Valley Financial Corp.* | 28,600 | 84,084 | ||||||
|
| |||||||
|
25,433,622 |
| ||||||
Commercial Services & Supplies - 6.17% |
| |||||||
ABM Industries, Inc. | 38,700 | 772,065 | ||||||
6 | Semi-Annual Report | December 31, 2012 (Unaudited) |
Bridgeway Omni Small-Cap Value Fund SCHEDULE OF INVESTMENTS (continued) | |
Showing percentage of net assets as of December 31, 2012 (Unaudited)
| Industry Company | Shares | Value | ||||||
Common Stocks (continued) | ||||||||
Commercial Services & Supplies (continued) |
| |||||||
American Reprographics Co.* | 125,850 | $ | 322,176 | |||||
AMREP Corp.* | 9,700 | 145,888 | ||||||
Asset Acceptance Capital Corp.* | 31,500 | 141,750 | ||||||
Brink’s Co. (The) | 49,150 | 1,402,250 | ||||||
Casella Waste Systems, Inc., Class A* | 20,650 | 90,447 | ||||||
Consolidated Graphics, Inc.* | 18,675 | 652,131 | ||||||
Courier Corp. | 9,200 | 101,200 | ||||||
Deluxe Corp. | 40,600 | 1,308,944 | ||||||
EnergySolutions, Inc.* | 288,000 | 898,560 | ||||||
Geo Group, Inc. (The) | 41,800 | 1,178,760 | ||||||
Herman Miller, Inc. | 29,300 | 627,606 | ||||||
HNI Corp. | 31,500 | 946,890 | ||||||
Industrial Services of America, Inc.*+ | 6,000 | 14,280 | ||||||
Intersections, Inc. | 31,300 | 296,724 | ||||||
Kimball International, Inc., Class B | 67,200 | 780,192 | ||||||
Metalico, Inc.* | 63,000 | 123,480 | ||||||
Multi-Color Corp. | 22,400 | 537,376 | ||||||
Perma-Fix Environmental Services* | 41,000 | 27,925 | ||||||
Standard Parking Corp.* | 13,750 | 302,362 | ||||||
Standard Register Co. (The) | 11,450 | 7,214 | ||||||
Sykes Enterprises, Inc.* | 21,900 | 333,318 | ||||||
TMS International Corp., Class A* | 42,100 | 527,092 | ||||||
TRC Cos., Inc.* | 31,650 | 184,203 | ||||||
United Stationers, Inc. | 32,600 | 1,010,274 | ||||||
Versar, Inc.* | 8,900 | 34,354 | ||||||
Viad Corp. | 17,400 | 472,584 | ||||||
|
| |||||||
|
13,240,045 |
| ||||||
Communications Equipment - 0.65% |
| |||||||
Bel Fuse, Inc., Class B | 13,500 | 263,925 | ||||||
Black Box Corp. | 18,250 | 444,205 | ||||||
Communications Systems, Inc. | 1,000 | 10,400 | ||||||
Globecomm Systems, Inc.* | 31,200 | 352,560 | ||||||
Harmonic, Inc.* | 28,700 | 145,509 | ||||||
Tessco Technologies, Inc. | 6,650 | 147,231 | ||||||
Zoom Technologies, Inc.* | 43,200 | 24,192 | ||||||
|
| |||||||
|
1,388,022 |
| ||||||
Computers & Peripherals - 0.28% |
| |||||||
Dot Hill Systems Corp.* | 35,800 | 33,563 | ||||||
Hutchinson Technology, Inc.* | 62,900 | 125,800 | ||||||
Imation Corp.* | 17,300 | 80,791 | ||||||
| Industry Company | Shares | Value | ||||||
| ||||||||
Computers & Peripherals (continued) |
| |||||||
Novatel Wireless, Inc.* | 71,100 | $ | 95,274 | |||||
Xyratex, Ltd.+ | 30,200 | 253,982 | ||||||
|
| |||||||
|
589,410 |
| ||||||
Construction & Engineering - 0.60% |
| |||||||
Argan, Inc. | 18,600 | 334,800 | ||||||
Michael Baker Corp. | 3,400 | 84,762 | ||||||
Northwest Pipe Co.* | 13,400 | 319,724 | ||||||
Orion Marine Group, Inc.* | 10,800 | 78,948 | ||||||
Primoris Services Corp. | 18,800 | 282,752 | ||||||
Sterling Construction Co., Inc.* | 18,250 | 181,405 | ||||||
|
| |||||||
|
1,282,391 |
| ||||||
Construction Materials - 0.34% | ||||||||
Headwaters, Inc.* | 84,800 | 725,888 | ||||||
Consumer Finance - 0.82% | ||||||||
Atlanticus Holdings Corp.*+ | 3,737 | 12,519 | ||||||
Cash America International, Inc. | 10,200 | 404,634 | ||||||
DFC Global Corp.* | 19,600 | 362,796 | ||||||
First Marblehead Corp. (The)* | 159,100 | 123,605 | ||||||
Nelnet, Inc., Class A | 25,800 | 768,582 | ||||||
QC Holdings, Inc. | 27,300 | 88,452 | ||||||
|
| |||||||
|
1,760,588 |
| ||||||
Containers & Packaging - 0.73% | ||||||||
AEP Industries, Inc.* | 5,550 | 328,726 | ||||||
Boise, Inc. | 127,050 | 1,010,048 | ||||||
Myers Industries, Inc. | 15,600 | 236,340 | ||||||
|
| |||||||
|
1,575,114 |
| ||||||
Distributors - 0.15% | ||||||||
Core-Mark Holding Co., Inc. | 5,600 | 265,160 | ||||||
VOXX International Corp.* | 9,700 | 65,281 | ||||||
|
| |||||||
|
330,441 |
| ||||||
Diversified Consumer Services - 1.04% |
| |||||||
Cambium Learning Group, Inc.* | 18,950 | 21,034 | ||||||
Capella Education Co.* | 9,700 | 273,831 | ||||||
Career Education Corp.* | 38,800 | 136,576 | ||||||
Carriage Services, Inc. | 13,950 | 165,587 | ||||||
Corinthian Colleges, Inc.* | 2,750 | 6,710 | ||||||
Learning Tree International, Inc.* | 11,700 | 63,765 | ||||||
Lincoln Educational Services Corp. | 37,025 | 206,970 | ||||||
Mac-Gray Corp. | 11,100 | 139,305 | ||||||
www.bridgewayomni.com | 7 |
Bridgeway Omni Small-Cap Value Fund SCHEDULE OF INVESTMENTS (continued) | |
Showing percentage of net assets as of December 31, 2012 (Unaudited)
| Industry Company | Shares | Value | ||||||
Common Stocks (continued) | ||||||||
Diversified Consumer Services (continued) |
| |||||||
Regis Corp. | 60,450 | $ 1,022,814 | ||||||
Universal Technical Institute, Inc. | 18,500 | 185,740 | ||||||
|
| |||||||
|
2,222,332 |
| ||||||
Diversified Financial Services - 0.86% |
| |||||||
Gain Capital Holdings, Inc. | 47,599 | 194,680 | ||||||
Interactive Brokers Group, Inc., Class A | 21,150 | 289,332 | ||||||
MicroFinancial, Inc. | 13,746 | 100,071 | ||||||
PHH Corp.*+ | 55,550 | 1,263,762 | ||||||
|
| |||||||
|
1,847,845 |
| ||||||
Diversified Telecommunication Services - 1.19% |
| |||||||
Atlantic Tele-Network, Inc. | 14,200 | 521,282 | ||||||
Cbeyond, Inc.* | 26,550 | 240,012 | ||||||
Consolidated Communications Holdings, Inc. | 22,300 | 355,016 | ||||||
General Communication, Inc., Class A* | 59,550 | 571,084 | ||||||
Hawaiian Telcom Holdco, Inc.* | 10,200 | 198,900 | ||||||
HickoryTech Corp. | 6,000 | 58,380 | ||||||
IDT Corp., Class B | 25,275 | 241,124 | ||||||
Iridium Communications, Inc.*+ | 29,800 | 200,852 | ||||||
Multiband Corp.*+ | 9,700 | 16,005 | ||||||
Primus Telecommunications Group, Inc.+ | 13,700 | 148,919 | ||||||
|
| |||||||
|
2,551,574 |
| ||||||
Electrical Equipment - 0.53% |
| |||||||
Allied Motion Technologies, Inc.+ | 17,400 | 113,448 | ||||||
China BAK Battery, Inc.* | 360 | 572 | ||||||
Coleman Cable, Inc. | 18,400 | 170,568 | ||||||
General Cable Corp.* | 3,900 | 118,599 | ||||||
Global Power Equipment Group, Inc. | 13,972 | 239,620 | ||||||
Lihua International, Inc. | 31,250 | 137,188 | ||||||
LSI Industries, Inc. | 36,100 | 253,061 | ||||||
Orion Energy Systems, Inc.* | 35,000 | 58,100 | ||||||
SL Industries, Inc. | 1,650 | 29,700 | ||||||
Ultralife Corp.* | 7,350 | 23,814 | ||||||
|
| |||||||
|
1,144,670 |
| ||||||
Electronic Equipment, Instruments & Components - 3.42% |
| |||||||
Agilysys, Inc.* | 14,400 | 120,528 | ||||||
IEC Electronics Corp.* | 800 | 5,408 | ||||||
Insight Enterprises, Inc.* | 29,800 | 517,626 | ||||||
| Industry Company | Shares | Value | ||||||
| ||||||||
Electronic Equipment, Instruments & Components (continued) |
| |||||||
Itron, Inc.* | 13,100 | $ 583,605 | ||||||
Kemet Corp.* | 58,850 | 296,016 | ||||||
LoJack Corp.* | 8,000 | 22,320 | ||||||
Multi-Fineline Electronix, Inc.* | 7,600 | 153,596 | ||||||
Newport Corp.* | 26,000 | 349,700 | ||||||
PAR Technology Corp.* | 29,000 | 142,100 | ||||||
PC Connection, Inc. | 12,000 | 138,000 | ||||||
PC Mall, Inc.* | 5,600 | 34,776 | ||||||
Plexus Corp.* | 40,200 | 1,037,160 | ||||||
Power-One, Inc.*+ | 8,800 | 36,168 | ||||||
Sanmina Corp.* | 102,150 | 1,130,800 | ||||||
SMTC Corp.*+ | 10,700 | 25,787 | ||||||
SYNNEX Corp.* | 35,900 | 1,234,242 | ||||||
TTM Technologies, Inc.* | 151,725 | 1,395,870 | ||||||
Vishay Precision Group, Inc.* | 9,048 | 119,615 | ||||||
|
| |||||||
|
7,343,317 |
| ||||||
Energy Equipment & Services - 2.91% |
| |||||||
Basic Energy Services, Inc.*+ | 49,000 | 559,090 | ||||||
Cal Dive International, Inc.* | 176,850 | 305,951 | ||||||
Dawson Geophysical Co.* | 26,000 | 685,880 | ||||||
ENGlobal Corp.* | 71,200 | 37,736 | ||||||
Exterran Holdings, Inc.* | 79,800 | 1,749,216 | ||||||
Global Geophysical Services, Inc.* | 41,500 | 159,775 | ||||||
Key Energy Services, Inc.* | 102,600 | 713,070 | ||||||
Parker Drilling Co.* | 184,950 | 850,770 | ||||||
PHI, Inc.* | 6,900 | 231,081 | ||||||
Pioneer Energy Services Corp.* | 63,000 | 457,380 | ||||||
TGC Industries, Inc. | 11,655 | 95,454 | ||||||
Vantage Drilling Co.* | 45,400 | 83,082 | ||||||
Willbros Group, Inc.* | 60,300 | 323,208 | ||||||
|
| |||||||
|
6,251,693 |
| ||||||
Food & Staples Retailing - 2.38% | ||||||||
Andersons, Inc. (The) | 25,400 | 1,089,660 | ||||||
Ingles Markets, Inc., Class A | 22,400 | 386,624 | ||||||
Nash Finch Co. | 20,300 | 431,984 | ||||||
Pantry, Inc. (The)* | 20,800 | 252,304 | ||||||
Spartan Stores, Inc. | 16,700 | 256,512 | ||||||
SUPERVALU, Inc.+ | 268,100 | 662,207 | ||||||
Susser Holdings Corp.* | 18,850 | 650,136 | ||||||
Village Super Market, Inc., Class A | 13,000 | 427,180 | ||||||
8 | Semi-Annual Report | December 31, 2012 (Unaudited) |
Bridgeway Omni Small-Cap Value Fund SCHEDULE OF INVESTMENTS (continued) | |
Showing percentage of net assets as of December 31, 2012 (Unaudited)
| Industry Company | Shares | Value | ||||||
Common Stocks (continued) | ||||||||
Food & Staples Retailing (continued) |
| |||||||
Weis Markets, Inc. | 24,300 | $ | 951,831 | |||||
|
| |||||||
|
5,108,438 |
| ||||||
Food Products - 1.32% |
| |||||||
Chiquita Brands | ||||||||
International, Inc.* | 18,800 | 155,100 | ||||||
Diamond Foods, Inc.+ | 15,300 | 209,151 | ||||||
Dole Food Co., Inc.* | 40,700 | 466,829 | ||||||
Farmer Bros. Co.* | 12,700 | 183,261 | ||||||
Feihe International, Inc.*+ | 13,800 | 91,080 | ||||||
Fresh Del Monte Produce, Inc. | 33,800 | 890,630 | ||||||
John B. Sanfilippo & Son, Inc. | 9,200 | 167,256 | ||||||
Omega Protein Corp.* | 23,650 | 144,738 | ||||||
Seneca Foods Corp., Class A* | 5,200 | 158,080 | ||||||
SkyPeople Fruit Juice, Inc.*+ | 62,900 | 126,429 | ||||||
Zhongpin, Inc.* | 18,700 | 240,108 | ||||||
|
| |||||||
|
2,832,662 |
| ||||||
Health Care Equipment & Supplies - 0.27% |
| |||||||
Alphatec Holdings, Inc.* | 124,200 | 204,930 | ||||||
DynaVox, Inc., Class A* | 66,300 | 24,531 | ||||||
Fonar Corp.* | 17,700 | 76,641 | ||||||
Invacare Corp. | 14,350 | 233,905 | ||||||
RTI Biologics, Inc.* | 1,600 | 6,832 | ||||||
Theragenics Corp.* | 20,000 | 31,800 | ||||||
|
| |||||||
|
578,639 |
| ||||||
Health Care Providers & Services - 3.86% |
| |||||||
Addus HomeCare Corp.* | 4,800 | 34,176 | ||||||
Almost Family, Inc. | 4,250 | 86,105 | ||||||
Amedisys, Inc.* | 13,150 | 148,200 | ||||||
AMN Healthcare Services, Inc.* | 44,134 | 509,748 | ||||||
Amsurg Corp.* | 28,550 | 856,785 | ||||||
BioScrip, Inc.* | 24,550 | 264,403 | ||||||
CardioNet, Inc.* | 74,500 | 169,860 | ||||||
Cross Country Healthcare, Inc.* | 24,050 | 115,440 | ||||||
Emeritus Corp.* | 31,200 | 771,264 | ||||||
Ensign Group, Inc. (The) | 9,450 | 256,946 | ||||||
Five Star Quality Care, Inc.* | 21,300 | 106,713 | ||||||
Healthways, Inc.* | 15,150 | 162,105 | ||||||
Kindred Healthcare, Inc.* | 28,550 | 308,911 | ||||||
Molina Healthcare, Inc.* | 41,650 | 1,127,049 | ||||||
PharMerica Corp.* | 44,350 | 631,544 | ||||||
Providence Service Corp. (The)* | 16,000 | 271,840 | ||||||
| Industry Company | Shares | Value | ||||||
Health Care Providers & Services (continued) |
| |||||||
Select Medical Holdings Corp. | 118,800 | $ | 1,120,284 | |||||
Skilled Healthcare Group, Inc., Class A* | 46,748 | 297,785 | ||||||
Triple-S Management Corp., Class B* | 39,900 | 736,953 | ||||||
Universal American Corp. | 35,100 | 301,509 | ||||||
|
| |||||||
|
8,277,620 |
| ||||||
Hotels, Restaurants & Leisure - 5.22% |
| |||||||
Ark Restaurants Corp. | 1,600 | 26,960 | ||||||
Bob Evans Farms, Inc. | 21,275 | 855,255 | ||||||
Boyd Gaming Corp.*+ | 136,100 | 903,704 | ||||||
Carrols Restaurant Group, Inc.* | 18,025 | 107,790 | ||||||
CEC Entertainment, Inc. | 21,650 | 718,564 | ||||||
Cracker Barrel Old Country Store, Inc. | 20,600 | 1,323,756 | ||||||
DineEquity, Inc.* | 10,300 | 690,100 | ||||||
Dover Downs Gaming & Entertainment, Inc. | 12,500 | 27,500 | ||||||
Einstein Noah Restaurant Group, Inc. | 19,225 | 234,737 | ||||||
Famous Dave’s of America, Inc.* | 3,400 | 31,246 | ||||||
Fiesta Restaurant Group, Inc.* | 18,025 | 276,143 | ||||||
Frisch’s Restaurants, Inc. | 6,800 | 125,800 | ||||||
Full House Resorts, Inc.* | 8,400 | 28,980 | ||||||
Isle of Capri Casinos, Inc.* | 53,600 | 300,160 | ||||||
Jack in the Box, Inc.* | 36,050 | 1,031,030 | ||||||
Kona Grill, Inc.* | 4,100 | 35,547 | ||||||
Lakes Entertainment, Inc.* | 22,700 | 68,100 | ||||||
Luby’s, Inc.* | 12,600 | 84,294 | ||||||
Marcus Corp. | 13,350 | 166,474 | ||||||
Monarch Casino & Resort, Inc.* | 29,400 | 320,754 | ||||||
MTR Gaming Group, Inc.* | 40,600 | 169,302 | ||||||
Nevada Gold & Casinos, Inc.* | 7,800 | 6,006 | ||||||
Pinnacle Entertainment, Inc.* | 47,450 | 751,134 | ||||||
Red Robin Gourmet Burgers, Inc.* | 6,800 | 239,972 | ||||||
Ruby Tuesday, Inc.* | 103,600 | 814,296 | ||||||
Ruth’s Hospitality Group, Inc.* | 44,000 | 319,880 | ||||||
Scientific Games Corp., | 41,350 | 358,504 | ||||||
Sonic Corp.* | 70,000 | 728,700 | ||||||
Speedway Motorsports, Inc. | 7,700 | 137,368 | ||||||
www.bridgewayomni.com | 9 |
Bridgeway Omni Small-Cap Value Fund SCHEDULE OF INVESTMENTS (continued) | |
Showing percentage of net assets as of December 31, 2012 (Unaudited)
| Industry Company | Shares | Value | ||||||
Common Stocks (continued) | ||||||||
Hotels, Restaurants & Leisure (continued) |
| |||||||
Town Sports International Holdings, Inc. | 30,000 | $ 319,500 | ||||||
|
| |||||||
|
11,201,556 |
| ||||||
Household Durables - 1.19% | ||||||||
Bassett Furniture Industries, Inc. | 21,900 | 273,093 | ||||||
CSS Industries, Inc. | 11,800 | 258,302 | ||||||
Flexsteel Industries, Inc. | 4,900 | 105,105 | ||||||
Hooker Furniture Corp. | 10,900 | 158,377 | ||||||
La-Z-Boy, Inc. | 21,800 | 308,470 | ||||||
Libbey, Inc.* | 30,649 | 593,058 | ||||||
Lifetime Brands, Inc. | 9,700 | 102,917 | ||||||
NACCO Industries, Inc., Class A | 9,250 | 561,383 | ||||||
Stanley Furniture Co., Inc.* | 44,900 | 202,050 | ||||||
|
| |||||||
|
2,562,755 |
| ||||||
Household Products - 0.61% | ||||||||
Central Garden & Pet Co., Class A* | 31,750 | 331,788 | ||||||
Harbinger Group, Inc.* | 115,200 | 885,888 | ||||||
Oil-Dri Corp. of America | 3,150 | 86,940 | ||||||
|
| |||||||
|
1,304,616 |
| ||||||
Independent Power Producers & Energy Traders - 0.03% |
| |||||||
Genie Energy, Ltd., Class B | 10,275 | 72,952 | ||||||
Insurance - 5.08% | ||||||||
American Equity Investment Life Holding Co. | 69,850 | 852,868 | ||||||
American Safety Insurance Holdings, Ltd.* | 17,200 | 325,424 | ||||||
Crawford & Co., Class B | 73,674 | 587,919 | ||||||
Eastern Insurance Holdings, Inc. | 15,400 | 263,032 | ||||||
EMC Insurance Group, Inc. | 5,800 | 138,504 | ||||||
FBL Financial Group, Inc., Class A | 13,950 | 477,229 | ||||||
Fortegra Financial Corp.* | 24,185 | 215,005 | ||||||
Hallmark Financial Services, Inc.* | 19,100 | 179,349 | ||||||
Homeowners Choice, Inc.+ | 9,900 | 205,821 | ||||||
Horace Mann Educators Corp. | 31,200 | 622,752 | ||||||
Independence Holding Co. | 19,326 | 183,984 | ||||||
Infinity Property & Casualty Corp. | 11,400 | 663,936 | ||||||
Maiden Holdings, Ltd. | 57,600 | 529,344 | ||||||
Meadowbrook Insurance Group, Inc. | 122,250 | 706,605 | ||||||
| Industry Company | Shares | Value | ||||||
| ||||||||
Insurance (continued) | ||||||||
Montpelier Re Holdings, Ltd. | 46,400 | $ 1,060,704 | ||||||
National Financial Partners Corp.* | 19,150 | 328,231 | ||||||
National Western Life Insurance Co., Class A | 1,625 | 256,328 | ||||||
Navigators Group, Inc. (The)* | 5,900 | 301,313 | ||||||
Selective Insurance Group, Inc. | 24,250 | 467,297 | ||||||
State Auto Financial Corp. | 18,100 | 270,414 | ||||||
Stewart Information Services Corp. | 8,650 | 224,900 | ||||||
Symetra Financial Corp. | 75,950 | 985,831 | ||||||
Tower Group, Inc. | 11,300 | 200,801 | ||||||
United Fire Group, Inc. | 27,500 | 600,600 | ||||||
Universal Insurance Holdings, Inc. | 56,816 | 248,854 | ||||||
|
| |||||||
|
10,897,045 |
| ||||||
Internet & Catalog Retail - 0.46% | ||||||||
1-800-Flowers.com, Inc., Class A* | 74,150 | 272,131 | ||||||
dELiA*s, Inc.* | 13,300 | 15,561 | ||||||
Nutrisystem, Inc.+ | 29,800 | 244,062 | ||||||
Orbitz Worldwide, Inc.* | 118,900 | 323,408 | ||||||
Overstock.com, Inc.*+ | 9,800 | 140,238 | ||||||
|
| |||||||
|
995,400 |
| ||||||
Internet Software & Services - 1.15% | ||||||||
Digital River, Inc.* | 29,100 | 418,749 | ||||||
EarthLink, Inc. | 113,700 | 734,502 | ||||||
Monster Worldwide, Inc.*+ | 65,100 | 365,862 | ||||||
QuinStreet, Inc.*+ | 20,000 | 134,400 | ||||||
Tucows, Inc.* | 76,800 | 110,592 | ||||||
United Online, Inc. | 126,900 | 709,371 | ||||||
|
| |||||||
|
2,473,476 |
| ||||||
IT Services - 2.38% | ||||||||
Acxiom Corp.* | 56,050 | 978,633 | ||||||
Analysts International Corp.* | 2,800 | 8,848 | ||||||
CACI International, Inc., Class A* | 21,400 | 1,177,642 | ||||||
CIBER, Inc.* | 32,350 | 108,049 | ||||||
CSG Systems International, Inc.* | 27,450 | 499,041 | ||||||
Dynamics Research Corp.* | 10,300 | 60,255 | ||||||
Edgewater Technology, Inc.* | 5,600 | 21,280 | ||||||
Global Cash Access Holdings, Inc.* | 51,500 | 403,760 | ||||||
Hackett Group, Inc. (The) | 22,300 | 95,444 | ||||||
10 | Semi-Annual Report | December 31, 2012 (Unaudited) |
Bridgeway Omni Small-Cap Value Fund SCHEDULE OF INVESTMENTS (continued) | |
Showing percentage of net assets as of December 31, 2012 (Unaudited)
| Industry Company | Shares | Value | ||||||
Common Stocks (continued) | ||||||||
IT Services (continued) | ||||||||
Lender Processing Services, Inc. | 10,700 | $ 263,434 | ||||||
Mantech International Corp., Class A+ | 50,600 | 1,312,564 | ||||||
NCI, Inc., Class A* | 6,100 | 28,609 | ||||||
Online Resources Corp.* | 53,250 | 120,877 | ||||||
Pfsweb, Inc.* | 10,300 | 29,252 | ||||||
|
| |||||||
|
5,107,688 |
| ||||||
Leisure Equipment & Products - 0.39% |
| |||||||
Arctic Cat, Inc.* | 8,400 | 280,476 | ||||||
Johnson Outdoors, Inc., Class A* | 15,700 | 312,744 | ||||||
Nautilus, Inc.* | 53,900 | 189,189 | ||||||
Summer Infant, Inc.* | 34,100 | 59,334 | ||||||
|
| |||||||
|
841,743 |
| ||||||
Life Sciences Tools & Services - 0.07% |
| |||||||
Cambrex Corp.* | 13,150 | 149,647 | ||||||
Machinery - 1.77% |
| |||||||
Accuride Corp.* | 61,900 | 198,699 | ||||||
Albany International Corp., Class A | 11,350 | 257,418 | ||||||
Ampco-Pittsburgh Corp. | 3,800 | 75,924 | ||||||
Briggs & Stratton Corp. | 24,300 | 512,244 | ||||||
China Valves Technology, Inc.* | 56,500 | 25,425 | ||||||
Cleantech Solutions International, Inc.*+ | 11,500 | 45,425 | ||||||
Columbus McKinnon Corp.* | 18,500 | 305,620 | ||||||
Commercial Vehicle Group, Inc.* | 39,100 | 321,011 | ||||||
FreightCar America, Inc. | 14,200 | 318,364 | ||||||
Greenbrier Cos., Inc.* | 10,200 | 164,934 | ||||||
Hyster-Yale Materials Handling, Inc. | 6,100 | 297,680 | ||||||
LB Foster Co., Class A | 3,900 | 169,416 | ||||||
Lydall, Inc.* | 8,200 | 117,588 | ||||||
Miller Industries, Inc. | 10,400 | 158,600 | ||||||
Mueller Water Products, Inc., Class A | 92,000 | 516,120 | ||||||
NF Energy Saving Corp.* | 29,200 | 29,784 | ||||||
NN, Inc.* | 17,950 | 164,422 | ||||||
Supreme Industries, Inc., Class A* | 34,100 | 116,281 | ||||||
|
| |||||||
|
3,794,955 |
| ||||||
Marine - 0.23% |
| |||||||
Baltic Trading, Ltd. | 42,800 | 127,544 | ||||||
Eagle Bulk Shipping, Inc.*+ | 19,000 | 28,500 | ||||||
Excel Maritime Carriers, Ltd.* | 99,400 | 43,239 | ||||||
| Industry Company | Shares | Value | ||||||
| ||||||||
Marine (continued) | ||||||||
Genco Shipping & Trading, Ltd.*+ | 45,200 | $ 157,748 | ||||||
International Shipholding Corp. | 8,050 | 132,664 | ||||||
|
| |||||||
|
489,695 |
| ||||||
Media - 1.99% | ||||||||
AH Belo Corp., Class A | 41,700 | 193,905 | ||||||
Ballantyne Strong, Inc.* | 14,000 | 46,200 | ||||||
Belo Corp., Class A | 28,550 | 218,978 | ||||||
Cumulus Media, Inc., Class A* | 25,200 | 67,284 | ||||||
Dex One Corp.* | 97,100 | 153,418 | ||||||
E.W. Scripps Co., Class A (The)* | 26,500 | 286,465 | ||||||
Entercom Communications Corp., Class A* | 46,545 | 324,884 | ||||||
Entravision Communications Corp., Class A | 38,300 | 63,578 | ||||||
Gray Television, Inc.* | 99,550 | 219,010 | ||||||
Journal Communications, Inc., Class A* | 57,100 | 308,911 | ||||||
Lee Enterprises, Inc.* | 43,200 | 49,248 | ||||||
Media General, Inc., Class A*+ | 15,300 | 65,790 | ||||||
New York Times Co., Class A (The)* | 93,850 | 800,541 | ||||||
Radio One, Inc., Class D* | 23,100 | 17,556 | ||||||
Reading International, Inc., Class A* | 10,700 | 64,307 | ||||||
Salem Communications Corp., Class A | 24,800 | 135,408 | ||||||
Scholastic Corp. | 18,250 | 539,470 | ||||||
Valassis Communications, Inc.+ | 28,100 | 724,418 | ||||||
|
| |||||||
|
4,279,371 |
| ||||||
Metals & Mining - 1.86% | ||||||||
Friedman Industries, Inc. | 3,000 | 30,360 | ||||||
Golden Star Resources, Ltd.* | 343,000 | 631,120 | ||||||
Handy & Harman, Ltd.* | 12,500 | 188,375 | ||||||
Horsehead Holding Corp.* | 7,800 | 79,638 | ||||||
Jaguar Mining, Inc.*+ | 168,800 | 106,597 | ||||||
Materion Corp. | 16,600 | 427,948 | ||||||
Noranda Aluminum Holding Corp. | 89,850 | 548,984 | ||||||
Worthington Industries, Inc. | 76,200 | 1,980,438 | ||||||
|
| |||||||
|
3,993,460 |
| ||||||
Multiline Retail - 0.53% | ||||||||
Bon-Ton Stores, Inc. (The) | 25,950 | 314,514 | ||||||
www.bridgewayomni.com | 11 |
Bridgeway Omni Small-Cap Value Fund SCHEDULE OF INVESTMENTS (continued) | |
Showing percentage of net assets as of December 31, 2012 (Unaudited)
| Industry Company | Shares | Value | ||||||
Common Stocks (continued) | ||||||||
Multiline Retail (continued) | ||||||||
Fred’s, Inc., Class A | 46,200 | $ 614,922 | ||||||
Tuesday Morning Corp.* | 34,600 | 216,250 | ||||||
|
| |||||||
|
1,145,686 |
| ||||||
Oil, Gas & Consumable Fuels - 5.84% | ||||||||
Adams Resources & Energy, Inc. | 9,500 | 333,165 | ||||||
Alon USA Energy, Inc. | 83,100 | 1,503,279 | ||||||
Bill Barrett Corp.* | 11,200 | 199,248 | ||||||
BioFuel Energy Corp.*+ | 10,900 | 40,112 | ||||||
Callon Petroleum Co.* | 57,300 | 269,310 | ||||||
Clayton Williams Energy, Inc.*+ | 16,000 | 640,000 | ||||||
Cloud Peak Energy, Inc.* | 82,800 | 1,600,524 | ||||||
Comstock Resources, Inc.* | 31,100 | 470,543 | ||||||
Crimson Exploration, Inc.* | 85,250 | 233,585 | ||||||
Crosstex Energy, Inc. | 59,450 | 852,513 | ||||||
Delek US Holdings, Inc. | 46,600 | 1,179,912 | ||||||
Double Eagle Petroleum Co.* | 17,600 | 69,344 | ||||||
EPL Oil & Gas, Inc.* | 21,500 | 484,825 | ||||||
Forest Oil Corp.* | 47,600 | 318,444 | ||||||
Green Plains Renewable Energy, Inc.* | 58,200 | 460,362 | ||||||
James River Coal Co.*+ | 22,400 | 71,680 | ||||||
Longwei Petroleum Investment Holding, Ltd.*+ | 100,300 | 211,633 | ||||||
Penn Virginia Corp. | 78,000 | 343,980 | ||||||
PostRock Energy Corp.* | 12,000 | 17,760 | ||||||
REX American Resources Corp.* | 12,800 | 246,912 | ||||||
Sino Clean Energy, Inc.* | 50,300 | 5,533 | ||||||
Stone Energy Corp.* | 42,100 | 863,892 | ||||||
Swift Energy Co.* | 45,400 | 698,706 | ||||||
W&T Offshore, Inc.+ | 74,600 | 1,195,838 | ||||||
Warren Resources, Inc.* | 79,600 | 223,676 | ||||||
|
| |||||||
|
12,534,776 |
| ||||||
Paper & Forest Products - 2.62% | ||||||||
Clearwater Paper Corp.* | 7,600 | 297,616 | ||||||
KapStone Paper & Packaging Corp. | 68,650 | 1,523,343 | ||||||
Mercer International, Inc.* | 77,250 | 553,110 | ||||||
Neenah Paper, Inc. | 20,200 | 575,094 | ||||||
Orient Paper, Inc. | 37,000 | 66,230 | ||||||
PH Glatfelter Co. | 53,450 | 934,306 | ||||||
Resolute Forest Products*+ | 77,000 | 1,019,480 | ||||||
Wausau Paper Corp. | 76,200 | 659,892 | ||||||
|
| |||||||
|
5,629,071 |
| ||||||
| Industry Company | Shares | Value | ||||||
| ||||||||
Personal Products - 0.06% | ||||||||
Nutraceutical International Corp. | 7,700 | $ 127,358 | ||||||
Synutra International, Inc.* | 300 | 1,389 | ||||||
|
| |||||||
|
128,747 |
| ||||||
Professional Services - 1.28% |
| |||||||
Barrett Business Services, Inc. | 10,100 | 384,709 | ||||||
CBIZ, Inc.* | 42,775 | 252,800 | ||||||
CDI Corp. | 15,400 | 263,802 | ||||||
CRA International, Inc.* | 13,800 | 272,826 | ||||||
Dolan Co. (The)* | 56,200 | 218,618 | ||||||
Hudson Global, Inc.* | 32,300 | 144,704 | ||||||
ICF International, Inc.* | 7,150 | 167,596 | ||||||
Insperity, Inc. | 15,400 | 501,424 | ||||||
Kelly Services, Inc., Class A | 13,600 | 214,064 | ||||||
Navigant Consulting, Inc.* | 11,000 | 122,760 | ||||||
RCM Technologies, Inc. | 6,100 | 30,805 | ||||||
VSE Corp. | 6,700 | 164,217 | ||||||
|
| |||||||
|
2,738,325 |
| ||||||
Road & Rail - 1.16% |
| |||||||
Arkansas Best Corp. | 25,000 | 238,750 | ||||||
Avis Budget Group, Inc.* | 70,750 | 1,402,265 | ||||||
Celadon Group, Inc. | 8,400 | 151,788 | ||||||
Covenant Transportation Group, Inc., Class A* | 5,300 | 29,309 | ||||||
Marten Transport, Ltd. | 8,150 | 149,879 | ||||||
Saia, Inc.* | 15,750 | 364,140 | ||||||
Universal Truckload Services, Inc. | 7,809 | 142,514 | ||||||
USA Truck, Inc.* | 300 | 1,029 | ||||||
|
| |||||||
|
2,479,674 |
| ||||||
Semiconductors & Semiconductor Equipment - 1.87% |
| |||||||
Advanced Energy Industries, Inc.* | 11,800 | 162,958 | ||||||
Amkor Technology, Inc.*+ | 124,750 | 530,187 | ||||||
AXT, Inc.* | 55,200 | 155,112 | ||||||
GT Advanced Technologies, Inc.*+ | 96,700 | 292,034 | ||||||
Integrated Silicon Solution, Inc.* | 49,000 | 441,000 | ||||||
inTEST Corp. | 8,000 | 22,400 | ||||||
Kulicke & Soffa Industries, Inc.* | 45,000 | 539,550 | ||||||
Magnachip Semiconductor Corp.* | 38,400 | 611,328 | ||||||
Photronics, Inc.* | 105,950 | 631,462 | ||||||
Spansion, Inc., Class A* | 26,500 | 368,615 | ||||||
12 | Semi-Annual Report | December 31, 2012 (Unaudited) |
Bridgeway Omni Small-Cap Value Fund SCHEDULE OF INVESTMENTS (continued) | |
Showing percentage of net assets as of December 31, 2012 (Unaudited)
| Industry Company | Shares | Value | ||||||
Common Stocks (continued) | ||||||||
Semiconductors & Semiconductor Equipment (continued) |
| |||||||
Ultra Clean Holdings* | 51,600 | $ 253,356 | ||||||
|
| |||||||
|
4,008,002 |
| ||||||
Software - 0.25% | ||||||||
Cinedigm Digital Cinema Corp., Class A* | 29,100 | 40,740 | ||||||
Majesco Entertainment Co.* | 58,800 | 61,740 | ||||||
Net 1 UEPS Technologies, Inc.* | 3,400 | 17,374 | ||||||
NetSol Technologies, Inc.* | 31,000 | 184,450 | ||||||
TeleCommunication Systems, Inc., Class A* | 92,500 | 228,475 | ||||||
|
| |||||||
|
532,779 |
| ||||||
Specialty Retail - 8.19% | ||||||||
Aeropostale, Inc.* | 29,100 | 378,591 | ||||||
ANN, Inc.* | 57,600 | 1,949,184 | ||||||
Appliance Recycling Centers of America, Inc.* | 5,300 | 6,996 | ||||||
Asbury Automotive Group, Inc.* | 13,125 | 420,394 | ||||||
Barnes & Noble, Inc.* | 73,400 | 1,107,606 | ||||||
Body Central Corp.* | 26,100 | 259,956 | ||||||
Books-A-Million, Inc.* | 31,600 | 84,056 | ||||||
Brown Shoe Co., Inc. | 51,400 | 944,218 | ||||||
Build-A-Bear Workshop, Inc.* | 8,050 | 30,751 | ||||||
Casual Male Retail Group, Inc.* | 20,500 | 86,100 | ||||||
Children’s Place Retail Stores, Inc. (The)* | 22,100 | 978,809 | ||||||
Citi Trends, Inc.* | 28,900 | 397,664 | ||||||
Conn’s, Inc.*+ | 13,450 | 412,646 | ||||||
Destination Maternity Corp. | 10,400 | 224,224 | ||||||
Group 1 Automotive, Inc. | 30,600 | 1,896,894 | ||||||
Haverty Furniture Cos., Inc. | 11,300 | 184,303 | ||||||
hhgregg, Inc.*+ | 55,200 | 387,504 | ||||||
Hot Topic, Inc. | 29,150 | 281,298 | ||||||
Kirkland’s, Inc.* | 11,550 | 122,314 | ||||||
New York & Co., Inc.* | 26,200 | 99,822 | ||||||
Office Depot, Inc.* | 338,900 | 1,111,592 | ||||||
OfficeMax, Inc. | 130,700 | 1,275,632 | ||||||
Pep Boys-Manny, Moe & Jack (The) | 52,000 | 511,160 | ||||||
Perfumania Holdings, Inc.* | 7,000 | 34,440 | ||||||
RadioShack Corp.+ | 41,804 | 88,624 | ||||||
rue21, inc.* | 8,300 | 235,637 | ||||||
Shoe Carnival, Inc. | 14,700 | 301,203 | ||||||
Sonic Automotive, Inc., Class A | 61,500 | 1,284,735 | ||||||
Stage Stores, Inc. | 46,600 | 1,154,748 | ||||||
Stein Mart, Inc. | 33,750 | 254,475 | ||||||
| Industry Company | Shares | Value | ||||||
| ||||||||
Specialty Retail (continued) | ||||||||
Systemax, Inc. | 33,700 | $ 325,205 | ||||||
TravelCenters of America LLC* | 35,400 | 166,380 | ||||||
West Marine, Inc.* | 35,300 | 379,475 | ||||||
Wet Seal, Inc., Class A (The)* | 72,200 | 199,272 | ||||||
|
| |||||||
|
17,575,908 |
| ||||||
Textiles, Apparel & Luxury Goods - 1.41% |
| |||||||
Crown Crafts, Inc. | 24,500 | 122,500 | ||||||
Jones Group, Inc. (The)+ | 87,800 | 971,068 | ||||||
Lakeland Industries, Inc.* | 3,300 | 16,401 | ||||||
Perry Ellis International, Inc. | 25,500 | 507,450 | ||||||
Quiksilver, Inc.* | 49,900 | 212,075 | ||||||
Rocky Brands, Inc.* | 9,900 | 128,898 | ||||||
Skechers U.S.A., Inc., Class A* | 27,000 | 499,500 | ||||||
Unifi, Inc.* | 44,300 | 576,343 | ||||||
|
| |||||||
|
3,034,235 |
| ||||||
Thrifts & Mortgage Finance - 2.49% |
| |||||||
Astoria Financial Corp. | 112,100 | 1,049,256 | ||||||
Bank Mutual Corp. | 77,700 | 334,110 | ||||||
BankFinancial Corp. | 35,100 | 260,442 | ||||||
BBX Capital Corp., Class A*+ | 11,000 | 73,700 | ||||||
Doral Financial Corp.* | 57,100 | 41,346 | ||||||
ESB Financial Corp. | 15,000 | 208,050 | ||||||
Federal Agricultural Mortgage Corp., Class C | 6,500 | 211,250 | ||||||
First Defiance Financial Corp. | 19,400 | 372,286 | ||||||
First Financial Holdings, Inc. | 31,900 | 417,252 | ||||||
First Financial Northwest, Inc.* | 35,182 | 265,624 | ||||||
First Pactrust Bancorp, Inc. | 13,200 | 161,964 | ||||||
Flushing Financial Corp. | 15,262 | 234,119 | ||||||
Heritage Financial Group, Inc. | 16,800 | 231,672 | ||||||
Meta Financial Group, Inc. | 1,400 | 31,920 | ||||||
MutualFirst Financial, Inc. | 10,900 | 126,876 | ||||||
NASB Financial, Inc.*+ | 1,800 | 38,466 | ||||||
Provident Financial Services, Inc. | 53,900 | 804,188 | ||||||
Pulaski Financial Corp.+ | 4,900 | 43,855 | ||||||
United Community Financial Corp.* | 52,300 | 151,147 | ||||||
WSFS Financial Corp. | 7,000 | 295,750 | ||||||
|
| |||||||
|
5,353,273 |
| ||||||
Trading Companies & Distributors - 0.23% |
| |||||||
Aircastle, Ltd. | 24,600 | 308,484 | ||||||
www.bridgewayomni.com | 13 |
Bridgeway Omni Small-Cap Value Fund SCHEDULE OF INVESTMENTS (continued) | |
Showing percentage of net assets as of December 31, 2012 (Unaudited)
| Industry Company | Shares | Value | ||||||
Common Stocks (continued) | ||||||||
Trading Companies & Distributors (continued) |
| |||||||
Willis Lease Finance Corp.* | 12,100 | $ | 173,151 | |||||
|
| |||||||
|
481,635 |
| ||||||
Wireless Telecommunication Services - 0.37% |
| |||||||
Leap Wireless International, Inc.*+ | 68,100 | 452,865 | ||||||
NTELOS Holdings Corp. | 11,800 | 154,698 | ||||||
Shenandoah Telecommunications Co. | 5,600 | 85,736 | ||||||
USA Mobility, Inc. | 8,400 | 98,112 | ||||||
|
| |||||||
| 791,411 | ||||||||
|
| |||||||
TOTAL COMMON STOCKS - 98.99% |
|
|
212,463,442 |
| ||||
|
| |||||||
(Cost $190,441,291) | ||||||||
| Rate^ | Shares | Value | ||||||||||
|
| |||||||||||
MONEY MARKET FUND - 1.09% |
| |||||||||||
BlackRock FedFund | 0.01 | % | 2,348,330 | 2,348,330 | ||||||||
|
| |||||||||||
TOTAL MONEY MARKET FUND - 1.09% |
|
|
2,348,330 |
| ||||||||
|
| |||||||||||
(Cost $2,348,330) | ||||||||||||
TOTAL INVESTMENTS - 100.08% |
| $ | 214,811,772 | |||||||||
(Cost $192,789,621) | ||||||||||||
Liabilities in Excess of Other Assets - (0.08%) |
| (172,797 | ) | |||||||||
|
| |||||||||||
NET ASSETS - 100.00% |
| $ | 214,638,975 | |||||||||
|
| |||||||||||
* Non-income producing security. ^ Rate disclosed as of December 31, 2012. + This security or a portion of the security is out on loan at December 31, 2012. Total loaned securities had a value of $13,117,516 at December 31, 2012.
LLC - Limited Liability Company
Summary of inputs used to value the Fund’s investments as of 12/31/2012 is as follows (See Note 2 in Notes to Financial Statements):
|
| |||||||||||
| Valuation Inputs | ||||||||||||||||
| Investment in Securities (Value) | ||||||||||||||||
| Level 1 Quoted Prices | Level 2 Significant Observable Inputs | Level 3 Significant Unobservable Inputs | Total | |||||||||||||
Common Stocks | $ | 212,463,442 | $ | — | $— | $ | 212,463,442 | |||||||||
Money Market | — | 2,348,330 | — | 2,348,330 | ||||||||||||
|
|
|
|
|
|
|
| |||||||||
TOTAL | $ | 212,463,442 | $ | 2,348,330 | $— | $ | 214,811,772 | |||||||||
|
|
|
|
|
|
|
| |||||||||
Following is a reconciliation of Level 3 investments for which significant unobservable inputs were used to determine fair value:
| Investment in Securities (Value) | ||||||||||||||||
| Common Stocks | Rights | Total | ||||||||||||||
Balance as of 06/30/2012 | $ 40,240 | $ | 16,167 | $ | 56,407 | |||||||||||
Purchases | — | — | — | |||||||||||||
Sales1 | — | (51,923) | (51,923) | |||||||||||||
Realized gain/(loss) | — | — | — | |||||||||||||
Change in unrealized appreciation/ (depreciation)2 | — | 35,756 | 35,756 | |||||||||||||
Transfers in | — | — | — | |||||||||||||
Transfers out3,4 | (40,240) | — | (40,240) | |||||||||||||
| �� |
|
|
|
|
|
| ||||||||||
Balance as of 12/31/2012 | $ — | $ | — | $ | — | |||||||||||
|
|
|
|
|
| |||||||||||
Net change in unrealized appreciation (depreciation) from investments held as of 12/31/2012 | $ — | $ | — | $ | — | |||||||||||
|
|
|
|
|
| |||||||||||
1 Sales include expiration of rights. |
2 Change in unrealized appreciation/(depreciation) for Level 3 securities is included on the Statement of Operations in the Change in Unrealized Appreciation (Depreciation) of Investments. |
3 Transfer out represents the value as of the beginning of the reporting period, for any investment security where significant transfers in the pricing level occurred during the period. The purchase value is used in situations where the investment was not held as of the beginning of the period. |
4 Transfer took place as a result of trading resuming.
See Notes to Financial Statements. |
14 | Semi-Annual Report | December 31, 2012 (Unaudited) |
|
December 31, 2012
Dear Fellow Omni Tax-Managed Small-Cap Value Fund Shareholder,
For the quarter ended December 31, 2012, total returns were 3.23% for the Fund and 3.22% for the Russell 2000 Value Index.
For the six-month “semi-annual” period ended December 31, 2012, total returns were 9.19% for the Fund and 9.07% for the Russell 2000 Value Index.
For the calendar year ended December 31, 2012, total returns were 16.62% for the Fund and 18.05% for the Russell 2000 Value Index.
The table below presents our quarter, six-month, one-year and inception-to-date financial results. See below for a graph of performance since inception.
Standardized Returns as of December 31, 2012
| Annualized | ||||||||
| Quarter | 6 Months | 1 Year | Since Inception (12/31/10) | |||||
| ||||||||
Omni Tax-Managed Small-Cap Value Fund | 3.23% | 9.19% | 16.62% | 5.03% | ||||
Russell 2000 Value Index | 3.22% | 9.07% | 18.05% | 5.62% | ||||
Performance figures quoted in the table above and the graph below represent past performance and are no guarantee of future results. Total return figures in the table above and the graph below include the reinvestment of dividends and capital gains. The table above and the graph below do not reflect the deduction of taxes that a shareholder would pay on Fund distributions or on the redemption of Fund shares.
The Russell 2000 Value Index is an unmanaged index that consists of stocks in the Russell 2000 Index with lower price-to-book ratios and lower forecasted growth values with dividends reinvested. It is not possible to invest directly in an index. Periods longer than one year are annualized.
Omni Tax-Managed Small-Cap Value Fund vs. Russell 2000 Value Index from Inception 12/31/10 to 12/31/12
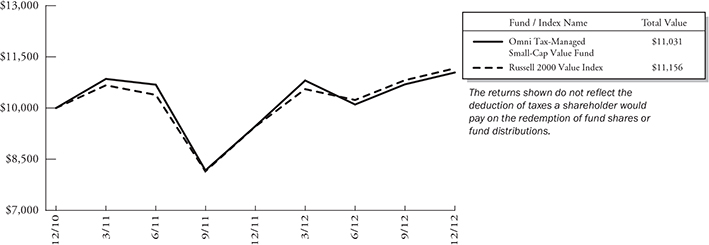
www.bridgewayomni.com | 15 |
Omni Tax-Managed Small-Cap Value Fund MANAGER’S COMMENTARY (Unaudited) (continued) | |
Detailed Explanation of Quarterly Performance
The Omni Tax-Managed Small-Cap Value Fund is designed to capture the returns of the small-cap value asset class through broad diversification of small company and value stocks. We also seek to minimize the distribution of capital gains within the constraints of the investment objective. This approach is sometimes referred to as “passive, asset class investing.” As of December 31, 2012, we held 651 such stocks in a market cap weighted style. We make no attempt to track any particular index in either performance or statistics.
The Fund returns were driven by the fact that returns for small value stocks were positive and outperformed small growth stocks as well as large stocks. Our design tilt toward deeper value and smaller stocks hurt our performance. Sector performance varied greatly and our underweighting in the poor performing Utilities sector as well as our overweighting in the solid performing Consumer Discretionary sector helped our performance for the quarter.
Detailed Explanation of Calendar Year Performance
Our smaller cap dominance and deeper value tilt hurt the performance for the fiscal year. We were overweighted in the Consumer Discretionary sector, the best performing sector, which helped the Fund’s return. That was offset by our underweighting in the Financials sector which also performed well for the year.
Top Ten Holdings as of December 31, 2012
| Rank | Description | Industry | % of Net Assets | |||
1 | Mantech International Corp. | IT Services | 0.7% | |||
2 | Schnitzer Steel Industries, Inc. | Metals & Mining | 0.7% | |||
3 | Group 1 Automotive, Inc. | Specialty Retail | 0.6% | |||
4 | Office Depot, Inc. | Specialty Retail | 0.6% | |||
5 | BancorpSouth, Inc. | Commercial Banks | 0.6% | |||
6 | Brink’s Co. (The) | Commercial Services & Supplies | 0.6% | |||
7 | First BanCorp. (Puerto Rico) | Commercial Banks | 0.6% | |||
8 | International Bancshares Corp. | Commercial Banks | 0.6% | |||
9 | Benchmark Electronics, Inc. | Electronic Equipment, Instruments & Components | 0.6% | |||
10 | PrivateBancorp, Inc. | Commercial Banks | 0.6% | |||
Total | 6.2% |
Industry Sector Representation as of December 31, 2012
| % of Net Assets | % of Russell 2000 Value Index | Difference | ||||
Consumer Discretionary | 19.7% | 11.9% | 7.8% | |||
Consumer Staples | 4.2% | 2.5% | 1.7% | |||
Energy | 8.6% | 6.4% | 2.2% | |||
Financials | 26.7% | 37.0% | -10.3% | |||
Health Care | 4.0% | 4.4% | -0.4% | |||
Industrials | 13.7% | 13.1% | 0.6% | |||
Information Technology | 13.1% | 12.1% | 1.0% | |||
Materials | 7.5% | 5.8% | 1.7% | |||
Telecommunication Services | 2.3% | 0.6% | 1.7% | |||
Utilities | 0.0% | 6.2% | -6.2% | |||
Cash & Other Assets | 0.2% | 0.0% | 0.2% | |||
Total | 100.0% | 100.0% |
16 | Semi-Annual Report | December 31, 2012 (Unaudited) |
Omni Tax-Managed Small-Cap Value Fund MANAGER’S COMMENTARY (Unaudited) (continued) | |
Disclaimer
The views expressed here are exclusively those of Fund management. These views, including those related to market sectors or individual stocks, are not meant as investment advice and should not be considered predictive in nature. Any favorable (or unfavorable) description of a holding applies only as of the quarter-end, December 31, 2012, unless otherwise stated. Security positions can and do change thereafter. Discussions of historical performance do not guarantee and may not be indicative of future performance.
Market volatility can significantly impact short-term performance. The Fund is not an appropriate investment for short-term investors. Investments in small companies generally carry greater risk than is customarily associated with larger companies. This additional risk is attributable to a number of factors, including the relatively limited financial resources that are typically available to small companies and the fact that small companies often have comparatively limited product lines. In addition, the stock of small companies tends to be more volatile than the stock of large companies, particularly in the short term and particularly in the early stages of an economic or market downturn. Shareholders of the Fund, therefore, are taking on more risk than they would if they invested in the stock market as a whole.
Conclusion
Thank you for your continued investment in Omni Tax-Managed Small-Cap Value Fund. We encourage your feedback; your reactions and concerns are important to us.
Sincerely,
The Investment Management Team
www.bridgewayomni.com | 17 |
Bridgeway Omni Tax-Managed Small-Cap Value Fund SCHEDULE OF INVESTMENTS | |
Showing percentage of net assets as of December 31, 2012 (Unaudited)
| Industry Company | Shares | Value | ||||||
COMMON STOCKS - 98.22% | ||||||||
Aerospace & Defense - 0.78% | ||||||||
AAR Corp. | 31,010 | $ | 579,267 | |||||
Astrotech Corp.* | 32,600 | 29,014 | ||||||
Ducommun, Inc.* | 12,950 | 209,401 | ||||||
Kratos Defense & Security Solutions, Inc.* | 76,900 | 386,807 | ||||||
Orbital Sciences Corp.* | 12,900 | 177,633 | ||||||
Sypris Solutions, Inc. | 28,400 | 112,464 | ||||||
|
| |||||||
|
1,494,586 |
| ||||||
Air Freight & Logistics - 0.76% | ||||||||
Air Transport Services Group, Inc.* | 100,250 | 402,002 | ||||||
Atlas Air Worldwide Holdings, Inc.* | 17,700 | 784,287 | ||||||
Pacer International, Inc.* | 36,000 | 140,400 | ||||||
Park-Ohio Holdings Corp.* | 6,154 | 131,142 | ||||||
|
| |||||||
|
1,457,831 |
| ||||||
Airlines - 1.41% | ||||||||
Hawaiian Holdings, Inc.* | 46,200 | 303,534 | ||||||
JetBlue Airways Corp.*+ | 119,050 | 679,775 | ||||||
Republic Airways Holdings, Inc.* | 39,200 | 222,656 | ||||||
SkyWest, Inc. | 45,600 | 568,176 | ||||||
US Airways Group, Inc.* | 68,950 | 930,825 | ||||||
|
| |||||||
|
2,704,966 |
| ||||||
Auto Components - 2.02% | ||||||||
China Automotive Systems, Inc.* | 51,200 | 245,248 | ||||||
China XD Plastics Co., Ltd.*+ | 16,000 | 61,440 | ||||||
Cooper Tire & Rubber Co. | 40,850 | 1,035,956 | ||||||
Exide Technologies* | 143,500 | 490,770 | ||||||
Federal-Mogul Corp.* | 56,400 | 452,328 | ||||||
Modine Manufacturing Co.* | 28,900 | 234,957 | ||||||
Shiloh Industries, Inc. | 6,950 | 71,585 | ||||||
SORL Auto Parts, Inc.*+ | 25,000 | 61,750 | ||||||
Spartan Motors, Inc. | 12,150 | 59,899 | ||||||
Standard Motor Products, Inc. | 23,300 | 517,726 | ||||||
Stoneridge, Inc.* | 11,900 | 60,928 | ||||||
Strattec Security Corp. | 4,380 | 113,048 | ||||||
Superior Industries International, Inc. | 16,600 | 338,640 | ||||||
Tower International, Inc.* | 15,600 | 125,580 | ||||||
|
| |||||||
|
3,869,855 |
| ||||||
Beverages - 0.14% | ||||||||
Coca-Cola Bottling Co. Consolidated | 3,950 | 262,675 | ||||||
| Industry Company | Shares | Value | ||||||
| ||||||||
Building Products - 0.66% | ||||||||
Ameresco, Inc., Class A* | 20,000 | $ 196,200 | ||||||
Gibraltar Industries, Inc.* | 10,100 | 160,792 | ||||||
Griffon Corp. | 30,150 | 345,519 | ||||||
Nortek, Inc.* | 4,900 | 324,625 | ||||||
Patrick Industries, Inc.* | 11,800 | 183,608 | ||||||
Universal Forest Products, Inc. | 1,200 | 45,648 | ||||||
|
| |||||||
|
1,256,392 |
| ||||||
Capital Markets - 2.09% | ||||||||
Calamos Asset Management, Inc., Class A | 36,700 | 387,919 | ||||||
Capital Southwest Corp. | 4,200 | 418,446 | ||||||
CIFC Corp.* | 25,200 | 201,600 | ||||||
Cowen Group, Inc., Class A* | 71,600 | 175,420 | ||||||
Direct Markets Holdings Corp.* | 46,900 | 328 | ||||||
FBR & Co.* | 47,100 | 182,277 | ||||||
INTL. FCStone, Inc.*+ | 8,650 | 150,596 | ||||||
Investment Technology Group, Inc.* | 63,250 | 569,250 | ||||||
Manning & Napier, Inc. | 19,800 | 249,480 | ||||||
NGP Capital Resources Co. | 26,300 | 189,886 | ||||||
Oppenheimer Holdings, Inc., Class A | 16,250 | 280,638 | ||||||
Piper Jaffray Cos.* | 16,100 | 517,293 | ||||||
SWS Group, Inc.* | 39,600 | 209,484 | ||||||
Walter Investment Management Corp.* | 11,200 | 481,824 | ||||||
|
| |||||||
|
4,014,441 |
| ||||||
Chemicals - 2.46% | ||||||||
China Green Agriculture, Inc.*+ | 39,800 | 130,942 | ||||||
Core Molding Technologies, Inc.* | 18,300 | 120,780 | ||||||
Georgia Gulf Corp. | 20,300 | 837,984 | ||||||
Gulf Resources, Inc.*+ | 45,000 | 52,200 | ||||||
Koppers Holdings, Inc. | 14,400 | 549,360 | ||||||
Kraton Performance Polymers, Inc.* | 16,075 | 386,282 | ||||||
Material Sciences Corp.* | 14,900 | 134,547 | ||||||
OM Group, Inc.* | 20,000 | 444,000 | ||||||
OMNOVA Solutions, Inc.* | 32,500 | 227,825 | ||||||
Penford Corp.* | 4,850 | 35,793 | ||||||
Schulman (A.), Inc. | 30,900 | 893,937 | ||||||
Stepan Co. | 4,100 | 227,714 | ||||||
Tredegar Corp. | 16,300 | 332,846 | ||||||
Yongye International, Inc.*+ | 9,900 | 57,717 | ||||||
18 | Semi-Annual Report | December 31, 2012 (Unaudited) |
Bridgeway Omni Tax-Managed Small-Cap Value Fund SCHEDULE OF INVESTMENTS (continued) | |
Showing percentage of net assets as of December 31, 2012 (Unaudited)
| Industry Company | Shares | Value | ||||||
Common Stocks (continued) | ||||||||
Chemicals (continued) | ||||||||
Zep, Inc. | 19,900 | $ | 287,356 | |||||
|
| |||||||
|
4,719,283 |
| ||||||
Commercial Banks - 14.15% | ||||||||
1st Source Corp. | 32,200 | 711,298 | ||||||
Access National Corp. | 600 | 7,800 | ||||||
American National Bankshares, Inc. | 4,560 | 92,066 | ||||||
Ameris Bancorp* | 30,300 | 378,447 | ||||||
BancorpSouth, Inc. | 81,400 | 1,183,556 | ||||||
Banner Corp. | 15,057 | 462,702 | ||||||
BCB Bancorp, Inc. | 11,300 | 105,542 | ||||||
BNC Bancorp+ | 5,000 | 40,050 | ||||||
C&F Financial Corp. | 2,400 | 93,456 | ||||||
Camden National Corp. | 1,000 | 33,970 | ||||||
Capital City Bank Group, Inc.* | 22,050 | 250,708 | ||||||
Central Valley Community Bancorp | 21,000 | 162,960 | ||||||
Century Bancorp, Inc., Class A | 3,300 | 108,735 | ||||||
Chemical Financial Corp. | 37,500 | 891,000 | ||||||
CoBiz Financial, Inc. | 37,035 | 276,651 | ||||||
Columbia Banking System, Inc. | 38,300 | 687,102 | ||||||
Enterprise Financial Services Corp. | 24,500 | 320,215 | ||||||
Fidelity Southern Corp.* | 13,348 | 127,473 | ||||||
Financial Institutions, Inc. | 1,500 | 27,945 | ||||||
First Bancorp | 1,600 | 20,512 | ||||||
First Bancorp, Inc. | 11,800 | 194,346 | ||||||
First BanCorp. (Puerto Rico)* | 254,700 | 1,166,526 | ||||||
First Busey Corp. | 111,500 | 518,475 | ||||||
First Business Financial Services, Inc. | 6,300 | 144,585 | ||||||
First Commonwealth Financial Corp. | 92,700 | 632,214 | ||||||
First Community Bancshares, Inc. | 13,100 | 209,207 | ||||||
First Financial Bancorp | 68,337 | 999,087 | ||||||
First Financial Corp. | 8,830 | 267,019 | ||||||
First Interstate Bancsystem, Inc. | 41,800 | 644,974 | ||||||
First Merchants Corp. | 33,500 | 497,140 | ||||||
First Midwest Bancorp, Inc. | 90,100 | 1,128,052 | ||||||
Glacier Bancorp, Inc. | 76,700 | 1,128,257 | ||||||
Great Southern Bancorp, Inc. | 20,750 | 528,088 | ||||||
Hanmi Financial Corp.* | 46,563 | 632,791 | ||||||
Heartland Financial USA, Inc. | 1,750 | 45,763 | ||||||
| Industry Company | Shares | Value | ||||||
| ||||||||
Commercial Banks (continued) | ||||||||
Horizon Bancorp | 1,363 | $ | 26,783 | |||||
Hudson Valley Holding Corp. | 7,800 | 121,446 | ||||||
Independent Bank Corp.* | 10,500 | 36,750 | ||||||
International Bancshares Corp. | 64,600 | 1,166,030 | ||||||
Intervest Bancshares | 29,200 | 113,588 | ||||||
Lakeland Bancorp, Inc. | 23,515 | 239,383 | ||||||
Macatawa Bank Corp.* | 12,550 | 36,270 | ||||||
MainSource Financial Group, Inc. | 22,600 | 286,342 | ||||||
MB Financial, Inc. | 8,700 | 171,825 | ||||||
Mercantile Bank Corp. | 500 | 8,250 | ||||||
Metro Bancorp, Inc.* | 1,250 | 16,525 | ||||||
MetroCorp Bancshares, Inc.* | 8,694 | 95,547 | ||||||
MidWestOne Financial Group, Inc. | 12,000 | 246,120 | ||||||
NewBridge Bancorp* | 800 | 3,704 | ||||||
Old National Bancorp | 30,600 | 363,222 | ||||||
Orrstown Financial Services, Inc.* | 9,000 | 88,290 | ||||||
Pacific Continental Corp. | 22,200 | 216,006 | ||||||
Peapack Gladstone Financial Corp. | 250 | 3,520 | ||||||
Peoples Bancorp, Inc. | 14,950 | 305,429 | ||||||
Pinnacle Financial Partners, Inc.* | 45,750 | 861,930 | ||||||
PrivateBancorp, Inc. | 73,900 | 1,132,148 | ||||||
Renasant Corp. | 23,700 | 453,618 | ||||||
Republic Bancorp, Inc., Class A | 25,700 | 543,041 | ||||||
S&T Bancorp, Inc. | 30,700 | 554,749 | ||||||
Sandy Spring Bancorp, Inc. | 14,300 | 277,706 | ||||||
SCBT Financial Corp. | 6,950 | 279,251 | ||||||
Shore Bancshares, Inc. | 50 | 269 | ||||||
Sierra Bancorp | 17,200 | 196,596 | ||||||
Southside Bancshares, Inc.+ | 11,000 | 231,660 | ||||||
Southwest Bancorp, Inc.* | 23,900 | 267,680 | ||||||
State Bank Financial Corp. | 28,600 | 454,168 | ||||||
StellarOne Corp. | 31,800 | 449,652 | ||||||
Suffolk Bancorp* | 11,500 | 150,650 | ||||||
Sun Bancorp, Inc.* | 97,800 | 346,212 | ||||||
Taylor Capital Group, Inc.*+ | 11,087 | 200,120 | ||||||
Trico Bancshares | 22,400 | 375,200 | ||||||
Union First Market Bankshares Corp. | 3,200 | 50,464 | ||||||
United Community Banks, Inc.* | 32,770 | 308,693 | ||||||
Univest Corp. of Pennsylvania | 10,000 | 171,000 | ||||||
www.bridgewayomni.com | 19 |
Bridgeway Omni Tax-Managed Small-Cap Value Fund SCHEDULE OF INVESTMENTS (continued) | |
Showing percentage of net assets as of December 31, 2012 (Unaudited)
| Industry Company | Shares | Value | ||||||
Common Stocks (continued) | ||||||||
Commercial Banks (continued) |
| |||||||
Virginia Commerce Bancorp, Inc.* | 27,000 | $ 241,650 | ||||||
Washington Banking Co. | 11,800 | 160,716 | ||||||
WesBanco, Inc. | 21,490 | 477,508 | ||||||
Wintrust Financial Corp. | 17,000 | 623,900 | ||||||
Yadkin Valley Financial Corp.* | 23,100 | 67,914 | ||||||
|
| |||||||
|
27,140,237 |
| ||||||
Commercial Services & Supplies - 4.85% |
| |||||||
ABM Industries, Inc. | 32,300 | 644,385 | ||||||
AMREP Corp.* | 10,300 | 154,912 | ||||||
Asset Acceptance Capital Corp.* | 29,500 | 132,750 | ||||||
Asta Funding, Inc. | 20,350 | 193,528 | ||||||
Brink’s Co. (The) | 40,900 | 1,166,877 | ||||||
Casella Waste Systems, Inc., Class A* | 21,350 | 93,513 | ||||||
Consolidated Graphics, Inc.* | 7,950 | 277,614 | ||||||
Courier Corp. | 9,350 | 102,850 | ||||||
Deluxe Corp. | 33,000 | 1,063,920 | ||||||
EnergySolutions, Inc.* | 80,600 | 251,472 | ||||||
Geo Group, Inc. (The) | 35,400 | 998,280 | ||||||
Herman Miller, Inc. | 14,800 | 317,016 | ||||||
HNI Corp. | 17,900 | 538,074 | ||||||
Intersections, Inc. | 20,650 | 195,762 | ||||||
Kimball International, Inc., Class B | 53,800 | 624,618 | ||||||
Metalico, Inc.* | 89,600 | 175,616 | ||||||
Multi-Color Corp. | 5,750 | 137,943 | ||||||
Perma-Fix Environmental Services* | 71,300 | 48,562 | ||||||
Quad/Graphics, Inc.+ | 24,000 | 489,360 | ||||||
Standard Parking Corp.* | 2,250 | 49,478 | ||||||
Standard Register Co. (The) | 19,200 | 12,096 | ||||||
Sykes Enterprises, Inc.* | 33,550 | 510,631 | ||||||
TMS International Corp., Class A* | 18,800 | 235,376 | ||||||
TRC Cos., Inc.* | 9,950 | 57,909 | ||||||
United Stationers, Inc. | 23,500 | 728,265 | ||||||
Versar, Inc.* | 11,400 | 44,004 | ||||||
Viad Corp. | 2,200 | 59,752 | ||||||
|
| |||||||
|
9,304,563 |
| ||||||
Communications Equipment - 0.92% |
| |||||||
Bel Fuse, Inc., Class B | 3,600 | 70,380 | ||||||
Black Box Corp. | 16,700 | 406,478 | ||||||
Communications Systems, Inc. | 6,600 | 68,640 | ||||||
Comtech Telecommunications Corp. | 4,000 | 101,520 | ||||||
| Industry Company | Shares | Value | ||||||
Communications Equipment (continued) |
| |||||||
Globecomm Systems, Inc.* | 38,700 | $ 437,310 | ||||||
Harmonic, Inc.* | 99,100 | 502,437 | ||||||
Tessco Technologies, Inc. | 7,100 | 157,194 | ||||||
Zoom Technologies, Inc.* | 31,400 | 17,584 | ||||||
|
| |||||||
|
1,761,543 |
| ||||||
Computers & Peripherals - 0.79% |
| |||||||
Avid Technology, Inc.* | 59,700 | 452,526 | ||||||
Datalink Corp.* | 350 | 2,992 | ||||||
Dot Hill Systems Corp.* | 26,900 | 25,219 | ||||||
Hutchinson Technology, Inc.* | 51,000 | 102,000 | ||||||
Imation Corp.* | 13,800 | 64,446 | ||||||
Novatel Wireless, Inc.* | 57,700 | 77,318 | ||||||
QLogic Corp.* | 36,400 | 354,172 | ||||||
STEC, Inc.* | 55,000 | 271,150 | ||||||
Xyratex, Ltd. | 18,900 | 158,949 | ||||||
|
| |||||||
|
1,508,772 |
| ||||||
Construction & Engineering - 0.66% |
| |||||||
Argan, Inc. | 150 | 2,700 | ||||||
Michael Baker Corp. | 350 | 8,725 | ||||||
Northwest Pipe Co.* | 9,000 | 214,740 | ||||||
Orion Marine Group, Inc.* | 45,400 | 331,874 | ||||||
Primoris Services Corp. | 21,300 | 320,352 | ||||||
Sterling Construction Co., Inc.* | 5,050 | 50,197 | ||||||
Tutor Perini Corp.* | 24,500 | 335,650 | ||||||
|
| |||||||
|
1,264,238 |
| ||||||
Construction Materials - 0.27% |
| |||||||
Headwaters, Inc.* | 60,900 | 521,304 | ||||||
Consumer Finance - 0.93% |
| |||||||
Atlanticus Holdings Corp.*+ | 18,877 | 63,238 | ||||||
Cash America International, Inc. | 14,900 | 591,083 | ||||||
DFC Global Corp.* | 13,800 | 255,438 | ||||||
First Marblehead Corp. (The)* | 4,650 | 3,613 | ||||||
Nelnet, Inc., Class A | 25,900 | 771,561 | ||||||
QC Holdings, Inc. | 29,300 | 94,932 | ||||||
|
| |||||||
|
1,779,865 |
| ||||||
Containers & Packaging - 0.68% |
| |||||||
AEP Industries, Inc.* | 6,100 | 361,303 | ||||||
Boise, Inc. | 90,825 | 722,059 | ||||||
Myers Industries, Inc. | 14,750 | 223,462 | ||||||
|
| |||||||
|
1,306,824 |
| ||||||
Distributors - 0.31% |
| |||||||
Core-Mark Holding Co., Inc. | 8,150 | 385,903 | ||||||
20 | Semi-Annual Report | December 31, 2012 (Unaudited) |
Bridgeway Omni Tax-Managed Small-Cap Value Fund SCHEDULE OF INVESTMENTS (continued) | |
Showing percentage of net assets as of December 31, 2012 (Unaudited)
| Industry Company | Shares | Value | ||||||
Common Stocks (continued) | ||||||||
Distributors (continued) | ||||||||
VOXX International Corp.* | 31,514 | $ 212,089 | ||||||
|
| |||||||
|
597,992 |
| ||||||
Diversified Consumer Services - 1.03% |
| |||||||
Bridgepoint Education, Inc.*+ | 3,400 | 35,020 | ||||||
Cambium Learning Group, Inc.* | 10,400 | 11,544 | ||||||
Capella Education Co.* | 12,600 | 355,698 | ||||||
Career Education Corp.* | 53,750 | 189,200 | ||||||
Carriage Services, Inc. | 6,550 | 77,749 | ||||||
Corinthian Colleges, Inc.* | 165,750 | 404,430 | ||||||
Education Management Corp.*+ | 8,550 | 37,449 | ||||||
Learning Tree International, Inc.* | 12,200 | 66,490 | ||||||
Lincoln Educational Services Corp. | 18,625 | 104,114 | ||||||
Mac-Gray Corp. | 5,950 | 74,672 | ||||||
Regis Corp. | 34,050 | 576,126 | ||||||
Universal Technical Institute, Inc. | 5,200 | 52,208 | ||||||
|
| |||||||
|
1,984,700 |
| ||||||
Diversified Financial Services - 0.94% |
| |||||||
Gain Capital Holdings, Inc. | 39,900 | 163,191 | ||||||
Interactive Brokers Group, Inc., Class A | 31,050 | 424,764 | ||||||
MicroFinancial, Inc. | 22,000 | 160,160 | ||||||
PHH Corp.*+ | 46,000 | 1,046,500 | ||||||
|
| |||||||
|
1,794,615 |
| ||||||
Diversified Telecommunication Services - 1.33% |
| |||||||
Atlantic Tele-Network, Inc. | 9,150 | 335,896 | ||||||
Cbeyond, Inc.* | 25,450 | 230,068 | ||||||
Consolidated Communications Holdings, Inc. | 3,892 | 61,961 | ||||||
General Communication, Inc., Class A* | 21,400 | 205,226 | ||||||
Hawaiian Telcom Holdco, Inc.* | 9,000 | 175,500 | ||||||
HickoryTech Corp. | 2,650 | 25,784 | ||||||
IDT Corp., Class B | 9,100 | 86,814 | ||||||
Iridium Communications, Inc.*+ | 120,925 | 815,035 | ||||||
Lumos Networks Corp. | 1,325 | 13,277 | ||||||
Multiband Corp.* | 1,200 | 1,980 | ||||||
Neutral Tandem, Inc. | 58,000 | 149,060 | ||||||
Primus Telecommunications Group, Inc. | 14,800 | 160,876 | ||||||
Vonage Holdings Corp.* | 125,100 | 296,487 | ||||||
|
| |||||||
|
2,557,964 |
| ||||||
| Industry Company | Shares | Value | ||||||
| ||||||||
Electrical Equipment - 0.26% | ||||||||
Allied Motion Technologies, Inc. | 250 | $ 1,630 | ||||||
China BAK Battery, Inc.* | 150 | 238 | ||||||
Coleman Cable, Inc. | 17,600 | 163,152 | ||||||
General Cable Corp.* | 2,000 | 60,820 | ||||||
Lihua International, Inc. | 4,300 | 18,877 | ||||||
LSI Industries, Inc. | 29,000 | 203,290 | ||||||
Orion Energy Systems, Inc.* | 17,224 | 28,592 | ||||||
SL Industries, Inc. | 400 | 7,200 | ||||||
Ultralife Corp.* | 7,150 | 23,166 | ||||||
|
| |||||||
|
506,965 |
| ||||||
Electronic Equipment, Instruments & Components - 4.91% |
| |||||||
Agilysys, Inc.* | 13,800 | 115,506 | ||||||
Benchmark Electronics, Inc.* | 69,000 | 1,146,780 | ||||||
GSI Group, Inc.* | 44,500 | 385,370 | ||||||
IEC Electronics Corp.* | 8,150 | 55,094 | ||||||
Insight Enterprises, Inc.* | 44,883 | 779,618 | ||||||
Itron, Inc.* | 8,400 | 374,220 | ||||||
Kemet Corp.* | 20,900 | 105,127 | ||||||
LoJack Corp.* | 3,650 | 10,183 | ||||||
Multi-Fineline Electronix, Inc.* | 38,000 | 767,980 | ||||||
Newport Corp.* | 12,600 | 169,470 | ||||||
PAR Technology Corp.* | 18,750 | 91,875 | ||||||
PC Connection, Inc. | 32,000 | 368,000 | ||||||
PC Mall, Inc.* | 6,450 | 40,054 | ||||||
Plexus Corp.* | 21,800 | 562,440 | ||||||
Power-One, Inc.*+ | 125,050 | 513,956 | ||||||
Sanmina Corp.* | 67,400 | 746,118 | ||||||
SMTC Corp.* | 4,750 | 11,448 | ||||||
SYNNEX Corp.* | 29,700 | 1,021,086 | ||||||
TTM Technologies, Inc.* | 108,000 | 993,600 | ||||||
Viasystems Group, Inc.* | 40,684 | 496,345 | ||||||
Vishay Intertechnology, Inc.* | 40,000 | 425,200 | ||||||
Vishay Precision Group, Inc.* | 18,500 | 244,570 | ||||||
|
| |||||||
|
9,424,040 |
| ||||||
Energy Equipment & Services - 3.02% |
| |||||||
Basic Energy Services, Inc.*+ | 25,400 | 289,814 | ||||||
Cal Dive International, Inc.* | 136,450 | 236,058 | ||||||
Dawson Geophysical Co.* | 19,000 | 501,220 | ||||||
ENGlobal Corp.* | 500 | 265 | ||||||
Exterran Holdings, Inc.* | 42,900 | 940,368 | ||||||
Global Geophysical Services, Inc.* | 38,700 | 148,995 | ||||||
Gulfmark Offshore, Inc., Class A | 28,800 | 992,160 | ||||||
www.bridgewayomni.com | 21 |
Bridgeway Omni Tax-Managed Small-Cap Value Fund SCHEDULE OF INVESTMENTS (continued) | |
Showing percentage of net assets as of December 31, 2012 (Unaudited)
| Industry Company | Shares | Value | ||||||
Common Stocks (continued) | ||||||||
Energy Equipment & Services (continued) |
| |||||||
Key Energy Services, Inc.* | 66,700 | $ 463,565 | ||||||
Mitcham Industries, Inc.* | 25,350 | 345,520 | ||||||
Natural Gas Services Group, Inc.* | 7,500 | 123,150 | ||||||
Parker Drilling Co.* | 55,400 | 254,840 | ||||||
PHI, Inc.* | 3,750 | 125,588 | ||||||
Pioneer Energy Services Corp.* | 119,400 | 866,844 | ||||||
TGC Industries, Inc. | 472 | 3,866 | ||||||
Vantage Drilling Co.* | 137,300 | 251,259 | ||||||
Willbros Group, Inc.* | 45,100 | 241,736 | ||||||
|
| |||||||
|
5,785,248 |
| ||||||
Food & Staples Retailing - 2.19% |
| |||||||
Andersons, Inc. (The) | 21,800 | 935,220 | ||||||
Ingles Markets, Inc., Class A | 20,200 | 348,652 | ||||||
Nash Finch Co. | 11,550 | 245,784 | ||||||
Pantry, Inc. (The)* | 24,900 | 302,037 | ||||||
Spartan Stores, Inc. | 20,300 | 311,808 | ||||||
SUPERVALU, Inc.+ | 147,550 | 364,448 | ||||||
Susser Holdings Corp.* | 16,850 | 581,157 | ||||||
Village Super Market, Inc., Class A | 6,850 | 225,091 | ||||||
Weis Markets, Inc. | 22,600 | 885,242 | ||||||
|
| |||||||
|
4,199,439 |
| ||||||
Food Products - 1.24% |
| |||||||
Chiquita Brands | ||||||||
International, Inc.* | 9,800 | 80,850 | ||||||
Diamond Foods, Inc.+ | 8,900 | 121,663 | ||||||
Dole Food Co., Inc.* | 41,550 | 476,578 | ||||||
Farmer Bros. Co.* | 18,700 | 269,841 | ||||||
Feihe International, Inc.* | 300 | 1,980 | ||||||
Fresh Del Monte Produce, Inc. | 16,450 | 433,458 | ||||||
John B. Sanfilippo & Son, Inc. | 8,750 | 159,075 | ||||||
Omega Protein Corp.* | 44,850 | 274,482 | ||||||
Seneca Foods Corp., Class A* | 1,350 | 41,040 | ||||||
SkyPeople Fruit Juice, Inc.* | 51,000 | 102,510 | ||||||
Zhongpin, Inc.* | 32,100 | 412,164 | ||||||
|
| |||||||
|
2,373,641 |
| ||||||
Health Care Equipment & Supplies - 0.81% |
| |||||||
Alphatec Holdings, Inc.* | 100,000 | 165,000 | ||||||
Fonar Corp.* | 13,600 | 58,888 | ||||||
Invacare Corp. | 48,550 | 791,365 | ||||||
Medical Action Industries, Inc.* | 36,350 | 97,782 | ||||||
NuVasive, Inc.* | 22,900 | 354,034 | ||||||
RTI Biologics, Inc.* | 10,000 | 42,700 | ||||||
| Industry Company | Shares | Value | ||||||
| ||||||||
Health Care Equipment & Supplies (continued) |
| |||||||
Symmetry Medical, Inc.* | 1,300 | $ 13,676 | ||||||
Theragenics Corp.* | 18,250 | 29,017 | ||||||
|
| |||||||
|
1,552,462 |
| ||||||
Health Care Providers & Services - 3.10% |
| |||||||
Addus HomeCare Corp.* | 700 | 4,984 | ||||||
Almost Family, Inc. | 14,050 | 284,653 | ||||||
Amedisys, Inc.* | 47,250 | 532,508 | ||||||
AMN Healthcare Services, Inc.* | 32,800 | 378,840 | ||||||
Amsurg Corp.* | 11,100 | 333,111 | ||||||
BioScrip, Inc.* | 9,500 | 102,315 | ||||||
CardioNet, Inc.* | 34,479 | 78,612 | ||||||
Cross Country Healthcare, Inc.* | 7,200 | 34,560 | ||||||
Emeritus Corp.* | 16,600 | 410,352 | ||||||
Ensign Group, Inc. (The) | 10,200 | 277,338 | ||||||
Five Star Quality Care, Inc.* | 74,700 | 374,247 | ||||||
Healthways, Inc.* | 29,321 | 313,735 | ||||||
Kindred Healthcare, Inc.* | 16,600 | 179,612 | ||||||
Molina Healthcare, Inc.* | 28,600 | 773,916 | ||||||
PharMerica Corp.* | 5,300 | 75,472 | ||||||
Providence Service Corp. (The)* | 16,150 | 274,388 | ||||||
Select Medical Holdings Corp.+ | 68,250 | 643,598 | ||||||
Skilled Healthcare Group, Inc., Class A* | 14,650 | 93,320 | ||||||
Triple-S Management Corp., Class B* | 31,500 | 581,805 | ||||||
Universal American Corp. | 22,525 | 193,490 | ||||||
|
| |||||||
|
5,940,856 |
| ||||||
Hotels, Restaurants & Leisure - 4.85% |
| |||||||
Ark Restaurants Corp. | 200 | 3,370 | ||||||
Bob Evans Farms, Inc. | 17,225 | 692,445 | ||||||
Boyd Gaming Corp.*+ | 112,400 | 746,336 | ||||||
Carrols Restaurant Group, Inc.* | 7,825 | 46,794 | ||||||
CEC Entertainment, Inc. | 8,500 | 282,115 | ||||||
Cracker Barrel Old Country Store, Inc. | 15,200 | 976,752 | ||||||
DineEquity, Inc.* | 12,475 | 835,825 | ||||||
Dover Downs Gaming & Entertainment, Inc. | 14,000 | 30,800 | ||||||
Einstein Noah Restaurant Group, Inc. | 6,050 | 73,870 | ||||||
Famous Dave’s of America, Inc.* | 1,650 | 15,164 | ||||||
Fiesta Restaurant Group, Inc.* | 7,825 | 119,879 | ||||||
Frisch’s Restaurants, Inc. | 2,400 | 44,400 | ||||||
22 | Semi-Annual Report | December 31, 2012 (Unaudited) |
Bridgeway Omni Tax-Managed Small-Cap Value Fund SCHEDULE OF INVESTMENTS (continued) | |
Showing percentage of net assets as of December 31, 2012 (Unaudited)
| Industry Company | Shares | Value | ||||||
Common Stocks (continued) | ||||||||
Hotels, Restaurants & Leisure (continued) |
| |||||||
Full House Resorts, Inc.* | 1,550 | $ 5,348 | ||||||
Isle of Capri Casinos, Inc.* | 72,150 | 404,040 | ||||||
Jack in the Box, Inc.* | 24,550 | 702,130 | ||||||
Kona Grill, Inc.* | 300 | 2,601 | ||||||
Lakes Entertainment, Inc.* | 23,900 | 71,700 | ||||||
Luby’s, Inc.* | 42,500 | 284,325 | ||||||
Marcus Corp. | 8,800 | 109,736 | ||||||
Monarch Casino & Resort, Inc.* | 22,300 | 243,293 | ||||||
MTR Gaming Group, Inc.* | 9,900 | 41,283 | ||||||
Nevada Gold & Casinos, Inc.* | 7,000 | 5,390 | ||||||
Pinnacle Entertainment, Inc.* | 46,100 | 729,763 | ||||||
Red Robin Gourmet Burgers, Inc.* | �� | 14,650 | 516,998 | |||||
Ruby Tuesday, Inc.* | 34,500 | 271,170 | ||||||
Ruth’s Hospitality Group, Inc.* | 29,250 | 212,648 | ||||||
Scientific Games Corp., Class A* | 42,150 | 365,440 | ||||||
Sonic Corp.* | 19,850 | 206,638 | ||||||
Speedway Motorsports, Inc. | 19,450 | 346,988 | ||||||
Town Sports International Holdings, Inc. | 23,000 | 244,950 | ||||||
WMS Industries, Inc.* | 37,900 | 663,250 | ||||||
|
| |||||||
|
9,295,441 |
| ||||||
Household Durables - 0.77% |
| |||||||
Comstock Holding Cos., Inc.* | 700 | 812 | ||||||
CSS Industries, Inc. | 8,058 | 176,390 | ||||||
Flexsteel Industries, Inc. | 150 | 3,218 | ||||||
Hooker Furniture Corp. | 9,300 | 135,129 | ||||||
La-Z-Boy, Inc. | 26,000 | 367,900 | ||||||
Libbey, Inc.* | 22,805 | 441,277 | ||||||
Lifetime Brands, Inc. | 10,199 | 108,211 | ||||||
NACCO Industries, Inc., Class A | 1,350 | 81,931 | ||||||
Stanley Furniture Co., Inc.* | 35,100 | 157,950 | ||||||
Universal Electronics, Inc.* | 600 | 11,610 | ||||||
|
| |||||||
|
1,484,428 |
| ||||||
Household Products - 0.47% |
| |||||||
Central Garden & Pet Co., | ||||||||
Class A* | 33,200 | 346,940 | ||||||
Harbinger Group, Inc.* | 70,100 | 539,069 | ||||||
Oil-Dri Corp. of America | 450 | 12,420 | ||||||
|
| |||||||
|
898,429 |
| ||||||
Independent Power Producers & Energy Traders - 0.03% |
| |||||||
Genie Energy, Ltd., Class B | 9,100 | 64,610 | ||||||
| Industry Company | Shares | Value | ||||||
| ||||||||
Insurance - 5.34% |
| |||||||
American Equity Investment Life Holding Co. | 44,250 | $ 540,292 | ||||||
American Safety Insurance Holdings, Ltd.* | 12,350 | 233,662 | ||||||
Baldwin & Lyons, Inc., Class B | 6,100 | 145,546 | ||||||
Crawford & Co., Class B | 20,350 | 162,393 | ||||||
Eastern Insurance Holdings, Inc. | 11,300 | 193,004 | ||||||
EMC Insurance Group, Inc. | 2,850 | 68,058 | ||||||
FBL Financial Group, Inc., Class A | 19,666 | 672,774 | ||||||
Fortegra Financial Corp.* | 27,600 | 245,364 | ||||||
Hallmark Financial Services, Inc.* | 4,000 | 37,560 | ||||||
Homeowners Choice, Inc.+ | 4,000 | 83,160 | ||||||
Horace Mann Educators Corp. | 23,050 | 460,078 | ||||||
Independence Holding Co. | 7,810 | 74,351 | ||||||
Infinity Property & Casualty Corp. | 9,200 | 535,808 | ||||||
Maiden Holdings, Ltd. | 37,550 | 345,085 | ||||||
Meadowbrook Insurance Group, Inc. | 30,800 | 178,024 | ||||||
Montpelier Re Holdings, Ltd. | 43,950 | 1,004,697 | ||||||
National Financial Partners Corp.* | 28,110 | 481,805 | ||||||
National Western Life Insurance Co., Class A | 2,050 | 323,367 | ||||||
Navigators Group, Inc. (The)* | 8,950 | 457,077 | ||||||
Safety Insurance Group, Inc. | 7,100 | 327,807 | ||||||
Selective Insurance Group, Inc. | 43,500 | 838,245 | ||||||
State Auto Financial Corp. | 18,350 | 274,149 | ||||||
Stewart Information Services Corp. | 12,450 | 323,700 | ||||||
Symetra Financial Corp. | 69,750 | 905,355 | ||||||
Tower Group, Inc. | 50,006 | 888,607 | ||||||
United Fire Group, Inc. | 12,500 | 273,000 | ||||||
Universal Insurance Holdings, Inc. | 40,650 | 178,047 | ||||||
|
| |||||||
|
10,251,015 |
| ||||||
Internet & Catalog Retail - 0.40% |
| |||||||
1-800-Flowers.com, Inc., | ||||||||
Class A* | 23,200 | 85,144 | ||||||
dELiA*s, Inc.* | 14,700 | 17,199 | ||||||
Nutrisystem, Inc.+ | 24,500 | 200,655 | ||||||
Orbitz Worldwide, Inc.* | 71,850 | 195,432 | ||||||
www.bridgewayomni.com | 23 |
Bridgeway Omni Tax-Managed Small-Cap Value Fund SCHEDULE OF INVESTMENTS (continued) | |
Showing percentage of net assets as of December 31, 2012 (Unaudited)
| Industry Company | Shares | Value | ||||||
Common Stocks (continued) | ||||||||
Internet & Catalog Retail (continued) | ||||||||
Overstock.com, Inc.*+ | 18,100 | $ 259,011 | ||||||
|
| |||||||
|
757,441 |
| ||||||
Internet Software & Services - 1.85% |
| |||||||
Digital River, Inc.* | 39,700 | 571,283 | ||||||
EarthLink, Inc. | 159,000 | 1,027,140 | ||||||
Monster Worldwide, Inc.* | 151,900 | 853,678 | ||||||
QuinStreet, Inc.*+ | 74,125 | 498,120 | ||||||
Tucows, Inc.* | 57,800 | 83,232 | ||||||
United Online, Inc. | 90,800 | 507,572 | ||||||
|
| |||||||
|
3,541,025 |
| ||||||
IT Services - 2.20% | ||||||||
Acxiom Corp.* | 31,800 | 555,228 | ||||||
Analysts International Corp.* | 4,300 | 13,588 | ||||||
CACI International, Inc., Class A* | 16,975 | 934,134 | ||||||
CIBER, Inc.* | 157,501 | 526,053 | ||||||
CSG Systems International, Inc.* | 1,600 | 29,088 | ||||||
Dynamics Research Corp.* | 11,350 | 66,398 | ||||||
Edgewater Technology, Inc.* | 6,100 | 23,180 | ||||||
Global Cash Access Holdings, Inc.* | 11,950 | 93,688 | ||||||
Hackett Group, Inc. (The) | 2,800 | 11,984 | ||||||
Lender Processing Services, Inc. | 13,900 | 342,218 | ||||||
Mantech International Corp., Class A+ | 48,200 | 1,250,308 | ||||||
NCI, Inc., Class A* | 9,700 | 45,493 | ||||||
Online Resources Corp.* | 40,974 | 93,011 | ||||||
Pfsweb, Inc.* | 450 | 1,278 | ||||||
TNS, Inc.* | 11,000 | 228,030 | ||||||
|
| |||||||
|
4,213,679 |
| ||||||
Leisure Equipment & Products - 0.09% |
| |||||||
Arctic Cat, Inc.* | 450 | 15,025 | ||||||
Johnson Outdoors, Inc., Class A* | 3,950 | 78,684 | ||||||
Nautilus, Inc.* | 10,786 | 37,859 | ||||||
Summer Infant, Inc.* | 27,700 | 48,198 | ||||||
|
| |||||||
|
179,766 |
| ||||||
Life Sciences Tools & Services - 0.03% |
| |||||||
Cambrex Corp.* | 5,800 | 66,004 | ||||||
Machinery - 1.49% |
| |||||||
Accuride Corp.* | 102,200 | 328,062 | ||||||
Albany International Corp., Class A | 9,200 | 208,656 | ||||||
Ampco-Pittsburgh Corp. | 3,700 | 73,926 | ||||||
| Industry Company | Shares | Value | ||||||
Machinery (continued) | ||||||||
Briggs & Stratton Corp. | 21,450 | $ 452,166 | ||||||
China Valves Technology, Inc.* | 52,700 | 23,715 | ||||||
Cleantech Solutions International, Inc.*+ | 12,000 | 47,400 | ||||||
Columbus McKinnon Corp.* | 19,700 | 325,444 | ||||||
Commercial Vehicle Group, Inc.* | 22,100 | 181,441 | ||||||
FreightCar America, Inc. | 6,100 | 136,762 | ||||||
Greenbrier Cos., Inc.* | 25,200 | 407,484 | ||||||
Hardinge, Inc. | 400 | 3,976 | ||||||
Hyster-Yale Materials Handling, Inc. | 2,700 | 131,760 | ||||||
John Bean Technologies Corp. | 1,820 | 32,341 | ||||||
LB Foster Co., Class A | 1,750 | 76,020 | ||||||
Lydall, Inc.* | 550 | 7,887 | ||||||
Miller Industries, Inc. | 150 | 2,288 | ||||||
Mueller Water Products, Inc., Class A | 7,200 | 40,392 | ||||||
NF Energy Saving Corp.* | 16,900 | 17,238 | ||||||
NN, Inc.* | 29,500 | 270,220 | ||||||
Supreme Industries, Inc., Class A* | 29,000 | 98,890 | ||||||
|
| |||||||
|
2,866,068 |
| ||||||
Marine - 0.19% | ||||||||
Eagle Bulk Shipping, Inc.*+ | 187 | 280 | ||||||
Excel Maritime Carriers, Ltd.* | 101,600 | 44,196 | ||||||
Genco Shipping & Trading, Ltd.*+ | 48,750 | 170,138 | ||||||
International Shipholding Corp. | 7,850 | 129,368 | ||||||
Ultrapetrol Bahamas, Ltd.* | 10,900 | 17,985 | ||||||
|
| |||||||
|
361,967 |
| ||||||
Media - 2.02% | ||||||||
AH Belo Corp., Class A | 33,800 | 157,170 | ||||||
Ballantyne Strong, Inc.* | 14,300 | 47,190 | ||||||
Belo Corp., Class A | 4,750 | 36,432 | ||||||
Cumulus Media, Inc., Class A* | 69,865 | 186,540 | ||||||
Dex One Corp.* | 72,000 | 113,760 | ||||||
Digital Generation, Inc.* | 210 | 2,281 | ||||||
E.W. Scripps Co., Class A (The)* | 14,600 | 157,826 | ||||||
Entercom Communications Corp., Class A* | 37,050 | 258,609 | ||||||
Entravision Communications Corp., Class A | 36,350 | 60,341 | ||||||
24 | Semi-Annual Report | December 31, 2012 (Unaudited) |
Bridgeway Omni Tax-Managed Small-Cap Value Fund SCHEDULE OF INVESTMENTS (continued) | |
Showing percentage of net assets as of December 31, 2012 (Unaudited)
| Industry Company | Shares | Value | ||||||
Common Stocks (continued) | ||||||||
Media (continued) | ||||||||
Gray Television, Inc.* | 58,950 | $ 129,690 | ||||||
Journal Communications, Inc., Class A* | 47,450 | 256,704 | ||||||
Lee Enterprises, Inc.* | 4,050 | 4,617 | ||||||
McClatchy Co., Class A (The)* | 100,000 | 327,000 | ||||||
Media General, Inc., Class A*+ | 800 | 3,440 | ||||||
New York Times Co., Class A (The)* | 60,550 | 516,492 | ||||||
Radio One, Inc., Class D* | 20,350 | 15,466 | ||||||
Reading International, Inc., Class A* | 9,900 | 59,499 | ||||||
Salem Communications Corp., Class A | 25,700 | 140,322 | ||||||
Scholastic Corp. | 31,900 | 942,964 | ||||||
Valassis Communications, Inc.+ | 17,700 | 456,306 | ||||||
|
| |||||||
|
3,872,649 |
| ||||||
Metals & Mining - 2.46% | ||||||||
Friedman Industries, Inc. | 3,500 | 35,420 | ||||||
Golden Star Resources, Ltd.* | 287,500 | 529,000 | ||||||
Handy & Harman, Ltd.* | 13,300 | 200,431 | ||||||
Horsehead Holding Corp.* | 8,900 | 90,869 | ||||||
Jaguar Mining, Inc.*+ | 80,400 | 50,773 | ||||||
Materion Corp. | 30,600 | 788,868 | ||||||
Noranda Aluminum Holding Corp. | 73,400 | 448,474 | ||||||
Olympic Steel, Inc. | 18,000 | 398,520 | ||||||
Revett Minerals, Inc.* | 60,000 | 169,200 | ||||||
Schnitzer Steel Industries, Inc., Class A | 41,200 | 1,249,596 | ||||||
Worthington Industries, Inc. | 29,100 | 756,309 | ||||||
|
| |||||||
|
4,717,460 |
| ||||||
Multiline Retail - 0.28% | ||||||||
Bon-Ton Stores, Inc. (The) | 9,050 | 109,686 | ||||||
Fred’s, Inc., Class A | 16,250 | 216,288 | ||||||
Tuesday Morning Corp.* | 32,950 | 205,937 | ||||||
|
| |||||||
|
531,911 |
| ||||||
Oil, Gas & Consumable Fuels - 5.34% | ||||||||
Adams Resources & Energy, Inc. | 400 | 14,028 | ||||||
Alon USA Energy, Inc. | 50,700 | 917,163 | ||||||
Bill Barrett Corp.* | 10,700 | 190,353 | ||||||
BioFuel Energy Corp.*+ | 10,000 | 36,800 | ||||||
Callon Petroleum Co.* | 56,300 | 264,610 | ||||||
Clayton Williams Energy, Inc.* | 5,600 | 224,000 | ||||||
| Industry Company | Shares | Value | ||||||
| ||||||||
Oil, Gas & Consumable Fuels (continued) | ||||||||
Cloud Peak Energy, Inc.* | 44,300 | $ 856,319 | ||||||
Comstock Resources, Inc.* | 38,500 | 582,505 | ||||||
Crimson Exploration, Inc.* | 64,200 | 175,908 | ||||||
Crosstex Energy, Inc. | 35,600 | 510,504 | ||||||
Delek US Holdings, Inc. | 22,900 | 579,828 | ||||||
Double Eagle Petroleum Co.* | 12,050 | 47,477 | ||||||
EPL Oil & Gas, Inc.* | 11,300 | 254,815 | ||||||
Forest Oil Corp.* | 35,500 | 237,495 | ||||||
Gran Tierra Energy, Inc.* | 60,200 | 331,702 | ||||||
Green Plains Renewable Energy, Inc.* | 26,450 | 209,219 | ||||||
Hallador Energy Co. | 7,800 | 64,428 | ||||||
James River Coal Co.*+ | 20,900 | 66,880 | ||||||
L&L Energy, Inc.* | 15,200 | 28,880 | ||||||
Longwei Petroleum Investment Holding, Ltd.*+ | 113,000 | 238,430 | ||||||
PDC Energy, Inc.* | 15,380 | 510,770 | ||||||
Penn Virginia Corp. | 92,900 | 409,689 | ||||||
PostRock Energy Corp.* | 12,000 | 17,760 | ||||||
Resolute Energy Corp.*+ | 76,629 | 622,994 | ||||||
REX American Resources Corp.* | 10,550 | 203,509 | ||||||
Stone Energy Corp.* | 45,300 | 929,556 | ||||||
Swift Energy Co.* | 34,100 | 524,799 | ||||||
Teekay Tankers, Ltd.+ | 80,800 | 234,320 | ||||||
U.S. Energy Corp.* | 20,200 | 30,300 | ||||||
W&T Offshore, Inc.+ | 47,800 | 766,234 | ||||||
Warren Resources, Inc.* | 17,380 | 48,838 | ||||||
Western Refining, Inc. | 4,300 | 121,217 | ||||||
|
| |||||||
|
10,251,330 |
| ||||||
Paper & Forest Products - 1.46% |
| |||||||
Clearwater Paper Corp.* | 9,500 | 372,020 | ||||||
KapStone Paper & Packaging Corp. | 20,575 | 456,559 | ||||||
Mercer International, Inc.* | 66,850 | 478,646 | ||||||
Neenah Paper, Inc. | 3,100 | 88,257 | ||||||
Orient Paper, Inc. | 34,250 | 61,308 | ||||||
PH Glatfelter Co. | 29,500 | 515,660 | ||||||
Resolute Forest Products*+ | 29,700 | 393,228 | ||||||
Wausau Paper Corp. | 49,550 | 429,103 | ||||||
|
| |||||||
|
2,794,781 |
| ||||||
Personal Products - 0.11% |
| |||||||
Nutraceutical International Corp. | 8,950 | 148,033 | ||||||
Synutra International, Inc.* | 14,700 | 68,061 | ||||||
|
| |||||||
|
216,094 |
| ||||||
www.bridgewayomni.com | 25 |
Bridgeway Omni Tax-Managed Small-Cap Value Fund SCHEDULE OF INVESTMENTS (continued) | |
Showing percentage of net assets as of December 31, 2012 (Unaudited)
| Industry Company | Shares | Value | ||||||
Common Stocks (continued) | ||||||||
Pharmaceuticals - 0.00% | ||||||||
Cornerstone Therapeutics, Inc.* | 900 | $4,257 | ||||||
Professional Services - 1.44% | ||||||||
Barrett Business Services, Inc. | 10,800 | 411,372 | ||||||
CBIZ, Inc.* | 5,275 | 31,175 | ||||||
CDI Corp. | 13,500 | 231,255 | ||||||
CRA International, Inc.* | 10,700 | 211,539 | ||||||
Dolan Co. (The)* | 41,000 | 159,490 | ||||||
Heidrick & Struggles International, Inc. | 13,950 | 212,877 | ||||||
Hudson Global, Inc.* | 34,300 | 153,664 | ||||||
ICF International, Inc.* | 10,400 | 243,776 | ||||||
Insperity, Inc. | 17,300 | 563,288 | ||||||
Kelly Services, Inc., Class A | 8,800 | 138,512 | ||||||
Navigant Consulting, Inc.* | 14,600 | 162,936 | ||||||
RCM Technologies, Inc. | 400 | 2,020 | ||||||
RPX Corp.* | 7,796 | 70,476 | ||||||
VSE Corp. | 7,130 | 174,756 | ||||||
|
| |||||||
|
2,767,136 |
| ||||||
Road & Rail - 0.89% | ||||||||
Arkansas Best Corp. | 8,500 | 81,175 | ||||||
Avis Budget Group, Inc.* | 49,700 | 985,054 | ||||||
Celadon Group, Inc. | 4,400 | 79,508 | ||||||
Covenant Transportation Group, Inc., Class A* | 2,550 | 14,101 | ||||||
Marten Transport, Ltd. | 8,644 | 158,963 | ||||||
Saia, Inc.* | 3,150 | 72,828 | ||||||
Swift Transportation Co.* | 20,000 | 182,400 | ||||||
Universal Truckload Services, Inc. | 7,503 | 136,930 | ||||||
USA Truck, Inc.* | 450 | 1,544 | ||||||
|
| |||||||
|
1,712,503 |
| ||||||
Semiconductors & Semiconductor Equipment - 2.42% |
| |||||||
Advanced Energy Industries, Inc.* | 11,800 | 162,958 | ||||||
Alpha & Omega Semiconductor, Ltd.* | 40,000 | 336,000 | ||||||
Amkor Technology, Inc.*+ | 169,400 | 719,950 | ||||||
AXT, Inc.* | 40,300 | 113,243 | ||||||
GT Advanced Technologies, Inc.*+ | 50,800 | 153,416 | ||||||
Integrated Silicon Solution, Inc.* | 36,394 | 327,546 | ||||||
inTEST Corp. | 10,150 | 28,420 | ||||||
Kulicke & Soffa Industries, Inc.* | 41,600 | 498,784 | ||||||
Magnachip Semiconductor Corp.* | 33,100 | 526,952 | ||||||
MEMSIC, Inc.* | 30,000 | 100,200 | ||||||
| Industry Company | Shares | Value | ||||||
| ||||||||
Semiconductors & Semiconductor Equipment (continued) |
| |||||||
Pericom Semiconductor | ||||||||
Corp.* | 31,500 | $252,945 | ||||||
Photronics, Inc.* | 118,170 | 704,293 | ||||||
Spansion, Inc., Class A* | 18,700 | 260,117 | ||||||
TriQuint Semiconductor, Inc.* | 45,900 | 222,156 | ||||||
Ultra Clean Holdings* | 46,100 | 226,351 | ||||||
|
| |||||||
|
4,633,331 |
| ||||||
Software - 0.22% |
| |||||||
Cinedigm Digital Cinema | ||||||||
Corp., Class A* | 2,200 | 3,080 | ||||||
Majesco Entertainment Co.* | 33,500 | 35,175 | ||||||
Net 1 UEPS Technologies, Inc.* | 15,700 | 80,227 | ||||||
NetSol Technologies, Inc.*+ | 11,100 | 66,045 | ||||||
TeleCommunication Systems, Inc., Class A* | 99,900 | 246,753 | ||||||
|
| |||||||
|
431,280 |
| ||||||
Specialty Retail - 6.08% |
| |||||||
Aeropostale, Inc.* | 40,750 | 530,158 | ||||||
ANN, Inc.* | 27,100 | 917,064 | ||||||
Appliance Recycling Centers of America, Inc.* | 4,300 | 5,676 | ||||||
Asbury Automotive Group, Inc.* | 16,075 | 514,882 | ||||||
Barnes & Noble, Inc.*+ | 43,800 | 660,942 | ||||||
Body Central Corp.* | 18,000 | 179,280 | ||||||
Books-A-Million, Inc.* | 350 | 931 | ||||||
Brown Shoe Co., Inc. | 25,150 | 462,006 | ||||||
Build-A-Bear Workshop, Inc.* | 3,800 | 14,516 | ||||||
Casual Male Retail Group, Inc.* | 31,500 | 132,300 | ||||||
Children’s Place Retail Stores, Inc. (The)* | 10,800 | 478,332 | ||||||
Citi Trends, Inc.* | 21,050 | 289,648 | ||||||
Conn’s, Inc.*+ | 23,400 | 717,912 | ||||||
Destination Maternity Corp. | 2,028 | 43,724 | ||||||
Group 1 Automotive, Inc. | 19,600 | 1,215,004 | ||||||
Haverty Furniture Cos., Inc. | 5,000 | 81,550 | ||||||
hhgregg, Inc.*+ | 41,450 | 290,979 | ||||||
Hot Topic, Inc. | 28,050 | 270,682 | ||||||
Kirkland’s, Inc.* | 3,900 | 41,301 | ||||||
New York & Co., Inc.* | 26,300 | 100,203 | ||||||
Office Depot, Inc.* | 368,000 | 1,207,040 | ||||||
OfficeMax, Inc. | 36,950 | 360,632 | ||||||
Pep Boys-Manny, Moe & Jack (The) | 37,250 | 366,168 | ||||||
Perfumania Holdings, Inc.*+ | 7,300 | 35,916 | ||||||
RadioShack Corp.+ | 43,500 | 92,220 | ||||||
26 | Semi-Annual Report | December 31, 2012 (Unaudited) |
Bridgeway Omni Tax-Managed Small-Cap Value Fund SCHEDULE OF INVESTMENTS (continued) | |
Showing percentage of net assets as of December 31, 2012 (Unaudited)
| Industry Company | Shares | Value | ||||||
Common Stocks (continued) |
| |||||||
Specialty Retail (continued) |
| |||||||
rue21, inc.* | 8,400 | $ 238,476 | ||||||
Shoe Carnival, Inc. | 15,525 | 318,107 | ||||||
Sonic Automotive, Inc., Class A | 24,650 | 514,938 | ||||||
Stage Stores, Inc. | 24,700 | 612,066 | ||||||
Stein Mart, Inc. | 32,400 | 244,296 | ||||||
Systemax, Inc. | 11,000 | 106,150 | ||||||
TravelCenters of America LLC* | 34,150 | 160,505 | ||||||
West Marine, Inc.* | 22,679 | 243,799 | ||||||
Wet Seal, Inc., Class A (The)* | 79,350 | 219,006 | ||||||
|
| |||||||
|
11,666,409 |
| ||||||
Textiles, Apparel & Luxury Goods - 1.23% |
| |||||||
Crown Crafts, Inc.+ | 21,000 | 105,000 | ||||||
Culp, Inc. | 5,650 | 84,807 | ||||||
Delta Apparel, Inc.* | 13,200 | 184,536 | ||||||
Jones Group, Inc. (The)+ | 36,400 | 402,584 | ||||||
Perry Ellis International, Inc. | 19,800 | 394,020 | ||||||
Quiksilver, Inc.* | 43,100 | 183,175 | ||||||
Rocky Brands, Inc.* | 3,150 | 41,013 | ||||||
Skechers U.S.A., Inc., Class A* | 31,600 | 584,600 | ||||||
Unifi, Inc.* | 29,100 | 378,591 | ||||||
|
| |||||||
|
2,358,326 |
| ||||||
Thrifts & Mortgage Finance - 2.95% |
| |||||||
Astoria Financial Corp. | 120,900 | 1,131,624 | ||||||
Bank Mutual Corp. | 62,600 | 269,180 | ||||||
BankFinancial Corp. | 25,100 | 186,242 | ||||||
BBX Capital Corp., Class A* | 590 | 3,953 | ||||||
Cape Bancorp, Inc. | 16,800 | 145,992 | ||||||
Doral Financial Corp.* | 56,100 | 40,622 | ||||||
ESB Financial Corp. | 1,708 | 23,690 | ||||||
Federal Agricultural Mortgage Corp., Class C | 16,500 | 536,250 | ||||||
First Defiance Financial Corp. | 15,750 | 302,242 | ||||||
First Financial Holdings, Inc. | 24,960 | 326,477 | ||||||
First Financial Northwest, Inc.* | 26,400 | 199,320 | ||||||
First Pactrust Bancorp, Inc. | 9,100 | 111,657 | ||||||
Flushing Financial Corp. | 21,000 | 322,140 | ||||||
Heritage Financial Group, Inc. | 12,200 | 168,238 | ||||||
Home Federal Bancorp, Inc. | 19,300 | 239,899 | ||||||
Meta Financial Group, Inc. | 300 | 6,840 | ||||||
| Industry Company | Shares | Value | ||||||
| ||||||||
Thrifts & Mortgage Finance (continued) |
| |||||||
MutualFirst Financial, Inc. | 8,700 | $ 101,268 | ||||||
NASB Financial, Inc.*+ | 500 | 10,685 | ||||||
Provident Financial Services, Inc. | 67,400 | 1,005,608 | ||||||
Provident New York Bancorp | 24,200 | 225,302 | ||||||
Pulaski Financial Corp.+ | 800 | 7,160 | ||||||
United Community Financial Corp.* | 33,400 | 96,526 | ||||||
WSFS Financial Corp. | 4,870 | 205,758 | ||||||
|
| |||||||
|
5,666,673 |
| ||||||
Trading Companies & Distributors - 0.29% |
| |||||||
Aircastle, Ltd. | 32,700 | 410,058 | ||||||
Willis Lease Finance Corp.* | 10,750 | 153,832 | ||||||
|
| |||||||
|
563,890 |
| ||||||
Wireless Telecommunication Services - 0.61% |
| |||||||
Leap Wireless International, Inc.*+ | 112,500 | 748,125 | ||||||
NTELOS Holdings Corp. | 12,625 | 165,514 | ||||||
Shenandoah Telecommunications Co. | 15,700 | 240,367 | ||||||
USA Mobility, Inc. | 1,300 | 15,184 | ||||||
|
| |||||||
|
1,169,190 |
| ||||||
|
| |||||||
TOTAL COMMON STOCKS - 98.22% |
|
188,422,390 |
| |||||
|
| |||||||
(Cost $176,358,009) | ||||||||
| Rate^ | Shares | Value | ||||||||||
MONEY MARKET FUND - 1.11% |
| |||||||||||
BlackRock FedFund | 0.01% | 2,134,206 | 2,134,206 | |||||||||
|
| |||||||||||
TOTAL MONEY MARKET FUND - 1.11% |
|
|
2,134,206 |
| ||||||||
|
| |||||||||||
(Cost $2,134,206) | ||||||||||||
TOTAL INVESTMENTS - 99.33% |
| $190,556,596 | ||||||||||
(Cost $178,492,215) | ||||||||||||
Other Assets in Excess of Liabilities - 0.67% |
| 1,276,911 | ||||||||||
|
| |||||||||||
NET ASSETS - 100.00% |
|
|
$191,833,507 |
| ||||||||
|
| |||||||||||
| * | Non-income producing security. |
| ^ | Rate disclosed as of December 31, 2012. |
| + | This security or a portion of the security is out on loan at December 31, 2012. Total loaned securities had a value of $10,456,391 at December 31, 2012. |
LLC - Limited Liability Company
www.bridgewayomni.com | 27 |
Bridgeway Omni Tax-Managed Small-Cap Value Fund SCHEDULE OF INVESTMENTS (continued) | |
Summary of inputs used to value the Fund’s investments as of 12/31/2012
| ||||||||||||||||
| Valuation Inputs | ||||||||||||||||
| Investment in Securities (Value) | ||||||||||||||||
| Level 1 Quoted Prices |
Level 2 |
Level 3 | Total | |||||||||||||
Common Stocks | $ | 188,422,390 | $ — | $— | $ | 188,422,390 | ||||||||||
Money Market | — | 2,134,206 | — | 2,134,206 | ||||||||||||
|
|
|
|
|
|
| ||||||||||
TOTAL |
$ |
188,422,390 |
|
|
$2,134,206 |
|
$— |
$ |
190,556,596 |
| ||||||
|
|
|
|
|
|
| ||||||||||
See Notes to Financial Statements.
28 | Semi-Annual Report | December 31, 2012 (Unaudited) |
STATEMENTS OF ASSETS AND LIABILITIES
| |
December 31, 2012 (Unaudited)
ASSETS | Omni Small-Cap Value |
Omni Tax-Managed | ||||||
Investments at value | $ | 214,811,772 | $ | 190,556,596 | ||||
Receivables: | ||||||||
Portfolio securities sold | 1,063,164 | 697,594 | ||||||
Fund shares sold | 1,529,159 | 3,285,026 | ||||||
Dividends and interest | 88,759 | 80,673 | ||||||
Prepaid expenses | 35,080 | 22,710 | ||||||
Total assets | 217,527,934 | 194,642,599 | ||||||
LIABILITIES | ||||||||
Payables: | ||||||||
Portfolio securities purchased | 1,949,680 | 2,523,034 | ||||||
Fund shares redeemed | 830,882 | 173,596 | ||||||
Accrued Liabilities: | ||||||||
Investment advisory fees | 51,712 | 46,558 | ||||||
Administration fees | 6,580 | 5,504 | ||||||
Directors’ fees | 3,022 | 2,105 | ||||||
Other | 47,083 | 58,295 | ||||||
Total liabilities |
|
2,888,959 |
|
|
2,809,092 |
| ||
NET ASSETS |
$ |
214,638,975 |
|
$ |
191,833,507 |
| ||
NET ASSETS REPRESENT | ||||||||
Paid-in capital | $ | 189,968,440 | $ | 177,027,083 | ||||
Distributions in excess of net investment income | (4,851 | ) | (691) | |||||
Accumulated net realized gain on investments | 2,653,235 | 2,742,734 | ||||||
Net unrealized appreciation on investments | 22,022,151 | 12,064,381 | ||||||
NET ASSETS | $ | 214,638,975 | $ | 191,833,507 | ||||
Shares of common stock outstanding of $.001 par value* |
|
18,026,857 |
|
|
17,688,934 |
| ||
Net asset value, offering price and redemption price per share |
$ |
11.91 |
|
$ |
10.84 |
| ||
Total investments at cost |
$ |
192,789,621 |
|
$ |
178,492,215 |
| ||
* See Note 1 - Organization in the Notes to Financial Statements for shares authorized for each Fund.
See Notes to Financial Statements.
www.bridgewayomni.com | 29 |
| |
Six Months Ended December 31, 2012 (Unaudited)
|
Omni |
Omni Tax-Managed | ||||||
INVESTMENT INCOME | ||||||||
Dividends | $ | 2,673,747 | $ | 2,071,650 | ||||
Securities lending | 238,527 | 153,352 | ||||||
Total Investment Income |
|
2,912,274 |
|
|
2,225,002 |
| ||
EXPENSES | ||||||||
Investment advisory fees | 491,367 | 370,740 | ||||||
Administration fees | 37,577 | 28,342 | ||||||
Accounting fees | 46,336 | 45,853 | ||||||
Transfer agent fees | 7,541 | 6,363 | ||||||
Professional fees | 34,961 | 27,863 | ||||||
Custody fees | 7,431 | 9,130 | ||||||
Blue sky fees | 4,847 | 15,497 | ||||||
Directors’ and officers’ fees | 16,360 | 11,860 | ||||||
Shareholder servicing fees | 62,695 | 49,083 | ||||||
Reports to shareholders | 17,045 | 12,272 | ||||||
Miscellaneous expenses | 26,901 | 19,255 | ||||||
Total Expenses |
|
753,061 |
|
|
596,258 |
| ||
Less investment advisory fees waived |
|
(163,419 |
) |
|
(151,370) |
| ||
Net Expenses |
|
589,642 |
|
|
444,888 |
| ||
NET INVESTMENT INCOME |
|
2,322,632 |
|
|
1,780,114 |
| ||
NET REALIZED AND UNREALIZED GAIN (LOSS) ON INVESTMENTS | ||||||||
Realized Gain (Loss) on: | ||||||||
Investments | 4,995,229 | 3,597,982 | ||||||
Change in Unrealized Appreciation (Depreciation) on: | ||||||||
Investments | 11,343,233 | 8,446,380 | ||||||
Net Realized and Unrealized Gain on Investments |
|
16,338,462 |
|
|
12,044,362 |
| ||
INCREASE IN NET ASSETS RESULTING FROM OPERATIONS |
$ |
18,661,094 |
|
$ |
13,824,476 |
| ||
See Notes to Financial Statements.
30 | Semi-Annual Report | December 31, 2012 (Unaudited) |
STATEMENTS OF CHANGES IN NET ASSETS
| |
Omni Small-Cap Value | Omni Tax-Managed Small-Cap Value | |||||||||||||||
Six Months Ended December 31, 2012 |
For the Period June 30, 2012 |
Six Months Ended December 31, 2012 |
Year Ended June 30, 2012 | |||||||||||||
| (Unaudited) | (Unaudited) | |||||||||||||||
OPERATIONS | ||||||||||||||||
Net investment income | $ | 2,322,632 | $ | 747,328 | $ | 1,780,114 | $ | 785,043 | ||||||||
Net realized gain (loss) on investments | 4,995,229 | (145,793 | ) | 3,597,982 | (827,085 | ) | ||||||||||
Net change in unrealized appreciation (depreciation) on investments | 11,343,233 | 10,678,918 | 8,446,380 | 3,181,198 | ||||||||||||
Net increase in net assets resulting from operations | 18,661,094 | 11,280,453 | 13,824,476 | 3,139,156 | ||||||||||||
DISTRIBUTIONS: | ||||||||||||||||
From net investment income | (2,835,617 | ) | (218,329 | ) | (2,235,902 | ) | (379,007 | ) | ||||||||
From net realized gains | (2,196,201 | ) | - | - | - | |||||||||||
Net decrease in net assets resulting from distributions | (5,031,818 | ) | (218,329 | ) | (2,235,902 | ) | (379,007 | ) | ||||||||
SHARE TRANSACTIONS: | ||||||||||||||||
Proceeds from sale of shares | 34,618,845 | 178,590,444 | 63,698,026 | 112,796,648 | ||||||||||||
Reinvestment of distributions | 5,031,818 | 218,329 | 2,235,803 | 379,007 | ||||||||||||
Cost of shares redeemed | (18,193,671 | ) | (10,318,190 | ) | (12,905,212 | ) | (26,664,208 | ) | ||||||||
Net increase in net assets resulting from share transactions | 21,456,992 | 168,490,583 | 53,028,617 | 86,511,447 | ||||||||||||
Net increase in net assets | 35,086,268 | 179,552,707 | 64,617,191 | 89,271,596 | ||||||||||||
NET ASSETS: | ||||||||||||||||
Beginning of period | 179,552,707 | - | 127,216,316 | 37,944,720 | ||||||||||||
End of period* | $214,638,975 | $179,552,707 | $191,833,507 | $127,216,316 | ||||||||||||
SHARES ISSUED & REDEEMED | ||||||||||||||||
Issued | 3,016,950 | 17,113,203 | 6,067,954 | 11,927,426 | ||||||||||||
Distributions reinvested | 422,842 | 21,942 | 206,255 | 41,833 | ||||||||||||
Redeemed | (1,567,357 | ) | (980,723 | ) | (1,245,876 | ) | (2,861,204 | ) | ||||||||
Net increase in shares | 1,872,435 | 16,154,422 | 5,028,333 | 9,108,055 | ||||||||||||
Outstanding at beginning of period | 16,154,422 | - | 12,660,601 | 3,552,546 | ||||||||||||
Outstanding at end of period | 18,026,857 | 16,154,422 | 17,688,934 | 12,660,601 | ||||||||||||
* Including undistributed (distributions in excess of) net investment income of: | $(4,851) | $508,134 | $(691) | $455,097 | ||||||||||||
1Commencement of operations.
See Notes to Financial Statements.
www.bridgewayomni.com | 31 |
(for a share outstanding throughout the period indicated)
| Income from Investment Operations | ||||||||||||||||
| Net Asset Value, Beginning of Period | Net Investment Income(a) | Net Realized and Unrealized Gain\(Loss) | Total from Investment Operations | |||||||||||||
OMNI SMALL-CAP VALUE | ||||||||||||||||
Period Ended December 31, 2012 (Unaudited) | $11.11 | $0.14 | $0.95 | $1.09 | ||||||||||||
Period Ended June 30, 2012(d)
|
| 10.00
|
|
| 0.08
|
|
| 1.06
|
|
| 1.14
|
| ||||
OMNI TAX-MANAGED SMALL-CAP VALUE | ||||||||||||||||
Period Ended December 31, 2012 (Unaudited) | 10.05 | 0.13 | 0.79 | 0.92 | ||||||||||||
Year Ended June 30, 2012 | 10.68 | 0.09 | (0.67 | )(e) | (0.58 | ) | ||||||||||
Period Ended June 30, 2011(f)
|
| 10.00
|
|
| 0.03
|
|
| 0.65
|
|
| 0.68
|
| ||||
| (a) | Per share amounts calculated based on the average daily shares outstanding during the period. |
| (b) | Annualized for periods less than one year. |
| (c) | Total return may have been lower had various fees not been waived during the period. |
| (d) | Commenced operations on August 31, 2011. |
| (e) | Realized and unrealized gain (loss) per share do not correlate to the aggregate of the net unrealized gain in the Statements of Changes in Net Assets for the year ended June 30, 2012, primarily due to the timing of the sales and repurchases of the Fund’s shares in relation to fluctuating market values for the Fund’s portfolio. |
| (f) | Commenced operations on December 31, 2010. |
See Notes to Financial Statements.
32 | Semi-Annual Report | December 31, 2012 (Unaudited) |
Less Distributions to Shareholders from: | Ratios & Supplemental Data | |||||||||||||||||||||||||||||||||||
| Net Realized Gain | Net Investment Income | Total Distributions | Net Asset Value, End of Period | Total Return | Net Assets End of Period (000’s) | Expenses Before Waivers and Reimbursements(b) | Expenses After Waivers and Reimbursements(b) | Net Investment Income After Waivers and Reimbursements(b) | Portfolio Turnover Rate | |||||||||||||||||||||||||||
$(0.13) | $(0.16) | $(0.29) | $11.91 | 9.80 | %(c) | $214,639 | 0.77 | % | 0.60 | % | 2.36 | % | 13 | % | ||||||||||||||||||||||
-
|
| (0.03)
|
|
| (0.03)
|
|
| 11.11
|
|
| 11.41
| %(c)
|
| $179,553
|
|
| 0.84
| %
|
| 0.60
| %
|
| 0.92
| %
|
| 8
| %
| |||||||||
- | (0.13) | (0.13) | 10.84 | 9.19 | %(c) | 191,834 | 0.80 | % | 0.60 | % | 2.40 | % | 18 | % | ||||||||||||||||||||||
- | (0.05) | (0.05) | 10.05 | (5.41 | %)(c) | 127,216 | 0.90 | % | 0.60 | % | 0.95 | % | 26 | % | ||||||||||||||||||||||
-
|
| -
|
|
| -
|
|
| 10.68
|
|
| 6.80
| %(c)
|
| 37,945
|
|
| 1.56
| %
|
| 0.60
| %
|
| 0.57
| %
|
| 7
| %
| |||||||||
www.bridgewayomni.com | 33 |
| |
December 31, 2012 (Unaudited)
1. Organization:
Bridgeway Funds, Inc. (“Bridgeway” or the “Company”) was organized as a Maryland corporation on October 19, 1993, and is registered under the Investment Company Act of 1940, as amended (the “1940 Act”), as an open-end management investment company.
Bridgeway is organized as a series fund, with 11 investment funds as of December 31, 2012 (each, a “Bridgeway Fund” and collectively, the “Bridgeway Funds”). Aggressive Investors 1, Ultra-Small Company, Ultra-Small Company Market, Small-Cap Momentum, Small-Cap Growth, Small-Cap Value, Large-Cap Growth, Blue Chip 35 Index and Managed Volatility Funds are presented in a separate report. The Omni Small-Cap Value Fund and the Omni Tax-Managed Small-Cap Value Fund (each a “Fund” and together, the “Funds”) are presented in this report.
Bridgeway is authorized to issue 1,915,000,000 shares of common stock at $0.001 per share. As of December 31, 2012, 100,000,000 shares have been classified into the Aggressive Investors 1 Fund. 130,000,000 shares have been classified into the Blue Chip 35 Index Fund. 15,000,000 shares have been classified into the Ultra-Small Company Fund. 100,000,000 shares each have been classified into the Ultra-Small Company Market, Omni Small-Cap Value, Omni Tax-Managed Small-Cap Value, Small-Cap Momentum, Small-Cap Growth, Small-Cap Value and Large-Cap Growth Funds. 50,000,000 shares have been classified into the Managed Volatility Fund.
All of the Bridgeway Funds are no-load, diversified funds.
The Funds seek to provide long-term total return on capital, primarily through capital appreciation.
Bridgeway Capital Management, Inc. (the “Adviser”) is the investment adviser for all of the Bridgeway Funds.
2. Significant Accounting Policies:
The following summary of significant accounting policies, followed in the preparation of the financial statements of the Funds, are in conformity with accounting principles generally accepted in the United States of America (“GAAP”).
Securities, Options and Other Investments Valuation Other than options, portfolio securities that are principally traded on a national securities exchange are valued at their last sale price on the principal exchange on which they are traded prior to the close of the New York Stock Exchange (“NYSE”), on each day the NYSE is open for business. If there is no closing price on the NYSE, the portfolio security will be valued using a composite price, which is defined as the last price for the security on any exchange. Portfolio securities other than options that are principally traded on the National Association of Securities Dealers Automated Quotation System (“NASDAQ”) are valued at the NASDAQ Official Closing Price (“NOCP”). In the absence of recorded sales on their home exchange, or NOCP, in the case of NASDAQ traded securities, the security will be valued as follows: bid prices for long positions and ask prices for short positions. Other investments for which no sales are reported are valued at the latest bid price in accordance with the pricing policy established by the Board of Directors.
Investments in open-end registered investment companies and closed-end registered investment companies that do not trade on an exchange are valued at the end of day net asset value (“NAV”) per share.
Investments in closed-end registered investment companies that trade on an exchange are valued at the last sales price as of the close of the customary trading session on the exchange where the security is principally traded.
When market quotations are not readily available or when events occur that make established valuation methods unreliable, securities of the Funds may be valued at fair value as determined in good faith by or under the direction of the Board of Directors. The valuation assigned to fair valued securities for purposes of calculating the Funds’ NAV may differ from the security’s most recent closing market price and from the prices used by other mutual funds to calculate their NAVs.
34 | Semi-Annual Report | December 31, 2012 (Unaudited) |
NOTES TO FINANCIAL STATEMENTS (continued)
| |
December 31, 2012 (Unaudited)
The inputs and valuation techniques used to determine the value of a Fund’s investments are summarized into three levels as described in the hierarchy below:
| — | Level 1 — quoted prices in active markets for identical assets |
Investments whose values are based on quoted market prices in active markets, and whose values are therefore classified as Level 1 prices, include active listed equity securities. The Funds do not adjust the quoted price for such investments, even in situations where the Funds hold a large position and a sale could reasonably impact the quoted price.
| — | Level 2 — other significant observable inputs (including quoted prices for similar securities, interest rates, prepayments speeds, credit risk, etc.) |
Investments that trade in markets that are not considered to be active, but whose values are based on quoted market prices, dealer quotations or valuations provided by alternative pricing sources supported by observable inputs are classified as Level 2 prices. These generally include certain U.S. government and sovereign obligations, most government agency securities, investment-grade corporate bonds and less liquid listed equity securities. As investments whose values are classified as Level 2 prices include positions that are not traded in active markets and/or are subject to transfer restrictions, valuations may be adjusted to reflect illiquidity and/or non-transferability, which are generally based on available market information.
Money market fund investments consist of mutual funds which invest primarily in securities that are valued at amortized cost, a Level 2 investment. Therefore, the money market funds are classified as Level 2 investments.
| — | Level 3 — significant unobservable inputs (including a Fund’s own assumptions in determining the fair value of investments) |
Investments whose values are classified as Level 3 prices have significant unobservable inputs, as they may trade infrequently or not at all. When observable prices are not available for these securities, the Funds use one or more valuation techniques for which sufficient and reliable data is available. The inputs used by the Funds in estimating the value of Level 3 prices may include the original transaction price, quoted prices for similar securities or assets in active markets, completed or pending third-party transactions in the underlying investment or comparable issuers, and changes in financial ratios or cash flows. Level 3 prices may also be adjusted to reflect illiquidity and/or non-transferability, with the amount of such discount estimated by the Funds in the absence of market information. Assumptions used by the Funds due to the lack of observable inputs may significantly impact the resulting value and therefore the Funds’ results of operations.
The inputs or methodology used for valuing investments are not necessarily an indication of the risk associated with investing in those investments. A summary of the inputs used to value the Funds’ investments as of December 31, 2012 is included with each Fund’s Schedule of Investments.
The Funds’ policy is to recognize transfers into, and transfers out of, each level of hierarchy as of the beginning of the reporting period. For the period ended December 31, 2012, there were no transfers between Level 1 and Level 2 in any of the Funds. Details regarding transfers into, and transfers out of, Level 3 can be found at the end of each Schedule of Investments for Funds that hold Level 3 securities.
In December 2011, the Financial Accounting Standards Board issued Accounting Standards Update (“ASU”) No. 2011-11 “Disclosures about Offsetting Assets and Liabilities” requiring disclosure of both gross and net information related to offsetting and related arrangements enabling users of its financial statements to understand the effect of those arrangements on the entity’s financial position. The objective of this disclosure is to facilitate comparison between those entities that prepare their financial statements on the basis of U.S. GAAP and those entities that prepare their financial statements on the basis of International Financial Reporting Standards. ASU No. 2011-11 is effective for interim and annual periods beginning on or after January 1, 2013. Management is evaluating any impact ASU No. 2011-11 may have on the Fund’s financial statements.
Securities Lending Upon lending its securities to third parties, each Fund receives compensation in the form of fees. A Fund also continues to receive dividends on the securities loaned. The loans are secured by collateral at least equal to the fair value of the securities loaned plus accrued interest. Gain or loss in the fair value of the securities loaned that may occur during the
www.bridgewayomni.com | 35 |
NOTES TO FINANCIAL STATEMENTS (continued)
| |
December 31, 2012 (Unaudited)
term of the loan will be for the account of a Fund. Each Fund has the right under the lending agreement to recover the securities from the borrower on demand. Additionally, a Fund does not have the right to sell or repledge collateral received in the form of securities unless the borrower goes into default. The risks to a Fund of securities lending are that the borrower may not provide additional collateral when required or return the securities when due.
As of December 31, 2012, the Funds had securities on loan and related collateral with values shown below:
| Bridgeway Fund | Securities on Loan Value | Value of Collateral | ||||||
Omni Small-Cap Value | $ | 13,117,516 | $ | 13,274,995 | ||||
Omni Tax-Managed Small-Cap Value | 10,456,391 | 10,601,442 | ||||||
It is each Fund’s policy to obtain additional collateral from or return excess collateral to the borrower by the end of the next business day, following the valuation date of the securities loaned. Therefore, the value of the collateral held may be temporarily less than that required under the lending contract. As of December 31, 2012, the collateral consisted of an institutional money market fund.
Use of Estimates in Financial Statements In preparing financial statements in conformity with GAAP, management makes estimates and assumptions that affect the reported amounts of assets and liabilities at the date of the financial statements and the disclosure of contingent assets and liabilities at the date of the financial statements as well as the reported amounts of revenue and expenses during the reporting period. Actual results could differ from those estimates.
Risks and Uncertainties The Funds provide for various investment options, including stocks. Such investments are exposed to various risks, such as interest rate, market and credit risks. Due to the risks involved, it is at least reasonably possible that changes in risks in the near term would materially affect shareholders’ account values and the amounts reported in the financial statements.
Security Transactions, Investment Income and Expenses Security transactions are accounted for as of the trade date, the date the order to buy or sell is executed. Realized gains and losses are computed on the identified cost basis. Dividend income is recorded on the ex-dividend date, and interest income is recorded on the accrual basis from settlement date.
Bridgeway Funds’ expenses that are not series-specific are allocated to each series based upon its relative proportion of net assets to the Bridgeway Funds’ total net assets or other appropriate basis.
Distributions to Shareholders The Funds pay dividends from net investment income and distribute realized capital gains annually, usually in December.
Indemnification Under the Company’s organizational documents, the Funds’ officers, directors, employees and agents are indemnified against certain liabilities that may arise out of the performance of their duties to the Funds. Additionally, in the normal course of business, the Funds enter into contracts that contain a variety of indemnification clauses. The Funds’ maximum exposure under these arrangements is unknown as this would involve future claims that may be made against the Funds that have not yet occurred. However, the Funds have not had prior claims or losses pursuant to these contracts.
3. Management Fees, Other Related Party Transactions and Contingencies:
The Funds have entered into a management agreement with the Adviser. As compensation for the advisory services rendered, facilities furnished, and expenses borne by the Adviser, the Funds pay the Adviser a fee of 0.50% of the value of each Fund’s average daily net assets, computed daily and payable monthly.
36 | Semi-Annual Report | December 31, 2012 (Unaudited) |
NOTES TO FINANCIAL STATEMENTS (continued)
| |
December 31, 2012 (Unaudited)
Expense limitations: The Adviser has agreed to reimburse the Funds for operating expenses and management fees above the expense limitations shown in the table below, which are shown as a ratio of net expenses to average net assets, for each Fund, for the period ended December 31, 2012. Any material change to the expense limitation would require a vote by shareholders of the applicable Fund.
| Bridgeway Fund | Expense Limitation | Total Waivers and Reimbursements for Period Ending 12/31/12 | |||||||||
Omni Small-Cap Value* | 0.60% | $163,419 | |||||||||
Omni Tax-Managed Small-Cap Value* | 0.60% | 151,370 | |||||||||
*The Funds are authorized to reimburse the Adviser for management fees previously waived and/or for expenses previously paid by the Adviser, provided, however, that any reimbursements must be paid at a date not more than three years after the fiscal year in which the Adviser waived the fees or reimbursed the expenses and the reimbursements do not cause the Funds to exceed the expense limitation in the agreement. The Omni Small-Cap Value Fund has recoupable expenses of $184,328 and $163,419, which expire on June 30, 2015 and June 30, 2016, respectively. The Omni Tax-Managed Small-Cap Value Fund has recoupable expenses of $85,793, $243,003, and $151,370, which expire June 30, 2014, June 30, 2015, and June 30, 2016, respectively.
Other Related Party Transactions: The Bridgeway Funds will engage in inter-portfolio trades between funds when it is to the benefit of both parties. The Board of Directors reviews these trades quarterly. Inter-portfolio purchases and sales for the Funds during the period ended December 31, 2012 were as follows:
| Bridgeway Fund | Inter-portfolio Purchases | Inter-portfolio Sales | ||||||||
Omni Small-Cap Value | $ | 8,260,863 | $ | 3,879,445 | ||||||
Omni Tax-Managed Small-Cap Value | 8,114,441 | 3,317,571 | ||||||||
The Adviser entered into an Administrative Services Agreement with Bridgeway, pursuant to which the Adviser provides various administrative services to the Funds including, but not limited to: (i) supervising and managing various aspects of the Funds’ business and affairs; (ii) selecting, overseeing and/or coordinating activities with other service providers to the Funds; (iii) providing reports to the Board of Directors as requested from time to time; (iv) assisting and/or reviewing amendments and updates to the Funds’ registration statement and other filings with the Securities and Exchange Commission (“SEC”); (v) providing certain shareholder services; (vi) providing administrative support in connection with meetings of the Board of Directors; and (vii) providing certain record-keeping services. For its services to all of the Bridgeway Funds, the Adviser is paid an aggregate annual fee of $535,000 payable in equal monthly installments. During the period ended December 31, 2012, the allocation of this expense to the Omni Small-Cap Value and Omni Tax-Managed Small-Cap Value Funds was $37,577 and $28,342, respectively.
One director of Bridgeway, John Montgomery, is an owner and director of the Adviser. Another director of Bridgeway, Michael Mulcahy, is an executive and director of the Adviser. Under the 1940 Act definitions, each is considered to be an “affiliated person” of the Adviser and an “interested person” of the Adviser and of Bridgeway. Compensation for Mr. Montgomery and Mr. Mulcahy is borne by the Adviser rather than the Bridgeway Funds.
www.bridgewayomni.com | 37 |
NOTES TO FINANCIAL STATEMENTS (continued)
| |
December 31, 2012 (Unaudited)
Board of Directors Compensation Independent Directors are paid an annual retainer of $14,000 with an additional retainer of $2,500 paid to the Independent Chairman of the Board and an additional retainer of $1,000 paid to the Nominating and Corporate Governance Committee Chair. The retainer is paid in quarterly installments. Independent Directors are paid $6,000 per meeting for meeting fees. Such compensation is the total compensation from all Bridgeway Funds and is allocated among the Bridgeway Funds.
The Independent Directors receive this compensation in the form of shares of the Bridgeway Funds, credited to his or her account. Such Directors are reimbursed for any expenses incurred in attending meetings and conferences and expenses for subscriptions or printed materials. The amount of Directors’ fees attributable to each Fund is disclosed in the Statement of Operations.
4. Distribution and Shareholder Servicing Fees:
Foreside Fund Services, LLC acts as distributor of the Funds’ shares pursuant to a Distribution Agreement dated November 12, 2010. The Adviser pays all costs and expenses associated with distribution of the Funds’ shares pursuant to a protective plan adopted by shareholders pursuant to Rule 12b-1.
5. Purchases and Sales of Investment Securities:
Purchases and sales of investments, other than short-term securities, for each Fund for the period ended December 31, 2012 were as follows:
| Purchases | Sales | |||||||
| U.S. Government | Other | U.S. Government | Other | |||||
Omni Small-Cap Value | $ - | $43,234,369 | $ - | $ 25,860,824 | ||||
Omni Tax-Managed Small-Cap Value | - | 76,809,235 | - | 26,543,967 | ||||
6. Federal Income Taxes
It is the Funds’ policy to continue to comply with the provisions of the Internal Revenue Code of 1986, as amended (“Internal Revenue Code”), applicable to regulated investment companies and distribute income to the extent necessary so that such Fund is not subject to federal income tax. Therefore, no federal income tax provision is required.
Unrealized Appreciation and Depreciation on Investments (Tax Basis) The amount of net unrealized appreciation/ depreciation and the cost of investment securities for tax purposes, including short-term securities at December 31, 2012, were as follows:
Omni Small-Cap Value | Omni Tax-Managed Small-Cap Value | |||
Gross appreciation (excess of value over tax cost) | $ 33,934,135 | $ 22,552,561 | ||
Gross depreciation (excess of tax cost over value) | (11,911,984) | 10,529,762) | ||
Net unrealized appreciation (depreciation) | $ 22,022,151 | $ 12,022,799 | ||
Cost of investments for income tax purposes | $192,789,621 | $178,533,797 |
The differences between book and tax net unrealized appreciation (depreciation) are due to wash sale loss deferrals.
Classifications of Distributions Net investment income (loss) and net realized gain (loss) may differ for financial statement and tax purposes. The character of distributions made during the year from net investment income or net realized gains may differ from its ultimate characterization for federal income tax purposes.
38 | Semi-Annual Report | December 31, 2012 (Unaudited) |
NOTES TO FINANCIAL STATEMENTS (continued)
| |
December 31, 2012 (Unaudited)
The Omni Small-Cap Value Fund commenced operations on August 31, 2011 and the Omni Tax-Managed Small-Cap Value Fund commenced operations on December 31, 2010. There were no cash distributions paid during the period ended June 30, 2011. The tax character of the distributions paid by the Funds during the fiscal year ended June 30, 2012, are as follows:
| Omni Small-Cap Value | Omni Tax-Managed Small-Cap Value | |||||||||
| Year Ended June 30, 2012 | Year Ended June 30, 2012 | |||||||||
Distributions paid from: | ||||||||||
Ordinary Income | $218,329 | $379,007 | ||||||||
Total | $218,329 | $379,007 | ||||||||
Under the Regulated Investment Company Modernization Act of 2010, capital losses incurred by the Funds will not be subject to expiration and will retain their character as either short-term or long-term capital losses. At June 30, 2012, the Omni Tax-Managed Small-Cap Value Fund had $691,466 of short-term capital loss carryforwards available for tax purposes with an indefinite expiration date. There are no capital loss carryovers for Omni Small-Cap Value Fund as of June 30, 2012.
Components of Accumulated Earnings (Deficit) As of June 30, 2012, the components of accumulated earnings (deficit) on a tax basis were:
| Omni Small-Cap Value | Omni Tax-Managed Small-Cap Value | |||||||||
Undistributed Net Investment Income | $ 508,151 | $ 455,114 | ||||||||
Accumulated Net Realized Loss on Investments* | (145,793) | (784,480) | ||||||||
Net Unrealized Appreciation of Investments | 10,678,901 | 3,547,216 | ||||||||
Total | $11,041,259 | $3,217,850 | ||||||||
| * | Includes qualified late-year losses that the Funds have elected to defer to the beginning of their next fiscal year ending June 30, 2013. The Omni Small-Cap Value Fund and Omni Tax-Managed Small-Cap Value Fund have deferred post October losses of $145,793 and $93,014, respectively. |
Accounting for Uncertainty in Income Taxes sets forth a minimum threshold for financial statement recognition of the benefit of a tax position taken or expected to be taken in a tax return. Management has analyzed each Fund’s tax positions and has concluded that no provision for income tax is required in each Fund’s financial statements. The Funds are not aware of any tax position for which it is reasonably possible that the total amounts of unrecognized tax benefits will significantly change in the next twelve months. Each Funds’ federal tax returns for the prior three fiscal years remain subject to examination by the Internal Revenue Service.
7. Line of Credit
Bridgeway established a line of credit agreement (“Facility”) with The Bank of New York Mellon effective November 5, 2010. The Facility is for temporary or emergency purposes, such as to provide liquidity for shareholder redemptions, and is cancellable by either party. Unless cancelled earlier, the Facility shall be held available until September 19, 2013. Advances under the Facility are limited to $10,000,000 in total for all Bridgeway Funds and advances to each Bridgeway Fund shall not exceed certain limits set forth in the credit agreement, including but not limited to, the maximum amount a Bridgeway Fund is permitted to borrow under the 1940 Act.
The Bridgeway Funds incur a commitment fee of 0.05% per annum on the unused portion of the Facility and interest expense to the extent of amounts borrowed under the Facility. Interest is based on the “Overnight Rate” plus 1.25%. The Overnight Rate means the higher of (a) the Federal Funds rate, (b) the Overnight Eurodollar Rate, or (c) the One-month Eurodollar Rate. The commitment fees are payable quarterly in arrears and are allocated to all participating Bridgeway Funds. Interest expense is charged directly to a Bridgeway Fund based upon actual amounts borrowed by such Bridgeway Fund.
www.bridgewayomni.com | 39 |
NOTES TO FINANCIAL STATEMENTS (continued)
| |
December 31, 2012 (Unaudited)
For the period ended December 31, 2012, borrowings by the Funds under this line of credit were as follows:
| Bridgeway Fund | Weighted Average Interest Rate | Weighted Average Loan Balance | Number of Days Outstanding | Interest Expense Incurred1 | Maximum Amount Borrowed During the Period | |||||
Omni Small-Cap Value | 1.46% | $496,741 | 27 | $538 | $813,000 | |||||
Omni Tax-Managed Small-Cap Value | 1.49% | 720,333 | 3 | 88 | 1,027,000 |
| 1Interest expense is included on the Statements of Operations in Miscellaneous expenses. |
There were no outstanding borrowings by the Funds under this line of credit as of December 31, 2012.
8. Subsequent Events
Management has evaluated the impact of all subsequent events on the Funds and has determined that there were no subsequent events requiring recognition or disclosure in the financial statements.
40 | Semi-Annual Report | December 31, 2012 (Unaudited) |
| |
December 31, 2012 (unaudited)
1. Proxy Voting
Fund policies and procedures used in determining how to vote proxies relating to the Funds’ securities and a summary of proxies voted by the Funds for the period ended June 30, 2012 are available without a charge, upon request, by contacting Bridgeway Funds at 1-800-661-3550 and on the SEC’s website at http://www.sec.gov.
2. Fund Holdings
The complete schedule of the Funds’ holdings for the second and fourth quarters of each fiscal year are contained in the Funds’ Semi-Annual and Annual shareholder reports, respectively.
The Bridgeway Funds file complete schedules of the Funds’ holdings with the SEC for the first and third quarters of each fiscal year on Form N-Q within 60 days after the end of the period. Copies of the Funds’ Form N-Q are available without charge, upon request, by contacting Bridgeway Funds at 1-800-661-3550 and on the SEC’s website at http://www.sec.gov. You may also review and copy Form N-Q at the SEC’s Public Reference Room in Washington, D.C. For more information about the operation of the Public Reference Room, please call 1-800-SEC-0330.
www.bridgewayomni.com | 41 |
| |
December 31, 2012 (unaudited)
As a shareholder of a Fund, you will incur no transaction costs from such Fund, including sales charges (loads) on purchases, on reinvested dividends, or on other distributions. There are no exchange fees. However, as a shareholder of a Fund, you will incur ongoing costs, including management fees and other Fund expenses. The following examples are intended to help you understand your ongoing costs (in dollars) of investing in a Fund and to compare these costs with ongoing costs of investing in other mutual funds. The examples are based on an investment of $1,000 invested on July 1, 2012 and held until December 31, 2012.
Actual Expenses. The first line of the table below provides information about actual account values and actual expenses. You may use the information in this line, together with the amount you invested, to estimate the expenses that you paid over the period. Simply divide your account value by $1,000 (for example, an $8,600 account value divided by $1,000 = 8.6), then multiply the result by the number in the first line under the heading “Expenses Paid During Period” to estimate the expenses you paid on your account during the period.
Hypothetical Example for Comparison Purposes. The second line of the table below provides information about hypothetical account values and hypothetical expenses based on the Fund’s actual expense ratio and an assumed rate of return of 5% per year before expenses, which is not the Fund’s actual return. The hypothetical account values and expenses may not be used to estimate the actual ending account balance or expenses you paid for the period. You may use this information to compare the ongoing costs of investing in a Fund and other mutual funds. To do so, compare this 5% hypothetical example with the 5% hypothetical examples that appear in the shareholder reports of other funds.
The expenses shown in the table are meant to highlight ongoing Fund costs only. Therefore, the second line of the table is useful in comparing ongoing costs only and will not help you determine the relative total costs of owning different funds, because other funds may also have transaction costs, such as sales charges, redemption fees or exchange fees.
| Beginning Account Value at 7/1/12 | Ending Account Value at 12/31/12 | Expense Ratio | Expenses Paid During Period* 7/1/12 - 12/31/12 | |||||||
Bridgeway Omni Small-Cap Value | ||||||||||
Actual Fund Return | $1,000.00 | $1,098.00 | 0.60% | $3.17 | ||||||
Hypothetical Fund Return | $1,000.00 | $1,022.18 | 0.60% | $3.06 | ||||||
| Bridgeway Omni Tax-Managed Small-Cap Value | ||||||||||
Actual Fund Return | $1,000.00 | $1,091.90 | 0.60% | $3.16 | ||||||
Hypothetical Fund Return | $1,000.00 | $1,022.18 | 0.60% | $3.06 | ||||||
| * | Expenses are equal to the average account value times the Fund’s annualized expense ratio multiplied by the number of days in the most recent six-month period (184) divided by the number of days in the fiscal year (365). |
42 | Semi-Annual Report | December 31, 2012 (Unaudited) |
THIS PAGE INTENTIONALLY LEFT BLANK
THIS PAGE INTENTIONALLY LEFT BLANK
BRIDGEWAY FUNDS, INC.
BNY Mellon Investment Servicing (US) Inc.
P.O. Box 9860
Providence, RI 02940-8060
CUSTODIAN
The Bank of New York Mellon
One Wall Street
New York, NY 10286
DISTRIBUTOR
Foreside Fund Services, LLC
Three Canal Plaza, Suite 100
Portland, ME 04101
| ||||
You can review and copy information about our Funds (including the SAI) at the SEC’s Public Reference Room in Washington, D.C. To find out more about this public service, call the SEC at 800-SEC-0330. Reports and other information about the Funds is also available on the SEC’s website at www.sec.gov. You can receive copies of this information, for a fee, by writing the Public Reference Section, Securities and Exchange Commission, Washington, D.C. 20549-1520 or by sending an electronic request to the following email address: publicinfo@sec.gov.
| ||||
| Item 2. | Code of Ethics. |
Not applicable.
| Item 3. | Audit Committee Financial Expert. |
Not applicable.
| Item 4. | Principal Accountant Fees and Services. |
Not applicable.
| Item 5. | Audit Committee of Listed registrants. |
Not applicable.
| Item 6. | Investments. |
| (a) | Schedule of Investments in securities of unaffiliated issuers as of the close of the reporting period is included as part of the report to shareholders filed under Item 1 of this form. |
| (b) | The Registrant made no divestments of securities in accordance with section 13(c) of the Investment Company Act of 1940. |
| Item 7. | Disclosure of Proxy Voting Policies and Procedures for Closed-End Management Investment Companies. |
Not applicable.
| Item 8. | Portfolio Managers of Closed-End Management Investment Companies. |
Not applicable.
| Item 9. | Purchases of Equity Securities by Closed-End Management Investment Company and Affiliated Purchasers. |
Not applicable.
| Item 10. | Submission of Matters to a Vote of Security Holders. |
There have been no material changes to the procedures by which the shareholders may recommend nominees to the Registrant’s Board of Directors, where those changes were implemented after the registrant last provided disclosure in response to the requirements of Item 407(c)(2)(iv) of Regulation S-K (17 CFR 229.407) (as required by Item 22(b)(15) of Schedule 14A (17 CFR 240.14a-101)), or this Item.
| Item 11. | Controls and Procedures. |
| (a) | The registrant’s principal executive officer and principal financial officer, or persons performing similar functions, have concluded that the registrant’s disclosure controls and procedures (as defined in Rule 30a-3(c) under the Investment Company Act of 1940, as amended (the “1940 Act”) (17 CFR 270.30a-3(c))) are effectively designed, as of a date within 90 days of the filing date of the report that includes the disclosure required by this paragraph, based on their evaluation of these controls and procedures required by Rule 30a-3(b) under the 1940 Act (17 CFR 270.30a-3(b)) and Rules 13a-15(b) or 15d-15(b) under the Securities Exchange Act of 1934, as amended (17 CFR 240.13a-15(b) or 240.15d-15(b)). |
| (b) | There were no changes in the registrant’s internal control over financial reporting (as defined in Rule 30a-3(d) under the Act (17 CFR 270.30a-3(d)) that occurred during the second fiscal quarter of the period covered by this report that have materially affected or are reasonably likely to materially affect, the registrant’s internal control over financial reporting. |
| Item 12. | Exhibits. |
| (a)(1) | Not applicable. | |
| (a)(2) | Certifications pursuant to Rule 30a-2(a) under the 1940 Act and Section 302 of the Sarbanes-Oxley Act of 2002 are attached hereto. | |
| (a)(3) | Not applicable. | |
| (b) | Certifications pursuant to Rule 30a-2(b) under the 1940 Act and Section 906 of the Sarbanes-Oxley Act of 2002 are attached hereto. | |
SIGNATURES
Pursuant to the requirements of the Securities Exchange Act of 1934 and the Investment Company Act of 1940, the registrant has duly caused this report to be signed on its behalf by the undersigned, thereunto duly authorized.
| (Registrant) | Bridgeway Funds, Inc. |
| By (Signature and Title)* | /s/ Michael D. Mulcahy | |||
| Michael D. Mulcahy, President and Principal Executive Officer | ||||
| (principal executive officer) | ||||
| Date | March 5, 2013 | |||
Pursuant to the requirements of the Securities Exchange Act of 1934 and the Investment Company Act of 1940, this report has been signed below by the following persons on behalf of the registrant and in the capacities and on the dates indicated.
| By (Signature and Title)* | /s/ Michael D. Mulcahy | |||
| Michael D. Mulcahy, President and Principal Executive Officer | ||||
| (principal executive officer) | ||||
| Date | March 5, 2013 | |||
| By (Signature and Title)* | /s/ Linda G. Giuffré | |||
| Linda G. Giuffré, Treasurer and Principal Financial Officer | ||||
| (principal financial officer) | ||||
| Date | March 5, 2013 | |||
* Print the name and title of each signing officer under his or her signature.