UNITED STATES
SECURITIES AND EXCHANGE COMMISSION
Washington, D.C. 20549
FORM N-CSR
CERTIFIED SHAREHOLDER REPORT OF REGISTERED
MANAGEMENT INVESTMENT COMPANIES
Investment Company Act file number 811-08200
(Exact name of registrant as specified in charter)
|
5615 Kirby Drive, Suite 518 Houston, Texas 77005-2448 |
(Address of principal executive offices) (Zip code)
|
Michael D. Mulcahy, President Bridgeway Funds, Inc. 5615 Kirby Drive, Suite 518 Houston, Texas 77005-2448 |
(Name and address of agent for service)
Registrant’s telephone number, including area code: (713) 661-3500
Date of fiscal year end: June 30
Date of reporting period: July 1, 2010 through December 31, 2010
Form N-CSR is to be used by management investment companies to file reports with the Commission not later than 10 days after the transmission to stockholders of any report that is required to be transmitted to stockholders under Rule 30e-1 under the Investment Company Act of 1940 (17 CFR 270.30e-1). The Commission may use the information provided on Form N-CSR in its regulatory, disclosure review, inspection, and policymaking roles.
A registrant is required to disclose the information specified by Form N-CSR, and the Commission will make this information public. A registrant is not required to respond to the collection of information contained in Form N-CSR unless the Form displays a currently valid Office of Management and Budget (“OMB”) control number. Please direct comments concerning the accuracy of the information collection burden estimate and any suggestions for reducing the burden to Secretary, Securities and Exchange Commission, 100 F Street, NE, Washington, DC 20549. The OMB has reviewed this collection of information under the clearance requirements of 44 U.S.C. § 3507.
| Item 1. | Reports to Stockholders. |
The Report to Shareholders is attached herewith.
| | |
| TABLE OF CONTENTS | |  |
| | |
| | |
Bridgeway Funds Standardized Returns as of December 31, 2010*
| | | | | | | | | | | | | | | | | | | | | | | | | | | | | | | | | | | | | | | | | | | | | | | | | | | | | | | | | | | | | | |
| | | | | | | | | | | | | | | | | | | Annualized | | | | | | | | | | | | | | | |
| Fund | | | | Dec. Qtr.
10/1/10
to 12/31/103 | | | | | | | Six Months
7/1/10 to 12/31/103 | | | | | | | 1 Year | | | | | | | 5 Years | | | | | | | 10 Years | | | | | | | Inception
to Date | | | | | | | Inception
Date | | | | | | | Gross
Expense
Ratio2 | |
Aggressive Investors 1 | | | | | 14.79% | | | | | | | | 30.68% | | | | | | | | 17.82% | | | | | | | | -2.91% | | | | | | | | 2.24% | | | | | | | | 13.56% | | | | | | | | 8/5/1994 | | | | | | | | 1.20%1 | |
Aggressive Investors 2 | | | | | 12.99% | | | | | | | | 26.71% | | | | | | | | 12.10% | | | | | | | | -1.84% | | | | | | | | NA | | | | | | | | 4.71% | | | | | | | | 10/31/2001 | | | | | | | | 1.02% | |
Ultra-Small Company | | | | | 17.21% | | | | | | | | 27.53% | | | | | | | | 23.55% | | | | | | | | 3.17% | | | | | | | | 14.59% | | | | | | | | 16.44% | | | | | | | | 8/5/1994 | | | | | | | | 1.17% | |
Ultra-Small Co Market | | | | | 17.21% | | | | | | | | 27.31% | | | | | | | | 24.86% | | | | | | | | 0.07% | | | | | | | | 11.34% | | | | | | | | 10.44% | | | | | | | | 7/31/1997 | | | | | | | | 0.79%1 | |
Micro-Cap Limited | | | | | 18.11% | | | | | | | | 29.34% | | | | | | | | 29.11% | | | | | | | | -3.86% | | | | | | | | 7.16% | | | | | | | | 10.30% | | | | | | | | 6/30/1998 | | | | | | | | 1.47%1 | |
Small-Cap Momentum | | | | | 14.34% | | | | | | | | 27.45% | | | | | | | | NA | | | | | | | | NA | | | | | | | | NA | | | | | | | | 18.91%3 | | | | | | | | 5/28/2010 | | | | | | | | 1.29%1 | |
Small-Cap Growth | | | | | 9.99% | | | | | | | | 20.82% | | | | | | | | 11.77% | | | | | | | | -3.94% | | | | | | | | NA | | | | | | | | 1.45% | | | | | | | | 10/31/2003 | | | | | | | | 0.93% | |
Small-Cap Value | | | | | 10.55% | | | | | | | | 19.91% | | | | | | | | 16.55% | | | | | | | | -0.58% | | | | | | | | NA | | | | | | | | 4.72% | | | | | | | | 10/31/2003 | | | | | | | | 0.91% | |
Large-Cap Growth | | | | | 10.05% | | | | | | | | 22.82% | | | | | | | | 13.34% | | | | | | | | 1.10% | | | | | | | | NA | | | | | | | | 3.45% | | | | | | | | 10/31/2003 | | | | | | | | 0.86%1 | |
Large-Cap Value | | | | | 10.56% | | | | | | | | 20.41% | | | | | | | | 14.51% | | | | | | | | 2.27% | | | | | | | | NA | | | | | | | | 6.26% | | | | | | | | 10/31/2003 | | | | | | | | 1.11%1 | |
Blue Chip 35 Index | | | | | 9.95% | | | | | | | | 20.98% | | | | | | | | 10.60% | | | | | | | | 2.72% | | | | | | | | 1.42% | | | | | | | | 4.36% | | | | | | | | 7/31/1997 | | | | | | | | 0.27%1 | |
Managed Volatility | | | | | 5.02% | | | | | | | | 11.49% | | | | | | | | 5.41% | | | | | | | | 1.66% | | | | | | | | NA | | | | | | | | 3.51% | | | | | | | | 6/30/2001 | | | | | | | | 1.05%1 | |
| | |
| 1 | | Some of the Funds’ fees were waived or expenses reimbursed; otherwise, returns would have been lower. The |
| Adviser has contractually agreed to waive fees and/or reimburse expenses. Any material change to this Fund policy would require a vote by shareholders. |
2 | | Expense ratios are as stated in the current prospectus. Please see financials for expense ratios as of |
| December 31, 2010. |
3 | | Return is not annualized. |
Bridgeway Funds Returns for Calendar Years 1997 through 2010*
| | | | | | | | | | | | | | | | | | | | | | | | | | | | |
| | | 1997 | | 1998 | | 1999 | | 2000 | | 2001 | | 2002 | | 2003 | | 2004 | | 2005 | | 2006 | | 2007 | | 2008 | | 2009 | | 2010 |
Aggressive Investors 1 | | 18.27% | | 19.28% | | 120.62% | | 13.58% | | -11.20% | | -18.01% | | 53.97% | | 12.21% | | 14.93% | | 7.11% | | 25.80% | | -56.16% | | 23.98% | | 17.82% |
Aggressive Investors 2 | | | | | | | | | | | | -19.02% | | 44.01% | | 16.23% | | 18.59% | | 5.43% | | 32.19% | | -55.07% | | 29.84% | | 12.10% |
Ultra-Small Company | | 37.99% | | -13.11% | | 40.41% | | 4.75% | | 34.00% | | 3.98% | | 88.57% | | 23.33% | | 2.99% | | 21.55% | | -2.77% | | -46.24% | | 48.93% | | 23.55% |
Ultra-Small Co Market | | | | -1.81% | | 31.49% | | 0.67% | | 23.98% | | 4.90% | | 79.43% | | 20.12% | | 4.08% | | 11.48% | | -5.40% | | -39.49% | | 25.95% | | 24.86% |
Micro-Cap Limited | | | | | | 49.55% | | 6.02% | | 30.20% | | -16.61% | | 66.97% | | 9.46% | | 22.55% | | -2.34% | | -4.97% | | -41.74% | | 17.65% | | 29.11% |
Small-Cap Growth | | | | | | | | | | | | | | | | 11.59% | | 18.24% | | 5.31% | | 6.87% | | -43.48% | | 15.04% | | 11.77% |
Small-Cap Value | | | | | | | | | | | | | | | | 17.33% | | 18.92% | | 12.77% | | 6.93% | | -45.57% | | 26.98% | | 16.55% |
Large-Cap Growth | | | | | | | | | | | | | | | | 6.77% | | 9.33% | | 4.99% | | 19.01% | | -45.42% | | 36.66% | | 13.34% |
Large-Cap Value | | | | | | | | | | | | | | | | 15.15% | | 11.62% | | 18.52% | | 4.49% | | -36.83% | | 24.92% | | 14.51% |
Blue Chip 35 Index | | | | 39.11% | | 30.34% | | -15.12% | | -9.06% | | -18.02% | | 28.87% | | 4.79% | | 0.05% | | 15.42% | | 6.07% | | -33.30% | | 26.61% | | 10.60% |
Managed Volatility | | | | | | | | | | | | -3.51% | | 17.82% | | 7.61% | | 6.96% | | 6.65% | | 6.58% | | -19.38% | | 12.39% | | 5.41% |
Performance figures quoted represent past performance and are no guarantee of future results. Current performance may be lower or higher than the performance data quoted. Investment return and principal value will fluctuate, so that an investor’s shares, when redeemed, may be worth more or less than original cost. To obtain performance current to the most recent month-end, please visit our website at www.bridgeway.com or call 1-800-661-3550. Total return figures include the reimbursement of dividends and capital gains.
This report is submitted for the general information of the shareholders of each Fund. It is not authorized for distribution to prospective investors unless preceded or accompanied by an effective prospectus, which includes information regarding a Fund’s risks, objectives, fees and expenses, experience of its management, and other information. Investors should read the prospectus carefully before investing in a Fund. For questions or other Fund information, call 1-800-661-3550 or visit the Funds’ website at www.bridgeway.com. Funds are available for purchase by residents of the United States, Puerto Rico, U.S. Virgin Islands and Guam only. Foreside Fund Services, LLC, Distributor.
The views expressed here are exclusively those of Fund management. These views, including those relating to the market, sectors or individual stocks are not meant as investment advice and should not be considered predictive in nature.
* Numbers with green highlighting indicate periods when the Fund outperformed its primary benchmark.
| | |
| LETTER FROM THE INVESTMENT MANAGEMENT TEAM | | |
December 31, 2010
Dear Fellow Shareholders,
Six of our twelve Funds beat their primary market benchmarks in the December quarter. Nine of twelve Funds had double digit returns, with two more just barely missing this mark. Our higher turnover models and Funds seem to be showing the first signs of “traction,” a market environment more driven by company level fundamentals and favorable to a majority of our stock picking models. However, signals on this score are still mixed, as demonstrated by the relative returns on all of our lower turnover “four corners funds” (Large-Cap Value, Large-Cap Growth, Small-Cap Value, and Small-Cap Growth).
A review of the market environment appears on page 2. We just experienced our second quarter of double digit broader stock market returns — something that is definitely not sustainable. Most notable was the dominance of small companies. Also noteworthy was the fact that mutual fund shareholders continued to dump domestic equity funds in favor of bonds, even as signs of the economy continue to improve and we approach the two year mark since the bottom of the bear market. See our comments and concerns on page 3.
We use the opportunity this quarter to discuss one of Bridgeway’s newest Funds on page 3. And on page 4 we discuss one of the first Funds we brought to market, in 1994. This gives an update on some of Bridgeway’s modeling research.
Each calendar year we have a friendly competition against Morningstar’s “Fund picks.” 2010 goes to Morningstar. The “score” was Bridgeway 4, Morningstar 7. See details on page 4.
Bridgeway has a culture and mission focused on three groups: 1) you — our investor and the reason we are in business, 2) our Bridgeway partners — the folks who work hard to provide you with a high level of service and long term investment results, and 3) our communities. In the latter category (see page 5), John takes some time on Martin Luther King Jr. Day to reflect on King’s wisdom about communities, and Mike Rome relates his experiences in a community far away from our home base of Houston. Far from being a distraction, Bridgeway believes these experiences and reflections build integrity, commitment, and perspective — making us stronger, more focused, and more capable in our investment management roles.
As always, we appreciate your feedback. We take your comments very seriously and regularly discuss them internally to help in managing our Funds and this company. Please keep your ideas coming — both favorable and critical. They provide us with a vital tool, helping us to serve you better.
| | |
| LETTER FROM THE INVESTMENT MANAGEMENT TEAM (continued) | | |
Market Review of Calendar 2010
The Short Version: A strong December quarter helped the stock market finish 2010 with positive double-digit returns. Small stocks led the way.
As 2010 came to a close, investors enjoyed their second straight year of double-digit returns. Of course, increased prices mean some additional risk relative to the lower valuations of early 2009. While the 2008 market tumult may be a fading memory for some, a quick look at three-year broad market returns should serve as a sobering reminder. During the year, investors overcame a variety of bad news to push stocks higher:
| | — | | a massive oil spill in the Gulf that shut down drilling for a lengthy cleanup process. |
| | — | | the debt crisis that spread from Greece to Ireland to Spain to Portugal and beyond. |
| | — | | the infamous day (May 6) when flash trades prompted a precipitous 1,000 point drop in the Dow. |
| | — | | a change in control of the House of Representatives that pushed the President into compromise mode. |
| | — | | gold pushed past $1,400 an ounce on inflation fears. |
| | — | | oil soared to a 25-month high of over $90/barrel, raising the spectre of inflation. |
Yet, the news is not all dark. Bush era tax cuts and favorable capital gains and dividend treatment were extended. A majority of companies reported earnings that exceeded Wall Street expectations. Boardroom confidence continued as IPOs returned to favor at double the pace of 2009. Late in the year, investors generally cheered the Fed’s formal commitment to buying $600 billion of long-term Treasuries. Stocks responded favorably to prospective future economic growth, but the bond market has suffered as rates moved higher. GDP expanded at just below a 3% pace. And while unemployment remains just under 10%, unemployment claims have continued to decline.
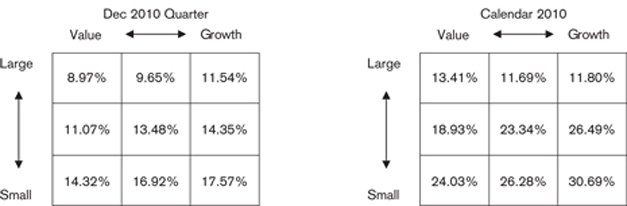
All sectors had positive returns in the December quarter, led by Materials (+16.4%) and Energy (+15.5%). Utilities (+2.1%) and Health Care (+4.7%) performed below the market, demonstrating how “defensive” sectors usually perform in a strong growth quarter.
As presented below, each “corner” of the domestic market had a positive return for the December quarter. The prior quarter trend of small-caps outperforming large-caps and mid-caps continued strongly in the December quarter. Growth outperformed value, but differences were less dramatic than on the size spectrum. Even with a rocky spring and summer, stocks across the style sprectrum posted double digit positive returns for the year.
Following are the stock market “style box” returns from Morningstar for the quarter and year:
| | |
| | |
| 2 | | Semi-Annual Report | December 31, 2010 (Unaudited) |
| | |
| LETTER FROM THE INVESTMENT MANAGEMENT TEAM (continued) | | |
The Year of the Bonds
One of the most remarkable aspects of 2010 was that, in spite of rising stock prices and a declared end of the recession, mutual fund investors continued to pull money out of stock funds and put it into bonds. Based on data from the Investment Company Institute, the graph below shows the degree to which this is true. $246 billion dollars flowed into bond mutual funds in 2010, the second strongest year of bond inflows of the last quarter century. Meanwhile, $88 billion flowed out of stocks. If you’ve followed our investment philosophy over the years, you know we cringe at the timing of the flows — typically poorly timed with respect to market movements. We continue to believe the best strategy for an investor is to develop a long term asset allocation plan commensurate with your investment time horizon and risk tolerance, write it down, and stick to it, especially when it feels least comfortable to do so.
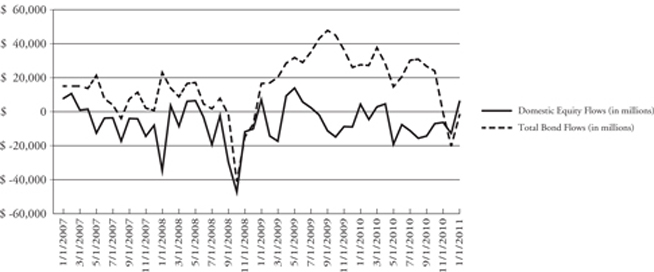
Source: Investment Company Institute
Small-Cap Momentum Fund
After not adding any new funds for six years, Bridgeway added two within the last year. We wanted to highlight one of these. How might the Small-Cap Momentum Fund fit into an investor’s portfolio?
Based on both academic literature and Bridgeway’s own historical research, the “momentum” style of investing is a particularly good diversifier of the value style of investing and has an attractive track record compared to the growth style. There are two potential problems with the momentum style of investing. First, it tends to have higher turnover (buying and selling stocks), potentially leading to higher transaction costs and less tax efficiency. We seek to address the transaction cost problem by devoting significant resources to trading and then measuring this issue, comparing our actual results to a theoretical “paper” portfolio that has no transaction costs. After seven months of operations, this Fund lags our paper portfolio by only 0.38%, less than the amount of our operating expenses. We are very pleased with this “right out of the box” performance.
Although our Fund will exhibit higher than average turnover, the style itself offsets the tax disadvantage somewhat: since a stock with large appreciation tends to remain a “hold” in the momentum style, some of the stocks with the biggest gains are only sold after a year, when the gains are long term, and thus taxed at a lower rate. However, a majority of losses are taken while they are short-term. In aggregate, we would expect to significantly tweak capital gains in favor of the lower cost long-term category. This might put our Fund’s tax efficiency somewhere between a very efficient index fund (e.g. Blue Chip 35 Index Fund) and a higher turnover actively managed fund. It could take years to prove this out, and there is no assurance we will be able to deliver these results.
The second problem with the momentum style of investing is that it tends to perform poorly during “inflection points,” major turns in the market, such as 2008 and 2009. Bridgeway seeks to address this problem by our own brand of momentum, which we call “risk adjusted” momentum. If successful, this methodology should provide some cushion in a sudden downturn,
| | |
| LETTER FROM THE INVESTMENT MANAGEMENT TEAM (continued) | | |
but would cause it to lag, relative to a pure momentum style, in an extended bull market. Net of everything, we hope to produce an attractive combination of market returns and “dampened” volatility — a powerful combination. Of course, past performance, including and especially that of our Fund’s short existence, does not guarantee future performance. Please see our prospectus, https://www.bridgeway.com/assets/pdf/prospectus/Prospectus 2010.10.30.pdf for a description of investment objective, strategy, fees, and risks.
Lump of Coal
The last few years have been challenging for our Aggressive Investors 1 Fund as a “macro-driven market” and severe recession put our quantitative models to test – a test which we largely failed. This fund, one of Bridgeway’s first funds, was started in 1994. Going into 2008 it carried a “5-star” designation from Morningstar, but it just emerged from 2010 as a “1-star” fund. This is certainly not something we are proud of nor used to. Because of the performance fee structure in this fund, the expense ratio actually went negative in 2010, as the Adviser was put in the position of reimbursing the fund because of lagging performance. (See 2010 Annual Report for explanation.) To that end, we received a “2010 Lump of Coal” award from one industry writer with the suggestion that we should shut the fund. While other fund companies shutter funds that might underperform for some time period, we are pressing on for several reasons:
1) We are focused on the long-term, and over the long-term (we now have 16 years of track record) this Fund has beaten its benchmark by 5.21% per year since inception. The recent underperformance is primarily from two quarters in 2008. While this period is incorporated into our backtested database, we don’t let any one period dominate our thinking, our process, or our models. The recent period has been a “macro dominated” market unfavorable to our Fund, but we believe stock prices will eventually be driven once again by company level economics more favorable to the design of our models. Indeed, we have beaten our primary market benchmark for the last two quarters, but this is too short a period to call a return to “traction,” or environment more favorable to our Fund.
2) Historically, some of our strongest periods have followed a poorer one. Admittedly, the two years from June 2008 to June 2010 were long enough and deep enough to test patience.
3) Our research process is one of seeking continual improvements. Last year we completed a multi-year research project, begun before the downturn, to re-evaluate all of our stock picking models. While we have made some tweaks and improvements along the way, including some risk management enhancements, we are making no wholesale changes. We believe the worst time to make major changes is immediately after the horse has left the barn.
4) The performance fee does just what a shareholder would want – it aligns the interests of the Advisor and shareholder.
We performed poorly in the most recent five year period; that hurts our investors and our fees.
Ironically, as we were receiving a “lump of coal” from one writer, Morningstar was adding this fund to their Morningstar Funds 500 list.
For those who have stuck with us, thank you for keeping the long-term perspective. This Fund was re-opened to new investors on January 14, 2011. If you are considering purchasing the Fund, we remind you that this Fund is “aggressive” and can be volatile (as we have seen over the last few years). It requires you to keep a long-term view and to consider this investment as a part of your entire portfolio and investment needs. Past performance does not guarantee future performance. Please see our prospectus, https://www.bridgeway.com/assets/pdf/prospectus/Prospectus 2010.10.30.pdf for a description of investment objective, strategy, fees, and risks.
Performance Versus Morningstar Analyst Picks
The Short Version: Bridgeway 4, Morningstar 7.
Morningstar, the Chicago-based independent research firm, publishes a list of “best funds” for each asset class as determined by its analysts every year. In January when the final tallies are in, we compare the performance of each of our Funds to the average returns of Morningstar’s top picks for the comparable asset class. How did we do in 2010?
| | |
| | |
| 4 | | Semi-Annual Report | December 31, 2010 (Unaudited) |
| | |
| LETTER FROM THE INVESTMENT MANAGEMENT TEAM (continued) | | |
2010 was a poor year relative to our market benchmarks — only two of eleven Funds, with at least one year of performance, beat their primary market benchmarks. We fared slightly better against the “higher hurdle” of Morningstar’s “top picks;” with four of those eleven Funds beating these benchmarks. We are not pleased with this record.
The table below depicts the results by Morningstar category and relevant Bridgeway Fund.
| | | | | | |
| Bridgeway Funds | | Morningstar Analyst “Pick” |
| Name | | 2010 Return | | Morningstar Category | | 2010 Return |
| Aggressive Investors 1 | | 17.82% | | Mid-cap growth | | 23.54% |
| Aggressive Investors 2 | | 12.10% | | Mid-cap growth | | 23.54% |
| Ultra-Small Company | | 23.55% | | Small growth | | 22.59% |
| Ultra-Small Company Market | | 24.86% | | Small blend | | 21.47% |
| Micro-Cap Limited | | 29.11% | | Small growth | | 22.59% |
| Small-Cap Growth | | 11.77% | | Small growth | | 22.59% |
| Small-Cap Value | | 16.55% | | Small value | | 26.70% |
| Large-Cap Growth | | 13.34% | | Large-cap growth | | 19.68% |
| Large-Cap Value | | 14.51% | | Large-cap value | | 13.53% |
| Blue Chip 35 Index | | 10.60% | | Large-cap blend | | 15.09% |
| Managed Volatility | | 5.41% | | Conservative Allocation | | 10.51% |
Past performance is not an indicator of future results. The Bridgeway Funds’ adviser, Bridgeway Capital Management, Inc., does not have any influence on the selection of the funds chosen by Morningstar’s analysts. The number and specific funds used in the comparison are at the control and discretion of Morningstar and their analysts and are subject to change. Morningstar’s criteria for choosing Analyst Picks includes, but is not limited to, factors such as performance, expenses, and quality of fund management. In addition, the comparison of Bridgeway Funds to the Morningstar Analyst Picks is limited to performance only and does not take into consideration other factors that are considered by Morningstar when compiling their list of Analyst Picks.
Each Bridgeway Fund is compared to the average total return of the group of funds selected by Morningstar at the beginning of 2010 for the one-year period ended December 31, 2010. The averages in the table are comprised of between three and thirteen funds from within each category. In an effort to provide a complete and balanced assessment, all of the Bridgeway Funds are used in the comparison table shown above, such that no attempt is made to cull out unfavorable results. The purpose of this comparison is to “raise the bar” on performance comparison, as this analysis uses an arguably higher benchmark by comparing the Bridgeway Funds to other funds chosen by an independent source that specializes in investment research.
A Reflection on Martin Luther King Jr. Day from John Montgomery
An annual tradition of mine is to read the “Letter from the Birmingham Jail“ on Martin Luther King Jr. Day. This year the following paragraph struck me:
Moreover, I am cognizant of the interrelatedness of all communities and states. I cannot sit idly by in Atlanta and not be concerned about what happens in Birmingham. Injustice anywhere is a threat to justice everywhere. We are caught in an inescapable network of mutuality, tied in a single garment of destiny. Whatever affects one directly, affects all indirectly. Never again can we afford to live with the narrow, provincial “outside agitator” idea. Anyone who lives inside the United States can never be considered an outsider anywhere within its bounds.
I think Martin Luther King Jr. was ahead of his time in understanding the interconnectedness of communities. I wonder who Rev. King would consider the outsider within our borders today. Or perhaps more importantly, I wonder if he would consider our communities to even stop at the U.S. borders. Today, CNN brings us news instantaneously from around the world. I’m able to step on a plane today and then disembark tomorrow halfway around the world. The world economies are now interwoven. Indeed, a crisis in Portugal or Greece or Southeast Asia is felt in the U.S. markets and affects the net asset values of Bridgeway’s domestic stock funds. I am particularly tuned into this “community interrelatedness,” reading the following section from Mike Rome, our head of business development . . .
| | |
| LETTER FROM THE INVESTMENT MANAGEMENT TEAM (continued) | | |
Transformative Change
Since its founding in 1994, Bridgeway Capital Management has maintained a strong commitment to stewardship. As part of this stewardship, we encourage all Bridgeway Partners to inspire and enable positive transformative change in our world. In this and subsequent shareholder letters, various Bridgeway Partners will share some of their personal reflections and experiences as they have pursued transformative change. We give each Partner great latitude in defining transformative change. While their views may not represent the views of all the Partners or the firm, we are excited to support them along their journey. We hope that their messages will inspire you to find your own way to transform the world into a better place.
Mike Rome’s Trip to Kenya
As a Partner at Bridgeway since December of 2002, I have come to realize that it is more important to be a part of something small and dynamic than big and sterile. If you are given a chance to make a difference in people’s lives versus making more money, the decision isn’t even close. Adversities in life have a funny way of changing us and catching our attention. On February 18, 2008, while attending my son’s high school baseball game, my life was taken and given back to me all within a matter of minutes when I was revived after my heart stopped beating. Being the lucky guy that I am, God sent me the warning of a heart attack and a message that it was time to go help make a difference in the world.
In August of 2010, I went on a mission trip to Nairobi, Kenya with Athletes in Action. My role was to help coordinate a basketball camp for kids, teach at the school in the Kibera slum, and meet with businessmen. First of all, I am just a regular guy who has been given the gift of talking. It became very obvious early on that it did not matter how good I was in any given area, but that it was more significant just that I was there on the ground, caring and giving hope to those around me. In the end, I was the one who came away feeling the most blessed. Even though the emotional strain was difficult for me, I did something that helped me feel as if I had earned my place in heaven.
After many years of working on Wall Street, Bridgeway has been a saving grace in my life. It is so great to give opportunities to folks who truly do just want a chance. Bridgeway really does live out the mission to make a difference in the lives of others. I have personally taken that message home with me and am confident that my family knows the value of living life as a servant leader and going out in the world and sharing the gift of hope. Thank you very much for your support of Bridgeway and our mission.
| | |
| | |
| 6 | | Semi-Annual Report | December 31, 2010 (Unaudited) |
THIS PAGE INTENTIONALLY LEFT BLANK
| | |
Aggressive Investors 1 Fund MANAGER’S COMMENTARY | | |
December 31, 2010
Dear Fellow Aggressive Investors 1 Fund Shareholder,
For the December 2010 quarter, Aggressive Investors 1 Fund ended the year on a strong note with a 14.79% return that outperformed its primary market benchmark, the S&P 500 Index (+10.76%) and its peer benchmark, the Lipper Capital Appreciation Funds Index (+11.16%). The Fund did lag the smaller-cap Russell 2000 Index (+16.25%) in a small-cap dominated market. It was a very good quarter on an absolute basis, but a mixed quarter on a relative basis, and we are generally pleased with the results.
For the six-month “semi-annual” period ending December 31, 2010, our Fund jumped 30.68%, beating each of its benchmarks: the S&P 500 Index (+23.27%), the Russell 2000 Index (+29.38%), and the Lipper Capital Appreciation Funds Index (+22.92%). Our growth leaning stock picking models tended to do very well in this growth dominated period. We are very pleased with these results.
For the calendar year ended December 31, 2010, our Fund was up 17.82% and outperformed both our primary market benchmark, the S&P 500 Index (+15.06%) and its peer benchmark, the Lipper Capital Appreciation Funds Index (+15.26%), but trailed the smaller-cap Russell 2000 Index (+26.85%). In spite of beating our primary market benchmark for the calendar year and the last decade, the “damage” of 2008 lingers as the determining period in the last five year period; we still have quite a bit of catch-up to do here.
The table below presents our December quarter, six-month, one-year, five-year, ten-year and life-to-date financial results according to the formula required by the SEC. See the next page for a graph of performance since inception.
| | | | | | | | | | | | |
| | | Dec. Qtr.
10/1/10
to 12/31/10 | | 6 Month
7/1/10
to 12/31/10 | | 1 Year
1/1/10
to 12/31/10 | | 5 Year
1/1/06
to 12/31/10 | | 10 Year
1/1/01
to 12/31/10 | | Life-to-Date
8/5/94 to 12/31/10 |
| | | | | | |
Aggressive Investors 1 Fund | | 14.79% | | 30.68% | | 17.82% | | -2.91% | | 2.24% | | 13.56% |
S&P 500 Index (large companies) | | 10.76% | | 23.27% | | 15.06% | | 2.29% | | 1.41% | | 8.35% |
Lipper Capital Appreciation Funds Index | | 11.16% | | 22.92% | | 15.26% | | 4.41% | | 2.26% | | 7.74% |
Russell 2000 Index (small companies) | | 16.25% | | 29.38% | | 26.85% | | 4.47% | | 6.33% | | 8.82% |
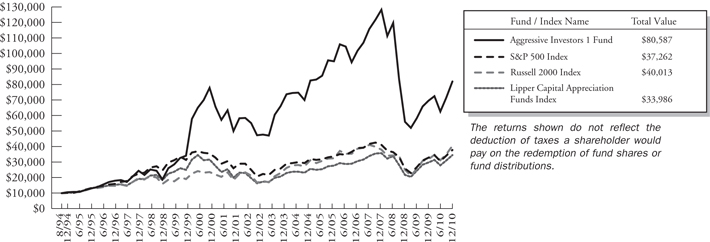
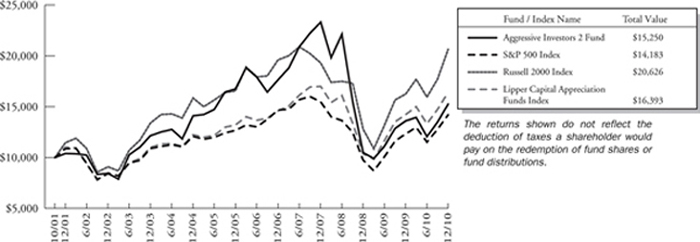
Performance figures quoted in the table above and graph below represent past performance and are no guarantee of future results. Total return figures in the table above include the reinvestment of dividends and capital gains. The table above and the graph below do not reflect the deduction of taxes that a shareholder would pay on Fund distributions or the redemption of Fund shares. The recent growth rate in the stock market has helped to produce short-term returns that are not typical and may not continue in the future.
The S&P 500 Index is a broad-based, unmanaged measurement of changes in stock market conditions, based on the average of 500 widely held common stocks with dividends reinvested, while the Russell 2000 Index is an unmanaged, market value weighted index that measures performance of the 2,000 companies that are between the 1,000th and 3,000th largest in the market with dividends reinvested. The Lipper Capital Appreciation Funds Index reflects the record of the 30 largest funds in this category, comprised of more aggressive domestic growth mutual funds, as reported by Lipper, Inc. It is not possible to invest directly in an index. Periods longer than one year are annualized.
According to data from Lipper, Inc. as of December 31, 2010, Aggressive Investors 1 Fund ranked 134th of 294 capital appreciation funds for the twelve months ending December 31, 2010, 212th of 217 over the last five years, 75th of 152 over the last ten years, and 2nd of 55 since inception in August, 1994. These long-term numbers and the graph below give two snapshots of our long-term record. Lipper, Inc. is an independent mutual fund rating service that ranks funds in various fund categories by making comparative calculations using total returns.
| | |
| | |
| 8 | | Semi-Annual Report | December 31, 2010 (Unaudited) |
| | |
Aggressive Investors 1 Fund MANAGER’S COMMENTARY (continued) | | |
Aggressive Investors 1 Fund vs. S&P 500 Index, Lipper Capital Appreciation Funds Index & Russell 2000 Index
from Inception 8/5/94 to 12/31/10
Detailed Explanation of Quarterly Performance
The Short Version: Three sectors (Consumer Discretionary, Materials, Information Technology) completed the entire top ten list of best contributors, while Information Technology dominated the worst contributors list.
The recent quarter could be deemed “the return of the consumer,” as retailers reported their best holiday season since the beginning of the economic downturn. Four Consumer Discretionary companies highlighted the list of best contributors, adding almost two percent to the overall return of the Fund. Three Materials stocks were also among the best contributors, as demand in the emerging markets continued to aid commodities and related companies. Information Technology companies were a mixed bag in the December quarter as three related holdings made the top ten list, but five other holdings made the worst contributors list.
These are the Fund’s ten best-contributing stocks for the quarter ended December 31, 2010:
| | | | | | |
Rank | | Description | | Industry | | % Contribution to Return |
| 1 | | Silvercorp Metals, Inc. | | Metals & Mining | | 0.7% |
| 2 | | Dillard’s, Inc. | | Multiline Retail | | 0.6% |
| 3 | | SanDisk Corp. | | Computers & Peripherals | | 0.6% |
| 4 | | Silver Wheaton Corp. | | Metals & Mining | | 0.5% |
| 5 | | Pier 1 Imports, Inc. | | Specialty Retail | | 0.5% |
| 6 | | Ford Motor Co. | | Automobiles | | 0.5% |
| 7 | | F5 Networks, Inc. | | Communications Equipment | | 0.5% |
| 8 | | Atmel Corp. | | Semiconductors & Semiconductor Equipment | | 0.4% |
| 9 | | Huntsman Corp. | | Chemicals | | 0.4% |
| 10 | | DSW, Inc. | | Specialty Retail | | 0.4% |
While gold continues to get much of the positive press when it comes to investing in precious metals, silver has more than made a name for itself, and related companies have benefited dramatically. Gold is known more as an inflation hedge and a safe-haven investment during times of crisis, but silver demand has continued to increase because of its industrial uses in batteries, bearings and electronics. In December, silver prices pushed to 30-year highs. Silvercorp Metals is a global silver mining company with a major presence in China. In December, the company announced a new mining venture in Guangdong Province as part of its overall expansion throughout this rapidly growing emerging market. Its stock price skyrocketed 55% during the three month period and was the top contributor to the Fund’s return.
| | |
Aggressive Investors 1 Fund MANAGER’S COMMENTARY (continued) | | |
Five Information Technology companies were among the biggest detractors from the Fund’s performance. In certain cases, corporations have limited technology purchases in order to keep costs in check and make earnings look stronger. The delayed activity has hindered some IT companies, many of which are still expecting a major surge in upgrades, but continue to wait out the economic uncertainty for another quarter or two (and hopefully not much longer). The five IT holdings on the list below cost the Fund about three-quarters of a percent in return.
These are the Fund’s ten worst-contributing stocks for the quarter ended December 31, 2010:
| | | | | | |
| Rank | | Description | | Industry | | % Contribution to Return |
1 | | Lexmark International, Inc. | | Computers & Peripherals | | -0.3% |
2 | | Newpark Resources, Inc. | | Energy Equipment & Services | | -0.3% |
3 | | Corinthian Colleges, Inc. | | Diversified Consumer Services | | -0.1% |
4 | | Cirrus Logic, Inc. | | Semiconductors & Semiconductor Equipment | | -0.1% |
5 | | TriQuint Semiconductor, Inc. | | Semiconductors & Semiconductor Equipment | | -0.1% |
6 | | Lloyds Banking Group PLC - ADR | | Commercial Banks | | -0.1% |
7 | | Unisys Corp. | | IT Services | | -0.1% |
8 | | Sauer-Danfoss, Inc. | | Machinery | | -0.1% |
9 | | Sprint Nextel Corp. | | Wireless Telecommunication Services | | -0.1% |
10 | | Baidu, Inc. - Sponsored ADR | | Internet Software & Services | | -0.1% |
Earnings can make a big difference to investors. In October, printer maker Lexmark disappointed investors with a weaker than expected earnings report that showed lackluster revenue growth and a large buildup in inventories. The company also announced that its CEO was stepping down. Its stock plummeted almost 20% on the earnings news, and some analysts questioned the company’s ability to compete with larger rivals like HP. For the three month period ended December 31, 2010, Lexmark was the costliest holding in the Fund as its stock price fell 22% for the quarter.
Detailed Explanation of Calendar Year Performance
The Short Version: The best contributors list was very diverse, while Information Technology dominated the worst contributors list for the calendar year as it did for the quarter.
All in all, calendar year 2010 was a nice year for stocks across most industries as five different sectors were represented on the top ten best contributors list. Of note, Consumer Discretionary companies again topped the list as retailers benefited from a late surge in activity and the three related holdings combined to contribute over 3.5% to the Fund’s performance. Two of these companies (TRW and Ford) come from auto-related industries and served as proof that demand continued to increase both domestically and abroad.
These are the Fund’s ten best-contributing stocks for the calendar year ended December 31, 2010:
| | | | | | |
| Rank | | Description | | Industry | | % Contribution to Return |
| 1 | | ev3, Inc. | | Health Care Equipment & Supplies | | 1.7% |
| 2 | | TRW Automotive Holdings Corp. | | Auto Components | | 1.7% |
| 3 | | Pier 1 Imports, Inc. | | Specialty Retail | | 1.1% |
| 4 | | Silvercorp Metals, Inc. | | Metals & Mining | | 0.9% |
| 5 | | W.W. Grainger, Inc. | | Trading Companies & Distributors | | 0.8% |
| 6 | | Tata Motors, Ltd. - Sponsored ADR | | Machinery | | 0.8% |
| 7 | | Ford Motor Co. | | Automobiles | | 0.8% |
| 8 | | Cognizant Technololgy Solutions Corp. | | IT Services | | 0.8% |
| 9 | | Acme Packet, Inc. | | Communications Equipment | | 0.7% |
| 10 | | Silver Wheaton Corp. | | Metals & Mining | | 0.7% |
TRW Automotive Holdings was the Fund’s second biggest contributor for the calendar year; its stock price more than doubled over the 12-month period. The auto industry had a strong resurgence as Ford rebounded nicely from the recession and GM
| | |
| | |
| 10 | | Semi-Annual Report | December 31, 2010 (Unaudited) |
| | |
Aggressive Investors 1 Fund MANAGER’S COMMENTARY (continued) | | |
went public to strong investor demand, thus benefitting the worldwide auto parts supplier. TRW’s recent earnings report beat expectations, a development that has been repeated often over the past few years. Because of its global presence, analysts continue to believe the company will benefit greatly as auto sales jump in the world’s emerging markets and regulators in these countries press for stronger safety standards.
As was the case for the quarter, Information Technology companies dominated the list of negative contributors; four related holdings were among the top detractors to Fund performance. Combined, they cost the Fund over three percent in return. Five other sectors were represented on this list, proving that even in strong years, laggards normally exist in virtually every industry. In fact, two consumer discretionary companies were on the worst contributors list, though neither was retail-oriented.
These are the Fund’s ten worst-contributing stocks for the calendar year ended December 31, 2010:
| | | | | | |
| Rank | | Description | | Industry | | % Contribution to Return |
| 1 | | Unisys Corp. | | IT Services | | -1.1% |
| 2 | | American Superconductor Corp. | | Electrical Equipment | | -1.1% |
| 3 | | Sanmina-SCI Corp. | | Electronic Equip., Instruments & Components | | -0.8% |
| 4 | | NewMarket Corp. | | Chemicals | | -0.7% |
| 5 | | Corinthian Colleges, Inc. | | Diversified Consumer Services | | -0.7% |
| 6 | | Fuel Systems Solutions, Inc. | | Auto Components | | -0.7% |
| 7 | | Micron Technology, Inc. | | Semiconductors & Semiconductor Equipment | | -0.6% |
| 8 | | Diamond Offshore Drilling, Inc. | | Energy Equipment & Services | | -0.6% |
| 9 | | Chiquita Brands International, Inc. | | Food Products | | -0.6% |
| 10 | | Seagate Technology PLC | | Computers & Peripherals | | -0.5% |
Technology companies like Unisys have struggled as their customers slashed IT budgets in an attempt to make their own bottom line look better to investors and analysts. In its most recent quarter, Unisys reported a 54% profit decline on weak server sales, and investors reacted negatively. Its stock fell almost 20% in one day and dropped over 30% for calendar year 2010. Earlier in the year, the multinational company suffered from negative economic developments in Venezuela. Unisys cost the Fund over one percent in return and was the worst contributor to its overall performance.
Top Ten Holdings as of December 31, 2010
Four of the Fund’s top contributors for the December 2010 quarter were also among the largest holdings at the end of the calendar year (Pier 1 Imports, Sandisk, F5 Networks, and Silvercorp Metals). Two electronic equipment companies and two semiconductor companies highlighted the Fund’s top ten holdings at year-end. Still, the Fund was broadly diversified, and no single holding accounted for greater than 2.1% of the net assets. The ten largest positions represented less than 20% of the total assets of the Fund.
| | | | | | |
| Rank | | Description | | Industry | | % of Net Assets |
| 1 | | Complete Production Services, Inc. | | Energy Equipment & Services | | 2.1% |
| 2 | | Pier 1 Imports, Inc. | | Speciality Retail | | 2.0% |
| 3 | | RPC, Inc. | | Energy Equipment & Services | | 2.0% |
| 4 | | SanDisk Corp. | | Computers & Peripherals | | 1.9% |
| 5 | | F5 Networks, Inc. | | Communications Equipment | | 1.8% |
| 6 | | TRW Automotive Holdings Corp. | | Auto Components | | 1.8% |
| 7 | | ARM Holdings PLC - Sponsored ADR | | Semiconductors & Semiconductor Equipment | | 1.8% |
| 8 | | Silvercorp Metals, Inc. | | Metals & Mining | | 1.6% |
| 9 | | Micron Technology, Inc. | | Semiconductors & Semiconductor Equipment | | 1.5% |
| 10 | | Tata Motors, Ltd. - Sponsored ADR | | Machinery | | 1.5% |
| | | Total | | | | 18.0% |
| | |
Aggressive Investors 1 Fund MANAGER’S COMMENTARY (continued) | | |
Industry Sector Representation as of December 31, 2010
The biggest disparity between the Fund and the S&P 500 Index was found in the Consumer Discretionary sector, and we benefited greatly from strong company performance in this area throughout the year, particularly in the midst of a favorable holiday season. The Fund’s largest allocation was in Information Technology, a sector that underperformed during the period.
| | | | | | |
| | | % of Net Assets | | % of S&P 500 Index | | Difference |
Consumer Discretionary | | 19.7% | | 10.6% | | 9.1% |
Consumer Staples | | 5.4% | | 10.6% | | -5.2% |
Energy | | 11.3% | | 12.0% | | -0.7% |
Financials | | 7.8% | | 16.3% | | -8.5% |
Health Care | | 6.1% | | 11.0% | | -4.9% |
Industrials | | 16.8% | | 10.9% | | 5.9% |
Information Technology | | 23.0% | | 18.5% | | 4.5% |
Materials | | 8.8% | | 3.7% | | 5.1% |
Telecommunication Services | | 0.9% | | 3.1% | | -2.2% |
Utilities | | 0.0% | | 3.3% | | -3.3% |
Cash & Other Assets | | 0.2% | | 0.0% | | 0.2% |
Total | | 100.0% | | 100.0% | | |
Disclaimer
The views expressed here are exclusively those of Fund management. These views, including those related to market sectors or individual stocks, are not meant as investment advice and should not be considered predictive in nature. Any favorable (or unfavorable) description of a holding applies only as of the quarter-end, December 31, 2010, unless otherwise stated. Security positions can and do change thereafter. Discussions of historical performance do not guarantee and may not be indicative of future performance.
Market volatility can significantly affect short-term performance. The Fund is not an appropriate investment for short-term investors. Investments in the small companies within this multi-cap fund generally carry greater risk than is customarily associated with larger companies. This additional risk is attributable to a number of factors, including the relatively limited financial resources that are typically available to small companies and the fact that small companies often have comparatively limited product lines. In addition, the stock of small companies tends to be more volatile than the stock of large companies, particularly in the short term and particularly in the early stages of an economic or market downturn. The Fund’s use of options, futures, and leverage can magnify the risk of loss in an unfavorable market, and the Fund’s use of short-sale positions can, in theory, expose shareholders to unlimited loss. Finally, the Fund exposes shareholders to “focus risk,” which may add to Fund volatility through the possibility that a single company could significantly affect total return. Shareholders of the Fund, therefore, are taking on more risk than they would if they invested in the stock market as a whole.
Conclusion
Thank you for your continued investment in Aggressive Investors 1 Fund. We encourage your feedback; your reactions and concerns are extremely important to us.
Sincerely,
Your Investment Management Team
| | |
| | |
| 12 | | Semi-Annual Report | December 31, 2010 (Unaudited) |
| | |
Bridgeway Aggressive Investors 1 Fund SCHEDULE OF INVESTMENTS | | |
| | |
Showing percentage of net assets as of December 31, 2010 (Unaudited) | | |
| | | | | | | | | | |
Industry | | Company | | | Shares | | | | Value | |
COMMON STOCKS - 99.78% | |
Aerospace & Defense - 2.85% | |
| | L - 3 Communications Holdings, Inc. | | | 12,900 | | | $ | 909,321 | |
| | Northrop Grumman Corp. | | | 17,400 | | | | 1,127,172 | |
| | Raytheon Co. | | | 22,500 | | | | 1,042,650 | |
| | | | | | | | | | |
| | | | | | | | | 3,079,143 | |
| |
Airlines - 3.17% | |
| | Lan Airlines SA - Sponsored ADR+ | | | 33,000 | | | | 1,015,740 | |
| | United Continental Holdings, Inc.*+ | | | 37,600 | | | | 895,632 | |
| | US Airways Group, Inc.* | | | 150,800 | | | | 1,509,508 | |
| | | | | | | | | | |
| | | | | | | | | 3,420,880 | |
| |
Auto Components - 4.26% | |
| | BorgWarner, Inc.* | | | 19,400 | | | | 1,403,784 | |
| | Magna International, Inc. | | | 24,800 | | | | 1,289,600 | |
| | TRW Automotive Holdings Corp.* | | | 36,200 | | | | 1,907,740 | |
| | | | | | | | | | |
| | | | | | | | | 4,601,124 | |
| |
Beverages - 2.26% | |
| | Brown - Forman Corp., Class B | | | 20,900 | | | | 1,455,058 | |
| | Dr. Pepper Snapple Group, Inc. | | | 28,000 | | | | 984,480 | |
| | | | | | | | | | |
| | | | | | | | | 2,439,538 | |
| |
Chemicals - 3.61% | |
| | Huntsman Corp. | | | 99,000 | | | | 1,545,390 | |
| | Sherwin - Williams Co. (The) | | | 13,300 | | | | 1,113,875 | |
| | Westlake Chemical Corp. | | | 28,600 | | | | 1,243,242 | |
| | | | | | | | | | |
| | | | | | | | | 3,902,507 | |
| |
Commercial Banks - 3.60% | |
| | KeyCorp | | | 124,700 | | | | 1,103,595 | |
| | Lloyds Banking Group PLC - ADR*+ | | | 215,200 | | | | 884,472 | |
| | M&T Bank Corp. | | | 14,200 | | | | 1,236,110 | |
| | Regions Financial Corp. | | | 94,600 | | | | 662,200 | |
| | | | | | | | | | |
| | | | | | | | | 3,886,377 | |
| |
Communications Equipment - 3.07% | |
| | F5 Networks, Inc.* | | | 15,300 | | | | 1,991,448 | |
| | Finisar Corp.*+ | | | 44,500 | | | | 1,321,205 | |
| | | | | | | | | | |
| | | | | | | | | 3,312,653 | |
| |
Computers & Peripherals - 2.88% | |
| | Lexmark International, Inc., Class A* | | | 30,200 | | | | 1,051,564 | |
| | | | | | | | | | |
Industry | | Company | | | Shares | | | | Value | |
| | | | | | | | | | |
Computers & Peripherals (continued) | |
| | SanDisk Corp.* | | | 41,400 | | | $ | 2,064,204 | |
| | | | | | | | | | |
| | | | | | | | | 3,115,768 | |
|
Consumer Finance - 1.03% | |
| | Credit Acceptance Corp.* | | | 17,700 | | | | 1,111,029 | |
|
Diversified Consumer Services - 0.34% | |
| | Corinthian Colleges, Inc.*+ | | | 71,500 | | | | 372,515 | |
|
Electronic Equipment, Instruments & Components - 4.17% | |
| | Arrow Electronics, Inc.* | | | 33,600 | | | | 1,150,800 | |
| | Ingram Micro, Inc., Class A* | | | 58,000 | | | | 1,107,220 | |
| | Tech Data Corp.* | | | 26,400 | | | | 1,162,128 | |
| | Vishay Intertechnology, Inc.* | | | 73,900 | | | | 1,084,852 | |
| | | | | | | | | | |
| | | | | | | | | 4,505,000 | |
|
Energy Equipment & Services - 8.12% | |
| | Atwood Oceanics, Inc.* | | | 33,300 | | | | 1,244,421 | |
| | Complete Production Services, Inc.* | | | 78,500 | | | | 2,319,675 | |
| | Halliburton Co. | | | 30,000 | | | | 1,224,900 | |
| | Newpark Resources, Inc.* | | | 121,800 | | | | 750,288 | |
| | RPC, Inc.+ | | | 118,050 | | | | 2,139,066 | |
| | Tetra Technologies, Inc.* | | | 92,400 | | | | 1,096,788 | |
| | | | | | | | | | |
| | | | | | | | | 8,775,138 | |
|
Food & Staples Retailing - 1.97% | |
| | Safeway, Inc. | | | 49,200 | | | | 1,106,508 | |
| | Wal - Mart Stores, Inc. | | | 19,000 | | | | 1,024,670 | |
| | | | | | | | | | |
| | | | | | | | | 2,131,178 | |
|
Health Care Equipment & Supplies - 1.09% | |
| | CR Bard, Inc. | | | 12,800 | | | | 1,174,656 | |
|
Health Care Providers & Services - 2.07% | |
| | Health Management Associates, Inc., Class A* | | | 125,000 | | | | 1,192,500 | |
| | Quest Diagnostics, Inc. | | | 19,300 | | | | 1,041,621 | |
| | | | | | | | | | |
| | | | | | | | | 2,234,121 | |
|
Hotels, Restaurants & Leisure - 1.91% | |
| | Chipotle Mexican Grill, Inc.* | | | 4,900 | | | | 1,042,034 | |
| | Las Vegas Sands Corp.* | | | 22,300 | | | | 1,024,685 | |
| | | | | | | | | | |
| | | | | | | | | 2,066,719 | |
|
Insurance - 1.00% | |
| | Travelers Cos., Inc. (The) | | | 19,400 | | | | 1,080,774 | |
|
Internet & Catalog Retail - 2.48% | |
| | NetFlix, Inc.*+ | | | 8,400 | | | | 1,475,880 | |
| | |
Bridgeway Aggressive Investors 1 Fund SCHEDULE OF INVESTMENTS (continued) | | |
| | |
| Showing percentage of net assets as of December 31, 2010 (Unaudited) | | |
| | | | | | | | | | |
Industry | | Company | | | Shares | | | | Value | |
Common Stocks (continued) | |
Internet & Catalog Retail (continued) | |
| | priceline.com, Inc.* | | | 3,000 | | | $ | 1,198,650 | |
| | | | | | | | | | |
| | | | | | | | | 2,674,530 | |
| |
Internet Software & Services - 2.04% | |
| | Akamai Technologies, Inc.* | | | 22,600 | | | | 1,063,330 | |
| | Baidu, Inc. - Sponsored ADR* | | | 11,800 | | | | 1,139,054 | |
| | | | | | | | | | |
| | | | | | | | | 2,202,384 | |
| |
IT Services - 2.23% | |
| | International Business Machines Corp. | | | 7,800 | | | | 1,144,728 | |
| | Unisys Corp.* | | | 48,883 | | | | 1,265,581 | |
| | | | | | | | | | |
| | | | | | | | | 2,410,309 | |
| |
Leisure Equipment & Products - 1.16% | |
| | Polaris Industries, Inc. | | | 16,000 | | | | 1,248,320 | |
| |
Life Sciences Tools & Services - 1.07% | |
| | Thermo Fisher Scientific, Inc.* | | | 20,900 | | | | 1,157,024 | |
| |
Machinery - 5.85% | |
| | CNH Global N.V.*+ | | | 31,100 | | | | 1,484,714 | |
| | Cummins, Inc. | | | 9,800 | | | | 1,078,098 | |
| | NACCO Industries, Inc., Class A | | | 10,900 | | | | 1,181,233 | |
| | Sauer-Danfoss, Inc.* | | | 34,500 | | | | 974,625 | |
| | Tata Motors, Ltd. - Sponsored ADR+ | | | 54,400 | | | | 1,596,096 | |
| | | | | | | | | | |
| | | | | | | | | 6,314,766 | |
| |
Marine - 0.00% | |
| | Kirby Corp.* | | | 20 | | | | 881 | |
| |
Media - 3.59% | |
| | CBS Corp., Class B
Non-Voting | | | 72,400 | | | | 1,379,220 | |
| | Liberty Global, Inc., Class A* | | | 30,000 | | | | 1,061,400 | |
| | Valassis Communications, Inc.* | | | 44,600 | | | | 1,442,810 | |
| | | | | | | | | | |
| | | | | | | | | 3,883,430 | |
| |
Metals & Mining - 3.08% | |
| | Silver Wheaton Corp.* | | | 40,000 | | | | 1,561,600 | |
| | Silvercorp Metals, Inc. | | | 137,900 | | | | 1,769,257 | |
| | | | | | | | | | |
| | | | | | | | | 3,330,857 | |
| |
Multiline Retail - 1.36% | |
| | Dillard’s, Inc., Class A | | | 38,600 | | | | 1,464,484 | |
| | | | | | | | | | |
Industry | | Company | | | Shares | | | | Value | |
| | | | | | | | |
Office Electronics - 1.16% | |
| | Xerox Corp. | | | 108,900 | | | $ | 1,254,528 | |
|
Oil, Gas & Consumable Fuels - 3.14% | |
| | Comstock Resources, Inc.* | | | 36,800 | | | | 903,808 | |
| | ConocoPhillips | | | 18,600 | | | | 1,266,660 | |
| | Exxon Mobil Corp. | | | 16,700 | | | | 1,221,104 | |
| | | | | | | | | | |
| | | | | | | | | 3,391,572 | |
|
Paper & Forest Products - 2.08% | |
| | Domtar Corp. | | | 15,900 | | | | 1,207,128 | |
| | MeadWestvaco Corp. | | | 39,600 | | | | 1,035,936 | |
| | | | | | | | | | |
| | | | | | | | | 2,243,064 | |
|
Personal Products - 1.22% | |
| | Estee Lauder Cos., Inc., Class A (The) | | | 16,300 | | | | 1,315,410 | |
|
Pharmaceuticals - 1.89% | |
| | Bristol-Myers Squibb Co. | | | 39,900 | | | | 1,056,552 | |
| | Medicines Co. (The)* | | | 69,600 | | | | 983,448 | |
| | | | | | | | | | |
| | | | | | | | | 2,040,000 | |
|
Professional Services - 1.19% | |
| | Dun & Bradstreet Corp. | | | 15,700 | | | | 1,288,813 | |
|
Real Estate Investment Trusts (REITs) - 2.14% | |
| | BioMed Realty Trust, Inc. | | | 64,700 | | | | 1,206,655 | |
| | Weingarten Realty Investors | | | 46,600 | | | | 1,107,216 | |
| | | | | | | | | | |
| | | | | | | | | 2,313,871 | |
|
Road & Rail - 1.40% | |
| | Amerco, Inc.* | | | 15,800 | | | | 1,517,432 | |
|
Semiconductors & Semiconductor Equipment - 6.45% | |
| | ARM Holdings PLC - Sponsored ADR+ | | | 91,400 | | | | 1,896,550 | |
| | Atmel Corp.* | | | 118,100 | | | | 1,454,992 | |
| | Cirrus Logic, Inc.*+ | | | 63,000 | | | | 1,006,740 | |
| | Micron Technology, Inc.* | | | 200,200 | | | | 1,605,604 | |
| | TriQuint Semiconductor, Inc.* | | | 85,800 | | | | 1,003,002 | |
| | | | | | | | | | |
| | | | | | | | | 6,966,888 | |
|
Software - 0.97% | |
| | VMware, Inc., Class A* | | | 11,800 | | | | 1,049,138 | |
|
Specialty Retail - 3.39% | |
| | DSW, Inc., Class A*+ | | | 37,900 | | | | 1,481,890 | |
| | Pier 1 Imports, Inc.*# | | | 207,400 | | | | 2,177,700 | |
| | | | | | | | | | |
| | | | | | | | | 3,659,590 | |
| | |
| | |
| 14 | | Semi-Annual Report | December 31, 2010 (Unaudited) |
| | |
Bridgeway Aggressive Investors 1 Fund SCHEDULE OF INVESTMENTS (continued) | | |
| | |
| Showing percentage of net assets as of December 31, 2010 (Unaudited) | | |
| | | | | | | | | | | | |
Industry | | Company | | Shares | | Value | | | | | | |
| | | | | | | | | | |
Common Stocks (continued) | |
Textiles, Apparel & Luxury Goods - 1.24% | |
| | Fossil, Inc.* | | | 19,000 | | | $ | 1,339,120 | |
| |
Trading Companies & Distributors - 2.39% | |
| | United Rentals, Inc.* | | | 56,000 | | | | 1,274,000 | |
| | W.W. Grainger, Inc. | | | 9,500 | | | | 1,312,045 | |
| | | | | | | | | | |
| | | | | | | | | 2,586,045 | |
| |
Wireless Telecommunication Services - 0.86% | |
| | Sprint Nextel Corp.* | | | 220,300 | | | | 931,869 | |
| | | | | | | | | | |
TOTAL COMMON STOCKS - 99.78% | | | | 107,793,445 | |
| | | | | | | | | | |
(Cost $90,261,568) | | | | | |
| |
TOTAL INVESTMENTS - 99.78% | | | $ | 107,793,445 | |
(Cost $90,261,568) | | | | | |
Other Assets in Excess of Liabilities - 0.22% | | | | 233,802 | |
| | | | | | | | | | |
NET ASSETS - 100.00% | | | $ | 108,027,247 | |
| | | | | | | | | | |
* Non-income producing security. # Securities, or a portion thereof, segregated to cover the Fund’s obligation under swap agreements. The total market value of segregated assets is $2,177,700. + This security or a portion of the security is out on loan at December 31, 2010. Total loaned securities had a market value of $12,126,288 at December 31, 2010. ADR - American Depositary Receipt PLC - Public Limited Company Summary of inputs used to value the Fund’s investments as of 12/31/2010 are as follows (See Note 2 in Notes to Financial Statements): | |
| | | | | | | | | | | | | | | | |
| |
| | | Valuation Inputs | |
| | |
| | | Investment in Securities (Market Value) | |
| | |
| | | Level 1
Quoted
Prices | | | Level 2
Significant
Observable
Inputs | | | Level 3
Significant Unobservable Inputs | | | Total | |
| | |
Common Stocks | | $ | 107,793,445 | | | $ | — | | | $ | — | | | $ | 107,793,445 | |
| | | | | | | | | | | | | | | | |
TOTAL | | $ | 107,793,445 | | | $ | — | | | $ | — | | | $ | 107,793,445 | |
| | | | | | | | | | | | | | | | |
Other Financial Instruments** | | | | | | | | | | | | | | | | |
Swaps | | $ | — | | | $ | 1,234 | | | $ | — | | | $ | 1,234 | |
| | | | | | | | | | | | | | | | |
TOTAL | | $ | — | | | $ | 1,234 | | | $ | — | | | $ | 1,234 | |
| | | | | | | | | | | | | | | | |
** Other financial instruments are derivative instruments not reflected in the Schedule of Investments, such as futures, forwards and swap contracts, which are valued at the unrealized appreciation/depreciation on the investment. See Notes to Financial Statements. | |
| | |
Aggressive Investors 2 Fund MANAGER’S COMMENTARY | | |
December 31, 2010
Dear Fellow Aggressive Investors 2 Fund Shareholder,
For the December 2010 quarter, Aggressive Investors 2 Fund ended the year on a strong note, with a 12.99% return that outperformed its primary market benchmark, the S&P 500 Index (+10.76%) and its peer benchmark, the Lipper Capital Appreciation Funds Index (+11.16%). The Fund did lag the smaller-cap Russell 2000 Index (+16.25%) in a small-cap dominated market. It was a very good quarter on an absolute basis, but a mixed quarter on a relative basis; we are generally pleased with the results.
For the six-month “semi-annual” period ending December 31, 2010, our Fund jumped 26.71%, beating its primary market benchmark, the S&P 500 Index (+23.27%) and its peer benchmark, the Lipper Capital Appreciation Funds Index (+22.92%), but lagged the Russell 2000 Index of smaller companies (+29.38%). Our growth leaning stock picking models tended to do very well in this growth dominated period. In spite of lagging our one benchmark of smaller companies, we were generally pleased with these results.
In spite of strong second half calendar year performance, we underperformed our performance benchmarks for the full calendar year ended December 31, 2010. Our Fund was up 12.10%, compared to the 15.06% return of our primary market benchmark, the S&P 500 Index, a 15.26% return of our peer benchmark, the Lipper Capital Appreciation Funds Index, and the stellar 26.85% return of the Russell 2000 Index of smaller companies.
The table below presents our December quarter, six-month, one-year, five-year and life-to-date financial results according to the formula required by the SEC. See the next page for a graph of performance since inception.
| | | | | | | | | | | | | | | | | | | | |
| | | Dec. Qtr. 10/1/10 to 12/31/10 | | | 6 Month 7/1/10 to 12/31/10 | | | 1 Year 1/1/10 to 12/31/10 | | | 5 Year 1/1/06 to 12/31/10 | | | Life-to-Date 10/31/01 to 12/31/10 | |
| | | | | |
Aggressive Investors 2 Fund | | | 12.99% | | | | 26.71% | | | | 12.10% | | | | -1.84% | | | | 4.71% | |
S&P 500 Index (large companies) | | | 10.76% | | | | 23.27% | | | | 15.06% | | | | 2.29% | | | | 3.89% | |
Russell 2000 Index (small companies) | | | 16.25% | | | | 29.38% | | | | 26.85% | | | | 4.47% | | | | 8.22% | |
Lipper Capital Appreciation Funds Index | | | 11.16% | | | | 22.92% | | | | 15.26% | | | | 4.41% | | | | 5.54% | |
Performance figures quoted in the table above and graph below represent past performance and are no guarantee of future results. Total return figures in the table above and the graph below do not reflect the deduction of taxes that a shareholder would pay on Fund distributions or the redemption of Fund shares. The recent growth rate in the stock market has helped to produce short-term returns that are not typical and may not continue in the future.
The S&P 500 Index is a broad-based, unmanaged measurement of changes in stock market conditions, based on the average of 500 widely held common stocks with dividends reinvested. The Russell 2000 Index is an unmanaged, market value weighted index that measures performance of the 2,000 companies that are between the 1,000th and 3,000th largest in the market with dividends reinvested. The Lipper Capital Appreciation Funds Index reflects the record of the 30 largest funds in this category, comprised of more aggressive domestic growth mutual funds, as reported by Lipper, Inc. It is not possible to invest directly in an index. Periods longer than one year are annualized.
According to data from Lipper, Inc. as of December 31, 2010, Aggressive Investors 2 Fund ranked 225th of 294 capital appreciation funds for the twelve months ending December 31, 2010, 209th of 217 over the last five years, and 99th of 170 since inception in October 2001. Lipper, Inc. is an independent mutual fund rating service that ranks funds in various fund categories by making comparative calculations using total returns.
| | |
| | |
| 16 | | Semi-Annual Report | December 31, 2010 (Unaudited) |
| | |
Aggressive Investors 2 Fund MANAGER’S COMMENTARY (continued) | | |
Aggressive Investors 2 Fund vs. S&P 500 Index, Lipper Capital Appreciation Funds Index & Russell 2000 Index
from Inception 10/31/01 to 12/31/10
Detailed Explanation of Quarterly Performance
The Short Version: Consumer Discretionary stocks were the stars for the quarter, while Information Technology stocks were well represented on both the best and worst contributors lists.
The recent quarter could be deemed “the return of the consumer” as retailers reported their best holiday season since the beginning of the economic downturn. Four Consumer Discretionary companies highlighted the list of top ten contributing stocks; combined, they contributed over two percent to the overall return of the Fund. Three Materials stocks also made the top-ten contributors list as demand in the emerging world markets continued to aid commodities and related companies. Information Technology companies were a mixed bag this past quarter as two related holdings made the top ten list, but they also made a showing on the worst contributors list.
These are the Fund’s ten best-contributing stocks for the quarter ended December 31, 2010:
| | | | | | |
| Rank | | Description | | Industry | | % Contribution to Return |
1 | | SanDisk Corp. | | Computers & Peripherals | | 1.0% |
2 | | Silvercorp Metals, Inc. | | Metals & Mining | | 0.8% |
3 | | Silver Wheaton Corp. | | Metals & Mining | | 0.6% |
4 | | Atmel Corp. | | Semiconductors & Semiconductor Equipment | | 0.6% |
5 | | Dillard’s, Inc. | | Multiline Retail | | 0.6% |
6 | | Ford Motor Co. | | Automobiles | | 0.5% |
7 | | Pier 1 Imports, Inc. | | Specialty Retail | | 0.5% |
8 | | TRW Automotive Holdings Corp. | | Auto Components | | 0.5% |
9 | | Tata Motors, Ltd. - Sponsored ADR | | Machinery | | 0.4% |
10 | | Huntsman Corp. | | Chemicals | | 0.4% |
While gold continues to get much of the positive press when it comes to investing in precious metals, silver has more than made a name for itself and related companies have benefited dramatically. Gold is known more as an inflation hedge and a safe-haven investment during times of crisis, but silver demand has continued to increase because of its industrial uses in batteries, bearings and electronics. In December, silver prices pushed to 30-year highs. Silvercorp Metals is a global silver mining company with a major presence in China. In December, the company announced a new mining venture in Guangdong Province as part of its overall expansion throughout this rapidly growing emerging market. Its stock price skyrocketed 55% during the three month period and was the second best contributor to the Fund’s return.
| | |
Aggressive Investors 2 Fund MANAGER’S COMMENTARY (continued) | | |
Three Information Technology companies were among the biggest detractors from the Fund’s performance. In certain cases, corporations have limited technology purchases in order to keep costs in check and make earnings look stronger. The delayed activity has hindered IT companies, many of which are still expecting a major surge in upgrades, but continue to wait out the economic uncertainty for another quarter or two (and hopefully not much longer). The three IT holdings on the worst contributors list cost the Fund over half of a percent in return.
These are the Fund’s ten worst-contributing stocks for the quarter ended December 31, 2010:
| | | | | | |
| Rank | | Description | | Industry | | % Contribution to Return |
1 | | Newpark Resources, Inc. | | Energy Equipment & Services | | -0.4% |
2 | | Lexmark International, Inc. | | Computers & Peripherals | | -0.3% |
3 | | Unisys Corp. | | IT Services | | -0.2% |
4 | | Lloyds Banking Group PLC - ADR | | Commercial Banks | | -0.2% |
5 | | Corinthian Colleges, Inc. | | Diversified Consumer Services | | -0.1% |
6 | | Cirrus Logic, Inc. | | Semiconductors & Semiconductor Equipment | | -0.1% |
7 | | Valassis Communications, Inc. | | Media | | -0.1% |
8 | | Las Vegas Sands Corp. | | Hotels Restaurants & Leisure | | -0.1% |
9 | | Sauer-Danfoss, Inc. | | Machinery | | -0.1% |
10 | | Sprint Nextel Corp. | | Wireless Telecommunication Services | | -0.1% |
Earnings can make a big difference to investors. In October, printer maker Lexmark disappointed investors with a weaker than expected earnings report that showed lackluster revenue growth and a large buildup in inventories. The company also announced that its CEO was stepping down. Its stock plummeted almost 20% on the earnings news and some analysts questioned the company’s ability to compete with larger rivals like HP. For the three month period ended December 31, 2010, Lexmark was the second costliest holding in the Fund as its stock price fell 22% for the quarter.
Detailed Explanation of Calendar Year Performance
The Short Version: The best contributors list was very diverse, while Information Technology dominated the worst contributors list for the calendar year as it did for the quarter.
All in all, calendar year 2010 was a nice year for stocks across most industries as four different sectors were represented on the top ten list of best contributors. Of note, Consumer Discretionary companies again topped the list as retailers benefited from a late surge in activity and the four related holdings combined to contribute over four percent to the Fund’s return. Two of these companies (TRW and Ford) come from auto-related industries and served as proof that demand continued to increase both domestically and abroad.
As was the case for the quarter, IT companies dominated the list of negative contributors as four related holdings were among top detractors to performance. Combined they cost the Fund over 3.5% in return. Five other sectors were represented in this list, proving that even in strong years, laggards will normally exist in virtually every industry. In fact, two consumer discretionary companies were on the worst contributors list, though neither was retail-oriented.
| | |
| | |
| 18 | | Semi-Annual Report | December 31, 2010 (Unaudited) |
| | |
Aggressive Investors 2 Fund MANAGER’S COMMENTARY (continued) | | |
These are the Fund’s ten best-contributing stocks for the calendar year ended December 31, 2010:
| | | | | | |
| Rank | | Description | | Industry | | % Contribution to Return |
1 | | TRW Automotive Holdings Corp. | | Auto Components | | 1.7% |
2 | | Acme Packet, Inc. | | Communications Equipment | | 1.2% |
3 | | Pier 1 Imports, Inc. | | Specialty Retail | | 1.1% |
4 | | Silvercorp Metals, Inc. | | Metals & Mining | | 1.1% |
5 | | Tata Motors, Ltd. - Sponsored ADR | | Machinery | | 0.9% |
6 | | Ford Motor Co. | | Automobiles | | 0.9% |
7 | | Cognizant Technology Solutions Corp. | | IT Services | | 0.9% |
8 | | Family Dollar Stores, Inc. | | Multiline Retail | | 0.7% |
9 | | SanDisk Corp. | | Computers & Peripherals | | 0.7% |
10 | | Huntsman Corp. | | Chemicals | | 0.6% |
TRW Automotive Holdings was the Fund’s biggest contributor for the calendar year; its stock price more than doubled over the 12-month period. The auto industry had a strong resurgence as Ford rebounded nicely from the recession and GM went public to strong investor demand, thus benefitting the worldwide auto parts supplier. TRW’s recent earnings report beat expectations, a development that has been repeated often over the past few years. Because of its global presence, analysts continue to believe the company will benefit greatly as auto sales jump in the world’s emerging markets and regulators in these countries press for stronger safety standards.
As was the case for the quarter, IT companies dominated the list of negative contributors; four related holdings were among the top detractors to the performance. Combined they cost the Fund over 3.5% in return. Five other sectors were represented in this list, proving that even in strong years, laggards will normally exist in virtually every industry. In fact, two consumer discretionary companies were on the worst contributors list, though neither was retail-oriented.
These are the Fund’s ten worst-contributing stocks for the calendar year ended December 31, 2010:
| | | | | | |
| Rank | | Description | | Industry | | % Contribution to Return |
1 | | Unisys Corp. | | IT Services | | -1.2% |
2 | | American Superconductor Corp. | | Electrical Equipment | | -1.1% |
3 | | Sanmina-SCI Corp. | | Electronic Equip., Instruments & Components | | -0.9% |
4 | | Seagate Technology PLC | | Computers & Peripherals | | -0.9% |
5 | | Fuel Systems Solutions, Inc. | | Auto Components | | -0.7% |
6 | | NewMarket Corp. | | Chemicals | | -0.7% |
7 | | Micron Technology, Inc. | | Semiconductors & Semiconductor Equipment | | -0.6% |
8 | | Diamond Offshore Drilling, Inc. | | Energy Equipment & Services | | -0.6% |
9 | | Corinthian Colleges, Inc. | | Diversified Consumer Services | | -0.5% |
10 | | First Bancshares, Inc. | | Thrifts & Mortgage Finance | | -0.5% |
Technology companies like Unisys have struggled as their customers slashed IT budgets in an attempt to make their own bottom line look better to investors and analysts. In its most recent quarter, Unisys reported a 54% profit decline on weak server sales, and investors reacted negatively. Its stock fell almost 20% in one day and dropped over 30% for calendar year 2010. Earlier in the year, the multinational company suffered from negative economic developments in Venezuela. Unisys cost the Fund over one percent in return and was the worst contributor to its overall performance.
Top Ten Holdings as of December 31, 2010
Five of the Fund’s top contributors for the December 2010 quarter were also among the largest holdings at the end of the calendar year (Sandisk, TRW, Pier 1 Imports, Tata Motors, and Silver Wheaton). Two auto-related companies highlighted the Fund’s top ten holdings at year-end. Still, the Fund was broadly diversified and no single holding accounted for greater than 2.6% of the net assets. The ten largest positions represented just over 20% of the total assets of the Fund.
| | |
Aggressive Investors 2 Fund MANAGER’S COMMENTARY (continued) | | |
| | | | | | |
| Rank | | Description | | Industry | | % of Net Assets |
1 | | SanDisk Corp. | | Computers & Peripherals | | 2.6% |
2 | | TRW Automotive Holdings Corp. | | Auto Components | | 2.2% |
3 | | Pier 1 Imports, Inc. | | Specialty Retail | | 2.2% |
4 | | Complete Production Services, Inc. | | Energy Equipment & Services | | 2.1% |
5 | | Tata Motors, Ltd. - Sponsored ADR | | Machinery | | 2.1% |
6 | | NetFlix, Inc. | | Internet & Catalog Retail | | 2.0% |
7 | | Valassis Communications, Inc. | | Media | | 1.9% |
8 | | US Airways Group, Inc. | | Airlines | | 1.9% |
9 | | CNH Global N.V. | | Machinery | | 1.8% |
10 | | Silver Wheaton Corp. | | Metals & Mining | | 1.8% |
| | Total | | | | 20.6% |
Industry Sector Representation as of December 31, 2010
The biggest disparity between the Fund and the S&P 500 Index was found in the Consumer Discretionary sector, and we benefited greatly from strong company performance in this area throughout the year, particularly in the midst of a favorable holiday season. The Fund’s largest allocation was in Information Technology, a sector that underperformed during the period.
| | | | | | |
| | | % of Net Assets | | % of S&P 500 Index | | Difference |
Consumer Discretionary | | 19.4% | | 10.6% | | 8.8% |
Consumer Staples | | 4.0% | | 10.6% | | -6.6% |
Energy | | 10.1% | | 12.0% | | -1.9% |
Financials | | 8.9% | | 16.3% | | -7.4% |
Health Care | | 7.0% | | 11.0% | | -4.0% |
Industrials | | 17.5% | | 10.9% | | 6.6% |
Information Technology | | 22.7% | | 18.5% | | 4.2% |
Materials | | 8.5% | | 3.7% | | 4.8% |
Telecommunication Services | | 1.1% | | 3.1% | | -2.0% |
Utilities | | - | | 3.3% | | -3.3% |
Cash & Other Assets | | 0.8% | | - | | 0.8% |
Total | | 100.0% | | 100.0% | | |
Disclaimer
The views expressed here are exclusively those of Fund management. These views, including those related to market sectors or individual stocks, are not meant as investment advice and should not be considered predictive in nature. Any favorable (or unfavorable) description of a holding applies only as of the quarter end, December 31, 2010, unless otherwise stated. Security positions can and do change thereafter. Discussions of historical performance do not guarantee and may not be indicative of future performance.
Market volatility can significantly affect short-term performance. The Fund is not an appropriate investment for short-term investors. Investments in the small companies within this multi-cap fund generally carry greater risk than is customarily associated with larger companies. This additional risk is attributable to a number of factors, including the relatively limited financial resources that are typically available to small companies and the fact that small companies often have comparatively limited product lines. In addition, the stock of small companies tends to be more volatile than the stock of large companies, particularly in the short term and particularly in the early stages of an economic or market downturn. The Fund’s use of options, futures, and leverage can magnify the risk of loss in an unfavorable market, and the Fund’s use of short-sale positions can, in theory, expose shareholders to unlimited loss. Finally, the Fund exposes shareholders to “focus risk” which may add to Fund volatility through the possibility that a single company could significantly affect total return. Shareholders of the Fund, therefore, are taking on more risk than they would if they invested in the stock market as a whole.
| | |
| | |
| 20 | | Semi-Annual Report | December 31, 2010 (Unaudited) |
| | |
Aggressive Investors 2 Fund MANAGER’S COMMENTARY (continued) | | |
Conclusion
Thank you for your continued investment in Aggressive Investors 2 Fund. We encourage your feedback; your reactions and concerns are extremely important to us.
Sincerely,
Your Investment Management Team
| | |
Bridgeway Aggressive Investors 2 Fund SCHEDULE OF INVESTMENTS | | |
| | |
| Showing percentage of net assets as of December 31, 2010 (Unaudited) | | |
| | | | | | | | | | |
Industry | | Company | | | Shares | | | | Value | |
COMMON STOCKS - 99.45% | |
Aerospace & Defense - 3.30% | |
| | L-3 Communications Holdings, Inc. | | | 38,600 | | | $ | 2,720,914 | |
| | Northrop Grumman Corp. | | | 43,600 | | | | 2,824,408 | |
| | Raytheon Co. | | | 53,100 | | | | 2,460,654 | |
| | | | | | | | | | |
| | | | | | | | | 8,005,976 | |
| |
Airlines - 3.99% | |
| | Lan Airlines SA - Sponsored ADR#+ | | | 100,000 | | | | 3,078,000 | |
| | United Continental Holdings, Inc.*+ | | | 86,100 | | | | 2,050,902 | |
| | US Airways Group, Inc.* | | | 454,400 | | | | 4,548,544 | |
| | | | | | | | | | |
| | | | | | | | | 9,677,446 | |
| |
Auto Components - 5.15% | |
| | BorgWarner, Inc.* | | | 47,100 | | | | 3,408,156 | |
| | Magna International, Inc. | | | 72,200 | | | | 3,754,400 | �� |
| | TRW Automotive Holdings Corp.* | | | 101,100 | | | | 5,327,970 | |
| | | | | | | | | | |
| | | | | | | | | 12,490,526 | |
| |
Beverages - 2.06% | |
| | Brown-Forman Corp., Class B | | | 37,700 | | | | 2,624,674 | |
| | Dr. Pepper Snapple Group, Inc. | | | 67,800 | | | | 2,383,848 | |
| | | | | | | | | | |
| | | | | | | | | 5,008,522 | |
| |
Chemicals - 2.80% | |
| | Huntsman Corp. | | | 229,500 | | | | 3,582,495 | |
| | Sherwin-Williams Co. (The) | | | 29,100 | | | | 2,437,125 | |
| | Westlake Chemical Corp. | | | 17,683 | | | | 768,680 | |
| | | | | | | | | | |
| | | | | | | | | 6,788,300 | |
| |
Commercial Banks - 4.61% | |
| | KeyCorp | | | 321,100 | | | | 2,841,735 | |
| | Lloyds Banking Group PLC - ADR* | | | 702,400 | | | | 2,886,864 | |
| | M&T Bank Corp. | | | 30,100 | | | | 2,620,205 | |
| | Regions Financial Corp. | | | 404,400 | | | | 2,830,800 | |
| | | | | | | | | | |
| | | | | | | | | 11,179,604 | |
| |
Communications Equipment - 2.74% | |
| | F5 Networks, Inc.* | | | 28,300 | | | | 3,683,528 | |
| | Finisar Corp.*+ | | | 100,000 | | | | 2,969,000 | |
| | | | | | | | | | |
| | | | | | | | | 6,652,528 | |
| |
Computers & Peripherals - 3.54% | |
| | Lexmark International, Inc., Class A* | | | 62,400 | | | | 2,172,768 | |
| | | | | | | | | | |
Industry | | Company | | | Shares | | | | Value | |
| | | | | | | | |
Computers & Peripherals (continued) | |
| | SanDisk Corp.* | | | 129,000 | | | $ | 6,431,940 | |
| | | | | | | | | | |
| | | | | | | | | 8,604,708 | |
|
Consumer Finance - 1.06% | |
| | Capital One Financial Corp. | | | 60,600 | | | | 2,579,136 | |
|
Diversified Consumer Services - 0.41% | |
| | Corinthian Colleges, Inc.*+ | | | 192,800 | | | | 1,004,488 | |
|
Electronic Equipment, Instruments & Components - 4.35% | |
| | Arrow Electronics, Inc.* | | | 76,000 | | | | 2,603,000 | |
| | Ingram Micro, Inc., Class A* | | | 143,700 | | | | 2,743,233 | |
| | Tech Data Corp.* | | | 60,800 | | | | 2,676,416 | |
| | Vishay Intertechnology, Inc.* | | | 172,800 | | | | 2,536,704 | |
| | | | | | | | | | |
| | | | | | | | | 10,559,353 | |
|
Energy Equipment & Services - 7.69% | |
| | Atwood Oceanics, Inc.* | | | 63,600 | | | | 2,376,732 | |
| | Complete Production Services, Inc.* | | | 176,900 | | | | 5,227,395 | |
| | Halliburton Co. | | | 74,700 | | | | 3,050,001 | |
| | Newpark Resources, Inc.* | | | 395,800 | | | | 2,438,128 | |
| | RPC, Inc.+ | | | 172,200 | | | | 3,120,264 | |
| | Tetra Technologies, Inc.* | | | 207,500 | | | | 2,463,025 | |
| | | | | | | | | | |
| | | | | | | | | 18,675,545 | |
|
Food & Staples Retailing - 0.96% | |
| | Safeway, Inc. | | | 103,700 | | | | 2,332,213 | |
|
Health Care Equipment & Supplies - 1.09% | |
| | CR Bard, Inc. | | | 28,800 | | | | 2,642,976 | |
|
Health Care Providers & Services - 3.42% | |
| | AmerisourceBergen Corp. | | | 92,700 | | | | 3,162,924 | |
| | Health Management Associates, Inc., Class A* | | | 281,700 | | | | 2,687,418 | |
| | Quest Diagnostics, Inc. | | | 45,500 | | | | 2,455,635 | |
| | | | | | | | | | |
| | | | | | | | | 8,305,977 | |
|
Hotels, Restaurants & Leisure - 1.91% | |
| | Chipotle Mexican Grill, Inc.* | | | 11,000 | | | | 2,339,260 | |
| | Las Vegas Sands Corp.* | | | 50,000 | | | | 2,297,500 | |
| | | | | | | | | | |
| | | | | | | | | 4,636,760 | |
|
Household Products - 1.01% | |
| | Procter & Gamble Co. (The) | | | 38,200 | | | | 2,457,406 | |
|
Insurance - 1.05% | |
| | Travelers Cos., Inc. (The) | | | 45,600 | | | | 2,540,376 | |
| | |
| | |
| 22 | | Semi-Annual Report | December 31, 2010 (Unaudited) |
| | |
Bridgeway Aggressive Investors 2 Fund SCHEDULE OF INVESTMENTS (continued) | | |
| | |
| Showing percentage of net assets as of December 31, 2010 (Unaudited) | | |
| | | | | | | | | | |
Industry | | Company | | | Shares | | | | Value | |
Common Stocks (continued) | |
Internet & Catalog Retail - 1.98% | |
| | NetFlix, Inc.*+ | | | 27,300 | | | $ | 4,796,610 | |
| |
Internet Software & Services - 2.78% | |
| | Akamai Technologies, Inc.* | | | 73,500 | | | | 3,458,175 | |
| | Baidu, Inc. - Sponsored ADR* | | | 34,000 | | | | 3,282,020 | |
| | | | | | | | | | |
| | | | | | | | | 6,740,195 | |
| |
IT Services - 1.54% | |
| | International Business Machines Corp. | | | 16,800 | | | | 2,465,568 | |
| | Unisys Corp.* | | | 49,505 | | | | 1,281,684 | |
| | | | | | | | | | |
| | | | | | | | | 3,747,252 | |
| |
Leisure Equipment & Products - 1.30% | |
| | Polaris Industries, Inc. | | | 40,500 | | | | 3,159,810 | |
| |
Life Sciences Tools & Services - 1.01% | |
| | Thermo Fisher Scientific, Inc.* | | | 44,300 | | | | 2,452,448 | |
| |
Machinery - 6.45% | |
| | CNH Global N.V.* | | | 91,200 | | | | 4,353,888 | |
| | Cummins, Inc. | | | 35,000 | | | | 3,850,350 | |
| | Sauer-Danfoss, Inc.* | | | 79,000 | | | | 2,231,750 | |
| | Tata Motors, Ltd. - Sponsored ADR+ | | | 178,000 | | | | 5,222,520 | |
| | | | | | | | | | |
| | | | | | | | | 15,658,508 | |
| |
Media - 3.15% | |
| | CBS Corp., Class B
Non-Voting | | | 157,500 | | | | 3,000,375 | |
| | Valassis Communications, Inc.* | | | 143,800 | | | | 4,651,930 | |
| | | | | | | | | | |
| | | | | | | | | 7,652,305 | |
| |
Metals & Mining - 3.18% | |
| | Silver Wheaton Corp.* | | | 109,900 | | | | 4,290,496 | |
| | Silvercorp Metals, Inc. | | | 268,100 | | | | 3,439,723 | |
| | | | | | | | | | |
| | | | | | | | | 7,730,219 | |
| |
Multiline Retail - 1.19% | |
| | Dillard’s, Inc., Class A | | | 76,100 | | | | 2,887,234 | |
| |
Office Electronics - 1.00% | |
| | Xerox Corp. | | | 211,400 | | | | 2,435,328 | |
| |
Oil, Gas & Consumable Fuels - 2.40% | |
| | Comstock Resources, Inc.* | | | 127,100 | | | | 3,121,576 | |
| | Exxon Mobil Corp. | | | 36,900 | | | | 2,698,128 | |
| | | | | | | | | | |
| | | | | | | | | 5,819,704 | |
| |
Paper & Forest Products - 2.50% | |
| | Domtar Corp. | | | 45,000 | | | | 3,416,400 | |
| | | | | | | | | | |
Industry | | Company | | | Shares | | | | Value | |
| | | | | | | | |
Paper & Forest Products (continued) | |
| | MeadWestvaco Corp. | | | 101,600 | | | $ | 2,657,856 | |
| | | | | | | | | | |
| | | | | | | | | 6,074,256 | |
|
Pharmaceuticals - 1.53% | |
| | Bristol-Myers Squibb Co. | | | 140,200 | | | | 3,712,496 | |
|
Professional Services - 1.22% | |
| | Dun & Bradstreet Corp. | | | 36,200 | | | | 2,971,658 | |
|
Real Estate Investment Trusts (REITs) - 2.19% | |
| | BioMed Realty Trust, Inc. | | | 156,400 | | | | 2,916,860 | |
| | Weingarten Realty Investors | | | 100,700 | | | | 2,392,632 | |
| | | | | | | | | | |
| | | | | | | | | 5,309,492 | |
|
Semiconductors & Semiconductor Equipment - 6.76% | |
| | ARM Holdings PLC - Sponsored ADR+ | | | 164,700 | | | | 3,417,525 | |
| | Atmel Corp.* | | | 309,400 | | | | 3,811,808 | |
| | Cirrus Logic, Inc.*+ | | | 204,100 | | | | 3,261,518 | |
| | Micron Technology, Inc.* | | | 451,800 | | | | 3,623,436 | |
| | TriQuint Semiconductor, Inc.* | | | 195,900 | | | | 2,290,071 | |
| | | | | | | | | | |
| | | | | | | | | 16,404,358 | |
|
Specialty Retail - 3.35% | |
| | Pier 1 Imports, Inc.* | | | 504,600 | | | | 5,298,300 | |
| | Ross Stores, Inc. | | | 44,800 | | | | 2,833,600 | |
| | | | | | | | | | |
| | | | | | | | | 8,131,900 | |
|
Textiles, Apparel & Luxury Goods - 1.07% | |
| | Fossil, Inc.* | | | 36,700 | | | | 2,586,616 | |
|
Trading Companies & Distributors - 2.59% | |
| | United Rentals, Inc.* | | | 137,000 | | | | 3,116,750 | |
| | W.W. Grainger, Inc. | | | 23,000 | | | | 3,176,530 | |
| | | | | | | | | | |
| | | | | | | | | 6,293,280 | |
|
Wireless Telecommunication Services - 1.12% | |
| | Sprint Nextel Corp.* | | | 645,300 | | | | 2,729,619 | |
| | | | | | | | | | |
TOTAL COMMON STOCKS - 99.45% | | | | | | | 241,435,128 | |
| | | | | | | | | | |
(Cost $206,835,099) | | | | | | | | |
| | |
Bridgeway Aggressive Investors 2 Fund SCHEDULE OF INVESTMENTS (continued) | | |
| | |
| Showing percentage of net assets as of December 31, 2010 (Unaudited) | | |
| | | | | | | | | | |
| | | Rate^ | | | Shares | | | | Value | |
MONEY MARKET FUND - 0.04% | | | | | |
BlackRock FedFund | | 0.06% | | | 94,792 | | | | $94,792 | |
| | | | | | | | | | |
TOTAL MONEY MARKET FUND - 0.04% | | | | 94,792 | |
| | | | | | | | | | |
(Cost $94,792) | | | | | | | | | | |
| | |
TOTAL INVESTMENTS - 99.49% | | | | | | $ | 241,529,920 | |
(Cost $206,929,891) | | | | | | | | | | |
Other Assets in Excess of Liabilities - 0.51% | | | | 1,245,139 | |
| | | | | | | | | | |
NET ASSETS - 100.00% | | | | | | | | $ | 242,775,059 | |
| | | | | | | | | | |
* Non-income producing security. # Securities, or a portion thereof, segregated to cover the Fund’s obligation under swap agreements. The total market value of segregated assets is $2,769,584. ^ Rate disclosed as of December 31, 2010. + This security or a portion of the security is out on loan at December 31, 2010. Total loaned securities had a market value of $22,568,420 at December 31, 2010. ADR - American Depositary Receipt PLC - Public Limited Company | |
| | | | | | | | | | |
| | | | | | | | | | |
| | | | | | | | | | |
| | | | | | | | | | |
| | | | | | | | | | |
| | | | | | | | | | |
| | | | | | | | | | |
| | | | | | | | | | |
| | | | | | | | |
Summary of inputs used to value the Fund’s investments as of 12/31/2010 are as follows (See Note 2 in Notes to Financial Statements): |
| | | | | | | | | | | | | | | | |
| |
| | | Valuation Inputs | |
| | |
| | | Investment in Securities (Market Value) | |
| | |
| | | Level 1 Quoted Prices | | | Level 2
Significant
Observable
Inputs | | | Level 3
Significant
Unobservable
Inputs | | | Total | |
| | |
| | | | |
Common Stocks | | $ | 241,435,128 | | | $ | — | | | $ | — | | | $ | 241,435,128 | |
Money Market Fund | | | — | | | | 94,792 | | | | — | | | | 94,792 | |
| | | | | | | | | | | | | | | | |
TOTAL | | $ | 241,435,128 | | | $ | 94,792 | | | $ | — | | | $ | 241,529,920 | |
| | | | | | | | | | | | | | | | |
| | | | |
Other Financial Instruments** | | | | | | | | | | | | | | | | |
Swaps | | $ | — | | | $ | 2,991 | | | $ | — | | | $ | 2,991 | |
| | | | | | | | | | | | | | | | |
TOTAL | | $ | — | | | $ | 2,991 | | | $ | — | | | $ | 2,991 | |
| | | | | | | | | | | | | | | | |
** Other financial instruments are derivative instruments not reflected in the Schedule of Investments, such as futures, forwards and swap contracts, which are valued at the unrealized appreciation/ depreciation on the investment. See Notes to Financial Statements. | |
| | |
| | |
| 24 | | Semi-Annual Report | December 31, 2010 (Unaudited) |
| | |
Ultra-Small Company Fund MANAGER’S COMMENTARY | | |
December 31, 2010
Dear Fellow Ultra-Small Company Fund Shareholder,
For the December 2010 quarter, Ultra-Small Company Fund ended the year on a strong note with a return of 17.21%, outperforming its primary market benchmark, the CRSP Cap-Based Portfolio 10 Index (+17.01%), its peer benchmark, the Lipper Micro-Cap Stock Funds Index (+16.69%), and the Russell 2000 Index (+16.25%). We did trail the Russell Microcap Index (+19.41%) during the three month period. We are mostly pleased with the results.
For the six-month “semi-annual” period ending December 31, 2010, our Fund jumped 27.53% and outperformed its primary market benchmark, the CRSP Cap-Based Portfolio 10 Index (+25.30%). We did underperform each of our other benchmarks: our peer benchmark, the Lipper Micro-Cap Stock Funds Index (+28.10%), the Russell Microcap Index (+28.73%), and the Russell 2000 Index (+29.38%), as these indexes all hold more stocks in the larger “micro-cap” segment. As presented in the table on the next page, ultra-small (“CRSP 10”) stocks took somewhat of a “breather” relative to micro-cap stocks (“CRSP 9”) stocks after ultra-small stock’s stellar relative performance in 2009.
For the calendar year ended December 31, 2010, Ultra-Small Company Fund returned 23.55%, underperforming each of our benchmarks. This is due to the dramatic “lack of traction” of our active stock picking models in the March quarter of 2010, which was documented in that quarterly letter.
The table below presents our December quarter, six-month, one-year, five-year, ten-year, and life-to-date financial results according to the formula required by the SEC. See the next page for a graph of performance since inception.
| | | | | | | | | | | | |
| | | Dec. Qtr.
10/1/10
to 12/31/10 | | 6 Month
7/1/10
to 12/31/10 | | 1 Year
1/1/10
to 12/31/10 | | 5 Year
1/1/06
to 12/31/10 | | 10 Year
1/1/01
to 12/31/10 | | Life-to-Date
8/5/94 to 12/31/10 |
| | | | | | |
Ultra-Small Company Fund | | 17.21% | | 27.53% | | 23.55% | | 3.17% | | 14.59% | | 16.44% |
CRSP Cap-Based Portfolio 10 Index | | 17.01% | | 25.30% | | 29.55% | | 6.04% | | 15.36% | | 13.12% |
Lipper Micro-Cap Stock Funds Index | | 16.69% | | 28.10% | | 27.57% | | 2.77% | | 6.26% | | N/A |
Russell Microcap Index | | 19.41% | | 28.73% | | 28.89% | | 1.19% | | 7.38% | | N/A |
Russell 2000 Index (small companies) | | 16.25% | | 29.38% | | 26.85% | | 4.47% | | 6.33% | | 8.82% |
Performance figures quoted in the table above and graph below represent past performance and are no guarantee of future results. Total return figures in the table above and the graph below include the reinvestment of dividends and capital gains. The table above and the graph below do not reflect the deduction of taxes that a shareholder would pay on Fund distributions or the redemption of Fund shares. The recent growth rate in the stock market has helped to produce short-term returns that are not typical and may not continue in the future.
The CRSP Cap-Based Portfolio 10 Index is an unmanaged index of 1,311 of the smallest publicly traded U.S. stocks (with dividends reinvested), as reported by the Center for Research on Security Prices. The Lipper Micro-Cap Stock Funds Index is an index of small-company funds compiled by Lipper, Inc. The Russell Microcap Index is an unmanaged, market value weighted index, which measures performance of 1,000 of the smallest securities in the Russell 2000 Index. The Russell 2000 Index is an unmanaged, market value weighted index, which measures performance of the 2,000 companies that are between the 1,000th and 3,000th largest in the market with dividends reinvested. It is not possible to invest directly in an index. Periods longer than one year are annualized.
According to data from Lipper, Inc. as of December 31, 2010, Ultra-Small Company Fund ranked 58th of 68 micro-cap funds for the twelve months ending December 31, 2010, 32nd of 60 over the last five years, 1st of 37 over the last ten years, and 1st of 9 since inception in August, 1994. These long-term numbers and the graph below give two snapshots of our long-term success. Lipper, Inc. is an independent mutual fund rating service that ranks funds in various fund categories by making comparative calculations using total returns.
| | |
Ultra-Small Company Fund MANAGER’S COMMENTARY (continued) | | |
Ultra-Small Company Fund vs. CRSP 10 Index, Lipper Micro-Cap Stock Funds Index*, Russell 2000 Index & Russell Microcap Index** from Inception 8/5/94 to 12/31/10
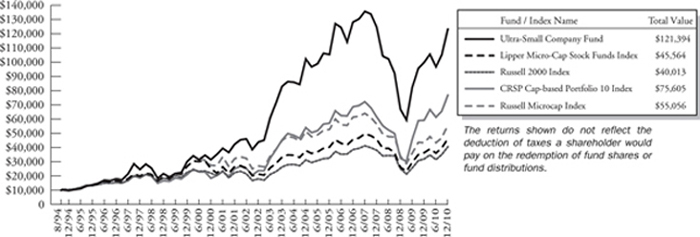
| * | The Lipper Micro-Cap Stock Funds Index began on 12/31/1995, and the line graph for the Index begins at the same value as the Fund on that date. |
| ** | The Russell Microcap Index began on 6/30/2000, and the line graph for the Index begins at the same value as the Fund on that date. |
The table below indicates that small-cap stocks generally outperformed large-cap stocks for the quarter, six-month and one-year periods.
| | | | | | | | | | | | | | | | | | | | | | | | |
| CRSP Decile1 | | Dec. Qtr.
10/1/10 to
12/31/10 | | | Six-months
7/1/10 to
12/31/10 | | | 1 Year
1/1/10 to
12/31/10 | | | 5 Years
1/1/06
to 12/31/10 | | | 10 Years
1/1/01
to 12/31/10 | | | 85 Years
1/1/1926
to 12/31/10 | |
| 1 (ultra-large) | | | 10.2% | | | | 22.6% | | | | 13.4% | | | | 2.3% | | | | 0.3% | | | | 9.1% | |
| 2 | | | 11.7% | | | | 26.0% | | | | 22.0% | | | | 4.0% | | | | 5.4% | | | | 10.5% | |
| 3 | | | 14.9% | | | | 31.0% | | | | 30.2% | | | | 5.0% | | | | 6.3% | | | | 10.9% | |
| 4 | | | 13.0% | | | | 26.1% | | | | 21.4% | | | | 5.2% | | | | 7.2% | | | | 10.8% | |
| 5 | | | 16.0% | | | | 31.7% | | | | 29.4% | | | | 8.5% | | | | 8.2% | | | | 11.4% | |
| 6 | | | 15.1% | | | | 29.6% | | | | 27.6% | | | | 5.5% | | | | 7.7% | | | | 11.4% | |
| 7 | | | 15.7% | | | | 32.2% | | | | 31.6% | | | | 6.7% | | | | 9.0% | | | | 11.4% | |
| 8 | | | 18.4% | | | | 31.4% | | | | 32.8% | | | | 7.3% | | | | 11.1% | | | | 11.6% | |
| 9 | | | 20.5% | | | | 30.8% | | | | 29.1% | | | | 5.9% | | | | 10.9% | | | | 11.7% | |
| 10 (ultra-small) | | | 17.0% | | | | 25.3% | | | | 29.6% | | | | 6.0% | | | | 15.4% | | | | 13.3% | |
| 1 | The CRSP Cap-Based Portfolio Indexes are unmanaged indexes of the publicly traded U.S. stocks with dividends reinvested, grouped by market capitalization, as reported by the Center for Research in Security Prices. Past performance is no guarantee of future results. |
Detailed Explanation of Quarterly Performance
The Short Version: We closely matched (slightly beat) our primary market benchmark in the December quarter. Industrial stocks were well represented on both the best and worst contributors list.
All in all, the December quarter was a nice period for ultra-small stocks across most industries as seven different sectors were represented on the top ten contributors list. Of note, three Industrial companies made this list; combined, they contributed over a percent-and-a-half to the Fund’s return. Many of these companies have benefited from enhanced demand in the emerging markets that have continued to lead the growth in the global economy.
| | |
| | |
| 26 | | Semi-Annual Report | December 31, 2010 (Unaudited) |
| | |
Ultra-Small Company Fund MANAGER’S COMMENTARY (continued) | | |
These are the Fund’s ten best-contributing stocks for the quarter ended December 31, 2010:
| | | | | | |
| Rank | | Description | | Industry | | % Contribution to Return |
1 | | IDT Corp. | | Diversified Telecommunication Services | | 1.2% |
2 | | Measurement Specialties, Inc. | | Electronic Equip., Instruments & Components | | 0.9% |
3 | | Cost Plus, Inc. | | Specialty Retail | | 0.9% |
4 | | Mercer International, Inc. | | Paper & Forest Products | | 0.7% |
5 | | Park-Ohio Holdings Corp. | | Air Freight & Logistics | | 0.7% |
6 | | NN, Inc. | | Machinery | | 0.6% |
7 | | Westell Technologies, Inc. | | Communications Equipment | | 0.5% |
8 | | Five Star Quality Care, Inc. | | Health Care Providers & Services | | 0.4% |
9 | | Virtus Investment Partners, Inc. | | Capital Markets | | 0.4% |
10 | | Aceto Corp. | | Trading Companies & Distributors | | 0.4% |
Sometimes a company simply needs to reinvent itself. After struggling for five years and watching its shareholder value plummet by more than 90%, management at IDT Corp began a restructuring plan that is starting to pay dividends. The company spun off a media subsidiary and is looking to do the same with its energy business. It is now flush with cash as it focuses its efforts on the more profitable telecom markets, primarily wholesale and retail long distance and calling card services. In December, IDT posted positive earnings and a second consecutive quarter of solid revenue growth. Shareholders were also rewarded for their patience with a dividend declaration. IDT climbed almost 50% during the quarter and contributed over one percent in return to the Fund.
Only three sectors comprised the “bottom ten” list for the December quarter as multiple holdings from Consumer Discretionary (4), Industrials (3), and IT (3) hindered the overall performance of the fund. Interestingly, while Industrials contributed nicely to the return in the quarter, three nevertheless appeared on the list below and cost the Fund almost three-quarters of a percent in performance.
These are the Fund’s ten worst-contributing stocks for the quarter ended December 31, 2010:
| | | | | | |
| Rank | | Description | | Industry | | % Contribution to Return |
1 | | Industrial Services of America, Inc. | | Commercial Services & Supplies | | -0.4% |
2 | | Kenneth Cole Productions, Inc. | | Textiles, Apparel & Luxury Goods | | -0.3% |
3 | | Jinpan International Ltd. | | Electrical Equipment | | -0.2% |
4 | | Nanometrics, Inc. | | Semiconductors & Semiconductor Equipment | | -0.2% |
5 | | Integrated Silicon Solution, Inc. | | Semiconductors & Semiconductor Equipment | | -0.2% |
6 | | Ballantyne Strong, Inc. | | Media | | -0.1% |
7 | | LJ International, Inc. | | Textiles, Apparel & Luxury Goods | | -0.1% |
8 | | Lionbridge Technologies, Inc. | | IT Services | | -0.1% |
9 | | LGL Group, Inc. | | Electrical Equipment | | -0.1% |
10 | | CPI Corp. | | Diversified Consumer Services | | -0.1% |
What happens when profits double and investors are still not pleased? Sometimes, the stock price plummets, which was the experience of chipmaker Integrated Silicon Solutions. The company reported profits below analysts’ expectations and also issued a lackluster forecast for the following quarter. Management pointed to decreased demand for certain consumer electronics devices that use its chips, but remained optimistic that business will improve by mid-2011. Though the stock price fell over 12% in the December quarter, we still realized over a 45% gain from the time we bought it in November 2009 to the time we sold it in October 2010.
Detailed Explanation of Calendar Year Performance
The Short Version: Information Technology stocks were the calendar year outliers, dominating both the best and worst contributors’ lists. The March quarter 2010 “junk rally” (significant price recovery by some of the market’s most beat up stocks) accounts for our lagging our primary market benchmark in calendar 2010.
| | |
Ultra-Small Company Fund MANAGER’S COMMENTARY (continued) | | |
Our calendar year 2010 underperformance relative to the CRSP Cap-Based Portfolio 10 Index occurred in the March quarter and was well documented in that quarterly letter. Specifically, some of the bear market’s very low quality stocks, ones our models tend to spurn, outpaced the broader market by a significant margin.
From a company specific and sector viewpoint, Information Technology companies have been a mixed bag in 2010. Three IT-related companies highlighted the list of top Fund contributors; combined, they added over five percent in total return.
These are the Fund’s ten best-contributing stocks for the calendar year ended December 31, 2010:
| | | | | | |
| Rank | | Description | | Industry | | % Contribution to Return |
1 | | IDT Corp. | | Diversified Telecommunication Services | | 3.2% |
2 | | Keithley Instruments, Inc. | | Electronic Equip., Instruments & Components | | 2.8% |
3 | | One Liberty Properties, Inc. | | Real Estate Investment Trusts | | 1.2% |
4 | | Measurement Specialties, Inc. | | Electronic Equip., Instruments & Components | | 1.2% |
5 | | Westell Technologies, Inc. | | Communications Equipment | | 1.0% |
6 | | Cost Plus, Inc. | | Specialty Retail | | 1.0% |
7 | | Triangle Capital Corp. | | Capital Markets | | 0.8% |
8 | | SunOpta, Inc. | | Food Products | | 0.8% |
9 | | Hawk Corp. | | Auto Components | | 0.8% |
10 | | NN, Inc. | | Machinery | | 0.7% |
Measurement Specialties manufactures sensors for use in the automotive, medical, and military sectors. At a time when analysts have been worried that higher corporate earnings are mainly the result of cost-cuts (and not revenue increases), Measurement Specialties has experienced revenue growth of between 25% and 45% during the past four quarters. Additionally the company has benefited from its recent acquisition of aerospace supplier PSI. For the year, Measurement Specialties’ share price spiked over 80%, and the company contributed over a percent to the Fund’s return.
On the flipside, Information Technology companies also dominated the list of worst contributors as four related holdings were among the top detractors to the Fund’s performance. Combined they cost the Fund over two-and-a-half percent in performance. Likewise, despite the surge in retail activity late in the year, four consumer discretionary companies were on the “bottom” list below, and they hindered the Fund’s return to the tune of two-plus percent.
These are the Fund’s ten worst-contributing stocks for the calendar year ended December 31, 2010:
| | | | | | |
| Rank | | Description | | Industry | | % Contribution to Return |
1 | | FSI International, Inc. | | Semiconductors & Semiconductor Equipment | | -1.1% |
2 | | Valuevision Media, Inc. | | Internet & Catalog Retail | | -0.7% |
3 | | Culp, Inc. | | Textiles, Apparel & Luxury Goods | | -0.6% |
4 | | Hi-Tech Pharmacal Co, Inc. | | Pharmaceuticals | | -0.6% |
5 | | Ikanos Communications, Inc. | | Semiconductors & Semiconductor Equipment | | -0.6% |
6 | | Industrial Services of America, Inc. | | Commercial Services & Supplies | | -0.5% |
7 | | Network Engines, Inc. | | Communications Equipment | | -0.5% |
8 | | MarineMax, Inc. | | Specialty Retail | | -0.5% |
9 | | Eon Communications Corp. | | Communications Equipment | | -0.5% |
10 | | Tongxin International Ltd. | | Auto Components | | -0.5% |
While 2010 may have represented a bounce-back year for many retailers, not everyone benefited. Luxury boat retailer MarineMax continued in its struggle from the economic downturn and has been in serious cost-cutting mode for the past two years. The company has closed stores, pared back inventories, and laid off personnel with hopes that a “leaner, meaner” company would prove more profitable. Unfortunately, those folks so inclined to buy boats these days have looked to save a buck or two and gone the used boat route; those related sales have increased significantly. And just when management thought it had the company prepared for its road to recovery, along came the BP oil spill, which brought sales in the Gulf region to a virtual standstill. MarineMax’s stock slid almost 30% during the calendar year and cost the Fund about half a percent in return.
| | |
| | |
| 28 | | Semi-Annual Report | December 31, 2010 (Unaudited) |
| | |
Ultra-Small Company Fund MANAGER’S COMMENTARY (continued) | | |
Top Ten Holdings as of December 31, 2010
Six of the Fund’s top contributors for the December 2010 quarter were also among the largest holdings at the end of the calendar year (IDT Corp, Measurement Specialties, NN Inc., Mercer Intl, Park-Ohio Holdings and Five State Quality Care). The Fund was broadly diversified, as no single stock accounted for greater than 2.1% of the net assets. The ten largest positions represented just 16% of the total assets of the Fund.
| | | | | | |
| Rank | | Description | | Industry | | % of Net
Assets |
1 | | IDT Corp. | | Diversified Telecommunication Services | | 2.1% |
2 | | Measurement Specialties, Inc. | | Electronic Equip., Instruments & Components | | 1.9% |
3 | | NN, Inc. | | Machinery | | 1.8% |
4 | | Warren Resources, Inc. | | Oil, Gas & Consumable Fuels | | 1.6% |
5 | | Mercer International, Inc. | | Paper & Forest Products | | 1.5% |
6 | | Park-Ohio Holdings Corp. | | Air Freight & Logistics | | 1.5% |
7 | | TICC Capital Corp. | | Capital Markets | | 1.4% |
8 | | Five Star Quality Care, Inc. | | Health Care Providers & Services | | 1.4% |
9 | | Callon Petroleum Co. | | Oil, Gas & Consumable Fuels | | 1.4% |
10 | | DDi Corp. | | Electronic Equip., Instruments & Components | | 1.4% |
| | Total | | | | 16.0% |
Industry Sector Representation as of December 31, 2010
The Fund’s largest allocation, 18.7%, was in Consumer Discretionary stocks. The Fund maintained a much smaller allocation than its benchmark in Health Care stocks, a defensive sector that tends to lag in a strong recovery period such as the December quarter. Our most over-weighted sector at quarter end was Industrials.
| | | | | | |
| | | % of Net Assets | | % of CRSP 10 Index | | Difference |
Consumer Discretionary | | 18.7% | | 15.7% | | 3.0% |
Consumer Staples | | 2.8% | | 3.2% | | -0.4% |
Energy | | 4.1% | | 6.8% | | -2.7% |
Financials | | 18.5% | | 20.7% | | -2.2% |
Health Care | | 9.4% | | 18.6% | | -9.2% |
Industrials | | 18.1% | | 12.9% | | 5.2% |
Information Technology | | 18.0% | | 16.5% | | 1.5% |
Materials | | 5.0% | | 4.0% | | 1.0% |
Telecommunication Services | | 3.2% | | 0.6% | | 2.6% |
Utilities | | 0.8% | | 1.0% | | -0.2% |
Cash & Other Assets | | 1.4% | | 0.0% | | 1.4% |
Total | | 100.0% | | 100.0% | | |
Disclaimer
The views expressed here are exclusively those of Fund management. These views, including those related to market sectors or individual stocks, are not meant as investment advice and should not be considered predictive in nature. Any favorable (or unfavorable) description of a holding applies only as of the quarter end, December 31, 2010, unless otherwise stated. Security positions can and do change thereafter. Discussions of historical performance do not guarantee and are not indicative of future performance.
The Fund is subject to very high, above market risk (volatility) and is not an appropriate investment for short-term investors. Investments in ultra-small companies generally carry greater risk than is customarily associated with larger companies and even “small companies” for various reasons, such as narrower markets (fewer investors), limited financial resources and greater trading difficulty.
| | |
Ultra-Small Company Fund MANAGER’S COMMENTARY (continued) | | |
Conclusion
Ultra-Small Company Fund remains closed to new investors. We encourage your feedback; your reactions and concerns are important to us.
Sincerely,
Your Investment Management Team
| | |
| | |
| 30 | | Semi-Annual Report | December 31, 2010 (Unaudited) |
| | |
Bridgeway Ultra-Small Company Fund SCHEDULE OF INVESTMENTS | | |
| | |
Showing percentage of net assets as of December 31, 2010 (Unaudited) | | |
| | | | | | | | | | |
Industry | | Company | | | Shares | | | | Value | |
COMMON STOCKS - 98.59% | |
Aerospace & Defense - 1.99% | |
| | Astronics Corp.* | | | 40,000 | | | $ | 840,000 | |
| | CPI Aerostructures, Inc.* | | | 20,000 | | | | 281,400 | |
| | Sparton Corp.* | | | 80,000 | | | | 659,200 | |
| | Todd Shipyards Corp. | | | 5,500 | | | | 123,145 | |
| | | | | | | | | | |
| | | | | | | | | 1,903,745 | |
| |
Air Freight & Logistics - 2.08% | |
| | Express-1 Expedited Solutions, Inc.* | | | 225,500 | | | | 575,025 | |
| | Park-Ohio Holdings Corp.* | | | 67,700 | | | | 1,415,607 | |
| | | | | | | | | | |
| | | | | | | | | 1,990,632 | |
| |
Airlines - 1.26% | |
| | Pinnacle Airlines Corp.* | | | 86,000 | | | | 679,400 | |
| | Republic Airways Holdings, Inc.*+ | | | 71,900 | | | | 526,308 | |
| | | | | | | | | | |
| | | | | | | | | 1,205,708 | |
| |
Auto Components - 2.34% | |
| | Motorcar Parts of America, Inc.* | | | 57,500 | | | | 749,800 | |
| | SORL Auto Parts, Inc.* | | | 52,000 | | | | 443,560 | |
| | Spartan Motors, Inc. | | | 127,000 | | | | 773,430 | |
| | Strattec Security Corp. | | | 7,960 | | | | 265,307 | |
| | | | | | | | | | |
| | | | | | | | | 2,232,097 | |
| |
Beverages - 0.63% | |
| | Craft Brewers Alliance, Inc.*+ | | | 82,000 | | | | 606,800 | |
| |
Capital Markets - 5.24% | |
| | Arlington Asset Investment Corp., Class A+ | | | 43,600 | | | | 1,045,964 | |
| | Ladenburg Thalmann Financial Services, Inc.* | | | 353,500 | | | | 413,595 | |
| | TICC Capital Corp. | | | 121,500 | | | | 1,362,015 | |
| | Triangle Capital Corp.+ | | | 67,171 | | | | 1,276,249 | |
| | Virtus Investment Partners, Inc.* | | | 20,000 | | | | 907,400 | |
| | | | | | | | | | |
| | | | | | | | | 5,005,223 | |
| |
Commercial Banks - 4.20% | |
| | Alliance Financial Corp. | | | 16,100 | | | | 520,835 | |
| | Bancorp Rhode Island, Inc. | | | 11,600 | | | | 337,444 | |
| | Farmers Capital Bank Corp.* | | | 20,000 | | | | 97,600 | |
| | Fidelity Southern Corp.*+ | | | 20,301 | | | | 141,701 | |
| | Financial Institutions, Inc. | | | 20,000 | | | | 379,400 | |
| | Lakeland Bancorp, Inc. | | | 45,000 | | | | 493,650 | |
| | MidWestOne Financial Group, Inc. | | | 45,000 | | | | 679,950 | |
| | | | | | | | | | |
Industry | | Company | | | Shares | | | | Value | |
| | | | | | | | |
Commercial Banks (continued) | |
| | NewBridge Bancorp* | | | 18,900 | | | $ | 88,074 | |
| | Penns Woods Bancorp, Inc. | | | 5,500 | | | | 218,900 | |
| | Peoples Bancorp, Inc. | | | 22,500 | | | | 352,125 | |
| | West Coast Bancorp* | | | 250,000 | | | | 705,000 | |
| | | | | | | | | | |
| | | | | | | | | 4,014,679 | |
|
Commercial Services & Supplies - 0.74% | |
| | A.T. Cross Co., Class A* | | | 12,000 | | | | 115,800 | |
| | Casella Waste Systems, Inc., Class A* | | | 83,700 | | | | 593,433 | |
| | | | | | | | | | |
| | | | | | | | | 709,233 | |
|
Communications Equipment - 3.18% | |
| | Anaren, Inc.* | | | 51,000 | | | | 1,063,350 | |
| | Bel Fuse, Inc., Class A | | | 5,200 | | | | 131,664 | |
| | Powerwave Technologies, Inc.* | | | 251,100 | | | | 637,794 | |
| | Westell Technologies, Inc., Class A* | | | 367,200 | | | | 1,200,744 | |
| | | | | | | | | | |
| | | | | | | | | 3,033,552 | |
|
Computers & Peripherals - 0.39% | |
| | Key Tronic Corp.* | | | 71,000 | | | | 370,620 | |
|
Construction & Engineering - 0.51% | |
| | Furmanite Corp.* | | | 70,000 | | | | 483,700 | |
|
Construction Materials - 1.15% | |
| | Headwaters, Inc.* | | | 239,600 | | | | 1,097,368 | |
|
Consumer Finance - 0.60% | |
| | CompuCredit Holdings Corp.* | | | 65,000 | | | | 453,700 | |
| | Nicholas Financial, Inc.* | | | 12,100 | | | | 121,121 | |
| | | | | | | | | | |
| | | | | | | | | 574,821 | |
|
Containers & Packaging - 1.14% | |
| | UFP Technologies, Inc.* | | | 89,000 | | | | 1,084,910 | |
|
Diversified Consumer Services - 1.83% | |
| | Collectors Universe | | | 40,000 | | | | 556,400 | |
| | CPI Corp. | | | 33,500 | | | | 755,425 | |
| | Mac-Gray Corp. | | | 29,000 | | | | 433,550 | |
| | | | | | | | | | |
| | | | | | | | | 1,745,375 | |
|
Diversified Telecommunication Services - 3.21% | |
| | 8X8, Inc.* | | | 250,000 | | | | 595,000 | |
| | HickoryTech Corp. | | | 32,800 | | | | 314,880 | |
| | IDT Corp., Class B+ | | | 78,600 | | | | 2,016,090 | |
| | SureWest Communications* | | | 12,735 | | | | 136,265 | |
| | | | | | | | | | |
| | | | | | | | | 3,062,235 | |
| | |
Bridgeway Ultra-Small Company Fund SCHEDULE OF INVESTMENTS (continued) | | |
| | |
Showing percentage of net assets as of December 31, 2010 (Unaudited) | | |
| | | | | | | | | | |
Industry | | Company | | | Shares | | | | Value | |
Common Stocks (continued) | |
Electrical Equipment - 2.31% | |
| | Jinpan International Ltd.+ | | | 50,400 | | | $ | 530,712 | |
| | LGL Group, Inc.* | | | 25,000 | | | | 452,000 | |
| | Preformed Line Products Co. | | | 13,000 | | | | 760,825 | |
| | Ultralife Corp.* | | | 70,200 | | | | 464,022 | |
| | | | | | | | | | |
| | | | | | | | | 2,207,559 | |
| |
Electronic Equipment, Instruments & Components - 8.56% | |
| | DDi Corp. | | | 111,000 | | | | 1,305,360 | |
| | GTSI Corp.* | | | 35,000 | | | | 164,500 | |
| | IEC Electronics Corp.*+ | | | 113,300 | | | | 861,080 | |
| | Iteris, Inc.* | | | 60,000 | | | | 108,600 | |
| | Kemet Corp.* | | | 63,033 | | | | 919,021 | |
| | LeCroy Corp.* | | | 74,000 | | | | 728,160 | |
| | Measurement Specialties, Inc.* | | | 62,500 | | | | 1,834,375 | |
| | PC Connection, Inc.* | | | 27,100 | | | | 240,106 | |
| | Richardson Electronics, Ltd. | | | 85,400 | | | | 998,326 | |
| | SMTC Corp.* | | | 136,000 | | | | 435,200 | |
| | Spectrum Control, Inc.* | | | 31,100 | | | | 466,189 | |
| | Wayside Technology Group, Inc. | | | 10,500 | | | | 118,230 | |
| | | | | | | | | | |
| | | | | | | | | 8,179,147 | |
| |
Energy Equipment & Services - 0.41% | |
| | Mitcham Industries, Inc.* | | | 33,800 | | | | 390,390 | |
| |
Food & Staples Retailing - 0.45% | |
| | Susser Holdings Corp.* | | | 31,000 | | | | 429,350 | |
| |
Food Products - 1.42% | |
| | Coffee Holding Co., Inc. | | | 50,000 | | | | 186,000 | |
| | SunOpta, Inc.* | | | 150,000 | | | | 1,173,000 | |
| | | | | | | | | | |
| | | | | | | | | 1,359,000 | |
| |
Gas Utilities - 0.13% | |
| | Gas Natural, Inc. | | | 12,000 | | | | 125,880 | |
| |
Health Care Equipment & Supplies - 0.22% | |
| | Uroplasty, Inc.* | | | 51,500 | | | | 207,030 | |
| |
Health Care Providers & Services - 8.81% | |
| | Alliance HealthCare Services, Inc.* | | | 125,000 | | | | 530,000 | |
| | Almost Family, Inc.*+ | | | 28,500 | | | | 1,094,970 | |
| | Continucare Corp.* | | | 142,000 | | | | 664,560 | |
| | Five Star Quality Care, Inc.* | | | 188,900 | | | | 1,335,523 | |
| | Medcath Corp.* | | | 48,800 | | | | 680,760 | |
| | Metropolitan Health Networks, Inc.* | | | 224,300 | | | | 1,002,621 | |
| | PDI, Inc.* | | | 39,000 | | | | 411,060 | |
| | Providence Service Corp. (The)* | | | 50,000 | | | | 803,500 | |
| | | | | | | | | | |
Industry | | Company | | | Shares | | | | Value | |
| | | | | | | | |
Health Care Providers & Services (continued) | |
| | Skilled Healthcare Group, Inc., Class A* | | | 95,000 | | | $ | 853,100 | |
| | U.S. Physical Therapy, Inc.* | | | 52,500 | | | | 1,040,550 | |
| | | | | | | | | | |
| | | | | | | | | 8,416,644 | |
|
Health Care Technology - 0.25% | |
| | HealthStream, Inc.* | | | 30,000 | | | | 241,200 | |
|
Hotels, Restaurants & Leisure - 2.71% | |
| | Caribou Coffee Co., Inc.* | | | 111,700 | | | | 1,125,936 | |
| | Carrols Restaurant Group, Inc.* | | | 100,000 | | | | 742,000 | |
| | Einstein Noah Restaurant Group, Inc.* | | | 30,000 | | | | 421,500 | |
| | Famous Dave’s of America, Inc.* | | | 27,000 | | | | 301,050 | |
| | | | | | | | | | |
| | | | | | | | | 2,590,486 | |
|
Household Durables - 1.74% | |
| | Flexsteel Industries | | | 7,200 | | | | 127,296 | |
| | Kid Brands, Inc.* | | | 82,300 | | | | 703,665 | |
| | Lifetime Brands, Inc.* | | | 59,400 | | | | 833,976 | |
| | | | | | | | | | |
| | | | | | | | | 1,664,937 | |
|
Insurance - 0.89% | |
| | Meadowbrook Insurance Group, Inc. | | | 83,000 | | | | 850,750 | |
|
Internet & Catalog Retail - 0.94% | |
| | 1-800-Flowers.com, Inc., Class A* | | | 183,500 | | | | 493,615 | |
| | US Auto Parts Network, Inc.* | | | 48,500 | | | | 407,400 | |
| | | | | | | | | | |
| | | | | | | | | 901,015 | |
|
Internet Software & Services - 0.62% | |
| | Marchex, Inc., Class B | | | 62,200 | | | | 593,388 | |
|
IT Services - 2.00% | |
| | Ciber, Inc.* | | | 127,500 | | | | 596,700 | |
| | Dynamics Research Corp.* | | | 19,000 | | | | 254,600 | |
| | Hackett Group, Inc. (The)* | | | 94,600 | | | | 332,046 | |
| | Lionbridge Technologies, Inc.* | | | 167,500 | | | | 618,075 | |
| | Newtek Business Services, Inc.* | | | 60,900 | | | | 104,748 | |
| | | | | | | | | | |
| | | | | | | | | 1,906,169 | |
|
Leisure Equipment & Products - 0.12% | |
| | Escalade, Inc. | | | 17,900 | | | | 113,665 | |
|
Life Sciences Tools & Services - 0.15% | |
| | Harvard Bioscience, Inc.* | | | 35,000 | | | | 143,150 | |
| | |
| | |
| 32 | | Semi-Annual Report | December 31, 2010 (Unaudited) |
| | |
Bridgeway Ultra-Small Company Fund SCHEDULE OF INVESTMENTS (continued) | | |
| | |
Showing percentage of net assets as of December 31, 2010 (Unaudited) | | |
| | | | | | | | | | |
Industry | | Company | | | Shares | | | | Value | |
Common Stocks (continued) | |
Machinery - 2.83% | |
| | Key Technology, Inc.* | | | 14,000 | | | $ | 238,140 | |
| | Miller Industries, Inc. | | | 50,000 | | | | 711,500 | |
| | NN, Inc.* | | | 141,800 | | | | 1,752,648 | |
| | | | | | | | | | |
| | | | | | | | | 2,702,288 | |
| |
Marine - 1.69% | |
| | Global Ship Lease, Inc., Class A*+ | | | 110,300 | | | | 545,985 | |
| | Horizon Lines, Inc., Class A | | | 100,000 | | | | 437,000 | |
| | International Shipholding Corp. | | | 25,000 | | | | 635,000 | |
| | | | | | | | | | |
| | | | | | | | | 1,617,985 | |
| |
Media - 3.20% | |
| | Ballantyne Strong, Inc.* | | | 108,900 | | | | 846,153 | |
| | Carmike Cinemas, Inc.* | | | 96,700 | | | | 746,524 | |
| | Cumulus Media, Inc., Class A*+ | | | 50,000 | | | | 215,500 | |
| | Fisher Communications, Inc.* | | | 18,000 | | | | 392,400 | |
| | Gray Television, Inc.* | | | 250,000 | | | | 467,500 | |
| | Saga Communications, Inc., Class A* | | | 3,800 | | | | 100,016 | |
| | Salem Communications Corp., Class A | | | 45,000 | | | | 142,650 | |
| | Spanish Broadcasting System, Inc., Class A* | | | 200,000 | | | | 141,600 | |
| | | | | | | | | | |
| | | | | | | | | 3,052,343 | |
| |
Metals & Mining - 1.98% | |
| | Friedman Industries | | | 23,700 | | | | 207,375 | |
| | Universal Stainless & Alloy* | | | 31,000 | | | | 969,680 | |
| | WHX Corp.* | | | 55,000 | | | | 713,900 | |
| | | | | | | | | | |
| | | | | | | | | 1,890,955 | |
| |
Multiline Retail - 1.02% | |
| | Tuesday Morning Corp.* | | | 184,000 | | | | 971,520 | |
| |
Oil, Gas & Consumable Fuels - 3.69% | |
| | Callon Petroleum Co.* | | | 223,900 | | | | 1,325,488 | |
| | RAM Energy Resources, Inc.* | | | 162,900 | | | | 299,736 | |
| | Warren Resources, Inc.* | | | 334,100 | | | | 1,510,132 | |
| | Westmoreland Coal Co.* | | | 32,500 | | | | 388,050 | |
| | | | | | | | | | |
| | | | | | | | | 3,523,406 | |
| |
Paper & Forest Products - 1.51% | |
| | Mercer International, Inc.*+ | | | 185,900 | | | | 1,440,725 | |
| |
Personal Products - 0.30% | |
| | Nutraceutical International Corp.* | | | 20,000 | | | | 283,800 | |
| | | | | | | | | | |
Industry | | Company | | | Shares | | | | Value | |
| | | | | | | | |
Professional Services - 1.27% | |
| | National Technical Systems, Inc. | | | 50,000 | | | $ | 403,000 | |
| | On Assignment, Inc.* | | | 100,000 | | | | 815,000 | |
| | | | | | | | | | |
| | | | | | | | | 1,218,000 | |
|
Real Estate Investment Trusts (REITs) - 3.79% | |
| | Agree Realty Corp. | | | 26,160 | | | | 685,130 | |
| | ARMOUR Residential REIT, Inc.+ | | | 50,000 | | | | 390,500 | |
| | MPG Office Trust, Inc.*+ | | | 283,700 | | | | 780,175 | |
| | One Liberty Properties, Inc. | | | 53,500 | | | | 893,450 | |
| | Winthrop Realty Trust | | | 67,900 | | | | 868,441 | |
| | | | | | | | | | |
| | | | | | | | | 3,617,696 | |
|
Road & Rail - 1.08% | |
| | Covenant Transportation | | | | | | | | |
| | Group, Inc., Class A* | | | 72,000 | | | | 699,840 | |
| | USA Truck, Inc.* | | | 25,000 | | | | 330,750 | |
| | | | | | | | | | |
| | | | | | | | | 1,030,590 | |
|
Semiconductors & Semiconductor Equipment - 3.31% | |
| | Amtech Systems, Inc.* | | | 47,500 | | | | 1,194,625 | |
| | China Sunergy Co., Ltd. - ADR*+ | | | 233,400 | | | | 975,612 | |
| | GSI Technology, Inc.* | | | 40,000 | | | | 324,000 | |
| | Photronics, Inc.* | | | 112,200 | | | | 663,102 | |
| | | | | | | | | | |
| | | | | | | | | 3,157,339 | |
|
Software - 0.95% | |
| | ePlus, Inc.* | | | 16,800 | | | | 397,152 | |
| | Magic Software Enterprises, Ltd.*+ | | | 81,900 | | | | 506,142 | |
| | | | | | | | | | |
| | | | | | | | | 903,294 | |
|
Specialty Retail - 2.95% | |
| | Casual Male Retail Group, Inc.* | | | 166,000 | | | | 786,840 | |
| | Cost Plus, Inc.*# | | | 122,100 | | | | 1,184,370 | |
| | Destination Maternity Corp.* | | | 12,000 | | | | 455,160 | |
| | Hastings Entertainment, Inc.* | | | 26,000 | | | | 159,120 | |
| | Syms Corp.* | | | 11,000 | | | | 79,530 | |
| | Winmark Corp. | | | 4,500 | | | | 151,380 | |
| | | | | | | | | | |
| | | | | | | | | 2,816,400 | |
|
Textiles, Apparel & Luxury Goods - 1.88% | |
| | Kenneth Cole Productions, Inc., Class A* | | | 53,300 | | | | 665,717 | |
| | LJ International, Inc.*+ | | | 85,600 | | | | 332,984 | |
| | R.G. Barry Corp. | | | 36,000 | | | | 400,320 | |
| | |
Bridgeway Ultra-Small Company Fund SCHEDULE OF INVESTMENTS (continued) | | |
| | |
| Showing percentage of net assets as of December 31, 2010 (Unaudited) | | |
| | | | | | | | | | | | | | |
Industry | | Company | | | | | | | Shares | | | | Value | |
Common Stocks (continued) | |
Textiles, Apparel & Luxury Goods (continued) | |
| | Unifi, Inc.* | | | | 23,566 | | | $ | 398,972 | |
| | | | | | | | | | | | | | |
| | | | | | | | | | | | | 1,797,993 | |
| |
Thrifts & Mortgage Finance - 2.99% | |
| | Abington Bancorp, Inc. | | | | 57,400 | | | | 684,782 | |
| | ESSA Bancorp, Inc. | | | | 50,000 | | | | 661,000 | |
| | Meridian Interstate Bancorp, Inc.* | | | | 35,500 | | | | 418,545 | |
| | Meta Financial Group, Inc. | | | | 2,700 | | | | 37,017 | |
| | United Financial Bancorp, Inc. | | | | 69,300 | | | | 1,058,211 | |
| | | | | | | | | | | | | | |
| | | | | | | | | | | | | 2,859,555 | |
| |
Trading Companies & Distributors - 1.29% | |
| | Aceto Corp. | | | | | | | 136,800 | | | | 1,231,200 | |
| |
Water Utilities - 0.64% | |
| | Connecticut Water Service, Inc. | | | | 22,000 | | | | 613,360 | |
| | | | | | | | | | | | | | |
TOTAL COMMON STOCKS - 98.59% | | | | 94,168,907 | |
| | | | | | | | | | | | | | |
(Cost $72,811,473) | | | | | | | | | | | | |
| | | | |
| | | | | Rate^ | | | Shares | | | Value | |
| | | | | | |
MONEY MARKET FUND - 1.62% | |
BlackRock FedFund | | | 0.06% | | | | 1,541,832 | | | | 1,541,832 | |
| | | | | | | | | | | | | | |
TOTAL MONEY MARKET FUND - 1.62% | | | | 1,541,832 | |
| | | | | | | | | | | | | | |
(Cost $1,541,832) | | | | | | | | | | | | |
| |
TOTAL INVESTMENTS - 100.21% | | | $ | 95,710,739 | |
(Cost $74,353,305) | | | | | | | | | | | | |
Liabilities in Excess of Other Assets - (0.21%) | | | | (197,728 | ) |
| | | | | | | | | | | | | | |
NET ASSETS - 100.00% | | | | | | | | | | $ | 95,513,011 | |
| | | | | | | | | | | | |
* Non-income producing security. # Securities, or a portion thereof, segregated to cover the Fund’s obligation under swap agreements. The total market value of segregated assets is $1,184,370. ^ Rate disclosed as of December 31, 2010. + This security or a portion of the security is out on loan at December 31, 2010. Total loaned securities had a market value of $7,259,196 at December 31, 2010. ADR - American Depositary Receipt | |
Summary of inputs used to value the Fund’s investments as of 12/31/2010 are as follows (See Note 2 in Notes to Financial Statements):
| | | | | | | | | | | | | | | | |
| | | Valuation Inputs | |
| | |
| | | Investment in Securities (Market Value) | |
| | |
| | | Level 1
Quoted
Prices | | | Level 2
Significant
Observable
Inputs | | | Level 3
Significant Unobservable
Inputs | | | Total | |
| | |
Common Stocks | | $ | 94,168,907 | | | $ | — | | | $ | — | | | $ | 94,168,907 | |
Money Market Fund | | | — | | | | 1,541,832 | | | | — | | | | 1,541,832 | |
| | | | | | | | | | | | | | | | |
TOTAL | | $ | 94,168,907 | | | $ | 1,541,832 | | | $ | — | | | $ | 95,710,739 | |
| | | | | | | | | | | | | | | | |
Other Financial Instruments** | | | | | | | | | | | | | | | | |
Swaps | | $ | — | | | $ | 26,124 | | | $ | — | | | $ | 26,124 | |
| | | | | | | | | | | | | | | | |
TOTAL | | $ | — | | | $ | 26,124 | | | $ | — | | | $ | 26,124 | |
| | | | | | | | | | | | | | | | |
| ** | Other financial instruments are derivative instruments not reflected in the Schedule of Investments, such as futures, forwards and swap contracts, which are valued at the unrealized appreciation/ depreciation on the investment. |
See Notes to Financial Statements.
| | |
| | |
| 34 | | Semi-Annual Report | December 31, 2010 (Unaudited) |
| | |
Ultra-Small Company Market Fund MANAGER’S COMMENTARY | | |
| | |
(Unaudited) December 31, 2010 | | |
Dear Fellow Ultra-Small Company Market Fund Shareholder,
In the December quarter our Fund increased 17.21%, slightly outperforming its primary market benchmark, the CRSP Cap-Based Port 10 Index (+17.01%), its peer benchmark, the Lipper Micro-Cap Stock Funds Index (+16.69%) and the Russell 2000 Index (+16.25%). We did underperform the Russell Microcap Index (+19.41%). We are pleased with these results.
For the six month “semi-annual” period ending December 31, 2010, our Fund jumped 27.31%, slightly beating its primary market benchmark, the CRSP Cap-Based Portfolio 10 Index (+25.30%). We did underperform the Lipper Micro-Cap Stock Funds Index (+28.10%), the Russell Microcap Index (+28.73%) and the Russell 2000 Index (+29.38%), as these indexes all hold more stocks in the larger “micro-cap” segment. As presented in the table on the next page, ultra-small (“CRSP 10”) stocks took somewhat of a “breather” relative to micro-cap stocks (“CRSP 9”) stocks after ultra-small stocks’ stellar relative performance in 2009.
For the calendar year ended December 31, 2010, the Fund returned 24.86%, trailing each of our benchmarks. All of this calendar year underperformance can be attributed to the March quarter, when there was a dramatic “junk rally” among stocks at risk of bankruptcy or precipitous price decline, which our Fund avoids. This was documented more fully in our March quarter letter.
The table below presents our December quarter, six-month, one-year, five-year, ten-year, and life-to-date financial results according to the formula required by the SEC.
| | | | | | | | | | | | |
| | | Dec. Qtr.
10/1/10
to 12/31/10 | | 6 Month
7/1/10
to 12/31/10 | | 1 Year
1/1/10
to 12/31/10 | | 5 Year
1/1/06
to 12/31/10 | | 10 Year
1/1/01
to 12/31/10 | | Life-to-Date
7/31/97
to 12/31/10 |
| | | | | | |
Ultra-Small Company Market Fund | | 17.21% | | 27.31% | | 24.86% | | 0.07% | | 11.34% | | 10.44% |
CRSP Cap-Based Portfolio 10 Index | | 17.01% | | 25.30% | | 29.55% | | 6.04% | | 15.36% | | 11.61% |
Russell Microcap Index | | 19.41% | | 28.73% | | 28.89% | | 1.19% | | 7.38% | | N/A |
Lipper Micro-Cap Stock Funds Index | | 16.69% | | 28.10% | | 27.57% | | 2.77% | | 6.26% | | 6.83% |
Russell 2000 Index (small companies) | | 16.25% | | 29.38% | | 26.85% | | 4.47% | | 6.33% | | 6.22% |
Performance figures quoted in the table above and graph below represent past performance and are no guarantee of future results. Total return figures in the table above and the graph below include the reinvestment of dividends and capital gains. The table above and the graph below do not reflect the deduction of taxes that a shareholder would pay on Fund distributions or the redemption of Fund shares. The recent growth rate in the stock market has helped to produce short-term returns that are not typical and may not continue in the future.
The CRSP Cap-Based Portfolio 10 Index is an unmanaged index of 1,311 of the smallest publicly traded U.S. stocks (with dividends reinvested), as reported by the Center for Research on Security Prices. The Lipper Micro-Cap Stock Funds Index is an index of small-company funds compiled by Lipper, Inc. The Russell Micro-Cap Index is an unmanaged, market value weighted index, which measures performance of 1,000 of the smallest securities in the Russell 2000 Index. The Russell 2000 Index is an unmanaged, market value weighted index that measures performance of the 2,000 companies that are between the 1,000th and 3,000th largest in the market with dividends reinvested. It is not possible to invest directly in an index. Periods longer than one year are annualized.
According to data from Lipper, Inc. as of December 31, 2010, Ultra-Small Company Market Fund ranked 53rd of 68 micro-cap funds for the twelve months ending December 31, 2010, 49th of 60 over the last five years, 9th of 37 over the last ten years, and 6th of 23 since inception in July 1997. These long-term numbers and the graph below give two snapshots of our long-term success. Lipper, Inc. is an independent mutual fund rating service that ranks funds in various fund categories by making comparative calculations using total returns.
| | |
Ultra-Small Company Market Fund MANAGER’S COMMENTARY (continued) | | |
Ultra-Small Company Market Fund vs. CRSP 10 Index, Lipper Micro-Cap Stock Funds Index, Russell 2000 Index & Russell Microcap Index* from Inception 7/31/97 to 12/31/10
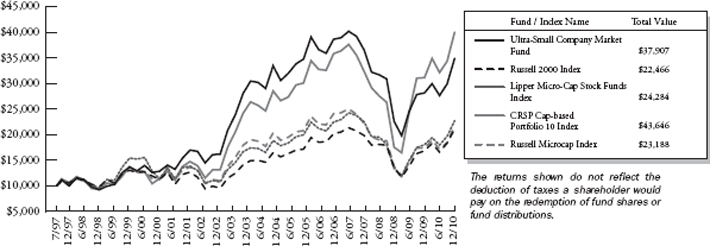
| * | The Russell Microcap Index began on 6/30/2000, and the line graph for the Index begins at the same value as the Fund on that date. |
Detailed Explanation of Quarterly Performance:
The table below indicates the short-term disadvantage of ultra-small stocks relative to their micro-cap (CRSP 9) siblings in the December quarter. This phenomenon, true for the last two quarters, gave our Fund a “headwind” relative to all of our performance benchmarks, except the CRSP 10 Index itself, against which it gave us a slight tailwind. This size effect was the predominant driver of our relative performance over the last six month period. Over the long-term, however, ultra-small stocks have had a significant performance advantage over every other size stock presented in the table below.
| | | | | | | | | | | | |
| CRSP Decile1 | | Dec. Qtr.
10/1/10
to 12/31/10 | | Six-months
7/1/10
to 12/31/10 | | 1 Year
1/1/10
to 12/31/10 | | 5 Years
1/1/06
to 12/31/10 | | 10 Years
1/1/01
to 12/31/10 | | 85 Years
1/1/1926
to 12/31/10 |
| 1 (ultra-large) | | 10.2% | | 22.6% | | 13.4% | | 2.3% | | 0.3% | | 9.1% |
| 2 | | 11.7% | | 26.0% | | 22.0% | | 4.0% | | 5.4% | | 10.5% |
| 3 | | 14.9% | | 31.0% | | 30.2% | | 5.0% | | 6.3% | | 10.9% |
| 4 | | 13.0% | | 26.1% | | 21.4% | | 5.2% | | 7.2% | | 10.8% |
| 5 | | 16.0% | | 31.7% | | 29.4% | | 8.5% | | 8.2% | | 11.4% |
| 6 | | 15.1% | | 29.6% | | 27.6% | | 5.5% | | 7.7% | | 11.4% |
| 7 | | 15.7% | | 32.2% | | 31.6% | | 6.7% | | 9.0% | | 11.4% |
| 8 | | 18.4% | | 31.4% | | 32.8% | | 7.3% | | 11.1% | | 11.6% |
| 9 | | 20.5% | | 30.8% | | 29.1% | | 5.9% | | 10.9% | | 11.7% |
| 10 (ultra-small) | | 17.0% | | 25.3% | | 29.6% | | 6.0% | | 15.4% | | 13.3% |
| 1 | The CRSP Cap-Based Portfolio Indexes are unmanaged indexes of the publicly traded U.S. stocks with dividends reinvested, grouped by market capitalization, as reported by the Center for Research in Security Prices. Past performance is no guarantee of future results. |
All in all, the December quarter 2010 was a nice period for stocks across most industries as seven different sectors were represented on the top 10 list of contributors. Three Information Technology companies were among the best contributors despite certain challenges encountered by others in this sector. Combined, these holdings contributed about half a percent to the overall return, partly reflecting the strong diversification of our Fund across more than 600 stocks purchased from the ultra-small asset class.
| | |
| | |
| 36 | | Semi-Annual Report | December 31, 2010 (Unaudited) |
| | |
Ultra-Small Company Market Fund MANAGER’S COMMENTARY (continued) | | |
These are the Fund’s ten best-contributing stocks for the quarter ended December 31, 2010:
| | | | | | |
| Rank | | Description | | Industry | | % Contribution to Return |
| 1 | | Applied Signal Technology, Inc. | | Aerospace & Defense | | 0.3% |
| 2 | | IDT Corp. | | Diversified Telecommunication Services | | 0.3% |
| 3 | | ValueVision Media, Inc. | | Internet & Catalog Retail | | 0.2% |
| 4 | | Federal Agricultural Mortgage Corp. | | Thrifts & Mortgage Finance | | 0.2% |
| 5 | | Support.com, Inc. | | Internet Software & Services | | 0.2% |
| 6 | | Mitcham Industries, Inc. | | Energy Equipment & Services | | 0.2% |
| 7 | | Measurement Specialties, Inc. | | Electronic Equip., Instruments & Components | | 0.2% |
| 8 | | OYO Geospace Corp. | | Energy Equipment & Services | | 0.2% |
| 9 | | Paramount Gold & Silver Corp. | | Metals & Mining | | 0.2% |
| 10 | | Cogo Group, Inc. | | Communications Equipment | | 0.2% |
Sometimes a company simply needs to reinvent itself. After struggling for five years and watching its shareholder value plummet by more than 90%, management at IDT Corp began a restructuring plan that is starting to pay dividends. The company spun off a media subsidiary and is looking to do the same with its energy business. It is now flush with cash as it focuses its efforts on the more profitable telecom markets, primarily wholesale and retail long distance and calling card services. In December, IDT posted positive earnings and a second consecutive quarter of solid revenue growth. Shareholders were also rewarded for their patience with a dividend declaration. IDT climbed almost 50% during the quarter and contributed 0.3% in return to the Fund.
Only three sectors comprised the worst contributors list for the December quarter, with multiple holdings from Health Care (5), Information Technology (3), and Consumer Discretionary (2). Many health-related companies struggled on concerns of significant industry reform being considered by the government (and ultimately passed), and others suffered unfortunate news on the development front. However, the damage of these five companies was limited to a third of one percent in performance, again reflecting our strong company-level diversification among these individually risky stocks.
These are the Fund’s ten worst-contributing stocks for the quarter ended December 31, 2010:
| | | | | | |
| Rank | | Description | | Industry | | % Contribution to Return |
| 1 | | Media General, Inc. | | Media | | -0.1% |
| 2 | | Cerus Corp. | | Health Care Equipment & Supplies | | -0.1% |
| 3 | | KVH Industries, Inc. | | Communications Equipment | | -0.1% |
| 4 | | Alexza Pharmaceuticals, Inc. | | Pharmaceuticals | | -0.1% |
| 5 | | Biodel, Inc. | | Pharmaceuticals | | -0.1% |
| 6 | | CryoLife, Inc. | | Health Care Equipment & Supplies | | -0.1% |
| 7 | | Anadys Pharmaceuticals, Inc. | | Biotechnology | | -0.1% |
| 8 | | China TransInfo Technology Corp. | | Software | | -0.1% |
| 9 | | Lionbridge Technologies, Inc. | | IT Services | | -0.1% |
| 10 | | China Education Alliance, Inc. | | Diversified Consumer Services | | -0.1% |
Pharmaceutical development companies live and die by their successes and failures. Alexza Pharmaceuticals has been developing a new treatment (AZ-004) for schizophrenia and bipolar disease. In October, the US Food and Drug Administration rejected the drug due to lung safety concerns, which caused the stock to plunge 50%. While Alexza is still planning to continue exploring options with the FDA, analysts have concerns about the delayed launch and the company’s ability to maintain adequate liquidity, as it has been burning through cash over the past few months. The holding dropped 68% and was the fourth worst performer during the December quarter.
Detailed Explanation of Calendar Year Performance
The Short Version: The March quarter 2010 “junk rally” (significant price recovery by some of the market’s most beat up stocks) accounts for our lagging our primary market benchmark in calendar 2010.
| | |
Ultra-Small Company Market Fund MANAGER’S COMMENTARY (continued) | | |
Our calendar year 2010 underperformance relative to the CRSP Cap-Based Portfolio 10 Index occurred in the March quarter and was well documented in that quarterly letter. Specifically, some of the bear market’s very low quality stocks with a higher risk of bankruptcy or precipitous price fall, stocks our Fund avoids, outpaced the broader market by a significant margin.
From a sector and industry perspective, three Industrial companies made the best contributors list for calendar year 2010; combined, they contributed a surprisingly strong percent-and-a-quarter to the Fund’s return. Many of these companies have benefited from enhanced demand in the emerging world markets that has continued to lead the growth in the global economy. Likewise, three Information Technology companies made the list.
These are the Fund’s ten best-contributing stocks for the calendar year ended December 31, 2010:
| | | | | | |
| Rank | | Description | | Industry | | % Contribution to Return |
| 1 | | IDT Corp. | | Diversified Telecommunication Services | | 0.8% |
| 2 | | Hawk Corp. | | Auto Components | | 0.6% |
| 3 | | Hypercom Corp. | | Computers & Peripherals | | 0.5% |
| 4 | | Callon Petroleum Co. | | Oil, Gas & Consumable Fuels | | 0.5% |
| 5 | | Applied Signal Technology, Inc. | | Aerospace & Defense | | 0.5% |
| 6 | | Support.com, Inc. | | Internet Software & Services | | 0.4% |
| 7 | | Wabash National Corp. | | Machinery | | 0.4% |
| 8 | | Trimas Corp. | | Machinery | | 0.4% |
| 9 | | Measurement Specialties, Inc. | | Electronic Equip., Instruments & Components | | 0.4% |
| 10 | | Federal Agricultural Mortgage Corp. | | Thrifts & Mortgage Finance | | 0.4% |
Measurement Specialties manufactures sensors for use in the automotive, medical, and military sectors. At a time when analysts have been worried that higher corporate earnings are mainly the result of cost-cuts (and not revenue increases), Measurement Specialties has experienced revenue growth of between 25% and 45% during the past four quarters. Additionally the company has benefited from its recent acquisition of aerospace supplier PSI. For the year, Measurement Specialties’ share price spiked over 80%, and the company contributed 0.4% to the Fund’s return.
Health care stocks also dominated the list of biggest detractors for calendar year 2010 as four related holdings combined to cost the Fund over three-quarters-of-a-percent in return. Four other sectors were represented on the worst contributors list, proving that even in strong periods, laggards will normally exist in virtually every industry.
These are the Fund’s ten worst-contributing stocks for the calendar year ended December 31, 2010:
| | | | | | |
| Rank | | Description | | Industry | | % Contribution to Return |
| 1 | | Bovie Medical Corp. | | Health Care Equipment & Supplies | | -0.3% |
| 2 | | Radio One, Inc. | | Media | | -0.3% |
| 3 | | AEP Industries, Inc. | | Containers & Packaging | | -0.2% |
| 4 | | Hi-Tech Pharmacal Co., Inc. | | Pharmaceuticals | | -0.2% |
| 5 | | Ikanos Communications, Inc. | | Semiconductors & Semiconductor Equipment | | -0.2% |
| 6 | | UQM Technologies, Inc. | | Electrical Equipment | | -0.2% |
| 7 | | M&F Worldwide Corp. | | Commercial Services & Supplies | | -0.2% |
| 8 | | Affymax, Inc. | | Biotechnology | | -0.2% |
| 9 | | KV Pharmaceutical Co. | | Pharmaceuticals | | -0.2% |
| 10 | | Alpha PRO Tech, Ltd. | | Textiles, Apparel & Luxury Goods | | -0.2% |
Another biopharmaceutical company, Affymax, received some bad news in June about its new treatment for anemia (currently under development) that management hoped would compete well against similar drugs offered by rival Amgen. Unfortunately, the Phase III clinical trial showed a higher than desired rate of stroke and even death, and analysts feared that Affymax would have serious difficulties getting approval. Its stock price plummeted over 60% on the news and dropped over 70% for the fiscal year.
| | |
| | |
| 38 | | Semi-Annual Report | December 31, 2010 (Unaudited) |
| | |
Ultra-Small Company Market Fund MANAGER’S COMMENTARY (continued) | | |
Top Ten Holdings as of December 31, 2010
Because our Fund is designed to model the ultra-small-cap index (CRSP 10) returns over the long haul, no single company comprises too high a percentage of its assets. In fact, the top ten holdings represent less than six percent of Fund net assets, and no stock currently accounts for even one percent of Fund net assets. Bear in mind, any stock with an allocation of greater than one-half-a-percent has appreciated in value, as we never initiate any position even that high.
| | | | | | |
| Rank | | Description | | Industry | | % of Net Assets |
| 1 | | IDT Corp. | | Diversified Telecommunication Services | | 0.7% |
| 2 | | Globecomm Systems, Inc. | | Communications Equipment | | 0.6% |
| 3 | | Rentrak Corp. | | Media | | 0.6% |
| 4 | | Integrated Silicon Solution, Inc. | | Semiconductors & Semiconductor Equipment | | 0.6% |
| 5 | | Actuate Corp. | | Software | | 0.6% |
| 6 | | Support.com, Inc. | | Internet Software & Services | | 0.6% |
| 7 | | Spartan Motors, Inc. | | Auto Components | | 0.6% |
| 8 | | Federal Agricultural Mortgage Corp. | | Thrifts & Mortgage Finance | | 0.5% |
| 9 | | Callon Petroleum Co. | | Oil, Gas & Consumable Fuels | | 0.5% |
| 10 | | Bolt Technology Corp. | | Energy Equipment & Services | | 0.5% |
| | Total | | | | 5.8% |
Industry Sector Representation as of December 31, 2010
Financials, Health Care, IT, and Consumer Discretionary were the four sectors with the largest allocations at quarter-end, each maintaining a percentage above 15%. As in the Fund design, the allocations were very similar to the CRSP 10 benchmark. In the case of a difference as high as two percent, such as Financials below, the adviser will take action to bring the Fund back into line with the index.
| | | | | | | | |
| | | % of Net Assets | | % of CRSP 10 Index | | Difference | |
Consumer Discretionary | | 15.8% | | 15.7% | | | 0.1% | |
Consumer Staples | | 2.7% | | 3.2% | | | -0.5% | |
Energy | | 6.6% | | 6.8% | | | -0.2% | |
Financials | | 19.8% | | 20.7% | | | -0.9% | |
Health Care | | 17.8% | | 18.6% | | | -0.8% | |
Industrials | | 11.7% | | 12.9% | | | -1.2% | |
Information Technology | | 16.7% | | 16.5% | | | 0.2% | |
Materials | | 3.7% | | 4.0% | | | -0.3% | |
Telecommunication Services | | 1.2% | | 0.6% | | | 0.6% | |
Utilities | | 1.1% | | 1.0% | | | 0.1% | |
Cash & Other Assets | | 2.9% | | 0.0% | | | 2.9% | |
Total | | 100.0% | | 100.0% | | | | |
Disclaimer
The views expressed here are exclusively those of Fund management. These views, including those related to market sectors or individual stocks, are not meant as investment advice and should not be considered predictive in nature. Any favorable (or unfavorable) description of a holding applies only as of the quarter end, December 31, 2010, unless otherwise stated. Security positions can and do change thereafter. Discussions of historical performance do not guarantee and are not indicative of future performance.
The Fund is subject to very high, above market risk (volatility) and is not an appropriate investment for short-term investors. Investments in ultra-small companies generally carry greater risk than is customarily associated with larger companies and even “small companies” for various reasons, such as narrower markets (fewer investors), limited financial resources and greater trading difficulty.
| | |
Ultra-Small Company Market Fund MANAGER’S COMMENTARY (continued) | | |
Conclusion
Thank you for your continued investment in Ultra-Small Company Market Fund. We encourage your feedback; your reactions and concerns are important to us.
Sincerely,
Your Investment Management Team
| | |
| | |
| 40 | | Semi-Annual Report | December 31, 2010 (Unaudited) |
| | |
Bridgeway Ultra-Small Company Market Fund SCHEDULE OF INVESTMENTS | |
|
| | |
Showing percentage of net assets as of December 31, 2010 (Unaudited) | | |
| | | | | | | | | | |
Industry | | Company | | | Shares | | | | Value | |
COMMON STOCKS - 97.36% | |
Aerospace & Defense - 0.95% | |
| | Ascent Solar Technologies,
Inc.*+ | | | 149,991 | | | $ | 503,970 | |
| | Astronics Corp.* | | | 22,700 | | | | 476,700 | |
| | GenCorp, Inc.* | | | 152,600 | | | | 788,942 | |
| | Herley Industries, Inc.* | | | 31,700 | | | | 549,044 | |
| | Innovative Solutions &
Support, Inc.* | | | 63,454 | | | | 359,784 | |
| | Kratos Defense & Security Solutions, Inc.* | | | 28,600 | | | | 376,662 | |
| | LMI Aerospace, Inc.* | | | 21,000 | | | | 335,790 | |
| | Sparton Corp.* | | | 63,300 | | | | 521,592 | |
| | | | | | | | | | |
| | | | | | | | | 3,912,484 | |
| |
Air Freight & Logistics - 0.56% | |
| | Express-1 Expedited
Solutions, Inc.* | | | 16,631 | | | | 42,409 | |
| | Pacer International, Inc.* | | | 188,800 | | | | 1,291,392 | |
| | Park-Ohio Holdings Corp.* | | | 46,000 | | | | 961,860 | |
| | | | | | | | | | |
| | | | | | | | | 2,295,661 | |
| |
Airlines - 0.28% | |
| | Pinnacle Airlines Corp.* | | | 86,100 | | | | 680,190 | |
| | Republic Airways Holdings,
Inc.*+ | | | 67,700 | | | | 495,564 | |
| | | | | | | | | | |
| | | | | | | | | 1,175,754 | |
| |
Auto Components - 1.25% | |
| | Amerigon, Inc.* | | | 42,200 | | | | 459,136 | |
| | Dorman Products, Inc.* | | | 18,000 | | | | 652,320 | |
| | Shiloh Industries, Inc. | | | 39,600 | | | | 473,220 | |
| | SORL Auto Parts, Inc.* | | | 54,700 | | | | 466,591 | |
| | Spartan Motors, Inc. | | | 382,600 | | | | 2,330,034 | |
| | Strattec Security Corp. | | | 24,100 | | | | 803,253 | |
| | | | | | | | | | |
| | | | | | | | | 5,184,554 | |
| |
Beverages - 0.27% | |
| | Craft Brewers Alliance, Inc.* | | | 40,200 | | | | 297,480 | |
| | MGP Ingredients, Inc. | | | 75,900 | | | | 837,936 | |
| | | | | | | | | | |
| | | | | | | | | 1,135,416 | |
| |
Biotechnology - 6.44% | |
| | Achillion Pharmaceuticals,
Inc.* | | | 134,500 | | | | 558,175 | |
| | ADVENTRX
Pharmaceuticals, Inc.*+ | | | 92,500 | | | | 241,425 | |
| | Affymax, Inc.* | | | 55,400 | | | | 368,410 | |
| | Amicus Therapeutics, Inc.* | | | 115,991 | | | | 534,719 | |
| | Anadys Pharmaceuticals,
Inc.* | | | 180,982 | | | | 256,994 | |
| | Arena Pharmaceuticals,
Inc.*+ | | | 352,800 | | | | 606,816 | |
| | | | | | | | | | |
Industry | | Company | | | Shares | | | | Value | |
| | | | | | | | |
Biotechnology (continued) | |
| | ARIAD Pharmaceuticals,
Inc.* | | | 222,000 | | | $ | 1,132,200 | |
| | ArQule, Inc.* | | | 131,300 | | | | 770,731 | |
| | Array Biopharma, Inc.* | | | 160,100 | | | | 478,699 | |
| | AVI BioPharma, Inc.* | | | 480,100 | | | | 1,017,812 | |
| | BioCryst Pharmaceuticals,
Inc.* | | | 90,894 | | | | 469,922 | |
| | BioSante Pharmaceuticals,
Inc.* | | | 212,800 | | | | 348,992 | |
| | BioSpecifics Technologies
Corp.* | | | 12,500 | | | | 320,000 | |
| | Biotime, Inc.*+ | | | 71,800 | | | | 598,094 | |
| | Celldex Therapeutics, Inc.*+ | | | 71,400 | | | | 294,168 | |
| | Codexis, Inc.* | | | 9,323 | | | | 98,824 | |
| | Curis, Inc.* | | | 363,100 | | | | 718,938 | |
| | Cyclacel Pharmaceuticals,
Inc.* | | | 287,200 | | | | 422,184 | |
| | Cytokinetics, Inc.* | | | 187,800 | | | | 392,502 | |
| | Cytori Therapeutics, Inc.*+ | | | 96,200 | | | | 499,278 | |
| | Dusa Pharmaceuticals, Inc.* | | | 181,000 | | | | 443,450 | |
| | Dyax Corp.* | | | 170,864 | | | | 365,649 | |
| | GTx, Inc.* | | | 195,000 | | | | 516,750 | |
| | Idenix Pharmaceuticals, Inc.* | | | 126,100 | | | | 635,544 | |
| | Infinity Pharmaceuticals,
Inc.*+ | | | 56,200 | | | | 333,266 | |
| | Inovio Pharmaceuticals, Inc.* | | | 251,600 | | | | 289,340 | |
| | Keryx Biopharmaceuticals,
Inc.* | | | 214,400 | | | | 981,952 | |
| | Ligand Pharmaceuticals,
Inc., Class B* | | | 57,133 | | | | 509,626 | |
| | Marina Biotech, Inc.*+ | | | 35,625 | | | | 55,931 | |
| | Maxygen, Inc. | | | 49,850 | | | | 195,911 | |
| | Myrexis, Inc.* | | | 98,700 | | | | 410,592 | |
| | Nabi Biopharmaceuticals* | | | 115,900 | | | | 671,061 | |
| | Nanosphere, Inc.* | | | 71,000 | | | | 309,560 | |
| | Neuralstem, Inc.* | | | 124,800 | | | | 264,576 | |
| | Neurocrine Biosciences,
Inc.* | | | 157,600 | | | | 1,204,064 | |
| | NeurogesX, Inc.*+ | | | 64,038 | | | | 407,282 | |
| | Novavax, Inc.* | | | 154,700 | | | | 375,921 | |
| | Omeros Corp.* | | | 21,283 | | | | 175,372 | |
| | Oncothyreon, Inc.*+ | | | 124,300 | | | | 403,975 | |
| | Orexigen Therapeutics, Inc.* | | | 41,600 | | | | 336,128 | |
| | Osiris Therapeutics, Inc.* | | | 52,000 | | | | 405,080 | |
| | PharmAthene, Inc.*+ | | | 70,800 | | | | 299,484 | |
| | Progenics Pharmaceuticals,
Inc.* | | | 72,400 | | | | 395,304 | |
| | PROLOR Biotech, Inc.*+ | | | 75,700 | | | | 489,779 | |
| | Repligen Corp.* | | | 74,634 | | | | 350,033 | |
| | Rexahn Pharmaceuticals,
Inc.* | | | 216,500 | | | | 244,645 | |
| | |
Bridgeway Ultra-Small Company Market Fund SCHEDULE OF INVESTMENTS (continued) | |
|
| | |
Showing percentage of net assets as of December 31, 2010 (Unaudited) | | |
| | | | | | | | | | |
Industry | | Company | | | Shares | | | | Value | |
Common Stocks (continued) | |
Biotechnology (continued) | |
| | Sangamo Biosciences, Inc.*+ | | | 127,436 | | | $ | 846,175 | |
| | Sciclone Pharmaceuticals, Inc.*+ | | | 174,307 | | | | 728,603 | |
| | Spectrum Pharmaceuticals, Inc.* | | | 86,700 | | | | 595,629 | |
| | Synta Pharmaceuticals Corp.* | | | 142,500 | | | | 872,100 | |
| | Transcept Pharmaceuticals, Inc.* | | | 48,200 | | | | 356,680 | |
| | Trimeris, Inc.* | | | 143,000 | | | | 353,210 | |
| | Vanda Pharmaceuticals, Inc.* | | | 78,600 | | | | 743,556 | |
| | Vical, Inc.* | | | 233,900 | | | | 472,478 | |
| | Zalicus, Inc.* | | | 313,021 | | | | 494,573 | |
| | | | | | | | | | |
| | | | | | | | | 26,662,162 | |
| |
Building Products - 0.31% | |
| | Builders FirstSource, Inc.* | | | 25,620 | | | | 50,471 | |
| | Insteel Industries, Inc. | | | 28,061 | | | | 350,482 | |
| | NCI Building Systems, Inc.* | | | 36,800 | | | | 514,832 | |
| | PGT, Inc.*+ | | | 143,300 | | | | 351,085 | |
| | | | | | | | | | |
| | | | | | | | | 1,266,870 | |
| |
Capital Markets - 3.25% | |
| | Arlington Asset Investment Corp., Class A | | | 38,700 | | | | 928,413 | |
| | Calamos Asset Management, Inc., Class A | | | 32,400 | | | | 453,600 | |
| | Diamond Hill Investment Group, Inc. | | | 5,600 | | | | 405,104 | |
| | Gladstone Capital Corp.+ | | | 76,600 | | | | 882,432 | |
| | Gladstone Investment Corp. | | | 28,200 | | | | 215,730 | |
| | Harris & Harris Group, Inc.*+ | | | 127,900 | | | | 560,202 | |
| | HFF, Inc., Class A* | | | 56,300 | | | | 543,858 | |
| | JMP Group, Inc. | | | 81,100 | | | | 618,793 | |
| | LaBranche & Co., Inc.* | | | 100,600 | | | | 362,160 | |
| | Ladenburg Thalmann Financial Services, Inc.* | | | 337,200 | | | | 394,524 | |
| | Main Street Capital Corp.+ | | | 50,000 | | | | 909,500 | |
| | Medallion Financial Corp. | | | 161,400 | | | | 1,323,480 | |
| | NGP Capital Resources Co. | | | 48,600 | | | | 447,120 | |
| | PennantPark Investment Corp. | | | 129,100 | | | | 1,580,184 | |
| | TICC Capital Corp. | | | 82,300 | | | | 922,583 | |
| | TradeStation Group, Inc.* | | | 114,174 | | | | 770,675 | |
| | Triangle Capital Corp. | | | 57,212 | | | | 1,087,028 | |
| | Westwood Holdings Group, Inc. | | | 25,600 | | | | 1,022,976 | |
| | | | | | | | | | |
| | | | | | | | | 13,428,362 | |
| | | | | | | | | | |
Industry | | Company | | | Shares | | | | Value | |
| | | | | | | | |
Chemicals - 1.38% | |
| | American Vanguard Corp. | | | 53,500 | | | $ | 456,890 | |
| | Chase Corp. | | | 27,800 | | | | 453,140 | |
| | Flotek Industries, Inc.* | | | 90,500 | | | | 493,225 | |
| | KMG Chemicals, Inc. | | | 58,800 | | | | 974,316 | |
| | Landec Corp.* | | | 124,900 | | | | 746,902 | |
| | Omnova Solutions, Inc.* | | | 163,700 | | | | 1,368,532 | |
| | Senomyx, Inc.* | | | 49,300 | | | | 351,509 | |
| | Zagg, Inc.*+ | | | 114,300 | | | | 870,966 | |
| | | | | | | | | | |
| | | | | | | | | 5,715,480 | |
|
Commercial Banks - 8.89% | |
| | 1st United Bancorp, Inc.* | | | 160,100 | | | | 1,106,291 | |
| | Alliance Financial Corp. | | | 25,000 | | | | 808,750 | |
| | American National Bankshares, Inc. | | | 20,700 | | | | 487,485 | |
| | American River Bankshares* | | | 25,800 | | | | 154,542 | |
| | Ameris Bancorp* | | | 58,600 | | | | 617,644 | |
| | Bancorp Rhode Island, Inc. | | | 35,400 | | | | 1,029,786 | |
| | Bancorp, Inc.* | | | 84,600 | | | | 860,382 | |
| | BancTrust Financial Group, Inc.*+ | | | 69,000 | | | | 184,230 | |
| | Bank of Commerce Holdings | | | 81,100 | | | | 344,675 | |
| | Banner Corp. | | | 314,717 | | | | 730,143 | |
| | Bar Harbor Bankshares | | | 6,000 | | | | 175,080 | |
| | Bridge Bancorp, Inc. | | | 26,800 | | | | 660,620 | |
| | Bryn Mawr Bank Corp. | | | 41,724 | | | | 728,084 | |
| | Camden National Corp. | | | 11,800 | | | | 427,514 | |
| | Capital City Bank Group, Inc.+ | | | 60,500 | | | | 762,300 | |
| | Center Bancorp, Inc.+ | | | 72,217 | | | | 585,680 | |
| | Central Pacific Financial Corp.*+ | | | 324,700 | | | | 496,791 | |
| | Century Bancorp, Inc., Class A | | | 23,272 | | | | 623,457 | |
| | Citizens Holding Co.+ | | | 20,670 | | | | 434,897 | |
| | CNB Financial Corp. | | | 40,800 | | | | 604,248 | |
| | CoBiz Financial, Inc.+ | | | 155,800 | | | | 947,264 | |
| | Eagle Bancorp, Inc.* | | | 5,964 | | | | 86,061 | |
| | Enterprise Financial Services Corp. | | | 85,700 | | | | 896,422 | |
| | Farmers Capital Bank Corp.* | | | 67,149 | | | | 327,687 | |
| | Financial Institutions, Inc. | | | 50,533 | | | | 958,611 | |
| | First Bancorp | | | 14,000 | | | | 214,340 | |
| | First Bancorp, Inc. | | | 33,300 | | | | 525,807 | |
| | First California Financial Group, Inc.* | | | 67,400 | | | | 188,720 | |
| | First South Bancorp, Inc. | | | 27,437 | | | | 177,517 | |
| | German American Bancorp, Inc. | | | 39,500 | | | | 727,392 | |
| | Guaranty Bancorp* | | | 123,200 | | | | 173,712 | |
| | |
| | |
| 42 | | Semi-Annual Report | December 31, 2010 (Unaudited) |
| | |
Bridgeway Ultra-Small Company Market Fund SCHEDULE OF INVESTMENTS (continued) | |
|
| | |
Showing percentage of net assets as of December 31, 2010 (Unaudited) | | |
| | | | | | | | | | |
Industry | | Company | | | Shares | | | | Value | |
Common Stocks (continued) | |
Commercial Banks (continued) | |
| | Hampden Bancorp, Inc. | | | 33,000 | | | $ | 373,890 | |
| | Heritage Commerce Corp.*+ | | | 74,000 | | | | 332,260 | |
| | Heritage Financial Corp.* | | | 55,700 | | | | 775,344 | |
| | Home Bancorp, Inc.* | | | 41,600 | | | | 574,912 | |
| | Lakeland Bancorp, Inc. | | | 93,200 | | | | 1,022,404 | |
| | LNB Bancorp, Inc. | | | 20,000 | | | | 97,600 | |
| | Merchants Bancshares, Inc. | | | 27,800 | | | | 766,168 | |
| | MidSouth Bancorp, Inc. | | | 46,900 | | | | 720,384 | |
| | MidWestOne Financial Group, Inc. | | | 50,300 | | | | 760,033 | |
| | National Bankshares, Inc. | | | 14,300 | | | | 450,307 | |
| | Northrim BanCorp, Inc. | | | 33,300 | | | | 643,356 | |
| | Ohio Valley Banc Corp. | | | 20,500 | | | | 399,750 | |
| | Pacific Continental Corp. | | | 81,900 | | | | 823,914 | |
| | Peapack-Gladstone Financial Corp. | | | 47,300 | | | | 617,265 | |
| | Penns Woods Bancorp, Inc. | | | 16,400 | | | | 652,720 | |
| | Peoples Bancorp, Inc. | | | 50,000 | | | | 782,500 | |
| | QCR Holdings, Inc. | | | 29,200 | | | | 210,240 | |
| | Sandy Spring Bancorp, Inc. | | | 27,600 | | | | 508,668 | |
| | Seacoast Banking Corp. of Florida* | | | 79,100 | | | | 115,486 | |
| | Shore Bancshares, Inc. | | | 72,900 | | | | 768,366 | |
| | Sierra Bancorp | | | 78,600 | | | | 843,378 | |
| | Southside Bancshares, Inc. | | | 59,067 | | | | 1,244,542 | |
| | State Bancorp, Inc. | | | 74,700 | | | | 690,975 | |
| | Sterling Bancorp | | | 59,509 | | | | 623,059 | |
| | Sun Bancorp, Inc.* | | | 30,895 | | | | 143,353 | |
| | Taylor Capital Group, Inc.* | | | 48,300 | | | | 635,145 | |
| | Tower Bancorp, Inc. | | | 16,700 | | | | 368,068 | |
| | United Community Banks, Inc.* | | | 446,300 | | | | 870,285 | |
| | Virginia Commerce Bancorp, Inc.* | | | 153,159 | | | | 946,523 | |
| | Washington Banking Co. | | | 51,700 | | | | 708,807 | |
| | West Bancorporation, Inc. | | | 27,100 | | | | 211,109 | |
| | West Coast Bancorp* | | | 87,917 | | | | 247,926 | |
| | Wilshire Bancorp, Inc. | | | 92,200 | | | | 702,564 | |
| | Yadkin Valley Financial Corp.* | | | 64,200 | | | | 116,202 | |
| | | | | | | | | | |
| | | | | | | | | 36,793,635 | |
| |
Commercial Services & Supplies - 1.84% | |
| | Amrep Corp.* | | | 14,500 | | | | 174,435 | |
| | APAC Customer Services, Inc.* | | | 265,500 | | | | 1,611,585 | |
| | Casella Waste Systems, Inc., Class A* | | | 81,800 | | | | 579,962 | |
| | CECO Environmental Corp.* | | | 61,600 | | | | 367,136 | |
| | | | | | | | | | |
Industry | | Company | | | Shares | | | | Value | |
| | | | | | | | | | |
Commercial Services & Supplies (continued) | |
| | Courier Corp. | | | 25,900 | | | $ | 401,968 | |
| | Fuel Tech, Inc.* | | | 62,700 | | | | 608,817 | |
| | Heritage-Crystal Clean, Inc.* | | | 18,100 | | | | 180,638 | |
| | Intersections, Inc. | | | 158,584 | | | | 1,658,788 | |
| | M&F Worldwide Corp.* | | | 19,798 | | | | 457,334 | |
| | Metalico, Inc.* | | | 110,800 | | | | 651,504 | |
| | Multi-Color Corp. | | | 21,800 | | | | 424,228 | |
| | Standard Register Co. (The) | | | 65,400 | | | | 223,014 | |
| | Versar, Inc.* | | | 81,100 | | | | 281,417 | |
| | | | | | | | | | |
| | | | | | | | | 7,620,826 | |
|
Communications Equipment - 2.72% | |
| | BigBand Networks, Inc.* | | | 197,100 | | | | 551,880 | |
| | Cogo Group, Inc.* | | | 228,100 | | | | 2,018,685 | |
| | Communications Systems, Inc. | | | 29,100 | | | | 405,654 | |
| | Globecomm Systems, Inc.* | | | 256,800 | | | | 2,568,000 | |
| | KVH Industries, Inc.* | | | 106,700 | | | | 1,275,065 | |
| | Network Engines, Inc.* | | | 64,860 | | | | 98,587 | |
| | Oplink Communications, Inc.* | | | 92,100 | | | | 1,701,087 | |
| | Opnext, Inc.* | | | 281,000 | | | | 494,560 | |
| | SeaChange International, Inc.* | | | 112,000 | | | | 957,600 | |
| | ShoreTel, Inc.* | | | 59,000 | | | | 460,790 | |
| | Westell Technologies, Inc., Class A* | | | 102,800 | | | | 336,156 | |
| | ZST Digital Networks, Inc.* | | | 55,600 | | | | 379,748 | |
| | | | | | | | | | |
| | | | | | | | | 11,247,812 | |
|
Computers & Peripherals - 0.98% | |
| | Concurrent Computer Corp.* | | | 55,300 | | | | 278,712 | |
| | Cray, Inc.* | | | 101,200 | | | | 723,580 | |
| | Dot Hill Systems Corp.* | | | 526,600 | | | | 916,284 | |
| | Hauppauge Digital, Inc.* | | | 85,200 | | | | 190,848 | |
| | Hutchinson Technology, Inc.* | | | 70,600 | | | | 261,926 | |
| | Immersion Corp.* | | | 104,100 | | | | 698,511 | |
| | TransAct Technologies, Inc.* | | | 105,800 | | | | 991,346 | |
| | | | | | | | | | |
| | | | | | | | | 4,061,207 | |
|
Construction & Engineering - 0.31% | |
| | Argan, Inc.* | | | 8,404 | | | | 77,905 | |
| | Furmanite Corp.* | | | 75,400 | | | | 521,014 | |
| | Northwest Pipe Co.* | | | 13,480 | | | | 323,924 | |
| | Sterling Construction Co., Inc.* | | | 28,400 | | | | 370,336 | |
| | | | | | | | | | |
| | | | | | | | | 1,293,179 | |
| | |
Bridgeway Ultra-Small Company Market Fund SCHEDULE OF INVESTMENTS (continued) | |
|
| | |
Showing percentage of net assets as of December 31, 2010 (Unaudited) | | |
| | | | | | | | | | |
Industry | | Company | | | Shares | | | | Value | |
Common Stocks (continued) | |
Construction Materials - 0.13% | |
| | Headwaters, Inc.* | | | 114,042 | | | $ | 522,312 | |
| |
Consumer Finance - 0.25% | |
| | CompuCredit Holdings Corp.* | | | 91,400 | | | | 637,972 | |
| | First Marblehead Corp.
(The)*+ | | | 185,600 | | | | 402,752 | |
| | | | | | | | | | |
| | | | | | | | | 1,040,724 | |
| |
Containers & Packaging - 0.40% | |
| | AEP Industries, Inc.* | | | 63,000 | | | | 1,634,850 | |
| |
Distributors - 0.10% | |
| | Audiovox Corp., Class A* | | | 47,707 | | | | 411,711 | |
| |
Diversified Consumer Services - 0.74% | |
| | Carriage Services, Inc.* | | | 81,100 | | | | 393,335 | |
| | China Education Alliance, Inc.*+ | | | 116,300 | | | | 294,239 | |
| | Collectors Universe | | | 69,460 | | | | 966,189 | |
| | CPI Corp. | | | 21,100 | | | | 475,805 | |
| | Learning Tree International, Inc. | | | 46,800 | | | | 447,408 | |
| | Mac-Gray Corp. | | | 33,300 | | | | 497,835 | |
| | | | | | | | | | |
| | | | | | | | | 3,074,811 | |
| |
Diversified Financial Services - 0.71% | |
| | Asset Acceptance Capital Corp.*+ | | | 36,100 | | | | 214,073 | |
| | Asta Funding, Inc. | | | 142,300 | | | | 1,152,630 | |
| | Encore Capital Group, Inc.* | | | 22,114 | | | | 518,573 | |
| | Marlin Business Services Corp.* | | | 28,300 | | | | 357,995 | |
| | Resource America, Inc., Class A | | | 100,700 | | | | 689,795 | |
| | | | | | | | | | |
| | | | | | | | | 2,933,066 | |
| |
Diversified Telecommunication Services - 1.05% | |
| | HickoryTech Corp. | | | 43,495 | | | | 417,552 | |
| | IDT Corp., Class B+ | | | 116,567 | | | | 2,989,944 | |
| | Otelco, Inc. | | | 28,600 | | | | 519,948 | |
| | Warwick Valley Telephone Co. | | | 30,200 | | | | 418,270 | |
| | | | | | | | | | |
| | | | | | | | | 4,345,714 | |
| |
Electric Utilities - 0.43% | |
| | Central Vermont Public Service Corp. | | | 81,600 | | | | 1,783,776 | |
| |
Electrical Equipment - 1.14% | |
| | Active Power, Inc.* | | | 143,900 | | | | 353,994 | |
| | China BAK Battery, Inc.*+ | | | 179,200 | | | | 345,856 | |
| | | | | | | | | | |
Industry | | Company | | | Shares | | | | Value | |
| | | | | | | | | | |
Electrical Equipment (continued) | |
| | Coleman Cable, Inc.* | | | 77,000 | | | $ | 483,560 | |
| | Hoku Corp.*+ | | | 122,600 | | | | 323,664 | |
| | LaBarge, Inc.* | | | 28,000 | | | | 439,880 | |
| | LGL Group, Inc.* | | | 7,900 | | | | 142,832 | |
| | LSI Industries, Inc. | | | 70,500 | | | | 596,430 | |
| | Magnetek, Inc.* | | | 188,311 | | | | 254,220 | |
| | New Energy Systems Group* | | | 51,900 | | | | 401,187 | |
| | Ocean Power Technologies, Inc.*+ | | | 84,483 | | | | 481,553 | |
| | PowerSecure International, Inc.*+ | | | 60,900 | | | | 473,802 | |
| | UQM Technologies, Inc.* | | | 183,522 | | | | 420,265 | |
| | | | | | | | | | |
| | | | | | | | | 4,717,243 | |
|
Electronic Equipment, Instruments & Components - 2.84% | |
| | Comverge, Inc.*+ | | | 85,700 | | | | 592,187 | |
| | DDi Corp. | | | 83,600 | | | | 983,136 | |
| | eMagin Corp.*+ | | | 56,300 | | | | 337,800 | |
| | Gerber Scientific, Inc.* | | | 64,900 | | | | 510,763 | |
| | IEC Electronics Corp.* | | | 64,500 | | | | 490,200 | |
| | Iteris, Inc.* | | | 126,700 | | | | 229,327 | |
| | LeCroy Corp.* | | | 56,000 | | | | 551,040 | |
| | Measurement Specialties, Inc.* | | | 59,552 | | | | 1,747,851 | |
| | Mercury Computer Systems, Inc.* | | | 60,600 | | | | 1,113,828 | |
| | Netlist, Inc.*+ | | | 130,000 | | | | 331,500 | |
| | PAR Technology Corp.* | | | 49,000 | | | | 279,790 | |
| | PC Connection, Inc.* | | | 30,000 | | | | 265,800 | |
| | PC Mall, Inc.* | | | 78,700 | | | | 595,759 | |
| | Pulse Electronics, Inc. | | | 109,800 | | | | 584,136 | |
| | RadiSys Corp.* | | | 187,900 | | | | 1,672,310 | |
| | Richardson Electronics, Ltd. | | | 52,011 | | | | 608,009 | |
| | Spectrum Control, Inc.* | | | 23,900 | | | | 358,261 | |
| | Zygo Corp.* | | | 39,200 | | | | 479,416 | |
| | | | | | | | | | |
| | | | | | | | | 11,731,113 | |
|
Energy Equipment & Services - 2.48% | |
| | Allis-Chalmers Energy, Inc.* | | | 78,300 | | | | 555,147 | |
| | Bolt Technology Corp.* | | | 155,763 | | | | 2,051,399 | |
| | Bronco Drilling Co., Inc.* | | | 83,900 | | | | 671,200 | |
| | Dawson Geophysical Co.* | | | 23,999 | | | | 765,568 | |
| | ENGlobal Corp.* | | | 34,761 | | | | 129,311 | |
| | Geokinetics, Inc.* | | | 82,300 | | | | 764,567 | |
| | Mitcham Industries, Inc.* | | | 161,700 | | | | 1,867,635 | |
| | Natural Gas Services Group, Inc.* | | | 35,000 | | | | 661,850 | |
| | OYO Geospace Corp.* | | | 15,700 | | | | 1,556,027 | |
| | PHI, Inc., Non Voting* | | | 27,400 | | | | 516,216 | |
| | |
| | |
| 44 | | Semi-Annual Report | December 31, 2010 (Unaudited) |
| | |
Bridgeway Ultra-Small Company Market Fund SCHEDULE OF INVESTMENTS (continued) | |
|
| | |
Showing percentage of net assets as of December 31, 2010 (Unaudited) | | |
| | | | | | | | | | |
Industry | | Company | | | Shares | | | | Value | |
Common Stocks (continued) | |
Energy Equipment & Services (continued) | |
| | TGC Industries, Inc.* | | | 117,000 | | | $ | 444,600 | |
| | Union Drilling, Inc.* | | | 37,100 | | | | 270,088 | |
| | | | | | | | | | |
| | | | | | | | | 10,253,608 | |
| |
Food & Staples Retailing - 0.30% | |
| | Susser Holdings Corp.* | | | 29,800 | | | | 412,730 | |
| | Village Super Market, Inc., Class A | | | 24,600 | | | | 811,800 | |
| | | | | | | | | | |
| | | | | | | | | 1,224,530 | |
| |
Food Products - 1.33% | |
| | AgFeed Industries, Inc.*+ | | | 205,801 | | | | 605,055 | |
| | Alico, Inc. | | | 21,000 | | | | 500,640 | |
| | Bridgford Foods Corp.+ | | | 20,500 | | | | 292,125 | |
| | Griffin Land & Nurseries, Inc. | | | 19,300 | | | | 624,934 | |
| | Imperial Sugar Co. | | | 30,400 | | | | 406,448 | |
| | John B. Sanfilippo & Son, Inc.* | | | 28,300 | | | | 352,052 | |
| | Lifeway Foods, Inc.*+ | | | 156,302 | | | | 1,492,684 | |
| | Overhill Farms, Inc.* | | | 102,100 | | | | 590,138 | |
| | Reddy Ice Holdings, Inc.*+ | | | 110,000 | | | | 302,500 | |
| | SkyPeople Fruit Juice, Inc.*+ | | | 69,300 | | | | 320,859 | |
| | | | | | | | | | |
| | | | | | | | | 5,487,435 | |
| |
Gas Utilities - 0.20% | |
| | Chesapeake Utilities Corp. | | | 15,906 | | | | 660,417 | |
| | Gas Natural, Inc. | | | 15,900 | | | | 166,791 | |
| | | | | | | | | | |
| | | | | | | | | 827,208 | |
| |
Health Care Equipment & Supplies - 4.04% | |
| | Alphatec Holdings, Inc.* | | | 164,740 | | | | 444,798 | |
| | Anika Therapeutics, Inc.* | | | 98,639 | | | | 653,976 | |
| | Antares Pharma, Inc.* | | | 197,000 | | | | 334,900 | |
| | AtriCure, Inc.* | | | 133,200 | | | | 1,363,968 | |
| | Atrion Corp. | | | 7,848 | | | | 1,408,402 | |
| | Cardica, Inc.* | | | 75,300 | | | | 328,308 | |
| | Cardiovascular Systems, Inc.* | | | 13,369 | | | | 156,016 | |
| | Cerus Corp.* | | | 244,600 | | | | 601,716 | |
| | CryoLife, Inc.* | | | 356,000 | | | | 1,929,520 | |
| | Kensey Nash Corp.*+ | | | 16,800 | | | | 467,544 | |
| | Medical Action Industries, Inc.* | | | 27,700 | | | | 265,366 | |
| | Orthovita, Inc.* | | | 255,300 | | | | 513,153 | |
| | Palomar Medical Technologies, Inc.* | | | 105,900 | | | | 1,504,839 | |
| | Rockwell Medical Technologies, Inc.*+ | | | 72,100 | | | | 569,590 | |
| | RTI Biologics, Inc.* | | | 125,000 | | | | 333,750 | |
| | | | | | | | | | |
Industry | | Company | | | Shares | | | | Value | |
| | | | | | | | |
Health Care Equipment & Supplies (continued) | |
| | Solta Medical, Inc.* | | | 158,400 | | | $ | 483,120 | |
| | Span-America Medical Systems, Inc. | | | 22,257 | | | | 327,846 | |
| | Spectranetics Corp.* | | | 54,948 | | | | 283,532 | |
| | STAAR Surgical Co.* | | | 91,200 | | | | 556,320 | |
| | Stereotaxis, Inc.* | | | 100,600 | | | | 385,298 | |
| | Synovis Life Technologies, Inc.* | | | 40,100 | | | | 646,011 | |
| | Theragenics Corp.* | | | 151,900 | | | | 229,369 | |
| | TomoTherapy, Inc.* | | | 115,400 | | | | 416,594 | |
| | TranS1, Inc.* | | | 129,500 | | | | 268,065 | |
| | Utah Medical Products, Inc. | | | 49,900 | | | | 1,330,833 | |
| | Vascular Solutions, Inc.* | | | 49,300 | | | | 577,796 | |
| | Young Innovations, Inc. | | | 10,726 | | | | 343,339 | |
| | | | | | | | | | |
| | | | | | | | | 16,723,969 | |
|
Health Care Providers & Services - 3.83% | |
| | Allied Healthcare International, Inc.* | | | 222,800 | | | | 559,228 | |
| | Almost Family, Inc.* | | | 11,600 | | | | 445,672 | |
| | America Service Group, Inc. | | | 47,100 | | | | 713,094 | |
| | Capital Senior Living Corp.* | | | 129,000 | | | | 864,300 | |
| | Chindex International, Inc.*+ | | | 121,200 | | | | 1,998,588 | |
| | Continucare Corp.* | | | 120,100 | | | | 562,068 | |
| | Corvel Corp.* | | | 37,733 | | | | 1,824,390 | |
| | Emergent Group, Inc. | | | 57,500 | | | | 368,575 | |
| | Five Star Quality Care, Inc.* | | | 121,600 | | | | 859,712 | |
| | LCA -Vision, Inc.* | | | 123,000 | | | | 707,250 | |
| | Medcath Corp.* | | | 43,400 | | | | 605,430 | |
| | Metropolitan Health Networks, Inc.* | | | 268,400 | | | | 1,199,748 | |
| | National Research Corp. | | | 25,500 | | | | 873,375 | |
| | PDI, Inc.* | | | 56,700 | | | | 597,618 | |
| | Providence Service Corp. (The)* | | | 115,200 | | | | 1,851,264 | |
| | RadNet, Inc.* | | | 176,300 | | | | 497,166 | |
| | Sunrise Senior Living, Inc.*+ | | | 85,695 | | | | 467,038 | |
| | U.S. Physical Therapy, Inc.* | | | 42,000 | | | | 832,440 | |
| | | | | | | | | | |
| | | | | | | | | 15,826,956 | |
|
Health Care Technology - 0.24% | |
| | HealthStream, Inc.* | | | 49,291 | | | | 396,300 | |
| | Transcend Services, Inc.* | | | 30,000 | | | | 587,700 | |
| | | | | | | | | | |
| | | | | | | | | 984,000 | |
|
Hotels, Restaurants & Leisure - 3.50% | |
| | AFC Enterprises, Inc.* | | | 127,732 | | | | 1,775,475 | |
| | Ambassadors Group, Inc. | | | 48,700 | | | | 560,050 | |
| | Benihana, Inc., Class A* | | | 26,200 | | | | 213,006 | |
| | |
Bridgeway Ultra-Small Company Market Fund SCHEDULE OF INVESTMENTS (continued) | |
|
| | |
Showing percentage of net assets as of December 31, 2010 (Unaudited) | | |
| | | | | | | | | | |
Industry | | Company | | | Shares | | | | Value | |
Common Stocks (continued) | |
Hotels, Restaurants & Leisure (continued) | |
| | Bluegreen Corp.* | | | 97,903 | | | $ | 315,248 | |
| | Canterbury Park Holding Corp.* | | | 39,500 | | | | 458,990 | |
| | Caribou Coffee Co., Inc.* | | | 79,600 | | | | 802,368 | |
| | Carrols Restaurant Group, Inc.* | | | 78,100 | | | | 579,502 | |
| | Dover Downs Gaming & Entertainment, Inc. | | | 9,637 | | | | 32,766 | |
| | Einstein Noah Restaurant Group, Inc.* | | | 49,100 | | | | 689,855 | |
| | Empire Resorts, Inc.*+ | | | 142,700 | | | | 146,981 | |
| | Famous Dave’s of America, Inc.* | | | 172,400 | | | | 1,922,260 | |
| | Full House Resorts, Inc.* | | | 60,700 | | | | 206,380 | |
| | Gaming Partners International Corp. | | | 56,300 | | | | 347,934 | |
| | Great Wolf Resorts, Inc.* | | | 164,300 | | | | 430,466 | |
| | Jamba, Inc.*+ | | | 204,454 | | | | 464,111 | |
| | Luby’s, Inc.* | | | 73,600 | | | | 461,472 | |
| | McCormick & Schmick’s Seafood Restaurants, Inc.* | | | 111,200 | | | | 1,010,808 | |
| | Monarch Casino & Resort, Inc.* | | | 48,685 | | | | 608,562 | |
| | Morgans Hotel Group Co.* | | | 84,300 | | | | 764,601 | |
| | Morton’s Restaurant Group, Inc.*+ | | | 64,200 | | | | 416,016 | |
| | Multimedia Games, Inc.* | | | 119,300 | | | | 665,694 | |
| | Nathan’s Famous, Inc.* | | | 12,000 | | | | 202,200 | |
| | O’Charleys, Inc.* | | | 54,900 | | | | 395,280 | |
| | Premier Exhibitions, Inc.* | | | 142,500 | | | | 280,725 | |
| | Ruth’s Hospitality Group, Inc.* | | | 86,700 | | | | 401,421 | |
| | Town Sports International Holdings, Inc.* | | | 76,387 | | | | 310,131 | |
| | | | | | | | | | |
| | | | | | | | | 14,462,302 | |
| |
Household Durables - 1.37% | |
| | Bassett Furniture Industries, Inc.* | | | 74,200 | | | | 311,640 | |
| | Brookfield Homes Corp.* | | | 46,400 | | | | 436,160 | |
| | Cavco Industries, Inc.* | | | 10,600 | | | | 494,914 | |
| | Emerson Radio Corp. | | | 219,300 | | | | 434,214 | |
| | Kid Brands, Inc.* | | | 83,400 | | | | 713,070 | |
| | Libbey, Inc.* | | | 36,825 | | | | 569,683 | |
| | Lifetime Brands, Inc.* | | | 63,300 | | | | 888,732 | |
| | M/I Homes, Inc.* | | | 55,500 | | | | 853,590 | |
| | NIVS IntelliMedia Technology Group, Inc.*+ | | | 232,100 | | | | 524,546 | |
| | Skyline Corp. | | | 17,300 | | | | 451,184 | |
| | | | | | | | | | |
| | | | | | | | | 5,677,733 | |
| | | | | | | | | | |
Industry | | Company | | | Shares | | | | Value | |
| | | | | | | | |
Household Products - 0.10% | |
| | Oil-Dri Corp. of America | | | 19,800 | | | $ | 425,502 | |
|
Independent Power Producers & Energy Traders - 0.08% | |
| | Synthesis Energy Systems, Inc.* | | | 272,471 | | | | 318,791 | |
|
Insurance - 1.28% | |
| | First Acceptance Corp.* | | | 111,700 | | | | 198,826 | |
| | Hallmark Financial Services, Inc.* | | | 40,400 | | | | 367,640 | |
| | Independence Holding Co. | | | 59,700 | | | | 479,988 | |
| | Meadowbrook Insurance Group, Inc. | | | 185,200 | | | | 1,898,300 | |
| | SeaBright Holdings, Inc. | | | 44,200 | | | | 407,524 | |
| | Stewart Information Services Corp. | | | 93,300 | | | | 1,075,749 | |
| | Universal Insurance Holdings, Inc. | | | 174,200 | | | | 848,354 | |
| | | | | | | | | | |
| | | | | | | | | 5,276,381 | |
|
Internet & Catalog Retail - 0.98% | |
| | 1-800-Flowers.com, Inc.,
Class A* | | | 170,000 | | | | 457,300 | |
| | dELiA*s, Inc.* | | | 75,767 | | | | 131,835 | |
| | drugstore.com, Inc.*+ | | | 226,100 | | | | 499,681 | |
| | Gaiam, Inc., Class A | | | 89,300 | | | | 687,610 | |
| | Geeknet, Inc.* | | | 7,408 | | | | 185,126 | |
| | US Auto Parts Network, Inc.* | | | 100,900 | | | | 847,560 | |
| | ValueVision Media, Inc.,
Class A* | | | 206,986 | | | | 1,264,684 | |
| | | | | | | | | | |
| | | | | | | | | 4,073,796 | |
|
Internet Software & Services - 2.51% | |
| | Globalscape, Inc.* | | | 139,700 | | | | 276,606 | |
| | Internap Network Services Corp.* | | | 82,900 | | | | 504,032 | |
| | Keynote Systems, Inc. | | | 94,300 | | | | 1,378,666 | |
| | KIT Digital, Inc.* | | | 36,000 | | | | 577,440 | |
| | Local.com Corp.*+ | | | 97,400 | | | | 632,126 | |
| | Marchex, Inc., Class B | | | 70,400 | | | | 671,616 | |
| | Saba Software, Inc.* | | | 81,517 | | | | 498,884 | |
| | Stamps.com, Inc. | | | 39,700 | | | | 526,025 | |
| | Support.com, Inc.* | | | 360,650 | | | | 2,337,012 | |
| | TheStreet.com, Inc. | | | 120,000 | | | | 320,400 | |
| | Web.com Group, Inc.* | | | 188,852 | | | | 1,595,800 | |
| | Zix Corp.* | | | 251,982 | | | | 1,075,963 | |
| | | | | | | | | | |
| | | | | | | | | 10,394,570 | |
|
IT Services - 2.13% | |
| | Acorn Energy, Inc.* | | | 71,400 | | | | 276,318 | |
| | |
| | |
| 46 | | Semi-Annual Report | December 31, 2010 (Unaudited) |
| | |
Bridgeway Ultra-Small Company Market Fund SCHEDULE OF INVESTMENTS (continued) | |
|
| | |
Showing percentage of net assets as of December 31, 2010 (Unaudited) | | |
| | | | | | | | | | |
Industry | | Company | | | Shares | | | | Value | |
Common Stocks (continued) | | | | | |
IT Services (continued) | | | | | | | | |
| | Cass Information Systems, Inc. | | | 50,570 | | | $ | 1,918,626 | |
| | Ciber, Inc.* | | | 121,800 | | | | 570,024 | |
| | Computer Task Group, Inc.* | | | 92,400 | | | | 1,005,312 | |
| | Dynamics Research Corp.* | | | 24,558 | | | | 329,077 | |
| | Hackett Group, Inc. (The)* | | | 126,389 | | | | 443,625 | |
| | Lionbridge Technologies, Inc.* | | | 316,595 | | | | 1,168,236 | |
| | MoneyGram International, Inc.* | | | 289,400 | | | | 784,274 | |
| | Ness Technologies, Inc.* | | | 157,500 | | | | 935,550 | |
| | Online Resources Corp.* | | | 92,812 | | | | 431,576 | |
| | Tier Technologies, Inc.* | | | 39,166 | | | | 234,604 | |
| | Virtusa Corp.* | | | 43,900 | | | | 718,204 | |
| | | | | | | | | | |
| | | | | | | | | 8,815,426 | |
| |
Leisure Equipment & Products - 0.89% | | | | | |
| | Arctic Cat, Inc.* | | | 55,500 | | | | 812,520 | |
| | Johnson Outdoors, Inc., Class A* | | | 34,800 | | | | 435,696 | |
| | Leapfrog Enterprises, Inc.* | | | 151,800 | | | | 842,490 | |
| | Marine Products Corp.*+ | | | 66,400 | | | | 442,224 | |
| | Smith & Wesson Holding Corp.* | | | 112,300 | | | | 420,002 | |
| | Sturm Ruger & Co., Inc. | | | 31,400 | | | | 480,106 | |
| | Summer Infant, Inc.* | | | 32,039 | | | | 242,856 | |
| | | | | | | | | | |
| | | | | | | | | 3,675,894 | |
| |
Life Sciences Tools & Services - 0.87% | | | | | |
| | Accelrys, Inc.* | | | 34,354 | | | | 285,138 | |
| | BioClinica, Inc.* | | | 77,100 | | | | 341,553 | |
| | Caliper Life Sciences, Inc.*+ | | | 98,100 | | | | 621,954 | |
| | Cambrex Corp.* | | | 104,100 | | | | 538,197 | |
| | Enzo Biochem, Inc.* | | | 86,600 | | | | 457,248 | |
| | Harvard Bioscience, Inc.* | | | 162,817 | | | | 665,922 | |
| | Kendle International, Inc.* | | | 29,500 | | | | 321,255 | |
| | Medtox Scientific, Inc. | | | 29,000 | | | | 379,900 | |
| | | | | | | | | | |
| | | | | | | | | 3,611,167 | |
Machinery - 3.73% | | | | | |
| | Alamo Group, Inc. | | | 21,800 | | | | 606,476 | |
| | Ampco-Pittsburgh Corp. | | | 68,387 | | | | 1,918,255 | |
| | China Wind Systems, Inc.*+ | | | 78,600 | | | | 281,388 | |
| | Commercial Vehicle Group, Inc.* | | | 66,900 | | | | 1,087,125 | |
| | Dynamic Materials Corp. | | | 34,000 | | | | 767,380 | |
| | Flow International Corp.* | | | 210,551 | | | | 861,154 | |
| | Graham Corp. | | | 59,500 | | | | 1,190,000 | |
| | Greenbrier Cos., Inc.* | | | 43,600 | | | | 915,164 | |
| | Hurco Cos., Inc.* | | | 60,234 | | | | 1,424,534 | |
| | Kadant, Inc.* | | | 37,800 | | | | 890,946 | |
| | | | | | | | | | |
Industry | | Company | | | Shares | | | | Value | |
| | | | | | | | | | |
Machinery (continued) | |
| | Key Technology, Inc.* | | | 17,600 | | | $ | 299,376 | |
| | L.S. Starrett Co., Class A | | | 29,200 | | | | 341,056 | |
| | Lydall, Inc.* | | | 74,200 | | | | 597,310 | |
| | Met-Pro Corp. | | | 40,200 | | | | 474,762 | |
| | Miller Industries, Inc. | | | 32,600 | | | | 463,898 | |
| | NN, Inc.* | | | 39,100 | | | | 483,276 | |
| | PMFG, Inc.*+ | | | 72,000 | | | | 1,180,800 | |
| | SmartHeat, Inc.*+ | | | 59,200 | | | | 312,576 | |
| | Twin Disc, Inc. | | | 29,600 | | | | 883,856 | |
| | Xerium Technologies, Inc.* | | | 29,200 | | | | 465,740 | |
| | | | | | | | | | |
| | | | | | | | | 15,445,072 | |
|
Marine - 0.17% | |
| | Horizon Lines, Inc., Class A+ | | | 86,560 | | | | 378,267 | |
| | International Shipholding Corp. | | | 12,400 | | | | 314,960 | |
| | | | | | | | | | |
| | | | | | | | | 693,227 | |
|
Media - 2.68% | |
| | A.H. Belo Corp., Class A* | | | 51,100 | | | | 444,570 | |
| | Ballantyne Strong, Inc.* | | | 68,100 | | | | 529,137 | |
| | Carmike Cinemas, Inc.* | | | 51,800 | | | | 399,896 | |
| | Cumulus Media, Inc., Class A* | | | 98,700 | | | | 425,397 | |
| | Entravision Communications Corp., Class A* | | | 209,800 | | | | 539,186 | |
| | Fisher Communications, Inc.* | | | 25,200 | | | | 549,360 | |
| | Global Traffic Network, Inc.* | | | 73,874 | | | | 683,335 | |
| | Gray Television, Inc.* | | | 128,600 | | | | 240,482 | |
| | Knology, Inc.* | | | 70,053 | | | | 1,094,928 | |
| | Lee Enterprises, Inc.* | | | 93,200 | | | | 229,272 | |
| | McClatchy Co., Class A (The)*+ | | | 173,000 | | | | 807,910 | |
| | Media General, Inc., Class A*+ | | | 134,170 | | | | 775,503 | |
| | Navarre Corp.* | | | 275,500 | | | | 584,060 | |
| | Outdoor Channel Holdings, Inc.* | | | 21,001 | | | | 150,577 | |
| | PRIMEDIA, Inc. | | | 254,837 | | | | 1,070,315 | |
| | Rentrak Corp.* | | | 83,800 | | | | 2,527,408 | |
| | Saga Communications, Inc., Class A* | | | 1,804 | | | | 47,481 | |
| | | | | | | | | | |
| | | | | | | | | 11,098,817 | |
|
Metals & Mining - 1.36% | |
| | Capital Gold Corp.* | | | 48,900 | | | | 247,923 | |
| | China Direct Industries, Inc.*+ | | | 163,410 | | | | 246,749 | |
| | Friedman Industries | | | 67,000 | | | | 586,250 | |
| | |
Bridgeway Ultra-Small Company Market Fund SCHEDULE OF INVESTMENTS (continued) | |
|
| | |
Showing percentage of net assets as of December 31, 2010 (Unaudited) | | |
| | | | | | | | | | |
Industry | | Company | | | Shares | | | | Value | |
Common Stocks (continued) | |
Metals & Mining (continued) | |
| | General Steel Holdings, Inc.* | | | 133,000 | | | $ | 381,710 | |
| | Great Northern Iron Ore Properties+ | | | 7,700 | | | | 1,081,773 | |
| | Mines Management, Inc.*+ | | | 6,200 | | | | 26,164 | |
| | Paramount Gold & Silver Corp.*+ | | | 266,800 | | | | 1,064,532 | |
| | Puda Coal, Inc.*+ | | | 37,400 | | | | 532,950 | |
| | Synalloy Corp. | | | 19,400 | | | | 235,128 | |
| | Universal Stainless & Alloy* | | | 38,500 | | | | 1,204,280 | |
| | | | | | | | | | |
| | | | | | | | | 5,607,459 | |
| |
Multiline Retail - 0.30% | |
| | Bon-Ton Stores, Inc. (The)*+ | | | 45,950 | | | | 581,727 | |
| | Tuesday Morning Corp.* | | | 126,500 | | | | 667,920 | |
| | | | | | | | | | |
| | | | | | | | | 1,249,647 | |
| |
Oil, Gas & Consumable Fuels - 4.29% | |
| | Adams Resources & Energy, Inc. | | | 22,300 | | | | 538,545 | |
| | Approach Resources, Inc.* | | | 46,900 | | | | 1,083,390 | |
| | BioFuel Energy Corp.* | | | 129,900 | | | | 226,026 | |
| | Callon Petroleum Co.* | | | 359,300 | | | | 2,127,056 | |
| | Cheniere Energy, Inc.*+ | | | 119,900 | | | | 661,848 | |
| | China North East Petroleum Holdings, Ltd.*+ | | | 63,900 | | | | 368,064 | |
| | CREDO Petroleum Corp.* | | | 25,300 | | | | 204,930 | |
| | Crimson Exploration, Inc.* | | | 123,700 | | | | 526,962 | |
| | Crosstex Energy, Inc. | | | 143,418 | | | | 1,270,683 | |
| | Double Eagle Petroleum Co.* | | | 127,200 | | | | 624,552 | |
| | Endeavour International Corp.*+ | | | 85,572 | | | | 1,180,894 | |
| | Evolution Petroleum Corp.* | | | 110,000 | | | | 717,200 | |
| | FX Energy, Inc.* | | | 105,800 | | | | 650,670 | |
| | GMX Resources, Inc.*+ | | | 152,200 | | | | 840,144 | |
| | HKN, Inc.* | | | 59,000 | | | | 206,500 | |
| | Miller Petroleum, Inc.*+ | | | 143,800 | | | | 747,760 | |
| | Panhandle Oil & Gas, Inc., Class A | | | 16,397 | | | | 449,606 | |
| | PostRock Energy Corp.* | | | 76,200 | | | | 277,368 | |
| | Pyramid Oil Co.*+ | | | 69,800 | | | | 357,376 | |
| | RAM Energy Resources, Inc.* | | | 182,000 | | | | 334,880 | |
| | REX American Resources Corp.* | | | 66,249 | | | | 1,017,585 | |
| | Toreador Resources Corp.*+ | | | 46,200 | | | | 717,024 | |
| | Uranium Energy Corp.*+ | | | 133,100 | | | | 803,924 | |
| | Verenium Corp.* | | | 105,600 | | | | 337,920 | |
| | Warren Resources, Inc.* | | | 165,600 | | | | 748,512 | |
| | | | | | | | | | |
Industry | | Company | | | Shares | | | | Value | |
| | | | | | | | | | |
Oil, Gas & Consumable Fuels (continued) | |
| | Westmoreland Coal Co.* | | | 59,675 | | | $ | 712,519 | |
| | | | | | | | | | |
| | | | | | | | | 17,731,938 | |
|
Paper & Forest Products - 0.56% | |
| | Mercer International, Inc.* | | | 119,400 | | | | 925,350 | |
| | Neenah Paper, Inc. | | | 30,000 | | | | 590,400 | |
| | Orient Paper, Inc.*+ | | | 70,300 | | | | 447,108 | |
| | Verso Paper Corp.* | | | 103,400 | | | | 353,628 | |
| | | | | | | | | | |
| | | | | | | | | 2,316,486 | |
|
Personal Products - 0.74% | |
| | American Oriental Bioengineering, Inc.*+ | | | 131,000 | | | | 314,400 | |
| | CCA Industries, Inc. | | | 14,100 | | | | 79,665 | |
| | China Sky One Medical, Inc.*+ | | | 103,500 | | | | 721,395 | |
| | Female Health Co. (The) | | | 87,300 | | | | 496,737 | |
| | Natural Alternatives International, Inc.* | | | 31,000 | | | | 173,600 | |
| | Nutraceutical International Corp.* | | | 23,300 | | | | 330,627 | |
| | Physicians Formula Holdings, Inc.* | | | 101,000 | | | | 379,760 | |
| | Schiff Nutrition International, Inc. | | | 62,758 | | | | 569,843 | |
| | | | | | | | | | |
| | | | | | | | | 3,066,027 | |
|
Pharmaceuticals - 2.66% | |
| | Adolor Corp.* | | | 252,547 | | | | 305,582 | |
| | Akorn, Inc.* | | | 132,502 | | | | 804,287 | |
| | AVANIR Pharmaceuticals, Inc., Class A* | | | 184,800 | | | | 753,984 | |
| | Biodel, Inc.*+ | | | 70,200 | | | | 128,466 | |
| | Caraco Pharmaceutical Laboratories, Ltd.*+ | | | 72,600 | | | | 329,604 | |
| | China Pharma Holdings, Inc.*+ | | | 62,193 | | | | 189,067 | |
| | Columbia Laboratories, Inc.* | | | 254,300 | | | | 577,261 | |
| | Cumberland Pharmaceuticals, Inc.*+ | | | 68,700 | | | | 411,513 | |
| | Depomed, Inc.* | | | 173,300 | | | | 1,102,188 | |
| | Durect Corp.* | | | 291,400 | | | | 1,005,330 | |
| | ISTA Pharmaceuticals, Inc.* | | | 200,800 | | | | 1,030,104 | |
| | Lannett Co., Inc.* | | | 79,500 | | | | 444,405 | |
| | Matrixx Initiatives, Inc.* | | | 38,700 | | | | 327,402 | |
| | Neostem, Inc.*+ | | | 123,500 | | | | 174,135 | |
| | Pain Therapeutics, Inc.* | | | 19,853 | | | | 134,008 | |
| | Pozen, Inc.* | | | 76,200 | | | | 506,730 | |
| | Santarus, Inc.* | | | 177,072 | | | | 579,025 | |
| | Sucampo Pharmaceuticals, Inc., Class A*+ | | | 104,000 | | | | 399,360 | |
| | |
| | |
| 48 | | Semi-Annual Report | December 31, 2010 (Unaudited) |
| | |
Bridgeway Ultra-Small Company Market Fund SCHEDULE OF INVESTMENTS (continued) | |
|
| | |
| Showing percentage of net assets as of December 31, 2010 (Unaudited) | | |
| | | | | | | | | | |
Industry | | Company | | | Shares | | | | Value | |
Common Stocks (continued) | |
Pharmaceuticals (continued) | |
| | SuperGen, Inc.* | | | 274,600 | | | $ | 719,452 | |
| | Tianyin Pharmaceutical Co., Inc. | | | 156,300 | | | | 425,136 | |
| | XenoPort, Inc.* | | | 77,800 | | | | 662,856 | |
| | | | | | | | | | |
| | | | | | | | | 11,009,895 | |
| |
Professional Services - 1.06% | |
| | Barrett Business Services, Inc. | | | 31,600 | | | | 491,380 | |
| | GP Strategies Corp.* | | | 76,500 | | | | 783,360 | |
| | Hill International, Inc.* | | | 53,007 | | | | 342,955 | |
| | Hudson Highland Group, Inc.* | | | 100,065 | | | | 583,379 | |
| | National Technical Systems, Inc. | | | 43,000 | | | | 346,580 | |
| | On Assignment, Inc.* | | | 187,000 | | | | 1,524,050 | |
| | Volt Information Sciences, Inc.* | | | 35,200 | | | | 304,480 | |
| | | | | | | | | | |
| | | | | | | | | 4,376,184 | |
| |
Real Estate Management & Development - 0.58% | |
| | Consolidated-Tomoka Land Co. | | | 43,800 | | | | 1,265,820 | |
| | Grubb & Ellis Co.*+ | | | 241,500 | | | | 306,705 | |
| | Stratus Properties, Inc.* | | | 17,300 | | | | 156,911 | |
| | Thomas Properties Group, Inc.* | | | 162,800 | | | | 687,016 | |
| | | | | | | | | | |
| | | | | | | | | 2,416,452 | |
| |
Road & Rail - 0.47% | |
| | Covenant Transportation Group, Inc., Class A* | | | 42,700 | | | | 415,044 | |
| | Quality Distribution, Inc.* | | | 88,000 | | | | 799,920 | |
| | Saia, Inc.* | | | 25,900 | | | | 429,681 | |
| | USA Truck, Inc.* | | | 23,500 | | | | 310,905 | |
| | | | | | | | | | |
| | | | | | | | | 1,955,550 | |
| |
Semiconductors & Semiconductor Equipment - 3.39% | |
| | Advanced Analogic Technologies, Inc.* | | | 200,000 | | | | 802,000 | |
| | Amtech Systems, Inc.* | | | 80,046 | | | | 2,013,157 | |
| | AuthenTec, Inc.* | | | 533,200 | | | | 1,333,000 | |
| | AXT, Inc.* | | | 80,000 | | | | 835,200 | |
| | Conexant Systems, Inc.* | | | 161,100 | | | | 262,593 | |
| | Energy Conversion Devices, Inc.*+ | | | 79,500 | | | | 365,700 | |
| | FSI International, Inc.* | | | 225,400 | | | | 996,268 | |
| | GSI Technology, Inc.* | | | 201,417 | | | | 1,631,478 | |
| | Integrated Silicon Solution, Inc.* | | | 297,741 | | | | 2,390,860 | |
| | Kopin Corp.* | | | 290,443 | | | | 1,208,243 | |
| | | | | | | | | | |
Industry | | Company | | | Shares | | | | Value | |
|
Semiconductors & Semiconductor Equipment (continued) | |
| | Mattson Technology, Inc.* | | | 93,900 | | | $ | 281,700 | |
| | Nanometrics, Inc.* | | | 39,200 | | | | 502,936 | |
| | PDF Solutions, Inc.* | | | 103,400 | | | | 498,388 | |
| | Photronics, Inc.* | | | 81,070 | | | | 479,123 | |
| | Rudolph Technologies, Inc.* | | | 52,600 | | | | 432,898 | |
| | | | | | | | | | |
| | | | | | | | | 14,033,544 | |
|
Software - 2.24% | |
| | Actuate Corp.* | | | 410,030 | | | | 2,337,171 | |
| | American Software, Inc., Class A | | | 60,700 | | | | 410,939 | |
| | Callidus Software, Inc.* | | | 109,200 | | | | 550,368 | |
| | China TransInfo Technology Corp.*+ | | | 119,100 | | | | 563,343 | |
| | CyberDefender Corp.*+ | | | 17,200 | | | | 51,600 | |
| | DemandTec, Inc.* | | | 51,600 | | | | 559,344 | |
| | Digimarc Corp.* | | | 23,100 | | | | 693,231 | |
| | ePlus, Inc.* | | | 19,559 | | | | 462,375 | |
| | Glu Mobile, Inc.*# | | | 140,500 | | | | 290,835 | |
| | Guidance Software, Inc.* | | | 63,000 | | | | 452,970 | |
| | Magma Design Automation, Inc.* | | | 208,365 | | | | 1,043,908 | |
| | PROS Holdings, Inc.* | | | 46,900 | | | | 534,191 | |
| | QAD, Inc., Class A* | | | 30,800 | | | | 280,280 | |
| | QAD, Inc., Class B* | | | 7,700 | | | | 76,538 | |
| | SRS Labs, Inc.* | | | 54,400 | | | | 479,264 | |
| | TeleCommunication Systems, Inc., Class A* | | | 106,600 | | | | 497,822 | |
| | | | | | | | | | |
| | | | | | | | | 9,284,179 | |
|
Specialty Retail - 2.45% | |
| | A.C. Moore Arts & Crafts, Inc.* | | | 80,100 | | | | 201,852 | |
| | America’s Car-Mart, Inc.* | | | 30,000 | | | | 812,400 | |
| | Books-A-Million, Inc. | | | 49,800 | | | | 288,840 | |
| | Borders Group, Inc.*+ | | | 237,300 | | | | 213,617 | |
| | Casual Male Retail Group, Inc.* | | | 112,700 | | | | 534,198 | |
| | China Auto Logistics, Inc.*+ | | | 58,800 | | | | 176,988 | |
| | Cost Plus, Inc.* | | | 79,800 | | | | 774,060 | |
| | Destination Maternity Corp.* | | | 22,700 | | | | 861,011 | |
| | Hot Topic, Inc. | | | 184,558 | | | | 1,157,179 | |
| | Lithia Motors, Inc., Class A | | | 55,500 | | | | 793,095 | |
| | MarineMax, Inc.* | | | 68,200 | | | | 637,670 | |
| | Midas, Inc.* | | | 56,400 | | | | 457,404 | |
| | New York & Co., Inc.* | | | 156,100 | | | | 689,962 | |
| | Shoe Carnival, Inc.* | | | 22,400 | | | | 604,800 | |
| | Syms Corp.* | | | 49,600 | | | | 358,608 | |
| | TravelCenters of America LLC* | | | 108,700 | | | | 409,799 | |
| | |
Bridgeway Ultra-Small Company Market Fund SCHEDULE OF INVESTMENTS (continued) | |
|
| | |
Showing percentage of net assets as of December 31, 2010 (Unaudited) | | |
| | | | | | | | | | |
Industry | | Company | | | Shares | | | | Value | |
Common Stocks (continued) | | | | | | | | |
Specialty Retail (continued) | | | | | | | | |
| | Winmark Corp. | | | 10,200 | | | $ | 343,128 | |
| | Zale Corp.*+ | | | 190,200 | | | | 810,252 | |
| | | | | | | | | | |
| | | | | | | | | 10,124,863 | |
| |
Textiles, Apparel & Luxury Goods - 1.35% | |
| | Alpha PRO Tech, Ltd.* | | | 175,000 | | | | 311,500 | |
| | Charles & Colvard, Ltd.*+ | | | 60,900 | | | | 183,918 | |
| | Cherokee, Inc. | | | 20,100 | | | | 378,081 | |
| | Culp, Inc.* | | | 109,016 | | | | 1,129,406 | |
| | Ever-Glory International Group, Inc.* | | | 45,900 | | | | 96,849 | |
| | Fuqi International, Inc.* | | | 45,103 | | | | 287,757 | |
| | Hallwood Group, Inc.* | | | 9,100 | | | | 241,150 | |
| | Kenneth Cole Productions, Inc., Class A* | | | 33,600 | | | | 419,664 | |
| | LaCrosse Footwear, Inc.+ | | | 21,829 | | | | 357,996 | |
| | Perry Ellis International, Inc.* | | | 40,100 | | | | 1,101,547 | |
| | Rocky Brands, Inc.* | | | 52,200 | | | | 524,088 | |
| | Unifi, Inc.* | | | 32,000 | | | | 541,760 | |
| | | | | | | | | | |
| | | | | | | | | 5,573,716 | |
| |
Thrifts & Mortgage Finance - 4.80% | |
| | Abington Bancorp, Inc. | | | 72,200 | | | | 861,346 | |
| | BankAtlantic Bancorp, Inc., Class A* | | | 306,061 | | | | 351,970 | |
| | BankFinancial Corp. | | | 79,700 | | | | 777,075 | |
| | Beacon Federal Bancorp, Inc. | | | 35,800 | | | | 419,218 | |
| | Bofl Holding, Inc.* | | | 56,200 | | | | 871,662 | |
| | Chicopee Bancorp, Inc.* | | | 26,500 | | | | 335,225 | |
| | Citizens Community Bancorp, Inc.* | | | 90,400 | | | | 357,080 | |
| | Clifton Savings Bancorp, Inc. | | | 127,300 | | | | 1,376,113 | |
| | ESB Financial Corp. | | | 57,500 | | | | 933,800 | |
| | ESSA Bancorp, Inc. | | | 99,884 | | | | 1,320,466 | |
| | Federal Agricultural Mortgage Corp., Class C+ | | | 134,300 | | | | 2,191,776 | |
| | First Defiance Financial Corp.* | | | 41,400 | | | | 492,660 | |
| | First Financial Holdings, Inc. | | | 53,800 | | | | 619,238 | |
| | First Financial Northwest, Inc. | | | 122,548 | | | | 491,418 | |
| | First Pactrust Bancorp, Inc.+ | | | 41,000 | | | | 544,070 | |
| | Fox Chase Bancorp, Inc.* | | | 57,932 | | | | 686,494 | |
| | Guaranty Federal Bancshares, Inc.* | | | 45,256 | | | | 203,652 | |
| | Home Federal Bancorp, Inc. | | | 32,200 | | | | 395,094 | |
| | Louisiana Bancorp, Inc.* | | | 18,000 | | | | 262,800 | |
| | | | | | | | | | |
Industry | | Company | | | Shares | | | | Value | |
| | | | | | | | | | |
Thrifts & Mortgage Finance (continued) | |
| | Meridian Interstate Bancorp, Inc.* | | | 39,200 | | | $ | 462,168 | |
| | New Hampshire Thrift Bancshares, Inc. | | | 18,100 | | | | 227,155 | |
| | Ocean Shore Holding Co. | | | 32,100 | | | | 367,545 | |
| | OceanFirst Financial Corp. | | | 58,183 | | | | 748,815 | |
| | Provident Financial Holdings, Inc. | | | 101,300 | | | | 733,412 | |
| | Pulaski Financial Corp.+ | | | 43,500 | | | | 329,730 | |
| | Rockville Financial, Inc. | | | 72,630 | | | | 887,539 | |
| | Territorial Bancorp, Inc. | | | 42,300 | | | | 842,193 | |
| | Tree.com, Inc.* | | | 27,100 | | | | 255,824 | |
| | United Community Financial Corp.* | | | 130,000 | | | | 167,700 | |
| | United Financial Bancorp, Inc. | | | 86,641 | | | | 1,323,008 | |
| | Waterstone Financial, Inc.* | | | 11,247 | | | | 36,553 | |
| | | | | | | | | | |
| | | | | | | | | 19,872,799 | |
|
Trading Companies & Distributors - 0.80% | |
| | Aceto Corp. | | | 58,500 | | | | 526,500 | |
| | CAI International, Inc.* | | | 23,238 | | | | 455,465 | |
| | DXP Enterprises, Inc.* | | | 27,800 | | | | 667,200 | |
| | Houston Wire & Cable Co.+ | | | 29,400 | | | | 395,136 | |
| | Lawson Products, Inc. | | | 28,300 | | | | 704,387 | |
| | Titan Machinery, Inc.* | | | 29,100 | | | | 561,630 | |
| | | | | | | | | | |
| | | | | | | | | 3,310,318 | |
|
Water Utilities - 0.33% | |
| | Artesian Resources Corp., Class A | | | 10,500 | | | | 198,975 | |
| | York Water Co. | | | 68,550 | | | | 1,185,230 | |
| | | | | | | | | | |
| | | | | | | | | 1,384,205 | |
|
Wireless Telecommunication Services - 0.05% | |
| | FiberTower Corp.* | | | 45,659 | | | | 203,639 | |
| | | | | | | | | | |
TOTAL COMMON STOCKS - 97.36% | | | | 402,802,007 | |
| | | | | | | | | | |
(Cost $292,674,364) | |
|
EXCHANGE TRADED FUND - 2.05% | |
| | iShares Russell Microcap Index Fund+ | | | 168,900 | | | | 8,463,579 | |
| | | | | | | | | | |
TOTAL EXCHANGE TRADED FUND - 2.05% | | | | 8,463,579 | |
| | | | | | | | | | |
(Cost $5,905,460) | |
| | |
| | |
| 50 | | Semi-Annual Report | December 31, 2010 (Unaudited) |
| | |
Bridgeway Ultra-Small Company Market Fund SCHEDULE OF INVESTMENTS (continued) | | |
| | |
| Showing percentage of net assets as of December 31, 2010 (Unaudited) | | |
| | | | | | | | | | | | | | |
Industry | | Company | | | | | | | Shares | | | | Value | |
RIGHTS - 0.00% | |
| | BioFuel Energy Corp.D | | | | 327,530 | | | | $22,927 | |
| | | | | | | | | | | | | | |
TOTAL RIGHTS - 0.00% | | | | | | | | | | | 22,927 | |
| | | | | | | | | | | | | | |
(Cost $126,048) | | | | | | | | | | | | |
| | | | |
| | | | | Rate^ | | | | Shares | | | | Value | |
MONEY MARKET FUND - 1.30% | |
BlackRock FedFund | | | 0.06% | | | | 5,372,684 | | | | 5,372,684 | |
| | | | | | | | | | | | | | |
TOTAL MONEY MARKET FUND - 1.30% | | | | 5,372,684 | |
| | | | | | | | | | | | | | |
(Cost $5,372,684) | | | | | |
| |
TOTAL INVESTMENTS - 100.71% | | | $ | 416,661,197 | |
(Cost $304,078,556) | | | | | |
Liabilities in Excess of Other Assets - (0.71%) | | | | (2,936,231 | ) |
| | | | | | | | | | | | | | |
NET ASSETS - 100.00% | | | $ | 413,724,966 | |
| | | | | | | | | | | | | | |
* Non-income producing security. # Securities, or a portion thereof, segregated to cover the Fund’s obligation under swap agreements. The total market value of segregated assets is $290,835. ^ Rate disclosed as of December 31, 2010. D Security was fair valued under procedures adopted by the Board of Directors (see Note 2). + This security or a portion of the security is out on loan at December 31, 2010. Total loaned securities had a market value of $27,676,283 at December 31, 2010. LLC - Limited Liability Company Summary of inputs used to value the Fund’s investments as of 12/31/2010 are as follows (See Note 2 in Notes to Financial Statements): | |
| | | | | | | | | | | | | | | | |
| |
| | | Valuation Inputs | |
| | |
| | | Investment in Securities (Market Value) | |
| | |
| | | Level 1
Quoted
Prices | | | Level 2
Significant
Observable
Inputs | | | Level 3
Significant Unobservable
Inputs | | | Total | |
| | |
Common Stocks | | $ | 402,802,007 | | | $ | — | | | $ | — | | | $ | 402,802,007 | |
Exchange-Traded Fund | | | 8,463,579 | | | | — | | | | — | | | | 8,463,579 | |
Rights | | | — | | | | — | | | | 22,927 | | | | 22,927 | |
Money Market Fund | | | — | | | | 5,372,684 | | | | — | | | | 5,372,684 | |
| | | | | | | | | | | | | | | | |
TOTAL | | $ | 411,265,586 | | | $ | 5,372,684 | | | $ | 22,927 | | | $ | 416,661,197 | |
| | | | | | | | | | | | | | | | |
Other Financial Instruments** | | | | | | | | | | | | | | | | |
Swaps | | $ | — | | | $ | 65,045 | | | $ | — | | | $ | 65,045 | |
| | | | | | | | | | | | | | | | |
TOTAL | | $ | — | | | $ | 65,045 | | | $ | — | | | $ | 65,045 | |
| | | | | | | | | | | | | | | | |
** Other financial instruments are derivative instruments not reflected in the Schedule of Investments, such as futures, forwards and swap contracts, which are valued at the unrealized appreciation/ depreciation on the investment. | |
| | | | | | | | | | | | | | | | | |
| | | Following is a reconciliation of Level 3 investments for which significant unobservable inputs were used to determine fair value: | |
| | | | | | | Investment in Securities (Market Value) | |
| | | | |
| | | | | | | Common Stocks | | | | | Rights | | | | | Total | |
| | | | |
| | | Balance as of 06/30/2010 | | | $ | 81,300 | | | | $ | 754 | | | | $ | 82,054 | |
| | | Net purchases (sales) | | | | — | | | | | 22,173 | | | | | 22,173 | |
| | | Change in unrealized appreciation/ (depreciation) | | | | — | | | | | — | | | | | — | |
| | | Transfers in/out of Level 31 | | | | (81,300) | | | | | — | | | | | (81,300) | |
| | | | | | | | | | | | | | | | | | |
| | | Balance as of 12/31/2010 | | | $ | — | | | | $ | 22,927 | | | | $ | 22,927 | |
| | | | | | | | | | | | | | | | | | |
| | | | | | | | |
| | | 1“Transfers in and/or out” represent the value as of the beginning of the year ended June 30, 2011, for any investment security where significant transfers in the pricing level occurred during the period. The purchase value is used in situations where the investment was not held as of the beginning of the period. The transfer above took place as a result of trading resuming on the security. The securities in the table above were considered Level 3 securities because they were fair valued under procedures adopted by the Board of Directors at December 31, 2010. Such valuation is based on a review of inputs such as, but not limited to, similar securities, company specific financial information and company specific news. See Notes to Financial Statements. |
| | |
Micro-Cap Limited Fund MANAGER’S COMMENTARY | | |
(Unaudited)
December 31, 2010
Dear Fellow Micro-Cap Limited Fund Shareholder,
For the December 2010 quarter, Micro-Cap Limited Fund ended the year on a strong note with a return of 18.11%, outperforming the Lipper Micro-Cap Stock Funds Index (+16.69%), and the Russell 2000 Index (16.25%), but underperforming the CRSP Cap-Based Portfolio 9 Index (+20.51%) It barely lagged the Russell Microcap Index (+19.41%) during the three month period. Overall, we are mostly pleased with these results.
For the six-month “semi-annual” period ending December 31, 2010, our Fund jumped 29.34% and was generally in line with our performance benchmarks: our primary benchmark, CRSP Cap-Based Portfolio 9 Index (+30.77%), the Lipper Micro-Cap Stock Funds Index (+28.10%), the Russell Microcap Index (+28.73%), and the Russell 2000 Index (+29.38%). The equity markets as a whole rebounded nicely from a summer slump in the September to December period when the sovereign debt crisis threatened contagion across Europe; ultimately, investors were rewarded for their patience. As detailed below, the percent and a half underperformance of our Fund relative to our primary market benchmark for this period occurred in the December quarter and was a result of a few poor Information Technology picks.
For the calendar year, the Fund was up 29.11%, slightly beating each of our benchmarks. While we lead all of our benchmarks since inception, we have some considerable catch-up to do for performance over the last five years.
The table below presents our December quarter, six-month, one-year, five-year, ten-year, and life-to-date financial results according to the formula required by the SEC. See the next page for a graph of performance since inception.
| | | | | | | | | | | | |
| | | Dec. Qtr.
10/1/10
to 12/31/10 | | 6 Month
7/1/10
to 12/31/10 | | 1 Year
1/1/10
to 12/31/10 | | 5 Year
1/1/06
to 12/31/10 | | 10 Year
1/1/01
to 12/31/10 | | Life-to-Date
6/30/98 to 12/31/10 |
| | | | | | |
Micro-Cap Limited Fund | | 18.11% | | 29.34% | | 29.11% | | -3.86% | | 7.16% | | 10.30% |
CRSP Cap-Based Portfolio 9 Index | | 20.51% | | 30.77% | | 29.08% | | 5.89% | | 10.88% | | 9.05% |
Lipper Micro-Cap Stock Funds Index | | 16.69% | | 28.10% | | 27.57% | | 2.77% | | 6.26% | | 6.49% |
Russell 2000 Index (small stocks) | | 16.25% | | 29.38% | | 26.85% | | 4.47% | | 6.33% | | 5.78% |
Russell Microcap Index | | 19.41% | | 28.73% | | 28.89% | | 1.19% | | 7.38% | | N/A |
Performance figures quoted in the table above and graph below represent past performance and are no guarantee of future results. Total return figures in the table above include the reinvestment of dividends and capital gains. The table above and the graph below do not reflect the deduction of taxes that a shareholder would pay on Fund distributions or the redemption of Fund shares. The recent growth rate in the stock market has helped to produce short-term returns that are not typical and may not continue in the future.
The CRSP Cap-Based Portfolio 9 Index is an unmanaged index of 511 publicly traded U.S. micro-cap stocks (with dividends reinvested), as reported by the Center for Research on Security Prices. The Russell Microcap Index is an unmanaged, market value weighted index that measures performance of 1,000 of the smallest securities in the Russell 2000 Index. The Russell 2000 Index is an unmanaged, market value weighted index that measures performance of the 2,000 companies that are between the 1,000th and 3,000th largest in the market with dividends reinvested. The Lipper Micro-Cap Stock Funds Index is an index of micro-cap funds compiled by Lipper, Inc. It is not possible to invest directly in an index. Periods longer than one year are annualized.
According to data from Lipper, Inc., for the period ended December 31, 2010, the Micro-Cap Limited Fund ranked 32nd of 68 micro-cap funds for the last twelve months ended December 31, 2010, 59th of 60 such funds for the last five years, 21st of 37 funds for the last 10 years and 15th of 33 funds since inception in June, 1998. Lipper, Inc. is an independent mutual fund rating service that ranks funds in various fund categories by making comparative calculations using total returns.
| | |
| | |
| 52 | | Semi-Annual Report | December 31, 2010 (Unaudited) |
| | |
Micro-Cap Limited Fund MANAGER’S COMMENTARY (continued) | | |
Micro-Cap Limited Fund vs. CRSP 9 Index, Lipper Micro-Cap Stock Funds Index, Russell 2000 Index & Russell
Microcap Index* from Inception 6/30/98 to 12/31/10

| * | The Russell Microcap Index began on 6/30/2000, and the line graph for the Index begins at the same value as the Fund on that date. |
Detailed Explanation of Quarterly Performance
The Short Version: The almost two and a half percent underperformance of our Fund relative to our primary market benchmark for the December quarter was a result of a very few poor Information Technology picks.
All in all, the December quarter was a nice period for stocks across most industries as six different sectors were represented on the top ten contributors list. Of note, three Industrial companies highlighted the list, and these holdings combined to add over one-and-a-quarter percent to the Fund’s return. As emerging markets continue to lead the global economy, many Industrials have benefited from the surge in demand. Consumer Discretionary companies were also well-represented, with two holdings making the list as enhanced retail activity contributed to a nice holiday season.
These are the Fund’s ten best-contributing stocks for the quarter ended December 31, 2010:
| | | | | | |
Rank | | Description | | Industry | | % Contribution to Return |
| 1 | | Petroleum Development Corp. | | Oil, Gas & Consumable Fuels | | 0.5% |
| 2 | | TriMas Corp. | | Machinery | | 0.5% |
| 3 | | IDT Corp. | | Diversified Telecommunication Services | | 0.5% |
| 4 | | Retail Ventures, Inc. | | Multiline Retail | | 0.5% |
| 5 | | Exide Technologies | | Auto Components | | 0.5% |
| 6 | | Air Methods Corp. | | Health Care Providers & Services | | 0.5% |
| 7 | | China Yuchai International, Ltd. | | Machinery | | 0.4% |
| 8 | | Ensign Group, Inc. | | Health Care Providers & Services | | 0.4% |
| 9 | | TPC Group, Inc. | | Chemicals | | 0.4% |
| 10 | | SFN Group, Inc. | | Professional Services | | 0.4% |
| | |
Micro-Cap Limited Fund MANAGER’S COMMENTARY (continued) | | |
Sometimes a company simply needs to reinvent itself. After struggling for five years and watching its shareholder value plummet by more than 90%, management at IDT Corp began a restructuring plan that is starting to pay dividends. The company spun off a media subsidiary and is looking to do the same with its energy business. It is now flush with cash as it focuses its efforts on the more profitable telecom markets, primarily wholesale and retail long distance and calling card services. In December, IDT posted positive earnings and a second consecutive quarter of solid revenue growth. Shareholders were also rewarded for their patience with a dividend declaration. IDT climbed almost 50% during the quarter and contributed half a percent in return to the Fund.
IT companies were a mixed bag this past quarter as five related holdings were among the Fund’s poorest performers. In certain cases, corporations have limited technology purchases in order to keep costs in check and make earnings look stronger. The delayed activity has hindered IT companies, many of which are still expecting a major surge in upgrades, but continue to wait out the economic uncertainty for another quarter or two (and hopefully not much longer). The five IT holdings on the list below cost the Fund just under a percent-and-a-half in return.
These are the Fund’s ten worst-contributing stocks for the quarter ended December 31, 2010:
| | | | | | |
| Rank | | Description | | Industry | | % Contribution to Return |
1 | | RINO International Corp. | | Commercial Services & Supplies | | -0.6% |
2 | | Solarfun Power Holdings Co., Ltd. | | Semiconductors & Semiconductor Equiptment | | -0.5% |
3 | | Newpark Resources, Inc. | | Energy Equipment & Services | | -0.3% |
4 | | Cirrus Logic, Inc. | | Semiconductors & Semiconductor Equiptment | | -0.3% |
5 | | Lionbridge Technologies, Inc. | | IT Services | | -0.2% |
6 | | Insight Enterprises, Inc. | | Electronic Equip., Instruments & Components | | -0.2% |
7 | | Vonage Holdings Corp. | | Diversified Telecommunication Services | | -0.1% |
8 | | Sourcefire, Inc. | | Software | | -0.1% |
9 | | Kingold Jewelry, Inc. | | Textiles, Apparel & Luxury Goods | | -0.1% |
10 | | Pantry, Inc. | | Food & Staples Retailing | | -0.1% |
Newpark Resources battles the big boys (i.e. Schlumberger and Halliburton) in providing various management, disposal, and well preparation services to the exploration and production industry. In October, the company announced weaker than expected demand; its stock plummeted about 30% on the news. For the quarter, Newpark dropped 25% and cost the Fund over a quarter percent in return.
Detailed Explanation of Calendar Year Performance
The Short Version: Consumer related stocks made strong showings on both the best and worst contributors list. That picture creates the feel for our calendar year performance too, as we eked out a tiny lead (0.03%) over our primary market benchmark.
The calendar year could be deemed “the return of the consumer” as retailers reported their best holiday season since the beginning of the economic downturn. One consumer discretionary company and one consumer staple highlighted the list of top-ten contributing stocks. Combined, they added about two percent to the overall Fund return. Three IT stocks made the “top ten” list for 2010 as our models detected certain winners despite other challenges in the sector. These companies enhanced the Fund’s performance by over four percent.
| | |
| | |
| 54 | | Semi-Annual Report | December 31, 2010 (Unaudited) |
| | |
Micro-Cap Limited Fund MANAGER’S COMMENTARY (continued) | | |
These are the Fund’s ten best-contributing stocks for the calendar year ended December 31, 2010:
| | | | | | |
Rank | | Description | | Industry | | % Contribution to Return |
| 1 | | Power-One, Inc. | | Electronic Equip., Instruments & Components | | 1.9% |
| 2 | | Cirrus Logic, Inc. | | Semiconductors & Semiconductor Equiptment | | 1.8% |
| 3 | | Odyssey HealthCare, Inc. | | Health Care Providers & Services | | 1.3% |
| 4 | | Lattice Semiconductor Corp. | | Semiconductors & Semiconductor Equiptment | | 1.2% |
| 5 | | Protection One, Inc. | | Commercial Services & Supplies | | 1.1% |
| 6 | | Boston Beer Co, Inc. | | Beverages | | 1.1% |
| 7 | | Pier 1 Imports, Inc. | | Specialty Retail | | 1.1% |
| 8 | | TriMas Corp. | | Machinery | | 1.0% |
| 9 | | TPC Group, Inc. | | Chemicals | | 1.0% |
| 10 | | Hawkins, Inc. | | Chemicals | | 0.9% |
Sam Adams touts itself as “America’s World Class Beer,” and apparently, investors agree. While the Boston Beer Co. distributes more than 20 different brands, Sam Adams is its most well-known. Regardless of the economic times, beer drinkers have continued to enjoy their favorite beverage as Boston Beer recently announced solid revenue growth and earnings that tripled from the prior year. The better-than-expected results were the second nice surprise for shareholders over the past three quarters. In December, the company increased its forecast for the year as shipment volumes continue to increase. For the year, Boston Beer’s share price jumped over 75%, and the holding contributed over a percent in return to the Fund.
Despite the surge in retail activity late in the year, four Consumer Discretionary companies were on the “bottom ten” contribution list. Combined, these holdings cost the Fund over two percent in performance. Four other sectors were represented on this list.
These are the Fund’s ten worst-contributing stocks for the calendar year ended December 31, 2010:
| | | | | | |
| Rank | | Description | | Industry | | % Contribution to Return |
1 | | RINO International Corp. | | Commercial Services & Supplies | | -1.1% |
2 | | Bon-Ton Stores, Inc. | | Multiline Retail | | -0.8% |
3 | | Stein Mart, Inc. | | Specialty Retail | | -0.6% |
4 | | L&L Energy, Inc. | | Oil, Gas & Consumable Fuels | | -0.6% |
5 | | China Sky One Medical, Inc. | | Personal Products | | -0.6% |
6 | | Lincoln Educational Services Corp. | | Diversified Consumer Services | | -0.5% |
7 | | China Integrated Energy, Inc. | | Oil, Gas & Consumable Fuels | | -0.5% |
8 | | Smart Balance, Inc. | | Food Products | | -0.4% |
9 | | Wave Systems Corp. | | Software | | -0.4% |
10 | | Entercom Communications Corp. | | Media | | -0.4% |
Being delisted is usually not a good thing for shareholders. In December, RINO International, an environmental protection and remediation company serving the Chinese steel industry, received word that is would be delisted by Nasdaq because of failure to respond adequately to allegations about accounting irregularities. Auditors suspected that RINO recorded revenue on activity derived from two business contracts that may never have actually existed, and independent investigators confirmed the concerns, claiming that the company’s accounting “has serious flaws.” Trading was halted in November pending the investigation. Subsequently, lawyers have been coming out of the woodwork to file class action suits on behalf of shareholders over the false and/or misleading statements about the company’s operations. The stock plummeted 87% during the year and cost the Fund over one percent in return.
| | |
Micro-Cap Limited Fund MANAGER’S COMMENTARY (continued) | | |
Top Ten Holdings as of December 31, 2010
Five of the Fund’s top contributors for the December 2010 quarter were also among the largest holdings at the end of the calendar year (TPC Group, Trimas, Air Methods, IDT Corp and Ensign Group). The Fund was broadly diversified, as no single stock accounted for greater than 1.7% of the net assets. The ten largest positions represented less than 15% of the total assets of the Fund.
| | | | | | |
Rank | | Description | | Industry | | % of Net
Assets |
| 1 | | World Acceptance Corp. | | Consumer Finance | | 1.7% |
| 2 | | TPC Group, Inc. | | Chemicals | | 1.6% |
| 3 | | TriMas Corp. | | Machinery | | 1.6% |
| 4 | | Air Methods Corp. | | Health Care Providers & Services | | 1.5% |
| 5 | | Power-One, Inc. | | Electronic Equip., Instruments & Components | | 1.5% |
| 6 | | IDT Corp. | | Diversified Telecommunication Services | | 1.3% |
| 7 | | Ensign Group, Inc. | | Health Care Providers & Services | | 1.3% |
| 8 | | Skilled Healthcare Group, Inc. | | Health Care Providers & Services | | 1.3% |
| 9 | | Layne Christensen Co. | | Construction & Engineering | | 1.3% |
| 10 | | Lattice Semiconductor Corp. | | Semiconductors & Semiconductor Equiptment | | 1.2% |
| | Total | | | | 14.3% |
Industry Sector Representation as of December 31, 2010
Along with our primary market index, the Fund’s largest allocation was in Financials. A number of banks and other financial institutions continue to rebound from the recent doldrums, and these companies contributed strongly to our calendar year returns. Compared to its benchmark, the Fund maintained a smaller allocation of Health Care, a sector with serious uncertainties due to the recently passed reform bill that could impact the future operations of many related companies.
| | | | | | | | |
| | | % of Net Assets | | % of Russell
2000 Index | | | Difference | |
| Consumer Discretionary | | 12.5% | | 13.6% | | | -1.1% | |
| Consumer Staples | | 5.3% | | 2.9% | | | 2.4% | |
| Energy | | 5.3% | | 6.4% | | | -1.1% | |
| Financials | | 20.9% | | 20.6% | | | 0.3% | |
| Health Care | | 4.7% | | 12.4% | | | -7.7% | |
| Industrials | | 16.5% | | 15.8% | | | 0.7% | |
| Information Technology | | 16.1% | | 18.6% | | | -2.5% | |
| Materials | | 8.7% | | 5.7% | | | 3.0% | |
| Telecommunication Services | | 1.2% | | 1.0% | | | 0.2% | |
| Utilities | | 7.7% | | 3.0% | | | 4.7% | |
| Cash & Other Assets | | 1.1% | | 0.0% | | | 1.1% | |
Total | | 100.0% | | 100.0% | | | | |
Disclaimer
The views expressed here are exclusively those of Fund management. These views, including those related to market sectors or individual stocks, are not meant as investment advice and should not be considered predictive in nature. Any favorable (or unfavorable) description of a holding applies only as of the quarter-end, December 31, 2010, unless otherwise stated. Security positions can and do change thereafter. Discussions of historical performance do not guarantee and may not be indicative of future performance.
The Fund is subject to very high, above market risk (volatility) and is not an appropriate investment for short-term investors. Investments in micro-cap companies generally carry greater risk than is customarily associated with larger companies and even “small companies” for various reasons, such as narrower markets (fewer investors), limited financial resources and greater trading difficulty.
| | |
| | |
| 56 | | Semi-Annual Report | December 31, 2010 (Unaudited) |
| | |
Micro-Cap Limited Fund MANAGER’S COMMENTARY (continued) | | |
Conclusion
Thank you for your continued investment in Micro-Cap Limited Fund, which remains open to all investors. We encourage your feedback; your reactions and concerns are important to us.
Sincerely,
Your Investment Management Team
| | |
Bridgeway Micro-Cap Limited Fund SCHEDULE OF INVESTMENTS | | |
| | |
Showing percentage of net assets as of December 31, 2010 (Unaudited) | | |
| | | | | | | | | | |
Industry | | Company | | | Shares | | | | Value | |
COMMON STOCKS - 99.56% | |
Aerospace & Defense - 0.43% | |
| | GenCorp, Inc.* | | | 21,000 | | | $ | 108,570 | |
| |
Airlines - 1.42% | |
| | Hawaiian Holdings, Inc.* | | | 32,600 | | | | 255,584 | |
| | Republic Airways Holdings, Inc.* | | | 13,900 | | | | 101,748 | |
| | | | | | | | | | |
| | | | | | | | | 357,332 | |
| |
Auto Components - 3.56% | |
| | American Axle & Manufacturing Holdings, Inc.* | | | 17,600 | | | | 226,336 | |
| | Dorman Products, Inc.* | | | 5,100 | | | | 184,824 | |
| | Exide Technologies* | | | 21,700 | | | | 204,197 | |
| | Standard Motor Products, Inc. | | | 20,500 | | | | 280,850 | |
| | | | | | | | | | |
| | | | | | | | | 896,207 | |
| |
Capital Markets - 1.24% | |
| | BlackRock Kelso Capital Corp. | | | 16,300 | | | | 180,278 | |
| | Calamos Asset Management, Inc., Class A | | | 9,500 | | | | 133,000 | |
| | | | | | | | | | |
| | | | | | | | | 313,278 | |
| |
Chemicals - 3.87% | |
| | Hawkins, Inc. | | | 6,600 | | | | 293,040 | |
| | Innospec, Inc.* | | | 7,000 | | | | 142,800 | |
| | Quaker Chemical Corp. | | | 3,100 | | | | 129,177 | |
| | TPC Group, Inc.* | | | 13,500 | | | | 409,320 | |
| | | | | | | | | | |
| | | | | | | | | 974,337 | |
| |
Commercial Banks - 2.59% | |
| | Cardinal Financial Corp. | | | 25,900 | | | | 301,217 | |
| | City Holding Co. | | | 4,400 | | | | 159,412 | |
| | Southwest Bancorp, Inc.* | | | 15,400 | | | | 190,960 | |
| | | | | | | | | | |
| | | | | | | | | 651,589 | |
| |
Commercial Services & Supplies - 1.54% | |
| | Cenveo, Inc.* | | | 17,500 | | | | 93,450 | |
| | Consolidated Graphics, Inc.* | | | 4,100 | | | | 198,563 | |
| | M&F Worldwide Corp.* | | | 4,200 | | | | 97,020 | |
| | | | | | | | | | |
| | | | | | | | | 389,033 | |
| |
Communications Equipment - 3.69% | |
| | Digi International, Inc.* | | | 19,700 | | | | 218,670 | |
| | Hughes Communications, Inc.* | | | 5,000 | | | | 202,200 | |
| | Ituran Location & Control, Ltd. | | | 14,500 | | | | 252,880 | |
| | | | | | | | | | |
Industry | | Company | | | Shares | | | | Value | |
| | | | | | | | |
Communications Equipment (continued) | |
| | Powerwave Technologies, Inc.* | | | 100,800 | | | $ | 256,032 | |
| | | | | | | | | | |
| | | | | | | | | 929,782 | |
|
Construction & Engineering - 2.19% | |
| | Great Lakes Dredge & Dock Corp.# | | | 31,900 | | | | 235,103 | |
| | Layne Christensen Co.* | | | 9,200 | | | | 316,664 | |
| | | | | | | | | | |
| | | | | | | | | 551,767 | |
|
Consumer Finance - 3.30% | |
| | Advance America, Cash Advance Centers, Inc. | | | 23,800 | | | | 134,232 | |
| | Cardtronics, Inc.* | | | 14,900 | | | | 263,730 | |
| | World Acceptance Corp.*+ | | | 8,200 | | | | 432,960 | |
| | | | | | | | | | |
| | | | | | | | | 830,922 | |
|
Diversified Consumer Services - 0.81% | |
| | Pre-Paid Legal Services, Inc.* | | | 3,400 | | | | 204,850 | |
|
Diversified Telecommunication Services - 4.60% | |
| | Alaska Communications Systems Group, Inc.+ | | | 22,400 | | | | 248,640 | |
| | Consolidated Communications Holdings, Inc. | | | 6,300 | | | | 121,590 | |
| | General Communication, Inc., Class A* | | | 20,000 | | | | 253,200 | |
| | IDT Corp., Class B | | | 13,000 | | | | 333,450 | |
| | Vonage Holdings Corp.* | | | 90,100 | | | | 201,824 | |
| | | | | | | | | | |
| | | | | | | | | 1,158,704 | |
|
Electrical Equipment - 0.58% | |
| | Solarfun Power Holdings Co., Ltd. - Sponsored ADR* | | | 18,000 | | | | 147,060 | |
|
Electronic Equipment, Instruments & Components - 5.34% | |
| | Insight Enterprises, Inc.* | | | 19,900 | | | | 261,884 | |
| | Kemet Corp.* | | | 16,600 | | | | 242,028 | |
| | Measurement Specialties, Inc.* | | | 7,100 | | | | 208,385 | |
| | OSI Systems, Inc.* | | | 3,300 | | | | 119,988 | |
| | Power-One, Inc.*+ | | | 36,800 | | | | 375,360 | |
| | X-Rite, Inc.* | | | 30,300 | | | | 138,471 | |
| | | | | | | | | | |
| | | | | | | | | 1,346,116 | |
|
Energy Equipment & Services - 1.90% | |
| | Hercules Offshore, Inc.* | | | 43,800 | | | | 151,548 | |
| | Newpark Resources, Inc.* | | | 27,300 | | | | 168,168 | |
| | Pioneer Drilling Co.* | | | 18,100 | | | | 159,461 | |
| | | | | | | | | | |
| | | | | | | | | 479,177 | |
| | |
| | |
| 58 | | Semi-Annual Report | December 31, 2010 (Unaudited) |
| | |
Bridgeway Micro-Cap Limited Fund SCHEDULE OF INVESTMENTS (continued) | | |
| | |
| Showing percentage of net assets as of December 31, 2010 (Unaudited) | | |
| | | | | | | | | | |
Industry | | Company | | | Shares | | | | Value | |
Common Stocks (continued) | |
Food & Staples Retailing - 0.88% | |
| | Pantry, Inc. (The)* | | | 4,600 | | | $ | 91,356 | |
| | Susser Holdings Corp.* | | | 9,400 | | | | 130,190 | |
| | | | | | | | | | |
| | | | | | | | | 221,546 | |
| |
Food Products - 0.59% | |
| | SunOpta, Inc.* | | | 19,100 | | | | 149,362 | |
| |
Gas Utilities - 0.78% | |
| | Chesapeake Utilities Corp. | | | 4,700 | | | | 195,144 | |
| |
Health Care Equipment & Supplies - 1.78% | |
| | Invacare Corp. | | | 5,400 | | | | 162,864 | |
| | Zoll Medical Corp.* | | | 7,700 | | | | 286,671 | |
| | | | | | | | | | |
| | | | | | | | | 449,535 | |
| |
Health Care Providers & Services - 10.12% | |
| | Air Methods Corp.* | | | 6,800 | | | | 382,636 | |
| | Corvel Corp.* | | | 6,300 | | | | 304,605 | |
| | Ensign Group, Inc. (The) | | | 13,400 | | | | 333,258 | |
| | Gentiva Health Services, Inc.* | | | 9,400 | | | | 250,040 | |
| | LHC Group, Inc.* | | | 8,400 | | | | 252,000 | |
| | MWI Veterinary Supply, Inc.* | | | 3,800 | | | | 239,970 | |
| | National Healthcare Corp. | | | 5,800 | | | | 268,366 | |
| | Skilled Healthcare Group, Inc., Class A* | | | 35,800 | | | | 321,484 | |
| | Sunrise Senior Living, Inc.*+ | | | 36,400 | | | | 198,380 | |
| | | | | | | | | | |
| | | | | | | | | 2,550,739 | |
| |
Hotels, Restaurants & Leisure - 1.37% | |
| | BJ’s Restaurants, Inc.*+ | | | 6,000 | | | | 212,580 | |
| | Isle of Capri Casinos, Inc.* | | | 12,900 | | | | 131,838 | |
| | | | | | | | | | |
| | | | | | | | | 344,418 | |
| |
Household Durables - 0.98% | |
| | Beazer Homes USA, Inc.*+ | | | 31,400 | | | | 169,246 | |
| | Furniture Brands International, Inc.* | | | 15,200 | | | | 78,128 | |
| | | | | | | | | | |
| | | | | | | | | 247,374 | |
| |
Industrial Conglomerates - 0.94% | |
| | Standex International Corp. | | | 7,900 | | | | 236,289 | |
| |
Insurance - 4.51% | |
| | American Equity Investment Life Holding Co. | | | 22,700 | | | | 284,885 | |
| | Employers Holdings, Inc. | | | 10,100 | | | | 176,548 | |
| | Infinity Property & Casualty Corp. | | | 4,700 | | | | 290,460 | |
| | Meadowbrook Insurance Group, Inc. | | | 14,300 | | | | 146,575 | |
| | | | | | | | | | |
Industry | | Company | | | Shares | | | | Value | |
| | | | | | | | |
Insurance (continued) | | | | | |
| | Safety Insurance Group, Inc. | | | 5,000 | | | $ | 237,850 | |
| | | | | | | | | | |
| | | | | | | | | 1,136,318 | |
|
Internet & Catalog Retail - 0.49% | |
| | NutriSystem, Inc. | | | 5,900 | | | | 124,077 | |
|
IT Services - 0.56% | |
| | CSG Systems International, Inc.* | | | 7,500 | | | | 142,050 | |
|
Leisure Equipment & Products - 1.15% | |
| | Jakks Pacific, Inc.* | | | 11,800 | | | | 214,996 | |
| | Leapfrog Enterprises, Inc.* | | | 13,203 | | | | 73,277 | |
| | | | | | | | | | |
| | | | | | | | | 288,273 | |
|
Machinery - 5.39% | |
| | Alamo Group, Inc. | | | 10,400 | | | | 289,328 | |
| | Altra Holdings, Inc.* | | | 15,400 | | | | 305,844 | |
| | Commercial Vehicle Group, Inc.* | | | 7,400 | | | | 120,250 | |
| | NACCO Industries, Inc., Class A | | | 800 | | | | 86,696 | |
| | TriMas Corp.* | | | 19,900 | | | | 407,154 | |
| | Twin Disc, Inc. | | | 5,000 | | | | 149,300 | |
| | | | | | | | | | |
| | | | | | | | | 1,358,572 | |
|
Media - 3.60% | |
| | Entravision Communications Corp., Class A* | | | 59,900 | | | | 153,943 | |
| | EW Scripps Co., Class A* | | | 11,200 | | | | 113,680 | |
| | Knology, Inc.* | | | 15,800 | | | | 246,954 | |
| | McClatchy Co., Class A (The)* | | | 34,800 | | | | 162,516 | |
| | Sinclair Broadcast Group, Inc., Class A | | | 28,200 | | | | 230,676 | |
| | | | | | | | | | |
| | | | | | | | | 907,769 | |
Metals & Mining - 1.60% | |
| | Brush Engineered Materials, Inc.* | | | 6,700 | | | | 258,888 | |
| | Kaiser Aluminum Corp. | | | 2,900 | | | | 145,261 | |
| | | | | | | | | | |
| | | | | | | | | 404,149 | |
|
Multiline Retail - 2.00% | |
| | Bon-Ton Stores, Inc. (The)*+ | | | 16,800 | | | | 212,688 | |
| | Retail Ventures, Inc.* | | | 17,900 | | | | 291,770 | |
| | | | | | | | | | |
| | | | | | | | | 504,458 | |
|
Oil, Gas & Consumable Fuels - 5.26% | |
| | Cheniere Energy, Inc.*+ | | | 26,200 | | | | 144,624 | |
| | |
Bridgeway Micro-Cap Limited Fund SCHEDULE OF INVESTMENTS (continued) | | |
| | |
| Showing percentage of net assets as of December 31, 2010 (Unaudited) | | |
| | | | | | | | | | | | |
Industry | | Company | | | | | Shares | | | | Value | |
Common Stocks (continued) | | | | | | | | | | |
Oil, Gas & Consumable Fuels (continued) | |
| | Delek US Holdings, Inc. | | | 23,500 | | | $ | 171,080 | |
| | Knightsbridge Tankers, Ltd.+ | | | 11,400 | | | | 253,878 | |
| | L&L Energy, Inc.* | | | 20,100 | | | | 217,080 | |
| | Petroleum Development Corp.* | | | 5,900 | | | | 249,039 | |
| | USEC, Inc.* | | | 22,800 | | | | 137,256 | |
| | Warren Resources, Inc.* | | | | | 33,500 | | | | 151,420 | |
| | | | | | | | | | | | |
| | | | | | | | | | | 1,324,377 | |
| |
Paper & Forest Products - 1.06% | |
| | Mercer International, Inc.* | | | | | 18,000 | | | | 139,500 | |
| | Neenah Paper, Inc. | | | | | 6,500 | | | | 127,920 | |
| | | | | | | | | | | | |
| | | | | | | | | | | 267,420 | |
| |
Personal Products - 1.28% | |
| | Elizabeth Arden, Inc.* | | | | | 9,300 | | | | 213,993 | |
| | Inter Parfums, Inc. | | | | | 5,800 | | | | 109,330 | |
| | | | | | | | | | | | |
| | | | | | | | | | | 323,323 | |
| |
Pharmaceuticals - 0.98% | |
| | Medicines Co. (The)* | | | | | 17,500 | | | | 247,275 | |
| |
Professional Services - 2.07% | |
| | CBIZ, Inc.* | | | | | 19,000 | | | | 118,560 | |
| | CDI Corp. | | | | | 9,800 | | | | 182,182 | |
| | SFN Group, Inc.* | | | | | 22,500 | | | | 219,600 | |
| | | | | | | | | | | | |
| | | | | | | | | | | 520,342 | |
| |
Real Estate Investment Trusts (REITs) - 1.69% | |
| | Newcastle Investment Corp.* | | | | | 31,600 | | | | 211,720 | |
| | Retail Opportunity Investments Corp. | | | | | 21,700 | | | | 215,047 | |
| | | | | | | | | | | | |
| | | | | | | | | | | 426,767 | |
| |
Real Estate Management & Development - 0.82% | |
| | IRSA Inversiones y Representaciones SA - Sponsored ADR | | | | | 12,800 | | | | 205,952 | |
| |
Semiconductors & Semiconductor Equipment - 5.88% | |
| | Advanced Energy Industries, Inc.* | | | | | 16,700 | | | | 227,788 | |
| | Cohu, Inc. | | | | | 15,900 | | | | 263,622 | |
| | IXYS Corp* | | | | | 13,000 | | | | 151,060 | |
| | Lattice Semiconductor Corp.* | | | | | 51,600 | | | | 312,696 | |
| | Micrel, Inc. | | | | | 21,700 | | | | 281,883 | |
| | Photronics, Inc.* | | | | | 41,200 | | | | 243,492 | |
| | | | | | | | | | | | |
| | | | | | | | | | | 1,480,541 | |
| | | | | | | | | | | | | | |
Industry | | Company | | | | | | | Shares | | | | Value | |
| | | | | | | | | | | | |
Specialty Retail - 1.04% | |
| | Pep Boys-Manny, Moe & Jack (The) | | | | 19,400 | | | $ | 260,542 | |
|
Textiles, Apparel & Luxury Goods - 2.54% | |
| | Liz Claiborne, Inc.*+ | | | | 21,700 | | | | 155,372 | |
| | Maidenform Brands, Inc.* | | | | 3,700 | | | | 87,949 | |
| | Quiksilver, Inc.* | | | | 22,000 | | | | 111,540 | |
| | Unifi, Inc.* | | | | 16,900 | | | | 286,117 | |
| | | | | | | | | | | | | | |
| | | | | | | | | | | | | 640,978 | |
|
Thrifts & Mortgage Finance - 0.99% | |
| | United Financial Bancorp, Inc. | | | | 7,700 | | | | 117,579 | |
| | WSFS Financial Corp. | | | | 2,800 | | | | 132,832 | |
| | | | | | | | | | | | | | |
| | | | | | | | | | | | | 250,411 | |
|
Trading Companies & Distributors - 2.15% | |
| | DXP Enterprises, Inc.* | | | | 11,400 | | | | 273,600 | |
| | TAL International Group, Inc. | | | | 8,700 | | | | 268,569 | |
| | | | | | | | | | | | | | |
| | | | | | | | | | | | | 542,169 | |
| | | | | | | | | | | | | | |
TOTAL COMMON STOCKS - 99.56% | | | | 25,088,894 | |
| | | | | | | | | | | | | | |
(Cost $20,118,922) | | | | | |
| | | | |
| | | | | Rate^ | | | | Shares | | | | Value | |
|
MONEY MARKET FUND - 0.58% | |
BlackRock FedFund | | | 0.06% | | | | 144,852 | | | | 144,852 | |
| | | | | | | | | | | | | | |
TOTAL MONEY MARKET FUND – 0.58% | | | | 144,852 | |
| | | | | | | | | | | | | | |
(Cost $144,852) | | | | | |
| |
TOTAL INVESTMENTS - 100.14% | | | $ | 25,233,746 | |
(Cost $20,263,774) | | | | | |
Liabilities in Excess of Other Assets - (0.14%) | | | | (34,118 | ) |
| | | | | | | | | | | | | | |
NET ASSETS - 100.00% | | | $ | 25,199,628 | |
| | | | | | | | | | | | | | |
| * | Non-income producing security. |
| # | Securities, or a portion thereof, segregated to cover the Fund’s obligation under swap agreements. The total market value of segregated assets is $235,103. |
| ^ | Rate disclosed as of December 31, 2010. |
| + | This security or a portion of the security is out on loan at December 31, 2010. Total loaned securities had a market value of $2,163,791 at December 31, 2010. |
ADR - American Depositary Receipt
| | |
| | |
| 60 | | Semi-Annual Report | December 31, 2010 (Unaudited) |
| | |
Bridgeway Micro-Cap Limited Fund SCHEDULE OF INVESTMENTS (continued) | | |
| | | | | | | | | | | | | | | | |
Summary of inputs used to value the Fund’s investments as of 12/31/2010 are as follows (See Note 2 in Notes to Financial Statements): | |
| | | Valuation Inputs | |
| | |
| | | Investment in Securities (Market Value) | |
| | |
| | | Level 1
Quoted
Prices | | | Level 2
Significant
Observable
Inputs | | | Level 3
Significant Unobservable
Inputs | | | Total | |
| | |
Common Stocks | | $ | 25,088,894 | | | $ | — | | | $ | — | | | $ | 25,088,894 | |
Money Market Funds | | | — | | | | 144,852 | | | | — | | | | 144,852 | |
| | | | | | | | | | | | | | | | |
TOTAL | | $ | 25,088,894 | | | $ | 144,852 | | | $ | — | | | $ | 25,233,746 | |
| | | | | | | | | | | | | | | | |
Other Financial Instruments** | | | | | | | | | | | | | | | | |
Swaps | | $ | — | | | $ | 3,663 | | | $ | — | | | $ | 3,663 | |
| | | | | | | | | | | | | | | | |
TOTAL | | $ | — | | | $ | 3,663 | | | $ | — | | | $ | 3,663 | |
| | | | | | | | | | | | | | | | |
** Other financial instruments are derivative instruments not reflected in the Schedule of Investments, such as futures, forwards and swap contracts, which are valued at the unrealized appreciation/ depreciation on the investment. See Notes to Financial Statements. | |
| | |
Small-Cap Momentum Fund MANAGER’S COMMENTARY | | |
(Unaudited)
December 31, 2010
Dear Fellow Small-Cap Momentum Fund Shareholder,
For the December 2010 quarter, Small-Cap Momentum Fund ended the year on a strong note and returned 14.34%, though we underperformed our primary market benchmark, the Russell 2000 Index (+16.25%) and its peer benchmarks, the Lipper Small-Cap Stock Funds Index (+14.82%) and Lipper Small-Cap Core Funds Index (+15.39%). We are never pleased with a clean sweep in the wrong direction. Momentum strategies trailed the overall market in this quarter. Our strategy, on the conservative end of the spectrum for momentum strategies, also added to the underperformance of the Fund.
For the six-month “semi-annual” period ending December 31, 2010, our Fund jumped 27.45%, still lagging its benchmarks as the Russell 2000 Index (+29.38%), Lipper Small-Cap Stock Funds Index (+28.25%), and Lipper Small-Cap Core Funds Index (28.39%) all performed extremely well. The equity markets as a whole rebounded nicely from a summer slump when the sovereign debt crisis threatened contagion across Europe; ultimately, investors were rewarded for their patience and confidence. One of the main design features of the Fund’s risk-adjusted momentum strategy is providing cushion during down periods, especially relative to a pure momentum strategy. On the other hand, the strategy is less likely to shine in a strong one-directional up market such as the recent period.
The table below presents our December quarter, six-month and life-to-date financial results according to the formula required by the SEC. See the next page for a graph of performance since inception.
| | | | | | | | | | | | |
| | | Dec. Qtr.
10/1/10
to 12/31/10 | | | 6 Month
7/1/10
to 12/31/10 | | | Life-to-Date
5/28/10 to 12/31/10 | |
| | | |
Small-Cap Momentum Fund | | | 14.34% | | | | 27.45% | | | | 18.91% | |
Russell 2000 Index | | | 16.25% | | | | 29.38% | | | | 19.35% | |
Lipper Small-Cap Stock Funds Index | | | 14.82% | | | | 28.25% | | | | 19.41% | |
Lipper Small-Cap Core Funds Index | | | 15.39% | | | | 28.39% | | | | 19.99% | |
Performance figures quoted in the table above and graph below represent past performance and are no guarantee of future results. Total return figures in the table above and the graph below include the reinvestment of dividends and capital gains. The table above and the graph below do not reflect the deduction of taxes that a shareholder would pay on Fund distributions or the redemption of Fund shares. The recent growth rate in the stock market has helped to produce short-term returns that are not typical and may not continue in the future.
The Russell 2000 Index is an unmanaged, market value weighted index that measures performance of the 2,000 companies that are between the 1,000th and 3,000th largest in the market with dividends reinvested. The Lipper Small-Cap Stock Funds Index is an index of small-company funds compiled by Lipper, Inc. The Lipper Small-Cap Core Funds Index is an index of small-company core funds compiled by Lipper, Inc. It is not possible to invest directly in an index. Periods longer than one year are annualized.
| | |
| | |
| 62 | | Semi-Annual Report | December 31, 2010 (Unaudited) |
| | |
Small-Cap Momentum Fund MANAGER’S COMMENTARY (continued) | | |
Small-Cap Momentum Fund vs. Russell 2000 Index, Lipper Small-Cap Stock Funds Index
& Lipper Small-Cap Core Funds Index from Inception 5/28/10 to 12/31/10
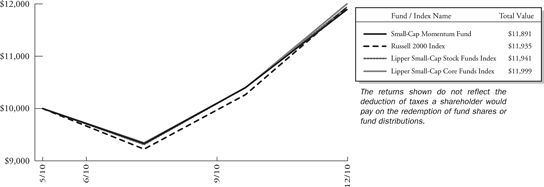
Detailed Explanation of Quarterly Performance
The Short Version: There was a very diverse group of companies in the best and worst contributors lists.
All in all, the December quarter was a nice period for stocks across most industries as five different sectors were represented on the top 10 list of contributors. Three holdings each from the energy and IT sectors made the best contributors list during the three month period.
These are the Fund’s ten best-contributing stocks for the quarter ended December 31, 2010:
| | | | | | |
Rank | | Description | | Industry | | % Contribution of Return |
| 1 | | RPC, Inc. | | Energy Equipment & Services | | 0.3% |
| 2 | | Acme Packet, Inc. | | Communications Equipment | | 0.3% |
| 3 | | Deckers Outdoor Corp. | | Textiles, Apparel & Luxury Goods | | 0.3% |
| 4 | | Isilon Systems, Inc. | | Computers & Peripherals | | 0.2% |
| 5 | | WABCO Holdings, Inc. | | Machinery | | 0.2% |
| 6 | | Loral Space & Communications, Inc. | | Communications Equipment | | 0.2% |
| 7 | | Apco Oil & Gas International, Inc. | | Oil, Gas & Consumable Fuels | | 0.2% |
| 8 | | Lufkin Industries, Inc. | | Energy Equipment & Services | | 0.2% |
| 9 | | Tenneco, Inc. | | Auto Components | | 0.2% |
| 10 | | American Capital Ltd. | | Capital Markets | | 0.2% |
Apparel company Deckers Outdoors has taken its popular winter-oriented UGGs brand and designed a summer line, complete with a slipper, sneaker, and clog. Additionally, it created a closed-toe hiking Teva to directly compete with Timberland. Given the immense popularity of both traditional UGGs and Teva, no one dares to bet against Deckers these days. The company has beaten earnings estimates in each of the past four quarters, and international sales are booming. Analysts believe its next growth phase will come from opening more retail stores to keep up with demand. Deckers contributed over a quarter-percent to the Fund’s return and its stock price rose over 50% for the December quarter.
Though the past few months saw “the return of the consumer” and many retailers thrived during the solid holiday shopping season, not all related companies fared quite so well. Three consumer discretionary holdings (including one retailer) were among the biggest detractors to the Fund; combined, they cost the Fund about a quarter-of-a-percent of return for the quarter.
| | |
Small-Cap Momentum Fund MANAGER’S COMMENTARY (continued) | | |
These are the Fund’s ten worst-contributing stocks for the quarter ended December 31, 2010:
| | | | | | |
| Rank | | Description | | Industry | | % Contribution of Return |
| 1 | | Alkermes, Inc. | | Biotechnology | | -0.1% |
| 2 | | Capella Education Co. | | Diversified Consumer Services | | -0.1% |
| 3 | | Renesola Ltd. | | Semiconductors & Semiconductor Equipment | | -0.1% |
| 4 | | Coinstar, Inc. | | Diversified Consumer Services | | -0.1% |
| 5 | | Transglobe Energy Corp. | | Oil, Gas & Consumable Fuels | | -0.1% |
| 6 | | Cytec Industries, Inc. | | Chemicals | | -0.1% |
| 7 | | DuPont Fabros Technology, Inc. | | Real Estate Investment Trusts | | -0.1% |
| 8 | | Oclaro, Inc. | | Communications Equipment | | -0.1% |
| 9 | | RadioShack Corp. | | Specialty Retail | | -0.1% |
| 10 | | Acorda Therapeutics, Inc. | | Biotechnology | | -0.1% |
Investors don’t take too kindly to negative news from the FDA. When the agency failed to approve the diabetes treatment Bydureon, several companies that were involved in the development suffered (biotechs Alkermes and Amylim, and pharmaceutical giant Eli Lilly). Alkermes plunged 30% on the negative news. The FDA wants further testing on the drug’s effect on heart rates, and the companies expect to respond by late-2011. Alkermes was the Fund’s biggest detractor and dropped over 25% for the three month period.
Detailed Explanation of Performance Since Inception
The Short Version: Health Care dominated the best contributors list, while Consumer Discretionary dominated the worst contributors list.
Health care reform has dominated much of the political discussion of the past year. The newly passed legislation still faces several hurdles, given the makeup of the new Congress. And yet, despite all the uncertainties in the industry, three related companies made the list of top contributors since Fund inception. Combined, these holdings added over a percent-and-a-quarter to the return of the Fund.
These are the Fund’s ten best-contributing stocks from inception on May 28, 2010 to December 31, 2010:
| | | | | | |
| Rank | | Description | | Industry | | % Contribution to Return |
| 1 | | Kronos Worldwide, Inc. | | Chemicals | | 1.2% |
| 2 | | Gran Tierra Energy, Inc. | | Oil, Gas & Consumable Fuels | | 0.8% |
| 3 | | Healthspring, Inc. | | Health Care Providers & Services | | 0.6% |
| 4 | | Universal American Corp. | | Health Care Providers & Services | | 0.4% |
| 5 | | RPC, Inc. | | Energy Equipment & Services | | 0.4% |
| 6 | | IDT Corp. | | Diversified Telecommunication Services | | 0.4% |
| 7 | | Enbridge Energy Management LLC | | Oil, Gas & Consumable Fuels | | 0.4% |
| 8 | | HeartWare International, Inc. | | Health Care Equipment & Supplies | | 0.4% |
| 9 | | Acme Packet, Inc. | | Communications Equipment | | 0.3% |
| 10 | | Southwest Gas Corp. | | Gas Utilities | | 0.3% |
At a time when many health care companies have struggled with the latest industry reform, Medicare Advantage provider Healthspring has seen membership soar and earnings increase. In fact, the company has surpassed analysts’ expectations in each of the past four quarters, and management recently raised earnings and revenue forecasts for the full year. In November, Healthspring acquired Bravo Health and expects the deal to reap additional earnings of about 50 cents for 2011. Since inception, the holding contributed over half-a-percent to the Fund’s return, and its stock climbed about 20%.
As was the case for the quarter, consumer discretionary companies highlighted the Fund’s detractors for this longer period, proving that even in strong times, laggards will normally exist in virtually every industry. Five related holdings made the worst contributors list; combined, the companies cost the Fund over a percent-and-a-half in return.
| | |
| | |
| 64 | | Semi-Annual Report | December 31, 2010 (Unaudited) |
| | |
Small-Cap Momentum Fund MANAGER’S COMMENTARY (continued) | | |
These are the Fund’s ten worst-contributing stocks from inception on May 28, 2010 to December 31, 2010:
| | | | | | |
| Rank | | Description | | Industry | | % Contribution to Return |
| 1 | | CVB Financial Corp. | | Commercial Banks | | -0.6% |
| 2 | | Brown Shoe Co, Inc. | | Specialty Retail | | -0.5% |
| 3 | | GSI Commerce, Inc. | | Internet Software & Services | | -0.4% |
| 4 | | Acxiom Corp. | | IT Services | | -0.4% |
| 5 | | Impax Laboratories, Inc. | | Pharmaceuticals | | -0.4% |
| 6 | | Radio One, Inc. | | Media | | -0.4% |
| 7 | | Pennsylvania Real Estate Investment Trust | | Real Estate Investment Trusts | | -0.3% |
| 8 | | DSW, Inc. | | Specialty Retail | | -0.3% |
| 9 | | McClatchy Co. | | Media | | -0.3% |
| 10 | | CEC Entertainment, Inc. | | Hotels, Restaurants & Leisure | | -0.2% |
CVB Financial is a bank holding company that serves small to mid-sized businesses and high net worth individuals, primarily in California. The institution was a participant in the government TARP program and was able to pay back its $130 million loan last year. In July, the bank received a subpoena from the SEC requesting information about its questionable lending practices and inadequate internal controls. As is often the case, class action lawsuits ensued on behalf of shareholders as the stock price plunged over 20% on the news of the investigation. CVB was the biggest detractor and cost the Fund over half-a-percent for the period.
Top Ten Holdings as of December 31, 2010
The Fund was broadly diversified, as no single stock accounted for even 1% of the net assets. In fact, only one industry (Aerospace/Defense) placed more than one company on the largest holdings list. Combined, the ten largest positions represented just under 7.5% of the total assets of the Fund.
| | | | | | |
| Rank | | Description | | Industry | | % of Net Assets |
| 1 | | RF Micro Devices, Inc. | | Semiconductors & Semiconductor Equipment | | 0.8% |
| 2 | | MBIA, Inc. | | Insurance | | 0.8% |
| 3 | | Genesee & Wyoming, Inc. | | Road & Rail | | 0.7% |
| 4 | | ADTRAN, Inc. | | Communications Equipment | | 0.7% |
| 5 | | Triumph Group, Inc. | | Aerospace & Defense | | 0.7% |
| 6 | | Esterline Technologies Corp. | | Aerospace & Defense | | 0.7% |
| 7 | | Hawaiian Electric Industries, Inc. | | Electric Utilities | | 0.7% |
| 8 | | Stillwater Mining Co. | | Metals & Mining | | 0.7% |
| 9 | | Alaska Air Group, Inc. | | Airlines | | 0.7% |
| 10 | | Syntel, Inc. | | IT Services | | 0.7% |
| | Total | | | | 7.2% |
Industry Sector Representation as of December 31, 2010
The Fund’s largest allocation was in Financials as many banks and other financial institutions continued to rebound from the recent doldrums. The Fund maintained a smaller allocation to Health Care than that of its benchmark. Many uncertainties surround the industry as it undergoes comprehensive reform. One over-weighted sector, Materials, has benefited from the increasing demand for commodities as emerging world markets significantly contributed to global growth.
| | |
Small-Cap Momentum Fund MANAGER’S COMMENTARY (continued) | | |
| | | | | | |
| | | % of Net Assets | | % of
Russell 2000
Index | | Difference |
Consumer Discretionary | | 12.5% | | 13.6% | | -1.1% |
Consumer Staples | | 5.3% | | 2.9% | | 2.4% |
Energy | | 5.3% | | 6.4% | | -1.1% |
Financials | | 20.9% | | 20.6% | | 0.3% |
Health Care | | 4.7% | | 12.4% | | -7.7% |
Industrials | | 16.5% | | 15.8% | | 0.7% |
Information Technology | | 16.1% | | 18.6% | | -2.5% |
Materials | | 8.7% | | 5.7% | | 3.0% |
Telecommunication Services | | 1.2% | | 1.0% | | 0.2% |
Utilities | | 7.7% | | 3.0% | | 4.7% |
Cash & Other Assets | | 1.1% | | 0.0% | | 1.1% |
Total | | 100.0% | | 100.0% | | |
Disclaimer
The views expressed here are exclusively those of Fund management. These views, including those related to market sectors or individual stocks, are not meant as investment advice and should not be considered predictive in nature. Any favorable (or unfavorable) description of a holding applies only as of the quarter end, December 31, 2010, unless otherwise stated. Security positions can and do change thereafter. Discussions of historical performance do not guarantee and are not indicative of future performance.
Market volatility can significantly impact short-term performance. The Fund is not an appropriate investment for short-term investors. Investments in small companies generally carry greater risk than is customarily associated with larger companies. This additional risk is attributable to a number of factors, including the relatively limited financial resources that are typically available to small companies and the fact that small companies often have comparatively limited product lines. In addition, the stock of small companies tends to be more volatile than the stock of large companies, particularly in the short term and particularly in the early stages of an economic or market downturn. Shareholders of the Fund, therefore, are taking on more risk than they would if they invested in the stock market as a whole.
Conclusion
Thank you for your continued investment in Small-Cap Momentum Fund. We encourage your feedback; your reactions and concerns are important to us.
Sincerely,
Your Investment Management Team
| | |
| | |
| 66 | | Semi-Annual Report | December 31, 2010 (Unaudited) |
| | |
Bridgeway Small-Cap Momentum Fund SCHEDULE OF INVESTMENTS | | |
| | |
| Showing percentage of net assets as of December 31, 2010 (Unaudited) | | |
| | | | | | | | | | |
Industry | | Company | | | Shares | | | | Value | |
COMMON STOCKS - 98.92% | |
Aerospace & Defense - 3.85% | |
| | AerCap Holdings NV* | | | 950 | | | $ | 13,414 | |
| | Astronics Corp.* | | | 100 | | | | 2,100 | |
| | CPI Aerostructures, Inc.* | | | 50 | | | | 704 | |
| | DigitalGlobe, Inc.* | | | 350 | | | | 11,098 | |
| | Esterline Technologies Corp.* | | | 250 | | | | 17,148 | |
| | GeoEye, Inc.* | | | 200 | | | | 8,478 | |
| | HEICO Corp.+ | | | 200 | | | | 10,206 | |
| | Herley Industries, Inc.* | | | 100 | | | | 1,732 | |
| | Hexcel Corp.* | | | 800 | | | | 14,472 | |
| | Triumph Group, Inc. | | | 200 | | | | 17,882 | |
| | | | | | | | | | |
| | | | | | | | | 97,234 | |
| |
Air Freight & Logistics - 0.16% | |
| | Air Transport Services Group, Inc.* | | | 500 | | | | 3,950 | |
| |
Airlines - 1.31% | |
| | Alaska Air Group, Inc.* | | | 300 | | | | 17,007 | |
| | Republic Airways Holdings, Inc.* | | | 400 | | | | 2,928 | |
| | US Airways Group, Inc.* | | | 1,300 | | | | 13,013 | |
| | | | | | | | | | |
| | | | | | | | | 32,948 | |
| |
Auto Components - 0.53% | |
| | Amerigon, Inc.* | | | 150 | | | | 1,632 | |
| | Dorman Products, Inc.* | | | 150 | | | | 5,436 | |
| | Motorcar Parts of America, Inc.* | | | 100 | | | | 1,304 | |
| | Shiloh Industries, Inc. | | | 150 | | | | 1,792 | |
| | Stoneridge, Inc.* | | | 200 | | | | 3,158 | |
| | | | | | | | | | |
| | | | | | | | | 13,322 | |
| |
Beverages - 0.60% | |
| | Boston Beer Co., Inc., Class A* | | | 100 | | | | 9,509 | |
| | Craft Brewers Alliance, Inc.* | | | 150 | | | | 1,110 | |
| | National Beverage Corp. | | | 350 | | | | 4,599 | |
| | | | | | | | | | |
| | | | | | | | | 15,218 | |
| |
Biotechnology - 0.84% | |
| | Emergent Biosolutions, Inc.* | | | 300 | | | | 7,038 | |
| | Neurocrine Biosciences, Inc.* | | | 450 | | | | 3,438 | |
| | NPS Pharmaceuticals, Inc.* | | | 550 | | | | 4,345 | |
| | Protalix BioTherapeutics, Inc.* | | | 650 | | | | 6,487 | |
| | | | | | | | | | |
| | | | | | | | | 21,308 | |
| |
Building Products - 0.53% | |
| | A.O. Smith Corp. | | | 350 | | | | 13,328 | |
| | | | | | | | | | |
Industry | | Company | | | Shares | | | | Value | |
| | | | | | | | | | |
Capital Markets - 2.20% | |
| | Arlington Asset Investment Corp., Class A+ | | | 50 | | | $ | 1,200 | |
| | BGC Partners, Inc., Class A | | | 1,850 | | | | 15,374 | |
| | BlackRock Kelso Capital Corp. | | | 550 | | | | 6,083 | |
| | Gladstone Capital Corp. | | | 150 | | | | 1,728 | |
| | Gladstone Investment Corp. | | | 200 | | | | 1,530 | |
| | HFF, Inc., Class A* | | | 450 | | | | 4,347 | |
| | Internet Capital Group, Inc.* | | | 300 | | | | 4,266 | |
| | Kohlberg Capital Corp. | | | 200 | | | | 1,394 | |
| | Main Street Capital Corp. | | | 150 | | | | 2,728 | |
| | MVC Capital, Inc. | | | 200 | | | | 2,920 | |
| | NGP Capital Resources Co. | | | 150 | | | | 1,380 | |
| | PennantPark Investment Corp. | | | 300 | | | | 3,672 | |
| | Safeguard Scientifics, Inc.* | | | 150 | | | | 2,562 | |
| | TICC Capital Corp. | | | 200 | | | | 2,242 | |
| | Triangle Capital Corp.+ | | | 100 | | | | 1,900 | |
| | Virtus Investment Partners, Inc.* | | | 50 | | | | 2,268 | |
| | | | | | | | | | |
| | | | | | | | | 55,594 | |
|
Chemicals - 3.09% | |
| | Ferro Corp.* | | | 700 | | | | 10,248 | |
| | Hawkins, Inc. | | | 100 | | | | 4,440 | |
| | Innophos Holdings, Inc. | | | 150 | | | | 5,412 | |
| | Kraton Performance Polymers, Inc.* | | | 250 | | | | 7,738 | |
| | LSB Industries, Inc.* | | | 150 | | | | 3,639 | |
| | Material Sciences Corp.* | | | 100 | | | | 639 | |
| | NL Industries, Inc. | | | 400 | | | | 4,464 | |
| | PolyOne Corp.* | | | 750 | | | | 9,367 | |
| | Quaker Chemical Corp. | | | 100 | | | | 4,167 | |
| | Sensient Technologies Corp. | | | 400 | | | | 14,692 | |
| | STR Holdings, Inc.*+ | | | 350 | | | | 7,000 | |
| | TPC Group, Inc.* | | | 150 | | | | 4,548 | |
| | Zagg, Inc.*+ | | | 200 | | | | 1,524 | |
| | | | | | | | | | |
| | | | | | | | | 77,878 | |
|
Commercial Banks - 1.55% | |
| | Alliance Financial Corp. | | | 50 | | | | 1,618 | |
| | Bank of Kentucky Financial Corp. | | | 50 | | | | 970 | |
| | Bank of the Ozarks, Inc.+ | | | 150 | | | | 6,502 | |
| | Community Bank System, Inc. | | | 250 | | | | 6,942 | |
| | Community Trust Bancorp, Inc. | | | 100 | | | | 2,896 | |
| | Lakeland Bancorp, Inc. | | | 200 | | | | 2,194 | |
| | Merchants Bancshares, Inc. | | | 50 | | | | 1,378 | |
| | |
Bridgeway Small-Cap Momentum Fund SCHEDULE OF INVESTMENTS (continued) | | |
| | |
| Showing percentage of net assets as of December 31, 2010 (Unaudited) | | |
| | | | | | | | | | |
Industry | | Company | | | Shares | | | | Value | |
Common Stocks (continued) | |
Commercial Banks (continued) | |
| | Middleburg Financial Corp. | | | 50 | | | $ | 713 | |
| | Oriental Financial Group, Inc. | | | 350 | | | | 4,372 | |
| | Sandy Spring Bancorp, Inc. | | | 200 | | | | 3,686 | |
| | Sterling Bancorp | | | 200 | | | | 2,094 | |
| | SY Bancorp, Inc. | | | 100 | | | | 2,455 | |
| | TowneBank | | | 200 | | | | 3,178 | |
| | | | | | | | | | |
| | | | | | | | | 38,998 | |
| |
Commercial Services & Supplies - 1.17% | |
| | A.T. Cross Co., Class A* | | | 100 | | | | 965 | |
| | Alexco Resource Corp.* | | | 450 | | | | 3,686 | |
| | CECO Environmental Corp.* | | | 100 | | | | 596 | |
| | Geo Group, Inc., (The)* | | | 500 | | | | 12,330 | |
| | Industrial Services of America, Inc.* | | | 50 | | | | 612 | |
| | Interface, Inc., Class A | | | 500 | | | | 7,825 | |
| | Intersections, Inc. | | | 150 | | | | 1,569 | |
| | Multi-Color Corp. | | | 100 | | | | 1,946 | |
| | | | | | | | | | |
| | | | | | | | | 29,529 | |
| |
Communications Equipment - 2.15% | |
| | ADTRAN, Inc. | | | 500 | | | | 18,105 | |
| | Alliance Fiber Optic Products, Inc.* | | | 50 | | | | 784 | |
| | Ixia* | | | 550 | | | | 9,229 | |
| | Numerex Corp., Class A* | | | 100 | | | | 897 | |
| | RADWARE, Ltd.* | | | 150 | | | | 5,626 | |
| | SeaChange International, Inc.* | | | 250 | | | | 2,138 | |
| | Silicom Ltd.* | | | 50 | | | | 931 | |
| | Tollgrade Communications, Inc.* | | | 100 | | | | 928 | |
| | Viasat, Inc.* | | | 350 | | | | 15,544 | |
| | | | | | | | | | |
| | | | | | | | | 54,182 | |
| |
Construction & Engineering - 0.08% | |
| | Furmanite Corp.* | | | 300 | | | | 2,073 | |
| |
Consumer Finance - 0.46% | |
| | CompuCredit Holdings Corp.* | | | 300 | | | | 2,094 | |
| | Nelnet, Inc., Class A | | | 400 | | | | 9,476 | |
| | | | | | | | | | |
| | | | | | | | | 11,570 | |
| |
Containers & Packaging - 0.22% | |
| | Boise, Inc. | | | 700 | | | | 5,551 | |
| |
Diversified Consumer Services - 0.90% | |
| | Carriage Services, Inc.* | | | 150 | | | | 728 | |
| | Coinstar, Inc.*+ | | | 250 | | | | 14,110 | |
| | | | | | | | | | |
Industry | | Company | | | Shares | | | | Value | |
| | | | | | | | | | |
Diversified Consumer Services (continued) | |
| | Collectors Universe | | | 50 | | | $ | 695 | |
| | CPI Corp. | | | 50 | | | | 1,128 | |
| | Pre-Paid Legal Services, Inc.* | | | 100 | | | | 6,025 | |
| | | | | | | | | | |
| | | | | | | | | 22,686 | |
|
Diversified Financial Services - 1.14% | |
| | Asta Funding, Inc. | | | 100 | | | | 810 | |
| | Compass Diversified Holdings | | | 350 | | | | 6,192 | |
| | MarketAxess Holdings, Inc. | | | 250 | | | | 5,202 | |
| | NewStar Financial, Inc.* | | | 400 | | | | 4,228 | |
| | Portfolio Recovery Associates, Inc.*+ | | | 150 | | | | 11,280 | |
| | Resource America, Inc., Class A | | | 150 | | | | 1,028 | |
| | | | | | | | | | |
| | | | | | | | | 28,740 | |
|
Diversified Telecommunication Services - 0.68% | |
| | Alaska Communications | | | | | | | | |
| | Systems Group, Inc.+ | | | 350 | | | | 3,885 | |
| | General Communication, Inc., Class A* | | | 400 | | | | 5,064 | |
| | IDT Corp., Class B | | | 200 | | | | 5,130 | |
| | Radcom, Ltd.* | | | 50 | | | | 547 | |
| | Vocaltec Communications, Ltd.* | | | 100 | | | | 2,493 | |
| | | | | | | | | | |
| | | | | | | | | 17,119 | |
|
Electric Utilities - 3.55% | |
| | Allete, Inc. | | | 150 | | | | 5,589 | |
| | Cleco Corp. | | | 500 | | | | 15,380 | |
| | El Paso Electric Co.* | | | 350 | | | | 9,636 | |
| | Empire District Electric Co. (The) | | | 350 | | | | 7,770 | |
| | Hawaiian Electric Industries, Inc. | | | 750 | | | | 17,092 | |
| | IDACORP, Inc. | | | 400 | | | | 14,792 | |
| | MGE Energy, Inc. | | | 200 | | | | 8,552 | |
| | Unisource Energy Corp. | | | 300 | | | | 10,752 | |
| | | | | | | | | | |
| | | | | | | | | 89,563 | |
|
Electrical Equipment - 2.23% | |
| | AZZ, Inc. | | | 100 | | | | 4,001 | |
| | EnerSys* | | | 400 | | | | 12,848 | |
| | Franklin Electric Co., Inc. | | | 200 | | | | 7,784 | |
| | II-VI, Inc.* | | | 250 | | | | 11,590 | |
| | Polypore International, Inc.* | | | 350 | | | | 14,255 | |
| | Vicor Corp. | | | 350 | | | | 5,740 | |
| | | | | | | | | | |
| | | | | | | | | 56,218 | |
| | |
| | |
| 68 | | Semi-Annual Report | December 31, 2010 (Unaudited) |
| | |
Bridgeway Small-Cap Momentum Fund SCHEDULE OF INVESTMENTS (continued) | | |
| | |
| Showing percentage of net assets as of December 31, 2010 (Unaudited) | | |
| | | | | | | | | | |
Industry | | Company | | | Shares | | | | Value | |
Common Stocks (continued) | |
Electronic Equipment, Instruments & Components - 2.03% | |
| | Coherent, Inc.* | | | 200 | | | $ | 9,028 | |
| | Daktronics, Inc. | | | 350 | | | | 5,572 | |
| | DDi Corp. | | | 150 | | | | 1,764 | |
| | DTS, Inc.* | | | 150 | | | | 7,357 | |
| | Kemet Corp.* | | | 200 | | | | 2,916 | |
| | LeCroy Corp.* | | | 150 | | | | 1,476 | |
| | Measurement Specialties, Inc.* | | | 100 | | | | 2,935 | |
| | Power-One, Inc.*+ | | | 850 | | | | 8,670 | |
| | RadiSys Corp.* | | | 200 | | | | 1,780 | |
| | Universal Display Corp.* | | | 300 | | | | 9,195 | |
| | Wayside Technology Group, Inc. | | | 50 | | | | 563 | |
| | | | | | | | | | |
| | | | | | | | | 51,256 | |
| |
Energy Equipment & Services - 0.99% | |
| | Lufkin Industries, Inc. | | | 250 | | | | 15,598 | |
| | Newpark Resources, Inc.* | | | 700 | | | | 4,312 | |
| | OYO Geospace Corp.* | | | 50 | | | | 4,955 | |
| | | | | | | | | | |
| | | | | | | | | 24,865 | |
| |
Food & Staples Retailing - 2.26% | |
| | Andersons, Inc. (The) | | | 150 | | | | 5,452 | |
| | Casey’s General Stores, Inc. | | | 300 | | | | 12,753 | |
| | Pricesmart, Inc. | | | 250 | | | | 9,508 | |
| | Ruddick Corp. | | | 400 | | | | 14,736 | |
| | United Natural Foods, Inc.* | | | 400 | | | | 14,672 | |
| | | | | | | | | | |
| | | | | | | | | 57,121 | |
| |
Food Products - 1.87% | |
| | B&G Foods, Inc. | | | 400 | | | | 5,492 | |
| | Cagle’s, Inc., Class A* | | | 50 | | | | 426 | |
| | Diamond Foods, Inc.+ | | | 150 | | | | 7,977 | |
| | Fresh Del Monte Produce, Inc. | | | 500 | | | | 12,475 | |
| | Hain Celestial Group, Inc. (The)* | | | 350 | | | | 9,471 | |
| | Omega Protein Corp.* | | | 150 | | | | 1,215 | |
| | SunOpta, Inc.* | | | 500 | | | | 3,910 | |
| | Zhongpin, Inc.* | | | 300 | | | | 6,120 | |
| | | | | | | | | | |
| | | | | | | | | 47,086 | |
| |
Gas Utilities - 2.73% | |
| | Chesapeake Utilities Corp. | | | 100 | | | | 4,152 | |
| | New Jersey Resources Corp. | | | 350 | | | | 15,088 | |
| | Northwest Natural Gas Co. | | | 200 | | | | 9,294 | |
| | South Jersey Industries, Inc. | | | 250 | | | | 13,205 | |
| | | | | | | | | | |
Industry | | Company | | | Shares | | | | Value | |
| | | | | | | | | | |
Gas Utilities (continued) | |
| | Southwest Gas Corp. | | | 350 | | | $ | 12,835 | |
| | WGL Holdings, Inc. | | | 400 | | | | 14,308 | |
| | | | | | | | | | |
| | | | | | | | | 68,882 | |
|
Health Care Equipment & Supplies - 1.57% | |
| | Delcath Systems, Inc.*+ | | | 350 | | | | 3,430 | |
| | DexCom, Inc.* | | | 500 | | | | 6,825 | |
| | HeartWare International, Inc.* | | | 100 | | | | 8,757 | |
| | LeMaitre Vascular, Inc.* | | | 100 | | | | 677 | |
| | Neogen Corp.* | | | 200 | | | | 8,206 | |
| | NxStage Medical, Inc.* | | | 400 | | | | 9,952 | |
| | Vascular Solutions, Inc.* | | | 150 | | | | 1,758 | |
| | | | | | | | | | |
| | | | | | | | | 39,605 | |
|
Health Care Providers & Services - 1.83% | |
| | Healthspring, Inc.* | | | 450 | | | | 11,938 | |
| | HMS Holdings Corp.* | | | 240 | | | | 15,545 | |
| | MWI Veterinary Supply, Inc.* | | | 100 | | | | 6,315 | |
| | Universal American Corp. | | | 600 | | | | 12,270 | |
| | | | | | | | | | |
| | | | | | | | | 46,068 | |
|
Health Care Technology - 0.05% | |
| | HealthStream, Inc.* | | | 150 | | | | 1,206 | |
|
Hotels, Restaurants & Leisure - 3.11% | |
| | BJ’s Restaurants, Inc.* | | | 200 | | | | 7,086 | |
| | Cracker Barrel Old Country Store, Inc. | | | 200 | | | | 10,954 | |
| | DineEquity, Inc.* | | | 150 | | | | 7,407 | |
| | Domino’s Pizza, Inc.* | | | 500 | | | | 7,975 | |
| | Famous Dave’s of America, Inc.* | | | 50 | | | | 557 | |
| | Gaylord Entertainment Co.* | | | 400 | | | | 14,376 | |
| | Krispy Kreme Doughnuts, Inc.* | | | 550 | | | | 3,839 | |
| | Life Time Fitness, Inc.*+ | | | 350 | | | | 14,346 | |
| | Luby’s, Inc.* | | | 200 | | | | 1,254 | |
| | Monarch Casino & Resort, Inc.* | | | 150 | | | | 1,875 | |
| | Morgans Hotel Group Co.* | | | 250 | | | | 2,268 | |
| | Ruby Tuesday, Inc.* | | | 500 | | | | 6,530 | |
| | | | | | | | | | |
| | | | | | | | | 78,467 | |
|
Household Durables - 0.11% | |
| | Kid Brands, Inc.* | | | 150 | | | | 1,282 | |
| | Lifetime Brands, Inc.* | | | 100 | | | | 1,404 | |
| | | | | | | | | | |
| | | | | | | | | 2,686 | |
| | |
Bridgeway Small-Cap Momentum Fund SCHEDULE OF INVESTMENTS (continued) | | |
| | |
| Showing percentage of net assets as of December 31, 2010 (Unaudited) | | |
| | | | | | | | | | |
Industry | | Company | | | Shares | | | | Value | |
Common Stocks (continued) | |
Household Products - 0.28% | |
| | Oil-Dri Corp. of America | | | 50 | | | $ | 1,074 | |
| | WD-40 Co. | | | 150 | | | | 6,042 | |
| | | | | | | | | | |
| | | | | | | | | 7,116 | |
| |
Insurance - 4.38% | |
| | American Safety Insurance Holdings, Ltd.* | | | 100 | | | | 2,138 | |
| | Eastern Insurance Holdings, Inc. | | | 50 | | | | 595 | |
| | Employers Holdings, Inc. | | | 300 | | | | 5,244 | |
| | Enstar Group, Ltd.* | | | 100 | | | | 8,458 | |
| | FBL Financial Group, Inc., Class A | | | 250 | | | | 7,168 | |
| | FPIC Insurance Group, Inc.* | | | 50 | | | | 1,848 | |
| | Global Indemnity PLC* | | | 350 | | | | 7,157 | |
| | Horace Mann Educators Corp. | | | 300 | | | | 5,412 | |
| | Infinity Property & Casualty Corp. | | | 100 | | | | 6,180 | |
| | Kansas City Life Insurance Co. | | | 100 | | | | 3,303 | |
| | Maiden Holdings, Ltd. | | | 550 | | | | 4,323 | |
| | MBIA, Inc.*+ | | | 1,700 | | | | 20,383 | |
| | Meadowbrook Insurance Group, Inc. | | | 400 | | | | 4,100 | |
| | OneBeacon Insurance Group, Ltd., Class A | | | 750 | | | | 11,370 | |
| | Platinum Underwriters Holdings, Ltd. | | | 300 | | | | 13,491 | |
| | Safety Insurance Group, Inc. | | | 100 | | | | 4,757 | |
| | United Fire & Casualty Co. | | | 200 | | | | 4,464 | |
| | | | | | | | | | |
| | | | | | | | | 110,391 | |
| |
Internet & Catalog Retail - 0.91% | |
| | HSN, Inc.* | | | 450 | | | | 13,788 | |
| | Shutterfly, Inc.* | | | 200 | | | | 7,006 | |
| | US Auto Parts Network, Inc.* | | | 250 | | | | 2,100 | |
| | | | | | | | | | |
| | | | | | | | | 22,894 | |
| |
Internet Software & Services - 1.97% | |
| | Ancestry.com, Inc.* | | | 350 | | | | 9,912 | |
| | comScore, Inc.* | | | 250 | | | | 5,578 | |
| | Insweb Corp.* | | | 50 | | | | 412 | |
| | LogMeln, Inc.* | | | 200 | | | | 8,868 | |
| | OpenTable, Inc.* | | | 190 | | | | 13,391 | |
| | RADVision, Ltd.* | | | 150 | | | | 1,345 | |
| | Stamps.com, Inc. | | | 100 | | | | 1,325 | |
| | Support.com, Inc.* | | | 400 | | | | 2,592 | |
| | Travelzoo, Inc.*+ | | | 150 | | | | 6,183 | |
| | | | | | | | | | |
| | | | | | | | | 49,606 | |
| | | | | | | | | | |
Industry | | Company | | | Shares | | | | Value | |
| | | | | | | | | | |
IT Services - 1.98% | |
| | iGate Corp. | | | 450 | | | $ | 8,870 | |
| | Lionbridge Technologies, Inc.* | | | 500 | | | | 1,845 | |
| | Sapient Corp. | | | 1,100 | | | | 13,310 | |
| | SRA International, Inc., Class A* | | | 450 | | | | 9,203 | |
| | Syntel, Inc. | | | 350 | | | | 16,726 | |
| | | | | | | | | | |
| | | | | | | | | 49,954 | |
Leisure Equipment & Products - 0.83% | |
| | Brunswick Corp. | | | 700 | | | | 13,118 | |
| | Clarus Corp.* | | | 150 | | | | 1,186 | |
| | Jakks Pacific, Inc.* | | | 200 | | | | 3,644 | |
| | Sturm Ruger & Co., Inc. | | | 150 | | | | 2,294 | |
| | Summer Infant, Inc.* | | | 100 | | | | 758 | |
| | | | | | | | | | |
| | | | | | | | | 21,000 | |
|
Life Sciences Tools & Services - 0.27% | |
| | Medtox Scientific, Inc. | | | 50 | | | | 655 | |
| | Nordion, Inc.* | | | 550 | | | | 6,264 | |
| | | | | | | | | | |
| | | | | | | | | 6,919 | |
|
Machinery - 3.83% | |
| | ArvinMeritor, Inc.* | | | 750 | | | | 15,390 | |
| | China Yuchai International, Ltd. | | | 300 | | | | 9,507 | |
| | Commercial Vehicle Group, Inc.* | | | 250 | | | | 4,063 | |
| | FreightCar America, Inc. | | | 100 | | | | 2,894 | |
| | Greenbrier Cos., Inc.* | | | 150 | | | | 3,148 | |
| | Middleby Corp.* | | | 150 | | | | 12,663 | |
| | NN, Inc.* | | | 150 | | | | 1,854 | |
| | Sauer-Danfoss, Inc.* | | | 400 | | | | 11,300 | |
| | Tennant Co. | | | 150 | | | | 5,762 | |
| | Toro Co. (The) | | | 250 | | | | 15,410 | |
| | TriMas Corp.* | | | 250 | | | | 5,115 | |
| | Twin Disc, Inc. | | | 100 | | | | 2,986 | |
| | Westport Innovations, Inc.* | | | 350 | | | | 6,482 | |
| | | | | | | | | | |
| | | | | | | | | 96,574 | |
|
Media - 0.91% | |
| | Ascent Media Corp., Class A* | | | 100 | | | | 3,876 | |
| | Ballantyne Strong, Inc.* | | | 100 | | | | 777 | |
| | Fisher Communications, Inc.* | | | 50 | | | | 1,090 | |
| | Insignia Systems, Inc.* | | | 150 | | | | 980 | |
| | MDC Partners, Inc., Class A | | | 250 | | | | 4,318 | |
| | National CineMedia, Inc. | | | 450 | | | | 8,959 | |
| | |
| | |
| 70 | | Semi-Annual Report | December 31, 2010 (Unaudited) |
| | |
Bridgeway Small-Cap Momentum Fund SCHEDULE OF INVESTMENTS (continued) | | |
| | |
| Showing percentage of net assets as of December 31, 2010 (Unaudited) | | |
| | | | | | | | | | |
Industry | | Company | | | Shares | | | | Value | |
Common Stocks (continued) | |
Media (continued) | |
| | Rentrak Corp.* | | | 100 | | | $ | 3,016 | |
| | | | | | | | | | |
| | | | | | | | | 23,016 | |
| |
Metals & Mining - 5.21% | |
| | A.M. Castle & Co.* | | | 200 | | | | 3,682 | |
| | Aurizon Mines, Ltd.* | | | 1,300 | | | | 9,516 | |
| | Brush Engineered Materials, Inc.* | | | 150 | | | | 5,796 | |
| | Fronteer Gold, Inc.* | | | 950 | | | | 11,143 | |
| | Globe Specialty Metals, Inc. | | | 600 | | | | 10,254 | |
| | Gold Resource Corp. | | | 400 | | | | 11,760 | |
| | Golden Star Resources, Ltd.* | | | 2,050 | | | | 9,409 | |
| | MAG Silver Corp.* | | | 450 | | | | 5,598 | |
| | Nevsun Resources, Ltd.* | | | 1,550 | | | | 11,672 | |
| | Puda Coal, Inc.*+ | | | 150 | | | | 2,138 | |
| | Silvercorp Metals, Inc. | | | 1,300 | | | | 16,679 | |
| | Stillwater Mining Co.* | | | 800 | | | | 17,080 | |
| | Tanzanian Royalty Exploration Corp.* | | | 750 | | | | 5,475 | |
| | Universal Stainless & Alloy* | | | 50 | | | | 1,564 | |
| | US Gold Corp.* | | | 1,050 | | | | 8,474 | |
| | WHX Corp.* | | | 100 | | | | 1,298 | |
| | | | | | | | | | |
| | | | | | | | | 131,538 | |
| |
Multiline Retail - 0.55% | |
| | Saks, Inc.* | | | 1,300 | | | | 13,910 | |
| |
Multi-Utilities - 1.39% | |
| | Avista Corp. | | | 450 | | | | 10,134 | |
| | Black Hills Corp. | | | 300 | | | | 9,000 | |
| | CH Energy Group, Inc. | | | 150 | | | | 7,333 | |
| | NorthWestern Corp. | | | 300 | | | | 8,649 | |
| | | | | | | | | | |
| | | | | | | | | 35,116 | |
| |
Oil, Gas & Consumable Fuels - 4.31% | |
| | Apco Oil & Gas International, Inc.+ | | | 250 | | | | 14,375 | |
| | Clayton Williams Energy, Inc.* | | | 100 | | | | 8,397 | |
| | Enbridge Energy Management LLC* | | | 152 | | | | 9,705 | |
| | GeoResources, Inc.* | | | 150 | | | | 3,332 | |
| | Harvest Natural Resources, Inc.* | | | 250 | | | | 3,042 | |
| | International Coal Group, Inc.* | | | 1,600 | | | | 12,384 | |
| | Knightsbridge Tankers, Ltd.+ | | | 200 | | | | 4,454 | |
| | L&L Energy, Inc.* | | | 250 | | | | 2,700 | |
| | Northern Oil & Gas, Inc.* | | | 400 | | | | 10,884 | |
| | Petroleum Development Corp.* | | | 200 | | | | 8,442 | |
| | | | | | | | | | |
Industry | | Company | | | Shares | | | | Value | |
| | | | | | | | | | |
Oil, Gas & Consumable Fuels (continued) | |
| | Ship Finance International, Ltd. | | | 650 | | | $ | 13,988 | |
| | Teekay Tankers, Ltd., Class A+ | | | 400 | | | | 4,936 | |
| | Transglobe Energy Corp.* | | | 550 | | | | 8,784 | |
| | Vaalco Energy, Inc.* | | | 450 | | | | 3,222 | |
| | | | | | | | | | |
| | | | | | | | | 108,645 | |
|
Paper & Forest Products - 0.42% | |
| | Clearwater Paper Corp.* | | | 100 | | | | 7,830 | |
| | Mercer International, Inc.*+ | | | 350 | | | | 2,712 | |
| | | | | | | | | | |
| | | | | | | | | 10,542 | |
|
Personal Products - 0.63% | |
| | Inter Parfums, Inc. | | | 250 | | | | 4,712 | |
| | Medifast, Inc.* | | | 100 | | | | 2,888 | |
| | Schiff Nutrition International, Inc. | | | 200 | | | | 1,816 | |
| | USANA Health Sciences, Inc.* | | | 150 | | | | 6,518 | |
| | | | | | | | | | |
| | | | | | | | | 15,934 | |
|
Pharmaceuticals - 1.23% | |
| | Medicis Pharmaceutical Corp., Class A | | | 500 | | | | 13,395 | |
| | Questcor Pharmaceuticals, Inc.* | | | 500 | | | | 7,365 | |
| | Viropharma, Inc.* | | | 600 | | | | 10,392 | |
| | | | | | | | | | |
| | | | | | | | | 31,152 | |
|
Professional Services - 0.59% | |
| | Acacia Research - Acacia Technologies* | | | 300 | | | | 7,782 | |
| | Advisory Board Co. (The)* | | | 150 | | | | 7,144 | |
| | | | | | | | | | |
| | | | | | | | | 14,926 | |
|
Real Estate Investment Trusts (REITs) - 10.84% | |
| | Acadia Realty Trust | | | 550 | | | | 10,032 | |
| | Agree Realty Corp. | | | 100 | | | | 2,619 | |
| | Ashford Hospitality Trust, Inc.* | | | 400 | | | | 3,860 | |
| | Associated Estates Realty Corp. | | | 350 | | | | 5,352 | |
| | Colonial Properties Trust | | | 600 | | | | 10,830 | |
| | DiamondRock Hospitality Co.* | | | 1,250 | | | | 15,000 | |
| | DuPont Fabros Technology, Inc.+ | | | 500 | | | | 10,635 | |
| | Education Realty Trust, Inc. | | | 450 | | | | 3,496 | |
| | Equity Lifestyle Properties, Inc. | | | 250 | | | | 13,982 | |
| | |
Bridgeway Small-Cap Momentum Fund SCHEDULE OF INVESTMENTS (continued) | | |
| | |
| Showing percentage of net assets as of December 31, 2010 (Unaudited) | | |
| | | | | | | | | | |
Industry | | Company | | | Shares | | | | Value | |
Common Stocks (continued) | |
Real Estate Investment Trusts (REITs) (continued) | |
| | Extra Space Storage, Inc. | | | 700 | | | $ | 12,180 | |
| | First Potomac Realty Trust | | | 400 | | | | 6,728 | |
| | Getty Realty Corp.+ | | | 250 | | | | 7,820 | |
| | Gladstone Commercial Corp. | | | 50 | | | | 942 | |
| | Glimcher Realty Trust | | | 700 | | | | 5,880 | |
| | Government Properties Income Trust | | | 300 | | | | 8,037 | |
| | Healthcare Realty Trust, Inc. | | | 500 | | | | 10,585 | |
| | Hersha Hospitality Trust | | | 1,350 | | | | 8,910 | |
| | Home Properties, Inc.+ | | | 300 | | | | 16,647 | |
| | Lexington Realty Trust+ | | | 1,050 | | | | 8,348 | |
| | Medical Properties Trust, Inc. | | | 900 | | | | 9,747 | |
| | National Health Investors, Inc. | | | 200 | | | | 9,004 | |
| | Pennsylvania Real Estate Investment Trust+ | | | 450 | | | | 6,539 | |
| | Post Properties, Inc. | | | 400 | | | | 14,520 | |
| | PS Business Parks, Inc. | | | 200 | | | | 11,144 | |
| | Ramco-Gershenson Properties Trust | | | 300 | | | | 3,735 | |
| | Saul Centers, Inc. | | | 150 | | | | 7,102 | |
| | Sovran Self Storage, Inc. | | | 200 | | | | 7,362 | |
| | Sun Communities, Inc.+ | | | 150 | | | | 4,996 | |
| | Tanger Factory Outlet Centers | | | 300 | | | | 15,357 | |
| | Urstadt Biddle Properties, Inc., Class A | | | 200 | | | | 3,890 | |
| | Washington Real Estate Investment Trust+ | | | 500 | | | | 15,495 | |
| | Winthrop Realty Trust | | | 200 | | | | 2,558 | |
| | | | | | | | | | |
| | | | | | | | | 273,332 | |
| |
Road & Rail - 1.91% | |
| | Amerco, Inc.* | | | 150 | | | | 14,406 | |
| | Covenant Transportation Group, Inc., Class A* | | | 100 | | | | 972 | |
| | Genesee & Wyoming, Inc., Class A* | | | 350 | | | | 18,532 | |
| | Old Dominion Freight Line, Inc.* | | | 450 | | | | 14,396 | |
| | | | | | | | | | |
| | | | | | | | | 48,306 | |
| |
Semiconductors & Semiconductor Equipment - 4.42% | |
| | Applied Micro Circuits Corp.* | | | 500 | | | | 5,340 | |
| | AXT, Inc.* | | | 250 | | | | 2,610 | |
| | Cirrus Logic, Inc.*+ | | | 550 | | | | 8,789 | |
| | Entropic Communications, Inc.*+ | | | 650 | | | | 7,852 | |
| | | | | | | | | | |
Industry | | Company | | | Shares | | | | Value | |
| | | | | | | | | | |
Semiconductors & Semiconductor Equipment (continued) | |
| | EZchip Semiconductor, Ltd.* | | | 200 | | | $ | 5,620 | |
| | GSI Technology, Inc.* | | | 200 | | | | 1,620 | |
| | GT Solar International, Inc.*+ | | | 1,200 | | | | 10,944 | |
| | IXYS Corp* | | | 250 | | | | 2,905 | |
| | MIPS Technologies, Inc.* | | | 400 | | | | 6,064 | |
| | Omnivision Technologies, Inc.* | | | 450 | | | | 13,325 | |
| | QuickLogic Corp.* | | | 300 | | | | 1,911 | |
| | RF Micro Devices, Inc.* | | | 2,800 | | | | 20,580 | |
| | Rubicon Technology, Inc.* | | | 200 | | | | 4,216 | |
| | Semtech Corp.* | | | 500 | | | | 11,320 | |
| | Silicon Image, Inc.* | | | 600 | | | | 4,410 | |
| | Ultratech, Inc.* | | | 200 | | | | 3,976 | |
| | | | | | | | | | |
| | | | | | | | | 111,482 | |
|
Software - 2.78% | |
| | Advent Software, Inc.*+ | | | 200 | | | | 11,584 | |
| | Allot Communications, Ltd.* | | | 200 | | | | 2,328 | |
| | DemandTec, Inc.* | | | 250 | | | | 2,710 | |
| | Digimarc Corp.* | | | 50 | | | | 1,500 | |
| | Ebix, Inc.* | | | 300 | | | | 7,101 | |
| | Lawson Software, Inc.* | | | 1,300 | | | | 12,025 | |
| | Netscout Systems, Inc.* | | | 350 | | | | 8,054 | |
| | Opnet Technologies, Inc. | | | 150 | | | | 4,016 | |
| | Radiant Systems, Inc.* | | | 300 | | | | 5,871 | |
| | Sonic Foundry, Inc.* | | | 50 | | | | 694 | |
| | Taleo Corp., Class A* | | | 300 | | | | 8,295 | |
| | VirnetX Holding Corp.+ | | | 400 | | | | 5,940 | |
| | | | | | | | | | |
| | | | | | | | | 70,118 | |
|
Specialty Retail - 1.15% | |
| | Cost Plus, Inc.* | | | 200 | | | | 1,940 | |
| | Hastings Entertainment, Inc.* | | | 50 | | | | 306 | |
| | Hibbett Sports, Inc.* | | | 250 | | | | 9,225 | |
| | Jos. A. Bank Clothiers, Inc.* | | | 200 | | | | 8,064 | |
| | Monro Muffler Brake, Inc. | | | 225 | | | | 7,783 | |
| | Winmark Corp. | | | 50 | | | | 1,682 | |
| | | | | | | | | | |
| | | | | | | | | 29,000 | |
|
Textiles, Apparel & Luxury Goods - 1.79% | |
| | Crocs, Inc.* | | | 700 | | | | 11,984 | |
| | Iconix Brand Group, Inc.* | | | 600 | | | | 11,586 | |
| | K-Swiss, Inc., Class A* | | | 300 | | | | 3,741 | |
| | LJ International, Inc.*+ | | | 250 | | | | 972 | |
| | Maidenform Brands, Inc.* | | | 200 | | | | 4,754 | |
| | R.G. Barry Corp. | | | 100 | | | | 1,112 | |
| | Steven Madden, Ltd.* | | | 200 | | | | 8,344 | |
| | |
| | |
| 72 | | Semi-Annual Report | December 31, 2010 (Unaudited) |
| | |
Bridgeway Small-Cap Momentum Fund SCHEDULE OF INVESTMENTS (continued) | | |
| | |
| Showing percentage of net assets as of December 31, 2010 (Unaudited) | | |
| | | | | | | | | | |
Industry | | Company | | | Shares | | | | Value | |
Common Stocks (continued) | |
Textiles, Apparel & Luxury Goods (continued) | |
| | Unifi, Inc.* | | | 150 | | | $ | 2,540 | |
| | | | | | | | | | |
| | | | | | | | | 45,033 | |
| |
Thrifts & Mortgage Finance - 0.35% | |
| | Abington Bancorp, Inc. | | | 150 | | | | 1,790 | |
| | Federal Agricultural Mortgage Corp., Class C+ | | | 100 | | | | 1,632 | |
| | First Pactrust Bancorp, Inc. | | | 50 | | | | 663 | |
| | Meridian Interstate Bancorp, Inc.* | | | 200 | | | | 2,358 | |
| | WSFS Financial Corp. | | | 50 | | | | 2,372 | |
| | | | | | | | | | |
| | | | | | | | | 8,815 | |
| |
Trading Companies & Distributors - 1.99% | |
| | Applied Industrial Technologies, Inc. | | | 350 | | | | 11,368 | |
| | CAI International, Inc.* | | | 150 | | | | 2,940 | |
| | DXP Enterprises, Inc.* | | | 100 | | | | 2,400 | |
| | TAL International Group, Inc. | | | 250 | | | | 7,718 | |
| | Textainer Group Holdings, Ltd. | | | 400 | | | | 11,396 | |
| | Titan Machinery, Inc.* | | | 150 | | | | 2,895 | |
| | United Rentals, Inc.* | | | 500 | | | | 11,375 | |
| | | | | | | | | | |
| | | | | | | | | 50,092 | |
| |
Water Utilities - 0.07% | |
| | York Water Co. | | | 100 | | | | 1,729 | |
| |
Wireless Telecommunication Services - 0.14% | |
| | USA Mobility, Inc. | | | 200 | | | | 3,554 | |
| | | | | | | | | | |
TOTAL COMMON STOCKS - 98.92% | | | | 2,494,945 | |
| | | | | | | | | | |
(Cost $2,287,246) | | | | | |
| |
EXCHANGE TRADED FUND - 1.29% | |
| | iShares Russell 2000 Index Fund | | | 415 | | | | 32,466 | |
| | | | | | | | | | |
TOTAL EXCHANGE TRADED FUND - 1.29% | | | | 32,466 | |
| | | | | | | | | | |
(Cost $32,064) | | | | | |
| |
TOTAL INVESTMENTS - 100.21% | | | $ | 2,527,411 | |
(Cost $2,319,310) | | | | | |
Liabilities in Excess of Other Assets - (0.21%) | | | | (5,245 | ) |
| | | | | | | | | | |
NET ASSETS - 100.00% | | | $ | 2,522,166 | |
| | | | | | | | | | |
* Non-income producing security. + This security or a portion of the security is out on loan at December 31, 2010. Total loaned securities had a market value of $249,233 at December 31, 2010. LLC - Limited Liability Company PLC - Public Limited Company | |
Summary of inputs used to value the Fund’s investments as of 12/31/2010 are as follows (See Note 2 in Notes to Financial Statements):
| | | | | | | | | | | | | | | | |
| | | Valuation Inputs | |
| | | Investment in Securities (Market Value) | |
| | | Level 1
Quoted
Prices | | | Level 2
Significant
Observable
Inputs | | | Level 3
Significant
Unobservable
Inputs | | | Total | |
| | | | |
Common | | | | | | | | | | | | | | | | |
Stocks | | $ | 2,494,945 | | | $ | — | | | $ | — | | | $ | 2,494,945 | |
Exchange-Traded | | | | | | | | | | | | | | | | |
Fund | | | 32,466 | | | | — | | | | — | | | | 32,466 | |
| | | | | | | | | | | | | | | | |
TOTAL | | $ | 2,527,411 | | | $ | — | | | $ | — | | | $ | 2,527,411 | |
| | | | | | | | | | | | | | | | |
See Notes to Financial Statements.
| | |
Small-Cap Growth Fund MANAGER’S COMMENTARY | | |
December 31, 2010
Dear Fellow Small-Cap Growth Fund Shareholder,
For the December 2010 quarter, Small-Cap Growth Fund ended the year with a return of 9.99%, significantly lagging its primary market benchmark, the Russell 2000 Growth Index (+17.11%) and its peer benchmark, the Lipper Small-Cap Growth Funds Index (+15.57%). It was a very poor quarter on a relative basis.
For the six-month “semi-annual” period ending December 31, 2010, our Fund jumped 20.82%, still heavily underperforming its benchmarks, the Russell 2000 Growth Index (+32.14%) and the Lipper Small-Cap Growth Funds Index (+30.12%). The equity markets as a whole rebounded nicely from a summer slump in the September through December timeframe, as investors were rewarded for their patience through the sovereign debt crisis. Our Fund’s relative returns were held back by some relatively poor picks among Information Technology Stocks, as described in the quarterly report below. The results for the quarter and semi-annual period were particularly disappointing given that our models performed well by some fundamental economic measures; the percentage of our companies beating Wall Street estimates was much stronger than that of our primary market benchmark. We have not been rewarded for this part of our models’ performance over the last year.
For the calendar year, Small-Cap Growth Fund returned 11.77%, significantly underperforming its primary market benchmark, the Russell 2000 Growth Index (+29.09%) and its peer benchmark, the Lipper Small-Cap Growth Funds Index (+26.08%). The last time our inception-to-date performance was above that of our primary market benchmark was just before the recession, at the end of the June quarter in 2008. We have quite a bit of catch-up to do now.
The table below presents our December quarter, six-month, one-year, five-year, and life-to-date financial results according to the formula required by the SEC. See the next page for a graph of performance since inception.
| | | | | | | | | | |
| | | Dec. Qtr.
10/1/10
to 12/31/10 | | 6 Month
7/1/10
to 12/31/10 | | 1 Year
1/1/10
to 12/31/10 | | 5 Year
1/1/06
to 12/31/10 | | Life-to-Date
10/31/03
to 12/31/10 |
| | | | | |
| Small-Cap Growth Fund | | 9.99% | | 20.82% | | 11.77% | | -3.94% | | 1.45% |
Russell 2000 Growth Index | | 17.11% | | 32.14% | | 29.09% | | 5.30% | | 6.76% |
Lipper Small-Cap Growth Funds Index | | 15.57% | | 30.12% | | 26.08% | | 3.92% | | 5.36% |
Performance figures quoted in the table above and graph below represent past performance and are no guarantee of future results. Total return figures in the table above and the graph below include the reinvestment of dividends and capital gains. The table above and the graph below do not reflect the deduction of taxes that a shareholder would pay on Fund distributions or the redemption of Fund shares. The recent growth rate in the stock market has helped to produce short-term returns that are not typical and may not continue in the future.
The Russell 2000 Growth Index is an unmanaged index that consists of stocks in the Russell 2000 Index with higher price-to-book ratios and higher forecasted growth values with dividends reinvested. The Lipper Small-Cap Growth Funds Index is an index of small-company, growth-oriented funds compiled by Lipper, Inc. It is not possible to invest directly in an index. Periods longer than one year are annualized.
According to data from Lipper, Inc. as of December 31, 2010, Small-Cap Growth Fund ranked 490th of 499 small-cap growth funds for the twelve-month period ended December 31, 2010, 385th of 386 over the last five years and 313th of 318 such funds since inception in October, 2003. Lipper, Inc. is an independent mutual fund rating service that ranks funds in various fund categories by making comparative calculations using total returns.
| | |
| | |
| 74 | | Semi-Annual Report | December 31, 2010 (Unaudited) |
| | |
Small-Cap Growth Fund MANAGER’S COMMENTARY (continued) | | |
Small-Cap Growth Fund vs. Russell 2000 Growth Index & Lipper Small-Cap Growth Funds Index
from Inception 10/31/03 to 12/31/10
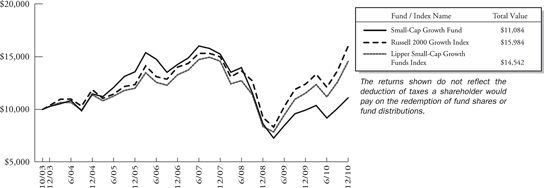
Detailed Explanation of Quarterly Performance
The Short Version: In spite of some strongly performing companies across a number of industries, the damage done by some of our Information Technology companies significantly held back our quarterly performance.
All in all, the December quarter was a nice period for stocks across most industries; seven different sectors were represented on the top ten contributors list. Of note, three consumer-related companies highlighted the list as enhanced retail activity contributed to a nice holiday season. These three holdings combined to add over a percent-and-a-half to the Fund’s return. Industrials and Financials were also well-represented with two holdings from both sectors making the list.
These are the Fund’s ten best-contributing stocks for the quarter ended December 31, 2010:
| | | | | | |
| Rank | | Description | | Industry | | % Contribution to Return |
| 1 | | Boston Beer Co., Inc. | | Beverages | | 0.9% |
| 2 | | TriMas Corp. | | Machinery | | 0.6% |
| 3 | | L&L Energy, Inc. | | Oil, Gas & Consumable Fuels | | 0.5% |
| 4 | | Crocs, Inc. | | Textiles, Apparel & Luxury Goods | | 0.5% |
| 5 | | Virtus Investment Partners, Inc. | | Capital Markets | | 0.5% |
| 6 | | Altra Holdings, Inc. | | Machinery | | 0.4% |
| 7 | | Ezcorp, Inc. | | Consumer Finance | | 0.4% |
| 8 | | Brush Engineered Materials, Inc. | | Metals & Mining | | 0.4% |
| 9 | | Lattice Semiconductor Corp. | | Semiconductors & Semiconductor Equipment | | 0.4% |
| 10 | | American Axle & Manufacturing Holdings, Inc. | | Auto Components | | 0.4% |
Though bank lending activity has picked up for institutions and well-to-do consumers, many individuals still have trouble accessing needed funds. Ezcorp provides short-term financing to individuals through pawn loans, payday loans, title loans, and other credit services. The company has seen its business pick up in the aftermath of the credit crisis. In its recent quarter, earnings jumped by one-third on 20% revenue growth. Management also offered an above-average forecast for the full year. In 2010, Ezcorp was in expansion mode as 127 new stores were opened throughout North America. Its stock soared over 30% during the three-month period and contributed just less than half a percent to the Fund’s return.
| | |
Small-Cap Growth Fund MANAGER’S COMMENTARY (continued) | | |
Information Technology companies hurt the most this past quarter as six related holdings were among the Fund’s poorest performers. In certain cases, corporations have limited technology purchases in order to keep costs in check and make earnings look stronger. The delayed activity has hindered IT companies, many of which are still expecting a major surge in upgrades, but continue to wait out the economic uncertainty for another quarter or two (and hopefully not much longer). The six IT holdings on the worst contributors list cost the Fund over a percent-and-a-half in return.
These are the Fund’s ten worst-contributing stocks for the quarter ended December 31, 2010:
| | | | | | |
| Rank | | Description | | Industry | | % Contribution to Return |
| 1 | | Nanometrics, Inc. | | Semiconductors & Semiconductor Equipment | | -0.4% |
| 2 | | Newpark Resources, Inc. | | Energy Equipment & Services | | -0.3% |
| 3 | | EnerNOC, Inc. | | Commercial Services & Supplies | | -0.3% |
| 4 | | Integrated Silicon Solution, Inc. | | Semiconductors & Semiconductor Equipment | | -0.3% |
| 5 | | Corinthian Colleges, Inc. | | Diversified Consumer Services | | -0.3% |
| 6 | | Lionbridge Technologies, Inc. | | IT Services | | -0.3% |
| 7 | | Cirrus Logic, Inc. | | Semiconductors & Semiconductor Equipment | | -0.2% |
| 8 | | 99 Cents Only Stores | | Multiline Retail | | -0.2% |
| 9 | | Insight Enterprises, Inc. | | Electronic Equip., Instruments & Components | | -0.2% |
| 10 | | Checkpoint Systems, Inc. | | Electronic Equip., Instruments & Components | | -0.2% |
Newpark Resources battles the big boys (i.e. Schlumberger and Halliburton) in providing various management, disposal, and well preparation services to the exploration and production industry. In October, the company posted a disappointing quarterly earnings report, and its stock plummeted about 30% on the news. While Newpark has touted its water-based drilling systems, the recent report showed weaker-than-anticipated demand. For the quarter, Newpark dropped 25% and cost the Fund over a quarter percent in return.
Detailed Explanation of Calendar Year Performance
The Short Version: Consumer stocks highlighted both the best and worst contributors lists.
The calendar year could be deemed “the return of the consumer” as retailers reported their best holiday season since the beginning of the economic downturn. Three consumer discretionary companies and one consumer staple highlighted the list of top-ten contributing stocks; combined, they contributed about four percent to the overall return of the Fund. Interestingly, three IT stocks made the list for 2010; our models detected certain winners despite other challenges in the sector, as described below.
These are the Fund’s ten best-contributing stocks for the calendar year ended December 31, 2010:
| | | | | | |
| Rank | | Description | | Industry | | % Contribution to Return |
| 1 | | Boston Beer Co., Inc. | | Beverages | | 1.3% |
| 2 | | Cirrus Logic, Inc. | | Semiconductors & Semiconductor Equipment | | 1.3% |
| 3 | | Odyssey HealthCare, Inc. | | Health Care Providers & Services | | 1.2% |
| 4 | | Destination Maternity Corp. | | Specialty Retail | | 1.1% |
| 5 | | Polypore International, Inc. | | Electrical Equipment | | 1.0% |
| 6 | | Cognizant Technology Solutions Corp. | | IT Services | | 1.0% |
| 7 | | TriMas Corp. | | Machinery | | 0.9% |
| 8 | | Jos. A. Bank Clothiers, Inc. | | Specialty Retail | | 0.9% |
| 9 | | Acme Packet, Inc. | | Communications Equipment | | 0.8% |
| 10 | | Crocs, Inc. | | Textiles, Apparel & Luxury Goods | | 0.8% |
While new and improved GM gets back on track, it is ramping up production of the “car-of-the-future,” the battery operated Volt. Polypore International provides products and processes for energy storage, specifically found in lithium and lead-acid batteries often used in electric-drive vehicles. In December, a major analyst upgraded Polypore’s stock to “outperform”
| | |
| | |
| 76 | | Semi-Annual Report | December 31, 2010 (Unaudited) |
| | |
Small-Cap Growth Fund MANAGER’S COMMENTARY (continued) | | |
because of the growth opportunities in electric cars like the Volt. Company earnings have consistently beaten expectations; the stock soared throughout the year and hit a 52-week high in December. Still, analysts remain quite positive with seven out of 10 who cover the company rating Polypor either “strong buy” or “buy”. The holding tripled in value during the 12-month period and contributed almost a percent in return.
Despite the surge in retail activity late in the year, three non-retail consumer discretionary companies, Corinthian Colleges, Culp Inc., and Lincoln Educational Services, were on the worst contributors list. Combined, these holdings cost the Fund over two-and-a-half percent in performance. Five other sectors were represented on this list.
These are the Fund’s ten worst-contributing stocks for the calendar year ended December 31, 2010:
| | | | | | |
| Rank | | Description | | Industry | | % Contribution to Return |
| 1 | | Corinthian Colleges, Inc. | | Diversified Consumer Services | | -1.3% |
| 2 | | Telestone Technologies Corp. | | Communications Equipment | | -0.9% |
| 3 | | Gleacher & Co, Inc. | | Capital Markets | | -0.9% |
| 4 | | American Superconductor Corp. | | Electrical Equipment | | -0.8% |
| 5 | | Culp, Inc. | | Textiles, Apparel & Luxury Goods | | -0.7% |
| 6 | | Unisys Corp. | | IT Services | | -0.7% |
| 7 | | VSE Corp. | | Professional Services | | -0.7% |
| 8 | | Orient Paper, Inc. | | Paper & Forest Products | | -0.7% |
| 9 | | Lincoln Educational Services Corp. | | Diversified Consumer Services | | -0.7% |
| 10 | | Almost Family, Inc. | | Health Care Providers & Services | | -0.6% |
While corporate earnings season has been met with positive investor reaction since mid-2009, many analysts have claimed that the stellar quarters have been the result of significant cost-cutting measures that may not be sustainable. Technology companies like Unisys have struggled as companies slash IT budgets in an attempt to make their bottom lines look better to investors and analysts. In its most recent quarter, Unisys reported a 54% profit decline on weak server sales; investors reacted accordingly. Its stock fell almost 20% in one day and dropped over 30% for calendar year 2010. Earlier in the year, the multinational company suffered from negative economic developments in Venezuela. Unisys cost the Fund just under three-quarters-of-a-percent in return and was among the worst contributors to its overall performance.
Top Ten Holdings as of December 31, 2010
Four of the Fund’s top contributors for the December 2010 quarter were also among the largest holdings at the end of the calendar year (Trimas, Boston Beer, Crocs, L&L Energy). The Fund was broadly diversified, as no single stock accounted for greater than 2.5% of the net assets. The ten largest positions represented less than 25% of the total assets of the Fund.
| | | | | | |
| Rank | | Description | | Industry | | % of Net Assets |
| 1 | | Nanometrics, Inc. | | Semiconductors & Semiconductor Equipment | | 2.5% |
| 2 | | Destination Maternity Corp. | | Specialty Retail | | 2.4% |
| 3 | | Cirrus Logic, Inc. | | Semiconductors & Semiconductor Equipment | | 2.3% |
| 4 | | Invacare Corp. | | Health Care Equipment & Suppliers | | 2.2% |
| 5 | | TriMas Corp. | | Machinery | | 2.1% |
| 6 | | RPC, Inc. | | Energy Equipment & Services | | 2.1% |
| 7 | | Boston Beer Co., Inc. | | Beverages | | 2.1% |
| 8 | | Crocs, Inc. | | Textiles, Apparel & Luxury Goods | | 2.0% |
| 9 | | L&L Energy, Inc. | | Oil, Gas & Consumable Fuels | | 2.0% |
| 10 | | TriQuint Semiconductor, Inc. | | Semiconductors & Semiconductor Equipment | | 1.9% |
| | Total | | | | 21.6% |
| | |
Small-Cap Growth Fund MANAGER’S COMMENTARY (continued) | | |
Industry Sector Representation as of December 31, 2010
At almost twenty-five percent of the Fund’s net assets, Information Technology is our largest sector exposure. This was a sector that underperformed during the period. With the exception of our underweighting in Health Care stocks, our sector representation is closer than usual to that of the Russell 2000 Growth Index.
| | | | | | |
| | | % of Net Assets | | % of Russell 2000
Growth Index | | Difference |
Consumer Discretionary | | 19.5% | | 17.2% | | 2.3% |
Consumer Staples | | 3.9% | | 2.9% | | 1.0% |
Energy | | 4.1% | | 5.0% | | -0.9% |
Financials | | 5.7% | | 4.8% | | 0.9% |
Health Care | | 14.6% | | 18.9% | | -4.3% |
Industrials | | 17.3% | | 17.2% | | 0.1% |
Information Technology | | 24.9% | | 27.5% | | -2.6% |
Materials | | 6.0% | | 5.0% | | 1.0% |
Telecommunication Services | | 3.2% | | 1.4% | | 1.8% |
Utilities | | 0.0% | | 0.1% | | -0.1% |
Cash & Other Assets | | 0.8% | | 0.0% | | 0.8% |
Total | | 100.0% | | 100.0% | | |
Disclaimer
The views expressed here are exclusively those of Fund management. These views, including those related to market sectors or individual stocks, are not meant as investment advice and should not be considered predictive in nature. Any favorable (or unfavorable) description of a holding applies only as of the quarter end, December 31, 2010, unless otherwise stated. Security positions can and do change thereafter. Discussions of historical performance do not guarantee and are not indicative of future performance.
Market volatility can significantly impact short-term performance. The Fund is not an appropriate investment for short-term investors. Investments in small companies generally carry greater risk than is customarily associated with larger companies. This additional risk is attributable to a number of factors, including the relatively limited financial resources that are typically available to small companies and the fact that small companies often have comparatively limited product lines. In addition, the stock of small companies tends to be more volatile than the stock of large companies, particularly in the short term and particularly in the early stages of an economic or market downturn. Shareholders of the Fund, therefore, are taking on more risk than they would if they invested in the stock market as a whole.
Conclusion
Thank you for your continued investment in Small-Cap Growth Fund. We encourage your feedback; your reactions and concerns are important to us.
Sincerely,
Your Investment Management Team
| | |
| | |
| 78 | | Semi-Annual Report | December 31, 2010 (Unaudited) |
| | |
Bridgeway Small-Cap Growth Fund SCHEDULE OF INVESTMENTS | |
|
| | |
| Showing percentage of net assets as of December 31, 2010 (Unaudited) | | |
| | | | | | | | | | |
| | | |
| | | | | | | | | | |
Industry | | Company | | | Shares | | | | Value | |
COMMON STOCKS - 99.45% | |
Air Freight & Logistics - 1.03% | |
| | Park-Ohio Holdings Corp.* | | | 24,600 | | | $ | 514,386 | |
| |
Airlines - 1.35% | |
| | Alaska Air Group, Inc.* | | | 11,900 | | | | 674,611 | |
| |
Auto Components - 2.24% | |
| | American Axle & Manufacturing Holdings, Inc.* | | | 47,100 | | | | 605,706 | |
| | Tenneco, Inc.* | | | 12,400 | | | | 510,384 | |
| | | | | | | | | | |
| | | | | | | | | 1,116,090 | |
| |
Beverages - 2.08% | |
| | Boston Beer Co., Inc.,
Class A* | | | 10,900 | | | | 1,036,481 | |
| |
Capital Markets - 1.63% | |
| | Virtus Investment Partners, Inc.* | | | 17,900 | | | | 812,123 | |
| |
Chemicals - 3.53% | |
| | Arch Chemicals, Inc. | | | 15,900 | | | | 603,087 | |
| | Ferro Corp.* | | | 41,700 | | | | 610,488 | |
| | KMG Chemicals, Inc. | | | 33,000 | | | | 546,810 | |
| | | | | | | | | | |
| | | | | | | | | 1,760,385 | |
| |
Commercial Banks - 1.22% | |
| | Southside Bancshares, Inc. | | | 28,957 | | | | 610,124 | |
| |
Commercial Services & Supplies - 3.42% | |
| | Consolidated Graphics, Inc.* | | | 14,500 | | | | 702,235 | |
| | Deluxe Corp. | | | 22,900 | | | | 527,158 | |
| | EnerNOC, Inc.*+ | | | 20,000 | | | | 478,200 | |
| | | | | | | | | | |
| | | | | | | | | 1,707,593 | |
| |
Communications Equipment - 3.61% | |
| | Digi International, Inc.* | | | 62,700 | | | | 695,970 | |
| | Finisar Corp.*+ | | | 20,400 | | | | 605,676 | |
| | Hughes Communications, Inc.* | | | 12,300 | | | | 497,412 | |
| | | | | | | | | | |
| | | | | | | | | 1,799,058 | |
| |
Construction & Engineering - 1.32% | |
| | Great Lakes Dredge & Dock Corp. | | | 89,400 | | | | 658,878 | |
| |
Consumer Finance - 2.88% | |
| | Cardtronics, Inc.* | | | 35,800 | | | | 633,660 | |
| | Ezcorp, Inc., Class A* | | | 29,500 | | | | 800,335 | |
| | | | | | | | | | |
| | | | | | | | | 1,433,995 | |
| | | | | | | | | | |
| | | |
| | | | | | | | | | |
Industry | | Company | | | Shares | | | | Value | |
| | | | | | | | | | |
Containers & Packaging - 0.99% | |
| | Rock-Tenn Co., Class A | | | 9,200 | | | $ | 496,340 | |
|
Diversified Consumer Services - 0.92% | |
| | Corinthian Colleges, Inc.*+ | | | 88,200 | | | | 459,522 | |
|
Diversified Telecommunication Services - 2.27% | |
| | Alaska Communications Systems Group, Inc.+ | | | 51,700 | | | | 573,870 | |
| | Vonage Holdings Corp.* | | | 248,300 | | | | 556,192 | |
| | | | | | | | | | |
| | | | | | | | | 1,130,062 | |
|
Electrical Equipment - 2.25% | |
| | American Superconductor Corp.*+ | | | 17,600 | | | | 503,184 | |
| | Polypore International, Inc.* | | | 15,200 | | | | 619,096 | |
| | | | | | | | | | |
| | | | | | | | | 1,122,280 | |
|
Electronic Equipment, Instruments & Components - 7.26% | |
| | Daktronics, Inc. | | | 33,800 | | | | 538,096 | |
| | Insight Enterprises, Inc.* | | | 33,700 | | | | 443,492 | |
| | OSI Systems, Inc.* | | | 16,300 | | | | 592,668 | |
| | Power-One, Inc.*+ | | | 77,800 | | | | 793,560 | |
| | Richardson Electronics, Ltd. | | | 60,900 | | | | 711,921 | |
| | Sanmina-SCI Corp.* | | | 47,100 | | | | 540,708 | |
| | | | | | | | | | |
| | | | | | | | | 3,620,445 | |
|
Energy Equipment & Services - 2.12% | |
| | RPC, Inc.+ | | | 58,350 | | | | 1,057,302 | |
|
Food & Staples Retailing - 0.98% | |
| | Ruddick Corp. | | | 13,300 | | | | 489,972 | |
|
Health Care Equipment & Supplies - 4.93% | |
| | Align Technology, Inc.* | | | 39,000 | | | | 762,060 | |
| | Analogic Corp. | | | 12,000 | | | | 594,120 | |
| | Invacare Corp. | | | 36,500 | | | | 1,100,840 | |
| | | | | | | | | | |
| | | | | | | | | 2,457,020 | |
|
Health Care Providers & Services - 8.68% | |
| | AMERIGROUP Corp.*# | | | 11,700 | | | | 513,864 | |
| | Corvel Corp.* | | | 18,500 | | | | 894,475 | |
| | Ensign Group, Inc. (The) | | | 14,300 | | | | 355,641 | |
| | Gentiva Health Services, Inc.* | | | 20,600 | | | | 547,960 | |
| | Metropolitan Health Networks, Inc.* | | | 129,900 | | | | 580,653 | |
| | MWI Veterinary Supply, Inc.* | | | 9,500 | | | | 599,925 | |
| | Providence Service Corp. (The)* | | | 52,100 | | | | 837,247 | |
| | | | | | | | | | |
| | | | | | | | | 4,329,765 | |
| | | | | | | | | | |
| | | | | | | | | | |
| | |
Bridgeway Small-Cap Growth Fund SCHEDULE OF INVESTMENTS (continued) | | |
| | |
| Showing percentage of net assets as of December 31, 2010 (Unaudited) | | |
| | | | | | | | | | |
Industry | | Company | | | Shares | | | | Value | |
Common Stocks (continued) | |
Hotels, Restaurants & Leisure - 1.40% | |
| | Peet’s Coffee & Tea, Inc.*+ | | | 16,700 | | | $ | 697,058 | |
| |
IT Services - 4.14% | |
| | Cognizant Technology Solutions Corp.,
Class A* | | | 8,080 | | | | 592,183 | |
| | Lionbridge Technologies, Inc.* | | | 199,500 | | | | 736,155 | |
| | Unisys Corp.* | | | 28,500 | | | | 737,865 | |
| | | | | | | | | | |
| | | | | | | | | 2,066,203 | |
| |
Machinery - 6.62% | |
| | Altra Holdings, Inc.* | | | 40,700 | | | | 808,302 | |
| | NACCO Industries, Inc., Class A | | | 6,700 | | | | 726,079 | |
| | Sauer-Danfoss, Inc.* | | | 24,600 | | | | 694,950 | |
| | TriMas Corp.* | | | 52,500 | | | | 1,074,150 | |
| | | | | | | | | | |
| | | | | | | | | 3,303,481 | |
| |
Media - 2.67% | |
| | Cinemark Holdings, Inc. | | | 34,000 | | | | 586,160 | |
| | Sinclair Broadcast Group, Inc., Class A | | | 90,900 | | | | 743,562 | |
| | | | | | | | | | |
| | | | | | | | | 1,329,722 | |
| |
Metals & Mining - 1.50% | |
| | Brush Engineered Materials, Inc.* | | | 19,400 | | | | 749,616 | |
| |
Multiline Retail - 2.30% | |
| | 99 Cents Only Stores* | | | 42,000 | | | | 669,480 | |
| | Bon-Ton Stores, Inc.
(The)*+ | | | 37,700 | | | | 477,282 | |
| | | | | | | | | | |
| | | | | | | | | 1,146,762 | |
| |
Oil, Gas & Consumable Fuels - 1.96% | |
| | L&L Energy, Inc.*+ | | | 90,500 | | | | 977,400 | |
| |
Personal Products - 0.83% | |
| | Inter Parfums, Inc. | | | 22,000 | | | | 414,700 | |
| |
Pharmaceuticals - 1.03% | |
| | Medicines Co. (The)* | | | 36,200 | | | | 511,506 | |
| |
Semiconductors & Semiconductor Equipment - 9.53% | |
| | Cirrus Logic, Inc.* | | | 70,800 | | | | 1,131,384 | |
| | GT Solar International, Inc.*+ | | | 56,700 | | | | 517,104 | |
| | Lattice Semiconductor Corp.* | | | 146,100 | | | | 885,366 | |
| | Nanometrics, Inc.* | | | 97,300 | | | | 1,248,359 | |
| | TriQuint Semiconductor, Inc.* | | | 83,000 | | | | 970,270 | |
| | | | | | | | | | |
| | | | | | | | | 4,752,483 | |
| | | | | | | | | | |
Industry | | Company | | | Shares | | | | Value | |
| | | | | | | | | | |
Software - 1.43% | |
| | Informatica Corp.* | | | 16,200 | | | $ | 713,286 | |
|
Specialty Retail - 8.04% | |
| | Destination Maternity Corp.* | | | 31,600 | | | | 1,198,588 | |
| | MarineMax, Inc.* | | | 63,300 | | | | 591,855 | |
| | Monro Muffler Brake, Inc. | | | 25,050 | | | | 866,480 | |
| | Sally Beauty Holdings, Inc.* | | | 48,800 | | | | 709,064 | |
| | Ulta Salon Cosmetics & Fragrance, Inc.* | | | 18,900 | | | | 642,600 | |
| | | | | | | | | | |
| | | | | | | | | 4,008,587 | |
|
Textiles, Apparel & Luxury Goods - 1.96% | |
| | Crocs, Inc.* | | | 57,100 | | | | 977,552 | |
|
Trading Companies & Distributors - 1.33% | |
| | DXP Enterprises, Inc.* | | | 27,700 | | | | 664,800 | |
| | | | | | | | | | |
TOTAL COMMON STOCKS - 99.45% | | | | 49,599,588 | |
| | | | | | | | | | |
(Cost $42,321,775) | |
| |
TOTAL INVESTMENTS - 99.45% | | | $ | 49,599,588 | |
(Cost $42,321,775) | |
Other Assets in Excess of Liabilities - 0.55% | | | | 273,436 | |
| | | | | | | | | | |
NET ASSETS - 100.00% | | | $ | 49,873,024 | |
| | | | | | | | | | |
| | | | | | |
* | | Non-income producing security. |
# | | Securities, or a portion thereof, segregated to cover the Fund’s obligation under swap agreements. The total market value of segregated assets is $513,864. |
+ | | This security or a portion of the security is out on loan at December 31, 2010. Total loaned securities had a market value of $7,348,566 at December 31, 2010. |
| | |
| | |
| 80 | | Semi-Annual Report | December 31, 2010 (Unaudited) |
| | |
Bridgeway Small-Cap Value Fund SCHEDULE OF INVESTMENTS (continued) | | |
| | | | | | | | | | | | | | | | |
Summary of inputs used to value the Fund’s investments as of 12/31/2010 are as follows (See Note 2 in Notes to Financial Statements): | |
| |
| | | Valuation Inputs | |
| | |
| | | Investment in Securities (Market Value) | |
| | |
| | | Level 1
Quoted
Prices | | | Level 2
Significant
Observable
Inputs | | | Level 3
Significant Unobservable Inputs | | | Total | |
| | |
Common Stocks | | $ | 49,599,588 | | | $ | — | | | $ | — | | | $ | 49,599,588 | |
| | | | | | | | | | | | | | | | |
TOTAL | | $ | 49,599,588 | | | $ | — | | | $ | — | | | $ | 49,599,588 | |
| | | | | | | | | | | | | | | | |
Other Financial Instruments** | | | | | | | | | | | | | | | | |
Swaps | | $ | — | | | $ | 4,309 | | | $ | — | | | $ | 4,309 | |
| | | | | | | | | | | | | | | | |
TOTAL | | $ | — | | | $ | 4,309 | | | $ | — | | | $ | 4,309 | |
| | | | | | | | | | | | | | | | |
** Other financial instruments are derivative instruments not reflected in the Schedule of Investments, such as futures, forwards and swap contracts, which are valued at the unrealized appreciation/ depreciation on the investment. See Notes to Financial Statements. | |
| | |
Small-Cap Value Fund MANAGER’S COMMENTARY | | |
| | |
(Unaudited) December 31, 2010 | | |
Dear Fellow Small-Cap Value Fund Shareholder,
For the December 2010 quarter, Small-Cap Value Fund returned 10.55%, significantly underperforming its primary market benchmark, the Russell 2000 Value Index (+15.36%) and its peer benchmark, the Lipper Small-Cap Value Funds Index (+15.53%). It was a poor quarter despite the double-digit returns, and we are not pleased.
For the six-month “semi-annual” period ending December 31, 2010, our Fund returned 19.91%, lagging its benchmarks as the Russell 2000 Value Index (+26.58%) and the Lipper Small-Cap Value Funds Index (+27.35%) performed quite well. The equity markets as a whole rebounded nicely from a summer slump in the September through December timeframe, as investors were rewarded for their patience through the sovereign debt crisis. Our Fund’s relative returns were held back by poor picks among Information Technology and Industrial stocks, as described in the quarterly best and worst contributors report below. The results for the quarter and semi-annual period were particularly disappointing, given that our models performed well by some fundamental economic measures, such as the percentage of our companies beating Wall Street estimates. In fact, relative to each Fund’s market benchmark, Small-Cap Value Fund was our best performer for the semi-annual period on this measure. Clearly, we have not been rewarded with market beating performance for this part of our models’ success over the last year.
For the calendar year, our Fund was up 16.55%, significantly underperforming both benchmarks, the Russell 2000 Value Index (+24.50%) and the Lipper Small-Cap Value Funds Index (+25.74%).
The table below presents our December quarter, six-month, one-year, five-year, and life-to-date financial results according to the formula required by the SEC. See the next page for a graph of performance since inception.
| | | | | | | | | | | | | | | | | | | | |
| | | Dec. Qtr.
10/1/10 to 12/31/10 | | | 6 Month
7/1/10 to 12/31/10 | | | 1 Year
1/1/10 to 12/31/10 | | | 5 Year
1/1/06 to 12/31/10 | | | Life-to-Date
10/31/03 to 12/31/10 | |
| | | | | |
Small-Cap Value Fund | | | 10.55% | | | | 19.91% | | | | 16.55% | | | | -0.58% | | | | 4.72% | |
Russell 2000 Value Index | | | 15.36% | | | | 26.58% | | | | 24.50% | | | | 3.52% | | | | 7.12% | |
Lipper Small-Cap Value Funds Index | | | 15.53% | | | | 27.35% | | | | 25.74% | | | | 4.66% | | | | 8.22% | |
Performance figures quoted in the table above and graph below represent past performance and are no guarantee of future results. Total return figures in the table above and the graph below include the reinvestment of dividends and capital gains. The table above and the graph below do not reflect the deduction of taxes that a shareholder would pay on Fund distributions or the redemption of Fund shares. The recent growth rate in the stock market has helped to produce short-term returns that are not typical and may not continue in the future.
The Russell 2000 Value Index is an unmanaged index that consists of stocks in the Russell 2000 Index with lower price-to-book ratios and lower forecasted growth values with dividends reinvested. The Lipper Small-Cap Value Funds Index is an index of small-company, value-oriented funds compiled by Lipper, Inc. It is not possible to invest directly in an index. Periods longer than one year are annualized.
According to data from Lipper, Inc. as of December 31, 2010, Small-Cap Value Fund ranked 779th of 797 small-cap core funds for the twelve-month period ended December 31, 2010, 537th of 569 over the last five years and 406th of 457 such funds since inception in October, 2003. Lipper, Inc. is an independent mutual fund rating service that ranks funds in various fund categories by making comparative calculations using total returns.
| | |
| | |
| 82 | | Semi-Annual Report | December 31, 2010 (Unaudited) |
| | |
Small-Cap Value Fund MANAGER’S COMMENTARY (continued) | | |
Small-Cap Value Fund vs. Russell 2000 Value Index & Lipper Small-Cap Value Funds Index from Inception 10/31/03 to 12/31/10
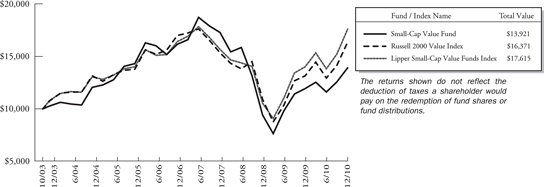
Detailed Explanation of Quarterly Performance
The Short Version: There was considerable diversity on both the best and worst contributors lists for the quarter.
All in all, the December quarter was a nice period for stocks across most industries; six different sectors were represented on the top 10 contributors list. Of note, three financial companies highlighted the list. Combined, they added over a percent-and-a-half to the Fund’s return. Consumer Discretionary companies were also well-represented, with two holdings making the list as enhanced retail activity contributed to a nice holiday season.
These are the Fund’s ten best-contributing stocks for the quarter ended December 31, 2010:
| | | | | | | | |
| Rank | | Description | | Industry | | % Contribution to Return | | |
| 1 | | Select Comfort Corp. | | Specialty Retail | | 0.7% | |
| 2 | | Par Pharmaceutical Cos, Inc. | | Pharmaceuticals | | 0.7% | |
| 3 | | Petroleum Development Corp. | | Oil, Gas & Consumable Fuels | | 0.6% | |
| 4 | | World Acceptance Corp. | | Consumer Finance | | 0.6% | |
| 5 | | First Industrial Realty Trust, Inc. | | Real Estate Investment Trusts | | 0.6% | |
| 6 | | IDT Corp. | | Diversified Telecommunication Services | | 0.5% | |
| 7 | | Hercules Offshore, Inc. | | Energy Equipment & Services | | 0.4% | |
| 8 | | Ezcorp, Inc. | | Consumer Finance | | 0.4% | |
| 9 | | TPC Group, Inc. | | Chemicals | | 0.4% | |
| 10 | | Sally Beauty Holdings, Inc. | | Specialty Retail | | 0.3% | |
Though bank lending activity has picked up for institutions and well-to-do consumers, many individuals still have trouble accessing needed funds. Ezcorp provides short-term financing to individuals through pawn loans, payday loans, title loans, and other credit services. The company has seen its business pick up in the aftermath of the credit crisis. In its recent quarter, earnings jumped by one-third on 20% revenue growth. Management also offered an above-average forecast for the full year. In 2010, Ezcorp was in expansion mode as 127 new stores were opened throughout North America. Its stock soared over 30% during the three-month period and contributed just less than half a percent to the Fund’s return.
Financial companies were a mixed bag this past quarter; three related holdings were among the Fund’s poorest performers. These companies combined to cost the Fund over three-quarters of a percent in return. Six other sectors were represented on this list of poor performers, proving that even in strong quarters, laggards will normally exist in virtually every industry.
| | |
Small-Cap Value Fund MANAGER’S COMMENTARY (continued) | | |
These are the Fund’s ten worst-contributing stocks for the quarter ended December 31, 2010:
| | | | | | | | |
| Rank | | Description | | Industry | | % Contribution to Return | | |
| 1 | | Flagstar Bancorp, Inc. | | Thrifts & Mortgage Finance | | -0.4% | |
| 2 | | Newpark Resources, Inc. | | Energy Equipment & Services | | -0.3% | |
| 3 | | Integrated Silicon Solution, Inc. | | Semiconductors & Semiconductor Equipment | | -0.3% | |
| 4 | | Beneficial Mutual Bancorp, Inc. | | Thrifts & Mortgage Finance | | -0.2% | |
| 5 | | Vonage Holdings Corp. | | Diversified Telecommunication Services | | -0.2% | |
| 6 | | Banner Corp. | | Commercial Banks | | -0.2% | |
| 7 | | Insight Enterprises, Inc. | | Electronic Equip., Instruments & Components | | -0.2% | |
| 8 | | International Shipholding Corp. | | Marine | | -0.2% | |
| 9 | | Blyth, Inc. | | Household Durables | | -0.2% | |
| 10 | | Medicis Pharmaceutical Corp. | | Pharmaceuticals | | -0.2% | |
Newpark Resources battles the big boys (i.e. Schlumberger and Halliburton) in providing various management, disposal, and well preparation services to the exploration and production industry. In October, the company posted a disappointing quarterly earnings report, and its stock plummeted about 30% on the news. Such is the reality for a small-cap company that surprises Wall Street (on the negative side). While Newpark has touted its water-based drilling systems, the recent report showed weaker-than-anticipated demand. For the quarter, Newpark dropped 25% and cost the Fund over a quarter percent in return.
Detailed Explanation of Calendar Year Performance
The Short Version: Financials and Health Care stocks made strong showings on the best contributors list, while Information Technology dominated the worst contributors list for the year.
Financial and Health Care companies highlighted the list of top contributors for 2010 with three holdings represented from each sector. While politicos were busy enacting reform measures during the past year, investors apparently perceived some winners (and losers) through the newly enacted legislation. Combined, Financials contributed two-and-a-half percent, while the health care companies added over four percent to the return of the Fund.
These are the Fund’s ten best-contributing stocks for the calendar year ended December 31, 2010:
| | | | | | | | |
| Rank | | Description | | Industry | | % Contribution to Return | | |
| 1 | | Polypore International, Inc. | | Electrical Equipment | | 3.1% | |
| 2 | | ev3, Inc. | | Health Care Equipment & Supplies | | 1.9% | |
| 3 | | Healthspring, Inc. | | Health Care Providers & Services | | 1.6% | |
| 4 | | Vonage Holdings Corp. | | Diversified Telecommunication Services | | 1.4% | |
| 5 | | World Acceptance Corp. | | Consumer Finance | | 1.2% | |
| 6 | | Par Pharmaceutical Cos, Inc. | | Pharmaceuticals | | 0.9% | |
| 7 | | Nelnet, Inc. | | Consumer Finance | | 0.7% | |
| 8 | | Meadowbrook Insurance Group, Inc. | | Insurance | �� | 0.7% | |
| 9 | | Petroleum Development Corp. | | Oil, Gas & Consumable Fuels | | 0.7% | |
| 10 | | IDT Corp. | | Diversified Telecommunication Services | | 0.6% | |
| | |
| | |
| 84 | | Semi-Annual Report | December 31, 2010 (Unaudited) |
| | |
Small-Cap Value Fund MANAGER’S COMMENTARY (continued) | | |
While new and improved GM gets back on track, it is ramping up production of the “car-of-the-future,” the battery operated Volt. Polypore International provides products and processes for energy storage, specifically found in lithium and lead-acid batteries often used in electric-drive vehicles. In December, a major analyst upgraded Polypore’s stock to “outperform” because of the growth opportunities in electric cars like the Volt. Company earnings have consistently beaten expectations; the stock soared throughout the year and hit a 52-week high in December. Still, analysts remain quite positive, with seven out of 10 who cover the company rating Polypore either “strong buy” or “buy”. The holding soared over 200% in value during the 12-month period and contributed over three percent in return.
Information Technology companies dominated the list of worst contributors as five related holdings were among the top detractors to the performance. Combined they cost the Fund about four percent in return. In certain cases, corporations have limited technology purchases in order to keep costs in check and make earning looks stronger. The delayed activity has hindered IT companies, many of which are still expecting a major surge in upgrades, but continue to wait out the economic uncertainty for another quarter or two (and hopefully not much longer).
These are the Fund’s ten worst-contributing stocks for the calendar year ended December 31, 2010:
| | | | | | | | |
| Rank | | Description | | Industry | | % Contribution to Return | | |
| 1 | | Sanmina-SCI Corp. | | Auto Components | | -1.1% | |
| 2 | | Agilysys, Inc. | | IT Services | | -0.9% | |
| 3 | | M&F Worldwide Corp. | | Commercial Services & Supplies | | -0.8% | |
| 4 | | Unisys Corp. | | IT Services | | -0.7% | |
| 5 | | Super Micro Computer, Inc | | Computers & Peripherals | | -0.6% | |
| 6 | | Wave Systems Corp. | | Software | | -0.6% | |
| 7 | | Beneficial Mutual Bancorp, Inc. | | Thrifts & Mortgage Finance | | -0.4% | |
| 8 | | Gentiva Health Services, Inc. | | Health Care Providers & Services | | -0.4% | |
| 9 | | Flagstar Bancorp, Inc. | | Thrifts & Mortgage Finance | | -0.4% | |
| 10 | | Dollar Financial Corp. | | Consumer Finance | | -0.4% | |
While corporate earnings season has been met with positive investor reaction since mid-2009, many analysts have claimed that the stellar quarters have been the result of significant cost-cutting measures. Technology companies like Unisys have struggled as companies slash IT budgets in an attempt to make their bottom lines look better to investors and analysts. In its most recent quarter, Unisys reported a 54% profit decline on weak server sales, and investors reacted (negatively) accordingly. Its stock fell almost 20% in one day and dropped over 30% for calendar year 2010. Earlier in the year, the multinational company suffered from negative economic developments in Venezuela. Unisys cost the Fund about three-quarters a percent in return and was among the worst contributors to its overall performance.
Top Ten Holdings as of December 31, 2010
Three of the Fund’s top contributors for the December 2010 quarter were also among the largest holdings at the end of the calendar year (World Acceptance Corp., Petroleum Development Corp., and First Industrial Reality). The Fund was broadly diversified as no single stock accounted for greater than 2.4% of the net assets. The ten largest positions represented just over 20% of the total assets of the Fund.
| | |
Small-Cap Value Fund MANAGER’S COMMENTARY (continued) | | |
| | | | | | |
| Rank | | Description | | Industry | | % of Net
Assets |
| 1 | | Meadowbrook Insurance Group, Inc. | | Insurance | | 2.4% |
| 2 | | BioMed Realty Trust, Inc. | | Real Estate Investment Trusts | | 2.4% |
| 3 | | World Acceptance Corp. | | Consumer Finance | | 2.2% |
| 4 | | Complete Production Services, Inc. | | Energy Equipment & Services | | 2.2% |
| 5 | | Weingarten Realty Investors | | Real Estate Investment Trusts | | 2.1% |
| 6 | | Healthspring, Inc. | | Health Care Providers & Services | | 2.1% |
| 7 | | Cleco Corp. | | Electric Utilities | | 2.0% |
| 8 | | Petroleum Development Corp. | | Oil, Gas & Consumable Fuels | | 1.8% |
| 9 | | First Industrial Realty Trust, Inc. | | Real Estate Investments Trusts | | 1.8% |
| 10 | | Safety Insurance Group, Inc. | | Insurance | | 1.8% |
| | Total | | | | 20.8% |
Industry Sector Representation as of December 31, 2010
The Fund’s largest allocation was in Financials, though the percentage still lagged that of its benchmark and many banks and other financial institutions continued to rebound from the recent doldrums. The Fund maintained a smaller allocation to Information Technology, a sector that was mixed in performance as PC and related companies continued to underperform, while mobile devices like smartphones led the way. One under-weighted sector, Industrials, hurt performance through some weak stock picks that underperformed the benchmark.
| | | | | | |
| | | % of Net Assets | | % of Russell 2000
Value Index | | Difference |
Consumer Discretionary | | 8.0% | | 9.9% | | -1.9% |
Consumer Staples | | 1.8% | | 2.9% | | -1.1% |
Energy | | 9.2% | | 7.8% | | 1.4% |
Financials | | 34.1% | | 37.1% | | -3.0% |
Health Care | | 5.9% | | 5.5% | | 0.4% |
Industrials | | 12.9% | | 14.3% | | -1.4% |
Information Technology | | 7.9% | | 9.3% | | -1.4% |
Materials | | 10.1% | | 6.4% | | 3.7% |
Telecommunication Services | | 4.2% | | 0.6% | | 3.6% |
Utilities | | 5.8% | | 6.2% | | -0.4% |
Cash & Other Assets | | 0.1% | | 0.0% | | 0.1% |
Total | | 100.0% | | 100.0% | | |
Disclaimer
The views expressed here are exclusively those of Fund management. These views, including those related to market sectors or individual stocks, are not meant as investment advice and should not be considered predictive in nature. Any favorable (or unfavorable) description of a holding applies only as of the quarter end, December 31, 2010, unless otherwise stated. Security positions can and do change thereafter. Discussions of historical performance do not guarantee and are not indicative of future performance.
Market volatility can significantly impact short-term performance. The Fund is not an appropriate investment for short-term investors. Investments in small companies generally carry greater risk than is customarily associated with larger companies. This additional risk is attributable to a number of factors, including the relatively limited financial resources that are typically available to small companies and the fact that small companies often have comparatively limited product lines. In addition, the stock of small companies tends to be more volatile than the stock of large companies, particularly in the short term and particularly in the early stages of an economic or market downturn. Shareholders of the Fund, therefore, are taking on more risk than they would if they invested in the stock market as a whole.
| | |
| | |
| 86 | | Semi-Annual Report | December 31, 2010 (Unaudited) |
| | |
Small-Cap Value Fund MANAGER’S COMMENTARY (continued) | | |
Conclusion
Thank you for your continued investment in Small-Cap Value Fund. We encourage your feedback; your reactions and concerns are important to us.
Sincerely,
Your Investment Management Team
| | |
Bridgeway Small-Cap Value Fund SCHEDULE OF INVESTMENTS | | |
| | |
| Showing percentage of net assets as of December 31, 2010 (Unaudited) | | |
| | | | | | | | | | |
Industry | | Company | | | Shares | | | | Value | |
COMMON STOCKS - 100.05% | |
Airlines - 3.62% | |
| | Alaska Air Group, Inc.* | | | 22,200 | | | $ | 1,258,518 | |
| | Republic Airways Holdings, Inc.*+ | | | 157,500 | | | | 1,152,900 | |
| | US Airways Group, Inc.* | | | 132,100 | | | | 1,322,321 | |
| | | | | | | | | | |
| | | | | | | | | 3,733,739 | |
| |
Beverages - 0.75% | |
| | Craft Brewers Alliance, Inc.*+ | | | 104,500 | | | | 773,300 | |
| |
Capital Markets - 1.75% | |
| | BlackRock Kelso Capital Corp. | | | 124,500 | | | | 1,376,970 | |
| | Prospect Capital Corp. | | | 39,400 | | | | 425,520 | |
| | | | | | | | | | |
| | | | | | | | | 1,802,490 | |
| |
Chemicals - 6.52% | |
| | Arch Chemicals, Inc. | | | 32,900 | | | | 1,247,897 | |
| | Ferro Corp.* | | | 86,900 | | | | 1,272,216 | |
| | Quaker Chemical Corp. | | | 32,500 | | | | 1,354,275 | |
| | TPC Group, Inc.* | | | 55,300 | | | | 1,676,696 | |
| | Westlake Chemical Corp. | | | 27,000 | | | | 1,173,690 | |
| | | | | | | | | | |
| | | | | | | | | 6,724,774 | |
| |
Commercial Banks - 3.19% | |
| | Alliance Financial Corp. | | | 27,500 | | | | 889,625 | |
| | City Holding Co. | | | 39,100 | | | | 1,416,593 | |
| | Southwest Bancorp, Inc.* | | | 79,800 | | | | 989,520 | |
| | | | | | | | | | |
| | | | | | | | | 3,295,738 | |
| |
Commercial Services & Supplies - 2.66% | |
| | M&F Worldwide Corp.* | | | 55,200 | | | | 1,275,120 | |
| | UniFirst Corp. | | | 26,800 | | | | 1,475,340 | |
| | | | | | | | | | |
| | | | | | | | | 2,750,460 | |
| |
Communications Equipment - 0.61% | |
| | UTStarcom, Inc.*+ | | | 305,800 | | | | 629,948 | |
| |
Construction & Engineering - 2.26% | |
| | Great Lakes Dredge & Dock Corp. | | | 168,600 | | | | 1,242,582 | |
| | MasTec, Inc.* | | | 75,000 | | | | 1,094,250 | |
| | | | | | | | | | |
| | | | | | | | | 2,336,832 | |
| |
Consumer Finance - 6.16% | |
| | Advance America, Cash Advance Centers, Inc. | | | 217,400 | | | | 1,226,136 | |
| | Ezcorp, Inc., Class A* | | | 62,600 | | | | 1,698,338 | |
| | Nelnet, Inc., Class A | | | 48,900 | | | | 1,158,441 | |
| | World Acceptance Corp.*+ | | | 43,000 | | | | 2,270,400 | |
| | | | | | | | | | |
| | | | | | | | | 6,353,315 | |
| | | | | | | | | | |
Industry | | Company | | | Shares | | | | Value | |
| | | | | | | | | | |
Containers & Packaging - 1.05% | |
| | Rock-Tenn Co., Class A | | | 20,100 | | | $ | 1,084,395 | |
|
Diversified Telecommunication Services - 4.17% | |
| | General Communication, Inc., Class A* | | | 121,400 | | | | 1,536,924 | |
| | IDT Corp., Class B | | | 68,200 | | | | 1,749,330 | |
| | Vonage Holdings Corp.* | | | 452,000 | | | | 1,012,480 | |
| | | | | | | | | | |
| | | | | | | | | 4,298,734 | |
|
Electric Utilities - 3.27% | |
| | Cleco Corp. | | | 67,700 | | | | 2,082,452 | |
| | El Paso Electric Co.* | | | 46,800 | | | | 1,288,404 | |
| | | | | | | | | | |
| | | | | | | | | 3,370,856 | |
|
Electronic Equipment, Instruments & Components - 4.98% | |
| | Insight Enterprises, Inc.* | | | 67,400 | | | | 886,984 | |
| | OSI Systems, Inc.* | | | 33,700 | | | | 1,225,332 | |
| | Power-One, Inc.*+ | | | 160,500 | | | | 1,637,100 | |
| | Richardson Electronics, Ltd. | | | 118,600 | | | | 1,386,434 | |
| | | | | | | | | | |
| | | | | | | | | 5,135,850 | |
|
Energy Equipment & Services - 5.10% | |
| | Complete Production Services, Inc.* | | | 75,400 | | | | 2,228,070 | |
| | Hercules Offshore, Inc.* | | | 439,100 | | | | 1,519,286 | |
| | Pioneer Drilling Co.* | | | 172,200 | | | | 1,517,082 | |
| | | | | | | | | | |
| | | | | | | | | 5,264,438 | |
|
Food & Staples Retailing - 1.03% | |
| | Ruddick Corp. | | | 28,900 | | | | 1,064,676 | |
|
Gas Utilities - 0.92% | |
| | Chesapeake Utilities Corp. | | | 22,800 | | | | 946,656 | |
|
Health Care Equipment & Supplies - 1.19% | |
| | Analogic Corp. | | | 24,800 | | | | 1,227,848 | |
|
Health Care Providers & Services - 2.06% | |
| | Healthspring, Inc.* | | | 80,100 | | | | 2,125,053 | |
|
Household Durables - 0.69% | |
| | Blyth, Inc. | | | 20,600 | | | | 710,288 | |
|
Insurance - 10.44% | |
| | AmTrust Financial Services, Inc. | | | 67,800 | | | | 1,186,500 | |
| | Employers Holdings, Inc. | | | 89,900 | | | | 1,571,452 | |
| | Harleysville Group, Inc. | | | 35,200 | | | | 1,293,248 | |
| | Infinity Property & Casualty Corp. | | | 22,400 | | | | 1,384,320 | |
| | Meadowbrook Insurance Group, Inc. | | | 239,800 | | | | 2,457,950 | |
| | |
| | |
| 88 | | Semi-Annual Report | December 31, 2010 (Unaudited) |
| | |
Bridgeway Small-Cap Value Fund SCHEDULE OF INVESTMENTS (continued) | | |
| | |
| Showing percentage of net assets as of December 31, 2010 (Unaudited) | | |
| | | | | | | | | | |
Industry | | Company | | | Shares | | | | Value | |
Common Stocks (continued) | |
Insurance (continued) | |
| | Safety Insurance Group, Inc. | | | 38,600 | | | $ | 1,836,202 | |
| | United Fire & Casualty Co. | | | 46,600 | | | | 1,040,112 | |
| | | | | | | | | | |
| | | | | | | | | 10,769,784 | |
| |
IT Services - 1.01% | |
| | Unisys Corp.* | | | 40,200 | | | | 1,040,778 | |
| |
Machinery - 1.41% | |
| | Mueller Industries, Inc. | | | 44,400 | | | | 1,451,880 | |
| |
Marine - 1.62% | |
| | International Shipholding Corp. | | | 65,649 | | | | 1,667,485 | |
| |
Media - 3.38% | |
| | Cinemark Holdings, Inc. | | | 60,100 | | | | 1,036,124 | |
| | Sinclair Broadcast Group, Inc., Class A | | | 171,200 | | | | 1,400,416 | |
| | Valassis Communications, Inc.* | | | 32,400 | | | | 1,048,140 | |
| | | | | | | | | | |
| | | | | | | | | 3,484,680 | |
| |
Metals & Mining - 1.55% | |
| | Kaiser Aluminum Corp. | | | 31,900 | | | | 1,597,871 | |
| |
Multi-Utilities - 1.68% | |
| | CH Energy Group, Inc. | | | 18,400 | | | | 899,576 | |
| | NorthWestern Corp. | | | 28,841 | | | | 831,486 | |
| | | | | | | | | | |
| | | | | | | | | 1,731,062 | |
| |
Oil, Gas & Consumable Fuels - 4.07% | |
| | International Coal Group, Inc.* | | | 133,500 | | | | 1,033,290 | |
| | Knightsbridge Tankers, Ltd. | | | 57,800 | | | | 1,287,206 | |
| | Petroleum Development Corp.* | | | 44,400 | | | | 1,874,124 | |
| | | | | | | | | | |
| | | | | | | | | 4,194,620 | |
| |
Paper & Forest Products - 1.02% | |
| | PH Glatfelter Co. | | | 85,600 | | | | 1,050,312 | |
| |
Pharmaceuticals - 2.70% | |
| | Medicines Co. (The)* | | | 75,100 | | | | 1,061,163 | |
| | Par Pharmaceutical Cos., Inc.* | | | 44,800 | | | | 1,725,248 | |
| | | | | | | | | | |
| | | | | | | | | 2,786,411 | |
| |
Real Estate Investment Trusts (REITs) - 9.64% | |
| | BioMed Realty Trust, Inc. | | | 130,400 | | | | 2,431,960 | |
| | First Industrial Realty Trust, Inc.*+ | | | 209,700 | | | | 1,836,972 | |
| | MPG Office Trust, Inc.*# | | | 392,700 | | | | 1,079,925 | |
| | Newcastle Investment Corp.* | | | 181,500 | | | | 1,216,050 | |
| | | | | | | | | | |
Industry | | Company | | | Shares | | | | Value | |
| | | | | | | | | | |
Real Estate Investment Trusts (REITs) (continued) | |
| | Retail Opportunity Investments Corp. | | | 123,500 | | | $ | 1,223,885 | |
| | Weingarten Realty Investors+ | | | 90,640 | | | | 2,153,606 | |
| | | | | | | | | | |
| | | | | | | | | 9,942,398 | |
|
Road & Rail - 1.46% | |
| | Amerco, Inc.* | | | 15,700 | | | | 1,507,828 | |
|
Semiconductors & Semiconductor Equipment - 1.32% | |
| | Photronics, Inc.* | | | 230,300 | | | | 1,361,073 | |
|
Specialty Retail - 2.53% | |
| | MarineMax, Inc.* | | | 124,200 | | | | 1,161,270 | |
| | Sally Beauty Holdings, Inc.* | | | 99,600 | | | | 1,447,188 | |
| | | | | | | | | | |
| | | | | | | | | 2,608,458 | |
|
Thrifts & Mortgage Finance - 2.94% | |
| | Flagstar Bancorp, Inc.* | | | 536,900 | | | | 875,147 | |
| | Meridian Interstate Bancorp, Inc.* | | | 81,300 | | | | 958,527 | |
| | WSFS Financial Corp. | | | 25,400 | | | | 1,204,976 | |
| | | | | | | | | | |
| | | | | | | | | 3,038,650 | |
|
Trading Companies & Distributors - 1.30% | |
| | United Rentals, Inc.* | | | 59,000 | | | | 1,342,250 | |
| | | | | | | | | | |
TOTAL COMMON STOCKS - 100.05% | | | | 103,204,930 | |
| | | | | | | | | | |
(Cost $85,015,819) | | | | | |
| |
TOTAL INVESTMENTS - 100.05% | | | $ | 103,204,930 | |
(Cost $85,015,819) | | | | | |
Liabilities in Excess of Other Assets - (0.05%) | | | | (56,477 | ) |
| | | | | | | | | | |
| |
NET ASSETS - 100.00% | | | $ | 103,148,453 | |
| | | | | | | | | | |
| * | Non-income producing security. |
| # | Securities, or a portion thereof, segregated to cover the Fund’s obligation under swap agreements. The total market value of segregated assets is $1,079,925. |
| + | This security or a portion of the security is out on loan at December 31, 2010. Total loaned securities had a market value of $4,917,858 at December 31, 2010. |
| | |
Bridgeway Small-Cap Value Fund SCHEDULE OF INVESTMENTS (continued) | | |
| | | | | | | | | | | | | | | | |
| Summary of inputs used to value the Fund’s investments as of 12/31/2010 are as follows (See Note 2 in Notes to Financial Statements): | |
| |
| | | Valuation Inputs | |
| | |
| | | Investment in Securities (Market Value) | |
| | |
| | | Level 1
Quoted
Prices | | | Level 2
Significant
Observable
Inputs | | | Level 3
Significant Unobservable Inputs | | | Total | |
| | |
Common Stocks | | $ | 103,204,930 | | | $ | — | | | $ | — | | | $ | 103,204,930 | |
| | | | | | | | | | | | | | | | |
TOTAL | | $ | 103,204,930 | | | $ | — | | | $ | — | | | $ | 103,204,930 | |
| | | | | | | | | | | | | | | | |
Other Financial Instruments** | | | | | | | | | | | | | | | | |
Swaps | | $ | — | | | $ | 3,712 | | | $ | — | | | $ | 3,712 | |
| | | | | | | | | | | | | | | | |
TOTAL | | $ | — | | | $ | 3,712 | | | $ | — | | | $ | 3,712 | |
| | | | | | | | | | | | | | | | |
** Other financial instruments are derivative instruments not reflected in the Schedule of Investments, such as futures, forwards and swap contracts, which are valued at the unrealized appreciation/ depreciation on the investment. See Notes to Financial Statements. | |
| | |
| | |
90 | | Semi-Annual Report | December 31, 2010 (Unaudited) |
| | |
Large-Cap Growth Fund MANAGER’S COMMENTARY | | |
December 31, 2010
Dear Fellow Large-Cap Growth Fund Shareholder,
For the December 2010 quarter, Large-Cap Growth Fund appreciated 10.05%, underperforming our primary market benchmark, the Russell 1000 Growth Index (+11.83%), and our peer benchmark, the Lipper Large-Cap Growth Funds Index (+12.14%). While still up “double-digits,” it was a poor quarter on a relative basis.
For the six-month “semi-annual” period ending December 31, 2010, our Fund jumped 22.82%, but still lagged our benchmarks, the Russell 1000 Growth Index (+26.37%) and the Lipper Large-Cap Growth Funds Index (+26.07%). Our lower turnover stock picking models did not perform up to standard for this period. Consumer Discretionary, Materials, and Health Care stocks lagged the most on a relative basis.
For the calendar year, our Fund was up 13.34%, trailing both our primary market benchmark, the Russell 1000 Growth Index (+16.71%), and our peer benchmark, the Lipper Large-Cap Growth Funds Index (+15.13%).
The table below presents our December quarter, six-month, one-year, five-year, and life-to-date financial results according to the formula required by the SEC. See the next page for a graph of performance since inception.
| | | | | | | | | | |
| | | Dec. Qtr.
10/1/10
to 12/31/10 | | 6 Month
7/1/10
to 12/31/10 | | 1 Year
1/1/10
to 12/31/10 | | 5 Year
1/1/06
to 12/31/10 | | Life-to-Date
10/31/03 to 12/31/10 |
| | | | | |
Large-Cap Growth Fund | | 10.05% | | 22.82% | | 13.34% | | 1.10% | | 3.45% |
Russell 1000 Growth Index | | 11.83% | | 26.37% | | 16.71% | | 3.75% | | 4.87% |
Lipper Large-Cap Growth Funds Index | | 12.14% | | 26.07% | | 15.13% | | 2.38% | | 4.28% |
Performance figures quoted in the table above and graph below represent past performance and are no guarantee of future results. Total return figures in the table above and the graph below include the reinvestment of dividends and capital gains. The table above and the graph below do not reflect the deduction of taxes that a shareholder would pay on Fund distributions or the redemption of Fund shares. The recent growth rate in the stock market has helped to produce short-term returns that are not typical and may not continue in the future.
The Russell 1000 Growth Index is an unmanaged index that consists of stocks in the Russell 1000 Index with higher price-to-book ratios and higher forecasted growth values with dividends reinvested. The Lipper Large-Cap Growth Funds Index is an index of large-company, growth-oriented funds compiled by Lipper, Inc. It is not possible to invest directly in an index. Periods longer than one year are annualized.
According to data from Lipper, Inc. as of December 31, 2010, Large-Cap Growth Fund ranked 366th of 433 multi-cap growth funds for the twelve-month period ended December 31, 2010, 251st of 298 over the last five years and 231st of 261 such funds since inception in October, 2003. The last three years have put a dent in our longer term performance, and we have some catch-up to do on a relative basis. Lipper, Inc. is an independent mutual fund rating service that ranks funds in various fund categories by making comparative calculations using total returns.
| | |
Large-Cap Growth Fund MANAGER’S COMMENTARY (continued) | | |
Large-Cap Growth Fund vs. Russell 1000 Growth Index & Lipper Large-Cap Growth Funds Index from Inception 10/31/03 to 12/31/10
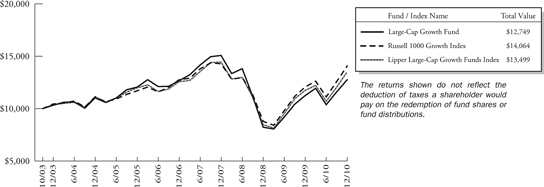
Detailed Explanation of Quarterly Performance
The Short Version: Information Technology companies led the best contributors, while consumer related companies dominated the worst contributors.
Information Technology companies have been a mixed bag as of late, and this past quarter was no exception. While many related companies are still waiting for businesses to upgrade their traditional IT systems, our models uncovered several that are already benefiting from some enhanced corporate spending and the mobile device wave that continues to sweep the country — and the world, for that matter. Five IT-related companies highlighted the list of top contributors; combined, they added over two percent in total return.
These are the Fund’s ten best-contributing stocks for the quarter ended December 31, 2010:
| | | | | | |
| Rank | | Description | | Industry | | % Contribution to Return |
| 1 | | F5 Networks, Inc. | | Communications Equipment | | 0.6% |
| 2 | | SanDisk Corp. | | Computers & Peripherals | | 0.5% |
| 3 | | Starbucks Corp. | | Hotels, Restaurants & Leisure | | 0.4% |
| 4 | | Atmel Corp. | | Semiconductors & Semiconductor Equipment | | 0.4% |
| 5 | | Apple, Inc. | | Computers & Peripherals | | 0.4% |
| 6 | | Coach, Inc. | | Textiles, Apparel & Luxury Goods | | 0.4% |
| 7 | | Medco Health Solutions, Inc. | | Health Care Providers & Services | | 0.4% |
| 8 | | Arrow Electronics, Inc. | | Electronic Equipment, Instruments & Components | | 0.3% |
| 9 | | Union Pacific Corp. | | Road & Rail | | 0.3% |
| 10 | | W.W. Grainger, Inc. | | Trading Companies & Distributors | | 0.3% |
Network equipment maker F5 Networks’ stock price jumped 25% during the three month period ended December 31, 2010 and was the top contributor to the Fund. The technology company provides products that help clients manage network traffic and security issues. In the fourth quarter, F5 reported a revenue increase of 45%, and management projected more growth for 2011. The Board also approved a stock repurchase program of up to $200 million. The company outpaced rival Cisco in several key product sectors. With Fortune 500 companies like Citigroup and GM included in its client list, F5 has been mentioned as a potential acquisition target for technology giants like HP, IBM, Dell, and even Cisco. The holding contributed over half a percent to the Fund’s return.
| | |
| | |
| 92 | | Semi-Annual Report | December 31, 2010 (Unaudited) |
| | |
Large-Cap Growth Fund MANAGER’S COMMENTARY (continued) | | |
On the flip-side, two other IT companies made the worst contributors list; combined, they cost the Fund over a quarter-of-a-percent in return. Interestingly, while the recent quarter could be deemed “the return of the consumer” because of the success of the holiday season for retailers, five consumer related companies were among the top detractors to our Fund’s performance during the December quarter. Combined, they cost the Fund half a percent in return. Four of these consumer companies were not retailers.
These are the Fund’s ten worst-contributing stocks for the quarter ended December 31, 2010:
| | | | | | |
| Rank | | Description | | Industry | | % Contribution to Return |
| 1 | | First Solar, Inc. | | Semiconductors & Semiconductor Equipment | | -0.2% |
| 2 | | Intuitive Surgical, Inc. | | Health Care Equipment & Supplies | | -0.2% |
| 3 | | Expedia, Inc. | | Internet & Catalog Retail | | -0.2% |
| 4 | | Big Lots, Inc. | | Multiline Retail | | -0.2% |
| 5 | | Akamai Technologies, Inc. | | Internet Software & Services | | -0.1% |
| 6 | | ITT Educational Services, Inc. | | Diversified Consumer Services | | -0.1% |
| 7 | | priceline.com, Inc. | | Internet & Catalog Retail | | -0.1% |
| 8 | | Express Scripts, Inc. | | Health Care Providers & Services | | 0.0% |
| 9 | | General Mills, Inc. | | Food Products | | 0.0% |
| 10 | | Newmont Mining Corp. | | Metals & Mining | | 0.0% |
As the world becomes more “green,” solar has long been mentioned as the energy source of the future. Unfortunately, “that” future still hasn’t arrived. First Solar designs and markets solar panel modules and uses a highly advanced proprietary system. In its most recent earnings report, the company posted an increase in profits, but its gross margin dropped for the fifth consecutive quarter. Shortly thereafter, a major analyst downgraded a number of solar players on concerns that lower prices and overall demand could cause further pressure on margins. Though the extension of the Bush tax cuts (and grants for solar project development) gave investors reason for optimism in the new year, some analysts worry that Germany may cut its subsidy program for solar energy, a move that could hinder future earnings, as almost 50% of all solar energy demand comes from this region. For the quarter, First Solar was the largest detractor to the Fund; its share price dropped over 10 percent.
Detailed Explanation of Calendar Year Performance
The Short Version: Information Technology companies were well represented on both the best and worst contributors lists.
All in all, calendar year 2010 was a nice year for stocks across most industries; six different sectors were represented on the top ten contributors list. Three Information Technology companies and two Consumer Discretionary companies highlighted the best contributors list. Combined, they contributed about 5.5% to the return of the Fund. Industrials and Materials stocks also appeared on the list as related companies continued to benefit from the growing demand in many emerging world markets.
These are the Fund’s ten best-contributing stocks for the calender year ended December 31, 2010:
| | | | | | |
| Rank | | Description | | Industry | | % Contribution to Return |
| 1 | | TRW Automotive Holdings Corp. | | Auto Components | | 1.7% |
| 2 | | Apple, Inc. | | Computers & Peripherals | | 1.4% |
| 3 | | Union Pacific Corp. | | Road & Rail | | 0.9% |
| 4 | | Cognizant Technology Solutions Corp. | | IT Services | | 0.9% |
| 5 | | FMC Technologies, Inc. | | Energy Equipment & Services | | 0.8% |
| 6 | | Estee Lauder Cos., Inc. | | Personal Products | | 0.8% |
| 7 | | F5 Networks, Inc. | | Communications Equipment | | 0.7% |
| 8 | | Family Dollar Stores, Inc. | | Multiline Retail | | 0.7% |
| 9 | | W.W. Grainger, Inc. | | Trading Companies & Distributors | | 0.7% |
| 10 | | Lubrizol Corp. | | Chemicals | | 0.7% |
| | |
Large-Cap Growth Fund MANAGER’S COMMENTARY (continued) | | |
TRW Automotive Holdings was the Fund’s biggest contributor for the calendar year; its stock price more than doubled over the 12-month period. The auto industry had a strong resurgence as Ford rebounded nicely from the recession and GM went public to strong investor demand, thus benefitting the worldwide auto parts supplier. TRW’s recent earnings report beat expectations, a development that has been repeated often over the past few years. Because of its global presence, analysts continue to believe the company will benefit greatly as auto sales jump in the world’s emerging markets and regulators in these countries press for stronger safety standards.
Information Technology companies dominated the list of negative contributors, as four related holdings were among the top detractors to the Fund’s performance. Combined, they cost the Fund almost 3% in performance. Likewise, despite the surge in retail activity late in the year, two Consumer Discretionary companies were on the worst contributors list, though neither was retail-oriented.
These are the Fund’s ten worst-contributing stocks for the calender year ended December 31, 2010:
| | | | | | |
| Rank | | Description | | Industry | | % Contribution to Return |
| 1 | | Micron Technology, Inc. | | Semiconductors & Semiconductor Equipment | | -1.1% |
| 2 | | Seagate Technology | | Computers & Peripherals | | -0.8% |
| 3 | | Hewlett-Packard Co. | | Computers & Peripherals | | -0.7% |
| 4 | | ITT Educational Services, Inc. | | Diversified Consumer Services | | -0.5% |
| 5 | | Gilead Sciences, Inc. | | Biotechnology | | -0.4% |
| 6 | | Diamond Offshore Drilling, Inc. | | Energy Equipment & Services | | -0.4% |
| 7 | | Southwestern Energy Co. | | Oil, Gas & Consumable Fuels | | -0.4% |
| 8 | | priceline.com, Inc. | | Internet & Catalog Retail | | -0.4% |
| 9 | | Google, Inc. | | Internet Software & Services | | -0.4% |
| 10 | | Intuitive Surgical, Inc. | | Health Care Equipment & Supplies | | -0.3% |
Who needs a PC when a smartphone does just about everything these days? That’s the concern of many companies that primarily target the PC industry. Micron Technology makes semiconductors that provide data storage and retrieval for personal computers. While it has a small foothold into mobile devices through flash memory chips, the bulk of its revenues still come from its legacy products. As PC demand slows, the company continues to try to increase its presence in the “new things,” but flash memory still accounted for just over 25% of memory chip sales last year. Still, management remains optimistic and recently issued a favorable outlook for the new year. For calendar year 2010, Micron lost over 30% and was the largest detractor of the Fund.
Top Ten Holdings as of December 31, 2010
Five of the Fund’s top contributors for the December 2010 quarter were also among the largest holdings at the end of the calendar year (Apple, Union Pacific, WW Grainger, Starbucks, and F5 Networks). The Fund was broadly diversified, as each of the largest positions represented a different industry and no single holding accounted for greater than 3% of the net assets. The ten largest positions represented just over 20% of the total assets of the Fund.
| | |
| | |
| 94 | | Semi-Annual Report | December 31, 2010 (Unaudited) |
| | |
Large-Cap Growth Fund MANAGER’S COMMENTARY (continued) | | |
| | | | | | |
| Rank | | Description | | Industry | | % of Net Assets |
| 1 | | Apple, Inc. | | Computers & Peripherals | | 3.0% |
| 2 | | Union Pacific Corp. | | Road & Rail | | 2.6% |
| 3 | | Gilead Sciences, Inc. | | Biotechnology | | 2.3% |
| 4 | | W.W. Grainger, Inc. | | Trading Companies & Distributors | | 2.2% |
| 5 | | Starbucks Corp. | | Hotels, Restaurants & Leisure | | 2.0% |
| 6 | | F5 Networks, Inc. | | Communications Equipment | | 2.0% |
| 7 | | Lubrizol Corp. | | Chemicals | | 1.9% |
| 8 | | Intel Corp. | | Semiconductors & Semiconductor Equipment | | 1.9% |
| 9 | | TJX Cos., Inc. | | Specialty Retail | | 1.9% |
| 10 | | Google, Inc. | | Internet Software & Services | | 1.8% |
| | Total | | | | 21.6% |
Industry Sector Representation as of December 31, 2010
The Fund’s largest allocation was in Information Technology, a sector that underperformed during the period. However, the Fund held a smaller percentage of this sector than its benchmark. On the other hand, the hot Consumer Discretionary sector made up a larger allocation of the Fund than that of the Russell 1000 Growth Index, but a number of non-retail holdings detracted from the overall return.
| | | | | | | | |
| | | % of Net Assets | | % of Russell 1000
Growth Index | | Difference | |
Consumer Discretionary | | 16.6% | | 14.7% | | | 1.9% | |
Consumer Staples | | 9.6% | | 9.4% | | | 0.2% | |
Energy | | 8.3% | | 10.9% | | | -2.6% | |
Financials | | 4.9% | | 4.7% | | | 0.2% | |
Health Care | | 10.5% | | 9.9% | | | 0.6% | |
Industrials | | 13.9% | | 13.2% | | | 0.7% | |
Information Technology | | 27.2% | | 31.1% | | | -3.9% | |
Materials | | 7.4% | | 5.2% | | | 2.2% | |
Telecommunication Services | | 1.4% | | 0.8% | | | 0.6% | |
Utilities | | 0.0% | | 0.1% | | | -0.1% | |
Cash & Other Assets | | 0.2% | | 0.0% | | | 0.2% | |
Total | | 100.0% | | 100.0% | | | | |
Disclaimer
The views expressed here are exclusively those of Fund management. These views, including those related to market sectors or individual stocks, are not meant as investment advice and should not be considered predictive in nature. Any favorable (or unfavorable) description of a holding applies only as of the quarter end, December 31, 2010, unless otherwise stated. Security positions can and do change thereafter. Discussions of historical performance do not guarantee and are not indicative of future performance.
The Fund is subject to market risk (volatility) and is not an appropriate investment for short-term investors.
Conclusion
Thank you for your continued investment in Large-Cap Growth Fund. We encourage your feedback; your reactions and concerns are important to us.
Sincerely,
Your Investment Management Team
| | |
Bridgeway Large-Cap Growth Fund SCHEDULE OF INVESTMENTS | |
|
| | |
| Showing percentage of net assets as of December 31, 2010 (Unaudited) | | |
| | | | | | | | | | |
Industry | | Company | | | Shares | | | | Value | |
| COMMON STOCKS - 100.04% | | | | | |
Aerospace & Defense - 3.63% | | | | | | | | |
| | Boeing Co. (The) | | | 9,400 | | | $ | 613,444 | |
| | Lockheed Martin Corp. | | | 12,300 | | | | 859,893 | |
| | Northrop Grumman Corp. | | | 10,500 | | | | 680,190 | |
| | | | | | | | | | |
| | | | | | | | | 2,153,527 | |
| | |
Auto Components - 1.42% | | | | | | | | |
| | TRW Automotive Holdings Corp.* | | | 16,000 | | | | 843,200 | |
| | |
Beverages - 2.45% | | | | | | | | |
| | Brown-Forman Corp., Class B | | | 12,600 | | | | 877,212 | |
| | Dr. Pepper Snapple Group, Inc. | | | 16,500 | | | | 580,140 | |
| | | | | | | | | | |
| | | | | | | | | 1,457,352 | |
| | |
Biotechnology - 2.30% | | | | | | | | |
| | Gilead Sciences, Inc.* | | | 37,740 | | | | 1,367,698 | |
| | |
Capital Markets - 2.16% | | | | | | | | |
| | Affiliated Managers Group, Inc.* | | | 4,200 | | | | 416,724 | |
| | Franklin Resources, Inc. | | | 7,800 | | | | 867,438 | |
| | | | | | | | | | |
| | | | | | | | | 1,284,162 | |
| | |
Chemicals - 5.26% | | | | | | | | |
| | Ashland, Inc. | | | 12,000 | | | | 610,320 | |
| | Lubrizol Corp. | | | 10,800 | | | | 1,154,304 | |
| | Praxair, Inc. | | | 6,500 | | | | 620,555 | |
| | Sherwin-Williams Co. (The)+ | | | 8,800 | | | | 737,000 | |
| | | | | | | | | | |
| | | | | | | | | 3,122,179 | |
| |
Communications Equipment - 4.65% | | | | | |
| | Cisco Systems, Inc.* | | | 29,000 | | | | 586,670 | |
| | F5 Networks, Inc.* | | | 9,000 | | | | 1,171,440 | |
| | Harris Corp. | | | 22,100 | | | | 1,001,130 | |
| | | | | | | | | | |
| | | | | | | | | 2,759,240 | |
| | |
Computers & Peripherals - 6.87% | | | | | | | | |
| | Apple, Inc.* | | | 5,500 | | | | 1,774,080 | |
| | Hewlett-Packard Co. | | | 14,200 | | | | 597,820 | |
| | NetApp, Inc.* | | | 11,700 | | | | 643,032 | |
| | SanDisk Corp.* | | | 21,400 | | | | 1,067,004 | |
| | | | | | | | | | |
| | | | | | | | | 4,081,936 | |
| |
Diversified Consumer Services - 0.79% | | | | | |
| | ITT Educational Services, Inc.* | | | 7,400 | | | | 471,306 | |
| | |
Electrical Equipment - 0.63% | | | | | | | | |
| | Thomas & Betts Corp.* | | | 7,700 | | | | 371,910 | |
| | | | | | | | | | |
Industry | | Company | | | Shares | | | | Value | |
| | | | | | | | | | |
Electronic Equipment, Instruments & Components - 1.46% | |
| | Arrow Electronics, Inc.* | | | 25,300 | | | $ | 866,525 | |
| |
Energy Equipment & Services - 1.62% | | | | | |
| | Atwood Oceanics, Inc.* | | | 6,800 | | | | 254,116 | |
| | Halliburton Co. | | | 17,400 | | | | 710,442 | |
| | | | | | | | | | |
| | | | | | | | | 964,558 | |
| | |
Food & Staples Retailing - 2.34% | | | | | | | | |
| | CVS Caremark Corp. | | | 20,440 | | | | 710,699 | |
| | Wal-Mart Stores, Inc. | | | 12,600 | | | | 679,518 | |
| | | | | | | | | | |
| | | | | | | | | 1,390,217 | |
| | |
Food Products - 1.31% | | | | | | | | |
| | General Mills, Inc. | | | 21,800 | | | | 775,862 | |
| |
Health Care Equipment & Supplies - 3.78% | | | | | |
| | CR Bard, Inc. | | | 7,900 | | | | 724,983 | |
| | Intuitive Surgical, Inc.* | | | 3,500 | | | | 902,125 | |
| | Medtronic, Inc. | | | 16,700 | | | | 619,403 | |
| | | | | | | | | | |
| | | | | | | | | 2,246,511 | |
| |
Health Care Providers & Services - 2.38% | | | | | |
| | AmerisourceBergen Corp. | | | 21,400 | | | | 730,168 | |
| | Quest Diagnostics, Inc.# | | | 12,600 | | | | 680,022 | |
| | | | | | | | | | |
| | | | | | | | | 1,410,190 | |
| |
Hotels, Restaurants & Leisure - 2.01% | | | | | |
| | Starbucks Corp. | | | 37,100 | | | | 1,192,023 | |
| | |
Household Products - 2.25% | | | | | | | | |
| | Colgate-Palmolive Co. | | | 7,500 | | | | 602,775 | |
| | Procter & Gamble Co. (The) | | | 11,400 | | | | 733,362 | |
| | | | | | | | | | |
| | | | | | | | | 1,336,137 | |
| |
Industrial Conglomerates - 1.18% | | | | | |
| | General Electric Co. | | | 38,400 | | | | 702,336 | |
| | |
Insurance - 2.76% | | | | | | | | |
| | Aflac, Inc. | | | 16,900 | | | | 953,667 | |
| | Travelers Cos., Inc. (The) | | | 12,300 | | | | 685,233 | |
| | | | | | | | | | |
| | | | | | | | | 1,638,900 | |
| |
Internet & Catalog Retail - 3.08% | | | | | |
| | NetFlix, Inc.*+ | | | 5,400 | | | | 948,780 | |
| | priceline.com, Inc.* | | | 2,200 | | | | 879,010 | |
| | | | | | | | | | |
| | | | | | | | | 1,827,790 | |
| |
Internet Software & Services - 3.55% | | | | | |
| | Akamai Technologies, Inc.* | | | 22,100 | | | | 1,039,805 | |
| | |
| | |
| 96 | | Semi-Annual Report | December 31, 2010 (Unaudited) |
| | |
Bridgeway Large-Cap Growth Fund SCHEDULE OF INVESTMENTS (continued) | | |
| | |
| Showing percentage of net assets as of December 31, 2010 (Unaudited) | | |
| | | | | | | | | | |
Industry | | Company | | | Shares | | | | Value | |
Common Stocks (continued) | | | | | | | | |
Internet Software & Services (continued) | |
| | Google, Inc., Class A* | | | 1,800 | | | $ | 1,069,146 | |
| | | | | | | | |
| | | | | | | | | 2,108,951 | |
| |
IT Services - 3.87% | |
| | Cognizant Technology Solutions Corp., Class A* | | | 9,600 | | | | 703,584 | |
| | International Business Machines Corp. | | | 6,300 | | | | 924,588 | |
| | Mastercard, Inc., Class A | | | 3,000 | | | | 672,330 | |
| | | | | | | | |
| | | | | | | | | 2,300,502 | |
| |
Leisure Equipment & Products - 1.04% | |
| | Hasbro, Inc. | | | 13,100 | | | | 618,058 | |
| |
Machinery - 1.41% | |
| | Cummins, Inc. | | | 7,600 | | | | 836,076 | |
| |
Media - 1.17% | |
| | Viacom, Inc., Class B | | | 17,600 | | | | 697,136 | |
| |
Metals & Mining - 2.18% | |
| | Freeport-McMoRan Copper & Gold, Inc. | | | 8,200 | | | | 984,738 | |
| | Newmont Mining Corp. | | | 5,000 | | | | 307,150 | |
| | | | | | | | | | |
| | | | | | | | | 1,291,888 | |
| |
Oil, Gas & Consumable Fuels - 6.72% | |
| | Chevron Corp. | | | 7,500 | | | | 684,375 | |
| | El Paso Corp. | | | 44,800 | | | | 616,448 | |
| | Exxon Mobil Corp. | | | 10,500 | | | | 767,760 | |
| | SM Energy Co. | | | 7,100 | | | | 418,403 | |
| | Southwestern Energy Co.* | | | 23,700 | | | | 887,091 | |
| | Ultra Petroleum Corp.* | | | 12,900 | | | | 616,233 | |
| | | | | | | | | | |
| | | | | | | | | 3,990,310 | |
| |
Personal Products - 1.24% | |
| | Estee Lauder Cos., Inc., Class A (The) | | | 9,100 | | | | 734,370 | |
| |
Pharmaceuticals - 2.08% | |
| | Bristol-Myers Squibb Co. | | | 21,653 | | | | 573,371 | |
| | Johnson & Johnson | | | 10,700 | | | | 661,795 | |
| | | | | | | | | | |
| | | | | | | | | 1,235,166 | |
| |
Road & Rail - 2.57% | |
| | Union Pacific Corp. | | | 16,500 | | | | 1,528,890 | |
| |
Semiconductors & Semiconductor Equipment - 5.69% | |
| | Atmel Corp.* | | | 71,600 | | | | 882,112 | |
| | First Solar, Inc.*+ | | | 5,500 | | | | 715,770 | |
| | Intel Corp. | | | 54,200 | | | | 1,139,826 | |
| | Xilinx, Inc.+ | | | 22,100 | | | | 640,458 | |
| | | | | | | | | | |
| | | | | | | | | 3,378,166 | |
| | | | | | | | | | |
Industry | | Company | | | Shares | | | | Value | |
Software - 3.49% | |
| | Microsoft Corp. | | | 23,600 | | | $ | 658,912 | |
| | Oracle Corp. | | | 24,900 | | | | 779,370 | |
| | VMware, Inc., Class A* | | | 7,100 | | | | 631,261 | |
| | | | | | | | | | |
| | | | | | | | | 2,069,543 | |
|
Specialty Retail - 5.50% | |
| | AutoZone, Inc.* | | | 2,900 | | | | 790,511 | |
| | Gap, Inc. (The) | | | 33,500 | | | | 741,690 | |
| | Ross Stores, Inc. | | | 9,400 | | | | 594,550 | |
| | TJX Cos., Inc. | | | 25,600 | | | | 1,136,384 | |
| | | | | | | | | | |
| | | | | | | | | 3,263,135 | |
|
Textiles, Apparel & Luxury Goods - 1.57% | |
| | Coach, Inc. | | | 16,800 | | | | 929,208 | |
|
Trading Companies & Distributors - 2.21% | |
| | W.W. Grainger, Inc. | | | 9,500 | | | | 1,312,045 | |
|
Wireless Telecommunication Services - 1.42% | |
| | MetroPCS Communications, Inc.* | | | 66,900 | | | | 844,947 | |
| | | | | | | | | | |
TOTAL COMMON STOCKS - 100.04% | | | | 59,401,950 | |
| | | | | | | | | | |
(Cost $48,620,817) | | | | | |
| |
TOTAL INVESTMENTS - 100.04% | | | $ | 59,401,950 | |
(Cost $48,620,817) | | | | | |
Liabilities in Excess of Other Assets - (0.04%) | | | | (24,221 | ) |
| | | | | | | | | | |
NET ASSETS - 100.00% | | | $ | 59,377,729 | |
| | | | | | | | | | |
| * | Non-income producing security. |
| # | Securities, or a portion thereof, segregated to cover the Fund’s obligation under swap agreements. The total market value of segregated assets is $680,022. |
| + | This security or a portion of the security is out on loan at December 31, 2010. Total loaned securities had a market value of $1,837,819 at December 31, 2010. |
| | |
Bridgeway Large-Cap Growth Fund SCHEDULE OF INVESTMENTS (continued) | | |
| | | | | | | | | | | | | | | | |
Summary of inputs used to value the Fund’s investments as of 12/31/2010 are as follows (See Note 2 in Notes to Financial Statements): | |
| | | Valuation Inputs | |
| | |
| | | Investment in Securities (Market Value) | |
| | |
| | | Level 1
Quoted
Prices | | | Level 2
Significant
Observable
Inputs | | | Level 3
Significant Unobservable
Inputs | | | Total | |
| | |
Common Stocks | | $
| 59,401,950
|
| | $ | — | | | $ | — | | | $
| 59,401,950
|
|
| | | | | | | | | | | | | | | | |
TOTAL | | $
| 59,401,950
|
| | $ | — | | | $ | — | | | $
| 59,401,950
|
|
| | | | | | | | | | | | | | | | |
Other Financial Instruments** | | | | | | | | | | | | | | | | |
Swaps | | $ | — | | | $ | 1,368 | | | $ | — | | | $
| 1,368
|
|
| | | | | | | | | | | | | | | | |
TOTAL | | $ | — | | | $ | 1,368 | | | $ | — | | | $
| 1,368
|
|
| | | | | | | | | | | | | | | | |
** Other financial instruments are derivative instruments not reflected in the Schedule of Investments, such as futures, forwards and swap contracts, which are valued at the unrealized appreciation/depreciation on the investment. See Notes to Financial Statements. | |
| | |
| | |
| 98 | | Semi-Annual Report | December 31, 2010 (Unaudited) |
| | |
Large-Cap Value Fund MANAGER’S COMMENTARY | | |
(Unaudited)
December 31, 2010
Dear Fellow Large-Cap Value Fund Shareholder,
For the December 2010 quarter, Large-Cap Value Fund ended the year on a strong note and returned 10.56%, barely surpassing our primary market benchmark, the Russell 1000 Value Index (+10.54%) and also its peer benchmark, the Lipper Large-Cap Value Funds Index (+10.34%). We are pleased with the absolute and relative returns.
For the six-month “semi-annual” period ending December 31, 2010, our Fund was up 20.41%, trailing both benchmarks, the Russell 1000 Value Index (+21.74%) and the Lipper Large-Cap Value Funds Index (+21.69%). While the absolute return was strong, some Technology picks in the September quarter brought our returns below our benchmarks.
For the calendar year, our Fund was up 14.51%, underperforming our primary market benchmark, the Russell 1000 Value Index (+15.51%), but outperforming our peer benchmark, the Lipper Large-Cap Value Funds Index (+13.02%). This broke a four calendar year stretch of beating our market benchmark.
The table below presents our December quarter, six-month, one-year, five-year, and life-to-date financial results according to the formula required by the SEC. See the next page for a graph of performance since inception.
| | | | | | | | | | |
| | | Dec. Qtr.
10/1/10
to 12/31/10 | | 6 Month
7/1/10
to 12/31/10 | | 1 Year
1/1/10
to 12/31/10 | | 5 Year
1/1/06
to 12/31/10 | | Life-to-Date
10/31/03 to 12/31/10 |
| | | | | |
Large-Cap Value Fund | | 10.56% | | 20.41% | | 14.51% | | 2.27% | | 6.26% |
Russell 1000 Value Index | | 10.54% | | 21.74% | | 15.51% | | 1.28% | | 5.11% |
Lipper Large-Cap Value Funds Index | | 10.34% | | 21.69% | | 13.02% | | 1.52% | | 4.58% |
Performance figures quoted in the table above and graph below represent past performance and are no guarantee of future results. Total return figures in the table above include the reinvestment of dividends and capital gains. The table above and the graph below do not reflect the deduction of taxes that a shareholder would pay on Fund distributions or the redemption of Fund shares. The recent growth rate in the stock market has helped to produce short-term returns that are not typical and may not continue in the future.
The Russell 1000 Value Index is an unmanaged index that consists of stocks in the Russell 1000 Index with lower price-to-book ratios and lower forecasted growth values with dividends reinvested. The Lipper Large-Cap Value Funds Index is an index of large-company, value-oriented funds compiled by Lipper, Inc. It is not possible to invest directly in an index. Periods longer than one year are annualized.
According to data from Lipper, Inc. as of December 31, 2010, Large-Cap Value Fund ranked 192nd of 345 multi-cap value funds for the twelve-month period ended December 31, 2010, 80th of 244 over the last five years and 43rd of 195 such funds since inception in October, 2003. Lipper, Inc. is an independent mutual fund rating service that ranks funds in various fund categories by making comparative calculations using total returns.
| | |
Large-Cap Value Fund MANAGER’S COMMENTARY (continued) | | |
Large-Cap Value Fund vs. Russell 1000 Value Index & Lipper Large-Cap Value Funds Index from Inception 8/5/94 to 12/31/10
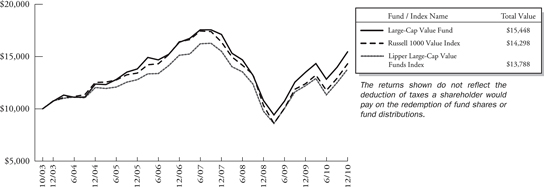
Detailed Explanation of Quarterly Performance
The Short Version: Some Energy and Consumer Discretionary stocks helped this quarter, while our worst performer, Berkshire Hathaway, gave back some of the excellent returns of the prior three quarters.
The recent quarter could be deemed “the return of the consumer” as retailers reported their best holiday season since the beginning of the economic downturn. Two Consumer Discretionary companies (both auto-related) highlighted the list of top ten contributing stocks; combined, they contributed almost one percent to the overall return of the Fund. Three Energy holdings also made the best contributors list as oil prices climbed during the quarter on expectations for global economic growth, primarily led by the emerging world markets.
These are the Fund’s ten best-contributing stocks for the quarter ended December 31, 2010:
| | | | | | |
Rank | | Description | | Industry | | % Contribution to Return |
1 | | National Oilwell Varco, Inc. | | Energy Equipment & Services | | 0.8% |
2 | | Ford Motor Corp. | | Automobiles | | 0.6% |
3 | | Wells Fargo & Co. | | Commercial Banks | | 0.5% |
4 | | Amtel Corp. | | Semiconductors & Semiconductor Equipment | | 0.5% |
5 | | Exxon Mobil Corp. | | Oil, Gas & Consumable Fuels | | 0.4% |
6 | | Chevron Corp. | | Oil, Gas & Consumable Fuels | | 0.4% |
7 | | New York Community Bancorp, Inc. | | Thrifts & Mortgage Finance | | 0.4% |
8 | | McKesson Corp. | | Health Care Providers & Services | | 0.3% |
9 | | TRW Automotive Holdings Corp. | | Auto Components | | 0.3% |
10 | | Arrow Electronics, Inc. | | Electronic Equip., Instruments & Components | | 0.3% |
In the heat of the financial crisis, automakers marched on Wall Street and requested a bailout of their own. Of the major domestic companies, only Ford chose not to participate in the government handout and has been accumulating market share ever since. The company has also benefited from the positive developments at its rivals (i.e. GM’s successful stock offering); its stock price soared over 30% this quarter. In November, Ford’s sales jumped almost 25% as demand increased across all product lines. Late in the quarter, the company announced its intent to build over 600,000 new cars and trucks in the first quarter of 2011, production that represents an 11% increase over last year and is certain to help the country’s ailing labor market. Ford contributed over a half a percent to the Fund’s return in the December quarter.
All in all, the December quarter was quite positive for stocks, though six sectors were represented on the worst contributors list, proving that even in strong periods, laggards will normally exist in virtually every industry. All told, however, the biggest laggards combined to cost the Fund less than a quarter-of-a-percent in return. Industrials placed three holdings on this list, with two aerospace related companies highlighting the negativity.
| | |
| | |
| 100 | | Semi-Annual Report | December 31, 2010 (Unaudited) |
| | |
Large-Cap Value Fund MANAGER’S COMMENTARY (continued) | | |
These are the Fund’s ten worst-contributing stocks for the quarter ended December 31, 2010:
| | | | | | |
| Rank | | Description | | Industry | | % Contribution to Return |
1 | | Berkshire Hathaway, Inc. | | Insurance | | -0.1% |
2 | | Bristol-Myers Squibb Co. | | Pharmaceuticals | | 0.0% |
3 | | DIRECTV | | Media | | 0.0% |
4 | | L-3 Communications Holdings, Inc. | | Aerospace & Defense | | 0.0% |
5 | | Lockheed Martin Corp. | | Aerospace & Defense | | 0.0% |
6 | | Campbell Soup Co. | | Food Products | | 0.0% |
7 | | Southwest Airlines Co. | | Airlines | | 0.0% |
8 | | Xerox Corp. | | Office Electronics | | 0.0% |
9 | | Dr. Pepper Snapple Group, Inc. | | Beverages | | 0.0% |
10 | | Merck & Co, Inc. | | Pharmaceuticals | | 0.0% |
Warren Buffet’s investment conglomerate, Berkshire Hathaway, dropped over 3% in the three month period and was the biggest detractor in the Fund. In its most recent quarter, the company reported earnings that plunged 8%, primarily the result of a near $100-million loss in its derivative portfolio. In reality, that portfolio had reaped significant gains in the prior year, so the loss was not as big a deal to Buffet as his shareholders initially feared. In fact, excluding the derivative losses, operating earnings grew nicely on strong results from Burlington Northern, among other holdings, and Berkshire Hathaway’s stock actually climbed over 20% for the entire year.
Detailed Explanation of Calendar Year Performance
The Short Version: Energy and Consumer Discretionary companies contributed nicely to our calendar year returns, while two semiconductor companies hurt the most.
Consumer Discretionary companies topped the list as retailers benefited from a late surge in activity and the three related holdings combined to contribute over 3.0% to the Fund’s performance. Two of these companies (TRW and Ford) come from auto-related industries and served as proof that demand continued to increase both domestically and abroad. Additionally, energy companies benefited from the rise in oil prices and growing global demand as three holdings made the best contributors list as well and contributed over 2% to the overall return of the Fund.
These are the Fund’s ten best-contributing stocks for the calendar year ended December 31, 2010:
| | | | | | |
| Rank | | Description | | Industry | | % Contribtuion to Return |
1 | | TRW Automotive Holdings Corp. | | Auto Components | | 1.5% |
2 | | Ford Motor Co. | | Automobiles | | 1.1% |
3 | | E.I. du Pont de Nemours & Co. | | Chemicals | | 0.9% |
4 | | National Oilwell Varco, Inc. | | Energy Equiptment & Services | | 0.8% |
5 | | Union Pacific Corp. | | Road & Rail | | 0.7% |
6 | | New York Community Bancorp, Inc. | | Thrifts & Mortgage Finance | | 0.7% |
7 | | Lubrizol Corp. | | Chemicals | | 0.6% |
8 | | ConocoPhilips | | Oil, Gas & Consumable Fuels | | 0.6% |
9 | | Chevron Corp. | | Oil, Gas & Consumable Fuels | | 0.6% |
10 | | Hasbro, Inc. | | Leisure Equipment & Products | | 0.6% |
TRW Automotive Holdings was the Fund’s biggest contributor for the calendar year; its stock price more than doubled over the 12-month period. The auto industry had a strong resurgence as Ford rebounded nicely from the recession and GM went
| | |
Large-Cap Value Fund MANAGER’S COMMENTARY (continued) | | |
public to strong investor demand, thus benefitting the worldwide auto parts supplier. TRW’s recent earnings report beat expectations, a development that has been repeated often over the past few years. Because of its global presence, analysts continue to believe the company will benefit greatly as auto sales jump in the world’s emerging markets and regulators in these countries press for stronger safety standards.
Information Technology companies dominated the list of negative contributors as four related holdings were among the top detractors to the Fund’s performance. Combined, they cost the Fund over 1.5% in return. Four other sectors were represented on this list. In fact, two Energy companies were on the “worst of” list despite the strong showing from three others in the best contributors list, as mentioned above.
These are the Fund’s ten worst-contributing stocks for the calendar year ended December 31, 2010:
| | | | | | |
| Rank | | Description | | Industry | | % Contribution to Return |
1 | | Western Digital Corp. | | Computers & Peripherals | | -0.7% |
2 | | Micron Technology, Inc. | | Semiconductors & Semiconductor Equipment | | -0.5% |
3 | | BlackRock, Inc. | | Capital Markets | | -0.4% |
4 | | Noble Corp. | | Energy Equipment & Services | | -0.4% |
5 | | Verizon Communications, Inc. | | Diversified Telecommunication Services | | -0.3% |
6 | | Comstock Resources, Inc. | | Oil, Gas & Consumable Fuels | | -0.3% |
7 | | L-3 Communications Holdings, Inc. | | Aerospace & Defense | | -0.3% |
8 | | Hewlett-Packard Co. | | Computers & Peripherals | | -0.2% |
9 | | Raytheon Co. | | Aerospace & Defense | | -0.2% |
10 | | Computer Sciences Corp. | | IT Services | | -0.2% |
Who needs a PC when a smartphone does just about everything these days? That’s the concern of many companies that primarily target the PC industry. Micron Technology makes semiconductors that provide data storage and retrieval for personal computers. While it has a small foothold into mobile devices through flash memory chips, the bulk of its revenues still come from its legacy products. As PC demand slows, the company continues to try to increase its presence in the “new things,” but flash memory still accounted for just over 25% of memory chip sales last year. Still, management remains optimistic and recently issued a favorable outlook for 2011. For calendar year 2010, Micron lost over 30% and was the second biggest detractor of the Fund.
Top Ten Holdings as of December 31, 2010
Five of the Fund’s top contributors for the December 2010 quarter were also among the largest holdings at the end of the calendar year (Chevron, McKesson, Wells Fargo, Exxon Mobil, and New York Community Bancorp). The Fund was broadly diversified, as only one sector (Oil/Gas) was represented by two holdings among the largest positions and no single stock accounted for greater than 2.5% of the net assets. The ten largest positions represented under 25% of the total assets of the Fund.
| | | | | | | | |
| Rank | | Description | | | Industry | | | % of Net
Assets |
| 1 | | AT&T, Inc. | | | Diversified Telecommunications Services | | | 2.5% |
| 2 | | Chevron Corp. | | | Oil, Gas & Consumable Fuels | | | 2.5% |
| 3 | | Berkshire Hathaway, Inc. | | | Insurance | | | 2.5% |
| 4 | | Raytheon Co. | | | Aerospace & Defense | | | 2.5% |
| 5 | | Pfizer, Inc. | | | Pharmaceuticals | | | 2.4% |
| 6 | | McKesson Corp. | |
| Health Care Providers & Services
|
| | 2.4% |
| 7 | | E.I. du Pont de Nemours & Co. | | | Chemicals | | | 2.3% |
| 8 | | Wells Fargo & Co. | | | Commercial Banks | | | 2.3% |
| 9 | | Exxon Mobil Corp. | | | Oil, Gas & Consumable Fuels | | | 2.2% |
| 10 | | New York Community Bancorp, Inc. | | | Thrifts & Mortgage Finance | | | 2.2% |
| | Total | | | | | | 23.8% |
| | |
| | |
| 102 | | Semi-Annual Report | December 31, 2010 (Unaudited) |
| | |
Large-Cap Value Fund MANAGER’S COMMENTARY (continued) | | |
Industry Sector Representation as of December 31, 2010
The Fund’s largest allocation was in Financials, even though the percentage still lagged that of its benchmark. The Fund maintained a larger relative allocation in Information Technology, a sector that was mixed in performance as PC and related companies continued to underperform, while mobile devices like smartphones led the way as the “new thing.”
| | | | | | | | |
| | | % of Net Assets | | % of Russell 1000
Value Index | | | Difference | |
| Consumer Discretionary | | 8.6% | | 7.8% | | | 0.8% | |
| Consumer Staples | | 9.3% | | 9.8% | | | -0.5% | |
| Energy | | 11.7% | | 12.4% | | | -0.7% | |
| Financials | | 23.8% | | 27.9% | | | -4.1% | |
| Health Care | | 12.4% | | 12.5% | | | -0.1% | |
| Industrials | | 12.5% | | 9.0% | | | 3.5% | |
| Information Technology | | 9.8% | | 5.5% | | | 4.3% | |
| Materials | | 4.5% | | 3.1% | | | 1.4% | |
| Telecommunication Services | | 3.7% | | 5.2% | | | -1.5% | |
| Utilities | | 3.3% | | 6.8% | | | -3.5% | |
| Cash & Other Assets | | 0.4% | | 0.0% | | | 0.4% | |
Total | | 100.0% | | 100.0% | | | | |
Disclaimer
The views expressed here are exclusively those of Fund management. These views, including those related to market sectors or individual stocks, are not meant as investment advice and should not be considered predictive in nature. Any favorable (or unfavorable) description of a holding applies only as of the quarter end, December 31, 2010, unless otherwise stated. Security positions can and do change thereafter. Discussions of historical performance do not guarantee and are not indicative of future performance.
The Fund is subject to market risk (volatility) and is not an appropriate investment for short-term investors.
Conclusion
Thank you for your continued investment in Large-Cap Value Fund. We encourage your feedback; your reactions and concerns are important to us.
Sincerely,
Your Investment Management Team
| | |
Bridgeway Large-Cap Value Fund SCHEDULE OF INVESTMENTS | | |
| | |
| Showing percentage of net assets as of December 31, 2010 (Unaudited) | | |
| | | | | | | | | | |
Industry | | Company | | | Shares | | | | Value | |
COMMON STOCKS - 99.79% | |
Aerospace & Defense - 6.50% | |
| | L-3 Communications Holdings, Inc. | | | 4,300 | | | $ | 303,107 | |
| | Lockheed Martin Corp. | | | 5,600 | | | | 391,496 | |
| | Northrop Grumman Corp. | | | 6,100 | | | | 395,158 | |
| | Raytheon Co. | | | 14,400 | | | | 667,296 | |
| | | | | | | | | | |
| | | | | | | | | 1,757,057 | |
| |
Airlines - 1.80% | |
| | Southwest Airlines Co. | | | 37,500 | | | | 486,750 | |
| |
Auto Components - 1.43% | |
| | TRW Automotive Holdings Corp.* | | | 7,300 | | | | 384,710 | |
| |
Beverages - 2.11% | |
| | Brown-Forman Corp., Class B+ | | | 4,600 | | | | 320,252 | |
| | Dr. Pepper Snapple Group, Inc. | | | 7,100 | | | | 249,636 | |
| | | | | | | | | | |
| | | | | | | | | 569,888 | |
| |
Chemicals - 4.56% | |
| | E.I. du Pont de Nemours & Co. | | | 12,600 | | | | 628,488 | |
| | Lubrizol Corp. | | | 2,600 | | | | 277,888 | |
| | Sherwin-Williams Co. (The)+ | | | 3,900 | | | | 326,625 | |
| | | | | | | | | | |
| | | | | | | | | 1,233,001 | |
| |
Commercial Banks - 3.50% | |
| | M&T Bank Corp. | | | 3,700 | | | | 322,085 | |
| | Wells Fargo & Co. | | | 20,100 | | | | 622,899 | |
| | | | | | | | | | |
| | | | | | | | | 944,984 | |
| |
Computers & Peripherals - 1.07% | |
| | SanDisk Corp.* | | | 5,800 | | | | 289,188 | |
| |
Construction & Engineering - 1.05% | |
| | URS Corp.* | | | 6,800 | | | | 282,948 | |
| |
Diversified Financial Services - 2.63% | |
| | CME Group, Inc. | | | 1,200 | | | | 386,100 | |
| | NYSE Euronext | | | 10,800 | | | | 323,784 | |
| | | | | | | | | | |
| | | | | | | | | 709,884 | |
| |
Diversified Telecommunication Services - 2.54% | |
| | AT&T, Inc. | | | 23,349 | | | | 685,994 | |
| |
Electric Utilities - 3.29% | |
| | American Electric Power Co., Inc. | | | 8,100 | | | | 291,438 | |
| | Duke Energy Corp. | | | 17,400 | | | | 309,894 | |
| | Southern Co. | | | 7,550 | | | | 288,636 | |
| | | | | | | | | | |
| | | | | | | | | 889,968 | |
| | | | | | | | | | |
Industry | | Company | | | Shares | | | | Value | |
| | | | | | | | | | |
Electronic Equipment, Instruments & Components - 2.43% | |
| | Arrow Electronics, Inc.* | | | 10,700 | | | $ | 366,475 | |
| | Vishay Intertechnology, Inc.* | | | 19,800 | | | | 290,664 | |
| | | | | | | | | | |
| | | | | | | | | 657,139 | |
|
Energy Equipment & Services - 3.30% | |
| | National Oilwell Varco, Inc. | | | 8,500 | | | | 571,625 | |
| | Unit Corp.* | | | 6,900 | | | | 320,712 | |
| | | | | | | | | | |
| | | | | | | | | 892,337 | |
|
Food & Staples Retailing - 3.78% | |
| | CVS Caremark Corp. | | | 11,480 | | | | 399,160 | |
| | Safeway, Inc. | | | 13,000 | | | | 292,370 | |
| | Wal-Mart Stores, Inc. | | | 6,100 | | | | 328,973 | |
| | | | | | | | | | |
| | | | | | | | | 1,020,503 | |
|
Food Products - 0.95% | |
| | Campbell Soup Co. | | | 7,400 | | | | 257,150 | |
|
Health Care Providers & Services - 6.43% | |
| | AmerisourceBergen Corp. | | | 8,600 | | | | 293,432 | |
| | CIGNA Corp. | | | 4,900 | | | | 179,634 | |
| | McKesson Corp. | | | 9,300 | | | | 654,534 | |
| | Quest Diagnostics, Inc. | | | 5,400 | | | | 291,438 | |
| | UnitedHealth Group, Inc. | | | 8,800 | | | | 317,768 | |
| | | | | | | | | | |
| | | | | | | | | 1,736,806 | |
|
Household Products - 2.52% | |
| | Colgate-Palmolive Co. | | | 4,300 | | | | 345,591 | |
| | Procter & Gamble Co. (The) | | | 5,200 | | | | 334,516 | |
| | | | | | | | | | |
| | | | | | | | | 680,107 | |
|
Industrial Conglomerates - 1.11% | |
| | General Electric Co. | | | 16,400 | | | | 299,956 | |
|
Insurance - 10.95% | |
| | Aflac, Inc. | | | 10,000 | | | | 564,300 | |
| | Berkshire Hathaway, Inc., Class B* | | | 8,400 | | | | 672,924 | |
| | Chubb Corp. | | | 8,000 | | | | 477,120 | |
| | Loews Corp. | | | 10,800 | | | | 420,228 | |
| | Prudential Financial, Inc. | | | 7,600 | | | | 446,196 | |
| | Travelers Cos., Inc. (The) | | | 6,800 | | | | 378,828 | |
| | | | | | | | | | |
| | | | | | | | | 2,959,596 | |
|
Leisure Equipment & Products - 0.87% | |
| | Hasbro, Inc. | | | 5,000 | | | | 235,900 | |
|
Media - 5.14% | |
| | DIRECTV, Class A* | | | 6,200 | | | | 247,566 | |
| | News Corp., Class A | | | 18,600 | | | | 270,816 | |
| | Time Warner, Inc. | | | 8,466 | | | | 272,351 | |
| | Walt Disney Co. (The) | | | 7,700 | | | | 288,827 | |
| | |
| | |
| 104 | | Semi-Annual Report | December 31, 2010 (Unaudited) |
| | |
Bridgeway Large-Cap Value Fund SCHEDULE OF INVESTMENTS (continued) | | |
| | |
| Showing percentage of net assets as of December 31, 2010 (Unaudited) | | |
| | | | | | | | | | |
Industry | | Company | | | Shares | | | | Value | |
Common Stocks (continued) | |
Media (continued) | |
| | Washington Post Co., Class B (The) | | | 700 | | | $ | 307,650 | |
| | | | | | | | | | |
| | | | | | | | | 1,387,210 | |
| |
Office Electronics - 1.01% | |
| | Xerox Corp. | | | 23,700 | | | | 273,024 | |
| |
Oil, Gas & Consumable Fuels - 8.41% | |
| | Chesapeake Energy Corp. | | | 11,400 | | | | 295,374 | |
| | Chevron Corp. | | | 7,514 | | | | 685,652 | |
| | Comstock Resources, Inc.* | | | 10,100 | | | | 248,056 | |
| | ConocoPhillips | | | 6,600 | | | | 449,460 | |
| | Exxon Mobil Corp. | | | 8,100 | | | | 592,272 | |
| | | | | | | | | | |
| | | | | | | | | 2,270,814 | |
| |
Pharmaceuticals - 5.98% | |
| | Bristol-Myers Squibb Co. | | | 12,172 | | | | 322,315 | |
| | Merck & Co., Inc. | | | 10,100 | | | | 364,004 | |
| | Pfizer, Inc. | | | 37,800 | | | | 661,878 | |
| | Watson Pharmaceuticals, Inc.* | | | 5,200 | | | | 268,580 | |
| | | | | | | | | | |
| | | | | | | | | 1,616,777 | |
| |
Real Estate Investment Trusts (REITs) - 4.58% | |
| | AvalonBay Communities, Inc. | | | 3,900 | | | | 438,945 | |
| | HCP, Inc. | | | 10,165 | | | | 373,970 | |
| | Ventas, Inc. | | | 8,100 | | | | 425,088 | |
| | | | | | | | | | |
| | | | | | | | | 1,238,003 | |
| |
Road & Rail - 2.02% | |
| | Union Pacific Corp. | | | 5,900 | | | | 546,694 | |
| |
Semiconductors & Semiconductor Equipment - 3.14% | |
| | Atmel Corp.* | | | 32,200 | | | | 396,704 | |
| | Micron Technology, Inc.* | | | 56,400 | | | | 452,328 | |
| | | | | | | | | | |
| | | | | | | | | 849,032 | |
| |
Software - 1.08% | |
| | Microsoft Corp.# | | | 10,400 | | | | 290,368 | |
| |
Specialty Retail - 1.21% | |
| | Gap, Inc. (The) | | | 14,700 | | | | 325,458 | |
| |
Textiles, Apparel & Luxury Goods - 1.05% | |
| | VF Corp. | | | 3,300 | | | | 284,394 | |
| |
Thrifts & Mortgage Finance - 2.16% | |
| | New York Community Bancorp, Inc. | | | 31,000 | | | | 584,350 | |
| | | | | | | | | | | | |
Industry | | Company | | | | | Shares | | | | Value | |
| | | | | | | | | | | | |
Wireless Telecommunication Services - 1.19% | |
| | MetroPCS Communications, Inc.* | | | 25,400 | | | $ | 320,802 | |
| | | | | | | | | | | | |
TOTAL COMMON STOCKS - 99.79% | | | | | | | 26,960,792 | |
| | | | | | | | | | | | |
(Cost $20,676,976) | | | | | | | | | | |
| | | | |
| | | | | Rate^ | | Shares | | | Value | |
| |
MONEY MARKET FUND - 0.14% | | | | | |
BlackRock FedFund | | 0.06% | | | 38,289 | | | | 38,289 | |
| | | | | | | | | | | | |
TOTAL MONEY MARKET FUND - 0.14% | | | | 38,289 | |
| | | | | | | | | | | | |
(Cost $38,289) | | | | | | | | | | |
| |
TOTAL INVESTMENTS - 99.93% | | | $ | 26,999,081 | |
(Cost $20,715,265) | | | | | | | | | | |
Other Assets in Excess of Liabilities - 0.07% | | | | 20,212 | |
| | | | | | | | | | | | |
NET ASSETS - 100.00% | | | | | | | | $ | 27,019,293 | |
| | | | | | | | | | | | |
| * | Non-income producing security. |
| # | Securities, or a portion thereof, segregated to cover the Fund’s obligation under swap agreements. The total market value of segregated assets is $290,368. |
| ^ | Rate disclosed as of December 31, 2010. |
| + | This security or a portion of the security is out on loan at December 31, 2010. Total loaned securities had a market value of $398,612 at December 31, 2010. |
Summary of inputs used to value the Fund’s investments as of 12/31/2010 are as follows (See Note 2 in Notes to Financial Statements):
| | | | | | | | | | | | | | | | |
| | | | Valuation Inputs | |
| | | | Investment in Securities (Market Value) | |
| | |
| Level 1
Quoted
Prices |
| |
| Level 2
Significant
Observable
Inputs |
| |
| Level 3
Significant
Unobservable
Inputs |
| | | Total | |
| | | | |
Common Stocks | | | $26,960,792 | | | $ | — | | | $ | — | | | $ | 26,960,792 | |
Money Market Fund | | | — | | | | 38,289 | | | | — | | | | 38,289 | |
| | | | | | | | | | | | | | | | |
TOTAL | | | $26,960,792 | | | $ | 38,289 | | | $ | — | | | $ | 26,999,081 | |
| | | | | | | | | | | | | | | | |
See Notes to Financial Statements.
| | |
Blue Chip 35 Index Fund MANAGER’S COMMENTARY | | |
December 31, 2010
Dear Fellow Blue Chip 35 Index Fund Shareholder,
In the hugely small-cap dominated December quarter, our “ultra-large” company Fund was up 9.95%, underperforming our primary market benchmark, the S&P 500 Index (+10.76%) and slightly underperforming our peer benchmark, the Lipper Large-Cap Core Funds Index (+10.05%). We did slightly outperform the Russell Top 50 Index (+9.56%). For the quarter, we were at a disadvantage, as the largest stocks were outperformed by all other size stocks.
For the six month “semi-annual” period ending December 31, 2010, our Fund returned 20.98%, underperforming our primary market benchmark, the S&P 500 Index (+23.27%) and our peer benchmark, the Lipper Large-Cap Core Funds Index (+22.12%). We slightly outperformed the Russell Top 50 Index (+20.46%). Our underperformance relative to our primary market benchmark was a function of the difference in size of our companies. Smaller companies tend to outperform coming out of a recession, and that was definitely true this six-month period. In fact, companies in just the second largest group (of ten groups), outperformed the largest ones, which comprise our Fund, by three and a half percentage points.
The table below presents our December quarter, six-month, one-year, five-year, ten-year and life-to-date financial results according to the formula required by the SEC. See the next page for a graph of performance from Inception.
| | | | | | | | | | | | |
| | | Dec. Qtr.
10/1/10
to 12/31/10 | | 6 Month
7/1/10
to 12/31/10 | | 1 Year
1/1/10
to 12/31/10 | | 5 Year
1/1/06
to 12/31/10 | | 10 Year
1/1/01
to 12/31/10 | | Life-to-Date
7/31/97 to 12/31/10 |
| | | | | | |
Blue Chip 35 Index Fund | | 9.95% | | 20.98% | | 10.60% | | 2.72% | | 1.42% | | 4.36% |
S&P 500 Index | | 10.76% | | 23.27% | | 15.06% | | 2.29% | | 1.41% | | 3.88% |
Russell Top 50 Index | | 9.56% | | 20.46% | | 9.48% | | 1.59% | | -0.51% | | NA |
Bridgeway Ultra-Large 35 Index | | 9.99% | | 20.96% | | 10.70% | | 2.92% | | 1.87% | | 4.51% |
Lipper Large-Cap Core Funds Index | | 10.05% | | 22.12% | | 12.77% | | 1.91% | | 0.76% | | 3.27% |
Performance figures quoted in the table above and graph below represent past performance and are no guarantee of future results. Total return figures in the table above and the graph below include the reinvestment of dividends and capital gains. The table above and the graph below do not reflect the deduction of taxes that a shareholder would pay on Fund distributions or the redemption of Fund shares. The recent growth rate in the stock market has helped to produce short-term returns that are not typical and may not continue in the future.
The S&P 500 Index is a broad-based, unmanaged measurement of changes in stock market conditions, based on the average of 500 widely held common stocks with dividends reinvested. The Russell Top 50 Index measures the performance of the largest companies in the Russell 3000 Index. It includes approximately 50 of the largest securities, based on a combination of their market cap and current index membership, and represents approximately 40% of the total market capitalization of the Russell 3000 Index. The Bridgeway Ultra-Large 35 Index is an index comprised of very large, “blue chip” U.S. stocks, excluding tobacco; it is compiled by the adviser of the Fund. The Lipper Large-Cap Core Funds Index reflects the aggregate record of domestic large-cap core mutual funds as reported by Lipper, Inc. It is not possible to invest directly in an index. Periods longer than one year are annualized.
According to data from Lipper, Inc. as of December 31, 2010, Blue-Chip 35 Index Fund ranked 881st of 1,069 large-cap core funds for the twelve months ending December 31, 2010, 253rd of 768 over the last five years, 223rd of 461 over the last ten years, and 85th of 279 since inception in July 1997. Lipper, Inc. is an independent mutual fund rating service that ranks funds in various fund categories by making comparative calculations using total returns.
| | |
| | |
| 106 | | Semi-Annual Report | December 31, 2010 (Unaudited) |
| | |
Blue Chip 35 Index Fund MANAGER’S COMMENTARY (continued) | |
|
Blue Chip 35 Index Fund vs. S&P 500 Index, Russell Top 50 Index*, Bridgeway Ultra-Large 35 Index & Lipper Large-Cap Core Funds Index from Inception 7/31/97 to 12/31/10
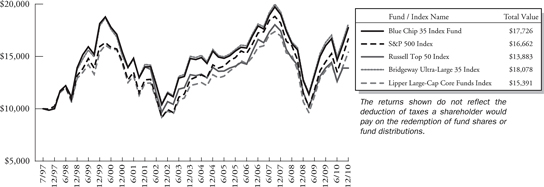
| * | The Russell Top 50 Index began on 12/31/2001, and the line graph for the Index begins at the same value as the Fund on that date. |
Explanation of Quarterly Performance
Small company dominance created a major headwind for our Fund in the December quarter. Companies in just the second largest group (of ten groups by size) outperformed the largest ones, which comprise our Fund, by more than a percent and a half. The Fund did outperform our benchmark of more similar sized ultra-large companies, the Russell Top 50 Index, as presented in the table on the prior page.
Calendar Year Performance
The Short Version: Energy was the only sector with more than two companies in the top ten contributors to performance.
There were four Energy companies among the top ten performers; combined, they added about three percent to the Fund’s performance. Information Technology made the largest contribution to performance (Apple added 1.68% and was up 53.1% for the year), but was offset by five IT companies (Visa, HP, Cisco, Microsoft and Google) that were among the worst contributors, reducing the Fund’s return by more than one and three-quarters percent.
| | |
Blue Chip 35 Index Fund MANAGER’S COMMENTARY (continued) | |
|
Contribution from Blue Chip 35 Index Fund Stocks for the Calendar Year Ended December 31, 2010
| | | | | | |
| Rank | | Company | | Industry | | % Contribution to Return |
1 | | Apple, Inc. | | Computers & Peripherals | | 1.7% |
2 | | ConocoPhillips | | Oil, Gas & Consumable Fuels | | 1.0% |
3 | | Oracle Corp. | | Software | | 0.8% |
4 | | Schlumberger, Ltd. | | Energy Equipment & Services | | 0.8% |
5 | | United Parcel Service, Inc. | | Air Freight & Logistics | | 0.8% |
6 | | McDonald’s Corp. | | Hotels, Restaurants & Leisure | | 0.7% |
7 | | General Electric Co. | | Industrial Conglomerates | | 0.7% |
8 | | Occidental Petroleum Corp. | | Oil, Gas & Consumable Fuels | | 0.7% |
9 | | Verizon Communications, Inc. | | Diversified Telecommunication Services | | 0.6% |
10 | | Chevron Corp. | | Oil, Gas & Consumable Fuels | | 0.6% |
11 | | Berkshire Hathaway, Inc. | | Insurance | | 0.6% |
12 | | Coca-Cola Co. | | Beverages | | 0.6% |
13 | | United Technologies Corp. | | Aerospace & Defense | | 0.4% |
14 | | International Business Machines Corp. | | IT Services | | 0.4% |
15 | | Wells Fargo & Co. | | Commercial Banks | | 0.4% |
16 | | AT&T, Inc. | | Diversified Telecommunication Services | | 0.4% |
17 | | Exxon Mobil Corp. | | Oil, Gas & Consumable Fuels | | 0.3% |
18 | | PepsiCo, Inc. | | Beverages | | 0.3% |
19 | | CVS Caremark Corp. | | Food & Staples Retailing | | 0.3% |
20 | | Procter & Gamble Co. | | Household Products | | 0.3% |
21 | | Merck & Co., Inc. | | Pharmaceuticals | | 0.2% |
22 | | 3M Co. | | Industrial Conglomerates | | 0.2% |
23 | | Intel Corp. | | Semiconductors & Semiconductor Equipment | | 0.2% |
24 | | Wal-Mart Stores, Inc. | | Food & Staples Retailing | | 0.1% |
25 | | JPMorgan Chase & Co. | | Diversified Financial Services | | 0.1% |
26 | | Pfizer, Inc. | | Pharmaceuticals | | 0.1% |
27 | | Goldman Sachs Group, Inc. | | Capital Markets | | 0.1% |
28 | | Johnson & Johnson | | Pharmaceuticals | | 0.0% |
29 | | Monsanto Co. | | Chemicals | | 0.0% |
30 | | Google, Inc. | | Internet Software & Services | | -0.1% |
31 | | Microsoft Corp. | | Software | | -0.2% |
32 | | Abbott Laboratories | | Pharmaceuticals | | -0.2% |
33 | | Bank of America Corp. | | Diversified Financial Services | | -0.3% |
34 | | Cisco Systems, Inc. | | Communications Equipment | | -0.4% |
35 | | Hewlett-Packard Co. | | Computers & Peripherals | | -0.5% |
36 | | Visa, Inc. | | IT Services | | -0.6% |
| | |
| | |
| 108 | | Semi-Annual Report | December 31, 2010 (Unaudited) |
| | |
Blue Chip 35 Index Fund MANAGER’S COMMENTARY (continued) | |
|
What Worked
Many IT firms continued to struggle as businesses wait for more signs of an economic rebound before upgrading their technology systems. Not Apple. Likewise, many IT firms continued to suffer as consumers shun PCs and change the way they communicate on the run with smartphones and tablets. Not Apple. Despite a few minor glitches along the road in 2010, Apple did very little struggling or suffering. First it introduced iPad, the first tablet, to rave reviews and extremely enthusiastic demand. Over 3 million units were sold in its first three months on the market. Then came the iPhone 4. There were over 600,000 advanced orders even before the launch. Not to be left out, the old reliable Apple Mac produced record sales in the latest quarter. Well, iPad sales tapered a bit as immense competition heated up throughout the year and iPhone was greeted was some initial reception challenges. But to date, both remain the products of choice among many consumers and businesses. (A recent survey of investment team cell phones reveals 4 iPhones, 2 iPads, and 2 iMacs among eight team members.) As Verizon becomes a new distribution outlet, Apple will now have two large network sources from which to draw customers, and AT&T will have to proceed without the coveted exclusive agreement. Finally, international demand has also aided the company as emerging countries like China cannot seem to get enough of the new technologies. For the calendar year 2010, Apple surged over 50% to an all-time high and contributed over a percent-and-a-half to the return of the Fund.
What Didn’t Work
On the flip side of IT . . . when it rains, it pours. Since the beginning of the economic downturn, many businesses have remained in cost-cutting mode and have been hesitant to upgrade technology. Likewise, consumers have feared their personal employment situations and have not been rushing out to buy the newest PC. Add to that . . . the tablet. Apple introduced the iPad, and many rivals have followed suit with their own versions. These tablets began taking away sales from traditional PC makers from day one. As the industry leader, Hewlett-Packard has struggled heavily. As if things could not get any worse for HP, in August the company said goodbye to CEO Mark Hurd after a scandal in which he submitted a series of reimbursable invoices that turned out to be of a personal nature. The departure was rushed, without anything in the way of a succession plan, and investors lost even more confidence in the technology leader. Outrage ensued over the terms of his severance package, and lawsuits followed. Despite the popularity of the tablets for consumer use, few analysts believe it will ever replace the PC, because of its limited in business applications. Still, HP has continued looking for more profitable business lines and moved forward with its M&A strategy of seeking perceived undervalued opportunities in the marketplace. Of note, it won out over rival Dell in a well-publicized bidding war for storage company 3Par. In its most recent quarter, the company reported a 5% rise in earnings and raised its forecast for the coming year. Though a company never wants the distinction of being the worst performer in the Dow, some analysts have actually turned more positive on HP. For the calendar year, the company lost over 17% and cost the Fund about a half-a-percent in return.
Post Script
One of the principles of investing that we believe generally holds true at Bridgeway is that, with respect to asset classes and “niches” or “corners” of the market, less return should accompany less risk. However, we are continually looking for exceptions to this rule. Specifically, we perform research in a continual quest to identify opportunities to capture any “risk adjusted return” left on the investing table.
With respect to Blue Chip 35 Index Fund, one would expect that the lower risk of our Fund from Inception through 2010, as reported by Morningstar and others, would be accompanied with lower returns. Not so. Even in this small company dominated period, we have beaten our primary market benchmark by 0.48%/year. Doesn’t sound like much? $10,000 invested in our Fund on Inception in 1997 is now worth $17,726. The same amount “invested” in the S&P 500 Index is worth $16,662. The difference is definitely not chump change.
Industry Sector Representation as of December 31, 2010
As presented below, Information Technology was our largest sector, as well as having the largest over-allocation compared to the S&P 500 Index. The Consumer Discretionary sector was the only sector that had a significant under-allocation.
| | |
Blue Chip 35 Index Fund MANAGER’S COMMENTARY (continued) | | |
| | | | | | |
| | | % of Net Assets | | % of S&P 500 | | Difference |
Consumer Discretionary | | 2.6% | | 10.6% | | -8.0% |
Consumer Staples | | 13.5% | | 10.6% | | 2.9% |
Energy | | 14.6% | | 12.0% | | 2.6% |
Financials | | 13.8% | | 16.3% | | -2.5% |
Health Care | | 10.6% | | 11.0% | | -0.4% |
Industrials | | 10.9% | | 10.9% | | 0.0% |
Information Technology | | 25.8% | | 18.5% | | 7.3% |
Materials | | 2.7% | | 3.7% | | -1.0% |
Telecommunication Services | | 5.4% | | 3.1% | | 2.3% |
Utilities | | 0.0% | | 3.3% | | -3.3% |
Cash & Other Assets | | 0.1% | | 0.0% | | 0.1% |
Total | | 100.0% | | 100.0% | | |
Disclaimer
The views expressed here are exclusively those of Fund management. These views, Including those related to market sectors or individual stocks, are not meant as investment advice and should not be considered predictive in nature. Any favorable (or unfavorable) description of a holding applies only as of the quarter end, December 31, 2010, unless otherwise stated. Security positions can and do change thereafter. Discussions of historical performance do not guarantee and are not indicative of future performance.
The Fund is subject to significant market risk (volatility) and is not an appropriate investment for short-term investors.
Conclusion
Thank you for your continued investment in Blue Chip 35 Index Fund. We encourage your feedback; your reactions and concerns are important to us.
Sincerely,
Your Investment Management Team
| | |
| | |
| 110 | | Semi-Annual Report | December 31, 2010 (Unaudited) |
| | |
Bridgeway Blue Chip 35 Index Fund SCHEDULE OF INVESTMENTS | | |
| | |
| Showing percentage of net assets as of December 31, 2010 (Unaudited) | | |
| | | | | | | | | | |
Industry | | Company | | | Shares | | | | Value | |
| COMMON STOCKS - 99.87% | |
Aerospace & Defense - 2.69% | | | | | | | | |
| | United Technologies Corp. | | | 105,480 | | | $ | 8,303,386 | |
| | |
Air Freight & Logistics - 2.66% | | | | | | | | |
| | United Parcel Service, Inc., Class B | | | 113,063 | | | | 8,206,113 | |
| |
Beverages - 5.38% | |
| | Coca-Cola Co. (The) | | | 128,457 | | | | 8,448,617 | |
| | PepsiCo, Inc. | | | 124,750 | | | | 8,149,917 | |
| | | | | | | | | | |
| | | | | | | | | 16,598,534 | |
| |
Capital Markets - 2.76% | |
| | Goldman Sachs Group, Inc. (The) | | | 50,600 | | | | 8,508,896 | |
| |
Chemicals - 2.75% | |
| | Monsanto Co. | | | 121,950 | | | | 8,492,598 | |
| |
Commercial Banks - 2.90% | |
| | Wells Fargo & Co. | | | 288,359 | | | | 8,936,245 | |
| |
Communications Equipment - 2.60% | |
| | Cisco Systems, Inc.* | | | 397,008 | | | | 8,031,472 | |
| |
Computers & Peripherals - 6.52% | |
| | Apple, Inc.* | | | 37,000 | | | | 11,934,720 | |
| | Hewlett-Packard Co. | | | 194,500 | | | | 8,188,450 | |
| | | | | | | | | | |
| | | | | | | | | 20,123,170 | |
| |
Diversified Financial Services - 5.46% | |
| | Bank of America Corp. | | | 629,308 | | | | 8,394,969 | |
| | JPMorgan Chase & Co. | | | 199,195 | | | | 8,449,852 | |
| | | | | | | | | | |
| | | | | | | | | 16,844,821 | |
| |
Diversified Telecommunication Services - 5.41% | |
| | AT&T, Inc. | | | 279,325 | | | | 8,206,569 | |
| | Verizon Communications, Inc. | | | 237,089 | | | | 8,483,044 | |
| | | | | | | | | | |
| | | | | | | | | 16,689,613 | |
| |
Energy Equipment & Services - 3.25% | |
| | Schlumberger, Ltd. | | | 120,200 | | | | 10,036,700 | |
| |
Food & Staples Retailing - 5.36% | |
| | CVS Caremark Corp. | | | 240,900 | | | | 8,376,093 | |
| | Wal-Mart Stores, Inc. | | | 151,519 | | | | 8,171,420 | |
| | | | | | | | | | |
| | | | | | | | | 16,547,513 | |
| |
Hotels, Restaurants & Leisure - 2.65% | |
| | McDonald’s Corp. | | | 106,300 | | | | 8,159,588 | |
| | | | | | | | | | |
Industry | | Company | | | Shares | | | | Value | |
| | | | | | | | | | |
Household Products - 2.71% | |
| | Procter & Gamble Co. (The) | | | 129,826 | | | $ | 8,351,707 | |
|
Industrial Conglomerates - 5.51% | |
| | 3M Co. | | | 97,200 | | | | 8,388,360 | |
| | General Electric Co. | | | 469,743 | | | | 8,591,599 | |
| | | | | | | | | | |
| | | | | | | | | 16,979,959 | |
|
Insurance - 2.67% | |
| | Berkshire Hathaway, Inc., Class B* | | | 102,650 | | | | 8,223,291 | |
|
Internet Software & Services - 2.77% | |
| | Google, Inc., Class A* | | | 14,370 | | | | 8,535,349 | |
|
IT Services - 5.38% | |
| | International Business Machines Corp. | | | 56,842 | | | | 8,342,132 | |
| | Visa, Inc., Class A | | | 117,200 | | | | 8,248,536 | |
| | | | | | | | | | |
| | | | | | | | | 16,590,668 | |
|
Oil, Gas & Consumable Fuels - 11.31% | |
| | Chevron Corp. | | | 92,395 | | | | 8,431,044 | |
| | ConocoPhillips | | | 124,015 | | | | 8,445,422 | |
| | Exxon Mobil Corp. | | | 115,687 | | | | 8,459,033 | |
| | Occidental Petroleum Corp. | | | 97,300 | | | | 9,545,130 | |
| | | | | | | | | | |
| | | | | | | | | 34,880,629 | |
|
Pharmaceuticals - 10.62% | |
| | Abbott Laboratories | | | 171,900 | | | | 8,235,729 | |
| | Johnson & Johnson | | | 131,752 | | | | 8,148,861 | |
| | Merck & Co., Inc. | | | 227,935 | | | | 8,214,777 | |
| | Pfizer, Inc. | | | 465,844 | | | | 8,156,929 | |
| | | | | | | | | | |
| | | | | | | | | 32,756,296 | |
|
Semiconductors & Semiconductor Equipment - 2.71% | |
| | Intel Corp. | | | 396,843 | | | | 8,345,608 | |
|
Software - 5.80% | |
| | Microsoft Corp. | | | 304,645 | | | | 8,505,688 | |
| | Oracle Corp. | | | 299,613 | | | | 9,377,887 | |
| | | | | | | | | | |
| | | | | | | | | 17,883,575 | |
| | | | | | | | | | |
TOTAL COMMON STOCKS - 99.87% | | | | | | | 308,025,731 | |
| | | | | | | | | | |
(Cost $249,949,435) | | | | | | | | |
| | |
Bridgeway Blue Chip 35 Index Fund SCHEDULE OF INVESTMENTS (continued) | | |
| | |
| Showing percentage of net assets as of December 31, 2010 (Unaudited) | | |
| | | | | | | | | | | | |
| | | Rate^ | | | Shares | | | Value | |
MONEY MARKET FUND - 3.45% | | | | | |
BlackRock FedFund | | | 0.06% | | | | 10,626,817 | | | | $10,626,817 | |
| | | | | | | | | | | | |
TOTAL MONEY MARKET FUND - 3.45% | | | | 10,626,817 | |
| | | | | | | | | | | | |
(Cost $10,626,817) | | | | | |
TOTAL INVESTMENTS - 103.32% | | | | $318,652,548 | |
(Cost $260,576,252) | | | | | |
Liabilities in Excess of Other Assets - (3.32%) | | | | (10,227,052 | ) |
| | | | | | | | | | | | |
NET ASSETS - 100.00% | | | | $308,425,496 | |
| | | | | | | | | | | | |
* Non-income producing security. ^ Rate disclosed as of December 31, 2010. | |
| |
| |
| |
| |
| |
| |
| |
Summary of inputs used to value the Fund’s investments as of 12/31/2010 are as follows (See Note 2 in Notes to Financial Statements):
| | | | | | | | | | | | | | | | |
| | | Valuation Inputs | |
| | | Investment in Securities (Market Value) | |
| | | Level 1 Quoted Prices | | | Level 2
Significant
Observable
Inputs | | | Level 3
Significant
Unobservable
Inputs | | | Total | |
| | | | |
Common Stocks | | | $308,025,731 | | | $ | — | | | $ | — | | | | $308,025,731 | |
Money Market Fund | | | — | | | | 10,626,817 | | | | — | | | | 10,626,817 | |
| | | | | | | | | | | | | | | | |
TOTAL | | $ | 308,025,731 | | | $ | 10,626,817 | | | $ | — | | | | $318,652,548 | |
| | | | | | | | | | | | | | | | |
See Notes to Financial Statements.
| | |
| | |
| 112 | | Semi-Annual Report | December 31, 2010 (Unaudited) |
Managed Volatility Fund
MANAGER’S COMMENTARY
(Unaudited)
December 31, 2010
Dear Fellow Managed Volatility Fund Shareholder:
For the December 31, 2010 quarter, Managed Volatility Fund rose 5.02%, outperforming the Managed Volatility Benchmark (+4.20%) and the primary market benchmark, the Bloomberg/EFFAS US Government 1-3 Year Total Return Bond Index (BBI) (-0.17%). It lagged its peer benchmark, the Lipper Balanced Funds Index (+6.03%) and the equity-only S&P 500 Index (+10.76%). Given the lower volatility of our fund relative to the S&P 500, we are quite happy with our quarterly performance.
For the six-month “semi-annual” period ending December 31, 2010, our Fund was up 11.49% and again beat the Managed Volatility Benchmark (+9.57%) and the primary market benchmark, the Bloomberg/EFFAS US Government 1-3 Year Total Return Bond Index (+0.44%). As was the case for the quarter, it underperformed Lipper Balanced Funds Index (+14.95%) and the S&P 500 Index (+23.27%). It was a mixed six-month period, but we are generally pleased that we achieved our volatility objective of capturing 40% of the return of the S&P 500 Index (40% or more in up markets, 40% or less in declining markets). The equity markets as a whole rebounded nicely from a summer slump in the September to December period when the sovereign debt crisis threatened contagion across Europe; ultimately, investors were rewarded for their patience and confidence.
For the calendar year ended December 31, 2010 , our Fund was up 5.41%, outperforming the Bloomberg/EFFAS US Government 1-3 Year Total Return Bond Index (+2.40%). We did underperform the Managed Volatility Benchmark (+7.47%), the Lipper Balanced Funds Index (+11.90%) and the S&P 500 Index (+15.06%). For the full year, we are somewhat disappointed with our performance; we failed to achieve our volatility objective of capturing 40% of the S&P 500 Index return. We are still well ahead of that goal for the longer five-year and inception-to-date periods.
Our hybrid Fund invests in equities, fixed-income, options and derivatives. Our strategy is designed to produce a lower level of volatility versus the overall stock market, more in line with the level of risk more commonly associated with bond funds. The Fund may perform poorly relative to the stock market during sharply rising markets and conversely look good relative to a sharply declining market. In essence, we are “managing” volatility to provide a Fund with more stable returns over a wide range of fixed-income and equity market environments.
The table below presents our December quarter, six-month, one-year, five-year and life-to-date financial results according to the formula required by the SEC. A graph of quarterly performance since inception appears on the following page.
| | | | | | | | | | |
| | | Dec. Qtr.
10/1/10
to 12/31/10 | | 6 Month
7/1/10
to 12/31/10 | | 1 Year
1/1/10
to 12/31/10 | | 5 Year
1/1/06
to 12/31/10 | | Life-to-Date
6/30/01 to
12/31/10 |
| | | | | |
Managed Volatility Fund | | 5.02% | | 11.49% | | 5.41% | | 1.66% | | 3.51% |
Bloomberg/EFFAS U.S. Government 1-3 Year
Total Return Bond Index | | -0.17% | | 0.44% | | 2.40% | | 4.21% | | 3.74% |
S&P 500 Index | | 10.76% | | 23.27% | | 15.06% | | 2.29% | | 2.23% |
Managed Volatility Benchmark | | 4.20% | | 9.57% | | 7.47% | | 3.46% | | 3.16% |
Lipper Balanced Funds Index | | 6.03% | | 14.95% | | 11.90% | | 3.91% | | 4.09% |
Performance figures quoted in the table above and graph below represent past performance and are no guarantee of future results. Total return figures in the table above and the graph below include the reinvestment of dividends and capital gains. The table above and the graph below do not reflect the deduction of taxes that a shareholder would pay on Fund distributions or the redemption of Fund shares.
Managed Volatility Benchmark is a combined index, of which 40% reflects the S&P 500 Index (an unmanaged index of large companies with dividends reinvested) and 60% reflects the Bloomberg/ EFFAS U.S. Government 1-3 year Total Return Bond Index (transparent benchmark for the total return of the 1-3 year U.S. Government bond market). The Lipper Balanced Funds
| | |
Managed Volatility Fund MANAGER’S COMMENTARY (continued) | | |
Index is an index of balanced funds compiled by Lipper, Inc. It is not possible to invest directly in an index. Periods longer than one year are annualized.
According to data from Lipper, Inc. as of December 31, 2010, the Managed Volatility Fund ranked 504th of 510 Mixed-Asset Target Allocation Moderate funds for the calendar year ended December 31, 2010, 359th of 392 for the past five years and 122nd of 199 funds since inception on June 30, 2001. Lipper, Inc. is an independent mutual fund rating service that ranks funds in various fund categories by making comparative calculations using total returns.
According to data from Morningstar as of December 31, 2010, the Managed Volatility Fund ranked 1,041st of 1,074 Moderate Allocation funds for the calendar year ended December 31, 2010, and 659th of 736 funds for five years. Morningstar ranks funds in various fund categories by making comparative calculations using total returns.
Managed Volatility Fund vs. S&P 500 Index, Bloomberg/EFFAS Bond Index, Lipper Balanced Funds Index & Managed Volatility Benchmark from Inception 6/30/01 to 12/31/10
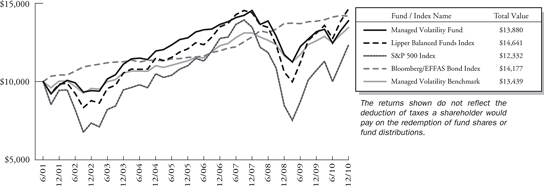
Detailed Explanation of Quarterly Performance
The Short Version: Energy was a strong contributor in the quarter, while Information Technology was the biggest drag on performance.
Oil soared to a 25-month high, over $90/barrel, on a better outlook for global growth as energy giants looked to expand exploration and production in 2011. As such, three energy holdings made the list of top contributors; combined, they added over a percent-and-a-quarter to the return of the Fund. Information Technology, Financial, and Consumer Discretionary also placed two stocks each on the best performers list.
These are the Fund’s ten best-contributing stocks for the quarter ended December 31, 2010:
| | |
| | |
| 114 | | Semi-Annual Report | December 31, 2010 (Unaudited) |
| | |
Managed Volatility Fund MANAGER’S COMMENTARY (continued) | | |
| | | | | | |
| Rank | | Description | | Industry | | % Contribution to Return |
1 | | Exxon Mobil Corp. | | Oil, Gas & Consumable Fuels | | 0.8% |
2 | | Seagate Technology PLC | | Computers & Peripherals | | 0.3% |
3 | | Travelers Cos., Inc. | | Insurance | | 0.3% |
4 | | AutoZone, Inc. | | Specialty Retail | | 0.3% |
5 | | Wells Fargo & Co. | | Commercial Banks | | 0.3% |
6 | | SanDisk Corp. | | Computers & Peripherals | | 0.3% |
7 | | Eaton Corp. | | Machinery | | 0.3% |
8 | | Chevron Corp. | | Oil, Gas & Consumable Fuels | | 0.3% |
9 | | Comcast Corp. | | Media | | 0.2% |
10 | | Halliburton Co. | | Energy Equipment & Services | | 0.2% |
Someone has to supply all those smartphones and tablets with flash memory cards. So it might as well be SanDisk. Recently a top analyst “conservatively” predicted tablet sales of 50 million in 2011, and SanDisk is taking advantage of the enhanced demand. In its most recent quarter, the company reported earnings growth of 39%. Even more impressively, revenues surged by 32%; the performance is, thus not merely the result of cost-cutting measures (as is so often the case these days), but it has come from solid sales activity. During the quarter, analysts from Raymond James and Robert W. Baird both upgraded the stock. SanDisk was the sixth best contributor for the December quarter and contributed over a quarter-of-a-percent to the Fund’s return.
Information Technology companies were a mixed bag this past quarter as two related holdings made the ten best contributors list, but five others were among the Fund’s poorest contributors. In certain cases, corporations have limited technology purchases in order to keep costs in check and make earning looks stronger. The delayed activity has hindered Information Technology companies, many of which are still expecting a major surge in upgrades, but continue to wait out the economic uncertainty for another quarter or two (and hopefully not much longer). The five Information Technology holdings on the worst contributors list cost the Fund about three-quarters-of-a-percent in return.
These are the Fund’s ten worst-contributing stocks for the quarter ended December 31, 2010:
| | | | | | |
| Rank | | Description | | Industry | | % Contribution to Return |
1 | | Cirrus Logic, Inc. | | Semiconductors & Semiconductor Equipment | | -0.3% |
2 | | Sanmina-SCI Corp. | | Electronic Equipment, Instruments & Components | | -0.2% |
3 | | Lexmark International, Inc. | | Computers & Peripherals | | -0.2% |
4 | | Cisco Systems, Inc. | | Communications Equipment | | -0.1% |
5 | | Big Lots, Inc. | | Multiline Retail | | -0.1% |
6 | | Berkshire Hathaway, Inc. | | Insurance | | -0.1% |
7 | | Archer-Daniels-Midland Co. | | Food Products | | 0.0% |
8 | | US Airways Group, Inc. | | Airlines | | 0.0% |
9 | | Visa, Inc. | | IT Services | | 0.0% |
10 | | Bristol-Myers Squibb Co. | | Pharmaceuticals | | 0.0% |
Yes, earnings do matter to investors (a lot). In October, printer maker Lexmark disappointed investors with a weaker than expected earnings report that showed lackluster revenue growth and a large buildup in inventories. The company also announced that its CEO was stepping down. Its stock plummeted almost 20% on the earnings news, and some analysts questioned the company’s ability to compete with larger rivals like HP. For the three month period ended December 31, 2010, Lexmark was among the worst contributing holdings in the Fund as its stock price fell over 20% for the quarter.
Detailed Explanation of Calendar Year Performance
The Short Version: Consumer Discretionary stocks gave the Fund a nice boost, while Information Technology stocks hurt returns.
| | |
Managed Volatility Fund MANAGER’S COMMENTARY (continued) | | |
Calendar year 2010 could be deemed “the return of the consumer” as retailers reported their best holiday season since the beginning of the economic downturn. Three Consumer Discretionary companies highlighted the list of top ten contributing stocks; combined, they enhanced performance of the Fund by about one-and-a-half percent.
These are the Fund’s ten best-contributing stocks for the calendar year ended December 31, 2010:
| | | | | | |
| Rank | | Description | | Industry | | % Contribution to Return |
1 | | AutoZone, Inc. | | Specialty Retail | | 0.7% |
2 | | Apple, Inc. | | Computers & Peripherals | | 0.7% |
3 | | Travelers Cos., Inc. | | Insurance | | 0.6% |
4 | | Eaton Corp. | | Machinery | | 0.6% |
5 | | Chevron Corp. | | Oil, Gas & Consumable Fuels | | 0.5% |
6 | | Exxon Mobil Corp. | | Oil, Gas & Consumable Fuels | | 0.5% |
7 | | Valassis Communications, Inc. | | Media | | 0.5% |
8 | | Union Pacific Corp. | | Road & Rail | | 0.4% |
9 | | American Greetings Corp. | | Household Durables | | 0.4% |
10 | | Citrix Systems, Inc. | | Software | | 0.4% |
AutoZone’s shares climbed throughout the calendar year as the auto parts supplier continued to benefit from the resurgence of the auto industry. Ford has rebounded nicely from the recession, and “new and improved” GM went public to strong investor demand. The rebound in the auto industry has definitely benefited parts suppliers to a great degree. AutoZone has experienced earnings per share (EPS) growth of over 20% for the past eight quarters. Additionally, net sales jumped 12.7% in its most recent quarterly report. For the 12 month period, the stock surged over 70% and was the top contributor to the Fund.
As was the case for the quarter, Information Technology companies dominated the list of negative contributors; six related holdings were among the top detractors to performance. Combined, they cost the Fund over two-and-a-quarter percent in return. Two Health Care companies also made the worst contributors list as uncertainties persisted throughout the year over industry reform.
These are the Fund’s ten worst-contributing stocks for the calendar year ended December 31, 2010:
| | | | | | |
| Rank | | Description | | Industry | | % Contribution to Return |
1 | | Unisys Corp. | | IT Services | | -0.6% |
2 | | Sanmina-SCI Corp. | | Electronic Equipment, Instruments & Components | | -0.6% |
3 | | Fuel Systems Solutions, Inc. | | Auto Components | | -0.4% |
4 | | Seagate Technology PLC | | Computers & Peripherals | | -0.4% |
5 | | Cisco Systems, Inc. | | Communications Equipment | | -0.4% |
6 | | Monsanto Co. | | Chemicals | | -0.3% |
7 | | Gilead Sciences, Inc. | | Biotechnology | | -0.2% |
8 | | Veeco Instruments, Inc. | | Semiconductors & Semiconductor Equipment | | -0.2% |
9 | | Visa, Inc. | | IT Services | | -0.2% |
10 | | Baxter International, Inc. | | Health Care Equipment & Supplies | | -0.1% |
While corporate earnings season generally has been met with positive investor reaction since mid-2009, many analysts have claimed that the stellar quarters have been the result of significant cost-cutting measures. Technology companies like Unisys have struggled as businesses slash IT budgets in an attempt to make their bottom lines look better to investors and analysts. In its most recent quarter, Unisys reported a 54% profit decline on weak server sales; investors reacted accordingly. Its stock fell almost 20% in one day and dropped over 40% for calendar year 2010. Earlier in the year, the multinational company suffered from negative economic developments in Venezuela. Unisys cost the Fund over half-a-percent in return and was the worst contributor to its overall performance.
| | |
| | |
| 116 | | Semi-Annual Report | December 31, 2010 (Unaudited) |
| | |
Managed Volatility Fund MANAGER’S COMMENTARY (continued) | | |
Background on Fixed Income Securities Strategy
Our fixed income approach has always been quite conservative, a strategy that has served the Fund well as we attempt to minimize interest rate and credit risk. During the year, as the sovereign debt crisis emerged throughout Europe, many investors shied away from risky assets and demonstrated a flight-to-quality to the safe haven of short-term treasuries. All of our fixed income holdings are now in short duration US Government Bills and Notes, which performed in line with our expectations for the semi-annual period.
Top Ten Holdings as of December 31, 2010
Three of the Fund’s top contributors for the December 2010 quarter were also among the largest holdings at the end of the calendar year (Exxon Mobil, Travelers, and Chevron). The Fund was broadly diversified; no single holding accounted for greater than 3% of the net assets. The ten largest positions represented just over 15% of the total assets of the Fund.
| | | | | | |
| Rank | | Description | | Industry | | % of Net
Assets |
| 1 | | Exxon Mobil Corp. | | Oil, Gas & Consumable Fuels | | 3.0% |
| 2 | | Travelers Cos., Inc. | | Insurance | | 2.6% |
| 3 | | Procter & Gamble Co. | | Household Products | | 1.8% |
| 4 | | Cirrus Logic, Inc. | | Semiconductors & Semiconductor Equipment | | 1.6% |
| 5 | | Berkshire Hathaway, Inc. | | Insurance | | 1.5% |
| 6 | | JPMorgan Chase & Co. | | Diversified Financial Services | | 1.2% |
| 7 | | Northrop Grumman Corp. | | Aerospace & Defense | | 1.1% |
| 8 | | Chevron Corp. | | Oil, Gas & Consumable Fuels | | 1.0% |
| 9 | | US Airways Group, Inc. | | Airlines | | 0.9% |
| 10 | | Cisco Systems, Inc. | | Communications Equipment | | 0.9% |
| | Total | | | | 15.6% |
Industry Sector Representation as of December 31, 2010
As of December 31, 2010, equities comprised 57.4% of the Fund’s overall allocation. Information Technology and Financials represented the largest allocations. IT was a mixed bag, as many companies have yet to enhance their budgets in the aftermath of the economic downturn, though anything related to tablets and smart-phones has benefited from the significant demand. Many Financials continue to rebound from the debacle as lending activity picks up, but plenty of economic uncertainties remain.
We curtailed our exposure to the potentially higher yielding corporate bond markets in favor of safer, short-duration US Treasuries. Finally, we utilized the options markets a great deal to generate additional income by selling puts and calls, a strategy that can be quite effective when premiums are high in volatile equity market environments.
| | |
Managed Volatility Fund MANAGER’S COMMENTARY (continued) | | |
| | | | |
| Asset Type | | % of Net
Assets | |
Common Stock | | | 57.4% | |
Consumer Discretionary | | | 4.9% | |
Consumer Staples | | | 6.8% | |
Energy | | | 7.3% | |
Financials | | | 10.9% | |
Health Care | | | 4.3% | |
Industrials | | | 7.4% | |
Information Technology | | | 11.6% | |
Materials | | | 1.4% | |
Telecommunication Services | | | 1.0% | |
Utilities | | | 1.8% | |
U.S. Government Obligations | | | 41.1% | |
Corporate Notes | | | 0.0% | |
Covered Call Options Written | | | -1.3% | |
Put Options Written | | | -0.6% | |
Money Market Funds | | | 3.1% | |
Other Assets in Excess of Liabilities | | | 0.3% | |
Total | | | 100.0% | |
Disclaimer
The views expressed here are exclusively those of Fund management. These views, including those related to market sectors or individual stocks, are not meant as investment advice and should not be considered predictive in nature. Any favorable (or unfavorable) description of a holding applies only as of the quarter end, December 31, 2010, unless otherwise stated. Security positions can and do change thereafter. Discussions of historical performance do not guarantee and are not indicative of future performance.
Market volatility can significantly affect short-term performance. The Fund is not an appropriate investment for short-term investors. Investments in the small companies within this multi-cap fund generally carry greater risk than is customarily associated with larger companies. This additional risk is attributable to a number of factors, including the relatively limited financial resources that are typically available to small companies and the fact that small companies often have comparatively limited product lines. In addition, the stock of small companies tends to be more volatile than the stock of large companies, particularly in the short term and particularly in the early stages of an economic or market downturn. The Fund’s use of options, futures, and leverage can magnify the risk of loss in an unfavorable market, and the Fund’s use of short-sale positions can, in theory, expose shareholders to unlimited loss. Shareholders of the Fund, therefore, are taking on more risk than they would if they invested in the stock market as a whole. The Fund uses an option writing strategy in which the Fund may sell covered calls or secured put options. Up to 75% of Fund assets may be invested in options. Options are subject to special risks and may not fully protect the Fund against declines in the value of its stocks. In addition, an option writing strategy limits the upside profit potential normally associated with stocks. Finally, the Fund’s fixed-income holdings are subject to three types of risk. Interest rate risk is the chance that bond prices overall will decline as interest rates rise. Credit risk is the chance a bond issuer will fail to pay interest and principal. Prepayment risk is the chance a mortgage-backed bond issuer will repay a higher yielding bond, resulting in a lower paying yield.
Conclusion
In closing, we would like to thank you for your continued investment in the Managed Volatility Fund. We encourage your feedback; your reactions and concerns are important to us.
Sincerely,
Your Investment Management Team
| | |
| | |
| 118 | | Semi-Annual Report | December 31, 2010 (Unaudited) |
| | |
Bridgeway Managed Volatility Fund SCHEDULE 0F INVESTMENTS | | |
| | |
| Showing percentage of net assets as of December 31, 2010 (Unaudited) | | |
| | | | | | | | | | |
Industry | | Company | | | Shares | | | | Value | |
COMMON STOCKS - 57.44% | |
Aerospace & Defense - 2.36% | |
| | General Dynamics Corp. | | | 1,400 | | | $ | 99,344 | |
| | Honeywell International, Inc. | | | 2,100 | | | | 111,636 | |
| | Lockheed Martin Corp.# | | | 1,670 | | | | 116,750 | |
| | Northrop Grumman Corp.# | | | 5,300 | | | | 343,334 | |
| | United Technologies Corp. | | | 940 | | | | 73,997 | |
| | | | | | | | | | |
| | | | | | | | | 745,061 | |
| |
Air Freight & Logistics - 0.35% | |
| | FedEx Corp. | | | 1,200 | | | | 111,612 | |
| |
Airlines - 0.95% | |
| | US Airways Group, Inc.*# | | | 30,000 | | | | 300,300 | |
| |
Beverages - 1.38% | |
| | Brown-Forman Corp., Class B | | | 2,950 | | | | 205,379 | |
| | Coca-Cola Co. (The) | | | 2,500 | | | | 164,425 | |
| | PepsiCo, Inc. | | | 1,000 | | | | 65,330 | |
| | | | | | | | | | |
| | | | | | | | | 435,134 | |
| |
Biotechnology - 0.56% | |
| | Gilead Sciences, Inc.*# | | | 4,900 | | | | 177,576 | |
| |
Capital Markets - 1.25% | |
| | Ameriprise Financial, Inc. | | | 2,080 | | | | 119,704 | |
| | Bank of New York Mellon Corp. (The)# | | | 1,832 | | | | 55,326 | |
| | Charles Schwab Corp. (The)# | | | 5,000 | | | | 85,550 | |
| | Franklin Resources, Inc. | | | 300 | | | | 33,363 | |
| | Morgan Stanley# | | | 1,500 | | | | 40,815 | |
| | State Street Corp. | | | 1,300 | | | | 60,242 | |
| | | | | | | | | | |
| | | | | | | | | 395,000 | |
| |
Chemicals - 0.84% | |
| | Dow Chemical Co. (The) | | | 3,900 | | | | 133,146 | |
| | Monsanto Co. | | | 500 | | | | 34,820 | |
| | Sherwin-Williams Co. (The) | | | 600 | | | | 50,250 | |
| | Sigma-Aldrich Corp. | | | 700 | | | | 46,592 | |
| | | | | | | | | | |
| | | | | | | | | 264,808 | |
| |
Commercial Banks - 1.65% | |
| | Comerica, Inc.# | | | 2,600 | | | | 109,824 | |
| | KeyCorp | | | 3,700 | | | | 32,745 | |
| | Marshall & Ilsley Corp.# | | | 2,500 | | | | 17,300 | |
| | US Bancorp | | | 4,100 | | | | 110,577 | |
| | Wells Fargo & Co.# | | | 8,071 | | | | 250,120 | |
| | | | | | | | | | |
| | | | | | | | | 520,566 | |
| | | | | | | | | | |
Industry | | Company | | | Shares | | | | Value | |
|
Communications Equipment - 1.18% | |
| | Cisco Systems, Inc.*# | | | 14,100 | | | $ | 285,243 | |
| | Juniper Networks, Inc.*# | | | 2,400 | | | | 88,608 | |
| | | | | | | | | | |
| | | | | | | | | 373,851 | |
|
Computers & Peripherals - 1.92% | |
| | Apple, Inc.* | | | 800 | | | | 258,048 | |
| | Lexmark International, Inc., Class A*# | | | 7,300 | | | | 254,186 | |
| | SanDisk Corp.*# | | | 1,900 | | | | 94,734 | |
| | | | | | | | | | |
| | | | | | | | | 606,968 | |
|
Consumer Finance - 0.73% | |
| | American Express Co.# | | | 2,200 | | | | 94,424 | |
| | Capital One Financial Corp.# | | | 3,200 | | | | 136,192 | |
| | | | | | | | | | |
| | | | | | | | | 230,616 | |
|
Diversified Financial Services - 1.71% | |
| | Bank of America Corp.# | | | 10,800 | | | | 144,072 | |
| | Citigroup, Inc.* | | | 5,100 | | | | 24,123 | |
| | JPMorgan Chase & Co.# | | | 8,800 | | | | 373,296 | |
| | | | | | | | | | |
| | | | | | | | | 541,491 | |
|
Diversified Telecommunication Services - 0.68% | |
| | AT&T, Inc. | | | 5,400 | | | | 158,652 | |
| | Frontier Communications Corp. | | | 672 | | | | 6,539 | |
| | Verizon Communications, Inc. | | | 1,400 | | | | 50,092 | |
| | | | | | | | | | |
| | | | | | | | | 215,283 | |
|
Electric Utilities - 0.45% | |
| | American Electric Power Co., Inc. | | | 1,600 | | | | 57,568 | |
| | Exelon Corp. | | | 1,100 | | | | 45,804 | |
| | Progress Energy, Inc. | | | 900 | | | | 39,132 | |
| | | | | | | | | | |
| | | | | | | | | 142,504 | |
|
Electrical Equipment - 0.20% | |
| | Emerson Electric Co. | | | 1,100 | | | | 62,887 | |
|
Electronic Equipment, Instruments & Components - 0.67% | |
| | Corning, Inc.# | | | 4,500 | | | | 86,940 | |
| | FLIR Systems, Inc.* | | | 1,200 | | | | 35,700 | |
| | Power-One, Inc.*# | | | 6,000 | | | | 61,200 | |
| | Sanmina-SCI Corp.*# | | | 2,500 | | | | 28,700 | |
| | | | | | | | | | |
| | | | | | | | | 212,540 | |
| | |
Bridgeway Managed Volatility Fund SCHEDULE OF INVESTMENTS (continued) | | |
| | |
| Showing percentage of net assets as of December 31, 2010 (Unaudited) | | |
| | | | | | | | | | |
Industry | | Company | | | Shares | | | | Value | |
Common Stocks (continued) | |
Energy Equipment & Services - 0.88% | |
| | Halliburton Co.# | | | 5,500 | | | $ | 224,565 | |
| | National Oilwell Varco, Inc. | | | 800 | | | | 53,800 | |
| | | | | | | | | | |
| | | | | | | | | 278,365 | |
| |
Food & Staples Retailing - 1.76% | |
| | CVS Caremark Corp. | | | 6,900 | | | | 239,913 | |
| | Kroger Co. (The) | | | 1,000 | | | | 22,360 | |
| | Safeway, Inc.# | | | 4,700 | | | | 105,703 | |
| | Wal-Mart Stores, Inc. | | | 3,500 | | | | 188,755 | |
| | | | | | | | | | |
| | | | | | | | | 556,731 | |
| |
Food Products - 1.27% | |
| | Archer-Daniels-Midland Co.# | | | 4,000 | | | | 120,320 | |
| | General Mills, Inc.# | | | 2,400 | | | | 85,416 | |
| | Kraft Foods, Inc., Class A | | | 2,200 | | | | 69,322 | |
| | Mead Johnson Nutrition Co.# | | | 2,016 | | | | 125,496 | |
| | | | | | | | | | |
| | | | | | | | | 400,554 | |
| |
Health Care Equipment & Supplies - 0.90% | |
| | Baxter International, Inc.# | | | 3,000 | | | | 151,860 | |
| | Becton Dickinson & Co. | | | 220 | | | | 18,594 | |
| | CR Bard, Inc. | | | 500 | | | | 45,885 | |
| | Stryker Corp. | | | 1,260 | | | | 67,662 | |
| | | | | | | | | | |
| | | | | | | | | 284,001 | |
| |
Health Care Providers & Services - 1.03% | |
| | Express Scripts, Inc.* | | | 1,500 | | | | 81,075 | |
| | Laboratory Corp. of America Holdings*# | | | 800 | | | | 70,336 | |
| | Medco Health Solutions, Inc.* | | | 1,400 | | | | 85,778 | |
| | Quest Diagnostics, Inc. | | | 800 | | | | 43,176 | |
| | UnitedHealth Group, Inc. | | | 1,300 | | | | 46,943 | |
| | | | | | | | | | |
| | | | | | | | | 327,308 | |
| |
Hotels, Restaurants & Leisure - 0.22% | |
| | McDonald’s Corp. | | | 900 | | | | 69,084 | |
| |
Household Products - 2.41% | |
| | Colgate-Palmolive Co. | | | 1,500 | | | | 120,555 | |
| | Kimberly-Clark Corp. | | | 1,000 | | | | 63,040 | |
| | Procter & Gamble Co.
(The)# | | | 9,000 | | | | 578,970 | |
| | | | | | | | | | |
| | | | | | | | | 762,565 | |
| |
Independent Power Producers & Energy Traders - 0.23% | |
| | AES Corp. (The)* | | | 6,100 | | | | 74,298 | |
| |
Industrial Conglomerates - 1.02% | |
| | 3M Co.# | | | 2,800 | | | | 241,640 | |
| | | | | | | | | | |
Industry | | Company | | | Shares | | | | Value | |
|
Industrial Conglomerates (continued) | |
| | General Electric Co. | | | 4,500 | | | $ | 82,305 | |
| | | | | | | | | | |
| | | | | | | | | 323,945 | |
|
Insurance - 5.41% | |
| | Aflac, Inc. | | | 800 | | | | 45,144 | |
| | AON Corp. | | | 2,500 | | | | 115,025 | |
| | Berkshire Hathaway, Inc., Class B*# | | | 6,000 | | | | 480,660 | |
| | Chubb Corp. | | | 2,500 | | | | 149,100 | |
| | Principal Financial Group, Inc.# | | | 1,000 | | | | 32,560 | |
| | Progressive Corp. (The)# | | | 4,020 | | | | 79,877 | |
| | Travelers Cos., Inc. (The)# | | | 14,500 | | | | 807,795 | |
| | | | | | | | | | |
| | | | | | | | | 1,710,161 | |
|
Internet & Catalog Retail - 0.57% | |
| | Amazon.com, Inc.* | | | 1,000 | | | | 180,000 | |
|
Internet Software & Services - 0.64% | |
| | eBay, Inc.* | | | 3,000 | | | | 83,490 | |
| | Google, Inc., Class A* | | | 200 | | | | 118,794 | |
| | | | | | | | | | |
| | | | | | | | | 202,284 | |
|
IT Services - 2.14% | |
| | Automatic Data Processing, Inc. | | | 800 | | | | 37,024 | |
| | Cognizant Technology | | | | | | | | |
| | Solutions Corp., Class A* | | | 1,000 | | | | 73,290 | |
| | International Business Machines Corp. | | | 1,200 | | | | 176,112 | |
| | Paychex, Inc. | | | 500 | | | | 15,455 | |
| | Teradata Corp.*# | | | 6,200 | | | | 255,192 | |
| | Visa, Inc., Class A | | | 1,300 | | | | 91,494 | |
| | Western Union Co. (The) | | | 1,500 | | | | 27,855 | |
| | | | | | | | | | |
| | | | | | | | | 676,422 | |
|
Leisure Equipment & Products - 0.22% | |
| | Hasbro, Inc. | | | 1,500 | | | | 70,770 | |
|
Life Sciences Tools & Services - 0.21% | |
| | Thermo Fisher Scientific, Inc.* | | | 1,200 | | | | 66,432 | |
|
Machinery - 1.44% | |
| | Danaher Corp.# | | | 3,000 | | | | 141,510 | |
| | Eaton Corp. | | | 2,400 | | | | 243,624 | |
| | Flowserve Corp.# | | | 600 | | | | 71,532 | |
| | | | | | | | | | |
| | | | | | | | | 456,666 | |
|
Media - 1.74% | |
| | Comcast Corp., Class A# | | | 10,950 | | | | 240,571 | |
| | |
| | |
| 120 | | Semi-Annual Report | December 31, 2010 (Unaudited) |
| | |
Bridgeway Managed Volatility Fund SCHEDULE OF INVESTMENTS (continued) | | |
| | |
| Showing percentage of net assets as of December 31, 2010 (Unaudited) | | |
| | | | | | | | | | |
Industry | | Company | | | Shares | | | | Value | |
Common Stocks (continued) | |
Media (continued) | |
| | News Corp., Class A# | | | 11,800 | | | $ | 171,808 | |
| | Omnicom Group, Inc. | | | 1,000 | | | | 45,800 | |
| | Time Warner, Inc.# | | | 2,833 | | | | 91,138 | |
| | | | | | | | | | |
| | | | | | | | | 549,317 | |
| |
Metals & Mining - 0.18% | |
| | Alcoa, Inc. | | | 600 | | | | 9,234 | |
| | United States Steel Corp.+ | | | 800 | | | | 46,736 | |
| | | | | | | | | | |
| | | | | | | | | 55,970 | |
| |
Multiline Retail - 0.89% | |
| | Big Lots, Inc.*# | | | 6,300 | | | | 191,898 | |
| | Sears Holdings Corp.*#+ | | | 1,200 | | | | 88,500 | |
| | | | | | | | | | |
| | | | | | | | | 280,398 | |
| |
Multi-Utilities - 1.08% | |
| | Dominion Resources, Inc.# | | | 2,620 | | | | 111,926 | |
| | Public Service Enterprise Group, Inc.# | | | 2,600 | | | | 82,706 | |
| | Sempra Energy# | | | 2,800 | | | | 146,944 | |
| | | | | | | | | | |
| | | | | | | | | 341,576 | |
| |
Oil, Gas & Consumable Fuels - 6.44% | |
| | Anadarko Petroleum Corp. | | | 1,000 | | | | 76,160 | |
| | Apache Corp. | | | 500 | | | | 59,615 | |
| | Chesapeake Energy Corp. | | | 1,000 | | | | 25,910 | |
| | Chevron Corp. | | | 3,378 | | | | 308,242 | |
| | ConocoPhillips# | | | 2,687 | | | | 182,985 | |
| | EOG Resources, Inc.# | | | 1,500 | | | | 137,115 | |
| | Exxon Mobil Corp.# | | | 13,000 | | | | 950,560 | |
| | Occidental Petroleum Corp. | | | 1,200 | | | | 117,720 | |
| | Peabody Energy Corp. | | | 1,200 | | | | 76,776 | |
| | Spectra Energy Corp.# | | | 4,050 | | | | 101,210 | |
| | | | | | | | | | |
| | | | | | | | | 2,036,293 | |
| |
Paper & Forest Products - 0.39% | |
| | International Paper Co.# | | | 4,500 | | | | 122,580 | |
| |
Pharmaceuticals - 1.62% | |
| | Allergan, Inc. | | | 1,900 | | | | 130,473 | |
| | Bristol-Myers Squibb Co.# | | | 5,579 | | | | 147,732 | |
| | Merck & Co., Inc.# | | | 2,800 | | | | 100,912 | |
| | Pfizer, Inc. | | | 7,600 | | | | 133,076 | |
| | | | | | | | | | |
| | | | | | | | | 512,193 | |
| |
Road & Rail - 0.82% | |
| | Union Pacific Corp.# | | | 2,800 | | | | 259,448 | |
| |
Semiconductors & Semiconductor Equipment - 3.17% | |
| | Broadcom Corp., Class A# | | | 3,500 | | | | 152,425 | |
| | Cirrus Logic, Inc.*# | | | 31,000 | | | | 495,380 | |
| | Intel Corp.# | | | 7,500 | | | | 157,725 | |
| | | | | | | | | | |
Industry | | Company | | | Shares | | | | Value | |
|
Semiconductors & Semiconductor Equipment (continued) | |
| | Texas Instruments, Inc.# | | | 6,070 | | | $ | 197,275 | |
| | | | | | | | | | |
| | | | | | | | | 1,002,805 | |
Software - 1.88% | |
| | BMC Software, Inc.* | | | 520 | | | | 24,513 | |
| | Citrix Systems, Inc.* | | | 1,400 | | | | 95,774 | |
| | Intuit, Inc.*# | | | 3,100 | | | | 152,830 | |
| | Microsoft Corp.# | | | 4,400 | | | | 122,848 | |
| | Oracle Corp.# | | | 6,360 | | | | 199,068 | |
| | | | | | | | | | |
| | | | | | | | | 595,033 | |
Specialty Retail - 0.87% | |
| | AutoZone, Inc.* | | | 900 | | | | 245,331 | |
| | Staples, Inc. | | | 1,250 | | | | 28,463 | |
| | | | | | | | | | |
| | | | | | | | | 273,794 | |
Textiles, Apparel & Luxury Goods - 0.40% | |
| | NIKE, Inc., Class B | | | 1,500 | | | | 128,130 | |
|
Thrifts & Mortgage Finance - 0.19% | |
| | Hudson City Bancorp, Inc. | | | 4,800 | | | | 61,152 | |
|
Trading Companies & Distributors - 0.22% | |
| | W.W. Grainger, Inc. | | | 500 | | | | 69,055 | |
|
Wireless Telecommunication Services - 0.32% | |
| | American Tower Corp., Class A* | | | 1,500 | | | | 77,460 | |
| | Sprint Nextel Corp.* | | | 6,000 | | | | 25,380 | |
| | | | | | | | | | |
| | | | | | | | | 102,840 | |
| | | | | | | | | | |
TOTAL COMMON STOCKS - 57.44% | | | | | | | 18,166,367 | |
| | | | | | | | | | |
(Cost $14,298,962) | |
|
| | | | | | | | | | | | |
| Due Date | | Discount Rate
or Coupon Rate | | | Principal
Amount | | | Value | |
|
U.S. GOVERNMENT OBLIGATIONS - 41.16% | |
U.S. Treasury Bills - 30.03% | |
01/20/2011 | | | 0.132%(a) | | | $ | 1,500,000 | | | | 1,499,904 | |
01/27/2011 | | | 0.127%(a) | | | | 1,500,000 | | | | 1,499,851 | |
02/03/2011 | | | 0.125%(a) | | | | 1,000,000 | | | | 999,878 | |
03/03/2011 | | | 0.175%(a) | | | | 2,500,000 | | | | 2,499,500 | |
03/31/2011 | | | 0.176%(a) | | | | 1,500,000 | | | | 1,499,547 | |
04/28/2011 | | | 0.170%(a) | | | | 1,500,000 | | | | 1,499,343 | |
| | | | | | | | | | | | |
| | | | | | | | | | | 9,498,023 | |
|
U.S. Treasury Notes - 11.13% | |
04/30/2011 | | | 4.875% | | | | 1,200,000 | | | | 1,218,140 | |
08/31/2011 | | | 4.625% | | | | 300,000 | | | | 308,602 | |
12/31/2011 | | | 1.000% | | | | 200,000 | | | | 201,305 | |
04/30/2012 | | | 4.500% | | | | 300,000 | | | | 316,512 | |
| | |
Bridgeway Managed Volatility Fund SCHEDULE OF INVESTMENTS (continued) | | |
| | |
| Showing percentage of net assets as of December 31, 2010 (Unaudited) | | |
| | | | | | | | |
| Due Date | | Discount Rate
or Coupon Rate | | Principal Amount | | Value | | |
| | | | | | | | | | | | | | | | |
U.S. Government Obligations (continued) | | | | | |
U.S. Treasury Notes (continued) | | | | | |
07/15/2012 | | | 1.500% | | | $ | 200,000 | | | $ | 203,321 | | | | | |
08/15/2012 | | | 1.750% | | | | 300,000 | | | | 306,164 | | | | | |
11/30/2012 | | | 3.375% | | | | 300,000 | | | | 316,195 | | | | | |
12/31/2012 | | | 3.625% | | | | 200,000 | | | | 212,125 | | | | | |
11/15/2013 | | | 4.250% | | | | 200,000 | | | | 218,828 | | | | | |
02/15/2015 | | | 4.000% | | | | 200,000 | | | | 219,109 | | | | | |
| | | | | | | | | | | | | | | | |
| | | | | | | | | | | 3,520,301 | | | | | |
| | | | | | | | | | | | | | | | |
TOTAL U.S. GOVERNMENT OBLIGATIONS - 41.16% | | | | | | | | | | | 13,018,324 | | | | | |
| | | | | | | | | | | | | | | | |
(Cost $12,895,058) | | | | | | | | | | | | | | | | |
| | | | |
| | | Rate^ | | | Shares | | | Value | | | | |
| |
MONEY MARKET FUND - 3.07% | | | | | |
BlackRock FedFund | | | 0.06% | | | | 973,103 | | | | 973,103 | | | | | |
| | | | | | | | | | | | | | | | |
| | |
TOTAL MONEY MARKET FUND — 3.07% | | | | 973,103 | | | | | |
| | | | | | | | | | | | | | | | |
(Cost $973,103) | | | | | | | | | |
| | |
TOTAL INVESTMENTS - 101.67% | | | $ | 32,157,794 | | | | | |
(Cost $28,167,123) | | | | | | | | | |
Liabilities in Excess of Other Assets - (1.67%) | | | | (529,326 | ) | | | | |
| | | | | | | | | | | | | | | | |
| | |
NET ASSETS - 100.00% | | | $ | 31,628,468 | | | | | |
| | | | | | | | | | | | | | | | |
* Non-income producing security. # Security subject to call option written by the Fund. ^ Rate disclosed as of December 31, 2010. + This security or a portion of the security is out on loan at December 31, 2010. Total loaned securities had a market value of $117,710 at December 31, 2010. (a) Rate represents the effective yield at purchase. ADR - American Depositary Receipt See Notes to Financial Statements. | | | | | |
| | |
| | |
| 122 | | Semi-Annual Report | December 31, 2010 (Unaudited) |
| | |
Bridgeway Managed Volatility Fund SCHEDULE OF OPTIONS WRITTEN | | |
| | |
| Showing percentage of net assets as of December 31, 2010 (Unaudited) | | |
| | | | | | | | |
Company | | Number
of Contracts | | | Value | |
CALL OPTIONS WRITTEN - (1.28%) | |
3M Co. | | | | | | |
| | Expiring January, 2011 at $90.00 | | 7 | | $ | (182 | ) |
| | Expiring April, 2011 at $90.00 | | 10 | | | (1,990 | ) |
| | | | | | | | |
| | | | | | | (2,172 | ) |
American Express Co. | | | | | | |
| | Expiring January, 2011 at $40.00 | | 7 | | | (2,093 | ) |
Archer-Daniels-Midland Co. | | | | | | |
| | Expiring January, 2011 at $34.00 | | 10 | | | (120 | ) |
| | Expiring March, 2011 at $30.00 | | 15 | | | (2,250 | ) |
| | | | | | | | |
| | | | | | | (2,370 | ) |
Bank of America Corp. | | | | | | |
| | Expiring April, 2011 at $14.00 | | 25 | | | (1,900 | ) |
Bank of New York Mellon Corp. (The) | |
| | Expiring January, 2011 at $26.00 | | 8 | | | (3,440 | ) |
Baxter International, Inc. | |
| | Expiring February, 2011 at $52.50 | | 10 | | | (870 | ) |
Berkshire Hathaway, Inc., Class B | |
| | Expiring January, 2011 at $90.00 | | 60 | | | (240 | ) |
Big Lots, Inc. | |
| | Expiring January, 2011 at $35.00 | | 15 | | | (150 | ) |
| | Expiring April, 2011 at $32.50 | | 35 | | | (4,725 | ) |
| | | | | | | | |
| | | | | | | (4,875 | ) |
Bristol-Myer Squibb Co. | |
| | Expiring January, 2011 at $28.00 | | 15 | | | (30 | ) |
Broadcom Corp., Class A | |
| | Expiring February, 2011 at $44.00 | | 10 | | | (2,060 | ) |
Capital One Financial Corp. | |
| | Expiring March, 2011 at $43.00 | | 12 | | | (2,916 | ) |
Charles Schwab Corp. (The) | |
| | Expiring January, 2011 at $15.00 | | 15 | | | (3,225 | ) |
Cirrus Logic, Inc. | |
| | Expiring January, 2011 at $14.00 | | 185 | | | (38,850 | ) |
| | Expiring March, 2011 at $15.00 | | 125 | | | (26,125 | ) |
| | | | | | | | |
| | | | | | | (64,975 | ) |
Cisco Systems, Inc. | |
| | Expiring January, 2011 at $22.50 | | 35 | | | (140 | ) |
| | Expiring February, 2011 at $20.00 | | 35 | | | (3,290 | ) |
| | Expiring March, 2011 at $20.00 | | 35 | | | (4,025 | ) |
| | | | | | | | |
| | | | | | | (7,455 | ) |
Comcast Corp., Class A | |
| | Expiring January, 2011 at $19.00 | | 25 | | | (7,500 | ) |
Comerica, Inc. | |
| | Expiring January, 2011 at $37.50 | | 10 | | | (5,330 | ) |
ConocoPhillips | |
| | Expiring February, 2011 at $62.50 | | 10 | | | (6,250 | ) |
| | | | | | | | | | |
Company | |
| Number
of Contracts |
| | | Value | |
| | | | | | | | | | |
Corning, Inc. | |
| | Expiring February, 2011 at $19.00 | | | 12 | | | $ | (1,164 | ) |
Danaher Corp. | |
| | Expiring March, 2011 at $48.00 | | | 10 | | | | (1,400 | ) |
Dominion Resources, Inc. | |
| | Expiring January, 2011 at $45.00 | | | 7 | | | | (35 | ) |
EOG Resources, Inc. | |
| | Expiring January, 2011 at $105.00 | | | 6 | | | | (36 | ) |
Exxon Mobil Corp. | |
| | Expiring January, 2011 at $65.00 | | | 80 | | | | (66,000 | ) |
Flowserve Corp. | |
| | Expiring April, 2011 at $120.00 | | | 6 | | | | (4,320 | ) |
General Mills, Inc. | |
| | Expiring January, 2011 at $37.50 | | | 7 | | | | (70 | ) |
Gilead Sciences, Inc. | |
| | Expiring February, 2011 at $38.00 | | | 15 | | | | (1,185 | ) |
Halliburton Co. | |
| | Expiring January, 2011 at $35.00 | | | 10 | | | | (6,050 | ) |
| | Expiring January, 2011 at $36.00 | | | 10 | | | | (5,200 | ) |
| | | | | | | | | | |
| | | | | | | | | (11,250 | ) |
Intel Corp. | |
| | Expiring January, 2011 at $20.00 | | | 10 | | | | (1,200 | ) |
International Paper Co. | |
| | Expiring January, 2011 at $22.50 | | | 15 | | | | (7,500 | ) |
Intuit, Inc. | |
| | Expiring January, 2011 at $47.50 | | | 8 | | | | (1,800 | ) |
JPMorgan Chase & Co. | |
| | Expiring January, 2011 at $40.00 | | | 15 | | | | (4,020 | ) |
Juniper Networks, Inc. | |
| | Expiring April, 2011 at $36.00 | | | 7 | | | | (2,240 | ) |
Laboratory Corp of America Holdings | |
| | Expiring February, 2011 at $85.00 | | | 5 | | | | (2,350 | ) |
Lexmark International, Inc., Class A | |
| | Expiring January, 2011 at $37.00 | | | 8 | | | | (280 | ) |
| | Expiring April, 2011 at $34.00 | | | 37 | | | | (12,210 | ) |
| | Expiring April, 2011 at $40.00 | | | 8 | | | | (840 | ) |
| | | | | | | | | | |
| | | | | | | | | (13,330 | ) |
Lockheed Martin Corp. | |
| | Expiring January, 2011 at $75.00 | | | 8 | | | | (40 | ) |
Marshall & Ilsley Corp. | |
| | Expiring March, 2011 at $6.00 | | | 25 | | | | (2,500 | ) |
Mead Johnson Nutrition Co. | |
| | Expiring February, 2011 at $65.00 | | | 7 | | | | (1,190 | ) |
Merck & Co. Inc | |
| | Expiring January, 2011 at $38.00 | | | 8 | | | | (80 | ) |
| | |
Bridgeway Managed Volatility Fund SCHEDULE OF OPTIONS WRITTEN (continued) | | |
| | |
| Showing percentage of net assets as of December 31, 2010 (Unaudited) | | |
| | | | | | | | |
Company | | Number
of Contracts | | | Value | |
Call Options Written (continued) | |
Microsoft Corp. | |
| | Expiring January, 2011 at $26.00 | | 11 | | $ | (2,222 | ) |
Morgan Stanley | |
| | Expiring January, 2011 at $26.00 | | 7 | | | (1,092 | ) |
News Corp., Class A | |
| | Expiring January, 2011 at $14.00 | | 27 | | | (2,160 | ) |
Northrop Grumman Corp. | |
| | Expiring February, 2011 at $60.00 | | 45 | | | (25,200 | ) |
Oracle Corp. | |
| | Expiring March, 2011 at $29.00 | | 15 | | | (4,110 | ) |
Power-One, Inc. | |
| | Expiring January, 2011 at $9.00 | | 60 | | | (8,100 | ) |
Principal Financial Group, Inc. | |
| | Expiring January, 2011 at $27.00 | | 6 | | | (3,540 | ) |
Procter & Gamble Co. (The) | |
| | Expiring April, 2011 at $62.50 | | 66 | | | (19,602 | ) |
| | Expiring April, 2011 at $65.00 | | 8 | | | (1,216 | ) |
| | | | | | | | |
| | | | | | | (20,818 | ) |
Progressive Corp. (The) | |
| | Expiring February, 2011 at $20.00 | | 12 | | | (540 | ) |
Public Service Enterprise Group, Inc. | |
| | Expiring March, 2011 at $35.00 | | 8 | | | (80 | ) |
Safeway, Inc. | |
| | Expiring January, 2011 at $21.00 | | 12 | | | (2,040 | ) |
SanDisk Corp. | |
| | Expiring January, 2011 at $50.00 | | 7 | | | (1,239 | ) |
Sanmina-SCI Corp. | |
| | Expiring April, 2011 at $10.00 | | 25 | | | (5,750 | ) |
Sears Holdings Corp. | |
| | Expiring March, 2011 at $67.50 | | 8 | | | (6,680 | ) |
Sempra Energy | |
| | Expiring January, 2011 at $55.00 | | 7 | | | (105 | ) |
| | Expiring April, 2011 at $50.00 | | 10 | | | (3,700 | ) |
| | | | | | | | |
| | | | | | | (3,805 | ) |
Spectra Energy Corp. | |
| | Expiring March, 2011 at $24.00 | | 12 | | | (1,800 | ) |
Teradata Corp. | |
| | Expiring January, 2011 at $40.00 | | 15 | | | (2,550 | ) |
Texas Instruments, Inc. | |
| | Expiring January, 2011 at $29.00 | | 15 | | | (5,175 | ) |
Time Warner, Inc. | |
| | Expiring January, 2011 at $32.00 | | 10 | | | (790 | ) |
Travelers Cos., Inc. (The) | |
| | Expiring April, 2011 at $55.00 | | 110 | | | (27,500 | ) |
Union Pacific Corp. | |
| | Expiring February, 2011 at $95.00 | | 8 | | | (1,864 | ) |
US Airways Group, Inc. | |
| | Expiring March, 2011 at $10.00 | | 300 | | | (28,200 | ) |
| | | | | | | | |
| | | | | | | | |
| | | | | | | | |
| | | | | | | | |
| | | | | | | | |
| | | | | | | | | | |
Company | |
| Number
of Contracts |
| | | Value | |
| | | | | | | | | | |
Wells Fargo & Co. | |
| | Expiring January, 2011 at $27.50 | | | 25 | | | $ | (9,250 | ) |
| | | | | | | | | | |
TOTAL CALL OPTIONS WRITTEN — (1.28%) | | | | (403,916 | ) |
| | | | | | | | | | |
(Premiums received $(327,561)) | | | | | |
|
PUT OPTIONS WRITTEN - (0.57%) | |
|
Atmel Corp. | |
| | Expiring January, 2011 at $10.00 | | | 6 | | | | (60 | ) |
| | Expiring February, 2011 at $12.00 | | | 160 | | | | (12,800 | ) |
| | | | | | | | | | |
| | | | | | | | | (12,860 | ) |
Bristol-Myers Squibb Co. | |
| | Expiring January, 2011 at $26.00 | | | 130 | | | | (4,030 | ) |
Brush Engineered Materials, Inc. | |
| | Expiring March, 2011 at $35.00 | | | 60 | | | | (9,600 | ) |
Campbell Soup Co. | |
| | Expiring February, 2011 at $35.00 | | | 35 | | | | (3,500 | ) |
Chubb Corp. | |
| | Expiring January, 2011 at $55.00 | | | 60 | | | | (720 | ) |
Cognex Corp. | |
| | Expiring February, 2011 at $25.00 | | | 50 | | | | (1,750 | ) |
Colgate-Palmolive Co. | |
| | Expiring February, 2011 at $75.00 | | | 30 | | | | (2,250 | ) |
Complete Production Services, Inc. | |
| | Expiring January, 2011 at $25.00 | | | 75 | | | | (1,200 | ) |
| | Expiring April, 2011 at $25.00 | | | 35 | | | | (4,200 | ) |
| | | | | | | | | | |
| | | | | | | | | (5,400 | ) |
Deckers Outdoor Corp. | |
| | Expiring January, 2011 at $80.00 | | | 60 | | | | (20,400 | ) |
Finisar Corp. | |
| | Expiring March, 2011 at $25.00 | | | 120 | | | | (15,000 | ) |
Fossil, Inc. | |
| | Expiring February, 2011 at $70.00 | | | 20 | | | | (6,800 | ) |
International Business Machines Corp. | |
| | Expiring February, 2011 at $135.00 | | | 20 | | | | (1,880 | ) |
Lockheed Martin Corp. | |
| | Expiring March, 2011 at $65.00 | | | 55 | | | | (6,050 | ) |
McKesson Corp | |
| | Expiring February, 2011 at $67.50 | | | 40 | | | | (5,400 | ) |
Northrop Grumman Corp. | |
| | Expiring January, 2011 at $55.00 | | | 15 | | | | (150 | ) |
| | Expiring February, 2011 at $65.00 | | | 20 | | | | (4,500 | ) |
| | | | | | | | | | |
| | | | | | | | | (4,650 | ) |
| | |
| | |
| 124 | | Semi-Annual Report | December 31, 2010 (Unaudited) |
| | |
Bridgeway Managed Volatility Fund SCHEDULE OF OPTIONS WRITTEN (continued) | | |
| | |
| Showing percentage of net assets as of December 31, 2010 (Unaudited) | | |
| | | | | | | | | | |
Company | |
| Number
of Contracts |
| | | Value | |
Put Options Written (continued) | |
Power-One, Inc. | | | | | | | | |
| | Expiring February, 2011 at $10.00 | | | 200 | | | $ | (17,000 | ) |
Raytheon Co. | |
| | Expiring January, 2011 at $46.00 | | | 75 | | | | (5,850 | ) |
RPC, Inc. | |
| | Expiring January, 2011 at $16.67 | | | 50 | | | | (3,000 | ) |
| | Expiring January, 2011 at $17.50 | | | 100 | | | | (6,000 | ) |
| | | | | | | | | | |
| | | | | | | | | (9,000 | ) |
Safeway, Inc. | |
| | Expiring January, 2011 at $20.00 | | | 140 | | | | (1,400 | ) |
Tata Motors, Ltd. - Sponsored ADR | |
| | Expiring January, 2011 at $30.00 | | | 75 | | | | (10,500 | ) |
Tenneco, Inc. | |
| | Expiring January, 2011 at $40.00 | | | 80 | | | | (7,600 | ) |
TriQuint Semiconductor, Inc. | |
| | Expiring January, 2011 at $12.00 | | | 265 | | | | (16,960 | ) |
TRW Automotive Holdings Corp. | |
| | Expiring January, 2011 at $45.00 | | | 60 | | | | (1,200 | ) |
United Rentals, Inc. | |
| | Expiring January, 2011 at $22.00 | | | 130 | | | | (6,500 | ) |
VF Corp. | |
| | Expiring February, 2011 at $75.00 | | | 20 | | | | (800 | ) |
Wal-Mart Stores, Inc. | |
| | Expiring March, 2011 at $52.50 | | | 40 | | | | (4,400 | ) |
| | | | | | | | | | |
TOTAL PUT OPTIONS WRITTEN — (0.57%) | | | | | | | (181,500 | ) |
| | | | | | | | | | |
(Premiums received $(285,070)) | | | | | | | | |
| | |
TOTAL OPTIONS WRITTEN — (1.85)% | | | | | | $ | (585,416 | ) |
| | | | | | | | | | |
(Premiums received $(612,631)) | | | | | | | | |
Summary of inputs used to value the Fund’s investments as of December 31, 2010 are as follows (See Note 2 in Notes to Financial Statements): | |
| | | | | | | | |
| |
Assets Table |
Valuation Inputs |
Investment in Securities (Market Value) |
| | | Level 1 Quoted Prices | | Level 2 Significant Observable Inputs | | Level 3 Significant Unobservable Inputs | | Total |
Common Stocks | | $18,166,367 | | $ — | | $ — | | $18,166,367 |
U.S. Government Obligations | | — | | 13,018,324 | | — | | 13,018,324 |
Money Market Fund | | — | | 973,103 | | — | | 973,103 |
| | | | | | | | |
TOTAL | | $18,166,367 | | $13,991,427 | | $ — | | $32,157,794 |
| | | | | | | | |
| | | | | | | | |
| | | | | | | | |
Liabilities Table |
Valuation Inputs |
Investment in Securities (Market Value) |
| | | Level 1 Quoted Prices | | Level 2 Significant Observable Inputs | | Level 3 Significant Unobservable Inputs | | Total |
Written Options | | $(585,416) | | $ — | | $ — | | $(585,416) |
| | | | | | | | |
TOTAL | | $(585,416) | | $ — | | $ — | | $(585,416) |
| | | | | | | | |
See Notes to Financial Statements.
|
STATEMENTS OF ASSETS AND LIABILITIES |
December 31, 2010 (Unaudited)
| | | | | | | | | | | | | | | | |
| ASSETS | | Aggressive
Investors 1 | | | Aggressive
Investors 2 | | | Ultra-Small
Company | | | Ultra-Small
Company Market | |
Investments at value | | | $107,793,445 | | | | $241,529,920 | | | | $95,710,739 | | | | $416,661,197 | |
Receivables: | | | | | | | | | | | | | | | | |
Portfolio securities sold. | | | 331,440 | | | | 2,675,495 | | | | - | | | | 1,779,196 | |
Fund shares sold | | | 53,354 | | | | 32,222 | | | | 25,000 | | | | 197,003 | |
Dividends and interest | | | 62,122 | | | | 128,347 | | | | 105,853 | | | | 343,828 | |
Reclaims receivable | | | 1,406 | | | | 2,113 | | | | - | | | | - | |
Receivable from investment adviser | | | 70,268 | | | | - | | | | - | | | | - | |
Deposits with brokers | | | - | | | | - | | | | - | | | | - | |
Total return swap | | | 1,234 | | | | 2,991 | | | | 26,124 | | | | 65,045 | |
Prepaid expenses. | | | 17,952 | | | | 36,535 | | | | 8,240 | | | | 34,978 | |
Total assets | | | 108,331,221 | | | | 244,407,623 | | | | 95,875,956 | | | | 419,081,247 | |
| | | | |
LIABILITIES | | | | | | | | | | | | | | | | |
Payables: | | | | | | | | | | | | | | | | |
Portfolio securities purchased | | | - | | | | 772,323 | | | | 256,609 | | | | 3,601,515 | |
Fund shares redeemed | | | 86,219 | | | | 612,258 | | | | 10,000 | | | | 1,466,688 | |
Due to Custodian | | | 168,843 | | | | - | | | | - | | | | - | |
Accrued Liabilities: | | | | | | | | | | | | | | | | |
Investment adviser fees | | | - | | | | 57,543 | | | | 72,494 | | | | 160,809 | |
Administration fees | | | 3,355 | | | | 7,592 | | | | 2,914 | | | | 12,512 | |
Directors’ fees | | | - | | | | - | | | | - | | | | - | |
Other | | | 45,557 | | | | 182,848 | | | | 20,928 | | | | 114,757 | |
Call options written at value | | | - | | | | - | | | | - | | | | - | |
Put options written at value | | | - | | | | - | | | | - | | | | - | |
Total liabilities | | | 303,974 | | | | 1,632,564 | | | | 362,945 | | | | 5,356,281 | |
NET ASSETS | | | $108,027,247 | | | | $242,775,059 | | | | $95,513,011 | | | | $413,724,966 | |
| | | | |
NET ASSETS REPRESENT | | | | | | | | | | | | | | | | |
Paid-in capital | | | $167,841,198 | | | | $416,010,607 | | | | $85,412,136 | | | | $293,699,353 | |
Undistributed (distributions in excess of) net investment income | | | 986,271 | | | | (359,935 | ) | | | 218,698 | | | | 2,474,785 | |
Accumulated net realized gain (loss) on investments | | | (78,333,333 | ) | | | (207,478,633 | ) | | | (11,501,381 | ) | | | 4,903,142 | |
Net unrealized appreciation on investments | | | 17,533,111 | | | | 34,603,020 | | | | 21,383,558 | | | | 112,647,686 | |
NET ASSETS | | | $108,027,247 | | | | $242,775,059 | | | | $95,513,011 | | | | $413,724,966 | |
Shares of common stock outstanding of $.001 par value* | | | 3,048,510 | | | | 17,234,091 | | | | 3,286,383 | | | | 28,019,417 | |
Net asset value per share | | | $ 35.44 | | | | $ 14.09 | | | | $ 29.06 | | | | $ 14.77 | |
Total investments at cost | | | $ 90,261,568 | | | | $206,929,891 | | | | $74,353,305 | | | | $304,078,556 | |
Premiums received on call options written | | | $ - | | | | $ - | | | | $ - | | | | $ - | |
Premiums received on put options written | | | $ - | | | | $ - | | | | $ - | | | | $ - | |
| * | See Note 1 - Organization in the Notes to Financial Statements for shares authorized for each Fund. |
See Notes to Financial Statements.
| | |
| | |
| 126 | | Semi-Annual Report | December 31, 2010 (Unaudited) |
| | |
| |
|
| | | | | | | | | | | | | | | | | | | | | | | | | | | | | | |
Micro-Cap
Limited | | | Small-Cap
Momentum | | | Small-Cap
Growth | | | Small-Cap
Value | | | Large-Cap
Growth | | | Large-Cap
Value | | | Blue Chip 35
Index | | | Managed
Volatility | |
| $ | 25,233,746 | | | $ | 2,527,411 | | | $ | 49,599,588 | | | $ | 103,204,930 | | | $ | 59,401,950 | | | $ | 26,999,081 | | | $ | 318,652,548 | | | $ | 32,157,794 | |
| | | | | | | |
| | 59,038 | | | | - | | | | 497,527 | | | | 2,475,985 | | | | 804,260 | | | | 48,194 | | | | 2,609,017 | | | | 39,131 | |
| | 91,057 | | | | - | | | | 4,058 | | | | 5,212 | | | | 275 | | | | 39,500 | | | | 602,594 | | | | 14,840 | |
| | 22,600 | | | | 3,339 | | | | 31,952 | | | | 122,002 | | | | 25,347 | | | | 28,983 | | | | 290,710 | | | | 38,456 | |
| | - | | | | - | | | | - | | | | - | | | | - | | | | - | | | | - | | | | - | |
| | 7,652 | | | | 6,805 | | | | - | | | | - | | | | - | | | | - | | | | 11,103 | | | | - | |
| | - | | | | - | | | | - | | | | - | | | | - | | | | - | | | | - | | | | 48,541 | |
| | 3,663 | | | | - | | | | 4,309 | | | | 3,712 | | | | 1,368 | | | | - | | | | - | | | | - | |
| | 9,916 | | | | 104 | | | | 10,964 | | | | 13,192 | | | | 10,409 | | | | 10,452 | | | | 30,558 | | | | 12,313 | |
| | 25,427,672 | | | | 2,537,659 | | | | 50,148,398 | | | | 105,825,033 | | | | 60,243,609 | | | | 27,126,210 | | | | 322,196,530 | | | | 32,311,075 | |
| | | | | | | |
| | 209,853 | | | | - | | | | - | | | | 213,787 | | | | 420,800 | | | | - | | | | 13,179,490 | | | | - | |
| | - | | | | - | | | | 152,184 | | | | 163,513 | | | | 137,337 | | | | 78,976 | | | | 560,845 | | | | 59,714 | |
| | - | | | | 1,365 | | | | 68,082 | | | | 2,182,982 | | | | 247,800 | | | | - | | | | - | | | | - | |
| | - | | | | - | | | | 17,021 | | | | 45,801 | | | | 20,685 | | | | 6,563 | | | | - | | | | 9,935 | |
| | 763 | | | | 76 | | | | 1,577 | | | | 3,330 | | | | 1,863 | | | | 831 | | | | 8,776 | | | | 990 | |
| | - | | | | 200 | | | | - | | | | - | | | | - | | | | - | | | | - | | | | - | |
| | 17,428 | | | | 13,852 | | | | 36,510 | | | | 67,167 | | | | 37,395 | | | | 20,547 | | | | 21,923 | | | | 26,552 | |
| | - | | | | - | | | | - | | | | - | | | | - | | | | - | | | | - | | | | 403,916 | |
| | - | | | | - | | | | - | | | | - | | | | - | | | | - | | | | - | | | | 181,500 | |
| | 228,044 | | | | 15,493 | | | | 275,374 | | | | 2,676,580 | | | | 865,880 | | | | 106,917 | | | | 13,771,034 | | | | 682,607 | |
| $ | 25,199,628 | | | $ | 2,522,166 | | | $ | 49,873,024 | | | $ | 103,148,453 | | | $ | 59,377,729 | | | $ | 27,019,293 | | | $ | 308,425,496 | | | $ | 31,628,468 | |
| | | | | | | |
| $ | 31,077,851 | | | $ | 2,148,349 | | | $ | 79,440,167 | | | $ | 159,360,254 | | | $ | 91,240,363 | | | $ | 26,143,218 | | | $ | 323,372,838 | | | $ | 35,280,253 | |
| | | | | | | |
| | 198,106 | | | | 166 | | | | 19,604 | | | | 461,657 | | | | (33,462 | ) | | | (9,655 | ) | | | 12,067 | | | | 86,429 | |
| | (11,049,964 | ) | | | 165,550 | | | | (36,868,869 | ) | | | (74,866,281 | ) | | | (42,611,673 | ) | | | (5,398,086 | ) | | | (73,035,705 | ) | | | (7,756,100 | ) |
| | 4,973,635 | | | | 208,101 | | | | 7,282,122 | | | | 18,192,823 | | | | 10,782,501 | | | | 6,283,816 | | | | 58,076,296 | | | | 4,017,886 | |
| $ | 25,199,628 | | | $ | 2,522,166 | | | $ | 49,873,024 | | | $ | 103,148,453 | | | $ | 59,377,729 | | | $ | 27,019,293 | | | $ | 308,425,496 | | | $ | 31,628,468 | |
| | | | | | | |
| | 3,620,826 | | | | 213,520 | | | | 4,525,725 | | | | 7,550,308 | | | | 4,779,437 | | | | 1,995,840 | | | | 41,989,111 | | | | 2,796,451 | |
| $ | 6.96 | | | $ | 11.81 | | | $ | 11.02 | | | $ | 13.66 | | | $ | 12.42 | | | $ | 13.54 | | | $ | 7.35 | | | $ | 11.31 | |
| $ | 20,263,774 | | | $ | 2,319,310 | | | $ | 42,321,775 | | | $ | 85,015,819 | | | $ | 48,620,817 | | | $ | 20,715,265 | | | $ | 260,576,252 | | | $ | 28,167,123 | |
| $ | - | | | $ | - | | | $ | - | | | $ | - | | | $ | - | | | $ | - | | | $ | - | | | $ | 327,561 | |
| $ | - | | | $ | - | | | $ | - | | | $ | - | | | $ | - | | | $ | - | | | $ | - | | | $ | 285,070 | |
|
STATEMENTS OF OPERATIONS |
| Six Months Ended December 31, 2010 (Unaudited) |
| | | | | | | | | | | | | | | | |
| | | Aggressive
Investors 1 | | | Aggressive
Investors 2 | | | Ultra-Small
Company | | | Ultra-Small
Company Market | |
INVESTMENT INCOME | | | | | | | | | | | | | | | | |
Dividends | | $ | 533,564 | | | $ | 1,464,287 | | | $ | 565,979 | | | | $ 2,507,362 | |
Less: foreign taxes withheld | | | (3,663 | ) | | | (12,930 | ) | | | - | | | | (303 | ) |
Interest | | | - | | | | - | | | | - | | | | - | |
Securities lending. | | | 62,610 | | | | 144,014 | | | | 114,555 | | | | 1,290,253 | |
Total Investment Income | | | 592,511 | | | | 1,595,371 | | | | 680,534 | | | | 3,797,312 | |
| | | | |
EXPENSES | | | | | | | | | | | | | | | | |
Investment advisory fees - Base fees | | | 458,567 | | | | 1,256,580 | | | | 382,638 | | | | 925,814 | |
Investment advisory fees - Performance adjustment | | | (938,333 | ) | | | (781,320 | ) | | | - | | | | - | |
Administration fees. | | | 19,380 | | | | 53,367 | | | | 16,167 | | | | 70,426 | |
Accounting fees | | | 28,245 | | | | 41,494 | | | | 28,829 | | | | 58,469 | |
Transfer agent fees | | | 31,616 | | | | 168,484 | | | | 22,832 | | | | 83,046 | |
Professional fees | | | 16,160 | | | | 41,996 | | | | 15,322 | | | | 58,447 | |
Custody fees | | | 3,135 | | | | 31 | | | | 7,723 | | | | 34,546 | |
Blue sky fees | | | 9,732 | | | | 21,774 | | | | 6,965 | | | | 14,947 | |
Directors’ and officers’ fees | | | 8,748 | | | | 25,057 | | | | 7,270 | | | | 31,571 | |
Shareholder servicing fees | | | 35,448 | | | | 136,209 | | | | 3,380 | | | | 108,440 | |
Reports to shareholders | | | 13,032 | | | | 43,239 | | | | 3,506 | | | | 37,733 | |
Miscellaneous expenses | | | 17,798 | | | | 58,281 | | | | 15,014 | | | | 64,587 | |
Total Expenses | | | (296,472 | ) | | | 1,065,192 | | | | 509,646 | | | | 1,488,026 | |
Less investment advisory fees waived. | | | - | | | | - | | | | - | | | | (99,304 | ) |
Less other fees waived. | | | - | | | | - | | | | - | | | | - | |
Less expense reimbursed by investment adviser | | | - | | | | - | | | | - | | | | - | |
Net Expenses | | | (296,472 | ) | | | 1,065,192 | | | | 509,646 | | | | 1,388,722 | |
NET INVESTMENT INCOME (LOSS) | | | 888,983 | | | | 530,179 | | | | 170,888 | | | | 2,408,590 | |
| | | | |
NET REALIZED AND UNREALIZED GAIN (LOSS) ON INVESTMENTS | | | | | | | | | | | | | | | | |
Realized Gain (Loss) on: | | | | | | | | | | | | | | | | |
Investments | | | 7,124,559 | | | | 25,936,300 | | | | 4,707,887 | | | | 14,189,206 | |
Written options | | | - | | | | - | | | | - | | | | - | |
Futures contracts | | | - | | | | - | | | | - | | | | - | |
Swaps | | | 50,434 | | | | 194,272 | | | | 481,297 | | | | 365,627 | |
Net Realized Gain (Loss) | | | 7,174,993 | | | | 26,130,572 | | | | 5,189,184 | | | | 14,554,833 | |
Change in Unrealized Appreciation (Depreciation) on: | | | | | | | | | | | | | | | | |
Investments | | | 18,815,328 | | | | 35,568,222 | | | | 15,592,647 | | | | 73,693,191 | |
Written options | | | - | | | | - | | | | - | | | | - | |
Swaps | | | 84,205 | | | | 2,991 | | | | 26,124 | | | | 65,045 | |
Net Change in Unrealized Appreciation (Depreciation) | | | 18,899,533 | | | | 35,571,213 | | | | 15,618,771 | | | | 73,758,236 | |
Net Realized and Unrealized Gain on Investments | | | 26,074,526 | | | | 61,701,785 | | | | 20,807,955 | | | | 88,313,069 | |
INCREASE IN NET ASSETS RESULTING FROM OPERATIONS | | $ | 26,963,509 | | | $ | 62,231,964 | | | $ | 20,978,843 | | | | $90,721,659 | |
See Notes to Financial Statements.
| | |
| | |
| 128 | | Semi-Annual Report | December 31, 2010 (Unaudited) |
| | |
| |
|
| | | | | | | | | | | | | | | | | | | | | | | | | | | | | | |
Micro-Cap Limited | | | Small-Cap
Momentum | | | Small-Cap
Growth | | | Small-Cap
Value | | | Large-Cap
Growth | | | Large-Cap
Value | | | Blue Chip 35
Index | | | Managed
Volatility | |
| | | | | | | |
| $ | 124,707 | | | | $ 24,068 | | | $ | 129,527 | | | $ | 1,033,743 | | | $ | 369,432 | | | $ | 340,880 | | | $ | 2,885,495 | | | $ | 166,219 | |
| | - | | | | (41 | ) | | | - | | | | - | | | | - | | | | - | | | | - | | | | - | |
| | - | | | | - | | | | - | | | | - | | | | - | | | | - | | | | - | | | | 122,982 | |
| | 51,875 | | | | 1,962 | | | | 99,671 | | | | 67,977 | | | | 2,628 | | | | 312 | | | | - | | | | 2,998 | |
| | 176,582 | | | | 25,989 | | | | 229,198 | | | | 1,101,720 | | | | 372,060 | | | | 341,192 | | | | 2,885,495 | | | | 292,199 | |
| | | | | | | |
| | 100,370 | | | | 5,952 | | | | 162,484 | | | | 329,865 | | | | 149,153 | | | | 66,547 | | | | 104,051 | | | | 99,960 | |
| | (162,608 | ) | | | - | | | | (33,211 | ) | | | (54,945 | ) | | | (23,928 | ) | | | 5,100 | | | | - | | | | - | |
| | 4,240 | | | | 411 | | | | 10,314 | | | | 20,933 | | | | 11,357 | | | | 5,067 | | | | 49,489 | | | | 6,348 | |
| | 22,875 | | | | 21,372 | | | | 24,574 | | | | 28,589 | | | | 24,703 | | | | 22,364 | | | | 38,630 | | | | 27,086 | |
| | 20,730 | | | | 18,893 | | | | 31,555 | | | | 51,116 | | | | 29,248 | | | | 22,168 | | | | 22,870 | | | | 21,038 | |
| | 6,764 | | | | 5,118 | | | | 11,274 | | | | 17,755 | | | | 11,317 | | | | 7,436 | | | | 38,354 | | | | 10,876 | |
| | 2,845 | | | | 2,529 | | | | 2,524 | | | | 3,666 | | | | 1,613 | | | | 1,227 | | | | 2,589 | | | | 4,739 | |
| | 8,751 | | | | 6,421 | | | | 11,469 | | | | 14,131 | | | | 11,915 | | | | 10,783 | | | | 14,762 | | | | 9,811 | |
| | 1,909 | | | | 376 | | | | 4,839 | | | | 9,746 | | | | 5,183 | | | | 2,313 | | | | 21,851 | | | | 2,945 | |
| | 3,737 | | | | 2 | | | | 19,157 | | | | 36,774 | | | | 20,396 | | | | 7,308 | | | | 19,424 | | | | 7,145 | |
| | 2,372 | | | | 1,863 | | | | 10,607 | | | | 17,620 | | | | 9,974 | | | | 3,652 | | | | 8,347 | | | | 3,096 | |
| | 4,111 | | | | 719 | | | | 11,096 | | | | 21,267 | | | | 12,309 | | | | 4,981 | | | | 38,910 | | | | 5,780 | |
| | 16,096 | | | | 63,656 | | | | 266,682 | | | | 496,517 | | | | 263,240 | | | | 158,946 | | | | 359,277 | | | | 198,824 | |
| | - | | | | (5,952 | ) | | | (11,925 | ) | | | - | | | | (12,314 | ) | | | (47,175 | ) | | | (104,051 | ) | | | (42,220 | ) |
| | - | | | | (11,250 | ) | | | - | | | | - | | | | - | | | | - | | | | - | | | | - | |
| | - | | | | (36,714 | ) | | | - | | | | - | | | | - | | | | - | | | | (59,903 | ) | | | - | |
| | 16,096 | | | | 9,740 | | | | 254,757 | | | | 496,517 | | | | 250,926 | | | | 111,771 | | | | 195,323 | | | | 156,604 | |
| | 160,486 | | | | 16,249 | | | | (25,559 | ) | | | 605,203 | | | | 121,134 | | | | 229,421 | | | | 2,690,172 | | | | 135,595 | |
| | | | | | | |
| | 1,704,882 | | | | 165,655 | | | | 3,687,405 | | | | 11,221,385 | | | | 4,282,835 | | | | 1,251,558 | | | | (3,024,462 | ) | | | (156,223 | ) |
| | - | | | | - | | | | - | | | | - | | | | - | | | | - | | | | - | | | | 1,127,631 | |
| | - | | | | - | | | | - | | | | - | | | | - | | | | - | | | | - | | | | (673,964 | ) |
| | 34,121 | | | | - | | | | (29,890 | ) | | | (123,769 | ) | | | 19,422 | | | | 507 | | | | - | | | | - | |
| | 1,739,003 | | | | 165,655 | | | | 3,657,515 | | | | 11,097,616 | | | | 4,302,257 | | | | 1,252,065 | | | | (3,024,462 | ) | | | 297,444 | |
| | | | | | | |
| | 3,876,497 | | | | 343,552 | | | | 6,093,642 | | | | 8,131,237 | | | | 7,704,059 | | | | 3,414,821 | | | | 48,181,651 | | | | 3,096,656 | |
| | - | | | | - | | | | - | | | | - | | | | - | | | | - | | | | - | | | | 94,356 | |
| | 3,663 | | | | - | | | | 49,516 | | | | 51,959 | | | | 1,368 | | | | - | | | | - | | | | - | |
| | 3,880,160 | | | | 343,552 | | | | 6,143,158 | | | | 8,183,196 | | | | 7,705,427 | | | | 3,414,821 | | | | 48,181,651 | | | | 3,191,012 | |
| | 5,619,163 | | | | 509,207 | | | | 9,800,673 | | | | 19,280,812 | | | | 12,007,684 | | | | 4,666,886 | | | | 45,157,189 | | | | 3,488,456 | |
| | | | | | | |
| $ | 5,779,649 | | | | $525,456 | | | $ | 9,775,114 | �� | | $ | 19,886,015 | | | $ | 12,128,818 | | | $ | 4,896,307 | | | $ | 47,847,361 | | | $ | 3,624,051 | |
|
STATEMENTS OF CHANGES IN NET ASSETS |
| | | | | | | | | | | | | | | | |
| | | Aggressive Investors 1 | | | Aggressive Investors 2 | |
| | | | |
| | | Six Months Ended
December 31, 2010 | | | Year Ended
June 30, 2010 | | | Six Months Ended
December 31, 2010 | | | Year Ended June 30, 2010 | |
| | | (Unaudited) | | | | | | (Unaudited) | | | | |
OPERATIONS | | | | | | | | | | | | | | | | |
Net investment income | | $ | 888,983 | | | $ | 2,258,003 | | | $ | 530,179 | | | $ | 1,950,934 | |
Net realized gain (loss) on investments | | | 7,174,993 | | | | 11,290,324 | | | | 26,130,572 | | | | 32,280,345 | |
Net change in unrealized appreciation/(depreciation) on investments | | | 18,899,533 | | | | (2,367,120 | ) | | | 35,571,213 | | | | 8,446,736 | |
Net increase/(decrease) in net assets resulting from operations. | | | 26,963,509 | | | | 11,181,207 | | | | 62,231,964 | | | | 42,678,015 | |
DISTRIBUTIONS: | | | | | | | | | | | | | | | | |
From net investment income. | | | (2,167,451 | ) | | | (930,085 | ) | | | (1,764,382 | ) | | | (1,620,063 | ) |
Net decrease in net assets from distributions | | | (2,167,451 | ) | | | (930,085 | ) | | | (1,764,382 | ) | | | (1,620,063 | ) |
| | | | |
SHARE TRANSACTIONS: | | | | | | | | | | | | | | | | |
Proceeds from sale of shares | | | 1,076,411 | | | | 3,655,994 | | | | 18,589,101 | | | | 114,813,049 | |
Reinvestment of distributions | | | 2,051,684 | | | | 881,283 | | | | 1,678,100 | | | | 1,413,787 | |
Cost of shares redeemed | | | (12,904,546 | ) | | | (37,615,713 | ) | | | (141,252,668 | ) | | | (237,848,301 | ) |
Redemption fees | | | - | | | | - | | | | - | | | | - | |
Net increase/(decrease) in net assets from share transactions | | | (9,776,451 | ) | | | (33,078,436 | ) | | | (120,985,467 | ) | | | (121,621,465 | ) |
Net increase/(decrease) in net assets. | | | 15,019,607 | | | | (22,827,314 | ) | | | (60,517,885 | ) | | | (80,563,513 | ) |
NET ASSETS: | | | | | | | | | | | | | | | | |
Beginning of period | | | 93,007,640 | | | | 115,834,954 | | | | 303,292,944 | | | | 383,856,457 | |
End of period* | | $ | 108,027,247 | | | $ | 93,007,640 | | | $ | 242,775,059 | | | $ | 303,292,944 | |
| | | | |
SHARES ISSUED & REDEEMED | | | | | | | | | | | | | | | | |
Issued | | | 34,136 | | | | 119,698 | | | | 1,533,925 | | | | 9,531,170 | |
Distributions reinvested | | | 58,220 | | | | 29,298 | | | | 119,779 | | | | 114,107 | |
Redeemed | | | (404,985 | ) | | | (1,255,542 | ) | | | (11,492,609 | ) | | | (19,605,918 | ) |
Net increase/(decrease) | | | (312,629 | ) | | | (1,106,546 | ) | | | (9,838,905 | ) | | | (9,960,641 | ) |
Outstanding at beginning of period | | | 3,361,139 | | | | 4,467,685 | | | | 27,072,996 | | | | 37,033,637 | |
Outstanding at end of period | | | 3,048,510 | | | | 3,361,139 | | | | 17,234,091 | | | | 27,072,996 | |
| | | | |
* Including undistributed net investment income of: | | $ | 986,271 | | | $ | 2,264,739 | | | $ | (359,935 | ) | | $ | 874,268 | |
| 1 | Commencement of operations. |
See Notes to Financial Statements.
| | |
| | |
| 130 | | Semi-Annual Report | December 31, 2010 (Unaudited) |
| | |
| |
|
| | | | | | | | | | | | | | | | | | | | | | | | | | | | | | |
| Ultra-Small Company | | | Ultra-Small Company Market | | | Micro-Cap Limited | | | Small-Cap Momentum | |
Six Months Ended
December 31, 2010 | | | Year Ended
June 30, 2010 | | | Six Months Ended
December 31, 2010 | | | Year Ended June 30, 2010 | | | Six Months Ended
December 31, 2010 | | | Year Ended
June 30, 2010 | | | Six Months Ended
December 31, 2010 | | | For the Period
May 28, 20101
through June 30, 2010 | |
| (Unaudited) | | | | | | (Unaudited) | | | | | | (Unaudited) | | | | | | (Unaudited) | | | | |
| | | | | | | |
| | $ 170,888 | | | $ | 713,280 | | | | $ 2,408,590 | | | | $ 4,192,088 | | | | $ 160,486 | | | | $ 445,655 | | | | $ 16,249 | | | $ | 807 | |
| | 5,189,184 | | | | 13,701,643 | | | | 14,554,833 | | | | 30,266,479 | | | | 1,739,003 | | | | 4,966,984 | | | | 165,655 | | | | (105 | ) |
| | | | | | | |
| | 15,618,771 | | | | (1,347,400 | ) | | | 73,758,236 | | | | 9,608,184 | | | | 3,880,160 | | | | (1,140,437 | ) | | | 343,552 | | | | (135,451 | ) |
| | | | | | | | |
| | 20,978,843 | | | | 13,067,523 | | | | 90,721,659 | | | | 44,066,751 | | | | 5,779,649 | | | | 4,272,202 | | | | 525,456 | | | | (134,749 | ) |
| | | | | | | |
| | (632,748 | ) | | | (837,589 | ) | | | (4,111,396 | ) | | | (5,060,400 | ) | | | (401,927 | ) | | | (300,332 | ) | | | (16,890 | ) | | | - | |
| | (632,748 | ) | | | (837,589 | ) | | | (4,111,396 | ) | | | (5,060,400 | ) | | | (401,927 | ) | | | (300,332 | ) | | | (16,890 | ) | | | - | |
| | | | | | | |
| | 413,527 | | | | 2,791,876 | | | | 28,788,408 | | | | 83,956,444 | | | | 1,111,831 | | | | 1,581,302 | | | | 108,601 | | | | 2,022,858 | |
| | 608,040 | | | | 783,940 | | | | 3,618,063 | | | | 4,532,570 | | | | 387,792 | | | | 292,385 | | | | 16,890 | | | | - | |
| | (7,436,296 | ) | | | (7,932,551 | ) | | | (48,978,139 | ) | | | (126,816,712 | ) | | | (2,403,647 | ) | | | (9,838,747 | ) | | | - | | | | - | |
| | - | | | | - | | | | 18,182 | | | | 66,739 | | | | - | | | | - | | | | - | | | | - | |
| | (6,414,729 | ) | | | (4,356,735 | ) | | | (16,553,486 | ) | | | (38,260,959 | ) | | | (904,024 | ) | | | (7,965,060 | ) | | | 125,491 | | | | 2,022,858 | |
| | 13,931,366 | | | | 7,873,199 | | | | 70,056,777 | | | | 745,392 | | | | 4,473,698 | | | | (3,993,190 | ) | | | 634,057 | | | | 1,888,109 | |
| | | | | | | |
| | 81,581,645 | | | | 73,708,446 | | | | 343,668,189 | | | | 342,922,797 | | | | 20,725,930 | | | | 24,719,120 | | | | 1,888,109 | | | | - | |
| | $95,513,011 | | | $ | 81,581,645 | | | | $413,724,966 | | | | $ 343,668,189 | | | | $25,199,628 | | | | $20,725,930 | | | | $2,522,166 | | | $ | 1,888,109 | |
| | | | | | | |
| | 14,885 | | | | 120,490 | | | | 2,231,846 | | | | 6,969,210 | | | | 167,372 | | | | 295,049 | | | | 9,697 | | | | 202,374 | |
| | 21,208 | | | | 34,611 | | | | 251,429 | | | | 393,794 | | | | 56,612 | | | | 54,448 | | | | 1,449 | | | | - | |
| | (306,291 | ) | | | (327,820 | ) | | | (3,795,896 | ) | | | (10,690,345 | ) | | | (390,640 | ) | | | (1,766,430 | ) | | | - | | | | - | |
| | (270,198 | ) | | | (172,719 | ) | | | (1,312,621 | ) | | | (3,327,341 | ) | | | (166,656 | ) | | | (1,416,933 | ) | | | 11,146 | | | | 202,374 | |
| | 3,556,581 | | | | 3,729,300 | | | | 29,332,038 | | | | 32,659,379 | | | | 3,787,482 | | | | 5,204,415 | | | | 202,374 | | | | - | |
| | 3,286,383 | | | | 3,556,581 | | | | 28,019,417 | | | | 29,332,038 | | | | 3,620,826 | | | | 3,787,482 | | | | 213,520 | | | | 202,374 | |
| | | | | | | |
| | $ 218,698 | | | $ | 680,558 | | | | $ 2,474,785 | | | | $ 4,177,591 | | | | $ 198,106 | | | | $ 439,547 | | | | $ 166 | | | $ | 807 | |
|
STATEMENTS OF CHANGES IN NET ASSETS (continued) |
| | | | | | | | | | | | | | | | |
| | | Small-Cap Growth | | | Small-Cap Value | |
| | | Six Months Ended
December 31, 2010 | | | Year Ended
June 30, 2010 | | | Six Months Ended
December 31, 2010 | | | Year Ended June 30, 2010 | |
| | | (Unaudited) | | | | | | (Unaudited) | | | | |
| | | | |
OPERATIONS | | | | | | | | | | | | | | | | |
Net investment income (loss) | | $ | (25,559 | ) | | $ | 139,914 | | | | $ 605,203 | | | $ | 863,013 | |
Net realized gain (loss) on investments | | | 3,657,515 | | | | 13,339,052 | | | | 11,097,616 | | | | 16,392,876 | |
Net change in unrealized appreciation/(depreciation) on investments | | | 6,143,158 | | | | (6,778,228 | ) | | | 8,183,196 | | | | 8,117,075 | |
Net increase in net assets resulting from operations | | | 9,775,114 | | | | 6,700,738 | | | | 19,886,015 | | | | 25,372,964 | |
| | | | |
DISTRIBUTIONS: | | | | | | | | | | | | | | | | |
From net investment income. | | | (107,719 | ) | | | (252,145 | ) | | | (557,827 | ) | | | (806,731 | ) |
Net decrease in net assets from distributions | | | (107,719 | ) | | | (252,145 | ) | | | (557,827 | ) | | | (806,731 | ) |
| | | | |
SHARE TRANSACTIONS: | | | | | | | | | | | | | | | | |
Proceeds from sale of shares | | | 1,494,999 | | | | 16,264,411 | �� | | | 2,349,233 | | | | 14,406,868 | |
Reinvestment of distributions | | | 103,847 | | | | 235,833 | | | | 518,027 | | | | 705,905 | |
Cost of shares redeemed | | | (18,404,602 | ) | | | (37,633,988 | ) | | | (27,747,865 | ) | | | (63,207,015 | ) |
Net increase/(decrease) in net assets from share transactions | | | (16,805,756 | ) | | | (21,133,744 | ) | | | (24,880,605 | ) | | | (48,094,242 | ) |
Net increase/(decrease) in net assets. | | | (7,138,361 | ) | | | (14,685,151 | ) | | | (5,552,417 | ) | | | (23,528,009 | ) |
NET ASSETS: | | | | | | | | | | | | | | | | |
Beginning of period | | | 57,011,385 | | | | 71,696,536 | | | | 108,700,870 | | | | 132,228,879 | |
End of period* | | $ | 49,873,024 | | | $ | 57,011,385 | | | | $103,148,453 | | | $ | 108,700,870 | |
| | | | |
SHARES ISSUED & REDEEMED | | | | | | | | | | | | | | | | |
Issued | | | 153,076 | | | | 1,683,629 | | | | 189,334 | | | | 1,267,266 | |
Distributions reinvested | | | 9,466 | | | | 24,464 | | | | 38,515 | | | | 61,490 | |
Redeemed | | | (1,871,052 | ) | | | (3,944,414 | ) | | | (2,171,322 | ) | | | (5,423,838 | ) |
Net increase/(decrease) | | | (1,708,510 | ) | | | (2,236,321 | ) | | | (1,943,473 | ) | | | (4,095,082 | ) |
Outstanding at beginning of period | | | 6,234,235 | | | | 8,470,556 | | | | 9,493,781 | | | | 13,588,863 | |
Outstanding at end of period | | | 4,525,725 | | | | 6,234,235 | | | | 7,550,308 | | | | 9,493,781 | |
| | | | |
* Including undistributed net investment income of: | | $ | 19,604 | | | $ | 152,882 | | | | $ 461,657 | | | $ | 414,281 | |
See Notes to Financial Statements.
| | |
| | |
| 132 | | Semi-Annual Report | December 31, 2010 (Unaudited) |
| | |
| |
|
| | | | | | | | | | | | | | | | | | | | | | | | | | | | | | |
Large-Cap Growth | | | Large-Cap Value | | | Blue Chip 35 Index | | | Managed Volatility | |
Six Months Ended | | | Year Ended | | | Six Months Ended | | | Year Ended | | | Six Months Ended | | | Year Ended | | | Six Months Ended | | | Year Ended | |
| December 31, 2010 | | | June 30, 2010 | | | December 31, 2010 | | | June 30, 2010 | | | December 31, 2010 | | | June 30, 2010 | | | December 31, 2010 | | | June 30, 2010 | |
(Unaudited) | | | | | | (Unaudited) | | | | | | (Unaudited) | | | | | | (Unaudited) | | | | |
| | | | | | | |
| | | | | | | | | | | | | | | | | | | | | | | | | | | | | | |
| | $ 121,134 | | | | $ 391,274 | | | | $ 229,421 | | | | $ 469,938 | | | | $ 2,690,172 | | | | $ 4,239,573 | | | | $ 135,595 | | | | $ 406,546 | |
| | 4,302,257 | | | | 931,464 | | | | 1,252,065 | | | | 2,963,788 | | | | (3,024,462) | | | | (10,168,908) | | | | 297,444 | | | | (221,955 | ) |
| | | | | | | | | | | | | | | | | | | | | | | | | | | | | | |
| | 7,705,427 | �� | | | 8,818,151 | | | | 3,414,821 | | | | 2,161,925 | | | | 48,181,651 | | | | 26,109,776 | | | | 3,191,012 | | | | 1,280,993 | |
| | | |
| | 12,128,818 | | | | 10,140,889 | | | | 4,896,307 | | | | 5,595,651 | | | | 47,847,361 | | | | 20,180,441 | | | | 3,624,051 | | | | 1,465,584 | |
| | | |
| | | | | | | |
| | | | | | | | | | | | | | | | | | | | | | | | | | | | | | |
| | (342,087) | | | | (417,231) | | | | (461,725) | | | | (565,868) | | | | (4,877,457) | | | | (4,072,171) | | | | (266,935) | | | | (612,394 | ) |
| | | |
| | (342,087) | | | | (417,231) | | | | (461,725) | | | | (565,868) | | | | (4,877,457) | | | | (4,072,171) | | | | (266,935) | | | | (612,394 | ) |
| | | |
| | | | | | | |
| | | | | | | | | | | | | | | | | | | | | | | | | | | | | | |
| | 657,588 | | | | 3,317,409 | | | | 857,611 | | | | 2,205,061 | | | | 70,144,837 | | | | 75,798,410 | | | | 1,032,941 | | | | 7,408,382 | |
| | 317,943 | | | | 393,794 | | | | 446,019 | | | | 523,937 | | | | 4,439,505 | | | | 3,847,889 | | | | 261,827 | | | | 599,982 | |
| | (11,793,890) | | | | (25,559,606) | | | | (4,253,130) | | | | (10,220,486) | | | | (31,714,895) | | | | (61,180,333) | | | | (6,706,936) | | | | (22,477,177 | ) |
| | | |
| | (10,818,359) | | | | (21,848,403) | | | | (2,949,500) | | | | (7,491,488) | | | | 42,869,447 | | | | 18,465,966 | | | | (5,412,168) | | | | (14,468,813 | ) |
| | | |
| | 968,372 | | | | (12,124,745) | | | | 1,485,082 | | | | (2,461,705) | | | | 85,839,351 | | | | 34,574,236 | | | | (2,055,052) | | | | (13,615,623 | ) |
| | | | | | | |
| | | | | | | | | | | | | | | | | | | | | | | | | | | | | | |
| | 58,409,357 | | | | 70,534,102 | | | | 25,534,211 | | | | 27,995,916 | | | | 222,586,145 | | | | 188,011,909 | | | | 33,683,520 | | | | 47,299,143 | |
| | | |
| | $ 59,377,729 | | | | $ 58,409,357 | | | | $27,019,293 | | | | $ 25,534,211 | | | | $308,425,496 | | | | $222,586,145 | | | | $31,628,468 | | | | $ 33,683,520 | |
| | | |
| | | | | | | |
| | | | | | | | | | | | | | | | | | | | | | | | | | | | | | |
| | 57,117 | | | | 313,191 | | | | 67,264 | | | | 183,704 | | | | 9,998,171 | | | | 11,535,727 | | | | 93,843 | | | | 697,925 | |
| | 25,703 | | | | 36,161 | | | | 33,535 | | | | 43,991 | | | | 613,191 | | | | 574,312 | | | | 23,315 | | | | 55,812 | |
| | (1,044,676) | | | | (2,394,855) | | | | (337,001) | | | | (869,788) | | | | (4,629,147) | | | | (9,336,887) | | | | (614,559) | | | | (2,101,935 | ) |
| | | |
| | (961,856) | | | | (2,045,503) | | | | (236,202) | | | | (642,093) | | | | 5,982,215 | | | | 2,773,152 | | | | (497,401) | | | | (1,348,198 | ) |
| | 5,741,293 | | | | 7,786,796 | | | | 2,232,042 | | | | 2,874,135 | | | | 36,006,896 | | | | 33,233,744 | | | | 3,293,852 | | | | 4,642,050 | |
| | | |
| | 4,779,437 | | | | 5,741,293 | | | | 1,995,840 | | | | 2,232,042 | | | | 41,989,111 | | | | 36,006,896 | | | | 2,796,451 | | | | 3,293,852 | |
| | | |
| | | | | | | |
| | $ (33,462) | | | | $ 187,491 | | | | $ (9,655) | | | | $ 222,649 | | | | $ 12,067 | | | | $ 2,199,352 | | | | $ 86,429 | | | | $ 217,769 | |
FINANCIAL HIGHLIGHTS
(for a share outstanding throughout the period indicated)
| | | | | | | | | | | | | | | | |
| | | | | | Income from
Investment Operations | |
| | | Net Asset Value, Beginning of Period | | | Net Investment Income (Loss)(a) | | | Net Realized and Unrealized Gain\(Loss) | | | Total from Investment Operations | |
| | | | |
AGGRESSIVE INVESTORS 1 | | | | | | | | | | | | | | | | |
| | | | |
Period Ended December 31, 2010 (Unaudited) | | | $27.67 | | | | $ 0.28 | | | | $ 8.20 | | | | $ 8.48 | |
Year Ended June 30, 2010 | | | 25.93 | | | | 0.58 | | | | 1.40 | | | | 1.98 | |
Year Ended June 30, 2009 | | | 53.96 | | | | 0.30 | | | | (28.00) | | | | (27.70) | |
Year Ended June 30, 2008 | | | 61.90 | | | | (0.59) | | | | 3.14 | | | | 2.55 | |
Year Ended June 30, 2007 | | | 61.90 | | | | (0.43) | | | | 6.41 | | | | 5.98 | |
Year Ended June 30, 2006 | | | 56.60 | | | | (0.42) | | | | 12.23 | | | | 11.81 | |
| | | | |
| | | | | | | | | | | | | | | | | |
| | | | |
AGGRESSIVE INVESTORS 2 | | | | | | | | | | | | | | | | |
| | | | |
Period Ended December 31, 2010 (Unaudited) | | | 11.20 | | | | 0.02 | | | | 2.97 | | | | 2.99 | |
Year Ended June 30, 2010 | | | 10.37 | | | | 0.06 | | | | 0.82 | | | | 0.88 | |
Year Ended June 30, 2009 | | | 20.67 | | | | 0.02 | | | | (10.32) | | | | (10.30) | |
Year Ended June 30, 2008 | | | 20.05 | | | | (0.08) | | | | 1.27 | | | | 1.19 | |
Year Ended June 30, 2007 | | | 17.55 | | | | (0.07) | | | | 2.94 | | | | 2.87 | |
Year Ended June 30, 2006 | | | 14.72 | | | | (0.05) | | | | 3.22 | | | | 3.17 | |
| | | | |
| | | | | | | | | | | | | | | | | |
| | | | |
ULTRA-SMALL COMPANY | | | | | | | | | | | | | | | | |
| | | | |
Period Ended December 31, 2010 (Unaudited) | | | 22.94 | | | | 0.05 | | | | 6.26 | | | | 6.31 | |
Year Ended June 30, 2010 | | | 19.76 | | | | 0.19 | | | | 3.22 | | | | 3.41 | |
Year Ended June 30, 2009 | | | 24.59 | | | | 0.23 | | | | (5.03) | | | | (4.80) | |
Year Ended June 30, 2008 | | | 37.65 | | | | 0.03 | | | | (8.67) | | | | (8.64) | |
Year Ended June 30, 2007 | | | 42.42 | | | | 0.12 | | | | 3.37 | | | | 3.49 | |
Year Ended June 30, 2006 | | | 38.44 | | | | (0.15) | | | | 9.23 | | | | 9.08 | |
| | | | |
| | | | | | | | | | | | | | | | | |
| | | | |
ULTRA-SMALL COMPANY MARKET | | | | | | | | | | | | | | | | |
| | | | |
Period Ended December 31, 2010 (Unaudited) | | | 11.72 | | | | 0.09 | | | | 3.11 | | | | 3.20 | |
Year Ended June 30, 2010 | | | 10.50 | | | | 0.14 | | | | 1.25 | | | | 1.39 | |
Year Ended June 30, 2009 | | | 15.33 | | | | 0.14 | | | | (3.88) | | | | (3.74) | |
Year Ended June 30, 2008 | | | 20.36 | | | | 0.14 | | | | (4.49) | | | | (4.35) | |
Year Ended June 30, 2007 | | | 18.94 | | | | 0.10 | | | | 1.76 | | | | 1.86 | |
Year Ended June 30, 2006 | | | 16.96 | | | | 0.05 | | | | 2.48 | | | | 2.53 | |
| (a) | Per share amounts calculated based on the average daily shares outstanding during the period. |
| (b) | Annualized for periods less than one year. |
| (c) | For the years ended June 30, 2009 and June 30, 2010 and the period ended December 31, 2010, the expense ratio was significantly lower than past years due to a negative performance adjustment to the investment advisory fee. Please refer to the Statement of Operations and Note 3 of the Notes to Financial Statements for further information. The rate shown may not be indicative of the rate going forward. |
| (d) | Total return may have been lower had various fees not been waived during the period. |
| (e) | Amount represents less than $0.005. |
See Notes to Financial Statements.
| | |
| | |
| 134 | | Semi-Annual Report | December 31, 2010 (Unaudited) |
| | |
| |
|
| | | | | | | | | | | | | | | | | | | | | | | | | | | | | | | | | | | | | | | | | | |
Less Distributions to Shareholders from: | | | | | | | | | | | | Ratios & Supplemental Data | |
| | | | | | | | | | | | | | | | | | | |
| | | | | | | | | | | | | | | | | | | | | | | | | Net Investment Income (Loss) After Waivers and Reimbursement (b) | | | | |
| | | | | | | | | | | | | | | | Net Assets | | | | | | | | | | | |
| | | | | | | | | | Paid in Capital Net Asset | | | | | | | | | | | | | | | |
Net
Realized
Gain | | | Net Investment
Income | | | Total Distributions | | | from
Redemption
Fees(a) | | | Value, End of Period | | | Total Return | | | End of Period
(000’s) | | | Expenses Before Waivers and
Reimbursements (b) | | | Expenses After Waivers and Reimbursements (b) | | | | Portfolio Turnover Rate | |
| | | |
| | | | | | | | | | |
| | $ - | | | | $(0.71) | | | | $ (0.71) | | | | $ - | | | | $35.44 | | | | 30.67% | | | | $ 108,027 | | | | (0.58%)(c) | | | | (0.58%) | | | | 1.75% | | | | 59% | |
| | - | | | | (0.24) | | | | (0.24) | | | | - | | | | 27.67 | | | | 7.56% | | | | 93,008 | | | | (0.51%)(c) | | | | (0.51%) | | | | 1.94% | | | | 118% | |
| | (0.33 | ) | | | - | | | | (0.33) | | | | - | | | | 25.93 | | | | (51.31%) | | | | 115,835 | | | | 0.34%(c) | | | | 0.34% | | | | 0.97% | | | | 134% | |
| | (10.49 | ) | | | - | | | | (10.49) | | | | - | | | | 53.96 | | | | 3.54% | (d) | | | 338,715 | | | | 1.78% | | | | 1.78% | | | | (1.03%) | | | | 142% | |
| | (5.98 | ) | | | - | | | | (5.98) | | | | - | | | | 61.90 | | | | 10.79% | | | | 367,958 | | | | 1.72% | | | | 1.72% | | | | (0.75%) | | | | 115% | |
| | (6.51 | ) | | | - | | | | (6.51) | | | | - | | | | 61.90 | | | | 21.79% | | | | 438,592 | | | | 1.58% | | | | 1.58% | | | | (0.69%) | | | | 128% | |
| | | | | | | | | | | | | | | | | | | | | | | | | | | | | | | | | | | | | | | | | | |
| | | |
| | | | | | | | | | |
| | - | | | | (0.10) | | | | (0.10) | | | | - | | | | 14.09 | | | | 26.71% | | | | 242,775 | | | | 0.76% | | | | 0.76% | | | | 0.38% | | | | 47% | |
| | - | | | | (0.05) | | | | (0.05) | | | | - | | | | 11.20 | | | | 8.44% | | | | 303,293 | | | | 1.02% | | | | 1.02% | | | | 0.52% | | | | 105% | |
| | - | | | | - | | | | - | | | | - | | | | 10.37 | | | | (49.83%) | | | | 383,856 | | | | 1.20% | | | | 1.20% | | | | 0.14% | | | | 126% | |
| | (0.57 | ) | | | - | | | | (0.57) | | | | - | | | | 20.67 | | | | 5.88% | (d) | | | 885,076 | | | | 1.17% | | | | 1.17% | | | | (0.40%) | | | | 127% | |
| | (0.37 | ) | | | - | | | | (0.37) | | | | - | | | | 20.05 | | | | 16.68% | | | | 650,939 | | | | 1.22% | | | | 1.22% | | | | (0.38%) | | | | 124% | |
| | (0.34 | ) | | | - | | | | (0.34) | | | | - | | | | 17.55 | | | | 21.65% | | | | 585,262 | | | | 1.12% | | | | 1.12% | | | | (0.26%) | | | | 89% | |
| | | | | | | | | | | | | | | | | | | | | | | | | | | | | | | | | | | | | | | | | | |
| | | |
| | | | | | | | | | |
| | - | | | | (0.19) | | | | (0.19) | | | | - | | | | 29.06 | | | | 27.53% | | | | 95,513 | | | | 1.20% | | | | 1.20% | | | | 0.40% | | | | 57% | |
| | - | | | | (0.23) | | | | (0.23) | | | | - | | | | 22.94 | | | | 17.26% | | | | 81,582 | | | | 1.17% | | | | 1.17% | | | | 0.83% | | | | 133% | |
| | - | | | | (0.03) | | | | (0.03) | | | | - | | | | 19.76 | | | | (19.48%) | | | | 73,708 | | | | 1.16% | | | | 1.16% | | | | 1.23% | | | | 90% | |
| | (4.31 | ) | | | (0.11) | | | | (4.42) | | | | - | | | | 24.59 | | | | (24.59%) | (d) | | | 94,933 | | | | 1.07% | | | | 1.07% | | | | 0.10% | | | | 102% | |
| | (8.26 | ) | | | - | | | | (8.26) | | | | - | | | | 37.65 | | | | 9.12% | | | | 137,236 | | | | 1.09% | | | | 1.09% | | | | 0.31% | | | | 106% | |
| | (5.10 | ) | | | - | | | | (5.10) | | | | - | | | | 42.42 | | | | 25.58% | | | | 132,193 | | | | 1.09% | | | | 1.09% | | | | (0.37%) | | | | 101% | |
| | | | | | | | | | | | | | | | | | | | | | | | | | | | | | | | | | | | | | | | | | |
| | | |
| | | | | | | | | | |
| | - | | | | (0.15) | | | | (0.15) | | | | -(e) | | | | 14.77 | | | | 27.31% | (d) | | | 413,725 | | | | 0.80% | | | | 0.75% | | | | 1.30% | | | | 30% | |
| | - | | | | (0.17) | | | | (0.17) | | | | -(e) | | | | 11.72 | | | | 13.30% | (d) | | | 343,668 | | | | 0.77% | | | | 0.75% | | | | 1.18% | | | | 48% | |
| | (0.89 | ) | | | (0.21) | | | | (1.10) | | | | 0.01 | | | | 10.50 | | | | (23.47%) | (d) | | | 342,923 | | | | 0.79% | | | | 0.75% | | | | 1.27% | | | | 42% | |
| | (0.65 | ) | | | (0.04) | | | | (0.69) | | | | 0.01 | | | | 15.33 | | | | (21.72%) | (d) | | | 721,412 | | | | 0.66% | | | | 0.66% | | | | 0.79% | | | | 29% | |
| | (0.37 | ) | | | (0.08) | | | | (0.45) | | | | 0.01 | | | | 20.36 | | | | 10.08% | | | | 1,162,416 | | | | 0.67% | | | | 0.67% | | | | 0.53% | | | | 34% | |
| | (0.53 | ) | | | (0.03) | | | | (0.56) | | | | 0.01 | | | | 18.94 | | | | 15.13% | | | | 1,087,750 | | | | 0.65% | | | | 0.65% | | | | 0.27% | | | | 27% | |
| | | |
FINANCIAL HIGHLIGHTS (continued)
(for a share outstanding throughout the period indicated)
| | | | | | | | | | | | | | | | |
| | | | | | Income from Investment Operations | |
| | | | | | | | |
| | | Net Asset Value, Beginning of Period | | | Net Investment Income (Loss)(a) | | | Net Realized and Unrealized Gain\(Loss) | | | Total from Investment Operations | |
| | | | |
MICRO-CAP LIMITED | | | | | | | | | | | | | | | | |
| | | | |
Period Ended December 31, 2010 (Unaudited) | | | $ 5.47 | | | | $ 0.04 | | | | $ 1.56 | | | | $ 1.60 | |
Year Ended June 30, 2010 | | | 4.75 | | | | 0.09 | | | | 0.69 | | | | 0.78 | |
Year Ended June 30, 2009 | | | 7.05 | | | | 0.06 | | | | (2.35) | | | | (2.29) | |
Year Ended June 30, 2008 | | | 8.56 | | | | 0.03 | | | | (1.53) | | | | (1.50) | |
Year Ended June 30, 2007 | | | 11.10 | | | | (0.01) | | | | (0.32) | | | | (0.33) | |
Year Ended June 30, 2006 | | | 11.09 | | | | (0.13) | | | | 1.81 | | | | 1.68 | |
| | | | |
| | | | | | | | | | | | | | | | | |
| | | | |
SMALL-CAP MOMENTUM | | | | | | | | | | | | | | | | |
| | | | |
Period Ended December 31, 2010 (Unaudited) | | | 9.33 | | | | 0.08 | | | | 2.48 | | | | 2.56 | |
Period Ended June 30, 2010(e) | | | 10.00 | | | | -(f) | | | | (0.67) | | | | (0.67) | |
| | | | |
| | | | | | | | | | | | | | | | | |
| | | | |
SMALL-CAP GROWTH | | | | | | | | | | | | | | | | |
| | | | |
Period Ended December 31, 2010 (Unaudited) | | | 9.14 | | | | (0.01) | | | | 1.91 | | | | 1.90 | |
Year Ended June 30, 2010 | | | 8.46 | | | | 0.02 | | | | 0.70 | | | | 0.72 | |
Year Ended June 30, 2009 | | | 13.95 | | | | 0.03 | | | | (5.52) | | | | (5.49) | |
Year Ended June 30, 2008 | | | 16.01 | | | | (0.03) | | | | (2.03) | | | | (2.06) | |
Year Ended June 30, 2007 | | | 14.75 | | | | (0.04) | | | | 1.30 | | | | 1.26 | |
Year Ended June 30, 2006 | | | 12.08 | | | | (0.03) | | | | 2.70 | | | | 2.67 | |
| | | | |
| | | | | | | | | | | | | | | | | |
| | | | |
SMALL-CAP VALUE | | | | | | | | | | | | | | | | |
| | | | |
Period Ended December 31, 2010 (Unaudited) | | | 11.45 | | | | 0.07 | | | | 2.21 | | | | 2.28 | |
Year Ended June 30, 2010 | | | 9.73 | | | | 0.07 | | | | 1.72 | | | | 1.79 | |
Year Ended June 30, 2009 | | | 15.86 | | | | 0.08 | | | | (6.14) | | | | (6.06) | |
Year Ended June 30, 2008 | | | 18.74 | | | | 0.03 | | | | (2.91) | | | | (2.88) | |
Year Ended June 30, 2007 | | | 16.02 | | | | (0.03) | | | | 2.75 | | | | 2.72 | |
Year Ended June 30, 2006 | | | 12.78 | | | | -(f) | | | | 3.24 | | | | 3.24 | |
| (a) | Per share amounts calculated based on the average daily shares outstanding during the period. |
| (b) | Annualized for periods less than one year. |
| (c) | For the year ended June 30, 2010 and the period ended December 31, 2010, the expense ratio was significantly lower than past years due to a negative performance adjustment to the investment advisory fee. Please refer to the Statement of Operations and Note 3 of the Notes to Financial Statements for further information. The rate shown may not be indicative of the rate going forward. |
| (d) | Total return may have been lower had various fees not been waived during the period. |
| (e) | Commenced operations on May 28, 2010. |
| (f) | Amount represents less than $0.005. |
See Notes to Financial Statements.
| | |
| | |
| 136 | | Semi-Annual Report | December 31, 2010 (Unaudited) |
| | |
| |
|
| | | | | | | | | | | | | | | | | | | | | | | | | | | | | | | | | | | | | | | | |
| | | Less Distributions to Shareholders from: | | | | | | | | | Ratios & Supplemental Data | |
| | | | | | | | | | | | | | | | |
| | | Net
Realized
Gain | | | Net Investment
Income | | | Total
Distributions | | | Net Asset
Value,
End of Period | | | Total Return | | | Net Assets
End of
Period (000’s) | | | Expenses Before Waivers and Reimbursements(b) | | | Expenses After Waivers and Reimbursements(b) | | | Net Investment Income (Loss) After Waivers and Reimbursements(b) | | | Portfolio Turnover
Rate | |
| | |
| | | | | | | | | | |
| | | $ - | | | | $(0.11) | | | | $(0.11) | | | | $ 6.96 | | | | 29.34% | | | | $ 25,200 | | | | 0.14%(c) | | | | 0.14% | | | | 1.44% | | | | 65% | |
| | | - | | | | (0.06) | | | | (0.06) | | | | 5.47 | | | | 16.44% | | | | 20,726 | | | | 0.00%(c) | | | | 0.00% | | | | 1.73% | | | | 123% | |
| | | - | | | | (0.01) | | | | (0.01) | | | | 4.75 | | | | (32.41%) | | | | 24,719 | | | | 0.87% | | | | 0.87% | | | | 1.13% | | | | 151% | |
| | | - | | | | (0.01) | | | | (0.01) | | | | 7.05 | | | | (17.49%)(d) | | | | 38,136 | | | | 0.75% | | | | 0.75% | | | | 0.36% | | | | 147% | |
| | | (2.21 | ) | | | - | | | | (2.21) | | | | 8.56 | | | | (3.37%) | | | | 62,244 | | | | 0.84% | | | | 0.84% | | | | (0.09%) | | | | 133% | |
| | | (1.67 | ) | | | - | | | | (1.67) | | | | 11.10 | | | | 14.72% | | | | 80,711 | | | | 1.60% | | | | 1.60% | | | | (1.05%) | | | | 125% | |
| | | | | | | | | | |
| | | | | | | | | | | | | | | | | | | | | | | | | | | | | | | | | | | | | | | | |
| | |
| | | | | | | | | | |
| | | - | | | | (0.08) | | | | (0.08) | | | | 11.81 | | | | 27.45%(d) | | | | 2,522 | | | | 5.88% | | | | 0.90% | | | | 1.50% | | | | 158% | |
| | | - | | | | - | | | | - | | | | 9.33 | | | | (6.70%)(d) | | | | 1,888 | | | | 11.24% | | | | 0.90% | | | | 0.50% | | | | 3% | |
| | | | | | | | | | |
| | | | | | | | | | | | | | | | | | | | | | | | | | | | | | | | | | | | | | | | |
| | |
| | | | | | | | | | |
| | | - | | | | (0.02) | | | | (0.02) | | | | 11.02 | | | | 20.82%(d) | | | | 49,873 | | | | 0.98% | | | | 0.94% | | | | (0.09%) | | | | 51% | |
| | | - | | | | (0.04) | | | | (0.04) | | | | 9.14 | | | | 8.44% | | | | 57,011 | | | | 0.93% | | | | 0.93% | | | | 0.21% | | | | 87% | |
| | | - | | | | - | | | | - | | | | 8.46 | | | | (39.35%) | | | | 71,697 | | | | 0.94% | | | | 0.94% | | | | 0.29% | | | | 75% | |
| | | - | | | | - | | | | - | | | | 13.95 | | | | (12.87%)(d) | | | | 144,668 | | | | 0.87% | | | | 0.87% | | | | (0.20%) | | | | 63% | |
| | | - | | | | - | | | | - | | | | 16.01 | | | | 8.54% | | | | 172,395 | | | | 0.92% | | | | 0.92% | | | | (0.31%) | | | | 37% | |
| | | - | | | | - | | | | - | | | | 14.75 | | | | 22.10% | | | | 275,278 | | | | 0.81% | | | | 0.81% | | | | (0.19%) | | | | 41% | |
| | | | | | | | | | |
| | | | | | | | | | | | | | | | | | | | | | | | | | | | | | | | | | | | | | | | |
| | |
| | | | | | | | | | |
| | | - | | | | (0.07) | | | | (0.07) | | | | 13.66 | | | | 19.91% | | | | 103,148 | | | | 0.90% | | | | 0.90% | | | | 1.10% | | | | 53% | |
| | | - | | | | (0.07) | | | | (0.07) | | | | 11.45 | | | | 18.35% | | | | 108,701 | | | | 0.91% | | | | 0.91% | | | | 0.64% | | | | 81% | |
| | | - | | | | (0.07) | | | | (0.07) | | | | 9.73 | | | | (38.15%) | | | | 132,229 | | | | 0.92% | | | | 0.92% | | | | 0.75% | | | | 83% | |
| | | - | | | | - | | | | - | | | | 15.86 | | | | (15.37%)(d) | | | | 331,648 | | | | 0.83% | | | | 0.83% | | | | 0.18% | | | | 73% | |
| | | - | | | | - | | | | - | | | | 18.74 | | | | 16.98% | | | | 280,177 | | | | 0.88% | | | | 0.88% | | | | (0.19%) | | | | 58% | |
| | | - | | | | - | | | | - | | | | 16.02 | | | | 25.35% | | | | 360,120 | | | | 0.77% | | | | 0.77% | | | | (0.03%) | | | | 49% | |
| | |
| | |
| FINANCIAL HIGHLIGHTS (continued) | | |
| | |
(for a share outstanding throughout the period indicated) | | |
| | | | | | | | | | | | | | | | | | | | |
| | | | | | Income from Investment Operations | | | | |
| | | | | | | | | | | | |
| | | Net Asset Value, Beginning of Period | | | Net Investment
Income(a) | | | Net Realized and Unrealized
Gain\(Loss) | | | Total from
Investment
Operations | | | | |
| | | | | |
LARGE-CAP GROWTH | | | | | | | | | | | | | | | | | | | | |
| | | | | |
Period Ended December 31, 2010 (Unaudited) | | | $10.17 | | | | $0.02 | | | | $ 2.30 | | | | $ 2.32 | | | | | |
Year Ended June 30, 2010 | | | 9.06 | | | | 0.06 | | | | 1.11 | | | | 1.17 | | | | | |
Year Ended June 30, 2009 | | | 13.73 | | | | 0.06 | | | | (4.66) | | | | (4.60) | | | | | |
Year Ended June 30, 2008 | | | 14.12 | | | | 0.06 | | | | (0.41) | | | | (0.35) | | | | | |
Year Ended June 30, 2007 | | | 12.11 | | | | 0.03 | | | | 2.02 | | | | 2.05 | | | | | |
Year Ended June 30, 2006 | | | 11.00 | | | | 0.04 | | | | 1.07 | | | | 1.11 | | | | | |
| | | | | |
| | | | | | | | | | | | | | | | | | | | | |
| | | | | |
LARGE-CAP VALUE | | | | | | | | | | | | | | | | | | | | |
| | | | | |
Period Ended December 31, 2010 (Unaudited) | | | 11.44 | | | | 0.11 | | | | 2.22 | | | | 2.33 | | | | | |
Year Ended June 30, 2010 | | | 9.74 | | | | 0.19 | | | | 1.73 | | | | 1.92 | | | | | |
Year Ended June 30, 2009 | | | 13.63 | | | | 0.23 | | | | (3.89) | | | | (3.66) | | | | | |
Year Ended June 30, 2008 | | | 17.07 | | | | 0.22 | | | | (2.94) | | | | (2.72) | | | | | |
Year Ended June 30, 2007 | | | 14.41 | | | | 0.17 | | | | 2.64 | | | | 2.81 | | | | | |
Year Ended June 30, 2006 | | | 12.70 | | | | 0.17 | | | | 1.69 | | | | 1.86 | | | | | |
| | | | | |
| | | | | | | | | | | | | | | | | | | | | |
| | | | | |
BLUE CHIP 35 INDEX | | | | | | | | | | | | | | | | | | | | |
| | | | | |
Period Ended December 31, 2010 (Unaudited) | | | 6.18 | | | | 0.07 | | | | 1.22 | | | | 1.29 | | | | | |
Year Ended June 30, 2010 | | | 5.66 | | | | 0.13 | | | | 0.52 | | | | 0.65 | | | | | |
Year Ended June 30, 2009 | | | 7.21 | | | | 0.15 | | | | (1.51) | | | | (1.36) | | | | | |
Year Ended June 30, 2008 | | | 8.52 | | | | 0.19 | | | | (1.39) | | | | (1.20) | | | | | |
Year Ended June 30, 2007 | | | 7.21 | | | | 0.16 | | | | 1.26 | | | | 1.42 | | | | | |
Year Ended June 30, 2006 | | | 6.86 | | | | 0.14 | | | | 0.32 | | | | 0.46 | | | | | |
| | | | | |
| | | | | | | | | | | | | | | | | | | | | |
| | | | | |
MANAGED VOLATILITY | | | | | | | | | | | | | | | | | | | | |
| | | | | |
Period Ended December 31, 2010 (Unaudited) | | | 10.23 | | | | 0.04 | | | | 1.13 | | | | 1.17 | | | | | |
Year Ended June 30, 2010 | | | 10.19 | | | | 0.10 | | | | 0.08 | | | | 0.18 | | | | | |
Year Ended June 30, 2009 | | | 12.58 | | | | 0.18 | | | | (1.69) | | | | (1.51) | | | | | |
Year Ended June 30, 2008 | | | 12.95 | | | | 0.29 | | | | (0.49) | | | | (0.20) | | | | | |
Year Ended June 30, 2007 | | | 12.65 | | | | 0.28 | | | | 0.44 | | | | 0.72 | | | | | |
Year Ended June 30, 2006 | | | 11.92 | | | | 0.22 | | | | 0.73 | | | | 0.95 | | | | | |
| (a) | Per share amounts calculated based on the average daily shares outstanding during the period. |
| (b) | Annualized for periods less than one year. |
| (c) | Total return may have been lower had various fees not been waived during the period. |
| (d) | Total return includes the effect of a reimbursement by the Adviser and the accounting agent due to a trading error. |
See Notes to Financial Statements.
| | |
| | |
| 138 | | Semi-Annual Report | December 31, 2010 (Unaudited) |
| | |
| |
|
| | | | | | | | | | | | | | | | | | | | | | | | | | | | | | | | | | | | | | |
Less Distributions to Shareholders from | | | | | | | | | Ratios & Supplemental Data | |
| | | | | | | | | | | | | | | |
Net
Realized
Gain | | | Net Investment
Income | | | Total
Distributions | | | Net Asset Value,
End of Period | | | Total Return | | | Net Assets End of Period (000’s) | | | Expenses Before
Waivers and
Reimbursements(b) | | | Expenses After
Waivers and
Reimbursements(b) | | | Net Investment Income After Waivers and
Reimbursements(b) | | | Portfolio Turnover
Rate | |
| | | | | | | | | |
| | $ - | | | | $(0.07) | | | | $(0.07) | | | | $12.42 | | | | 22.82%(c) | | | | $ 59,378 | | | | 0.88% | | | | 0.84% | | | | 0.41% | | | | 38% | |
| | - | | | | (0.06) | | | | (0.06) | | | | 10.17 | | | | 12.89%(c) | | | | 58,409 | | | | 0.86% | | | | 0.84% | | | | 0.55% | | | | 40% | |
| | - | | | | (0.07) | | | | (0.07) | | | | 9.06 | | | | (33.43%) | | | | 70,534 | | | | 0.82% | | | | 0.82% | | | | 0.63% | | | | 49% | |
| | - | | | | (0.04) | | | | (0.04) | | | | 13.73 | | | | (2.50%)(c) | | | | 174,813 | | | | 0.71% | | | | 0.71% | | | | 0.39% | | | | 37% | |
| | - | | | | (0.04) | | | | (0.04) | | | | 14.12 | | | | 16.98% | | | | 138,138 | | | | 0.78% | | | | 0.78% | | | | 0.25% | | | | 39% | |
| | - | | | | - | | | | - | | | | 12.11 | | | | 10.09% | | | | 103,861 | | | | 0.82% | | | | 0.82% | | | | 0.31% | | | | 26% | |
| | | | | | | | | |
| | | | | | | | | | | | | | | | | | | | | | | | | | | | | | | | | | | | | | | |
| | | | | | | | | |
| | - | | | | (0.23) | | | | (0.23) | | | | 13.54 | | | | 20.41%(c) | | | | 27,019 | | | | 1.19% | | | | 0.84% | | | | 1.72% | | | | 19% | |
| | - | | | | (0.22) | | | | (0.22) | | | | 11.44 | | | | 19.65%(c) | | | | 25,534 | | | | 1.11% | | | | 0.84% | | | | 1.58% | | | | 49% | |
| | - | | | | (0.23) | | | | (0.23) | | | | 9.74 | | | | (26.88%)(c) | | | | 27,996 | | | | 0.98% | | | | 0.84% | | | | 2.20% | | | | 65% | |
| | (0.51 | ) | | | (0.21) | | | | (0.72) | | | | 13.63 | | | | (16.46%)(c) | | | | 54,144 | | | | 0.80% | | | | 0.79% | | | | 1.38% | | | | 28% | |
| | - | | | | (0.15) | | | | (0.15) | | | | 17.07 | | | | 19.57% | | | | 86,095 | | | | 0.79% | | | | 0.79% | | | | 1.08% | | | | 34% | |
| | - | | | | (0.15) | | | | (0.15) | | | | 14.41 | | | | 14.69%(c) | | | | 87,718 | | | | 0.86% | | | | 0.84% | | | | 1.18% | | | | 23% | |
| | | | | | | | | |
| | | | | | | | | | | | | | | | | | | | | | | | | | | | | | | | | | | | | | | |
| | | | | | | | | |
| | - | | | | (0.12) | | | | (0.12) | | | | 7.35 | | | | 20.98%(c) | | | | 308,425 | | | | 0.28% | | | | 0.15% | | | | 2.07% | | | | 12% | |
| | - | | | | (0.13) | | | | (0.13) | | | | 6.18 | | | | 11.25%(c)(d) | | | | 222,586 | | | | 0.27% | | | | 0.15% | | | | 1.99% | | | | 28% | |
| | - | | | | (0.19) | | | | (0.19) | | | | 5.66 | | | | (18.77%)(c) | | | | 188,012 | | | | 0.25% | | | | 0.15% | | | | 2.58% | | | | 86% | |
| | - | | | | (0.11) | | | | (0.11) | | | | 7.21 | | | | (14.28%)(c) | | | | 250,988 | | | | 0.22% | | | | 0.15% | | | | 2.35% | | | | 12% | |
| | - | | | | (0.11) | | | | (0.11) | | | | 8.52 | | | | 19.81%(c) | | | | 99,082 | | | | 0.35% | | | | 0.15% | | | | 1.98% | | | | 11% | |
| | - | | | | (0.11) | | | | (0.11) | | | | 7.21 | | | | 6.64%(c) | | | | 42,471 | | | | 0.47% | | | | 0.15% | | | | 1.90% | | | | 41% | |
| | | | | | | | | |
| | | | | | | | | | | | | | | | | | | | | | | | | | | | | | | | | | | | | | | |
| | | | | | | | | |
| | - | | | | (0.09) | | | | (0.09) | | | | 11.31 | | | | 11.49%(c) | | | | 31,628 | | | | 1.19% | | | | 0.94% | | | | 0.81% | | | | 13% | |
| | - | | | | (0.14) | | | | (0.14) | | | | 10.23 | | | | 1.67%(c) | | | | 33,684 | | | | 1.05% | | | | 0.94% | | | | 0.91% | | | | 33% | |
| | (0.52 | ) | | | (0.36) | | | | (0.88) | | | | 10.19 | | | | (11.66%)(c) | | | | 47,299 | | | | 1.01% | | | | 0.94% | | | | 1.72% | | | | 51% | |
| | - | | | | (0.17) | | | | (0.17) | | | | 12.58 | | | | (1.57%)(c) | | | | 75,417 | | | | 0.88% | | | | 0.88% | | | | 2.23% | | | | 44% | |
| | (0.15 | ) | | | (0.27) | | | | (0.42) | | | | 12.95 | | | | 5.87%(c) | | | | 87,056 | | | | 0.98% | | | | 0.94% | | | | 2.16% | | | | 27% | |
| | (0.11 | ) | | | (0.11) | | | | (0.22) | | | | 12.65 | | | | 8.01% | | | | 85,340 | | | | 0.94% | | | | 0.94% | | | | 1.81% | | | | 51% | |
| | |
| NOTES TO FINANCIAL STATEMENTS | |
|
December 31, 2010 (Unaudited)
1. Organization:
Bridgeway Funds, Inc. (“Bridgeway” or the “Company”) was organized as a Maryland corporation on October 19, 1993, and is registered under the Investment Company Act of 1940, as amended (the “1940 Act”), as an open-end management investment company.
Bridgeway is organized as a series fund, which currently has 13 investment funds (each, a “Fund” and collectively, the “Funds”): Aggressive Investors 1, Aggressive Investors 2, Ultra-Small Company, Ultra-Small Company Market, Micro-Cap Limited, Small-Cap Momentum, Small-Cap Growth, Small-Cap Value, Large-Cap Growth, Large-Cap Value, Blue Chip 35 Index and Managed Volatility Funds are presented in this report. The Omni Tax-Managed Small-Cap Value Fund (formerly, the Omni Small-Cap Value Fund) commenced operations on December 31, 2010 and is included in a separate report.
Bridgeway is authorized to issue 2,000,000,000 shares of common stock at $0.001 per share. 15,000,000 shares have been classified into the Aggressive Investors 1 Fund. 130,000,000 shares each have been classified into the Aggressive Investors 2 and Blue Chip 35 Index Funds. 5,000,000 shares have been classified into the Ultra-Small Company Fund. 10,000,000 shares have been classified in the Micro-Cap Limited Fund. 100,000,000 shares each have been classified into the Ultra-Small Company Market, Omni Tax-Managed Small-Cap Value, Small-Cap Momentum, Small-Cap Growth, Small-Cap Value, Large-Cap Growth, and Large-Cap Value Funds. 50,000,000 shares have been classified into the Managed Volatility Fund. All shares outstanding currently represent Class N shares.
The Ultra-Small Company Fund is open to existing investors (direct only).
All of the Funds are no-load, diversified funds.
The Aggressive Investors 1 and 2 Funds seek to exceed the stock market total return (primarily through capital appreciation) at a level of total risk roughly equal to that of the stock market over longer periods of time (three years or more).
The Ultra-Small Company, Ultra-Small Company Market, Micro-Cap Limited, Small-Cap Momentum, Small-Cap Growth, Small-Cap Value and Large-Cap Growth Funds seek to provide a long-term total return of capital, primarily through capital appreciation.
The Blue Chip 35 Index and Large-Cap Value Funds seek to provide long-term total return of capital, primarily through capital appreciation but also some income.
The Managed Volatility Fund seeks to provide a high current return with short-term risk less than or equal to 40% of the stock market.
Bridgeway Capital Management, Inc. (the “Adviser”) is the investment adviser for all of the Funds.
2. Significant Accounting Policies:
The following summary of significant accounting policies, followed in the preparation of the financial statements of the Funds, are in conformity with accounting principles generally accepted in the United States of America (“GAAP”).
Securities, Options, Futures and Other Investments Valuation Other than options, portfolio securities that are principally traded on a national securities exchange are valued at their last sale price on the principal exchange on which they are traded prior to the close of the New York Stock Exchange (“NYSE”), on each day the NYSE is open for business. If there is no closing price on the NYSE, the portfolio security will be valued using a composite price, which is defined as the last price for the security on any exchange. Portfolio securities other than options that are principally traded on the National Association of Securities Dealers Automated Quotation System (“NASDAQ”) are valued at the NASDAQ Official Closing Price (“NOCP”). In the absence of recorded sales on their home exchange or NOCP in the case of NASDAQ traded securities, the security will be valued as follows: bid prices for long positions and ask prices for short positions.
Short-term fixed income securities having a remaining maturity of 60 days or less are valued at amortized cost, which approximates market value. Options are valued at the close if there is trading volume and if there is no trading volume, the bid on long positions and ask on the short positions. Other investments for which no sales are reported are valued at the latest bid price in accordance with the pricing policy established by the Board of Directors.
| | |
| | |
| 140 | | Semi-Annual Report | December 31, 2010 (Unaudited) |
| | |
| NOTES TO FINANCIAL STATEMENTS (continued) | |
|
| | |
December 31, 2010 (Unaudited) | | |
Investments in open-end registered investment companies and closed-end registered investment companies that do not trade on an exchange are valued at the end of day net asset value (“NAV”) per share.
Investments in closed-end registered investment companies that trade on an exchange are valued at the last sales price as of the close of the customary trading session on the exchange where the security is principally traded.
When market quotations are not readily available or when events occur that make established valuation methods unreliable, securities of the Funds may be valued at fair value as determined in good faith by or under the direction of the Board of Directors. The valuation assigned to fair valued securities for purposes of calculating the Funds’ NAVs may differ from the security’s most recent closing market price and from the prices used by other mutual funds to calculate their NAVs.
The inputs and valuation techniques used to determine the value of a Fund’s investments are summarized into three levels as described in the hierarchy below:
| • | | Level 1 — quoted prices in active markets for identical assets |
Investments whose values are based on quoted market prices in active markets, and whose values are therefore classified as Level 1 prices, include active listed equity securities. The Funds do not adjust the quoted price for such investments, even in situations where the Funds hold a large position and a sale could reasonably impact the quoted price.
| • | | Level 2 — other significant observable inputs (including quoted prices for similar securities, interest rates, prepayments speeds, credit risk, etc.) |
Investments that trade in markets that are not considered to be active, but whose values are based on quoted market prices, dealer quotations or valuations provided by alternative pricing sources supported by observable inputs are classified as Level 2 prices. These generally include certain U.S. government and sovereign obligations, most government agency securities, investment-grade corporate bonds and less liquid listed equity securities. As investments whose values are classified as Level 2 prices include positions that are not traded in active markets and/or are subject to transfer restrictions, valuations may be adjusted to reflect illiquidity and/or non-transferability, which are generally based on available market information.
Money market fund investments consist of mutual funds which invest primarily in securities that are valued at amortized cost, a Level 2 investment. Therefore, the money market funds are classified as Level 2 investments. The Funds’ total return swap values are derived by applying observable inputs to the outstanding notional values.
| • | | Level 3 — significant unobservable inputs (including a Fund’s own assumptions in determining the fair value of investments) |
Investments whose values are classified as Level 3 prices have significant unobservable inputs, as they may trade infrequently or not at all. When observable prices are not available for these securities, the Funds use one or more valuation techniques for which sufficient and reliable data is available. The inputs used by the Funds in estimating the value of Level 3 prices may include the original transaction price, quoted prices for similar securities or assets in active markets, completed or pending third-party transactions in the underlying investment or comparable issuers, and changes in financial ratios or cash flows. Level 3 prices may also be adjusted to reflect illiquidity and/or non-transferability, with the amount of such discount estimated by the Funds in the absence of market information. Assumptions used by the Funds due to the lack of observable inputs may significantly impact the resulting value and therefore the Funds’ results of operations.
The inputs or methodology used for valuing investments are not necessarily an indication of the risk associated with investing in those investments. A summary of the inputs used to value the Funds’ investments as of December 31, 2010 is included with each Fund’s Schedule of Investments.
| | |
| NOTES TO FINANCIAL STATEMENTS (continued) | |
|
| | |
December 31, 2010 (Unaudited) | | |
In January 2010, the Financial Accounting Standards Board (“FASB”) issued Accounting Standards Update (“ASU”) No. 2010-06 “Improving Disclosures about Fair Value Measurements.” ASU No. 2010-06 amends FASB Accounting Standards Codification Topic 820, Fair Value Measurements and Disclosures, to require additional disclosures regarding fair value measurements. Certain disclosures required by ASU No. 2010-06 are effective for fiscal years beginning after December 15, 2010, and for interim periods within those fiscal years. Management is currently evaluating the impact ASU No. 2010-06 will have on its financial statement disclosures.
Securities Lending Upon lending its securities to third parties, each Fund receives compensation in the form of fees. A Fund also continues to receive dividends on the securities loaned. The loans are secured by collateral at least equal to the fair value of the securities loaned plus accrued interest. Gain or loss in the fair value of the securities loaned that may occur during the term of the loan will be for the account of a Fund. Each Fund has the right under the lending agreement to recover the securities from the borrower on demand. Additionally, a Fund does not have the right to sell or repledge collateral received in the form of securities unless the borrower goes into default. The risks to a Fund of securities lending are that the borrower may not provide additional collateral when required or return the securities when due.
As of December 31, 2010, the Funds had securities on loan and related collateral with values shown below:
| | | | | | | | |
| | | Securities on | | | Value of | |
| Bridgeway Fund | | Loan Value | | | Collateral | |
| | | | | | | | |
Aggressive Investors 1 | | | $12,126,288 | | | | $12,566,374 | |
Aggressive Investors 2 | | | 22,568,420 | | | | 23,413,026 | |
Ultra-Small Company | | | 7,259,196 | | | | 7,919,040 | |
Ultra-Small Company Market | | | 27,676,283 | | | | 30,681,411 | |
Micro-Cap Limited | | | 2,163,791 | | | | 2,316,573 | |
Small-Cap Momentum | | | 249,233 | | | | 262,500 | |
Small-Cap Growth | | | 7,348,566 | | | | 7,742,897 | |
Small-Cap Value | | | 4,917,858 | | | | 5,190,389 | |
Large-Cap Growth | | | 1,837,819 | | | | 1,909,200 | |
Large-Cap Value | | | 398,612 | | | | 408,814 | |
Managed Volatility | | | 117,710 | | | | 121,700 | |
It is each Fund’s policy to obtain additional collateral from or return excess collateral to the borrower by the end of the next business day, following the valuation date of the securities loaned. Therefore, the value of the collateral held may be temporarily less than that required under the lending contract. As of December 31, 2010 the collateral consisted of an institutional money market fund.
Use of Estimates in Financial Statements In preparing financial statements in conformity with GAAP, management makes estimates and assumptions that affect the reported amounts of assets and liabilities at the date of the financial statements and the disclosure of contingent assets and liabilities at the date of the financial statements as well as the reported amounts of revenue and expenses during the reporting period. Actual results could differ from those estimates.
Risks and Uncertainties The Funds provide for various investment options, including stocks and call and put options. Such investments are exposed to various risks, such as interest rate, market and credit risks. Due to the risks involved, it is at least reasonably possible that changes in risks in the near term would materially affect shareholders’ account values and the amounts reported in the financial statements.
Security Transactions, Expenses, Gains and Losses and Allocations Fund expenses that are not series-specific are allocated to each series based upon its relative proportion of net assets to the Funds’ total net assets or other appropriate basis.
Security transactions are accounted for as of the trade date, the date the order to buy or sell is executed. Realized gains and losses are computed on the identified cost basis. Dividend income is recorded on the ex-dividend date, and interest income is recorded on the accrual basis from settlement date. Particularly related to the Managed Volatility Fund, discounts and premiums are accreted/amortized on the effective interest method.
| | |
| | |
| 142 | | Semi-Annual Report | December 31, 2010 (Unaudited) |
| | |
| NOTES TO FINANCIAL STATEMENTS (continued) | |
|
| | |
December 31, 2010 (Unaudited) | | |
Distributions to Shareholders The Funds pay dividends from net investment income and distribute realized capital gains annually, usually in December.
Derivatives
The Funds’ use of derivatives for the period ended December 31, 2010 was limited to futures contracts, total return swaps and written options. The following is a summary of how these derivatives are treated in the financial statements and their impact on the Funds.
| | | | | | | | | | | | | | |
| | | Asset Derivatives | | | Liability Derivatives | |
Fund/Financial Instrument Type | | Location on Statement of Assets and Liabilities | | Fair Value | | | Location on
Statement of
Assets and
Liabilities | | | Fair Value | |
Aggressive Investors 1 | | | | | | | | | | | | | | |
Other | | Receivable, Total Return | | | | | | | | | | | | |
| | Swap | | | $ 1,234 | | | | | | | $ | - | |
Aggressive Investors 2 | | | | | | | | | | | | | | |
Other | | Receivable, Total Return | | | | | | | | | | | | |
| | Swap | | | 2,991 | | | | | | | | - | |
Ultra-Small Company | | | | | | | | | | | | | | |
Other | | Receivable, Total Return | | | 26,124 | | | | | | | | | |
| | Swap | | | | | | | | | | | - | |
Ultra-Small Company Market | | | | | | | | | | | | | | |
Other | | Receivable, Total Return | | | 65,045 | | | | | | | | | |
| | Swap | | | | | | | | | | | - | |
Micro-Cap Limited | | | | | | | | | | | | | | |
Other | | Receivable, Total Return | | | 3,663 | | | | | | | | | |
| | Swap | | | | | | | | | | | - | |
Small-Cap Growth | | | | | | | | | | | | | | |
Other | | Receivable, Total Return | | | 4,309 | | | | | | | | | |
| | Swap | | | | | | | | | | | - | |
Small-Cap Value | | | | | | | | | | | | | | |
Other | | Receivable, Total Return | | | 3,712 | | | | | | | | | |
| | Swap | | | | | | | | | | | - | |
Large-Cap Growth | | | | | | | | | | | | | | |
Other | | Receivable, Total Return | | | | | | | | | | | | |
| | Swap | | | 1,368 | | | | | | | | - | |
Managed Volatility | | | | | | | | | | | | | | |
Equity Contracts | | | | | - | | | | Call Options Written | | | | 403,916 | |
| | | | | | | | | Put Options Written | | | | 181,500 | |
| | | | | | | | | | |
Fund/Financial Instrument Type | | Location of Gain (Loss) on Derivatives Recognized in Income | | Amount of
Realized Gain
(Loss) | | | Amount of
Unrealized
Gain
(Loss) | |
Aggressive Investors 1 | | | | | | | | | | |
Other | | Realized Gain (Loss) on Swaps | | | $50,434 | | | | | |
| | Change in Unrealized Appreciation (Depreciation)
on Swaps | | | | | | | $84,205 | |
| | |
| NOTES TO FINANCIAL STATEMENTS (continued) | |
|
| | |
December 31, 2010 (Unaudited) | | |
| | | | | | | | | | |
Fund/Financial Instrument Type | | Location of Gain (Loss) on Derivatives Recognized in Income | | Amount of
Realized Gain
(Loss) | | | Amount of
Unrealized
Gain
(Loss) | |
Aggressive Investors 2 | | | | | | | | | | |
Other | | Realized Gain (Loss) on Swaps | | | $ 194,272 | | | | | |
| | Change in Unrealized Appreciation (Depreciation)
on Swaps | | | | | | | $ 2,991 | |
Ultra-Small Company | | | | | | | | | | |
Other | | Realized Gain (Loss) on Swaps | | | 481,297 | | | | | |
| | Change in Unrealized Appreciation (Depreciation)
on Swaps | | | | | | | 26,124 | |
Ultra-Small Company | | | | | | | | | | |
Market | | | | | | | | | | |
Other | | Realized Gain (Loss) on Swaps | | | 365,627 | | | | | |
| | Change in Unrealized Appreciation (Depreciation)
on Swaps | | | | | | | 65,045 | |
Micro-Cap Limited | | | | | | | | | | |
Other | | Realized Gain (Loss) on Swaps | | | 34,121 | | | | | |
| | Change in Unrealized Appreciation (Depreciation)
on Swaps | | | | | | | 3,663 | |
| | | |
Small-Cap Growth | | | | | | | | | | |
Other | | Realized Gain (Loss) on Swaps | | | (29,890 | ) | | | | |
| | Change in Unrealized Appreciation (Depreciation)
on Swaps | | | | | | | 49,516 | |
| | | |
Small-Cap Value | | | | | | | | | | |
Other | | Realized Gain (Loss) on Swaps | | | (123,769 | ) | | | | |
| | Change in Unrealized Appreciation (Depreciation)
on Swaps | | | | | | | 51,959 | |
| | | |
Large-Cap Growth | | | | | | | | | | |
Other | | Realized Gain (Loss) on Swaps | | | 19,422 | | | | | |
| | Change in Unrealized Appreciation (Depreciation)
on Swaps | | | | | | | 1,368 | |
| | | |
Large-Cap Value | | | | | | | | | | |
Other | | Realized Gain (Loss) on Swaps | | | 507 | | | | | |
| | | |
Managed Volatility | | | | | | | | | | |
Equity Contracts | | Realized Gain (Loss) on Written Options | | | 1,127,631 | | | | | |
| | Change in Unrealized Appreciation (Depreciation)
on Written Options | | | | | | | 94,356 | |
| | Realized Gain (Loss) on Futures Contracts | | | (673,964 | ) | | | | |
The derivative instruments outstanding as of December 31, 2010, as disclosed in the Notes to the Financial Statements, and the amounts of realized and changes in unrealized gains and losses on derivative instruments during the period, as disclosed in the Statement of Operations, serve as indicators of the volume of derivative activity for the Funds.
Futures Contracts The Funds may purchase or sell financial futures contracts to hedge cash positions, manage market risk and to dampen volatility in line with investment objectives. A futures contract is an agreement between two parties to buy or sell a financial instrument at a set price on a future date. Upon entering into such a contract, a Fund is required to pledge to
| | |
| | |
| 144 | | Semi-Annual Report | December 31, 2010 (Unaudited) |
| | |
| NOTES TO FINANCIAL STATEMENTS (continued) | |
|
| | |
December 31, 2010 (Unaudited) | | |
the broker an amount of cash or U.S. government securities equal to the minimum “initial margin” requirements of the exchange on which the futures contract is traded. The contract amount reflects the extent of a Fund’s exposure in these financial instruments. A Fund’s participation in the futures markets involves certain risks, including imperfect correlation between movements in the price of futures contracts and movements in the price of the securities hedged or used for cover. Pursuant to a contract, such Fund agrees to receive from or pay to the broker an amount of cash equal to the fluctuation in value of the contract. Such receipts or payments are known as “variation margin” and are recorded by a Fund as unrealized appreciation or depreciation. When a contract is closed, a Fund records a realized gain or loss equal to the difference between the value of the contract at the time it was opened and the value at the time it was closed. With futures, there is minimal counterparty risk to the Funds since futures are exchange traded and the exchange’s clearinghouse, as counterparty to all exchange traded futures, guarantees the futures against default. As of December 31, 2010, the Funds had no open futures contracts.
Options The Aggressive Investors 1 and Aggressive Investors 2 Funds may buy and sell calls and puts to increase or decrease each Fund’s exposure to stock market risk or for purposes of diversification of risk. The Managed Volatility Fund may buy and sell calls and puts to reduce the Fund’s volatility and provide some cash flow. An option is a contract conveying a right to buy or sell a financial instrument at a specified price during a stipulated period. The premium paid by a Fund for the purchase of a call or a put option is included in such Fund’s Schedule of Investments as an investment and subsequently marked-to-market to reflect the current market value of the option. When a Fund writes a call or a put option, an amount equal to the premium received by such Fund is included in its Statement of Assets and Liabilities as a liability and is subsequently marked-to-market to reflect the current market value of the option written. If an option which a Fund has written either expires on its stipulated expiration date, or if such Fund enters into a closing purchase transaction, that Fund realizes a gain (or a loss if the cost of a closing purchase transaction exceeds the premium received when the option was written) without regard to any unrealized gain or loss on the underlying security, and the liability related to such options is extinguished. If a call option that a Fund has written is assigned, such Fund realizes a gain or loss from the sale of the underlying security and the proceeds from such sale are increased by the premium originally received. If a put option that a Fund has written is assigned, the amount of the premium originally received reduces the cost of the security that such Fund purchased upon exercise of the option. Buying calls increases a Fund’s exposure to the underlying security to the extent of any premium paid. Buying puts on a stock market index tends to limit a Fund’s exposure to a stock market decline. All options purchased by the Funds were listed on exchanges and considered liquid positions with readily available market quotes.
Covered Call Options and Secured Puts The Aggressive Investors 1, Aggressive Investors 2 and Managed Volatility Funds may write call options on a covered basis, that is, a Fund will own the underlying security, or a Fund may write secured puts. The principal reason for writing covered calls and secured puts on a security is to attempt to realize income through the receipt of premiums. The option writer has, in return for the premium, given up the opportunity for profit from a substantial price increase in the underlying security so long as the obligation as a writer continues, but has retained the risk of loss should the price of the security decline. All options were listed on exchanges and considered liquid positions with readily available market quotes. Transactions in options written during the period ended December 31, 2010 are as follows:
| | | | | | | | | | | | | | | | | | | | |
| | | Managed Volatility Fund | | | | | | Managed Volatility Fund | |
| | | Written Call Options | | | | | | Written Put Options | |
| | | Contracts | | | Premiums | | | | | | Contracts | | | Premiums | |
| | | | | | | | | | | | | | | | | | | | |
Outstanding, June 30, 2010 | | | 2,212 | | | | $ 297,023 | | | | | | | | 2,581 | | | | $ 335,089 | |
Positions Opened | | | 5,601 | | | | 999,640 | | | | | | | | 4,894 | | | | 747,061 | |
Exercised | | | (2,233) | | | | (436,012) | | | | | | | | (1,406) | | | | (157,883) | |
Expired | | | (3,290) | | | | (461,152) | | | | | | | | (2,879) | | | | (500,964) | |
Closed | | | (423) | | | | (71,938) | | | | | | | | (964) | | | | (138,233) | |
Outstanding, December 31, 2010 | | | 1,867 | | | | $ 327,561 | | | | | | | | 2,226 | | | | $ 285,070 | |
Market Value, December 31, 2010 | | | | | | | $ 403,916 | | | | | | | | | | | | $ 181,500 | |
The Aggressive Investors 1 and Aggressive Investors 2 Funds had no transactions in options during the period ended December 31, 2010.
| | |
| NOTES TO FINANCIAL STATEMENTS (continued) | |
|
| | |
December 31, 2010 (Unaudited) | | |
Swaps. Each Fund may enter into total return swaps. Total return swaps are agreements that provide a Fund with a return based on the performance of an underlying asset, in exchange for fee payments to a counterparty based on a specified rate. The difference in the value of these income streams is recorded daily by the Funds and is settled in cash monthly.
The fee paid by a Fund will typically be determined by multiplying the face value of the swap agreement by an agreed upon interest rate. In addition, if the underlying asset declines in value over the term of the swap, a Fund would also be required to pay the dollar value of that decline to the counterparty. Total return swaps could result in losses if the underlying asset does not perform as anticipated by the Adviser. A Fund may use its own NAV as the underlying asset in a total return swap. This strategy serves to reduce cash drag (the impact of cash on a Fund’s overall return) by replacing it with the impact of market exposure based upon a Fund’s own investment holdings. The following total return swaps were open as of December 31, 2010:
| | | | | | | | | | | | |
| Portfolio | | Swap Counterparty | | Notional
Principal | | | Maturity Date | | Net Unrealized
Gain\(Loss) | |
| | | | | | | | | | | | |
Aggressive Investors 2 | | ReFlow Management Co. | | | 2,056,623 | | | January 3, 2011 | | | 2,991 | |
Ultra-Small Company | | ReFlow Management Co. | | | 1,370,017 | | | January 3, 2011 | | | 26,124 | |
Ultra-Small Company Market | | ReFlow Management Co. | | | 3,806,434 | | | January 3, 2011 | | | 65,045 | |
Large-Cap Growth | | ReFlow Management Co. | | | 149,367 | | | January 3, 2011 | | | 1,368 | |
Indemnification Under the Company’s organizational documents, the Funds’ officers, directors, employees and agents are indemnified against certain liabilities that may arise out of the performance of their duties to the Funds. Additionally, in the normal course of business, the Funds enter into contracts that contain a variety of indemnification clauses. The Funds’ maximum exposure under these arrangements is unknown as this would involve future claims that may be made against the Funds that have not yet occurred. However, the Funds have not had prior claims or losses pursuant to these contracts.
3. Management Fees, Other Related Party Transactions and Contingencies:
The Funds have entered into management agreements with the Adviser. As compensation for the advisory services rendered, facilities furnished, and expenses borne by the Adviser, the Funds pay the Adviser a fee pursuant to each Fund’s management agreement, as described below.
Aggressive Investors 1: A total advisory fee is paid by the Fund to the Adviser that is comprised of a Base Fee and a Performance Adjustment. The Base Fee equals the Base Fee Rate times the average daily net assets of the Fund. The Base Fee Rate is based on the following annual rates: 0.90% of the first $250 million of the Fund’s average daily net assets, 0.875% of the next $250 million and 0.85% of any excess over $500 million.
The Performance Adjustment equals 4.67% times the difference in cumulative total return between the Fund and the Standard and Poor’s 500 Composite Stock Price Index with dividends reinvested (hereinafter “Index”) over a rolling five-year performance period. The Performance Adjustment Rate varies from a minimum of –0.70% to a maximum of +0.70%. However, the Performance Adjustment Rate is zero if the difference between the cumulative Fund performance and the Index performance is less than or equal to 2%.
Aggressive Investors 2: A total advisory fee is paid by the Fund to the Adviser that is comprised of a Base Fee and a Performance Adjustment. The Base Fee equals the Base Fee Rate times the average daily net assets of the Fund. The Base Fee rate is based on the following annual rates: 0.90% of the first $250 million of the Fund’s average daily net assets, 0.875% of the next $250 million, 0.85% from $500 million to $1 billion, and 0.80% over $1 billion.
The Performance Adjustment equals 2.00% times the difference in cumulative total return between the Fund and the Standard and Poor’s 500 Composite Stock Price Index with dividends reinvested (hereinafter “Index”) over a rolling five-year performance period. The Performance Adjustment Rate varies from a minimum of -0.30% to a maximum of +0.30%. However, the Performance Adjustment Rate is zero if the difference between the cumulative Fund performance and the Index performance is less than or equal to 2%.
| | |
| | |
| 146 | | Semi-Annual Report | December 31, 2010 (Unaudited) |
| | |
| NOTES TO FINANCIAL STATEMENTS (continued) | |
|
| | |
December 31, 2010 (Unaudited) | | |
Ultra-Small Company: The Fund pays management fees based on the following annual rates: 0.90% of the first $250 million of the Fund’s average daily net assets, 0.875% of the next $250 million and 0.85% of any excess over $500 million. The management fees are computed daily and are payable monthly. However, during any period that the Fund’s net assets range from $27,500,000 to $55,000,000, the advisory fee will be determined as if the Fund had $55,000,000 under management. This is limited to a maximum annualized expense ratio of 1.49% of average net assets.
Ultra-Small Company Market: The Fund’s management fee is a flat 0.50% of the value of the Fund’s average daily net assets, computed daily and payable monthly.
Micro-Cap Limited: A total advisory fee is paid by the Fund to the Adviser that is comprised of a Base Fee and a Performance Adjustment. The Base Fee equals the Base Fee Rate times the average daily net assets of the Fund. The Base Fee Rate is based on the following annual rates: 0.90% of the first $250 million of the Fund’s average daily net assets, 0.875% of the next $250 million and 0.85% of any excess over $500 million. However, during any quarter that the Fund’s net assets range from $27,500,000 to $55,000,000, the advisory fee will be determined as if the Fund had $55,000,000 under management. This is limited to a maximum annualized expense ratio of 1.49% of the net assets in the quarter the advisory fee is determined.
The Performance Adjustment equals 2.87% times the difference in cumulative total return between the Fund and the CRSP Cap-based Portfolio 9 Index with dividends reinvested (hereinafter “Index”) over a rolling five-year performance period. The Performance Adjustment Rate varies from a minimum of –0.70% to a maximum of +0.70%. However, the Performance Adjustment Rate is zero if the difference between the cumulative Fund performance and the Index performance is less than or equal to 2%.
Small-Cap Momentum: The Fund’s management fee is a flat 0.55% of the value of the Fund’s average daily net assets, computed daily and payable monthly.
Small-Cap Growth and Small-Cap Value: A total advisory fee is paid by each Fund to the Adviser that is comprised of a Base Fee and a Performance Adjustment. The Base Fee equals the Base Fee Rate times the average daily net assets of the Fund. The Base Fee Rate is based on the annual rate of 0.60% of the value of the Fund’s average daily net assets.
The Performance Adjustment equals 0.33% times the difference in cumulative total return between the Fund and the Russell 2000 Growth Index for Small-Cap Growth Fund and the Russell 2000 Value Index for Small-Cap Value Fund, with dividends reinvested (hereinafter “Index”) over a rolling five-year performance period. The Performance Adjustment Rate varies from a minimum of -0.05% to a maximum of +0.05%. However, the Performance Adjustment Rate is zero if the difference between the cumulative Fund’s performance and the Index performance is less than or equal to 2%.
Large-Cap Growth and Large-Cap Value: A total advisory fee is paid by each Fund to the Adviser that is comprised of a Base Fee and a Performance Adjustment. The Base Fee equals the Base Fee Rate times the average daily net assets of the Fund. The Base Fee Rate is based on the annual rate of 0.50% of the value of the Fund’s average daily net assets.
The Performance Adjustment equals 0.33% times the difference in cumulative total return between the Fund and the Russell 1000 Growth Index for Large-Cap Growth Fund and the Russell 1000 Value Index for the Large-Cap Value Fund, with dividends reinvested (hereinafter “Index”) over a rolling five-year performance period. The Performance Adjustment Rate varies from a minimum of -0.05% to a maximum of +0.05%. However, the Performance Adjustment Rate is zero if the difference between the cumulative Fund’s performance and the Index performance is less than or equal to 2%.
Blue Chip 35 Index: The Fund’s management fee is a flat 0.08% of the value of the Fund’s average daily Net Assets, computed daily and payable monthly.
Managed Volatility: The Fund’s management fee is a flat 0.60% of the value of the Fund’s average daily Net Assets, computed daily and payable monthly.
Expense limitations: At a special meeting on March 31, 2005, shareholders of the Funds (except for the Small-Cap Momentum Fund, which was launched on May 28, 2010) approved amendments to the Management Agreements detailing expense limitations. With regard to the Small-Cap Momentum Fund, the Board of Directors and sole initial shareholder approved an
| | |
| NOTES TO FINANCIAL STATEMENTS (continued) | |
|
| | |
December 31, 2010 (Unaudited) | | |
expense limitation beginning on May 28, 2010. The Adviser agrees to reimburse the Funds for operating expenses and management fees above the expense limitations, which are shown as a ratio of net expenses to average net assets, for each Fund, for the period ended December 31, 2010. Such expense limitations and total reimbursements for the period ended December 31, 2010, are shown below.
| | | | | | | | |
| Bridgeway Fund | | Expense
Limitation | | | Total Waivers and
Reimbursements
for Period Ending
12/31/10 | | |
| | | | | | | | |
Aggressive Investors 1 | | | 1.80% | | | $ - | | |
Aggressive Investors 2 | | | 1.75% | | | - | | |
Ultra-Small Company | | | 2.00% | | | - | | |
Ultra-Small Company Market | | | 0.75% | | | 99,304 | | |
Micro-Cap Limited | | | 1.85% | | | - | | |
Small-Cap Momentum* | | | 0.90% | | | 42,666 | | |
Small-Cap Growth | | | 0.94% | | | 11,925 | | |
Small-Cap Value | | | 0.94% | | | - | | |
Large-Cap Growth | | | 0.84% | | | 12,314 | | |
Large-Cap Value | | | 0.84% | | | 47,175 | | |
Blue Chip 35 Index | | | 0.15% | | | 163,954 | | |
Managed Volatility | | | 0.94% | | | 42,220 | | |
| *The Fund is authorized to reimburse the Adviser for management fees previously waived and/or for expenses previously paid by the Adviser, provided, however, that any reimbursements must be paid at a date not more than three years after the fiscal year in which the Adviser waived the fees or reimbursed the expenses and the reimbursements do not cause the Fund to exceed the expense limitation in the agreement. | | |
Other Waivers and Reimbursements: BNY Mellon Asset Servicing, the Funds’ accounting agent, at its discretion, voluntarily waived a portion of its accounting and transfer agent fees for the Small-Cap Momentum Fund. For the period ended December 31, 2010, BNY Mellon Asset Servicing waived $6,250 in accounting fees and $5,000 in transfer agent fees.
Other Related Party Transactions: On occasion, the Funds will engage in inter-portfolio trades when it is to the benefit of both parties. The Board of Directors reviews these trades quarterly. During the period ended December 31, 2010, the Ultra-Small Company Fund had an inter-portfolio purchase of $279,552 and the Ultra-Small Company Market Fund had an inter-portfolio sale of $279,552. The Micro-Cap Limited Fund had an inter-portfolio purchase of $128,214 and the Ultra-Small Company Market Fund had an inter-portfolio sale of $128,214. The Small-Cap Growth Fund had an inter-portfolio purchase of $600,886 and the Small-Cap Value Fund had an inter-portfolio sale of $600,886. No inter-portfolio purchases or sales were entered into during the period ended December 31, 2010 by the Aggressive Investors 1, Aggressive Investors 2, Small-Cap Momentum, Large-Cap Growth, Large-Cap Value, Blue Chip 35 Index and Managed Volatility Funds.
The Adviser entered into an Administrative Services Agreement with Bridgeway, pursuant to which the Adviser provides various administrative services to the Funds including, but not limited to: (i) supervising and managing various aspects of the Funds’ business and affairs; (ii) selecting, overseeing and/or coordinating activities with other service providers to the Funds; (iii) providing reports to the Board of Directors as requested from time to time; (iv) assisting and/or reviewing amendments and updates to the Funds’ registration statement and other filings with the Securities and Exchange Commission (“SEC”); (v) providing certain shareholder services; (vi) providing administrative support in connection with meetings of the Board of Directors; and (vii) providing certain record-keeping services. For its services to all of the Funds, the Adviser is paid an aggregate annual fee of $535,000 payable in equal monthly installments.
One director of Bridgeway, John Montgomery, is an owner and director of the Adviser. Another director of Bridgeway, Michael Mulcahy, is an executive and director of the Adviser. Under the 1940 Act definitions, each is considered to be an “affiliated person” of the Adviser and an “interested person” of the Adviser and of Bridgeway. Compensation for Mr. Montgomery and Mr. Mulcahy is borne by the Adviser rather than the Funds.
| | |
| | |
| 148 | | Semi-Annual Report | December 31, 2010 (Unaudited) |
| | |
| NOTES TO FINANCIAL STATEMENTS (continued) | |
|
| | |
December 31, 2010 (Unaudited) | | |
Board of Directors Compensation Independent Directors are paid an annual retainer of $14,000 with an additional retainer of $2,500 paid to the Independent Chairman of the Board and an additional retainer of $1,000 paid to the Nominating and Corporate Governance Committee Chair. Independent Directors are paid $6,000 per meeting for meeting fees. Such compensation is the total compensation from all Funds and is allocated among the Funds.
The Independent Directors receive this compensation in the form of shares of the Funds, credited to his or her account. Such Directors are reimbursed for any expenses incurred in attending meetings and conferences and expenses for subscriptions or printed materials. During the period ended December 31, 2010, no such reimbursements were paid. The amount of directors’ fees attributable to each Fund is disclosed in the Statements of Operations.
4. Distribution and Shareholder Servicing Fees:
Foreside Fund Services, LLC acts as distributor of the Funds’ shares pursuant to a Distribution Agreement dated November 12, 2010. The Adviser pays all costs and expenses associated with distribution of the Funds’ shares pursuant to a protective plan adopted by shareholders pursuant to Rule 12b-1.
5. Purchases and Sales of Investment Securities:
Purchases and sales of investments, other than short-term securities, for each Fund for the period ended December 31, 2010 were as follows:
| | | | | | | | | | | | | | | | |
| | | Purchases | | | | | | Sales | |
| Bridgeway Fund | | U.S. Government | | Other | | | | | | U.S. Government | | Other | |
| | | | | | | | | | | | | | | | |
Aggressive Investors 1 | | - | | $ | 58,980,078 | | | | | | | - | | $ | 69,159,578 | |
Aggressive Investors 2 | | - | | | 128,937,056 | | | | | | | - | | | 249,491,054 | |
Ultra-Small Company | | - | | | 46,470,762 | | | | | | | - | | | 51,818,560 | |
Ultra-Small Company Market | | - | | | 109,873,421 | | | | | | | - | | | 124,417,677 | |
Micro-Cap Limited | | - | | | 14,221,180 | | | | | | | - | | | 15,515,652 | |
Small-Cap Momentum | | - | | | 3,522,682 | | | | | | | - | | | 3,391,936 | |
Small-Cap Growth | | - | | | 27,072,310 | | | | | | | - | | | 43,588,470 | |
Small-Cap Value | | - | | | 57,336,696 | | | | | | | - | | | 81,200,079 | |
Large-Cap Growth | | - | | | 21,920,384 | | | | | | | - | | | 32,495,777 | |
Large-Cap Value | | - | | | 4,830,842 | | | | | | | - | | | 8,031,680 | |
Blue Chip 35 Index | | - | | | 69,740,906 | | | | | | | - | | | 29,341,929 | |
Managed Volatility | | - | | | 3,208,097 | | | | | | | $500,000 | | | 6,619,918 | |
6. Federal Income Taxes
It is the Funds’ policy to continue to comply with the provisions of the Internal Revenue Code of 1986, as amended, applicable to regulated investment companies and distribute income to the extent necessary so that the Funds are not subject to federal income tax. Therefore, no federal income tax provision is required.
| | |
| NOTES TO FINANCIAL STATEMENTS (continued) | |
|
| | |
December 31, 2010 (Unaudited) | | |
Unrealized Appreciation and Depreciation on Investments (Tax Basis) The amount of net unrealized appreciation/ depreciation and the cost of investment securities for tax purposes, including short-term securities at December 31, 2010, were as follows:
| | | | | | | | | | | | | | | | |
| | | Aggressive Investors 1 | | | Aggressive Investors 2 | | | Ultra-Small
Company | | | Ultra-Small
Company Market | |
As of December 31, 2010 | | | | | | | | | | | | | | | | |
Gross appreciation (excess of value over tax cost) | | | $19,784,170 | | | | $ 40,966,713 | | | | $22,819,234 | | | | $125,054,093 | |
Gross depreciation (excess of tax cost over value) | | | (2,252,293) | | | | (6,366,684) | | | | (1,461,801) | | | | (13,326,348) | |
Net unrealized appreciation (depreciation) | | | $17,531,877 | | | | $ 34,600,029 | | | | $21,357,433 | | | | $111,727,745 | |
Cost of investments for income tax purposes | | | $90,261,568 | | | | $206,929,891 | | | | $74,353,306 | | | | $304,933,452 | |
| | | | |
| | | Micro-Cap Limited | | | Small-Cap Momentum | | | Small-Cap Growth | | | Small-Cap Value | |
As of December 31, 2010 | | | | | | | | | | | | | | | | |
Gross appreciation (excess of value over tax cost) | | | $ 5,328,601 | | | | $ 233,180 | | | | $ 9,396,747 | | | | $20,486,272 | |
Gross depreciation (excess of tax cost over value) | | | (358,629) | | | | (25,079) | | | | (2,118,934) | | | | (2,322,621) | |
Net unrealized appreciation (depreciation) | | | $ 4,969,972 | | | | $ 208,101 | | | | $ 7,277,813 | | | | $18,163,651 | |
Cost of investments for income tax purposes | | | $20,263,774 | | | | $2,319,310 | | | | $42,321,775 | | | | $85,041,279 | |
| | | | |
| | | Large-Cap Growth | | | Large-Cap Value | | | Blue Chip 35 Index | | | Managed Volatility | |
As of December 31, 2010 | | | | | | | | | | | | | | | | |
Gross appreciation (excess of value over tax cost) | | | $11,836,356 | | | | $ 6,669,412 | | | | $ 58,979,237 | | | | $ 4,898,085 | |
Gross depreciation (excess of tax cost over value) | | | (1,055,223) | | | | (501,023) | | | | (5,156,850) | | | | (903,121) | |
Net unrealized appreciation | | | $10,781,133 | | | | $ 6,168,389 | | | | $ 53,822,387 | | | | $ 3,994,964 | |
Cost of investments for income tax purposes | | | $48,620,817 | | | | $20,830,692 | | | | $264,830,161 | | | | $27,577,414 | |
The differences between book and tax net unrealized appreciation (depreciation) are primarily due to wash sale loss deferrals, and adjustments to basis from investments in real estate investment trusts, business development companies and partnerships.
Classifications of Distributions Net investment income (loss) and net realized gain (loss) may differ for financial statement and tax purposes. The character of distributions made during the year from net investment income or net realized gains may differ from its ultimate characterization for federal income tax purposes.
The tax character of the distributions paid by the Funds during the last two fiscal years ended June 30, 2010 and June 30, 2009, respectively, are as follows:
| | | | | | | | | | | | | | |
| | | Aggressive Investors 1 | | | Aggressive Investors 2 |
| | | Year | | | Year | | | Year | | | Year |
| | | Ended | | | Ended | | | Ended | | | Ended |
| | | June 30, 2010 | | | June 30, 2009 | | | June 30, 2010 | | | June 30, 2009 |
Distributions paid from: | | | | | | | | | | | | | | |
Ordinary Income | | | $930,085 | | | | $ - | | | | $1,620,063 | | | $ - |
Long Term Capital Gain | | | - | | | | 1,868,083 | | | | - | | | - |
Total | | | $930,085 | | | | $1,868,083 | | | | $1,620,063 | | | $ - |
| | |
| | |
| 150 | | Semi-Annual Report | December 31, 2010 (Unaudited) |
| | |
| NOTES TO FINANCIAL STATEMENTS (continued) | |
|
| | |
December 31, 2010 (Unaudited) | | |
| | | | | | | | | | | | | | | | |
| | | Ultra-Small Company | | | Ultra-Small Company Market | |
| | | Year Ended
June 30, 2010 | | | Year Ended
June 30, 2009 | | | Year Ended
June 30, 2010 | | | Year Ended June 30, 2009 | |
Distributions paid from: | | | | | | | | | | | | | | | | |
Ordinary income | | | $837,589 | | | | $ 114,124 | | | | $5,060,400 | | | | $ 6,894,767 | |
Long Term Capital Gain | | | - | | | | - | | | | - | | | | 28,745,392 | |
Total | | | $837,589 | | | | $ 114,124 | | | | $5,060,400 | | | | $35,640,159 | |
| | |
| | | Micro-Cap Limited | | | Small-Cap Growth | |
| | | Year Ended June 30, 2010 | | | Year Ended June 30, 2009 | | | Year Ended June 30, 2010 | | | Year Ended June 30, 2009 | |
Distributions paid from: | | | | | | | | | | | | | | | | |
Ordinary income | | | $300,332 | | | | $ 76,498 | | | | $ 252,145 | | | | $ - | |
Total | | | $300,332 | | | | $ 76,498 | | | | $ 252,145 | | | | $ - | |
| | |
| | | Small-Cap Value | | | Large-Cap Growth | |
| | | Year Ended June 30, 2010 | | | Year Ended June 30, 2009 | | | Year Ended June 30, 2010 | | | Year Ended June 30, 2009 | |
Distributions paid from: | | | | | | | | | | | | | | | | |
Ordinary income | | | $806,731 | | | | $1,307,246 | | | | $ 417,231 | | | | $ 732,353 | |
Total | | | $806,731 | | | | $1,307,246 | | | | $ 417,231 | | | | $ 732,353 | |
| | |
| | | Large-Cap Value | | | Blue Chip 35 Index | |
| | | Year Ended June 30, 2010 | | | Year Ended June 30, 2009 | | | Year Ended June 30, 2010 | | | Year Ended June 30, 2009 | |
Distributions paid from: | | | | | | | | | | | | | | | | |
Ordinary income | | | $565,868 | | | | $ 822,272 | | | | $4,072,171 | | | | $ 5,724,513 | |
Total | | | $565,868 | | | | $ 822,272 | | | | $4,072,171 | | | | $ 5,724,513 | |
| | | |
| | | Managed Volatility | | | | | | | |
| | | Year Ended
June 30, 2010 | | | Year Ended
June 30, 2009 | | | | | | | |
Distributions paid from: | | | | | | | | | | | | | | | | |
Ordinary income | | | $612,394 | | | | $2,683,137 | | | | | | | | | |
Long Term Capital Gain | | | - | | | | 1,939,390 | | | | | | | | | |
Total | | | $612,394 | | | | $4,622,527 | | | | | | | | | |
There were no distributions paid from Small-Cap Momentum Fund.
| | |
| NOTES TO FINANCIAL STATEMENTS (continued) | |
|
| | |
December 31, 2010 (Unaudited) | | |
At June 30, 2010, the Funds had available for tax purposes, capital loss carryovers as follows:
| | | | | | | | | | | | | | |
| | | | | Aggressive Investor 1 | | | Aggressive Investor 2 | | | Ultra-Small Company | |
Expiring | | 6/30/2016 | | | $ - | | | | $ - | | | | $ 3,822,016 | |
| | 6/30/2017 | | | 11,662,159 | | | | 56,263,750 | | | | 11,429,146 | |
| | 6/30/2018 | | | 73,846,167 | | | | 177,345,455 | | | | 1,365,778 | |
| | | | | | | | | | | | | | | | | | |
| | | | | Ultra-Small
Company Market | | | Micro-Cap Limited | | | Small-Cap Growth | | | Small-Cap Value | |
Expiring | | 6/30/2013 | | | $ - | | | | $ - | | | | $ - | | | | $ 948,551 | |
| | 6/30/2015 | | | - | | | | 1,910,229 | | | | 9,909,411 | | | | - | |
| | 6/30/2016 | | | - | | | | 1,720,318 | | | | - | | | | 1,491,117 | |
| | 6/30/2017 | | | 8,675,110 | | | | 4,648,974 | | | | 7,823,854 | | | | 32,945,776 | |
| | 6/30/2018 | | | - | | | | 4,507,635 | | | | 22,793,119 | | | | 50,552,993 | |
| | | | | |
| | | | | Large-Cap Growth | | | Large-Cap Value | | | Blue Chip 35 Index | | | Managed Volatility | |
Expiring | | 6/30/2011 | | | $ - | | | | $ - | | | | $ 337,509 | | | | $ - | |
| | 6/30/2012 | | | - | | | | - | | | | 327,296 | | | | - | |
| | 6/30/2013 | | | 2,323,531 | | | | - | | | | 282,192 | | | | - | |
| | 6/30/2014 | | | 2,412,639 | | | | - | | | | 402,963 | | | | - | |
| | 6/30/2015 | | | - | | | | - | | | | 418,882 | | | | - | |
| | 6/30/2016 | | | 1,302,044 | | | | - | | | | 31,461 | | | | - | |
| | 6/30/2017 | | | 7,385,621 | | | | 3,172,735 | | | | 28,604,419 | | | | - | |
| | 6/30/2018 | | | 33,490,095 | | | | 3,361,989 | | | | 34,451,339 | | | | 8,024,220 | |
There are no capital loss carryovers for Small-Cap Momentum Fund as of June 30, 2010.
Capital loss carryovers utilized during the fiscal year ended June 30, 2010 were $10,158,128 for Ultra-Small Company Market Fund.
Capital loss carryovers expired during the fiscal year ended June 30, 2010 were $429,064 for Blue Chip 35 Index Fund.
Components of Accumulated Earnings (Deficit) As of June 30, 2010, the components of accumulated earnings (deficit) on a tax basis were:
| | | | | | | | | | | | |
| | | Aggressive Investors 1 | | | Aggressive Investors 2 | | | Ultra-Small Company | |
Accumulated Net Investment Income (Loss) | | | $ 2,167,449 | | | | $ 836,213 | | | | $ 632,732 | |
Accumulated Net Realized Gain (Loss) on Investments* | | | (85,508,326) | | | | (233,609,205) | | | | (16,616,940) | |
Net unrealized appreciation/depreciation of investments | | | (1,269,132) | | | | (930,138) | | | | 5,738,988 | |
Total | | | $(84,610,009) | | | | $(233,703,130) | | | | $(10,245,220) | |
| | | |
| | | Ultra-Small Company Market | | | Micro-Cap Limited | | | Small-Cap Momentum | |
Accumulated Net Investment Income (Loss) | | | $ 4,111,229 | | | | $ 401,921 | | | | $ 807 | |
Accumulated Net Realized Gain (Loss) on Investments* | | | (8,675,110) | | | | (12,787,156) | | | | (39) | |
Net unrealized appreciation/depreciation of investments | | | 37,979,231 | | | | 1,129,290 | | | | (135,517) | |
Total | | | $33,415,350 | | | | $(11,255,945) | | | | $(134,749) | |
| | |
| | |
| 152 | | Semi-Annual Report | December 31, 2010 (Unaudited) |
| | |
| NOTES TO FINANCIAL STATEMENTS (continued) | |
|
| | |
December 31, 2010 (Unaudited) | | |
| | | | | | | | | | | | |
| | | Small-Cap Growth | | | Small-Cap Value | | | Large-Cap Growth | |
Accumulated Net Investment Income (Loss) | | | $ 107,675 | | | | $ 147,101 | | | | $ 187,491 | |
Accumulated Net Realized Gain (Loss) on Investments* | | | (40,526,384) | | | | (85,938,437) | | | | (46,913,930) | |
Net unrealized appreciation/depreciation of investments | | | 1,184,171 | | | | 10,251,347 | | | | 3,077,074 | |
Total | | | $(39,234,538) | | | | $(75,539,989) | | | | $(43,649,365) | |
| | | |
| | | Large-Cap Value | | | Blue Chip 35 Index | | | Managed Volatility | |
Accumulated Net Investment Income (Loss) | | | $ 222,649 | | | | $ 2,199,352 | | | | $ 217,769 | |
Accumulated Net Realized Gain (Loss) on Investments* | | | (6,534,724) | | | | (67,493,709) | | | | (8,024,220) | |
Net unrealized appreciation/depreciation of investments | | | 2,753,568 | | | | 7,377,111 | | | | 797,550 | |
Total | | | $ (3,558,507) | | | | $(57,917,246) | | | | $ (7,008,901) | |
| * | Includes losses incurred during the period November 1, 2009 through June 30, 2010, which a Fund has elected to defer to its fiscal year ending June 30, 2011. Post October Losses - Under current tax law, capital losses realized after October 31 of a Fund’s fiscal year may be deferred and treated as occurring on the first business day of the following fiscal year for tax purposes. The Small-Cap Momentum and The Blue-Chip 35 Index Funds have deferred post October losses of $39 and $2,637,648 respectively. |
Accounting for Uncertainty in Income Taxes sets forth a minimum threshold for financial statement recognition of the benefit of a tax position taken or expected to be taken in a tax return. Management has analyzed each Fund’s tax positions and has concluded that no provision for income tax is required in each Fund’s financial statements. The Funds are not aware of any tax position for which it is reasonably possible that the total amounts of unrecognized tax benefits will significantly change in the next twelve months. Each Fund’s federal tax returns for the prior three fiscal years remains subject to examination by the Internal Revenue Service.
7. Line of Credit
Bridgeway established a line of credit agreement (“Facility”) with The Bank of New York Mellon (the “Bank” or “Lender”) effective November 5, 2010. The Facility is for temporary or emergency purposes, such as to provide liquidity for shareholder redemptions, and is cancellable by either party. Unless cancelled earlier, the Facility shall be held available until November 4, 2011. Advances under the Facility are limited to $10,000,000 in total for all Funds and advances to each Fund shall not exceed certain limits set forth in the credit agreement, including but not limited to, the maximum amount a Fund is permitted to borrow under the 1940 Act.
The Funds incur a commitment fee of 0.05% per annum on the unused portion of the Facility and interest expense to the extent of amounts borrowed under the Facility. Interest is based on the higher of (a) the Federal Funds rate, (b) the Overnight Eurodollar Rate, or (c) the One-month Eurodollar Rate, plus 1.25%. The commitment fees are payable quarterly in arrears and are allocated to all participating Funds. Interest expense is charged directly to a Fund based upon actual amounts borrowed by such Fund. During the period ended December 31, 2010, there were no borrowings under this Facility.
8. Redemption Fees
In Ultra-Small Company Market and Small-Cap Momentum Funds, a 2% redemption fee may be charged on shares held less than six months. The fee is charged for the benefit of the remaining shareholders and will be paid to the appropriate Fund to help offset transaction costs. The fee is accounted for as an addition to paid-in capital.
9. Subsequent Events
Management has evaluated the impact of all subsequent events on the Funds and has determined that there was the following subsequent event.
The Funds’ Board of Directors approved the re-opening of the Aggressive Investors 1 Fund to all investors effective as of January 14, 2011.
| | |
| OTHER INFORMATION | |
|
| | |
December 31, 2010 (Unaudited) | | |
1. Proxy Voting
Fund policies and procedures used in determining how to vote proxies relating to the Funds’ securities and a summary of proxies voted by the Funds for the period ended June 30, 2010 available without a charge, upon request, by contacting Bridgeway Funds at 1-800-661-3550 and on the SEC’s website at http://www.sec.gov.
2. Fund Holdings
The complete schedules of the Funds’ holdings for the second and fourth quarters of each fiscal year are contained in the Funds’ Semi-Annual and Annual shareholder reports, respectively.
The Bridgeway Funds file complete schedules of the Funds’ holdings with the SEC for the first and third quarters of each fiscal year on Form N-Q within 60 days after the end of the period. Copies of the Funds’ Form N-Q are available without charge, upon request, by contacting Bridgeway Funds at 1-800-661-3550 and on the SEC’s website at http://www.sec.gov. You may also review and copy Form N-Q at the SEC’s Public Reference Room in Washington, D.C. For more information about the operation of the Public Reference Room, please call 1-800-SEC-0330.
| | |
| | |
| 154 | | Semi-Annual Report | December 31, 2010 (Unaudited) |
| | |
| DISCLOSURE OF FUND EXPENSES | |
|
| | |
December 31, 2010 (Unaudited) | | |
As a shareholder of a Fund, you will incur no transaction costs from such Fund, including sales charges (loads) on purchases, on reinvested dividends or on other distributions. There are no exchange fees. Shareholders are subject to redemption fees on the Ultra-Small Company Market and Small-Cap Momentum Funds under certain circumstances. However, as a shareholder of a Fund, you will incur ongoing costs, including management fees and other Fund expenses. The following examples are intended to help you understand your ongoing costs (in dollars) of investing in a Fund and to compare these costs with ongoing costs of investing in other mutual funds. The examples are based on an investment of $1,000 invested on July 1, 2010 and held until December 31, 2010.
Actual Expenses. The first line of the table below provides information about actual account values and actual expenses. You may use the information in this line, together with the amount you invested, to estimate the expenses that you paid over the period. Simply divide your account value by $1,000 (for example, an $8,600 account value divided by $1,000 = 8.6), then multiply the result by the number in the first line under the heading “Expenses Paid During the Period” to estimate the expenses you paid on your account during the period.
Hypothetical Example for Comparison Purposes. The second line of the table below provides information about hypothetical account values and hypothetical expenses based on the Fund’s actual expense ratio and an assumed rate of return of 5% per year before expenses, which is not the Fund’s actual return. The hypothetical account values and expenses may not be used to estimate the actual ending account balance or expenses you paid for the period. You may use this information to compare the ongoing costs of investing in a Fund and other mutual funds. To do so, compare this 5% hypothetical example with the 5% hypothetical examples that appear in the shareholder reports of other funds.
The expenses shown in the table are meant to highlight ongoing Fund costs only. Therefore, the second line of the table is useful in comparing ongoing costs only, and will not help you determine the relative total costs of owning different funds, because other funds may also have transaction costs, such as sales charges, redemption fees or exchange fees.
| | | | | | | | | | | | | | | | |
| | | Beginning Account
Value at 7/1/10 | | | Ending Account
Value at 12/31/10 | | | Expense
Ratio | | | Expenses Paid
During Period*
7/1/10 - 12/31/10 | |
| | | | |
Bridgeway Aggressive Investors 1 | | | | | | | | | | | | | | | | |
Actual Fund Return | | | $1,000.00 | | | | $1,306.70 | | | | -0.58% | ** | | | $(3.37) | |
Hypothetical Fund Return | | | $1,000.00 | | | | $1,028.13 | | | | -0.58% | ** | | | $(2.96) | |
| | | | |
Bridgeway Aggressive Investors 2 | | | | | | | | | | | | | | | | |
Actual Fund Return | | | $1,000.00 | | | | $1,267.10 | | | | 0.76% | | | | $ 4.34 | |
Hypothetical Fund Return | | | $1,000.00 | | | | $1,021.37 | | | | 0.76% | | | | $ 3.87 | |
| | | | |
Bridgeway Ultra-Small Company Fund | | | | | | | | | | | | | | | | |
Actual Fund Return | | | $1,000.00 | | | | $1,275.30 | | | | 1.20% | | | | $ 6.88 | |
Hypothetical Fund Return | | | $1,000.00 | | | | $1,019.16 | | | | 1.20% | | | | $ 6.11 | |
| | | | |
Bridgeway Ultra-Small Company Market Fund | | | | | | | | | | | | | | | | |
Actual Fund Return | | | $1,000.00 | | | | $1,273.10 | | | | 0.75% | | | | $ 4.30 | |
Hypothetical Fund Return | | | $1,000.00 | | | | $1,021.42 | | | | 0.75% | | | | $ 3.82 | |
| | | | |
Bridgeway Micro-Cap Limited Fund | | | | | | | | | | | | | | | | |
Actual Fund Return | | | $1,000.00 | | | | $1,293.40 | | | | 0.14% | | | | $ 0.81 | |
Hypothetical Fund Return | | | $1,000.00 | | | | $1,024.50 | | | | 0.14% | | | | $ 0.71 | |
| | | | |
Bridgeway Small-Cap Momentum Fund | | | | | | | | | | | | | | | | |
Actual Fund Return | | | $1,000.00 | | | | $1,274.50 | | | | 0.90% | | | | $ 5.16 | |
Hypothetical Fund Return | | | $1,000.00 | | | | $1,020.67 | | | | 0.90% | | | | $ 4.58 | |
| | |
| DISCLOSURE OF FUND EXPENSES (continued) | |
|
| | |
December 31, 2010 (Unaudited) | | |
| | | | | | | | | | | | | | | | |
| | | Beginning Account
Value at 7/1/10 | | | Ending Account
Value at 12/31/10 | | | Expense
Ratio | | | Expenses Paid
During Period*
7/1/10 - 12/31/10 | |
| | | | |
Bridgeway Small-Cap Growth Fund | | | | | | | | | | | | | | | | |
Actual Fund Return | | | $1,000.00 | | | | $1,208.20 | | | | 0.94% | | | | $5.23 | |
Hypothetical Fund Return | | | $1,000.00 | | | | $1,020.47 | | | | 0.94% | | | | $4.79 | |
| | | | |
Bridgeway Small-Cap Value Fund | | | | | | | | | | | | | | | | |
Actual Fund Return | | | $1,000.00 | | | | $1,199.10 | | | | 0.90% | | | | $4.99 | |
Hypothetical Fund Return | | | $1,000.00 | | | | $1,020.67 | | | | 0.90% | | | | $4.58 | |
| | | | |
Bridgeway Large-Cap Growth Fund | | | | | | | | | | | | | | | | |
Actual Fund Return | | | $1,000.00 | | | | $1,228.20 | | | | 0.84% | | | | $4.72 | |
Hypothetical Fund Return | | | $1,000.00 | | | | $1,020.97 | | | | 0.84% | | | | $4.28 | |
| | | | |
Bridgeway Large-Cap Value Fund | | | | | | | | | | | | | | | | |
Actual Fund Return | | | $1,000.00 | | | | $1,204.10 | | | | 0.84% | | | | $4.67 | |
Hypothetical Fund Return | | | $1,000.00 | | | | $1,020.97 | | | | 0.84% | | | | $4.28 | |
| | | | |
Bridgeway Blue Chip 35 Fund | | | | | | | | | | | | | | | | |
Actual Fund Return | | | $1,000.00 | | | | $1,209.80 | | | | 0.15% | | | | $0.84 | |
Hypothetical Fund Return | | | $1,000.00 | | | | $1,024.45 | | | | 0.15% | | | | $0.77 | |
| | | | |
Bridgeway Managed Volatility | | | | | | | | | | | | | | | | |
Actual Fund Return | | | $1,000.00 | | | | $1,114.90 | | | | 0.94% | | | | $5.01 | |
Hypothetical Fund Return | | | $1,000.00 | | | | $1,020.47 | | | | 0.94% | | | | $4.79 | |
| * | Expenses are equal to the average account value times the Fund’s annualized expense ratio multiplied by the number of days in the most recent half-year divided by the number of days in the fiscal year. |
| ** | The expense ratio for Aggressive Investors 1 Fund is negative due to the negative performance adjustment of the investment advisory fee. The expense ratio for this period excluding the negative performance adjustment was 1.26%. |
| | |
| | |
| 156 | | Semi-Annual Report | December 31, 2010 (Unaudited) |
THIS PAGE INTENTIONALLY LEFT BLANK
THIS PAGE INTENTIONALLY LEFT BLANK
THIS PAGE INTENTIONALLY LEFT BLANK


OMNI TAX-MANAGED SMALL-CAP BOSVX
VALUE
(formerly, Omni Small-Cap Value)

| | |
| TABLE OF CONTENTS | |  |
THIS PAGE INTENTIONALLY LEFT BLANK
| | |
| Omni Tax-Managed Small-Cap Value Fund | | |
MANAGER’S COMMENTARY
(Unaudited)
December 31, 2010
Dear Fellow Omni Tax-Managed Small-Cap Value Fund Shareholder,
The Omni Tax-Managed Small-Cap Value Fund (the “Fund”) began operating on December 31, 2010. Performance reporting and commentary will begin with the next shareholder letter. We will be using the Russell 2000 Value Index as the primary market benchmark and the Lipper Small-Cap Value Funds Index as the peer index for performance comparison purposes.
The Fund uses a market capitalization weighted approach to invest in a broad and diverse group of small-cap stocks that Bridgeway determines to be value stocks. This approach is sometimes referred to as “passive, asset-class investing.” Use of the term “Omni” in the name refers to the fact that the Fund intends to provide risk and return characteristics similar to investing in a basket of stocks in a specific asset class. The Fund’s tax management approach strives to minimize taxable distributions to shareholders.
Top Ten Holdings as of December 31, 2010
| | | | | | | | | | |
| Rank | | Description | | Industry | |
| % of Net
Assets |
| | |
| 1 | | Packaging Corp. of America | | Containers & Packaging | | | 0.7% | | | |
| 2 | | Armstrong World Industries, Inc. | | Building Products | | | 0.7% | | | |
| 3 | | Tenneco, Inc. | | Auto Components | | | 0.6% | | | |
| 4 | | Allied World Assurance Co. Holdings, Ltd. | | Insurance | | | 0.6% | | | |
| 5 | | AOL, Inc. | | Internet Software & Services | | | 0.6% | | | |
| 6 | | Dillard’s, Inc. | | Multiline Retail | | | 0.6% | | | |
| 7 | | Alaska Air Group, Inc. | | Airlines | | | 0.6% | | | |
| 8 | | Harsco Corp. | | Machinery | | | 0.6% | | | |
| 9 | | Cabot Corp. | | Chemicals | | | 0.6% | | | |
| 10 | | Teradyne, Inc. | | Semiconductors & Semiconductor Equipment | | | 0.6% | | | |
| | Total | | | | | 6.2% | | | |
Disclaimer
Security positions can and do change.
Market volatility can significantly impact short-term performance. The Fund is not an appropriate investment for short-term investors. Investments in small companies generally carry greater risk than is customarily associated with larger companies. This additional risk is attributable to a number of factors, including the relatively limited financial resources that are typically available to small companies, and the fact that small companies often have comparatively limited product lines. In addition, the stock of small companies tends to be more volatile than the stock of large companies, particularly in the short term and particularly in the early stages of an economic or market downturn. Shareholders of the Fund, therefore, are taking on more risk than they would if they invested in the stock market as a whole.
Conclusion
Thank you for your investment in Omni Tax-Managed Small-Cap Value Fund. We encourage your feedback; your reactions and concerns are important to us.
Sincerely,
Your Investment Management Team
| | |
| 4 | | Semi-Annual Report | December 31, 2010 (Unaudited) |
| | |
| Bridgeway Omni Tax-Managed Small-Cap Value Fund | | |
SCHEDULE OF INVESTMENTS
Showing percentage of net assets as of December 31, 2010 (Unaudited)
| | | | | | | | | | | | | | | | | | | | | | |
| Industry Company | | | Shares | | | | Value | | | | | | | Industry Company | | | Shares | | | | Value | |
COMMON STOCKS - 98.19% | | | | | | | | | | | | | | | |
Aerospace & Defense - 2.46% | | | | | | | Beverages - 0.24% | |
AAR Corp.* | | | 100 | | | $ | 2,747 | | | | | | | Cott Corp.* | | | 200 | | | $ | 1,802 | |
AerCap Holdings NV* | | | 350 | | | | 4,942 | | | | | | | MGP Ingredients, Inc. | | | 50 | | | | 552 | |
Alliant Techsystems, Inc.* | | | 50 | | | | 3,722 | | | | | | | | | | | | | | 2,354 | |
Astrotech Corp.* | | | 50 | | | | 56 | | | | | | | Building Products - 1.47% | |
Curtiss-Wright Corp. | | | 100 | | | | 3,320 | | | | | | | A.O. Smith Corp. | | | 100 | | | | 3,808 | |
Kratos Defense & Security Solutions, Inc.* | | | 50 | | | | 658 | | | | | | | Armstrong World Industries, Inc. | | | 150 | | | | 6,450 | |
| | | | | | | | Gibraltar Industries, Inc.* | | | 50 | | | | 678 | |
LMI Aerospace, Inc.* | | | 50 | | | | 800 | | | | | | | Griffon Corp.* | | | 150 | | | | 1,911 | |
Moog, Inc., Class A* | | | 100 | | | | 3,980 | | | | | | | Quanex Building Products Corp. | | | 100 | | | | 1,897 | |
Teledyne Technologies, Inc.* | | | 100 | | | | 4,397 | | | | | | | | | | | | | | 14,744 | |
| | | | | | | 24,622 | | | | | | | Capital Markets - 0.74% | | | | | | | | |
Air Freight & Logistics - 0.57% | | | | | | | Calamos Asset Management, Inc., Class A | | | 50 | | | | 700 | |
Air Transport Services Group, Inc.* | | | 150 | | | | 1,185 | | | | | | | GFI Group, Inc. | | | 250 | | | | 1,172 | |
Atlas Air Worldwide Holdings, Inc.* | | | 50 | | | | 2,792 | | | | | | | Gleacher & Co., Inc.* | | | 300 | | | | 711 | |
Pacer International, Inc.* | | | 100 | | | | 684 | | | | | | | International Assets Holding Corp.* | | | 50 | | | | 1,180 | |
Park-Ohio Holdings Corp.* | | | 50 | | | | 1,045 | | | | | | | Investment Technology Group, Inc.* | | | 100 | | | | 1,637 | |
| | | | | | | 5,706 | | | | | | | LaBranche & Co., Inc.* | | | 100 | | | | 360 | |
Airlines - 1.69% | | | | | | | Oppenheimer Holdings, Inc., Class A | | | 50 | | | | 1,311 | |
Alaska Air Group, Inc.* | | | 100 | | | | 5,669 | | | | | | | Sanders Morris Harris Group, Inc. | | | 50 | | | | 363 | |
Hawaiian Holdings, Inc.* | | | 100 | | | | 784 | | | | | | | | | | | | | | 7,434 | |
JetBlue Airways Corp.* | | | 650 | | | | 4,296 | | | | | | | Chemicals - 3.01% | |
Pinnacle Airlines Corp.* | | | 50 | | | | 395 | | | | | | | American Vanguard Corp. | | | 50 | | | | 427 | |
Republic Airways Holdings, Inc.* | | | 100 | | | | 732 | | | | | | | Arabian American Development Co.* | | | 50 | | | | 224 | |
Skywest, Inc. | | | 100 | | | | 1,562 | | | | | | | Arch Chemicals, Inc. | | | 50 | | | | 1,896 | |
US Airways Group, Inc.* | | | 350 | | | | 3,504 | | | | | | | Cabot Corp. | | | 150 | | | | 5,648 | |
| | | | | | | 16,942 | | | | | | | Cytec Industries, Inc. | | | 100 | | | | 5,306 | |
Auto Components - 2.41% | | | | | | | Ferro Corp.* | | | 200 | | | | 2,928 | |
China Automotive Systems, Inc.* | | | 50 | | | | 680 | | | | | | | Innospec, Inc.* | | | 50 | | | | 1,020 | |
Cooper Tire & Rubber Co. | | | 150 | | | | 3,537 | | | | | | | Koppers Holdings, Inc. | | | 50 | | | | 1,789 | |
Dana Holding Corp.* | | | 300 | | | | 5,163 | | | | | | | Minerals Technologies, Inc. | | | 50 | | | | 3,270 | |
Exide Technologies* | | | 150 | | | | 1,411 | | | | | | | OM Group, Inc.* | | | 50 | | | | 1,926 | |
Federal-Mogul Corp.* | | | 200 | | | | 4,130 | | | | | | | Omnova Solutions, Inc.* | | | 100 | | | | 836 | |
Fuel Systems Solutions, Inc.* | | | 50 | | | | 1,469 | | | | | | | Penford Corp.* | | | 50 | | | | 306 | |
Motorcar Parts of America, Inc.* | | | 50 | | | | 652 | | | | | | | PolyOne Corp.* | | | 200 | | | | 2,498 | |
Shiloh Industries, Inc. | | | 50 | | | | 598 | | | | | | | Spartech Corp.* | | | 50 | | | | 468 | |
Spartan Motors, Inc. | | | 50 | | | | 304 | | | | | | | TPC Group, Inc.* | | | 50 | | | | 1,516 | |
Tenneco, Inc.* | | | 150 | | | | 6,174 | | | | | | | | | | | | | | 30,058 | |
| | | | | | | 24,118 | | | | | | | | | | | | | | | |
Automobiles - 0.08% | | | | | | | | | | | | | | | |
Winnebago Industries, Inc.* | | | 50 | | | | 760 | | | | | | | | | | | | | | | |
| | |
| Bridgeway Omni Tax-Managed Small-Cap Value Fund | | |
SCHEDULE OF INVESTMENTS (continued)
Showing percentage of net assets as of December 31, 2010 (Unaudited)
| | | | | | | | | | | | | | | | | | | | | | |
| Industry Company | | | Shares | | | | Value | | | | | | | Industry Company | | | Shares | | | | Value | |
Common Stocks (continued) | | | | | | | | | | | | | | | |
Commercial Banks - 3.10% | | | | | | | Commercial Services & Supplies (continued) | |
Ameris Bancorp* | | | 50 | | | $ | 527 | | | | | | | APAC Customer Services, Inc.* | | | 100 | | | $ | 607 | |
Banner Corp. | | | 250 | | | | 580 | | | | | | | Brink’s Co. (The) | | | 100 | | | | 2,688 | |
Boston Private Financial Holdings, Inc. | | | 150 | | | | 982 | | | | | | | Casella Waste Systems, Inc., Class A* | | | 50 | | | | 354 | |
Capital City Bank Group, Inc. | | | 50 | | | | 630 | | | | | | | Consolidated Graphics, Inc.* | | | 50 | | | | 2,422 | |
Enterprise Financial Services Corp. | | | 50 | | | | 523 | | | | | | | Courier Corp. | | | 50 | | | | 776 | |
First Busey Corp. | | | 150 | | | | 705 | | | | | | | Deluxe Corp. | | | 100 | | | | 2,302 | |
First Merchants Corp. | | | 50 | | | | 443 | | | | | | | EnergySolutions, Inc. | | | 200 | | | | 1,114 | |
Great Southern Bancorp, Inc. | | | 50 | | | | 1,180 | | | | | | | Ennis, Inc. | | | 50 | | | | 855 | |
Green Bankshares, Inc.* | | | 50 | | | | 160 | | | | | | | G&K Services, Inc., Class A | | | 50 | | | | 1,546 | |
Hanmi Financial Corp.* | | | 350 | | | | 402 | | | | | | | Guanwei Recycling Corp.* | | | 50 | | | | 172 | |
Heartland Financial USA, Inc. | | | 50 | | | | 873 | | | | | | | Intersections, Inc. | | | 50 | | | | 523 | |
Intervest Bancshares Corp., Class A* | | | 50 | | | | 147 | | | | | | | KAR Auction Services, Inc.* | | | 300 | | | | 4,140 | |
Macatawa Bank Corp.* | | | 50 | | | | 206 | | | | | | | M&F Worldwide Corp.* | | | 50 | | | | 1,155 | |
MainSource Financial Group, Inc. | | | 50 | | | | 520 | | | | | | | Multi-Color Corp. | | | 50 | | | | 973 | |
MB Financial, Inc. | | | 100 | | | | 1,732 | | | | | | | Standard Parking Corp.* | | | 50 | | | | 945 | |
Metro Bancorp, Inc.* | | | 50 | | | | 550 | | | | | | | Standard Register Co. (The) | | | 50 | | | | 171 | |
MetroCorp Bancshares, Inc.* | | | 50 | | | | 182 | | | | | | | Team, Inc.* | | | 50 | | | | 1,210 | |
Nara Bancorp, Inc.* | | | 100 | | | | 982 | | | | | | | UniFirst Corp. | | | 50 | | | | 2,752 | |
Pinnacle Financial Partners, Inc.* | | | 50 | | | | 679 | | | | | | | Viad Corp. | | | 50 | | | | 1,274 | |
Republic Bancorp, Inc., Class A | | | 50 | | | | 1,188 | | | | | | | | | | | | | | 29,850 | |
Seacoast Banking Corp. of Florida* | | | 200 | | | | 292 | | | | | | | Communications Equipment - 1.73% | |
Sierra Bancorp | | | 50 | | | | 537 | | | | | | | Arris Group, Inc.* | | | 250 | | | | 2,805 | |
Southwest Bancorp, Inc.* | | | 50 | | | | 620 | | | | | | | Brocade Communications Systems, Inc.* | | | 1,050 | | | | 5,554 | |
State Bancorp, Inc. | | | 50 | | | | 462 | | | | | | | Comtech Telecommuni- cations Corp | | | 50 | | | | 1,386 | |
Susquehanna Bancshares, Inc. | | | 300 | | | | 2,904 | | | | | | | EchoStar Corp., Class A* | | | 200 | | | | 4,994 | |
Synovus Financial Corp. | | | 1,750 | | | | 4,620 | | | | | | | Hughes Communications, Inc.* | | | 50 | | | | 2,022 | |
TCF Financial Corp. | | | 300 | | | | 4,443 | | | | | | | Zoom Technologies, Inc.* | | | 50 | | | | 224 | |
Tennessee Commerce Bancorp, Inc.* | | | 50 | | | | 246 | | | | | | | ZST Digital Networks, Inc.* | | | 50 | | | | 342 | |
United Community Banks, Inc.* | | | 200 | | | | 390 | | | | | | | | | | | | | | 17,327 | |
Virginia Commerce Bancorp, Inc.* | | | 50 | | | | 309 | | | | | | | Computers & Peripherals - 1.27% | |
Webster Financial Corp. | | | 150 | | | | 2,955 | | | | | | | Datalink Corp.* | | | 50 | | | | 241 | |
| | | | | | | 30,969 | | | | | | | Diebold, Inc. | | | 150 | | | | 4,808 | |
Commercial Services & Supplies - 2.99% | | | | | | | Hutchinson Technology, Inc.* | | | 50 | | | | 185 | |
A.T. Cross Co., Class A* | | | 50 | | | | 482 | | | | | | | Imation Corp.* | | | 100 | | | | 1,031 | |
ABM Industries, Inc. | | | 100 | | | | 2,630 | | | | | | | NCR Corp.* | | | 350 | | | | 5,380 | |
American Reprographics Co.* | | | 100 | | | | 759 | | | | | | | Presstek, Inc.* | | | 100 | | | | 222 | |
| | | | | | | | | | | | | | Xyratex, Ltd.* | | | 50 | | | | 815 | |
| | | | | | | | | | | | | | | | | | | | | 12,682 | |
| | | | | | | | | | | | | | Construction & Engineering - 0.82% | |
| | | | | | | | | | | | | | Argan, Inc.* | | | 50 | | | | 464 | |
| | | | | | | | | | | | | | Dycom Industries, Inc.* | | | 100 | | | | 1,475 | |
| | | | | | | | | | | | | | Great Lakes Dredge & Dock Corp. | | | 150 | | | | 1,106 | |
| | |
| 6 | | Semi-Annual Report | December 31, 2010 (Unaudited) |
| | |
| Bridgeway Omni Tax-Managed Small-Cap Value Fund | | |
SCHEDULE OF INVESTMENTS (continued)
Showing percentage of net assets as of December 31, 2010 (Unaudited)
| | | | | | | | | | | | | | | | | | | | | | |
| Industry Company | | | Shares | | | | Value | | | | | | | Industry Company | | | Shares | | | | Value | |
Common Stocks (continued) | | | | | | | | | | | | | | | |
Construction & Engineering (continued) | | | | | | | Diversified Consumer Services (continued) | |
Layne Christensen Co.* | | | 50 | | | $ | 1,721 | | | | | | | Mac-Gray Corp. | | | 50 | | | $ | 748 | |
MasTec, Inc.* | | | 150 | | | | 2,188 | | | | | | | Regis Corp. | | | 150 | | | | 2,490 | |
Orion Marine Group, Inc.* | | | 50 | | | | 580 | | | | | | | Service Corp. International | | | 550 | | | | 4,538 | |
Sterling Construction Co., Inc.* | | | 50 | | | | 652 | | | | | | | Universal Technical Institute, Inc. | | | 50 | | | | 1,101 | |
| | | | | | | 8,186 | | | | | | | | | | | | | | 26,645 | |
Construction Materials - 0.07% | | | | | | | Diversified Financial Services - 0.25% | |
Headwaters, Inc.* | | | 150 | | | | 687 | | | | | | | Asta Funding, Inc. | | | 50 | | | | 405 | |
Consumer Finance - 0.84% | | | | | | | Interactive Brokers Group, Inc., Class A | | | 100 | | | | 1,782 | |
Advance America, Cash Advance Centers, Inc. | | | 150 | | | | 846 | | | | | | | Resource America, Inc., Class A | | | 50 | | | | 343 | |
Cash America International, Inc. | | | 50 | | | | 1,847 | | | | | | | | | | | | | | 2,530 | |
CompuCredit Holdings Corp.* | | | 100 | | | | 698 | | | | | | | Diversified Telecommunication Services - 1.01% | |
Nelnet, Inc., Class A | | | 100 | | | | 2,369 | | | | | | | Atlantic Tele-Network, Inc. | | | 50 | | | | 1,917 | |
World Acceptance Corp.* | | | 50 | | | | 2,640 | | | | | | | Cbeyond, Inc.* | | | 50 | | | | 764 | |
| | | | | | | 8,400 | | | | | | | Consolidated Communications Holdings, Inc. | | | 50 | | | | 965 | |
Containers & Packaging - 2.78% | | | | | | | General Communication, Inc., Class A* | | | 100 | | | | 1,266 | |
Boise, Inc. | | | 200 | | | | 1,586 | | | | | | | HickoryTech Corp. | | | 50 | | | | 480 | |
Graphic Packaging Holding Co.* | | | 750 | | | | 2,917 | | | | | | | IDT Corp., Class B | | | 50 | | | | 1,282 | |
Myers Industries, Inc. | | | 100 | | | | 974 | | | | | | | Iridium Communications, Inc.* | | | 150 | | | | 1,238 | |
Packaging Corp. of America | | | 250 | | | | 6,460 | | | | | | | PAETEC Holding Corp.* | | | 300 | | | | 1,122 | |
Rock-Tenn Co., Class A | | | 100 | | | | 5,395 | | | | | | | Premiere Global Services, Inc.* | | | 150 | | | | 1,020 | |
Smurfit-Stone Container Corp.* | | | 200 | | | | 5,120 | | | | | | | | | | | | | | 10,054 | |
Temple-Inland, Inc. | | | 250 | | | | 5,310 | | | | | | | Electrical Equipment - 0.64% | |
| | | | | | | 27,762 | | | | | | | A-Power Energy Generation Systems, Ltd.* | | | 100 | | | | 546 | |
Distributors - 0.27% | | | | | | | General Cable Corp.* | | | 100 | | | | 3,509 | |
Audiovox Corp., Class A* | | | 50 | | | | 432 | | | | | | | New Energy Systems Group* | | | 50 | | | | 386 | |
Pool Corp. | | | 100 | | | | 2,254 | | | | | | | Powell Industries, Inc.* | | | 50 | | | | 1,644 | |
| | | | | | | 2,686 | | | | | | | Ultralife Corp.* | | | 50 | | | | 331 | |
Diversified Consumer Services - 2.67% | | | | | | | | | | | | | | 6,416 | |
Career Education Corp.* | | | 200 | | | | 4,146 | | | | | | | Electronic Equipment, Instruments & Components - 3.12% | |
Carriage Services, Inc.* | | | 50 | | | | 242 | | | | | | | Anixter International, Inc. | | | 50 | | | | 2,986 | |
China Education Alliance, Inc.* | | | 50 | | | | 126 | | | | | | | Brightpoint, Inc.* | | | 150 | | | | 1,310 | |
Coinstar, Inc.* | | | 50 | | | | 2,822 | | | | | | | Celestica, Inc.* | | | 500 | | | | 4,850 | |
Corinthian Colleges, Inc.* | | | 200 | | | | 1,042 | | | | | | | Gerber Scientific, Inc.* | | | 50 | | | | 394 | |
Education Management Corp.* | | | 300 | | | | 5,430 | | | | | | | Insight Enterprises, Inc.* | | | 100 | | | | 1,316 | |
ITT Educational Services, Inc.* | | | 50 | | | | 3,184 | | | | | | | Itron, Inc.* | | | 100 | | | | 5,545 | |
Lincoln Educational Services Corp. | | | 50 | | | | 776 | | | | | | | Kemet Corp.* | | | 100 | | | | 1,458 | |
| | | | | | | | | | | | | | LoJack Corp.* | | | 50 | | | | 323 | |
| | |
| Bridgeway Omni Tax-Managed Small-Cap Value Fund | | |
SCHEDULE OF INVESTMENTS (continued)
Showing percentage of net assets as of December 31, 2010 (Unaudited)
| | | | | | | | | | | | | | | | | | | | | | |
| Industry Company | | | Shares | | | | Value | | | | | | | Industry Company | | | Shares | | | | Value | |
Common Stocks (continued) | | | | | | | | | | | | | | | | | | | | | | |
Electronic Equipment, Instruments & Components (continued) | | | | | | | Food & Staples Retailing (continued) | |
Multi-Fineline Electronix, Inc.* | | | 50 | | | $ | 1,324 | | | | | | | Winn-Dixie Stores, Inc.* | | | 100 | | | $ | 717 | |
NAM TAI Electronics, Inc. | | | 100 | | | | 640 | | | | | | | | | | | | | | 27,060 | |
PAR Technology Corp.* | | | 50 | | | | 286 | | | | | | | Food Products - 3.14% | | | | | | | | |
PC Mall, Inc.* | | | 50 | | | | 378 | | | | | | | B&G Foods, Inc. | | | 100 | | | | 1,373 | |
Power-One, Inc.* | | | 250 | | | | 2,550 | | | | | | | Cal-Maine Foods, Inc. | | | 50 | | | | 1,579 | |
Pulse Electronics, Inc. | | | 100 | | | | 532 | | | | | | | Chiquita Brands International, Inc.* | | | 100 | | | | 1,402 | |
RadiSys Corp.* | | | 50 | | | | 445 | | | | | | | Dean Foods Co.* | | | 400 | | | | 3,536 | |
Richardson Electronics, Ltd. | | | 50 | | | | 584 | | | | | | | Dole Food Co., Inc.* | | | 200 | | | | 2,702 | |
SMTC Corp.* | | | 50 | | | | 160 | | | | | | | Feihe International, Inc.* | | | 50 | | | | 532 | |
Viasystems Group, Inc.* | | | 50 | | | | 1,007 | | | | | | | Flowers Foods, Inc. | | | 200 | | | | 5,382 | |
Vishay Intertechnology, Inc.* | | | 350 | | | | 5,138 | | | | | | | Inventure Foods, Inc.* | | | 50 | | | | 216 | |
| | | | | | | 31,226 | | | | | | | Omega Protein Corp.* | | | 50 | | | | 405 | |
Energy Equipment & Services - 2.31% | | | | | | | Overhill Farms, Inc.* | | | 50 | | | | 289 | |
Cal Dive International, Inc.* | | | 200 | | | | 1,134 | | | | | | | Pilgrim’s Pride Corp.* | | | 450 | | | | 3,191 | |
ENGlobal Corp.* | | | 50 | | | | 186 | | | | | | | Sanderson Farms, Inc. | | | 50 | | | | 1,958 | |
Exterran Holdings, Inc.* | | | 150 | | | | 3,593 | | | | | | | Seneca Foods Corp., Class A* | | | 50 | | | | 1,349 | |
Geokinetics, Inc.* | | | 50 | | | | 465 | | | | | | | Snyders-Lance, Inc. | | | 50 | | | | 1,172 | |
Helix Energy Solutions Group, Inc.* | | | 250 | | | | 3,035 | | | | | | | SunOpta, Inc.* | | | 150 | | | | 1,173 | |
Hercules Offshore, Inc.* | | | 250 | | | | 865 | | | | | | | TreeHouse Foods, Inc.* | | | 100 | | | | 5,109 | |
Hornbeck Offshore Services, Inc.* | | | 50 | | | | 1,044 | | | | | | | | | | | | | | 31,368 | |
Newpark Resources, Inc.* | | | 200 | | | | 1,232 | | �� | | | | | Health Care Equipment & Supplies - 1.06% | |
North American Energy Partners, Inc.* | | | 100 | | | | 1,226 | | | | | | | CryoLife, Inc.* | | | 50 | | | | 271 | |
Parker Drilling Co.* | | | 250 | | | | 1,142 | | | | | | | Greatbatch, Inc.* | | | 50 | | | | 1,208 | |
PHI, Inc., Non Voting* | | | 50 | | | | 942 | | | | | | | Invacare Corp. | | | 50 | | | | 1,508 | |
Pioneer Drilling Co.* | | | 100 | | | | 881 | | | | | | | Medical Action Industries, Inc.* | | | 50 | | | | 479 | |
SEACOR Holdings, Inc. | | | 50 | | | | 5,055 | | | | | | | Synergetics USA, Inc.* | | | 50 | | | | 234 | |
Tetra Technologies, Inc.* | | | 150 | | | | 1,780 | | | | | | | Teleflex, Inc. | | | 100 | | | | 5,381 | |
TGC Industries, Inc.* | | | 50 | | | | 190 | | | | | | | Wright Medical Group, Inc.* | | | 100 | | | | 1,553 | |
Union Drilling, Inc.* | | | 50 | | | | 364 | | | | | | | | | | | | | | 10,634 | |
| | | | | | | 23,134 | | | | | | | Health Care Providers & Services - 6.28% | |
Food & Staples Retailing - 2.71% | | | | | | | Alliance HealthCare Services, Inc.* | | | 100 | | | | 424 | |
BJ’s Wholesale Club, Inc.* | | | 100 | | | | 4,790 | | | | | | | Allied Healthcare International, Inc.* | | | 100 | | | | 251 | |
Casey’s General Stores, Inc. | | | 100 | | | | 4,251 | | | | | | | Amedisys, Inc.* | | | 50 | | | | 1,675 | |
Ingles Markets, Inc., Class A | | | 50 | | | | 960 | | | | | | | American Dental Partners, Inc.* | | | 50 | | | | 676 | |
Nash Finch Co. | | | 50 | | | | 2,126 | | | | | | | AMERIGROUP Corp.* | | | 100 | | | | 4,392 | |
Pantry, Inc. (The)* | | | 50 | | | | 993 | | | | | | | Amsurg Corp.* | | | 50 | | | | 1,048 | |
Ruddick Corp. | | | 100 | | | | 3,684 | | | | | | | BioScrip, Inc.* | | | 100 | | | | 523 | |
Spartan Stores, Inc. | | | 50 | | | | 847 | | | | | | | Capital Senior Living Corp.* | | | 50 | | | | 335 | |
SUPERVALU, Inc. | | | 450 | | | | 4,334 | | | | | | | Cross Country Healthcare, Inc.* | | | 50 | | | | 424 | |
Susser Holdings Corp.* | | | 50 | | | | 692 | | | | | | | Ensign Group, Inc. (The) | | | 50 | | | | 1,243 | |
Village Super Market, Inc., Class A | | | 50 | | | | 1,650 | | | | | | | Five Star Quality Care, Inc.* | | | 100 | | | | 707 | |
Weis Markets, Inc. | | | 50 | | | | 2,016 | | | | | | | | | | | | | | | |
| | |
| 8 | | Semi-Annual Report | December 31, 2010 (Unaudited) |
| | |
| Bridgeway Omni Tax-Managed Small-Cap Value Fund | | |
SCHEDULE OF INVESTMENTS (continued)
Showing percentage of net assets as of December 31, 2010 (Unaudited)
| | | | | | | | | | | | | | | | | | | | | | |
| Industry Company | | | Shares | | | | Value | | | | | | | Industry Company | | | Shares | | | | Value | |
Common Stocks (continued) | | | | | | | | | | | | | | | |
Health Care Providers & Services (continued) | �� | | | | | | Hotels, Restaurants & Leisure (continued) | |
Gentiva Health Services, Inc.* | | | 50 | | | | $ 1,330 | | | | | | | CEC Entertainment, Inc.* | | | 50 | | | | $1,942 | |
Hanger Orthopedic Group, Inc.* | | | 50 | | | | 1,059 | | | | | | | Cracker Barrel Old Country Store, Inc. | | | 50 | | | | 2,738 | |
Health Management Associates, Inc., Class A* | | | 550 | | | | 5,247 | | | | | | | DineEquity, Inc.* | | | 50 | | | | 2,469 | |
Health Net, Inc.* | | | 200 | | | | 5,458 | | | | | | | Einstein Noah Restaurant Group, Inc.* | | | 50 | | | | 702 | |
Healthspring, Inc.* | | | 150 | | | | 3,980 | | | | | | | Full House Resorts, Inc.* | | | 50 | | | | 170 | |
Healthways, Inc.* | | | 100 | | | | 1,116 | | | | | | | Great Wolf Resorts, Inc.* | | | 50 | | | | 131 | |
Integramed America, Inc.* | | | 50 | | | | 432 | | | | | | | Isle of Capri Casinos, Inc.* | | | 50 | | | | 511 | |
Kindred Healthcare, Inc.* | | | 100 | | | | 1,837 | | | | | | | Luby’s, Inc.* | | | 50 | | | | 314 | |
LHC Group, Inc.* | | | 50 | | | | 1,500 | | | | | | | Marcus Corp. | | | 50 | | | | 664 | |
LifePoint Hospitals, Inc.* | | | 100 | | | | 3,675 | | | | | | | McCormick & Schmick’s Seafood Restaurants, Inc.* | | | 50 | | | | 454 | |
Magellan Health Services, Inc.* | | | 50 | | | | 2,364 | | | | | | | Morton’s Restaurant Group, Inc.* | | | 50 | | | | 324 | |
Medcath Corp.* | | | 50 | | | | 698 | | | | | | | Multimedia Games, Inc.* | | | 50 | | | | 279 | |
Metropolitan Health Networks, Inc.* | | | 100 | | | | 447 | | | | | | | O’Charleys, Inc.* | | | 50 | | | | 360 | |
Molina Healthcare, Inc.* | | | 50 | | | | 1,392 | | | | | | | Papa John’s International, Inc.* | | | 50 | | | | 1,385 | |
National Healthcare Corp. | | | 50 | | | | 2,313 | | | | | | | PF Chang’s China Bistro, Inc. | | | 50 | | | | 2,423 | |
Owens & Minor, Inc. | | | 150 | | | | 4,414 | | | | | | | Pinnacle Entertainment, Inc.* | | | 150 | | | | 2,103 | |
PharMerica Corp.* | | | 50 | | | | 572 | | | | | | | Red Lion Hotels Corp.* | | | 50 | | | | 399 | |
Providence Service Corp. (The)* | | | 50 | | | | 804 | | | | | | | Red Robin Gourmet Burgers, Inc.* | | | 50 | | | | 1,074 | |
PSS World Medical, Inc.* | | | 100 | | | | 2,260 | | | | | | | Ruby Tuesday, Inc.* | | | 150 | | | | 1,959 | |
RehabCare Group, Inc.* | | | 50 | | | | 1,185 | | | | | | | Ruth’s Hospitality Group, Inc.* | | | 100 | | | | 463 | |
Select Medical Holdings Corp.* | | | 350 | | | | 2,558 | | | | | | | Scientific Games Corp., Class A* | | | 200 | | | | 1,992 | |
Skilled Healthcare Group, Inc., Class A* | | | 100 | | | | 898 | | | | | | | Sonic Corp.* | | | 150 | | | | 1,518 | |
Sunrise Senior Living, Inc.* | | | 100 | | | | 545 | | | | | | | Speedway Motorsports, Inc. | | | 100 | | | | 1,532 | |
Triple-S Management Corp., Class B* | | | 50 | | | | 954 | | | | | | | Universal Travel Group* | | | 50 | | | | 306 | |
U.S. Physical Therapy, Inc.* | | | 50 | | | | 991 | | | | | | | Wendy’s/Arby’s Group, Inc., Class A | | | 900 | | | | 4,158 | |
Universal American Corp. | | | 150 | | | | 3,068 | | | | | | | | | | | | | | 42,460 | |
| | | | | | | 62,795 | | | | | | | Household Durables - 1.00% | |
Health Care Technology - 0.09% | | | | | | | American Greetings Corp., Class A | | | 100 | | | | 2,216 | |
MedQuist, Inc. | | | 100 | | | | 865 | | | | | | | Beazer Homes USA, Inc.* | | | 150 | | | | 808 | |
| | | | |
Hotels, Restaurants & Leisure - 4.25% | | | | | | | Brookfield Homes Corp.* | | | 50 | | | | 470 | |
Ameristar Casinos, Inc. | | | 150 | | | | 2,344 | | | | | | | Emerson Radio Corp. | | | 50 | | | | 99 | |
Benihana, Inc., Class A* | | | 50 | | | | 406 | | | | | | | Furniture Brands International, Inc.* | | | 100 | | | | 514 | |
Bluegreen Corp.* | | | 50 | | | | 161 | | | | | | | Kid Brands, Inc.* | | | 50 | | | | 428 | |
Bob Evans Farms, Inc. | | | 50 | | | | 1,648 | | | | | | | La-Z-Boy, Inc.* | | | 100 | | | | 902 | |
Boyd Gaming Corp.* | | | 200 | | | | 2,120 | | | | | | | Libbey, Inc.* | | | 50 | | | | 774 | |
Brinker International, Inc. | | | 200 | | | | 4,176 | | | | | | | Lifetime Brands, Inc.* | | | 50 | | | | 702 | |
California Pizza Kitchen, Inc.* | | | 50 | | | | 864 | | | | | | | | | | | | | | | |
Carrols Restaurant Group, Inc.* | | | 50 | | | | 371 | | | | | | | | | | | | | | | |
| | |
| Bridgeway Omni Tax-Managed Small-Cap Value Fund | | |
SCHEDULE OF INVESTMENTS (continued)
Showing percentage of net assets as of December 31, 2010 (Unaudited)
| | | | | | | | | | | | | | | | | | | | | | |
| Industry Company | | | Shares | | | | Value | | | | | | | Industry Company | | | Shares | | | | Value | |
Common Stocks (continued) | | | | | | | | | | | | | | | | | | | | | | |
Household Durables (continued) | | | | | | | Insurance (continued) | | | | | | | | |
Meritage Homes Corp.* | | | 50 | | | | $1,110 | | | | | | | Stewart Information Services Corp. | | | 50 | | | | $ 576 | |
NIVS IntelliMedia Technology Group, Inc.* | | | 100 | | | | 226 | | | | | | | Symetra Financial Corp. | | | 250 | | | | 3,425 | |
Ryland Group, Inc. (The) | | | 100 | | | | 1,703 | | | | | | | Tower Group, Inc. | | | 100 | | | | 2,558 | |
| | | | | | | 9,952 | | | | | | | United Fire & Casualty Co. | | | 50 | | | | 1,116 | |
Household Products - 0.15% | | | | | | | | | | | | | | Universal Insurance | | | | | | | | |
Central Garden & Pet Co., Class A* | | | 150 | | | | 1,482 | | | | | | | Holdings, Inc. | | | 100 | | | | 487 | |
Insurance - 6.87% | | | | | | | | | | | | | | | | | | | | | 68,642 | |
Allied World Assurance Co. Holdings, Ltd. | | | 100 | | | | 5,944 | | | | | | | Internet & Catalog Retail - 0.37% | |
American Equity Investment Life Holding Co. | | | 150 | | | | 1,882 | | | | | | | 1-800-Flowers.com, Inc., Class A* | | | 150 | | | | 403 | |
Aspen Insurance Holdings, Ltd. | | | 150 | | | | 4,293 | | | | | | | NutriSystem, Inc. | | | 50 | | | | 1,052 | |
Baldwin & Lyons, Inc., Class B | | | 50 | | | | 1,176 | | | | | | | Orbitz Worldwide, Inc.* | | | 250 | | | | 1,397 | |
CNO Financial Group, Inc.* | | | 550 | | | | 3,729 | | | | | | | Overstock.com, Inc.* | | | 50 | | | | 824 | |
Crawford & Co., Class B* | | | 100 | | | | 340 | | | | | | | | | | | | | | 3,676 | |
Delphi Financial Group, Inc., Class A | | | 100 | | | | 2,884 | | | | | | | Internet Software & Services - 1.17% | |
EMC Insurance Group, Inc. | | | 50 | | | | 1,132 | | | | | | | AOL, Inc.* | | | 250 | | | | 5,928 | |
Endurance Specialty Holdings, Ltd. | | | 100 | | | | 4,607 | | | | | | | EarthLink, Inc. | | | 250 | | | | 2,150 | |
FBL Financial Group, Inc., Class A | | | 50 | | | | 1,434 | | | | | | | EasyLink Services International Corp.,
Class A* | | | 50 | | | | 210 | |
Flagstone Reinsurance Holdings SA | | | 150 | | | | 1,890 | | | | | | | Infospace, Inc.* | | | 100 | | | | 830 | |
Hallmark Financial Services, Inc.* | | | 50 | | | | 455 | | | | | | | Internap Network Services Corp.* | | | 100 | | | | 608 | |
Harleysville Group, Inc. | | | 50 | | | | 1,837 | | | | | | | ModusLink Global Solutions, Inc.* | | | 100 | | | | 670 | |
Horace Mann Educators Corp. | | | 100 | | | | 1,804 | | | | | | | United Online, Inc. | | | 200 | | | | 1,320 | |
Infinity Property & Casualty Corp. | | | 50 | | | | 3,090 | | | | | | | | | | | | | | 11,716 | |
Maiden Holdings, Ltd. | | | 150 | | | | 1,179 | | | | | | | IT Services - 3.07% | | | | | | | | |
Meadowbrook Insurance Group, Inc. | | | 100 | | | | 1,025 | | | | | | | Acxiom Corp.* | | | 200 | | | | 3,430 | |
Montpelier Re Holdings, Ltd. | | | 150 | | | | 2,991 | | | | | | | CACI International, Inc., Class A* | | | 50 | | | | 2,670 | |
National Financial Partners Corp.* | | | 100 | | | | 1,340 | | | | | | | Ciber, Inc.* | | | 150 | | | | 702 | |
National Interstate Corp. | | | 50 | | | | 1,070 | | | | | | | Convergys Corp.* | | | 250 | | | | 3,292 | |
Navigators Group, Inc. (The)* | | | 50 | | | | 2,518 | | | | | | | CSG Systems International, Inc.* | | | 100 | | | | 1,894 | |
Protective Life Corp. | | | 200 | | | | 5,328 | | | | | | | DST Systems, Inc. | | | 100 | | | | 4,435 | |
SeaBright Holdings, Inc. | | | 50 | | | | 461 | | | | | | | Global Cash Access Holdings, Inc.* | | | 150 | | | | 478 | |
Selective Insurance Group, Inc. | | | 100 | | | | 1,815 | | | | | | | Information Services Group, Inc.* | | | 50 | | | | 104 | |
StanCorp Financial Group, Inc. | | | 100 | | | | 4,514 | | | | | | | Integral Systems, Inc.* | | | 50 | | | | 496 | |
State Auto Financial Corp. | | | 100 | | | | 1,742 | | | | | | | Lionbridge Technologies, Inc.* | | | 150 | | | | 554 | |
| | | | | | | | | | | | | | Mantech International Corp., Class A* | | | 100 | | | | 4,133 | |
| | | | | | | | | | | | | | Ness Technologies, Inc.* | | | 100 | | | | 594 | |
| | | | | | | | | | | | | | Online Resources Corp.* | | | 50 | | | | 232 | |
| | | | | | | | | | | | | | PFSweb, Inc.* | | | 50 | | | | 198 | |
| | |
| 10 | | Semi-Annual Report | December 31, 2010 (Unaudited) |
| | |
| Bridgeway Omni Tax-Managed Small-Cap Value Fund | | |
SCHEDULE OF INVESTMENTS (continued)
Showing percentage of net assets as of December 31, 2010 (Unaudited)
| | | | | | | | | | | | | | | | | | | | | | |
| Industry Company | | | Shares | | | | Value | | | | | | | Industry Company | | | Shares | | | | Value | |
Common Stocks (continued) | | | | | | | | | | | | | | | | | | | | | | |
IT Services (continued) | | | | | | | | | | | | | | Marine (continued) | | | | | | | | |
SRA International, Inc., Class A* | | | 150 | | | $ | 3,068 | | | | | | | Global Ship Lease, Inc., Class A* | | | 100 | | | $ | 495 | |
StarTek, Inc.* | | | 50 | | | | 254 | | | | | | | Horizon Lines, Inc., Class A | | | 50 | | | | 218 | |
TeleTech Holdings, Inc.* | | | 150 | | | | 3,088 | | | | | | | Navios Maritime Holdings, Inc. | | | 200 | | | | 1,056 | |
TNS, Inc.* | | | 50 | | | | 1,040 | | | | | | | Paragon Shipping, Inc., Class A | | | 100 | | | | 343 | |
| | | | | | | 30,662 | | | | | | | Star Bulk Carriers Corp. | | | 150 | | | | 400 | |
Leisure Equipment & Products - 0.89% | | | | | | | TBS International PLC,
Class A* | | | 50 | | | | 144 | |
Arctic Cat, Inc.* | | | 50 | | | | 732 | | | | | | | Ultrapetrol Bahamas, Ltd.* | | | 50 | | | | 322 | |
Brunswick Corp. | | | 200 | | | | 3,748 | | | | | | | | | | | | | | 7,226 | |
Callaway Gulf Co. | | | 150 | | | | 1,211 | | | | | | | Media - 2.58% | | | | | | | | |
Jakks Pacific, Inc.* | | | 50 | | | | 911 | | | | | | | A.H. Belo Corp., Class A* | | | 50 | | | | 435 | |
Smith & Wesson Holding Corp.* | | | 150 | | | | 561 | | | | | | | Belo Corp., Class A* | | | 250 | | | | 1,770 | |
Steinway Musical Instruments, Inc.* | | | 50 | | | | 992 | | | | | | | Carmike Cinemas, Inc.* | | | 50 | | | | 386 | |
Sturm Ruger & Co., Inc. | | | 50 | | | | 765 | | | | | | | Cinemark Holdings, Inc. | | | 250 | | | | 4,310 | |
| | | | | | | 8,920 | | | | | | | CKX, Inc.* | | | 200 | | | | 806 | |
Life Sciences Tools & Services - 0.05% | | | | | | | Dex One Corp.* | | | 100 | | | | 746 | |
Cambrex Corp.* | | | 50 | | | | 258 | | | | | | | Entercom Communications Corp., Class A* | | | 100 | | | | 1,158 | |
Harvard Bioscience, Inc.* | | | 50 | | | | 205 | | | | | | | Entravision Communications Corp., Class A* | | | 200 | | | | 514 | |
| | | | | | | 463 | | | | | | | Gray Television, Inc.* | | | 100 | | | | 187 | |
Machinery - 2.54% | | | | | | | | | | | | | | Harris Interactive, Inc.* | | | 100 | | | | 122 | |
Alamo Group, Inc. | | | 50 | | | | 1,391 | | | | | | | Harte-Hanks, Inc. | | | 150 | | | | 1,916 | |
Albany International Corp., Class A | | | 50 | | | | 1,184 | | | | | | | Journal Communications, Inc., Class A* | | | 100 | | | | 505 | |
Briggs & Stratton Corp. | | | 100 | | | | 1,969 | | | | | | | Lee Enterprises, Inc.* | | | 100 | | | | 246 | |
China Wind Systems, Inc.* | | | 50 | | | | 179 | | | | | | | McClatchy Co., Class A
(The)* | | | 200 | | | | 934 | |
Duoyuan Printing, Inc.* | | | 50 | | | | 146 | | | | | | | Media General, Inc., Class A* | | | 50 | | | | 289 | |
Federal Signal Corp. | | | 150 | | | | 1,029 | | | | | | | Meredith Corp. | | | 100 | | | | 3,465 | |
Greenbrier Cos., Inc.* | | | 50 | | | | 1,050 | | | | | | | New York Times Co., Class A (The)* | | | 300 | | | | 2,940 | |
Harsco Corp. | | | 200 | | | | 5,664 | | | | | | | Radio One, Inc., Class D* | | | 100 | | | | 112 | |
Lydall, Inc.* | | | 50 | | | | 402 | | | | | | | Reading International, Inc., Class A* | | | 50 | | | | 252 | |
Manitowoc Co., Inc. (The) | | | 300 | | | | 3,933 | | | | | | | Scholastic Corp. | | | 50 | | | | 1,477 | |
Miller Industries, Inc. | | | 50 | | | | 712 | | | | | | | Valassis Communications, Inc.* | | | 100 | | | | 3,235 | |
Mueller Water Products, Inc., Class A | | | 350 | | | | 1,460 | | | | | | | | | | | | | | 25,805 | |
NN, Inc.* | | | 50 | | | | 618 | | | | | | | Metals & Mining - 0.17% | | | | | | | | |
Sauer-Danfoss, Inc.* | | | 100 | | | | 2,825 | | | | | | | A.M. Castle & Co.* | | | 50 | | | | 920 | |
TriMas Corp.* | | | 100 | | | | 2,046 | | | | | | | China Gerui Advanced Materials Group, Ltd.* | | | 100 | | | | 588 | |
Xerium Technologies, Inc.* | | | 50 | | | | 798 | | | | | | | Sutor Technology Group, Ltd.* | | | 100 | | | | 216 | |
| | | | | | | 25,406 | | | | | | | | | | | | | | 1,724 | |
Marine - 0.72% | | | | | | | | | | | | | | | | | | | | | | |
Danaos Corp.* | | | 250 | | | | 935 | | | | | | | | | | | | | | | |
Eagle Bulk Shipping, Inc.* | | | 150 | | | | 747 | | | | | | | | | | | | | | | |
Excel Maritime Carriers, Ltd.* | | | 200 | | | | 1,126 | | | | | | | | | | | | | | | |
Genco Shipping & Trading, Ltd.* | | | 100 | | | | 1,440 | | | | | | | | | | | | | | | |
| | | | | | | | | | | | | | | | | | | | | | |
| | |
| Bridgeway Omni Tax-Managed Small-Cap Value Fund | | |
SCHEDULE OF INVESTMENTS (continued)
Showing percentage of net assets as of December 31, 2010 (Unaudited)
| | | | | | | | | | | | | | | | | | | | | | |
| Industry Company | | | Shares | | | | Value | | | | | | | Industry Company | | | Shares | | | | Value | |
Common Stocks (continued) | | | | | | | | |
Multiline Retail - 1.82% | | | | | | | Paper & Forest Products (continued) | |
Big Lots, Inc.* | | | 150 | | | | $ 4,569 | | | | | | | Wausau Paper Corp. | | | 100 | | | | $ 861 | |
Bon-Ton Stores, Inc. (The)* | | | 50 | | | | 633 | | | | | | | | | | | | | | 12,053 | |
Dillard’s, Inc., Class A | | | 150 | | | | 5,691 | | | | | | | Personal Products - 0.28% | | | | | | | | |
Fred’s, Inc., Class A | | | 100 | | | | 1,376 | | | | | | | China Sky One Medical, Inc.* | | | 50 | | | | 348 | |
Retail Ventures, Inc.* | | | 100 | | | | 1,630 | | | | | | | Elizabeth Arden, Inc.* | | | 50 | | | | 1,150 | |
Saks, Inc.* | | | 350 | | | | 3,745 | | | | | | | Inter Parfums, Inc. | | | 50 | | | | 943 | |
Tuesday Morning Corp.* | | | 100 | | | | 528 | | | | | | | Parlux Fragrances, Inc.* | | | 50 | | | | 147 | |
| | | | | | | 18,172 | | | | | | | Physicians Formula Holdings, Inc.* | | | 50 | | | | 188 | |
Oil, Gas & Consumable Fuels - 3.61% | | | | | | | | | | | | | | 2,776 | |
BioFuel Energy Corp.* | | | 100 | | | | 174 | | | | | | | Pharmaceuticals - 0.39% | |
Callon Petroleum Co.* | | | 50 | | | | 296 | | | | | | | Biostar Pharmaceuticals, Inc.* | | | 50 | | | | 141 | |
China Integrated Energy, Inc.* | | | 100 | | | | 733 | | | | | | | Cornerstone Therapeutics, Inc.* | | | 50 | | | | 290 | |
China North East Petroleum Holdings, Ltd.* | | | 50 | | | | 288 | | | | | | | Impax Laboratories, Inc.* | | | 150 | | | | 3,016 | |
Crimson Exploration, Inc.* | | | 100 | | | | 426 | | | | | | | Jiangbo Pharmaceuticals, Inc.* | | | 50 | | | | 286 | |
Crosstex Energy, Inc. | | | 100 | | | | 886 | | | | | | | Tianyin Pharmaceutical Co., Inc. | | | 50 | | | | 136 | |
CVR Energy, Inc.* | | | 200 | | | | 3,036 | | | | | | | | | | | | | | 3,869 | |
Delek US Holdings, Inc. | | | 100 | | | | 728 | | | | | | | Professional Services - 0.99% | |
Equal Energy, Ltd.* | | | 50 | | | | 307 | | | | | | | Administaff, Inc. | | | 50 | | | | 1,465 | |
GMX Resources, Inc.* | | | 50 | | | | 276 | | | | | | | CBIZ, Inc.* | | | 100 | | | | 624 | |
Green Plains Renewable Energy, Inc.* | | | 100 | | | | 1,126 | | | | | | | Dolan Co. (The)* | | | 50 | | | | 696 | |
Holly Corp. | | | 100 | | | | 4,077 | | | | | | | GP Strategies Corp.* | | | 50 | | | | 512 | |
James River Coal Co.* | | | 50 | | | | 1,266 | | | | | | | Heidrick & Struggles International, Inc. | | | 50 | | | | 1,432 | |
Penn Virginia Corp. | | | 100 | | | | 1,682 | | | | | | | Huron Consulting Group, Inc.* | | | 50 | | | | 1,322 | |
RAM Energy Resources, Inc.* | | | 200 | | | | 368 | | | | | | | ICF International, Inc.* | | | 50 | | | | 1,286 | |
StealthGas, Inc.* | | | 50 | | | | 399 | | | | | | | Navigant Consulting, Inc.* | | | 100 | | | | 920 | |
Stone Energy Corp.* | | | 100 | | | | 2,229 | | | | | | | School Specialty, Inc.* | | | 50 | | | | 697 | |
Teekay Corp. | | | 150 | | | | 4,962 | | | | | | | SFN Group, Inc.* | | | 100 | | | | 976 | |
Tesoro Corp.* | | | 300 | | | | 5,562 | | | | | | | | | | | | | | 9,930 | |
Tsakos Energy Navigation, Ltd. | | | 100 | | | | 1,000 | | | | | | | Real Estate Management & Development - 0.16% | |
USEC, Inc.* | | | 250 | | | | 1,505 | | | | | | | China Housing & Land Development, Inc.* | | | 50 | | | | 137 | |
W&T Offshore, Inc. | | | 150 | | | | 2,680 | | | | | | | FirstService Corp.* | | | 50 | | | | 1,514 | |
Western Refining, Inc.* | | | 200 | | | | 2,116 | | | | | | | | | | | | | | 1,651 | |
| | | | | | | 36,122 | | | | | | | Road & Rail - 2.50% | |
Paper & Forest Products - 1.21% | | | | | | | Amerco, Inc.* | | | 50 | | | | 4,802 | |
Buckeye Technologies, Inc. | | | 100 | | | | 2,101 | | | | | | | Avis Budget Group, Inc.* | | | 250 | | | | 3,890 | |
Clearwater Paper Corp.* | | | 50 | | | | 3,915 | | | | | | | Celadon Group, Inc.* | | | 50 | | | | 740 | |
KapStone Paper & Packaging Corp.* | | | 100 | | | | 1,530 | | | | | | | | | | | | | | | |
Mercer International, Inc.* | | | 100 | | | | 775 | | | | | | | | | | | | | | | |
Neenah Paper, Inc. | | | 50 | | | | 984 | | | | | | | | | | | | | | | |
Orient Paper, Inc.* | | | 50 | | | | 318 | | | | | | | | | | | | | | | |
PH Glatfelter Co. | | | 100 | | | | 1,227 | | | | | | | | | | | | | | | |
Verso Paper Corp.* | | | 100 | | | | 342 | | | | | | | | | | | | | | | |
| | |
| 12 | | Semi-Annual Report | December 31, 2010 (Unaudited) |
| | |
| Bridgeway Omni Tax-Managed Small-Cap Value Fund | | |
SCHEDULE OF INVESTMENTS (continued)
Showing percentage of net assets as of December 31, 2010 (Unaudited)
| | | | | | | | | | | | | | | | | | | | | | |
| Industry Company | | | Shares | | | | Value | | | | | | | Industry Company | | | Shares | | | | Value | |
Common Stocks (continued) | | | | | | | | | | | | | | | | | | | | | | |
Road & Rail (continued) | | | | | | | | | | | | | | Specialty Retail (continued) | | | | | | | | |
Con-way, Inc. | | | 100 | | | | $ 3,657 | | | | | | | Childrens Place Retail Stores, Inc., (The)* | | | 50 | | | | $ 2,482 | |
Covenant Transportation Group, Inc., Class A* | | | 50 | | | | 486 | | | | | | | Christopher & Banks Corp. | | | 100 | | | | 615 | |
Frozen Food Express Industries* | | | 50 | | | | 222 | | | | | | | Citi Trends, Inc.* | | | 50 | | | | 1,228 | |
Marten Transport, Ltd. | | | 50 | | | | 1,069 | | | | | | | Collective Brands, Inc.* | | | 150 | | | | 3,165 | |
Ryder System, Inc. | | | 100 | | | | 5,264 | | | | | | | Conn’s, Inc.* | | | 50 | | | | 234 | |
Saia, Inc.* | | | 50 | | | | 829 | | | | | | | Dress Barn, Inc. (The)* | | | 150 | | | | 3,963 | |
Vitran Corp., Inc.* | | | 50 | | | | 656 | | | | | | | Express, Inc. | | | 200 | | | | 3,760 | |
Werner Enterprises, Inc. | | | 150 | | | | 3,390 | | | | | | | Finish Line, Inc., Class A (The) | | | 100 | | | | 1,719 | |
| | | | | | | 25,005 | | | | | | | Genesco, Inc.* | | | 50 | | | | 1,874 | |
Semiconductors & Semiconductor Equipment - 1.50% | | | | | | | Haverty Furniture Cos., Inc. | | | 50 | | | | 649 | |
Amkor Technology, Inc.* | | | 400 | | | | 2,956 | | | | | | | Hot Topic, Inc. | | | 100 | | | | 627 | |
DSP Group, Inc.* | | | 50 | | | | 407 | | | | | | | Kirkland’s, Inc.* | | | 50 | | | | 702 | |
Fairchild Semiconductor International, Inc.* | | | 250 | | | | 3,902 | | | | | | | MarineMax, Inc.* | | | 50 | | | | 468 | |
Kulicke & Soffa Industries, Inc.* | | | 150 | | | | 1,080 | | | | | | | Men’s Wearhouse, Inc. (The) | | | 100 | | | | 2,498 | |
Mindspeed Technologies, Inc.* | | | 50 | | | | 305 | | | | | | | Midas, Inc.* | | | 50 | | | | 406 | |
Photronics, Inc.* | | | 100 | | | | 591 | | | | | | | Office Depot, Inc.* | | | 600 | | | | 3,240 | |
Pixelworks, Inc.* | | | 50 | | | | 175 | | | | | | | OfficeMax, Inc.* | | | 200 | | | | 3,540 | |
Teradyne, Inc.* | | | 400 | | | | 5,616 | | | | | | | Pacific Sunwear of California, Inc.* | | | 150 | | | | 813 | |
| | | | | | | 15,032 | | | | | | | Penske Automotive Group, Inc.* | | | 200 | | | | 3,484 | |
Software - 0.39% | | | | | | | | | | | | | | Pep Boys-Manny, Moe & Jack (The) | | | 100 | | | | 1,343 | |
CDC Corp., Class A* | | | 100 | | | | 351 | | | | | | | Pier 1 Imports, Inc.* | | | 250 | | | | 2,625 | |
GSE Systems, Inc.* | | | 50 | | | | 181 | | | | | | | RadioShack Corp. | | | 250 | | | | 4,622 | |
QAD, Inc., Class B* | | | 50 | | | | 497 | | | | | | | Rent-A-Center, Inc. | | | 150 | | | | 4,842 | |
Take-Two Interactive Software, Inc.* | | | 200 | | | | 2,448 | | | | | | | Select Comfort Corp.* | | | 100 | | | | 913 | |
TeleCommunication Systems, Inc., Class A* | | | 100 | | | | 467 | | | | | | | Shoe Carnival, Inc.* | | | 50 | | | | 1,350 | |
| | | | | | | 3,944 | | | | | | | Sonic Automotive, Inc., Class A | | | 100 | | | | 1,324 | |
Specialty Retail - 7.73% | | | | | | | | | | | | | | Stage Stores, Inc. | | | 100 | | | | 1,734 | |
A.C. Moore Arts & Crafts, Inc.* | | | 50 | | | | 126 | | | | | | | Stein Mart, Inc. | | | 100 | | | | 925 | |
Aeropostale, Inc.* | | | 200 | | | | 4,928 | | | | | | | Talbots, Inc.* | | | 150 | | | | 1,278 | |
AnnTaylor Stores Corp.* | | | 150 | | | | 4,108 | | | | | | | TravelCenters of America LLC* | | | 50 | | | | 189 | |
Barnes & Noble, Inc. | | | 150 | | | | 2,122 | | | | | | | West Marine, Inc.* | | | 50 | | | | 529 | |
Big 5 Sporting Goods Corp. | | | 50 | | | | 764 | | | | | | | Wet Seal, Inc., Class A (The)* | | | 200 | | | | 740 | |
Books-A-Million, Inc. | | | 50 | | | | 290 | | | | | | | Zale Corp.* | | | 50 | | | | 213 | |
Brown Shoe Co., Inc. | | | 100 | | | | 1,393 | | | | | | | | | | | | | | 77,313 | |
Build-A-Bear-Workshop, Inc.* | | | 50 | | | | 382 | | | | | | | Textiles, Apparel & Luxury Goods - 2.15% | | | | | |
Cabela’s, Inc.* | | | 150 | | | | 3,262 | | | | | | | Culp, Inc.* | | | 50 | | | | 518 | |
Casual Male Retail Group, Inc.* | | | 100 | | | | 474 | | | | | | | Hanesbrands, Inc.* | | | 200 | | | | 5,080 | |
Cato Corp., Class A (The) | | | 50 | | | | 1,370 | | | | | | | Jones Group, Inc. (The) | | | 200 | | | | 3,108 | |
| | | | | | | | | | | | | | Kenneth Cole Productions, Inc., Class A* | | | 50 | | | | 625 | |
| | | | | | | | | | | | | | Liz Claiborne, Inc.* | | | 200 | | | | 1,432 | |
| | |
| Bridgeway Omni Tax-Managed Small-Cap Value Fund | | |
SCHEDULE OF INVESTMENTS (continued)
Showing percentage of net assets as of December 31, 2010 (Unaudited)
| | | | | | | | | | | | | | | | | | | | | | | | | | | | | | |
| Industry Company | | | Shares | | | | Value | | | | | | | | | | | | | | | | | | | | | | | |
Common Stocks (continued) | | | | | | | Summary of inputs used to value the Fund’s investments as of 12/31/2010 are as follows (See Note 2 in Notes to Financial Statements): | |
Textiles, Apparel & Luxury Goods (continued) | | | | | | |
Movado Group, Inc.* | | | 50 | | | | $ 807 | | | | | | |
Oxford Industries, Inc. | | | 50 | | | | 1,280 | | | | | | |
Perry Ellis International, Inc.* | | | 50 | | | | 1,374 | | | | | | | | | | Valuation Inputs | |
Quiksilver, Inc.* | | | 350 | | | | 1,774 | | | | | | | | | | Investment in Securities (Market Value) | |
Warnaco Group, Inc. (The)* | | | 100 | | | | 5,507 | | | | | | | | |
| Level 1
Quoted
Prices |
| |
| Level 2
Significant
Observable
Inputs |
| |
| Level 3
Significant
Unobservable Inputs |
| | | Total | |
| | | | | | | 21,505 | | | | | | | | | | |
Thrifts & Mortgage Finance - 0.34% | | | | | | | | | | |
BankAtlantic Bancorp, Inc., Class A* | | | 150 | | | | 172 | | | | | | | | | | |
| | | | | | | | Common Stocks | | | $981,537 | | | | $— | | | | $— | | | | $981,537 | |
First Financial Holdings, Inc. | | | 50 | | | | 576 | | | | | | | TOTAL | | | $981,537 | | | | $— | | | | $— | | | | $981,537 | |
First Financial Northwest, Inc. | | | 50 | | | | 201 | | | | | | | | | | | | | | | | | | | | | | | |
| | | | | | | | See Notes to Financial Statements. | |
Radian Group, Inc. | | | 300 | | | | 2,421 | | | | | | | | | | | | | | | | | | | | | | | |
| | | | | | | 3,370 | | | | | | | | | | | | | | | | | | | | | | | |
Trading Companies & Distributors - 1.19% | | | | | | | | | | | | | | | | | | | | | | | |
Aircastle, Ltd. | | | 200 | | | | 2,090 | | | | | | | | | | | | | | | | | | | | | | | |
Applied Industrial | | | | | | | | | | | | | | | | | | | | | | | | | | | | | | |
Technologies, Inc. | | | 100 | | | | 3,248 | | | | | | | | | | | | | | | | | | | | | | | |
Beacon Roofing Supply, Inc.* | | | 100 | | | | 1,787 | | | | | | | | | | | | | | | | | | | | | | | |
| | | | | | | | | | | | | | | | | | | | | | | | |
DXP Enterprises, Inc.* | | | 50 | | | | 1,200 | | | | | | | | | | | | | | | | | | | | | | | |
GATX Corp. | | | 100 | | | | 3,528 | | | | | | | | | | | | | | | | | | | | | | | |
| | | | | | | 11,853 | | | | | | | | | | | | | | | | | | | | | | | |
Wireless Telecommunication Services - 0.28% | | | | | | | | | | | | | | | | | | | | | | | |
NTELOS Holdings Corp. | | | 100 | | | | 1,905 | | | | | | | | | | | | | | | | | | | | | | | |
USA Mobility, Inc. | | | 50 | | | | 889 | | | | | | | | | | | | | | | | | | | | | | | |
| | | | | | | 2,794 | | | | | | | | | | | | | | | | | | | | | | | |
| TOTAL COMMON STOCKS - 98.19% | | | | 981,537 | | | | | | | | | | | | | | | | | | | | | | | |
| (Cost $981,898) | | | | | | | | | | | | | | | | | | | | | | | | | | | | | | |
| | | | | | | |
| TOTAL INVESTMENTS - 98.19% | | | | $981,537 | | | | | | | | | | | | | | | | | | | | | | | |
| (Cost $981,898) | | | | | | | | | | | | | | | | | | | | | | | | | | | |
Other Assets in Excess of Liabilities -
1.81% | | | | 18,102 | | | | | | | | | | | | | | | | | | | | | | | |
| NET ASSETS - 100.00% | | | | $999,639 | | | | | | | | | | | | | | | | | | | | | | | |
| | | | | | |
| * Non-income producing security. | | | | | | | | | | | | | | | | | | | | | | | |
| LLC - Limited Liability Company | | | | | | | | | | | | | | | | | | | | | | | |
| PLC - Public Limited Company | | | | | | | | | | | | | | | | | | | | | | | |
| | |
| 14 | | Semi-Annual Report | December 31, 2010 (Unaudited) |
| | |
| STATEMENT OF ASSETS AND LIABILITIES | | |
| | | | | | | | |
December 31, 2010 (Unaudited) ASSETS | | | | Omni Tax-Managed Small-Cap Value | | | |
| | | |
Investments at value | | | | | $ 981,537 | | | |
Receivables: | | | | | | | | |
Fund shares sold | | | | | 1,000,000 | | | |
| | | |
Total assets | | | | | 1,981,537 | | | |
| | | |
LIABILITIES | | | | | | | | |
Payables: | | | | | | | | |
Portfolio securities purchased | | | | | 981,898 | | | |
| | | |
Total liabilities | | | | | 981,898 | | | |
| | | |
NET ASSETS | | | | | $ 999,639 | | | |
| | | |
NET ASSETS REPRESENT | | | | | | | | |
Paid-in capital | | | | | $1,000,000 | | | |
Net unrealized depreciation on investments | | | | | (361) | | | |
| | | |
NET ASSETS | | | | | $ 999,639 | | | |
| | | |
Shares of common stock outstanding of $.001 par value* | | | | | 100,000 | | | |
| | | |
Net asset value per share | | | | | $ 10.00 | | | |
| | | |
Total investments at cost | | | | | $ 981,898 | | | |
* See Note 1 - Organization in the Notes to Financial Statements for shares authorized for the Fund.
See Notes to Financial Statements.
| | |
| STATEMENT OF OPERATIONS | | |
| | | | | | | | |
| Period Ended December 31, 2010 (Unaudited) | | | | Omni Tax-Managed Small-Cap Value1 | | | |
| | | |
NET REALIZED AND UNREALIZED GAIN (LOSS) ON INVESTMENTS | | | | | | | | |
Change in Unrealized Appreciation (Depreciation) on: | | | | | | | | |
Investments | | | | | $(361) | | | |
| | | |
Net Change in Unrealized Appreciation (Depreciation) | | | | | (361) | | | |
| | | |
Net Realized and Unrealized Loss on Investments | | | | | (361) | | | |
| | | |
DECREASE IN NET ASSETS RESULTING FROM OPERATIONS | | | | | $(361) | | | |
1 Commencement of operations December 31, 2010.
See Notes to Financial Statements.
| | |
| 16 | | Semi-Annual Report | December 31, 2010 (Unaudited) |
| | |
| STATEMENT OF CHANGES IN NET ASSETS | | |
| | | | | | | | |
| | | |
| | | | | Omni Tax-Managed
Small-Cap Value | | | |
| | | | | December 31, 20101 (Unaudited) | | | |
| | | |
OPERATIONS | | | | | | | | |
Net change in unrealized appreciation/(depreciation) on investments | | | | | $ (361) | | | |
| | | |
Net decrease in net assets resulting from operations | | | | | (361) | | | |
| | | |
SHARE TRANSACTIONS: | | | | | | | | |
Proceeds from sale of shares | | | | | 1,000,000 | | | |
| | | |
Net increase in net assets from share transactions | | | | | 1,000,000 | | | |
| | | |
Net increase in net assets | | | | | 999,639 | | | |
NET ASSETS: | | | | | | | | |
Beginning of period | | | | | - | | | |
| | | |
End of period* | | | | | $ 999,639 | | | |
| | | |
SHARES ISSUED & REDEEMED | | | | | | | | |
Issued | | | | | 100,000 | | | |
| | | |
Net increase | | | | | 100,000 | | | |
| | | |
Outstanding at beginning of period | | | | | - | | | |
| | | |
Outstanding at end of period | | | | | 100,000 | | | |
| | |
| * Including undistributed net investment income of: | | | $ - | | | |
1 Commencement of operations December 31, 2010.
See Notes to Financial Statements.
FINANCIAL HIGHLIGHTS
(for a share outstanding throughout the period indicated)
| | | | | | | | | | | | | | | | |
| | | | | | Income from
Investment Operations | |
| | | Net Asset
Value,
Beginning
of Period | | | Net Investment
Income (Loss)(a) | | | Net Realized
and Unrealized
Gain\(Loss) | | | Total from
Investment
Operations | |
OMNI TAX-MANAGED SMALL-CAP VALUE | | | | | | | | | | | | | | | | |
| | | | |
Period Ended December 31, 2010 (Unaudited)(c) | | | $10.00 | | | | $ - | | | | $ -(d) | | | | $ - | |
(a) Per share amounts calculated based on the average daily shares outstanding during the period.
(b) Annualized for periods less than one year.
(c) Commenced operations on December 31, 2010. No expenses or income were acrrued, therefore, there are no ratios for the period.
(d) Amount represents less than $0.005.
See Notes to Financial Statements.
| | |
| 18 | | Semi-Annual Report | December 31, 2010 (Unaudited) |
| | | | | | | | | | | | | | | | | | |
Less Distributions
to Shareholders from: | | | | | | Ratios & Supplemental Data |
Net
Realized
Gain | | Net
Investment
Income | | Total
Distributions | | Net Asset
Value, End of
Period | | Total
Return | | Net Assets
End of
Period (000’s) | | Expenses Before
Waivers and
Reimbursements(b) | | Expenses After
Waivers and
Reimbursements(b) | | Net Investment
Income (Loss)
After Waivers and
Reimbursements(b) | | Portfolio
Turnover
Rate |
| | | | | | | | | | | | | | | | | | |
| $- | | $- | | $- | | $10.00 | | - | | $1,000 | | - | | - | | - | | - |
| | |
| NOTES TO FINANCIAL STATEMENTS | | |
December 31, 2010 (Unaudited)
1. Organization:
Bridgeway Funds, Inc. (“Bridgeway” or the “Company”) was organized as a Maryland corporation on October 19, 1993, and is registered under the Investment Company Act of 1940, as amended (the “1940 Act”), as an open-end management investment company.
Bridgeway is organized as a series fund, which currently has 13 investment funds (each, a “Bridgeway Fund” and collectively, the “Bridgeway Funds”). Aggressive Investors 1, Aggressive Investors 2, Ultra-Small Company, Ultra-Small Company Market, Micro-Cap Limited, Small-Cap Momentum, Small-Cap Growth, Small-Cap Value, Large-Cap Growth, Large-Cap Value, Blue Chip 35 Index and Managed Volatility Funds are presented in a separate report. The Omni Tax-Managed Small-Cap Value Fund (the “Fund”) commenced operations on December 31, 2010 and is presented in this report.
Effective January 18, 2011, the Omni Small-Cap Value Fund changed its name to Omni Tax-Managed Small-Cap Value Fund.
Bridgeway is authorized to issue 2,000,000,000 shares of common stock at $0.001 per share. 15,000,000 shares have been classified into the Aggressive Investors 1 Fund. 130,000,000 shares each have been classified into the Aggressive Investors 2 and Blue Chip 35 Index Funds. 5,000,000 shares have been classified into the Ultra-Small Company Fund. 10,000,000 shares have been classified in the Micro-Cap Limited Fund. 100,000,000 shares each have been classified into the Ultra-Small Company Market, Omni Tax-Managed Small-Cap Value, Small-Cap Momentum, Small-Cap Growth, Small-Cap Value, Large-Cap Growth, and Large-Cap Value Funds. 50,000,000 shares have been classified into the Managed Volatility Fund. All shares outstanding currently represent Class N shares.
All of the Bridgeway Funds are no-load, diversified funds.
The Fund seeks to provide long-term total return on capital, primarily through capital appreciation.
Bridgeway Capital Management, Inc. (the “Adviser”) is the investment adviser for all of the Bridgeway Funds.
2. Significant Accounting Policies:
The following summary of significant accounting policies, followed in the preparation of the financial statements of the Fund, are in conformity with accounting principles generally accepted in the United States of America (“GAAP”).
Securities, Options, Futures and Other Investments Valuation Other than options, portfolio securities that are principally traded on a national securities exchange are valued at their last sale price on the principal exchange on which they are traded prior to the close of the New York Stock Exchange (“NYSE”), on each day the NYSE is open for business. If there is no closing price on the NYSE, the portfolio security will be valued using a composite price, which is defined as the last price for the security on any exchange. Portfolio securities other than options that are principally traded on the National Association of Securities Dealers Automated Quotation System (“NASDAQ”) are valued at the NASDAQ Official Closing Price (“NOCP”). In the absence of recorded sales on their home exchange or NOCP in the case of NASDAQ traded securities, the security will be valued as follows: bid prices for long positions and ask prices for short positions. Other investments for which no sales are reported are valued at the latest bid price in accordance with the pricing policy established by the Board of Directors.
Investments in open-end registered investment companies and closed-end registered investment companies that do not trade on an exchange are valued at the end of day net asset value (“NAV”) per share.
Investments in closed-end registered investment companies that trade on an exchange are valued at the last sales price as of the close of the customary trading session on the exchange where the security is principally traded.
When market quotations are not readily available or when events occur that make established valuation methods unreliable, securities of the Fund may be valued at fair value as determined in good faith by or under the direction of the Board of Directors. The valuation assigned to fair valued securities for purposes of calculating the Fund’s NAV may differ from the security’s most recent closing market price and from the prices used by other mutual funds to calculate their NAVs.
| | |
| 20 | | Semi-Annual Report | December 31, 2010 (Unaudited) |
| | |
| NOTES TO FINANCIAL STATEMENTS (continued) | | |
December 31, 2010 (Unaudited)
The inputs and valuation techniques used to determine the value of the Fund’s investments are summarized into three levels as described in the hierarchy below:
| • | | Level 1 — quoted prices in active markets for identical assets |
Investments whose values are based on quoted market prices in active markets, and whose values are therefore classified as Level 1 prices, include active listed equity securities. The Fund does not adjust the quoted price for such investments, even in situations where the Fund holds a large position and a sale could reasonably impact the quoted price.
| • | | Level 2 — other significant observable inputs (including quoted prices for similar securities, interest rates, prepayments speeds, credit risk, etc.) |
Investments that trade in markets that are not considered to be active, but whose values are based on quoted market prices, dealer quotations or valuations provided by alternative pricing sources supported by observable inputs are classified as Level 2 prices. These generally include certain U.S. government and sovereign obligations, most government agency securities, investment-grade corporate bonds and less liquid listed equity securities. As investments whose values are classified as Level 2 prices include positions that are not traded in active markets and/or are subject to transfer restrictions, valuations may be adjusted to reflect illiquidity and/or non-transferability, which are generally based on available market information.
Money market fund investments consist of mutual funds which invest primarily in securities that are valued at amortized cost, a Level 2 investment. Therefore, the money market funds are classified as Level 2 investments.
| • | | Level 3 — significant unobservable inputs (including the Fund’s own assumptions in determining the fair value of investments) |
Investments whose values are classified as Level 3 prices have significant unobservable inputs, as they may trade infrequently or not at all. When observable prices are not available for these securities, the Fund uses one or more valuation techniques for which sufficient and reliable data is available. The inputs used by the Fund in estimating the value of Level 3 prices may include the original transaction price, quoted prices for similar securities or assets in active markets, completed or pending third-party transactions in the underlying investment or comparable issuers, and changes in financial ratios or cash flows. Level 3 prices may also be adjusted to reflect illiquidity and/or non-transferability, with the amount of such discount estimated by the Fund in the absence of market information. Assumptions used by the Fund due to the lack of observable inputs may significantly impact the resulting value and therefore the Fund’s results of operations.
The inputs or methodology used for valuing investments are not necessarily an indication of the risk associated with investing in those investments. A summary of the inputs used to value the Fund’s investments as of December 31, 2010 is included with the Fund’s Schedule of Investments.
In January 2010, the Financial Accounting Standards Board (“FASB”) issued Accounting Standards Update (“ASU”) No. 2010-06 “Improving Disclosures about Fair Value Measurements.” ASU No. 2010-06 amends FASB Accounting Standards Codification Topic 820, Fair Value Measurements and Disclosures, to require additional disclosures regarding fair value measurements. Certain disclosures required by ASU No. 2010-06 are effective for fiscal years beginning after December 15, 2010, and for interim periods within those fiscal years. Management is currently evaluating the impact ASU No. 2010-06 will have on its financial statement disclosures.
Securities Lending Upon lending its securities to third parties, the Fund receives compensation in the form of fees. The Fund also continues to receive dividends on the securities loaned. The loans are secured by collateral at least equal to the fair value of the securities loaned plus accrued interest. Gain or loss in the fair value of the securities loaned that may occur during the term of the loan will be for the account of the Fund. The Fund has the right under the lending agreement to recover the securities from the borrower on demand. Additionally, the Fund does not have the right to sell or repledge collateral received in the form of securities unless the borrower goes into default. The risks to the Fund of securities lending are that the borrower may not provide additional collateral when required or return the securities when due.
As of December 31, 2010, the Fund had no securities on loan.
| | |
| NOTES TO FINANCIAL STATEMENTS (continued) | | |
December 31, 2010 (Unaudited)
It is the Fund’s policy to obtain additional collateral from or return excess collateral to the borrower by the end of the next business day, following the valuation date of the securities loaned. Therefore, the value of the collateral held may be temporarily less than that required under the lending contract.
Use of Estimates in Financial Statements In preparing financial statements in conformity with GAAP, management makes estimates and assumptions that affect the reported amounts of assets and liabilities at the date of the financial statements and the disclosure of contingent assets and liabilities at the date of the financial statements as well as the reported amounts of revenue and expenses during the reporting period. Actual results could differ from those estimates.
Risks and Uncertainties The Fund provides for various investment options, including stocks. Such investments are exposed to various risks, such as interest rate, market and credit risks. Due to the risks involved, it is at least reasonably possible that changes in risks in the near term would materially affect shareholders’ account values and the amounts reported in the financial statements.
Security Transactions, Expenses, Gains and Losses and Allocations Bridgeway Funds’ expenses that are not series-specific are allocated to each series based upon its relative proportion of net assets to the Bridgeway Funds’ total net assets or other appropriate basis.
Security transactions are accounted for as of the trade date, the date the order to buy or sell is executed. Realized gains and losses are computed on the identified cost basis. Dividend income is recorded on the ex-dividend date, and interest income is recorded on the accrual basis from settlement date.
Distributions to Shareholders The Fund pays dividends from net investment income and distributes realized capital gains annually, usually in December.
Derivatives
Futures Contracts The Fund may purchase or sell financial futures contracts to hedge cash positions, manage market risk and to dampen volatility in line with investment objectives. A futures contract is an agreement between two parties to buy or sell a financial instrument at a set price on a future date. Upon entering into such a contract the Fund is required to pledge to the broker an amount of cash or U.S. government securities equal to the minimum “initial margin” requirements of the exchange on which the futures contract is traded. The contract amount reflects the extent of the Fund’s exposure in these financial instruments. The Fund’s participation in the futures markets involves certain risks, including imperfect correlation between movements in the price of futures contracts and movements in the price of the securities hedged or used for cover. Pursuant to a contract, the Fund agrees to receive from or pay to the broker an amount of cash equal to the fluctuation in value of the contract. Such receipts or payments are known as “variation margin” and are recorded by the Fund as unrealized appreciation or depreciation. When a contract is closed, the Fund records a realized gain or loss equal to the difference between the value of the contract at the time it was opened and the value at the time it was closed. With futures, there is minimal counterparty risk to the Fund since futures are exchange traded and the exchange’s clearinghouse, as counterparty to all exchange traded futures, guarantees the futures against default. As of December 31, 2010, the Fund had no open futures contracts.
Swaps. The Fund may enter into total return swaps. Total return swaps are agreements that provide the Fund with a return based on the performance of an underlying asset, in exchange for fee payments to a counterparty based on a specified rate. The difference in the value of these income streams is recorded daily by the Fund and is settled in cash monthly.
The fee paid by the Fund will typically be determined by multiplying the face value of the swap agreement by an agreed upon interest rate. In addition, if the underlying asset declines in value over the term of the swap, the Fund would also be required to pay the dollar value of that decline to the counterparty. Total return swaps could result in losses if the underlying asset does not perform as anticipated by the Adviser. The Fund may use its own net asset value as the underlying asset in a total return swap. This strategy serves to reduce cash drag (the impact of cash on the Fund’s overall return) by replacing it with the impact of market exposure based upon the Fund’s own investment holdings. No total return swaps were open as of December 31, 2010.
| | |
| 22 | | Semi-Annual Report | December 31, 2010 (Unaudited) |
| | |
| NOTES TO FINANCIAL STATEMENTS (continued) | | |
December 31, 2010 (Unaudited)
Indemnification Under the Company’s organizational documents, the Fund’s officers, directors, employees and agents are indemnified against certain liabilities that may arise out of the performance of their duties to the Fund. Additionally, in the normal course of business, the Fund enters into contracts that contain a variety of indemnification clauses. The Fund’s maximum exposure under these arrangements is unknown as this would involve future claims that may be made against the Fund that have not yet occurred. However, the Fund has not had prior claims or losses pursuant to these contracts.
3. Management Fees, Other Related Party Transactions and Contingencies:
The Fund has entered into a management agreement with the Adviser. As compensation for the advisory services rendered, facilities furnished, and expenses borne by the Adviser, the Fund pays the Adviser a fee of 0.50% of the value of the Fund’s average daily net assets, computed daily and payable monthly.
Expense limitations: The Board of Directors and sole initial shareholder approved an expense limitation beginning on December 31, 2010 for the Fund. The Adviser agrees to reimburse the Fund for operating expenses and management fees above the expense limitation of 0.60% of the value of its average net assets for the fiscal year. The Fund is authorized to reimburse the Adviser for management fees previously waived and/or for expenses previously paid by the Adviser, provided, however, that any reimbursement must be paid at a date not more than three years after the fiscal year in which the Adviser waived the fees or reimbursed the expenses and the reimbursements do not cause the Fund to exceed the expense limitation in the agreement.
The Fund commenced operations on December 31, 2010 and as a result, there were no fees or fee waivers for the period ended December 31, 2010.
Other Related Party Transactions: On occasion, the Fund may engage in inter-portfolio trades when it is to the benefit of both parties. The Board of Directors reviews these trades quarterly. No inter-portfolio purchases or sales were entered into during the period ended December 31, 2010.
The Adviser entered into an Administrative Services Agreement with Bridgeway, pursuant to which the Adviser provides various administrative services to the Fund including, but not limited to: (i) supervising and managing various aspects of the Fund’s business and affairs; (ii) selecting, overseeing and/or coordinating activities with other service providers to the Fund; (iii) providing reports to the Board of Directors as requested from time to time; (iv) assisting and/or reviewing amendments and updates to the Fund’s registration statement and other filings with the Securities and Exchange Commission (“SEC”); (v) providing certain shareholder services; (vi) providing administrative support in connection with meetings of the Board of Directors; and (vii) providing certain record-keeping services. For its services to all of the Bridgeway Funds, the Adviser is paid an aggregate annual fee of $535,000 payable in equal monthly installments.
One director of Bridgeway, John Montgomery, is an owner and director of the Adviser. Another director of Bridgeway, Michael Mulcahy, is an executive and director of the Adviser. Under the 1940 Act definitions, each is considered to be an “affiliated person” of the Adviser and an “interested person” of the Adviser and of Bridgeway. Compensation for Mr. Montgomery and Mr. Mulcahy is borne by the Adviser rather than the Bridgeway Funds.
Board of Directors Compensation Independent Directors are paid an annual retainer of $14,000 with an additional retainer of $2,500 paid to the Independent Chairman of the Board and an additional retainer of $1,000 paid to the Nominating and Corporate Governance Committee Chair. Independent Directors are paid $6,000 per meeting for meeting fees. Such compensation is the total compensation from all Bridgeway Funds and is allocated among the Bridgeway Funds.
The Independent Directors receive this compensation in the form of shares of the Bridgeway Funds, credited to his or her account. Such Directors are reimbursed for any expenses incurred in attending meetings and conferences and expenses for subscriptions or printed materials. During the period ended December 31, 2010, no such reimbursements were paid.
4. Distribution and Shareholder Servicing Fees:
Foreside Fund Services, LLC acts as distributor of the Fund’s shares pursuant to a Distribution Agreement dated November 12, 2010. The Adviser pays all costs and expenses associated with distribution of the Fund’s shares pursuant to a protective plan adopted by shareholders pursuant to Rule 12b-1.
| | |
| NOTES TO FINANCIAL STATEMENTS (continued) | | |
December 31, 2010 (Unaudited)
5. Purchases and Sales of Investment Securities:
Purchases and sales of investments, other than short-term securities, for the Fund for the period ended December 31, 2010 were as follows:
| | | | | | | | | | | | | | | | |
| | | Purchases | | | Sales | |
| | | U.S. Government | | | Other | | | U.S. Government | | | Other | |
| | $ | - | | | $ | 981,898 | | | $ | - | | | $ | - | |
6. Federal Income Taxes
It is the Fund’s policy to continue to comply with the provisions of the Internal Revenue Code of 1986, as amended, applicable to regulated investment companies and distribute income to the extent necessary so that the Fund is not subject to federal income tax. Therefore, no federal income tax provision is required.
Unrealized Appreciation and Depreciation on Investments (Tax Basis) The amount of net unrealized appreciation/depreciation and the cost of investment securities for tax purposes, including short-term securities at December 31, 2010, were as follows:
| | | | |
| | | | | |
As of December 31, 2010 | | | | |
Gross appreciation (excess of value over tax cost) | | $ | - | |
Gross depreciation (excess of tax cost over value) | | | (361 | ) |
Net unrealized appreciation (depreciation) | | $ | (361 | ) |
Cost of investments for income tax purposes | | $ | 981,898 | |
There were no differences between book and tax net unrealized appreciation (depreciation).
Classifications of Distributions Net investment income (loss) and net realized gain (loss) may differ for financial statement and tax purposes. The character of distributions made during the year from net investment income or net realized gains may differ from its ultimate characterization for federal income tax purposes.
The Fund commenced operations on December 31, 2010, therefore there were no distributions paid during the period ended December 31, 2010.
Accounting for Uncertainty in Income Taxes sets forth a minimum threshold for financial statement recognition of the benefit of a tax position taken or expected to be taken in a tax return. Management has analyzed the Fund’s tax positions and has concluded that no provision for income tax is required in the Fund’s financial statements. The Fund is not aware of any tax position for which it is reasonably possible that the total amounts of unrecognized tax benefits will significantly change in the next twelve months.
7. Subsequent Events
Management has evaluated the impact of all subsequent events on the Fund and has determined that there were no subsequent events requiring recognition or disclosure in the financial statements.
| | |
| 24 | | Semi-Annual Report | December 31, 2010 (Unaudited) |
| | |
| OTHER INFORMATION | | |
December 31, 2010 (Unaudited)
1. Proxy Voting
Fund policies and procedures used in determining how to vote proxies relating to the Fund’s securities are available without a charge, upon request, by contacting Bridgeway Funds at 1-800-661-3550 and on the SEC’s website at http://www.sec.gov. There were no proxies voted by the Fund for the period ended June 30, 2010 since the Fund commenced operations on December 31, 2010.
2. Fund Holdings
The complete schedule of the Fund’s holdings for the second and fourth quarters of each fiscal year are contained in the Fund’s Semi-Annual and Annual shareholder reports, respectively.
The Bridgeway Funds file complete schedules of the Fund’s holdings with the SEC for the first and third quarters of each fiscal year on Form N-Q within 60 days after the end of the period. Copies of the Fund’s Form N-Q are available without charge, upon request, by contacting Bridgeway Funds at 1-800-661-3550 and on the SEC’s website at http://www.sec.gov. You may also review and copy Form N-Q at the SEC’s Public Reference Room in Washington, D.C. For more information about the operation of the Public Reference Room, please call 1-800-SEC-0330.
3. Approval of Investment Management Agreement For Omni Small-Cap Value Fund
The Board of Directors (“Board”), including a majority of the non-interested or independent Directors (hereinafter, “Directors”), met in person on November 12, 2010 (the “Meeting”) to consider, among other things, the creation of the Omni Small-Cap Value Fund (the “Fund”), and to consider whether to approve an investment management agreement (the “Advisory Agreement”) between Bridgeway Capital Management, Inc. (the “Adviser”) and the Fund.
In reaching its decision to approve the new Advisory Agreement for the Fund, the Board considered information provided specifically in relation to the approval of the Advisory Agreement for the Meeting including the following: (1) the proposed management fees and total expenses of the Fund as compared to a comparable group of funds (the “peer funds”); (2) the nature, extent and quality of services to be provided by the Adviser to the Fund, including investment advisory and administrative services to the Fund; (3) the costs of providing services to the Fund; (4) the extent to which economies of scale may be present and if so, whether they would be shared with the Fund’s shareholders; and (5) any “fall out” or ancillary benefits that may accrue to the Adviser as a result of the relationship with the Fund. In addition to evaluating, among other things, the written information provided by the Adviser, the Board also evaluated the answers to questions posed by the independent Directors to representatives of the Adviser at the Meeting. In considering the information and materials described above, the independent Directors received assistance from independent legal counsel.
Because the Fund is new, the Board could not consider comparative information regarding Fund performance or the level of profitability (or lack thereof) that the Adviser would receive for its investment management services to the Fund. The Board considered the Fund’s proposed investment objective, strategy and proposed performance benchmarks. The Board considered that the proposed management fee for the Fund is comparable to that of peer funds and the Fund’s projected total annual operating expenses, after taking into account waivers/reimbursements, also was projected to be comparable to that of peer funds. The Board also noted that the proposed management fee for the Fund is less than the management fee the Adviser plans to charge for managing a similar mandate for separate accounts. The Board also considered that the Adviser agreed to waive fees and reimburse expenses so that the total operating expenses do not exceed a cap for the Fund. Although the Fund does not have fee breakpoints in its management fee schedule, the Adviser indicated that the Fund was priced low in anticipation of future growth to be competitive with the largest peer funds. The Board also considered its satisfactory experience with the nature, extent and quality of the services the Adviser has provided to other funds in the complex and this experience supported approval of the Advisory Agreement with the Fund. In terms of potential “fall out” or ancillary benefits to the Adviser due to its position as manager of the Fund, the Board noted that the Adviser continues to use no soft dollars and its fees for administrative services to the Fund are structured to approximate an at-cost relationship.
Based on all of the information presented, the Board, including a majority of its independent Directors, approved the Advisory Agreement for the Fund and determined that the fees to be charged under the Advisory Agreement are reasonable in relation
| | |
| OTHER INFORMATION (continued) | | |
December 31, 2010 (Unaudited)
to the services to be provided under the Advisory Agreement. In view of the broad scope and variety of factors and information, the Directors did not identify any single factor as being of paramount importance in reaching their conclusions and determination to approve the Advisory Agreement for the Fund. Rather, the approval determination was made on the basis of each Director’s business judgment after consideration of all of the factors taken in their entirety.
| | |
| 26 | | Semi-Annual Report | December 31, 2010 (Unaudited) |
| | |
| DISCLOSURE OF FUND EXPENSES | | |
December 31, 2010 (Unaudited)
As a shareholder of the Fund, you will incur no transaction costs from the Fund, including sales charges (loads) on purchases, on reinvested dividends, or on other distributions. There are no exchange fees. However, as a shareholder of the Fund, you will incur ongoing costs, including management fees and other Fund expenses.
The Fund did not commence operations until the date of this semi-annual report and therefore no expense example is provided.
THIS PAGE INTENTIONALLY LEFT BLANK

BRIDGEWAY FUNDS, INC.
BNY Mellon Investment Servicing (US) Inc.
301 Bellevue Parkway
Wilmington, DE 19809
CUSTODIAN
PFPC Trust Company
8800 Tinicum Blvd., 4th Floor
Philadelphia, PA 19153
DISTRIBUTOR
Foreside Fund Services, LLC
Three Canal Plaza, Suite 100
Portland, ME 04101

Not applicable.
| Item 3. | Audit Committee Financial Expert. |
Not applicable.
| Item 4. | Principal Accountant Fees and Services. |
Not applicable.
| Item 5. | Audit Committee of Listed registrants. |
Not applicable.
| (a) | Schedule of Investments in securities of unaffiliated issuers as of the close of the reporting period is included as part of the report to shareholders filed under Item 1 of this form. |
| (b) | The Registrant made no divestments of securities in accordance with section 13(c) of the Investment Company Act of 1940. |
| Item 7. | Disclosure of Proxy Voting Policies and Procedures for Closed-End Management Investment Companies. |
Not applicable.
| Item 8. | Portfolio Managers of Closed-End Management Investment Companies. |
Not applicable.
| Item 9. | Purchases of Equity Securities by Closed-End Management Investment Company and Affiliated Purchasers. |
Not applicable.
| Item 10. | Submission of Matters to a Vote of Security Holders. |
There have been no material changes to the procedures by which the shareholders may recommend nominees to the Registrant’s Board of Directors, where those changes were implemented after the registrant last provided disclosure in response to the requirements of Item 407(c)(2)(iv) of Regulation S-K (17 CFR 229.407) (as required by Item 22(b)(15) of Schedule 14A (17 CFR 240.14a-101)), or this Item.
| Item 11. | Controls and Procedures. |
| | (a) | The registrant’s principal executive officer and principal financial officer, or persons performing similar functions, have concluded that the registrant’s disclosure controls and procedures (as defined in Rule 30a-3(c) under the Investment Company Act of 1940, as amended (the “1940 Act”) (17 CFR 270.30a-3(c))) are effectively designed, as of a date within 90 days of the filing date of the report that includes the disclosure required by this paragraph, based on their evaluation of these controls and procedures required by Rule 30a-3(b) under the 1940 Act (17 CFR 270.30a-3(b)) and Rules 13a-15(b) or 15d-15(b) under the Securities Exchange Act of 1934, as amended (17 CFR 240.13a-15(b) or 240.15d-15(b)). |
| | (b) | There were no changes in the registrant’s internal control over financial reporting (as defined in Rule 30a-3(d) under the Act (17 CFR 270.30a-3(d)) that occurred during the second fiscal quarter of the period covered by this report that have materially affected or are reasonably likely to materially affect, the registrant’s internal control over financial reporting. |
| | (a)(2) | Certifications pursuant to Rule 30a-2(a) under the 1940 Act and Section 302 of the Sarbanes-Oxley Act of 2002 are attached hereto. |
| | (b) | Certifications pursuant to Rule 30a-2(b) under the 1940 Act and Section 906 of the Sarbanes- Oxley Act of 2002 are attached hereto. |
SIGNATURES
Pursuant to the requirements of the Securities Exchange Act of 1934 and the Investment Company Act of 1940, the registrant has duly caused this report to be signed on its behalf by the undersigned, thereunto duly authorized.
| | | | |
(registrant) | | Bridgeway Funds, Inc. | | |
| | |
By (Signature and Title)* | | /s/ Michael D. Mulcahy | | |
| | Michael D. Mulcahy, President and Principal Executive Officer | | |
| | (principal executive officer) | | |
Pursuant to the requirements of the Securities Exchange Act of 1934 and the Investment Company Act of 1940, this report has been signed below by the following persons on behalf of the registrant and in the capacities and on the dates indicated.
| | | | |
By (Signature and Title)* | | /s/ Michael D. Mulcahy | | |
| | Michael D. Mulcahy, President and Principal Executive Officer | | |
| | (principal executive officer) | | |
| | | | |
By (Signature and Title)* | | /s/ Linda G. Giuffré | | |
| | Linda G. Giuffré, Treasurer and Principal Financial Officer | | |
| | (principal financial officer) | | |
| * | Print the name and title of each signing officer under his or her signature. |