As filed with the Securities and Exchange Commission on March 7, 2008
UNITED STATES
SECURITIES AND EXCHANGE COMMISSION
WASHINGTON, D.C. 20549
FORM N-CSR
CERTIFIED SHAREHOLDER REPORT OF REGISTERED MANAGEMENT
INVESTMENT COMPANIES
| | |
Investment Company Act file number | | 811-08200 |
BRIDGEWAY FUNDS, INC.
5615 Kirby Drive, Suite 518
Houston, Texas 77005-2448
(800) 661-3550
Michael D. Mulcahy, President
Bridgeway Funds, Inc.
5615 Kirby Drive, Suite 518
Houston, Texas 77005-2448
Date of fiscal year end: June 30
Date of reporting period: July 1, 2007 - December 31, 2007
| ITEM 1. | REPORT TO STOCKHOLDERS |

| | |
| | A no-load mutual fund family of domestic funds |
| | |
| |
| | Semi-Annual Report December 31, 2007 (Unaudited) |
| | | | |
| | |
| | AGGRESSIVE INVESTORS 1 | | BRAGX |
| | (Closed to New Investors) | | |
| | |
| | AGGRESSIVE INVESTORS 2 | | BRAIX |
| | |
| | ULTRA-SMALL COMPANY | | BRUSX |
| | (Closed) | | |
| | |
| | ULTRA-SMALL COMPANY MARKET | | BRSIX |
| | |
| | MICRO-CAP LIMITED | | BRMCX |
| | (Closed to New Investors) | | |
| | |
| | SMALL-CAP GROWTH | | BRSGX |
| | |
| | SMALL-CAP VALUE | | BRSVX |
| | |
| | LARGE-CAP GROWTH | | BRLGX |
| | |
| | LARGE-CAP VALUE | | BRLVX |
| | |
| | BLUE CHIP 35 INDEX | | BRLIX |
| | |
| | BALANCED | | BRBPX |

TABLE OF CONTENTS
Bridgeway Funds Standardized Returns as of December 31, 2007*
| | | | | | | | | | | | | | | | | |
| | | Dec. Qtr.
10/1/07
to 12/31/07 | | 6 Month
7/1/07
to 12/31/07 | | Annualized | | | | | |
| Fund | | | | 1 Year | | 5 Years | | 10 Years | | Inception
to Date | | Inception
Date | | Gross
Expense
Ratio1 | |
Aggressive Investors 1 | | 5.26% | | 10.66% | | 25.80% | | 21.76% | | 19.26% | | 20.79% | | 8/5/1994 | | 1.69% | |
Aggressive Investors 2 | | 5.02% | | 11.62% | | 32.19% | | 22.57% | | | | 14.72% | | 10/31/2001 | | 1.19% | |
Ultra-Small Company | | -7.00% | | -8.22% | | -2.77% | | 23.14% | | 17.56% | | 20.57% | | 8/5/1994 | | 1.06% | |
Ultra-Small Co Market | | -6.78% | | -9.21% | | -5.40% | | 18.79% | | 14.87% | | 14.18% | | 7/31/1997 | | 0.65% | |
Micro-Cap Limited | | -3.16% | | -5.19% | | -4.97% | | 15.76% | | | | 15.24% | | 6/30/1998 | | 0.79% | |
Small-Cap Growth | | -3.30% | | -4.75% | | 6.87% | | | | | | 10.66% | | 10/31/2003 | | 0.88% | |
Small-Cap Value | | -3.63% | | -7.79% | | 6.93% | | | | | | 14.03% | | 10/31/2003 | | 0.84% | |
Large-Cap Growth | | 0.81% | | 6.45% | | 19.01% | | | | | | 10.36% | | 10/31/2003 | | 0.73% | |
Large-Cap Value | | -2.55% | | -2.61% | | 4.49% | | | | | | 13.73% | | 10/31/2003 | | 0.74% | |
Blue Chip 35 Index | | -3.73% | | 0.34% | | 6.07% | | 10.59% | | 6.62% | | 6.34% | | 7/31/1997 | | 0.30% | 2 |
Balanced | | 2.26% | | 3.21% | | 6.58% | | 9.04% | | | | 5.92% | | 6/30/2001 | | 0.93% | |
1 Expense ratio for the fiscal year ended June 30, 2007 restated to reflect current Fund Administration, Fund Accountant and Fund Transfer Agency Service fees.
2 Some of the Fund’s fees were waived or expenses reimbursed otherwise returns would have been lower. The Adviser has contractually agreed to waive fees and/or reimburse expenses such that the total operating expenses of the Fund do not exceed 0.15%. Any material change to this Fund policy would require a vote by shareholders.
Bridgeway Funds Returns for Calendar Years 1995 through 2007*
| | | | | | | | | | | | | | | | | | | | | | | | | | |
| | | 1995 | | 1996 | | 1997 | | 1998 | | 1999 | | 2000 | | 2001 | | 2002 | | 2003 | | 2004 | | 2005 | | 2006 | | 2007 |
Aggressive Investors 1 | | 27.10% | | 32.20% | | 18.27% | | 19.28% | | 120.62% | | 13.58% | | -11.20% | | -18.01% | | 53.97% | | 12.21% | | 14.93% | | 7.11% | | 25.80% |
Aggressive Investors 2 | | | | | | | | | | | | | | | | -19.02% | | 44.01% | | 16.23% | | 18.59% | | 5.43% | | 32.19% |
Ultra-Small Company | | 39.84% | | 29.74% | | 37.99% | | -13.11% | | 40.41% | | 4.75% | | 34.00% | | 3.98% | | 88.57% | | 23.33% | | 2.99% | | 21.55% | | -2.77% |
Ultra-Small Co Market | | | | | | | | -1.81% | | 31.49% | | 0.67% | | 23.98% | | 4.90% | | 79.43% | | 20.12% | | 4.08% | | 11.48% | | -5.40% |
Micro-Cap Limited | | | | | | | | | | 49.55% | | 6.02% | | 30.20% | | -16.61% | | 66.97% | | 9.46% | | 22.55% | | -2.34% | | -4.97% |
Small-Cap Growth | | | | | | | | | | | | | | | | | | | | 11.59% | | 18.24% | | 5.31% | | 6.87% |
Small-Cap Value | | | | | | | | | | | | | | | | | | | | 17.33% | | 18.92% | | 12.77% | | 6.93% |
Large-Cap Growth | | | | | | | | | | | | | | | | | | | | 6.77% | | 9.33% | | 4.99% | | 19.01% |
Large-Cap Value | | | | | | | | | | | | | | | | | | | | 15.15% | | 11.62% | | 18.52% | | 4.49% |
Blue Chip 35 Index | | | | | | | | 39.11% | | 30.34% | | -15.12% | | -9.06% | | -18.02% | | 28.87% | | 4.79% | | 0.05% | | 15.42% | | 6.07% |
Balanced | | | | | | | | | | | | | | | | -3.51% | | 17.82% | | 7.61% | | 6.96% | | 6.65% | | 6.58% |
Performance figures quoted represent past performance and are no guarantee of future results. Current performance may be lower or higher than the performance data quoted. Investment return and principal value will fluctuate so that an investor’s shares, when redeemed, may be worth more or less than original cost. Total return figures include the reimbursement of dividends and capital gains.
This report is submitted for the general information of the shareholders of each Fund. It is not authorized for distribution to prospective investors unless preceded or accompanied by an effective prospectus, which includes information regarding a Fund’s risks, objectives, fees and expenses, experience of its management, and other information. Investors should read the prospectus carefully before investing in a Fund. For questions or other Fund information, call 1-800-661-3550 or visit the Funds’ website www.bridgeway.com. Funds are available for purchase by residents of the United States, Puerto Rico, U.S. Virgin Islands and Guam only. Foreside Fund Services, LLC, Distributor.
The views expressed here are exclusively those of Fund management. These views including those relating to the market, sectors or individual stocks are not meant as investment advice and should not be considered predictive in nature.
| * | Numbers with green highlight indicate periods when the Fund outperformed its primary benchmark. |
LETTER FROM THE INVESTMENT MANAGEMENT TEAM
February 25, 2008
Dear Fellow Shareholders,
Fighting the broader market benchmark declines, four of eleven Bridgeway Funds ended the December 2007 quarter in positive territory. In addition, nine of eleven Funds beat their primary market benchmark. For the second quarter in a row, our Aggressive Investors 1 and 2 Funds were the performance standouts, both with returns exceeding 5%—quite favorable in a bear market environment. Our “laggard” of the prior two years, Micro-Cap Limited Fund, completed its second quarter in a row beating its primary market benchmark, though with an absolute return of -3.16%.
Of course, our primary focus is on long-term numbers. We like to think of an individual quarter as a single and statistically insignificant data point. With this in mind, both the quarterly and long-term performance numbers for each of our Funds are presented on the top of the adjacent page. Green indicates a Fund beating its primary market benchmark for the relevant period. In the top table, green on the left hand side (shorter term performance) is good, but doesn’t mean a lot. Moving right, green is more significant, and one of our goals is to have green in the “inception” column of each Fund and wherever we have 10-year numbers to report.
Perhaps most notable in the market landscape for calendar 2007 was the return—and it’s been a long time coming—to better performance by larger and especially faster-growing companies. Against this backdrop, our ultra-small, micro-cap, and small-cap Funds ended the year in negative, though, market-beating territory—with one exception (Small-Cap Growth Fund). A short market commentary is offered on page 3. Think a recession’s in store? See page 3.
One of the arguments against comparing mutual fund performance to peer indexes is that “mediocrity” is not a good benchmark, nor a high enough standard. This is one reason we also compare our Funds’ performance to that of market benchmarks, which have the advantage of zero operating and transaction costs, making them generally harder to beat. Additionally, in recent years we have had a “friendly competition” against Morningstar’s analyst picks. Interesting results for 2007 appear on page 4.
Occasionally, investors or journalists draw inappropriate conclusions about one or more of our Funds, and we try to set the record straight. Recently, our Ultra-Small Company Market Fund was highlighted in an article about “shock absorber” funds, funds that should do well in a market downturn. We like our Ultra-Small Company and Ultra-Small Company Market Funds as long term, aggressive holdings and as good diversifiers of what most people otherwise hold, regardless of market conditions. However, “shock absorber” is not one of the adjectives that first pops to mind. The section on page 4 explains our view.
Page 5 presents our brief commentary on the sub-prime lending debacle and what we really don’t like about it. A section on the same page gives an update on our report of investors redeeming shares of Aggressive Investors 2 Fund in early calendar year 2007—more data supporting our view that timing the market or the Fund’s short-term performance, is a poor and inappropriate use of our Funds.
Last quarter marked the twentieth anniversary of Black Monday, the largest single day drop of the Dow Jones Industrial Average. Being the oldest member of our team, John can recount the day and reveal what he learned from it on page 6. Page 7 ends with a review of two trade journal subjects.
A detailed review of performance by Fund starts on page 8 (see table of contents). Unaudited financial statements for the six month period ending December 31, 2007 begin on page 112.
LETTER FROM THE INVESTMENT MANAGEMENT TEAM (continued)
As always, we appreciate your feedback. We take your comments very seriously and regularly discuss them internally to help in managing our Funds and this company. Please keep your ideas coming—both favorable and critical. They provide us with a vital tool in helping us serve you better.
Sincerely,
| | |
 | | 
|
| John Montgomery | | Richard P. Cancelmo |
| |
 | |  |
| Elena Khoziaeva | | Michael Whipple |

Rasool Shaik | | |
| | |
| 2 | | Semi-Annual Report | December 31, 2007 (Unaudited) |
LETTER FROM THE INVESTMENT MANAGEMENT TEAM (continued)
Market Review
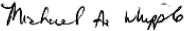
The Short Version: The largest companies (as measured by data from the Center for Research in Securities Prices) returned 7% more than ultra-small companies for the quarter ended December 31, 2007. Likewise, growth companies returned 3% to 7% more than value companies.
The December quarter stock market results were negative for all “style” segments of the U.S. market (see the table below). Nevertheless, growth stocks (those growing sales and earnings at a faster rate) declined by much smaller amounts than value stocks (those which appear cheaper based on certain economic measures) across the board. The segments’ performance for the full calendar year of 2007 gives evidence that the trend in favor of smaller and more value-oriented companies of the prior seven years has finally turned. We will see in 2008 whether the pendulum continues in this direction. Below are the style box stock returns for the December quarter (data from Morningstar):
Recession or not—what to do—and not do
The Short Version: Looking at prior history, by the time you know for sure it’s a recession, the horse has probably already left the barn. If so, it would be a poor time to “pull out.”
The current period could be seen as one of the most confusing economic periods since the 1930’s. Seemingly everywhere you look and in everything you read, there are predictions of recession, inflation, the “uncoupling” of world economies, the devaluation of the dollar and other economic projections that could make your head swim. You might ask, what is a recession, and what can I do to protect my resources?
In the February 4, 2008 issue of Newsweek, Daniel Gross defines recession as: “a widespread contraction in economic activity lasting more than a few months, and because of the lag in financial data, recessions typically aren’t officially declared until long after they start.” There is no major economic sector that has not experienced challenges lately. The effect of scaled-back spending in the holiday season rippled through the U.S. economy and abroad. In a recent story, Wall Street Journal writer Paul J. Lim says that “it’s often the anticipation of a recession that depresses stock prices, not the actual experience of a recession.” His research showed that once the recession is in full force, historically, prices have stabilized. In other words, by the time you can actually see a recession in the economy, the “stock market horse” has already left the barn. Recessionary periods since World War II have lasted on average ten months, during which stock prices have been fairly stable. In ten of the last eleven recessions, stocks rose an average of 24% after the low. Alas, no one knows when the low will occur.
So if you believe in “buy low, sell high,” then you’ve probably already missed a recent “high.” And if you go ahead and get out of the market, then you may also miss buying at the “low.” That’s the problem with timing the market: you have to make two very good calls, and the chances of this are stacked wildly against you. The real risk may be that you are out of the market during the exact period of its rise. If you are a Bridgeway Funds shareholder and have been with Bridgeway for awhile, you have “heard” me say, “get a good, diversified plan consistent with your investment horizon (when you’ll actually need the money) and risk profile (how much up and down of the market you’re willing to endure), write it down, and stick with it.” We stick to this at Bridgeway in bull markets and bear markets, good times and bad. Taking a long-term perspective can take much of the stress out of investing.
LETTER FROM THE INVESTMENT MANAGEMENT TEAM (continued)
Bridgeway 8, Morningstar 3
The Short Version: After an off year in 2006, most of our Funds returned to their winning ways in 2007.
Morningstar, the Chicago-based independent research firm publishes a list of “best funds” for each asset class as determined by its analysts every year. In January when the final tallies are in, we compare the performance of each of our Funds to the average returns of Morningstar’s top picks for the comparable asset class. (Of particular note: part way through 2007, two Bridgeway Funds made the Morningstar “best of” lists in their respective classes: Small-Cap Value and Small-Cap Growth.) We enjoy seeing how we stack up against the “best of the best.”
By a wide 8-3 margin, the Bridgeway Funds came out on top of the Morningstar picks in calendar year 2007. In fact, the three Funds that underperformed (Micro-Cap Limited Fund., Ultra-Small Company Fund, and Ultra-Small Company Market Fund) actually beat their own market benchmarks. In a period when very small stocks badly lagged the broader market, the headwinds were too strong for these funds compared to the larger company (but still small) peers.
The table below depicts the results by Morningstar category and relevant Bridgeway Fund.
| | | | | | |
| Bridgeway Funds | | Morningstar Analyst "Picks" |
| Name | | 2007 Return | | Morningstar Category | | 2007 Return |
Large-Cap Value | | 4.49% | | Large-Cap Value | | -1.18% |
Blue Chip 35 Index | | 6.07% | | Large-Cap Blend | | 2.17% |
Large-Cap Growth | | 19.01% | | Large-Cap Growth | | 16.88% |
Aggressive Investors 1 | | 25.80% | | Mid-Cap Growth | | 11.74% |
Aggressive Investors 2 | | 32.19% | | Mid-Cap Growth | | 11.74% |
Small-Cap Value | | 6.93% | | Small-Value | | -2.74% |
Ultra-Small Co. Market | | -5.40% | | Small Blend | | -1.23% |
Ultra-Small Company | | -2.77% | | Small-Growth | | 5.01% |
Micro-Cap Limited | | -4.97% | | Small-Growth | | 5.01% |
Small-Cap Growth | | 6.87% | | Small-Growth | | 5.01% |
Balanced | | 6.58% | | Conservative Allocation | | 5.99% |
Past performance is not an indicator of future results. The Bridgeway Funds’ adviser, Bridgeway Capital Management, Inc., does not have any influence on the selection of the funds chosen by Morningstar’s analysts. The number and specific funds used in the comparison are in the control and discretion of Morningstar and their analysts and are subject to change. Morningstar’s criteria for choosing Analyst Picks includes, but is not limited to, factors such as performance, expenses, and quality of fund management. In addition, the comparison of Bridgeway Funds to the Morningstar Analyst Picks is limited to performance only and does not take into consideration other factors that are considered by Morningstar when compiling their list of Analyst Picks.
Each Bridgeway Fund is compared to the average total return of the group of funds selected by Morningstar at the beginning of 2007 for the one year period ended December 31, 2007. Although these Analyst Picks changed from the beginning of the year to the final quarter, the same Bridgeway Funds beat the average of the end of year Morningstar picks as well. These averages in the table are comprised of between three and nine funds from within each category. In an effort to provide a complete and balanced assessment, all of the Bridgeway Funds are used in the comparison table shown above such that no attempt is made to cull out unfavorable results. The purpose of this comparison is to “raise the bar” on performance comparison as this analysis uses an arguably higher benchmark by comparing the Bridgeway Funds to other funds chosen by an independent source that specializes in investment research.
Shock Absorber Funds and a Lesson in Ultra-Small Stocks
An article recently highlighted Bridgeway’s Ultra-Small Company Market Fund among those funds that let you sleep better at night. All of us on the investment management team at Bridgeway own at least one of our ultra-small company funds. We all sleep pretty well at night because we have a long term view, keep appropriate diversification in mind, and plan to sleep through some future daunting corrections in the ultra-small company market. It’s most definitely not because we think they are
| | |
| 4 | | Semi-Annual Report | December 31, 2007 (Unaudited) |
LETTER FROM THE INVESTMENT MANAGEMENT TEAM (continued)
“tamer.” Indeed, John watched in 1998 as ultra-small stocks dropped almost in half from their peak in April to the bottom in October. It tested even his steel stomach, but he stayed put to watch them recover handsomely over the next five years. Looking farther back in history over the last eight decades of data on such stocks, one would have to conclude that they are significantly more volatile than the broader stock market, including during a bear market. Did the writer of this recent article get it wrong? How did he come to this conclusion?
Ultra-small stocks were surprisingly tame during the broader bear market of 2000-2002. Indeed, our ultra-small company Funds had positive returns each year of the bear market and continued to do so until last year (although they still beat their market benchmark in 2007). The early part of this decade was a very unusual period for ultra-small stocks, primarily because it followed a dramatic period of large stock dominance (1994-1998). It was time for the pendulum to swing back the other direction, and swing it did from 1999 to 2006—the longest running dominance of ultra-small and small stocks on record. The conclusion of the writer above was a fair assumption based on data from only the last decade. However, Bridgeway’s methods caution us to look at longer periods across multiple market “cycles.” Any examination of the longer-term data before 2000 will paint a picture of a higher level of ultra-small company short-term risk, including during most market declines. (Specifically, from 1926 to 2000, ultra-small stocks fell an average of 35% more than large stocks during the average calendar year market decline.)
What does this mean for future downturns? First, we discourage investors from trying to time the market. Second, the best clues about risk come from the long-term historical view. The vast majority of calendar year stock market declines have resulted in bigger declines for ultra-small stocks. The period earlier this decade was an anomaly. Does that mean one should sell his or her ultra-small stock funds? Our best generalized advice is not to have more in these funds than an investor means to have for the long haul, nor more than an investor can afford to hold through a downturn. This is actually pretty good generalized advice for holding any kind of stocks.
Alas. Where to turn if you really want a less bumpy ride? There are a number of ways to reduce risk in a portfolio. For example, holding some cash. Among the Bridgeway Funds, our Balanced Fund, which is designed to give you roughly 40% of the volatility of the broader market, is on the tamer end of the spectrum. In addition to the section on Balanced Fund following, you can learn more about objectives, risks, and fees in the prospectus at www.bridgeway.com.
Sub-Prime Lending Debacle
Apart from the obvious and significant destructive effects on homeowners and their families, companies and their employees, and the broader economy and stock market, these are the parts of the subprime lending debacle that outrage us the most:
| | a) | mortgage originators not counting the downstream cost of lending money to people beyond their means, |
| | b) | the lack of serious efforts to educate borrowers about the potential risks of high interest, low/no down payment, and variable rate mortgages, and |
| | c) | fees that get paid to “middle-men,” regardless of the ultimate outcome of the transactions they make. |
Bridgeway is also in the financial services business, and we have always considered it our duty to address concerns such as these: fair and open communication of risk, education, and serious examination of all fees ultimately borne by a Bridgeway shareholder. These efforts may result in less money in our pockets in the short-term, but may also help avoid situations that would be devastating for shareholders. Ultimately, we believe such efforts lead to better outcomes for our investors, for our corporation, and for the communities we serve. Some of this is very easy, and some of it takes a lot of work, creativity, and strong moral compass. The scary part is that most people who really get off track (we’re students of our hometown’s Enron debacle, for example), don’t start out thinking they’re doing anything remotely wrong. It takes diligence to stay on track.
“Timing” Aggressive Investors 2—an Update
In Bridgeway’s June 30, 2007 annual report, we discussed the problem of investors chasing hot returns, buying after a big run-up and selling in a downturn. Aggressive Investors 2 is a case in point. 2006 was the first calendar year that the Fund underperformed its primary market benchmark. During the following March 2007 quarter, shareholders redeemed 17% of their investment in the Fund. Not only did these shareholders miss the 11% returns of the June quarter previously reported,
LETTER FROM THE INVESTMENT MANAGEMENT TEAM (continued)
they also failed to earn the 12% return over the following six months. Altogether, they missed the best calendar year relative returns since inception. The moral of the story… Know why you’re investing, understand the strategy and risks of your Fund, invest in stocks (and stock funds) only when you have a long term investment need, and stay put for the long haul as long as your needs remain the same. As highlighted in the prospectus, our Funds are not meant to be a short-term investment vehicle, nor for those who would panic in a market downturn.
Celebrating Black Monday or What I learned from a two day 21% market drop (from John)
We passed an interesting milestone last quarter, the twentieth anniversary of Black Monday, or the single biggest percentage drop of the Dow Jones Industrial Average (and other major market averages). Here’s what I remember about that day more than twenty years ago.
| • | | I had been a serious investor for just over two years. I used quantitative methods in investing even at that time and had measured what I thought were the risks of my strategy. I had done some “stress testing” to see what things might look like in a major market downturn. However, I hadn’t stress-tested them for a sudden downturn of this magnitude, because such data didn’t exist. |
| • | | I had a “day job” in the public sector. This was six years before starting Bridgeway. |
| • | | The market had dropped 5.2% on Friday, the previous market day. That day didn’t really get my attention. I generally yawn through market downturns, and in my book that one was just a normal (if compressed) downturn. |
| • | | At noontime on Black Monday I was delivering the eulogy for the father of a close friend. However, I had made a habit of not checking the market. My philosophy was, “if it doesn’t make a difference in a decision you make, don’t look.” So I actually didn’t know how much the market was down until I heard it on the evening news. |
| • | | A corollary to my rule about not looking is: “Don’t waste time following the market, and have a real life.” Following stocks (or mutual funds) is not it. Having three creative, energetic young daughters helped a lot back then. An active faith life is central. (Having three creative, energetic adult daughters still works pretty well; I ran my first half marathon with my eldest recently.) |
| • | | My most nervous moment through the Black Monday experience was checking my brokerage account balance on Tuesday before the market opened on a pay phone (no cell phones in 1987.) I had calculated the decline of my investment capital, manually putting in prices from the newspaper into my “visicalc” spreadsheet on an early generation Apple computer, but I thought I’d just confirm the balance to make sure. Some people couldn’t even get through by phone to their brokers that morning. (There was no Internet to look up prices or balances or to download information.) When I did get through to my brokerage firm, my broker was busy. The junior broker I talked to was obviously harried and read me an incorrect number that was much lower than my actual balance. That did increase my heart rate, but I led him through finding the correct numbers and was satisfied. |
| • | | From the peak in August 1987 to the bottom in December 1987, my account fell a total of 41%. It recovered to the prior peak level before a year was up. I didn’t change anything about my strategy or methods during the downturn. |
What did I learn from this experience?
| • | | Have a plan and stick with it. That really helped in 1987 and has helped a lot since then. It was also very beneficial in the week following 9/11. |
| • | | Stress test models to a deeper level. I didn’t expect things to move so quickly in 1987. Now I routinely expect things to get worse than what I think is reasonable. I study markets back to the 1920’s and another database back to the nineteenth century. I think about what it would be like to live through “another” Great Depression. And I plan accordingly. This stress testing, along with other strongly held principles such as diversification, is what helped Bridgeway when some other quant shops were severely “tested” in August of last year. |
| • | | If it doesn’t make a difference in a decision to be made, don’t look. I have taken this even further since 1987. For example, I have four computer screens in my office, and none carries a ticker tape or market average. I have a general idea of |
| | |
| 6 | | Semi-Annual Report | December 31, 2007 (Unaudited) |
LETTER FROM THE INVESTMENT MANAGEMENT TEAM (continued)
| | market averages, but I can’t tell you within a thousand points the level of the Dow. I don’t open my quarterly account statements except to make sure any transactions are correct and that I don’t need to fill out some administrative or regulatory form. I can’t tell you within a 15% range what my investments (retirement funds) are worth. With all the time and emotional energy I save, I focus on things I think will actually add value. |
| • | | Have a real life. I have an amazing and blessed life. It’s about relationships, not prices and indexes. I didn’t learn this from Black Monday, but it reinforced it. I do really enjoy what I do at Bridgeway, but the relationships we have built together are a big part of that. |
| • | | Derivatives are securities or contracts whose price are dependent upon or “derived” from one or more underlying assets. Futures contracts, options and swaps are the most common types of derivatives. Investing in this type of instrument is surely an example of where a little knowledge can be a very dangerous thing. It’s OK to use them if you understand exactly how they work, but derivatives are significantly more complex than they may appear with many subtle ways to lose capital. Perhaps the greatest lure of derivatives is the leverage (trading with borrowed money.) Many investors lost more money than they ever thought possible during the 1987 crash using various derivative contracts. The market crash effectively took investors out of their positions at the worst possible time. They were not in control; the market was, leaving them with little or no opportunity to recover in the years ahead. |
Patience
We like the following quote from another fund manager, Bill Nygren.
Nygren called the performance of his fund “dreadful” and noted that although the market overall had suffered, ‘our Fund [sic] has fared meaningfully worse.’ The waiting part can be frustrating, especially in a time when our stock prices are moving in the wrong direction. But there are only two ways we can fail—we can fail if our analysis is wrong, and we can fail if we run out of patience.
We like it when a manager refuses, against marketing and competitive and perhaps personal pressures, to sugarcoat the bad stuff, and Nygren earns our respect for refusing to do so. It’s something we aspire to and work on. We also like the exhortation to patience. In our case, most of our Funds went the right direction relative to their market benchmarks last quarter. . . . but we have seen and will see more downturns also. Patience is a good quality in investing, whether times are good or bad, during euphoria and stress.
The Real Expense of Soft Dollars
Last quarter we wrote about the problems of an industry practice called soft dollars (using your fund trading commission dollars to pay for your fund company’s research and brokerage services) and why we stay away from them at Bridgeway. I was amused by a recent article in a trade journal:
As scrutiny over how fund managers choose, use and value the research [writer’s note: presumably paid for with soft dollars] on which they base investment decisions increases, so too will the amount shops need to spend on systems to help track it. That’s according to a recently released report from TowerGroup.
Not only do the commissions cost you more. But someone has to pay for the increased costs of systems to track it, lawyers to review it and compliance people to ensure it follows regulations. Why not just keep it simple? This is one more reason to “just say no.”
Thanks to a Shareholder
A shareholder, Mr. Shuster, made the following suggestion:
I was unaware that Bridgeway had the option of electronic delivery of annual reports. To reduce paper and operating costs, Bridgeway should devote some space in its shareholder publications to promote shareholders to electronic delivery.
If you received this bulky report (or worse, multiple copies of it) in snail mail, but would prefer only to see it online, just call 800-661-3550, extension 2, or email funds@bridgeway.com to make this switch.
Aggressive Investors 1 Fund
MANAGER’S COMMENTARY
(Unaudited)
December 31, 2007
Dear Fellow Aggressive Investors 1 Fund Shareholder,
For the fifth quarter in a row, Aggressive Investors 1 Fund outperformed both its primary market benchmark and also its peer benchmark. Our Fund appreciated an impressive 5.26%, compared to a decline of 3.33% for the S&P 500 Index and a small gain of 0.42% for the Lipper Capital Appreciation Funds Index. The Russell 2000 Index of small companies, which had done so well in recent prior years, declined over 4.58%. It was an excellent quarter for our Fund.
For the six month semi-annual period, our Fund gained 10.66%, significantly beating the S&P 500 Index (-1.37%), the Lipper Capital Appreciation Funds Index (5.35%), and the Russell 2000 Index (-7.53%). This period was marked by extreme market volatility as investors faced the growing subprime debacle that morphed into a true credit crisis, and our Fund performed quite well under those difficult conditions.
Likewise, we are quite pleased with our Fund’s calendar year performance for 2007, both on an absolute and relative return basis. Aggressive Investors 1 Fund gained more than 25% for the twelve months ending December 31, 2007, far exceeding the performance of the S&P 500 Index (5.49%), the Lipper Capital Appreciation Funds Index (16.39%), and the Russell 2000 Index (-1.57%). You may recall that 2006 was the first year since 1998 that we had underperformed the S&P 500 Index. It has not been that unusual for a poorer period such as 2006 to be followed by a strong one such as 2007—one more reason I think it’s a bad idea to leave our Funds for reasons related to short-term performance. As always, long-term performance and risk management remain our key objectives. The information below bears out our historical success in these areas.
The table below presents our December quarter, six-month, one-year, five-year, ten-year and life-to-date financial results according to the formula required by the SEC. See the next page for a graph of performance for the last ten years.
| | | | | | | | | | | | | | | | | | |
| | | Dec. Qtr. 10/1/07
to 12/31/07 | | | 6 Month. 7/1/07
to 12/31/07 | | | 1 Year 1/1/07
to 12/31/07 | | | 5 Year 1/1/03
to 12/31/07 | | | 10 Year 1/1/98
to 12/31/07 | | | Life-to-Date 8/5/94 to 12/31/07 | |
| | | | | | |
Aggressive Investors 1 Fund | | 5.26 | % | | 10.66 | % | | 25.80 | % | | 21.76 | % | | 19.26 | % | | 20.79 | % |
S&P 500 Index (large companies) | | -3.33 | % | | -1.37 | % | | 5.49 | % | | 12.82 | % | | 5.91 | % | | 11.05 | % |
Lipper Capital Appreciation Funds Index | | 0.42 | % | | 5.35 | % | | 16.39 | % | | 15.18 | % | | 6.54 | % | | 9.85 | % |
Russell 2000 Index (small companies) | | -4.58 | % | | -7.53 | % | | -1.57 | % | | 16.25 | % | | 7.08 | % | | 10.35 | % |
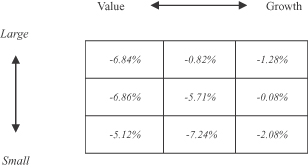
Performance figures quoted in the table above and graph below represent past performance and are no guarantee of future results. The table above and the graph below do not reflect the deduction of taxes that a shareholder would pay on Fund distributions or the redemption of Fund shares.
The S&P 500 Index is a broad-based, unmanaged measurement of changes in stock market conditions based on the average of 500 widely held common stocks with dividends reinvested, while the Russell 2000 Index is an unmanaged, market value weighted index, that measures performance of the 2,000 companies that are between the 1,000th and 3,000th largest in the market with dividends reinvested. The Lipper Capital Appreciation Funds Index reflects the record of the 30 largest funds in this category, comprised of more aggressive domestic growth mutual funds, as reported by Lipper, Inc. It is not possible to invest directly in an index. Periods longer than one year are annualized.
According to data from Lipper, Inc. as of December 31, 2007, Aggressive Investors 1 Fund ranked 45th of 357 capital appreciation funds for the twelve months ending December 31, 2007, 15th of 247 over the last five years, 2nd of 124 over the last ten years, and 1st of 60 since inception in August 1994. These long-term numbers and the graph below give two snapshots of our long-term success. Lipper, Inc. is an independent mutual fund rating service that ranks funds in various fund categories by making comparative calculations using total returns.
| | |
| 8 | | Semi-Annual Report | December 31, 2007 (Unaudited) |
Aggressive Investors 1 Fund
MANAGER’S COMMENTARY (continued)
(Unaudited)
Aggressive Investors 1 Fund vs. S & P 500 Index & Lipper Capital Appreciation Funds Index & Russell 2000 Index 1/1/98 to 12/31/07
Detailed Explanation of Quarterly Performance—What Worked Well
The Short Version: Talk about a chemical reaction. Chemical companies highlighted our top performers during the quarter. Four were among the top ten. Combined, these companies contributed over 4% to the return of the Fund. Our top two performers, both of which were chemical-related, each earned over 50% during the three-month period. The Fund also benefited from a bit of a global flavor as two of our top holdings are internationally based companies. (The Fund may invest up to 15% in foreign stocks, though the actual number has historically been, and is currently, significantly less than this.)
These are the ten best performers for the quarter ended December 31, 2007:
| | | | | | |
| Rank | | Description | | Industry | | % Gain |
| 1 | | Mosaic Co | | Chemicals | | 56.6% |
| 2 | | Terra Industries Inc | | Chemicals | | 52.8% |
| 3 | | Mobile Telesystems OJSC ADR | | Telecommunications (Russia) | | 39.7% |
| 4 | | Intuitive Surgical Inc | | Healthcare-Products | | 37.3% |
| 5 | | CF Industries Holdings Inc | | Chemicals | | 36.7% |
| 6 | | Deckers Outdoor Corp | | Apparel | | 36.7% |
| 7 | | Potash Corp of Saskatchewan | | Chemicals (Canada) | | 36.2% |
| 8 | | priceline.com Inc | | Internet | | 29.4% |
| 9 | | Apple Inc | | Computers | | 29.1% |
| 10 | | Owens-Illinois Inc | | Packaging & Containers | | 19.4% |
| | | | | | | |
The Mosaic Company was the Fund’s top performer and appreciated over 56% for the three-month period. Based in Minneapolis, Minnesota, the chemical company is a leading global manufacturer of crop nutrients, which serve as primary ingredients for fertilizer. Two significant factors have surfaced as of late that greatly benefited fertilizer companies like Mosaic. Rising oil prices and government subsidies have led to increased demand for ethanol which has prompted greater production of corn. Additionally, as the populations in China and other developing Asian and Latin American countries become increasingly affluent, their residents are adding more meat to their diets. As a result, corn and others feed grains have been met with even greater global demand and thus, the need for more fertilizer. During the past quarter, the company used its recent windfall from ongoing business operations to pay down long-term debt and strengthen its overall financial position. The stock contributed over 1.6% to the performance of the Fund during the three-month period.
Intuitive Surgical Inc. is a healthcare-related company that manufactures and markets specialty surgical products for a variety of medical applications. In particular, the company has designed robotic tools known as da Vinci systems which are used for urology, cardiology, gynecology, and general surgeries. In its most recent quarter, company profits doubled and sales increased by over 60%. Additionally, Intuitive has started to make inroads into the international medical markets. While many analysts remain quite positive about the company’s prospects for continued growth, others express concerns that it could
Aggressive Investors 1 Fund
MANAGER’S COMMENTARY (continued)
(Unaudited)
encounter future challenges because it essentially remains a one-product company. To counter these fears, management points out that revenue is also tied to sales of accessories, system service and training; therefore, the potential for recurring revenue streams is becoming more substantial. Intuitive Systems contributed 1.10% to the performance of the Fund this past quarter.
Detailed Explanation of Quarterly Performance—What Didn’t Work
The Short Version: Companies from five different sectors were represented in our list of weak performers; no one industry served as the primary (negative) catalyst. Interestingly, the stock that made the greatest negative contribution to the Fund’s performance during the last three months had been our top performer over the prior two quarters. Nine companies lost over 20% during the past quarter.
These are the ten stocks that performed the worst in the quarter ended December 31, 2007:
| | | | | | |
| Rank | | Description | | Industry | | % Loss |
| 1 | | WellCare Health Plans Inc | | Healthcare-Services | | -78.6% |
| 2 | | CROCS Inc | | Apparel | | -45.3% |
| 3 | | Cooper Tire & Rubber Co | | Auto Parts & Equipment | | -32.2% |
| 4 | | Ceradyne Inc | | Miscellaneous Manufacturing | | -30.8% |
| 5 | | Perini Corp | | Engineering & Construction | | -29.9% |
| 6 | | Amkor Technology Inc | | Semiconductors | | -29.2% |
| 7 | | Big Lots Inc | | Retail | | -27.5% |
| 8 | | Jones Lang LaSalle Inc | | Real Estate | | -27.1% |
| 9 | | Varian Semiconductor Equipment Assoc | | Semiconductors | | -20.4% |
| 10 | | Synaptics Inc | | Computers | | -19.4% |
| | | | | | | |
Our worst performer for the quarter, managed care company, WellCare Health Plans offers government-sponsored healthcare and prescription drug programs through Medicare and Medicaid. In late October, federal investigators raided company headquarters and initiated an investigation over what most believe to be fraud-related issues. Unfortunately, our models can’t identify issues like this before they happen. To add insult to injury, company execs sold off over $45 million in stock during the year in advance of the raid, far more than the insider sales totaled for all of 2006. The company’s stock priced plunged over 70% in one day. News did not get any better for the company as the quarter progressed, as shareholder lawsuits ensued and plan enrollments declined. Fortunately, our position in this lightly-traded company is relatively small, and it cost the Fund less than 0.75% in return for the quarter. We purchased this stock late in the September quarter and our models jettisoned it a couple of months later.
Trendy shoemaker, CROCS, has been a dependable performer for several quarters. CROCS was the Fund’s top performer, and returned over 50% during the three months ended September 30, 2007. While its latest earnings report actually beat Wall Street forecasts, its future guidance on revenues fell short of expectations. In reality, CROCS had trouble keeping up with the increasing demand for its products throughout Europe and Japan, an issue that cost the company about $30 million in potential quarterly sales. Its stock price fell by almost half for the quarter and a few shareholder suits followed. The holding cost the Fund over 2% during the past three months. Despite the down quarter, CROCS remained our sixth best performer for the calendar year and appreciated more than 70%.
Detailed Explanation of Calendar Year Performance—What Worked Well
The Short Version: With a gain of over 25%, lots of things went right for the Fund during the calendar year. Our two top holdings (both technology companies) earned well in excess of 100% and a total of 12 stocks returned over 50% for the calendar year. Basic materials and technology highlighted the list, as six companies came from those two sectors.
| | |
| 10 | | Semi-Annual Report | December 31, 2007 (Unaudited) |
Aggressive Investors 1 Fund
MANAGER’S COMMENTARY (continued)
(Unaudited)
These are the ten best performers for the calendar year ended December 31, 2007:
| | | | | | |
| Rank | | Description | | Industry | | % Gain |
| 1 | | Research In Motion Ltd | | Computers | | 166.2% |
| 2 | | Apple Inc | | Computers | | 132.6% |
| 3 | | priceline.com Inc | | Internet | | 87.5% |
| 4 | | Terra Industries Inc | | Chemicals | | 86.2% |
| 5 | | Potash Corp of Saskatchewan | | Chemicals | | 84.8% |
| 6 | | CROCS Inc | | Apparel | | 70.4% |
| 7 | | Chaparral Steel Co | | Iron/Steel | | 70.1% |
| 8 | | National Oilwell Varco Inc | | Oil & Gas Services | | 67.9% |
| 9 | | Vimpel-Communications ADR | | Telecommunications | | 62.8% |
| 10 | | Mosaic Co | | Chemicals | | 56.6% |
| | | | | | | |
A strong fourth quarter showing pushed Mosaic into the list of top 10 performers where it was joined by two other chemical companies (Terra Industries and Potash Corp of Saskatchewan). Increased global demand for basic materials, particularly from emerging markets like China, led to strong sales of related products. The weaker dollar throughout the year also sparked higher exports. These three chemical companies contributed over 4% to the return of the Fund.
The Fund’s best two performers, Research in Motion and Apple, topped the list with returns greater than 100% in 2007. Consumers are still in love with their time-tested Blackberries (Research in Motion), even after the successful debut of the iPhone (Apple) in June. (Apparently there is room for both in this growing global market.) In its most recent report, Research in Motion more than doubled its profits and beat Wall Street expectations once again; the company is reaping benefits of higher sales of its Pearl and Curve. Likewise, Apple reported a 67% increase in earnings in its latest report as all the publicity related to the iPhone has led to increased demand for the old trusted iPods and Macs. The company also successfully launched the iPhone in Europe later in the year and has its sights set on Asia for 2008. Combined, these two techs contributed over 3.5% to the Fund’s performance in 2007.
Detailed Explanation of Calendar Year Performance—What Didn’t Work
The Short Version: Six industry sectors were represented in the list of poor performers, highlighted by three financials firms. Combined, those three holdings only cost the Fund about 1% in performance. Fortunately, only one company lost over 50% for the calendar year, and the Fund owned a relatively small position of that stock.
These are the ten stocks that performed the worst for the calendar year ended December 31, 2007:
| | | | | | |
| Rank | | Description | | Industry | | % Loss |
| 1 | | WellCare Health Plans Inc | | Healthcare-Services | | -77.5% |
| 2 | | First Marblehead Corp | | Diversified Financial Services | | -36.0% |
| 3 | | Perini Corp | | Engineering & Construction | | -29.9% |
| 4 | | Valueclick Inc | | Internet | | -29.3% |
| 5 | | Cooper Tire & Rubber Co | | Auto Parts & Equipment | | -29.3% |
| 6 | | NutriSystem Inc | | Internet | | -28.9% |
| 7 | | Western Refining Inc | | Oil & Gas | | -27.4% |
| 8 | | Jones Lang LaSalle Inc | | Real Estate | | -27.1% |
| 9 | | Washington Mutual Inc | | Savings & Loans | | -27.0% |
| 10 | | Baldor Electric Co | | Hand/Machine Tools | | -23.0% |
| | | | | | | |
The year 2007 turned out to be highly volatile for Cooper Tire and Rubber. After trading around $28 in July, the stock plunged over 20% in one day following its recent quarterly earnings announcement and closed the year around $16.50. While higher sales in Europe and Asia contributed to a quarterly profit, U.S. analysts remained concerned about plant inefficiencies and how the company will handle rising costs of raw materials in 2008. The stock cost the Fund 0.8% in annual return.
Aggressive Investors 1 Fund
MANAGER’S COMMENTARY (continued)
(Unaudited)
Managing Risks (on the margin) with Puts and Calls
We have mentioned in previous letters the occasional use of calls to provide some exposure to a stock’s “upside,” while limiting the risk of a stock’s major decline. A related strategy is even more defensive in nature and involves selling calls or buying puts on Fund stocks in order to “manage down” (in accordance with our investment objective) the risk that our Fund might fall faster than the market overall. As our Fund had become measurably more volatile than we would like over the last two years, we employed such a strategy in the fourth quarter with a portion of the Fund. The total capital employed with this strategy is small, equal to 0.5% of net assets. In the downturn between mid-October to mid-December, this strategy provided a bit of cushion, however, as our options returned a 0.6% of net assets gain. The purpose is not really to add to returns significantly over the long haul, but rather to decrease downside volatility or short term risk.
Top Ten Holdings as of December 31, 2007
Six of our top holdings at the end of the calendar year were among the Fund’s best performers during the December quarter: Decker Outdoor, Owens-Illinois, Mosaic Co., Intuitive Surgical, Potash Corp., and Apple Inc. Combined, these six companies contributed almost 7% to the overall performance of the Fund during the quarter. The top 10 holdings represented almost 44% of the net assets of the Fund.
| | | | | | |
| Rank | | Description | | Industry | | Percent of
Net Assets |
| 1 | | Deckers Outdoor Corp | | Apparel | | 5.5% |
| 2 | | Owens-Illinois Inc | | Packaging & Containers | | 5.4% |
| 3 | | OSI Pharmaceuticals Inc | | Pharmaceuticals | | 4.8% |
| 4 | | Mosaic Co | | Chemicals | | 4.6% |
| 5 | | Invitrogen Corp | | Biotechnology | | 4.6% |
| 6 | | Perrigo Co | | Pharmaceuticals | | 4.6% |
| 7 | | Intuitive Surgical Inc | | Healthcare-Products | | 4.0% |
| 8 | | Potash Corp of Saskatchewan | | Chemicals | | 3.7% |
| 9 | | Apple Inc | | Computers | | 3.6% |
| 10 | | CROCS Inc | | Apparel | | 2.9% |
| | | | | | | |
| | | | | | 43.7% |
Industry Sector Representation as of December 31, 2007
Our Fund’s strong relative weighting in basic materials has had a strong positive effect in the December quarter, as our “picks” performed well as a group. Interestingly, our under-representation of financial stocks also helped significantly, as many finance stocks got pounded by the subprime lending and related credit crisis. Our largest sector was consumer, non-cyclicals, probably a good place to be if we should enter a recession in 2008. None of this reflects a view of the economy at Bridgeway, however. It is simply the sum total of our individual stock picks.
| | | | | | |
| | | % of Portfolio | | % S&P 500 Index | | Difference |
Basic Materials | | 15.6% | | 3.4% | | 12.2% |
Communications | | 6.1% | | 11.3% | | -5.2% |
Consumer, Cyclical | | 9.1% | | 7.1% | | 2.0% |
Consumer, Non-cyclical | | 27.0% | | 20.5% | | 6.5% |
Energy | | 4.5% | | 12.9% | | -8.4% |
Financial | | 3.9% | | 17.6% | | -13.7% |
Industrial | | 18.3% | | 11.8% | | 6.5% |
Technology | | 13.0% | | 11.8% | | 1.2% |
Utilities | | 0.0% | | 3.5% | | -3.5% |
Diversified | | 0.0% | | 0.1% | | -0.1% |
Cash | | 2.5% | | 0.0% | | 2.5% |
| | | | | | | |
Total | | 100.0% | | 100.0% | | |
| | |
| 12 | | Semi-Annual Report | December 31, 2007 (Unaudited) |
Aggressive Investors 1 Fund
MANAGER’S COMMENTARY (continued)
(Unaudited)
Interesting Historical Statistics
Of the surviving 127 members of the triple digit club (Funds that appreciated at least 100%) of 1999, only three beat the market each year of the bear market following. During that three year period (2000-2002), Aggressive Investors 1 Fund declined 17%, the S&P 500 Index declined 38%, and the entire triple digit club (only the surviving members) declined a whopping 59%. That’s part of our Fund design: when we do underperform the market for a year or two, we try not to do it in a bear market. Past history (and Fund design) does not guarantee future performance. We do and have underperformed for shorter down periods such as months and quarters.
Disclaimer
The following is a reminder from the friendly folks at your Fund who worry about liability. The views expressed here are exclusively those of Fund management. These views, including those of market sectors or individual stocks, are not meant as investment advice and should not be considered predictive in nature. Any favorable (or unfavorable) description of a holding applies only as of the quarter end, December 31, 2007, unless otherwise stated. Security positions can and do change thereafter. Discussions of historical performance do not guarantee and may not be indicative of future performance.
Market volatility can significantly affect short-term performance. The Fund is not an appropriate investment for short-term investors. Investments in the small companies within this multi-cap fund generally carry greater risk than is customarily associated with larger companies. This additional risk is attributable to a number of factors, including the relatively limited financial resources that are typically available to small companies, and the fact that small companies often have comparatively limited product lines. In addition, the stock of small companies tends to be more volatile than the stock of large companies, particularly in the short term and particularly in the early stages of an economic or market downturn. The Fund’s use of options, futures, and leverage magnifies the risk of loss in an unfavorable market, and the Fund’s use of short-sale positions can, in theory, expose shareholders to unlimited loss. Finally, the Fund exposes shareholders to “focus risk” which adds to Fund volatility through the possibility that a single company could significantly affect total return. Shareholders of the Fund, therefore, are taking on more risk than they would if they invested in the stock market as a whole.
Conclusion
Thank you for your continued investment in Aggressive Investors 1 Fund. We encourage your feedback; your reactions and concerns are important to us.
Sincerely,
Your Investment Management Team
Aggressive Investors 1 Fund
SCHEDULE OF INVESTMENTS
Showing percentage of net assets as of December 31, 2007 (Unaudited)
| | | | | | | |
| Industry | | Company | | Shares | | Value |
|
COMMON STOCKS - 99.81% |
Aerospace/Defense - 1.50% |
| | Lockheed Martin Corp. | | 53,400 | | $ | 5,620,884 |
|
Apparel - 9.31% |
| | CROCS, Inc.*(a) | | 290,800 | | | 10,704,348 |
| | Deckers Outdoor Corp.*(a) | | 133,300 | | | 20,669,498 |
| | Warnaco Group, Inc.* | | 101,200 | | | 3,521,760 |
| | | | | | | |
| | | | | | | 34,895,606 |
|
Banks - 1.19% |
| | US Bancorp(a) | | 141,000 | | | 4,475,340 |
|
Biotechnology - 4.57% |
| | Invitrogen Corp.* | | 183,400 | | | 17,131,394 |
|
Chemicals - 12.84% |
| | CF Industries Holdings, Inc. | | 91,600 | | | 10,081,496 |
| | Mosaic Co.* | | 184,000 | | | 17,358,560 |
| | Potash Corp. of Saskatchewan | | 95,100 | | | 13,690,596 |
| | Terra Industries, Inc.* | | 146,370 | | | 6,990,631 |
| | | | | | | |
| | | | | | | 48,121,283 |
|
Commercial Services - 0.65% |
| | Apollo Group, Inc.* | | 34,600 | | | 2,427,190 |
|
Computers - 10.44% |
| | Apple, Inc.* | | 67,400 | | | 13,350,592 |
| | Research In Motion, Ltd.* | | 94,200 | | | 10,682,280 |
| | Sigma Designs, Inc.*(a) | | 155,300 | | | 8,572,560 |
| | Sun Microsystems, Inc.* | | 180,725 | | | 3,276,544 |
| | Synaptics, Inc.* | | 79,000 | | | 3,251,640 |
| | | | | | | |
| | | | | | | 39,133,616 |
|
Diversified Financial Services - 2.03% |
| | Goldman Sachs Group, Inc. | | 17,900 | | | 3,849,395 |
| | Greenhill & Co., Inc.(a) | | 56,800 | | | 3,776,064 |
| | | | | | | |
| | | | | | | 7,625,459 |
|
Electrical Components & Equipment - 1.26% |
| | GrafTech International, Ltd.*(a) | | 265,100 | | | 4,705,525 |
|
Electronics - 1.77% |
| | Garmin, Ltd.(a) | | 68,500 | | | 6,644,500 |
|
Energy-Alternative Sources - 1.54% |
| | Sunpower Corp.*(a) | | 44,400 | | | 5,789,316 |
|
Engineering & Construction - 3.51% |
| | McDermott International, Inc.* | | 177,900 | | | 10,501,437 |
| | Perini Corp.* | | 63,900 | | | 2,646,738 |
| | | | | | | |
| | | | | | | 13,148,175 |
| | | | | | | |
| Industry | | Company | | Shares | | Value |
|
|
Food - 2.80% |
| | Fresh Del Monte Produce, Inc.* | | 313,000 | | $ | 10,510,540 |
|
Healthcare-Products - 4.05% |
| | Intuitive Surgical, Inc.* | | 46,800 | | | 15,186,600 |
|
Internet - 3.29% |
| | Amazon.com, Inc.* | | 53,900 | | | 4,993,296 |
| | priceline.com, Inc.*(a) | | 64,000 | | | 7,351,040 |
| | | | | | | |
| | | | | | | 12,344,336 |
|
Machinery-Diversified - 2.56% |
| | AGCO Corp.* | | 141,000 | | | 9,585,180 |
|
Metal Fabrication - Hardware - 2.74% |
| | Precision Castparts Corp. | | 44,000 | | | 6,102,800 |
| | Valmont Industries, Inc. | | 47,000 | | | 4,188,640 |
| | | | | | | |
| | | | | | | 10,291,440 |
Mining - 3.11% |
| | Freeport-McMoRan Copper & Gold, Inc. | | 57,200 | | | 5,859,568 |
| | Southern Copper Corp.(a) | | 55,100 | | | 5,792,663 |
| | | | | | | |
| | | | | | | 11,652,231 |
|
Oil & Gas Services - 3.03% |
| | National Oilwell Varco, Inc.* | | 97,200 | | | 7,140,312 |
| | Oceaneering International, Inc.* | | 62,600 | | | 4,216,110 |
| | | | | | | |
| | | | | | | 11,356,422 |
|
Packaging & Containers - 5.41% |
| | Owens-Illinois, Inc.* | | 409,600 | | | 20,275,200 |
|
Pharmaceuticals - 15.59% |
| | Bristol-Myers Squibb Co. | | 174,300 | | | 4,622,436 |
| | Gilead Sciences, Inc.* | | 117,600 | | | 5,410,776 |
| | Medco Health Solutions, Inc.* | | 34,100 | | | 3,457,740 |
| | Onyx Pharmaceuticals, Inc.* | | 176,800 | | | 9,833,616 |
| | OSI Pharmaceuticals, Inc.*(a) | | 371,700 | | | 18,031,167 |
| | Perrigo Co. | | 488,000 | | | 17,084,880 |
| | | | | | | |
| | | | | | | 58,440,615 |
|
Real Estate - 0.76% |
| | Jones Lang LaSalle, Inc. | | 40,200 | | | 2,860,632 |
|
Semiconductors - 0.95% |
| | NVIDIA Corp.*(a) | | 104,500 | | | 3,555,090 |
| | |
| 14 | | Semi-Annual Report | December 31, 2007 (Unaudited) |
Aggressive Investors 1 Fund
SCHEDULE OF INVESTMENTS (continued)
Showing percentage of net assets as of December 31, 2007 (Unaudited)
| | | | | | | |
| Industry | | Company | | Shares | | Value |
|
Common Stocks (continued) |
Software - 1.90% |
| | Oracle Corp.* | | 315,200 | | $ | 7,117,216 |
|
Telecommunications - 3.01% |
| | Cisco Systems, Inc.* | | 131,200 | | | 3,551,584 |
| | Nokia OYJ, ADR | | 114,300 | | | 4,387,977 |
| | Telefonica SA(a) | | 34,400 | | | 3,357,096 |
| | | | | | | |
| | | | | | | 11,296,657 |
|
Transportation - 0.00% |
| | Kirby Corp.* | | 20 | | | 930 |
| | | | | | | |
| |
TOTAL COMMON STOCKS - 99.81% | | | 374,191,377 |
| | | | | | | |
(Cost $289,769,329) | | | |
| | | | | | | | |
|
MONEY MARKET FUNDS - 2.58% | |
| | | |
| | | Rate^ | | Shares | | Value | |
BlackRock TempCash Liquidity Fund, Institutional Shares #21 | | 4.78% | | 9,668,243 | | | 9,668,243 | |
| | | | | | | | |
| |
TOTAL MONEY MARKET FUNDS - 2.58% | | | 9,668,243 | |
| | | | | | | | |
(Cost $9,668,243) | | | | | | | | |
| |
TOTAL INVESTMENTS - 102.39% | | $ | 383,859,620 | |
(Cost $299,437,572) | | | | |
Liabilities in Excess of Other Assets - (2.39)% | | | (8,956,140 | ) |
| | | | | | | | |
NET ASSETS - 100.00% | | $ | 374,903,480 | |
| | | | | | | | |
| * | Non-income producing security. |
| ^ | Rate disclosed is as of December 31, 2007. |
| (a) | This security or a portion of the security is out on loan at December 31, 2007. Total loaned securities had a market value of $71,389,161 at December 31, 2007. |
ADR American Depositary Receipt
See Notes to Financial Statements.
Aggressive Investors 2 Fund
MANAGER’S COMMENTARY
(Unaudited)
December 31, 2007
Dear Fellow Aggressive Investors 2 Fund Shareholder,
For the fifth quarter in a row, Aggressive Investors 2 Fund outperformed both its primary market benchmark and also its peer benchmark. Our Fund earned an impressive 5.02%, compared to a decline of 3.33% for the S&P 500 Index and a small gain of 0.42% for the Lipper Capital Appreciation Funds Index. The Russell 2000 Index of small companies, which had done so well in recent prior years, declined over 4.5%. It was an excellent quarter for our Fund.
For the six month semi-annual period, our Fund gained 11.62%, significantly beating the S&P 500 Index (-1.37%), the Lipper Capital Appreciation Funds Index (5.35%), and the Russell 2000 Index (-7.53%). This period was marked by extreme market volatility as investors faced the growing subprime debacle that morphed into a true credit crisis, and our Fund performed quite well under those difficult conditions.
Likewise, we are quite pleased with our Fund’s calendar year performance for 2007, both on an absolute and relative return basis. Aggressive Investors 2 Fund gained more than 30% for the 12-months ending December 31, 2007, far exceeding the performance of the S&P 500 Index (5.49%), the Lipper Capital Appreciation Funds Index (16.39%), and the Russell 2000 Index (-1.57%). You may recall that 2006 was the first year since inception that we had underperformed the S&P 500 Index. It has not been that unusual for a poorer period such as 2006 to be followed by a strong one such as 2007—one more reason I think it’s a bad idea to leave our Funds for reasons related to short-term performance. As always, long-term performance and risk management remain our key objectives. The information below bears out our historical success in these areas.
The table below presents our December quarter, six-month, one-year, five-year and life-to-date financial results according to the formula required by the SEC. See the next page for a graph of performance since inception.
| | | | | | | | | | |
| | | Dec. Qtr. 10/1/07
to 12/31/07 | | 6 Month. 7/1/07
to 12/31/07 | | 1 Year 1/1/07
to 12/31/07 | | 5 Year 1/1/03
to 12/31/07 | | Life-to-Date 10/31/01 to 12/31/07 |
| | | | | |
Aggressive Investors 2 Fund | | 5.02% | | 11.62% | | 32.19% | | 22.57% | | 14.72% |
S&P 500 Index (large companies) | | -3.33% | | -1.37% | | 5.49% | | 12.82% | | 7.33% |
Lipper Capital Appreciation Funds Index | | 0.42% | | 5.35% | | 16.39% | | 15.18% | | 8.98% |
Russell 2000 Index (small companies) | | -4.58% | | -7.53% | | -1.57% | | 16.25% | | 11.26% |
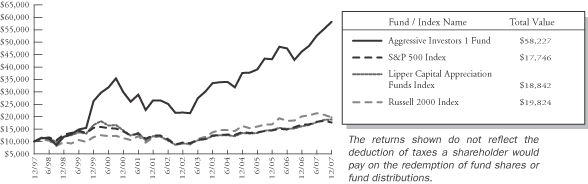
Performance figures quoted in the table above and graph below represent past performance and are no guarantee of future results. The table above and the graph below do not reflect the deduction of taxes that a shareholder would pay on Fund distributions or the redemption of Fund shares.
The S&P 500 Index is a broad-based, unmanaged measurement of changes in stock market conditions based on the average of 500 widely held common stocks with dividends reinvested, while the Russell 2000 Index is an unmanaged, market value weighted index, that measures performance of the 2,000 companies that are between the 1,000th and 3,000th largest in the market with dividends reinvested. The Lipper Capital Appreciation Funds Index reflects the record of the 30 largest funds in this category, comprised of more aggressive domestic growth mutual funds, as reported by Lipper, Inc. It is not possible to invest directly in an index. Periods longer than one year are annualized.
According to data from Lipper, Inc. as of December 31, 2007, Aggressive Investors 2 Fund ranked 12th of 357 capital appreciation funds for the twelve months ending December 31, 2007, 14th of 247 over the last five years, 16th of 225 since inception in October, 2001. Lipper, Inc. is an independent mutual fund rating service that ranks funds in various fund categories by making comparative calculations using total returns.
| | |
| 16 | | Semi-Annual Report | December 31, 2007 (Unaudited) |
Aggressive Investors 2 Fund
MANAGER’S COMMENTARY (continued)
(Unaudited)
Aggressive Investors 2 Fund vs. S&P 500 Index & Lipper Capital Appreciation Funds Index & Russell 2000 Index 10/31/01 to 12/31/07
Detailed Explanation of Quarterly Performance—What Worked Well
The Short Version: Talk about a chemical reaction. Chemical companies highlighted our top performers during the quarter. Four were among the top ten. Combined, these companies contributed over 4% to the return of the Fund. Our top two performers, both of which were chemical-related, each earned over 50% during the three-month period. The Fund also benefited from a bit of a global flavor as two of our top holdings are internationally based companies. (The Fund may invest up to 15% in foreign stocks, though the actual number has historically been, or is currently, significantly less than this.)
These are the ten best performers for the quarter ended December 31, 2007:
| | | | | | |
| Rank | | Description | | Industry | | % Gain |
| 1 | | Mosaic Co | | Chemicals | | 55.8% |
| 2 | | Terra Industries Inc | | Chemicals | | 52.8% |
| 3 | | Mobile Telesystems OJSC ADR | | Telecommunications | | 46.9% |
| 4 | | Deckers Outdoor Corp | | Apparel | | 37.7% |
| 5 | | Potash Corp of Saskatchewan | | Chemicals | | 36.5% |
| 6 | | Intuitive Surgical Inc | | Healthcare-Products | | 36.2% |
| 7 | | CF Industries Holdings Inc | | Chemicals | | 36.1% |
| 8 | | Apple Inc | | Computers | | 29.1% |
| 9 | | priceline.com Inc | | Internet | | 23.4% |
| 10 | | Belden Inc | | Electrical Compo & Equip | | 21.1% |
| | | | | | | |
The Mosaic Company was the Fund’s top performer and earned over 55% for the three-month period. Based in Minneapolis, Minnesota, the chemical company is a leading global manufacturer of crop nutrients which serve as primary ingredients for fertilizer. Two significant factors have surfaced as of late that greatly benefited fertilizer companies like Mosaic. Rising oil prices and government subsidies have led to increased demand for ethanol which has prompted greater production of corn. Additionally, as the populations in China and other developing Asian and Latin American countries become increasingly affluent, their residents are adding more meat to their diets. As a result, corn and others feed grains have been met with even greater global demand and thus, the need for more fertilizer. During the past quarter, the company used its recent windfall from ongoing business operations to pay down long-term debt and strengthen its overall financial position. The stock contributed over 1.7% to the performance of the Fund during the three-month period.
Intuitive Surgical Inc. is a healthcare-related company that manufactures and markets specialty surgical products for a variety of medical applications. In particular, the company has designed robotic tools known as da Vinci systems which are used for urology, cardiology, gynecology, and general surgeries. In its most recent quarter, company profits doubled and sales increased by over 60%. Additionally, Intuitive has started to make inroads into the international medical markets. While many
Aggressive Investors 2 Fund
MANAGER’S COMMENTARY (continued)
(Unaudited)
analysts remain quite positive about the company’s prospects for continued growth, others express concerns that it could encounter future challenges because it essentially remains a one-product company. To counter these fears, management points out that revenue is also tied to sales of accessories, system service and training; therefore, the potential for recurring revenue streams is becoming more substantial. Intuitive Systems contributed just over 1.0% to the performance of the Fund this past quarter.
Detailed Explanation of Quarterly Performance—What Didn’t Work
The Short Version: Companies from five different sectors were represented in our list of weak performers; no one industry served as the primary (negative) catalyst. Interestingly, the stock (CROCS) that made the greatest negative contribution to the Fund’s performance during the last three months had been our top performer over the prior two quarters. Nine companies lost 20% or more during the past quarter.
These are the ten stocks that performed the worst in the quarter ended December 31, 2007:
| | | | | | |
| Rank | | Description | | Industry | | % Loss |
| 1 | | WellCare Health Plans Inc | | Healthcare-Services | | -78.6% |
| 2 | | CROCS Inc | | Apparel | | -45.3% |
| 3 | | Cooper Tire & Rubber Co | | Auto Parts & Equipment | | -35.4% |
| 4 | | Ceradyne Inc | | Miscellaneous Manufacturing | | -32.5% |
| 5 | | Perini Corp | | Engineering & Construction | | -29.6% |
| 6 | | Amkor Technology Inc | | Semiconductors | | -29.2% |
| 7 | | Jones Lang LaSalle Inc | | Real Estate | | -29.2% |
| 8 | | Big Lots Inc | | Retail | | -28.5% |
| 9 | | Varian Semiconductor Equipment Assoc | | Semiconductors | | -20.0% |
| 10 | | Synaptics Inc | | Computers | | -19.6% |
| | | | | | | |
Our worst performer for the quarter, managed care company, WellCare Health Plans offers government-sponsored healthcare and prescription drug programs through Medicare and Medicaid. In late October, federal investigators raided company headquarters and initiated an investigation over what most believe to be fraud-related issues. Unfortunately, our models can’t identify issues like this before they happen. To add insult to injury, company execs sold off over $45 million in stock during the year in advance of the raid, far more than the insider sales totaled for all of 2006. The company’s stock priced plunged over 70% in one day. News did not get any better for the company as the quarter progressed as shareholder lawsuits ensued and plan enrollments declined. Fortunately, our position in this lightly traded company is relatively small and it cost the Fund less than 0.80% in return for the quarter. We purchased this stock late in the September quarter and our models jettisoned it a couple of months later.
Trendy shoemaker, CROCS has been a dependable performer for several quarters. CROCS was the Fund’s top performer, and returned over 50% during the three months ended September 30, 2007. While its latest earnings report actually beat Wall Street forecasts, its future guidance on revenues fell short of expectations. In reality, CROCS had trouble keeping up with the increasing demand for its products throughout Europe and Japan, an issue that cost the company about $30 million in potential quarterly sales. Its stock price fell by almost half for the quarter and a few shareholder suits followed. The holding cost the Fund just under 2% during the past three months. Despite the down quarter, CROCS remained our fourth best performer for the calendar year and appreciated more than 70%.
Detailed Explanation of Calendar Year Performance—What Worked Well
The Short Version: With a gain of over 30%, lots of things went right for the Fund during the prior 12-months. Our three top holdings (including two technology companies) earned well in excess of 100% and a total of 14 stocks returned over 50% for the calendar year. Basic materials and energy highlighted the list of top 10 performers as six companies came from those two sectors.
| | |
| 18 | | Semi-Annual Report | December 31, 2007 (Unaudited) |
Aggressive Investors 2 Fund
MANAGER’S COMMENTARY (continued)
(Unaudited)
These are the ten best performers for the calendar year ended December 31, 2007:
| | | | | | |
| Rank | | Description | | Industry | | % Gain |
| 1 | | Research In Motion Ltd | | Computers | | 166.2% |
| 2 | | Apple Inc | | Computers | | 132.6% |
| 3 | | Potash Corp of Saskatchewan | | Chemicals | | 113.3% |
| 4 | | CROCS Inc | | Apparel | | 70.4% |
| 5 | | Chaparral Steel Co | | Iron/Steel | | 69.8% |
| 6 | | Terra Industries Inc | | Chemicals | | 69.3% |
| 7 | | National Oilwell Varco Inc | | Oil & Gas Services | | 67.6% |
| 8 | | Frontier Oil Corp | | Oil & Gas | | 66.8% |
| 9 | | Vimpel-Communications ADR | | Telecommunications | | 66.0% |
| 10 | | Tesoro Corp | | Oil & Gas | | 62.6% |
| | | | | | | |
The Fund’s best two performers, Research in Motion and Apple, topped the list with returns greater than 100% in 2007. Consumers are still in love with their time-tested Blackberries (Research in Motion), even after the successful debut of the iPhone (Apple) in June. (Apparently there is room for both in this growing global market.) In its most recent report, Research in Motion more than doubled its profits and beat Wall Street expectations once again; the company is reaping benefits of higher sales of its Pearl and Curve. Likewise, Apple reported a 67% increase in earnings in its latest report as all the publicity related to the iPhone has led to increased demand for the old trusted iPods and Macs. The company also successfully launched the iPhone in Europe later in the year and has it sights set on Asia for 2008. Combined, these two techs contributed over 4.25% to the Fund’s performance in 2007.
Detailed Explanation of Calendar Year Performance—What Didn’t Work
The Short Version: Six industry sectors were represented in the list of poor performers, highlighted by three financials firms. Combined, those three holdings only cost the Fund just over 1% in performance. Fortunately, only one company lost over 50% for the calendar year and the Fund owned a relatively small position of that stock.
These are the ten stocks that performed the worst for the calendar year ended December 31, 2007:
| | | | | | |
| Rank | | Description | | Industry | | % Loss |
| 1 | | WellCare Health Plans Inc | | Healthcare-Services | | -77.5% |
| 2 | | Cooper Tire & Rubber Co | | Auto Parts & Equipment | | -41.1% |
| 3 | | First Marblehead Corp/The | | Diversified Financial Svcs | | -37.8% |
| 4 | | Jones Lang LaSalle Inc | | Real Estate | | -36.6% |
| 5 | | Perini Corp | | Engineering & Construction | | -29.6% |
| 6 | | Valueclick Inc | | Internet | | -29.1% |
| 7 | | Western Refining Inc | | Oil & Gas | | -28.4% |
| 8 | | Washington Mutual Inc | | Savings & Loans | | -27.0% |
| 9 | | Baldor Electric Co | | Hand/Machine Tools | | -23.2% |
| 10 | | China Southern Airlines Co Ltd ADR | | Airlines | | -23.2% |
| | | | | | | |
The year 2007 turned out to be highly volatile for Cooper Tire and Rubber. After trading around $28 in July, the stock plunged over 20% in one day following its recent quarterly earnings announcement and closed the year around $16.50. While higher sales in Europe and Asia contributed to a quarterly profit, U.S. analysts remained concerned about plant inefficiencies and how the company will handle rising costs of raw materials in 2008. The stock cost the Fund less than 0.5% in annual return.
Aggressive Investors 2 Fund
MANAGER’S COMMENTARY (continued)
(Unaudited)
Managing Risks (on the margin) with Puts and Calls
We have mentioned in previous letters the occasional use of calls to provide some exposure to a stock’s “upside,” while limiting the risk of a stock’s major decline. A related strategy is even more defensive in nature and involves selling calls or buying puts on Fund stocks in order to “manage down” (in accordance with our investment objective) the risk that our Fund might fall faster than the market overall. As our Fund had measurably become more volatile than we would like over the last two years, we employed such a strategy in the fourth quarter with a portion of the Fund. The total capital employed with this strategy is small, equal to 0.5% of net assets. In the downturn between mid-October to mid-December, this strategy provided a bit of cushion, however, as our options returned a 0.6% of net assets gain. The purpose here is not really to add to returns significantly over the long haul, but rather to decrease downside volatility or short term risk.
Top Ten Holdings as of December 31, 2007
Five of our top holdings at the end of the calendar year were among the Fund’s best performers during the December quarter: Decker Outdoor, Mosaic Co., Intuitive Surgical, Potash Corp., and Apple Inc. Combined, these five companies contributed over 6% to the overall performance of the Fund during the quarter. The top 10 holdings represented just under 40% of the net assets of the Fund.
| | | | | | |
| Rank | | Description | | Industry | | Percent of
Net Assets |
| 1 | | Deckers Outdoor Corp | | Apparel | | 5.4% |
| 2 | | Owens-Illinois Inc | | Packaging & Containers | | 4.5% |
| 3 | | Mosaic Co | | Chemicals | | 4.3% |
| 4 | | Invitrogen Corp | | Biotechnology | | 4.2% |
| 5 | | AGCO Corp | | Machinery-Diversified | | 3.8% |
| 6 | | Onyx Pharmaceuticals Inc | | Pharmaceuticals | | 3.6% |
| 7 | | Intuitive Surgical Inc | | Healthcare-Products | | 3.6% |
| 8 | | Apple Inc | | Computers | | 3.2% |
| 9 | | Amazon.Com Inc | | Internet | | 3.2% |
| 10 | | Potash Corp of Saskatchewan | | Chemicals | | 3.1% |
| | | | | | | |
| | | | | | 38.9% |
Industry Sector Representation as of December 31, 2007
Our Fund’s strong relative weighting in basic materials has had a very positive effect in the December quarter, as our “picks” performed well as a group. Interestingly, our under-representation of financials also helped significantly, as many banks and related investment stocks got pounded by the subprime lending and related credit crisis. Our second largest sector was consumer, non-cyclicals, probably a good place to be if we should enter a recession in 2008, as some analysts predict. None of this reflects a view of the economy at Bridgeway, however. It is simply the sum total of our individual stock picks.
| | | | | | | | |
| | | % of Portfolio | | % S&P 500 Index | | Difference |
Basic Materials | | 17.7% | | 3.4% | | 14.3% |
Communications | | 10.1% | | 11.3% | | -1.2% |
Consumer, Cyclical | | 10.2% | | 7.1% | | 3.1% |
Consumer, Non-cyclical | | 18.5% | | 20.5% | | -2.0% |
Energy | | 4.9% | | 12.9% | | -8.0% |
Financial | | 4.6% | | 17.6% | | -13.0% |
Industrial | | 21.7% | | 11.8% | | 9.9% |
Technology | | 12.0% | | 11.8% | | 0.2% |
Utilities | | 0.0% | | 3.5% | | -3.5% |
Diversified | | 0.0% | | 0.1% | | -0.1% |
Cash | | 0.3% | | 0.0% | | 0.3% |
| | | | | | | | | |
Total | | 100.0% | | 100.0% | | |
| | |
| 20 | | Semi-Annual Report | December 31, 2007 (Unaudited) |
Aggressive Investors 2 Fund
MANAGER’S COMMENTARY (continued)
(Unaudited)
Disclaimer
The following is a reminder from the friendly folks at your Fund who worry about liability. The views expressed here are exclusively those of Fund management. These views, including those of market sectors or individual stocks, are not meant as investment advice and should not be considered predictive in nature. Any favorable (or unfavorable) description of a holding applies only as of the quarter end, December 31, 2007, unless otherwise stated. Security positions can and do change thereafter. Discussions of historical performance do not guarantee and are not indicative of future performance.
Market volatility can significantly affect short-term performance. The Fund is not an appropriate investment for short-term investors. Investments in the small companies within this multi-cap fund generally carry greater risk than is customarily associated with larger companies. This additional risk is attributable to a number of factors, including the relatively limited financial resources that are typically available to small companies, and the fact that small companies often have comparatively limited product lines. In addition, the stock of small companies tends to be more volatile than the stock of large companies, particularly in the short term and particularly in the early stages of an economic or market downturn. The Fund’s use of options, futures, and leverage magnifies the risk of loss in an unfavorable market, and the Fund’s use of short-sale positions can, in theory, expose shareholders to unlimited loss. Finally, the Fund exposes shareholders to “focus risk” which adds to Fund volatility through the possibility that a single company could significantly affect total return. Shareholders of the Fund, therefore, are taking on more risk than they would if they invested in the stock market as a whole.
Conclusion
Thank you for your continued investment in Aggressive Investors 2 Fund. We encourage your feedback; your reactions and concerns are important to us.
Sincerely,
Your Investment Management Team
Aggressive Investors 2 Fund
SCHEDULE OF INVESTMENTS
Showing percentage of net assets as of December 31, 2007 (Unaudited)
| | | | | | | |
| Industry | | Company | | Shares | | Value |
|
COMMON STOCKS - 99.70% |
Aerospace/Defense - 1.35% |
| | Lockheed Martin Corp. | | 107,400 | | $ | 11,304,924 |
|
Airlines - 0.48% |
| | China Southern Airlines Co., Ltd., ADR | | 60,700 | | | 3,972,815 |
|
Apparel - 8.20% |
| | CROCS, Inc.*(a) | | 460,800 | | | 16,962,048 |
| | Deckers Outdoor Corp.*(a) | | 290,700 | | | 45,075,942 |
| | Warnaco Group, Inc.* | | 188,700 | | | 6,566,760 |
| | | | | | | |
| | | | | | | 68,604,750 |
|
Auto Manufacturers - 0.56% |
| | Daimler AG | | 49,400 | | | 4,724,122 |
|
Banks - 0.30% |
| | US Bancorp(a) | | 79,000 | | | 2,507,460 |
|
Biotechnology - 4.19% |
| | Invitrogen Corp.* | | 375,100 | | | 35,038,091 |
|
Chemicals - 13.26% |
| | CF Industries Holdings, Inc. | | 184,400 | | | 20,295,064 |
| | Monsanto Co. | | 120,800 | | | 13,492,152 |
| | Mosaic Co.* | | 381,600 | | | 36,000,144 |
| | Potash Corp. of Saskatchewan | | 181,299 | | | 26,099,804 |
| | Terra Industries, Inc.* | | 313,800 | | | 14,987,088 |
| | | | | | | |
| | | | | | | 110,874,252 |
|
Commercial Services - 1.51% |
| | Apollo Group, Inc.* | | 72,200 | | | 5,064,830 |
| | Sotheby's | | 197,800 | | | 7,536,180 |
| | | | | | | |
| | | | | | | 12,601,010 |
|
Computers - 9.45% |
| | Apple, Inc.* | | 136,100 | | | 26,958,688 |
| | Hewlett-Packard Co. | | 138,900 | | | 7,011,672 |
| | Research In Motion, Ltd.* | | 136,800 | | | 15,513,120 |
| | Sigma Designs, Inc.*(a) | | 304,800 | | | 16,824,960 |
| | Sun Microsystems, Inc.* | | 341,625 | | | 6,193,661 |
| | Synaptics, Inc.* | | 159,100 | | | 6,548,556 |
| | | | | | | |
| | | | | | | 79,050,657 |
|
Diversified Financial Services - 2.80% |
| | Goldman Sachs Group, Inc. | | 34,800 | | | 7,483,740 |
| | Greenhill & Co., Inc.(a) | | 114,400 | | | 7,605,312 |
| | TD Ameritrade Holding Corp.* | | 414,600 | | | 8,316,876 |
| | | | | | | |
| | | | | | | 23,405,928 |
| | | | | | | |
| Industry | | Company | | Shares | | Value |
|
|
Electrical Components & Equipment - 2.17% |
| | General Cable Corp.* | | 112,500 | | $ | 8,244,000 |
| | GrafTech International, Ltd.* | | 557,500 | | | 9,895,625 |
| | | | | | | |
| | | | | | | 18,139,625 |
|
Electronics - 3.02% |
| | Avnet, Inc.* | | 169,400 | | | 5,923,918 |
| | Flir Systems, Inc.* | | 221,000 | | | 6,917,300 |
| | Garmin, Ltd.(a) | | 128,100 | | | 12,425,700 |
| | | | | | | |
| | | | | | | 25,266,918 |
|
Energy-Alternative Sources - 2.05% |
| | Sunpower Corp.*(a) | | 131,500 | | | 17,146,285 |
|
Engineering & Construction - 4.28% |
| | ABB, Ltd.(a) | | 268,600 | | | 7,735,680 |
| | McDermott International, Inc.* | | 387,500 | | | 22,874,125 |
| | Perini Corp.* | | 125,400 | | | 5,194,068 |
| | | | | | | |
| | | | | | | 35,803,873 |
|
Healthcare-Products - 3.59% |
| | Intuitive Surgical, Inc.* | | 92,500 | | | 30,016,250 |
|
Insurance - 0.84% |
| | MetLife, Inc. | | 114,300 | | | 7,043,166 |
|
Internet - 5.39% |
| | Amazon.com, Inc.*(a) | | 290,100 | | | 26,874,864 |
| | priceline.com, Inc.*(a) | | 158,100 | | | 18,159,366 |
| | | | | | | |
| | | | | | | 45,034,230 |
|
Iron/Steel - 0.65% |
| | Mechel, ADR | | 55,600 | | | 5,400,984 |
|
Machinery-Diversified - 4.47% |
| | AGCO Corp.* | | 470,400 | | | 31,977,792 |
| | CNH Global NV | | 82,400 | | | 5,423,568 |
| | | | | | | |
| | | | | | | 37,401,360 |
|
Metal Fabrication-Hardware - 1.93% |
| | Precision Castparts Corp. | | 61,300 | | | 8,502,310 |
| | Valmont Industries, Inc. | | 86,000 | | | 7,664,320 |
| | | | | | | |
| | | | | | | 16,166,630 |
|
Mining - 3.82% |
| | Cameco Corp. | | 164,800 | | | 6,560,688 |
| | Freeport-McMoRan Copper & Gold, Inc. | | 105,400 | | | 10,797,176 |
| | Southern Copper Corp.(a) | | 139,000 | | | 14,613,070 |
| | | | | | | |
| | | | | | | 31,970,934 |
| | |
| 22 | | Semi-Annual Report | December 31, 2007 (Unaudited) |
Aggressive Investors 2 Fund
SCHEDULE OF INVESTMENTS (continued)
Showing percentage of net assets as of December 31, 2007 (Unaudited)
| | | | | | | |
| Industry | | Company | | Shares | | Value |
|
Common Stocks (continued) |
Oil & Gas Services - 2.81% |
| | National Oilwell Varco, Inc.* | | 202,800 | | $ | 14,897,688 |
| | Oceaneering International, Inc.* | | 128,000 | | | 8,620,800 |
| | | | | | | |
| | | | | | | 23,518,488 |
|
Packaging & Containers - 4.51% |
| | Owens-Illinois, Inc.* | | 762,300 | | | 37,733,850 |
|
Pharmaceuticals - 9.20% |
| | Bristol-Myers Squibb Co. | | 465,500 | | | 12,345,060 |
| | Express Scripts, Inc.* | | 126,800 | | | 9,256,400 |
| | Gilead Sciences, Inc.* | | 182,000 | | | 8,373,820 |
| | Medco Health Solutions, Inc.* | | 81,100 | | | 8,223,540 |
| | Onyx Pharmaceuticals, Inc.* | | 540,600 | | | 30,068,172 |
| | Pfizer, Inc. | | 380,400 | | | 8,646,492 |
| | | | | | | |
| | | | | | | 76,913,484 |
|
Real Estate - 0.68% |
| | Jones Lang LaSalle, Inc.(a) | | 79,400 | | | 5,650,104 |
|
Retail - 1.00% |
| | GameStop Corp.* | | 134,000 | | | 8,322,740 |
|
Semiconductors - 1.26% |
| | NVIDIA Corp.*(a) | | 309,600 | | | 10,532,592 |
|
Software - 1.25% |
| | Oracle Corp.* | | 464,500 | | | 10,488,410 |
|
Telecommunications - 4.68% |
| | Cisco Systems, Inc.* | | 324,300 | | | 8,778,801 |
| | Mobile Telesystems OJSC, ADR | | 142,400 | | | 14,494,896 |
| | Nokia OYJ, ADR | | 232,900 | | | 8,941,031 |
| | Telefonica SA | | 71,200 | | | 6,948,408 |
| | | | | | | |
| | | | | | | 39,163,136 |
| | | | | | | |
| | |
TOTAL COMMON STOCKS - 99.70% | | | | | 833,797,068 |
| | | | | | | |
(Cost $670,932,448) | | | | | |
| | | | | | | |
| | | Rate^ | | Shares | | Value |
|
MONEY MARKET FUNDS - 0.29% |
BlackRock TempCash Liquidity Fund, Institutional Shares #21 | | 4.78% | | 2,378,284 | | $ | 2,378,284 |
| | | | | | | |
| |
TOTAL MONEY MARKET FUNDS - 0.29%
| | | 2,378,284 |
| | | | | | | |
(Cost $2,378,284) | | | |
| | |
TOTAL INVESTMENTS - 99.99%
| | | | $ | 836,175,352 |
(Cost $673,310,732) | | | | | |
Other Assets in Excess of Liabilities - 0.01% | | | 104,539 |
| | | | | | | |
NET ASSETS - 100.00% | | | | | | $ | 836,279,891 |
| | | | | | | |
| * | Non-income producing security. |
| ^ | Rate disclosed is as of December 31, 2007. |
| (a) | This security or a portion of the security is out on loan at December 31, 2007. Total loaned securities had a market value of $137,594,226 at December 31, 2007. |
| ADR | American Depositary Receipt |
See Notes to Financial Statements.
Ultra-Small Company Fund
MANAGER’S COMMENTARY
(Unaudited)
December 31, 2007
Dear Fellow Ultra-Small Company Fund Shareholder,
For the quarter-ended December 31, 2007, Ultra-Small Company Fund declined by 7.00%, outperforming its primary benchmark index, CRSP Cap Based Portfolio 10 Index, which lost 9.14%, but underperforming both the Lipper Small-Cap Stock Funds Index (-3.87%) and the Russell 2000 Index (-4.58%). In general, ultra-small companies had a rough quarter as continued market and economic uncertainty led many investors to shy away from these smallest companies in favor of larger industry leaders. It was a mixed record in a down market environment.
For the six month semi-annual period, our Fund dropped 8.22%, again outperforming its primary benchmark, the CRSP Cap-Based Portfolio 10 Index (-14.45%). Both the Lipper Small-Cap Stock Funds Index (-5.44), and the Russell 2000 Index (-7.53%) fell in value as well, though, reflecting the better record of these (less small) companies for the period, not as much as our Fund. This semi-annual period was marked by extreme market volatility, as investors faced the growing subprime debacle that morphed into a true credit crisis.
For the full calendar year, Ultra-Small Company Fund fell by only 2.77%, significantly beating the CRSP Cap-Based Portfolio 10 Index benchmark, which declined 9.88%. The other small-cap indexes fared somewhat better on an annual basis with the Lipper Small-Cap Stock Funds Index increasing by 4.19% and the Russell 2000 Index declining 1.57%. The calendar year 2007 appears to have reversed a prior trend that had favored smaller issues over the past seven years. Most importantly, we view the shorter-term results in conjunction with long-term returns. For each of the longer time horizons (five year, ten year, and since inception in 1994), the performance of our Fund has significantly surpassed that of its peer and market benchmarks.
The table below presents our December quarter, six-month, one-year, five-year, ten-year and life-to-date financial results according to the formula required by the SEC. See the next page for a graph of performance for the last ten years.
| | | | | | | | | | | | |
| | | Dec Qtr. 10/1/07
to 12/31/07 | | 6 Month 7/1/07
to 12/31/07 | | 1 Year 1/1/07
to 12/31/07 | | 5 Year 1/1/03
to 12/31/07 | | 10 Year 1/1/98
to 12/31/07 | | Life-to-Date 8/5/94 to 12/31/07 |
| | | | | | |
Ultra-Small Company Fund | | -7.00% | | -8.22% | | -2.77% | | 23.14% | | 17.56% | | 20.57% |
CRSP Cap-Based Port. 10 Index | | -9.14% | | -14.45% | | -9.88% | | 21.06% | | 12.73% | | 14.46% |
Lipper Small-Cap Stock Funds Index | | -3.87% | | -5.44% | | 4.19% | | 16.28% | | 7.10% | | 10.22% |
Russell 2000 Index (small companies) | | -4.58% | | -7.53% | | -1.57% | | 16.25% | | 7.08% | | 10.35% |
Performance figures quoted in the table above and graph below represent past performance and are no guarantee of future results. The table above and the graph below do not reflect the deduction of taxes that a shareholder would pay on Fund distributions or the redemption of Fund shares.
The Lipper Small-Cap Stock Funds Index is an index of small-company funds compiled by Lipper, Inc. The Russell 2000 Index is an unmanaged, market value weighted index, which measures performance of the 2,000 companies that are between the 1,000th and 3,000th largest in the market with dividends reinvested. The CRSP Cap-Based Portfolio 10 Index is an unmanaged index of 1,670 of the smallest publicly traded U.S. stocks (with dividends reinvested), as reported by the Center for Research on Security Prices. It is not possible to invest directly in an index. Periods longer than one year are annualized.
According to data from Lipper, Inc. as of December 31, 2007, the Ultra-Small Company Fund ranked 45th of 96 micro-cap funds for the last twelve months ended December 31, 2007, 1st of 65 such funds for the last five years, 2nd of 32 funds for ten years and 1st of 9 funds since inception in August, 1994. Lipper, Inc. is an independent mutual fund rating service that ranks funds in various fund categories by making comparative calculations using total returns.
| | |
| 24 | | Semi-Annual Report | December 31, 2007 (Unaudited) |
Ultra-Small Company Fund
MANAGER’S COMMENTARY (continued)
(Unaudited)
Ultra-Small Company Fund vs. CRSP 10 Index & Russell 2000 Index & Lipper Small Company Funds Index 1/1/98 to 12/31/07

Detailed Explanation of Quarterly Performance—What Worked Well
The Short Version: Here’s a big surprise… in this day and age (and market), a financial services company actually topped the list of best performers during the December quarter. All told, six different sectors were represented in the list.
These are the ten best performers for the quarter ended December 31, 2007:
| | | | | | |
| Rank | | Description | | Industry | | % Gain |
| 1 | | AeroCentury Corp | | Diversified Financial Services | | 63.1% |
| 2 | | Chindex International Inc | | Distribution/Wholesale | | 43.0% |
| 3 | | Ebix Inc | | Software | | 40.5% |
| 4 | | Chase Corp | | Miscellaneous Manufacturing | | 35.2% |
| 5 | | Arabian American Development Co | | Oil & Gas | | 28.5% |
| 6 | | Novatel Inc | | Electronics | | 26.7% |
| 7 | | Kewaunee Scientific Corp | | Healthcare-Products | | 25.9% |
| 8 | | K-Tron International Inc | | Hand/Machine Tools | | 25.5% |
| 9 | | Somanetics Corp | | Healthcare-Products | | 24.7% |
| 10 | | CAM Commerce Solutions Inc | | Software | | 22.1% |
| | | | | | | |
AeroCentury Corp. was the Fund’s top performer this quarter and the only holding to return more than 50% in performance. While many other financial services companies were caught up in subprime lending problems and the related credit crisis, this aircraft and engine leasing company reported third quarter results in November that far exceeded its sole analyst’s expectations. (Many of the smallest companies do not generate significant coverage from Wall Street and other major firms.) The quarterly earnings jumped 230% from last year’s level, though some of the strong comparative performance can be attributed to accounting restatements from 2006 results. The company contributed almost 0.25% to the return of the Fund during the past three months.
Detailed Explanation of Quarterly Performance—What Didn’t Work
The Short Version: Financial and consumer-related companies highlighted the list of poor performers during the quarter, as the credit concerns threatened to slow consumer activity even more in the months to come. One holding plunged over 50% during the three month period, and another 14 companies lost more than 25% in value.
Ultra-Small Company Fund
MANAGER’S COMMENTARY (continued)
(Unaudited)
These are the ten stocks that performed the worst in the quarter ended December 31, 2007:
| | | | | | |
| Rank | | Description | | Industry | | % Loss |
| 1 | | PC Mall Inc | | Retail | | -51.0% |
| 2 | | Hardinge Inc | | Hand/Machine Tools | | -48.4% |
| 3 | | Green Bankshares Inc | | Banks | | -47.2% |
| 4 | | CPI Corp | | Commercial Services | | -45.1% |
| 5 | | KMG Chemicals Inc | | Chemicals | | -40.1% |
| 6 | | Silicom Ltd | | Electronics | | -40.0% |
| 7 | | Technology Investment Capital Corp | | Investment Companies | | -31.0% |
| 8 | | PRG-Schultz International Inc | | Commercial Services | | -30.9% |
| 9 | | Movie Star Inc/NY | | Apparel | | -29.2% |
| 10 | | SAVVIS Inc | | Telecommunications | | -28.1% |
| | | | | | | |
Green Bankshares was among the worst performers in the Fund this quarter and another victim of the ongoing credit crisis. The Tennessee-based bank holding company also oversees a wealth management group and mortgage banking operation. In December, the bank lowered its 4th quarter 2007 earnings forecast and withdrew its guidance for all of 2008. As the real estate market continued to decline, Green was forced to increase its loan-loss provision due to the potential for additional defaults and foreclosures. For the quarter, the holding cost the Fund almost 0.25% in return.
Detailed Explanation of Calendar Year Performance—What Worked Well
The Short Version: Five holdings gained over 100% in 2007, and a total of 14 other stocks surged by 50% or more. Six different sectors were represented among the top performers in the calendar year with four consumer-related holdings appearing on the list. Combined, these four stocks contributed over 4% to the return of the Fund.
These are the ten best performers for the calendar year ended December 31, 2007:
| | | | | | |
| Rank | | Description | | Industry | | % Gain |
| 1 | | Life Partners Holdings Inc | | Insurance | | 158.3% |
| 2 | | Arabian American Development Co | | Oil & Gas | | 150.9% |
| 3 | | ICO Inc | | Chemicals | | 127.7% |
| 4 | | RadNet Inc | | Healthcare-Services | | 112.1% |
| 5 | | Cal-Maine Foods Inc | | Food | | 102.1% |
| 6 | | Twin Disc Inc | | Machinery-Diversified | | 99.4% |
| 7 | | LB Foster Co | | Metal Fabricate/Hardware | | 98.3% |
| 8 | | M&F Worldwide Corp | | Food | | 97.3% |
| 9 | | Everlast Worldwide Inc | | Apparel | | 94.1% |
| 10 | | Dawson Geophysical Co | | Oil & Gas Services | | 86.0% |
| | | | | | | |
RadNet Inc. was one of the five Fund holdings to double its price during the calendar year 2007. The company owns and operates diagnostic imaging centers throughout the country and has been in expansion mode through acquisitions since 2006. In July, management announced that it had obtained a substantial credit line with the intention of refinancing company debt, though the challenges in the credit markets prompted them to delay the move. Instead, GE Healthcare Financial Services agreed to provide an incremental $35 million in credit that will help the company meet its needed liquidity to proceed with its growth plans. RadNet contributed over 0.50% to the return of the Fund.
| | |
| 26 | | Semi-Annual Report | December 31, 2007 (Unaudited) |
Ultra-Small Company Fund
MANAGER’S COMMENTARY (continued)
(Unaudited)
Detailed Explanation of Calendar Year Performance—What Didn’t Work
The Short Version: If misery loves company, the Fund had plenty of company during this, the first calendar year decline of ultra-small companies generally since 1998 (a remarkable statistic). A total of 38 holdings declined in value by 25% or more during the 12-month period. Six different sectors were represented on the list of weak performers with four industrial companies costing the Fund over 1.0% in return.
These are the ten stocks that performed the worst for the fiscal year ended December 31, 2007:
| | | | | | |
| Rank | | Description | | Industry | | % Loss |
| 1 | | Tessco Technologies Inc | | Telecommunications | | -61.0% |
| 2 | | Constar International Inc | | Packaging & Containers | | -54.2% |
| 3 | | CPI Corp | | Commercial Services | | -53.2% |
| 4 | | Synalloy Corp | | Miscellaneous Manufacturing | | -53.0% |
| 5 | | Green Bankshares Inc | | Banks | | -51.5% |
| 6 | | PC Mall Inc | | Retail | | -51.0% |
| 7 | | Captaris Inc | | Software | | -51.0% |
| 8 | | Silicom Ltd | | Electronics | | -49.2% |
| 9 | | Technology Investment Capital Corp | | Investment Companies | | -46.0% |
| 10 | | Swank Inc | | Miscellaneous Manufacturing | | -45.0% |
| | | | | | | |
PC Mall was one of seven holdings to decline more than 50% during the calendar year 2007 and our worst performer in the December quarter. The direct marketer of computer hardware, software, and peripherals had been riding high on strong sales, mainly of Apple-related products. The company hit a 52-week high in late October (around the time we bought), before getting caught up in the recessionary fears and gloom and doom of the holiday season that affected many retailers. The stock got a brief reprieve from a decent week of activity in the days following Thanksgiving. For the year, PC Mall cost the Fund over 0.50% in return in 2007.
Top Ten Holdings as of December 31, 2007
Unfortunately, none of the Fund’s top 10 holdings appeared in the list of best performers during the past three months. A total of four chemical and oil and gas companies were among the top holdings and accounted for 13% of the net assets of the Fund.
| | | | | | |
| Rank | | Description | | Industry | | Percent of
Net Assets |
| 1 | | Cal-Maine Foods, Inc. | | Food | | 4.6% |
| 2 | | Air Methods Corp. | | Healthcare-Services | | 4.2% |
| 3 | | Dawson Geophysical Co. | | Oil & Gas Services | | 3.7% |
| 4 | | Bolt Technology Corp. | | Oil & Gas Services | | 3.7% |
| 5 | | Penford Corp. | | Chemicals | | 3.0% |
| 6 | | LB Foster Co. | | Metal Fabrication - Hardware | | 2.9% |
| 7 | | Dollar Financial Corp. | | Commercial Services | | 2.7% |
| 8 | | ICO, Inc. | | Chemicals | | 2.6% |
| 9 | | ICF International, Inc. | | Commercial Services | | 2.5% |
| 10 | | VSE Corp. | | Engineering & Construction | | 2.4% |
| | | | | | | |
| | | | | | 32.3% |
Ultra-Small Company Fund
MANAGER’S COMMENTARY (continued)
(Unaudited)
Industry Sector Representation as of December 31, 2007
Our models’ underweighting of financials versus our market benchmark proved beneficial to the Fund, as the ongoing credit crisis continued to take its toll on the performance of related stocks. On the other hand, the Fund was overweighted in industrials, and some of those holdings cost the Fund in overall return.
| | | | | | |
| | | % of Portfolio | | % CRSP
Portfolio 10 Index | | Difference |
Basic Materials | | 7.1% | | 2.6% | | 4.5% |
Communications | | 7.9% | | 9.1% | | -1.2% |
Consumer, Cyclical | | 7.8% | | 14.0% | | -6.2% |
Consumer, Non-cyclical | | 23.6% | | 24.8% | | -1.2% |
Energy | | 12.2% | | 5.4% | | 6.8% |
Financial | | 7.0% | | 22.7% | | -15.7% |
Industrial | | 24.7% | | 10.3% | | 14.4% |
Technology | | 7.8% | | 9.1% | | -1.3% |
Utilities | | 0.1% | | 0.9% | | -0.8% |
Diversified | | 0% | | 1.1% | | -1.1% |
Cash | | 1.8% | | 0.0% | | 1.8% |
| | | | | | | |
Total | | 100% | | 100% | | |
Disclaimer
The following is a reminder from the friendly folks at your Fund who worry about liability. The views expressed here are exclusively those of Fund management. These views are not meant as investment advice and should not be considered predictive in nature. Any favorable (or unfavorable) description of a holding applies only as of December 31, 2007, unless otherwise stated. Security positions can and do change thereafter. Discussions of historical performance do not guarantee and are not indicative of future performance.
The Fund is subject to very high, above market risk (volatility) and is not an appropriate investment for short-term investors. Investments in ultra-small companies generally carry greater risk than is customarily associated with larger companies and even “small companies” for various reasons such as narrower markets (fewer investors), limited financial resources and greater trading difficulty.
Conclusion
Ultra-Small Company Fund remains closed to investors. We encourage your feedback; your reactions and concerns are important to us.
Sincerely,
Your Investment Management Team
| | |
| 28 | | Semi-Annual Report | December 31, 2007 (Unaudited) |
THIS PAGE INTENTIONALLY LEFT BLANK
Ultra-Small Company Fund
SCHEDULE OF INVESTMENTS
Showing percentage of net assets as of December 31, 2007 (Unaudited)
| | | | | | | |
| Industry | | Company | | Shares | | Value |
|
COMMON STOCKS - 99.29% |
Advertising - 0.59% |
| | MDC Partners, Inc. | | 72,600 | | $ | 707,124 |
|
Aerospace/Defense - 1.46% |
| | LMI Aerospace, Inc. | | 36,500 | | | 967,615 |
| | SIFCO Industries, Inc. | | 46,000 | | | 774,180 |
| | | | | | | |
| | | | | | | 1,741,795 |
|
Agriculture - 0.47% |
| | AgFeed Industries, Inc.(a) | | 66,600 | | | 560,772 |
|
Apparel - 1.55% |
| | G-III Apparel Group, Ltd.* | | 119,200 | | | 1,760,584 |
| | Movie Star, Inc. | | 57,000 | | | 91,770 |
| | | | | | | |
| | | | | | | 1,852,354 |
|
Banks - 0.39% |
| | Centrue Financial Corp. | | 10,000 | | | 222,400 |
| | Silver State Bancorp(a) | | 17,000 | | | 239,700 |
| | | | | | | |
| | | | | | | 462,100 |
|
Chemicals - 7.13% |
| | American Pacific Corp. | | 23,200 | | | 395,560 |
| | ICO, Inc.* | | 237,500 | | | 3,049,500 |
| | Landec Corp.* | | 107,800 | | | 1,444,520 |
| | Penford Corp. | | 142,100 | | | 3,636,339 |
| | | | | | | |
| | | | | | | 8,525,919 |
|
Commercial Services - 7.54% |
| | Carriage Services, Inc. | | 62,500 | | | 550,000 |
| | Dollar Financial Corp.* | | 107,200 | | | 3,289,968 |
| | ICF International, Inc.* | | 115,800 | | | 2,925,108 |
| | Princeton Review, Inc.* | | 91,700 | | | 763,861 |
| | SM&A* | | 38,000 | | | 221,540 |
| | Transcend Services, Inc. | | 77,600 | | | 1,261,000 |
| | | | | | | |
| | | | | | | 9,011,477 |
|
Computers - 5.03% |
| | BluePhoenix Solutions, Ltd.*(a) | | 126,700 | | | 2,295,804 |
| | Integral Systems, Inc. | | 47,700 | | | 1,109,502 |
| | Rimage Corp.* | | 62,300 | | | 1,616,685 |
| | Synplicity, Inc. | | 75,400 | | | 437,320 |
| | TechTeam Global, Inc.* | | 21,600 | | | 272,160 |
| | Tier Technologies, Inc.* | | 33,200 | | | 282,200 |
| | | | | | | |
| | | | | | | 6,013,671 |
|
Distribution/Wholesale - 2.03% |
| | Chindex International, Inc.* | | 70,200 | | | 2,424,006 |
| | | | | | | |
| Industry | | Company | | Shares | | Value |
|
|
Diversified Financial Services - 0.64% |
| | AeroCentury Corp. | | 33,000 | | $ | 765,600 |
|
Electric Utilities - 0.15% |
| | Maine & Maritimes Corp. | | 5,500 | | | 182,875 |
|
Electrical Components & Equipment - 2.37% |
| | Advanced Battery Technologies, Inc.(a) | | 197,700 | | | 929,190 |
| | Espey Manufacturing & Electronics Corp. | | 6,000 | | | 112,680 |
| | Graham Corp. | | 22,400 | | | 1,173,760 |
| | SL Industries, Inc.* | | 30,800 | | | 619,696 |
| | | | | | | |
| | | | | | | 2,835,326 |
|
Electronics - 3.73% |
| | Insignia Systems, Inc. | | 52,500 | | | 146,475 |
| | IntriCon Corp. | | 30,500 | | | 379,725 |
| | Jinpan International, Ltd. | | 36,400 | | | 1,124,760 |
| | Mechanical Technology, Inc. | | 138,400 | | | 103,800 |
| | Spectrum Control, Inc.* | | 96,400 | | | 1,484,560 |
| | Vicon Industries, Inc. | | 127,100 | | | 1,220,160 |
| | | | | | | |
| | | | | | | 4,459,480 |
|
Energy-Alternative Sources - 0.04% |
| | Millennium Cell, Inc. | | 159,800 | | | 48,100 |
|
Engineering & Construction - 3.65% |
| | Michael Baker Corp.* | | 35,700 | | | 1,467,270 |
| | VSE Corp. | | 59,400 | | | 2,901,096 |
| | | | | | | |
| | | | | | | 4,368,366 |
|
Entertainment - 0.14% |
| | Magna Entertainment Corp. | | 173,000 | | | 167,810 |
|
Food - 4.63% |
| | Cal-Maine Foods, Inc.(a) | | 208,900 | | | 5,542,117 |
|
Hand/Machine Tools - 1.21% |
| | Hardinge, Inc. | | 55,700 | | | 934,646 |
| | K-Tron International, Inc.* | | 4,300 | | | 512,775 |
| | | | | | | |
| | | | | | | 1,447,421 |
|
Healthcare-Products - 5.48% |
| | CuraGen Corp. | | 85,333 | | | 78,507 |
| | Cynosure, Inc.*(a) | | 39,600 | | | 1,047,816 |
| | Exactech, Inc. | | 13,200 | | | 273,900 |
| | Kewaunee Scientific Corp. | | 9,100 | | | 179,179 |
| | MTS Medication Technologies, Inc. | | 11,500 | | | 151,225 |
| | Osteotech, Inc.* | | 110,700 | | | 865,674 |
| | |
| 30 | | Semi-Annual Report | December 31, 2007 (Unaudited) |
Ultra-Small Company Fund
SCHEDULE OF INVESTMENTS (continued)
Showing percentage of net assets as of December 31, 2007 (Unaudited)
| | | | | | | |
| Industry | | Company | | Shares | | Value |
|
Common Stocks (continued) |
Healthcare-Products (continued) |
| | Somanetics Corp.* | | 72,300 | | $ | 1,709,895 |
| | Synovis Life Technologies, Inc.* | | 50,600 | | | 989,230 |
| | Vnus Medical Technologies, Inc. | | 86,800 | | | 1,260,336 |
| | | | | | | |
| | | | | | | 6,555,762 |
|
Healthcare-Services - 5.52% |
| | Air Methods Corp.* | | 101,246 | | | 5,028,889 |
| | National Dentex Corp.* | | 7,500 | | | 120,900 |
| | RadNet, Inc. | | 143,000 | | | 1,451,450 |
| | | | | | | |
| | | | | | | 6,601,239 |
|
Insurance - 5.29% |
| | 21st Century Holding Co. | | 45,300 | | | 608,379 |
| | American Physicians Capital, Inc. | | 59,550 | | | 2,468,943 |
| | Citizens, Inc.(a) | | 90,400 | | | 499,912 |
| | Hallmark Financial Services* | | 55,000 | | | 872,300 |
| | Life Partners Holdings, Inc.(a) | | 17,230 | | | 477,271 |
| | Mercer Insurance Group, Inc. | | 13,000 | | | 233,480 |
| | Navigators Group, Inc.* | | 18,000 | | | 1,170,000 |
| | | | | | | |
| | | | | | | 6,330,285 |
|
Internet - 2.15% |
| | Aladdin Knowledge Systems, Ltd. | | 67,400 | | | 1,761,162 |
| | TheStreet.com, Inc. | | 50,500 | | | 803,960 |
| | | | | | | |
| | | | | | | 2,565,122 |
|
Investment Companies - 0.62% |
| | TICC Capital Corp.(a) | | 80,100 | | | 739,323 |
|
Machinery-Diversified - 2.94% |
| | Hurco Cos, Inc.* | | 19,900 | | | 868,635 |
| | Key Technology, Inc.* | | 37,100 | | | 1,279,950 |
| | Twin Disc, Inc. | | 19,300 | | | 1,365,861 |
| | | | | | | |
| | | | | | | 3,514,446 |
|
Media - 0.17% |
| | ADDvantage Technologies Group, Inc. | | 32,600 | | | 201,142 |
|
Metal Fabrication - Hardware - 2.93% |
| | LB Foster Co.* | | 67,800 | | | 3,507,294 |
|
Miscellaneous Manufacturers - 5.24% |
| | Argan, Inc. | | 10,500 | | | 140,175 |
| | AZZ, Inc.* | | 94,800 | | | 2,687,580 |
| | Chase Corp. | | 33,500 | | | 845,875 |
| | | | | | | |
| Industry | | Company | | Shares | | Value |
|
|
Miscellaneous Manufacturers (continued) |
| | GP Strategies Corp. | | 30,200 | | $ | 321,630 |
| | LSB Industries, Inc.*(a) | | 66,861 | | | 1,886,817 |
| | Peerless Manufacturing Co. | | 9,400 | | | 387,186 |
| | | | | | | |
| | | | | | | 6,269,263 |
|
Oil & Gas Services - 12.31% |
| | Bolt Technology Corp.*(a) | | 115,250 | | | 4,377,195 |
| | Dawson Geophysical Co.* | | 61,500 | | | 4,394,790 |
| | Matrix Service Co.* | | 83,300 | | | 1,817,606 |
| | Mitcham Industries, Inc.* | | 119,900 | | | 2,465,144 |
| | Natural Gas Services Group, Inc. | | 84,800 | | | 1,662,928 |
| | | | | | | |
| | | | | | | 14,717,663 |
|
Pharmaceuticals - 0.24% |
| | Cell Therapeutics, Inc. | | 155,614 | | | 292,554 |
|
Real Estate - 0.03% |
| | HouseValues, Inc.* | | 13,493 | | | 41,828 |
|
Retail - 4.22% |
| | Allion Healthcare, Inc. | | 46,700 | | | 256,383 |
| | Aristotle Corp. | | 13,200 | | | 177,936 |
| | Books-A-Million, Inc. | | 82,586 | | | 984,425 |
| | EZCORP, Inc.* | | 151,418 | | | 1,709,509 |
| | PC Connection, Inc.*(a) | | 108,027 | | | 1,226,107 |
| | PC Mall, Inc.* | | 73,800 | | | 687,078 |
| | | | | | | |
| | | | | | | 5,041,438 |
|
Savings & Loans - 0.14% |
| | Rainier Pacific Financial Group, Inc. | | 11,100 | | | 163,836 |
|
Semiconductors - 1.09% |
| | Amtech Systems, Inc. | | 88,800 | | | 1,153,512 |
| | Jazz Technologies, Inc. | | 24,000 | | | 37,440 |
| | MathStar, Inc. | | 168,100 | | | 109,265 |
| | | | | | | |
| | | | | | | 1,300,217 |
|
Shipbuilding - 0.18% |
| | Todd Shipyards Corp. | | 11,600 | | | 220,516 |
|
Software - 1.75% |
| | BSQUARE Corp.* | | 135,000 | | | 904,500 |
| | CAM Commerce Solutions, Inc. | | 11,500 | | | 480,815 |
| | Ebix, Inc.* | | 9,800 | | | 709,030 |
| | | | | | | |
| | | | | | | 2,094,345 |
|
Telecommunications - 5.03% |
| | Anaren, Inc.* | | 97,500 | | | 1,607,775 |
| | Carrier Access Corp. | | 107,275 | | | 257,460 |
| | Fibernet Telecom Group, Inc. | | 55,211 | | | 440,032 |
Ultra-Small Company Fund
SCHEDULE OF INVESTMENTS (continued)
Showing percentage of net assets as of December 31, 2007 (Unaudited)
| | | | | | | |
| Industry | | Company | | Shares | | Value |
|
Common Stocks (continued) |
Telecommunications (continued) |
| | Globecomm Systems, Inc.* | | 172,100 | | $ | 2,013,570 |
| | HickoryTech Corp. | | 26,000 | | | 243,360 |
| | LCC International, Inc. | | 58,900 | | | 106,020 |
| | SAVVIS, Inc.*(a) | | 48,333 | | | 1,348,974 |
| | | | | | | |
| | | | | | | 6,017,191 |
|
Transportation - 1.04% |
| | FreeSeas, Inc.(a) | | 54,600 | | | 327,600 |
| | International Shipholding Corp. | | 42,100 | | | 917,780 |
| | | | | | | |
| | | | | | | 1,245,380 |
|
Trucking & Leasing - 0.17% |
| | Willis Lease Finance Corp. | | 16,200 | | | 203,148 |
| | | | | | | |
| |
TOTAL COMMON STOCKS - 99.29%
| | | 118,738,305 |
| | | | | | | |
(Cost $96,332,336) | | | |
|
RIGHTS - 0.00% |
Apparel - 0.00% |
| | Movie Star, Inc. | | 57,000 | | | 0 |
| | | | | | | |
| |
TOTAL RIGHTS - 0.0%
| | | 0 |
| | | | | | | |
(Cost $—) | | | |
| | | | | | | | |
| | | Rate^ | | Shares | | Value | |
|
MONEY MARKET FUNDS - 1.59% | |
BlackRock TempCash Liquidity Fund, Institutional Shares #21 | | 4.78% | | 1,904,357 | | $ | 1,904,357 | |
| | | | | | | | |
| |
TOTAL MONEY MARKET FUNDS - 1.59%
| | | 1,904,357 | |
| | | | | | | | |
(Cost $1,904,357) | | | | |
| |
TOTAL INVESTMENTS - 100.88%
| | $ | 120,642,662 | |
(Cost $98,236,693) | | | | |
Liabilities in Excess of Other Assets - (0.88)% | | | (1,054,077 | ) |
| | | | | | | | |
NET ASSETS - 100.00% | | $ | 119,588,585 | |
| | | | | | | | |
| * | Non-income producing security. |
| ^ | Rate disclosed is as of December 31, 2007. |
| (a) | This security or a portion of the security is out on loan at December 31, 2007. Total loaned securities had a market value of $16,082,751 at December 31, 2007. |
See Notes to Financial Statements.
| | |
| 32 | | Semi-Annual Report | December 31, 2007 (Unaudited) |
THIS PAGE INTENTIONALLY LEFT BLANK
Ultra-Small Company Market Fund
MANAGER’S COMMENTARY
(Unaudited)
December 31, 2007
Dear Fellow Ultra-Small Company Market Fund Shareholder,
For the six-months ending December 31, 2007, our passively-managed Ultra-Small Company Market Fund declined by 9.21%, significantly outperforming its primary benchmark index, the CRSP Cap Based Portfolio 10 Index (-14.45%), but underperforming both the Lipper Small-Cap Stock Funds Index (-5.44%) and the Russell 2000 Index (-7.53%). In general, ultra-small companies had a rough semi-annual period as continued market and economic uncertainty led many investors to shy away from these smallest companies in favor of larger industry leaders. It was a mixed record in a down market environment.
For the full calendar year, Ultra-Small Company Market Fund fell by 5.40%, significantly beating the CRSP Cap-Based Portfolio 10 Index benchmark, which declined 9.88%. The other small-cap indexes fared better on an annual basis with the Lipper Small-Cap Stock Funds Index rising by 4.19% and the Russell 2000 Index dropping 1.57%. The calendar year 2007 appears to have reversed a prior trend that had favored smaller issues over the prior seven years. For both the 10-year time horizon and since inception in 1997, the performance of our Fund has surpassed each of its peer and market benchmarks.
The table below presents the six-month, one-year, five-year, ten-year and life-to-date financial results according to the formula required by the SEC. See the next page for a graph of performance for the last ten years.
| | | | | | | | | | |
| | | 6 Months 7/1/07
to 12/31/07 | | 1 Year 1/1/07
to 12/31/07 | | 5 Year 1/1/03
to 12/31/07 | | 10 Year 1/1/98
to 12/31/07 | | Life-to-Date 7/31/97 to 12/31/07 |
| | | | | |
Ultra-Small Company Market Fund | | -9.21% | | -5.40% | | 18.79% | | 14.87% | | 14.18% |
CRSP Cap-Based Portfolio 10 Index | | -14.45% | | -9.88% | | 21.06% | | 12.73% | | 12.88% |
Lipper Small-Cap Stock Funds Index | | -5.44% | | 4.19% | | 16.28% | | 7.10% | | 7.65% |
Russell 2000 Index | | -7.53% | | -1.57% | | 16.25% | | 7.08% | | 7.40% |
Performance figures quoted in the table above and graph below represent past performance and are no guarantee of future results. The table above and the graph below do not reflect the deduction of taxes that a shareholder would pay on Fund distributions or the redemption of Fund shares.
The Lipper Small-Cap Stock Funds Index is an index of small-company funds compiled by Lipper, Inc. The Russell 2000 Index is an unmanaged, market value weighted index, which measures performance of the 2,000 companies that are between the 1,000th and 3,000th largest in the market with dividends reinvested. The CRSP Cap-Based Portfolio 10 Index is an unmanaged index of 1,670 of the smallest publicly traded U.S. stocks (with dividends reinvested), as reported by the Center for Research on Security Prices. It is not possible to invest directly in an index. Periods longer than one year are annualized.
According to data from Lipper, Inc as of December 31, 2007, Ultra-Small Company Market Fund ranked 59th of 96 micro-cap funds for the last twelve months, 22nd of 65 over the last five years, 6th of 32 over the last 10 years and 6th of 30 since inception in July 1997. Lipper, Inc. is an independent mutual fund rating service that ranks funds in various fund categories by making comparative calculations using total returns.
| | |
| 34 | | Semi-Annual Report | December 31, 2007 (Unaudited) |
Ultra-Small Company Market Fund
MANAGER’S COMMENTARY (continued)
(Unaudited)
Ultra-Small Company Market Fund vs. CRSP 10 Index & Lipper Small Company Funds Index & Russell 2000 Index 1/1/98 to 12/31/07
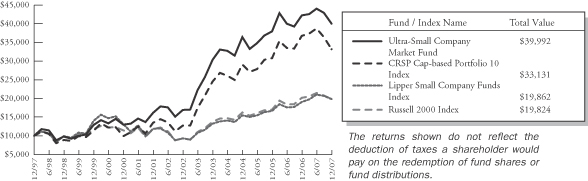
Detailed Explanation of Semi-Annual Performance—What Worked Well
The Short Version: The past six-months were clearly difficult for small company stocks; the smallest of the small-caps fared worst of all market sizes, with the CRSP 10 Index losing over 14%. However, there were still some bright spots, and the Fund had three holdings that increased over 100% during the period.
The table below tells the short-term and long-term story for ultra-small stocks (bottom row): the last six month period significantly reversed (as has happened from time to time through the years) the favorable long-term trend. As we have warned in previous letters, this is very much “normal,” based on history.
| | | | | | | | |
Company Size
According to the CRSP
Cap-Based Portfolio
Indexes1 | | 6 Months | | 1 Year | | 5 Year | | 80 Years2 |
| 1 (ultra-large) | | 1.2% | | 7.1% | | 11.8% | | 9.3% |
| 2 | | -2.3% | | 7.5% | | 18.1% | | 10.8% |
| 3 | | -6.6% | | 3.6% | | 17.2% | | 11.2% |
| 4 | | -7.4% | | 4.4% | | 17.2% | | 10.9% |
| 5 | | -7.3% | | 8.0% | | 17.8% | | 11.6% |
| 6 | | -5.1% | | 5.0% | | 17.7% | | 11.6% |
| 7 | | -8.7% | | -1.8% | | 17.7% | | 11.5% |
| 8 | | -10.8% | | -5.7% | | 18.1% | | 11.9% |
| 9 | | -11.7% | | -6.5% | | 16.7% | | 12.0% |
| 10 (ultra-small) | | -14.4% | | -9.9% | | 21.1% | | 13.7% |
| | | | | | | | | |
1 | The CRSP Cap-Based Portfolio Indexes are unmanaged indexes of the publicly traded U.S. stocks with dividends reinvested, grouped by the market capitalization, as reported by the Center for Research in Security Prices. Past performance is no guarantee of future results. |
2 | December 31, 1927 to December 31, 2007. |
Ultra-Small Company Market Fund
MANAGER’S COMMENTARY (continued)
(Unaudited)
These are the ten best performers for the six-month period ended December 31, 2007:
| | | | | | |
| Rank | | Description | | Industry | | % Gain |
| 1 | | Rigel Pharmaceuticals Inc | | Pharmaceuticals | | 185.0% |
| 2 | | Spire Corp | | Semiconductors | | 148.7% |
| 3 | | Document Sciences Corp | | Software | | 132.2% |
| 4 | | Hill International Inc | | Commercial Services | | 92.0% |
| 5 | | Auxilium Pharmaceuticals Inc | | Pharmaceuticals | | 88.1% |
| 6 | | Evergreen Solar Inc | | Energy-Alternate Sources | | 85.7% |
| 7 | | LB Foster Co | | Metal Fabricate/Hardware | | 80.4% |
| 8 | | INVESTools Inc | | Commercial Services | | 78.1% |
| 9 | | Learning Tree International Inc | | Commercial Services | | 75.3% |
| 10 | | HMS Holdings Corp | | Commercial Services | | 73.5% |
| | | | | | | |
Rigel Pharmaceuticals returned 185% over the six-month period and was the Fund’s top performer. The company conducts clinical trials on drugs being developed for treatment of various auto-immune, inflammatory, and viral diseases. In mid-December, it reported positive results regarding a study for an arthritis drug under development and is now preparing to move forward with a later-stage trial. Just a month earlier, a key Wall Street analyst had predicted that the study results would prove negative. The surprising report prompted a significant rise in the company’s stock, which hit a two-year high. Rigel is positioning itself to compete for a large percentage of the growing market of over 2 million Americans who suffer from arthritis. During the period, the stock contributed over 0.3% to the return of the Fund.
Detailed Explanation of Semi-Annual Performance—What Didn’t Work
The Short Version: While many analysts have been calling for a positive reversal of fortunes for the largest industry leaders versus their small-cap counterparts for some time, their words finally proved prophetic during the past year. This demonstrates two principles we agree with at Bridgeway: a) size domination trends don’t last forever, and b) it’s probably impossible to predict the timing of changes in these trends.
During periods of market uncertainty, investors tend to shy away from the more lightly traded small-cap companies and instead invest in the largest industry leaders that often hold up better during negative times and in the periods that follow. As such, the six-month period ended in December proved far better for investors of large- and ultra-large-cap companies than their small-cap and ultra-small-cap counterparts. To demonstrate this wide dispersion for the six-month period, the ultra-small-cap index lost over 14%, while the largest-cap index actually gained over 1%, a huge variance of over 15%. A total of 28 holdings lost over 50% during the six-month period.
These are the ten stocks that performed the worst for the six-month period ended December 31, 2007:
| | | | | | |
| Rank | | Description | | Industry | | % Loss |
| 1 | | Delta Financial Corp | | Diversified Financial Services | | -99.6% |
| 2 | | Sonus Pharmaceuticals Inc | | Biotechnology | | -89.0% |
| 3 | | Tarragon Corp | | Real Estate | | -80.8% |
| 4 | | Universal Security Instruments Inc | | Commercial Services | | -76.2% |
| 5 | | Federal Trust Corp | | Savings & Loans | | -74.8% |
| 6 | | Hythiam Inc | | Healthcare-Services | | -66.1% |
| 7 | | CPI Corp | | Commercial Services | | -66.1% |
| 8 | | Nastech Pharmaceutical Co Inc | | Pharmaceuticals | | -65.2% |
| 9 | | Spectrum Pharmaceuticals Inc | | Pharmaceuticals | | -62.1% |
| 10 | | Authentidate Holding Corp | | Software | | -61.7% |
| | | | | | | |
| | |
| 36 | | Semi-Annual Report | December 31, 2007 (Unaudited) |
Ultra-Small Company Market Fund
MANAGER’S COMMENTARY (continued)
(Unaudited)
While a boutique pharmaceutical company was the Fund’s strongest performer, the industry remains very risky for small firms that put all of their future hopes on one product. In September, Sonus Pharmaceuticals announced that a once promising oncology drug under development did not perform well in clinical trials and would not be submitted for new drug application approval. The company expected that its partner, Bayer Schering Pharma, would choose not to pursue any further testing. Sonus’ stock price plunged on the news, and the holding cost the Fund over 0.15% during the six-month period.
Industry Sector Representation as of December 31, 2007
Consumer non-cyclicals represented the largest sector allocation for both our Fund and the CRSP Cap-Based Portfolio 10 Index. Typically, differences in the sector weightings between the Fund and the index will be small, though occasional variances occur due to our decision to consider turnover, costs, and tax efficiency in this mostly passively managed fund. At December 31, the Fund was underweighted in financials, a sector that has gotten hammered during the prior six months given the development of the credit crisis.
| | | | | | |
| | | % of Stocks | | % CRSP
Portfolio 10 Index | | Difference |
Basic Materials | | 2.7% | | 2.6% | | 0.1% |
Communications | | 8.0% | | 9.1% | | -1.1% |
Consumer, Cyclical | | 10.7% | | 14.0% | | -3.3% |
Consumer, Non-cyclical | | 27.2% | | 24.8% | | 2.4% |
Energy | | 6.0% | | 5.4% | | 0.6% |
Financial | | 18.2% | | 22.7% | | -4.5% |
Industrial | | 10.9% | | 10.3% | | 0.6% |
Technology | | 10.3% | | 9.1% | | 1.2% |
Utilities | | 1.4% | | 0.9% | | 0.5% |
Diversified | | 3.4% | | 1.1% | | 2.3% |
Cash | | 1.2% | | 0.0% | | 1.2% |
| | | | | | | |
Total | | 100.0% | | 100.0% | | |
Disclaimer
The following is a reminder from the friendly folks at your Fund who worry about liability. The views expressed here are exclusively those of Fund management. These views are not meant as investment advice and should not be considered predictive in nature. Any favorable (or unfavorable) description of a holding applies only as of December 31, 2007, unless otherwise stated. Security positions can and do change thereafter. Discussions of historical performance do not guarantee and are not indicative of future performance.
The Fund is subject to very high, above market risk (volatility) and is not an appropriate investment for short-term investors. Investments in ultra-small companies generally carry greater risk than is customarily associated with larger companies and even “small companies” for various reasons such as narrower markets (fewer investors), limited financial resources and greater trading difficulty.
Conclusion
Thank you for your continued investment in Ultra-Small Company Market Fund. We encourage your feedback; your reactions and concerns are important to us.
Sincerely,
Your Investment Management Team
Ultra-Small Company Market Fund
SCHEDULE OF INVESTMENTS
Showing percentage of net assets as of December 31, 2007 (Unaudited)
| | | | | | | |
| Industry | | Company | | Shares | | Value |
|
COMMON STOCKS - 96.33% |
Advertising - 0.78% |
| | inVentiv Health, Inc.* | | 198,300 | | $ | 6,139,368 |
| | Traffix, Inc. | | 248,700 | | | 1,522,044 |
| | | | | | | |
| | | | | | | 7,661,412 |
|
Aerospace/Defense - 0.40% |
| | CPI Aerostructures, Inc. | | 33,400 | | | 290,580 |
| | Ducommun, Inc.* | | 94,700 | | | 3,598,600 |
| | | | | | | |
| | | | | | | 3,889,180 |
|
Agriculture - 0.98% |
| | Andersons, Inc.(a) | | 202,362 | | | 9,065,818 |
| | Maui Land & Pineapple Co., Inc.*(a) | | 17,155 | | | 499,382 |
| | | | | | | |
| | | | | | | 9,565,200 |
|
Airlines - 0.59% |
| | Frontier Airlines Holdings, Inc.*(a) | | 323,500 | | | 1,701,610 |
| | Hawaiian Holdings, Inc. | | 173,900 | | | 886,890 |
| | Midwest Air Group, Inc.* | | 84,209 | | | 1,246,293 |
| | Pinnacle Airlines Corp.(a) | | 129,235 | | | 1,970,834 |
| | | | | | | |
| | | | | | | 5,805,627 |
|
Apparel - 0.91% |
| | Cherokee, Inc. | | 52,400 | | | 1,690,948 |
| | G-III Apparel Group, Ltd.* | | 143,400 | | | 2,118,018 |
| | Perry Ellis International, Inc.* | | 115,967 | | | 1,783,573 |
| | Sport-Haley, Inc. | | 104,900 | | | 219,241 |
| | Tandy Brands Accessories, Inc. | | 65,009 | | | 633,838 |
| | Unifi, Inc. | | 441,900 | | | 1,069,398 |
| | Weyco Group, Inc. | | 48,675 | | | 1,338,562 |
| | | | | | | |
| | | | | | | 8,853,578 |
|
Auto Parts & Equipment - 1.08% |
| | Fuel Systems Solutions, Inc. | | 81,750 | | | 1,168,207 |
| | Miller Industries, Inc. | | 70,600 | | | 966,514 |
| | Proliance International, Inc. | | 112,500 | | | 202,500 |
| | Spartan Motors, Inc.(a) | | 242,470 | | | 1,852,471 |
| | Tenneco, Inc.* | | 73,000 | | | 1,903,110 |
| | Titan International, Inc.(a) | | 144,000 | | | 4,501,440 |
| | | | | | | |
| | | | | | | 10,594,242 |
|
Banks - 10.27% |
| | Abigail Adams National Bancorp | | 22,220 | | | 231,088 |
| | American River Bankshares | | 42,000 | | | 719,880 |
| | AmericanWest Bancorp | | 80,371 | | | 1,416,941 |
| | Arrow Financial Corp. | | 109,545 | | | 2,354,122 |
| | Bancorp Rhode Island, Inc. | | 59,200 | | | 2,021,088 |
| | | | | | | |
| Industry | | Company | | Shares | | Value |
|
|
Banks (continued) |
| | Bancorp, Inc.* | | 173,700 | | $ | 2,338,002 |
| | BancTrust Financial Group, Inc. | | 103,151 | | | 1,248,127 |
| | Bank of Florida Corp.*(a) | | 83,641 | | | 961,871 |
| | Bank of Granite Corp. | | 23,120 | | | 244,378 |
| | Beach First National Bancshares, Inc. | | 28,900 | | | 450,840 |
| | Beverly Hills Bancorp, Inc. | | 147,900 | | | 754,290 |
| | Camden National Corp. | | 52,400 | | | 1,488,160 |
| | Capital Bank Corp. | | 56,914 | | | 602,150 |
| | Capital Corp. of the West | | 121,800 | | | 2,366,574 |
| | Cardinal Financial Corp. | | 287,700 | | | 2,681,364 |
| | Cass Information Systems, Inc.(a) | | 101,070 | | | 3,376,749 |
| | Center Bancorp, Inc.(a) | | 68,342 | | | 755,863 |
| | Center Financial Corp. | | 38,476 | | | 474,024 |
| | Central Bancorp, Inc. | | 12,300 | | | 247,845 |
| | Centrue Financial Corp. | | 31,200 | | | 693,888 |
| | Columbia Bancorp | | 93,300 | | | 1,541,316 |
| | Enterprise Financial Services Corp.(a) | | 76,373 | | | 1,818,441 |
| | Farmers Capital Bank Corp. | | 23,800 | | | 642,600 |
| | Financial Institutions, Inc. | | 78,000 | | | 1,389,960 |
| | First Bancorp | | 109,500 | | | 2,068,455 |
| | First Community Bancshares, Inc. | | 35,796 | | | 1,141,534 |
| | First Mutual Bancshares, Inc. | | 20,418 | | | 539,648 |
| | First Regional Bancorp* | | 93,449 | | | 1,765,252 |
| | First Security Group, Inc. | | 24,656 | | | 221,165 |
| | First South BanCorp, Inc.(a) | | 43,306 | | | 960,960 |
| | FNB Corp./VA | | 7,669 | | | 178,151 |
| | FNB Corp./PA(a) | | 8,640 | | | 127,008 |
| | Fremont General Corp.* | | 17,200 | | | 60,200 |
| | Gateway Financial Holdings, Inc. | | 94,122 | | | 1,122,875 |
| | Glacier Bancorp, Inc. | | 1,458 | | | 27,323 |
| | Green Bankshares, Inc. | | 70,263 | | | 1,349,050 |
| | Guaranty Federal Bancshares, Inc. | | 62,556 | | | 1,796,608 |
| | Horizon Financial Corp. | | 78,581 | | | 1,370,453 |
| | Independent Bank Corp. | | 87,675 | | | 832,912 |
| | Intervest Bancshares Corp. | | 96,210 | | | 1,656,736 |
| | Lakeland BanCorp, Inc.(a) | | 200,304 | | | 2,321,523 |
| | MainSource Financial Group, Inc. | | 143,600 | | | 2,234,416 |
| | MBT Financial Corp. | | 69,100 | | | 609,462 |
| | Mercantile Bank Corp. | | 123,100 | | | 1,908,050 |
| | MetroCorp Bancshares, Inc. | | 18,349 | | | 238,537 |
| | MidWestOne Financial Group, Inc. | | 38,612 | | | 645,593 |
| | NewBridge Bancorp | | 47,313 | | | 510,507 |
| | Nexity Financial Corp. | | 54,000 | | | 358,560 |
| | Northeast Bancorp | | 4,700 | | | 66,975 |
| | |
| 38 | | Semi-Annual Report | December 31, 2007 (Unaudited) |
Ultra-Small Company Market Fund
SCHEDULE OF INVESTMENTS (continued)
Showing percentage of net assets as of December 31, 2007 (Unaudited)
| | | | | | | |
| Industry | | Company | | Shares | | Value |
|
Common Stocks (continued) |
Banks (continued) |
| | Northrim Bancorp, Inc. | | 90,269 | | $ | 1,924,535 |
| | Omega Financial Corp.(a) | | 34,170 | | | 999,814 |
| | Oriental Financial Group(a) | | 239,900 | | | 3,217,059 |
| | PAB Bankshares, Inc. | | 70,000 | | | 884,100 |
| | Pacific Mercantile Bancorp | | 71,000 | | | 874,010 |
| | Pacific State Bancorp(a) | | 26,786 | | | 334,825 |
| | Pennsylvania Commerce Bancorp, Inc. | | 27,751 | | | 772,866 |
| | Peoples Bancorp, Inc. | | 75,600 | | | 1,881,684 |
| | Pinnacle Financial Partners, Inc.* | | 127,700 | | | 3,246,134 |
| | Preferred Bank(a) | | 63,750 | | | 1,658,775 |
| | Prosperity Bancshares, Inc. | | 15,418 | | | 453,135 |
| | SCBT Financial Corp. | | 33,883 | | | 1,073,075 |
| | Seacoast Banking Corp. | | 148,775 | | | 1,529,407 |
| | Shore Bancshares, Inc.(a) | | 95,455 | | | 2,092,374 |
| | Sierra Bancorp(a) | | 49,419 | | | 1,230,039 |
| | Silver State Bancorp | | 139,700 | | | 1,969,770 |
| | Smithtown Bancorp, Inc.(a) | | 70,730 | | | 1,567,377 |
| | Southern Community Financial Corp. | | 66,700 | | | 435,551 |
| | Southside Bancshares, Inc.(a) | | 102,542 | | | 2,098,009 |
| | State Bancorp, Inc. | | 34,500 | | | 448,500 |
| | Sterling Bancorp | | 147,468 | | | 2,011,464 |
| | Suffolk Bancorp(a) | | 42,800 | | | 1,314,388 |
| | Superior Bancorp*(a) | | 354,193 | | | 1,902,016 |
| | Tennessee Commerce Bancorp, Inc.(a) | | 46,300 | | | 1,157,500 |
| | Trico Bancshares | | 106,500 | | | 2,055,450 |
| | Umpqua Holdings Corp.(a) | | 1 | | | 15 |
| | Union Bankshares Corp.(a) | | 47,079 | | | 995,250 |
| | United Security Bancshares(a) | | 100,700 | | | 1,538,696 |
| | Univest Corp. of Pennsylvania(a) | | 57,865 | | | 1,221,530 |
| | Virginia Commerce Bancorp*(a) | | 123,284 | | | 1,446,121 |
| | Washington Trust Bancorp, Inc. | | 54,577 | | | 1,376,978 |
| | West Bancorporation, Inc. | | 138,244 | | | 1,802,702 |
| | | | | | | |
| | | | | | | 100,444,663 |
|
Beverages - 0.71% |
| | Central European Distribution Corp.* | | 52,125 | | | 3,027,420 |
| | Green Mountain Coffee Roasters, Inc.*(a) | | 79,200 | | | 3,223,440 |
| | Peet's Coffee & Tea, Inc.*(a) | | 17,400 | | | 505,818 |
| | Redhook ALE Brewery, Inc.(a) | | 23,000 | | | 152,490 |
| | | | | | | |
| | | | | | | 6,909,168 |
| | | | | | | |
| Industry | | Company | | Shares | | Value |
|
|
Biotechnology - 4.43% |
| | Anesiva, Inc.(a) | | 150,464 | | $ | 752,320 |
| | Avigen, Inc. | | 298,900 | | | 1,270,325 |
| | BioSphere Medical, Inc. | | 126,900 | | | 650,997 |
| | CryoLife, Inc.* | | 356,000 | | | 2,830,200 |
| | Cytokinetics, Inc. | | 144,900 | | | 685,377 |
| | Encysive Pharmaceuticals, Inc.*(a) | | 330,900 | | | 281,265 |
| | Entremed, Inc. | | 1,263,500 | | | 1,516,200 |
| | Exact Sciences Corp. | | 595,200 | | | 1,916,544 |
| | GenVec, Inc.(a) | | 337,463 | | | 496,071 |
| | Harvard Bioscience, Inc. | | 5,668 | | | 25,959 |
| | Immunogen, Inc. | | 371,504 | | | 1,541,741 |
| | Immunomedics, Inc.(a) | | 340,635 | | | 790,273 |
| | Keryx Biopharmaceuticals, Inc.*(a) | | 57,647 | | | 484,235 |
| | Kosan Biosciences, Inc.(a) | | 417,282 | | | 1,502,215 |
| | Lexicon Pharmaceuticals, Inc. | | 180,844 | | | 547,957 |
| | Lifecell Corp.*(a) | | 197,526 | | | 8,515,346 |
| | Maxygen, Inc. | | 183,751 | | | 1,475,521 |
| | Neose Technologies, Inc. | | 672,200 | | | 719,254 |
| | Sangamo Biosciences, Inc.*(a) | | 370,100 | | | 4,844,609 |
| | Seattle Genetics, Inc.* | | 373,255 | | | 4,255,107 |
| | StemCells, Inc.(a) | | 602,800 | | | 904,200 |
| | SuperGen, Inc.(a) | | 437,100 | | | 1,595,415 |
| | Third Wave Technologies, Inc. | | 449,000 | | | 4,332,850 |
| | Vical, Inc. | | 337,600 | | | 1,434,800 |
| | | | | | | |
| | | | | | | 43,368,781 |
|
Building Materials - 0.34% |
| | AAON, Inc. | | 90,430 | | | 1,792,323 |
| | Comfort Systems USA, Inc. | | 43,900 | | | 561,042 |
| | US Home Systems, Inc. | | 173,100 | | | 926,085 |
| | | | | | | |
| | | | | | | 3,279,450 |
|
Chemicals - 1.82% |
| | Aceto Corp. | | 128,044 | | | 1,024,352 |
| | American Pacific Corp. | | 35,524 | | | 605,684 |
| | American Vanguard Corp. | | 152,000 | | | 2,637,200 |
| | Balchem Corp. | | 181,575 | | | 4,063,649 |
| | ICO, Inc.* | | 205,490 | | | 2,638,492 |
| | Landec Corp.* | | 205,000 | | | 2,747,000 |
| | NewMarket Corp. | | 29,200 | | | 1,626,148 |
| | Penford Corp. | | 11,592 | | | 296,639 |
| | Quaker Chemical Corp. | | 99,700 | | | 2,190,409 |
| | | | | | | |
| | | | | | | 17,829,573 |
Ultra-Small Company Market Fund
SCHEDULE OF INVESTMENTS (continued)
Showing percentage of net assets as of December 31, 2007 (Unaudited)
| | | | | | | |
| Industry | | Company | | Shares | | Value |
|
Common Stocks (continued) |
Coal - 0.20% |
| | James River Coal Co. | | 176,499 | | $ | 1,973,259 |
|
Commercial Services - 5.00% |
| | Bankrate, Inc.*(a) | | 144,800 | | | 6,963,432 |
| | Carriage Services, Inc. | | 134,500 | | | 1,183,600 |
| | Corvel Corp.* | | 75,433 | | | 1,736,468 |
| | CPI Corp.(a) | | 57,600 | | | 1,356,480 |
| | Diamond Management & Technology Consultants, Inc. | | 4,600 | | | 33,442 |
| | Edgewater Technology, Inc. | | 100,000 | | | 730,000 |
| | Franklin Covey Co. | | 192,400 | | | 1,527,656 |
| | Geo Group, Inc.* | | 228,600 | | | 6,400,800 |
| | Healthcare Services Group(a) | | 53,325 | | | 1,129,423 |
| | Hill International, Inc. | | 75,000 | | | 1,062,750 |
| | HMS Holdings Corp.* | | 218,000 | | | 7,239,780 |
| | Intersections, Inc.* | | 218,900 | | | 1,823,437 |
| | INVESTools, Inc.* | | 22,700 | | | 402,698 |
| | Kendle International, Inc.* | | 22,390 | | | 1,095,319 |
| | Learning Tree International, Inc.* | | 10,737 | | | 246,521 |
| | Multi-Color Corp. | | 88,704 | | | 2,436,699 |
| | National Research Corp. | | 40,300 | | | 1,088,100 |
| | On Assignment, Inc.* | | 173,500 | | | 1,216,235 |
| | PeopleSupport, Inc. | | 75,296 | | | 1,030,049 |
| | PRG-Schultz International, Inc.* | | 6,770 | | | 58,019 |
| | QC Holdings, Inc.(a) | | 30,000 | | | 337,500 |
| | RCM Technologies, Inc.* | | 170,459 | | | 1,002,299 |
| | Standard Parking Corp.* | | 81,100 | | | 3,932,539 |
| | Team, Inc.* | | 131,200 | | | 4,799,296 |
| | Universal Security Instruments, Inc.(a) | | 12,816 | | | 94,838 |
| | | | | | | |
| | | | | | | 48,927,380 |
|
Computers - 3.52% |
| | Ansoft Corp.* | | 100,600 | | | 2,600,510 |
| | Comtech Group, Inc.* | | 36,492 | | | 587,886 |
| | Cray, Inc. | | 80,700 | | | 483,393 |
| | Dot Hill Systems Corp. | | 516,068 | | | 1,254,045 |
| | Furmanite Corp.* | | 151,200 | | | 1,784,160 |
| | Immersion Corp.* | | 273,226 | | | 3,538,277 |
| | Integral Systems, Inc. | | 62,056 | | | 1,443,423 |
| | InterVoice, Inc.* | | 268,300 | | | 2,143,717 |
| | LaserCard Corp.(a) | | 146,775 | | | 1,555,815 |
| | Magma Design Automation, Inc.* | | 220,300 | | | 2,689,863 |
| | Netscout Systems, Inc.* | | 236,500 | | | 3,020,105 |
| | Printronix, Inc. | | 20,797 | | | 329,632 |
| | Radiant Systems, Inc.* | | 141,800 | | | 2,443,214 |
| | SI International, Inc.* | | 76,700 | | | 2,106,949 |
| | | | | | | |
| Industry | | Company | | Shares | | Value |
|
|
Computers (continued) |
| | Stratasys, Inc.*(a) | | 160,400 | | $ | 4,144,736 |
| | Synplicity, Inc. | | 320,700 | | | 1,860,060 |
| | TechTeam Global, Inc.* | | 190,370 | | | 2,398,662 |
| | | | | | | |
| | | | | | | 34,384,447 |
|
Distribution/Wholesale - 0.49% |
| | Bell Microproducts, Inc.* | | 207,300 | | | 1,245,873 |
| | Industrial Distribution Group, Inc.* | | 131,200 | | | 1,502,240 |
| | Infosonics Corp. | | 232,461 | | | 332,419 |
| | Navarre Corp.(a) | | 223,644 | | | 465,180 |
| | Rentrak Corp.* | | 83,800 | | | 1,209,234 |
| | | | | | | |
| | | | | | | 4,754,946 |
|
Diversified Financial Services - 1.77% |
| | AeroCentury Corp.(b) | | 143,800 | | | 3,336,160 |
| | Asta Funding, Inc.(a) | | 62,100 | | | 1,641,924 |
| | Consumer Portfolio Services(a) | | 332,800 | | | 1,114,880 |
| | Delta Financial Corp.(a) | | 156,954 | | | 7,848 |
| | Encore Capital Group, Inc.* | | 214,400 | | | 2,075,392 |
| | Federal Agricultural Mortgage Corp. | | 83,900 | | | 2,208,248 |
| | Marlin Business Services Corp. | | 93,800 | | | 1,131,228 |
| | Sanders Morris Harris Group, Inc.(a) | | 225,109 | | | 2,307,367 |
| | TradeStation Group, Inc.* | | 245,974 | | | 3,495,290 |
| | | | | | | |
| | | | | | | 17,318,337 |
|
Electric Utilities - 0.29% |
| | Central Vermont Public Service Corp.(a) | | 81,600 | | | 2,516,544 |
| | Unitil Corp. | | 9,400 | | | 266,960 |
| | | | | | | |
| | | | | | | 2,783,504 |
|
Electrical Components & Equipment - 0.38% |
| | American Superconductor Corp.*(a) | | 125,100 | | | 3,420,234 |
| | Nortech Systems, Inc. | | 1,400 | | | 8,764 |
| | TII Network Technologies, Inc. | | 143,700 | | | 278,778 |
| | | | | | | |
| | | | | | | 3,707,776 |
|
Electronics - 1.80% |
| | Advanced Photonix, Inc.(a) | | 156,350 | | | 293,938 |
| | Axsys Technologies, Inc.* | | 86,887 | | | 3,184,409 |
| | Frequency Electronics, Inc. | | 14,600 | | | 140,014 |
| | Measurement Specialties, Inc. | | 104,500 | | | 2,309,450 |
| | |
| 40 | | Semi-Annual Report | December 31, 2007 (Unaudited) |
Ultra-Small Company Market Fund
SCHEDULE OF INVESTMENTS (continued)
Showing percentage of net assets as of December 31, 2007 (Unaudited)
| | | | | | | |
| Industry | | Company | | Shares | | Value |
|
Common Stocks (continued) |
Electronics (continued) |
| | Merix Corp.* | | 282,300 | | $ | 1,312,695 |
| | Napco Security Systems, Inc.* | | 113,934 | | | 712,087 |
| | OI Corp. | | 35,200 | | | 420,640 |
| | OYO Geospace Corp. | | 36,600 | | | 2,758,176 |
| | Stoneridge, Inc.* | | 199,200 | | | 1,601,568 |
| | Technology Research Corp. | | 7,300 | | | 24,674 |
| | UQM Technologies, Inc.*(a) | | 191,100 | | | 647,829 |
| | Vicon Industries, Inc. | | 109,556 | | | 1,051,737 |
| | X-Rite, Inc.* | | 148,500 | | | 1,725,570 |
| | Zygo Corp. | | 116,600 | | | 1,452,836 |
| | | | | | | |
| | | | | | | 17,635,623 |
|
Energy-Alternative Sources - 0.69% |
| | Evergreen Solar, Inc.*(a) | | 178,400 | | | 3,080,968 |
| | Plug Power, Inc.*(a) | | 736,900 | | | 2,910,755 |
| | Syntroleum Corp.(a) | | 940,800 | | | 790,272 |
| | | | | | | |
| | | | | | | 6,781,995 |
|
Engineering & Construction - 1.03% |
| | Layne Christensen Co.* | | 161,900 | | | 7,967,099 |
| | Michael Baker Corp.* | | 51,700 | | | 2,124,870 |
| | | | | | | |
| | | | | | | 10,091,969 |
|
Entertainment - 0.59% |
| | Canterbury Park Holding Corp. | | 59,400 | | | 712,800 |
| | Dover Motorsports, Inc. | | 125,829 | | | 824,179 |
| | Lakes Entertainment, Inc.* | | 340,102 | | | 2,356,907 |
| | Point.360 | | 1,500 | | | 3,150 |
| | Silverleaf Resorts, Inc.(a) | | 388,800 | | | 1,613,520 |
| | Steinway Musical Instruments | | 10,561 | | | 291,167 |
| | | | | | | |
| | | | | | | 5,801,723 |
|
Environmental Control - 0.57% |
| | Ceco Environmental Corp. | | 60,575 | | | 665,113 |
| | Darling International, Inc.* | | 424,600 | | | 4,908,376 |
| | | | | | | |
| | | | | | | 5,573,489 |
|
Food - 3.04% |
| | Cal-Maine Foods, Inc.(a) | | 312,700 | | | 8,295,931 |
| | Cuisine Solutions, Inc. | | 65,800 | | | 282,940 |
| | Imperial Sugar Co.(a) | | 121,316 | | | 2,277,101 |
| | Lifeway Foods, Inc.*(a) | | 156,302 | | | 1,849,053 |
| | M&F Worldwide Corp.* | | 106,598 | | | 5,740,302 |
| | Rocky Mountain Chocolate Factory, Inc. | | 113,543 | | | 1,803,063 |
| | Spartan Stores, Inc. | | 343,650 | | | 7,852,403 |
| | | | | | | |
| Industry | | Company | | Shares | | Value |
|
|
Food (continued) |
| | Village Super Market | | 24,600 | | $ | 1,251,894 |
| | Zapata Corp. | | 57,600 | | | 421,632 |
| | | | | | | |
| | | | | | | 29,774,319 |
|
Gas - 0.52% |
| | Chesapeake Utilities Corp. | | 57,400 | | | 1,828,190 |
| | EnergySouth, Inc. | | 56,450 | | | 3,274,100 |
| | | | | | | |
| | | | | | | 5,102,290 |
|
Hand/Machine Tools - 0.26% |
| | Hardinge, Inc. | | 46,598 | | | 781,914 |
| | K-Tron International, Inc.* | | 10,600 | | | 1,264,050 |
| | LS Starrett Co. | | 29,200 | | | 493,772 |
| | | | | | | |
| | | | | | | 2,539,736 |
|
Healthcare-Products - 4.77% |
| | Abaxis, Inc.* | | 169,700 | | | 6,085,442 |
| | Angiodynamics, Inc. | | 44,256 | | | 842,634 |
| | Arrhythmia Research Technology | | 109,100 | | | 752,790 |
| | Atrion Corp. | | 39,148 | | | 4,991,370 |
| | Bovie Medical Corp. | | 286,900 | | | 1,836,160 |
| | Cantel Medical Corp. | | 64,599 | | | 941,853 |
| | Criticare Systems, Inc.* | | 60,350 | | | 197,344 |
| | Endologix, Inc. | | 589,800 | | | 1,651,440 |
| | Hanger Orthopedic Group, Inc.* | | 146,317 | | | 1,610,950 |
| | Lifecore Biomedical, Inc.* | | 217,646 | | | 3,144,985 |
| | Merit Medical Systems, Inc.* | | 17,500 | | | 243,250 |
| | Micrus Endovascular Corp.(a) | | 127,500 | | | 2,509,200 |
| | Natus Medical, Inc.* | | 138,600 | | | 2,681,910 |
| | NMT Medical, Inc. | | 171,100 | | | 961,582 |
| | NxStage Medical, Inc.*(a) | | 77,421 | | | 1,174,477 |
| | Orthologic Corp. | | 441,899 | | | 596,564 |
| | Osteotech, Inc.* | | 10,215 | | | 79,881 |
| | Rochester Medical Corp.(a) | | 128,000 | | | 1,425,920 |
| | Somanetics Corp.* | | 167,852 | | | 3,969,700 |
| | Sonic Innovations, Inc. | | 324,800 | | | 2,507,456 |
| | Span-America Medical Systems, Inc. | | 96,900 | | | 1,095,939 |
| | SRI/Surgical Express, Inc.* | | 6,755 | | | 39,855 |
| | Utah Medical Products, Inc. | | 49,900 | | | 1,483,028 |
| | Vnus Medical Technologies, Inc. | | 106,000 | | | 1,539,120 |
| | Zoll Medical Corp.* | | 160,200 | | | 4,280,544 |
| | | | | | | |
| | | | | | | 46,643,394 |
|
Healthcare-Services - 2.89% |
| | Air Methods Corp.*(a) | | 115,939 | | | 5,758,690 |
| | Alliance Imaging, Inc.* | | 335,992 | | | 3,232,243 |
Ultra-Small Company Market Fund
SCHEDULE OF INVESTMENTS (continued)
Showing percentage of net assets as of December 31, 2007 (Unaudited)
| | | | | | | |
| Industry | | Company | | Shares | | Value |
|
Common Stocks (continued) |
Healthcare-Services (continued) |
| | Almost Family, Inc. | | 11,600 | | $ | 224,576 |
| | Amedisys, Inc.* | | 228,134 | | | 11,069,062 |
| | Five Star Quality Care, Inc.* | | 171,900 | | | 1,426,770 |
| | Hythiam, Inc.*(a) | | 270,099 | | | 791,390 |
| | I-Trax, Inc.*(a) | | 445,657 | | | 1,582,082 |
| | NovaMed, Inc.(a) | | 194,400 | | | 826,200 |
| | Psychiatric Solutions, Inc.*(a) | | 104,600 | | | 3,399,500 |
| | | | | | | |
| | | | | | | 28,310,513 |
|
Holding Companies-Diversified - 0.17% |
| | Resource America, Inc. | | 114,900 | | | 1,685,583 |
|
Home Builders - 0.30% |
| | Amrep Corp.(a) | | 17,100 | | | 522,405 |
| | Nobility Homes, Inc. | | 16,300 | | | 297,475 |
| | Skyline Corp. | | 72,600 | | | 2,130,810 |
| | | | | | | |
| | | | | | | 2,950,690 |
|
Home Furnishings - 0.78% |
| | Audiovox Corp.* | | 85,900 | | | 1,065,160 |
| | Cobra Electronics Corp. | | 170,300 | | | 814,034 |
| | DTS, Inc.*(a) | | 112,000 | | | 2,863,840 |
| | Koss Corp. | | 4,138 | | | 74,070 |
| | Universal Electronics, Inc.* | | 84,315 | | | 2,819,494 |
| | | | | | | |
| | | | | | | 7,636,598 |
|
Household Products/Wares - 0.20% |
| | Nashua Corp. | | 38,600 | | | 448,532 |
| | Russ Berrie & Co, Inc.* | | 90,400 | | | 1,478,944 |
| | | | | | | |
| | | | | | | 1,927,476 |
|
Housewares - 0.42% |
| | Libbey, Inc. | | 126,800 | | | 2,008,512 |
| | National Presto Industries, Inc. | | 38,804 | | | 2,043,419 |
| | | | | | | |
| | | | | | | 4,051,931 |
|
Insurance - 2.36% |
| | 21st Century Holding Co. | | 150,500 | | | 2,021,215 |
| | American Independence Corp. | | 45,135 | | | 412,985 |
| | Amerisafe, Inc.* | | 108,900 | | | 1,689,039 |
| | Donegal Group, Inc., Class A | | 185,425 | | | 3,183,747 |
| | Investors Title Co. | | 56,432 | | | 2,121,843 |
| | Meadowbrook Insurance Group, Inc.* | | 370,400 | | | 3,485,464 |
| | Mercer Insurance Group, Inc. | | 144,257 | | | 2,590,856 |
| | Penn Treaty American Corp. | | 162,300 | | | 1,053,327 |
| | Procentury Corp. | | 124,200 | | | 1,906,470 |
| | SCPIE Holdings, Inc.* | | 64,797 | | | 1,779,974 |
| | | | | | | |
| Industry | | Company | | Shares | | Value |
|
|
Insurance (continued) |
| | SeaBright Insurance Holdings, Inc.* | | 150,350 | | $ | 2,267,278 |
| | United America Indemnity, Ltd.* | | 28,704 | | | 571,784 |
| | | | | | | |
| | | | | | | 23,083,982 |
|
Internet - 3.45% |
| | ActivIdentity Corp. | | 453,900 | | | 1,761,132 |
| | Aladdin Knowledge Systems, Ltd. | | 51,974 | | | 1,358,081 |
| | Art Technology Group, Inc.* | | 586,137 | | | 2,532,112 |
| | Cybersource Corp.* | | 205,852 | | | 3,657,990 |
| | Drugstore.Com | | 645,534 | | | 2,130,262 |
| | ePlus, Inc.* | | 100,800 | | | 974,736 |
| | Harris Interactive, Inc. | | 473,800 | | | 2,018,388 |
| | I-many, Inc. | | 523,200 | | | 1,621,920 |
| | Insure.com, Inc. | | 30,400 | | | 121,600 |
| | Jupitermedia Corp.* | | 164,000 | | | 626,480 |
| | Knot, Inc.*(a) | | 186,800 | | | 2,977,592 |
| | Napster, Inc.*(a) | | 784,400 | | | 1,545,268 |
| | Network Engines, Inc. | | 850,400 | | | 1,369,144 |
| | Online Resources Corp.* | | 165,400 | | | 1,971,568 |
| | Perficient, Inc.* | | 186,138 | | | 2,929,812 |
| | TheStreet.com, Inc. | | 335,500 | | | 5,341,160 |
| | Valueclick, Inc.* | | 38,914 | | | 852,216 |
| | | | | | | |
| | | | | | | 33,789,461 |
|
Iron/Steel - 0.40% |
| | Friedman Industries | | 98,300 | | | 624,205 |
| | Great Northern Iron Ore Property(a) | | 12,000 | | | 1,533,000 |
| | Universal Stainless & Alloy* | | 50,500 | | | 1,796,285 |
| | | | | | | |
| | | | | | | 3,953,490 |
|
Leisure Time - 0.75% |
| | Aldila, Inc. | | 97,779 | | | 1,602,598 |
| | Ambassadors International, Inc.(a) | | 77,678 | | | 1,132,545 |
| | Cybex International, Inc. | | 162,100 | | | 739,176 |
| | GameTech International, Inc. | | 222,600 | | | 1,597,155 |
| | Multimedia Games, Inc.*(a) | | 274,800 | | | 2,291,832 |
| | | | | | | |
| | | | | | | 7,363,306 |
|
Lodging - 0.74% |
| | Gaylord Entertainment Co.* | | 44,852 | | | 1,815,161 |
| | Interstate Hotels & Resorts, Inc. | | 372,266 | | | 1,474,173 |
| | Monarch Casino & Resort, Inc.* | | 164,800 | | | 3,968,384 |
| | | | | | | |
| | | | | | | 7,257,718 |
| | |
| 42 | | Semi-Annual Report | December 31, 2007 (Unaudited) |
Ultra-Small Company Market Fund
SCHEDULE OF INVESTMENTS (continued)
Showing percentage of net assets as of December 31, 2007 (Unaudited)
| | | | | | | |
| Industry | | Company | | Shares | | Value |
|
Common Stocks (continued) |
Machinery-Diversified - 2.24% |
| | Gehl Co.* | | 165,150 | | $ | 2,649,006 |
| | Hurco Cos, Inc.* | | 219,934 | | | 9,600,119 |
| | Twin Disc, Inc. | | 136,400 | | | 9,653,028 |
| | | | | | | |
| | | | | | | 21,902,153 |
|
Media - 1.03% |
| | ADDvantage Technologies Group, Inc. | | 194,100 | | | 1,197,597 |
| | DG FastChannel, Inc.*(a) | | 126,484 | | | 3,243,050 |
| | Lodgenet Entertainment Corp.* | | 144,700 | | | 2,523,568 |
| | Nexstar Broadcasting Group, Inc. | | 109,600 | | | 1,001,744 |
| | Outdoor Channel Holdings, Inc.* | | 91,431 | | | 630,874 |
| | Salem Communications Corp. | | 152,300 | | | 1,003,657 |
| | Sirius Satellite Radio, Inc.*(a) | | 163,500 | | | 495,405 |
| | | | | | | |
| | | | | | | 10,095,895 |
|
Metal Fabrication - Hardware - 1.29% |
| | Ampco-Pittsburgh Corp. | | 89,800 | | | 3,424,074 |
| | Ladish Co., Inc. | | 64,700 | | | 2,794,393 |
| | LB Foster Co.* | | 95,300 | | | 4,929,869 |
| | Northwest Pipe Co.* | | 11,347 | | | 444,122 |
| | Sun Hydraulics Corp. | | 41,349 | | | 1,043,235 |
| | | | | | | |
| | | | | | | 12,635,693 |
|
Mining - 0.48% |
| | Allied Nevada Gold Corp. | | 8,971 | | | 55,890 |
| | Kinross Gold Corp. | | 22,353 | | | 411,295 |
| | United States Lime & Minerals, Inc. | | 53,700 | | | 1,629,795 |
| | Uranerz Energy Corp.(a) | | 686,100 | | | 1,790,721 |
| | US Gold Corp.(a) | | 242,500 | | | 717,800 |
| | Vista Gold Corp.(a) | | 11,300 | | | 56,726 |
| | | | | | | |
| | | | | | | 4,662,227 |
|
Miscellaneous Manufacturers - 1.27% |
| | AZZ, Inc.* | | 68,000 | | | 1,927,800 |
| | Ceradyne, Inc.* | | 122,625 | | | 5,754,791 |
| | EnPro Industries, Inc.* | | 13,600 | | | 416,840 |
| | Flanders Corp.*(a) | | 85,183 | | | 478,728 |
| | Park-Ohio Holdings Corp. | | 98,597 | | | 2,474,785 |
| | Raven Industries, Inc. | | 35,600 | | | 1,366,684 |
| | | | | | | |
| | | | | | | 12,419,628 |
|
Office Furnishing - 0.14% |
| | Compx International, Inc. | | 94,500 | | | 1,381,590 |
| | | | | | | |
| Industry | | Company | | Shares | | Value |
|
|
Oil & Gas - 3.05% |
| | American Oil & Gas, Inc. | | 192,550 | | $ | 1,116,790 |
| | ATP Oil & Gas Corp.* | | 188,700 | | | 9,536,898 |
| | Brigham Exploration Co.* | | 388,500 | | | 2,921,520 |
| | Callon Petroleum Co.* | | 156,600 | | | 2,576,070 |
| | Cano Petroleum, Inc.(a) | | 490,000 | | | 3,376,100 |
| | Clayton Williams Energy, Inc.* | | 82,500 | | | 2,570,700 |
| | Contango Oil & Gas Co. | | 30,190 | | | 1,536,369 |
| | FX Energy, Inc.(a) | | 327,900 | | | 1,862,472 |
| | Meridian Resource Corp.* | | 404,000 | | | 731,240 |
| | Royale Energy, Inc. | | 93,856 | | | 218,685 |
| | Teton Energy Corp. | | 234,500 | | | 1,149,050 |
| | Vaalco Energy, Inc.* | | 473,100 | | | 2,199,915 |
| | | | | | | |
| | | | | | | 29,795,809 |
|
Oil & Gas Services - 2.10% |
| | Bolt Technology Corp.*(a) | | 207,509 | | | 7,881,192 |
| | Dawson Geophysical Co.* | | 31,599 | | | 2,258,064 |
| | Lufkin Industries, Inc. | | 95,742 | | | 5,485,059 |
| | Matrix Service Co.* | | 142,332 | | | 3,105,684 |
| | Omni Energy Services Corp. | | 181,994 | | | 888,131 |
| | TGC Industries, Inc. | | 91,455 | | | 882,541 |
| | | | | | | |
| | | | | | | 20,500,671 |
|
Packaging & Containers - 0.21% |
| | AEP Industries, Inc.* | | 63,000 | | | 2,016,630 |
|
Pharmaceuticals - 5.38% |
| | Anika Therapeutics, Inc. | | 197,639 | | | 2,869,718 |
| | Array Biopharma, Inc.* | | 244,314 | | | 2,057,124 |
| | Auxilium Pharmaceuticals, Inc.* | | 132,568 | | | 3,975,714 |
| | Caraco Pharmaceutical Laboratories, Ltd.* | | 76,488 | | | 1,311,769 |
| | Cell Therapeutics, Inc.(a) | | 261,350 | | | 491,338 |
| | Collagenex Pharmaceuticals, Inc. | | 184,300 | | | 1,760,065 |
| | Cypress Bioscience, Inc.* | | 218,000 | | | 2,404,540 |
| | Dendreon Corp.(a) | | 424,900 | | | 2,642,878 |
| | Discovery Laboratories, Inc.*(a) | | 1,083,000 | | | 2,328,450 |
| | EPIX Pharmaceuticals, Inc.(a) | | 141,993 | | | 559,453 |
| | Hemispherx Biopharma, Inc. | | 831,400 | | | 656,806 |
| | Indevus Pharmaceuticals, Inc.* | | 480,300 | | | 3,338,085 |
| | Inspire Pharmaceuticals, Inc. | | 334,070 | | | 1,997,739 |
| | Integrated Biopharma, Inc. | | 54,100 | | | 140,660 |
Ultra-Small Company Market Fund
SCHEDULE OF INVESTMENTS (continued)
Showing percentage of net assets as of December 31, 2007 (Unaudited)
| | | | | | | |
| Industry | | Company | | Shares | | Value |
|
Common Stocks (continued) |
Pharmaceuticals (continued) |
| | Introgen Therapeutics, Inc.(a) | | 57,080 | | $ | 167,244 |
| | Mannatech, Inc.(a) | | 90,680 | | | 573,098 |
| | Nastech Pharmaceutical Co, Inc.*(a) | | 105,596 | | | 401,265 |
| | NitroMed, Inc. | | 181,721 | | | 183,538 |
| | Pain Therapeutics, Inc.*(a) | | 114,000 | | | 1,208,400 |
| | PetMed Express, Inc.* | | 211,999 | | | 2,565,188 |
| | Pharmacyclics, Inc.(a) | | 208,500 | | | 302,325 |
| | Quigley Corp. | | 124,000 | | | 591,480 |
| | Reliv International, Inc.(a) | | 206,200 | | | 1,688,778 |
| | Rigel Pharmaceuticals, Inc.*(a) | | 220,562 | | | 5,600,069 |
| | Sciclone Pharmaceuticals, Inc. | | 677,800 | | | 1,396,268 |
| | Sciele Pharma, Inc.*(a) | | 279,200 | | | 5,709,640 |
| | Spectrum Pharmaceuticals, Inc. | | 463,400 | | | 1,260,448 |
| | Theragenics Corp.* | | 459,131 | | | 1,643,689 |
| | Vivus, Inc. | | 545,977 | | | 2,828,161 |
| | | | | | | |
| | | | | | | 52,653,930 |
Real Estate - 0.38% | | | |
| | Consolidated-Tomoka Land Co.(a) | | 43,800 | | | 2,745,384 |
| | Stratus Properties, Inc. | | 3,344 | | | 113,495 |
| | United Capital Corp. | | 255 | | | 6,069 |
| | ZipRealty, Inc.(a) | | 155,800 | | | 872,480 |
| | | | | | | |
| | | | | | | 3,737,428 |
Retail - 3.67% | | | |
| | Big Dog Holdings, Inc.(a) | | 147,000 | | | 2,113,860 |
| | Books-A-Million, Inc. | | 191,906 | | | 2,287,519 |
| | Buffalo Wild Wings, Inc.*(a) | | 95,000 | | | 2,205,900 |
| | Cache, Inc.* | | 201,852 | | | 1,885,298 |
| | EZCORP, Inc.* | | 294,600 | | | 3,326,034 |
| | Famous Dave's of America, Inc. | | 172,400 | | | 2,337,744 |
| | Finish Line, Inc. | | 171,224 | | | 414,362 |
| | First Cash Financial Services, Inc.* | | 232,500 | | | 3,413,100 |
| | Frisch's Restaurants, Inc. | | 47,800 | | | 1,118,520 |
| | GTSI Corp. | | 17,086 | | | 168,981 |
| | Hastings Entertainment, Inc. | | 33,500 | | | 312,555 |
| | Hot Topic, Inc.* | | 151,694 | | | 882,859 |
| | Kona Grill, Inc. | | 76,700 | | | 1,118,286 |
| | Luby's, Inc. | | 252,700 | | | 2,567,432 |
| | PC Connection, Inc.*(a) | | 87,331 | | | 991,207 |
| | PC Mall, Inc.* | | 182,200 | | | 1,696,282 |
| | Pricesmart, Inc. | | 126,200 | | | 3,793,572 |
| | Rush Enterprises, Inc., Class A* | | 65,400 | | | 1,188,972 |
| | Rush Enterprises, Inc., Class B | | 65,400 | | | 1,164,120 |
| | Sport Supply Group, Inc.(a) | | 129,300 | | | 1,027,935 |
| | | | | | | |
| Industry | | Company | | Shares | | Value |
|
Common Stocks (continued) |
Retail (continued) | | | |
| | West Marine, Inc.* | | 49,584 | | $ | 445,264 |
| | Zones, Inc.* | | 136,767 | | | 1,481,187 |
| | | | | | | |
| | | | | | | 35,940,989 |
Savings & Loans - 3.59% | | | |
| | Abington Bancorp, Inc. | | 251,680 | | | 2,365,792 |
| | American Bancorp of New Jersey | | 183,800 | | | 1,861,894 |
| | Berkshire Hills Bancorp, Inc. | | 57,500 | | | 1,495,000 |
| | Brookline Bancorp, Inc. | | 72,316 | | | 734,731 |
| | Citizens Community Bancorp, Inc. | | 90,400 | | | 792,808 |
| | Citizens First Bancorp, Inc. | | 9,930 | | | 121,841 |
| | Clifton Savings Bancorp, Inc.(a) | | 127,300 | | | 1,247,540 |
| | Cooperative Bankshares, Inc. | | 57,250 | | | 675,550 |
| | Federal Trust Corp.(a) | | 45,500 | | | 95,550 |
| | Fidelity Bancorp, Inc. | | 47,512 | | | 620,507 |
| | First Pactrust Bancorp, Inc.(a) | | 53,800 | | | 968,400 |
| | First Place Financial Corp. | | 31,446 | | | 439,930 |
| | Flushing Financial Corp. | | 91,092 | | | 1,462,027 |
| | Harrington West Financial Group, Inc. | | 86,320 | | | 971,100 |
| | HMN Financial, Inc. | | 55,300 | | | 1,335,495 |
| | Home Federal Bancorp | | 14,076 | | | 323,607 |
| | Home Federal Bancorp, Inc.(a) | | 90,425 | | | 907,867 |
| | K-Fed Bancorp(a) | | 40,900 | | | 412,681 |
| | Legacy Bancorp, Inc. | | 81,700 | | | 1,083,342 |
| | LSB Corp. | | 76,350 | | | 1,210,147 |
| | MASSBANK Corp. | | 20,536 | | | 747,921 |
| | NewAlliance Bancshares, Inc. | | 67,028 | | | 772,162 |
| | OceanFirst Financial Corp. | | 122,500 | | | 1,936,725 |
| | Pacific Premier Bancorp, Inc.* | | 28,400 | | | 196,244 |
| | Pulaski Financial Corp. | | 113,193 | | | 1,131,930 |
| | PVF Capital Corp. | | 11,853 | | | 132,161 |
| | Rainier Pacific Financial Group, Inc. | | 61,400 | | | 906,264 |
| | Rockville Financial, Inc.(a) | | 40,200 | | | 490,440 |
| | Rome Bancorp, Inc. | | 36,219 | | | 419,054 |
| | Teche Holding Co. | | 11,400 | | | 424,650 |
| | Timberland Bancorp, Inc. | | 141,102 | | | 1,718,622 |
| | United Community Financial Corp.(a) | | 137,536 | | | 759,199 |
| | United Financial Bancorp, Inc. | | 86,641 | | | 960,849 |
| | United Western Bancorp, Inc. | | 59,600 | | | 1,192,000 |
| | Washington Savings Bank FSB | | 95,850 | | | 503,212 |
| | |
| 44 | | Semi-Annual Report | December 31, 2007 (Unaudited) |
Ultra-Small Company Market Fund
SCHEDULE OF INVESTMENTS (continued)
Showing percentage of net assets as of December 31, 2007 (Unaudited)
| | | | | | | |
| Industry | | Company | | Shares | | Value |
|
Common Stocks (continued) |
Savings & Loans (continued) | | | |
| | Westfield Financial, Inc. | | 279,800 | | $ | 2,714,060 |
| | Willow Financial Bancorp, Inc. | | 121,014 | | | 1,015,307 |
| | | | | | | |
| | | | | | | 35,146,609 |
| |
Semiconductors - 3.32% | | | |
| | Anadigics, Inc.*(a) | | 402,158 | | | 4,652,968 |
| | AXT, Inc. | | 250,000 | | | 1,550,000 |
| | Diodes, Inc.* | | 94,837 | | | 2,851,749 |
| | Integrated Silicon Solution, Inc. | | 498,400 | | | 3,299,408 |
| | IXYS Corp. | | 45,110 | | | 361,782 |
| | Kopin Corp.* | | 445,000 | | | 1,406,200 |
| | Leadis Technology, Inc. | | 417,100 | | | 1,192,906 |
| | LTX Corp.(a) | | 402,900 | | | 1,281,222 |
| | Microtune, Inc.* | | 289,700 | | | 1,891,741 |
| | Mindspeed Technologies, Inc.*(a) | | 432,900 | | | 528,138 |
| | MIPS Technologies, Inc.*(a) | | 134,916 | | | 669,183 |
| | MoSys, Inc.*(a) | | 129,409 | | | 627,634 |
| | Pericom Semiconductor Corp.* | | 249,600 | | | 4,667,520 |
| | QuickLogic Corp. | | 352,900 | | | 1,164,570 |
| | Richardson Electronics, Ltd. | | 35,900 | | | 251,659 |
| | Spire Corp. | | 13,200 | | | 312,180 |
| | Trio Tech International(b) | | 142,182 | | | 1,300,965 |
| | Ultra Clean Holdings* | | 304,200 | | | 3,711,240 |
| | White Electronic Designs Corp. | | 171,400 | | | 795,296 |
| | | | | | | |
| | | | | | | 32,516,361 |
| |
Software - 3.55% | | | |
| | Actuate Corp.* | | 652,030 | | | 5,066,273 |
| | Allscripts Healthcare Solutions, Inc.*(a) | | 94,453 | | | 1,834,277 |
| | American Software, Inc. | | 236,538 | | | 2,010,573 |
| | Authentidate Holding Corp. | | 334,299 | | | 197,236 |
| | Bottomline Technologies, Inc. | | 227,800 | | | 3,189,200 |
| | CAM Commerce Solutions, Inc. | | 93,900 | | | 3,925,959 |
| | Captaris, Inc.* | | 398,100 | | | 1,719,792 |
| | Concur Technologies, Inc.* | | 112,900 | | | 4,088,109 |
| | Digi International, Inc.* | | 112,936 | | | 1,602,562 |
| | Document Sciences Corp. | | 8,788 | | | 127,338 |
| | Interactive Intelligence, Inc.* | | 168,700 | | | 4,445,245 |
| | Moldflow Corp. | | 163,600 | | | 2,635,596 |
| | Quality Systems, Inc.(a) | | 92,000 | | | 2,805,080 |
| | Unica Corp. | | 114,099 | | | 1,055,416 |
| | | | | | | |
| | | | | | | 34,702,656 |
| |
Telecommunications - 2.77% | | | |
| | Anaren, Inc.* | | 144,500 | | | 2,382,805 |
| | Avanex Corp.*(a) | | 18,000 | | | 18,000 |
| | | | | | | |
| Industry | | Company | | Shares | | Value |
|
|
Telecommunications - 2.77% | | | |
| | Avici Systems, Inc. | | 345,601 | | $ | 2,740,616 |
| | Aware, Inc. | | 373,800 | | | 1,566,222 |
| | Comarco, Inc. | | 12,100 | | | 66,913 |
| | Communications Systems, Inc. | | 7,000 | | | 83,230 |
| | Comtech Telecommunications Corp.*(a) | | 7,050 | | | 380,771 |
| | Ditech Networks, Inc.*(a) | | 255,470 | | | 886,481 |
| | Globecomm Systems, Inc.* | | 256,800 | | | 3,004,560 |
| | HickoryTech Corp. | | 5,895 | | | 55,177 |
| | Knology, Inc.*(a) | | 229,700 | | | 2,935,566 |
| | KVH Industries, Inc. | | 208,100 | | | 1,677,286 |
| | Network Equipment Technologies, Inc.*(a) | | 296,700 | | | 2,498,214 |
| | Parkervision, Inc.(a) | | 107,800 | | | 1,705,396 |
| | RF Micro Devices, Inc.*(a) | | 697,142 | | | 3,980,681 |
| | SBA Communications Corp.* | | 11,100 | | | 375,624 |
| | Tessco Technologies, Inc. | | 1,332 | | | 24,056 |
| | Tollgrade Communications, Inc.* | | 92,100 | | | 738,642 |
| | Vyyo, Inc.(a) | | 19,331 | | | 60,699 |
| | Warwick Valley Telephone Co. | | 4,400 | | | 52,668 |
| | WJ Communications | | 780,899 | | | 577,865 |
| | WPCS International, Inc.(a) | | 139,000 | | | 1,314,940 |
| | | | | | | |
| | | | | | | 27,126,412 |
Textiles - 0.40% | | | |
| | Angelica Corp. | | 167,100 | | | 3,191,610 |
| | Culp, Inc. | | 94,400 | | | 657,968 |
| | | | | | | |
| | | | | | | 3,849,578 |
Transportation - 1.18% | | | |
| | Celadon Group, Inc. | | 256,275 | | | 2,347,479 |
| | HUB Group, Inc.* | | 289,200 | | | 7,686,936 |
| | Patriot Transportation Holding, Inc.(a) | | 16,400 | | | 1,512,572 |
| | | | | | | |
| | | | | | | 11,546,987 |
Water - 0.59% | | | |
| | Connecticut Water Service, Inc. | | 48,900 | | | 1,152,573 |
| | Middlesex Water Co. | | 64,957 | | | 1,230,935 |
| | Southwest Water Co.(a) | | 183,500 | | | 2,297,420 |
| | York Water Co. | | 68,550 | | | 1,062,525 |
| | | | | | | |
| | | | | | | 5,743,453 |
| | | | | | | |
| |
TOTAL COMMON STOCKS - 96.33% | | | 942,380,508 |
| | | | | | | |
(Cost $660,246,479) | | | |
Ultra-Small Company Market Fund
SCHEDULE OF INVESTMENTS (continued)
Showing percentage of net assets as of December 31, 2007 (Unaudited)
| | | | | | | | |
| | | Rate^ | | Shares | | Value | |
EXCHANGE TRADED FUNDS - 3.32% | |
iShares Russell 2000 Index Fund(a) | | | | 220,400 | | $ | 16,761,420 | |
iShares Russell 2000 Value Index Fund(a) | | | | 222,600 | | | 15,726,690 | |
| | | | | | | | |
| |
TOTAL EXCHANGE TRADED FUNDS - 3.32% | | | 32,488,110 | |
| | | | | | | | |
(Cost $32,312,645) | | | | |
MONEY MARKET FUNDS - 0.93% | |
BlackRock TempCash Liquidity Fund, Institutional Shares #21 | | 4.78% | | 9,050,476 | | | 9,050,476 | |
| | | | | | | | |
| |
TOTAL MONEY MARKET FUNDS - 0.93% | | | 9,050,476 | |
| | | | | | | | |
(Cost $9,050,476) | | | | |
| |
TOTAL INVESTMENTS - 100.58% | | $ | 983,919,094 | |
(Cost $701,609,600) | | | | | | | | |
Liabilities in Excess of Other Assets - (0.58)% | | | (5,685,001 | ) |
| | | | | | | | |
NET ASSETS - 100.00% | | $ | 978,234,093 | |
| | | | | | | | |
| * | Non-income producing security. |
| ^ | Rate disclosed is as of December 31, 2007. |
| (a) | This security or a portion of the security is out on loan at December 31, 2007. Total loaned securities had a market value of $170,609,372 at December 31, 2007. |
| (b) | Affiliated Company. An affiliated company is a company in which the Fund has ownership of at least 5% of the voting securities. Transactions during the year with companies which were affiliates are as follows: |
| | | | | | | | | | | | | | | | |
| Name of Issuer | | Shares held as of
Beginning of Period | | Gross
Additions | | Gross
Reductions | | Income | | Shares held as of
end of Period | | Value as of
end of Period |
AeroCentury | | 143,800 | | $ | - | | $ | - | | $ | - | | 143,800 | | $ | 3,336,160 |
Trio Tech | | 228,300 | | | - | | | 816,852 | | | - | | 142,182 | | | 1,300,965 |
| | | | | | | | | | | | | | | | |
| | 372,100 | | $ | - | | | 816,852 | | $ | - | | 285,982 | | $ | 4,637,125 |
| | | | | | | | | | | | | | | | |
See Notes to Financial Statements.
| | |
| 46 | | Semi-Annual Report | December 31, 2007 (Unaudited) |
THIS PAGE INTENTIONALLY LEFT BLANK
Micro-Cap Limited Fund
MANAGER’S COMMENTARY
(Unaudited)
December 31, 2007
Dear Fellow Micro-Cap Limited Fund Shareholder,
For the quarter-ended December 31, 2007, Micro-Cap Limited Fund declined by 3.16%, outperforming each of its benchmarks in a down market. The CRSP Cap Based Portfolio 9 Index declined a strong 7.03%, while the Lipper Small-Cap Stock Funds Index declined 3.87% and the Russell 2000 Index declined 4.58%. In general, it was a poor period for micro-cap stocks, as continued market and economic uncertainty led many investors to shy away from these companies in favor of larger industry leaders. It was a solid quarter of market beating performance in spite of negative returns.
For the six month semi-annual period, our Fund declined 5.19%, though it outperformed CRSP Cap-Based Portfolio 9 Index (down 11.92%), the Lipper Small-Cap Stock Funds Index (down 5.44), and the Russell 2000 Index (down 7.53%). This period was marked by extreme market volatility influenced by the growing subprime debacle that morphed into a true credit crisis. Micro-cap and small-cap stocks underperformed under those difficult conditions.
For the full calendar year, Micro-Cap Limited Fund fell by 4.97%, once again beating its primary benchmark, the CRSP Cap-Based Portfolio 9 Index, but faring poorly against our peer and small cap benchmarks as presented in the table below. This table presents our December quarter, six-month, one-year, five-year and life-to-date financial results according to the formula required by the SEC. See the next page for a graph of performance since inception.
| | | | | | | | | | |
| | | Dec. qtr.
10/1/07
to 12/31/07 | | 6 Month
7/1/07
to 12/31/07 | | 1 Year
1/1/07
to 12/31/07 | | 5 Year
1/1/03
to 12/31/07 | | Life-to-Date
6/30/98
to 12/31/07 |
| | | | | |
Micro-Cap Limited Fund | | -3.16% | | -5.19% | | -4.97% | | 15.76% | | 15.24% |
CRSP Cap-Based Portfolio 9 Index | | -7.03% | | -11.92% | | -6.75% | | 16.68% | | 9.85% |
Lipper Small-Cap Stock Funds Index | | -3.87% | | -5.44% | | 4.19% | | 16.28% | | 6.78% |
Russell 2000 Index (small stocks) | | -4.58% | | -7.53% | | -1.57% | | 16.25% | | 6.92% |
Performance figures quoted in the table above and graph below represent past performance and are no guarantee of future results. The table above and the graph below do not reflect the deduction of taxes that a shareholder would pay on Fund distributions or the redemption of Fund shares.
The Lipper Small-Cap Stock Funds Index is an index of small-company funds compiled by Lipper, Inc. The Russell 2000 Index is an unmanaged, market value weighted index, which measures performance of the 2,000 companies that are between the 1,000th and 3,000th largest in the market with dividends reinvested. The CRSP Cap-Based Portfolio 9 Index is an unmanaged index of 644 publicly traded U.S. micro-cap stocks (with dividends reinvested), as reported by the Center for Research on Security Prices. It is not possible to invest directly in an index. Periods longer than one year are annualized.
According to data from Lipper, Inc., for the period ended December 31, 2007, the Micro-Cap Limited Fund ranked 54th of 96 micro-cap funds for the last twelve months, 34th of 65 such funds for the last five years and 7th of 40 funds since inception in June, 1998. Lipper, Inc. is an independent mutual fund rating service that ranks funds in various fund categories by making comparative calculations using total returns.
| | |
| 48 | | Semi-Annual Report | December 31, 2007 (Unaudited) |
Micro-Cap Limited Fund
MANAGER’S COMMENTARY (continued)
(Unaudited)
Micro-Cap Limited Fund vs. CRSP 9 Index & Lipper Small-Cap Stock Funds Index & Russell 2000 Index 6/30/98 to 12/31/07
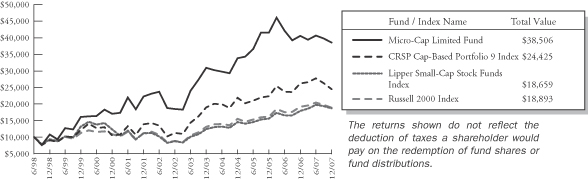
Detailed Explanation of Quarterly Performance—What Worked Well
The Short Version: Industrial companies dominated the Fund’s top 10 performers this past quarter with four related holdings on the list. In fact, three of the top four performing stocks came from this sector. Combined, the four industrial companies contributed over 1.5% to the return of the Fund.
These are the ten best-performing stocks for the quarter ended December 31, 2007:
| | | | | | |
| Rank | | Description | | Industry | | % Gain |
| 1 | | Fushi International Inc | | Electrical Compo & Equip | | 56.4% |
| 2 | | Interactive Intelligence Inc | | Software | | 34.7% |
| 3 | | Robbins & Myers Inc | | Machinery-Diversified | | 32.0% |
| 4 | | Dynamic Materials Corp | | Metal Fabricate/Hardware | | 28.5% |
| 5 | | Pricesmart Inc | | Retail | | 27.4% |
| 6 | | Arena Resources Inc | | Oil & Gas | | 27.4% |
| 7 | | Aspreva Pharmaceuticals Corp | | Pharmaceuticals | | 24.6% |
| 8 | | Raser Technologies Inc | | Hand/Machine Tools | | 24.5% |
| 9 | | Open Text Corp | | Software | | 22.7% |
| 10 | | Hornbeck Offshore Services Inc | | Oil & Gas Services | | 22.5% |
| | | | | | | |
Fushi International was the Fund’s top performer this quarter and the only holding to return greater than 50%. Fushi is China’s largest manufacturer of copper clad wires, which have significant applications in the telecommunications and automotive industries. The company took major globalization strides this quarter with the purchase of a chief U.S. competitor, Copperweld Bimetallics, in a $22.50 million deal. (The company has since changed its name to Fushi Copperweld, Inc.) A few weeks later, management announced its intent to upgrade the newly acquired Tennessee facility with a $3.2 million capital investment. While its stock price surged late in the year, some analysts still look at its healthy quarterly growth rate as reason for continued strong prospects. Fushi contributed 0.20% to the return of the Fund over the past three months.
Micro-Cap Limited Fund
MANAGER’S COMMENTARY (continued)
(Unaudited)
Detailed Explanation of Quarterly Performance—What Didn’t Work
The Short Version: Four industrial holdings also made the Fund’s worst performing list for the quarter, which highlights that our performance is more driven by individual stock picks than overweighting or underweighting economic sectors. While no stock dropped by 50% or more during the three month period, each of the bottom 10 performers lost over 25% in value.
These are the ten worst-performing stocks for the December quarter ended December 31, 2007:
| | | | | | |
| Rank | | Description | | Industry | | % Loss |
| 1 | | Hardinge Inc | | Hand/Machine Tools | | -48.3% |
| 2 | | Sturm Ruger & Co Inc | | Miscellaneous Manufacturing | | -45.7% |
| 3 | | FARO Technologies Inc | | Electronics | | -38.7% |
| 4 | | Perry Ellis International Inc | | Apparel | | -38.4% |
| 5 | | Ceragon Networks Ltd | | Telecommunications | | -37.5% |
| 6 | | Superior Essex Inc | | Electrical Compo & Equip | | -35.6% |
| 7 | | 1-800-FLOWERS.COM Inc | | Internet | | -32.7% |
| 8 | | Salix Pharmaceuticals Ltd | | Pharmaceuticals | | -31.1% |
| 9 | | Novatel Wireless Inc | | Telecommunications | | -25.9% |
| 10 | | Amkor Technology Inc | | Semiconductors | | -25.7% |
| | | | | | | |
Miss earnings by a penny, and your stock price falls; miss by 8 cents (by two analysts predictions) and the price plummets. That’s what happened to machine tool maker, Hardinge, Inc., when the company reported 3rd quarter earnings that actually rose by 35%. Unfortunately, the results were not strong enough, and investors immediately sold on the announcement. It was the Fund’s worst performer for the quarter (and the calendar year). Weaker than expected sales, particularly in North America where orders declined by 21%, dramatically hindered the company’s performance. During periods of market uncertainty, such an earnings miss often proves disastrous for the stock price, especially for a relatively lightly traded micro-cap company. For the quarter, Hardinge cost the Fund almost 0.65% in return.
Detailed Explanation of Calendar Year Performance—What Worked Well
The Short Version: Diversification paid off in 2007, as stocks from five different sectors were represented on the list of top performers with six holdings returning over 50% for the calendar year. All told, 29 companies rose in value over 20% in 2007.
These are the ten best performers for the calendar year ended December 31, 2007:
| | | | | | |
| Rank | | Description | | Industry | | % Gain |
| 1 | | GigaMedia Ltd | | Internet | | 97.7% |
| 2 | | EDO Corp | | Aerospace/Defense | | 81.7% |
| 3 | | Pricesmart Inc | | Retail | | 66.4% |
| 4 | | Open Text Corp | | Software | | 57.0% |
| 5 | | Fushi International Inc | | Electrical Compo & Equip | | 56.4% |
| 6 | | Witness Systems Inc | | Software | | 53.9% |
| 7 | | Arena Resources Inc | | Oil & Gas | | 48.3% |
| 8 | | Layne Christensen Co | | Engineering & Construction | | 48.1% |
| 9 | | Keystone Automotive Industries Inc | | Auto Parts & Equipment | | 46.1% |
| 10 | | Dawson Geophysical Co | | Oil & Gas Services | | 44.2% |
| | | | | | | |
GigaMedia Ltd was the Fund’s top performer for the calendar year. The Taiwan-based gaming company returned just under 100% in 2007. In each of the past two quarters, the company reported better than expected earnings on strong sales of its core poker software and other newly released online games. Management remained optimistic about future operations, as
| | |
| 50 | | Semi-Annual Report | December 31, 2007 (Unaudited) |
Micro-Cap Limited Fund
MANAGER’S COMMENTARY (continued)
(Unaudited)
web-based gaming continues to gain in popularity worldwide. In October, Bear Stearns initiated coverage on GigaMedia with an outperform rating. For the year, the holding contributed almost 1.5% to the return of the Fund.
Detailed Explanation of Calendar Year Performance—What Didn’t Work
The Short Version: Three consumer-related companies made the list of worst performers for the calendar year, possibly due to the slowdown in the economy beginning to take its toll on consumer activity, particularly late in the year. The three holdings cost the Fund over 1.25% in return over the past 12-months.
These are the ten stocks that performed the worst in the calendar year ended December 31, 2007:
| | | | | | |
| Rank | | Description | | Industry | | % Loss |
| 1 | | Hardinge Inc | | Hand/Machine Tools | | -49.6% |
| 2 | | Perry Ellis International Inc | | Apparel | | -48.8% |
| 3 | | ICT Group Inc | | Commercial Services | | -44.0% |
| 4 | | Syntax-Brillian Corp | | Semiconductors | | -43.9% |
| 5 | | Sturm Ruger & Co Inc | | Miscellaneous Manufacturing | | -42.7% |
| 6 | | Community Bancorp/NV | | Banks | | -37.9% |
| 7 | | Ceragon Networks Ltd | | Telecommunications | | -37.5% |
| 8 | | Novatel Wireless Inc | | Telecommunications | | -32.7% |
| 9 | | 1-800-FLOWERS.COM Inc | | Internet | | -32.7% |
| 10 | | Viropharma Inc | | Pharmaceuticals | | -32.3% |
| | | | | | | |
Add Perry Ellis to the list of victims of the economic downturn that impacted retailers throughout the latter part of the year. The company designs a variety of men’s and women’s apparel for sale domestically and abroad. Management tried to remain optimistic during much of the year, and the company even reported strong earnings in the third quarter. However, many retailers started predicting gloom and doom for the holiday season. In November, the company reduced its sales outlook for the fourth quarter and warned of slumping activity throughout the holidays and beyond. For the 12-month period, the holding cost the Fund over 0.5% in return.
Top Ten Holdings as of December 31, 2007
Four of the Fund’s largest holdings at the end of the calendar year were also among the top performers in 2007: Robbins & Myers, Open Text Corp., Hornbeck Offshore, and Pricesmart, Inc. These four stocks made up over 12% of the Fund’s net assets and contributed over 2.5% to its return during the calendar year. The top 10 holdings comprised almost 30% of the net assets of Micro-Cap Limited Fund.
| | | | | | |
| Rank | | Description | | Industry | | Percent of
Net Assets |
| 1 | | Robbins & Myers, Inc. | | Machinery-Diversified | | 4.9% |
| 2 | | Navigators Group, Inc. | | Insurance | | 3.9% |
| 3 | | LSB Industries, Inc. | | Miscellaneous Manufacturing | | 3.2% |
| 4 | | Open Text Corp. | | Software | | 3.2% |
| 5 | | Dollar Financial Corp. | | Commercial Services | | 2.9% |
| 6 | | Axsys Technologies, Inc. | | Electronics | | 2.7% |
| 7 | | ICF International, Inc. | | Commercial Services | | 2.3% |
| 8 | | Hornbeck Offshore Services, Inc. | | Oil & Gas Services | | 2.2% |
| 9 | | Pricesmart, Inc. | | Retail | | 2.1% |
| 10 | | Layne Christensen Co. | | Engineering & Construction | | 1.9% |
| | | | | | | |
| | | | | | 29.3% |
Micro-Cap Limited Fund
MANAGER’S COMMENTARY (continued)
(Unaudited)
Industry Sector Representation as of December 31, 2007
Industrials represented the largest sector within the Fund at the end of the quarter, and the results were mixed at best. In the most recent quarter, four industrial companies made the list of top 10 performers, while four others could be found among the bottom tier. On a more positive note, the models’ underweighting of financials proved beneficial, as that sector got pounded throughout the year due to the subprime fiasco and ongoing credit crisis.
| | | | | | |
| | | % of Portfolio | | % S&P
Small-Cap Index | | Difference |
Basic Materials | | 2.8% | | 2.8% | | 0.0% |
Communications | | 8.2% | | 4.1% | | 4.1% |
Consumer, Cyclical | | 8.2% | | 14.3% | | -6.1% |
Consumer, Non-cyclical | | 20.5% | | 19.6% | | 0.9% |
Energy | | 10.2% | | 8.0% | | 2.2% |
Financial | | 9.7% | | 15.8% | | -6.1% |
Industrial | | 28.5% | | 20.5% | | 8.0% |
Technology | | 10.6% | | 10.1% | | 0.5% |
Utilities | | 0.8% | | 4.8% | | -4.0% |
Cash | | 0.5% | | 0.0% | | 0.5% |
| | | | | | | |
Total | | 100.0% | | 100.0% | | |
Disclaimer
The following is a reminder from the friendly folks at your Fund who worry about liability. The views expressed here are exclusively those of Fund management. These views are not meant as investment advice and should not be considered predictive in nature. Any favorable (or unfavorable) description of a holding applies only as of December 31, 2007, unless otherwise stated. Security positions can and do change thereafter. Discussions of historical performance do not guarantee and are not indicative of future performance.
The Fund is subject to very high, above market risk (volatility) and is not an appropriate investment for short-term investors. Investments in micro-cap companies generally carry greater risk than is customarily associated with larger companies and even “small companies” for various reasons such as narrower markets (fewer investors), limited financial resources and greater trading difficulty.
Conclusion
Micro-Cap Limited Fund remains closed to new shareholders, but is open to your additional investments. We encourage your feedback; your reactions and concerns are important to us.
Sincerely,
Your Investment Management Team
| | |
| 52 | | Semi-Annual Report | December 31, 2007 (Unaudited) |
THIS PAGE INTENTIONALLY LEFT BLANK
Micro-Cap Limited Fund
SCHEDULE OF INVESTMENTS
Showing percentage of net assets as of December 31, 2007 (Unaudited)
| | | | | | | |
| Industry | | Company | | Shares | | Value |
|
COMMON STOCKS - 99.29% |
Aerospace/Defense - 1.99% |
| | Astronics Corp.* | | 5,600 | | $ | 238,000 |
| | Ducommun, Inc.* | | 16,200 | | | 615,600 |
| | Kaman Corp. | | 6,300 | | | 231,903 |
| | | | | | | |
| | | | | | | 1,085,503 |
| |
Apparel - 1.74% | | | |
| | Iconix Brand Group, Inc.* | | 48,200 | | | 947,612 |
| |
Biotechnology - 0.43% | | | |
| | Clinical Data, Inc. | | 5,300 | | | 117,925 |
| | Third Wave Technologies, Inc. | | 12,100 | | | 116,765 |
| | | | | | | |
| | | | | | | 234,690 |
| |
Chemicals - 2.76% | | | |
| | ICO, Inc.* | | 39,700 | | | 509,748 |
| | Landec Corp.* | | 74,600 | | | 999,640 |
| | | | | | | |
| | | | | | | 1,509,388 |
| |
Commercial Services - 11.48% | | | |
| | Dollar Financial Corp.* | | 51,600 | | | 1,583,604 |
| | Geo Group, Inc.* | | 23,000 | | | 644,000 |
| | H&E Equipment Services, Inc.* | | 29,700 | | | 560,736 |
| | ICF International, Inc.* | | 50,600 | | | 1,278,156 |
| | Kforce, Inc.* | | 57,700 | | | 562,575 |
| | Learning Tree International, Inc.* | | 26,300 | | | 603,848 |
| | LECG Corp.* | | 34,700 | | | 522,582 |
| | MAXIMUS, Inc. | | 8,900 | | | 343,629 |
| | Premier Exhibitions, Inc.*(a) | | 15,700 | | | 171,758 |
| | | | | | | |
| | | | | | | 6,270,888 |
| |
Computers - 2.55% | | | |
| | BluePhoenix Solutions, Ltd.* | | 7,700 | | | 139,524 |
| | Furmanite Corp.* | | 52,500 | | | 619,500 |
| | Manhattan Associates, Inc.* | | 24,100 | | | 635,276 |
| | | | | | | |
| | | | | | | 1,394,300 |
| |
Diversified Financial Services - 1.32% | | | |
| | TradeStation Group, Inc.* | | 50,600 | | | 719,026 |
| |
Electric Utilities - 0.53% | | | |
| | MGE Energy, Inc. | | 8,100 | | | 287,307 |
| |
Electrical Components & Equipment - 1.30% | | | |
| | Fushi International, Inc.(a) | | 13,500 | | | 339,795 |
| | Superior Essex, Inc.* | | 15,500 | | | 372,000 |
| | | | | | | |
| | | | | | | 711,795 |
| |
Electronics - 3.14% | | | |
| | Axsys Technologies, Inc.* | | 40,400 | | | 1,480,660 |
| | Taser International, Inc.*(a) | | 16,400 | | | 235,996 |
| | | | | | | |
| | | | | | | 1,716,656 |
| | | | | | | |
| Industry | | Company | | Shares | | Value |
|
|
Energy-Alternative Sources - 0.73% | | | |
| | Headwaters, Inc.*(a) | | 34,000 | | $ | 399,160 |
| |
Engineering & Construction - 3.77% | | | |
| | Layne Christensen Co.* | | 21,600 | | | 1,062,936 |
| | Michael Baker Corp.* | | 12,200 | | | 501,420 |
| | Stanley, Inc.* | | 15,500 | | | 496,310 |
| | | | | | | |
| | | | | | | 2,060,666 |
|
|
Environmental Control - 3.44% | | | |
| | Calgon Carbon Corp.(a) | | 30,000 | | | 476,700 |
| | Darling International, Inc.* | | 70,400 | | | 813,824 |
| | Metalico, Inc. | | 54,100 | | | 586,444 |
| | | | | | | |
| | | | | | | 1,876,968 |
| |
Food - 3.37% | | | |
| | Cal-Maine Foods, Inc.(a) | | 33,400 | | | 886,102 |
| | Ingles Markets, Inc. | | 20,400 | | | 517,956 |
| | Spartan Stores, Inc. | | 19,100 | | | 436,435 |
| | | | | | | |
| | | | | | | 1,840,493 |
| |
Hand/Machine Tools - 1.09% | | | |
| | Hardinge, Inc. | | 10,000 | | | 167,800 |
| | Raser Technologies, Inc.* | | 28,600 | | | 424,710 |
| | | | | | | |
| | | | | | | 592,510 |
| |
Healthcare-Products - 0.48% | | | |
| | Hansen Medical, Inc.*(a) | | 8,800 | | | 263,472 |
| |
Holding Companies-Diversified - 0.50% | | | |
| | Compass Diversified Holdings | | 18,400 | | | 274,160 |
| |
Household Products/Wares - 0.90% | | | |
| | Russ Berrie & Co, Inc.* | | 30,100 | | | 492,436 |
| |
Insurance - 8.37% | | | |
| | Darwin Professional Underwriters, Inc. | | 25,400 | | | 613,918 |
| | Life Partners Holdings, Inc.(a) | | 6,400 | | | 177,280 |
| | Navigators Group, Inc.* | | 32,600 | | | 2,119,000 |
| | Safety Insurance Group, Inc. | | 16,100 | | | 589,582 |
| | SeaBright Insurance Holdings, Inc.* | | 30,300 | | | 456,924 |
| | Tower Group, Inc. | | 18,400 | | | 614,560 |
| | | | | | | |
| | | | | | | 4,571,264 |
| |
Internet - 5.94% | | | |
| | 1-800-FLOWERS.COM, Inc.* | | 32,800 | | | 286,344 |
| | Aladdin Knowledge Systems, Ltd. | | 22,100 | | | 577,473 |
| | |
| 54 | | Semi-Annual Report | December 31, 2007 (Unaudited) |
Micro-Cap Limited Fund
SCHEDULE OF INVESTMENTS (continued)
Showing percentage of net assets as of December 31, 2007 (Unaudited)
| | | | | | | |
| Industry | | Company | | Shares | | Value |
|
Common Stocks (continued) |
Internet (continued) |
| | eResearchTechnology, Inc.* | | 29,900 | | $ | 353,418 |
| | FTD Group, Inc. | | 71,700 | | | 923,496 |
| | GigaMedia, Ltd.* | | 27,100 | | | 508,125 |
| | Shutterfly, Inc.* | | 9,900 | | | 253,638 |
| | Vocus, Inc.* | | 9,900 | | | 341,847 |
| | | | | | | |
| | | | | | | 3,244,341 |
| |
Machinery-Diversified - 5.53% | | | |
| | Hurco Cos, Inc.* | | 3,800 | | | 165,870 |
| | Robbins & Myers, Inc. | | 35,300 | | | 2,669,739 |
| | Tennant Co. | | 4,200 | | | 186,018 |
| | | | | | | |
| | | | | | | 3,021,627 |
| |
Metal Fabrication - Hardware - 1.74% | | | |
| | Dynamic Materials Corp. | | 6,400 | | | 376,960 |
| | LB Foster Co.* | | 11,100 | | | 574,203 |
| | | | | | | |
| | | | | | | 951,163 |
| |
Miscellaneous Manufacturing - 4.51% | | | |
| | China Fire & Security Group, Inc. | | 8,500 | | | 109,480 |
| | Koppers Holdings, Inc. | | 13,400 | | | 579,416 |
| | LSB Industries, Inc.*(a) | | 62,900 | | | 1,775,038 |
| | | | | | | |
| | | | | | | 2,463,934 |
| |
Oil & Gas - 2.91% | | | |
| | Arena Resources, Inc.* | | 22,600 | | | 942,646 |
| | Parker Drilling Co.* | | 85,600 | | | 646,280 |
| | | | | | | |
| | | | | | | 1,588,926 |
| |
Oil & Gas Services - 6.48% | | | |
| | Dawson Geophysical Co.* | | 12,900 | | | 921,834 |
| | Flotek Industries, Inc.* | | 7,400 | | | 266,696 |
| | Hornbeck Offshore Services, Inc.*(a) | | 26,600 | | | 1,195,670 |
| | NATCO Group, Inc.* | | 6,600 | | | 357,390 |
| | T-3 Energy Services, Inc.* | | 10,900 | | | 512,409 |
| | Willbros Group, Inc.*(a) | | 7,500 | | | 287,175 |
| | | | | | | |
| | | | | | | 3,541,174 |
| |
Pharmaceuticals - 3.66% | | | |
| | BioScrip, Inc.* | | 60,200 | | | 465,346 |
| | I-Flow Corp. | | 6,700 | | | 105,726 |
| | Neogen Corp.* | | 20,600 | | | 546,930 |
| | PetMed Express, Inc.* | | 40,400 | | | 488,840 |
| | Salix Pharmaceuticals, Ltd.*(a) | | 49,500 | | | 390,060 |
| | | | | | | |
| | | | | | | 1,996,902 |
| | | | | | | |
| Industry | | Company | | Shares | | Value |
|
|
Retail - 6.47% | | | |
| | EZCORP, Inc.* | | 67,682 | | $ | 764,130 |
| | PC Connection, Inc.* | | 49,400 | | | 560,690 |
| | Pricesmart, Inc. | | 38,000 | | | 1,142,280 |
| | School Specialty, Inc.* | | 15,800 | | | 545,890 |
| | Systemax, Inc.(a) | | 25,600 | | | 520,192 |
| | | | | | | |
| | | | | | | 3,533,182 |
| |
Semiconductors - 1.34% | | | |
| | Advanced Analogic Technologies, Inc.* | | 16,800 | | | 189,504 |
| | Monolithic Power Systems, Inc.* | | 17,000 | | | 364,990 |
| | Pericom Semiconductor Corp.* | | 9,500 | | | 177,650 |
| | | | | | | |
| | | | | | | 732,144 |
| |
Software - 6.65% | | | |
| | Interactive Intelligence, Inc.* | | 14,600 | | | 384,710 |
| | JDA Software Group, Inc.* | | 32,300 | | | 660,858 |
| | Open Text Corp.*(a) | | 56,200 | | | 1,767,490 |
| | Taleo Corp.* | | 27,400 | | | 815,972 |
| | | | | | | |
| | | | | | | 3,629,030 |
| |
Telecommunications - 2.18% | | | |
| | Alvarion, Ltd.* | | 25,200 | | | 239,400 |
| | Ceragon Networks, Ltd. | | 22,704 | | | 224,543 |
| | Novatel Wireless, Inc.* | | 44,900 | | | 727,380 |
| | | | | | | |
| | | | | | | 1,191,323 |
| |
Transportation - 1.75% | | | |
| | Euroseas, Ltd. | | 11,900 | | | 147,560 |
| | Gulfmark Offshore, Inc.* | | 17,298 | | | 809,373 |
| | | | | | | |
| | | | | | | 956,933 |
| |
Water - 0.24% | | | |
| | Consolidated Water Co, Inc. | | 5,100 | | | 128,469 |
| | | | | | | |
| |
TOTAL COMMON STOCKS - 99.29% | | | 54,227,442 |
| | | | | | | |
(Cost $49,609,307) | | | |
| |
TOTAL INVESTMENTS - 99.29% | | $ | 54,227,442 |
(Cost $49,609,307) | | | |
Other Assets in Excess of Liabilities - 0.71% | | | 388,237 |
| | | | | | | |
NET ASSETS - 100.00% | | $ | 54,615,679 |
| | | | | | | |
| * | Non-income producing security. |
| (a) | This security or a portion of the security is out on loan at December 31, 2007. Total loaned securities had a market value of $8,200,482 at December 31, 2007. |
See Notes to Financial Statements.
Small-Cap Growth Fund
MANAGER’S COMMENTARY
(Unaudited)
December 31, 2007
Dear Fellow Small-Cap Growth Fund Shareholder,
For the quarter ending December 31, 2007, Small-Cap Growth Fund declined 3.30%, underperforming its primary market benchmark, the Russell 2000 Growth Index (down 2.10%) and its peer benchmark, the Lipper Small-Cap Growth Funds Index (down 2.57%). In general, smaller companies had a very poor quarter, as continued market and economic uncertainty led many investors to shy away from these companies in favor of larger industry leaders. This was a poor quarter.
For the six month semi-annual period, our Fund declined 4.75%, and also lost ground to the Russell 2000 Growth Index (down 2.09%) and the Lipper Small-Cap Growth Funds Index (down 1.17%). This period was marked by extreme market volatility while investors faced the growing subprime debacle that morphed into a true credit crisis. In this market environment, small stocks, including many in our fund, underperformed the broader market averages.
For the full calendar year, Small-Cap Growth Fund returned 6.87% as the first two quarters of 2007 produced solid results, before the headwinds from the credit crisis began to take their toll. The Russell 2000 Growth Index gained 7.05%, and the Lipper Small-Cap Growth Funds Index increased 9.68% during the past twelve months. The 2007 calendar year appears to have reversed the prior seven year trend that had favored smaller issues.
The table below presents our December quarter, six-month, one-year and life-to-date financial results according to the formula required by the SEC. See the next page for a graph of performance since inception.
| | | | | | | | |
| | | Dec. Qtr. 10/1/07 to 12/31/07 | | 6 Month 7/1/07 to 12/31/07 | | 1 Year 1/1/07 to 12/31/07 | | Life-to-Date 10/31/03 to 12/31/07 |
| | | | |
Small-Cap Growth Fund | | -3.30% | | -4.75% | | 6.87% | | 10.66% |
Russell 2000 Growth Index | | -2.10% | | -2.09% | | 7.05% | | 10.19% |
Lipper Small-Cap Growth Funds Index | | -2.57% | | -1.17% | | 9.68% | | 9.44% |
Performance figures quoted in the table above and graph below represent past performance and are no guarantee of future results. The table above and the graph below do not reflect the deduction of taxes that a shareholder would pay on Fund distributions or the redemption of Fund shares.
The Russell 2000 Growth Index is an unmanaged index which consists of stocks in the Russell 2000 Index with higher price-to-book ratios and higher forecasted growth values with dividends reinvested. The Lipper Small-Cap Growth Funds Index is an index of small-company, growth-oriented funds compiled by Lipper, Inc. It is not possible to invest directly in an index. Periods longer than one year are annualized.
According to data from Lipper, Inc. as of December 31, 2007, Small-Cap Growth Fund ranked 349th of 591 small-cap growth funds for the twelve-month period ended December 31, 2007 and 147th of 422 such funds since inception in October, 2003. Lipper, Inc. is an independent mutual fund rating service that ranks funds in various fund categories by making comparative calculations using total returns.
| | |
| 56 | | Semi-Annual Report | December 31, 2007 (Unaudited) |
Small-Cap Growth Fund
MANAGER’S COMMENTARY (continued)
(Unaudited)
Small-Cap Growth Fund vs. Lipper Small-Cap Growth Funds Index & Russell 2000 Growth Index 10/31/03 to 12/31/07
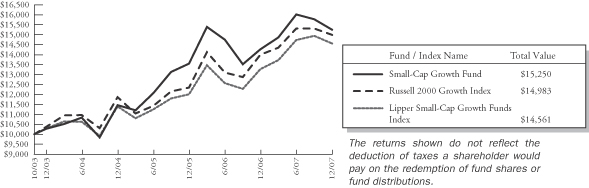
Detailed Explanation of Quarterly Performance—What Worked Well
The Short Version: Six different sectors were represented within the list of ten best-performers this quarter, revealing solid diversification within the Fund. While no individual stock returned greater than 50%, nine holdings earned more than 20% during the three month period.
These are the ten best-performing stocks for the quarter ended December 31, 2007:
| | | | | | |
| Rank | | Description | | Industry | | % Gain |
| 1 | | Deckers Outdoor Corp | | Apparel | | 41.2% |
| 2 | | Intuitive Surgical Inc | | Healthcare-Products | | 41.1% |
| 3 | | priceline.com Inc | | Internet | | 29.4% |
| 4 | | Pricesmart Inc | | Retail | | 27.4% |
| 5 | | Arena Resources Inc | | Oil & Gas | | 27.4% |
| 6 | | IntercontinentalExchange Inc | | Diversified Financial Services | | 26.7% |
| 7 | | AAR Corp | | Aerospace/Defense | | 25.4% |
| 8 | | Dynamic Materials Corp | | Metal Fabricate/Hardware | | 23.0% |
| 9 | | FTI Consulting Inc | | Commercial Services | | 22.5% |
| 10 | | Owens-Illinois Inc | | Packaging & Containers | | 19.4% |
| | | | | | | |
Intuitive Surgical Inc. is a healthcare-related company that manufactures and markets specialty surgical products for a variety of medical applications. In particular, the company has designed robotic tools known as da Vinci systems which are used for urology, cardiology, gynecology, and general surgeries. In its most recent quarter, company profits doubled, and sales increased by over 60%. Additionally, Intuitive has started to make inroads into the international medical markets. While many analysts remain quite positive about the company’s prospects for continued growth, others express concerns that it could encounter future challenges because it essentially remains a one-product company. To counter these fears, management points out that revenue is also tied to sales of accessories, system service and training; therefore, the potential for recurring revenue streams is becoming more substantial. Intuitive Systems contributed about 0.25% to the performance of the Fund this past quarter.
Detailed Explanation of Quarterly Performance—What Didn’t Work
The Short Version: The record of the stocks above was not nearly enough to offset the declining Fund stocks on the other side of the ledger. Four industrial companies highlighted the list of poor performers this quarter, indicating that the economic slowdown that began in housing is now moving into other sectors of the economy like manufacturing. Altogether, those four firms cost the Fund about 1.25% in return during the three month period. Thirteen companies lost 25% or more this quarter.
Small-Cap Growth Fund
MANAGER’S COMMENTARY (continued)
(Unaudited)
These are the ten worst-performing stocks for the quarter ended December 31, 2007:
| | | | | | |
| Rank | | Description | | Industry | | % Loss |
| 1 | | Sturm Ruger & Co Inc | | Miscellaneous Manufacturing | | -49.8% |
| 2 | | KMG Chemicals Inc | | Chemicals | | -45.6% |
| 3 | | CROCS Inc | | Apparel | | -45.3% |
| 4 | | Mfri Inc | | Miscellaneous Manufacturing | | -40.2% |
| 5 | | Ceradyne Inc | | Miscellaneous Manufacturing | | -38.0% |
| 6 | | NBTY Inc | | Pharmaceuticals | | -32.5% |
| 7 | | Varian Semiconductor Equipment Assoc | | Semiconductors | | -30.9% |
| 8 | | Novatel Wireless Inc | | Telecommunications | | -28.5% |
| 9 | | NutriSystem Inc | | Internet | | -27.1% |
| 10 | | Trinity Industries Inc | | Miscellaneous Manufacturing | | -26.1% |
| | | | | | | |
While manufacturing firms were prominent in the list, trendy shoemaker CROCS made a rare appearance after several quarters of strong returns. In fact, CROCS was the Fund’s second top performer and returned over 50% during the three months ended September 30, 2007. While its latest earnings report actually beat Wall Street forecasts, its future guidance on revenues fell short of expectations. In reality, CROCS had trouble keeping up with the increasing demand for its products throughout Europe and Japan, an issue that cost the company about $30 million in potential quarterly sales. Its stock price fell by almost half for the quarter, and a few shareholder suits followed. The holding cost the Fund about 0.3% during the past three months.
Detailed Explanation of Calendar Year Performance—What Worked Well
The Short Version: Though industrials may have lagged last quarter, the sector placed four firms within the Fund’s top performer list for the calendar year 2007. Combined, these companies contributed over 2.3% to the return of the Fund. During the year, one holding returned over 100%, while thirteen others earned over 50% in performance.
These are the ten best performers for the calendar year ended December 31, 2007:
| | | | | | |
| Rank | | Description | | Industry | | % Gain |
| 1 | | Dynamic Materials Corp | | Metal Fabricate/Hardware | | 109.6% |
| 2 | | priceline.com Inc | | Internet | | 97.8% |
| 3 | | FMC Technologies Inc | | Oil & Gas Services | | 84.0% |
| 4 | | Foster Wheeler Ltd | | Engineering &Construction | | 83.6% |
| 5 | | Lifecell Corp | | Biotechnology | | 78.6% |
| 6 | | Air Methods Corp | | Healthcare-Services | | 77.9% |
| 7 | | EDO Corp | | Aerospace/Defense | | 72.9% |
| 8 | | Bolt Technology Corp | | Oil & Gas Services | | 70.3% |
| 9 | | General Cable Corp | | Electrical Compo & Equip | | 67.7% |
| 10 | | Deckers Outdoor Corp | | Apparel | | 62.0% |
| | | | | | | |
Dynamic Materials was the Fund’s top performer in the calendar year 2007 and the only holding to earn a return of over 100%. The industrial company produces welded metal plates that are used by upstream oil and gas companies, refineries, and in certain chemical and petrochemical-related applications. In its latest quarter, the company reported skyrocketing sales and earnings, and management predicts continued growth due to a strong backlog of orders. The Colorado-based company acquired a German explosion welder in November in a transaction valued at just under $100 million. During the calendar year, the company contributed over 1% to the Fund’s return.
| | |
| 58 | | Semi-Annual Report | December 31, 2007 (Unaudited) |
Small-Cap Growth Fund
MANAGER’S COMMENTARY (continued)
(Unaudited)
Detailed Explanation of Calendar Year Performance—What Didn’t Work
The Short Version: For the calendar year 2007, only one holding lost over 50% in value; however, eight others declined by at least 40%. Consumer-related companies ranging from pharmaceutical to biotech to healthcare highlighted the list, revealing that the slowing economy is starting to impact consumer spending as recessionary fears emerge.
These are the ten stocks that performed the worst in the calendar year ended December 31, 2007:
| | | | | | |
| Rank | | Description | | Industry | | % Gain |
| 1 | | US Global Investors Inc | | Diversified Financial Services | | -50.4% |
| 2 | | NutriSystem Inc | | Internet | | -46.1% |
| 3 | | Sturm Ruger & Co Inc | | Miscellaneous Manufacturing | | -45.5% |
| 4 | | Mfri Inc | | Miscellaneous Manufacturing | | -44.9% |
| 5 | | KMG Chemicals Inc | | Chemicals | | -44.7% |
| 6 | | Vital Images Inc | | Healthcare-Products | | -43.4% |
| 7 | | NBTY Inc | | Pharmaceuticals | | -41.8% |
| 8 | | ICT Group Inc | | Commercial Services | | -41.3% |
| 9 | | Martha Stewart Living Omnimedia | | Media | | -41.1% |
| 10 | | CryoLife Inc | | Biotechnology | | -38.5% |
| | | | | | | |
Weight management company NutriSystem, Inc. was one of the Fund’s worst performers during the calendar year 2007 as the stock declined 46% in value during the past two quarters. In July, the company reported solid 2nd quarter earnings, but warned that the 3rd quarter may not be as strong. Many similar diet companies also declined, as the FDA approved a new weight-loss pill that was viewed as new competition in this marketplace. In October, NutriSystem again lowered its earnings’ forecast even further, and management was greeted with a class action lawsuit, alleging materially misleading statements had led to artificially high stock prices earlier in the year. The holding cost the Fund over 0.8% during the calendar year.
Top Ten Holdings as of December 31, 2007
Only two of the top holdings appeared on the list of best performers during the quarter. Deckers Outdoor and Dynamic Materials contributed over 1.5% to the Fund’s quarterly performance and made up over 6% of its net assets. The ten top holdings comprised almost 30% of the net assets of the Fund.
| | | | | | |
| Rank | | Description | | Industry | | Percent of
Net Assets |
| 1 | | Deckers Outdoor Corp | | Apparel | | 4.1% |
| 2 | | Dril-Quip Inc | | Oil & Gas Services | | 4.1% |
| 3 | | CommScope Inc | | Telecommunications | | 3.2% |
| 4 | | Guess ? Inc | | Retail | | 3.2% |
| 5 | | Lifecell Corp | | Biotechnology | | 2.5% |
| 6 | | OSI Pharmaceuticals Inc | | Pharmaceuticals | | 2.3% |
| 7 | | Fresh Del Monte Produce Inc | | Food | | 2.3% |
| 8 | | Air Methods Corp | | Healthcare-Services | | 2.2% |
| 9 | | Dynamic Materials Corp | | Metal Fabrication - Hardware | | 2.2% |
| 10 | | General Cable Corp | | Electrical Components & Equipment | | 2.1% |
| | | | | | | |
| Total | | | | | | 28.2% |
Small-Cap Growth Fund
MANAGER’S COMMENTARY (continued)
(Unaudited)
Industry Sector Representation as of December 31, 2007
Fortunately, the allocation to financials, a sector that has clearly been out of favor for the past few quarters, is well below that of the benchmark. Our overweighting in energy also helped as the sector had strong performance.
| | | | | | |
| | | % of Portfolio | | % of S&P Small Cap Index | | Difference |
Basic Materials | | 2.2% | | 2.8% | | -0.6% |
Communications | | 7.5% | | 4.1% | | 3.4% |
Consumer, Cyclical | | 14.8% | | 14.3% | | 0.5% |
Consumer, Non-cyclical | | 25.5% | | 19.6% | | 5.9% |
Energy | | 13.1% | | 8.0% | | 5.1% |
Financial | | 2.7% | | 15.8% | | -13.1% |
Industrial | | 21.2% | | 20.5% | | 0.7% |
Technology | | 11.4% | | 10.1% | | 1.3% |
Utilities | | 1.0% | | 4.8% | | -3.8% |
Cash | | 0.6% | | 0.0% | | 0.6% |
| | | | | | | |
Total | | 100.0% | | 100.0% | | |
Disclaimer
The following is a reminder from the friendly folks at your Fund who worry about liability. The views expressed here are exclusively those of Fund management. These views are not meant as investment advice and should not be considered predictive in nature. Any favorable (or unfavorable) description of a holding applies only as of December 31, 2007, unless otherwise stated. Security positions can and do change thereafter. Discussions of historical performance do not guarantee and are not indicative of future performance.
Market volatility can significantly impact short-term performance. The Fund is not an appropriate investment for short-term investors. Investments in small companies generally carry greater risk than is customarily associated with larger companies. This additional risk is attributable to a number of factors, including the relatively limited financial resources that are typically available to small companies, and the fact that small companies often have comparatively limited product lines. In addition, the stock of small companies tends to be more volatile than the stock of large companies, particularly in the short term and particularly in the early stages of an economic or market downturn. Shareholders of the Fund, therefore, are taking on more risk than they would if they invested in the stock market as a whole.
Conclusion
Thank you for your continued investment in Small-Cap Growth Fund. We encourage your feedback; your reactions and concerns are important to us.
Sincerely,
Your Investment Management Team
| | |
| 60 | | Semi-Annual Report | December 31, 2007 (Unaudited) |
THIS PAGE INTENTIONALLY LEFT BLANK
Small-Cap Growth Fund
SCHEDULE OF INVESTMENTS
Showing percentage of net assets as of December 31, 2007 (Unaudited)
| | | | | | | |
| Industry | | Company | | Shares | | Value |
|
COMMON STOCKS - 98.97% |
Aerospace/Defense - 1.40% |
| | AAR Corp.* | | 58,129 | | $ | 2,210,646 |
|
Apparel - 5.43% |
| | CROCS, Inc.*(a) | | 18,000 | | | 662,580 |
| | Deckers Outdoor Corp.*(a) | | 41,800 | | | 6,481,508 |
| | G-III Apparel Group, Ltd.* | | 47,316 | | | 698,857 |
| | Iconix Brand Group, Inc.* | | 38,100 | | | 749,046 |
| | | | | | | |
| | | | | | | 8,591,991 |
|
Beverages - 0.38% |
| | Boston Beer Co., Inc.* | | 16,000 | | | 602,400 |
|
Biotechnology - 3.82% |
| | CryoLife, Inc.* | | 53,663 | | | 426,621 |
| | Lifecell Corp.* | | 92,600 | | | 3,991,986 |
| | Qiagen NV*(a) | | 77,256 | | | 1,626,239 |
| | | | | | | |
| | | | | | | 6,044,846 |
|
Chemicals - 2.19% |
| | Albemarle Corp. | | 18,000 | | | 742,500 |
| | Landec Corp.* | | 41,958 | | | 562,237 |
| | Lubrizol Corp. | | 6,000 | | | 324,960 |
| | NewMarket Corp. | | 31,500 | | | 1,754,235 |
| | Zep, Inc.* | | 6,000 | | | 83,220 |
| | | | | | | |
| | | | | | | 3,467,152 |
|
Commercial Services - 8.99% |
| | Bright Horizons Family Solutions, Inc.* | | 8,800 | | | 303,952 |
| | Dollar Financial Corp.* | | 51,800 | | | 1,589,742 |
| | FTI Consulting, Inc.* | | 6,065 | | | 373,846 |
| | Geo Group, Inc.* | | 109,000 | | | 3,052,000 |
| | ICF International, Inc.* | | 33,000 | | | 833,580 |
| | MPS Group, Inc.* | | 109,500 | | | 1,197,930 |
| | Sotheby’s | | 57,000 | | | 2,171,700 |
| | Strayer Education, Inc. | | 6,227 | | | 1,062,202 |
| | TeleTech Holdings, Inc.* | | 135,300 | | | 2,877,831 |
| | Transcend Services, Inc. | | 10,000 | | | 162,500 |
| | Watson Wyatt Worldwide, Inc. | | 13,000 | | | 603,330 |
| | | | | | | |
| | | | | | | 14,228,613 |
|
Computers - 3.64% |
| | Ansoft Corp.* | | 61,800 | | | 1,597,530 |
| | Cognizant Technology Solutions Corp.* | | 72,880 | | | 2,473,547 |
| | Sigma Designs, Inc.*(a) | | 5,600 | | | 309,120 |
| | Synaptics, Inc.* | | 33,400 | | | 1,374,744 |
| | | | | | | |
| | | | | | | 5,754,941 |
|
|
Diversified Financial Services - 2.64% |
| | Greenhill & Co., Inc.(a) | | 28,700 | | | 1,907,976 |
| | IntercontinentalExchange, Inc.*(a) | | 5,600 | | | 1,078,000 |
| | US Global Investors, Inc.(a) | | 71,586 | | | 1,192,623 |
| | | | | | | |
| | | | | | | 4,178,599 |
| | | | | | | |
| Industry | | Company | | Shares | | Value |
|
|
Electric Utilities - 1.03% |
| | Portland General Electric Co. | | 58,500 | | $ | 1,625,130 |
|
Electrical Components & Equipment - 3.56% |
| | Belden, Inc. | | 13,700 | | | 609,650 |
| | General Cable Corp.* | | 46,200 | | | 3,385,536 |
| | GrafTech International, Ltd.*(a) | | 92,322 | | | 1,638,716 |
| | | | | | | |
| | | | | | | 5,633,902 |
|
Engineering & Construction - 1.55% |
| | Foster Wheeler, Ltd.* | | 7,500 | | | 1,162,650 |
| | Layne Christensen Co.* | | 21,200 | | | 1,043,252 |
| | VSE Corp. | | 5,000 | | | 244,200 |
| | | | | | | |
| | | | | | | 2,450,102 |
|
Food - 3.06% |
| | Cal-Maine Foods, Inc.(a) | | 45,800 | | | 1,215,074 |
| | Fresh Del Monte Produce, Inc.* | | 107,900 | | | 3,623,282 |
| | | | | | | |
| | | | | | | 4,838,356 |
|
Hand/Machine Tools - 1.67% |
| | Baldor Electric Co. | | 78,400 | | | 2,638,944 |
|
Healthcare-Products - 4.21% |
| | Bovie Medical Corp. | | 14,810 | | | 94,784 |
| | Hologic, Inc.*(a) | | 30,000 | | | 2,059,200 |
| | Intuitive Surgical, Inc.*(a) | | 4,200 | | | 1,362,900 |
| | Inverness Medical Innovations, Inc.* | | 55,900 | | | 3,140,462 |
| | | | | | | |
| | | | | | | 6,657,346 |
|
Healthcare-Services - 2.16% |
| | Air Methods Corp.* | | 68,904 | | | 3,422,462 |
|
Internet - 2.39% |
| | Interwoven, Inc.* | | 181,300 | | | 2,578,086 |
| | Priceline.com, Inc.* | | 10,500 | | | 1,206,030 |
| | | | | | | |
| | | | | | | 3,784,116 |
|
Machinery-Diversified - 2.54% |
| | Gardner Denver, Inc.* | | 40,000 | | | 1,320,000 |
| | Middleby Corp.* | | 35,200 | | | 2,697,024 |
| | | | | | | |
| | | | | | | 4,017,024 |
|
Metal Fabrication-Hardware - 3.37% |
| | Dynamic Materials Corp. | | 58,100 | | | 3,422,090 |
| | Valmont Industries, Inc. | | 21,500 | | | 1,916,080 |
| | | | | | | |
| | | | | | | 5,338,170 |
| | |
| 62 | | Semi-Annual Report | December 31, 2007 (Unaudited) |
Small-Cap Growth Fund
SCHEDULE OF INVESTMENTS (continued)
Showing percentage of net assets as of December 31, 2007 (Unaudited)
| | | | | | | |
| Industry | | Company | | Shares | | Value |
|
Common Stocks (continued) |
Miscellaneous Manufacturing - 3.77% |
| | AZZ, Inc.* | | 15,303 | | $ | 433,840 |
| | Ceradyne, Inc.* | | 35,000 | | | 1,642,550 |
| | LSB Industries, Inc.* | | 65,700 | | | 1,854,054 |
| | MFRI, Inc.* | | 9,000 | | | 96,030 |
| | Trinity Industries, Inc.(a) | | 70,050 | | | 1,944,588 |
| | | | | | | |
| | | | | | | 5,971,062 |
|
Oil & Gas - 3.16% |
| | Arena Resources, Inc.* | | 60,600 | | | 2,527,626 |
| | Frontier Oil Corp. | | 61,000 | | | 2,475,380 |
| | | | | | | |
| | | | | | | 5,003,006 |
|
Oil & Gas Services - 9.91% |
| | Bolt Technology Corp.*(a) | | 79,518 | | | 3,020,094 |
| | Dawson Geophysical Co.* | | 12,000 | | | 857,520 |
| | Dril-Quip, Inc.* | | 115,800 | | | 6,445,428 |
| | Flotek Industries, Inc.*(a) | | 27,840 | | | 1,003,353 |
| | FMC Technologies, Inc.* | | 14,030 | | | 795,501 |
| | Matrix Service Co.* | | 14,988 | | | 327,038 |
| | Oceaneering International, Inc.* | | 13,000 | | | 875,550 |
| | Superior Energy Services* | | 68,600 | | | 2,361,212 |
| | | | | | | |
| | | | | | | 15,685,696 |
|
Packaging & Containers - 0.50% |
| | Owens-Illinois, Inc.* | | 16,100 | | | 796,950 |
|
Pharmaceuticals - 2.73% |
| | NBTY, Inc.* | | 25,000 | | | 685,000 |
| | OSI Pharmaceuticals, Inc.*(a) | | 75,000 | | | 3,638,250 |
| | | | | | | |
| | | | | | | 4,323,250 |
|
Retail - 9.28% |
| | Cash America International, Inc. | | 49,800 | | | 1,608,540 |
| | Dick’s Sporting Goods, Inc.* | | 75,600 | | | 2,098,656 |
| | EZCORP, Inc.* | | 5,000 | | | 56,450 |
| | Guess ?, Inc. | | 132,600 | | | 5,024,214 |
| | Gymboree Corp.* | | 43,100 | | | 1,312,826 |
| | Jack in the Box, Inc.* | | 43,200 | | | 1,113,264 |
| | JOS A Bank Clothiers, Inc.*(a) | | 16,918 | | | 481,317 |
| | MSC Industrial Direct Co. | | 30,200 | | | 1,222,194 |
| | Pricesmart, Inc. | | 58,500 | | | 1,758,510 |
| | | | | | | |
| | | | | | | 14,675,971 |
|
Semiconductors - 3.84% |
| | Amkor Technology, Inc.* | | 177,550 | | | 1,514,502 |
| | NVIDIA Corp.*(a) | | 78,600 | | | 2,673,972 |
| | Ultra Clean Holdings* | | 27,330 | | | 333,426 |
| | Varian Semiconductor Equipment Associates, Inc.* | | 19,500 | | | 721,500 |
| | Zoran Corp.* | | 37,300 | | | 839,623 |
| | | | | | | |
| | | | | | | 6,083,023 |
| | | | | | | |
| Industry | | Company | | Shares | | Value |
|
|
Software - 3.87% |
| | BMC Software, Inc.* | | 92,500 | | $ | 3,296,700 |
| | Informatica Corp.* | | 101,900 | | | 1,836,238 |
| | Moldflow Corp. | | 26,042 | | | 419,537 |
| | SkillSoft PLC* | | 9,679 | | | 92,531 |
| | Taleo Corp.* | | 15,794 | | | 470,345 |
| | | | | | | |
| | | | | | | 6,115,351 |
|
Telecommunications - 5.11% |
| | CommScope, Inc.*(a) | | 103,500 | | | 5,093,235 |
| | Comtech Telecommunications Corp.* | | 16,687 | | | 901,265 |
| | Knology, Inc.*(a) | | 31,053 | | | 396,857 |
| | Novatel Wireless, Inc.* | | 24,600 | | | 398,520 |
| | RF Micro Devices, Inc.* | | 54,000 | | | 308,340 |
| | Tekelec* | | 57,720 | | | 721,500 |
| | WPCS International, Inc.(a) | | 28,878 | | | 273,186 |
| | | | | | | |
| | | | | | | 8,092,903 |
|
Transportation - 2.77% |
| | Gulfmark Offshore, Inc.* | | 9,000 | | | 421,110 |
| | Kirby Corp.* | | 44,000 | | | 2,045,120 |
| | Tidewater, Inc.(a) | | 35,000 | | | 1,920,100 |
| | | | | | | |
| | | | | | | 4,386,330 |
| | | | | | | |
| |
TOTAL COMMON STOCKS - 98.97% | | | 156,618,282 |
| | | | | | | |
(Cost $118,821,147) | | | |
| | | | | | | |
|
MONEY MARKET FUNDS - 0.64% |
| | | |
| | | Rate^ | | Shares | | Value |
BlackRock TempCash Liquidity Fund, Institutional Shares #21 | | 4.78% | | 1,007,934 | | | 1,007,934 |
| | | | | | | |
| |
TOTAL MONEY MARKET FUNDS - 0.64% | | | 1,007,934 |
| | | | | | | |
(Cost $1,007,934) | | | |
| |
TOTAL INVESTMENTS - 99.61% | | $ | 157,626,216 |
(Cost $119,829,081) | | | |
Other Assets in Excess of Liabilities - 0.39% | | | 620,851 |
| | | | | | | |
NET ASSETS - 100.00% | | $ | 158,247,067 |
| | | | | | | |
| * | Non-income producing security. |
| ^ | Rate disclosed is as of December 31, 2007. |
| (a) | This security or a portion of the security is out on loan at December 31, 2007. Total loaned securities had a market value of $33,934,933 at December 31, 2007. |
See Notes to Financial Statements.
Small-Cap Value Fund
MANAGER’S COMMENTARY
(Unaudited)
December 31, 2007
Dear Fellow Small-Cap Value Fund Shareholder,
For the quarter-ended December 31, 2007, Small-Cap Value Fund declined by 3.63%, though it significantly outperformed its primary market benchmark index, the Russell 2000 Value Index (down 7.28%) and its peer benchmark, the Lipper Small-Cap Value Funds Index (down 6.75%). In general, smaller companies had a very poor quarter, as continued market and economic uncertainty led many investors to shy away from this segment of the market in favor of larger industry leaders. Nevertheless, our Fund cushioned the impact of this decline and it was an OK quarter on a relative basis.
For the six month semi-annual period, our Fund declined 7.79%, still outperforming the Russell 2000 Value Index (down 13.08%) and the Lipper Small-Cap Value Funds Index (down 12.13%). This period was marked by extreme market volatility as investors faced the growing subprime debacle that morphed into a true credit crisis.
For the full calendar year, Small-Cap Value Fund returned a very favorable 6.93%. The first two quarters of 2007 produced solid results before the headwinds from the credit crisis began to take their toll on smaller issues. By comparison, the Russell 2000 Value Index declined 9.78%, and the Lipper Small-Cap Value Funds Index by 4.57%. The 2007 calendar year appears to have reversed a prior trend that had favored smaller and more value-oriented issues over the past seven years.
The table below presents our December quarter, six-month, one-year and life-to-date financial results according to the formula required by the SEC. See the next page for a graph of performance since inception.
| | | | | | | | |
| | | Dec. Qtr. 10/1/07 to 12/31/07 | | 6 Month 7/1/07 to 12/31/07 | | 1 Year 1/1/07 to 12/31/07 | | Life-to-Date 10/31/03 to 12/31/07 |
| | | | |
Small-Cap Value Fund | | -3.63% | | -7.79% | | 6.93% | | 14.03% |
Russell 2000 Value Index | | -7.28% | | -13.08% | | -9.78% | | 10.82% |
Lipper Small-Cap Value Funds Index | | -6.75% | | -12.13% | | -4.57% | | 11.39% |
Performance figures quoted in the table above and graph below represent past performance and are no guarantee of future results. The table above and the graph below do not reflect the deduction of taxes that a shareholder would pay on Fund distributions or the redemption of Fund shares.
The Russell 2000 Value Index is an unmanaged index which consists of stocks in the Russell 2000 Index with higher price-to-book ratios and higher forecasted growth values with dividends reinvested. The Lipper Small-Cap Value Funds Index is an index of small-company, value-oriented funds compiled by Lipper, Inc. It is not possible to invest directly in an index. Periods longer than one year are annualized.
According to data from Lipper, Inc. as of December 31, 2007, Small-Cap Value Fund ranked 8th of 296 small-cap value funds for the twelve-month period ended December 31, 2007 and 19th of 206 such funds since inception in October, 2003. Lipper, Inc. is an independent mutual fund rating service that ranks funds in various fund categories by making comparative calculations using total returns.
| | |
| 64 | | Semi-Annual Report | December 31, 2007 (Unaudited) |
Small-Cap Value Fund
MANAGER’S COMMENTARY (continued)
(Unaudited)
Small-Cap Value Fund vs. Lipper Small-Cap Value Funds Index & Russell 2000 Value Index 10/31/03 to 12/31/07
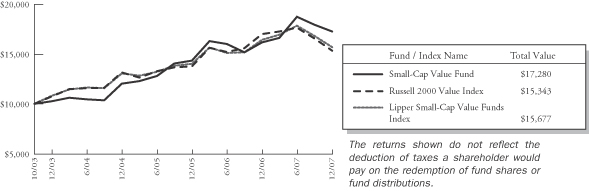
Detailed Explanation of Quarterly Performance—What Worked Well
The Short Version: Basic materials and industrial companies highlighted the top performers of the December quarter with six companies on the top ten list. Only one holding returned greater than 50%, with six others gaining 20% or higher.
These are the ten best-performing stocks for the quarter ended December 31 2007:
| | | | | | |
| Rank | | Description | | Industry | | % Gain |
| 1 | | Terra Industries Inc | | Chemicals | | 52.8% |
| 2 | | Robbins & Myers Inc | | Machinery-Diversified | | 32.0% |
| 3 | | Nasdaq Stock Market Inc | | Diversified Financial Services | | 31.3% |
| 4 | | Tower Group Inc | | Insurance | | 27.6% |
| 5 | | Steel Dynamics Inc | | Iron/Steel | | 27.6% |
| 6 | | AAR Corp | | Aerospace/Defense | | 25.4% |
| 7 | | Hornbeck Offshore Services Inc | | Oil & Gas Services | | 22.1% |
| 8 | | Foster Wheeler Ltd | | Engineering & Construction | | 18.1% |
| 9 | | DynCorp International Inc | | Commercial Services | | 17.1% |
| 10 | | LSB Industries Inc | | Miscellaneous Manufacturing | | 16.5% |
| | | | | | | |
Terra Industries was the Fund’s top performer this quarter and the only holding to return more than 50%. The company produces agricultural-related products used in the manufacturing of fertilizer. Two significant factors have surfaced recently that greatly benefited such companies. Rising oil prices and government subsidies have led to increased demand for ethanol, which has prompted greater production of corn. Additionally, as the populations in China and other developing Asian and Latin American countries become increasingly affluent, their residents are adding more meat to their diets. As a result, corn and other feed grains have been met with even greater global demand, thus, the need for more fertilizer. In mid-December, Merrill Lynch increased its outlook for the entire industry and raised its rating on Terra Industries from neutral to buy. During the quarter, the company contributed over 0.7% to the return of the Fund.
Small-Cap Value Fund
MANAGER’S COMMENTARY (continued)
(Unaudited)
Detailed Explanation of Quarterly Performance—What Didn’t Work
The Short Version: Eight consumer-related companies could be found on the list of the Fund’s worst quarterly performers, lending credence to the view that consumer spending accounts for over half of the activity of the economy. In total, these eight holdings cost the Fund over 3% in return this quarter.
These are the ten worst-performing stocks for the quarter ended December 31, 2007:
| | | | | | |
| Rank | | Description | | Industry | | % Loss |
| 1 | | WellCare Health Plans Inc | | Healthcare-Services | | -79.0% |
| 2 | | Hardinge Inc | | Hand/Machine Tools | | -51.8% |
| 3 | | Big Lots Inc | | Retail | | -46.4% |
| 4 | | Ceradyne Inc | | Miscellaneous Manufacturing | | -38.0% |
| 5 | | NBTY Inc | | Pharmaceuticals | | -32.5% |
| 6 | | Cooper Tire & Rubber Co | | Auto Parts & Equipment | | -32.1% |
| 7 | | PRG-Schultz International Inc | | Commercial Services | | -31.7% |
| 8 | | Men's Wearhouse Inc | | Retail | | -31.0% |
| 9 | | Imperial Sugar Co | | Food | | -28.2% |
| 10 | | Anika Therapeutics Inc | | Pharmaceuticals | | -28.1% |
| | | | | | | |
Our worst performer for the quarter, managed care company, WellCare Health Plans offers government-sponsored healthcare and prescription drug programs through Medicare and Medicaid. In late October, federal investigators raided company headquarters and initiated an investigation over what most believe to be fraud-related issues. To add insult to injury, company execs sold off over $45 million in stock during the year in advance of the raid, far more than the insider sales totaled for all of 2006. The company’s stock priced plunged over 70% in one day. News did not get any better for the company as the quarter progressed. Shareholder lawsuits ensued, and plan enrollments declined. Our position in this lightly traded company cost the Fund about 0.80% in return for the quarter.
Detailed Explanation of Calendar Year Performance—What Worked Well
The Short Version: As with the top quarterly performers, basic materials and industrial companies were prominently featured in the “best of” list for the calendar year 2007. Many of these companies benefited from strong global demand of products and services in developing countries like China; additionally, the declining value of the dollar has made exports less expensive over the year. Seven companies from these two sectors made the list and contributed a remarkable 10+% to the Fund’s return.
These are the ten best performers for the calendar year ended December 31, 2007:
| | | | | | |
| Rank | | Description | | Industry | | % Gain |
| 1 | | Foster Wheeler Ltd | | Engineering & Construction | | 183.9% |
| 2 | | McDermott International Inc | | Engineering & Construction | | 132.1% |
| 3 | | Terra Industries Inc | | Chemicals | | 117.5% |
| 4 | | Cleveland-Cliffs Inc | | Iron/Steel | | 91.7% |
| 5 | | Chaparral Steel Co | | Iron/Steel | | 89.8% |
| 6 | | Steel Dynamics Inc | | Iron/Steel | | 83.6% |
| 7 | | Air Methods Corp | | Healthcare-Services | | 77.9% |
| 8 | | Robbins & Myers Inc | | Machinery-Diversified | | 64.7% |
| 9 | | Rush Enterprises Inc Class A | | Retail | | 61.2% |
| 10 | | Nasdaq Stock Market Inc | | Diversified Financial Services | | 60.7% |
| | | | | | | |
An engineering and construction firm, Foster Wheeler, was one of three holdings to return over 100% during the past 12 months. The company constructs large scale oil pipelines and natural gas plants and has benefited from its significant
| | |
| 66 | | Semi-Annual Report | December 31, 2007 (Unaudited) |
Small-Cap Value Fund
MANAGER’S COMMENTARY (continued)
(Unaudited)
exposure to the growing markets of China and the Middle East. It’s most recent quarterly earnings showed substantial growth of 70%, and the company announced a 2-for-1 stock split at that time. Its stock price has risen steadily throughout the calendar year and recently hit a six-year high in December. Foster Wheeler contributed over 1.8% to the return of the Fund during the year.
Detailed Explanation of Calendar Year Performance—What Didn’t Work
The Short Version: Five consumer-related companies, including two retailers, highlighted the list of poor performers. These companies cost the Fund over 2.25% in return.
These are the ten stocks that performed the worst in the calendar year ended December 31, 2007:
| | | | | | |
| Rank | | Description | | Industry | | % Gain |
| 1 | | WellCare Health Plans Inc | | Healthcare-Services | | -75.8% |
| 2 | | Hardinge Inc | | Hand/Machine Tools | | -56.3% |
| 3 | | Trio Tech International | | Semiconductors | | -48.9% |
| 4 | | Vaalco Energy Inc | | Oil & Gas | | -44.4% |
| 5 | | Mfri Inc | | Miscellaneous Manufacturing | | -41.9% |
| 6 | | NBTY Inc | | Pharmaceuticals | | -40.3% |
| 7 | | Imperial Sugar Co | | Food | | -38.6% |
| 8 | | Big Lots Inc | | Retail | | -37.9% |
| 9 | | Dress Barn Inc | | Retail | | -37.5% |
| 10 | | Ocwen Financial Corp | | Diversified Financial Services | | -35.6% |
| | | | | | | |
Miss earnings by a penny and your company’s stock price is likely to fall; miss by 8 cents (by two analysts’ predictions) and the price may plummet. That’s what happened to machine tool maker, Hardinge, Inc., when the company reported 3rd quarter earnings that actually rose by 35%. Unfortunately, the results were not strong enough, and investors immediately sold on the announcement. Weaker than expected sales, particular in North America where orders declined by 21%, dramatically hindered the company’s performance. During periods of market uncertainty, such an earnings miss often proves disastrous, especially for a relatively lightly traded small-cap company. For the calendar year, Hardinge cost the Fund almost 0.7% in return.
Top Ten Holdings as of December 31, 2007
Five of the Fund’s top holdings were also among the best performers for the December quarter: Robbins & Myers, Foster Wheeler, AAR Corp, Terra Industries, Hornbeck Offshore. The companies made up 11.1% of the net assets of the Fund and contributed about 2.5% to its quarterly performance.
| | | | | | |
| Rank | | Description | | Industry | | Percent of Net Assets |
| 1 | | McDermott International, Inc. | | Engineering & Construction | | 5.5% |
| 2 | | General Cable Corp. | | Electrical Comp & Equip | | 2.6% |
| 3 | | Robbins & Myers, Inc. | | Machinery-Diversified | | 2.6% |
| 4 | | Foster Wheeler, Ltd. | | Engineering & Construction | | 2.3% |
| 5 | | AAR Corp. | | Aerospace/Defense | | 2.2% |
| 6 | | Amkor Technology, Inc. | | Semiconductors | | 2.0% |
| 7 | | Terra Industries, Inc. | | Chemicals | | 2.0% |
| 8 | | Hornbeck Offshore Services, Inc. | | Oil & Gas Services | | 2.0% |
| 9 | | Quanta Services, Inc. | | Commercial Services | | 1.9% |
| 10 | | Dril-Quip, Inc. | | Oil & Gas Services | | 1.9% |
| | | | | | | |
| Total | | | | | | 25.0% |
Small-Cap Value Fund
MANAGER’S COMMENTARY (continued)
(Unaudited)
Industry Sector Representation as of December 31, 2007
Here's the story on sector allocation as of December 31, 2007: Our Fund’s significant underweighting of financial stocks certainly benefited the overall returns, as the sector got hammered over the past three months due to the growing credit crisis and mounting market uncertainty. On the other hand, the Fund was overweighted in both basic materials and industrial companies, two sectors that performed quite well for us during the quarter and the year.
| | | | | | |
| | | % of Portfolio | | % of S&P Small Cap Index | | Difference |
Basic Materials | | 8.7% | | 2.8% | | 5.9% |
Communications | | 1.9% | | 4.1% | | -2.2% |
Consumer, Cyclical | | 10.4% | | 14.3% | | -3.9% |
Consumer, Non-cyclical | | 21.7% | | 19.6% | | 2.1% |
Energy | | 8.5% | | 8.0% | | 0.5% |
Financial | | 7.2% | | 15.8% | | -8.6% |
Industrial | | 31.3% | | 20.5% | | 10.8% |
Technology | | 3.5% | | 10.1% | | -6.6% |
Utilities | | 4.0% | | 4.8% | | -0.8% |
Cash | | 2.8% | | 0.0% | | 2.8% |
| | | | | | | |
Total | | 100.0% | | 100.0% | | |
Disclaimer
The following is a reminder from the friendly folks at your Fund who worry about liability. The views expressed here are exclusively those of Fund management. These views are not meant as investment advice and should not be considered predictive in nature. Any favorable (or unfavorable) description of a holding applies only as of December 31, 2007, unless otherwise stated. Security positions can and do change thereafter. Discussions of historical performance do not guarantee and are not indicative of future performance.
Market volatility can significantly impact short-term performance. The Fund is not an appropriate investment for short-term investors. Investments in small companies generally carry greater risk than is customarily associated with larger companies. This additional risk is attributable to a number of factors, including the relatively limited financial resources that are typically available to small companies, and the fact that small companies often have comparatively limited product lines. In addition, the stock of small companies tends to be more volatile than the stock of large companies, particularly in the short term and particularly in the early stages of an economic or market downturn. Shareholders of the Fund, therefore, are taking on more risk than they would if they invested in the stock market as a whole.
Conclusion
Thank you for your continued investment in Small-Cap Value Fund. We encourage your feedback; your reactions and concerns are important to us.
Sincerely,
Your Investment Management Team
| | |
| 68 | | Semi-Annual Report | December 31, 2007 (Unaudited) |
THIS PAGE INTENTIONALLY LEFT BLANK
Small-Cap Value Fund
SCHEDULE OF INVESTMENTS
Showing percentage of net assets as of December 31, 2007 (Unaudited)
| | | | | | | |
| Industry | | Company | | Shares | | Value |
|
COMMON STOCKS - 98.44% |
Aerospace/Defense - 2.43% |
| | AAR Corp.* | | 186,600 | | $ | 7,096,398 |
| | SIFCO Industries, Inc. | | 37,700 | | | 634,491 |
| | | | | | | |
| | | | | | | 7,730,889 |
|
Apparel - 1.41% |
| | Warnaco Group, Inc.* | | 129,100 | | | 4,492,680 |
|
Auto Parts & Equipment - 2.58% |
| | Cooper Tire & Rubber Co. | | 303,400 | | | 5,030,372 |
| | Goodyear Tire & Rubber Co.* | | 2,100 | | | 59,262 |
| | Lear Corp.* | | 112,500 | | | 3,111,750 |
| | | | | | | |
| | | | | | | 8,201,384 |
|
Biotechnology - 1.15% |
| | Invitrogen Corp.* | | 39,300 | | | 3,671,013 |
|
Chemicals - 3.59% |
| | Hercules, Inc. | | 70,000 | | | 1,354,500 |
| | ICO, Inc.* | | 81,843 | | | 1,050,864 |
| | Penford Corp. | | 95,497 | | | 2,443,768 |
| | Terra Industries, Inc.*(a) | | 131,300 | | | 6,270,888 |
| | Zep, Inc.* | | 20,000 | | | 277,400 |
| | | | | | | |
| | | | | | | 11,397,420 |
|
Commercial Services - 8.11% |
| | Albany Molecular Research, Inc.* | | 130,670 | | | 1,879,035 |
| | CDI Corp. | | 91,800 | | | 2,227,068 |
| | Deluxe Corp. | | 119,000 | | | 3,913,910 |
| | DynCorp. International, Inc.* | | 131,500 | | | 3,534,720 |
| | Emergency Medical Services Corp.(a) | | 106,700 | | | 3,124,176 |
| | MAXIMUS, Inc. | | 61,000 | | | 2,355,210 |
| | MPS Group, Inc.* | | 246,500 | | | 2,696,710 |
| | Quanta Services, Inc.* | | 230,500 | | | 6,048,320 |
| | | | | | | |
| | | | | | | 25,779,149 |
|
Computers - 0.52% |
| | Hutchinson Technology, Inc.* | | 28,639 | | | 753,779 |
| | Syntel, Inc. | | 23,305 | | | 897,708 |
| | | | | | | |
| | | | | | | 1,651,487 |
|
Distribution/Wholesale - 0.01% |
| | Chindex International, Inc.* | | 705 | | | 24,344 |
|
Diversified Financial Services - 0.77% |
| | Nasdaq Stock Market, Inc.*(a) | | 49,660 | | | 2,457,673 |
| | | | | | | |
| Industry | | Company | | Shares | | Value |
|
|
Electric Utilities - 4.05% |
| | Central Vermont Public Service Corp. | | 59,018 | | $ | 1,820,115 |
| | El Paso Electric Co.* | | 118,100 | | | 3,019,817 |
| | MGE Energy, Inc. | | 96,300 | | | 3,415,761 |
| | Portland General Electric Co. | | 166,350 | | | 4,621,203 |
| | | | | | | |
| | | | | | | 12,876,896 |
|
Electrical Components & Equipment - 3.29% |
| | Belden, Inc. | | 50,000 | | | 2,225,000 |
| | General Cable Corp.* | | 112,200 | | | 8,222,016 |
| | | | | | | |
| | | | | | | 10,447,016 |
|
Electronics - 1.26% |
| | Avnet, Inc.* | | 25,000 | | | 874,250 |
| | Cubic Corp. | | 79,700 | | | 3,124,240 |
| | | | | | | |
| | | | | | | 3,998,490 |
|
Energy-Alternative Sources - 1.46% |
| | Headwaters, Inc.*(a) | | 396,000 | | | 4,649,040 |
|
Engineering & Construction - 10.83% |
| | EMCOR Group, Inc.* | | 161,000 | | | 3,804,430 |
| | Foster Wheeler, Ltd.* | | 47,600 | | | 7,378,952 |
| | McDermott International, Inc.* | | 294,600 | | | 17,390,238 |
| | Michael Baker Corp.* | | 65,300 | | | 2,683,830 |
| | Perini Corp.* | | 76,400 | | | 3,164,488 |
| | | | | | | |
| | | | | | | 34,421,938 |
|
Environmental Control - 0.38% |
| | Metalico, Inc. | | 111,385 | | | 1,207,413 |
|
Food - 4.14% |
| | Cal-Maine Foods, Inc.(a) | | 147,900 | | | 3,923,787 |
| | Corn Products International, Inc. | | 75,000 | | | 2,756,250 |
| | Imperial Sugar Co.(a) | | 102,771 | | | 1,929,012 |
| | Ingles Markets, Inc. | | 5,000 | | | 126,950 |
| | Spartan Stores, Inc. | | 193,300 | | | 4,416,905 |
| | | | | | | |
| | | | | | | 13,152,904 |
|
Forest Products & Paper - 0.49% |
| | Rock-Tenn Co. | | 61,797 | | | 1,570,262 |
|
Hand/Machine Tools - 1.16% |
| | Hardinge, Inc. | | 79,300 | | | 1,330,654 |
| | Regal-Beloit Corp.(a) | | 52,500 | | | 2,359,875 |
| | | | | | | |
| | | | | | | 3,690,529 |
|
Healthcare-Services - 4.48% |
| | Air Methods Corp.* | | 119,900 | | | 5,955,433 |
| | AMERIGROUP Corp.* | | 134,800 | | | 4,913,460 |
| | |
| 70 | | Semi-Annual Report | December 31, 2007 (Unaudited) |
Small-Cap Value Fund
SCHEDULE OF INVESTMENTS (continued)
Showing percentage of net assets as of December 31, 2007 (Unaudited)
| | | | | | | |
| Industry | | Company | | Shares | | Value |
|
Common Stocks (continued) |
Healthcare-Services (continued) |
| | Humana, Inc.*(a) | | 13,460 | | $ | 1,013,673 |
| | Kindred Healthcare, Inc.* | | 83,100 | | | 2,075,838 |
| | RadNet, Inc. | | 28,914 | | | 293,477 |
| | | | | | | |
| | | | | | | 14,251,881 |
|
Household Products 0.57% |
| | Blyth, Inc. | | 83,100 | | | 1,823,214 |
|
Insurance - 6.57% |
| | American Physicians Capital, Inc. | | 88,500 | | | 3,669,210 |
| | Amerisafe, Inc.* | | 36,947 | | | 573,048 |
| | CNA Surety Corp.* | | 9,800 | | | 193,942 |
| | Meadowbrook Insurance Group, Inc.* | | 144,200 | | | 1,356,922 |
| | Navigators Group, Inc.* | | 81,700 | | | 5,310,500 |
| | Odyssey Re Holdings Corp. | | 44,400 | | | 1,629,924 |
| | RLI Corp. | | 78,700 | | | 4,469,373 |
| | Tower Group, Inc. | | 110,000 | | | 3,674,000 |
| | | | | | | |
| | | | | | | 20,876,919 |
|
Internet - 0.95% |
| | FTD Group, Inc. | | 235,200 | | | 3,029,376 |
|
Iron/Steel - 3.56% |
| | AK Steel Holding Corp.* | | 85,000 | | | 3,930,400 |
| | Cleveland-Cliffs, Inc. | | 51,200 | | | 5,160,960 |
| | Steel Dynamics, Inc. | | 37,400 | | | 2,227,918 |
| | | | | | | |
| | | | | | | 11,319,278 |
|
Leisure Time - 1.10% |
| | Callaway Golf Co. | | 199,800 | | | 3,482,514 |
|
Machinery-Diversified - 3.71% |
| | Gardner Denver, Inc.* | | 112,400 | | | 3,709,200 |
| | Robbins & Myers, Inc. | | 107,000 | | | 8,092,410 |
| | | | | | | |
| | | | | | | 11,801,610 |
|
Mining - 1.13% |
| | AMCOL International Corp. | | 99,600 | | | 3,588,588 |
|
Miscellaneous Manufacturing - 2.91% |
| | Ceradyne, Inc.* | | 40,000 | | | 1,877,200 |
| | Koppers Holdings, Inc. | | 74,000 | | | 3,199,760 |
| | LSB Industries, Inc.* | | 147,800 | | | 4,170,916 |
| | | | | | | |
| | | | | | | 9,247,876 |
|
Oil & Gas - 3.26% |
| | Frontier Oil Corp. | | 30,000 | | | 1,217,400 |
| | Parker Drilling Co.* | | 281,800 | | | 2,127,590 |
| | Stone Energy Corp.* | | 77,100 | | | 3,616,761 |
| | Tesoro Corp. | | 71,400 | | | 3,405,780 |
| | | | | | | |
| | | | | | | 10,367,531 |
| | | | | | | |
| Industry | | Company | | Shares | | Value |
|
|
Oil & Gas Services - 3.85% |
| | Dril-Quip, Inc.* | | 108,400 | | $ | 6,033,544 |
| | Hornbeck Offshore Services, Inc.*(a) | | 138,200 | | | 6,212,090 |
| | | | | | | |
| | | | | | | 12,245,634 |
|
Packaging & Containers - 2.00% |
| | Greif, Inc. | | 52,200 | | | 3,412,314 |
| | Packaging Corp. of America | | 104,600 | | | 2,949,720 |
| | | | | | | |
| | | | | | | 6,362,034 |
|
Pharmaceuticals - 3.58% |
| | Anika Therapeutics, Inc. | | 42,800 | | | 621,456 |
| | BioScrip, Inc.* | | 211,100 | | | 1,631,803 |
| | NBTY, Inc.* | | 26,100 | | | 715,140 |
| | Onyx Pharmaceuticals, Inc.* | | 76,300 | | | 4,243,806 |
| | Perrigo Co. | | 118,900 | | | 4,162,689 |
| | | | | | | |
| | | | | | | 11,374,894 |
|
Retail - 4.64% |
| | Big Lots, Inc.* | | 128,500 | | | 2,054,715 |
| | EZCORP, Inc.* | | 396,000 | | | 4,470,840 |
| | PC Connection, Inc.* | | 137,300 | | | 1,558,355 |
| | Rush Enterprises, Inc.* | | 195,000 | | | 3,545,100 |
| | Systemax, Inc.(a) | | 152,950 | | | 3,107,944 |
| | | | | | | |
| | | | | | | 14,736,954 |
|
Semiconductors - 2.04% |
| | Amkor Technology, Inc.*(a) | | 760,700 | | | 6,488,771 |
|
Software - 0.97% |
| | Compuware Corp.* | | 346,100 | | | 3,073,368 |
|
Telecommunications - 0.99% |
| | Anixter International, Inc.* | | 18,000 | | | 1,120,860 |
| | RF Micro Devices, Inc.*(a) | | 355,800 | | | 2,031,618 |
| | | | | | | |
| | | | | | | 3,152,478 |
|
Toys/Games/Hobbies - 0.77% |
| | Hasbro, Inc. | | 95,900 | | | 2,453,122 |
|
Transportation - 3.73% |
| | Gulfmark Offshore, Inc.* | | 59,245 | | | 2,772,073 |
| | HUB Group, Inc.* | | 107,400 | | | 2,854,692 |
| | Kirby Corp.* | | 110,200 | | | 5,122,096 |
| | Tidewater, Inc.(a) | | 20,000 | | | 1,097,200 |
| | | | | | | |
| | | | | | | 11,846,061 |
| | | | | | | |
| |
TOTAL COMMON STOCKS - 98.44% | | | 312,942,630 |
| | | | | | | |
(Cost $259,311,209) | | | |
Small-Cap Value Fund
SCHEDULE OF INVESTMENTS (continued)
Showing percentage of net assets as of December 31, 2007 (Unaudited)
| | | | | | | | |
| | | Rate^ | | Shares | | Value | |
|
MONEY MARKET FUNDS - 2.86% | |
BlackRock TempCash Liquidity Fund, Institutional Shares #21 | | 4.78% | | 9,096,026 | | $ | 9,096,026 | |
| | | | | | | | |
| |
TOTAL MONEY MARKET FUNDS - 2.86% | | | 9,096,026 | |
| | | | | | | | |
(Cost $9,096,026) | | | | | | | | |
| |
TOTAL INVESTMENTS - 101.30% | | $ | 322,038,656 | |
(Cost $268,407,235) | | | | | | | | |
Liabilities in Excess of Other Assets - (1.30)% | | | (4,121,490 | ) |
| | | | | | | | |
NET ASSETS - 100.00% | | | | | | $ | 317,917,166 | |
| | | | | | | | |
| * | Non-income producing security. |
| ^ | Rate disclosed is as of December 31, 2007. |
| (a) | This security or a portion of the security is out on loan at December 31, 2007. Total loaned securities had a market value of $33,791,126 at December 31, 2007. |
See Notes to Financial Statements.
| | |
| 72 | | Semi-Annual Report | December 31, 2007 (Unaudited) |
THIS PAGE INTENTIONALLY LEFT BLANK
Large-Cap Growth Fund
MANAGER’S COMMENTARY
(Unaudited)
December 31, 2007
Dear Fellow Large-Cap Growth Fund Shareholder,
For the fourth quarter in a row, our Large-Cap Growth Fund outperformed its primary market benchmark and its peer benchmark. In the context of a declining market and growing economic concerns, our Fund nevertheless squeaked out a small gain of 0.81%. This performance compares to a decline of 0.77% for the Russell 1000 Growth Index and a slight return of 0.30% for the Lipper Large-Cap Growth Funds Index. This was an OK quarter on a relative basis.
For the six month semi-annual period, our Fund gained 6.45%, beating the Russell 1000 Growth Index (up 3.41%), but barely lagging the Lipper Large-Cap Growth Funds Index (up 6.80%). This period was marked by extreme market volatility, as investors faced the growing subprime debacle that morphed into a true credit crisis.
For the full calendar year, we are quite pleased with our Fund’s absolute and relative return. The Large-Cap Growth Fund gained more 19.01% for the 12-months ending December 31, 2007, far exceeding the performance of the Russell 1000 Growth Index (11.81%) and the Lipper Large-Cap Growth Funds Index (14.97%).
The table below presents our December quarter, six-month, one-year, and life-to-date financial results according to the formula required by the SEC. See the next page for a graph of performance since inception.
| | | | | | | | |
| | | Dec. Qtr.
10/1/07
to 12/31/07 | | 6 Month
7/1/07
to 12/31/07 | | 1 Year
1/1/07
to 12/31/07 | | Life-to-Date
10/31/03
to 12/31/07 |
| | | | |
Large-Cap Growth Fund | | 0.81% | | 6.45% | | 19.01% | | 10.36% |
Russell 1000 Growth Index | | -0.77% | | 3.41% | | 11.81% | | 8.90% |
Lipper Large-Cap Growth Funds Index | | 0.30% | | 6.80% | | 14.97% | | 9.23% |
Performance figures quoted in the table above and graph below represent past performance and are no guarantee of future results. The table above and the graph below do not reflect the deduction of taxes that a shareholder would pay on Fund distributions or the redemption of Fund shares.
The Russell 1000 Growth Index is an unmanaged index which consists of stocks in the Russell 1000 Index with higher price-to-book ratios and higher forecasted growth values with dividends reinvested. The Lipper Large-Cap Growth Funds Index is an index of large-company, growth-oriented funds compiled by Lipper, Inc. It is not possible to invest directly in an index. Periods longer than one year are annualized.
According to data from Lipper, Inc. as of December 31, 2007, Large-Cap Growth Fund ranked 149th of 518 multi-cap growth funds for the twelve-month period ended December 31, 2007 and 211th of 367 such funds since inception in October, 2003. Lipper, Inc. is an independent mutual fund rating service that ranks funds in various fund categories by making comparative calculations using total returns.
| | |
| 74 | | Semi-Annual Report | December 31, 2007 (Unaudited) |
Large-Cap Growth Fund
MANAGER’S COMMENTARY (continued)
(Unaudited)
Large-Cap Growth Fund vs. Lipper Large-Cap Growth Funds Index & Russell 1000 Growth Index 10/31/03 to 12/31/07
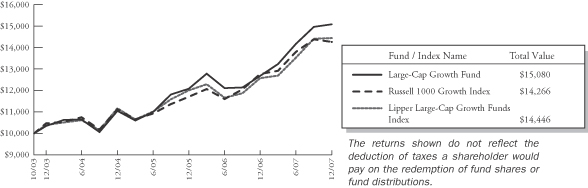
Detailed Explanation of Quarterly Performance—What Worked Well
The Short Version: Seven sectors were represented in the list of top performers for the December quarter, reflecting the strong diversification of the Fund. Two chemical companies (including our top holding) highlighted the list and contributed about 1.5% to the overall performance.
These are the ten best-performing stocks for the quarter ended December, 31, 2007:
| | | | | | |
| Rank | | Description | | Industry | | % Gain |
| 1 | | Mosaic Co | | Chemicals | | 63.6% |
| 2 | | MEMC Electronic Materials Inc | | Semiconductors | | 50.3% |
| 3 | | Intuitive Surgical Inc | | Healthcare-Products | | 35.8% |
| 4 | | Express Scripts Inc | | Pharmaceuticals | | 30.7% |
| 5 | | Apple Inc | | Computers | | 29.0% |
| 6 | | Monsanto Co | | Chemicals | | 27.7% |
| 7 | | Sunpower Corp | | Energy-Alternate Sources | | 26.9% |
| 8 | | IntercontinentalExchange Inc | | Diversified Financial Services | | 26.7% |
| 9 | | Google Inc | | Internet | | 21.9% |
| 10 | | Allegheny Energy Inc | | Electric | | 21.7% |
| | | | | | | |
The Mosaic Company was the Fund’s top performer and earned over 60% for the three-month period. Based in Minneapolis, Minnesota, the chemical company is a leading global manufacturer of crop nutrients which serve as primary ingredients for fertilizer. Two significant factors have surfaced as of late that greatly benefited fertilizer companies like Mosaic. Rising oil prices and government subsidies have led to increased demand for ethanol, which has prompted greater production of corn. Additionally, as the populations in China and other developing Asian and Latin American countries become increasingly affluent, their residents are adding more meat to their diets. As a result, corn and others feed grains have been met with even greater global demand thus, the need for more fertilizer. During the past quarter, the company used its recent windfall from ongoing business operations to pay down long-term debt and strengthen its overall financial position. The stock contributed 1% to the performance of the Fund during the quarter.
`
Large-Cap Growth Fund
MANAGER’S COMMENTARY (continued)
(Unaudited)
Detailed Explanation of Quarterly Performance—What Didn’t Work
The Short Version: Consumer-related companies dominated our poor-performers last quarter with a total of six holdings (including four consumer, cyclical stocks) making the list. Given the growing fears that an economic slowdown would hinder consumer activity, many of these stocks gave up ground over the last three months. The six consumer-related holdings cost the Fund 1.75% in return.
These are the ten worst-performing stocks for the quarter ended December, 31, 2007:
| | | | | | |
| Rank | | Description | | Industry | | % Loss |
| 1 | | SanDisk Corp | | Computers | | -39.8% |
| 2 | | Celgene Corp | | Biotechnology | | -35.6% |
| 3 | | Coach Inc | | Retail | | -35.3% |
| 4 | | Wynn Resorts Ltd | | Lodging | | -33.9% |
| 5 | | CB Richard Ellis Group Inc | | Real Estate | | -22.6% |
| 6 | | Nordstrom Inc | | Retail | | -21.7% |
| 7 | | Mattel Inc | | Toys/Games/Hobbies | | -18.8% |
| 8 | | Lam Research Corp | | Semiconductors | | -18.8% |
| 9 | | Zimmer Holdings Inc | | Healthcare-Products | | -18.3% |
| 10 | | Cisco Systems Inc | | Telecommunications | | -18.3% |
| | | | | | | |
The Fund’s worst performer, SanDisk Corporation, produces and sells flash memory cards for use in electronic products, namely MP3 players. In October, the company reported lower than anticipated earnings, though management attributed the results to one-time acquisition costs. During the quarter, SanDisk filed over two dozen patent infringement lawsuits against competitors, primarily Asian companies; some analysts believe that prospects for significant success are poor due to the weak intellectual property laws in China. The company was also a victim of the weaker economy and fears that consumer activity will falter in the days (and months) ahead. SanDisk cost the Fund about 0.4% in return during the quarter.
Detailed Explanation of Calendar Year Performance—What Worked Well
The Short Version: With a gain of close to 20%, lots of things went right for the Fund during the prior 12 months. The two best performing stocks were technology holdings, and both earned well over 100% over the calendar year; combined they contributed almost 4% to the Fund return.
These are the ten best performers for the calendar year ended December 31, 2007:
| | | | | | |
| Rank | | Description | | Industry | | % Gain |
| 1 | | Apple Inc | | Computers | | 126.7% |
| 2 | | MEMC Electronic Materials Inc | | Semiconductors | | 126.1% |
| 3 | | National Oilwell Varco Inc | | Oil & Gas Services | | 87.1% |
| 4 | | Cameron International Corp | | Oil & Gas Services | | 81.5% |
| 5 | | Precision Castparts Corp | | Metal Fabricate/Hardware | | 77.2% |
| 6 | | Express Scripts Inc | | Pharmaceuticals | | 76.5% |
| 7 | | Smith International Inc | | Oil & Gas Services | | 68.6% |
| 8 | | Mosaic Co | | Chemicals | | 63.6% |
| 9 | | Monsanto Co | | Chemicals | | 62.8% |
| 10 | | Noble Energy Inc | | Oil & Gas | | 62.1% |
| | | | | | | |
Apple Inc. topped the Fund’s list of best performers and returned over 125% in 2007. The company reported a 67% increase in earnings in its latest report, as all the publicity related to the iPhone has led to increased demand for the old trusted iPods and Macs. Apple also successfully launched the iPhone in Europe later in the year and has it sights set on Asia for 2008. Earlier in the year, the SEC announced that they would not be sanctioning Apple for backdated stock options that had been paid to company executives. For the calendar year, the technology giant contributed over 2.5% to the Fund’s performance.
| | |
| 76 | | Semi-Annual Report | December 31, 2007 (Unaudited) |
Large-Cap Growth Fund
MANAGER’S COMMENTARY (continued)
(Unaudited)
Detailed Explanation of Calendar Year Performance—What Didn’t Work
The Short Version: Four retailers made the list of the Fund’s poorest performing stocks in 2007, which could be an indication that consumer activity is already slowing as the economic uncertainty continues. Though the final results have yet to be reported, many retailers had been predicting “gloom and doom” for the recent holiday shopping season. Still, those four companies only cost the Fund about 1.25% in return for the calendar year.
These are the ten stocks that performed the worst in the calendar year ended December 31, 2007:
| | | | | | |
| Rank | | Description | | Industry | | % Gain |
| 1 | | E*Trade Financial Corp | | Diversified Financial Services | | -36.3% |
| 2 | | Celgene Corp | | Biotechnology | | -35.6% |
| 3 | | Wynn Resorts Ltd | | Lodging | | -33.9% |
| 4 | | CB Richard Ellis Group Inc | | Real Estate | | -33.6% |
| 5 | | Office Depot Inc | | Retail | | -33.5% |
| 6 | | Moody’s Corp | | Commercial Services | | -32.7% |
| 7 | | Akamai Technologies Inc | | Internet | | -29.1% |
| 8 | | Coach Inc | | Retail | | -28.8% |
| 9 | | Kohl’s Corp | | Retail | | -28.6% |
| 10 | | Bed Bath & Beyond Inc | | Retail | | -28.3% |
| | | | | | | |
Though retailers dominated the worst performer list, the holding that suffered the largest decline during the calendar year came from the financial services sector. E*Trade was one of many victims of the subprime mortgage fiasco and lost over 35% during the twelve months. The online trading giant had expanded into other areas of financial services and paid dearly for its wholesale mortgage operation. While the company has shut down that segment and is again concentrating on its core trading business, it suffered from significant mortgage-related write-downs that dramatically impacted its bottom line. Still, in 2007, E*Trade only cost the Fund about 0.30% in return.
Top Ten Holdings as of December 31, 2007
Four of our top holdings at the end of the calendar year were among the Fund’s best performers during the December quarter: Apple Inc., Mosaic Co., Intuitive Surgical, and Monsanto Co. Combined, these four companies contributed just under 2.8% to the overall performance during the quarter and represented almost 9% of the net assets of the Fund. Four technology-related companies were among our largest positions. The top 10 holdings accounted for over 20% of the net assets of the Fund.
| | | | | | |
| Rank | | Description | | Industry | | Percent of Net Assets |
| 1 | | Apple, Inc. | | Computers | | 2.6% |
| 2 | | Mosaic Co. | | Chemicals | | 2.3% |
| 3 | | Intuitive Surgical, Inc. | | Healthcare-Products | | 2.2% |
| 4 | | McDermott International, Inc. | | Engineering & Construction | | 2.2% |
| 5 | | Microsoft Corp. | | Software | | 2.1% |
| 6 | | Amazon.com, Inc. | | Internet | | 2.0% |
| 7 | | Oracle Corp. | | Software | | 2.0% |
| 8 | | Monsanto Co. | | Chemicals | | 1.9% |
| 9 | | Coca-Cola Co. | | Beverages | | 1.9% |
| 10 | | AT&T, Inc. | | Telecommunications | | 1.8% |
| | | | | | | |
| Total | | | | | | 21.0% |
Large-Cap Growth Fund
MANAGER’S COMMENTARY (continued)
(Unaudited)
Industry Sector Representation as of December 31, 2007
Here’s the full story on sector allocation as of December 31, 2007: Our Fund’s slight overweighting in basic materials has had a positive effect in the December quarter, as our “picks” performed well as a group. Interestingly, our under-representation of financials also helped significantly. Many banks and related investment stocks got pounded by the subprime lending and related credit crisis. Technology represented our largest sector at the end of the year, and our overweighting relative to the benchmark helped out for the year.
| | | | | | |
| | | % of Portfolio | | % of S&P 500 Index | | Difference |
Basic Materials | | 6.6% | | 3.4% | | 3.2% |
Communications | | 11.4% | | 11.3% | | 0.1% |
Consumer, Cyclical | | 5.1% | | 7.1% | | -2.0% |
Consumer, Non-cyclical | | 20.8% | | 20.5% | | 0.3% |
Energy | | 11.7% | | 12.9% | | -1.2% |
Financial | | 9.0% | | 17.6% | | -8.6% |
Industrial | | 11.5% | | 11.8% | | -0.3% |
Technology | | 20.9% | | 11.8% | | 9.1% |
Utilities | | 0.7% | | 3.5% | | -2.8% |
Diversified | | 0.0% | | 0.1% | | -0.1% |
Cash | | 2.3% | | 0.0% | | 2.3% |
| | | | | | | |
Total | | 100.0% | | 100.0% | | |
Disclaimer
The following is a reminder from the friendly folks at your Fund who worry about liability. The views expressed here are exclusively those of Fund management. These views are not meant as investment advice and should not be considered predictive in nature. Any favorable (or unfavorable) description of a holding applies only as of December 31, 2007, unless otherwise stated. Security positions can and do change thereafter. Discussions of historical performance do not guarantee and may not be indicative of future performance.
The Fund is subject to market risk (volatility) and is not an appropriate investment for short-term investors.
Conclusion
Thank you for your continued investment in Large-Cap Growth Fund. We encourage your feedback; your reactions and concerns are important to us.
Sincerely,
Your Investment Management Team
| | |
| 78 | | Semi-Annual Report | December 31, 2007 (Unaudited) |
THIS PAGE INTENTIONALLY LEFT BLANK
Large-Cap Growth Fund
SCHEDULE OF INVESTMENTS
Showing percentage of net assets as of December 31, 2007 (Unaudited)
| | | | | | | |
| Industry | | Company | | Shares | | Value |
|
COMMON STOCKS - 99.40% |
Advertising - 0.24% |
| | Omnicom Group, Inc. | | 10,000 | | $ | 475,300 |
|
Aerospace/Defense - 0.79% |
| | L-3 Communications Holdings, Inc.(a) | | 2,000 | | | 211,880 |
| | Rockwell Collins, Inc. | | 18,300 | | | 1,317,051 |
| | | | | | | |
| | | | | | | 1,528,931 |
|
Auto Manufacturers - 0.19% |
| | Paccar, Inc. | | 6,750 | | | 367,740 |
|
Banks - 2.57% |
| | Bank of America Corp. | | 23,700 | | | 977,862 |
| | State Street Corp.(a) | | 17,700 | | | 1,437,240 |
| | US Bancorp(a) | | 81,000 | | | 2,570,940 |
| | | | | | | |
| | | | | | | 4,986,042 |
|
Beverages - 2.54% |
| | Coca-Cola Co. | | 59,300 | | | 3,639,241 |
| | PepsiCo, Inc. | | 16,900 | | | 1,282,710 |
| | | | | | | |
| | | | | | | 4,921,951 |
|
Biotechnology - 3.02% |
| | Amgen, Inc.* | | 15,900 | | | 738,396 |
| | Biogen Idec, Inc.* | | 44,700 | | | 2,544,324 |
| | Celgene Corp.* | | 24,900 | | | 1,150,629 |
| | Genentech, Inc.* | | 21,400 | | | 1,435,298 |
| | | | | | | |
| | | | | | | 5,868,647 |
|
Chemicals - 5.97% |
| | Monsanto Co.(a) | | 32,700 | | | 3,652,263 |
| | Mosaic Co.* | | 47,300 | | | 4,462,282 |
| | Potash Corp. of Saskatchewan | | 24,100 | | | 3,469,436 |
| | | | | | | |
| | | | | | | 11,583,981 |
|
Computers - 7.64% |
| | Apple, Inc.* | | 25,200 | | | 4,991,616 |
| | Cognizant Technology Solutions Corp.* | | 20,000 | | | 678,800 |
| | EMC Corp.* | | 178,400 | | | 3,305,752 |
| | Research In Motion, Ltd.* | | 16,100 | | | 1,825,740 |
| | SanDisk Corp.* | | 35,000 | | | 1,160,950 |
| | Sun Microsystems, Inc.* | | 113,550 | | | 2,058,662 |
| | Teradata Corp.* | | 29,200 | | | 800,372 |
| | | | | | | |
| | | | | | | 14,821,892 |
|
Cosmetics/Personal Care - 0.69% |
| | Procter & Gamble Co. | | 18,232 | | | 1,338,594 |
| | | | | | | |
| Industry | | Company | | Shares | | Value |
|
|
Diversified Financial Services - 5.90% |
| | Charles Schwab Corp. | | 124,500 | | $ | 3,180,975 |
| | CME Group, Inc. | | 3,200 | | | 2,195,200 |
| | Franklin Resources, Inc. | | 19,800 | | | 2,265,714 |
| | Interactive Brokers Group, Inc.* | | 63,000 | | | 2,036,160 |
| | IntercontinentalExchange, Inc.* | | 1,000 | | | 192,500 |
| | T Rowe Price Group, Inc.(a) | | 25,900 | | | 1,576,792 |
| | | | | | | |
| | | | | | | 11,447,341 |
|
Electric Utilities - 0.75% |
| | Allegheny Energy, Inc. | | 22,900 | | | 1,456,669 |
|
Electronics - 1.01% |
| | Waters Corp.* | | 24,900 | | | 1,968,843 |
|
Energy-Alternative Sources - 1.01% |
| | Sunpower Corp.*(a) | | 15,000 | | | 1,955,850 |
|
Engineering & Construction - 3.22% |
| | Jacobs Engineering Group, Inc.* | | 21,600 | | | 2,065,176 |
| | McDermott International, Inc.* | | 70,900 | | | 4,185,227 |
| | | | | | | |
| | | | | | | 6,250,403 |
|
Healthcare-Products - 6.40% |
| | CR Bard, Inc. | | 1,800 | | | 170,640 |
| | Intuitive Surgical, Inc.* | | 12,900 | | | 4,186,050 |
| | Johnson & Johnson | | 27,300 | | | 1,820,910 |
| | Medtronic, Inc. | | 4,400 | | | 221,188 |
| | St Jude Medical, Inc.* | | 48,100 | | | 1,954,784 |
| | Stryker Corp. | | 38,800 | | | 2,899,136 |
| | Zimmer Holdings, Inc.* | | 17,760 | | | 1,174,824 |
| | | | | | | |
| | | | | | | 12,427,532 |
|
Healthcare-Services - 0.77% |
| | UnitedHealth Group, Inc. | | 25,716 | | | 1,496,671 |
|
Internet - 4.28% |
| | Amazon.com, Inc.* | | 41,900 | | | 3,881,616 |
| | eBay, Inc.*(a) | | 100,200 | | | 3,325,638 |
| | Google, Inc.* | | 1,600 | | | 1,106,368 |
| | | | | | | |
| | | | | | | 8,313,622 |
|
Lodging - 0.69% |
| | Wynn Resorts, Ltd. | | 11,900 | | | 1,334,347 |
|
Machinery-Diversified - 0.08% |
| | Rockwell Automation, Inc. | | 2,400 | | | 165,504 |
| | |
| 80 | | Semi-Annual Report | December 31, 2007 (Unaudited) |
Large-Cap Growth Fund
SCHEDULE OF INVESTMENTS (continued)
Showing percentage of net assets as of December 31, 2007 (Unaudited)
| | | | | | | |
| Industry | | Company | | Shares | | Value |
|
Common Stocks (continued) |
Media - 0.55% |
| | Walt Disney Co. | | 33,200 | | $ | 1,071,696 |
| | | | | | | |
| | | | | | | 1,071,696 |
|
Metal Fabrication-Hardware - 1.69% |
| | Precision Castparts Corp. | | 23,700 | | | 3,287,190 |
|
Mining - 0.76% |
| | Southern Copper Corp.(a) | | 14,000 | | | 1,471,820 |
|
Miscellaneous Manufacturing - 2.01% |
| | Danaher Corp. | | 14,800 | | | 1,298,552 |
| | Dover Corp. | | 15,700 | | | 723,613 |
| | General Electric Co. | | 23,300 | | | 863,731 |
| | Illinois Tool Works, Inc.(a) | | 19,000 | | | 1,017,260 |
| | | | | | | |
| | | | | | | 3,903,156 |
|
Oil & Gas - 4.88% |
| | ConocoPhillips | | 3,607 | | | 318,498 |
| | Exxon Mobil Corp.(a) | | 33,800 | | | 3,166,722 |
| | Noble Corp. | | 39,700 | | | 2,243,447 |
| | Noble Energy, Inc. | | 17,900 | | | 1,423,408 |
| | XTO Energy, Inc. | | 45,333 | | | 2,328,277 |
| | | | | | | |
| | | | | | | 9,480,352 |
|
Oil & Gas Services - 5.96% |
| | Baker Hughes, Inc. | | 22,700 | | | 1,840,970 |
| | Cameron International Corp.* | | 41,800 | | | 2,011,834 |
| | FMC Technologies, Inc.* | | 30,900 | | | 1,752,030 |
| | Grant Prideco, Inc.* | | 27,200 | | | 1,509,872 |
| | National Oilwell Varco, Inc.*(a) | | 30,400 | | | 2,233,184 |
| | Smith International, Inc. | | 30,200 | | | 2,230,270 |
| | | | | | | |
| | | | | | | 11,578,160 |
|
Packaging & Containers - 1.72% |
| | Owens-Illinois, Inc.* | | 67,400 | | | 3,336,300 |
|
Pharmaceuticals - 7.71% |
| | Bristol-Myers Squibb Co. | | 110,700 | | | 2,935,764 |
| | Express Scripts, Inc.* | | 35,900 | | | 2,620,700 |
| | Gilead Sciences, Inc.* | | 69,240 | | | 3,185,732 |
| | Merck & Co., Inc. | | 50,800 | | | 2,951,988 |
| | Pfizer, Inc. | | 7,200 | | | 163,656 |
| | Schering-Plough Corp. | | 116,800 | | | 3,111,552 |
| | | | | | | |
| | | | | | | 14,969,392 |
|
Real Estate - 0.62% |
| | CB Richard Ellis Group, Inc.*(a) | | 55,800 | | | 1,202,490 |
| | | | | | | |
| Industry | | Company | | Shares | | Value |
|
|
Retail - 3.86% |
| | Bed Bath & Beyond, Inc.* | | 13,000 | | $ | 382,070 |
| | Coach, Inc.* | | 35,320 | | | 1,080,086 |
| | CVS Caremark Corp. | | 3,340 | | | 132,765 |
| | GameStop Corp.* | | 41,400 | | | 2,571,354 |
| | Nordstrom, Inc.(a) | | 62,140 | | | 2,282,402 |
| | Staples, Inc.(a) | | 25,890 | | | 597,282 |
| | Tiffany & Co. | | 9,700 | | | 446,491 |
| | | | | | | |
| | | | | | | 7,492,450 |
|
Semiconductors - 5.87% |
| | Kla-Tencor Corp. | | 37,950 | | | 1,827,672 |
| | Lam Research Corp.* | | 10,000 | | | 432,300 |
| | MEMC Electronic Materials, Inc.* | | 29,100 | | | 2,575,059 |
| | NVIDIA Corp.*(a) | | 92,700 | | | 3,153,654 |
| | Texas Instruments, Inc. | | 101,790 | | | 3,399,786 |
| | | | | | | |
| | | | | | | 11,388,471 |
|
Software - 7.91% |
| | Adobe Systems, Inc.* | | 10,000 | | | 427,300 |
| | BMC Software, Inc.* | | 5,000 | | | 178,200 |
| | CA, Inc. | | 35,000 | | | 873,250 |
| | MasterCard, Inc. | | 10,000 | | | 2,152,000 |
| | Microsoft Corp. | | 116,200 | | | 4,136,720 |
| | Oracle Corp.* | | 169,200 | | | 3,820,536 |
| | Paychex, Inc. | | 68,000 | | | 2,462,960 |
| | SEI Investments Co. | | 40,200 | | | 1,293,234 |
| | | | | | | |
| | | | | | | 15,344,200 |
|
Telecommunications - 6.46% |
| | AT&T, Inc. | | 83,800 | | | 3,482,728 |
| | Cisco Systems, Inc.* | | 119,200 | | | 3,226,744 |
| | Corning, Inc. | | 59,300 | | | 1,422,607 |
| | Harris Corp. | | 22,100 | | | 1,385,228 |
| | Juniper Networks, Inc.*(a) | | 53,900 | | | 1,789,480 |
| | US Cellular Corp.* | | 14,600 | | | 1,227,860 |
| | | | | | | |
| | | | | | | 12,534,647 |
|
Toys/Games/Hobbies - 0.49% |
| | Mattel, Inc. | | 50,065 | | | 953,238 |
|
Transportation - 1.15% |
| | CH Robinson Worldwide, Inc. | | 22,200 | | | 1,201,464 |
| | Expeditors International Washington, Inc. | | 23,200 | | | 1,036,576 |
| | | | | | | |
| | | | | | | 2,238,040 |
| | | | | | | |
| |
TOTAL COMMON STOCKS - 99.40% | | | 192,961,462 |
| | | | | | | |
(Cost $156,868,694) | | | |
Large-Cap Growth Fund
SCHEDULE OF INVESTMENTS (continued)
Showing percentage of net assets as of December 31, 2007 (Unaudited)
| | | | | | | | |
| | | Rate^ | | Shares | | Value | |
|
MONEY MARKET FUNDS - 2.51% | |
BlackRock TempCash Liquidity Fund, Institutional Shares #21 | | 4.78% | | 4,868,168 | | $ | 4,868,168 | |
| | | | | | | | |
| |
TOTAL MONEY MARKET FUNDS - 2.51% | | | 4,868,168 | |
| | | | | | | | |
(Cost $4,868,168) | | | | |
| |
TOTAL INVESTMENTS - 101.91% | | $ | 197,829,630 | |
(Cost $161,736,862) | | | | |
Liabilities in Excess of Other Assets - (1.91)% | | | (3,715,678 | ) |
| | | | | | | | |
NET ASSETS - 100.00% | | $ | 194,113,952 | |
| | | | | | | | |
| * | Non-income producing security. |
| ^ | Rate disclosed is as of December 31, 2007. |
| (a) | This security or a portion of the security is out on loan at December 31, 2007. Total loaned securities had a market value of $25,917,400 at December 31, 2007. |
See Notes to Financial Statements.
| | |
| 82 | | Semi-Annual Report | December 31, 2007 (Unaudited) |
THIS PAGE INTENTIONALLY LEFT BLANK
Large-Cap Value Fund
MANAGER’S COMMENTARY
(Unaudited)
December 31, 2007
Dear Fellow Large-Cap Value Fund Shareholder,
Our Large-Cap Value Fund outperformed its primary market benchmark in three of the last four quarters. In the context of a declining market, our Fund fell a mild 2.55%, providing some cushion against the downturn of both the Russell 1000 Value Index (-5.80%) and the Lipper Large-Cap Value Funds Index (-4.67%). It was a good quarter of market-beating performance in spite of negative returns.
For the six month semi-annual period, our Fund lost 2.61%, again beating both the Russell 1000 Value Index (down 6.03%), and the Lipper Large-Cap Value Funds Index (down 4.48%). This period was marked by extreme market volatility, as investors faced the growing subprime debacle that morphed into a true credit crisis.
For the full calendar year, our Fund managed a moderate 4.49% return, still beating both our benchmarks as presented below. In 2007, growth stocks moved into the limelight. The markets appear to have strongly reversed the prior trend, which had favored more value-oriented companies (and, since inception, this Fund) over the past seven years.
The table below presents our December quarter, six-month, one-year, and life-to-date financial results according to the formula required by the SEC. It was a “clean sweep,” with the Fund beating both our benchmarks in each period. See the next page for a graph of performance since inception.
| | | | | | | | |
| | | Dec. Qtr.
10/1/07
to 12/31/07 | | 6 Month
7/1/07
to 12/31/07 | | 1 Year
1/1/07
to 12/31/07 | | Life-to-Date
10/31/03
to 12/31/07 |
| | | | |
Large-Cap Value Fund | | -2.55% | | -2.61% | | 4.49% | | 13.73% |
Russell 1000 Value Index | | -5.80% | | -6.03% | | -0.17% | | 12.57% |
Lipper Large-Cap Value Funds Index | | -4.67% | | -4.48% | | 2.46% | | 11.08% |
Performance figures quoted in the table above and graph below represent past performance and are no guarantee of future results. The table above and the graph below do not reflect the deduction of taxes that a shareholder would pay on Fund distributions or the redemption of Fund shares.
The Russell 1000 Value Index is an unmanaged index which consists of stocks in the Russell 1000 Index with higher price-to-book ratios and higher forecasted growth values with dividends reinvested. The Lipper Large-Cap Value Funds Index is an index of large-company, value-oriented funds compiled by Lipper, Inc. It is not possible to invest directly in an index. Periods longer than one year are annualized.
According to data from Lipper, Inc. as of December 31, 2007, Large-Cap Value Fund ranked 97th of 441 multi-cap value funds for the twelve-month period ended December 31, 2007 and 34th of 289 such funds since inception in October, 2003. Lipper, Inc. is an independent mutual fund rating service that ranks funds in various fund categories by making comparative calculations using total returns.
| | |
| 84 | | Semi-Annual Report | December 31, 2007 (Unaudited) |
[GRAPHIC]
Large-Cap Value Fund
MANAGER’S COMMENTARY (continued)
(Unaudited)
Large-Cap Value Fund vs. Lipper Large-Cap Value Funds Index & Russell 1000 Value Index 10/31/03 to 12/31/07
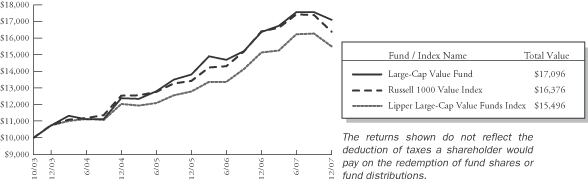
Detailed Explanation of Quarterly Performance—What Worked Well
The Short Version: Five sectors were represented among our top 10 performers during the December quarter, with three energy companies highlighting the list. Only one holding returned greater than 20% over the past three months and just five appreciated over 10%.
These are the ten best-performing stocks for the quarter ended December 31, 2007:
| | | | | | |
| Rank | | Description | | Industry | | % Gain |
| 1 | | Express Scripts Inc | | Pharmaceuticals | | 30.8% |
| 2 | | Berkshire Hathaway Inc Class B | | Insurance | | 19.8% |
| 3 | | Textron Inc | | Miscellaneous Manufacturing | | 14.6% |
| 4 | | Medco Health Solutions Inc | | Pharmaceuticals | | 12.2% |
| 5 | | Chesapeake Energy Corp | | Oil & Gas | | 11.2% |
| 6 | | Duke Energy Corp | | Electric | | 7.9% |
| 7 | | Southern Co | | Electric | | 6.8% |
| 8 | | Valero Energy Corp | | Oil & Gas | | 6.8% |
| 9 | | Marathon Oil Corp | | Oil & Gas | | 6.7% |
| 10 | | AON Corp | | Insurance | | 6.4% |
| | | | | | | |
Express Scripts was the Fund’s top performer and earned about 30% over the past three months. The company offers retail pharmacy management services (primarily mail order sales) and competes against the more traditional “brick and mortar” pharmacies, particularly in the generic drug markets. In October, the company announced higher earnings on growing generic sales and a declining cost structure. Management also raised its 2008 guidance above analysts’ forecasts. Its stock price moved to an all-time high during the quarter. Express Scripts contributed 0.3% to the return of the Fund.
Large-Cap Value Fund
MANAGER’S COMMENTARY (continued)
(Unaudited)
Detailed Explanation of Quarterly Performance—What Didn’t Work
The Short Version: Five financial services companies made the list of worst quarterly performers as the subprime fiasco continued to gain steam and led to a full-fledge credit crisis. The nation’s (and the world’s) largest banks, savings institutions, and brokerage firms announced record write-downs during the quarter, the result of growing defaults in their mortgage portfolios and losses in related securities. These five companies cost the Fund about 1.5% during the quarter.
These are the ten worst-performing stocks for the quarter ended December 31, 2007:
| | | | | | |
| Rank | | Description | | Industry | | % Loss |
| 1 | | Qwest Communications Int’l Inc | | Telecommunications | | -23.5% |
| 2 | | Mattel Inc | | Toys/Games/Hobbies | | -18.8% |
| 3 | | Washington Mutual Inc | | Savings & Loans | | -18.8% |
| 4 | | Target Corp | | Retail | | -17.3% |
| 5 | | American International Group Inc | | Insurance | | -17.0% |
| 6 | | Bank of America Corp | | Banks | | -16.2% |
| 7 | | Southern Copper Corp | | Mining | | -15.1% |
| 8 | | CNA Financial Corp | | Insurance | | -14.2% |
| 9 | | Morgan Stanley | | Diversified Financial Services | | -13.8% |
| 10 | | Kla-Tencor Corp | | Semiconductors | | -13.7% |
| | | | | | | |
Though financial services companies dominated our list of weakest holdings and headlined (negatively) the daily business news, Qwest Communications was the Fund’s worst performing stock and the only one to lose more than 20%. In October, the telecommunication giant announced surging profits; however, a closer look inside the numbers revealed a one-time tax benefit that significantly aided the results. In reality, net of that tax benefit, the company actually missed Wall Street’s profit projections and also suffered from declining sales. Qwest continued to suffer from the lower demand for traditional landline and long-distance services, as more customers moved into wireless and/or cable-based plans. In November, its stock price fell to a 52-week low. The holding cost the Fund over 0.35% to the return.
Detailed Explanation of Calendar Year Performance—What Worked Well
The Short Version: Only four sectors were represented on the top-performer list during the calendar year with consumer, non-cyclicals, energy, and industrials placing three firms each. Rising energy and commodities prices throughout the year contributed to the performances of a number of our top holdings (namely within the mining and oil and gas industries). A total of 21 stocks within our Fund returned greater than 20% during 2007.
These are the ten best performers for the calendar year ended December 31, 2007:
| | | | | | |
| Rank | | Description | | Industry | | % Gain |
| 1 | | Southern Copper Corp | | Mining | | 95.1% |
| 2 | | Textron Inc | | Miscellaneous Manufacturing | | 52.1% |
| 3 | | Parker Hannifin Corp | | Miscellaneous Manufacturing | | 46.9% |
| 4 | | Express Scripts Inc | | Pharmaceuticals | | 43.6% |
| 5 | | Valero Energy Corp | | Oil & Gas | | 40.2% |
| 6 | | Honeywell International Inc | | Miscellaneous Manufacturing | | 36.1% |
| 7 | | Chesapeake Energy Corp | | Oil & Gas | | 34.9% |
| 8 | | Aetna Inc | | Healthcare-Services | | 33.7% |
| 9 | | Marathon Oil Corp | | Oil & Gas | | 31.6% |
| 10 | | Medco Health Solutions Inc | | Pharmaceuticals | | 30.9% |
| | | | | | | |
While many companies in various industries suffered the ill-effects of the plummeting dollar during the year, the Fund’s top performer, Southern Copper Corporation, actually benefited from the currency weakness. Throughout 2007, the mining company reaped the benefits of strong global demand for commodities like copper and developing nations like China took
| | |
| 86 | | Semi-Annual Report | December 31, 2007 (Unaudited) |
Large-Cap Value Fund
MANAGER’S COMMENTARY (continued)
(Unaudited)
advantage of the more affordable exports. (The company did give back a bit of ground in the December quarter and was the Fund’s 7th worst performer.) Despite the domestic economic weakness, Southern Copper plans to increase output through 2009 as it maintains a strong pipeline of global projects. Late in the year, the company also avoided the threats of strikes at facilities in Peru. In 2007, Southern Copper contributed 0.76% to the performance of the Fund.
Detailed Explanation of Calendar Year Performance—What Didn’t Work
The Short Version: Financials almost made a clean sweep among poor performers for the calendar year, as a total of nine holdings (out of 10) made the list. Only food giant, Tyson, stands out among a grouping that reads like a relative “who’s who” of financial services mega-firms. Subprime, credit crisis, mortgage write-downs…say no more. These nine holdings cost the Fund over 3% in annual return.
These are the ten stocks that performed the worst in the calendar year ended December 31, 2007:
| | | | | | |
| Rank | | Description | | Industry | | % Gain |
| 1 | | E*Trade Financial Corp | | Diversified Financial Services | | -31.1% |
| 2 | | Lehman Brothers Holdings Inc | | Diversified Financial Services | | -30.4% |
| 3 | | Keycorp | | Banks | | -26.0% |
| 4 | | Morgan Stanley | | Diversified Financial Services | | -20.5% |
| 5 | | Merrill Lynch & Co Inc | | Diversified Financial Services | | -20.3% |
| 6 | | Bank of America Corp | | Banks | | -19.5% |
| 7 | | Tyson Foods Inc | | Food | | -19.4% |
| 8 | | Allstate Corp/The | | Insurance | | -18.9% |
| 9 | | American International Group Inc | | Insurance | | -18.2% |
| 10 | | CNA Financial Corp | | Insurance | | -16.4% |
| | | | | | | |
Though not the biggest name, E*Trade was one of many victims of the subprime mortgage fiasco and lost over 30% during the calendar year. The online trading giant had expanded into other areas of financial services and paid dearly for its wholesale mortgage operation. While the company has shut down that segment and is again concentrating on its core trading business, it suffered from significant mortgage-related write-downs that dramatically impacted its bottom line. Still, in 2007, E*Trade only cost the Fund about 0.30% in return. E*Trade is an example of a stock that we own in growth and value portfolios as it was a value stock when we purchased it beginning in late 2003. Our Large-Cap Growth Fund also purchased it, but not until the second quarter of 2006 after it became a growth stock.
Top Ten Holdings as of December 31, 2007
Only two of our top holdings at the end of the calendar year were among the Fund’s best performers during the December quarter: Berkshire Hathaway and Medco Health. Combined, these two companies contributed just under 0.8% to the overall performance during the quarter and represented over 6% of the net assets of the Fund. The top 10 holdings accounted for over 30% of the net assets of the Fund.
| | | | | | |
| Rank | | Description | | Industry | | Percent of
Net Assets |
| 1 | | Hewlett-Packard Co. | | Computers | | 4.2% |
| 2 | | AT&T, Inc. | | Telecommunications | | 3.7% |
| 3 | | Goldman Sachs Group, Inc. | | Diversified Financial Services | | 3.5% |
| 4 | | Berkshire Hathaway, Inc. | | Insurance | | 3.3% |
| 5 | | Verizon Communications, Inc. | | Telecommunications | | 3.2% |
| 6 | | Medco Health Solutions, Inc. | | Pharmaceuticals | | 2.8% |
| 7 | | Exxon Mobil Corp. | | Oil & Gas | | 2.8% |
| 8 | | Bristol-Myers Squibb Co. | | Pharmaceuticals | | 2.7% |
| 9 | | Alcoa, Inc. | | Mining | | 2.7% |
| 10 | | Lockheed Martin Corp. | | Aerospace/Defense | | 2.7% |
| | | | | | | |
| Total | | | | | | 31.6% |
Large-Cap Value Fund
MANAGER’S COMMENTARY (continued)
(Unaudited)
Industry Sector Representation as of December 31, 2007
Here's the full story on sector allocation as of December 31, 2007: Financials… Financials… Financials. Our models’ overweighting of financial services companies hindered the Fund’s performance during the December quarter and the calendar year. As mentioned throughout, the negative subprime issues spread throughout the industry and even impacted other sectors as well. Even with this concentration, our models contributed to some nice stock picking which helped the Fund outperform its benchmarks (market and peer) during the quarter.
| | | | | | |
| | | % of Portfolio | | % of S&P 500 Index | | Difference |
Basic Materials | | 8.0% | | 3.4% | | 4.6% |
Communications | | 14.0% | | 11.3% | | 2.7% |
Consumer, Cyclical | | 1.4% | | 7.1% | | -5.7% |
Consumer, Non-cyclical | | 13.9% | | 20.5% | | -6.6% |
Energy | | 10.8% | | 12.9% | | -2.1% |
Financial | | 29.0% | | 17.6% | | 11.4% |
Industrial | | 9.5% | | 11.8% | | -2.3% |
Technology | | 9.0% | | 11.8% | | -2.8% |
Utilities | | 4.3% | | 3.5% | | 0.8% |
Cash | | 0.1% | | 0.1% | | 0.0% |
| | | | | | | |
Total | | 100.0% | | 100.0% | | |
Disclaimer
The following is a reminder from the friendly folks at your Fund who worry about liability. The views expressed here are exclusively those of Fund management. These views are not meant as investment advice and should not be considered predictive in nature. Any favorable (or unfavorable) description of a holding applies only as of December 31, 2007, unless otherwise stated. Security positions can and do change thereafter. Discussions of historical performance do not guarantee and are not indicative of future performance.
The Fund is subject to market risk (volatility) and is not an appropriate investment for short-term investors.
Conclusion
Thank you for your continued investment in Large-Cap Value Fund. We encourage your feedback; your reactions and concerns are important to us.
Sincerely,
Your Investment Management Team
| | |
| 88 | | Semi-Annual Report | December 31, 2007 (Unaudited) |
THIS PAGE INTENTIONALLY LEFT BLANK
Large-Cap Value Fund
SCHEDULE OF INVESTMENTS
Showing percentage of net assets as of December 31, 2007 (Unaudited)
| | | | | | | |
| Industry | | Company | | Shares | | Value |
|
COMMON STOCKS - 99.71% |
Aerospace/Defense - 4.33% |
| | Lockheed Martin Corp. | | 18,300 | | $ | 1,926,258 |
| | Raytheon Co. | | 20,000 | | | 1,214,000 |
| | | | | | | |
| | | | | | | 3,140,258 |
|
Banks - 3.79% |
| | Bank of America Corp. | | 27,508 | | | 1,134,980 |
| | US Bancorp(a) | | 27,000 | | | 856,980 |
| | Wachovia Corp.(a) | | 20,000 | | | 760,600 |
| | | | | | | |
| | | | | | | 2,752,560 |
|
Beverages - 0.97% |
| | Pepsi Bottling Group, Inc. | | 17,900 | | | 706,334 |
|
Chemicals - 2.28% |
| | EI Du Pont de Nemours & Co | | 37,500 | | | 1,653,375 |
|
Commercial Services - 1.56% |
| | RR Donnelley & Sons Co. | | 30,000 | | | 1,132,200 |
|
Computers - 7.16% |
| | Hewlett-Packard Co. | | 60,000 | | | 3,028,800 |
| | International Business Machines Corp. | | 14,800 | | | 1,599,880 |
| | Teradata Corp.* | | 20,700 | | | 567,387 |
| | | | | | | |
| | | | | | | 5,196,067 |
|
Diversified Financial Services - 6.69% |
| | Citigroup, Inc. | | 21,100 | | | 621,184 |
| | Goldman Sachs Group, Inc. | | 11,800 | | | 2,537,590 |
| | JPMorgan Chase & Co. | | 38,950 | | | 1,700,167 |
| | | | | | | |
| | | | | | | 4,858,941 |
|
Electric Utilities - 4.28% |
| | American Electric Power Co., Inc. | | 24,000 | | | 1,117,440 |
| | Duke Energy Corp. | | 26,100 | | | 526,437 |
| | Reliant Energy, Inc.* | | 33,600 | | | 881,664 |
| | Southern Co. | | 15,050 | | | 583,188 |
| | | | | | | |
| | | | | | | 3,108,729 |
|
Food - 0.65% |
| | Safeway, Inc. | | 13,700 | | | 468,677 |
|
Healthcare-Services - 1.80% |
| | Aetna, Inc. | | 22,600 | | | 1,304,698 |
|
Insurance - 18.43% |
| | Aflac, Inc. | | 15,000 | | | 939,450 |
| | Allstate Corp. | | 14,600 | | | 762,558 |
| | AON Corp.(a) | | 20,000 | | | 953,800 |
| | | | | | | |
| Industry | | Company | | Shares | | Value |
|
|
Insurance (continued) |
| | Berkshire Hathaway, Inc.*, Class B | | 510 | | $ | 2,415,360 |
| | Chubb Corp. | | 25,100 | | | 1,369,958 |
| | CIGNA Corp. | | 21,000 | | | 1,128,330 |
| | CNA Financial Corp. | | 29,700 | | | 1,001,484 |
| | Hartford Financial Services Group, Inc. | | 17,200 | | | 1,499,668 |
| | MetLife, Inc. | | 31,100 | | | 1,916,382 |
| | Prudential Financial, Inc. | | 15,000 | | | 1,395,600 |
| | | | | | | |
| | | | | | | 13,382,590 |
|
Internet - 1.37% |
| | Expedia, Inc.*(a) | | 31,500 | | | 996,030 |
|
Media - 3.64% |
| | Time Warner, Inc. | | 20,400 | | | 336,804 |
| | Walt Disney Co. | | 46,900 | | | 1,513,932 |
| | Washington Post Co. | | 1,000 | | | 791,430 |
| | | | | | | |
| | | | | | | 2,642,166 |
|
Mining - 5.69% |
| | Alcoa, Inc. | | 52,800 | | | 1,929,840 |
| | Freeport-McMoRan Copper & Gold, Inc. | | 8,156 | | | 835,501 |
| | Southern Copper Corp.(a) | | 13,000 | | | 1,366,690 |
| | | | | | | |
| | | | | | | 4,132,031 |
|
Miscellaneous Manufacturing - 5.18% |
| | Eastman Kodak Co.(a) | | 34,500 | | | 754,515 |
| | Honeywell International, Inc. | | 20,000 | | | 1,231,400 |
| | Parker Hannifin Corp. | | 5,250 | | | 395,377 |
| | Textron, Inc. | | 19,400 | | | 1,383,220 |
| | | | | | | |
| | | | | | | 3,764,512 |
|
Office/Business Equipment - 1.51% |
| | Xerox Corp.* | | 67,600 | | | 1,094,444 |
|
Oil & Gas - 10.76% |
| | Chesapeake Energy Corp.(a) | | 22,000 | | | 862,400 |
| | Chevron Corp. | | 18,514 | | | 1,727,912 |
| | ConocoPhillips | | 21,600 | | | 1,907,280 |
| | Exxon Mobil Corp. | | 21,600 | | | 2,023,704 |
| | Marathon Oil Corp. | | 21,200 | | | 1,290,232 |
| | | | | | | |
| | | | | | | 7,811,528 |
|
Pharmaceuticals - 8.92% |
| | Bristol-Myers Squibb Co. | | 75,000 | | | 1,989,000 |
| | Express Scripts, Inc.* | | 15,000 | | | 1,095,000 |
| | Medco Health Solutions, Inc.* | | 20,000 | | | 2,028,000 |
| | Pfizer, Inc. | | 60,000 | | | 1,363,800 |
| | | | | | | |
| | | | | | | 6,475,800 |
| | |
| 90 | | Semi-Annual Report | December 31, 2007 (Unaudited) |
Large-Cap Value Fund
SCHEDULE OF INVESTMENTS (continued)
Showing percentage of net assets as of December 31, 2007 (Unaudited)
| | | | | | | |
| Industry | | Company | | Shares | | Value |
|
Common Stocks (continued) |
Retail - 0.63% |
| | CVS Caremark Corp. | | 11,480 | | $ | 456,330 |
Semiconductors - 0.33% |
| | Kla-Tencor Corp. | | 5,000 | | | 240,800 |
Telecommunications - 8.95% |
| | AT&T, Inc. | | 65,292 | | | 2,713,535 |
| | Corning, Inc. | | 22,600 | | | 542,174 |
| | Qwest Communications International, Inc.* | | 131,800 | | | 923,918 |
| | Verizon Communications, Inc. | | 53,030 | | | 2,316,881 |
| | | | | | | |
| | | | | | | 6,496,508 |
Toys/Games/Hobbies - 0.79% |
| | Mattel, Inc. | | 30,000 | | | 571,200 |
| | | | | | | |
| |
TOTAL COMMON STOCKS - 99.71% | | | 72,385,778 |
| | | | | | | |
(Cost $56,234,196) | | | |
| | | | | | | |
|
MONEY MARKET FUNDS - 0.08% |
| | | |
| | | Rate^ | | Shares | | Value |
BlackRock TempCash
Liquidity Fund,
Institutional Shares #21 | | 4.78% | | 57,622 | | | 57,622 |
| | | | | | | |
| |
TOTAL MONEY MARKET FUNDS - 0.08% | | | 57,622 |
| | | | | | | |
(Cost $57,622) | | | |
| |
TOTAL INVESTMENTS - 99.79% | | $ | 72,443,400 |
(Cost $56,291,818) | | | |
Other Assets in Excess of Liabilities - 0.21% | | | 152,721 |
| | | | | | | |
NET ASSETS - 100.00% | | $ | 72,596,121 |
| | | | | | | |
| * | Non-income producing security. |
| ^ | Rate disclosed is as of December 31, 2007. |
| (a) | This security or a portion of the security is out on loan at December 31, 2007. Total loaned securities had a market value of $6,442,980 at December 31, 2007. |
See Notes to Financial Statements.
Blue Chip 35 Index Fund
MANAGER’S COMMENTARY
(Unaudited)
December 31, 2007
Dear Fellow Blue Chip 35 Index Fund Shareholder,
For the six months ending December 31, 2007, our Fund rose slightly (up 0.34%), going against the tide of the broader market decline. We beat both of our external benchmarks: the S&P 500 Index (down 1.37%), and the Lipper Large-Cap Core Funds Index (down 0.65%). Our own proprietary index, the Bridgeway Ultra-Large 35 Index, gained 0.35% during the past six months, virtually the same return as our Fund (even after considering our expense ratio). Our Fund was helped by such stocks as Google and Berkshire Hathaway. On the other side of the ledger, our four banks cost us over 4% of total return due to the subprime lending fiasco. We are very pleased with our semi-annual performance compared to each of our performance benchmarks.
For the full calendar year, our Fund was up a reasonable 6.07%, again beating the S&P 500 Index (up 5.49%), but underperforming the Lipper Large-Cap Core Funds Index (up 6.63%). Calendar year 2007 appears to have reversed a seven year trend of smaller company market dominance.
The table below presents our six-month, one-year, five-year, 10-year and life-to-date financial results according to the formula required by the SEC. Taking a longer-term view (our recommended primary area of focus), we have outperformed each of the external benchmark indexes since inception in 1997. We have underperformed our own Ultra-Large 35 Index by less than the amount of our expense ratio—also a favorable result. We are especially pleased that we have beaten the S&P Index over every timeframe except for the “five year” period, even though that benchmark includes more smaller and mid-range stocks (the “sweet” part of the market over the last seven years). Given the shift toward larger company stocks that occurred this year, we look forward to seeing how our Fund will perform in the periods to follow. A graph of performance for the last ten years appears at the top of the following page.
| | | | | | | | | | |
| | | 6 Months
7/1/07 to 12/31/07 | | 1 Year 1/1/07 To 12/31/07 | | 5 Year 1/1/03 to 12/31/07 | | 10 Year 1/1/98 To 12/31/07 | | Life-to-Date 7/31/97
to 12/31/07 |
| | | | | |
Blue Chip 35 Index Fund | | 0.34% | | 6.07% | | 10.59% | | 6.62% | | 6.34% |
S&P 500 Index | | -1.37% | | 5.49% | | 12.82% | | 5.91% | | 5.91% |
Bridgeway Ultra-Large 35 Index | | 0.35% | | 6.28% | | 10.65% | | 6.75% | | 6.47% |
Lipper Large-Cap Core Funds Index | | -0.65% | | 6.63% | | 11.55% | | 5.23% | | 5.18% |
Performance figures quoted in the table above and graph below represent past performance and are no guarantee of future results. The table above and the graph below do not reflect the deduction of taxes that a shareholder would pay on Fund distributions or the redemption of Fund shares
The S&P 500 Index is a broad-based, unmanaged measurement of changes in stock market conditions based on the average of 500 widely held common stocks with dividends reinvested. The Bridgeway Ultra-Large 35 Index is an index comprised of very large, “blue chip” U.S. stocks, excluding tobacco; it is compiled by the adviser of the Fund. The Lipper Large-Cap Core Funds Index reflects the aggregate record of domestic large-cap core mutual funds as reported by Lipper, Inc. It is not possible to invest directly in an index. Periods longer than one year are annualized.
According to data from Lipper, Inc. as of December 31, 2007, our Fund ranked 384th of 835 large-cap core funds for the twelve months ended December 31, 2007, 384th of 572 such funds for the last five years, 44th of 287 such funds for the last 10 years and 50th of 266 such funds since inception in July 1997. Lipper, Inc. is an independent mutual fund rating service that ranks funds in various fund categories by making comparative calculations using total returns.
| | |
| 92 | | Semi-Annual Report | December 31, 2007 (Unaudited) |
Blue Chip 35 Index Fund
MANAGER’S COMMENTARY (continued)
(Unaudited)
Blue Chip 35 Index Fund vs. S&P 500 Index & Ultra-Large 35 Index & Lipper Large-Cap Core Funds Index 1/1/98 to 12/31/07
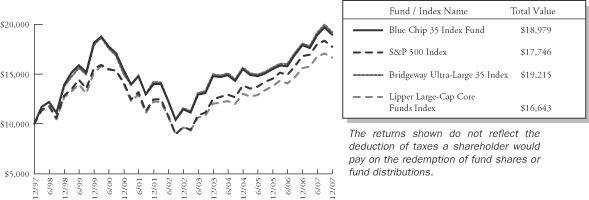
Bigger is Better (for a change)
The Short Version: While many analysts have been calling for a positive reversal of fortunes for the largest industry leaders versus their small-cap counterparts for some time, their words finally proved prophetic during the past year. This demonstrates two principles we agree with at Bridgeway: a) size domination trends don’t last forever, and b) it’s probably impossible to predict the timing of changes in these trends.
During periods of market uncertainty, investors tend to shy away from the more lightly traded small-cap companies and instead invest in the largest industry leaders that often hold up better during negative times and in the periods that follow. As such, the 2007 calendar year proved far better for investors of large- and ultra-large-cap companies than their small-cap and ultra-small-cap counterparts. To demonstrate this wide dispersion for the calendar year, ultra-large stocks returned over 7% in 2007, while the smallest stocks actually lost about 10%, a huge variation of 17%. This is based on data below from the Center for Research in Security Prices (“CRSP”), which ranks companies by market size. The shift toward larger company stocks is clearly evident during the one year timeframe and shorter. The most recent quarter indicates things could be shifting back in the “bulls-eye” of our Fund.
| | | | | | | | | | |
Company Size According to the CRSP Cap-Based Portfolio Indexes1 | | Dec qtr | | 6 months | | 1 year | | 5 years | | 80 years2 |
| 1 (ultra-large) | | -2.1% | | 1.2% | | 7.1% | | 11.8% | | 9.3% |
| 2 | | -2.6% | | -2.3% | | 7.5% | | 18.1% | | 10.8% |
| 3 | | -5.4% | | -6.6% | | 3.6% | | 17.2% | | 11.2% |
| 4 | | -4.2% | | -7.4% | | 4.4% | | 17.2% | | 10.9% |
| 5 | | -4.9% | | -7.3% | | 8.0% | | 17.8% | | 11.6% |
| 6 | | -3.4% | | -5.1% | | 5.0% | | 17.7% | | 11.6% |
| 7 | | -5.3% | | -8.7% | | -1.8% | | 17.7% | | 11.5% |
| 8 | | -7.0% | | -10.8% | | -5.7% | | 18.1% | | 11.9% |
| 9 | | -6.8% | | -11.7% | | -6.5% | | 16.7% | | 12.0% |
| 10 (ultra-small) | | -9.1% | | -14.4% | | -9.9% | | 21.1% | | 13.7% |
| | | | | | | | | | | |
1 | The CRSP Cap-Based Portfolio Indexes are unmanaged indexes of the publicly traded U.S. stocks with dividends reinvested, grouped by the market capitalization, as reported by the Center for Research in Security Prices. Past performance is no guarantee of future results. |
2 | December 31, 1927 to December 31, 2007. |
Blue Chip 35 Index Fund
MANAGER’S COMMENTARY (continued)
(Unaudited)
Calendar Year Performance
The Short Version: Larger company stocks have been the beneficiary in 2007, as investors sought out industry leaders during these times of market and economic uncertainty. Financial services companies were the clear losers over the past 12-months and found themselves in the not-so-prominent spots at the bottom of the Fund’s performance rankings. Technology and energy issues were among the top performers.
Total Return for Blue Chip 35 Index Fund Stocks for the calendar year ended December 31, 2007:
| | | | | | |
| Rank | | Company | | Industry | | % Change |
| 1 | | Google Inc | | Internet | | 30.8% |
| 2 | | Berkshire Hathaway Inc Class B | | Insurance | | 23.1% |
| 3 | | Merck & Co Inc | | Pharmaceuticals | | 19.7% |
| 4 | | Oracle Corp | | Software | | 18.8% |
| 5 | | Intel Corp | | Semiconductors | | 18.0% |
| 6 | | Coca-Cola Co | | Beverages | | 17.5% |
| 7 | | Microsoft Corp | | Software | | 17.0% |
| 8 | | Chevron Corp | | Oil & Gas | | 16.5% |
| 9 | | PepsiCo Inc | | Beverages | | 15.3% |
| 10 | | ConocoPhillips | | Oil & Gas | | 15.3% |
| 11 | | Exxon Mobil Corp | | Oil & Gas | | 15.2% |
| 12 | | United Technologies Corp | | Aerospace/Defense | | 12.4% |
| 13 | | Procter & Gamble Co | | Cosmetics/Personal Care | | 11.6% |
| 14 | | AT&T Inc | | Telecommunications | | 10.3% |
| 15 | | Verizon Communications Inc | | Telecommunications | | 9.8% |
| 16 | | Texas Instruments Inc | | Semiconductors | | 7.1% |
| 17 | | Johnson & Johnson | | Healthcare-Products | | 3.1% |
| 18 | | Wal-Mart Stores Inc | | Retail | | 2.9% |
| 19 | | International Business Machines Corp | | Computers | | 2.4% |
| 20 | | 3M Co | | Miscellaneous Manufacturing | | 1.8% |
| 21 | | Eli Lilly & Co | | Pharmaceuticals | | -0.7% |
| 22 | | General Electric Co | | Miscellaneous Manufacturing | | -1.8% |
| 23 | | United Parcel Service Inc | | Transportation | | -4.7% |
| 24 | | Dell Inc | | Computers | | -4.8% |
| 25 | | Cisco Systems Inc | | Telecommunications | | -5.6% |
| 26 | | JPMorgan Chase & Co | | Diversified Financial Services | | -6.1% |
| 27 | | Applied Materials Inc | | Semiconductors | | -7.6% |
| 28 | | Pfizer Inc | | Pharmaceuticals | | -9.1% |
| 29 | | Wells Fargo & Co | | Banks | | -12.8% |
| 30 | | American International Group Inc | | Insurance | | -13.2% |
| 31 | | Genentech Inc | | Biotechnology | | -13.4% |
| 32 | | Time Warner Inc | | Media | | -14.6% |
| 33 | | Bank of America Corp | | Banks | | -17.4% |
| 34 | | Wachovia Corp | | Banks | | -20.8% |
| 35 | | Home Depot Inc | | Retail | | -23.6% |
| 36 | | Citigroup Inc | | Diversified Financial Services | | -30.7% |
| | | | | | | |
| | |
| 94 | | Semi-Annual Report | December 31, 2007 (Unaudited) |
[GRAPHIC]
Blue Chip 35 Index Fund
MANAGER’S COMMENTARY (continued)
(Unaudited)
Industry Sector Representation as of December 31, 2007
Technology represented the largest sector allocation dispersion between our Fund and the S&P 500 Index. In general, tech-related stocks performed well during the calendar year with Oracle, Intel and Microsoft among our top calendar year performers. The Fund does not have an allocation to Basic Materials, a sector that also did well in 2007.
| | | | | | |
| | | % of Portfolio | | S&P 500 Index | | Difference |
Basic Materials | | 0.0% | | 3.4% | | -3.4% |
Communications | | 14.2% | | 11.3% | | 2.9% |
Consumer, Cyclical | | 5.3% | | 7.1% | | -1.8% |
Consumer, Non-cyclical | | 22.3% | | 20.5% | | 1.8% |
Energy | | 8.3% | | 12.9% | | -4.6% |
Financial | | 18.0% | | 17.6% | | 0.4% |
Industrial | | 10.5% | | 11.8% | | -1.3% |
Technology | | 19.4% | | 11.8% | | 7.6% |
Utilities | | 0.0% | | 3.5% | | -3.5% |
Cash | | 2.0% | | 0.1% | | 1.9% |
| | | | | | | |
Total | | 100.0% | | 100.0% | | |
Disclaimer
The following is a reminder from the friendly folks at your Fund who worry about liability. The views expressed here are exclusively those of Fund management. These views, including those of market sectors or individual stocks, are not meant as investment advice and should not be considered predictive in nature. Any favorable (or unfavorable) description of a holding applies only as of the quarter end, December 31, 2007, unless otherwise stated. Security positions can and do change thereafter. Discussions of historical performance do not guarantee and are not indicative of future performance.
The Fund is subject to above average market risk (volatility) and is not an appropriate investment for short-term investors.
Conclusion
Thank you for your continued investment in Blue Chip 35 Index Fund. This Fund remains open to both current and new investors. As always, we appreciate your feedback.
Sincerely,
Your Investment Management Team
Blue-Chip 35 Index Fund
SCHEDULE OF INVESTMENTS
Showing percentage of net assets as of December 31, 2007 (Unaudited)
| | | | | | | |
| Industry | | Company | | Shares | | Value |
|
COMMON STOCKS - 99.28% |
Aerospace/Defense - 2.73% |
| | United Technologies Corp. | | 64,580 | | $ | 4,942,953 |
|
Banks - 7.32% |
| | Bank of America Corp. | | 101,508 | | | 4,188,220 |
| | Wachovia Corp.(a) | | 128,135 | | | 4,872,974 |
| | Wells Fargo & Co.(a) | | 139,559 | | | 4,213,286 |
| | | | | | | |
| | | | | | | 13,274,480 |
|
Beverages - 5.89% |
| | Coca-Cola Co. | | 88,357 | | | 5,422,469 |
| | PepsiCo, Inc. | | 69,250 | | | 5,256,075 |
| | | | | | | |
| | | | | | | 10,678,544 |
|
Biotechnology - 2.52% |
| | Genentech, Inc.* | | 68,115 | | | 4,568,473 |
|
Computers - 5.05% |
| | Dell, Inc.*(a) | | 183,944 | | | 4,508,468 |
| | International Business Machines Corp.(a) | | 42,942 | | | 4,642,030 |
| | | | | | | |
| | | | | | | 9,150,498 |
|
Cosmetics/Personal Care - 2.92% |
| | Procter & Gamble Co. | | 72,226 | | | 5,302,833 |
|
Diversified Financial Services - 5.13% |
| | Citigroup, Inc. | | 151,049 | | | 4,446,882 |
| | JPMorgan Chase & Co. | | 110,995 | | | 4,844,932 |
| | | | | | | |
| | | | | | | 9,291,814 |
|
Healthcare-Products - 2.87% |
| | Johnson & Johnson | | 77,952 | | | 5,199,398 |
|
Insurance - 5.79% |
| | American International Group, Inc. | | 75,536 | | | 4,403,749 |
| | Berkshire Hathaway, Inc., Class B* | | 1,285 | | | 6,085,760 |
| | | | | | | |
| | | | | | | 10,489,509 |
|
Internet - 3.59% |
| | Google, Inc.* | | 9,405 | | | 6,503,370 |
|
Media - 2.77% |
| | Idearc, Inc.(b) | | 2,211 | | | 38,825 |
| | Time Warner, Inc.(a) | | 301,630 | | | 4,979,912 |
| | | | | | | |
| | | | | | | 5,018,737 |
| | | | | | | |
| Industry | | Company | | Shares | | Value |
|
|
Miscellaneous Manufacturers - 5.24% |
| | 3M Co. | | 58,728 | | $ | 4,951,945 |
| | General Electric Co. | | 122,643 | | | 4,546,376 |
| | | | | | | |
| | | | | | | 9,498,321 |
|
Oil & Gas - 8.40% |
| | Chevron Corp. | | 54,295 | | | 5,067,352 |
| | ConocoPhillips | | 57,515 | | | 5,078,575 |
| | Exxon Mobil Corp.(a) | | 54,187 | | | 5,076,780 |
| | | | | | | |
| | | | | | | 15,222,707 |
|
Pharmaceuticals - 8.38% |
| | Eli Lilly & Co. | | 89,195 | | | 4,762,121 |
| | Merck & Co., Inc. | | 98,235 | | | 5,708,436 |
| | Pfizer, Inc. | | 207,844 | | | 4,724,294 |
| | | | | | | |
| | | | | | | 15,194,851 |
|
Retail - 5.35% |
| | Home Depot, Inc. | | 154,530 | | | 4,163,038 |
| | Wal-Mart Stores, Inc. | | 116,319 | | | 5,528,642 |
| | | | | | | |
| | | | | | | 9,691,680 |
|
Semiconductors - 8.14% |
| | Applied Materials, Inc. | | 273,265 | | | 4,853,187 |
| | Intel Corp. | | 198,023 | | | 5,279,293 |
| | Texas Instruments, Inc. | | 138,690 | | | 4,632,246 |
| | | | | | | |
| | | | | | | 14,764,726 |
Software - 6.48% |
| | Microsoft Corp. | | 172,845 | | | 6,153,282 |
| | Oracle Corp.* | | 247,613 | | | 5,591,102 |
| | | | | | | |
| | | | | | | 11,744,384 |
|
Telecommunications - 8.07% |
| | AT&T, Inc. | | 120,025 | | | 4,988,239 |
| | Cisco Systems, Inc.* | | 171,304 | | | 4,637,199 |
| | Verizon Communications, Inc. | | 114,689 | | | 5,010,763 |
| | | | | | | |
| | | | | | | 14,636,201 |
|
Transportation - 2.64% |
| | United Parcel Service, Inc. | | 67,613 | | | 4,781,591 |
| | | | | | | |
| |
TOTAL COMMON STOCKS - 99.28% | | | 179,955,070 |
| | | | | | | |
(Cost $166,206,125) | | | |
| | |
| 96 | | Semi-Annual Report | December 31, 2007 (Unaudited) |
Blue-Chip 35 Index Fund
SCHEDULE OF INVESTMENTS (continued)
Showing percentage of net assets as of December 31, 2007 (Unaudited)
| | | | | | | | |
| | | Rate^ | | Shares | | Value | |
|
MONEY MARKET FUNDS - 2.02% | |
BlackRock TempCash Liquidity Fund, Institutional Shares #21 | | 4.78% | | 3,660,320 | | $ | 3,660,320 | |
| | | | | | | | |
| |
TOTAL MONEY MARKET FUNDS - 2.02% | | | 3,660,320 | |
| | | | | | | | |
(Cost $3,660,320) | | | | |
| |
TOTAL INVESTMENTS - 101.30% | | $ | 183,615,390 | |
(Cost $169,866,445) | | | | |
Liabilities in Excess of Other Assets - (1.30)% | | | (2,360,492 | ) |
| | | | | | | | |
NET ASSETS - 100.00% | | $ | 181,254,898 | |
| | | | | | | | |
| * | Non-income producing security. |
| ^ | Rate disclosed is as of December 31, 2007. |
| (a) | This security or a portion of the security is out on loan at December 31, 2007. Total loaned securities had a market value of $18,995,068 at December 31, 2007. |
| (b) | This security is a spin off from Verizon Communications, Inc. The Fund will hold the security for a limited time. |
See Notes to Financial Statements.
Balanced Fund
MANAGER’S COMMENTARY
(Unaudited)
December 31, 2007
Dear Fellow Balanced Fund Shareholder:
For the quarter ending December 31, 2007, Balanced Fund gained 2.26%. This compares to a gain of 2.58% for the Bloomberg/EFFAS US Government 1-3 year Total Return Bond Index, a gain of 0.22% for the Balanced Benchmark, a loss of 1.11% for the Lipper Balanced Funds Index and a loss of 3.33% for the S&P 500 Index. All in all, a pretty good quarter.
The Balanced Fund invests in both equity and fixed income securities, while incorporating an options strategy designed to produce a conservative, lower volatility balanced portfolio. During very favorable equity market conditions, the Fund often under-performs many of the more aggressive benchmarks. On the other hand, when stocks decline, Balanced Fund tends to perform better than the equity-only indexes. Such was the case during the last quarter when continued market and economic uncertainty led many investors to a flight-to-quality, ask questions later mentality.
For the six month period ending December 31, 2007, Balanced Fund gained 3.21%. This compares to a gain of 5.24% for the Bloomberg/EFFAS US Government 1-3 Year Total Return Bond Index, a gain of 2.59% for the Balanced Benchmark, a gain of 0.76% for the Lipper Balanced Funds Index and a loss of 1.37% for the S&P 500 Index.
Finally, for the calendar year 2007, Balanced Fund gained 6.58%. This compares to a gain of 7.49% for the Bloomberg/EFFAS US Government 1-3 year Total Return Bond Index, a gain of 6.69% for the Balanced Benchmark, a gain of 6.53% for the Lipper Balanced Funds Index and a gain of 5.49% for the S&P 500 Index.
The table below presents our December quarter, six-month, one-year, five-year and life-to-date financial results according to the formula required by the SEC. A graph of quarterly performance since inception appears on the following page.
| | | | | | | | | | |
| | | Dec. Qtr.
10/1/07
to 12/31/07 | | 6 Month
7/1/07
to 12/31/07 | | 1 Year
1/1/07
to 12/31/07 | | 5 Year
1/1/03
to 12/31/07 | | Life-to-Date
6/30/01
to 12/31/07 |
| | | | | |
Balanced Portfolio | | 2.26% | | 3.21% | | 6.58% | | 9.04% | | 5.92% |
Bloomberg/EFFAS U.S. Government 1-3 Year Total Return Bond Index | | 2.58% | | 5.24% | | 7.49% | | 3.11% | | 3.94% |
Balanced Benchmark | | 0.22% | | 2.59% | | 6.69% | | 7.43% | | 4.23% |
S&P 500 Index | | -3.33% | | -1.37% | | 5.49% | | 12.82% | | 4.67% |
Lipper Balanced Funds Index | | -1.11% | | 0.76% | | 6.53% | | 10.33% | | 5.73% |
Performance figures quoted in the table above and graph on the next page represent past performance and are no guarantee of future results. The table above and graph on the next page do not reflect the deduction of taxes that a shareholder would pay on Fund distributions or the redemption of Fund shares.
The Lipper Balanced Funds Index is an index of balanced funds compiled by Lipper, Inc. Balanced Benchmark is a combined index of which 40% reflects the S&P 500 Index (an unmanaged index of large companies with dividends reinvested) and 60% reflects the Bloomberg/ EFFAS U.S. Government 1-3 year Total Return Bond Index (transparent benchmark for the total return of the 1-3 year U.S. Government bond market).
One exercise that I have done before in these letters is to examine our returns on a calendar year basis relative to the percentage increase or decrease of the S&P 500 Index. While not our primary benchmark, I find it very informative given that our investment objective is to “seek a high current return with short-term risk less than or equal to 40% of the stock market.” The numbers are below, and given that we have achieved these returns with a beta of .40 or 60% less risk than the S&P 500, we are quite pleased.
| | |
| 98 | | Semi-Annual Report | December 31, 2007 (Unaudited) |
Balanced Fund
MANAGER’S COMMENTARY (continued)
(Unaudited)
| | | | | | |
| Year | | Balanced Fund | | S&P 500 Index | | % of S&P 500
Gain/Loss |
2007 | | 6.58% | | 5.49% | | 119.9% |
2006 | | 6.65% | | 15.79% | | 42.1% |
2005 | | 6.96% | | 4.91% | | 141.8% |
2004 | | 7.61% | | 10.88% | | 69.9% |
2003 | | 17.82% | | 28.68% | | 62.1% |
2002 | | -3.51% | | -22.10% | | 15.9% |
According to data from Lipper, Inc. as of December 31, 2007, the Balanced Fund ranked 154th of 458 Mixed-Asset Moderate funds for the calendar year ended December 31, 2007, 158th of 240 for the past five years and 71st of 191 funds since inception. Lipper, Inc. is an independent mutual fund rating service that ranks funds in various fund categories by making comparative calculations using total returns.
According to data from Morningstar as of December 31, 2007, the Balanced Fund ranked 90th of 609 Conservative Allocation funds for the calendar year ended December 31, 2007 and 31st out of 239 funds for five years. Morningstar ranks funds in various fund categories by making comparative calculations using total returns.
Balanced Fund vs. S&P 500 Index, Bloomberg/EFFAS Bond Index, Balanced Benchmark & Lipper Balanced Funds Index 6/30/01 to 12/31/07
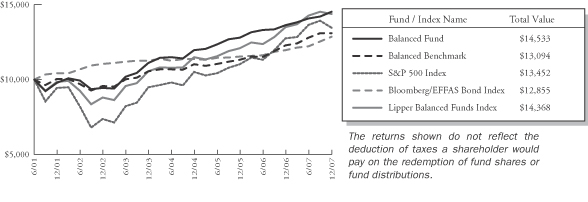
Detailed Explanation of Quarterly Performance—What Worked Well
The Short Version: Diversification was the name of the game this quarter as seven sectors were represented among the top Fund performers. Of note, three energy companies made the list, while a technology holding led the way in terms of contribution to the overall return of the Fund. While only one stock gained over 50% in value, five others returned over 25% during the three-month period.
These are the ten best-performing stocks for the quarter ended December 31, 2007:
| | | | | | |
| Rank | | Description | | Industry | | % Gain |
| 1 | | Hess Corp | | Oil & Gas | | 51.6% |
| 2 | | Archer-Daniels-Midland Co | | Agriculture | | 40.4% |
| 3 | | Express Scripts Inc | | Pharmaceuticals | | 30.8% |
| 4 | | Monsanto Co | | Chemicals | | 30.3% |
| 5 | | Apple Inc | | Computers | | 29.1% |
| 6 | | Deere & Co | | Machinery-Diversified | | 25.5% |
| 7 | | EOG Resources Inc | | Oil & Gas | | 23.4% |
| 8 | | Anadarko Petroleum Corp | | Oil & Gas | | 22.2% |
| 9 | | Google Inc | | Internet | | 21.9% |
| 10 | | Allegheny Energy Inc | | Electric | | 21.7% |
| | | | | | | |
Balanced Fund
MANAGER’S COMMENTARY (continued)
(Unaudited)
An apple a day…well, apparently consumers can’t get enough Apples these days. The computer giant rose almost 30% during the December quarter and contributed over 0.25% to the return of the Fund, the best contribution of any holding. The company reported a 67% increase in earnings in its latest quarterly report as all the publicity related to the iPhone has led to enhanced demand for the old trusted iPods and Macs. Apple also successfully launched the iPhone in Europe during the quarter and has it sights set on Asia for 2008. Meanwhile, the company is benefiting from stronger profit margins as prices of electronic components declined during the quarter.
Detailed Explanation of Quarterly Performance—What Didn’t Work
The Short Version: Financials and consumer-related companies highlighted the least of poorest performers this quarter, hardly a surprise given the ongoing credit crisis and the “gloom and doom” reports of retailers during the holiday season. Five financial holdings cost the Fund over 1% during the quarter, while three retail firms hindered its overall performance by about 0.15%.
These are the ten worst-performing stocks for the quarter ended December 31, 2007:
| | | | | | |
| Rank | | Description | | Industry | | % Loss |
| 1 | | E*Trade Financial Corp | | Diversified Financial Services | | -72.8% |
| 2 | | SLM Corp | | Diversified Financial Services | | -59.5% |
| 3 | | Washington Mutual Inc | | Savings & Loans | | -47.6% |
| 4 | | CIT Group Inc | | Diversified Financial Services | | -40.2% |
| 5 | | OfficeMax Inc | | Retail | | -39.7% |
| 6 | | Citigroup Inc | | Diversified Financial Services | | -36.9% |
| 7 | | Coach Inc | | Retail | | -35.3% |
| 8 | | Office Depot Inc | | Retail | | -32.5% |
| 9 | | Tellabs Inc | | Telecommunications | | -31.3% |
| 10 | | Sprint Nextel Corp | | Telecommunications | | -30.9% |
| | | | | | | |
E*Trade Financial was the Fund’s worst performer over the last three months and one of many victims of the subprime mortgage fiasco. During the quarter, the financial company lost over 70% in value. The online trading giant had expanded into other areas of financial services and paid dearly for its wholesale mortgage operation. While the company has shut down that segment and is again concentrating on its core trading business, it suffered from significant mortgage-related write-downs that dramatically impacted its bottom line. During the quarter, E*Trade cost the Fund just under 0.15% in return.
Detailed Explanation of Calendar Year Performance—What Worked Well
The Short Version: Industrial (5) and basic materials (2) companies were well represented among top performers in 2007 as these seven holdings combined to contribute about 0.75% to the Fund’s performance. Some of these global companies benefited from the weakness in the dollar that led to higher exports abroad, particularly to developing countries like China and India.
Here are the ten best-performing companies for the calendar year ended December 31, 2007:
| | | | | | |
| Rank | | Description | | Industry | | % Gain |
| 1 | | Monsanto Co | | Chemicals | | 112.6% |
| 2 | | Express Scripts Inc | | Pharmaceuticals | | 103.9% |
| 3 | | Hess Corp | | Oil & Gas | | 103.5% |
| 4 | | Medco Health Solutions Inc | | Pharmaceuticals | | 89.8% |
| 5 | | Fluor Corp | | Engineering & Construction | | 78.5% |
| 6 | | Cummins Inc | | Machinery-Diversified | | 73.9% |
| 7 | | United States Steel Corp | | Iron/Steel | | 65.3% |
| 8 | | Deere & Co | | Machinery-Diversified | | 56.6% |
| 9 | | Goodrich Corp | | Aerospace/Defense | | 55.0% |
| 10 | | Textron Inc | | Miscellaneous Manufacturing | | 52.1% |
| | | | | | | |
| | |
| 100 | | Semi-Annual Report | December 31, 2007 (Unaudited) |
Balanced Fund
MANAGER’S COMMENTARY (continued)
(Unaudited)
Monsanto, the world’s largest agricultural seed company, was the Fund’s top performer in 2007 and one of three holdings to return greater than 100%. A few significant factors have surfaced as of late that greatly benefited agricultural companies. Rising oil prices and government subsidies have led to increased demand for ethanol which has prompted greater production of corn. Additionally, as the populations in China and other developing Asian and Latin American countries become increasingly affluent, their residents are adding more meat to their diets. As a result, corn and others feed grains have been met with even greater global demand. During the year, Monsanto also reaped the benefits of some favorable tax treatments from prior audits and raised its earnings targets for 2008. For the year, the holding contributed over 0.30% to the Fund’s return.
Detailed Explanation of Calendar Year Performance—What Didn’t Work
The Short Version: While financials and retailers may have merely dominated the quarterly list of poor performers, these firms comprised the calendar year list (of losers) in its entirety. All told, seven financial firms and three consumer-related companies cost the Fund over 2% in return over the past 12-months. Six holdings lost over 50% in value in 2007.
These are the ten worst-performing stocks for the calendar year ended December 31, 2007:
| | | | | | |
| Rank | | Description | | Industry | | % Loss |
| 1 | | E*Trade Financial Corp | | Diversified Financial Services | | -84.2% |
| 2 | | Office Depot Inc | | Retail | | -63.6% |
| 3 | | SLM Corp | | Diversified Financial Services | | -58.7% |
| 4 | | Countrywide Financial Corp | | Diversified Financial Services | | -57.4% |
| 5 | | CIT Group Inc | | Diversified Financial Services | | -56.9% |
| 6 | | Washington Mutual Inc | | Savings & Loans | | -54.5% |
| 7 | | Moody’s Corp | | Commercial Services | | -48.3% |
| 8 | | Citigroup Inc | | Diversified Financial Services | | -47.2% |
| 9 | | JC Penney Co Inc | | Retail | | -43.1% |
| 10 | | Merrill Lynch & Co Inc | | Diversified Financial Services | | -42.3% |
| | | | | | | |
The list of poor performing companies that hindered the Fund’s return during the calendar year looked like a virtual “who’s who” of global financial mega-giants. The nation’s largest mortgage lender, Countrywide, seemed to be reporting record defaults and loan write-downs with each passing day and turned to Bank of America for a semblance of a “bailout” during the last quarter of the year. Merrill Lynch and Citigroup both gave their top execs their respective walking papers and became beneficiaries of some much needed capital infusions from a handful of foreign government investment arms. As mentioned above, E*Trade suffered from a shift in business model and has since abandoned its wholesale mortgage operation. The seven financial companies cost the Fund over 1.75% during the calendar year.
Background on Fixed Income Securities Strategy
With the weak housing market and the sub-prime mortgage crisis as a back drop, the Fed continued their attempt to bolster the economy by cutting rates. This caused a rising demand for the safe haven in U.S. Government Securities. We assume very little credit and interest rate risk, while structuring a laddered bond portfolio of US Government obligations ranging from three month treasury bills to 10 year notes.
Balanced Fund
MANAGER’S COMMENTARY (continued)
(Unaudited)
Top Ten Equity Holdings as of December 31, 2007
Here are the top ten equity positions at the end of December. These holdings reveal broad diversity of the Fund and make up above 13% of its total assets. Two of our top holdings (Apple Inc. and Archer-Daniels Midland) were also among the best performers for the quarter. Combined they contributed over 0.5% to the Fund’s return and represented about 2% of net assets.
| | | | | | |
| Rank | | Description | | Industry | | % of Net Assets |
| 1 | | Bristol-Myers Squibb Co | | Pharmaceuticals | | 1.9% |
| 2 | | Pfizer Inc | | Pharmaceuticals | | 1.8% |
| 3 | | Bank of America Corp | | Banks | | 1.6% |
| 4 | | US Bancorp | | Banks | | 1.5% |
| 5 | | AT&T Inc | | Telecommunications | | 1.4% |
| 6 | | Wachovia Corp | | Banks | | 1.2% |
| 7 | | Apple Inc | | Computers | | 1.2% |
| 8 | | Cooper Tire & Rubber Co | | Auto Parts & Equipment | | 0.9% |
| 9 | | Nvidia Corp | | Semiconductors | | 0.8% |
| 10 | | Archer-Daniels-Midland Co | | Agriculture | | 0.8% |
| | | | | | | |
| | | | | | 13.1% |
Industry Sector Representation as of December 31, 2007
As of December 31, 2007, equities comprised 57.1% of the Fund, while fixed income securities (mainly government obligations) made up just over 42% of the Fund. The Fund continued to maintain a relatively large weighting in financials (it was our second largest sector), a decision that prompted some losses during both the quarterly and annual time frames and cost us in terms of absolute performance. Still, the models generated some excellent stock picks that propelled the returns into positive territory, while other benchmarks lagged behind.
| | |
Common Stock | | 57.1% |
Basic Materials | | 2.1% |
Communications | | 6.2% |
Consumer, Cyclical | | 3.9% |
Consumer, Non-cyclical | | 13.7% |
Energy | | 5.7% |
Financial | | 12.9% |
Industrial | | 6.0% |
Technology | | 5.4% |
Utilities | | 1.2% |
U.S. Government Obligations | | 40.5% |
Corporate Notes | | 2.3% |
Covered Call Options Written | | -0.6% |
Put Options Written | | -0.5% |
Money Market Funds | | 1.1% |
| | | |
Total | | 100.0% |
| | |
| 102 | | Semi-Annual Report | December 31, 2007 (Unaudited) |
Balanced Fund
MANAGER’S COMMENTARY (continued)
(Unaudited)
Disclaimer
The following is a reminder from the friendly folks at your Fund who worry about liability. The views expressed here are exclusively those of Fund management. These views, including those of market sectors or individual stocks, are not meant as investment advice and should not be considered predictive in nature. Any favorable (or unfavorable) description of a holding applies only as of the quarter end, December 31, 2007, unless otherwise stated. Security positions can and do change thereafter. Discussions of historical performance do not guarantee and are not indicative of future performance.
Market volatility can significantly affect short-term performance. The Fund is not an appropriate investment for short-term investors. Investments in the small companies within this multi-cap fund generally carry greater risk than is customarily associated with larger companies. This additional risk is attributable to a number of factors, including the relatively limited financial resources that are typically available to small companies, and the fact that small companies often have comparatively limited product lines. In addition, the stock of small companies tends to be more volatile than the stock of large companies, particularly in the short term and particularly in the early stages of an economic or market downturn. The Fund’s use of options, futures, and leverage magnifies the risk of loss in an unfavorable market, and the Fund’s use of short-sale positions can, in theory, expose shareholders to unlimited loss. Shareholders of the Fund, therefore, are taking on more risk than they would if they invested in the stock market as a whole. The Fund uses an option writing strategy in which the Fund may sell covered calls or secured put options. Up to 75% of Fund assets may be invested in common stocks and options. Options are subject to special risks and may not fully protect the Fund against declines in the value of its stocks. In addition, an option writing strategy limits the upside profit potential normally associated with stocks. Finally, the Fund’s fixed-income holdings are subject to three types of risk. Interest rate risk is the chance that bond prices overall will decline as interest rates rise. Credit risk is the chance a bond issuer will fail to pay interest and principal. Prepayment risk is the chance a mortgage-backed bond issuer will repay a higher yielding bond, resulting in a lower paying yield.
Conclusion
In closing, we would like to thank you for your continued investment in Balanced Fund. We appreciate your feedback, so please call or write us with any questions or comments. We work for you and value your input.
Sincerely,
Your Investment Management Team
Balanced Fund
SCHEDULE OF INVESTMENTS
Showing percentage of net assets as of December 31, 2007 (Unaudited)
| | | | | | | |
| Industry | | Company | | Shares | | Value |
|
COMMON STOCKS - 55.85% |
Advertising - 0.11% | | | | | |
| | Omnicom Group, Inc. | | 2,000 | | $ | 95,060 |
| | |
Aerospace/Defense - 1.25% | | | | | |
| | Boeing Co. | | 1,100 | | | 96,206 |
| | General Dynamics Corp. | | 1,400 | | | 124,586 |
| | Goodrich Corp.(a) | | 1,800 | | | 127,098 |
| | Lockheed Martin Corp. | | 3,470 | | | 365,252 |
| | Northrop Grumman Corp. | | 2,200 | | | 173,008 |
| | Rockwell Collins, Inc. | | 1,000 | | | 71,970 |
| | United Technologies Corp. | | 1,740 | | | 133,180 |
| | | | | | | |
| | | | | | | 1,091,300 |
| | |
Agriculture - 0.83% | | | | | |
| | Archer-Daniels-Midland Co.(b) | | 15,600 | | | 724,308 |
| | |
Auto Manufacturers - 0.19% | | | | | |
| | Paccar, Inc. | | 3,000 | | | 163,440 |
| | |
Auto Parts & Equipment - 0.98% | | | | | |
| | Cooper Tire & Rubber Co.(b) | | 45,000 | | | 746,100 |
| | Johnson Controls, Inc. | | 2,340 | | | 84,334 |
| | WABCO Holdings, Inc. | | 600 | | | 30,054 |
| | | | | | | |
| | | | | | | 860,488 |
| | |
Banks - 6.79% | | | | | |
| | Bank of America Corp.(b) | | 34,100 | | | 1,406,966 |
| | Bank of New York Mellon Corp.(b) | | 8,032 | | | 391,640 |
| | BB&T Corp.(a) | | 6,500 | | | 199,355 |
| | KeyCorp. | | 5,400 | | | 126,630 |
| | Northern Trust Corp. | | 2,900 | | | 222,082 |
| | Regions Financial Corp.(b) | | 22,200 | | | 525,030 |
| | State Street Corp.(a) | | 3,300 | | | 267,960 |
| | SunTrust Banks, Inc.(a)(b) | | 3,200 | | | 199,968 |
| | Synovus Financial Corp.(b) | | 1,000 | | | 24,080 |
| | US Bancorp(a)(b) | | 40,300 | | | 1,279,122 |
| | Wachovia Corp.(a)(b) | | 27,389 | | | 1,041,604 |
| | Wells Fargo & Co.(a)(b) | | 8,200 | | | 247,558 |
| | | | | | | |
| | | | | | | 5,931,995 |
| | |
Beverages - 1.20% | | | | | |
| | Anheuser-Busch Cos, Inc.(b) | | 2,000 | | | 104,680 |
| | Brown-Forman Corp.(a) | | 2,500 | | | 185,275 |
| | Coca-Cola Co. | | 4,300 | | | 263,891 |
| | Pepsi Bottling Group, Inc. | | 5,200 | | | 205,192 |
| | PepsiCo, Inc. | | 3,800 | | | 288,420 |
| | | | | | | |
| | | | | | | 1,047,458 |
| | |
Biotechnology - 0.42% | | | | | |
| | Biogen Idec, Inc.*(b) | | 2,200 | | | 125,224 |
| | Genzyme Corp.* | | 3,300 | | | 245,652 |
| | | | | | | |
| | | | | | | 370,876 |
| | | | | | | |
| Industry | | Company | | Shares | | Value |
|
|
Chemicals - 1.30% | | | | | |
| | Dow Chemical Co.(b) | | 5,000 | | $ | 197,100 |
| | Monsanto Co.(a)(b) | | 4,700 | | | 524,943 |
| | Sherwin-Williams Co.(a) | | 3,500 | | | 203,140 |
| | Sigma-Aldrich Corp. | | 3,800 | | | 207,480 |
| | | | | | | |
| | | | | | | 1,132,663 |
| | |
Commercial Services - 0.40% | | | | | |
| | Equifax, Inc. | | 2,600 | | | 94,536 |
| | Moody’s Corp.(a) | | 800 | | | 28,560 |
| | Robert Half International, Inc. | | 600 | | | 16,224 |
| | RR Donnelley & Sons Co.(b) | | 2,200 | | | 83,028 |
| | Western Union Co. | | 5,100 | | | 123,828 |
| | | | | | | |
| | | | | | | 346,176 |
| | |
Computers - 2.30% | | | | | |
| | Apple, Inc.*(b) | | 5,200 | | | 1,030,016 |
| | Hewlett-Packard Co.(b) | | 7,800 | | | 393,744 |
| | International Business Machines Corp. | | 1,000 | | | 108,100 |
| | NCR Corp.*(b) | | 6,300 | | | 158,130 |
| | Network Appliance, Inc.* | | 5,800 | | | 144,768 |
| | Teradata Corp.* | | 6,300 | | | 172,683 |
| | | | | | | |
| | | | | | | 2,007,441 |
| | |
Cosmetics/Personal Care - 0.81% | | | | | |
| | Colgate-Palmolive Co.(b) | | 4,400 | | | 343,024 |
| | Estee Lauder Cos, Inc.(b) | | 1,600 | | | 69,776 |
| | Procter & Gamble Co. | | 4,000 | | | 293,680 |
| | | | | | | |
| | | | | | | 706,480 |
| | |
Distribution/Wholesale - 0.05% | | | | | |
| | WW Grainger, Inc. | | 500 | | | 43,760 |
| | |
Diversified Financial Services - 2.72% | | | | | |
| | Ameriprise Financial, Inc.(a) | | 2,780 | | | 153,206 |
| | Bear Stearns Cos, Inc.(b) | | 700 | | | 61,775 |
| | Charles Schwab Corp.(b) | | 16,300 | | | 416,465 |
| | CIT Group, Inc. | | 4,900 | | | 117,747 |
| | Citigroup, Inc.(b) | | 5,100 | | | 150,144 |
| | Discover Financial Services(b) | | 1,550 | | | 23,374 |
| | E*Trade Financial Corp.*(a)(b) | | 11,400 | | | 40,470 |
| | Franklin Resources, Inc.(b) | | 2,800 | | | 320,404 |
| | Goldman Sachs Group, Inc. | | 1,100 | | | 236,555 |
| | Lehman Brothers Holdings, Inc. | | 4,400 | | | 287,936 |
| | Merrill Lynch & Co., Inc.(b) | | 1,600 | | | 85,888 |
| | Morgan Stanley(b) | | 3,100 | | | 164,641 |
| | SLM Corp.(b) | | 810 | | | 16,313 |
| | T Rowe Price Group, Inc.(a) | | 5,000 | | | 304,400 |
| | | | | | | |
| | | | | | | 2,379,318 |
| | |
| 104 | | Semi-Annual Report | December 31, 2007 (Unaudited) |
Balanced Fund
SCHEDULE OF INVESTMENTS (continued)
Showing percentage of net assets as of December 31, 2007 (Unaudited)
| | | | | | | |
| Industry | | Company | | Shares | | Value |
|
Common Stocks (continued) |
Electric - 0.62% | | | | | |
| | AES Corp.*(b) | | 9,600 | | $ | 205,344 |
| | Allegheny Energy, Inc. | | 2,800 | | | 178,108 |
| | Dominion Resources, Inc. | | 1,520 | | | 72,124 |
| | Exelon Corp. | | 1,100 | | | 89,804 |
| | | | | | | |
| | | | | | | 545,380 |
| |
Electrical Components & Equipment - 0.23% | | | |
| | Emerson Electric Co. | | 3,600 | | | 203,976 |
| | |
Electronics - 0.23% | | | | | |
| | Agilent Technologies, Inc.* | | 1,900 | | | 69,806 |
| | Thermo Fisher Scientific, Inc.*(a) | | 2,300 | | | 132,664 |
| | | | | | | |
| | | | | | | 202,470 |
| | |
Engineering & Construction - 0.81% | | | | | |
| | Fluor Corp. | | 800 | | | 116,576 |
| | McDermott International, Inc.*(b) | | 10,000 | | | 590,300 |
| | | | | | | |
| | | | | | | 706,876 |
| | |
Entertainment - 0.07% | | | | | |
| | International Game Technology | | 1,200 | | | 52,716 |
| | |
Environmental Control - 0.07% | | | | | |
| | Allied Waste Industries, Inc.* | | 5,200 | | | 57,304 |
| | |
Food - 0.71% | | | | | |
| | Campbell Soup Co.(a)(b) | | 3,200 | | | 114,336 |
| | Kraft Foods, Inc. | | 3,400 | | | 110,942 |
| | Kroger Co. | | 3,800 | | | 101,498 |
| | Safeway, Inc. | | 8,700 | | | 297,627 |
| | | | | | | |
| | | | | | | 624,403 |
| | |
Forest Products & Paper - 0.17% | | | | | |
| | International Paper Co. | | 4,500 | | | 145,710 |
| | |
Gas - 0.56% | | | | | |
| | Nicor, Inc.(b) | | 2,700 | | | 114,345 |
| | Sempra Energy(b) | | 6,000 | | | 371,280 |
| | | | | | | |
| | | | | | | 485,625 |
| | |
Healthcare - Products - 1.72% | | | | | |
| | Baxter International, Inc.(b) | | 6,500 | | | 377,325 |
| | Becton Dickinson & Co. | | 3,420 | | | 285,844 |
| | CR Bard, Inc. | | 3,700 | | | 350,760 |
| | Medtronic, Inc. | | 1,000 | | | 50,270 |
| | St Jude Medical, Inc.* | | 1,080 | | | 43,891 |
| | Stryker Corp.(b) | | 5,260 | | | 393,027 |
| | | | | | | |
| | | | | | | 1,501,117 |
| | | | | | | |
| Industry | | Company | | Shares | | Value |
|
|
Healthcare - Services - 0.92% | | | | | |
| | Aetna, Inc. | | 2,900 | | $ | 167,417 |
| | Humana, Inc.*(a) | | 3,000 | | | 225,930 |
| | Laboratory Corp. of America Holdings* | | 800 | | | 60,424 |
| | Quest Diagnostics, Inc. | | 2,700 | | | 142,830 |
| | UnitedHealth Group, Inc. | | 3,600 | | | 209,520 |
| | | | | | | |
| | | | | | | 806,121 |
| | |
Home Furnishings - 0.06% | | | | | |
| | Whirlpool Corp. | | 600 | | | 48,978 |
| | |
Household Products/Wares - 0.33% | | | | | |
| | Clorox Co. | | 1,530 | | | 99,710 |
| | Kimberly-Clark Corp. | | 2,700 | | | 187,218 |
| | | | | | | |
| | | | | | | 286,928 |
| | |
Housewares - 0.09% | | | | | |
| | Newell Rubbermaid, Inc. | | 2,900 | | | 75,052 |
| | |
Insurance - 3.11% | | | | | |
| | ACE, Ltd. | | 1,400 | | | 86,492 |
| | Aflac, Inc. | | 800 | | | 50,104 |
| | Allstate Corp. | | 1,000 | | | 52,230 |
| | AON Corp.(a) | | 3,500 | | | 166,915 |
| | Berkshire Hathaway, Inc., Class B* | | 120 | | | 568,320 |
| | Chubb Corp. | | 4,500 | | | 245,610 |
| | CIGNA Corp. | | 2,700 | | | 145,071 |
| | Genworth Financial, Inc.(b) | | 2,600 | | | 66,170 |
| | Hartford Financial Services Group, Inc. | | 900 | | | 78,471 |
| | MetLife, Inc. | | 4,600 | | | 283,452 |
| | Principal Financial Group, Inc. | | 4,700 | | | 323,548 |
| | Progressive Corp.(b) | | 5,520 | | | 105,763 |
| | Prudential Financial, Inc. | | 1,200 | | | 111,648 |
| | Safeco Corp. | | 3,420 | | | 190,426 |
| | Travelers Cos, Inc. | | 4,500 | | | 242,100 |
| | | | | | | |
| | | | | | | 2,716,320 |
| | |
Internet - 0.76% | | | | | |
| | eBay, Inc.*(a)(b) | | 6,900 | | | 229,011 |
| | Google, Inc.* | | 600 | | | 414,888 |
| | Yahoo!, Inc.* | | 1,000 | | | 23,260 |
| | | | | | | |
| | | | | | | 667,159 |
| | |
Iron/Steel - 0.19% | | | | | |
| | United States Steel Corp. | | 1,400 | | | 169,274 |
| | |
Leisure Time - 0.15% | | | | | |
| | Harley-Davidson, Inc. | | 2,900 | | | 135,459 |
Balanced Fund
SCHEDULE OF INVESTMENTS (continued)
Showing percentage of net assets as of December 31, 2007 (Unaudited)
| | | | | | | |
| Industry | | Company | | Shares | | Value |
|
Common Stocks (continued) |
Lodging - 0.12% | | | | | |
| | Marriott International, Inc.(b) | | 3,000 | | $ | 102,540 |
| |
Machinery - Construction & Mining - 0.12% | | | |
| | Terex Corp.* | | 1,600 | | | 104,912 |
| | |
Machinery - Diversified - 0.11% | | | | | |
| | Deere & Co. | | 1,000 | | | 93,120 |
| | |
Media - 1.46% | | | | | |
| | CBS Corp.(b) | | 5,000 | | | 136,250 |
| | Comcast Corp.*(b) | | 10,950 | | | 199,947 |
| | McGraw-Hill Cos, Inc.(a) | | 4,000 | | | 175,240 |
| | News Corp. | | 14,000 | | | 286,860 |
| | Time Warner, Inc.(a) | | 15,900 | | | 262,509 |
| | Walt Disney Co. | | 6,700 | | | 216,276 |
| | | | | | | |
| | | | | | | 1,277,082 |
| | |
Mining - 0.43% | | | | | |
| | Alcoa, Inc.(b) | | 1,600 | | | 58,480 |
| | Southern Copper Corp.(b) | | 2,100 | | | 220,773 |
| | Vulcan Materials Co.(a) | | 1,200 | | | 94,908 |
| | | | | | | |
| | | | | | | 374,161 |
| | |
Miscellaneous Manufacturing - 2.24% | | | | | |
| | Cooper Industries, Ltd. | | 5,200 | | | 274,976 |
| | Danaher Corp. | | 3,400 | | | 298,316 |
| | Eaton Corp. | | 2,200 | | | 213,290 |
| | General Electric Co. | | 4,900 | | | 181,643 |
| | Honeywell International, Inc. | | 3,900 | | | 240,123 |
| | Illinois Tool Works, Inc.(a) | | 2,000 | | | 107,080 |
| | Parker Hannifin Corp.(b) | | 4,350 | | | 327,598 |
| | Textron, Inc. | | 4,400 | | | 313,720 |
| | | | | | | |
| | | | | | | 1,956,746 |
Office/Business Equipment - 0.07% |
| | Pitney Bowes, Inc.(a) | | 1,600 | | | 60,864 |
|
Oil & Gas - 4.39% |
| | Anadarko Petroleum Corp.(b) | | 4,200 | | | 275,898 |
| | Apache Corp. | | 2,400 | | | 258,096 |
| | Chevron Corp.(b) | | 3,878 | | | 361,934 |
| | ConocoPhillips(b) | | 5,487 | | | 484,502 |
| | EOG Resources, Inc. | | 2,400 | | | 214,200 |
| | Exxon Mobil Corp.(a)(b) | | 5,400 | | | 505,926 |
| | Hess Corp. | | 3,060 | | | 308,632 |
| | Marathon Oil Corp.(b) | | 5,800 | | | 352,988 |
| | Nabors Industries, Ltd.* | | 6,800 | | | 186,252 |
| | Occidental Petroleum Corp.(b) | | 5,300 | | | 408,047 |
| | Rowan Cos, Inc. | | 1,200 | | | 47,352 |
| | Sunoco, Inc.(b) | | 2,400 | | | 173,856 |
| | Valero Energy Corp. | | 3,700 | | | 259,111 |
| | | | | | | |
| | | | | | | 3,836,794 |
| | | | | | | |
| Industry | | Company | | Shares | | Value |
|
|
Oil & Gas Services - 0.84% |
| | Baker Hughes, Inc.(b) | | 1,200 | | $ | 97,320 |
| | Halliburton Co.(a)(b) | | 11,000 | | | 417,010 |
| | National Oilwell Varco, Inc.*(a) | | 3,000 | | | 220,380 |
| | | | | | | |
| | | | | | | 734,710 |
|
Packaging & Containers - 0.06% |
| | Pactiv Corp.* | | 2,100 | | | 55,923 |
|
Pharmaceuticals - 6.05% |
| | Allergan, Inc. | | 3,800 | | | 244,112 |
| | Bristol-Myers Squibb Co.(a)(b) | | 62,400 | | | 1,654,848 |
| | Cardinal Health, Inc.(b) | | 2,100 | | | 121,275 |
| | Express Scripts, Inc.*(b) | | 4,400 | | | 321,200 |
| | Gilead Sciences, Inc.*(b) | | 9,800 | | | 450,898 |
| | Hospira, Inc.* | | 7,700 | | | 328,328 |
| | King Pharmaceuticals, Inc.*(b) | | 5,500 | | | 56,320 |
| | Medco Health Solutions, Inc.* | | 3,500 | | | 354,900 |
| | Merck & Co., Inc.(b) | | 3,700 | | | 215,007 |
| | Pfizer, Inc.(b) | | 67,600 | | | 1,536,548 |
| | | | | | | |
| | | | | | | 5,283,436 |
|
Pipelines - 0.25% |
| | El Paso Corp. | | 5,000 | | | 86,200 |
| | Spectra Energy Corp. | | 5,250 | | | 135,555 |
| | | | | | | |
| | | | | | | 221,755 |
|
Retail - 2.09% |
| | Autozone, Inc.*(a) | | 1,700 | | | 203,847 |
| | Bed Bath & Beyond, Inc.* | | 2,020 | | | 59,368 |
| | Circuit City Stores, Inc.(b) | | 900 | | | 3,780 |
| | Coach, Inc.* | | 4,600 | | | 140,668 |
| | Costco Wholesale Corp. | | 1,000 | | | 69,760 |
| | CVS Caremark Corp. | | 7,000 | | | 278,250 |
| | Dillard’s, Inc.(b) | | 6,200 | | | 116,436 |
| | JC Penney Co., Inc.(a)(b) | | 2,000 | | | 87,980 |
| | Limited Brands, Inc.(b) | | 4,400 | | | 83,292 |
| | Nordstrom, Inc.(a)(b) | | 5,000 | | | 183,650 |
| | Office Depot, Inc.*(b) | | 4,300 | | | 59,813 |
| | OfficeMax, Inc. | | 1,500 | | | 30,990 |
| | Sears Holdings Corp.*(a) | | 1,200 | | | 122,460 |
| | Staples, Inc.(a) | | 3,950 | | | 91,126 |
| | Starbucks Corp.* | | 3,700 | | | 75,739 |
| | Wal-Mart Stores, Inc. | | 2,600 | | | 123,578 |
| | Walgreen Co.(b) | | 2,500 | | | 95,200 |
| | | | | | | |
| | | | | | | 1,825,937 |
|
Semiconductors - 1.35% |
| | Applied Materials, Inc.(b) | | 10,700 | | | 190,032 |
| | NVIDIA Corp.*(a)(b) | | 21,300 | | | 724,626 |
| | Texas Instruments, Inc.(a) | | 8,070 | | | 269,538 |
| | | | | | | |
| | | | | | | 1,184,196 |
| | |
| 106 | | Semi-Annual Report | December 31, 2007 (Unaudited) |
Balanced Fund
SCHEDULE OF INVESTMENTS (continued)
Showing percentage of net assets as of December 31, 2007 (Unaudited)
| | | | | | | |
| Industry | |
Company | | Shares | | Value |
|
Common Stocks (continued) |
Software - 1.62% |
| | Adobe Systems, Inc.*(b) | | 7,000 | | $ | 299,110 |
| | Automatic Data Processing, Inc. | | 3,700 | | | 164,761 |
| | BMC Software, Inc.* | | 3,920 | | | 139,709 |
| | Citrix Systems, Inc.* | | 4,300 | | | 163,443 |
| | IMS Health, Inc.(b) | | 2,800 | | | 64,512 |
| | Intuit, Inc.* | | 5,600 | | | 177,016 |
| | Novell, Inc.* | | 5,400 | | | 37,098 |
| | Oracle Corp.* | | 11,860 | | | 267,799 |
| | Paychex, Inc. | | 2,900 | | | 105,038 |
| | | | | | | |
| | | | | | | 1,418,486 |
|
Telecommunications - 3.70% |
| | AT&T, Inc.(b) | | 28,700 | | | 1,192,772 |
| | Ciena Corp.*(a)(b) | | 5,942 | | | 202,682 |
| | Cisco Systems, Inc.*(b) | | 14,900 | | | 403,343 |
| | Citizens Communications Co. | | 8,800 | | | 112,024 |
| | Corning, Inc. | | 11,200 | | | 268,688 |
| | Embarq Corp. | | 385 | | | 19,069 |
| | Motorola, Inc. | | 5,300 | | | 85,012 |
| | Qualcomm, Inc. | | 5,300 | | | 208,555 |
| | Sprint Nextel Corp.(a)(b) | | 12,800 | | | 168,064 |
| | Tellabs, Inc.*(b) | | 9,400 | | | 61,476 |
| | Verizon Communications, Inc.(b) | | 11,100 | | | 484,959 |
| | Windstream Corp. | | 1,964 | | | 25,571 |
| | | | | | | |
| | | | | | | 3,232,215 |
|
Toys/Games/Hobbies - 0.05% |
| | Mattel, Inc. | | 2,200 | | | 41,888 |
|
Transportation - 0.75% |
| | CSX Corp.(b) | | 5,400 | | | 237,492 |
| | Norfolk Southern Corp. | | 1,900 | | | 95,836 |
| | Union Pacific Corp. | | 1,400 | | | 175,868 |
| | United Parcel Service, Inc. | | 2,100 | | | 148,512 |
| | | | | | | |
| | | | | | | 657,708 |
| | | | | | | |
| |
TOTAL COMMON STOCKS | | | 48,794,104 |
| | | | | | | |
(Cost $38,017,603) | | | | | |
| | | | | | | | |
|
CORPORATE NOTES - 2.29% |
| | | |
| Due Date | | Discount Rate
or Coupon Rate | | Principal
Amount | | Value |
Holding Companies - Diversified - 2.29% |
| | Leucadia National Corp.
8/15/2013 7.750% | | $ | 2,000,000 | | $ | 1,997,500 |
| | | | | | | | |
| |
TOTAL CORPORATE NOTES | | | 1,997,500 |
| | | | | | | | |
(Cost $2,062,766) | | | |
| | | | | | | | |
| Due Date | | Discount Rate
or Coupon Rate | | Principal
Amount | | Value |
|
U.S. GOVERNMENT OBLIGATIONS - 39.66% |
U.S. Treasury Bill - 23.27% |
1/10/2008 | | 3.897% | | $ | 2,000,000 | | $ | 1,998,914 |
2/7/2008 | | 4.251% | | | 5,500,000 | | | 5,484,050 |
4/10/2008 | | 4.092% | | | 2,000,000 | | | 1,982,400 |
5/1/2008 | | 3.955% | | | 3,000,000 | | | 2,967,699 |
5/8/2008 | | 3.784% | | | 2,000,000 | | | 1,977,140 |
5/22/2008 | | 3.443% | | | 4,000,000 | | | 3,948,768 |
6/12/2008 | | 3.190% | | | 2,000,000 | | | 1,970,570 |
| | | | | | | | |
| | | | | | | | 20,329,541 |
|
U.S. Treasury Notes - 16.39% |
1/31/2008 | | 4.375% | | | 3,000,000 | | | 3,003,282 |
2/15/2008 | | 3.375% | | | 300,000 | | | 300,023 |
8/31/2008 | | 4.875% | | | 300,000 | | | 302,625 |
10/15/2008 | | 3.125% | | | 200,000 | | | 199,656 |
11/15/2008 | | 3.375% | | | 200,000 | | | 199,984 |
4/15/2009 | | 3.125% | | | 300,000 | | | 300,141 |
4/30/2009 | | 4.500% | | | 300,000 | | | 305,414 |
6/15/2009 | | 4.000% | | | 300,000 | | | 303,914 |
8/15/2009 | | 3.500% | | | 200,000 | | | 201,328 |
10/15/2009 | | 3.375% | | | 300,000 | | | 301,852 |
11/15/2009 | | 3.500% | | | 200,000 | | | 201,766 |
11/30/2009 | | 3.125% | | | 300,000 | | | 300,328 |
12/31/2009 | | 3.250% | | | 200,000 | | | 200,688 |
2/15/2010 | | 3.500% | | | 300,000 | | | 302,602 |
4/15/2010 | | 4.000% | | | 300,000 | | | 306,094 |
6/15/2010 | | 3.625% | | | 500,000 | | | 506,836 |
7/15/2010 | | 3.875% | | | 500,000 | | | 510,156 |
10/15/2010 | | 4.250% | | | 500,000 | | | 515,976 |
3/31/2011 | | 4.750% | | | 1,000,000 | | | 1,049,062 |
4/30/2011 | | 4.875% | | | 2,000,000 | | | 2,106,562 |
7/31/2011 | | 4.875% | | | 1,000,000 | | | 1,055,312 |
8/31/2011 | | 4.625% | | | 300,000 | | | 314,063 |
4/30/2012 | | 4.500% | | | 300,000 | | | 313,383 |
11/30/2012 | | 3.375% | | | 300,000 | | | 298,992 |
12/31/2012 | | 3.625% | | | 200,000 | | | 201,500 |
11/15/2013 | | 4.250% | | | 200,000 | | | 207,359 |
2/15/2015 | | 4.000% | | | 200,000 | | | 202,828 |
5/15/2017 | | 4.500% | | | 300,000 | | | 310,945 |
| | | | | | | | |
| | | | | | | | 14,322,671 |
| | | | | | | | |
| |
TOTAL U.S. GOVERNMENT OBLIGATIONS | | | 34,652,212 |
| | | | | | | | |
(Cost $34,264,940) | | | |
Balanced Fund
SCHEDULE OF INVESTMENTS (continued)
Showing percentage of net assets as of December 31, 2007 (Unaudited)
| | | | | | | |
|
MONEY MARKET FUNDS - 1.12% |
| | | |
| | | Rate^ | | Shares | | Value |
BlackRock TempCash
Liquidity Fund,
Institutional Shares #21 | | 4.78% | | 975,523 | | $ | 975,523 |
| | | | | | | |
| |
TOTAL MONEY MARKET FUNDS | | | 975,523 |
| | | | | | | |
(Cost $975,523) | | | |
| |
TOTAL INVESTMENTS - 98.92% | | $ | 86,419,339 |
(Cost $75,320,832) | | | | | | | |
Other Assets in Excess of Liabilities - 1.08% | | | 944,314 |
| | | | | | | |
NET ASSETS - 100.00% | | $ | 87,363,653 |
| | | | | | | |
| * | Non-income producing security. |
| ^ | Rate disclosed is as of December 31, 2007. |
| (a) | This security or a portion of the security is out on loan at December 31, 2007. Total loaned securities had a market value of $10,431,389 at December 31, 2007. |
| (b) | Security subject to call option written by the Fund. |
See Notes to Financial Statements.
| | |
| 108 | | Semi-Annual Report | December 31, 2007 (Unaudited) |
Balanced Fund
SCHEDULE OF OPTIONS WRITTEN
Showing percentage of net assets as of December 31, 2007 (Unaudited)
| | | | | | |
| Company | | Number
of Contracts | | Value | |
| | |
COVERED CALL OPTIONS WRITTEN | | | | | | |
Adobe Systems, Inc. | | | | | | |
Expiring April, 2008 at $45.00 | | 30 | | $ | (6,000 | ) |
AES Corp. | | | | | | |
Expiring January, 2008 at $22.50 | | 45 | | | (675 | ) |
Alcoa, Inc. | | | | | | |
Expiring January, 2008 at $42.50 | | 8 | | | (100 | ) |
Anadarko Petroleum Corp. | | | | | | |
Expiring February, 2008 at $60.00 | | 11 | | | (7,590 | ) |
Anheuser-Busch Cos, Inc. | | | | | | |
Expiring January, 2008 at $55.00 | | 10 | | | (200 | ) |
Apple, Inc. | | | | | | |
Expiring January, 2008 at $200.00 | | 15 | | | (12,375 | ) |
Applied Materials, Inc. | | | | | | |
Expiring January, 2008 at $20.00 | | 50 | | | (375 | ) |
Archer-Daniels-Midland Co. | | | | | | |
Expiring January, 2008 at $40.00 | | 100 | | | (67,000 | ) |
AT&T, Inc. | | | | | | |
Expiring January, 2008 at $45.00 | | 100 | | | (600 | ) |
Expiring January, 2008 at $42.50 | | 122 | | | (5,429 | ) |
Baker Hughes, Inc. | | | | | | |
Expiring January, 2008 at $100.00 | | 6 | | | (15 | ) |
Bank of America Corp. | | | | | | |
Expiring January, 2008 at $45.00 | | 21 | | | (157 | ) |
Expiring January, 2008 at $50.00 | | 50 | | | (125 | ) |
Expiring January, 2008 at $47.50 | | 270 | | | (675 | ) |
Bank of New York Mellon Corp. | | | | | | |
Expiring March, 2008 at $50.00 | | 40 | | | (10,000 | ) |
Baxter International, Inc. | | | | | | |
Expiring January, 2008 at $60.00 | | 15 | | | (825 | ) |
Bear Stearns Cos, Inc. | | | | | | |
Expiring January, 2008 at $105.00 | | 7 | | | (140 | ) |
Biogen Idec, Inc. | | | | | | |
Expiring January, 2008 at $80.00 | | 10 | | | (75 | ) |
Bristol-Myers Squibb Co. | | | | | | |
Expiring March, 2008 at $30.00 | | 100 | | | (2,300 | ) |
Expiring January, 2008 at $30.00 | | 138 | | | (414 | ) |
Campbell Soup Co. | | | | | | |
Expiring February, 2008 at $37.50 | | 15 | | | (825 | ) |
Cardinal Health, Inc. | | | | | | |
Expiring January, 2008 at $70.00 | | 10 | | | (25 | ) |
CBS Corp. | | | | | | |
Expiring March, 2008 at $27.50 | | 50 | | | (6,625 | ) |
Charles Schwab Corp. | | | | | | |
Expiring March, 2008 at $25.00 | | 50 | | | (10,125 | ) |
Chevron Corp. | | | | | | |
Expiring March, 2008 at $90.00 | | 10 | | | (6,550 | ) |
Ciena Corp. | | | | | | |
Expiring January, 2008 at $50.00 | | 30 | | | (75 | ) |
| | | | | | |
| Company | | Number
of Contracts | | Value | |
|
| |
Circuit City Stores, Inc. | | | | | | |
Expiring January, 2008 at $12.50 | | 9 | | $ | (22 | ) |
Cisco Systems, Inc. | | | | | | |
Expiring April, 2008 at $30.00 | | 35 | | | (3,343 | ) |
Citigroup, Inc. | | | | | | |
Expiring January, 2008 at $45.00 | | 26 | | | (13 | ) |
Colgate-Palmolive Co. | | | | | | |
Expiring January, 2008 at $80.00 | | 14 | | | (490 | ) |
Comcast Corp. | | | | | | |
Expiring January, 2008 at $17.50 | | 109 | | | (20,438 | ) |
ConocoPhillips | | | | | | |
Expiring February, 2008 at $85.00 | | 15 | | | (8,663 | ) |
Cooper Tire & Rubber Co. | | | | | | |
Expiring January, 2008 at $15.00 | | 350 | | | (65,625 | ) |
Expiring January, 2008 at $22.50 | | 100 | | | (250 | ) |
CSX Corp. | | | | | | |
Expiring January, 2008 at $50.00 | | 12 | | | (90 | ) |
Dillards, Inc. | | | | | | |
Expiring January, 2008 at $20.00 | | 62 | | | (3,100 | ) |
Discover Financial Services | | | | | | |
Expiring January, 2008 at $17.50 | | 15 | | | (187 | ) |
Dow Chemical Co. | | | | | | |
Expiring March, 2008 at $45.00 | | 50 | | | (2,375 | ) |
E*trade Financial Corp. | | | | | | |
Expiring January, 2008 at $12.50 | | 57 | | | (142 | ) |
Expiring January, 2008 at $15.00 | | 57 | | | (142 | ) |
eBay, Inc. | | | | | | |
Expiring January, 2008 at $45.00 | | 35 | | | (87 | ) |
Estee Lauder Cos, Inc. | | | | | | |
Expiring January, 2008 at $45.00 | | 16 | | | (1,080 | ) |
Express Scripts, Inc. | | | | | | |
Expiring January, 2008 at $70.00 | | 22 | | | (8,580 | ) |
Exxon Mobil Corp. | | | | | | |
Expiring January, 2008 at $100.00 | | 13 | | | (228 | ) |
Expiring April, 2008 at $100.00 | | 12 | | | (3,300 | ) |
Franklin Resources, Inc. | | | | | | |
Expiring January, 2008 at $140.00 | | 7 | | | (52 | ) |
Genworth Financial, Inc. | | | | | | |
Expiring March, 2008 at $30.00 | | 12 | | | (660 | ) |
Gilead Sciences, Inc. | | | | | | |
Expiring February, 2008 at $50.00 | | 25 | | | (1,750 | ) |
Halliburton Co. | | | | | | |
Expiring April, 2008 at $40.00 | | 30 | | | (5,250 | ) |
Hewlett-Packard Co. | | | | | | |
Expiring January, 2008 at $55.00 | | 20 | | | (150 | ) |
IMS Health, Inc. | | | | | | |
Expiring January, 2008 at $25.00 | | 18 | | | (270 | ) |
JC Penney Co., Inc. | | | | | | |
Expiring January, 2008 at $75.00 | | 10 | | | (25 | ) |
Balanced Fund
SCHEDULE OF OPTIONS WRITTEN (continued)
Showing percentage of net assets as of December 31, 2007 (Unaudited)
| | | | | | |
| Company | | Number
of Contracts | | Value | |
|
Covered Call Options Written (continued) | |
King Pharmaceuticals, Inc. | | | | | | |
Expiring January, 2008 at $10.00 | | 30 | | $ | (2,325 | ) |
Limited Brands, Inc. | | | | | | |
Expiring February, 2008 at $17.50 | | 24 | | | (5,340 | ) |
Expiring January, 2008 at $22.50 | | 20 | | | (200 | ) |
Marathon Oil Corp. | | | | | | |
Expiring January, 2008 at $65.00 | | 15 | | | (638 | ) |
Expiring April, 2008 at $60.00 | | 15 | | | (8,100 | ) |
Marriott International, Inc. | | | | | | |
Expiring January, 2008 at $45.00 | | 15 | | | (75 | ) |
Expiring April, 2008 at $40.00 | | 15 | | | (1,463 | ) |
McDermott International, Inc. | | | | | | |
Expiring February, 2008 at $60.00 | | 75 | | | (27,375 | ) |
Expiring January, 2008 at $52.50 | | 25 | | | (17,875 | ) |
Merck & Co., Inc. | | | | | | |
Expiring January, 2008 at $60.00 | | 10 | | | (475 | ) |
Merrill Lynch & Co., Inc. | | | | | | |
Expiring January, 2008 at $80.00 | | 16 | | | (40 | ) |
Monsanto Co. | | | | | | |
Expiring January, 2008 at $110.00 | | 12 | | | (7,260 | ) |
Morgan Stanley | | | | | | |
Expiring January, 2008 at $55.00 | | 31 | | | (3,255 | ) |
NCR Corp. | | | | | | |
Expiring January, 2008 at $25.00 | | 25 | | | (1,938 | ) |
Expiring April, 2008 at $25.00 | | 38 | | | (7,600 | ) |
Nicor Inc. | | | | | | |
Expiring April, 2008 at $45.00 | | 12 | | | (1,350 | ) |
Nordstrom, Inc. | | | | | | |
Expiring April, 2008 at $40.00 | | 25 | | | (6,063 | ) |
NVIDIA Corp. | | | | | | |
Expiring March, 2008 at $37.50 | | 50 | | | (10,250 | ) |
Expiring January, 2008 at $40.00 | | 35 | | | (525 | ) |
Occidental Petroleum Corp. | | | | | | |
Expiring February, 2008 at $75.00 | | 20 | | | (10,400 | ) |
Office Depot, Inc. | | | | | | |
Expiring January, 2008 at $20.00 | | 43 | | | (107 | ) |
Parker Hannifan Corp. | | | | | | |
Expiring January, 2008 at $85.00 | | 10 | | | (275 | ) |
Pfizer, Inc. | | | | | | |
Expiring January, 2008 at $25.00 | | 70 | | | (525 | ) |
Expiring March, 2008 at $25.00 | | 300 | | | (8,250 | ) |
Progressive Corp. | | | | | | |
Expiring February, 2008 at $20.00 | | 25 | | | (1,625 | ) |
Regions Financial Corp. | | | | | | |
Expiring February, 2008 at $25.00 | | 192 | | | (26,400 | ) |
RR Donnelley & Sons Co. | | | | | | |
Expiring January, 2008 at $40.00 | | 11 | | | (220 | ) |
| | | | | | |
| Company | | Number
of Contracts | | Value | |
|
| |
Sempra Energy | | | | | | |
Expiring January, 2008 at $65.00 | | 15 | | $ | (187 | ) |
SLM Corp. | | | | | | |
Expiring April, 2008 at $30.00 | | 8 | | | (380 | ) |
Southern Copper Corp. | | | | | | |
Expiring January, 2008 at $110.00 | | 21 | | | (5,250 | ) |
Sprint Nextel Corp. | | | | | | |
Expiring January, 2008 at $17.50 | | 75 | | | (188 | ) |
Stryker Corp. | | | | | | |
Expiring March, 2008 at $75.00 | | 20 | | | (7,500 | ) |
Sunoco, Inc. | | | | | | |
Expiring February, 2008 at $65.00 | | 24 | | | (21,120 | ) |
SunTrust Banks, Inc. | | | | | | |
Expiring February, 2008 at $65.00 | | 32 | | | (5,920 | ) |
Synovus Financial Corp. | | | | | | |
Expiring January, 2008 at $25.00 | | 10 | | | (525 | ) |
Tellabs, Inc. | | | | | | |
Expiring January, 2008 at $10.00 | | 50 | | | (125 | ) |
US Bancorp | | | | | | |
Expiring January, 2008 at $32.50 | | 81 | | | (4,253 | ) |
Expiring March, 2008 at $25.00 | | 100 | | | (14,250 | ) |
Verizon Communications, Inc. | | | | | | |
Expiring January, 2008 at $47.50 | | 9 | | | (67 | ) |
Expiring February, 2008 at $45.00 | | 25 | | | (2,750 | ) |
Wachovia Corp. | | | | | | |
Expiring January, 2008 at $45.00 | | 73 | | | (913 | ) |
Expiring January, 2008 at $47.50 | | 100 | | | (750 | ) |
Expiring February, 2008 at $40.00 | | 100 | | | (14,750 | ) |
Walgreen Co. | | | | | | |
Expiring January, 2008 at $42.50 | | 13 | | | (97 | ) |
Wells Fargo & Co. | | | | | | |
Expiring January, 2008 at $32.50 | | 82 | | | (2,050 | ) |
| | | | | | |
| |
TOTAL COVERED CALL OPTIONS WRITTEN | | | (496,631 | ) |
| | | | | | |
(Cost $(693,712)) | | | | | | |
| | |
| 110 | | Semi-Annual Report | December 31, 2007 (Unaudited) |
Balanced Fund
SCHEDULE OF OPTIONS WRITTEN (continued)
Showing percentage of net assets as of December 31, 2007 (Unaudited)
| | | | | | |
| Company | | Number
of Contracts | | Value | |
| | |
PUT OPTIONS WRITTEN | | | | | | |
AGCO Corp. | | | | | | |
Expiring January, 2008 at $65.00 | | 150 | | $ | (22,875 | ) |
AT&T, Inc. | | | | | | |
Expiring January, 2008 at $40.00 | | 50 | | | (2,550 | ) |
Bristol-Myers Squibb Co. | | | | | | |
Expiring January, 2008 at $27.50 | | 100 | | | (14,500 | ) |
CBC Corp. | | | | | | |
Expiring January, 2008 at $27.50 | | 100 | | | (7,750 | ) |
CBS Corp. | | | | | | |
Expiring January, 2008 at $25.00 | | 100 | | | (1,000 | ) |
Citigroup, Inc. | | | | | | |
Expiring January, 2008 at $30.00 | | 250 | | | (37,125 | ) |
Deckers Outdoor Corp. | | | | | | |
Expiring January, 2008 at $150.00 | | 100 | | | (45,000 | ) |
Dow Chemical Co. | | | | | | |
Expiring January, 2008 at $40.00 | | 250 | | | (33,125 | ) |
Intuitive Surgery Inc. | | | | | | |
Expiring January, 2008 at $300.00 | | 30 | | | (14,700 | ) |
Expiring January, 2008 at $250.00 | | 25 | | | (1,187 | ) |
Invitrogen Corp. | | | | | | |
Expiring February, 2008 at $90.00 | | 40 | | | (10,800 | ) |
Expiring January, 2008 at $90.00 | | 40 | | | (4,100 | ) |
Expiring January, 2008 at $85.00 | | 80 | | | (2,400 | ) |
McDermott International, Inc. | | | | | | |
Expiring January, 2008 at $50.00 | | 100 | | | (2,000 | ) |
Expiring February, 2008 at $57.50 | | 50 | | | (15,125 | ) |
Mosaic Co. | | | | | | |
Expiring January, 2008 at $85.00 | | 40 | | | (8,700 | ) |
Expiring January, 2008 at $55.00 | | 150 | | | (375 | ) |
Expiring February, 2008 at $85.00 | | 40 | | | (18,000 | ) |
Onyx Pharmaceuticals, Inc. | | | | | | |
Expiring January, 2008 at $55.00 | | 75 | | | (15,188 | ) |
Expiring January, 2008 at $50.00 | | 69 | | | (4,140 | ) |
OSI Pharmaceuticals, Inc. | | | | | | |
Expiring January, 2008 at $50.00 | | 100 | | | (26,250 | ) |
Expiring February, 2008 at $50.00 | | 100 | | | (37,500 | ) |
Owens-Illinois, Inc. | | | | | | |
Expiring January, 2008 at $40.00 | | 150 | | | (375 | ) |
Perrigo Co. | | | | | | |
Expiring January, 2008 at $30.00 | | 7 | | | (70 | ) |
Expiring February, 2008 at $30.00 | | 50 | | | (1,750 | ) |
Pfizer, Inc. | | | | | | |
Expiring March, 2008 at $22.50 | | 100 | | | (9,250 | ) |
| | | | | | |
| Company | | Number
of Contracts | | Value | |
|
| |
Potash Corp. of Saskatchewan | | | | | | |
Expiring January, 2008 at $125.00 | | 30 | | $ | (3,450 | ) |
Expiring January, 2008 at $115.00 | | 40 | | | (1,300 | ) |
Priceline.com, Inc. | | | | | | |
Expiring January, 2008 at $110.00 | | 75 | | | (20,063 | ) |
Expiring February, 2008 at $110.00 | | 62 | | | (47,430 | ) |
Research In Motion | | | | | | |
Expiring January, 2008 at $110.00 | | 25 | | | (9,250 | ) |
Southern Copper Corp. | | | | | | |
Expiring January, 2008 at $100.00 | | 60 | | | (12,900 | ) |
Sunpower Corp. | | | | | | |
Expiring January, 2008 at $100.00 | | 50 | | | (1,500 | ) |
Verizon Communications, Inc. | | | | | | |
Expiring January, 2008 at $42.50 | | 150 | | | (9,750 | ) |
| | | | | | |
| | |
TOTAL PUT OPTIONS WRITTEN | | | | | (441,478 | ) |
| | | | | | |
(Cost $(751,571)) | | | | | | |
| | |
TOTAL OPTIONS WRITTEN | | | | $ | (938,109 | ) |
| | | | | | |
(Premiums received $1,445,283) | | | | | | |
See Notes to Financial Statements.
STATEMENTS OF ASSETS AND LIABILITIES
December 31, 2007 (Unaudited)
| | | | | | | | | | | | | | | |
| ASSETS | | Aggressive
Investors 1 | | | Aggressive
Investors 2 | | | Ultra-Small
Company | | | Ultra-Small
Company Market |
| | | | |
Unaffiliated investments at value | | $ | 383,859,620 | | | $ | 836,175,352 | | | $ | 120,642,662 | | | $ | 979,281,969 |
Affiliated investments at value | | | - | | | | - | | | | - | | | | 4,637,125 |
| | | | | | | | | | | | | | | | |
Total Investments at value | | | 383,859,620 | | | | 836,175,352 | | | | 120,642,662 | | | | 983,919,094 |
| | | | | | | | | | | | | | | | |
Cash | | | - | | | | - | | | | - | | | | 316 |
Receivables | | | | | | | | | | | | | | | |
Due from custodian | | | - | | | | 11,210,589 | | | | - | | | | - |
Reclaims receivable | | | 1,406 | | | | 2,113 | | | | - | | | | - |
Portfolio securities sold | | | 2,616,098 | | | | - | | | | - | | | | 3,961,528 |
Fund shares sold | | | 725,044 | | | | 5,423,200 | | | | - | | | | 2,583,905 |
Dividends and interest | | | 121,376 | | | | 206,128 | | | | 37,235 | | | | 1,362,414 |
From investment adviser | | | - | | | | - | | | | - | | | | - |
Deposits with brokers | | | - | | | | - | | | | - | | | | - |
Total return swaps | | | 128,463 | | | | - | | | | - | | | | - |
Prepaid expenses | | | 31,629 | | | | 42,478 | | | | 5,755 | | | | 52,749 |
| | | | | | | | | | | | | | | | |
Total assets | | | 387,483,636 | | | | 853,059,860 | | | | 120,685,652 | | | | 991,880,006 |
| | | | | | | | | | | | | | | | |
| | | | |
LIABILITIES | | | | | | | | | | | | | | | |
Payables | | | | | | | | | | | | | | | |
Due to Custodian | | | 11,235,126 | | | | - | | | | - | | | | - |
Payable for investments purchased | | | - | | | | 15,487,472 | | | | 968,961 | | | | 9,369,850 |
Fund shares redeemed | | | 316,421 | | | | 330,148 | | | | 9,980 | | | | 3,681,760 |
Covered call options written at value | | | - | | | | - | | | | - | | | | - |
Put options written at value | | | - | | | | - | | | | - | | | | - |
Total return swap | | | - | | | | - | | | | - | | | | - |
Accrued Liabilities | | | | | | | | | | | | | | | |
Investment adviser fees | | | 920,725 | | | | 832,644 | | | | 91,532 | | | | 422,624 |
Administration fees | | | 5,555 | | | | 11,261 | | | | 1,778 | | | | 15,165 |
Other | | | 102,329 | | | | 118,444 | | | | 24,816 | | | | 156,514 |
| | | | | | | | | | | | | | | | |
Total liabilities | | | 12,580,156 | | | | 16,779,969 | | | | 1,097,067 | | | | 13,645,913 |
| | | | | | | | | | | | | | | | |
NET ASSETS | | $ | 374,903,480 | | | $ | 836,279,891 | | | $ | 119,588,585 | | | $ | 978,234,093 |
| | | | | | | | | | | | | | | | |
| | | | |
NET ASSETS REPRESENT | | | | | | | | | | | | | | | |
Paid-in capital | | $ | 274,064,460 | | | $ | 643,069,525 | | | $ | 101,300,882 | | | $ | 679,149,107 |
Accumulated net investment income (loss) | | | (1,694,004 | ) | | | (1,029,091 | ) | | | (100,286 | ) | | | 3,499,672 |
Accumulated net realized gain (loss) from investment transactions | | | 17,982,513 | | | | 31,374,837 | | | | (4,017,980 | ) | | | 13,275,820 |
Net unrealized appreciation on investments | | | 84,550,511 | | | | 162,864,620 | | | | 22,405,969 | | | | 282,309,494 |
| | | | | | | | | | | | | | | | |
NET ASSETS | | $ | 374,903,480 | | | $ | 836,279,891 | | | $ | 119,588,585 | | | $ | 978,234,093 |
| | | | | | | | | | | | | | | | |
| | | | |
Shares of common stock outstanding of $.001 par value* | | | 6,500,469 | | | | 38,379,733 | | | | 3,995,349 | | | | 55,008,323 |
| | | | | | | | | | | | | | | | |
Net asset value per share | | $ | 57.67 | | | $ | 21.79 | | | $ | 29.93 | | | $ | 17.78 |
| | | | | | | | | | | | | | | | |
Unaffiliated investments at cost | | $ | 299,437,572 | | | $ | 673,310,732 | | | $ | 98,236,693 | | | $ | 697,612,381 |
Affiliated investments at cost | | $ | - | | | $ | - | | | $ | - | | | $ | 3,997,219 |
| | | | | | | | | | | | | | | | |
Total investments at cost | | $ | 299,437,572 | | | $ | 673,310,732 | | | $ | 98,236,693 | | | $ | 701,609,600 |
Premiums received on covered call options written | | $ | - | | | $ | - | | | $ | - | | | $ | - |
Premiums received on put options written | | $ | - | | | $ | - | | | $ | - | | | $ | - |
| * | See Note 1 - Organization in the Notes to Financial Statements for shares authorized for each Fund. |
See Notes to Financial Statements
| | |
| 112 | | Semi-Annual Report | December 31, 2007 (Unaudited) |
| | | | | | | | | | | | | | | | | | | | | | | | |
Micro-Cap
Limited | | | Small-Cap
Growth | | | Small-Cap
Value | | Large-Cap
Growth | | | Large-Cap
Value | | Blue-Chip 35
Index | | | Balanced | |
| | | | | | |
| $ | 54,227,442 | | | $ | 157,626,216 | | | $ | 322,038,656 | | $ | 197,829,630 | | | $ | 72,443,400 | | $ | 183,615,390 | | | $ | 86,419,339 | |
| | - | | | | - | | | | - | | | - | | | | - | | | - | | | | - | |
| | | | | | | | | | | | | | | | | | | | | | | | | |
| | 54,227,442 | | | | 157,626,216 | | | | 322,038,656 | | | 197,829,630 | | | | 72,443,400 | | | 183,615,390 | | | | 86,419,339 | |
| | | | | | | | | | | | | | | | | | | | | | | | | |
| | - | | | | - | | | | - | | | - | | | | - | | | - | | | | 193,138 | |
| | | | | | | | | | | | | | | | | | | | | | | | |
| | - | | | | - | | | | - | | | - | | | | - | | | - | | | | - | |
| | - | | | | - | | | | - | | | - | | | | - | | | - | | | | - | |
| | 537,645 | | | | - | | | | 2,208,249 | | | - | | | | - | | | - | | | | - | |
| | 37,539 | | | | 758,001 | | | | 2,302,840 | | | 607,496 | | | | 185,849 | | | 805,835 | | | | 311,087 | |
| | 43,709 | | | | 97,333 | | | | 487,694 | | | 167,608 | | | | 76,746 | | | 163,776 | | | | 297,319 | |
| | - | | | | - | | | | - | | | - | | | | - | | | 151 | | | | - | |
| | - | | | | - | | | | - | | | - | | | | - | | | - | | | | 1,416,858 | |
| | - | | | | - | | | | 475,664 | | | - | | | | - | | | - | | | | - | |
| | 6,341 | | | | 19,461 | | | | 21,202 | | | 19,218 | | | | 22,587 | | | 17,832 | | | | 12,209 | |
| | | | | | | | | | | | | | | | | | | | | | | | | |
| | 54,852,676 | | | | 158,501,011 | | | | 327,534,305 | | | 198,623,952 | | | | 72,728,582 | | | 184,602,984 | | | | 88,649,950 | |
| | | | | | | | | | | | | | | | | | | | | | | | | |
| | | | | | |
| | | | | | | | | | | | | | | | | | | | | | | | |
| | | | | | | | | | | | | | | | | | | | | | | | |
| | 70,496 | | | | - | | | | 566 | | | - | | | | - | | | - | | | | - | |
| | - | | | | - | | | | 9,145,330 | | | 4,336,628 | | | | - | | | 3,223,936 | | | | - | |
| | 137,262 | | | | 136,328 | | | | 256,357 | | | 64,381 | | | | 67,401 | | | 107,216 | | | | 269,147 | |
| | - | | | | - | | | | - | | | - | | | | - | | | - | | | | 496,631 | |
| | - | | | | - | | | | - | | | - | | | | - | | | - | | | | 441,478 | |
| | - | | | | 3,256 | | | | - | | | - | | | | - | | | - | | | | - | |
| | | | | | | | | | | | | | | | | | | | | | | | |
| | 11,370 | | | | 83,189 | | | | 175,131 | | | 83,884 | | | | 34,119 | | | - | | | | 44,312 | |
| | 848 | | | | 2,343 | | | | 4,219 | | | 2,604 | | | | 1,154 | | | 2,391 | | | | 1,276 | |
| | 17,021 | | | | 28,828 | | | | 35,536 | | | 22,503 | | | | 29,787 | | | 14,543 | | | | 33,453 | |
| | | | | | | | | | | | | | | | | | | | | | | | | |
| | 236,997 | | | | 253,944 | | | | 9,617,139 | | | 4,510,000 | | | | 132,461 | | | 3,348,086 | | | | 1,286,297 | |
| | | | | | | | | | | | | | | | | | | | | | | | | |
| $ | 54,615,679 | | | $ | 158,247,067 | | | $ | 317,917,166 | | $ | 194,113,952 | | | $ | 72,596,121 | | $ | 181,254,898 | | | $ | 87,363,653 | |
| | | | | | | | | | | | | | | | | | | | | | | | | |
| | | | | | |
| | | | | | | | | | | | | | | | | | | | | | | | |
| $ | 50,336,185 | | | $ | 132,970,066 | | | $ | 261,046,138 | | $ | 162,558,569 | | | $ | 56,332,296 | | $ | 170,477,947 | | | $ | 76,649,148 | |
| | 9,343 | | | | (227,782 | ) | | | 177,269 | | | 14,665 | | | | 3,166 | | | 14,343 | | | | 973,229 | |
| | | | | | | | | | | | | | | | | | | | | | | | |
| | (347,984 | ) | | | (12,289,096 | ) | | | 2,586,674 | | | (4,552,050 | ) | | | 109,077 | | | (2,986,337 | ) | | | (1,864,405 | ) |
| | 4,618,135 | | | | 37,793,879 | | | | 54,107,085 | | | 36,092,768 | | | | 16,151,582 | | | 13,748,945 | | | | 11,605,681 | |
| | | | | | | | | | | | | | | | | | | | | | | | | |
| $ | 54,615,679 | | | $ | 158,247,067 | | | $ | 317,917,166 | | $ | 194,113,952 | | | $ | 72,596,121 | | $ | 181,254,898 | | | $ | 87,363,653 | |
| | | | | | | | | | | | | | | | | | | | | | | | | |
| | | | | | |
| | 6,737,107 | | | | 10,375,316 | | | | 18,397,111 | | | 12,947,822 | | | | 4,567,443 | | | 21,469,373 | | | | 6,621,677 | |
| | | | | | | | | | | | | | | | | | | | | | | | | |
| $ | 8.11 | | | $ | 15.25 | | | $ | 17.28 | | $ | 14.99 | | | $ | 15.89 | | $ | 8.44 | | | $ | 13.19 | |
| | | | | | | | | | | | | | | | | | | | | | | | | |
| $ | 49,609,307 | | | $ | 119,829,081 | | | $ | 268,407,235 | | $ | 161,736,862 | | | $ | 56,291,818 | | $ | 169,866,445 | | | $ | 75,320,832 | |
| $ | - | | | $ | - | | | $ | - | | $ | - | | | $ | - | | $ | - | | | $ | - | |
| | | | | | | | | | | | | | | | | | | | | | | | | |
| $ | 49,609,307 | | | $ | 119,829,081 | | | $ | 268,407,235 | | $ | 161,736,862 | | | $ | 56,291,818 | | $ | 169,866,445 | | | $ | 75,320,832 | |
| $ | - | | | $ | - | | | $ | - | | $ | - | | | $ | - | | $ | - | | | $ | 693,712 | |
| $ | - | | | $ | - | | | $ | - | | $ | - | | | $ | - | | $ | - | | | $ | 751,571 | |
STATEMENTS OF OPERATIONS
Six Months Ended December 31, 2007 (Unaudited)
| | | | | | | | | | | | | | | | |
| | | Aggressive
Investors 1 | | | Aggressive
Investors 2 | | | Ultra-Small
Company | | | Ultra-Small
Company Market | |
| | | | |
INVESTMENT INCOME | | | | | | | | | | | | | | | | |
Dividends | | $ | 1,294,849 | | | $ | 2,566,350 | | | $ | 235,827 | | | $ | 4,192,368 | |
Less: foreign taxes withheld | | | (27,791 | ) | | | (42,524 | ) | | | - | | | | (963 | ) |
Interest | | | 78,250 | | | | 298,190 | | | | 98,373 | | | | 359,151 | |
Securities lending | | | 178,893 | | | | 389,448 | | | | 257,115 | | | | 2,458,925 | |
| | | | | | | | | | | | | | | | | |
Total Investment Income | | | 1,524,201 | | | | 3,211,464 | | | | 591,315 | | | | 7,009,481 | |
| | | | | | | | | | | | | | | | | |
| | | | |
EXPENSES | | | | | | | | | | | | | | | | |
Investment advisory fees - Base fees | | | 1,655,103 | | | | 3,206,282 | | | | 585,750 | | | | 2,708,839 | |
Investment advisory fees - Performance adjustment | | | 1,252,970 | | | | 423,185 | | | | - | | | | - | |
Administration fees | | | 33,291 | | | | 66,355 | | | | 11,634 | | | | 96,741 | |
Shareholder servicing fees | | | 65,720 | | | | 162,574 | | | | 4,527 | | | | 161,305 | |
Accounting fees | | | 20,621 | | | | 21,248 | | | | 20,158 | | | | 22,224 | |
Transfer agent fees | | | 43,931 | | | | 115,854 | | | | 18,468 | | | | 116,606 | |
Professional fees | | | 26,862 | | | | 42,972 | | | | 11,469 | | | | 70,556 | |
Custody fees | | | 10,447 | | | | 21,808 | | | | 9,937 | | | | 57,505 | |
Directors’ and officers’ fees | | | 9,175 | | | | 16,604 | | | | 3,340 | | | | 28,164 | |
Reports to shareholders | | | 50,114 | | | | 92,433 | | | | 17,665 | | | | 165,940 | |
Blue sky fees | | | 8,995 | | | | 13,597 | | | | 803 | | | | 14,656 | |
Interest expense | | | 26,802 | | | | 21,639 | | | | - | | | | 220 | |
Miscellaneous expenses | | | 22,987 | | | | 39,216 | | | | 8,330 | | | | 71,162 | |
| | | | | | | | | | | | | | | | | |
Total expenses | | | 3,227,018 | | | | 4,243,767 | | | | 692,081 | | | | 3,513,918 | |
| | | | | | | | | | | | | | | | | |
Less investment advisory fees waived | | | - | | | | - | | | | - | | | | - | |
Less expense reimbursed by investment adviser | | | - | | | | - | | | | - | | | | - | |
Less other expense reimbursements | | | (1,521 | ) | | | (3,212 | ) | | | (499 | ) | | | (4,123 | ) |
| | | | | | | | | | | | | | | | | |
Net Expenses | | | 3,225,497 | | | | 4,240,555 | | | | 691,582 | | | | 3,509,795 | |
| | | | | | | | | | | | | | | | | |
| | | | |
NET INVESTMENT INCOME (LOSS) | | | (1,701,296 | ) | | | (1,029,091 | ) | | | (100,267 | ) | | | 3,499,686 | |
NET REALIZED AND UNREALIZED GAIN (LOSS)
ON INVESTMENTS | | | | | | | | | | | | | | | | |
Realized Gain (Loss) on: | | | | | | | | | | | | | | | | |
Unaffiliated investments | | | 21,855,683 | | | | 51,306,793 | | | | (4,017,971 | ) | | | 15,211,659 | |
Affiliated investments | | | - | | | | - | | | | - | | | | (387,434 | ) |
Written options | | | 503,863 | | | | 763,376 | | | | - | | | | - | |
Futures | | | 4,034,963 | | | | 8,068,728 | | | | - | | | | (1,471,840 | ) |
Swaps | | | 210,987 | | | | - | | | | - | | | | - | |
| | | | | | | | | | | | | | | | | |
Net realized gain (loss) | | | 26,605,496 | | | | 60,138,897 | | | | (4,017,971 | ) | | | 13,352,385 | |
| | | | | | | | | | | | | | | | | |
Change in Unrealized Appreciation (Depreciation) on: | | | | | | | | | | | | | | | | |
Investments | | | 12,610,849 | | | | 20,657,899 | | | | (6,949,153 | ) | | | (121,776,262 | ) |
Written options | | | - | | | | - | | | | - | | | | - | |
Futures contracts | | | - | | | | - | | | | - | | | | 192,755 | |
Swaps | | | 128,463 | | | | - | | | | - | | | | - | |
| | | | | | | | | | | | | | | | | |
Net change in unrealized appreciation (depreciation) | | | 12,739,312 | | | | 20,657,899 | | | | (6,949,153 | ) | | | (121,583,507 | ) |
| | | | | | | | | | | | | | | | | |
Net realized and unrealized gain (loss) on investments | | | 39,344,808 | | | | 80,796,796 | | | | (10,967,124 | ) | | | (108,231,122 | ) |
| | | | | | | | | | | | | | | | | |
INCREASE (DECREASE) IN NET ASSETS
RESULTING FROM OPERATIONS | | $ | 37,643,512 | | | $ | 79,767,705 | | | $ | (11,067,391 | ) | | $ | (104,731,436 | ) |
| | | | | | | | | | | | | | | | | |
See Notes to Financial Statements
| | |
| 114 | | Semi-Annual Report | December 31, 2007 (Unaudited) |
| | | | | | | | | | | | | | | | | | | | | | | | | | |
Micro-Cap
Limited | | | Small-Cap
Growth | | | Small-Cap
Value | | | Large-Cap
Growth | | | Large-Cap
Value | | | Blue-Chip
35 Index | | | Balanced | |
| | | | | | |
| | | | | | | | | | | | | | | | | | | | | | | | | | |
| $ | 136,480 | | | $ | 217,237 | | | $ | 1,021,922 | | | $ | 833,303 | | | $ | 777,688 | | | $ | 1,466,993 | | | $ | 513,101 | |
| | - | | | | - | | | | - | | | | - | | | | - | | | | - | | | | - | |
| | 18,044 | | | | 62,393 | | | | 174,083 | | | | 104,583 | | | | 15,116 | | | | 46,026 | | | | 1,141,380 | |
| | 106,558 | | | | 193,866 | | | | 125,204 | | | | 31,392 | | | | 24,910 | | | | 16,344 | | | | 13,532 | |
| | | | | | | | | | | | | | | | | | | | | | | | | | | |
| | 261,082 | | | | 473,496 | | | | 1,321,209 | | | | 969,278 | | | | 817,714 | | | | 1,529,363 | | | | 1,668,013 | |
| | | | | | | | | | | | | | | | | | | | | | | | | | | |
| | | | | | |
| | | | | | | | | | | | | | | | | | | | | | | | | | |
| | 260,113 | | | | 493,267 | | | | 909,169 | | | | 421,715 | | | | 195,699 | | | | 56,353 | | | | 261,558 | |
| | (183,917 | ) | | | 7,443 | | | | 43,006 | | | | 7,042 | | | | 2,079 | | | | - | | | | - | |
| | 5,153 | | | | 14,708 | | | | 27,375 | | | | 15,434 | | | | 6,944 | | | | 13,038 | | | | 7,846 | |
| | 6,048 | | | | 36,976 | | | | 48,883 | | | | 28,376 | | | | 13,367 | | | | 8,018 | | | | 11,445 | |
| | 20,009 | | | | 20,214 | | | | 20,439 | | | | 20,174 | | | | 20,053 | | | | 20,095 | | | | 20,078 | |
| | 9,847 | | | | 50,450 | | | | 59,697 | | | | 26,959 | | | | 15,753 | | | | 18,214 | | | | 23,613 | |
| | 7,728 | | | | 15,024 | | | | 21,063 | | | | 11,899 | | | | 8,652 | | | | 9,532 | | | | 8,862 | |
| | 5,916 | | | | 11,287 | | | | 12,910 | | | | 5,008 | | | | 8,311 | | | | 6,247 | | | | 19,536 | |
| | 1,522 | | | | 4,185 | | | | 7,020 | | | | 3,669 | | | | 2,167 | | | | 2,798 | | | | 2,155 | |
| | 8,385 | | | | 23,946 | | | | 38,418 | | | | 16,393 | | | | 12,170 | | | | 14,400 | | | | 11,596 | |
| | 7,324 | | | | 9,888 | | | | 11,427 | | | | 10,260 | | | | 9,835 | | | | 8,117 | | | | 7,028 | |
| | 84 | | | | 1,134 | | | | - | | | | 370 | | | | 4,615 | | | | 1,236 | | | | 1,444 | |
| | 3,860 | | | | 10,532 | | | | 16,693 | | | | 8,413 | | | | 5,530 | | | | 7,119 | | | | 14,814 | |
| | | | | | | | | | | | | | | | | | | | | | | | | | | |
| | 152,072 | | | | 699,054 | | | | 1,216,100 | | | | 575,712 | | | | 305,175 | | | | 165,167 | | | | 389,975 | |
| | | | | | | | | | | | | | | | | | | | | | | | | | | |
| | - | | | | - | | | | - | | | | - | | | | - | | | | (56,353 | ) | | | - | |
| | - | | | | - | | | | - | | | | - | | | | - | | | | (5,047 | ) | | | - | |
| | (224 | ) | | | (643 | ) | | | (1,246 | ) | | | (756 | ) | | | (301 | ) | | | (678 | ) | | | (353 | ) |
| | | | | | | | | | | | | | | | | | | | | | | | | | | |
| | 151,848 | | | | 698,411 | | | | 1,214,854 | | | | 574,956 | | | | 304,874 | | | | 103,089 | | | | 389,622 | |
| | | | | | | | | | | | | | | | | | | | | | | | | | | |
| | | | | | |
| | 109,234 | | | | (224,915 | ) | | | 106,355 | | | | 394,322 | | | | 512,840 | | | | 1,426,274 | | | | 1,278,391 | |
| | | | | | | | | | | | | | | | | | | | | | | | | | |
| | | | | | | | | | | | | | | | | | | | | | | | | | |
| | 1,562,245 | | | | 2,956,013 | | | | 3,689,253 | | | | 269,166 | | | | 677,466 | | | | (58,317 | ) | | | (654,503 | ) |
| | - | | | | - | | | | - | | | | - | | | | - | | | | - | | | | - | |
| | - | | | | - | | | | - | | | | - | | | | - | | | | - | | | | 1,713,698 | |
| | - | | | | - | | | | - | | | | - | | | | - | | | | - | | | | 898,005 | |
| | - | | | | 99,695 | | | | (120,295 | ) | | | - | | | | - | | | | - | | | | - | |
| | | | | | | | | | | | | | | | | | | | | | | | | | | |
| | 1,562,245 | | | | 3,055,708 | | | | 3,568,958 | | | | 269,166 | | | | 677,466 | | | | (58,317 | ) | | | 1,957,200 | |
| | | | | | | | | | | | | | | | | | | | | | | | | | | |
| | | | | | | | | | | | | | | | | | | | | | | | | | |
| | (4,748,454 | ) | | | (10,948,294 | ) | | | (29,562,010 | ) | | | 9,866,943 | | | | (3,575,010 | ) | | | (1,366,013 | ) | | | (656,839 | ) |
| | - | | | | - | | | | - | | | | - | | | | - | | | | - | | | | 363,422 | |
| | - | | | | - | | | | - | | | | - | | | | - | | | | - | | | | - | |
| | - | | | | (4,735 | ) | | | 547,966 | | | | - | | | | - | | | | - | | | | - | |
| | | | | | | | | | | | | | | | | | | | | | | | | | | |
| | (4,748,454 | ) | | | (10,953,029 | ) | | | (29,014,044 | ) | | | 9,866,943 | | | | (3,575,010 | ) | | | (1,366,013 | ) | | | (293,417 | ) |
| | | | | | | | | | | | | | | | | | | | | | | | | | | |
| | (3,186,209 | ) | | | (7,897,321 | ) | | | (25,445,086 | ) | | | 10,136,109 | | | | (2,897,544 | ) | | | (1,424,330 | ) | | | 1,663,783 | |
| | | | | | | | | | | | | | | | | | | | | | | | | | | |
$ |
(3,076,975 |
) | | $ | (8,122,236 | ) | | $ | (25,338,731 | ) | | $ | 10,530,431 | | | $ | (2,384,704 | ) | | $ | 1,944 | | | $ | 2,942,174 | |
| | | | | | | | | | | | | | | | | | | | | | | | | | | |
STATEMENTS OF CHANGES IN NET ASSETS
| | | | | | | | | | | | | | | | |
| | | Aggressive Investors 1 | | | Aggressive Investors 2 | |
| | | Six Months Ended
December 31, | | | Year Ended
June 30, | | | Six Months Ended
December 31, | | | Year Ended
June 30, | |
| | 2007 | | | 2007 | | | 2007 | | | 2007 | |
| | | (Unaudited) | | | | | | (Unaudited) | | | | |
| | | | |
OPERATIONS | | | | | | | | | | | | | | | | |
Net investment income (loss) | | $ | (1,701,296 | ) | | $ | (2,879,612 | ) | | $ | (1,029,091 | ) | | $ | (2,250,598 | ) |
Net realized gain (loss) on investments | | | 26,605,496 | | | | 63,389,624 | | | | 60,138,897 | | | | (7,746,640 | ) |
Net change in unrealized appreciation/(depreciation) on investments | | | 12,739,312 | | | | (25,083,021 | ) | | | 20,657,899 | | | | 100,819,182 | |
| | | | | | | | | | | | | | | | | |
Net increase/(decrease) in net assets resulting from operations | | | 37,643,512 | | | | 35,426,991 | | | | 79,767,705 | | | | 90,821,944 | |
| | | | | | | | | | | | | | | | | |
| | | | |
DISTRIBUTIONS: | | | | | | | | | | | | | | | | |
From net investment income | | | - | | | | - | | | | - | | | | - | |
From net realized gains | | | (59,134,240 | ) | | | (38,922,847 | ) | | | (21,016,813 | ) | | | (12,277,639 | ) |
| | | | | | | | | | | | | | | | | |
Net decrease in net assets from distributions | | | (59,134,240 | ) | | | (38,922,847 | ) | | | (21,016,813 | ) | | | (12,277,639 | ) |
| | | | | | | | | | | | | | | | | |
| | | | |
SHARE TRANSACTIONS: | | | | | �� | | | | | | | | | | | |
Proceeds from sale of shares | | | 11,081,596 | | | | 25,500,417 | | | | 177,503,230 | | | | 257,748,964 | |
Reinvestment of distributions | | | 52,128,200 | | | | 33,935,405 | | | | 19,722,703 | | | | 11,193,522 | |
Cost of shares redeemed | | | (34,773,450 | ) | | | (126,574,282 | ) | | | (70,636,218 | ) | | | (281,809,367 | ) |
Redemption fees | | | - | | | | - | | | | - | | | | - | |
| | | | | | | | | | | | | | | | | |
Net increase/(decrease) in net assets from share transactions | | | 28,436,346 | | | | (67,138,460 | ) | | | 126,589,715 | | | | (12,866,881 | ) |
| | | | | | | | | | | | | | | | | |
| | | | |
Net increase/(decrease) in net assets | | | 6,945,618 | | | | (70,634,316 | ) | | | 185,340,607 | | | | 65,677,424 | |
| | | | |
NET ASSETS: | | | | | | | | | | | | | | | | |
Beginning of period | | | 367,957,862 | | | | 438,592,178 | | | | 650,939,284 | | | | 585,261,860 | |
| | | | | | | | | | | | | | | | | |
End of period* | | $ | 374,903,480 | | | $ | 367,957,862 | | | $ | 836,279,891 | | | $ | 650,939,284 | |
| | | | | | | | | | | | | | | | | |
| | | | |
SHARES ISSUED & REDEEMED | | | | | | | | | | | | | | | | |
Issued | | | 179,017 | | | | 449,096 | | | | 8,360,650 | | | | 14,911,236 | |
Distributions reinvested | | | 933,528 | | | | 613,217 | | | | 936,501 | | | | 647,402 | |
Redeemed | | | (556,588 | ) | | | (2,202,942 | ) | | | (3,378,771 | ) | | | (16,441,911 | ) |
| | | | | | | | | | | | | | | | | |
Net increase/(decrease) | | | 555,957 | | | | (1,140,629 | ) | | | 5,918,380 | | | | (883,273 | ) |
Outstanding at beginning of period | | | 5,944,512 | | | | 7,085,141 | | | | 32,461,353 | | | | 33,344,626 | |
| | | | | | | | | | | | | | | | | |
Outstanding at end of period | | | 6,500,469 | | | | 5,944,512 | | | | 38,379,733 | | | | 32,461,353 | |
| | | | | | | | | | | | | | | | | |
| | | | |
* Including accumulated net investment income (loss) of: | | $ | (1,694,004 | ) | | $ | 7,292 | | | $ | (1,029,091 | ) | | $ | - | |
See Notes to Financial Statements
| | |
| 116 | | Semi-Annual Report | December 31, 2007 (Unaudited) |
| | | | | | | | | | | | | | | | | | | | | | |
Ultra-Small Company | | | Ultra-Small Company Market | | | Micro-Cap Limited | |
Six Months Ended
December 31, | | | Year Ended
June 30, | | | Six Months Ended
December 31, | | | Year Ended
June 30, | | | Six Months Ended
December 31, | | | Year Ended
June 30, | |
| 2007 | | | 2007 | | | 2007 | | | 2007 | | | 2007 | | | 2007 | |
| (Unaudited) | | | | | | (Unaudited) | | | | | | (Unaudited) | | | | |
| | | | | |
| | | | | | | | | | | | | | | | | | | | | | |
| $ | (100,267 | ) | | $ | 408,100 | | | $ | 3,499,686 | | | $ | 6,105,627 | | | $ | 109,234 | | | $ | (61,758 | ) |
| | (4,017,971 | ) | | | 25,260,501 | | | | 13,352,385 | | | | 51,335,453 | | | | 1,562,245 | | | | (1,910,229 | ) |
| (6,949,153 | ) | | | (14,050,480 | ) | | | (121,583,507 | ) | | | 55,403,853 | | | | (4,748,454 | ) | | | (780,270 | ) |
| | | | | | | | | | | | | | | | | | | | | | | |
| (11,067,391 | ) | | | 11,618,121 | | | | (104,731,436 | ) | | | 112,844,933 | | | | (3,076,975 | ) | | | (2,752,257 | ) |
| | | | | | | | | | | | | | | | | | | | | | | |
| | | | | |
| | | | | | | | | | | | | | | | | | | | | | |
| | (394,094 | ) | | | - | | | | (2,258,281 | ) | | | (4,933,248 | ) | | | (99,891 | ) | | | - | |
| | (15,085,229 | ) | | | (25,378,384 | ) | | | (34,714,496 | ) | | | (22,318,728 | ) | | | - | | | | (14,955,401 | ) |
| | | | | | | | | | | | | | | | | | | | | | | |
| | (15,479,323 | ) | | | (25,378,384 | ) | | | (36,972,777 | ) | | | (27,251,976 | ) | | | (99,891 | ) | | | (14,955,401 | ) |
| | | | | | | | | | | | | | | | | | | | | | | |
| | | | | |
| | | | | | | | | | | | | | | | | | | | | | |
| | 220,747 | | | | 2,892,005 | | | | 129,195,558 | | | | 368,886,509 | | | | 622,358 | | | | 2,149,314 | |
| | 14,780,751 | | | | 24,602,886 | | | | 35,587,475 | | | | 25,618,053 | | | | 91,050 | | | | 14,435,520 | |
| | (6,102,092 | ) | | | (8,691,768 | ) | | | (207,426,425 | ) | | | (405,818,662 | ) | | | (5,164,943 | ) | | | (17,343,613 | ) |
| | - | | | | - | | | | 165,225 | | | | 387,659 | | | | - | | | | - | |
| | | | | | | | | | | | | | | | | | | | | | | |
| 8,899,406 | | | | 18,803,123 | | | | (42,478,167 | ) | | | (10,926,441 | ) | | | (4,451,535 | ) | | | (758,779 | ) |
| | | | | | | | | | | | | | | | | | | | | | | |
| | | | | |
| | (17,647,308 | ) | | | 5,042,860 | | | | (184,182,380 | ) | | | 74,666,516 | | | | (7,628,401 | ) | | | (18,466,437 | ) |
| | | | | |
| | | | | | | | | | | | | | | | | | | | | | |
| | 137,235,893 | | | | 132,193,033 | | | | 1,162,416,473 | | | | 1,087,749,957 | | | | 62,244,080 | | | | 80,710,517 | |
| | | | | | | | | | | | | | | | | | | | | | | |
| $ | 119,588,585 | | | $ | 137,235,893 | | | $ | 978,234,093 | | | $ | 1,162,416,473 | | | $ | 54,615,679 | | | $ | 62,244,080 | |
| | | | | | | | | | | | | | | | | | | | | | | |
| | | | | |
| | | | | | | | | | | | | | | | | | | | | | |
| | 6,409 | | | | 76,935 | | | | 6,702,175 | | | | 19,173,707 | | | | 75,782 | | | | 235,605 | |
| | 516,990 | | | | 683,778 | | | | 2,047,611 | | | | 1,315,771 | | | | 11,584 | | | | 1,651,661 | |
| | (173,431 | ) | | | (231,431 | ) | | | (10,832,273 | ) | | | (20,839,119 | ) | | | (617,936 | ) | | | (1,892,871 | ) |
| | | | | | | | | | | | | | | | | | | | | | | |
| | 349,968 | | | | 529,282 | | | | (2,082,487 | ) | | | (349,641 | ) | | | (530,570 | ) | | | (5,605 | ) |
| | 3,645,381 | | | | 3,116,099 | | | | 57,090,810 | | | | 57,440,451 | | | | 7,267,677 | | | | 7,273,282 | |
| | | | | | | | | | | | | | | | | | | | | | | |
| | 3,995,349 | | | | 3,645,381 | | | | 55,008,323 | | | | 57,090,810 | | | | 6,737,107 | | | | 7,267,677 | |
| | | | | | | | | | | | | | | | | | | | | | | |
| | | | | |
| $ | (100,286 | ) | | $ | 394,075 | | | $ | 3,499,672 | | | $ | 2,258,267 | | | $ | 9,343 | | | $ | - | |
STATEMENTS OF CHANGES IN NET ASSETS (continued)
| | | | | | | | | | | | | | | | |
| | | Small-Cap Growth | | | Small-Cap Value | |
| | | Six Months Ended
December 31, | | | Year Ended
June 30, | | | Six Months Ended
December 31, | | | Year Ended
June 30, | |
| | | 2007 | | | 2007 | | | 2007 | | | 2007 | |
| | | (Unaudited) | | | | | | (Unaudited) | | | | |
| | | | |
OPERATIONS | | | | | | | | | | | | | | | | |
Net investment income (loss) | | $ | (224,915 | ) | | $ | (599,494 | ) | | $ | 106,355 | | | $ | (524,387 | ) |
Net realized gain (loss) on investments | | | 3,055,708 | | | | (11,045,092 | ) | | | 3,568,958 | | | | 4,920,957 | |
Net change in unrealized appreciation/(depreciation) on investments | | | (10,953,029 | ) | | | 18,709,955 | | | | (29,014,044 | ) | | | 29,678,491 | |
| | | | | | | | | | | | | | | | | |
Net increase/(decrease) in net assets resulting from operations | | | (8,122,236 | ) | | | 7,065,369 | | | | (25,338,731 | ) | | | 34,075,061 | |
| | | | | | | | | | | | | | | | | |
| | | | |
DISTRIBUTIONS: | | | | | | | | | | | | | | | | |
From net investment income | | | - | | | | - | | | | - | | | | - | |
From net realized gains | | | - | | | | - | | | | - | | | | - | |
| | | | | | | | | | | | | | | | | |
Net decrease in net assets from distributions | | | - | | | | - | | | | - | | | | - | |
| | | | | | | | | | | | | | | | | |
| | | | |
SHARE TRANSACTIONS: | | | | | | | | | | | | | | | | |
Proceeds from sale of shares | | | 20,816,956 | | | | 48,904,578 | | | | 113,120,225 | | | | 93,045,370 | |
Reinvestment of distributions | | | - | | | | - | | | | - | | | | - | |
Cost of shares redeemed | | | (26,842,317 | ) | | | (158,852,967 | ) | | | (50,040,854 | ) | | | (207,064,202 | ) |
| | | | | | | | | | | | | | | | | |
Net increase/(decrease) in net assets from share
transactions | | | (6,025,361 | ) | | | (109,948,389 | ) | | | 63,079,371 | | | | (114,018,832 | ) |
| | | | | | | | | | | | | | | | | |
| | | | |
Net increase/(decrease) in net assets | | | (14,147,597 | ) | | | (102,883,020 | ) | | | 37,740,640 | | | | (79,943,771 | ) |
| | | | |
NET ASSETS: | | | | | | | | | | | | | | | | |
Beginning of period | | | 172,394,664 | | | | 275,277,684 | | | | 280,176,526 | | | | 360,120,297 | |
| | | | | | | | | | | | | | | | | |
End of period* | | $ | 158,247,067 | | | $ | 172,394,664 | | | $ | 317,917,166 | | | $ | 280,176,526 | |
| | | | | | | | | | | | | | | | | |
| | | | |
SHARES ISSUED & REDEEMED | | | | | | | | | | | | | | | | |
Issued | | | 1,336,017 | | | | 3,426,645 | | | | 6,319,301 | | | | 5,710,836 | |
Distributions reinvested | | | - | | | | - | | | | - | | | | - | |
Redeemed | | | (1,726,420 | ) | | | (11,322,443 | ) | | | (2,873,635 | ) | | | (13,240,019 | ) |
| | | | | | | | | | | | | | | | | |
Net increase/(decrease) | | | (390,403 | ) | | | (7,895,798 | ) | | | 3,445,666 | | | | (7,529,183 | ) |
Outstanding at beginning of period | | | 10,765,719 | | | | 18,661,517 | | | | 14,951,445 | | | | 22,480,628 | |
| | | | | | | | | | | | | | | | | |
Outstanding at end of period | | | 10,375,316 | | | | 10,765,719 | | | | 18,397,111 | | | | 14,951,445 | |
| | | | | | | | | | | | | | | | | |
| | | | |
* Including accumulated net investment income (loss) of: | | $ | (227,782 | ) | | $ | (2,867 | ) | | $ | 177,269 | | | $ | 70,914 | |
See Notes to Financials Statements
| | |
| 118 | | Semi-Annual Report | December 31, 2007 (Unaudited) |
| | | | | | | | | | | | | | | | | | | | | | | | | | | | | | |
Large-Cap Growth | | | Large-Cap Value | | | Blue-Chip 35 Index | | | Balanced | |
Six Months Ended
December 31, | | | Year Ended
June 30, | | | Six Months Ended
December 31, | | | Year Ended
June 30, | | | Six Months Ended
December 31, | | | Year Ended
June 30, | | | Six Months Ended
December 31, | | | Year Ended
June 30, | |
| 2007 | | | 2007 | | | 2007 | | | 2007 | | | 2007 | | | 2007 | | | 2007 | | | 2007 | |
| (Unaudited) | | | | | | (Unaudited) | | | | | | (Unaudited) | | | | | | (Unaudited) | | | | |
| | | | | | | |
| | | | | | | | | | | | | | | | | | | | | | | | | | | | | | |
| $ | 394,322 | | | $ | 271,736 | | | $ | 512,840 | | | $ | 949,079 | | | $ | 1,426,274 | | | $ | 1,363,198 | | | $ | 1,278,391 | | | $ | 1,859,563 | |
| | 269,166 | | | | 486,313 | | | | 677,466 | | | | 2,784,881 | | | | (58,317 | ) | | | (232,846 | ) | | | 1,957,200 | | | | (3,724,855 | ) |
| | 9,866,943 | | | | 16,911,227 | | | | (3,575,010 | ) | | | 11,542,582 | | | | (1,366,013 | ) | | | 10,307,323 | | | | (293,417 | ) | | | 6,819,420 | |
| | | | | | | | | | | | | | | | | | | | | | | | | | | | | | | |
| | 10,530,431 | | | | 17,669,276 | | | | (2,384,704 | ) | | | 15,276,542 | | | | 1,944 | | | | 11,437,675 | | | | 2,942,174 | | | | 4,954,128 | |
| | | | | | | | | | | | | | | | | | | | | | | | | | | | | | | |
| | | | | | | |
| | | | | | | | | | | | | | | | | | | | | | | | | | | | | | |
| | (501,206 | ) | | | (357,354 | ) | | | (935,231 | ) | | | (819,616 | ) | | | (2,216,904 | ) | | | (1,021,236 | ) | | | (1,132,035 | ) | | | (1,860,754 | ) |
| | - | | | | - | | | | (2,259,581 | ) | | | - | | | | - | | | | - | | | | - | | | | (1,041,917 | ) |
| | | | | | | | | | | | | | | | | | | | | | | | | | | | | | | |
| | (501,206 | ) | | | (357,354 | ) | | | (3,194,812 | ) | | | (819,616 | ) | | | (2,216,904 | ) | | | (1,021,236 | ) | | | (1,132,035 | ) | | | (2,902,671 | ) |
| | | | | | | | | | | | | | | | | | | | | | | | | | | | | | | |
| | | | | | | |
| | | | | | | | | | | | | | | | | | | | | | | | | | | | | | |
| | 59,689,232 | | | | 53,352,870 | | | | 9,205,427 | | | | 38,671,336 | | | | 94,135,397 | | | | 64,503,705 | | | | 11,027,516 | | | | 26,839,294 | |
| | 403,318 | | | | 304,098 | | | | 3,077,813 | | | | 794,313 | | | | 2,117,136 | | | | 985,385 | | | | 1,075,310 | | | | 2,766,204 | |
| | (14,145,396 | ) | | | (36,692,288 | ) | | | (20,202,779 | ) | | | (55,545,831 | ) | | | (11,864,974 | ) | | | (19,293,804 | ) | | | (13,605,059 | ) | | | (29,941,283 | ) |
| | | | | | | | | | | | | | | | | | | | | | | | | | | | | | | |
|
45,947,154 |
| | | 16,964,680 | | | | (7,919,539 | ) | | | (16,080,182 | ) | | | 84,387,559 | | | | 46,195,286 | | | | (1,502,233 | ) | | | (335,785 | ) |
| | | | | | | | | | | | | | | | | | | | | | | | | | | | | | | |
| | | | | | | |
| | 55,976,379 | | | | 34,276,602 | | | | (13,499,055 | ) | | | (1,623,256 | ) | | | 82,172,599 | | | | 56,611,725 | | | | 307,906 | | | | 1,715,672 | |
| | | | | | | |
| | | | | | | | | | | | | | | | | | | | | | | | | | | | | | |
| | 138,137,573 | | | | 103,860,971 | | | | 86,095,176 | | | | 87,718,432 | | | | 99,082,299 | | | | 42,470,574 | | | | 87,055,747 | | | | 85,340,075 | |
| | | | | | | | | | | | | | | | | | | | | | | | | | | | | | | |
| $ | 194,113,952 | | | $ | 138,137,573 | | | $ | 72,596,121 | | | $ | 86,095,176 | | | $ | 181,254,898 | | | $ | 99,082,299 | | | $ | 87,363,653 | | | $ | 87,055,747 | |
| | | | | | | | | | | | | | | | | | | | | | | | | | | | | | | |
| | | | | | | |
| | | | | | | | | | | | | | | | | | | | | | | | | | | | | | |
| | 4,199,768 | | | | 4,091,823 | | | | 550,246 | | | | 2,461,638 | | | | 10,967,050 | | | | 8,004,336 | | | | 862,312 | | | | 2,108,086 | |
| | 27,587 | | | | 23,573 | | | | 195,790 | | | | 49,771 | | | | 252,040 | | | | 121,644 | | | | 82,336 | | | | 220,590 | |
| | (1,060,149 | ) | | | (2,908,564 | ) | | | (1,222,565 | ) | | | (3,556,554 | ) | | | (1,382,510 | ) | | | (2,381,492 | ) | | | (1,044,603 | ) | | | (2,354,584 | ) |
| | | | | | | | | | | | | | | | | | | | | | | | | | | | | | | |
| | 3,167,206 | | | | 1,206,832 | | | | (476,529 | ) | | | (1,045,145 | ) | | | 9,836,580 | | | | 5,744,488 | | | | (99,955 | ) | | | (25,908 | ) |
| | 9,780,616 | | | | 8,573,784 | | | | 5,043,972 | | | | 6,089,117 | | | | 11,632,793 | | | | 5,888,305 | | | | 6,721,632 | | | | 6,747,540 | |
| | | | | | | | | | | | | | | | | | | | | | | | | | | | | | | |
| | 12,947,822 | | | | 9,780,616 | | | | 4,567,443 | | | | 5,043,972 | | | | 21,469,373 | | | | 11,632,793 | | | | 6,621,677 | | | | 6,721,632 | |
| | | | | | | | | | | | | | | | | | | | | | | | | | | | | | | |
| | | | | | | |
| $ | 14,665 | | | $ | 121,549 | | | $ | 3,166 | | | $ | 425,557 | | | $ | 14,343 | | | $ | 804,973 | | | $ | 973,229 | | | $ | 826,873 | |
FINANCIAL HIGHLIGHTS
(for a share outstanding throughout the period indicated)
| | | | | | | | | | | | | | | |
| | | | | Income from
Investment Operations | |
| | | Net Asset
Value,
Beginning
of Period | | Net
Investment
Income (Loss)(a) | | | Net Realized
and Unrealized
Gain\(Loss) | | | Total from
Investment
Operations | |
| | | | |
| AGGRESSIVE INVESTORS 1 | | | | | | | | | | | | | | | |
| | | | |
Period Ended December 31, 2007 (Unaudited) | | $ | 61.90 | | $ | (0.29 | ) | | $ | 6.55 | | | $ | 6.26 | |
Year Ended June 30, 2007 | | | 61.90 | | | (0.43 | ) | | | 6.41 | | | | 5.98 | |
Year Ended June 30, 2006 | | | 56.60 | | | (0.42 | ) | | | 12.23 | | | | 11.81 | |
Year Ended June 30, 2005 | | | 49.43 | | | (0.26 | ) | | | 7.43 | | | | 7.17 | |
Year Ended June 30, 2004 | | | 39.94 | | | (0.58 | ) | | | 10.07 | | | | 9.49 | |
Year Ended June 30, 2003 | | | 36.51 | | | (0.27 | ) | | | 3.70 | | | | 3.43 | |
| | | | |
| | | | | | | | | | | | | | | | |
| | | | |
| AGGRESSIVE INVESTORS 2 | | | | | | | | | | | | | | | |
| | | | |
Period Ended December 31, 2007 (Unaudited) | | | 20.05 | | | (0.03 | ) | | | 2.34 | | | | 2.31 | |
Year Ended June 30, 2007 | | | 17.55 | | | (0.07 | ) | | | 2.94 | | | | 2.87 | |
Year Ended June 30, 2006 | | | 14.72 | | | (0.05 | ) | | | 3.22 | | | | 3.17 | |
Year Ended June 30, 2005 | | | 12.75 | | | (0.04 | ) | | | 2.01 | | | | 1.97 | |
Year Ended June 30, 2004 | | | 10.28 | | | (0.09 | ) | | | 2.56 | | | | 2.47 | |
Year Ended June 30, 2003 | | | 10.25 | | | (0.09 | ) | | | 0.12 | | | | 0.03 | |
| | | | |
| | | | | | | | | | | | | | | | |
| | | | |
| ULTRA-SMALL COMPANY | | | | | | | | | | | | | | | |
| | | | |
Period Ended December 31, 2007 (Unaudited) | | | 37.65 | | | (0.03 | ) | | | (3.27 | ) | | | (3.30 | ) |
Year Ended June 30, 2007 | | | 42.42 | | | 0.12 | | | | 3.37 | | | | 3.49 | |
Year Ended June 30, 2006 | | | 38.44 | | | (0.15 | ) | | | 9.23 | | | | 9.08 | |
Year Ended June 30, 2005 | | | 40.97 | | | (0.10 | ) | | | 6.69 | | | | 6.59 | |
Year Ended June 30, 2004 | | | 32.93 | | | (0.33 | ) | | | 13.66 | | | | 13.33 | |
Year Ended June 30, 2003 | | | 28.83 | | | (0.21 | ) | | | 7.99 | | | | 7.78 | |
| | | | |
| | | | | | | | | | | | | | | | |
| | | | |
| ULTRA-SMALL COMPANY MARKET | | | | | | | | | | | | | | | |
| | | | |
Period Ended December 31, 2007 (Unaudited) | | | 20.36 | | | 0.06 | | | | (1.95 | ) | | | (1.89 | ) |
Year Ended June 30, 2007 | | | 18.94 | | | 0.10 | | | | 1.76 | | | | 1.86 | |
Year Ended June 30, 2006 | | | 16.96 | | | 0.05 | | | | 2.48 | | | | 2.53 | |
Year Ended June 30, 2005 | | | 16.14 | | | 0.02 | | | | 0.97 | | | | 0.99 | |
Year Ended June 30, 2004 | | | 10.98 | | | 0.02 | | | | 5.16 | | | | 5.18 | |
Year Ended June 30, 2003 | | | 8.70 | | | (0.03 | ) | | | 2.31 | | | | 2.28 | |
| | | | |
| | | | | | | | | | | | | | | | |
| | | | |
| MICRO-CAP LIMITED | | | | | | | | | | | | | | | |
| | | | |
Period Ended December 31, 2007 (Unaudited) | | | 8.56 | | | 0.02 | | | | (0.46 | ) | | | (0.44 | ) |
Year Ended June 30, 2007 | | | 11.10 | | | (0.01 | ) | | | (0.32 | ) | | | (0.33 | ) |
Year Ended June 30, 2006 | | | 11.09 | | | (0.13 | ) | | | 1.81 | | | | 1.68 | |
Year Ended June 30, 2005 | | | 10.75 | | | (0.13 | ) | | | 2.45 | | | | 2.32 | |
Year Ended June 30, 2004 | | | 9.36 | | | (0.17 | ) | | | 2.49 | | | | 2.32 | |
Year Ended June 30, 2003 | | | 10.19 | | | (0.11 | ) | | | 0.01 | | | | (0.10 | ) |
| | | | |
| | | | | | | | | | | | | | | | |
See Notes to Financial Statements
| | |
| 120 | | Semi-Annual Report | December 31, 2007 (Unaudited) |
| | | | | | | | | | | | | | | | | | | | | | | | | | | | | | | | | | |
Less Distributions
to Shareholders from | | | | | | | | | | Ratios & Supplemental Data | |
Net
Realized
Gain | | | Net
Investment
Income | | | Total
Distributions | | | Paid in Capital
from
Redemption
Fees(a) | | Net Asset
Value,
End of
Period | | Total
Return(b) | | | Net Assets
End of Period
(000’s) | | Expenses After
Waivers and
Reimbursements | | | Expenses Before
Waivers and
Reimbursements | | | Net Investment
Income (Loss)
After Waivers and
Reimbursements | | | Portfolio
Turnover
Rate | |
| | | | | | | | | | |
| | | | | | | | | | | | | | | | | | | | | | | | | | | | | | | | | | |
| | | | | | | | | | |
| $ | (10.49 | ) | | $ | - | | | $ | (10.49 | ) | | $ | - | | $ | 57.67 | | 10.66 | % | | $ | 374,903 | | 1.74 | %(c) | | 1.74 | %(c) | | (0.92 | %)(c) | | 83 | % |
| | (5.98 | ) | | | - | | | | (5.98 | ) | | | - | | | 61.90 | | 10.79 | % | | | 367,958 | | 1.72 | % | | 1.72 | % | | (0.75 | %) | | 115 | % |
| | (6.51 | ) | | | - | | | | (6.51 | ) | | | - | | | 61.90 | | 21.79 | % | | | 438,592 | | 1.58 | % | | 1.58 | % | | (0.69 | %) | | 128 | % |
| | - | | | | - | | | | - | | | | - | | | 56.60 | | 14.51 | % | | | 368,886 | | 1.58 | % | | 1.58 | % | | (0.51 | %) | | 155 | % |
| | - | | | | - | | | | - | | | | - | | | 49.43 | | 23.76 | % | | | 353,684 | | 1.74 | % | | 1.74 | % | | (1.24 | %) | | 151 | % |
| | - | | | | - | | | | - | | | | - | | | 39.94 | | 9.40 | % | | | 281,375 | | 1.90 | % | | 1.90 | % | | (0.81 | %) | | 138 | % |
| | | | | | | | | | |
| | | | | | | | | | | | | | | | | | | | | | | | | | | | | | | | | | | |
| | | | | | | | | | |
| | | | | | | | | | | | | | | | | | | | | | | | | | | | | | | | �� | | |
| | | | | | | | | | |
| | (0.57 | ) | | | - | | | | (0.57 | ) | | | - | | | 21.79 | | 11.62 | % | | | 836,280 | | 1.16 | %(c) | | 1.16 | %(c) | | (0.28 | %)(c) | | 73 | % |
| | (0.37 | ) | | | - | | | | (0.37 | ) | | | - | | | 20.05 | | 16.68 | % | | | 650,939 | | 1.22 | % | | 1.22 | % | | (0.38 | %) | | 124 | % |
| | (0.34 | ) | | | - | | | | (0.34 | ) | | | - | | | 17.55 | | 21.65 | % | | | 585,262 | | 1.12 | % | | 1.12 | % | | (0.26 | %) | | 89 | % |
| | - | | | | - | | | | - | | | | - | | | 14.72 | | 15.45 | % | | | 156,053 | | 1.37 | % | | 1.37 | % | | (0.33 | %) | | 148 | % |
| | - | | | | - | | | | - | | | | - | | | 12.75 | | 24.03 | % | | | 110,395 | | 1.58 | % | | 1.58 | % | | (1.13 | %) | | 152 | % |
| | - | | | | - | | | | - | | | | - | | | 10.28 | | 0.29 | % | | | 22,107 | | 1.90 | % | | 1.90 | % | | (1.05 | %) | | 143 | % |
| | | | | | | | | | |
| | | | | | | | | | | | | | | | | | | | | | | | | | | | | | | | | | | |
| | | | | | | | | | |
| | | | | | | | | | | | | | | | | | | | | | | | | | | | | | | | | | |
| | | | | | | | | | |
| | (4.31 | ) | | | (0.11 | ) | | | (4.42 | ) | | | - | | | 29.93 | | (8.22 | %) | | | 119,589 | | 1.07 | %(c) | | 1.07 | %(c) | | (0.15 | %)(c) | | 53 | % |
| | (8.26 | ) | | | - | | | | (8.26 | ) | | | - | | | 37.65 | | 9.12 | % | | | 137,236 | | 1.09 | % | | 1.09 | % | | 0.31 | % | | 106 | % |
| | (5.10 | ) | | | - | | | | (5.10 | ) | | | - | | | 42.42 | | 25.58 | % | | | 132,193 | | 1.09 | % | | 1.09 | % | | (0.37 | %) | | 101 | % |
| | (9.12 | ) | | | - | | | | (9.12 | ) | | | - | | | 38.44 | | 15.37 | % | | | 110,634 | | 1.12 | % | | 1.12 | % | | (0.25 | %) | | 86 | % |
| | (5.29 | ) | | | - | | | | (5.29 | ) | | | - | | | 40.97 | | 40.88 | % | | | 101,233 | | 1.15 | % | | 1.15 | % | | (0.84 | %) | | 71 | % |
| | (3.68 | ) | | | - | | | | (3.68 | ) | | | - | | | 32.93 | | 32.00 | % | | | 77,450 | | 1.29 | % | | 1.29 | % | | (0.82 | %) | | 56 | % |
| | | | | | | | | | |
| | | | | | | | | | | | | | | | | | | | | | | | | | | | | | | | | | | |
| | | | | | | | | | |
| | | | | | | | | | | | | | | | | | | | | | | | | | | | | | | | | | |
| | | | | | | | | | |
| | (0.65 | ) | | | (0.04 | ) | | | (0.69 | ) | | | - | | | 17.78 | | (9.21 | %) | | | 978,234 | | 0.65 | %(c) | | 0.65 | %(c) | | 0.65 | %(c) | | 13 | % |
| | (0.37 | ) | | | (0.08 | ) | | | (0.45 | ) | | | 0.01 | | | 20.36 | | 10.08 | % | | | 1,162,416 | | 0.67 | % | | 0.67 | % | | 0.53 | % | | 34 | % |
| | (0.53 | ) | | | (0.03 | ) | | | (0.56 | ) | | | 0.01 | | | 18.94 | | 15.13 | % | | | 1,087,750 | | 0.65 | % | | 0.65 | % | | 0.27 | % | | 27 | % |
| | (0.15 | ) | | | (0.03 | ) | | | (0.18 | ) | | | 0.01 | | | 16.96 | | 6.12 | % | | | 593,883 | | 0.73 | % | | 0.73 | % | | 0.15 | % | | 13 | % |
| | (0.04 | ) | | | - | | | | (0.04 | ) | | | 0.02 | | | 16.14 | | 47.41 | % | | | 816,748 | | 0.67 | % | | 0.67 | % | | 0.11 | % | | 19 | % |
| | - | | | | - | | | | - | | | | - | | | 10.98 | | 26.21 | %(d) | | | 312,041 | | 0.75 | % | | 0.85 | % | | (0.14 | %) | | 18 | % |
| | | | | | | | | | |
| | | | | | | | | | | | | | | | | | | | | | | | | | | | | | | | | | | |
| | | | | | | | | | |
| | | | | | | | | | | | | | | | | | | | | | | | | | | | | | | | | | |
| | | | | | | | | | |
| | - | | | | (0.01 | ) | | | (0.01 | ) | | | - | | | 8.11 | | (5.19 | %) | | | 54,616 | | 0.53 | %(c) | | 0.53 | %(c) | | 0.38 | %(c) | | 69 | % |
| | (2.21 | ) | | | - | | | | (2.21 | ) | | | - | | | 8.56 | | (3.43 | %) | | | 62,244 | | 0.84 | % | | 0.84 | % | | (0.09 | %) | | 133 | % |
| | (1.67 | ) | | | - | | | | (1.67 | ) | | | - | | | 11.10 | | 14.72 | % | | | 80,711 | | 1.60 | % | | 1.60 | % | | (1.05 | %) | | 125 | % |
| | (1.98 | ) | | | - | | | | (1.98 | ) | | | - | | | 11.09 | | 22.94 | % | | | 66,637 | | 1.75 | % | | 1.75 | % | | (1.27 | %) | | 87 | % |
| | (0.93 | ) | | | - | | | | (0.93 | ) | | | - | | | 10.75 | | 24.30 | % | | | 57,750 | | 1.79 | % | | 1.79 | % | | (1.50 | %) | | 98 | % |
| | (0.73 | ) | | | - | | | | (0.73 | ) | | | - | | | 9.36 | | 0.93 | %(d) | | | 56,422 | | 1.90 | % | | 2.13 | % | | (1.35 | %) | | 99 | % |
| | | | | | | | | | |
| | | | | | | | | | | | | | | | | | | | | | | | | | | | | | | | | | | |
FINANCIAL HIGHLIGHTS (continued)
(for a share outstanding throughout the period indicated)
| | | | | | | | | | | | | | | |
| | | | | Income from
Investment Operations | |
| | | Net Asset
Value,
Beginning
of Period | | Net
Investment
Income (Loss)(a) | | | Net Realized
and Unrealized
Gain\(Loss) | | | Total from
Investment
Operations | |
| | | | |
| Small-Cap Growth | | | | | | | | | | | | | | | |
| | | | |
Period Ended December 31, 2007 (Unaudited) | | $ | 16.01 | | $ | (0.02 | ) | | $ | (0.74 | ) | | $ | (0.76 | ) |
Year Ended June 30, 2007 | | | 14.75 | | | (0.04 | ) | | | 1.30 | | | | 1.26 | |
Year Ended June 30, 2006 | | | 12.08 | | | (0.03 | ) | | | 2.70 | | | | 2.67 | |
Year Ended June 30, 2005 | | | 10.84 | | | (0.07 | ) | | | 1.31 | | | | 1.24 | |
Period from October 31, 2003 to June 30, 2004(e) | | | 10.00 | | | (0.05 | ) | | | 0.89 | | | | 0.84 | |
| | | | |
| | | | | | | | | | | | | | | | |
| | | | |
| Small-Cap Value | | | | | | | | | | | | | | | |
| | | | |
Period Ended December 31, 2007 (Unaudited) | | | 18.74 | | | 0.01 | | | | (1.47 | ) | | | (1.46 | ) |
Year Ended June 30, 2007 | | | 16.02 | | | (0.03 | ) | | | 2.75 | | | | 2.72 | |
Year Ended June 30, 2006 | | | 12.78 | | | - | | | | 3.24 | | | | 3.24 | |
Year Ended June 30, 2005 | | | 10.46 | | | (0.02 | ) | | | 2.34 | | | | 2.32 | |
Period from October 31, 2003 to June 30, 2004(e) | | | 10.00 | | | (0.03 | ) | | | 0.49 | | | | 0.46 | |
| | | | |
| | | | | | | | | | | | | | | | |
| | | | |
| Large-Cap Growth | | | | | | | | | | | | | | | |
| | | | |
Period Ended December 31, 2007 (Unaudited) | | | 14.12 | | | 0.03 | | | | 0.88 | | | | 0.91 | |
Year Ended June 30, 2007 | | | 12.11 | | | 0.03 | | | | 2.02 | | | | 2.05 | |
Year Ended June 30, 2006 | | | 11.00 | | | 0.04 | | | | 1.07 | | | | 1.11 | |
Year Ended June 30, 2005 | | | 10.63 | | | - | | | | 0.37 | | | | 0.37 | |
Period from October 31, 2003 to June 30, 2004(e) | | | 10.00 | | | (0.01 | ) | | | 0.64 | | | | 0.63 | |
| | | | |
| | | | | | | | | | | | | | | | |
| | | | |
| Large-Cap Value | | | | | | | | | | | | | | | |
| | | | |
Period Ended December 31, 2007 (Unaudited) | | | 17.07 | | | 0.11 | | | | (0.57 | ) | | | (0.46 | ) |
Year Ended June 30, 2007 | | | 14.41 | | | 0.17 | | | | 2.64 | | | | 2.81 | |
Year Ended June 30, 2006 | | | 12.70 | | | 0.17 | | | | 1.69 | | | | 1.86 | |
Year Ended June 30, 2005 | | | 11.11 | | | 0.14 | | | | 1.55 | | | | 1.69 | |
Period from October 31, 2003 to June 30, 2004(e) | | | 10.00 | | | 0.03 | | | | 1.08 | | | | 1.11 | |
| | | | |
| | | | | | | | | | | | | | | | |
| | | | |
| Blue-Chip 35 Index | | | | | | | | | | | | | | | |
| | | | |
Period Ended December 31, 2007 (Unaudited) | | | 8.52 | | | 0.09 | | | | (0.06 | ) | | | 0.03 | |
Year Ended June 30, 2007 | | | 7.21 | | | 0.16 | | | | 1.26 | | | | 1.42 | |
Year Ended June 30, 2006 | | | 6.86 | | | 0.14 | | | | 0.32 | | | | 0.46 | |
Year Ended June 30, 2005 | | | 7.02 | | | 0.14 | | | | (0.18 | ) | | | (0.04 | ) |
Year Ended June 30, 2004 | | | 6.14 | | | 0.10 | | | | 0.83 | | | | 0.93 | |
Year Ended June 30, 2003 | | | 5.93 | | | 0.09 | | | | 0.21 | | | | 0.30 | |
| | | | |
| | | | | | | | | | | | | | | | |
| | | | |
| Balanced | | | | | | | | | | | | | | | |
| | | | |
Period Ended December 31, 2007 (Unaudited) | | | 12.95 | | | 0.19 | | | | 0.22 | | | | 0.41 | |
Year Ended June 30, 2007 | | | 12.65 | | | 0.28 | | | | 0.44 | | | | 0.72 | |
Year Ended June 30, 2006 | | | 11.92 | | | 0.22 | | | | 0.73 | | | | 0.95 | |
Year Ended June 30, 2005 | | | 11.30 | | | 0.14 | | | | 0.66 | | | | 0.80 | |
Year Ended June 30, 2004 | | | 10.05 | | | 0.06 | | | | 1.24 | | | | 1.30 | |
Year Ended June 30, 2003 | | | 9.87 | | | 0.10 | | | | 0.15 | | | | 0.25 | |
| | | | |
| | | | | | | | | | | | | | | | |
| (a) | Per share amounts calculated based on the average daily shares outstanding during the period. |
| (b) | Total returns for periods less than one year are not annualized. |
| (d) | Total return would have been lower had various fees not been waived during the period. |
| (e) | Fund commenced operations on October 31, 2003 |
See Notes to Financial Statements
| | |
| 122 | | Semi-Annual Report | December 31, 2007 (Unaudited) |
| | | | | | | | | | | | | | | | | | | | | | | | | | | | | | | | | | |
Less Distributions
to Shareholders from | | | | | | | | | | Ratios & Supplemental Data | |
Net
Realized
Gain | | | Net
Investment
Income | | | Total
Distributions | | | Paid in Capital
from
Redemption
Fees(a) | | Net Asset
Value,
End of
Period | | Total
Return(b) | | | Net Assets
End of Period
(000’s) | | Expenses After
Waivers and
Reimbursements | | | Expenses Before
Waivers and
Reimbursements | | | Net Investment
Income (Loss)
After Waivers and
Reimbursements | | | Portfolio
Turnover
Rate | |
| | | | | | | | | | |
| | | | | | | | | | | | | | | | | | | | | | | | | | | | | | | | | | |
| | | | | | | | | | |
| $ | - | | | $ | - | | | $ | - | | | $ | - | | $ | 15.25 | | (4.75 | %) | | $ | 158,247 | | 0.85 | %(c) | | 0.85 | %(c) | | (0.27 | )%(c) | | 25 | % |
| | - | | | | - | | | | - | | | | - | | | 16.01 | | 8.54 | % | | | 172,395 | | 0.92 | % | | 0.92 | % | | (0.31 | )% | | 37 | % |
| | - | | | | - | | | | - | | | | - | | | 14.75 | | 22.10 | % | | | 275,278 | | 0.81 | % | | 0.81 | % | | (0.19 | )% | | 41 | % |
| | - | | | | - | | | | - | | | | - | | | 12.08 | | 11.44 | %(d) | | | 55,704 | | 0.94 | % | | 1.08 | % | | (0.68 | )% | | 51 | % |
| | - | | | | - | | | | - | | | | - | | | 10.84 | | 8.40 | %(d) | | | 37,968 | | 0.94 | %(c) | | 1.25 | %(c) | | (0.74 | %)(c) | | 17 | % |
| | | | | | | | | | |
| | | | | | | | | | | | | | | | | | | | | | | | | | | | | | | | | | | |
| | | | | | | | | | |
| | | | | | | | | | | | | | | | | | | | | | | | | | | | | | | | | | |
| | | | | | | | | | |
| | - | | | | - | | | | - | | | | - | | | 17.28 | | (7.79 | %) | | | 317,917 | | 0.80 | %(c) | | 0.80 | %(c) | | 0.07 | %(c) | | 32 | % |
| | - | | | | - | | | | - | | | | - | | | 18.74 | | 16.98 | % | | | 280,177 | | 0.88 | % | | 0.88 | % | | (0.19 | %) | | 58 | % |
| | - | | | | - | | | | - | | | | - | | | 16.02 | | 25.35 | % | | | 360,120 | | 0.77 | % | | 0.77 | % | | (0.03 | %) | | 49 | % |
| | - | | | | - | | | | - | | | | - | | | 12.78 | | 22.18 | %(d) | | | 68,545 | | 0.94 | % | | 1.07 | % | | (0.32 | %) | | 57 | % |
| | - | | | | - | | | | - | | | | - | | | 10.46 | | 4.60 | %(d) | | | 28,193 | | 0.94 | %(c) | | 1.49 | %(c) | | (0.42 | %)(c) | | 21 | % |
| | | | | | | | | | |
| | | | | | | | | | | | | | | | | | | | | | | | | | | | | | | | | | | |
| | | | | | | | | | |
| | | | | | | | | | | | | | | | | | | | | | | | | | | | | | | | | | |
| | | | | | | | | | |
| | - | | | | (0.04 | ) | | | (0.04 | ) | | | - | | | 14.99 | | 6.45 | % | | | 194,114 | | 0.68 | %(c) | | 0.68 | %(c) | | 0.47 | %(c) | | 19 | % |
| | - | | | | (0.04 | ) | | | (0.04 | ) | | | - | | | 14.12 | | 16.98 | % | | | 138,138 | | 0.78 | % | | 0.78 | % | | 0.25 | % | | 39 | % |
| | - | | | | - | | | | - | | | | - | | | 12.11 | | 10.09 | % | | | 103,861 | | 0.82 | % | | 0.82 | % | | 0.31 | % | | 26 | % |
| | - | | | | - | | | | - | | | | - | | | 11.00 | | 3.48 | %(d) | | | 42,988 | | 0.84 | % | | 1.03 | % | | (0.04 | %) | | 20 | % |
| | - | | | | - | | | | - | | | | - | | | 10.63 | | 6.30 | %(d) | | | 39,532 | | 0.84 | %(c) | | 1.13 | %(c) | | (0.09 | %)(c) | | 7 | % |
| | | | | | | | | | |
| | | | | | | | | | | | | | | | | | | | | | | | | | | | | | | | | | | |
| | | | | | | | | | |
| | | | | | | | | | | | | | | | | | | | | | | | | | | | | | | | | | |
| | | | | | | | | | |
| | (0.51 | ) | | | (0.21 | ) | | | (0.72 | ) | | | - | | | 15.89 | | (2.61 | %) | | | 72,596 | | 0.78 | %(c) | | 0.78 | %(c) | | 1.31 | %(c) | | 17 | % |
| | - | | | | (0.15 | ) | | | (0.15 | ) | | | - | | | 17.07 | | 19.57 | % | | | 86,095 | | 0.79 | % | | 0.79 | % | | 1.08 | % | | 34 | % |
| | - | | | | (0.15 | ) | | | (0.15 | ) | | | - | | | 14.41 | | 14.69 | %(d) | | | 87,718 | | 0.84 | % | | 0.86 | % | | 1.18 | % | | 23 | % |
| | - | | | | (0.10 | ) | | | (0.10 | ) | | | - | | | 12.70 | | 15.22 | %(d) | | | 27,476 | | 0.84 | % | | 1.10 | % | | 1.24 | % | | 30 | % |
| | - | | | | - | | | | - | | | | - | | | 11.11 | | 11.10 | %(d) | | | 20,598 | | 0.84 | %(c) | | 1.52 | %(c) | | 0.86 | %(c) | | 11 | % |
| | | | | | | | | | |
| | | | | | | | | | | | | | | | | | | | | | | | | | | | | | | | | | | |
| | | | | | | | | | |
| | | | | | | | | | | | | | | | | | | | | | | | | | | | | | | | | | |
| | | | | | | | | | |
| | - | | | | (0.11 | ) | | | (0.11 | ) | | | - | | | 8.44 | | 0.34 | %(d) | | | 181,255 | | 0.15 | %(c) | | 0.24 | %(c) | | 2.03 | %(c) | | 2 | % |
| | - | | | | (0.11 | ) | | | (0.11 | ) | | | - | | | 8.52 | | 19.81 | %(d) | | | 99,082 | | 0.15 | % | | 0.35 | % | | 1.98 | % | | 11 | % |
| | - | | | | (0.11 | ) | | | (0.11 | ) | | | - | | | 7.21 | | 6.64 | %(d) | | | 42,471 | | 0.15 | % | | 0.47 | % | | 1.90 | % | | 41 | % |
| | - | | | | (0.12 | ) | | | (0.12 | ) | | | - | | | 6.86 | | (0.59 | %)(d) | | | 34,612 | | 0.15 | % | | 0.56 | % | | 2.07 | % | | 20 | % |
| | - | | | | (0.05 | ) | | | (0.05 | ) | | | - | | | 7.02 | | 15.20 | %(d) | | | 35,960 | | 0.15 | % | | 0.58 | % | | 1.64 | % | | 5 | % |
| | - | | | | (0.09 | ) | | | (0.09 | ) | | | - | | | 6.14 | | 5.13 | %(d) | | | 7,763 | | 0.15 | % | | 1.07 | % | | 1.65 | % | | 25 | % |
| | | | | | | | | | |
| | | | | | | | | | | | | | | | | | | | | | | | | | | | | | | | | | | |
| | | | | | | | | | |
| | | | | | | | | | | | | | | | | | | | | | | | | | | | | | | | | | |
| | | | | | | | | | |
| | - | | | | (0.17 | ) | | | (0.17 | ) | | | - | | | 13.19 | | 3.21 | % | | | 87,364 | | 0.90 | %(c) | | 0.90 | %(c) | | 2.95 | %(c) | | 18 | % |
| | (0.15 | ) | | | (0.27 | ) | | | (0.42 | ) | | | - | | | 12.95 | | 5.87 | %(d) | | | 87,056 | | 0.94 | % | | 0.98 | % | | 2.16 | % | | 27 | % |
| | (0.11 | ) | | | (0.11 | ) | | | (0.22 | ) | | | - | | | 12.65 | | 8.01 | % | | | 85,340 | | 0.94 | % | | 0.94 | % | | 1.81 | % | | 51 | % |
| | (0.10 | ) | | | (0.08 | ) | | | (0.18 | ) | | | - | | | 11.92 | | 7.15 | %(d) | | | 42,264 | | 0.94 | % | | 1.19 | % | | 1.20 | % | | 126 | % |
| | - | | | | (0.05 | ) | | | (0.05 | ) | | | - | | | 11.30 | | 12.94 | %(d) | | | 23,212 | | 0.94 | % | | 1.51 | % | | 0.60 | % | | 124 | % |
| | (0.01 | ) | | | (0.06 | ) | | | (0.07 | ) | | | - | | | 10.05 | | 2.57 | %(d) | | | 8,344 | | 0.94 | % | | 1.66 | % | | 1.06 | % | | 98 | % |
| | | | | | | | | | |
| | | | | | | | | | | | | | | | | | | | | | | | | | | | | | | | | | | |
NOTES TO FINANCIAL STATEMENTS
1. Organization:
Bridgeway Funds, Inc. (“Bridgeway”) was organized as a Maryland corporation on October 19, 1993, and is registered under the Investment Company Act of 1940, as amended, as an open-end management investment company.
Bridgeway is organized as a series fund, which currently has 11 investment funds (collectively, the “Funds”): Aggressive Investors 1, Aggressive Investors 2, Ultra-Small Company, Ultra-Small Company Market, Micro-Cap Limited, Small-Cap Growth, Small-Cap Value, Large-Cap Growth, Large-Cap Value, Blue Chip 35 Index, and Balanced Funds.
Bridgeway is authorized to issue 1,000,000,000 shares of common stock at $0.001 per share. 15,000,000 shares have been classified into the Aggressive Investors 1 Fund. 130,000,000 shares each have been classified into the Aggressive Investors 2 and Blue Chip 35 Index Funds. 5,000,000 shares have been classified into the Ultra-Small Company Fund. 100,000,000 shares have been classified in the Ultra-Small Company Market Fund. 10,000,000 shares have been classified in the Micro-Cap Limited Fund. 100,000,000 shares each have been classified into the Small-Cap Growth, Small-Cap Value, Large-Cap Growth, and Large-Cap Value Funds. 50,000,000 shares have been classified into the Balanced Fund. All shares outstanding currently represent Class N shares.
Amounts disclosed above for each Fund that have been authorized do not include Class R shares, of which there are none currently issued and outstanding.
The Aggressive Investors 1 Fund and the Micro-Cap Limited Fund are closed to new investors. The Ultra-Small Company Fund is closed to all investors.
All of the Funds are no-load, diversified funds.
The Aggressive Investors 1 and 2 Funds seek to exceed the stock market total return (primarily through capital appreciation) at a level of total risk roughly equal to that of the stock market over longer periods of time (three years or more).
The Ultra-Small Company, Ultra-Small Company Market, Micro-Cap Limited, Small-Cap Growth, Small-Cap Value, and Large-Cap Growth Funds seek to provide a long-term total return of capital, primarily through capital appreciation.
The Blue Chip 35 Index and Large-Cap Value Funds seek to provide long-term total return of capital, primarily through capital appreciation but also some income.
The Balanced Fund seeks to provide a high current return with short-term risk less than or equal to 40% of the stock market.
Bridgeway Capital Management, Inc. (the “Adviser”) is the Adviser for all of the Funds.
2. Significant Accounting Policies:
The following summary of significant accounting policies, followed in the preparation of the financial statements of the Funds, are in conformity with accounting principles generally accepted in the United States of America.
Securities, Options, Futures and Other Investments Valuation Other than options, portfolio securities that are principally traded on a national securities exchange are valued at their last sale on the principal exchange on which they are traded prior to the close of the New York Stock Exchange (“NYSE”), on each day the NYSE is open for business. Portfolio securities other than options that are principally traded on the National Association of Securities Dealers Automated Quotation System (“NASDAQ”) are valued at the NASDAQ Official Closing Price (“NOCP”). In the absence of recorded sales on their home exchange or NOCP in the case of NASDAQ traded securities, the security will be valued as follows: bid prices for long positions and ask prices for short positions.
Short-term fixed income securities having a remaining maturity of 60 days or less are valued at amortized cost, which approximates market value. Options are valued at the average of the best bid and best asked quotations. Other investments for which no sales are reported are valued at the latest bid price in accordance with the pricing policy established by the Board of Directors.
Investments in open-end registered investment companies and closed-end registered investment companies that do not trade on an exchange are valued at the end of day net asset value per share.
Investments in closed-end registered investment companies that trade on an exchange are valued at the last sales price as of the close of the customary trading session on the exchange where the security is principally traded.
When market quotations are not readily available or when events occur that make established valuation methods unreliable, securities of the Funds may be valued at fair value as determined in good faith by or under the direction of the Board of Directors. The valuation assigned to fair valued securities for purposes of calculating the Funds’ NAVs may differ from the security’s most recent closing market price and from the prices used by other mutual funds to calculate their NAVs.
| | |
| 124 | | Semi-Annual Report | December 31, 2007 (Unaudited) |
NOTES TO FINANCIAL STATEMENTS (continued)
Securities Lending Upon lending its securities to third parties, the Fund receives compensation in the form of fees. The Fund also continues to receive dividends on the securities loaned. The loans are secured by collateral at least equal to the fair value of the securities loaned plus accrued interest. Gain or loss in the fair value of the securities loaned that may occur during the term of the loan will be for the account of the Fund. The Fund has the right under the lending agreement to recover the securities from the borrower on demand. Additionally, the Fund does not have the right to sell or repledge collateral received in the form of securities unless the borrower goes into default. The risks to the Fund of securities lending are that the borrower may not provide additional collateral when required or return the securities when due.
As of December 31, 2007, the Funds had securities on loan and related collateral with values shown below:
| | | | | | |
| Bridgeway Fund | | Securities
on Loan Value | | Value of
Securities
Received as
Collateral
|
| | | | | | |
Aggressive Investors 1 | | $ | 71,389,161 | | $ | 74,812,569 |
Aggressive Investors 2 | | $ | 137,594,226 | | $ | 144,350,974 |
Ultra-Small Company | | $ | 16,082,751 | | $ | 16,976,503 |
Ultra-Small Company Market | | $ | 170,609,372 | | $ | 183,935,846 |
Micro-Cap Limited | | $ | 8,200,482 | | $ | 8,686,238 |
Small-Cap Growth | | $ | 33,934,933 | | $ | 35,658,437 |
Small-Cap Value | | $ | 33,791,126 | | $ | 35,723,142 |
Large-Cap Growth | | $ | 25,917,400 | | $ | 26,897,579 |
Large-Cap Value | | $ | 6,442,980 | | $ | 6,677,004 |
Blue Chip 35 Index | | $ | 18,995,068 | | $ | 19,684,773 |
Balanced | | $ | 10,431,389 | | $ | 10,766,058 |
It is the Fund’s policy to obtain additional collateral from or return excess collateral to the borrower by the end of the next business day, following the valuation date of the securities loaned. Therefore, the value of the collateral held may be temporarily less than the value of the securities on loan.
Federal Income Taxes It is the Funds’ policy to continue to comply with the provisions of the Internal Revenue Code applicable to registered investment companies and to distribute income to the extent necessary so that the Funds are not subject to federal income tax. Therefore, no federal income tax provision is required.
Use of Estimates in Financial Statements In preparing financial statements in conformity with accounting principles generally accepted in the United States of America, management makes estimates and assumptions that affect the reported amounts of assets and liabilities at the date of the financial statements, as well as the reported amounts of income and expenses during the reporting period. Actual results could differ from those estimates.
Risks and Uncertainties The Funds provide for various investment options, including stocks and call and put options. Such investments are exposed to various risks, such as interest rate, market and credit. Due to the risks involved, it is at least reasonably possible that changes in risks in the near term would materially affect shareholders’ account values and the amounts reported in the financial statements and financial highlights.
Security Transactions, Expenses, Gains and Losses and Allocations Fund expenses that are not series specific are allocated to each series based upon its relative proportion of net assets to the Funds’ total net assets.
Security transactions are accounted for as of the trade date, the date the order to buy or sell is executed. Realized gains and losses are computed on the identified cost basis. Dividend income is recorded on the ex-dividend date, and interest income is recorded on the accrual basis from settlement date. Particularly related to the Balanced Fund, discounts and premiums are accreted/amortized on the effective interest method.
Futures Contracts A futures contract is an agreement between two parties to buy or sell a financial instrument at a set price on a future date. Upon entering into such a contract a Fund is required to pledge to the broker an amount of cash or U.S. government securities equal to the minimum “initial margin” requirements of the exchange on which the futures contract is traded. The contract amount reflects the extent of a Fund’s exposure in these financial instruments. The Fund’s participation in the futures markets involves certain risks, including imperfect correlation between movements in the price of futures contracts and movements in the price of the securities hedged or used for cover. The Fund’s activities in the futures contracts are conducted through regulated exchanges that do not result in counterparty credit risks on a periodic basis. Pursuant to a contract, the Fund agrees to receive from or pay to the broker an amount of cash equal to the fluctuation in value of the contract. Such receipts or payments are known as “variation margin” and are recorded by the Fund as unrealized appreciation or depreciation. When a contract is closed, the Fund records a realized gain or loss equal to the difference between the value of the contract at the time it was opened and the value at the time it was closed. As of December 31, 2007, no Fund had open futures contracts.
[GRAPHIC]
NOTES TO FINANCIAL STATEMENTS (continued)
Options An option is a contract conveying a right to buy or sell a financial instrument at a specified price during a stipulated period. The premium paid by a Fund for the purchase of a call or a put option is included in the Fund’s Schedule of Investments as an investment and subsequently marked to market to reflect the current market value of the option. When a Fund writes a call or a put option, an amount equal to the premium received by the Fund is included in the Fund’s Statement of Assets and Liabilities as a liability and is subsequently marked to market to reflect the current market value of the option written. If an option which a Fund has written either expires on its stipulated expiration date, or if the Fund enters into a closing purchase transaction, the Fund realizes a gain (or a loss if the cost of a closing purchase transaction exceeds the premium received when the option was written) without regard to any unrealized gain or loss on the underlying security, and the liability related to such option is extinguished. If a call option that a Fund has written is assigned, the Fund realizes a gain or loss from the sale of the underlying security and the proceeds from such sale are increased by the premium originally received. If a put option that a Fund has written is assigned, the amount of the premium originally received reduces the cost of the security that the Fund purchased upon exercise of the option. Buying calls increases a Fund’s exposure to the underlying security to the extent of any premium paid. Buying puts on a stock market index tends to limit a Fund’s exposure to a stock market decline. All options purchased by the Funds were listed on exchanges and considered liquid positions with readily available market quotes.
Covered Call Options and Secured Puts The Aggressive Investors 1, Aggressive Investors 2, and Balanced Funds may write call options on a covered basis, that is, the Fund will own the underlying security, or the Fund may write secured puts. The principal reason for writing covered calls and secured puts on a security is to attempt to realize income, through the receipt of premiums. The option writer has, in return for the premium, given up the opportunity for profit from a substantial price increase in the underlying security so long as the obligation as a writer continues, but has retained the risk of loss should the price of the security decline. All options were listed on exchanges and considered liquid positions with readily available market quotes. Only Balanced Fund had outstanding written options as of December 31, 2007.
A summary of the options transactions written by each of the funds is as follows:
| | | | | | | |
| Aggressive Investors 1 Fund | |
| | | Written Call Options | |
| | | Contracts | | | Premiums | |
| | | | | | | |
Outstanding, June 30, 2007 | | — | | | $ | — | |
Positions Opened | | 3,435 | | | | 1,141,957 | |
Exercised | | (740 | ) | | | (241,776 | ) |
Expired | | — | | | | — | |
Closed | | (2,695 | ) | | | (900,181 | ) |
| | | | | | | | |
Outstanding, December 31, 2007 | | — | | | $ | — | |
| | | | | | | | |
Market Value, December 31, 2007 | | | | | $ | — | |
| | | | | | | | |
|
| Aggressive Investors 2 Fund | |
| | | Written Call Options | |
| | | Contracts | | | Premiums | |
| | | | | | | |
Outstanding, June 30, 2007 | | — | | | $ | — | |
Positions Opened | | 5,803 | | | | 2,051,350 | |
Exercised | | — | | | | — | |
Expired | | — | | | | — | |
Closed | | (5,803 | ) | | | (2,051,350 | ) |
| | | | | | | | |
Outstanding, December 31, 2007 | | — | | | $ | — | |
| | | | | | | | |
Market Value, December 31, 2007 | | | | | $ | — | |
| | | | | | | | |
|
| Balanced Fund | |
| | | Written Call Options | |
| | | Contracts | | | Premiums | |
| | | | | | | |
Outstanding, June 30, 2007 | | 3,906 | | | $ | 515,704 | |
Positions Opened | | 10,980 | | | | 1,694,299 | |
Exercised | | (984 | ) | | | (219,568 | ) |
Expired | | — | | | | — | |
Closed | | (9,461 | ) | | | (1,296,723 | ) |
| | | | | | | | |
Outstanding, December 31, 2007 | | 4,441 | | | $ | 693,712 | |
| | | | | | | | |
Market Value, December 31, 2007 | | | | | $ | 496,631 | |
| | | | | | | | |
| |
| | | Written Put Options | |
| | | Contracts | | | Premiums | |
| | | | | | | |
Outstanding, June 30, 2007 | | 3,140 | | | $ | 413,618 | |
Positions Opened | | 10,623 | | | | 2,380,223 | |
Exercised | | (2,032 | ) | | | (265,890 | ) |
Expired | | — | | | | — | |
Closed | | (8,893 | ) | | | (1,776,380 | ) |
| | | | | | | | |
Outstanding, December 31, 2007 | | 2,838 | | | $ | 751,571 | |
| | | | | | | | |
Market Value, December 31, 2007 | | | | | $ | 441,478 | |
| | | | | | | | |
| | |
| 126 | | Semi-Annual Report | December 31, 2007 (Unaudited) |
NOTES TO FINANCIAL STATEMENTS (continued)
Swaps Each Fund may enter into total return swaps. Total return swaps are agreements that provide a Fund with a return based on the performance of an underlying asset, in exchange for fee payments to a counterparty based on a specified rate. The difference in the value of these income streams is recorded daily by the Funds, and is settled in cash at the end of each month. The fee paid by a Fund will typically be determined by multiplying the face value of the swap agreement by an agreed upon interest rate. In addition, if the underlying asset declines in value over the term of the swap, the Fund would also be required to pay the dollar value of that decline to the counterparty. Total return swaps could result in losses if the underlying asset does not perform as anticipated by the Adviser. A Fund may use its own net asset value as the underlying asset in a total return swap. This strategy serves to reduce cash drag (the impact of cash on a Fund’s overall return) by replacing it with the impact of market exposure based upon the Fund’s own investment holdings. The following total return swaps were open as of December 31, 2007:
| | | | | | | | | | | |
| Portfolio | | Swap
Counterparty | | Notional
Principal | | Maturity
Date | | Net Unrealized
Gain\(Loss) | |
| | | | | | | | | | | |
Aggressive Investors 1 | | Reflow Management Co. | | $ | 148,000 | | Jan 1, 08 | | $ | 128,463 | |
Small-Cap Growth | | Reflow Management Co. | | | 728,911 | | Jan 1, 08 | | | (3,256 | ) |
Small-Cap Value | | Reflow Management Co. | | | 6,694,240 | | Jan 1, 08 | | | 475,664 | |
Indemnification Under the Company’s organizational documents, the Funds’ officers, directors, employees and agents are indemnified against certain liabilities that may arise out of performance of their duties to the Funds. Additionally, in the normal course of business, the Funds enter into contracts that contain a variety of indemnification clauses. The Funds’ maximum exposure under these arrangements is unknown as this would involve future claims that may be made against the Funds that have not yet occurred. However, the Funds have not had prior claims or losses pursuant to these contracts.
| 3. | Management Fees, Other Related Party Transactions and Contingencies: |
The Funds have entered into management agreements with the Adviser. As compensation for the advisory services rendered, facilities furnished, and expenses borne by the Adviser, the Funds pay the Adviser a fee pursuant to each Fund’s management agreement, as described below.
Aggressive Investors 1: A total advisory fee is paid by the Fund to the Adviser that is comprised of a Base Fee and a Performance Adjustment. The Base Fee equals the Base Fee Rate times the average daily net assets of the Fund. The Base Fee Rate is based on the following annual rates: 0.90% of the first $250 million of the Fund’s average daily net assets, 0.875% of the next $250 million and 0.85% of any excess over $500 million.
The Performance Adjustment equals 4.67% times the difference in cumulative total return between the Fund and the Standard and Poor’s 500 Index with dividends reinvested (hereinafter “Index”) over a rolling five-year performance period. The Performance Adjustment Rate varies from a minimum of -0.70% to a maximum of +0.70%. However, the Performance Adjustment Rate is zero if the difference between the cumulative Fund performance and the Index performance is less than or equal to 2%.
Aggressive Investors 2: A total advisory fee is paid by the Fund to the Adviser that is comprised of a Base Fee and a Performance Adjustment. The Base Fee equals the Base Fee Rate times the average daily net assets of the Fund. The Base Fee rate is based on the following annual rates: 0.90% of the first $250 million of the Fund’s average daily net assets, 0.875% of the next $250 million, 0.850% from $500 million to $1 billion, and 0.800% over $1 billion.
The Performance Adjustment equals 2.00% times the difference in cumulative total return between the Fund and the Standard and Poor’s 500 Index with dividends reinvested (hereinafter “Index”) over a rolling five-year performance period. The Performance Adjustment Rate, which was revised effective April 1, 2005, varies from a minimum of -0.30% to a maximum of +0.30%. However, the Performance Adjustment Rate is zero if the difference between the cumulative Fund performance and the Index performance is less than or equal to 2%.
Ultra-Small Company: The Fund pays management fees based on the following annual rates: 0.90% of the first $250 million of the Fund’s average daily net assets, 0.875% of the next $250 million and 0.85% of any excess over $500 million. The management fees are computed daily and are payable monthly. However, during any quarter that the Fund’s net assets range from $27,500,000 to $55,000,000, the advisory fee will be determined as if the Fund had $55,000,000 under management. This is limited to a maximum annualized expense ratio of 1.49% of average net assets.
NOTES TO FINANCIAL STATEMENTS (continued)
Ultra-Small Company Market: The Fund pays a flat 0.50% annual management fee, computed daily and payable monthly.
Micro-Cap Limited: A total advisory fee is paid by the Fund to the Adviser that is comprised of a Base Fee and a Performance Adjustment. The Base Fee equals the Base Fee Rate times the average daily net assets of the Fund. The Base Fee Rate is based on the following annual rates: 0.90% of the first $250 million of the Fund’s average daily net assets, 0.875% of the next $250 million and 0.85% of any excess over $500 million. However, during any quarter that the Fund’s net assets range from $27,500,000 to $55,000,000, the advisory fee will be determined as if the Fund had $55,000,000 under management. This is limited to a maximum annualized expense ratio of 1.49% of the net assets in the quarter the advisory fee is determined.
The Performance Adjustment equals 2.87% times the difference in cumulative total return between the Fund and the CRSP Cap-based Portfolio 9 Index with dividends reinvested (hereinafter “Index”) over a rolling five-year performance period. The Performance Adjustment Rate varies from a minimum of -0.70% to a maximum of +0.70%. However, the Performance Adjustment Rate is zero if the difference between the cumulative Fund performance and the Index performance is less than or equal to 2%.
Small-Cap Growth and Small-Cap Value: A total advisory fee is paid by each Fund to the Adviser that is comprised of a Base Fee and a Performance Adjustment. The Base Fee equals the Base Fee Rate times the average daily net assets of the Fund. The Base Fee Rate is based on the annual rate of 0.60% of the value of the Fund’s average daily net assets.
The Performance Adjustment equals 0.33% times the difference in cumulative total return between the Fund and the Russell 2000 Growth Index for Small-Cap Growth Fund and the Russell 2000 Value Index for Small-Cap Value Fund, with dividends reinvested (hereinafter “Index”) over a rolling five-year performance period. Since each Fund does not have a five-year operating history, the Performance Adjustment Rate will be calculated as follows during the initial five-year period: (a) From inception through September 30, 2004, the Performance Adjustment Rate was inoperative thus the Advisory Fee was calculated based on the Base Advisory Fee Rate times the average daily net assets of the Funds only; (b) From September 30, 2004 through September 30, 2008, the Performance Adjustment Rate will be calculated based upon a comparison of the investment performance of the Fund and the Index over the number of quarters that have elapsed since the Fund’s inception. Each time the Performance Adjustment Rate is calculated, it will cover a longer time span, until it can cover a running five-year period as intended. In the meantime, the early months of the transition period will have a disproportionate effect on the performance adjustment of the fee. The Performance Adjustment Rate varies from a minimum of -0.05% to a maximum of +0.05%. However, the Performance Adjustment Rate is zero if the difference between the cumulative Fund’s performance and the Index performance is less than or equal to 2%.
Large-Cap Growth and Large-Cap Value: A total advisory fee is paid by each Fund to the Adviser that is comprised of a Base Fee and a Performance Adjustment. The Base Fee equals the Base Fee Rate times the average daily net assets of the Fund. The Base Fee Rate is based on the annual rate of 0.50% of the value of the Fund’s average daily net assets.
The Performance Adjustment equals 0.33% times the difference in cumulative total return between the Fund and the Russell 1000 Growth Index for Large-Cap Growth Fund and the Russell 1000 Value Index for the Large-Cap Value Fund, with dividends reinvested (hereinafter “Index”) over a rolling five-year performance period. Since each Fund does not have a five-year operating history, the Performance Adjustment Rate will be calculated as follows during the initial five-year period: (a) From inception through September 30, 2004, the Performance Adjustment Rate was inoperative thus the Advisory Fee was calculated based on the Base Advisory Fee Rate times the average daily net assets of the Funds only; (b) From September 30, 2004 through September 30, 2008, the Performance Adjustment Rate will be calculated based upon a comparison of the investment performance of the Fund and the Index over the number of quarters that have elapsed since the Fund’s inception. Each time the Performance Adjustment Rate is calculated, it will cover a longer time span, until it can cover a running five-year period as intended. In the meantime, the early months of the transition period will have a disproportionate effect on the performance adjustment of the fee. The Performance Adjustment Rate varies from a minimum of -0.05% to a maximum of +0.05%. However, the Performance Adjustment Rate is zero if the difference between the cumulative Fund’s performance and the Index performance is less than or equal to 2%.
Blue Chip 35 Index: The Fund pays a flat 0.08% annual management fee, computed daily and payable monthly.
Balanced: The Fund pays a flat 0.60% annual management fee, computed daily and payable monthly.
Expense limitations: At a special meeting on March 31, 2005, shareholders of the Funds approved amendments to the Management Agreements detailing expense limitations. The Adviser agrees to reimburse the Funds for operating expenses and management fees above the expense limitations, which are shown as a ratio of net expenses to average net assets, for each Fund, for the fiscal period ended
| | |
| 128 | | Semi-Annual Report | December 31, 2007 (Unaudited) |
NOTES TO FINANCIAL STATEMENTS (continued)
December 31, 2007. All expense limitations and total reimbursements for the fiscal period ended December 31, 2007, are shown below.
| | | | | | | | |
| | | | | Total Waivers and
Reimbursements
for fiscal
period ending
12/31/2007 |
Bridgeway
Fund | | Expense
Limitation | | Adviser
Waived and
Reimbursed | | Other*
Reimbursements |
| | | | | | | | |
Aggressive Investors 1 | | 1.80% | | $ | - | | $ | 1,521 |
Aggressive Investors 2 | | 1.75% | | | - | | | 3,212 |
Ultra-Small Company | | 2.00% | | | - | | | 499 |
Ultra-Small Company Market | | 0.75% | | | - | | | 4,123 |
Micro-Cap Limited | | 1.85% | | | - | | | 224 |
Small-Cap Growth | | 0.94% | | | - | | | 643 |
Small-Cap Value | | 0.94% | | | - | | | 1,246 |
Large-Cap Growth | | 0.84% | | | - | | | 756 |
Large-Cap Value | | 0.84% | | | - | | | 301 |
Blue Chip 35 Index | | 0.15% | | | 61,400 | | | 678 |
Balanced | | 0.94% | | | - | | | 353 |
| * | The Funds’ accounting agent voluntarily reimbursed certain expenses during the fiscal period ended December 31, 2007. |
Other Related Party Transactions: On occasion, the Funds will engage in inter-portfolio trades when it is to the benefit of both parties. The Board of Directors reviews these trades quarterly. No Fund entered into inter-portfolio purchases or sales during the period ended December 31, 2007.
The Adviser entered into an Administrative Services Agreement with Bridgeway Funds pursuant to which the Adviser provides various administrative services to the Funds including, but not limited to: (i) supervising and managing various aspects of the Funds’ business and affairs; (ii) selecting, overseeing and/or coordinating activities with other service providers to the Funds; (iii) providing reports to the Board as requested from time to time; (iv) assisting and/or reviewing amendments and updates to the Funds’ registration statement and other filings with the SEC; (v) providing certain shareholder services; (vi) providing administrative support in connection with meetings of the Board of Directors; and (vii) providing certain recordkeeping services. For its services to the Funds, the Adviser is paid an aggregate annual fee of $635,000 is payable in equal monthly installments.
One director of the Funds, John Montgomery, is an owner and director of the Adviser. Another director of the Fund, Michael Mulcahy, is an executive and director of the Adviser. Under the Investment Company Act of 1940 definitions, each is considered to be an “affiliated person” of the Adviser and an “interested person” of the Adviser and of the Funds. Compensation for Mr. Montgomery and Mr. Mulcahy is borne by the Adviser rather than the Funds.
Board of Directors Compensation Prior to November 2007, Bridgeway paid an annual retainer of $8,000 and fees of $4,000 per meeting to each Independent Director. The Independent Chairman of the Board received an annual retainer of $10,500 and fees of $5,000 per meeting. In addition, the chairperson of the Nominating and Corporate Governance Committee received an additional $1,000 for chairing the annual Board self-assessment. At its meeting of November 16, 2007, the Board of Directors approved revisions in its compensation. Under the revised compensation, Independent Directors are paid an annual retainer of $8,000 with an additional retainer of $1,000 paid to the Nominating and Corporate Governance Committee Chair and an additional retainer of $2,500 paid to the Independent Chairman of the Board. Independent Director meeting fees are $6,000 per meeting effective November 16, 2007.
The Independent Directors receive this compensation in the form of shares of Bridgeway Funds, credited to his or her account. Such Directors are reimbursed for any expenses incurred in attending meetings and conferences and expenses for subscriptions or printed materials. During the fiscal period ended December 31, 2007, total reimbursements made, across all of the Funds, was $928. The amount of directors’ fees attributable to each Fund is disclosed in the Statements of Operations.
NOTES TO FINANCIAL STATEMENTS (continued)
4. Distribution and Shareholder Servicing Fees:
Foreside Fund Services, LLC acts as distributor of the Funds’ shares pursuant to a restated and amended Distribution Agreement dated July 1, 2007. The Adviser pays all costs and expenses associated with distribution of the Funds’ shares pursuant to a protective plan adopted by shareholders pursuant to Rule 12b-1.
5. Purchases and Sales of Investment Securities:
Purchases and sales of investments, other than short-term securities, for each Bridgeway Fund for the fiscal period ended December 31, 2007 were as follows:
| | | | | | | | | | | | |
| | | Purchases | | Sales |
| Bridgeway Fund | | U.S. Government | | Other | | U.S. Government | | Other |
| | | | | | | | | | | | |
Aggressive Investors 1 | | | - | | $ | 304,448,110 | | | - | | $ | 332,124,755 |
Aggressive Investors 2 | | | - | | $ | 644,380,429 | | | - | | $ | 527,201,626 |
Ultra-Small Company | | | - | | $ | 66,029,175 | | | - | | $ | 69,575,675 |
Ultra-Small Company Market | | | - | | $ | 142,137,290 | | | - | | $ | 187,474,340 |
Micro-Cap Limited | | | - | | $ | 39,170,012 | | | - | | $ | 42,032,906 |
Small-Cap Growth | | | - | | $ | 39,838,678 | | | - | | $ | 46,668,481 |
Small-Cap Value | | | - | | $ | 153,845,432 | | | - | | $ | 94,456,275 |
Large-Cap Growth | | | - | | $ | 77,782,554 | | | - | | $ | 31,900,424 |
Large-Cap Value | | | - | | $ | 13,208,845 | | | - | | $ | 23,223,895 |
Blue Chip 35 Index | | | - | | $ | 85,408,238 | | | - | | $ | 2,163,885 |
Balanced | | $ | 998,886 | | $ | 12,677,202 | | $ | 3,085,635 | | $ | 8,534,851 |
6. Federal Income Taxes
Unrealized Appreciation and Depreciation on Investments (Tax Basis) The amount of net unrealized appreciation/depreciation and the cost of investment securities for tax purposes, including short-term securities at December 31, 2007, were as follows:
| | | | | | | | | | | | |
| | | Aggressive Investors 1 | | | Aggressive Investors 2 | | | Ultra-Small Company | |
As of December 31, 2007 | | | | | | | | | | | | |
Gross appreciation (excess of value over tax cost) | | $ | 89,107,694 | | | $ | 178,843,421 | | | $ | 28,165,525 | |
Gross depreciation (excess of tax cost over value) | | | (5,124,553 | ) | | | (16,649,770 | ) | | | (6,466,458 | ) |
| | | | | | | | | | | | | |
Net unrealized appreciation | | $ | 83,983,141 | | | $ | 162,193,651 | | | $ | 21,699,067 | |
| | | | | | | | | | | | | |
Cost of investments for income tax purposes | | $ | 299,876,479 | | | $ | 673,981,701 | | | $ | 98,943,595 | |
| | | | | | | | | | | | | |
| | | | | | | | | | | | | | | | |
| | | Ultra-Small
Company Market | | | Micro-Cap Limited | | | Small-Cap Growth | | | Small-Cap Value | |
As of December 31, 2007 | | | | | | | | | | | | | | | | |
Gross appreciation (excess of value over tax cost) | | $ | 368,039,792 | | | $ | 8,729,648 | | | $ | 43,125,404 | | | $ | 72,907,703 | |
Gross depreciation (excess of tax cost over value) | | | (85,918,493 | ) | | | (4,111,513 | ) | | | (5,908,546 | ) | | | (19,276,282 | ) |
| | | | | | | | | | | | | | | | | |
Net unrealized appreciation | | $ | 282,121,299 | | | $ | 4,618,135 | | | $ | 37,216,858 | | | $ | 53,631,421 | |
| | | | | | | | | | | | | | | | | |
Cost of investments for income tax purposes | | $ | 701,797,795 | | | $ | 49,609,307 | | | $ | 120,409,358 | | | $ | 268,407,235 | |
| | | | | | | | | | | | | | | | | |
| | |
| 130 | | Semi-Annual Report | December 31, 2007 (Unaudited) |
NOTES TO FINANCIAL STATEMENTS (continued)
| | | | | | | | | | | | | | | | |
| | | | |
| | | Large-Cap Growth | | | Large-Cap Value | | | Blue Chip 35 Index | | | Balanced | |
As of December 31, 2007 | | | | | | | | | | | | | | | | |
Gross appreciation (excess of value over tax cost) | | $ | 41,488,607 | | | $ | 16,968,888 | | | $ | 20,601,075 | | | $ | 13,524,445 | |
Gross depreciation (excess of tax cost over value) | | | (5,480,885 | ) | | | (820,138 | ) | | | (7,414,720 | ) | | | (2,473,501 | ) |
| | | | | | | | | | | | | | | | | |
Net unrealized appreciation | | $ | 36,007,722 | | | $ | 16,148,750 | | | $ | 13,186,355 | | | $ | 11,050,944 | |
| | | | | | | | | | | | | | | | | |
Cost of investments for income tax purposes | | $ | 161,821,908 | | | $ | 56,294,650 | | | $ | 170,429,035 | | | $ | 75,368,395 | |
| | | | | | | | | | | | | | | | | |
The difference between book and tax net unrealized appreciation are wash sale loss deferrals.
Classifications of Distributions Net investment income (loss) and net realized gain (loss) may differ for financial statement and tax purposes. The character of distributions made during the year from net investment income or net realized gains may differ from its ultimate characterization for federal income tax purposes.
The difference between book and tax components of net assets and the resulting reclassifications were primarily a result of the differing book/tax treatment of net operating losses and certain expenses.
The tax character of the distributions paid by the Funds during the last two fiscal years ended June 30, 2007 and June 30, 2006, respectively, were as follows:
| | | | | | | | | | | | |
| | | Aggressive Investors 1 | | Aggressive Investors 2 |
| | | Year
Ended
June 30, 2007 | | Year
Ended
June 30, 2006 | | Year
Ended
June 30, 2007 | | Year
Ended
June 30, 2006 |
Distributions paid from: | | | | | | | | | | | | |
Ordinary income | | $ | - | | $ | 1,866,101 | | $ | - | | $ | 554,558 |
Long Term Capital Gain | | | 38,922,847 | | | 40,753,725 | | | 12,277,639 | | | 5,415,124 |
| | | | | | | | | | | | | |
Total | | $ | 38,922,847 | | $ | 42,619,826 | | $ | 12,277,639 | | $ | 5,969,682 |
| | | | | | | | | | | | | |
| | |
| | | Ultra-Small Company | | Ultra-Small Company Market |
| | | Year
Ended
June 30, 2007 | | Year
Ended
June 30, 2006 | | Year
Ended
June 30, 2007 | | Year
Ended
June 30, 2006 |
Distributions paid from: | | | | | | | | | | | | |
Ordinary income | | $ | 1,877,630 | | $ | 897,342 | | $ | 4,933,248 | | $ | 1,179,985 |
Long Term Capital Gain | | | 23,500,754 | | | 13,492,318 | | | 22,318,728 | | | 21,617,958 |
| | | | | | | | | | | | | |
Total | | $ | 25,378,384 | | $ | 14,389,660 | | $ | 27,251,976 | | $ | 22,797,943 |
| | | | | | | | | | | | | |
| | |
| | | Micro-Cap Limited | | Large-Cap Growth |
| | | Year
Ended
June 30, 2007 | | Year
Ended
June 30, 2006 | | Year
Ended
June 30, 2007 | | Year
Ended
June 30, 2006 |
Distributions paid from: | | | | | | | | | | | | |
Ordinary income | | $ | 1,475 | | $ | 130,000 | | $ | 357,354 | | $ | - |
Long Term Capital Gain | | | 14,953,926 | | | 9,975,182 | | | - | | | - |
| | | | | | | | | | | | | |
Total | | $ | 14,955,401 | | $ | 10,105,182 | | $ | 357,354 | | $ | - |
| | | | | | | | | | | | | |
NOTES TO FINANCIAL STATEMENTS (continued)
| | | | | | | | | | | | |
| | |
| | | Large-Cap Value | | Blue Chip 35 Index |
| | | Year
Ended
June 30, 2007 | | Year
Ended
June 30, 2006 | | Year
Ended
June 30, 2007 | | Year
Ended
June 30, 2006 |
Distributions paid from: | | | | | | | | | | | | |
Ordinary income | | $ | 819,616 | | $ | 445,034 | | $ | 1,021,236 | | $ | 720,188 |
Long Term Capital Gain | | | - | | | - | | | - | | | - |
| | | | | | | | | | | | | |
Total | | $ | 819,616 | | $ | 445,034 | | $ | 1,021,236 | | $ | 720,188 |
| | | | | | | | | | | | | |
| | |
| | | Balanced | | |
| | | Year
Ended
June 30, 2007 | | Year
Ended
June 30, 2006 | | | | |
Distributions paid from: | | | | | | | | | | | | |
Ordinary income | | $ | 2,182,831 | | $ | 679,739 | | | | | | |
Long Term Capital Gain | | | 719,840 | | | 319,094 | | | | | | |
| | | | | | | | | | | | | |
Total | | $ | 2,902,671 | | $ | 998,833 | | | | | | |
| | | | | | | | | | | | | |
At June 30, 2007, the Funds had available for tax purposes, capital loss carryovers as follows:
| | | | | | | | | | | | | | | | | | | | | | | |
| | | | | Aggressive
Investors 2 | | Micro-Cap
Limited | | Small-Cap
Growth | | Small-Cap
Value | | Large-Cap
Growth | | Blue Chip 35
Index | | Balanced |
| Expiring | | 6/30/2008 | | $ | - | | $ | - | | $ | - | | $ | - | | $ | - | | $ | 106,811 | | $ | - |
| | 6/30/2009 | | | - | | | - | | | - | | | - | | | - | | | 100,306 | | | - |
| | 6/30/2010 | | | - | | | - | | | - | | | - | | | - | | | 429,064 | | | - |
| | 6/30/2011 | | | - | | | - | | | - | | | - | | | - | | | 337,509 | | | - |
| | 6/30/2012 | | | - | | | - | | | - | | | - | | | - | | | 327,296 | | | - |
| | 6/30/2013 | | | - | | | - | | | 3,213,476 | | | 948,551 | | | 2,323,531 | | | 282,192 | | | - |
| | 6/30/2014 | | | - | | | - | | | 1,027,472 | | | - | | | 2,412,639 | | | 402,963 | | | - |
| | 6/30/2015 | | | 7,747,247 | | | 1,910,229 | | | 10,523,579 | | | - | | | - | | | 418,882 | | | 2,910,049 |
Components of Net Assets (Tax Basis) As of June 30, 2007, the components of net assets on a tax basis were:
| | | | | | | | | | | |
| | | Aggressive Investors 1 | | Aggressive Investors 2 | | | Ultra-Small Company | |
Accumulated Net Investment Income (Loss) | | $ | - | | $ | - | | | $ | 394,075 | |
Accumulated Net Realized Gain (Loss) on Investments | | | 50,511,257 | | | (7,747,247 | ) | | | 15,085,220 | |
Net unrealized appreciation\deprection of investments | | | 71,818,491 | | | 142,206,721 | | | | 29,355,122 | |
| | | | | | | | | | | | |
Total | | $ | 122,329,748 | | $ | 134,459,474 | | | $ | 44,834,417 | |
| | | | | | | | | | | | |
| | | |
| | | Ultra-Small
Company Market | | Micro-Cap Limited | | | Small-Cap Growth | |
Accumulated Net Investment Income (Loss) | | $ | 2,258,267 | | $ | - | | | $ | - | |
Accumulated Net Realized Gain (Loss) on Investments | | | 34,714,369 | | | (1,910,229 | ) | | | (14,764,527 | ) |
Net unrealized appreciation\deprection of investments | | | 403,816,563 | | | 9,366,589 | | | | 48,165,152 | |
Other Book/Tax Differences | | | - | | | - | | | | (1,388 | ) |
| | | | | | | | | | | | |
Total | | $ | 440,789,199 | | $ | 7,456,360 | | | $ | 33,399,237 | |
| | | | | | | | | | | | |
| | |
| 132 | | Semi-Annual Report | December 31, 2007 (Unaudited) |
NOTES TO FINANCIAL STATEMENTS (continued)
| | | | | | | | | | | | |
| | | |
| | | Small-Cap Value | | | Large-Cap Growth | | | Large-Cap Value | |
Accumulated Net Investment Income (Loss) | | $ | - | | | $ | 122,905 | | | $ | 426,913 | |
Accumulated Net Realized Gain (Loss) on Investments | | | (948,551 | ) | | | (4,736,170 | ) | | | 1,696,514 | |
Net unrealized appreciation\deprection of investments | | | 83,159,698 | | | | 26,140,779 | | | | 19,721,270 | |
Other Book/Tax Differences | | | (1,388 | ) | | | (1,356 | ) | | | (1,356 | ) |
| | | | | | | | | | | | | |
Total | | $ | 82,209,759 | | | $ | 21,526,158 | | | $ | 21,843,341 | |
| | | | | | | | | | | | | |
| | | |
| | | Blue Chip 35 Index | | | Balanced | | | | |
Accumulated Net Investment Income (Loss) | | $ | 804,973 | | | $ | 826,873 | | | | | |
Accumulated Net Realized Gain (Loss) on Investments | | | (2,417,737 | )* | | | (3,741,146 | )* | | | | |
Net unrealized appreciation\deprection of investments | | | 14,604,675 | | | | 11,818,639 | | | | | |
| | | | | | | | | | | | | |
Total | | $ | 12,991,911 | | | $ | 8,904,366 | | | | | |
| | | | | | | | | | | | | |
| * | Includes losses incurred in the period November 1, 2006 through June 30, 2007 which the Fund has elected to defer to its fiscal year ending June 30, 2008 of $12,714 for Blue Chip 35 Index and $831,097 of Balanced Fund. |
7. Bank Borrowings
Certain Bridgeway Funds established a line of credit agreement (“Facility”) with PNC Bank, N.A. (the “Bank” or “Lender”) which matures on October 9, 2008 and is renewable annually at the Bank’s option, to be used for temporary or emergency purposes, primarily for financing redemption payments. Any and all advances under this Facility would be at the sole discretion of the Lender based on the merits of the specific transaction. Advances under the Facility are limited to $5,000,000 in total for all Funds (except Aggressive Investors 1 and Aggressive Investors 2 Funds), or 33 1/3% of a Fund’s net assets. Borrowings under the line of credit bear interest based on the Lender’s Prime Rate. Principal is due fifteen days after each advance and at maturity. Interest Is payable monthly in arrears. No Fund had borrowings under the Facility during the fiscal period ended December 31, 2007.
During the fiscal period ended December 31, 2007 each of the Funds engaged in short-term borrowings from PFPC Trust Company, the Funds’ Custodian. Interest on the borrowings was charged at 1.25 times the Federal Funds Rate. The average daily loan balance during the period for which loans were outstanding and the weighted average interest rate was:
| | | | | | | |
| | | Average Borrowing | | | Average Rate | |
Aggressive Investors 1 | | $ | (2,968,908 | ) | | 5.86 | % |
Aggressive Investors 2 | | | (3,336,461 | ) | | 6.03 | |
Ultra-Small Company | | | (532,235 | ) | | 5.74 | |
Ultra-Small Company Market | | | (1,345,606 | ) | | 6.08 | |
Micro-Cap Ltd | | | (246,887 | ) | | 5.49 | |
Small-Cap Growth | | | (329,348 | ) | | 6.13 | |
Large-Cap Growth | | | (901,014 | ) | | 6.35 | |
Large-Cap Value | | | (694,769 | ) | | 6.31 | |
Blue Chip 35 Index | | | (235,725 | ) | | 6.49 | |
Balanced | | | (1,053,732 | ) | | 5.88 | |
8. Redemption Fees:
In Ultra-Small Company Market Fund a 2.00% redemption fee may be charged on shares held less than six months or for redemptions in a down market, subject to a maximum combined redemption fee of 2.00%. In Blue Chip 35 Index Fund a 1.00% redemption fee may be charged on redemptions in a down market.
NOTES TO FINANCIAL STATEMENTS (continued)
9. Recent Accounting Pronouncements
In June 2006, Financial Accounting Standards Board Interpretation No. 48, Accounting for Uncertainty in Income Taxes (“FIN 48”), was issued.
The Funds implemented the provisions of FIN 48, which prescribe a minimum threshold for financial statement recognition of the benefit of a tax position taken in a tax return. As of December 31, 2007, Fund management has determined that the Fund did not have any unrecognized tax benefits as a result of tax positions taken in the current or prior reporting periods that would require reporting under FIN 48.
In September 2006, the Financial Accounting Standards Board issued Statement of Financial Accounting Standards (“SFAS”) 157, Fair Value Measurements, which clarifies the definition of fair value and requires companies to expand their disclosure about the use of fair value to measure assets and liabilities in interim and annual periods subsequent to initial recognition. Adoption of SFAS 157 requires the use of the price that would be received to sell an asset or paid to transfer a liability in an orderly transaction between market participants at the measurement date. SFAS 157 is effective for financial statements issued for fiscal years beginning after November 15, 2007, and interim periods within those fiscal years. At this time, management is in the process of reviewing the impact, if any, of SFAS 157 on the Funds’ financial statements.
| | |
| 134 | | Semi-Annual Report | December 31, 2007 (Unaudited) |
OTHER INFORMATION
December 31, 2007 (unaudited)
1. Proxy Voting
Fund policies and procedures used in determining how to vote proxies relating to Funds’ securities and a summary of proxies voted by the Funds for the period ended June 30, 2007 are available without a charge, upon request, by contacting Bridgeway Funds at 1-800-661-3550 and on the Securities and Exchange Commission’s (“SEC”) website at http://www.sec.gov.
2. Fund Holdings
The complete schedules of the Funds’ holdings for the second and fourth quarters of each fiscal year are contained in the Funds’ Semi-Annual and Annual shareholder reports, respectively.
The Bridgeway Funds file complete schedules of the Funds’ holdings with the SEC for the first and third quarters of each fiscal year on Form N-Q within 60 days after the end of the period. Copies of the Funds’ Form N-Q are available without charge, upon request, by contacting Bridgeway Funds at 1-800-661-3550 and on the SEC’s website at http://www.sec.gov. You may also review and copy Form N-Q at the SEC’s Public Reference Room in Washington, D.C. For more information about the operation of the Public Reference Room, please call 1-800-SEC-0330.
DISCLOSURE OF FUND EXPENSES
December 31, 2007 (unaudited)
As a shareholder of a Fund, you will not incur sales charges (loads) on purchases, on reinvested dividends, or on other distributions. There are no exchange fees. Shareholders are subject to redemption fees on the Ultra-Small Company Market and Blue Chip 35 Index Funds under certain circumstances. However, as a shareholder of the Fund, you will incur ongoing costs, including management fees and other Fund expenses. The following examples are intended to help you understand your ongoing costs (in dollars) of investing in the Fund and to compare these costs with ongoing costs of investing in other mutual funds. The examples are based on an investment of $1,000 invested on July 1, 2007 and held until December 31, 2007.
Actual Return. The first line of the table below provides information about actual account values and actual expenses. You may use the information in this line, together with the amount you invested, to estimate the expenses that you paid over the period. Simply divide you’re account value by $1,000 (for example, an $8,600 account value divided by $1,000 = 8.6), then multiply the result by the number in the first line under the heading “Expense Paid During the Period” to estimate the expenses you paid on your account during the period.
Hypothetical 5% Return. The second line of the table below provides information about hypothetical account values and hypothetical expenses based on the Fund’s actual expense ratio and an assumed rate of return of 5% per year before expenses, which is not the Fund’s actual return. The hypothetical account values and expenses may not be used to estimate the actual ending account balance or expenses you paid for the period. You may use this information to compare the ongoing costs of investing in a Fund and other mutual funds. To do so, compare this 5% hypothetical example with the 5% hypothetical examples that appear In the shareholder reports of other funds.
The expenses shown in the table are meant to highlight ongoing Fund costs only. Therefore, the second line of the table is useful in comparing ongoing costs only, and will not help you determine the relative total costs of owning different funds, because other funds may also have transaction costs, such as sales charges, redemption fees or exchange fees.
| | | | | | | | | | | |
| | | Beginning Account
Value at 7/1/07 | | Ending Account
Value at 12/31/07 | | Expense
Ratio | | Expense Paid
During Period*
7/1/07 - 12/31/07 |
| | | | |
| Bridgeway Aggressive Investors 1 | | | | | | | | | | | |
| | | | | | | | | | | | |
Actual Fund Return | | $ | 1,000.00 | | $ | 1,106.93 | | 1.74% | | $ | 9.21 |
Hypothetical Fund Return | | $ | 1,000.00 | | $ | 1,016.39 | | 1.74% | | $ | 8.82 |
| | | | |
| Bridgeway Aggressive Investors 2 | | | | | | | | | | | |
| | | | | | | | | | | | |
Actual Fund Return | | $ | 1,000.00 | | $ | 1,116.19 | | 1.16% | | $ | 6.17 |
Hypothetical Fund Return | | $ | 1,000.00 | | $ | 1,019.30 | | 1.16% | | $ | 5.89 |
| | | | |
| Bridgeway Ultra-Small Company Fund | | | | | | | | | | | |
| | | | | | | | | | | | |
Actual Fund Return | | $ | 1,000.00 | | $ | 917.83 | | 1.07% | | $ | 5.11 |
Hypothetical Fund Return | | $ | 1,000.00 | | $ | 1,019.81 | | 1.07% | | $ | 5.38 |
| | | | |
| Bridgeway Ultra-Small Company Market Fund | | | | | | | | | | | |
| | | | | | | | | | | | |
Actual Fund Return | | $ | 1,000.00 | | $ | 907.88 | | 0.65% | | $ | 3.12 |
Hypothetical Fund Return | | $ | 1,000.00 | | $ | 1,021.87 | | 0.65% | | $ | 3.30 |
| | | | |
| Bridgeway Micro-Cap Limited Fund | | | | | | | | | | | |
| | | | | | | | | | | | |
Actual Fund Return | | $ | 1,000.00 | | $ | 948.11 | | 0.53% | | $ | 2.60 |
Hypothetical Fund Return | | $ | 1,000.00 | | $ | 1,022.47 | | 0.53% | | $ | 2.69 |
| | |
| 136 | | Semi-Annual Report | December 31, 2007 (Unaudited) |
DISCLOSURE OF FUND EXPENSES (continued)
December 31, 2007 (unaudited)
| | | | | | | | | | | |
| | | Beginning Account
Value at 7/1/07 | | Ending Account
Value at 12/31/07 | | Expense
Ratio | | Expense Paid
During Period*
7/1/07 - 12/31/07 |
| | | | |
| Bridgeway Small-Cap Growth Fund | | | | | | | | | | | |
| | | | | | | | | | | | |
Actual Fund Return | | $ | 1,000.00 | | $ | 952.53 | | 0.85% | | $ | 4.17 |
Hypothetical Fund Return | | $ | 1,000.00 | | $ | 1,020.86 | | 0.85% | | $ | 4.32 |
| | | | |
| Bridgeway Small-Cap Value Fund | | | | | | | | | | | |
| | | | | | | | | | | | |
Actual Fund Return | | $ | 1,000.00 | | $ | 922.10 | | 0.80% | | $ | 3.87 |
Hypothetical Fund Return | | $ | 1,000.00 | | $ | 1,021.11 | | 0.80% | | $ | 4.06 |
| | | | |
| Bridgeway Large-Cap Growth Fund | | | | | | | | | | | |
| | | | | | | | | | | | |
Actual Fund Return | | $ | 1,000.00 | | $ | 1,064.47 | | 0.68% | | $ | 3.53 |
Hypothetical Fund Return | | $ | 1,000.00 | | $ | 1,021.72 | | 0.68% | | $ | 3.46 |
| | | | |
| Bridgeway Large-Cap Value Fund | | | | | | | | | | | |
| | | | | | | | | | | | |
Actual Fund Return | | $ | 1,000.00 | | $ | 973.90 | | 0.78% | | $ | 3.87 |
Hypothetical Fund Return | | $ | 1,000.00 | | $ | 1,021.22 | | 0.78% | | $ | 3.96 |
| | | | |
| Bridgeway Blue Chip 35 Index Fund | | | | | | | | | | | |
| | | | | | | | | | | | |
Actual Fund Return | | $ | 1,000.00 | | $ | 1,003.42 | | 0.15% | | $ | 0.76 |
Hypothetical Fund Return | | $ | 1,000.00 | | $ | 1,024.38 | | 0.15% | | $ | 0.76 |
| | | | |
| Bridgeway Balanced Fund | | | | | | | | | | | |
| | | | | | | | | | | | |
Actual Fund Return | | $ | 1,000.00 | | $ | 1,032.06 | | 0.89% | | $ | 4.55 |
Hypothetical Fund Return | | $ | 1,000.00 | | $ | 1,020.66 | | 0.89% | | $ | 4.52 |
| * | Expenses are equal to the Fund’s annualized expense ratio multiplied by the average account value over the period, multiplied by the number of days in the most recent fiscal half year, then divided by 366. |
BRIDGEWAY FUNDS, INC.
Citi Fund Services, LLC
PO Box 182218
Columbus, OH 43218-2218
(713) 661-3500 (800)-661-3550
CUSTODIAN
PFPC Trust Company
8800 Tinicum Blvd., 4th Floor
Philadelphia, PA 19153
DISTRIBUTOR
Foreside Fund Services, LLC
2 Portland Square
Portland, ME 04101
You can review and copy information about our Funds (including the SAI) at the SEC’s Public Reference Room in Washington, D.C. To find out more about this public service, call the SEC at 800-SEC-0330. Reports and other information about the Funds is also available on the SEC’s website at www.sec.gov. You can receive copies of this information, for a fee, by writing the Public Reference Section, Securities and Exchange Commission, Washington, D.C. 20549-0102 or by sending an electronic request to the following email address: publicinfo@sec.gov
185-SR-1207
Not Applicable.
| ITEM 3. | AUDIT COMMITTEE FINANCIAL EXPERT |
Not Applicable.
| ITEM 4. | PRINCIPAL ACCOUNTANT FEES AND SERVICES |
Not Applicable.
| ITEM 5. | AUDIT COMMITTEE OF LISTED REGISTRANTS |
Not Applicable.
| ITEM 6. | SCHEDULE OF INVESTMENTS |
Schedule of Investments is included as part of the Report to Stockholders filed under Item 1 of this form.
| ITEM 7. | DISCLOSURE OF PROXY VOTING POLICIES AND PROCEDURES FOR CLOSED-END MANAGEMENT INVESTMENT COMPANIES |
Not Applicable.
| ITEM 8. | PORTFOLIO MANAGERS OF CLOSED-END MANAGEMENT INVESTMENT COMPANIES |
Not Applicable.
| ITEM 9. | PURCHASES OF EQUITY SECURITIES BY CLOSED-END MANAGEMENT INVESTMENT COMPANY AND AFFILIATED PURCHASERS |
Not Applicable.
| ITEM 10. | SUBMISSION OF MATTERS TO A VOTE OF SECURITY HOLDERS |
There has been no material change to the procedures by which shareholders may recommend nominees to the Registrant’s Board of Directors.
| ITEM 11. | CONTROLS AND PROCEDURES |
(a) The Registrant’s principal executive officer and principal financial officer have concluded that the Registrant’s disclosure controls and procedures (as defined in Rule 30a-3(c) under the Investment Company Act of 1940, as amended) are effective based on their evaluation of these controls and procedures as of a date within 90 days of the filing date of this document.
(b) There was no change in the Registrant’s internal control over financial reporting (as defined in Rule 30a-3(d) under the Investment Company Act of 1940, as amended) during the second fiscal quarter of the period covered by this report that has materially affected, or is reasonably likely to materially affect, the Registrant’s internal control over financial reporting.
(a)(1) Not applicable.
(a)(2) The certifications required by Rule 30a-2(a) of the Investment Company Act of 1940, as amended, and Section 302 of the Sarbanes-Oxley Act of 2002 are attached hereto as Ex99.Cert.
(a)(3) Not applicable.
(b) Certification for the Registrant’s Principal Executive Officer and Principal Financial Officer, as required by Rule 30a-2(b) of the Investment Company Act of 1940, as amended, and Section 906 of the Sarbanes-Oxley Act of 2002 are attached hereto as Ex99.906Cert.
SIGNATURES
Pursuant to the requirements of the Securities Exchange Act of 1934 and the Investment Company Act of 1940, the registrant has duly caused this report to be signed on its behalf by the undersigned, thereunto duly authorized.
| | |
| Registrant BRIDGEWAY FUNDS, INC. |
| |
| By | | /s/ Michael D. Mulcahy |
| | Michael D. Mulcahy |
| | President and Principal Executive Officer |
| |
| Date | | 3/7/08 |
Pursuant to the requirements of the Securities Exchange Act of 1934 and the Investment Company Act of 1940, this report has been signed below by the following persons on behalf of the registrant and in the capacities and on the dates indicated.
| | |
| By | | /s/ Michael D. Mulcahy |
| | Michael D. Mulcahy |
| | President and Principal Executive Officer |
| |
| Date | | 3/7/08 |
| |
| By | | /s/ Linda Giuffre |
| | Linda Giuffre |
| | Treasurer and Principal Financial Officer |
| |
| Date | | 3/7/08 |