As filed with the Securities and Exchange Commission on March 7, 2007
UNITED STATES
SECURITIES AND EXCHANGE COMMISSION
WASHINGTON, D.C. 20549
FORM N-CSR
CERTIFIED SHAREHOLDER REPORT OF REGISTERED
MANAGEMENT INVESTMENT COMPANIES
| Investment Company Act file number | 811-08200 |
BRIDGEWAY FUNDS, INC.
5615 Kirby Drive, Suite 518
Houston, Texas 77005-2448
Michael D. Mulcahy, President
Bridgeway Funds, Inc.
5615 Kirby Drive, Suite 518
Houston, Texas 77005-2448
Date of fiscal year end: June 30
Date of reporting period: July 1, 2006 - December 31, 2006
Form N-CSR is to be used by management investment companies to file reports with the Commission not later than 10 days after the transmission to stockholders of any report that is required to be transmitted to stockholders under Rule 30e-1 under the Investment Company Act of 1940 (17 CFR 270.30e-1). The Commission may use the information provided on Form N-CSR in its regulatory, disclosure review, inspection, and policymaking roles.
A registrant is required to disclose the information specified by Form N-CSR, and the Commission will make this information public. A registrant is not required to respond to the collection of information contained in Form N-CSR unless the Form displays a currently valid Office of Management and Budget (“OMB”) control number. Please direct comments concerning the accuracy of the information collection burden estimate and any suggestions for reducing the burden to Secretary, Securities and Exchange Commission, 100 F Street, NE, Washington, DC 20549. The OMB has reviewed this collection of information under the clearance requirements of 44 U.S.C. ss. 3507.
| ITEM 1. | REPORT TO STOCKHOLDERS |
A no-load mutual fund family of domestic funds
Semi-Annual Report
December 31, 2006 (Unaudited)
AGGRESSIVE INVESTORS 1
(Closed to New Investors)
AGGRESSIVE INVESTORS 2
ULTRA-SMALL COMPANY
(Closed)
ULTRA-SMALL COMPANY MARKET
MICRO-CAP LIMITED
(Closed to New Investors)
SMALL-CAP GROWTH
SMALL-CAP VALUE
LARGE-CAP GROWTH
LARGE-CAP VALUE
BLUE CHIP 35 INDEX
BALANCED
www.Bridgeway.com

| 1 | ||
AGGRESSIVE INVESTORS 1 | ||
| 8 | ||
| 14 | ||
AGGRESSIVE INVESTORS 2 | ||
| 16 | ||
| 22 | ||
ULTRA-SMALL COMPANY | ||
| 24 | ||
| 30 | ||
ULTRA-SMALL COMPANY MARKET | ||
| 32 | ||
| 36 | ||
MICRO-CAP LIMITED | ||
| 46 | ||
| 52 | ||
SMALL-CAP GROWTH | ||
| 54 | ||
| 60 | ||
SMALL-CAP VALUE | ||
| 62 | ||
| 68 | ||
LARGE-CAP GROWTH | ||
| 70 | ||
| 76 | ||
LARGE-CAP VALUE | ||
| 80 | ||
| 86 | ||
BLUE CHIP 35 INDEX | ||
| 88 | ||
| 92 | ||
BALANCED | ||
| 94 | ||
| 100 | ||
| 106 | ||
| 110 | ||
| 112 | ||
| 114 | ||
| 120 | ||
| 126 | ||
| 135 | ||
| 136 | ||
| 138 |
Bridgeway Funds Standardized Returns for One, Five and Ten Years and Inception to Date As of December 31, 2006*
| 1995 | 1996 | 1997 | 1998 | 1999 | 2000 | 2001 | 2002 | 2003 | 2004 | 2005 | 2006 | |||||||||||||
| Aggressive Investors 1 | 27.10% | 32.20% | 18.27% | 19.28% | 120.62% | 13.58% | -11.20% | -18.01% | 53.97% | 12.21% | 14.93% | 7.11% | ||||||||||||
| Aggressive Investors 2 | -19.02% | 44.01% | 16.23% | 18.59% | 5.43% | |||||||||||||||||||
| Ultra-Small Company | 39.84% | 29.74% | 37.99% | -13.11% | 40.41% | 4.75% | 34.00% | 3.98% | 88.57% | 23.33% | 2.99% | 21.55% | ||||||||||||
| Ultra-Small Company Market | -1.81% | 31.49% | 0.67% | 23.98% | 4.90% | 79.43% | 20.12% | 4.08% | 11.48% | |||||||||||||||
| Micro-Cap Limited | 49.55% | 6.02% | 30.20% | -16.61% | 66.97% | 9.46% | 22.55% | -2.34% | ||||||||||||||||
| Small-Cap Growth | 11.59% | 18.24% | 5.31% | |||||||||||||||||||||
| Small-Cap Value | 17.33% | 18.92% | 12.77% | |||||||||||||||||||||
| Large-Cap Growth | 6.77% | 9.33% | 4.99% | |||||||||||||||||||||
| Large-Cap Value | 15.15% | 11.62% | 18.52% | |||||||||||||||||||||
| Blue Chip 35 | 39.11% | 30.34% | -15.12% | -9.06% | -18.02% | 28.87% | 4.79% | 0.05% | 15.42% | |||||||||||||||
| Balanced | -3.51% | 17.82% | 7.61% | 6.96% | 6.65% |
| Fund | 1 Year | 5 Year | 10 Year | Inception to Date | Inception | |||||
| Aggressive Investors 1 | 7.11% | 11.76% | 18.53% | 20.40% | August 5, 1994 | |||||
| Aggressive Investors 2 | 5.43% | 11.13% | 11.61% | October 31, 2001 | ||||||
| Ultra-Small Company | 21.55% | 24.80% | 21.75% | 22.68% | August 5, 1994 | |||||
| Ultra-Small Company Market | 11.48% | 21.27% | 16.49% | July 31, 1997 | ||||||
| Micro-Cap Limited | -2.34% | 12.77% | 17.88% | June 30, 1998 | ||||||
| Small-Cap Growth | 5.31% | 11.88% | October 31, 2003 | |||||||
| Small-Cap Value | 12.77% | 16.36% | October 31, 2003 | |||||||
| Large-Cap Growth | 4.99% | 7.76% | October 31, 2003 | |||||||
| Large-Cap Value | 18.52% | 16.82% | October 31, 2003 | |||||||
| Blue Chip 35 Index | 15.42% | 5.03% | 6.37% | July 31, 1997 | ||||||
| Balanced | 6.65% | 6.89% | 5.80% | June 30, 2001 |
Performance figures quoted represent past performance and are no guarantee of future results. Current performance may be lower or higher than the performance figures quoted, and an investor’s shares, when redeemed, may be worth more or less than original cost. For the most recent month-end performance, please call 1-800-661-3550 or visit the Fund’s website at www.bridgeway.com.
*Numbers highlighted in green indicate periods when the Fund out performed its primary benchmark.
| i | www.Bridgeway.com |
LETTER FROM THE INVESTMENT MANAGEMENT TEAM
January 31, 2007
Dear Fellow Shareholders,
The eleven Bridgeway Funds’ returns were mixed in the December quarter and calendar year 2006. Our best showing was from our “smallest fry” Ultra-Small Company Fund, which returned 12.19% in the quarter and 21.55% for the year. Very surprisingly, our worst performer was the Fund most similarly managed, Micro-Cap Limited Fund, demonstrating how different the returns of these two Funds can be in shorter time periods. Micro-Cap Limited Fund returned only 3.41% for the quarter and was our only Fund with a negative return for the calendar year, down 2.34%. (See the facing page for returns in the format required by the SEC.) Overall, this was a poor year for most of our quantitative models. As reflected in the returns to the left, we do not expect or even hope for market-beating returns every year, since our quantitative models are designed with longer-term performance in mind. Looking at the longer haul, eight of eleven Bridgeway Funds are beating their primary market benchmark since inception, and ten of eleven are beating their peer benchmarks since inception. While some may think we would be happy enough with this record, we never like lagging the market with any Fund since inception. Some “catch up” is in order with three of our younger Funds.
The recent market environment is most astonishing in what has not changed. In both the quarter and year, stocks of smaller size companies and more “value-oriented” ones (those which are priced cheaply based on some financial measures of worth) continue to lead the broader market. A turnaround toward larger and more growth-oriented stocks has been delayed another year, proving that even when things get “out of kilter” on a relative basis over a number of years, trends can always continue yet one more year. We present a brief discussion of the markets on page 2. Financial statements and notes begin on page 110.
In addition to performance, financial information, and market environment, we’d like to highlight several additional sections of this report. At Bridgeway, we like competition. In some prior years, in addition to market benchmarks, we’ve compared our performance to the recommended “picks” of a high profile rating agency. The analysis for 2006 is presented on page 3. Page 4 presents a discussion on “dollar weighted returns”, and what you can glean from this statistic.
As always, we appreciate your feedback. We take your comments seriously and discuss them regularly. Please keep your ideas coming—both favorable and critical. They are a vital tool in helping us serve you better.
Sincerely,
 |  | |
| John Montgomery | Richard P. Cancelmo, Jr. | |
 |  | |
Elena Khoziaeva | Michael A. Whipple | |
Your investment management team
| www.Bridgeway.com | 1 |
LETTER FROM THE INVESTMENT MANAGEMENT TEAM (continued)
Market Review
The Short Version: On the strength of the small company rally of the December quarter, 2006 was yet another year highly slanted toward small and value stocks. It might continue into 2007, but it’s gone on so long that the tide could shift quickly (in the direction of growth-oriented and large companies) when it does.
As you probably know, we don’t pay a lot of attention to market trends at Bridgeway. Our investment process looks the same in a bear or bull market, and we look at market trends primarily to explain what happened by way of looking in the rear view mirror.
After last quarter’s both positive and negative results across the style box (various “niches” of the market), each corner of the stock market achieved a welcome positive return for the December quarter as follows from Morningstar data:
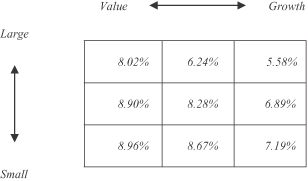
What is most remarkable about the last quarter and year is really what didn’t change. By many measures, 2006 was the eighth year in a row that the smallest companies, which we define as “ultra-small” or those in the smallest “decile” of the market, have outperformed the largest companies, those in the top “decile,” according to data from the Center for Research in Security Prices (“CRSP”). Through the middle part of the year, our large blue chip stocks (especially Blue Chip 35 Index Fund) made a great comeback, only to be somewhat left behind by year end. The longest “small cap run” in the 80-year history of the CRSP database thus continues. It won’t continue forever, but there’s never a guarantee it won’t last one more year.
Like small stocks, “value” stocks have also had a great run in recent years. In fact, if you compare larger growth-oriented stocks to small value-oriented ones, this is the seventh year that the latter have beaten the former. This factor has not been good for the more growth-oriented of our models, especially those of Aggressive Investors 1 and 2, and Large Cap Growth and Small Cap Growth. Similar to small stocks, we think growth stocks will again have their day in the sun.
What to Conclude? Before the last couple of years, the longest running period of small company dominance (outperformance relative to large stocks) was five years. This period has endured three years longer. Let’s consider three alternatives of what this might mean:
a. Large stocks just aren’t as good any more, and we can expect small company dominance to continue indefinitely.
| 2 | Semi-Annual Report | December 31, 2006 (Unaudited) |
LETTER FROM THE INVESTMENT MANAGEMENT TEAM (continued)
b. This trend has obviously gone on too long and large (especially growth) stocks are relatively undervalued, so 2007 will be a large company dominated year.
c. There is conflicting evidence. A firm trend has been established and confirmed (annual small company dominance), and this particular trend has tended to persist historically. On the other hand, the pendulum has swung out very far to one side (in favor of smaller companies), and statistically it is “overdue” to “correct” back the other direction. Thus, there is no assurance either large or smaller stocks will dominate in 2007. But of course, one of them will.
Historically, there have been continual periods of large and small company dominated periods, and I expect that to continue into the future. Therefore, I strongly disagree with alternative (a) above, but I hear the argument for such persistent trends to continue, surprisingly frequently. Although personally I’m a contrarian at heart and believe the pendulum will swing back in favor of large companies at some time in the future, it may not be next year. A major market trend, such as we have experienced, can always theoretically go on for another year. So I reject alternative (b). That leaves us with alternative (c), which is not very helpful if you want to time the market. However, at Bridgeway we don’t believe in timing the market anyway, and I’ll live with the ambiguity of (and vote for a wishy-washy) alternative (c).
Bridgeway 4, Morningstar 7
The Short Version: In 2006, the tide changed, and Morningstar’s “analyst picks” beat Bridgeway Funds in seven of eleven cases.
One of the arguments in favor of purchasing actively managed funds is the desire to have better than average returns. Usually, our Bridgeway Fund performance tables compare our returns to relevant market indexes. We think of indexes as “average,” but in fact we believe indexes have beaten roughly 80% of actively managed mutual funds over the long haul historically. So comparing our performance against indexes rather than the “average” mutual fund is actually a very high hurdle. Nevertheless, we’d still like to know that we don’t just beat the indexes or the average of our peers, but that we also beat the “predictably better” actively managed funds. After all, who wants an average doctor or teacher? We want superior ones. Likewise with mutual funds, we want to know how we stack up against other funds as chosen by an independent firm specializing in investment research.
Of course, the difficult part is identifying “best” funds up front, at the beginning of the performance period in question. For this purpose we turn to Morningstar, an independent Chicago-based firm, which publishes a list of fund “picks” selected by their analysts. We then look at how the performance of Bridgeway Funds compares with the average performance of these “best” funds. Thus, we pit the Bridgeway Funds in a given category against Morningstar’s candidates for best funds. Think of it as a friendly competition.
In 2006, the results of this competition shifted to Morningstar’s favor for the one-year period. The score was 4 to 7 in favor of Morningstar. The table below presents the results by category and Bridgeway Fund.
| Bridgeway Funds | Morningstar Analyst “Picks” | |||||
| Name | 2006 Return | Morningstar Category | 2006 Return | |||
| Large-Cap Value | 18.52% | Large-cap value | 17.85% | |||
| Blue Chip 35 Index | 15.42% | Large-cap blend | 14.59% | |||
| Large-Cap Growth | 4.99% | Large-cap growth | 6.48% | |||
| Aggressive Investors 1 | 7.11% | Mid-cap growth | 10.15% | |||
| Aggressive Investors 2 | 5.43% | Mid-cap growth | 10.15% | |||
| Small-Cap Value | 12.77% | Small-Value | 12.19% | |||
| Ultra-Small Co. Market | 11.48% | Small Blend | 13.36% | |||
| Ultra-Small Company | 21.55% | Small-Growth | 9.54% | |||
| Micro-Cap Limited | -2.34% | Small-Growth | 9.54% | |||
| Small-Cap Growth | 5.31% | Small-Growth | 9.54% | |||
| Balanced | 6.65% | Conservative Allocation | 9.98% | |||
| www.Bridgeway.com | 3 |
LETTER FROM THE INVESTMENT MANAGEMENT TEAM (continued)
Past performance is not an indicator of future results. The Bridgeway Funds’ adviser, Bridgeway Capital Management, Inc., does not have any influence on the selection of the funds chosen by Morningstar’s analysts. The number and specific funds used in the comparison are in the control and discretion of Morningstar and their analysts and are subject to change. Morningstar’s criteria for choosing Analyst Picks includes, but is not limited to, factors such as performance, expenses, and quality of fund management. In addition, the comparison of Bridgeway Funds to the Morningstar Analyst Picks is limited to performance only and does not take into consideration other factors that are considered by Morningstar when compiling their list of Analyst Picks.
Each Bridgeway Fund is compared to the average total return of the group of funds selected by Morningstar at the beginning of 2006 for the one year period ended December 31, 2006. Although these Analyst Picks changed from the beginning of the year to the final quarter, the same three out of four Bridgeway Funds beat the average of the end of year Morningstar picks as well. These averages in the table are comprised of between one and nine funds from within each category. In an effort to provide a complete and balanced assessment, all of the Bridgeway Funds are used in the comparison table shown above such that no attempt is made to cull out unfavorable results. The purpose of this comparison is to “raise the bar” on performance comparison as this analysis uses an arguably higher benchmark by comparing the Bridgeway Funds to other funds chosen by an independent source that specializes in investment research.
Preaching to the Choir about Statistics or Dollar-Weighted Returns
The Short Version: Most of us have a pretty clear idea of what we mean by a fund’s returns. If $10,000 grows to $11,000, that’s a 10% return. Some press and advisers have begun talking more frequently about “dollar-weighted returns,” an interesting, if highly problematic, alternative statistic to measure the return of a fund. An important lesson learned from this analysis? Overall, it’s probably best to stick with a well-managed fund with an objective and strategy that meets your needs, rather than “jump in and out” of funds based on trailing favorable or unfavorable performance.
A “quant firm” is an investment management firm that focuses on statistics and models to pick stocks rather than reading analyst research reports, talking to management, conducting industry and competitive analysis, etc. We’re always interested in new industry statistics or numerical ways of representing something about our funds or industry. Every statistic has certain advantages and disadvantages. I need to warn you though, if numbers aren’t what interest you or if they give you a headache, you may want to skip this section.
One of the statistics on performance I’ve been interested in for a long time is called dollar-weighted returns. Generally, when we speak of the “total return” of a fund, we mean time-weighted returns, or the return a hypothetical investor would receive between two dates, assuming they reinvested dividends and made no additional investments or withdrawals. For example, you invest $10,000 on 12/31/05, the investment appreciates and is worth $11,000 on 12/31/06, then you have a 10.0% (time weighted) total return. But what if you invested an additional $500 on 3/31/06 and withdrew $1,000 on 9/1/06. The fund’s total return doesn’t change, but your personal actual total return probably does. That’s where dollar-weighted (also known as asset-weighted) returns come in. The dollar-weighted return weights (or emphasizes) more heavily the returns during the period of time when there were more assets in the fund. The reason they are attractive in theory is that these can be considered as the returns that the aggregate of actual investors actually received. That has a lot of appeal to me. For this reason, Morningstar has added dollar-weighted returns to the statistics that they report.
Unfortunately, two disadvantages of this statistic are 1) while it may be the average return of all shareholders, it still doesn’t relate to what you’d probably really like to know (your own actual individual return), and 2) since the difference between the fund’s time-weighted return and a dollar-weighted return is driven by the timing of investors’ purchases and withdrawals, the fund company has little impact on this. Or do they? Morningstar recently added dollar-weighted returns to their lineup of statistics. Morningstar’s Don Phillips makes the following argument:
| 4 | Semi-Annual Report | December 31, 2006 (Unaudited) |
LETTER FROM THE INVESTMENT MANAGEMENT TEAM (continued)
Fund companies don’t have complete control over how investors use their funds, but that doesn’t mean they can’t exercise any control. Fund companies can influence investor behavior through fund design, the timing of launches and closings, marketing efforts, and shareholder communications.
I’m reasonably persuaded by this argument, but even these factors won’t necessarily eliminate (and may not significantly narrow) the gap between time-weighted and dollar-weighted returns. Let’s look at Bridgeway’s record in each of these areas:
a. Fund design. We have some very high octane funds (Aggressive Investors 1 and 2, Micro-Cap Limited, and Ultra-Small Company). If you think you might panic in a downturn or be tempted to invest more after an extended run, you should stay away from these funds. Our primary advice is don’t chase hot returns, including and especially ours. Know how volatile a given fund is likely to be, and invest in accordance with your risk tolerance and an asset allocation plan you have committed to writing. Even our “four corners funds” have higher short-term volatility (by some measures) than some of their peers. All our funds are intended for long-term investments. If you think you might be tempted to buy or sell on short-term whims or emotions, please look for lower volatility funds. Our lowest volatility fund is Bridgeway Balanced Fund, which seeks shorter term volatility equal to about 40% of the stock market. (You can find information on investment objective, risks and fees in our prospectus at www.bridgeway.com.)
b. Timing of fund launches. One industry problem is that a sales-driven organization will launch a new fund in a hot sector, e.g., Internet stocks in 1999. Investors are eager to invest, but do so near the “top of the market,” and are ultimately disappointed. Bridgeway has never launched a fund in a “hot” segment.
c. Timing of fund closings. Bridgeway has a stellar record in this department. We are known for closing small cap funds early. In 2003, we closed our Ultra-Small Company Market Fund at two-thirds the level we had anticipated, because the sector of ultra-small stocks was overheated and the money was coming in faster than we wanted. When things cooled down, we reopened it.
d. Marketing efforts. We have a web site, and we work very hard on investor communications and education. Beyond that we do little marketing, and thus don’t use abusive marketing practices, like advertising the returns of (only) our best performing funds.
e. Shareholder communications. This is one of the top three areas about which we get the most “kudos” from shareholders. We aim for honest, straight-forward, and educational communications.
Does this mean we have an excellent history with respect to dollar-weighted returns? The record is mixed. In our Aggressive Investors 2 Fund, for example, we outperformed the market in the first four years of our Fund’s history. During the same period, our dollar-weighted returns almost exactly matched our total fund returns. In the first year (2006) when we underperformed our benchmarks, however, our dollar-weighted returns significantly lagged our total fund return, indicating investors timed their purchases and sells poorly.
In conclusion, I think the statistic is interesting, but fund companies are only partially responsible for the timing of their shareholders’ purchases and redemptions. Even though we work very hard at the items on the list above, we still see some shareholders making buy and sell decisions at relatively poor times. Obviously, if you are still a shareholder after 2006, I’m preaching to the choir and you probably don’t have the problem of chasing hot returns (or at least if you got in after a “runup,” you stuck with us through our relatively poor short-term performance in mid-2006). Over the next decade, I hope to see many more investors just like you. We don’t want to be a vehicle through which people end up with returns poorer than the time-weighted returns we generate.
| www.Bridgeway.com | 5 |
LETTER FROM THE INVESTMENT MANAGEMENT TEAM (continued)
Interesting Reactions
The Short Version: As long as we keep “cranking the models,” we don’t get significantly distracted with respect to investment results.
We received a small number of interesting reactions to our underperformance in the September quarter among our actively managed accounts, which I will paraphrase into three groups. If you didn’t read our rather extensive explanations of third quarter results, they are available at www.bridgeway.com. I’ve put these comments into three categories:
a. “Eyes off the ball.” One interesting concern expressed is that Bridgeway’s interest in charitable service and mission, along with the death of one of our Foundation staff members caused us to “take our eyes off the ball” of our primary task of picking stocks. It is a most interesting and surprising comment to me, in that the only way to figuratively take your eyes off the ball with our investment management process would be to stop maintaining (“running”) our quantitative models. We didn’t at any point last year stop running models. One great thing about our quantitative process is that it takes all the emotion out of the process.
b. “Elena’s three-month leave.” Another question was, “Were you hamstrung by Elena’s absence?” If any of the investment management team is on vacation or out, we have backup plans and capabilities to continue to run the models. In this case, a team member was on maternity leave, which we obviously knew about (and made detailed plans for) months ahead of time. As leave time goes, this was an easy one. We missed Elena, but we didn’t stop running the models. Actually, I really appreciate this question because it emphasizes the very significant contribution of our other team members and that the success of our group is less and less dependent on me.
c. “It’s too bad that this was only a couple of quarters of underperformance.” It would be much healthier for Bridgeway and your shareholders if it were a couple of years of underperformance; then it would flush out the people that shouldn’t be in the funds to begin with.” By way of disclosure, this comment was from my brother, who is both a substantial Fund shareholder and a member of the advisory firm’s board of directors. Also, a bit amusing as a comment, but I honestly can’t argue with the logic of it.
In conclusion, it’s true that I don’t like underperforming the market in any reporting period, including a quarter or a year. But since our investment philosophy is to concentrate on long-term performance (at least three years and longer) and our models are calibrated over longer periods of time, my statistical view is that shorter time periods, while they may contribute helpful data points about the short-term riskiness of our funds, they do not contribute significant information about the effectiveness of our investment management process.
Another Instance of Timing the Market
At the opposite end of the spectrum from selling on a downturn is not buying while waiting for a better opportunity. Consider this text from a shareholder’s letter to Bridgeway:
Unfortunately, the national debt, the trade balance, the war, the oil problem, the yield curve and the further tightening of interest rates has been a cause for me to, at least temporarily, delay taking advantage of your offerings.
When I hear statements like this, I think, “so he wants to wait for all these things to be going simultaneously well, at which point the market will be undoubtedly higher?” That sounds like a formula for buying high, or worse (and I’ve actually seen this), missing the boat all together. Personally, I don’t have faith in any professional or individual investor calling this correctly, except by luck. If our Funds are too risky when times are difficult, they are probably all the more so when times are good.
| 6 | Semi-Annual Report | December 31, 2006 (Unaudited) |
THIS PAGE INTENTIONALLY LEFT BLANK
| www.Bridgeway.com | 7 |
Bridgeway Aggressive Investors 1 Fund
MANAGER’S COMMENTARY
(Unaudited)
January 31, 2007
Dear Fellow Aggressive Investors 1 Fund Shareholder,
Our Fund was up 7.88% in the December quarter compared to a gain of 6.70% for our primary benchmark, the S&P 500 Index and 5.46% for our peer benchmark, the Lipper Capital Appreciation Funds Index. Small stocks made a strong finish to extend an eighth year of dominance over large stocks. In this environment, the Russell 2000 Index was up a stronger 8.90% for the December quarter. Overall, it was a good quarter.
The Fund’s December quarter return was not nearly enough to make up for the lagging performance in the prior quarters, however, and our calendar year returns lagged our benchmarks as presented in the table below. The calendar year return was a dismal 7.11%, compared to a gain of 15.79% for our primary benchmark, the S&P 500 Index and 10.53% for our peer benchmark, the Lipper Capital Appreciation Funds Index.
Our poor showing was the result of poor performance across four of our five models and an unusual market environment that did not reward the favorable reports of some of our stocks, while pummeling our stocks with unfavorable reports. It was also the first calendar year since 1998 that we underperformed our primary market benchmark.
The table below presents our December quarter, one-year, five-year, ten-year and life-to-date financial results according to the formula required by the SEC. A graph of quarterly performance for the past ten years appears at the top of the following page.
Dec. Qtr. 10/1/06 to 12/31/06 | 1 Year 1/1/06 to 12/31/06 | 5 Year 1/1/02 to 12/31/06 | 10 Year 1/1/97 to 12/31/06 | Life-to-Date 8/5/94 to 12/31/06 | ||||||
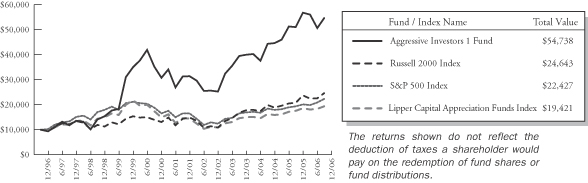
Aggressive Investors 1 Fund | 7.88% | 7.11% | 11.76% | 18.53% | 20.40% | |||||
S&P 500 Index (large companies) | 6.70% | 15.79% | 6.19% | 8.41% | 11.49% | |||||
Russell 2000 Index (small companies) | 8.90% | 18.37% | 11.39% | 9.44% | 11.37% | |||||
Lipper Capital Appreciation Funds Index | 5.46% | 10.53% | 5.78% | 6.86% | 9.34% | |||||
Performance figures quoted represent past performance and are no guarantee of future results. Current performance may be lower or higher than the performance figures quoted, and an investor’s shares, when redeemed, may be worth more or less than original cost. For the most recent month-end performance, please call 1-800-661-3550 or visit the Fund’s website at www.bridgeway.com.
The S&P 500 Index is a broad-based, unmanaged measurement of changes in stock market conditions based on the average of 500 widely held common stocks with dividends reinvested, while the Russell 2000 Index is an unmanaged, market value weighted index, that measures performance of the 2,000 companies that are between the 1,000th and 3,000th largest in the market with dividends reinvested. The Lipper Capital Appreciation Funds Index reflects the aggregate record of more aggressive domestic growth mutual funds, as reported by Lipper, Inc. It is not possible to invest directly in an index. Periods longer than one year are annualized.
According to data from Lipper, Inc. as of December 31, 2006, Aggressive Investors 1 Fund ranked 232nd of 354 capital appreciation funds for 2006, 23rd of 242 over the last five years, 2nd of 113 over the last ten years, and 1st of 68 since inception in August, 1994. Lipper, Inc. is an independent mutual fund rating service that ranks funds in various fund categories by making comparative calculations using total returns.
| 8 | Semi-Annual Report | December 31, 2006 (Unaudited) |
Bridgeway Aggressive Investors 1 Fund
MANAGER’S COMMENTARY (continued)
(Unaudited)
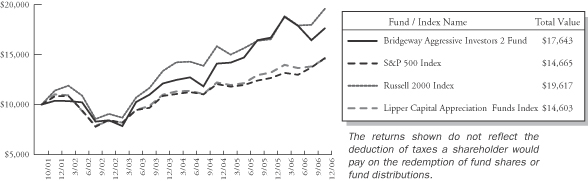
Growth of $10,000 Invested in Aggressive Investors 1 Fund and Indexes from 1/1/97 to 12/31/06
Detailed Explanation of Quarterly Performance—What Worked Well
The Short Version: Of our Fund’s 71 holdings, 10 had better than 20% return for the December quarter, and only 3 were down more than 20%. Companies in the technology sector (semiconductor, software, and computers industries) added the most to performance, although only one, Amkor Technology, made the top ten.
These are the ten best performers for the December quarter:
| Rank | Description | Industry | % Gain | |||
| 1 | Amkor Technology, Inc. | Semiconductors | 59.2% | |||
| 2 | Tenaris SA | Iron/Steel | 41.0% | |||
| 3 | Ceradyne, Inc. | Misc. Manufacturing | 37.5% | |||
| 4 | CROCS, Inc. | Apparel | 27.3% | |||
| 5 | Cleveland-Cliffs, Inc. | Iron/Steel | 27.1% | |||
| 6 | Administaff, Inc. | Commercial Services | 26.9% | |||
| 7 | Dobson Communications Corp. | Telecommunications | 24.1% | |||
| 8 | McDermott International, Inc. | Engineering & Construction | 21.7% | |||
| 9 | ConocoPhillips | Oil & Gas | 20.9% | |||
| 10 | Marathon Oil Corp. | Oil & Gas | 20.3% | |||
Last quarter, I promised an update on our worst performer, Amkor Technology. At the time, I didn’t know just how interesting the story would get. Amkor is a leading provider of advanced semiconductor assembly and test services. As you may recall, through the summer and early fall, the company was fraught with problems that seemed to be one domino of bad news falling after another: the company warning of slowing growth rates, the SEC looking into option award practices, delays in filing its 10Q financial statements with the federal government pending the results of the stock option inquiry, threat of stock exchange delisting, announcement of likely restated financial results from the options probe, probable non-compliance with lending requirements (bondholder covenants) due to the delayed filings, and the specter of bankruptcy should the bondholders accelerate bond payment. On top of all this, the market environment was very unfriendly to this kind of stock, and for all these reasons, the stock price was pummeled. It would seem things just couldn’t get worse. (Things can always get worse.) In the midst of all this bad news, the company continued to report favorable underlying economic results. At the lower price, one of our models still liked the stock. This is where the advantage of quantitative investing comes into play—taking all the emotion out of the process. During the September quarter, we took a rather unusual action in the area of risk management (and cash management) in the Fund. We bought call options on the stock and shortly thereafter trimmed our position in the stock itself. This had the net effect of allowing us to participate in the stock’s recovery (should that happen), while providing some downside protection (as compared to owning the equivalent shares of the stock). And recover it did in the December quarter. Amkor had started out the September quarter at a price
| www.Bridgeway.com | 9 |
Bridgeway Aggressive Investors 1 Fund
MANAGER’S COMMENTARY (continued)
(Unaudited)
of $9.46 and ended that quarter at $5.15. Thereafter, much of the “bad news” unwound as more facts came to light. The company reported another quarter of good financial results. The stock option inquiry exonerated all current members of management. Prior financials were restated, and the company was able to make their financial filings. The bondholders dropped their threat of accelerated payments, and the threat of bankruptcy filings vanished. With help from the market recovery in the fourth quarter, the stock price recovered to $9.34 at December quarter end. The net result to Aggressive Investors 1 shareholders? We decreased risk in Amkor by buying calls and selling a portion of our stock, and we participated in the stock price recovery. Combining our stock and call option positions, Amkor contributed a full 1.0% to our December quarter performance, significant for a single holding.
Although Amkor was our largest gainer for the quarter, McDermott International added almost as much (0.9%) to December quarter returns. Founded in 1923 in Bridgeway’s hometown of Houston, Texas, McDermott International, Inc., through its subsidiaries, operates as an energy services company worldwide. It operates in three segments: Marine Construction Services, Government Operations, and Power Generation Systems. Since our original purchase in the fall of 2005, it has been a steady performer for the Fund. Third quarter reports of higher earnings, revenues and operating income resulted in a 13% share price boost.
Detailed Explanation of Quarterly Performance—What Didn’t Work
The Short Version: For a number of our stocks, December quarter price movements were nearly a mirror image of the prior quarter. Three of the worst performers in the December quarter were among the best stocks in the September quarter: Motorola, Gymboree and Steven Madden. OM Group cost us the most in performance—a little more than a half percent. As losers go, it wasn’t a bad list.
These are the ten stocks that performed the worst in the December quarter:
| Rank | Description | Industry | % Loss | |||
| 1 | LifeCell Corp. | Biotechnology | -24.5% | |||
| 2 | Corning, Inc. | Telecommunications | -23.4% | |||
| 3 | OM Group, Inc. | Chemicals | -20.0% | |||
| 4 | Motorola, Inc. | Telecommunications | -16.4% | |||
| 5 | Archer-Daniels-Midland Co. | Agriculture | -15.9% | |||
| 6 | EGL, Inc. | Transportation | -15.3% | |||
| 7 | TXU Corp. | Electric | -13.3% | |||
| 8 | Encore Wire Corp. | Electrical Compo & Equip | -11.2% | |||
| 9 | Gymboree Corp. | Apparel | -9.5% | |||
| 10 | Steven Madden Ltd. | Apparel | -8.7% | |||
LifeCell Corporation engages in the development and marketing of human-derived tissue-based products for use in reconstructive, orthopedic, and urogynecologic surgical procedures to repair soft tissue defects. In late October, the company announced negative news on third quarter results. Even though earnings went from $2.5 million and 7 cents a share last year to $5.1 million and 15 cents a share this year, it had targeted 16 cents a share. You would think that investors would be happy with such an increase; however, LifeCell also lowered fourth quarter revenue and earnings projections, signaling a slow down in sales growth. Shares tumbled almost 25% on the news. We sold our position before quarter end.
Motorola, our third best performer in the September quarter, dropped to fourth worst this quarter. Cell phone competition has been fierce, not only with Nokia and Samsung, but also from its own Krzr, the new version of the popular slim phone, Razr, which has sold more than 50 million units world-wide (including the one I bought my wife last year). After announcing in mid-October that third quarter revenues fell short of expectations and that earnings fell 45% year-over-year, its share price fell 11% over the next few days. Nevertheless, the model that picked this stock still liked it enough to hold through quarter end.
| 10 | Semi-Annual Report | December 31, 2006 (Unaudited) |
Bridgeway Aggressive Investors 1 Fund
MANAGER’S COMMENTARY (continued)
(Unaudited)
Detailed Explanation of Calendar Year Performance—What Worked Well
The Short Version: Although eight out of ten of the stocks below had better than 50% return, they were not enough to pull us ahead of our benchmarks for the calendar year.
These are the ten best performers for the calendar year:
| Rank | Description | Industry | % Gain | |||
| 1 | Tenaris SA | Iron/Steel | 117.9% | |||
| 2 | Nutri/System, Inc. | Internet | 76.0% | |||
| 3 | BellSouth Corp. | Telecommunications | 67.5% | |||
| 4 | CROCS, Inc. | Apparel | 65.3% | |||
| 5 | Hansen Natural Corp. | Beverages | 63.6% | |||
| 6 | McDermott International, Inc. | Engineering & Construction | 63.1% | |||
| 7 | BMC Software, Inc. | Software | 55.0% | |||
| 8 | NS Group, Inc. | Metal Fabricate/Hardware | 53.9% | |||
| 9 | WESCO International, Inc. | Distribution/Wholesale | 40.6% | |||
| 10 | AT&T, Inc. | Telecommunications | 40.3% | |||
Oil and gas companies world wide continue to increase their exploration and production spending in response to generally sustained high oil and gas prices. Our biggest gainer for the calendar year, Tenaris SA, has had a steady corresponding increase in demand for its products. Based in Luxembourg, the company manufactures seamless steel tubing in a number of countries, including Argentina, Brazil, Canada, Italy, Japan, Mexico and Venezuela. Its annual earnings growth rate over the past five years has been a huge 75.12%. Good third quarter results added fuel to rising share price, including a more than two-fold return for our Fund.
Detailed Explanation of Calendar Year Performance—What Didn’t Work
The Short Version: Five of the ten worst performers for the calendar year were in the industrial sector (electronics, building materials and transportation sectors).
These are the ten worst-performing stocks for the calendar year:
| Rank | Description | Industry | % Loss | |||
| 1 | Plexus Corp. | Electronics | -52.4% | |||
| 2 | American Science & Eng., Inc. | Electronics | -45.4% | |||
| 3 | Zoran Corp. | Semiconductors | -40.8% | |||
| 4 | Eagle Materials, Inc. | Building Materials | -39.3% | |||
| 5 | Brightpoint, Inc. | Distribution/Wholesale | -37.7% | |||
| 6 | USG Corp. | Building Materials | -36.1% | |||
| 7 | EGL, Inc. | Transportation | -34.2% | |||
| 8 | Advanced Micro Devices, Inc. | Semiconductors | -33.9% | |||
| 9 | Volt Information Sciences, Inc. | Commercial Services | -26.2% | |||
| 10 | Carpenter Technology Corp. | Iron/Steel | -25.9% | |||
There were no industry-related negative trends for these stocks. Nevertheless, although most of these companies have been good performers for the Fund at various times, they all “hit the skids” together, mostly in the early May through mid-September period. Is this just a fluke or was there a common statistical theme underlying their poor performance? From a statistical standpoint, it is too short a time period and too small a sample to draw any such conclusion (though part of our ongoing research seeks to determine the answer to such questions).
| www.Bridgeway.com | 11 |
Bridgeway Aggressive Investors 1 Fund
MANAGER’S COMMENTARY (continued)
(Unaudited)
Top Ten Holdings as of December 31, 2006
Three of the largest holdings for the December quarter: BMC Software, McDermott International and Big Lots, were in the top quartile of performers, adding almost two and a half percentage points to our return. The top ten holdings represented 39.0% of net assets, higher than the average of domestic equity funds (35%), but slightly lower than the average aggressive growth fund (40%), according to data from Morningstar.
| Rank | Description | Industry | Percent of Net Assets | |||
| 1 | BMC Software, Inc. | Software | 5.6% | |||
| 2 | McDermott International, Inc. | Engineering & Construction | 5.1% | |||
| 3 | Big Lots, Inc. | Retail | 4.6% | |||
| 4 | Cephalon, Inc. | Pharmaceuticals | 4.0% | |||
| 5 | Dillard’s, Inc. | Retail | 3.8% | |||
| 6 | Digene Corp. | Biotechnology | 3.7% | |||
| 7 | Tesoro Corp. | Oil & Gas | 3.3% | |||
| 8 | Nutri/System, Inc. | Internet | 3.2% | |||
| 9 | AT&T, Inc. | Telecommunications | 3.1% | |||
| 10 | Cognizant Tech. Solutions Corp. | Computers | 2.6% | |||
| 39.0% |
Industry Sector Representation as of December 31, 2006
Consumer, cyclical was the largest sector representative at the end of the December quarter and also the sector in which we were most over weighted compared to the market—very slightly to our advantage. The Fund was most underweighted in the financial sector—very slightly to our disadvantage.
| % of Net Assets | % S&P 500 Index | Difference | ||||
Basic Materials | 6.9% | 2.9% | 4.0% | |||
Communications | 15.1% | 11.6% | 3.5% | |||
Consumer, Cyclical | 19.1% | 8.3% | 10.8% | |||
Consumer, Non-cyclical | 14.4% | 19.9% | -5.5% | |||
Energy | 11.4% | 9.9% | 1.5% | |||
Financial | 11.3% | 22.2% | -10.9% | |||
Industrial | 8.8% | 11.1% | -2.3% | |||
Technology | 12.5% | 10.6% | 1.9% | |||
Utilities | 0.9% | 3.5% | -2.6% | |||
Cash | -0.4% | 0.0% | -0.4% | |||
Total | 100.0% | 100.0% |
Disclaimer
The following is a reminder from the friendly folks at your Fund who worry about liability. The views expressed here are exclusively those of Fund management. These views, including those of market sectors or individual stocks, are not meant as investment advice and should not be considered predictive in nature. Any favorable (or unfavorable) description of a holding applies only as of the quarter end, December 31, 2006, unless otherwise stated. Security positions can and do change thereafter. Discussions of historical performance do not guarantee and are not indicative of future performance.
The Fund is subject to above average market risk (volatility) and is not an appropriate investment for short-term investors. Investments in the small companies within this multi-cap fund generally carry greater risk than is customarily associated with larger companies for various reasons such as narrower markets (fewer investors), limited financial resources and greater trading difficulty.
| 12 | Semi-Annual Report | December 31, 2006 (Unaudited) |
Bridgeway Aggressive Investors 1 Fund
MANAGER’S COMMENTARY (continued)
(Unaudited)
This report is submitted for the general information of the shareholders of the Fund. It is not authorized for distribution to prospective investors unless preceded or accompanied by an effective prospectus, which includes information regarding the Fund’s risks, objectives, fees and expenses, experience of its management, and other information. For questions or other Fund information, call 1-800-661-3550 or visit the Fund’s website www.bridgeway.com. Foreside Fund Services, LLC, distributor.
Conclusion
Thank you for your continued investment in Aggressive Investors 1 Fund. This Fund remains open only to current investors as we seek to keep the nimbleness that has fared very well over the long haul. As always, we appreciate your feedback.
Sincerely,
John Montgomery
| www.Bridgeway.com | 13 |
Bridgeway Aggressive Investors 1 Fund
SCHEDULE OF INVESTMENTS
Showing percentage of net assets as of December 31, 2006 (Unaudited)
| Industry | Company | Shares | Value | ||||
COMMON STOCKS - 100.53% | |||||||
Apparel - 6.32% | |||||||
CROCS, Inc.*+ | 145,400 | $ | 6,281,280 | ||||
Guess?, Inc.* | 129,000 | 8,182,470 | |||||
Gymboree Corp.* | 253,000 | 9,654,480 | |||||
| 24,118,230 | |||||||
Auto Manufacturers - 1.00% | |||||||
General Motors Corp.+ | 124,900 | 3,836,928 | |||||
Banks - 1.34% | |||||||
US Bancorp+ | 141,000 | 5,102,790 | |||||
Biotechnology - 5.41% | |||||||
Digene Corp.* | 292,300 | 14,007,016 | |||||
Illumina, Inc.*+ | 168,600 | 6,627,666 | |||||
| 20,634,682 | |||||||
Chemicals - 3.24% | |||||||
Albemarle Corp. | 117,000 | 8,400,600 | |||||
OM Group, Inc.* | 87,400 | 3,957,472 | |||||
| 12,358,072 | |||||||
Commercial Services - 1.09% | |||||||
Administaff, Inc. | 97,400 | 4,165,798 | |||||
Computers - 3.68% | |||||||
Cognizant Technology Solutions Corp.* | 129,900 | 10,023,084 | |||||
Research In Motion Ltd.* | 31,400 | 4,012,292 | |||||
| 14,035,376 | |||||||
Distribution/Wholesale - 1.95% | |||||||
WESCO International, Inc.* | 126,400 | 7,433,584 | |||||
Diversified Financial Services - 8.18% | |||||||
First Marblehead Corp.+ | 78,000 | 4,262,700 | |||||
Goldman Sachs Group, Inc.+ | 49,500 | 9,867,825 | |||||
Merrill Lynch & Co., Inc.+ | 92,400 | 8,602,440 | |||||
Morgan Stanley | 104,300 | 8,493,149 | |||||
| 31,226,114 | |||||||
Electric - 0.89% | |||||||
TXU Corp. | 62,700 | 3,398,967 | |||||
Engineering & Construction - 5.16% | |||||||
McDermott International, Inc.* | 387,000 | 19,682,820 | |||||
Insurance - 0.56% | |||||||
WR Berkley Corp.+ | 61,850 | 2,134,442 | |||||
| Industry | Company | Shares | Value | ||||
Internet - 3.24% | |||||||
Nutri/System, Inc.*+ | 195,000 | $ | 12,361,050 | ||||
Iron/Steel - 3.71% | |||||||
Cleveland-Cliffs, Inc.+ | 107,800 | 5,221,832 | |||||
Tenaris SA** | 179,000 | 8,930,310 | |||||
| 14,152,142 | |||||||
Machinery - Construction & Mining - 1.22% | |||||||
Joy Global, Inc.+ | 96,350 | 4,657,559 | |||||
Media - 1.19% | |||||||
Comcast Corp.*+ | 102,900 | 4,309,452 | |||||
Idearc, Inc.* | 7,850 | 224,903 | |||||
| 4,534,355 | |||||||
Miscellaneous Manufacturing - 2.39% | |||||||
Ceradyne, Inc.* | 90,300 | 5,101,950 | |||||
Freightcar America, Inc.+ | 72,800 | 4,036,760 | |||||
| 9,138,710 | |||||||
Oil & Gas - 7.52% | |||||||
Chesapeake Energy Corp.+ | 102,800 | 2,986,340 | |||||
ConocoPhillips | 121,300 | 8,727,535 | |||||
Marathon Oil Corp. | 46,000 | 4,255,000 | |||||
Tesoro Corp. | 193,400 | 12,719,918 | |||||
| 28,688,793 | |||||||
Oil & Gas Services - 3.94% | |||||||
Dril-Quip, Inc.* | 96,800 | 3,790,688 | |||||
Oceaneering International, Inc.* | 100,100 | 3,973,970 | |||||
Tetra Technologies, Inc.*+ | 283,600 | 7,254,488 | |||||
| 15,019,146 | |||||||
Pharmaceuticals - 7.92% | |||||||
Bristol-Myers Squibb Co.+ | 174,300 | 4,587,576 | |||||
Cephalon, Inc.* | 216,100 | 15,215,601 | |||||
Gilead Sciences, Inc.* | 58,800 | 3,817,884 | |||||
Merck & Co., Inc. | 151,200 | 6,592,320 | |||||
| 30,213,381 | |||||||
Retail - 9.84% | |||||||
Big Lots, Inc.* | 770,100 | 17,650,692 | |||||
Dillard’s, Inc.+ | 410,600 | 14,358,682 | |||||
Kohl’s Corp.*+ | 80,800 | 5,529,144 | |||||
| 37,538,518 | |||||||
| 14 | Semi-Annual Report | December 31, 2006 (Unaudited) |
Bridgeway Aggressive Investors 1 Fund
SCHEDULE OF INVESTMENTS (continued)
Showing percentage of net assets as of December 31, 2006 (Unaudited)
| Industry | Company | Shares | Value | |||||
Common Stocks (continued) |
| |||||||
Savings & Loans - 1.20% |
| |||||||
Washington Mutual, Inc.+ | 101,100 | $ | 4,599,039 | |||||
Semiconductors - 1.90% |
| |||||||
Amkor Technology, Inc.* | 774,700 | 7,235,698 | ||||||
Software - 6.98% |
| |||||||
BMC Software, Inc.* | 660,000 | 21,252,000 | ||||||
Oracle Corp.* | 315,200 | 5,402,528 | ||||||
| 26,654,528 | ||||||||
Telecommunications - 10.66% |
| |||||||
AT&T, Inc.+ | 327,300 | 11,700,975 | ||||||
BellSouth Corp. | 128,300 | 6,044,213 | ||||||
BT Group PLC** | 78,600 | 4,707,354 | ||||||
Corning, Inc.* | 209,000 | 3,910,390 | ||||||
Dobson Communications Corp.* | 594,500 | 5,178,095 | ||||||
Motorola, Inc.+ | 160,800 | 3,306,048 | ||||||
Verizon Communications, Inc. | 157,000 | 5,846,680 | ||||||
| 40,693,755 | ||||||||
Transportation - 0.00%# |
| |||||||
Kirby Corp.* | 20 | 683 | ||||||
TOTAL COMMON STOCKS | 383,615,160 | |||||||
(Cost $308,954,790) | ||||||||
TOTAL INVESTMENTS - 100.53% | $ | 383,615,160 | ||||||
(Cost $308,954,790) | ||||||||
Liabilities in Excess of Other Assets - (0.53)% | (2,038,336 | ) | ||||||
NET ASSETS - 100.00% | $ | 381,576,824 | ||||||
| * | Non Income Producing Security |
| ** | ADR - American Depositary Receipt |
| # | Less than 0.005% of Net Assets |
| + | This security or a portion of the security is out on loan at December 31, 2006. Total loaned securities had a market value of $109,170,543 at December 31, 2006. |
See Notes to Financial Statements.
| www.Bridgeway.com | 15 |
Bridgeway Aggressive Investors 2 Fund
MANAGER’S COMMENTARY
(Unaudited)
January 31, 2007
Dear Fellow Aggressive Investors 2 Fund Shareholder,
Our Fund had a positive return of 7.26% in the December quarter, compared with 6.70% for the S&P 500 Index and 5.46% for our peer benchmark, the Lipper Capital Appreciation Funds Index. Small stocks made a strong finish to extend an eighth year of dominance over large stocks. In this environment, the Russell 2000 Index was up a strong 8.90% for the December quarter. Overall, it was a good quarter.
The Fund’s December quarter return was not nearly enough to make up for the lagging performance in the prior quarters, however, and our calendar year returns lagged our benchmarks as presented in the table below. The calendar year return was a dismal 5.43%, compared to a gain of 15.79% for our primary benchmark, the S&P 500 Index and 10.53% for our peer benchmark, the Lipper Capital Appreciation Funds Index.
Our poor showing was the result of poor performance across four of our five models and an unusual market environment that did not reward the favorable reports of some of our stocks, while pummeling our stocks with unfavorable reports. It was the first time in the five calendar year history of our Fund that we underperformed the S&P 500 Index.
The table below presents our December quarter, one-year, five-year, and life-to-date financial results according to the formula required by the SEC. A graph of quarterly performance since inception appears on the following page.
Dec. Qtr. 10/1/06 to 12/31/06 | 1 Year 1/1/06 to 12/31/06 | 5 Year 1/1/02 to 12/31/06 | Life-to-Date 10/31/01 to 12/31/06 | |||||
Aggressive Investors 2 Fund | 7.26% | 5.43% | 11.13% | 11.61% | ||||
S&P 500 Index (large companies) | 6.70% | 15.79% | 6.19% | 7.69% | ||||
Russell 2000 Index (small companies) | 8.90% | 18.37% | 11.39% | 13.93% | ||||
Lipper Capital Appreciation Funds Index | 5.46% | 10.53% | 5.78% | 7.60% | ||||
Performance figures quoted represent past performance and are no guarantee of future results. Current performance may be lower or higher than the performance figures quoted, and an investor’s shares, when redeemed, may be worth more or less than original cost. For the most recent month-end performance, please call 1-800-661-3550 or visit the Fund’s website at www.bridgeway.com.
The S&P 500 Index is a broad-based, unmanaged measurement of changes in stock market conditions based on the average of 500 widely held common stocks with dividends reinvested, while the Russell 2000 Index is an unmanaged, market value weighted index that measures performance of the 2,000 companies that are between the 1,000th and 3,000th largest in the market with dividends reinvested. The Lipper Capital Appreciation Funds Index reflects the aggregate record of more aggressive domestic growth mutual funds, as reported by Lipper, Inc. It is not possible to invest directly in an index. Periods longer than one year are annualized.
According to data from Lipper, Inc. as of December 31, 2006, Aggressive Investors 2 Fund ranked 266th of 354 capital appreciation funds for 2006, 27th of 242 for the past five years and 53rd of 241 such funds since inception in October, 2001. Lipper, Inc. is an independent mutual fund rating service that ranks funds in various fund categories by making comparative calculations using total returns.
| 16 | Semi-Annual Report | December 31, 2006 (Unaudited) |
Bridgeway Aggressive Investors 2 Fund
MANAGER’S COMMENTARY (continued)
(Unaudited)
Growth of $10,000 Invested in Aggressive Investors 2 Fund and Indexes from 10/31/01 (inception) to 12/31/06
Detailed Explanation of Quarterly Performance—What Worked Well
The Short Version: Of the 89 holdings at the end of the December quarter, 14 had returns greater than 20%, and only 4 had returns down 20% or more. Companies in communications and technology were bright spots, together adding about 3% to return.
These are the ten best performers for the December quarter:
| Rank | Description | Industry | % Gain | |||
| 1 | Amkor Technology, Inc. | Semiconductors | 64.0% | |||
| 2 | Tenaris SA | Iron/Steel | 41.0% | |||
| 3 | Ceradyne, Inc. | Miscellaneous Manufacturing | 37.5% | |||
| 4 | CDC Corp. Class A | Internet | 33.4% | |||
| 5 | CROCS, Inc. | Apparel | 27.3% | |||
| 6 | Cleveland-Cliffs, Inc. | Iron/Steel | 27.1% | |||
| 7 | Administaff, Inc. | Commercial Services | 26.9% | |||
| 8 | DIRECTV Group, Inc. | Media | 26.7% | |||
| 9 | Dobson Communications Corp. | Telecommunications | 24.1% | |||
| 10 | McDermott International, Inc. | Engineering & Construction | 21.7% | |||
Last quarter, I promised an update on our worst performer, Amkor Technology. At the time, I didn’t know just how interesting the story would get. Amkor is a leading provider of advanced semiconductor assembly and test services. As you may recall, through the summer and early fall, the company was fraught with problems that seemed to be one domino of bad news falling after another: the company warning of slowing growth rates, the SEC looking into option award practices, delays in filing its 10Q financial statements with the federal government pending the results of the stock option inquiry, threat of stock exchange delisting, announcement of likely restated financial results from the options probe, probable non-compliance with lending requirements (bondholder covenants) due to the delayed filings, and the specter of bankruptcy should the bondholders accelerate bond payment. On top of all this, the market environment was very unfriendly to this kind of stock, and for all these reasons the stock price was pummeled. It would seem things just couldn’t get worse. (Things can always get worse.) In the midst of all this bad news, the company continued to report favorable underlying economic results. At the lower price, one of our models still liked the stock. This is where the advantage of quantitative investing comes into play—taking all the emotion out of the process. During the September quarter, we took a rather unusual action in the area of risk management (and cash management) in the Fund. We bought call options on the stock and shortly thereafter trimmed our position in the stock itself. This had the net effect of allowing us to participate in the stock’s recovery (should that happen), while providing some downside protection (as compared to owning the equivalent shares of the stock). And recover it did in the December quarter. Amkor had started out the September quarter at a price
| www.Bridgeway.com | 17 |
Bridgeway Aggressive Investors 2 Fund
MANAGER’S COMMENTARY (continued)
(Unaudited)
of $9.46 and ended that quarter at $5.15. Thereafter, much of the “bad news” unwound as more facts came to light. The company reported another quarter of good financial results. The stock option inquiry exonerated all current members of management. Prior financials were restated, and the company was able to make their financial filings. The bondholders dropped their threat of accelerated payments, and the threat of bankruptcy filings vanished. With help from the market recovery in the fourth quarter, the stock price recovered to $9.34 at December quarter end. The net result to Aggressive Investors 2 shareholders? We decreased risk in Amkor by buying calls and selling a portion of our stock, and we participated in the stock price recovery. Combining our stock and call option positions, Amkor contributed 0.8% to our December quarter performance, significant for a single holding.
Although Amkor was our largest gainer for the quarter, McDermott International added more to performance (0.9%). Founded in 1923 in Bridgeway’s hometown of Houston, Texas, McDermott International, Inc., through its subsidiaries, operates as an energy services company worldwide. It operates in three segments: Marine Construction Services, Government Operations, and Power Generation Systems. Since our original purchase in the fall of 2005, it has been a steady performer for the Fund. Third quarter reports of higher earnings, revenues and operating income resulted in a 21.7% share price boost.
Detailed Explanation of Quarterly Performance—What Didn’t Work
The Short Version: For a number of our stocks, December quarter price movements were nearly a mirror image of the prior quarter. Two of the worst performers in the December quarter were among the best stocks in the September quarter: NovAtel and Motorola. OM Group cost us the most in performance—more than a half percent. As losers go, it wasn’t a bad list.
These are the ten stocks that performed the worst in the December quarter:
| Rank | Description | Industry | % Loss | |||
| 1 | LifeCell Corp. | Biotechnology | -26.3% | |||
| 2 | Encore Wire Corp. | Electrical Compo & Equip | -25.0% | |||
| 3 | Corning, Inc. | Telecommunications | -23.4% | |||
| 4 | Aspreva Pharmaceuticals Corp. | Pharmaceuticals | -20.9% | |||
| 5 | OM Group, Inc. | Chemicals | -19.1% | |||
| 6 | Motorola, Inc. | Telecommunications | -17.8% | |||
| 7 | Archer-Daniels-Midland Co. | Agriculture | -16.3% | |||
| 8 | EGL, Inc. | Transportation | -14.6% | |||
| 9 | TXU Corp. | Electric | -13.3% | |||
| 10 | NovAtel, Inc. | Electronics | -13.1% | |||
What happened to NovAtel and Motorola? At the end of October, although NovAtel posted almost double third quarter profit from a year ago, it missed Wall Street expectations, and the price dropped 15%. It has recovered somewhat since then, and we continue to hold. Motorola, our fourth best performer in the September quarter, dropped to sixth worst this quarter. Cell phone competition has been fierce, not only with Nokia and Samsung, but also from its own Krzr, the new version of the popular slim phone, Razr, which has sold more than 50 million units world-wide (including the one I bought my wife last year). After announcing in mid-October that third quarter revenues fell short of expectations and that earnings fell 45% year-over-year, its share price fell 11% over the next few days. Nevertheless, the model that picked this stock liked it enough to hold through quarter end.
LifeCell Corporation engages in the development and marketing of human-derived tissue-based products for use in reconstructive, orthopedic, and urogynecologic surgical procedures to repair soft tissue defects. In late October, the company announced negative news on third quarter results. Even though earnings went from $2.5 million and 7 cents a share last year to $5.1 million and 15 cents a share this year, it had targeted 16 cents a share. You would think that investors would be happy with such an increase; however, LifeCell also lowered fourth quarter revenue and earnings projections, signaling a slow down in sales growth. Shares tumbled almost 25% on the news. We sold our position before quarter end.
| 18 | Semi-Annual Report | December 31, 2006 (Unaudited) |
Bridgeway Aggressive Investors 2 Fund
MANAGER’S COMMENTARY (continued)
(Unaudited)
Detailed Explanation of Calendar Year Performance—What Worked Well
The Short Version: Although five out of ten of the stocks below had better than 50% return, they were not enough to pull us ahead of our benchmarks for the calendar year.
These are the ten best performers for the calendar year:
| Rank | Description | Industry | % Gain | |||
| 1 | Tenaris SA | Iron/Steel | 117.9% | |||
| 2 | BellSouth Corp. | Telecommunications | 73.8% | |||
| 3 | CROCS, Inc. | Apparel | 60.5% | |||
| 4 | NS Group, Inc. | Metal Fabricate/Hardware | 53.9% | |||
| 5 | BMC Software, Inc. | Software | 52.0% | |||
| 6 | DIRECTV Group, Inc. | Media | 49.7% | |||
| 7 | AT&T, Inc. | Telecommunications | 46.0% | |||
| 8 | McDermott International, Inc. | Engineering & Construction | 45.2% | |||
| 9 | NovAtel, Inc. | Electronics | 44.5% | |||
| 10 | Foundation Coal Holdings, Inc. | Coal | 40.1% | |||
Oil and gas companies world wide continue to increase their exploration and production spending in response to generally sustained high oil and gas prices. Our biggest gainer for the calendar year, Tenaris SA, has had a steady corresponding increase in demand for its products. Based in Luxembourg, the company manufactures seamless steel tubing in a number of countries, including Argentina, Brazil, Canada, Italy, Japan, Mexico and Venezuela. Its annual earnings growth rate over the past five years has been a huge 75.12%. Good third quarter results added fuel to rising share price, including a more than two-fold return for our Fund.
Detailed Explanation of Calendar Year Performance—What Didn’t Work
The Short Version: The four worst-performing companies in the industrial sector (electronics, building materials and transportation industries) practically cancelled the performance of their three counterparts in the best performers for the calendar year. In addition, the three tech companies below more than offset BMC Software. Not a winning combination for us for 2006.
The stocks that performed worst for the calendar year:
| Rank | Description | Industry | % Loss | |||
| 1 | Portalplayer, Inc. | Semiconductors | -60.3% | |||
| 2 | American Science & Eng., Inc. | Electronics | -49.7% | |||
| 3 | Advanced Micro Devices, Inc. | Semiconductors | -47.1% | |||
| 4 | Plexus Corp. | Electronics | -42.9% | |||
| 5 | Zoran Corp. | Semiconductors | -41.7% | |||
| 6 | Aspreva Pharmaceuticals Corp. | Pharmaceuticals | -38.0% | |||
| 7 | Brightpoint, Inc. | Distribution/Wholesale | -37.6% | |||
| 8 | Energy Partners Ltd. | Oil & Gas | -35.7% | |||
| 9 | Eagle Materials, Inc. | Building Materials | -34.9% | |||
| 10 | EGL, Inc. | Transportation | -31.1% | |||
Aspreva is the only stock of the ten that we continued to hold after year end. Aspreva Pharmaceuticals Corporation provides drugs for patients living with less common diseases. Its CellCept product was approved in 1995 for the prevention of rejection of kidney, heart and liver transplants and was being tested for its effectiveness in treating myasthenia gravis, a disease characterized by chronic fatigue and muscular weakness, especially in the face and neck. When CellCept failed to meet its primary and secondary endpoints in the Phase III clinical trial, Aspreva’s shares sank 14.1% to $19.03. Although we have trimmed our position, we continue to hold.
| www.Bridgeway.com | 19 |
Bridgeway Aggressive Investors 2 Fund
MANAGER’S COMMENTARY (continued)
(Unaudited)
Top Ten Holdings as of December 31, 2006
Unfortunately, none of our largest holdings were ultra performers; however, only one was in negative performance territory. The top ten holdings represented 32.7% of net assets, below the average of both domestic equity funds (35%) and aggressive growth funds (40%), according to data from Morningstar.
| Rank | Description | Industry | Percent of Net Assets | |||
| 1 | McDermott International, Inc. | Engineering & Construction | 4.7% | |||
| 2 | Big Lots, Inc. | Retail | 4.4% | |||
| 3 | BMC Software, Inc. | Software | 4.0% | |||
| 4 | Cephalon, Inc. | Pharmaceuticals | 3.8% | |||
| 5 | Dillard’s, Inc. | Retail | 3.5% | |||
| 6 | Tetra Technologies, Inc. | Oil & Gas Services | 2.6% | |||
| 7 | Illumina, Inc. | Biotechnology | 2.5% | |||
| 8 | Goldman Sachs Group, Inc. | Diversified Finan Serv | 2.5% | |||
| 9 | America Movil SAB de CV | Telecommunications | 2.4% | |||
| 10 | Cognizant Tech. Solutions Corp. | Computers | 2.3% | |||
| 32.7% |
Industry Sector Representation as of December 31, 2006
Our significant underweighting in financial stocks compared to the market had a slightly negative effect in the quarter; strong stock selection nearly made up for fewer holdings. Fortunately, our overweighting and strong performance among technology stocks carried us into market-beating territory.
| % of Net Assets | % S&P 500 Index | Difference | ||||
Basic Materials | 6.1% | 2.9% | 3.2% | |||
Communications | 11.9% | 11.6% | 0.3% | |||
Consumer, Cyclical | 18.0% | 8.3% | 9.7% | |||
Consumer, Non-cyclical | 12.2% | 19.9% | -7.7% | |||
Energy | 15.6% | 9.9% | 5.7% | |||
Financial | 9.5% | 22.2% | -12.7% | |||
Industrial | 11.5% | 11.1% | 0.4% | |||
Technology | 13.2% | 10.6% | 2.6% | |||
Utilities | 1.8% | 3.5% | -1.7% | |||
Cash | 0.2% | 0.0% | 0.2% | |||
Total | 100.0% | 100.0% |
Disclaimer
The following is a reminder from the friendly folks at your Fund who worry about liability. The views expressed here are exclusively those of Fund management. These views, including those of market sectors or individual stocks, are not meant as investment advice and should not be considered predictive in nature. Any favorable (or unfavorable) description of a holding applies only as of the quarter end, December 31, 2006, unless otherwise stated. Security positions can and do change thereafter. Discussions of historical performance do not guarantee and are not indicative of future performance.
The Fund is subject to above average market risk (volatility) and is not an appropriate investment for short-term investors. Investments in the small companies within this multi-cap fund generally carry greater risk than is customarily associated with larger companies for various reasons such as narrower markets (fewer investors), limited financial resources and greater trading difficulty.
| 20 | Semi-Annual Report | December 31, 2006 (Unaudited) |
Bridgeway Aggressive Investors 2 Fund
MANAGER’S COMMENTARY (continued)
(Unaudited)
This report is submitted for the general information of the shareholders of the Fund. It is not authorized for distribution to prospective investors unless preceded or accompanied by an effective prospectus, which includes information regarding the Fund’s risks, objectives, fees and expenses, experience of its management, and other information. For questions or other Fund information, call 1-800-661-3550 or visit the Fund’s website www.bridgeway.com. Foreside Fund Services, LLC, distributor.
Conclusion
Thank you for your continued investment in Aggressive Investors 2 Fund. This Fund remains open to both current and new investors. As always, we appreciate your feedback.
Sincerely,
John Montgomery
| www.Bridgeway.com | 21 |
Bridgeway Aggressive Investors 2 Fund
SCHEDULE OF INVESTMENTS
Showing percentage of net assets as of December 31, 2006 (Unaudited)
| Industry | Company | Shares | Value | ||||
COMMON STOCKS - 99.90% | |||||||
Apparel - 5.95% | |||||||
CROCS, Inc.*+ | 230,400 | $ | 9,953,280 | ||||
Guess?, Inc.* | 190,400 | 12,077,072 | |||||
Gymboree Corp.* | 337,400 | 12,875,184 | |||||
| 34,905,536 | |||||||
Auto Manufacturers - 0.97% | |||||||
General Motors Corp.+ | 184,300 | 5,661,696 | |||||
Banks - 0.49% | |||||||
US Bancorp+ | 79,000 | 2,859,010 | |||||
Biotechnology - 3.02% | |||||||
Amgen, Inc.* | 44,500 | 3,039,795 | |||||
Illumina, Inc.*+ | 373,400 | 14,678,354 | |||||
| 17,718,149 | |||||||
Chemicals - 3.50% | |||||||
Albemarle Corp. | 179,900 | 12,916,820 | |||||
OM Group, Inc.* | 167,771 | 7,596,671 | |||||
| 20,513,491 | |||||||
Commercial Services - 0.45% | |||||||
Administaff, Inc. | 62,100 | 2,656,017 | |||||
Computers - 3.27% | |||||||
Cognizant Technology Solutions Corp.* | 173,300 | 13,371,828 | |||||
Research In Motion Ltd.* | 45,600 | 5,826,768 | |||||
| 19,198,596 | |||||||
Distribution/Wholesale - 1.52% | |||||||
WESCO International, Inc.*+ | 151,800 | 8,927,358 | |||||
Diversified Financial Services - 7.73% | |||||||
First Marblehead Corp.+ | 113,850 | 6,221,903 | |||||
Goldman Sachs Group, Inc.+ | 73,300 | 14,612,355 | |||||
JPMorgan Chase & Co. | 138,400 | 6,684,720 | |||||
Merrill Lynch & Co., Inc.+ | 56,800 | 5,288,080 | |||||
Morgan Stanley | 153,600 | 12,507,648 | |||||
| 45,314,706 | |||||||
Electric - 0.85% | |||||||
TXU Corp. | 92,500 | 5,014,425 | |||||
Electronics - 2.99% | |||||||
Avnet, Inc.* | 466,700 | 11,914,851 | |||||
NovAtel, Inc.* | 141,300 | 5,637,870 | |||||
| 17,552,721 | |||||||
| Industry | Company | Shares | Value | ||||
Engineering & Construction - 4.73% | |||||||
McDermott International, Inc.* | 546,050 | $ | 27,772,103 | ||||
Gas - 0.92% | |||||||
Energen Corp. | 114,700 | 5,384,018 | |||||
Insurance - 0.90% | |||||||
Selective Insurance Group | 55,900 | 3,202,511 | |||||
WR Berkley Corp.+ | 59,950 | 2,068,874 | |||||
| 5,271,385 | |||||||
Internet - 2.32% | |||||||
CDC Corp.*+ | 864,200 | 8,209,900 | |||||
Nutri/System, Inc.*+ | 84,800 | 5,375,472 | |||||
| 13,585,372 | |||||||
Iron/Steel - 1.84% | |||||||
Cleveland-Cliffs, Inc.+ | 133,600 | 6,471,584 | |||||
Tenaris SA**+ | 86,500 | 4,315,485 | |||||
| 10,787,069 | |||||||
Machinery - Construction & Mining - 1.16% | |||||||
Joy Global, Inc.+ | 140,200 | 6,777,268 | |||||
Media - 1.47% | |||||||
DIRECTV Group, Inc.*+ | 339,900 | 8,477,106 | |||||
Idearc, Inc.* | 4,245 | 121,619 | |||||
| 8,598,725 | |||||||
Mining - 0.77% | |||||||
Alcoa, Inc. | 151,100 | 4,534,511 | |||||
Miscellaneous Manufacturers - 1.43% | |||||||
Ceradyne, Inc.* | 61,567 | 3,478,536 | |||||
Freightcar America, Inc.+ | 89,000 | 4,935,050 | |||||
| 8,413,586 | |||||||
Oil & Gas - 6.42% | |||||||
Chesapeake Energy Corp.+ | 85,060 | 2,470,993 | |||||
ConocoPhillips | 128,900 | 9,274,355 | |||||
EnCana Corp. | 107,000 | 4,916,650 | |||||
Frontier Oil Corp.+ | 192,600 | 5,535,324 | |||||
Marathon Oil Corp. | 66,500 | 6,151,250 | |||||
Tesoro Corp.+ | 69,300 | 4,557,861 | |||||
Unit Corp.* | 98,200 | 4,757,790 | |||||
| 37,664,223 | |||||||
| 22 | Semi-Annual Report | December 31, 2006 (Unaudited) |
Bridgeway Aggressive Investors 2 Fund
SCHEDULE OF INVESTMENTS (continued)
Showing percentage of net assets as of December 31, 2006 (Unaudited)
| Industry | Company | Shares | Value | ||||
Common Stocks (continued) | |||||||
Oil & Gas Services - 9.19% | |||||||
Dril-Quip, Inc.* | 278,600 | $ | 10,909,976 | ||||
Oceaneering International, Inc.* | 286,620 | 11,378,814 | |||||
Schlumberger Ltd.+ | 122,200 | 7,718,152 | |||||
Swift Energy Co.* | 186,500 | 8,357,065 | |||||
Tetra Technologies, Inc.*+ | 607,000 | 15,527,060 | |||||
| 53,891,067 | |||||||
Pharmaceuticals - 8.72% | |||||||
Aspreva Pharmaceuticals Corp.* | 190,000 | 3,898,800 | |||||
Bristol-Myers Squibb Co.+ | 465,500 | 12,251,960 | |||||
Cephalon, Inc.*+ | 314,300 | 22,129,863 | |||||
Gilead Sciences, Inc.* | 83,400 | 5,415,162 | |||||
Merck & Co., Inc.+ | 171,000 | 7,455,600 | |||||
| 51,151,385 | |||||||
Retail - 9.59% | |||||||
Big Lots, Inc.*+ | 1,128,200 | 25,858,344 | |||||
Dillard’s, Inc.+ | 591,600 | 20,688,252 | |||||
Kohl’s Corp.*+ | 141,500 | 9,682,845 | |||||
| 56,229,441 | |||||||
Savings & Loans - 0.45% | |||||||
Washington Mutual, Inc.+ | 58,000 | 2,638,420 | |||||
Semiconductors - 4.00% | |||||||
Amkor Technology, Inc.* | 1,114,300 | 10,407,562 | |||||
Varian Semiconductor Equipment Associates, Inc.*+ | 287,300 | 13,077,896 | |||||
| 23,485,458 | |||||||
Software - 5.93% | |||||||
BMC Software, Inc.* | 733,400 | 23,615,480 | |||||
Informatica Corp.* | 264,500 | 3,229,545 | |||||
Oracle Corp.* | 464,500 | 7,961,530 | |||||
| 34,806,555 | |||||||
| Industry | Company | Shares | Value | ||||
Telecommunications - 8.13% | |||||||
America Movil SAB de CV** | 311,000 | $ | 14,063,420 | ||||
AT&T, Inc.+ | 163,600 | 5,848,700 | |||||
BellSouth Corp. | 196,600 | 9,261,826 | |||||
BT Group PLC** | 116,000 | 6,947,240 | |||||
Corning, Inc.* | 180,200 | 3,371,542 | |||||
Dobson Communications Corp.* | 327,600 | 2,853,396 | |||||
Motorola, Inc.+ | 106,400 | 2,187,584 | |||||
Verizon Communications, Inc. | 84,900 | 3,161,676 | |||||
| 47,695,384 | |||||||
Transportation - 1.19% | |||||||
American Commercial Lines, Inc.* | 106,200 | 6,957,162 | |||||
TOTAL COMMON STOCKS | 585,964,837 | ||||||
(Cost $518,625,696) | |||||||
TOTAL INVESTMENTS - 99.90% | $ | 585,964,837 | |||||
(Cost $518,625,696) | |||||||
Other Assets in Excess of Liabilities - 0.10% | 605,644 | ||||||
NET ASSETS - 100.00% | $ | 586,570,481 | |||||
| * | Non Income Producing Security |
| ** | ADR - American Depositary Receipt |
| + | This security or a portion of the security is out on loan at December 31, 2006. Total loaned securities had a market value of $184,765,948 at December 31, 2006. |
See Notes to Financial Statements.
| www.Bridgeway.com | 23 |
Bridgeway Ultra-Small Company Fund
MANAGER’S COMMENTARY
(Unaudited)
January 31, 2007
Dear Fellow Ultra-Small Company Fund Shareholder,
Our Fund was up 12.19% in the December quarter, compared to an 8.90% return for the Russell 2000 Index, 7.81% for our peer group, the Lipper Small-Cap Stock Funds Index, and 10.27% for our primary benchmark, the CRSP Cap-Based Portfolio 10 Index. It was a very good quarter.
For the calendar year 2006, we also had a “clean sweep.” Our Fund was up 21.55% for the full year, compared to 18.37% for the Russell 2000 Index, 14.66% for the Lipper Small-Cap Stock Funds Index, and 19.42% for the CRSP Cap-Based Portfolio 10 Index. Small stocks made a strong finish to extend a record-breaking eighth year of dominance over large stocks.
The table below presents the December quarter, one-year, five-year, ten-year and life-to-date performance of our Fund and benchmarks. A graph of quarterly performance appears for the past ten years at the top of the following page.
Dec. Qtr. 10/1/06 to 12/31/06 | 1 Year 1/1/06 to 12/31/06 | 5 Year 1/1/02 to 12/31/06 | 10 Year 1/1/97 to 12/31/06 | Life-to-Date 8/5/94 to 12/31/06 | ||||||
Ultra-Small Company Fund | 12.19% | 21.55% | 24.80% | 21.75% | 22.68% | |||||
Lipper Small-Cap Stock Funds Index | 7.81% | 14.66% | 9.91% | 8.17% | 10.72% | |||||
Russell 2000 Index (small companies) | 8.90% | 18.37% | 11.39% | 9.44% | 11.37% | |||||
CRSP Cap-Based Port. 10 Index | 10.27% | 19.42% | 22.19% | 16.18% | 16.67% | |||||
Performance figures quoted represent past performance and are no guarantee of future results. Current performance may be lower or higher than the performance figures quoted, and an investor’s shares, when redeemed, may be worth more or less than original cost. For the most recent month-end performance, please call 1-800-661-3550 or visit the Fund’s website at www.bridgeway.com.
The Lipper Small-Cap Stock Funds Index is an index of small-company funds compiled by Lipper, Inc. The Russell 2000 Index is an unmanaged, market value weighted index, which measures performance of the 2,000 companies that are between the 1,000th and 3,000th largest in the market with dividends reinvested. The CRSP Cap-Based Portfolio 10 Index is an unmanaged index of 1,729 of the smallest publicly traded U.S. stocks (with dividends reinvested), as reported by the Center for Research on Security Prices. It is not possible to invest directly in an index. Periods longer than one year are annualized.
According to data from Lipper, Inc., for the period ended December 31, 2006, the Ultra-Small Company Fund ranked 5th of 66 micro-cap funds for the last twelve months, 1st of 59 such funds for the last five years, 2nd of 23 funds for ten years and 1st of 9 funds since inception in August, 1994. Lipper, Inc. is an independent mutual fund rating service that ranks funds in various fund categories by making comparative calculations using total returns.
| 24 | Semi-Annual Report | December 31, 2006 (Unaudited) |
Bridgeway Ultra-Small Company Fund
MANAGER’S COMMENTARY (continued)
(Unaudited)
Growth of $10,000 Invested in Ultra-Small Company Fund and Indexes from 1/1/97 to 12/31/06
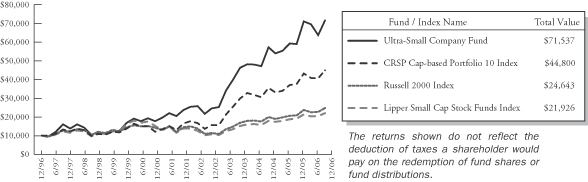
Detailed Explanation of Quarterly Performance—What Worked Well
The Short Version: Almost a quarter of our 109 stocks had better than 20% return for the December period. Four of the companies in the list below added more than 1% return to our quarterly performance—US Global Investors, iMergent, Allis-Chalmers Energy and Intevac. Interestingly, they represented four completely different industries.
These are the ten best-performing stocks for the December quarter:
| Rank | Description | Industry | % Gain | |||
| 1 | US Global Investors, Inc. | Diversified Finan Services | 173.4% | |||
| 2 | iMergent, Inc. | Internet | 94.3% | |||
| 3 | Bolt Technology Corp. | Oil & Gas Services | 66.5% | |||
| 4 | LB Foster Co. | Metal Fabricate/Hardware | 61.3% | |||
| 5 | Allis-Chalmers Energy, Inc. | Oil & Gas Services | 58.2% | |||
| 6 | Intevac, Inc. | Machinery-Diversified | 54.5% | |||
| 7 | M&F Worldwide Corp. | Food | 53.9% | |||
| 8 | DXP Enterprises, Inc. | Machinery-Diversified | 46.3% | |||
| 9 | Midwest Air Group, Inc. | Airlines | 41.7% | |||
| 10 | Bovie Medical Corp. | Healthcare-Products | 35.1% | |||
Similar to your Fund’s investment adviser, Bridgeway Capital Management, Inc., U.S. Global Investors provides mutual fund management services to institutions and individuals. The company primarily invests in early-stage or start-up businesses. Unlike Bridgeway, U.S. Global is publicly traded. It was started in 1968 in San Antonio, Texas and developed the first no load precious metals fund. Since then, it has expanded into a widely diversified range of investments as well as “gone public” with its management company. The stock price has had a steady upward trend since October, and after announcing plans in November for a stock split and a special dividend, the upward trend became even steeper. For our Fund, it was a case of a well-timed purchase and a great ride. As our seventh largest holding at the beginning of the quarter, the 173% price increase added a whopping 4% to our quarterly return. This demonstrates how just one top-performing ultra-small stock can really carry the return of our Fund. I love these little powerhouses. (Of course, the returns can go the other direction too.)
| www.Bridgeway.com | 25 |
Bridgeway Ultra-Small Company Fund
MANAGER’S COMMENTARY (continued)
(Unaudited)
iMergent, Inc. provides e-commerce solutions to entrepreneurs and small businesses, which enables its customers to market and sell their business products or ideas via the Internet. In early November, the company announced outstanding third-quarter results: strong domestic sales, more than doubling revenue from the same period a year ago, net income went from a net loss of $5.5 million and ($0.45) per share to this year’s $2.3 million and $0.31 per share. More contracts, shorter delivery times, more workshops, high levels of customer service, quicker response times—they were running “on all cylinders.” Our model made a just-in-time pick early in the quarter, and we benefited from the good-news price increase through the quarter—to the tune of almost 2%.
Detailed Explanation of Quarterly Performance—What Didn’t Work
The Short Version: Four companies in the tech sector (computers and semiconductors industries) landed on the list of worst performers, accumulating almost 1% of negative return.
These are the ten worst-performing stocks for the December quarter:
| Rank | Description | Industry | % Loss | |||
| 1 | Datalink Corp. | Computers | -37.6% | |||
| 2 | Optimal Group, Inc. | Computers | -30.4% | |||
| 3 | Zones, Inc. | Retail | -30.1% | |||
| 4 | US Xpress Enterprises, Inc. | Transportation | -28.9% | |||
| 5 | Advanced Environmental Recycling Technology | Building Materials | -26.0% | |||
| 6 | Integral Systems, Inc./MD | Computers | -25.9% | |||
| 7 | Graham Corp. | Electrical Compo & Equip | -25.4% | |||
| 8 | Art Technology Group, Inc. | Internet | -22.8% | |||
| 9 | BTU International, Inc. | Semiconductors | -22.6% | |||
| 10 | United Retail Group, Inc. | Retail | -22.0% | |||
Our purchase of iMergent (discussed above) just happened to be well-timed (although we don’t try to “time” the market), and our purchase of Datalink was just the opposite—at the absolute peak for the quarter. Datalink Corporation analyzes, designs, implements, and supports information storage infrastructures that store, protect, and provide continuous access to information, via area networks, network-attached storage, direct-attached storage, and IP-based storage, using hardware, software, and technical services. Shares fell 13% in mid-October after the company reported third quarter net earnings of $1.26 million, or 11 cents a share, disappointing Wall Street analysts who had forecast a range of 11 cents to 16 cents a share. Revenue rose to $33.2 million from $31.2 million a year ago but badly missed analysts’ expectations of $36 to $40 million. Zones, an online reseller of technology products, also had an October drop after announcing falling third quarter revenues. It was our best performing company in the September quarter. We continue to hold both companies.
Detailed Explanation of Calendar Year Performance—What Worked Well
The Short Version: Fourteen companies had better than 50% return for the calendar year, with three over 100%. Results like this make me feel like the man who dances and swings his arms around singing, “It’s my birthday, it’s my birthday,” until I realize that the models and our team, not me, deserve the cake.
| 26 | Semi-Annual Report | December 31, 2006 (Unaudited) |
Bridgeway Ultra-Small Company Fund
MANAGER’S COMMENTARY (continued)
(Unaudited)
These are the ten best-performing stocks for the calendar year 2006:
| Rank | Description | Industry | % Gain | |||
| 1 | US Global Investors, Inc. | Diversified Finan Services | 250.6% | |||
| 2 | Ezcorp, Inc. | Retail | 193.4% | |||
| 3 | Books-A-Million, Inc. | Retail | 134.1% | |||
| 4 | Intevac, Inc. | Machinery-Diversified | 96.6% | |||
| 5 | iMergent, Inc. | Internet | 94.3% | |||
| 6 | Midwest Air Group, Inc. | Airlines | 86.6% | |||
| 7 | Clean Harbors, Inc. | Environmental Control | 68.0% | |||
| 8 | Allis-Chalmers Energy, Inc. | Oil & Gas Services | 60.0% | |||
| 9 | Ladish Co, Inc. | Metal Fabricate/Hardware | 56.9% | |||
| 10 | PW Eagle, Inc. | Miscellaneous Manufacture | 56.0% | |||
Ezcorp has been a steady performer for our Fund since late 2004. It operates pawn shops and payday loan stores. In early November this year, company officials announced that earnings from loans were better because of a recent increase in paid debt. The company opened 46 stores in the September quarter with plans for 100 more in fiscal 2007. Upon the news that earnings were 61 cents to 64 cents a share, above its earlier prediction of 43 to 46 cents, the stock price rose almost 20%. We trimmed our position to reign in our risk—a problem we enjoy solving.
Founded in 1917 in Alabama, Books-A-Million, Inc. is a retailer of bargain books with 173 superstores, 32 traditional stores and a brisk online business. It has been a steady performer for our Fund for a couple of years now. It has increased sales and cut its debt in half over the past year. However, strong competition from Barnes & Noble, Borders and Amazon could temper future results.
Detailed Explanation of Calendar Year Performance—What Didn’t Work
The Short Version: Four companies declined more than 50% for the calendar year; heavily represented were the personal care, health care and food industries in the consumer, non-cyclical sector. We continue to own only three of the worst-performing group: NeuroMetrix, Paragon Technologies and Datalink.
These are the ten worst-performing stocks for the calendar year 2006:
| Rank | Description | Industry | % Loss | |||
| 1 | China Energy Savings Technology, Inc. | Electrical Compo & Equip | -93.2% | |||
| 2 | Parlux Fragrances, Inc. | Cosmetics/Personal Care | -60.5% | |||
| 3 | Cuisine Solutions, Inc. | Food | -52.1% | |||
| 4 | Somanetics Corp. | Healthcare-Products | -51.3% | |||
| 5 | Optimal Group, Inc. | Computers | -44.8% | |||
| 6 | Infosonics Corp. | Distribution/Wholesale | -43.9% | |||
| 7 | NeuroMetrix, Inc. | Healthcare-Products | -42.6% | |||
| 8 | Graham Corp. | Electrical Compo & Equip | -41.4% | |||
| 9 | Paragon Technologies, Inc. | Machinery-Diversified | -38.3% | |||
| 10 | Datalink Corp. | Computers | -37.6% | |||
| www.Bridgeway.com | 27 |
Bridgeway Ultra-Small Company Fund
MANAGER’S COMMENTARY (continued)
(Unaudited)
NeuroMetrix, Inc. is the only company of the ten worst performers for the calendar year that we continued to own on December 31. The company designs proprietary medical devices used to diagnose neuropathies, diseases of the nervous system. Their NC-stat System provides physicians the ability to diagnose patients with neuropathies at the point-of-service. Although financial results have been strong and generally above expectations, news that a number of insurers have said they would restrict reimbursement for use of the tests has resulted in a downward price movement. Although we have trimmed our position, we still have a small investment in the stock.
Top Ten Holdings as of December 31, 2006
Seven of the largest holdings were among the twenty best-performing companies for the December quarter. Six sectors were represented for a total of 34.2% of net assets.
| Rank | Description | Industry | Percent of Net Assets | |||
| 1 | US Global Investors, Inc. | Diversified Finan Services | 5.8% | |||
| 2 | Ezcorp, Inc. | Retail | 4.9% | |||
| 3 | Intevac, Inc. | Machinery-Diversified | 4.7% | |||
| 4 | Vaalco Energy, Inc. | Oil & Gas | 3.1% | |||
| 5 | Allis-Chalmers Energy, Inc. | Oil & Gas Services | 3.1% | |||
| 6 | NovAtel, Inc. | Electronics | 2.8% | |||
| 7 | iMergent, Inc. | Internet | 2.7% | |||
| 8 | Celadon Group, Inc. | Transportation | 2.5% | |||
| 9 | Matrix Service Co. | Oil & Gas Services | 2.4% | |||
| 10 | Dollar Financial Corp. | Commercial Services | 2.2% | |||
| 34.2% |
Industry Sector Representation as of December 31, 2006
Our largest sector representative, industrial, was also the sector most over weighted in comparison to our market index, which helped performance somewhat. Our under weighting in consumer, non-cyclical had only a slight negative effect.
| Sector | % of Net Assets | % CRSP Portfolio 10 Index | Difference | |||
Basic Materials | 2.8% | 2.9% | -0.1% | |||
Communications | 7.8% | 10.3% | -2.5% | |||
Consumer, Cyclical | 15.9% | 11.6% | 4.3% | |||
Consumer, Non-cyclical | 10.4% | 24.9% | -14.5% | |||
Energy | 13.7% | 4.5% | 9.2% | |||
Financial | 13.3% | 23.2% | -9.9% | |||
Industrial | 28.7% | 10.0% | 18.7% | |||
Technology | 7.1% | 9.4% | -2.3% | |||
Utilities | 0.0% | 1.2% | -1.2% | |||
Diversified | 0.0% | 2.0% | -2.0% | |||
Cash | 0.3% | 0.0% | 0.3% | |||
Total | 100.0% | 100.0% |
| 28 | Semi-Annual Report | December 31, 2006 (Unaudited) |
Bridgeway Ultra-Small Company Fund
MANAGER’S COMMENTARY (continued)
(Unaudited)
Disclaimer
The following is a reminder from the friendly folks at your Fund who worry about liability. The views expressed here are exclusively those of Fund management. These views are not meant as investment advice and should not be considered predictive in nature. Any favorable (or unfavorable) description of a holding applies only as of December 31, 2006, unless otherwise stated. Security positions can and do change thereafter. Discussions of historical performance do not guarantee and are not indicative of future performance.
The Fund is subject to very high, above market risk (volatility) and is not an appropriate investment for short-term investors. Investments in ultra-small companies generally carry greater risk than is customarily associated with larger companies and even “small companies” for various reasons such as narrower markets (fewer investors), limited financial resources and greater trading difficulty.
This report is submitted for the general information of the shareholders of the Fund. It is not authorized for distribution to prospective investors unless preceded or accompanied by an effective prospectus, which includes information regarding the Fund’s risks, objectives, fees and expenses, experience of its management, and other information. For questions or other Fund information, call 1-800-661-3550 or visit the Fund’s website www.bridgeway.com. Foreside Fund Services, LLC, distributor.
Conclusion
Ultra-Small Company Fund remains closed to investors as we seek to keep the nimbleness that has fared well through the years. As always, we appreciate your feedback.
Sincerely,
John Montgomery
| www.Bridgeway.com | 29 |
Bridgeway Ultra Small Company Fund
SCHEDULE OF INVESTMENTS
Showing percentage of net assets as of December 31, 2006 (Unaudited)
| Industry | Company | Shares | Value | ||||
COMMON STOCKS - 99.69% | |||||||
Airlines - 1.73% | |||||||
Midwest Air Group, Inc.* | 201,000 | $ | 2,311,500 | ||||
Apparel - 0.29% | |||||||
Everlast Worldwide, Inc.* | 23,000 | 391,000 | |||||
Auto Parts & Equipment - 0.95% | |||||||
Spartan Motors, Inc. | 83,400 | 1,266,012 | |||||
Banks - 1.54% | |||||||
First Regional Bancorp* | 5,700 | 194,313 | |||||
Greene County Bancshares, Inc. | 18,200 | 723,086 | |||||
Intervest Bancshares Corp.* | 32,900 | 1,132,089 | |||||
| 2,049,488 | |||||||
Biotechnology - 0.02% | |||||||
Repligen Corp.* | 7,984 | 22,435 | |||||
Building Materials - 0.28% | |||||||
International Aluminum Corp. | 7,700 | 375,375 | |||||
Chemicals - 2.81% | |||||||
ICO, Inc.* | 237,500 | 1,339,500 | |||||
Landec Corp.* | 98,000 | 1,054,480 | |||||
Pioneer Companies* | 47,300 | 1,355,618 | |||||
| 3,749,598 | |||||||
Commercial Services - 4.12% | |||||||
CPI Corp. | 54,000 | 2,510,460 | |||||
Dollar Financial Corp.* | 107,200 | 2,986,592 | |||||
| 5,497,052 | |||||||
Computers - 2.03% | |||||||
Cray, Inc.* | 119,000 | 1,413,720 | |||||
Datalink Corp.* | 45,000 | 338,400 | |||||
Integral Systems, Inc. | 22,781 | 527,836 | |||||
Synplicity, Inc.* | 68,300 | 427,558 | |||||
| 2,707,514 | |||||||
Distribution - Wholesale - 0.99% | |||||||
Chindex International, Inc.*+ | 70,200 | 1,323,972 | |||||
Diversified Financial Services - 6.87% | |||||||
Prospect Energy Corp. | 79,700 | 1,365,261 | |||||
US Global Investors, Inc.+ | 115,900 | 7,794,275 | |||||
| 9,159,536 | |||||||
Electronics - 2.83% | |||||||
NovAtel, Inc.* | 94,400 | 3,766,560 | |||||
| Industry | Company | Shares | Value | ||||
Engineering & Construction - 1.46% | |||||||
Goldfield Corp.*+ | 138,000 | $ | 164,220 | ||||
Sterling Construction Co., Inc.* | 82,100 | 1,786,496 | |||||
| 1,950,716 | |||||||
Environmental Control - 1.64% | |||||||
Clean Harbors, Inc.* | 45,200 | 2,188,132 | |||||
Food - 2.13% | |||||||
Imperial Sugar Co.+ | 52,000 | 1,258,920 | |||||
M&F Worldwide Corp.* | 60,000 | 1,515,600 | |||||
Overhill Farms, Inc.* | 21,000 | 60,270 | |||||
| 2,834,790 | |||||||
Hand/Machine Tools - 0.15% | |||||||
K-Tron International, Inc.* | 2,600 | 194,142 | |||||
Healthcare - Products - 1.55% | |||||||
Angeion Corp.*+ | 104,400 | 1,276,812 | |||||
Bovie Medical Corp.* | 30,000 | 272,100 | |||||
Neurometrix, Inc.*+ | 22,300 | 332,493 | |||||
Signalife, Inc.* | 171,500 | 188,650 | |||||
| 2,070,055 | |||||||
Healthcare - Services - 2.57% | |||||||
Air Methods Corp.* | 101,246 | 2,826,788 | |||||
Q-Med, Inc.* | 4,900 | 22,540 | |||||
RadNet, Inc.*+ | 125,000 | 577,500 | |||||
| 3,426,828 | |||||||
Insurance - 4.91% | |||||||
American Physicians Capital, Inc.* | 59,550 | 2,384,382 | |||||
Meadowbrook Insurance Group, Inc.* | 180,000 | 1,780,200 | |||||
Mercer Insurance Group, Inc. | 74,900 | 1,509,984 | |||||
Navigators Group, Inc.* | 18,000 | 867,240 | |||||
| 6,541,806 | |||||||
Internet - 3.94% | |||||||
iMergent, Inc.*+ | 127,100 | 3,640,144 | |||||
TheStreet.com, Inc. | 171,700 | 1,528,130 | |||||
Web.com, Inc.* | 18,800 | 78,772 | |||||
| 5,247,046 | |||||||
Machinery - Diversified - 8.72% | |||||||
DXP Enterprises, Inc.*+ | 47,700 | 1,671,408 | |||||
Gerber Scientific, Inc.* | 80,000 | 1,004,800 | |||||
Intevac, Inc.* | 239,600 | 6,217,620 | |||||
| 30 | Semi-Annual Report | December 31, 2006 (Unaudited) |
Bridgeway Ultra Small Company Fund
SCHEDULE OF INVESTMENTS (continued)
Showing percentage of net assets as of December 31, 2006 (Unaudited)
| Industry | Company | Shares | Value | ||||
Common Stocks (continued) | |||||||
Machinery - Diversified (continued) | |||||||
Kadant, Inc.* | 82,100 | $ | 2,001,598 | ||||
Paragon Technologies, Inc.* | 8,500 | 47,345 | |||||
Twin Disc, Inc. | 19,300 | 685,150 | |||||
| 11,627,921 | |||||||
Media - 0.01% | |||||||
Regent Communication* | 5,794 | 16,397 | |||||
Metal Fabrication - Hardware - 5.10% | |||||||
AM Castle & Co. | 83,600 | 2,127,620 | |||||
Ampco-Pittsburgh Corp. | 39,100 | 1,309,068 | |||||
L.B. Foster Co.* | 55,900 | 1,448,369 | |||||
Ladish Co., Inc.* | 51,600 | 1,913,328 | |||||
| 6,798,385 | |||||||
Miscellaneous Manufacturers - 4.01% | |||||||
Core Molding Technologies, Inc.* | 50,000 | 482,500 | |||||
GenTek, Inc.* | 63,500 | 2,196,465 | |||||
PW Eagle, Inc.+ | 77,200 | 2,663,400 | |||||
| 5,342,365 | |||||||
Oil & Gas - 3.89% | |||||||
Arabian American Devices* | 42,500 | 133,875 | |||||
Transglobe Energy Corp.* | 174,600 | 874,746 | |||||
Vaalco Energy, Inc.* | 619,800 | 4,183,650 | |||||
| 5,192,271 | |||||||
Oil & Gas Services - 9.80% | |||||||
Allis-Chalmers Energy, Inc.* | 178,300 | 4,108,032 | |||||
Bolt Technology Corp.* | 22,600 | 503,980 | |||||
Dawson Geophysical Co.* | 40,200 | 1,464,486 | |||||
Matrix Service Co.* | 200,800 | 3,232,880 | |||||
Metretek Technologies, Inc.*+ | 80,800 | 995,456 | |||||
TGC Industries, Inc.* | 100,500 | 844,200 | |||||
Union Drilling, Inc.* | 136,100 | 1,916,288 | |||||
| 13,065,322 | |||||||
Pharmaceuticals - 0.03% | |||||||
Point Therapeutics* | 41,380 | 42,621 | |||||
Retail - 11.89% | |||||||
Books-A-Million, Inc. | 37,900 | 859,572 | |||||
Ezcorp, Inc.* | 401,118 | 6,518,168 | |||||
Jewett-Cameron Trading* | 19,300 | 265,375 | |||||
Mothers Work, Inc.* | 56,500 | 2,225,535 | |||||
The Pantry, Inc.*+ | 21,200 | 993,008 | |||||
PC Connection, Inc.* | 189,227 | 2,806,236 | |||||
United Retail Group, Inc.* | 91,300 | 1,280,026 | |||||
Zones, Inc.* | 120,800 | 902,376 | |||||
| 15,850,296 | |||||||
| Industry | Company | Shares | Value | ||||
Semiconductors - 2.99% | |||||||
Trio-Tech Internatonal | 107,500 | $ | 1,209,375 | ||||
Ultra Clean Holdings, Inc.* | 224,700 | 2,775,045 | |||||
| 3,984,420 | |||||||
Software - 2.05% | |||||||
Convera Corp - Class A* | 500 | 2,295 | |||||
Interactive Intelligence, Inc.* | 77,700 | 1,742,034 | |||||
Opnet Technologies, Inc.* | 68,000 | 982,600 | |||||
| 2,726,929 | |||||||
Telecommunications - 3.86% | |||||||
Anaren, Inc.* | 61,600 | 1,094,016 | |||||
Knology, Inc.* | 149,600 | 1,591,744 | |||||
SAVVIS, Inc.* | 48,333 | 1,725,971 | |||||
US Lec Corp. - Class A*+ | 79,300 | 738,283 | |||||
| 5,150,014 | |||||||
Transportation - 4.53% | |||||||
Celadon Group, Inc.* | 200,250 | 3,354,188 | |||||
US Xpress Enterprises, Inc.* | 162,800 | 2,681,316 | |||||
| 6,035,504 | |||||||
TOTAL COMMON STOCKS | 132,906,002 | ||||||
(Cost $97,821,820) | |||||||
MONEY MARKET MUTUAL FUNDS - 0.38% |
| |||||||
| Rate^ | Shares | Value | ||||||
Blackrock TempCash Liquidity Fund | 5.17% | 509,954 | 509,954 | |||||
TOTAL MONEY MARKET MUTUAL FUNDS | 509,954 | |||||||
(Cost $509,954) | ||||||||
TOTAL INVESTMENTS - 100.07% | $ | 133,415,956 | ||||||
(Cost $98,331,774) | ||||||||
Liabilities in Excess of Other Assets - (0.07)% | (89,448 | ) | ||||||
NET ASSETS - 100.00% | $ | 133,326,508 | ||||||
| * | Non Income Producing Security |
| ^ | Rate disclosed is as of December 31, 2006. |
| + | This security or a portion of the security is out on loan at December 31, 2006. Total loaned securities had a market value of $19,526,856 at December 31, 2006. |
See Notes to Financial Statements.
| www.Bridgeway.com | 31 |
Bridgeway Ultra-Small Company Market Fund
MANAGERS COMMENTARY
(Unaudited)
January 31, 2007
Dear Fellow Ultra-Small Company Market Fund Shareholder,
Our Fund was up 5.65% in the six-month, semi-annual period from July through December of 2006. For the same period, our primary benchmark, the CRSP Cap-Based Portfolio 10 Index, was up 9.65%, our peer benchmark, the Lipper Small-Cap Stock Funds Index, was up 8.25%, and the Russell 2000 Index was up 9.38%. This was a mediocre period in absolute terms, poor on a relative basis.
For the calendar year, the Fund was up 11.48%, lagging our primary market benchmark by 7.94% and our peer benchmark by 3.18%. While farther away from index performance than I prefer to be, it is still in an acceptable range for shorter timeframes. Overall, small stocks made a strong finish to extend a record breaking eighth year of dominance over large stocks.
The table below presents our semi-annual, one-year, five-year, and life-to-date financial results according to the formula required by the SEC. A graph of quarterly performance since inception appears at the top of the following page.
6 Months 7/1/06 to 12/31/06 | 1 Year 1/1/06 to 12/31/06 | 5 Year 1/1/02 to 12/31/06 | Life-to-Date 7/31/97 | |||||
Ultra-Small Company Market Fund | 5.65% | 11.48% | 21.27% | 16.49% | ||||
CRSP Cap-Based Portfolio 10 Index | 9.65% | 19.42% | 22.19% | 15.60% | ||||
Lipper Small-Cap Stock Funds Index | 8.25% | 14.66% | 9.91% | 8.02% | ||||
Russell 2000 Index | 9.38% | 18.37% | 11.39% | 8.39% | ||||
Performance figures quoted represent past performance and are no guarantee of future results. Current performance may be lower or higher than the performance figures quoted, and an investor’s shares, when redeemed, may be worth more or less than original cost. For the most recent month-end performance, please call 1-800-661-3550 or visit the Fund’s website at www.bridgeway.com
The CRSP Cap-Based Portfolio 10 Index is an unmanaged index of 1,729 of the smallest publicly traded U.S. stocks (with dividends reinvested), as reported by the Center for Research on Security Prices. The Lipper Small-Cap Stock Funds Index is an index of small-company funds compiled by Lipper, Inc. The Russell 2000 Index is an unmanaged, market value weighted index, which measures performance of the 2,000 companies that are between the 1,000th and 3,000th largest in the market with dividends reinvested. It is not possible to invest directly in an index. Periods longer than one year are annualized.
According to data from Lipper, Inc., Ultra-Small Company Market Fund ranked 65th of 95 micro-cap funds for the calendar year, 2nd of 59 over the last five years and 4th of 31 since inception in July 1997. Lipper, Inc. is an independent mutual fund rating service that ranks funds in various fund categories by making comparative calculations using total returns.
| 32 | Semi-Annual Report | December 31, 2006 (Unaudited) |
Bridgeway Ultra-Small Company Market Fund
MANAGERS COMMENTARY (continued)
(Unaudited)
Growth of $10,000 Invested in Ultra-Small Company Market Fund and Indexes from 7/31/97 (inception ) to 12/31/06
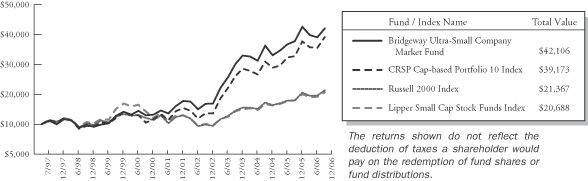
Detailed Explanation of Semi-Annual Performance—What Worked Well
The Short Version: Usually volatile and never dull, tiny companies always have a story. Of the six companies that more than doubled in value, two have seen their day in the sun overshadowed—one by internal circumstances and the other by external forces.
These are the best-performing stocks for the last six-month period:
| Rank | Description | Industry | % Gain | |||
| 1 | DHB Industries, Inc. | Apparel | 1374.1% | |||
| 2 | Midwest Air Group, Inc. | Airlines | 127.7% | |||
| 3 | Sirna Therapeutics, Inc. | Biotechnology | 127.0% | |||
| 4 | Amrep Corp. | Home Builders | 125.5% | |||
| 5 | iMergent, Inc. | Internet | 120.3% | |||
| 6 | Corvel Corp. | Commercial Services | 105.0% | |||
| 7 | Auxilium Pharmaceuticals, Inc. | Pharmaceuticals | 88.8% | |||
| 8 | Ambassadors International, Inc. | Leisure Time | 85.9% | |||
| 9 | Bolt Technology Corp. | Oil & Gas Services | 84.8% | |||
| 10 | Almost Family, Inc. | Healthcare-Services | 82.5% | |||
DHB Industries, Inc. engages in the manufacture and marketing of protective body armors. DHB missed the deadline to file its 2005 annual report and its March 31, 2006 quarterly report as it reviewed the accuracy of reported inventory levels. In addition, the Director of Finance resigned his post on April 28, less than a month after taking over from the former Director. On May 26, 2006, the Amex instituted a trading halt on the Company’s securities, due to the Company not having filed the required Form 10-K and Form 10-Q. Representatives from the SEC preliminarily determined to recommend that the SEC bring a civil injunctive action against the Company alleging fraud, including the Company’s recording false journal entries in 2005 relating to its inventory for the purpose of materially increasing its gross profit margin and net income. On March 31, 2006, the Company disclosed that investors should no longer rely on the Company’s previously issued interim financial statements for 2005 as a result of the identification of certain adjustments of inventory, both positive and negative, that are individually material to each quarter. At this point, you’re probably thinking, “Surely, this stock is not on the best performers list!” Keep reading . . . Through the next month while the stock was halted, our internal pricing process reduced the value to $0.20 per share. On July 5, 2006 the NYSE announced that the ticker DHB would be changed to DHBT and it would resume trading over the counter effective July 6, 2006. It began trading on July 6 at $0.50 and closed that day at $0.86. We completed our liquidation of the stock at $2.95, hence the large increase from $0.20 at the beginning of the period.
| www.Bridgeway.com | 33 |
Bridgeway Ultra-Small Company Market Fund
MANAGERS COMMENTARY (continued)
(Unaudited)
Number three Sirna Therapeutics was another dramatic story, but on a much more positive note. The company had been in the news because Andrew Fire and Craig Mello, the discoverers of the technology upon which Sirna’s drugs are based, won a Nobel Prize for medicine in early fall. The technology is a form of gene silencing and could lead to a new class of medicines to treat a variety of diseases. Discussions with a number of large pharmaceutical firms about a collaboration became a buyout offer. Merck announced the buy October 30, which resulted in a 95.8% stock price increase. We sold the last of our position in December for a very nice return.
Detailed Explanation of Semi-Annual Performance—What Didn’t Work
The Short Version: Twelve of our nearly 650 holdings declined more than negative 50%. Although the consumer, non-cyclical sector (pharmaceuticals and biotechnology industries) had four companies on the list, it also had four in the best-performers’ list, indicating no particular sector play for the period.
These are the worst-performing stocks for the six-month period ended December 31, 2006:
| Rank | Description | Industry | % Loss | |||
| 1 | Global Power Equipment Group, Inc. | Machinery-Diversified | -77.8% | |||
| 2 | Microfield Group, Inc. | Holding Companies-Divers | -76.6% | |||
| 3 | Nuvelo, Inc. | Pharmaceuticals | -76.0% | |||
| 4 | Neopharm, Inc. | Pharmaceuticals | -70.0% | |||
| 5 | Delphax Technologies, Inc. | Computers | -59.0% | |||
| 6 | Northfield Laboratories, Inc. | Biotechnology | -58.9% | |||
| 7 | United PanAm Financial Corp. | Diversified Finan Service | -58.3% | |||
| 8 | Genta, Inc. | Pharmaceuticals | -52.9% | |||
| 9 | ESS Technology | Semiconductors | -52.0% | |||
| 10 | TRM Corp. | Office/Business Equip | -51.6% | |||
Industry Sector Representation as of December 31, 2006
Consumer, non-cyclical was our largest sector representative and also added the most to our return. The financial sector was our second best performer; a bit heavier weighting would have helped our return.
| Sector | % of Net Assets | CRSP Portfolio 10 Index | Difference | |||
Basic Materials | 3.3% | 2.9% | 0.4% | |||
Communications | 10.6% | 10.3% | 0.3% | |||
Consumer, Cyclical | 11.8% | 11.6% | 0.2% | |||
Consumer, Non-cyclical | 24.7% | 24.9% | -0.2% | |||
Energy | 3.8% | 4.5% | -0.7% | |||
Financial | 19.4% | 23.2% | -3.8% | |||
Industrial | 10.9% | 10.0% | 0.9% | |||
Technology | 10.3% | 9.4% | 0.9% | |||
Utilities | 1.2% | 1.2% | 0.0% | |||
Diversified | 0.3% | 2.0% | -1.7% | |||
Cash | 3.7% | 0.0% | 3.7% | |||
Total | 100.0% | 100.0% |
| 34 | Semi-Annual Report | December 31, 2006 (Unaudited) |
Bridgeway Ultra-Small Company Market Fund
MANAGERS COMMENTARY (continued)
(Unaudited)
Disclaimer
The following is a reminder from the friendly folks at your Fund who worry about liability. The views expressed here are exclusively those of Fund management. These views are not meant as investment advice and should not be considered predictive in nature. Any favorable (or unfavorable) description of a holding applies only as of December 31, 2006, unless otherwise stated. Security positions can and do change thereafter. Discussions of historical performance do not guarantee and are not indicative of future performance.
The Fund is subject to very high, above market risk (volatility) and is not an appropriate investment for short-term investors. Investments in ultra-small companies generally carry greater risk than is customarily associated with larger companies and even “small companies” for various reasons such as narrower markets (fewer investors), limited financial resources and greater trading difficulty.
This report is submitted for the general information of the shareholders of the Fund. It is not authorized for distribution to prospective investors unless preceded or accompanied by an effective prospectus, which includes information regarding the Fund’s risks, objectives, fees and expenses, experience of its management, and other information. For questions or other Fund information, call 1-800-661-3550 or visit the Fund’s website www.bridgeway.com. Foreside Fund Services, LLC, distributor.
Conclusion
Thank you for your continued investment in Ultra-Small Company Market Fund. This Fund remains open to both current and new investors. As always, we appreciate your feedback.
Sincerely,
John Montgomery
| www.Bridgeway.com | 35 |
Bridgeway Ultra Small Company Market Fund
SCHEDULE OF INVESTMENTS
Showing percentage of net assets as of December 31, 2006 (Unaudited)
| Industry | Company | Shares | Value | ||||
COMMON STOCKS - 96.33% | |||||||
Advertising - 0.71% | |||||||
inVentiv Health, Inc.* | 198,300 | $ | 7,009,905 | ||||
Traffix, Inc. | 248,700 | 1,362,876 | |||||
| 8,372,781 | |||||||
Aerospace/Defense - 0.11% | |||||||
CPI Aerostructures, Inc.* | 33,400 | 239,812 | |||||
Ducommun, Inc.* | 46,200 | 1,057,056 | |||||
| 1,296,868 | |||||||
Agriculture - 0.78% | |||||||
The Andersons, Inc. | 202,362 | 8,578,125 | |||||
Maui Land & Pineapple Co., Inc.* | 17,155 | 581,898 | |||||
| 9,160,023 | |||||||
Airlines - 0.58% | |||||||
Frontier Airlines Holdings, Inc.*+ | 174,970 | 1,294,778 | |||||
Hawaiian Holdings, Inc.* | 276,666 | 1,355,663 | |||||
Midwest Air Group, Inc.* | 323,709 | 3,722,654 | |||||
World Air Holdings, Inc.* | 47,700 | 420,714 | |||||
| 6,793,809 | |||||||
Apparel - 0.87% | |||||||
Ashworth, Inc.* | 182,057 | 1,321,734 | |||||
Bakers Footwear Group, Inc.* | 35,114 | 317,431 | |||||
Cherokee, Inc. | 52,400 | 2,248,484 | |||||
Hartmarx Corp.* | 213,500 | 1,507,310 | |||||
Lakeland Industries, Inc.* | 92,510 | 1,260,911 | |||||
Sport-Haley, Inc. | 104,900 | 508,765 | |||||
Tandy Brands Accessories, Inc. | 65,009 | 761,905 | |||||
Unifi, Inc.* | 441,900 | 1,082,655 | |||||
Weyco Group, Inc. | 48,675 | 1,209,574 | |||||
| 10,218,769 | |||||||
Auto Parts & Equipment - 1.09% | |||||||
Fuel Systems Solutions, Inc.* | 81,750 | 1,805,040 | |||||
Miller Industries, Inc.* | 70,600 | 1,694,400 | |||||
Noble International Ltd. | 127,900 | 2,564,395 | |||||
Proliance International, Inc.* | 197,300 | 907,580 | |||||
Spartan Motors, Inc. | 74,482 | 1,130,637 | |||||
Tenneco, Inc.* | 73,000 | 1,804,560 | |||||
Titan International, Inc.+ | 144,000 | 2,901,600 | |||||
| 12,808,212 | |||||||
| Industry | Company | Shares | Value | ||||
Banks - 10.56% | |||||||
Abigail Adams National Bancorp | 22,220 | $ | 299,970 | ||||
Ameris Bancorp | 80,400 | 2,265,672 | |||||
Appalachian Bancshares, Inc.* | 33,500 | 644,875 | |||||
ARROW Financial Corp. | 43,446 | 1,076,157 | |||||
Associated Banc-Corp.+ | 78,480 | 2,737,382 | |||||
Bancorp Rhode Island, Inc. | 14,400 | 622,800 | |||||
The Bancorp, Inc.* | 120,700 | 3,572,720 | |||||
Bancshares of Florida, Inc.* | 22,000 | 450,560 | |||||
Bank of America Corp.+ | 1 | 53 | |||||
Bank of Granite Corp. | 113,253 | 2,148,409 | |||||
Camden National Corp. | 52,400 | 2,416,688 | |||||
Capital Bank Corp. | 67,400 | 1,159,280 | |||||
Capital Corp. of the West | 95,220 | 3,055,610 | |||||
Capital Crossing Bank* | 16,474 | 490,596 | |||||
Cardinal Financial Corp. | 175,800 | 1,801,950 | |||||
Cass Information Systems, Inc.+ | 91,882 | 3,324,291 | |||||
Center Bancorp, Inc. | 36,421 | 576,180 | |||||
Center Financial Corp. | 135,600 | 3,250,332 | |||||
Central Bancorp, Inc. | 12,300 | 384,990 | |||||
Coast Financial Holdings, Inc.* | 76,800 | 1,262,592 | |||||
CoBiz, Inc. | 900 | 19,836 | |||||
Columbia Bancorp | 75,741 | 2,003,349 | |||||
Community Bancorp* | 118,876 | 3,588,866 | |||||
Enterprise Financial Services | 59,487 | 1,938,086 | |||||
Fidelity Southern Corp. | 57,476 | 1,069,628 | |||||
Financial Institutions, Inc. | 13,883 | 320,003 | |||||
First Bancorp | 60,114 | 1,312,890 | |||||
First Community Bancshares, Inc. | 35,796 | 1,416,090 | |||||
First Mariner Bancorp, Inc.* | 48,724 | 903,830 | |||||
First Mutual Bancshares, Inc. | 20,418 | 473,289 | |||||
First Regional Bancorp* | 35,049 | 1,194,820 | |||||
First South Bancorp | 7,303 | 232,893 | |||||
First State Bancorporation | 17,000 | 420,750 | |||||
FNB Corp./PA | 8,640 | 157,853 | |||||
FNB Corp./VA | 21,298 | 884,932 | |||||
FNB Financial Services Corp. | 44,218 | 655,311 | |||||
Fulton Financial Corp. | 130,373 | 2,177,229 | |||||
Gateway Financial Holdings, Inc. | 94,122 | 1,348,768 | |||||
GB&T Bancshares, Inc. | 100,538 | 2,228,927 | |||||
Glacier Bancorp, Inc. | 1,458 | 35,634 | |||||
Greater Community Bancorp | 4,703 | 84,231 | |||||
Greene County Bancshares, Inc. | 85,613 | 3,401,405 | |||||
Guaranty Federal Bancshares, Inc. | 62,556 | 1,797,859 | |||||
Heritage Commerce Corp. | 71,594 | 1,907,264 | |||||
| 36 | Semi-Annual Report | December 31, 2006 (Unaudited) |
Bridgeway Ultra Small Company Market Fund
SCHEDULE OF INVESTMENTS (continued)
Showing percentage of net assets as of December 31, 2006 (Unaudited)
| Industry | Company | Shares | Value | ||||
Common Stocks (continued) | |||||||
Banks (continued) | |||||||
Intervest Bancshares Corp.* | 85,200 | $ | 2,931,732 | ||||
Lakeland Bancorp | 11,020 | 164,198 | |||||
Lakeland Financial Corp. | 79,463 | 2,028,690 | |||||
LNB Bancorp, Inc. | 40,000 | 642,000 | |||||
Macatawa Bank Corp. | 107,940 | 2,294,804 | |||||
MB Financial, Inc. | 4,602 | 173,081 | |||||
MBT Financial Corp. | 17,674 | 270,766 | |||||
Mercantile Bank Corp. | 72,320 | 2,726,464 | |||||
MidWestOne Financial Group, Inc. | 77,412 | 1,543,595 | |||||
Northeast Bancorp | 4,700 | 89,770 | |||||
Northern Empire Bancshares*+ | 55,400 | 1,636,516 | |||||
Northrim BanCorp, Inc. | 85,971 | 2,286,829 | |||||
PAB Bankshares, Inc. | 70,000 | 1,495,900 | |||||
Pacific Mercantile Bancorp* | 71,000 | 1,152,330 | |||||
Peoples Bancorp, Inc. | 75,600 | 2,245,320 | |||||
Pinnacle Financial Partners, Inc.*+ | 127,700 | 4,237,086 | |||||
Preferred Bank | 42,500 | 2,553,825 | |||||
PrivateBancorp, Inc. | 37,200 | 1,548,636 | |||||
Prosperity Bancshares, Inc. | 800 | 27,608 | |||||
SCBT Financial Corp. | 32,270 | 1,346,627 | |||||
Smithtown Bancorp, Inc.+ | 14,707 | 398,854 | |||||
Southern Community Financial Corp. | 66,700 | 673,670 | |||||
Southside Bancshares, Inc.+ | 80,264 | 2,065,193 | |||||
Southwest Bancorp, Inc. | 96,300 | 2,682,918 | |||||
State National Bancshares, Inc. | 30,710 | 1,182,028 | |||||
Sterling Financial Corp. | 22,811 | 771,240 | |||||
Suffolk Bancorp | 42,800 | 1,631,964 | |||||
Superior Bancorp* | 61,700 | 699,678 | |||||
Tennessee Commerce* | 16,801 | 525,031 | |||||
Texas United Bancshares, Inc. | 14,618 | 501,982 | |||||
TIB Financial Corp. | 53,250 | 931,343 | |||||
Umpqua Holdings Corp. | 189,034 | 5,563,271 | |||||
United Security Bancshares+ | 63,618 | 1,533,194 | |||||
Univest Corp. of Pennsylvania | 57,865 | 1,763,725 | |||||
Virginia Commerce Bancorp*+ | 112,077 | 2,228,091 | |||||
Virginia Financial Group, Inc. | 36,150 | 1,011,839 | |||||
Washington Trust Bancorp, Inc. | 54,577 | 1,522,153 | |||||
Webster Financial Corp. | 28,741 | 1,400,262 | |||||
West Bancorporation, Inc. | 10,744 | 191,028 | |||||
Wilshire Bancorp, Inc. | 234,944 | 4,456,888 | |||||
| 124,244,979 | |||||||
| Industry | Company | Shares | Value | ||||
Beverages - 0.16% | |||||||
Green Mountain Coffee Roasters, Inc.* | 26,400 | $ | 1,299,672 | ||||
Peet’s Coffee & Tea, Inc.* | 17,400 | 456,576 | |||||
Redhook ALE Brewery, Inc.* | 23,000 | 119,370 | |||||
| 1,875,618 | |||||||
Biotechnology - 4.40% | |||||||
Anesiva, Inc.* | 150,464 | 1,053,248 | |||||
Avant Immunotherapeutics, Inc.* | 1,233,400 | 1,652,756 | |||||
Avigen, Inc.*+ | 298,900 | 1,578,192 | |||||
BioSphere Medical, Inc.* | 126,900 | 847,692 | |||||
Cell Genesys, Inc.* | 144,100 | 488,499 | |||||
Cotherix, Inc.* | 179,800 | 2,425,502 | |||||
CryoLife, Inc.* | 356,000 | 2,723,400 | |||||
CuraGen Corp.* | 158,500 | 729,100 | |||||
Cytogen Corp.* | 59,061 | 137,612 | |||||
Cytokinetics, Inc.* | 144,900 | 1,083,852 | |||||
Embrex, Inc.* | 136,406 | 2,302,533 | |||||
Encysive Pharmaceuticals, Inc.*+ | 330,900 | 1,393,089 | |||||
Entremed, Inc.*+ | 1,263,500 | 1,996,330 | |||||
Exact Sciences Corp.* | 521,142 | 1,474,832 | |||||
GenVec, Inc.* | 337,463 | 806,537 | |||||
Illumina, Inc.*+ | 52,843 | 2,077,258 | |||||
Inovio Biomedical Corp.*+ | 250,700 | 824,803 | |||||
Keryx Biopharmaceuticals, Inc.* | 57,647 | 766,705 | |||||
Lexicon Genetics, Inc.* | 305,300 | 1,102,133 | |||||
Lifecell Corp.*+ | 299,250 | 7,223,895 | |||||
Maxygen, Inc.* | 183,751 | 1,978,998 | |||||
Micromet, Inc.* | 44,454 | 133,362 | |||||
Monogram Biosciences, Inc.* | 754,390 | 1,342,814 | |||||
Neose Technologies, Inc.* | 651,648 | 1,453,175 | |||||
Northfield Laboratories, Inc.*+ | 149,700 | 609,279 | |||||
Novavax, Inc.* | 124,610 | 510,901 | |||||
Panacos Pharm, Inc.* | 118,856 | 476,613 | |||||
Repligen Corp.* | 697,764 | 1,960,717 | |||||
Sangamo Biosciences, Inc.*+ | 370,100 | 2,442,660 | |||||
Seattle Genetics, Inc.* | 373,255 | 1,989,449 | |||||
Sonus Pharmaceuticals, Inc.* | 409,200 | 2,500,212 | |||||
StemCells, Inc* | 515,500 | 1,366,075 | |||||
Stratagene Corp.* | 23,761 | 176,782 | |||||
Vical, Inc.* | 337,600 | 2,170,768 | |||||
| 51,799,773 | |||||||
| www.Bridgeway.com | 37 |
Bridgeway Ultra Small Company Market Fund
SCHEDULE OF INVESTMENTS (continued)
Showing percentage of net assets as of December 31, 2006 (Unaudited)
| Industry | Company | Shares | Value | ||||
Common Stocks (continued) | |||||||
Building Materials - 0.34% | |||||||
AAON, Inc. | 60,287 | $ | 1,584,342 | ||||
Comfort Systems USA, Inc. | 43,900 | 554,896 | |||||
Imperial Industries, Inc.*+ | 54,900 | 445,788 | |||||
International Aluminum Corp. | 5,120 | 249,600 | |||||
LSI Industries, Inc. | 60,600 | 1,202,910 | |||||
| 4,037,536 | |||||||
Chemicals - 1.37% | |||||||
Aceto Corp. | 128,044 | 1,106,300 | |||||
American Pacific Corp.* | 35,524 | 283,837 | |||||
American Vanguard Corp.+ | 152,000 | 2,416,800 | |||||
Balchem Corp. | 121,050 | 3,108,564 | |||||
ICO, Inc.* | 205,490 | 1,158,964 | |||||
Landec Corp.* | 205,000 | 2,205,800 | |||||
Lesco, Inc.* | 69,306 | 599,497 | |||||
NewMarket Corp. | 29,200 | 1,724,260 | |||||
Omnova Solutions, Inc.* | 243,600 | 1,115,688 | |||||
Penford Corp. | 11,592 | 200,541 | |||||
Quaker Chemical Corp. | 99,700 | 2,200,379 | |||||
| 16,120,630 | |||||||
Coal - 0.08% | |||||||
Westmoreland Coal Co.* | 49,000 | 963,830 | |||||
Commercial Services - 4.61% | |||||||
Bankrate, Inc.*+ | 144,800 | 5,495,160 | |||||
Barrett Business Services | 99,331 | 2,326,332 | |||||
Carriage Services, Inc.* | 134,500 | 684,605 | |||||
Collectors Universe | 149,000 | 1,996,600 | |||||
Cornell Cos., Inc.* | 42,226 | 770,624 | |||||
Corvel Corp.* | 75,433 | 3,588,348 | |||||
CPI Corp. | 24,400 | 1,134,356 | |||||
Diamond Management & Technology Consultants, Inc. | 4,600 | 57,224 | |||||
Edgewater Technology, Inc.* | 100,000 | 611,000 | |||||
Franklin Covey Co.* | 192,400 | 1,342,952 | |||||
The Geo Group, Inc.* | 114,300 | 4,288,536 | |||||
Healthcare Services Group | 35,550 | 1,029,528 | |||||
HMS Holdings Corp.* | 218,000 | 3,302,700 | |||||
Home Solutions of America, Inc.*+ | 403,900 | 2,366,854 | |||||
ICT Group, Inc.* | 69,828 | 2,205,867 | |||||
Intersections, Inc.* | 218,900 | 2,311,584 | |||||
Kendle International, Inc.* | 22,390 | 704,165 | |||||
Learning Tree International, Inc.* | 10,737 | 95,452 | |||||
Medifast, Inc.* | 199,100 | 2,504,678 | |||||
Multi-Color Corp. | 59,136 | 1,942,618 | |||||
National Research Corp. | 40,300 | 921,258 | |||||
| Industry | Company | Shares | Value | ||||
Commercial Services (continued) | |||||||
On Assignment, Inc.* | 173,500 | $ | 2,038,625 | ||||
PeopleSupport, Inc.* | 205,900 | 4,334,195 | |||||
Perceptron, Inc.* | 119,274 | 1,010,251 | |||||
RCM Technologies, Inc.* | 170,459 | 1,021,049 | |||||
Rewards Network, Inc.* | 238,700 | 1,658,965 | |||||
Standard Parking Corp.* | 81,100 | 3,115,051 | |||||
Universal Security* | 50,700 | 1,416,558 | |||||
| 54,275,135 | |||||||
Computers - 3.38% | |||||||
Ansoft Corp.* | 100,600 | 2,796,680 | |||||
Comtech Group, Inc.* | 36,492 | 663,790 | |||||
Cray, Inc.* | 172,265 | 2,046,508 | |||||
Datalink Corp.* | 382,100 | 2,873,392 | |||||
Dataram Corp. | 82,533 | 345,813 | |||||
Dot Hill Systems Corp.* | 516,068 | 2,028,147 | |||||
Immersion Corp.* | 273,226 | 1,980,889 | |||||
Integral Systems, Inc. | 77,500 | 1,795,675 | |||||
InterVoice, Inc.* | 268,300 | 2,055,178 | |||||
LaserCard Corp.*+ | 162,100 | 1,736,091 | |||||
Magma Design Automation* | 220,300 | 1,967,279 | |||||
Netscout Systems, Inc.* | 236,500 | 1,962,950 | |||||
Printronix, Inc. | 69,800 | 865,520 | |||||
Radiant Systems, Inc.* | 141,800 | 1,480,392 | |||||
Rimage Corp.* | 112,700 | 2,930,200 | |||||
SI International, Inc.* | 76,700 | 2,486,614 | |||||
Stratasys, Inc.*+ | 80,200 | 2,519,082 | |||||
Synplicity, Inc.* | 320,700 | 2,007,582 | |||||
TechTeam Global, Inc.* | 190,370 | 2,141,663 | |||||
Tier Technologies, Inc.* | 160,200 | 1,025,280 | |||||
Transact Technologies, Inc.* | 155,331 | 1,284,587 | |||||
Xanser Corp.* | 151,200 | 734,832 | |||||
| 39,728,144 | |||||||
Cosmetics/Personal Care - 0.07% | |||||||
Parlux Fragrances, Inc.*+ | 156,409 | 871,198 | |||||
Distribution/Wholesale - 0.76% | |||||||
Bell Microproducts, Inc.* | 207,300 | 1,461,465 | |||||
Central European Distribution Corp.*+ | 52,125 | 1,548,113 | |||||
Handleman Co.+ | 123,100 | 833,387 | |||||
Industrial Distribution Group, Inc.* | 131,200 | 1,298,880 | |||||
Infosonics Corp.*+ | 297,200 | 1,459,252 | |||||
Navarre Corp.*+ | 223,644 | 890,103 | |||||
Rentrak Corp.* | 83,800 | 1,298,900 | |||||
Valley National Gases, Inc.* | 6,500 | 171,925 | |||||
| 8,962,025 | |||||||
| 38 | Semi-Annual Report | December 31, 2006 (Unaudited) |
Bridgeway Ultra Small Company Market Fund
SCHEDULE OF INVESTMENTS (continued)
Showing percentage of net assets as of December 31, 2006 (Unaudited)
| Industry | Company | Shares | Value | ||||
Common Stocks (continued) | |||||||
Diversified Financial Services - 1.43% | |||||||
Asta Funding, Inc.+ | 62,100 | $ | 1,890,324 | ||||
Consumer Portfolio Services* | 332,800 | 2,166,528 | |||||
Delta Financial Corp.* | 22,500 | 227,925 | |||||
Federal Agricultural Mortgage Corp. | 83,900 | 2,276,207 | |||||
Marlin Business Services* | 93,800 | 2,254,014 | |||||
NexCen Brands, Inc.* | 186,054 | 1,345,170 | |||||
Nicholas Financial, Inc.* | 118,500 | 1,398,300 | |||||
Sanders Morris Harris Group, Inc. | 146,409 | 1,869,643 | |||||
TradeStation Group, Inc.* | 245,974 | 3,382,143 | |||||
| 16,810,254 | |||||||
Electric - 0.24% | |||||||
Central Vermont Public Service Corp. | 66,700 | 1,570,785 | |||||
Green Mountain Power Corp. | 29,266 | 991,825 | |||||
Unitil Corp. | 9,400 | 238,290 | |||||
| 2,800,900 | |||||||
Electrical Components & Equipment - 0.82% | |||||||
Active Power, Inc.* | 425,625 | 1,115,138 | |||||
American Superconductor Corp.*+ | 125,100 | 1,227,231 | |||||
C&D Technologies, Inc.+ | 76,600 | 363,084 | |||||
Graham Corp. | 43,900 | 577,285 | |||||
The Lamson & Sessions Co.*+ | 203,600 | 4,939,336 | |||||
Nortech Systems, Inc.* | 1,400 | 10,752 | |||||
TII Network Technologies, Inc.* | 143,700 | 357,813 | |||||
Ultralife Batteries, Inc.* | 43,132 | 474,883 | |||||
Valence Technology, Inc.*+ | 327,025 | 539,591 | |||||
| 9,605,113 | |||||||
Electronics - 2.06% | |||||||
Advanced Photonix, Inc.*+ | 156,350 | 359,605 | |||||
Axsys Technologies, Inc.* | 86,887 | 1,526,605 | |||||
Cyberoptics Corp.* | 59,700 | 756,399 | |||||
DDi Corp.* | 64,800 | 466,560 | |||||
FARO Technologies, Inc.* | 145,600 | 3,500,224 | |||||
Frequency Electronics, Inc. | 14,600 | 174,470 | |||||
Keithley Instruments, Inc. | 86,552 | 1,138,159 | |||||
Measurement Specialties, Inc.* | 104,500 | 2,261,380 | |||||
Merix Corp.* | 286,700 | 2,663,443 | |||||
Napco Security Systems, Inc.* | 177,334 | 1,040,950 | |||||
NU Horizons Electronics Corp.* | 189,200 | 1,946,868 | |||||
| Industry | Company | Shares | Value | ||||
Electronics (continued) | |||||||
OI Corp. | 35,200 | $ | 401,280 | ||||
OYO Geospace Corp.* | 36,600 | 2,126,094 | |||||
Pemstar, Inc.* | 30,000 | 115,500 | |||||
Planar Systems, Inc.* | 120,000 | 1,160,400 | |||||
Tech Research Corp. | 83,900 | 350,702 | |||||
UQM Technologies, Inc.* | 191,100 | 523,614 | |||||
X-Rite, Inc. | 148,500 | 1,826,550 | |||||
Zygo Corp.* | 116,600 | 1,918,070 | |||||
| 24,256,873 | |||||||
Energy - Alternate Sources - 0.19% | |||||||
Evergreen Solar, Inc.*+ | 178,400 | 1,350,488 | |||||
MGP Ingredients, Inc. | 41,493 | 938,157 | |||||
| 2,288,645 | |||||||
Engineering & Construction - 0.68% | |||||||
Layne Christensen Co.* | 161,900 | 5,315,177 | |||||
Michael Baker Corp.* | 51,700 | 1,171,005 | |||||
Sterling Construction Co., Inc.* | 71,700 | 1,560,192 | |||||
| 8,046,374 | |||||||
Entertainment - 0.70% | |||||||
Canterbury Park Holding Corp. | 59,400 | 813,780 | |||||
Dover Motorsports, Inc. | 124,000 | 658,440 | |||||
Gaming Partners International Corp. | 124,800 | 2,245,152 | |||||
Silverleaf Resorts, Inc.*+ | 388,800 | 1,741,824 | |||||
Steinway Musical Instruments* | 61,400 | 1,902,786 | |||||
Sunterra Corp.* | 73,747 | 888,651 | |||||
| �� | |||||||
| 8,250,633 | |||||||
Environmental Control - 1.24% | |||||||
Ceco Environmental Corp.* | 60,575 | 543,358 | |||||
Clean Harbors, Inc.* | 157,947 | 7,646,214 | |||||
Darling International, Inc.* | 424,600 | 2,339,546 | |||||
Waste Industries USA, Inc. | 130,900 | 3,995,068 | |||||
| 14,524,186 | |||||||
Food - 1.73% | |||||||
Cal-Maine Foods, Inc. | 312,700 | 2,682,966 | |||||
Cuisine Solutions, Inc.* | 65,800 | 375,060 | |||||
Imperial Sugar Co.+ | 121,316 | 2,937,060 | |||||
Lifeway Foods, Inc.*+ | 156,302 | 1,461,424 | |||||
M&F Worldwide Corp.* | 106,598 | 2,692,665 | |||||
Rocky Mountain Chocolate Factory, Inc. | 108,136 | 1,589,599 | |||||
Spartan Stores, Inc. | 343,650 | 7,192,595 | |||||
Village Super Market | 12,300 | 1,051,527 | |||||
| www.Bridgeway.com | 39 |
Bridgeway Ultra Small Company Market Fund
SCHEDULE OF INVESTMENTS (continued)
Showing percentage of net assets as of December 31, 2006 (Unaudited)
| Industry | Company | Shares | Value | ||||
Common Stocks (continued) | |||||||
Food (continued) | |||||||
Zapata Corp.* | 57,600 | $ | 403,200 | ||||
| 20,386,096 | |||||||
Forest Products & Paper - 0.21% | |||||||
Mercer International, Inc.*+ | 183,187 | 2,174,430 | |||||
Pope & Talbot, Inc.* | 48,900 | 267,483 | |||||
| 2,441,913 | |||||||
Gas - 0.50% | |||||||
Chesapeake Utilities Corp. | 57,400 | 1,759,310 | |||||
EnergySouth, Inc. | 56,450 | 2,263,645 | |||||
SEMCO Energ, Inc.* | 297,000 | 1,811,700 | |||||
| 5,834,655 | |||||||
Hand/Machine Tools - 0.05% | |||||||
K-Tron International, Inc.* | 2,056 | 153,522 | |||||
LS Starrett Co. | 29,200 | 474,500 | |||||
| 628,022 | |||||||
Healthcare - Products - 4.99% | |||||||
Abaxis, Inc.* | 169,700 | 3,266,725 | |||||
Angiodynamics, Inc.* | 83,256 | 1,789,171 | |||||
Arrhythmia Research Technology, Inc. | 33,365 | 811,770 | |||||
Atrion Corp. | 39,148 | 3,043,757 | |||||
Biolase Technology, Inc.* | 110,278 | 964,932 | |||||
Bovie Medical Corp.* | 22,950 | 208,157 | |||||
Candela Corp.* | 121,000 | 1,496,770 | |||||
Cantel Medical Corp.* | 64,599 | 1,045,858 | |||||
Cerus Corp.* | 358,590 | 2,101,337 | |||||
Cholestech Corp.* | 114,900 | 2,116,458 | |||||
Criticare Systems, Inc.* | 60,350 | 181,654 | |||||
Endologix, Inc.* | 589,800 | 2,064,300 | |||||
EPIX Pharmaceuticals, Inc.* | 141,993 | 979,752 | |||||
E-Z-EM, Inc.* | 53,100 | 927,657 | |||||
Hanger Orthopedic Group, Inc.* | 146,317 | 1,101,767 | |||||
IRIS International, Inc.*+ | 165,100 | 2,088,515 | |||||
Lifecore Biomedical, Inc.* | 217,646 | 3,880,628 | |||||
Medical Action Industries, Inc.* | 39,416 | 1,270,772 | |||||
Merit Medical Systems, Inc.* | 17,500 | 277,200 | |||||
Microtek Medical Holdings, Inc.* | 405,639 | 1,865,939 | |||||
Micrus Endovascular Corp.* | 89,541 | 1,708,442 | |||||
Natus Medical, Inc.* | 138,600 | 2,302,146 | |||||
Neurometrix, Inc.*+ | 146,812 | 2,188,967 | |||||
| Industry | Company | Shares | Value | ||||
Healthcare - Products (continued) | |||||||
NMT Medical, Inc.* | 171,100 | $ | 2,314,983 | ||||
NXStage Medical, Inc.* | 52,865 | 443,009 | |||||
Orthologic Corp.* | 441,899 | 631,916 | |||||
PhotoMedex, Inc.*+ | 404,800 | 449,328 | |||||
Somanetics Corp.* | 167,852 | 3,832,061 | |||||
Spectranetics Corp.* | 166,700 | 1,882,043 | |||||
SRI/Surgical Express, Inc.* | 6,755 | 37,085 | |||||
Tutogen Medical, Inc.* | 192,800 | 1,393,944 | |||||
Utah Medical Products, Inc. | 49,900 | 1,646,201 | |||||
Vital Images, Inc.* | 1,851 | 64,415 | |||||
Young Innovations, Inc. | 62,100 | 2,067,930 | |||||
ZEVEX International, Inc.* | 161,550 | 1,592,075 | |||||
Zoll Medical Corp.* | 80,100 | 4,665,024 | |||||
| 58,702,688 | |||||||
Healthcare - Services - 2.09% | |||||||
Air Methods Corp.*+ | 115,939 | 3,237,017 | |||||
Alliance Imaging, Inc.* | 335,992 | 2,234,347 | |||||
Almost Family, Inc.* | 5,800 | 251,546 | |||||
Amedisys, Inc.*+ | 228,133 | 7,498,743 | |||||
Five Star Quality Care, Inc.* | 171,900 | 1,916,685 | |||||
Hythiam, Inc.*+ | 270,099 | 2,495,715 | |||||
I-Trax, Inc.* | 293,364 | 909,428 | |||||
NovaMed, Inc.* | 194,400 | 1,471,608 | |||||
Psychiatric Solutions, Inc.* | 104,600 | 3,924,592 | |||||
VistaCare, Inc.* | 63,600 | 645,540 | |||||
| 24,585,221 | |||||||
Holding Companies - Diversified Operations - 0.26% | |||||||
Resource America, Inc. | 114,900 | 3,033,360 | |||||
Home Builders - 0.72% | |||||||
Amrep Corp.+ | 17,100 | 2,094,750 | |||||
Cavalier Homes, Inc.* | 40,087 | 168,365 | |||||
Cavco Industries, Inc.* | 53,700 | 1,881,648 | |||||
Modtech Holdings, Inc.* | 198,400 | 982,080 | |||||
Nobility Homes, Inc. | 16,300 | 430,972 | |||||
Skyline Corp. | 72,600 | 2,919,972 | |||||
| 8,477,787 | |||||||
Home Furnishings - 0.70% | |||||||
Applica, Inc.* | 100,000 | 799,000 | |||||
Audiovox Corp.* | 85,900 | 1,210,331 | |||||
Cobra Electronics Corp. | 174,800 | 1,671,088 | |||||
Digital Theater System, Inc.* | 112,000 | 2,709,280 | |||||
Koss Corp. | 4,138 | 96,664 | |||||
Universal Electronics, Inc.* | 84,315 | 1,772,301 | |||||
| 8,258,664 | |||||||
| 40 | Semi-Annual Report | December 31, 2006 (Unaudited) |
Bridgeway Ultra Small Company Market Fund
SCHEDULE OF INVESTMENTS (continued)
Showing percentage of net assets as of December 31, 2006 (Unaudited)
| Industry | Company | Shares | Value | ||||
Common Stocks (continued) | |||||||
Household Products/Wares - 0.15% | |||||||
Nashua Corp.* | 38,600 | $ | 323,082 | ||||
Russ Berrie & Co., Inc.* | 90,400 | 1,396,680 | |||||
| 1,719,762 | |||||||
Housewares - 0.30% | |||||||
Lifetime Brands, Inc. | 76,303 | 1,253,658 | |||||
National Presto Industries | 38,804 | 2,323,196 | |||||
| 3,576,854 | |||||||
Insurance - 2.51% | |||||||
21st Century Holding Co. | 97,611 | 2,318,261 | |||||
American Independence Corp.* | 45,135 | 487,458 | |||||
Donegal Group, Inc. | 185,425 | 3,632,476 | |||||
Investors Title Co. | 56,432 | 2,934,464 | |||||
Meadowbrook Insurance Group, Inc.* | 370,400 | 3,663,256 | |||||
Mercer Insurance Group, Inc. | 118,531 | 2,389,585 | |||||
NYMAGIC, Inc. | 62,400 | 2,283,840 | |||||
Penn Treaty American Corp.* | 162,300 | 1,248,087 | |||||
PMA Capital Corp.* | 121,802 | 1,123,015 | |||||
Procentury Corp. | 124,200 | 2,297,700 | |||||
SCPIE Holdings, Inc.* | 89,550 | 2,340,837 | |||||
SeaBright Insurance Holdings, Inc.* | 127,631 | 2,298,634 | |||||
Specialty Underwriters’ Alliance, Inc.* | 209,308 | 1,758,187 | |||||
United America Indemnity Ltd.* | 28,704 | 727,072 | |||||
| 29,502,872 | |||||||
Internet - 4.66% | |||||||
Access Integrated Technologies*+ | 168,000 | 1,464,960 | |||||
ActivIdentity Corp.* | 453,900 | 2,301,273 | |||||
Aladdin Knowledge Systems* | 51,974 | 1,012,973 | |||||
Art Technology Group, Inc.* | 1,112,200 | 2,591,426 | |||||
Centillium Communications, Inc.* | 374,700 | 801,858 | |||||
Corillian Corp.* | 490,486 | 1,849,132 | |||||
Digitas, Inc.* | 118,076 | 1,583,399 | |||||
Drugstore.Com* | 474,797 | 1,737,757 | |||||
EDGAR Online, Inc.* | 104,000 | 364,000 | |||||
ePlus, Inc.* | 100,800 | 1,053,360 | |||||
Expedia, Inc.* | 144,098 | 3,023,176 | |||||
Harris Interactive, Inc.* | 473,800 | 2,387,952 | |||||
| Industry | Company | Shares | Value | ||||
Internet (continued) | |||||||
IAC/InterActive Corp.*+ | 144,098 | $ | 5,354,682 | ||||
I-many, Inc.* | 523,200 | 863,280 | |||||
iMergent, Inc.*+ | 176,500 | 5,054,960 | |||||
Insure.com, Inc.* | 30,400 | 120,384 | |||||
Jupitermedia Corp.*+ | 164,000 | 1,298,880 | |||||
The Knot, Inc.* | 186,800 | 4,901,632 | |||||
Looksmart* | 99,776 | 445,001 | |||||
Napster, Inc.* | 784,400 | 2,847,372 | |||||
Network Engines, Inc.* | 561,906 | 1,460,956 | |||||
Online Resources Corp.* | 218,500 | 2,230,885 | |||||
PC-Tel, Inc.* | 218,287 | 2,040,983 | |||||
Perficient, Inc.* | 186,138 | 3,054,525 | |||||
Quovadx, Inc.* | 370,128 | 1,043,761 | |||||
TheStreet.com, Inc. | 335,500 | 2,985,950 | |||||
Valueclick, Inc.*+ | 38,914 | 919,538 | |||||
| 54,794,055 | |||||||
Iron/Steel - 1.49% | |||||||
Friedman Industries | 98,300 | 1,189,430 | |||||
Great Northern Iron ORE Property+ | 12,000 | 1,433,280 | |||||
Olympic Steel, Inc. | 86,700 | 1,927,341 | |||||
Oregon Steel Mills, Inc.* | 170,000 | 10,609,700 | |||||
Steel Dynamics, Inc. | 72,000 | 2,336,400 | |||||
| 17,496,151 | |||||||
Leisure Time - 0.90% | |||||||
Aldila, Inc. | 112,579 | 1,678,553 | |||||
Ambassadors International, Inc. | 94,278 | 4,300,962 | |||||
Cybex International* | 162,100 | 974,221 | |||||
GameTech International, Inc.* | 222,600 | 2,666,748 | |||||
Multimedia Games, Inc.* | 97,465 | 935,664 | |||||
| 10,556,148 | |||||||
Lodging - 0.65% | |||||||
Gaylord Entertainment Co.* | 44,852 | 2,284,312 | |||||
Interstate Hotels and Resorts, Inc.* | 187,900 | 1,401,734 | |||||
Monarch Casino & Resort, Inc.* | 164,800 | 3,935,424 | |||||
| 7,621,470 | |||||||
Machinery - Diversified - 1.39% | |||||||
Gehl Co.* | 165,150 | 4,546,579 | |||||
Hurco Cos., Inc.* | 219,934 | 6,989,503 | |||||
Twin Disc, Inc. | 136,400 | 4,842,200 | |||||
| 16,378,282 | |||||||
| www.Bridgeway.com | 41 |
Bridgeway Ultra Small Company Market Fund
SCHEDULE OF INVESTMENTS (continued)
Showing percentage of net assets as of December 31, 2006 (Unaudited)
| Industry | Company | Shares | Value | ||||
Common Stocks (continued) | |||||||
Media - 1.38% | |||||||
ADDvantage Technologies Group, Inc.* | 194,100 | $ | 541,539 | ||||
DG FastChannel, Inc.* | 98,292 | 1,324,976 | |||||
Lodgenet Entertainment Corp.* | 144,700 | 3,621,841 | |||||
Moscow CableCom Corp.* | 111,000 | 1,174,380 | |||||
Nexstar Broadcasting Group, Inc.* | 109,600 | 504,160 | |||||
Outdoor Channel Holdings, Inc.* | 242,500 | 3,111,275 | |||||
Point.360* | 61,200 | 222,768 | |||||
Salem Communications Corp. - Class A | 146,943 | 1,755,969 | |||||
Sirius Satellite Radio, Inc.*+ | 582,300 | 2,061,342 | |||||
Spanish Broadcasting System* | 472,039 | 1,940,080 | |||||
| 16,258,330 | |||||||
Metal Fabrication - Hardware - 0.85% | |||||||
Ampco-Pittsburgh Corp. | 89,800 | 3,006,504 | |||||
L.B. Foster Co.* | 95,300 | 2,469,223 | |||||
Ladish Co., Inc.* | 64,700 | 2,399,076 | |||||
Lawson Products | 25,900 | 1,188,551 | |||||
Northwest Pipe Co.* | 11,347 | 381,486 | |||||
Sun Hydraulics Corp. | 27,566 | 565,379 | |||||
| 10,010,219 | |||||||
Mining - 0.19% | |||||||
Kinross Gold Corp.* | 22,353 | 265,554 | |||||
Mines Management, Inc.* | 53,794 | 267,894 | |||||
United States Lime & Minerals, Inc.* | 53,700 | 1,619,055 | |||||
Vista Gold Corp.*+ | 11,300 | 97,519 | |||||
| 2,250,022 | |||||||
Miscellaneous Manufacturers - 1.18% | |||||||
AZZ Incorporated* | 8,000 | 409,600 | |||||
Ceradyne, Inc.*+ | 122,625 | 6,928,312 | |||||
Core Molding Technologies, Inc.* | 67,600 | 652,340 | |||||
EnPro Industries, Inc.* | 13,600 | 451,656 | |||||
Flanders Corp.* | 270,542 | 2,678,366 | |||||
Park-Ohio Holdings Corp.* | 98,597 | 1,585,440 | |||||
PW Eagle, Inc.+ | 5,000 | 172,500 | |||||
Raven Industries, Inc. | 35,600 | 954,080 | |||||
| 13,832,294 | |||||||
Office Furnishings - 0.03% | |||||||
Compx International, Inc. | 19,400 | 391,104 | |||||
| Industry | Company | Shares | Value | ||||
Oil & Gas - 1.94% | |||||||
American Oil & Gas*+ | 208,650 | $ | 1,366,658 | ||||
ATP Oil & Gas Corp.*+ | 188,700 | 7,466,859 | |||||
Brigham Exploration Co.* | 176,600 | 1,290,946 | |||||
FieldPoint Petroleum Corp.*+ | 76,800 | 179,712 | |||||
Gasco Energy, Inc.*+ | 197,081 | 482,848 | |||||
Giant Industries, Inc.* | 133,800 | 10,028,310 | |||||
Kodiak Oil & Gas* | 97,699 | 382,980 | |||||
Meridian Resource Corp.* | 404,000 | 1,248,360 | |||||
Royale Energy, Inc.* | 93,856 | 326,619 | |||||
| 22,773,292 | |||||||
Oil & Gas Services - 1.57% | |||||||
Bolt Technology Corp.* | 207,509 | 4,627,451 | |||||
Dawson Geophysical Co.* | 31,599 | 1,151,152 | |||||
Lufkin Industries, Inc. | 95,742 | 5,560,695 | |||||
Matrix Service Co.* | 142,332 | 2,291,545 | |||||
Metretek Technologies, Inc.*+ | 120,216 | 1,481,061 | |||||
Mitcham Industries, Inc.* | 68,405 | 817,440 | |||||
Omni Energy Services Corp.* | 181,994 | 1,781,721 | |||||
TGC Industries, Inc.* | 87,100 | 731,640 | |||||
| 18,442,705 | |||||||
Packaging & Containers - 0.29% | |||||||
AEP Industries, Inc.* | 63,000 | 3,358,530 | |||||
Pharmaceuticals - 5.61% | |||||||
Advancis Pharmaceutical Corp.*+ | 300,300 | 1,165,164 | |||||
Anika Therapeutics, Inc.* | 197,639 | 2,622,670 | |||||
Array Biopharma, Inc.* | 244,314 | 3,156,537 | |||||
Auxilium Pharmaceuticals, Inc.* | 132,568 | 1,947,424 | |||||
AVI BioPharma, Inc.* | 432,800 | 1,376,304 | |||||
Bentley Pharmaceuticals, Inc.* | 191,556 | 1,948,124 | |||||
Cell Therapeutics, Inc.*+ | 1,045,400 | 1,829,450 | |||||
Collagenex Pharmaceuticals, Inc.* | 140,200 | 1,958,594 | |||||
Cypress Bioscience* | 121,540 | 941,935 | |||||
Dendreon Corp.*+ | 424,900 | 1,771,833 | |||||
Discovery Laboratories, Inc.*+ | 1,083,000 | 2,555,880 | |||||
Eli Lilly & Co.+ | 1 | 52 | |||||
Emisphere Technologies, Inc.*+ | 312,600 | 1,653,654 | |||||
Hemispherx Biopharma, Inc.*+ | 831,400 | 1,829,080 | |||||
| 42 | Semi-Annual Report | December 31, 2006 (Unaudited) |
Bridgeway Ultra Small Company Market Fund
SCHEDULE OF INVESTMENTS (continued)
Showing percentage of net assets as of December 31, 2006 (Unaudited)
| Industry | Company | Shares | Value | ||||
Common Stocks (continued) | |||||||
Pharmaceuticals (continued) | |||||||
Hollis-Eden Pharmaceuticals* | 232,517 | $ | 1,223,039 | ||||
Indevus Pharmaceuticals, Inc.* | 480,300 | 3,410,130 | |||||
Inspire Pharmaceuticals, Inc.* | 235,966 | 1,498,384 | |||||
Integrated Biopharma, Inc.* | 54,100 | 373,290 | |||||
Intrabiotics Pharmaceuticals, Inc.* | 21,000 | 91,560 | |||||
Introgen Therapeutics, Inc.*+ | 57,080 | 251,152 | |||||
Mannatech, Inc.+ | 90,680 | 1,335,716 | |||||
Matrixx Initiatives, Inc.* | 49,344 | 786,050 | |||||
Nastech Pharmaceutical Co., Inc.*+ | 82,994 | 1,255,699 | |||||
Neopharm, Inc.*+ | 429,700 | 717,599 | |||||
NitroMed, Inc.*+ | 223,938 | 548,648 | |||||
NPS Pharmaceuticals, Inc.* | 374,237 | 1,695,294 | |||||
Nuvelo, Inc.* | 136,104 | 544,416 | |||||
Pain Therapeutics, Inc.* | 114,000 | 1,014,600 | |||||
Penwest Pharmaceuticals Co.*+ | 28,000 | 465,360 | |||||
PetMed Express, Inc.* | 211,999 | 2,830,187 | |||||
Pharmacyclics, Inc.* | 208,500 | 1,057,095 | |||||
The Quigley Corp.* | 124,000 | 705,560 | |||||
Reliv International, Inc. | 206,200 | 1,789,816 | |||||
Rigel Pharmaceuticals, Inc.* | 220,562 | 2,618,071 | |||||
SciClone Pharmaceuticals, Inc.* | 677,800 | 2,182,516 | |||||
Sciele Pharma, Inc.* | 279,200 | 6,700,800 | |||||
Spectrum Pharmaceuticals, Inc.*+ | 463,400 | 2,562,602 | |||||
Threshold Pharmaceuticals, Inc.*+ | 618,000 | 2,286,600 | |||||
Trimeris, Inc.*+ | 174,800 | 2,221,708 | |||||
Vivus, Inc.*+ | 297,500 | 1,076,950 | |||||
| 65,999,543 | |||||||
Real Estate - 0.49% | |||||||
California Coastal Communities, Inc.* | 109,900 | 2,357,355 | |||||
Consolidated-Tomoka Land Co. | 43,800 | 3,171,120 | |||||
Wilshire Enterprises, Inc. | 27,300 | 124,215 | |||||
ZipRealty, Inc.*+ | 20,900 | 156,541 | |||||
| 5,809,231 | |||||||
Retail - 4.26% | |||||||
Big Dog Holdings, Inc.*+ | 147,000 | 2,410,800 | |||||
Books-A-Million, Inc. | 191,906 | 4,352,428 | |||||
Buffalo Wild Wings, Inc.* | 47,500 | 2,527,000 | |||||
| Industry | Company | Shares | Value | ||||
Retail (continued) | |||||||
Cache, Inc.* | 155,936 | $ | 3,935,825 | ||||
Collegiate Pacific, Inc. | 129,300 | 1,223,178 | |||||
Ezcorp, Inc.* | 294,600 | 4,787,250 | |||||
Famous Dave’s Of America, Inc.* | 172,400 | 2,839,428 | |||||
First Cash Financial Services, Inc.* | 232,500 | 6,014,775 | |||||
Friendly Ice Cream Corp.* | 97,900 | 1,199,275 | |||||
Frisch’s Restaurants, Inc. | 47,800 | 1,405,320 | |||||
GTSI Corp.* | 17,086 | 158,216 | |||||
Hastings Entertainment, Inc.* | 33,500 | 237,180 | |||||
Luby’s, Inc.* | 252,700 | 2,751,903 | |||||
Mothers Work, Inc.* | 61,700 | 2,430,363 | |||||
The Pantry, Inc.*+ | 3,300 | 154,572 | |||||
PC Connection, Inc.* | 87,331 | 1,295,119 | |||||
PriceSmart, Inc.* | 126,200 | 2,260,242 | |||||
Restoration Hardware, Inc.*+ | 328,000 | 2,791,280 | |||||
Rush Enterprises, Inc. - Class A* | 43,600 | 737,712 | |||||
Rush Enterprises, Inc. - Class B* | 43,600 | 688,008 | |||||
Shoe Carnival, Inc.* | 78,700 | 2,486,920 | |||||
United Retail Group, Inc.* | 167,100 | 2,342,742 | |||||
Zones, Inc.* | 136,767 | 1,021,649 | |||||
| 50,051,185 | |||||||
Savings & Loans - 4.55% | |||||||
Abington Community Bancorp, Inc. | 82,300 | 1,578,514 | |||||
American Bancorp of New Jersey | 183,800 | 2,209,276 | |||||
Berkshire Hills Bancorp, Inc. | 65,700 | 2,198,322 | |||||
BFC Financial Corp.* | 238,400 | 1,523,376 | |||||
Brookline Bancorp, Inc.+ | 72,316 | 952,402 | |||||
Carver Bancorp, Inc. | 49,600 | 772,768 | |||||
Centrue Financial Corp. | 31,200 | 607,464 | |||||
Citizens First Banco, Inc. | 96,018 | 2,951,593 | |||||
Clifton Savings Bancorp, Inc. | 127,300 | 1,551,787 | |||||
Cooperative Bankshares, Inc.+ | 57,250 | 1,016,188 | |||||
Fidelity Bancorp, Inc. | 47,512 | 889,900 | |||||
First Defiance Financial Corp. | 49,237 | 1,491,881 | |||||
First Pactrust Bancorp, Inc. | 53,800 | 1,490,798 | |||||
First Place Financial Corp. | 44,584 | 1,047,278 | |||||
Flushing Financial Corp. | 117,319 | 2,002,635 | |||||
Harrington West Financial Group, Inc. | 86,320 | 1,489,020 | |||||
| www.Bridgeway.com | 43 |
Bridgeway Ultra Small Company Market Fund
SCHEDULE OF INVESTMENTS (continued)
Showing percentage of net assets as of December 31, 2006 (Unaudited)
| Industry | Company | Shares | Value | ||||
Common Stocks (continued) | |||||||
Savings & Loans (continued) | |||||||
HMN Financial, Inc. | 55,300 | $ | 1,908,403 | ||||
Home Federal Bancorp, Inc. | 79,600 | 1,365,936 | |||||
Home Federal Bancorp | 14,076 | 400,884 | |||||
Horizon Financial Corp. | 73,875 | 1,777,432 | |||||
ITLA Capital Corp. | 41,200 | 2,385,892 | |||||
LSB Corp. | 76,350 | 1,252,140 | |||||
MASSBANK Corp. | 20,536 | 675,429 | |||||
NewAlliance Bancshares, Inc. | 67,028 | 1,099,259 | |||||
OceanFirst Financial Corp. | 85,460 | 1,959,598 | |||||
Pacific Premier Bancorp, Inc.* | 28,400 | 345,912 | |||||
PennFed Financial Services, Inc. | 89,700 | 1,733,004 | |||||
Provident Financial Holdings, Inc. | 35,642 | 1,086,725 | |||||
Pulaski Financial Corp. | 113,193 | 1,800,901 | |||||
PVF Capital Corp. | 83,292 | 880,396 | |||||
Rainier Pacific Financial Group, Inc. | 61,400 | 1,217,562 | |||||
Riverview Bancorp, Inc. | 138,600 | 2,106,720 | |||||
Rockville Financial | 40,200 | 717,570 | |||||
Rome Bancorp, Inc. | 36,219 | 461,792 | |||||
Synergy Financial Group, Inc. | 22,700 | 374,096 | |||||
Teche Holding Co. | 11,400 | 592,800 | |||||
Timberland Bancorp, Inc. | 71,400 | 2,649,654 | |||||
United Community Financial Corp. | 78,304 | 958,441 | |||||
United Financial Bancorp, Inc. | 82,900 | 1,144,020 | |||||
Washington Savings Bank FSB | 95,850 | 838,688 | |||||
| 53,506,456 | |||||||
Semiconductors - 2.89% | |||||||
ALL American Semiconductor* | 13,200 | 43,164 | |||||
Anadigics, Inc.*+ | 402,158 | 3,563,120 | |||||
Diodes, Inc.* | 63,225 | 2,243,223 | |||||
ESS Technology* | 4,750 | 4,892 | |||||
Integrated Silicon Solution, Inc.* | 445,797 | 2,563,333 | |||||
IXYS Corp* | 45,110 | 401,479 | |||||
Kopin Corp.* | 445,000 | 1,588,650 | |||||
Leadis Technology, Inc.* | 417,100 | 1,956,199 | |||||
LTX Corp.* | 402,900 | 2,256,240 | |||||
Microtune, Inc.* | 289,700 | 1,361,590 | |||||
Mindspeed Technologies, Inc.*+ | 432,900 | 826,839 | |||||
MIPS Technologies, Inc.* | 134,916 | 1,119,803 | |||||
MoSys, Inc.* | 184,709 | 1,708,558 | |||||
| Industry | Company | Shares | Value | ||||
Semiconductors (continued) | |||||||
Pericom Semiconductor Corp.* | 249,600 | $ | 2,862,912 | ||||
Pixelworks, Inc.* | 697,024 | 1,596,185 | |||||
QuickLogic Corp.* | 352,900 | 1,048,113 | |||||
Rudolph Technologies, Inc.* | 61,200 | 974,304 | |||||
Spire Corp.* | 13,200 | 109,296 | |||||
Staktek Holdings, Inc.* | 399,700 | 2,058,455 | |||||
Therma-Wave, Inc.* | 392,200 | 466,718 | |||||
Trio-Tech International* | 42,510 | 478,238 | |||||
Ultra Clean Holdings, Inc.* | 309,100 | 3,817,385 | |||||
White Electronic Designs Corp.* | 171,400 | 932,416 | |||||
| 33,981,112 | |||||||
Software - 4.01% | |||||||
Actuate Corp.* | 652,030 | 3,873,058 | |||||
Allscripts Healthcare Solutions, Inc.*+ | 94,453 | 2,549,287 | |||||
American Software, Inc. | 91,538 | 634,358 | |||||
Authentidate Holding Corp.* | 334,299 | 534,878 | |||||
Bottomline Technologies, Inc.* | 227,800 | 2,608,310 | |||||
CAM Commerce Solutions, Inc. | 93,900 | 2,278,953 | |||||
Captaris, Inc.* | 380,938 | 2,959,888 | |||||
Concur Technologies, Inc.*+ | 112,900 | 1,810,916 | |||||
Digi International, Inc.* | 112,936 | 1,557,387 | |||||
Digital Angel Corp.*+ | 251,050 | 640,178 | |||||
Document Sciences Corp.* | 8,788 | 58,880 | |||||
Embarcadero Technologies, Inc.* | 199,200 | 1,219,104 | |||||
Interactive Intelligence, Inc.* | 168,700 | 3,782,254 | |||||
INVESTools, Inc.* | 22,700 | 313,033 | |||||
Moldflow Corp.* | 163,600 | 2,272,404 | |||||
MSC Software Corp* | 42,200 | 642,706 | |||||
Neoware, Inc.* | 110,000 | 1,453,100 | |||||
Nuance Communications, Inc.*+ | 130,592 | 1,496,584 | |||||
Opnet Technologies, Inc.* | 233,000 | 3,366,850 | |||||
Peerless Systems Corp.* | 379,550 | 1,032,376 | |||||
Pervasive Software, Inc.* | 174,800 | 631,028 | |||||
Quality Systems, Inc. | 92,000 | 3,428,840 | |||||
Seachange International, Inc.* | 407,000 | 4,159,540 | |||||
Unica Corp.* | 114,099 | 1,477,582 | |||||
Witness Systems, Inc.* | 138,850 | 2,434,041 | |||||
| 47,215,535 | |||||||
| 44 | Semi-Annual Report | December 31, 2006 (Unaudited) |
Bridgeway Ultra Small Company Market Fund
SCHEDULE OF INVESTMENTS (continued)
Showing percentage of net assets as of December 31, 2006 (Unaudited)
| Industry | Company | Shares | Value | ||||
Common Stocks (continued) | |||||||
Telecommunications - 3.88% | |||||||
Anaren, Inc.* | 144,500 | $ | 2,566,320 | ||||
Avanex Corp.* | 18,000 | 34,020 | |||||
Avici Systems, Inc.*+ | 345,601 | 2,678,408 | |||||
Aware, Inc.* | 373,800 | 1,992,354 | |||||
CalAmp Corp.* | 293,700 | 2,478,828 | |||||
Carrier Access Corp.* | 315,600 | 2,070,336 | |||||
Comarco, Inc.* | 12,100 | 104,181 | |||||
Communications Systems, Inc. | 7,000 | 69,930 | |||||
Comtech Telecommunications Corp.* | 7,050 | 268,393 | |||||
CT Communications, Inc. | 127,397 | 2,919,939 | |||||
Ditech Networks, Inc.* | 267,670 | 1,852,276 | |||||
Eschelon Telecom, Inc.* | 60,755 | 1,203,557 | |||||
Globecomm Systems, Inc.* | 256,800 | 2,262,408 | |||||
HickoryTech Corp. | 5,895 | 42,149 | |||||
ID Systems, Inc.*+ | 88,700 | 1,669,334 | |||||
Knology, Inc.* | 229,700 | 2,444,008 | |||||
KVH Industries, Inc.* | 208,100 | 2,207,941 | |||||
Lightbridge, Inc.* | 177,291 | 2,400,520 | |||||
Network Equipment Technologies, Inc.* | 41,836 | 243,486 | |||||
NMS Communications Corp.* | 497,300 | 1,019,465 | |||||
North Pittsburgh Systems, Inc. | 36,397 | 878,624 | |||||
Optical Cable Corp.* | 89,225 | 405,974 | |||||
ParkerVision Inc.*+ | 74,842 | 834,488 | |||||
Radyne Corp.* | 172,100 | 1,848,354 | |||||
Relm Wireless Corp.* | 257,900 | 1,542,242 | |||||
SBA Communications Corp.* | 11,100 | 305,250 | |||||
Sirenza Microdevices, Inc.* | 390,600 | 3,070,116 | |||||
Spectralink Corp. | 30,210 | 259,806 | |||||
Stratos International, Inc.* | 212,779 | 1,617,120 | |||||
Tollgrade Communications, Inc.* | 147,500 | 1,559,075 | |||||
Vyyo, Inc.* | 19,331 | 86,410 | |||||
Warwick Valley Telephone Co. | 5,400 | 95,796 | |||||
WJ Communications* | 780,899 | 1,226,011 | |||||
WPCS International, Inc.* | 139,000 | 1,427,530 | |||||
| 45,684,649 | |||||||
Textiles - 0.08% | |||||||
Culp, Inc.* | 5,200 | 26,780 | |||||
Dixie Group, Inc.* | 73,473 | 928,699 | |||||
| 955,479 | |||||||
Toys/Games/Hobbies - 0.19% | |||||||
Topps Company, Inc. | 245,246 | 2,182,689 | |||||
| Industry | Company | Shares | Value | ||||
Transportation - 1.71% | |||||||
Celadon Group, Inc.* | 256,275 | $ | 4,292,606 | ||||
Covenant Transport, Inc.* | 141,100 | 1,608,540 | |||||
Frozen Food Express Industries | 187,600 | 1,613,360 | |||||
HUB Group, Inc.* | 289,200 | 7,967,460 | |||||
Marten Transport Ltd.* | 168,099 | 3,081,255 | |||||
Patriot Transportation Holding, Inc.* | 16,400 | 1,531,104 | |||||
| 20,094,325 | |||||||
Trucking & Leasing - 0.20% | |||||||
Greenbrier Cos., Inc. | 77,800 | 2,334,000 | |||||
Water - 0.50% | |||||||
Connecticut Water Service, Inc. | 48,900 | 1,112,475 | |||||
Middlesex Water Co. | 64,957 | 1,216,645 | |||||
Southwest Water Co. | 165,254 | 2,273,895 | |||||
York Water Co. | 68,550 | 1,225,674 | |||||
| 5,828,689 | |||||||
TOTAL COMMON STOCKS | 1,133,065,697 | ||||||
(Cost $760,455,120) | |||||||
EXCHANGE TRADED FUNDS - 2.68% | |||||||
iShares Russell 2000 Index Fund+ | 199,200 | 15,555,528 | |||||
iShares Russell 2000 Value Index Fund+ | 200,000 | 16,004,000 | |||||
| 31,559,528 | |||||||
TOTAL EXCHANGE TRADED FUNDS | 31,559,528 | ||||||
(Cost $27,396,180) | |||||||
TOTAL INVESTMENTS - 99.01% | $ | 1,164,625,225 | |||||
(Cost $787,851,300) | |||||||
Other Assets in Excess of Liabilities - 0.99% | 11,606,825 | ||||||
NET ASSETS - 100.00% | $ | 1,176,232,050 | |||||
| * | Non Income Producing Security |
| + | This security or a portion of the security is out on loan at December 31, 2006. Total loaned securities had a market value of $144,131,227 at December 31, 2006. |
See Notes to Financial Statements.
| www.Bridgeway.com | 45 |
Bridgeway Micro-Cap Limited Fund
MANAGER’S COMMENTARY
(Unaudited)
January 31, 2007
Dear Fellow Micro-Cap Limited Fund Shareholder,
The Fund was up 3.41% in the December quarter, compared to the 10.88% return for our primary benchmark, the CRSP Cap-Based Portfolio 9 Index, 7.81% for our peer benchmark, the Lipper Small-Cap Stock Funds Index, and 8.90% for the Russell 2000 Index of small companies. It was a poor quarter.
The Fund lagged its benchmarks for the calendar year as presented in the table below, down 2.34% versus 17.16% for the CRSP 9 Index, 14.66% for our peer benchmark, the Lipper Small-Cap Stock Funds Index, and 18.37% for the Russell 2000 Index. This was the result of poor performance across four of our five models and an unusual market environment (especially in the September quarter) that did not reward the favorable reports of some of our stocks, while pummeling our stocks with unfavorable reports. It was only the second calendar year since inception in 1998 that we had a negative return.
The table below presents our December quarter, one-year, five-year, and life-to-date financial results according to the formula required by the SEC. A graph of quarterly performance since inception appears on the following page.
Dec. Qtr. 10/1/06 to 12/31/06 | 1 Year 1/1/06 to 12/31/06 | 5 Year 1/1/02 to 12/31/06 | Life-to-Date 6/30/98 to 12/31/06 | |||||
Micro-Cap Limited Fund | 3.41% | -2.34% | 12.77% | 17.88% | ||||
CRSP Cap-Based Portfolio 9 Index | 10.88% | 17.16% | 13.51% | 11.99% | ||||
Lipper Small-Cap Stock Funds Index | 7.81% | 14.66% | 9.91% | 7.09% | ||||
Russell 2000 Index (small stocks) | 8.90% | 18.37% | 11.39% | 7.97% | ||||
Performance figures quoted represent past performance and are no guarantee of future results. Current performance may be lower or higher than the performance figures quoted, and an investor’s shares, when redeemed, may be worth more or less than original cost. For the most recent month-end performance, please call 1-800-661-3550 or visit the Fund’s website at www.bridgeway.com.
The CRSP Cap-Based Portfolio 9 Index is an unmanaged index of 700 micro-cap companies compiled by the Center for Research in Security Prices, with dividends reinvested. The Lipper Small Cap Stock Funds Index is an index of small-cap funds compiled by Lipper, Inc. The Russell 2000 Index is an unmanaged, market value weighted index, which measures performance of the 2,000 companies that are between the 1,000th and 3,000th largest in the market with dividends reinvested. It is not possible to invest directly in an index. Periods longer than one year are annualized.
According to data from Lipper, Inc., Micro-Cap Limited Fund ranked 95th of 95 micro-cap funds for the past twelve months, 35th of 59 such funds over the past five years and 5th of 42 funds since inception in June, 1998. Lipper, Inc. is an independent mutual fund rating service that ranks funds in various fund categories by making comparative calculations using total returns.
| 46 | Semi-Annual Report | December 31, 2006 (Unaudited) |
Bridgeway Micro-Cap Limited Fund
MANAGER’S COMMENTARY (continued)
(Unaudited)
Growth of $10,000 Invested in Micro-Cap Limited Fund and Indexes from 6/30/98 (inception) to 12/31/06
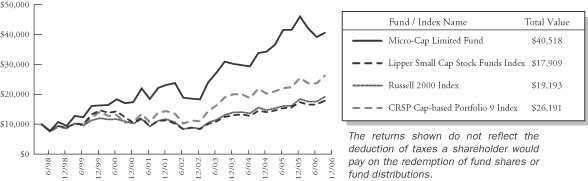
Detailed Explanation of Quarterly Performance—What Worked Well
The Short Version: Our energy stocks contributed the most to our December quarter performance, although only two, Allis-Chalmers and Superior Well Services, made it to the top ten. Our ten best stocks added a respectable 5% to quarterly return, enough to overcome the worst ten, but not enough to bring up our calendar-year numbers.
These are the ten best-performing companies in the December quarter:
| Rank | Description | Industry | % Gain | |||
| 1 | Amkor Technology, Inc. | Semiconductors | 77.7% | |||
| 2 | Allis-Chalmers Energy, Inc. | Oil & Gas Services | 53.5% | |||
| 3 | Smart Modular Technologies | Computers | 41.8% | |||
| 4 | CDC Corp., Class A | Internet | 31.0% | |||
| 5 | Newport Corp. | Telecommunications | 28.5% | |||
| 6 | Superior Well Services, Inc. | Oil & Gas Services | 26.4% | |||
| 7 | Ezcorp, Inc. | Retail | 26.0% | |||
| 8 | Kimball International Inc., Class B | Home Furnishings | 22.9% | |||
| 9 | HUB Group, Inc. | Transportation | 20.9% | |||
| 10 | AEP Industries, Inc. | Packaging & Containers | 20.7% | |||
Amkor is a leading provider of advanced semiconductor assembly and test services. It had been a strong buy in our all-cap funds, Aggressive Investors 1 and 2, which can buy companies of any size. Through the summer and early fall of 2006, the company was fraught with problems that seemed to be one domino of bad news falling after another: the company warning of slowing growth rates, the SEC looking into option award practices, delays in filing its 10Q financial statements with the SEC pending the results of the stock option inquiry, threat of stock exchange delisting, announcement of likely restated financial results from the options probe, probable non-compliance with lending requirements (bondholder covenants) due to the delayed filings, and the specter of bankruptcy should the bondholders accelerate bond payment. On top of all this, the market environment was very unfriendly to this kind of stock, and for all these reasons the stock price was pummeled. It would seem things just couldn’t get worse. (Things can always get worse.) In the midst of all this bad news, the company continued to report favorable underlying economic results. At the lower price, one of our models still liked the stock. And at the lower price, the company had become a micro-cap stock. This is where the advantage of quantitative investing comes into play—taking all the emotion out of the process. Based on its reclassification and model recommendation, we bought it for Micro-Cap Limited at prices under $5.50. (A personal footnote: on our team we say that we guard against favorite stocks or models—avoiding emotional attachment which could take one in the wrong direction. We also “confess” to personal attachments, so here’s mine: I’m actually most comfortable buying stocks, like Amkor, after the price has been “beaten up” on speculation of “more bad things to come.” This is “my kind of stock buy.” Having said that, I’ll revert to my official position: it’s just another stock.)
| www.Bridgeway.com | 47 |
Bridgeway Micro-Cap Limited Fund
MANAGER’S COMMENTARY (continued)
(Unaudited)
Amkor had started out the September quarter at a price of $9.46 and ended that quarter at $5.15. Thereafter, much of the “bad news” unwound as more facts came to light. The company reported another quarter of good financial results. The stock option inquiry exonerated all current members of management. Prior financials were restated, and the company was able to make their financial filings. The bondholders dropped their threat of accelerated payments, and the threat of bankruptcy filings vanished. With help from the market recovery in the fourth quarter, the stock price recovered to $9.34 at December quarter end. Amkor contributed a bit over 1% to our December quarter performance, significant for a single holding.
Oil and gas companies worldwide continue to increase their exploration and production spending in response to generally sustained high oil and gas prices. Founded in 1913 in Houston, Allis-Chalmers Energy, Inc. provides oilfield services and equipment to the oil and gas exploration and development companies primarily in Texas, Louisiana, New Mexico, Colorado, and Oklahoma. Companies like Allis-Chalmers became great buys when the price of oil dipped over the summer. But, like one analyst said, “if you haven’t already traded in your SUV for tennis shoes while the used car market is hot, you may have missed an opportunity”. An interesting side note is that most companies that provide equipment and chemicals to the exploration industry get paid whether wells produce or not. However, as you know, we don’t get caught up in stories and emotion. We trust the models, one of which brought us to this stock, which performed nicely through the quarter and contributed over 0.5% to return.
Detailed Explanation of Quarterly Performance—What Didn’t Work
The Short Version: Two of our worst-performing stocks for the December quarter were among the best stocks in the September quarter: Saia Inc. and SYKES Enterprises. As poor performers go, seven companies with performance under -20% is not too bad a showing.
These are the ten worst-performing companies in the December quarter:
| Rank | Description | Industry | % Loss | |||
| 1 | Optimal Group, Inc. | Computers | -29.4% | |||
| 2 | Lionbridge Technologies | Internet | -27.1% | |||
| 3 | True Religion Apparel, Inc. | Apparel | -24.7% | |||
| 4 | BTU International, Inc. | Semiconductors | -24.4% | |||
| 5 | Mothers Work, Inc. | Retail | -21.8% | |||
| 6 | Aspreva Pharmaceuticals Corp. | Pharmaceuticals | -20.9% | |||
| 7 | Encore Wire Corp. | Electrical Compo & Equip | -20.9% | |||
| 8 | Pantry, Inc. | Retail | -16.9% | |||
| 9 | Saia, Inc. | Transportation | -14.4% | |||
| 10 | SYKES Enterprises, Inc. | Computers | -13.9% | |||
The consumer, cyclical sector (retail and apparel industries) was our poorest-performing group, with True Religion costing us 0.87% in return. True Religion Apparel, Inc., through its wholly owned subsidiary, Guru Denim, Inc., designs, manufactures and sells denim jeans, corduroy jeans and jackets, velvet jeans and jackets, skirts, shorts, T-shirts, sweaters, and sportswear. Its stock price “fell off the cliff” after third quarter reports of 37 cents per share earnings when analysts expected 44 cents. Fashion trends can play havoc on revenues; international sales were down, 48% in Japan alone compared to a year ago. Our model decided not to wait for a revival, and we sold our position before the end of the quarter.
The Pantry operates 1,506 convenience stores in 11 states under a variety of banners, primarily Kangaroo Express. In the midst of a slew of good company news, one negative can cause a price tumble. The Pantry announced fiscal fourth quarter results: earnings of $26.7 million, $1.16 a share, up from $25.4 million and $1.12 a share, beating its target by a penny. Revenue rose to $1.69 billion from $1.38 billion, also exceeding projections of $1.66 billion. However, company officials project $2.80 to $3 per share for the next fiscal year, and analysts expected $3.32. On that news alone, the stock price fell 13%. Although we have trimmed our position recently, we still hold the stock.
| 48 | Semi-Annual Report | December 31, 2006 (Unaudited) |
Bridgeway Micro-Cap Limited Fund
MANAGER’S COMMENTARY (continued)
(Unaudited)
Detailed Explanation of Calendar Year Performance—What Worked Well
The Short Version: Our best stocks for the calendar year came from six different sectors and nine different industries. We had some good companies, just not enough to bring us out of our dismal performance against our benchmarks.
| Rank | Description | Industry | % Gain | |||
| 1 | Ezcorp, Inc. | Retail | 219.0% | |||
| 2 | Amkor, Technology Inc. | Semiconductors | 67.2% | |||
| 3 | Nutri/System, Inc. | Internet | 63.9% | |||
| 4 | Clean Harbors, Inc. | Environmental Control | 55.9% | |||
| 5 | HUB Group, Inc. | Transportation | 55.9% | |||
| 6 | Allis-Chalmers Energy, Inc. | Oil & Gas Services | 53.5% | |||
| 7 | Knot, Inc. | Internet | 48.4% | |||
| 8 | Kendle International, Inc. | Commercial Services | 46.8% | |||
| 9 | Broadwing Corp. | Telecommunications | 44.1% | |||
| 10 | Smart Modular Technologies | Computers | 41.8% | |||
Ezcorp has been a steady performer for our Fund since mid 2004. It operates pawn shops and payday loan stores. In early November this year, company officials announced that earnings from loans were better because of a recent increase in paid debt. The company opened 46 stores in the September quarter with plans for 100 more in fiscal 2007. Upon the news that earnings were 61 cents to 64 cents a share, above its earlier prediction of 43 to 46 cents, the stock price rose almost 20%, which increased our position to 3% of the portfolio.
HUB Group is a freight transportation management company, providing intermodal, truck brokerage and logistics services. The spikes on the graph of its stock price over the last year will make you dizzy. The announcement of its repurchase of up to $75 million of Class A common stock in late October gave the price upward movement that continues at this writing.
Detailed Explanation of Calendar Year Performance—What Didn’t Work
The Short Version: As you can see in the list below, our worst performers clustered around technology stocks (semiconductors and computers industries.) Even though we only had three stocks with lower than -50% performance, 80 out of 145 holdings were in negative performance for the calendar year.
Here are the ten worst-performing companies for the calendar year:
| Rank | Description | Industry | % Loss | |||
| 1 | Bookham, Inc. | Semiconductors | -70.1% | |||
| 2 | BTU International, Inc. | Semiconductors | -56.4% | |||
| 3 | Portalplayer, Inc. | Semiconductors | -52.3% | |||
| 4 | Optimal Group, Inc. | Computers | -47.8% | |||
| 5 | Conn’s, Inc. | Retail | -41.5% | |||
| 6 | Multi-Fineline Electronix, Inc. | Electronics | -40.6% | |||
| 7 | American Science & Eng., Inc. | Electronics | -39.8% | |||
| 8 | Forgent Networks, Inc. | Telecommunications | -36.1% | |||
| 9 | Glenayre Technologies, Inc. | Telecommunications | -35.5% | |||
| 10 | Bronco Drilling Co., Inc. | Oil & Gas | -33.8% | |||
Bookham, Inc. supplies optical component solutions for the telecommunications and industrial applications. It designs, manufactures, and markets optical components, modules, and subsystems that generate, detect, amplify, combine, and separate light signals principally for use in fiber optics communications networks. The first month after we purchased Bookham last spring, the price went up steadily. Since then, it has gone down, not so steadily. For their April quarter, the company posted an adjusted net loss of 34 cents a share on sales of $53 million. Analysts were looking for a net loss of
| www.Bridgeway.com | 49 |
Bridgeway Micro-Cap Limited Fund
MANAGER’S COMMENTARY (continued)
(Unaudited)
20 cents on sales of $52.7 million. The company blamed the hefty loss on surprisingly high costs related to the shutdown of its Paignton, U.K., factory and lower production in the quarter. We no longer hold this stock.
Top Ten Holdings as of December 31, 2006
Six of our top ten holdings were in the industrial sector (industries such as machinery, transportation, and electronics). Unfortunately, only two were star performers: HUB Group and Ezcorp. The top ten represented 32.5% of December 31, 2006 net assets, which is in line with our flexibility to concentrate more assets in a few names. Based on data from Morningstar, the median micro-cap fund has about 26% of net assets in the top 10 names.
| Rank | Description | Industry | Percent of Net Assets | |||
| 1 | Robbins & Myers, Inc. | Machinery-Diversified | 4.9% | |||
| 2 | Lindsay Manufacturing Co. | Machinery-Diversified | 4.6% | |||
| 3 | HUB Group, Inc. | Transportation | 4.0% | |||
| 4 | Freightcar America, Inc. | Miscell. Manufacturing | 3.0% | |||
| 5 | Ezcorp, Inc. | Retail | 3.0% | |||
| 6 | Rogers Corp. | Electronics | 2.9% | |||
| 7 | Aspreva Pharmaceuticals Corp. | Pharmaceuticals | 2.8% | |||
| 8 | Navigators Group, Inc. | Insurance | 2.6% | |||
| 9 | Open Text Corp. | Software | 2.4% | |||
| 10 | II-VI, Inc. | Electronics | 2.3% | |||
| 32.5% |
Industry Sector Representation as of December 31, 2006
Industrial sector stocks performed well for the Fund; however, the overweighting compared to our market index had little benefit to performance. On the other hand, our under weighting in consumer, cyclicals was a drag on our return.
| Sector | % of Net Assets | % S&P Small-Cap Index | Difference | |||
Basic Materials | 1.5% | 4.0% | -2.5% | |||
Communications | 11.4% | 4.1% | 7.3% | |||
Consumer, Cyclical | 9.0% | 17.3% | -8.3% | |||
Consumer, Non-cyclical | 10.5% | 17.5% | -7.0% | |||
Energy | 14.1% | 7.2% | 6.9% | |||
Financial | 8.9% | 16.0% | -7.1% | |||
Industrial | 38.7% | 18.7% | 20.0% | |||
Technology | 6.2% | 10.1% | -3.9% | |||
Utilities | 0.0% | 5.1% | -5.1% | |||
Cash | -0.3% | 0.0% | -0.3% | |||
Total | 100.0% | 100.0% |
Disclaimer
The following is a reminder from the friendly folks at your Fund who worry about liability. The views expressed here are exclusively those of Fund management. These views are not meant as investment advice and should not be considered predictive in nature. Any favorable (or unfavorable) description of a holding applies only as of December 31, 2006, unless otherwise stated. Security positions can and do change thereafter. Discussions of historical performance do not guarantee and are not indicative of future performance.
The Fund is subject to very high, above market risk (volatility) and is not an appropriate investment for short-term investors. Investments in micro-cap companies generally carry greater risk than is customarily associated with larger companies for various reasons such as narrower markets (fewer investors), limited financial resources and greater trading difficulty.
| 50 | Semi-Annual Report | December 31, 2006 (Unaudited) |
Bridgeway Micro-Cap Limited Fund
MANAGER’S COMMENTARY (continued)
(Unaudited)
This report is submitted for the general information of the shareholders of the Fund. It is not authorized for distribution to prospective investors unless preceded or accompanied by an effective prospectus, which includes information regarding the Fund’s risks, objectives, fees and expenses, experience of its management, and other information. For questions or other Fund information, call 1-800-661-3550 or visit the Fund’s website www.bridgeway.com. Foreside Fund Services, LLC, distributor.
Conclusion
Thank you for your continued investment in Micro-Cap Limited Fund. This Fund remains open only to current investors as we seek to keep the nimbleness that has fared well through the years. As always, we appreciate your feedback.
Sincerely,
John Montgomery
| www.Bridgeway.com | 51 |
Bridgeway Micro-Cap Limited Fund
SCHEDULE OF INVESTMENTS
Showing percentage of net assets as of December 31, 2006 (Unaudited)
| Industry | Company | Shares | Value | ||||
COMMON STOCKS - 100.36% | |||||||
Apparel - 2.00% | |||||||
Steven Madden Ltd. | 40,100 | $ | 1,407,109 | ||||
Beverages - 0.89% | |||||||
National Beverage Corp. | 44,900 | 629,947 | |||||
Chemicals - 1.48% | |||||||
NewMarket Corp. | 17,700 | 1,045,185 | |||||
Commercial Services - 4.35% | |||||||
Dollar Financial Corp.* | 51,600 | 1,437,576 | |||||
The Geo Group, Inc.* | 19,100 | 716,632 | |||||
ICT Group, Inc.* | 28,900 | 912,951 | |||||
| 3,067,159 | |||||||
Computers - 1.54% | |||||||
SMART Modular Technology (WWE), Inc.* | 80,500 | 1,083,530 | |||||
Diversified Financial Services - 2.31% | |||||||
Ocwen Financial Corp.* | 102,500 | 1,625,650 | |||||
Electrical Components & Equipment - 1.67% | |||||||
Superior Essex, Inc.* | 35,300 | 1,173,725 | |||||
Electronics - 6.51% | |||||||
II-VI, Inc.* | 59,100 | 1,651,254 | |||||
NovAtel, Inc.* | 22,700 | 905,730 | |||||
Rogers Corp.* | 34,300 | 2,028,845 | |||||
| 4,585,829 | |||||||
Environmental Control - 3.55% | |||||||
Clean Harbors, Inc.* | 26,000 | 1,258,660 | |||||
Metal Management, Inc.* | 32,900 | 1,245,265 | |||||
| 2,503,925 | |||||||
Hand/Machine Tools - 1.36% | |||||||
Baldor Electric Co. | 28,600 | 955,812 | |||||
Healthcare - Products - 0.95% | |||||||
SurModics, Inc.*+ | 21,400 | 665,968 | |||||
Healthcare - Services - 0.52% | |||||||
Res-Care, Inc.* | 20,300 | 368,445 | |||||
Home Furnishings - 1.08% | |||||||
Kimball International, Inc. | 31,400 | 763,020 | |||||
| Industry | Company | Shares | Value | ||||
Insurance - 6.63% | |||||||
CNA Surety Corp.* | 53,000 | $ | 1,139,500 | ||||
Navigators Group, Inc.* | 37,700 | 1,816,386 | |||||
Safety Insurance Group, Inc. | 9,100 | 461,461 | |||||
Tower Group, Inc. | 40,400 | 1,255,228 | |||||
| 4,672,575 | |||||||
Internet - 8.97% | |||||||
CDC Corp.*+ | 152,200 | 1,445,900 | |||||
FTD Group, Inc.* | 46,900 | 839,041 | |||||
GigaMedia Ltd.*+ | 109,500 | 1,069,815 | |||||
Interwoven, Inc.* | 81,100 | 1,189,737 | |||||
The Knot, Inc.* | 50,700 | 1,330,368 | |||||
Nutri/System, Inc.*+ | 7,000 | 443,730 | |||||
| 6,318,591 | |||||||
Machinery - Diversified - 10.53% | |||||||
Kadant, Inc.* | 29,800 | 726,524 | |||||
Lindsay Corp. | 98,500 | 3,216,025 | |||||
Robbins & Myers, Inc. | 75,600 | 3,471,552 | |||||
| 7,414,101 | |||||||
Miscellaneous Manufacturers - 4.02% | |||||||
Freightcar America, Inc.+ | 37,800 | 2,096,010 | |||||
PW Eagle, Inc.+ | 21,400 | 738,300 | |||||
| 2,834,310 | |||||||
Oil & Gas - 1.75% | |||||||
Bronco Drilling Co., Inc.* | 71,800 | 1,234,242 | |||||
Oil & Gas Services - 12.32% | |||||||
Allis-Chalmers Energy, Inc.* | 49,500 | 1,140,480 | |||||
Gulf Island Fabrication, Inc. | 22,200 | 819,180 | |||||
Hercules Offshore, Inc.* | 34,100 | 985,490 | |||||
Lufkin Industries, Inc. | 15,600 | 906,048 | |||||
NATCO Group, Inc.* | 45,100 | 1,437,788 | |||||
Seitel, Inc.* | 226,539 | 809,877 | |||||
Superior Well Services, Inc.* | 42,300 | 1,081,188 | |||||
Trico Marine Services, Inc.* | 39,000 | 1,494,090 | |||||
| 8,674,141 | |||||||
Packaging & Containers - 1.63% | |||||||
AEP Industries, Inc.* | 21,500 | 1,146,165 | |||||
Pharmaceuticals - 3.81% | |||||||
Aspreva Pharmaceuticals Corp.* | 96,300 | 1,976,076 | |||||
Axcan Pharma, Inc.* | 49,800 | 709,152 | |||||
| 2,685,228 | |||||||
| 52 | Semi-Annual Report | December 31, 2006 (Unaudited) |
Bridgeway Micro-Cap Limited Fund
SCHEDULE OF INVESTMENTS (continued)
Showing percentage of net assets as of December 31, 2006 (Unaudited)
| Industry | Company | Shares | Value | |||||
Common Stocks (continued) |
| |||||||
Retail - 5.96% | ||||||||
Ezcorp, Inc.* | 128,082 | $ | 2,081,333 | |||||
Mothers Work, Inc.* | 28,800 | 1,134,432 | ||||||
The Pantry, Inc.*+ | 20,916 | 979,705 | ||||||
| 4,195,470 | ||||||||
Semiconductors - 2.00% | ||||||||
Amkor Technology, Inc.* | 150,700 | 1,407,538 | ||||||
Software - 2.67% | ||||||||
Open Text Corp.* | 84,200 | 1,709,260 | ||||||
Witness Systems, Inc.* | 9,600 | 168,288 | ||||||
| 1,877,548 | ||||||||
Telecommunications - 3.85% | ||||||||
Knology, Inc.* | 75,100 | 799,064 | ||||||
Newport Corp.* | 46,900 | 982,555 | ||||||
Sirenza Microdevices, Inc.* | 117,900 | 926,694 | ||||||
| 2,708,313 | ||||||||
Transportation - 8.01% | ||||||||
Celadon Group, Inc.* | 74,100 | 1,241,175 | ||||||
Gulfmark Offshore, Inc.* | 42,000 | 1,571,220 | ||||||
HUB Group, Inc.* | 102,800 | 2,832,140 | ||||||
| 5,644,535 | ||||||||
TOTAL COMMON STOCKS | 70,688,061 | |||||||
(Cost $60,536,134) | ||||||||
TOTAL INVESTMENTS - 100.36% | $ | 70,688,061 | ||||||
(Cost $60,536,134) | ||||||||
Liabilities in Excess of Other Assets - (0.36)% | (254,633 | ) | ||||||
NET ASSETS - 100.00% | $ | 70,433,428 | ||||||
| * | Non Income Producing Security |
| + | This security or a portion of the security is out on loan at December 31, 2006. Total loaned securities had a market value of $6,531,795 at December 31, 2006. |
See Notes to Financial Statements.
| www.Bridgeway.com | 53 |
Bridgeway Small-Cap Growth Fund
MANAGER’S COMMENTARY
(Unaudited)
January 31, 2007
Dear Fellow Small-Cap Growth Fund Shareholder,
Our Fund was up 5.55% for the December 2006 quarter, compared to an 8.77% return for our primary market benchmark, the Russell 2000 Growth Index, and an 8.15% return of our peer benchmark, the Lipper Small-Cap Growth Index. It was a poor quarter relative to our benchmarks.
The one-year return was a dismal 5.31%, compared to a gain of 13.35% for our primary benchmark, the Russell 2000 Growth Index and 10.65% for our peer benchmark, the Lipper Small-Cap Growth Index. Our poor showing was the result of poor performance across a majority of our models and an unusual market environment that did not reward the favorable reports of some of our stocks, while pummeling our stocks with unfavorable reports.
The table below presents our December quarter, one-year and life-to-date financial results according to the formula required by the SEC. In line with our investment philosophy of focusing on the long term, we still lead both our performance benchmarks over the more relevant life-to-date period. A graph of quarterly performance since inception appears below.
Dec. Qtr. 10/1/06 to 12/31/06 | 1 Year 1/1/06 to 12/31/06 | Life-to-Date 10/31/03 to 12/31/06 | ||||
Small-Cap Growth Fund | 5.55% | 5.31% | 11.88% | |||
Russell 2000 Growth Index | 8.77% | 13.35% | 11.20% | |||
Lipper Small-Cap Growth Index | 8.15% | 10.65% | 9.36% | |||
Performance data quoted represents past performance and is no guarantee of future results. Current performance may be lower or higher than the performance data quoted. Investment return and principal value will fluctuate so that an investor's shares, when redeemed, may be worth more or less than original cost. For the most recent month end performance, please call 1-800-661-3550 or visit the Fund’s website at www.bridgeway.com.
The Russell 2000 Growth Index is an unmanaged index which consists of stocks in the Russell 2000 Index with higher price-to-book ratios and higher forecasted growth values with dividends reinvested. The Lipper Small-Cap Growth Index is an index of small-company, growth-oriented funds compiled by Lipper, Inc. It is not possible to invest directly in an index. Periods longer than one year are annualized.
According to data from Lipper, Inc., Small-Cap Growth Fund ranked 457th of 557 small-cap growth funds for the twelve-month period ended December 31, 2006 and 110th of 453 such funds since inception in October, 2003. Lipper, Inc. is an independent mutual fund rating service that ranks funds in various fund categories by making comparative calculations using total returns.
Growth of $10,000 Invested in Small-Cap Growth Fund and Indexes from 10/31/03 (inception) to 12/31/06
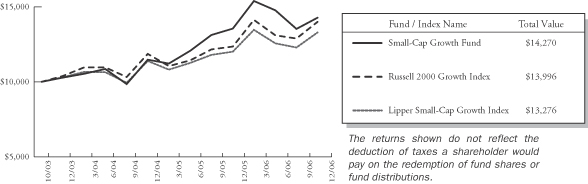
| 54 | Semi-Annual Report | December 31, 2006 (Unaudited) |
Bridgeway Small-Cap Growth Fund
MANAGER’S COMMENTARY (continued)
(Unaudited)
Detailed Explanation of Quarterly Performance—What Worked Well
The Short Version: Four of the ten best performers for the December quarter were industrial sector companies (machinery and manufacturing industries). Our top ten performers had good returns, adding just under 3% to quarterly return, but not enough to beat our benchmarks.
These are the ten best-performing stocks for the December quarter:
| Rank | Description | Industry | % Gain | |||
| 1 | Amkor Technology, Inc. | Semiconductors | 81.4% | |||
| 2 | Bolt Technology Corp. | Oil & Gas Services | 59.0% | |||
| 3 | Intevac, Inc. | Machinery-Diversified | 54.5% | |||
| 4 | DXP Enterprises, Inc. | Machinery-Diversified | 49.8% | |||
| 5 | US Global Investors, Inc. | Diversified Finan Service | 47.6% | |||
| 6 | TeleTech Holdings, Inc. | Commercial Services | 47.0% | |||
| 7 | Medifast, Inc. | Commercial Services | 41.1% | |||
| 8 | RPC, Inc. | Oil & Gas Services | 40.8% | |||
| 9 | Ceradyne, Inc. | Miscellaneous Manufacturing | 37.5% | |||
| 10 | Middleby Corp. | Machinery-Diversified | 35.8% | |||
Amkor is a leading provider of advanced semiconductor assembly and test services. We first purchased it into our Fund in April. Through the summer and early fall of 2006, the company was fraught with problems that seemed to be one domino of bad news falling after another: the company warning of slowing growth rates, the SEC looking into option award practices, delays in filing its 10Q financial statements with the federal government pending the results of the stock option inquiry, threat of stock exchange delisting, announcement of likely restated financial results from the options probe, probable non-compliance with lending requirements (bondholder covenants) due to the delayed filings, and the specter of bankruptcy should the bondholders accelerate bond payment. On top of all this, the market environment was very unfriendly to this kind of stock, and for all these reasons the stock price was pummeled. It would seem things just couldn’t get worse. (Things can always get worse.) In the midst of all this bad news, the company continued to report favorable underlying economic results. At the lower price, one of our models still liked the stock. This is where the advantage of quantitative investing comes into play—taking all the emotion out of the process. Based on a model recommendation, we added to our position. (A personal footnote: on our team we say that we guard against favorite stocks or models—avoiding emotional attachment, which could take one in the wrong direction. We also “confess” to personal attachments, so here’s mine: I’m actually most comfortable buying stocks, like Amkor, after the price has been “beaten up” on speculation of “more bad things to come.” This is “my kind of stock buy.” Having said that, I’ll revert to my official position: it’s just another stock.)
Amkor had started out the September quarter at a price of $9.46 and ended that quarter at $5.15. We added to our position at a cost of roughly $6 per share in this quarter. Thereafter, much of the “bad news” unwound as more facts came to light. The company reported another quarter of good financial results. The stock option inquiry exonerated all current members of management. Prior financials were restated, and the company was able to make their financial filings. The bondholders dropped their threat of accelerated payments, and the threat of bankruptcy filings vanished. With help from the market recovery in the fourth quarter, the stock price recovered to $9.34 at December quarter end—less than our original share cost, but much higher than the cost of shares added.
Detailed Explanation of Quarterly Performance—What Didn’t Work
The Short Version: Interestingly, we had five of the worst performers in the industrial sector (four in the best performers.) Of the 140 companies in our Fund as of December 31, we had only six declining more than 20%, including one more than 30%. Still, it was enough to keep us from beating our benchmarks.
| www.Bridgeway.com | 55 |
Bridgeway Small-Cap Growth Fund
MANAGER’S COMMENTARY (continued)
(Unaudited)
These are the ten worst-performing stocks for the December quarter:
| Rank | Description | Industry | % Loss | |||
| 1 | Encore Wire Corp. | Electrical Compo & Equip | -30.8% | |||
| 2 | LCA-Vision, Inc. | Healthcare-Products | -25.0% | |||
| 3 | FieldPoint Petroleum Corp. | Oil & Gas | -24.7% | |||
| 4 | Graham Corp. | Electrical Compo & Equip | -23.6% | |||
| 5 | EGL, Inc. | Transportation | -23.4% | |||
| 6 | United Retail Group, Inc. | Retail | -23.1% | |||
| 7 | Technitrol, Inc. | Electronics | -20.0% | |||
| 8 | United Industrial Corp./New York | Aerospace/Defense | -20.0% | |||
| 9 | NeuroMetrix, Inc. | Healthcare-Products | -19.4% | |||
| 10 | Datalink Corp. | Computers | -19.1% | |||
Encore Wire Corporation manufactures copper electrical wire and cable for residential and commercial building. Its wire products are sold through wholesale electrical distributors and retail home improvement stores. Copper is the principal raw material used by Encore in manufacturing its products. The price of copper fluctuates, based on general economic conditions, supply, demand and other factors, which has caused monthly variations in the cost of copper. In fact, if you look at a graph showing the price of copper over the last few months, you’ll see some sharp volatility. Even though revenues had increased over the twelve months, the average cost per pound of raw copper had also increased 106%. Naturally, the cost of goods was higher, causing ratios to dip, which caused analysts to react negatively. Our model had a similar reaction, and we exited the stock before quarter end.
Detailed Explanation of Calendar Year Performance—What Worked Well
The Short Version: Our best-performing companies for the calendar year were a diverse group, representing six sectors and nine industries. Although we had 19 companies with over 50% gain for the year, it did not pull our performance up to our benchmarks. That hurts.
These are the ten best-performing companies for the calendar year:
| Rank | Description | Industry | % Gain | |||
| 1 | Nvidia Corp. | Semiconductors | 102.5% | |||
| 2 | Intevac, Inc. | Machinery-Diversified | 96.2% | |||
| 3 | Titanium Metals Corp. | Mining | 86.6% | |||
| 4 | Holly Corp. | Oil & Gas | 78.1% | |||
| 5 | Guess?, Inc. | Apparel | 71.0% | |||
| 6 | Clean Harbors, Inc. | Environmental Control | 68.0% | |||
| 7 | Ocwen Financial Corp. | Diversified Finan Service | 64.2% | |||
| 8 | Ansoft Corp. | Computers | 63.0% | |||
| 9 | Cybersource Corp. | Internet | 61.9% | |||
| 10 | Nutri/System, Inc. | Internet | 59.2% | |||
Nvidia Corporation manufactures programmable graphics processor technologies: graphics processing units, media and communications processors, handheld, and consumer electronics. It was our third best performer in the March quarter, second best in the September quarter and number 16 in the December quarter. If Nvidia is able to benefit from its largest client, Apple’s pricey new phone, it will be “in high cotton,” which is not a component our models track, by the way.
Guess? Inc. engages in the design, marketing, distribution, and licensing of lifestyle collections of casual apparel and accessories for men, women, and children. The company also grants licenses to manufacture and distribute a range of products, including eyewear, watches, handbags, footwear, fragrance, jewelry, and other fashion accessories. Guess? had a great fourth quarter, with December sales up 14.5% over December 2005 and annual sales up 12.2%, winning positive recommendations from analysts. We’ve held it since late 2005.
| 56 | Semi-Annual Report | December 31, 2006 (Unaudited) |
Bridgeway Small-Cap Growth Fund
MANAGER’S COMMENTARY (continued)
(Unaudited)
Detailed Explanation of Calendar Year Performance—What Didn’t Work
The Short Version: We had more companies on the negative side of performance in the apparel and retail industries—consumer, cyclical sector—for the calendar year. We had six stocks with declines more than 50%.
These are the ten worst-performing companies for the calendar year:
| Rank | Description | Industry | % Loss | |||
| 1 | Escala Group, Inc. | Commercial Services | -77.2% | |||
| 2 | Empire Resources, Inc. | Metal Fabricate/Hardware | -73.2% | |||
| 3 | FieldPoint Petroleum Corp. | Oil & Gas | -67.0% | |||
| 4 | Chico's FAS, Inc. | Retail | -59.7% | |||
| 5 | Bookham, Inc. | Semiconductors | -54.9% | |||
| 6 | Conn's, Inc. | Retail | -50.4% | |||
| 7 | Volcom, Inc. | Apparel | -47.9% | |||
| 8 | NeuroMetrix, Inc. | Healthcare-Products | -47.0% | |||
| 9 | Brightpoint, Inc. | Distribution/Wholesale | -46.1% | |||
| 10 | Wind River Systems, Inc. | Software | -45.5% | |||
NeuroMetrix, Inc. is the only company of the ten worst performers for the calendar year that we continued to own on December 31. The company designs proprietary medical devices used to diagnose neuropathies, diseases of the nervous system. Their NC-stat System provides physicians the ability to diagnose patients with neuropathies at the point-of-service. Although financial results have been strong and generally above expectations, news that a number of insurers have said they would restrict reimbursement for use of the tests has resulted in a downward price movement. As of December 31, we still have a small investment in the stock.
Top Ten Holdings as of December 31, 2006
Our top ten holdings represented only 22.3% of net assets, illustrating the diversification of the Fund across holdings and sectors.
| Rank | Description | Industry | Percent of Net Assets | |||
| 1 | American Commercial Lines, Inc. | Transportation | 4.3% | |||
| 2 | Dril-Quip, Inc. | Oil & Gas Services | 2.6% | |||
| 3 | Guess?, Inc. | Apparel | 2.4% | |||
| 4 | Ocwen Financial Corp. | Diversified Finan Service | 2.0% | |||
| 5 | Ladish Co., Inc. | Metal Fabricate/Hardware | 2.0% | |||
| 6 | Ansoft Corp. | Computers | 1.9% | |||
| 7 | TeleTech Holdings, Inc. | Commercial Services | 1.8% | |||
| 8 | CommScope, Inc. | Telecommunications | 1.8% | |||
| 9 | Nutri/System, Inc. | Internet | 1.8% | |||
| 10 | BMC Software, Inc. | Software | 1.7% | |||
| 22.3% |
| www.Bridgeway.com | 57 |
Bridgeway Small-Cap Growth Fund
MANAGER’S COMMENTARY (continued)
(Unaudited)
Industry Sector Representation as of December 31, 2006
Our largest sector weighting was in the industrial sector, which was also the best performer during the December quarter, adding almost 2% to our return. The financial sector showed the greatest disparity to our market index; however, the difference did not affect performance significantly.
| Industry | % of Net Assets | % S&P Small-cap Index | Difference | |||
Basic Materials | 2.5% | 4.0% | -1.5% | |||
Communications | 9.3% | 4.1% | 5.2% | |||
Consumer, Cyclical | 9.1% | 17.3% | -8.2% | |||
Consumer, Non-cyclical | 20.3% | 17.5% | 2.8% | |||
Energy | 16.1% | 7.2% | 8.9% | |||
Financial | 5.5% | 16.0% | -10.5% | |||
Industrial | 26.9% | 18.7% | 8.2% | |||
Technology | 10.9% | 10.1% | 0.8% | |||
Utilities | 0.0% | 5.1% | -5.1% | |||
Cash | -0.6% | 0.0% | -0.6% | |||
Total | 100.0% | 100.0% | ||||
Disclaimer
The following is a reminder from the friendly folks at your Fund who worry about liability. The views expressed here are exclusively those of Fund management. These views, including those regarding market sectors or individual stocks, are not meant as investment advice and should not be considered predictive in nature. Any favorable (or unfavorable) description of a holding applies only as of the quarter end, December 31, 2006, unless otherwise stated. Security positions can and do change thereafter. Discussions of historical performance do not guarantee and are not indicative of future performance.
The Fund is subject to above average market risk (volatility) and is not an appropriate investment for short-term investors. Investments in small companies carry greater risk than is customarily associated with larger companies for various reasons such as narrower markets (fewer investors), limited financial resources and greater trading difficulty.
This report is submitted for the general information of the shareholders of the Fund. It is not authorized for distribution to prospective investors unless preceded or accompanied by an effective prospectus, which includes information regarding the Fund’s risks, objectives, fees and expenses, experience of its management, and other information. For questions or other Fund information, call 1-800-661-3550 or visit the Fund’s website www.bridgeway.com. Foreside Fund Services, LLC, distributor.
Conclusion
Thank you for your continued investment in Small-Cap Growth Fund. This Fund remains open to both current and new investors. As always, we appreciate your feedback.
Sincerely,
John Montgomery
| 58 | Semi-Annual Report | December 31, 2006 (Unaudited) |
THIS PAGE INTENTIONALLY LEFT BLANK
| www.Bridgeway.com | 59 |
Bridgeway Small-Cap Growth Fund
SCHEDULE OF INVESTMENTS
Showing percentage of net assets as of December 31, 2006 (Unaudited)
| Industry | Company | Shares | Value | ||||
COMMON STOCKS - 100.82% | |||||||
Aerospace/Defense - 0.97% | |||||||
AAR Corp.*+ | 58,129 | $ | 1,696,786 | ||||
Apparel - 4.13% | |||||||
Guess?, Inc.*+ | 66,300 | 4,205,409 | |||||
Gymboree Corp.* | 43,100 | 1,644,696 | |||||
Steven Madden Ltd. | 39,792 | 1,396,301 | |||||
| 7,246,406 | |||||||
Banks - 0.91% | |||||||
Corus Bankshares, Inc.+ | 69,200 | 1,596,444 | |||||
Biotechnology - 3.61% | |||||||
Digene Corp.* | 43,385 | 2,079,009 | |||||
Illumina, Inc.*+ | 51,377 | 2,019,630 | |||||
Lifecell Corp.* | 92,600 | 2,235,364 | |||||
| 6,334,003 | |||||||
Chemicals - 1.23% | |||||||
Lubrizol Corp. | 6,000 | 300,780 | |||||
NewMarket Corp. | 31,500 | 1,860,075 | |||||
| 2,160,855 | |||||||
Commercial Services - 9.44% | |||||||
Administaff, Inc.+ | 42,959 | 1,837,356 | |||||
Barrett Business Services | 9,798 | 229,469 | |||||
Bright Horizons Family Solutions, Inc.* | 8,800 | 340,208 | |||||
The Geo Group, Inc.* | 54,500 | 2,044,840 | |||||
Home Solutions of America, Inc.*+ | 110,300 | 646,358 | |||||
ICT Group, Inc.* | 56,164 | 1,774,221 | |||||
Kendle International, Inc.* | 71,800 | 2,258,110 | |||||
Korn/Ferry International* | 37,700 | 865,592 | |||||
MPS Group, Inc.* | 109,500 | 1,552,710 | |||||
Sotheby's+ | 57,000 | 1,768,140 | |||||
TeleTech Holdings, Inc.*+ | 135,300 | 3,230,964 | |||||
| 16,547,968 | |||||||
Computers - 4.41% | |||||||
Ansoft Corp.* | 121,800 | 3,386,040 | |||||
Cognizant Technology Solutions Corp.* | 36,440 | 2,811,710 | |||||
Synplicity, Inc.* | 246,600 | 1,543,716 | |||||
| 7,741,466 | |||||||
Diversified Financial Services - 4.64% | |||||||
Greenhill & Co., Inc.+ | 31,000 | 2,287,800 | |||||
Ocwen Financial Corp.* | 216,700 | 3,436,862 | |||||
US Global Investors, Inc.+ | 35,793 | 2,407,079 | |||||
| 8,131,741 | |||||||
| Industry | Company | Shares | Value | ||||
Electrical Components & Equipment - 2.21% | |||||||
General Cable Corp.* | 46,200 | $ | 2,019,402 | ||||
Graham Corp. | 11,400 | 149,910 | |||||
The Lamson & Sessions Co.* | 70,200 | 1,703,052 | |||||
| 3,872,364 | |||||||
Electronics - 3.05% | |||||||
Itron, Inc.*+ | 30,200 | 1,565,568 | |||||
Technitrol, Inc. | 65,000 | 1,552,850 | |||||
Thomas & Betts Corp.* | 47,000 | 2,222,160 | |||||
| 5,340,578 | |||||||
Engineering & Construction - 0.62% | |||||||
ENGlobal Corp.* | 169,244 | 1,088,239 | |||||
Entertainment - 0.98% | |||||||
Pinnacle Entertainment, Inc.* | 52,000 | 1,723,280 | |||||
Environmental Control - 0.75% | |||||||
Clean Harbors, Inc.* | 27,000 | 1,307,070 | |||||
Hand/Machine Tools - 1.49% | |||||||
Baldor Electric Co. | 78,400 | 2,620,128 | |||||
Healthcare - Products - 5.54% | |||||||
Bovie Medical Corp.* | 14,810 | 134,327 | |||||
Cutera, Inc.* | 46,200 | 1,247,400 | |||||
Hologic, Inc.*+ | 30,000 | 1,418,400 | |||||
Inverness Medical Innovations, Inc.* | 55,900 | 2,163,330 | |||||
NeuroMetrix, Inc.*+ | 89,700 | 1,337,427 | |||||
SurModics, Inc.*+ | 18,000 | 560,160 | |||||
Vital Images, Inc.* | 81,800 | 2,846,640 | |||||
| 9,707,684 | |||||||
Healthcare - Services - 1.10% | |||||||
Air Methods Corp.* | 68,904 | 1,923,800 | |||||
Internet - 2.66% | |||||||
Move, Inc.* | 145,000 | 798,950 | |||||
Nutri/System, Inc.*+ | 49,000 | 3,106,110 | |||||
TheStreet.com, Inc. | 85,000 | 756,500 | |||||
| 4,661,560 | |||||||
Machinery - Construction & Mining - 1.24% | |||||||
Joy Global, Inc.+ | 45,000 | 2,175,300 | |||||
Machinery - Diversified - 3.97% | |||||||
DXP Enterprises, Inc.*+ | 39,000 | 1,366,560 | |||||
Gardner Denver, Inc.* | 40,000 | 1,492,400 | |||||
| 60 | Semi-Annual Report | December 31, 2006 (Unaudited) |
Bridgeway Small-Cap Growth Fund
SCHEDULE OF INVESTMENTS (continued)
Showing percentage of net assets as of December 31, 2006 (Unaudited)
| Industry | Company | Shares | Value | ||||
Common Stocks (continued) | |||||||
Machinery - Diversified (continued) | |||||||
Intevac, Inc.* | 87,000 | $ | 2,257,650 | ||||
Middleby Corp.* | 17,600 | 1,842,192 | |||||
| 6,958,802 | |||||||
Media - 0.75% | |||||||
Martha Stewart Living Omnimedia, Inc.* | 60,400 | 1,322,760 | |||||
Metal Fabricate/Hardware - 3.79% | |||||||
Dynamic Materials Corp. | 58,100 | 1,632,610 | |||||
Kaydon Corp.+ | 40,000 | 1,589,600 | |||||
Ladish Co., Inc.* | 92,599 | 3,433,571 | |||||
| 6,655,781 | |||||||
Mining - 1.25% | |||||||
Titanium Metals Corp.*+ | 74,400 | 2,195,544 | |||||
Miscellaneous Manufacturers - 3.31% | |||||||
Ceradyne, Inc.*+ | 35,000 | 1,977,500 | |||||
Freightcar America, Inc.+ | 24,700 | 1,369,615 | |||||
Trinity Industries, Inc. | 70,050 | 2,465,760 | |||||
| 5,812,875 | |||||||
Oil & Gas - 2.61% | |||||||
Frontier Oil Corp.+ | 61,000 | 1,753,140 | |||||
Grey Wolf, Inc.* | 74,000 | 507,640 | |||||
Occidental Petroleum Corp. | 16,800 | 820,344 | |||||
Parallel Petroleum Corp.* | 85,000 | 1,493,450 | |||||
| 4,574,574 | |||||||
Oil & Gas Services - 13.49% | |||||||
Bolt Technology Corp.* | 79,518 | 1,773,251 | |||||
Dril-Quip, Inc.* | 115,800 | 4,534,728 | |||||
FMC Technologies, Inc.* | 7,015 | 432,335 | |||||
Helix Energy Solutions Group, Inc.* | 47,000 | 1,474,390 | |||||
Hercules Offshore, Inc.* | 39,000 | 1,127,100 | |||||
Input/Output, Inc.*+ | 87,900 | 1,198,077 | |||||
Lufkin Industries, Inc. | 37,600 | 2,183,808 | |||||
Mitcham Industries, Inc.* | 98,700 | 1,179,465 | |||||
NATCO Group, Inc.* | 55,400 | 1,766,152 | |||||
RPC, Inc. | 48,050 | 811,084 | |||||
Superior Energy Services* | 68,600 | 2,241,848 | |||||
Tetra Technologies, Inc.*+ | 90,000 | 2,302,200 | |||||
Tidewater, Inc.+ | 35,000 | 1,692,600 | |||||
Trico Marine Services, Inc.* | 24,600 | 942,426 | |||||
| 23,659,464 | |||||||
Pharmaceuticals - 0.70% | |||||||
Anika Therapeutics, Inc.* | 54,325 | 720,893 | |||||
Valeant Pharmaceuticals International | 29,500 | 508,580 | |||||
| 1,229,473 | |||||||
| Industry | Company | Shares | Value | |||||
Retail - 4.01% |
| |||||||
Cash America International, Inc. | 41,846 | $ | 1,962,577 | |||||
Coldwater Creek, Inc.*+ | 73,650 | 1,805,898 | ||||||
Dress Barn, Inc.*+ | 75,000 | 1,749,750 | ||||||
MSC Industrial Direct Co. | 30,200 | 1,182,330 | ||||||
United Retail Group, Inc.* | 24,000 | 336,480 | ||||||
| 7,037,035 | ||||||||
Semiconductors - 2.44% |
| |||||||
Amkor Technology, Inc.*+ | 177,550 | 1,658,317 | ||||||
MKS Instruments, Inc.* | 30,000 | 677,400 | ||||||
Nvidia Corp.*+ | 52,400 | 1,939,324 | ||||||
| 4,275,041 | ||||||||
Software - 4.06% |
| |||||||
BMC Software, Inc.* | 92,500 | 2,978,500 | ||||||
Informatica Corp.* | 70,400 | 859,584 | ||||||
Opnet Technologies, Inc.* | 145,000 | 2,095,250 | ||||||
Quality Systems, Inc. | 31,800 | 1,185,186 | ||||||
| 7,118,520 | ||||||||
Telecommunications - 5.91% |
| |||||||
CommScope, Inc.* | 103,500 | 3,154,680 | ||||||
Comtech Telecommunications Corp.* | 16,687 | 635,274 | ||||||
Interdigital Communications Corp.* | 9,312 | 312,418 | ||||||
Knology, Inc.* | 31,053 | 330,404 | ||||||
Lightbridge, Inc.* | 180,400 | 2,442,616 | ||||||
Oplink Communications, Inc.* | 73,000 | 1,500,880 | ||||||
Sonus Networks, Inc.* | 257,000 | 1,693,630 | ||||||
WPCS International, Inc.* | 28,878 | 296,577 | ||||||
| 10,366,479 | ||||||||
Transportation - 5.55% |
| |||||||
American Commercial Lines, Inc.*+ | 114,600 | 7,507,446 | ||||||
EGL, Inc.* | 24,091 | 717,430 | ||||||
Kirby Corp.* | 44,000 | 1,501,720 | ||||||
| 9,726,596 | ||||||||
TOTAL COMMON STOCKS | 176,808,616 | |||||||
(Cost $148,358,885) | ||||||||
TOTAL INVESTMENTS - 100.82% | $ | 176,808,616 | ||||||
(Cost $148,358,885) | ||||||||
Liabilities in Excess of Other Assets - (0.82)% | (1,433,028 | ) | ||||||
NET ASSETS - 100.00% | $ | 175,375,588 | ||||||
| * | Non Income Producing Security |
| + | This security or a portion of the security is out on loan at December 31, 2006. Total loaned securities had a market value of $50,518,698 at December 31, 2006. |
See Notes to Financial Statements.
| www.Bridgeway.com | 61 |
Bridgeway Small-Cap Value Fund
MANAGER’S COMMENTARY
(Unaudited)
January 31, 2007
Dear Fellow Small-Cap Value Fund Shareholder,
Our Fund was up 6.39% in the December 2006 quarter, compared to a 9.03% gain for our primary market benchmark, the Russell 2000 Value Index, and an 8.18% return of our peer benchmark, the Lipper Small-Cap Value Index. It was a poor quarter relative to our benchmarks.
For the calendar year, the Fund was up 12.77%, trailing the Russell 2000 Value Index by 10.71% and the Lipper Small-Cap Value Index by 4.36%. Our poor showing was the result of poor performance across a majority of our models and an unusual market environment that did not reward the favorable reports of some of our stocks, while pummeling our stocks with unfavorable reports. As a result, we have some “catch up” to do on our relative performance since inception.
The table below presents our December quarter, one-year and life-to-date financial results according to the formula required by the SEC. A graph of quarterly performance since inception appears below.
Dec. Qtr. 10/1/06 to 12/31/06 | 1 Year 1/1/06 to 12/31/06 | Life-to-Date 10/31/03 to 12/31/06 | ||||
Small-Cap Value Fund | 6.39% | 12.77% | 16.36% | |||
Russell 2000 Value Index | 9.03% | 23.48% | 18.25% | |||
Lipper Small-Cap Value Index | 8.18% | 17.13% | 16.97% | |||
Performance figures quoted represent past performance and are no guarantee of future results. Current performance may be lower or higher than the performance figures quoted, and an investor’s shares, when redeemed, may be worth more or less than original cost. For the most recent month-end performance, please call 1-800-661-3550 or visit the Fund’s website at www.bridgeway.com.
The Russell 2000 Value Index is an unmanaged index which consists of stocks in the Russell 2000 Index with lower price-to-book ratios and lower forecasted growth values with dividends reinvested. The Lipper Small-Cap Value Index is an index of small-company, value-oriented funds compiled by Lipper, Inc. It is not possible to invest directly in an index. Periods longer than one year are annualized.
According to data from Lipper, Inc., Small-Cap Value Fund ranked 196th of 256 small-cap value funds for the twelve-month period ended December 31, 2006 and 94th of 209 such funds since inception in October, 2003. Lipper, Inc. is an independent mutual fund rating service that ranks funds in various fund categories by making comparative calculations using total returns.
Growth of $10,000 Invested in Small-Cap Value Fund and Indexes from 10/31/03 (inception) to 12/31/06
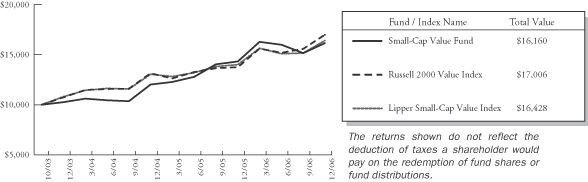
| 62 | Semi-Annual Report | December 31, 2006 (Unaudited) |
Bridgeway Small-Cap Value Fund
MANAGER’S COMMENTARY (continued)
(Unaudited)
Detailed Explanation of Quarterly Performance—What Worked Well
The Short Version: Fifteen stocks had greater than 20% gains for the December quarter, and unfortunately we had only one star performer. The ten best performers in the list below represented a diverse group of sectors and industries.
These are the ten best-performing companies for the December quarter:
| Rank | Description | Industry | % Gain | |||
| 1 | Amkor Technology, Inc. | Semiconductors | 81.4% | |||
| 2 | Cleveland-Cliffs, Inc. | Iron/Steel | 27.1% | |||
| 3 | Commercial Metals Co. | Metal Fabricate/Hardware | 26.9% | |||
| 4 | Administaff, Inc. | Commercial Services | 26.9% | |||
| 5 | Ezcorp, Inc. | Retail | 26.0% | |||
| 6 | iMergent, Inc. | Internet | 25.0% | |||
| 7 | FEI Co. | Electronics | 24.9% | |||
| 8 | American Physicians Capital, Inc. | Insurance | 24.1% | |||
| 9 | Dobson Communications Corp. | Telecommunications | 24.1% | |||
| 10 | Spartan Stores, Inc. | Food | 23.9% | |||
Amkor is a leading provider of advanced semiconductor assembly and test services. We first purchased it into our Fund in February. Through the summer and early fall of 2006, the company was fraught with problems that seemed to be one domino of bad news falling after another: the company warning of slowing growth rates, the SEC looking into option award practices, delays in filing its 10Q financial statements with the federal government pending the results of the stock option inquiry, threat of stock exchange delisting, announcement of likely restated financial results from the options probe, probable non-compliance with lending requirements (bondholder covenants) due to the delayed filings, and the specter of bankruptcy should the bondholders accelerate bond payment. On top of all this, the market environment was very unfriendly to this kind of stock, and for all these reasons the stock price was pummeled. It would seem things just couldn’t get worse. (Things can always get worse.) In the midst of all this bad news, the company continued to report favorable underlying economic results. At the lower price, one of our models still liked the stock. This is where the advantage of quantitative investing comes into play – taking all the emotion out of the process. Based on the model “advice,” we held on to our position. (A personal footnote: on our team we say that we guard against favorite stocks or models – avoiding emotional attachment, which could take one in the wrong direction. We also “confess” to personal attachments, so here’s mine: I’m actually most comfortable buying (or holding) stocks, like Amkor, after the price has been “beaten up” on speculation of “more bad things to come.” This is “my kind of stock buy.” Having said that, I’ll revert to my official position: it’s just another stock.)
Amkor had started out the September quarter at a price of $9.46 and ended that quarter at $5.15. Thereafter, much of the “bad news” unwound as more facts came to light. The company reported another quarter of good financial results. The stock option inquiry exonerated all current members of management. Prior financials were restated, and the company was able to make their financial filings. The bondholders dropped their threat of accelerated payments, and the threat of bankruptcy filings vanished. With help from the market recovery in the fourth quarter, the stock price recovered to $9.34 at December quarter end.
Detailed Explanation of Quarterly Performance—What Didn’t Work
The Short Version: Of the 105 companies in our Fund as of December 31, we had only three declining more than 20%. Although the industrial sector (transportation, electronics and aerospace industries) was our best-performing sector in the quarter, we had four industrial stocks in the list below. As losers go, it wasn’t a bad list, but it was enough to drag our performance below our benchmarks.
| www.Bridgeway.com | 63 |
Bridgeway Small Cap Value Fund
MANAGER’S COMMENTARY (continued)
(Unaudited)
These are the ten worst-performing companies for the December quarter:
| Rank | Description | Industry | % Loss | |||
| 1 | Saia, Inc. | Transportation | -28.8% | |||
| 2 | United Retail Group, Inc. | Retail | -23.1% | |||
| 3 | Intervest Bancshares Corp. | Banks | -21.0% | |||
| 4 | Technitrol, Inc. | Electronics | -20.0% | |||
| 5 | United Industrial Corp./New York | Aerospace/Defense | -20.0% | |||
| 6 | Park Electrochemical Corp. | Electronics | -19.0% | |||
| 7 | Pantry, Inc. | Retail | -16.7% | |||
| 8 | Humana, Inc. | Healthcare-Services | -16.3% | |||
| 9 | Valeant Pharmaceuticals International | Pharmaceuticals | -13.4% | |||
| 10 | Meadowbrook Insurance Group, Inc. | Insurance | -12.2% | |||
Saia, Inc., through its subsidiary, Saia Motor Freight Line, Inc., provides various trucking transportation and supply chain solutions to the retail, chemical, and manufacturing industries. Its stock price took a steep downward trend in mid to late October resulting from reports of a lackluster beginning of the holiday season. Retail customers had also delayed orders, keeping lean control of inventories and using software to manage products corresponding to customer choices. Rising gasoline prices didn’t help matters. We trimmed our position slightly, but continue holding the company.
The Pantry operates 1,506 convenience stores in 11 states under a variety of banners, primarily Kangaroo Express. In the midst of a slew of good company news, one negative can cause a price tumble. The Pantry announced fiscal fourth quarter results: earnings of $26.7 million, $1.16 a share, up from $25.4 million and $1.12 a share, beating its target by a penny. Revenue rose to $1.69 billion from $1.38 billion, also exceeding projections of $1.66 billion. However, company officials project $2.80 to $3 per share for the next fiscal year, and analysts expected $3.32. On that news alone, the stock price fell 13%. We continue to hold.
Detailed Explanation of Calendar Year Performance—What Worked Well
The Short Version: Small value stocks performed much better the second six months than the first, and fairly evenly across sectors and industries.
These are the ten best-performing companies for the calendar year:
| Rank | Description | Industry | % Gain | |||
| 1 | Ezcorp, Inc. | Retail | 219.0% | |||
| 2 | Knight Capital Group, Inc. | Diversified Finan Service | 95.7% | |||
| 3 | Spartan Stores, Inc. | Food | 93.9% | |||
| 4 | Titanium Metals Corp. | Mining | 86.6% | |||
| 5 | Interdigital Communications Corp. | Telecommunications | 81.7% | |||
| 6 | Clean Harbors, Inc. | Environmental Control | 68.5% | |||
| 7 | Stewart & Stevenson Services, Inc. | Machinery-Diversified | 66.5% | |||
| 8 | Dril-Quip, Inc. | Oil & Gas Services | 65.9% | |||
| 9 | Holly Corp. | Oil & Gas | 65.3% | |||
| 10 | EMCOR Group, Inc. | Engineering & Construction | 64.7% | |||
Ezcorp has been a steady performer for our Fund since the fall of 2005. It operates pawn shops and payday loan stores. In early November this year, company officials announced that earnings from loans were better because of a recent increase
| 64 | Semi-Annual Report | December 31, 2006 (Unaudited) |
Bridgeway Small Cap Value Fund
MANAGER’S COMMENTARY (continued)
(Unaudited)
in paid debt. The company opened 46 stores in the September quarter with plans for 100 more in fiscal 2007. Upon the news that earnings were 61 cents to 64 cents a share, above its earlier prediction of 43 to 46 cents, the stock price rose almost 20%.
Founded in 1917 in Grand Rapids, Michigan, Spartan Stores, Inc. engages in the distribution and retailing of groceries principally in Michigan, Ohio, and Indiana through approximately 350 independent grocery stores and 73 corporate-owned stores. It has been a steady performer for us since early 2005. Second-quarter results beat analysts’ expectations, resulting in an almost 12% stock price increase in mid-October. Since then, the price has moved slowly, steadily upward.
Detailed Explanation of Calendar Year Performance—What Didn’t Work
The Short Version: Four of the worst-performing companies for the calendar year in the list below are in the consumer, cyclical sector (home builders, retail and distribution industries). We had sold all of them by the end of the summer, stopping the drag on performance for the fourth quarter.
These are the ten worst-performing companies for the calendar year:
| Rank | Description | Industry | % Loss | |||
| 1 | Escala Group, Inc. | Commercial Services | -76.7% | |||
| 2 | Peerless Systems Corp. | Software | -57.7% | |||
| 3 | Wind River Systems, Inc. | Software | -44.6% | |||
| 4 | KB Home | Home Builders | -37.7% | |||
| 5 | Building Material Holding Corp. | Distribution/Wholesale | -36.9% | |||
| 6 | MarineMax, Inc. | Retail | -34.9% | |||
| 7 | Mitcham Industries, Inc. | Oil & Gas Services | -31.6% | |||
| 8 | Navarre Corp. | Distribution/Wholesale | -31.2% | |||
| 9 | Checkpoint Systems, Inc. | Electronics | -31.2% | |||
| 10 | Omnivision Technologies, Inc. | Semiconductors | -30.2% | |||
The only stock that we continued to hold after December 31, 2006 of the ten in the list above is Mitcham Industries. The company leases and sells geophysical and other equipment used primarily by seismic data acquisition contractors to perform seismic data acquisition surveys on land and in transition zones, such as marsh and shallow water areas. In mid-September shares were down 12% after the company reported a slim rise in quarterly results along with skittish oil prices, causing analysts to be wary. However, our model hasn’t signaled a sell, and we’re holding.
Top Ten Holdings as of December 31, 2006
All of our largest holdings were in positive performance territory, but only two were in the top ten best performers, Amkor Technology and Ezcorp. Our largest stocks comprised 25.3% of net assets.
| Rank | Description | Industry | Percent of Net Assets | |||
| 1 | Quanta Services, Inc. | Commercial Services | 3.4% | |||
| 2 | McDermott International, Inc. | Engineering & Construction | 2.9% | |||
| 3 | Amkor Technology, Inc. | Semiconductors | 2.8% | |||
| 4 | General Cable Corp. | Electrical Compo & Equip | 2.7% | |||
| 5 | Ocwen Financial Corp. | Diversified Finan Service | 2.6% | |||
| 6 | Ezcorp, Inc. | Retail | 2.5% | |||
| 7 | Celadon Group, Inc. | Transportation | 2.2% | |||
| 8 | AAR Corp. | Aerospace/Defense | 2.1% | |||
| 9 | Knight Capital Group, Inc. | Diversified Finan Service | 2.1% | |||
| 10 | Dress Barn, Inc. | Retail | 2.0% | |||
| 25.3% | ||||||
| www.Bridgeway.com | 65 |
Bridgeway Small Cap Value Fund
MANAGER’S COMMENTARY (continued)
(Unaudited)
Industry Sector Representation as of December 31, 2006
Our most heavily-weighted sector and the one most divergent to our market index was industrial, which was also our best-performing sector. However, technology was also a better-performing sector, and our underweighting hurt our return somewhat.
| Industry | % of Net Assets | % S&P Small-Cap Index | Difference | |||
Basic Materials | 5.7% | 4.0% | 1.7% | |||
Communications | 5.1% | 4.1% | 1.0% | |||
Consumer, Cyclical | 17.2% | 17.3% | -0.1% | |||
Consumer, Non-cyclical | 15.9% | 17.5% | -1.6% | |||
Energy | 7.3% | 7.2% | 0.1% | |||
Financial | 11.8% | 16.0% | -4.2% | |||
Industrial | 29.3% | 18.7% | 10.6% | |||
Technology | 4.2% | 10.1% | -5.9% | |||
Utilities | 3.6% | 5.1% | -1.5% | |||
Cash | -0.1% | 0.0% | -0.1% | |||
Total | 100.0% | 100.0% |
Disclaimer
The following is a reminder from the friendly folks at your Fund who worry about liability. The views expressed here are exclusively those of Fund management. These views, including those regarding market sectors or individual stocks, are not meant as investment advice and should not be considered predictive in nature. Any favorable (or unfavorable) description of a holding applies only as of the quarter end, December 31, 2006, unless otherwise stated. Security positions can and do change thereafter. Discussions of historical performance do not guarantee and are not indicative of future performance.
The Fund is subject to above average market risk (volatility) and is not an appropriate investment for short-term investors. Investments in small companies carry greater risk than is customarily associated with larger companies for various reasons such as narrower markets (fewer investors), limited financial resources and greater trading difficulty.
This report is submitted for the general information of the shareholders of the Fund. It is not authorized for distribution to prospective investors unless preceded or accompanied by an effective prospectus, which includes information regarding the Fund’s risks, objectives, fees and expenses, experience of its management, and other information. For questions or other Fund information, call 1-800-661-3550 or visit the Fund’s website www.bridgeway.com. Foreside Fund Services, LLC, distributor.
Conclusion
Thank you for your continued investment in Small-Cap Value Fund. As always, we appreciate your feedback.
Sincerely,
John Montgomery
| 66 | Semi-Annual Report | December 31, 2006 (Unaudited) |
THIS PAGE INTENTIONALLY LEFT BLANK
| www.Bridgeway.com | 67 |
Bridgeway Small-Cap Value Fund
SCHEDULE OF INVESTMENTS
Showing percentage of net assets as of December 31, 2006 (Unaudited)
| Industry | Company | Shares | Value | ||||
COMMON STOCKS - 100.15% | |||||||
Aerospace/Defense - 2.12% | |||||||
AAR Corp.*+ | 186,600 | $ | 5,446,854 | ||||
Agriculture - 1.27% | |||||||
The Andersons, Inc. | 77,100 | 3,268,269 | |||||
Airlines - 1.70% | |||||||
Alaska Air Group, Inc.*+ | 110,700 | 4,372,650 | |||||
Apparel - 1.61% | |||||||
Steven Madden Ltd. | 118,000 | 4,140,620 | |||||
Banks - 0.94% | |||||||
Intervest Bancshares Corp.* | 70,102 | 2,412,210 | |||||
Chemicals - 0.32% | |||||||
UAP Holding Corp. | 32,266 | 812,458 | |||||
Commercial Services - 8.10% | |||||||
Administaff, Inc.+ | 70,200 | 3,002,454 | |||||
Consolidated Graphics, Inc.* | 14,500 | 856,515 | |||||
CPI Corp. | 20,300 | 943,747 | |||||
Kendle International, Inc.* | 58,700 | 1,846,115 | |||||
Korn/Ferry International* | 78,900 | 1,811,544 | |||||
MPS Group, Inc.* | 246,500 | 3,495,370 | |||||
Quanta Services, Inc.*+ | 451,600 | 8,882,972 | |||||
| 20,838,717 | |||||||
Distribution/Wholesale - 0.93% | |||||||
WESCO International, Inc.*+ | 40,800 | 2,399,448 | |||||
Diversified Financial Services - 6.07% | |||||||
Knight Capital Group, Inc.* | 279,900 | 5,365,683 | |||||
The Nasdaq Stock Market, Inc.*+ | 49,660 | 1,529,031 | |||||
Ocwen Financial Corp.* | 420,300 | 6,665,958 | |||||
Piper Jaffray Cos.*+ | 31,600 | 2,058,740 | |||||
| 15,619,412 | |||||||
Electric - 3.62% | |||||||
OGE Energy Corp. | 119,500 | 4,780,000 | |||||
UIL Holdings Corp. | 107,666 | 4,542,428 | |||||
| 9,322,428 | |||||||
Electrical Components & Equipment - 2.69% | |||||||
General Cable Corp.* | 158,500 | 6,928,035 | |||||
| Industry | Company | Shares | Value | ||||
Electronics - 2.74% | |||||||
FEI Co.* | 51,129 | $ | 1,348,272 | ||||
Park Electrochemical Corp. | 56,200 | 1,441,530 | |||||
Rogers Corp.* | 10,500 | 621,075 | |||||
Technitrol, Inc. | 152,900 | 3,652,781 | |||||
| 7,063,658 | |||||||
Engineering & Construction - 5.38% | |||||||
EMCOR Group, Inc.* | 80,500 | 4,576,425 | |||||
McDermott International, Inc.* | 147,300 | 7,491,678 | |||||
Sterling Construction Co., Inc.* | 81,700 | 1,777,792 | |||||
| 13,845,895 | |||||||
Environmental Control - 1.95% | |||||||
Clean Harbors, Inc.* | 103,800 | 5,024,958 | |||||
Food - 2.81% | |||||||
Great Atlantic & Pacific Tea Co., Inc.+ | 124,100 | 3,194,334 | |||||
Spartan Stores, Inc. | 193,300 | 4,045,769 | |||||
| 7,240,103 | |||||||
Hand/Machine Tools - 1.19% | |||||||
Regal-Beloit Corp.* | 58,500 | 3,071,835 | |||||
Healthcare - Products - 0.98% | |||||||
ICU Medical, Inc.* | 61,894 | 2,517,848 | |||||
Healthcare - Services - 2.37% | |||||||
Air Methods Corp.* | 119,900 | 3,347,608 | |||||
Humana, Inc.* | 13,460 | 744,473 | |||||
Res-Care, Inc.* | 110,600 | 2,007,390 | |||||
| 6,099,471 | |||||||
Insurance - 4.84% | |||||||
American Physicians Capital, Inc.* | 24,300 | 972,972 | |||||
Argonaut Group, Inc.* | 29,500 | 1,028,370 | |||||
CNA Surety Corp.* | 9,800 | 210,700 | |||||
Commerce Group, Inc. | 67,400 | 2,005,150 | |||||
Meadowbrook Insurance Group, Inc.* | 144,200 | 1,426,138 | |||||
Odyssey RE Holdings | 44,400 | 1,656,120 | |||||
Safety Insurance Group, Inc. | 14,234 | 721,806 | |||||
Tower Group, Inc. | 110,000 | 3,417,700 | |||||
United Fire & Casualty Co. | 28,600 | 1,008,150 | |||||
| 12,447,106 | |||||||
| 68 | Semi-Annual Report | December 31, 2006 (Unaudited) |
Bridgeway Small-Cap Value Fund
SCHEDULE OF INVESTMENTS (continued)
Showing percentage of net assets as of December 31, 2006 (Unaudited)
| Industry | Company | Shares | Value | ||||
Common Stocks (continued) | |||||||
Internet - 0.58% | |||||||
iMergent, Inc.*+ | 8,700 | $ | 249,168 | ||||
Move, Inc.* | 226,800 | 1,249,668 | |||||
| 1,498,836 | |||||||
Iron/Steel - 4.57% | |||||||
Carpenter Technology Corp. | 39,300 | 4,029,036 | |||||
Chaparral Steel Co. | 35,000 | 1,549,450 | |||||
Cleveland-Cliffs, Inc.+ | 102,400 | 4,960,256 | |||||
Steel Dynamics, Inc. | 37,400 | 1,213,630 | |||||
| 11,752,372 | |||||||
Machinery - Diversified - 3.54% | |||||||
Gardner Denver, Inc.* | 112,400 | 4,193,644 | |||||
Robbins & Myers, Inc. | 107,000 | 4,913,440 | |||||
| 9,107,084 | |||||||
Media - 0.52% | |||||||
Mediacom Communications Corp.* | 167,142 | 1,343,822 | |||||
Metal Fabricate/Hardware - 2.19% | |||||||
AM Castle & Co. | 110,400 | 2,809,680 | |||||
Commercial Metals Co. | 109,400 | 2,822,520 | |||||
| 5,632,200 | |||||||
Mining - 0.78% | |||||||
Titanium Metals Corp.*+ | 68,000 | 2,006,680 | |||||
Miscellaneous Manufacturers - 1.69% | |||||||
PW Eagle, Inc.+ | 125,818 | 4,340,721 | |||||
Office Furnishings - 0.50% | |||||||
Steelcase, Inc. | 70,900 | 1,287,544 | |||||
Oil & Gas - 3.31% | |||||||
Penn Virginia Corp. | 44,000 | 3,081,760 | |||||
Tesoro Corp.+ | 35,700 | 2,347,989 | |||||
Vaalco Energy, Inc.* | 457,900 | 3,090,825 | |||||
| 8,520,574 | |||||||
Oil & Gas Services - 3.95% | |||||||
Dril-Quip, Inc.* | 108,400 | 4,244,944 | |||||
Mitcham Industries, Inc.* | 141,900 | 1,695,705 | |||||
Petroquest Energy, Inc.* | 93,500 | 1,191,190 | |||||
Swift Energy Co.* | 45,900 | 2,056,779 | |||||
Tidewater, Inc.+ | 20,000 | 967,200 | |||||
| 10,155,818 | |||||||
| Industry | Company | Shares | Value | |||||
Pharmaceuticals - 0.37% |
| |||||||
Anika Therapeutics, Inc.* | 67,800 | $ | 899,706 | |||||
Valeant Pharmaceuticals International | 3,300 | 56,892 | ||||||
| 956,598 | ||||||||
Retail - 11.91% |
| |||||||
Big Lots, Inc.*+ | 75,000 | 1,719,000 | ||||||
Dillard’s, Inc.+ | 124,200 | 4,343,274 | ||||||
Dress Barn, Inc.*+ | 224,000 | 5,225,920 | ||||||
Ezcorp, Inc.* | 396,000 | 6,435,000 | ||||||
Group 1 Automotive, Inc.+ | 40,000 | 2,068,800 | ||||||
Men’s Wearhouse, Inc.+ | 93,800 | 3,588,788 | ||||||
The Pantry, Inc.*+ | 50,400 | 2,360,736 | ||||||
Rush Enterprises, Inc.* | 130,000 | 2,199,600 | ||||||
United Retail Group, Inc.* | 193,884 | 2,718,254 | ||||||
| 30,659,372 | ||||||||
Semiconductors - 4.24% |
| |||||||
Amkor Technology, Inc.* | 760,700 | 7,104,938 | ||||||
MKS Instruments, Inc.* | 168,363 | 3,801,636 | ||||||
| 10,906,574 | ||||||||
Telecommunications - 3.97% |
| |||||||
Anixter International, Inc.* | 18,000 | 977,400 | ||||||
Dobson Communications Corp.* | 435,500 | 3,793,205 | ||||||
Interdigital Communications Corp.* | 90,455 | 3,034,765 | ||||||
RF Micro Devices, Inc.*+ | 355,800 | 2,415,882 | ||||||
| 10,221,252 | ||||||||
Toys/Games/Hobbies - 0.58% |
| |||||||
Topps Company, Inc. | 168,500 | 1,499,650 | ||||||
Transportation - 5.82% |
| |||||||
Celadon Group, Inc.* | 335,700 | 5,622,975 | ||||||
HUB Group, Inc.* | 107,400 | 2,958,870 | ||||||
Kirby Corp.* | 110,200 | 3,761,126 | ||||||
Saia, Inc.* | 113,180 | 2,626,908 | ||||||
| 14,969,879 | ||||||||
TOTAL COMMON STOCKS (Cost $201,255,403) | 257,730,951 | |||||||
TOTAL INVESTMENTS - 100.15% | $ | 257,730,951 | ||||||
(Cost $201,255,403) | ||||||||
Liabilities in Excess of Other Assets - (0.15)% | (395,778 | ) | ||||||
NET ASSETS - 100.00% | $ | 257,335,173 | ||||||
| * | Non income producing security |
| + | This security or a portion of the security is out on loan at December 31, 2006. Total loaned securities had a market value of $56,530,087 at December 31, 2006. |
See Notes to Financial Statements.
| www.Bridgeway.com | 69 |
Bridgeway Large-Cap Growth Fund
MANAGER’S COMMENTARY
(Unaudited)
January 31, 2007
Dear Fellow Large-Cap Growth Fund Shareholder,
Our Fund had a positive return of 4.47% for the December 2006 quarter, compared to a 5.93% return for our primary market benchmark, the Russell 1000 Growth Index, and a 5.92% return of our peer benchmark, the Lipper Large-Cap Growth Index. It was a poor quarter on a relative basis.
For the full calendar year, the Fund was up 4.99%, trailing the Russell 1000 Growth Index (up 9.07%) but easing by the Lipper Large-Cap Growth Index (up 4.72%). This was enough to put us slightly behind our market benchmark since inception, and we’ve got some catch up to do.
The table below presents our December quarter, one-year and life-to-date financial results according to the formula required by the SEC. A graph of quarterly performance since inception appears at the top of the following page.
Dec. Qtr. 10/1/06 to 12/31/06 | 1 Year 1/1/06 to 12/31/06 | Life-to-Date 10/31/03 to 12/31/06 | ||||
Large-Cap Growth Fund | 4.47% | 4.99% | 7.76% | |||
Russell 1000 Growth Index | 5.93% | 9.07% | 8.00% | |||
Lipper Large-Cap Growth Index | 5.92% | 4.72% | 7.47% | |||
Performance figures quoted represent past performance and are no guarantee of future results. Current performance may be lower or higher than the performance figures quoted, and an investor’s shares, when redeemed, may be worth more or less than original cost. For the most recent month-end performance, please call 1-800-661-3550 or visit the Fund’s website at www.bridgeway.com
The Russell 1000 Growth Index is an unmanaged index which consists of stocks in the Russell 1000 Index with higher price-to-book ratios and higher forecasted growth values with dividends reinvested. The Lipper Large-Cap Growth Index is an index of large-company, growth-oriented funds compiled by Lipper, Inc. It is not possible to invest directly in an index. Periods longer than one year are annualized.
According to data from Lipper, Inc., Large-Cap Growth Fund ranked 382nd of 489 multi-cap growth funds for the twelve-month period as of December 31, 2006 and 297th of 392 such funds since inception in October, 2003. Lipper, Inc. is an independent mutual fund rating service that ranks funds in various fund categories by making comparative calculations using total returns.
| 70 | Semi-Annual Report | December 31, 2006 (Unaudited) |
Bridgeway Large-Cap Growth Fund
MANAGER’S COMMENTARY (continued)
(Unaudited)
Growth of $10,000 Invested in Large-Cap Growth Fund and Indexes from 10/31/03 (inception) to 12/31/06
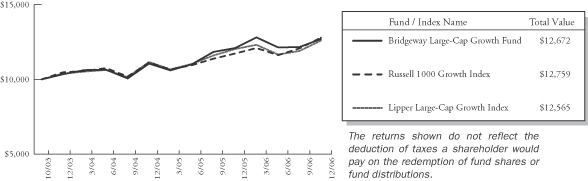
Detailed Explanation of Quarterly Performance—What Worked Well
The Short Version: Our best performers for the December quarter represented a wide range of sectors and industries. Only seven posted returns above 20%, which was not enough to pull our quarterly performance above our benchmarks.
These are the ten best-performing stocks for the December quarter:
| Rank | Description | Industry | % Gain | |||
| 1 | Allegheny Technologies, Inc. | Iron/Steel | 45.8% | |||
| 2 | CB Richard Ellis Group, Inc. | Real Estate | 35.0% | |||
| 3 | Joy Global, Inc. | Machinery-Constr & Mining | 28.7% | |||
| 4 | Coach, Inc. | Apparel | 24.9% | |||
| 5 | Precision Castparts Corp. | Metal Fabricate/Hardware | 23.9% | |||
| 6 | ConocoPhillips | Oil & Gas | 20.9% | |||
| 7 | DIRECTV Group, Inc. | Media | 20.0% | |||
| 8 | Harman International Industries, Inc. | Home Furnishings | 19.7% | |||
| 9 | Merrill Lynch & Co., Inc. | Diversified Finan Service | 19.0% | |||
| 10 | Cisco Systems, Inc. | Telecommunications | 18.9% | |||
Allegheny Technologies Incorporated engages in the production and sale of a range of specialty metals such as nickel and cobalt-based alloys; titanium and titanium-based alloys; zirconium, and many other specialty metals. It has diverse clients from aerospace, defense, chemical processing, oil and gas, to food processing equipment and medical industries. In mid-October Allegheny signed a long-term agreement with Boeing for titanium products for commercial aerospace applications, with estimated revenue of $2.5 billion. It has been a steady climber for our Fund since our mid-summer purchase.
CB Richard Ellis is a well-known name in commercial real estate. In late September it sponsored an IPO for its financing division, CBRE Realty Finance Inc. Shortly thereafter, it joined the S&P 500 Index, replacing Bell South, which was about to be acquired by AT&T. At the end of October, its announcement of plans to buy its rival, Trammell Crow sent both stocks upward, 6.4% and 24.7%, respectively. The transaction was completed in December. In the January 23 issue of Investors Business Daily, Marilyn Alva wrote, “There are two kinds of real estate. There’s the kind that’s been down in the dumps; that would be on the residential side. And there’s the bright-eyed, happy one – the commercial real estate market. CB Richard Ellis Group wears the happy face.” As you might guess, our model doesn’t really care who’s smiling. It just seeks to pick one good stock at a time. This is one.
| www.Bridgeway.com | 71 |
Bridgeway Large-Cap Growth Fund
MANAGER’S COMMENTARY (continued)
(Unaudited)
Detailed Explanation of Quarterly Performance—What Didn’t Work
The Short Version: “What didn’t work” in the December quarter, as you can see in the list below, was not that we had a great number of stocks under water. We just needed more depth on the bench of positive performers above. Only two companies had returns that declined more than 20%.
These are the ten worst-performing stocks for the December quarter:
| Rank | Description | Industry | % Loss | |||
| 1 | Citrix Systems, Inc. | Software | -25.3% | |||
| 2 | Corning, Inc. | Telecommunications | -23.4% | |||
| 3 | SanDisk Corp. | Computers | -19.6% | |||
| 4 | Molex, Inc. | Electrical Compo &Equip | -18.8% | |||
| 5 | Motorola, Inc. | Telecommunications | -17.8% | |||
| 6 | TD Ameritrade Holding Corp. | Diversified Finan Service | -14.2% | |||
| 7 | Texas Instruments, Inc. | Semiconductors | -13.4% | |||
| 8 | TXU Corp. | Electric | -13.3% | |||
| 9 | Abercrombie & Fitch Co. | Retail | -10.9% | |||
| 10 | Expeditors Inter. Washington, Inc. | Transportation | -9.2% | |||
Motorola, our fourth best performer in the September quarter, dropped to fifth worst this quarter. Cell phone competition has been fierce, not only with Nokia and Samsung, but also from its own Krzr, the new version of the popular slim phone, Razr, which has sold more than 50 million units world-wide (including the one I bought my wife last year). After announcing in mid-October that third quarter revenues fell short of expectations and that earnings fell 45% year-over-year, its share price fell 11% over the next few days.
We continued to hold all ten of these companies at December 31; we sold our positions in Molex and Motorola in January of 2007.
Detailed Explanation of Calendar Year Performance—What Worked Well
The Short Version: Our best-performing stocks for the calendar year represented six sectors and nine industries, quite a diverse group. Precision Castparts, Cisco Systems and Nordstrom each added over 1% to our return for the year.
These are the ten best-performing stocks for the calendar year:
| Rank | Description | Industry | % Gain | |||
| 1 | Precision Castparts Corp. | Metal Fabricate/Hardware | 52.7% | |||
| 2 | Freescale Semiconductor, Inc. Class B | Semiconductors | 52.0% | |||
| 3 | Freescale Semiconductor, Inc. | Semiconductors | 44.0% | |||
| 4 | Cisco Systems, Inc. | Telecommunications | 43.8% | |||
| 5 | Walt Disney Co. | Media | 43.0% | |||
| 6 | Paccar, Inc. | Auto Manufacturers | 40.6% | |||
| 7 | Allegheny Technologies, Inc. | Iron/Steel | 38.2% | |||
| 8 | Chicago Mercan. Exch. Hold., Inc. | Diversified Finan Service | 37.3% | |||
| 9 | Monsanto Co. | Chemicals | 35.5% | |||
| 10 | Nordstrom, Inc. | Retail | 31.9% | |||
Founded in 1949 in Oregon, Precision Castparts Corp. manufactures metal components and products and provides investment (outer covering) castings, forgings, and fasteners/fastener systems for critical aerospace and industrial gas turbine applications. In late October in its quarterly report, it announced that profit figures were double over a year ago, soundly beating analysts’ expectations. Its stock price did not spike, but continued its gentle rise, which has continued into 2007 as well.
| 72 | Semi-Annual Report | December 31, 2006 (Unaudited) |
Bridgeway Large-Cap Growth Fund
MANAGER’S COMMENTARY (continued)
(Unaudited)
Freescale, which was spun off from Motorola in 2004, makes chips for the cell phone handset market, as well as integrated circuits for automotive and industrial equipment. In September, the company began considering an acquisition bid from Blackstone Group. The announcement resulted in a 20.5% price jump, and we sold our shares shortly thereafter. Freescale is interesting in that we owned two different “share classes” of the stock. Typically, a company may have more than a single share class in order to keep voting control of the company in the hands of a small number of shareholders, as is the case here. We may buy one or both share classes depending on the price and trading characteristics of the two share classes.
Generally, companies that choose to have multiple classes of common stock assign more voting rights to one class of stock than the other. The company may provide its founders, executives or other large stakeholders with a different class of common stock that carries multiple votes for each single share of stock. Investors should always research the details of a company’s share classes if they are considering investing in a firm with more than one class. The purpose of the super voting shares is often to give key company insiders greater control over the company’s voting rights, which can also be an effective defense against hostile takeovers. Different share classes typically have the same rights to profits and company ownership. Provided the large stakeholders who own the disproportionate voting shares are successful in running the company, this should be of little concern to investors – especially the typical retail investor who has a very tiny stake in the company anyway. Normally, the existence of dual share classes would only be a problem if an investor believed the disproportionate voting rights were allowing inferior management to remain in place in spite of the best interests of shareholders. In the case of Freescale, we received the “B” share class of stock from the Motorola spin off. Early in 2006, we purchased the “A” share class of the stock because it had more attractive trading characteristics. After we sold both positions, the deal finally closed on December 1, and both classes were acquired by Blackstone.
Detailed Explanation of Calendar Year Performance—What Didn’t Work
The Short Version: Eight stocks had a decline in return over 30% for the calendar year. We sold Chico’s and Advance Micro Devices in the late summer, but their cumulative effect had already hurt our calendar year performance, earning them the top two spots.
| Rank | Description | Industry | % Loss | |||
| 1 | Chico’s FAS, Inc. | Retail | -58.8% | |||
| 2 | Advanced Micro Devices, Inc. | Semiconductors | -42.9% | |||
| 3 | Broadcom Corp. | Semiconductors | -36.1% | |||
| 4 | SanDisk Corp. | Computers | -34.5% | |||
| 5 | Jabil Circuit, Inc. | Electronics | -34.4% | |||
| 6 | TD Ameritrade Holding Corp. | Diversified Finan Service | -32.6% | |||
| 7 | Citrix Systems, Inc. | Software | -32.0% | |||
| 8 | Juniper Networks, Inc. | Telecommunications | -30.0% | |||
| 9 | Joy Global, Inc. | Machinery-Constr & Mining | -29.0% | |||
| 10 | Getty Images, Inc. | Advertising | -25.7% | |||
SanDisk Corporation makes flash storage card products that allow data to be stored in a compact format that retains the data for an extended period of time after the power has been turned off. Its products are used in digital cameras, feature phones, and other digital consumer devices. Through the late summer and early fall, its volatile stock price reflected the whim of tech analysts’ speculation. For instance, when Skype announced that it would use SanDisk’s flash memory chips, its price fell over 8%. Ten days later, the price went up 14% when its quarterly results exceeded expectations. We trimmed our position in this volatile stock during the third quarter, but continue to hold the stock.
| www.Bridgeway.com | 73 |
Bridgeway Large-Cap Growth Fund
MANAGER’S COMMENTARY (continued)
(Unaudited)
Top Ten Holdings as of December 31, 2006
Our largest holdings at the end of the calendar year were also in “double digits” for performance for the period, with the exception of Amgen. The pharmaceuticals industry was heavily represented with three companies. The top ten holdings represented 22.4% of net assets, reflecting the diversification of our Fund.
| Rank | Description | Industry | Percent of Net Assets | |||
| 1 | Nordstrom, Inc. | Retail | 2.8% | |||
| 2 | Bristol-Myers Squibb Co. | Pharmaceuticals | 2.5% | |||
| 3 | Cisco Systems, Inc. | Telecommunications | 2.5% | |||
| 4 | Exxon Mobil Corp. | Oil & Gas | 2.4% | |||
| 5 | Gilead Sciences, Inc. | Pharmaceuticals | 2.1% | |||
| 6 | Schlumberger Ltd. | Oil & Gas Services | 2.1% | |||
| 7 | DIRECTV Group, Inc. | Media | 2.1% | |||
| 8 | Schering-Plough Corp. | Pharmaceuticals | 2.0% | |||
| 9 | Franklin Resources, Inc. | Diversified Finan Service | 2.0% | |||
| 10 | Amgen, Inc. | Biotechnology | 1.9% | |||
| 22.4% |
Industry Sector Representation as of December 31, 2006
Our overweighting in the energy sector helped our performance, but the underweighting in the financial sector held it back.
| Sector | % of Net Assets | % of S&P 500 Index | Difference | |||
Basic Materials | 2.5% | 2.9% | -0.4% | |||
Communications | 10.8% | 11.6% | -0.8% | |||
Consumer, Cyclical | 14.0% | 8.3% | 5.7% | |||
Consumer, Non-cyclical | 21.6% | 19.9% | 1.7% | |||
Energy | 17.5% | 9.9% | 7.6% | |||
Financial | 10.6% | 22.2% | -11.6% | |||
Industrial | 9.1% | 11.1% | -2.0% | |||
Technology | 10.1% | 10.6% | -0.5% | |||
Utilities | 2.4% | 3.5% | -1.1% | |||
‘Cash | 1.4% | 0.0% | 1.4% | |||
Total | 100.0% | 100.0% |
Disclaimer
The following is a reminder from the friendly folks at your Fund who worry about liability. The views expressed here are exclusively those of Fund management. These views are not meant as investment advice and should not be considered predictive in nature. Any favorable (or unfavorable) description of a holding applies only as of December 31, 2006, unless otherwise stated. Security positions can and do change thereafter. Discussions of historical performance do not guarantee and are not indicative of future performance.
The Fund is subject to market risk (volatility) and is not an appropriate investment for short-term investors.
This report is submitted for the general information of the shareholders of the Fund. It is not authorized for distribution to prospective investors unless preceded or accompanied by an effective prospectus, which includes information regarding the Fund’s risks, objectives, fees and expenses, experience of its management, and other information. For questions or other Fund information, call 1-800-661-3550 or visit the Fund’s website www.bridgeway.com. Foreside Fund Services, LLC, distributor.
| 74 | Semi-Annual Report | December 31, 2006 (Unaudited) |
Bridgeway Large-Cap Growth Fund
MANAGER’S COMMENTARY (continued)
(Unaudited)
Conclusion
Thank you for your continued investment in Large-Cap Growth Fund. This Fund remains open to both current and new investors. As always, we appreciate your feedback.
Sincerely,
John Montgomery
| www.Bridgeway.com | 75 |
Bridgeway Large-Cap Growth Fund
SCHEDULE OF INVESTMENTS
Showing percentage of net assets as of December 31, 2006 (Unaudited)
| Industry | Company | Shares | Value | ||||
COMMON STOCKS - 98.89% | |||||||
Aerospace/Defense - 0.15% | |||||||
L-3 Communications Holdings, Inc. | 2,000 | $ | 163,560 | ||||
Apparel - 1.83% | |||||||
Coach, Inc.* | 35,320 | 1,517,347 | |||||
Polo Ralph Lauren Corp.+ | 5,700 | 442,662 | |||||
| 1,960,009 | |||||||
Auto Manufacturers - 0.27% | |||||||
Paccar, Inc. | 4,500 | 292,050 | |||||
Banks - 2.16% | |||||||
State Street Corp. | 12,700 | 856,488 | |||||
Synovus Financial Corp. | 31,000 | 955,730 | |||||
US Bancorp+ | 14,000 | 506,660 | |||||
| 2,318,878 | |||||||
Beverages - 2.05% | |||||||
The Coca-Cola Co. | 23,700 | 1,143,525 | |||||
PepsiCo., Inc.+ | 16,900 | 1,057,095 | |||||
| 2,200,620 | |||||||
Biotechnology - 3.55% | |||||||
Amgen, Inc.* | 30,400 | 2,076,624 | |||||
Genentech, Inc.* | 21,400 | 1,736,182 | |||||
| 3,812,806 | |||||||
Chemicals - 0.37% | |||||||
Monsanto Co. | 7,600 | 399,228 | |||||
Commercial Services - 0.95% | |||||||
Moody’s Corp.+ | 14,700 | 1,015,182 | |||||
Computers - 4.39% | |||||||
Apple Computer, Inc.* | 24,300 | 2,061,612 | |||||
Cognizant Technology Solutions Corp.* | 10,000 | 771,600 | |||||
Network Appliance, Inc.*+ | 9,600 | 377,088 | |||||
SanDisk Corp.* | 22,600 | 972,478 | |||||
Sun Microsystems, Inc.* | 97,000 | 525,740 | |||||
| 4,708,518 | |||||||
Cosmetics/Personal Care - 1.09% | |||||||
Procter & Gamble Co. | 18,232 | 1,171,771 | |||||
Diversified Financial Services - 7.08% | |||||||
The Charles Schwab Corp. | 30,000 | 580,200 | |||||
Chicago Mercantile Exchange Holdings, Inc.+ | 3,200 | 1,631,200 | |||||
E*Trade Financial Co.*+ | 43,000 | 964,060 | |||||
| Industry | Company | Shares | Value | ||||
Diversified Financial Services (continued) | |||||||
Franklin Resources, Inc. | 19,800 | $ | 2,181,366 | ||||
Merrill Lynch & Co., Inc. | 20,107 | 1,871,962 | |||||
TD Ameritrade Holding Corp.+ | 22,600 | 365,668 | |||||
| 7,594,456 | |||||||
Electric - 2.39% | |||||||
Allegheny Energy, Inc.*+ | 22,900 | 1,051,339 | |||||
TXU Corp. | 28,000 | 1,517,880 | |||||
| 2,569,219 | |||||||
Electrical Components & Equipment - 0.91% | |||||||
Molex, Inc. | 30,900 | 977,367 | |||||
Healthcare - Products - 3.87% | |||||||
CR Bard, Inc. | 1,800 | 149,346 | |||||
Johnson & Johnson | 27,300 | 1,802,346 | |||||
Medtronic, Inc.+ | 4,400 | 235,444 | |||||
Stryker Corp.+ | 17,000 | 936,870 | |||||
Zimmer Holdings, Inc.* | 13,160 | 1,031,481 | |||||
| 4,155,487 | |||||||
Healthcare - Services - 1.29% | |||||||
UnitedHealth Group, Inc. | 25,716 | 1,381,721 | |||||
Home Furnishings - 1.19% | |||||||
Harman International Industries, Inc. | 12,740 | 1,272,853 | |||||
Household Products/Wares - 1.08% | |||||||
Fortune Brands, Inc.+ | 13,520 | 1,154,473 | |||||
Internet - 0.69% | |||||||
Google, Inc.*+ | 1,600 | 736,768 | |||||
Iron/Steel - 0.84% | |||||||
Allegheny Technologies, Inc. | 10,000 | 906,800 | |||||
Machinery - Construction & Mining - 0.68% | |||||||
Joy Global, Inc.+ | 15,000 | 725,100 | |||||
Machinery - Diversified - 0.14% | |||||||
Rockwell Automation, Inc. | 2,400 | 146,592 | |||||
Media - 3.13% | |||||||
DIRECTV Group, Inc.* | 89,100 | 2,222,154 | |||||
Walt Disney Co.+ | 33,200 | 1,137,764 | |||||
| 3,359,918 | |||||||
Metal Fabricate/Hardware - 1.73% | |||||||
Precision Castparts Corp. | 23,700 | 1,855,236 | |||||
| 76 | Semi-Annual Report | December 31, 2006 (Unaudited) |
Bridgeway Large-Cap Growth Fund
SCHEDULE OF INVESTMENTS (continued)
Showing percentage of net assets as of December 31, 2006 (Unaudited)
| Industry | Company | Shares | Value | ||||
Common Stocks (continued) | |||||||
Mining - 1.26% | |||||||
Freeport-McMoRan Copper & Gold, Inc. | 5,000 | $ | 278,650 | ||||
Vulcan Materials Co. | 12,000 | 1,078,440 | |||||
| 1,357,090 | |||||||
Miscellaneous Manufacturers - 3.34% | |||||||
Danaher Corp.+ | 14,800 | 1,072,112 | |||||
Dover Corp. | 15,700 | 769,614 | |||||
General Electric Co. | 23,300 | 866,993 | |||||
Illinois Tool Works, Inc.+ | 19,000 | 877,610 | |||||
| 3,586,329 | |||||||
Oil & Gas - 7.51% | |||||||
Baker Hughes, Inc. | 22,700 | 1,694,782 | |||||
ConocoPhillips | 3,607 | 259,524 | |||||
Diamond Offshore Drilling, Inc.+ | 11,600 | 927,304 | |||||
Exxon Mobil Corp. | 33,800 | 2,590,094 | |||||
Noble Energy, Inc. | 17,900 | 878,353 | |||||
XTO Energy, Inc. | 36,266 | 1,706,315 | |||||
| 8,056,372 | |||||||
Oil & Gas Services - 9.45% | |||||||
BJ Services Co.+ | 30,500 | 894,260 | |||||
Cameron International Corp.*+ | 20,900 | 1,108,745 | |||||
EOG Resources, Inc. | 21,100 | 1,317,695 | |||||
Grant Prideco, Inc.*+ | 27,200 | 1,081,744 | |||||
Halliburton Co.+ | 44,000 | 1,366,200 | |||||
Schlumberger Ltd. | 35,400 | 2,235,864 | |||||
Smith International, Inc.+ | 27,000 | 1,108,890 | |||||
Weatherford International Ltd.*+ | 24,400 | 1,019,676 | |||||
| 10,133,074 | |||||||
Pharmaceuticals - 7.75% | |||||||
Bristol-Myers Squibb Co.+ | 100,700 | 2,650,424 | |||||
Caremark Rx, Inc. | 2,000 | 114,220 | |||||
Express Scripts, Inc.* | 13,000 | 930,800 | |||||
Gilead Sciences, Inc.* | 34,620 | 2,247,876 | |||||
Pfizer, Inc. | 7,200 | 186,480 | |||||
Schering-Plough Corp.+ | 92,600 | 2,189,064 | |||||
| 8,318,864 | |||||||
Pipelines - 0.65% | |||||||
Questar Corp.+ | 8,400 | 697,620 | |||||
Real Estate - 1.35% | |||||||
CB Richard Ellis Group, Inc.* | 43,500 | 1,444,200 | |||||
| Industry | Company | Shares | Value | ||||
Retail - 10.79% | |||||||
Abercrombie & Fitch Co. | 15,100 | $ | 1,051,413 | ||||
Best Buy Co., Inc.+ | 28,145 | 1,384,452 | |||||
Kohl’s Corp.*+ | 10,000 | 684,300 | |||||
Nordstrom, Inc.+ | 62,140 | 3,065,988 | |||||
Office Depot, Inc.*+ | 42,400 | 1,618,408 | |||||
Staples, Inc. | 25,890 | 691,263 | |||||
Starbucks Corp.* | 28,300 | 1,002,386 | |||||
Tiffany & Co. | 9,700 | 380,628 | |||||
Walgreen Co.+ | 37,000 | 1,697,930 | |||||
| 11,576,768 | |||||||
Semiconductors - 2.45% | |||||||
MEMC Electronic Materials, Inc.* | 29,100 | 1,138,974 | |||||
Texas Instruments, Inc. | 51,790 | 1,491,552 | |||||
| 2,630,526 | |||||||
Software - 3.30% | |||||||
Citrix Systems, Inc.* | 17,300 | 467,965 | |||||
Oracle Corp.* | 85,600 | 1,467,184 | |||||
Paychex, Inc. | 40,500 | 1,601,370 | |||||
| 3,536,519 | |||||||
Telecommunications - 6.98% | |||||||
Cisco Systems, Inc.* | 96,900 | 2,648,277 | |||||
Corning, Inc.* | 59,300 | 1,109,503 | |||||
Harris Corp. | 22,100 | 1,013,506 | |||||
Motorola, Inc.+ | 70,500 | 1,449,480 | |||||
Qualcomm, Inc.+ | 33,500 | 1,265,965 | |||||
| 7,486,731 | |||||||
Transportation - 2.23% | |||||||
CH Robinson Worldwide, Inc.+ | 22,200 | 907,758 | |||||
Expeditors International Washington, Inc.+ | 23,200 | 939,600 | |||||
FedEx Corp. | 5,000 | 543,100 | |||||
| 2,390,458 | |||||||
TOTAL COMMON STOCKS | 106,093,163 | ||||||
(Cost $90,384,699) | |||||||
| www.Bridgeway.com | 77 |
Bridgeway Large-Cap Growth Fund
SCHEDULE OF INVESTMENTS (continued)
Showing percentage of net assets as of December 31, 2006 (Unaudited)
MONEY MARKET MUTUAL FUNDS - 0.95% | |||||||
| Rate^ | Shares | Value | |||||
Blackrock TempCash Liquidity Fund | 5.17% | 1,015,777 | $ | 1,015,777 | |||
TOTAL MONEY MARKET MUTUAL FUNDS | 1,015,777 | ||||||
(Cost $1,015,777) | |||||||
TOTAL INVESTMENTS - 99.84% | $ | 107,108,940 | |||||
(Cost $91,400,476) | |||||||
Other Assets in Excess of Liabilities - 0.16% | 167,944 | ||||||
NET ASSETS - 100.00% | $ | 107,276,884 | |||||
| * | Non Income Producing Security |
| ^ | Rate disclosed is as of December 31, 2006 |
| + | This security or a portion of the security is out on loan at December 31, 2006. Total loaned securities had a market value of $36,317,138 at December 31, 2006. |
See Notes to Financial Statements.
| 78 | Semi-Annual Report | December 31, 2006 (Unaudited) |
THIS PAGE INTENTIONALLY LEFT BLANK
| www.Bridgeway.com | 79 |
Bridgeway Large-Cap Value Fund
MANAGER’S COMMENTARY
(Unaudited)
January 31, 2007
Dear Fellow Large-Cap Value Fund Shareholder,
Our Fund was up 7.56% for the December 2006 quarter, compared to an 8.00% gain for our primary market benchmark, the Russell 1000 Value Index, and a 7.02% return of our peer benchmark, the Lipper Large-Cap Value Index. It was a strong quarter on an absolute basis, but mixed on a relative basis.
For the calendar year, the Fund was up 18.52%, trailing the Russell 1000 Value Index (up 22.25%) but easing by the Lipper Large-Cap Value Index (up 18.28%). The calendar year was better than the quarter, but not one of our better years by Bridgeway standards. We continue to lead our peer benchmark by a reasonable margin since inception, but now have some catch-up to regain a reasonable lead over our primary market benchmark.
The table below presents our December quarter, one-year and life-to-date financial results according to the formula required by the SEC. A graph of quarterly performance since inception appears at the top of the following page.
Dec. Qtr. 10/1/06 to 12/31/06 | 1 Year 1/1/06 to 12/31/06 | Life-to-Date 10/31/03 to 12/31/06 | ||||
Large-Cap Value Fund | 7.56% | 18.52% | 16.82% | |||
Russell 1000 Value Index | 8.00% | 22.25% | 16.92% | |||
Lipper Large-Cap Value Index | 7.02% | 18.28% | 13.95% | |||
Performance figures quoted represent past performance and are no guarantee of future results. Current performance may be lower or higher than the performance figures quoted, and an investor’s shares, when redeemed, may be worth more or less than original cost. For the most recent month-end performance, please call 1-800-661-3550 or visit the Fund’s website at www.bridgeway.com.
The Russell 1000 Value Index is an unmanaged index which consists of stocks in the Russell 1000 Index with lower price-to-book ratios and lower forecasted growth values with dividends reinvested. The Lipper Large-Cap Value Index is an index of large-company, value-oriented funds compiled by Lipper, Inc. It is not possible to invest directly in an index. Periods longer than one year are annualized.
According to data from Lipper, Inc., Large-Cap Value Fund ranked 177th of 444 multi-cap value funds for the twelve-month period as of December 31, 2006 and 45th of 332 such funds since inception in October, 2003. Lipper, Inc. is an independent mutual fund rating service that ranks funds in various fund categories by making comparative calculations using total returns.
| 80 | Semi-Annual Report | December 31, 2006 (Unaudited) |
Bridgeway Large-Cap Value Fund
MANAGER’S COMMENTARY (continued)
(Unaudited)
Growth of $10,000 Invested in Large-Cap Value Fund and Indexes from 10/31/03 (inception) to 12/31/06
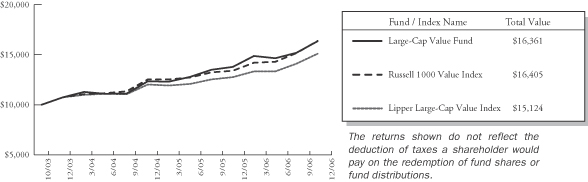
Detailed Explanation of Quarterly Performance—What Worked Well
The Short Version: Although we had only one stock with a return over 30%, of the 81 holdings, all but 15 were in positive territory for the quarter. Financial sector stocks added over 3% to performance for the quarter, followed by energy stocks at 1.3%.
These are the ten best-performing companies in the December quarter:
| Rank | Description | Industry | % Gain | |||
| 1 | Phelps Dodge Corp. | Mining | 41.4% | |||
| 2 | Marathon Oil Corp. | Oil & Gas | 20.3% | |||
| 3 | Hess Corp. | Oil & Gas | 19.7% | |||
| 4 | ConocoPhillips | Oil & Gas | 19.5% | |||
| 5 | Time Warner, Inc. | Media | 19.5% | |||
| 6 | Merrill Lynch & Co., Inc. | Diversified Finan Service | 19.0% | |||
| 7 | Expedia, Inc. | Internet | 18.3% | |||
| 8 | Goldman Sachs Group, Inc. | Diversified Finan Service | 17.8% | |||
| 9 | American Electric Power Co., Inc. | Electric | 17.1% | |||
| 10 | Southern Copper Corp. | Mining | 16.5% | |||
Phelps Dodge, co-founded by Anson Phelps and William Dodge in 1834, engages in the production of copper, molybdenum, molybdenum-based chemicals, and continuous-cast copper rod worldwide. Its products are sold to original equipment manufacturers for use in electrical motors, generators, transformers, medical applications and public utilities. Anson and William would be glad to know that Freeport-McMoRan offered to buy their company for $25.9 billion as a way to boost copper reserves in the soaring precious metals market. After the mid-November announcement, Phelps Dodge shares shot up 27%. Shareholders of both companies will vote in February.
Another company well over 100 years old and a household name, Goldman Sachs Group, Inc., provides investment banking, securities, and investment management services worldwide. It was among the first companies purchased in our Fund in 2003. Liz Moyer expresses Goldman’s dynamic capabilities well in the November 15 issue of Forbes, “Goldman’s ability to spin gold out of virtually any market scenario on a consistent basis is the envy of many on Wall Street, but it is not by accident. Sophisticated technology systems developed over the last decade allow it to inch out on the limb without risking too much.” While spinning gold is not a component that our model tracks, so far, it’s signaling a hold.
| www.Bridgeway.com | 81 |
Bridgeway Large-Cap Value Fund
MANAGER’S COMMENTARY (continued)
(Unaudited)
Detailed Explanation of Quarterly Performance—What Didn’t Work
The Short Version: Only five stocks declined by more than 10% for the quarter. We also owned each of the ten companies in the list below at quarter end, which is also unusual.
These are the ten worst-performing companies in the December quarter:
| Rank | Description | Industry | % Loss | |||
| 1 | Corning, Inc. | Telecommunications | -23.4% | |||
| 2 | Archer-Daniels-Midland Co. | Agriculture | -15.6% | |||
| 3 | Humana, Inc. | Healthcare-Services | -15.5% | |||
| 4 | Electronic Arts, Inc. | Software | -13.5% | |||
| 5 | TXU Corp. | Electric | -13.3% | |||
| 6 | General Motors Corp. | Auto Manufacturers | -8.0% | |||
| 7 | Parker Hannifin Corp. | Miscellaneous Manufacturer | -6.3% | |||
| 8 | E*Trade Financial Corp. | Diversified Finan Services | -6.3% | |||
| 9 | Qwest Comm. Int’l, Inc. | Telecommunications | -4.0% | |||
| 10 | Office Depot, Inc. | Retail | -3.9% | |||
Of the ten companies listed above, Archer-Daniels-Midland (“ADM”) had the most negative effect on our performance for the quarter. The company engages in the procurement, transportation, storing, processing, and merchandising of agricultural commodities and products. Until recently, the most widely known products were flours and feeds ground from wheat, corn and milo for commercial bakeries, food companies and animal nutrients. Its ethanol and biodiesel segment has made it a player in the alternative energy market rush. We have held the stock since late 2005, and it had performed well for us until recently. It was the ninth best performer in the June 2006 quarter. In late October it announced very strong third quarter results, with net income doubling and revenue up 10% over the same period a year ago. However, the stock price dropped almost 15% over the next week after the announcement. According to ADM’s CEO, price movements will continue to be subject to volatile commodity prices.
Corning Incorporated manufactures an amazing variety of glass-based products from liquid crystal displays (LCDs), which are used in computer monitors and LCD televisions, optical fiber and cable, with all necessary cable components, ceramic technologies and solutions for emissions and pollution control, and laboratory products, which include items like coated slides, culture dishes, flasks, glass beakers. In mid-October, the stock price dropped on news that sales of its fiber optic cable were weaker and that it was adjusting earnings accordingly. The price remained rocky to year end but has recovered somewhat since then.
Detailed Explanation of Calendar Year Performance—What Worked Well
The Short Version: Like the December quarter, financial and energy stocks were the star performers.
These are the ten best-performing companies for the calendar year:
| Rank | Description | Industry | % Gain | |||
| 1 | BellSouth Corp. | Telecommunications | 73.9% | |||
| 2 | Kerr-McGee Corp. | Oil & Gas | 58.2% | |||
| 3 | AT&T, Inc. | Telecommunications | 46.0% | |||
| 4 | Goldman Sachs Group, Inc. | Diversified Finan Service | 38.0% | |||
| 5 | Hewlett-Packard Co. | Computers | 34.7% | |||
| 6 | Merrill Lynch & Co., Inc. | Diversified Finan Service | 34.3% | |||
| 7 | Morgan Stanley | Diversified Finan Service | 32.4% | |||
| 8 | Freescale Semiconductor, Inc. | Semiconductors | 30.5% | |||
| 9 | Chevron Corp. | Oil & Gas | 29.5% | |||
| 10 | Southern Copper Corp. | Mining | 27.2% | |||
| 82 | Semi-Annual Report | December 31, 2006 (Unaudited) |
Bridgeway Large-Cap Value Fund
MANAGER’S COMMENTARY (continued)
(Unaudited)
“The new AT&T” seems to be gobbling up companies right and left, just the opposite of the “Ma Bell divestiture” and “Baby Bells”, which most adults under 50 have never even heard of. In May AT&T announced plans to merge with BellSouth (number one on our list). However, it took the Federal Communications Commission (FCC) the rest of the year—actually until the first week in January—to approve the transaction. (Hence, BellSouth appears as a separate company in our holdings and also enjoyed a bigger gain because it was the “acquiree.”) We have owned it in this Fund since early 2004, adding to our position periodically through the years until it has become our fourth largest holding as of December 31st. Its price has had a steady upward trend since May.
Detailed Explanation of Calendar Year Performance—What Didn’t Work
The Short Version: The main thing that “didn’t work” over the calendar year was home builders. Our positions in all four companies on the list below were jettisoned from the Fund by the end of June; however, their decline was enough to give them worst-performer standing for the year.
These are the ten worst-performing companies for the calendar year:
| Rank | Description | Industry | % Loss | |||
| 1 | Juniper Networks, Inc. | Telecommunications | -38.8% | |||
| 2 | KB Home | Home Builders | -37.7% | |||
| 3 | Lennar Corp. | Home Builders | -28.1% | |||
| 4 | Barr Pharmaceuticals, Inc. | Pharmaceuticals | -25.4% | |||
| 5 | Centex Corp. | Home Builders | -25.2% | |||
| 6 | ENSCO International, Inc. | Oil & Gas | -19.9% | |||
| 7 | Humana, Inc. | Healthcare-Services | -15.5% | |||
| 8 | Pulte Homes, Inc. | Home Builders | -15.3% | |||
| 9 | Black & Decker Corp. | Hand/Machine Tools | -15.1% | |||
| 10 | Electronic Arts, Inc. | Software | -13.5% | |||
We continue to hold both Humana and Electronic Arts. Humana, Inc. is a well-known provider of health insurance coverage and related services through various traditional and Internet-based plans for employer groups, government-sponsored programs, and individuals. Its stock rose steadily upward from May to October this year. When it announced third quarter revenue and profit, while up significantly from a year ago, its price tumbled over 8% upon missing analysts’ expectations. With its booming Medicare business, the company sees better days ahead. Interestingly, upon a stock drop like this, some of our models like the stock even better while others “choke.”
Top Ten Holdings as of December 31, 2006
The ten largest holdings are littered with mammoth financial services companies. Fortunately, they, along with HP and AT&T, have delivered pretty good performance too. Our largest positions totaled 23.5% of net assets.
| Rank | Description | Industry | Percent of Net Assets | |||
| 1 | Hewlett-Packard Co. | Computers | 2.8% | |||
| 2 | Morgan Stanley | Diversified Finan Service | 2.7% | |||
| 3 | Goldman Sachs Group, Inc. | Diversified Finan Service | 2.7% | |||
| 4 | AT&T, Inc. | Telecommunications | 2.6% | |||
| 5 | Bear Stearns Cos., Inc. | Diversified Finan Service | 2.2% | |||
| 6 | JPMorgan Chase & Co. | Diversified Finan Service | 2.1% | |||
| 7 | Berkshire Hathaway, Inc. Class B | Insurance | 2.1% | |||
| 8 | Bristol-Myers Squibb Co. | Pharmaceuticals | 2.1% | |||
| 9 | Metlife, Inc. | Insurance | 2.1% | |||
| 10 | EI Du Pont de Nemours & Co. | Chemicals | 2.1% | |||
| 23.5% |
| www.Bridgeway.com | 83 |
Bridgeway Large-Cap Value Fund
MANAGER’S COMMENTARY (continued)
(Unaudited)
Industry Sector Representation as of December 31, 2006
Our overweighting in the financial sector, as discussed above, compared to our market index, aided our performance. On the other hand, our underweighting in consumer, non-cyclical affected performance very little.
| Sector | % of Net Assets | S&P 500 Index | Difference | |||
Basic Materials | 8.0% | 2.9% | 5.1% | |||
Communications | 13.7% | 11.6% | 2.1% | |||
Consumer, Cyclical | 7.2% | 8.3% | -1.1% | |||
Consumer, Non-cyclical | 7.0% | 19.9% | -12.9% | |||
Energy | 10.8% | 9.9% | 0.9% | |||
Financial | 34.6% | 22.2% | 12.4% | |||
Industrial | 9.0% | 11.1% | -2.1% | |||
Technology | 5.5% | 10.6% | -5.1% | |||
Utility | 3.9% | 3.5% | 0.4% | |||
Cash | 0.3% | 0.0% | 0.3% | |||
Total | 100.0% | 100.0% |
Disclaimer
The following is a reminder from the friendly folks at your Fund who worry about liability. The views expressed here are exclusively those of Fund management. These views are not meant as investment advice and should not be considered predictive in nature. Any favorable (or unfavorable) description of a holding applies only as of December 31, 2006, unless otherwise stated. Security positions can and do change thereafter. Discussions of historical performance do not guarantee and are not indicative of future performance.
The Fund is subject to market risk (volatility) and is not an appropriate investment for short-term investors.
This report is submitted for the general information of the shareholders of the Fund. It is not authorized for distribution to prospective investors unless preceded or accompanied by an effective prospectus, which includes information regarding the Fund’s risks, objectives, fees and expenses, experience of its management, and other information. For questions or other Fund information, call 1-800-661-3550 or visit the Fund’s website www.bridgeway.com. Foreside Fund Services, LLC, distributor.
Conclusion
Thank you for your continued investment in Large-Cap Value Fund. This Fund remains open to both current and new investors. As always, we appreciate your feedback.
Sincerely,
John Montgomery
| 84 | Semi-Annual Report | December 31, 2006 (Unaudited) |
THIS PAGE INTENTIONALLY LEFT BLANK
| www.Bridgeway.com | 85 |
Bridgeway Large-Cap Value Fund
SCHEDULE OF INVESTMENTS
Showing percentage of net assets as of December 31, 2006 (Unaudited)
| Industry | Company | Shares | Value | ||||
COMMON STOCKS - 99.71% | |||||||
Aerospace/Defense - 3.12% | |||||||
Lockheed Martin Corp. | 18,300 | $ | 1,684,881 | ||||
Raytheon Co.+ | 20,000 | 1,056,000 | |||||
| 2,740,881 | |||||||
Agriculture - 1.30% | |||||||
Archer-Daniels-Midland Co. | 35,700 | 1,140,972 | |||||
Auto Manufacturers - 1.40% | |||||||
General Motors Corp.+ | 40,000 | 1,228,800 | |||||
Banks - 3.77% | |||||||
Bank of America Corp.+ | 17,808 | 950,769 | |||||
Keycorp+ | 13,000 | 494,390 | |||||
Regions Financial Corp.+ | 23,842 | 891,691 | |||||
US Bancorp+ | 27,000 | 977,130 | |||||
| 3,313,980 | |||||||
Chemicals - 2.08% | |||||||
EI Du Pont de Nemours & Co.+ | 37,500 | 1,826,625 | |||||
Commercial Services - 1.21% | |||||||
RR Donnelley & Sons Co. | 30,000 | 1,066,200 | |||||
Computers - 3.09% | |||||||
Hewlett-Packard Co. | 60,000 | 2,471,400 | |||||
NCR Corp.*+ | 5,700 | 243,732 | |||||
| 2,715,132 | |||||||
Diversified Financial Services - 14.96% | |||||||
The Bear Stearns Cos., Inc. | 11,834 | 1,926,338 | |||||
Citigroup, Inc. | 13,240 | 737,468 | |||||
E*Trade Financial Co.*+ | 39,600 | 887,832 | |||||
Goldman Sachs Group, Inc. | 11,800 | 2,352,330 | |||||
JPMorgan Chase & Co. | 38,950 | 1,881,285 | |||||
Lehman Brothers Holdings, Inc.+ | 21,140 | 1,651,457 | |||||
Merrill Lynch & Co., Inc.+ | 14,600 | 1,359,260 | |||||
Morgan Stanley | 29,060 | 2,366,356 | |||||
| 13,162,326 | |||||||
Electric - 3.88% | |||||||
American Electric Power Co., Inc. | 24,000 | 1,021,920 | |||||
Duke Energy Corp. | 32,100 | 1,066,041 | |||||
The Southern Co.+ | 15,050 | 554,743 | |||||
TXU Corp. | 14,300 | 775,203 | |||||
| 3,417,907 | |||||||
| Industry | Company | Shares | Value | ||||
Electronics - 1.23% | |||||||
Agilent Technologies, Inc.* | 31,000 | $ | 1,080,350 | ||||
Environmental Control - 1.02% | |||||||
Waste Management, Inc. | 24,500 | 900,865 | |||||
Forest Products & Paper - 0.91% | |||||||
International Paper Co.+ | 23,600 | 804,760 | |||||
Healthcare - Services - 2.36% | |||||||
Aetna, Inc. | 22,600 | 975,868 | |||||
Humana, Inc.* | 12,200 | 674,782 | |||||
WellPoint, Inc.* | 5,400 | 424,926 | |||||
| 2,075,576 | |||||||
Insurance - 14.91% | |||||||
The Allstate Corp. | 26,700 | 1,738,437 | |||||
Berkshire Hathaway, Inc.*+ | 510 | 1,869,660 | |||||
Chubb Corp. | 25,100 | 1,328,041 | |||||
Cigna Corp. | 7,000 | 920,990 | |||||
CNA Financial Corp.* | 29,700 | 1,197,504 | |||||
Hartford Financial Services Group, Inc.+ | 17,200 | 1,604,932 | |||||
Metlife, Inc.+ | 31,100 | 1,835,211 | |||||
Prudential Financial, Inc. | 15,000 | 1,287,900 | |||||
Safeco Corp. | 5,264 | 329,263 | |||||
WR Berkley Corp.+ | 29,050 | 1,002,516 | |||||
| 13,114,454 | |||||||
Internet - 0.48% | |||||||
Expedia, Inc.* | 20,000 | 419,600 | |||||
Iron/Steel - 1.47% | |||||||
Nucor Corp.+ | 23,600 | 1,289,976 | |||||
Media - 4.55% | |||||||
Comcast Corp.*+ | 30,300 | 1,282,599 | |||||
Idearc, Inc.* | 1,401 | 40,138 | |||||
Time Warner, Inc.+ | 49,200 | 1,071,576 | |||||
Walt Disney Co.+ | 46,900 | 1,607,263 | |||||
| 4,001,576 | |||||||
Mining - 3.52% | |||||||
Alcoa, Inc. | 52,800 | 1,584,528 | |||||
Phelps Dodge Corp. | 6,800 | 814,096 | |||||
Southern Copper Corp.+ | 13,000 | 700,570 | |||||
| 3,099,194 | |||||||
| 86 | Semi-Annual Report | December 31, 2006 (Unaudited) |
Bridgeway Large-Cap Value Fund
SCHEDULE OF INVESTMENTS (continued)
Showing percentage of net assets as of December 31, 2006 (Unaudited)
| Industry | Company | Shares | Value | ||||
Common Stocks (continued) | |||||||
Miscellaneous Manufacturers - 2.37% | |||||||
Honeywell International, Inc. | 20,000 | $ | 904,800 | ||||
Parker Hannifin Corp.+ | 3,500 | 269,080 | |||||
Textron, Inc. | 9,700 | 909,569 | |||||
| 2,083,449 | |||||||
Office/Business Equipment - 1.30% | |||||||
Xerox Corp.* | 67,600 | 1,145,820 | |||||
Oil & Gas - 9.03% | |||||||
Chesapeake Energy Corp.+ | 22,000 | 639,100 | |||||
Chevron Corp. | 18,514 | 1,361,334 | |||||
ConocoPhillips | 21,600 | 1,554,120 | |||||
Exxon Mobil Corp. | 21,600 | 1,655,208 | |||||
Marathon Oil Corp. | 10,600 | 980,500 | |||||
Occidental Petroleum Corp. | 19,200 | 937,536 | |||||
Valero Energy Corp. | 16,000 | 818,560 | |||||
| 7,946,358 | |||||||
Oil & Gas Services - 0.81% | |||||||
Hess Corp.+ | 14,340 | 710,834 | |||||
Pharmaceuticals - 2.09% | |||||||
Bristol-Myers Squibb Co.+ | 70,000 | 1,842,400 | |||||
Pipelines - 0.98% | |||||||
Williams Cos., Inc. | 32,900 | 859,348 | |||||
Retail - 5.04% | |||||||
CVS Corp. | 11,480 | 354,847 | |||||
JC Penney Co., Inc.+ | 17,100 | 1,322,856 | |||||
Office Depot, Inc.*+ | 37,000 | 1,412,290 | |||||
Sears Holdings Corp.* | 8,000 | 1,343,440 | |||||
| 4,433,433 | |||||||
Savings & Loans - 0.99% | |||||||
Washington Mutual, Inc. | 19,200 | 873,408 | |||||
Software - 1.14% | |||||||
Electronic Arts, Inc.* | 20,000 | 1,007,200 | |||||
Telecommunications - 8.65% | |||||||
AT&T, Inc.+ | 63,310 | 2,263,333 | |||||
BellSouth Corp. | 38,100 | 1,794,891 | |||||
Corning, Inc.* | 22,600 | 422,846 | |||||
Qwest Communications International, Inc.*+ | 204,600 | 1,712,502 | |||||
Verizon Communications, Inc. | 38,030 | 1,416,237 | |||||
| 7,609,809 | |||||||
| Industry | Company | Shares | Value | ||||
Toys/Games/Hobbies - 0.77% | |||||||
Mattel, Inc. | 30,000 | $ | 679,800 | ||||
Transportation - 1.28% | |||||||
Burlington Northern Santa Fe Corp. | 3,000 | 221,430 | |||||
FedEx Corp. | 8,300 | 901,546 | |||||
| 1,122,976 | |||||||
TOTAL COMMON STOCKS | 87,714,009 | ||||||
(Cost $71,667,635) | |||||||
MONEY MARKET MUTUAL FUNDS - 0.05% | |||||||
| Rate^ | Shares | Value | |||||
Blackrock TempCash Liquidity Fund | 5.17% | 39,688 | 39,688 | ||||
TOTAL MONEY MARKET MUTUAL FUNDS | 39,688 | ||||||
(Cost $39,688) | |||||||
TOTAL INVESTMENTS - 99.76% | $ | 87,753,697 | |||||
(Cost $71,707,323) | |||||||
Other Assets in Excess of Liabilities - 0.24% | 212,258 | ||||||
NET ASSETS - 100.00% | $ | 87,965,955 | |||||
| * | Non Income Producing Security |
| ^ | Rate disclosed is as of December 31, 2006. |
| + | This security or a portion of the security is out on loan at December 31, 2006. Total loaned securities had a market value of $29,886,422 at December 31, 2006. |
See Notes to Financial Statements.
| www.Bridgeway.com | 87 |
Bridgeway Blue Chip 35 Index Fund
MANAGER’S COMMENTARY
(Unaudited)
January 31, 2007
Dear Fellow Blue Chip 35 Index Fund Shareholder,
For the six months ending December 31, 2006, our Fund was up 13.34%, compared with a 12.74% increase of our primary benchmark, the S&P 500 Index, and a 10.98% increase for our peer group, the Lipper Large-Cap Core Funds Index. This was a very good six-month period on both an absolute and relative basis, and I am pleased.
For the full calendar year our Fund was up 15.42%, compared to 15.79% for the S&P 500 Index and 13.39% for the Lipper Large-Cap Core Funds Index. We underperformed our primary index, Bridgeway Ultra-Large 35 Index by less than the amount of our expense ratio—also a favorable result. As detailed below, ultra-large stocks underperformed ultra-small stocks for the eighth year in a row, representing the longest period of small company dominance in the last eight decades. This is not the environment within which we would expect our Fund to shine. Our internal goal, however, is seeking to outperform the S&P 500 Index each year that ultra-large stocks beat small stocks (the record so far is one for one) and half the years that ultra-small stocks beat ultra-large ones (the record so far is four of eight).
The table below presents our six-month, one-year, five-year and life-to-date financial results according to the formula required by the SEC. Since inception (see the right-hand column in the table below), we trail our own proprietary index, Bridgeway Ultra-Large 35, by a very small amount. There is more quarterly and annual variation between these numbers than many index funds, however. A graph of quarterly performance since inception appears at the top of the following page.
6 Months to 12/31/06 | 1 Year 1/1/06 to 12/31/06 | 5 Year 1/1/02 to 12/31/06 | Life-to-Date 7/31/97 to 12/31/06 | |||||
Blue Chip 35 Index Fund | 13.34% | 15.42% | 5.03% | 6.37% | ||||
S&P 500 Index | 12.74% | 15.79% | 6.19% | 5.95% | ||||
Bridgeway Ultra-Large 35 Index | 12.90% | 15.47% | 4.92% | 6.49% | ||||
Lipper Large-Cap Core Funds Index | 10.98% | 13.39% | 5.00% | 5.03% | ||||
Performance figures quoted represent past performance and are no guarantee of future results. Current performance may be lower or higher than the performance figures quoted, and an investor’s shares, when redeemed, may be worth more or less than original cost. For the most recent month-end performance, please call 1-800-661-3550 or visit the Fund’s website at www.bridgeway.com.
The S&P 500 Index is a broad-based, unmanaged measurement of changes in stock market conditions based on the average of 500 widely held common stocks with dividends reinvested. The Bridgeway Ultra-Large 35 Index is an index comprised of very large, “blue chip” U.S. stocks, excluding tobacco; it is compiled by the adviser of the Fund. The Lipper Large-Cap Core Funds Index reflects the aggregate record of domestic large-cap core mutual funds as reported by Lipper, Inc. It is not possible to invest directly in an index. Periods longer than one year are annualized.
According to data from Lipper, Inc., our Fund ranked 249th of 811 large blend funds for the last twelve months, 234th of 581 such funds for the last five years and 42nd of 281 such funds since inception in July 1997. Lipper, Inc. is an independent mutual fund rating service that ranks funds in various fund categories by making comparative calculations using total returns.
| 88 | Semi-Annual Report | December 31, 2006 (Unaudited) |
Bridgeway Blue Chip 35 Index Fund
MANAGER’S COMMENTARY (continued)
(Unaudited)
Growth of $10,000 Invested in Blue Chip 35 Index Fund and Indexes from 7/31/97 (inception) to 12/31/06
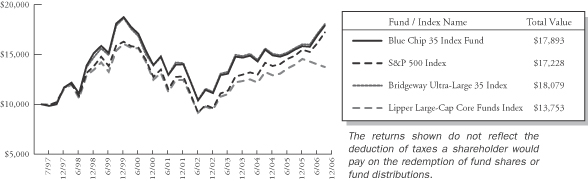
Performance Summary: Are times a-changin’?
The Short Version: After five years of a dramatically small-cap dominated market, ultra-large stocks (our Blue Chip 35 “staple”) finally achieved performance that looked something like the rest of the market.
Based on data from the Center for Research in Security Prices (“CRSP”), things turned back in our favor in the last six month period as demonstrated by the table below. We think we’ve been overdue for our “day in the sun,” but . . . there are never any guarantees in the short run. It will be interesting to see if 2007 represents a multi-year turning point.
Company Size According to the CRSP Cap-Based Portfolio Indexes1 | 6 months | 1 year | 5 year | 80 years2 | ||||
| 1 (ultra large) | 13.3% | 15.6% | 4.8% | 9.7% | ||||
| 2 | 10.8% | 15.6% | 12.0% | 11.1% | ||||
| 3 | 9.9% | 14.5% | 11.4% | 11.5% | ||||
| 4 | 7.8% | 11.6% | 11.7% | 11.5% | ||||
| 5 | 8.8% | 15.6% | 11.6% | 12.0% | ||||
| 6 | 8.8% | 15.1% | 11.2% | 11.9% | ||||
| 7 | 7.9% | 16.2% | 12.1% | 11.9% | ||||
| 8 | 11.7% | 17.9% | 14.3% | 12.2% | ||||
| 9 | 10.6% | 17.2% | 13.5% | 12.4% | ||||
| 10 (ultra-small) | 9.7% | 19.4% | 22.2% | 14.1% | ||||
1 | The CRSP Cap-Based Portfolio Indexes are unmanaged indexes of the publicly traded U.S. stocks with dividends reinvested, grouped by the market capitalization, as reported by the Center for Research in Security Prices. Past performance is no guarantee of future results. |
2 | December 1926 to December 2006. |
Calendar Year Performance
The Short Version: The calendar year performance of our Fund and its primary benchmark and index clustered around 15.5%, our best showing since 2003.
There are some signs in the market and around our office that large companies may be inching toward the performance spotlight. Of our eleven funds, Blue Chip 35 Index had the largest net inflows of new investment during the December quarter and was one of our better performing funds (see page i). Of the stocks below, telecommunications and energy led the pack, reflecting the performance of these sectors in the broader market.
| www.Bridgeway.com | 89 |
Bridgeway Blue Chip 35 Index Fund
MANAGER’S COMMENTARY (continued)
(Unaudited)
Total Return for Blue Chip 35 Index Fund Stocks for the Calendar Year 2006*
| Rank | Company | Industry | % Change | |||
| 1 | Cisco Systems, Inc. | Telecommunications | 40.20% | |||
| 2 | AT&T, Inc. | Telecommunications | 29.49% | |||
| 3 | Oracle Corp. | Software | 24.77% | |||
| 4 | Exxon Mobil Corp. | Oil & Gas | 23.02% | |||
| 5 | ConocoPhillips* | Oil & Gas | 21.18% | |||
| 6 | Chevron Corp. | Oil & Gas | 20.27% | |||
| 7 | Merck & Co, Inc. | Pharmaceuticals | 19.89% | |||
| 8 | Time Warner, Inc. | Media | 18.65% | |||
| 9 | Verizon Communications, Inc. | Telecommunications | 16.73% | |||
| 10 | JPMorgan Chase & Co.* | Diversified Finan Service | 15.96% | |||
| 11 | Berkshire Hathaway, Inc., Class B | Insurance | 14.50% | |||
| 12 | International Business Machines Corp. | Computers | 14.22% | |||
| 13 | Coca-Cola Co. | Beverages | 12.53% | |||
| 14 | Microsoft Corp. | Software | 11.79% | |||
| 15 | Citigroup, Inc. | Diversified Finan Service | 10.42% | |||
| 16 | Bank of America Corp. | Banks | 9.44% | |||
| 17 | Wells Fargo & Co. | Banks | 7.91% | |||
| 18 | Google, Inc.* | Internet | 7.83% | |||
| 19 | Procter & Gamble Co. | Cosmetics/Personal Care | 7.65% | |||
| 20 | United Technologies Corp.* | Aerospace/Defense | 7.57% | |||
| 21 | Wachovia Corp.* | Banks | 6.29% | |||
| 22 | Johnson & Johnson | Healthcare-Products | 5.67% | |||
| 23 | Pfizer, Inc. | Pharmaceuticals | 5.64% | |||
| 24 | American International Group, Inc. | Insurance | 5.55% | |||
| 25 | General Electric Co. | Miscellaneous Manufacturing | 5.02% | |||
| 26 | Applied Materials, Inc.* | Semiconductors | 4.37% | |||
| 27 | PepsiCo, Inc. | Beverages | 3.12% | |||
| 28 | Home Depot, Inc. | Retail | 2.95% | |||
| 29 | 3M Co. | Miscellaneous Manufacturing | 2.47% | |||
| 30 | Idearc, Inc.* | Media | 0.00% | |||
| 31 | United Parcel Service, Inc. | Transportation | -0.04% | |||
| 32 | Wal-Mart Stores, Inc. | Retail | -2.14% | |||
| 33 | Dell, Inc. | Computers | -5.27% | |||
| 34 | Eli Lilly & Co. | Pharmaceuticals | -5.75% | |||
| 35 | Texas Instruments, Inc. | Semiconductors | -6.08% | |||
| 36 | Genentech, Inc.* | Biotechnology | -7.94% | |||
| 37 | Intel Corp. | Semiconductors | -10.64% | |||
| * | Performance for footnoted companies is for a partial year (six months) due to portfolio recomposition. In the case of Idearc, the partial year is due to its being spun off from Verizon. |
| 90 | Semi-Annual Report | December 31, 2006 (Unaudited) |
Bridgeway Blue Chip 35 Index Fund
MANAGER’S COMMENTARY (continued)
(Unaudited)
Sector Representation as of December 31, 2006
The following table presents the percentage of our Fund’s stocks by sector of the economy relative to that of our primary market benchmark.
| % of Net Assets | % S&P 500 Index | Difference | ||||
Basic Materials | 0.0% | 2.9% | -2.9% | |||
Communications | 14.8% | 11.6% | 3.2% | |||
Consumer, Cyclical | 5.1% | 8.3% | -3.2% | |||
Consumer, Non-cyclical | 20.7% | 19.9% | 0.8% | |||
Energy | 8.9% | 9.9% | -1.0% | |||
Financial | 20.0% | 22.2% | -2.2% | |||
Industrial | 10.8% | 11.1% | -0.3% | |||
Technology | 19.6% | 10.6% | 9.0% | |||
Utilities | 0.0% | 3.5% | -3.5% | |||
Cash | 0.1% | 0.0% | 0.1% | |||
Total | 100.0% | 100.0% |
Disclaimer
The following is a reminder from the friendly folks at your Fund who worry about liability. The views expressed here are exclusively those of Fund management. These views, including those of market sectors or individual stocks, are not meant as investment advice and should not be considered predictive in nature. Any favorable (or unfavorable) description of a holding applies only as of the quarter end, December 31, 2006, unless otherwise stated. Security positions can and do change thereafter. Discussions of historical performance do not guarantee and are not indicative of future performance.
The Fund is subject to above average market risk (volatility) and is not an appropriate investment for short-term investors.
This report is submitted for the general information of the shareholders of the Fund. It is not authorized for distribution to prospective investors unless preceded or accompanied by an effective prospectus, which includes information regarding the Fund’s risks, objectives, fees and expenses, experience of its management, and other information. For questions or other Fund information, call 1-800-661-3550 or visit the Fund’s website www.bridgeway.com. Foreside Fund Services, LLC, distributor.
Conclusion
Thank you for your continued investment in Blue Chip 35 Index Fund. This Fund remains open to both current and new investors. As always, we appreciate your feedback.
Sincerely,
John Montgomery
| www.Bridgeway.com | 91 |
Bridgeway Blue Chip 35 Index Fund
SCHEDULE OF INVESTMENTS
Showing percentage of net assets as of December 31, 2006 (Unaudited)
| Industry | Company | Shares | Value | ||||
COMMON STOCKS - 99.50% | |||||||
Aerospace/Defense - 2.67% | |||||||
United Technologies Corp. | 32,200 | $ | 2,013,144 | ||||
Banks - 7.98% | |||||||
Bank of America Corp.+ | 40,428 | 2,158,451 | |||||
Wachovia Corp.+ | 34,100 | 1,941,995 | |||||
Wells Fargo & Co.+ | 54,020 | 1,920,951 | |||||
| 6,021,397 | |||||||
Beverages - 5.15% | |||||||
The Coca-Cola Co.+ | 43,757 | 2,111,275 | |||||
PepsiCo., Inc.+ | 28,405 | 1,776,733 | |||||
| 3,888,008 | |||||||
Biotechnology - 2.60% | |||||||
Genentech, Inc.* | 24,200 | 1,963,346 | |||||
Computers - 6.06% | |||||||
Dell, Inc.*+ | 86,544 | 2,171,389 | |||||
International Business Machines Corp. | 24,742 | 2,403,685 | |||||
| 4,575,074 | |||||||
Cosmetics/Personal Care - 2.55% | |||||||
Procter & Gamble Co. | 29,936 | 1,923,987 | |||||
Diversified Financial Services - 6.20% | |||||||
Citigroup, Inc. | 39,954 | 2,225,438 | |||||
JPMorgan Chase & Co. | 50,800 | 2,453,640 | |||||
| 4,679,078 | |||||||
Healthcare - Products - 2.63% | |||||||
Johnson & Johnson | 30,012 | 1,981,392 | |||||
Insurance - 5.72% | |||||||
American International Group, Inc.+ | 28,501 | 2,042,382 | |||||
Berkshire Hathaway, Inc.*+ | 620 | 2,272,920 | |||||
| 4,315,302 | |||||||
Internet - 2.94% | |||||||
Google, Inc.*+ | 4,820 | 2,219,514 | |||||
Media - 3.16% | |||||||
Idearc, Inc.* | 2,211 | 63,345 | |||||
Time Warner, Inc.+ | 106,630 | 2,322,402 | |||||
| 2,385,747 | |||||||
| Industry | Company | Shares | Value | ||||
Miscellaneous Manufacturers - 5.39% | |||||||
3M Co. | 25,853 | $ | 2,014,724 | ||||
General Electric Co. | 55,138 | 2,051,685 | |||||
| 4,066,409 | |||||||
Oil & Gas - 8.85% | |||||||
Chevron Corp. | 30,550 | 2,246,341 | |||||
ConocoPhillips | 31,200 | 2,244,840 | |||||
Exxon Mobil Corp. | 28,527 | 2,186,024 | |||||
| 6,677,205 | |||||||
Pharmaceuticals - 7.72% | |||||||
Eli Lilly & Co.+ | 35,380 | 1,843,298 | |||||
Merck & Co., Inc. | 44,200 | 1,927,120 | |||||
Pfizer, Inc. | 79,323 | 2,054,466 | |||||
| 5,824,884 | |||||||
Retail - 5.12% | |||||||
Home Depot, Inc. | 53,115 | 2,133,098 | |||||
Wal-Mart Stores, Inc.+ | 37,519 | 1,732,628 | |||||
| 3,865,726 | |||||||
Semiconductors - 7.48% | |||||||
Applied Materials, Inc.+ | 107,300 | 1,979,685 | |||||
Intel Corp. | 94,733 | 1,918,343 | |||||
Texas Instruments, Inc. | 60,680 | 1,747,584 | |||||
| 5,645,612 | |||||||
Software - 5.94% | |||||||
Microsoft Corp. | 70,840 | 2,115,282 | |||||
Oracle Corp.* | 138,148 | 2,367,857 | |||||
| 4,483,139 | |||||||
Telecommunications - 8.65% | |||||||
AT&T, Inc.+ | 60,875 | 2,176,281 | |||||
Cisco Systems, Inc.* | 84,374 | 2,305,942 | |||||
Verizon Communications, Inc. | 54,839 | 2,042,204 | |||||
| 6,524,427 | |||||||
Transportation - 2.69% | |||||||
United Parcel Service, Inc. | 27,003 | 2,024,685 | |||||
TOTAL COMMON STOCKS | 75,078,076 | ||||||
(Cost $63,920,142) | |||||||
| 92 | Semi-Annual Report | December 31, 2006 (Unaudited) |
Bridgeway Blue Chip 35 Index Fund
SCHEDULE OF INVESTMENTS (continued)
Showing percentage of net assets as of December 31, 2006 (Unaudited)
MONEY MARKET MUTUAL FUNDS - 0.36% | |||||||
| Rate^ | Shares | Value | |||||
Blackrock TempCash Liquidity Fund | 5.17% | 276,656 | $ | 276,656 | |||
TOTAL MONEY MARKET MUTUAL FUNDS | 276,656 | ||||||
(Cost $276,656) | |||||||
TOTAL INVESTMENTS - 99.86% | $ | 75,354,732 | |||||
(Cost $64,196,798) | |||||||
Other Assets in Excess of Liabilities - 0.14% | 106,296 | ||||||
NET ASSETS - 100.00% | $ | 75,461,028 | |||||
| * | Non Income Producing Security |
| ^ | Rate disclosed is as of December 31, 2006. |
| + | This security or a portion of the security is out on loan at December 31, 2006. Total loaned securities had a market value of $22,917,466 at December 31, 2006. |
See Notes to Financial Statements.
| www.Bridgeway.com | 93 |
MANAGER’S COMMENTARY
(Unaudited)
January 31, 2007
Dear Fellow Balanced Fund Shareholders,
Our Fund was up 2.12% in the December quarter compared to a 0.90% return for the Bloomberg/EFFAS U.S. Government 1-3 year Total Return Bond Index, a 5.07% return for the Lipper Balanced Fund Index and a 3.23% return for the Balanced Benchmark. The December quarter performance was a great improvement over last quarter, but we still lagged the majority of our benchmarks for the quarter. I never like to see that, but (as we preach) our focus is totally long term.
Our Fund was up 6.65% for the 2006 calendar year compared to a 3.67% return for the Bloomberg/EFFAS U.S. Government 1-3 year Total Return Bond Index, an 11.60% return for the Lipper Balanced Fund Index and an 8.38% return for the Balanced Benchmark. Now when we start to look at annual performance, it is more interesting because we have 4 times as much data as we do for a quarter. (We love being quants!) The 2006 calendar year was “ok” on an absolute basis but lagged pretty well versus our benchmarks. This was the first calendar year since inception that we didn’t beat our Balanced Benchmark. Again, as a “quant,” this is interesting because by definition you have to have one annual period that is your worst, and this is it on a calendar year basis. When I dug a little deeper, I noticed that even with this worst ever annual relative performance, we still accomplished our stated investment objective – to provide a high current return with risk less than or equal to 40% of the stock market. With the S&P 500 Index up 15.79% and our return up 6.65% we achieved 42% of the S&P return. That is nice, but actually beating the S&P since inception with our risk profile is what really excites us!
The table below presents our December quarter, one year, five year and life-to-date financial results according to the formula required by the SEC. A graph of quarterly performance since inception appears at the top of the following page.
Dec. Qtr. 10/1/06 to 12/31/06 | 1 Year 1/1/06 | 5 Year 1/1/02 to 12/31/06 | Life-to-Date 7/1/01 | |||||
Balanced Portfolio | 2.12% | 6.65% | 6.89% | 5.80% | ||||
Bloomberg/ EFFAS U.S. Government 1-3 year | 0.90% | 3.67% | 2.78% | 3.30% | ||||
Lipper Balanced Fund Index | 5.07% | 11.60% | 6.51% | 5.59% | ||||
S&P 500 Index | 6.70% | 15.79% | 6.19% | 4.51% | ||||
Balanced Benchmark | 3.23% | 8.38% | 4.12% | 3.80% | ||||
Performance figures quoted represent past performance and are no guarantee of future results. Current performance may be lower or higher than the performance figures quoted, and an investor’s shares, when redeemed, may be worth more or less than original cost. For the most recent month-end performance, please call 1-800-661-3550 or visit the Fund’s website at www.bridgeway.com.
The Lipper Balanced Funds is an index of balanced funds compiled by Lipper, Inc. Balanced Benchmark is a combined index of which 40% reflects the S&P 500 Index (an unmanaged index of large companies with dividends reinvested) and 60% reflects the Bloomberg/ EFFAS U.S. Government 1-3 year Total Return Bond Index (transparent benchmark for the total return of the 1-3 year U.S. Government bond market).
According to data from Lipper, Inc., the Balanced Fund ranked 415th of 425 Mixed-Asset Moderate funds for the calendar year 2006, 87th of 219 for the past five years and 94th of 207 funds since inception. Lipper, Inc. is an independent mutual fund rating service that ranks funds in various fund categories by making comparative calculations using total returns.
According to data from Morningstar, the Balanced Fund ranked 311th of 540 Conservative Allocation funds for the calendar year 2006 and 21st out of 177 funds for five years. Morningstar ranks funds in various fund categories by making comparative calculations using total returns.
| 94 | Semi-Annual Report | December 31, 2006 (Unaudited) |
Bridgeway Balanced Fund
MANAGER’S COMMENTARY (continued)
(Unaudited)
Growth of $10,000 Invested in Balanced Fund and Indexes from 7/1/01 (inception) to 12/31/06

Detailed Explanation of Quarterly Performance—What Worked Well
The Short Version: Our holdings in the financial sector contributed the most (about 1.5%) to December quarter performance, although we only had one in the list of top stocks below.
These are the ten best-performing stocks for the December quarter:
| Rank | Description | Industry | % Gain | |||
| 1 | Amkor Technology, Inc. | Semiconductors | 52.7% | |||
| 2 | Lexmark International, Inc. | Computers | 27.0% | |||
| 3 | Pactiv Corp. | Packaging & Containers | 25.6% | |||
| 4 | Hilton Hotels Corp. | Lodging | 25.3% | |||
| 5 | Nvidia Corp. | Semiconductors | 25.1% | |||
| 6 | Coach, Inc. | Apparel | 24.9% | |||
| 7 | Marriott International, Inc. | Lodging | 23.5% | |||
| 8 | OfficeMax, Inc. | Retail | 21.9% | |||
| 9 | Countrywide Financial Corp. | Diversified Finan Service | 21.2% | |||
| 10 | ConocoPhillips | Oil & Gas | 20.9% | |||
Last quarter, I promised an update on our worst performer, Amkor Technology. At the time, I didn’t know just how interesting the story would get. Amkor is a leading provider of advanced semiconductor assembly and test services. As you may recall, through the summer and early fall, the company was fraught with problems that seemed to be one domino of bad news falling after another: the company warning of slowing growth rates, the SEC looking into option award practices, delays in filing its 10Q financial statements with the federal government pending the results of the stock option inquiry, threat of stock exchange delisting, announcement of likely restated financial results from the options probe, probable non-compliance with lending requirements (bondholder covenants) due to the delayed filings, and the specter of bankruptcy should the bondholders accelerate bond payment. On top of all this, the market environment was very unfriendly to this kind of stock, and for all these reasons the stock price was pummeled. It would seem things just couldn’t get worse. (Things can always get worse.) In the midst of all this bad news, the company continued to report favorable underlying economic results. At the lower price, one of our models still liked the stock. However, under the circumstances, it was not as strong a buy as it might seem and we decided to sell call options. One of the risks of our option-writing strategy is in the area of timing. If the stock price rises, the gain is capped. In the case of Amkor, our “best laid plans” resulted in a bit less of a gain than we could have had. This is demonstrative of one of the ways we control risks in this Fund.
| www.Bridgeway.com | 95 |
Bridgeway Balanced Fund
MANAGER’S COMMENTARY (continued)
(Unaudited)
Detailed Explanation of Quarterly Performance—What Didn’t Work
The Short Version: Five of the ten worst-performing stocks listed below are from the consumer, non-cyclical sector (cosmetics, healthcare, agriculture and beverage industries).
These are the ten worst-performing stocks for the December quarter:
| Rank | Description | Industry | % Loss | |||
| 1 | Citrix Systems, Inc. | Software | -25.3% | |||
| 2 | Circuit City Stores, Inc. | Retail | -24.4% | |||
| 3 | Corning, Inc. | Telecommunications | -23.4% | |||
| 4 | Motorola, Inc. | Telecommunications | -17.8% | |||
| 5 | Humana, Inc. | Healthcare-Services | -16.3% | |||
| 6 | Archer-Daniels-Midland Co. | Agriculture | -15.6% | |||
| 7 | Brown-Forman Corp. Class B | Beverages | -13.6% | |||
| 8 | Texas Instruments, Inc. | Semiconductors | -13.4% | |||
| 9 | Quest Diagnostics, Inc. | Healthcare-Services | -13.3% | |||
| 10 | TXU Corp. | Electric | -13.3% | |||
Of the ten companies listed above, Archer-Daniels-Midland (“ADM”) had the most negative effect on our performance for the quarter. The company engages in the procurement, transportation, storing, processing, and merchandising of agricultural commodities and products. Until recently, the most widely known products were flours and feeds ground from wheat, corn and milo for commercial bakeries, food companies and animal nutrients. Its ethanol and biodiesel segment has made it a player in the alternative energy market rush. We have held the stock since mid 2005, and it had performed well for us until recently. It was the third best performer in the June 2006 quarter. In late October it announced very strong third quarter results, with net income doubling and revenue up 10% over the same period a year ago. However, the stock price dropped almost 15% over the next week after the announcement. According to ADM’s CEO, price movements will continue to be subject to volatile commodity prices. We still hold our position.
Detailed Explanation of Calendar Year Performance—What Worked Well
The Short Version: Of the approximately 300 companies we held in the calendar year, 12 had greater than 40% return, with one more than doubling. However, their performance was not enough to pull our performance above most benchmarks.
Here are the ten best-performing companies for the calendar year:
| Rank | Description | Industry | % Gain | |||
| 1 | Nvidia Corp. | Semiconductors | 102.5% | |||
| 2 | BMC Software, Inc. | Software | 57.2% | |||
| 3 | Comcast Corp. Class A | Media | 51.9% | |||
| 4 | Thermo Electron Corp. | Electronics | 50.3% | |||
| 5 | Safeway, Inc. | Food | 50.3% | |||
| 6 | Pactiv Corp. | Packaging & Containers | 49.4% | |||
| 7 | Cisco Systems, Inc. | Telecommunications | 46.6% | |||
| 8 | Allegheny Energy, Inc. | Electric | 45.1% | |||
| 9 | Freescale Semiconductor, Inc. Class B | Semiconductors | 44.5% | |||
| 10 | Marriott International, Inc. | Lodging | 41.9% | |||
Nvidia Corporation manufactures programmable graphics processor technologies: graphics processing units, media and communications processors, handheld, and consumer electronics. It was our best performer in the September quarter. In
| 96 | Semi-Annual Report | December 31, 2006 (Unaudited) |
Bridgeway Balanced Fund
MANAGER’S COMMENTARY (continued)
(Unaudited)
late December, the company announced that it has teamed up with the University of Washington’s Harborview Burn Center and Seattle, Wash.-based Imprint Interactive on technology related to a pioneering virtual reality system known as “SnowWorld,” which mitigates pain for burn victims. If Nvidia is also able to benefit from its largest client, Apple’s pricey new phone, it will be “in high cotton,” which is not a component our models track, by the way.
Detailed Explanation of Calendar Year Performance—What Didn’t Work
The Short Version: On the other side of the ledger, we had only two companies with greater than 40% decline for the calendar year.
These are the ten worst-performing stocks for the calendar year:
| Rank | Description | Industry | % Loss | |||
| 1 | Eagle Materials, Inc. | Building Materials | -42.7% | |||
| 2 | Plexus Corp. | Electronics | -41.8% | |||
| 3 | KB Home | Home Builders | -37.3% | |||
| 4 | Jabil Circuit, Inc. | Electronics | -35.0% | |||
| 5 | Brightpoint, Inc. | Distribution/Wholesale | -34.3% | |||
| 6 | St Jude Medical, Inc. | Healthcare-Products | -31.3% | |||
| 7 | Advanced Micro Devices, Inc. | Semiconductors | -29.9% | |||
| 8 | Novell, Inc. | Software | -29.8% | |||
| 9 | Yahoo!, Inc. | Internet | -29.3% | |||
| 10 | Centex Corp. | Home Builders | -28.8% | |||
Eagle Materials manufactures and sells gypsum wallboard, portland cement, recycled paperboard, and concrete and aggregates. Although financial results had generally been positive over the first two quarters of the calendar year, unfortunately, our original purchase happened to be at a high point during the second quarter. The price decline reflected the volatile home-building market. Our model signaled an exit in the late summer, but it had already fallen enough to earn the worst spot for the calendar year.
Background on Fixed Income Securities Strategy
The return of our fixed-income investments for the December quarter was approximately 0.79%, which is consistent with short-term US Treasury securities returns and in line with our expectations. The return of our fixed income investments for the calendar year 2006 was 4.45%.
| www.Bridgeway.com | 97 |
Bridgeway Balanced Fund
MANAGER’S COMMENTARY (continued)
(Unaudited)
Top Ten Equity Holdings as of December 31, 2006
Here are the top ten equity holdings at the end of December. Please note that the asterisk next to the position indicates that we have sold put options with respect to that particular security. This means that we are obligated to purchase more of this stock at a specific price and date in the future. The percentage of net assets figures include the effect these put options have on the entire portfolio. The low 9.5% total indicates the diversity of our holdings.
| Rank | Description | Industry | % of Net Assets | |||
| 1 | Bristol-Myers Squibb Co.* | Pharmaceuticals | 1.9% | |||
| 2 | Dillard’s, Inc.* | Retail | 1.5% | |||
| 3 | Merck & Co., Inc.* | Pharmaceuticals | 1.0% | |||
| 4 | Washington Mutual, Inc.* | Savings & Loans | 1.0% | |||
| 5 | Bank of America Corp.* | Banks | 0.9% | |||
| 6 | US Bancorp* | Banks | 0.7% | |||
| 7 | Archer-Daniels-Midland Co. | Agriculture | 0.7% | |||
| 8 | Verizon Communications, Inc.* | Telecommunications | 0.7% | |||
| 9 | Nvidia Corp. | Semiconductors | 0.6% | |||
| 10 | Bear Stearns Cos., Inc. | Diversified Finan Service | 0.5% | |||
| 9.5% |
Industry Sector Representation as of December 31, 2006
Common Stock | 53.4% | |
Basic Materials | 1.8% | |
Communications | 5.9% | |
Consumer, Cyclical | 5.5% | |
Consumer, Non-cyclical | 12.3% | |
Energy | 4.4% | |
Financial | 12.4% | |
Industrial | 4.8% | |
Technology | 4.6% | |
Utilities | 1.7% | |
U.S. Government Obligations | 43.8% | |
Corporate Notes | 2.2% | |
Covered Call Options Written | -0.3% | |
Put Options Written | -0.4% | |
Money Market Funds | 0.4% | |
Other Assets in Excess of Liabilities | 0.9% | |
Total | 100.0% |
| 98 | Semi-Annual Report | December 31, 2006 (Unaudited) |
Bridgeway Balanced Fund
MANAGER’S COMMENTARY (continued)
(Unaudited)
Disclaimer
The following is a reminder from the friendly folks at your Fund who worry about liability. The views expressed here are exclusively those of Fund management. These views, including those of market sectors or individual stocks, are not meant as investment advice and should not be considered predictive in nature. Any favorable (or unfavorable) description of a holding applies only as of the quarter end, December 31, 2006, unless otherwise stated. Security positions can and do change thereafter. Discussions of historical performance do not guarantee and are not indicative of future performance.
The Fund uses an option writing strategy in which the Fund may sell covered calls or secured put options. Up to 75% of Fund assets may be invested in options. Options are subject to special risks and may not fully protect the Fund against declines in the value of its stocks. In addition, an option writing strategy limits the upside profit potential normally associated with stocks. The Fund’s fixed-income holdings are subject to three types of risk. Interest rate risk is the chance that bond prices overall will decline as interest rates rise. Credit risk is the chance a bond issuer will fail to pay interest and principal. Prepayment risk is the chance a mortgage-backed bond issuer will repay a higher yielding bond, resulting in a lower paying yield.
This report is submitted for the general information of the shareholders of the Fund. It is not authorized for distribution to prospective investors unless preceded or accompanied by an effective prospectus, which includes information regarding the Fund’s risks, objectives, fees and expenses, experience of its management, and other information. For questions or other Fund information, call 1-800-661-3550 or visit the Fund’s website www.bridgeway.com. Foreside Fund Services, LLC, distributor.
Conclusion
In closing, we would like to thank you for your continued investment in Balanced Fund. We appreciate your feedback, so please call or write us with any questions or comments. We work for you and value your input.
Sincerely,
Richard P. Cancelmo, Jr.
| www.Bridgeway.com | 99 |
SCHEDULE OF INVESTMENTS
Showing percentage of net assets as of December 31, 2006 (Unaudited)
| Industry | Company | Shares | Value | ||||
COMMON STOCKS - 53.44% | |||||||
Advertising - 0.12% | |||||||
Omnicom Group, Inc. | 1,000 | $ | 104,540 | ||||
Aerospace/Defense - 1.07% | |||||||
Boeing Co. | 1,100 | 97,724 | |||||
General Dynamics Corp.+ | 1,400 | 104,090 | |||||
Goodrich Corp.+ | 1,800 | 81,990 | |||||
Lockheed Martin Corp. | 3,470 | 319,483 | |||||
Northrop Grumman Corp. | 2,200 | 148,940 | |||||
Rockwell Collins, Inc. | 1,000 | 63,290 | |||||
United Technologies Corp. | 1,740 | 108,785 | |||||
| 924,302 | |||||||
Agriculture - 0.69% | |||||||
Archer-Daniels-Midland Co.# | 18,600 | 594,456 | |||||
Airlines - 0.04% | |||||||
Southwest Airlines Co. | 2,400 | 36,768 | |||||
Apparel - 0.35% | |||||||
Coach, Inc.*# | 4,600 | 197,616 | |||||
Gymboree Corp.*# | 2,700 | 103,032 | |||||
| 300,648 | |||||||
Auto Manufacturers - 0.20% | |||||||
Paccar, Inc. | 2,700 | 175,230 | |||||
Auto Parts & Equipment - 0.08% | |||||||
Johnson Controls, Inc. | 780 | 67,018 | |||||
Banks - 4.28% | |||||||
Bank of America Corp.+# | 15,100 | 806,189 | |||||
The Bank of New York Co., Inc.# | 6,500 | 255,905 | |||||
BB&T Corp. | 6,500 | 285,545 | |||||
Keycorp+ | 5,400 | 205,362 | |||||
Northern Trust Corp. | 2,900 | 176,001 | |||||
State Street Corp.# | 3,300 | 222,552 | |||||
SunTrust Banks, Inc. | 3,200 | 270,240 | |||||
Synovus Financial Corp. | 5,500 | 169,565 | |||||
US Bancorp+# | 16,900 | 611,611 | |||||
Wachovia Corp.+ | 7,389 | 420,804 | |||||
Wells Fargo & Co.+# | 8,200 | 291,592 | |||||
| 3,715,366 | |||||||
Beverages - 1.00% | |||||||
Anheuser-Busch Cos., Inc. | 2,000 | 98,400 | |||||
Brown-Forman Corp. | 2,500 | 165,600 | |||||
The Coca-Cola Co.+ | 4,300 | 207,475 | |||||
Pepsi Bottling Group, Inc. | 5,200 | 160,732 | |||||
PepsiCo., Inc.+# | 3,800 | 237,690 | |||||
| 869,897 | |||||||
| Industry | Company | Shares | Value | ||||
Biotechnology - 0.36% | |||||||
Biogen Idec, Inc.*# | 2,200 | $ | 108,218 | ||||
Genzyme Corp.*# | 3,300 | 203,214 | |||||
| 311,432 | |||||||
Building Materials - 0.10% | |||||||
American Standard Cos., Inc.+# | 1,800 | 82,530 | |||||
Chemicals - 1.23% | |||||||
Monsanto Co. | 4,700 | 246,891 | |||||
OM Group, Inc.*# | 10,000 | 452,800 | |||||
The Sherwin-Williams Co. | 3,500 | 222,530 | |||||
Sigma-Aldrich Corp. | 1,900 | 147,668 | |||||
| 1,069,889 | |||||||
Commercial Services - 0.46% | |||||||
Equifax, Inc. | 2,600 | 105,560 | |||||
Moody’s Corp.+ | 800 | 55,248 | |||||
Robert Half International, Inc.+ | 1,300 | 48,256 | |||||
RR Donnelley & Sons Co. | 2,200 | 78,188 | |||||
The Western Union Co. | 5,100 | 114,342 | |||||
| 401,594 | |||||||
Computers - 1.95% | |||||||
Affiliated Computer Services, Inc.*+# | 4,000 | 195,360 | |||||
Apple Computer, Inc.*# | 5,200 | 441,168 | |||||
Hewlett-Packard Co.# | 7,800 | 321,282 | |||||
Lexmark International, Inc.*+# | 3,200 | 234,240 | |||||
NCR Corp.*+# | 6,300 | 269,388 | |||||
Network Appliance, Inc.*+# | 5,800 | 227,824 | |||||
| 1,689,262 | |||||||
Cosmetics/Personal Care - 0.78% | |||||||
Alberto-Culver Co.# | 3,000 | 64,350 | |||||
Colgate-Palmolive Co. | 4,400 | 287,056 | |||||
The Estee Lauder Cos., Inc. | 1,600 | 65,312 | |||||
Procter & Gamble Co.# | 4,000 | 257,080 | |||||
| 673,798 | |||||||
Distribution/Wholesale - 0.04% | |||||||
WW Grainger, Inc.+ | 500 | 34,970 | |||||
Diversified Financial Services - 4.14% | |||||||
Ameriprise Financial, Inc.# | 2,780 | 151,510 | |||||
The Bear Stearns Cos., Inc.# | 2,800 | 455,784 | |||||
Capital One Financial Corp.# | 2,400 | 184,368 | |||||
The Charles Schwab Corp.# | 16,300 | 315,242 | |||||
| 100 | Semi-Annual Report | December 31, 2006 (Unaudited) |
Bridgeway Balanced Fund
SCHEDULE OF INVESTMENTS (continued)
Showing percentage of net assets as of December 31, 2006 (Unaudited)
| Industry | Company | Shares | Value | ||||
Common Stocks (continued) | |||||||
Diversified Financial Services (continued) | |||||||
CIT Group, Inc.# | 4,900 | $ | 273,273 | ||||
Citigroup, Inc.# | 5,100 | 284,070 | |||||
Countrywide Financial Corp.+ | 500 | 21,225 | |||||
E*Trade Financial Co.*+# | 11,400 | 255,588 | |||||
Franklin Resources, Inc. | 2,800 | 308,476 | |||||
Goldman Sachs Group, Inc.+# | 1,700 | 338,895 | |||||
Lehman Brothers Holdings, Inc.+ | 4,400 | 343,728 | |||||
Merrill Lynch & Co., Inc.+ | 1,600 | 148,960 | |||||
Morgan Stanley | 3,100 | 252,433 | |||||
SLM Corp. | 810 | 39,504 | |||||
T Rowe Price Group, Inc.# | 5,000 | 218,850 | |||||
| 3,591,906 | |||||||
Electric - 1.52% | |||||||
The AES Corp.*# | 9,600 | 211,584 | |||||
Allegheny Energy, Inc.* | 2,800 | 128,548 | |||||
Ameren Corp. | 600 | 32,238 | |||||
American Electric Power Co., Inc.+ | 2,435 | 103,682 | |||||
Dominion Resources, Inc.+ | 760 | 63,719 | |||||
Duke Energy Corp.# | 10,500 | 348,705 | |||||
Exelon Corp.+# | 3,200 | 198,048 | |||||
TXU Corp. | 4,200 | 227,682 | |||||
| 1,314,206 | |||||||
Electrical Components & Equipment - 0.18% | |||||||
Emerson Electric Co. | 3,600 | 158,652 | |||||
Electronics - 0.23% | |||||||
Agilent Technologies, Inc.* | 1,900 | 66,215 | |||||
Sanmina-SCI Corp.* | 9,500 | 32,775 | |||||
Thermo Fisher Scientific, Inc.*+ | 2,300 | 104,167 | |||||
| 203,157 | |||||||
Engineering & Construction - 0.08% | |||||||
Fluor Corp. | 800 | 65,320 | |||||
Entertainment - 0.06% | |||||||
International Game Technology | 1,200 | 55,440 | |||||
Environmental Control - 0.07% | |||||||
Allied Waste Industries, Inc.* | 5,200 | 63,908 | |||||
Food - 0.73% | |||||||
Campbell Soup Co.+# | 3,200 | 124,448 | |||||
Kellogg Co. | 4,100 | 205,246 | |||||
Safeway, Inc.+# | 8,700 | 300,672 | |||||
| 630,366 | |||||||
| Industry | Company | Shares | Value | ||||
Forest Products & Paper - 0.18% | |||||||
International Paper Co.+ | 4,500 | $ | 153,450 | ||||
Gas - 0.13% | |||||||
Sempra Energy | 2,000 | 111,940 | |||||
Hand/Machine Tools - 0.04% | |||||||
Black & Decker Corp.# | 400 | 31,988 | |||||
Healthcare - Products - 1.64% | |||||||
Baxter International, Inc.+ | 6,500 | 301,535 | |||||
Becton Dickinson & Co. | 3,420 | 239,913 | |||||
CR Bard, Inc. | 3,700 | 306,989 | |||||
Medtronic, Inc.+# | 4,500 | 240,795 | |||||
St Jude Medical, Inc.* | 1,080 | 39,485 | |||||
Stryker Corp.# | 5,260 | 289,878 | |||||
| 1,418,595 | |||||||
Healthcare - Services - 0.79% | |||||||
Aetna, Inc.# | 2,900 | 125,222 | |||||
Humana, Inc.* | 3,000 | 165,930 | |||||
Laboratory Corp. of America Holdings*+ | 800 | 58,776 | |||||
Quest Diagnostics, Inc. | 2,700 | 143,100 | |||||
UnitedHealth Group, Inc.# | 3,600 | 193,428 | |||||
| 686,456 | |||||||
Home Furnishings - 0.06% | |||||||
Whirlpool Corp.+ | 600 | 49,812 | |||||
Household Products/Wares - 0.32% | |||||||
Clorox Co. | 1,530 | 98,150 | |||||
Kimberly-Clark Corp. | 2,700 | 183,465 | |||||
| 281,615 | |||||||
Housewares - 0.10% | |||||||
Newell Rubbermaid, Inc. | 2,900 | 83,955 | |||||
Insurance - 2.90% | |||||||
ACE Ltd. | 1,400 | 84,798 | |||||
Aflac, Inc.+ | 800 | 36,800 | |||||
The Allstate Corp. | 1,000 | 65,110 | |||||
AON Corp.+# | 3,500 | 123,690 | |||||
Berkshire Hathaway, Inc.*+ | 120 | 439,920 | |||||
Chubb Corp. | 4,500 | 238,095 | |||||
Cigna Corp. | 900 | 118,413 | |||||
Genworth Financial, Inc.+ | 2,600 | 88,946 | |||||
Hartford Financial Services Group, Inc.+ | 900 | 83,979 | |||||
Metlife, Inc.+# | 4,600 | 271,446 | |||||
Principal Financial Group, Inc. | 4,700 | 275,890 | |||||
The Progressive Corp. | 5,520 | 133,694 | |||||
| www.Bridgeway.com | 101 |
Bridgeway Balanced Fund
SCHEDULE OF INVESTMENTS (continued)
Showing percentage of net assets as of December 31, 2006 (Unaudited)
| Industry | Company | Shares | Value | ||||
Common Stocks (continued) | |||||||
Insurance (continued) | |||||||
Prudential Financial, Inc. | 1,200 | $ | 103,032 | ||||
Safeco Corp. | 3,420 | 213,921 | |||||
The St Paul Travelers Cos., Inc. | 4,500 | 241,605 | |||||
| 2,519,339 | |||||||
Internet - 0.76% | |||||||
eBay, Inc.*+# | 6,900 | 207,483 | |||||
Google, Inc.*+ | 600 | 276,288 | |||||
Symantec Corp.* | 2,000 | 41,700 | |||||
Yahoo!, Inc.*# | 5,400 | 137,916 | |||||
| 663,387 | |||||||
Iron/Steel - 0.12% | |||||||
United States Steel Corp. | 1,400 | 102,396 | |||||
Leisure Time - 0.09% | |||||||
Harley-Davidson, Inc. | 1,100 | 77,517 | |||||
Lodging - 0.35% | |||||||
Hilton Hotels Corp.# | 4,500 | 157,050 | |||||
Marriott International, Inc.+ | 3,000 | 143,160 | |||||
| 300,210 | |||||||
Machinery - Diversified - 0.08% | |||||||
Cummins, Inc.+ | 600 | 70,908 | |||||
Media - 1.78% | |||||||
Comcast Corp.*+# | 7,300 | 309,009 | |||||
Idearc, Inc.* | 770 | 22,060 | |||||
The McGraw-Hill Cos., Inc. | 4,000 | 272,080 | |||||
News Corp. | 14,000 | 300,720 | |||||
Time Warner, Inc.+# | 15,900 | 346,302 | |||||
Tribune Co.+ | 2,200 | 67,716 | |||||
Walt Disney Co.+# | 6,700 | 229,609 | |||||
| 1,547,496 | |||||||
Mining - 0.28% | |||||||
Alcoa, Inc. | 1,600 | 48,016 | |||||
Freeport-McMoRan Copper & Gold, Inc. | 1,500 | 83,595 | |||||
Vulcan Materials Co. | 1,200 | 107,844 | |||||
| 239,455 | |||||||
Miscellaneous Manufacturers - 2.08% | |||||||
Cooper Industries Ltd. | 2,600 | 235,118 | |||||
Danaher Corp.+# | 3,400 | 246,296 | |||||
Eaton Corp. | 2,200 | 165,308 | |||||
General Electric Co. | 4,900 | 182,329 | |||||
Honeywell International, Inc. | 5,300 | 239,772 | |||||
| Industry | Company | Shares | Value | ||||
Miscellaneous Manufacturers (continued) | |||||||
Illinois Tool Works, Inc.+ | 2,000 | $ | 92,380 | ||||
Leggett & Platt, Inc.# | 8,800 | 210,320 | |||||
Parker Hannifin Corp.+ | 2,900 | 222,952 | |||||
Textron, Inc.# | 2,200 | 206,294 | |||||
| 1,800,769 | |||||||
Office/Business Equipment - 0.09% | |||||||
Pitney Bowes, Inc. | 1,600 | 73,904 | |||||
Oil & Gas - 2.39% | |||||||
Baker Hughes, Inc.# | 2,600 | 194,116 | |||||
Chevron Corp.# | 5,078 | 373,385 | |||||
ConocoPhillips# | 5,487 | 394,790 | |||||
Exxon Mobil Corp.# | 5,400 | 413,802 | |||||
Marathon Oil Corp.# | 1,700 | 157,250 | |||||
Occidental Petroleum Corp.# | 6,000 | 292,980 | |||||
Valero Energy Corp.# | 4,900 | 250,684 | |||||
| 2,077,007 | |||||||
Oil & Gas Services - 1.82% | |||||||
Anadarko Petroleum Corp.# | 4,200 | 182,784 | |||||
Apache Corp.# | 3,200 | 212,832 | |||||
EOG Resources, Inc.# | 2,400 | 149,880 | |||||
Halliburton Co.# | 4,700 | 145,935 | |||||
Hess Corp.+# | 3,060 | 151,684 | |||||
Nabors Industries Ltd.*# | 6,800 | 202,504 | |||||
Rowan Cos., Inc.# | 5,500 | 182,600 | |||||
Schlumberger Ltd.# | 3,200 | 202,112 | |||||
Sunoco, Inc. | 2,400 | 149,664 | |||||
| 1,579,995 | |||||||
Packaging & Containers - 0.09% | |||||||
Pactiv Corp.* | 2,100 | 74,949 | |||||
Pharmaceuticals - 5.67% | |||||||
Allergan, Inc.+ | 1,900 | 227,506 | |||||
Bristol-Myers Squibb Co.+# | 72,400 | 1,905,568 | |||||
Cardinal Health, Inc.# | 2,100 | 135,303 | |||||
Caremark Rx, Inc.# | 3,800 | 217,018 | |||||
Cephalon, Inc.*# | 5,000 | 352,050 | |||||
Express Scripts, Inc.*# | 2,200 | 157,520 | |||||
Gilead Sciences, Inc.*# | 4,900 | 318,157 | |||||
Hospira, Inc.* | 7,700 | 258,566 | |||||
King Pharmaceuticals, Inc.*# | 5,500 | 87,560 | |||||
Medco Health Solutions, Inc.*# | 3,500 | 187,040 | |||||
Merck & Co., Inc.# | 20,100 | 876,360 | |||||
Pfizer, Inc. | 7,600 | 196,840 | |||||
| 4,919,488 | |||||||
| 102 | Semi-Annual Report | December 31, 2006 (Unaudited) |
Bridgeway Balanced Fund
SCHEDULE OF INVESTMENTS (continued)
Showing percentage of net assets as of December 31, 2006 (Unaudited)
| Industry | Company | Shares | Value | ||||
Common Stocks (continued) | |||||||
Pipelines - 0.17% | |||||||
El Paso Corp. | 9,900 | $ | 151,272 | ||||
Retail - 4.01% | |||||||
Autonation, Inc.* | 736 | 15,692 | |||||
Autozone, Inc.* | 1,700 | 196,452 | |||||
Bed Bath & Beyond, Inc.*# | 2,020 | 76,962 | |||||
Circuit City Stores, Inc.+# | 6,900 | 130,962 | |||||
Costco Wholesale Corp. | 1,000 | 52,870 | |||||
CVS Corp.# | 3,500 | 108,185 | |||||
Dillard’s, Inc.+# | 38,400 | 1,342,848 | |||||
Federated Department Stores, Inc.+# | 800 | 30,504 | |||||
JC Penney Co., Inc.+# | 2,000 | 154,720 | |||||
Ltd. Brands, Inc. | 4,400 | 127,336 | |||||
Nordstrom, Inc.+# | 5,000 | 246,700 | |||||
Office Depot, Inc.*+# | 4,300 | 164,131 | |||||
OfficeMax, Inc.# | 2,700 | 134,055 | |||||
Sally Beauty Holdings, Inc.* | 3,000 | 23,400 | |||||
Sears Holdings Corp.* | 1,200 | 201,516 | |||||
Staples, Inc. | 3,950 | 105,465 | |||||
Starbucks Corp.*# | 3,700 | 131,054 | |||||
Walgreen Co.+ | 2,500 | 114,725 | |||||
Wal-Mart Stores, Inc. | 2,600 | 120,068 | |||||
| 3,477,645 | |||||||
Savings & Loans - 0.99% | |||||||
Washington Mutual, Inc.+# | 18,943 | 861,717 | |||||
Semiconductors - 1.12% | |||||||
Altera Corp.* | 500 | 9,840 | |||||
Applied Materials, Inc.+# | 10,700 | 197,415 | |||||
Nvidia Corp.*+# | 14,400 | 532,944 | |||||
Texas Instruments, Inc.# | 8,070 | 232,416 | |||||
| 972,615 | |||||||
Software - 1.55% | |||||||
Adobe Systems, Inc.*# | 7,000 | 287,840 | |||||
Automatic Data Processing, Inc.# | 4,400 | 216,700 | |||||
BMC Software, Inc.* | 3,920 | 126,224 | |||||
Citrix Systems, Inc.*# | 4,300 | 116,315 | |||||
IMS Health, Inc. | 2,800 | 76,944 | |||||
Intuit, Inc.*# | 5,600 | 170,856 | |||||
Novell, Inc.* | 5,400 | 33,480 | |||||
Oracle Corp.*# | 11,860 | 203,280 | |||||
Paychex, Inc.# | 2,900 | 114,666 | |||||
| 1,346,305 | |||||||
Telecommunications - 3.17% | |||||||
Alltel Corp.# | 1,900 | 114,912 | |||||
AT&T, Inc.# | 7,200 | 257,400 | |||||
| Industry | Company | Shares | Value | ||||
Telecommunications (continued) | |||||||
Ciena Corp.* | 5,942 | $ | 164,653 | ||||
Cisco Systems, Inc.*# | 14,900 | 407,217 | |||||
Citizens Communications Co. | 8,800 | 126,456 | |||||
Comverse Technology, Inc.*+# | 7,900 | 166,769 | |||||
Corning, Inc.*# | 11,200 | 209,552 | |||||
Embarq Corp. | 385 | 20,235 | |||||
Motorola, Inc. + | 5,300 | 108,968 | |||||
Qualcomm, Inc.# | 5,300 | 200,287 | |||||
Sprint Nextel Corp.+# | 12,800 | 241,792 | |||||
Tellabs, Inc.*# | 12,400 | 127,224 | |||||
Verizon Communications, Inc.# | 15,400 | 573,496 | |||||
Windstream Corp. | 1,964 | 27,928 | |||||
| 2,746,889 | |||||||
Textiles - 0.05% | |||||||
Cintas Corp. | 1,200 | 47,652 | |||||
Toys/Games/Hobbies - 0.06% | |||||||
Mattel, Inc. | 2,200 | 49,852 | |||||
Transportation - 0.80% | |||||||
Burlington Northern Santa Fe Corp.# | 1,400 | 103,334 | |||||
CSX Corp.# | 5,400 | 185,922 | |||||
FedEx Corp. | 1,300 | 141,206 | |||||
Norfolk Southern Corp. | 2,700 | 135,783 | |||||
Union Pacific Corp. | 1,400 | 128,828 | |||||
| 695,073 | |||||||
TOTAL COMMON STOCKS | 46,348,306 | ||||||
(Cost $37,102,237) | |||||||
CORPORATE NOTES - 2.23% | |||||||
| Due Date | Discount Rate or Coupon Rate | Principal Amount | Value | ||||
Holding Companies - Diversified - 1.88% | |||||||
Leucadia National Corp. | |||||||
8/15/2013 | 7.750% | $ | 1,550,000 | 1,635,250 | |||
Transportation - 0.35% | |||||||
Sea Containers Ltd.*+@ | |||||||
2/15/2008 | 7.875% | 426,000 | 300,862 | ||||
TOTAL CORPORATE NOTES | 1,936,112 | ||||||
(Cost $2,029,409) | |||||||
| www.Bridgeway.com | 103 |
Bridgeway Balanced Fund
SCHEDULE OF INVESTMENTS (continued)
Showing percentage of net assets as of December 31, 2006 (Unaudited)
| Due Date | Discount Rate or Coupon Rate | Principal Amount | Value | |||||
U.S. GOVERNMENT OBLIGATIONS - 43.83% | ||||||||
U.S. Treasury Bills - 22.75% | ||||||||
2/1/2007 | 3.162% | $ | 3,000,000 | $ | 2,986,318 | |||
2/22/2007 | 3.722% | 3,000,000 | 2,977,612 | |||||
4/12/2007 | 2.610% | 7,000,000 | 6,906,116 | |||||
5/3/2007 | 3.170% | 2,000,000 | 1,967,420 | |||||
5/24/2007 | 3.719% | 3,000,000 | 2,942,661 | |||||
6/14/2007 | 4.269% | 2,000,000 | 1,956,124 | |||||
| 19,736,251 | ||||||||
U.S. Treasury Notes - 21.08% | ||||||||
3/31/2007 | 3.750% | 300,000 | 299,016 | |||||
7/31/2007 | 3.875% | 500,000 | 496,679 | |||||
8/15/2007 | 2.750% | 300,000 | 295,828 | |||||
11/15/2007 | 3.000% | 200,000 | 196,570 | |||||
1/31/2008+ | 4.375% | 3,000,000 | 2,980,194 | |||||
2/15/2008 | 3.375% | 300,000 | 294,762 | |||||
8/31/2008 | 4.875% | 300,000 | 299,977 | |||||
10/15/2008 | 3.125% | 200,000 | 194,227 | |||||
11/15/2008 | 3.375% | 200,000 | 194,875 | |||||
4/15/2009 | 3.125% | 300,000 | 289,383 | |||||
6/15/2009 | 4.000% | 300,000 | 294,832 | |||||
8/15/2009 | 3.500% | 200,000 | 193,953 | |||||
10/15/2009 | 3.375% | 300,000 | 289,430 | |||||
11/15/2009 | 3.500% | 200,000 | 193,445 | |||||
2/15/2010 | 3.500% | 300,000 | 289,453 | |||||
4/15/2010+ | 4.000% | 300,000 | 293,555 | |||||
6/15/2010 | 3.625% | 500,000 | 482,969 | |||||
7/15/2010 | 3.875% | 500,000 | 486,758 | |||||
10/15/2010+ | 4.250% | 500,000 | 492,266 | |||||
1/15/2011+ | 4.250% | 2,000,000 | 1,966,876 | |||||
2/28/2011+ | 4.500% | 1,000,000 | 992,617 | |||||
3/31/2011+ | 4.750% | 1,000,000 | 1,001,680 | |||||
4/30/2011 | 4.875% | 2,000,000 | 2,012,968 | |||||
7/31/2011+ | 4.875% | 1,000,000 | 1,007,031 | |||||
8/31/2011 | 4.625% | 300,000 | 299,051 | |||||
11/15/2013+ | 4.250% | 200,000 | 194,719 | |||||
2/15/2015 | 4.000% | 200,000 | 190,523 | |||||
5/15/2016+ | 5.125% | 2,000,000 | 2,060,078 | |||||
| 18,283,715 | ||||||||
TOTAL U.S. GOVERNMENT OBLIGATIONS | 38,019,966 | |||||||
(Cost $38,106,731) | ||||||||
| Number of Contracts | Value | ||||
PURCHASED CALL OPTIONS - 0.25% | |||||
AT&T, Inc. | |||||
expiring: January, 2007 at $25.00 | 200 | $ | 214,000 | ||
TOTAL PURCHASED CALL OPTIONS | 214,000 | ||||
(Cost $28,010) | |||||
MONEY MARKET MUTUAL FUNDS - 0.40% |
| |||||||
| Rate^ | Shares | Value | ||||||
Blackrock TempCash Liquidity Fund | 5.17% | 343,740 | 343,740 | |||||
TOTAL MONEY MARKET MUTUAL FUNDS | 343,740 | |||||||
(Cost $343,740) | ||||||||
TOTAL INVESTMENTS - 100.15% | $ | 86,862,124 | ||||||
(Cost $77,610,127) | ||||||||
Liabilities in Excess of Other Assets - (0.15)% | (129,001 | ) | ||||||
NET ASSETS - 100.00% | $ | 86,733,123 | ||||||
| * | Non Income Producing Security |
| ^ | Rate disclosed is as of December 31, 2006. |
| + | This security or a portion of the security is out on loan at December 31, 2006. Total loaned securities had a market value of $22,138,400 at December 31, 2006. |
| # | Security subject to call option written by the Fund. |
| @ | On October 15, 2006, Sea Containers Ltd., filed for Chapter 11 bankruptcy. |
See Notes to Financial Statements
| 104 | Semi-Annual Report | December 31, 2006 (Unaudited) |
THIS PAGE INTENTIONALLY LEFT BLANK
| www.Bridgeway.com | 105 |
SCHEDULE OF OPTIONS WRITTEN
As of December 31, 2006 (Unaudited)
| Company | Number of Contracts | Value | ||||
COVERED CALL OPTIONS WRITTEN |
| |||||
Adobe Systems, Inc. |
| |||||
expiring: January 07 at $42.50 | 20 | $ | (1,000 | ) | ||
AES Corp. |
| |||||
expiring: January 07 at $22.50 | 25 | (625 | ) | |||
Aetna, Inc. |
| |||||
expiring: February 07 at $45.00 | 8 | (1,000 | ) | |||
Affiliated Computer Services, Inc. |
| |||||
expiring: April 07 at $55.00 | 10 | (700 | ) | |||
Alberto-Culver Co. |
| |||||
expiring: January 07 at $20.00 | 30 | (4,650 | ) | |||
Alltell Corp. |
| |||||
expiring: February 07 at $60.00 | 5 | (1,413 | ) | |||
American Standard Cos., Inc. |
| |||||
expiring: April 07 at $50.00 | 6 | (660 | ) | |||
Ameriprise Financial, Inc. |
| |||||
expiring: March 07 at $55.00 | 7 | (1,435 | ) | |||
Anadarko Petroleum Corp. |
| |||||
expiring: February 07 at $50.00 | 20 | (600 | ) | |||
AON Corp. |
| |||||
expiring: April 07 at $37.50 | 8 | (680 | ) | |||
Apache Corp. |
| |||||
expiring: February 07 at $70.00 | 8 | (1,160 | ) | |||
Apple Computer, Inc. |
| |||||
expiring: January 07 at $90.00 | 25 | (5,187 | ) | |||
expiring: February 07 at $90.00 | 13 | (4,615 | ) | |||
Applied Materials, Inc. |
| |||||
expiring: January 07 at $17.50 | 25 | (2,813 | ) | |||
Archer-Daniels-Midland Co. |
| |||||
expiring: January 07 at $35.00 | 50 | (875 | ) | |||
expiring: March 07 at $35.00 | 86 | (7,740 | ) | |||
AT&T, Inc. |
| |||||
expiring: January 07 at $32.50 | 200 | (65,000 | ) | |||
expiring: January 07 at $35.00 | 15 | (1,425 | ) | |||
expiring: April 07 at $35.00 | 15 | (2,813 | ) | |||
Automatic Data Processing, Inc. |
| |||||
expiring: February 07 at $52.50 | 20 | (550 | ) | |||
Baker Hughes, Inc. |
| |||||
expiring: January 07 at $75.00 | 13 | (2,438 | ) | |||
Bank of America Corp. |
| |||||
expiring: January 07 at $55.00 | 18 | (225 | ) | |||
expiring: January 07 at $52.50 | 80 | (10,800 | ) | |||
Bank of New York Co., Inc. |
| |||||
expiring: April 07 at $40.00 | 15 | (2,175 | ) | |||
The Bear Stearns Cos., Inc. |
| |||||
expiring: February 07 at $175.00 | 7 | (910 | ) | |||
Bed Bath & Beyond, Inc. |
| |||||
expiring: January 07 at $42.50 | 10 | (25 | ) | |||
Biogen Idec, Inc. |
| |||||
expiring: April 07 at $55.00 | 8 | (760 | ) | |||
Black & Decker Corp. |
| |||||
expiring: February 07 at $75.00 | 4 | (2,560 | ) | |||
| Company | Number of Contracts | Value | ||||
Bristol-Myers Squibb Co. |
| |||||
expiring: January 07 at $25.00 | 100 | $ | (13,500 | ) | ||
expiring: March 07 at $27.50 | 30 | (1,875 | ) | |||
expiring: June 07 at $27.50 | 300 | (31,500 | ) | |||
Burlington Northern Santa Fe Corp. |
| |||||
expiring: April 07 at $80.00 | 5 | (1,075 | ) | |||
Campbell Soup Co. |
| |||||
expiring: January 07 at $40.00 | 16 | (280 | ) | |||
Capital One Financial Corp. |
| |||||
expiring: February 07 at $80.00 | 6 | (840 | ) | |||
Cardinal Health, Inc. |
| |||||
expiring: March 07 at $70.00 | 7 | (455 | ) | |||
Caremark Rx, Inc. |
| |||||
expiring: March 07 at $55.00 | 10 | (3,900 | ) | |||
Cephalon, Inc. |
| |||||
expiring: January 07 at $75.00 | 50 | (2,375 | ) | |||
The Charles Schwab Corp. | ||||||
expiring: January 07 at $20.00 | 50 | (1,250 | ) | |||
Chevron Corp. |
| |||||
expiring: March 07 at $80.00 | 18 | (1,350 | ) | |||
Circuit City Stores, Inc. |
| |||||
expiring: January 07 at $30.00 | 18 | (45 | ) | |||
Cisco Systems, Inc. |
| |||||
expiring: January 07 at $22.50 | 30 | (14,550 | ) | |||
CIT Group, Inc. |
| |||||
expiring: January 07 at $55.00 | 15 | (2,625 | ) | |||
Citigroup, Inc. |
| |||||
expiring: March 07 at $57.50 | 12 | (1,050 | ) | |||
Citrix Systems, Inc. |
| |||||
expiring: January 07 at $35.00 | 15 | (75 | ) | |||
Coach, Inc. |
| |||||
expiring: February 07 at $45.00 | 15 | (2,137 | ) | |||
Comcast Corp. |
| |||||
expiring: April 07 at $45.00 | 15 | (1,800 | ) | |||
Comverse Technology, Inc. |
| |||||
expiring: January 07 at $22.50 | 20 | (450 | ) | |||
ConocoPhillips |
| |||||
expiring: February 07 at $80.00 | 15 | (750 | ) | |||
Corning, Inc. |
| |||||
expiring: February 07 at $22.50 | 50 | (875 | ) | |||
CSX Corp. |
| |||||
expiring: February 07 at $40.00 | 25 | (375 | ) | |||
CVS Corp. |
| |||||
expiring: May 07 at $35.00 | 9 | (675 | ) | |||
Danaher Corp. |
| |||||
expiring: January 07 at $75.00 | 8 | (240 | ) | |||
Dillards, Inc. |
| |||||
expiring: January 07 at $30.00 | 15 | (7,650 | ) | |||
expiring: January 07 at $35.00 | 54 | (4,860 | ) | |||
expiring: February 07 at $35.00 | 268 | (41,540 | ) | |||
Duke Energy Corp. |
| |||||
expiring: January 07 at $32.50 | 30 | (3,000 | ) | |||
| 106 | Semi-Annual Report | December 31, 2006 (Unaudited) |
Bridgeway Balanced Fund
SCHEDULE OF OPTIONS WRITTEN (continued)
As of December 31, 2006 (Unaudited)
| Company | Number of Contracts | Value | ||||
Covered Call Options Written (continued) |
| |||||
E*Trade Financial Co. |
| |||||
expiring: January 07 at $25.00 | 20 | $ | (50 | ) | ||
eBAY, Inc. |
| |||||
expiring: January 07 at $32.50 | 20 | (350 | ) | |||
EOG Resources, Inc. |
| |||||
expiring: January 07 at $75.00 | 10 | (25 | ) | |||
Exelon Corp. |
| |||||
expiring: January 07 at $65.00 | 8 | (100 | ) | |||
Express Scripts, Inc. |
| |||||
expiring: January 07 at $70.00 | 8 | (2,340 | ) | |||
Exxon Mobile Corp. |
| |||||
expiring: January 07 at $80.00 | 12 | (450 | ) | |||
Federated Department Stores, Inc. |
| |||||
expiring: February 07 at $35.00 | 8 | (3,080 | ) | |||
Genzyme Corp. |
| |||||
expiring: January 07 at $70.00 | 13 | (97 | ) | |||
Gilead Sciences, Inc. |
| |||||
expiring: January 07 at $70.00 | 15 | (300 | ) | |||
Goldman Sachs Group, Inc. |
| |||||
expiring: January 07 at $200.00 | 9 | (3,195 | ) | |||
Gymboree Corp. |
| |||||
expiring: January 07 at $40.00 | 25 | (2,062 | ) | |||
Halliburton Co. |
| |||||
expiring: April 07 at $35.00 | 12 | (1,230 | ) | |||
Hess Corp. |
| |||||
expiring: February 07 at $50.00 | 30 | (7,800 | ) | |||
Hewlett- Packard Co. |
| |||||
expiring: January 07 at $40.00 | 30 | (4,650 | ) | |||
Hilton Hotels Corp. |
| |||||
expiring: January 07 at $30.00 | 20 | (10,400 | ) | |||
Intuit, Inc. |
| |||||
expiring: April 07 at $32.50 | 10 | (1,150 | ) | |||
JC Penny Co., Inc. |
| |||||
expiring: February 07 at $85.00 | 10 | (650 | ) | |||
King Pharmaceuticals, Inc. |
| |||||
expiring: January 07 at $17.50 | 15 | (37 | ) | |||
Leggett & Platt, Inc. |
| |||||
expiring: January 07 at $22.50 | 88 | (13,200 | ) | |||
Lexmark International, Inc. |
| |||||
expiring: January 07 at $75.00 | 10 | (1,075 | ) | |||
Marathon Oil Corp. |
| |||||
expiring: January 07 at $100.00 | 9 | (292 | ) | |||
Medco Health Solutions, Inc. |
| |||||
expiring: April 07 at $55.00 | 8 | (2,260 | ) | |||
Medtronic, Inc. |
| |||||
expiring: January 07 at $55.00 | 12 | (450 | ) | |||
Merck & Co., Inc. |
| |||||
expiring: April 07 at $45.00 | 164 | (22,960 | ) | |||
Metlife, Inc. |
| |||||
expiring: January 07 at $60.00 | 12 | (480 | ) | |||
Nabors Industries Ltd. |
| |||||
expiring: March 07 at $35.00 | 15 | (750 | ) | |||
| Company | Number of Contracts | Value | ||||
NCR Corp. | ||||||
expiring: April 07 at $45.00 | 15 | $ | (2,587 | ) | ||
Network Appliance, Inc. | ||||||
expiring: March 07 at $45.00 | 17 | (1,360 | ) | |||
Nordstrom, Inc. | ||||||
expiring: January 07 at $50.00 | 15 | (1,350 | ) | |||
Nvidia Corp. | ||||||
expiring: January 07 at $37.50 | 50 | (6,250 | ) | |||
Occidental Petroleum Corp. | ||||||
expiring: February 07 at $55.00 | 30 | (1,350 | ) | |||
Office Depot, Inc. | ||||||
expiring: April 07 at $45.00 | 12 | (600 | ) | |||
OfficeMax, Inc. | ||||||
expiring: January 07 at $50.00 | 15 | (1,425 | ) | |||
OM Group, Inc. | ||||||
expiring: January 07 at $50.00 | 50 | (1,625 | ) | |||
expiring: March 07 at $50.00 | 50 | (11,625 | ) | |||
Oracle Corp. | ||||||
expiring: March 07 at $20.00 | 30 | (375 | ) | |||
Paychex, Inc. | ||||||
expiring: March 07 at $40.00 | 7 | (840 | ) | |||
PepsiCo., Inc. | ||||||
expiring: April 07 at $65.00 | 8 | (840 | ) | |||
Procter & Gamble Co. | ||||||
expiring: April 07 at $65.00 | 10 | (1,775 | ) | |||
Qualcomm, Inc. | ||||||
expiring: April 07 at $45.00 | 15 | (1,050 | ) | |||
Rowan Cos., Inc. | ||||||
expiring: January 07 at $35.00 | 12 | (540 | ) | |||
expiring: January 07 at $32.50 | 43 | (6,342 | ) | |||
Safeway, Inc. | ||||||
expiring: March 07 at $35.00 | 21 | (3,308 | ) | |||
Schlumberger Ltd. | ||||||
expiring: January 07 at $70.00 | 10 | (150 | ) | |||
expiring: February 07 at $70.00 | 8 | (640 | ) | |||
Sprint Nextel Corp. | ||||||
expiring: January 07 at $20.00 | 30 | (375 | ) | |||
Starbucks Corp. | ||||||
expiring: January 07 at $37.50 | 15 | (188 | ) | |||
State Street Corp. | ||||||
expiring: February 07 at $70.00 | 8 | (900 | ) | |||
Stryker Corp. | ||||||
expiring: March 07 at $60.00 | 12 | (720 | ) | |||
T Rowe Price Group, Inc. | ||||||
expiring: January 07 at $50.00 | 15 | (75 | ) | |||
Tellabs, Inc. | ||||||
expiring: March 07 at $10.00 | 30 | (2,925 | ) | |||
Texas Instruments, Inc. | ||||||
expiring: January 07 at $35.00 | 20 | (50 | ) | |||
Textron, Inc. | ||||||
expiring: March 07 at $100.00 | 5 | (825 | ) | |||
Time Warner, Inc. | ||||||
expiring: April 07 at $22.50 | 30 | (2,175 | ) | |||
| www.Bridgeway.com | 107 |
Bridgeway Balanced Fund
SCHEDULE OF OPTIONS WRITTEN (continued)
As of December 31, 2006 (Unaudited)
| Company | Number of Contracts | Value | ||||
Covered Call Options Written (continued) |
| |||||
United Health Group, Inc. | ||||||
expiring: March 07 at $55.00 | 9 | $ | (1,755 | ) | ||
US Bancorp | ||||||
expiring: January 07 at $35.00 | 8 | (1,140 | ) | |||
Valero Energy Corp. | ||||||
expiring: March 07 at $60.00 | 12 | (840 | ) | |||
Verizon Communications, Inc. | ||||||
expiring: January 07 at $37.50 | 75 | (9,188 | ) | |||
The Walt Disney Co. | ||||||
expiring: January 07 at $32.50 | 20 | (4,050 | ) | |||
Washington Mutual | ||||||
expiring: April 07 at $45.00 | 120 | (24,000 | ) | |||
Wells Fargo & Co. | ||||||
expiring: January 07 at $37.50 | 20 | (100 | ) | |||
Yahoo!, Inc. | ||||||
expiring: January 07 at $30.00 | 15 | (38 | ) | |||
TOTAL COVERED CALL OPTIONS WRITTEN | (438,740 | ) | ||||
(Premiums received $449,240) | ||||||
PUT OPTIONS WRITTEN | ||||||
Albemarle Corp. | ||||||
expiring: January 07 at $70.00 | 100 | (9,000 | ) | |||
expiring: March 07 at $70.00 | 100 | (23,750 | ) | |||
AT&T Corp. | ||||||
expiring: January 07 at $30.00 | 100 | (250 | ) | |||
expiring: January 07 at $32.50 | 250 | (625 | ) | |||
Bank of America | ||||||
expiring: January 07 at $52.50 | 80 | (2,800 | ) | |||
expiring: February 07 at $52.50 | 40 | (2,700 | ) | |||
Big Lots, Inc. | ||||||
expiring: January 07 at $20.00 | 200 | (2,500 | ) | |||
expiring: January 07 at $22.50 | 200 | (11,000 | ) | |||
expiring: April 07 at $22.50 | 100 | (15,000 | ) | |||
expiring: January 07 at $17.50 | 350 | (1,750 | ) | |||
BMC Software, Inc. | ||||||
expiring: January 07 at $30.00 | 405 | (6,075 | ) | |||
expiring: February 07 at $30.00 | 150 | (9,000 | ) | |||
Bristol-Myers Squibb | ||||||
expiring: March 07 at $25.00 | 100 | (5,750 | ) | |||
Cephalon, Inc. | ||||||
expiring: January 07 at $70.00 | 50 | (7,500 | ) | |||
expiring: February 07 at $70.00 | 50 | (14,375 | ) | |||
ConocoPhillips | ||||||
expiring: January 07 at $60.00 | 90 | (225 | ) | |||
expiring: February 07 at $70.00 | 100 | (18,750 | ) | |||
| Company | Number of Contracts | Value | ||||
Continental Airlines | ||||||
expiring: January 07 at $40.00 | 100 | $ | (12,750 | ) | ||
expiring: March 07 at $40.00 | 100 | (32,000 | ) | |||
Digene Corp. | ||||||
expiring: January 07 at $45.00 | 100 | (2,500 | ) | |||
expiring: March 07 at $45.00 | 80 | (17,000 | ) | |||
Dillard’s, Inc. | ||||||
expiring: January 07 at $35.00 | 180 | (15,300 | ) | |||
Duke Energy Corp. | ||||||
expiring: January 07 at $30.00 | 430 | (1,075 | ) | |||
expiring: April 07 at $32.50 | 150 | (12,000 | ) | |||
Gymboree Corp. | ||||||
expiring: February 07 at $40.00 | 150 | (48,750 | ) | |||
Merck & Co., Inc. | ||||||
expiring: January 07 at $42.50 | 160 | (4,400 | ) | |||
OM Group, Inc. | ||||||
expiring: January 07 at $45.00 | 200 | (30,500 | ) | |||
Pfizer, Inc. | ||||||
expiring: March 07 at $25.00 | 400 | (22,000 | ) | |||
Research In Motion Ltd. | ||||||
expiring: January 07 at $120.00 | 25 | (3,687 | ) | |||
Teletech Holdings | ||||||
expiring: January 07 at $22.50 | 100 | (2,500 | ) | |||
expiring: April 07 at $22.50 | 100 | (10,750 | ) | |||
US Bancorp | ||||||
expiring: March 07 at $35.00 | 100 | (4,000 | ) | |||
Verizon Communications, Inc. | ||||||
expiring: January 07 at $32.50 | 150 | (375 | ) | |||
expiring: January 07 at $35.00 | 295 | (738 | ) | |||
Washington Mutual | ||||||
expiring: April 07 at $45.00 | 100 | (13,750 | ) | |||
TOTAL PUT OPTIONS WRITTEN | (365,125 | ) | ||||
(Premiums received $568,112) | ||||||
TOTAL OPTIONS WRITTEN | $ | (803,865 | ) | |||
(Premiums received $1,017,352) | ||||||
See Notes to Financial Statements.
| 108 | Semi-Annual Report | December 31, 2006 (Unaudited) |
THIS PAGE INTENTIONALLY LEFT BLANK
| www.Bridgeway.com | 109 |
STATEMENT OF ASSETS AND LIABILITIES
December 31, 2006 (Unaudited)
| ASSETS | Aggressive Investors 1 | Aggressive Investors 2 | Ultra-Small Company | Ultra-Small Company Market | |||||||||||
Investments at value | $ | 383,615,160 | $ | 585,964,837 | $ | 133,415,956 | $ | 1,164,625,225 | |||||||
Cash | - | - | - | 1,084,983 | |||||||||||
Receivable for portfolio securities sold | 379,028 | 6,386,724 | - | 10,713,495 | |||||||||||
Receivable for fund shares sold | 107,390 | 754,664 | 71,216 | 1,638,020 | |||||||||||
Dividends receivable | 271,760 | �� | 339,585 | 207,129 | 858,529 | ||||||||||
Interest receivable | 43,570 | 68,878 | 107,768 | 387,498 | |||||||||||
Receivable from investment adviser | - | - | - | - | |||||||||||
Prepaid and other assets | 108,817 | 97,185 | 11,150 | 162,759 | |||||||||||
Variation margin receivable | - | 8 | - | - | |||||||||||
Total assets | 384,525,725 | 593,611,881 | 133,813,219 | 1,179,470,509 | |||||||||||
LIABILITIES | |||||||||||||||
Payable for portfolio securities purchased | - | - | 279,537 | 1,010,445 | |||||||||||
Payable for fund shares redeemed | 1,001,526 | 2,127,011 | 71,217 | 1,615,889 | |||||||||||
Accrued investment advisory fees | 867,590 | 537,477 | 94,553 | 468,986 | |||||||||||
Accrued administration fees | 15,619 | 23,339 | 5,253 | 46,899 | |||||||||||
Accrued directors fees | 999 | 917 | 2,056 | 2,207 | |||||||||||
Other payables | 38,288 | 20,555 | 34,095 | 94,033 | |||||||||||
Covered call options written at value^ | - | - | - | - | |||||||||||
Due to custodian | 1,024,879 | 4,332,101 | - | - | |||||||||||
Put options written at value+ | - | - | - | ||||||||||||
Total liabilities | 2,948,901 | 7,041,400 | 486,711 | 3,238,459 | |||||||||||
NET ASSETS | $ | 381,576,824 | $ | 586,570,481 | $ | 133,326,508 | $ | 1,176,232,050 | |||||||
NET ASSETS REPRESENT | |||||||||||||||
Paid-in capital | $ | 300,796,486 | $ | 552,102,067 | $ | 95,403,408 | $ | 774,936,550 | |||||||
Accumulated net investment income/(loss) | (1,295,238 | ) | (991,794 | ) | 66,889 | (965,936 | ) | ||||||||
Accumulated net realized gain/(loss) on investments | 7,415,206 | (31,878,933 | ) | 2,772,029 | 25,487,511 | ||||||||||
Net unrealized appreciation/(depreciation) on investments | 74,660,370 | 67,339,141 | 35,084,182 | 376,773,925 | |||||||||||
NET ASSETS | $ | 381,576,824 | $ | 586,570,481 | $ | 133,326,508 | $ | 1,176,232,050 | |||||||
Shares of common stock outstanding of $.001 par value* | 7,008,823 | 34,646,877 | 3,750,989 | 60,189,237 | |||||||||||
Net asset value per share | $ | 54.44 | $ | 16.93 | $ | 35.54 | $ | 19.54 | |||||||
Investments at cost | $ | 308,954,790 | $ | 518,625,696 | $ | 98,331,774 | $ | 787,851,300 | |||||||
| * | See Note 1 - Organization in the Notes to Financial Statements for shares authorized for each Fund. |
| ^ | Premiums received on covered call options written were $449,240 for Balanced Fund. |
| + | Premiums received on put options written were $568,112 for Balanced Fund. |
See Notes to Financial Statements
| 110 | Semi-Annual Report | December 31, 2006 (Unaudited) |
| Micro-Cap Limited | Small-Cap Growth | Small-Cap Value | Large-Cap Growth | Large-Cap Value | Blue Chip 35 Index | Balanced | ||||||||||||||||||||
| $ | 70,688,061 | $ | 176,808,616 | $ | 257,730,951 | $ | 107,108,940 | $ | 87,753,697 | $ | 75,354,732 | $ | 86,862,124 | |||||||||||||
| - | - | - | - | - | - | - | ||||||||||||||||||||
| 806,212 | 5,871,312 | 1,244,548 | 227,106 | 35 | - | 33,886 | ||||||||||||||||||||
| 1,400 | 158,252 | 427,030 | 347,398 | 349,381 | 348,252 | 262,160 | ||||||||||||||||||||
| 13,703 | 60,239 | 91,456 | 98,967 | 101,658 | 55,554 | 53,950 | ||||||||||||||||||||
| 9,596 | 50,852 | 43,050 | 5,936 | 5,554 | 4,504 | 288,917 | ||||||||||||||||||||
| - | - | - | - | - | 21,129 | 5,203 | ||||||||||||||||||||
| 16,840 | 36,805 | 25,053 | 19,629 | 10,014 | 12,622 | 30,264 | ||||||||||||||||||||
| - | - | - | - | - | - | 163,720 | ||||||||||||||||||||
| 71,535,812 | 182,986,076 | 259,562,088 | 107,807,976 | 88,220,339 | 75,796,793 | 87,700,224 | ||||||||||||||||||||
| - | - | - | - | - | 299,396 | - | ||||||||||||||||||||
| 29,697 | 469,858 | 500,410 | 476,058 | 193,507 | 10,000 | 89,211 | ||||||||||||||||||||
| 79,452 | 96,414 | 127,358 | 42,918 | 36,877 | - | 44,307 | ||||||||||||||||||||
| 2,867 | 7,796 | 10,512 | 4,292 | 3,479 | 2,925 | 3,473 | ||||||||||||||||||||
| 469 | 1,274 | 749 | 763 | 1,392 | 721 | 3,436 | ||||||||||||||||||||
| 20,156 | 34,450 | 45,352 | 7,061 | 19,129 | 22,723 | 22,799 | ||||||||||||||||||||
| - | - | - | - | - | - | 438,740 | ||||||||||||||||||||
| 969,743 | 7,000,696 | 1,542,534 | - | - | - | 10 | ||||||||||||||||||||
| - | - | - | - | - | 365,125 | |||||||||||||||||||||
| 1,102,384 | 7,610,488 | 2,226,915 | 531,092 | 254,384 | 335,765 | 967,101 | ||||||||||||||||||||
| $ | 70,433,428 | $ | 175,375,588 | $ | 257,335,173 | $ | 107,276,884 | $ | 87,965,955 | $ | 75,461,028 | $ | 86,733,123 | |||||||||||||
| $ | 62,534,396 | $ | 161,904,920 | $ | 213,111,715 | $ | 98,707,683 | $ | 72,123,986 | $ | 67,047,104 | $ | 80,613,693 | |||||||||||||
| (92,264 | ) | (255,973 | ) | (127,646 | ) | (6,429 | ) | 6,356 | 2,658 | (26,808 | ) | |||||||||||||||
| (2,160,631 | ) | (14,723,090 | ) | (12,124,444 | ) | (7,132,834 | ) | (210,761 | ) | (2,746,668 | ) | (3,319,249 | ) | |||||||||||||
| 10,151,927 | 28,449,731 | 56,475,548 | 15,708,464 | 16,046,374 | 11,157,934 | 9,465,487 | ||||||||||||||||||||
| $ | 70,433,428 | $ | 175,375,588 | $ | 257,335,173 | $ | 107,276,884 | $ | 87,965,955 | $ | 75,461,028 | $ | 86,733,123 | |||||||||||||
| 8,239,268 | 12,286,558 | 15,919,726 | 8,490,531 | 5,528,973 | 9,367,137 | 6,918,603 | ||||||||||||||||||||
| $ | 8.55 | $ | 14.27 | $ | 16.16 | $ | 12.63 | $ | 15.91 | $ | 8.06 | $ | 12.54 | |||||||||||||
| $ | 60,536,134 | $ | 148,358,885 | $ | 201,255,403 | $ | 91,400,476 | $ | 71,707,323 | $ | 64,196,798 | $ | 77,610,127 | |||||||||||||
| www.Bridgeway.com | 111 |
For the Six Months Ended December 31, 2006 (Unaudited)
| Aggressive Investors 1 | Aggressive Investors 2 | Ultra-Small Company | Ultra-Small Company Market | |||||||||||||
INVESTMENT INCOME | ||||||||||||||||
Dividends | $ | 1,576,251 | * | $ | 1,818,868 | ** | $ | 289,967 | $ | 3,839,731 | *** | |||||
Interest | 109,543 | 215,897 | 101,648 | 418,656 | ||||||||||||
Securities Lending | 227,024 | 322,596 | 372,984 | 1,863,748 | ||||||||||||
Other | 25,707 | - | 2 | 670 | ||||||||||||
Total Investment Income | 1,938,525 | 2,357,361 | 764,601 | 6,122,805 | ||||||||||||
EXPENSES | ||||||||||||||||
Investment advisory fees - Base fees | 1,759,446 | 2,520,656 | 563,251 | 2,777,501 | ||||||||||||
Investment advisory fees - Performance adjustment | 1,173,861 | 233,085 | - | - | ||||||||||||
Administration fees | 98,759 | 140,774 | 32,792 | 276,750 | ||||||||||||
Accounting fees | 24,592 | 28,245 | 26,039 | 30,815 | ||||||||||||
Transfer agent fees | 74,469 | 140,185 | 22,041 | 166,201 | ||||||||||||
Professional fees | 22,000 | 54,610 | 9,681 | 95,152 | ||||||||||||
Custody fees | 1,020 | 53,395 | 4,387 | 48,542 | ||||||||||||
Blue sky fees | 6,430 | 59,095 | 3,760 | 16,906 | ||||||||||||
Directors fees | 10,865 | 14,475 | 4,336 | 20,725 | ||||||||||||
ICI Registration fees | 4,214 | 5,100 | 2,885 | 4,472 | ||||||||||||
Reports to Shareholders | 4,197 | 6,850 | 1,200 | 6,832 | ||||||||||||
Insurance | 6,616 | 25,270 | 8,998 | 45,456 | ||||||||||||
Miscellaneous | 47,294 | 67,415 | 18,342 | 150,079 | ||||||||||||
Total expenses | 3,233,763 | 3,349,155 | 697,712 | 3,639,431 | ||||||||||||
Less investment advisory fees waived | - | - | - | - | ||||||||||||
Less expense reimbursed by investment adviser | - | - | - | - | ||||||||||||
Net Expenses | 3,233,763 | 3,349,155 | 697,712 | 3,639,431 | ||||||||||||
NET INVESTMENT INCOME (LOSS) | (1,295,238 | ) | (991,794 | ) | 66,889 | 2,483,374 | ||||||||||
NET REALIZED AND UNREALIZED GAIN | ||||||||||||||||
Net realized gain/(loss) on investment securities | 10,910,221 | (33,412,065 | ) | 12,120,049 | 33,422,656 | |||||||||||
Net realized gain/(loss) on options | 106,230 | (277,441 | ) | - | - | |||||||||||
Net realized gain/(loss) on futures contracts | - | - | - | - | ||||||||||||
Net change in unrealized appreciation/(depreciation) on investments | (22,233,850 | ) | 25,951,602 | (8,321,420 | ) | 28,284,777 | ||||||||||
Net realized and unrealized gain/(loss) on investments | (11,217,399 | ) | (7,737,904 | ) | 3,798,629 | 61,707,433 | ||||||||||
NET INCREASE/(DECREASE) IN NET ASSETS | $ | (12,512,637 | ) | $ | (8,729,698 | ) | $ | 3,865,518 | $ | 64,190,807 | ||||||
| * | Net of foreign withholding tax of $2,835 (Aggressive Investors 1) |
| ** | Net of foreign withholding tax of $3,210 (Aggressive Investors 2) |
| *** | Net of foreign withholding tax of $265 (Ultra Small Company Market) |
See Notes to Financial Statements
| 112 | Semi-Annual Report | December 31, 2006 (Unaudited) |
| Micro-Cap Limited | Small-Cap Growth | Small-Cap Value | Large-Cap Growth | Large-Cap Value | Blue Chip 35 Index | Balanced | |||||||||||||||||||
| $ | 114,817 | $ | 390,574 | $ | 847,949 | $ | 460,054 | $ | 767,072 | $ | 580,308 | $ | 444,867 | ||||||||||||
| 17,780 | 59,869 | 91,447 | 41,966 | 19,325 | 13,485 | 928,069 | |||||||||||||||||||
| 189,185 | 248,928 | 200,463 | 16,827 | 25,374 | 9,480 | 16,043 | |||||||||||||||||||
| - | - | - | - | - | - | 39,459 | |||||||||||||||||||
| 321,782 | 699,371 | 1,139,859 | 518,847 | 811,771 | 603,273 | 1,428,438 | |||||||||||||||||||
| 330,309 | 653,130 | 875,624 | 252,905 | 207,431 | 23,121 | 259,496 | |||||||||||||||||||
| (3,009 | ) | 8,141 | (4,650 | ) | 130 | 33 | - | - | |||||||||||||||||
| 17,350 | 54,427 | 72,969 | 25,290 | 20,743 | 14,632 | 20,624 | |||||||||||||||||||
| 23,956 | 27,328 | 27,230 | 23,805 | 24,170 | 24,770 | 24,606 | |||||||||||||||||||
| 13,442 | 71,610 | 84,110 | 27,275 | 26,311 | 13,526 | 26,755 | |||||||||||||||||||
| 8,588 | 32,769 | 45,575 | 6,219 | 6,443 | 5,340 | 21,771 | |||||||||||||||||||
| 3,262 | 10,917 | 7,813 | 8,220 | 2,680 | 2,902 | 5,192 | |||||||||||||||||||
| 1,316 | 21,640 | 41,960 | 13,572 | 23,440 | 15,198 | 19,430 | |||||||||||||||||||
| 1,674 | 6,637 | 8,249 | 1,894 | 244 | 1,260 | 5,588 | |||||||||||||||||||
| 1,820 | 3,998 | 7,978 | 576 | 1,390 | 1,194 | 4,000 | |||||||||||||||||||
| 604 | 6,180 | 18,532 | 820 | 1,133 | 242 | 5,790 | |||||||||||||||||||
| 4,186 | 16,220 | 24,140 | 4,215 | 3,838 | 2,320 | 10,320 | |||||||||||||||||||
| 10,548 | 39,917 | 55,545 | 10,009 | 11,120 | 7,740 | 17,146 | |||||||||||||||||||
| 414,046 | 952,914 | 1,265,075 | 374,930 | 328,976 | 112,245 | 420,718 | |||||||||||||||||||
| - | - | - | - | - | (23,121 | ) | (5,203 | ) | |||||||||||||||||
| - | - | - | - | - | (46,734 | ) | (2,348 | ) | |||||||||||||||||
| 414,046 | 952,914 | 1,265,075 | 374,930 | 328,976 | 42,390 | 413,167 | |||||||||||||||||||
| (92,264 | ) | (253,543 | ) | (125,216 | ) | 143,917 | 482,795 | 560,883 | 1,015,271 | ||||||||||||||||
| (2,789,985 | ) | (10,481,814 | ) | (6,422,077 | ) | (1,825,305 | ) | 211,661 | (25,738 | ) | (1,143,575 | ) | |||||||||||||
| - | - | - | - | - | - | 1,101,382 | |||||||||||||||||||
| - | - | - | - | - | - | (3,181,639 | ) | ||||||||||||||||||
| 5,068 | (1,587,222 | ) | 3,032,910 | 6,393,866 | 7,862,364 | 6,350,299 | 4,385,809 | ||||||||||||||||||
| (2,784,917 | ) | (12,069,036 | ) | (3,389,167 | ) | 4,568,561 | 8,074,025 | 6,324,561 | 1,161,977 | ||||||||||||||||
| $ | (2,877,181 | ) | $ | (12,322,579 | ) | $ | (3,514,383 | ) | $ | 4,712,478 | $ | 8,556,820 | $ | 6,885,444 | $ | 2,177,248 | |||||||||
| www.Bridgeway.com | 113 |
STATEMENT OF CHANGES IN NET ASSETS
| Aggressive Investors 1 | Aggressive Investors 2 | |||||||||||||||
| Six Months Ended December 31, | Year Ended June 30, | Six Months Ended December 31, | Year Ended June 30, | |||||||||||||
| 2006** | 2006 | 2006** | 2006 | |||||||||||||
OPERATIONS: | ||||||||||||||||
Net investment income/(loss) | $ | (1,295,238 | ) | $ | (2,895,367 | ) | $ | (991,794 | ) | $ | (943,483 | ) | ||||
Net realized gain/(loss) from investment securities | 10,910,221 | 57,574,148 | (33,412,065 | ) | 22,380,513 | |||||||||||
Net realized gain/(loss) on options | 106,230 | (659,897 | ) | (277,441 | ) | (311,964 | ) | |||||||||
Net realized gain/(loss) on futures contracts | - | - | - | - | ||||||||||||
Net change in unrealized appreciation/(depreciation) on investments | (22,233,850 | ) | 25,737,738 | 25,951,602 | 13,950,408 | |||||||||||
Net change in unrealized appreciation/(depreciation) on futures contracts | - | - | - | - | ||||||||||||
Net increase/(decrease) in net assets resulting from operations | (12,512,637 | ) | 79,756,622 | (8,729,698 | ) | 35,075,474 | ||||||||||
DISTRIBUTIONS: | ||||||||||||||||
From net investment income | - | - | - | - | ||||||||||||
From net realized gains | (38,922,847 | ) | (42,619,826 | ) | (12,277,778 | ) | (5,969,682 | ) | ||||||||
Net increase/(decrease) in net assets from distributions | (38,922,847 | ) | (42,619,826 | ) | (12,277,778 | ) | (5,969,682 | ) | ||||||||
SHARE TRANSACTIONS: | ||||||||||||||||
Proceeds from sale of shares | 11,791,507 | 53,941,063 | 162,914,353 | 509,374,846 | ||||||||||||
Reinvestment of distributions | 33,930,174 | 36,621,902 | 11,193,522 | 5,717,750 | ||||||||||||
Cost of shares redeemed | (51,301,551 | ) | (57,993,953 | ) | (151,791,778 | ) | (114,989,912 | ) | ||||||||
Net increase/(decrease) in net assets from share transactions | (5,579,870 | ) | 32,569,012 | 22,316,097 | 400,102,684 | |||||||||||
Net increase/(decrease) in net assets | (57,015,354 | ) | 69,705,808 | 1,308,621 | 429,208,476 | |||||||||||
NET ASSETS: | ||||||||||||||||
Beginning of period | 438,592,178 | 368,886,370 | 585,261,860 | 156,053,384 | ||||||||||||
End of period* | $ | 381,576,824 | $ | 438,592,178 | $ | 586,570,481 | $ | 585,261,860 | ||||||||
SHARES ISSUED & REDEEMED | ||||||||||||||||
Issued | 206,642 | 880,680 | 9,827,352 | 28,830,562 | ||||||||||||
Distributions reinvested | 613,122 | 638,791 | 647,399 | 342,791 | ||||||||||||
Redeemed | (896,082 | ) | (951,594 | ) | (9,172,500 | ) | (6,428,057 | ) | ||||||||
Net increase/(decrease) | (76,318 | ) | 567,877 | 1,302,251 | 22,745,296 | |||||||||||
Outstanding at beginning of period | 7,085,141 | 6,517,264 | 33,344,626 | 10,599,330 | ||||||||||||
Outstanding at end of period | 7,008,823 | 7,085,141 | 34,646,877 | 33,344,626 | ||||||||||||
* Including accumulated net investment income (loss) of: | $ | (1,295,238 | ) | $ | - | $ | (991,794 | ) | $ | - | ||||||
| ** | Unaudited |
| *** | Net of redemption fees of $259,383 and $439,575 for the six months ended December 31, 2006 and the year ended June 30, 2006, respectively. (Ultra Small Company Market) |
See Notes to Financial Statements
| 114 | Semi-Annual Report | December 31, 2006 (Unaudited) |
| Ultra-Small Company | Ultra-Small Company Market | Micro-Cap Limited | ||||||||||||||||||||
| Six Months Ended December 31, | Year Ended June 30, | Six Months Ended December 31, | Year Ended June 30, | Six Months Ended December 31, | Year Ended June 30, | |||||||||||||||||
| 2006** | 2006 | 2006** | 2006 | 2006** | 2006 | |||||||||||||||||
| $ | 66,889 | $ | (453,627 | ) | $ | 2,483,374 | $ | 2,196,436 | $ | (92,264 | ) | $ | (831,300 | ) | ||||||||
| 12,120,049 | 19,368,103 | 33,422,656 | 25,040,466 | (2,789,985 | ) | 23,482,718 | ||||||||||||||||
| - | - | - | - | - | - | |||||||||||||||||
| - | - | - | 483,010 | - | - | |||||||||||||||||
| (8,321,420 | ) | 8,673,884 | 28,284,777 | 61,433,756 | 5,068 | (13,091,825 | ) | |||||||||||||||
| - | - | - | 8,204 | - | - | |||||||||||||||||
| 3,865,518 | 27,588,360 | 64,190,807 | 89,161,872 | (2,877,181 | ) | 9,559,593 | ||||||||||||||||
| - | - | (4,933,248 | ) | (1,179,985 | ) | - | - | |||||||||||||||
| (25,378,383 | ) | (14,389,660 | ) | (22,318,728 | ) | (21,617,958 | ) | (14,955,401 | ) | (10,105,182 | ) | |||||||||||
| (25,378,383 | ) | (14,389,660 | ) | (27,251,976 | ) | (22,797,943 | ) | (14,955,401 | ) | (10,105,182 | ) | |||||||||||
| 1,132,107 | 1,903,411 | 219,890,695 | 590,305,879 | 15,108,216 | 12,030,141 | |||||||||||||||||
| 24,602,886 | 14,108,045 | 4,523,297 | 21,199,206 | - | 10,001,354 | |||||||||||||||||
| (3,088,653 | ) | (7,650,663 | ) | (172,870,730 | )*** | (184,002,179 | )*** | (7,552,723 | ) | (7,412,829 | ) | |||||||||||
| 22,646,340 | 8,360,793 | 51,543,262 | 427,502,906 | 7,555,493 | 14,618,666 | |||||||||||||||||
| 1,133,475 | 21,559,493 | 88,482,093 | 493,866,835 | (10,277,089 | ) | 14,073,077 | ||||||||||||||||
| 132,193,033 | 110,633,540 | 1,087,749,957 | 593,883,122 | 80,710,517 | 66,637,440 | |||||||||||||||||
| $ | 133,326,508 | $ | 132,193,033 | $ | 1,176,232,050 | $ | 1,087,749,957 | $ | 70,433,428 | $ | 80,710,517 | |||||||||||
| 27,771 | 45,835 | 11,687,885 | 31,169,559 | 1,716,960 | 1,016,697 | |||||||||||||||||
| 683,793 | 381,402 | 232,322 | 1,168,628 | - | 875,775 | |||||||||||||||||
| (76,674 | ) | (189,025 | ) | (9,171,421 | ) | (9,914,510 | ) | (750,974 | ) | (628,001 | ) | |||||||||||
| 634,890 | 238,212 | 2,748,786 | 22,423,677 | 965,986 | 1,264,471 | |||||||||||||||||
| 3,116,099 | 2,877,887 | 57,440,451 | 35,016,774 | 7,273,282 | 6,008,811 | |||||||||||||||||
| 3,750,989 | 3,116,099 | 60,189,237 | 57,440,451 | 8,239,268 | 7,273,282 | |||||||||||||||||
| $ | 66,889 | $ | - | $ | (965,936 | ) | $ | 1,483,938 | $ | (92,264 | ) | - | ||||||||||
| www.Bridgeway.com | 115 |
STATEMENT OF CHANGES IN NET ASSETS (continued)
| Small-Cap Growth | Small-Cap Value | |||||||||||||||
| Six Months Ended December 31, | Year Ended June 30, | Six Months Ended December 31, | Year Ended June 30, | |||||||||||||
| 2006** | 2006 | 2006** | 2006 | |||||||||||||
OPERATIONS: | ||||||||||||||||
Net investment income/(loss) | $ | (253,543 | ) | $ | (304,530 | ) | $ | (125,216 | ) | $ | (60,141 | ) | ||||
Net realized gain/(loss) from investment securities | (10,481,814 | ) | 66,079 | (6,422,077 | ) | (2,370,124 | ) | |||||||||
Net realized gain/(loss) on options | - | - | - | - | ||||||||||||
Net realized gain/(loss) on futures contracts | - | - | - | - | ||||||||||||
Net change in unrealized appreciation/(depreciation) on investments | (1,587,222 | ) | 17,975,131 | 3,032,910 | 41,582,066 | |||||||||||
Net change in unrealized appreciation/(depreciation) on futures contracts | - | - | - | - | ||||||||||||
Net increase/(decrease) in net assets resulting from operations | (12,322,579 | ) | 17,736,680 | (3,514,383 | ) | 39,151,801 | ||||||||||
DISTRIBUTIONS: | ||||||||||||||||
From net investment income | - | - | - | - | ||||||||||||
From net realized gains | - | - | - | - | ||||||||||||
Net increase/(decrease) in net assets from distributions | - | - | - | - | ||||||||||||
SHARE TRANSACTIONS: | ||||||||||||||||
Proceeds from sale of shares | 30,795,112 | 249,408,379 | 49,601,131 | 324,600,970 | ||||||||||||
Reinvestment of distributions | - | - | - | - | ||||||||||||
Cost of shares redeemed | (118,374,629 | ) | (47,571,775 | ) | (148,871,872 | ) | (72,177,050 | ) | ||||||||
Net increase/(decrease) in net assets from share transactions | (87,579,517 | ) | 201,836,604 | (99,270,741 | ) | 252,423,920 | ||||||||||
Net increase/(decrease) in net assets | (99,902,096 | ) | 219,573,284 | (102,785,124 | ) | 291,575,721 | ||||||||||
NET ASSETS: | ||||||||||||||||
Beginning of period | 275,277,684 | 55,704,400 | 360,120,297 | 68,544,576 | ||||||||||||
End of period* | $ | 175,375,588 | $ | 275,277,684 | $ | 257,335,173 | $ | 360,120,297 | ||||||||
SHARES ISSUED & REDEEMED | ||||||||||||||||
Issued | 2,228,698 | 17,336,669 | 3,216,359 | 21,907,119 | ||||||||||||
Distributions reinvested | - | - | - | - | ||||||||||||
Redeemed | (8,603,657 | ) | (3,287,752 | ) | (9,777,261 | ) | (4,788,234 | ) | ||||||||
Net increase/(decrease) | (6,374,959 | ) | 14,048,917 | (6,560,902 | ) | 17,118,885 | ||||||||||
Outstanding at beginning of period | 18,661,517 | 4,612,600 | 22,480,628 | 5,361,743 | ||||||||||||
Outstanding at end of period | 12,286,558 | 18,661,517 | 15,919,726 | 22,480,628 | ||||||||||||
* Including accumulated net investment income (loss) of: | $ | (255,973 | ) | $ | (2,430 | ) | $ | (127,646 | ) | $ | (2,430 | ) | ||||
| ** | Unaudited |
See Notes to Financial Statements
| 116 | Semi-Annual Report | December 31, 2006 (Unaudited) |
| Large-Cap Growth | Large-Cap Value | Blue Chip 35 Index | ||||||||||||||||||||
| Six Months Ended December 31, | Year Ended June 30, | Six Months Ended December 31, | Year Ended June 30, | Six Months Ended December 31, | Year Ended June 30, | |||||||||||||||||
| 2006** | 2006 | 2006** | 2006 | 2006** | 2006 | |||||||||||||||||
| $ | 143,917 | $ | 210,397 | $ | 482,795 | $ | 595,369 | $ | 560,883 | $ | 833,896 | |||||||||||
| (1,825,305 | ) | (328,693 | ) | 211,661 | 170,815 | (25,738 | ) | (213,778 | ) | |||||||||||||
| - | - | - | - | - | - | |||||||||||||||||
| - | - | - | - | - | - | |||||||||||||||||
| 6,393,866 | 2,773,526 | 7,862,364 | 3,982,733 | 6,350,299 | 2,507,818 | |||||||||||||||||
| - | - | - | - | - | - | |||||||||||||||||
| 4,712,478 | 2,655,230 | 8,556,820 | 4,748,917 | 6,885,444 | 3,127,936 | |||||||||||||||||
| (357,355 | ) | - | (819,616 | ) | (445,034 | ) | (1,021,236 | ) | (720,188 | ) | ||||||||||||
| - | - | - | - | - | - | |||||||||||||||||
| (357,355 | ) | - | (819,616 | ) | (445,034 | ) | (1,021,236 | ) | (720,188 | ) | ||||||||||||
| 20,462,448 | 73,245,902 | 21,240,716 | 64,726,457 | 33,621,646 | 24,662,088 | |||||||||||||||||
| 304,098 | - | 794,313 | 438,970 | 985,385 | 692,946 | |||||||||||||||||
| (21,705,756 | ) | (15,028,381 | ) | (29,524,710 | ) | (9,227,025 | ) | (7,480,785 | ) | (19,903,775 | ) | |||||||||||
| (939,210 | ) | 58,217,521 | (7,489,681 | ) | 55,938,402 | 27,126,246 | 5,451,259 | |||||||||||||||
| 3,415,913 | 60,872,751 | 247,523 | 60,242,285 | 32,990,454 | 7,859,007 | |||||||||||||||||
| 103,860,971 | 42,988,220 | 87,718,432 | 27,476,147 | 42,470,574 | 34,611,567 | |||||||||||||||||
| $ | 107,276,884 | $ | 103,860,971 | $ | 87,965,955 | $ | 87,718,432 | $ | 75,461,028 | $ | 42,470,574 | |||||||||||
| 1,677,143 | 5,902,620 | 1,405,819 | 4,558,708 | 4,301,767 | 3,528,092 | |||||||||||||||||
| 23,573 | 49,769 | 31,902 | 121,644 | 96,109 | ||||||||||||||||||
| (1,783,969 | ) | (1,237,457 | ) | (2,015,732 | ) | (665,418 | ) | (944,579 | ) | (2,783,097 | ) | |||||||||||
| (83,253 | ) | 4,665,163 | (560,144 | ) | 3,925,192 | 3,478,832 | 841,104 | |||||||||||||||
| 8,573,784 | 3,908,621 | 6,089,117 | 2,163,925 | 5,888,305 | 5,047,201 | |||||||||||||||||
| 8,490,531 | 8,573,784 | 5,528,973 | 6,089,117 | 9,367,137 | 5,888,305 | |||||||||||||||||
| $ | (6,429 | ) | $ | 207,009 | $ | 6,356 | $ | 343,177 | $ | 2,658 | $ | 463,011 | ||||||||||
| www.Bridgeway.com | 117 |
STATEMENT OF CHANGES IN NET ASSETS (continued)
| Balanced | ||||||||
| Six Months Ended December 31, | Year Ended June 30, | |||||||
| 2006** | 2006 | |||||||
OPERATIONS: | ||||||||
Net investment income/(loss) | $ | 1,015,271 | $ | 1,112,062 | ||||
Net realized gain/(loss) from investment securities | (1,143,575 | ) | (918,578 | ) | ||||
Net realized gain/(loss) on options | 1,101,382 | 1,523,741 | ||||||
Net realized gain/(loss) on futures contracts | (3,181,639 | ) | 435,407 | |||||
Net change in unrealized appreciation/(depreciation) on investments | 4,385,809 | 2,318,902 | ||||||
Net change in unrealized appreciation/(depreciation) on futures contracts | - | - | ||||||
Net increase/(decrease) in net assets resulting from operations | 2,177,248 | 4,471,534 | ||||||
DISTRIBUTIONS: | ||||||||
From net investment income | (1,860,754 | ) | (500,081 | ) | ||||
From net realized gains | (1,041,916 | ) | (498,752 | ) | ||||
Net increase/(decrease) in net assets from distributions | (2,902,670 | ) | (998,833 | ) | ||||
SHARE TRANSACTIONS: | ||||||||
Proceeds from sale of shares | 13,696,181 | 56,790,992 | ||||||
Reinvestment of distributions | 2,766,204 | 968,461 | ||||||
Cost of shares redeemed | (14,343,915 | ) | (18,155,753 | ) | ||||
Net increase/(decrease) in net assets from share transactions | 2,118,470 | 39,603,700 | ||||||
Net increase/(decrease) in net assets | 1,393,048 | 43,076,401 | ||||||
NET ASSETS: | ||||||||
Beginning of period | 85,340,075 | 42,263,674 | ||||||
End of period* | $ | 86,733,123 | $ | 85,340,075 | ||||
SHARES ISSUED & REDEEMED | ||||||||
Issued | 1,082,668 | 4,595,294 | ||||||
Distributions reinvested | 220,590 | 79,317 | ||||||
Redeemed | (1,132,195 | ) | (1,471,217 | ) | ||||
Net increase/(decrease) | 171,063 | 3,203,394 | ||||||
Outstanding at beginning of period | 6,747,540 | 3,544,146 | ||||||
Outstanding at end of period | 6,918,603 | 6,747,540 | ||||||
* Including accumulated net investment income (loss) of: | $ | (26,808 | ) | $ | 818,675 | |||
| ** | Unaudited |
See Notes to Financial Statements
| 118 | Semi-Annual Report | December 31, 2006 (Unaudited) |
THIS PAGE INTENTIONALLY LEFT BLANK
| www.Bridgeway.com | 119 |
(for a share outstanding throughout the period indicated)
Income from Investment Operations | |||||||||||||||
| Net Asset Value, Beginning of Period | Net Investment Income (Loss)^ | Net Realized and Unrealized Gain (Loss) | Total from Investment Operations | ||||||||||||
| AGGRESSIVE INVESTORS 1 | |||||||||||||||
Six Months Ended December 31, 2006** | $ | 61.90 | $ | (0.19 | ) | $ | (1.29 | ) | $ | (1.48 | ) | ||||
Year Ended June 30, 2006 | 56.60 | (0.42 | ) | 12.23 | 11.81 | ||||||||||
Year Ended June 30, 2005 | 49.43 | (0.26 | ) | 7.43 | 7.17 | ||||||||||
Year Ended June 30, 2004 | 39.94 | (0.58 | ) | 10.07 | 9.49 | ||||||||||
Year Ended June 30, 2003 | 36.51 | (0.27 | ) | 3.70 | 3.43 | ||||||||||
Year Ended June 30, 2002 | 41.94 | (0.34 | ) | (5.09 | ) | (5.43 | ) | ||||||||
| AGGRESSIVE INVESTORS 2 | |||||||||||||||
Six Months Ended December 31, 2006** | 17.55 | (0.03 | ) | (0.22 | ) | (0.25 | ) | ||||||||
Year Ended June 30, 2006 | 14.72 | (0.05 | ) | 3.22 | 3.17 | ||||||||||
Year Ended June 30, 2005 | 12.75 | (0.04 | ) | 2.01 | 1.97 | ||||||||||
Year Ended June 30, 2004 | 10.28 | (0.09 | ) | 2.56 | 2.47 | ||||||||||
Year Ended June 30, 2003 | 10.25 | (0.09 | ) | 0.12 | 0.03 | ||||||||||
Period from October 31, 2001 to June 30, 2002ç | 10.00 | (0.08 | ) | 0.33 | 0.25 | ||||||||||
| ULTRA SMALL COMPANY | |||||||||||||||
Six Months Ended December 31, 2006** | 42.42 | 0.02 | 1.36 | 1.38 | |||||||||||
Year Ended June 30, 2006 | 38.44 | (0.15 | ) | 9.23 | 9.08 | ||||||||||
Year Ended June 30, 2005 | 40.97 | �� | (0.10 | ) | 6.69 | 6.59 | |||||||||
Year Ended June 30, 2004 | 32.93 | (0.33 | ) | 13.66 | 13.33 | ||||||||||
Year Ended June 30, 2003 | 28.83 | (0.21 | ) | 7.99 | 7.78 | ||||||||||
Year Ended June 30, 2002 | 26.99 | (0.14 | ) | 4.43 | 4.29 | ||||||||||
| ULTRA SMALL COMPANY MARKET | |||||||||||||||
Six Months Ended December 31, 2006** | 18.94 | 0.04 | 1.01 | 1.05 | |||||||||||
Year Ended June 30, 2006 | 16.96 | 0.05 | 2.48 | 2.53 | |||||||||||
Year Ended June 30, 2005 | 16.14 | 0.02 | 0.97 | 0.99 | |||||||||||
Year Ended June 30, 2004 | 10.98 | 0.02 | 5.16 | 5.18 | |||||||||||
Year Ended June 30, 2003 | 8.70 | (0.03 | ) | 2.31 | 2.28 | ||||||||||
Year Ended June 30, 2002 | 7.22 | - | 1.49 | 1.49 | |||||||||||
| * | Annualized |
| ** | Unaudited |
| ^ | Per share amounts calculated based on the average daily shares outstanding during the period. |
| # | Total returns for periods less than one year are not annualized. |
| + | Total return would have been lower had various fees not been waived during the period. |
| ç | Fund commenced operations on October 31, 2001. |
| (a) | Less than $0.01 per share. |
See Notes to Financial Statements
| 120 | Semi-Annual Report | December 31, 2006 (Unaudited) |
Less Distributions to Shareholders from: | Ratios & Supplemental Data: | ||||||||||||||||||||||||||||||||||
| Net Realized Gain | Net Investment Income | Total Distributions | Paid-in Capital from Redemption Fees^ | Net Asset Value, End of Period | Total Return# | Net Assets End of Period (000’s) | Expenses After Waivers and Reimbursements | Expenses Before Waivers and Reimbursements | Net Investment Income After Waivers and Reimbursements | Portfolio Turnover Rate | |||||||||||||||||||||||||
| $ | (5.98 | ) | $ | - | $ | (5.98 | ) | $ | - | $ | 54.44 | (2.56 | %) | $ | 381,577 | 1.62 | %* | 1.62 | %* | (0.65 | %)* | 46.9 | % | ||||||||||||
| (6.51 | ) | - | (6.51 | ) | - | 61.90 | 21.79 | % | 438,592 | 1.58 | % | 1.58 | % | (0.69 | %) | 127.6 | % | ||||||||||||||||||
| - | - | - | - | 56.60 | 14.51 | % | 368,886 | 1.58 | % | 1.58 | % | (0.51 | %) | 155.0 | % | ||||||||||||||||||||
| - | - | - | - | 49.43 | 23.76 | % | 353,684 | 1.74 | % | 1.74 | % | (1.24 | %) | 150.7 | % | ||||||||||||||||||||
| - | - | - | - | 39.94 | 9.40 | % | 281,375 | 1.90 | % | 1.90 | % | (0.81 | %) | 138.0 | % | ||||||||||||||||||||
| - | - | - | - | 36.51 | (12.95 | %) | 276,876 | 1.81 | % | 1.81 | % | (0.89 | %) | 154.0 | % | ||||||||||||||||||||
| (0.37 | ) | - | (0.37 | ) | - | 16.93 | (1.48 | %) | 586,570 | 1.16 | %* | 1.16 | %* | (0.34 | %)* | 57.8 | % | ||||||||||||||||||
| (0.34 | ) | - | (0.34 | ) | - | 17.55 | 21.65 | % | 585,262 | 1.12 | % | 1.12 | % | (0.26 | %) | 89.1 | % | ||||||||||||||||||
| - | - | - | - | 14.72 | 15.45 | % | 156,053 | 1.37 | % | 1.37 | % | (0.33 | %) | 148.4 | % | ||||||||||||||||||||
| - | - | - | - | 12.75 | 24.03 | % | 110,395 | 1.58 | % | 1.58 | % | (1.13 | %) | 151.5 | % | ||||||||||||||||||||
| - | - | - | - | 10.28 | 0.29 | % | 22,107 | 1.90 | % | 1.90 | % | (1.05 | %) | 143.2 | % | ||||||||||||||||||||
| - | - | - | - | 10.25 | 2.50 | %+ | 11,448 | 1.90 | %* | 1.98 | %* | (1.24 | %)* | 68.0 | %* | ||||||||||||||||||||
| (8.26 | ) | - | (8.26 | ) | - | 35.54 | 3.01 | % | 133,327 | 1.10 | %* | 1.10 | %* | 0.11 | %* | 52.5 | % | ||||||||||||||||||
| (5.10 | ) | - | (5.10 | ) | - | 42.42 | 25.58 | % | 132,193 | 1.09 | % | 1.09 | % | (0.37 | %) | 100.8 | % | ||||||||||||||||||
| (9.12 | ) | - | (9.12 | ) | - | 38.44 | 15.37 | % | 110,634 | 1.12 | % | 1.12 | % | (0.25 | %) | 85.9 | % | ||||||||||||||||||
| (5.29 | ) | - | (5.29 | ) | - | 40.97 | 40.88 | % | 101,233 | 1.15 | % | 1.15 | % | (0.84 | %) | 71.1 | % | ||||||||||||||||||
| (3.68 | ) | - | (3.68 | ) | - | 32.93 | 32.00 | % | 77,450 | 1.29 | % | 1.29 | % | (0.82 | %) | 56.1 | % | ||||||||||||||||||
| (2.45 | ) | - | (2.45 | ) | - | 28.83 | 17.04 | % | 60,809 | 1.26 | % | 1.26 | % | (0.53 | %) | 120.6 | % | ||||||||||||||||||
| (0.37 | ) | (0.08 | ) | (0.45 | ) | - | (a) | 19.54 | 5.65 | % | 1,176,232 | 0.65 | %* | 0.65 | %* | 0.44 | %* | 15.7 | % | ||||||||||||||||
| (0.53 | ) | (0.03 | ) | (0.56 | ) | 0.01 | 18.94 | 15.13 | % | 1,087,750 | 0.65 | % | 0.65 | % | 0.27 | % | 26.5 | % | |||||||||||||||||
| (0.15 | ) | (0.03 | ) | (0.18 | ) | 0.01 | 16.96 | 6.12 | % | 593,883 | 0.73 | % | 0.73 | % | 0.15 | % | 13.0 | % | |||||||||||||||||
| (0.04 | ) | - | (0.04 | ) | 0.02 | 16.14 | 47.41 | % | 816,748 | 0.67 | % | 0.67 | % | 0.11 | % | 19.4 | % | ||||||||||||||||||
| - | - | - | - | 10.98 | 26.21 | %+ | 312,041 | 0.75 | % | 0.85 | % | (0.14 | %) | 17.7 | % | ||||||||||||||||||||
| - | (0.01 | ) | (0.01 | ) | - | 8.70 | 20.70 | %+ | 68,824 | 0.75 | % | 1.01 | % | (0.05 | %) | 55.8 | % | ||||||||||||||||||
| www.Bridgeway.com | 121 |
FINANCIAL HIGHLIGHTS (continued)
(for a share outstanding throughout the period indicated)
Income from Investment Operations | |||||||||||||||
| Net Asset Value, Beginning of Period | Net Investment Income (Loss)^ | Net Realized and Unrealized Gain (Loss) | Total from Investment Operations | ||||||||||||
| MICRO CAP LIMITED | |||||||||||||||
Six Months Ended December 31, 2006** | $ | 11.10 | $ | (0.01 | ) | $ | (0.33 | ) | $ | (0.34 | ) | ||||
Year Ended June 30, 2006 | 11.09 | (0.13 | ) | 1.81 | 1.68 | ||||||||||
Year Ended June 30, 2005 | 10.75 | (0.13 | ) | 2.45 | 2.32 | ||||||||||
Year Ended June 30, 2004 | 9.36 | (0.17 | ) | 2.49 | 2.32 | ||||||||||
Year Ended June 30, 2003 | 10.19 | (0.11 | ) | 0.01 | (0.10 | ) | |||||||||
Year Ended June 30, 2002 | 9.92 | (0.12 | ) | 0.87 | 0.75 | ||||||||||
| SMALL CAP GROWTH | |||||||||||||||
Six Months Ended December 31, 2006** | 14.75 | (0.02 | ) | (0.46 | ) | (0.48 | ) | ||||||||
Year Ended June 30, 2006 | 12.08 | (0.03 | ) | 2.70 | 2.67 | ||||||||||
Year Ended June 30, 2005 | 10.84 | (0.07 | ) | 1.31 | 1.24 | ||||||||||
Period from October 31, 2003 to June 30, 2004ç | 10.00 | (0.05 | ) | 0.89 | 0.84 | ||||||||||
| SMALL CAP VALUE | |||||||||||||||
Six Months Ended December 31, 2006** | 16.02 | (0.01 | ) | 0.15 | 0.14 | ||||||||||
Year Ended June 30, 2006 | 12.78 | - | 3.24 | 3.24 | |||||||||||
Year Ended June 30, 2005 | 10.46 | (0.02 | ) | 2.34 | 2.32 | ||||||||||
Period from October 31, 2003 to June 30, 2004ç | 10.00 | (0.03 | ) | 0.49 | 0.46 | ||||||||||
| LARGE CAP GROWTH | |||||||||||||||
Six Months Ended December 31, 2006** | 12.11 | 0.02 | 0.54 | 0.56 | |||||||||||
Year Ended June 30, 2006 | 11.00 | 0.04 | 1.07 | 1.11 | |||||||||||
Year Ended June 30, 2005 | 10.63 | - | 0.37 | 0.37 | |||||||||||
Period from October 31, 2003 to June 30, 2004ç | 10.00 | (0.01 | ) | 0.64 | 0.63 | ||||||||||
| * | Annualized |
| ** | Unaudited |
| ^ | Per share amounts calculated based on the average daily shares outstanding during the period. |
| # | Total returns for periods less than one year are not annualized. |
| + | Total return would have been lower had various fees not been waived during the period. |
| ç | Fund commenced operations on October 31, 2003. |
See Notes to Financial Statements
| 122 | Semi-Annual Report | December 31, 2006 (Unaudited) |
Less Distributions to Shareholders from: | Ratios & Supplemental Data: | |||||||||||||||||||||||||||||||||
| Net Realized Gain | Net Investment Income | Total Distributions | Paid-in Capital from Redemption Fees^ | Net Asset Value, End of Period | Total Return# | Net Assets End of Period (000’s) | Expenses After Waivers and Reimbursements | Expenses Before Waivers and Reimbursements | Net Investment Income After Waivers and Reimbursements | Portfolio Turnover Rate | ||||||||||||||||||||||||
| $ | (2.21 | ) | $ | - | $ | (2.21 | ) | $ | - | $ | 8.55 | (3.48 | %) | $ | 708,433 | 1.12 | %* | 1.12 | %* | (0.25 | %)* | 62.8 | % | |||||||||||
| (1.67 | ) | - | (1.67 | ) | - | 11.10 | 14.72 | % | 80,711 | 1.60 | % | 1.60 | % | (1.05 | %) | 125.4 | % | |||||||||||||||||
| (1.98 | ) | - | (1.98 | ) | - | 11.09 | 22.94 | % | 66,637 | 1.75 | % | 1.75 | % | (1.27 | %) | 87.1 | % | |||||||||||||||||
| (0.93 | ) | - | (0.93 | ) | - | 10.75 | 24.30 | % | 57,750 | 1.79 | % | 1.79 | % | (1.50 | %) | 98.2 | % | |||||||||||||||||
| (0.73 | ) | - | (0.73 | ) | - | 9.36 | 0.93 | %+ | 56,422 | 1.90 | % | 2.13 | % | (1.35 | %) | 99.1 | % | |||||||||||||||||
| (0.48 | ) | - | (0.48 | ) | - | 10.19 | 8.09 | %+ | 57,885 | 1.90 | % | 1.94 | % | (1.22 | %) | 124.0 | % | |||||||||||||||||
| - | - | - | - | 14.27 | (3.25 | %) | 175,376 | 0.87 | %* | 0.87 | %* | (0.23 | %)* | 15.0 | % | |||||||||||||||||||
| - | - | - | - | 14.75 | 22.10 | % | 275,278 | 0.81 | % | 0.81 | % | (0.19 | %) | 41.2 | % | |||||||||||||||||||
| - | - | - | - | 12.08 | 11.44 | %+ | 55,704 | 0.94 | % | 1.08 | % | (0.68 | %) | 51.3 | % | |||||||||||||||||||
| - | - | - | - | 10.84 | 8.40 | %+ | 37,968 | 0.94 | %* | 1.25 | %* | (0.74 | %)* | 16.6 | % | |||||||||||||||||||
| - | - | - | - | 16.16 | 0.87 | % | 257,335 | 0.86 | %* | 0.86 | %* | (0.09 | %)* | 20.1 | % | |||||||||||||||||||
| - | - | - | - | 16.02 | 25.35 | % | 360,120 | 0.77 | % | 0.77 | % | (0.03 | %) | 48.6 | % | |||||||||||||||||||
| - | - | - | - | 12.78 | 22.18 | %+ | 68,545 | 0.94 | % | 1.07 | % | (0.32 | %) | 57.0 | % | |||||||||||||||||||
| - | - | - | - | 10.46 | 4.60 | %+ | 28,193 | 0.94 | %* | 1.49 | %* | (0.42 | %)* | 20.5 | % | |||||||||||||||||||
| - | (0.04 | ) | (0.04 | ) | - | 12.63 | 4.64 | % | 107,277 | 0.73 | %* | 0.73 | %* | 0.28 | %* | 18.2 | % | |||||||||||||||||
| - | - | - | - | 12.11 | 10.09 | % | 103,861 | 0.82 | % | 0.82 | % | 0.31 | % | 26.1 | % | |||||||||||||||||||
| - | - | - | - | 11.00 | 3.48 | %+ | 42,988 | 0.84 | % | 1.03 | % | (0.04 | %) | 20.2 | % | |||||||||||||||||||
| - | - | - | - | 10.63 | 6.30 | %+ | 39,532 | 0.84 | %* | 1.13 | %* | (0.09 | %)* | 6.7 | % | |||||||||||||||||||
| www.Bridgeway.com | 123 |
FINANCIAL HIGHLIGHTS (continued)
(for a share outstanding throughout the period indicated)
Income from Investment Operations | ||||||||||||||
| Net Asset Value, Beginning of Period | Net Investment Income (Loss)^ | Net Realized and Unrealized Gain (Loss) | Total from Investment Operations | |||||||||||
| LARGE CAP VALUE | ||||||||||||||
Six Months Ended December 31, 2006** | $ | 14.41 | $ | 0.09 | $ | 1.56 | $ | 1.65 | ||||||
Year Ended June 30, 2006 | 12.70 | 0.17 | 1.69 | 1.86 | ||||||||||
Year Ended June 30, 2005 | 11.11 | 0.14 | 1.55 | 1.69 | ||||||||||
For the Period October 31, 2003 to June 30, 2004ç | 10.00 | 0.03 | 1.08 | 1.11 | ||||||||||
| BLUE CHIP 35 INDEX | ||||||||||||||
Six Months Ended December 31, 2006** | 7.21 | 0.03 | 0.93 | 0.96 | ||||||||||
Year Ended June 30, 2006 | 6.86 | 0.14 | 0.32 | 0.46 | ||||||||||
Year Ended June 30, 2005 | 7.02 | 0.14 | (0.18 | ) | (0.04 | ) | ||||||||
Year Ended June 30, 2004 | 6.14 | 0.10 | 0.83 | 0.93 | ||||||||||
Year Ended June 30, 2003 | 5.93 | 0.09 | 0.21 | 0.30 | ||||||||||
Year Ended June 30, 2002 | 7.23 | 0.09 | (1.31 | ) | (1.22 | ) | ||||||||
| BALANCED | ||||||||||||||
Six Months Ended December 31, 2006** | 12.65 | 0.15 | 0.16 | 0.31 | ||||||||||
Year Ended June 30, 2006 | 11.92 | 0.22 | 0.73 | 0.95 | ||||||||||
Year Ended June 30, 2005 | 11.30 | 0.14 | 0.66 | 0.80 | ||||||||||
Year Ended June 30, 2004 | 10.05 | 0.06 | 1.24 | 1.30 | ||||||||||
Year Ended June 30, 2003 | 9.87 | 0.10 | 0.15 | 0.25 | ||||||||||
Year Ended June 30, 2002 | 10.00 | 0.04 | (0.12 | ) | (0.08 | ) | ||||||||
| * | Annualized |
| ** | Unaudited |
| ^ | Per share amounts calculated based on the average daily shares outstanding during the period. |
| # | Total returns for periods less than one year are not annualized. |
| + | Total return would have been lower had various fees not been waived during the period. |
| ç | Fund commenced operations on October 31, 2003. |
See Notes to Financial Statements
| 124 | Semi-Annual Report | December 31, 2006 (Unaudited) |
Less Distributions to Shareholders from: | Ratios & Supplemental Data: | |||||||||||||||||||||||||||||||||
| Net Realized Gain | Net Investment Income | Total Distributions | Paid-in Capital from Redemption Fees^ | Net Asset Value, End of Period | Total Return# | Net Assets End of Period (000’s) | Expenses After Waivers and Reimbursements | Expenses Before Waivers and Reimbursements | Net Investment Income After Waivers and Reimbursements | Portfolio Turnover Rate | ||||||||||||||||||||||||
| $ | - | $ | (0.15 | ) | $ | (0.15 | ) | $ | - | $ | 15.91 | 11.44 | % | $ | 87,966 | 0.78 | %* | 0.78 | %* | 1.15 | %* | 17.5 | % | |||||||||||
| - | (0.15 | ) | (0.15 | ) | - | 14.41 | 14.69 | %+ | 87,718 | 0.84 | % | 0.86 | % | 1.18 | % | 23.1 | % | |||||||||||||||||
| - | (0.10 | ) | (0.10 | ) | - | 12.70 | 15.22 | %+ | 27,476 | 0.84 | % | 1.10 | % | 1.24 | % | 30.0 | % | |||||||||||||||||
| - | - | - | - | 11.11 | 11.10 | %+ | 20,598 | 0.84 | %* | 1.52 | %* | 0.86 | %* | 11.3 | % | |||||||||||||||||||
| - | (0.11 | ) | (0.11 | ) | - | 8.06 | 13.34 | %+ | 75,461 | 0.15 | %* | 0.39 | %* | 1.95 | %* | 4.5 | % | |||||||||||||||||
| - | (0.11 | ) | (0.11 | ) | - | 7.21 | 6.64 | %+ | 42,471 | 0.15 | % | 0.47 | % | 1.90 | % | 41.1 | % | |||||||||||||||||
| - | (0.12 | ) | (0.12 | ) | - | 6.86 | (0.59 | %)+ | 34,612 | 0.15 | % | 0.56 | % | 2.07 | % | 20.3 | % | |||||||||||||||||
| - | (0.05 | ) | (0.05 | ) | - | 7.02 | 15.20 | %+ | 35,960 | 0.15 | % | 0.58 | % | 1.64 | % | 5.3 | % | |||||||||||||||||
| - | (0.09 | ) | (0.09 | ) | - | 6.14 | 5.13 | %+ | 7,763 | 0.15 | % | 1.07 | % | 1.65 | % | 24.9 | % | |||||||||||||||||
| - | (0.08 | ) | (0.08 | ) | - | 5.93 | (17.01 | %)+ | 5,532 | 0.15 | % | 0.93 | % | 1.35 | % | 40.8 | % | |||||||||||||||||
| (0.15 | ) | (0.27 | ) | (0.42 | ) | - | 12.54 | 2.52 | %+ | 86,733 | 0.94 | %* | 0.96 | % | 2.32 | % | 16.7 | % | ||||||||||||||||
| (0.11 | ) | (0.11 | ) | (0.22 | ) | - | 12.65 | 8.01 | % | 85,340 | 0.94 | % | 0.94 | % | 1.81 | % | 51.3 | % | ||||||||||||||||
| (0.10 | ) | (0.08 | ) | (0.18 | ) | - | 11.92 | 7.15 | %+ | 42,264 | 0.94 | % | 1.19 | % | 1.20 | % | 125.5 | % | ||||||||||||||||
| - | (0.05 | ) | (0.05 | ) | - | 11.30 | 12.94 | %+ | 23,212 | 0.94 | % | 1.51 | % | 0.60 | % | 123.7 | % | |||||||||||||||||
| (0.01 | ) | (0.06 | ) | (0.07 | ) | - | 10.05 | 2.57 | %+ | 8,344 | 0.94 | % | 1.66 | % | 1.06 | % | 98.2 | % | ||||||||||||||||
| - | (0.05 | ) | (0.05 | ) | - | 9.87 | (0.80 | %)+ | 4,960 | 0.94 | % | 2.07 | % | 0.49 | % | 112.5 | % | |||||||||||||||||
| www.Bridgeway.com | 125 |
December 31, 2006 (Unaudited)
1. Organization:
Bridgeway Funds, Inc. (“Bridgeway”) was organized as a Maryland corporation on October 19, 1993, and is registered under the Investment Company Act of 1940, as amended, as an open-end management investment company.
Bridgeway is organized as a series fund, which currently has 11 investment funds (collectively, the “Funds”): Aggressive Investors 1, Aggressive Investors 2, Ultra-Small Company, Ultra-Small Company Market, Micro-Cap Limited, Small-Cap Growth, Small-Cap Value, Large-Cap Growth, Large-Cap Value, Blue Chip 35 Index, and Balanced Funds.
Bridgeway is authorized to issue 1,000,000,000 shares of common stock at $0.001 par value. 15,000,000 shares have been classified into the Aggressive Investors 1 Fund. 130,000,000 shares each have been classified into the Aggressive Investors 2 and Blue Chip 35 Index Funds. 5,000,000 shares have been classified into the Ultra-Small Company Fund. 100,000,000 shares have been classified in the Ultra-Small Company Market Fund. 10,000,000 shares have been classified in the Micro-Cap Limited Fund. 100,000,000 shares each have been classified into the Small-Cap Growth, Small-Cap Value, Large-Cap Growth, and Large-Cap Value Funds. 50,000,000 shares have been classified into the Balanced Fund.
Amounts disclosed above for each Fund that have been authorized do not include Class R shares, of which there are none currently issued.
The Aggressive Investors 1 Fund and the Micro-Cap Limited Fund are closed to new investors. The Ultra-Small Company Fund is closed to all investors.
All of the Funds are no-load, diversified funds.
The Aggressive Investors 1 and 2 Funds seek to exceed the stock market total return (primarily through capital appreciation) at a level of total risk roughly equal to that of the stock market over longer periods of time (three years or more).
The Ultra-Small Company, Ultra-Small Company Market, Micro-Cap Limited, Small-Cap Growth, Small-Cap Value, and Large-Cap Growth Funds seek to provide a long-term total return of capital, primarily through capital appreciation.
The Blue Chip 35 Index and Large-Cap Value Funds seek to provide long-term total return of capital, primarily through capital appreciation but also some income.
The Balanced Fund seeks to provide a high current return with short-term risk less than or equal to 40% of the stock market.
Bridgeway Capital Management, Inc. (the “Adviser”) is the investment adviser for all of the Funds.
2 . Significant Accounting Policies:
The following summary of significant accounting policies, followed in the preparation of the financial statements of the Funds, are in conformity with accounting principles generally accepted in the United States of America.
Securities, Options, Futures and Other Investments Valuation. Other than options, portfolio securities that are principally traded on a national securities exchange are valued at their last sale on the principal exchange on which they are traded prior to the close of the New York Stock Exchange (“NYSE”), on each day the NYSE is open for business. Portfolio securities other than options that are principally traded on the National Association of Securities Dealers Automated Quotation System (“NASDAQ”) are valued at the NASDAQ Official Closing Price (“NOCP”). In the absence of recorded sales on their home exchange or NOCP in the case of NASDAQ traded securities, the security will be valued as follows: bid prices for long positions and ask prices for short positions.
Short-term fixed income securities having a remaining maturity of 60 days or less are valued at amortized cost, which approximates market value. Options are valued at the average of the best bid and best asked quotations. Other investments for which no sales are reported are valued at the latest bid price in accordance with the pricing policy established by the Board of Directors.
Investments in open-end registered investment companies and closed-end registered investment companies that do not trade on an exchange are valued at the end of day net asset value per share.
Investments in closed-end registered investment companies that trade on an exchange are valued at the last sales price as of the close of the customary trading session on the exchange where the security is principally traded.
When market quotations are not readily available or when events occur that make established valuation methods unreliable, securities of the Funds may be valued at fair value as determined in good faith by or under the direction of the Board of Directors. The valuation assigned to fair valued securities for purposes of calculating the Funds’
| 126 | Semi-Annual Report | December 31, 2006 (Unaudited) |
NOTES TO FINANCIAL STATEMENTS (continued)
December 31, 2006 (Unaudited)
NAVs may differ from the security’s most recent closing market price and from the prices used by other mutual funds to calculate their NAVs.
Securities Lending. Upon lending its securities to third parties, the Fund receives compensation in the form of fees. The Fund also continues to receive dividends on the securities loaned. The loans are secured by collateral at least equal to the fair value of the securities loaned plus accrued interest. Gain or loss in the fair value of the securities loaned that may occur during the term of the loan will be for the account of the Fund. The Fund has the right under the lending agreement to recover the securities from the borrower on demand. Additionally, the Fund does not have the right to sell or repledge collateral received in the form of securities unless the borrower goes into default. The risks to the Fund of securities lending are that the borrower may not provide additional collateral when required or return the securities when due.
As of December 31, 2006, the Funds had securities on loan and related collateral with values shown below:
| Bridgeway Fund | Securities on Loan Value | Value of Securities Received as Collateral | ||||
Aggressive Investors 1 | $ | 109,170,543 | $ | 113,326,589 | ||
Aggressive Investors 2 | $ | 184,765,948 | $ | 191,940,343 | ||
Ultra-Small Company | $ | 19,526,856 | $ | 21,054,761 | ||
Ultra-Small Company Market | $ | 144,131,227 | $ | 158,203,238 | ||
Micro-Cap Limited | $ | 6,531,795 | $ | 6,919,200 | ||
Small-Cap Growth | $ | 50,518,698 | $ | 53,019,442 | ||
Small-Cap Value | $ | 56,530,087 | $ | 59,641,531 | ||
Large-Cap Growth | $ | 36,317,138 | $ | 37,582,262 | ||
Large-Cap Value | $ | 29,886,422 | $ | 31,059,807 | ||
Blue Chip 35 Index | $ | 22,917,466 | $ | 23,816,896 | ||
Balanced | $ | 22,138,400 | $ | 22,780,126 | ||
It is the Fund’s policy to obtain additional collateral from or return excess collateral to the borrower by the end of the next business day, following the valuation date of the securities loaned. Therefore, the value of the collateral held may be temporarily less than the value of the securities on loan.
Federal Income Taxes. It is the Funds’ policy to continue to comply with the provisions of the Internal Revenue Code applicable to registered investment companies and to distribute income to the extent necessary so that the Funds are not subject to federal income tax. Therefore, no federal income tax provision is required.
Use of Estimates in Financial Statements. In preparing financial statements in conformity with accounting principles generally accepted in the United States of America, management makes estimates and assumptions that affect the reported amounts of assets and liabilities at the date of the financial statements, as well as the reported amounts of income and expenses during the reporting period. Actual results could differ from those estimates.
Risks and Uncertainties. The Funds provide for various investment options, including stocks and call and put options. Such investments are exposed to various risks, such as interest rate, market and credit. Due to the risks involved, it is at least reasonably possible that changes in risks in the near term would materially affect shareholders’ account values and the amounts reported in the financial statements and financial highlights.
Security Transactions, Expenses, Gains and Losses and Allocations. Fund expenses that are not series fund specific are allocated to each series based upon its relative proportion of net assets to the Funds’ total net assets.
Security transactions are accounted for as of the trade date, the date the order to buy or sell is executed. Realized gains and losses are computed on the identified cost basis. Dividend income is recorded on the ex-dividend date, and interest income is recorded on the accrual basis from settlement date. Particularly related to the Balanced Fund, discounts and premiums are accreted/amortized on the effective interest method.
Futures Contracts. A futures contract is an agreement between two parties to buy or sell a financial instrument at a set price on a future date. Upon entering into such a contract a Fund is required to pledge to the broker an amount of cash or U.S. government securities equal to the minimum “initial margin” requirements of the exchange on which the futures contract is traded. The contract amount reflects the extent of a Fund’s exposure in these financial instruments. The Fund’s participation in the futures markets involves certain risks, including imperfect correlation between movements in the price of futures contracts and movements in the price of the securities hedged or used for cover. The Fund’s activities in the futures contracts are conducted through regulated exchanges that do not result in counterparty credit risks on a periodic basis. Pursuant to a contract, the Fund agrees to receive from or pay to the broker an amount of cash equal to the fluctuation in value of the contract. Such receipts or payments are known as “variation margin” and are recorded by the Fund as unrealized appreciation or depreciation. When a contract is closed, the Fund records a realized gain or loss equal to the difference between the value of the contract at the time it
| www.Bridgeway.com | 127 |
NOTES TO FINANCIAL STATEMENTS (continued)
December 31, 2006 (Unaudited)
was opened and the value at the time it was closed. As of December 31, 2006, no Funds had futures contracts open.
Options. An option is a contract conveying a right to buy or sell a financial instrument at a specified price during a stipulated period. The premium paid by a Fund for the purchase of a call or a put option is included in the Fund’s Schedule of Investments as an investment and subsequently marked to market to reflect the current market value of the option. When a Fund writes a call or a put option, an amount equal to the premium received by the Fund is included in the Fund’s Statement of Assets and Liabilities as a liability and is subsequently marked to market to reflect the current market value of the option written. If an option which a Fund has written either expires on its stipulated expiration date, or if the Fund enters into a closing purchase transaction, the Fund realizes a gain (or a loss if the cost of a closing purchase transaction exceeds the premium received when the option was written) without regard to any unrealized gain or loss on the underlying security, and the liability related to such options is extinguished. If a call option that a Fund has written is assigned, the Fund realizes a gain or loss from the sale of the underlying security and the proceeds from such sale are increased by the premium originally received. If a put option that a Fund has written is assigned, the amount of the premium originally received reduces the cost of the security that the Fund purchased upon exercise of the option. Buying calls increases a Fund’s exposure to the underlying security to the extent of any premium paid. Buying puts on a stock market index tends to limit a Fund’s exposure to a stock market decline. All options purchased by the Funds were listed on exchanges and considered liquid positions with readily available market quotes. As of December 31, 2006, Balanced Fund held $214,000 in purchased call options.
Covered Call Options and Secured Puts. The Aggressive Investors 1, Aggressive Investors 2, and Balanced Funds may write call options on a covered basis, that is, the Fund will own the underlying security, or the Fund may write secured puts. The principal reason for writing covered calls and secured puts on a security is to attempt to realize income, through the receipt of premiums. The option writer has, in return for the premium, given up the opportunity for profit from a substantial price increase in the underlying security so long as the obligation as a writer continues, but has retained the risk of loss should the price of the security decline. All options were listed on exchanges and considered liquid positions with readily available market quotes. Only Balanced Fund had outstanding written options as of December 31, 2006.
A summary of the options transactions written by the Balanced Fund follows:
| Written Call Options | |||||||
| Contracts | Premiums | ||||||
Outstanding, June 30, 2006 | 4,039 | $ | 509,455 | ||||
Positions Opened | 11,358 | 1,469,930 | |||||
Exercised | (6,411 | ) | (811,397 | ) | |||
Expired | (5,160 | ) | (660,537 | ) | |||
Closed | (500 | ) | (58,211 | ) | |||
Split | 86 | - | |||||
Outstanding, December 31, 2006 | 3,412 | $ | 449,240 | ||||
Market Value, December 31, 2006 | $ | (438,740 | ) | ||||
| Written Put Options | |||||||
| Contracts | Premiums | ||||||
Outstanding, June 30, 2006 | 4,886 | $ | 545,588 | ||||
Positions Opened | 14,386 | 1,499,640 | |||||
Exercised | (1,790 | ) | (209,473 | ) | |||
Expired | (9,185 | ) | (928,161 | ) | |||
Closed | (2,912 | ) | (339,482 | ) | |||
Split | - | - | |||||
Outstanding, December 31, 2006 | 5,385 | $ | 568,112 | ||||
Market Value, December 31, 2006 | $ | (365,125 | ) | ||||
Swaps. Each Fund may enter into total return swaps. This gives a Fund the right to receive the appreciation in value of an underlying asset in return for paying a fee to the counterparty. The fee paid by a Fund will typically be determined by multiplying the face value of the swap agreement by an agreed-upon interest rate. If the underlying asset declines in value over the term of the swap, the Fund would also be required to pay the dollar value of that decline to the counterparty. Total return swaps could result in losses if the underlying asset or reference does not perform as anticipated by the Adviser. The swaps are entered into for liquidity reasons only and the underlying assets for each swap is the Fund’s market value. No fund had total return swaps open as of December 31, 2006.
Indemnification. Under the Company’s organizational documents, the Funds’ officers, directors, employees and agents are indemnified against certain liabilities that may arise out of performance of their duties to the Funds. Additionally, in the normal course of business, the Funds enter into contracts that contain a variety of indemnification clauses. The Funds’ maximum exposure under these arrangements is unknown as this would involve future claims that may be made against the Funds that have not yet occurred. However, the Funds have not had prior claims or losses pursuant to these contracts.
| 128 | Semi-Annual Report | December 31, 2006 (Unaudited) |
NOTES TO FINANCIAL STATEMENTS (continued)
December 31, 2006 (Unaudited)
| 3. | Management Fees, Other Related Party Transactions and Contingencies: |
The Funds have entered into management agreements with the Adviser. As compensation for the advisory services rendered, facilities furnished, and expenses borne by the Adviser, the Funds pay the Adviser a fee pursuant to each Fund’s management agreement, each described below.
Aggressive Investors 1: A total advisory fee is paid by the Fund to the Adviser that is comprised of a Base Fee and a Performance Adjustment. The Base Fee equals the Base Fee Rate times the average daily net assets of the Fund. The Base Fee Rate is based on the following annual rates: 0.90% of the first $250 million of the Fund’s average daily net assets, 0.875% of the next $250 million and 0.85% of any excess over $500 million.
The Performance Adjustment equals 4.67% times the difference in cumulative total return between the Fund and the Standard and Poor’s 500 Index with dividends reinvested (hereinafter “Index”) over a rolling five-year performance period. The Performance Adjustment Rate varies from a minimum of –0.70% to a maximum of +0.70% However, the Performance Adjustment Rate is zero if the difference between the cumulative Fund performance and the Index performance is less than or equal to 2%.
Aggressive Investors 2: A total advisory fee is paid by the Fund to the Adviser that is comprised of a Base Fee and a Performance Adjustment. The Base Fee equals the Base Fee Rate times the average daily net assets of the Fund. The Base Fee rate is based on the following annual rates: 0.90% of the first $250 million of the Fund’s average daily net assets, 0.875% of the next $250 million, 0.850% from $500 million to $1 billion, and 0.800% over $1 billion.
The Performance Adjustment equals 2.00% times the difference in cumulative total return between the Fund and the Standard and Poor’s 500 Index with dividends reinvested (hereinafter “Index”) over a rolling five-year performance period. The Performance Adjustment Rate, which was revised effective April 1, 2005, varies from a minimum of -0.30% to a maximum of +0.30%. However, the Performance Adjustment Rate is zero if the difference between the cumulative Fund performance and the Index performance is less than or equal to 2%.
Ultra-Small Company: The Fund pays management fees based on the following annual rates: 0.90% of the first $250 million of the Fund’s average daily net assets, 0.875% of the next $250 million and 0.85% of any excess over $500 million. The management fees are computed daily and are payable monthly. The fee is subject to a maximum rate of 1.49%.
Ultra-Small Company Market: The Fund pays a flat 0.50% annual management fee, computed daily and payable monthly.
Micro-Cap Limited: A total advisory fee is paid by the Fund to the Adviser that is comprised of a Base Fee and a Performance Adjustment. The Base Fee equals the Base Fee Rate times the average daily net assets of the Fund. The Base Fee Rate is based on the following annual rates: 0.90% of the first $250 million of the Fund’s average daily net assets, 0.875% of the next $250 million and 0.85% of any excess over $500 million. This is limited to a maximum annualized ratio of 1.49% of the assets in the quarter the Advisory Fee is determined.
The Performance Adjustment equals 2.87% times the difference in cumulative total return between the Fund and the CRSP Cap-based Portfolio 9 Index with dividends reinvested (hereinafter “Index”) over a rolling five-year performance period. The Performance Adjustment Rate varies from a minimum of -0.70% to a maximum of +0.70% However, the Performance Adjustment Rate is zero if the difference between the cumulative Fund performance and the Index performance is less than or equal to 2%.
Small-Cap Growth and Small-Cap Value: A total advisory fee is paid by each Fund to the Adviser that is comprised of a Base Fee and a Performance Adjustment. The Base Fee equals the Base Fee Rate times the average daily net assets of the Fund. The Base Fee Rate is based on the annual rate of 0.60% of the value of the Fund’s average daily net assets.
The Performance Adjustment equals 0.33% times the difference in cumulative total return between the Fund and the Russell 2000 Growth Index for Small-Cap Growth Fund and the Russell 2000 Value Index for Small-Cap Value Fund, with dividends reinvested (hereinafter “Index”) over a rolling five-year performance period. Since each Fund does not have a five-year operating history, the Performance Adjustment Rate will be calculated as follows during the initial five-year period: (a) From inception through September 30, 2004, the Performance Adjustment Rate was inoperative thus the Advisory Fee was calculated based on the Base Advisory Fee Rate times the average daily net assets of the Funds only; (b) From October 1, 2004 through September 30, 2008, the Performance Adjustment Rate will be calculated based upon a comparison of the investment performance of the Fund and the Index over the number of quarters that have elapsed since the Fund’s inception. Each time the Performance Adjustment Rate is calculated, it will cover a longer time span, until it can cover a running five-year period as intended. In the meantime, the early months of the transition period will have a disproportionate effect on the per - -
| www.Bridgeway.com | 129 |
NOTES TO FINANCIAL STATEMENTS (continued)
December 31, 2006 (Unaudited)
formance adjustment of the fee. The Performance Adjustment Rate varies from a minimum of -0.05% to a maximum of +0.05% However, the Performance Adjustment Rate is zero if the difference between the cumulative Fund’s performance and the Index performance is less than or equal to 2%.
Large-Cap Growth and Large-Cap Value: A total advisory fee is paid by each Fund to the Adviser that is comprised of a Base Fee and a Performance Adjustment. The Base Fee equals the Base Fee Rate times the average daily net assets of the Fund. The Base Fee Rate is based on the annual rate of 0.50% of the value of the Fund’s average daily net assets.
The Performance Adjustment equals 0.33% times the difference in cumulative total return between the Fund and the Russell 1000 Growth Index for Large-Cap Growth Fund and the Russell 1000 Value Index for the Large-Cap Value Fund, with dividends reinvested (hereinafter “Index”) over a rolling five-year performance period. Since each Fund does not have a five-year operating history, the Performance Adjustment Rate will be calculated as follows during the initial five-year period: (a) From inception through September 30, 2004, the Performance Adjustment Rate was inoperative thus the Advisory Fee was calculated based on the Base Advisory Fee Rate times the average daily net assets of the Funds only; (b) From October 1, 2004 through September 30, 2008, the Performance Adjustment Rate will be calculated based upon a comparison of the investment performance of the Fund and the Index over the number of quarters that have elapsed since the Fund’s inception. Each time the Performance Adjustment Rate is calculated, it will cover a longer time span, until it can cover a running five-year period as intended. In the meantime, the early months of the transition period will have a disproportionate effect on the performance adjustment of the fee. The Performance Adjustment Rate varies from a minimum of -0.05% to a maximum of +0.05% However, the Performance Adjustment Rate is zero if the difference between the cumulative Fund’s performance and the Index performance is less than or equal to 2%.
Blue Chip 35 Index: The Fund pays a flat 0.08% annual management fee, computed daily and payable monthly.
Balanced: The Fund pays a flat 0.60% annual management fee, computed daily and payable monthly.
Expense limitations: At a special meeting on March 31, 2005, shareholders of the Funds approved amendments to the Management Agreements detailing expense limitations. The Adviser agrees to reimburse the Funds for operating expenses and management fees above the expense limitations, which are shown as a ratio of net expenses to average net assets, for each Fund, for the six months ended December 31, 2006. All expense limitations and total reimbursements for the six months ended December 31, 2006, are shown below.
| Bridgeway Fund | Expense Limitations | Total Reimbursements for six months ended 12/31/06 | ||||
Aggressive Investors 1 | 1.80 | % | - | |||
Aggressive Investors 2 | 1.75 | % | - | |||
Ultra-Small Company | 2.00 | % | - | |||
Ultra-Small Company Market | 0.75 | % | - | |||
Micro-Cap Limited | 1.85 | % | - | |||
Small-Cap Growth | 0.94 | % | - | |||
Small-Cap Value | 0.94 | % | - | |||
Large-Cap Growth | 0.84 | % | - | |||
Large-Cap Value | 0.84 | % | - | |||
Blue Chip 35 Index | 0.15 | % | $ | 69,855 | ||
Balanced | 0.94 | % | $ | 7,551 | ||
Other Related Party Transactions: On occasion, the Funds will engage in inter-portfolio trades when it is to the benefit of both parties. These trades are reviewed quarterly by the Board of Directors. During the six months ended December 31, 2006, the Ultra-Small Company Fund had $5,765,289 and $7,920,143 in inter-porfolio purchases and sales, respectively. The Ultra-Small Company Market Fund had $8,127,809 and $11,553,098 in inter-portfolio purchases and sales, respectively. The Micro-Cap Limited Fund had $5,787,809 in inter-portfolio purchases during the six month period. The Small-Cap Growth Fund had $145,854 in inter-portfolio purchases during the six month period. The Small-Cap Value Fund had $353,520 in inter-portfolio sales during the six month period. No inter-portfolio purchases or sales were entered into during the six month period ended December 31, 2006 by the Aggressive Investors 1, Aggressive Investors 2, Blue Chip 35 Index, Large-Cap Growth, Large-Cap Value, and Balanced Funds.
The Adviser entered into a Master Administrative Agreement with the Funds pursuant to which the Adviser acts as Administrator for the Funds. Under the terms of the agreement, the Adviser provides or arranges for the provision of certain accounting and other administrative services to the Funds that it is not required to provide under the terms of the management agreement. As compensation under the Master Administrative Agreement, the Adviser receives a monthly fee from each Fund calculated at the annual rate of 0.05% of average daily net assets.
| 130 | Semi-Annual Report | December 31, 2006 (Unaudited) |
NOTES TO FINANCIAL STATEMENTS (continued)
December 31, 2006 (Unaudited)
One director of the Funds, John Montgomery, is an owner and director of the Adviser. Another director of the Fund, Michael Mulcahy, is an executive and director of the Adviser. Under the Investment Company Act of 1940 definitions, each is considered to be an “affiliated person” of the Adviser and an “interested person” of the Adviser and of the Funds. Compensation for Mr. Montgomery and Mr. Mulcahy is borne by the Adviser rather than the Funds.
Board of Directors Compensation. Bridgeway paid an annual retainer of $8,000 and fees of $4,000 per meeting to each Independent Director. The Independent Chairman of the Board received an annual retainer of $10,500 and fees of $5,000 per meeting. The Chairperson of the Nominating Committee receives an additional $1,000 per year.
The Independent Directors receive this compensation in the form of shares of Bridgeway Funds, credited to his or her account. Such Directors are reimbursed for any expenses incurred in attending meetings and conferences and expenses for subscriptions or printed materials. During the six months ended December 31, 2006, total reimbursements made, across all of the Funds, was $2,398. The amount of directors fees attributable to each Fund is disclosed in the Statements of Operations.
4. Distribution and Shareholder Servicing Fees:
Foreside Fund Services, LLC acts as distributor of the Funds’ shares pursuant to a Distribution Agreement dated January 2, 2004. The Adviser pays all costs and expenses associated with distribution of the Funds’ shares pursuant to a protective plan adopted by shareholders pursuant to Rule 12b-1 on October 15, 1996.
5. Purchases and Sales of Investment Securities:
Purchases and sales of investments, other than short-term securities, for each Bridgeway Fund for the six month period ended December 31, 2006 were as follows:
| Purchases | Sales | |||||||||||
| Bridgeway Fund | U.S. Government | Other | U.S. Government | Other | ||||||||
Aggressive Investors 1 | - | $ | 186,196,609 | - | $ | 219,368,565 | ||||||
Aggressive Investors 2 | - | $ | 349,502,520 | - | $ | 331,364,245 | ||||||
Ultra-Small Company | - | $ | 65,297,315 | - | $ | 65,965,739 | ||||||
Ultra-Small Company Market | - | $ | 211,911,667 | - | $ | 173,053,599 | ||||||
Micro-Cap Limited | - | $ | 46,382,006 | - | $ | 53,324,917 | ||||||
Small-Cap Growth | - | $ | 32,515,624 | - | $ | 115,077,631 | ||||||
Small-Cap Value | - | $ | 58,727,442 | - | $ | 156,217,809 | ||||||
Large-Cap Growth | - | $ | 18,514,564 | - | $ | 21,022,280 | ||||||
Large-Cap Value | - | $ | 14,555,956 | - | $ | 22,500,876 | ||||||
Blue Chip 35 Index | - | $ | 28,957,933 | - | $ | 2,576,769 | ||||||
Balanced | $ | 1,592,995 | $ | 9,911,411 | $ | 1,195,781 | $ | 14,090,909 | ||||
6. Federal Income Taxes
Unrealized Appreciation and Depreciation on Investments (Tax Basis). The amount of net unrealized appreciation/depreciation and the cost of investment securities for tax purposes, including short-term securities at December 31, 2006 were as follows:
Bridgeway Funds
| Aggressive Invesors 1 | Aggressive Invesors 2 | Ultra-Small Company | ||||||||||
As of December 31, 2006 | ||||||||||||
Gross appreciation (excess of value over tax cost) | $ | 80,258,054 | $ | 88,183,943 | $ | 38,927,212 | ||||||
Gross depreciation (excess of tax cost over value) | (5,597,684 | ) | (20,844,802 | ) | (4,329,462 | ) | ||||||
Net unrealized appreciation/(depreciation) | $ | 74,660,370 | $ | 67,339,141 | $ | 34,597,750 | ||||||
Cost of investment for income tax purposes | $ | 308,954,790 | $ | 518,625,696 | $ | 98,818,206 | ||||||
| www.Bridgeway.com | 131 |
NOTES TO FINANCIAL STATEMENTS (continued)
December 31, 2006 (Unaudited)
| Ultra-Small Company Market | Micro-Cap Limited | Small-Cap Growth | Small-Cap Value | |||||||||||||
As of December 31, 2006 | ||||||||||||||||
Gross appreciation (excess of value over tax cost) | $ | 417,758,700 | $ | 12,624,270 | $ | 35,127,253 | $ | 59,995,227 | ||||||||
Gross depreciation (excess of tax cost over value) | (41,271,573 | ) | (2,472,343 | ) | (7,257,799 | ) | (3,560,711 | ) | ||||||||
Net unrealized appreciation/(depreciation) | $ | 376,487,127 | $ | 10,151,927 | $ | 27,869,454 | $ | 56,434,516 | ||||||||
Cost of investment for income tax purposes | $ | 788,138,098 | $ | 60,536,134 | $ | 148,939,162 | $ | 201,296,435 | ||||||||
| Large-Cap Growth | Large-Cap Value | Blue Chip 35 Index | Balanced* | |||||||||||||
As of December 31, 2006 | ||||||||||||||||
Gross appreciation (excess of value over tax cost) | $ | 18,602,398 | $ | 16,789,645 | $ | 11,718,293 | $ | 10,335,264 | ||||||||
Gross depreciation (excess of tax cost over value) | (2,978,980 | ) | (748,593 | ) | (888,946 | ) | (913,333 | ) | ||||||||
Net unrealized appreciation/(depreciation) | $ | 15,623,418 | $ | 16,041,052 | $ | 10,829,347 | $ | 9,421,931 | ||||||||
Cost of investment for income tax purposes | $ | 91,485,522 | $ | 71,712,645 | $ | 64,525,385 | $ | 77,653,926 | ||||||||
The differences between book and tax net unrealized appreciation are wash sale loss deferrals.
| * | Does not include written options. |
Classifications of Distributions. Net investment income (loss) and net realized gain (loss) may differ for financial statement and tax purposes. The character of distributions made during the year from net investment income or net realized gains may differ from its ultimate characterization for federal income tax purposes.
The difference between book and tax components of net assets and the resulting reclassifications were primarily a result of the differing book/tax treatment of net operating losses and certain expenses.
The tax character of the distributions paid by the Funds during the last two fiscal years ended June 30, 2006 and June 30, 2005, respectively, were as follows:
| Aggressive Investors 1 | Aggressive Investors 2 | |||||||||||
Year June 30, 2006 | Year June 30, 2005 | Year June 30, 2006 | Year June 30, 2005 | |||||||||
Distributions paid from: | ||||||||||||
Ordinary Income | $ | 1,866,101 | $ | - | $ | 554,558 | $ | - | ||||
Long-Term Capital Gain | 40,753,725 | - | 5,415,124 | - | ||||||||
Total | $ | 42,619,826 | $ | - | $ | 5,969,682 | $ | - | ||||
| Ultra-Small Company | Ultra-Small Company Market | |||||||||||
Year June 30, 2006 | Year June 30, 2005 | Year June 30, 2006 | Year June 30, 2005 | |||||||||
Distributions paid from: | ||||||||||||
Ordinary Income | $ | 897,342 | $ | 2,401,271 | $ | 1,179,985 | $ | 1,224,997 | ||||
Long-Term Capital Gain | 13,492,318 | 19,650,404 | 21,617,958 | 6,669,718 | ||||||||
Total | $ | 14,389,660 | $ | 22,051,675 | $ | 22,797,943 | $ | 7,894,715 | ||||
| 132 | Semi-Annual Report | December 31, 2006 (Unaudited) |
NOTES TO FINANCIAL STATEMENTS (continued)
December 31, 2006 (Unaudited)
| Micro-Cap Limited | Large-Cap Value | |||||||||||
Year June 30, 2006 | Year June 30, 2005 | Year June 30, 2006 | Year June 30, 2005 | |||||||||
Distributions paid from: | ||||||||||||
Ordinary Income | $ | 130,000 | $ | 4,576,049 | $ | 445,034 | $ | 195,000 | ||||
Long-Term Capital Gain | 9,975,182 | 5,543,706 | - | - | ||||||||
Total | $ | 10,105,182 | $ | 10,119,755 | $ | 445,034 | $ | 195,000 | ||||
| Blue Chip 35 Index | Balanced | |||||||||||
Year June 30, 2006 | Year June 30, 2005 | Year June 30, 2006 | Year June 30, 2005 | |||||||||
Distributions paid from: | ||||||||||||
Ordinary Income | $ | 720,188 | $ | 674,999 | $ | 679,739 | $ | 393,526 | ||||
Long-Term Capital Gain | - | - | 319,094 | 29,323 | ||||||||
Total | $ | 720,188 | $ | 674,999 | $ | 998,833 | $ | 422,849 | ||||
Note the Small-Cap Growth, Small-Cap Value and Large-Cap Growth Funds had no distributions for the fiscal years ended June 30, 2006 and June 30, 2005.
Components of Net Assets (Tax Basis). As of June 30, 2006, the components of net assets on a tax basis were:
| Aggressive Investors 1 | Aggressive Investors 2 | Ultra-Small Company | ||||||||||
Accumulated net investment income | $ | - | $ | - | $ | - | ||||||
Accumulated net realized gain/(loss) on investments | 35,321,602 | 14,088,958 | 16,203,325 | |||||||||
Net unrealized appreciation/(depreciation) of investments | 96,894,220 | 41,386,932 | 43,232,640 | |||||||||
Total | $ | 132,215,822 | $ | 55,475,890 | $ | 59,435,965 | ||||||
| Ultra-Small Company Market | Micro-Cap Limited | Small-Cap Growth | ||||||||||
Accumulated net investment income | $ | 1,483,938 | $ | 1,475 | $ | - | ||||||
Accumulated net realized gain/(loss) on investments | 14,775,503 | 15,583,280 | (4,240,948 | ) | ||||||||
Net unrealized appreciation/(depreciation) of investments | 348,097,228 | 10,146,859 | 30,036,625 | |||||||||
Cumulative effect of other differences | - | - | (2,430 | ) | ||||||||
Total | $ | 364,356,669 | $ | 25,731,614 | $ | 25,793,247 | ||||||
| Small-Cap Value | Large-Cap Growth | Large-Cap Value | ||||||||||
Accumulated net investment income | $ | - | $ | 209,381 | $ | 345,549 | ||||||
Accumulated net realized gain/(loss) on investments | (5,695,068 | )* | (5,222,483 | )* | (419,590 | ) | ||||||
Net unrealized appreciation/(depreciation) of investments | 53,435,339 | 9,229,552 | 8,181,178 | |||||||||
Cumulative effect of other differences | (2,430 | ) | (2,372 | ) | (2,372 | ) | ||||||
Total | $ | 47,737,841 | $ | 4,214,078 | $ | 8,104,765 | ||||||
| Blue Chip 35 | Balanced | |||||||||||
Accumulated net investment income | $ | 463,011 | $ | 1,142,084 | ||||||||
Accumulated net realized gain/(loss) on investments | (2,509,837 | ) | 719,840 | |||||||||
Net unrealized appreciation/(depreciation) of investments | 4,596,542 | 4,982,928 | ||||||||||
Cumulative effect of other differences | - | - | ||||||||||
Total | $ | 2,549,716 | $ | 6,844,852 | ||||||||
| * | Includes losses incurred in the period November 1, 2005 through June 30, 2006 which the Fund has elected to defer to its fiscal year ending June 30, 2007 of $3,510,147 for Small-Cap Value, $312,706 for Large-Cap Growth, and $497,940 for Blue Chip 35. |
| www.Bridgeway.com | 133 |
NOTES TO FINANCIAL STATEMENTS (continued)
December 31, 2006 (Unaudited)
At June 30, 2006, the Funds had available for tax purposes capital loss carryovers as follows:
| Small-Cap Growth | Small-Cap Value | Large-Cap Growth | Large-Cap Value | Blue Chip 35 | |||||||||||
Expiring 6/30/2007 | - | - | - | - | $ | 25,756 | |||||||||
6/30/2008 | - | - | - | - | 106,811 | ||||||||||
6/30/2009 | - | - | - | - | 100,306 | ||||||||||
6/30/2010 | - | - | - | - | 429,064 | ||||||||||
6/30/2011 | - | - | - | - | 337,509 | ||||||||||
6/30/2012 | - | - | - | - | 327,296 | ||||||||||
6/30/2013 | $ | 3,213,476 | $ | 2,184,921 | $ | 2,497,138 | $ | 413,746 | 282,192 | ||||||
6/30/2014 | 1,027,472 | - | 2,412,639 | 5,844 | 402,963 | ||||||||||
Capital loss carryovers used during the period ended June 30, 2006 were $174,365 for Small-Cap Value.
7. Line of Credit:
Certain Bridgeway Funds established a line of credit agreement (“LOC”) with PNC Bank, N.A. (the ”Bank” or “Lender”) which matures on October 9, 2007 and is renewable annually at the Bank’s option, to be used for temporary or emergency purposes, primarily for financing redemption payments. Any and all advances under this Facility would be at the sole discretion of the Lender based on the merits of the specific transaction. Advances under the Facility are limited to $5,000,000 in total for all Funds (except Aggressive Investors 1 and Aggressive Investors 2 Funds), or 33 1/3% of a Funds’ net assets. Borrowings under the line of credit bear interest based on the Lender’s Prime Rate. Principal is due fifteen days after each advance and at Maturity. Interest is payable monthly in arrears.
As of December 31, 2006, no Fund had borrowings during the six month period.
8. Redemption Fees:
In Ultra-Small Company Market Fund a 2.00% redemption fee may be charged on shares held less than six months or a 2.00% redemption fee may be charged in a down market, subject to a maximum combined redemption fee of 2.00%. In Blue Chip 35 Index Fund a 1.00% redemption fee may be charged on redemptions in a down market.
9. Accounting for Uncertainty in Income Taxes:
On July 13, 2006, the Financial Accounting Standards Board (FASB) released FASB Interpretation No. 48 “Accounting for Uncertainty in Income Taxes” (FIN 48). FIN 48 provides guidance for how uncertain tax positions should be recognized, measured, presented and disclosed in the financial statements. FIN 48 requires the evaluation of tax positions taken or expected to be taken in the course of preparing the Funds’ tax returns to determine whether the tax positions are “more-likely-than-not” of being sustained by the applicable tax authority. Tax positions not deemed to meet the more-likely-than-not threshold would be recorded as a tax benefit or expense in the current year. Adoption of FIN 48 is required for fiscal years beginning after December 15, 2006 and is to be applied to all open tax years as of the effective date. At this time, management is evaluating the implications of FIN 48. Although not yet determined, management does not expect FIN 48 to have a material impact on the financial statements.
In September 2006, the Financial Accounting Standards Board issued Statement of Financial Accounting Standards (“SFAS”) 157, Fair Value Measurements, which clarifies the definition of fair value and requires companies to expand their disclosure about the use of fair value to measure assets and liabilities in interim and annual periods subsequent to initial recognition. Adoption of SFAS 157 requires the use of the price that would be received to sell an asset or paid to transfer a liability in an orderly transaction between market participants at the measurement date. SFAS 157 is effective for financial statements issued for fiscal years beginning after November 15, 2007, and interim periods within those fiscal years. At this time, management is in the process of reviewing the impact, if any, of the SFAS on the Funds’ financial statements.
| 134 | Semi-Annual Report | December 31, 2006 (Unaudited) |
December 31, 2006 (unaudited)
1. Proxy Voting
Fund policies and procedures used in determining how to vote proxies relating to Funds’ securities and a summary of proxies voted by the Funds for the period ended June 30, 2006 are available without a charge, upon request, by contacting Bridgeway Funds at 1-800-661-3550 and on the Securities and Exchange Commission’s (“SEC”) website at http://www.sec.gov.
2. Fund Holdings
The complete schedules of the Funds’ holdings for the second and fourth quarters of each fiscal year are contained in the Funds’ Semi-Annual and Annual shareholder reports, respectively.
The Bridgeway Funds file complete schedules of the Funds’ holdings with the SEC for the first and third quarters of each fiscal year on Form N-Q within 60 days after the end of the period. Copies of the Funds’ Form N-Q are available without charge, upon request, by contacting Bridgeway Funds at 1-800-661-3550 and on the SEC’s website at http://www.sec.gov. You may also review and copy Form N-Q at the SEC’s Public Reference Room in Washington, D.C. For more information about the operation of the Public Reference Room, please call 1-800-SEC-0330.
| www.Bridgeway.com | 135 |
December 31, 2006 (unaudited)
As a shareholder of the Fund, you will incur no transaction costs from the Fund, including sales charges (loads) on purchases, on reinvested dividends, or on other distributions. There are no exchange fees. Shareholders are subject to redemption fees on the Ultra-Small Company Market and Blue Chip 35 Index Funds under certain circumstances. However, as a shareholder of the Fund, you will incur ongoing costs, including management fees and other Fund expenses. The following examples are intended to help you understand your ongoing costs (in dollars) of investing in the Fund and to compare these costs with ongoing costs of investing in other mutual funds. The examples are based on an investment of $1,000 invested on July 1, 2006 and held until December 31, 2006.
Actual Return. The first line of the table below provides information about actual account values and actual expenses. You may use the information in this line, together with the amount you invested, to estimate the expenses that you paid over the period. Simply divide you’re account value by $1,000 (for example, an $8,600 account value divided by $1,000 = 8.6), then multiply the result by the number in the first line under the heading “Expense Paid During the Period” to estimate the expenses you paid on you’re account during the period.
Hypothetical 5% Return. The second line of the table below provides information about hypothetical account values and hypothetical expenses based on the Fund’s actual expense ratio and an assumed rate of return of 5% per year before expenses, which is not the Fund’s actual return. The hypothetical account values and expenses may not be used to estimate the actual ending account balance or expenses you paid for the period. You may use this information to compare the ongoing costs of investing in a Fund and other mutual funds. To do so, compare this 5% hypothetical example with the 5% hypothetical examples that appear In the shareholder reports of other funds.
The expenses shown in the table are meant to highlight ongoing Fund costs only. Therefore, the second line of the table Is useful In comparing ongoing costs only, and will not help you determine the relative total costs of owning different funds, because other funds may also have transaction costs, such as sales charges, redemption fees or exchange fees.
| Beginning Account Value at 7/1/06 | Ending Account Value at 12/31/06 | Expense Ratio | Expense Paid During Period* 7/1/06 - 12/31/06 | ||||||||
| Bridgeway Aggressive Investors 1 Fund | |||||||||||
Actual Fund Return | $ | 1,000.00 | $ | 974.50 | 1.62% | $ | 8.07 | ||||
Hypothetical Fund Return | $ | 1,000.00 | $ | 1,017.03 | 1.62% | $ | 8.24 | ||||
| Bridgeway Aggressive Investors 2 Fund | |||||||||||
Actual Fund Return | $ | 1,000.00 | $ | 985.20 | 1.16% | $ | 5.80 | ||||
Hypothetical Fund Return | $ | 1,000.00 | $ | 1,019.36 | 1.16% | $ | 5.90 | ||||
| Bridgeway Ultra-Small Company Fund | |||||||||||
Actual Fund Return | $ | 1,000.00 | $ | 1,030.10 | 1.10% | $ | 5.64 | ||||
Hypothetical Fund Return | $ | 1,000.00 | $ | 1,019.65 | 1.10% | $ | 5.61 | ||||
| Bridgeway Ultra-Small Company Market Fund | |||||||||||
Actual Fund Return | $ | 1,000.00 | $ | 1,056.50 | 0.65% | $ | 3.36 | ||||
Hypothetical Fund Return | $ | 1,000.00 | $ | 1,021.94 | 0.65% | $ | 3.30 | ||||
| Bridgeway Micro-Cap Limited Fund | |||||||||||
Actual Fund Return | $ | 1,000.00 | $ | 965.20 | 1.12% | $ | 5.53 | ||||
Hypothetical Fund Return | $ | 1,000.00 | $ | 1,019.57 | 1.12% | $ | 5.69 | ||||
| Bridgeway Small-Cap Growth Fund | |||||||||||
Actual Fund Return | $ | 1,000.00 | $ | 967.50 | 0.87% | $ | 4.31 | ||||
Hypothetical Fund Return | $ | 1,000.00 | $ | 1,020.82 | 0.87% | $ | 4.43 | ||||
| 136 | Semi-Annual Report | December 31, 2006 (Unaudited) |
DISCLOSURE OF FUND EXPENSES (continued)
December 31, 2006 (unaudited)
| Beginning Account Value at 7/1/06 | Ending Account Value at 12/31/06 | Expense Ratio | Expense Paid During Period* 7/1/06 - 12/31/06 | ||||||||
| Bridgeway Small-Cap Value Fund | |||||||||||
Actual Fund Return | $ | 1,000.00 | $ | 1,008.70 | 0.86% | $ | 4.36 | ||||
Hypothetical Fund Return | $ | 1,000.00 | $ | 1,020.87 | 0.86% | $ | 4.38 | ||||
| Bridgeway Large-Cap Growth Fund | |||||||||||
Actual Fund Return | $ | 1,000.00 | $ | 1,046.40 | 0.73% | $ | 3.78 | ||||
Hypothetical Fund Return | $ | 1,000.00 | $ | 1,021.51 | 0.73% | $ | 3.73 | ||||
| Bridgeway Large-Cap Value Fund | |||||||||||
Actual Fund Return | $ | 1,000.00 | $ | 1,114.40 | 0.78% | $ | 4.18 | ||||
Hypothetical Fund Return | $ | 1,000.00 | $ | 1,021.25 | 0.78% | $ | 3.99 | ||||
| Bridgeway Blue Chip 35 Index Fund | |||||||||||
Actual Fund Return | $ | 1,000.00 | $ | 1,133.40 | 0.15% | $ | 0.79 | ||||
Hypothetical Fund Return | $ | 1,000.00 | $ | 1,024.46 | 0.15% | $ | 0.75 | ||||
| Bridgeway Balanced Fund | |||||||||||
Actual Fund Return | $ | 1,000.00 | $ | 1,025.20 | 0.94% | $ | 4.80 | ||||
Hypothetical Fund Return | $ | 1,000.00 | $ | 1,020.43 | 0.94% | $ | 4.79 | ||||
| * | Expenses are equal to the Fund’s annualized expense ratio multiplied by the average account value over the period, multiplied by the number of days in the most recent fiscal half year, then divided by 365. |
| www.Bridgeway.com | 137 |
December 31, 2006 (Unaudited)
| Independent Directors | ||||||||||
| Name, Address and Age1 | Position(s) Held with Bridgeway Funds | Term of office and Length of Time Served | Principal Occupation(s) During Past Five Years | No. of Bridgeway Funds Overseen by Director | Other Directorships Held by Director | |||||
Kirbyjon Caldwell Age 53 | Director | Term: 1 Year Length: 2001 to Present. | Senior Pastor of Windsor Village United Methodist Church, since 1982. | Eleven | Continental Airlines, Inc., American Church Mortgage Company, Reliant Energy, Amegy Bancshares | |||||
Karen S. Gerstner Age 51 | Director | Term: 1 Year Length: 1994 to Present. | Principal, Karen S. Gerstner & Associates, P.C., 2004 to present; Attorney and Partner, Davis, Ridout, Jones and Gerstner LLP, 1999 to 2003. | Eleven | None | |||||
Miles Douglas Harper, III* Age 44 | Director | Term: 1 Year Length: 1994 to Present. | Partner, 10/1998 to present, Gainer, Donnelly, Desroches, LLP. | Eleven | Calvert Large-Cap Growth Fund2 (1 Portfolio) | |||||
Evan Harrel Age 46 | Term: 1 Year Length: 2006 to Present. | Executive Director, Small Steps Nurturing Center, 8/2004 to present. Senior Portfolio Manager, AIM Capital Management, 1998 to 2003. | Eleven | None | ||||||
| * | Independent Chairman |
| “Interested” or Affiliated Directors and Officers | ||||||||||
| Name, Address and Age1 | Position(s) Held with Bridgeway Funds | Term of office and Length of Time Served | Principal Occupation(s) During Past Five Years | No. of Bridgeway Funds Overseen by Director | Other Directorships Held by Director | |||||
Michael D. Mulcahy3 Age 43 | President and Director | Term: 1 Year Length: 2003 to Present. | President, Bridgeway Funds, 6/2005 to present. Director and Staff Member, Bridgeway Capital Management, Inc., 12/2002 to present. Vice President, Hewlett Packard, 1/2001 - 12/2002. | Eleven | None | |||||
| 138 | Semi-Annual Report | December 31, 2006 (Unaudited) |
DIRECTORS & OFFICERS (continued)
December 31, 2006 (Unaudited)
| “Interested” or Affiliated Directors and Officers (continued) | ||||||||||
| Name, Address and Age1 | Position(s) Held with Bridgeway Funds | Term of office and Length of Time Served | Principal Occupation(s) During Past Five Years | No. of Bridgeway Funds Overseen by Director | Other Directorships Held by Director | |||||
John N. R. Montgomery4 Age 51 | Vice President and Director | Term: 1 Year Length: 1993 to Present. | Vice President, Bridgeway Funds, 6/2005 to present. President, Bridgeway Funds, 11/1993 - 6/2005. President, Bridgeway Capital Management Inc., 7/1993 to present. | Eleven | None | |||||
Richard P. Cancelmo, Jr. Age 47 | Vice President | Term: 1 Year Length: 2004 to Present. | Vice-President, Bridgeway Funds, 11/2004 to present. Staff member, Bridgeway Capital Management, Inc., 2000 to present. | None | ||||||
Joanna Barnhill5 Age 57 | Secretary | Term: 1 Year Length: 1993 to Present. | Staff Member, Bridgeway Capital Management, Inc., since 1993. | None | ||||||
Linda G. Giuffré Age 45 | Treasurer and Chief Compliance Officer | Term: 1 Year Length: 2004 to Present. | Chief Compliance Officer, Bridgeway Capital Management, Inc., 5/2004 to present. Staff member, Bridgeway Capital Management, Inc., 5/2004 to present. Vice President - Compliance, Capstone Asset Management Company, 1998 - 2004. | None | ||||||
1 | The address of all of the Directors and Officers of Bridgeway Funds is 5615 Kirby Drive, Suite 518, Houston, Texas, 77005-2448. |
2 | The Calvert Large-Cap Growth Fund is sub-advised by Bridgeway Capital Management, Inc., the Adviser to Bridgeway Funds. |
3 | Michael Mulcahy is a director and officer of Bridgeway Capital Management, Inc., and therefore an interested person of Bridgeway Funds. |
4 | John Montgomery is president, director and majority shareholder of Bridgeway Capital Management, Inc., and therefore an interested person of Bridgeway Funds. |
5 | Effective February 16, 2007, Deborah L. Hanna will assume the role of Secretary of Bridgeway Funds replacing Joanna Barnhill. |
The overall management of the business and affairs of Bridgeway Funds is vested with its Board of Directors (the “Board”). The Board approves all significant agreements between Bridgeway Funds and persons or companies furnishing services to it, including agreements with its Adviser and Custodian. The day-to-day operations of Bridgeway Funds are delegated to its officers, subject to its investment objectives and policies and general supervision by the Board.
The Funds’ Statement of Additional Information includes additional information about the Funds’ Board and is available, without charge, upon request by calling 1-800-661-3550.
| www.Bridgeway.com | 139 |
BRIDGEWAY FUNDS, INC.
c/o Citigroup Fund Services, LLC
P. O. Box 446
Portland, ME 04112
713-661-3500 800-661-3550
CUSTODIAN
PFPC Trust Company
8800 Tinicum Blvd., 4th Floor
Philadelphia, PA 19153
DISTRIBUTOR
Foreside Fund Services, LLC
2 Portland Square
Portland, ME 04101
You can review and copy information about our Funds (including the SAI) at the SEC’s Public Reference Room in Washington, D.C. To find out more about this public service, call the SEC at 800-SEC-0330. Reports and other information about the Funds is also available on the SEC’s website at www.sec.gov. You can receive copies of this information, for a fee, by writing the Public Reference Section, Securities and Exchange Commission, Washington, D.C. 20549-0102 or by sending an electronic request to the following email address: publicinfo@sec.gov
| ITEM 2. | CODE OF ETHICS |
Not Applicable.
| ITEM 3. | AUDIT COMMITTEE FINANCIAL EXPERT |
Not Applicable.
| ITEM 4. | PRINCIPAL ACCOUNTANT FEES AND SERVICES |
Not Applicable.
| ITEM 5. | AUDIT COMMITTEE OF LISTED REGISTRANTS |
Not Applicable.
| ITEM 6. | SCHEDULE OF INVESTMENTS |
Schedule of Investments is included as part of the Report to Stockholders filed under Item 1 of this form.
| ITEM 7. | DISCLOSURE OF PROXY VOTING POLICIES AND PROCEDURES FOR CLOSED-END MANAGEMENT INVESTMENT COMPANIES |
Not Applicable.
| ITEM 8. | PORTFOLIO MANAGERS OF CLOSED-END MANAGEMENT INVESTMENT COMPANIES |
Not Applicable.
| ITEM 9. | PURCHASES OF EQUITY SECURITIES BY CLOSED-END MANAGEMENT INVESTMENT COMPANY AND AFFILIATED PURCHASERS |
Not Applicable.
| ITEM 10. | SUBMISSION OF MATTERS TO A VOTE OF SECURITY HOLDERS |
There has been no material change to the procedures by which shareholders may recommend nominees to the registrant’s Board of Directors.
| ITEM 11. | CONTROLS AND PROCEDURES |
(a) The registrant’s President and Treasurer have concluded that the registrant’s disclosure controls and procedures (as defined in rule 30a-3(c) under the Investment Company Act of 1940 (the “Act”)) are effective, based on their evaluation of these disclosure controls and procedures required by Rule 30a-3(b) as of a date within 90 days of the filing date of this report.
(b) There were no changes in the registrant’s internal control over financial reporting (as defined in rule 30a-3(d) under the Act) that occurred during the registrant’s last fiscal quarter that have materially affected, or are reasonably likely to materially affect, the registrant’s internal control over financial reporting.
| ITEM 12. | EXHIBITS |
(a)(1) Not applicable.
(a)(2) Certifications pursuant to Section 302 of the Sarbanes-Oxley Act of 2002 (Exhibit filed herewith).
(a)(3) Not applicable.
(b) Certifications pursuant to Section 906 of the Sarbanes-Oxley Act of 2002 (Exhibit filed herewith).
SIGNATURES
Pursuant to the requirements of the Securities Exchange Act of 1934 and the Investment Company Act of 1940, the registrant has duly caused this report to be signed on its behalf by the undersigned, thereunto duly authorized.
| Registrant BRIDGEWAY FUNDS, INC. | ||
| By | /s/ Michael D. Mulcahy | |
| Michael D. Mulcahy | ||
| President and Principal Executive Officer | ||
| Date | March 2, 2007 | |
Pursuant to the requirements of the Securities Exchange Act of 1934 and the Investment Company Act of 1940, this report has been signed below by the following persons on behalf of the registrant and in the capacities and on the dates indicated.
| By | /s/ Michael D. Mulcahy | |
| Michael D. Mulcahy | ||
| President and Principal Executive Officer | ||
| Date | March 2, 2007 | |
| By | /s/ Linda Giuffre | |
| Linda Giuffre | ||
| Treasurer and Principal Financial Officer | ||
| Date | March 1, 2007 | |