Use these links to rapidly review the document
Table of Contents
UNITED STATES
SECURITIES AND EXCHANGE COMMISSION
Washington, D.C. 20549
FORM N-CSR
CERTIFIED SHAREHOLDER REPORT OF REGISTERED
MANAGEMENT INVESTMENT COMPANIES
Investment Company Act file number: 811-08200
BRIDGEWAY FUNDS, INC.
(Exact name of registrant as specified in charter)
5615 Kirby Drive, Suite 518
Houston, Texas 77005-2448
(Address of principal executive offices) (Zip code)
Michael D. Mulcahy, President
Bridgeway Funds, Inc.
5615 Kirby Drive, Suite 518
Houston, Texas 77005-2448
(Name and address of agent for service)
Registrant's Telephone Number, including Area Code: (713) 661-3500
Date of fiscal year end: June 30
Date of reporting period: December 31, 2005
Item 1.—Reports to Stockholders
The following is a copy of the report to stockholders pursuant to Rule 30e-1 under the Investment Company Act of 1940 (17 CFR 270.30e-1).
1

A no-load mutual fund family of domestic funds
Semi-Annual Report
December 31, 2005 (Unaudited)
AGGRESSIVE INVESTORS 1
(Closed to New Investors)
AGGRESSIVE INVESTORS 2
ULTRA-SMALL COMPANY
(Closed)
ULTRA-SMALL COMPANY MARKET
MICRO-CAP LIMITED
(Closed to New Investors)
SMALL-CAP GROWTH
SMALL-CAP VALUE
LARGE-CAP GROWTH
LARGE-CAP VALUE
BLUE CHIP 35 INDEX
BALANCED
www.Bridgeway.com
Table of Contents
Letter from the Investment Management Team
December 31, 2005
Dear Fellow Shareholders,
Calendar year 2005 was excellent for Bridgeway and its shareholders across the majority of our Funds. All of our actively managed Funds beat their market benchmarks for the year, while our index and passively managed Funds did exactly what they are designed to do: reasonably match the performance of their underlying indexes. You can find our usual detailed discussion of performance by individual fund, beginning on page 12.
In addition to performance and financial information, we'd like to highlight several sections of this report. First, a discussion of the market context of our performance is found on page 5. At Bridgeway, we like competition (it helps keep everyone on their toes). However, it's one thing to beat a peer average, but how do we compare to the recommended "picks" of a high profile rating agency? This analysis is presented on pages 6 and 7.
We solicit shareholder feedback with each letter, and a number of investors who have studied our lists of worst-performing stocks have written to us with the following question, "Why don't you set 'stop loss orders' to limit exposure to losses on individual stocks we own?" It seems to make sense that if you could limit your losses, you'd improve overall returns. Not necessarily: see our take on pages 7 and 8.
As many of you know, one of Bridgeway's four business values is achieving superior (efficient) cost structure, and it's useful at times to step back and look at the big picture. Are costs headed in the right direction? We try to answer this question on pages 8 and 9. Finally, you may know that the Funds' adviser donates half of its own net profits to charitable and non-profit organizations. On pages 10 and 11, John gives a report of a trip to Africa and highlights two organizations that the Adviser is particularly proud to help support.
As always, we appreciate your feedback. This is a brand new format for our semi-annual report and we are considering using it twice a year, with the annual and semi-annual reports, when we present the Funds' financial statements. Let us know how you like it at feedback@bridgeway.com. We take your comments seriously and discuss them regularly. Please keep your ideas coming—both favorable and critical. They are a vital tool in helping us serve you better.
Sincerely,

John Montgomery | | 
Richard P. Cancelmo, Jr. |
Michael A. Whipple |
|

Elena Khoziaeva |
Your investment management team
4
Market Commentary
As you probably know, we don't pay a lot of attention to market trends at Bridgeway. Our investment process looks the same in a bear or bull market. I have four computer screens in my office, and not one of them runs a ticker tape. Our disciplined rule of thumb is: "If it's not going to make a difference in a decision you make, don't look." This saves a lot of time and emotional energy and lets our investment management team concentrate on what we think we do best—running our models in search of both the next good stock and the appropriate time to sell.
With this as a preface you may be wondering what we would possibly have to say about the market overall. Actually, market trends sometimes do help to explain the context within which our various funds operate. For example, surging energy prices and their effect on energy stocks help explain a portion of both Aggressive Investors Funds' market-beating performance in 2005.
One of the interesting trends since 1999 has been the dramatic lead of small companies over larger ones. By many (but not all) measures, 2005 was the seventh year in a row that small companies have outperformed large ones. For example, this is the seventh year in a row that the smallest companies ("ultra-small" or those in the smallest "decile" of the market) have outperformed the largest companies (those in the top "decile") according to data from the Center for Research in Security Prices ("CRSP"). It is the longest "small cap run" in the 79-year history of the CRSP database; however, we believe that large companies will have their "day in the sun" over the next three- to five-year period. We certainly don't claim to know when the turning point will come, and we don't think it's a good idea for anyone to try to "time" the market. Nor do we think you should go out and sell all your small or ultra-small stocks. However, we do think this would be a good time to make sure your portfolio is in line with your original plan, and that you are not inadvertently over-weighted in small or ultra-small stocks or funds due to their great performance over the last few years.
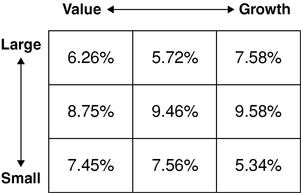
Like small stocks, "value" stocks have also had a great run in recent years. These stocks, which are characterized by their comparatively low prices (based on certain financial measures), dominated growth-oriented stocks over each of the last six years. On a contrarian basis, we believe growth stocks are also due for a "day in the sun." Indeed, growth stocks did outperform value stocks in the December quarter and in some isolated examples for all of 2005. (For example, large-cap growth mutual funds outperformed large-cap value mutual funds.) Thus, we also think this is a poor time for you to be over-weighted in value stocks or value-oriented funds—and a good time to check your portfolio for inadvertent over-weighting. The box below presents style box returns for 2005 according to data from Lipper.
Lipper Fund Category Returns by Style Box for Calendar 2005
Finally, one of the major market trends of 2005 was the boom in energy stocks, driven by rising oil prices. As a group, these stocks zoomed up by an average of 33%—more than twice the return of any other sector of the economy. Most of our Funds benefited from this trend; our Aggressive Investors Funds, in particular, had substantial weightings in energy, and included energy companies that performed better than the average ones. However, there was some reversal of fortune in the last quarter of the calendar year, as energy lagged all other market sectors.
5
Bridgeway Funds Standardized Returns for One, Five and Ten Years and Inception to Date As of December 31, 2005*
Fund
| | 1 year
| | 5 year
| | 10 Year
| | Inception to date
| | Inception
|
|---|
| Aggressive Investors 1 | | 14.93 | % | 7.65 | % | 21.05 | % | 21.64 | % | August 5, 1994 |
| Aggressive Investors 2 | | 18.59 | % | | | | | 13.15 | % | October 31, 2001 |
| Ultra-Small Company | | 2.99 | % | 27.26 | % | 22.54 | % | 22.77 | % | August 5, 1994 |
| Ultra-Small Company Market | | 4.08 | % | 23.88 | % | | | 17.10 | % | July 31, 1997 |
| Micro-Cap Limited | | 22.55 | % | 19.45 | % | | | 20.88 | % | June 30, 1998 |
| Small-Cap Growth | | 18.24 | % | | | | | 15.05 | % | October 31, 2003 |
| Small-Cap Value | | 18.92 | % | | | | | 18.06 | % | October 31, 2003 |
| Large-Cap Growth | | 9.33 | % | | | | | 9.07 | % | October 31, 2003 |
| Large-Cap Value | | 11.62 | % | | | | | 16.04 | % | October 31, 2003 |
| Blue Chip 35 Index | | 0.05 | % | 0.14 | % | | | 5.35 | % | July 31, 1997 |
| Balanced | | 6.96 | % | | | | | 5.61 | % | June 30, 2001 |
- *
- Performance figures quoted represent past performance and are no guarantee of future results. Current performance may be lower or higher than the performance figures quoted, and an investor's shares, when redeemed, may be worth more or less than original cost. For the most recent month-end performance, please call 1-800-661-3550 or visit the Fund's website at www.bridgeway.com.
Bridgeway 8, Morningstar 3
The Short Version: In 2005, Bridgeway's Funds beat Morningstar's "analyst picks" in eight of eleven equivalent categories.
One of the arguments in favor of purchasing actively managed funds is the desire to do better than average. Usually, our Bridgeway fund performance tables compare our returns to relevant market indexes. We think of indexes as "average," but in fact we believe indexes have beaten roughly 80% of actively managed mutual funds over the long haul historically. So comparing our performance against indexes rather than the "average" mutual fund is actually a very high hurdle. Nevertheless, we'd still like to know that we don't just beat the indexes or the average of our peers, but that we also beat comparable actively managed funds. After all, nobody wants an average doctor—we want a superior one. Likewise with mutual funds, we want to know how we stack up against other funds as chosen by an independent firm specializing in investment research.
Of course, the difficult part is identifying "best" funds up front, at the beginning of the performance period in question. For this purpose we turn to Morningstar, an independent Chicago-based firm, which publishes a list of fund "picks" selected by their analysts. We then look at how the performance of Bridgeway Funds compares with the average performance of these "best" funds. Thus, we pit the Bridgeway Funds in a given category against Morningstar's candidates for best funds. Think of it as a friendly competition.
In 2005, the results of this competition: eight to three in favor of Bridgeway. Of our 11 funds, eight beat the average for the Morningstar "analysts' picks" funds in the equivalent category, including
6
all but one of our actively managed funds. The table below presents the results by category and Bridgeway Fund.
Bridgeway Funds
| | Morningstar Analyst "Picks"
|
|---|
Name
| | 2005 Return
| | Morningstar Category
| | 2005 Return
|
|---|
| Large-Cap Value | | 11.62 | | Large-cap value | | 5.04 |
| Blue Chip 35 Index | | 0.05 | | Large-cap blend | | 4.86 |
| Large-Cap Growth | | 9.33 | | Large-cap growth | | 9.03 |
| Aggressive Investors 1 | | 14.93 | | Mid-cap growth | | 10.33 |
| Aggressive Investors 2 | | 18.59 | | Mid-cap growth | | 10.33 |
| Small-Cap Value | | 18.92 | | Small-Value | | 5.51 |
| Ultra-Small Co. Market | | 4.08 | | Small Blend | | 13.50 |
| Ultra-Small Company | | 2.99 | | Small-Growth | | 7.29 |
| Micro-Cap Limited | | 22.55 | | Small-Growth | | 7.29 |
| Small-Cap Growth | | 18.24 | | Small-Growth | | 7.29 |
| Balanced | | 6.96 | | Conservative Allocation | | 4.70 |
Past performance is not an indicator of future results. The Bridgeway Funds' adviser, Bridgeway Capital Management, does not have any influence on the selection of the funds chosen by Morningstar's analysts. The number and specific funds used in the comparison are in the control and discretion of Morningstar and their analysts and are subject to change. Morningstar's criteria for choosing Analyst Picks includes, but is not limited to, factors such as performance, expenses, and quality of fund management. In addition, the comparison of Bridgeway Funds to the Morningstar Analyst Picks is limited to performance only and does not take into consideration other factors that are considered by Morningstar when compiling their list of Analyst Picks.
Each Bridgeway Fund is compared to the average total return of the group of funds selected by Morningstar at the beginning of 2005 for the one year period ended December 31, 2005. Although these Analyst Picks changed from the beginning of the year to the final quarter, the same eight Bridgeway Funds beat the average of the end of year Morningstar picks as well. These averages in the table are comprised of between one and eight funds from within each category. In an effort to provide a complete and balanced assessment, all of the Bridgeway Funds are used in the comparison table shown above such that no attempt is made to cull out unfavorable results. The purpose of this comparison is to "raise the bar" on performance comparison, as this analysis uses an arguably higher benchmark by comparing the Bridgeway Funds to other funds chosen by an independent source that specializes in investment research.
Could One Limit Losses and Improve Returns with "Stop Loss" Orders?
The Short Version: It's tempting to think that we could save money and improve returns by instituting "stop loss" orders to eradicate our biggest declining stocks in a period. However, our simplified analysis indicates that is not the case.
For some shareholders, it's painful when the end-of-the-year round-up shows stock performance with a lot of red ink. Sure, the portfolio as a whole might have beaten the market, the peer-group average, or some other benchmark. But some can't help thinking how much better things might have been if your manager had sold earlier.
For example, take a look at the calendar year "losers" for Aggressive Investors 1 Fund on page 15. Even in an "up market" year, ten of our stocks declined more than 22%; one declined 58%. That list is ugly, a blot on an otherwise strong record, and it's only natural to want to wipe it out. A number of our shareholders have suggested we do just that, by setting stop-loss orders. Essentially, these are sell orders that execute automatically if a stock drops below a certain price. Would stop-loss orders have
7
increased our returns? We asked Elena Khoziaeva to test out this hypothesis under one scenario, using an analysis similar to one we did a number of years ago.
To perform the test, Elena looked at the results from stocks in our aggressive investors style for a representative period, from June 30, 2004 through October 31, 2005. She then set a theoretical stop loss of 20% (i.e. 20% less than either the price on June 30 or else 20% less than the purchase price) on all stocks in Aggressive Investors 1. If a stock continued dropping to, say, a total loss of 40%, Elena assumed that we had sold at the 20% drop and reinvested the proceeds in the remaining stocks in our portfolio. (There are any number of other stop loss programs we could have studied; this is just one, but reflects an answer to a specific suggestion by a shareholder and is representative of other work we have done previously.)
It sounds like it should have been a "slam-dunk" strategy. See the graph of ImClone Systems below. If we had sold the ImClone when the 20% stop order hit, we could have avoided a substantial additional loss of another 15% and increased the Fund's total return for the period by about 0.9%.
ImClone Systems from 6/30/04 to 9/30/04
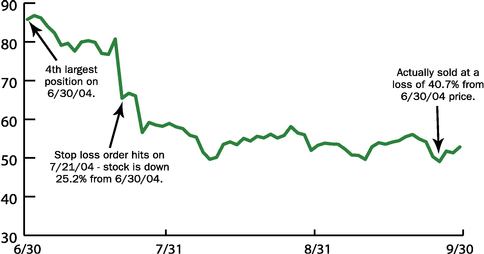
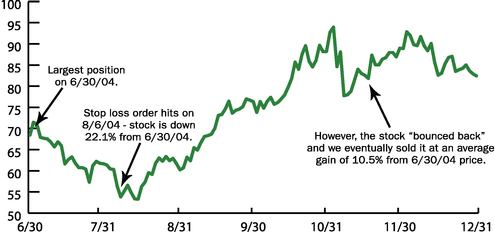
The problem, though, is that there are plenty of stocks that drop by more than 20% but eventually bounce back up above the 20% level. Sometimes, in fact, they bounce up higher than the price at which we bought, for a nice gain. One example is Research In Motion Ltd., which was our largest position on June 30, 2004. If we had sold this stock when it declined below our theoretical stop loss limit of 20%, we would have missed out on the 33% gain from the stop loss point. Selling at the 20%-down mark would have decreased the Fund's total return for the period by about 4.4% (since this was a core holding).
Research in Motion Ltd. from 6/30/04 to 12/31/04
So, what was the bottom line on Elena's analysis? The answer was interesting. According to the analysis, we would have gained nothing by implementing "stop loss" orders. The actual return of the
8
Fund over the period in question was 28.00%, while the hypothetical "stop loss" portfolio return was 27.99%—call it a wash. However, those figures don't include all transaction costs, such as trading commissions; we believe that adding those costs in tips the scales in favor of not setting stop loss orders under the specific stop loss program proposed. On top of that, setting stop loss orders would disrupt part of the process we used to manage the Fund's tax-efficiency, thus hurting after-tax returns for shareholders in taxable accounts. Our conclusion from this and other analysis is that setting stop-loss orders sounds good on paper, but our time and efforts are better focused elsewhere.
Six and a Half Years of Expenses
The Short Version: In our fiscal year (June) report we reviewed some data comparing our expense ratios to those of other funds. In our semi-annual report, however, we review our trend of expenses over time, to see whether we're doing a good job of keeping costs low or (ideally) pushing them even lower.
Bridgeway's four business values are integrity, investment performance, efficient cost, and friendly service. In every report we talk a lot about performance and not infrequently about integrity, but I thought it would be appropriate to revisit the record on expenses. We may be doing well relative to our peers, but one of our Bridgeway colleagues recently reviewed our expenses to test our goal of becoming even more efficient.
Overall, the trend is definitely in the right direction, and you, our shareholders, deserve some thanks for that. When investors buy shares in the Funds, the company's net assets increase (good performance on the part of the Funds' stocks has the same effect). Growth in assets is important in helping to drive expenses down on a per share basis, as it allows the Funds' costs to be spread over a larger base. This trend can go the other direction, however, when assets decline or when growth in costs outstrips asset growth. Thus, it is very important to do a good job of managing costs independent of the direction of asset growth.
The table below presents the operating costs for each of our Funds over the past several years. I'm excluding management fees because we covered those separately in our last annual report and because the performance-based fees on some of the Funds can cloud the picture. Thus, expenses in the table are not total operating expenses, but correspond to the "other expenses" category in our prospectus fee table.
One area of greatly increased costs in the last year has been in compliance-related activities. A recent survey of advisory firms indicated that the average firm saw compliance costs rise by 60% in 2005 as firms responded to an abundance of new regulations. These costs have increased for Bridgeway as well, and we'll cover this topic separately in a future letter. Overall, however, we continue to make progress on the expense front, and I am proud of our record of reducing expense ratios in the current decade. As the numbers get leaner, the job gets harder, but we are committed to vigilance in cost management.
9
Bridgeway Funds Expense Trends 2000 - 2005
"Other expenses" before waivers and reimbursements
| | Year
ended
6/30/2000
| | Year
ended
6/30/2001
| | Year
ended
6/30/2002
| | Year
ended
6/30/2003
| | Year
ended
6/30/2004
| | Year
ended
6/30/2005
| | 6 Months
ended
12/31/2005
annualized
| | Decline
Over
Period
Shown
| |
|---|
| Aggressive Investors 1 | | 0.54 | % | 0.20 | % | 0.21 | % | 0.30 | % | 0.23 | % | 0.19 | % | 0.34 | % | 0.20 | % |
| Aggressive Investors 2 | | | | | | 1.40 | %* | 1.05 | % | 0.27 | % | 0.28 | % | 0.25 | % | 1.15 | % |
| Ultra-Small Company | | 0.56 | % | 0.52 | % | 0.36 | % | 0.39 | % | 0.25 | % | 0.22 | % | 0.16 | % | 0.40 | % |
| Ultra-Small Company Market | | 1.44 | % | 1.11 | % | 0.51 | % | 0.35 | % | 0.17 | % | 0.23 | % | 0.16 | % | 1.28 | % |
| Micro-Cap Limited | | 0.78 | % | 0.49 | % | 0.34 | % | 0.52 | % | 0.23 | % | 0.30 | % | 0.24 | % | 0.54 | % |
| Small-Cap Growth | | | | | | | | | | 0.65 | %** | 0.48 | % | 0.26 | % | 0.39 | % |
| Small-Cap Value | | | | | | | | | | 0.89 | %** | 0.47 | % | 0.20 | % | 0.69 | % |
| Large-Cap Growth | | | | | | | | | | 0.63 | %** | 0.53 | % | 0.31 | % | 0.32 | % |
| Large-Cap Value | | | | | | | | | | 1.02 | %** | 0.60 | % | 0.32 | % | 0.70 | % |
| Blue Chip 35 Index | | 0.39 | % | 0.60 | % | 0.85 | % | 0.99 | % | 0.50 | % | 0.48 | % | 0.26 | % | 0.13 | % |
| Balanced | | | | | | 1.47 | %* | 1.06 | % | 0.91 | % | 0.59 | % | 0.45 | % | 1.02 | % |
Simple Average of Funds
existing in FY2000 | | 0.74 | % | 0.58 | % | 0.45 | % | 0.51 | % | 0.28 | % | 0.28 | % | 0.23 | % | 0.51 | % |
- *
- inception date was 10/31/01
- **
- Class N only, from inception date 10/31/03
Comfort in the Mediocre
The Short Version: I'd rather settle for market beating performance.
Sometimes I'm amazed at the reasoning that accompanies lousy performance. I've come to expect it in the "management discussion and analysis" from funds that continually under perform. I was surprised at the following rationale by a rating agency that accompanied market lagging performance, however. (Names have been changed to protect the. .. uh, people involved.)
On November 5 Joe Manager Smith stepped down from Mediocre Fund's ZZZ class shares. This month would have marked Smith's seventh year managing the fund. Before taking the helm of these funds, he was an analyst for more than ten funds. While the funds were rarely top-quartile performers—indeed, they haven't beaten the S&P in years—his lengthy experience and the structural setup of the fund gave us comfort.
Comfort? OK, but experience isn't a good thing unless it's good experience, and structure only helps if it's is likely to lead to good results. Where else do you look for proof, if not the long term performance and consistency of performance of a fund?
Some Personal Thoughts on Genocide by John Montgomery
Genocide is not a typical subject for a portfolio manager's letter. However, the Bridgeway Funds are unusual in a number of ways, including the fact that the Funds' Adviser, Bridgeway Capital Management, donates half of its after-tax profits to charitable and non-profit organizations. Some of the projects the Adviser has helped to finance include a college preparatory high school for low-income students, an arts program for bereaved children, and a clean-water system for a small town in Honduras. But one of the Adviser's "core missions" is working to further global peace and to help end genocide. In September, a colleague and I traveled to Africa for two weeks to deepen our understanding of human rights issues, establish new relationships, and find new opportunities to make a difference. After concluding that Sudan and the Congo were currently too dangerous to visit, we
10
traveled instead to a somewhat safer, yet war-ravaged region of Uganda, and to Rwanda, where in 1994—over a span of just 100 days—800,000 civilians were killed for no reason other than their ethnicity.
Of course, that kind of atrocity is nothing new for the world. Thirty-eight years ago, my life was changed when a seventh-grade history class introduced me to the Holocaust. The horror was almost inconceivable to me, and as a twelve-year-old boy in Houston, Texas, those dreadful events seemed like ancient history, and as remote as a distant planet. But they planted a seed for future action and commitment. With all that we know about that hideous chapter in world history, it seems incredible to me that genocide is still being perpetrated today. And yet, the genocide in Africa is not ancient history; it continues as I write this letter. And thanks to instant news reporting and economic globalization, distances have shrunk to the point that Africa now seems as close as our own back yard. There is no aspect of society, whether family structure, cultural traditions, economic well-being, physical health, or spiritual life, that is undamaged by the violence.
One of the most painful, most unbelievable aspects of our trip involved listening to the personal testimony of Ugandan children, typically between the ages of eight and twelve, who were kidnapped, horribly abused by their captors, trained as soldiers, and forced to mutilate and kill other children from their own villages. I shuddered to think what I would do had my own daughters been among those children. In Rwanda, I stood on a hill where 250,000 victims of the genocide lie buried. How would I feel if my family and friends were in that grave? Such inhumanity is unfathomable and soul wrenching, and yet it continues to exist.
Despite the painful thoughts, the trip was also enormously uplifting. I met some people who had made the courageous decision to turn away from revenge, others who work relentlessly for justice and real reconciliation. I met many individuals who were devoting their energy and creativity to work in government service or with non-governmental or with religious organizations or with philanthropic projects undertaken by small, local businesses. And I met many, many people who were and are making a difference one relationship, one opportunity at a time. So how can you and I make a difference as we go about our own lives here in the United States? To answer that, I'd like to tell you a little about a couple of the organizations that we help fund.
One, about which we're very excited, is called Invisible Children (www.invisiblechildren.com). The children in question are the children of northern Uganda like the ones I met, abducted and forced into a world of brutality that for most of us is simply beyond imagining. As the Invisible Children project comes to fruition, however, we won't need to imagine this world: It will be up in front of us on a movie screen. The three young filmmakers, all of them in their 20s, who created the Invisible Children documentary, have traveled extensively in Uganda. They have filmed hundreds and hundreds of hours' worth of interviews—with children, with their families, with government officials, including the President of Uganda, with members of the military and local NGOs. Young and a little shaggy, with equipment purchased mostly on Ebay, the group appears to present relatively little threat, and this has helped them gain access to some areas that would be unlikely to admit a CNN camera crew. At the same time, the Ugandan children have been willing to open up to these young filmmakers in a way they would probably not have opened up to a team of older journalists.
The Invisible Children: Rough Cut film, complete with an MTV-style soundtrack, is currently being made available, for free, to college and high-school groups around the United States. Students are encouraged to gather their friends and their friends' friends, and their friends' friends' friends to watch and learn and "blog" about what they've learned, to raise money and donate time and energy, to get involved. The filmmakers intend on releasing the Invisible Children: Final Cut in theatres nationwide in early 2007. The immediate cause, of course, is help for the children of Uganda and the restoration of peace, which this area has not seen for 20 years. But perhaps just as important is the cause of helping
11
America's young people realize that with their time and their energy and their networks of friends, they can help shape the world.
Another group of young people striving for social change, the Genocide Intervention Network (www.genocideinterventionnetwork.com) is focused on helping to end the terrible violence that is ravaging the Darfur region of Sudan. "GI-Net" was started by students and recent alumni of Swarthmore College (which happens to be my alma mater); among their founding members are a Christian, a Jew whose grandparents were Holocaust survivors, and an observant Muslim. The group produces educational materials about Darfur, which it offers to student organizations across the U.S. Last spring, in commemoration of the "100 Days" of genocide in Rwanda, and in concert with hundreds and hundreds of young people from all over the U.S., they raised a quarter of a million dollars for the African Union's peacekeeping efforts in Darfur. I am proud to help support their work.
You might be asking how this all relates to investment. One answer is that there are many different ways to invest, and different ways of defining profit. I regard our support of groups such as GI-Net and Invisible Children (as well as more mature organizations, such as Amnesty International and Human Rights Watch) as investments in the hope for a better world. If these investments help produce a better world for my daughters, and for their families, I will regard that as a very significant profit indeed.
Another answer is that as a money manager, I have always looked for opportunities across the full range of alternatives. Both the world of money-management and the world of philanthropy tend to be very conservative, focused almost exclusively on large, well known companies and organizations. There is no question that large companies such as Apple Computer and well known organizations such as Amnesty International can produce impressive results, and I am happy to invest in them. At the same time, however, I believe it's a mistake to disregard smaller, young companies and organizations. The best of them have energy and fresh, valuable approaches to contribute to the market and the marketplace of ideas. For example, the Bridgeway Ultra-Small Company Fund earned more than 200% on both Quicksilver Resources (an energy company) and SPC Pool (a distributor of swimming-pool supplies). These were tiny companies that yielded enormous gains. Invisible Children and GI-Net may not even be in existence in ten years—or they may be our "ten baggers" that make the difference in actually helping stop a war or end genocide. If we don't take a chance on them, we risk missing out on something extraordinary.
12
Aggressive Investors 1 Fund
MANAGER'S COMMENTARY
(Unaudited)
December 31, 2005
Dear Fellow Aggressive Investors 1 Fund Shareholder,
Our Fund was down 0.57% in the December quarter compared to a gain of 2.09% for our primary benchmark, the S&P 500 Index and 1.81% for our peer benchmark, the Lipper Capital Appreciation Funds Index. It was a poor quarter.
On the heels of three very fine quarters, however, our calendar year return was very strong: 14.93% compared to 4.91% for our primary benchmark, the S&P 500 Index and 7.96% for our peer benchmark, the Lipper Capital Appreciation Funds Index.
The table below presents our December quarter, six-month, one-year, five-year, ten-year and life-to-date financial results according to the formula required by the SEC.
| | Dec. Qtr.
10/1/05
to 12/31/05
| | 6 Months
7/1/05
to 12/31/05
| | 1 Year
1/1/05
to 12/31/05
| | 5 Year
1/1/01
to 12/31/05
| | 10 Year
1/1/96
to 12/31/05
| | Life-to-Date
8/5/94
to 12/31/05
| |
|---|
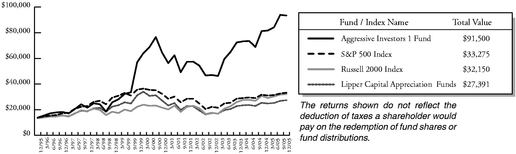
| Aggressive Investors 1 Fund | | -0.57 | % | 10.83 | % | 14.93 | % | 7.65 | % | 21.05 | % | 21.64 | % |
| S&P 500 Index (large companies) | | 2.09 | % | 5.77 | % | 4.91 | % | 0.54 | % | 9.06 | % | 11.12 | % |
| Russell 2000 Index (small companies) | | 1.13 | % | 5.88 | % | 4.55 | % | 8.22 | % | 9.26 | % | 10.78 | % |
| Lipper Capital Appreciation Funds | | 1.81 | % | 8.56 | % | 7.96 | % | 0.15 | % | 7.28 | % | 9.24 | % |
Performance figures quoted represent past performance and are no guarantee of future results. Current performance may be lower or higher than the performance figures quoted, and an investor's shares, when redeemed, may be worth more or less than original cost. For the most recent month-end performance, please call 1-800-661-3550 or visit the Fund's website at www.bridgeway.com.
The S&P 500 Index is a broad-based, unmanaged measurement of changes in stock market conditions based on the average of 500 widely held common stocks with dividends reinvested, while the Russell 2000 Index is an unmanaged, market value weighted index, that measures performance of the 2,000 companies that are between the 1,000th and 3,000th largest in the market with dividends reinvested. The Lipper Capital Appreciation Funds Index reflects the aggregate record of more aggressive domestic growth mutual funds, as reported by Lipper, Inc. It is not possible to invest directly in an index or average. Periods longer than one year are annualized.
For the six-month semi-annual period, our Fund was up 10.83%, compared to 5.77% for the S&P 500 Index of large companies. As reported last quarter, our substantial energy holdings had a very favorable impact in the September quarter, although they "gave back" a bit of return in the December quarter.
According to data from Lipper, Inc. as of December 31, 2005, Aggressive Investors 1 Fund ranked 63rd of 445 capital appreciation funds for 2005, 32nd of 284 over the last five years, 1st of 101 over the last ten years, and 1st of 74 since inception in August, 1994. Lipper, Inc. is an independent mutual fund rating service that ranks funds in various fund categories by making comparative calculations using total returns.
13
Growth of $10,000 Invested in Aggressive Investors 1 Fund and Indexes from 12/31/95 to 12/31/05
Detailed Explanation of Quarterly Performance—What Worked Well
The Short Version: Energy stocks took a back seat this quarter, making way for good performers from a variety of industries.
These are the ten best-performers for the December quarter:
Rank
| | Description
| | Industry
| | % Gain
| |
|---|
| 1 | | Hansen Natural Corp | | Beverages | | 67.4 | % |
| 2 | | Apple Computer Inc | | Computers | | 34.6 | % |
| 3 | | Coldwater Creek Inc | | Retail | | 32.2 | % |
| 4 | | LCA-Vision Inc | | Healthcare-Products | | 28.0 | % |
| 5 | | Joy Global Inc | | Machinery-Const & Mining | | 28.0 | % |
| 6 | | WESCO International Inc | | Distribution/Wholesale | | 26.2 | % |
| 7 | | Marvell Technology Group Ltd | | Semiconductors | | 21.6 | % |
| 8 | | Red Hat Inc | | Software | | 17.7 | % |
| 9 | | Cal Dive International Inc | | Oil & Gas Services | | 13.2 | % |
| 10 | | Goodyear Tire & Rubber Co | | Auto Parts & Equipment | | 11.9 | % |
While last quarter's best performers list was packed with energy stocks, you may be surprised to see only one on our list of gainers above. Our models are still enamored by energy and energy-related companies. However, when we see a run up in a fairly volatile sector that takes its weighting in the portfolio over 35%, our "top-down" risk management strategy may dictate that we begin to trim our holdings, as happened with energy at the beginning of October. Our sector representation went from 35.8% to 22.6% during the quarter.
You might say that our top performer, Hansen Natural, is also involved in energy—energy drinks. Hubert Hansen started making fresh, non-pasteurized juices for film studios and retailers in Southern California in the 30's. Lately, with the addition of smoothies, ready-to-drink iced teas, juice cocktails and energy drinks, its brands have caught the public's attention. Forbes listed Hansen in first place in its "200 Best Small Companies" for 2005, with "new energy drinks targeted at the youth sports market and white-collar workforce." (We gathered our staff recently for a Hansen taste test—the juices were the staff's favorites; I liked the ginseng drink.) Hansen also tops our list of performers for the year, increasing over 166% since our original purchase in March.
Apple's iPod products continue to grow in popularity and to spawn derivative products, which provide diversity for the company beyond personal computers. Although the tremendous price appreciation since our first purchase almost a year and a half ago means this stock is not nearly as cheap as it was, our models still like it, and currently, we're holding.
14
Detailed Explanation of Quarterly Performance—What Didn't Work
The Short Version: Careful trimming of our energy holdings gave us a softer landing this quarter than I would have expected.
These are the ten stocks that performed the worst in the December quarter:
Rank
| | Description
| | Industry
| | % Loss
| |
|---|
| 1 | | Forward Industries Inc | | Textiles | | -58.3 | % |
| 2 | | Building Material Holding Corp | | Distribution/Wholesale | | -26.3 | % |
| 3 | | UGI Corp | | Gas | | -23.0 | % |
| 4 | | Digital River Inc | | Internet | | -21.7 | % |
| 5 | | Toll Brothers Inc | | Home Builders | | -18.0 | % |
| 6 | | Chesapeake Energy Corp | | Oil & Gas | | -17.5 | % |
| 7 | | Tenaris SA | | Iron/Steel | | -16.9 | % |
| 8 | | ConocoPhillips | | Oil & Gas | | -16.8 | % |
| 9 | | Consol Energy Inc | | Coal | | -15.2 | % |
| 10 | | Overseas Shipholding Group | | Transportation | | -14.6 | % |
Although significantly reduced, our exposure to the energy sector was still more than twice that of the broader market, which hurt our quarterly performance. Our energy-related stocks fell 8.17% on average, more favorable than the S&P 500 Index's 9.8% decline of energy stocks. In summary, our energy stocks performed better than average, but still held back our performance substantially in the December quarter.
Forward Industries, maker of carrying cases for cell phones, laptops and other equipment, is our worst performer for the quarter. Timing of product shipments, pricing pressures and higher operating costs are a bad combination and caused the Florida-based company's recent price tumble, which in turn cost the fund 0.5% in performance for the quarter. Digital River was a strong performer through the summer, but by the time we sold the last of our holdings in late October, it had given back most of its gains.
Detailed Explanation of Calendar Year Performance—What Worked Well
The Short Version: Energy, energy, energy.
These are the ten best-performers for the calendar year:
Rank
| | Description
| | Industry
| | % Gain
| |
|---|
| 1 | | Hansen Natural Corp | | Beverages | | 166.8 | % |
| 2 | | Valero Energy Corp | | Oil & Gas | | 105.6 | % |
| 3 | | Tesoro Corp | | Oil & Gas | | 94.1 | % |
| 4 | | Chesapeake Energy Corp | | Oil & Gas | | 91.3 | % |
| 5 | | Coldwater Creek Inc | | Retail | | 62.0 | % |
| 6 | | Foundation Coal Holdings Inc | | Coal | | 61.6 | % |
| 7 | | Kos Pharmaceuticals Inc | | Pharmaceuticals | | 59.9 | % |
| 8 | | Southwestern Energy Co | | Oil & Gas | | 48.8 | % |
| 9 | | Brookfield Asset Management Inc | | Real Estate | | 48.6 | % |
| 10 | | Marvell Technology Group Ltd | | Semiconductors | | 47.8 | % |
Two-thirds of our performance for the calendar year can be attributed to energy stocks. Six of the ten companies listed above also appeared in our fiscal year winners in June; however, five are in industries other than oil and gas, which helped our diversity later in the year as energy stock prices
15
began to decline. Coldwater Creek, which provides specialty clothing and gifts purchased through catalogs or the Internet, was our number two performer for the fiscal year (through last June 2005) and a steady performer through the calendar year. Although our Retail weighting was about equal to the market, our stocks did particularly well and gave us a 2% performance boost above the market during the quarter.
Detailed Explanation of Calendar Year Performance—What Didn't Work
The Short Version: Compared to seven companies that appreciated at least 50% in the calendar year, only one declined that much. Still, it hurt.
The stocks that performed worst for the calendar year:
Rank
| | Description
| | Industry
| | % Loss
| |
|---|
| 1 | | Forward Industries Inc | | Textiles | | -58.3 | % |
| 2 | | Oregon Steel Mills Inc | | Iron/Steel | | -44.0 | % |
| 3 | | AK Steel Holding Corp | | Iron/Steel | | -37.3 | % |
| 4 | | Deckers Outdoor Corp | | Apparel | | -32.6 | % |
| 5 | | Ford Motor Co | | Auto Manufacturers | | -31.3 | % |
| 6 | | eBay Inc | | Internet | | -29.5 | % |
| 7 | | Digital River Inc | | Internet | | -25.4 | % |
| 8 | | Cleveland-Cliffs Inc | | Iron/Steel | | -23.7 | % |
| 9 | | Commercial Metals Co | | Metal Fabricate/Hardware | | -22.7 | % |
| 10 | | Petroleum Development Corp | | Oil & Gas | | -22.2 | % |
A number of our problem holdings for the year centered on two disparate industries: steel and the Internet. Both of these industries did well for the year overall but some of our individual picks did not. In the case of Oregon Steel, the company also did very well for the year, but unfortunately, the timing of our purchase and sale was particularly poor. As reported above, Forward Industries is facing some order-timing and production expense challenges. Personally, I'm kind of sad to see Ford Motor go (we sold earlier in the year, but not before a substantial loss), but our models know no such emotion. Here are our worst ten for the year:
Top Ten Holdings
At quarter end, Goodyear Tire & Rubber Company comprised our largest company representation at 6.9% of net assets, followed by Apple Computer at 4.0% and Joy Global at 3.8%. From the standpoint of diversification, I love seeing three such disparate companies at the top of our list. Our top ten holdings represented 36.5% of net assets.
Rank
| | Description
| | Industry
| | Percent of
Net Assets
| |
|---|
| 1 | | Goodyear Tire & Rubber Co | | Auto Parts & Equipment | | 6.9 | % |
| 2 | | Apple Computer Inc | | Computers | | 4.0 | % |
| 3 | | Joy Global Inc | | Machinery-Const & Mining | | 3.8 | % |
| 4 | | Valero Energy Corp | | Oil & Gas | | 3.7 | % |
| 5 | | McDermott International Inc | | Engineering & Const | | 3.3 | % |
| 6 | | Dress Barn Inc | | Retail | | 3.2 | % |
| 7 | | BMC Software Inc | | Software | | 3.1 | % |
| 8 | | Quanta Services Inc | | Commercial Services | | 3.0 | % |
| 9 | | Tesoro Corp | | Oil & Gas | | 3.0 | % |
| 10 | | Sunoco Inc | | Oil & Gas | | 2.5 | % |
| | | | | | |
| |
| | Total | | | | 36.5 | % |
16
Industry Sector Representation as of December 31, 2005
Energy continues as our Fund's largest sector, but we trimmed it substantially, down from 35.8% last quarter. The industry we are most underrepresented in is Financial.
| | % of Net Assets
| | S&P 500 Index
| | Difference
| |
|---|
| Basic Materials | | 1.0 | % | 2.9 | % | -1.9 | % |
| Communications | | 9.2 | % | 10.2 | % | -1.0 | % |
| Consumer, Cyclical | | 15.8 | % | 8.5 | % | 7.3 | % |
| Consumer, Non-cyclical | | 16.0 | % | 21.6 | % | -5.6 | % |
| Energy | | 22.6 | % | 9.6 | % | 13.0 | % |
| Financial | | 5.3 | % | 21.1 | % | -15.8 | % |
| Industrial | | 15.8 | % | 11.3 | % | 4.5 | % |
| Technology | | 13.4 | % | 11.4 | % | 2.0 | % |
| Utilities | | 0.0 | % | 3.4 | % | -3.4 | % |
| Cash | | 0.9 | % | 0.0 | % | 0.9 | % |
| | |
| |
| | | |
| | Total | | 100.0 | % | 100.0 | % | | |
Disclaimer
The following is a reminder from the friendly folks at your Fund who worry about liability. The views expressed here are exclusively those of Fund management. These views, including those of market sectors or individual stocks, are not meant as investment advice and should not be considered predictive in nature. Any favorable (or unfavorable) description of a holding applies only as of the quarter end, December 31, 2005, unless otherwise stated. Security positions can and do change thereafter. Discussions of historical performance do not guarantee and are not indicative of future performance.
The Fund is subject to above average market risk (volatility) and is not an appropriate investment for short-term investors. Investments in the small companies within this multi-cap fund generally carry greater risk than is customarily associated with larger companies for various reasons such as narrower markets, limited financial resources and less liquid stock.
This report is submitted for the general information of the shareholders of the Fund. It is not authorized for distribution to prospective investors unless preceded or accompanied by an effective prospectus, which includes information regarding the Fund's risks, objectives, fees and expenses, experience of its management, and other information. The prospectus and other fund information may be obtained by calling 1800-661-3550 or visiting the Fund's website www.bridgeway.com. Foreside Fund Services, LLC, distributor.
Conclusion
Thank you for your continued investment in Aggressive Investors 1. This Fund remains open only to current investors as we seek to keep the nimbleness that has fared well through the years. As always, we appreciate your feedback.
Sincerely,
John Montgomery
17
DISCLOSURE OF FUND EXPENSES
(Unaudited)
As a shareholder of the Fund, you will incur no transaction costs from the Fund, including sales charges (loads) on purchases, on reinvested dividends, or on other distributions. There are also no redemption fees or exchange fees. However, as a shareholder of the Fund, you will incur ongoing costs, including management fees and other Fund expenses. The following examples are intended to help you understand your ongoing costs (in dollars) of investing in the Fund and to compare these costs with the ongoing costs of investing in other mutual funds. The examples are based on an investment of $1,000 invested on July 1, 2005 and held until December 31, 2005.
Actual Return. The first line of the table below provides information about actual account values and actual expenses. You may use the information in this line, together with the amount you invested, to estimate the expenses that you paid over the period. Simply divide your account value by $1,000 (for example, an $8,600 account value divided by $1,000 = 8.6), then multiply the result by the number in the first line under the heading "Expense Paid During Period" to estimate the expenses you paid on your account during this period.
Hypothetical 5% Return. The second line of the table below provides information about hypothetical account values and hypothetical expenses based on the Fund's actual expense ratio and an assumed rate of return of 5% per year before expenses, which is not the Fund's actual return. The hypothetical account values and expenses may not be used to estimate the actual ending account balance or expenses you paid for the period. You may use this information to compare the ongoing costs of investing in a Fund and other mutual funds. To do so, compare this 5% hypothetical example with the 5% hypothetical examples that appear in the shareholder reports of the other funds.
The expenses shown in the table are meant to highlight ongoing Fund costs only. Therefore, the second line of the table is useful in comparing ongoing costs only, and will not help you determine the relative total costs of owning different funds, because other funds may also have transaction costs, such as sales charges, redemption fees or exchange fees.
Bridgeway Aggressive Investors 1 Fund
| | Beginning Account
Value at 7/1/05
| | Ending Account
Value at 12/31/05
| | Expense Paid
During Period*
7/1/05 - 12/31/05
|
|---|
| Actual Fund Return | | $ | 1,000.00 | | $ | 1,108.30 | | $ | 9.25 |
| Hypothetical Fund Return | | $ | 1,000.00 | | $ | 1,016.43 | | $ | 8.84 |
- *
- Expenses are equal to the Fund's annualized expense ratio of 1.74% multiplied by the average account value over the period, multiplied by the number of days in the first fiscal half-year divided by 365 days in the current year (to reflect the one half-year period).
18
SCHEDULE OF INVESTMENTS
Showing percentage of net assets as of December 31, 2005
(Unaudited)
Industry
| | Company
| | Shares
| | Value
|
|---|
COMMON STOCKS—99.1% |
|
|
|
|
|
| Apparel—2.1% | | | | | |
| | | Guess? Inc* | | 240,000 | | $ | 8,544,000 |
Auto Parts & Equipment—6.9% |
|
|
|
|
|
| | | The Goodyear Tire & Rubber Co* | | 1,599,000 | | | 27,790,620 |
Banks—1.4% |
|
|
|
|
|
| | | US Bancorp | | 187,400 | | | 5,601,386 |
Beverages—2.4% |
|
|
|
|
|
| | | Hansen Natural Corp*+ | | 124,800 | | | 9,835,488 |
Coal—1.0% |
|
|
|
|
|
| | | Foundation Coal Holdings Inc | | 102,000 | | | 3,876,000 |
Commercial Services—4.0% |
|
|
|
|
|
| | | Administaff Inc | | 97,400 | | | 4,095,670 |
| | | Quanta Services Inc* | | 924,500 | | | 12,175,665 |
| | | | | | |
|
| | | | | | | | 16,271,335 |
Computers—6.1% |
|
|
|
|
|
| | | Apple Computer Inc* | | 223,800 | | | 16,088,982 |
| | | Sandisk Corp* | | 136,700 | | | 8,587,494 |
| | | | | | |
|
| | | | | | | | 24,676,476 |
Distribution/Wholesale—2.5% |
|
|
|
|
|
| | | WESCO International Inc* | | 233,300 | | | 9,968,909 |
Diversified Financial Services—1.6% |
|
|
|
|
|
| | | Merrill Lynch & Co | | 92,400 | | | 6,258,252 |
Electronics—2.2% |
|
|
|
|
|
| | | Agilent Technologies* | | 241,200 | | | 8,029,548 |
| | | American Science & Engineering* | | 12,500 | | | 779,625 |
| | | | | | |
|
| | | | | | | | 8,809,173 |
Engineering & Construction—3.3% |
|
|
|
|
|
| | | McDermott International* | | 302,000 | | | 13,472,220 |
Healthcare Products—4.1% |
|
|
|
|
|
| | | Alcon Inc | | 67,300 | | | 8,722,080 |
| | | LCA-Vision Inc | | 162,000 | | | 7,696,620 |
| | | | | | |
|
| | | | | | | | 16,418,700 |
Internet—1.7% |
|
|
|
|
|
| | | Nutri System Inc* | | 195,000 | | | 7,023,900 |
Iron & Steel—1.0% |
|
|
|
|
|
| | | Tenaris | | 35,800 | | | 4,099,100 |
| | | | | | | | |
19
Machinery—Construction & Mining—5.8% |
|
|
|
|
|
| | | JLG Industries Inc | | 178,800 | | $ | 8,164,008 |
| | | Joy Global Inc | | 382,350 | | | 15,294,000 |
| | | | | | |
|
| | | | | | | | 23,458,008 |
Metal Fabricate/Hardware—1.2% |
|
|
|
|
|
| | | NS Group Inc* | | 112,800 | | | 4,716,168 |
Miscellaneous Manufacturing—1.9% |
|
|
|
|
|
| | | Ceradyne Inc* | | 170,000 | | | 7,446,000 |
Oil & Gas—19.1% |
|
|
|
|
|
| | | Anadarko Petroleum Corp | | 65,900 | | | 6,244,025 |
| | | Chesapeake Energy Corp | | 102,800 | | | 3,261,844 |
| | | ConocoPhillips | | 83,000 | | | 4,828,940 |
| | | EOG Resources Inc | | 97,600 | | | 7,160,912 |
| | | Occidental Petroleum Corp | | 71,700 | | | 5,727,396 |
| | | Southwestern Energy Co* | | 193,000 | | | 6,936,420 |
| | | Sunoco Inc | | 130,800 | | | 10,252,104 |
| | | Tesoro Petroleum Corp | | 193,400 | | | 11,903,770 |
| | | Valero Energy Corp | | 285,200 | | | 14,716,320 |
| | | XTO Energy Inc | | 136,442 | | | 5,995,247 |
| | | | | | |
|
| | | | | | | | 77,026,978 |
Oil & Gas Services—2.5% |
|
|
|
|
|
| | | Cal Dive International Inc* | | 281,600 | | | 10,106,624 |
Pharmaceuticals—5.4% |
|
|
|
|
|
| | | Bristol-Myers Squibb Co | | 367,500 | | | 8,445,150 |
| | | Express Scripts Inc* | | 102,000 | | | 8,547,600 |
| | | Merck & Co Inc | | 151,200 | | | 4,809,672 |
| | | | | | |
|
| | | | | | | | 21,802,422 |
Real Estate Operations—1.3% |
|
|
|
|
|
| | | Brookfield Asset Management | | 102,900 | | | 5,178,957 |
Retail—4.3% |
|
|
|
|
|
| | | Dress Barn Inc* | | 334,373 | | | 12,910,142 |
| | | Nordstrom Inc | | 118,200 | | | 4,420,680 |
| | | | | | |
|
| | | | | | | | 17,330,822 |
Savings & Loans—1.1% |
|
|
|
|
|
| | | Washington Mutual Inc | | 101,100 | | | 4,397,850 |
Semiconductors—2.5% |
|
|
|
|
|
| | | Marvell Technology Group Ltd* | | 177,800 | | | 9,972,802 |
Software—4.8% |
|
|
|
|
|
| | | BMC Software Inc* | | 608,000 | | | 12,457,920 |
| | | Red Hat Inc* | | 258,000 | | | 7,027,920 |
| | | | | | |
|
| | | | | | | | 19,485,840 |
| | | | | | | | |
20
Telecommunications—7.5% |
|
|
|
|
|
| | | AT&T Inc | | 388,300 | | $ | 9,509,467 |
| | | BellSouth Corp | | 148,500 | | | 4,024,350 |
| | | Corning Inc* | | 209,000 | | | 4,108,940 |
| | | Dobson Communications* | | 594,500 | | | 4,458,750 |
| | | Motorola Inc | | 181,500 | | | 4,100,085 |
| | | Powerwave Technologies* | | 316,800 | | | 3,982,176 |
| | | | | | |
|
| | | | | | | | 30,183,768 |
Transportation—0.0%^ |
|
|
|
|
|
| | | Kirby Corp* | | 10 | | | 522 |
Trucking & Leasing—1.4% |
|
|
|
|
|
| | | GATX Corp | | 158,000 | | | 5,700,640 |
| | | | | | |
|
TOTAL COMMON STOCKS
(Cost $326,464,093) | | | | | 399,452,960 |
| | | | | | |
|
PURCHASED CALL OPTIONS—LONG—0.1% |
|
|
|
|
|
| |
| | Number of contracts
| |
|
|---|
| ConocoPhillips | | | | | |
| | | expiring Jan 06 at $62.50 | | 300 | | | 6,750 |
| The Goodyear Tire & Rubber Co | | | | | |
| | | expiring Jan 06 at $17.50 | | 1,000 | | | 50,000 |
| Joy Global Inc | | | | | |
| | | expiring Feb 06 at $40.00 | | 250 | | | 65,625 |
| | | expiring Apr 06 at $40.00 | | 650 | | | 260,000 |
| | | | | | |
|
TOTAL PURCHASED CALL OPTIONS
(Cost $625,844) | | | | | 382,375 |
| | | | | | |
|
MONEY MARKET MUTUAL FUNDS—0.6% |
|
|
|
|
|
| First American Treasury Obligations Fund—Class S | | 2,317,457 | | | 2,317,457 |
| | | | | | |
|
TOTAL MONEY MARKET MUTUAL FUNDS
(Cost $2,317,457) | | | | | 2,317,457 |
| | | | | | |
|
TOTAL INVESTMENTS—99.7%
(Cost $329,407,394) |
|
|
|
$ |
402,152,792 |
| Other Assets in excess of Liabilities—0.3% | | | | | 1,093,094 |
| | | | | | |
|
| NET ASSETS—100.0% | | | | $ | 403,245,886 |
| | | | | | |
|
- *
- Non-income producing security
- ^
- Less than 0.05% of net assets
- +
- This security or a portion of this security is out on loan at December 31, 2005. Total loaned securities had a market value of $9,835,488 at December 31, 2005.
See Notes to Financial Statements
21
Aggressive Investors 2 Fund
MANAGER'S COMMENTARY
(Unaudited)
December 31, 2005
Dear Fellow Aggressive Investors 2 Fund Shareholder,
Our Fund had a positive return of 1.72% in the December quarter, compared with 2.09% for the S&P 500 Index and 1.81% for our peer benchmark, the Lipper Capital Appreciation Funds Index. It was a poor quarter.
On the heels of three very fine quarters, however, our calendar year return was very strong: 18.59% compared to 4.91% for our primary benchmark, the S&P 500 Index and 7.96% for our peer benchmark, the Lipper Capital Appreciation Funds Index.
The table below presents our December quarter, six-month, one-year, and life-to-date financial results according to the formula required by the SEC.
| | Dec. Qtr.
10/1/05
to 12/31/05
| | 6 Months
7/1/05
to 12/31/05
| | 1 Year
1/1/05
to 12/31/05
| | Life-to-Date
10/31/01
to 12/31/05
| |
|---|
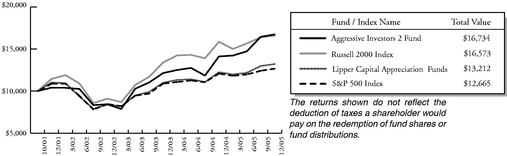
| Aggressive Investors 2 Fund | | 1.72 | % | 13.68 | % | 18.59 | % | 13.15 | % |
| S&P 500 Index (large companies) | | 2.09 | % | 5.77 | % | 4.91 | % | 5.83 | % |
| Russell 2000 Index (small companies) | | 1.13 | % | 5.88 | % | 4.55 | % | 12.89 | % |
| Lipper Capital Appreciation Funds | | 1.81 | % | 8.56 | % | 7.96 | % | 6.91 | % |
Performance figures quoted represent past performance and are no guarantee of future results. Current performance may be lower or higher than the performance figures quoted, and an investor's shares, when redeemed, may be worth more or less than original cost. For the most recent month-end performance, please call 1-800-661-3550 or visit the Fund's website at www.bridgeway.com.
The S&P 500 Index is a broad-based, unmanaged measurement of changes in stock market conditions based on the average of 500 widely held common stocks with dividends reinvested, while the Russell 2000 Index is an unmanaged, market value weighted index that measures performance of the 2,000 companies that are between the 1,000th and 3,000th largest in the market with dividends reinvested. The Lipper Capital Appreciation Funds Index reflects the aggregate record of more aggressive domestic growth mutual funds, as reported by Lipper, Inc. It is not possible to invest directly in an index or average. Periods longer than one year are annualized.
For the six-month semi-annual period, our Fund was up 13.68%, compared to 5.77% for the S&P 500 Index of large companies. As reported last quarter, our substantial energy holdings had a very favorable impact in the September quarter, although they "gave back" a bit of returns in the December quarter.
According to data from Lipper, Inc. as of December 31, 2005, Aggressive Investors 2 Fund ranked 35th of 445 capital appreciation funds for 2005 and 31st of 319 such funds since inception in October, 2001. Lipper, Inc. is an independent mutual fund rating service that ranks funds in various fund categories by making comparative calculations using total returns.
22
Growth of $10,000 Invested in Aggressive Investors 2 Fund and Indexes from 10/31/01 (inception) to 12/31/05
Detailed Explanation of Quarterly Performance—What Worked Well
The Short Version: Energy stocks had much less effect on performance this quarter, making way for good performers from a variety of industries.
These are the ten best-performers for the December quarter:
Rank
| | Description
| | Industry
| | % Gain
| |
|---|
| 1 | | Hansen Natural Corp | | Beverages | | 67.4 | % |
| 2 | | Apple Computer Inc | | Computers | | 34.6 | % |
| 3 | | LCA-Vision Inc | | Healthcare-Products | | 28.0 | % |
| 4 | | Coldwater Creek Inc | | Retail | | 26.7 | % |
| 5 | | WESCO International Inc | | Distribution/Wholesale | | 26.2 | % |
| 6 | | Joy Global Inc | | Machinery-Constr & Mining | | 24.8 | % |
| 7 | | Red Hat Inc | | Software | | 17.3 | % |
| 8 | | JPMorgan Chase & Co | | Diversified Financial Services | | 17.0 | % |
| 9 | | Parker Drilling Co | | Oil & Gas | | 15.1 | % |
| 10 | | Cal Dive International Inc | | Oil & Gas Services | | 13.4 | % |
While last quarter's best performers list was packed with energy stocks, you may be surprised to see only two on our list of gainers above. Our models are still enamored by energy and energy-related companies. However, when we see a run up in a fairly volatile sector that takes its weighting in the portfolio over 33%, our "top-down" risk management strategy may dictate that we begin to trim our holdings, as happened with energy at the beginning of October. Our sector representation went from 34.5% to 19.2% during the quarter.
You might say that our top performer, Hansen Natural, is also involved in energy—energy drinks. Hubert Hansen started making fresh, non-pasteurized juices for film studios and retailers in Southern California in the 30's. Lately, with the addition of smoothies, ready-to-drink iced teas, juice cocktails and energy drinks, its brands have caught the public's attention. Forbes listed Hansen in first place in its "200 Best Small Companies" for 2005, with "new energy drinks targeted at the youth sports market and white-collar workforce." (We gathered our staff recently for a Hansen taste test—the juices were the staff's favorites; I liked the ginseng drink.) Hansen also tops our list of performers for the year, increasing over 164.6% since our original purchase in March.
Apple's iPod products continue to grow in popularity and to spawn derivative products, which provide diversity for the company beyond personal computers. Although the tremendous price appreciation since our first purchase almost a year and a half ago means this stock is not nearly as cheap as it was, our models still like it, and currently, we're holding.
23
Detailed Explanation of Quarterly Performance—What Didn't Work
The Short Version: Careful trimming of our energy holdings gave us a softer landing this quarter than I would have expected.
These are the ten stocks that performed the worst in the December quarter:
Rank
| | Description
| | Industry
| | % Loss
| |
|---|
| 1 | | Forward Industries Inc | | Textiles | | -57.4 | % |
| 2 | | Building Material Holding Corp | | Distribution/Wholesale | | -26.9 | % |
| 3 | | Comtech Telecomm. Corp | | Telecommunications | | -25.4 | % |
| 4 | | UGI Corp | | Gas | | -23.0 | % |
| 5 | | Digital River Inc | | Internet | | -21.6 | % |
| 6 | | Toll Brothers Inc | | Home Builders | | -18.0 | % |
| 7 | | Chesapeake Energy Corp | | Oil & Gas | | -17.1 | % |
| 8 | | Tenaris SA | | Iron/Steel | | -16.9 | % |
| 9 | | ConocoPhillips | | Oil & Gas | | -16.8 | % |
| 10 | | Gold Kist Inc | | Food | | -15.1 | % |
Although significantly reduced, our exposure to the energy sector was still more than twice that of the broader market, which hurt our quarterly performance. On the other hand, our energy-related stocks fell only 7.06% on average versus the S&P 500 Index's 9.8% decline of energy stocks. In summary, while we picked better energy stocks than average, our sizeable weighting of energy still held back our performance substantially in the December quarter.
Forward Industries, maker of carrying cases for cell phones, laptops and other equipment, is our worst performer for the quarter. Timing of product shipments, pricing pressures and higher operating costs are a bad combination and caused the Florida-based company's recent price tumble, which in turn cost the fund 0.5% in performance for the quarter. Digital River was a strong performer through the summer, but by the time we sold the last of our holdings in late October, it had given back most of its gains.
Detailed Explanation of Calendar Year Performance—What Worked Well
The Short Version: Energy, energy, energy.
These are the ten best-performers for the calendar year:
Rank
| | Description
| | Industry
| | % Gain
| |
|---|
| 1 | | Hansen Natural Corp | | Beverages | | 164.6 | % |
| 2 | | Chesapeake Energy Corp | | Oil & Gas | | 92.3 | % |
| 3 | | America Movil SA de CV | | Telecommunications | | 74.5 | % |
| 4 | | Tesoro Corp | | Oil & Gas | | 69.5 | % |
| 5 | | Foundation Coal Holdings Inc | | Coal | | 63.2 | % |
| 6 | | Valero Energy Corp | | Oil & Gas | | 59.8 | % |
| 7 | | Coldwater Creek Inc | | Retail | | 55.2 | % |
| 8 | | Kos Pharmaceuticals Inc | | Pharmaceuticals | | 53.2 | % |
| 9 | | Sunoco Inc | | Oil & Gas | | 51.7 | % |
| 10 | | Brookfield Asset Management | | Real Estate | | 49.9 | % |
Half of our performance for the calendar year can be attributed to energy stocks. Our number one and four other top performers are in industries other than oil and gas, which helped our diversification later in the year as energy stock prices began to decline. Of our 18.59% return for the year, Hansen contributed approximately 2.8%. Coldwater Creek, which provides specialty clothing and gifts
24
purchased through catalogs or the Internet, was our number two performer for the fiscal year and a steady performer through the calendar year. Although our Retail weighting was about equal to the market, our stocks did particularly well and gave us a 2% performance boost above the market during the quarter.
Detailed Explanation of Calendar Year Performance—What Didn't Work
The Short Version: Compared to nine companies that appreciated at least 50% in the calendar year, only one declined that much. Still, it hurt.
The stocks that performed worst for the calendar year:
Rank
| | Description
| | Industry
| | % Loss
| |
|---|
| 1 | | Forward Industries Inc | | Textiles | | -57.4 | % |
| 2 | | Oregon Steel Mills Inc | | Iron/Steel | | -47.8 | % |
| 3 | | AK Steel Holding Corp | | Iron/Steel | | -40.6 | % |
| 4 | | eBay Inc | | Internet | | -29.5 | % |
| 5 | | Digital River Inc | | Internet | | -29.4 | % |
| 6 | | Ford Motor Co | | Auto Manufacturers | | -28.5 | % |
| 7 | | Deckers Outdoor Corp | | Apparel | | -26.7 | % |
| 8 | | Commercial Metals Co | | Metal Fabricate/Hardware | | -25.6 | % |
| 9 | | Petroleum Development Corp | | Oil & Gas | | -23.2 | % |
| 10 | | Overseas Shipholding Group | | Transportation | | -22.1 | % |
Only one company lost over 50% for the calendar year. As reported for the quarter, Forward Industries tops our worst performers. Increases in energy, raw materials and employment costs have affected the Iron/Steel industry. However, the combined effect of Oregon Steel and AK Steel on our performance for the year was about -1.6%.
Top Ten Holdings
At quarter end, Energy comprised our largest sector representation at 19.2% of net assets, followed by Industrial at 16.6% and Technology at 15.7%. Our top ten holdings represented 31.6% of net assets.
Rank
| | Description
| | Industry
| | Percent of
Net Assets
| |
|---|
| 1 | | Goodyear Tire & Rubber Co | | Auto Parts & Equipment | | 5.3 | % |
| 2 | | McDermott International Inc | | Engineering & Construction | | 3.6 | % |
| 3 | | Joy Global Inc | | Machinery-Constr & Mining | | 3.4 | % |
| 4 | | SanDisk Corp | | Computers | | 3.2 | % |
| 5 | | Marvell Technology Group Ltd | | Semiconductors | | 3.0 | % |
| 6 | | Apple Computer Inc | | Computers | | 3.0 | % |
| 7 | | Express Scripts Inc | | Pharmaceuticals | | 2.8 | % |
| 8 | | Hansen Natural Corp | | Beverages | | 2.5 | % |
| 9 | | BMC Software Inc | | Software | | 2.5 | % |
| 10 | | Valero Energy Corp | | Oil & Gas | | 2.3 | % |
| | | | | | |
| |
| | Total | | | | 31.6 | % |
25
Industry Sector Representation as of December 31, 2005
Energy continues as our Fund's largest sector, but we trimmed it substantially, down from 34.5% last quarter. The industry we are most underrepresented in is Financial.
| | % of Net Assets
| | S&P 500 Index
| | Difference
| |
|---|
| Basic Materials | | 0.6 | % | 2.9 | % | -2.3 | % |
| Communications | | 10.4 | % | 10.2 | % | 0.2 | % |
| Consumer, Cyclical | | 11.4 | % | 8.5 | % | 2.9 | % |
| Consumer, Non-cyclical | | 14.8 | % | 21.6 | % | -6.8 | % |
| Energy | | 19.2 | % | 9.6 | % | 9.6 | % |
| Financial | | 7.1 | % | 21.1 | % | -14.0 | % |
| Industrial | | 16.6 | % | 11.3 | % | 5.3 | % |
| Technology | | 15.7 | % | 11.4 | % | 4.4 | % |
| Utilities | | 0.00 | % | 3.4 | % | -3.4 | % |
| Cash | | 4.2 | % | 0.0 | % | 4.2 | % |
| | |
| |
| | | |
| | Total | | 100.0 | % | 100.0 | % | | |
Disclaimer
The following is a reminder from the friendly folks at your Fund who worry about liability. The views expressed here are exclusively those of Fund management. These views, including those of market sectors or individual stocks, are not meant as investment advice and should not be considered predictive in nature. Any favorable (or unfavorable) description of a holding applies only as of the quarter end, December 31, 2005, unless otherwise stated. Security positions can and do change thereafter. Discussions of historical performance do not guarantee and are not indicative of future performance.
The Fund is subject to above average market risk (volatility) and is not an appropriate investment for short-term investors. Investments in the small companies within this multi-cap fund generally carry greater risk than is customarily associated with larger companies for various reasons such as narrower markets, limited financial resources and less liquid stock.
This report is submitted for the general information of the shareholders of the Fund. It is not authorized for distribution to prospective investors unless preceded or accompanied by an effective prospectus, which includes information regarding the Fund's risks, objectives, fees and expenses, experience of its management, and other information. For questions or other Fund information, call 1-800-661-3550 or visit the Fund's website www.bridgeway.com. Foreside Fund Services, LLC, distributor.
Conclusion
Thank you for your continued investment in Aggressive Investors 2. This Fund remains open to both current and new investors. As always, we appreciate your feedback.
Sincerely,
John Montgomery
26
DISCLOSURE OF FUND EXPENSES
(Unaudited)
As a shareholder of the Fund, you will incur no transaction costs from the Fund, including sales charges (loads) on purchases, on reinvested dividends, or on other distributions. There are also no redemption fees or exchange fees. However, as a shareholder of the Fund, you will incur ongoing costs, including management fees and other Fund expenses. The following examples are intended to help you understand your ongoing costs (in dollars) of investing in the Fund and to compare these costs with the ongoing costs of investing in other mutual funds. The examples are based on an investment of $1,000 invested on July 1, 2005 and held until December 31, 2005.
Actual Return. The first line of the table below provides information about actual account values and actual expenses. You may use the information in this line, together with the amount you invested, to estimate the expenses that you paid over the period. Simply divide your account value by $1,000 (for example, an $8,600 account value divided by $1,000 = 8.6), then multiply the result by the number in the first line under the heading "Expense Paid During Period" to estimate the expenses you paid on your account during this period.
Hypothetical 5% Return. The second line of the table below provides information about hypothetical account values and hypothetical expenses based on the Fund's actual expense ratio and an assumed rate of return of 5% per year before expenses, which is not the Fund's actual return. The hypothetical account values and expenses may not be used to estimate the actual ending account balance or expenses you paid for the period. You may use this information to compare the ongoing costs of investing in a Fund and other mutual funds. To do so, compare this 5% hypothetical example with the 5% hypothetical examples that appear in the shareholder reports of the other funds.
The expenses shown in the table are meant to highlight ongoing Fund costs only. Therefore, the second line of the table is useful in comparing ongoing costs only, and will not help you determine the relative total costs of owning different funds, because other funds may also have transaction costs, such as sales charges, redemption fees or exchange fees.
Bridgeway Aggressive Investors 2 Fund
| | Beginning Account
Value at 7/1/05
| | Ending Account
Value at 12/31/05
| | Expense Paid
During Period*
7/1/05 - 12/31/05
|
|---|
| Actual Fund Return | | $ | 1,000.00 | | $ | 1,136.80 | | $ | 6.62 |
| Hypothetical Fund Return | | $ | 1,000.00 | | $ | 1,019.00 | | $ | 6.26 |
- *
- Expenses are equal to the Fund's annualized expense ratio of 1.23% multiplied by the average account value over the period, multiplied by the number of days in the first fiscal half-year divided by 365 days in the current year (to reflect the one half-year period).
27
Aggressive Investors 2 Fund
SCHEDULE OF INVESTMENTS
Showing percentage of net assets as of December 31, 2005
(Unaudited)
Industry
| | Company
| | Shares
| | Value
|
|---|
COMMON STOCKS—95.7% |
|
|
|
|
|
| Aerospace/Defense—0.7% | | | | | |
| | | Armor Holdings Inc* | | 50,200 | | $ | 2,141,030 |
Apparel—1.9% |
|
|
|
|
|
| | | Guess? Inc* | | 164,200 | | | 5,845,520 |
Auto Parts & Equipment—5.3% |
|
|
|
|
|
| | | The Goodyear Tire & Rubber Co* | | 940,600 | | | 16,347,628 |
Banks—1.6% |
|
|
|
|
|
| | | Corus Bankshares Inc | | 45,146 | | | 2,540,365 |
| | | US Bancorp | | 79,000 | | | 2,361,310 |
| | | | | | |
|
| | | | | | | | 4,901,675 |
Beverages—2.5% |
|
|
|
|
|
| | | Hansen Natural Corp*+ | | 99,800 | | | 7,865,238 |
Biotechnology—1.1% |
|
|
|
|
|
| | | Amgen Inc* | | 44,500 | | | 3,509,270 |
Building Materials—0.8% |
|
|
|
|
|
| | | USG Corp* | | 36,100 | | | 2,346,500 |
Coal—1.4% |
|
|
|
|
|
| | | Foundation Coal | | | | | |
| | | Holdings Inc | | 52,000 | | | 1,976,000 |
| | | Peabody Energy Corp | | 28,700 | | | 2,365,454 |
| | | | | | |
|
| | | | | | | | 4,341,454 |
Commercial Services—0.9% |
|
|
|
|
|
| | | Administaff Inc | | 62,100 | | | 2,611,305 |
Computers—7.4% |
|
|
|
|
|
| | | Apple Computer Inc* | | 126,700 | | | 9,108,463 |
| | | Komag Inc* | | 115,900 | | | 4,017,094 |
| | | Sandisk Corp* | | 154,200 | | | 9,686,844 |
| | | | | | |
|
| | | | | | | | 22,812,401 |
Distribution/Wholesale—2.2% |
|
|
|
|
|
| | | Building Material Holding | | | | | |
| | | Corp | | 49,200 | | | 3,355,932 |
| | | WESCO International Inc* | | 81,600 | | | 3,486,768 |
| | | | | | |
|
| | | | | | | | 6,842,700 |
| | | | | | | | |
28
Diversified Financial Services—3.2% |
|
|
|
|
|
| | | Chicago Mercantile Exchange | | 10,000 | | $ | 3,674,900 |
| | | JPMorgan Chase & Co | | 62,800 | | | 2,492,532 |
| | | Merrill Lynch & Co | | 56,800 | | | 3,847,064 |
| | | | | | |
|
| | | | | | | | 10,014,496 |
Electrical Components & Equipment—1.0% |
|
|
|
|
|
| | | Lamson & Sessions Co* | | 120,400 | | | 3,012,408 |
Electronics—1.5% |
|
|
|
|
|
| | | American Science & Engineering* | | 13,800 | | | 860,706 |
| | | NovAtel Inc* | | 141,300 | | | 3,901,293 |
| | | | | | |
|
| | | | | | | | 4,761,999 |
Engineering & Construction—3.6% |
|
|
|
|
|
| | | McDermott International* | | 245,300 | | | 10,942,833 |
Food—0.0%^ |
|
|
|
|
|
| | | Gold Kist Inc* | | 4,208 | | | 62,910 |
Healthcare Products—4.5% |
|
|
|
|
|
| | | Alcon Inc | | 34,500 | | | 4,471,200 |
| | | Hologic Inc* | | 166,000 | | | 6,294,720 |
| | | LCA-Vision Inc | | 67,300 | | | 3,197,423 |
| | | | | | |
|
| | | | | | | | 13,963,343 |
Insurance—1.0% |
|
|
|
|
|
| | | Selective Insurance | | 55,900 | | | 2,968,290 |
Internet—1.9% |
|
|
|
|
|
| | | j2 Global Communications Inc* | | 70,200 | | | 3,000,348 |
| | | Nutri System Inc* | | 78,400 | | | 2,823,968 |
| | | | | | |
|
| | | | | | | | 5,824,316 |
Iron & Steel—0.6% |
|
|
|
|
|
| | | Tenaris | | 17,300 | | | 1,980,850 |
Machinery—Construction & Mining—5.2% |
|
|
|
|
|
| | | JLG Industries Inc | | 121,700 | | | 5,556,822 |
| | | Joy Global Inc | | 261,400 | | | 10,456,000 |
| | | | | | |
|
| | | | | | | | 16,012,822 |
Metal Fabricate/Hardware—1.1% |
|
|
|
|
|
| | | NS Group Inc* | | 78,700 | | | 3,290,447 |
Miscellaneous Manufacturing—1.7% |
|
|
|
|
|
| | | Ceradyne Inc* | | 116,000 | | | 5,080,800 |
Oil & Gas—13.6% |
|
|
|
|
|
| | | Anadarko Petroleum Corp | | 46,100 | | | 4,367,975 |
| | | Chesapeake Energy Corp | | 85,060 | | | 2,698,954 |
| | | ConocoPhillips | | 38,000 | | | 2,210,840 |
| | | EOG Resources Inc | | 42,300 | | | 3,103,551 |
| | | Holly Corp | | 72,000 | | | 4,238,640 |
| | | Occidental Petroleum Corp | | 22,300 | | | 1,781,324 |
| | | | | | | | |
29
| | | Parker Drilling Co* | | 270,500 | | $ | 2,929,515 |
| | | Southwestern Energy Co* | | 134,200 | | | 4,823,148 |
| | | Sunoco Inc | | 56,600 | | | 4,436,308 |
| | | Tesoro Petroleum Corp | | 69,300 | | | 4,265,415 |
| | | Valero Energy Corp | | 139,600 | | | 7,203,360 |
| | | | | | |
|
| | | | | | | | 42,059,030 |
Oil & Gas Services—4.1% |
|
|
|
|
|
| | | Cal Dive International Inc* | | 154,078 | | | 5,529,859 |
| | | Halliburton Co | | 89,200 | | | 5,526,832 |
| | | Hydril Co* | | 24,100 | | | 1,508,660 |
| | | | | | |
|
| | | | | | | | 12,565,351 |
Pharmaceuticals—5.7% |
|
|
|
|
|
| | | Bristol-Myers Squibb Co | | 154,900 | | | 3,559,602 |
| | | Express Scripts Inc* | | 101,900 | | | 8,539,220 |
| | | Merck & Co Inc | | 171,000 | | | 5,439,510 |
| | | | | | |
|
| | | | | | | | 17,538,332 |
Real Estate Operations—0.6% |
|
|
|
|
|
| | | Brookfield Asset Management | | 33,700 | | | 1,696,121 |
Retail—1.9% |
|
|
|
|
|
| | | Chico's FAS Inc* | | 69,600 | | | 3,057,528 |
| | | Nordstrom Inc | | 78,400 | | | 2,932,160 |
| | | | | | |
|
| | | | | | | | 5,989,688 |
Savings & Loans—0.8% |
|
|
|
|
|
| | | Washington Mutual Inc | | 58,000 | | | 2,523,000 |
Semiconductors—3.0% |
|
|
|
|
|
| | | Marvell Technology Group Ltd* | | 165,600 | | | 9,288,504 |
Software—5.3% |
|
|
|
|
|
| | | BMC Software Inc* | | 380,000 | | | 7,786,200 |
| | | Quality Systems Inc* | | 57,400 | | | 4,406,024 |
| | | Red Hat Inc* | | 155,000 | | | 4,222,200 |
| | | | | | |
|
| | | | | | | | 16,414,424 |
Telecommunications—8.5% |
|
|
|
|
|
| | | America Movil S.A. de C.V. | | 123,000 | | | 3,598,980 |
| | | AT&T Inc | | 163,600 | | | 4,006,564 |
| | | BellSouth Corp | | 196,600 | | | 5,327,860 |
| | | Corning Inc* | | 180,200 | | | 3,542,732 |
| | | Dobson Communications* | | 327,600 | | | 2,457,000 |
| | | Motorola Inc | | 106,400 | | | 2,403,576 |
| | | Powerwave Technologies* | | 194,600 | | | 2,446,122 |
| | | Verizon Communications Inc | | 84,900 | | | 2,557,188 |
| | | | | | |
|
| | | | | | | | 26,340,022 |
| | | | | | | | |
30
Trucking & Leasing—1.1% |
|
|
|
|
|
| | | GATX Corp | | 95,000 | | $ | 3,427,600 |
| | | | | | |
|
TOTAL COMMON STOCKS
(Cost $252,441,815) | | | | | 295,322,307 |
| | | | | | |
|
PURCHASED CALL OPTIONS—LONG—0.1% |
|
|
|
|
|
| |
| | Number of contracts
| |
|
|---|
| ConocoPhillips | | | | | |
| | | expiring Jan 06 at $62.50 | | 150 | | | 3,375 |
| Goodyear Tire & Rubber Co | | | | | |
| | | expiring Jan 06 at $17.50 | | 600 | | | 30,000 |
| Joy Global Inc | | | | | |
| | | expiring Feb 06 at $40.00 | | 200 | | | 52,500 |
| | | expiring Apr 06 at $40.00 | | 500 | | | 200,000 |
| | | | | | |
|
TOTAL PURCHASED CALL OPTIONS
(Cost $414,360) | | | | | 285,875 |
| | | | | | |
|
MONEY MARKET MUTUAL FUNDS—3.7% |
|
|
|
|
|
| |
| | Shares
| |
|
|---|
| First American Treasury Obligations Fund—Class S | | 11,638,563 | | | 11,638,563 |
| | | | | | |
|
TOTAL MONEY MARKET MUTUAL FUNDS
(Cost $11,638,563) | | | | | 11,638,563 |
| | | | | | |
|
TOTAL INVESTMENTS—99.5%
(Cost $264,494,738) |
|
|
|
$ |
307,246,745 |
| Other Assets in excess of Liabilities—0.5% | | | | | 1,434,640 |
| | | | | | |
|
| NET ASSETS—100.0% | | | | $ | 308,681,385 |
| | | | | | |
|
- *
- Non-income producing security
- ^
- Less than 0.05% of net assets
- +
- This security or a portion of this security is out on loan at December 31, 2005. Total loaned securities had a market value of $7,865,238 at December 31, 2005.
See Notes to Financial Statements
31
Ultra-Small Company Fund
MANAGER'S COMMENTARY
(Unaudited)
December 31, 2005
Dear Fellow Ultra-Small Company Shareholder,
Our Fund was down 0.80% in the December quarter, compared to a 1.13% return for the Russell 2000 Index, 2.02% for our peer group, the Lipper Small-Cap Stock Funds Index, and 1.42% for our primary benchmark, the CRSP Cap-Based Portfolio 10 Index. It was a poor quarter.
For the calendar year 2005, our Fund was up 2.99%, compared to 4.55% for the Russell 2000 Index, 7.63% for the Lipper Small-Cap Stock Funds Index, and 5.80% for the CRSP Cap-Based Portfolio 10 Index—also poor by our standards. In spite of placing first among all mutual funds of any kind since inception in 1994, this was the fourth year in eleven calendar years that we did not beat our primary market benchmark.
The table below presents the December quarter, six month, one-year, five-year, ten-year and life-to-date performance of our Fund and benchmarks. It was a very poor quarter, six months and calendar year.
| | Dec. Qtr.
10/1/05
to 12/31/05
| | 6 Months
7/1/05
to 12/31/05
| | 1 Year
1/1/05
to 12/31/05
| | 5 Year
1/1/01
to 12/31/05
| | 10 Year
1/1/96
to 12/31/05
| | Life-to-Date
8/5/94
to 12/31/05
| |
|---|
| Ultra-Small Company Fund | | -0.80 | % | 6.42 | % | 2.99 | % | 27.26 | % | 22.54 | % | 22.77 | % |
| Lipper Small-Cap Stock Funds | | 2.02 | % | 7.34 | % | 7.63 | % | 4.87 | % | 8.14 | % | 10.38 | % |
| Russell 2000 (small companies) | | 1.13 | % | 5.88 | % | 4.55 | % | 8.22 | % | 9.26 | % | 10.78 | % |
| CRSP Cap-Based Port. 10 Index | | 1.42 | % | 10.48 | % | 5.80 | % | 25.48 | % | 15.94 | % | 16.41 | % |
Performance figures quoted represent past performance and are no guarantee of future results. Current performance may be lower or higher than the performance figures quoted, and an investor's shares, when redeemed, may be worth more or less than original cost. For the most recent month-end performance, please call 1-800-661-3550 or visit the Fund's website at www.bridgeway.com.
The Lipper Small-Cap Stock Funds Index is an index of small-company funds compiled by Lipper, Inc. The Russell 2000 Index is an unmanaged, market value weighted index, which measures performance of the 2,000 companies that are between the 1,000th and 3,000th largest in the market with dividends reinvested. The CRSP Cap-Based Portfolio 10 Index is an unmanaged index of 1,682 of the smallest publicly traded U.S. stocks (with dividends reinvested), as reported by the Center for Research on Security Prices. It is not possible to invest directly in an index or average. Periods longer than one year are annualized.
For the six-month (semi-annual) period, our Fund was up 6.42%, compared to the 10.48% of our primary market benchmark, the CRSP Cap-based Portfolio 10 Index of ultra-small companies. There were no major negative themes for this period, but several individual holdings took a big bite out of returns, including World Health Alternatives, Deckers Outdoor, and SFBC International.
According to data from Lipper, Inc., for the period ended December 31, 2005, the Ultra-Small Company Fund ranked 67th of 87 micro-cap funds for the last twelve months, 1st of 50 such funds for the last five years, 2nd of 13 funds for ten years and 1st of 8 funds since inception in August, 1994. Lipper, Inc. is an independent mutual fund rating service that ranks funds in various fund categories by making comparative calculations using total returns.
32
Growth of $10,000 Invested in Ultra-Small Company Fund and Indexes from 12/31/95 to 12/31/05
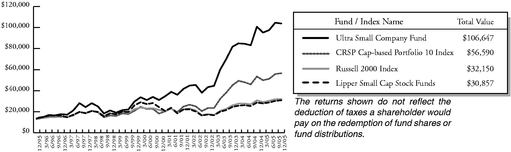
Detailed Explanation of Quarterly Performance—What Worked Well
The Short Version: There were a few bright spots in an otherwise dull quarter.
Rank
| | Description
| | Industry
| | % Gain
| |
|---|
| 1 | | Hansen Natural Corp | | Beverages | | 67.4 | % |
| 2 | | Matrixx Initiatives Inc | | Pharmaceuticals | | 47.3 | % |
| 3 | | Hurco Cos Inc | | Machinery-Diversified | | 37.5 | % |
| 4 | | Lamson & Sessions Co | | Electrical Compo & Equip | | 36.6 | % |
| 5 | | Benthos Inc | | Machinery-Diversified | | 36.4 | % |
| 6 | | Air Methods Corp | | Healthcare-Services | | 34.0 | % |
| 7 | | American Retirement Corp | | Healthcare-Services | | 33.5 | % |
| 8 | | Monarch Casino & Resort Inc | | Lodging | | 33.0 | % |
| 9 | | Celadon Group Inc | | Transportation | | 29.2 | % |
| 10 | | Intevac Inc | | Machinery-Diversified | | 29.1 | % |
Our performance in the December quarter was poor amid the lack-luster performance of ultra-small companies generally. Only one ultra-small company gave us better than 50% performance for the quarter. We first bought Hansen Natural in the spring of 2004 at just under $14.00 per share, and it remained a buy for the Fund through the fall. By June of 2005, when the price rose to over $81.00, we did some trimming to avoid over exposure. Although it was an ultra-small company at the time of purchase, it is not so small any more, so we expect to continue in selling mode. It's a great "little company makes good" story. Hubert Hansen started making fresh, non-pasteurized juices for film studios and retailers in Southern California in the 30's. Lately, with the addition of smoothies, ready-to-drink iced teas, juice cocktails and energy drinks, its brands have caught the public's attention. Forbes listed Hansen in first place in its "200 Best Small Companies" for 2005, with "new energy drinks targeted at the youth sports market and white-collar workforce." (We gathered our staff recently for a Hansen taste test—the juices were the staff's favorites; I liked the ginseng drink.) Hansen also tops our list of best performers for the year, increasing a whopping 312%.
33
Detailed Explanation of Quarterly Performance—What Didn't Work
The Short Version: The Fund had two stocks that lost over 50% this quarter, which, together, cost us about 2.5% in return. That hurts!
Rank
| | Description
| | Industry
| | % Loss
| |
|---|
| 1 | | SFBC International Inc | | Commercial Services | | -63.4 | % |
| 2 | | Forward Industries Inc | | Textiles | | -56.1 | % |
| 3 | | Wireless Xcessories Group | | Telecommunications | | -38.4 | % |
| 4 | | Sterling Construction Co Inc | | Engineering & Construction | | -35.0 | % |
| 5 | | Wilsons The Leather Experts | | Retail | | -33.8 | % |
| 6 | | Mikohn Gaming Corp | | Entertainment | | -28.5 | % |
| 7 | | Dominion Homes Inc | | Home Builders | | -25.7 | % |
| 8 | | FieldPoint Petroleum Corp | | Oil & Gas | | -25.5 | % |
| 9 | | Sun Hydraulics Corp | | Metal Fabricate/Hardware | | -25.4 | % |
| 10 | | Nash Finch Co | | Food | | -24.9 | % |
SFBC International provides clinical research studies to branded and generic pharmaceutical and biotechnology companies around the world. It had been a steady performer from our original purchase in mid-2002. Then came bad news. In early November, Bloomberg News published an article entitled," Big Pharma's Shameful Secret," making allegations of substandard clinical human drug testing procedures, hazardous conditions in their buildings, and corporate mismanagement. The stock fell over 26% on the news. In mid-December several company officers either resigned or retired, the company lowered its profit forecast for 2005 and analysts revised their recommendation from "outperform" to "neutral." The stock fell another 42%, in spite of the fact that a third party investigation exonerated the company of some of the external claims. I believe that the stock may be currently significantly undervalued, but we follow the sell discipline of our process. We sold the last of our holdings in early 2006.
Forward Industries, maker of carrying cases for cell phones, laptops and other equipment, is our second worst performer for the quarter. Timing of product shipments, pricing pressures and higher operating costs are a bad combination and caused the Florida-based company's recent price tumble.
Detailed Explanation of Calendar Year Performance—What Worked Well
The Short Version: Although there are very few ultra-small companies in the Energy Industry, the hot spot in the broader market for calendar 2005, we had seven stocks that returned over 80%.
Rank
| | Description
| | Industry
| | % Gain
| |
|---|
| 1 | | Hansen Natural Corp | | Beverages | | 312.0 | % |
| 2 | | Learning Care Group Inc | | Commercial Services | | 127.1 | % |
| 3 | | American Retirement Corp | | Healthcare-Services | | 113.2 | % |
| 4 | | Somanetics Corp | | Healthcare-Products | | 107.7 | % |
| 5 | | Building Material Holding Corp | | Distribution/Wholesale | | 90.2 | % |
| 6 | | Columbus McKinnon Corp/NY | | Machinery-Diversified | | 82.3 | % |
| 7 | | Matrixx Initiatives Inc | | Pharmaceuticals | | 80.6 | % |
| 8 | | Clean Harbors Inc | | Environmental Control | | 68.0 | % |
| 9 | | Kendle International Inc | | Commercial Services | | 67.7 | % |
| 10 | | Riviera Holdings Corp | | Lodging | | 62.7 | % |
As discussed for the quarter, Hansen was also the darling for the year. We sure hate to see it grow out of this asset class. Like kudzu vines that keep growing back, we completed a second major round of trimming this January 2006. Learning Care Group, our number two stock for the year, is a provider of
34
early child care and educational services for children from six weeks to 12 years. 459 centers serve 69,000 children in 25 states and internationally. From our initial purchases in the summer of 2004, the stock price appreciated about 75% to $5.45. On November 15 of last year its board announced a cash merger agreement with A.B.C. Learning Centres Limited of Australia for a purchase price of $7.50 per share. Predictably, the next day, the stock closed at $7.45. Our dilemma: hold out for another 2%? Or take the less risky early bailout at $7.45? We elected the certainty—and to put the appreciation into another good stock with greater growth possibilities. We really liked this company—mainly for its performance, but also because it's just a great little organization: "...an international leader in child education and family solutions, which impact and inspire lifelong learning," according to its mission statement. "The rest of the story" is that on January 10, 2006 shareholders approved the cash merger, which took place at $7.50.
Detailed Explanation of Calendar Year Performance—What Didn't Work
The Short Version: The combination of accounting problems and officer resignation in today's market can be "sudden death" for a stock price.
Rank
| | Description
| | Industry
| | % Loss
| |
|---|
| 1 | | World Health Alternatives Inc | | Commercial Services | | -92.7 | % |
| 2 | | Navarre Corp | | Distribution/Wholesale | | -65.2 | % |
| 3 | | Atlantis Plastics Inc | | Miscellaneous Manufacturer | | -61.6 | % |
| 4 | | Innodata Isogen Inc | | Software | | -53.9 | % |
| 5 | | Deckers Outdoor Corp | | Apparel | | -49.0 | % |
| 6 | | Wireless Xcessories Group | | Telecommunications | | -48.5 | % |
| 7 | | Friedman Industries | | Iron/Steel | | -46.7 | % |
| 8 | | SFBC International Inc | | Commercial Services | | -44.7 | % |
| 9 | | Olympic Steel Inc | | Iron/Steel | | -44.6 | % |
| 10 | | IC Isaacs & Co Inc | | Apparel | | -43.6 | % |
World Health Alternatives is a medical staffing company that provides medical, professional and administrative staffing services to the healthcare industry. As reported at the end of the September quarter, very soon after we bought it, the stock began tumbling as the company lost its CEO and CFO, its accounting firm was forced to restate its financial results, it got buried under class-action lawsuits, and it became the subject of an investigation by the SEC. In one week the stock price went from $2.37 to $0.41.Why didn't we sell the company well before it plummeted to $0.41? See page 7.
35
Top Ten Holdings
At quarter end, Consumer, Non-cyclical stocks comprised our largest sector representation at 30.7% of net assets, followed by Industrial at 27.7% and Consumer, Cyclical at 12.1%. Our top ten holdings represented 37.7% of net assets, higher than normal.
Rank
| | Description
| | Industry
| | Percent of
Net Assets
| |
|---|
| 1 | | Hansen Natural Corp | | Beverages | | 9.0 | % |
| 2 | | Matrixx Initiatives Inc | | Pharmaceuticals | | 4.3 | % |
| 3 | | Edge Petroleum Corp | | Oil & Gas | | 3.9 | % |
| 4 | | Celadon Group Inc | | Transportation | | 3.7 | % |
| 5 | | Lamson & Sessions Co/The | | Electrical Compo & Equip | | 3.0 | % |
| 6 | | Ventiv Health Inc | | Advertising | | 2.9 | % |
| 7 | | Columbus McKinnon Corp/NY | | Machinery-Diversified | | 2.9 | % |
| 8 | | Intevac Inc | | Machinery-Diversified | | 2.8 | % |
| 9 | | Parlux Fragrances Inc | | Cosmetics/Personal Care | | 2.6 | % |
| 10 | | Cutera Inc | | Healthcare-Products | | 2.6 | % |
| | | | | | |
| |
| | Total | | | | 37.7 | % |
Industry Sector Representation as of December 31, 2005
Sector
| | % of Net Assets
| | CRSP Portfolio 10 Index
| | Difference
| |
|---|
| Basic Materials | | 0.4 | % | 2.4 | % | -2.0 | % |
| Communications | | 4.2 | % | 11.3 | % | -7.1 | % |
| Consumer, Cyclical | | 12.1 | % | 12.3 | % | -0.2 | % |
| Consumer, Non-cyclical | | 30.7 | % | 25.0 | % | 5.7 | % |
| Energy | | 5.9 | % | 3.2 | % | 2.7 | % |
| Financial | | 4.0 | % | 22.5 | % | -18.5 | % |
| Industrial | | 27.7 | % | 12.2 | % | 15.5 | % |
| Technology | | 4.1 | % | 10.0 | % | -5.9 | % |
| Utilities | | 0.0 | % | 1.0 | % | -1.0 | % |
| Diversified | | 0.0 | % | 0.1 | % | -0.1 | % |
| Cash | | 10.9 | % | 0.0 | % | 10.9 | % |
| | |
| |
| |
| |
| | Total | | 100.0 | % | 100.0 | % | | |
Calendar Year Comparisons by Company Size
The Short Version: The very largest and the very smallest companies were the most "performance challenged" for the calendar year.
As you can see in the following table, the largest companies, as indicated in group one, and the smallest companies, in groups 8, 9, and 10, lagged the performance of most other groups for the year. Not atypical of this asset class, a mediocre 2005 follows the stellar performance of ultra-small stocks from 1999 through 2004. And as illustrated in the table (and as "preached" periodically by me) a critical feature of ultra-small companies is that the higher historical returns of ultra-small stocks does not happen every year; ultra-small stocks can underperform larger stocks (running counter to the long-term trend) for multi-year periods. On a recent internet chat page, a shareholder commented that he had held the sister fund Ultra-Small Company Market a full eight months and the fund just hadn't
36
done much. Another shareholder responded, "It's a long-term investment! You have to hold it a hundred years!" Although that's a little longer than I define "long-term," he has the right idea.
Company Size
According to the CRSP
Cap-Based Portfolio Indexes(1)
| | 6 months
| | 1 year
| | 79 years(2)
| |
|---|
| 1 (ultra-large) | | 5.2 | % | 3.7 | % | 9.6 | % |
| 2 | | 8.1 | % | 12.0 | % | 11.0 | % |
| 3 | | 8.6 | % | 12.4 | % | 11.4 | % |
| 4 | | 6.8 | % | 10.6 | % | 11.5 | % |
| 5 | | 9.4 | % | 10.1 | % | 11.8 | % |
| 6 | | 4.2 | % | 3.2 | % | 11.9 | % |
| 7 | | 7.7 | % | 10.5 | % | 11.8 | % |
| 8 | | 9.1 | % | 7.6 | % | 11.9 | % |
| 9 | | 6.4 | % | 2.0 | % | 12.1 | % |
| 10 (ultra-small) | | 10.5 | % | 5.8 | % | 14.1 | % |
- (1)
- The CRSP Cap-Based Portfolio Indexes are unmanaged indexes of the publicly traded U.S. stocks with dividends reinvested, grouped by the market capitalization, as reported by the Center for Research in Security Prices. Past performance is no guarantee of future results.
- (2)
- December 1926 to December 2005.
Disclaimer
The following is a reminder from the friendly folks at your Fund who worry about liability. The views expressed here are exclusively those of Fund management. These views are not meant as investment advice and should not be considered predictive in nature. Any favorable (or unfavorable) description of a holding applies only as of December 31, 2005, unless otherwise stated. Security positions can and do change thereafter. Discussions of historical performance do not guarantee and are not indicative of future performance.
The Fund is subject to above average market risk (volatility) and is not an appropriate investment for short-term investors. Investments in ultra-small companies generally carry greater risk than is customarily associated with larger companies and even "small companies" for various reasons such as narrower markets, limited financial resources and less liquid stock.
This report is submitted for the general information of the shareholders of the Fund. It is not authorized for distribution to prospective investors unless preceded or accompanied by an effective prospectus, which includes information regarding the Fund's risks, objectives, fees and expenses, experience of its management, and other information. For questions or other fund information, call 1-800-661-3550 or visit the Fund's website www.bridgeway.com. Foreside Fund Services, LLC, distributor.
Conclusion
Ultra-Small Company Fund remains closed to investors as we seek to keep the nimbleness that has fared well through the years. As always, we appreciate your feedback.
Sincerely,
John Montgomery
37
DISCLOSURE OF FUND EXPENSES
(Unaudited)
As a shareholder of the Fund, you will incur no transaction costs from the Fund, including sales charges (loads) on purchases, on reinvested dividends, or on other distributions. There are also no redemption fees or exchange fees. However, as a shareholder of the Fund, you will incur ongoing costs, including management fees and other Fund expenses. The following examples are intended to help you understand your ongoing costs (in dollars) of investing in the Fund and to compare these costs with the ongoing costs of investing in other mutual funds. The examples are based on an investment of $1,000 invested on July 1, 2005 and held until December 31, 2005.
Actual Return. The first line of the table below provides information about actual account values and actual expenses. You may use the information in this line, together with the amount you invested, to estimate the expenses that you paid over the period. Simply divide your account value by $1,000 (for example, an $8,600 account value divided by $1,000 = 8.6), then multiply the result by the number in the first line under the heading "Expense Paid During Period" to estimate the expenses you paid on your account during this period.
Hypothetical 5% Return. The second line of the table below provides information about hypothetical account values and hypothetical expenses based on the Fund's actual expense ratio and an assumed rate of return of 5% per year before expenses, which is not the Fund's actual return. The hypothetical account values and expenses may not be used to estimate the actual ending account balance or expenses you paid for the period. You may use this information to compare the ongoing costs of investing in a Fund and other mutual funds. To do so, compare this 5% hypothetical example with the 5% hypothetical examples that appear in the shareholder reports of the other funds.
The expenses shown in the table are meant to highlight ongoing Fund costs only. Therefore, the second line of the table is useful in comparing ongoing costs only, and will not help you determine the relative total costs of owning different funds, because other funds may also have transaction costs, such as sales charges, redemption fees or exchange fees.
Bridgeway Ultra Small Company Fund
| | Beginning Account
Value at 7/1/05
| | Ending Account
Value at 12/31/05
| | Expense Paid
During Period*
7/1/05 - 12/31/05
|
|---|
| Actual Fund Return | | $ | 1,000.00 | | $ | 1,064.24 | | $ | 5.57 |
| Hypothetical Fund Return | | $ | 1,000.00 | | $ | 1,019.81 | | $ | 5.45 |
- *
- Expenses are equal to the Fund's annualized expense ratio of 1.07% multiplied by the average account value over the period, multiplied by the number of days in the first fiscal half-year divided by 365 days in the current year (to reflect the one half-year period).
38
SCHEDULE OF INVESTMENTS
Showing percentage of net assets as of December 31, 2005
(Unaudited)
Industry
| | Company
| | Shares
| | Value
|
|---|
COMMON STOCKS—89.1% |
|
|
|
|
|
| Advertising—2.9% | | | | | |
| | | Ventiv Health Inc* | | 141,800 | | $ | 3,349,316 |
Aerospace/Defense—1.2% |
|
|
|
|
|
| | | LMI Aerospace Inc* | | 98,100 | | | 1,391,058 |
Apparel—0.3% |
|
|
|
|
|
| | | Bakers Footwear Group Inc* | | 25,000 | | | 384,500 |
Auto Parts & Equipment—2.0% |
|
|
|
|
|
| | | Titan International Inc | | 136,000 | | | 2,346,000 |
Banks—0.9% |
|
|
|
|
|
| | | Bank of the Ozarks | | 13,600 | | | 501,840 |
| | | First Regional Bank* | | 1,900 | | | 128,345 |
| | | Flag Financial Corp | | 1,451 | | | 24,449 |
| | | Guaranty Federal Bancshares Inc | | 14,800 | | | 412,920 |
| | | | | | |
|
| | | | | | | | 1,067,554 |
Beverages—9.0% |
|
|
|
|
|
| | | Hansen Natural Corp*+ | | 130,602 | | | 10,292,744 |
Biotechnology—1.4% |
|
|
|
|
|
| | | Arqule Inc* | | 144,500 | | | 884,340 |
| | | Repligen Corp* | | 169,700 | | | 678,800 |
| | | | | | |
|
| | | | | | | | 1,563,140 |
Chemicals—0.4% |
|
|
|
|
|
| | | Balchem Corp | | 11,700 | | | 348,777 |
| | | ICO Inc* | | 40,300 | | | 130,169 |
| | | | | | |
|
| | | | | | | | 478,946 |
Commercial Services—5.8% |
|
|
|
|
|
| | | Barrett Business Services* | | 52,500 | | | 1,311,975 |
| | | Home Solutions Inc* | | 208,000 | | | 931,840 |
| | | Kendle International Inc* | | 35,600 | | | 916,344 |
| | | Providence Service Co* | | 61,800 | | | 1,779,222 |
| | | Rural/Metro Corp* | | 107,174 | | | 967,781 |
| | | SFBC International Inc* | | 45,549 | | | 729,239 |
| | | | | | |
|
| | | | | | | | 6,636,401 |
Computers—2.4% |
|
|
|
|
|
| | | PAR Technology Corp* | | 85,000 | | | 2,359,600 |
| | | Synplicity Inc* | | 44,300 | | | 367,690 |
| | | | | | |
|
| | | | | | | | 2,727,290 |
Cosmetics/Personal Care—2.6% |
|
|
|
|
|
| | | Parlux Fragrances Inc* | | 99,600 | | | 3,040,788 |
| | | | | | | | |
39
Distribution/Wholesale—2.7% |
|
|
|
|
|
| | | Central European Distribution Corp* | | 44,950 | | $ | 1,804,293 |
| | | Navarre Corp* + | | 230,484 | | | 1,274,576 |
| | | | | | |
|
| | | | | 3,078,869 | | | |
Electrical Components & Equipment—3.6% |
|
|
|
|
|
| | | Graham Corp | | 29,100 | | | 654,750 |
| | | Lamson & Sessions Co* | | 140,000 | | | 3,502,800 |
| | | | | | |
|
| | | | | 4,157,550 | | | |
Electronics—3.2% |
|
|
|
|
|
| | | LeCroy Corp* | | 70,900 | | | 1,084,061 |
| | | NovAtel Inc* | | 94,400 | | | 2,606,384 |
| | | | | | |
|
| | | | | 3,690,445 | | | |
Engineering & Construction—1.9% |
|
|
|
|
|
| | | Meadow Valley Corp* | | 70,400 | | | 815,232 |
| | | Sterling Construction Co* | | 82,100 | | | 1,381,743 |
| | | | | | |
|
| | | | | 2,196,975 | | | |
Environmental Control—1.1% |
|
|
|
|
|
| | | Clean Harbors Inc* | | 45,200 | | | 1,302,212 |
Food—1.3% |
|
|
|
|
|
| | | Cuisine Solutions* | | 15,000 | | | 135,000 |
| | | Spartan Stores Inc* | | 126,100 | | | 1,313,962 |
| | | | | | |
|
| | | | | | | | 1,448,962 |
Healthcare—Products—3.4% |
|
|
|
|
|
| | | Cutera Inc* | | 115,000 | | | 3,031,400 |
| | | Somanetics Corp* | | 28,000 | | | 896,000 |
| | | | | | |
|
| | | | | | | | 3,927,400 |
Healthcare—Services—0.9% |
|
|
|
|
|
| | | Air Methods Corp* | | 30,046 | | | 519,796 |
| | | American Retirement Corp* | | 22,000 | | | 552,860 |
| | | | | | |
|
| | | | | | | | 1,072,656 |
Insurance—2.5% |
|
|
|
|
|
| | | American Physicians Capital Inc* | | 39,700 | | | 1,817,863 |
| | | Brooke Corp | | 8,500 | | | 119,000 |
| | | Citizens Inc* | | 32,100 | | | 174,945 |
| | | Navigators Group Inc* | | 18,000 | | | 784,980 |
| | | | | | |
|
| | | | | | | | 2,896,788 |
Internet—0.3% |
|
|
|
|
|
| | | Click Commerce Inc* | | 3,398 | | | 71,426 |
| | | Raindance Communications Inc* | | 146,000 | | | 297,840 |
| | | | | | |
|
| | | | | | | | 369,266 |
Leisure Time—2.1% |
|
|
|
|
|
| | | Aldila Inc | | 93,600 | | | 2,380,248 |
| | | | | | | | |
40
Lodging—1.2% |
|
|
|
|
|
| | | Monarch Casino & Resort Inc* | | 60,000 | | $ | 1,356,000 |
Machinery—Diversified—5.8% |
|
|
|
|
|
| | | Columbus McKinnon Co* | | 150,000 | | | 3,297,000 |
| | | Intevac Inc* | | 239,600 | | | 3,162,720 |
| | | Paragon Technologies Inc* | | 19,500 | | | 194,025 |
| | | | | | |
|
| | | | | | | | 6,653,745 |
Media—0.2% |
|
|
|
|
|
| | | Metromedia International Group* | | 122,700 | | | 185,277 |
Metal Fabricate/Hardware—1.7% |
|
|
|
|
|
| | | AM Castle & Co* | | 83,600 | | | 1,825,824 |
| | | Webco Industries Inc* | | 1,550 | | | 103,850 |
| | | | | | |
|
| | | | | | | | 1,929,674 |
Miscellaneous Manufacturing—1.4% |
|
|
|
|
|
| | | PW Eagle Inc | | 77,200 | | | 1,582,600 |
Oil & Gas—5.9% |
|
|
|
|
|
| | | Barnwell Industries | | 17,400 | | | 436,740 |
| | | Edge Petroleum Corp* | | 178,600 | | | 4,448,926 |
| | | FieldPoint Petroleum* | | 77,600 | | | 534,664 |
| | | Vaalco Energy Inc* | | 324,600 | | | 1,376,304 |
| | | | | | |
|
| | | | | | | | 6,796,634 |
Pharmaceuticals—6.4% |
|
|
|
|
|
| | | Anika Therapeutics Inc* | | 170,525 | | | 1,993,437 |
| | | Matrixx Initiatives Inc* | | 234,984 | | | 4,922,915 |
| | | Neogen Corp* | | 20,100 | | | 422,301 |
| | | | | | |
|
| | | | | | | | 7,338,653 |
Retail—3.8% |
|
|
|
|
|
| | | Books-A-Million Inc | | 37,900 | | | 367,251 |
| | | EZ CORP Inc* | | 164,406 | | | 2,512,124 |
| | | The Pantry Inc* | | 21,200 | | | 996,188 |
| | | Zones Inc* | | 88,000 | | | 440,880 |
| | | | | | |
|
| | | | | | | | 4,316,443 |
Savings & Loans—0.5% |
|
|
|
|
|
| | | Pacific Premier Bancorp Inc* | | 48,900 | | | 577,020 |
Semiconductors—1.7% |
|
|
|
|
|
| | | BTU International* | | 150,700 | | | 1,900,312 |
Software—0.0%^ |
|
|
|
|
|
| | | Unify Corp* | | 101,837 | | | 34,625 |
Telecommunications—0.8% |
|
|
|
|
|
| | | NMS Communications* | | 242,100 | | | 844,929 |
| | | RIT Technologies Ltd.* | | 47,000 | | | 109,510 |
| | | | | | |
|
| | | | | | | | 954,439 |
| | | | | | | | |
41
Transportation—7.8% |
|
|
|
|
|
| | | Celadon Group Inc* | | 147,000 | | $ | 4,233,600 |
| | | Maritrans Inc | | 36,000 | | | 936,720 |
| | | SCS Transportaion* | | 111,400 | | | 2,367,250 |
| | | USA Truck Inc* | | 47,700 | | | 1,389,501 |
| | | | | | |
|
| | | | | | | | 8,927,071 |
| | | | | | |
|
TOTAL COMMON STOCKS
(Cost $69,687,508) | | | | | 102,351,601 |
| | | | | | |
|
MONEY MARKET MUTUAL FUNDS—7.0% |
|
|
|
|
|
| First American Treasury Obligations Fund—Class S | | 8,048,230 | | | 8,048,230 |
| | | | | | |
|
TOTAL MONEY MARKET MUTUAL FUNDS
(Cost $8,048,230) | | | | | 8,048,230 |
| | | | | | |
|
TOTAL INVESTMENTS—96.1%
(Cost $77,735,738) |
|
|
|
$ |
110,399,831 |
| Other Assets in excess of Liabilities—3.9% | | | | | 4,472,580 |
| | | | | | |
|
| NET ASSETS—100.0% | | | | $ | 114,872,411 |
| | | | | | |
|
- *
- Non-income producing security
- ^
- Less than 0.05% of net assets
- +
- This security or a portion of this security is out on loan at December 31, 2005. Total loaned securities had a market value of $11,321,236 at December 31, 2005.
See Notes to Financial Statements
42
Ultra-Small Company Market Fund
MANAGER'S COMMENTARY
(Unaudited)
December 31, 2005
Dear Fellow Ultra-Small Company Market Fund Shareholder,
Our Fund was up 9.05% in the six months from July through December of 2005. For the same period, our primary benchmark, the CRSP Cap-Based Portfolio 10 Index, was up 10.48%, our peer benchmark, the Lipper Small-Cap Stock Funds Index, was up 7.34%, and the Russell 2000 Index was up 5.88%. It was a strong period in absolute terms, but mixed relative to our benchmarks.
For the calendar year, the Fund was up 4.08%, lagging our primary market benchmark by 1.72%, more than the amount of our expense ratio (0.73% for the calendar year period.) This was the third calendar year of the last eight that we lagged our primary market benchmark. While I expect year-to-year fluctuations relative to our benchmark, I'm much happier when they're on the positive side—as is true of the annualized period since inception. Our strategy of holding positions longer than would be required by the Index's quarterly rebalancing reduces turnover and, I believe, works to our advantage in most market environments; however, it put a drag on relative performance in 2005. A smaller piece of the underperformance was due to our selling stocks to meet shareholder redemption requests in the first half of 2005. If we could turn back the hands of time, I would have recommended reopening our Fund to new investors earlier than we did (June, 2005).
The table below presents our six months, one-year, five-year, and life-to-date financial results according to the formula required by the SEC.
| | 6 Months
7/1/05
to 12/31/05
| | 1 Year
1/1/05
to 12/31/05
| | 5 Year
1/1/01
to 12/31/05
| | Life-to-Date
7/31/97
to 12/31/05
| |
|---|
| Ultra-Small Company Market Fund | | 9.05 | % | 4.08 | % | 23.88 | % | 17.10 | % |
| CRSP Cap-Based Portfolio 10 Index | | 10.48 | % | 5.80 | % | 25.48 | % | 15.80 | % |
| Lipper Small-Cap Stock Funds Index | | 7.34 | % | 7.63 | % | 4.87 | % | 7.26 | % |
| Russell 2000 Index | | 5.88 | % | 4.55 | % | 8.22 | % | 7.27 | % |
Performance figures quoted represent past performance and are no guarantee of future results. Current performance may be lower or higher than the performance figures quoted, and an investor's shares, when redeemed, may be worth more or less than original cost. For the most recent month-end performance, please call 1-800-661-3550 or visit the Fund's website at www.bridgeway.com
The CRSP Cap-Based Portfolio 10 Index is an unmanaged index of 1,682 of the smallest publicly traded U.S. stocks (with dividends reinvested), as reported by the Center for Research on Security Prices. The Lipper Small-Cap Stock Funds is an index of small-company funds compiled by Lipper, Inc. The Russell 2000 Index is an unmanaged, market value weighted index, which measures performance of the 2,000 companies that are between the 1,000th and 3,000th largest in the market with dividends reinvested. It is not possible to invest directly in an index or average. Periods longer than one year are annualized.
According to data from Lipper, Inc., the Ultra-Small Company Market Fund ranked 60th of 87 micro-cap funds for the calendar year, 3rd of 50 over the last five years and 6th of 30 since inception in July 1997. Lipper, Inc. is an independent mutual fund rating service that ranks funds in various fund categories by making comparative calculations using total returns.
43
Growth of $10,000 Invested in Ultra-Small Company Market Fund and Indexes from 7/31/97 (inception) to 12/31/05
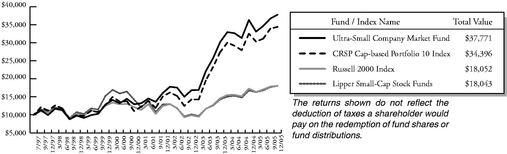
Detailed Explanation of Six Months Performance—What Worked Well
The Short Version: When they're up, they're up. (Especially volatile ultra-small stocks.) Of our top ten performers, seven doubled in price over the six-month period.
Rank
| | Description
| | Industry
| | % Gain
| |
|---|
| 1 | | Anadigics Inc | | Semiconductors | | 159.5 | % |
| 2 | | Supertex Inc | | Semiconductors | | 124.5 | % |
| 3 | | Ladish Co Inc | | Metal Fabricate/Hardware | | 123.7 | % |
| 4 | | Air Methods Corp | | Healthcare-Services | | 116.8 | % |
| 5 | | Lamson & Sessions Co | | Electrical Compo & Equip | | 111.7 | % |
| 6 | | Twin Disc Inc | | Machinery-Diversified | | 104.1 | % |
| 7 | | TheStreet.com Inc | | Internet | | 100.0 | % |
| 8 | | Castle Energy Corp | | Oil & Gas | | 97.9 | % |
| 9 | | Advanced Power Technology Inc | | Semiconductors | | 93.3 | % |
| 10 | | Hurco Cos Inc | | Machinery-Diversified | | 93.1 | % |
Our Fund's leading industry for the period is Semiconductors and its relative, Electrical Components and Equipment. Although the chip-related industries are volatile, the consumer's appetite for the hottest and fastest electronic devices and leading-edge medical innovations does not waiver. Anadigics manufactures radio frequency integrated circuits for the growing broadband and wireless communications markets. They are more expensive, but smaller, faster and more energy efficient than silicon chips. Supertex makes analog switches and multiplexers, high voltage pulser integrated circuits and drivers primarily for ultrasound diagnostic imaging equipment, portable instruments, non-impact printers and plotters and telephone central office equipment. Advanced Power Technology makes radio frequency and switching power semiconductors, used in radio transmitters and receivers for communications, radar and avionics, as well as for induction heating, dielectric heating plasma generation and illumination. Their products are used in F-22 fighter cockpits, the Boeing 777 back-up power system and even the international space station. The remaining top performers added to our diversification over a variety of industries.
44
Detailed Explanation of Six Months Performance—What Didn't Work
The Short Version: And when they're down, they're really down. Six companies went down more than 50% for the period.
Rank
| | Description
| | Industry
| | % Loss
| |
|---|
| 1 | | EndWave Corp | | Telecommunications | | -70.7 | % |
| 2 | | Forward Industries Inc | | Textiles | | -65.8 | % |
| 3 | | SFBC International Inc | | Commercial Services | | -58.2 | % |
| 4 | | Rigel Pharmaceuticals Inc | | Pharmaceuticals | | -58.0 | % |
| 5 | | Pharmacyclics Inc | | Pharmaceuticals | | -52.7 | % |
| 6 | | BKF Capital Group Inc | | Diversified Finan Serv | | -51.2 | % |
| 7 | | NYFIX Inc | | Computers | | -49.8 | % |
| 8 | | Gaming Partners International Corp | | Entertainment | | -47.0 | % |
| 9 | | Dominion Homes Inc | | Home Builders | | -45.2 | % |
| 10 | | TRM Corp | | Office/Business Equip | | -43.6 | % |
Oddly enough, our worst performer for the six months, EndWave Corp, is in the same industry as three of our top performers. Similar to their products, EndWave makes high frequency modules for telecom networks, defense electronics and homeland security systems. Another odd fact is that EndWave was our #1 gainer for the last fiscal year, up over 400%. What happened? Even great performers are not exempt from a skittish market. In mid-September the company said it would sell more than 3.3 million shares of stock and granted underwriters a 30-day option to buy about 500,000 in additional stock to cover over-allotments. The price dropped 16%. In late September the price dropped another 40%. What happened? Subsequently, the company announced that "management is not aware of any developments related to the company that would account for recent weakness in the company's share price and increased market activity." (Bloomberg News, September 29, 2005) Then on October 7, a hedge fund reported that it owned 4.29 million shares of End-Wave, which amounted to 40% of net assets in the fund. It had neglected to notify the SEC when its ownership exceeded the 5% threshold. EndWave subsequently filed suit for damages suffered as a result of the activities surrounding the situation. We continue to watch developments.
Forward Industries, maker of carrying cases for cell phones, laptops and other equipment, is our next worst performer for the period. Timing of product shipments, pricing pressures and higher operating costs are a bad combination and caused the Florida-based company's recent price tumble.
SFBC International provides clinical research studies to branded and generic pharmaceutical and biotechnology companies around the world. It was a steady performer from our original purchase in mid-2002. Then came bad news. In early November, Bloomberg News published an article entitled, "Big Pharma's Shameful Secret," making allegations of substandard clinical human drug testing procedures and hazardous conditions in its buildings, along with corporate mismanagement. The stock fell over 26% on the news. In mid-December several company officers either resigned or retired, the company lowered its profit forecast for 2005 and analysts revised their recommendation from "outperform" to "neutral." The stock fell another 42%, in spite of the fact that a third party investigation exonerated the company of some of the external claims. The stock may now be significantly undervalued (although that's not why we would hold it; recall that this is primarily a passively managed fund), but we harvested our losses in late 2005.
45
Industry Sector Representation as of December 31, 2005
Sector
| | % of Net Assets
| | CRSP
Portfolio
10 Index
| | Difference
| |
|---|
| Basic Materials | | 3.4 | % | 2.4 | % | 1.0 | % |
| Communications | | 10.9 | % | 11.3 | % | -0.4 | % |
| Consumer, Cyclical | | 12.0 | % | 12.3 | % | -0.3 | % |
| Consumer, Non-cyclical | | 24.2 | % | 25.0 | % | -0.8 | % |
| Energy | | 3.8 | % | 3.2 | % | 0.6 | % |
| Financial | | 18.6 | % | 22.5 | % | -3.9 | % |
| Industrial | | 11.6 | % | 12.2 | % | -0.4 | % |
| Technology | | 10.2 | % | 10.0 | % | 0.2 | % |
| Utilities | | 1.1 | % | 1.0 | % | 0.1 | % |
| Diversified | | 0.0 | % | 0.1 | % | -0.1 | % |
| Cash | | 4.2 | % | 0.0 | % | 4.2 | % |
| | |
| |
| | | |
| | Total | | 100.0 | % | 100.0 | % | | |
Calendar Year Comparisons by Company Size
The Short Version: The very largest and the very smallest companies were the most "performance challenged" for the calendar year.
As you can see in the following table, the largest companies, as indicated in group one, and the smallest companies, in groups 8, 9, and 10, lagged the performance of most other groups for the year. Typical of this asset class, a mediocre 2005 follows the stellar performance of ultra-small stocks from 1999 through 2004. And as illustrated in the table (and as "preached" periodically by me) the critical feature of ultra-small companies is the long-term commitment to hold through their volatile nature. On a recent internet chat page, a shareholder commented that he had held the fund a full eight months and the fund just hadn't done much. Another shareholder responded, "It's a long-term investment! You have to hold it a hundred years!" Although that's a little longer than I define "long-term," he has the right idea.
Company Size
According to the CRSP
Cap-Based Portfolio Indexes(1)
| | 6 months
| | 1 year
| | 79 years(2)
| |
|---|
| 1 (ultra large) | | 5.2 | % | 3.7 | % | 9.6 | % |
| 2 | | 8.1 | % | 12.0 | % | 11.0 | % |
| 3 | | 8.6 | % | 12.4 | % | 11.4 | % |
| 4 | | 6.8 | % | 10.6 | % | 11.5 | % |
| 5 | | 9.4 | % | 10.1 | % | 11.8 | % |
| 6 | | 4.2 | % | 3.2 | % | 11.9 | % |
| 7 | | 7.7 | % | 10.5 | % | 11.8 | % |
| 8 | | 9.1 | % | 7.6 | % | 11.9 | % |
| 9 | | 6.4 | % | 2.0 | % | 12.1 | % |
| 10 (ultra-small) | | 10.5 | % | 5.8 | % | 14.1 | % |
- (1)
- The CRSP Cap-Based Portfolio Indexes are unmanaged indexes of the publicly traded U.S. stocks with dividends reinvested, grouped by the market capitalization, as reported by the Center for Research in Security Prices. Past performance is no guarantee of future results.
- (2)
- December 1926 to December 2005
46
Disclaimer
The following is a reminder from the friendly folks at your Fund who worry about liability. The views expressed here are exclusively those of Fund management. These views are not meant as investment advice and should not be considered predictive in nature. Any favorable (or unfavorable) description of a holding applies only as of December 31, 2005, unless otherwise stated. Security positions can and do change thereafter. Discussions of historical performance do not guarantee and are not indicative of future performance.
The Fund is subject to above average market risk (volatility) and is not an appropriate investment for short-term investors. Investments in ultra-small companies generally carry greater risk than is customarily associated with larger companies and even "small companies" for various reasons such as narrower markets, limited financial resources and less liquid stock.
This report is submitted for the general information of the shareholders of the Fund. It is not authorized for distribution to prospective investors unless preceded or accompanied by an effective prospectus, which includes information regarding the Fund's risks, objectives, fees and expenses, experience of its management, and other information For questions or other Fund information, call 1-800-661-3550 or visit the Fund's website www.bridgeway.com. Foreside Fund Services, LLC, distributor.
Conclusion
Thank you for your continued investment in Ultra-Small Company Market Fund. This Fund remains open to both current and new investors. As always, we appreciate your feedback.
Sincerely,
John Montgomery
47
DISCLOSURE OF FUND EXPENSES
(Unaudited)
As a shareholder of the Fund, you will incur no transaction costs from the Fund, including sales charges (loads) on purchases, on reinvested dividends, or on other distributions. There are also no redemption fees or exchange fees. However, as a shareholder of the Fund, you will incur ongoing costs, including management fees and other Fund expenses. The following examples are intended to help you understand your ongoing costs (in dollars) of investing in the Fund and to compare these costs with the ongoing costs of investing in other mutual funds. The examples are based on an investment of $1,000 invested on July 1, 2005 and held until December 31, 2005.
Actual Return. The first line of the table below provides information about actual account values and actual expenses. You may use the information in this line, together with the amount you invested, to estimate the expenses that you paid over the period. Simply divide your account value by $1,000 (for example, an $8,600 account value divided by $1,000 = 8.6), then multiply the result by the number in the first line under the heading "Expense Paid During Period" to estimate the expenses you paid on your account during this period.
Hypothetical 5% Return. The second line of the table below provides information about hypothetical account values and hypothetical expenses based on the Fund's actual expense ratio and an assumed rate of return of 5% per year before expenses, which is not the Fund's actual return. The hypothetical account values and expenses may not be used to estimate the actual ending account balance or expenses you paid for the period. You may use this information to compare the ongoing costs of investing in a Fund and other mutual funds. To do so, compare this 5% hypothetical example with the 5% hypothetical examples that appear in the shareholder reports of the other funds.
The expenses shown in the table are meant to highlight ongoing Fund costs only. Therefore, the second line of the table is useful in comparing ongoing costs only, and will not help you determine the relative total costs of owning different funds, because other funds may also have transaction costs, such as sales charges, redemption fees or exchange fees.
Bridgeway Ultra Small Company Market Fund
| | Beginning Account
Value at 7/1/05
| | Ending Account
Value at 12/31/05
| | Expense Paid
During Period*
7/1/05-12/31/05
|
|---|
| Actual Fund Return | | $ | 1,000.00 | | $ | 1,090.56 | | $ | 3.48 |
| Hypothetical Fund Return | | $ | 1,000.00 | | $ | 1,021.88 | | $ | 3.36 |
- *
- Expenses are equal to the Fund's annualized expense ratio of 0.66% multiplied by the average account value over the period, multiplied by the number of days in the first fiscal half-year divided by 365 days in the current year (to reflect the one half-year period).
48
SCHEDULE OF INVESTMENTS
Showing percentage of net assets as of December 31, 2005 (Unaudited)
Industry
| | Company
| | Shares
| | Value
| |
|---|
| COMMON STOCKS—95.8% | | | | | | |
| | Advertising—0.9% | | | | | | |
| | | Miva Inc* | | 201,200 | | $ | 995,940 | |
| | | | | Traffix Inc | | 248,700 | | | 1,273,344 | |
| | | | | Ventiv Health Inc* | | 198,300 | | | 4,683,846 | |
| | | | | | |
| |
| | | | | | | | 6,953,130 | |
| | Aerospace/Defense—0.6% | | | | | | |
| | | | | Argon ST Inc* | | 137,600 | | | 4,262,848 | |
| | | | | CPI Aerostructures Inc* | | 33,400 | | | 336,004 | |
| | | | | EDO Corp | | 3,700 | | | 100,122 | |
| | | | | | |
| |
| | | | | | | | 4,698,974 | |
| | Agriculture—0.6% | | | | | | |
| | | | | Andersons Inc | | 101,181 | | | 4,358,877 | |
| |
Airlines—0.4% |
|
|
|
|
|
|
| | | | | Hawaiian Holdings Inc* | | 4,700 | | | 18,753 | |
| | | | | Mesa Air Group Inc* | | 134,600 | | | 1,407,916 | |
| | | | | Midwest Air Group Inc* | | 80,200 | | | 452,328 | |
| | | | | Pinnacle Airlines* | | 22,200 | | | 148,074 | |
| | | | | World Air Holdings* | | 98,900 | | | 951,418 | |
| | | | | | |
| |
| | | | | | | | 2,978,489 | |
| | Apparel—1.1% | | | | | | |
| | | | | Bakers Footwear Group* | | 51,600 | | | 793,608 | |
| | | | | Cherokee Inc | | 30,500 | | | 1,048,895 | |
| | | | | Cutter & Buck Inc | | 34,958 | | | 390,481 | |
| | | | | Hartmarx Corp* | | 199,200 | | | 1,555,752 | |
| | | | | Lakeland Industries Inc* | | 71,600 | | | 1,345,364 | |
| | | | | Sport Haley Inc* | | 25,438 | | | 123,374 | |
| | | | | Tandy Brands Accessories Inc | | 65,009 | | | 780,108 | |
| | | | | United Retail Group* | | 140,700 | | | 1,850,205 | |
| | | | | | |
| |
| | | | | | | | 7,887,787 | |
| | Auto Parts & Equipment—1.0% | | | | | | |
| | | | | Noble International Ltd | | 77,400 | | | 1,613,016 | |
| | | | | Proliance Intl Inc* | | 197,300 | | | 1,043,717 | |
| | | | | R&B Inc* | | 76,314 | | | 723,457 | |
| | | | | Tenneco Automotive Inc* | | 73,000 | | | 1,431,530 | |
| | | | | Titan International Inc | | 144,000 | | | 2,484,000 | |
| | | | | | |
| |
| | | | | | | | 7,295,720 | |
| | Banks—10.9% | | | | | | |
| | | | | Abigail Adams National Bancorp | | 22,220 | | | 311,082 | |
| | | | | American West Bancorp* | | 8,888 | | | 210,023 | |
| | | | | Ameris Bancorp | | 73,800 | | | 1,464,192 | |
| | | | | Appalachian Banchares Inc* | | 18,646 | | | 338,798 | |
| | | | | Associated Banc-Corp | | 78,480 | | | 2,554,524 | |
| | | | | Bancorp Rhode Island Inc | | 65,200 | | | 2,171,160 | |
| | | | | Banctrust Financial | | 2,200 | | | 44,220 | |
| | | | | Bank of America Corp | | 59,718 | | | 2,755,986 | |
| | | | | Bank of Granite Corp | | 2,400 | | | 44,472 | |
| | | | | Bank of the Ozarks Inc | | 40,800 | | | 1,505,520 | |
| | | | | | | | | |
49
| | | | | BB&T Corp | | 1,300 | | $ | 54,483 | |
| | | | | Brookline Bancorp Inc | | 72,316 | | | 1,024,718 | |
| | | | | Capital Bank Corp | | 55,300 | | | 848,855 | |
| | | | | Capital Corp of the West | | 95,220 | | | 3,089,889 | |
| | | | | Capital Crossing Bank* | | 87,600 | | | 2,925,840 | |
| | | | | Cardinal Financial Corp | | 10,000 | | | 110,000 | |
| | | | | Cascade Bancorp | | 900 | | | 20,709 | |
| | | | | Cass Information Systems Inc | | 61,255 | | | 2,033,666 | |
| | | | | Center Financial Corp | | 135,600 | | | 3,411,696 | |
| | | | | Central Bancorp Inc | | 12,300 | | | 343,563 | |
| | | | | City National Corp | | 579 | | | 41,943 | |
| | | | | CoastFinancial holdings* | | 48,200 | | | 795,782 | |
| | | | | CoBiz Inc | | 900 | | | 16,407 | |
| | | | | Columbia Bancorp/Oregon | | 26,741 | | | 590,441 | |
| | | | | Commercial Bankshares Inc | | 10,937 | | | 386,842 | |
| | | | | Community Bancorp/CA | | 15,100 | | | 536,050 | |
| | | | | Community Bancorp/NV* | | 7,536 | | | 238,213 | |
| | | | | Fidelity Southern Corp | | 57,476 | | | 1,028,820 | |
| | | | | Finlay Enterprise* | | 68,000 | | | 664,360 | |
| | | | | First Mariner Bancorp Inc* | | 48,724 | | | 852,670 | |
| | | | | First Mutual Bancshares Inc | | 16,335 | | | 423,730 | |
| | | | | First Place Financial Corp. | | 14,388 | | | 346,031 | |
| | | | | First State Bancorporation | | 17,000 | | | 407,830 | |
| | | | | FNB Corp | | 26,830 | | | 822,876 | |
| | | | | FNB Corp Inc | | 8,640 | | | 149,990 | |
| | | | | FNB Financial Services Corp | | 44,218 | | | 725,175 | |
| | | | | Fulton Financial Corp | | 124,165 | | | 2,185,304 | |
| | | | | Gateway Financial Holdings | | 12,200 | | | 202,264 | |
| | | | | Glacier Bancorp Inc | | 972 | | | 29,209 | |
| | | | | Greater Community Bancorp | | 4,589 | | | 68,376 | |
| | | | | Greene County Bancshares | | 48,717 | | | 1,332,897 | |
| | | | | Guaranty Federal Bancshares Inc | | 62,556 | | | 1,745,312 | |
| | | | | Heritage Commerce Corp* | | 15,000 | | | 322,500 | |
| | | | | Intervest Banchares* | | 42,218 | | | 1,044,896 | |
| | | | | Lakeland Financial Corp | | 23,300 | | | 940,854 | |
| | | | | LNB Bancorp Inc | | 23,033 | | | 413,442 | |
| | | | | Macatawa Bank Corp | | 68,534 | | | 2,493,267 | |
| | | | | Main Source Financial Group | | 13,921 | | | 248,490 | |
| | | | | MB Financial Inc | | 47,818 | | | 1,692,757 | |
| | | | | Mercantile Bank Corp | | 37,677 | | | 1,450,565 | |
| | | | | Midsouth Bancorp Inc | | 17,750 | | | 479,073 | |
| | | | | MidWestOne Financial Group Inc | | 77,412 | | | 1,375,611 | |
| | | | | Northrim BanCorp Inc | | 81,878 | | | 1,920,039 | |
| | | | | North Valley Bancorp | | 25,300 | | | 450,846 | |
| | | | | Oak Hill Financial | | 42,700 | | | 1,418,494 | |
| | | | | PAB Bankshares Inc | | 70,000 | | | 1,277,500 | |
| | | | | Pacific Mercantile Bancorp* | | 70,100 | | | 1,217,637 | |
| | | | | | | | | |
50
| | | | | Pelican Financial Inc* | | 75,000 | | $ | 416,250 | |
| | | | | Pinnacle Financial Partners Inc* | | 127,700 | | | 3,189,946 | |
| | | | | PrivateBancorp Inc | | 37,200 | | | 1,323,204 | |
| | | | | Prosperity Bancshares Inc | | 800 | | | 22,992 | |
| | | | | Southcoast Financial Corp* | | 29,700 | | | 715,770 | |
| | | | | Southern Community Financial | | 55,469 | | | 499,221 | |
| | | | | South Financial Group Inc/The | | 72,457 | | | 1,995,466 | |
| | | | | Southside Bancshares Inc | | 49,199 | | | 993,816 | |
| | | | | TD Banknorth Inc | | 8,718 | | | 253,258 | |
| | | | | Toronto-Dominion Bank | | 4,183 | | | 220,444 | |
| | | | | Umpqua Holdings Corp | | 100,288 | | | 2,861,217 | |
| | | | | UnionBanCal Corp | | 10,606 | | | 728,844 | |
| | | | | United Security Bancshares | | 26,059 | | | 794,800 | |
| | | | | Vail Banks Inc | | 78,000 | | | 1,170,000 | |
| | | | | Valley Bancorp* | | 21,200 | | | 735,470 | |
| | | | | Vineyard National Bancorp Co | | 91,940 | | | 2,835,430 | |
| | | | | Virginia Commerce Bancorp* | | 74,718 | | | 2,173,547 | |
| | | | | Western Sierra Bancorp* | | 55,122 | | | 2,005,890 | |
| | | | | Wilshire Bancorp Inc | | 234,944 | | | 4,038,687 | |
| | | | | Yardville National Bancorp | | 6,200 | | | 214,830 | |
| | | | | | |
| |
| | | | | | | | 82,788,971 | |
| | Beverages—0.4% | | | | | | |
| | | | | Green Mountain Coffee Roasters* | | 56,300 | | | 2,285,780 | |
| | | | | Peet's Coffee & Tea Inc* | | 17,400 | | | 528,090 | |
| | | | | Redhook Ale Brewery Inc* | | 23,000 | | | 72,910 | |
| | | | | | |
| |
| | | | | | | | 2,886,780 | |
| | Biotechnology—3.4% | | | | | | |
| | | | | Arqule Inc* | | 387,489 | | | 2,371,432 | |
| | | | | Barrier Therapeutics* | | 9,037 | | | 74,103 | |
| | | | | Corgentech Inc* | | 56,954 | | | 585,487 | |
| | | | | Curagen* | | 26,848 | | | 82,692 | |
| | | | | Curis Inc* | | 104,671 | | | 372,629 | |
| | | | | Cytogen Corp* | | 254,700 | | | 697,878 | |
| | | | | Cytokinetics Inc* | | 8,000 | | | 52,320 | |
| | | | | Embrex Inc* | | 146,024 | | | 2,023,893 | |
| | | | | Encysive Pharmaceuticals Inc* | | 330,900 | | | 2,610,801 | |
| | | | | Entremed Inc* | | 404,784 | | | 785,281 | |
| | | | | Genitope Corp* | | 111,699 | | | 888,007 | |
| | | | | GenVec Inc* | | 254,585 | | | 420,065 | |
| | | | | Illumina Inc* | | 52,843 | | | 745,086 | |
| | | | | Immunogen Inc* | | 115,385 | | | 591,925 | |
| | | | | Inovio Biomedical* | | 250,700 | | | 569,089 | |
| | | | | Keryx Biopharmaceuticals* | | 57,647 | | | 843,952 | |
| | | | | Lifecell Corp* | | 299,250 | | | 5,706,698 | |
| | | | | Nanogen Inc* | | 236,311 | | | 619,135 | |
| | | | | | | | | |
51
| | | | | Neose Technologies* | | 376,178 | | $ | 726,024 | |
| | | | | Oscient Pharmaceuticals Corp* | | 137,100 | | | 311,217 | |
| | | | | Repligen Corp* | | 280,400 | | | 1,121,600 | |
| | | | | Sangamo Biosciences Inc* | | 297,600 | | | 1,199,328 | |
| | | | | Seattle Genetics Inc /WA* | | 115,055 | | | 543,059 | |
| | | | | Sirna Therapeutics* | | 428,265 | | | 1,297,643 | |
| | | | | Stratagene Corp* | | 53,513 | | | 537,271 | |
| | | | | | |
| |
| | | | | | | | 25,776,615 | |
| | Building Materials—0.1% | | | | | | |
| | | | | AAON Inc* | | 11,687 | | | 209,431 | |
| | | | | Comfort Systems USA Inc | | 43,900 | | | 403,880 | |
| | | | | Craftmade International | | 7,700 | | | 154,077 | |
| | | | | Graham Corp | | 9,000 | | | 202,500 | |
| | | | | | |
| |
| | | | | | | | 969,888 | |
| | Chemicals—1.6% | | | | | | |
| | | | | Aceto Corp | | 102,046 | | | 671,463 | |
| | | | | American Vanguard Corp | | 114,000 | | | 2,679,000 | |
| | | | | Balchem Corp | | 80,700 | | | 2,405,667 | |
| | | | | Landec Corp* | | 205,000 | | | 1,594,900 | |
| | | | | Lesco Inc* | | 69,306 | | | 1,057,610 | |
| | | | | Lumera Corp* | | 202,900 | | | 760,875 | |
| | | | | NewMarket Corp* | | 29,200 | | | 714,232 | |
| | | | | Quaker Chemical Corp | | 99,700 | | | 1,917,231 | |
| | | | | Omnova Solutions Inc* | | 75,700 | | | 363,360 | |
| | | | | | |
| |
| | | | | | | | 12,164,338 | |
| | Coal—0.1% | | | | | | |
| | | | | Westmoreland Coal Co* | | 39,500 | | | 904,550 | |
| |
Commercial Services—3.5% |
|
|
|
|
|
|
| | | | | ACE Cash Express Inc* | | 94,000 | | | 2,194,900 | |
| | | | | Bankrate Inc* | | 144,800 | | | 4,274,496 | |
| | | | | Cadmus Communications Corp | | 67,446 | | | 1,357,688 | |
| | | | | Carriage Services Inc* | | 134,500 | | | 672,500 | |
| | | | | Competitive Tech Inc* | | 205,600 | | | 803,896 | |
| | | | | Cornell Cos Inc* | | 120,900 | | | 1,670,838 | |
| | | | | Discovery Partners International Inc* | | 114,957 | | | 304,636 | |
| | | | | EZCORP Inc* | | 98,200 | | | 1,500,496 | |
| | | | | Franklin Covey Co* | | 192,400 | | | 1,215,968 | |
| | | | | Geo Group Inc.* | | 14,400 | | | 330,192 | |
| | | | | Healthcare Services Group | | 35,550 | | | 736,241 | |
| | | | | HMS Holdings Corp* | | 172,800 | | | 1,321,920 | |
| | | | | Home Solutions* | | 268,700 | | | 1,203,776 | |
| | | | | Hudson Highland Group Inc* | | 32,590 | | | 565,762 | |
| | | | | Kendle International Inc* | | 22,390 | | | 576,319 | |
| | | | | Lenox Group Inc* | | 53,100 | | | 703,044 | |
| | | | | Medifast Inc* | | 199,100 | | | 1,043,284 | |
| | | | | Multi-Color Corp | | 59,136 | | | 1,641,024 | |
| | | | | | | | | |
52
| | | | | National Research Corp | | 40,300 | | $ | 697,190 | |
| | | | | Opinion Research Corp* | | 17,400 | | | 97,962 | |
| | | | | Perceptron Inc* | | 119,274 | | | 844,460 | |
| | | | | Providence Services Corp* | | 52,992 | | | 1,525,640 | |
| | | | | RCM Technologies Inc* | | 170,459 | | | 869,341 | |
| | | | | Rent-Way Inc* | | 94,300 | | | 602,577 | |
| | | | | | |
| |
| | | | | | | | 26,754,150 | |
| | Computers—3.5% | | | | | | |
| | | | | Ansoft Corp* | | 50,300 | | | 1,712,715 | |
| | | | | BindView Development Corp* | | 33,878 | | | 134,834 | |
| | | | | Cyberguard Corp* | | 103,200 | | | 911,256 | |
| | | | | Dataram Corp | | 82,533 | | | 434,124 | |
| | | | | Delphax Technologies Inc* | | 21,350 | | | 55,937 | |
| | | | | Dynamics Research Corp* | | 80,900 | | | 1,249,905 | |
| | | | | Immersion Corp* | | 221,226 | | | 1,457,879 | |
| | | | | InterVoice Inc* | | 257,500 | | | 2,049,700 | |
| | | | | LaserCard Corp* | | 154,000 | | | 2,308,460 | |
| | | | | Merge Technologies Inc* | | 59,200 | | | 1,482,368 | |
| | | | | Neoware Systems* | | 110,000 | | | 2,563,000 | |
| | | | | Netscout Systems Inc* | | 149,030 | | | 812,214 | |
| | | | | Planar Systems Inc* | | 68,546 | | | 573,730 | |
| | | | | Printronix Inc | | 69,800 | | | 1,072,128 | |
| | | | | Rimage Corp* | | 120,069 | | | 3,479,600 | |
| | | | | SI International Inc* | | 76,700 | | | 2,344,719 | |
| | | | | TechTeam Global Inc* | | 159,170 | | | 1,598,067 | |
| | | | | Tier Technologies Inc* | | 176,500 | | | 1,295,510 | |
| | | | | Transact Technologies* | | 122,031 | | | 964,045 | |
| | | | | Xanser Corp* | | 151,200 | | | 444,528 | |
| | | | | | |
| |
| | | | | | | | 26,944,719 | |
| | Cosmetics/Personal Care—1.6% | | | | | | |
| | | | | Chattem Inc* | | 5,800 | | | 211,062 | |
| | | | | Parlux Fragrances Inc* | | 381,363 | | | 11,643,012 | |
| | | | | | |
| |
| | | | | | | | 11,854,074 | |
| | Distribution/Wholesale—0.9% | | | | | | |
| | | | | Brightpoint Inc* | | 69,562 | | | 1,928,954 | |
| | | | | Central European Distribution Corp* | | 34,750 | | | 1,394,865 | |
| | | | | Huttig Building Products* | | 31,800 | | | 267,120 | |
| | | | | Navarre Corp* + | | 521,700 | | | 2,885,001 | |
| | | | | | |
| |
| | | | | | | | 6,475,940 | |
| | Diversified Financial Services—1.1% | | | | | | |
| | | | | Asta Funding Inc | | 62,100 | | | 1,697,814 | |
| | | | | BKF Capital Group Inc | | 43,100 | | | 816,745 | |
| | | | | Consumer Portfolio Services* | | 332,800 | | | 1,912,934 | |
| | | | | Nicholas Financial | | 118,500 | | | 1,245,435 | |
| | | | | Sanders Morris Harris Group Inc | | 85,509 | | | 1,401,493 | |
| | | | | United PanAm Financial Corp* | | 53,100 | | | 1,373,697 | |
| | | | | | |
| |
| | | | | | | | 8,448,118 | |
53
| | Electric—0.3% | | | | | | |
| | | | | Central Vermont Publishing | | 42,800 | | $ | 770,828 | |
| | | | | Green Mountain Power Corp | | 51,100 | | | 1,470,147 | |
| | | | | Unitil Corp | | 9,400 | | | 235,940 | |
| | | | | | |
| |
| | | | | | | | 2,476,915 | |
| | Electrical Components & Equipment—1.1% | | | | | | |
| | | | | Active Power Inc* | | 290,009 | | | 1,116,535 | |
| | | | | American Superconductor Corp* | | 125,100 | | | 984,537 | |
| | | | | C&D Technologies | | 114,000 | | | 868,680 | |
| | | | | China Energy Savings* | | 9,000 | | | 74,880 | |
| | | | | The Lamson & Sessions Co* | | 203,600 | | | 5,094,072 | |
| | | | | Nortech Systems Inc* | | 1,400 | | | 8,190 | |
| | | | | TII Network Technologies Inc* | | 143,700 | | | 362,124 | |
| | | | | | |
| |
| | | | | | | | 8,509,018 | |
| | Electronics—1.4% | | | | | | |
| | | | | Advanced Photonix Inc—Class A* | | 156,350 | | | 431,526 | |
| | | | | Axsys Technologies Inc* | | 61,200 | | | 1,098,540 | |
| | | | | Cal Micro Devices* | | 185,200 | | | 1,205,652 | |
| | | | | Fargo Electronics Inc* | | 33,550 | | | 645,838 | |
| | | | | Faro Technologies Inc* | | 34,900 | | | 698,000 | |
| | | | | Frequency Electronics Inc | | 14,600 | | | 153,154 | |
| | | | | Lowrance Electronics Inc | | 57,900 | | | 1,517,559 | |
| | | | | Measurement Specialties Inc* | | 99,800 | | | 2,430,130 | |
| | | | | OI Corp* | | 35,200 | | | 436,480 | |
| | | | | Quicklogic* | | 248,751 | | | 982,566 | |
| | | | | Unifi Inc* | | 247,300 | | | 751,792 | |
| | | | | UQM Technologies* | | 17,300 | | | 66,951 | |
| | | | | | |
| |
| | | | | | | | 10,418,188 | |
| | Energy—Alternate Sources—0.3% | | | | | | |
| | | | | Evergreen Solar Inc* | | 178,400 | | | 1,899,960 | |
| |
Engineering & Construction—1.1% |
|
|
|
|
|
|
| | | | | Cyber Optics Corp* | | 6,700 | | | 90,316 | |
| | | | | Keithley Instruments | | 23,800 | | | 332,724 | |
| | | | | Layne Christensen Co* | | 161,900 | | | 4,117,117 | |
| | | | | LeCroy Corp* | | 13,600 | | | 207,944 | |
| | | | | Mechanical Technology Inc* | | 16,900 | | | 47,320 | |
| | | | | Merix Corp* | | 224,855 | | | 1,625,702 | |
| | | | | Michael Baker Corp* | | 51,700 | | | 1,320,935 | |
| | | | | Napco Securities System* | | 20,167 | | | 209,137 | |
| | | | | Perini Corp* | | 5,500 | | | 132,825 | |
| | | | | | |
| |
| | | | | | | | 8,084,020 | |
| | Entertainment—0.8% | | | | | | |
| | | | | Canterbury Park Holdings Corp | | 59,400 | | | 822,690 | |
| | | | | Fox & Hound Group* | | 122,581 | | | 1,886,522 | |
| | | | | | | | | |
54
| | | | | Gaming Partners Intl* | | 60,300 | | $ | 674,751 | |
| | | | | Gaylord Entertainment Co* | | 44,852 | | | 1,955,098 | |
| | | | | Nevada Gold & Casino* | | 84,000 | | | 872,760 | |
| | | | | | |
| |
| | | | | | | | 6,211,821 | |
| | Environmental Control—1.0% | | | | | | |
| | | | | Clean Harbors Inc* | | 157,947 | | | 4,550,453 | |
| | | | | Darling International Inc* | | 370,100 | | | 1,469,297 | |
| | | | | Waste Industries USA Inc | | 130,900 | | | 1,685,992 | |
| | | | | | |
| |
| | | | | | | | 7,705,742 | |
| | Forest Products—0.1% | | | | | | |
| | | | | Mercer International* | | 60,600 | | | 476,316 | |
| |
Food—1.2% |
|
|
|
|
|
|
| | | | | Cal-Maine Foods Inc | | 211,600 | | | 1,436,764 | |
| | | | | Imperial Sugar Co | | 79,016 | | | 1,073,029 | |
| | | | | Lifeway Foods Inc* | | 78,151 | | | 972,198 | |
| | | | | Monterey Gourmet Foods Co* | | 6,510 | | | 26,235 | |
| | | | | Rocky Mountain Chocolate Factory Inc | | 59,136 | | | 962,495 | |
| | | | | Spartan Stores Inc* | | 343,650 | | | 3,580,833 | |
| | | | | Village Super Market—Class A | | 12,300 | | | 741,075 | |
| | | | | Zapata Corp* | | 57,600 | | | 332,352 | |
| | | | | | |
| |
| | | | | | | | 9,124,981 | |
| | Gas—0.4% | | | | | | |
| | | | | Chesapeake Utilities Corp | | 57,400 | | | 1,767,920 | |
| | | | | EnergySouth Inc | | 44,250 | | | 1,185,015 | |
| | | | | | |
| |
| | | | | | | | 2,952,935 | |
| | Hand/Machine Tools—0.1% | | | | | | |
| | | | | Starrett (L.S.) Co—Class A | | 29,200 | | | 453,768 | |
| |
Healthcare—Products—5.0% |
|
|
|
|
|
|
| | | | | Abaxis Inc* | | 169,700 | | | 2,796,656 | |
| | | | | Atrion Corp | | 39,148 | | | 2,718,046 | |
| | | | | Cardiac Science Corp* | | 53,409 | | | 483,352 | |
| | | | | Cardiotech International Inc* | | 11,500 | | | 25,875 | |
| | | | | Compex Technologies Inc* | | 45,240 | | | 295,870 | |
| | | | | Criticare Systems Inc* | | 60,350 | | | 299,336 | |
| | | | | Encore Medical Corp* | | 111,400 | | | 551,430 | |
| | | | | Endologix Inc* | | 80,000 | | | 552,000 | |
| | | | | LCA-Vision Inc | | 241,297 | | | 11,464,020 | |
| | | | | Lifecore Biomedical Inc* | | 217,646 | | | 3,532,395 | |
| | | | | Merit Medical Systems Inc* | | 17,500 | | | 212,450 | |
| | | | | Natus Medical Inc* | | 111,000 | | | 1,791,540 | |
| | | | | NMT Medical Inc* | | 161,800 | | | 2,588,800 | |
| | | | | PhotoMedex Inc* | | 153,900 | | | 264,708 | |
| | | | | Somanetics Corp* | | 234,200 | | | 7,494,400 | |
| | | | | Spectranetics Corp* | | 87,400 | | | 983,250 | |
| | | | | SRI/Surgical Express Inc* | | 6,755 | | | 40,530 | |
| | | | | Tutogen Medical Inc* | | 192,800 | | | 574,544 | |
| | | | | Utah Medical Products Inc | | 49,900 | | | 1,598,796 | |
| | | | | Vital Images Inc* | | 1,851 | | | 48,404 | |
| | | | | | |
| |
| | | | | | | | 38,316,402 | |
| | | | | | | | | |
55
| | Healthcare—Services—2.5% | | | | | | |
| | | | | Air Methods Corp* | | 61,555 | | $ | 1,064,901 | |
| | | | | Almost Family Inc* | | 5,800 | | | 92,800 | |
| | | | | Amedisys Inc* | | 171,100 | | | 7,227,264 | |
| | | | | America Service Group Inc* | | 101,800 | | | 1,614,548 | |
| | | | | Bio-Reference Labs Inc* | | 135,600 | | | 2,550,636 | |
| | | | | Five Star Quality Care Inc* | | 171,900 | | | 1,352,853 | |
| | | | | Medcath Corp* | | 50,020 | | | 927,871 | |
| | | | | NovaMed Inc* | | 181,100 | | | 1,182,456 | |
| | | | | Option Care Inc | | 7,312 | | | 97,688 | |
| | | | | Penn Treaty American* | | 52,300 | | | 3,072,102 | |
| | | | | Radiologix Inc* | | 58,500 | | | 178,425 | |
| | | | | | |
| |
| | | | | | | | 19,361,544 | |
| | Home Builders—0.4% | | | | | | |
| | | | | AMREP Corp* | | 4,000 | | | 104,520 | |
| | | | | Cavco Industries Inc* | | 32,000 | | | 1,224,960 | |
| | | | | Dominion Homes Inc* | | 4,772 | | | 50,774 | |
| | | | | Dover Motorsport | | 10,800 | | | 65,988 | |
| | | | | Hovnanian Enterprises Inc—Class A* | | 822 | | | 40,804 | |
| | | | | Meritage Corp* | | 1,800 | | | 113,256 | |
| | | | | Nobility Homes Inc | | 28,500 | | | 770,070 | |
| | | | | Silverleaf Resorts* | | 170,500 | | | 555,830 | |
| | | | | Technical Olympic USA Inc | | 1,406 | | | 29,653 | |
| | | | | | |
| |
| | | | | | | | 2,955,855 | |
| | Home Furnishings—0.5% | | | | | | |
| | | | | Cobra Electronics Corp* | | 100,675 | | | 1,346,024 | |
| | | | | Koss Corp | | 4,138 | | | 108,167 | |
| | | | | Stanley Furniture Co Inc | | 88,600 | | | 2,053,748 | |
| | | | | | |
| |
| | | | | | | | 3,507,939 | |
| | Household Products/Wares—0.3% | | | | | | |
| | | | | CNS Inc | | 105,050 | | | 2,301,646 | |
| | | | | Nashua Corp* | | 38,600 | | | 270,972 | |
| | | | | | |
| |
| | | | | | | | 2,572,618 | |
| | Housewares—0.3% | | | | | | |
| | | | | Enesco Group Inc* | | 17,700 | | | 32,568 | |
| | | | | Libbey | | 110,300 | | | 1,127,266 | |
| | | | | Lifetime Brands Inc | | 57,000 | | | 1,178,190 | |
| | | | | | |
| |
| | | | | | | | 2,338,024 | |
| | Insurance—2.1% | | | | | | |
| | | | | Affirmative Insurance | | 5,400 | | | 78,786 | |
| | | | | American Independence Corp* | | 45,135 | | | 518,601 | |
| | | | | Capital Title Group | | 183,700 | | | 1,015,861 | |
| | | | | Ceres Group Inc* | | 354,900 | | | 1,834,833 | |
| | | | | Donegal Group Inc | | 139,069 | | | 3,231,964 | |
| | | | | Fidelity National Title Group | | 8,039 | | | 195,750 | |
| | | | | Fidelity National Financial Inc | | 45,941 | | | 1,690,169 | |
| | | | | Investors Title Co | | 56,432 | | | 2,380,866 | |
| | | | | | | | | |
56
| | | | | Meadowbrook Insurance Group Inc* | | 370,400 | | $ | 2,163,136 | |
| | | | | Merchants Group Inc | | 3,400 | | | 102,510 | |
| | | | | Penn Treaty American* | | 130,400 | | | 1,309,216 | |
| | | | | Procentury Corp | | 71,000 | | | 763,250 | |
| | | | | SCPIE Holdings Inc* | | 18,200 | | | 378,560 | |
| | | | | 21st Century Holdings | | 6,800 | | | 116,348 | |
| | | | | United America Indemnity* | | 28,704 | | | 527,006 | |
| | | | | | |
| |
| | | | | | | | 16,306,856 | |
| | Internet—4.6% | | | | | | |
| | | | | Aladdin Knowledge Systems* | | 51,974 | | | 894,992 | |
| | | | | Answerthink Inc* | | 242,700 | | | 1,031,475 | |
| | | | | Art Technology Group* | | 498,642 | | | 977,338 | |
| | | | | Blue Coat Systems Inc* | | 55,300 | | | 2,528,316 | |
| | | | | Captiva Software Corp* | | 232,000 | | | 5,162,000 | |
| | | | | Digitas Inc* | | 134,521 | | | 1,684,203 | |
| | | | | ePlus Inc* | | 100,800 | | | 1,394,265 | |
| | | | | Expedia Inc* | | 144,098 | | | 3,452,588 | |
| | | | | Harris Interactive Inc* | | 70,300 | | | 302,993 | |
| | | | | IAC/InteractiveCorp* | | 144,098 | | | 4,079,414 | |
| | | | | I-Many Inc* | | 523,200 | | | 732,480 | |
| | | | | Imergent Inc* | | 90,100 | | | 594,660 | |
| | | | | Jupitermedia Corp* | | 164,000 | | | 2,423,920 | |
| | | | | Knot Inc* | | 186,800 | | | 2,136,992 | |
| | | | | Online Resources Corp* | | 158,500 | | | 1,751,425 | |
| | | | | Quotesmith.com Inc* | | 30,400 | | | 91,200 | |
| | | | | Raindance Communications Inc* | | 501,606 | | | 1,023,276 | |
| | | | | Selectica Inc* | | 18,714 | | | 53,335 | |
| | | | | TheStreet.com Inc* | | 246,800 | | | 1,779,428 | |
| | | | | Tumbleweed Communications* | | 380,100 | | | 1,170,708 | |
| | | | | United Online Inc | | 14,029 | | | 199,492 | |
| | | | | Valueclick Inc* | | 38,914 | | | 704,733 | |
| | | | | Watchguard Tech* | | 289,200 | | | 1,070,040 | |
| | | | | | |
| |
| | | | | | | | 35,239,273 | |
| | Iron/Steel—1.5% | | | | | | |
| | | | | Friedman Industries | | 98,300 | | | 578,987 | |
| | | | | Great Northern Iron Ore Properties | | 12,000 | | | 1,671,000 | |
| | | | | Olympic Steel Inc* | | 72,800 | | | 1,809,080 | |
| | | | | Oregon Steel Mills Inc* | | 170,000 | | | 5,001,400 | |
| | | | | Roanoke Electric Steel Corp | | 90,000 | | | 2,124,000 | |
| | | | | | |
| |
| | | | | | | | 11,184,467 | |
| | Leisure Time—0.5% | | | | | | |
| | | | | Aldila Inc | | 78,979 | | | 2,008,436 | |
| | | | | Ambassadors International Inc | | 77,600 | | | 1,202,800 | |
| | | | | Pegasus Solutions* | | 84,610 | | | 758,952 | |
| | | | | | |
| |
| | | | | | | | 3,970,188 | |
| | | | | | | | | |
57
| | Lodging—0.6% | | | | | | |
| | | | | Jameson Inns Inc* | | 296,728 | | $ | 637,965 | |
| | | | | Monarch Casino & Resort Inc* | | 164,800 | | | 3,724,480 | |
| | | | | | |
| |
| | | | | | | | 4,362,445 | |
| | Machinery-Diversified—2.0% | | | | | | |
| | | | | Columbus McKinnon Co* | | 35,700 | | | 784,686 | |
| | | | | Gehl Co* | | 165,150 | | | 4,335,188 | |
| | | | | Hurco Cos Inc* | | 219,934 | | | 6,778,366 | |
| | | | | Twin Disc Inc | | 68,200 | | | 3,047,858 | |
| | | | | | |
| |
| | | | | | | | 14,946,098 | |
| | Media—0.7% | | | | | | |
| | | | | 4Kids Entertainment* | | 10,600 | | | 166,314 | |
| | | | | New Fontier Media* | | 121,142 | | | 791,057 | |
| | | | | Point.360* | | 61,200 | | | 109,548 | |
| | | | | Sirius Satellite Radio Inc* | | 582,300 | | | 3,901,410 | |
| | | | | | |
| |
| | | | | | | | 4,968,329 | |
| | Metal Fabricate/Hardware—0.5% | | | | | | |
| | | | | Hawk Corp* | | 17,400 | | | 255,258 | |
| | | | | Ladish Co Inc* | | 64,700 | | | 1,446,045 | |
| | | | | NN Inc | | 7,608 | | | 80,645 | |
| | | | | Northwest Pipe Co* | | 75,600 | | | 2,026,080 | |
| | | | | | |
| |
| | | | | | | | 3,808,028 | |
| | Mining—0.2% | | | | | | |
| | | | | Kinross Gold Corp* | | 22,353 | | | 206,095 | |
| | | | | US Lime & Minerals* | | 53,700 | | | 1,421,439 | |
| | | | | | |
| |
| | | | | | | | 1,627,534 | |
| | Miscellaneous Manufacturing—1.9% | | | | | | |
| | | | | Ceradyne Inc* | | 122,625 | | | 5,370,975 | |
| | | | | Charles & Colvard+ | | 12,925 | | | 261,085 | |
| | | | | EnPro Industries Inc* | | 13,600 | | | 366,520 | |
| | | | | Flanders Corp* | | 270,542 | | | 3,289,791 | |
| | | | | Park-Ohio Holdings Corp* | | 235,715 | | | 3,323,582 | |
| | | | | Raven Industries Inc | | 35,600 | | | 1,027,060 | |
| | | | | Steinway Instruments* | | 45,800 | | | 1,168,358 | |
| | | | | | |
| |
| | | | | | | | 14,807,371 | |
| | Office/Business Equipment—0.0%^ | | | | | | |
| | | | | Compx International | | 12,100 | | | 193,842 | |
| |
Oil & Gas—2.8% |
|
|
|
|
|
|
| | | | | ATP Oil & Gas Corp* | | 188,700 | | | 6,983,787 | |
| | | | | Brigham Exploration Co* | | 176,600 | | | 2,094,476 | |
| | | | | Castle Energy Corp | | 7,650 | | | 186,660 | |
| | | | | Edge Petroleum Corp/DE* | | 109,618 | | | 2,730,584 | |
| | | | | Giant Industries Inc* | | 133,800 | | | 6,952,248 | |
| | | | | Meridian Resource Corp* | | 404,000 | | | 1,696,800 | |
| | | | | Remington Oil & Gas Corp* | | 1,400 | | | 51,100 | |
| | | | | Royale Energy Inc* | | 93,856 | | | 595,985 | |
| | | | | | |
| |
| | | | | | | | 21,291,640 | |
| | | | | | | | | |
58
| | Oil & Gas Services—0.6% | | | | | | |
| | | | | Lufkin Industries Inc | | 95,742 | | $ | 4,774,654 | |
| |
Packaging & Containers—0.2% |
|
|
|
|
|
|
| | | | | AEP Industries Inc* | | 58,800 | | | 1,470,000 | |
| |
Pharmaceuticals—5.5% |
|
|
|
|
|
|
| | | | | Anika Therapeutics Inc* | | 155,400 | | | 1,816,626 | |
| | | | | BioScript Inc* | | 98,661 | | | 743,904 | |
| | | | | Dov Pharmaceuticals Inc * | | 158,400 | | | 2,325,312 | |
| | | | | Dusa Pharm. Inc* | | 131,400 | | | 1,415,178 | |
| | | | | Dyax Corp* | | 107,400 | | | 565,998 | |
| | | | | Eli Lilly & Co | | 34,669 | | | 1,961,919 | |
| | | | | Emisphere Technologies Inc * | | 144,800 | | | 628,432 | |
| | | | | First Horizon Pharmaceutical Corp* | | 279,200 | | | 4,816,200 | |
| | | | | Genta Inc* | | 1,074,000 | | | 1,568,040 | |
| | | | | HealthExtras Inc * | | 21,900 | | | 549,690 | |
| | | | | Hemispherx Biopharmaceuticals* | | 333,300 | | | 723,261 | |
| | | | | Hi-Tech Pharmacal Co Inc * | | 112,476 | | | 4,981,562 | |
| | | | | Hollis-Eden Pharmaceuticals * | | 132,160 | | | 639,654 | |
| | | | | Indevus Pharmaceuticals* | | 442,800 | | | 2,386,692 | |
| | | | | Integrated Biopharma Inc* | | 54,100 | | | 219,105 | |
| | | | | Intrabiotics Pharmaceuticals Inc * | | 61,300 | | | 221,293 | |
| | | | | Introgen Therapeutics Inc * | | 167,875 | | | 884,701 | |
| | | | | Ista Pharmaceuticals Inc* | | 101,400 | | | 644,904 | |
| | | | | Mannatech Inc | | 90,680 | | | 1,252,291 | |
| | | | | Matrixx Initiatives Inc * | | 90,300 | | | 1,891,785 | |
| | | | | Memory Pharmaceuticals* | | 263,772 | | | 601,400 | |
| | | | | National Medical Health Cardinal * | | 103,408 | | | 2,812,698 | |
| | | | | Natural Health Trend* | | 87,600 | | | 845,340 | |
| | | | | Neogen Corp * | | 69,281 | | | 1,455,594 | |
| | | | | Nuvelo Inc * | | 136,104 | | | 1,103,803 | |
| | | | | Pain Therapeutics Inc * | | 114,000 | | | 770,640 | |
| | | | | Penwest Pharmaceuticals Co * | | 28,000 | | | 546,560 | |
| | | | | Pharmacyclics Inc * | | 142,300 | | | 505,165 | |
| | | | | Rigel Pharmaceuticals Inc* | | 35,566 | | | 297,332 | |
| | | | | ViroPharma Inc* | | 125,800 | | | 2,333,590 | |
| | | | | Vivus Inc * | | 163,600 | | | 484,256 | |
| | | | | | |
| |
| | | | | | | | 41,992,925 | |
| | Real Estate—1.1% | | | | | | |
| | | | | California Coastal Communities Inc * | | 109,900 | | | 4,311,377 | |
| | | | | Consolidated—Tomoka Land Co* | | 43,800 | | | 3,105,420 | |
| | | | | United Capital Corp * | | 26,100 | | | 643,887 | |
| | | | | Wilshire Enterprises Inc * | | 27,300 | | | 212,667 | |
| | | | | | |
| |
| | | | | | | | 8,273,351 | |
| | | | | | | | | |
59
| | Retail—5.0% | | | | | | |
| | | | | America's Car Mart Inc * | | 92,220 | | $ | 1,523,474 | |
| | | | | Blair Corp | | 33,000 | | | 1,285,020 | |
| | | | | Books-A-Millions Inc | | 191,906 | | | 1,859,569 | |
| | | | | Buffalo Wild Wings Inc* | | 28,600 | | | 949,806 | |
| | | | | Celebrate Express* | | 24,100 | | | 325,350 | |
| | | | | Collegiate Pacific | | 154,200 | | | 1,403,220 | |
| | | | | Dave & Buster's Inc * | | 143,600 | | | 2,528,796 | |
| | | | | Famous Dave's Of America Inc * | | 158,800 | | | 1,789,676 | |
| | | | | First Cash Financial Services Inc * | | 116,250 | | | 3,389,850 | |
| | | | | Friendly's Ice Cream Corp * | | 97,900 | | | 841,940 | |
| | | | | Frisch's Restaurants Inc | | 47,800 | | | 1,168,710 | |
| | | | | GTSI Corp * | | 17,086 | | | 119,602 | |
| | | | | Hastings Entertainment Inc * | | 33,500 | | | 183,580 | |
| | | | | JOS A Bank Clothiers Inc * | | 40,125 | | | 1,741,826 | |
| | | | | Kirkland's Inc* | | 68,500 | | | 408,945 | |
| | | | | Luby's Inc * | | 252,700 | | | 3,360,910 | |
| | | | | Main Street Restaurant Group * | | 10,100 | | | 44,339 | |
| | | | | The Pantry Inc * | | 3,300 | | | 155,067 | |
| | | | | Perry Ellis International Inc* | | 65,800 | | | 1,250,200 | |
| | | | | Restoration Hardware* | | 160,745 | | | 967,685 | |
| | | | | REX Stores Corp* | | 105,700 | | | 1,589,728 | |
| | | | | Riviera Holdings Corp* | | 106,100 | | | 1,738,979 | |
| | | | | Rocky Shoes & Boots* | | 55,100 | | | 1,342,236 | |
| | | | | Rush Enterprises Inc—Class A* | | 43,600 | | | 648,768 | |
| | | | | Rush Enterprises Inc—Class B* | | 43,600 | | | 627,840 | |
| | | | | The Sportsman's Guide Inc * | | 165,900 | | | 3,956,715 | |
| | | | | TweeterHome Entertainment* | | 280,000 | | | 1,601,600 | |
| | | | | Wilsons The Leather Experts * | | 159,996 | | | 580,785 | |
| | | | | Zones Inc * | | 60,000 | | | 300,600 | |
| | | | | | |
| |
| | | | | | | | 37,684,816 | |
| | Savings & Loans—3.0% | | | | | | |
| | | | | American Bancorp NJ | | 84,213 | | | 835,393 | |
| | | | | Berkshire Hills Bancorp Inc | | 24,900 | | | 834,150 | |
| | | | | Beverly Hills Bancorp | | 4,700 | | | 48,739 | |
| | | | | BFC Financal Corp* | | 83,372 | | | 460,213 | |
| | | | | Carver Bancorp Inc | | 53,600 | | | 821,688 | |
| | | | | Centrue Financial Corp* | | 26,000 | | | 683,800 | |
| | | | | Cooperative Bankshares Inc | | 10,100 | | | 205,535 | |
| | | | | Fidelity Bancorp Inc | | 47,512 | | | 896,551 | |
| | | | | FirstBank NW Corp | | 21,492 | | | 683,875 | |
| | | | | First Pactrust Bancorp Inc | | 53,800 | | | 1,464,113 | |
| | | | | Harrington West Financial Group Inc | | 86,320 | | | 1,437,427 | |
| | | | | Heritage Financial Corp | | 6,405 | | | 156,410 | |
| | | | | HMN Financial Inc | | 55,300 | | | 1,631,350 | |
| | | | | Horizon Financial Corp | | 24,300 | | | 530,712 | |
| | | | | LSB Corp | | 76,350 | | | 1,324,673 | |
| | | | | | | | | |
60
| | | | | MASSBANK Corp | | 20,536 | | $ | 676,661 | |
| | | | | NewAlliance Bancshares Inc | | 67,028 | | | 974,587 | |
| | | | | NewMil Bancorp Inc | | 32,900 | | | 980,420 | |
| | | | | Northeast Bancorp | | 4,700 | | | 112,800 | |
| | | | | Pacific Premier Bancorp * | | 28,400 | | | 335,120 | |
| | | | | Provident Financial Hldgs | | 17,550 | | | 461,565 | |
| | | | | Pulaski Financial Corp | | 113,193 | | | 2,032,946 | |
| | | | | PVF Capital Corp | | 83,292 | | | 875,399 | |
| | | | | Rainier Pacific Financial Group Inc* | | 45,200 | | | 723,657 | |
| | | | | Riverview Bancorp Inc | | 25,800 | | | 601,398 | |
| | | | | Sterling Financial Corp* | | 1,206 | | | 30,126 | |
| | | | | Synergy Financial Group | | 21,400 | | | 268,356 | |
| | | | | Teche Holding Co | | 11,400 | | | 445,854 | |
| | | | | Timberland Bancorp Inc | | 19,800 | | | 464,528 | |
| | | | | Union Community Bancorp | | 29,839 | | | 798,193 | |
| | | | | Washington Savings Bank FSB | | 95,850 | | | 833,895 | |
| | | | | Willow Grove Bancorp | | 6,011 | | | 90,946 | |
| | | | | | |
| |
| | | | | | | | 22,721,080 | |
| | Semiconductors—3.0% | | | | | | |
| | | | | Advanced Power Technology Inc * | | 206,500 | | | 2,814,595 | |
| | | | | All American Semiconductor* | | 13,200 | | | 52,140 | |
| | | | | Anadigics Inc* | | 402,158 | | | 2,412,948 | |
| | | | | BTU International* | | 81,473 | | | 1,027,366 | |
| | | | | Diodes Inc * | | 63,225 | | | 1,963,136 | |
| | | | | ESS Technology* | | 292,103 | | | 1,001,913 | |
| | | | | IXYS Corp* | | 45,110 | | | 527,335 | |
| | | | | Kopin Corp* | | 132,300 | | | 707,805 | |
| | | | | LogicVision Inc* | | 52,194 | | | 65,243 | |
| | | | | Mindspeed Tech* | | 323,000 | | | 759,050 | |
| | | | | Monolithic System* | | 184,709 | | | 1,015,900 | |
| | | | | Pericom Semiconductors* | | 176,000 | | | 1,402,720 | |
| | | | | Rudolph Technologies* | | 61,200 | | | 788,256 | |
| | | | | SBS Technologies Inc* | | 12,723 | | | 128,121 | |
| | | | | Spire Corp* | | 13,200 | | | 98,340 | |
| | | | | Supertex Inc* | | 62,100 | | | 2,747,925 | |
| | | | | Therma-Wave Inc* | | 392,200 | | | 560,846 | |
| | | | | Transwitch Corp* | | 886,400 | | | 1,622,112 | |
| | | | | TRM Corp* | | 78,400 | | | 584,080 | |
| | | | | Virage Logic Corp* | | 159,800 | | | 1,578,824 | |
| | | | | White Electronic Designs Corp * | | 171,400 | | | 875,854 | |
| | | | | | |
| |
| | | | | | | | 22,734,509 | |
| | Services, Business—0.0%^ | | | | | | |
| | | | | RAE Systems, Inc* | | 37,405 | | | 131,292 | |
| |
Software—4.5% |
|
|
|
|
|
|
| | | | | Actuate Corp* | | 570,200 | | | 1,790,428 | |
| | | | | Allscripts Healthcare Soutions Inc * | | 94,453 | | | 1,265,670 | |
| | | | | American Software | | 31,038 | | | 202,926 | |
| | | | | Authentidate Holding Corp* | | 334,299 | | | 645,197 | |
| | | | | | | | | |
61
| | | | | CAM Commerce Solutions Inc | | 93,900 | | $ | 1,954,050 | |
| | | | | Computer Programs & Systems | | 16,547 | | | 685,542 | |
| | | | | Concur Technologies Inc * | | 112,900 | | | 1,455,281 | |
| | | | | Ceva Inc* | | 142,296 | | | 890,773 | |
| | | | | Digi International Inc * | | 112,936 | | | 1,184,699 | |
| | | | | Digital Angel Corp* | | 251,050 | | | 775,745 | |
| | | | | DocuCorp International Inc * | | 77,872 | | | 496,045 | |
| | | | | Document Sciences Corp * | | 8,788 | | | 70,304 | |
| | | | | Dot Hill Systems* | | 193,800 | | | 1,343,034 | |
| | | | | Embarcadero Technologies Inc.* | | 8,600 | | | 62,608 | |
| | | | | Intervideo, Inc. * | | 43,700 | | | 461,035 | |
| | | | | INVESTools, Inc. * | | 22,700 | | | 122,580 | |
| | | | | Manugistics* | | 708,100 | | | 1,239,175 | |
| | | | | MetaSolv Inc* | | 255,093 | | | 739,770 | |
| | | | | Mind CTI Ltd | | 318,495 | | | 834,457 | |
| | | | | Moldflow Corp * | | 163,600 | | | 2,280,584 | |
| | | | | MSC Software Corp* | | 42,200 | | | 717,400 | |
| | | | | Napster Inc* | | 208,000 | | | 732,160 | |
| | | | | Nuance Communications * | | 130,592 | | | 996,416 | |
| | | | | PAR Technology Corp* | | 7,200 | | | 199,872 | |
| | | | | Perficient Inc* | | 133,300 | | | 1,187,703 | |
| | | | | Pervasive Software Inc * | | 174,800 | | | 765,624 | |
| | | | | Phoenix Technologies* | | 186,581 | | | 1,167,997 | |
| | | | | QAD Inc | | 49,150 | | | 375,506 | |
| | | | | Quality Systems Inc * | | 46,000 | | | 3,530,960 | |
| | | | | TradeStation Group Inc * | | 245,974 | | | 3,045,158 | |
| | | | | Witness Systems Inc * | | 138,850 | | | 2,731,180 | |
| | | | | | |
| |
| | | | | | | | 33,949,879 | |
| | Telecommunications—4.6% | | | | | | |
| | | | | Airspan Networks* | | 10,600 | | | 60,314 | |
| | | | | Anaren Inc* | | 31,800 | | | 497,034 | |
| | | | | AVI BioPharma Inc* | | 432,800 | | | 1,493,160 | |
| | | | | Avici Systems Inc * | | 80,901 | | | 316,323 | |
| | | | | Aware Inc * | | 373,800 | | | 1,659,672 | |
| | | | | CalAmp Corp* | | 293,700 | | | 3,080,913 | |
| | | | | Comarco Inc * | | 12,100 | | | 120,758 | |
| | | | | Communications Systems Inc | | 7,000 | | | 85,960 | |
| | | | | Comtech Telecommunications* | | 7,050 | | | 215,307 | |
| | | | | Ditech Communications Corp * | | 191,670 | | | 1,600,445 | |
| | | | | EndWave Corp * + | | 129,942 | | | 1,530,717 | |
| | | | | Essex Corp * | | 11,800 | | | 201,190 | |
| | | | | Forgent Networks Inc * | | 15,119 | | | 39,309 | |
| | | | | Glenayre Technologies Inc * | | 541,400 | | | 1,759,550 | |
| | | | | GlobeTel Communications * | | 446,000 | | | 1,645,740 | |
| | | | | Globecomm Systems Inc * | | 68,500 | | | 422,645 | |
| | | | | Hickory Tech Corp | | 5,895 | | | 46,512 | |
| | | | | ID Sytems Inc* | | 79,100 | | | 1,886,535 | |
| | | | | KVH Industries Inc * | | 148,300 | | | 1,450,374 | |
| | | | | NMS Communications Corp* | | 284,300 | | | 992,207 | |
| | | | | | | | | |
62
| | | | | Optical Cable Corp* | | 89,225 | | $ | 486,981 | |
| | | | | Performance Technologies Inc* | | 148,850 | | | 1,219,082 | |
| | | | | Radyne Corp* | | 134,900 | | | 1,965,493 | |
| | | | | RELM Wirelss Corp* | | 121,180 | | | 885,825 | |
| | | | | SafeNet Inc* | | 27,100 | | | 873,162 | |
| | | | | SBA Communications Corp* | | 11,100 | | | 198,690 | |
| | | | | Sirenza Microdevices Inc* | | 360,500 | | | 1,661,905 | |
| | | | | Spectralink Corp | | 110,950 | | | 1,316,977 | |
| | | | | Stratos International* | | 212,779 | | | 1,297,952 | |
| | | | | Ubiquitel Inc* | | 618,000 | | | 6,112,020 | |
| | | | | Vyyo Inc* | | 12,031 | | | 58,110 | |
| | | | | Warwick Valley Telephone Co | | 5,400 | | | 103,086 | |
| | | | | XETA Technologies Inc* | | 17,700 | | | 40,710 | |
| | | | | | |
| |
| | | | | | | | 35,324,658 | |
| | Textiles—0.1% | | | | | | |
| | | | | Culp Inc* | | 5,200 | | | 24,596 | |
| | | | | Forward Industries*+ | | 46,700 | | | 415,630 | |
| | | | | | |
| |
| | | | | | | | 440,226 | |
| | Transportation—1.6% | | | | | | |
| | | | | Celadon Group Inc* | | 113,900 | | | 3,280,320 | |
| | | | | HUB Group Inc—Class A* | | 144,600 | | | 5,111,610 | |
| | | | | Marten Transport Ltd* | | 168,099 | | | 3,062,764 | |
| | | | | Patriot Transportation Holding Inc* | | 16,400 | | | 1,064,032 | |
| | | | | | |
| |
| | | | | | | | 12,518,726 | |
| | Trucking & Leasing—0.3% | | | | | | |
| | | | | Greenbrier Cos Inc | | 77,800 | | | 2,209,520 | |
| |
Water—0.4% |
|
|
|
|
|
|
| | | | | Artesian Resources Corp—Class A | | 14,850 | | | 439,560 | |
| | | | | Connecticut Water | | 44,700 | | | 1,095,597 | |
| | | | | Pennichuck Corp | | 10,621 | | | 217,093 | |
| | | | | York Water Co | | 45,700 | | | 1,181,345 | |
| | | | | | |
| |
| | | | | | | | 2,933,595 | |
| | | | | | |
| |
TOTAL COMMON STOCKS
(Cost $403,155,072) | | | | | 727,372,468 | |
| | | | | | |
| |
| EXCHANGE TRADED FUNDS—1.7% | | | | | | |
| | iShares Russell 2000 Index Fund | | 94,100 | | | 6,276,470 | |
| | iShares Russell 2000 Value Index Fund | | 105,200 | | | 6,934,784 | |
| | | | | | |
| |
TOTAL EXCHANGE TRADED FUNDS
(Cost $13,091,369) | | | | | 13,211,254 | |
| | | | | | |
| |
| MONEY MARKET MUTUAL FUNDS—2.9% | | | | | | |
| | First American Treasury Obligations Fund Class S | | 21,867,406 | | | 21,867,406 | |
| | | | | | |
| |
TOTAL MONEY MARKET MUTUAL FUNDS
Cost $21,867,406) | | | | | 21,867,406 | |
| | | | | | |
| |
TOTAL INVESTMENTS—100.4%
(Cost $438,113,847) | | | | $ | 762,451,128 | |
| Liabilities in excess of Other Assets—(0.4%) | | | | | (2,766,790 | ) |
| | | | | | |
| |
| TOTAL NET ASSETS—100.0% | | | | $ | 759,684,338 | |
| | | | | | |
| |
- *
- Non-income producing security
- ^
- Less than 0.05% of net assets
- +
- This security or a portion of this security is out on loan at December 31, 2005.Total loaned securities had a market value of $4,683,612 at December 31, 2005.
See Notes to Financial Statements
| | Unrealized
Depreciation
| |
|---|
| Financial Futures | | | | |
| Russell 2000 E-Mini, 84 contracts, expires March 2006 | | $ | (123,732 | ) |
63
Micro-Cap Limited Fund
MANAGER'S COMMENTARY
(Unaudited)
December 31, 2005
Dear Fellow Micro-Cap Limited Shareholder,
The Fund was down 0.13% in the December quarter, compared to the 1.50% return for our primary benchmark, the CRSP Cap-Based Portfolio 9 Index, 2.02% for our peer benchmark, the Lipper Small-Cap Stock Index, and 1.13% for the Russell 2000 Index of small companies. It was a poor quarter.
I like our calendar year return a lot better. For the twelve months through December, the Fund was up 22.55%, compared to 2.00% for the CRSP Cap-Based Portfolio 9 Index, 7.63% for our peer benchmark, the Lipper Small-Cap Stock Index, and 4.55% for the Russell 2000 Index of small companies.
The table below presents our December quarter, six months, one-year, five-year, and life-to-date financial results according to the formula required by the SEC.
| | Dec. Qtr.
10/1/05
to 12/31/05
| | 6 Months
7/1/05
to 12/31/05
| | 1 Year
1/1/05
to 12/31/05
| | 5 Year
1/1/01
to 12/31/05
| | Life-to-Date
6/30/98
to 12/31/05
| |
|---|
| Micro-Cap Limited Fund | | -0.13 | % | 13.38 | % | 22.55 | % | 19.45 | % | 20.88 | % |
| CRSP Cap-Based Portfolio 9 Index | | 1.50 | % | 6.37 | % | 2.00 | % | 16.18 | % | 11.30 | % |
| Lipper Small-Cap Stock Funds | | 2.02 | % | 7.34 | % | 7.63 | % | 4.87 | % | 6.12 | % |
| Russell 2000 Index (small stocks) | | 1.13 | % | 5.88 | % | 4.55 | % | 8.22 | % | 6.65 | % |
Performance figures quoted represent past performance and are no guarantee of future results. Current performance may be lower or higher than the performance figures quoted, and an investor's shares, when redeemed, may be worth more or less than original cost. For the most recent month-end performance, please call 1-800-661-3550 or visit the Fund's website at www.bridgeway.com.
The CRSP Cap-Based Portfolio 9 Index is an unmanaged index of 627 micro-cap companies compiled by the Center for Research in Security Prices, with dividends reinvested. The Lipper Small Cap Stock Funds is an index of small-cap funds compiled by Lipper, Inc. The Russell 2000 Index is an unmanaged, market value weighted index, which measures performance of the 2,000 companies that are between the 1,000th and 3,000th largest in the market with dividends reinvested. It is not possible to invest directly in an index or average. Periods longer than one year are annualized.
For the six-month (semi-annual) period, our Fund was up 13.38%, compared to 5.88% for the Russell 2000 Index of small companies. As reported last quarter, our lack of energy-dependent holdings kept our Fund diversified when energy stocks lost favor. Our outperformance was due to a handful of stocks across a broad cross-section of industries.
According to data from Lipper, Inc., Micro-Cap Limited Fund ranked 1st of 87 micro-cap funds for the past twelve months, 9th of 50 such funds over the past five years, and 4th of 42 funds since inception in June, 1998. Lipper, Inc. is an independent mutual fund rating service that ranks funds in various fund categories by making comparative calculations using total returns. The graph on the following page presents our financial performance by quarter since inception.
Your Fund Needs a Scrapbook
Over the past few months, Micro-Cap Limited has been mentioned in a number of articles: Louis Rukeyser's Mutual Funds December, 2005 newsletter, Investor's Business Daily on December 6, 2005,
64
Kiplinger's January 2006 and February 2006 issues, Investment News' Databook 2005 published on December 19, 2005, the Wall Street Journal on January 5, 2006 and January 10, 2006 and in Business Week Online on January 13, 2006. Are we marketing the Fund? No. In fact, the Fund remains closed to new investors. However, we do appreciate the fact that the media likes to feature the Fund. Will the small-cap (and micro-cap) dominance continue? In the three- to five-year timeframe, historical patterns suggest, probably not. (Large companies will probably have their day in the sun again, though it might not be in 2006.) Will investors be selling their investments in very small companies and putting the proceeds in large companies to capture this possibility? No doubt, some will, so once again we ring the caution bell about trying to time the market. (It's very difficult to time the market, even major market moves.) Should investors check their allocation plans, to be sure they are not over-weighted in small and micro-cap stocks after such a favorable period? Absolutely. Under any circumstances, we suggest shareholders only invest money in the stock market that they can afford to leave there long term, and that they take a long-term view of these investments. Speaking of the long-term, I like this graph (but there were major bumps along the way):
Growth of $10,000 Invested in Micro-Cap Limited Fund and Indexes from 6/30/98 (inception) to 12/31/05
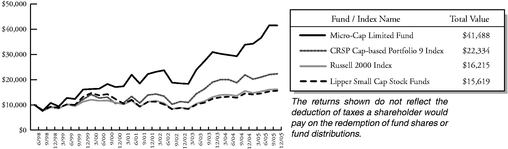
Detailed Explanation of Quarterly Performance—What Worked Well
The Short Version: Of our top-performing companies for the quarter, three had better than 50% return.
Rank
| | Description
| | Industry
| | % Gain
| |
|---|
| 1 | | Multi-Fineline Electronix Inc | | Electronics | | 64.6 | % |
| 2 | | Titanium Metals Corp | | Mining | | 59.9 | % |
| 3 | | RPC Inc | | Oil & Gas Services | | 53.4 | % |
| 4 | | Nutri/System Inc | | Internet | | 44.0 | % |
| 5 | | American Retirement Corp | | Healthcare-Services | | 33.5 | % |
| 6 | | Intevac Inc | | Machinery-Diversified | | 28.0 | % |
| 7 | | LCA-Vision Inc | | Healthcare-Products | | 28.0 | % |
| 8 | | Consolidated-Tomoka Land Co | | Real Estate | | 24.9 | % |
| 9 | | Alaska Air Group Inc | | Airlines | | 22.9 | % |
| 10 | | Trizetto Group | | Internet | | 20.3 | % |
Our top ten performing stocks came from nine different industries. Multi-Fineline Electronix engineers, designs, and manufactures flexible printed circuit boards and component assembly solutions for electronics. Its products include mobile phone and smart mobile devices, bar code scanners, personal digital assistants, computer-storage products, printed circuits for medical applications, and blood oxygen sensors. A recent addition to the Fund, Multi-Fineline Electronix was our #2 best-performing stock in the September quarter and the #4 best stock for the calendar year at 121.1% return (although we didn't own it that full period).
65
Titanium reminds me of the 21st Century's elixir, the bottle of mysterious brown liquid hawked by slick salesmen to cure, energize or clean everything you could imagine. "Ti" on the periodic chart, it is a light, strong, lustrous, corrosion-resistant (including sea water and chlorine) transition metal with a white-silvery metallic color. It's used in white paint, paper, toothpaste, plastics, cement, joint replacements, tennis rackets, gemstones and air purifiers. Its alloys are used in aircraft, amour plating, naval ships, spacecraft and missiles because of its low density (60% as dense as steel), lightness and strength (as strong as steel and 43% lighter.) Our number two best performer, Titanium Metals Corporation offers titanium sponge, melted, and mill products for aerospace, industrial, and other applications. Titanium Metals has been a steady performer for the Fund for four years, making periodic appearances on our winner's list. As you'll see below, the company is our best performer for the calendar year, up a whopping 176.6%.
Detailed Explanation of Quarterly Performance—What Didn't Work
The Short Version: One stock was down over 50% for the quarter. Our underweighting in energy compared to the market (S&P Small-cap) kept our losses to a minimum overall.
Rank
| | Description
| | Industry
| | % Loss
| |
|---|
| 1 | | Forward Industries Inc | | Textiles | | -60.1 | % |
| 2 | | Horizon Health Corp | | Healthcare-Services | | -28.6 | % |
| 3 | | Building Material Holding Corp | | Distribution/Wholesale | | -26.8 | % |
| 4 | | Sun Hydraulics Corp | | Metal Fabricate/Hardware | | -26.2 | % |
| 5 | | Comtech Telecomm. Corp | | Telecommunications | | -24.6 | % |
| 6 | | Digital River Inc | | Internet | | -21.6 | % |
| 7 | | Labor Ready Inc | | Commercial Services | | -18.8 | % |
| 8 | | Gold Kist Inc | | Food | | -18.3 | % |
| 9 | | ACT Teleconferencing Inc | | Telecommunications | | -15.3 | % |
| 10 | | Clean Harbors Inc | | Environmental Control | | -15.1 | % |
Forward Industries, maker of carrying cases for cell phones, laptops and other equipment, is our worst performer for the quarter. Timing of product shipments, pricing pressures and higher operating costs are a bad combination and caused the Florida-based company's recent price tumble.
Building Material Holding Corporation's performance illustrates the volatile nature of these tiny companies. It was our 11th best performing stock last quarter. It was the #1 performer for the June quarter. It is our #7 best stock for the calendar year, up 78.4%. This quarter, it's the 3rd worst performer. (Granted, -26.8% is not a dramatic downturn in the context of micro-cap companies.) The company markets and sells building products, and manufactures building components, such as lumber, millwork, floor and roof trusses, and wall panels and services to production homebuilders. Our models decided not to wait for an upturn, and we sold our holdings in Building Materials at the end of December.
66
Detailed Explanation of Calendar Year Performance—What Worked Well
The Short Version: Of our ten top-performing stocks, four more than doubled in return. Essentially, the four companies are not related, four different industries, four different sectors.
Rank
| | Description
| | Industry
| | % Gain
| |
|---|
| 1 | | Titanium Metals Corp | | Mining | | 176.6 | % |
| 2 | | Quality Systems Inc | | Software | | 156.7 | % |
| 3 | | RPC Inc | | Oil & Gas Services | | 135.9 | % |
| 4 | | Multi-Fineline Electronix Inc | | Electronics | | 121.1 | % |
| 5 | | LCA-Vision Inc | | Healthcare-Products | | 94.2 | % |
| 6 | | Trizetto Group | | Internet | | 83.4 | % |
| 7 | | Building Material Holding Corp | | Distribution/Wholesale | | 78.4 | % |
| 8 | | American Retirement Corp | | Healthcare-Services | | 78.1 | % |
| 9 | | SS&C Technologies Inc | | Software | | 76.0 | % |
| 10 | | Middleby Corp | | Machinery-Diversified | | 70.5 | % |
Most of the ten companies listed above have been very consistent performers. Five of the ten were in our winners for the September quarter, and six were top ranked for the fiscal year in the June report. Quality Systems is one of those. The company sells healthcare information systems that automate medical and dental information. Its software systems include general patient information, appointment scheduling, billing, insurance claims submission and other care services. Quality Systems is in the Technology Sector, which, together with SS&C Technologies and others, added over 8% to our calendar year return. It's also our top holding at just under 5% of the portfolio.
Detailed Explanation of Calendar Year Performance—What Didn't Work
The Short Version: Two stocks lost over 50% for the calendar year, and, similar to our winners, they represented a fairly wide range of industries and sectors.
Rank
| | Description
| | Industry
| | % Loss
| |
|---|
| 1 | | ACT Teleconferencing Inc | | Telecommunications | | -69.7 | % |
| 2 | | Forward Industries Inc | | Textiles | | -52.6 | % |
| 3 | | Deckers Outdoor Corp | | Apparel | | -43.2 | % |
| 4 | | CFC International Inc | | Chemicals | | -40.5 | % |
| 5 | | America Service Group Inc | | Healthcare-Services | | -40.2 | % |
| 6 | | Navarre Corp | | Distribution/Wholesale | | -36.7 | % |
| 7 | | Cantel Medical Corp | | Healthcare-Products | | -35.6 | % |
| 8 | | Olympic Steel Inc | | Iron/Steel | | -34.9 | % |
| 9 | | Digital River Inc | | Internet | | -34.3 | % |
| 10 | | ACE Cash Express Inc | | Commercial Services | | -33.7 | % |
ACT Teleconferencing, Inc. provides audio, video, data, and Web-based conferencing services to businesses and organizations in North America, Europe, and Asia Pacific. Financial difficulties in the early fall of 2005 resulting in increased loans and credit extensions created stock price jitters, and a steep drop in value, which precipitated delisting. Fortunately, its light weighting in the Fund caused very little effect overall.
Decker Outdoor makes footwear for outdoor sports and recreation under the Teva and Ugg brands. Sales continued to slide under increased competition and lack of new products. Uncharacteristically, it was a "hot potato" to our models; we held it from February to late April. As of December 30, Forward Industries and Navarre were the only companies of this list of ten decliners that we continued to own. We sold the last of our holdings in Forward after the first of the year.
67
Top Ten Holdings
At quarter end, Industrial comprised our largest sector representation at 32.2% of net assets, followed by Consumer, Non-cyclical at 16.3% and Communications at 13.7%. Our top ten holdings represented 37.0% of net assets.
Rank
| | Description
| | Industry
| | Percent of
Net Assets
| |
|---|
| 1 | | Quality Systems Inc | | Software | | 4.9 | % |
| 2 | | NS Group Inc | | Metal Fabricate/Hardware | | 4.5 | % |
| 3 | | Middleby Corp | | Machinery-Diversified | | 4.4 | % |
| 4 | | Parker Drilling Co | | Oil & Gas | | 4.1 | % |
| 5 | | American Science & Engineering Inc | | Electronics | | 3.6 | % |
| 6 | | ASV Inc | | Auto Manufacturers | | 3.5 | % |
| 7 | | j2 Global Communications Inc | | Internet | | 3.3 | % |
| 8 | | Nutri/System Inc | | Internet | | 2.9 | % |
| 9 | | Freightcar America Inc | | Miscellaneous Manufacturer | | 2.9 | % |
| 10 | | Lamson & Sessions Co | | Electrical Compo & Equip | | 2.9 | % |
| | | | | | |
| |
| | Total | | | | | | 37.0 | % |
Industry Sector Representation as of December 31, 2005
Sector
| | % of Net
Assets
| | % S&P Small-Cap
Index
| | Difference
| |
|---|
| Basic Materials | | 1.0 | % | 3.4 | % | -2.4 | % |
| Communications | | 13.7 | % | 3.4 | % | 10.3 | % |
| Consumer, Cyclical | | 11.1 | % | 18.7 | % | -7.6 | % |
| Consumer, Non-cyclical | | 16.3 | % | 17.6 | % | -1.3 | % |
| Energy | | 6.1 | % | 7.9 | % | -1.8 | % |
| Financial | | 5.3 | % | 14.7 | % | -9.4 | % |
| Industrial | | 32.2 | % | 20.1 | % | 12.1 | % |
| Technology | | 9.0 | % | 9.8 | % | -0.8 | % |
| Utilites | | 0.0 | % | 4.4 | % | -4.4 | % |
| Cash | | 5.3 | % | 0.0 | % | 5.3 | % |
| | |
| |
| | | |
| | Total | | 100.0 | % | 100.0 | % | | |
Calendar Year Comparisons by Company Size
The Short Version: The very largest and the very smallest companies were the most "performance challenged" for the calendar year.
As you can see in the following table, the largest companies, as indicated in group one, and the smallest companies, in groups 8, 9, and 10, lagged the performance of most other groups for the year. Typical of this asset class, a mediocre 2005 follows the stellar performance of ultra-small stocks from 1999 through 2004. And as illustrated in the table (and as "preached" periodically by me) the critical feature of micro-cap companies is the long-term commitment to hold through their volatile nature. On a recent internet chat page, a shareholder commented that he had held another of our very small
68
company funds a full eight months and the fund just hadn't done much. Another shareholder responded, "It's a long-term investment! You have to hold it a hundred years!" Although that's a little longer than I define "long-term," he has the right idea.
Company Size
According to the CRSP
Cap-Based Portfolio Indexes(1)
| | 6 months
| | 1 year
| | 79 years(2)
| |
|---|
| 1 (ultra large) | | 5.2 | % | 3.7 | % | 9.6 | % |
| 2 | | 8.1 | % | 12.0 | % | 11.0 | % |
| 3 | | 8.6 | % | 12.4 | % | 11.4 | % |
| 4 | | 6.8 | % | 10.6 | % | 11.5 | % |
| 5 | | 9.4 | % | 10.1 | % | 11.8 | % |
| 6 | | 4.2 | % | 3.2 | % | 11.9 | % |
| 7 | | 7.7 | % | 10.5 | % | 11.8 | % |
| 8 | | 9.1 | % | 7.6 | % | 11.9 | % |
| 9 | | 6.4 | % | 2.0 | % | 12.1 | % |
| 10 (ultra-small) | | 10.5 | % | 5.8 | % | 14.1 | % |
- (1)
- The CRSP Cap-Based Portfolio Indexes are unmanaged indexes of the publicly traded U.S. stocks with dividends reinvested, grouped by the market capitalization, as reported by the Center for Research in Security Prices. Past performance is no guarantee of future results.
- (2)
- December 1926 to December 2005
Disclaimer
The following is a reminder from the friendly folks at your Fund who worry about liability. The views expressed here are exclusively those of Fund management. These views are not meant as investment advice and should not be considered predictive in nature. Any favorable (or unfavorable) description of a holding applies only as of December 31, 2005, unless otherwise stated. Security positions can and do change thereafter. Discussions of historical performance do not guarantee and are not indicative of future performance.
The Fund is subject to above average market risk (volatility) and is not an appropriate investment for short-term investors. Investments in small companies generally carry greater risk than is customarily associated with larger companies for various reasons such as narrower markets, limited financial resources and less liquid stock.
This report is submitted for the general information of the shareholders of the Fund. It is not authorized for distribution to prospective investors unless preceded or accompanied by an effective prospectus, which includes information regarding the Fund's risks, objectives, fees and expenses, experience of its management, and other information For questions or other fund information, call 1-800-661-3550 or visit the Fund's website www.bridgeway.com. Foreside Fund Services, LLC, distributor.
Conclusion
Thank you for your continued investment in Micro-Cap Limited. This Fund remains open only to current investors as we seek to keep the nimbleness that has fared well through the years. As always, we appreciate your feedback.
Sincerely,
John Montgomery
69
DISCLOSURE OF FUND EXPENSES
(Unaudited)
As a shareholder of the Fund, you will incur no transaction costs from the Funds, including sales charges (loads) on purchases, on reinvested dividends, or on other distributions. There are also no redemption fees or exchange fees. However, as a shareholder of the Fund, you will incur ongoing costs, including management fees and other Fund expenses. The following examples are intended to help you understand your ongoing costs (in dollars) of investing in the Fund and to compare these costs with the ongoing costs of investing in other mutual funds. The examples are based on an investment of $1,000 invested on July 1, 2005 and held until December 31, 2005.
Actual Return. The first line of the table below provides information about actual account values and actual expenses. You may use the information in this line, together with the amount you invested, to estimate the expenses that you paid over the period. Simply divide your account value by $1,000 (for example, an $8,600 account value divided by $1,000 = 8.6), then multiply the result by the number in the first line under the heading "Expense Paid During Period" to estimate the expenses you paid on your account during this period.
Hypothetical 5% Return. The second line of the table below provides information about hypothetical account values and hypothetical expenses based on the Fund's actual expense ratio and an assumed rate of return of 5% per year before expenses, which is not the Fund's actual return. The hypothetical account values and expenses may not be used to estimate the actual ending account balance or expenses you paid for the period. You may use this information to compare the ongoing costs of investing in a Fund and other mutual funds. To do so, compare this 5% hypothetical example with the 5% hypothetical examples that appear in the shareholder reports of the other funds.
The expenses shown in the table are meant to highlight ongoing Fund costs only. Therefore, the second line of the table is useful in comparing ongoing costs only, and will not help you determine the relative total costs of owning different funds, because other funds may also have transaction costs, such as sales charges, redemption fees or exchange fees.
Bridgeway Micro-Cap Limited Fund
| | Beginning Account
Value at 7/1/05
| | Ending Account
Value at 12/31/05
| | Expense Paid
During Period*
7/1/05-12/31/05
|
|---|
| Actual Fund Return | | $ | 1,000.00 | | $ | 1,133.76 | | $ | 9.25 |
| Hypothetical Fund Return | | $ | 1,000.00 | | $ | 1,016.53 | | $ | 8.74 |
- *
- Expenses are equal to the Fund's annualized expense ratio of 1.72% multiplied by the average account value over the period, multiplied by the number of days in the first fiscal half-year divided by 365 days in the current year (to reflect the one half-year period).
70
SCHEDULE OF INVESTMENTS
Showing percentage of net assets as of December 31, 2005 (Unaudited)
Industry
| | Company
| | Shares
| | Value
|
|---|
| COMMON STOCKS—94.7% | | | | | |
| | Advertising—0.5% | | | | | |
| | | | | Ventiv Health Inc* | | 16,100 | | $ | 380,282 |
| |
Airlines—2.0% |
|
|
|
|
|
| | | | | Alaska Air Group Inc* | | 43,400 | | $ | 1,550,248 |
| |
Apparel—1.6% |
|
|
|
|
|
| | | | | True Religion Apparel Inc* | | 80,300 | | | 1,236,620 |
| |
Auto Manufacturers—3.5% |
|
|
|
|
|
| | | | | ASV Inc* | | 106,226 | | | 2,653,525 |
| |
Banks—2.5% |
|
|
|
|
|
| | | | | City Holding Co | | 19,300 | | | 693,835 |
| | | | | First Regional Bank* | | 5,500 | | | 371,525 |
| | | | | Macatawa Bank Corp | | 18,653 | | | 678,596 |
| | | | | Old Second Bancorp Inc | | 5,954 | | | 182,014 |
| | | | | | |
|
| | | | | | | | 1,925,970 |
| | Building Materials—0.1% | | | | | |
| | | | | ElkCorp | | 2,100 | | | 70,686 |
| |
Commercial Services—3.5% |
|
|
|
|
|
| | | | | Escala Group* | | 49,000 | | | 993,720 |
| | | | | Kendle International* | | 31,400 | | | 808,236 |
| | | | | Labor Ready Inc* | | 39,800 | | | 828,636 |
| | | | | | |
|
| | | | | | | | 2,630,592 |
| | Computers—1.7% | | | | | |
| | | | | Komag Inc* | | 37,000 | | | 1,282,420 |
| |
Distribution/Wholesale—0.3% |
|
|
|
|
|
| | | | | Navarre Corp* | | 35,000 | | | 193,550 |
| |
Electronics—8.3% |
|
|
|
|
|
| | | | | American Science & Engineering Inc* | | 44,300 | | | 2,762,991 |
| | | | | Itron Inc* | | 41,600 | | | 1,665,664 |
| | | | | Molecular Devices Co* | | 30,800 | | | 891,044 |
| | | | | Multi-Fineline Electronix Inc* | | 20,300 | | | 977,851 |
| | | | | | |
|
| | | | | | | | 6,297,550 |
| | | | | | | | |
71
| | Electronic Components & Equipment—2.9% | | | | | |
| | | | | Lamson & Sessions Co* | | 87,500 | | | 2,189,250 |
| |
Environmental Control—1.5% |
|
|
|
|
|
| | | | | Clean Harbors Inc* | | 38,200 | | | 1,100,542 |
| |
Hand/ Machine Tools—0.7% |
|
|
|
|
|
| | | | | Baldor Electric Co | | 19,600 | | | 502,740 |
| |
Healthcare—Products—9.7% |
|
|
|
|
|
| | | | | Cutera Inc* | | 71,000 | | | 1,871,560 |
| | | | | ICU Medical Inc* | | 3,278 | | | 128,530 |
| | | | | IRIS International* | | 66,300 | | | 1,449,318 |
| | | | | LCA—Vision Inc | | 34,550 | | | 1,641,471 |
| | | | | SurModics Inc* | | 40,200 | | | 1,486,998 |
| | | | | Vital Images Inc* | | 29,400 | | | 768,810 |
| | | | | | |
|
| | | | | | | | 7,346,687 |
| | Healthcare—Services—8.0% | | | | | |
| | | | | American Retirement Corp* | | 81,000 | | | 2,035,530 |
| | | | | Quality Systems Inc* | | 48,400 | | | 3,715,184 |
| | | | | Res-Care Inc* | | 20,300 | | | 352,611 |
| | | | | | |
|
| | | | | | | | 6,103,325 |
| | Insurance—2.0% | | | | | |
| | | | | Navigators Group Inc* | | 18,700 | | $ | 815,507 |
| | | | | United Fire & Casualty Co | | 17,389 | | | 703,037 |
| | | | | | |
|
| | | | | | | | 1,518,544 |
| | Internet—8.2% | | | | | |
| | | | | j2 Global Communications Inc* | | 58,900 | | | 2,517,386 |
| | | | | NutriSystem Inc* | | 62,000 | | | 2,233,240 |
| | | | | Trizetto Group Inc* | | 86,000 | | | 1,461,140 |
| | | | | | |
|
| | | | | | | | 6,211,766 |
| | Leisure Time—0.9% | | | | | |
| | | | | Ambassadors Group Inc | | 30,000 | | | 686,700 |
| |
Machinery-Diversified—6.9% |
|
|
|
|
|
| | | | | Columbus McKinnon Co* | | 57,300 | | | 1,259,454 |
| | | | | Intevac Inc* | | 50,000 | | | 660,000 |
| | | | | Middleby Corp* | | 38,200 | | | 3,304,300 |
| | | | | | |
|
| | | | | | | | 5,223,754 |
| | | | | | | | |
72
| | Metal Fabricate/Hardware—4.5% | | | | | |
| | | | | NS Group Inc* | | 82,200 | | | 3,436,782 |
| |
Mining—2.1% |
|
|
|
|
|
| | | | | Tennant Company | | 16,900 | | | 878,800 |
| | | | | Titanium Metals Corp* | | 11,800 | | | 746,468 |
| | | | | | |
|
| | | | | | | | 1,625,268 |
| | Miscellaneous Manufacturers—2.9% | | | | | |
| | | | | FreightCar America Inc | | 45,600 | | | 2,192,448 |
| |
Oil & Gas—4.1% |
|
|
|
|
|
| | | | | Parker Drilling Co* | | 285,900 | | | 3,096,297 |
| |
Oil & Gas Services—2.0% |
|
|
|
|
|
| | | | | Lufkin Industries | | 3,200 | | | 159,584 |
| | | | | NATCO Group Inc* | | 28,500 | | | 583,110 |
| | | | | RPC Inc* | | 29,250 | | | 770,445 |
| �� | | | | | |
|
| | | | | | | | 1,513,139 |
| | Real Estate—0.7% | | | | | |
| | | | | Consolidated Tomoka | | 7,900 | | | 560,110 |
| |
Retail—2.2% |
|
|
|
|
|
| | | | | EZCORP Inc* | | 42,694 | | | 652,364 |
| | | | | Pantry Inc/The * | | 20,916 | | | 982,843 |
| | | | | | |
|
| | | | | | | | 1,635,207 |
| | Software—1.3% | | | | | |
| | | | | Witness Systems Inc* | | 50,000 | | | 983,500 |
| |
Telecommunications—6.2% |
|
|
|
|
|
| | | | | Hypercom Corp* | | 209,000 | | | 1,335,510 |
| | | | | Powerwave Technologies Inc* | | 100,400 | | | 1,262,028 |
| | | | | Sykes Enterprises* | | 62,600 | | | 836,962 |
| | | | | UbiquiTel Inc* | | 48,500 | | | 479,665 |
| | | | | Viasat Inc * | | 28,200 | | | 753,786 |
| | | | | | |
|
| | | | | | | | 4,667,951 |
| | | | | | | | |
73
| | Textiles—0.6% | | | | | |
| | | | | Forward Industries Inc* | | 50,860 | | $ | 452,654 |
| |
Transportation—2.4% |
|
|
|
|
|
| | | | | HUB Group Inc—Class A* | | 51,400 | | | 1,816,990 |
| |
Trucking & Leasing—0.9% |
|
|
|
|
|
| | | | | Greenbrier Companies Inc | | 23,500 | | | 667,400 |
| | | | | | |
|
TOTAL COMMON STOCKS
(Cost $49,769,073) | | | | | 71,752,497 |
| | | | | | |
|
| MONEY MARKET MUTUAL FUNDS—2.5% | | | | | |
| | First American Treasury Obligations Fund—Class S | | 1,899,390 | | | 1,899,390 |
| | | | | | |
|
TOTAL MONEY MARKET MUTUAL FUNDS
(Cost $1,899,390) | | | | | 1,899,390 |
| | | | | | |
|
TOTAL INVESTMENTS—97.2%
(Cost $51,668,463) | | | | $ | 73,651,887 |
| Other Assets in excess of Liabilities—2.8% | | | | | 2,103,817 |
| | | | | | |
|
| NET ASSETS—100.0% | | | | $ | 75,755,704 |
| | | | | | |
|
- *
- Non-income producing security
See Notes to Financial Statements
74
Small-Cap Growth Fund
MANAGER'S COMMENTARY
(Unaudited)
December 31, 2005
Dear Fellow Small-Cap Growth Shareholder,
Our Fund had a positive return of 3.28% for the December 2005 quarter, compared to a 1.61% return for our primary market benchmark, the Russell 2000 Growth Index, and a 1.71% return of our peer benchmark, the Lipper Small-Cap Growth Index. It was a good quarter.
For the calendar year, the Fund was up 18.24%, beating the Russell 2000 Growth Index by 14.09% and the Lipper Small-Cap Growth Index by 12.90%. We beat both benchmarks for the quarter, six-month, one year and life-to-date periods, a "clean sweep," with which I am very pleased.
The table below presents our performance for the December quarter, six month, 1 year and annualized performance since inception, followed by a graph of performance since inception.
| | Dec. Qtr.
10/1/05
to 12/31/05
| | 6 Months
7/1/05
to 12/31/05
| | 1 Year
1/1/05
to 12/31/05
| | Life-to-Date
10/31/03
to 12/31/05
| |
|---|
| Small-Cap Growth Fund | | 3.28 | % | 12.17 | % | 18.24 | % | 15.05 | % |
| Russell 2000 Growth Index | | 1.61 | % | 8.03 | % | 4.15 | % | 10.22 | % |
| Lipper Small-Cap Growth Index | | 1.71 | % | 6.63 | % | 5.34 | % | 8.77 | % |
Performance data quoted represents past performance and is no guarantee of future results. Current performance may be lower or higher than the performance data quoted. Investment return and principal value will fluctuate so that an investor's shares, when redeemed, may be worth more or less than original cost. For the most recent month end performance, please call 1-800-661-3550 or visit the Fund's website at www.bridgeway.com
The Russell 2000 Growth Index is an unmanaged index which consists of stocks in the Russell 2000 Index with higher price-to-book ratios and higher forecasted growth values with dividends reinvested. The Lipper Small-Cap Growth Index is an index of small-company, growth-oriented funds compiled by Lipper, Inc. It is not possible to invest directly in an index. Periods longer than one year are annualized.
For the six-month semi-annual period, our Fund was up 12.17%, compared to 8.03% for the Russell 2000 Growth Index and 6.63% for the Lipper Small-Cap Growth Index. Fourth quarter performance shows evidence of losing the energy boost that we had enjoyed during the third quarter; however, the six-month numbers don't show the effect.
According to data from Morningstar, Inc., our Fund ranked 9th of 774 small-cap growth funds for the last twelve months. The Fund's numeric rankings are based solely on total return performance. Morningstar ranks funds in various fund categories by making comparative calculations using total returns.
75
Growth of $10,000 Invested in Small-Cap Growth Fund and Indexes from 10/31/03 (inception) to 12/31/05
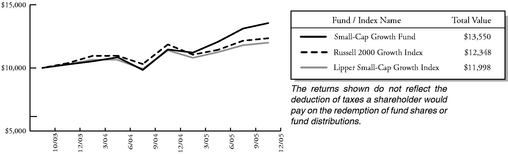
Detailed Explanation of Quarterly Performance—What Worked Well
The Short Version: Two of our ten top performers garnered over 50% return. The combined efforts of companies in the health-related arena added better than 2.5% to our Fund's quarterly return.
Rank
| | Description
| | Industry
| | % Gain
| |
|---|
| 1 | | Hansen Natural Corp | | Beverages | | 67.4 | % |
| 2 | | Titanium Metals Corp | | Mining | | 59.9 | % |
| 3 | | Matrixx Initiatives Inc | | Pharmaceuticals | | 47.3 | % |
| 4 | | Mitcham Industries Inc | | Oil & Gas Services | | 43.2 | % |
| 5 | | Intuitive Surgical Inc | | Healthcare-Products | | 34.4 | % |
| 6 | | American Retirement Corp | | Healthcare-Services | | 33.5 | % |
| 7 | | LCA-Vision Inc | | Healthcare-Products | | 28.0 | % |
| 8 | | MarineMax Inc | | Retail | | 23.9 | % |
| 9 | | Astec Industries Inc | | Machinery-Constr & Mining | | 22.5 | % |
| 10 | | Homestore Inc | | Internet | | 21.2 | % |
We first bought Hansen Natural in the fall of 2004 at just under $26 per share, and it remained a buy for the following twelve months. Currently, it's selling for about $90 per share. It's a great "little company makes good" story. Hubert Hansen started making fresh, non-pasteurized juices for film studios and retailers in Southern California in the 30's. Lately, with the addition of smoothies, ready-to-drink iced teas, juice cocktails and energy drinks, its brands have caught the public's attention. Forbes listed Hansen in first place in its "200 Best Small Companies" for 2005, with "new energy drinks targeted at the youth sports market and white-collar workforce." (We gathered our staff recently for a Hansen taste test—the juices were the staff's favorites; I liked the ginseng drink.) Hansen is also in second place on our list of performers for the year, with a 258.2% increase, and our largest portfolio holding at 2%.
Titanium reminds me of the 21st century's elixir, the bottle of mysterious brown liquid hawked by slick salesmen to cure, energize or clean everything you could imagine. "Ti" on the periodic chart, it is a light, strong, lustrous, corrosion-resistant (including sea water and chlorine) transition metal with a white-silvery metallic color. It's used in white paint, paper, toothpaste, plastics, cement, joint replacements, tennis rackets, gemstones and air purifiers. Its alloys are used in aircraft, armor plating, naval ships, spacecraft and missiles because of its low density (60% as dense as steel), lightness and strength (as strong as steel and 43% lighter.) Our number two best performer, Titanium Metals Corporation, offers titanium sponge, melted, and mill products for aerospace, industrial, and other applications. Titanium Metals has been a steady performer for the Fund over the last year, making quarterly appearances on our winner's list. As you'll see below, the company is our best performer for the calendar year, up a whopping 424.3%.
76
For shareholders who own both Small-Cap Value and Small-Cap Growth Funds, you may notice that three stocks on the list above are also in Small-Cap Value. How can the same company be classified as both value and growth? At the time of purchase, a stock qualifies for only one fund. However, price changes, and to a lesser degree, changes in fundamental financial characteristics can change the designation from growth to value, especially for stocks on the margin between value and growth. Therefore, over time it is possible to have purchased a stock at different times for more than one of these funds. Similarly, a stock can grow from small to large and end up in, for instance, both the Small-Cap Value Fund and the Large-Cap Value Fund. Since we don't immediately sell a stock when it moves across one of these "boundaries," it can end up in more than one fund at the same time. Overall, there is currently a 23% "overlap" between Small-Cap Value and Small-Cap Growth Funds, most near the border of designation.
Detailed Explanation of Quarterly Performance—What Didn't Work
The Short Version: Only one company had a more than 50% drop and one additional one over 30%.
Rank
| | Description
| | Industry
| | % Loss
| |
|---|
| 1 | | Forward Industries Inc | | Textiles | | -56.0 | % |
| 2 | | Calgon Carbon Corp | | Environmental Control | | -32.5 | % |
| 3 | | Comtech Telecomm. Corp | | Telecommunications | | -26.4 | % |
| 4 | | Gold Kist Inc | | Food | | -23.7 | % |
| 5 | | Kos Pharmaceuticals Inc | | Pharmaceuticals | | -22.6 | % |
| 6 | | Arqule Inc | | Biotechnology | | -21.8 | % |
| 7 | | Digital River Inc | | Internet | | -21.8 | % |
| 8 | | UGI Corp | | Gas | | -21.4 | % |
| 9 | | ADC Telecommunications Inc | | Telecommunications | | -19.6 | % |
| 10 | | MTS Systems Corp | | Computers | | -18.5 | % |
Forward Industries, maker of carrying cases for cell phones, laptops and other equipment, is our second worst performer for the quarter. Timing of product shipments, pricing pressures and higher operating costs are a bad combination and caused the Florida-based company's recent price tumble.
Calgon Carbon Corporation offers products and services for the purification, separation, and concentration of liquids and gases and is primarily known for water treatment. The stock price may have been affected by contract delays and higher production costs. We trimmed our exposure in October. The stock has made a fair recovery since late December, and currently, we're holding.
77
Detailed Explanation of Calendar Year Performance—What Worked Well
The Short Version: Of our ten top-performing stocks, four more than doubled in return. Although many companies in the Energy sector have cooled, the two small energy-related companies in the list below have continued to add to our returns.
Rank
| | Description
| | Industry
| | % Gain
| |
|---|
| 1 | | Titanium Metals Corp | | Mining | | 424.3 | % |
| 2 | | Hansen Natural Corp | | Beverages | | 258.2 | % |
| 3 | | Southwestern Energy Co | | Oil & Gas | | 179.3 | % |
| 4 | | Peabody Energy Corp | | Coal | | 103.7 | % |
| 5 | | LCA-Vision Inc | | Healthcare-Products | | 103.1 | % |
| 6 | | Chico's FAS Inc | | Retail | | 93.0 | % |
| 7 | | SS&C Technologies Inc | | Software | | 80.4 | % |
| 8 | | Matrixx Initiatives Inc | | Pharmaceuticals | | 77.2 | % |
| 9 | | Intuitive Surgical Inc | | Healthcare-Products | | 76.2 | % |
| 10 | | American Retirement Corp | | Healthcare-Services | | 75.0 | % |
The top two gainers for the calendar year (profiled above in the quarterly section), along with eight other companies, registering 75% and above, created a winning lineup for our Fund. Southwestern Energy and Peabody Energy are at the larger end of company size for Small-Cap Growth, after recent appreciation. Four of our top ten winners are in the Consumer, Non-Cyclical Sector: LCA Vision, Matrixx Initiatives, Intuitive Surgical and American Retirement. The Fund had almost twice the weighting in this sector as the general market (S&P Small-cap,) and our models picked the cream of the crop, resulting in just shy of 4% contribution to our return from this group.
Detailed Explanation of Calendar Year Performance—What Didn't Work
The Short Version: We had four stocks that lost over 50%
Rank
| | Description
| | Industry
| | % Loss
| |
|---|
| 1 | | Navarre Corp | | Distribution/Wholesale | | -66.1 | % |
| 2 | | Looksmart | | Internet | | -61.2 | % |
| 3 | | Travelzoo Inc | | Internet | | -59.9 | % |
| 4 | | Forward Industries Inc | | Textiles | | -56.0 | % |
| 5 | | Deckers Outdoor Corp | | Apparel | | -49.2 | % |
| 6 | | Artesyn Technologies Inc | | Electrical Compo & Equip | | -41.8 | % |
| 7 | | Calgon Carbon Corp | | Environmental Control | | -39.5 | % |
| 8 | | Navigant Consulting Inc | | Commercial Services | | -37.9 | % |
| 9 | | Ceradyne Inc | | Miscellaneous Manufacturing | | -34.3 | % |
| 10 | | Sapient Corp | | Internet | | -34.1 | % |
Of the ten worst-performing stocks for the calendar year, four are in the Technology sector. However, because we were not over-weighted in this group, the negative effect on performance was less than 0.5%. By December 31, 2005, we had sold all except Navarre, Forward and Ceradyne.
First place loser, Navarre Corporation, publishes and distributes home entertainment and multimedia products such as personal computer software, compact disc and DVD audio, DVD and VHS video, video games, and accessories. In mid-November when the company announced that it would be restating financials for 2003 through 2005 and had to file its September 30 report without auditor and officer certifications, it faced delisting. By month end, it had settled report filings and had
78
been reinstated with NASDAQ. Its share price rose 8% in early December after announcing officer changes. For now, we are "staying put."
Top Ten Holdings
At quarter end, Consumer, Non-Cyclical comprised our largest sector representation at 24.2% of net assets, followed by Energy at 16.5% and Industrial at 16.5%. Our top ten holdings represented only 15.2% of net assets, which demonstrates the diversification of this Fund. This strategy spreads the risk associated with any one company in an attempt to reduce overall portfolio volatility (and contrasts with some of our more aggressively managed styles which can place some pretty big bets on individual stocks.)
Rank
| | Description
| | Industry
| | Percent of
Net Assets
| |
|---|
| 1 | | Hansen Natural Corp | | Beverages | | 2.0 | % |
| 2 | | Southwestern Energy Co | | Oil & Gas | | 2.0 | % |
| 3 | | LCA-Vision Inc | | Healthcare-Products | | 1.5 | % |
| 4 | | Cognizant Technology Solutions Corp | | Computers | | 1.5 | % |
| 5 | | Matrixx Initiatives Inc | | Pharmaceuticals | | 1.5 | % |
| 6 | | Intuitive Surgical Inc | | Healthcare-Products | | 1.5 | % |
| 7 | | Consol Energy Inc | | Coal | | 1.3 | % |
| 8 | | Urban Outfitters Inc | | Retail | | 1.3 | % |
| 9 | | Chico's FAS Inc | | Retail | | 1.3 | % |
| 10 | | Helmerich & Payne Inc | | Oil & Gas | | 1.3 | % |
| | | | | | |
| |
| | Total | | | | 15.2 | % |
Industry Sector Representation as of December 31, 2005
Industry
| | % of Net Assets
| | % S&P
Small-cap Index
| | Difference
| |
|---|
| Basic Materials | | 2.9 | % | 3.4 | % | -0.5 | % |
| Communications | | 9.9 | % | 3.4 | % | 6.5 | % |
| Consumer, Cyclical | | 8.8 | % | 18.7 | % | -9.9 | % |
| Consumer, Non-cyclical | | 24.2 | % | 17.6 | % | 6.6 | % |
| Energy | | 16.5 | % | 7.9 | % | 8.6 | % |
| Financial | | 2.4 | % | 14.7 | % | -12.3 | % |
| Industrial | | 16.5 | % | 20.1 | % | -3.6 | % |
| Technology | | 12.0 | % | 9.8 | % | 2.2 | % |
| Utilities | | 0.0 | % | 4.4 | % | -4.4 | % |
| Diversified | | 0.5 | % | 0.0 | % | 0.5 | % |
| Cash | | 6.3 | % | 0.0 | % | 6.3 | % |
| | |
| |
| | | |
| | Total | | 100.0 | % | 100.0 | % | | |
Disclaimer
The following is a reminder from the friendly folks at your Fund who worry about liability. The views expressed here are exclusively those of Fund management. These views, including those regarding market sectors or individual stocks, are not meant as investment advice and should not be considered predictive in nature. Any favorable (or unfavorable) description of a holding applies only as of the quarter end, December 31, 2005, unless otherwise stated. Security positions can and do change
79
thereafter. Discussions of historical performance do not guarantee and are not indicative of future performance.
The Fund is subject to above average market risk (volatility) and is not an appropriate investment for short-term investors. Investments in small companies carry greater risk than is customarily associated with larger companies for various reasons such as narrower markets, limited financial resources and less liquid stock.
This report is submitted for the general information of the shareholders of the Fund. It is not authorized for distribution to prospective investors unless preceded or accompanied by an effective prospectus, which includes information regarding the Fund's risks, objectives, fees and expenses, experience of its management, and other information For questions or other fund information, call 1-800-661-3550 or visit the Fund's website www.bridgeway.com. Foreside Fund Services, LLC, distributor.
Conclusion
Thank you for your continued investment in Small-Cap Growth. This Fund remains open to both current and new investors. As always, we appreciate your feedback.
Sincerely,
John Montgomery
80
DISCLOSURE OF FUND EXPENSES
(Unaudited)
As a shareholder of the Fund, you will incur no transaction costs from the Fund, including sales charges (loads) on purchases, on reinvested dividends, or on other distributions. There are also no redemption fees or exchange fees. However, as a shareholder of the Fund, you will incur ongoing costs, including management fees and other Fund expenses. The following examples are intended to help you understand your ongoing costs (in dollars) of investing in the Fund and to compare these costs with the ongoing costs of investing in other mutual funds. The examples are based on an investment of $1,000 invested on July 1, 2005 and held until December 31, 2005.
Actual Return. The first line of the table below provides information about actual account values and actual expenses. You may use the information in this line, together with the amount you invested, to estimate the expenses that you paid over the period. Simply divide your account value by $1,000 (for example, an $8,600 account value divided by $1,000 = 8.6), then multiply the result by the number in the first line under the heading "Expense Paid During Period" to estimate the expenses you paid on your account during this period.
Hypothetical 5% Return. The second line of the table below provides information about hypothetical account values and hypothetical expenses based on the Fund's actual expense ratio and an assumed rate of return of 5% per year before expenses, which is not the Fund's actual return. The hypothetical account values and expenses may not be used to estimate the actual ending account balance or expenses you paid for the period. You may use this information to compare the ongoing costs of investing in a Fund and other mutual funds. To do so, compare this 5% hypothetical example with the 5% hypothetical examples that appear in the shareholder reports of the other funds.
The expenses shown in the table are meant to highlight ongoing Fund costs only. Therefore, the second line of the table is useful in comparing ongoing costs only, and will not help you determine the relative total costs of owning different funds, because other funds may also have transaction costs, such as sales charges, redemption fees or exchange fees.
Bridgeway Small-Cap Growth Fund
| | Beginning Account
Value at 7/1/05
| | Ending Account
Value at 12/31/05
| | Expense Paid
During Period*
7/1/05 - 12/31/05
|
|---|
| Actual Fund Return | | $ | 1,000.00 | | $ | 1,121.70 | | $ | 4.71 |
| Hypothetical Fund Return | | $ | 1,000.00 | | $ | 1,020.77 | | $ | 4.48 |
- *
- Expenses are equal to the Fund's annualized expense ratio of 0.88% multiplied by the average account value over the period, multiplied by the number of days in the first fiscal half-year divided by 365 days in the current year (to reflect the one half-year period).
81
SCHEDULE OF INVESTMENTS
Showing percentage of net assets as of December 31, 2005
(Unaudited)
Industry
| | Company
| | Shares
| | Value
| |
|---|
COMMON STOCKS—93.7% |
|
|
|
|
|
|
| Advertising—0.2% | | | | | | |
| | | Ventiv Health Inc* | | 12,975 | | $ | 306,469 | |
Aerospace/Defense—2.1% |
|
|
|
|
|
|
| | | Armor Holdings Inc* | | 24,800 | | | 1,057,720 | |
| | | Engineered Support Systems Inc | | 25,350 | | | 1,055,574 | |
| | | Teledyne Technologies Inc* | | 8,000 | | | 232,800 | |
| | | United Industrial Corp | | 7,000 | | | 289,590 | |
| | | | | | |
| |
| | | | | | | | 2,635,684 | |
Apparel—1.0% |
|
|
|
|
|
|
| | | Guess? Inc* | | 27,100 | | | 964,760 | |
| | | I.C. Isaacs & Co Inc* | | 73,000 | | | 335,070 | |
| | | | | | |
| |
| | | | | | | | 1,299,830 | |
| Banks—1.8% | | | | | | |
| | | Corus Bankshares Inc | | 17,300 | | | 973,471 | |
| | | First Regional Bancorp* | | 2,151 | | | 145,300 | |
| | | Old Second Bancorp Inc | | 7,800 | | | 238,446 | |
| | | PrivateBancorp Inc | | 24,200 | | | 860,794 | |
| | | | | | |
| |
| | | | | | | | 2,218,011 | |
Beverages—2.0% |
|
|
|
|
|
|
| | | Hansen Natural Corp*+ | | 32,800 | | | 2,584,968 | |
Biotechnology—0.8% |
|
|
|
|
|
|
| | | ArQule Inc* | | 19,050 | | | 116,586 | |
| | | SuperGen Inc* | | 184,202 | | | 930,220 | |
| | | | | | |
| |
| | | | | | | | 1,046,806 | |
Chemicals—1.4% |
|
|
|
|
|
|
| | | CFC International Inc* | | 39,000 | | | 547,599 | |
| | | Eastman Chemical Co | | 17,000 | | | 877,030 | |
| | | The Lubrizol Corp | | 8,000 | | | 347,440 | |
| | | | | | |
| |
| | | | | | | | 1,772,069 | |
Coal—2.3% |
|
|
|
|
|
|
| | | CONSOL Energy Inc | | 25,300 | | | 1,649,054 | |
| | | Foundation Coal Holdings Inc | | 26,200 | | | 995,600 | |
| | | Peabody Energy Corp | | 4,000 | | | 329,680 | |
| | | | | | |
| |
| | | | | | | | 2,974,334 | |
Commercial Services—5.2% |
|
|
|
|
|
|
| | | Barrett Business Services* | | 39,200 | | | 979,608 | |
| | | Bright Horizons Family Solutions Inc* | | 8,800 | | | 326,040 | |
| | | Education Management Corp* | | 12,300 | | | 412,173 | |
| | | Home Solutions of America Inc* | | 198,000 | | | 887,040 | |
| | | | | | | | | |
82
| | | Kendle International Inc* | | 39,000 | | $ | 1,003,860 | |
| | | Korn/Ferry International* | | 37,700 | | | 704,613 | |
| | | Labor Ready Inc* | | 53,100 | | | 1,105,542 | |
| | | MPS Group Inc* | | 83,100 | | | 1,135,977 | |
| | | | | | |
| |
| | | | | | | | 6,554,853 | |
Computers—3.7% |
|
|
|
|
|
|
| | | Ansoft Corp* | | 19,807 | | | 674,428 | |
| | | Cognizant Technology Solutions Corp* | | 36,440 | | | 1,834,754 | |
| | | Electronics for Imaging* | | 35,500 | | | 944,655 | |
| | | PAR Technology Corp* | | 34,000 | | | 943,840 | |
| | | Synplicity Inc* | | 37,760 | | | 313,408 | |
| | | | | | |
| |
| | | | | | | | 4,711,085 | |
Cosmetics/ Personal Care—0.2% |
|
|
|
|
|
|
| | | Chattem Inc* | | 6,000 | | | 218,340 | |
�� Distribution/Wholesale—0.1% |
|
|
|
|
|
|
| | | Navarre Corp*+ | | 22,100 | | | 122,213 | |
Electrical Components & Equipment—1.5% |
|
|
|
|
|
|
| | | Graham Corp | | 41,900 | | | 942,750 | |
| | | The Lamson & Sessions Co* | | 39,400 | | | 985,788 | |
| | | | | | |
| |
| | | | | | | | 1,928,538 | |
Electronics—3.9% |
|
|
|
|
|
|
| | | American Science & Engineering Inc* | | 17,000 | | | 1,060,290 | |
| | | Checkpoint Systems Inc* | | 26,000 | | | 640,900 | |
| | | Itron Inc* | | 30,200 | | | 1,209,208 | |
| | | Molecular Devices Corp* | | 35,500 | | | 1,027,015 | |
| | | Park Electrochemical Corp | | 40,900 | | | 1,062,582 | |
| | | | | | |
| |
| | | | | | | | 4,999,995 | |
Environmental Control—0.6% |
|
|
|
|
|
|
| | | Clean Harbors Inc* | | 27,000 | | | 777,870 | |
Food—0.4% |
|
|
|
|
|
|
| | | Gold Kist Inc* | | 30,000 | | | 448,500 | |
Hand/Machine Tools—0.7% |
|
|
|
|
|
|
| | | Baldor Electric Co | | 36,000 | | | 923,400 | |
Healthcare Products—7.5% |
|
|
|
|
|
|
| | | Cutera Inc* | | 46,200 | | | 1,217,832 | |
| | | Hologic Inc* | | 25,000 | | | 948,000 | |
| | | Intuitive Surgical Inc* | | 15,400 | | | 1,805,958 | |
| | | IRIS International Inc* | | 44,300 | | | 968,398 | |
| | | LCA-Vision Inc | | 38,850 | | | 1,845,764 | |
| | | SurModics Inc* | | 18,000 | | | 665,820 | |
| | | Techne Corp* | | 20,100 | | | 1,128,615 | |
| | | Vital Images Inc* | | 36,300 | | | 949,245 | |
| | | | | | |
| |
| | | | | | | | 9,529,632 | |
| | | | | | | | | |
83
Healthcare Services—3.3% |
|
|
|
|
|
|
| | | Amedisys Inc* | | 10,100 | | $ | 426,624 | |
| | | American Retirement Corp* | | 51,400 | | | 1,291,682 | |
| | | DaVita Inc* | | 25,785 | | | 1,305,752 | |
| | | Psychiatric Solutions Inc* | | 9,000 | | | 528,660 | |
| | | UnitedHealth Group Inc | | 11,250 | | | 699,075 | |
| | | | | | |
| |
| | | | | | | | 4,251,793 | |
Holding Companies Diversified—0.5% |
|
|
|
|
|
|
| | | Walter Industries Inc | | 13,300 | | | 661,276 | |
Household Products/Wares—0.2% |
|
|
|
|
|
|
| | | CNS Inc | | 14,000 | | | 306,740 | |
Internet—5.0% |
|
|
|
|
|
|
| | | CNET Networks Inc* | | 100,400 | | | 1,474,876 | |
| | | Cybersource Corp* | | 127,100 | | | 838,860 | |
| | | Earthlink Inc* | | 65,400 | | | 726,594 | |
| | | Homestore Inc* | | 145,000 | | | 739,500 | |
| | | NetFlix Inc* | | 23,000 | | | 622,380 | |
| | | Nutri/System Inc* | | 24,000 | | | 864,480 | |
| | | SonicWall Inc* | | 104,100 | | | 824,472 | |
| | | United Online Inc | | 22,800 | | | 324,216 | |
| | | | | | |
| |
| | | | | | | | 6,415,378 | |
Iron/Steel—0.6% |
|
|
|
|
|
|
| | | Carpenter Technology Corp | | 10,900 | | | 768,123 | |
Lodging—0.7% |
|
|
|
|
|
|
| | | Riviera Holdings Corp* | | 52,500 | | | 860,475 | |
Machinery-Construction & Mining—2.2% |
|
|
|
|
|
|
| | | Astec Industries Inc* | | 20,000 | | | 653,200 | |
| | | JLG Industries Inc | | 25,300 | | | 1,155,198 | |
| | | Joy Global Inc | | 24,000 | | | 960,000 | |
| | | | | | |
| |
| | | | | | | | 2,768,398 | |
Machinery Diversified—1.8% |
|
|
|
|
|
|
| | | Intevac Inc* | | 62,200 | | | 821,040 | |
| | | The Middleby Corp* | | 17,600 | | | 1,522,400 | |
| | | | | | |
| |
| | | | | | | | 2,343,440 | |
Metal Fabricate/Hardware—1.0% |
|
|
|
|
|
|
| | | Sun Hydraulics Corp | | 58,000 | | | 1,121,140 | |
| | | The Timken Co | | 4,825 | | | 154,497 | |
| | | | | | |
| |
| | | | | | | | 1,275,637 | |
Mining—0.9% |
|
|
|
|
|
|
| | | Titanium Metals Corp* | | 18,600 | | | 1,176,636 | |
84
Miscellaneous Manufacturing—1.5% |
|
|
|
|
|
|
| | | Ceradyne Inc* | | 20,000 | | $ | 876,000 | |
| | | Trinity Industries Inc | | 22,400 | | | 987,168 | |
| | | | | | |
| |
| | | | | | | | 1,863,168 | |
Office Furnishing—0.7% |
|
|
|
|
|
|
| | | HNI Corp | | 16,300 | | | 895,359 | |
Oil & Gas—9.0% |
|
|
|
|
|
|
| | | Berry Petroleum Co | | 18,000 | | | 1,029,600 | |
| | | Cabot Oil & Gas Corp | | 4,000 | | | 180,400 | |
| | | FieldPoint Petroleum Corp* | | 64,900 | | | 447,161 | |
| | | Frontier Oil Corp | | 24,500 | | | 919,485 | |
| | | Goodrich Petroleum Corp* | | 52,000 | | | 1,307,800 | |
| | | Grey Wolf Inc* | | 74,000 | | | 572,020 | |
| | | Helmerich & Payne Inc | | 24,900 | | | 1,541,559 | |
| | | Holly Corp | | 16,000 | | | 941,920 | |
| | | Parker Drilling Co* | | 90,000 | | | 974,700 | |
| | | Southwestern Energy Co* | | 68,400 | | | 2,458,296 | |
| | | Vintage Petroleum Inc | | 20,000 | | | 1,066,600 | |
| | | | | | |
| |
| | | | | | | | 11,439,541 | |
Oil & Gas Services—5.1% |
|
|
|
|
|
|
| | | Cal Dive International Inc* | | 25,000 | | | 897,250 | |
| | | Dril-Quip Inc* | | 23,000 | | | 1,085,600 | |
| | | Lufkin Industries Inc | | 18,100 | | | 902,647 | |
| | | Mitcham Industries Inc* | | 53,500 | | | 934,645 | |
| | | NATCO Group Inc* | | 43,400 | | | 887,964 | |
| | | RPC Inc | | 33,880 | | | 892,399 | |
| | | Superior Energy Services* | | 42,800 | | | 900,940 | |
| | | | | | |
| |
| | | | | | | | 6,501,445 | |
Pharmaceuticals—4.6% |
|
|
|
|
|
|
| | | Anika Therapeutics Inc* | | 78,200 | | | 914,158 | |
| | | Kos Pharmaceuticals Inc* | | 13,500 | | | 698,355 | |
| | | Matrixx Initiatives Inc* | | 87,500 | | | 1,833,125 | |
| | | United Therapeutics Corp* | | 13,100 | | | 905,472 | |
| | | Valeant Pharmaceuticals International | | 29,500 | | | 533,360 | |
| | | Viropharma Inc* | | 50,000 | | | 927,500 | |
| | | | | | |
| |
| | | | | | | | 5,811,970 | |
Real Estate—0.7% |
|
|
|
|
|
|
| | | Consolidated Tomoka Land Co. | | 12,200 | | | 864,980 | |
Retail—6.3% |
|
|
|
|
|
|
| | | Chico's FAS Inc* | | 35,400 | | | 1,555,122 | |
| | | Coldwater Creek Inc* | | 29,300 | | | 894,529 | |
| | | MarineMax Inc* | | 8,250 | | | 260,452 | |
| | | MSC Industrial Direct Co | | 30,200 | | | 1,214,644 | |
| | | O'Reilly Automotive Inc* | | 33,800 | | | 1,081,938 | |
| | | The Sportsman's Guide Inc* | | 60,150 | | | 1,434,578 | |
| | | | | | | | | |
85
| | | Urban Outfitters Inc* | | 61,600 | | $ | 1,559,096 | |
| | | | | | |
| |
| | | | | | | | 8,000,359 | |
Semiconductors—5.0% |
|
|
|
|
|
|
| | | BTU International Inc* | | 116,486 | | | 1,468,877 | |
| | | Cohu Inc | | 38,000 | | | 869,060 | |
| | | Kopin Corp* | | 141,396 | | | 756,469 | |
| | | Nvidia Corp* | | 26,200 | | | 957,872 | |
| | | Supertex Inc* | | 29,500 | | | 1,305,375 | |
| | | Zoran Corp* | | 58,000 | | | 940,180 | |
| | | | | | |
| |
| | | | | | | | 6,297,833 | |
Software—3.4% |
|
|
|
|
|
|
| | | BMC Software Inc* | | 47,600 | | | 975,324 | |
| | | Informatica Corp* | | 70,400 | | | 844,800 | |
| | | Quality Systems Inc* | | 15,900 | | | 1,220,484 | |
| | | Transaction Systems Architects Inc* | | 17,800 | | | 512,462 | |
| | | Wind River Systems Inc* | | 49,000 | | | 723,730 | |
| | | | | | |
| |
| | | | | | | | 4,276,800 | |
Telecommunications—4.6% |
|
|
|
|
|
|
| | | CommScope Inc* | | 39,300 | | | 791,109 | |
| | | Comtech Telecommunications Corp* | | 9,000 | | | 274,860 | |
| | | Hypercom Corp* | | 134,700 | | | 860,733 | |
| | | Lightbridge Inc* | | 95,355 | | | 790,493 | |
| | | NMS Communications Corp* | | 253,400 | | | 884,366 | |
| | | Powerwave Technologies Inc* | | 69,000 | | | 867,330 | |
| | | Ubiquitel Inc* | | 45,900 | | | 453,951 | |
| | | ViaSat Inc* | | 34,400 | | | 919,512 | |
| | | | | | |
| |
| | | | | | | | 5,842,354 | |
Textiles—0.1% |
|
|
|
|
|
|
| | | Forward Industries Inc* | | 14,000 | | | 124,600 | |
Transportation—1.1% |
|
|
|
|
|
|
| | | JB Hunt Transport Services Inc | | 60,500 | | | 1,369,720 | |
| | | | | | |
| |
TOTAL COMMON STOCKS
(Cost $99,543,599) | | | | | 119,168,622 | |
| | | | | | |
| |
MONEY MARKET MUTUAL FUNDS—6.9% |
|
|
|
|
|
|
| First American Treasury Obligations Fund—Class S | | 8,748,961 | | | 8,748,961 | |
| | | | | | |
| |
TOTAL MONEY MARKET MUTUAL FUNDS
(Cost $8,748,961) | | | | | 8,748,961 | |
| | | | | | |
| |
TOTAL INVESTMENTS—100.6%
(Cost $108,292,560) |
|
|
|
$ |
127,917,583 |
|
| Liabilities in excess of Other Assets—(0.6%) | | | | | (708,354 | ) |
| | | | | | |
| |
| NET ASSETS—100.0% | | | | $ | 127,209,229 | |
| | | | | | |
| |
- *
- Non-income producing security
- +
- This security or a portion of this security is out on loan at December 31, 2005. Total loaned securities had a market value of $2,344,655 at December 31, 2005.
See Notes to Financial Statements
86
Small-Cap Value Fund
MANAGER'S COMMENTARY
(Unaudited)
December 31, 2005
Dear Fellow Small-Cap Value Shareholder,
Our Fund was up 1.85% in the December 2005 quarter, compared to a 0.66% gain for our primary market benchmark, the Russell 2000 Value Index, and a 1.34% return of our peer benchmark, the Lipper Small-Cap Value Index. It was a good but not exceptional quarter.
For the calendar year, the Fund was up 18.92%, beating the Russell 2000 Value Index by 14.21% and the Lipper Small-Cap Value Index by 11.47%. We beat both benchmarks for the quarter, six-month, one year and life-to-date periods, a "clean sweep," with which I am very pleased.
The table below presents our performance for the December quarter, six month, 1 year, and annualized performance since inception, followed by a graph of performance since inception.
| | Dec. Qtr.
10/1/05
to 12/31/05
| | 6 Months
7/1/05
to 12/31/05
| | 1 Year
1/1/05
to 12/31/05
| | Life-to-Date
10/31/03
to 12/31/05
| |
|---|
| Small-Cap Value Fund | | 1.85 | % | 12.13 | % | 18.92 | % | 18.06 | % |
| Russell 2000 Value Index | | 0.66 | % | 3.78 | % | 4.71 | % | 15.92 | % |
| Lipper Small-Cap Value Index | | 1.34 | % | 6.04 | % | 7.45 | % | 16.90 | % |
Performance figures quoted represent past performance and are no guarantee of future results. Current performance may be lower or higher than the performance figures quoted, and an investor's shares, when redeemed, may be worth more or less than original cost. For the most recent month-end performance, please call 1-800-661-3550 or visit the Fund's website at www.bridgeway.com.
The Russell 2000 Value Index is an unmanaged index which consists of stocks in the Russell 2000 Index with lower price-to-book ratios and lower forecasted growth values with dividends reinvested. The Lipper Small-Cap Value Index is an index of small-company, value-oriented funds compiled by Lipper, Inc. It is not possible to invest directly in an index. Periods longer than one year are annualized.
For the six-month semi-annual period, our Fund was up 12.13%, compared to 3.78% for the Russell 2000 Value Index and 6.04% for the Lipper Small-Cap Value Index. Fourth quarter performance shows evidence of losing the energy boost that we had enjoyed during the third quarter; however, the six-month numbers don't show the effect.
According to data from Morningstar, Inc., our Fund ranked 2nd of 355 small-cap value funds for the last twelve months. The Fund's numeric rankings are based solely on total return performance. Morningstar ranks funds in various fund categories by making comparative calculations using total returns.
Growth of $10,000 Invested in Small-Cap Value Fund and Indexes from 10/31/03 (inception) to 12/31/05

87
Detailed Explanation of Quarterly Performance—What Worked Well
The Short Version: Three stocks gained over 50% for the December quarter. Grubb and Ellis was the top-performer out of all eleven Bridgeway mutual funds for the quarter.
Seven stocks gained more than 30% in the December quarter.
Rank
| | Description
| | Industry
| | % Gain
| |
|---|
| 1 | | Grubb & Ellis Co | | Real Estate | | 105.1 | % |
| 2 | | Titanium Metals Corp | | Mining | | 59.9 | % |
| 3 | | Mitcham Industries Inc | | Oil & Gas Services | | 53.3 | % |
| 4 | | Supertex Inc | | Semiconductors | | 47.2 | % |
| 5 | | AAR Corp | | Aerospace/Defense | | 44.3 | % |
| 6 | | Andersons Inc/The | | Agriculture | | 37.4 | % |
| 7 | | American Retirement Corp | | Healthcare-Services | | 34.3 | % |
| 8 | | Darden Restaurants Inc | | Retail | | 29.1 | % |
| 9 | | WESCO International Inc | | Distribution/Wholesale | | 26.2 | % |
| 10 | | SonicWALL Inc | | Internet | | 24.7 | % |
Since 1958, Grubb & Ellis, a commercial real estate company, has provided a wide range of integrated real estate services to owners/investors and tenants. They advise buyers, sellers, landlords, and tenants on the sale, leasing, and valuation of commercial property, along with property management and related services for owners of investment properties. In early December, in a privately negotiated transaction, the company purchased 5.8 million shares of its common stock at $4.00 per share. According to Grubb & Ellis' CEO, "We believe our stock is undervalued by the market, and we are constantly exploring strategic initiatives designed to enhance stockholder value." The street must have agreed. The publicly-traded share price the same day was $7.10; it closed on December 30 at $11.70.
Titanium reminds me of the 21st century's elixir, the bottle of mysterious brown liquid hawked by slick salesmen to cure, energize or clean everything you could imagine. "Ti" on the periodic chart, it is a light, strong, lustrous, corrosion-resistant (including sea water and chlorine) transition metal with a white-silvery metallic color. It's used in white paint, paper, toothpaste, plastics, cement, joint replacements, tennis rackets, gemstones and air purifiers. Its alloys are used in aircraft, armor plating, naval ships, spacecraft and missiles because of its low density (60% as dense as steel), lightness and strength (as strong as steel and 43% lighter.) Our number two best performer, Titanium Metals Corporation, offers titanium sponge, melted, and mill products for aerospace, industrial, and other applications. Titanium Metals has been a steady performer for the Fund over the last year and a half. As you'll see below, the company is our best performer for the calendar year, up a whopping 424.1%.
For shareholders who own both Small-Cap Value and Small-Cap Growth Funds, you may notice that three stocks on the list above are also in Small-Cap Growth. How can the same company be classified as both value and growth? At the time of purchase a stock qualifies for only one Fund. However, price changes, and to a lesser degree, changes in fundamental financial characteristics can change the designation from growth to value, especially for stocks on the margin between value and growth. Therefore, over time it is possible to have purchased a stock at different times for more than one of these Funds. Similarly, a stock can grow from small to large and end up in, for instance, both the Small-Cap Value Fund and the Large-Cap Value Fund. Since we don't immediately sell a stock when it moves across one of these "boundaries," it can end up in more than one fund at the same time. Overall, there is currently a 23% "overlap" between these two funds, most near the border of designation.
88
Detailed Explanation of Quarterly Performance—What Didn't Work
The Short Version: Except for one stock with an over-50% loss, there wasn't much not to like for the quarter in this Fund.
Rank
| | Description
| | Industry
| | % Loss
| |
|---|
| 1 | | Forward Industries Inc | | Textiles | | -62.1 | % |
| 2 | | Wilsons The Leather Experts | | Retail | | -29.4 | % |
| 3 | | Dominion Homes Inc | | Home Builders | | -29.0 | % |
| 4 | | Riviera Holdings Corp | | Lodging | | -26.0 | % |
| 5 | | Building Material Holding Corp | | Distribution/Wholesale | | -25.1 | % |
| 6 | | Toll Brothers Inc | | Home Builders | | -24.6 | % |
| 7 | | MDC Holdings Inc | | Home Builders | | -21.4 | % |
| 8 | | Petroquest Energy Inc | | Oil & Gas | | -20.7 | % |
| 9 | | SuperGen Inc | | Biotechnology | | -19.8 | % |
| 10 | | Clayton Williams Energy Inc | | Oil & Gas | | -19.6 | % |
Forward Industries, maker of carrying cases for cell phones, laptops and other equipment, is our top worst performer for the quarter. Timing of product shipments, pricing pressures and higher operating costs are a bad combination and caused the Florida-based company's recent price tumble.
Five of the ten companies listed above are related to the homebuilding and materials business, industries that were hurt by the threat of a slowdown following rising interest rates. These stocks are classified in the Consumer, Cyclical Sector. Although it was our second heaviest weighted sector for the quarter, its losses were not severe, costing us about a percent of return.
Detailed Explanation of Calendar Year Performance—What Worked Well
The Short Version: All ten of our top performers for the calendar year rendered above 50% return. Clearly, we benefited from energy holdings during the full twelve-month period.
Twelve stocks gained more than 50% in the calendar year.
Rank
| | Description
| | Industry
| | % Gain
| |
|---|
| 1 | | Titanium Metals Corp | | Mining | | 424.1 | % |
| 2 | | Holly Corp | | Oil & Gas | | 104.2 | % |
| 3 | | Peabody Energy Corp | | Coal | | 103.7 | % |
| 4 | | McDermott International Inc | | Engineering & Construction | | 93.1 | % |
| 5 | | Mitcham Industries Inc | | Oil & Gas Services | | 87.6 | % |
| 6 | | Humana Inc | | Healthcare-Services | | 83.0 | % |
| 7 | | Grubb & Ellis Co | | Real Estate | | 82.3 | % |
| 8 | | Tesoro Corp | | Oil & Gas | | 64.8 | % |
| 9 | | AAR Corp | | Aerospace/Defense | | 59.3 | % |
| 10 | | Consol Energy Inc | | Coal | | 58.8 | % |
As outlined in the quarterly returns, Titanium Metals was the absolute bright spot for the calendar year as well. Even doubling in price, Holly Corp. and Peabody Energy Corp. are in distant second and third places. Holly's five year annualized total return of 80.7% has been reported the best in the oil and gas industry. Headquartered in Dallas, Texas, Holly Corporation is an independent petroleum refiner and marketer producing high value light products such as gasoline, diesel fuel and jet fuel. Forbes magazine has named it as one of America's best managed companies in 2005. "Holly's remarkable growth is a testament to its dedicated employees, disciplined operations and proven business strategy," said Matthew Clifton, Holly's Chief Executive Officer. Peabody Energy is one of the
89
biggest US coal companies, whose growth has been boosted by record production and high coal and fuel prices.
Detailed Explanation of Calendar Year Performance—What Didn't Work
The Short Version: Although a couple of stocks hovered closely, there were no holdings with losses greater than 50% for the calendar year, which helped our stats.
Rank
| | Description
| | Industry
| | % Loss
| |
|---|
| 1 | | Forward Industries Inc | | Textiles | | -49.9 | % |
| 2 | | AK Steel Holding Corp | | Iron/Steel | | -46.0 | % |
| 3 | | Park-Ohio Holdings Corp | | Miscellaneous Manufacturing | | -43.9 | % |
| 4 | | InterVoice Inc | | Computers | | -40.4 | % |
| 5 | | OM Group Inc | | Chemicals | | -38.5 | % |
| 6 | | Wilsons The Leather Experts | | Retail | | -36.6 | % |
| 7 | | Bluegreen Corp | | Entertainment | | -36.6 | % |
| 8 | | Northwest Airlines Corp | | Airlines | | -36.2 | % |
| 9 | | Sapient Corp | | Internet | | -34.9 | % |
| 10 | | America Service Group Inc | | Healthcare-Services | | -34.7 | % |
Our ten stocks "in the red" were spread over ten different industries. The stock price of steelmaker AK Steel Holding Corporation, pressured by offshore producers, had a rickety ride the last three quarters of 2005. Although we sold the last of our holdings in May, its price affected our return for the year.
There is one fairly unusual statistic I want to share (and for which I am very pleased): only one sector in our Fund was in negative territory for the calendar year, and even though it was down for the year, it beat our S&P Small-cap market bogey for that sector.
Top Ten Holdings
At quarter end, Industrial comprised our largest sector representation at 25.1% of net assets, followed by Consumer, Cyclical at 18.3% and Consumer, Non-cyclical at 16.7%. Our top ten holdings represented only 17.1% of net assets, which demonstrates the diversification of this Fund. This strategy spreads the risk associated with any one company in an attempt to reduce overall portfolio volatility (and contrasts with some of our more aggressively managed styles which can place some pretty big bets on individual stocks.)
Rank
| | Description
| | Industry
| | Percent of
Net Assets
| |
|---|
| 1 | | Quanta Services Inc | | Commercial Services | | 2.8 | % |
| 2 | | Goodyear Tire & Rubber Co | | Auto Parts & Equipment | | 2.6 | % |
| 3 | | Intergraph Corp | | Computers | | 2.0 | % |
| 4 | | Columbus McKinnon Corp | | Machinery-Diversified | | 1.8 | % |
| 5 | | GATX Corp | | Trucking & Leasing | | 1.6 | % |
| 6 | | AAR Corp | | Aerospace/Defense | | 1.4 | % |
| 7 | | Eastman Chemical Co | | Chemicals | | 1.3 | % |
| 8 | | LMI Aerospace Inc | | Aerospace/Defense | | 1.2 | % |
| 9 | | Dril-Quip Inc | | Oil & Gas Services | | 1.2 | % |
| 10 | | McDermott International Inc | | Engineering & Construction | | 1.2 | % |
| | | | | | |
| |
| | Total | | | | 17.1 | % |
90
Industry Sector Representation as of December 31, 2005
Industry
| | % of Net Assets
| | % S&P Small-cap
| | Difference
| |
|---|
| Basic Materials | | 5.5 | % | 3.4 | % | 2.1 | % |
| Communications | | 8.6 | % | 3.4 | % | 5.2 | % |
| Consumer, Cyclical | | 18.3 | % | 18.7 | % | -0.4 | % |
| Consumer, Non-cyclical | | 16.7 | % | 17.6 | % | -0.9 | % |
| Energy | | 7.7 | % | 7.9 | % | -0.2 | % |
| Financial | | 9.6 | % | 14.7 | % | -5.1 | % |
| Industrial | | 25.1 | % | 20.1 | % | 5.0 | % |
| Technology | | 6.7 | % | 9.8 | % | -3.1 | % |
| Utilities | | 0.7 | % | 4.4 | % | -3.7 | % |
| Diversified | | 0.3 | % | 0.0 | % | 0.3 | % |
| Cash | | 0.8 | % | 0.0 | % | 0.8 | % |
| | |
| |
| | | |
| | Total | | 100.0 | % | 100.0 | % | | |
Disclaimer
The following is a reminder from the friendly folks at your Fund who worry about liability. The views expressed here are exclusively those of Fund management. These views, including those regarding market sectors or individual stocks, are not meant as investment advice and should not be considered predictive in nature. Any favorable (or unfavorable) description of a holding applies only as of the quarter end, December 31, 2005, unless otherwise stated. Security positions can and do change thereafter. Discussions of historical performance do not guarantee and are not indicative of future performance.
The Fund is subject to above average market risk (volatility) and is not an appropriate investment for short-term investors. Investments in the small companies within this fund carry greater risk than is customarily associated with larger companies for various reasons such as narrower markets, limited financial resources and less liquid stock.
This report is submitted for the general information of the shareholders of the Fund. It is not authorized for distribution to prospective investors unless preceded or accompanied by an effective prospectus, which includes information regarding the Fund's risks, objectives, fees and expenses, experience of its management, and other information For questions or other fund information, call 1-800-661-3550 or visit the Fund's website www.bridgeway.com. Foreside Fund Services, LLC, distributor.
Conclusion
Thank-you for your continued investment in Small-Cap Value. This Fund remains open to both current and new investors. As always, we appreciate your feedback.
Sincerely,
John Montgomery
91
DISCLOSURE OF FUND EXPENSES
(Unaudited)
As a shareholder of the Fund, you will incur no transaction costs from the Fund, including sales charges (loads) on purchases, on reinvested dividends, or on other distributions. There are also no redemption fees or exchange fees. However, as a shareholder of the Fund, you will incur ongoing costs, including management fees and other Fund expenses. The following examples are intended to help you understand your ongoing costs (in dollars) of investing in the Fund and to compare these costs with the ongoing costs of investing in other mutual funds. The examples are based on an investment of $1,000 invested on July 1, 2005 and held until December 31, 2005.
Actual Return. The first line of the table below provides information about actual account values and actual expenses. You may use the information in this line, together with the amount you invested, to estimate the expenses that you paid over the period. Simply divide your account value by $1,000 (for example, an $8,600 account value divided by $1,000 = 8.6), then multiply the result by the number in the first line under the heading "Expense Paid During Period" to estimate the expenses you paid on your account during this period.
Hypothetical 5% Return. The second line of the table below provides information about hypothetical account values and hypothetical expenses based on the Fund's actual expense ratio and an assumed rate of return of 5% per year before expenses, which is not the Fund's actual return. The hypothetical account values and expenses may not be used to estimate the actual ending account balance or expenses you paid for the period. You may use this information to compare the ongoing costs of investing in a Fund and other mutual funds. To do so, compare this 5% hypothetical example with the 5% hypothetical examples that appear in the shareholder reports of the other funds.
The expenses shown in the table are meant to highlight ongoing Fund costs only. Therefore, the second line of the table is useful in comparing ongoing costs only, and will not help you determine the relative total costs of owning different funds, because other funds may also have transaction costs, such as sales charges, redemption fees or exchange fees.
Bridgeway Small-Cap Value Fund
| | Beginning Account
Value at 7/1/05
| | Ending Account
Value at 12/31/05
| | Expense Paid
During Period*
7/1/05 - 12/31/05
|
|---|
| Actual Fund Return | | $ | 1,000.00 | | $ | 1,121.30 | | $ | 4.28 |
| Hypothetical Fund Return | | $ | 1,000.00 | | $ | 1,021.17 | | $ | 4.08 |
- *
- Expenses are equal to the Fund's annualized expense ratio of 0.80% multiplied by the average account value over the period, multiplied by the number of days in the first fiscal half-year divided by 365 days in the current year (to reflect the one half-year period).
92
SCHEDULE OF INVESTMENTS
Showing percentage of net assets as of December 31, 2005
(Unaudited)
Industry
| | Company
| | Shares
| | Value
| |
|---|
COMMON STOCKS—99.2% |
|
|
|
|
|
|
| Advertising—0.3% | | | | | | |
| | | Ventiv Health Inc* | | 30,300 | | $ | 715,686 | |
Aerospace/Defense—3.9% |
|
|
|
|
|
|
| | | AAR Corp* | | 129,900 | | | 3,111,105 | |
| | | Armor Holdings Inc* | | 54,000 | | | 2,303,100 | |
| | | LMI Aerospace Inc* | | 184,100 | | | 2,610,538 | |
| | | United Industrial Corp | | 11,000 | | | 455,070 | |
| | | | | | |
| |
| | | | | | | | 8,479,813 | |
Airlines—0.7% |
|
|
|
|
|
|
| | | Alaska Air Group Inc* | | 42,400 | | | 1,514,528 | |
Apparel—1.7% |
|
|
|
|
|
|
| | | Bakers Footwear Group Inc* | | 75,200 | | | 1,156,576 | |
| | | Oxford Industries Inc | | 44,600 | | | 2,439,620 | |
| | | | | | |
| |
| | | | | | | | 3,596,196 | |
Auto Parts & Equipment—2.7% |
|
|
|
|
|
|
| | | The Goodyear Tire & Rubber Co* | | 331,900 | | | 5,768,422 | |
Banks—2.2% |
|
|
|
|
|
|
| | | Center Financial Corp | | 53,100 | | | 1,335,996 | |
| | | City Holding Co | | 48,000 | | | 1,725,600 | |
| | | Intervest Bancshares Corp* | | 70,102 | | | 1,735,025 | |
| | | | | | |
| |
| | | | | | | | 4,796,621 | |
Beverages—0.2% |
|
|
|
|
|
|
| | | Constellation Brands Inc—Class A* | | 17,000 | | | 445,910 | |
Biotechnology—1.4% |
|
|
|
|
|
|
| | | Arqule Inc* | | 387,093 | | | 2,369,009 | |
| | | SuperGen Inc* | | 147,400 | | | 744,370 | |
| | | | | | |
| |
| | | | | | | | 3,113,379 | |
Building Materials—0.9% |
|
|
|
|
|
|
| | | Eagle Materials Inc | | 7,300 | | | 893,228 | |
| | | Universal Forest Products Inc | | 20,400 | | | 1,127,100 | |
| | | | | | |
| |
| | | | | | | | 2,020,328 | |
Chemicals—2.8% |
|
|
|
|
|
|
| | | Eastman Chemical Co | | 55,000 | | | 2,837,450 | |
| | | Lubrizol Corp | | 15,700 | | | 681,851 | |
| | | Lyondell Chemical Co | | 8,360 | | | 199,135 | |
| | | Schulman A Inc | | 111,600 | | | 2,401,632 | |
| | | | | | |
| |
| | | | | | | | 6,120,068 | |
| | | | | | | | | |
93
Coal—0.3% |
|
|
|
|
|
|
| | | CONSOL Energy Inc | | 4,000 | | $ | 260,720 | |
| | | Peabody Energy Corp | | 5,180 | | | 426,936 | |
| | | | | | |
| |
| | | | | | | | 687,656 | |
Commercial Services—6.8% |
|
|
|
|
|
|
| | | Administaff Inc | | 54,900 | | | 2,308,545 | |
| | | Consolidated Graphics Inc* | | 14,500 | | | 686,430 | |
| | | Kendle International Inc* | | 58,700 | | | 1,510,938 | |
| | | Korn/Ferry International* | | 78,900 | | | 1,474,641 | |
| | | Labor Ready Inc* | | 36,200 | | | 753,684 | |
| | | Quanta Services Inc* | | 455,100 | | | 5,993,667 | |
| | | Rural/Metro Corp* | | 229,663 | | | 2,073,857 | |
| | | | | | |
| |
| | | | | | | | 14,801,762 | |
Computers—3.3% |
|
|
|
|
|
|
| | | Agilysys Inc | | 131,400 | | | 2,394,108 | |
| | | Covansys Corp* | | 18,099 | | | 246,327 | |
| | | Intergraph Corp* | | 87,700 | | | 4,368,337 | |
| | | Intervoice Inc* | | 10,800 | | | 85,968 | |
| | | | | | |
| |
| | | | | | | | 7,094,740 | |
Distribution/Wholesale—3.1% |
|
|
|
|
|
|
| | | Brightpoint Inc* | | 83,500 | | | 2,315,455 | |
| | | Building Material Holding Corp | | 29,700 | | | 2,025,837 | |
| | | Navarre Corp* | | 109,600 | | | 606,088 | |
| | | Wesco International Inc* | | 40,800 | | | 1,743,384 | |
| | | | | | |
| |
| | | | | | | | 6,690,764 | |
Diversified Financial Services—2.4% |
|
|
|
|
|
|
| | | Knight Capital Group Inc* | | 238,400 | | | 2,357,776 | |
| | | Nelnet Inc* | | 13,000 | | | 528,840 | |
| | | Piper Jaffray Cos* | | 59,200 | | | 2,391,680 | |
| | | | | | |
| |
| | | | | | | | 5,278,296 | |
Electric—0.1% |
|
|
|
|
|
|
| | | OGE Energy Corp | | 5,400 | | | 144,666 | |
Electric Utilities—0.6% |
|
|
|
|
|
|
| | | WPS Resources Corp | | 23,500 | | | 1,299,785 | |
Electronics—1.6% |
|
|
|
|
|
|
| | | American Science & Engineering Inc* | | 6,000 | | | 374,220 | |
| | | Check Point Systems Inc* | | 66,500 | | | 1,639,225 | |
| | | CTS Corp | | 9,437 | | | 104,373 | |
| | | Park Electrochemical Corp | | 56,200 | | | 1,460,076 | |
| | | | | | |
| |
| | | | | | | | 3,577,894 | |
| | | | | | | | | |
94
Engineering & Construction—2.7% |
|
|
|
|
|
|
| | | EMCOR Group Inc* | | 34,800 | | $ | 2,350,044 | |
| | | McDermott International Inc* | | 56,800 | | | 2,533,848 | |
| | | Sterling Construction Co Inc* | | 53,200 | | | 895,356 | |
| | | | | | |
| |
| | | | | | | | 5,779,248 | |
Environmental Control—1.1% |
|
|
|
|
|
|
| | | Clean Harbors Inc* | | 81,000 | | | 2,333,610 | |
Food—2.0% |
|
|
|
|
|
|
| | | Seaboard Corp | | 1,400 | | | 2,115,400 | |
| | | Spartan Stores Inc* | | 215,300 | | | 2,243,426 | |
| | | | | | |
| |
| | | | | | | | 4,358,826 | |
Healthcare Services—2.3% |
|
|
|
|
|
|
| | | American Retirement Corp* | | 96,800 | | | 2,432,584 | |
| | | Humana Inc* | | 13,460 | | | 731,282 | |
| | | Res-Care Inc* | | 110,600 | | | 1,921,122 | |
| | | | | | |
| |
| | | | | | | | 5,084,988 | |
Holding Companies Diversified—0.3% |
|
|
|
|
|
|
| | | Walter Industries Inc | | 14,000 | | | 696,080 | |
Home Builders—2.3% |
|
|
|
|
|
|
| | | Beazer Homes USA Inc | | 22,100 | | | 1,609,764 | |
| | | Brookfield Homes Corp | | 5,708 | | | 283,859 | |
| | | Hovnanian Enterprises Inc—Class A* | | 26,820 | | | 1,331,345 | |
| | | KB Home | | 11,080 | | | 805,073 | |
| | | MDC Holdings Inc | | 9,062 | | | 561,663 | |
| | | Standard-Pacific Corp | | 9,200 | | | 338,560 | |
| | | | | | |
| |
| | | | | | | | 4,930,264 | |
Household Products/Wares—1.7% |
|
|
|
|
|
|
| | | Ennis Inc | | 77,600 | | | 1,409,992 | |
| | | Playtex Products* | | 170,000 | | | 2,323,900 | |
| | | | | | |
| |
| | | | | | | | 3,733,892 | |
Housewares—0.1% |
|
|
|
|
|
|
| | | Toro Co | | 5,800 | | | 253,866 | |
Insurance—4.5% |
|
|
|
|
|
|
| | | American Physicians Capital Inc* | | 16,200 | | | 741,798 | |
| | | Argonaut Group Inc* | | 29,500 | | | 966,715 | |
| | | Commerce Group Inc | | 33,700 | | | 1,930,336 | |
| | | Horace Mann Educators Corp | | 93,300 | | | 1,768,968 | |
| | | Ohio Casualty Corp | | 25,700 | | | 727,824 | |
| | | Stewart Information Services Corp | | 40,400 | | | 1,966,268 | |
| | | United Fire & Casualty Co | | 43,500 | | | 1,758,705 | |
| | | | | | |
| |
| | | | | | | | 9,860,614 | |
| | | | | | | | | |
95
Internet—2.4% |
|
|
|
|
|
|
| | | HomeStore Inc* | | 364,000 | | $ | 1,856,400 | |
| | | NetFlix Inc* | | 60,500 | | | 1,637,130 | |
| | | SonicWall Inc* | | 233,100 | | | 1,846,152 | |
| | | | | | |
| |
| | | | | | | | 5,339,682 | |
| Iron/Steel—2.2% | | | | | | |
| | | Carpenter Technology Corp | | 33,900 | | | 2,388,933 | |
| | | Reliance Steel and Aluminum Co | | 38,100 | | | 2,328,672 | |
| | | | | | |
| |
| | | | | | | | 4,717,605 | |
Lodging—0.5% |
|
|
|
|
|
|
| | | Riviera Holdings Corp* | | 62,900 | | | 1,030,931 | |
Machinery Diversified—2.9% |
|
|
|
|
|
|
| | | Columbus McKinnon Corp* | | 174,100 | | | 3,826,718 | |
| | | Intermec Inc* | | 31,400 | | | 1,061,320 | |
| | | Stewart & Stevenson Services Inc | | 72,300 | | | 1,527,699 | |
| | | | | | |
| |
| | | | | | | | 6,415,737 | |
Metal Fabricate/Hardware—2.4% |
|
|
|
|
|
|
| | | AM Castle & Co* | | 105,600 | | | 2,306,304 | |
| | | Commercial Metals Co | | 54,700 | | | 2,053,438 | |
| | | NS Group Inc* | | 22,500 | | | 940,725 | |
| | | | | | |
| |
| | | | | | | | 5,300,467 | |
Mining—0.5% |
|
|
|
|
|
|
| | | Titanium Metals Corp* | | 17,000 | | | 1,075,420 | |
Miscellaneous Manufacturer—0.5% |
|
|
|
|
|
|
| | | Clarcor Inc | | 38,200 | | | 1,134,922 | |
Office Furnishing—0.6% |
|
|
|
|
|
|
| | | CompX International Inc | | 7,300 | | | 116,946 | |
| | | Steelcase Inc | | 70,900 | | | 1,122,347 | |
| | | | | | |
| |
| | | | | | | | 1,239,293 | |
Oil & Gas—5.0% |
|
|
|
|
|
|
| | | Callon Petroleum Co* | | 15,000 | | | 264,750 | |
| | | Giant Industries Inc* | | 46,100 | | | 2,395,356 | |
| | | Holly Corp | | 16,400 | | | 965,468 | |
| | | Penn Virginia Corp | | 40,700 | | | 2,336,180 | |
| | | Petroquest Energy Inc* | | 93,500 | | | 774,180 | |
| | | Swift Energy Co* | | 45,900 | | | 2,068,713 | |
| | | Tesoro Corp | | 35,700 | | | 2,197,335 | |
| | | | | | |
| |
| | | | | | | | 11,001,982 | |
Oil & Gas Services—2.3% |
|
|
|
|
|
|
| | | Dril-Quip Inc* | | 54,200 | | | 2,558,240 | |
| | | Mitcham Industries* | | 141,900 | | | 2,478,993 | |
| | | | | | |
| |
| | | | | | | | 5,037,233 | |
| | | | | | | | | |
96
Packaging & Containers—0.3% |
|
|
|
|
|
|
| | | Silgan Holdings Inc | | 19,400 | | $ | 700,728 | |
Pharmaceuticals—2.3% |
|
|
|
|
|
|
| | | Alpharma Inc | | 81,900 | | | 2,334,969 | |
| | | Anika Therapeutics* | | 101,200 | | | 1,183,028 | |
| | | Valeant Pharmaceuticals International | | 81,100 | | | 1,466,288 | |
| | | | | | |
| |
| | | | | | | | 4,984,285 | |
Real Estate—0.5% |
|
|
|
|
|
|
| | | Grubb & Ellis Co* | | 92,000 | | | 1,104,000 | |
Retail—6.7% |
|
|
|
|
|
|
| | | Casey's General Store Inc | | 90,600 | | | 2,246,880 | |
| | | Darden Restaurants Inc | | 39,000 | | | 1,516,320 | |
| | | Denny's Corp* | | 64,420 | | | 259,613 | |
| | | Dillard's Inc | | 96,300 | | | 2,390,166 | |
| | �� | EZCORP Inc* | | 132,000 | | | 2,016,960 | |
| | | Luby's Inc* | | 150,700 | | | 2,004,310 | |
| | | MarineMax Inc* | | 23,100 | | | 729,267 | |
| | | Men's Wearhouse Inc* | | 4,800 | | | 141,312 | |
| | | Pantry Inc/The* | | 28,900 | | | 1,358,011 | |
| | | Rush Enterprises Inc* | | 130,000 | | | 1,934,400 | |
| | | | | | |
| |
| | | | | | | | 14,597,239 | |
Semiconductors—1.8% |
|
|
|
|
|
|
| | | Cohu Inc | | 7,300 | | | 166,951 | |
| | | PMC—Sierra Inc* | | 18,800 | | | 144,948 | |
| | | Supertex Inc* | | 45,804 | | | 2,026,827 | |
| | | Zoran Corp* | | 102,000 | | | 1,653,420 | |
| | | | | | |
| |
| | | | | | | | 3,992,146 | |
Software—1.6% |
|
|
|
|
|
|
| | | CCC Information Services Group* | | 30,738 | | | 805,950 | |
| | | Sybase Inc* | | 35,400 | | | 773,844 | |
| | | Transaction Systems Architects Inc* | | 45,000 | | | 1,295,550 | |
| | | Wind River Systems Inc* | | 41,400 | | | 611,478 | |
| | | | | | |
| |
| | | | | | | | 3,486,822 | |
Telecommunications—5.8% |
|
|
|
|
|
|
| | | Adaptec Inc* | | 432,000 | | | 2,514,240 | |
| | | Anixter International Inc | | 18,000 | | | 704,160 | |
| | | Dobson Communications Corp* | | 312,500 | | | 2,343,750 | |
| | | EMS Technologies Inc* | | 119,100 | | | 2,108,070 | |
| | | Interdigital Communications Corp* | | 101,555 | | | 1,860,488 | |
| | | Lantronix Inc* | | 449,300 | | | 741,345 | |
| | | SureWest Communications | | 6,961 | | | 183,561 | |
| | | Sycamore Networks Inc* | | 527,200 | | | 2,277,504 | |
| | | | | | |
| |
| | | | | | | | 12,733,118 | |
Textiles—0.2% |
|
|
|
|
|
|
| | | Forward Industries Inc* | | 50,600 | | | 450,340 | |
| | | | | | | | | |
97
Transportation—7.1% |
|
|
|
|
|
|
| | | Aleris International Inc* | | 73,500 | | $ | 2,369,640 | |
| | | Celadon Group Inc* | | 71,363 | | | 2,055,254 | |
| | | Hub Group Inc* | | 53,700 | | | 1,898,295 | |
| | | Maritrans Inc | | 60,700 | | | 1,579,414 | |
| | | OMI Corp | | 72,370 | | | 1,313,515 | |
| | | Overseas Shipholding Group | | 30,600 | | | 1,541,934 | |
| | | SCS Transportation Inc* | | 109,900 | | | 2,335,375 | |
| | | USA Truck Inc* | | 84,700 | | | 2,467,311 | |
| | | | | | |
| |
| | | | | | | | 15,560,738 | |
Trucking & Leasing—1.6% |
|
|
|
|
|
|
| | | GATX Corp | | 95,100 | | | 3,431,208 | |
| | | | | | |
| |
TOTAL COMMON STOCKS
(Cost $191,302,897) | | | | | 216,511,798 | |
| | | | | | |
| |
MONEY MARKET MUTUAL FUNDS—1.4% |
|
|
|
|
|
|
| First American Treasury Obligations Fund—Class S | | 3,057,433 | | | 3,057,433 | |
| | | | | | |
| |
TOTAL MONEY MARKET MUTUAL FUNDS
(Cost $3,057,433) | | | | | 3,057,433 | |
| | | | | | |
| |
TOTAL INVESTMENTS—100.6%
(Cost $194,360,330) |
|
|
|
$ |
219,569,231 |
|
| Liabilities in excess of Other Assets—(0.6%) | | | | | 1,241,613 | ) |
| | | | | | |
| |
| NET ASSETS—100.0% | | | | $ | 218,327,618 | |
| | | | | | |
| |
- *
- Non-income producing security
See Notes to Financial Statements
98
Large-Cap Growth Fund
MANAGER'S COMMENTARY
(Unaudited)
December 31, 2005
Dear Fellow Large-Cap Growth Shareholder,
Our Fund had a positive return of 2.20% for the December 2005 quarter, compared to a 2.98% return for our primary market benchmark, the Russell 1000 Growth Index, and a 3.63% return of our peer benchmark, the Lipper Large-Cap Growth Index. It was a poor quarter.
The six-month performance is more in line with my expectations, and I am pleased with the full calendar year returns, 9.33%, compared to 5.26% return for the Russell 1000 Growth Index and 7.58% for the Lipper Large-Cap Growth Index.
The table below presents our performance for the December quarter, six month, one year and annualized performance since inception, followed by a graph of performance since inception.
| | Dec. Qtr.
10/1/05
to 12/31/05
| | 6 Months
7/1/05
to 12/31/05
| | 1 Year
1/1/05
to 12/31/05
| | Life-to-Date
10/31/03
to 12/31/05
| |
|---|
| Large-Cap Growth Fund | | 2.20 | % | 9.73 | % | 9.33 | % | 9.07 | % |
| Russell 1000 Growth Index | | 2.98 | % | 7.11 | % | 5.26 | % | 7.50 | % |
| Lipper Large-Cap Growth Index | | 3.63 | % | 8.97 | % | 7.58 | % | 8.77 | % |
Performance figures quoted represent past performance and are no guarantee of future results. Current performance may be lower or higher than the performance figures quoted, and an investor's shares, when redeemed, may be worth more or less than original cost. For the most recent month-end performance, please call 1-800-661-3550 or visit the Fund's website at www.bridgeway.com
The Russell 1000 Growth Index is an unmanaged index which consists of stocks in the Russell 1000 Index with higher price-to-book ratios and higher forecasted growth values with dividends reinvested. The Lipper Large-Cap Growth Index is an index of large-company, growth-oriented funds compiled by Lipper, Inc. It is not possible to invest directly in an index or average. Periods longer than one year are annualized.
For the six-month semi-annual period, our Fund was up 9.73%, compared to a 7.11% return for the Russell 1000 Growth Index and 8.97% for the Lipper Large-Cap Growth Index. Fourth quarter performance shows evidence of losing the energy sector boost that we had enjoyed during the third quarter.
According to data from Morningstar, Inc., our Fund ranked 318th of 1639 large-cap growth funds for the last twelve months. The Fund's numeric rankings are based solely on total return performance. Morningstar ranks funds in various fund categories by making comparative calculations using total returns.
99
Growth of $10,000 Invested in Large-Cap Growth Fund and Indexes from 10/31/03 (inception) to 12/31/05
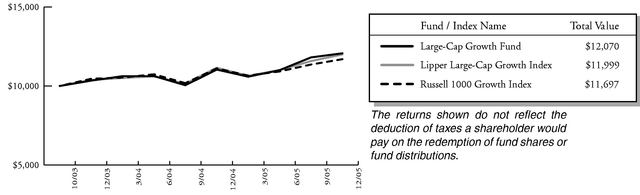
Detailed Explanation of Quarterly Performance—What Worked Well
The Short Version: Five (very different) stocks were up 20% or more for the December quarter.
Rank
| | Description
| | Industry
| | % Gain
| |
|---|
| 1 | | Apple Computer Inc | | Computers | | 34.1 | % |
| 2 | | Fastenal Co | | Distribution/Wholesale | | 28.3 | % |
| 3 | | Adobe Systems Inc | | Software | | 23.8 | % |
| 4 | | Monsanto Co | | Agriculture | | 23.6 | % |
| 5 | | Jabil Circuit Inc | | Electronics | | 20.0 | % |
| 6 | | Whole Foods Market Inc | | Food | | 17.3 | % |
| 7 | | Yahoo! Inc | | Internet | | 15.8 | % |
| 8 | | Schlumberger Ltd | | Oil & Gas Services | | 15.1 | % |
| 9 | | Scientific-Atlanta Inc | | Telecommunications | | 13.1 | % |
| 10 | | Franklin Resources Inc | | Diversified Finan Serv | | 12.0 | % |
Apple's iPod products continue to grow in popularity and to spawn derivative products, which provide diversity for the company beyond its personal computer line. Although the tremendous price appreciation since our first purchase almost a year and a half ago means this stock is not nearly as cheap as it was, our models still like it, and currently, we're holding.
Second place performer, Fastenal Company, is in the wholesale and retail distribution business of industrial and construction supplies, including threaded fasteners, such as bolts, nuts, screws, studs, washers and other supplies, such as paints, concrete anchors, batteries, sealants, metal framing systems, wire rope, anchors, rivets, and related accessories. Founded in 1967 in Minnesota, it's a company that had a modest beginning and has continued to grow steadily through the years. CEO Robert Kierlin, in his book The Power of Fastenal People, writes: "When we only had about 30 employees in our Winona office and warehouse, all of the men signed up for their week to clean the men's restroom, and all the women signed up for their week to clean the women's restroom. We saved by not hiring out janitorial services and kept egos in check (we also were more careful about keeping the place clean)." The original 30 has grown to 6,392, with 1,700 stores in 50 states. Although we like the story, our models just like the stock.
100
Detailed Explanation of Quarterly Performance—What Didn't Work
The Short Version: Our fund had two stocks that lost more than 20% for the December quarter.
Rank
| | Description
| | Industry
| | % Loss
| |
|---|
| 1 | | Symantec Corp | | Internet | | -22.8 | % |
| 2 | | ACCO Brands Corp | | Household Products/Wares | | -21.6 | % |
| 3 | | Total System Services Inc | | Software | | -18.0 | % |
| 4 | | Questar Corp | | Pipelines | | -14.1 | % |
| 5 | | Dell Inc | | Computers | | -12.3 | % |
| 6 | | Exxon Mobil Corp | | Oil & Gas | | -11.6 | % |
| 7 | | TXU Corp | | Electric | | -11.1 | % |
| 8 | | CH Robinson Worldwide Inc | | Transportation | | -10.1 | % |
| 9 | | Paychex Inc | | Commercial Services | | -8.3 | % |
| 10 | | Autodesk Inc | | Software | | -7.5 | % |
Interestingly, five companies from our list of winners were technology related, and four companies from our list of losers were also from the technology area. No consistent trend here.
Symantec Corporation provides software, appliances, and services to secure and manage information technology infrastructure for individuals and businesses. The Norton Anti-Virus software line is a familiar brand. In early July, Symantec acquired Veritas with high hopes for a great combo company; however, late shipping problems, over-optimistic sales estimates, and some accounting difficulties resulted in a drop of over 19% in early November. If that weren't enough bad news, the CFO announced his retirement on the heels of the resignation of the President just weeks earlier. Naturally, analysts reacted by downgrading the stock. Bad news and negative reactions aside, our models still like the stock, and we're holding.
Detailed Explanation of Calendar Year Performance—What Worked Well
The Short Version: Six of the ten best performers returned over 50%, with the other four close behind. The name of the game for our calendar year performance was energy.
Rank
| | Description
| | Industry
| | % Gain
| |
|---|
| 1 | | Apple Computer Inc | | Computers | | 112.0 | % |
| 2 | | EOG Resources Inc | | Oil & Gas | | 103.3 | % |
| 3 | | Genentech Inc | | Biotechnology | | 69.9 | % |
| 4 | | Nordstrom Inc | | Retail | | 60.1 | % |
| 5 | | TXU Corp | | Electric Utilities | | 55.5 | % |
| 6 | | Questar Corp | | Pipelines | | 50.4 | % |
| 7 | | Phelps Dodge Corp | | Mining | | 45.4 | % |
| 8 | | Schlumberger Ltd | | Oil & Gas Services | | 45.1 | % |
| 9 | | UnitedHealth Group Inc | | Healthcare-Services | | 41.2 | % |
| 10 | | Baker Hughes Inc | | Oil & Gas Services | | 41.2 | % |
Over a third of our performance for the calendar year can be attributed to energy stocks. Five of our best ten performers were from the energy sector; the other five spanned the spectrum from computers to electric utilities to healthcare, however. Five of these best performers were also "repeaters" from last quarter.
EOG Resources, Inc. is an independent oil and natural gas company, engaging in the exploration, development, production, and marketing of natural gas and crude oil. We have held it in this Fund for about two years. It was listed in Forbes "400 Best Big Companies" at the end of December. Besides good stock performance, selection criteria for the Forbes honor are these: revenue of at least $1 billion,
101
a share price over $5, publicly traded for more than two years, innovation, efficiency, market leadership, financial measures compared against peers and accounting integrity standards. We're glad to have EOG Resources in our Fund and happy to have it as a Houston neighbor.
For shareholders who own both Large-Cap Value and Large-Cap Growth Funds, you may notice that two stocks on the list above are also in Large-Cap Value. How can the same company be classified as both value and growth? At the time of purchase a stock qualifies for only one Fund. However, price changes, and to a lesser degree, changes in fundamental financial characteristics can change the designation from growth to value, especially for stocks on the margin between value and growth. Therefore, over time it is possible to have purchased a stock at different times for more than one of these Funds. Similarly, a stock can grow from small to large and end up in, for instance, both the Small-Cap Growth Fund and the Large-Cap Growth Fund. Since we don't immediately sell a stock when it moves across one of these "boundaries," it can end up in more than one fund at the same time. Overall, 18% of the Large-Cap Growth Fund stocks are also owned by Large-Cap Value, most near the border of designation.
Detailed Explanation of Calendar Year Performance—What Didn't Work
The Short Version: We had no stocks that lost over 50%, and only two additional ones over 40%. Our overweighting in the Communications Sector, compared to the S&P 500, cost the Fund almost 1.50% in return.
Rank
| | Description
| | Industry
| | % Loss
| |
|---|
| 1 | | Avaya Inc | | Telecommunications | | -43.4 | % |
| 2 | | Biogen Idec Inc | | Biotechnology | | -42.6 | % |
| 3 | | Symantec Corp | | Internet | | -32.1 | % |
| 4 | | MBNA Corp | | Diversified Finan Serv | | -31.4 | % |
| 5 | | Lexmark International Inc | | Computers | | -29.1 | % |
| 6 | | Dell Inc | | Computers | | -27.5 | % |
| 7 | | Network Appliance Inc | | Computers | | -26.4 | % |
| 8 | | Millennium Pharmaceuticals Inc | | Biotechnology | | -26.3 | % |
| 9 | | Waters Corp | | Electrical Comp & Equip | | -26.0 | % |
| 10 | | eBay Inc | | Internet | | -25.7 | % |
Avaya, Inc. provides communication systems, applications, and services in voice and data systems. The company announced March quarter earnings at 7 cents per share, significantly lower than 27 cents a year ago. The market reacted negatively to that announcement, and the price dropped almost 18%. Although we sold the last of our holdings in mid-May, the drop was steep enough to make Avaya our worst performer for the calendar year.
Drug company, Biogen Idec, is a leader in the development and manufacture of medications for relapsing forms of multiple sclerosis, certain forms of cancer, and moderate-to-severe chronic plaque psoriasis. Then came what is probably a drug company's worst nightmare. In late February there was one confirmed death and one suspected case of a rare, often fatal, disorder among participants in clinical trials of Biogen's Tysabri MS drug. It was pulled from usage, and Biogen stock fell 43% in one day. We sold our holdings in mid March.
Top Ten Holdings
At quarter end, Consumer, Non-cyclical stocks comprised our largest sector representation at 21.4% of net assets, followed by Communications at 20.3% and Consumer, Cyclicals at 18.6%. Our top ten holdings represented only 28.2% of net assets, which demonstrates the diversification of the fund. This strategy spreads the risk associated with any one company in an attempt to reduce overall
102
portfolio volatility (and contrasts with some of our more aggressively managed styles which can place some pretty big bets on individual stocks.)
Rank
| | Description
| | Industry
| | Percent of
Net Assets
| |
|---|
| 1 | | Nordstrom Inc | | Retail | | 4.0 | % |
| 2 | | Genentech Inc | | Biotechnology | | 3.1 | % |
| 3 | | Sprint Nextel Corp | | Telecommunications | | 3.0 | % |
| 4 | | Schlumberger Ltd | | Oil & Gas Services | | 3.0 | % |
| 5 | | UnitedHealth Group Inc | | Healthcare-Services | | 2.8 | % |
| 6 | | Home Depot Inc | | Retail | | 2.7 | % |
| 7 | | Motorola Inc | | Telecommunications | | 2.5 | % |
| 8 | | Qualcomm Inc | | Telecommunications | | 2.5 | % |
| 9 | | TXU Corp | | Electric | | 2.4 | % |
| 10 | | Texas Instruments Inc | | Semiconductors | | 2.2 | % |
| | | | | | |
| |
| | Total | | | | 28.2 | % |
Industry Sector Representation as of December 31, 2005
Sector
| | % of Net Assets
| | % of S&P 500 Index
| | Difference
| |
|---|
| Basic Materials | | 0.7 | % | 2.9 | % | -2.2 | % |
| Communications | | 20.2 | % | 10.2 | % | 10.0 | % |
| Consumer, Cyclical | | 18.5 | % | 8.5 | % | 10.0 | % |
| Consumer, Non-cyclical | | 21.3 | % | 21.6 | % | -0.3 | % |
| Energy | | 14.7 | % | 9.6 | % | 5.1 | % |
| Financial | | 5.3 | % | 21.1 | % | -15.8 | % |
| Industrial | | 7.0 | % | 11.3 | % | -4.3 | % |
| Technology | | 9.1 | % | 11.4 | % | -2.3 | % |
| Utilities | | 2.4 | % | 3.4 | % | -1.0 | % |
| Cash | | 0.8 | % | 0.0 | % | 0.8 | % |
| | |
| |
| | | |
| | Total | | 100.0 | % | 100.0 | % | | |
Disclaimer
The following is a reminder from the friendly folks at your Fund who worry about liability. The views expressed here are exclusively those of Fund management. These views are not meant as investment advice and should not be considered predictive in nature. Any favorable (or unfavorable) description of a holding applies only as of December 31, 2005, unless otherwise stated. Security positions can and do change thereafter. Discussions of historical performance do not guarantee and are not indicative of future performance.
The Fund is subject to market risk (volatility) and is not an appropriate investment for short-term investors.
This report is submitted for the general information of the shareholders of the Fund. It is not authorized for distribution to prospective investors unless preceded or accompanied by an effective prospectus, which includes information regarding the Fund's risks, objectives, fees and expenses, experience of its management, and other information For questions or other fund information, call 1-800-661-3550 or visit the Fund's website www.bridgeway.com. Foreside Fund Services, LLC, distributor.
103
Conclusion
Thank you for your continued investment in Large-Cap Growth. This Fund remains open to both current and new investors. As always, we appreciate your feedback.
Sincerely,
John Montgomery
104
DISCLOSURE OF FUND EXPENSES
(Unaudited)
As a shareholder of the Fund, you will incur no transaction costs from the Fund, including sales charges (loads) on purchases, on reinvested dividends, or on other distributions. There are also no redemption fees or exchange fees. However, as a shareholder of the Fund, you will incur ongoing costs, including management fees and other Fund expenses. The following examples are intended to help you understand your ongoing costs (in dollars) of investing in the Fund and to compare these costs with the ongoing costs of investing in other mutual funds. The examples are based on an investment of $1,000 invested on July 1, 2005 and held until December 31, 2005.
Actual Return. The first line of the table below provides information about actual account values and actual expenses. You may use the information in this line, together with the amount you invested, to estimate the expenses that you paid over the period. Simply divide your account value by $1,000 (for example, an $8,600 account value divided by $1,000 = 8.6), then multiply the result by the number in the first line under the heading "Expense Paid During Period" to estimate the expenses you paid on your account during this period.
Hypothetical 5% Return. The second line of the table below provides information about hypothetical account values and hypothetical expenses based on the Fund's actual expense ratio and an assumed rate of return of 5% per year before expenses, which is not the Fund's actual return. The hypothetical account values and expenses may not be used to estimate the actual ending account balance or expenses you paid for the period. You may use this information to compare the ongoing costs of investing in a Fund and other mutual funds. To do so, compare this 5% hypothetical example with the 5% hypothetical examples that appear in the shareholder reports of the other funds.
The expenses shown in the table are meant to highlight ongoing Fund costs only. Therefore, the second line of the table is useful in comparing ongoing costs only, and will not help you determine the relative total costs of owning different funds, because other funds may also have transaction costs, such as sales charges, redemption fees or exchange fees.
Bridgeway Large-Cap Growth Fund
| | Beginning Account
Value at 7/1/05
| | Ending Account
Value at 12/31/05
| | Expense Paid
During Period*
7/1/05-12/31/05
|
|---|
| Actual Fund Return | | $ | 1,000.00 | | $ | 1,097.27 | | $ | 4.33 |
| Hypothetical Fund Return | | $ | 1,000.00 | | $ | 1,021.07 | | $ | 4.18 |
- *
- Expenses are equal to the Fund's annualized expense ratio of 0.82% multiplied by the average account value over the period, multiplied by the number of days in the first fiscal half-year divided by 365 days in the current year (to reflect the one half-year period).
105
SCHEDULE OF INVESTMENTS
Showing percentage of net assets as of December 31, 2005
(Unaudited)
Industry
| | Company
| | Shares
| | Value
|
|---|
COMMON STOCKS—99.2% |
|
|
|
|
|
| Advertising—1.1% | | | | | |
| | | Getty Images Inc* | | 6,900 | | $ | 615,963 |
Aerospace/Defense—0.3% |
|
|
|
|
|
| | | L-3 Communications Holdings Inc | | 2,000 | | | 148,700 |
Agriculture—0.5% |
|
|
|
|
|
| | | Monsanto Co | | 3,800 | | | 294,614 |
Apparel—2.0% |
|
|
|
|
|
| | | Coach Inc* | | 35,320 | | | 1,177,569 |
Auto Manufacturers—0.4% |
|
|
|
|
|
| | | PACCAR Inc | | 3,000 | | | 207,690 |
Beverages—1.7% |
|
|
|
|
|
| | | Coca-Cola Co | | 10,500 | | | 423,255 |
| | | PepsiCo Inc | | 9,500 | | | 561,260 |
| | | | | | |
|
| | | | | | | | 984,515 |
Biotechnology—4.3% |
|
|
|
|
|
| | | Amgen Inc* | | 9,000 | | | 709,740 |
| | | Genentech Inc* | | 19,000 | | | 1,757,500 |
| | | | | | |
|
| | | | | | | | 2,467,240 |
Coal—1.7% |
|
|
|
|
|
| | | CONSOL Energy Inc | | 5,700 | | | 371,526 |
| | | Peabody Energy Corp | | 7,500 | | | 618,150 |
| | | | | | |
|
| | | | | | | | 989,676 |
Commercial Services—0.9% |
|
|
|
|
|
| | | Paychex Inc | | 14,000 | | | 533,680 |
Computers—1.6% |
|
|
|
|
|
| | | Apple Computer Inc* | | 5,000 | | | 359,450 |
| | | Dell Inc* | | 3,500 | | | 104,965 |
| | | NCR Corp* | | 14,400 | | | 488,736 |
| | | | | | |
|
| | | | | | | | 953,151 |
Cosmetic/Personal Care—1.8% |
|
|
|
|
|
| | | Procter & Gamble Co | | 18,232 | | | 1,055,268 |
Distribution/Wholesale—0.7% |
|
|
|
|
|
| | | Fastenal Co | | 10,000 | | | 391,900 |
Diversified Financial Services—3.6% |
|
|
|
|
|
| | | Ameritrade Holdings Corp* | | 22,600 | | | 542,400 |
| | | Chicago Mercantile Exchange | | 1,000 | | | 367,490 |
| | | Franklin Resources Inc | | 12,200 | | | 1,146,922 |
| | | | | | |
|
| | | | | | | | 2,056,812 |
| | | | | | | | |
106
Electric Utilities—2.4% |
|
|
|
|
|
| | | TXU Corp | | 28,000 | | $ | 1,405,320 |
Electronics—1.2% |
|
|
|
|
|
| | | Agilent Technologies* | | 2,000 | | | 66,580 |
| | | Jabil Circuit Inc* | | 16,400 | | | 608,276 |
| | | | | | |
|
| | | | | | | | 674,856 |
Food—1.1% |
|
|
|
|
|
| | | Whole Foods Market Inc | | 8,000 | | | 619,120 |
Healthcare—Products—3.1% |
|
|
|
|
|
| | | C.R. Bard Inc | | 1,800 | | | 118,656 |
| | | Johnson & Johnson | | 9,000 | | | 540,900 |
| | | Medtronic Inc | | 4,400 | | | 253,308 |
| | | Zimmer Holdings Inc* | | 13,160 | | | 887,510 |
| | | | | | |
|
| | | | | | | | 1,800,374 |
Healthcare—Services—2.9% |
|
|
|
|
|
| | | Laboratory Corp of American Holdings* | | 1,600 | | | 86,160 |
| | | UnitedHealth Group Inc | | 25,716 | | | 1,597,992 |
| | | WellPoint Health Networks Inc* | | 60 | | | 4,787 |
| | | | | | |
|
| | | | | | | | 1,688,939 |
Home Furnishings—2.2% |
|
|
|
|
|
| | | Harman International Industries Inc | | 12,740 | | | 1,246,609 |
Household Products/Wares—1.8% |
|
|
|
|
|
| | | Fortune Brands Inc | | 13,520 | | | 1,054,830 |
Insurance—1.8% |
|
|
|
|
|
| | | The Progressive Corp | | 8,800 | | | 1,027,664 |
Internet—5.1% |
|
|
|
|
|
| | | eBay Inc* | | 29,160 | | | 1,261,170 |
| | | Google Inc* | | 1,600 | | | 663,776 |
| | | Symantec Corp* | | 42,920 | | | 751,100 |
| | | Yahoo! Inc* | | 7,220 | | | 282,880 |
| | | | | | |
|
| | | | | | | | 2,958,926 |
Machinery Diversified—0.2% |
|
|
|
|
|
| | | Rockwell Automation Inc | | 2,400 | | | 141,984 |
Media—1.9% |
|
|
|
|
|
| | | News Corp—Class A | | 17,544 | | | 272,809 |
| | | Walt Disney Co | | 33,200 | | | 795,804 |
| | | | | | |
|
| | | | | | | | 1,068,613 |
Metal Fabricate/ Harware—1.5% |
|
|
|
|
|
| | | Precision Castparts | | 17,000 | | | 880,770 |
Mining—0.2% |
|
|
|
|
|
| | | Phelps Dodge Corp | | 1,000 | | | 143,870 |
| | | | | | | | |
107
Miscellaneous Manufacturing—2.9% |
|
|
|
|
|
| | | 3M Co | | 6,232 | | $ | 482,980 |
| | | Danaher Corp | | 14,800 | | | 825,544 |
| | | General Electric Co | | 11,000 | | | 385,550 |
| | | | | | |
|
| | | | | | | | 1,694,074 |
Oil & Gas—6.2% |
|
|
|
|
|
| | | Burlington Resources Inc | | 5,000 | | | 431,000 |
| | | EOG Resources Inc | | 10,000 | | | 733,700 |
| | | Exxon Mobil Corp | | 15,700 | | | 881,869 |
| | | Noble Energy Inc | | 15,900 | | | 640,770 |
| | | Southwestern Energy Co.* | | 11,000 | | | 395,340 |
| | | XTO Energy Inc | | 10,666 | | | 468,664 |
| | | | | | |
|
| | | | | | | | 3,551,343 |
Oil & Gas Services—6.2% |
|
|
|
|
|
| | | Baker Hughes Inc | | 4,600 | | | 279,588 |
| | | BJ Services Co | | 11,400 | | | 418,038 |
| | | Halliburton Co | | 12,000 | | | 743,520 |
| | | Schlumberger Ltd | | 17,700 | | | 1,719,555 |
| | | Weatherford International Ltd.* | | 11,000 | | | 398,200 |
| | | | | | |
|
| | | | | | | | 3,558,901 |
Pharmaceuticals—3.6% |
|
|
|
|
|
| | | Bristol-Myers Squibb Co | | 44,400 | | | 1,020,312 |
| | | Caremark Rx Inc* | | 2,000 | | | 103,580 |
| | | Gilead Sciences Inc* | | 15,020 | | | 790,503 |
| | | Pfizer Inc | | 7,200 | | | 167,904 |
| | | | | | |
|
| | | | | | | | 2,082,299 |
Pipelines—0.7% |
|
|
|
|
|
| | | Questar Corp | | 5,000 | | | 378,500 |
Retail—13.2% |
|
|
|
|
|
| | | Best Buy Co Inc | | 15,645 | | | 680,245 |
| | | Chico's FAS Inc* | | 9,000 | | | 395,370 |
| | | Home Depot Inc | | 38,960 | | | 1,577,101 |
| | | Lowe's Companies Inc | | 10,340 | | | 689,264 |
| | | Nordstrom Inc | | 62,140 | | | 2,324,037 |
| | | Office Depot Inc.* | | 20,000 | | | 628,000 |
| | | Staples Inc | | 25,890 | | | 587,962 |
| | | Tiffany & Co | | 13,200 | | | 505,428 |
| | | Walgreen Co | | 5,900 | | | 261,134 |
| | | | | | |
|
| | | | | | | | 7,648,541 |
| | | | | | | | |
108
Semiconductors—6.3% |
|
|
|
|
|
| | | Advanced Micro Devices Inc* | | 17,000 | | $ | 520,200 |
| | | Broadcom Corp* | | 13,400 | | | 631,810 |
| | | Freescale Semiconductor Inc* | | 7,121 | | | 179,236 |
| | | Intel Corp | | 17,800 | | | 444,288 |
| | | Nvidia Corp* | | 16,500 | | | 603,240 |
| | | Texas Instruments Inc | | 39,590 | | | 1,269,651 |
| | | | | | |
|
| | | | | | | | 3,648,425 |
Software—1.1% |
|
|
|
|
|
| | | Adobe Systems Inc | | 5,400 | | | 199,584 |
| | | Autodesk Inc | | 7,200 | | | 309,240 |
| | | BMC Software Inc* 6 | | 1,13 | | | 23,277 |
| | | Fiserv Inc* | | 2,000 | | | 86,540 |
| | | Oracle Corp* | | 2,000 | | | 24,420 |
| | | | | | |
|
| | | | | | | | 643,061 |
Telecommunications—12.2% |
|
|
|
|
|
| | | Cisco Systems Inc* | | 46,200 | | | 790,944 |
| | | Corning Inc* | | 37,200 | | | 731,352 |
| | | Harris Corp | | 12,100 | | | 520,421 |
| | | Juniper Networks Inc* | | 15,700 | | | 350,110 |
| | | Motorola Inc | | 64,500 | | | 1,457,055 |
| | | QUALCOMM Inc | | 33,500 | | | 1,443,180 |
| | | Sprint Nextel Corp | | 73,743 | | | 1,722,636 |
| | | | | | |
|
| | | | | | | | 7,015,698 |
Transportation—0.8% |
|
|
|
|
|
| | | CH Robinson Worldwide | | 13,000 | | | 481,390 |
| | | | | | |
|
TOTAL COMMON STOCKS
(Cost $47,044,596) | | | | | 57,290,885 |
| | | | | | |
|
MONEY MARKET MUTUAL FUNDS—0.6% |
|
|
|
|
|
| First American Treasury Obligations Fund—Class S | | 332,001 | | | 332,001 |
| | | | | | |
|
TOTAL MONEY MARKET MUTUAL FUNDS
(Cost $332,001) | | | | | 332,001 |
| | | | | | |
|
TOTAL INVESTMENTS—99.8%
(Cost $47,376,597) |
|
|
|
$ |
57,622,886 |
| Other Assets in excess of Liabilities—0.2% | | | | | 113,912 |
| | | | | | |
|
| NET ASSETS—100.0% | | | | $ | 57,736,798 |
| | | | | | |
|
- *
- Non-income producing security
See Notes to Financial Statements
109
Large-Cap Value Fund
MANAGER'S COMMENTARY
(Unaudited)
December 31, 2005
Dear Fellow Large-Cap Value Shareholder,
Our Fund was up 2.29% for the December 2005 quarter, compared to a 1.27% gain for our primary market benchmark, the Russell 1000 Value Index, and a 1.87% return of our peer benchmark, the Lipper Large-Cap Value Index. It was a fairly good quarter.
It was a better calendar year. The Fund was up 11.62%, beating the Russell 1000 Value Index by 4.57% and the Lipper Large-Cap Value Index by 5.36%. I am pleased with these results.
The table below presents our performance for the December quarter, six month, 1 year, and annualized performance since inception, followed by a graph of performance since inception.
| | Dec. Qtr.
10/1/05
to 12/31/05
| | 6 Months
7/1/05
to 12/31/05
| | 1 Year
1/1/05
to 12/31/05
| | Life-to-Date
10/31/03
to 12/31/05
| |
|---|
| Large-Cap Value Fund | | 2.29 | % | 7.84 | % | 11.62 | % | 16.04 | % |
| Russell 1000 Value Index | | 1.27 | % | 5.20 | % | 7.05 | % | 14.54 | % |
| Lipper Large-Cap Value Index | | 1.87 | % | 5.74 | % | 6.26 | % | 12.01 | % |
Performance figures quoted represent past performance and are no guarantee of future results. Current performance may be lower or higher than the performance figures quoted, and an investor's shares, when redeemed, may be worth more or less than original cost. For the most recent month-end performance, please call 1-800-661-3550 or visit the Fund's website at www.bridgeway.com.
The Russell 1000 Value Index is an unmanaged index which consists of stocks in the Russell 1000 Index with lower price-to-book ratios and lower forecasted growth values with dividends reinvested. The Lipper Large-Cap Value Index is an index of large-company, value-oriented funds compiled by Lipper, Inc. It is not possible to invest directly in an index or average. Periods longer than one year are annualized.
For the six-month semi-annual period, our Fund was up 7.84%, compared to a 5.20% return for the Russell 1000 Value Index and 5.74% for the Lipper Large-Cap Value Index. Fourth quarter performance shows evidence of losing the energy sector boost that we had enjoyed during the third quarter. However, the full six-month period does not show the effect.
According to data from Morningstar, Inc., our Fund ranked 57th of 1292 large-cap value funds for the last twelve months. The Fund's numeric rankings are based solely on total return performance. Morningstar ranks funds in various fund categories by making comparative calculations using total returns.
110
Growth of $10,000 Invested in Large-Cap Value Fund and Indexes from 10/31/03 (inception) to 12/31/05
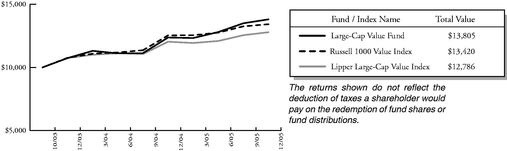
Detailed Explanation of Quarterly Performance—What Worked Well
The Short Version: We had one stock with over 30% return in a rather lackluster quarter.
Rank
| | Description
| | Industry
| | % Gain
| |
|---|
| 1 | | Express Scripts Inc | | Pharmaceuticals | | 34.7 | % |
| 2 | | Darden Restaurants Inc | | Retail | | 28.0 | % |
| 3 | | E*Trade Financial Corp | | Diversified Finan Serv | | 18.5 | % |
| 4 | | JC Penney Co Inc | | Retail | | 18.5 | % |
| 5 | | Burlington Northern Santa Fe Corp | | Transportation | | 18.4 | % |
| 6 | | JPMorgan Chase & Co | | Diversified Finan Serv | | 17.0 | % |
| 7 | | Costco Wholesale Corp | | Retail | | 14.8 | % |
| 8 | | Washington Mutual Inc | | Savings & Loans | | 13.2 | % |
| 9 | | Golden West Financial Corp | | Savings & Loans | | 11.1 | % |
| 10 | | Phelps Dodge Corp | | Mining | | 10.7 | % |
Our top performer, Express Scripts, manages pharmacy benefits for organizations such as health maintenance organizations, health insurers, third-party administrators, employers, union-sponsored benefit plans, and government health programs. They provide claims processing, mail pharmacy services, specialty prescription fulfillment, and benefit design consultation, drug utilization review, formulary management and disease management. Express Scripts was listed in Forbes "400 Best Big Companies" at the end of December. Besides good stock performance, selection criteria for the Forbes honor are these: revenue of at least $1 billion, a share price over $5, publicly traded for more than two years, innovation, efficiency, market leadership, financial measures compared against peers and accounting integrity standards. Express Scripts has been a steady performer for this Fund for several years.
Four companies in our winners list are in the Financial Sector, which filled in a bit of the performance gap left by energy stocks for the December quarter. Altogether the sector added a little less than 2% to our return for the quarter.
111
Detailed Explanation of Quarterly Performance—What Didn't Work
The Short Version: I'm not too unhappy when our worst performer is down only 16.8%. In addition, the list of ten generally represents several industries, illustrating the Fund's diversity.
Rank
| | Description
| | Industry
| | % Loss
| |
|---|
| 1 | | ConocoPhillips | | Oil & Gas | | -16.8 | % |
| 2 | | United States Steel Corp | | Iron/Steel | | -15.7 | % |
| 3 | | Toll Brothers Inc | | Home Builders | | -15.6 | % |
| 4 | | Chevron Corp | | Oil & Gas | | -12.3 | % |
| 5 | | DR Horton Inc | | Home Builders | | -9.9 | % |
| 6 | | Georgia-Pacific Corp | | Forest Products & Paper | | -9.4 | % |
| 7 | | CVS Corp | | Retail | | -8.9 | % |
| 8 | | Fidelity National Financial Inc | | Insurance | | -8.0 | % |
| 9 | | Verizon Communications Inc | | Telecommunications | | -7.9 | % |
| 10 | | RR Donnelley & Sons Co | | Commercial Services | | -7.8 | % |
Two of the worst performers, ConocoPhillips and Chevron, have had a rickety ride the past three months. Hurricane Katrina, political influences, consumer demands for energy and foreign agreements (or lack thereof) reflect some short-term bumps. These are a couple of blue chips that our models like; we're holding.
Toll Brothers and DR Horton both engage in the development, construction, financing and sale of residential homes, including single-family, duplexes and condominiums. Reactions to stories on the deflating of the real estate bubble have caused fluctuations in prices. DR Horton was our second best performer for the fiscal year ending June 30, evidence of the bubble's rise and fall. We sold our holdings in both companies before year end.
Detailed Explanation of Calendar Year Performance—What Worked Well
The Short Version: Four stocks gained over 50% for the calendar year, with the other six close behind. For the calendar year, of course, the most dramatic sector play was energy.
Rank
| | Description
| | Industry
| | % Gain
| |
|---|
| 1 | | Corning Inc | | Telecommunications | | 67.0 | % |
| 2 | | Nordstrom Inc | | Retail | | 60.1 | % |
| 3 | | Amerada Hess Corp | | Oil & Gas | | 54.0 | % |
| 4 | | Aetna Inc | | Healthcare-Services | | 51.2 | % |
| 5 | | Valero Energy Corp | | Oil & Gas | | 49.3 | % |
| 6 | | Burlington Northern Santa Fe Corp | | Transportation | | 49.2 | % |
| 7 | | Express Scripts Inc | | Pharmaceuticals | | 47.6 | % |
| 8 | | Office Depot Inc | | Retail | | 46.0 | % |
| 9 | | Phelps Dodge Corp | | Mining | | 45.4 | % |
| 10 | | Eagle Materials Inc | | Building Materials | | 41.7 | % |
Almost half of our performance for the calendar year can be attributed to energy stocks. Even though the sector "cooled" somewhat in the fourth quarter, three of our best ten performers for the calendar year were from the energy sector. The other seven spanned the industry spectrum from Retail to Transportation to Building Materials, however. Five of these best performers were also "repeaters" from last quarter.
Corning Incorporated manufactures an amazing variety of glass-based products from liquid crystal displays (LCDs), which are used in computer monitors and LCD televisions, optical fiber and cable,
112
with all necessary cable components, ceramic technologies and solutions for emissions and pollution control, and laboratory products, which include items like coated slides, culture dishes, flasks, glass beakers. The company has demonstrated steady growth over the last couple of years and had an excellent third quarter report.
Second place fashion retailer, Nordstrom, was also a best-performer in our fiscal year period ending in June, 2005. Founded in 1901 in Seattle, it has grown to be a world-wide standard in department store products, adding restaurants, coffee bars and spas to its "shopping experience" and full service e-shopping as well. It has been a steady performer for the Fund since our original purchase in December 2004.
For shareholders who own both Large-Cap Value and Large-Cap Growth Funds, you may notice that two stocks on the list above are also in Large-Cap Growth. How can the same company be classified as both value and growth? At the time of purchase a stock qualifies for only one fund. However, price changes, and to a lesser degree, changes in fundamental financial characteristics, can change the designation from growth to value, especially for stocks on the margin between value and growth. Therefore, over time it is possible to have purchased a stock at different times for more than one of these funds. Similarly, a stock can grow from small to large and end up in, for instance, both the Small-Cap Value Fund and the Large-Cap Value Fund. Since we don't immediately sell a stock when it moves across one of these "boundaries," it can end up in more than one fund at the same time. Overall, 11% of the Large-Cap Value Fund stocks are also owned by Large-Cap Growth, most near the border of designation.
Detailed Explanation of Calendar Year Performance—What Didn't Work
The Short Version: Two stocks lost more than 30% for the calendar year.
Rank
| | Description
| | Industry
| | % Loss
| |
|---|
| 1 | | Ford Motor Co | | Auto Manufacturers | | -32.8 | % |
| 2 | | United States Steel Corp | | Iron/Steel | | -30.3 | % |
| 3 | | Verizon Communications Inc | | Telecommunications | | -25.7 | % |
| 4 | | Freddie Mac | | Diversified Finan Serv | | -25.5 | % |
| 5 | | Advanced Micro Devices Inc | | Semiconductors | | -23.5 | % |
| 6 | | General Motors Corp | | Auto Manufacturers | | -22.6 | % |
| 7 | | Xerox Corp | | Office/Business Equip | | -21.7 | % |
| 8 | | Juniper Networks Inc | | Telecommunications | | -18.0 | % |
| 9 | | Georgia-Pacific Corp | | Forest Products & Paper | | -17.7 | % |
| 10 | | Eaton Corp | | Misc Manufacturing | | -17.2 | % |
The US Auto Manufacturing Industry woes continue. Ford heads up our "performance-challenged" list. It remains to be seen whether their restructuring can turn stock prices around. Our models decided not to wait to find out, and we sold the last of our holdings in August.
In a late October report, a US Steel company representative said, "As previously announced, the company's third quarter 2005 results were impacted by a significant cost increase for natural gas, primarily the result of gas production disruptions following Hurricanes Katrina and Rita, as well as increased costs for steel scrap and other raw material inputs." Although they have no information about hurricanes and industry raw material trends, our models signaled a sell, and we sold shortly thereafter. The next week, the stock price began to rise, and it's closing now over our original purchase price. Clearly, our models don't get it right all the time.
113
Top Ten Holdings
At quarter end, Financial comprised our largest sector representation at 31.6% of net assets, followed by Energy at 16.5% and Communications at 10.8%. Our top ten holdings represented only 23.6% of net assets, which demonstrates the diversification of the fund. This strategy spreads the risk associated with any one company in an attempt to reduce overall portfolio volatility (and contrasts with some of our more aggressively managed styles which can place some pretty big bets on individual stocks.)
Rank
| | Description
| | Industry
| | Percent of
Net Assets
| |
|---|
| 1 | | AT&T Inc | | Telecommunications | | 3.4 | % |
| 2 | | Aetna Inc | | Healthcare-Services | | 2.5 | % |
| 3 | | Chevron Corp | | Oil & Gas | | 2.5 | % |
| 4 | | CSX Corp | | Transportation | | 2.3 | % |
| 5 | | Berkshire Hathaway Inc | | Insurance | | 2.2 | % |
| 6 | | BellSouth Corp | | Telecommunications | | 2.2 | % |
| 7 | | Hewlett-Packard Co | | Computers | | 2.2 | % |
| 8 | | Lehman Brothers Holdings Inc | | Diversified Financial Services | | 2.2 | % |
| 9 | | Phelps Dodge Corp | | Mining | | 2.1 | % |
| 10 | | Merrill Lynch & Co Inc | | Diversified Financial Services | | 2.0 | % |
| | | | | | |
| |
| | Total | | | | | | 23.6 | % |
Industry Sector Representation as of December 31, 2005
Sector
| | % of Net Assets
| | S&P 500 Index
| | Difference
| |
|---|
| Basic Materials | | 2.8 | % | 2.9 | % | -0.1 | % |
| Communications | | 10.8 | % | 10.2 | % | 0.6 | % |
| Consumer, Cyclical | | 9.9 | % | 8.5 | % | 1.4 | % |
| Consumer, Non-cyclical | | 8.5 | % | 21.6 | % | -13.1 | % |
| Energy | | 16.5 | % | 9.6 | % | 6.9 | % |
| Financial | | 31.6 | % | 21.1 | % | 10.5 | % |
| Industrial | | 8.0 | % | 11.3 | % | -3.3 | % |
| Technology | | 4.4 | % | 11.4 | % | -7.0 | % |
| Utility | | 6.9 | % | 3.4 | % | 3.5 | % |
| Cash | | 0.6 | % | 0.0 | % | 0.6 | % |
| | |
| |
| | | |
| | Total | | 100.0 | % | 100.0 | % | | |
Disclaimer
The following is a reminder from the friendly folks at your Fund who worry about liability. The views expressed here are exclusively those of Fund management. These views are not meant as investment advice and should not be considered predictive in nature. Any favorable (or unfavorable) description of a holding applies only as of December 31, 2005, unless otherwise stated. Security positions can and do change thereafter. Discussions of historical performance do not guarantee and are not indicative of future performance.
114
The Fund is subject to market risk (volatility) and is not an appropriate investment for short-term investors.
This report is submitted for the general information of the shareholders of the Fund. It is not authorized for distribution to prospective investors unless preceded or accompanied by an effective prospectus, which includes information regarding the Fund's risks, objectives, fees and expenses, experience of its management, and other information For questions or other fund information, call 1-800-661-3550 or visit the Fund's website www.bridgeway.com. Foreside Fund Services, LLC, distributor.
Conclusion
Thank you for your continued investment in Large-Cap Value. This Fund remains open to both current and new investors. As always, we appreciate your feedback.
Sincerely,
John Montgomery
115
DISCLOSURE OF FUND EXPENSES
(Unaudited)
As a shareholder of the Fund, you will incur no transaction costs from the Fund, including sales charges (loads) on purchases, on reinvested dividends, or on other distributions. There are also no redemption fees or exchange fees. However, as a shareholder of the Fund, you will incur ongoing costs, including management fees and other Fund expenses. The following examples are intended to help you understand your ongoing costs (in dollars) of investing in the Fund and to compare these costs with the ongoing costs of investing in other mutual funds. The examples are based on an investment of $1,000 invested on July 1, 2005 and held until December 31, 2005.
Actual Return. The first line of the table below provides information about actual account values and actual expenses. You may use the information in this line, together with the amount you invested, to estimate the expenses that you paid over the period. Simply divide your account value by $1,000 (for example, an $8,600 account value divided by $1,000 = 8.6), then multiply the result by the number in the first line under the heading "Expense Paid During Period" to estimate the expenses you paid on your account during this period.
Hypothetical 5% Return. The second line of the table below provides information about hypothetical account values and hypothetical expenses based on the Fund's actual expense ratio and an assumed rate of return of 5% per year before expenses, which is not the Fund's actual return. The hypothetical account values and expenses may not be used to estimate the actual ending account balance or expenses you paid for the period. You may use this information to compare the ongoing costs of investing in a Fund and other mutual funds. To do so, compare this 5% hypothetical example with the 5% hypothetical examples that appear in the shareholder reports of the other funds.
The expenses shown in the table are meant to highlight ongoing Fund costs only. Therefore, the second line of the table is useful in comparing ongoing costs only, and will not help you determine the relative total costs of owning different funds, because other funds may also have transaction costs, such as sales charges, redemption fees or exchange fees.
Bridgeway Large-Cap Value Fund
| | Beginning Account
Value at 7/1/05
| | Ending Account
Value at 12/31/05
| | Expense Paid
During Period*
7/1/05-12/31/05
|
|---|
| Actual Fund Return | | $ | 1,000.00 | | $ | 1,078.44 | | $ | 4.35 |
| Hypothetical Fund Return | | $ | 1,000.00 | | $ | 1,021.02 | | $ | 4.23 |
- *
- Expenses are equal to the Fund's annualized expense ratio of 0.83% multiplied by the average account value over the period, multiplied by the number of days in the first fiscal half-year divided by 365 days in the current year (to reflect the one half-year period).
116
SCHEDULE OF INVESTMENTS
Showing percentage of net assets as of December 31, 2005 (Unaudited)
Industry
| | Company
| | Shares
| | Value
|
|---|
| COMMON STOCKS—99.4% | | | | | |
| |
Aerospace/Defense—0.7% |
|
|
|
|
|
| | | | | Goodrich Corp | | 7,000 | | $ | 287,700 |
| |
Agriculture—1.0% |
|
|
|
|
|
| | | | | Archer Daniels Midland Co | | 17,000 | | | 419,220 |
| |
Banks—4.6% |
|
|
|
|
|
| | | | | AmSouth Bancorp | | 17,100 | | | 448,191 |
| | | | | Bank of America Corp | | 9,008 | | | 415,719 |
| | | | | KeyCorp | | 13,000 | | | 428,090 |
| | | | | US Bancorp | | 21,800 | | | 651,602 |
| | | | | | |
|
| | | | | | | | | | 1,943,602 |
| |
Building Materials—0.0%^ |
|
|
|
|
|
| | | | | Eagle Materials Inc | | 133 | | | 16,274 |
| |
Chemicals—0.7% |
|
|
|
|
|
| | | | | Eastman Chemical Co | | 6,000 | | | 309,540 |
| |
Commercial Services—0.8% |
|
|
|
|
|
| | | | | RR Donnelley & Sons | | 10,400 | | | 355,784 |
| |
Computers—3.4% |
|
|
|
|
|
| | | | | Affiliated Computer Services Inc* | | 2,000 | | | 118,360 |
| | | | | Hewlett-Packard Co | | 31,700 | | | 907,571 |
| | | | | NCR Corp* | | 12,300 | | | 417,462 |
| | | | | | |
|
| | | | | | | | | | 1,443,393 |
| |
Diversified Financial Services—12.4% |
|
|
|
|
|
| | | | | Bear Stearns Companies Inc | | 4,534 | | | 523,813 |
| | | | | Citigroup Inc | | 13,240 | | | 642,537 |
| | | | | E*TRADE Group Inc* | | 39,600 | | | 826,056 |
| | | | | Goldman Sachs Group Inc | | 4,800 | | | 613,008 |
| | | | | JP Morgan Chase & Co | | 10,850 | | | 430,637 |
| | | | | Lehman Brothers Holdings Inc | | 7,070 | | | 906,162 |
| | | | | Merrill Lynch & Company | | 12,500 | | | 846,625 |
| | | | | Morgan Stanley & Co | | 7,400 | | | 419,876 |
| | | | | | |
|
| | | | | | | | | | 5,208,714 |
| |
Electric—5.5% |
|
|
|
|
|
| | | | | American Electric Power Inc | | 11,700 | | | 433,953 |
| | | | | Duke Energy Corp | | 26,100 | | | 716,445 |
| | | | | Edison International | | 14,700 | | | 641,067 |
| | | | | Southern Co | | 15,050 | | | 519,677 |
| | | | | | |
|
| | | | | | | | | | 2,311,142 |
| |
Electric Utilities—1.3% |
|
|
|
|
|
| | | | | TXU Corp | | 11,000 | | | 552,090 |
| | | | | | | | |
117
| |
Electronics—0.2% |
|
|
|
|
|
| | | | | Parker Hannifin Corp | | 1,000 | | $ | 65,960 |
| |
Gas—0.1% |
|
|
|
|
|
| | | | | Sempra Energy | | 900 | | | 40,356 |
| |
Hand/Machine Tools—0.8% |
|
|
|
|
|
| | | | | Black & Decker Corp | | 4,000 | | | 347,840 |
| |
Healthcare—Products—0.8% |
|
|
|
|
|
| | | | | Zimmer Holdings Inc* | | 5,000 | | | 337,200 |
| |
Healthcare—Services—3.5% |
|
|
|
|
|
| | | | | Aetna Inc | | 11,300 | | | 1,065,702 |
| | | | | WellPoint Health Networks Inc* | | 5,400 | | | 430,866 |
| | | | | | |
|
| | | | | | | | | | 1,496,568 |
| |
Home Builders—4.4% |
|
|
|
|
|
| | | | | Centex Corp | | 7,840 | | | 560,482 |
| | | | | DR Horton Inc | | 1 | | | 34 |
| | | | | KB Home | | 5,500 | | | 399,630 |
| | | | | Lennar Corp—Class A | | 8,260 | | | 504,025 |
| | | | | Pulte Homes Inc | | 9,420 | | | 370,771 |
| | | | | | |
|
| | | | | | | | | | 1,834,942 |
| |
Insurance—13.1% |
|
|
|
|
|
| | | | | Allstate Corp | | 7,000 | | | 378,490 |
| | | | | AON Corp | | 12,200 | | | 438,590 |
| | | | | Berkshire Hathaway Inc—Class B* | | 310 | | | 910,005 |
| | | | | Chubb Corp | | 4,000 | | | 390,600 |
| | | | | Cigna Corp | | 6,100 | | | 681,370 |
| | | | | CNA Financial Corp* | | 13,000 | | | 425,490 |
| | | | | Fidelity National | | 11,000 | | | 404,690 |
| | | | | Metlife Inc | | 15,800 | | | 774,200 |
| | | | | Prudential Financial Inc | | 11,000 | | | 805,090 |
| | | | | Safeco Corp | | 5,264 | | | 297,416 |
| | | | | | |
|
| | | | | | | | | | 5,505,941 |
| |
Media—2.0% |
|
|
|
|
|
| | | | | Time Warner Inc | | 26,900 | | | 469,136 |
| | | | | Walt Disney Co | | 15,900 | | | 381,123 |
| | | | | | |
|
| | | | | | | | | | 850,259 |
| |
Mining—2.1% |
|
|
|
|
|
| | | | | Phelps Dodge Corp | | 6,200 | | | 891,994 |
| |
Miscellaneous Manufacturing—1.8% |
|
|
|
|
|
| | | | | Textron Inc | | 9,700 | | | 746,706 |
| |
Oil & Gas—16.5% |
|
|
|
|
|
| | | | | Amerada Hess Corp | | 4,780 | | | 606,200 |
| | | | | Anadarko Petroleum Corp | | 7,300 | | | 691,675 |
| | | | | Chesapeake Energy Corp | | 22,000 | | | 698,060 |
| | | | | | | | |
118
| | | | | ChevronTexaco Corp | | 18,514 | | $ | 1,051,040 |
| | | | | Conoco Phillips | | 11,600 | | | 674,888 |
| | | | | Kerr-McGee Corp | | 4,191 | | | 380,794 |
| | | | | Marathon Oil Corp | | 5,000 | | | 304,850 |
| | | | | Occidental Petroleum Corp | | 9,600 | | | 766,848 |
| | | | | Sunoco Inc | | 5,200 | | | 407,576 |
| | | | | Tesoro Corp | | 11,100 | | | 683,205 |
| | | | | Valero Energy Corp | | 13,200 | | | 681,120 |
| | | | | | |
|
| | | | | | | | | | 6,946,256 |
| |
Pharmaceuticals—2.3% |
|
|
|
|
|
| | | | | Bristol-Myers Squibb Co | | 400 | | | 9,192 |
| | | | | Express Scripts Inc* | | 6,000 | | | 502,800 |
| | | | | Hospira Inc* | | 10,400 | | | 444,912 |
| | | | | | |
|
| | | | | | | | | | 956,904 |
| |
Retail—5.6% |
|
|
|
|
|
| | | | | Costco Wholesale Corp | | 3,000 | | | 148,410 |
| | | | | CVS Corp | | 11,480 | | | 303,302 |
| | | | | Darden Resturants | | 8,000 | | | 311,040 |
| | | | | Federated Department Stores Inc | | 2,400 | | | 159,192 |
| | | | | Home Depot Inc/The | | 15,700 | | | 635,536 |
| | | | | JC Penny Co Inc | | 8,600 | | | 478,160 |
| | | | | Nordstrom Inc | | 6,000 | | | 224,400 |
| | | | | Office Depot Inc* | | 3,000 | | | 94,200 |
| | | | | | |
|
| | | | | | | | | | 2,354,240 |
| |
Savings and Loans—1.5% |
|
|
|
|
|
| | | | | Golden West Financial Corp | | 3,200 | | | 211,200 |
| | | | | Washington Mutual | | 10,100 | | | 439,350 |
| | | | | | |
|
| | | | | | | | | | 650,550 |
| |
Semiconductors—1.0% |
|
|
|
|
|
| | | | | National Semiconductor | | 16,000 | | | 415,680 |
| |
Telecommunications—8.8% |
|
|
|
|
|
| | | | | AT&T Corp | | 58,310 | | | 1,428,011 |
| | | | | BellSouth Corp | | 33,500 | | | 907,850 |
| | | | | Corning Inc* | | 22,600 | | | 444,316 |
| | | | | Juniper Networks Inc* | | 22,775 | | | 507,883 |
| | | | | Verizon Communications Inc | | 14,030 | | | 422,584 |
| | | | | | |
|
| | | | | | | | | | 3,710,644 |
| |
Transportation—4.5% |
|
|
|
|
|
| | | | | Burlington Northern Santa Fe Corp | | 3,000 | | | 212,460 |
| | | | | CSX Corp | | 18,800 | | | 954,476 |
| | | | | Norfolk Southern Corp | | 16,250 | | | 728,488 |
| | | | | | |
|
| | | | | | | | | | 1,895,424 |
| | | | | | |
|
TOTAL COMMON STOCKS
(Cost $35,339,387) | | | | | 41,894,923 |
| | | | | | |
|
| | | | | | | | |
119
| MONEY MARKET MUTUAL FUNDS—0.5% | | | | | |
| First American Treasury Obligations Fund—Class S | | 224,751 | | $ | 224,751 |
| | | | | | |
|
| | | | | TOTAL MONEY MARKET MUTUAL FUNDS
(Cost $224,751) | | | | | 224,751 |
| | | | | | |
|
TOTAL INVESTMENTS—99.9%
(Cost $35,564,138) | | | | $ | 42,119,674 |
| Other Assets in Excess of Liabilities—0.1% | | | | | 50,989 |
| | | | | | |
|
| NET ASSETS—100.0% | | | | $ | 42,170,663 |
| | | | | | |
|
- *
- Non-income producing security
- ^
- Less than 0.05% of net assets
See Notes to Financial Statements
120
Blue Chip 35 Index Fund
MANAGER'S COMMENTARY
(Unaudited)
December 31, 2005
Dear Fellow Blue Chip 35 Index Fund Shareholder,
For the six months ending December 2005, our Fund was up 4.72%, compared with a 5.77% increase of our primary benchmark, the S&P 500 Index, and a 6.79% increase for our peer group, the Lipper Large-Cap Core Funds Index. We essentially matched the return of the Index we seek to track, the Bridgeway Ultra-Large 35 Index (up 4.73%). In an environment that continues to be more favorable to smaller companies, our performance was mixed.
For the full calendar year our Fund was up 0.05%, compared to 4.91% for the S&P 500 Index and 5.72% for the Lipper Large-Cap Core Funds Index. As detailed below, ultra-large stocks lagged behind most market segments by size in 2005. It has not been an environment favorable to our ultra-large companies for an extended period, specifically, since 1999. On a contrarian basis (as in "each market niche gets its day in the sun"), we believe we are overdue for a period of large-cap company outperformance, an environment which would probably be favorable to our Fund.
The table below presents our six-month, one-year, five-year and life-to-date financial results according to the formula required by the SEC. Since inception (see the right-hand column in the table below), we still lead our primary market benchmark, the S&P 500 Index, and our peer benchmark, the Lipper Large-Cap Core Funds Index. We trail our own proprietary index, Bridgeway Ultra-Large 35, by an amount roughly equal to our expense ratio, a result I am pleased with.
| | 6 Months
7/1/05
to 12/31/05
| | 1 Year
1/1/05
to 12/31/05
| | 5 Year
1/1/01
to 12/31/05
| | Life-to-Date
7/31/97
to 12/31/05
| |
|---|
| Blue Chip 35 Index Fund | | 4.72 | % | 0.05 | % | 0.14 | % | 5.35 | % |
| S&P 500 Index | | 5.77 | % | 4.91 | % | 0.54 | % | 4.83 | % |
| Bridgeway Ultra-Large 35 Index | | 4.73 | % | 0.08 | % | 0.84 | % | 5.47 | % |
| Lipper Large-Cap Core Funds | | 6.79 | % | 5.72 | % | -0.38 | % | 4.08 | % |
Performance figures quoted represent past performance and are no guarantee of future results. Current performance may be lower or higher than the performance figures quoted, and an investor's shares, when redeemed, may be worth more or less than original cost. For the most recent month-end performance, please call 1-800-661-3550 or visit the Fund's website at www.bridgeway.com.
The S&P 500 Index is a broad-based, unmanaged measurement of changes in stock market conditions based on the average of 500 widely held common stocks with dividends reinvested. The Bridgeway Ultra-Large 35 Index is an index comprised of very large, "blue chip" U.S. stocks, excluding tobacco; it is compiled by the adviser of the Fund. The Lipper Large-Cap Core Funds reflect the aggregate record of domestic large-cap core mutual funds as reported by Lipper, Inc. It is not possible to invest directly in an index or average. Periods longer than one year are annualized.
According to data from Morningstar, Inc., our Fund ranked 1,483rd of 1,851 large blend funds for the last twelve months and 509th of 1,155 such funds for the last five years. The Fund's numeric rankings are based solely on total return performance. Morningstar ranks funds in various fund categories by making comparative calculations using total returns.
121
Growth of $10,000 Invested in Blue Chip 35 Fund and Indexes from 7/31/97 (inception) to 12/31/05
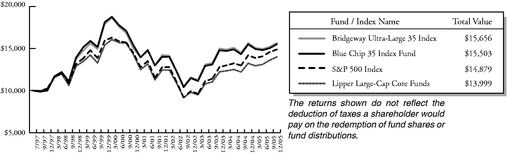
Performance Summary in a Small Company Dominated Market
The Short Version: It's been a small-cap dominated market for at least six years, which is not the environment most favorable to our Fund.
"First decile" stocks, those the size of the largest 10% on the New York Stock Exchange, significantly underperformed almost every other category of stocks in the six-month, one-year and five-year periods reported below. While a majority of the weighting in the S&P 500 Index is also in this first decile, it also has substantial exposure to the second decile and even some exposure to companies as small as the fourth decile. When small stocks are in favor, our fund is at a relative disadvantage, since ours is more a "pure large cap," "high end of the first decile," fund. This fact has put a significant damper on our performance relative to the S&P 500 and most large-cap mutual funds over the last six-months, year, and even five years.
Company Size
According to the CRSP
Cap-Based Portfolio Indexes(1)
| | 6 months
| | 1 year
| | 5 years
| | 79 years(2)
| |
|---|
| 1 (ultra-large) | | 5.2 | % | 3.7 | % | -1.6 | % | 9.6 | % |
| 2 | | 8.1 | % | 12.0 | % | 6.8 | % | 11.0 | % |
| 3 | | 8.6 | % | 12.4 | % | 7.5 | % | 11.4 | % |
| 4 | | 6.8 | % | 10.6 | % | 9.0 | % | 11.5 | % |
| 5 | | 9.4 | % | 10.1 | % | 7.9 | % | 11.8 | % |
| 6 | | 4.2 | % | 3.2 | % | 10.1 | % | 11.9 | % |
| 7 | | 7.7 | % | 10.5 | % | 11.4 | % | 11.8 | % |
| 8 | | 9.1 | % | 7.6 | % | 14.9 | % | 11.9 | % |
| 9 | | 6.4 | % | 2.0 | % | 16.2 | % | 12.1 | % |
| 10 (ultra-small) | | 10.5 | % | 5.8 | % | 25.5 | % | 14.1 | % |
- (1)
- The CRSP Cap-Based Portfolio Indexes are unmanaged indexes of the publicly traded U.S. stocks with dividends reinvested, grouped by the market capitalization, as reported by the Center for Research in Security Prices. Past performance is no guarantee of future results.
- (2)
- December 1926 to December 2005.
Informal Long-term Goal
The Short Version: Informally, we have a goal of outperforming the S&P 500 Index in each year that large companies outperform small ones and half the years that small ones beat large ones. So far, we've done just about that.
So far, there has only been one calendar year data point since inception of this Fund when large companies beat small companies. (I'm expecting several more data points in the next five years; we'll see.) In that year (1998), our Fund handily beat the S&P 500, at least partly, if not entirely, due to the advantage of our ultra-large companies in that environment. Our "swimming with the current," was
122
reflected in our performance. What is interesting is that we also seek to outperform the S&P 500 Index in half the years that small companies beat large. This may seem counterintuitive, but it relates to interesting aspects of our contrarian strategy of "roughly equally weighting" the stocks in the Bridgeway Ultra-Large 35 Index. In a "market cap weighted" index, such as the S&P 500 Index, the more an index company goes up in price (and thus, perhaps, the more expensive it becomes) the more heavily weighted it is in the index. Ours is the opposite. The Bridge-way Ultra-Large 35 Index structure is such that the more a company goes up in price; the more we tend to "pull back" from it in weighting. Likewise, the more the stock price goes down, the more we are increasing our weighting (or adding back). As the table below indicates, we have beaten the S&P 500 Index in four of seven years that small company performance has exceeded that of large companies. Overall, this has led to our beating the S&P 500 Index on a cumulative basis since inception. (See the table on page 94.) Of course, past performance is no guarantee of future performance, so it will be interesting to continue to track this feature.
Calendar Year
| | Large or Small
Dominance?
| | Blue Chip 35
Index Fund
| | S&P 500
Index
| | Difference
| |
|---|
| 1998 | | Large | | 39.1 | % | 28.5 | % | 10.6 | % |
| 1999 | | Small | | 30.3 | % | 21.0 | % | 9.3 | % |
| 2000 | | Small | | -15.1 | % | -9.1 | % | -6.0 | % |
| 2001 | | Small | | -9.1 | % | -11.9 | % | 2.8 | % |
| 2002 | | Small | | -18.0 | % | -22.1 | % | 4.1 | % |
| 2003 | | Small | | 28.9 | % | 28.7 | % | 0.2 | % |
| 2004 | | Small | | 4.8 | % | 10.9 | % | -6.1 | % |
| 2005 | | Small | | 0.1 | % | 4.9 | % | -4.9 | % |
Calendar Year Performance
The Short Version: It was a poor calendar year, relative to both our primary market benchmark and our peer benchmarks.
At the end of the fiscal year in June, we reported the re-composition of the index and the fund, which we do every few years to keep our focus on the largest "blue chip" U.S. stocks and to do so in a way that pays attention to diversification and risk. We dropped seven companies and added seven. However, since all fourteen contributed to the calendar year return, they are all listed below, with returns for the half year period only. (We own 36 companies rather than 35, in anticipation of a merger between two companies, something that historically has happened every few years.)
Total Return for Blue Chip 35 Index Fund Stocks for the Calendar Year 2005*
Rank
| | Company
| | Industry
| | % Change
| |
|---|
| 1 | | Google Inc(2) | | Internet | | 39.9 | % |
| 2 | | Texas Instruments Inc | | Semiconductors | | 18.9 | % |
| 3 | | Genentech Inc(2) | | Biotechnology | | 13.5 | % |
| 4 | | JPMorgan Chase & Co(2) | | Diversified Financial Services | | 13.5 | % |
| 5 | | PepsiCo Inc | | Beverages | | 10.6 | % |
| 6 | | Applied Materials Inc(2) | | Semiconductors | | 9.4 | % |
| 7 | | Wachovia Corp(2) | | Banks | | 8.5 | % |
| 8 | | Hewlett-Packard Co(1) | | Computers | | 8.5 | % |
| 9 | | United Technologies Corp(2) | | Aerospace/Defense | | 8.3 | % |
| 10 | | Exxon Mobil Corp | | Oil & Gas | | 8.1 | % |
| 11 | | Intel Corp | | Semiconductors | | 5.9 | % |
| 12 | | American International Group Inc | | Insurance | | 5.8 | % |
| | | | | | | | |
123
| 13 | | Chevron Corp | | Oil & Gas | | 5.8 | % |
| 14 | | Merck & Co Inc | | Pharmaceuticals | | 3.7 | % |
| 15 | | Procter & Gamble Co | | Cosmetics/Personal Care | | 3.3 | % |
| 16 | | Citigroup Inc | | Diversified Finan Services | | 2.3 | % |
| 17 | | Berkshire Hathaway Inc | | Insurance | | 2.1 | % |
| 18 | | Wells Fargo & Co | | Banks | | 2.0 | % |
| 19 | | Eli Lilly & Co | | Pharmaceuticals | | 1.0 | % |
| 20 | | Bank of America Corp | | Banks | | 0.1 | % |
| 21 | | Microsoft Corp | | Software | | -0.5 | % |
| 22 | | Bristol-Myers Squibb Co(1) | | Pharmaceuticals | | -1.3 | % |
| 23 | | General Electric Co | | Miscellaneous Manufacturing | | -1.3 | % |
| 24 | | AT&T Inc | | Telecommunications | | -2.4 | % |
| 25 | | Home Depot Inc | | Retail | | -2.4 | % |
| 26 | | Coca-Cola Co | | Beverages | | -2.5 | % |
| 27 | | Wal-Mart Stores Inc | | Retail | | -2.9 | % |
| 28 | | 3M Co | | Miscellaneous Manufacturing | | -3.1 | % |
| 29 | | ConocoPhillips(2) | | Oil & Gas | | -3.9 | % |
| 30 | | United Parcel Service Inc | | Transportation | | -4.3 | % |
| 31 | | Johnson & Johnson | | Healthcare-Products | | -4.6 | % |
| 32 | | Comcast Corp(1) | | Media | | -7.1 | % |
| 33 | | Oracle Corp | | Software | | -7.7 | % |
| 34 | | Time Warner Inc | | Media | | -8.1 | % |
| 35 | | Cisco Systems Inc | | Telecommunications | | -8.5 | % |
| 36 | | Pfizer Inc | | Pharmaceuticals | | -9.9 | % |
| 37 | | International Business Machines Corp | | Computers | | -10.0 | % |
| 38 | | Fannie Mae(1) | | Diversified Financial Services | | -10.9 | % |
| 39 | | McDonald's Corp(1) | | Retail | | -12.0 | % |
| 40 | | EI Du Pont de Nemours & Co(1) | | Chemicals | | -12.2 | % |
| 41 | | Verizon Communications Inc | | Telecommunications | | -16.5 | % |
| 42 | | Dell Inc | | Computers | | -19.7 | % |
| 43 | | Ford Motor Co(1) | | Auto Manufacturers | | -23.2 | % |
- *
- Performance for footnoted companies is for a partial year due to portfolio recomposition.
- (1)
- Sold during 2005.
- (2)
- Purchased during 2005.
The biggest industry shift in the last six months has been in energy stocks, as their recent hot performance has begun to cool. ExxonMobil, number one in the June report, dropped to number ten in December. Number two ChevronTexaco dropped to number thirteen. The Communications and Technology sectors have taken some of that performance leadership, with newcomer Google and Texas Instruments leading the Index.
Google was added to the Index in July and quickly rose to the number one slot by year end. In competition with a couple of other browser companies, it has introduced "G-mail" for email and instant messaging to add to its Google Talk for its combo "instant messaging"/free web-based calling feature. Google techs are working hard to provide extra features to retain customer loyalty, such as ease of contact lists, program loading and updating and purchase options for e-shoppers. Number two performer, Texas Instruments, has benefited from the increase in demand—up 6.8% over 2004—for microchips for computers, mobile phones and digital music players and other consumer devices.
124
On the other end of the performance spectrum, computer makers Dell and IBM have had a challenging calendar year. Dell is working on expanding foreign production, particularly in India, in hopes of filling in the gap from slowing US sales. IBM's results were under expectations early in the calendar year. It continues to struggle against competition and to try to diversify its business units.
Sector Representation as of December 31, 2005
The Short Version: Our sector representation does not vary significantly relative to the S&P 500, except, perhaps, that we have more technology.
The following table presents the percentage of our Fund's stocks by sector of the economy relative to that of our primary market benchmark.
| | % of Net Assets
| | S&P 500 Index
| | Difference
| |
|---|
| Basic Materials | | 0.0 | % | 2.9 | % | -2.9 | % |
| Communications | | 14.0 | % | 10.2 | % | 3.8 | % |
| Consumer, Cyclical | | 5.8 | % | 8.5 | % | -2.7 | % |
| Consumer, Non-cyclical | | 21.9 | % | 21.6 | % | 0.3 | % |
| Energy | | 7.6 | % | 9.6 | % | -2.0 | % |
| Financial | | 20.3 | % | 21.1 | % | -0.8 | % |
| Industrial | | 11.6 | % | 11.3 | % | 0.3 | % |
| Technology | | 18.6 | % | 11.4 | % | 7.2 | % |
| Utilities | | 0.0 | % | 3.4 | % | -3.4 | % |
| Cash | | 0.2 | % | 0.0 | % | 0.2 | % |
| | |
| |
| | | |
| | Total | | 100.0 | % | 100.0 | % | | |
Tax Efficiency
The Short Version: We just completed our eighth year of not distributing any capital gains. While all index funds tend toward tax efficiency, this one has been so in the extreme.
| | 1 Year
1/1/05
to 12/31/05
| | 5 Year
1/1/01
to 12/31/05
| | Life-to-Date
7/31/97
to 12/31/05
| |
|---|
| Blue Chip 35 Index Fund | | | | | | | |
| | Return Before Taxes | | 0.05 | % | 0.14 | % | 5.35 | % |
| | Return After Taxes on Distributions | | -0.45 | % | -0.34 | % | 4.92 | % |
| | Return After Taxes on Distributions and Sale of Fund Shares | | -0.17 | % | -0.17 | % | 4.39 | % |
I recently came across this commentary online:
XYZ ETF Company says the distributions result from changes in companies found within the indexes that the ETFs track and from the nature of assets flowing into the funds. Changes in indexes can create capital gains because ETF managers must sell off stocks that are being removed from the index.
I thought the final comment a bit unusual: distributions were caused by the "nature of the assets flowing into the funds." Hmmm. I thought a dollar was a dollar was a dollar.
Most index funds track indexes that were created to typify a particular market niche, for instance, large or small U.S. companies. Typically, these are "rebalanced" quarterly or annually. As companies are "jettisoned" from the index that have appreciated over time, the mutual funds tracking them necessarily take capital gains when rebalancing. The index that our Fund tracks, Bridgeway Ultra-Large 35 Index, was specifically created with mutual fund shareholders' needs in mind, however. Our
125
structure is much less likely to create a capital gain, thus seeking to preserve our tax efficiency in the extreme. For example, since our fund tracks the largest of the large companies, a company doesn't leave the Index just because it gets larger. We only rebalance every two, or more likely three years, which also reduces the need for selling appreciated stocks. A divested company (a smaller company created when a large company sells shares of a division on the market as a separate company) is not automatically sold at the first opportunity, but when it is more advantageous to shareholder interests. These are just some of the ways we have been able to avoid making a capital gain distribution, thus saving more of our Fund returns from the tax man.
Contrarian Viewpoint
The Short Version: I'm a contrarian at heart. Here's another "take" on a theme in this letter. With small companies having recently outperformed large ones for six or seven years in a row (depending on what measure you use), ultra-large companies appear overdue for a comeback. That would bode well for our Fund.
In that same vein, the following recent web site posting caught my eye:
Can anyone point me to any investment guru or writer or anybody who recommends funds that have poor performance? Certainly there are managers out there who have great strategies but haven't had good returns. Why isn't anyone talking about and buying these funds?
In spite of beating its market benchmark since inception, I would describe this Fund as Bridgeway's "good Fund with poor performance." All other Bridgeway Funds with a three year track record have five stars as rated by Morningstar. This one has just two. However, I don't think that's reflective of its prospects. (Overall ratings are based on 3- and 5-year Morning-star Risk-Adjusted Returns and account for variation in a fund's monthly performance. Past performance is no guarantee of future results.)
Disclaimer
The following is a reminder from the friendly folks at your Fund who worry about liability. The views expressed here are exclusively those of Fund management. These views, including those of market sectors or individual stocks, are not meant as investment advice and should not be considered predictive in nature. Any favorable (or unfavorable) description of a holding applies only as of the quarter end, December 31, 2005, unless otherwise stated. Security positions can and do change thereafter. Discussions of historical performance do not guarantee and are not indicative of future performance.
The Fund is subject to above average market risk (volatility) and is not an appropriate investment for short-term investors.
This report is submitted for the general information of the shareholders of the Fund. It is not authorized for distribution to prospective investors unless preceded or accompanied by an effective prospectus, which includes information regarding the Fund's risks, objectives, fees and expenses, experience of its management, and other information For questions or other fund information, call 1-800-661-3550 or visit the Fund's website www.bridgeway.com. Foreside Fund Services, LLC, distributor.
Conclusion
Thank you for your continued investment in Blue Chip 35 Index. This Fund remains open to both current and new investors. As always, we appreciate your feedback.
Sincerely,
John Montgomery
126
DISCLOSURE OF FUND EXPENSES
(Unaudited)
As a shareholder of the Fund, you will incur no transaction costs from the Fund, including sales charges (loads) on purchases, on reinvested dividends, or on other distributions. There are also no redemption fees or exchange fees. However, as a shareholder of the Fund, you will incur ongoing costs, including management fees and other Fund expenses. The following examples are intended to help you understand your ongoing costs (in dollars) of investing in the Fund and to compare these costs with the ongoing costs of investing in other mutual funds. The examples are based on an investment of $1,000 invested on July 1, 2005 and held until December 31, 2005.
Actual Return. The first line of the table below provides information about actual account values and actual expenses. You may use the information in this line, together with the amount you invested, to estimate the expenses that you paid over the period. Simply divide your account value by $1,000 (for example, an $8,600 account value divided by $1,000 = 8.6), then multiply the result by the number in the first line under the heading "Expense Paid During Period" to estimate the expenses you paid on your account during this period.
Hypothetical 5% Return. The second line of the table below provides information about hypothetical account values and hypothetical expenses based on the Fund's actual expense ratio and an assumed rate of return of 5% per year before expenses, which is not the Fund's actual return. The hypothetical account values and expenses may not be used to estimate the actual ending account balance or expenses you paid for the period. You may use this information to compare the ongoing costs of investing in a Fund and other mutual funds. To do so, compare this 5% hypothetical example with the 5% hypothetical examples that appear in the shareholder reports of the other funds.
The expenses shown in the table are meant to highlight ongoing Fund costs only. Therefore, the second line of the table is useful in comparing ongoing costs only, and will not help you determine the relative total costs of owning different funds, because other funds may also have transaction costs, such as sales charges, redemption fees or exchange fees.
Bridgeway Blue Chip 35 Fund
| | Beginning Account
Value at 7/1/05
| | Ending Account
Value at 12/31/05
| | Expense Paid
During Period*
7/1/05 - 12/31/05
|
|---|
| Actual Fund Return | | $ | 1,000.00 | | $ | 1,047.20 | | $ | 0.77 |
| Hypothetical Fund Return | | $ | 1,000.00 | | $ | 1,024.45 | | $ | 0.77 |
- *
- Expenses are equal to the Fund's annualized expense ratio of 0.15% multiplied by the average account value over the period, multiplied by the number of days in the first fiscal half-year divided by 365 days in the current year (to reflect the one half-year period).
127
SCHEDULE OF INVESTMENTS
Showing percentage of net assets as of December 31, 2005
(Unaudited)
Industry
| | Company
| | Shares
| | Value
|
|---|
COMMON STOCKS—99.8% |
|
|
|
|
|
| Aerospace/Defense—2.9% | | | | | |
| | | United Technologies Corp | | 24,900 | | $ | 1,392,159 |
Banks—8.3% |
|
|
|
|
|
| | | Bank of America Corp | | 28,328 | | | 1,307,337 |
| | | Wachovia Corp | | 26,400 | | | 1,395,504 |
| | | Wells Fargo & Co | | 20,660 | | | 1,298,068 |
| | | | | | |
|
| | | | | | | | 4,000,909 |
Beverages—5.2% |
|
|
|
|
|
| | | Coca-Cola Co/The | | 27,457 | | | 1,106,792 |
| | | PepsiCo Inc | | 23,605 | | | 1,394,583 |
| | | | | | |
|
| | | | | | | | 2,501,375 |
Biotechnology—3.0% |
|
|
|
|
|
| | | Genentech Inc.* | | 15,500 | | | 1,433,750 |
Computers—5.0% |
|
|
|
|
|
| | | Dell Inc* | | 36,344 | | | 1,089,957 |
| | | International Business Machines Corp | | 15,942 | | | 1,310,432 |
| | | | | | |
|
| | | | | | | | 2,400,389 |
Cosmetics/Personal Care—2.6% |
|
|
|
|
|
| | | Procter & Gamble Co | | 21,636 | | | 1,252,292 |
Diversified Financial Services—5.9% |
|
|
|
|
|
| | | Citigroup Inc | | 29,314 | | | 1,422,608 |
| | | JPMorgan Chase & Co | | 35,900 | | | 1,424,871 |
| | | | | | |
|
| | | | | | | | 2,847,479 |
Healthcare—Products—2.7% |
|
|
|
|
|
| | | Johnson & Johnson | | 21,312 | | | 1,280,851 |
Insurance—6.0% |
|
|
|
|
|
| | | American International Group Inc | | 21,801 | | | 1,487,482 |
| | | Berkshire Hathaway Inc—Class B* | | 474 | | | 1,391,427 |
| | | | | | |
|
| | | | | | | | 2,878,909 |
Internet—3.8% |
|
|
|
|
|
| | | Google Inc* | | 4,400 | | | 1,825,384 |
Media—2.6% |
|
|
|
|
|
| | | Time Warner Inc | | 71,830 | | | 1,252,715 |
Miscellaneous Manufacturing—5.7% |
|
|
|
|
|
| | | 3M Co | | 18,053 | | | 1,399,108 |
| | | General Electric Co | | 37,438 | | | 1,312,202 |
| | | | | | |
|
| | | | | | | | 2,711,310 |
Oil & Gas—7.6% |
|
|
|
|
|
| | | ChevronTexaco Corp | | 22,550 | | | 1,280,164 |
| | | ConocoPhillips | | 19,100 | | | 1,111,238 |
| | | | | | | | |
128
| | | Exxon Mobil Corp | | 21,827 | | $ | 1,226,023 |
| | | | | | |
|
| | | | | | | | 3,617,425 |
Pharmaceuticals—8.4% |
|
|
|
|
|
| | | Eli Lilly & Co | | 24,080 | | | 1,362,687 |
| | | Merck & Co Inc | | 47,746 | | | 1,518,799 |
| | | Pfizer Inc | | 50,023 | | | 1,166,536 |
| | | | | | |
|
| | | | | | | | 4,048,022 |
Retail—5.8% |
|
|
|
|
|
| | | Depot Inc | | 33,915 | | | 1,372,879 |
| | | Wal-Mart Stores Inc | | 29,719 | | | 1,390,849 |
| | | | | | |
|
| | | | | | | | 2,763,728 |
Semiconductors—8.4% |
|
|
|
|
|
| | | Applied Materials Inc | | 77,500 | | | 1,390,350 |
| | | Intel Corp | | 51,933 | | | 1,296,248 |
| | | Texas Instruments Inc | | 40,980 | | | 1,314,229 |
| | | | | | |
|
| | | | | | | | 4,000,827 |
Software—5.3% |
|
|
|
|
|
| | | Microsoft Corp | | 48,440 | | | 1,266,706 |
| | | Oracle Corp* | | 103,348 | | | 1,261,879 |
| | | | | | |
|
| | | | | | | | 2,528,585 |
Telecommunications—7.6% |
|
|
|
|
|
| | | AT&T Inc | | 52,975 | | | 1,297,358 |
| | | Cisco Systems Inc* | | 71,174 | | | 1,218,499 |
| | | Verizon Communications Inc | | 37,439 | | | 1,127,663 |
| | | | | | |
|
| | | | | | | | 3,643,520 |
Transportation—3.0% |
|
|
|
|
|
| | | United Parcel Service Inc | | 19,203 | | | 1,443,105 |
| | | | | | |
|
TOTAL COMMON STOCKS
(Cost $43,833,458) | | | | | 47,822,734 |
| | | | | | |
|
MONEY MARKET MUTUAL FUNDS—0.0%^ |
|
|
|
|
|
| First American Treasury Obligations Fund—Class S | | 17,344 | | | 17,344 |
| | | | | | |
|
TOTAL MONEY MARKET MUTUAL FUNDS
(Cost $17,344) | | | | | 17,344 |
| | | | | | |
|
TOTAL INVESTMENTS—99.8%
(Cost $43,850,802) |
|
|
|
$ |
47,840,078 |
| Other Assets in Excess of Liabilities—0.2% | | | | | 101,034 |
| | | | | | |
|
| NET ASSETS—100.0% | | | | $ | 47,941,112 |
| | | | | | |
|
- *
- Non-income producing security
- ^
- Less than 0.05% of net assets
See Notes to Financial Statements
129
Balanced Fund
MANAGER'S COMMENTARY
(Unaudited)
December 31, 2005
Dear Fellow Balanced Fund Shareholder,
Our Fund was up 0.86% in the December quarter compared to a 0.66% return for the Bloomberg/EFFAS U.S. Government 1-3 year Total Return Bond Index, a 1.70% return for the Lipper Balanced Fund Index and a 1.21% return for the Balanced Benchmark. Not much to say about this quarter except that it was a poor one on both an absolute and relative basis.
The six-month performance is more in line with my expectations, and I am quite pleased with the full calendar year returns, 6.96% compared to 1.58% for the Bloomberg/EFFAS U.S. Government 1-3 year Total Return Bond Index, 5.20% for the Lip-per Balanced Fund Index and 2.85% for the Balanced Benchmark.
The table below presents our December quarter, six month, one year and life-to-date financial results according to the formula required by the SEC.
| | Dec. Qtr.
10/1/05
to 12/31/05
| | 6 Months
7/1/05
to 12/31/05
| | 1 Year
1/1/05
to 12/31/05
| | Life-to-Date
7/1/01
to 12/31/05
| |
|---|
| Balanced Portfolio | | 0.86 | % | 3.83 | % | 6.96 | % | 5.61 | % |
| Bloomberg/ EFFAS U.S. Government 1-3 year Total Return Bond Index | | 0.66 | % | 0.71 | % | 1.58 | % | 3.22 | % |
| Lipper Balanced Fund Index | | 1.70 | % | 4.68 | % | 5.20 | % | 4.30 | % |
| S&P 500 Index | | 2.09 | % | 5.77 | % | 4.91 | % | 2.16 | % |
| Balanced Benchmark | | 1.21 | % | 2.62 | % | 2.85 | % | 2.80 | % |
Performance figures quoted represent past performance and are no guarantee of future results. Current performance may be lower or higher than the performance figures quoted, and an investor's shares, when redeemed, may be worth more or less than original cost. For the most recent month-end performance, please call 1-800-661-3550 or visit the Fund's website at www.bridgeway.com.
The Lipper Balanced Funds is an index of balanced funds compiled by Lipper, Inc. Balanced Benchmark is a combined index of which 40% reflects the S&P 500 Index (an unmanaged index of large companies with dividends reinvested) and 60% reflects the Bloomberg/ EFFAS U.S. Government 1-3 year Total Return Bond Index (transparent benchmark for the total return of the 1-3 year U.S. Government bond market).
According to data from Lipper, Inc., the Balanced Fund ranked 270th of 650 balanced funds for the calendar year 2005 and 61st of 396 funds since inception. Lipper, Inc. is an independent mutual fund rating service that ranks funds in various fund categories by making comparative calculations using total returns.
According to data from Morningstar, the Balanced Fund ranked 6th of 563 Conservative Allocation funds for the calendar year 2005 and 35th out of 365 funds for three years. Morningstar ranks funds in various fund categories by making comparative calculations using total returns.
130
Growth of $10,000 Invested in Balanced Fund and Indexes from 6/30/01 (inception) to 12/31/05
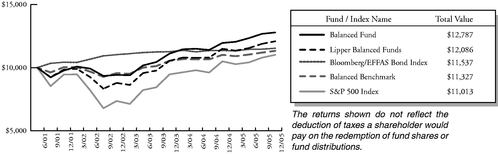
Detailed Explanation of Quarterly Performance—What Worked Well
The Short Version: The energy component that we had been enjoying in the last several quarters is noticeably absent from this list of best-performers. Even so, we had seven companies above 20% return for the quarter.
Rank
| | Description
| | Industry
| | % Gain
| |
|---|
| 1 | | Apple Computer Inc | | Computers | | 34.1 | % |
| 2 | | Circuit City Stores Inc | | Retail | | 31.6 | % |
| 3 | | Georgia-Pacific Corp | | Forest Products & Paper | | 27.5 | % |
| 4 | | Fluor Corp | | Engineering & Construction | | 26.8 | % |
| 5 | | Adobe Systems Inc | | Software | | 23.8 | % |
| 6 | | Monsanto Co | | Agriculture | | 23.6 | % |
| 7 | | Jabil Circuit Inc | | Electronics | | 20.0 | % |
| 8 | | Starbucks Corp | | Retail | | 19.8 | % |
| 9 | | National Semiconductor Corp | | Semiconductors | | 18.9 | % |
| 10 | | Dillard's Inc | | Retail | | 18.9 | % |
Apple's iPod products continue to grow in popularity and to spawn derivative products, which provide diversity for the company beyond its personal computers line. Although the tremendous price appreciation since our first purchase over four years ago means this stock is not nearly as cheap as it was, our models still like it.
Circuit City, reported a 10.8% increase in December sales, following an increase in share price from $16 in September to $22.95 at the end of the year. Although we can align good December gains to sales of flat-panel TVs, digital audio players, video games and other electronics, share price increases have continued into January 2006.
131
Detailed Explanation of Quarterly Performance—What Didn't Work
The Short Version: Two companies lost more than 20% for the quarter.
Rank
| | Description
| | Industry
| | % Loss
| |
|---|
| 1 | | General Motors Corp | | Auto Manufacturers | | -31.9 | % |
| 2 | | American Standard Cos Inc | | Building Materials | | -22.7 | % |
| 3 | | Ford Motor Co | | Auto Manufacturers | | -19.6 | % |
| 4 | | ConocoPhillips | | Oil & Gas | | -16.8 | % |
| 5 | | ADC Telecommunications Inc | | Telecommunications | | -16.4 | % |
| 6 | | Bausch & Lomb Inc | | Healthcare-Products | | -15.8 | % |
| 7 | | American Power Conversion Corp | | Electrical Compo & Equip | | -15.2 | % |
| 8 | | Symantec Corp | | Internet | | -14.8 | % |
| 9 | | American Express Co | | Diversified Finan Serv | | -14.8 | % |
| 10 | | Toll Brothers Inc | | Home Builders | | -14.8 | % |
The Auto Manufacturing Industry woes continue this quarter. Both General Motors and Ford appear on our "performance challenged" list. It remains to be seen whether their restructuring can turn stock prices around. American Standard, maker of air conditioning systems, fixtures and fittings for bathrooms and kitchens, and vehicle control systems, revised its third quarter earnings and full-year forecasts in mid-October. The stock price immediately tumbled 17% and has not recovered since. Our models got cold feet, and we sold the last of our holdings shortly afterward.
Detailed Explanation of Calendar Year Performance—What Worked Well
The Short Version: Obviously, the name of the game for our calendar year performance was energy. Six of the ten best performers were over 50% in return, with the other four close behind.
Rank
| | Description
| | Industry
| | % Gain
| |
|---|
| 1 | | Valero Energy Corp | | Oil & Gas | | 115.8 | % |
| 2 | | Burlington Resources Inc | | Oil & Gas | | 71.5 | % |
| 3 | | Gilead Sciences Inc | | Pharmaceuticals | | 56.7 | % |
| 4 | | Amerada Hess Corp | | Oil & Gas | | 54.0 | % |
| 5 | | Nordstrom Inc | | Retail | | 51.7 | % |
| 6 | | Aetna Inc | | Healthcare-Services | | 51.2 | % |
| 7 | | Freeport-McMoRan Copper & Gold Inc | | Mining | | 49.2 | % |
| 8 | | EOG Resources Inc | | Oil & Gas | | 47.7 | % |
| 9 | | Anadarko Petroleum Corp | | Oil & Gas | | 46.2 | % |
| 10 | | Circuit City Stores Inc | | Retail | | 43.7 | % |
Six out of ten companies on our winners list are in the Energy Sector. In explaining why that is significant, I want to tell you a little about the management of your Fund. In line with our Balanced Fund objective, 45% of the equity holdings in the portfolio are indexed, which keeps us in line with the market (S&P 500) in general, and our sector weightings will also be aligned with the market, within a small percentage over time. A minimum of 25% of assets is invested in fixed income securities. The remaining 30% is actively managed using our stock picking models. We try to keep about 15% of those selections in growth companies and about 15% in value. It's in these two baskets that we employ our put-writing strategy. It's also an area in which I believe some of our competitive advantage exists. The energy holdings in our Fund for this calendar year are a good illustration. We had almost the same weighting in Energy as the S&P 500; however, our stocks performed twice as well, adding significantly
132
to our return for the year because of our careful selection. Of course, I cannot promise results like this with every sector every year; we just concentrate on picking one good stock at a time.
Detailed Explanation of Calendar Year Performance—What Didn't Work
The Short Version: One stock was down over 50% for the calendar year.
Rank
| | Description
| | Industry
| | % Loss
| |
|---|
| 1 | | Winn-Dixie Stores Inc | | Food | | -84.9 | % |
| 2 | | AK Steel Holding Corp | | Iron/Steel | | -47.9 | % |
| 3 | | Avaya Inc | | Telecommunications | | -47.1 | % |
| 4 | | Avon Products Inc | | Cosmetics/Personal Care | | -30.4 | % |
| 5 | | QLogic Corp | | Semiconductors | | -28.3 | % |
| 6 | | Toll Brothers Inc | | Home Builders | | -27.7 | % |
| 7 | | Waters Corp | | Electrical Compo & Equip | | -26.0 | % |
| 8 | | MBNA Corp | | Diversified Finan Serv | | -25.8 | % |
| 9 | | Power-One Inc | | Electrical Compo & Equip | | -21.8 | % |
| 10 | | Ford Motor Co | | Auto Manufacturers | | -21.8 | % |
Of the ten worst-performers for the year, all ten are in different industries, which illustrates both the diversity of the portfolio and that there was no particular sector influence. Winn-Dixie's dramatic price drop in February and subsequent delisting after filing Chapter 11 rendered it our worst performer for the year, even though we sold it in late February.
The stock price of steelmaker AK Steel Holding Corporation, pressured by offshore producers and rising energy costs, had a rickety ride in 2005. We sold our holdings in late May. Avaya, Inc. provides communication systems, applications, and services in voice and data systems. The company announced March quarter earnings at 7 cents per share, significantly lower than 27 cents a year ago. The market reacted negatively to that announcement, and the price dropped almost 18%. We completed our exit in mid-May.
Top Ten Holdings
Here are the top ten holdings at the end of December. Please note that the option positions included here are short puts. The percentages are based on a theoretical stock position, that is, as if we
133
owned the underlying stock. We are obligated to buy the underlying stock at a specific strike price for a specific period of time.
Rank
| | Description
| | Industry
| | % of
Net Assets
| |
|---|
| 1 | | Goodyear Tire & Rubber Co/The, incl. Feb $17.5, Jan $15 & Jan $17.5 | | Auto Parts & Equipment | | 2.1 | % |
| 2 | | Bristol-Myers Squibb Co, inl. June $22.5 | | Pharmaceuticals | | 2.0 | % |
| 3 | | McDermott Int, incl. Jan $35 & Jan $40 | | Engineering & Construction | | 2.0 | % |
| 4 | | Express Scripts Inc, incl. Feb $80 & Jan $80 | | Pharmaceuticals | | 1.7 | % |
| 5 | | Merck & Co Inc, incl. Apr $27.5, Feb $32.5 & Jan $30 | | Pharmaceuticals | | 1.6 | % |
| 6 | | BellSouth Corp, incl. Jan $25 | | Telecommunications | | 1.5 | % |
| 7 | | Washington Mutual Inc, incl. Jan $40 | | Savings & Loans | | 1.5 | % |
| 8 | | BMC Software Inc, incl. Feb $20 & Jan $20 | | Software | | 1.4 | % |
| 9 | | Apple Computer Inc, incl. Jan $60 | | Computers | | 1.4 | % |
| 10 | | ConocoPhillips, incl. Feb $55 & Jan $60 | | Oil & Gas | | 1.2 | % |
| | | | | | |
| |
| | Total | | | | 16.4 | % |
Industry Sector Representation as of December 31, 2005
| Common Stock | | 56.5 | % |
| | Basic Materials | | 1.9 | % |
| | Communications | | 5.5 | % |
| | Consumer, Cyclical | | 7.0 | % |
| | Consumer, Non- Cyclical | | 12.4 | % |
| | Energy | | 5.5 | % |
| | Financial | | 9.6 | % |
| | Industrial | | 6.9 | % |
| | Technology | | 6.5 | % |
| | Utilities | | 1.2 | % |
| U. S. Government Obligations | | 35.8 | % |
| Corporate Notes | | 2.2 | % |
| Covered Call Options Written | | -0.4 | % |
| Put Options Written | | -0.3 | % |
| Money Market Funds | | 9.2 | % |
| Other Assets In Excess of Liabilities | | -3.0 | % |
| | |
| |
| | Total | | 100.0 | % |
Disclaimer
The following is a reminder from the friendly folks at your Fund who worry about liability. The views expressed here are exclusively those of Fund management. These views, including those of market
134
sectors or individual stocks, are not meant as investment advice and should not be considered predictive in nature. Any favorable (or unfavorable) description of a holding applies only as of the quarter end, December 31, 2005, unless otherwise stated. Security positions can and do change thereafter. Discussions of historical performance do not guarantee and are not indicative of future performance.
This report is submitted for the general information of the shareholders of the Fund. It is not authorized for distribution to prospective investors unless preceded or accompanied by an effective prospectus, which includes information regarding the Fund's risks, objectives, fees and expenses, experience of its management, and other information For questions or other fund information, call 1-800-661-3550 or visit the Fund's website www.bridgeway.com. Foreside Fund Services, LLC, distributor.
Conclusion
In closing, we would like to thank you for your continued investment in Balanced Fund. We appreciate your feedback, so please call or write us with any questions or comments. We work for you and value your input.
Sincerely,
Richard P. Cancelmo, Jr.
135
DISCLOSURE OF FUND EXPENSES
(Unaudited)
As a shareholder of the Fund, you will incur no transaction costs from the Fund, including sales charges (loads) on purchases, on reinvested dividends, or on other distributions. There are also no redemption fees or exchange fees. However, as a shareholder of the Fund, you will incur ongoing costs, including management fees and other Fund expenses. The following examples are intended to help you understand your ongoing costs (in dollars) of investing in the Fund and to compare these costs with the ongoing costs of investing in other mutual funds. The examples are based on an investment of $1,000 invested on July 1, 2005 and held until December 31, 2005.
Actual Return. The first line of the table below provides information about actual account values and actual expenses. You may use the information in this line, together with the amount you invested, to estimate the expenses that you paid over the period. Simply divide your account value by $1,000 (for example, an $8,600 account value divided by $1,000 = 8.6), then multiply the result by the number in the first line under the heading "Expense Paid During Period" to estimate the expenses you paid on your account during this period.
Hypothetical 5% Return. The second line of the table below provides information about hypothetical account values and hypothetical expenses based on the Fund's actual expense ratio and an assumed rate of return of 5% per year before expenses, which is not the Fund's actual return. The hypothetical account values and expenses may not be used to estimate the actual ending account balance or expenses you paid for the period. You may use this information to compare the ongoing costs of investing in a Fund and other mutual funds. To do so, compare this 5% hypothetical example with the 5% hypothetical examples that appear in the shareholder reports of the other funds.
The expenses shown in the table are meant to highlight ongoing Fund costs only. Therefore, the second line of the table is useful in comparing ongoing costs only, and will not help you determine the relative total costs of owning different funds, because other funds may also have transaction costs, such as sales charges, redemption fees or exchange fees.
Bridgeway Balanced Fund
| | Beginning Account
Value at 7/1/05
| | Ending Account
Value at 12/31/05
| | Expense Paid
During Period*
7/1/05-12/31/05
|
|---|
| Actual Fund Return | | $ | 1,000.00 | | $ | 1,038.30 | | $ | 4.77 |
| Hypothetical Fund Return | | $ | 1,000.00 | | $ | 1,020.52 | | $ | 4.74 |
- *
- Expenses are equal to the Fund's annualized expense ratio of 0.93% multiplied by the average account value over the period, multiplied by the number of days in the first fiscal half-year divided by 365 days in the current year (to reflect the one half-year period).
136
Balanced Fund
SCHEDULE OF INVESTMENTS
Showing percentage of net assets as of December 31, 2005
(Unaudited)
Industry
| | Company
| | Shares
| | Value
|
|---|
COMMON STOCKS—56.5% |
|
|
|
|
|
| Aerospace/Defenese—0.9% | | | | | |
| | | General Dynamics Corp | | 700 | | $ | 79,835 |
| | | Goodrich Corp | | 1,800 | | | 73,980 |
| | | Lockheed Martin Corp | | 2,470 | | | 157,166 |
| | | Northrop Grumman Corp | | 1,200 | | | 72,132 |
| | | Rockwell Collins Inc | | 1,000 | | | 46,470 |
| | | United Technologies Corp | | 1,740 | | | 97,283 |
| | | | | | |
|
| | | | | | | | 526,866 |
Agriculture—1.3% |
|
|
|
|
|
| | | Archers-Daniels-Midland Co | | 18,600 | | | 458,676 |
| | | Monsanto Co | | 3,900 | | | 302,367 |
| | | | | | |
|
| | | | | | | | 761,043 |
Airlines—0.1% |
|
|
|
|
|
| | | Southwest Airlines Co | | 2,400 | | | 39,432 |
Apparel—0.2% |
|
|
|
|
|
| | | Coach Inc* | | 2,700 | | | 90,018 |
Auto Manufacturers—0.9% |
|
|
|
|
|
| | | Ford Motor Co | | 22,800 | | | 176,016 |
| | | General Motors Corp | | 12,000 | | | 233,040 |
| | | Paccar Inc | | 1,300 | | | 89,999 |
| | | | | | |
|
| | | | | | | | 499,055 |
Auto Parts & Equipment—0.7% |
|
|
|
|
|
| | | Goodyear Tire & Rubber Co* | | 22,400 | | | 389,312 |
| | | Johnson Controls Inc | | 480 | | | 34,997 |
| | | | | | |
|
| | | | | | | | 424,309 |
Banks—3.7% |
|
|
|
|
|
| | | AmSouth Bancorp | | 5,840 | | | 153,066 |
| | | Bank of America Corp | | 3,400 | | | 156,910 |
| | | Bank of New York Co | | 6,500 | | | 207,025 |
| | | Comerica Inc | | 3,400 | | | 192,984 |
| | | KeyCorp | | 4,600 | | | 151,478 |
| | | State Street Corp | | 2,000 | | | 110,880 |
| | | SunTrust Bank Inc | | 2,500 | | | 181,900 |
| | | Synovus Financial Corp | | 5,500 | | | 148,555 |
| | | US Bancorp | | 14,800 | | | 442,372 |
| | | Wachovia Corp | | 2,457 | | | 129,877 |
| | | Wells Fargo & Co | | 2,900 | | | 182,207 |
| | | Zions Bancorporation | | 1,700 | | | 128,452 |
| | | | | | |
|
| | | | | | | | 2,185,706 |
| | | | | | | | |
137
Beverages—1.0% |
|
|
|
|
|
| | | Brown-Forman Corp | | 2,500 | | $ | 173,300 |
| | | Coca-Cola Co | | 4,100 | | | 165,271 |
| | | Coca-Cola Enterprise | | 7,800 | | | 149,526 |
| | | PepsiCo Inc | | 2,100 | | | 124,068 |
| | | | | | |
|
| | | | | | | | 612,165 |
Biotechnology—0.6% |
|
|
|
|
|
| | | Amgen Inc* | | 2,500 | | | 197,150 |
| | | Genzyme Corp* | | 2,400 | | | 169,872 |
| | | | | | |
|
| | | | | | | | 367,022 |
Building Materials—0.1% |
|
|
|
|
|
| | | Vulcan Materials Co | | 1,200 | | | 81,300 |
Chemicals—0.6% |
|
|
|
|
|
| | | Ecolab Inc | | 2,400 | | | 87,048 |
| | | Sherwin-Williams Co | | 3,500 | | | 158,970 |
| | | Sigma-Aldrich Corp | | 1,900 | | | 120,251 |
| | | | | | |
|
| | | | | | | | 366,269 |
Coal—0.6% |
|
|
|
|
|
| | | Peabody Energy Corp | | 4,000 | | | 329,680 |
Commercial Services—1.2% |
|
|
|
|
|
| | | Equifax Inc | | 2,600 | | | 98,852 |
| | | Moody's Corp | | 1,600 | | | 98,272 |
| | | Quanta Services Inc* | | 30,000 | | | 395,100 |
| | | Robert Half International | | 1,300 | | | 49,257 |
| | | RR Donnelley & Sons | | 2,200 | | | 75,262 |
| | | | | | |
|
| | | | | | | | 716,743 |
Computers—2.0% |
|
|
|
|
|
| | | Affiliated Computer Services Inc* | | 2,500 | | | 147,950 |
| | | Apple Computer Inc* | | 5,200 | | | 373,828 |
| | | EMC Corp* | | 14,200 | | | 193,404 |
| | | Hewlett-Packard Co | | 4,700 | | | 134,561 |
| | | International Business Machines | | 1,800 | | | 147,960 |
| | | NCR Corp* | | 4,400 | | | 149,336 |
| | | | | | |
|
| | | | | | | | 1,147,039 |
Cosmetics/Personal Care—1.2% |
|
|
|
|
|
| | | Alberto-Culver Co | | 3,000 | | | 137,250 |
| | | Colgate-Palmolive Co | | 4,400 | | | 241,340 |
| | | Kimberly-Clark Corp | | 1,100 | | | 65,615 |
| | | Procter & Gamble Co | | 4,000 | | | 231,520 |
| | | | | | |
|
| | | | | | | | 675,725 |
Distribution/Wholesale—0.4% |
|
|
|
|
|
| | | Building Materials Holding Corp | | 2,500 | | | 170,525 |
| | | WW Grainger Inc | | 500 | | | 35,550 |
| | | | | | |
|
| | | | | | | | 206,075 |
| | | | | | | | |
138
Diversified Financial Services—4.1% |
|
|
|
|
|
| | | Ameriprise Financial | | 480 | | $ | 19,680 |
| | | Bear Stearns Cos Inc | | 1,400 | | | 161,742 |
| | | Charles Schwab Corp | | 11,800 | | | 173,106 |
| | | CIT Group Inc | | 3,500 | | | 181,230 |
| | | Citigroup Inc | | 2,800 | | | 135,884 |
| | | Countrywide Financial Corp | | 2,000 | | | 68,380 |
| | | E*Trade Financial Corp* | | 11,400 | | | 237,804 |
| | | Franklin Resources Inc | | 2,000 | | | 188,020 |
| | | Goldman Sachs Group Inc | | 1,700 | | | 217,107 |
| | | Janus Capital Group | | 3,300 | | | 61,479 |
| | | JP Morgan Chase & Co | | 4,000 | | | 158,760 |
| | | Lehman Brothers Holdings Inc | | 2,200 | | | 281,974 |
| | | Merrill Lynch & Co Inc | | 2,500 | | | 169,325 |
| | | Morgan Stanley & Co Inc | | 1,800 | | | 102,132 |
| | | SLM Corp | | 810 | | | 44,623 |
| | | T Rowe Price Group Inc | | 2,500 | | | 180,075 |
| | | | | | |
|
| | | | | | | | 2,381,321 |
Electric—1.5% |
|
|
|
|
|
| | | Allegheny Energy Inc* | | 2,800 | | | 88,620 |
| | | Ameren Corp | | 600 | | | 30,744 |
| | | American Electric Power Co Inc | | 2,435 | | | 90,314 |
| | | Dominion Resources Inc | | 760 | | | 58,672 |
| | | Duke Energy Corp | | 3,000 | | | 82,350 |
| | | Edison International | | 2,300 | | | 100,303 |
| | | Exelon Corp | | 1,900 | | | 100,966 |
| | | TECO Energy Inc | | 5,600 | | | 96,208 |
| | | TXU Corp | | 4,200 | | | 210,798 |
| | | | | | |
|
| | | | | | | | 858,975 |
Electrical Components & Equipment—0.2% |
|
|
|
|
|
| | | Emerson Electric Co | | 1,800 | | | 134,460 |
Electronics—1.2% |
|
|
|
|
|
| | | Itron Inc* | | 10,000 | | | 400,400 |
| | | Jabil Circuit Inc* | | 2,300 | | | 85,307 |
| | | Parker Hannifin Corp | | 2,400 | | | 158,304 |
| | | Thermo Electron Corp* | | 2,300 | | | 69,299 |
| | | | | | |
|
| | | | | | | | 713,310 |
Engineering & Construction—0.1% |
|
|
|
|
|
| | | Fluor Corp | | 800 | | | 61,808 |
Environmental Control—0.1% |
|
|
|
|
|
| | | Allied Waste Industries Inc* | | 5,200 | | | 45,448 |
Food—1.0% |
|
|
|
|
|
| | | Albertson's Inc | | 12,500 | | | 266,875 |
| | | Campbell Soup Co | | 3,200 | | | 95,264 |
| | | Hershey Co/The | | 1,300 | | | 71,825 |
| | | Kellogg Co | | 3,900 | | | 168,558 |
| | | | | | |
|
| | | | | | | | 602,522 |
| | | | | | | | |
139
Forest Products & Paper—0.2% |
|
|
|
|
|
| | | Lousiana-Pacific Co | | 3,300 | | $ | 90,651 |
Gas—0.1% |
|
|
|
|
|
| | | Sempra Energy | | 1,600 | | | 71,744 |
Hand/Machine Tools—0.1% |
|
|
|
|
|
| | | Black & Decker Corp | | 400 | | | 34,784 |
Healthcare—Products—1.6% |
|
|
|
|
|
| | | Bausch & Lomb Inc | | 1,500 | | | 101,850 |
| | | Becton Dickinson & Co | | 2,420 | | | 145,394 |
| | | CR Bard Inc | | 2,300 | | | 151,616 |
| | | Johnson & Johnson | | 2,100 | | | 126,210 |
| | | St Jude Medical Inc* | | 3,280 | | | 164,656 |
| | | Stryker Corp | | 2,660 | | | 118,184 |
| | | Zimmer Holdings Inc* | | 1,700 | | | 114,648 |
| | | | | | |
|
| | | | | | | | 922,558 |
Healthcare—Services—1.0% |
|
|
|
|
|
| | | Aetna Inc | | 1,200 | | | 113,172 |
| | | Coventry Health Care Inc* | | 1,800 | | | 102,528 |
| | | Health Management Associates Inc | | 1,500 | | | 32,940 |
| | | Quest Diagnostics Inc | | 2,200 | | | 113,256 |
| | | United Health Group Inc | | 2,000 | | | 124,280 |
| | | WellPoint Inc* | | 1,300 | | | 103,727 |
| | | | | | |
|
| | | | | | | | 589,903 |
Home Builders—0.2% |
|
|
|
|
|
| | | Centex Corp | | 400 | | | 28,596 |
| | | KB Home | | 1,200 | | | 87,192 |
| | | | | | |
|
| | | | | | | | 115,788 |
Home Furnishings—0.3% |
|
|
|
|
|
| | | Leggett & Platt Inc | | 7,600 | | | 174,496 |
Household Products/Wares—0.1% |
|
|
|
|
|
| | | Clorox Co | | 830 | | | 47,219 |
Insurance—2.4% |
|
|
|
|
|
| | | ACE Ltd | | 1,400 | | | 74,816 |
| | | Aflac Inc | | 800 | | | 37,136 |
| | | Allstate Corp | | 1,000 | | | 54,070 |
| | | AON Corp | | 5,000 | | | 179,750 |
| | | Chubb Corp | | 1,600 | | | 156,240 |
| | | Cigna Corp | | 1,400 | | | 156,380 |
| | | Genworth Financial | | 2,600 | | | 89,908 |
| | | Metlife Inc | | 3,100 | | | 151,900 |
| | | Principal Financial Group Inc | | 2,700 | | | 128,061 |
| | | Progressive Corp | | 1,380 | | | 161,156 |
| | | Prudential Financial | | 1,200 | | | 87,828 |
| | | Safeco Corp | | 2,720 | | | 153,680 |
| | | | | | |
|
| | | | | | | | 1,430,925 |
| | | | | | | | |
140
Internet—0.8% |
|
|
|
|
|
| | | Amazon.com Inc* | | 2,600 | | $ | 122,590 |
| | | eBay Inc* | | 2,800 | | | 121,100 |
| | | Symantec Corp* | | 7,400 | | | 129,500 |
| | | Yahoo! Inc* | | 3,100 | | | 121,458 |
| | | | | | |
|
| | | | | | | | 494,648 |
Iron/Steel—0.0%^ |
|
|
|
|
|
| | | United States Steel Corp | | 500 | | | 24,035 |
Leisure Time—0.2% |
|
|
|
|
|
| | | Brunswick Corp | | 1,670 | | | 67,902 |
| | | Carnival Corp | | 1,400 | | | 74,858 |
| | | | | | |
|
| | | | | | | | 142,760 |
Lodging—0.1% |
|
|
|
|
|
| | | Marriott International Inc | | 1,300 | | | 87,061 |
Machinery—Construction & Mining—0.2% |
|
|
|
|
|
| | | Caterpiller Inc | | 1,700 | | | 98,209 |
Machinery—Diversified—0.1% |
|
|
|
|
|
| | | Cummins Inc | | 600 | | | 53,838 |
| | | Deere & Co | | 300 | | | 20,433 |
| | | | | | |
|
| | | | | | | | 74,271 |
Media—1.3% |
|
|
|
|
|
| | | Comcast Corp* | | 4,700 | | | 122,012 |
| | | McGraw-Hill Cos Inc | | 4,000 | | | 206,520 |
| | | Meredith Corp | | 2,900 | | | 151,786 |
| | | News Corp Class A | | 2,000 | | | 31,100 |
| | | Time Warner Inc | | 6,700 | | | 116,848 |
| | | Viacom Inc* | | 3,300 | | | 107,580 |
| | | | | | |
|
| | | | | | | | 735,846 |
Mining—0.3% |
|
|
|
|
|
| | | Freeport-McMoRan Copper & Gold Inc | | 3,000 | | | 161,400 |
Miscellaneous Manufacturing—1.9% |
|
|
|
|
|
| | | Cooper Industries Ltd | | 2,600 | | | 189,800 |
| | | Danaher Corp | | 3,400 | | | 189,652 |
| | | Eaton Corp | | 2,200 | | | 147,598 |
| | | Honeywell International Inc | | 5,300 | | | 197,425 |
| | | Ingersoll-Rand Co | | 5,800 | | | 234,146 |
| | | Textron Inc | | 2,200 | | | 169,356 |
| | | | | | |
|
| | | | | | | | 1,127,977 |
Office/Business Equipment—0.1% |
|
|
|
|
|
| | | Xerox Corp* | | 4,800 | | | 70,320 |
| | | | | | | | |
141
Oil & Gas—4.1% |
|
|
|
|
|
| | | Amerada Hess Corp | | 1,020 | | $ | 129,356 |
| | | Anadarko Petroleum Corp | | 1,400 | | | 132,650 |
| | | Apache Corp | | 1,700 | | | 116,484 |
| | | Burlington Resources Inc | | 2,200 | | | 189,640 |
| | | Chesapeake Energy Co | | 10,000 | | | 317,300 |
| | | Chevron Corp | | 878 | | | 49,844 |
| | | ConocoPhillips | | 2,400 | | | 139,632 |
| | | EOG Resources Inc | | 2,400 | | | 176,088 |
| | | Marathon Oil Corp | | 2,200 | | | 134,134 |
| | | Nabors Industries Ltd* | | 3,400 | | | 257,550 |
| | | Occidental Petroleum Corp | | 2,100 | | | 167,748 |
| | | Rowan Cos Inc | | 5,500 | | | 196,020 |
| | | Sunoco Inc | | 2,400 | | | 188,112 |
| | | Valero Energy Corp | | 3,600 | | | 185,760 |
| | | | | | |
|
| | | | | | | | 2,380,318 |
Oil & Gas Services—0.6% |
|
|
|
|
|
| | | Baker Hughes Inc | | 1,800 | | | 109,404 |
| | | Halliburton Co | | 2,350 | | | 145,606 |
| | | Schlumberger Ltd | | 1,100 | | | 106,865 |
| | | | | | |
|
| | | | | | | | 361,875 |
Pharmaceuticals—4.5% |
|
|
|
|
|
| | | Abbott Laboratories | | 3,200 | | | 126,176 |
| | | Allergan Inc | | 1,400 | | | 151,144 |
| | | Bristol-Myers Squibb Co | | 50,900 | | | 1,169,682 |
| | | Cardinal Health Inc | | 1,200 | | | 82,500 |
| | | Caremark RX Inc* | | 3,800 | | | 196,802 |
| | | Express Scripts Inc* | | 1,600 | | | 134,080 |
| | | Gilead Sciences Inc* | | 4,900 | | | 257,887 |
| | | Hospira Inc* | | 6,900 | | | 295,182 |
| | | Medco Health Solutions Inc* | | 3,500 | | | 195,300 |
| | | Pfizer Inc | | 1,500 | | | 34,980 |
| | | | | | |
|
| | | | | | | | 2,643,733 |
Pipelines—0.1% |
|
|
|
|
|
| | | El Paso Corp | | 5,000 | | | 60,800 |
| | | | | | | | |
142
Retail—2.5% |
|
|
|
|
|
| | | AutoNation Inc* | | 1,000 | | $ | 21,730 |
| | | AutoZone Inc* | | 1,000 | | | 91,750 |
| | | Bed Bath & Beyond Inc* | | 2,920 | | | 105,558 |
| | | Circuit City Stores Inc | | 2,900 | | | 65,511 |
| | | Costco Wholesale Corp | | 1,000 | | | 49,470 |
| | | CVS Corp | | 3,500 | | | 92,470 |
| | | Dillard's Inc | | 2,000 | | | 49,640 |
| | | Federated Department Stores Inc | | 400 | | | 26,532 |
| | | J.C. Penney Co Inc | | 2,000 | | | 111,200 |
| | | Lowe's Cos Inc | | 940 | | | 62,660 |
| | | Nordstrom Inc | | 5,000 | | | 187,000 |
| | | Office Depot Inc* | | 4,300 | | | 135,020 |
| | | Sears Holding Corp* | | 900 | | | 103,977 |
| | | Staples Inc | | 3,950 | | | 89,705 |
| | | Starbucks Corp* | | 3,000 | | | 90,030 |
| | | Walgreen Co | | 2,500 | | | 110,650 |
| | | Wal-Mart Stores Inc | | 2,000 | | | 93,600 |
| | | | | | |
|
| | | | | | | | 1,486,503 |
Savings & Loans—1.1% |
|
|
|
|
|
| | | Golden West Financial Corp | | 1,934 | | | 127,644 |
| | | Washington Mutual Inc | | 12,443 | | | 541,271 |
| | | | | | |
|
| | | | | | | | 668,915 |
Semiconductors—1.4% |
|
|
|
|
|
| | | Altera Corp* | | 2,200 | | | 40,766 |
| | | Applied Materials Inc | | 4,400 | | | 78,936 |
| | | Freescale Semiconductors Inc* | | 3,776 | | | 95,042 |
| | | Linear Technology Co | | 2,800 | | | 100,996 |
| | | National Semiconductors | | 1,800 | | | 46,764 |
| | | Nvidia Corp* | | 7,200 | | | 263,232 |
| | | Texas Instruments Inc | | 5,570 | | | 178,630 |
| | | | | | |
|
| | | | | | | | 804,366 |
Software—1.7% |
|
|
|
|
|
| | | Adobe Systems Inc | | 5,000 | | | 184,800 |
| | | Autodesk Inc | | 6,000 | | | 257,700 |
| | | Automatic Data Processing Inc | | 1,600 | | | 73,424 |
| | | BMC Software Inc* | | 3,920 | | | 80,321 |
| | | Citrix Systems Inc* | | 4,300 | | | 123,754 |
| | | Compuware Corp* | | 11,000 | | | 98,670 |
| | | First Data Corp | | 2,300 | | | 98,923 |
| | | Novell Inc* | | 5,400 | | | 47,682 |
| | | Oracle Corp* | | 1,560 | | | 19,048 |
| | | | | | |
|
| | | | | | | | 984,322 |
| | | | | | | | |
143
Telecommunications—4.2% |
|
|
|
|
|
| | | ALLTEL Corp | | 1,900 | | $ | 119,890 |
| | | AT&T Corp | | 10,100 | | | 247,349 |
| | | BellSouth Corp | | 22,700 | | | 615,170 |
| | | Cisco Systems Inc* | | 6,300 | | | 107,856 |
| | | Citizens Communications Co | | 4,800 | | | 58,704 |
| | | Comverse Technology Inc* | | 7,900 | | | 210,061 |
| | | Corning Inc* | | 11,200 | | | 220,192 |
| | | Motorola Inc | | 5,300 | | | 119,727 |
| | | QUALCOMM Inc | | 1,700 | | | 73,236 |
| | | Scientific-Atlanta Inc | | 2,100 | | | 90,447 |
| | | Sprint Corp-FON Group | | 3,800 | | | 88,768 |
| | | Tellabs Inc* | | 12,400 | | | 135,160 |
| | | Verizon Communications Inc | | 12,500 | | | 376,500 |
| | | | | | |
|
| | | | | | | | 2,463,060 |
Toys, Games & Hobbies—0.1% |
|
|
|
|
|
| | | Hasbro Inc | | 2,500 | | | 50,450 |
Transportation—0.8% |
|
|
|
|
|
| | | Burlington Northern Sante Fe Corp | | 1,100 | | | 77,902 |
| | | CSX Corp | | 2,700 | | | 137,079 |
| | | FedEx Corp | | 1,300 | | | 134,407 |
| | | Norfolk Southern Corp | | 2,700 | | | 121,041 |
| | | | | | |
|
| | | | | | | | 470,429 |
Trucking/Leasing—0.7% |
|
|
|
|
|
| | | GATX Corp | | 10,500 | | | 378,840 |
| | | | | | |
|
TOTAL COMMON STOCKS
(Cost $28,763,917) | | | | | 33,074,497 |
| | | | | | |
|
Due Date
| | Discount Rate or
Coupon Rate
| | Principal Amount
| | Value
|
|---|
| U.S. GOVERNMENT OBLIGATIONS—35.8% | | | | | | |
| U.S. Treasury Bills—23.5% | | | | | | |
| | | 01/05/06 | | 3.53 | %** | $ | 2,000,000 | | $ | 1,999,021 |
| | | 01/12/06 | | 3.67 | %** | | 1,000,000 | | | 998,776 |
| | | 01/19/06 | | 3.42 | %** | | 900,000 | | | 898,375 |
| | | 03/09/06 | | 3.57 | %** | | 2,000,000 | | | 1,986,513 |
| | | 04/06/06 | | 3.87 | %** | | 2,000,000 | | | 1,979,360 |
| | | 04/13/06 | | 3.97 | %** | | 1,000,000 | | | 988,636 |
| | | 05/25/06 | | 4.16 | %** | | 2,000,000 | | | 1,967,826 |
| | | 06/08/06 | | 4.19 | %** | | 2,000,000 | | | 1,964,356 |
| | | 06/22/06 | | 4.22 | %** | | 1,000,000 | | | 979,721 |
| | | | | | | |
|
| | | | | | | | | 13,762,584 |
| | | | | | | | | |
144
| |
U.S. Treasury Notes—12.3% |
|
|
|
|
|
|
| | | 01/31/06 | | 1.88 | % | | 300,000 | | $ | 299,531 |
| | | 04/30/06 | | 2.25 | % | | 500,000 | | | 496,739 |
| | | 05/15/06 | | 2.00 | % | | 200,000 | | | 198,312 |
| | | 05/31/06 | | 2.50 | % | | 300,000 | | | 297,797 |
| | | 11/15/06 | | 3.50 | % | | 200,000 | | | 198,430 |
| | | 03/31/07 | | 3.75 | % | | 300,000 | | | 297,445 |
| | | 07/31/07 | | 3.88 | % | | 500,000 | | | 495,937 |
| | | 08/15/07 | | 2.75 | % | | 300,000 | | | 292,242 |
| | | 11/15/07 | | 3.00 | % | | 200,000 | | | 195,016 |
| | | 02/15/08 | | 3.38 | % | | 300,000 | | | 293,824 |
| | | 10/15/08 | | 3.13 | % | | 200,000 | | | 193,461 |
| | | 11/15/08 | | 3.38 | % | | 200,000 | | | 194,633 |
| | | 04/15/09 | | 3.13 | % | | 300,000 | | | 288,609 |
| | | 06/15/09 | | 4.00 | % | | 300,000 | | | 296,356 |
| | | 08/15/09 | | 3.50 | % | | 200,000 | | | 194,180 |
| | | 10/15/09 | | 3.38 | % | | 300,000 | | | 289,699 |
| | | 11/15/09 | | 3.50 | % | | 200,000 | | | 193,836 |
| | | 02/15/10 | | 3.50 | % | | 300,000 | | | 290,180 |
| | | 04/15/10 | | 4.00 | % | | 300,000 | | | 295,641 |
| | | 06/15/10 | | 3.63 | % | | 500,000 | | | 485,254 |
| | | 07/15/10 | | 3.88 | % | | 500,000 | | | 490,039 |
| | | 10/15/10 | | 4.25 | % | | 500,000 | | | 497,383 |
| | | 11/15/13 | | 4.25 | % | | 200,000 | | | 198,094 |
| | | 02/15/15 | | 4.00 | % | | 200,000 | | | 193,906 |
| | | | | | | |
|
| | | | | | | | | 7,166,544 |
| | | | | | | |
|
TOTAL U.S. GOVERNMENT OBLIGATIONS
(Cost $21,044,581) | | | | | | | | 20,929,128 |
| | | | | | | |
|
CORPORATE NOTES—2.2% |
|
|
|
|
|
|
| | | Leucadia National Corp Senior Notes 7.75%, 08/15/13* | | 1,000,000 | | | 1,055,000 | |
| | | Sea Containers Ltd, Class A, Series B 7.88%, 02/15/08 | | 276,000 | | | 264,615 | |
| | | | | | |
| |
TOTAL CORPORATE NOTES
(Cost $1,315,863) | | | | | 1,319,615 | |
| | | | | | |
| |
PURCHASED CALL OPTIONS—LONG—0.1% |
|
|
|
|
|
|
| |
| | Number of Contracts
| |
| |
|---|
| | | SBC Communications expiring Jan 07 at $25.00 | | 30,000 | | | 39,750 | |
| | | | | | |
| |
TOTAL PURCHASED CALL OPTIONS
(Cost $41,080) | | | | | 39,750 | |
| | | | | | |
| |
MONEY MARKET MUTUAL FUNDS—9.2% |
|
|
|
|
|
|
| |
| | Shares
| |
| |
|---|
| First American Treasury Obligations Fund—Class S | | 5,400,234 | | | 5,400,234 | |
| | | | | | |
| |
TOTAL MONEY MARKET MUTUAL FUNDS
(Cost $5,400,234) | | | | | 5,400,234 | |
| | | | | | |
| |
TOTAL INVESTMENTS—103.8%
(Cost $56,565,675) |
|
|
|
$ |
60,763,224 |
|
| Liabilities in excess of Other Assets—(3.8%) | | | | | (2,246,002 | ) |
| | | | | | |
| |
| NET ASSETS—100.0% | | | | $ | 58,517,222 | |
| | | | | | |
| |
145
- *
- Non-income producing security
- **
- Rate disclosed represents discount rate.
- ^
- Less than 0.05% of net assets
See Notes to Financial Statements
146
Balanced Fund
SCHEDULE OF OPTIONS WRITTEN
As of December 31, 2005 (Unaudited)
Company
| | Number
of Contracts
| | Value
| |
|---|
| COVERED CALL OPTIONS WRITTEN | | | | |
| | Abbott Laboratories
expiring Jan 06 at $45.00 | | 1,000 | | $ | (50 | ) |
| | ACE Ltd
expiring Jan 06 at $50.00 | | 700 | | | (2,590 | ) |
| | Adobe Systems Inc
expiring Jan 06 at $35.00 | | 1,500 | | | (3,487 | ) |
| | Aetna Inc
expiring Jan 06 at $100.00 | | 500 | | | (125 | ) |
| | Affiliated Computer Services Inc
expiring Jan 06 at $60.00 | | 1,000 | | | (1,650 | ) |
| | Albertson's Inc
expiring Jan 06 at $25.00 | | 2,500 | | | (63 | ) |
| | Allstate Corp
expring Jan 06 at $60.00 | | 1,000 | | | (25 | ) |
| | Amgen Inc
expiring Jan 06 at $90.00 | | 700 | | | (18 | ) |
| | AON Corp
expiring Jan 06 at $37.50 | | 2,000 | | | (600 | ) |
| | Apple Computer Inc
expiring Apr 06 at $80.00 | | 3,000 | | | (12,000 | ) |
| | Applied Materials Inc
expiring Apr 06 at $20.00 | | 1,500 | | | (562 | ) |
| | Archer-Daniels-Midland Co
expiring Mar 06 at $25.00 | | 2,500 | | | (2,812 | ) |
| | AT&T Inc
expiring Jan 06 at $25.00 | | 5,000 | | | (375 | ) |
| | Autodesk Inc
expiring Jan 06 at $50.00 | | 3,000 | | | (75 | ) |
| | Autonation Inc
expiring Jan 06 at $22.50 | | 1,000 | | | (125 | ) |
| | Bausch & Lomb Inc
expiring Jan 06 at $90.00 | | 700 | | | (18 | ) |
| | Bed Bath & Beyond Inc
expiring Jan 06 at $45.00 | | 800 | | | (20 | ) |
| | BellSouth Corp
expiring Apr 06 at $27.50 | | 15,000 | | | (12,750 | ) |
| | Bristol-Myers Squibb Co
expiring Jan 06 at $22.50 | | 5,000 | | | (2,750 | ) |
| | expiring Feb 06 at $22.50 | | 10,000 | | | (8,500 | ) |
| | Brunswick Corp
expiring Mar 06 at $45.00 | | 1,000 | | | (700 | ) |
| | Building Materials Holding Corp
expiring Jan 06 at $80.00 | | 2,500 | | | (625 | ) |
| | | | | | | |
147
| | Burlington Northern
expiring Jan 06 at $70.00 | | 500 | | $ | (950 | ) |
| | Burlington Resources Inc
expiring Jan 06 at $85.00 | | 2,200 | | | (3,960 | ) |
| | Cardinal Health Inc
expiring Jan 06 at $70.00 | | 500 | | | (275 | ) |
| | Caremark RX Inc
expiring Jan 06 at $55.00 | | 1,200 | | | (120 | ) |
| | Chesapeake Energy
expiring Jan 06 at $30.00 | | 10,000 | | | (22,500 | ) |
| | CIT Group Inc
expiring Jan 06 at $50.00 | | 1,500 | | | (3,525 | ) |
| | Coach Inc
expiring Feb 06 at $40.00 | | 800 | | | (100 | ) |
| | Comerica Inc
expiring Jan 06 at $60.00 | | 1,200 | | | (120 | ) |
| | Comverse Technology
expiring Apr 06 at $30.00 | | 2,000 | | | (1,200 | ) |
| | Corning Inc
expiring Jan 06 at $22.50 | | 5,000 | | | (375 | ) |
| | Countrywide Financial Corp
expiring Jan 06 at $37.50 | | 2,000 | | | (200 | ) |
| | CSX Corp
expiring Jan 06 at $50.00 | | 500 | | | (700 | ) |
| | Circuit City Stores
expring Jan 06 at $22.50 | | 800 | | | (600 | ) |
| | Citrix Systems Inc
expiring Mar 06 at $30.00 | | 1,500 | | | (1,800 | ) |
| | CVS Corp
expiring Feb 06 at $30.00 | | 1,200 | | | (180 | ) |
| | eBay Inc
expiring Jan 06 at $50.00 | | 500 | | | (88 | ) |
| | Ecolab Inc
expiring Apr 06 at $35.00 | | 500 | | | (1,212 | ) |
| | EMC Corp
expiring Apr 06 at $15.00 | | 3,000 | | | (1,125 | ) |
| | EOG Resources
expiring Jan 06 at $85.00 | | 1,000 | | | (175 | ) |
| | E*Trade Financial
expiring Apr 06 at $22.50 | | 3,000 | | | (3,150 | ) |
| | First Data Corp
expiring Feb 06 at $45.00 | | 800 | | | (660 | ) |
| | Freeport-McMoran Copper & Gold Inc
expiring Jan 06 at $55.00 | | 2,000 | | | (2,200 | ) |
| | Freescale Semiconductor Inc
expiring Mar 06 at $30.00 | | 2,000 | | | (800 | ) |
| | GATX Corp
expiring Jan 06 at $35.00 | | 10,500 | | | (16,800 | ) |
| | General Motors Corp
expiring Jan 06 at $25.00 | | 12,000 | | | (900 | ) |
| | | | | | | |
148
| | Gilead Sciences Inc
expiring Jan 06 at $60.00 | | 1,500 | | $ | (225 | ) |
| | Goodyear Tire & Rubber Co
expiring Jan 06 at $17.50 | | 10,000 | | | (5,000 | ) |
| | expiring Feb 06 at $17.50 | | 10,000 | | | (8,250 | ) |
| | expiring Apr 06 at $17.50 | | 1,200 | | | (1,710 | ) |
| | Halliburton Co
expiring Apr 06 at $70.00 | | 1,300 | | | (2,697 | ) |
| | Health Management Association
expiring Feb 06 at $25.00 | | 1,500 | | | (113 | ) |
| | Honeywell International Inc
expiring Jan 06 at $37.50 | | 2,000 | | | (1,200 | ) |
| | Hospira Inc
expiring Feb 06 at $45.00 | | 2,000 | | | (1,650 | ) |
| | ITRON
expiring Jan 06 at $50.00 | | 10,000 | | | (1,250 | ) |
| | Jabil Circuit Inc
expiring Jan 06 at $32.50 | | 800 | | | (3,760 | ) |
| | JPMorgan Chase & Co
expiring Jan 06 at $37.50 | | 4,000 | | | (8,600 | ) |
| | KB Home
expiring Jan 06 at $75.00 | | 600 | | | (690 | ) |
| | Kimberly Clark Corp
expiring Jan 06 at $65.00 | | 1,100 | | | (55 | ) |
| | Lehman Brothers Holding Inc
expiring Jan 06 at $115.00 | | 700 | | | (9,520 | ) |
| | Linear Technology
expiring Jan 06 at $40.00 | | 800 | | | (60 | ) |
| | Marathon Oil Corp
expiring Jan 06 at $70.00 | | 1,000 | | | (25 | ) |
| | Marriott International
expiring Jan 06 at $70.00 | | 500 | | | (188 | ) |
| | McGraw-Hill Cos Inc
expiring Jan 06 at $55.00 | | 1,200 | | | (120 | ) |
| | Medco Health Solutions Inc
expiring Jan 06 at $55.00 | | 1,000 | | | (1,925 | ) |
| | Monsanto Co
expiring Jan 06 at $70.00 | | 1,000 | | | (7,700 | ) |
| | Motorala Inc
expiring Jan 06 at $22.50 | | 2,500 | | | (2,000 | ) |
| | Nabors Industries
expiring Jan 06 at $75.00 | | 800 | | | (1,900 | ) |
| | NCR Corp
expiring Apr 06 at $35.00 | | 1,000 | | | (1,800 | ) |
| | News Corp Cl A
expiring Jan 06 at $15.00 | | 2,000 | | | (1,300 | ) |
| | Nordstrom Inc
expiring Jan 06 at $40.00 | | 1,000 | | | (300 | ) |
| | Norfolk Southern Corp
expiring Jan 06 at $45.00 | | 900 | | | (855 | ) |
| | | | | | | |
149
| | Novell Inc
expiring Jan 06 at $7.50 | | 2,500 | | $ | (3,250 | ) |
| | Nvidia Corp
expiring Mar 06 at $40.00 | | 2,500 | | | (3,687 | ) |
| | Office Depot Inc
expiring Apr 06 at $35.00 | | 1,500 | | | (1,275 | ) |
| | Peabody Energy Corp
expiring Jan 06 at $80.00 | | 4,000 | | | (17,000 | ) |
| | PepsiCo Inc
expiring Jan 06 at $60.00 | | 1,000 | | | (350 | ) |
| | Procter & Gamble Co
expiring Jan 06 at $60.00 | | 1,000 | | | (125 | ) |
| | Qualcomm Inc
expiring Jan 06 at $50.00 | | 1,000 | | | (25 | ) |
| | Quanta Services Inc
expiring Jan 06 at $15.00 | | 10,000 | | | (250 | ) |
| | Quest Diagnostics Inc
expiring Feb 06 at $55.00 | | 1,000 | | | (325 | ) |
| | Safeco Corp
expiring Jan 06 at $55.00 | | 1,000 | | | (1,875 | ) |
| | Sears Holding Corp
expiring Jan 06 at $115.00 | | 900 | | | (3,420 | ) |
| | Sprint Nextel Corp
expiring Jan 06 at $25.00 | | 1,000 | | | (150 | ) |
| | Starbucks Corp
expiring Jan 06 at $32.50 | | 1,500 | | | (113 | ) |
| | St. Jude Medical Inc
expiring Jan 06 at $55.00 | | 1,200 | | | (120 | ) |
| | Stryker Corp
expiring Jan 06 at $47.50 | | 1,600 | | | (360 | ) |
| | Texas Instruments Inc
expiring Jan 06 at $35.00 | | 2,000 | | | (150 | ) |
| | Textron Inc
expiring Jan 06 at $80.00 | | 1,000 | | | (300 | ) |
| | United Health Group
expiring Mar 06 at $65.00 | | 1,000 | | | (1,850 | ) |
| | US Bancorp
expiring Jan 06 at $30.00 | | 10,000 | | | (4,500 | ) |
| | expiring June 06 at $32.50 | | 4,800 | | | (2,160 | ) |
| | Verizon Communication Inc
expiring Jan 06 at $35.00 | | 5,000 | | | (125 | ) |
| | expiring Jan 06 at $32.50 | | 7,500 | | | (563 | ) |
| | Washington Mutual Inc
expiring Jan 06 at $40.00 | | 8,000 | | | (30,400 | ) |
| | expiring Apr 06 at $45.00 | | 1,500 | | | (2,475 | ) |
| | Yahoo! Inc
expiring Jan 06 at $45.00 | | 1,000 | | | (175 | ) |
| | | | |
| |
| | TOTAL COVERED CALL OPTIONS WRITTEN | | | | | (251,551 | ) |
| | | | |
| |
| | (Premiums Received—$313,462) | | | | | | |
See Notes to Financial Statements
150
Company
| | Number
of Contracts
| | Value
| |
|---|
| PUT OPTIONS WRITTEN | | | | |
| | Albertson's Inc
expiring Jan 06 at $22.50 | | 2,500 | | $ | (3,875 | ) |
| | expiring Mar 06 at $22.50 | | 5,000 | | | (10,375 | ) |
| | Apple Computer Inc
expiring Jan 06 at $60.00 | | 6,000 | | | (1,800 | ) |
| | BellSouth Corp
expiring Jan 06 at $25.00 | | 10,500 | | | (525 | ) |
| | BMC Software Inc
expiring Jan 06 at $20.00 | | 16,000 | | | (4,400 | ) |
| | expiring Feb 06 at $20.00 | | 20,000 | | | (12,500 | ) |
| | Brightpoint Inc
expiring Jan 06 at $25.00 | | 3,000 | | | (825 | ) |
| | expiring Feb 06 at $25.00 | | 8,000 | | | (6,200 | ) |
| | expiring Feb 06 at $30.00 | | 2,500 | | | (8,000 | ) |
| | ConocoPhillips
expiring Jan 06 at $60.00 | | 5,000 | | | (11,875 | ) |
| | expiring Feb 06 at $55.00 | | 5,000 | | | (4,875 | ) |
| | Dress Barn
expiring Jan 06 at $35.00 | | 9,500 | | | (3,562 | ) |
| | Express Scripts Inc
expiring Jan 06 at $80.00 | | 5,000 | | | (4,000 | ) |
| | expiring Feb 06 at $80.00 | | 5,000 | | | (10,375 | ) |
| | Fidelity National Financial Inc
expiring Jan 06 at $35.00 | | 5,000 | | | (500 | ) |
| | Ford Motor Co
expiring Jan 06 at $7.50 | | 20,000 | | | (5,500 | ) |
| | Georgia-Pacific Corp
expiring Jan 06 at $30.00 | | 2,500 | | | 0 | |
| | Goodyear Tire & Rubber Co
expiring Jan 06 at $15.00 | | 25,000 | | | (1,875 | ) |
| | expiring Jan 06 at $17.50 | | 20,000 | | | (12,000 | ) |
| | expiring Feb 06 at $17.50 | | 5,000 | | | (4,500 | ) |
| | Guess? Inc
expiring Jan 06 at $35.00 | | 10,000 | | | (10,500 | ) |
| | expiring Feb 06 at $35.00 | | 5,000 | | | (10,000 | ) |
| | JLG Industries Inc
expiring Jan 06 at $40.00 | | 5,000 | | | (625 | ) |
| | McDermott Intl Inc
expiring Jan 06 at $35.00 | | 15,000 | | | (375 | ) |
| | expiring Jan 06 at $40.00 | | 11,000 | | | (1,925 | ) |
| | Merck & Co
expiring Jan 06 at $30.00 | | 10,000 | | | (1,000 | ) |
| | expiring Apr 06 at $27.50 | | 20,000 | | | (9,000 | ) |
| | Red Hat Inc
expiring Jan 06 at $25.00 | | 10,000 | | | (2,250 | ) |
| | Sandisk Corp
expiring Jan 06 at $55.00 | | 5,000 | | | (2,125 | ) |
| | expiring Feb 06 at $55.00 | | 5,000 | | | (9,750 | ) |
| | | | | | | |
151
| | Southwestern Energy Co
expiring Jan 06 at $35.00 | | 15,000 | | $ | (14,625 | ) |
| | United States Steel Corp
expiring Apr 06 at $35.00 | | 8,000 | | | (3,600 | ) |
| | US Bancorp
expiring Jan 06 at $27.50 | | 5,000 | | | (250 | ) |
| | expiring June 06 at $27.50 | | 4,000 | | | (2,200 | ) |
| | Verizon Communications Inc
expiring Jan 06 at $32.50 | | 5,000 | | | (14,500 | ) |
| | expiring Apr 06 at $30.00 | | 4,000 | | | (5,700 | ) |
| | Washington Mutual Inc
expiring Jan 06 at $40.00 | | 8,000 | | | (1,400 | ) |
| | | | |
| |
| | TOTAL PUT OPTIONS WRITTEN
(Premiums Received—$315,213) | | | | | (197,387 | ) |
| | | | |
| |
| | TOTAL OPTIONS WRITTEN
(Total Premiums Received—$628,675) | | | | $ | (448,938 | ) |
| | | | |
| |
See Notes to Financial Statements
152
STATEMENT OF ASSETS AND LIABILITIES
December 31, 2005 (Unaudited)
| | Aggressive
Investors 1
| | Aggressive
Investors 2
| | Ultra-Small
Company
| | Ultra-Small
Company Market
| |
|---|
| ASSETS | | | | | | | | | | | | | |
| Investments at value | | $ | 402,152,792 | | $ | 307,246,745 | | $ | 110,399,831 | | $ | 762,451,128 | |
| Cash | | | — | | | 34,879 | | | 97 | | | — | |
| Receivable for portfolio securities sold | | | 14,751,047 | | | — | | | 5,253,736 | | | 1,208,740 | |
| Receivable for fund shares sold | | | 640,087 | | | 4,169,188 | | | 15,597 | | | 3,595,679 | |
| Dividends receivable | | | 156,161 | | | 165,700 | | | 17,153 | | | 282,633 | |
| Interest receivable | | | 2,956 | | | 76,585 | | | 61,773 | | | 113,080 | |
| Receivable from investment adviser | | | — | | | — | | | — | | | — | |
| Prepaid and other assets | | | 26,785 | | | 39,223 | | | 14,162 | | | 99,944 | |
| Variation margin receivable | | | — | | | — | | | — | | | 491,368 | |
| | |
| |
| |
| |
| |
| | Total assets | | | 417,729,828 | | | 311,732,320 | | | 115,762,349 | | | 768,242,572 | |
| | |
| |
| |
| |
| |
LIABILITIES |
|
|
|
|
|
|
|
|
|
|
|
|
|
| Overdraft | | | 5,633 | | | — | | | — | | | 35,657 | |
| Payable for fund shares redeemed | | | 441,832 | | | 383,397 | | | 14,636 | | | 431,663 | |
| Payable for portfolio securities purchased | | | 12,886,146 | | | 2,296,457 | | | 754,373 | | | 7,520,887 | |
| Interest on loan payable to bank | | | — | | | — | | | — | | | — | |
| Accrued investment adviser fees | | | 831,086 | | | 274,589 | | | 88,455 | | | 310,588 | |
| Accrued administration fees | | | 20,394 | | | 20,095 | | | 8,743 | | | 34,641 | |
| Accrued directors fees | | | 32,110 | | | 22,645 | | | 8,706 | | | 7,000 | |
| Other payables | | | 266,741 | | | 53,752 | | | 15,025 | | | 94,066 | |
| Covered call options written at value | | | — | | | — | | | — | | | — | |
| Put options written at value | | | — | | | — | | | — | | | — | |
| Futures contracts | | | — | | | — | | | — | | | 123,732 | |
| Variation margin payable | | | — | | | — | | | — | | | — | |
| | |
| |
| |
| |
| |
| | Total liabilities | | | 14,483,942 | | | 3,050,935 | | | 889,938 | | | 8,558,234 | |
| | |
| |
| |
| |
| |
| NET ASSETS | | $ | 403,245,886 | | $ | 308,681,385 | | $ | 114,872,411 | | $ | 759,684,338 | |
| | |
| |
| |
| |
| |
| NET ASSETS REPRESENT | | | | | | | | | | | | | |
| Paid-in capital | | $ | 308,502,126 | | $ | 263,005,076 | | $ | 76,044,918 | | $ | 424,015,376 | |
| Accumulated net investment income (loss) | | | (1,624,119 | ) | | (162,908 | ) | | (109,809 | ) | | 205,350 | |
| Accumulated net realized gain (loss) on investments | | | 23,622,481 | | | 3,087,210 | | | 6,273,209 | | | 11,250,063 | |
| Net unrealized appreciation of investments | | | 72,745,398 | | | 42,752,007 | | | 32,664,093 | | | 324,337,281 | |
| Net unrealized depreciation on futures contracts | | | — | | | — | | | — | | | (123,732 | ) |
| | |
| |
| |
| |
| |
| NET ASSETS | | $ | 403,245,886 | | $ | 308,681,385 | | $ | 114,872,411 | | $ | 759,684,338 | |
| | |
| |
| |
| |
| |
| Shares of common stock outstanding of $.001 par value* | | | 7,158,107 | | | 18,824,874 | | | 3,195,258 | | | 42,346,236 | |
| | |
| |
| |
| |
| |
| Net asset value per share | | $ | 56.33 | | $ | 16.40 | | $ | 35.95 | | $ | 17.94 | |
| | |
| |
| |
| |
| |
| Investments at cost | | $ | 329,407,394 | | $ | 264,494,738 | | $ | 77,735,738 | | $ | 438,113,847 | |
| | |
| |
| |
| |
| |
- *
- See Note 1—Organization in the Notes to Financial Statements for shares authorized for each Fund.
See Notes to Financial Statements
153
| | Micro-Cap
Limited
| | Small-Cap
Growth
| | Small-Cap
Value
| | Large-Cap
Growth
| | Large-Cap
Value
| | Blue Chip 35
Index
| | Balanced
| |
|---|
| ASSETS | | | | | | | | | | | | | | | | | | | | | | |
| Investments at value | | $ | 73,651,887 | | $ | 127,917,583 | | $ | 219,569,231 | | $ | 57,622,886 | | $ | 42,119,674 | | $ | 47,840,078 | | $ | 60,763,224 | |
| Cash | | | 533 | | | — | | | — | | | — | | | — | | | — | | | — | |
| Receivable for portfolio securities sold | | | 2,670,819 | | | — | | | 495,182 | | | — | | | — | | | — | | | 1,328,955 | |
| Receivable for fund shares sold | | | 27,777 | | | 7,296,360 | | | 2,072,800 | | | 549,682 | | | 251,509 | | | 80,367 | | | 84,185 | |
| Dividends receivable | | | 11,862 | | | 49,429 | | | 75,428 | | | 50,892 | | | 46,000 | | | 45,195 | | | 31,871 | |
| Interest receivable | | | 11,055 | | | 40,011 | | | 12,307 | | | 1,119 | | | 1,155 | | | 10 | | | 108,429 | |
| Receivable from investment adviser | | | — | | | — | | | — | | | — | | | — | | | 18,957 | | | — | |
| Prepaid and other assets | | | 12,058 | | | 39,345 | | | 30,422 | | | 34,709 | | | 37,199 | | | 29,325 | | | 17,179 | |
| Variation margin receivable | | | — | | | — | | | — | | | — | | | — | | | — | | | — | |
| | |
| |
| |
| |
| |
| |
| |
| |
| | Total assets | | | 76,385,991 | | | 135,342,728 | | | 222,255,370 | | | 58,259,288 | | | 42,455,537 | | | 48,013,932 | | | 62,333,843 | |
| | |
| |
| |
| |
| |
| |
| |
| |
LIABILITIES |
|
|
|
|
|
|
|
|
|
|
|
|
|
|
|
|
|
|
|
|
|
|
| Overdraft | | | — | | | — | | | — | | | — | | | — | | | — | | | 112,509 | |
| Payable for fund shares redeemed | | | 1,155 | | | 89,266 | | | 94,495 | | | 26,251 | | | 15,924 | | | 55,444 | | | 75,897 | |
| Payable for portfolio securities purchased | | | 424,083 | | | 7,947,924 | | | 3,691,056 | | | 431,991 | | | 225,555 | | | — | | | 3,108,572 | |
| Interest on loan payable to bank | | | — | | | — | | | — | | | — | | | — | | | 1,833 | | | — | |
| Accrued investment adviser fees | | | 157,881 | | | 55,336 | | | 110,920 | | | 28,300 | | | 17,463 | | | 47 | | | 27,181 | |
| Accrued administration fees | | | 7,552 | | | 9,045 | | | 12,611 | | | 7,164 | | | 6,591 | | | 6,663 | | | 6,177 | |
| Accrued directors fees | | | 6,172 | | | 3,627 | | | 906 | | | 1,000 | | | 65 | | | 14 | | | 4,332 | |
| Other payables | | | 33,444 | | | 28,301 | | | 17,764 | | | 27,784 | | | 19,276 | | | 8,819 | | | 16,199 | |
| Covered call options written at value | | | — | | | — | | | — | | | — | | | — | | | — | | | 251,551 | |
| Put options written at value | | | — | | | — | | | — | | | — | | | — | | | — | | | 197,387 | |
| Futures contracts | | | — | | | — | | | — | | | — | | | — | | | — | | | — | |
| Variation margin payable | | | — | | | — | | | — | | | — | | | — | | | — | | | 16,816 | |
| | |
| |
| |
| |
| |
| |
| |
| |
| | Total liabilities | | | 630,287 | | | 8,133,499 | | | 3,927,752 | | | 522,490 | | | 284,874 | | | 72,820 | | | 3,816,621 | |
| | |
| |
| |
| |
| |
| |
| |
| |
| NET ASSETS | | $ | 75,755,704 | | $ | 127,209,229 | | $ | 218,327,618 | | $ | 57,736,798 | | $ | 42,170,663 | | $ | 47,941,112 | | $ | 58,517,222 | |
| | |
| |
| |
| |
| |
| |
| |
| |
| NET ASSETS REPRESENT | | | | | | | | | | | | | | | | | | | | | | |
| Paid-in capital | | $ | 50,529,489 | | $ | 112,251,595 | | $ | 196,955,660 | | $ | 52,018,809 | | $ | 36,405,162 | | $ | 46,370,381 | | $ | 54,476,651 | |
| Accumulated net investment income (loss) | | | (513,819 | ) | | (25,457 | ) | | 33,876 | | | (17,070 | ) | | 12,680 | | | 14,760 | | | 74,925 | |
| Accumulated net realized gain (loss) on investments | | | 3,756,610 | | | (4,641,932 | ) | | (3,870,819 | ) | | (4,511,230 | ) | | (802,715 | ) | | (2,433,305 | ) | | (411,640 | ) |
| Net unrealized appreciation of investments | | | 21,983,424 | | | 19,625,023 | | | 25,208,901 | | | 10,246,289 | | | 6,555,536 | | | 3,989,276 | | | 4,377,286 | |
| Net unrealized depreciation on futures contracts | | | — | | | — | | | — | | | — | | | — | | | — | | | — | |
| | |
| |
| |
| |
| |
| |
| |
| |
| NET ASSETS | | $ | 75,755,704 | | $ | 127,209,229 | | $ | 218,327,618 | | $ | 57,736,798 | | $ | 42,170,663 | | $ | 47,941,112 | | $ | 58,517,222 | |
| | |
| |
| |
| |
| |
| |
| |
| |
| Shares of common stock outstanding of $.001 par value* | | | 6,905,985 | | | 9,388,287 | | | 15,241,425 | | | 4,784,787 | | | 3,113,190 | | | 6,775,402 | | | 4,812,964 | |
| | |
| |
| |
| |
| |
| |
| |
| |
| Net asset value per share | | $ | 10.97 | | $ | 13.55 | | $ | 14.32 | | $ | 12.07 | | $ | 13.55 | | $ | 7.08 | | $ | 12.16 | |
| | |
| |
| |
| |
| |
| |
| |
| |
| Investments at cost | | $ | 51,668,463 | | $ | 108,292,560 | | $ | 194,360,330 | | $ | 47,376,597 | | $ | 35,564,138 | | $ | 43,850,802 | | $ | 56,565,675 | |
| | |
| |
| |
| |
| |
| |
| |
| |
154
STATEMENT OF OPERATIONS
Six Months Ended December 31, 2005 (Unaudited)
| | Aggressive
Investors 1
| | Aggressive
Investors 2
| | Ultra-Small
Company
| | Ultra-Small
Company Market
| |
|---|
| INVESTMENT INCOME: | | | | | | | | | | | | | |
| | Dividends* | | $ | 1,758,835 | | $ | 965,954 | | $ | 191,367 | | $ | 2,399,146 | |
| | Interest | | | 87,117 | | | 163,125 | | | 62,392 | | | 391,627 | |
| | Securities Lending | | | 13,391 | | | 89,472 | | | 265,427 | | | 263,654 | |
| | Other | | | — | | | — | | | — | | | 797 | |
| | |
| |
| |
| |
| |
| | Total investment income | | | 1,859,343 | | | 1,218,551 | | | 519,186 | | | 3,055,224 | |
| | |
| |
| |
| |
| |
| EXPENSES: | | | | | | | | | | | | | |
| | Investment advisory fees—Base fees | | | 1,777,011 | | | 1,001,963 | | | 525,250 | | | 1,692,871 | |
| | Investment advisory fees— | | | | | | | | | | | | | |
| | | Performance adjustment | | | 1,029,065 | | | 104,349 | | | — | | | — | |
| | Administration fees | | | 99,198 | | | 55,726 | | | 29,181 | | | 169,287 | |
| | Accounting fees | | | 40,162 | | | 26,690 | | | 24,637 | | | 32,807 | |
| | Transfer agent fees | | | 176,328 | | | 74,037 | | | 13,487 | | | 93,261 | |
| | Professional expenses | | | 183,716 | | | 45,299 | | | 13,796 | | | 85,608 | |
| | Custody fees | | | 30,166 | | | 6,389 | | | 8,636 | | | 52,865 | |
| | Blue sky fees | | | 28,458 | | | 30,235 | | | 3,892 | | | 24,494 | |
| | Directors fees | | | 41,736 | | | 25,767 | | | 9,693 | | | 19,029 | |
| | Registration fees | | | 3,542 | | | 894 | | | — | | | 525 | |
| | Reports to shareholders | | | 28,140 | | | 6,276 | | | 183 | | | 13,169 | |
| | Interest | | | — | | | — | | | — | | | — | |
| | Miscellaneous | | | 45,940 | | | 3,834 | | | 240 | | | 53,298 | |
| | |
| |
| |
| |
| |
| | | Total expenses | | | 3,483,462 | | | 1,381,459 | | | 628,995 | | | 2,237,214 | |
| | |
| |
| |
| |
| |
| | Less investment advisory fees waived | | | — | | | — | | | — | | | — | |
| | Less expense reimbursed by investment adviser | | | — | | | — | | | — | | | — | |
| | |
| |
| |
| |
| |
| | | Net expenses | | | 3,483,462 | | | 1,381,459 | | | 628,995 | | | 2,237,214 | |
| | |
| |
| |
| |
| |
| NET INVESTMENT INCOME (LOSS) | | | (1,624,119 | ) | | (162,908 | ) | | (109,809 | ) | | 818,010 | |
| | |
| |
| |
| |
| |
| NET REALIZED AND UNREALIZED GAIN (LOSS) ON INVESTMENTS: | | | | | | | | | | | | | |
| | Net realized gain (loss) on investment securities | | | 40,945,889 | | | 10,565,032 | | | 9,229,928 | | | 18,428,834 | |
| | Net realized gain (loss) on options | | | (835,327 | ) | | (436,028 | ) | | — | | | — | |
| | Net realized gain (loss) on futures contract | | | — | | | — | | | — | | | 291,368 | |
| | Net change in unrealized appreciation/depreciation on investments | | | 1,588,916 | | | 15,314,876 | | | (2,067,625 | ) | | 37,281,889 | |
| | Net change in unrealized appreciation/depreciation on futures contracts | | | — | | | — | | | — | | | (115,528 | ) |
| | |
| |
| |
| |
| |
| | Net realized and unrealized gain on investments | | | 41,699,478 | | | 25,443,880 | | | 7,162,303 | | | 55,886,563 | |
| | |
| |
| |
| |
| |
| NET INCREASE IN NET ASSETS RESULTING FROM OPERATIONS | | $ | 40,075,359 | | $ | 25,280,972 | | $ | 7,052,494 | | $ | 56,704,573 | |
| | |
| |
| |
| |
| |
- *
- Net of foreign withholding taxes of $5,877, $2,642, and $677 for Aggressive Investors 1, Aggressive Investors 2, and Ultra Small Company Market Funds, respectively.
See Notes to Financial Statements
155
| | Micro-Cap
Limited
| | Small-Cap
Growth
| | Small-Cap
Value
| | Large-Cap
Growth
| | Large-Cap
Value
| | Blue Chip 35
Index
| | Balanced
| |
|---|
| INVESTMENT INCOME: | | | | | | | | | | | | | | | | | | | | | | |
| | Dividends* | | $ | 78,646 | | $ | 151,112 | | $ | 515,599 | | $ | 180,695 | | $ | 399,970 | | $ | 413,305 | | $ | 201,721 | |
| | Interest | | | 20,186 | | | 23,651 | | | 82,300 | | | 4,862 | | | 5,918 | | | 4,066 | | | 374,761 | |
| | Securities Lending | | | 32,318 | | | 134,548 | | | 17,182 | | | — | | | — | | | — | | | — | |
| | Other | | | — | | | — | | | — | | | — | | | — | | | — | | | — | |
| | |
| |
| |
| |
| |
| |
| |
| |
| | Total investment income | | | 131,150 | | | 309,311 | | | 615,081 | | | 185,557 | | | 405,888 | | | 417,371 | | | 576,482 | |
| | |
| |
| |
| |
| |
| |
| |
| |
| EXPENSES: | | | | | | | | | | | | | | | | | | | | | | |
| | Investment advisory fees—Base fees | | | 549,746 | | | 223,636 | | | 427,606 | | | 120,770 | | | 84,046 | | | 16,819 | | | 151,322 | |
| | Investment advisory fees— | | | | | | | | | | | | | | | | | | | | | | |
| | | Performance adjustment | | | — | | | 8,231 | | | 3,654 | | | 2,643 | | | 891 | | | — | | | — | |
| | Administration fees | | | 18,639 | | | 18,636 | | | 35,634 | | | 12,077 | | | 8,405 | | | 10,512 | | | 12,610 | |
| | Accounting fees | | | 24,339 | | | 24,997 | | | 24,371 | | | 26,304 | | | 25,082 | | | 23,790 | | | 24,248 | |
| | Transfer agent fees | | | 14,983 | | | 32,085 | | | 23,658 | | | 24,457 | | | 13,593 | | | 8,367 | | | 16,575 | |
| | Professional expenses | | | 25,505 | | | 5,482 | | | 12,845 | | | 1,279 | | | 2,353 | | | 3,234 | | | 14,373 | |
| | Custody fees | | | 2,997 | | | 6,972 | | | 15,270 | | | 2,868 | | | 3,640 | | | 1,215 | | | 16,874 | |
| | Blue sky fees | | | 1,060 | | | 3,465 | | | 29,547 | | | 3,297 | | | 1,127 | | | 2,856 | | | 18,953 | |
| | Directors fees | | | 5,794 | | | 4,400 | | | 2,963 | | | 3,992 | | | 744 | | | 557 | | | 5,494 | |
| | Registration fees | | | 528 | | | — | | | — | | | 42 | | | — | | | 21 | | | 162 | |
| | Reports to shareholders | | | 637 | | | 1,825 | | | 504 | | | 378 | | | 309 | | | 441 | | | 2,509 | |
| | Interest | | | — | | | — | | | — | | | — | | | — | | | 3,954 | | | — | |
| | Miscellaneous | | | 741 | | | 1,567 | | | 1,681 | | | 1,132 | | | 826 | | | 336 | | | 1,145 | |
| | |
| |
| |
| |
| |
| |
| |
| |
| | | Total expenses | | | 644,969 | | | 331,296 | | | 577,733 | | | 199,239 | | | 141,016 | | | 72,102 | | | 264,265 | |
| | |
| |
| |
| |
| |
| |
| |
| |
| | Less investment advisory fees waived | | | — | | | — | | | — | | | — | | | — | | | (16,819 | ) | | — | |
| | Less expense reimbursed by investment adviser | | | — | | | — | | | — | | | — | | | — | | | (23,748 | ) | | (26,874 | ) |
| | |
| |
| |
| |
| |
| |
| |
| |
| | | Net expenses | | | 644,969 | | | 331,296 | | | 577,733 | | | 199,239 | | | 141,016 | | | 31,535 | | | 237,391 | |
| | |
| |
| |
| |
| |
| |
| |
| |
| NET INVESTMENT INCOME (LOSS) | | | (513,819 | ) | | (21,985 | ) | | 37,348 | | | (13,682 | ) | | 264,872 | | | 385,836 | | | 339,091 | |
| | |
| |
| |
| |
| |
| |
| |
| |
| NET REALIZED AND UNREALIZED GAIN (LOSS) ON INVESTMENTS: | | | | | | | | | | | | | | | | | | | | | | |
| | Net realized gain (loss) on investment securities | | | 10,669,623 | | | (334,577 | ) | | (538,576 | ) | | 467,606 | | | (209,478 | ) | | 74,732 | | | (456,734 | ) |
| | Net realized gain (loss) on options | | | — | | | — | | | — | | | — | | | — | | | — | | | 587,687 | |
| | Net realized gain (loss) on futures contract | | | — | | | — | | | — | | | — | | | — | | | — | | | (518,641 | ) |
| | Net change in unrealized appreciation/depreciation on investments | | | (1,255,260 | ) | | 7,563,201 | | | 13,348,329 | | | 3,705,217 | | | 2,354,259 | | | 1,689,459 | | | 1,616,510 | |
| | Net change in unrealized appreciation/depreciation on futures contracts | | | — | | | — | | | — | | | — | | | — | | | — | | | — | |
| | |
| |
| |
| |
| |
| |
| |
| |
| | Net realized and unrealized gain on investments | | | 9,414,363 | | | 7,228,624 | | | 12,809,753 | | | 4,172,823 | | | 2,144,781 | | | 1,764,191 | | | 1,228,822 | |
| | |
| |
| |
| |
| |
| |
| |
| |
| NET INCREASE IN NET ASSETS RESULTING FROM OPERATIONS | | $ | 8,900,544 | | $ | 7,206,639 | | $ | 12,847,101 | | $ | 4,159,141 | | $ | 2,409,653 | | $ | 2,150,027 | | $ | 1,567,913 | |
| | |
| |
| |
| |
| |
| |
| |
| |
156
STATEMENT OF CHANGES IN NET ASSETS
| | Aggressive Investors I
| | Aggressive Investors 2
| |
|---|
| | Six Months
Ended
December 31,
2005**
| | Year Ended
June 30,
2005
| | Six Months
Ended
December 31,
2005**
| | Year Ended
June 30,
2005
| |
|---|
| OPERATIONS: | | | | | | | | | | | | | |
| Net investment income (loss) | | $ | (1,624,119 | ) | $ | (1,735,143 | ) | $ | (162,908 | ) | $ | (396,036 | ) |
| Net realized gain on investment securities | | | 40,945,889 | | | 47,718,083 | | | 10,565,032 | | | 1,449,196 | |
| Net realized gain (loss) on options | | | (835,327 | ) | | 218,611 | | | (436,028 | ) | | 34,395 | |
| Net realized gain on futures contracts | | | — | | | 548,257 | | | — | | | 251,402 | |
| Net change in unrealized appreciation/depreciation on investments | | | 1,588,916 | | | (796,784 | ) | | 15,314,876 | | | 15,155,019 | |
| Net change in unrealized appreciation/depreciation on futures contracts | | | — | | | — | | | — | | | — | |
| | |
| |
| |
| |
| |
| | Net increase in net assets from operations | | | 40,075,359 | | | 45,953,024 | | | 25,280,972 | | | 16,493,976 | |
| | |
| |
| |
| |
| |
| DISTRIBUTIONS: | | | | | | | | | | | | | |
| From net investment income | | | — | | | — | | | — | | | — | |
| From net realized gains | | | (42,619,826 | ) | | — | | | (5,974,761 | ) | | — | |
| | |
| |
| |
| |
| |
| | Net decrease in net assets from distributions | | | (42,619,826 | ) | | — | | | (5,974,761 | ) | | — | |
| | |
| |
| |
| |
| |
| SHARE TRANSACTIONS: | | | | | | | | | | | | | |
| Proceeds from sale of shares | | | 22,636,442 | | | 35,958,371 | | | 154,260,786 | | | 78,881,920 | |
| Reinvestment of distributions | | | 36,610,444 | | | — | | | 5,717,329 | | | — | |
| Cost of shares redeemed | | | (22,342,903 | ) | | (66,709,206 | ) | | (26,656,325 | ) | | (49,717,584 | ) |
| | |
| |
| |
| |
| |
| | Net increase (decrease) in net assets from share transactions | | | 36,903,983 | | | (30,750,835 | ) | | 133,321,790 | | | 29,164,336 | |
| | |
| |
| |
| |
| |
| Net increase (decrease) in net assets | | | 34,359,516 | | | 15,202,189 | | | 152,628,001 | | | 45,658,312 | |
| NET ASSETS: | | | | | | | | | | | | | |
| Beginning of period | | | 368,886,370 | | | 353,684,181 | | | 156,053,384 | | | 110,395,072 | |
| | |
| |
| |
| |
| |
| End of period* | | $ | 403,245,886 | | $ | 368,886,370 | | $ | 308,681,385 | | $ | 156,053,384 | |
| | |
| |
| |
| |
| |
| SHARES ISSUED & REDEEMED: | | | | | | | | | | | | | |
| Issued | | | 375,495 | | | 684,470 | | | 9,572,709 | | | 5,847,003 | |
| Distributions reinvested | | | 638,591 | | | — | | | 342,765 | | | — | |
| Redeemed | | | (373,243 | ) | | (1,323,130 | ) | | (1,689,930 | ) | | (3,905,883 | ) |
| | |
| |
| |
| |
| |
| | Net increase (decrease) | | | 640,843 | | | (638,660 | ) | | 8,225,544 | | | 1,941,120 | |
| Outstanding at beginning of period | | | 6,517,264 | | | 7,155,924 | | | 10,599,330 | | | 8,658,210 | |
| | |
| |
| |
| |
| |
| Outstanding at end of period | | | 7,158,107 | | | 6,517,264 | | | 18,824,874 | | | 10,599,330 | |
| | |
| |
| |
| |
| |
| * Including accumulated net investment income (loss) of: | | $ | (1,624,119 | ) | $ | — | | $ | (162,908 | ) | $ | — |
- **
- Unaudited
- ***
- Net of redemption fees of $104,442 and $276,563 for the six months ended December 31, 2005 and year ended June 30, 2005, respectively.
See Notes to Financial Statements
157
| | Ultra-Small Company
| | Ultra-Small Company Market
| | Micro-Cap Limited
| |
|---|
| | Six Months
Ended
December 31,
2005**
| | Year Ended
June 30,
2005
| | Six Months
Ended
December 31,
2005**
| | Year Ended
June 30,
2005
| | Six Months
Ended
December 31,
2005**
| | Year Ended
June 30,
2005
| |
|---|
| OPERATIONS: | | | | | | | | | | | | | | | | | | | |
| Net investment income (loss) | | $ | (109,809 | ) | $ | (258,388 | ) | $ | 818,010 | | $ | 998,532 | | $ | (513,819 | ) | $ | (746,350 | ) |
| Net realized gain on investment securities | | | 9,229,928 | | | 17,529,494 | | | 18,428,834 | | | 14,263,596 | | | 10,669,623 | | | 4,089,990 | |
| Net realized gain (loss) on options | | | — | | | — | | | — | | | — | | | — | | | — | |
| Net realized gain on futures contracts | | | — | | | — | | | 291,368 | | | — | | | — | | | — | |
| Net change in unrealized appreciation/depreciation on investments | | | (2,067,625 | ) | | (2,097,422 | ) | | 37,281,889 | | | 15,160,942 | | | (1,255,260 | ) | | 9,180,886 | |
| Net change in unrealized appreciation/depreciation on futures contracts | | | — | | | — | | | (115,528 | ) | | (8,204 | ) | | — | | | — | |
| | |
| |
| |
| |
| |
| |
| |
| | Net increase in net assets from operations | | | 7,052,494 | | | 15,173,684 | | | 56,704,573 | | | 30,414,866 | | | 8,900,544 | | | 12,524,526 | |
| | |
| |
| |
| |
| |
| |
| |
| DISTRIBUTIONS: | | | | | | | | | | | | | | | | | | | |
| From net investment income | | | — | | | — | | | (1,180,000 | ) | | (1,224,997 | ) | | — | | | — | |
| From net realized gains | | | (14,389,660 | ) | | (22,051,675 | ) | | (21,617,927 | ) | | (6,669,718 | ) | | (10,105,298 | ) | | (10,119,755 | ) |
| | |
| |
| |
| |
| |
| |
| |
| | Net decrease in net assets from distributions | | | (14,389,660 | ) | | (22,051,675 | ) | | (22,797,927 | ) | | (7,894,715 | ) | | (10,105,298 | ) | | (10,119,755 | ) |
| | |
| |
| |
| |
| |
| |
| |
| SHARE TRANSACTIONS: | | | | | | | | | | | | | | | | | | | |
| Proceeds from sale of shares | | | 879,440 | | | 1,767,134 | | | 185,182,778 | | | 149,035,161 | | | 3,419,718 | | | 2,660,102 | |
| Reinvestment of distributions | | | 14,107,999 | | | 21,605,229 | | | 21,198,600 | | | 7,133,407 | | | 10,001,345 | | | 9,802,070 | |
| Cost of shares redeemed | | | (3,411,402 | ) | | (7,093,824 | ) | | (74,486,808 | )*** | | (401,553,889 | )*** | | (3,098,045 | ) | | (5,979,806 | ) |
| | |
| |
| |
| |
| |
| |
| |
| | Net increase (decrease) in net assets from share transactions | | | 11,576,037 | | | 16,278,539 | | | 131,894,570 | | | (245,385,321 | ) | | 10,323,018 | | | 6,482,366 | |
| | |
| |
| |
| |
| |
| |
| |
| Net increase (decrease) in net assets | | | 4,238,871 | | | 9,400,548 | | | 165,801,216 | | | (222,865,170 | ) | | 9,118,264 | | | 8,887,137 | |
| NET ASSETS: | | | | | | | | | | | | | | | | | | | |
| Beginning of period | | | 110,633,540 | | | 101,232,992 | | | 593,883,122 | | | 816,748,292 | | | 66,637,440 | | | 57,750,303 | |
| | |
| |
| |
| |
| |
| |
| |
| End of period* | | $ | 114,872,411 | | $ | 110,633,540 | | $ | 759,684,338 | | $ | 593,883,122 | | $ | 75,755,704 | | $ | 66,637,440 | |
| | |
| |
| |
| |
| |
| |
| |
| SHARES ISSUED & REDEEMED: | | | | | | | | | | | | | | | | | | | |
| Issued | | | 21,803 | | | 45,885 | | | 10,333,790 | | | 9,247,195 | | | 278,886 | | | 255,813 | |
| Distributions reinvested | | | 381,400 | | | 543,939 | | | 1,168,611 | | | 403,018 | | | 875,775 | | | 947,976 | |
| Redeemed | | | (85,832 | ) | | (183,051 | ) | | (4,172,939 | ) | | (25,229,480 | ) | | (257,487 | ) | | (567,086 | ) |
| | |
| |
| |
| |
| |
| |
| |
| | Net increase (decrease) | | | 317,371 | | | 406,773 | | | 7,329,462 | | | (15,579,267 | ) | | 897,174 | | | 636,703 | |
| Outstanding at beginning of period | | | 2,877,887 | | | 2,471,114 | | | 35,016,774 | | | 50,596,041 | | | 6,008,811 | | | 5,372,108 | |
| | |
| |
| |
| |
| |
| |
| |
| Outstanding at end of period | | | 3,195,258 | | | 2,877,887 | | | 42,346,236 | | | 35,016,774 | | | 6,905,985 | | | 6,008,811 | |
| | |
| |
| |
| |
| |
| |
| |
| * Including accumulated net investment income (loss) of: | | $ | (109,809 | ) | $ | — | | $ | 205,350 | | $ | 567,340 | | $ | (513,819 | ) | $ | — |
158
STATEMENT OF CHANGES IN NET ASSETS
| | Small-Cap Growth
| | Small-Cap Value
| |
|---|
| | Six Months
Ended
December 31,
2005**
| | Year Ended
June 30,
2005
| | Six Months
Ended
December 31,
2005**
| | Year Ended
June 30,
2005
| |
|---|
| OPERATIONS: | | | | | | | | | | | | | |
| Net investment income (loss) | | $ | (21,985 | ) | $ | (358,783 | ) | $ | 37,348 | | $ | (153,914 | ) |
| Net realized gain (loss) on investment securities | | | (334,577 | ) | | (3,815,358 | ) | | (538,576 | ) | | (2,331,261 | ) |
| Net realized gain on options | | | — | | | — | | | — | | | — | |
| Net realized gain (loss) on futures contracts | | | — | | | — | | | — | | | — | |
| Net change in unrealized appreciation/depreciation on investments | | | 7,563,201 | | | 9,884,953 | | | 13,348,329 | | | 10,843,378 | |
| | |
| |
| |
| |
| |
| | Net increase (decrease) in net assets from operations | | | 7,206,639 | | | 5,710,812 | | | 12,847,101 | | | 8,358,203 | |
| | |
| |
| |
| |
| |
| DISTRIBUTIONS: | | | | | | | | | | | | | |
| From net investment income | | | | | | | | | | | | | |
| | Class N | | | — | | | — | | | — | | | — | |
| | Class R§ | | | — | | | — | | | — | | | — | |
| From net realized gains | | | — | | | — | | | — | | | — | |
| | |
| |
| |
| |
| |
| | Net decrease in net assets from distributions | | | — | | | — | | | — | | | — | |
| | |
| |
| |
| |
| |
| SHARE TRANSACTIONS: | | | | | | | | | | | | | |
| Proceeds from sale of shares | | | | | | | | | | | | | |
| | Class N | | | 70,587,812 | | | 28,489,283 | | | 156,202,966 | | | 46,980,701 | |
| | Class R§ | | | — | | | 2,010,488 | | | — | | | 1,615,958 | |
| Reinvestment of distributions | | | | | | | | | | | | | |
| | Class N | | | — | | | — | | | — | | | — | |
| | Class R§ | | | — | | | — | | | — | | | — | |
| Cost of shares redeemed | | | | | | | | | | | | | |
| | Class N | | | (6,289,622 | ) | | (15,712,548 | ) | | (19,267,025 | ) | | (14,154,816 | ) |
| | Class R§ | | | — | | | (13,173,420 | ) | | — | | | (7,149,130 | ) |
| | |
| |
| |
| |
| |
| | Net increase (decrease) in net assets from share transactions | | | 64,298,190 | | | 1,613,803 | | | 136,935,941 | | | 27,292,713 | |
| | |
| |
| |
| |
| |
| Net increase (decrease) in net assets | | | 71,504,829 | | | 7,324,615 | | | 149,783,042 | | | 35,650,916 | |
NET ASSETS: |
|
|
|
|
|
|
|
|
|
|
|
|
|
| Beginning of period | | | 55,704,400 | | | 48,379,785 | | | 68,544,576 | | | 32,893,660 | |
| | |
| |
| |
| |
| |
| End of period* | | $ | 127,209,229 | | $ | 55,704,400 | | $ | 218,327,618 | | $ | 68,544,576 | |
| | |
| |
| |
| |
| |
| SHARES ISSUED & REDEEMED: | | | | | | | | | | | | | |
| Issued | | | | | | | | | | | | | |
| | Class N | | | 5,262,171 | | | 2,583,636 | | | 11,282,088 | | | 3,889,211 | |
| | Class R§ | | | — | | | 187,851 | | | — | | | 140,369 | |
| Distributions reinvested | | | | | | | | | | | | | |
| | Class N | | | — | | | — | | | — | | | — | |
| | Class R§ | | | — | | | — | | | — | | | — | |
| Redeemed | | | | | | | | | | | | | |
| | Class N | | | (486,484 | ) | | (1,472,557 | ) | | (1,402,406 | ) | | (1,223,036 | ) |
| | Class R§ | | | — | | | (1,149,048 | ) | | — | | | (590,810 | ) |
| | |
| |
| |
| |
| |
| | Net increase (decrease) | | | 4,775,687 | | | 149,882 | | | 9,879,682 | | | 2,215,734 | |
| Outstanding at beginning of period | | | 4,612,600 | | | 4,462,718 | | | 5,361,743 | | | 3,146,009 | |
| | |
| |
| |
| |
| |
| Outstanding at end of period | | | 9,388,287 | | | 4,612,600 | | | 15,241,425 | | | 5,361,743 | |
| | |
| |
| |
| |
| |
| * Including accumulated net investment income (loss) of: | | $ | (25,457 | ) | $ | (3,472 | ) | $ | 33,876 | | $ | (3,472 | ) |
- **
- Unaudited
- §
- Effective June 27, 2005, Class R shares of the Fund converted to Class N shares.
See Notes to Financial Statements
159
| | Large-Cap Growth
| | Large-Cap Value
| | Blue Chip 35 Index
| | Balanced
| |
|---|
| | Six Months
Ended
December 31,
2005**
| | Year Ended
June 30,
2005
| | Six Months
Ended
December 31,
2005**
| | Year Ended
June 30,
2005
| | Six Months
Ended
December 31,
2005**
| | Year Ended
June 30,
2005
| | Six Months
Ended
December 31,
2005**
| | Year Ended
June 30,
2005
| |
|---|
| OPERATIONS: | | | | | | | | | | | | | | | | | | | | | | | | | |
| Net investment income (loss) | | $ | (13,682 | ) | $ | (42,069 | ) | $ | 264,872 | | $ | 301,975 | | $ | 385,836 | | $ | 763,026 | | $ | 339,091 | | $ | 344,923 | |
| Net realized gain (loss) on investment securities | | | 467,606 | | | (4,425,461 | ) | | (209,478 | ) | | (569,611 | ) | | 74,732 | | | (960,307 | ) | | (456,734 | ) | | (685,205 | ) |
| Net realized gain on options | | | — | | | — | | | — | | | — | | | — | | | — | | | 587,687 | | | 932,043 | |
| Net realized gain (loss) on futures contracts | | | — | | | — | | | — | | | — | | | — | | | — | | | (518,641 | ) | | 304,201 | |
| Net change in unrealized appreciation/depreciation on investments | | | 3,705,217 | | | 5,692,548 | | | 2,354,259 | | | 3,701,172 | | | 1,689,459 | | | 155,378 | | | 1,616,510 | | | 1,251,827 | |
| | |
| |
| |
| |
| |
| |
| |
| |
| |
| | Net increase (decrease) in net assets from operations | | | 4,159,141 | | | 1,225,018 | | | 2,409,653 | | | 3,433,536 | | | 2,150,027 | | | (41,903 | ) | | 1,567,913 | | | 2,147,789 | |
| | |
| |
| |
| |
| |
| |
| |
| |
| |
| DISTRIBUTIONS: | | | | | | | | | | | | | | | | | | | | | | | | | |
| From net investment income | | | | | | | | | | | | | | | | | | | | | | | | | |
| | Class N | | | — | | | — | | | (445,034 | ) | | (178,134 | ) | | (720,379 | ) | | (674,999 | ) | | (500,000 | ) | | (179,176 | ) |
| | Class R§ | | | — | | | — | | | — | | | (16,866 | ) | | — | | | — | | | — | | | — | |
| From net realized gains | | | — | | | — | | | — | | | — | | | — | | | — | | | (498,752 | ) | | (243,673 | ) |
| | |
| |
| |
| |
| |
| |
| |
| |
| |
| | Net decrease in net assets from distributions | | | — | | | — | | | (445,034 | ) | | (195,000 | ) | | (720,379 | ) | | (674,999 | ) | | (998,752 | ) | | (422,849 | ) |
| | |
| |
| |
| |
| |
| |
| |
| |
| |
| SHARE TRANSACTIONS: | | | | | | | | | | | | | | | | | | | | | | | | | |
| Proceeds from sale of shares | | | | | | | | | | | | | | | | | | | | | | | | | |
| | Class N | | | 16,152,373 | | | 16,123,492 | | | 15,743,062 | | | 11,032,282 | | | 19,571,243 | | | 13,017,125 | | | 22,697,396 | | | 26,406,530 | |
| | Class R§ | | | — | | | 677,327 | | | — | | | 365,369 | | | — | | | — | | | — | | | — | |
| Reinvestment of distributions | | | | | | | | | | | | | | | | | | | | | | | | | |
| | Class N | | | — | | | — | | | 438,970 | | | 176,053 | | | 693,137 | | | 650,124 | | | 968,380 | | | 414,200 | |
| | Class R§ | | | — | | | — | | | — | | | 16,866 | | | — | | | — | | | — | | | — | |
| Cost of shares redeemed | | | | | | | | | | | | | | | | | | | | | | | | | |
| | Class N | | | (5,562,936 | ) | | (13,771,576 | ) | | (3,452,135 | ) | | (7,191,337 | ) | | (8,364,483 | ) | | (14,298,479 | ) | | (7,981,389 | ) | | (9,493,747 | ) |
| | Class R§ | | | — | | | (13,293,605 | ) | | — | | | (3,989,586 | ) | | — | | | — | | | — | | | — | |
| | |
| |
| |
| |
| |
| |
| |
| |
| |
| | Net increase (decrease) in net assets from share transactions | | | 10,589,437 | | | (10,264,362 | ) | | 12,729,897 | | | 409,647 | | | 11,899,897 | | | (631,230 | ) | | 15,684,387 | | | 17,326,983 | |
| | |
| |
| |
| |
| |
| |
| |
| |
| |
| Net increase (decrease) in net assets | | | 14,748,578 | | | (9,039,344 | ) | | 14,694,516 | | | 3,648,183 | | | 13,329,545 | | | (1,348,132 | ) | | 16,253,548 | | | 19,051,923 | |
NET ASSETS: |
|
|
|
|
|
|
|
|
|
|
|
|
|
|
|
|
|
|
|
|
|
|
|
|
|
| Beginning of period | | | 42,988,220 | | | 52,027,564 | | | 27,476,147 | | | 23,827,964 | | | 34,611,567 | | | 35,959,699 | | | 42,263,674 | | | 23,211,751 | |
| | |
| |
| |
| |
| |
| |
| |
| |
| |
| End of period* | | $ | 57,736,798 | | $ | 42,988,220 | | $ | 42,170,663 | | $ | 27,476,147 | | $ | 47,941,112 | | $ | 34,611,567 | | $ | 58,517,222 | | $ | 42,263,674 | |
| | |
| |
| |
| |
| |
| |
| |
| |
| |
| SHARES ISSUED & REDEEMED: | | | | | | | | | | | | | | | | | | | | | | | | | |
| Issued | | | | | | | | | | | | | | | | | | | | | | | | | |
| | Class N | | | 1,352,715 | | | 1,511,948 | | | 1,178,735 | | | 3,102,238 | | | 2,819,397 | | | 1,888,073 | | | 1,848,531 | | | 2,286,141 | |
| | Class R§ | | | — | | | 65,728 | | | — | | | 30,950 | | | — | | | — | | | — | | | — | |
| Distributions reinvested | | | | | | | | | | | | | | | | | | | | | | | | | |
| | Class N | | | — | | | — | | | 31,902 | | | 14,337 | | | 96,136 | | | 90,295 | | | 79,310 | | | 35,799 | |
| | Class R§ | | | — | | | — | | | — | | | 1,374 | | | — | | | — | | | — | | | — | |
| Redeemed | | | | | | | | | | | | | | | | | | | | | | | | | |
| | Class N | | | (476,549 | ) | | (1,320,994 | ) | | (261,372 | ) | | (2,806,760 | ) | | (1,187,332 | ) | | (2,051,789 | ) | | (659,023 | ) | | (831,504 | ) |
| | Class R§ | | | — | | | (1,242,365 | ) | | — | | | (323,547 | ) | | — | | | — | | | — | | | — | |
| | |
| |
| |
| |
| |
| |
| |
| |
| |
| | Net increase (decrease) | | | 876,166 | | | (985,683 | ) | | 949,265 | | | 18,592 | | | 1,728,201 | | | (73,421 | ) | | 1,268,818 | | | 1,490,436 | |
| Outstanding at beginning of period | | | 3,908,621 | | | 4,894,304 | | | 2,163,925 | | | 2,145,333 | | | 5,047,201 | | | 5,120,622 | | | 3,544,146 | | | 2,053,710 | |
| | |
| |
| |
| |
| |
| |
| |
| |
| |
| Outstanding at end of period | | | 4,784,787 | | | 3,908,621 | | | 3,113,190 | | | 2,163,925 | | | 6,775,402 | | | 5,047,201 | | | 4,812,964 | | | 3,544,146 | |
| | |
| |
| |
| |
| |
| |
| |
| |
| |
| * Including accumulated net investment income (loss) of: | | $ | (17,070 | ) | $ | (3,388 | ) | $ | 12,680 | | $ | 192,842 | | $ | 14,760 | | $ | 349,303 | | $ | 74,925 | | $ | 235,833 |
160
FINANCIAL HIGHLIGHTS
(For a share outstanding throughout the period indicated)
| |
| | Income from
Investment Operations
| |
|---|
| | Net Asset
Value,
Beginning
of Period
| | Net
Investment
Income (Loss)^
| | Net Realized
and Unrealized
Gain
(Loss)
| | Total
from
Investment
Operations
| |
|---|
| AGGRESSIVE INVESTORS 1 | | | | | | | | | | | | | |
Six Months Ended
December 31, 2005** | | $ | 56.60 | | $ | (0.25 | ) | $ | 6.49 | | $ | 6.24 | |
| Year Ended June 30, 2005 | | | 49.43 | | | (0.26 | ) | | 7.43 | | | 7.17 | |
| Year Ended June 30, 2004 | | | 39.94 | | | (0.58 | ) | | 10.07 | | | 9.49 | |
| Year Ended June 30, 2003 | | | 36.51 | | | (0.27 | ) | | 3.70 | | | 3.43 | |
| Year Ended June 30, 2002 | | | 41.94 | | | (0.34 | ) | | (5.09 | ) | | (5.43 | ) |
| Year Ended June 30, 2001 | | | 48.99 | | | (0.42 | ) | | (4.21 | ) | | (4.63 | ) |
| AGGRESSIVE INVESTORS 2 | | | | | | | | | | | | | |
Six Months Ended
December 31, 2005** | | | 14.72 | | | (0.01 | ) | | 2.03 | | | 2.02 | |
| Year Ended June 30, 2005 | | | 12.75 | | | (0.04 | ) | | 2.01 | | | 1.97 | |
| Year Ended June 30, 2004 | | | 10.28 | | | (0.09 | ) | | 2.56 | | | 2.47 | |
| Year Ended June 30, 2003 | | | 10.25 | | | (0.09 | ) | | 0.12 | | | 0.03 | |
| Period from October 31, 2001 to June 30, 2002 *** | | | 10.00 | | | (0.08 | ) | | 0.33 | | | 0.25 | |
| ULTRA-SMALL COMPANY | | | | | | | | | | | | | |
Six Months Ended
December 31, 2005** | | | 38.44 | | | (0.04 | ) | | 2.65 | | | 2.61 | |
| Year Ended June 30, 2005 | | | 40.97 | | | (0.10 | ) | | 6.69 | | | 6.59 | |
| Year Ended June 30, 2004 | | | 32.93 | | | (0.33 | ) | | 13.66 | | | 13.33 | |
| Year Ended June 30, 2003 | | | 28.83 | | | (0.21 | ) | | 7.99 | | | 7.78 | |
| Year Ended June 30, 2002 | | | 26.99 | | | (0.14 | ) | | 4.43 | | | 4.29 | |
| Year Ended June 30, 2001 | | | 21.59 | | | (0.22 | ) | | 5.62 | | | 5.40 | |
| ULTRA-SMALL COMPANY MARKET | | | | | | | | | | | | | |
Six Months Ended
December 31, 2005** | | | 16.96 | | | 0.02 | | | 1.52 | | | 1.54 | |
| Year Ended June 30, 2005 | | | 16.14 | | | 0.02 | | | 0.97 | | | 0.99 | |
| Year Ended June 30, 2004 | | | 10.98 | | | 0.02 | | | 5.16 | | | 5.18 | |
| Year Ended June 30, 2003 | | | 8.70 | | | (0.03 | ) | | 2.31 | | | 2.28 | �� |
| Year Ended June 30, 2002 | | | 7.22 | | | 0.00 | | | 1.49 | | | 1.49 | |
| Year Ended June 30, 2001 | | | 6.62 | | | 0.05 | | | 0.59 | | | 0.64 | |
- *
- Annualized
- **
- Unaudited
- ***
- Fund commenced operations on October 31, 2001.
- #
- Total returns for periods less than one year are not annualized.
- ^
- Per share amounts calculated based on the average daily shares outstanding during the period.
- +
- Total return would have been lower had various fees not been waived during the period.
- ~
- Total redemption fees of $104,442 for the six months ended December 31, 2005, are less than 0.005 of average daily shares outstanding during the period.
161
| | Less Distributions
to Shareholders from:
| |
| |
| |
|---|
| | Net
Realized
Gain
| | Net
Investment
Income
| | Total
Distributions
| | Paid-in-
Capital
from
Redemption
Fees^
| | Net Asset
Value,
End of
Period
| | Total
Return#
| |
|---|
| AGGRESSIVE INVESTORS 1 | | | | | | | | | | | | | | | | | | |
Six Months Ended
December 31, 2005** | | $ | (6.51 | ) | $ | — | | $ | (6.51 | ) | $ | — | | $ | 56.33 | | 10.83 | % |
| Year Ended June 30, 2005 | | | — | | | — | | | — | | | — | | | 56.60 | | 14.51 | % |
| Year Ended June 30, 2004 | | | — | | | — | | | — | | | — | | | 49.43 | | 23.76 | % |
| Year Ended June 30, 2003 | | | — | | | — | | | — | | | — | | | 39.94 | | 9.40 | % |
| Year Ended June 30, 2002 | | | — | | | — | | | — | | | — | | | 36.51 | | (12.95 | )% |
| Year Ended June 30, 2001 | | | (2.42 | ) | | — | | | (2.42 | ) | | — | | | 41.94 | | (9.40 | )% |
| AGGRESSIVE INVESTORS 2 | | | | | | | | | | | | | | | | | | |
Six Months Ended
December 31, 2005** | | | (0.34 | ) | | — | | | (0.34 | ) | | — | | | 16.40 | | 13.68 | % |
| Year Ended June 30, 2005 | | | — | | | — | | | — | | | — | | | 14.72 | | 15.45 | % |
| Year Ended June 30, 2004 | | | — | | | — | | | — | | | — | | | 12.75 | | 24.03 | % |
| Year Ended June 30, 2003 | | | — | | | — | | | — | | | — | | | 10.28 | | 0.29 | % |
| Period from October 31, 2001 to June 30, 2002 *** | | | — | | | — | | | — | | | — | | | 10.25 | | 2.50 | %+ |
| ULTRA-SMALL COMPANY | | | | | | | | | | | | | | | | | | |
Six Months Ended
December 31, 2005** | | | (5.10 | ) | | — | | | (5.10 | ) | | — | | | 35.95 | | 6.42 | % |
| Year Ended June 30, 2005 | | | (9.12 | ) | | — | | | (9.12 | ) | | — | | | 38.44 | | 15.37 | % |
| Year Ended June 30, 2004 | | | (5.29 | ) | | — | | | (5.29 | ) | | — | | | 40.97 | | 40.88 | % |
| Year Ended June 30, 2003 | | | (3.68 | ) | | — | | | (3.68 | ) | | — | | | 32.93 | | 32.00 | % |
| Year Ended June 30, 2002 | | | (2.45 | ) | | — | | | (2.45 | ) | | — | | | 28.83 | | 17.04 | % |
| Year Ended June 30, 2001 | | | (0.00 | ) | | — | | | (0.00 | ) | | — | | | 26.99 | | 25.01 | % |
| ULTRA-SMALL COMPANY MARKET | | | | | | | | | | | | | | | | | | |
Six Months Ended
December 31, 2005** | | | (0.53 | ) | | (0.03 | ) | | (0.56 | ) | | 0.00~ | | | 17.94 | | 9.05 | % |
| Year Ended June 30, 2005 | | | (0.15 | ) | | (0.03 | ) | | (0.18 | ) | | 0.01 | | | 16.96 | | 6.12 | % |
| Year Ended June 30, 2004 | | | (0.04 | ) | | (0.00 | ) | | (0.04 | ) | | 0.02 | | | 16.14 | | 47.41 | % |
| Year Ended June 30, 2003 | | | (0.00 | ) | | (0.00 | ) | | (0.00 | ) | | — | | | 10.98 | | 26.21 | %+ |
| Year Ended June 30, 2002 | | | (0.00 | ) | | (0.01 | ) | | (0.01 | ) | | — | | | 8.70 | | 20.70 | %+ |
| Year Ended June 30, 2001 | | | (0.00 | ) | | (0.04 | ) | | (0.04 | ) | | — | | | 7.22 | | 9.80 | %+ |
See Notes to Financial Statements
162
| | Ratios & Supplemental Data:
| |
|---|
| | Net Assets
End of Period
("000"s)
| | Expenses
After
Waivers and
Reimbursements
| | Expenses
Before
Waivers and
Reimbursements
| | Net Investment
Income After
Waivers and
Reimbursements
| | Portfolio
Turnover
Rate
| |
|---|
| AGGRESSIVE INVESTORS 1 | | | | | | | | | | | | |
Six Months Ended
December 31, 2005** | | $ | 403,246 | | 1.74 | %* | 1.74 | %* | (0.81 | )%* | 75.9 | % |
| Year Ended June 30, 2005 | | | 368,886 | | 1.58 | % | 1.58 | % | (0.51 | )% | 155.0 | % |
| Year Ended June 30, 2004 | | | 353,684 | | 1.74 | % | 1.74 | % | (1.24 | )% | 150.7 | % |
| Year Ended June 30, 2003 | | | 281,375 | | 1.90 | % | 1.90 | % | (0.81 | )% | 138.0 | % |
| Year Ended June 30, 2002 | | | 276,876 | | 1.81 | % | 1.81 | % | (0.89 | )% | 154.0 | % |
| Year Ended June 30, 2001 | | | 257,396 | | 1.80 | % | 1.80 | % | (0.95 | )% | 109.6 | % |
| AGGRESSIVE INVESTORS 2 | | | | | | | | | | | | |
Six Months Ended
December 31, 2005** | | | 308,681 | | 1.23 | %* | 1.23 | %* | (0.14 | )%* | 58.2 | % |
| Year Ended June 30, 2005 | | | 156,053 | | 1.37 | % | 1.37 | % | (0.33 | )% | 148.4 | % |
| Year Ended June 30, 2004 | | | 110,395 | | 1.58 | % | 1.58 | % | (1.13 | )% | 151.5 | % |
| Year Ended June 30, 2003 | | | 22,107 | | 1.90 | % | 1.90 | % | (1.05 | )% | 143.2 | % |
| Period from October 31, 2001 to June 30, 2002 *** | | | 11,448 | | 1.90 | %* | 1.98 | %* | (1.24 | )%* | 68.0 | %* |
| ULTRA-SMALL COMPANY | | | | | | | | | | | | |
Six Months Ended
December 31, 2005** | | | 114,872 | | 1.07 | %* | 1.07 | %* | (0.17 | )%* | 52.7 | % |
| Year Ended June 30, 2005 | | | 110,634 | | 1.12 | % | 1.12 | % | (0.25 | )% | 85.9 | % |
| Year Ended June 30, 2004 | | | 101,233 | | 1.15 | % | 1.15 | % | (0.84 | )% | 71.1 | % |
| Year Ended June 30, 2003 | | | 77,450 | | 1.29 | % | 1.29 | % | (0.82 | )% | 56.1 | % |
| Year Ended June 30, 2002 | | | 60,809 | | 1.26 | % | 1.26 | % | (0.53 | )% | 120.6 | % |
| Year Ended June 30, 2001 | | | 51,764 | | 1.61 | % | 1.61 | % | (0.93 | )% | 57.0 | % |
| ULTRA-SMALL COMPANY MARKET | | | | | | | | | | | | |
Six Months Ended
December 31, 2005** | | | 759,684 | | 0.66 | %* | 0.66 | %* | 0.24 | %* | 8.4 | % |
| Year Ended June 30, 2005 | | | 593,883 | | 0.73 | % | 0.73 | % | 0.15 | % | 13.0 | % |
| Year Ended June 30, 2004 | | | 816,748 | | 0.67 | % | 0.67 | % | 0.11 | % | 19.4 | % |
| Year Ended June 30, 2003 | | | 312,041 | | 0.75 | % | 0.85 | % | (0.14 | )% | 17.7 | % |
| Year Ended June 30, 2002 | | | 68,824 | | 0.75 | % | 1.01 | % | (0.05 | )% | 55.8 | % |
| Year Ended June 30, 2001 | | | 9,078 | | 0.75 | % | 1.61 | % | 0.77 | % | 215.0 | % |
See Notes to Financial Statements
163
| |
| | Income from
Investment Operations
| |
|---|
| | Net Asset
Value,
Beginning
of Period
| | Net
Investment
Income (Loss)^
| | Net Realized
and Unrealized
Gain
(Loss)
| | Total
from
Investment
Operations
| |
|---|
| MICRO-CAP LIMITED | | | | | | | | | | | | | |
Six Months Ended
December 31, 2005** | | $ | 11.09 | | $ | (0.08 | ) | $ | 1.63 | | $ | 1.55 | |
| Year Ended June 30, 2005 | | | 10.75 | | | (0.13 | ) | | 2.45 | | | 2.32 | |
| Year Ended June 30, 2004 | | | 9.36 | | | (0.17 | ) | | 2.49 | | | 2.32 | |
| Year Ended June 30, 2003 | | | 10.19 | | | (0.11 | ) | | 0.01 | | | (0.10 | ) |
| Year Ended June 30, 2002 | | | 9.92 | | | (0.12 | ) | | 0.87 | | | 0.75 | |
| Year Ended June 30, 2001 | | | 7.86 | | | (0.05 | ) | | 2.53 | | | 2.48 | |
| | |
| |
| |
| |
| |
| SMALL-CAP GROWTH§ | | | | | | | | | | | | | |
Six Months Ended
December 31, 2005** | | | 12.08 | | | (0.00 | ) | | 1.47 | | | 1.47 | |
| Year Ended June 30, 2005 | | | 10.84 | | | (0.07 | ) | | 1.31 | | | 1.24 | |
| Period from October 31, 2003 to June 30, 2004 Ç | | | 10.00 | | | (0.05 | ) | | 0.89 | | | 0.84 | |
| | |
| |
| |
| |
| |
| SMALL-CAP VALUE§ | | | | | | | | | | | | | |
| Six Months Ended | | | | | | | | | | | | | |
| December 31, 2005** | | | 12.78 | | | 0.00 | | | 1.54 | | | 1.54 | |
| Year Ended June 30, 2005 | | | 10.46 | | | (0.02 | ) | | 2.34 | | | 2.32 | |
| Period from October 31, 2003 to June 30, 2004 Ç | | | 10.00 | | | (0.03 | ) | | 0.49 | | | 0.46 | |
| | |
| |
| |
| |
| |
| LARGE-CAP GROWTH* | | | | | | | | | | | | | |
Six Months Ended
December 31, 2005** | | | 11.00 | | | (0.00 | ) | | 1.07 | | | 1.07 | |
| Year Ended June 30, 2005 | | | 10.63 | | | 0.00 | | | 0.37 | | | 0.37 | |
| Period from October 31, 2003 to June 30, 2004 Ç | | | 10.00 | | | (0.01 | ) | | 0.64 | | | 0.63 | |
| | |
| |
| |
| |
| |
- *
- Annualized
- **
- Unaudited
- #
- Total returns for periods less than one year are not annualized.
- ^
- Per share amounts calculated based on the average daily shares outstanding during the period.
- +
- Total return would have been lower had various fees not been waived during the period.
- Ç
- Fund commenced operations on October 31, 2003.
- §
- Effective June 27, 2005, Class R shares of the Fund converted into Class N shares.
164
| | Less Distributions
to Shareholders from:
| |
| | Ratios & Supplemental Data:
| |
|---|
| | Net
Realized
Gain
| | Net
Investment
Income
| | Total
Distributions
| | Net Asset
Value,
End of
Period
| | Total
Return#
| | Net Assets
End of Period
("000"s)
| | Expenses
After
Waivers and
Reimbursements
| | Expenses
Before
Waivers and
Reimbursements
| | Net Investment
Income After
Waivers and
Reimbursements
| | Portfolio
Turnover
Rate
| |
|---|
| MICRO-CAP LIMITED | | | | | | | | | | | | | | | | | | | | | | | | | | |
Six Months Ended
December 31, 2005** | | $ | (1.67 | ) | $ | — | | $ | (1.67 | ) | $ | 10.97 | | 13.38 | % | $ | 75,756 | | 1.72 | %* | 1.72 | %* | (1.37 | )%* | 51.0 | % |
| Year Ended June 30, 2005 | | | (1.98 | ) | | — | | | (1.98 | ) | | 11.09 | | 22.94 | % | | 66,637 | | 1.75 | % | 1.75 | % | (1.27 | )% | 87.1 | % |
| Year Ended June 30, 2004 | | | (0.93 | ) | | — | | | (0.93 | ) | | 10.75 | | 24.30 | % | | 57,750 | | 1.79 | % | 1.79 | % | (1.50 | )% | 98.2 | % |
| Year Ended June 30, 2003 | | | (0.73 | ) | | — | | | (0.73 | ) | | 9.36 | | 0.93 | %+ | | 56,422 | | 1.90 | % | 2.13 | % | (1.35 | )% | 99.1 | % |
| Year Ended June 30, 2002 | | | (0.48 | ) | | — | | | (0.48 | ) | | 10.19 | | 8.09 | %+ | | 57,885 | | 1.90 | % | 1.94 | % | (1.22 | )% | 124.0 | % |
| Year Ended June 30, 2001 | | | (0.42 | ) | | — | | | (0.42 | ) | | 9.92 | | 33.64 | %+ | | 51,451 | | 1.90 | % | 2.09 | % | (0.62 | )% | 74.3 | % |
| | |
| |
| |
| |
| |
| |
| |
| |
| |
| |
| |
| SMALL-CAP GROWTH§ | | | | | | | | | | | | | | | | | | | | | | | | | | |
Six Months Ended
December 31, 2005** | | | — | | | — | | | — | | | 13.55 | | 12.17 | % | | 127,209 | | 0.88 | %* | 0.88 | %* | (0.06 | )%* | 23.9 | % |
| Year Ended June 30, 2005 | | | — | | | — | | | — | | | 12.08 | | 11.44 | %+ | | 55,704 | | 0.94 | % | 1.08 | % | (0.68 | )% | 51.3 | % |
| Period from October 31, 2003 to June 30, 2004 Ç | | | — | | | — | | | — | | | 10.84 | | 8.40 | %+ | | 37,968 | | 0.94 | %* | 1.25 | %* | (0.74 | )%* | 16.6 | % |
| | |
| |
| |
| |
| |
| |
| |
| |
| |
| |
| |
| SMALL-CAP VALUE§ | | | | | | | | | | | | | | | | | | | | | | | | | | |
Six Months Ended
December 31, 2005** | | | — | | | — | | | — | | | 14.32 | | 12.13 | % | | 218,328 | | 0.80 | %* | 0.80 | %* | 0.05 | %* | 27.8 | % |
| Year Ended June 30, 2005 | | | — | | | — | | | — | | | 12.78 | | 22.18 | %+ | | 68,545 | | 0.94 | % | 1.07 | % | (0.32 | )% | 57.0 | % |
| Period from October 31, 2003 to June 30, 2004 Ç | | | — | | | — | | | — | | | 10.46 | | 4.60 | %+ | | 28,193 | | 0.94 | %* | 1.49 | %* | (0.42 | )%* | 20.5 | % |
| | |
| |
| |
| |
| |
| |
| |
| |
| |
| |
| |
| LARGE-CAP GROWTH* | | | | | | | | | | | | | | | | | | | | | | | | | | |
Six Months Ended
December 31, 2005** | | | — | | | — | | | — | | | 12.07 | | 9.73 | % | | 57,737 | | 0.82 | %* | 0.82 | %* | (0.06 | )%* | 17.7 | % |
| Year Ended June 30, 2005 | | | — | | | — | | | — | | | 11.00 | | 3.48 | %+ | | 42,988 | | 0.84 | % | 1.03 | % | (0.04 | )% | 20.2 | % |
| Period from October 31, 2003 to June 30, 2004 Ç | | | — | | | — | | | — | | | 10.63 | | 6.30 | %+ | | 39,532 | | 0.84 | %* | 1.13 | %* | (0.09 | )%* | 6.7 | % |
| | |
| |
| |
| |
| |
| |
| |
| |
| |
| |
| |
See Notes to Financial Statements
165
| |
| | Income from
Investment Operations
| |
|---|
| | Net Asset
Value,
Beginning
of Period
| | Net
Investment
Income (Loss)^
| | Net Realized
and Unrealized
Gain
(Loss)
| | Total
from
Investment
Operations
| |
|---|
| LARGE-CAP VALUE§ | | | | | | | | | | | | | |
Six Months Ended
December 31, 2005** | | $ | 12.70 | | $ | 0.11 | | $ | 0.89 | | $ | 1.00 | |
| Year Ended June 30, 2005 | | | 11.11 | | | 0.14 | | | 1.55 | | | 1.69 | |
| For the Period October 31, 2003 to June 30, 2004 Ç | | | 10.00 | | | 0.03 | | | 1.08 | | | 1.11 | |
| | |
| |
| |
| |
| |
| BLUE CHIP 35 INDEX | | | | | | | | | | | | | |
Six Months Ended
December 31, 2005** | | | 6.86 | | | 0.07 | | | 0.26 | | | 0.33 | |
| Year Ended June 30, 2005 | | | 7.02 | | | 0.14 | | | (0.18 | ) | | (0.04 | ) |
| Year Ended June 30, 2004 | | | 6.14 | | | 0.10 | | | 0.83 | | | 0.93 | |
| Year Ended June 30, 2003 | | | 5.93 | | | 0.09 | | | 0.21 | | | 0.30 | |
| Year Ended June 30, 2002 | | | 7.23 | | | 0.09 | | | (1.31 | ) | | (1.22 | ) |
| Year Ended June 30, 2001 | | | 8.77 | | | 0.09 | | | (1.54 | ) | | (1.45 | ) |
| | |
| |
| |
| |
| |
| BALANCED | | | | | | | | | | | | | |
Six Months Ended
December 31, 2005** | | | 11.92 | | | 0.09 | | | 0.37 | | | 0.46 | |
| Year Ended June 30, 2005 | | | 11.30 | | | 0.14 | | | 0.66 | | | 0.80 | |
| Year Ended June 30, 2004 | | | 10.05 | | | 0.06 | | | 1.24 | | | 1.30 | |
| Year Ended June 30, 2003 | | | 9.87 | | | 0.10 | | | 0.15 | | | 0.25 | |
| Year Ended June 30, 2002 | | | 10.00 | | | 0.04 | | | (0.12 | ) | | (0.08 | ) |
| For the Period Ended June 30, 2001ß | | | 10.00 | | | 0.00 | | | 0.00 | | | 0.00 | |
- *
- Annualized
- **
- Unaudited
- Ç
- Fund commenced operations on October 31, 2003.
- #
- Total returns for periods less than one year are not annualized.
- ^
- Per share amounts calculated based on the average daily shares outstanding during the period.
- +
- Total return would have been lower had various fees not been waived during the period.
- §
- Effective June 27, 2005, Class R shares of the Fund converted into Class N shares.
- ß
- Fund commenced operations on June 30, 2001.
166
| | Less Distributions
to Shareholders from:
| |
| | Ratios & Supplemental Data:
| |
|---|
| | Net
Realized
Gain
| | Net
Investment
Income
| | Total
Distributions
| | Net Asset
Value,
End of
Period
| | Total
Return#
| | Net Assets
End of Period
("000"s)
| | Expenses
After
Waivers and
Reimbursements
| | Expenses
Before
Waivers and
Reimbursements
| | Net Investment
Income After
Waivers and
Reimbursements
| | Portfolio
Turnover
Rate
| |
|---|
| LARGE-CAP VALUE§ | | | | | | | | | | | | | | | | | | | | | | | | | | |
Six Months Ended
December 31, 2005** | | $ | — | | $ | (0.15 | ) | $ | (0.15 | ) | $ | 13.55 | | 7.84 | % | $ | 42,171 | | 0.83 | %* | 0.83 | %* | 1.56 | %* | 18.6 | % |
| Year Ended June 30, 2005 | | | — | | | (0.10 | ) | | (0.10 | ) | | 12.70 | | 15.22 | %+ | | 27,476 | | 0.84 | % | 1.10 | % | 1.24 | % | 30.0 | % |
| For the Period October 31, 2003 to June 30, 2004 Ç | | | (0.00 | ) | | — | | | (0.00 | ) | | 11.11 | | 11.10 | %+ | | 20,598 | | 0.84 | %* | 1.52 | %* | 0.86 | %* | 11.3 | % |
| | |
| |
| |
| |
| |
| |
| |
| |
| |
| |
| |
| BLUE CHIP 35 INDEX | | | | | | | | | | | | | | | | | | | | | | | | | | |
Six Months Ended
December 31, 2005** | | | — | | | (0.11 | ) | | (0.11 | ) | | 7.08 | | 4.72 | %+ | | 47,941 | | 0.15 | %* | 0.34 | %* | 1.82 | %* | 25.9 | % |
| Year Ended June 30, 2005 | | | — | | | (0.12 | ) | | (0.12 | ) | | 6.86 | | (0.59 | )%+ | | 34,612 | | 0.15 | % | 0.56 | % | 2.07 | % | 20.3 | % |
| Year Ended June 30, 2004 | | | — | | | (0.05 | ) | | (0.05 | ) | | 7.02 | | 15.20 | %+ | | 35,960 | | 0.15 | % | 0.58 | % | 1.64 | % | 5.3 | % |
| Year Ended June 30, 2003 | | | — | | | (0.09 | ) | | (0.09 | ) | | 6.14 | | 5.13 | %+ | | 7,763 | | 0.15 | % | 1.07 | % | 1.65 | % | 24.9 | % |
| Year Ended June 30, 2002 | | | — | | | (0.08 | ) | | (0.08 | ) | | 5.93 | | (17.01 | )%+ | | 5,532 | | 0.15 | % | 0.93 | % | 1.35 | % | 40.8 | % |
| Year Ended June 30, 2001 | | | — | | | (0.09 | ) | | (0.09 | ) | | 7.23 | | (16.61 | )%# | | 5,975 | | 0.15 | % | 0.68 | % | 1.15 | % | 24.0 | % |
| | |
| |
| |
| |
| |
| |
| |
| |
| |
| |
| |
| BALANCED | | | | | | | | | | | | | | | | | | | | | | | | | | |
Six Months Ended
December 31, 2005** | | | (0.11 | ) | | (0.11 | ) | | (0.22 | ) | | 12.16 | | 3.83 | %+ | | 58,517 | | 0.93 | %* | 1.04 | %* | 1.33 | %* | 21.6 | % |
| Year Ended June 30, 2005 | | | (0.10 | ) | | (0.08 | ) | | (0.18 | ) | | 11.92 | | 7.15 | %+ | | 42,264 | | 0.94 | % | 1.19 | % | 1.20 | % | 125.5 | % |
| Year Ended June 30, 2004 | | | (0.00 | ) | | (0.05 | ) | | (0.05 | ) | | 11.30 | | 12.94 | %+ | | 23,212 | | 0.94 | % | 1.51 | % | 0.60 | % | 123.7 | % |
| Year Ended June 30, 2003 | | | (0.01 | ) | | (0.06 | ) | | (0.07 | ) | | 10.05 | | 2.57 | %+ | | 8,344 | | 0.94 | % | 1.66 | % | 1.06 | % | 98.2 | % |
| Year Ended June 30, 2002 | | | (0.00 | ) | | (0.05 | ) | | (0.05 | ) | | 9.87 | | (0.80 | )%+ | | 4,960 | | 0.94 | % | 2.07 | % | 0.49 | % | 112.5 | % |
| For the Period Ended June 30, 2001ß | | | (0.00 | ) | | (0.00 | ) | | (0.00 | ) | | 10.00 | | 0.00 | % | | 370 | | 0.00 | %* | 0.00 | %* | 0.00 | %* | 0.0 | % |
See Notes to Financial Statements
167
NOTES to FINANCIAL STATEMENTS
December 31, 2005 (Unaudited)
1. Organization:
Bridgeway Funds, Inc. ("Bridgeway") was organized as a Maryland corporation on October 19, 1993, and is registered under the Investment Company Act of 1940, as amended, as an open-end management investment company.
Bridgeway is organized as a series fund which currently has 11 investment funds (collectively, the "Funds"): Aggressive Investors 1, Aggressive Investors 2, Ultra-Small Company, Ultra-Small Company Market, Micro-Cap Limited, Small-Cap Growth, Small-Cap Value, Large-Cap Growth, Large-Cap Value, Blue Chip 35 Index, and Balanced Funds.
Bridgeway is authorized to issue 1,000,000,000 shares of common stock at $0.001 per share for each Fund. 15,000,000 shares have been classified into the Aggressive Investors 1 Fund. 130,000,000 shares each have been classified into the Aggressive Investors 2 and Blue Chip 35 Index Funds. 5,000,000 shares have been classified into the Ultra Small Company Fund. 100,000,000 shares have been classified in the Ultra Small Company Market Fund. 10,000,000 shares have been classified in the Micro Cap Limited Fund. 100,000,000 of class N shares each have been classified into the Small Cap Growth, Small Cap Value, Large Cap Growth, and Large Cap Value Funds. 50,000,000 shares have classified into the Balanced Fund.
Amounts disclosed above for each Fund that have been authorized do not include Class R shares, of which there are none currently issued.
The Aggressive Investors 1 Fund and the Micro-Cap Limited Fund are closed to new investors. The Ultra-Small Company Fund is closed to all investors.
All of the Funds are no-load, diversified funds.
The Aggressive Investors 1 and 2 Funds seek to exceed the stock market total return (primarily through capital appreciation) at a level of total risk roughly equal to that of the stock market over longer periods of time (three years or more).
The Ultra Small Company, Ultra Small Company Market, Micro Cap Limited, Small Cap Growth, Small Cap Value, and Large Cap Growth Funds seek to provide a long-term total return of capital, primarily through capital appreciation.
The Blue Chip 35 Index and Large Cap Value Funds seek to provide long-term total return of capital, primarily through capital appreciation but also some income.
The Balanced Fund seeks to provide a high current return with short-term risk less than or equal to 40% of the stock market.
Bridgeway Capital Management, Inc. (the "Adviser") is the Adviser for all of the Funds.
2. Significant Accounting Policies:
The following summary of significant accounting policies, followed in the preparation of the financial statements of the Funds, are in conformity with accounting principles generally accepted in the United States of America.
Securities, Options, Futures and Other Investments Valuation Other than options, portfolio securities that are principally traded on a national securities exchange are valued at their last sale on the principal exchange on which they are traded prior to the close of the New York Stock Exchange
168
("NYSE"), on each day the NYSE is open for business. Portfolio securities other than options that are principally traded on the National Association of Securities Dealers Automated Quotation System ("NASDAQ") are valued at the NASDAQ Official Closing Price ("NOCP"). In the absence of recorded sales on their home exchange or NOCP in the case of NASDAQ traded securities, the security will be valued as follows: bid prices for long positions and ask prices for short positions.
Short-term fixed income securities having a remaining maturity of 60 days or less are valued at amortized cost, which approximates market value. Options are valued at the average of the best bid and best asked quotations. Other investments for which no sales are reported are valued at the latest bid price in accordance with the pricing policy established by the Board of Directors.
Investments in open-end registered investment companies and closed-end registered investment companies that do not trade on an exchange are valued at the end of day net asset value per share.
Investments in closed-end registered investment companies that trade on an exchange are valued at the last sales price as of the close of the customary trading session on the exchange where the security is principally traded.
When market quotations are not readily available or when events occur that make established valuation methods unreliable, securities of the Funds may be valued at fair value as determined in good faith by or under the direction of the Board of Directors. The valuation assigned to fair valued securities for purposes of calculating the Funds' NAVs may differ from the security's most recent closing market price and from the prices used by other mutual funds to calculate their NAVs.
Securities Lending Upon lending its securities to third parties, the Fund receives compensation in the form of fees. The Fund also continues to receive dividends on the securities loaned. The loans are secured by collateral at least equal to the fair value of the securities loaned plus accrued interest. Gain or loss in the fair value of the securities loaned that may occur during the term of the loan will be for the account of the Fund. The Fund has the right under the lending agreement to recover the securities from the borrower on demand. Additionally, the Fund does not have the right to sell or repledge collateral received in the form of securities unless the borrower goes into default. The risks to the Fund of securities lending are that the borrower may not provide additional collateral when required or return the securities when due.
As of December 31, 2005, the Aggressive Investors I Fund had securities on loan valued at $9,835,488 and received U.S. Treasury securities with a value of $10,032,198 as collateral. The Aggressive Investors 2 Fund had securities on loan valued at $7,865,238 and received U.S. Treasury securities with a value of $8,093,380 as collateral. The Ultra Small Company Fund had securities on loan valued at $11,321,236 and received U.S. Treasury securities with a value of $11,632,071.The Ultra Small Company Market Fund had securities on loan valued at $4,683,612 and received U.S. Treasury securities with a value of $4,761,116. The Small Cap Growth Fund had securities on loan valued at $2,344,655 and received U.S. Treasury securities with a value of $2,498,471.
As of December 31, 2005, the Micro Cap Limited, Small Cap Value, Large Cap Growth, Large Cap Value, Blue Chip 35 Index, and Balanced Funds had no securities on loan.
It is the Fund's policy to obtain additional collateral from or return excess collateral to the borrower by the end of the next business day, following the valuation date of the securities loaned.
169
Therefore, the value of the collateral held may be temporarily less than the value of the securities on loan.
Federal Income Taxes It is the Funds' policy to continue to comply with the provisions of the Internal Revenue Code applicable to registered investment companies and to distribute income to the extent necessary so that the Funds are not subject to federal income tax. Therefore, no federal income tax provision is required.
Use of Estimates in Financial Statements In preparing financial statements in conformity with accounting principles generally accepted in the United States of America, management makes estimates and assumptions that affect the reported amounts of assets and liabilities at the date of the financial statements, as well as the reported amounts of income and expenses during the reporting period. Actual results could differ from those estimates.
Risks and Uncertainties The Funds provide for various investment options, including stocks and call and put options. Such investments are exposed to various risks, such as interest rate, market and credit. Due to the risks involved, it is at least reasonably possible that changes in risks in the near term would materially affect shareholders' account values and the amounts reported in the financial statements and financial highlights.
Security Transactions, Expenses, Gains and Losses and Allocations Bridgeway expenses that are not series fund specific are allocated to each series based upon its relative proportion of net assets to Bridgeway's total net assets.
Security transactions are accounted for as of the trade date, the date the order to buy or sell is executed. Realized gains and losses are computed on the identified cost basis. Dividend income is recorded on the ex-dividend date, and interest income is recorded on the accrual basis from settlement date. Particularly related to the Balanced Fund, discounts and premiums are accreted/amortized on the interest method.
Futures Contracts A futures contract is an agreement between two parties to buy or sell a financial instrument at a set price on a future date. Upon entering into such a contract a Fund is required to pledge to the broker an amount of cash or U.S. government securities equal to the minimum "initial margin" requirements of the exchange on which the futures contract is traded. The contract amount reflects the extent of a Fund's exposure in these financial instruments. The Fund's participation in the futures markets involves certain risks, including imperfect correlation between movements in the price of futures contracts and movements in the price of the securities hedged or used for cover. The Fund's activities in the futures contracts are conducted through regulated exchanges that do not result in counterparty credit risks on a periodic basis. Pursuant to a contract, the Fund agrees to receive from or pay to the broker an amount of cash equal to the fluctuation in value of the contract. Such receipts or payments are known as "variation margin" and are recorded by the Fund as unrealized appreciation or depreciation. When a contract is closed, the Fund records a realized gain or loss equal to the difference between the value of the contract at the time it was opened and the value at the time it was closed. As of December 31, 2005 Ultra Small Company Market Fund held futures contracts in the amount of $5,697,720. No other Funds had futures contracts open as of December 31, 2005.
170
Options An option is a contract conveying a right to buy or sell a financial instrument at a specified price during a stipulated period. The premium paid by a Fund for the purchase of a call or a put option is included in the Fund's Schedule of Investments as an investment and subsequently marked to market to reflect the current market value of the option. When a Fund writes a call or a put option, an amount equal to the premium received by the Fund is included in the Fund's Statement of Assets and Liabilities as a liability and is subsequently marked to market to reflect the current market value of the option written. If an option which a Fund has written either expires on its stipulated expiration date, or if the Fund enters into a closing purchase transaction, the Fund realizes a gain (or a loss if the cost of a closing purchase transaction exceeds the premium received when the option was written) without regard to any unrealized gain or loss on the underlying security, and the liability related to such options is extinguished. If a call option that a Fund has written is assigned, the Fund realizes a gain or loss from the sale of the underlying security and the proceeds from such sale are increased by the premium originally received. If a put option that a Fund has written is assigned, the amount of the premium originally received reduces the cost of the security that the Fund purchased upon exercise of the option. Buying calls increases a Fund's exposure to the underlying security to the extent of any premium paid. Buying puts on a stock market index tends to limit a Fund's exposure to a stock market decline. All options purchased by the Funds were listed on exchanges and considered liquid positions with readily available market quotes. As of December 31, 2005 the Aggressive Investors 1, Aggressive Investors 2, and Balanced Funds held $382,375, $285,875, and $39,750 in purchased call options, respectively.
Covered Call Options and Secured Puts The Aggressive Investors 1, Aggressive Investors 2, and Balanced Funds may write call options on a covered basis, that is, the Fund will own the underlying security, or the Fund may write secured puts. The principal reason for writing covered calls and secured puts on a security is to attempt to realize income, through the receipt of premiums. The option writer has, in return for the premium, given up the opportunity for profit from a substantial price increase in the underlying security so long as the obligation as a writer continues, but has retained the risk of loss should the price of the security decline. All options were listed on exchanges and considered liquid positions with readily available market quotes. Only Balanced Fund had outstanding written options as of December 31, 2005.
171
A summary of the options transactions written by the Balanced Fund follows:
| | Written Call Options
| |
|---|
| | Contracts
| | Premiums
| |
|---|
| Outstanding, June 30, 2005 | | 1,002 | | $ | 104,380 | |
| Positions Opened | | 5,968 | | | 804,108 | |
| Exercised | | (318 | ) | | (45,726 | ) |
| Expired | | (1,974 | ) | | (204,682 | ) |
| Closed | | (2,068 | ) | | (344,618 | ) |
| Split | | 10 | | | — | |
| | |
| |
| |
| Outstanding, December 31, 2005 | | 2,620 | | $ | 313,462 | |
| | |
| |
| |
| Market Value, December 31, 2005 | | | | $ | (251,551 | ) |
| | |
| |
| |
| | Written Put Options
| |
|---|
| | Contracts
| | Premiums
| |
|---|
| Outstanding, June 30, 2005 | | 2,955 | | $ | 308,669 | |
| Positions Opened | | 9,356 | | | 1,043,873 | |
| Exercised | | (2,492 | ) | | (290,884 | ) |
| Expired | | (6,032 | ) | | (650,331 | ) |
| Closed | | (732 | ) | | (96,114 | ) |
| Split | | 200 | | | — | |
| | |
| |
| |
| Outstanding, December 31, 2005 | | 3,255 | | $ | 315,213 | |
| | |
| |
| |
| Market Value, December 31, 2005 | | | | $ | (197,387 | ) |
| | |
| |
| |
Indemnification Under the Company's organizational documents, the Funds' officers, directors, employees and agents are indemnified against certain liabilities that may arise out of performance of their duties to the Funds.
Additionally, in the normal course of business, the Funds enter into contracts that contain a variety of indemnification clauses. The Funds' maximum exposure under these arrangements is unknown as this would involve future claims that may be made against the Funds that have not yet occurred. However, the Funds have not had prior claims or losses pursuant to these contracts.
3. Management Fees, Other Related Party Transactions and Contingencies:
The Funds have entered into management agreements with the Adviser. As compensation for the advisory services rendered, facilities furnished, and expenses borne by the Adviser, the Funds pay the Adviser a fee pursuant to each Fund's management agreement, each described below.
Aggressive Investors 1: A total advisory fee is paid by the Fund to the Adviser which is comprised of a Base Fee and a Performance Adjustment. The Base Fee equals the Base Fee Rate times the average daily net assets of the Fund. The Base Fee Rate is based on the following annual rates: 0.90% of the first $250 million of the Fund's average daily net assets, 0.875% of the next $250 million and 0.85% of any excess over $500 million.
172
The Performance Adjustment equals 4.67% times the difference in cumulative total return between the Fund and the Standard and Poor's 500 Index with dividends reinvested (hereinafter "Index") over a rolling five-year performance period. The Performance Adjustment Rate varies from a minimum of -0.70% to a maximum of +0.70% However, the Performance Adjustment Rate is zero if the difference between the cumulative Fund performance and the Index performance is less than or equal to 2%.
Aggressive Investors 2: A total advisory fee is paid by the Fund to the Adviser which is comprised of a Base Fee and a Performance Adjustment. The Base Fee equals the Base Fee Rate times the average daily net assets of the Fund. The Base Fee rate is based on the following annual rates: 0.90% of the first $250 million of the Fund's average daily net assets, 0.875% of the next $250 million, 0.850% from $500 million to $1 billion, and 0.800% over $1 billion.
The Performance Adjustment equals 2.00% times the difference in cumulative total return between the Fund and the Standard and Poor's 500 Index with dividends reinvested (hereinafter "Index") over a rolling five-year performance period. Since the Fund does not have a five-year operating history, the Performance Adjustment Rate will be calculated as follows during the initial five-year period: (a) From inception through September 30, 2004, the Performance Adjustment Rate was inoperative thus the Advisory Fee was calculated based on the Base Advisory Fee Rate times the average daily net assets of the Fund only; (b) From September 30, 2004 through September 30, 2008, the Performance Adjustment Rate will be calculated based upon a comparison of the investment performance of the Fund and the Index over the number of quarters that have elapsed since the Fund's inception. Each time the Performance Adjustment Rate is calculated, it will cover a longer time span, until it can cover a running five-year period as intended. In the meantime, the early months of the transition period will have a disproportionate effect on the performance adjustment of the fee. The Performance Adjustment Rate varies from a minimum of -0.30% to a maximum of +0.30%. However, the Performance Adjustment Rate is zero if the difference between the cumulative Fund performance and the Index performance is less than or equal to 2%.
Ultra Small Company: The Fund pays management fees based on the following annual rates: 0.90% of the first $250 million of the Fund's average daily net assets, 0.875% of the next $250 million and 0.85% of any excess over $500 million. The management fees are computed daily and are payable monthly. The fee is subject to a maximum rate of 1.49% and a maximum expense ratio of 2.00%.
Ultra Small Company Market: The Fund pays a flat 0.50% annual management fee, computed daily and payable monthly, subject to a maximum expense ratio of 0.75%.
Micro Cap Limited: A total advisory fee is paid by the Fund to the Adviser which is comprised of a Base Fee and a Performance Adjustment. The Base Fee equals the Base Fee Rate times the average daily net assets of the Fund. The Base Fee Rate is based on the following annual rates: 0.90% of the first $250 million of the Fund's average daily net assets, 0.875% of the next $250 million and 0.85% of any excess over $500 million. This is limited to a maximum annualized ratio of 1.49% of the assets in the quarter the Advisory Fee is determined.
The Performance Adjustment equals 2.87% times the difference in cumulative total return between the Fund and the CRSP Cap-based Portfolio 9 Index with dividends reinvested (hereinafter "Index") over a rolling five-year performance period. The Performance Adjustment Rate varies from a minimum of -0.70% to a maximum of +0.70% However, the Performance Adjustment Rate is zero if the
173
difference between the cumulative Fund performance and the Index performance is less than or equal to 2%.
Small Cap Growth: A total advisory fee is paid by the Fund to the Adviser which is comprised of a Base Fee and a Performance Adjustment. The Base Fee equals the Base Fee Rate times the average daily net assets of the Fund. The Base Fee Rate is based on the annual rate of 0.60% of the value of the Fund's average daily net assets.
The Performance Adjustment equals 0.33% times the difference in cumulative total return between the Fund and the Russell 2000 Growth Index with dividends reinvested (hereinafter "Index") over a rolling five-year performance period. Since the Fund does not have a five-year operating history, the Performance Adjustment Rate will be calculated as follows during the initial five-year period: (a) From inception through September 30, 2004, the Performance Adjustment Rate was inoperative thus the Advisory Fee was calculated based on the Base Advisory Fee Rate times the average daily net assets of the Fund only; (b) From September 30, 2004 through September 30, 2008, the Performance Adjustment Rate will be calculated based upon a comparison of the investment performance of the Fund and the Index over the number of quarters that have elapsed since the Fund's inception. Each time the Performance Adjustment Rate is calculated, it will cover a longer time span, until it can cover a running five-year period as intended. In the meantime, the early months of the transition period will have a disproportionate effect on the performance adjustment of the fee. The Performance Adjustment Rate varies from a minimum of -0.05% to a maximum of +0.05% However, the Performance Adjustment Rate is zero if the difference between the cumulative Fund performance and the Index performance is less than or equal to 2%.
Small Cap Value: A total advisory fee is paid by the Fund to the Adviser which is comprised of a Base Fee and a Performance Adjustment. The Base Fee equals the Base Fee Rate times the average daily net assets of the Fund. The Base Fee Rate is based on the annual rate of 0.60% of the value of the Fund's average daily net assets.
The Performance Adjustment equals 0.33% times the difference in cumulative total return between the Fund and the Russell 2000 Value Index with dividends reinvested (hereinafter "Index") over a rolling five-year performance period. Since the Fund does not have a five-year operating history, the Performance Adjustment Rate will be calculated as follows during the initial five-year period: (a) From inception through September 30, 2004, the Performance Adjustment Rate was inoperative thus the Advisory Fee was calculated based on the Base Advisory Fee Rate times the average daily net assets of the Fund only; (b) From September 30, 2004 through September 30, 2008, the Performance Adjustment Rate will be calculated based upon a comparison of the investment performance of the Fund and the Index over the number of quarters that have elapsed since the Fund's inception. Each time the Performance Adjustment Rate is calculated, it will cover a longer time span, until it can cover a running five-year period as intended. In the meantime, the early months of the transition period will have a disproportionate effect on the performance adjustment of the fee. The Performance Adjustment Rate varies from a minimum of -0.05% to a maximum of +0.05% However, the Performance Adjustment Rate is zero if the difference between the cumulative Fund performance and the Index performance is less than or equal to 2%.
Large Cap Growth: A total advisory fee is paid by the Fund to the Adviser which is comprised of a Base Fee and a Performance Adjustment. The Base Fee equals the Base Fee Rate times the average
174
daily net assets of the Fund. The Base Fee Rate is based on the annual rate of 0.50% of the value of the Fund's average daily net assets.
The Performance Adjustment equals 0.33% times the difference in cumulative total return between the Fund and the Russell 1000 Growth Index with dividends reinvested (hereinafter "Index") over a rolling five-year performance period. Since the Fund does not have a five-year operating history, the Performance Adjustment Rate will be calculated as follows during the initial five-year period: (a) From inception through September 30, 2004, the Performance Adjustment Rate was inoperative thus the Advisory Fee was calculated based on the Base Advisory Fee Rate times the average daily net assets of the Fund only; b) From September 30, 2004 through September 30, 2008, the Performance Adjustment Rate will be calculated based upon a comparison of the investment performance of the Fund and the Index over the number of quarters that have elapsed since the Fund's inception. Each time the Performance Adjustment Rate is calculated, it will cover a longer time span, until it can cover a running five-year period as intended. In the meantime, the early months of the transition period will have a disproportionate effect on the performance adjustment of the fee. The Performance Adjustment Rate varies from a minimum of -0.05% to a maximum of +0.05% However, the Performance Adjustment Rate is zero if the difference between the cumulative Fund performance and the Index performance is less than or equal to 2%.
Large Cap Value: A total advisory fee is paid by the Fund to the Adviser which is comprised of a Base Fee and a Performance adjustment. The Base Fee equals the Base Fee Rate times the average daily net assets of the Fund. The Base Fee Rate is based on the annual rate of 0.50% of the value of the Fund's average daily net assets.
The Performance Adjustment equals 0.33% times the difference in cumulative total return between the Fund and the Russell 1000 Value Index with dividends reinvested (hereinafter "Index") over a rolling five-year performance period. Since the Fund does not have a five-year operating history, the Performance Adjustment Rate will be calculated as follows during the initial five-year period: (a) From inception through September 30, 2004, the Performance Adjustment Rate was inoperative thus the Advisory Fee was calculated based on the Base Advisory Fee Rate times the average daily net assets of the Fund only; (b) From September 30, 2004 through September 30, 2008, the Performance Adjustment Rate will be calculated based upon a comparison of the investment performance of the Fund and the Index over the number of quarters that have elapsed since the Fund's inception. Each time the Performance Adjustment Rate is calculated, it will cover a longer time span, until it can cover a running five-year period as intended. In the meantime, the early months of the transition period will have a disproportionate effect on the performance adjustment of the fee. The Performance Adjustment Rate varies from a minimum of -0.05% to a maximum of +0.05% However, the Performance Adjustment Rate is zero if the difference between the cumulative Fund performance and the Index performance is less than or equal to 2%.
Blue Chip 35 Index: The Fund pays a flat 0.08% annual management fee, computed daily and payable monthly, subject to a maximum expense ratio of 0.15%.
Balanced: The Fund pays a flat 0.60% annual management fee, computed daily and payable monthly, subject to a maximum expense ratio of 0.94%.
Expense limitations: At a special meeting on March 31, 2005, shareholders of the Funds approved amendments to the Management Agreements detailing expense limitations.
175
Listed below are descriptions of these limitations for each fund.
Aggressive Investors 1: The Adviser agreed to reimburse the Fund for operating expenses and management fees above 1.80% of the value of its average net assets for the six months ended December 31, 2005.There were no reimbursements to the Fund for the six months ended December 31, 2005.
Aggressive Investors 2: The Adviser agreed to reimburse the Fund for operating expenses and management fees above 1.75% of the value of its average net assets for the six months ended December 31, 2005.There were no reimbursements to the Fund for the six months ended December 31, 2005.
Ultra Small Company: The Adviser has agreed to reimburse the Fund for operating expenses and management fees above 2.00% of the value of its average net assets for the six months ended December 31, 2005. There were no reimbursements to the Fund for the six months ended December 31, 2005.
Ultra Small Company Market: The Adviser has agreed to reimburse the Fund for operating expenses and management fees above 0.75% of the value of its average net assets six months ended December 31, 2005.There were no reimbursements to the Fund for the six months ended December 31, 2005.
Micro Cap Limited: The Adviser agreed to reimburse the Fund for operating expenses and management fees above 1.85% of the value of its average net assets for the six months ended December 31, 2005.There were no reimbursements to the Fund for the six months ended December 31, 2005.
Small Cap Growth: The Adviser has agreed to reimburse the Fund for operating expenses and management fees above 0.94% of the value of its average net assets for the six months ended December 31, 2005. There were no reimbursements to the Fund for the six months ended December 31, 2005.
Small Cap Value: The Adviser has agreed to reimburse the Fund for operating expenses and management fees above 0.94% of the value of its average net assets for the six months ended December 31, 2005. There were no reimbursements to the Fund for the six months ended December 31, 2005.
Large Cap Growth: The Adviser has agreed to reimburse the Fund for operating expenses and management fees above 0.84% of the value of its average net assets for the six months ended December 31, 2005. There were no reimbursements to the Fund for the six months ended December 31, 2005.
Large Cap Value: The Adviser has agreed to reimburse the Fund for operating expenses and management fees above 0.84% of the value of its average net assets for the six months ended December 31, 2005. There were no reimbursements to the Fund for the six months ended December 31, 2005.
Blue Chip 35 Index: The Adviser has agreed to reimburse the Fund for operating expenses and management fees above 0.15% of the value of its average net assets for the six months ended
176
December 31, 2005. During the period, the Adviser reimbursed expenses of $23,748 and waived Advisory fees of $16,819.
Balanced: The Adviser has agreed to reimburse the Fund for operating expenses and management fees above 0.94% of the value of its average net assets for the six months ended December 31, 2005. During the six months ended December 31, 2005, the Adviser reimbursed expenses of $26,874.
Other Related Party Transactions: On occasion, the Funds will engage in inter-portfolio trades when it is to the benefit of both parties. These trades are reviewed quarterly by the Board of Directors. No inter-portfolio purchases or sales were entered into during the six months ended December 31, 2005 by any of the Funds.
On July 1, 2004, the Adviser entered into a Master Administrative Agreement with the Funds pursuant to which Bridgeway Capital Management acts as Administrator for the Funds. Under the terms of the agreement, Bridgeway Capital Management provides or arranges for the provision of certain accounting and other administrative services to the Funds that it is not required to provide under the terms of the management agreement. As compensation under the Master Administrative Agreement, Bridgeway Capital Management receives a monthly fee from each Fund calculated at the annual rate of 0.05% of average daily net assets.
One director of the Funds, John Montgomery, is an owner and director of the Adviser. Another director of the Fund, Michael Mulcahy, is an executive and director of the Adviser. Under the Investment Company Act of 1940 definitions, both are considered to be an "affiliated person" of the Adviser and an "interested person" of the Adviser and of the Funds. Compensation for Mr. Montgomery and Mr. Mulcahy is borne by the Adviser rather than the Funds.
Board of Directors Compensation: Bridgeway paid an annual retainer of $7,500 and fees of $2,500 per meeting to each Independent Director. The Independent Chairman of the Board received an annual retainer of $10,000 and fees of $3,000 per meeting. At the Board of Directors meeting on November 9, 2005, the compensation plan for the Board of Directors was amended as follows. Bridgeway pays an annual retainer of $8,000 and fees of $4,000 per meeting to each Independent Director. The Independent Chairman of the Board receives an annual retainer of $10,500 and fees of $5,000 per meeting.
The Independent Directors receive this compensation in the form of shares of Bridgeway Funds, credited to his or her account. Such Directors are reimbursed for any expenses incurred in attending meetings and conferences and expenses for subscriptions or printed materials. During the six months ended December 31, 2005, total reimbursements made, across all of the Funds, was $936. The amount of directors fees attributable to each Fund is disclosed in the Statements of Operations.
4. Distribution and Shareholder Servicing Fees:
Foreside Fund Services, LLC acts as distributor of the Funds' shares pursuant to a Distribution Agreement dated January 2, 2004. The Adviser pays all costs and expenses associated with distribution of the Funds, shares pursuant to a protective plan adopted by shareholders pursuant to Rule 12b-1 on October 15, 1996.
177
5. Purchases and Sales of Investment Securities:
Purchases and sales of investments, other than short-term securities, for each Bridgeway Fund for the six month period ended December 31, 2005 were as follows:
Purchases
|
|---|
Bridgeway Fund
| | U.S.
Government
| | Other
|
|---|
| Aggressive Investors 1 | | | — | | $ | 297,775,638 |
| Aggressive Investors 2 | | | — | | $ | 241,403,936 |
| Ultra-Small Company | | | — | | $ | 48,295,615 |
| Ultra-Small Company Market | | | — | | $ | 163,668,511 |
| Micro-Cap Limited | | | — | | $ | 37,112,469 |
| Small-Cap Growth | | | — | | $ | 74,771,287 |
| Small-Cap Value | | | — | | $ | 175,139,826 |
| Large-Cap Growth | | | — | | $ | 18,887,557 |
| Large-Cap Value | | | — | | $ | 18,389,198 |
| Blue Chip 35 Index | | | — | | $ | 22,523,691 |
| Balanced | | $ | 1,496,465 | | $ | 20,263,361 |
| | |
| |
|
Sales
|
|---|
Bridgeway Fund
| | U.S.
Government
| | Other
|
|---|
| Aggressive Investors 1 | | | — | | $ | 308,460,179 |
| Aggressive Investors 2 | | | — | | $ | 127,275,944 |
| Ultra-Small Company | | | — | | $ | 62,489,533 |
| Ultra-Small Company Market | | | — | | $ | 55,182,393 |
| Micro-Cap Limited | | | — | | $ | 40,995,723 |
| Small-Cap Growth | | | — | | $ | 18,298,891 |
| Small-Cap Value | | | — | | $ | 38,798,790 |
| Large-Cap Growth | | | — | | $ | 8,603,187 |
| Large-Cap Value | | | — | | $ | 6,215,472 |
| Blue Chip 35 Index | | | — | | $ | 11,063,952 |
| Balanced | | $ | 1,000,000 | | $ | 8,251,879 |
| | |
| |
|
178
6. Federal Income Taxes
Unrealized Appreciation and Depreciation on Investments (Tax Basis) The amount of net unrealized appreciation/depreciation and the cost of investment securities for tax purposes, including short-term securities at December 31, 2005 were as follows:
| | Aggressive
Investors 1
| | Aggressive
Investors 2
| | Ultra-Small
Company
| |
|---|
| As of December 31, 2005 | | | | | | | | | | |
| Gross appreciation (excess of value over tax cost) | | $ | 75,783,969 | | $ | 45,172,442 | | $ | 34,999,823 | |
| Gross depreciation (excess of tax cost over value) | | | (3,217,649 | ) | | (2,461,514 | ) | | (2,444,833 | ) |
| | |
| |
| |
| |
| Net unrealized appreciation/(depreciation) | | $ | 72,566,320 | | $ | 42,710,928 | | $ | 32,554,990 | |
| | |
| |
| |
| |
| Cost of investments for income tax purposes | | $ | 329,586,472 | | $ | 264,535,817 | | $ | 77,844,841 | |
| | |
| |
| |
| |
| |
Ultra-Small
Company Market
| | Micro-Cap Limited
| | Small-Cap Growth
| | Small-Cap Value
| |
|---|
| As of December 31, 2005 | | | | | | | | | | | | | |
| Gross appreciation (excess of value over tax cost) | | $ | 339,446,277 | | $ | 23,292,132 | | $ | 22,754,695 | | $ | 29,909,785 | |
| Gross depreciation (excess of tax cost over value) | | | (15,338,031 | ) | | (1,310,081 | ) | | (3,129,673 | ) | | (4,708,183 | ) |
| | |
| |
| |
| |
| |
| Net unrealized appreciation | | $ | 324,108,246 | | $ | 21,982,051 | | $ | 19,625,022 | | $ | 25,201,602 | |
| | |
| |
| |
| |
| |
| Cost of investments for income tax purposes | | $ | 438,342,882 | | $ | 51,669,836 | | $ | 108,292,561 | | $ | 194,367,629 | |
| | |
| |
| |
| |
| |
| |
Large-Cap Growth
| | Large-Cap Value
| | Blue Chip 35 Index
| | Balanced*
| |
|---|
| As of December 31, 2005 | | | | | | | | | | | | | |
| Gross appreciation (excess of value over tax cost) | | $ | 11,166,205 | | $ | 6,882,353 | | $ | 4,500,471 | | $ | 4,902,181 | |
| Gross depreciation (excess of tax cost over value) | | | (1,004,963 | ) | | (329,647 | ) | | (749,496 | ) | | (746,398 | ) |
| | |
| |
| |
| |
| |
| Net unrealized appreciation | | $ | 10,161,242 | | $ | 6,552,706 | | $ | 3,750,975 | | $ | 4,155,783 | |
| | |
| |
| |
| |
| |
| Cost of investments for income tax purposes | | $ | 47,461,643 | | $ | 35,566,970 | | $ | 44,089,103 | | $ | 56,607,441 | |
| | |
| |
| |
| |
| |
The differences between book and tax net unrealized appreciation are wash sale loss deferrals.
- *
- Does not include written options.
Classifications of Distributions Net investment income (loss) and net realized gain (loss) may differ for financial statement and tax purposes. The character of distributions made during the year from net investment income or net realized gains may differ from its ultimate characterization for federal income tax purposes.
The difference between book and tax components of net assets and the resulting reclassifications were primarily a result of the differing book/tax treatment of net operating losses and certain expenses.
179
The tax character of the distributions paid by the Funds during the last two fiscal years ended June 30, 2005 and June 30, 2004, respectively, were as follows:
| | Ultra-Small Company
| | Ultra-Small Company Market
|
|---|
| | Year
Ended
June 30, 2005
| | Year
Ended
June 30, 2004
| | Year
Ended
June 30, 2005
| | Year
Ended
June 30, 2004
|
|---|
| Distributions paid from: | | | | | | | | | | | | |
| Ordinary Income | | $ | 2,401,271 | | $ | 1,778,425 | | $ | 1,224,997 | | $ | — |
| Long-Term Capital Gain | | | 19,650,404 | | | 11,659,278 | | | 6,669,718 | | | 710,875 |
| | |
| |
| |
| |
|
| Total | | | 22,051,675 | | | 13,437,703 | | | 7,894,715 | | | 710,875 |
| | |
| |
| |
| |
|
| |
Micro-Cap Limited
| | Large-Cap Value
|
|---|
| | Year
Ended
June 30, 2005
| | Year
Ended
June 30, 2004
| | Year
Ended
June 30, 2005
| | Year
Ended
June 30, 2004
|
|---|
| Distributions paid from: | | | | | | | | | | | | |
| Ordinary Income | | $ | 4,576,049 | | $ | 1,375,981 | | $ | 195,000 | | $ | — |
| Long-Term Capital Gain | | | 5,543,706 | | | 5,054,263 | | | — | | | — |
| | |
| |
| |
| |
|
| Total | | | 10,119,755 | | | 6,430,244 | | | 195,000 | | | — |
| | |
| |
| |
| |
|
| | Blue Chip 35 Index
| | Balanced
|
|---|
| | Year
Ended
June 30, 2005
| | Year
Ended
June 30, 2004
| | Year
Ended
June 30, 2005
| | Year
Ended
June 30, 2004
|
|---|
| Distributions paid from: | | | | | | | | | | | | |
| Ordinary Income | | $ | 674,999 | | $ | 169,895 | | $ | 393,526 | | $ | 61,044 |
| Long-Term Capital Gain | | | — | | | — | | | 29,323 | | | — |
| | |
| |
| |
| |
|
| Total | | | 674,999 | | | 169,895 | | | 422,849 | | | 61,044 |
| | |
| |
| |
| |
|
Note the Aggressive Investors 1, Aggressive Investors 2, Small Cap Growth, Small Cap Value and Large Cap Growth Funds had no distributions for the fiscal years ended June 30, 2004 and June 30, 2005.
Components of Net Assets (Tax Basis) As of June 30, 2005, the components of net assets on a tax basis were:
| | Aggressive
Investors 1
| | Aggressive
Investors 2
| | Ultra-Small
Company
|
|---|
| Accumulated net investment income | | $ | — | | $ | — | | $ | 927,966 |
| Accumulated net realized gain/(loss) on investments | | | 26,515,437 | | | (1,026,561 | ) | | 10,617,666 |
| Net unrealized appreciation/(depreciation) of investments | | | 70,772,790 | | | 27,396,659 | | | 34,619,027 |
| | |
| |
| |
|
| Total | | $ | 97,288,227 | | $ | 26,370,098 | | $ | 46,164,659 |
| | |
| |
| |
|
180
| |
Ultra Small
Company Market
| | Micro Cap Limited
| | Small-Cap Growth
| |
|---|
| Accumulated net investment income | | $ | 567,340 | | $ | — | | $ | — | |
| Accumulated net realized gain/(loss) on investments | | | 14,240,872 | | | 3,197,038 | | | (4,307,355 | ) |
| Net unrealized appreciation/(depreciation) of investments | | | 286,954,104 | | | 23,233,931 | | | 12,061,822 | |
| Cumulative effect of other differences | | | — | | | — | | | (3,472 | ) |
| | |
| |
| |
| |
| Total | | $ | 301,762,316 | | $ | 26,430,969 | | $ | 7,750,995 | |
| | |
| |
| |
| |
| | Small-Cap Value
| | Large-Cap Growth
| | Large-Cap Value
| |
|---|
| Accumulated net investment income | | $ | — | | $ | — | | $ | 196,230 | |
| Accumulated net realized gain/(loss) on investments | | | (3,332,243 | ) | | (4,893,790 | ) | | (593,237 | ) |
| Net unrealized appreciation/(depreciation) of investments | | | 11,860,572 | | | 6,456,026 | | | 4,201,277 | |
| Cumulative effect of other differences | | | (3,472 | ) | | (3,388 | ) | | (3,388 | ) |
| | |
| |
| |
| |
| Total | | $ | 8,524,857 | | $ | 1,558,848 | | $ | 3,800,882 | |
| | |
| |
| |
| |
| | Blue Chip 35
| | Balanced
|
|---|
| Accumulated net investment income | | $ | 349,303 | | $ | 439,260 |
| Accumulated net realized gain/(loss) on investments | | | (2,372,091 | ) | | 364,079 |
| Net unrealized appreciation/(depreciation) of investments | | | 2,163,871 | | | 2,668,070 |
| Cumulative effect of other differences | | | — | | | — |
| | |
| |
|
| Total | | $ | 141,083 | | $ | 3,471,409 |
| | |
| |
|
7. Line of Credit
The Bridgeway Blue Chip 35 Index Fund and Ultra Small Company Market Fund established a line of credit agreement ("LOC") with U.S. Bank, N.A. (the "Bank" or "Lender") which matures on June 1, 2006 and is renewable annually at the Bank's option, to be used for temporary or emergency purposes, primarily for financing redemption payments. Any and all advances under this Facility would be for a maximum of fifteen (15) business days and are at the sole discretion of the Lender based on the merits of the specific transaction. Advances under the Facility are limited to the lesser of $1,650,000 for the Blue Chip 35 Index Fund and $36,750,000 for the Ultra Small Company Market Fund, or 331/3% of the Funds' net assets. Borrowings under the line of credit bear interest based on the Lender's Prime Rate. Principal is due fifteen days after each advance and at Maturity. Interest is payable monthly in arrears. The minimum advance is $1,000.
As of December 31, 2005 the Blue Chip 35 Index Fund had a zero balance with its secured line of credit. During the six months ended December 31, 2005, the average borrowing was $131,255 with an average rate on borrowings of 6.75%.
The Ultra Small Company Market Fund had no borrowings during the six months ended December 31, 2005.
181
8. Redemption Fees:
In Ultra-Small Company Market Fund a 2.00% redemption fee may be charged on shares held less than six months and a 2.00% redemption fee may be charged in a down market. In Blue Chip 35 Index Fund a 1.00% redemption fee may be charged on redemptions in a down market.
9. Change in Independent Registered Public Accounting Firm:
On November 10, 2004, PricewaterhouseCoopers LLP was dismissed as the independent registered public accounting firm for Bridgeway Funds. PricewaterhouseCoopers LLP was previously engaged as the independent registered public accounting firm to audit the Funds' financial statements. PricewaterhouseCoopers LLP issued reports on the Funds' financial statements as of June 30, 2004 and 2003. Such reports did not contain an adverse opinion or a disclaimer of opinion, nor were they qualified or modified as to uncertainty, audit scope, or accounting principles. The decision to remove PricewaterhouseCoopers LLP was approved by the Funds' Audit Committee and ratified by the Funds' Board of Directors. At no time during the period immediately preceding the dismissal of PricewaterhouseCoopers LLP through June 30, 2004, were there any disagreements with PricewaterhouseCoopers LLP on any matter of accounting principles or practices, financial statement disclosure, or auditing scope or procedure, which disagreements, if not resolved to the satisfaction of PricewaterhouseCoopers LLP, would have caused it to make reference to the subject matter of the disagreements in connection with its report. At no time during the period immediately preceding the dismissal of PricewaterhouseCoopers LLP through June 30, 2004, did any of the events relating to management's representations, an expansion of the scope of audit work or discovery information impacting the fairness or reliability of Bridgeway Funds' financial statements enumerated in paragraphs (1)(v)(B) through (D) of Item 304(a) of Regulation S-K occur. With respect to internal control matters described in paragraph (1)(v)(A) PricewaterhouseCoopers LLP noted that during the years ended June 30, 2004 and 2003, daily cash reconciliations were not performed in accordance with the Fund's procedures. With respect to the Funds' Transfer Agent, PricewaterhouseCoopers LLP noted that during the year ended November 30, 2003 there was a lack of segregation of duties surrounding access to the Returned by Post Office ("RPO") function and over the monitoring of shareholder accounts placed on RPO status. These matters were considered to be a material weakness in control procedure and its operation. The audit committee of the Funds discussed these matters with PricewaterhouseCoopers LLP and PricewaterhouseCoopers LLP has been authorized to respond fully to inquiries of the successor independent registered public accounting firm. The Funds engaged Briggs Bunting & Dougherty, LLP as its new independent registered public accounting firm on November 10, 2004.
182
OTHER INFORMATION
(Unaudited)
1. Proxy Voting:
Fund policies and procedures used in determining how to vote proxies relating to fund securities and a summary of proxies voted by the Fund for the period ended June 30, 2005 are available without a charge, upon request, by contacting Bridgeway Funds at 1-800-661-3550 and on the Securities Exchange Commission's ("SEC") website at http:/www.sec.gov.
2. Fund Holdings:
The complete schedules of the Funds' holdings for the second and fourth quarters of each fiscal year are contained in the Funds' semi-annual and annual shareholder reports, respectively.
The Bridgeway Funds file complete schedules of the Funds' holdings with the SEC for the first and third quarters of each fiscal year on Form N-Q within 60 days after the end of the period. Copies of the Fund's Form N-Q are available without charge, upon request, by contacting Bridgeway Funds at 1-800-661-3550 and on the SEC's website at http:/www.sec.gov. You may also review and copy Form N-Q at the SEC's Public Reference Room in Washington, D.C. For more information about the operation of the Public Reference Room, please call the SEC at 1-800-SEC-0330.
183
3. Other
Shareholders of record owning more than 5% of the outstanding shares of each Bridgeway Fund as of December 31, 2005, are listed in the table below, followed by the total percentage ownership of all Officers and Directors of Bridgeway Funds, Inc.
Name
| | Address
| | Aggressive
Investors 1
Fund
| | Aggressive
Investors 2
Fund
| | Ultra-Small
Company
Fund
| | Ultra-Small
Company
Market
Fund
| | Blue Chip 35
Index Fund
| | Micro-Cap
Limited
Fund
| |
|---|
Bridgeway Capital Management, Inc.
Houston, TX 77005 | | 5615 Kirby Drive,
Ste 518 | | | | | | | | | | | | | |
Charles Schwab & Co., Inc.
Special Custody Account for the Benefit of Customers (incorporated in the state of Delaware) | | 101 Montgomery Street
San Francisco, CA 94101 | | 19.02 | % | 19.06 | % | | | 28.42 | % | 17.35 | % | | |
| FTC & Co. | | PO Box 173736
Denver, CO 80217-3736 | | | | | | | | | | 6.96 | % | | |
| Eternity LTD. | | P O Box N-7776
Nassau, Bahamas | | | | | | | | | | | | 15.23 | % |
| Letort Management Trust Company | | 3130 Morningside Camp Hill, PA 17011 | | | | | | | | | | 35.52 | % | | |
| National Financial Services, Corp. | | PO Box 989030
New York, NY 10281 | | 18.14 | % | 17.66 | % | 10.09 | % | 18.73 | % | 5.15 | % | 12.55 | % |
| National Investors Services Inc. | | 55 Water Street
32nd Floor
New York, NY 10041-3299 | | 6.18 | % | 5.04 | % | | | 5.90 | % | 7.34 | % | 10.92 | % |
| Prudential Investment Management Services | | 100 Mulberry St.
3 Gateway Center
FL 11
Newark, NJ 07102 | | | | 6.01 | % | | | 8.64 | % | | | | |
| All Officers/Directors | | | | 0.386 | % | 0.117 | % | 1.089 | % | 0.000 | % | 0.835 | % | 0.403 | % |
184
Name
| | Address
| | Balanced Fund
| | Small-Cap
Growth Fund
| | Small-Cap
Value Fund
| | Large-Cap
Growth Fund
| | Large-Cap
Value Fund
| |
|---|
Bridgeway Capital Management, Inc.
Houston, TX 77005 | | 5615 Kirby Drive,
Ste 518 | | 6.10 | % | | | | | | | | |
Charles Schwab & Co., Inc.
Special Custody Account for the Benefit of Customers (incorporated in the state of Delaware) | | 101 Montgomery Street
San Francisco, CA 94101 | | 41.03 | % | 19.61 | % | 15.80 | % | 19.97 | % | 12.17 | % |
| National Financial Services, Corp. | | P O Box 989030
New York, NY 10281 | | 9.59 | % | 21.06 | % | 25.81 | % | 13.61 | % | 17.08 | % |
| National Investors Services Inc. | | 55 Water Street
32nd Floor
New York, NY 10041-3299 | | 9.33 | % | 8.35 | % | 13.08 | % | 5.45 | % | 8.18 | % |
| Trust Company of America | | P O Box 6503
Englewood, CO 80155 | | | | | | | | | | 9.70 | % |
| All Officers/Directors | | | | 0.652 | % | 0.011 | % | 0.007 | % | 0.021 | % | 0.031 | % |
4. Directors & Officers
Independent Directors
Name, Address(1),
and Age
| | Positions(s)
Held with
Bridgeway
Funds
| | Term of
Office and
Length of
Time Served
| | Principal Occupation(s)
During Past
Five Years
| | No. of Bridgeway
Funds Overseen
by Director
| | Other Directorship
Held by Director
|
|---|
Kirbyjon Caldwell
Age 52 | | Director | | Term: 1 Year
Length: 4 Years | | Senior Pastor of Windsor Village United Methodist Church, since 1982 | | Eleven | | Contintental Airlines, Inc., American Church Mortgage Company, Reliant Energy, Amegy Bancshares |
Karen S. Gerstner
Age 50 | | Director | | Term: 1 Year
Length: 11 Years | | Principal, Karen S. Gerstner & Associates, P.C., 1/2004 to present, Attorney and Partner, Davis Ridout, Jones and Gerstner LLP, 1/1999 to 12/2003. | | Eleven | | None |
Miles Douglas Harpers, III*
Age 43 | | Director | | Term: 1 Year
Length: 11 Years | | Partner, 10/1998 to present Gainer, Donnelly, Desroches, LLP | | Eleven | | Calvert Large-Cap Growth Fund(2) (1 Portfolio) |
- *
- Independent Chairman
185
"Interested" or Affiliated Directors and Officers
Name, Address(1),
and Age
| | Positions(s)
Held with
Bridgeway
Funds
| | Term of
Office and
Length of
Time Served
| | Principal Occupation(s)
During Past
Five Years
| | No. of Bridgeway
Funds Overseen
by Director
| | Other Directorship
Held by Director
|
|---|
Michael D. Mulcahy(3)
Age 42 | | President and Director | | Term: 1 Year
Length: 10/01/2003 to present | | President, Bridgeway Funds, 6/2005 to present. Director and Staff Member, Bridgeway Capital Management, Inc., 12/2002-6/2005. Vice President, Hewlett Packard, 1/2001-12/2002. Executive Vice President, Artios, Inc., 10/1998-1/2001. | | Eleven | | None |
John N. R. Montgomery(4)
Age 50 |
|
Vice-President and Director |
|
Term: 1 Year
Length: 12 Years |
|
Vice-President, Bridgeway Funds, 6/2005 to present. President, Bridgeway Funds, 11/1993 - 6/2005. President, Bridgeway Capital Management, Inc., 7/1993 - present. |
|
Eleven |
|
None |
186
"Interested" or Affiliated Directors and Officers
Name, Address(1),
and Age
| | Positions(s)
Held with
Bridgeway
Funds
| | Term of
Office and
Length of
Time Served
| | Principal Occupation(s)
During Past
Five Years
| | No. of Bridgeway
Funds Overseen
by Director
| | Other Directorship
Held by Director
|
|---|
Richard P. Cancelmo, Jr.
Age 46 | | Vice-President | | Term: 1 Year Length: 11/10/2004 to present | | Vice-President, Bridgeway Funds, 11/2004 to present. Staff member, Bridgeway Capital Management, Inc., since 2000. | | | | None |
Joanna Barnhill
Age 56 | | Secretary | | Term: 1 Year
Length: 11/22/1993 to present | | Staff Member, Bridgeway Capital Management, Inc., since 1993. | | | | None |
Linda G. Giuffré
Age 44 | | Treasurer and Chief Compliance Officer | | Term: 1 Year
Length: 5/14/2004 to present | | Chief Compliance Officer, Bridgeway Capital Management, Inc., 5/2004 to present. Vice President—Compliance Capstone Asset Management Company, 1998 - 2004 | | | | None |
- (1)
- The address of all of the Directors and Officers of Bridgeway Funds is 5615 Kirby Drive, Suite 518, Houston, Texas, 77005-2448.
- (2)
- The Calvert Large-Cap Growth Fund is sub-advised by Bridgeway Capital Management, Inc., the Adviser to Bridgeway Funds.
- (3)
- Michael Mulcahy is a director and officer of Bridgeway Capital Management, Inc., and therefore an interested person of Bridgeway Funds.
- (4)
- John Montgomery is president, director and majority shareholder of Bridgeway Capital Management, Inc., and therefore an interested person of Bridgeway Funds.
The overall management of the business and affairs of Bridgeway Funds is vested with its Board of Directors (the "Board"). The Board approves all significant agreements between Bridgeway Funds and persons or companies furnishing services to it, including Agreements with its Adviser and Custodian. The day-to-day operations of Bridgeway Funds are delegated to its Officers, subject to its investment objectives and policies and general supervision by the Board.
The Fund's Statement of Additional Information includes additional information about the Fund's Board and is available, without charge, upon request by calling 1-800-661-3550.
187
BRIDGEWAY FUNDS, INC.
c/o Forum Shareholder Services
P. O. Box 446
Portland, ME 04112
713-661-3500 800-661-3550
CUSTODIAN
US Bank N.A.
425 Walnut Street, 6TH Floor
Cincinnati, OH 45202
DISTRIBUTOR
Foreside Fund Services, LLC
2 Portland Square
Portland, ME 04101
You can review and copy information about our Funds (including the SAI) at the SEC's Public Reference Room in Washington, D.C. To find out more about this public service, call the SEC at 202-942-8090. Reports and other information about the Funds is also available on the SEC's website at www.sec.gov. You can receive copies of this information, for a fee, by writing the Public Reference Section, Securities and Exchange Commission, Washington, D.C. 20549-0102 or by sending an electronic request to the following email address: publicinfo@sec.gov
Item 2. Code of Ethics.
Not applicable to semi-annual report.
Item 3. Audit Committee Financial Expert.
Not applicable to semi-annual report.
Item 4. Principal Accounting Fees and Services.
Not applicable to semi-annual report.
Item 5. Audit Committee of Listed Registrants.
Not applicable.
Item 6. Schedule of Investments.
Schedule of Investments is included as part of the Report to Stockholders filed under Item 1 of this form.
Item 7. Disclosure of Proxy Voting Policies and Procedures for Closed-End Management Investment Companies.
Not applicable.
Item 8. Portfolio Managers of Closed-End Management Investment Companies.
Not applicable.
Item 9. Purchases of Equity Securities by Closed-End Management Investment Companies and Affiliated
Purchasers.
Not applicable.
Item 10. Submission of Matters to Vote of Security Holders.
There has been no material change to the procedures by which shareholders may recommend nominees to the registrant's Board of Directors.
Item 11. Controls and Procedures.
- (a)
- The registrant's principal executive officer and principal financial officer have concluded that the registrant's disclosure controls and procedures (as defined in Rule 30a-3(c) under the Investment Company Act of 1940, as amended) are effective based on their evaluation of these controls and procedures as of a date within 90 days of the filing date of this document.
- (b)
- There was no change in the registrant's internal control over financial reporting (as defined in Rule 30a-3(d) under the Investment Company Act of 1940, as amended) during the second fiscal quarter of the period covered by this report that has materially affected, or is reasonably likely to materially affect, the registrant's internal control over financial reporting.
Item 12. Exhibits.
(a)(1) Not applicable to semi-annual report.
(a)(2) The certifications required by Rule 30a-2(a) of the Investment Company Act of 1940, as amended, and Section 302 of the Sarbanes-Oxley Act of 2002 are attached hereto as Ex99.Cert.
(a)(3) Not applicable.
(b) Certification for the registrant's Principal Executive Officer and Principal Financial Officer, as required by Rule 30a-2(b) of the Investment Company Act of 1940, as amended, and Section 906 of the Sarbanes-Oxley Act of 2002 are attached hereto as Ex99.906Cert.
189
SIGNATURES
Pursuant to the requirements of the Securities Exchange Act of 1934 and the Investment Company Act of 1940, the registrant has duly caused this report to be signed on its behalf by the undersigned, thereunto duly authorized.
|
|
BRIDGEWAY FUNDS, INC. |
|
|
By: |
|
/s/ Michael D. Mulcahy
Michael D. Mulcahy
President and Principal Executive Officer |
|
|
Date: |
|
March 9, 2006 |
Pursuant to the requirements of the Securities Exchange Act of 1934 and the Investment Company Act of 1940, this report has been signed below by the following persons on behalf of the registrant and in the capacities and on the dates indicated.
|
|
By: |
|
/s/ Michael D. Mulcahy
Michael D. Mulcahy
President and Principal Executive Officer |
|
|
Date: |
|
March 9, 2006 |
|
|
By: |
|
/s/ Linda Giuffre
Linda Giuffre
Treasurer and Principal Financial Officer |
|
|
Date: |
|
March 9, 2006 |
190