UNITED STATES
SECURITIES AND EXCHANGE COMMISSION
Washington, D.C. 20549
FORM N-CSR
CERTIFIED SHAREHOLDER REPORT OF REGISTERED
MANAGEMENT INVESTMENT COMPANIES
Investment Company Act file number 811-08200
BRIDGEWAY FUNDS, INC.
(Exact name of registrant as specified in charter)
| | |
5615 Kirby Drive, Suite 518 | | |
Houston, Texas | | 77005-2448 |
| | |
(Address of principal executive offices) | | (Zip code) |
Michael D. Mulcahy, President
Bridgeway Funds, Inc.
5615 Kirby Drive, Suite 518
Houston, Texas 77005-2448
(Name and address of agent for service)
Registrant’s telephone number, including area code: (713) 661-3500
Date of fiscal year end: June 30
Date of reporting period: July 1, 2008 and December 31, 2008
Item 1. Reports to Stockholders.

| | |
| | A no-load mutual fund family of domestic funds |
| | |
| |
| | Semi-Annual Report December 31, 2008 (Unaudited) |
| | | | |
| | |
| | AGGRESSIVE INVESTORS 1 | | BRAGX |
| | (Closed to New Investors) | | |
| | |
| | AGGRESSIVE INVESTORS 2 | | BRAIX |
| | |
| | ULTRA-SMALL COMPANY | | BRUSX |
| | (Open to Existing Investors—Direct Only) | | |
| | |
| | ULTRA-SMALL COMPANY MARKET | | BRSIX |
| | |
| | MICRO-CAP LIMITED | | BRMCX |
| | |
| | SMALL-CAP GROWTH | | BRSGX |
| | |
| | SMALL-CAP VALUE | | BRSVX |
| | |
| | LARGE-CAP GROWTH | | BRLGX |
| | |
| | LARGE-CAP VALUE | | BRLVX |
| | |
| | BLUE CHIP 35 INDEX | | BRLIX |
| | |
| | BALANCED | | BRBPX |

TABLE OF CONTENTS
Bridgeway Funds Standardized Returns as of December 31, 2008*
| | | | | | | | | | | | | | | |
| | | | | Annualized | | | | | |
| Fund | | Dec. Qtr.
10/1/08
to 12/31/08 | | 1 Year | | 5 Years | | 10 Years | | Inception
to Date | | Inception
Date | | Gross
Expense
Ratio | |
Aggressive Investors 1 | | -32.80% | | -56.16% | | -5.30% | | 7.90% | | 12.59% | | 8/5/1994 | | 1.78% | |
Aggressive Investors 2 | | -32.58% | | -55.07% | | -2.90% | | NA | | 0.65% | | 10/31/2001 | | 1.17% | |
Ultra-Small Company | | -27.19% | | -46.24% | | -4.19% | | 12.05% | | 13.99% | | 8/5/1994 | | 1.07% | |
Ultra-Small Co Market | | -27.93% | | -39.49% | | -4.42% | | 9.44% | | 8.01% | | 7/31/97 | | 0.66% | |
Micro-Cap Limited | | -26.74% | | -41.74% | | -6.22% | | 7.62% | | 8.00% | | 6/30/1998 | | 0.75% | |
Small-Cap Growth | | -25.43% | | -43.48% | | -3.44% | | NA | | -2.83% | | 10/31/2003 | | 0.87% | |
Small-Cap Value | | -28.58% | | -45.57% | | -1.74% | | NA | | -1.18% | | 10/31/2003 | | 0.83% | |
Large-Cap Growth | | -26.49% | | -45.42% | | -4.46% | | NA | | -3.70% | | 10/31/2003 | | 0.71% | |
Large-Cap Value | | -18.26% | | -36.83% | | 0.11% | | NA | | 1.50% | | 10/31/2003 | | 0.80% | |
Blue Chip 35 Index | | -19.01% | | -33.30% | | -3.06% | | -0.94% | | 2.09% | | 7/31/97 | | 0.22% | 1 |
Balanced | | -9.19% | | -19.38% | | 1.07% | | NA | | 2.13% | | 6/30/2001 | | 0.88% | |
1 Some of the Fund’s fees were waived or expenses reimbursed otherwise returns would have been lower. The Adviser has contractually agreed to waive fees and/or reimburse expenses such that the total operating expenses of the Fund do not exceed 0.15%. Any material change to this Fund policy would require a vote by shareholders.
Bridgeway Funds Returns for Calendar Years 1995 through 2008*
| | | | | | | | | | | | | | | | | | | | | | | | | | | | |
| | | 1995 | | 1996 | | 1997 | | 1998 | | 1999 | | 2000 | | 2001 | | 2002 | | 2003 | | 2004 | | 2005 | | 2006 | | 2007 | | 2008 |
Aggressive Investors 1 | | 27.10% | | 32.20% | | 18.27% | | 19.28% | | 120.62% | | 13.58% | | -11.20% | | -18.01% | | 53.97% | | 12.21% | | 14.93% | | 7.11% | | 25.80% | | -56.16% |
Aggressive Investors 2 | | | | | | | | | | | | | | | | -19.02% | | 44.01% | | 16.23% | | 18.59% | | 5.43% | | 32.19% | | -55.07% |
Ultra-Small Company | | 39.84% | | 29.74% | | 37.99% | | -13.11% | | 40.41% | | 4.75% | | 34.00% | | 3.98% | | 88.57% | | 23.33% | | 2.99% | | 21.55% | | -2.77% | | -46.24% |
Ultra-Small Co Market | | | | | | | | -1.81% | | 31.49% | | 0.67% | | 23.98% | | 4.90% | | 79.43% | | 20.12% | | 4.08% | | 11.48% | | -5.40% | | -39.49% |
Micro-Cap Limited | | | | | | | | | | 49.55% | | 6.02% | | 30.20% | | -16.61% | | 66.97% | | 9.46% | | 22.55% | | -2.34% | | -4.97% | | -41.74% |
Small-Cap Growth | | | | | | | | | | | | | | | | | | | | 11.59% | | 18.24% | | 5.31% | | 6.87% | | -43.48% |
Small-Cap Value | | | | | | | | | | | | | | | | | | | | 17.33% | | 18.92% | | 12.77% | | 6.93% | | -45.57% |
Large-Cap Growth | | | | | | | | | | | | | | | | | | | | 6.77% | | 9.33% | | 4.99% | | 19.01% | | -45.42% |
Large-Cap Value | | | | | | | | | | | | | | | | | | | | 15.15% | | 11.62% | | 18.52% | | 4.49% | | -36.83% |
Blue Chip 35 Index | | | | | | | | 39.11% | | 30.34% | | -15.12% | | -9.06% | | -18.02% | | 28.87% | | 4.79% | | 0.05% | | 15.42% | | 6.07% | | -33.30% |
Balanced | | | | | | | | | | | | | | | | -3.51% | | 17.82% | | 7.61% | | 6.96% | | 6.65% | | 6.58% | | -19.38% |
Performance figures quoted represent past performance and are no guarantee of future results. Current performance may be lower or higher than the performance data quoted. Investment return and principal value will fluctuate so that an investor’s shares, when redeemed, may be worth more or less than original cost. To obtain performance current to the most recent month-end, please visit our website at www.bridgeway.com or call 1-800-661-3550. Total return figures include the reimbursement of dividends and capital gains.
This report is submitted for the general information of the shareholders of each Fund. It is not authorized for distribution to prospective investors unless preceded or accompanied by an effective prospectus, which includes information regarding a Fund’s risks, objectives, fees and expenses, experience of its management, and other information. Investors should read the prospectus carefully before investing in a Fund. For questions or other Fund information, call 1-800-661-3550 or visit the Funds’ website www.bridgeway.com. Funds are available for purchase by residents of the United States, Puerto Rico, U.S. Virgin Islands and Guam only. Foreside Fund Services, LLC, Distributor.
The views expressed here are exclusively those of Fund management. These views including those relating to the market, sectors or individual stocks are not meant as investment advice and should be not considered predictive in nature.
* Numbers with green highlight indicate periods when the Fund outperformed its primary benchmark.
LETTER FROM THE INVESTMENT MANAGEMENT TEAM
December 31, 2008
Dear Fellow Shareholders,
In the midst of the worst quarterly stock market decline since 1987, as well as what has now become the worst overall bear market since the 1930’s, each of our Funds also set new “worst quarter” performance records. On a relative basis, six of eleven funds provided some cushion against the decline of their primary market benchmarks. Our full-year performance was worse, with only four of eleven Funds outperforming their primary market benchmarks. With the exception of one fund (Ultra-Small Company Fund) in 1998, 2008 is the only year in Bridgeway’s 15+ year history that we have underperformed a primary market benchmark in a down year. 2008 was thus a very poor overall record of relative performance by Bridgeway standards. Disappointed is not a strong enough word. Our most aggressive Funds, Aggressive Investors 1 and 2 Funds, lagged their benchmarks the most in the quarter. At the other end of the spectrum, Large-Cap Value, Small-Cap Growth, Blue Chip 35 Index, Ultra-Small Company and Micro-Cap Limited Funds provided some cushion against the fall of their market and peer benchmarks, while Balanced Fund beat its peer benchmark.
An overview of market factors that negatively impacted our returns is described in the “Market Review” section on page 3. Beyond the overall steep market decline, these factors contributed to our poorer-than-benchmark returns:
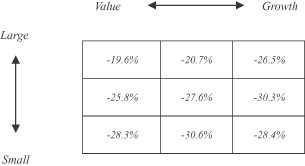
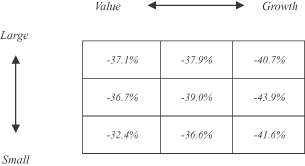
| | • | | A number of Funds were positioned toward the growth stock spectrum, i.e. companies that have experienced faster rates of growth. Across all size stocks, growth-stocks performed more poorly in the quarter (and year), despite what we measured as strong relative valuations in this market segment. For example, the style box “home” of Aggressive Investors, mid-cap growth stocks (down 43.9%), significantly underperformed small-cap value stocks (down “only” 32.4%) according to data from Morningstar. |
| | • | | Unlike the bear market of 2000-2002, some of the hardest hit stocks had solid balance sheets, strong earnings, and historically favorable valuations. Simiarly, one of our normally diversifying models picked up some “deep-value” stocks, including a financial stock, which were hit late in the downturn. |
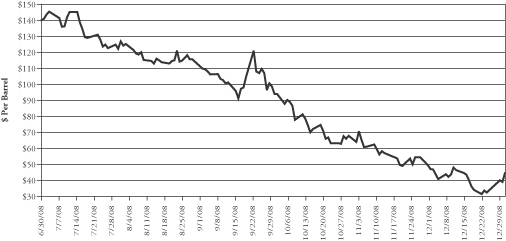
| | • | | A number of our models had identified strong picks among chemical and energy stocks. While these stocks significantly helped our strong performance of the June quarter, the models didn’t know that commodity prices, and thus the revenues of these companies, would be falling precipitously, as crude oil prices declined from a peak of $146/barrel in July to a December low of less than $31/barrel. |
| | • | | One of Bridgeway’s risk management “safety nets” is intended to guard against too high an overconcentration in one sector or industry. While this part of our risk process did “kick in,” reducing the amount of chemical and energy stock we would have held otherwise, it didn’t recommend trimming stocks at a rate that would have been as helpful as it did for technology stocks in 1999/2000. More details appear on pages 6 to 7. |
We had such a strong response from our October paper, “How to Survive and Succeed Through a Bear Market,” that we updated it with more current numbers and put it on our website. One of our major conclusions is to focus on “time to return to the previous peak.” You can get our “take” on when the market might recover on pages 3 to 4.
Discussing 2008 and our Funds’ performance feels quite a bit like “Monday morning quarterbacking.” We dissect the results of our worst performers on pages 5 to 6 in a section by the same name. We’re glad to be leaving 2008 behind. And looking forward to climbing back up the performance ladder—though we can’t guarantee and don’t want to guess exactly how long that will take. We do provide two data points of how our Funds have performed during some short-term “bounce back” periods on pages 7 to 8.
After a year like 2008, it’s fair to question the appropriateness of quantitative investing. Our position is presented on page 7. Finally, each calendar year we have a friendly competition against Morningstar’s “Fund picks.” After a pretty good year for Bridgeway in 2007, 2008 goes to Morningstar. The “score” was Bridgeway 3, Morningstar 8.
LETTER FROM THE INVESTMENT MANAGEMENT TEAM (continued)
As always, we appreciate your feedback. We take your comments very seriously and regularly discuss them internally to help in managing our Funds and this company. Please keep your ideas coming—both favorable and critical. They provide us with a vital tool helping us serve you better.
Sincerely,
Your Investment Team
| | |
| 2 | | Semi-Annual Report | December 31, 2008 (Unaudited) |
LETTER FROM THE INVESTMENT MANAGEMENT TEAM (continued)
Market Review
The Short Version: Any way you slice it or dice it, it was a very very ugly year.
The depth of the 2008 bear market trumps every other year since 1931. The sub-prime lending fiasco early in the year spread to the broader credit market, hurting companies dependent on debt for their operating cycle (e.g. funding purchases for inventory) and fixed asset needs (e.g. major equipment). As some people lost their jobs (unemployment rose from under 5% at the beginning of the year to over 7% by the end of the year) and as housing values declined and foreclosures climbed, consumer and corporations alike “pulled in their reins” in the uncertain environment. By the end of the September quarter, declining forecasts and plummeting stock prices had affected the vast majority of businesses. These in turn also fed a “fear mentality,” reinforcing the recession’s progress. Official numbers became available that a recession began in December 2007. Most of this negative news accelerated in the December 2008 quarter, even as the Federal Reserve and Congress struggled to stabilize the economy with rock bottom Federal Funds rates and bailout packages. Assuming it lasts until May 2009, which we think is quite possible, this will become the longest recession since the 1930’s.
How did all of these factors affect the stocks of various industries and sectors? No sector of the economy was left unscathed. Among the components of the S&P 500 Index, financial companies (banks, insurance companies, and real estate companies) led the decline at 55%. Typically, non-cylical companies (food and healthcare) and utilities are the ones that hold up best in a recession since people continue to eat and to heat and cool their homes. However, even these stock prices were hard hit as non-cyclicals declined 20% for the year and utilities declined 29%.
Looking at the market from a “style box” perspective below, no corner of the market, large or small, value or growth, held up either. Nevertheless, there were some dramatic differences between corners of the style box. Mid-cap growth stocks really took it on the chin in both the quarter and the year, especially negatively impacting our Aggressive Investors Funds. The “style box” stock market data below is from Morningstar:
| | |
Dec 2008 Quarter | | Calendar 2008 |
 | |  |
How Long Will This Bear Market Last?
The Short Version: (Very) generally speaking, the deeper the recession, the farther the market decline and the longer it takes to recover to a previous stock market peak. The stock market has already declined farther than any time since the 1930’s, and we think it’s likely that unemployment could reach double digits. However, we don’t expect a depression (e.g., 25% unemployment at the peak in the 1930’s). Based on modern history, a normal length of time to recover from these levels would be from a few months to four or five years. Since it’s impossible to know and can be very risky to try to time the market, our own strategy is to “sit tight” (remain invested) with money one doesn’t plan to actually spend in the next few years.
Since our September quarter letter, the broader market averages have broken through to new lows, setting new records. As measured by the percentage decline of the S&P 500 Index from the peak on October 9, 2007, to the low on November 20, 2008, this is now the worst bear market since the Great Depression. The total market capitalization (the value of all shares of all companies’ stock) declined by just more than half between the all time high and the recent low of the current bear market. As mentioned in the cover letter, last October on our website, we presented an analysis of bear markets and actions you can take (and not take) seeking to “survive and succeed” through a bear market. We have now updated that analysis, which is available online at: www.bridgeway.com/assets/pdf/Surviving a Bear Market 2009.02.pdf.
LETTER FROM THE INVESTMENT MANAGEMENT TEAM (continued)
One question frequently asked by shareholders is, “How long will this bear market last?” Bridgeway is not a proponent of macroeconomic analysis to provide insights to stock market movements. However, our investment management team does believe that history can provide good insights into risks. Along these lines, we believe the updated data in the table below gives some relevant insights, which were outlined in the bear market piece referenced above. The conclusion we’d like to highlight is that while most people focus on the magnitude of decline, we think a better place to focus—assuming that it really is long-term money you are investing in the stock market—is length of time to recovery. Thus, the relevance of the question, “How long will this bear market last?”
The data below which includes the Great Depression (first line), shows some correlation between the magnitude of a recession, the magnitude of a stock market decline, and the time it takes for the stock market to recover. One way to look at this is that the stock market, as a leading indicator, is currently “signaling” that this recession will be one of the deeper and longer ones since the 1930’s. We feel it is more likely that the unemployment rate will continue to climb in early 2009. The big questions are, “Has the recent market decline already incorporated the severity of this recession?” and “How long will the recovery take?” If you believe as we do, that the eventual peak of unemployment is on the order of magnitude of 10%, rather than the 25% of the Great Depression, it is reasonable to believe that the time to recovery will look more like recent history, rather than the longer timeframe of the Great Depression. If this is true, a “longer” time to recovery might be four or five more years. But keep in mind that it can also be very quick. In the bear market of 1980-1982, the unemployment rate hit the worst level since the Great Depression, over 10%. However the time to recovery from the trough was a remarkably fast 2 months. Our conclusion is three-fold: a) a reasonable timeframe to recovery is probably two months to four or five years, b) this likely range is quite variable (we translate: impossible to predict with accuracy), and c) it is thus a very bad idea to try to time it. From this we conclude again our philosophy that we have held since Bridgeway’s founding: don’t time the market and don’t put money in the market that you might need in the near term.
One other note to highlight from the table: with reference to the last line, based on recent market activity, we are not sure if we have reached the low for the current bear market.
| | | | | | | | | | | | | | | |
| Analysis of Bear Markets Since the Great Depression | |
Date of
Peak | | Date of
Low | | Date Back
to Previous
Peak | | Magnitude
of Decline | | | Peak
Unemployment
Rate | | | # of Months
From Peak
to Low | | # of Months
From Low to
Prev. Peak | |
| Sep 16, 1929 | | Jun 1, 1932 | | Jan 3, 1945 | | -84.7 | % | | 24.9 | % | | 33 | | 151 | * |
| May 31, 1946 | | Oct 9, 1946 | | Oct 11, 1949 | | -25.5 | % | | 7.9 | % | | 5 | | 36 | |
| Dec 12, 1961 | | Jun 26, 1962 | | Apr 24, 1963 | | -26.9 | % | | 6.0 | % | | 6 | | 10 | |
| Feb 9, 1966 | | Oct 7, 1966 | | Mar 23, 1967 | | -20.4 | % | | 3.9 | % | | 8 | | 5 | |
| Nov 29, 1968 | | May 26, 1970 | | Mar 15, 1971 | | -33.1 | % | | 6.1 | % | | 18 | | 10 | |
| Jan 11, 1973 | | Oct 4, 1974 | | July 9, 1976 | | -44.8 | % | | 9.0 | % | | 21 | | 21 | |
| Nov 28, 1980 | | Aug 12, 1982 | | Oct 7, 1982 | | -20.2 | % | | 10.4 | % | | 21 | | 2 | |
| Aug 25, 1987 | | Oct 19, 1987 | | May 17, 1989 | | -32.9 | % | | 6.0 | % | | 2 | | 19 | |
| Sep 1, 2000 | | Oct 9, 2002 | | Oct 23, 2006 | | -47.5 | % | | 6.3 | % | | 25 | | 48 | |
| Oct 9, 2007 | | Nov 20, 2008 | | NA | | -50.7 | % | | 7.2 | % | | 13 | | | |
| Avg. excluding Great Depression & current | | -31.4 | % | | 7.0 | % | | 13 | | 19 | |
Information for the current bear market is through December 31, 2008
| * | While the S&P Composite Index took twelve and a half years to return to the previous peak in the Great Depression, some market benchmarks touched the level of the previous high in seven years, before dipping down again. |
Underperforming in a Down Market Year—A major dent in Bridgeway’s armor
The Short Version: With the exception of one Fund in one year, Bridgeway has never underperformed a primary market benchmark in a down year. Unfortunately, 2008 shattered that record.
Before 2008, Bridgeway had 15 (overlapping) data points about how the active funds we manage performed against market benchmarks in the same style. The down years were 1998 (ultra-small stocks only), 2000 (all stock categories), 2001 (large stocks), 2002 (all stock categories), and 2007 (ultra-small, micro-cap, small-cap value, and large-cap value stocks). In 14 of the 15 cases, we outperformed in these down market years. The only other periods of underperformance were in up market
| | |
| 4 | | Semi-Annual Report | December 31, 2008 (Unaudited) |
LETTER FROM THE INVESTMENT MANAGEMENT TEAM (continued)
years. This was not surprising to us, since our stock picking model design, investment process, and risk process are all designed with an objective of not “adding to the pain” by underperforming in a down market. That record was reasonably shattered in 2008—the worst stock market calendar year since 1931—as seven of nine actively managed Bridgeway Funds underperformed their market benchmarks and only five of all eleven Bridgeway Funds outperformed their peer benchmarks. The following several sections attempt to answer the questions “How were our Funds positioned with respect to the bear market?” and “What contributed to the dismal performance? ”and “Do we think quantitative investing will work again in the future?”
Monday Morning Quarterbacking for 2008
The Short Version: At the beginning of 2008, if you knew this was going to be a bad year led by the financial sector, knew we were positioned light on financial stocks and light on companies with debt, you might think that at least this would be a good year on a relative basis. Not so for a majority of our Funds.
In a calendar year in which only four of our eleven funds beat their market benchmarks and five beat their peer benchmarks, it’s appropriate to look back and reflect, to understand the reasons for lagging returns where they occurred. Each Fund section below will address this by individual Fund, but since some of the reasons are common across a number of Funds, we’d like to address these in summary fashion, concentrating on our actively managed Funds, and specifically our highest octane Funds (Aggressive Investors 1 and 2)—which performed the most poorly.
If all we knew at the beginning of the calendar year was that a) we were entering a recession and the worst bear market of the last 75 years, b) Bridgeway has outperformed our market benchmarks in down years the vast majority of the time, c) this bear market would be led by a financial crisis and financial stocks would fall the farthest of any sector, d) our models were significantly underweighted in financial stocks, e) the stocks we did own had, in aggregate, less debt versus their peers, and were thus more conservatively positioned with respect to the negative effects of financial leverage in a recession, and f) we were significantly overweighted in the stocks that historically have correlated least well with the overall market (i.e., in stocks that provided the most diversification historically), we would conclude that chances were strong that it would be a rough year on an absolute basis, but that we would likely provide some nice “cushion” against the fall, as we have in most previous down market years. Unfortunately, this was not so across most of our Funds, and two, Aggressive Investors 1 and 2, underperformed their market benchmarks by double digit amounts. What happened?
Dissecting the 2008 Underperformance of Aggressive Investors 1 and 2
The Short Version: As with the September quarter, the precipitous decline of commodity prices took a strong bite out of some of our Funds.
The primary reasons for our December quarter Aggressive Investors poor performance were very similar to the September quarter, as outlined in the prior quarter shareholder letter. While financial stocks continued to take much of the business news headlines, we were significantly underweighted in these stocks, and the stocks we did own outperformed their category, in total adding more than two percentage points to returns on a relative basis. However, approximately 18% of the Aggressive Investors Funds was invested in stocks of basic materials (mostly chemicals) during the December quarter, while approximately 10% was invested in energy stocks. Energy and other commodity prices continued to plummet during the quarter, pounding oil and gas, coal, iron and steel, and chemical stocks in the process. In spite of the fact that the indicated valuations of these stocks had become amazingly cheap, the adage “cheap stocks can, nevertheless, always become cheaper” was definitely true. And ultimately, if commodity prices remain at the current depressed levels, revenues and earnings of
LETTER FROM THE INVESTMENT MANAGEMENT TEAM (continued)
these companies dry up, along with the stellar cash flows and strong balance sheets. The graph below presents the prices of crude oil, just one example of commodity prices, which nevertheless tells the story.
West Texas Crude Oil June 30, 2008 to December 31, 2008
Cash is King or The Effects of Cash on Relative Performance
The Short Version: The average mutual fund maintains about 5% cash. This provides some cushion in a severe bear market, but is a significant drag on performance over the long haul. Since our strategy is based on long-term performance, we seek “full investment” or close to zero cash.
In a bear market and recession, it’s great to be sitting on a bunch of cash. In fact, coming into the December quarter, the average domestic equity fund held more than 5% of net assets in cash. Two advantages of this are that you can theoretically deploy this cash to invest in stocks that are much cheaper than at the market peak, and mathematically, it shields a Fund from some of the free fall of a bear market. For example, if a Fund held 5% cash from the market peak in October 2007 through the 50% decline in November 2008, the cash would add roughly 2 1/2 percent return relative to the broader market. That’s not chump change. So why did Aggressive Investors 1 and 2 hold almost no cash during this period?
One concept in engineering and economics is “opportunity cost,” or the cost of an opportunity that must be forgone in order to pursue a certain action. The benefit of a fund holding cash is improved relative performance in a downturn, and potentially putting that cash to work at a favorable price. The disadvantage or opportunity cost is “cash drag” in an up market. Thus, if the average interest on cash is about three and a half percent per year and the average return of stocks is ten percent per year (the average over the last eight decades including the Great Depression and current bear market), you will come out ahead owning stocks over the long haul. This begs the question of whether a Fund manager could hold little or no cash on the way up and more on the way down. However, previous studies indicate that the reverse is true; managers tend to move into cash closer to a market bottom than a market top. Since we think trying to time the market is a very bad idea, we think holding cash is a doubly bad idea.
Top-Down Risk Control
The Short Version: Our process in managing the risk of industry and sector concentration did not work as well in 2008 in our Aggressive Investors’ styles as in some previous years.
Part of Bridgeway’s risk management process is to review sector and industry concentrations (how much we own of chemical stocks or technology stocks, for example) to ensure that related stocks don’t all decline at the same time. For example, late in 1999, technology stocks comprised too large a percentage of Aggressive Investors 1 Fund’s net assets and we both put a hold on new buys and looked for early opportunities to trim back on these stocks, even though our stock picking models continued to identify new technology buys. Our trimming helped cushion the stock market decline in 2000, as these stocks were particularly hard hit. Similarly, this risk “hold/trim” process kicked in with respect to internet stocks in Micro-Cap Limited Fund in 2003 as these stocks came roaring back. Energy stocks received the same treatment in Aggressive Investors 1 and 2 in 2005, as energy comprised a concentrated 35% of our Fund in September of that year. A natural question, then, is “Why didn’t this process ‘kick in’ with respect to Aggressive Investors’ concentration in basic materials and energy stocks?
| | |
| 6 | | Semi-Annual Report | December 31, 2008 (Unaudited) |
LETTER FROM THE INVESTMENT MANAGEMENT TEAM (continued)
The short answer is, “they did, just not as early and as dramatically as would have been really helpful.” In fact, by late summer both basic materials and energy stocks were on our “watch list” with respect to risk. We noticed that these two groups had become unusually strongly correlated with each other and we put a “hold” on the sum of these two groups. Thus, we did, in fact, buy fewer of these stocks than we would have otherwise. However, the risk was not appraised to be so dramatic that we aggressively sold these stocks. Thus, we bore significantly more damage from a concentrated part of our Fund than at any time in Bridgeway’s history, or John’s experience before Bridgeway.
Does Bridgeway Think Quantitative Investing Will Work in the Future?
The Short Version: Not all of our Funds underperformed in 2008, but our highest octane ones certainly did. The statistical concept of “reversion to the mean” would indicate that the “pendulum” may swing back the other direction toward positive relative performance, but we advise people against trying to time this. Overall, we have faith in our process, and actual history over 14 years gives us both experience and confidence.
Focusing on Aggressive Investors 1 as one of our longest running actively managed funds, our quantitative models have helped us beat our primary market benchmark in nine of fourteen years since inception and by an average of 5.8% per year as presented on page 10. One to two-year periods of underperformance have been followed by periods of outperformance. We can’t make any representations about future performance, but we can state definitively what we think are the advantages of quantitative investing:
| | • | | taking emotion out of the process. Emotions tend to push investors in the direction of selling when stocks are low and buying after a runup. This is a formula for financial disaster, and quantitative models are extremely helpful in keeping us disciplined and unemotional. |
| | • | | lack of dependence on a single person (a four-person team runs the models, and this team is supported by experienced staff in trading, accounting, compliance, information technology, etc.) |
| | • | | a historical framework to assess risk. |
| | • | | an efficient structure which feeds a low cost structure. |
| | • | | the ability to back-test, learn and refine with real, historic data. |
Why Did Bridgeway’s More Actively Managed Funds Perform So Much Better in the Bear Market of 2000-2002?
The Short Version: The 2000-2002 bear market was driven more by company economics and our models did very well on a relative basis. Event driven markets, or ones where there is not a strong relationship between stock prices and company level economic results are not as favorable to our models overall.
Each bear market—and bull market, for the matter—has its own unique characteristics. The bear market of 2000-2002 was driven by fundamental economic factors that were measurable based on company level financial data. Relative valuations also played a big role. Our quantitative models did a good job of picking up on these valuations and trends. For example, Internet stocks, many of which had little in the way of actual revenues, earnings, and cash flows were among those hardest hit. Since, in aggregate (this is not true across the board), our models look for these financial fundamentals and rank their attractiveness, we were “light” on those stocks which were hardest hit. By contrast, the bear market of 2008 was very fast moving and some of the companies hardest hit started out the bear market with very strong valuations based on historical standards. Nevertheless, company fundamentals were eventually affected, either by plummeting commodity prices, as highlighted above, or with deteriorating financial performance as various real aspects of the recession kicked into high gear. Examples of the latter are a decline in capital spending and shrinking inventories, as companies scaled back in anticipation of lean times and as it became very difficult or impossible to plan for future demand for a company’s goods or services. Some of this is fear driven which feeds on itself. Event driven markets, or ones where there is a delinking of company level economic results and stock price movements tend to be a poorer environment for our models.
“Bounce-Back” Data
The Short Version: When the markets do eventually turn around, will our Funds bounce back with them? Only time will tell, but we can look at two smaller data points on this topic. With respect to our higher octane actively managed Funds—those that dropped the most in the downturn—both of these data points are positive.
One of our biggest concerns in a precipitous bear market is that we might do more poorly than the market on the way down, as we have—our first market-lagging returns in a down market year—only to have our models then rotate into more conservative stocks, which do more poorly on the way back up, if the latter also happened precipitously. There are some safeguards in Bridgeway’s process to protect against this, but we’ve been looking for some periods where the market bounces back off a low point to measure our Funds’ reaction. Now we have a couple of confirming data points in the current bear market. On October 13, 2008, for example, the S&P 500 Index popped back up 11.58% after a horrible prior week. Bridgeway Aggressive Investors 1 and 2 popped back up 14.99% and 15.20%, respectively. More importantly—but still just
LETTER FROM THE INVESTMENT MANAGEMENT TEAM (continued)
a data point—we bounced back significantly farther from the current bear market low on November 20 to a recent, or intermediate, high point on January 6, 2009. The table below presents the results for our actively managed Funds. Our more aggressive Funds bounced back very nicely. Also noteworthy is the fact that of the two Funds which didn’t bounce back farther than their respective market benchmarks, neither were among our more aggressive Funds, and one had outperformed it’s benchmark over the full calendar.
| | | | | | | | |
| | | | | “Bounce-back” Performance 11/20/08-1/6/09 |
| Fund | | Market
Benchmark | | Market
Benchmark | | Fund | | Difference |
Aggressive Investors 1 | | S&P 500 Index | | 24.69% | | 35.50% | | 10.81% |
Aggressive Investors 2 | | S&P 500 Index | | 24.69% | | 34.02% | | 9.33% |
Ultra-Small Company | | CRSP 10 (estimated) | | 28.74% | | 33.75% | | 5.01% |
Micro-Cap Limited | | CRSP 9 (estimated) | | 29.23% | | 36.50% | | 7.27% |
Small-Cap Growth | | Russell 2000 Growth | | 33.99% | | 30.03% | | -3.96% |
Small-Cap Value | | Russell 2000 Value | | 33.96% | | 38.40% | | 4.44% |
Large-Cap Growth | | Russell 1000 Growth | | 25.17% | | 26.99% | | 1.82% |
Large-Cap Value | | Russell 1000 Value | | 26.98% | | 24.74% | | -2.24% |
Balanced | | Balanced Benchmark | | 10.21% | | 13.27% | | 3.06% |
Please note that the two data points referenced in this section are very short term in duration and were specifically picked to investigate “bounce-back” potential within the bear market environment. They may not be representative of “bounce-back” potential of a much longer duration or higher magnitude market move. In any case, past performance does not guarantee future returns.
Debt Levels and the Recession
The Short Version: In aggregate, each of our Funds is more conservatively positioned than the broader market with respect to debt.
You may recall that for Bridgeway’s actively managed Funds, those except Blue Chip 35 Index and Ultra-Small Company Market, we consider ourselves to be a “bottom-up stock picking shop.” This means we don’t do “top-down” macroeconomic or sector fundamental analysis, but rather seek to buy one stock at a time by considering company level data. However, three things we do pursue from a “top-down” basis are a) cost efficiency (operating costs, such as the cost to service your account, and transaction costs, the costs associated with buying and selling shares of stock), b) tax efficiency (paying attention to the timing of taxable gains), and c) risk management, themes that run through our shareholder letters. In the last category, we discussed risk management associated with sector and industry concentration risk above. Another risk we began focusing on early last summer was the level of debt our companies held. At a time that credit became very tight, i.e. banks were increasingly unwilling to lend or might look for excuses to discontinue or “call” outstanding loans, we asked the question, “What is the next shoe to fall?” We became worried that even companies that were reasonably conservatively managed with respect to debt might have debt come due at a time no one was willing to lend for a reasonable interest rate. In such an environment, bankruptcies could skyrocket, and we wanted to make sure we didn’t have too much exposure to debt-laden companies. Our analysis across all our Funds indicated that our aggregate debt levels were less than the broader market, and it was unnecessary to consider dramatic action. If the section above (“bounce-back” data) provides some encouragement that we would participate in a market turnaround, the following table might similarly provide some encouragement should the bear market get significantly worse—but even then, only on a relative basis. Here’s the debt data for our Funds:
| | | | | | | | | | | | |
| | | Short-Term Debt/Equity* | | Total Debt/Equity* |
| | | Fund | | Index | | Difference | | Fund | | Index | | Difference |
Aggressive Investors 1 vs. S&P 500 Index | | 7.7% | | 17.9% | | -10.2% | | 45.1% | | 83.5% | | -38.4% |
Aggressive Investors 2 vs. S&P 500 Index | | 7.3% | | 17.9% | | -10.6% | | 54.3% | | 83.5% | | -29.2% |
Ultra-Small Company vs. CRSP 10 Index | | 5.2% | | 18.7% | | -13.5% | | 30.4% | | 306.8% | | -276.4% |
Ultra-Small Company Market vs. CRSP 10 Index | | 3.9% | | 18.7% | | -14.8% | | 174.0% | | 306.8% | | -132.8% |
Micro-Cap Limited vs. Russell 2000 Growth Index | | 3.8% | | 13.9% | | -10.1% | | 35.7% | | 161.4% | | -125.7% |
Small-Cap Growth vs. Russell 2000 Growth Index | | 3.8% | | 13.9% | | -10.1% | | 96.3% | | 161.4% | | -65.1% |
Small-Cap Value vs. Russell 2000 Value Index | | 7.0% | | 5.5% | | 1.5% | | 65.3% | | 65.3% | | 0.0% |
Large-Cap Growth vs. Russell 1000 Growth Index | | 7.7% | | 13.1% | | -5.4% | | 42.9% | | 71.0% | | -28.1% |
Large-Cap Value vs. Russell 1000 Value Index | | 11.9% | | 14.0% | | -2.1% | | 61.1% | | 74.0% | | -12.9% |
Blue Chip 35 Index vs. S&P 500 Index | | 13.5% | | 17.9% | | -4.4% | | 47.8% | | 83.5% | | -35.7% |
| | | | | | | | | | | | | |
| * | All calculations exclude financial stocks since the adviser believes they skew the data unreasonably. The differences are even greater if financial companies are included. |
| | |
| 8 | | Semi-Annual Report | December 31, 2008 (Unaudited) |
LETTER FROM THE INVESTMENT MANAGEMENT TEAM (continued)
Bridgeway 3, Morningstar 8
The Short Version: After a good year for Bridgeway in 2007, Morningstar takes the honors in 2008.
Morningstar, the Chicago-based independent research firm publishes a list of “best funds” for each asset class as determined by its analysts every year. In January when the final tallies are in, we compare the performance of each of our Funds to the average returns of Morningstar’s top picks for the comparable asset class. We enjoy seeing how we stack up against the “best of the best.”
By a wide 3-8 margin, the Bridgeway Funds lost out to the Morningstar picks in calendar year 2008. Two of the Funds that underperformed (Ultra-Small Company Fund and Ultra-Small Company Market Fund) actually beat their own market benchmarks of much smaller companies. In a period when very small stocks badly lagged the broader market, the headwinds were too strong for these funds compared to the larger company (but still small) peers.
The table below depicts the results by Morningstar category and relevant Bridgeway Fund.
| | | | | | |
| Bridgeway Funds | | Morningstar Analyst “Picks” |
| Name | | 2008 Return | | Morningstar Category | | 2008 Return |
Large-Cap Value | | -36.83% | | Large-cap value | | -40.00% |
Blue Chip 35 Index | | -33.30% | | Large-cap blend | | -39.74% |
Large-Cap Growth | | -45.42% | | Large-cap growth | | -37.21% |
Aggressive Investors 1 | | -56.16% | | Mid-cap growth | | -34.34% |
Aggressive Investors 2 | | -55.07% | | Mid-cap growth | | -34.34% |
Small-Cap Value | | -45.57% | | Small-Value | | -36.07% |
Ultra-Small Co. Market | | -39.49% | | Small Blend | | -37.87% |
Ultra-Small Company | | -46.24% | | Small-Growth | | -42.05% |
Micro-Cap Limited | | -41.74% | | Small-Growth | | -42.05% |
Small-Cap Growth | | -43.48% | | Small-Growth | | -42.05% |
Balanced | | -19.38% | | Conservative Allocation | | -16.17% |
Past performance is not an indicator of future results. The Bridgeway Funds’ adviser, Bridgeway Capital Management, Inc., does not have any influence on the selection of the funds chosen by Morningstar’s analysts. The number and specific funds used in the comparison are in the control and discretion of Morningstar and their analysts and are subject to change. Morningstar’s criteria for choosing Analyst Picks includes, but is not limited to, factors such as performance, expenses, and quality of fund management. In addition, the comparison of Bridgeway Funds to the Morningstar Analyst Picks is limited to performance only and does not take into consideration other factors that are considered by Morningstar when compiling their list of Analyst Picks.
Each Bridgeway Fund is compared to the average total return of the group of funds selected by Morningstar at the beginning of 2008 for the one year period ended December 31, 2008. Although these Analyst Picks changed from the beginning of the year to the final quarter, the same Bridgeway Funds beat the average of the end of year Morningstar picks as well. These averages in the table are comprised of between three and thirteen funds from within each category. In an effort to provide a complete and balanced assessment, all of the Bridgeway Funds are used in the comparison table shown above such that no attempt is made to cull out unfavorable results. The purpose of this comparison is to “raise the bar” on performance comparison as this analysis uses an arguably higher benchmark by comparing the Bridgeway Funds to other funds chosen by an independent source that specializes in investment research.
Aggressive Investors 1 Fund
MANAGER’S COMMENTARY
(Unaudited)
December 31, 2008
Dear Fellow Aggressive Investors 1 Fund Shareholder,
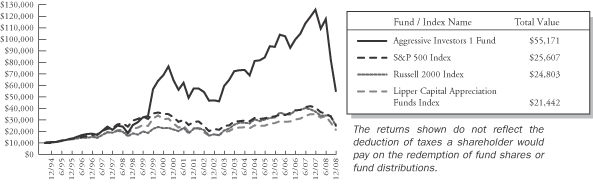
Our Fund’s performance for the December 31, 2008 quarter was the worst quarterly performance for both our Fund and our performance benchmarks during our Fund’s fourteen year history. It was our fifth worst quarter on the basis of returns relative to our primary market benchmark. Aggressive Investors 1 declined 32.80%, compared to declines of 21.94% for the S&P 500 Index (our primary market benchmark), 22.59% for the Lipper Capital Appreciation Funds Index (our peer benchmark), and 26.12% for the Russell 2000 Index of small companies. It was an awful quarter.
For the six-month “semi-annual” period ending December 31, 2008, our Fund declined 53.13%, versus declines of 28.48% for the S&P 500 Index, 35.71% for the Lipper Capital Appreciation Funds Index , and 26.94% for the Russell 2000 Index of small companies. This period was a “perfect storm” of poor positioning: a) a large number of more “growth leaning” companies (those with historical faster growing earnings, for example), b) good, but not strong enough representation among the largest “blue chip” companies that held up best, c) none of our different stock picking models “picked up the slack” in this particular downturn, and d) especially damaging exposure to energy and chemical companies during a period when commodity prices fell off a cliff.
In some other periods of quarterly underperformance, our preceding and/or following quarters were strong enough to make up for the poor quarter. For example, our second worst quarter of underperformance, September 2006, was followed by five market-beating quarters and preceded by two. Our third worst, December 1997, was preceded by two and followed by one. And our fourth worst quarter, September 1998, was followed by the longest running outperformance in our history (eight quarters). With the back to back September and December quarters, however, we have a very significant “hole” from which to work our way back.
The table below presents our December quarter, six-month, one-year, five-year, ten-year and life-to-date financial results according to the formula required by the SEC. The last two quarters caused even our five year performance to lag our five-year benchmarks for the first time in our history. We still lead all our benchmarks over the last ten years and since inception. See the next page for a graph of performance from inception to December 31, 2008.
| | | | | | | | | | | | |
| | | Dec. Qtr. 10/1/08
to 12/31/08 | | 6 Month
7/1/08
to 12/31/08 | | 1 Year 1/1/08
to 12/31/08 | | 5 Year 1/1/04
to 12/31/08 | | 10 Year 1/1/99
to 12/31/08 | | Life-to-Date 8/5/94 to 12/31/08 |
| | | | | | |
Aggressive Investors 1 Fund | | -32.80% | | -53.13% | | -56.16% | | -5.30% | | 7.90% | | 12.59% |
S&P 500 Index (large companies) | | -21.94% | | -28.48% | | -37.00% | | -2.19% | | -1.38% | | 6.74% |
Lipper Capital Appreciation Funds Index | | -22.59% | | -35.71% | | -39.08% | | -1.19% | | -0.44% | | 5.45% |
Russell 2000 Index (small companies) | | -26.12% | | -26.94% | | -33.79% | | -0.93% | | 3.02% | | 6.51% |
Performance figures quoted in the table above and graph below represent past performance and are no guarantee of future results. The table above and the graph below do not reflect the deduction of taxes that a shareholder would pay on Fund distributions or the redemption of Fund shares.
The S&P 500 Index is a broad-based, unmanaged measurement of changes in stock market conditions based on the average of 500 widely held common stocks with dividends reinvested, while the Russell 2000 Index is an unmanaged, market value weighted index, that measures performance of the 2,000 companies that are between the 1,000th and 3,000th largest in the market with dividends reinvested. The Lipper Capital Appreciation Funds Index reflects the record of the 30 largest funds in this category, comprised of more aggressive domestic growth mutual funds, as reported by Lipper, Inc. It is not possible to invest directly in an index. Periods longer than one year are annualized.
According to data from Lipper, Inc. as of December 31, 2008, Aggressive Investors 1 Fund ranked 208th of 281 capital appreciation funds for the twelve months ending December 31, 2008, 182nd of 212 over the last five years, 5th of 125 over
| | |
| 10 | | Semi-Annual Report | December 31, 2008 (Unaudited) |
Aggressive Investors 1 Fund
MANAGER’S COMMENTARY (continued)
(Unaudited)
the last ten years, and 1st of 54 since inception in August, 1994. These long-term numbers and the graph below give two snapshots of our long- term success. Lipper, Inc. is an independent mutual fund rating service that ranks funds in various fund categories by making comparative calculations using total returns.
Aggressive Investors 1 Fund vs. S&P 500 Index & Lipper Capital Appreciation Funds Index & Russell 2000 Index Inception 8/5/94 to 12/31/08
Why Was our Fund Positioned so Poorly?
Our introductory section on the previous page gives some details on the poor positioning of our Fund for this market environment, while the sections below give details of our performance at the stock level. A fair question to ask is “why the poor positioning?” Answering this question could require a lot of discussion at the level of our individual stock picking models, so we’ll address it more generally in this section.
Growth companies generally fall more in a downturn; why did we hold more than a normal level? Growth companies had been significantly out of favor from 2000-2006. That trend reversed in 2007, and it looked like it might continue into 2008. From a risk perspective, we believed that growth stocks might even provide more “cushion” against a downturn than value stocks, just as small stocks provided more cushion than large stocks in the last bear market of 2000-2002. That strategy turned out not to be the case; growth stocks were much harder hit. In aggregate, our models were picking up on what appeared to be stronger relative valuations among growth stocks, which did not translate into better returns for this period, however.
Why did we own so many mid-cap companies that lagged larger ones? Our models pick stocks among all size companies, small, medium, and large ones. However, there are many more mid-cap and small-cap companies to choose from which normally leads to more holdings in this “middle range”. In the current market environment the largest ones fared best, giving an advantage to our large company weighted primary market benchmark. Actually, our models have favored large companies for the last couple of years, but our small and mid-size ones still caused a performance drag of about six percentage points during the quarter relative to the S&P 500 Index.
Bridgeway’s strategy is to use stock picking models of different styles that don’t all go the same direction at the same time. Why didn’t some provide more cushion? As described above, perhaps predictably, strong growth models didn’t do as well in the recent fast moving, very steep decline. On the other end of the spectrum, one of our more value-oriented models that usually does well in a downturn unfortunately picked up some distressed companies, including some financial stocks such as Bank of America. Two more technically focused models did poorly for . . . technical reasons I can’t go into detail with here. One of these was specifically designed to be less volatile than the market, but did not prove to be so this time. In summary, our Fund design includes some models that usually zig while the others zag. Unlike in previous downturns, however, these models all went the same (poor) direction at the same time.
Why did we hold so much of energy and chemicals through the downturn? These companies, as detailed below, caused the most damage to our Fund’s returns. Normally, a turnaround in fundamentals, including inputs such as precipitously falling
Aggressive Investors 1 Fund
MANAGER’S COMMENTARY (continued)
(Unaudited)
commodity prices would result in a sell signal. However, for some models, if the stock price declines at a rate much faster than the fundamentals (e.g. net income) of a company, it may not create a sell signal in anticipation of a “bounce back.” While this has worked in some previous market environments, and contributed to the positive “bounce back” phenomenon on page 7, it added to the pain of the downturn in October and most of November.
Detailed Explanation of Quarterly Performance—Some stocks (slightly) cushioned the blow
The Short Version: With a dramatic December quarter downturn, there were very few stocks that helped cushion the blow. 21 of our 90 stocks had positive returns, with only seven in double digits.
In a quarter where misery found plenty of company, investors had to search long and hard for winners. While every major sector declined double digits amid the credit crisis and broadening economic downturn, non-cyclical consumer stocks held up somewhat better than most. Of the top ten best performers in the Fund, five came from that sector. Combined, they contributed just under one and a half percent to the overall performance of the Fund.
These are the ten best performers for the quarter ended December 31, 2008:
| | | | | | |
| Rank | | Description | | Industry | | % Gain |
| 1 | | Apollo Group Inc | | Commercial Services | | 30.5% |
| 2 | | Thoratec Corp | | Healthcare-Products | | 23.8% |
| 3 | | Broadcom Corp | | Semiconductors | | 15.1% |
| 4 | | Telephone & Data Systems Inc | | Telecommunications | | 14.2% |
| 5 | | Bristol-Myers Squibb Co | | Pharmaceuticals | | 11.5% |
| 6 | | Amgen Inc | | Biotechnology | | 11.3% |
| 7 | | AT&T Inc | | Telecommunications | | 10.0% |
| 8 | | Cerner Corp | | Software | | 9.9% |
| 9 | | Time Warner Inc | | Media | | 9.5% |
| 10 | | Corinthian Colleges Inc | | Commercial Services | | 9.1% |
| | | | | | | |
When the going gets tough, the tough…go back to school. Apollo Group was the best-performing company in the Fund over the past three months and the only one to earn greater than 30% in return. Apollo provides educational programs for high school, college, and graduate levels and operates under such brands as University of Phoenix and College for Financial Planning Institute. During the quarter, enrollment soared by just under 20%, as students realized that additional education (and degrees) could be beneficial amid the struggling job market. The company’s profits doubled in its fiscal 4th quarter, a trend that some analysts expect to continue given the ongoing sluggish economy and dire labor picture.
Detailed Explanation of Quarterly Performance—What Didn’t Work
The Short Version: Basic materials stocks (iron, chemicals) and industrial companies did the most damage in the quarter.
What happened to the commodities boom of a few quarters back? Just six months ago, the top eight performing stocks in the Fund were involved in various commodity-related industries (energy, coal, steel, mining), and each returned over 35% that quarter. When commodity prices turned around, however, the downward trend was relentless, and stock prices followed suit. The global recession is widely recognized as the primary culprit, and demand for such products is expected to decline further in the foreseeable future. Nine of the Fund’s worst-performing holdings were commodity-related (steel, coal, oil, chemicals), and each fell over 50% during the quarter.
| | |
| 12 | | Semi-Annual Report | December 31, 2008 (Unaudited) |
Aggressive Investors 1 Fund
MANAGER’S COMMENTARY (continued)
(Unaudited)
These are the ten stocks that performed the worst in the quarter ended December 31, 2008:
| | | | | | |
| Rank | | Description | | Industry | | % Loss |
| 1 | | Mechel ADR | | Iron/Steel | | -77.7% |
| 2 | | Massey Energy Co | | Coal | | -61.3% |
| 3 | | Bucyrus International Inc | | Machinery-Construction & Mining | | -58.6% |
| 4 | | Energy Conversion Devices Inc | | Electrical Components & Equip | | -57.8% |
| 5 | | Warnaco Group Inc | | Apparel | | -56.7% |
| 6 | | Genco Shipping & Trading Ltd | | Transportation | | -55.5% |
| 7 | | Cliffs Natural Resources Inc | | Iron/Steel | | -54.9% |
| 8 | | Chesapeake Energy Corp | | Oil & Gas | | -54.9% |
| 9 | | United States Steel Corp | | Iron/Steel | | -54.7% |
| 10 | | Dow Chemical Co | | Chemicals | | -52.5% |
| | | | | | | |
Mechel ADR is a coal mining and steel production company based in Russia. Though the company reported strong results for the first nine months of the year, its outlook for 2009 remains extremely weak, while management determines how best to cope with sluggish worldwide demand. The company said it will cut steel production by up to 25% during the year, and analysts do not foresee any imminent rebound in the price of coal, steel, and other commodities over the next few quarters. Management continues to remain optimistic about its long-term prospects and believes the company is in a great position to benefit from a global economic recovery in the future. From early-2007 to mid-2008, the stock had risen five-fold, only to give up all of those gains and more by the end of the year.
Genco Shipping and Trading Ltd. transports drybulk cargos (coal, grains, steel products, etc.) to destinations across the globe. While the bursting of the commodities’ bubble dramatically impacted miners and manufacturers of related products, it also diminished the need for shipping these goods. As such, cargo shipment rates have plunged by up to 90% since summer 2008 in some cases. In November, because of the dwindling demand for its services, Genco cancelled plans to purchase six cargo ships and will be forced to forfeit over $50 million in lost deposits. As a result, the company expects to take a $54 million hit to its bottom line in the fourth quarter. However, some analysts believe that Genco is in a better position to weather the storm than certain competitors, as it maintains longer-term contracts that produce more attractive margins.
Detailed Explanation of Calendar Year Performance—Companies With Positive Returns
The Short Version: Twenty-seven of the 155 stocks we owned during the year had positive returns. Unfortunately, all but two were smaller diversifying positions. In aggregate, these 27 added about a percent and a half to our annual returns.
With all 10 S&P sectors recording sizable market losses in 2008, investors had few places to turn for relief from the equity market carnage. Still, our models found some. Eight of the best-performing stocks returned 10% or more and represented six different sectors, an indication that needles can be found in even the most depressing haystacks. In conjunction with the worst bear market of a lifetime, this is the “leanest” list of top annual performers in our history.
These are the ten best performers for the calendar year ended December 31, 2008:
| | | | | | |
| Rank | | Description | | Industry | | % Gain |
| 1 | | Thoratec Corp | | Healthcare-Products | | 24.9% |
| 2 | | Callaway Golf Co | | Leisure Time | | 16.0% |
| 3 | | Broadcom Corp | | Semiconductors | | 15.1% |
| 4 | | Telephone & Data Systems Inc | | Telecommunications | | 14.2% |
| 5 | | Range Resources Corp | | Oil & Gas | | 12.6% |
| 6 | | Jones Lang LaSalle Inc | | Real Estate | | 12.0% |
| 7 | | Amgen Inc | | Biotechnology | | 11.3% |
| 8 | | AT&T Inc | | Telecommunications | | 10.0% |
| 9 | | Cerner Corp | | Software | | 9.9% |
| 10 | | Time Warner Inc | | Media | | 9.5% |
| | | | | | | |
Aggressive Investors 1 Fund
MANAGER’S COMMENTARY (continued)
(Unaudited)
Thoratec Corp. was the Fund’s best performing company during the year, with much of the returns coming in the fourth quarter (where it was our second top holding). In December, its management reported that a clinical trial for its HeartMate II pump produced better results than its existing products that target similar patients; management believes it could receive its next round of FDA approval more quickly than originally expected. Currently, the HeartMate II is considered a temporary treatment for heart patients in need of transplants, but the strong data could speed up the approval process and make the device available for more candidates. The good news was not limited to the past three months, however. In late July, the company posted outstanding quarterly earnings due to favorable treatment results of its existing medical product line. For the year, Thoratec returned almost 25%.
Detailed Explanation of Calendar Year Performance—What Didn’t Work
The Short Version: As goes the December quarter, so goes the year.
Basic materials and energy, in almost any form, were not a good place to be in 2008; neither coal, iron, steel, oil, nor most chemicals survived the onslaught. As the global recession expanded, the commodities bubble burst, and prices plummeted. Nine of the ten worst-performing companies in the Fund were engaged in some commodities-related operations (mining, drilling, production, transportation, etc.). Of the 155 holdings in the Fund during 2008, 32 declined by at least 50% during the year.
These are the ten stocks that performed the worst for the calendar year ended December 31, 2008:
| | | | | | |
| Rank | | Description | | Industry | | % Loss |
| 1 | | Mechel ADR | | Iron/Steel | | -92.1% |
| 2 | | Massey Energy Co | | Coal | | -80.5% |
| 3 | | Genco Shipping & Trading Ltd | | Transportation | | -77.5% |
| 4 | | United States Steel Corp | | Iron/Steel | | -75.5% |
| 5 | | Cliffs Natural Resources Inc | | Iron/Steel | | -75.4% |
| 6 | | Arch Coal Inc | | Coal | | -72.4% |
| 7 | | W&T Offshore Inc | | Oil & Gas | | -69.0% |
| 8 | | Chesapeake Energy Corp | | Oil & Gas | | -67.5% |
| 9 | | Sigma Designs Inc | | Semiconductors | | -66.9% |
| 10 | | Terra Industries Inc | | Chemicals | | -66.6% |
| | | | | | | |
Massey Energy produces and markets coal and related products for utilities, steel manufacturers, and industrial companies. The company had benefited dramatically from the surging price of coal early in the year. Emerging markets such as China had been experiencing dramatic growth, and the increased demand for coal was expected to continue with the need to generate electricity in these regions. By mid-year, however, the price of coal peaked and began a freefall that was sustained through the remainder of 2008. A far weaker global economy translates into lower demand for coal and other commodities. Even the largest coal consumer, China, has shown significant signs of a slowdown. This bear market has truly demonstrated how interwoven our world economy has become. As if the news for Massey was not bad enough, late in the year, one of its subsidiaries was fined $4.2 million for safety hazards. The settlement was the largest in the industry’s history. Massey lost over 80% in 2008 and cost the Fund over one and a third percent in return.
Sigma Designs is a chip manufacturer whose processors are used for various video applications. Its stock price plunged early in the year and by mid-March had lost over 60% of its value. At that time, the California-based company offered a lower outlook for the remainder of the year, blaming excess chip inventory at one of its major customers, Motorola, for its misfortunes. Motorola had accounted for over 25% of the sales at Sigma during the prior two quarters. Further, analysts believe that Sigma will face increased competition in chip sales for Internet Protocol TVs and Blu-ray DVDs, two significant markets for the company. Sigma cost the Fund over one and a half percent during the 12-month period.
| | |
| 14 | | Semi-Annual Report | December 31, 2008 (Unaudited) |
Aggressive Investors 1 Fund
MANAGER’S COMMENTARY (continued)
(Unaudited)
Top Ten Holdings as of December 31, 2008
Chemical companies highlighted the Fund’s top ten holdings, as four related stocks comprised the list at year-end. Two of our largest positions were also among the Fund’s top performers of the quarter (Thoratec Corp. and Bristol-Myers). No one holding accounted for greater than five percent of the net assets, indicating that the Fund was well-diversified across many companies in this difficult environment for stocks. The ten largest positions represented just over 25% of the total assets of the Fund.
| | | | | | |
| Rank | | Description | | Industry | | Percent of Net Assets |
| 1 | | Thoratec Corp | | Healthcare-Products | | 4.7% |
| 2 | | Potash Corp of Saskatchewan | | Chemicals | | 3.2% |
| 3 | | Bristol-Myers Squibb Co | | Pharmaceuticals | | 2.9% |
| 4 | | Mosaic Co | | Chemicals | | 2.9% |
| 5 | | Pfizer Inc | | Pharmaceuticals | | 2.9% |
| 6 | | Bucyrus International Inc | | Machinery-Construction & Mining | | 2.5% |
| 7 | | Terra Industries Inc | | Chemicals | | 2.1% |
| 8 | | CF Industries Holdings Inc | | Chemicals | | 2.1% |
| 9 | | Myriad Genetics Inc | | Biotechnology | | 2.0% |
| 10 | | Flir Systems Inc | | Electronics | | 1.9% |
| | | | | | | |
| | | | | | 27.2% |
Industry Sector Representation as of December 31, 2008
No sector of the economy was spared the negative returns of the past three months. Even recession-resistant utilities and consumer non-cyclical stocks were down double digits. For the full year they were each down more than 20%. Our models’ overweighting of basic materials was very costly to the Fund’s performance relative to the benchmarks. We did benefit from our models’ underweighting of financials (with some stronger stock picks), as this sector remained depressed throughout the quarter. At quarter end, the largest sector represented in both the broader market and our Fund was consumer non-cyclicals (e.g. healthcare, food, education).
| | | | | | |
| | | % of Portfolio | | % S&P 500 Index | | Difference |
Basic Materials | | 14.9% | | 3.0% | | 11.9% |
Communications | | 10.0% | | 10.9% | | -0.9% |
Consumer, Cyclical | | 5.9% | | 8.2% | | -2.3% |
Consumer, Non-cyclical | | 29.6% | | 25.2% | | 4.4% |
Energy | | 6.7% | | 13.5% | | -6.8% |
Financial | | 6.6% | | 13.0% | | -6.4% |
Industrial | | 17.0% | | 11.2% | | 5.8% |
Technology | | 7.8% | | 10.9% | | -3.1% |
Utilities | | 0.9% | | 4.1% | | -3.2% |
Diversified | | 0.0% | | 0.0% | | 0.0% |
Cash | | 0.6% | | 0.0% | | 0.6% |
| | | | | | | |
Total | | 100.0% | | 100.0% | | |
Expense Ratio Explanation—What is the Current Expense Ratio?
The Short Version: Our Fund has a “performance based” management fee which goes up and down with our performance relative to our primary market benchmark over a trailing five year period. With our recent poor relative performance, the expense ratio has dropped significantly.
Aggressive Investors 1 Fund
MANAGER’S COMMENTARY (continued)
(Unaudited)
One risk Bridgeway identified and communicated to shareholders in 2004 was that should the fund experience declining assets and underperformance against the benchmark, it might create a situation where the total management fee (base fee +/- performance fee) to the adviser is actually negative. This situation may be approaching us. In our current prospectus, the expense ratio is listed as 1.78%, of which 1.61% is the management fee. Through December 31, 2008, as presented in the financial statements later in this report, the unaudited total management fee for the fund was 0.30%, reflecting both the drop in net assets and our relative performance. However, should the fund not close the gap in performance versus the S&P 500 benchmark, the management fee could drop to 0.0% or even go negative for a period of time. This is the reason our expense ratio has dropped significantly in the recent two quarters.
Disclaimer
The views expressed here are exclusively those of Fund management. These views, including those of market sectors or individual stocks, are not meant as investment advice and should not be considered predictive in nature. Any favorable (or unfavorable) description of a holding applies only as of the quarter end, December 31, 2008, unless otherwise stated. Security positions can and do change thereafter. Discussions of historical performance do not guarantee and may not be indicative of future performance.
Market volatility can significantly affect short-term performance. The Fund is not an appropriate investment for short-term investors. Investments in the small companies within this multi-cap fund generally carry greater risk than is customarily associated with larger companies. This additional risk is attributable to a number of factors, including the relatively limited financial resources that are typically available to small companies, and the fact that small companies often have comparatively limited product lines. In addition, the stock of small companies tends to be more volatile than the stock of large companies, particularly in the short term and particularly in the early stages of an economic or market downturn. The Fund’s use of options, futures, and leverage can magnify the risk of loss in an unfavorable market, and the Fund’s use of short-sale positions can, in theory, expose shareholders to unlimited loss. Finally, the Fund exposes shareholders to “focus risk” which may add to Fund volatility through the possibility that a single company could significantly affect total return. Shareholders of the Fund, therefore, are taking on more risk than they would if they invested in the stock market as a whole.
Conclusion
Thank you for your continued investment in Aggressive Investors 1 Fund. We encourage your feedback; your reactions and concerns are extremely important to us.
Sincerely,
Your Investment Management Team
| | |
| 16 | | Semi-Annual Report | December 31, 2008 (Unaudited) |
THIS PAGE INTENTIONALLY LEFT BLANK
Aggressive Investors 1 Fund
SCHEDULE OF INVESTMENTS
Showing percentage of net assets as of December 31, 2008 (Unaudited)
| | | | | | | |
| Industry | | Company | | Shares | | Value |
|
COMMON STOCKS - 99.43% |
Apparel - 1.42% |
| | Warnaco Group, Inc.* | | 101,200 | | $ | 1,986,556 |
|
Banks - 2.76% |
| | BB&T Corp. | | 45,700 | | | 1,254,922 |
| | US Bancorp+ | | 103,800 | | | 2,596,038 |
| | | | | | | |
| | | | | | | 3,850,960 |
|
Biotechnology - 6.69% |
| | Amgen, Inc.* | | 33,200 | | | 1,917,300 |
| | Celgene Corp.* | | 37,600 | | | 2,078,528 |
| | Life Technologies Corp.* | | 107,600 | | | 2,508,156 |
| | Myriad Genetics, Inc.* | | 42,800 | | | 2,835,928 |
| | | | | | | |
| | | | | | | 9,339,912 |
|
Chemicals - 13.29% |
| | CF Industries Holdings, Inc. | | 59,100 | | | 2,905,356 |
| | Dow Chemical Co. | | 82,300 | | | 1,241,907 |
| | Monsanto Co. | | 21,100 | | | 1,484,385 |
| | Mosaic Co.+ | | 116,300 | | | 4,023,980 |
| | Potash Corp. of Saskatchewan, Inc.+# | | 60,900 | | | 4,459,098 |
| | Syngenta AG - ADR+ | | 37,900 | | | 1,483,406 |
| | Terra Industries, Inc. | | 177,570 | | | 2,960,092 |
| | | | | | | |
| | | | | | | 18,558,224 |
|
Coal - 1.56% |
| | Arch Coal, Inc.+ | | 57,100 | | | 930,159 |
| | Massey Energy Co.+ | | 90,600 | | | 1,249,374 |
| | | | | | | |
| | | | | | | 2,179,533 |
|
Commercial Services - 3.96% |
| | Apollo Group, Inc., Class A* | | 22,500 | | | 1,723,950 |
| | Corinthian Colleges, Inc.*+ | | 143,400 | | | 2,347,458 |
| | ITT Educational Services, Inc.*+ | | 15,400 | | | 1,462,692 |
| | | | | | | |
| | | | | | | 5,534,100 |
|
Computers - 1.13% |
| | Diebold, Inc. | | 56,300 | | | 1,581,467 |
|
Distribution/Wholesale - 1.25% |
| | WW Grainger, Inc.+ | | 22,100 | | | 1,742,364 |
|
Electrical Components & Equipment - 0.93% |
| | GrafTech International, Ltd.* | | 156,400 | | | 1,301,248 |
|
Electronics - 2.97% |
| | FLIR Systems, Inc.*+ | | 88,700 | | | 2,721,316 |
| | Woodward Governor Co.+ | | 62,200 | | | 1,431,844 |
| | | | | | | |
| | | | | | | 4,153,160 |
| | | | | | | |
| Industry | | Company | | Shares | | Value |
|
|
Engineering & Construction - 3.96% |
| | ABB, Ltd. - ADR+ | | 143,400 | | $ | 2,152,434 |
| | EMCOR Group, Inc.* | | 78,200 | | | 1,754,026 |
| | Fluor Corp.+ | | 36,300 | | | 1,628,781 |
| | | | | | | |
| | | | | | | 5,535,241 |
|
Environmental Control - 1.08% |
| | Tetra Tech, Inc.* | | 62,300 | | | 1,504,545 |
|
Food - 3.17% |
| | Campbell Soup Co. | | 42,400 | | | 1,272,424 |
| | General Mills, Inc. | | 26,200 | | | 1,591,650 |
| | TreeHouse Foods, Inc.* | | 57,200 | | | 1,558,128 |
| | | | | | | |
| | | | | | | 4,422,202 |
|
Gas - 0.94% |
| | The Laclede Group, Inc. | | 27,900 | | | 1,306,836 |
|
Healthcare - Products - 7.46% |
| | Cyberonics, Inc.* | | 84,100 | | | 1,393,537 |
| | St. Jude Medical, Inc.* | | 76,700 | | | 2,528,032 |
| | Thoratec Corp.*+ | | 199,800 | | | 6,491,502 |
| | | | | | | |
| | | | | | | 10,413,071 |
|
Household Products/Wares - 1.27% |
| | Tupperware Brands Corp. | | 78,200 | | | 1,775,140 |
|
Insurance - 2.80% |
| | AmTrust Financial Services, Inc. | | 209,400 | | | 2,429,040 |
| | Marsh & McLennan Cos., Inc. | | 61,100 | | | 1,482,897 |
| | | | | | | |
| | | | | | | 3,911,937 |
|
Internet - 2.63% |
| | EarthLink, Inc.*+ | | 388,100 | | | 2,623,556 |
| | Symantec Corp.* | | 78,000 | | | 1,054,560 |
| | | | | | | |
| | | | | | | 3,678,116 |
|
Iron/Steel - 0.24% |
| | Mechel - Sponsored ADR+ | | 85,300 | | | 332,670 |
|
Machinery - Construction & Mining - 2.51% |
| | Bucyrus International, Inc., Class A+ | | 189,200 | | | 3,503,984 |
|
Machinery - Diversified - 0.88% |
| | AGCO Corp.*+ | | 52,100 | | | 1,229,039 |
|
Media - 2.17% |
| | Time Warner, Inc.+ | | 164,700 | | | 1,656,882 |
| | |
| 18 | | Semi-Annual Report | December 31, 2008 (Unaudited) |
Aggressive Investors 1 Fund
SCHEDULE OF INVESTMENTS (continued)
Showing percentage of net assets as of December 31, 2008 (Unaudited)
| | | | | | | |
| Industry | | Company | | Shares | | Value |
|
Common Stocks (continued) |
Media - (continued) |
| | Walt Disney Co. | | 60,400 | | $ | 1,370,476 |
| | | | | | | |
| | | | | | | 3,027,358 |
|
Metal Fabrication - Hardware - 1.01% |
| | CIRCOR International, Inc. | | 51,542 | | | 1,417,405 |
|
Miscellaneous Manufacturing - 0.87% |
| | General Electric Co. | | 74,600 | | | 1,208,520 |
|
Oil & Gas - 2.82% |
| | Chesapeake Energy Corp. | | 65,400 | | | 1,057,518 |
| | Petroleo Brasileiro S.A. - ADR | | 68,400 | | | 1,675,116 |
| | W&T Offshore, Inc. | | 84,300 | | | 1,207,176 |
| | | | | | | |
| | | | | | | 3,939,810 |
|
Oil & Gas Services - 2.34% |
| | FMC Technologies, Inc.* | | 51,600 | | | 1,229,628 |
| | National Oilwell Varco, Inc.* | | 83,200 | | | 2,033,408 |
| | | | | | | |
| | | | | | | 3,263,036 |
|
Packaging & Containers - 1.35% |
| | Rock-Tenn Co., Class A | | 55,300 | | | 1,890,154 |
|
Pharmaceuticals - 7.03% |
| | Bristol-Myers Squibb Co. | | 174,300 | | | 4,052,475 |
| | Express Scripts, Inc.* | | 32,300 | | | 1,775,854 |
| | Pfizer, Inc. | | 225,200 | | | 3,988,292 |
| | | | | | | |
| | | | | | | 9,816,621 |
|
Retail - 3.22% |
| | Aeropostale, Inc.*+ | | 91,600 | | | 1,474,760 |
| | Home Depot, Inc. | | 73,800 | | | 1,698,876 |
| | Panera Bread Co., Class A*+ | | 25,400 | | | 1,326,896 |
| | | | | | | |
| | | | | | | 4,500,532 |
|
Savings & Loans - 1.04% |
| | Hudson City Bancorp, Inc. | | 90,600 | | | 1,445,976 |
|
Semiconductors - 4.51% |
| | Altera Corp. | | 146,000 | | | 2,439,660 |
| | Intel Corp. | | 100,100 | | | 1,467,466 |
| | QLogic Corp.* | | 178,300 | | | 2,396,352 |
| | | | | | | |
| | | | | | | 6,303,478 |
|
Software - 2.22% |
| | Cerner Corp.*+ | | 35,600 | | | 1,368,820 |
| | Oracle Corp.* | | 98,000 | | | 1,737,540 |
| | | | | | | |
| | | | | | | 3,106,360 |
| | | | | | | |
| Industry | | Company | | Shares | | Value |
|
|
Telecommunications - 5.17% |
| | AT&T, Inc. | | 53,800 | | $ | 1,533,300 |
| | Comtech Telecommunications Corp.* | | 26,300 | | | 1,205,066 |
| | MasTec, Inc.* | | 174,200 | | | 2,017,236 |
| | NII Holdings, Inc.* | | 27,970 | | | 508,495 |
| | Telephone & Data Systems, Inc. | | 61,700 | | | 1,958,975 |
| | | | | | | |
| | | | | | | 7,223,072 |
|
Transportation - 2.78% |
| | CSX Corp. | | 49,700 | | | 1,613,759 |
| | Genco Shipping & Trading, Ltd.+ | | 47,900 | | | 708,920 |
| | Kirby Corp.* | | 20 | | | 547 |
| | Norfolk Southern Corp. | | 33,000 | | | 1,552,650 |
| | | | | | | |
| | | | | | | 3,875,876 |
| | | | | | | |
| |
TOTAL COMMON STOCKS - 99.43% | | | 138,858,503 |
| | | | | | | |
(Cost $202,393,951) | | | |
| |
TOTAL INVESTMENTS - 99.32% | | $ | 138,858,503 |
(Cost $202,393,951) | | | |
Other Assets in Excess of Liabilities - 0.68% | | | 791,799 |
| | | | | | | |
NET ASSETS - 100.00% | | $ | 139,650,302 |
| | | | | | | |
| * | Non Income Producing Security. |
| + | This security or a portion of the security is out on loan at December 31, 2008. Total loaned securities had a market value of $38,667,815 at December 31, 2008. |
| # | Security subject to call option written by the Fund. |
| ADR | - American Depositary Receipt |
See Notes to Financial Statements.
Aggressive Investors 1 Fund
SCHEDULE OF OPTIONS WRITTEN
Showing percentage of net assets as of December 31, 2008 (Unaudited)
| | | | | | |
| Company | | Number
of Contracts | | Value | |
|
COVERED CALL OPTIONS WRITTEN - (0.11)% | |
Potash Corp. of Saskatchewan, Inc. | | | | | | |
Expiring January, 2009 at $70.00 | | 160 | | $ | (100,800 | ) |
Expiring March, 2009 at $70.00 | | 40 | | | (50,200 | ) |
| | | | | | |
| |
TOTAL COVERED CALL OPTIONS WRITTEN | | $ | (151,000 | ) |
| | | | | | |
(Premiums received $(166,749)) | | | | | | |
See Notes to Financial Statements.
| | |
| 20 | | Semi-Annual Report | December 31, 2008 (Unaudited) |
THIS PAGE INTENTIONALLY LEFT BLANK
Aggressive Investors 2 Fund
MANAGER’S COMMENTARY
(Unaudited)
December 31, 2008
Dear Fellow Aggressive Investors 2 Fund Shareholder,
In the midst of the worst bear market since the 1930’s, this was the worst absolute quarterly performance for both our Fund and each of our performance benchmarks since Fund inception in October 2001. It was our third worst quarter on the basis of returns relative to our primary market benchmark. Aggressive Investors 2 declined 32.58%, compared to declines of 21.94% for the S&P 500 Index (our primary market benchmark), 22.59% for the Lipper Capital Appreciation Funds Index (our peer benchmark), and 26.12% for the Russell 2000 Index of small companies. It was an awful quarter.
For the six-month “semi-annual” period ending December 31, 2008, our Fund declined 52.64%, versus declines of 28.48% for the S&P 500 Index, 35.71% for the Lipper Capital Appreciation Funds Index, and 26.94% for the Russell 2000 Index of small companies. This period was a “perfect storm” of poor positioning: a) a large number of more “growth leaning” companies (those with historical faster growing earnings, for example), b) good, but not strong enough representation among the largest “blue chip” companies that held up best, c) none of our different stock-picking models “picked up the slack” in this particular downturn, and d) especially damaging exposure to energy and chemical companies during a period when commodity prices fell off a cliff.
In some other periods of quarterly underperformance, our preceding and/or following quarters were strong enough to make up for the poor quarter. For example, our second worst quarter of underperformance, September 2006, was followed by five market-beating quarters. With the back-to-back September and December quarters, however, we have a very significant “hole” from which to work our way back.
The table below presents our December quarter, six-month, one-year, five-year and life-to-date financial results according to the formula required by the SEC. The last two quarters caused even our five year performance to lag our five year benchmarks for the first time in our history. We still lead our primary market and peer benchmark since inception. See the next page for a graph of performance from inception to December 31, 2008.
| | | | | | | | | | |
| | | Dec Qtr.
10/1/08
to 12/31/08 | | 6 Months
7/1/08
to 12/31/08 | | 1 Year
1/1/08
to 12/31/08 | | 5 Year
1/1/04
to 12/31/08 | | Life-to-Date
10/31/01
to 12/31/08 |
| | | | | |
Aggressive Investors 2 Fund | | -32.58% | | -52.64% | | -55.07% | | -2.90% | | 0.65% |
S&P 500 Index (large companies) | | -21.94% | | -28.48% | | -37.00% | | -2.19% | | -0.36% |
Lipper Capital Appreciation Funds Index | | -22.59% | | -35.71% | | -39.08% | | -1.19% | | 0.49% |
Russell 2000 Index (small companies) | | -26.12% | | -26.94% | | -33.79% | | -0.93% | | 3.49% |
Performance figures quoted in the table above and graph below represent past performance and are no guarantee of future results. The table above and the graph below do not reflect the deduction of taxes that a shareholder would pay on Fund distributions or the redemption of Fund shares.
The S&P 500 Index is a broad-based, unmanaged measurement of changes in stock market conditions based on the average of 500 widely held common stocks with dividends reinvested, while the Russell 2000 Index is an unmanaged, market value weighted index, that measures performance of the 2,000 companies that are between the 1,000th and 3,000th largest in the market with dividends reinvested. The Lipper Capital Appreciation Funds Index reflects the record of the 30 largest funds in this category, comprised of more aggressive domestic growth mutual funds, as reported by Lipper, Inc. It is not possible to invest directly in an index. Periods longer than one year are annualized.
According to data from Lipper, Inc. as of December 31, 2008, Aggressive Investors 2 Fund ranked 279th of 281 capital appreciation funds for the twelve months ending December 31, 2008, 128th of 212 over the last five years, and 84th of 182 since inception in October, 2001. Lipper, Inc. is an independent mutual fund rating service that ranks funds in various fund categories by making comparative calculations using total returns.
| | |
| 22 | | Semi-Annual Report | December 31, 2008 (Unaudited) |
Aggressive Investors 2 Fund
MANAGER’S COMMENTARY (continued)
(Unaudited)
Aggressive Investors 2 Fund vs. S&P 500 Index & Lipper Capital Appreciation Funds Index & Russell 2000 Index 10/31/01 to 12/31/08
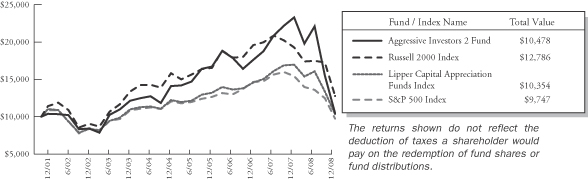
Why Was our Fund Positioned so Poorly?
Our introductory section on the previous page gives some details on the poor positioning of our Fund for this market environment, while the sections below give details of our performance at the stock level. A fair question to ask is “why the poor positioning?” While answering this question could require a lot of discussion at the level of our individual stock picking models, we’ll address it more generally in this section.
Growth companies generally fall more in a downturn; why did we hold more than a normal level? Growth companies had been significantly out of favor from 2000-2006. That trend reversed in 2007, and it looked like it might continue into 2008. From a risk perspective, we felt that growth stocks might even provide more “cushion” against a downturn than value stocks, just as small stocks provided more cushion than large stocks in the last bear market of 2000-2002. That strategy turned out not to be the case; growth stocks were much harder hit. In aggregate, our models were picking up on what appeared to be stronger relative valuations among growth stocks, which did not translate into better returns for this period, however.
Why did we own so many mid-cap companies that lagged larger ones? Our models pick stocks among all size companies, small, medium, and large ones. However, there are many more mid-cap and small-cap companies to choose from which normally leads to more holdings in this “middle range”. In the current market environment the largest ones fared best, giving an advantage to our large company weighted primary market benchmark. Actually, our models have favored large companies for the last couple of years, but our small and mid-size ones still caused a performance drag of about eleven percentage points during the quarter relative to the S&P 500 Index.
Bridgeway’s strategy is to use stock picking models of different styles that don’t all go the same direction at the same time. Why didn’t some provide more cushion? As described above, perhaps predictably, strong growth models didn’t do as well in the recent fast moving, very steep decline. On the other end of the spectrum, one of our more value-oriented models that usually does well in a downturn unfortunately picked up some distressed companies, including some financial stocks such as Bank of America. Two more technically focused models did poorly for . . . technical reasons I can’t go into detail with here. One of these was specifically designed to be less volatile than the market, but did not prove to be so this time. In summary, our Fund design includes some models that usually zig while the others zag. Unlike in previous downturns, however, these models all went the same (poor) direction at the same time.
Why did we hold so much of energy and chemicals through the downturn? These companies, as detailed below, caused the most damage to our Fund’s returns. Normally, a turnaround in fundamentals, including inputs such as precipitously falling commodity prices would result in a sell signal. However, for some models, if the stock price declines at a rate much faster than the fundamentals (e.g. net income) of a company, it may not create a sell signal in anticipation of a “bounce back.” While this has worked in most previous market environments, and contributed to the positive “bounce back” phenomenon on page 7, it added to the pain of the downturn in October and most of November.
Aggressive Investors 2 Fund
MANAGER’S COMMENTARY (continued)
(Unaudited)
Detailed Explanation of Quarterly Performance—Some stocks (slightly) cushioned the blow
The Short Version: With a dramatic December quarter downturn, there were very few stocks that helped cushion the blow. 19 of our 95 stocks had positive returns with only eight in double digits.
In a quarter where misery found plenty of company, investors had to search long and hard for winners. While every major sector declined double digits amid the credit crisis and broadening economic downturn, non-cyclical consumer stocks held up somewhat better than most. Of the top ten best performers in the Fund, five came from that sector, three of which were education-related companies. Combined, the top ten holdings contributed about one and a quarter percent to the overall performance of the Fund.
These are the ten best performers for the quarter ended December 31, 2008:
| | | | | | |
| Rank | | Description | | Industry | | % Gain |
| 1 | | Apollo Group Inc | | Commercial Services | | 30.3% |
| 2 | | Thoratec Corp | | Healthcare-Products | | 21.9% |
| 3 | | ITT Educational Services Inc | | Commercial Services | | 17.4% |
| 4 | | Broadcom Corp | | Semiconductors | | 16.2% |
| 5 | | Telephone & Data Systems Inc | | Telecommunications | | 14.5% |
| 6 | | General Electric Co | | Miscellaneous Manufacturing | | 11.9% |
| 7 | | Cerner Corp | | Software | | 11.8% |
| 8 | | Bristol-Myers Squibb Co | | Pharmaceuticals | | 11.5% |
| 9 | | Time Warner Inc | | Media | | 9.5% |
| 10 | | Corinthian Colleges Inc | | Commercial Services | | 9.1% |
| | | | | | | |
When the going gets tough, the tough…go back to school. Apollo Group was the best-performing company in the Fund over the past three months and the only one to earn greater than 30% in return. Apollo provides educational programs for high school, college, and graduate levels and operates under such brands as University of Phoenix and College for Financial Planning Institute. During the quarter, enrollment soared by just under 20%, as students realized that additional education (and degrees) could be beneficial amid the struggling job market. The company’s profits doubled in its fiscal 4th quarter, a trend that some analysts expect to continue given the ongoing sluggish economy and dire labor picture.
Detailed Explanation of Quarterly Performance—What Didn’t Work
The Short Version: Basic materials stocks (iron, chemicals) and industrial companies did the most damage in the quarter.
What happened to the commodities boom of a few quarters back? Just six months ago, the top nine performing stocks in the Fund were involved in various commodity-related industries (energy, coal, steel, mining), and each returned over 35% that quarter. When commodity prices turned around, however, the downward trend was relentless and stock prices followed suit. The global recession is widely recognized as the primary culprit, and demand for such products is expected to decline further in the foreseeable future. Eight of the Fund’s worst-performing holdings were commodity-related (steel, coal, oil, chemicals), and each fell over 50% during the quarter.
| | |
| 24 | | Semi-Annual Report | December 31, 2008 (Unaudited) |
Aggressive Investors 2 Fund
MANAGER’S COMMENTARY (continued)
(Unaudited)
These are the ten stocks that performed the worst in the quarter ended December 31, 2008:
| | | | | | |
| Rank | | Description | | Industry | | % Loss |
| 1 | | Mechel ADR | | Iron/Steel | | -77.7% |
| 2 | | Massey Energy Co | | Coal | | -61.3% |
| 3 | | Bucyrus International Inc | | Machinery-Construction & Mining | | -58.6% |
| 4 | | Energy Conversion Devices Inc | | Electrical Components & Equipment | | -57.6% |
| 5 | | Warnaco Group Inc | | Apparel | | -56.7% |
| 6 | | Swift Energy Co | | Oil & Gas | | -56.6% |
| 7 | | Cliffs Natural Resources Inc | | Iron/Steel | | -55.0% |
| 8 | | Urban Outfitters Inc | | Retail | | -52.8% |
| 9 | | Dow Chemical Co | | Chemicals | | -52.5% |
| 10 | | Steel Dynamics Inc | | Iron/Steel | | -52.2% |
| | | | | | | |
Mechel ADR is a coal mining and steel production company based in Russia. Though the company reported strong results for the first nine months of the year, its outlook for 2009 remains extremely weak, while management determines how best to cope with sluggish worldwide demand. The company said it will cut steel production by up to 25% during the year, and analysts do not foresee any imminent rebound in the price of coal, steel, and other commodities over the next few quarters. Management continues to remain optimistic about its long-term prospects and believes the company is in a great position to benefit from a global economic recovery in the future. From early-2007 to mid-2008, the stock had risen five-fold, only to give up all of those gains and more by the end of the year.
Genco Shipping and Trading Ltd. transports drybulk cargos (coal, grains, steel products, etc.) to destinations across the globe. While the bursting of the commodities’ bubble dramatically impacted miners and manufacturers of related products, it also diminished the need for shipping these goods. As such, cargo shipment rates have plunged by up to 90% since summer 2008 in some cases. In November, because of the dwindling demand for its services, Genco cancelled plans to purchase six cargo ships and will be forced to forfeit over $50 million in lost deposits. As a result, the company expects to take a $54 million hit to its bottom line in the fourth quarter. However, some analysts believe that Genco is in a better position to weather the storm than certain competitors, as it maintains longer-term contracts that produce more attractive margins.
Detailed Explanation of Calendar Year Performance—Companies With Positive Returns
The Short Version: Twenty-two of the 166 stocks we owned during the year had positive returns. Unfortunately, all but two were smaller diversifying positions. In aggregate, these 22 added about a percent and a half to our annual returns.
With all 10 S&P sectors recording sizable market losses in 2008, investors had few places to turn for relief from the equity market carnage. Still, our models found some. Each of our top ten performing stocks returned double digits and represented six different sectors, an indication that needles can be found in even the most depressing haystacks. In conjunction with the worst bear market of a lifetime, this is the “leanest” list of top annual performers in our history.
These are the ten best performers for the calendar year ended December 31, 2008:
| | | | | | |
| Rank | | Description | | Industry | | % Gain |
| 1 | | ITT Educational Services Inc | | Commercial Services | | 25.4% |
| 2 | | Thoratec Corp | | Healthcare-Products | | 21.9% |
| 3 | | Broadcom Corp | | Semiconductors | | 16.2% |
| 4 | | Telephone & Data Systems Inc | | Telecommunications | | 14.5% |
| 5 | | Range Resources Corp | | Oil & Gas | | 13.6% |
| 6 | | OSI Pharmaceuticals Inc | | Biotechnology | | 13.2% |
| 7 | | Jones Lang LaSalle Inc | | Real Estate | | 12.0% |
| 8 | | General Electric Co | | Miscellaneous Manufacturing | | 11.9% |
| 9 | | Cerner Corp | | Software | | 11.8% |
| 10 | | Gilead Sciences Inc | | Biotechnology | | 10.1% |
| | | | | | | |
Aggressive Investors 2 Fund
MANAGER’S COMMENTARY (continued)
(Unaudited)
ITT Educational Services was the Fund’s top performer of the year. This education-related company offers various postsecondary degree programs to students in such fields as information technology, electronics, drafting and design. While most industries have struggled in the weak economic times, schools have seen dramatic increases in enrollment as individuals seek to learn additional skills and make themselves more marketable to current and potential employers. ITT opened several new technical institutes during the year and expanded into Wisconsin, West Virginia, and Mississippi. The company raised its earnings guidance in July and then posted strong third-quarter results in October as total enrollment increased by 15% during that period.
Detailed Explanation of Calendar Year Performance—What Didn’t Work
The Short Version: As goes the December quarter, so goes the year.
Basic materials and energy, in almost any form, were not a good place to be in 2008; neither coal, iron, steel, oil, nor most chemicals survived the onslaught. As the global recession expanded, the commodities bubble burst, and prices plummeted. Eight of the worst ten performing companies in the Fund were engaged in some commodities-related operations (mining, drilling, production, transportation, etc.). Of our 166 holdings during 2008, 29 declined by at least 50% during 2008.
These are the ten stocks that performed the worst for the calendar year ended December 31, 2008:
| | | | | | |
| Rank | | Description | | Industry | | % Loss |
| 1 | | Mechel ADR | | Iron/Steel | | -88.8% |
| 2 | | Massey Energy Co | | Coal | | -82.5% |
| 3 | | Steel Dynamics Inc | | Iron/Steel | | -78.5% |
| 4 | | Cliffs Natural Resources Inc | | Iron/Steel | | -75.3% |
| 5 | | Arch Coal Inc | | Coal | | -72.4% |
| 6 | | NII Holdings Inc | | Telecommunications | | -67.2% |
| 7 | | Sigma Designs Inc | | Semiconductors | | -67.0% |
| 8 | | National Oilwell Varco Inc | | Oil & Gas Services | | -66.7% |
| 9 | | Terra Industries Inc | | Chemicals | | -66.5% |
| 10 | | Swift Energy Co | | Oil & Gas | | -66.3% |
| | | | | | | |
Steel Dynamics produces and sells steel products across the country. Its stock price plunged by over 50% in September and early October, though the company announced that income had risen by 92% in the third-quarter. While investors may have expected some pullback given the decline in demand for commodities, Steel Dynamic was thought to be a victim of the dramatic redemptions within the hedge fund industry due to certain funds being among its largest shareholders as of its June 2008 reports. Steel makers had been among the hedge funds’ darlings early in the year. However, when managers were forced to sell assets to raise cash and meet the high levels of redemptions faced over the last two quarters of 2008, many of these commodity-related stocks dropped far more than company fundamentals would have dictated. Steel Dynamics cost the Fund about three-quarters of a percent in return during 2008.
Taking a break from commodities, Sigma Designs is a chip manufacturer whose processors are used for various video applications. Its stock price plunged early in the year and by mid-March had lost over 60% of its value. At that time, the California-based company offered a lower outlook for the remainder of the year, blaming excess chip inventory at one of its major customers, Motorola, for its misfortunes. Motorola had accounted for over 25% of the sales at Sigma during the prior two quarters. Further, analysts believe that Sigma will face increased competition in chip sales for Internet Protocol TVs and Blu-ray DVDs, two significant markets for the company. Sigma cost the Fund over one and a half percent during the 12-month period.
Top Ten Holdings as of December 31, 2008
Chemical companies highlighted the Fund’s top ten holdings, as four related stocks comprised the list at year-end. Two of our largest positions were also among the Fund’s top performers of the quarter (Thoratec Corp. and Bristol-Myers). No one
| | |
| 26 | | Semi-Annual Report | December 31, 2008 (Unaudited) |
Aggressive Investors 2 Fund
MANAGER’S COMMENTARY (continued)
(Unaudited)
holding accounted for greater than five percent of the net assets, indicating that the Fund was well-diversified across many companies in this difficult environment for stocks. The ten largest positions represented just over 25% of the total assets of the Fund.
| | | | | | |
| Rank | | Description | | Industry | | Percent of Net Assets |
| 1 | | Pfizer Inc | | Pharmaceuticals | | 3.1% |
| 2 | | Potash Corp of Saskatchewan | | Chemicals | | 3.1% |
| 3 | | Bristol-Myers Squibb Co | | Pharmaceuticals | | 2.9% |
| 4 | | Terra Industries Inc | | Chemicals | | 2.7% |
| 5 | | ITT Educational Services Inc | | Commercial Services | | 2.7% |
| 6 | | Rock-Tenn Co | | Packaging & Containers | | 2.7% |
| 7 | | Mosaic Co | | Chemicals | | 2.4% |
| 8 | | Bucyrus International Inc | | Machinery-Construction & Mining | | 2.2% |
| 9 | | CF Industries Holdings Inc | | Chemicals | | 2.1% |
| 10 | | Myriad Genetics Inc | | Biotechnology | | 2.0% |
| | | | | | | |
| Total | | | | | | 26.0% |
Industry Sector Representation as of December 31, 2008
No sector of the economy was spared the negative returns of the past three months. Even recession-resistant utilities and consumer non-cyclical stocks were down double digits. For the full year they were each down more than 20%. Our models’ overweighting of basic materials was very costly to the Fund’s performance relative to the benchmarks. We did benefit from our models’ underweighting of financials (with some stronger stock picks), as this sector remained depressed throughout the quarter. At quarter end, the largest sector represented in both the broader market and our Fund was consumer non-cyclicals (e.g. healthcare, food, education).
| | | | | | |
| | | % of Portfolio | | % S&P 500 Index | | Difference |
Basic Materials | | 13.4% | | 3.0% | | 10.4% |
Communications | | 7.0% | | 10.9% | | -3.9% |
Consumer, Cyclical | | 7.5% | | 8.2% | | -0.7% |
Consumer, Non-cyclical | | 24.8% | | 25.2% | | -0.4% |
Energy | | 7.6% | | 13.5% | | -5.9% |
Financial | | 4.0% | | 13.0% | | -9.0% |
Industrial | | 21.9% | | 11.2% | | 10.7% |
Technology | | 13.6% | | 10.9% | | 2.7% |
Utilities | | 0.0% | | 4.1% | | -4.1% |
Diversified | | 0.0% | | 0.0% | | 0.0% |
Cash | | 0.2% | | 0.0% | | 0.2% |
| | | | | | | |
Total | | 100.0% | | 100.0% | | |
Disclaimer
The views expressed here are exclusively those of Fund management. These views, including those of market sectors or individual stocks, are not meant as investment advice and should not be considered predictive in nature. Any favorable (or unfavorable) description of a holding applies only as of the quarter end, December 31, 2008, unless otherwise stated. Security positions can and do change thereafter. Discussions of historical performance do not guarantee and are not indicative of future performance.
Aggressive Investors 2 Fund
MANAGER’S COMMENTARY (continued)
(Unaudited)
Market volatility can significantly affect short-term performance. The Fund is not an appropriate investment for short-term investors. Investments in the small companies within this multi-cap fund generally carry greater risk than is customarily associated with larger companies. This additional risk is attributable to a number of factors, including the relatively limited financial resources that are typically available to small companies, and the fact that small companies often have comparatively limited product lines. In addition, the stock of small companies tends to be more volatile than the stock of large companies, particularly in the short term and particularly in the early stages of an economic or market downturn. The Fund’s use of options, futures, and leverage can magnify the risk of loss in an unfavorable market, and the Fund’s use of short-sale positions can, in theory, expose shareholders to unlimited loss. Finally, the Fund exposes shareholders to “focus risk” which may add to Fund volatility through the possibility that a single company could significantly affect total return. Shareholders of the Fund, therefore, are taking on more risk than they would if they invested in the stock market as a whole.
Conclusion
Thank you for your continued investment in Aggressive Investors 2 Fund. We encourage your feedback; your reactions and concerns are important to us.
Sincerely,
Your Investment Management Team
| | |
| 28 | | Semi-Annual Report | December 31, 2008 (Unaudited) |
THIS PAGE INTENTIONALLY LEFT BLANK
Aggressive Investors 2 Fund
SCHEDULE OF INVESTMENTS
Showing percentage of net assets as of December 31, 2008 (Unaudited)
| | | | | | | |
| Industry | | Company | | Shares | | Value |
|
COMMON STOCKS - 99.75% |
Apparel - 1.32% |
| | Warnaco Group, Inc.* | | 252,300 | | $ | 4,952,649 |
|
Banks - 1.73% |
| | US Bancorp+ | | 260,100 | | | 6,505,101 |
|
Biotechnology - 6.81% |
| | Amgen, Inc.* | | 102,600 | | | 5,925,150 |
| | Celgene Corp.* | | 94,500 | | | 5,223,960 |
| | Life Technologies Corp.*+ | | 290,200 | | | 6,764,562 |
| | Myriad Genetics, Inc.*+ | | 116,300 | | | 7,706,038 |
| | | | | | | |
| | | | | | | 25,619,710 |
|
Chemicals - 13.20% |
| | CF Industries Holdings, Inc. | | 160,400 | | | 7,885,264 |
| | Dow Chemical Co. | | 201,000 | | | 3,033,090 |
| | Monsanto Co. | | 55,800 | | | 3,925,530 |
| | Mosaic Co.+ | | 260,400 | | | 9,009,840 |
| | Potash Corp. of Saskatchewan, Inc.+,# | | 159,199 | | | 11,656,551 |
| | Syngenta AG - ADR+ | | 97,200 | | | 3,804,408 |
| | Terra Industries, Inc. | | 620,900 | | | 10,350,403 |
| | | | | | | |
| | | | | | | 49,665,086 |
|
Coal - 1.46% |
| | Arch Coal, Inc.+ | | 138,000 | | | 2,248,020 |
| | Massey Energy Co.+ | | 235,700 | | | 3,250,303 |
| | | | | | | |
| | | | | | | 5,498,323 |
|
Commercial Services - 6.78% |
| | Apollo Group, Inc., Class A* | | 61,000 | | | 4,673,820 |
| | Corinthian Colleges, Inc.*+ | | 382,900 | | | 6,268,073 |
| | ITT Educational Services, Inc.*+ | | 107,400 | | | 10,200,852 |
| | Quanta Services, Inc.*+ | | 221,300 | | | 4,381,740 |
| | | | | | | |
| | | | | | | 25,524,485 |
|
Computers - 3.43% |
| | Diebold, Inc. | | 151,300 | | | 4,250,017 |
| | EMC Corp.* | | 470,700 | | | 4,928,229 |
| | Synaptics, Inc.*+ | | 225,500 | | | 3,734,280 |
| | | | | | | |
| | | | | | | 12,912,526 |
|
Electrical Components & Equipment - 1.23% |
| | GrafTech International, Ltd.* | | 557,500 | | | 4,638,400 |
|
Electronics - 2.92% |
| | FLIR Systems, Inc.*+ | | 244,100 | | | 7,488,988 |
| | Woodward Governor Co. | | 152,400 | | | 3,508,248 |
| | | | | | | |
| | | | | | | 10,997,236 |
| | | | | | | |
| Industry | | Company | | Shares | | Value |
|
|
Engineering & Construction - 4.43% |
| | ABB, Ltd. - ADR+ | | 334,400 | | $ | 5,019,344 |
| | EMCOR Group, Inc.* | | 325,100 | | | 7,291,993 |
| | Fluor Corp.+ | | 97,000 | | | 4,352,390 |
| | | | | | | |
| | | | | | | 16,663,727 |
|
Environmental Control - 2.45% |
| | Darling International, Inc.* | | 579,400 | | | 3,180,906 |
| | Tetra Tech, Inc.* | | 250,600 | | | 6,051,990 |
| | | | | | | |
| | | | | | | 9,232,896 |
|
Food - 2.07% |
| | Campbell Soup Co. | | 113,400 | | | 3,403,134 |
| | General Mills, Inc. | | 72,000 | | | 4,374,000 |
| | | | | | | |
| | | | | | | 7,777,134 |
|
Healthcare - Products - 3.11% |
| | St. Jude Medical, Inc.* | | 172,100 | | | 5,672,416 |
| | Thoratec Corp.*+ | | 186,100 | | | 6,046,389 |
| | | | | | | |
| | | | | | | 11,718,805 |
|
Insurance - 1.06% |
| | Marsh & McLennan Cos., Inc. | | 164,700 | | | 3,997,269 |
|
Internet - 2.58% |
| | EarthLink, Inc.*+ | | 1,009,800 | | | 6,826,248 |
| | Symantec Corp.* | | 212,900 | | | 2,878,408 |
| | | | | | | |
| | | | | | | 9,704,656 |
|
Iron/Steel - 0.23% |
| | Mechel - Sponsored ADR+ | | 222,600 | | | 868,140 |
|
Machinery - Construction & Mining - 2.20% |
| | Bucyrus International, Inc., Class A+ | | 447,600 | | | 8,289,552 |
|
Machinery - Diversified - 0.89% |
| | AGCO Corp.*+ | | 141,500 | | | 3,337,985 |
|
Media - 1.17% |
| | Time Warner, Inc.+ | | 439,000 | | | 4,416,340 |
|
Miscellaneous Manufacturing - 2.15% |
| | General Electric Co. | | 224,600 | | | 3,638,520 |
| | Parker Hannifin Corp. | | 104,900 | | | 4,462,446 |
| | | | | | | |
| | | | | | | 8,100,966 |
| | |
| 30 | | Semi-Annual Report | December 31, 2008 (Unaudited) |
Aggressive Investors 2 Fund
SCHEDULE OF INVESTMENTS (continued)
Showing percentage of net assets as of December 31, 2008 (Unaudited)
| | | | | | | |
| Industry | | Company | | Shares | | Value |
|
Common Stocks (continued) |
Oil & Gas - 4.01% |
| | Petroleo Brasileiro S.A. - ADR | | 216,200 | | $ | 5,294,738 |
| | Southwestern Energy Co.*+ | | 145,100 | | | 4,203,547 |
| | Swift Energy Co.*+ | | 159,300 | | | 2,677,833 |
| | W&T Offshore, Inc. | | 204,700 | | | 2,931,304 |
| | | | | | | |
| | | | | | | 15,107,422 |
|
Oil & Gas Services - 2.11% |
| | FMC Technologies, Inc.* | | 125,800 | | | 2,997,814 |
| | National Oilwell Varco, Inc.* | | 202,800 | | | 4,956,432 |
| | | | | | | |
| | | | | | | 7,954,246 |
|
Packaging & Containers - 2.68% |
| | Rock-Tenn Co., Class A | | 294,900 | | | 10,079,682 |
|
Pharmaceuticals - 5.99% |
| | Bristol-Myers Squibb Co. | | 465,500 | | | 10,822,875 |
| | Pfizer, Inc. | | 661,500 | | | 11,715,165 |
| | | | | | | |
| | | | | | | 22,538,040 |
|
Retail - 6.22% |
| | Aeropostale, Inc.*+ | | 250,900 | | | 4,039,490 |
| | Family Dollar Stores, Inc.+ | | 124,100 | | | 3,235,287 |
| | Gymboree Corp.* | | 198,400 | | | 5,176,256 |
| | Home Depot, Inc. | | 198,600 | | | 4,571,772 |
| | Panera Bread Co., Class A*+ | | 68,400 | | | 3,573,216 |
| | Urban Outfitters, Inc.*+ | | 188,000 | | | 2,816,240 |
| | | | | | | |
| | | | | | | 23,412,261 |
|
Savings & Loans - 1.17% |
| | Hudson City Bancorp, Inc. | | 276,600 | | | 4,414,536 |
|
Semiconductors - 4.85% |
| | Altera Corp.+ | | 383,200 | | | 6,403,272 |
| | Intel Corp. | | 263,300 | | | 3,859,978 |
| | QLogic Corp.* | | 410,300 | | | 5,514,432 |
| | United Microelectronics Corp.-Sponsored ADR+ | | 1,268,900 | | | 2,487,044 |
| | | | | | | |
| | | | | | | 18,264,726 |
|
Software - 5.29% |
| | ANSYS, Inc.*+ | | 165,300 | | | 4,610,217 |
| | Cerner Corp.*+ | | 99,000 | | | 3,806,550 |
| | Microsoft Corp. | | 219,100 | | | 4,259,304 |
| | Oracle Corp.* | | 408,300 | | | 7,239,159 |
| | | | | | | |
| | | | | | | 19,915,230 |
| | | | | | | |
| Industry | | Company | | Shares | | Value |
|
|
Telecommunications - 3.22% |
| | AT&T, Inc. | | 220,000 | | $ | 6,270,000 |
| | NII Holdings, Inc.* | | 146,500 | | | 2,663,370 |
| | Telephone & Data Systems, Inc. | | 100,067 | | | 3,177,127 |
| | | | | | | |
| | | | | | | 12,110,497 |
|
Transportation - 2.99% |
| | CSX Corp. | | 150,100 | | | 4,873,747 |
| | Norfolk Southern Corp. | | 135,700 | | | 6,384,685 |
| | | | | | | |
| | | | | | | 11,258,432 |
| |
TOTAL COMMON STOCKS - 99.75% | | | 375,476,058 |
| | | | | | | |
(Cost $563,544,797) | | | |
| | | | | | | | |
|
MONEY MARKET FUND - 0.33% | |
| | | |
| | | Rate^ | | Shares | | Value | |
BlackRock Temp Cash Liquidity Fund Institutional Shares #21 | | 1.68% | | 1,248,817 | | | 1,248,817 | |
| | | | | | | | |
TOTAL MONEY MARKET FUNDS - 0.33% | | | 1,248,817 | |
| | | | | | | | |
(Cost $1,248,817) | | | | |
| |
TOTAL INVESTMENTS - 100.02% | | $ | 376,724,875 | |
(Cost $564,793,614) | | | | |
Liabilities in Excess of Other Assets - (0.02)% | | | (306,450 | ) |
| | | | | | | | |
NET ASSETS - 100.00% | | $ | 376,418,425 | |
| | | | | | | | |
| * | Non Income Producing Security. |
| + | This security or a portion of the security is out on loan at December 31, 2008. Total loaned securities had a market value of $82,210,098 at December 31, 2008. |
| # | Security subject to call option written by the Fund. |
| ^ | Rate disclosed is as of December 31, 2008. |
| ADR | - American Depositary Receipt |
See Notes to Financial Statements.
Aggressive Investors 2 Fund
SCHEDULE OF OPTIONS WRITTEN
Showing percentage of net assets as of December 31, 2008 (Unaudited)
| | | | | | |
| Company | | Number
of Contracts | | Value | |
|
COVERED CALL OPTIONS WRITTEN - (0.06)% | |
Potash Corp. of Saskatchewan, Inc. | | | | | | |
Expiring January, 2009 at $70.00 | | 250 | | $ | (157,500 | ) |
Expiring March, 2009 at $70.00 | | 70 | | | (87,850 | ) |
| | | | | | |
| |
TOTAL COVERED CALL OPTIONS WRITTEN | | $ | (245,350 | ) |
| | | | | | |
(Premiums received $(270,338)) | | | | | | |
See Notes to Financial Statements.
| | |
| 32 | | Semi-Annual Report | December 31, 2008 (Unaudited) |
THIS PAGE INTENTIONALLY LEFT BLANK
Ultra-Small Company Fund
MANAGER’S COMMENTARY
(Unaudited)
December 31, 2008
Dear Fellow Ultra-Small Company Fund Shareholder,
In the midst of what has now become the worst bear market since the 1930’s, our Fund declined 27.19% for the December quarter. Although this was the second steepest quarterly decline in the Fund’s history, it was significantly better than the 34.77% decline of our primary market benchmark, the CRSP Cap-Based Portfolio 10 Index, and a bit better than the 27.69% decline of our peer benchmark, the Lipper Micro-Cap Stock Funds Index. We lagged the Russell 2000 Index, which is comprised of companies quite a bit larger than our tiny ones. While it’s hard to take a 27% decline any time, we are pleased with providing this much cushion against our market benchmark
For the six month semi-annual period, our Fund declined 34.56%, also providing some cushion against the 37.90% decline for CRSP Cap-Based Portfolio 10 Index. However, we lagged both of our other benchmarks: the Lipper Micro-Cap Stock Funds Index (down 33.37%) and the Russell 2000 Index of small companies (down 26.94%). The economic and market factors detailed on page 3 are the primary reasons for the Fund’s decline. Relative to our primary market benchmark, two factors helped our relative performance: superior stock picks among financial companies, and a 1.7% performance boost from holding some cash awaiting investment. Our lagging performance relative to the Russell 2000 Index was due to the fact that ultra-small companies fell farther in the downturn than those of “small” companies comprising the Russell Index. As detailed in the table on page 35, in this quarter (and in many downturns), ultra-small stocks fell the most of any size group.
For the full calendar year, our Fund declined 46.24%, compared to the 47.33% decline of the CRSP Cap-Based Portfolio 10 Index, the 42.71% decline of the Lipper Micro-Cap Stock Funds Index, and the 33.79% decline of the Russell 2000 Index. Factors contributing to this performance were very similar to the semi-annual period discussed above. This is the fourth ultra-small bear market year (2000, 2002, 2007, and 2008) that we have beaten our primary market index. We have lagged it only once in a bear market (by 1.56% in 1998).
The table below presents our December quarter, six-month, one-year, five-year, ten-year, and life-to-date financial results according to the formula required by the SEC. See the next page for a graph of performance from inception to December 31, 2008.
| | | | | | | | | | | | |
| | | Dec. Qtr.
10/1/08
to 12/31/08 | | 6 Month
7/1/08
to 12/31/08 | | 1 Year
1/1/08
to 12/31/08 | | 5 Year
1/1/04
to 12/31/08 | | 10 Year
1/1/99
to 12/31/08 | | Life-to-Date
8/5/94
to 12/31/08 |
| | | | | | |
Ultra-Small Company Fund | | -27.19% | | -34.56% | | -46.24% | | -4.19% | | 12.05% | | 13.99% |
CRSP Cap-Based Port. 10 Index | | -34.77% | | -37.90% | | -47.33% | | -6.57% | | 7.04% | | 8.46% |
Lipper Micro-Cap Stock Funds Index | | -27.69% | | -33.37% | | -42.71% | | -4.59% | | 3.00% | | NA |
Russell 2000 Index (small companies) | | -26.12% | | -26.94% | | -33.79% | | -0.93% | | 3.02% | | 6.51% |
Performance figures quoted in the table above and graph below represent past performance and are no guarantee of future results. The table above and the graph below do not reflect the deduction of taxes that a shareholder would pay on Fund distributions or the redemption of Fund shares.
The Lipper Micro-Cap Stock Funds Index is an index of micro-cap funds compiled by Lipper, Inc. The Russell 2000 Index is an unmanaged, market value weighted index, which measures performance of the 2,000 companies that are between the 1,000th and 3,000th largest in the market with dividends reinvested. The CRSP Cap-Based Portfolio 10 Index is an unmanaged index of 1,780 of the smallest publicly traded U.S. stocks (with dividends reinvested), as reported by the Center for Research on Security Prices. It is not possible to invest directly in an index. Periods longer than one year are annualized.
According to data from Lipper, Inc. as of December 31, 2008, Ultra-Small Company Fund ranked 69th of 94 micro-cap funds for the twelve months ending December 31, 2008, 35th of 70 over the last five years, 2nd of 40 over the last ten years, and 1st of 9 since inception in August, 1994. These long-term numbers and the graph below give two snapshots of our long-term success. Lipper, Inc. is an independent mutual fund rating service that ranks funds in various fund categories by making comparative calculations using total returns.
| | |
| 34 | | Semi-Annual Report | December 31, 2008 (Unaudited) |
Ultra-Small Company Fund
MANAGER’S COMMENTARY (continued)
(Unaudited)
Ultra-Small Company Fund vs. CRSP 10 Index & Lipper Micro-Cap Stock Funds Index & Russell 2000 Index Inception 8/5/94 to 12/31/08
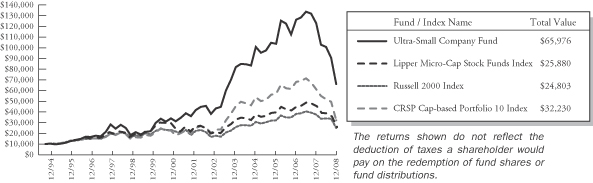
| | The Lipper Micro-Cap Stock Funds Index began on 12/31/1995 and the line graph for the Index begins at the same value as the Fund on that date. |
The Performance “Big Picture:” Large Cap Dominance Continues in a Severe Down Market
The Short Version: After leading large companies for eight years in a row from 1999 through 2006, ultra-small stocks as an asset class have been in the performance cellar versus their larger company peers in 2007 and 2008. Add to that the fact that ultra-small stocks have typically fallen farther in a downturn and the fact that 2008 was the worst bear market year since the 1930’s, and you have a formula for a pretty ugly year. Nevertheless, our Fund’s record of beating its market benchmark, especially in down years, is pretty impressive.
The table below presents short-term and long-term statistics for various size companies. There are a number of things to glean from this table. As indicated by the second, third, and fourth columns, ultra-small stocks (last row of the table) tend to be on the “tail end of the whip” in down markets, falling farther than other groups. However, they also tend to be the leaders in up markets and overall, as demonstrated by the ten-year and 83-year periods (last two columns to the right). The long-term numbers are the reason we like ultra-small stocks, although the higher historical average annual return comes at the cost of more risk, especially the risk of falling farther in a bear market. The other two things we like about ultra-small companies are their historical tendency to “bounce back” faster after downturns, and the potential to add value through quantitative stock picking, i.e. the potential to beat the CRSP 10 market by successful stock picking. This latter potential was borne out in each period of the performance table on the previous page, as we have a “clean sweep” beating our primary market benchmark. In addition, of the last fourteen calendar years, we have beaten our primary market benchmark ten times. Of the five down years for CRSP 10, we have added “cushion” (outperformed) four times, and lagged once (1998). We are very proud of this record.
| | | | | | | | | | | | |
| CRSP Decile1 | | Dec. Qtr.
10/1/08
to 12/31/08 | | Six-months
7/1/08 to
12/31/08 | | 1 Year
1/1/08
to 12/31/08 | | 5 Years
1/1/04
to 12/31/08 | | 10 Years
1/1/99
to 12/31/08 | | 83 Years
1/1/1926
to 12/31/08 |
1 (ultra-large) | | -20.2% | | -26.1% | | -35.1% | | -2.1% | | -2.2% | | 8.9% |
2 | | -24.5% | | -34.5% | | -41.9% | | -0.5% | | 1.9% | | 10.1% |
3 | | -26.5% | | -36.0% | | -40.4% | | -1.3% | | 2.5% | | 10.4% |
4 | | -24.1% | | -32.4% | | -37.1% | | -0.8% | | 2.8% | | 10.3% |
5 | | -26.0% | | -31.0% | | -35.2% | | 0.9% | | 3.3% | | 10.9% |
6 | | -28.0% | | -32.7% | | -40.0% | | -1.8% | | 3.5% | | 10.8% |
7 | | -27.6% | | -27.0% | | -36.3% | | -0.8% | | 3.5% | | 10.8% |
8 | | -26.8% | | -27.1% | | -35.6% | | -1.3% | | 5.6% | | 11.0% |
9 | | -27.2% | | -25.8% | | -36.9% | | -4.0% | | 5.5% | | 11.0% |
10 (ultra-small) | | -34.8% | | -37.9% | | -47.3% | | -6.6% | | 7.0% | | 12.3% |
1 | The CRSP Cap-Based Portfolio Indexes are unmanaged indexes of the publicly traded U.S. stocks with dividends reinvested, grouped by the market capitalization, as reported by the Center for Research in Security Prices. Past performance is no guarantee of future results. |
Ultra-Small Company Fund
MANAGER’S COMMENTARY (continued)
(Unaudited)
Detailed Explanation of Quarterly Performance—Some stocks (slightly?) cushioned the blow
The Short Version: With a dramatic December quarter downturn, we did have a few stocks that helped cushion the blow. All of our top ten stocks had significant positive returns.
In a quarter where misery found plenty of company, investors had to search long and hard for winners in their portfolios. While all economic sectors suffered negative ramifications of the credit crisis and severe downturn, non-cyclical consumer stocks held up better than most. Of the top ten best performers in the Fund, four came from that sector. These are the ten best-performing stocks for the quarter ended December 31, 2008:
| | | | | | |
| Rank | | Description | | Industry | | % Gain |
| 1 | | Spherion Corp | | Commercial Services | | 36.5% |
| 2 | | Spartan Motors Inc | | Auto Parts & Equipment | | 28.4% |
| 3 | | Kirkland’s Inc | | Retail | | 27.9% |
| 4 | | TeleCommunication Systems Inc | | Internet | | 24.3% |
| 5 | | RadNet Inc | | Healthcare-Services | | 23.5% |
| 6 | | Callon Petroleum Co | | Oil & Gas | | 23.4% |
| 7 | | Fibernet Telecom Group Inc | | Telecommunications | | 16.7% |
| 8 | | VSE Corp | | Engineering & Construction | | 16.3% |
| 9 | | Maui Land & Pineapple Co Inc | | Agriculture | | 14.3% |
| 10 | | Almost Family Inc | | Healthcare-Services | | 13.7% |
| | | | | | | |
In the midst of stunningly awful headlines about auto manufacturers and their suppliers, it seems inconceivable that our second best performer could be an auto parts supplier. Read on. This manufacturing company designs and produces chassis for fire trucks and military vehicles and includes major defense contractors like BAE Systems and General Dynamics among its customers. In December, one of its subsidiary companies settled a legal matter with the Department of Justice over terms of a military contract and agreed to pay fines and penalties totaling $6 million. During the review period in advance of the agreement, Spartan revised its code of conduct and compliance, named a new chief compliance officer, and hired a new general counsel. Because of these measures and the resolution of all civil and criminal matters, Spartan expects to remain a major supplier to its defense customers. Its stock rose 20% after the announcement and investors were again able to focus on the strong annual revenue and earnings growth of the past three years.
Detailed Explanation of Quarterly Performance—What Didn’t Work
The Short Version: While plummeting energy prices took a bite out of our returns in the December quarter, industrial companies (manufacturing, electronics, and transportation) did even more damage.
In mid-summer, oil prices surged to $146/barrel, and many analysts were calling for $200 and beyond. What a difference a few quarters makes. Over the past six months, the commodities bubbles burst, and crude prices plummeted to a low in December of $31/barrel, a 79% drop. Virtually every company with ties to the energy sector plunged in value. Still, the carnage among small companies was wide spread as demonstrated by the table below. During the quarter, 21 holdings lost over 50% in value.
These are the ten stocks that performed the worst in the quarter ended December 31, 2008:
| | | | | | |
| Rank | | Description | | Industry | | % Loss |
| 1 | | Conexant Systems Inc | | Semiconductors | | -78.0% |
| 2 | | BMB Munai Inc | | Oil & Gas | | -66.5% |
| 3 | | China Direct Inc | | Commercial Services | | -65.6% |
| 4 | | NN Inc | | Metal Fabricate/Hardware | | -64.9% |
| 5 | | Chyron International Corp | | Electronics | | -63.4% |
| 6 | | LIN TV Corp | | Media | | -62.0% |
| 7 | | Dawson Geophysical Co | | Oil & Gas Services | | -61.9% |
| 8 | | Mitcham Industries Inc | | Oil & Gas Services | | -60.7% |
| 9 | | CombiMatrix Corp | | Biotechnology | | -59.0% |
| 10 | | CTI Industries Corp | | Miscellaneous Manufacturing | | -58.9% |
| | | | | | | |
| | |
| 36 | | Semi-Annual Report | December 31, 2008 (Unaudited) |
Ultra-Small Company Fund
MANAGER’S COMMENTARY (continued)
(Unaudited)
Conexant Systems was the Fund’s worst performer during the period and lost 78% in return. Like so many technology-related firms, this semiconductor company struggled over the past three months from lackluster sales and canceled orders. During these recessionary times, consumers and businesses alike are hesitant to upgrade technology and make many related purchases. Conexant lowered its quarterly outlook in October and then again in December, as demand for its products continued to decline. The company sold off some non-core assets to raise cash and improve its balance sheet, though the moves did little to generate investor enthusiasm. Conexant cost the Fund over a percent in return during the quarter.
Detailed Explanation of Calendar Year Performance—Companies With Positive Returns
The Short Version: Forty-eight of the 252 companies we held during the calendar year had positive returns. With all ten S&P sectors recording sizable market losses in 2008, investors had few places to turn for relief from the equity market carnage. Fortunately, our models uncovered some positive-performing companies that produced nice results during the year. Nine different industries in five different sectors were represented on the list, an indication that needles can be found in even the most depressing haystacks. These ten companies contributed about three and a half percent to the return of the Fund during 2008.
These are the ten best performers for the calendar year ended December 31, 2008:
| | | | | | |
| Rank | | Description | | Industry | | % Gain |
| 1 | | Crawford & Co | | Insurance | | 163.0% |
| 2 | | Almost Family Inc | | Healthcare-Services | | 82.6% |
| 3 | | TeleCommunication Systems Inc | | Internet | | 72.1% |
| 4 | | PetMed Express Inc | | Retail | | 60.1% |
| 5 | | Eagle Test Systems Inc | | Semiconductors | | 53.3% |
| 6 | | HQ Sustainable Maritime Industries Inc | | Food | | 44.6% |
| 7 | | Spherion Corp | | Commercial Services | | 36.5% |
| 8 | | Moldflow Corp | | Software | | 36.4% |
| 9 | | Westwood Holdings Group Inc | | Diversified Financial Services | | 34.9% |
| 10 | | Ezcorp Inc | | Retail | | 32.1% |
| | | | | | | |
One more reason to be nice to your kids…they will be choosing your nursing home. Almost Family provides home health and eldercare services across the eastern half of the country. As baby-boomers age and move into their twilight years, the demand for assisted living and homecare services has grown dramatically. Almost Family has benefited significantly from this trend. In August, the company closed on its $45 million acquisition of Patient Care, a move expected to generate substantial revenues immediately. Almost Family added locations in Connecticut, New Jersey, and Pennsylvania during the year and reported an 84% increase in quarterly revenue in November. The company was named the 24th Best Small Company in America by Forbes Magazine in October and contributed over three-quarters of a percent to the return of the Fund in 2008.
Detailed Explanation of Calendar Year Performance—What Didn’t Work
The Short Version: Investors would love to forget about 2008, as nothing seemed to work and all sectors were hindered by the economic downturn and financial crisis. Even though we beat our primary market benchmark, 41 of the 252 companies we held at some point during the year fell 50% or more. Each of the ten worst performers dropped at least 70% in value, and combined they cost the Fund over five percent in return. While financial companies took the brunt of the negativity early, energy and other commodities contributed losses during the second half of the year, and consumer-driven companies suffered late as the economy moved further into recession.
Ultra-Small Company Fund
MANAGER’S COMMENTARY (continued)
(Unaudited)
These are the ten stocks that performed the worst for the calendar year ended December 31, 2008:
| | | | | | |
| Rank | | Description | | Industry | | % Loss |
| 1 | | China Direct Inc | | Commercial Services | | -80.2% |
| 2 | | Rainier Pacific Financial Group Inc | | Savings & Loans | | -77.8% |
| 3 | | Conexant Systems Inc | | Semiconductors | | -77.6% |
| 4 | | WSI Industries Inc | | Hand/Machine Tools | | -76.2% |
| 5 | | BMB Munai Inc | | Oil & Gas | | -74.4% |
| 6 | | Chyron International Corp | | Electronics | | -73.4% |
| 7 | | Crimson Exploration Inc | | Oil & Gas | | -72.4% |
| 8 | | Centrue Financial Corp | | Banks | | -72.3% |
| 9 | | Art’s-Way Manufacturing Co Inc | | Machinery-Diversified | | -71.8% |
| 10 | | BluePhoenix Solutions Ltd | | Computers | | -71.0% |
| | | | | | | |
Rainier Pacific Financial, a Tacoma Washington-based savings bank, was the Fund’s second worst performer during 2008. The institution suffered from the depressed national real estate market and ongoing deterioration of its construction loan portfolio. Rainier Pacific posted a loss of $3 million in the 3rd quarter and increased its provision for loan loss reserves in anticipation of additional defaults and write-downs in the periods to come. The bank is heavily tied to the residential housing market, which has shown no signs of rebounding in the near future. Its stock price began falling in February 2008 and closed around an all-time low at the end of the year. Rainier Pacific was one of four holdings to lose over three-quarters of its market value during the twelve-month period.
Top Ten Holdings as of December 31, 2008
Three of the Fund’s largest holdings were among its top performers of the quarter: Almost Family, Telecommunications Systems, and VSE Corp. The Fund was well-diversified with eight different industries represented on the top holdings list. Combined, these ten companies accounted for less than 30% of the Fund’s net asset with no single company representing greater than 5%.
| | | | | | |
| Rank | | Description | | Industry | | Percent of
Net Assets |
| 1 | | American Physicians Capital Inc | | Insurance | | 4.8% |
| 2 | | Almost Family Inc | | Healthcare-Services | | 3.6% |
| 3 | | Ezcorp Inc - Class A | | Retail | | 3.2% |
| 4 | | Telecommunication Systems Inc | | Internet | | 3.1% |
| 5 | | VSE Corp | | Engineering & Construction | | 3.1% |
| 6 | | AZZ Inc | | Miscellaneous Manufacturing | | 3.0% |
| 7 | | NVE Corp | | Electronics | | 2.5% |
| 8 | | VNUS Medical Technologies Inc | | Healthcare-Products | | 2.4% |
| 9 | | Einstein Noah Restaurant Group Inc | | Retail | | 1.9% |
| 10 | | Dollar Financial Corp | | Commercial Services | | 1.6% |
| | | | | | | |
| Total | | | | | | 29.2% |
Industry Sector Representation as of December 31, 2008
Virtually no sector was spared the negativity of the past three months (and full year, for that matter). Our models’ overweighting of energy (which plummeted) and underweighting of utilities (which held up better than all other sectors) cost the Fund a couple of percentage points of return. Offsetting this were some relatively strong stock picks among financial companies (banks and insurance companies), as well as the cushioning effect of cash, being held awaiting new data and model picks. Surprisingly, our models’ overall underweighting financials slightly hurt our relative performance during the quarter and the year, as ultra-small banks and insurance companies held up much better than larger companies in the same industries.
| | |
| 38 | | Semi-Annual Report | December 31, 2008 (Unaudited) |
Ultra-Small Company Fund
MANAGER’S COMMENTARY (continued)
(Unaudited)
| | | | | | |
| | | % of Portfolio | | % of CRSP 10 Index | | Difference |
Basic Materials | | 1.7% | | 3.6% | | -1.9% |
Communications | | 8.5% | | 10.4% | | -1.9% |
Consumer, Cyclical | | 14.0% | | 12.5% | | 1.5% |
Consumer, Non-cyclical | | 24.5% | | 20.0% | | 4.5% |
Energy | | 8.1% | | 8.4% | | -0.3% |
Financial | | 10.2% | | 22.1% | | -11.9% |
Industrial | | 23.9% | | 11.3% | | 12.6% |
Technology | | 5.3% | | 9.2% | | -3.9% |
Utilities | | 0.0% | | 0.8% | | -0.8% |
Diversified | | 0.0% | | 1.7% | | -1.7% |
Cash | | 3.8% | | 0.0% | | 3.8% |
| | | | | | | |
Total | | 100.0% | | 100.0% | | |
Disclaimer
The views expressed here are exclusively those of Fund management. These views are not meant as investment advice and should not be considered predictive in nature. Any favorable (or unfavorable) description of a holding applies only as of December 31, 2008, unless otherwise stated. Security positions can and do change thereafter. Discussions of historical performance do not guarantee and are not indicative of future performance.
The Fund is subject to very high, above market risk (volatility) and is not an appropriate investment for short-term investors. Investments in ultra-small companies generally carry greater risk than is customarily associated with larger companies and even “small companies” for various reasons such as narrower markets (fewer investors), limited financial resources and greater trading difficulty.
Conclusion
Ultra-Small Company Fund remains closed to new investors, but is open to current investors who purchase directly from Bridgeway. We encourage your feedback; your reactions and concerns are important to us.
Sincerely,
Your Investment Management Team
Ultra-Small Company Fund
SCHEDULE OF INVESTMENTS
Showing percentage of net assets as of December 31, 2008 (Unaudited)
| | | | | | | |
| Industry | | Company | | Shares | | Value |
|
COMMON STOCKS - 96.16% |
Advertising - 0.20% |
| | APAC Customer Services, Inc.* | | 100,000 | | $ | 121,000 |
|
Aerospace/Defense - 1.35% |
| | LMI Aerospace, Inc.* | | 50,000 | | | 568,500 |
| | The Allied Defense Group, Inc.* | | 39,000 | | | 241,800 |
| | | | | | | |
| | | | | | | 810,300 |
|
Agriculture - 0.48% |
| | Maui Land & Pineapple Co., Inc.* | | 21,400 | | | 287,402 |
|
Airlines - 1.13% |
| | Hawaiian Holdings, Inc.* | | 106,000 | | | 676,280 |
|
Auto Parts & Equipment - 3.11% |
| | China Automotive Systems, Inc.* | | 143,800 | | | 487,482 |
| | Spartan Motors, Inc. | | 182,468 | | | 863,073 |
| | Wonder Auto Technology, Inc.* | | 130,000 | | | 509,600 |
| | | | | | | |
| | | | | | | 1,860,155 |
|
Banks - 2.18% |
| | Centrue Financial Corp. | | 10,000 | | | 61,700 |
| | First United Corp. | | 5,700 | | | 76,836 |
| | German American Bancorp, Inc. | | 8,000 | | | 91,120 |
| | Hanmi Financial Corp. | | 239,900 | | | 494,194 |
| | Pennsylvania Commerce Bancorp, Inc.* | | 21,700 | | | 578,522 |
| | | | | | | |
| | | | | | | 1,302,372 |
|
Biotechnology - 1.16% |
| | Repligen Corp.* | | 184,300 | | | 696,654 |
|
Chemicals - 1.60% |
| | ICO, Inc.* | | 79,300 | | | 250,588 |
| | Landec Corp.* | | 107,800 | | | 709,324 |
| | | | | | | |
| | | | | | | 959,912 |
|
Commercial Services - 8.65% |
| | American CareSource Holdings, Inc.* | | 71,000 | | | 500,550 |
| | China Direct, Inc.*+ | | 172,900 | | | 250,705 |
| | Dollar Financial Corp.* | | 95,000 | | | 978,500 |
| | Intersections, Inc.* | | 20,000 | | | 104,000 |
| | Medifast, Inc.* | | 144,500 | | | 799,085 |
| | | | | | | |
| Industry | | Company | | Shares | | Value |
|
|
Commercial Services (continued) |
| | PRG-Schultz International, Inc.* | | 153,300 | | $ | 625,464 |
| | Spherion Corp.* | | 252,300 | | | 557,583 |
| | The Hackett Group, Inc.* | | 258,900 | | | 755,988 |
| | Transcend Services, Inc.* | | 61,700 | | | 605,277 |
| | | | | | | |
| | | | | | | 5,177,152 |
|
Computers - 3.22% |
| | Computer Task Group, Inc.* | | 70,000 | | | 225,400 |
| | Datalink Corp.* | | 60,000 | | | 186,600 |
| | Integral Systems, Inc.* | | 62,093 | | | 748,221 |
| | LaserCard Corp.* | | 50,000 | | | 182,000 |
| | TechTeam Global, Inc.* | | 21,600 | | | 126,360 |
| | TransAct Technologies, Inc.* | | 100,000 | | | 459,000 |
| | | | | | | |
| | | | | | | 1,927,581 |
|
Diversified Financial Services - 0.50% |
| | Advanta Corp., Class B | | 11,174 | | | 23,354 |
| | AeroCentury Corp.* | | 9,100 | | | 82,810 |
| | Broadpoint Securities Group, Inc.* | | 65,000 | | | 193,050 |
| | | | | | | |
| | | | | | | 299,214 |
|
Electrical Components & Equipment - 1.54% |
| | Advanced Battery Technologies, Inc.*+ | | 229,200 | | | 609,672 |
| | Nortech Systems, Inc.*+ | | 11,500 | | | 46,000 |
| | PowerSecure International, Inc.* | | 80,000 | | | 263,200 |
| | | | | | | |
| | | | | | | 918,872 |
|
Electronics - 5.56% |
| | Chyron International Corp.* | | 24,000 | | | 36,000 |
| | Digital Ally, Inc.*+ | | 195,900 | | | 605,331 |
| | Jinpan International, Ltd.+ | | 36,400 | | | 528,164 |
| | LaBarge, Inc.* | | 48,000 | | | 688,800 |
| | NVE Corp.*+ | | 56,100 | | | 1,465,893 |
| | | | | | | |
| | | | | | | 3,324,188 |
|
Engineering & Construction - 3.36% |
| | Argan, Inc.* | | 14,000 | | | 153,020 |
| | VSE Corp.+ | | 47,300 | | | 1,855,579 |
| | | | | | | |
| | | | | | | 2,008,599 |
|
Entertainment - 0.09% |
| | Gaming Partners International Corp.* | | 10,000 | | | 51,300 |
| | |
| 40 | | Semi-Annual Report | December 31, 2008 (Unaudited) |
Ultra-Small Company Fund
SCHEDULE OF INVESTMENTS (continued)
Showing percentage of net assets as of December 31, 2008 (Unaudited)
| | | | | | | |
| Industry | | Company | | Shares | | Value |
|
Common Stocks (continued) |
Environmental Control - 0.70% |
| | Industrial Services of America, Inc. | | 79,000 | | $ | 416,330 |
|
Food - 1.05% |
| | Overhill Farms, Inc.* | | 149,600 | | | 626,824 |
|
Hand/Machine Tools - 1.48% |
| | K-Tron International, Inc.* | | 4,300 | | | 343,570 |
| | LS Starrett Co., Class A | | 18,000 | | | 289,800 |
| | WSI Industries, Inc. | | 82,800 | | | 254,196 |
| | | | | | | |
| | | | | | | 887,566 |
|
Healthcare - Products - 4.15% |
| | Cardiac Science Corp.* | | 30,800 | | | 231,000 |
| | Northstar Neuroscience, Inc.* | | 300,000 | | | 363,000 |
| | Vascular Solutions, Inc.* | | 53,000 | | | 478,060 |
| | Vnus Medical Technologies, Inc.* | | 86,800 | | | 1,407,896 |
| | | | | | | |
| | | | | | | 2,479,956 |
|
Healthcare - Services - 5.98% |
| | Almost Family, Inc.*+ | | 47,400 | | | 2,132,052 |
| | America Service Group, Inc.* | | 63,000 | | | 674,100 |
| | Continucare Corp.* | | 71,000 | | | 149,810 |
| | NovaMed, Inc.*+ | | 80,000 | | | 276,800 |
| | RadNet, Inc.* | | 102,700 | | | 344,045 |
| | | | | | | |
| | | | | | | 3,576,807 |
|
Insurance - 6.44% |
| | American Physicians Capital, Inc. | | 59,550 | | | 2,864,355 |
| | Crawford & Co., Class B*+ | | 31,200 | | | 453,648 |
| | Meadowbrook Insurance Group, Inc. | | 83,000 | | | 534,520 |
| | | | | | | |
| | | | | | | 3,852,523 |
|
Internet - 4.69% |
| | Bidz.com, Inc.*+ | | 100,600 | | | 462,760 |
| | iPass, Inc.* | | 170,700 | | | 208,254 |
| | TeleCommunication Systems, Inc., Class A* | | 219,100 | | | 1,882,069 |
| | Zix Corp.*+ | | 213,200 | | | 253,708 |
| | | | | | | |
| | | | | | | 2,806,791 |
|
Investment Companies - 1.06% |
| | Medallion Financial Corp. | | 60,000 | | | 457,800 |
| | Triangle Capital Corp.+ | | 17,300 | | | 173,692 |
| | | | | | | |
| | | | | | | 631,492 |
| | | | | | | |
| Industry | | Company | | Shares | | Value |
|
|
Machinery - Diversified - 0.58% |
| | Adept Technology, Inc.* | | 17,356 | | $ | 65,085 |
| | Presstek, Inc.* | | 87,000 | | | 279,270 |
| | | | | | | |
| | | | | | | 344,355 |
|
Media - 0.50% |
| | LIN TV Corp., Class A* | | 221,300 | | | 241,217 |
| | Saga Communications, Inc., Class A* | | 35,000 | | | 57,750 |
| | | | | | | |
| | | | | | | 298,967 |
|
Metal Fabrication - Hardware - 2.56% |
| | Hawk Corp., Class A* | | 54,500 | | | 904,700 |
| | NN, Inc. | | 10,100 | | | 23,129 |
| | North American Galvanizing & Coatings, Inc.* | | 157,333 | | | 602,585 |
| | | | | | | |
| | | | | | | 1,530,414 |
|
Mining - 0.08% |
| | United States Lime & Minerals, Inc.* | | 2,100 | | | 50,295 |
|
Miscellaneous Manufacturing - 4.02% |
| | AZZ, Inc.* | | 71,300 | | | 1,789,630 |
| | CTI Industries Corp.* | | 23,500 | | | 47,000 |
| | LSB Industries, Inc.* | | 53,000 | | | 440,960 |
| | Portec Rail Products, Inc. | | 18,000 | | | 130,140 |
| | | | | | | |
| | | | | | | 2,407,730 |
|
Oil & Gas - 3.42% |
| | Adams Resources & Energy, Inc. | | 18,000 | | | 306,000 |
| | BMB Munai, Inc.*+ | | 219,900 | | | 305,661 |
| | Callon Petroleum Co.* | | 116,100 | | | 301,860 |
| | Crimson Exploration, Inc.* | | 30,000 | | | 93,000 |
| | Double Eagle Petroleum Co.*+ | | 54,000 | | | 379,080 |
| | FieldPoint Petroleum Corp.* | | 121,000 | | | 278,300 |
| | GeoResources, Inc.*+ | | 37,600 | | | 326,744 |
| | Royale Energy, Inc.* | | 20,700 | | | 57,960 |
| | | | | | | |
| | | | | | | 2,048,605 |
|
Oil & Gas Services - 4.66% |
| | Bolt Technology Corp.* | | 80,025 | | | 556,974 |
| | Boots & Coots International Well Control, Inc.* | | 586,810 | | | 692,436 |
| | Dawson Geophysical Co.* | | 26,400 | | | 470,184 |
| | Mitcham Industries, Inc.* | | 52,300 | | | 207,631 |
| | Natural Gas Services Group, Inc.* | | 84,800 | | | 859,024 |
| | | | | | | |
| | | | | | | 2,786,249 |
Ultra-Small Company Fund
SCHEDULE OF INVESTMENTS (continued)
Showing percentage of net assets as of December 31, 2008 (Unaudited)
| | | | | | | |
| Industry | | Company | | Shares | | Value |
|
Common Stocks (continued) |
Packaging & Containers - 0.93% |
| | UFP Technologies, Inc.* | | 105,100 | | $ | 555,979 |
|
Pharmaceuticals - 3.01% |
| | Hi-Tech Pharmacal Co., Inc.* | | 66,300 | | | 367,302 |
| | Matrixx Initiatives, Inc.* | | 49,500 | | | 816,255 |
| | Schiff Nutrition International, Inc.* | | 45,000 | | | 268,650 |
| | Spectrum Pharmaceuticals, Inc.* | | 240,000 | | | 350,400 |
| | | | | | | |
| | | | | | | 1,802,607 |
|
Retail - 9.67% |
| | Allion Healthcare, Inc.* | | 85,500 | | | 352,260 |
| | America’s Car-Mart, Inc.*+ | | 65,100 | | | 899,031 |
| | Einstein Noah Restaurant Group, Inc.* | | 193,600 | | | 1,113,200 |
| | EZCORP, Inc., Class A* | | 127,818 | | | 1,944,112 |
| | Kirkland’s, Inc.* | | 73,000 | | | 193,450 |
| | PetMed Express, Inc.* | | 34,538 | | | 608,905 |
| | Sport Supply Group, Inc., Class A | | 95,800 | | | 670,600 |
| | | | | | | |
| | | | | | | 5,781,558 |
|
Semiconductors - 0.87% |
| | GSI Technology, Inc.* | | 70,000 | | | 191,800 |
| | Mindspeed Technologies, Inc.* | | 119,500 | | | 97,990 |
| | Ramtron International Corp.* | | 99,000 | | | 182,160 |
| | Richardson Electronics, Ltd. | | 16,000 | | | 47,200 |
| | | | | | | |
| | | | | | | 519,150 |
|
Software - 1.17% |
| | Ebix, Inc.*+ | | 29,400 | | | 702,660 |
|
Telecommunications - 3.11% |
| | Applied Signal Technology, Inc. | | 49,800 | | | 893,412 |
| | Communications Systems, Inc. | | 10,900 | | | 85,020 |
| | Fibernet Telecom Group, Inc.*+ | | 55,211 | | | 579,715 |
| | Hypercom Corp.* | | 280,000 | | | 302,400 |
| | | | | | | |
| | | | | | | 1,860,547 |
|
Textiles - 0.04% |
| | Forward Industries, Inc. | | 11,100 | | | 24,753 |
|
Transportation - 1.70% |
| | Air T., Inc. | | 20,000 | | | 118,000 |
| | CAI International, Inc.* | | 36,000 | | | 114,120 |
| | USA Truck, Inc.* | | 56,900 | | | 784,651 |
| | | | | | | |
| | | | | | | 1,016,771 |
| | | | | | | |
| Industry | | Company | | Shares | | Value |
|
|
Trucking & Leasing - 0.16% |
| | Willis Lease Finance Corp.* | | 10,000 | | $ | 92,700 |
| | | | | | | |
| |
TOTAL COMMON STOCKS - 96.16% | | | 57,522,610 |
| | | | | | | |
(Cost $73,993,972) | | | |
| | | | | | | | |
|
MONEY MARKET FUND - 5.85% | |
| | | |
| | | Rate^ | | Shares | | Value | |
BlackRock Liquidity Funds TempFund Portfolio #24 | | 1.61% | | 614,166 | | | 614,166 | |
BlackRock Temp Cash Liquidity Fund Institutional Shares #21 | | 1.68% | | 2,888,199 | | | 2,888,199 | |
| | | | | | | | |
| |
TOTAL MONEY MARKET FUND - 5.85% | | | 3,502,365 | |
| | | | | | | | |
(Cost $3,502,365) | | | | | | | | |
| |
TOTAL INVESTMENTS - 102.01% | | $ | 61,024,975 | |
(Cost $77,496,337) | | | | | | | | |
Liabilities in Excess of Other Assets - (2.01)% | | | (1,204,688 | ) |
| | | | | | | | |
NET ASSETS - 100.00% | | $ | 59,820,287 | |
| | | | | | | | |
| * | Non Income Producing Security. |
| + | This security or a portion of the security is out on loan at December 31, 2008. Total loaned securities had a market value of $7,823,129 at December 31, 2008. |
| ^ | Rate disclosed is as of December 31, 2008. |
See Notes to Financial Statements.
| | |
| 42 | | Semi-Annual Report | December 31, 2008 (Unaudited) |
THIS PAGE INTENTIONALLY LEFT BLANK
Ultra-Small Company Market Fund
MANAGER’S COMMENTARY
(Unaudited)
December 31, 2008
Dear Fellow Ultra-Small Company Market Fund Shareholder,
In the midst of what has now become the worst bear market since the 1930’s, our Fund declined 27.93% for the December quarter. Although this was the steepest quarterly decline in the Fund’s history, it was significantly better than the 34.77% decline of our primary market benchmark, the CRSP Cap-Based Portfolio 10 Index. Nevertheless, it slightly lagged the 27.69% decline of our peer benchmark, the Lipper Micro-Cap Stock Funds Index, and the 26.12% decline of the Russell 2000 Index, which is comprised of companies quite a bit larger than our tiny ones. While it’s hard to take a 27% decline any time, we are pleased with providing this much cushion against the ultra-small company bear market.
For the six month semi-annual period, our Fund declined 29.81%, also providing some cushion against the 37.90% decline for CRSP Cap-Based Portfolio 10 Index and the 33.37% decline of the Lipper Micro-Cap Stock Funds Index. However, we lagged the Russell 2000 Index of small companies (down 26.94%). The economic and market factors detailed on page 3 are the primary reasons for the Fund’s decline. In addition, ultra-small companies tend to fall farther in a bear market than both small companies, which comprise the Russell 2000 Index, and especially larger companies which comprise the broader market indexes. Relative to our primary market benchmark, our strategy of trying to “sidestep” or avoid companies we believe might go bankrupt was predictably quite successful in this bear market and recession.
For the full calendar year, our Fund declined 39.49%, compared to the 47.33% decline of the CRSP Cap-Based Portfolio 10 Index and the 42.71% decline of the Lipper Micro-Cap Stock Funds Index, and the 33.79% decline of the Russell 2000 Index. Factors contributing to this performance were very similar to the semi-annual period discussed above. This is the fifth ultra-small company bear market calendar year since inception of the Fund. We have beaten our primary market benchmark in every single one of these years (1998, 2000, 2002, 2007), and now, the big test, 2008—one we won’t forget anytime soon.
The table below presents our December quarter, six-month, one-year, five-year, ten-year, and life-to-date financial results according to the formula required by the SEC. See the next page for a graph of performance from inception to December 31, 2008.
| | | | | | | | | | | | |
| | | Dec. Qtr. 10/1/08
to 12/31/08 | | Six-month 7/1/08
to 12/31/08 | | 1 Year 1/1/08
to 12/31/08 | | 5 Year 1/1/04
to 12/31/08 | | 10 Year 1/1/99
to 12/31/08 | | Life-to-Date 7/31/97
to 12/31/08 |
| | | | | | |
Ultra-Small Company Market Fund | | -27.93% | | -29.81% | | -39.49% | | -4.42% | | 9.44% | | 8.01% |
CRSP Cap-Based Port. 10 Index | | -34.77% | | -37.90% | | -47.33% | | -6.57% | | 7.04% | | 5.60% |
Lipper Micro-Cap Stock Funds Index | | -27.69% | | -33.37% | | -42.71% | | -4.59% | | 3.00% | | 2.86% |
Russell 2000 Index (small companies) | | -26.12% | | -26.94% | | -33.79% | | -0.93% | | 3.02% | | 2.94% |
Performance figures quoted in the table above and graph below represent past performance and are no guarantee of future results. The table above and the graph below do not reflect the deduction of taxes that a shareholder would pay on Fund distributions or the redemption of Fund shares.
The Lipper Micro-Cap Stock Funds Index is an index of micro-cap funds compiled by Lipper, Inc. The Russell 2000 Index is an unmanaged, market value weighted index, which measures performance of the 2,000 companies that are between the 1,000th and 3,000th largest in the market with dividends reinvested. The CRSP Cap-Based Portfolio 10 Index is an unmanaged index of 1,780 of the smallest publicly traded U.S. stocks (with dividends reinvested), as reported by the Center for Research on Security Prices. It is not possible to invest directly in an index. Periods longer than one year are annualized.
According to data from Lipper, Inc. as of December 31, 2008, Ultra-Small Company Market Fund ranked 33rd of 94 micro-cap funds for the twelve months ending December 31, 2008, 37th of 70 over the last five years, 6th of 40 over the last ten years, and 6th of 30 since inception in July 1997. These long-term numbers and the graph below give two snapshots of our long-term success. Lipper, Inc. is an independent mutual fund rating service that ranks funds in various fund categories by making comparative calculations using total returns.
| | |
| 44 | | Semi-Annual Report | December 31, 2008 (Unaudited) |
Ultra-Small Company Market Fund
MANAGER’S COMMENTARY (continued)
(Unaudited)
Ultra-Small Company Market Fund vs. CRSP 10 Index & Lipper Micro-Cap Stock Funds Index & Russell 2000 Index Inception 7/31/97 to 12/31/08
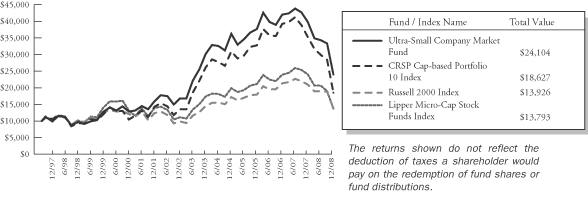
The Performance “Big Picture:” Large-Cap Dominance Continues in a Severe Down Market
The Short Version: After leading large companies for eight years in a row from 1999 through 2006, ultra-small stocks as an asset class have been in the performance cellar versus their larger company peers in 2007 and 2008. Add to that the fact that ultra-small stocks have typically fallen farther in a downturn and the fact that 2008 was the worst bear market year since the 1930’s, and you have a formula for a pretty ugly year.
The table below presents short-term and long-term statistics for various size companies. There are a number of things to glean from this table. As indicated by the second, third, and fourth columns, ultra-small stocks (last row of the table) tend to be on the “tail end of the whip” in down markets, falling farther than other groups. However, they also tend to be the leaders in up markets and overall, as demonstrated by the ten-year and 83-year periods (last two columns to the right). The long-term numbers are the reason we like ultra-small stocks, although the higher historical average annual return comes at the cost of more risk, especially the risk of falling farther in a bear market. The other two things we like about ultra-small companies are their historical tendency to “bounce back” faster after downturns, and the potential to add value through quantitative stock picking, i.e. the potential to beat the CRSP 10 market by successful stock picking. This latter potential was borne out in each period of the performance table on the previous page, as we have a “clean sweep” beating our primary market benchmark. In addition, of the last fourteen calendar years, we have beaten our primary market benchmark ten times. Of the five down years for CRSP 10, we have added “cushion” (outperformed) four times, and lagged once (1998). We are very proud of this record.
| | | | | | | | | | | | |
| CRSP Decile1 | | Dec. Qtr.
10/1/08
to 12/31/08 | | Six-Months
7/1/08
to 12/31/08 | | 1 Year
1/1/08
to 12/31/08 | | 5 Years
1/1/04
to 12/31/08 | | 10 Years
1/1/99
to 12/31/08 | | 83 Years
1/1/1926
to 12/31/08 |
1 (ultra-large) | | -20.2% | | -26.1% | | -35.1% | | -2.1% | | -2.2% | | 8.9% |
2 | | -24.5% | | -34.5% | | -41.9% | | -0.5% | | 1.9% | | 10.1% |
3 | | -26.5% | | -36.0% | | -40.4% | | -1.3% | | 2.5% | | 10.4% |
4 | | -24.1% | | -32.4% | | -37.1% | | -0.8% | | 2.8% | | 10.3% |
5 | | -26.0% | | -31.0% | | -35.2% | | 0.9% | | 3.3% | | 10.9% |
6 | | -28.0% | | -32.7% | | -40.0% | | -1.8% | | 3.5% | | 10.8% |
7 | | -27.6% | | -27.0% | | -36.3% | | -0.8% | | 3.5% | | 10.8% |
8 | | -26.8% | | -27.1% | | -35.6% | | -1.3% | | 5.6% | | 11.0% |
9 | | -27.2% | | -25.8% | | -36.9% | | -4.0% | | 5.5% | | 11.0% |
10 (ultra-small) | | -34.8% | | -37.9% | | -47.3% | | -6.6% | | 7.0% | | 12.3% |
1 | The CRSP Cap-Based Portfolio Indexes are unmanaged indexes of the publicly traded U.S. stocks with dividends reinvested, grouped by the market capitalization, as reported by the Center for Research in Security Prices. Past performance is no guarantee of future results. |
Ultra-Small Company Market Fund
MANAGER’S COMMENTARY (continued)
(Unaudited)
Providing Some Protection in the Down Years
The Short Version: “Protection” would probably be a wild overstatement; “cushion” against the downturn would be more accurate. Nevertheless, our Fund’s perfect record of beating its market benchmark in bear market calendar years is very impressive and has significantly “tweaked” the risk and return of our asset class in a direction favorable to shareholders. Since inception in 1997, we have outperformed both the CRSP 10 Index of ultra-small companies and the Russell 2000 Index of small companies with less downside risk than both. That’s a powerful combination.
| | | | | | | | |
| Year | | Fund | | CRSP 10 | | Difference | | Bear? |
1998 | | -1.8% | | -11.6% | | 9.8% | | bear |
1999 | | 31.5% | | 28.1% | | 3.4% | | bull |
2000 | | 0.7% | | -12.9% | | 13.6% | | bear |
2001 | | 24.0% | | 36.8% | | -12.8% | | bull |
2002 | | 4.9% | | -5.5% | | 10.4% | | bear |
2003 | | 79.4% | | 92.4% | | -13.0% | | bull |
2004 | | 20.1% | | 18.6% | | 1.5% | | bull |
2005 | | 4.1% | | 5.9% | | -1.8% | | bull |
2006 | | 11.5% | | 19.5% | | -8.0% | | bull |
2007 | | -5.4% | | -9.9% | | 4.5% | | bear |
2008 | | -39.5% | | -47.3% | | 7.8% | | bear |
Average (Life to Date) | | 8.0% | | 5.6% | | 2.4% | | |
The table above shows our record of performance versus our primary market benchmark of ultra-small companies. We consider our Fund to be mostly passively managed. We seek to match the industry and sector representation and other characteristics of the CRSP Index by choosing a representative sample of companies from the same universe. However, we try to add some value (or at least not to destroy value) with a) excellent trading execution, e.g., not paying brokers too much for the stocks we buy, and b) by trying to avoid companies at higher risk of going bankrupt. This latter effort has an interesting aspect of potentially adding slightly to returns over the long haul, but also providing some cushion just when you need it: in a down market. Good questions are, “how much more return?” and “how much less risk?”
To the first question, there is a definitive answer. Since inception, we have outperformed our index by 2.4% per year. This is probably slightly misleading as a long-term benchmark, however, since the period both began and ended with a bear market, the environment favorable to our Fund on a relative basis. If you “take out” 2008, we beat the CRSP 10 Index by about 1.3%/year, which we think is a more realistic number.
The risk side of the equation is quite a bit “dicier,” since there are no universally accepted measures of risk. One measure is beta, or market risk. Versus the CRSP 10 Index, our Fund has been about 19% less risky. Interestingly, on this measure we are also less risky (about 3%) than the Russell 2000 Index of small companies. If we look at total magnitude of decline in down markets, our Fund has been 20% less risky than the CRSP 10 Index, and about 6% less risky than the Russell 2000 Index. We are very pleased with these results.
Detailed Explanation of Quarterly Performance—Some stocks (slightly) cushioned the blow
The Short Version: With a dramatic December quarter downturn, we did have a few stocks that helped cushion the blow. All of our top ten stocks had significant positive returns.
| | |
| 46 | | Semi-Annual Report | December 31, 2008 (Unaudited) |
Ultra-Small Company Market Fund
MANAGER’S COMMENTARY (continued)
(Unaudited)
In a quarter where misery found plenty of company, investors had to search long and hard for winners in their portfolios. While virtually all sectors suffered negative ramifications of the credit crisis and severe downturn in the economy, the Fund held multiple winners from various industries that performed quite well during the past three months. In fact, ten industries in six different sectors were represented in the list of best performers. These are the ten best performers for the quarter ended December 31, 2008:
| | | | | | |
| Rank | | Description | | Industry | | % Gain |
| 1 | | Dolan Media Co | | Media | | 79.1% |
| 2 | | BankAtlantic Bancorp Inc | | Savings & Loans | | 64.3% |
| 3 | | Westmoreland Coal Co | | Coal | | 53.8% |
| 4 | | Hot Topic Inc | | Retail | | 40.2% |
| 5 | | Comverge Inc | | Energy-Alternate Sources | | 37.2% |
| 6 | | Virginia Commerce Bancorp | | Banks | | 30.7% |
| 7 | | Spartan Motors Inc | | Auto Parts & Equipment | | 28.7% |
| 8 | | Dynamics Research Corp | | Computers | | 25.2% |
| 9 | | Unica Corp | | Software | | 24.6% |
| 10 | | HMS Holdings Corp | | Commercial Services | | 24.4% |
| | | | | | | |
With retailers across the country crying doom and gloom over the recessionary times, Hot Topic somehow managed to buck the negative trend. While many consumers have avoided the malls and restricted purchases to only the necessities of life, the products sold by this teen apparel company have become “must buys” despite the economic downturn. Hot Topics has realized increased demand for its clothing and merchandise tied to the latest in music trends and pop culture. It reported strong sales in both October and November and raised its quarterly outlook, something few other retailers have been able to do. Its stock closed at a new 52-week high to end 2008.
Detailed Explanation of Quarterly Performance—What Didn’t Work
The Short Version: The carnage was deep and broad.
When all ten of the worst performing stocks in a Fund lose over 75% in value…that constitutes a very tough quarter for equities. This mostly passively-managed Fund is well-diversified across the sectors, and no industry was spared from the market carnage. Financials, energy, and retail may have garnered much of the negative talk from market pundits, but technology, communications, healthcare and others were all caught up in the economic downturn during the past three months as well. Six different sectors were represented in the list of poor performers. These are the ten stocks that performed the worst in the quarter ended December 31, 2008:
| | | | | | |
| Rank | | Description | | Industry | | % Loss |
| 1 | | Xerium Technologies Inc | | Forest Products & Paper | | -89.8% |
| 2 | | Cerus Corp | | Healthcare-Products | | -83.4% |
| 3 | | Consumer Portfolio Services Inc | | Diversified Financial Services | | -82.7% |
| 4 | | Commercial Vehicle Group Inc | | Auto Parts & Equipment | | -82.1% |
| 5 | | United Community Financial Corp | | Savings & Loans | | -81.5% |
| 6 | | NMT Medical Inc | | Healthcare-Products | | -81.1% |
| 7 | | Avigen Inc | | Biotechnology | | -81.0% |
| 8 | | Dot Hill Systems Corp | | Computers | | -79.2% |
| 9 | | NN Inc | | Metal Fabricate/Hardware | | -77.5% |
| 10 | | Dover Motorsports Inc | | Entertainment | | -76.2% |
NN, Inc. produces various metals, plastics, and rubber products for manufacturers across the globe. The company experienced a dramatic decline in demand for its products in the recession, particularly among its automotive-related customers. Additionally, its European business suffered when the dire economic times spread abroad. In November, management reduced both its 4th quarter and full-2008 outlooks and announced plans to substantially lower operating costs. NN will shut down a facility is Kilkenny, Ireland and predicts a quarterly charge of over $5 million for severance and other closing costs.
Ultra-Small Company Market Fund
MANAGER’S COMMENTARY (continued)
(Unaudited)
Detailed Explanation of Calendar Year Performance—Companies With Positive Returns
The Short Version: 146 of the 711 companies we held during the calendar year had positive returns.
For energy companies, 2008 was a tale of two markets. Oil prices soared to $146/barrel in the first half of the year, only to dive dramatically to a low of $31/barrel in December. Other commodities followed a similar price trek. Surprisingly, three of our best Fund performers were commodity-related and experienced great returns during our early year holding period. One advantage of ultra-small stocks is that they can sometimes create lucrative niche markets that do well even in a downturn. Six of our top performers doubled (or more) in value, with the best increasing over 300% during the time we owned it in 2008.
These are the ten best performers for the calendar year ended December 31, 2008.
| | | | | | |
| Rank | | Description | | Industry | | % Gain |
| 1 | | James River Coal Co | | Coal | | 339.5% |
| 2 | | Clayton Williams Energy Inc | | Oil & Gas | | 167.6% |
| 3 | | Encysive Pharmaceuticals Inc | | Pharmaceuticals | | 165.6% |
| 4 | | Finish Line | | Retail | | 132.6% |
| 5 | | Almost Family Inc | | Healthcare-Services | | 132.3% |
| 6 | | Fuel Systems Solutions Inc | | Auto Parts & Equipment | | 129.3% |
| 7 | | Dolan Media Co | | Media | | 79.1% |
| 8 | | Contango Oil & Gas Co | | Oil & Gas | | 72.9% |
| 9 | | Collagenex Pharmaceuticals Inc | | Pharmaceuticals | | 72.1% |
| 10 | | Criticare Systems Inc | | Healthcare-Products | | 68.2% |
| | | | | | | |
One more reason to be nice to your kids…they will be choosing your nursing home. Almost Family provides home health and eldercare services across the eastern half of the country. As baby-boomers age and move into their twilight years, the demand for assisted living and homecare services has grown dramatically. Almost Family has benefited significantly from this trend. In August, the company closed on its $45 million acquisition of Patient Care, a move expected to generate substantial revenues immediately. Almost Family added locations in Connecticut, New Jersey, and Pennsylvania during the year and reported an 84% increase in quarterly revenue in November. The company was named the 24th Best Small Company in America by Forbes Magazine in October and contributed over three-quarters of a percent to the return of the Fund in 2008.
Detailed Explanation of Calendar Year Performance—What Didn’t Work
The Short Version: Perhaps not surprisingly, finance-related companies heavily populated our worst performers list for the calendar year.
Much of the current negative economic and market conditions stem from the subprime mortgage debacle and other problems with poor lending and toxic securities at the nation’s financial companies. While the negativity has spread to all other sectors, financials continue to struggle in this depressed environment. Five of the worst performers for 2008 were financial services-related and, combined, they cost this passively-managed Fund about a half a percent in return.
These are the ten stocks that performed the worst for the calendar year ended December 31, 2008:
| | | | | | |
| Rank | | Description | | Industry | | % Loss |
| 1 | | Keryx Biopharmaceuticals Inc | | Pharmaceuticals | | -93.0% |
| 2 | | Rainier Pacific Financial Group Inc | | Savings & Loans | | -90.5% |
| 3 | | Consumer Portfolio Services Inc | | Diversified Financial Services | | -88.1% |
| 4 | | Federal Agricultural Mortgage Corp | | Diversified Financial Services | | -86.7% |
| 5 | | Commercial Vehicle Group Inc | | Auto Parts & Equipment | | -86.3% |
| 6 | | Xerium Technologies Inc | | Forest Products & Paper | | -85.9% |
| 7 | | DEI Holdings Inc | | Distribution/Wholesale | | -84.9% |
| 8 | | Cerus Corp | | Healthcare-Products | | -84.4% |
| 9 | | Pacific State Bancorp | | Banks | | -83.9% |
| 10 | | Beverly Hills Bancorp Inc | | Banks | | -82.8% |
| | | | | | | |
| | |
| 48 | | Semi-Annual Report | December 31, 2008 (Unaudited) |
Ultra-Small Company Market Fund
MANAGER’S COMMENTARY (continued)
(Unaudited)
Rainier Pacific Financial, a Tacoma Washington-based savings bank, was the Fund’s second worst performer during 2008. The institution suffered from the depressed national real estate market and ongoing deterioration of its construction loan portfolio. Rainier Pacific posted a loss of $3 million in the 3rd quarter and increased its provision for loan loss reserves in anticipation of additional defaults and write-downs in the periods to come. The bank is heavily tied to the residential housing market, which has shown no signs of rebounding in the near future. Its stock price began falling in February 2008 and closed around an all-time low at the end of the year. Rainier Pacific lost over 90% during the calendar year 2008.
Top Ten Holdings as of December 31, 2008
Because this passively-managed fund is designed to generally track the ultra-small-cap index (CRSP 10), no one company comprises too high a percentage of its assets. In fact, the top ten holdings represent less than twelve percent of overall Fund net assets and no stock accounts for greater than one-and-a-half percent. The only way a stock makes this list is by appreciation, since we never buy as much as even a half percent of net assets in a single stock.
| | | | | | |
| Rank | | Description | | Industry | | Percent of
Net Assets |
| 1 | | Axsys Technologies Inc | | Electronics | | 1.5% |
| 2 | | Ezcorp Inc | | Retail | | 1.4% |
| 3 | | Spartan Stores Inc | | Food | | 1.2% |
| 4 | | PetMed Express Inc | | Retail | | 1.2% |
| 5 | | Hub Group Inc | | Transportation | | 1.1% |
| 6 | | Cal-Maine Foods Inc | | Food | | 1.1% |
| 7 | | Hot Topic Inc | | Retail | | 1.1% |
| 8 | | HMS Holdings Corp | | Commercial Services | | 1.1% |
| 9 | | Cryolife Inc | | Healthcare-Products | | 1.1% |
| 10 | | Standard Parking Corp | | Commercial Services | | 1.0% |
| | | | | | | |
| | | | | | 11.8% |
Industry Sector Representation as of December 31, 2008
Virtually no sector was spared the negativity of the past three months (and full year, for that matter). Despite the ongoing problems faced by banks and other financial services companies given the credit crisis and economic recession, financials represented the largest sector allocation for both our Fund and the CRSP 10 Index. Typically, any differences in the sector weightings between the Fund and the index will be slight, and we are continually, but gradually working to bring the sector weights back in line with the underlying Index. At December 31, the largest sectors were finance and consumer non-cyclicals.
| | | | | | |
| | | % of Portfolio | | % CRSP 10 Index | | Difference |
Basic Materials | | 2.6% | | 3.6% | | -1.0% |
Communications | | 8.8% | | 10.4% | | -1.6% |
Consumer, Cyclical | | 13.4% | | 12.5% | | 0.9% |
Consumer, Non-cyclical | | 21.3% | | 20.0% | | 1.3% |
Energy | | 5.2% | | 8.4% | | -3.2% |
Financial | | 25.6% | | 22.1% | | 3.5% |
Industrial | | 10.7% | | 11.3% | | -0.6% |
Technology | | 7.0% | | 9.2% | | -2.2% |
Utilities | | 1.4% | | 0.8% | | 0.6% |
Diversified | | 0.4% | | 1.7% | | -1.3% |
Cash | | 3.6% | | 0.0% | | 3.6% |
| | | | | | | |
Total | | 100.0% | | 100.0% | | |
Ultra-Small Company Market Fund
MANAGER’S COMMENTARY (continued)
(Unaudited)
Disclaimer
The views expressed here are exclusively those of Fund management. These views are not meant as investment advice and should not be considered predictive in nature. Any favorable (or unfavorable) description of a holding applies only as of December 31, 2008, unless otherwise stated. Security positions can and do change thereafter. Discussions of historical performance do not guarantee and are not indicative of future performance.
The Fund is subject to very high, above market risk (volatility) and is not an appropriate investment for short-term investors. Investments in ultra-small companies generally carry greater risk than is customarily associated with larger companies and even “small companies” for various reasons such as narrower markets (fewer investors), limited financial resources and greater trading difficulty.
Conclusion
Thank you for your continued investment in Ultra-Small Company Market Fund. We encourage your feedback; your reactions and concerns are important to us.
Sincerely,
Your Investment Management Team
| | |
| 50 | | Semi-Annual Report | December 31, 2008 (Unaudited) |
THIS PAGE INTENTIONALLY LEFT BLANK
Ultra-Small Company Market Fund
SCHEDULE OF INVESTMENTS
Showing percentage of net assets as of December 31, 2008 (Unaudited)
| | | | | | | |
| Industry | | Company | | Shares | | Value |
|
COMMON STOCKS - 95.22% |
Advertising - 0.10% |
| | APAC Customer Services, Inc.* | | 265,500 | | $ | 321,255 |
|
Aerospace/Defense - 0.06% |
| | Astronics Corp.* | | 900 | | | 8,010 |
| | Astronics Corp., Class B* | | 11,017 | | | 94,636 |
| | CPI Aerostructures, Inc.* | | 15,300 | | | 84,150 |
| | | | | | | |
| | | | | | | 186,796 |
|
Agriculture - 0.01% |
| | AgFeed Industries, Inc.*+ | | 25,001 | | | 40,252 |
|
Airlines - 0.69% |
| | Hawaiian Holdings, Inc.* | | 348,000 | | | 2,220,240 |
|
Apparel - 0.48% |
| | Cherokee, Inc.+ | | 15,880 | | | 275,518 |
| | Tandy Brands Accessories, Inc.(a) | | 13,600 | | | 18,360 |
| | Unifi, Inc.* | | 441,900 | | | 1,246,158 |
| | | | | | | |
| | | | | | | 1,540,036 |
|
Auto Parts & Equipment - 1.56% |
| | Commercial Vehicle Group, Inc.* | | 16,229 | | | 15,093 |
| | Dorman Products, Inc.* | | 41,100 | | | 542,520 |
| | Fuel Systems Solutions, Inc.*+ | | 81,750 | | | 2,678,130 |
| | Spartan Motors, Inc. | | 382,600 | | | 1,809,698 |
| | | | | | | |
| | | | | | | 5,045,441 |
|
Banks - 12.55% |
| | Abigail Adams National Bancorp | | 22,220 | | | 55,772 |
| | Arrow Financial Corp. | | 109,545 | | | 2,753,961 |
| | Bancorp Rhode Island, Inc. | | 70,800 | | | 1,500,960 |
| | Capitol Bancorp, Ltd.+ | | 137,820 | | | 1,074,996 |
| | Cass Information Systems, Inc. | | 70,317 | | | 2,141,856 |
| | Center Bancorp, Inc. | | 68,342 | | | 559,038 |
| | Centrue Financial Corp. | | 31,200 | | | 192,504 |
| | Financial Institutions, Inc. | | 78,000 | | | 1,119,300 |
| | First Community Bancshares, Inc. | | 35,796 | | | 1,248,207 |
| | First Security Group, Inc. | | 106,900 | | | 493,878 |
| | First South Bancorp, Inc.+ | | 43,306 | | | 543,923 |
| | Gateway Financial Holdings, Inc.+ | | 87,654 | | | 512,776 |
| | Guaranty Federal Bancshares, Inc. | | 62,556 | | | 332,172 |
| | Irwin Financial Corp.*+ | | 197,971 | | | 255,383 |
| | Lakeland Financial Corp. | | 77,388 | | | 1,843,382 |
| | MainSource Financial Group, Inc. | | 143,600 | | | 2,225,800 |
| | | | | | | |
| Industry | | Company | | Shares | | Value |
|
|
Banks (continued) |
| | Mercantile Bank Corp. | | 77,894 | | $ | 334,944 |
| | Merchants Bancshares, Inc. | | 17,800 | | | 334,462 |
| | Midwest Banc Holdings, Inc.+ | | 262,900 | | | 368,060 |
| | MidWestOne Financial Group, Inc. | | 36,681 | | | 364,609 |
| | Northeast Bancorp | | 4,700 | | | 33,887 |
| | Oriental Financial Group, Inc. | | 239,900 | | | 1,451,395 |
| | PAB Bankshares, Inc.+ | | 1,301 | | | 5,724 |
| | Pacific Mercantile Bancorp | | 20,700 | | | 101,430 |
| | Pacific State Bancorp*+ | | 26,386 | | | 50,133 |
| | Pennsylvania Commerce Bancorp, Inc.* | | 27,751 | | | 739,842 |
| | Peoples Bancorp, Inc. | | 59,120 | | | 1,130,966 |
| | Pinnacle Financial Partners, Inc.* | | 63,700 | | | 1,898,897 |
| | Republic First Bancorp, Inc.* | | 174,900 | | | 1,539,120 |
| | Sierra Bancorp+ | | 75,000 | | | 1,575,000 |
| | Smithtown Bancorp, Inc.+ | | 70,730 | | | 1,133,802 |
| | Southcoast Financial Corp.* | | 27,099 | | | 113,274 |
| | Southside Bancshares, Inc. | | 107,670 | | | 2,530,245 |
| | State Bancorp, Inc. | | 34,500 | | | 336,030 |
| | Sterling Bancorp | | 183,400 | | | 2,573,102 |
| | Suffolk Bancorp | | 27,397 | | | 984,374 |
| | Superior Bancorp*+ | | 59,792 | | | 189,541 |
| | Tennessee Commerce Bancorp, Inc.*+ | | 40,981 | | | 245,476 |
| | Union Bankshares Corp. | | 8,099 | | | 200,855 |
| | United Security Bancshares+ | | 101,707 | | | 1,177,767 |
| | Univest Corp. of Pennsylvania+ | | 57,865 | | | 1,859,781 |
| | Virginia Commerce Bancorp* | | 59,659 | | | 308,437 |
| | West Bancorporation, Inc. | | 131,378 | | | 1,609,380 |
| | West Coast Bancorp | | 83,440 | | | 549,870 |
| | | | | | | |
| | | | | | | 40,594,311 |
|
Beverages - 0.12% |
| | Peet’s Coffee & Tea, Inc.* | | 17,400 | | | 404,550 |
|
Biotechnology - 2.26% |
| | Affymax, Inc.* | | 29,303 | | | 292,737 |
| | Avigen, Inc.* | | 298,900 | | | 227,164 |
| | Discovery Laboratories, Inc.*+ | | 1,083,000 | | | 1,212,960 |
| | Dynavax Technologies Corp.* | | 214,234 | | | 179,957 |
| | Immunogen, Inc.*+ | | 423,217 | | | 1,815,601 |
| | Repligen Corp.* | | 41,134 | | | 155,486 |
| | |
| 52 | | Semi-Annual Report | December 31, 2008 (Unaudited) |
Ultra-Small Company Market Fund
SCHEDULE OF INVESTMENTS (continued)
Showing percentage of net assets as of December 31, 2008 (Unaudited)
| | | | | | | |
| Industry | | Company | | Shares | | Value |
|
Common Stocks (continued) |
Biotechnology (continued) |
| | Sangamo Biosciences, Inc.*+ | | 370,100 | | $ | 1,287,948 |
| | Seattle Genetics, Inc.*+ | | 187,455 | | | 1,675,848 |
| | Vical, Inc.*+ | | 337,600 | | | 476,016 |
| | | | | | | |
| | | | | | | 7,323,717 |
|
Building Materials - 0.16% |
| | Comfort Systems USA, Inc. | | 43,900 | | | 465,340 |
| | US Home Systems, Inc.* | | 16,067 | | | 41,614 |
| | | | | | | |
| | | | | | | 506,954 |
|
Chemicals - 1.69% |
| | American Pacific Corp.* | | 35,524 | | | 285,968 |
| | American Vanguard Corp.+ | | 41,700 | | | 487,890 |
| | Balchem Corp. | | 45,675 | | | 1,137,764 |
| | ICO, Inc.* | | 182,600 | | | 577,016 |
| | Landec Corp.* | | 205,000 | | | 1,348,900 |
| | Quaker Chemical Corp. | | 99,700 | | | 1,640,065 |
| | | | | | | |
| | | | | | | 5,477,603 |
|
Coal - 0.41% |
| | James River Coal Co.*+ | | 26,074 | | | 399,714 |
| | National Coal Corp.* | | 201,400 | | | 255,778 |
| | Westmoreland Coal Co.* | | 59,675 | | | 662,393 |
| | | | | | | |
| | | | | | | 1,317,885 |
|
Commercial Services - 5.62% |
| | Carriage Services, Inc.* | | 134,500 | | | 270,345 |
| | Corvel Corp.* | | 75,433 | | | 1,658,017 |
| | Franklin Covey Co.* | | 192,400 | | | 1,164,020 |
| | Geo Group, Inc.* | | 48,863 | | | 881,000 |
| | Healthcare Services Group | | 53,325 | | | 849,467 |
| | Hill International, Inc.* | | 75,000 | | | 528,000 |
| | HMS Holdings Corp.* | | 109,700 | | | 3,457,744 |
| | Intersections, Inc.* | | 158,584 | | | 824,637 |
| | Kendle International, Inc.* | | 22,390 | | | 575,871 |
| | Multi-Color Corp. | | 88,704 | | | 1,403,297 |
| | National Research Corp.+ | | 40,300 | | | 1,167,088 |
| | RCM Technologies, Inc.* | | 84,959 | | | 91,756 |
| | Standard Parking Corp.* | | 162,200 | | | 3,136,948 |
| | Team, Inc.* | | 65,200 | | | 1,806,040 |
| | The Hackett Group, Inc.* | | 126,389 | | | 369,056 |
| | | | | | | |
| | | | | | | 18,183,286 |
|
Computers - 2.65% |
| | Cogo Group, Inc.* | | 228,100 | | | 1,108,566 |
| | Computer Task Group, Inc.* | | 92,400 | | | 297,528 |
| | Cray, Inc.* | | 101,200 | | | 210,496 |
| | Dynamics Research Corp.* | | 24,558 | | | 196,464 |
| | Integral Systems, Inc.*+ | | 124,112 | | | 1,495,550 |
| | LaserCard Corp.*+ | | 146,775 | | | 534,261 |
| | Mercury Computer Systems, Inc.* | | 60,600 | | | 382,386 |
| | | | | | | |
| Industry | | Company | | Shares | | Value |
|
|
Computers (continued) |
| | Netscout Systems, Inc.* | | 117,900 | | $ | 1,016,298 |
| | Planar Systems, Inc.* | | 146,905 | | | 89,612 |
| | RadiSys Corp.* | | 187,900 | | | 1,039,087 |
| | Rimage Corp.* | | 28,500 | | | 382,185 |
| | TechTeam Global, Inc.* | | 190,370 | | | 1,113,665 |
| | Tier Technologies, Inc., Class B* | | 39,166 | | | 211,496 |
| | TransAct Technologies, Inc.* | | 105,800 | | | 485,622 |
| | | | | | | |
| | | | | | | 8,563,216 |
|
Distribution/Wholesale - 0.60% |
| | Chindex International, Inc.* | | 121,200 | | | 963,540 |
| | Rentrak Corp.* | | 83,800 | | | 988,002 |
| | | | | | | |
| | | | | | | 1,951,542 |
|
Diversified Financial Services - 1.78% |
| | AeroCentury Corp.*(b) | | 85,700 | | | 779,870 |
| | Consumer Portfolio Services* | | 311,127 | | | 122,895 |
| | Cowen Group, Inc.* | | 32,158 | | | 200,666 |
| | Encore Capital Group, Inc.* | | 154,914 | | | 1,115,381 |
| | International Assets Holding Corp.*+ | | 33,886 | | | 290,742 |
| | Rodman & Renshaw Capital Group, Inc.*+ | | 247,958 | | | 213,244 |
| | TradeStation Group, Inc.*+ | | 245,974 | | | 1,586,532 |
| | Westwood Holdings Group, Inc.+ | | 51,200 | | | 1,454,592 |
| | | | | | | |
| | | | | | | 5,763,922 |
|
Electric Utilities - 0.72% |
| | Central Vermont Public Service Corp. | | 81,600 | | | 1,946,976 |
| | EnerNOC, Inc.* | | 39,400 | | | 293,136 |
| | Unitil Corp. | | 5,100 | | | 105,315 |
| | | | | | | |
| | | | | | | 2,345,427 |
|
Electrical Components & Equipment - 0.97% |
| | American Superconductor Corp.* | | 62,300 | | | 1,016,113 |
| | China BAK Battery, Inc.*+ | | 143,811 | | | 232,974 |
| | Fushi Copperweld, Inc.*+ | | 226,000 | | | 1,191,020 |
| | PowerSecure International, Inc.* | | 208,800 | | | 686,952 |
| | | | | | | |
| | | | | | | 3,127,059 |
|
Electronics - 1.85% |
| | Advanced Photonix, Inc., Class A* | | 76,550 | | | 51,288 |
| | Axsys Technologies, Inc.* | | 86,887 | | | 4,766,621 |
| | Measurement Specialties, Inc.* | | 104,500 | | | 726,275 |
| | Napco Security Technologies* | | 57,034 | | | 73,574 |
| | Vicon Industries, Inc.* | | 66,400 | | | 370,512 |
| | | | | | | |
| | | | | | | 5,988,270 |
Ultra-Small Company Market Fund
SCHEDULE OF INVESTMENTS (continued)
Showing percentage of net assets as of December 31, 2008 (Unaudited)
| | | | | | | |
| Industry | | Company | | Shares | | Value |
|
Common Stocks (continued) |
Energy - Alternative Sources - 0.82% |
| | Ascent Solar Technologies, Inc.*+ | | 83,000 | | $ | 312,080 |
| | Aventine Renewable Energy Holdings, Inc.* | | 400,300 | | | 260,195 |
| | Comverge, Inc.*+ | | 164,500 | | | 806,050 |
| | Hoku Scientific, Inc.*+ | | 205,387 | | | 548,384 |
| | Ocean Power Technologies, Inc.*+ | | 84,483 | | | 565,191 |
| | Plug Power, Inc.* | | 167,897 | | | 171,255 |
| | | | | | | |
| | | | | | | 2,663,155 |
|
Engineering & Construction - 1.45% |
| | ENGlobal Corp.* | | 259,200 | | | 842,400 |
| | Layne Christensen Co.* | | 81,000 | | | 1,944,810 |
| | Michael Baker Corp.* | | 51,700 | | | 1,908,247 |
| | | | | | | |
| | | | | | | 4,695,457 |
|
Entertainment - 0.35% |
| | Canterbury Park Holding Corp. | | 59,400 | | | 351,054 |
| | Dover Motorsports, Inc.+ | | 159,500 | | | 207,350 |
| | Great Wolf Resorts, Inc.* | | 30,998 | | | 47,737 |
| | Silverleaf Resorts, Inc.*+ | | 308,414 | | | 218,974 |
| | Steinway Musical Instruments* | | 18,314 | | | 320,678 |
| | | | | | | |
| | | | | | | 1,145,793 |
|
Environmental Control - 0.48% |
| | Casella Waste Systems, Inc., Class A* | | 192,634 | | | 785,947 |
| | Darling International, Inc.* | | 139,500 | | | 765,855 |
| | | | | | | |
| | | | | | | 1,551,802 |
|
Food - 3.44% |
| | Cal-Maine Foods, Inc.+ | | 126,600 | | | 3,633,420 |
| | Lifeway Foods, Inc.*+ | | 156,302 | | | 1,403,592 |
| | M&F Worldwide Corp.* | | 53,898 | | | 832,724 |
| | Spartan Stores, Inc. | | 165,457 | | | 3,846,875 |
| | Village Super Market, Inc., Class A | | 24,600 | | | 1,411,794 |
| | | | | | | |
| | | | | | | 11,128,405 |
Forest Products & Paper - 0.01% |
| | Xerium Technologies, Inc.* | | 62,373 | | | 41,166 |
|
Gas - 0.31% |
| | Chesapeake Utilities Corp. | | 31,606 | | | 994,957 |
|
Hand/Machine Tools - 0.15% |
| | LS Starrett Co., Class A | | 29,200 | | | 470,120 |
|
Healthcare - Products - 5.41% |
| | Abaxis, Inc.*+ | | 80,400 | | | 1,288,812 |
| | Atrion Corp. | | 31,792 | | | 3,087,003 |
| | | | | | | |
| Industry | | Company | | Shares | | Value |
|
|
Healthcare - Products (continued) |
| | Bovie Medical Corp.* | | 145,900 | | $ | 903,121 |
| | Cardiac Science Corp.* | | 78,123 | | | 585,922 |
| | CryoLife, Inc.*+ | | 356,000 | | | 3,456,760 |
| | Cynosure, Inc., Class A* | | 47,185 | | | 430,799 |
| | Hanger Orthopedic Group, Inc.* | | 146,317 | | | 2,123,060 |
| | Natus Medical, Inc.* | | 66,800 | | | 865,060 |
| | Span-America Medical Systems, Inc. | | 47,900 | | | 455,529 |
| | Utah Medical Products, Inc. | | 49,900 | | | 1,095,305 |
| | Vnus Medical Technologies, Inc.* | | 106,000 | | | 1,719,320 |
| | Zoll Medical Corp.* | | 78,700 | | | 1,486,643 |
| | | | | | | |
| | | | | | | 17,497,334 |
|
Healthcare - Services - 2.51% |
| | Alliance Imaging, Inc.* | | 335,992 | | | 2,677,856 |
| | Almost Family, Inc.*+ | | 11,600 | | | 521,768 |
| | Amedisys, Inc.*+ | | 67,560 | | | 2,792,931 |
| | America Service Group, Inc.* | | 93,000 | | | 995,100 |
| | Nighthawk Radiology Holdings, Inc.* | | 97,200 | | | 472,392 |
| | NovaMed, Inc.*+ | | 194,400 | | | 672,624 |
| | | | | | | |
| | | | | | | 8,132,671 |
|
Holding Companies - Diversified - 0.41% |
| | GSC Acquisition Co.*+ | | 127,592 | | | 1,199,365 |
| | Resource America, Inc., Class A | | 31,731 | | | 126,924 |
| | | | | | | |
| | | | | | | 1,326,289 |
|
Home Builders - 0.51% |
| | Amrep Corp.* | | 17,100 | | | 534,888 |
| | M/I Homes, Inc. | | 19,800 | | | 208,692 |
| | Nobility Homes, Inc.(a) | | 16,300 | | | 128,933 |
| | Palm Harbor Homes, Inc.* | | 116,229 | | | 578,820 |
| | Skyline Corp. | | 10,041 | | | 200,720 |
| | | | | | | |
| | | | | | | 1,652,053 |
|
Home Furnishings - 0.01% |
| | Koss Corp. | | 4,138 | | | 38,483 |
|
Insurance - 2.47% |
| | Donegal Group, Inc., Class A | | 53,750 | | | 901,388 |
| | Hallmark Financial Services* | | 88,400 | | | 775,268 |
| | Investors Title Co. | | 56,432 | | | 2,107,735 |
| | Meadowbrook Insurance Group, Inc. | | 185,200 | | | 1,192,688 |
| | Mercer Insurance Group, Inc. | | 144,257 | | | 1,823,408 |
| | NYMAGIC, Inc.+ | | 62,000 | | | 1,181,100 |
| | | | | | | |
| | | | | | | 7,981,587 |
| | |
| 54 | | Semi-Annual Report | December 31, 2008 (Unaudited) |
Ultra-Small Company Market Fund
SCHEDULE OF INVESTMENTS (continued)
Showing percentage of net assets as of December 31, 2008 (Unaudited)
| | | | | | | |
| Industry | | Company | | Shares | | Value |
|
Common Stocks (continued) |
Internet - 3.48% |
| | A.D.A.M., Inc.* | | 125,700 | | $ | 502,800 |
| | ActivIdentity Corp.* | | 453,900 | | | 812,481 |
| | Art Technology Group, Inc.* | | 586,137 | | | 1,131,244 |
| | drugstore.com, Inc.*+ | | 819,834 | | | 1,016,594 |
| | Entrust, Inc.* | | 248,074 | | | 391,957 |
| | Health Grades, Inc.* | | 162,679 | | | 335,119 |
| | Insure.com, Inc.* | | 30,400 | | | 85,728 |
| | Keynote Systems, Inc.* | | 147,400 | | | 1,136,454 |
| | Lionbridge Technologies, Inc.* | | 516,595 | | | 645,744 |
| | LookSmart, Ltd.* | | 390,080 | | | 635,830 |
| | New Motion, Inc.* | | 145,173 | | | 166,949 |
| | PC-TEL, Inc. | | 143,000 | | | 939,510 |
| | Perficient, Inc.* | | 186,138 | | | 889,740 |
| | SumTotal Systems, Inc.* | | 429,730 | | | 1,220,433 |
| | SupportSoft, Inc.* | | 168,000 | | | 374,640 |
| | TheStreet.com, Inc. | | 335,500 | | | 972,950 |
| | | | | | | |
| | | | | | | 11,258,173 |
|
Investment Companies - 0.38% |
| | Medallion Financial Corp. | | 161,400 | | | 1,231,482 |
|
Iron/Steel - 0.47% |
| | Friedman Industries | | 98,300 | | | 656,644 |
| | General Steel Holdings, Inc.*+ | | 2,271 | | | 8,948 |
| | Great Northern Iron Ore Property+ | | 12,000 | | | 858,000 |
| | | | | | | |
| | | | | | | 1,523,592 |
|
Leisure Time - 0.20% |
| | GameTech International, Inc.* | | 149,290 | | | 216,471 |
| | Nautilus, Inc.* | | 197,700 | | | 436,917 |
| | | | | | | |
| | | | | | | 653,388 |
|
|
Lodging - 0.17% |
| | Lodgian, Inc.* | | 122,500 | | | 260,925 |
| | Monarch Casino & Resort, Inc.* | | 2,185 | | | 25,455 |
| | Red Lion Hotels Corp.* | | 110,194 | | | 262,262 |
| | | | | | | |
| | | | | | | 548,642 |
|
Machinery - Diversified - 1.00% |
| | Hurco Cos, Inc.*+ | | 82,556 | | | 990,672 |
| | Presstek, Inc.* | | 110,757 | | | 355,530 |
| | Twin Disc, Inc. | | 272,800 | | | 1,879,592 |
| | | | | | | |
| | | | | | | 3,225,794 |
|
Media - 1.12% |
| | Acacia Research Corp.* | | 73,509 | | | 223,468 |
| | DG FastChannel, Inc.* | | 64,184 | | | 801,016 |
| | Dolan Media Co.*+ | | 246,700 | | | 1,625,753 |
| | | | | | | |
| Industry | | Company | | Shares | | Value |
|
|
Media (continued) |
| | Global Traffic Network, Inc.* | | 27,874 | | $ | 162,784 |
| | LIN TV Corp., Class A* | | 233,823 | | | 254,867 |
| | PRIMEDIA, Inc. | | 254,837 | | | 552,996 |
| | | | | | | |
| | | | | | | 3,620,884 |
|
Metal Fabrication - Hardware - 1.19% |
| | Ampco-Pittsburgh Corp. | | 68,387 | | | 1,483,998 |
| | Furmanite Corp.* | | 151,200 | | | 814,968 |
| | Hawk Corp., Class A* | | 56,600 | | | 939,560 |
| | NN, Inc. | | 60,200 | | | 137,858 |
| | Northwest Pipe Co.* | | 11,347 | | | 483,496 |
| | | | | | | |
| | | | | | | 3,859,880 |
|
Mining - 0.40% |
| | United States Lime & Minerals, Inc.* | | 53,700 | | | 1,286,115 |
|
Miscellaneous Manufacturing - 1.27% |
| | AZZ, Inc.* | | 34,100 | | | 855,910 |
| | Flanders Corp.*+ | | 85,183 | | | 399,508 |
| | Park-Ohio Holdings Corp.* | | 98,597 | | | 608,344 |
| | PMFG, Inc.* | | 102,000 | | | 975,120 |
| | Raven Industries, Inc. | | 35,600 | | | 857,960 |
| | Spire Corp.*+ | | 55,700 | | | 286,298 |
| | TriMas Corp.* | | 89,000 | | | 122,820 |
| | | | | | | |
| | | | | | | 4,105,960 |
|
Oil & Gas - 1.96% |
| | Adams Resources & Energy, Inc. | | 22,300 | | | 379,100 |
| | ATP Oil & Gas Corp.*+ | | 29,600 | | | 173,160 |
| | BMB Munai, Inc.*+ | | 362,839 | | | 504,346 |
| | Brigham Exploration Co.* | | 388,500 | | | 1,243,200 |
| | Double Eagle Petroleum Co.* | | 93,900 | | | 659,178 |
| | GeoMet, Inc.* | | 259,900 | | | 447,028 |
| | GeoResources, Inc.*+ | | 37,134 | | | 322,695 |
| | RAM Energy Resources, Inc.*+ | | 556,522 | | | 489,739 |
| | Royale Energy, Inc.* | | 93,856 | | | 262,797 |
| | Teton Energy Corp.* | | 116,200 | | | 113,876 |
| | Vaalco Energy, Inc.* | | 236,200 | | | 1,757,328 |
| | | | | | | |
| | | | | | | 6,352,447 |
|
Oil & Gas Services - 1.97% |
| | Bolt Technology Corp.*+ | | 155,763 | | | 1,084,110 |
| | Boots & Coots International Well Control, Inc.* | | 542,700 | | | 640,386 |
| | Dawson Geophysical Co.* | | 15,799 | | | 281,380 |
| | Lufkin Industries, Inc. | | 63,842 | | | 2,202,549 |
| | Matrix Service Co.* | | 32,632 | | | 250,287 |
| | Mitcham Industries, Inc.* | | 161,700 | | | 641,949 |
| | Natural Gas Services Group, Inc.* | | 67,966 | | | 688,496 |
Ultra-Small Company Market Fund
SCHEDULE OF INVESTMENTS (continued)
Showing percentage of net assets as of December 31, 2008 (Unaudited)
| | | | | | | |
| Industry | | Company | | Shares | | Value |
|
Common Stocks (continued) |
Oil & Gas Services (continued) |
| | Omni Energy Services Corp.* | | 49,041 | | $ | 58,359 |
| | Trico Marine Services, Inc.*+ | | 114,100 | | | 510,027 |
| | | | | | | |
| | | | | | | 6,357,543 |
|
Packaging & Containers - 0.34% |
| | AEP Industries, Inc.* | | 63,000 | | | 1,107,540 |
|
Pharmaceuticals - 1.94% |
| | Anika Therapeutics, Inc.* | | 197,639 | | | 600,823 |
| | Indevus Pharmaceuticals, Inc.*+ | | 239,600 | | | 752,344 |
| | Mannatech, Inc.+ | | 90,680 | | | 222,166 |
| | Matrixx Initiatives, Inc.* | | 94,800 | | | 1,563,252 |
| | MiddleBrook Pharmaceuticals, Inc.*+ | | 450,600 | | | 675,900 |
| | Quigley Corp.*+ | | 124,000 | | | 507,160 |
| | Reliv International, Inc.+ | | 103,100 | | | 463,950 |
| | Rigel Pharmaceuticals, Inc.*+ | | 108,962 | | | 871,696 |
| | Sciclone Pharmaceuticals, Inc.*+ | | 15,200 | | | 11,248 |
| | Spectrum Pharmaceuticals, Inc.* | | 47,261 | | | 69,001 |
| | Theragenics Corp.* | | 459,131 | | | 537,183 |
| | | | | | | |
| | | | | | | 6,274,723 |
|
Real Estate - 0.64% |
| | Consolidated-Tomoka Land Co. | | 43,800 | | | 1,672,722 |
| | Stratus Properties, Inc.* | | 32,300 | | | 402,458 |
| | | | | | | |
| | | | | | | 2,075,180 |
|
Retail - 8.75% |
| | AFC Enterprises, Inc.* | | 127,732 | | | 599,063 |
| | Allion Healthcare, Inc.* | | 314,500 | | | 1,295,740 |
| | America’s Car-Mart, Inc.*+ | | 154,500 | | | 2,133,645 |
| | Buffalo Wild Wings, Inc.*+ | | 95,000 | | | 2,436,750 |
| | Einstein Noah Restaurant Group, Inc.* | | 7,195 | | | 41,371 |
| | EZCORP, Inc., Class A* | | 294,600 | | | 4,480,866 |
| | Famous Dave’s of America, Inc.* | | 172,400 | | | 499,960 |
| | Frisch’s Restaurants, Inc. | | 47,800 | | | 901,030 |
| | Fuqi International, Inc.* | | 157,900 | | | 988,454 |
| | Hastings Entertainment, Inc.* | | 79,800 | | | 138,054 |
| | Hot Topic, Inc.* | | 375,258 | | | 3,478,642 |
| | Kona Grill, Inc.* | | 89,100 | | | 196,020 |
| | Luby’s, Inc.* | | 252,700 | | | 1,058,813 |
| | PetMed Express, Inc.*+ | | 211,999 | | | 3,737,542 |
| | Pricesmart, Inc. | | 80,849 | | | 1,670,340 |
| | Retail Ventures, Inc.* | | 223,440 | | | 775,337 |
| | REX Stores Corp.* | | 66,249 | | | 534,630 |
| | Rush Enterprises, Inc., Class B* | | 65,400 | | | 535,626 |
| | | | | | | |
| Industry | | Company | | Shares | | Value |
|
|
Retail (continued) |
| | Rush Enterprises, Inc., Class A* | | 400 | | $ | 3,428 |
| | Sport Supply Group, Inc., Class A | | 178,000 | | | 1,246,000 |
| | The Finish Line, Inc., Class A | | 240,324 | | | 1,345,814 |
| | The Walking Co. Holdings, Inc.*+ | | 100,400 | | | 200,800 |
| | | | | | | |
| | | | | | | 28,297,925 |
|
Savings & Loans - 6.62% |
| | Abington Bancorp, Inc. | | 183,880 | | | 1,700,890 |
| | Anchor BanCorp Wisconsin, Inc.+ | | 171,800 | | | 474,168 |
| | BankAtlantic Bancorp, Inc., Class A+ | | 92,000 | | | 533,600 |
| | Citizens Community Bancorp, Inc. | | 90,400 | | | 623,760 |
| | Clifton Savings Bancorp, Inc.+ | | 127,300 | | | 1,509,778 |
| | ESSA Bancorp, Inc. | | 99,884 | | | 1,411,361 |
| | Fidelity Bancorp, Inc. | | 47,512 | | | 291,249 |
| | First Financial Holdings, Inc. | | 82,400 | | | 1,667,776 |
| | First Financial Northwest, Inc. | | 56,460 | | | 527,336 |
| | First Pactrust Bancorp, Inc. | | 53,800 | | | 518,632 |
| | First Place Financial Corp. | | 33,924 | | | 129,929 |
| | Harrington West Financial Group, Inc. | | 86,320 | | | 179,546 |
| | HMN Financial, Inc. | | 36,213 | | | 151,370 |
| | Home Federal Bancorp, Inc. | | 90,425 | | | 969,356 |
| | Legacy Bancorp, Inc. | | 81,700 | | | 863,569 |
| | LSB Corp. | | 76,350 | | | 564,990 |
| | OceanFirst Financial Corp. | | 159,400 | | | 2,646,040 |
| | Provident Financial Holdings, Inc.+ | | 41,100 | | | 185,772 |
| | Pulaski Financial Corp. | | 84,496 | | | 565,278 |
| | Rainier Pacific Financial Group, Inc. | | 61,400 | | | 85,960 |
| | Rockville Financial, Inc. | | 72,630 | | | 1,014,641 |
| | Rome Bancorp, Inc. | | 36,219 | | | 315,105 |
| | Teche Holding Co. | | 11,400 | | | 285,114 |
| | United Community Financial Corp. | | 246,108 | | | 221,497 |
| | United Financial Bancorp, Inc. | | 86,641 | | | 1,311,745 |
| | United Western Bancorp, Inc. | | 59,600 | | | 557,856 |
| | Westfield Financial, Inc. | | 177,274 | | | 1,829,468 |
| | WSB Holdings, Inc. | | 95,850 | | | 285,633 |
| | | | | | | |
| | | | | | | 21,421,419 |
|
Semiconductors - 2.27% |
| | Amtech Systems, Inc.* | | 22,546 | | | 83,195 |
| | Anadigics, Inc.* | | 255,258 | | | 377,782 |
| | AuthenTec, Inc.*+ | | 533,200 | | | 890,444 |
| | |
| 56 | | Semi-Annual Report | December 31, 2008 (Unaudited) |
Ultra-Small Company Market Fund
SCHEDULE OF INVESTMENTS (continued)
Showing percentage of net assets as of December 31, 2008 (Unaudited)
| | | | | | | |
| Industry | | Company | | Shares | | Value |
|
Common Stocks (continued) |
Semiconductors (continued) |
| | AXT, Inc.* | | 354,800 | | $ | 478,980 |
| | CEVA, Inc.* | | 186,900 | | | 1,308,300 |
| | Diodes, Inc.* | | 24,437 | | | 148,088 |
| | GSI Technology, Inc.* | | 201,417 | | | 551,882 |
| | Integrated Silicon Solution, Inc.* | | 297,741 | | | 485,318 |
| | Kopin Corp.* | | 290,443 | | | 592,504 |
| | Microtune, Inc.* | | 23,545 | | | 48,032 |
| | Ramtron International Corp.* | | 410,000 | | | 754,400 |
| | Richardson Electronics, Ltd. | | 92,711 | | | 273,497 |
| | Techwell, Inc.* | | 154,000 | | | 1,001,000 |
| | Virage Logic Corp.* | | 117,600 | | | 351,624 |
| | | | | | | |
| | | | | | | 7,345,046 |
|
Software - 2.13% |
| | Actuate Corp.* | | 652,030 | | | 1,930,009 |
| | AMICAS, Inc.* | | 142,502 | | | 237,978 |
| | Callidus Software, Inc.* | | 250,100 | | | 747,799 |
| | Innodata Isogen, Inc.* | | 191,306 | | | 478,265 |
| | Interactive Intelligence, Inc.* | | 168,700 | | | 1,081,367 |
| | Pervasive Software, Inc.* | | 66,292 | | | 280,415 |
| | SeaChange International, Inc.* | | 237,200 | | | 1,710,212 |
| | Unica Corp.* | | 77,300 | | | 423,604 |
| | | | | | | |
| | | | | | | 6,889,649 |
|
Telecommunications - 4.11% |
| | Anaren, Inc.* | | 55,312 | | | 660,978 |
| | Applied Signal Technology, Inc. | | 77,834 | | | 1,396,342 |
| | Communications Systems, Inc. | | 7,000 | | | 54,600 |
| | Globecomm Systems, Inc.* | | 256,800 | | | 1,409,832 |
| | HickoryTech Corp. | | 5,895 | | | 32,069 |
| | Hypercom Corp.* | | 491,300 | | | 530,604 |
| | I.D. Systems, Inc.* | | 80,200 | | | 324,810 |
| | Knology, Inc.* | | 70,053 | | | 361,473 |
| | KVH Industries, Inc.* | | 208,100 | | | 1,077,958 |
| | Oplink Communications, Inc.* | | 188,600 | | | 1,621,960 |
| | Orbcomm, Inc.*+ | | 287,000 | | | 619,920 |
| | Parkervision, Inc.*+ | | 103,472 | | | 255,576 |
| | Soapstone Networks, Inc.* | | 345,601 | | | 891,651 |
| | SureWest Communications | | 64,503 | | | 736,624 |
| | Telular Corp.* | | 240,200 | | | 317,064 |
| | Tessco Technologies, Inc.* | | 111,500 | | | 971,165 |
| | USA Mobility, Inc. | | 151,200 | | | 1,749,384 |
| | WPCS International, Inc.* | | 139,000 | | | 273,830 |
| | | | | | | |
| | | | | | | 13,285,840 |
|
Textiles - 0.05% |
| | Culp, Inc.* | | 74,016 | | | 146,552 |
| | | | | | | |
| Industry | | Company | | Shares | | Value |
|
|
Transportation - 1.77% |
| | CAI International, Inc.* | | 52,200 | | $ | 165,474 |
| | HUB Group, Inc., Class A* | | 139,000 | | | 3,687,670 |
| | Patriot Transportation Holding, Inc.* | | 9,916 | | | 694,814 |
| | Saia, Inc.* | | 107,900 | | | 1,171,794 |
| | | | | | | |
| | | | | | | 5,719,752 |
|
Water - 0.38% |
| | Connecticut Water Service, Inc.+ | | 16,920 | | | 399,481 |
| | York Water Co. | | 68,550 | | | 832,197 |
| | | | | | | |
| | | | | | | 1,231,678 |
| | | | | | | |
| |
TOTAL COMMON STOCKS - 95.22%
| | | 308,040,238 |
| | | | | | | |
(Cost $329,108,653) | | | |
|
EXCHANGE TRADED FUND - 1.15% |
| | iShares Russell Microcap Index Fund+ | | 116,818 | | | 3,720,653 |
| | | | | | | |
| |
TOTAL EXCHANGE TRADED FUNDS - 1.15% | | | 3,720,653 |
| | | | | | | |
(Cost $4,925,352) | | | |
| | | | | | | |
|
MONEY MARKET FUND - 1.61% |
| | | |
| | | Rate^ | | Shares | | Value |
BlackRock Temp Cash Liquidity Fund Institutional Shares #21 | | 1.68% | | 5,197,506 | | | 5,197,506 |
| | | | | | | |
| |
TOTAL MONEY MARKET FUND - 1.61% | | | 5,197,506 |
| | | | | | | |
(Cost $5,197,506) | | | |
| |
TOTAL INVESTMENTS - 97.98%
| | $ | 316,958,397 |
(Cost $339,231,511) | | | |
Other Assets in Excess of Liabilities - 2.02% | | | 6,537,434 |
| | | | | | | |
NET ASSETS - 100.00% | | $ | 323,495,831 |
| | | | | | | |
| * | Non Income Producing Security. |
| + | This security or a portion of the security is out on loan at December 31, 2008. Total loaned securities had a market value of $75,189,086 at December 31, 2008. |
| ^ | Rate disclosed is as of December 31, 2008. |
| (b) | Affiliated Company. An affiliated company is a company in which the Fund has ownership of at least 5% of the voting securities. Transactions during the year with companies which were affiliates are as follows: |
See Notes to Financial Statements.
Ultra-Small Company Market Fund
SCHEDULE OF INVESTMENTS (continued)
Showing percentage of net assets as of December 31, 2008 (Unaudited)
| | | | | | | | | | | | | | | | |
| | | | | | |
Name of
Issuer | | Shares
Held as of
Beginning
of Year | | Gross
Additions | | Gross
Reductions | | Income | | Shares
Held as
of End
of Year | | Value as
of End
of Year |
| AeroCentury Corp. | | 85,700 | | $ | - | | $ | - | | $ | - | | 85,700 | | $ | 779,870 |
| | | | | | | | | | | | | | | | |
| | 85,700 | | $ | - | | $ | - | | $ | - | | 85,700 | | $ | 779,870 |
| | | | | | | | | | | | | | | | |
See Notes to Financial Statements.
| | |
| 58 | | Semi-Annual Report | December 31, 2008 (Unaudited) |
THIS PAGE INTENTIONALLY LEFT BLANK
Micro-Cap Limited Fund
MANAGER’S COMMENTARY
(Unaudited)
December 31, 2008
Dear Fellow Micro-Cap Limited Fund Shareholder,
In the midst of what has now become the worst bear market since the 1930’s, our Fund declined 26.74% for the December quarter. Although this was the steepest quarterly decline in the Fund’s history, it was slightly better than both our primary market and peer benchmarks. The CRSP Cap-Based Portfolio 9 Index declined 27.19% and the Lipper Micro-Cap Stock Funds Index declined 27.69% for the same period. While still market beating, we would have liked to provide more cushion.
For the six month semi-annual period, our Fund declined 32.98%, as compared to a 25.78% decline for CRSP Cap-Based Portfolio 9 Index. We did beat our peer benchmark, the Lipper Micro-Cap Stock Funds Index, which declined 33.37%. We also trailed the 26.94% decline of the Russell 2000 Index. Two factors contributed significantly to our poor performance relative to our market benchmark: a larger number of more “growth leaning” companies during a period when growth stocks were very much out of favor, and damaging exposure to some particularly poor-performing energy and basic materials companies during a period when commodity prices fell off a cliff.
For the full calendar year, our Fund declined 41.74%, compared to the 36.89% decline of the CRSP Cap-Based Portfolio 9 Index and the 42.71% decline of the Lipper Micro-Cap Stock Funds Index. The table below presents our December quarter, six-month, one-year, five-year, ten-year, and life-to-date financial results according to the formula required by the SEC. Our last two quarters of performance were poor enough to put us “under water” for the five-year period, though we still lead all our benchmarks over the last decade and since inception. See the next page for a graph of performance since inception.
| | | | | | | | | | | | |
| | | Dec. qtr.
10/1/08
to 12/31/08 | | Six-Month
7/1/08
to 12/31/08 | | 1 Year
1/1/08
to 12/31/08 | | 5 Year
1/1/04
to 12/31/08 | | 10 Year
1/1/99
to 12/31/08 | | Life-to-Date
6/30/98
to 12/31/08 |
| | | | | | |
Micro-Cap Limited Fund | | -26.74% | | -32.98% | | -41.74% | | -6.22% | | 7.62% | | 8.00% |
CRSP Cap-Based Portfolio 9 Index | | -27.19% | | -25.78% | | -36.89% | | -4.04% | | 5.46% | | 4.21% |
Lipper Micro-Cap Stock Funds Index | | -27.69% | | -33.37% | | -42.71% | | -4.59% | | 3.00% | | 2.13% |
Russell 2000 Index (small stocks) | | -26.12% | | -26.94% | | -33.79% | | -0.93% | | 3.02% | | 2.15% |
Performance figures quoted in the table above and graph below represent past performance and are no guarantee of future results. The table above and the graph below do not reflect the deduction of taxes that a shareholder would pay on Fund distributions or the redemption of Fund shares.
The Lipper Micro-Cap Stock Funds Index is an index of micro-cap funds compiled by Lipper, Inc. The Russell 2000 Index is an unmanaged, market value weighted index, which measures performance of the 2,000 companies that are between the 1,000th and 3,000th largest in the market with dividends reinvested. The CRSP Cap-Based Portfolio 9 Index is an unmanaged index of 644 publicly traded U.S. micro-cap stocks (with dividends reinvested), as reported by the Center for Research on Security Prices. It is not possible to invest directly in an index. Periods longer than one year are annualized.
According to data from Lipper, Inc., for the period ended December 31, 2008, the Micro-Cap Limited Fund ranked 52nd of 94 micro-cap funds for the last twelve months ended December 31, 2008, 48th of 70 such funds for the last five years, 14th of 40 funds for the last 10 years and 5th of 40 funds since inception in June, 1998. Lipper, Inc. is an independent mutual fund rating service that ranks funds in various fund categories by making comparative calculations using total returns.
| | |
| 60 | | Semi-Annual Report | December 31, 2008 (Unaudited) |
Micro-Cap Limited Fund
MANAGER’S COMMENTARY (continued)
(Unaudited)
Micro-Cap Limited Fund vs. CRSP 9 Index & Lipper Micro-Cap Stock Funds Index & Russell 2000 Index 6/30/98 to 12/31/08
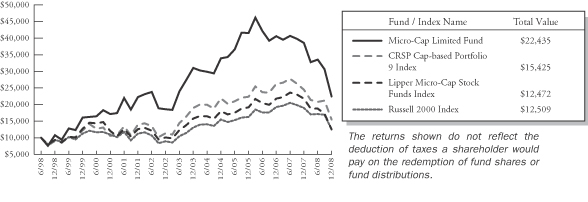
Detailed Explanation of Quarterly Performance—Some stocks (slightly) cushioned the blow
The Short Version: With a dramatic December quarter downturn, we did have a few stocks that helped cushion the blow. All of our top ten stocks had significant positive returns.
In a quarter where misery found plenty of company, investors had to search long and hard for winners in their portfolios. While all economic sectors suffered negative ramifications of the credit crisis and severe downturn, non-cyclical consumer stocks held up somewhat better than most. Of the top ten best performers in the Fund, five came from that sector and, combined, they contributed one percent to the overall return of the Fund. These are the ten best-performing stocks for the quarter ended December 31, 2008:
| | | | | | |
| Rank | | Description | | Industry | | % Gain |
| 1 | | American Italian Pasta Co | | Food | | 54.4% |
| 2 | | Hot Topic Inc | | Retail | | 43.3% |
| 3 | | Cantel Medical Corp | | Healthcare-Products | | 39.8% |
| 4 | | Cyberonics Inc | | Healthcare-Products | | 31.3% |
| 5 | | TeleCommunication Systems Inc | | Internet | | 24.3% |
| 6 | | Pricesmart Inc | | Retail | | 23.4% |
| 7 | | LHC Group Inc | | Healthcare-Services | | 22.3% |
| 8 | | Life Partners Holdings Inc | | Insurance | | 21.3% |
| 9 | | Monro Muffler Inc | | Commercial Services | | 21.3% |
| 10 | | Pike Electric Corp | | Electric | | 20.1% |
| | | | | | | |
With retailers across the country crying doom and gloom over the recessionary times, Hot Topic somehow managed to buck the negative trend. While many consumers have avoided the malls and restricted purchases to only the necessities of life, the products sold by this teen apparel company have become “must buys” despite the economic downturn. Hot Topics has realized increased demand for its clothing and merchandise tied to the latest in music trends and pop culture. It reported strong sales in both October and November and raised its quarterly outlook, something few other retailers have been able to do. Its stock closed at a new 52-week high to end 2008. The holding contributed over a quarter percent to the return of the Fund during the quarter.
Micro-Cap Limited Fund
MANAGER’S COMMENTARY (continued)
(Unaudited)
Detailed Explanation of Quarterly Performance—What Didn’t Work
The Short Version: A very bad quarter in energy and industrial companies.
With oil prices plunging by $100/barrel since setting highs in July, any and all companies with ties to the energy sector suffered as well. Likewise, as the country moved deeper and deeper into recession, many manufacturers and heavy industry-related companies have struggled from lack of demand. The list of ten worst performers for the quarter was made up of three oil and gas-related companies and four industrial stocks. Combined, these seven holdings cost the Fund over three and a half percent in return for the quarter. Then again, perhaps no list of poorly performing companies would be complete without a bank and an IT firm.
These are the ten worst-performing stocks for the quarter ended December 31, 2008:
| | | | | | |
| Rank | | Description | | Industry | | % Loss |
| 1 | | Warren Resources Inc | | Oil & Gas | | -80.1% |
| 2 | | Conexant Systems Inc | | Semiconductors | | -78.7% |
| 3 | | North American Energy Partners Inc | | Oil & Gas Services | | -67.8% |
| 4 | | Oriental Financial Group Inc | | Banks | | -66.6% |
| 5 | | Chart Industries Inc | | Machinery-Diversified | | -62.8% |
| 6 | | Gulfport Energy Corp | | Oil & Gas | | -60.7% |
| 7 | | ENGlobal Corp | | Engineering & Construction | | -60.1% |
| 8 | | Ultrapetrol Bahamas Ltd | | Transportation | | -59.4% |
| 9 | | Layne Christensen Co | | Engineering & Construction | | -59.2% |
| 10 | | Entravision Communications Corp | | Media | | -58.6% |
| | | | | | | |
Oriental Financial Group is a bank holding company operating primarily in Florida and Puerto Rico. Needless to say, very many financial services companies have suffered ill-effects of the subprime lending fiasco, the ongoing credit crisis, and the economic downturn; Oriental Financial was no exception. The company has been forced to take significant charges (write-downs) to assets related to its mortgage derivative portfolio and warned investors in November about an impending quarterly loss (at a time analysts were expecting a slight profit). The company scrapped plans to raise funds through a private placement and instead applied to participate in the TARP bailout plan. Oriental Financial’s stock cost the Fund over a third of a percent in return during the quarter.
Detailed Explanation of Calendar Year Performance—Companies With Positive Returns
The Short Version: Only twenty-five of the companies we held during the calendar year had positive returns.
With all ten S&P sectors recording sizable market losses in 2008, investors had few places to turn for relief from the equity market carnage. Fortunately, our models and trading experiences uncovered some positive performing companies that produced nice results during the year. Nine of the best performing stocks returned over 40% (and the 10th barely missed). Four of these companies were sold earlier in the year before much of the downturn. Six different sectors were represented on the list, an indication that needles can be found in even the most depressing haystacks. These ten companies contributed over five percent to the return of the Fund during 2008.
| | |
| 62 | | Semi-Annual Report | December 31, 2008 (Unaudited) |
Micro-Cap Limited Fund
MANAGER’S COMMENTARY (continued)
(Unaudited)
These are the ten best performers for the calendar year ended December 31, 2008:
| | | | | | |
| Rank | | Description | | Industry | | % Gain |
| 1 | | Superior Essex Inc | | Electrical Components & Equipment | | 82.0% |
| 2 | | Questcor Pharmaceuticals Inc | | Pharmaceuticals | | 74.8% |
| 3 | | CSG Systems International Inc | | Software | | 55.8% |
| 4 | | American Italian Pasta Co | | Food | | 54.4% |
| 5 | | Hill International Inc | | Commercial Services | | 47.4% |
| 6 | | Life Partners Holdings Inc | | Insurance | | 45.7% |
| 7 | | Hot Topic Inc | | Retail | | 43.3% |
| 8 | | General Steel Holdings Inc | | Iron/Steel | | 42.3% |
| 9 | | Axsys Technologies Inc | | Electronics | | 40.2% |
| 10 | | Cantel Medical Corp | | Healthcare-Products | | 39.8% |
| | | | | | | |
Life Partners helps maintain an active secondary market for life insurance by purchasing policies from individuals and re-offering them as packaged investment vehicles. Institutions and high net worth individuals have found these “life settlements” to be attractive non-correlated, alternative investments, particularly in this environment. These life settlements may be considered recession-proof as mortality (death) occurs regardless of the state of the economy. Investors also reap the tax advantages associated with life insurance once the policies are paid. Life Partners posted record earnings in December, which marked the third straight quarter management had upwardly revised its outlook. The holding contributed about a half a percent to the Fund’s return in 2008.
Detailed Explanation of Calendar Year Performance—What Didn’t Work
The Short Version: As goes the quarter, so goes the year.
No industry was immune from the economic downturn and market negativity. Six different sectors were represented on the list of worst performers for 2008, with three coming from the depressed oil and gas industry. Combined, these ten holdings cost the Fund over five percent in return. 27 holdings fell 50% or more during the year.
These are the ten stocks that performed the worst in the calendar year ended December 31, 2008:
| | | | | | |
| Rank | | Description | | Industry | | % Loss |
| 1 | | Conexant Systems Inc | | Semiconductors | | -84.2% |
| 2 | | Warren Resources Inc | | Oil & Gas | | -83.7% |
| 3 | | North American Energy Partners Inc | | Oil & Gas Services | | -81.9% |
| 4 | | Ultrapetrol Bahamas Ltd | | Transportation | | -76.3% |
| 5 | | BioScrip Inc | | Pharmaceuticals | | -72.2% |
| 6 | | Gulfport Energy Corp | | Oil & Gas | | -71.9% |
| 7 | | China Fire & Security Group Inc | | Miscellaneous Manufacturing | | -69.5% |
| 8 | | Oriental Financial Group Inc | | Banks | | -67.1% |
| 9 | | Bidz.com Inc | | Internet | | -65.2% |
| 10 | | ENGlobal Corp | | Engineering & Construction | | -64.0% |
| | | | | | | |
Conexant Systems was the Fund’s worst performer during 2008 and lost over 80% in return. Like so many technology-related firms, this semiconductor company struggled during the year from lackluster sales and canceled orders. During these recessionary times, consumers and businesses alike are hesitant to upgrade technology and make many related purchases. Conexant lowered its quarterly outlook in October and then again in December, as demand for its products continued to decline. The company sold off some non-core assets to raise cash and improve its balance sheet, though the moves did little to generate investor enthusiasm. Conexant cost the Fund over half a percent in return during the year.
Micro-Cap Limited Fund
MANAGER’S COMMENTARY (continued)
(Unaudited)
Top Ten Holdings as of December 31, 2008
Insurance companies highlighted the Fund’s top ten holdings, as three related stocks comprised the list at year-end. Two of our largest positions were also among the Fund’s top performers of the quarter (Life Partners Holdings and PriceSmart). While one holding accounted for greater than five percent of the net assets, the Fund was well-diversified across many companies in this difficult environment for stocks. The ten largest positions represented under 30% of the total assets of the Fund.
| | | | | | |
| Rank | | Description | | Industry | | % of
Net Assets |
| 1 | | Crawford & Co - Class B | | Insurance | | 5.9% |
| 2 | | Axsys Technologies Inc | | Electronics | | 4.0% |
| 3 | | Questcor Pharmaceuticals Inc | | Pharmaceuticals | | 3.6% |
| 4 | | Life Partners Holdings Inc | | Insurance | | 2.8% |
| 5 | | Tyler Technologies Inc | | Software | | 2.2% |
| 6 | | Calgon Carbon Corp | | Environmental Control | | 2.1% |
| 7 | | Kendle International Inc | | Commercial Services | | 2.1% |
| 8 | | Tower Group Inc | | Insurance | | 2.1% |
| 9 | | PriceSmart Inc | | Retail | | 2.0% |
| 10 | | CryoLife Inc | | Healthcare-Products | | 2.0% |
| | | | | | | |
| | | | | | 28.8% |
Industry Sector Representation as of December 31, 2008
While virtually no sector was spared the negativity of the past three months (and full year, for that matter), our models’ overweighting industrials and, earlier in the year, in basic materials (chemicals, steel, iron, lumber) was costly to the Fund’s performance relative to the benchmarks. Many of these companies had been solid performers in the June quarter, but plunged in value as the weak global economy hindered demand for such products. Surprisingly, our models’ underweighting financials also hurt our relative performance during the quarter and the year, as micro-cap banks held up much better than the large ones.
| | | | | | |
| | | % of Net Assets | | % S&P
Small-Cap Index | | Difference |
Basic Materials | | 3.0% | | 2.9% | | 0.1% |
Communications | | 10.1% | | 4.5% | | 5.6% |
Consumer, Cyclical | | 12.5% | | 14.2% | | -1.7% |
Consumer, Non-cyclical | | 19.0% | | 20.9% | | -1.9% |
Energy | | 4.1% | | 3.8% | | 0.3% |
Financial | | 13.6% | | 20.3% | | -6.7% |
Industrial | | 23.4% | | 19.3% | | 4.1% |
Technology | | 10.5% | | 8.5% | | 2.0% |
Utilities | | 1.7% | | 5.6% | | -3.9% |
Cash | | 2.1% | | 0.0% | | 2.1% |
| | | | | | | |
Total | | 100.0% | | 100.0% | | |
| | |
| 64 | | Semi-Annual Report | December 31, 2008 (Unaudited) |
Micro-Cap Limited Fund
MANAGER’S COMMENTARY (continued)
(Unaudited)
Disclaimer
The views expressed here are exclusively those of Fund management. These views are not meant as investment advice and should not be considered predictive in nature. Any favorable (or unfavorable) description of a holding applies only as of December 31, 2008, unless otherwise stated. Security positions can and do change thereafter. Discussions of historical performance do not guarantee and are not indicative of future performance.
The Fund is subject to very high, above market risk (volatility) and is not an appropriate investment for short-term investors. Investments in micro-cap companies generally carry greater risk than is customarily associated with larger companies and even “small companies” for various reasons such as narrower markets (fewer investors), limited financial resources and greater trading difficulty.
Conclusion
Thank you for your continued investment in Micro-Cap Limited Fund. We encourage your feedback; your reactions and concerns are important to us.
Sincerely,
Your Investment Management Team
Micro-Cap Limited Fund
SCHEDULE OF INVESTMENTS
Showing percentage of net assets as of December 31, 2008 (Unaudited)
| | | | | | | |
| Industry | | Company | | Shares | | Value |
|
COMMON STOCKS - 97.97% |
Airlines - 0.55% |
| | Hawaiian Holdings, Inc.* | | 21,600 | | $ | 137,808 |
|
Apparel - 0.67% |
| | True Religion Apparel, Inc.* | | 13,700 | | | 170,428 |
|
Banks - 1.43% |
| | Southside Bancshares, Inc. | | 15,400 | | | 361,900 |
|
Beverages - 1.03% |
| | Peet’s Coffee & Tea, Inc.* | | 11,200 | | | 260,400 |
|
Building Materials - 1.89% |
| | Comfort Systems USA, Inc. | | 14,000 | | | 148,400 |
| | NCI Building Systems, Inc.* | | 10,700 | | | 174,410 |
| | Trex Co., Inc.* | | 9,400 | | | 154,724 |
| | | | | | | |
| | | | | | | 477,534 |
|
Chemicals - 1.99% |
| | Aceto Corp. | | 11,500 | | | 115,115 |
| | Innophos Holdings, Inc. | | 19,600 | | | 388,276 |
| | | | | | | |
| | | | | | | 503,391 |
|
Commercial Services - 4.31% |
| | Kendle International, Inc.* | | 20,700 | | | 532,404 |
| | Landauer, Inc. | | 4,600 | | | 337,180 |
| | Monro Muffler Brake, Inc. | | 5,700 | | | 145,350 |
| | TNS, Inc.* | | 8,000 | | | 75,120 |
| | | | | | | |
| | | | | | | 1,090,054 |
|
Computers - 2.83% |
| | Manhattan Associates, Inc.* | | 16,200 | | | 256,122 |
| | MTS Systems Corp. | | 7,800 | | | 207,792 |
| | NCI, Inc., Class A* | | 8,300 | | | 250,079 |
| | | | | | | |
| | | | | | | 713,993 |
|
Electric Utilities - 1.23% |
| | Pike Electric Corp.* | | 25,200 | | | 309,960 |
|
Electrical Components & Equipment - 0.93% |
| | Powell Industries, Inc.* | | 8,100 | | | 235,062 |
|
Electronics - 5.30% |
| | Axsys Technologies, Inc.* | | 18,600 | | | 1,020,396 |
| | Multi-Fineline Electronix, Inc.* | | 6,900 | | | 80,661 |
| | NVE Corp.* | | 9,095 | | | 237,652 |
| | | | | | | |
| | | | | | | 1,338,709 |
|
Engineering & Construction - 1.13% |
| | Stanley, Inc.* | | 7,900 | | | 286,138 |
| | | | | | | |
| Industry | | Company | | Shares | | Value |
| | | |
| | | | | | | |
Environmental Control - 3.16% |
| | Calgon Carbon Corp.* | | 34,900 | | $ | 536,064 |
| | Darling International, Inc.* | | 47,600 | | | 261,324 |
| | | | | | | |
| | | | | | | 797,388 |
|
Food - 1.28% |
| | American Italian Pasta Co., Class A* | | 6,400 | | | 142,976 |
| | Diamond Foods, Inc. | | 8,900 | | | 179,335 |
| | | | | | | |
| | | | | | | 322,311 |
|
Forest Products & Paper - 0.98% |
| | Glatfelter | | 26,500 | | | 246,450 |
|
Gas - 0.46% |
| | Chesapeake Utilities Corp. | | 3,700 | | | 116,476 |
|
Hand/Machine Tools - 1.17% |
| | K-Tron International, Inc.* | | 3,700 | | | 295,630 |
|
Healthcare - Products - 6.95% |
| | Cantel Medical Corp.* | | 21,600 | | | 316,872 |
| | CryoLife, Inc.* | | 51,300 | | | 498,123 |
| | Cyberonics, Inc.* | | 28,800 | | | 477,216 |
| | Hanger Orthopedic Group, Inc.* | | 12,600 | | | 182,826 |
| | Somanetics Corp.* | | 9,700 | | | 160,147 |
| | Vascular Solutions, Inc.* | | 13,500 | | | 121,770 |
| | | | | | | |
| | | | | | | 1,756,954 |
|
Healthcare - Services - 1.85% |
| | Almost Family, Inc.* | | 2,600 | | | 116,948 |
| | LHC Group, Inc.*+ | | 9,700 | | | 349,200 |
| | | | | | | |
| | | | | | | 466,148 |
|
Insurance - 12.21% |
| | Crawford & Co., Class B*+ | | 102,800 | | | 1,494,712 |
| | Life Partners Holdings, Inc. | | 16,000 | | | 698,240 |
| | Meadowbrook Insurance Group, Inc. | | 57,800 | | | 372,232 |
| | Tower Group, Inc. | | 18,400 | | | 519,064 |
| | | | | | | |
| | | | | | | 3,084,248 |
|
Internet - 5.73% |
| | Bidz.com, Inc.*+ | | 31,400 | | | 144,440 |
| | EarthLink, Inc.*+ | | 48,600 | | | 328,536 |
| | eResearchTechnology, Inc.* | | 29,900 | | | 198,237 |
| | TeleCommunication Systems, Inc., Class A* | | 57,500 | | | 493,925 |
| | VASCO Data Security International, Inc.*+ | | 27,400 | | | 283,042 |
| | | | | | | |
| | | | | | | 1,448,180 |
| | |
| 66 | | Semi-Annual Report | December 31, 2008 (Unaudited) |
Micro-Cap Limited Fund
SCHEDULE OF INVESTMENTS (continued)
Showing percentage of net assets as of December 31, 2008 (Unaudited)
| | | | | | | |
| Industry | | Company | | Shares | | Value |
|
Common Stocks (continued) |
Machinery - Diversified - 0.96% |
| | Chart Industries, Inc.* | | 14,000 | | $ | 148,820 |
| | Columbus McKinnon Corp.* | | 6,900 | | | 94,185 |
| | | | | | | |
| | | | | | | 243,005 |
|
Metal Fabrication - Hardware - 2.75% |
| | Ampco-Pittsburgh Corp. | | 10,400 | | | 225,680 |
| | CIRCOR International, Inc. | | 3,700 | | | 101,750 |
| | Northwest Pipe Co.* | | 8,600 | | | 366,446 |
| | | | | | | |
| | | | | | | 693,876 |
|
Miscellaneous Manufacturing - 3.33% |
| | AZZ, Inc.* | | 10,200 | | | 256,020 |
| | Blount International, Inc.* | | 26,100 | | | 247,428 |
| | EnPro Industries, Inc.* | | 4,900 | | | 105,546 |
| | PMFG, Inc.* | | 14,200 | | | 135,752 |
| | Standex International Corp. | | 4,900 | | | 97,216 |
| | | | | | | |
| | | | | | | 841,962 |
|
Oil & Gas - 1.79% |
| | Arena Resources, Inc.*+ | | 9,600 | | | 269,664 |
| | Gulfport Energy Corp.* | | 28,500 | | | 112,575 |
| | Warren Resources, Inc.* | | 35,200 | | | 70,048 |
| | | | | | | |
| | | | | | | 452,287 |
|
Oil & Gas Services - 2.34% |
| | Dawson Geophysical Co.* | | 11,400 | | | 203,034 |
| | Natural Gas Services Group, Inc.* | | 17,400 | | | 176,262 |
| | Newpark Resources, Inc.* | | 45,200 | | | 167,240 |
| | North American Energy Partners, Inc.* | | 13,700 | | | 45,758 |
| | | | | | | |
| | | | | | | 592,294 |
|
Pharmaceuticals - 3.62% |
| | Questcor Pharmaceuticals, Inc.*+ | | 98,200 | | | 914,242 |
|
Retail - 11.28% |
| | America’s Car-Mart, Inc.* | | 9,200 | | | 127,052 |
| | Buffalo Wild Wings, Inc.* | | 9,300 | | | 238,545 |
| | EZCORP, Inc., Class A* | | 21,482 | | | 326,741 |
| | Hot Topic, Inc.* | | 38,800 | | | 359,676 |
| | JOS A Bank Clothiers, Inc.*+ | | 9,800 | | | 256,270 |
| | PetMed Express, Inc.* | | 27,900 | | | 491,877 |
| | Pricesmart, Inc. | | 24,700 | | | 510,302 |
| | The Finish Line, Inc., Class A | | 36,800 | | | 206,080 |
| | The Wet Seal, Inc., Class A* | | 112,500 | | | 334,125 |
| | | | | | | |
| | | | | | | 2,850,668 |
|
Semiconductors - 1.81% |
| | Silicon Image, Inc.* | | 67,600 | | | 283,920 |
| | | | | | | |
Industry | | Company | | Shares | | | Value |
|
|
Semiconductors (continued) |
| | Volterra Semiconductor Corp.* | | 24,400 | | $ | 174,460 |
| | | | | | | |
| | | | | | | 458,380 |
|
Software - 5.86% |
| | Ebix, Inc.* | | 18,000 | | | 430,200 |
| | SYNNEX Corp.* | | 16,000 | | | 181,280 |
| | Tyler Technologies, Inc.* | | 46,800 | | | 560,664 |
| | Wind River Systems, Inc.* | | 34,300 | | | 309,729 |
| | | | | | | |
| | | | | | | 1,481,873 |
|
Telecommunications - 4.33% |
| | Adaptec, Inc.* | | 38,900 | | | 128,370 |
| | Applied Signal Technology, Inc. | | 20,300 | | | 364,182 |
| | Atlantic Tele-Network, Inc. | | 8,400 | | | 223,020 |
| | Preformed Line Products Co. | | 5,800 | | | 267,032 |
| | SureWest Communications | | 9,800 | | | 111,916 |
| | | | | | | |
| | | | | | | 1,094,520 |
|
Transportation - 1.94% |
| | American Commercial Lines, Inc.* | | 39,900 | | | 195,510 |
| | Gulfmark Offshore, Inc.* | | 8,373 | | | 199,194 |
| | Ultrapetrol (Bahamas), Ltd.*+ | | 30,200 | | | 96,338 |
| | | | | | | |
| | | | | | | 491,042 |
|
Trucking & Leasing - 0.88% |
| | TAL International Group, Inc. | | 15,800 | | | 222,780 |
| | | | | | | |
| |
TOTAL COMMON STOCKS - 97.97% | | | 24,756,091 |
| | | | | | | |
(Cost $29,146,155) | | | |
| | | | | | | |
|
MONEY MARKET FUND - 0.78% |
| | | |
| | | Rate^ | | Shares | | Value |
BlackRock Temp Cash Liquidity Fund Institutional Shares #21 | | 1.68% | | 196,522 | | | 196,522 |
| | | | | | | |
| |
TOTAL MONEY MARKET FUNDS - 0.78% | | | 196,522 |
| | | | | | | |
(Cost $196,522) | | | |
| |
TOTAL INVESTMENTS - 98.75% | | $ | 24,952,613 |
(Cost $29,342,677) | | | |
Other Assets in Excess of Liabilities - 1.25% | | | 315,977 |
| | | | | | | |
NET ASSETS - 100.00% | | $ | 25,268,590 |
| | | | | | | |
| * | Non Income Producing Security. |
| + | This security or a portion of the security is out on loan at December 31, 2008. Total loaned securities had a market value of $3,031,379 at December 31, 2008. |
| ^ | Rate disclosed is as of December 31, 2008. |
See Notes to Financial Statements.
Small-Cap Growth Fund
MANAGER’S COMMENTARY
(Unaudited)
December 31, 2008
Dear Fellow Small-Cap Growth Fund Shareholder,
In the midst of what has now become the worst bear market since the 1930’s, our Fund declined 25.43% for the December quarter. Although this was the steepest quarterly decline in the Fund’s history, it did provide some “cushion” against both the 27.45% decline the Russell 2000 Growth Index of small companies and the 26.59% decline of the Lipper Small-Cap Growth Funds Index. It was a decent quarter on a relative basis.
For the six month semi-annual period, our Fund declined 38.21%, compared to a 32.51% decline for the Russell 2000 Growth Index and a 34.36% decline of the Lipper Small-Cap Growth Funds Index. Several factors contributed to our poor relative performance in the semi-annual period: a larger number of more “growth leaning” companies, even relative to our growth benchmarks, during a period when growth stocks were very much out of favor, none of our different stock-picking models “picked up the slack” in this particular downturn, and damaging exposure to some particularly poor performing energy companies during a period when commodity prices fell off a cliff.
For the full calendar year, our Fund declined 43.48%, compared to the 38.54% decline of the Russell 2000 Growth Index, and the 42.62% decline of the Lipper Small-Cap Growth Funds Index.
The table below presents our December quarter, six-month, one-year, five-year and life-to-date financial results according to the formula required by the SEC. Our last two quarters of performance were poor enough to put us “under water” since inception. See the next page for a graph of performance since inception.
| | | | | | | | | | |
| | | Dec. Qtr.
10/1/08
to 12/31/08 | | Six-Month
7/1/08
to 12/31/08 | | 1 Year
1/1/08
to 12/31/08 | | 5 Year
1/1/04
to 12/31/08 | | Life-to-Date
10/31/03
to 12/31/08 |
| | | | | |
Small-Cap Growth Fund | | -25.43% | | -38.21% | | -43.48% | | -3.44% | | -2.83% |
Russell 2000 Growth Index | | -27.45% | | -32.51% | | -38.54% | | -2.35% | | -1.58% |
Lipper Small-Cap Growth Funds Index | | -26.59% | | -34.36% | | -42.62% | | -4.06% | | -3.42% |
Performance figures quoted in the table above and graph below represent past performance and are no guarantee of future results. The table above and the graph below do not reflect the deduction of taxes that a shareholder would pay on Fund distributions or the redemption of Fund shares.
The Russell 2000 Growth Index is an unmanaged index which consists of stocks in the Russell 2000 Index with higher price-to-book ratios and higher forecasted growth values with dividends reinvested. The Lipper Small-Cap Growth Funds Index is an index of small-company, growth-oriented funds compiled by Lipper, Inc. It is not possible to invest directly in an index. Periods longer than one year are annualized.
According to data from Lipper, Inc. as of December 31, 2008, Small-Cap Growth Fund ranked 378th of 603 small-cap growth funds for the twelve-month period ended December 31, 2008, 178th of 406 over the last five years and 185th of 403 such funds since inception in October, 2003. Lipper, Inc. is an independent mutual fund rating service that ranks funds in various fund categories by making comparative calculations using total returns.
| | |
| 68 | | Semi-Annual Report | December 31, 2008 (Unaudited) |
Small-Cap Growth Fund
MANAGER’S COMMENTARY (continued)
(Unaudited)
Small-Cap Growth Fund vs. Russell 2000 Growth Index & Lipper Small-Cap Growth Funds Index 10/31/03 to 6/30/08
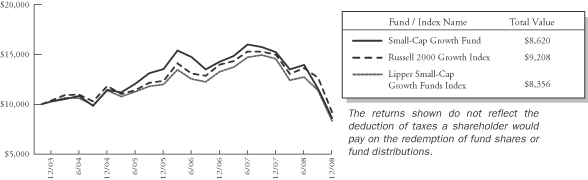
Detailed Explanation of Quarterly Performance—Some stocks (slightly) cushioned the blow
The Short Version: With a dramatic December quarter downturn, there were very few stocks that helped cushion the blow. Nevertheless, all of our top ten stocks had positive returns.
In a quarter where misery found plenty of company, investors had to search long and hard for winners in their portfolios. While virtually all sectors suffered negative ramifications of the credit crisis and severe downturn in the economy, certain non-cyclical consumer stocks held up somewhat better than most. Of the top ten best performers in the Fund, four came from that sector and combined to contribute just under one and a half percent to the overall performance. These are the ten best-performing stocks for the quarter ended December 31, 2008:
| | | | | | |
| Rank | | Description | | Industry | | % Gain |
| 1 | | SYKES Enterprises Inc | | Computers | | 41.4% |
| 2 | | TeleCommunication Systems Inc | | Internet | | 37.3% |
| 3 | | Thoratec Corp | | Healthcare-Products | | 31.2% |
| 4 | | Questcor Pharmaceuticals Inc | | Pharmaceuticals | | 26.7% |
| 5 | | ICF International Inc | | Commercial Services | | 24.4% |
| 6 | | Pricesmart Inc | | Retail | | 23.4% |
| 7 | | Life Partners Holdings Inc | | Insurance | | 17.9% |
| 8 | | VSE Corp | | Engineering & Construction | | 16.3% |
| 9 | | Almost Family Inc | | Healthcare-Services | | 13.7% |
| 10 | | Compass Minerals International Inc | | Mining | | 12.0% |
| | | | | | | |
A company with real heart. Thoratec Corporation manufactures circulatory medical devices for ailing heart patients. In December, its management reported that a clinical trial for its HeartMate II pump produced better results than its existing products that target similar patients; management believes it could receive its next round of FDA approval more quickly than originally expected. Currently, the HeartMate II is considered a temporary treatment for heart patients in need of transplants, but the strong data could speed up the approval process and make the device available for more candidates. The holding contributed just under half a percent to the return of the Fund during the quarter.
Small-Cap Growth Fund
MANAGER’S COMMENTARY (continued)
(Unaudited)
Detailed Explanation of Quarterly Performance—What Didn’t Work
The Short Version: A very bad quarter in energy.
In mid-summer, oil prices had surged to $146/barrel, and many analysts were calling for $200 and beyond. What a difference a few quarters make. Over the past six months, crude prices plummeted over $100/barrel, with much of the losses coming during the 4th quarter. Virtually every company with ties to the energy sector plunged in value. Five of the worst performers in the Fund were oil and gas-related and, combined, they cost shareholders over two percent in return. During the quarter, all ten of the Fund’s worst performers dropped by over 50%; in fact, seventeen of our 104 holdings lost half of their value over the past three months.
These are the ten worst-performing stocks for the quarter ended December 31, 2008:
| | | | | | |
| Rank | | Description | | Industry | | % Loss |
| 1 | | Life Sciences Research Inc | | Healthcare-Services | | -73.1% |
| 2 | | Parexel International Corp | | Commercial Services | | -66.1% |
| 3 | | Graham Corp | | Electrical Components & Equipment | | -65.9% |
| 4 | | Dawson Geophysical Co | | Oil & Gas Services | | -61.9% |
| 5 | | Rosetta Resources Inc | | Oil & Gas | | -61.4% |
| 6 | | Gulfport Energy Corp | | Oil & Gas | | -60.7% |
| 7 | | Mitcham Industries Inc | | Oil & Gas Services | | -60.7% |
| 8 | | Bucyrus International Inc | | Machinery-Construction & Mining | | -58.6% |
| 9 | | Gulf Island Fabrication Inc | | Oil & Gas Services | | -58.2% |
| 10 | | JDS Uniphase Corp | | Telecommunications | | -56.9% |
| | | | | | | |
While many healthcare related companies have held up better than those in other sectors, research firms suffered from the economic downturn, as pharmaceuticals and bio-techs delayed or canceled certain drug trials. Parexel International provides clinical research and medical consulting services for the pharmaceutical industry. The company reported lower than expected earnings and revenue last quarter and downwardly revised its outlook for the next period as well. Many of its customers have begun conserving cash to shore up their balance sheets, and research-related programs have been put on hold for the time being. Parexel also faced considerable growing pains as it tried to incorporate a 2007 acquisition, ClinPhone, into its operations during these weaker times. The holding declined 66% during the quarter and cost the Fund over three-quarters of a percent in return.
| | |
| 70 | | Semi-Annual Report | December 31, 2008 (Unaudited) |
Small-Cap Growth Fund
MANAGER’S COMMENTARY (continued)
(Unaudited)
Detailed Explanation of Calendar Year Performance—What Worked Well
The Short Version: Only 27 of the 163 companies we held during the calendar year had positive returns.
With all ten sectors recording sizable market losses in 2008, investors had few places to turn for relief from the equity market carnage. As was the case for the quarter, however, certain non-cyclical stocks saved the day, or at least limited the damage. Five related companies were included in the list of the best performers for the calendar year. Combined, they contributed about two and a half percent to the overall return. These are the ten best performers for the calendar year ended December 31, 2008:
| | | | | | |
| Rank | | Description | | Industry | | % Gain |
| 1 | | Questcor Pharmaceuticals Inc | | Pharmaceuticals | | 102.4% |
| 2 | | Almost Family Inc | | Healthcare-Services | | 86.8% |
| 3 | | SYKES Enterprises Inc | | Computers | | 41.4% |
| 4 | | Mfri Inc | | Miscellaneous Manufacturing | | 40.8% |
| 5 | | TeleCommunication Systems Inc | | Internet | | 37.3% |
| 6 | | Bright Horizons Family Solutions Inc | | Commercial Services | | 36.5% |
| 7 | | Ezcorp Inc | | Retail | | 34.7% |
| 8 | | Thoratec Corp | | Healthcare-Products | | 26.9% |
| 9 | | Strayer Education Inc | | Commercial Services | | 25.7% |
| 10 | | Fuel Systems Solutions Inc | | Auto Parts & Equipment | | 25.5% |
| | | | | | | |
One more reason to be nice to your kids…they may be choosing your nursing home. Almost Family provides home health and eldercare services across the eastern half of the country. As baby-boomers age and move into their twilight years, the demand for assisted living and homecare services has grown dramatically. Almost Family has benefited significantly from this trend. In August, the company closed on its $45 million acquisition of Patient Care, a move expected to generate substantial revenues immediately. Almost Family added locations in Connecticut, New Jersey, and Pennsylvania during the year and reported an 84% increase in quarterly revenue in November. The company was named the 24th Best Small Company in America by Forbes Magazine in October and contributed over three-quarters of a percent to the return of the Fund in 2008.
Detailed Explanation of Calendar Year Performance—What Didn’t Work
The Short Version: As goes the quarter, so goes the year.
Investors would love to forget about 2008, as nothing seemed to work and all sectors were hindered by the economic downturn and financial crisis. 38 Fund holdings fell 50% or more during the year. Each of the ten worst performers dropped at least 70% in value. While financial stocks took the brunt of the negativity early, energy contributed losses during the second half of the year, and consumer-driven companies like retail suffered late as the economy moved further into recession. Five of the lowest performers were oil and gas-related; combined they cost the Fund over three and a half percent in return.
Small-Cap Growth Fund
MANAGER’S COMMENTARY (continued)
(Unaudited)
These are the ten stocks that performed the worst in the calendar year ended December 31, 2008:
| | | | | | |
| Rank | | Description | | Industry | | % Gain |
| 1 | | Graham Corp | | Electrical Components & Equipment | | -79.8% |
| 2 | | Mitcham Industries Inc | | Oil & Gas Services | | -79.5% |
| 3 | | Metalico Inc | | Environmental Control | | -76.4% |
| 4 | | Dawson Geophysical Co | | Oil & Gas Services | | -75.1% |
| 5 | | JDS Uniphase Corp | | Telecommunications | | -75.0% |
| 6 | | Bolt Technology Corp | | Oil & Gas Services | | -72.5% |
| 7 | | CROCS Inc | | Apparel | | -71.7% |
| 8 | | General Cable Corp | | Electrical Components & Equipment | | -71.4% |
| 9 | | Gulfport Energy Corp | | Oil & Gas | | -71.1% |
| 10 | | Rosetta Resources Inc | | Oil & Gas | | -70.0% |
| | | | | | | |
Dawson Geophysical accumulates and provides seismic data that helps natural gas companies determine the most promising spots to drill. For its fiscal year 2008, the company posted a 26% increase in revenue and a 29% rise in earnings. Management boasts of a strong balance sheet with excellent cash flow and points out that the company has several long-term projects locked up through 2009, particularly in the Appalachian Basin. However, like so many small companies with limited Wall Street analyst coverage, this company has gotten caught up in the negativity of the overall market and the plummeting energy prices. Its stock price was sitting at close to an all-time high at the beginning of the summer of 2008, but plummeted over 75% by the end of the year, even though its operations have weathered the storm quite well. Though analysts expect natural gas companies to cut capital expenditures in a dramatic way until the economy shows signs of rebounding, Dawson continues to see excellent demand for its services. Unfortunately, that demand does not seem to be reflected in its share price.
Top Ten Holdings as of December 31, 2008
Health-care related companies were well-represented on the list of top holdings, and those four companies (OSI Pharmaceuticals, Questcor Pharmaceuticals, Almost Family, and Thoratec Corp.) accounted for over 14% of the Funds assets. Five of the Fund’s largest holdings were among its top performers of the quarter: Questcor Pharmaceuticals, Almost Family, Compass Minerals, Thoratec, and VSE Corp. The top ten holdings accounted for about 30% of the Fund’s net assets with no single company representing even as much as 5%. Diversification can be key in these difficult markets.
| | | | | | |
| Rank | | Description | | Industry | | % of
Net Assets |
| 1 | | OSI Pharmaceuticals Inc | | Biotechnology | | 4.3% |
| 2 | | Questcor Pharmaceuticals Inc | | Pharmaceuticals | | 3.8% |
| 3 | | Almost Family Inc | | Healthcare-Services | | 3.6% |
| 4 | | Axsys Technologies Inc | | Electronics | | 3.5% |
| 5 | | Compass Minerals International Inc | | Mining | | 2.9% |
| 6 | | Interwoven Inc | | Internet | | 2.8% |
| 7 | | Thoratec Corp | | Healthcare-Products | | 2.6% |
| 8 | | Arena Resources Inc | | Oil & Gas | | 2.3% |
| 9 | | Fuel Systems Solutions Inc | | Auto Parts & Equipment | | 2.3% |
| 10 | | VSE Corp | | Engineering & Construction | | 2.1% |
| | | | | | | |
| Total | | | | | | 30.2% |
| | |
| 72 | | Semi-Annual Report | December 31, 2008 (Unaudited) |
Small-Cap Growth Fund
MANAGER’S COMMENTARY (continued)
(Unaudited)
Industry Sector Representation as of December 31, 2008
While virtually no sector was spared the negativity of the past three months, our models’ overweighting of energy stocks was very costly to the Fund’s performance relative to the benchmarks. This sector was severely impacted in the latter half of the year when oil prices plummeted. While many of these companies had been solid performers for us in the second quarter, some plunged in value, as the weak global economy hindered demand for energy and related products. Our models’ underweighting financials also hurt our relative performance during the quarter and the year.
| | | | | | |
| | | % of Net Assets | | % of S&P
Small Cap Index | | Difference |
Basic Materials | | 5.2% | | 2.9% | | 2.3% |
Communications | | 9.7% | | 4.5% | | 5.2% |
Consumer, Cyclical | | 12.5% | | 14.2% | | -1.7% |
Consumer, Non-cyclical | | 28.3% | | 20.9% | | 7.4% |
Energy | | 11.5% | | 3.8% | | 7.7% |
Financial | | 2.4% | | 20.3% | | -17.9% |
Industrial | | 19.4% | | 19.3% | | 0.1% |
Technology | | 10.4% | | 8.5% | | 1.9% |
Utilities | | 0.5% | | 5.6% | | -5.1% |
Cash | | 0.1% | | 0.0% | | 0.1% |
| | | | | | | |
Total | | 100.0% | | 100.0% | | |
Disclaimer
The views expressed here are exclusively those of Fund management. These views are not meant as investment advice and should not be considered predictive in nature. Any favorable (or unfavorable) description of a holding applies only as of December 31, 2008, unless otherwise stated. Security positions can and do change thereafter. Discussions of historical performance do not guarantee and are not indicative of future performance.
Market volatility can significantly impact short-term performance. The Fund is not an appropriate investment for short-term investors. Investments in small companies generally carry greater risk than is customarily associated with larger companies. This additional risk is attributable to a number of factors, including the relatively limited financial resources that are typically available to small companies, and the fact that small companies often have comparatively limited product lines. In addition, the stock of small companies tends to be more volatile than the stock of large companies, particularly in the short term and particularly in the early stages of an economic or market downturn. Shareholders of the Fund, therefore, are taking on more risk than they would if they invested in the stock market as a whole.
Conclusion
Thank you for your continued investment in Small-Cap Growth Fund. We encourage your feedback; your reactions and concerns are important to us.
Sincerely,
Your Investment Management Team
Small-Cap Growth Fund
SCHEDULE OF INVESTMENTS
Showing percentage of net assets as of December 31, 2008 (Unaudited)
| | | | | | | |
| Industry | | Company | | Shares | | Value |
|
COMMON STOCKS - 99.93% |
Aerospace/Defense - 0.17% |
| | AAR Corp.* | | 7,429 | | $ | 136,768 |
|
Apparel - 0.09% |
| | Warnaco Group, Inc.* | | 3,600 | | | 70,668 |
|
Auto Parts & Equipment - 2.28% |
| | Fuel Systems Solutions, Inc.*+ | | 57,700 | | | 1,890,252 |
|
Beverages - 0.55% |
| | Boston Beer Co., Inc.* | | 16,000 | | | 454,400 |
|
Biotechnology - 5.20% |
| | Life Technologies Corp.* | | 32,800 | | | 764,568 |
| | OSI Pharmaceuticals, Inc.*+ | | 90,800 | | | 3,545,740 |
| | | | | | | |
| | | | | | | 4,310,308 |
|
Chemicals - 2.32% |
| | Innophos Holdings, Inc. | | 47,700 | | | 944,937 |
| | Lubrizol Corp. | | 6,000 | | | 218,340 |
| | Quaker Chemical Corp. | | 46,200 | | | 759,990 |
| | | | | | | |
| | | | | | | 1,923,267 |
|
Coal - 0.69% |
| | Penn Virginia GP Holdings LP+ | | 57,200 | | | 567,996 |
|
Commercial Services - 5.20% |
| | Emergency Medical Services Corp., Class A*+ | | 21,100 | | | 772,471 |
| | FTI Consulting, Inc.*+ | | 6,065 | | | 270,984 |
| | ICF International, Inc.* | | 33,000 | | | 810,810 |
| | PAREXEL International Corp.* | | 51,200 | | | 497,152 |
| | Strayer Education, Inc.+ | | 6,227 | | | 1,335,131 |
| | Watson Wyatt Worldwide, Inc., Class A | | 13,000 | | | 621,660 |
| | | | | | | |
| | | | | | | 4,308,208 |
|
Computers - 5.59% |
| | Cognizant Technology Solutions Corp., Class A* | | 72,880 | | | 1,316,213 |
| | Integral Systems, Inc.* | | 118,800 | | | 1,431,540 |
| | Manhattan Associates, Inc.* | | 89,490 | | | 1,414,837 |
| | Sykes Enterprises, Inc.* | | 24,200 | | | 462,704 |
| | | | | | | |
| | | | | | | 4,625,294 |
|
Distribution/Wholesale - 1.18% |
| | LKQ Corp.* | | 83,900 | | | 978,274 |
|
Electrical Components & Equipment - 1.53% |
| | EnerSys*+ | | 45,100 | | | 496,100 |
| | GrafTech International, Ltd.* | | 92,322 | | | 768,119 |
| | | | | | | |
| | | | | | | 1,264,219 |
| | | | | | | |
| Industry | | Company | | Shares | | Value |
|
|
Electronics - 3.54% |
| | Axsys Technologies, Inc.* | | 53,500 | | $ | 2,935,010 |
|
Engineering & Construction - 3.29% |
| | Layne Christensen Co.* | | 40,200 | | | 965,202 |
| | VSE Corp. | | 44,900 | | | 1,761,427 |
| | | | | | | |
| | | | | | | 2,726,629 |
|
Environmental Control - 1.95% |
| | Calgon Carbon Corp.* | | 105,300 | | | 1,617,408 |
|
Food - 1.11% |
| | Cal-Maine Foods, Inc.+ | | 31,920 | | | 916,104 |
|
Gas - 0.50% |
| | The Laclede Group, Inc. | | 8,800 | | | 412,192 |
|
Healthcare - Products - 8.03% |
| | CryoLife, Inc.* | | 131,763 | | | 1,279,419 |
| | Gen-Probe, Inc.*+ | | 13,400 | | | 574,056 |
| | Hologic, Inc.*+ | | 60,000 | | | 784,200 |
| | Intuitive Surgical, Inc.*+ | | 4,200 | | | 533,358 |
| | Qiagen NV*+ | | 77,256 | | | 1,356,615 |
| | Thoratec Corp.*+ | | 65,300 | | | 2,121,597 |
| | | | | | | |
| | | | | | | 6,649,245 |
|
Healthcare - Services - 3.80% |
| | Almost Family, Inc.*+ | | 66,800 | | | 3,004,664 |
| | Life Sciences Research, Inc.* | | 15,386 | | | 144,628 |
| | | | | | | |
| | | | | | | 3,149,292 |
|
Insurance - 2.42% |
| | Crawford & Co., Class B* | | 61,684 | | | 896,885 |
| | Life Partners Holdings, Inc. | | 25,400 | | | 1,108,456 |
| | | | | | | |
| | | | | | | 2,005,341 |
|
Internet - 5.92% |
| | eResearchTechnology, Inc.* | | 106,500 | | | 706,095 |
| | Interwoven, Inc.* | | 181,300 | | | 2,284,380 |
| | priceline.com, Inc.*+ | | 10,500 | | | 773,325 |
| | TeleCommunication Systems, Inc., Class A* | | 132,700 | | | 1,139,893 |
| | | | | | | |
| | | | | | | 4,903,693 |
|
Machinery - Construction & Mining - 0.64% |
| | Bucyrus International, Inc., Class A+ | | 28,700 | | | 531,524 |
|
Machinery - Diversified - 2.40% |
| | Gardner Denver, Inc.* | | 37,300 | | | 870,582 |
| | Westinghouse Air Brake Technologies Corp.+ | | 28,200 | | | 1,120,950 |
| | | | | | | |
| | | | | | | 1,991,532 |
| | |
| 74 | | Semi-Annual Report | December 31, 2008 (Unaudited) |
Small-Cap Growth Fund
SCHEDULE OF INVESTMENTS (continued)
Showing percentage of net assets as of December 31, 2008 (Unaudited)
| | | | | | | |
| Industry | | Company | | Shares | | Value |
|
Common Stocks (continued) |
Metal Fabrication - Hardware - 1.13% |
| | Valmont Industries, Inc.+ | | 15,300 | | $ | 938,808 |
|
Mining - 2.90% |
| | Compass Minerals International, Inc. | | 40,900 | | | 2,399,194 |
|
Miscellaneous Manufacturing - 0.46% |
| | AZZ, Inc.* | | 15,303 | | | 384,105 |
|
Oil & Gas - 5.70% |
| | Arena Resources, Inc.*+ | | 67,400 | | | 1,893,266 |
| | GeoResources, Inc.*+ | | 133,000 | | | 1,155,770 |
| | Gulfport Energy Corp.* | | 29,765 | | | 117,572 |
| | Mariner Energy, Inc.*+ | | 54,300 | | | 553,860 |
| | Rosetta Resources, Inc.* | | 94,300 | | | 667,644 |
| | Swift Energy Co.*+ | | 19,641 | | | 330,165 |
| | | | | | | |
| | | | | | | 4,718,277 |
|
Oil & Gas Services - 5.12% |
| | Bolt Technology Corp.* | | 119,277 | | | 830,168 |
| | Dawson Geophysical Co.* | | 12,000 | | | 213,720 |
| | Dril-Quip, Inc.* | | 18,300 | | | 375,333 |
| | FMC Technologies, Inc.*+ | | 14,030 | | | 334,335 |
| | Gulf Island Fabrication, Inc. | | 34,500 | | | 497,145 |
| | Mitcham Industries, Inc.* | | 77,800 | | | 308,866 |
| | Natural Gas Services Group, Inc.* | | 20,300 | | | 205,639 |
| | Oceaneering International, Inc.* | | 13,000 | | | 378,820 |
| | Superior Energy Services, Inc.* | | 68,600 | | | 1,092,798 |
| | | | | | | |
| | | | | | | 4,236,824 |
|
Packaging & Containers - 0.53% |
| | Owens-Illinois, Inc.* | | 16,100 | | | 440,013 |
|
Pharmaceuticals - 4.44% |
| | Matrixx Initiatives, Inc.* | | 32,200 | | | 530,978 |
| | Questcor Pharmaceuticals, Inc.*+ | | 337,700 | | | 3,143,987 |
| | | | | | | |
| | | | | | | 3,674,965 |
|
Retail - 8.93% |
| | Aeropostale, Inc.*+ | | 15,900 | | | 255,990 |
| | Cash America International, Inc. | | 49,800 | | | 1,362,030 |
| | EZCORP, Inc., Class A* | | 5,000 | | | 76,050 |
| | Guess ?, Inc. | | 48,000 | | | 736,800 |
| | Gymboree Corp.* | | 43,100 | | | 1,124,479 |
| | MSC Industrial Direct Co., Class A | | 30,200 | | | 1,112,266 |
| | Pricesmart, Inc. | | 58,500 | | | 1,208,610 |
| | | | | | | |
| Industry | | Company | | Shares | | Value |
|
|
Retail (continued) |
| | The Buckle, Inc.+ | | 35,850 | | $ | 782,247 |
| | Tractor Supply Co.*+ | | 20,400 | | | 737,256 |
| | | | | | | |
| | | | | | | 7,395,728 |
|
Semiconductors - 1.20% |
| | QLogic Corp.* | | 73,900 | | | 993,216 |
|
Software - 3.66% |
| | Informatica Corp.* | | 101,900 | | | 1,399,087 |
| | Tyler Technologies, Inc.* | | 136,300 | | | 1,632,874 |
| | | | | | | |
| | | | | | | 3,031,961 |
|
Telecommunications - 3.76% |
| | Comtech Telecommunications Corp.* | | 16,687 | | | 764,598 |
| | Infinera Corp.*+ | | 135,500 | | | 1,214,080 |
| | JDS Uniphase Corp.* | | 98,900 | | | 360,985 |
| | Tekelec* | | 57,720 | | | 769,985 |
| | | | | | | |
| | | | | | | 3,109,648 |
|
Transportation - 3.59% |
| | Gulfmark Offshore, Inc.* | | 15,050 | | | 358,040 |
| | Kirby Corp.* | | 44,000 | | | 1,203,840 |
| | Tidewater, Inc. | | 35,000 | | | 1,409,450 |
| | | | | | | |
| | | | | | | 2,971,330 |
|
Trucking & Leasing - 0.11% |
| | TAL International Group, Inc. | | 6,325 | | | 89,183 |
| | | | | | | |
| |
TOTAL COMMON STOCKS - 99.93% | | | 82,750,876 |
| | | | | | | |
(Cost $104,992,977) | | | |
| |
TOTAL INVESTMENTS - 99.93% | | $ | 82,750,876 |
(Cost $104,992,977) |
Other Assets in Excess of Liabilities - 0.07% | | | 60,992 |
| | | | | | | |
NET ASSETS - 100.00% | | $ | 82,811,868 |
| | | | | | | |
| * | Non Income Producing Security. |
| + | This security or a portion of the security is out on loan at December 31, 2008. Total loaned securities had a market value of $24,594,643 at December 31, 2008. |
See Notes to Financial Statements.
Small-Cap Value Fund
MANAGER’S COMMENTARY
(Unaudited)
December 31, 2008
Dear Fellow Small-Cap Value Fund Shareholder,
In the midst of what has now become the worst bear market since the 1930’s, our Fund declined 28.58% for the December quarter. This performance lagged both our primary market benchmark, the Russell 2000 Value Index (down 24.89%) and the Lipper Small-Cap Value Funds Index (down 25.11%). It was a poor quarter in both absolute and relative terms.
For the six month semi-annual period, our Fund declined 40.70%, compared to a 21.17% decline for the Russell 2000 Value Index and a 26.77% decline of the Lipper Small-Cap Value Funds Index. Particularly damaging during this period was our exposure to energy and industrial stocks and poor model stock picks within these categories. Not having previously sold some stocks that drifted into the growth side of the small-stock spectrum was also costly.
For the full calendar year, our Fund declined 45.57%, considerably worse than the 28.92% Russell 2000 Value Index decline and the 32.82% Lipper Small-Cap Value Funds Index decline. The table below presents our December quarter, six-month, one-year, five-year and life-to-date financial results according to the formula required by the SEC. Our last two quarters of performance were poor enough to put us “under water” since inception. See the next page for a graph of performance since inception.
| | | | | | | | | | |
| | | Dec. Qtr.
10/1/08
to 12/31/08 | | Six-Month
7/1/08
to 12/31/08 | | 1 Year
1/1/08
to 12/31/08 | | 5 Year
1/1/04
to 12/31/08 | | Life-to-Date
10/31/03
to 12/31/08 |
| | | | | |
Small-Cap Value Fund | | -28.58% | | -40.70% | | -45.57% | | -1.74% | | -1.18% |
Russell 2000 Value Index | | -24.89% | | -21.17% | | -28.92% | | 0.27% | | 1.69% |
Lipper Small-Cap Value Funds Index | | -25.11% | | -26.77% | | -32.82% | | -0.53% | | 1.01% |
Performance figures quoted in the table above and graph below represent past performance and are no guarantee of future results. The table above and the graph below do not reflect the deduction of taxes that a shareholder would pay on Fund distributions or the redemption of Fund shares.
The Russell 2000 Value Index is an unmanaged index which consists of stocks in the Russell 2000 Index with lower price-to-book ratios and lower forecasted growth values with dividends reinvested. The Lipper Small-Cap Value Funds Index is an index of small-company, value-oriented funds compiled by Lipper, Inc. It is not possible to invest directly in an index. Periods longer than one year are annualized.
According to data from Lipper, Inc. as of December 31, 2008, Small-Cap Value Fund ranked 727th of 775 small-cap core funds for the twelve-month period ended December 31, 2008, 260th of 487 over the last five years and 306th of 474 such funds since inception in October, 2003. Lipper, Inc. is an independent mutual fund rating service that ranks funds in various fund categories by making comparative calculations using total returns.
| | |
| 76 | | Semi-Annual Report | December 31, 2008 (Unaudited) |
Small-Cap Value Fund
MANAGER’S COMMENTARY (continued)
(Unaudited)
Small-Cap Value Fund vs. Russell 2000 Value Index & Lipper Small-Cap Value Funds Index 10/31/03 to 12/31/08
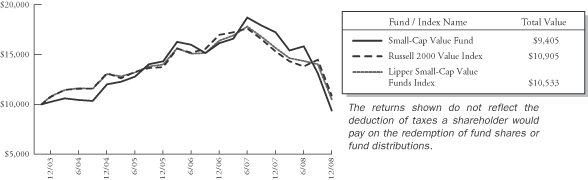
Detailed Explanation of Quarterly Performance—Some stocks (slightly) cushioned the blow
The Short Version: With a dramatic December quarter downturn, there were only a few stocks that helped cushion the blow. 20 of our 112 stocks had positive returns.
In a quarter where misery found plenty of company, investors had to search long and hard for winners in their portfolios. Virtually all sectors suffered negative ramifications of the credit crisis and severe downturn in the economy over the past three months. Fortunately, our models uncovered some positive-performing companies that produced nice results during the year. These are the ten best-performing stocks for the quarter ended December 31, 2008:
| | | | | | |
| Rank | | Description | | Industry | | % Gain |
| 1 | | Alaska Air Group Inc | | Airlines | | 34.6% |
| 2 | | Briggs & Stratton Corp | | Machinery-Diversified | | 25.9% |
| 3 | | ICF International Inc | | Commercial Services | | 24.4% |
| 4 | | Tower Group Inc | | Insurance | | 19.7% |
| 5 | | Amerigroup Corp | | Healthcare-Services | | 17.0% |
| 6 | | NorthWestern Corp | | Electric | | 15.2% |
| 7 | | Nelnet Inc | | Diversified Financial Services | | 14.1% |
| 8 | | American Physicians Capital Inc | | Insurance | | 13.6% |
| 9 | | Amerisafe Inc | | Insurance | | 12.8% |
| 10 | | AAR Corp | | Aerospace/Defense | | 11.0% |
| | | | | | | |
How do you spell relief in a hurricane…GENERATOR. Briggs & Stratton produces gasoline powered outdoor equipment for various consumer applications. In particular, the company manufactures generators that can be used during long-lasting power outages like those encountered following ice storms and hurricanes. Demand for these generators fueled increased quarterly sales as the North Atlantic suffered its fourth most active hurricane season since 1944. Unfortunately, Bridgeway partners experienced the trials and tribulations of living without electricity during the heat and humidity of the late Houston summer. Hurricane Ike made near direct landfall in Galveston, Texas and proved devastating (or, at least, uncomfortable) for many of us residents in Houston. In October, the company issued a surprising surge in earnings and declared a quarterly dividend. Briggs & Stratton was our second top performer and increased over 25% during the quarter.
Small-Cap Value Fund
MANAGER’S COMMENTARY (continued)
(Unaudited)
Detailed Explanation of Quarterly Performance—What Didn’t Work
The Short Version: A very bad quarter in energy.
With oil prices plunging by $100/barrel since setting highs in July, any and all companies with ties to the energy sector suffered as well. Likewise, as the country moved deeper and deeper into recession, many consumers went into hibernation and focused their budgets only on the absolute necessities of life. The list of ten worst performers for the quarter was made up of six oil and gas-related companies and four consumer cyclical stocks. Combined, these ten holdings cost the Fund over seven percent in return for the quarter.
These are the ten worst-performing stocks for the quarter ended December 31, 2008:
| | | | | | |
| Rank | | Description | | Industry | | % Loss |
| 1 | | Callon Petroleum Co | | Oil & Gas | | -85.6% |
| 2 | | Energy Partners Ltd | | Oil & Gas | | -84.4% |
| 3 | | Quiksilver Inc | | Apparel | | -67.9% |
| 4 | | ATP Oil & Gas Corp | | Oil & Gas | | -67.2% |
| 5 | | Federal Mogul Corp | | Auto Parts & Equipment | | -63.1% |
| 6 | | Rosetta Resources Inc | | Oil & Gas | | -61.4% |
| 7 | | Genesco Inc | | Retail | | -60.2% |
| 8 | | McMoRan Exploration Co | | Oil & Gas | | -58.5% |
| 9 | | Hornbeck Offshore Services Inc | | Oil & Gas Services | | -57.7% |
| 10 | | Warnaco Group Inc | | Apparel | | -56.7% |
| | | | | | | |
The current recessionary times truly hindered sales and ongoing operations at virtually all of the nation’s (non-discount) retail stores. Quiksilver produces and markets outdoor apparel and equipment. Like most of its retail counterparts, it suffered from the downturn in the economy and resorted to significant price markdowns simply to move inventory. In November, the company sold its Rossignol unit, a business that had been losing money and bleeding cash for most of the year. While the transaction was initially considered good news for shareholders, the sales price had been reduced and the company was unable to retire certain debt as anticipated. Moody’s Investors Services downgraded Quiksilver following the deal, citing liquidity concerns. This holding cost the Fund a half percent in return for the three-month period.
Detailed Explanation of Calendar Year Performance—Companies With Positive Returns
The Short Version: Only twenty-eight of the 185 companies we held during the calendar year had positive returns.
With all ten S&P sectors recording sizable market losses in 2008, investors had few places to turn for relief from the equity market carnage. Diversification turned out to be the key for what limited success the Fund experienced, as six different sectors were represented in the best performer list for the calendar year. The top six performers each returned greater than 25% in 2008 and combined to contribute just under two percent to Fund return. These are the ten best performers for the calendar year ended December 31, 2008:
| | | | | | |
| Rank | | Description | | Industry | | % Gain |
| 1 | | Superior Essex Inc | | Electrical Components & Equipment | | 59.7% |
| 2 | | Ezcorp Inc | | Retail | | 34.7% |
| 3 | | Alaska Air Group Inc | | Airlines | | 34.6% |
| 4 | | Rock-Tenn Co | | Packaging & Containers | | 34.5% |
| 5 | | Amerisafe Inc | | Insurance | | 28.2% |
| 6 | | Briggs & Stratton Corp | | Machinery-Diversified | | 25.9% |
| 7 | | Zep Inc | | Chemicals | | 19.8% |
| 8 | | Healthspring Inc | | Healthcare-Services | | 18.6% |
| 9 | | American Physicians Capital Inc | | Insurance | | 16.0% |
| 10 | | Laclede Group Inc | | Gas | | 15.6% |
| | | | | | | |
| | |
| 78 | | Semi-Annual Report | December 31, 2008 (Unaudited) |
Small-Cap Value Fund
MANAGER’S COMMENTARY (continued)
(Unaudited)
While most retailers struggled through a horrid holiday season, pawn shops like Ezcorp actually reaped the benefits of the downturn in the economy. During the summer months, many consumers took those government stimulus checks straight to their local pawn shops for deals on jewelry, sporting goods, electronics, and other products. In July, the company reported that operating income surged almost 50%, and it also experienced a nice increase in its highly profitable lending activity. In September, Ezcorp entered into an agreement to acquire Value Financial Services, a deal which had practically fallen apart in the previous month. The company continued its growth mode late in the year by buying the assets of eleven pawn shops throughout Nevada. The holding contributed about a half a percent to the return of the Fund during 2008.
Detailed Explanation of Calendar Year Performance—What Didn’t Work
The Short Version: As goes the December quarter, so goes the year.
During the last six months of the year, oil prices plunged from $146 to a low of $31/barrel in December. Needless to say, most energy companies experienced significant setbacks during this timeframe. Five oil and gas-related holdings made our list of worst performers for the year and combined to cost the Fund about three and a half percent in return in 2008. 32 holdings fell 50% or more during the year. These are the ten stocks that performed the worst in the calendar year ended December 31, 2008:
| | | | | | |
| Rank | | Description | | Industry | | % Gain |
| 1 | | Callon Petroleum Co | | Oil & Gas | | -90.4% |
| 2 | | Energy Partners Ltd | | Oil & Gas | | -88.7% |
| 3 | | Quiksilver Inc | | Apparel | | -81.7% |
| 4 | | ATP Oil & Gas Corp | | Oil & Gas | | -79.3% |
| 5 | | Capstone Turbine Corp | | Electrical Components & Equipment | | -77.6% |
| 6 | | Rosetta Resources Inc | | Oil & Gas | | -74.0% |
| 7 | | Swift Energy Co | | Oil & Gas | | -72.4% |
| 8 | | General Cable Corp | | Electrical Components & Equipment | | -72.0% |
| 9 | | Federal Mogul Corp | | Auto Parts & Equipment | | -70.7% |
| 10 | | Steel Dynamics Inc | | Iron/Steel | | -69.1% |
| | | | | | | |
Callon Petroleum is an exploration and development company, primarily operating along the Louisiana Gulf Coast. With Hurricanes Gustav and Ike wreaking havoc on oil and gas platforms in September, Callon suffered from production slowdowns and work stoppages. By November, the company decided to cease development of its Entrada deepwater field while plunging energy prices severely dampened any positive economic reasons for continuation of this project. Jefferies and Co. slashed its ratings on Callon to “underperform,” stating that the company had “few growth prospects apart from Entrada.” The stock price fell to a 14-year low, and the position cost the Fund just under a percent in return for the twelve-month period.
Small-Cap Value Fund
MANAGER’S COMMENTARY (continued)
(Unaudited)
Top Ten Holdings as of December 31, 2008
Three of the top holdings at the end of the year were also among the best quarterly performers: American Physicians Capital, Amerisafe, and Amerigroup. Combined, these ten companies accounted for about 25% of the Fund’s net assets with no single holding representing as much as 4%.
| | | | | | |
| Rank | | Description | | Industry | | % of
Net Assets |
| 1 | | Ezcorp Inc | | Retail | | 3.7% |
| 2 | | Spartan Stores Inc | | Food | | 2.8% |
| 3 | | American Physicians Capital Inc | | Insurance | | 2.6% |
| 4 | | Amerisafe Inc | | Insurance | | 2.6% |
| 5 | | Healthsprings Inc | | Healthcare-Services | | 2.4% |
| 6 | | Celera Corp | | Biotechnology | | 2.3% |
| 7 | | The Laclede Group Inc | | Gas | | 2.3% |
| 8 | | Emcor Group | | Engineering & Construction | | 2.2% |
| 9 | | Amerigroup Corp | | Healthcare-Services | | 2.1% |
| 10 | | Labranche & Company Inc | | Diversified Financial Services | | 2.1% |
| | | | | | | |
| Total | | | | | | 25.1% |
Industry Sector Representation as of December 31, 2008
While virtually no sector was spared the negativity of the past three months (and full year, for that matter), our models’ overweighting of basic materials, energy, and industrials was very costly to the Fund’s performance relative to the benchmarks. Remarkably, we did not benefit from our models’ underweighting financials. The financial blowups were mostly among that sector’s largest companies; small company financial stocks actually declined less than every other sector except utilities among the market’s smaller companies.
| | | | | | |
| | | % of Net Assets | | % of S&P
Small Cap Index | | Difference |
Basic Materials | | 5.9% | | 2.9% | | 3.0% |
Communications | | 2.3% | | 4.5% | | -2.2% |
Consumer, Cyclical | | 16.0% | | 14.2% | | 1.8% |
Consumer, Non-cyclical | | 20.7% | | 20.9% | | -0.2% |
Energy | | 7.1% | | 3.8% | | 3.3% |
Financial | | 12.6% | | 20.3% | | -7.7% |
Industrial | | 22.7% | | 19.3% | | 3.4% |
Technology | | 2.7% | | 8.5% | | -5.8% |
Utilities | | 10.2% | | 5.6% | | 4.6% |
Cash | | -0.2% | | 0.0% | | -0.2% |
| | | | | | | |
Total | | 100.0% | | 100.0% | | |
Disclaimer
The views expressed here are exclusively those of Fund management. These views are not meant as investment advice and should not be considered predictive in nature. Any favorable (or unfavorable) description of a holding applies only as of December 31, 2008, unless otherwise stated. Security positions can and do change thereafter. Discussions of historical performance do not guarantee and are not indicative of future performance.
Market volatility can significantly impact short-term performance. The Fund is not an appropriate investment for short-term investors. Investments in small companies generally carry greater risk than is customarily associated with larger companies. This additional risk is attributable to a number of factors, including the relatively limited financial resources that are typically
| | |
| 80 | | Semi-Annual Report | December 31, 2008 (Unaudited) |
Small-Cap Value Fund
MANAGER’S COMMENTARY (continued)
(Unaudited)
available to small companies, and the fact that small companies often have comparatively limited product lines. In addition, the stock of small companies tends to be more volatile than the stock of large companies, particularly in the short term and particularly in the early stages of an economic or market downturn. Shareholders of the Fund, therefore, are taking on more risk than they would if they invested in the stock market as a whole.
Conclusion
Thank you for your continued investment in Small-Cap Value Fund. We encourage your feedback; your reactions and concerns are important to us.
Sincerely,
Your Investment Management Team
Small-Cap Value Fund
SCHEDULE OF INVESTMENTS
Showing percentage of net assets as of December 31, 2008 (Unaudited)
| | | | | | | |
| Industry | | Company | | Shares | | Value |
|
COMMON STOCKS - 100.23% |
Aerospace/Defense - 0.24% |
| | AAR Corp.* | | 20,921 | | $ | 385,156 |
|
Airlines - 2.88% |
| | Alaska Air Group, Inc.* | | 74,600 | | | 2,182,050 |
| | Hawaiian Holdings, Inc.* | | 386,500 | | | 2,465,870 |
| | | | | | | |
| | | | | | | 4,647,920 |
|
Apparel - 1.96% |
| | Quiksilver, Inc.* | | 341,300 | | | 627,992 |
| | Warnaco Group, Inc.* | | 129,100 | | | 2,534,233 |
| | | | | | | |
| | | | | | | 3,162,225 |
|
Auto Parts & Equipment - 1.21% |
| | ATC Technology Corp.* | | 105,000 | | | 1,536,150 |
| | Federal-Mogul Corp.*+ | | 98,562 | | | 416,917 |
| | | | | | | |
| | | | | | | 1,953,067 |
|
Beverages - 1.07% |
| | PepsiAmericas, Inc. | | 85,100 | | | 1,732,636 |
|
Biotechnology - 3.46% |
| | Celera Corp.*+ | | 338,300 | | | 3,765,279 |
| | Life Technologies Corp.* | | 78,600 | | | 1,832,166 |
| | | | | | | |
| | | | | | | 5,597,445 |
|
Building Materials - 2.05% |
| | Comfort Systems USA, Inc. | | 178,780 | | | 1,895,068 |
| | NCI Building Systems, Inc.* | | 87,100 | | | 1,419,730 |
| | | | | | | |
| | | | | | | 3,314,798 |
|
Chemicals - 4.04% |
| | A. Schulman, Inc. | | 141,600 | | | 2,407,200 |
| | Innophos Holdings, Inc. | | 78,605 | | | 1,557,165 |
| | Terra Industries, Inc. | | 154,000 | | �� | 2,567,180 |
| | | | | | | |
| | | | | | | 6,531,545 |
|
Coal - 0.70% |
| | Arch Coal, Inc.+ | | 69,000 | | | 1,124,010 |
|
Commercial Services - 3.10% |
| | Emergency Medical Services Corp., Class A*+ | | 59,300 | | | 2,170,973 |
| | ICF International, Inc.*+ | | 115,846 | | | 2,846,336 |
| | | | | | | |
| | | | | | | 5,017,309 |
|
Distribution/Wholesale - 0.55% |
| | United Stationers, Inc.* | | 26,300 | | | 880,787 |
| | | | | | | |
| Industry | | Company | | Shares | | Value |
|
|
Diversified Financial Services - 4.15% |
| | Knight Capital Group, Inc., Class A* | | 165,600 | | $ | 2,674,440 |
| | LaBranche & Co., Inc.* | | 705,200 | | | 3,377,908 |
| | Nelnet, Inc., Class A | | 45,100 | | | 646,283 |
| | | | | | | |
| | | | | | | 6,698,631 |
|
Electric Utilities - 6.83% |
| | Central Vermont Public Service Corp. | | 117,010 | | | 2,791,859 |
| | Hawaiian Electric Industries, Inc.+ | | 126,100 | | | 2,791,854 |
| | MGE Energy, Inc. | | 96,300 | | | 3,177,900 |
| | NorthWestern Corp. | | 97,100 | | | 2,278,937 |
| | | | | | | |
| | | | | | | 11,040,550 |
|
Electrical Components & Equipment - 1.06% |
| | Belden, Inc. | | 50,000 | | | 1,044,000 |
| | Capstone Turbine Corp.*+ | | 801,000 | | | 672,840 |
| | | | | | | |
| | | | | | | 1,716,840 |
|
Electronics - 1.14% |
| | Multi-Fineline Electronix, Inc.* | | 157,600 | | | 1,842,344 |
|
Engineering & Construction - 3.34% |
| | EMCOR Group, Inc.* | | 161,000 | | | 3,611,230 |
| | Perini Corp.* | | 76,400 | | | 1,786,232 |
| | | | | | | |
| | | | | | | 5,397,462 |
|
Food - 4.71% |
| | Cal-Maine Foods, Inc.+ | | 33,267 | | | 954,763 |
| | Corn Products International, Inc. | | 75,000 | | | 2,163,750 |
| | Spartan Stores, Inc. | | 193,300 | | | 4,494,225 |
| | | | | | | |
| | | | | | | 7,612,738 |
|
Forest Products & Paper - 1.22% |
| | Glatfelter | | 212,300 | | | 1,974,390 |
|
Gas - 3.35% |
| | Piedmont Natural Gas Co., Inc. | | 54,100 | | | 1,713,347 |
| | The Laclede Group, Inc.+ | | 79,000 | | | 3,700,360 |
| | | | | | | |
| | | | | | | 5,413,707 |
|
Healthcare - Products - 1.50% |
| | Cyberonics, Inc.* | | 145,900 | | | 2,417,563 |
|
Healthcare - Services - 6.90% |
| | AMERIGROUP Corp.*+ | | 115,700 | | | 3,415,464 |
| | |
| 82 | | Semi-Annual Report | December 31, 2008 (Unaudited) |
Small-Cap Value Fund
SCHEDULE OF INVESTMENTS (continued)
Showing percentage of net assets as of December 31, 2008 (Unaudited)
| | | | | | | |
| Industry | | Company | | Shares | | Value |
|
Common Stocks (continued) |
Healthcare - Services (continued) |
| | Gentiva Health Services, Inc.* | | 69,300 | | $ | 2,027,718 |
| | HealthSpring, Inc.* | | 196,000 | | | 3,914,120 |
| | Triple-S Management Corp., Class B*+ | | 155,600 | | | 1,789,400 |
| | | | | | | |
| | | | | | | 11,146,702 |
|
Insurance - 8.42% |
| | American Physicians Capital, Inc. | | 88,500 | | | 4,256,850 |
| | Amerisafe, Inc.* | | 204,747 | | | 4,203,456 |
| | AmTrust Financial Services, Inc. | | 176,600 | | | 2,048,560 |
| | Tower Group, Inc. | | 110,000 | | | 3,103,100 |
| | | | | | | |
| | | | | | | 13,611,966 |
|
Internet - 1.92% |
| | EarthLink, Inc.*+ | | 369,600 | | | 2,498,496 |
| | United Online, Inc. | | 98,448 | | | 597,579 |
| | | | | | | |
| | | | | | | 3,096,075 |
|
Iron/Steel - 0.60% |
| | Cliffs Natural Resources, Inc.+ | | 38,100 | | | 975,741 |
|
Machinery - Diversified - 2.93% |
| | Briggs & Stratton Corp.+ | | 84,500 | | | 1,486,355 |
| | Columbus McKinnon Corp.* | | 111,100 | | | 1,516,515 |
| | Gardner Denver, Inc.* | | 74,300 | | | 1,734,162 |
| | | | | | | |
| | | | | | | 4,737,032 |
|
Metal Fabrication - Hardware - 0.48% |
| | Worthington Industries, Inc. | | 70,800 | | | 780,216 |
|
Miscellaneous Manufacturing - 2.16% |
| | EnPro Industries, Inc.* | | 77,200 | | | 1,662,888 |
| | Koppers Holdings, Inc. | | 66,500 | | | 1,437,730 |
| | LSB Industries, Inc.* | | 47,000 | | | 391,040 |
| | | | | | | |
| | | | | | | 3,491,658 |
|
Office Furnishing - 0.43% |
| | Knoll, Inc. | | 77,400 | | | 698,148 |
|
Oil & Gas - 3.29% |
| | ATP Oil & Gas Corp.*+ | | 109,900 | | | 642,915 |
| | Callon Petroleum Co.* | | 119,600 | | | 310,960 |
| | Energy Partners, Ltd.* | | 93,300 | | | 125,955 |
| | Mariner Energy, Inc.*+ | | 65,800 | | | 671,160 |
| | McMoRan Exploration Co.*+ | | 193,400 | | | 1,895,320 |
| | Rosetta Resources, Inc.* | | 116,400 | | | 824,112 |
| | | | | | | |
| Industry | | Company | | Shares | | Value |
|
|
Oil & Gas (continued) |
| | Swift Energy Co.*+ | | 50,700 | | $ | 852,267 |
| | | | | | | |
| | | | | | | 5,322,689 |
|
Oil & Gas Services - 3.13% |
| | Dril-Quip, Inc.* | | 58,900 | | | 1,208,039 |
| | Hornbeck Offshore Services, Inc.*+ | | 138,200 | | | 2,258,188 |
| | Oil States International, Inc.* | | 85,200 | | | 1,592,388 |
| | | | | | | |
| | | | | | | 5,058,615 |
|
Packaging & Containers - 2.39% |
| | Greif, Inc., Class A | | 52,200 | | | 1,745,046 |
| | Rock-Tenn Co., Class A | | 61,797 | | | 2,112,221 |
| | | | | | | |
| | | | | | | 3,857,267 |
|
Retail - 7.24% |
| | Big Lots, Inc.*+ | | 51,500 | | | 746,235 |
| | Casey’s General Stores, Inc. | | 6,900 | | | 157,113 |
| | CEC Entertainment, Inc.* | | 90,400 | | | 2,192,200 |
| | EZCORP, Inc., Class A* | | 396,000 | | | 6,023,160 |
| | Jo-Ann Stores, Inc.* | | 81,480 | | | 1,262,125 |
| | The Finish Line, Inc., Class A | | 236,200 | | | 1,322,720 |
| | | | | | | |
| | | | | | | 11,703,553 |
|
Semiconductors - 0.52% |
| | Standard Microsystems Corp.* | | 32,897 | | | 537,537 |
| | Supertex, Inc.* | | 12,400 | | | 297,724 |
| | | | | | | |
| | | | | | | 835,261 |
|
Software - 2.20% |
| | Compuware Corp.* | | 292,500 | | | 1,974,375 |
| | SYNNEX Corp.* | | 138,800 | | | 1,572,604 |
| | | | | | | |
| | | | | | | 3,546,979 |
|
Telecommunications - 0.42% |
| | Anixter International, Inc.* | | 18,000 | | | 542,160 |
| | UTStarcom, Inc.* | | 75,000 | | | 138,750 |
| | | | | | | |
| | | | | | | 680,910 |
|
Toys/Games/Hobbies - 1.73% |
| | Hasbro, Inc.+ | | 95,900 | | | 2,797,403 |
|
Transportation - 6.91% |
| | Gulfmark Offshore, Inc.* | | 64,945 | | | 1,545,042 |
| | HUB Group, Inc., Class A* | | 107,400 | | | 2,849,322 |
| | Kirby Corp.* | | 110,200 | | | 3,015,072 |
| | Overseas Shipholding Group, Inc. | | 32,400 | | | 1,364,364 |
| | Pacer International, Inc. | | 67,700 | | | 706,111 |
Small-Cap Value Fund
SCHEDULE OF INVESTMENTS (continued)
Showing percentage of net assets as of December 31, 2008 (Unaudited)
| | | | | | | | |
| Industry | | Company | | Shares | | Value | |
|
Common Stocks (continued) | |
Transportation (continued) | |
| | Ryder System, Inc. | | 22,500 | | $ | 872,550 | |
| | Tidewater, Inc. | | 20,000 | | | 805,400 | |
| | | | | | | | |
| | | | | | | 11,157,861 | |
| | | | | | | | |
| |
TOTAL COMMON STOCKS - 100.23% | | | 161,959,199 | |
| | | | | | | | |
(Cost $217,863,788) | | | | |
| |
TOTAL INVESTMENTS - 100.23% | | $ | 161,959,199 | |
(Cost $217,863,788) | | | | |
Liabilities in Excess of Other Assets - (0.23)% | | | (370,696 | ) |
| | | | | | | | |
NET ASSETS - 100.00% | | $ | 161,588,503 | |
| | | | | | | | |
| * | Non Income Producing Security. |
| + | This security or a portion of the security is out on loan at December 31, 2008. Total loaned securities had a market value of $22,107,190 at December 31, 2008. |
See Notes to Financial Statements.
| | |
| 84 | | Semi-Annual Report | December 31, 2008 (Unaudited) |
THIS PAGE INTENTIONALLY LEFT BLANK
Large-Cap Growth Fund
MANAGER’S COMMENTARY
(Unaudited)
December 31, 2008
Dear Fellow Large-Cap Growth Fund Shareholder,
In the midst of what has now become the worst bear market since the 1930’s, our Fund declined 26.49% for the December quarter. This performance lagged both our primary market benchmark, the Russell 1000 Growth Index (down 22.79%) and the Lipper Large-Cap Growth Funds Index (down 23.75%). It was a poor quarter in both absolute and relative terms.
For the six-month semi-annual period, our Fund declined 40.41%, as compared to a 32.31% decline for the Russell 1000 Growth Index and a 34.66% decline of the Lipper Large-Cap Growth Funds Index. Several factors contributed to our poor relative performance: a larger number of more “growth leaning” companies, even relative to our growth benchmarks during a period when growth stocks were very much out of favor, none of our different stock picking models “picked up the slack” in this particular downturn, and damaging exposure to some particularly poor-performing energy companies during a period when commodity prices fell off a cliff. For the full calendar year, our Fund was down 45.42% compared to declines of 38.44% for the Russell 1000 Growth Index and 41.39% for the Lipper Large-Cap Growth Funds Index.
The table below presents our December quarter, six-month, one-year, five-year and life-to-date financial results according to the formula required by the SEC. Our last two quarters of performance were poor enough to put us “under water” since inception. See the next page for a graph of performance since inception.
| | | | | | | | | | |
| | | Dec. Qtr. 10/1/08 to 12/31/08 | | Six-Month
7/1/08 to 12/31/08 | | 1 Year 1/1/08 to 12/31/08 | | 5 Year
1/1/04
to 12/31/08 | | Life-to-Date 10/31/03 to 12/31/08 |
| | | | | |
Large-Cap Growth Fund | | -26.49% | | -40.41% | | -45.42% | | -4.46% | | -3.70% |
Russell 1000 Growth Index | | -22.79% | | -32.31% | | -38.44% | | -3.42% | | -2.48% |
Lipper Large-Cap Growth Funds Index | | -23.75% | | -34.66% | | -41.39% | | -3.99% | | -3.17% |
Performance figures quoted in the table above and graph below represent past performance and are no guarantee of future results. The table above and the graph below do not reflect the deduction of taxes that a shareholder would pay on Fund distributions or the redemption of Fund shares.
The Russell 1000 Growth Index is an unmanaged index which consists of stocks in the Russell 1000 Index with higher price-to-book ratios and higher forecasted growth values with dividends reinvested. The Lipper Large-Cap Growth Funds Index is an index of large-company, growth-oriented funds compiled by Lipper, Inc. It is not possible to invest directly in an index. Periods longer than one year are annualized.
According to data from Lipper, Inc. as of December 31, 2008, Large-Cap Growth Fund ranked 688th of 803 large-cap growth funds for the twelve-month period ended December 31, 2008, 340th of 567 over the last five years and 346th of 558 such funds since inception in October, 2003. Lipper, Inc. is an independent mutual fund rating service that ranks funds in various fund categories by making comparative calculations using total returns.
| | |
| 86 | | Semi-Annual Report | December 31, 2008 (Unaudited) |
Large-Cap Growth Fund
MANAGER’S COMMENTARY (continued)
(Unaudited)
Large-Cap Growth Fund vs. Russell 1000 Growth Index & Lipper Large-Cap Growth Funds Index 10/31/03 to 12/31/08
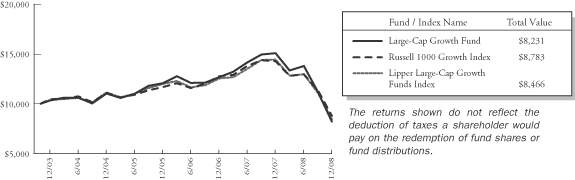
Detailed Explanation of Quarterly Performance—Some stocks (slightly) cushioned the blow
The Short Version: With a dramatic December quarter downturn, there were only a few stocks that helped cushion the blow. Only five of our stocks had positive returns.
In a quarter where misery found plenty of company, investors had to search long and hard for winners in their portfolios. While virtually all sectors suffered negative ramifications of the credit crisis and severe downturn in the economy, non-cyclical consumer stocks (especially drug-related) held up better than most. Of the top ten best performers in the Fund, six came from that sector. Sadly, five of our top performers actually posted negative returns, an indication of just how bad the quarter was for equities.
These are the ten best-performing stocks for the quarter ended December 31, 2008:
| | | | | | |
| Rank | | Description | | Industry | | % Gain |
| 1 | | Gilead Sciences Inc | | Biotechnology | | 8.9% |
| 2 | | CH Robinson Worldwide Inc | | Transportation | | 8.0% |
| 3 | | IntercontinentalExchange Inc | | Diversified Financial Services | | 5.8% |
| 4 | | Bristol-Myers Squibb Co | | Pharmaceuticals | | 3.8% |
| 5 | | AT&T Inc | | Telecommunications | | 2.1% |
| 6 | | Amgen Inc | | Biotechnology | | -0.3% |
| 7 | | Exxon Mobil Corp | | Oil & Gas | | -0.7% |
| 8 | | Merck & Co Inc | | Pharmaceuticals | | -3.7% |
| 9 | | Pfizer Inc | | Pharmaceuticals | | -4.0% |
| 10 | | Abbott Laboratories | | Pharmaceuticals | | -4.1% |
| | | | | | | |
Gilead Sciences is a biotech company that develops and markets drug treatments for infectious diseases. In October, the company announced financial results that beat analysts’ expectations on favorable sales of an HIV treatment. Management also accelerated a stock-buyback initiative, a move perceived as confidence-building by shareholders. In November, the Department of Heath and Human Services issued updated guidelines for HIV treatments and named a Gilead drug (Truvada) as the lone preferred regimen.
Large-Cap Growth Fund
MANAGER’S COMMENTARY (continued)
(Unaudited)
Detailed Explanation of Quarterly Performance—What Didn’t Work
The Short Version: A very bad quarter in energy.
With oil prices plunging by $100/barrel since setting highs in July, any and all companies with ties to the industry suffered as well. Similarly, commodities companies such as coal producers experienced similar fates. The list of ten worst performers for the quarter was made up of five energy-related companies which combined, cost the Fund over two and a half percent in return for the quarter.
These are the ten worst-performing stocks for the quarter ended December 31, 2008:
| | | | | | |
| Rank | | Description | | Industry | | % Loss |
| 1 | | Massey Energy Co | | Coal | | -61.3% |
| 2 | | Smith International Inc | | Oil & Gas Services | | -61.0% |
| 3 | | Bank of America Corp | | Banks | | -56.1% |
| 4 | | Urban Outfitters Inc | | Retail | | -53.0% |
| 5 | | NII Holdings Inc | | Telecommunications | | -52.1% |
| 6 | | National Oilwell Varco Inc | | Oil & Gas Services | | -51.3% |
| 7 | | Noble Corp | | Oil & Gas | | -49.7% |
| 8 | | Mosaic Co | | Chemicals | | -49.1% |
| 9 | | FMC Technologies Inc | | Oil & Gas Services | | -48.8% |
| 10 | | Cummins Inc | | Machinery-Diversified | | -48.2% |
| | | | | | | |
Initially considered the “white knight” for the financial services world, banking giant Bank of America fell on hard times of its own during the past quarter, as the recession accelerated, the bailout began, and shareholders worried about how the company would “synergize” with its latest acquisitions. In July, Bank of America welcomed Countrywide (of subprime lending infamy) into its family and in September announced plans to rescue brokerage behemoth Merrill Lynch from a fate similar to Lehman and Bear Stearns. By October, it accepted government funds as a participant in the TARP bailout plan, and its stock began a steady freefall once investors realized the true magnitude of the financial crisis. In December, Bank of America shareholders approved the Merrill deal, but at a valuation far less than initially negotiated. Its share price had dropped dramatically since the announcement. The transaction made Bank of America the largest domestic brokerage and wealth management shop (at a time that those businesses seem to be out of favor). The company plans to lay off about 30,000 employees as it incorporates Merrill into its operations. Its stock price plunged over 50% during the quarter and cost the Fund over a quarter of a percent in return.
Detailed Explanation of Calendar Year Performance—Companies With Positive Returns
The Short Version: Only nine of the 125 companies we held during the calendar year had positive returns.
Drug makers also highlighted the Fund’s best performers in 2008 with four biotech firms in the top ten list (though, one was in negative territory). Combined, the four companies contributed about a half a percent to the Fund’s performance. Even a few retailers made the list, despite the challenges experienced throughout the year.
| | |
| 88 | | Semi-Annual Report | December 31, 2008 (Unaudited) |
Large-Cap Growth Fund
MANAGER’S COMMENTARY (continued)
(Unaudited)
These are the ten best performers for the calendar year ended December 31, 2008:
| | | | | | |
| Rank | | Description | | Industry | | % Gain |
| 1 | | Genentech Inc | | Biotechnology | | 37.7% |
| 2 | | Celgene Corp | | Biotechnology | | 19.6% |
| 3 | | Staples Inc | | Retail | | 9.8% |
| 4 | | Gilead Sciences Inc | | Biotechnology | | 7.9% |
| 5 | | Zimmer Holdings Inc | | Healthcare-Products | | 6.1% |
| 6 | | Omnicom Group Inc | | Advertising | | 2.6% |
| 7 | | Nordstrom Inc | | Retail | | 2.3% |
| 8 | | CH Robinson Worldwide Inc | | Transportation | | 1.7% |
| 9 | | Mattel Inc | | Toys/Games/Hobbies | | 0.2% |
| 10 | | Amgen Inc | | Biotechnology | | -3.4% |
| | | | | | | |
Biotech firm Genentech was our top performer during the fiscal year and returned over 37%. In July, Roche Holdings made an unsolicited offer to buy the remaining 44% of Genentech for $89/share (it already owned 56%), but the proposed transaction was viewed as inadequate by management. Genentech remained confident about the early results from its colon cancer treatment, Avastin, and believed it would dramatically improve its market value as it moved through the trial study process. In December, Roche maintained its commitment to buy the remaining shares of the company at the same terms, though no agreement had been reached.
Detailed Explanation of Calendar Year Performance—What Didn’t Work
The Short Version: As goes the December quarter, so goes the year.
No industry was immune from the economic downturn and market negativity. Six different sectors were represented on the list of worst performers for 2008 with three coming from the depressed oil and gas industry. Combined, these ten holdings cost the Fund about eight and a half percent in return.
These are the ten stocks that performed the worst in the calendar year ended December 31, 2008:
| | | | | | |
| Rank | | Description | | Industry | | % Gain |
| 1 | | Massey Energy Co | | Coal | | -81.7% |
| 2 | | Smith International Inc | | Oil & Gas Services | | -69.0% |
| 3 | | Cummins Inc | | Machinery-Diversified | | -67.0% |
| 4 | | National Oilwell Varco Inc | | Oil & Gas Services | | -66.7% |
| 5 | | Plains Exploration & Production Co | | Oil & Gas | | -66.4% |
| 6 | | NII Holdings Inc | | Telecommunications | | -65.7% |
| 7 | | AGCO Corp | | Machinery-Diversified | | -65.5% |
| 8 | | GameStop Corp | | Retail | | -63.8% |
| 9 | | Mosaic Co | | Chemicals | | -63.3% |
| 10 | | Bank of America Corp | | Banks | | -62.8% |
| | | | | | | |
Massey Energy produces and markets coal and related products for utilities, steel manufacturers, and industrial companies. The company had benefited dramatically from the surging price of coal early in the year. Emerging markets such as China had been experiencing dramatic growth, and the increased demand for coal was expected to continue with the need to generate electricity in these regions. By mid-year, however, the price of coal peaked and began a freefall that was sustained through the remainder of 2008. A far weaker global economy translates into lower demand for coal and other commodities. Even the largest coal consumer, China, has shown significant signs of a slowdown. This bear market has truly demonstrated how interwoven our world economy has become. As if the news for Massey was not bad enough, late in the year, one of its subsidiaries was fined $4.2 million for safety hazards. The settlement was the largest in the industry’s history. Massey lost over 80% in 2008 and cost the Fund over one and a third percent in return.
Large-Cap Growth Fund
MANAGER’S COMMENTARY (continued)
(Unaudited)
Top Ten Holdings as of December 31, 2008
Drug-related companies were well represented among our top ten holdings with two biotech and two pharmaceutical companies making the list. Two of the Fund’s best performers of the quarter were also among its top holdings (AT&T and Gilead Sciences). No one holding accounted for greater than 3.1% of the net assets, indicating that the Fund was well-diversified across many companies in this difficult environment for stocks. Similarly, the ten largest positions represented under 30% of the total assets of the Fund.
| | | | | | |
| Rank | | Description | | Industry | | Percent of
Net Assets |
| 1 | | AT&T Inc | | Telecommunications | | 3.1% |
| 2 | | Oracle Corp | | Software | | 3.1% |
| 3 | | Gilead Sciences Inc | | Biotechnology | | 2.9% |
| 4 | | Biogen Idec Inc | | Biotechnology | | 2.7% |
| 5 | | Hewlett-Packard Co | | Computers | | 2.7% |
| 6 | | International Business Machines Corp | | Computers | | 2.6% |
| 7 | | Schering Plough Corp | | Pharmaceuticals | | 2.6% |
| 8 | | Express Scripts Inc | | Pharmaceuticals | | 2.5% |
| 9 | | Apple Inc | | Computers | | 2.5% |
| 10 | | Cisco Systems Inc | | Telecommunications | | 2.5% |
| | | | | | | |
| Total | | | | | | 27.2% |
Industry Sector Representation as of December 31, 2008
While virtually no sector was spared the negativity of the past three months (and full year), our models’ overweighting of basic materials was very costly to the Fund’s performance relative to the benchmarks. This sector included commodities-related stocks, many of which had been solid performers in the past, but plunged in value as the weak global economy hindered demand for such products. We did benefit from our significant underweighting of financials, the sector that initiated the downturn and remained depressed throughout the year.
| | | | | | |
| | | % of Net Assets | | % of S&P 500 Index | | Difference |
Basic Materials | | 8.9% | | 3.0% | | 5.9% |
Communications | | 14.0% | | 10.9% | | 3.1% |
Consumer, Cyclical | | 2.4% | | 8.2% | | -5.8% |
Consumer, Non-cyclical | | 32.3% | | 25.2% | | 7.1% |
Energy | | 14.7% | | 13.5% | | 1.2% |
Financial | | 2.0% | | 13.0% | | -11.0% |
Industrial | | 8.6% | | 11.2% | | -2.6% |
Technology | | 16.1% | | 10.9% | | 5.2% |
Utilities | | 1.0% | | 4.1% | | -3.1% |
Diversified | | 0.0% | | 0.0% | | 0.0% |
Cash | | 0.0% | | 0.0% | | 0.0% |
| | | | | | | |
Total | | 100.0% | | 100.0% | | |
Disclaimer
The views expressed here are exclusively those of Fund management. These views are not meant as investment advice and should not be considered predictive in nature. Any favorable (or unfavorable) description of a holding applies only as of December 31, 2008, unless otherwise stated. Security positions can and do change thereafter. Discussions of historical performance do not guarantee and may not be indicative of future performance.
| | |
| 90 | | Semi-Annual Report | December 31, 2008 (Unaudited) |
Large-Cap Growth Fund
MANAGER’S COMMENTARY (continued)
(Unaudited)
The Fund is subject to market risk (volatility) and is not an appropriate investment for short-term investors.
Conclusion
Thank you for your continued investment in Large-Cap Growth Fund. We encourage your feedback; your reactions and concerns are important to us.
Sincerely,
Your Investment Management Team
Large-Cap Growth Fund
SCHEDULE OF INVESTMENTS
Showing percentage of net assets as of December 31, 2008 (Unaudited)
| | | | | | | |
| Industry | | Company | | Shares | | Value |
| | |
COMMON STOCKS - 100.00% | | | | | |
Aerospace/Defense - 1.11% | | | | | |
| | L-3 Communications Holdings, Inc. | | 2,000 | | $ | 147,560 |
| | Rockwell Collins, Inc. | | 18,300 | | | 715,347 |
| | | | | | | |
| | | | | | | 862,907 |
|
Banks - 2.03% |
| | State Street Corp. | | 22,700 | | | 892,791 |
| | US Bancorp | | 27,500 | | | 687,775 |
| | | | | | | |
| | | | | | | 1,580,566 |
|
Beverages - 1.04% |
| | Coca-Cola Co. | | 17,800 | | | 805,806 |
|
Biotechnology - 9.75% |
| | Amgen, Inc.* | | 32,200 | | | 1,859,550 |
| | Biogen Idec, Inc.*+ | | 44,400 | | | 2,114,772 |
| | Celgene Corp.* | | 24,900 | | | 1,376,472 |
| | Gilead Sciences, Inc.* | | 43,640 | | | 2,231,749 |
| | | | | | | |
| | | | | | | 7,582,543 |
|
Chemicals - 8.87% |
| | CF Industries Holdings, Inc. | | 20,500 | | | 1,007,780 |
| | Monsanto Co. | | 11,900 | | | 837,165 |
| | Mosaic Co.+ | | 47,300 | | | 1,636,580 |
| | Potash Corp. of Saskatchewan, Inc. | | 24,100 | | | 1,764,602 |
| | Praxair, Inc. | | 27,900 | | | 1,656,144 |
| | | | | | | |
| | | | | | | 6,902,271 |
|
Coal - 0.49% |
| | Massey Energy Co.+ | | 27,800 | | | 383,362 |
|
Commercial Services - 3.48% |
| | MasterCard, Inc., Class A | | 10,000 | | | 1,429,300 |
| | Paychex, Inc.+ | | 48,700 | | | 1,279,836 |
| | | | | | | |
| | | | | | | 2,709,136 |
|
Computers - 10.20% |
| | Apple, Inc.* | | 23,000 | | | 1,963,050 |
| | EMC Corp.* | | 178,400 | | | 1,867,848 |
| | Hewlett-Packard Co. | | 57,300 | | | 2,079,417 |
| | International Business Machines Corp.+ | | 24,000 | | | 2,019,840 |
| | | | | | | |
| | | | | | | 7,930,155 |
| | |
Electric Utilities - 1.00% | | | | | |
| | Allegheny Energy, Inc. | | 22,900 | | | 775,394 |
| |
Energy - Alternative Sources - 1.17% | | | |
| | First Solar Inc.* | | 6,600 | | | 910,536 |
| | | | | | | |
| Industry | | Company | | Shares | | Value |
|
|
Engineering & Construction - 1.34% | | | |
| | Jacobs Engineering Group, Inc.*+ | | 21,600 | | $ | 1,038,960 |
| |
Food - 0.10% | | | |
| | General Mills, Inc. | | 1,300 | | | 78,975 |
|
Healthcare - Products - 8.30% |
| | CR Bard, Inc. | | 1,800 | | | 151,668 |
| | Intuitive Surgical, Inc.*+ | | 12,900 | | | 1,638,171 |
| | Johnson & Johnson+ | | 27,300 | | | 1,633,359 |
| | Medtronic, Inc. | | 4,400 | | | 138,248 |
| | St. Jude Medical, Inc.* | | 40,900 | | | 1,348,064 |
| | Stryker Corp.+ | | 38,800 | | | 1,550,060 |
| | | | | | | |
| | | | | | | 6,459,570 |
|
Internet - 3.82% |
| | eBay, Inc.* | | 100,200 | | | 1,398,792 |
| | Google, Inc., Class A* | | 5,100 | | | 1,569,015 |
| | | | | | | |
| | | | | | | 2,967,807 |
|
Machinery - Diversified - 0.98% |
| | Flowserve Corp. | | 14,800 | | | 762,200 |
|
Media - 1.69% |
| | Comcast Corp., Class A | | 33,100 | | | 558,728 |
| | Walt Disney Co. | | 33,200 | | | 753,308 |
| | | | | | | |
| | | | | | | 1,312,036 |
|
Metal Fabrication - Hardware - 1.81% |
| | Precision Castparts Corp. | | 23,700 | | | 1,409,676 |
|
Oil & Gas - 7.15% |
| | Diamond Offshore Drilling, Inc.+ | | 22,900 | | | 1,349,726 |
| | Exxon Mobil Corp. | | 23,200 | | | 1,852,056 |
| | Noble Corp. | | 34,400 | | | 758,864 |
| | XTO Energy, Inc. | | 45,332 | | | 1,598,860 |
| | | | | | | |
| | | | | | | 5,559,506 |
|
Oil & Gas Services - 4.83% |
| | Baker Hughes, Inc. | | 22,700 | | | 727,989 |
| | Cameron International Corp.*+ | | 41,800 | | | 856,900 |
| | FMC Technologies, Inc.* | | 30,900 | | | 736,347 |
| | National Oilwell Varco, Inc.* | | 30,400 | | | 742,976 |
| | Smith International, Inc. | | 30,200 | | | 691,278 |
| | | | | | | |
| | | | | | | 3,755,490 |
|
Pharmaceuticals - 9.62% |
| | Bristol-Myers Squibb Co. | | 79,500 | | | 1,848,375 |
| | Express Scripts, Inc.* | | 35,900 | | | 1,973,782 |
| | |
| 92 | | Semi-Annual Report | December 31, 2008 (Unaudited) |
Large-Cap Growth Fund
SCHEDULE OF INVESTMENTS (continued)
Showing percentage of net assets as of December 31, 2008 (Unaudited)
| | | | | | | |
| Industry | | Company | | Shares | | Value |
|
Common Stocks (continued) |
Pharmaceuticals (continued) |
| | Merck & Co., Inc. | | 50,800 | | $ | 1,544,320 |
| | Pfizer, Inc. | | 7,200 | | | 127,512 |
| | Schering-Plough Corp. | | 116,800 | | | 1,989,104 |
| | | | | | | |
| | | | | | | 7,483,093 |
|
Pipelines - 1.09% |
| | The Williams Cos., Inc. | | 58,466 | | | 846,588 |
|
Retail - 2.42% |
| | CVS Caremark Corp. | | 3,340 | | | 95,992 |
| | GameStop Corp., Class A*+ | | 45,300 | | | 981,198 |
| | Urban Outfitters, Inc.* | | 53,600 | | | 802,928 |
| | | | | | | |
| | | | | | | 1,880,118 |
|
Software - 5.90% |
| | CA, Inc. | | 35,000 | | | 648,550 |
| | Microsoft Corp. | | 79,800 | | | 1,551,312 |
| | Oracle Corp.* | | 134,700 | | | 2,388,231 |
| | | | | | | |
| | | | | | | 4,588,093 |
|
Telecommunications - 8.45% |
| | AT&T, Inc. | | 83,800 | | | 2,388,300 |
| | Cisco Systems, Inc.* | | 119,200 | | | 1,942,960 |
| | Harris Corp. | | 22,100 | | | 840,905 |
| | Juniper Networks, Inc.*+ | | 53,900 | | | 943,789 |
| | NII Holdings, Inc.* | | 25,300 | | | 459,954 |
| | | | | | | |
| | | | | | | 6,575,908 |
|
Transportation - 3.36% |
| | CH Robinson Worldwide, Inc. | | 22,200 | | | 1,221,666 |
| | Union Pacific Corp. | | 29,100 | | | 1,390,980 |
| | | | | | | |
| | | | | | | 2,612,646 |
| | | | | | | |
| |
TOTAL COMMON STOCKS - 100.00% | | | 77,773,342 |
| | | | | | | |
(Cost $111,049,104) | | | |
| | |
TOTAL INVESTMENTS - 100.00% | | | | $ | 77,773,342 |
(Cost $111,049,104) | | | |
Other Assets in Excess of Liabilities - 0.00% | | | 3,511 |
| | | | | | | |
NET ASSETS - 100.00% | | | | $ | 77,776,853 |
| | | | | | | |
| * | Non Income Producing Security. |
| + | This security or a portion of the security is out on loan at December 31, 2008. Total loaned securities had a market value of $11,399,173 at December 31, 2008. |
See Notes to Financial Statements.
Large-Cap Value Fund
MANAGER’S COMMENTARY
(Unaudited)
December 31, 2008
Dear Fellow Large-Cap Value Fund Shareholder,
In the midst of what has now become the worst bear market since the 1930’s, our Fund declined 18.26% for the December quarter. As bad as this is in absolute terms, we outperformed each of our performance benchmarks, providing some “cushion” in the downturn. Our primary market benchmark, the Russell 1000 Value Index was down 22.18%, and our peer benchmark, the Lipper Large-Cap Value Funds Index was down 21.09%. It was a good quarter on a relative basis.
For the six month semi-annual period, our Fund declined 26.36%, relative to declines of 26.93% for Russell 1000 Value Index and 27.90% for the Lipper Large Cap Value Funds Index. Overall, the Fund was helped some by an overweighting in the communications sector, which held up better than most sectors, and especially by good picking among these stocks.
For the full calendar year, Large-Cap Value Fund declined 36.83%, a “hair” better than the Russell 1000 Value Index (down 36.85%) and the Lipper Large-Cap Value Funds Index (down 37.00%). We were able to add a slight cushion against our benchmarks for the year and we are pleased with that.
The table below presents our December quarter, six-month, one-year, five-year and life-to-date financial results according to the formula required by the SEC. Although there is a lot of “red ink” in the table, our record is a perfect “clean sweep” with respect to our market benchmarks across all these time periods. See the next page for a graph of performance since inception.
| | | | | | | | | | |
| | | Dec. Qtr.
10/1/08
to 12/31/08 | | Six-Month
7/1/08
to 12/31/08 | | 1 Year
1/1/08
to 12/31/08 | | 5 Year
1/1/04
to 12/31/08 | | Life-to-Date
10/31/03
to 12/31/08 |
| | | | | |
Large-Cap Value Fund | | -18.26% | | -26.36% | | -36.83% | | 0.11% | | 1.50% |
Russell 1000 Value Index | | -22.18% | | -26.93% | | -36.85% | | -0.79% | | 0.65% |
Lipper Large-Cap Value Funds Index | | -21.09% | | -27.90% | | -37.00% | | -1.90% | | -0.46% |
Performance figures quoted in the table above and graph below represent past performance and are no guarantee of future results. The table above and the graph below do not reflect the deduction of taxes that a shareholder would pay on Fund distributions or the redemption of Fund shares.
The Russell 1000 Value Index is an unmanaged index which consists of stocks in the Russell 1000 Index with lower price-to-book ratios and lower forecasted growth values with dividends reinvested. The Lipper Large-Cap Value Funds Index is an index of large-company, value-oriented funds compiled by Lipper, Inc. It is not possible to invest directly in an index. Periods longer than one year are annualized.
According to data from Lipper, Inc. as of December 31, 2008, Large-Cap Value Fund ranked 297th of 596 large-cap value funds for the twelve-month period ended December 31, 2008, 60th of 429 over the last five years and 67th of 423 such funds since inception in October, 2003. Lipper, Inc. is an independent mutual fund rating service that ranks funds in various fund categories by making comparative calculations using total returns.
| | |
| 94 | | Semi-Annual Report | December 31, 2008 (Unaudited) |
Large-Cap Value Fund
MANAGER’S COMMENTARY (continued)
(Unaudited)
Large-Cap Value Fund vs. Russell 1000 Value Index & Lipper Large-Cap Value Funds Index 10/31/03 to 12/31/08
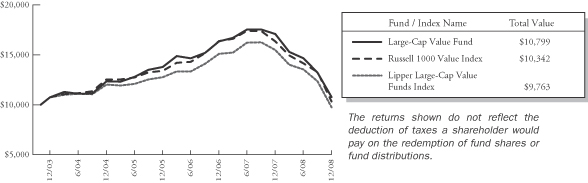
Detailed Explanation of Quarterly Performance—Some stocks (slightly) cushioned the blow
The Short Version: With a dramatic December quarter downturn, there were very few stocks that helped cushion the blow. Nevertheless, we did beat our market benchmarks, even though only nine of our stocks had positive returns.
In a quarter where misery found plenty of company, investors had to search long and hard for winners in their portfolios. Virtually all sectors suffered negative ramifications of the credit crisis and severe downturn in the economy. Nevertheless, our models were able to find relative value among pharmaceuticals and telecommunications, as our top four performers came from these industries. For the quarter, our stock picks were strong across a broad array of the general market, including each sector except industrials and basic materials.
These are the ten best-performing stocks for the quarter ended December 31, 2008:
| | | | | | |
| Rank | | Description | | Industry | | % Gain |
| 1 | | Telephone & Data Systems Inc | | Telecommunications | | 15.2% |
| 2 | | Merck & Co Inc | | Pharmaceuticals | | 12.7% |
| 3 | | Bristol-Myers Squibb Co | | Pharmaceuticals | | 11.5% |
| 4 | | Verizon Communications Inc | | Telecommunications | | 5.6% |
| 5 | | Exxon Mobil Corp | | Oil & Gas | | 2.8% |
| 6 | | AT&T Inc | | Telecommunications | | 2.1% |
| 7 | | Home Depot Inc | | Retail | | 1.8% |
| 8 | | United Technologies Corp | | Aerospace/Defense | | 0.5% |
| 9 | | Time Warner Inc | | Media | | 0.1% |
| 10 | | Hess Corp | | Oil & Gas | | -0.6% |
Pharmaceutical giant Bristol-Myers Squibb struggled along with its big pharmaceutical counterparts early in the quarter while the recession kicked into high gear. Investors worried about pricing pressures and job cuts, as these companies would be forced to reevaluate their business models given the dire economic times. Its stock price hit a 52-week low in mid-October. However, shortly thereafter, it received good news from the FDA about a cancer drug it was developing with Imclone Systems. The FDA will implement a priority review of this treatment, which should be completed within six months. In November, management announced plans to increase cashflow significantly over the next few years by more efficient oversight of inventory, receivables, and payables. Finally, in December, Bristol-Myers Squibb joined forces with Exelixis to develop new cancer treatments. The deal represents its new partnership strategy designed to reduce internal research and development expenses, while still participating in the early-stage and advanced development of promising treatments. The holding contributed just under half a percent to the return of the Fund during the quarter.
Large-Cap Value Fund
MANAGER’S COMMENTARY (continued)
(Unaudited)
Detailed Explanation of Quarterly Performance—What Didn’t Work
The Short Version: Energy, chemicals, and . . . finance. A bad combination in the December quarter.
So much for diversification. No industry was immune from the economic downturn and market negativity. Six different sectors were represented on the list of worst performers for the quarter with three coming from non-cyclical consumer industries. Combined, these ten holdings cost the Fund over seven percent in return. Four of the worst performers lost over 50% in value. These are the ten worst-performing stocks for the quarter ended December 31, 2008:
| | | | | | |
| Rank | | Description | | Industry | | % Loss |
| 1 | | Textron Inc | | Miscellaneous Manufacturing | | -55.1% |
| 2 | | Chesapeake Energy Corp | | Oil & Gas | | -54.9% |
| 3 | | Bank of America Corp | | Banks | | -52.0% |
| 4 | | Cigna Corp | | Healthcare-Services | | -50.4% |
| 5 | | Dow Chemical Co | | Chemicals | | -46.8% |
| 6 | | Expedia Inc | | Internet | | -45.5% |
| 7 | | RR Donnelley & Sons Co | | Commercial Services | | -44.6% |
| 8 | | AGCO Corp | | Machinery-Diversified | | -44.6% |
| 9 | | MetLife Inc | | Insurance | | -37.1% |
| 10 | | Bunge Ltd | | Agriculture | | -31.9% |
| | | | | | | |
Initially considered the “white knight” for the financial services world, banking giant Bank of America fell on hard times of its own during the past quarter, as the recession accelerated, the bailout began, and shareholders worried about how the company would “synergize” with its latest acquisitions. In July, Bank of America welcomed Countrywide (of subprime lending infamy) into its family and in September announced plans to rescue brokerage behemoth Merrill Lynch from a fate similar to Lehman and Bear Stearns. By October, it accepted government funds as a participant in the TARP bailout plan, and its stock began a steady freefall once investors realized the true magnitude of the financial crisis. In December, Bank of America shareholders approved the Merrill deal, but at a valuation far less than initially negotiated. Its share price had dropped dramatically since the announcement. The transaction made Bank of America the largest domestic brokerage and wealth management shop (at a time that those businesses seem to be out of favor). The company plans to lay off about 30,000 employees as it incorporates Merrill into its operations. Its stock price plunged over 50% during the quarter and cost the Fund over a quarter of a percent in return.
Detailed Explanation of Calendar Year Performance—A handful of companies with positive returns
The Short Version: Only five of the 83 companies we held during the calendar year had positive returns.
A sign of the times…half of the year’s best-performing stocks in the Fund actually lost market value. Seven different sectors were represented in the list. Only two of the top performers increased more than 10%. Say no more…2008 was a tough year for stock picking, no matter how many different ways you analyze it.
| | |
| 96 | | Semi-Annual Report | December 31, 2008 (Unaudited) |
Large-Cap Value Fund
MANAGER’S COMMENTARY (continued)
(Unaudited)
These are the ten best performers for the calendar year ended December 31, 2008:
| | | | | | |
| Rank | | Description | | Industry | | % Gain |
| 1 | | Telephone & Data Systems Inc | | Telecommunications | | 15.2% |
| 2 | | Merck & Co Inc | | Pharmaceuticals | | 12.7% |
| 3 | | Mattel Inc | | Toys/Games/Hobbies | | 5.0% |
| 4 | | Home Depot Inc | | Retail | | 1.8% |
| 5 | | United Technologies Corp | | Aerospace/Defense | | 0.5% |
| 6 | | Freeport-McMoRan Copper & Gold Inc | | Mining | | -0.1% |
| 7 | | Allstate Corp | | Insurance | | -3.5% |
| 8 | | Time Warner Inc | | Media | | -4.5% |
| 9 | | Southern Co | | Electric | | -4.5% |
| 10 | | Union Pacific Corp | | Transportation | | -5.2% |
| | | | | | | |
Move over Barbie…here come the Bratz. In July, toymaker Mattel won a legal battle against MGA Entertainment over the ownership rights of Bratz dolls. The Court found that much of the design had occurred when the doll’s creator was under Mattel’s employment and MGA intentionally interfered with an exclusivity arrangement. Since good news often follows more good news (just not enough these days), a day later, Mattel posted better than expected earnings on surprisingly strong sales of merchandise related to movie hits The Dark Knight, Speed Racer, and Kung Fu Panda. Perhaps toys are the boom industry in the bear market. Mattel returned five percent for the year.
Detailed Explanation of Calendar Year Performance—What Didn’t Work
The Short Version: This was definitely the worst year since 1931. Thirteen of our 83 companies lost more than half their value.
While financials, energy, and retailers may have garnered much of the negative press in 2008, the carnage made no distinction of industry. Six different sectors were represented on the list of the year’s worst performers. All 10 of the holdings lost over 50% in value, and combined they cost the Fund over eight and a half percent.
These are the ten stocks that performed the worst in the calendar year ended December 31, 2008:
| | | | | | |
| Rank | | Description | | Industry | | % Gain |
| 1 | | Textron Inc | | Miscellaneous Manufacturing | | -81.5% |
| 2 | | Expedia Inc | | Internet | | -73.9% |
| 3 | | AGCO Corp | | Machinery-Diversified | | -64.0% |
| 4 | | RR Donnelley & Sons Co | | Commercial Services | | -64.0% |
| 5 | | Wachovia Corp | | Banks | | -61.0% |
| 6 | | Cigna Corp | | Healthcare-Services | | -60.1% |
| 7 | | Bank of America Corp | | Banks | | -59.2% |
| 8 | | Chesapeake Energy Corp | | Oil & Gas | | -58.8% |
| 9 | | Bunge Ltd | | Agriculture | | -56.4% |
| 10 | | Southern Copper Corp | | Mining | | -52.8% |
| | | | | | | |
While large companies often benefit from diversification of business segments, some major conglomerates have struggled as of late, with many of their diverse units suffering from the dire economy at exactly the same time. Textron operates aircraft (Bell, Cessna), industrial, and financial divisions. In July, the company announced higher profits, but missed analysts’ expectations because rising energy costs resulted in larger than expected expenses. By October, the company’s financial arm was hurting, as its asset-based lending business and other product lines were devastated in the credit crunch. Following a worse than expected earnings announcement, some analysts went so far as to call for Textron to exit those financial businesses altogether. In December, the company reduced its outlook for the fourth quarter, eliminated five percent of its workforce, and
Large-Cap Value Fund
MANAGER’S COMMENTARY (continued)
(Unaudited)
announced plans to shut down most of its commercial finance arm to raise much needed liquidity. The stock plunged over 80% and cost the Fund over one-and-a-half percent in return in 2008. This stock demonstrates that the financial crisis has definitely spread beyond Wall Street and the financial sector.
Top Ten Holdings as of December 31, 2008
Four of our largest positions were also among the Fund’s top performers of the quarter: Verizon Communications, Bristol-Myers Squibb, Exxon Mobil, AT&T. Five different industries were represented on the list of top holdings, revealing strong diversification across sectors. The ten largest positions represented 45.7% of the total assets of the Fund.
| | | | | | |
| Rank | | Description | | Industry | | Percent of
Net Assets |
| 1 | | Hewlett-Packard Co | | Computers | | 5.3% |
| 2 | | Verizon Communications Inc | | Telecommunications | | 5.1% |
| 3 | | Bristol-Myers Squibb Co | | Pharmaceuticals | | 5.0% |
| 4 | | Exxon Mobil Corp | | Oil & Gas | | 4.9% |
| 5 | | Medco Health Solutions Inc | | Pharmaceuticals | | 4.8% |
| 6 | | AT&T Inc | | Telecommunications | | 4.8% |
| 7 | | Lockheed Martin Corp | | Aerospace/Defense | | 4.4% |
| 8 | | ChevronTexaco Corp | | Oil & Gas | | 3.9% |
| 9 | | Pfizer Inc | | Pharmaceuticals | | 3.9% |
| 10 | | International Business Machines Corp | | Computers | | 3.6% |
| | | | | | | |
| Total | | | | | | 45.7% |
Industry Sector Representation as of December 31, 2008
While virtually no sector was spared the negativity of the past three months (and full year, for that matter), our models’ overweighting of industrial companies was costly to the Fund’s performance relative to the benchmarks. The sector included manufacturing and commodities-related stocks, many of which had been solid performers in the past, but plunged in value, as the weak global economy hindered demand for such products. Fortunately, our overweighting of communications companies more than made up the difference. Even though the sector declined during the quarter, it outperformed many others and helped limit some of the Fund’s overall losses.
| | | | | | |
| | | % of Net Assets | | % of S&P 500 Index | | Difference |
Basic Materials | | 2.0% | | 3.0% | | -1.0% |
Communications | | 17.4% | | 10.9% | | 6.5% |
Consumer, Cyclical | | 3.2% | | 8.2% | | -5.0% |
Consumer, Non-cyclical | | 25.7% | | 25.2% | | 0.5% |
Energy | | 9.9% | | 13.5% | | -3.6% |
Financial | | 11.5% | | 13.0% | | -1.5% |
Industrial | | 15.4% | | 11.2% | | 4.2% |
Technology | | 9.8% | | 10.9% | | -1.1% |
Utilities | | 5.0% | | 4.1% | | 0.9% |
Cash | | 0.1% | | 0.0% | | 0.1% |
| | | | | | | |
Total | | 100.0% | | 100.0% | | |
Disclaimer
The following is a reminder from the friendly folks at your Fund who worry about liability. The views expressed here are exclusively those of Fund management. These views are not meant as investment advice and should not be considered
| | |
| 98 | | Semi-Annual Report | December 31, 2008 (Unaudited) |
Large-Cap Value Fund
MANAGER’S COMMENTARY (continued)
(Unaudited)
predictive in nature. Any favorable (or unfavorable) description of a holding applies only as of December 31, 2008, unless otherwise stated. Security positions can and do change thereafter. Discussions of historical performance do not guarantee and are not indicative of future performance.
The Fund is subject to market risk (volatility) and is not an appropriate investment for short-term investors.
Conclusion
Thank you for your continued investment in Large-Cap Value Fund. We encourage your feedback; your reactions and concerns are important to us.
Sincerely,
Your Investment Management Team
Large-Cap Value Fund
SCHEDULE OF INVESTMENTS
Showing percentage of net assets as of December 31, 2008 (Unaudited)
| | | | | | | |
| Industry | | Company | | Shares | | Value |
| | |
COMMON STOCKS - 99.77% | | | | | |
Aerospace/Defense - 9.92% | | | | | |
| | Lockheed Martin Corp. | | 18,300 | | $ | 1,538,664 |
| | Raytheon Co. | | 20,000 | | | 1,020,800 |
| | United Technologies Corp. | | 16,900 | | | 905,840 |
| | | | | | | |
| | | | | | | 3,465,304 |
| | |
Banks - 2.80% | | | | | |
| | JPMorgan Chase & Co. | | 9,600 | | | 302,688 |
| | US Bancorp | | 27,000 | | | 675,270 |
| | | | | | | |
| | | | | | | 977,958 |
| | |
Beverages - 1.15% | | | | | |
| | Pepsi Bottling Group, Inc. | | 17,900 | | | 402,929 |
| | |
Biotechnology - 2.12% | | | | | |
| | Amgen, Inc.* | | 12,800 | | | 739,200 |
| | |
Chemicals - 1.97% | | | | | |
| | Dow Chemical Co. | | 26,100 | | | 393,849 |
| | E.I. du Pont de Nemours & Co. | | 11,700 | | | 296,010 |
| | | | | | | |
| | | | | | | 689,859 |
| | |
Commercial Services - 1.17% | | | | | |
| | RR Donnelley & Sons Co. | | 30,000 | | | 407,400 |
| | |
Computers - 8.82% | | | | | |
| | Hewlett-Packard Co. | | 50,600 | | | 1,836,274 |
| | International Business Machines Corp. | | 14,800 | | | 1,245,568 |
| | | | | | | |
| | | | | | | 3,081,842 |
|
Diversified Financial Services - 1.33% |
| | Interactive Brokers Group, Inc., Class A*+ | | 26,000 | | | 465,140 |
|
Electric Utilities - 5.00% |
| | American Electric Power Co., Inc.+ | | 24,000 | | | 798,720 |
| | Duke Energy Corp. | | 26,100 | | | 391,761 |
| | Southern Co. | | 15,050 | | | 556,850 |
| | | | | | | |
| | | | | | | 1,747,331 |
|
Healthcare - Services - 2.59% |
| | Aetna, Inc. | | 22,600 | | | 644,100 |
| | CIGNA Corp. | | 15,500 | | | 261,175 |
| | | | | | | |
| | | | | | | 905,275 |
|
Insurance - 7.42% |
| | Aflac, Inc. | | 15,000 | | | 687,600 |
| | Berkshire Hathaway, Inc., Class B* | | 280 | | | 899,920 |
| | | | | | | |
| Industry | | Company | | Shares | | Value |
|
|
Insurance (continued) |
| | Chubb Corp. | | 19,700 | | $ | 1,004,700 |
| | | | | | | |
| | | | | | | 2,592,220 |
Internet - 0.74% |
| | Expedia, Inc.* | | 31,500 | | | 259,560 |
|
Machinery - Diversified - 0.71% |
| | AGCO Corp.* | | 10,500 | | | 247,695 |
|
Media - 5.33% |
| | CBS Corp., Class B | | 20,100 | | | 164,619 |
| | Time Warner, Inc. | | 62,900 | | | 632,774 |
| | Walt Disney Co. | | 46,900 | | | 1,064,161 |
| | | | | | | |
| | | | | | | 1,861,554 |
|
Miscellaneous Manufacturing - 2.83% |
| | General Electric Co. | | 27,100 | | | 439,020 |
| | Honeywell International, Inc. | | 10,000 | | | 328,300 |
| | Parker Hannifin Corp. | | 5,250 | | | 223,335 |
| | | | | | | |
| | | | | | | 990,655 |
|
Oil & Gas - 9.87% |
| | Chesapeake Energy Corp. | | 22,000 | | | 355,740 |
| | Chevron Corp. | | 18,514 | | | 1,369,481 |
| | Exxon Mobil Corp. | | 21,600 | | | 1,724,328 |
| | | | | | | |
| | | | | | | 3,449,549 |
|
Packaging & Containers - 1.02% |
| | Owens-Illinois, Inc.* | | 13,000 | | | 355,290 |
|
Pharmaceuticals - 18.65% |
| | Bristol-Myers Squibb Co. | | 75,000 | | | 1,743,750 |
| | Express Scripts, Inc.* | | 15,000 | | | 824,700 |
| | Medco Health Solutions, Inc.* | | 40,000 | | | 1,676,400 |
| | Merck & Co., Inc. | | 30,400 | | | 924,160 |
| | Pfizer, Inc. | | 76,200 | | | 1,349,502 |
| | | | | | | |
| | | | | | | 6,518,512 |
|
Retail - 3.16% |
| | CVS Caremark Corp. | | 11,480 | | | 329,935 |
| | Home Depot, Inc. | | 23,900 | | | 550,178 |
| | Target Corp.+ | | 6,500 | | | 224,445 |
| | | | | | | |
| | | | | | | 1,104,558 |
|
Semiconductors - 0.96% |
| | Altera Corp.+ | | 20,000 | | | 334,200 |
|
Telecommunications - 11.28% |
| | AT&T, Inc. | | 58,792 | | | 1,675,572 |
| | Telephone & Data Systems, Inc. | | 14,800 | | | 469,900 |
| | |
| 100 | | Semi-Annual Report | December 31, 2008 (Unaudited) |
Large-Cap Value Fund
SCHEDULE OF INVESTMENTS (continued)
Showing percentage of net assets as of December 31, 2008 (Unaudited)
| | | | | | | |
| Industry | | Company | | Shares | | Value |
|
Common Stocks (continued) |
Telecommunications (continued) |
| | Verizon Communications, Inc. | | 53,030 | | $ | 1,797,717 |
| | | | | | | |
| | | | | | | 3,943,189 |
Transportation - 0.93% |
| | Union Pacific Corp. | | 6,800 | | | 325,040 |
| | | | | | | |
| | |
TOTAL COMMON STOCKS - 99.77% | | | | | 34,864,260 |
| | | | | | | |
(Cost $37,432,780) | | | | | |
| | | | | | | |
|
MONEY MARKET FUND - 0.07% |
| | | |
| | | Rate^ | | Shares | | Value |
BlackRock Temp Cash Liquidity Fund Institutional Shares #21 | | 1.68% | | 24,054 | | | 24,054 |
| | | | | | | |
| |
TOTAL MONEY MARKET FUND - 0.07% | | | 24,054 |
| | | | | | | |
(Cost $24,054) | | | | | | | |
| | |
TOTAL INVESTMENTS - 99.84% | | | | $ | 34,888,314 |
(Cost $37,456,835) | | | | | | | |
Other Assets in Excess of Liabilities - 0.16% | | | 56,164 |
| | | | | | | |
NET ASSETS - 100.00% | | | | $ | 34,944,478 |
| | | | | | | |
| * | Non Income Producing Security. |
| + | This security or a portion of the security is out on loan at December 31, 2008. Total loaned securities had a market value of $528,625 at December 31, 2008. |
| ^ | Rate disclosed is as of December 31, 2008. |
See Notes to Financial Statements.
Blue Chip 35 Index Fund
MANAGER’S COMMENTARY
(Unaudited)
December 31, 2008
Dear Fellow Blue Chip 35 Index Fund Shareholder,
In the midst of the worst bear market since the 1930’s, our Fund declined 21.93% in the second half of calendar 2008, providing a handful of percentage points of “cushion” versus our market and peer benchmarks. The S&P 500 Index of large stocks (although somewhat smaller than our “ultra-large” ones) declined 28.48%, while the Lipper Large-Cap Core Funds Index declined 29.46%. Across nearly all sectors of the market, our weighting of the very largest companies helped our Fund do just what it was designed to do in a majority of bear markets. While double digit declines are never a good thing, on a relative performance basis, we are pleased.
For the full calendar year, our Fund dropped 33.30%, versus the 37.00% drop of the S&P 500 (the worst performance since 1931!) and the 37.07% drop of the Lipper Large-Cap Core Funds Index. Also noteworthy over the last year is that we very slightly outperformed our own proprietary index, Bridgeway Ultra-Large 35 Index. This record in 2008 exceeds one internal goal, which is to underperform this index of the same stocks by less than the amount of our net operating expense ratio, a very lean 0.15%.
The table below presents our December quarter, six-month, one-year, five-year, ten-year and life-to-date financial results according to the formula required by the SEC. See the next page for a graph of performance from inception.
| | | | | | | | | | | | |
| | | Dec. Qtr. 10/1/08
to 12/31/08 | | Six-Month 7/1/08
to 12/31/08 | | 1 Year 1/1/08
to 12/31/08 | | 5 Year 1/1/04
to 12/31/08 | | 10 Year 1/1/99
to 12/31/08 | | Life-to-Date 7/31/97
to 12/31/08 |
| | | | | | |
Blue Chip 35 Index Fund | | -19.01% | | -21.93% | | -33.30% | | -3.06% | | -0.94% | | 2.09% |
S&P 500 Index | | -21.94% | | -28.48% | | -37.00% | | -2.19% | | -1.38% | | 1.19% |
Bridgeway Ultra-Large 35 Index | | -19.20% | | -21.89% | | -33.52% | | -3.15% | | -0.73% | | 2.17% |
Lipper Large-Cap Core Funds Index | | -22.16% | | -29.46% | | -37.07% | | -2.73% | | -1.90% | | 0.55% |
Performance figures quoted in the table above and graph below represent past performance and are no guarantee of future results. The table above and the graph below do not reflect the deduction of taxes that a shareholder would pay on Fund distributions or the redemption of Fund shares.
The S&P 500 Index is a broad-based, unmanaged measurement of changes in stock market conditions based on the average of 500 widely held common stocks with dividends reinvested. The Bridgeway Ultra-Large 35 Index is an index comprised of very large, “blue chip” U.S. stocks, excluding tobacco; it is compiled by the adviser of the Fund. The Lipper Large-Cap Core Funds Index reflects the aggregate record of domestic large-cap core mutual funds as reported by Lipper, Inc. It is not possible to invest directly in an index. Periods longer than one year are annualized.
According to data from Lipper, Inc. as of December 31, 2008, Blue-Chip 35 Index Fund ranked 148th of 851 large-cap core funds for the twelve months ending December 31, 2008, 340th of 606 over the last five years, 111th of 344 over the last ten years, and 48th of 271 since inception in July 1997. Lipper, Inc. is an independent mutual fund rating service that ranks funds in various fund categories by making comparative calculations using total returns.
| | |
| 102 | | Semi-Annual Report | December 31, 2008 (Unaudited) |
Blue Chip 35 Index Fund
MANAGER’S COMMENTARY (continued)
(Unaudited)
Blue Chip 35 Index Fund vs. S&P 500 Index & Bridgeway Ultra-Large 35 Index & Lipper Large-Cap Core Funds Index Inception 7/31/97 to 12/31/08
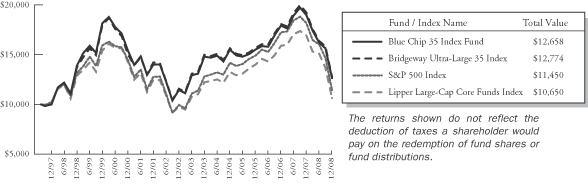
Six-Month Performance: Large Cap Dominance Continues (just when we need it)
The Short Version: We don’t expect our blue chip stocks to outperform very small ones over the long haul, since small stocks are riskier and should command a performance premium. However, due to the unusual construction of Bridgeway Ultra-Large 35 Index, we hope to do better than the more classically constructed large company indexes, as we have recently, over the last decade and since inception. If we can also time our periods of significant outperformance around bear markets, we will have tweaked both the return and risk of our shareholders’ results in a favorable direction. Add in a tiny expense ratio, excellent execution, and a so far perfect record for not distributing capital gains . . . We love this Fund!
The table on the next page presents short-term and long-term statistics for various size companies. There are a number of things to glean from this table. First (third column), in a down market, very large “blue chip” or “ultra-large” companies have frequently fallen less far. We certainly took advantage of that phenomenon in the last six months of the bear market.
Second (seventh column), over the long haul, ultra-large companies somewhat lag other size companies. This makes sense because they have been less risky/more stable. So far, nothing surprising. However, . . .
Third (column six), if you compare the ten-year performance of the CRSP 1 decile (-2.2%) to the S&P 500 Index (-1.4%) and our Fund (-0.9%), you get a very surprising result. The last ten year period included the longest running dominance of small companies over the last eight decades. In this environment you would expect large companies (both CRSP 1 and the S&P 500) to underperform the smallest ones, which they did. But you would also expect our Fund of ultra-large companies to perform in line with (or a hair worse than) CRSP 1 and definitely lag the S&P 500. In fact our Fund beat both! We attribute that partially to the unusual “roughly equal weighting” structure of our Fund. So far, our Fund has outperformed CRSP 1 by just over one percent/year on average. Over the long haul that’s no chump change. While not predictive of Fund return, simple math says that over a twenty-five year period, 1 percentage additional return translates into over 28% more return on a cumulative basis.
Blue Chip 35 Index Fund
MANAGER’S COMMENTARY (continued)
(Unaudited)
| | | | | | | | | | | | |
| CRSP Decile1 | | Dec. Qtr.
10/1/08
to 12/31/08 | | Six-Months
7/1/08
to 12/31/08 | | 1 Year
1/1/08
to 12/31/08 | | 5 Years
1/1/04
to 12/31/08 | | 10 Years
1/1/99
to 12/31/08 | | 83 Years
1/1/1926
to 12/31/08 |
| | | | | | |
1 (ultra-large) | | -20.2% | | -26.1% | | -35.1% | | -2.1% | | -2.2% | | 8.9% |
2 | | -24.5% | | -34.5% | | -41.9% | | -0.5% | | 1.9% | | 10.1% |
3 | | -26.5% | | -36.0% | | -40.4% | | -1.3% | | 2.5% | | 10.4% |
4 | | -24.1% | | -32.4% | | -37.1% | | -0.8% | | 2.8% | | 10.3% |
5 | | -26.0% | | -31.0% | | -35.2% | | 0.9% | | 3.3% | | 10.9% |
6 | | -28.0% | | -32.7% | | -40.0% | | -1.8% | | 3.5% | | 10.8% |
7 | | -27.6% | | -27.0% | | -36.3% | | -0.8% | | 3.5% | | 10.8% |
8 | | -26.8% | | -27.1% | | -35.6% | | -1.3% | | 5.6% | | 11.0% |
9 | | -27.2% | | -25.8% | | -36.9% | | -4.0% | | 5.5% | | 11.0% |
10 (ultra-small) | | -34.8% | | -37.9% | | -47.3% | | -6.6% | | 7.0% | | 12.3% |
1 | The CRSP Cap-Based Portfolio Indexes are unmanaged indexes of the publicly traded U.S. stocks with dividends reinvested, grouped by the market capitalization, as reported by the Center for Research in Security Prices. Past performance is no guarantee of future results. |
Calendar Year Performance
The Short Version: Only four of our companies posted positive returns in 2008. Ouch!
The table below presents our results at the company level. As would be expected in a recession, healthcare (“non-cyclical”) stocks held up the best. Four of our top ten performers were from this sector. At the other end of the spectrum, many financial stocks appeared.
Total Return for Blue Chip 35 Index Fund Stocks for the Calendar Year Ended December 31, 2008:
| | | | | | |
| Rank | | Company | | Industry | | % Change |
| 1 | | Genentech Inc | | Biotechnology | | 21.5% |
| 2 | | Wal-Mart Stores Inc | | Retail | | 12.4% |
| 3 | | Wells Fargo & Co | | Banks | | 8.2% |
| 4 | | Applied Materials Inc* | | Semiconductors | | 6.0% |
| 5 | | Abbott Laboratories** | | Pharmaceuticals | | -0.6% |
| 6 | | Dell Inc* | | Computers | | -2.7% |
| 7 | | Time Warner Inc* | | Media | | -9.0% |
| 8 | | Exxon Mobil Corp | | Oil & Gas | | -9.1% |
| 9 | | Johnson & Johnson | | Healthcare-Products | | -9.9% |
| 10 | | Procter & Gamble Co | | Cosmetics/Personal Care | | -11.9% |
| 11 | | Chevron Corp | | Oil & Gas | | -12.6% |
| 12 | | Idearc Inc | | Media | | -12.7% |
| 13 | | United Parcel Service Inc | | Transportation | | -12.8% |
| 14 | | Home Depot Inc* | | Retail | | -12.8% |
| 15 | | Eli Lilly & Co* | | Pharmaceuticals | | -12.8% |
| 16 | | Texas Instruments Inc* | | Semiconductors | | -13.7% |
| 17 | | 3M Co* | | Miscellaneous Manufacturing | | -14.9% |
| 18 | | Pfizer Inc | | Pharmaceuticals | | -15.2% |
| 19 | | Hewlett-Packard Co** | | Computers | | -16.2% |
| 20 | | Oracle Corp | | Software | | -16.2% |
| 21 | | International Business Machines Corp | | Computers | | -17.5% |
| | | | | | | |
| | |
| 104 | | Semi-Annual Report | December 31, 2008 (Unaudited) |
Blue Chip 35 Index Fund
MANAGER’S COMMENTARY (continued)
(Unaudited)
| | | | | | |
| Rank | | Company | | Industry | | % Change |
| 22 | | Coca-Cola Co | | Beverages | | -18.6% |
| 23 | | Verizon Communications Inc | | Telecommunications | | -18.7% |
| 24 | | JPMorgan Chase & Co | | Banks | | -19.6% |
| 25 | | PepsiCo Inc | | Beverages | | -21.6% |
| 26 | | CVS/Caremark Corp** | | Retail | | -22.7% |
| 27 | | AT&T Inc | | Telecommunications | | -23.2% |
| 28 | | United Technologies Corp | | Aerospace/Defense | | -24.7% |
| 29 | | Berkshire Hathaway Inc | | Insurance | | -24.9% |
| 30 | | Occidental Petroleum Corp** | | Oil & Gas | | -25.9% |
| 31 | | ConocoPhillips | | Oil & Gas | | -26.4% |
| 32 | | Intel Corp | | Semiconductors | | -27.3% |
| 33 | | Visa Inc** | | Commercial Services | | -30.1% |
| 34 | | Cisco Systems Inc | | Telecommunications | | -33.1% |
| 35 | | Google Inc | | Internet | | -33.7% |
| 36 | | Merck & Co Inc | | Pharmaceuticals | | -34.2% |
| 37 | | Bank of America Corp | | Banks | | -35.6% |
| 38 | | Microsoft Corp | | Software | | -35.7% |
| 39 | | Apple Inc** | | Computers | | -36.2% |
| 40 | | Monsanto Co** | | Chemicals | | -38.3% |
| 41 | | General Electric Co | | Miscellaneous Manufacturing | | -43.2% |
| 42 | | Wachovia Corp* | | Banks | | -48.4% |
| 43 | | Citigroup Inc | | Banks | | -57.3% |
| 44 | | Halliburton Co** | | Oil & Gas Services | | -62.7% |
| 45 | | American International Group Inc*** | | Insurance | | -91.4% |
| | | | | | | |
| * | These companies were removed from the Bridgeway Ultra-Large 35 Index at the end of the quarter ended June 30, 2008. |
| ** | These companies were added to the Bridgeway Ultra-Large 35 Index at the end of the quarter ended June 30, 2008. |
| *** | This company was removed from the Bridgeway Ultra-Large 35 Index at the end of the quarter ended September 30, 2008. |
In the Midst of the Worst Bear Market in a Lifetime, Our Fund’s First Blue Chip “Blowup”
The Short Version: At the time of our Index rebalancing in June, one stock we wish we had avoided was AIG. However, as the largest insurance company in America, and based on the quantitative discipline of our index composition process, the company was bound to remain with us... but not for long.
An interesting aspect of our Index process is that we start with 36 companies in the Ultra-large 35 Index (and thus our Fund) each time we rebalance. We usually anticipate the merger of two of our companies, reducing the number back to 35. For example, this happened when Time Warner merged with AOL in 2003. The other way a company may exit our Index is when one of the companies goes bankrupt—a very rare occurrence for ultra-large companies. AIG is an interesting, if very unfortunate twist on this possibility.
While analysts claimed that AIG’s insurance business remained sound, bad bets (to put it mildly) on mortgage derivatives brought about the company’s rapid demise and no white knight emerged to keep the financial markets from further unraveling. Once again, the Fed was forced to step in and orchestrate another government bailout, hugely diluting current investors’ ownership in the process. While the U.S. government ensured AIG’s rescue from bankruptcy, shareholder wealth was largely wiped out, and since it was no longer an ultra-large company, it was booted from our index at the end of September—but only after declining 91% for the year. This was the first blue chip “blowup” in our Fund’s eleven-year history. Previously, we sidestepped Enron, Worldcom, Wachovia and Washington Mutual.
Blue Chip 35 Index Fund
MANAGER’S COMMENTARY (continued)
(Unaudited)
Industry Sector Representation as of December 31, 2008
As consumer non-cyclical stocks generally hold up better than most sectors in a recession, this sector now represents a strong 28.1% of our Fund, a few percentage points more than the S&P 500 Index. Our largest weighting relative to the S&P 500 was technology. We currently own no utility stocks, a sector that has also held up better than most of the market.
| | | | | | |
| | | % of Fund | | % S&P 500 | | Difference |
Basic Materials | | 2.6% | | 3.0% | | -0.4% |
Communications | | 11.4% | | 10.9% | | 0.5% |
Consumer, Cyclical | | 7.2% | | 8.2% | | -1.0% |
Consumer, Non-cyclical | | 28.1% | | 25.2% | | 2.9% |
Energy | | 13.7% | | 13.5% | | 0.2% |
Financial | | 12.6% | | 13.0% | | -0.4% |
Industrial | | 8.6% | | 11.2% | | -2.6% |
Technology | | 15.9% | | 10.9% | | 5.0% |
Utilities | | 0.0% | | 4.1% | | -4.1% |
Cash | | -0.1% | | 0.0% | | -0.1% |
| | | | | | | |
Total | | 100.0% | | 100.0% | | |
Disclaimer
The views expressed here are exclusively those of Fund management. These views, including those of market sectors or individual stocks, are not meant as investment advice and should not be considered predictive in nature. Any favorable (or unfavorable) description of a holding applies only as of the quarter end, December 31, 2008, unless otherwise stated. Security positions can and do change thereafter. Discussions of historical performance do not guarantee and are not indicative of future performance.
The Fund is subject to significant market risk (volatility) and is not an appropriate investment for short-term investors.
Conclusion
Thank you for your continued investment in Blue Chip 35 Index Fund. We encourage your feedback; your reactions and concerns are important to us.
Sincerely,
Your Investment Management Team
| | |
| 106 | | Semi-Annual Report | December 31, 2008 (Unaudited) |
THIS PAGE INTENTIONALLY LEFT BLANK
Blue Chip 35 Index Fund
SCHEDULE OF INVESTMENTS
Showing percentage of net assets as of December 31, 2008 (Unaudited)
| | | | | | | |
| Industry | | Company | | Shares | | Value |
| | |
COMMON STOCKS - 100.08% | | | | | |
Aerospace/Defense - 3.26% | | | | | |
| | United Technologies Corp. | | 96,780 | | $ | 5,187,408 |
|
Banks - 9.47% |
| | Bank of America Corp. | | 166,308 | | | 2,341,617 |
| | Citigroup, Inc. | | 276,549 | | | 1,855,644 |
| | JPMorgan Chase & Co. | | 156,295 | | | 4,927,981 |
| | Wells Fargo & Co.+ | | 200,759 | | | 5,918,375 |
| | | | | | | |
| | | | | | | 15,043,617 |
|
Beverages - 5.76% |
| | Coca-Cola Co. | | 104,757 | | | 4,742,349 |
| | PepsiCo., Inc. | | 80,550 | | | 4,411,724 |
| | | | | | | |
| | | | | | | 9,154,073 |
|
Biotechnology - 3.42% |
| | Genentech, Inc.* | | 65,515 | | | 5,431,849 |
|
Chemicals - 2.62% |
| | Monsanto Co. | | 59,100 | | | 4,157,685 |
|
Commercial Services - 2.94% |
| | Visa, Inc., Class A+ | | 89,200 | | | 4,678,540 |
|
Computers - 7.81% |
| | Apple, Inc.* | | 45,750 | | | 3,904,762 |
| | Hewlett-Packard Co. | | 125,000 | | | 4,536,250 |
| | International Business Machines Corp. | | 47,142 | | | 3,967,471 |
| | | | | | | |
| | | | | | | 12,408,483 |
|
Cosmetics/Personal Care - 2.90% |
| | Procter & Gamble Co. | | 74,526 | | | 4,607,197 |
|
Healthcare-Products - 3.27% |
| | Johnson & Johnson | | 86,752 | | | 5,190,372 |
|
Insurance - 3.09% |
| | Berkshire Hathaway, Inc., Class B* | | 1,528 | | | 4,910,992 |
|
Internet - 2.78% |
| | Google, Inc., Class A* | | 14,370 | | | 4,420,931 |
|
Miscellaneous Manufacturing - 2.34% |
| | General Electric Co. | | 229,443 | | | 3,716,977 |
|
Oil & Gas - 11.89% |
| | Chevron Corp. | | 65,095 | | | 4,815,077 |
| | ConocoPhillips | | 88,815 | | | 4,600,617 |
| | Exxon Mobil Corp. | | 61,687 | | | 4,924,473 |
| | Occidental Petroleum Corp. | | 75,800 | | | 4,547,242 |
| | | | | | | |
| | | | | | | 18,887,409 |
| | | | | | | | |
| Industry | | Company | | Shares | | Value | |
|
| |
Oil & Gas Services - 1.79% | |
| | Halliburton Co. | | 156,800 | | $ | 2,850,624 | |
|
Pharmaceuticals - 9.76% | |
| | Abbott Laboratories | | 112,000 | | | 5,977,440 | |
| | Merck & Co., Inc. | | 159,135 | | | 4,837,704 | |
| | Pfizer, Inc. | | 265,344 | | | 4,699,242 | |
| | | | | | | | |
| | | | | | | 15,514,386 | |
|
Retail - 7.23% | |
| | CVS Caremark Corp. | | 182,500 | | | 5,245,050 | |
| | Wal-Mart Stores, Inc. | | 111,219 | | | 6,234,937 | |
| | | | | | | | |
| | | | | | | 11,479,987 | |
|
Semiconductors - 2.81% | |
| | Intel Corp. | | 304,043 | | | 4,457,271 | |
|
Software - 5.28% | |
| | Microsoft Corp. | | 196,645 | | | 3,822,779 | |
| | Oracle Corp.* | | 257,213 | | | 4,560,386 | |
| | | | | | | | |
| | | | | | | 8,383,165 | |
|
Telecommunications - 8.67% | |
| | AT&T, Inc. | | 172,825 | | | 4,925,513 | |
| | Cisco Systems, Inc.* | | 235,704 | | | 3,841,975 | |
| | Verizon Communications, Inc. | | 147,589 | | | 5,003,267 | |
| | | | | | | | |
| | | | | | | 13,770,755 | |
|
Transportation - 2.99% | |
| | United Parcel Service, Inc., Class B+ | | 86,163 | | | 4,752,751 | |
| | | | | | | | |
| |
TOTAL COMMON STOCKS - 100.08% | | | 159,004,472 | |
| | | | | | | | |
(Cost $201,463,289) | | | | |
| |
TOTAL INVESTMENTS - 100.08% | | $ | 159,004,472 | |
(Cost $201,463,289) | | | | |
Liabilities in Excess of Other Assets - (0.08)% | | | (131,231 | ) |
| | | | | | | | |
NET ASSETS - 100.00% | | $ | 158,873,241 | |
| | | | | | | | |
| + | This security or a portion of the security is out on loan at December 31, 2008. Total loaned securities had a market value of $10,767,911 at December 31, 2008. |
| * | Non Income Producing Security. |
See Notes to Financial Statements.
| | |
| 108 | | Semi-Annual Report | December 31, 2008 (Unaudited) |
THIS PAGE INTENTIONALLY LEFT BLANK
Balanced Fund
MANAGER’S COMMENTARY
(Unaudited)
December 31, 2008
Dear Fellow Balanced Fund Shareholder:
For the quarter ending December 31, 2008, Balanced Fund fell by 9.19%, beating the 21.94% decline of the equity-only S&P 500 Index and the 13.49% loss experienced by its peer index, the Lipper Balanced Funds Index. Our Fund trailed the Balanced Benchmark which fell 7.16% and the fixed income-only Bloomberg/EFFAS US Government 1-3 Year Total Return Bond Index, our primary market benchmark, which was up 2.69% for the quarter. As always, our investment objective is to manage a conservative, balanced portfolio with volatility less than or equal to 40% of the of the S&P Index (i.e. 60% less risk). For the quarter, however, we slightly missed this objective, as our losses accounted for 41.9% of those of the S&P 500. While we received attractive premiums throughout the quarter on written options that expired worthless, the strategy failed to serve as much of a hedge with many of the underlying stocks declining in the value along with the rest of the equity markets.
For the six-month period ending December 31, 2008, the Balanced Fund declined 15.47%, beating the 28.48% decline of the S&P 500 Index and the peer benchmark, the Lipper Balanced Funds Index, which lost 20.74%. The Fund lost by a considerable margin to the 8.66% decline of the Balanced Benchmark and the Bloomberg/EFFAS US Government 1-3 Year Total Return Bond Index, which was up 4.55% for the six-month period. While many of our losses could be traced to the overall equity market downturn, we also had poor performances from some of our growth picks during the six-month period. Our strategies stay constant and consistent in both good times and bad, and long-term results always will remain the key objective of our firm. We are pleased that our Fund has outperformed each of the benchmarks other than the fixed income-only index since inception in 2001, and that our use of options and derivatives has been successful over the long term. However, we realize that such longer-term results offer little consolation for the more recent returns. We assure our investors (ourselves included) that we will continue to work hard for them to overcome the difficulties brought about by this dire economic and financial environment.
The results for the full year 2008 look even less favorable. Balanced Fund dropped by 19.38%, trailing the Balanced Benchmark, which declined 10.78% and the fixed income-only Bloomberg/EFFAS US Government 1-3 Year Total Return Bond Index, up 6.70, while outperforming the peer index Lipper Balanced Funds Index which lost 25.73%. Our loss represented 52.4% of the decline of the S&P 500 (-37%), so we again failed to meet our objective of only experiencing 40% of the volatility of the equity-only index.
Our hybrid total-return Fund invests in both equity and fixed income securities, while incorporating an options strategy designed to produce a conservative, lower volatility balanced portfolio. During very favorable equity market conditions, the Fund often under-performs many of the more aggressive benchmarks. On the other hand, when stocks struggle and investors seek the safe haven of more conservative bonds, Balanced Fund tends to perform better than the equity-only indexes.
The table below presents our December quarter, six-month, one-year, five-year and life-to-date financial results according to the formula required by the SEC. A graph of quarterly performance since inception appears on the following page.
| | | | | | | | | | |
| | | Dec, Qtr.
10/1/08
to 12/31/08 | | Six-Month
7/1/08
to 12/31/08 | | 1 Year
1/1/08
to 12/31/08 | | 5 Year
1/1/04
to 12/31/08 | | Life-to-Date
6/30/01
to 12/31/08 |
| | | | | |
Balanced Fund | | -9.19% | | -15.47% | | -19.38% | | 1.07% | | 2.13% |
Balanced Benchmark | | -7.16% | | -8.66% | | -10.78% | | 1.71% | | 2.01% |
S&P 500 Index | | -21.94% | | -28.48% | | -37.00% | | -2.19% | | -2.18% |
Bloomberg/EFFAS U.S. Government 1-3 Year Total Return Bond Index | | 2.69% | | 4.55% | | 6.70% | | 4.01% | | 4.29% |
Lipper Balanced Funds Index | | -13.49% | | -20.74% | | -25.73% | | 0.24% | | 0.87% |
Performance figures quoted in the table above and graph on the next page represent past performance and are no guarantee of future results. The table above and graph below do not reflect the deduction of taxes that a shareholder would pay on Fund distributions or the redemption of Fund shares.
| | |
| 110 | | Semi-Annual Report | December 31, 2008 (Unaudited) |
Balanced Fund
MANAGER’S COMMENTARY (continued)
(Unaudited)
The Lipper Balanced Funds Index is an index of balanced funds compiled by Lipper, Inc. Balanced Benchmark is a combined index of which 40% reflects the S&P 500 Index (an unmanaged index of large companies with dividends reinvested) and 60% reflects the Bloomberg/EFFAS U.S. Government 1-3 year Total Return Bond Index (transparent benchmark for the total return of the 1-3 year U.S. Government bond market).
According to data from Lipper, Inc. as of December 31, 2008, the Balanced Fund ranked 76th of 513 Mixed-Asset Moderate funds for the calendar year ended December 31, 2008, 51st of 273 for the past five years and 31st of 176 funds since inception on June 30, 2001. Lipper, Inc. is an independent mutual fund rating service that ranks funds in various fund categories by making comparative calculations using total returns.
According to data from Morningstar as of December 31, 2008, the Balanced Fund ranked 303rd of 679 Conservative Allocation funds for the calendar year ended December 31, 2008 and 81st out of 290 funds for five years. Morningstar ranks funds in various fund categories by making comparative calculations using total returns.
Balanced Fund vs. S&P 500 Index & Bloomberg/EFFAS Bond Index & Lipper Balanced Funds Index & Balanced Benchmark 6/30/01 to 12/31/08
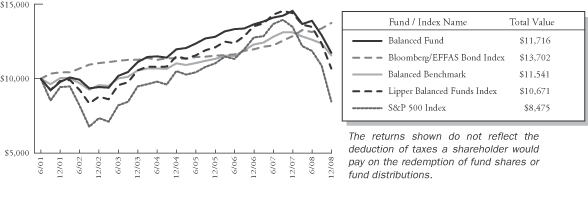
Detailed Explanation of Quarterly Performance—What Worked Well
The Short Version: During the last quarter of 2008, misery found plenty of company, and investors had to search long and hard for winners in their portfolios. While virtually all sectors suffered negative ramifications of the credit crisis and severe downturn in the economy, non-cyclical consumer stocks held up somewhat better than most. Of the top ten best performers in the Fund, five came from that sector, four of which were healthcare-related companies. Combined, the top ten holdings contributed over one and a quarter percent to the overall performance of the Fund.
These are the ten best-performing stocks for the quarter ended December 31, 2008:
| | | | | | |
| Rank | | Description | | Industry | | % Gain |
| 1 | | Wachovia Corp | | Banks | | 65.5% |
| 2 | | Sunoco Inc | | Oil & Gas | | 57.6% |
| 3 | | Mylan Inc | | Pharmaceuticals | | 43.4% |
| 4 | | Thoratec Corp | | Healthcare-Products | | 40.3% |
| 5 | | Archer-Daniels-Midland Co | | Agriculture | | 32.5% |
| 6 | | Autozone Inc | | Retail | | 13.1% |
| 7 | | Verizon Communications Inc | | Telecommunications | | 12.5% |
| 8 | | Gilead Sciences Inc | | Biotechnology | | 12.2% |
| 9 | | Bristol-Myers Squibb Co | | Pharmaceuticals | | 11.5% |
| 10 | | Masco Corp | | Building Materials | | 10.2% |
| | | | | | | |
Balanced Fund
MANAGER’S COMMENTARY (continued)
(Unaudited)
Mylan Inc. is one of the world’s leading generic and specialty pharmaceutical companies that distributes products in more than 140 countries across the globe. In October, the company announced much better than expected earnings as sales tripled in the third quarter. Mylan has started to reap nice benefits from its purchase of Merck’s generics business (cheaper drugs during a recession) and also recognized some deferred revenues during the past three months from its sale of a blood pressure medication, Bystolic. Late in the year, the company got FDA approval to begin selling a generic version of an HIV drug produced by Bristol-Myers Squibb. The holding increased over 40% in the quarter and was the third best performer in the Fund.
Detailed Explanation of Quarterly Performance—What Didn’t Work
The Short Version: Much of the current negative economic and market conditions stem from the subprime mortgage debacle and other problems with poor lending and toxic securities at the nation’s financial companies. While the negativity has spread to all other sectors, financials continue to struggle in this depressed environment. Five of the worst performers over the past three months were financial services-related and, combined, they cost the Fund over two percent in return.
These are the ten worst-performing stocks for the quarter ended December 31, 2008:
| | | | | | |
| Rank | | Description | | Industry | | % Loss |
| 1 | | Cliffs Natural Resources Inc | | Iron/Steel | | -70.3% |
| 2 | | Sprint Nextel Corp | | Telecommunications | | -70.0% |
| 3 | | Citigroup Inc | | Banks | | -68.6% |
| 4 | | Genworth Financial Inc | | Insurance | | -67.1% |
| 5 | | Dillard’s Inc | | Retail | | -66.4% |
| 6 | | Bank of America Corp | | Banks | | -61.8% |
| 7 | | Massey Energy Co | | Coal | | -61.3% |
| 8 | | E*Trade Financial Corp | | Diversified Financial Services | | -58.9% |
| 9 | | Prudential Financial Inc | | Insurance | | -58.7% |
| 10 | | Kansas City Southern | | Transportation | | -58.6% |
| | | | | | | |
Initially considered the “white knight” for the financial services world, banking giant Bank of America fell on hard times of its own during the past quarter, as the recession accelerated, the bailout began, and shareholders worried about how the company would “synergize” with its latest acquisitions. In July, Bank of America welcomed Countrywide (of subprime lending infamy) into its family and in September announced plans to rescue brokerage behemoth Merrill Lynch from a fate similar as Lehman and Bear Stearns. By October, it accepted government funds as a participant in the TARP bailout plan, and its stock began a steady freefall once investors realized the true magnitude of the financial crisis. In December, Bank of America shareholders approved the Merrill deal, but at a valuation far less than initially negotiated. Its share price had dropped dramatically since the announcement. The transaction made Bank of America the largest domestic brokerage and wealth management shop (at a time that those businesses seem to be out of favor). The company plans to lay off about 30,000 employees as it incorporates Merrill into its operations. Its stock price plunged over 60% during the quarter and cost the Fund over a one and a quarter percent in return.
Detailed Explanation of Calendar Year Performance—What Worked Well
The Short Version: Healthcare highlighted the Fund’s best performers in 2008 with three related firms (biotech, pharmaceutical and medical devices) in the top ten list. Combined, the three companies contributed over a third of a percent to the Fund’s performance. Somehow a few retailers even snuck onto the list despite the gloom and doom experienced throughout the year. This is further proof that the models often reveal some positive needles in a negative haystack.
| | |
| 112 | | Semi-Annual Report | December 31, 2008 (Unaudited) |
Balanced Fund
MANAGER’S COMMENTARY (continued)
(Unaudited)
Here are the ten best-performing companies for the calendar year ended December 31, 2008:
| | | | | | |
| Rank | | Description | | Industry | | % Gain |
| 1 | | Mylan Inc | | Pharmaceuticals | | 43.4% |
| 2 | | Thoratec Corp | | Healthcare-Products | | 40.3% |
| 3 | | Anheuser-Busch Cos Inc | | Beverages | | 28.9% |
| 4 | | Safeco Corp | | Insurance | | 22.6% |
| 5 | | Rowan Cos Inc | | Oil & Gas | | 16.9% |
| 6 | | Autozone Inc | | Retail | | 16.3% |
| 7 | | Wal-Mart Stores Inc | | Retail | | 14.5% |
| 8 | | Potash Corp of Saskatchewan | | Chemicals | | 12.1% |
| 9 | | Gilead Sciences Inc | | Biotechnology | | 11.2% |
| 10 | | Masco Corp | | Building Materials | | 10.2% |
| | | | | | | |
Thoratec Corporation manufactures circulatory medical devices for heart patients. In December, the company reported that a clinical trial for its HeartMate II pump produced excellent results, and management believes it could receive its next round of FDA approval more quickly than originally expected. Currently, the HeartMate II is considered a temporary treatment for patients in need of heart transplants, but the strong data could speed up the approval process and make the device available for more candidates. The good news was not limited to the past three months, however. In late July, the company posted quarterly earnings that far exceeded analysts’ expectations based on the favorable treatment results of its existing medical product line. For the year, Thoratec returned over 40% and contributed almost a quarter of a percent to the performance of the Fund.
Detailed Explanation of Calendar Year Performance—What Didn’t Work
The Short Version: Managers and investors alike would love to forget 2008, as 58 companies within the Fund lost over 50% in value. While no sector was immune, financials again highlighted the list of poor performers. Each of the ten worst performers plunged by over 70% and, combined they cost the Fund over two and three quarters percent in return.
These are the ten worst-performing stocks for the calendar year ended December 31, 2008:
| | | | | | |
| Rank | | Description | | Industry | | % Loss |
| 1 | | Genworth Financial Inc | | Insurance | | -88.9% |
| 2 | | Bear Stearns Cos Inc | | Equity Fund | | -87.8% |
| 3 | | Sprint Nextel Corp | | Telecommunications | | -86.1% |
| 4 | | Ciena Corp | | Telecommunications | | -80.4% |
| 5 | | Hartford Financial Services Group Inc | | Insurance | | -78.9% |
| 6 | | Office Depot Inc | | Retail | | -78.6% |
| 7 | | Cliffs Natural Resources Inc | | Iron/Steel | | -75.8% |
| 8 | | International Game Technology | | Entertainment | | -72.9% |
| 9 | | Wachovia Corp | | Banks | | -71.6% |
| 10 | | Citigroup Inc | | Banks | | -71.6% |
| | | | | | | |
In March, Bear Stearns became the first bailout “beneficiary”. The one-time investment giant was sold to JPMorgan Chase in a deal arranged by the Federal Reserve. More than many of its competitors, Bear Stearns had ridden the mortgage derivative game to great profitability before crashing in its wake as the market dramatically deteriorated. With other banks, investment houses, and hedge funds financially interconnected to the eight-decade old firm, Fed Chair Bernanke believed that its outright failure was not an option and a “bailout” was in order. Bear Stearns was one of four holdings to lose more than 80% during 2008.
Balanced Fund
MANAGER’S COMMENTARY (continued)
(Unaudited)
Background on Fixed Income Securities Strategy
While many investors sought the safe-haven of US Treasuries during the quarter (and calendar year), other fixed income securities (even the highest quality corporate notes) suffered from the frozen credit markets. Of our bond holdings, the vast majority were short-duration Treasuries with only a small percentage (less than 10%) representing corporate notes. It has always been our mandate to take minimal interest rate and duration risk. In this environment, however, investors may begin to find some seemingly attractive yields in the high quality corporate and municipal markets. Spreads on these securities have widened significantly, as investors continue their flight-to-quality into the sheer (perceived) safety of government securities.
Top Ten Equity Holdings as of December 31, 2008
Healthcare companies highlighted the Fund’s top ten holdings with four related stocks in the list at year-end. Four of our largest positions were also among the Fund’s top performers of the quarter: Bristol-Myers Squibb, Verizon, Archer Daniels Midland, and Thoratec. No one holding accounted for greater than 2.3% of the net assets, indicating that the Fund was well-diversified across many companies in this difficult environment for stocks. The ten largest positions represented just under 15% of the total assets of the Fund.
| | | | | | |
| Rank | | Description | | Industry | | % of
Net Assets |
| 1 | | Bristol-Myers Squibb Co | | Pharmaceuticals | | 2.3% |
| 2 | | Verizon Communications Inc | | Telecommunications | | 2.2% |
| 3 | | AT&T Inc | | Telecommunications | | 1.8% |
| 4 | | Archer Daniels Midland Co | | Agriculture | | 1.4% |
| 5 | | Thoratec Corp | | Healthcare-Products | | 1.2% |
| 6 | | US Bancorp | | Banks | | 1.2% |
| 7 | | Union Pacific Corp | | Transportation | | 1.1% |
| 8 | | St Jude Medical Inc | | Healthcare-Products | | 1.1% |
| 9 | | Celgene Corp | | Biotechnology | | 1.0% |
| 10 | | Exxon Mobil Corp | | Oil & Gas | | 1.0% |
| | | | | | | |
| | | | | | 14.3% |
Industry Sector Representation as of December 31, 2008
As of December 31, 2008, equities comprised about 65% of the Fund’s allocation, while U.S. government obligations made up just over 30% of its net assets. The Fund also maintained a relatively small allocation to corporate notes, as spreads on certain high quality securities have started to look quite attractive. Consumer non-cyclicals represented the largest equity allocation within the Fund by far and healthcare-related companies were among our best performers. Virtually no sector was spared the negativity of the past three months (and full year, for that matter), and our positions within financials, energy, and industrials, in particular, dramatically hindered the overall performance of the Fund.
| | |
| 114 | | Semi-Annual Report | December 31, 2008 (Unaudited) |
Balanced Fund
MANAGER’S COMMENTARY (continued)
(Unaudited)
| | |
Common Stock | | 65.3% |
Basic Materials | | 3.7% |
Communications | | 8.7% |
Consumer, Cyclical | | 3.9% |
Consumer, Non-cyclical | | 19.4% |
Energy | | 6.8% |
Financial | | 8.4% |
Industrial | | 7.3% |
Technology | | 5.1% |
Utilities | | 2.0% |
U.S. Government Obligations | | 31.4% |
Corporate Notes | | 3.1% |
Covered Call Options Written | | -1.6% |
Put Options Written | | -0.3% |
Money Market Funds | | 0.0% |
Other Assets in Excess of Liabilities | | 2.1% |
| | | |
Total | | 100.0% |
Disclaimer
The views expressed here are exclusively those of Fund management. These views, including those of market sectors or individual stocks, are not meant as investment advice and should not be considered predictive in nature. Any favorable (or unfavorable) description of a holding applies only as of the quarter end, December 31, 2008, unless otherwise stated. Security positions can and do change thereafter. Discussions of historical performance do not guarantee and are not indicative of future performance.
Market volatility can significantly affect short-term performance. The Fund is not an appropriate investment for short-term investors. Investments in the small companies within this multi-cap fund generally carry greater risk than is customarily associated with larger companies. This additional risk is attributable to a number of factors, including the relatively limited financial resources that are typically available to small companies, and the fact that small companies often have comparatively limited product lines. In addition, the stock of small companies tends to be more volatile than the stock of large companies, particularly in the short term and particularly in the early stages of an economic or market downturn. The Fund’s use of options, futures, and leverage can magnify the risk of loss in an unfavorable market, and the Fund’s use of short-sale positions can, in theory, expose shareholders to unlimited loss. Shareholders of the Fund, therefore, are taking on more risk than they would if they invested in the stock market as a whole. The Fund uses an option writing strategy in which the Fund may sell covered calls or secured put options. Up to 75% of Fund assets may be invested in options. Options are subject to special risks and may not fully protect the Fund against declines in the value of its stocks. In addition, an option writing strategy limits the upside profit potential normally associated with stocks. Finally, the Fund’s fixed-income holdings are subject to three types of risk. Interest rate risk is the chance that bond prices overall will decline as interest rates rise. Credit risk is the chance a bond issuer will fail to pay interest and principal. Prepayment risk is the chance a mortgage-backed bond issuer will repay a higher yielding bond, resulting in a lower paying yield.
Conclusion
Thank you for your continued investment in Balanced Fund. We encourage your feedback; your reactions and concerns are important to us.
Sincerely,
Your Investment Management Team
Balanced Fund
SCHEDULE OF INVESTMENTS
Showing percentage of net assets as of December 31, 2008 (Unaudited)
| | | | | | | |
| Industry | | Company | | Shares | | Value |
| | |
COMMON STOCKS - 65.28% | | | | | |
Advertising - 0.10% |
| | Omnicom Group, Inc. | | 2,000 | | $ | 53,840 |
|
Aerospace/Defense - 1.19% |
| | General Dynamics Corp. | | 1,400 | | | 80,626 |
| | Goodrich Corp. | | 1,800 | | | 66,636 |
| | Lockheed Martin Corp. | | 3,470 | | | 291,758 |
| | Northrop Grumman Corp. | | 2,200 | | | 99,088 |
| | United Technologies Corp. | | 1,740 | | | 93,264 |
| | | | | | | |
| | | | | | | 631,372 |
|
Agriculture - 1.39% |
| | Archer-Daniels-Midland Co. | | 25,600 | | | 738,048 |
|
Apparel - 0.33% |
| | Coach, Inc.* | | 4,600 | | | 95,542 |
| | NIKE, Inc., Class B | | 1,600 | | | 81,600 |
| | | | | | | |
| | | | | | | 177,142 |
|
Banks - 4.99% |
| | Bank of America Corp.# | | 17,100 | | | 240,768 |
| | Bank of New York Mellon Corp. | | 11,332 | | | 321,036 |
| | BB&T Corp.# | | 5,800 | | | 159,268 |
| | Citigroup, Inc. | | 5,100 | | | 34,221 |
| | Comerica, Inc. | | 3,600 | | | 71,460 |
| | Goldman Sachs Group, Inc.# | | 1,100 | | | 92,829 |
| | JPMorgan Chase & Co. | | 4,300 | | | 135,579 |
| | KeyCorp. | | 9,900 | | | 84,348 |
| | Marshall & Ilsley Corp.+ | | 8,200 | | | 111,848 |
| | Morgan Stanley+ | | 3,000 | | | 48,120 |
| | State Street Corp. | | 5,800 | | | 228,114 |
| | SunTrust Banks, Inc. | | 5,800 | | | 171,332 |
| | US Bancorp#+ | | 25,300 | | | 632,753 |
| | Wachovia Corp. | | 7,389 | | | 40,935 |
| | Wells Fargo & Co.+ | | 9,600 | | | 283,008 |
| | | | | | | |
| | | | | | | 2,655,619 |
|
Beverages - 1.37% |
| | Brown-Forman Corp., Class B | | 2,950 | | | 151,895 |
| | Coca-Cola Co. | | 3,900 | | | 176,553 |
| | Dr Pepper Snapple Group, Inc.* | | 5,700 | | | 92,625 |
| | Pepsi Bottling Group, Inc. | | 4,400 | | | 99,044 |
| | PepsiCo., Inc. | | 3,800 | | | 208,126 |
| | | | | | | |
| | | | | | | 728,243 |
|
Biotechnology - 3.02% |
| | Biogen Idec, Inc.*+ | | 2,200 | | | 104,786 |
| | Celgene Corp.*# | | 10,000 | | | 552,800 |
| | Genzyme Corp.* | | 1,800 | | | 119,466 |
| | Gilead Sciences, Inc.* | | 9,800 | | | 501,172 |
| | Myriad Genetics, Inc.*# | | 5,000 | | | 331,300 |
| | | | | | | |
| | | | | | | 1,609,524 |
| | | | | | | |
| Industry | | Company | | Shares | | Value |
|
|
Building Materials - 0.15% |
| | Masco Corp.# | | 7,100 | | $ | 79,023 |
|
Chemicals - 3.44% |
| | CF Industries Holdings, Inc.# | | 7,200 | | | 353,952 |
| | Dow Chemical Co.# | | 16,600 | | | 250,494 |
| | Monsanto Co.# | | 4,700 | | | 330,645 |
| | Mosaic Co. | | 7,100 | | | 245,660 |
| | Sherwin-Williams Co. | | 3,500 | | | 209,125 |
| | Sigma-Aldrich Corp. | | 2,900 | | | 122,496 |
| | Terra Industries, Inc.# | | 19,100 | | | 318,397 |
| | | | | | | |
| | | | | | | 1,830,769 |
|
Coal - 0.30% |
| | Massey Energy Co.# | | 8,900 | | | 122,731 |
| | Peabody Energy Corp. | | 1,700 | | | 38,675 |
| | | | | | | |
| | | | | | | 161,406 |
|
Commercial Services - 0.62% |
| | Automatic Data Processing, Inc.+ | | 3,700 | | | 145,558 |
| | Equifax, Inc. | | 2,600 | | | 68,952 |
| | Moody’s Corp. | | 800 | | | 16,072 |
| | Paychex, Inc.+ | | 2,200 | | | 57,816 |
| | Western Union Co. | | 3,000 | | | 43,020 |
| | | | | | | |
| | | | | | | 331,418 |
|
Computers - 2.15% |
| | Apple, Inc.*+ | | 5,200 | | | 443,820 |
| | EMC Corp.* | | 7,300 | | | 76,431 |
| | Hewlett-Packard Co. | | 7,800 | | | 283,062 |
| | International Business Machines Corp.+ | | 1,000 | | | 84,160 |
| | Lexmark International, Inc., Class A*+ | | 3,000 | | | 80,700 |
| | NetApp, Inc.*# | | 5,800 | | | 81,026 |
| | Teradata Corp.*# | | 6,300 | | | 93,429 |
| | | | | | | |
| | | | | | | 1,142,628 |
|
Cosmetics/Personal Care - 1.38% |
| | Avon Products, Inc.# | | 5,700 | | | 136,971 |
| | Colgate-Palmolive Co.#+ | | 4,400 | | | 301,576 |
| | Estee Lauder Cos., Inc., Class A | | 1,600 | | | 49,536 |
| | Procter & Gamble Co.# | | 4,000 | | | 247,280 |
| | | | | | | |
| | | | | | | 735,363 |
|
Distribution/Wholesale - 0.07% |
| | WW Grainger, Inc.+ | | 500 | | | 39,420 |
| | |
| 116 | | Semi-Annual Report | December 31, 2008 (Unaudited) |
Balanced Fund
SCHEDULE OF INVESTMENTS (continued)
Showing percentage of net assets as of December 31, 2008 (Unaudited)
| | | | | | | |
| Industry | | Company | | Shares | | Value |
|
Common Stocks (continued) |
Diversified Financial Services - 0.81% |
| | Ameriprise Financial, Inc.# | | 2,780 | | $ | 64,941 |
| | Charles Schwab Corp. | | 9,700 | | | 156,849 |
| | E*Trade Financial Corp.* | | 11,400 | | | 13,110 |
| | Franklin Resources, Inc.# | | 2,800 | | | 178,584 |
| | Merrill Lynch & Co., Inc. | | 1,000 | | | 11,640 |
| | SLM Corp.* | | 810 | | | 7,209 |
| | | | | | | |
| | | | | | | 432,333 |
|
Electric Utilities - 1.40% |
| | AES Corp.*# | | 14,100 | | | 116,184 |
| | Allegheny Energy, Inc.# | | 2,300 | | | 77,878 |
| | Dominion Resources, Inc. | | 5,620 | | | 201,421 |
| | Exelon Corp. | | 1,100 | | | 61,171 |
| | Pepco Holdings, Inc. | | 3,700 | | | 65,712 |
| | Progress Energy, Inc.+ | | 1,900 | | | 75,715 |
| | Public Service Enterprise Group, Inc. | | 5,100 | | | 148,767 |
| | | | | | | |
| | | | | | | 746,848 |
|
Electrical Components & Equipment - 0.58% |
| | Emerson Electric Co.+ | | 3,600 | | | 131,796 |
| | Energy Conversion Devices, Inc.*# | | 7,000 | | | 176,470 |
| | | | | | | |
| | | | | | | 308,266 |
|
Electronics - 0.15% |
| | Thermo Fisher Scientific, Inc.* | | 2,300 | | | 78,361 |
|
Engineering & Construction - 0.13% |
| | Fluor Corp.+ | | 1,600 | | | 71,792 |
|
Entertainment - 0.03% |
| | International Game Technology | | 1,200 | | | 14,268 |
|
Environmental Control - 0.04% |
| | Republic Services, Inc., Class A | | 810 | | | 20,080 |
|
Food - 1.07% |
| | Campbell Soup Co. | | 3,200 | | | 96,032 |
| | General Mills, Inc. | | 1,200 | | | 72,900 |
| | Kraft Foods, Inc., Class A | | 3,400 | | | 91,290 |
| | Kroger Co. | | 3,800 | | | 100,358 |
| | Safeway, Inc. | | 8,700 | | | 206,799 |
| | | | | | | |
| | | | | | | 567,379 |
|
Forest Products & Paper - 0.10% |
| | International Paper Co.# | | 4,500 | | | 53,100 |
| | | | | | | |
| Industry | | Company | | Shares | | Value |
|
|
Gas - 0.56% |
| | Nicor, Inc. | | 1,200 | | $ | 41,688 |
| | Sempra Energy | | 6,000 | | | 255,780 |
| | | | | | | |
| | | | | | | 297,468 |
|
Healthcare-Products - 4.63% |
| | Baxter International, Inc. | | 6,500 | | | 348,335 |
| | Becton Dickinson & Co. | | 3,420 | | | 233,894 |
| | CR Bard, Inc. | | 2,600 | | | 219,076 |
| | Hospira, Inc.* | | 7,700 | | | 206,514 |
| | Medtronic, Inc. | | 1,000 | | | 31,420 |
| | St. Jude Medical, Inc.*# | | 17,080 | | | 562,957 |
| | Stryker Corp.+ | | 5,260 | | | 210,137 |
| | Thoratec Corp.*# | | 20,000 | | | 649,800 |
| | | | | | | |
| | | | | | | 2,462,133 |
|
Healthcare-Services - 0.67% |
| | Aetna, Inc. | | 1,800 | | | 51,300 |
| | CIGNA Corp. | | 2,700 | | | 45,495 |
| | Humana, Inc.* | | 1,000 | | | 37,280 |
| | Laboratory Corp. of America Holdings*+ | | 800 | | | 51,528 |
| | Quest Diagnostics, Inc. | | 1,500 | | | 77,865 |
| | UnitedHealth Group, Inc. | | 3,600 | | | 95,760 |
| | | | | | | |
| | | | | | | 359,228 |
|
Household Products/Wares - 0.43% |
| | Clorox Co.# | | 1,530 | | | 85,007 |
| | Kimberly-Clark Corp.# | | 2,700 | | | 142,398 |
| | | | | | | |
| | | | | | | 227,405 |
|
Insurance - 2.64% |
| | Aflac, Inc. | | 800 | | | 36,672 |
| | Allstate Corp.# | | 1,000 | | | 32,760 |
| | AON Corp. | | 3,500 | | | 159,880 |
| | Berkshire Hathaway, Inc., Class B* | | 120 | | | 385,680 |
| | Chubb Corp. | | 4,500 | | | 229,500 |
| | Genworth Financial, Inc., Class A | | 2,600 | | | 7,358 |
| | MetLife, Inc.# | | 4,600 | | | 160,356 |
| | Principal Financial Group, Inc. | | 4,700 | | | 106,079 |
| | Progressive Corp. | | 5,520 | | | 81,751 |
| | Travelers Cos., Inc. | | 4,500 | | | 203,400 |
| | | | | | | |
| | | | | | | 1,403,436 |
|
Internet - 0.85% |
| | Amazon.com, Inc.*# | | 3,100 | | | 158,968 |
| | eBay, Inc.* | | 6,900 | | | 96,324 |
| | Google, Inc., Class A* | | 600 | | | 184,590 |
| | Yahoo!, Inc.* | | 1,000 | | | 12,200 |
| | | | | | | |
| | | | | | | 452,082 |
Balanced Fund
SCHEDULE OF INVESTMENTS (continued)
Showing percentage of net assets as of December 31, 2008 (Unaudited)
| | | | | | | |
| Industry | | Company | | Shares | | Value |
|
Common Stocks (continued) |
Iron/Steel - 0.10% |
| | United States Steel Corp.# | | 1,400 | | $ | 52,080 |
|
Leisure Time - 0.09% |
| | Harley-Davidson, Inc.+ | | 2,900 | | | 49,213 |
|
Lodging - 0.05% |
| | Marriott International, Inc., Class A | | 1,500 | | | 29,175 |
|
Machinery-Construction & Mining - 0.09% |
| | Terex Corp.*# | | 2,700 | | | 46,764 |
|
Machinery-Diversified - 0.90% |
| | Deere & Co. | | 2,100 | | | 80,472 |
| | Westinghouse Air Brake Technologies Corp. | | 10,000 | | | 397,500 |
| | | | | | | |
| | | | | | | 477,972 |
|
Media - 1.86% |
| | CBS Corp., Class B# | | 33,200 | | | 271,908 |
| | Comcast Corp., Class A | | 10,950 | | | 184,836 |
| | McGraw-Hill Cos., Inc.+ | | 4,000 | | | 92,760 |
| | News Corp., Class A# | | 14,000 | | | 127,260 |
| | Time Warner, Inc.+ | | 15,900 | | | 159,954 |
| | Walt Disney Co. | | 6,700 | | | 152,023 |
| | | | | | | |
| | | | | | | 988,741 |
|
Mining - 0.03% |
| | Alcoa, Inc.# | | 1,600 | | | 18,016 |
|
Miscellaneous Manufacturing - 2.08% |
| | 3M Co. | | 4,400 | | | 253,176 |
| | Cooper Industries, Ltd., Class A | | 5,200 | | | 151,996 |
| | Danaher Corp. | | 2,400 | | | 135,864 |
| | General Electric Co.# | | 8,500 | | | 137,700 |
| | Honeywell International, Inc. | | 3,900 | | | 128,037 |
| | Illinois Tool Works, Inc. | | 2,000 | | | 70,100 |
| | Parker Hannifin Corp. | | 4,350 | | | 185,049 |
| | Textron, Inc. | | 3,200 | | | 44,384 |
| | | | | | | |
| | | | | | | 1,106,306 |
|
Office/Business Equipment - 0.08% |
| | Pitney Bowes, Inc. | | 1,600 | | | 40,768 |
|
Oil & Gas - 5.44% |
| | Anadarko Petroleum Corp.# | | 5,300 | | | 204,315 |
| | Apache Corp.# | | 1,700 | | | 126,701 |
| | Chesapeake Energy Corp. | | 7,100 | | | 114,807 |
| | Chevron Corp. | | 6,578 | | | 486,575 |
| | ConocoPhillips# | | 5,987 | | | 310,126 |
| | | | | | | |
| Industry | | Company | | Shares | | Value |
|
|
Oil & Gas (continued) |
| | EOG Resources, Inc.# | | 2,400 | | $ | 159,792 |
| | Exxon Mobil Corp.# | | 6,500 | | | 518,895 |
| | Hess Corp.# | | 2,700 | | | 144,828 |
| | Marathon Oil Corp.# | | 4,000 | | | 109,440 |
| | Nabors Industries, Ltd.* | | 4,400 | | | 52,668 |
| | Occidental Petroleum Corp.# | | 5,300 | | | 317,947 |
| | Sunoco, Inc.+ | | 1,600 | | | 69,536 |
| | Transocean, Ltd.* | | 1,700 | | | 80,325 |
| | Valero Energy Corp. | | 3,700 | | | 80,068 |
| | XTO Energy, Inc.+ | | 3,400 | | | 119,918 |
| | | | | | | |
| | | | | | | 2,895,941 |
|
Oil & Gas Services - 0.77% |
| | Halliburton Co.# | | 11,000 | | | 199,980 |
| | National Oilwell Varco, Inc.* | | 6,300 | | | 153,972 |
| | Smith International, Inc. | | 2,500 | | | 57,225 |
| | | | | | | |
| | | | | | | 411,177 |
|
Pharmaceuticals - 4.79% |
| | Allergan, Inc. | | 4,900 | | | 197,568 |
| | Bristol-Myers Squibb Co.# | | 52,400 | | | 1,218,300 |
| | Cardinal Health, Inc. | | 4,800 | | | 165,456 |
| | Express Scripts, Inc.* | | 3,000 | | | 164,940 |
| | Medco Health Solutions, Inc.*# | | 7,000 | | | 293,370 |
| | Merck & Co., Inc. | | 3,700 | | | 112,480 |
| | Mylan, Inc.*+ | | 26,500 | | | 262,085 |
| | Pfizer, Inc.# | | 7,600 | | | 134,596 |
| | | | | | | |
| | | | | | | 2,548,795 |
|
Pipelines - 0.23% |
| | El Paso Corp. | | 5,000 | | | 39,150 |
| | Spectra Energy Corp. | | 5,250 | | | 82,635 |
| | | | | | | |
| | | | | | | 121,785 |
|
Retail - 3.23% |
| | Autozone, Inc.*+ | | 1,700 | | | 237,099 |
| | Big Lots, Inc.*#+ | | 6,300 | | | 91,287 |
| | Costco Wholesale Corp. | | 1,500 | | | 78,750 |
| | CVS Caremark Corp.# | | 9,600 | | | 275,904 |
| | Dillard’s, Inc., Class A | | 1,500 | | | 5,955 |
| | Family Dollar Stores, Inc.+ | | 3,700 | | | 96,459 |
| | JC Penney Co., Inc.# | | 1,000 | | | 19,700 |
| | Limited Brands, Inc.# | | 2,000 | | | 20,080 |
| | McDonald’s Corp.+ | | 1,800 | | | 111,942 |
| | Nordstrom, Inc.# | | 5,000 | | | 66,550 |
| | Office Depot, Inc.* | | 4,300 | | | 12,814 |
| | OfficeMax, Inc. | | 1,500 | | | 11,460 |
| | Sears Holdings Corp.*+ | | 1,200 | | | 46,644 |
| | Staples, Inc.+ | | 3,950 | | | 70,784 |
| | Wal-Mart Stores, Inc. | | 9,100 | | | 510,146 |
| | Walgreen Co. | | 2,500 | | | 61,675 |
| | | | | | | |
| | | | | | | 1,717,249 |
| | |
| 118 | | Semi-Annual Report | December 31, 2008 (Unaudited) |
Balanced Fund
SCHEDULE OF INVESTMENTS (continued)
Showing percentage of net assets as of December 31, 2008 (Unaudited)
| | | | | | | |
| Industry | | Company | | Shares | | Value |
|
Common Stocks (continued) |
Semiconductors - 0.93% |
| | Applied Materials, Inc.# | | 10,700 | | $ | 108,391 |
| | Broadcom Corp., Class A* | | 4,500 | | | 76,365 |
| | Intel Corp.# | | 10,000 | | | 146,600 |
| | NVIDIA Corp.* | | 5,000 | | | 40,350 |
| | Texas Instruments, Inc.# | | 8,070 | | | 125,246 |
| | | | | | | |
| | | | | | | 496,952 |
|
Software - 1.99% |
| | Adobe Systems, Inc.*# | | 7,000 | | | 149,030 |
| | BMC Software, Inc.* | | 3,920 | | | 105,487 |
| | Citrix Systems, Inc.* | | 4,300 | | | 101,351 |
| | IMS Health, Inc. | | 2,800 | | | 42,448 |
| | Intuit, Inc.* | | 5,600 | | | 133,224 |
| | Microsoft Corp. | | 4,400 | | | 85,536 |
| | Novell, Inc.* | | 40,300 | | | 156,767 |
| | Oracle Corp.*# | | 16,160 | | | 286,517 |
| | | | | | | |
| | | | | | | 1,060,360 |
|
Telecommunications - 5.86% |
| | American Tower Corp., Class A* | | 2,500 | | | 73,300 |
| | AT&T, Inc.# | | 32,700 | | | 931,950 |
| | Ciena Corp.*+ | | 5,942 | | | 39,811 |
| | Cisco Systems, Inc.* | | 16,900 | | | 275,470 |
| | Corning, Inc.# | | 4,500 | | | 42,885 |
| | Juniper Networks, Inc.*+ | | 4,000 | | | 70,040 |
| | Motorola, Inc.# | | 13,900 | | | 61,577 |
| | Nortel Networks Corp.*+ | | 1,542 | | | 401 |
| | QUALCOMM, Inc. | | 11,800 | | | 422,794 |
| | Sprint Nextel Corp.* | | 12,800 | | | 23,424 |
| | Verizon Communications, Inc.# | | 34,700 | | | 1,176,330 |
| | | | | | | |
| | | | | | | 3,117,982 |
|
Toys/Games/Hobbies - 0.14% |
| | Hasbro, Inc. | | 2,500 | | | 72,924 |
|
Transportation - 2.03% |
| | CSX Corp. | | 5,400 | | | 175,338 |
| | FedEx Corp. | | 2,400 | | | 153,960 |
| | Kansas City Southern*# | | 2,700 | | | 51,435 |
| | Norfolk Southern Corp. | | 1,900 | | | 89,395 |
| | Union Pacific Corp.# | | 12,800 | | | 611,840 |
| | | | | | | |
| | | | | | | 1,081,968 |
| | | | | | | |
| | |
TOTAL COMMON STOCKS - 65.28% | | | | | 34,742,162 |
| | | | | | | |
(Cost $42,006,796) | | | |
| | | | | | | | |
|
CORPORATE NOTES - 3.08% |
| | | |
| Due Date | | Discount Rate
or Coupon��Rate | | Principal
Amount | | Value |
Holding Companies - Diversified - 3.08% | | | |
Leucadia National Corp. 8/15/2013 | | 7.750% | | $ | 2,000,000 | | $ | 1,642,500 |
| | | | | | | | |
| |
TOTAL CORPORATE NOTES - 3.08% | | | 1,642,500 |
| | | | | | | | |
(Cost $2,053,291) | | | |
| | | | | | |
|
U.S. GOVERNMENT OBLIGATIONS - 31.45% |
U.S. Treasury Bills - 11.28% | | |
1/15/2009 | | 1.975% | | 3,000,000 | | 2,999,985 |
1/29/2009 | | 1.924% | | 3,000,000 | | 2,999,934 |
| | | | | | |
| | | | | | 5,999,919 |
| |
U.S. Treasury Notes - 20.17% | | |
4/15/2009 | | 3.125% | | 300,000 | | 302,496 |
4/30/2009 | | 4.500% | | 300,000 | | 304,242 |
6/15/2009 | | 4.000% | | 300,000 | | 305,086 |
8/15/2009 | | 3.500% | | 200,000 | | 203,914 |
10/15/2009 | | 3.375% | | 300,000 | | 307,231 |
11/15/2009 | | 3.500% | | 200,000 | | 205,375 |
11/30/2009 | | 3.125% | | 300,000 | | 307,442 |
12/31/2009 | | 3.250% | | 200,000 | | 205,711 |
2/15/2010 | | 3.500% | | 300,000 | | 310,664 |
4/15/2010 | | 4.000% | | 300,000 | | 314,519 |
6/15/2010 | | 3.625% | | 500,000 | | 522,578 |
7/15/2010 | | 3.875% | | 500,000 | | 527,403 |
10/15/2010 | | 4.250% | | 500,000 | | 533,926 |
3/31/2011 | | 4.750% | | 1,000,000 | | 1,088,984 |
4/30/2011 | | 4.875% | | 2,000,000 | | 2,192,656 |
8/31/2011 | | 4.625% | | 300,000 | | 329,742 |
4/30/2012 | | 4.500% | | 300,000 | | 332,250 |
11/30/2012 | | 3.375% | | 300,000 | | 326,977 |
12/31/2012 | | 3.625% | | 200,000 | | 220,375 |
6/30/2013 | | 3.375% | | 500,000 | | 545,156 |
7/31/2013 | | 3.375% | | 500,000 | | 546,133 |
11/15/2013 | | 4.250% | | 200,000 | | 228,250 |
2/15/2015 | | 4.000% | | 200,000 | | 227,875 |
5/15/2017 | | 4.500% | | 300,000 | | 352,031 |
| | | | | | |
| | | | | | 10,741,016 |
| | | | | | |
| |
TOTAL U.S. GOVERNMENT OBLIGATIONS - 31.45% | | 16,740,935 |
| | | | | | |
(Cost $15,965,038) | | | | | | |
Balanced Fund
SCHEDULE OF INVESTMENTS (continued)
Showing percentage of net assets as of December 31, 2008 (Unaudited)
| | | | | | | |
| Industry | | Company | | Shares | | Value |
|
PURCHASED CALL OPTIONS - 0.15% |
Pfizer, Inc. | | | | | |
Expiring January, 2010 at $20.00 | | 550 | | $ | 77,825 |
| | | | | | | |
| |
TOTAL PURCHASED CALL OPTIONS - 0.15% | | | 77,825 |
| | | | | | | |
(Cost $115,234) | | | | | |
| | |
TOTAL INVESTMENTS - 97.93% | | | | $ | 53,203,422 |
(Cost $60,140,359) | | | | | |
Other Assets in Excess of Liabilities - 2.07% | | | 18,765 |
| | | | | | | |
NET ASSETS - 100.00% | | | | $ | 53,222,187 |
| | | | | | | |
| * | Non Income Producing Security. |
| # | Security subject to call option written by the Fund. |
| + | This security or a portion of the security is out on loan at December 31, 2008. Total loaned securities had a market value of $3,791,244 at December 31, 2008. |
| (a) | Rate represents the effective yield at purchase. |
See Notes to Financial Statements.
| | |
| 120 | | Semi-Annual Report | December 31, 2008 (Unaudited) |
Balanced Fund
SCHEDULE OF OPTIONS WRITTEN
Showing percentage of net assets as of December 31, 2008 (Unaudited)
| | | | | | |
| Company | | Number of
Contracts | | Value | |
|
COVERED CALL OPTIONS WRITTEN - (1.73)% | |
Adobe Systems, Inc. | | | | | | |
Expiring January, 2009 at $45.00 | | 17 | | $ | (42 | ) |
AES Corp. | | | | | | |
Expiring May, 2009 at $10.00 | | 60 | | | (5,250 | ) |
Alcoa, Inc. | | | | | | |
Expiring January, 2009 at $10.00 | | 16 | | | (2,616 | ) |
Allegheny Energy, Inc. | | | | | | |
Expiring April, 2009 at $35.00 | | 10 | | | (2,650 | ) |
Allstate Corp. | | | | | | |
Expiring January, 2009 at $45.00 | | 5 | | | (12 | ) |
Amazon.Com, Inc. | | | | | | |
Expiring April, 2009 at $55.00 | | 15 | | | (8,925 | ) |
Ameriprise Financial, Inc. | | | | | | |
Expiring March, 2009 at $22.50 | | 12 | | | (4,680 | ) |
Anadarko Petroleum Corp. | | | | | | |
Expiring January, 2009 at $40.00 | | 20 | | | (2,750 | ) |
Expiring February, 2009 at $40.00 | | 33 | | | (10,560 | ) |
Apache Corp. | | | | | | |
Expiring January, 2009 at $80.00 | | 17 | | | (2,890 | ) |
Applied Materials, Inc. | | | | | | |
Expiring January, 2009 at $15.00 | | 70 | | | (175 | ) |
AT&T, Inc. | | | | | | |
Expiring January, 2009 at $27.50 | | 240 | | | (31,320 | ) |
Avon Products, Inc. | | | | | | |
Expiring February, 2009 at $25.00 | | 25 | | | (3,688 | ) |
Bank of America Corp. | | | | | | |
Expiring January, 2009 at $32.50 | | 100 | | | (50 | ) |
Expiring January, 2009 at $27.50 | | 50 | | | (25 | ) |
BB&T Corp. | | | | | | |
Expiring March, 2009 at $30.00 | | 25 | | | (5,250 | ) |
Big Lot, Inc. | | | | | | |
Expiring April, 2009 at $15.00 | | 30 | | | (6,825 | ) |
Bristol-Myers Squibb Co. | | | | | | |
Expiring January, 2009 at $22.50 | | 100 | | | (12,450 | ) |
Expiring February, 2009 at $25.00 | | 100 | | | (6,950 | ) |
Expiring March, 2009 at $22.50 | | 100 | | | (22,750 | ) |
CBS Corp. | | | | | | |
Expiring January, 2009 at $15.00 | | 50 | | | (125 | ) |
Expiring March, 2009 at $7.50 | | 282 | | | (44,415 | ) |
Celgene Corp. | | | | | | |
Expiring January, 2009 at $50.00 | | 100 | | | (60,000 | ) |
CF Industries Holdings, Inc. | | | | | | |
Expiring February, 2009 at $50.00 | | 72 | | | (40,680 | ) |
Clorox Co. | | | | | | |
Expiring January, 2009 at $65.00 | | 8 | | | (20 | ) |
Colgate-Palmolive Co. | | | | | | |
Expiring January, 2009 at $80.00 | | 11 | | | (27 | ) |
ConocoPhillips | | | | | | |
Expiring January, 2009 at $55.00 | | 30 | | | (2,670 | ) |
Corning, Inc. | | | | | | |
Expiring January, 2009 at $17.50 | | 45 | | | (112 | ) |
CVS Caremark Corp. | | | | | | |
Expiring January, 2009 at $40.00 | | 24 | | | (60 | ) |
| | | | | | |
| Company | | Number of
Contracts | | Value | |
|
| |
Dow Chemical Co. | | | | | | |
Expiring January, 2009 at $35.00 | | 75 | | $ | (188 | ) |
Expiring March, 2009 at $20.00 | | 91 | | | (4,095 | ) |
Energy Conversion Devices, Inc. | | | | | | |
Expiring January, 2009 at $25.00 | | 70 | | | (14,525 | ) |
EOG Resources, Inc. | | | | | | |
Expiring January, 2009 at $75.00 | | 15 | | | (1,125 | ) |
Exxon Mobil Corp. | | | | | | |
Expiring January, 2009 at $85.00 | | 15 | | | (915 | ) |
Expiring January, 2009 at $90.00 | | 50 | | | (450 | ) |
Franklin Resources, Inc. | | | | | | |
Expiring January, 2009 at $80.00 | | 15 | | | (75 | ) |
Expiring January, 2009 at $110.00 | | 7 | | | (17 | ) |
General Electric Co. | | | | | | |
Expiring March, 2009 at $17.50 | | 25 | | | (2,163 | ) |
Goldman Sachs Group, Inc. | | | | | | |
Expiring April, 2009 at $90.00 | | 11 | | | (10,533 | ) |
Halliburton Co. | | | | | | |
Expiring January, 2009 at $45.00 | | 28 | | | (14 | ) |
Hess Corp. | | | | | | |
Expiring January, 2009 at $85.00 | | 27 | | | (67 | ) |
Intel Corp. | | | | | | |
Expiring April, 2009 at $17.00 | | 100 | | | (7,100 | ) |
International Paper Co. | | | | | | |
Expiring January, 2009 at $15.00 | | 45 | | | (113 | ) |
JC Penney Co., Inc. | | | | | | |
Expiring January, 2009 at $20.00 | | 10 | | | (1,000 | ) |
Kansas City Southern | | | | | | |
Expiring March, 2009 at $20.00 | | 26 | | | (5,785 | ) |
Kimberly-Clark Corp. | | | | | | |
Expiring January, 2009 at $65.00 | | 13 | | | (32 | ) |
Limited Brands, Inc. | | | | | | |
Expiring February, 2009 at $10.00 | | 20 | | | (2,100 | ) |
Marathon Oil Corp. | | | | | | |
Expiring January, 2009 at $45.00 | | 40 | | | (100 | ) |
Massey Energy Co. | | | | | | |
Expiring January, 2009 at $30.00 | | 89 | | | (223 | ) |
Medco Health Solutions, Inc. | | | | | | |
Expiring January, 2009 at $50.00 | | 17 | | | (128 | ) |
MetLife, Inc. | | | | | | |
Expiring March, 2009 at $25.00 | | 46 | | | (55,200 | ) |
Monsanto Co. | | | | | | |
Expiring January, 2009 at $115.00 | | 12 | | | (30 | ) |
Motorola, Inc. | | | | | | |
Expiring January, 2009 at $10.00 | | 25 | | | (12 | ) |
Myriad Genetics, Inc. | | | | | | |
Expiring February, 2009 at $70.00 | | 50 | | | (17,500 | ) |
NetApp, Inc. | | | | | | |
Expiring January, 2009 at $12.50 | | 58 | | | (9,715 | ) |
News Corp. | | | | | | |
Expiring January, 2009 at $15.00 | | 140 | | | (350 | ) |
Nordstrom, Inc. | | | | | | |
Expiring January, 2009 at $12.50 | | 50 | | | (7,625 | ) |
Balanced Fund
SCHEDULE OF OPTIONS WRITTEN (continued)
Showing percentage of net assets as of December 31, 2008 (Unaudited)
| | | | | | |
| Company | | Number of
Contracts | | Value | |
|
Covered Call Options Written (continued) | |
Occidental Petroleum Corp. | | | | | | |
Expiring January, 2009 at $70.00 | | 39 | | $ | (1,170 | ) |
Oracle Corp. | | | | | | |
Expiring March, 2009 at $18.00 | | 25 | | | (3,250 | ) |
Procter & Gamble Co. | | | | | | |
Expiring January, 2009 at $75.00 | | 10 | | | (25 | ) |
St. Jude Medical, Inc. | | | | | | |
Expiring January, 2009 at $30.00 | | 100 | | | (33,000 | ) |
Expiring January, 2009 at $40.00 | | 60 | | | (150 | ) |
Teradata Corp. | | | | | | |
Expiring January, 2009 at $25.00 | | 15 | | | (37 | ) |
Terex Corp. | | | | | | |
Expiring January, 2009 at $20.00 | | 27 | | | (743 | ) |
Terra Industries, Inc. | | | | | | |
Expiring March, 2009 at $17.50 | | 191 | | | (42,975 | ) |
Texas Instruments, Inc. | | | | | | |
Expiring April, 2009 at $17.50 | | 80 | | | (6,320 | ) |
The Mosaic Co. | | | | | | |
Expiring January, 2009 at $40.00 | | 71 | | | (5,858 | ) |
Thoratec Corp. | | | | | | |
Expiring January, 2009 at $22.50 | | 200 | | | (201,000 | ) |
Union Pacific Corp. | | | | | | |
Expiring January, 2009 at $50.00 | | 59 | | | (5,310 | ) |
Expiring January, 2009 at $55.00 | | 41 | | | (410 | ) |
United States Steel Corp. | | | | | | |
Expiring January, 2009 at $50.00 | | 14 | | | (175 | ) |
US Bancorp | | | | | | |
Expiring January, 2009 at $25.00 | | 81 | | | (8,910 | ) |
Expiring March, 2009 at $25.00 | | 150 | | | (42,000 | ) |
Verizon Communications, Inc. | | | | | | |
Expiring January, 2009 at $35.00 | | 25 | | | (1,000 | ) |
Expiring January, 2009 at $30.00 | | 250 | | | (98,750 | ) |
Wabtec Corp. | | | | | | |
Expiring January, 2009 at $35.00 | | 100 | | | (51,000 | ) |
| | | | | | |
| |
TOTAL COVERED CALL OPTIONS WRITTEN | | | (921,230 | ) |
| | | | | | |
(Premiums received $(1,010,668)) | | | | | | |
|
PUT OPTIONS WRITTEN - (0.30)% | |
Amgen, Inc. | | | | | | |
Expiring January, 2009 at $50.00 | | 150 | | | (4,200 | ) |
Apollo Group, Inc. | | | | | | |
Expiring February, 2009 at $60.00 | | 40 | | | (6,800 | ) |
Expiring February, 2009 at $65.00 | | 40 | | | (10,800 | ) |
Bristol-Myers Squibb Co. | | | | | | |
Expiring March, 2009 at $22.50 | | 100 | | | (15,150 | ) |
Dollar Tree, Inc. | | | | | | |
Expiring January, 2009 at $40.00 | | 70 | | | (7,525 | ) |
Expiring February, 2009 at $40.00 | | 8 | | | (2,000 | ) |
Family Dollar Stores, Inc. | | | | | | |
Expiring January, 2009 at $20.00 | | 168 | | | (2,520 | ) |
| | | | | | |
| Company | | Number of
Contracts | | Value | |
|
| |
General Electric Co. | | | | | | |
Expiring March, 2009 at $16.00 | | 300 | | $ | (47,850 | ) |
General Mills, Inc. | | | | | | |
Expiring January, 2009 at $60.00 | | 80 | | | (10,400 | ) |
Home Depot, Inc. | | | | | | |
Expiring January, 2009 at $20.00 | | 100 | | | (2,050 | ) |
Intel Corp. | | | | | | |
Expiring January, 2009 at $15.00 | | 100 | | | (8,500 | ) |
ITT Educational Services, Inc. | | | | | | |
Expiring January, 2009 at $85.00 | | 30 | | | (2,475 | ) |
Johnson & Johnson | | | | | | |
Expiring January, 2009 at $55.00 | | 130 | | | (4,225 | ) |
Merck & Co., Inc. | | | | | | |
Expiring January, 2009 at $30.00 | | 230 | | | (19,550 | ) |
Myriad Genetics, Inc. | | | | | | |
Expiring January, 2009 at $60.00 | | 60 | | | (4,200 | ) |
Nike, Inc. | | | | | | |
Expiring January, 2009 at $45.00 | | 100 | | | (3,250 | ) |
Thoratec Corp. | | | | | | |
Expiring January, 2009 at $25.00 | | 50 | | | (875 | ) |
Expiring February, 2009 at $25.00 | | 35 | | | (3,063 | ) |
Time Warner, Inc. | | | | | | |
Expiring January, 2009 at $10.00 | | 100 | | | (4,000 | ) |
| | | | | | |
| | |
TOTAL PUT OPTIONS WRITTEN | | | | | (159,433 | ) |
| | | | | | |
(Premiums received $(470,043)) | | | | | | |
| | |
TOTAL OPTIONS WRITTEN | | | | $ | (1,080,663 | ) |
| | | | | | |
(Premiums received $(1,480,711)) | | | | | | |
See Notes to Financial Statements.
| | |
| 122 | | Semi-Annual Report | December 31, 2008 (Unaudited) |
THIS PAGE INTENTIONALLY LEFT BLANK
STATEMENTS OF ASSETS AND LIABILITIES
December 31, 2008 (Unaudited)
| | | | | | | | | | | | | | | | |
| ASSETS | | Aggressive
Investors 1 | | | Aggressive
Investors 2 | | | Ultra-Small
Company | | | Ultra-Small
Company Market | |
| | | | |
Unaffiliated investments at value | | $ | 138,858,503 | | | $ | 376,724,875 | | | $ | 61,024,975 | | | $ | 316,178,527 | |
Affiliated investments at value | | | - | | | | - | | | | - | | | | 779,870 | |
| | | | | | | | | | | | | | | | | |
Total Investments at value | | | 138,858,503 | | | | 376,724,875 | | | | 61,024,975 | | | | 316,958,397 | |
| | | | | | | | | | | | | | | | | |
Cash | | | - | | | | 39,158 | | | | 1,767 | | | | 33,067 | |
Receivables: | | | | | | | | | | | | | | | | |
Fund shares sold | | | 130,428 | | | | 1,551,940 | | | | 60,000 | | | | 728,216 | |
Portfolio securities sold | | | 1,944,219 | | | | - | | | | 73,106 | | | | 6,823,600 | |
Dividends and interest | | | 334,880 | | | | 632,511 | | | | 46,455 | | | | 381,761 | |
Reclaims receivable | | | 1,406 | | | | 2,113 | | | | - | | | | - | |
Receivable from Investment advisor | | | 40,237 | | | | - | | | | - | | | | - | |
Deposits with brokers | | | - | | | | - | | | | - | | | | - | |
Total return swap | | | 3,310 | | | | - | | | | - | | | | - | |
Prepaid expenses | | | 19,203 | | | | 57,499 | | | | 6,128 | | | | 40,256 | |
| | | | | | | | | | | | | | | | | |
Total assets | | | 141,332,186 | | | | 379,008,096 | | | | 61,212,431 | | | | 324,965,297 | |
| | | | | | | | | | | | | | | | | |
| | | | |
LIABILITIES | | | | | | | | | | | | | | | | |
Payables: | | | | | | | | | | | | | | | | |
Portfolio securities purchased | | | - | | | | - | | | | 1,284,003 | | | | - | |
Fund shares redeemed | | | 359,502 | | | | 1,806,251 | | | | 32,326 | | | | 1,003,026 | |
Total return swap | | | - | | | | - | | | | - | | | | - | |
Due to Custodian | | | 1,084,918 | | | | - | | | | - | | | | - | |
Accrued Liabilities: | | | | | | | | | | | | | | | | |
Investment advisor fees | | | - | | | | 280,513 | | | | 42,894 | | | | 138,132 | |
Administration fees | | | 4,845 | | | | 13,144 | | | | 2,017 | | | | 11,691 | |
Directors’ fees | | | 3,222 | | | | 7,279 | | | | 710 | | | | 7,526 | |
Other | | | 78,397 | | | | 237,134 | | | | 30,194 | | | | 309,091 | |
Covered call options written at value | | | 151,000 | | | | 245,350 | | | | - | | | | - | |
Put options written at value | | | - | | | | - | | | | - | | | | - | |
| | | | | | | | | | | | | | | | | |
Total liabilities | | | 1,681,884 | | | | 2,589,671 | | | | 1,392,144 | | | | 1,469,466 | |
| | | | | | | | | | | | | | | | | |
NET ASSETS | | $ | 139,650,302 | | | $ | 376,418,425 | | | $ | 59,820,287 | | | $ | 323,495,831 | |
| | | | | | | | | | | | | | | | | |
| | | | |
NET ASSETS REPRESENT | | | | | | | | | | | | | | | | |
Paid-in capital | | $ | 237,699,725 | | | $ | 671,412,895 | | | $ | 95,340,962 | | | $ | 355,827,914 | |
Accumulated net investment income (loss) | | | 673,615 | | | | (90,634 | ) | | | 848,108 | | | | 4,061,016 | |
Accumulated net realized loss on investments | | | (35,206,649 | ) | | | (106,860,085 | ) | | | (19,897,421 | ) | | | (14,119,984 | ) |
Net unrealized depreciation on investments | | | (63,516,389 | ) | | | (188,043,751 | ) | | | (16,471,362 | ) | | | (22,273,115 | ) |
| | | | | | | | | | | | | | | | | |
NET ASSETS | | $ | 139,650,302 | | | $ | 376,418,425 | | | $ | 59,820,287 | | | $ | 323,495,831 | |
| | | | | | | | | | | | | | | | | |
| | | | |
Shares of common stock outstanding of $.001 par value* | | | 5,596,332 | | | | 38,459,084 | | | | 3,724,618 | | | | 33,591,497 | |
| | | | | | | | | | | | | | | | | |
Net asset value per share | | $ | 24.95 | | | $ | 9.79 | | | $ | 16.06 | | | $ | 9.63 | |
| | | | | | | | | | | | | | | | | |
Unaffiliated investments at cost | | $ | 202,393,951 | | | $ | 564,793,614 | | | $ | 77,496,337 | | | $ | 338,018,881 | |
Affiliated investments at cost | | $ | - | | | $ | - | | | $ | - | | | $ | 1,212,631 | |
| | | | | | | | | | | | | | | | | |
Total investments at cost | | $ | 202,393,951 | | | $ | 564,793,614 | | | $ | 77,496,337 | | | $ | 339,231,512 | |
Premiums received on covered call options written | | $ | 166,749 | | | $ | 270,338 | | | $ | - | | | $ | - | |
Premiums received on put options written | | $ | - | | | $ | - | | | $ | - | | | $ | - | |
| * | See Notes 1 - Organization in the Notes to Financial Statements for shares authorized for each Fund. |
See Notes to Financial Statements
| | |
| 124 | | Semi-Annual Report | December 31, 2008 (Unaudited) |
| | | | | | | | | | | | | | | | | | | | | | | | | | |
Micro-Cap
Limited | | | Small-Cap
Growth | | | Small-Cap
Value | | | Large-Cap
Growth | | | Large-Cap
Value | | | Blue Chip 35
Index | | | Balanced | |
| | | | | | |
| $ | 24,952,613 | | | $ | 82,750,876 | | | $ | 161,959,199 | | | $ | 77,773,342 | | | $ | 34,888,314 | | | $ | 159,004,472 | | | $ | 53,203,422 | |
| | - | | | | - | | | | - | | | | - | | | | - | | | | - | | | | - | |
| | | | | | | | | | | | | | | | | | | | | | | | | | | |
| | 24,952,613 | | | | 82,750,876 | | | | 161,959,199 | | | | 77,773,342 | | | | 34,888,314 | | | | 159,004,472 | | | | 53,203,422 | |
| | | | | | | | | | | | | | | | | | | | | | | | | | | |
| | 981 | | | | - | | | | - | | | | - | | | | 1,561 | | | | - | | | | 1,825,234 | |
| | | | | | | | | | | | | | | | | | | | | | | | | | |
| | 277,799 | | | | 317,399 | | | | 174,966 | | | | 45,370 | | | | 81,755 | | | | 135,821 | | | | 194,468 | |
| | 613,585 | | | | 1,002,347 | | | | 2,800,753 | | | | 882,558 | | | | - | | | | 3,649,755 | | | | 17,188 | |
| | 21,601 | | | | 32,239 | | | | 173,570 | | | | 122,723 | | | | 113,490 | | | | 245,705 | | | | 232,497 | |
| | - | | | | - | | | | - | | | | - | | | | - | | | | - | | | | - | |
| | - | | | | - | | | | - | | | | - | | | | - | | | | 10,337 | | | | - | |
| | - | | | | - | | | | - | | | | - | | | | - | | | | - | | | | 42 | |
| | - | | | | 13,328 | | | | - | | | | - | | | | - | | | | - | | | | - | |
| | 7,329 | | | | 15,799 | | | | 27,442 | | | | 18,272 | | | | 11,948 | | | | 26,055 | | | | 10,787 | |
| | | | | | | | | | | | | | | | | | | | | | | | | | | |
| | 25,873,908 | | | | 84,131,988 | | | | 165,135,930 | | | | 78,842,265 | | | | 35,097,068 | | | | 163,072,145 | | | | 55,483,638 | |
| | | | | | | | | | | | | | | | | | | | | | | | | | | |
| | | | | | |
| | | | | | | | | | | | | | | | | | | | | | | | | | |
| | | | | | | | | | | | | | | | | | | | | | | | | | |
| | 562,864 | | | | 487,879 | | | | - | | | | - | | | | - | | | | - | | | | - | |
| | 11,441 | | | | 529,466 | | | | 817,472 | | | | 399,845 | | | | 111,180 | | | | 550,971 | | | | 1,133,375 | |
| | - | | | | - | | | | 22,859 | | | | - | | | | - | | | | - | | | | - | |
| | - | | | | 198,462 | | | | 2,521,325 | | | | 553,479 | | | | - | | | | 3,616,928 | | | | - | |
| | | | | | | | | | | | | | | | | | | | | | | | | | |
| | 10,238 | | | | 35,352 | | | | 74,624 | | | | 31,885 | | | | 6,062 | | | | - | | | | 27,540 | |
| | 826 | | | | 2,849 | | | | 5,652 | | | | 2,870 | | | | 1,250 | | | | 5,830 | | | | 1,942 | |
| | 361 | | | | 1,409 | | | | 3,524 | | | | 1,926 | | | | 428 | | | | 2,361 | | | | 723 | |
| | 19,588 | | | | 64,703 | | | | 101,971 | | | | 75,407 | | | | 33,670 | | | | 22,814 | | | | 17,208 | |
| | - | | | | - | | | | - | | | | - | | | | - | | | | - | | | | 921,230 | |
| | - | | | | - | | | | - | | | | - | | | | - | | | | - | | | | 159,433 | |
| | | | | | | | | | | | | | | | | | | | | | | | | | | |
| | 605,318 | | | | 1,320,120 | | | | 3,547,427 | | | | 1,065,412 | | | | 152,590 | | | | 4,198,904 | | | | 2,261,451 | |
| | | | | | | | | | | | | | | | | | | | | | | | | | | |
| $ | 25,268,590 | | | $ | 82,811,868 | | | $ | 161,588,503 | | | $ | 77,776,853 | | | $ | 34,944,478 | | | $ | 158,873,241 | | | $ | 53,222,187 | |
| | | | | | | | | | | | | | | | | | | | | | | | | | | |
| | | | | | |
| | | | | | | | | | | | | | | | | | | | | | | | | | |
| $ | 40,594,853 | | | $ | 126,323,720 | | | $ | 265,502,666 | | | $ | 138,969,756 | | | $ | 42,777,431 | | | $ | 242,212,012 | | | $ | 62,797,338 | |
| | 219,589 | | | | 423,970 | | | | (79,354 | ) | | | (10,853 | ) | | | 26,270 | | | | (6,980 | ) | | | 124,281 | |
| | (11,155,788 | ) | | | (21,707,049 | ) | | | (47,907,361 | ) | | | (27,906,288 | ) | | | (5,290,702 | ) | | | (40,872,974 | ) | | | (3,162,543 | ) |
| | (4,390,064 | ) | | | (22,228,773 | ) | | | (55,927,448 | ) | | | (33,275,762 | ) | | | (2,568,521 | ) | | | (42,458,817 | ) | | | (6,536,889 | ) |
| | | | | | | | | | | | | | | | | | | | | | | | | | | |
| $ | 25,268,590 | | | $ | 82,811,868 | | | $ | 161,588,503 | | | $ | 77,776,853 | | | $ | 34,944,478 | | | $ | 158,873,241 | | | $ | 53,222,187 | |
| | | | | | | | | | | | | | | | | | | | | | | | | | | |
| | | | | | |
| | 5,361,422 | | | | 9,603,082 | | | | 17,311,907 | | | | 9,592,247 | | | | 3,563,605 | | | | 29,223,698 | | | | 5,456,628 | |
| | | | | | | | | | | | | | | | | | | | | | | | | | | |
| $ | 4.71 | | | $ | 8.62 | | | $ | 9.33 | | | $ | 8.11 | | | $ | 9.81 | | | $ | 5.44 | | | $ | 9.75 | |
| | | | | | | | | | | | | | | | | | | | | | | | | | | |
| $ | 29,342,677 | | | $ | 104,992,977 | | | $ | 217,863,788 | | | $ | 111,049,104 | | | $ | 37,456,835 | | | $ | 201,463,289 | | | $ | 60,140,359 | |
| $ | - | | | $ | - | | | $ | - | | | $ | - | | | $ | - | | | $ | - | | | $ | - | |
| | | | | | | | | | | | | | | | | | | | | | | | | | | |
| $ | 29,342,677 | | | $ | 104,992,977 | | | $ | 217,863,788 | | | $ | 111,049,104 | | | $ | 37,456,835 | | | $ | 201,463,289 | | | $ | 60,140,359 | |
| $ | - | | | $ | - | | | $ | - | | | $ | - | | | $ | - | | | $ | - | | | $ | 1,010,668 | |
| $ | - | | | $ | - | | | $ | - | | | $ | - | | | $ | - | | | $ | - | | | $ | 470,043 | |
STATEMENTS OF OPERATIONS
Six Months Ended December 31, 2008 (Unaudited)
| | | | | | | | | | | | | | | | |
| | | Aggressive
Investors 1 | | | Aggressive
Investors 2 | | | Ultra-Small
Company | | | Ultra-Small
Company Market | |
| | | | |
INVESTMENT INCOME | | | | | | | | | | | | | | | | |
Dividends from unaffiliated issuers | | $ | 1,201,861 | | | $ | 3,125,519 | | | $ | 305,284 | | | $ | 2,768,206 | |
Less: foreign taxes withheld | | | (3,411 | ) | | | (7,207 | ) | | | - | | | | (6,717 | ) |
Interest | | | - | | | | - | | | | - | | | | - | |
Securities lending | | | 96,899 | | | | 194,847 | | | | 985,784 | | | | 3,168,098 | |
| | | | | | | | | | | | | | | | | |
Total Investment Income | | | 1,295,349 | | | | 3,313,159 | | | | 1,291,068 | | | | 5,929,587 | |
| | | | | | | | | | | | | | | | | |
| | | | |
EXPENSES | | | | | | | | | | | | | | | | |
Investment advisory fees - Base fees | | | 992,264 | | | | 2,564,205 | | | | 356,461 | | | | 1,247,919 | |
Investment advisory fees - Performance adjustment | | | (663,200 | ) | | | 189,274 | | | | - | | | | - | |
Administration fees | | | 31,689 | | | | 83,524 | | | | 11,381 | | | | 71,582 | |
Accounting fees | | | 20,369 | | | | 21,715 | | | | 21,069 | | | | 25,842 | |
Transfer agent fees | | | 39,762 | | | | 117,715 | | | | 15,844 | | | | 105,429 | |
Professional fees | | | 22,861 | | | | 49,963 | | | | 8,907 | | | | 54,136 | |
Custody fees | | | 5,892 | | | | 11,771 | | | | 7,760 | | | | 51,290 | |
Blue sky fees | | | 10,101 | | | | 12,243 | | | | 1,312 | | | | 10,686 | |
Directors’ and officers’ fees | | | 11,766 | | | | 30,951 | | | | 3,758 | | | | 26,503 | |
Shareholder servicing fees | | | 59,338 | | | | 174,280 | | | | 4,528 | | | | 123,078 | |
Reports to shareholders | | | 14,921 | | | | 70,862 | | | | 2,628 | | | | 95,397 | |
Interest expense | | | - | | | | 7,434 | | | | - | | | | 5,686 | |
Miscellaneous expenses | | | 25,347 | | | | 69,856 | | | | 8,960 | | | | 66,436 | |
| | | | | | | | | | | | | | | | | |
Total expenses | | | 571,110 | | | | 3,403,793 | | | | 442,608 | | | | 1,883,984 | |
| | | | | | | | | | | | | | | | | |
Less investment advisory fees waived | | | - | | | | - | | | | - | | | | (15,417 | ) |
| | | | | | | | | | | | | | | | | |
Net Expenses | | | 571,110 | | | | 3,403,793 | | | | 442,608 | | | | 1,868,567 | |
| | | | | | | | | | | | | | | | | |
| | | | |
NET INVESTMENT INCOME (LOSS) | | | 724,239 | | | | (90,634 | ) | | | 848,460 | | | | 4,061,020 | |
NET REALIZED AND UNREALIZED GAIN
(LOSS) ON INVESTMENTS | | | | | | | | | | | | | | | | |
Realized Gain (Loss) on: | | | | | | | | | | | | | | | | |
Unaffiliated investments | | | (37,637,462 | ) | | | (95,463,591 | ) | | | (12,092,079 | ) | | | (13,987,172 | ) |
Written options | | | 3,294,699 | | | | 3,918,531 | | | | - | | | | - | |
Futures contracts | | | - | | | | - | | | | - | | | | - | |
Swaps | | | (837,242 | ) | | | - | | | | - | | | | - | |
| | | | | | | | | | | | | | | | | |
Net realized gain (loss) | | | (35,180,005 | ) | | | (91,545,060 | ) | | | (12,092,079 | ) | | | (13,987,172 | ) |
| | | | | | | | | | | | | | | | | |
Change in Unrealized Appreciation (Depreciation) on: | | | | | | | | | | | | | | | | |
Investments in unaffiliated companies | | | (139,795,094 | ) | | | (360,925,055 | ) | | | (21,257,714 | ) | | | (147,158,442 | ) |
Investments in affiliated companies | | | - | | | | - | | | | - | | | | (155,126 | ) |
Written options | | | 15,749 | | | | 24,988 | | | | - | | | | - | |
Swaps | | | (47,314 | ) | | | - | | | | - | | | | - | |
| | | | | | | | | | | | | | | | | |
Net change in unrealized appreciation (depreciation) | | | (139,826,659 | ) | | | (360,900,067 | ) | | | (21,257,714 | ) | | | (147,313,568 | ) |
| | | | | | | | | | | | | | | | | |
Net realized and unrealized gain (loss) on investments | | | (175,006,664 | ) | | | (452,445,127 | ) | | | (33,349,793 | ) | | | (161,300,740 | ) |
| | | | | | | | | | | | | | | | | |
DECREASE IN NET ASSETS RESULTING FROM OPERATIONS | | $ | (174,282,425 | ) | | $ | (452,535,761 | ) | | $ | (32,501,333 | ) | | $ | (157,239,720 | ) |
| | | | | | | | | | | | | | | | | |
See Notes to Financial Statements
| | |
| 126 | | Semi-Annual Report | December 31, 2008 (Unaudited) |
| | | | | | | | | | | | | | | | | | | | | | | | | | |
Micro-Cap
Limited | | | Small-Cap
Growth | | | Small-Cap
Value | | | Large-Cap
Growth | | | Large-Cap
Value | | | Blue Chip 35
Index | | | Balanced | |
| | | | | | |
| | | | | | | | | | | | | | | | | | | | | | | | | | |
| $ | 109,211 | | | $ | 314,086 | | | $ | 1,125,059 | | | $ | 920,258 | | | $ | 653,776 | | | $ | 2,921,419 | | | $ | 459,876 | |
| | (153 | ) | | | - | | | | - | | | | (723 | ) | | | - | | | | - | | | | (348 | ) |
| | - | | | | - | | | | - | | | | - | | | | - | | | | - | | | | 435,521 | |
| | 267,779 | | | | 515,305 | | | | 875,969 | | | | 38,156 | | | | 11,047 | | | | 44,739 | | | | 15,340 | |
| | | | | | | | | | | | | | | | | | | | | | | | | | | |
| | 376,837 | | | | 829,391 | | | | 2,001,028 | | | | 957,691 | | | | 664,823 | | | | 2,966,158 | | | | 910,389 | |
| | | | | | | | | | | | | | | | | | | | | | | | | | | |
| | | | | | |
| | | | | | | | | | | | | | | | | | | | | | | | | | |
| | 184,997 | | | | 339,306 | | | | 737,149 | | | | 343,795 | | | | 108,062 | | | | 85,156 | | | | 196,416 | |
| | (89,466 | ) | | | (17,611 | ) | | | (32,731 | ) | | | (2,673 | ) | | | 1,936 | | | | - | | | | - | |
| | 4,488 | | | | 16,128 | | | | 35,257 | | | | 19,731 | | | | 6,211 | | | | 30,590 | | | | 9,413 | |
| | 20,727 | | | | 21,119 | | | | 22,125 | | | | 22,091 | | | | 21,003 | | | | 20,319 | | | | 27,005 | |
| | 10,221 | | | | 47,115 | | | | 61,385 | | | | 31,624 | | | | 17,745 | | | | 11,975 | | | | 13,298 | |
| | 6,055 | | | | 11,509 | | | | 23,070 | | | | 15,301 | | | | 5,935 | | | | 22,140 | | | | 20,398 | |
| | 3,785 | | | | 5,207 | | | | 8,433 | | | | 3,957 | | | | 2,221 | | | | 4,855 | | | | 11,934 | |
| | 5,418 | | | | 7,618 | | | | 10,698 | | | | 9,070 | | | | 7,151 | | | | 9,335 | | | | 6,495 | |
| | 1,553 | | | | 5,909 | | | | 13,504 | | | | 7,540 | | | | 1,974 | | | | 11,362 | | | | 3,183 | |
| | 2,992 | | | | 32,789 | | | | 65,441 | | | | 34,212 | | | | 9,576 | | | | 10,979 | | | | 12,010 | |
| | 3,486 | | | | 11,815 | | | | 26,223 | | | | 28,019 | | | | 10,565 | | | | 3,984 | | | | 4,052 | |
| | - | | | | - | | | | - | | | | - | | | | 671 | | | | 3,494 | | | | - | |
| | 2,990 | | | | 9,773 | | | | 25,669 | | | | 12,460 | | | | 4,702 | | | | 20,516 | | | | 2,629 | |
| | | | | | | | | | | | | | | | | | | | | | | | | | | |
| | 157,246 | | | | 490,677 | | | | 996,223 | | | | 525,127 | | | | 197,752 | | | | 234,705 | | | | 306,833 | |
| | | | | | | | | | | | | | | | | | | | | | | | | | | |
| | - | | | | - | | | | - | | | | - | | | | (16,533 | ) | | | (74,986 | ) | | | - | |
| | | | | | | | | | | | | | | | | | | | | | | | | | | |
| | 157,246 | | | | 490,677 | | | | 996,223 | | | | 525,127 | | | | 181,219 | | | | 159,719 | | | | 306,833 | |
| | | | | | | | | | | | | | | | | | | | | | | | | | | |
| | | | | | |
| | 219,591 | | | | 338,714 | | | | 1,004,805 | | | | 432,564 | | | | 483,604 | | | | 2,806,439 | | | | 603,556 | |
| | | | | | |
| | | | | | | | | | | | | | | | | | | | | | | | | | |
| | | | | | | | | | | | | | | | | | | | | | | | | | |
| | (5,202,435 | ) | | | (11,757,205 | ) | | | (37,817,491 | ) | | | (19,727,679 | ) | | | (4,061,372 | ) | | | (36,845,815 | ) | | | (5,560,635 | ) |
| | - | | | | - | | | | - | | | | - | | | | - | | | | - | | | | 778,379 | |
| | - | | | | - | | | | - | | | | - | | | | - | | | | - | | | | 4,610,075 | |
| | - | | | | (40,433 | ) | | | 346,579 | | | | - | | | | - | | | | - | | | | - | |
| | | | | | | | | | | | | | | | | | | | | | | | | | | |
| | (5,202,435 | ) | | | (11,797,638 | ) | | | (37,470,912 | ) | | | (19,727,679 | ) | | | (4,061,372 | ) | | | (36,845,815 | ) | | | (172,181 | ) |
| | | | | | | | | | | | | | | | | | | | | | | | | | | |
| | | | | | | | | | | | | | | | | | | | | | | | | | |
| | (7,335,936 | ) | | | (44,558,747 | ) | | | (96,531,042 | ) | | | (56,134,326 | ) | | | (9,767,502 | ) | | | (18,099,036 | ) | | | (11,915,174 | ) |
| | - | | | | - | | | | - | | | | - | | | | - | | | | - | | | | - | |
| | - | | | | - | | | | - | | | | - | | | | - | | | | - | | | | 152,940 | |
| | - | | | | 98,930 | | | | (93,406 | ) | | | - | | | | - | | | | - | | | | - | |
| | | | | | | | | | | | | | | | | | | | | | | | | | | |
| | (7,335,936 | ) | | | (44,459,817 | ) | | | (96,624,448 | ) | | | (56,134,326 | ) | | | (9,767,502 | ) | | | (18,099,036 | ) | | | (11,762,234 | ) |
| | | | | | | | | | | | | | | | | | | | | | | | | | | |
| | (12,538,371 | ) | | | (56,257,455 | ) | | | (134,095,360 | ) | | | (75,862,005 | ) | | | (13,828,874 | ) | | | (54,944,851 | ) | | | (11,934,415 | ) |
| | | | | | | | | | | | | | | | | | | | | | | | | | | |
| | | | | | |
| $ | (12,318,780 | ) | | $ | (55,918,741 | ) | | $ | (133,090,555 | ) | | $ | (75,429,441 | ) | | $ | (13,345,270 | ) | | $ | (52,138,412 | ) | | $ | (11,330,859 | ) |
| | | | | | | | | | | | | | | | | | | | | | | | | | | |
STATEMENTS OF CHANGES IN NET ASSETS
| | | | | | | | | | | | | | | | |
| | | Aggressive Investors 1 | | | Aggressive Investors 2 | |
| | | Six Months Ended
December 31, | | | Year Ended
June 30, | | | Six Months Ended
December 31, | | | Year Ended
June 30, | |
| | | 2008 | | | 2008 | | | 2008 | | | 2008 | |
| | | (Unaudited) | | | | | | (Unaudited) | | | | |
| | | | |
OPERATIONS | | | | | | | | | | | | | | | | |
Net investment income (loss) | | $ | 724,239 | | | $ | (3,608,240 | ) | | $ | (90,634 | ) | | $ | (3,034,805 | ) |
Net realized gain (loss) on investments | | | (35,180,005 | ) | | | 12,102,813 | | | | (91,545,060 | ) | | | 12,505,237 | |
Net change in unrealized appreciation/(depreciation) on investments | | | (139,826,659 | ) | | | 4,499,071 | | | | (360,900,067 | ) | | | 30,649,595 | |
| | | | | | | | | | | | | | | | | |
Net increase/(decrease) in net assets resulting from operations | | | (174,282,425 | ) | | | 12,993,644 | | | | (452,535,761 | ) | | | 40,120,027 | |
| | | | | | | | | | | | | | | | | |
| | | | |
DISTRIBUTIONS: | | | | | | | | | | | | | | | | |
From net investment income | | | - | | | | - | | | | - | | | | - | |
From net realized gains | | | (1,868,083 | ) | | | (59,135,745 | ) | | | - | | | | (21,016,161 | ) |
| | | | | | | | | | | | | | | | | |
Net decrease in net assets from distributions | | | (1,868,083 | ) | | | (59,135,745 | ) | | | - | | | | (21,016,161 | ) |
| | | | | | | | | | | | | | | | | |
| | | | |
SHARE TRANSACTIONS: | | | | | | | | | | | | | | | | |
Proceeds from sale of shares | | | 12,594,687 | | | | 22,693,076 | | | | 187,361,175 | | | | 373,518,838 | |
Reinvestment of distributions | | | 1,627,084 | | | | 52,129,569 | | | | - | | | | 19,724,944 | |
Cost of shares redeemed | | | (37,135,851 | ) | | | (57,923,516 | ) | | | (243,483,039 | ) | | | (178,210,882 | ) |
Redemption fees | | | - | | | | - | | | | - | | | | - | |
| | | | | | | | | | | | | | | | | |
Net increase/(decrease) in net assets from share transactions | | | (22,914,080 | ) | | | 16,899,129 | | | | (56,121,864 | ) | | | 215,032,900 | |
| | | | | | | | | | | | | | | | | |
| | | | |
Net increase/(decrease) in net assets | | | (199,064,588 | ) | | | (29,242,972 | ) | | | (508,657,625 | ) | | | 234,136,766 | |
| | | | |
NET ASSETS: | | | | | | | | | | | | | | | | |
Beginning of period | | | 338,714,890 | | | | 367,957,862 | | | | 885,076,050 | | | | 650,939,284 | |
| | | | | | | | | | | | | | | | | |
End of period* | | $ | 139,650,302 | | | $ | 338,714,890 | | | $ | 376,418,425 | | | $ | 885,076,050 | |
| | | | | | | | | | | | | | | | | |
| | | | |
SHARES ISSUED & REDEEMED | | | | | | | | | | | | | | | | |
Issued | | | 393,774 | | | | 404,802 | | | | 12,874,852 | | | | 18,346,826 | |
Distributions reinvested | | | 65,529 | | | | 933,553 | | | | - | | | | 936,476 | |
Redeemed | | | (1,140,354 | ) | | | (1,005,484 | ) | | | (17,225,235 | ) | | | (8,935,188 | ) |
| | | | | | | | | | | | | | | | | |
Net increase/(decrease) | | | (681,051 | ) | | | 332,871 | | | | (4,350,383 | ) | | | 10,348,114 | |
Outstanding at beginning of period | | | 6,277,383 | | | | 5,944,512 | | | | 42,809,467 | | | | 32,461,353 | |
| | | | | | | | | | | | | | | | | |
Outstanding at end of period | | | 5,596,332 | | | | 6,277,383 | | | | 38,459,084 | | | | 42,809,467 | |
| | | | | | | | | | | | | | | | | |
| | | | |
* Including accumulated net investment income (loss) of: | | $ | 673,615 | | | $ | (50,624 | ) | | $ | (90,634 | ) | | $ | - | |
See Notes to Financial Statements
| | |
| 128 | | Semi-Annual Report | December 31, 2008 (Unaudited) |
| | | | | | | | | | | | | | | | | | | | | | |
Ultra-Small Company | | | Ultra-Small Company Market | | | Micro-Cap Limited | |
Six Months Ended
December 31, | | | Year Ended
June 30, | | | Six Months Ended
December 31, | | | Year Ended
June 30, | | | Six Months Ended
December 31, | | | Year Ended
June 30, | |
| 2008 | | | 2008 | | | 2008 | | | 2008 | | | 2008 | | | 2008 | |
| (Unaudited) | | | | | | (Unaudited) | | | | | | (Unaudited) | | | | |
| | | | | |
| | | | | | | | | | | | | | | | | | | | | | |
| $ | 848,460 | | | $ | 113,791 | | | $ | 4,061,020 | | | $ | 7,675,103 | | | $ | 219,591 | | | $ | 176,370 | |
| | (12,092,079 | ) | | | (7,791,457 | ) | | | (13,987,172 | ) | | | 38,086,367 | | | | (5,202,435 | ) | | | (4,043,124 | ) |
| | | | | |
| | (21,257,714 | ) | | | (24,568,770 | ) | | | (147,313,568 | ) | | | (278,852,548 | ) | | | (7,335,936 | ) | | | (6,420,717 | ) |
| | | | | | | | | | | | | | | | | | | | | | | |
| | | | | |
| | (32,501,333 | ) | | | (32,246,436 | ) | | | (157,239,720 | ) | | | (233,091,078 | ) | | | (12,318,780 | ) | | | (10,287,471 | ) |
| | | | | | | | | | | | | | | | | | | | | | | |
| | | | | |
| | | | | | | | | | | | | | | | | | | | | | |
| | (114,124 | ) | | | (394,094 | ) | | | (6,894,757 | ) | | | (2,258,281 | ) | | | (76,498 | ) | | | (99,874 | ) |
| | (13,875 | ) | | | (15,085,229 | ) | | | (28,745,402 | ) | | | (34,714,496 | ) | | | - | | | | - | |
| | | | | | | | | | | | | | | | | | | | | | | |
| | (127,999 | ) | | | (15,479,323 | ) | | | (35,640,159 | ) | | | (36,972,777 | ) | | | (76,498 | ) | | | (99,874 | ) |
| | | | | | | | | | | | | | | | | | | | | | | |
| | | | | |
| | | | | | | | | | | | | | | | | | | | | | |
| | 1,453,994 | | | | 1,223,204 | | | | 89,528,910 | | | | 256,154,976 | | | | 1,825,265 | | | | 2,320,692 | |
| | 120,978 | | | | 14,780,752 | | | | 33,435,471 | | | | 35,539,226 | | | | 74,543 | | | | 91,033 | |
| | (4,057,947 | ) | | | (10,581,496 | ) | | | (328,087,164 | ) | | | (462,864,797 | ) | | | (2,371,447 | ) | | | (16,132,953 | ) |
| | - | | | | - | | | | 86,892 | | | | 229,578 | | | | - | | | | - | |
| | | | | | | | | | | | | | | | | | | | | | | |
| | | | | |
| | (2,482,975 | ) | | | 5,422,460 | | | | (205,035,891 | ) | | | (170,941,017 | ) | | | (471,639 | ) | | | (13,721,228 | ) |
| | | | �� | | | | | | | | | | | | | | | | | | | |
| | | | | |
| | (35,112,307 | ) | | | (42,303,299 | ) | | | (397,915,770 | ) | | | (441,004,872 | ) | | | (12,866,917 | ) | | | (24,108,573 | ) |
| | | | | |
| | | | | | | | | | | | | | | | | | | | | | |
| | 94,932,594 | | | | 137,235,893 | | | | 721,411,601 | | | | 1,162,416,473 | | | | 38,135,507 | | | | 62,244,080 | |
| | | | | | | | | | | | | | | | | | | | | | | |
| $ | 59,820,287 | | | $ | 94,932,594 | | | $ | 323,495,831 | | | $ | 721,411,601 | | | $ | 25,268,590 | | | $ | 38,135,507 | |
| | | | | | | | | | | | | | | | | | | | | | | |
| | | | | |
| | | | | | | | | | | | | | | | | | | | | | |
| | 87,852 | | | | 44,362 | | | | 6,547,480 | | | | 14,573,622 | | | | 393,154 | | | | 314,887 | |
| | 7,340 | | | | 516,990 | | | | 3,538,145 | | | | 2,044,835 | | | | 16,602 | | | | 11,582 | |
| | (231,075 | ) | | | (346,232 | ) | | | (23,544,681 | ) | | | (26,658,714 | ) | | | (459,580 | ) | | | (2,182,900 | ) |
| | | | | | | | | | | | | | | | | | | | | | | |
| | (135,883 | ) | | | 215,120 | | | | (13,459,056 | ) | | | (10,040,257 | ) | | | (49,824 | ) | | | (1,856,431 | ) |
| | 3,860,501 | | | | 3,645,381 | | | | 47,050,553 | | | | 57,090,810 | | | | 5,411,246 | | | | 7,267,677 | |
| | | | | | | | | | | | | | | | | | | | | | | |
| | 3,724,618 | | | | 3,860,501 | | | | 33,591,497 | | | | 47,050,553 | | | | 5,361,422 | | | | 5,411,246 | |
| | | | | | | | | | | | | | | | | | | | | | | |
| | | | | |
| $ | 848,108 | | | $ | 113,772 | | | $ | 4,061,016 | | | $ | 6,894,753 | | | $ | 219,589 | | | $ | 76,496 | |
STATEMENTS OF CHANGES IN NET ASSETS (continued)
| | | | | | | | | | | | | | | | |
| | | Small-Cap Growth | | | Small-Cap Value | |
| | | Six Months Ended
December 31, | | | Year Ended
June 30, | | | Six Months Ended
December 31, | | | Year Ended
June 30, | |
| | | 2008 | | | 2008 | | | 2008 | | | 2008 | |
| | | (Unaudited) | | | | | | (Unaudited) | | | | |
OPERATIONS | | | | | | | | | | | | | | | | |
Net investment income (loss) | | $ | 338,714 | | | $ | (312,307 | ) | | $ | 1,004,805 | | | $ | 536,623 | |
Net realized gain (loss) on investments | | | (11,797,638 | ) | | | 5,039,948 | | | | (37,470,912 | ) | | | (9,848,797 | ) |
Net change in unrealized appreciation/(depreciation) on investments | | | (44,459,817 | ) | | | (26,515,864 | ) | | | (96,624,448 | ) | | | (42,424,129 | ) |
| | | | | | | | | | | | | | | | | |
Net increase/(decrease) in net assets resulting from operations | | | (55,918,741 | ) | | | (21,788,223 | ) | | | (133,090,555 | ) | | | (51,736,303 | ) |
| | | | | | | | | | | | | | | | | |
| | | | |
DISTRIBUTIONS: | | | | | | | | | | | | | | | | |
From net investment income | | | - | | | | - | | | | (1,307,246 | ) | | | - | |
From net realized gains | | | - | | | | - | | | | - | | | | - | |
| | | | | | | | | | | | | | | | | |
Net decrease in net assets from distributions | | | - | | | | - | | | | (1,307,246 | ) | | | - | |
| | | | | | | | | | | | | | | | | |
| | | | |
SHARE TRANSACTIONS: | | | | | | | | | | | | | | | | |
Proceeds from sale of shares | | | 16,619,566 | | | | 41,766,427 | | | | 27,501,060 | | | | 212,944,988 | |
Reinvestment of distributions | | | - | | | | - | | | | 1,175,041 | | | | - | |
Cost of shares redeemed | | | (22,556,711 | ) | | | (47,705,114 | ) | | | (64,338,063 | ) | | | (109,736,945 | ) |
Redemption fees | | | - | | | | - | | | | - | | | | - | |
| | | | | | | | | | | | | | | | | |
Net increase/(decrease) in net assets from share transactions | | | (5,937,145 | ) | | | (5,938,687 | ) | | | (35,661,962 | ) | | | 103,208,043 | |
| | | | | | | | | | | | | | | | | |
| | | | |
Net increase/(decrease) in net assets | | | (61,855,886 | ) | | | (27,726,910 | ) | | | (170,059,763 | ) | | | 51,471,740 | |
| | | | |
NET ASSETS: | | | | | | | | | | | | | | | | |
Beginning of period | | | 144,667,754 | | | | 172,394,664 | | | | 331,648,266 | | | | 280,176,526 | |
| | | | | | | | | | | | | | | | | |
End of period* | | $ | 82,811,868 | | | $ | 144,667,754 | | | $ | 161,588,503 | | | $ | 331,648,266 | |
| | | | | | | | | | | | | | | | | |
| | | | |
SHARES ISSUED & REDEEMED | | | | | | | | | | | | | | | | |
Issued | | | 1,543,398 | | | | 2,834,069 | | | | 2,266,791 | | | | 12,592,357 | |
Distributions reinvested | | | - | | | | - | | | | 129,982 | | | | - | |
Redeemed | | | (2,310,042 | ) | | | (3,230,062 | ) | | | (5,997,678 | ) | | | (6,630,990 | ) |
| | | | | | | | | | | | | | | | | |
Net increase/(decrease) | | | (766,644 | ) | | | (395,993 | ) | | | (3,600,905 | ) | | | 5,961,367 | |
Outstanding at beginning of period | | | 10,369,726 | | | | 10,765,719 | | | | 20,912,812 | | | | 14,951,445 | |
| | | | | | | | | | | | | | | | | |
Outstanding at end of period | | | 9,603,082 | | | | 10,369,726 | | | | 17,311,907 | | | | 20,912,812 | |
| | | | | | | | | | | | | | | | | |
| | | | |
* Including accumulated net investment income (loss) of: | | $ | 423,970 | | | $ | 85,256 | | | $ | (79,354 | ) | | $ | 223,087 | |
See Notes to Financial Statements
| | |
| 130 | | Semi-Annual Report | December 31, 2008 (Unaudited) |
| | | | | | | | | | | | | | | | | | | | | | | | | | | | | | |
Large-Cap Growth | | | Large-Cap Value | | | Blue Chip 35 Index | | | Balanced | |
Six Months Ended
December 31, | | | Year Ended
June 30, | | | Six Months Ended
December 31, | | | Year Ended
June 30, | | | Six Months Ended
December 31, | | | Year Ended
June 30, | | | Six Months Ended
December 31, | | | Year Ended
June 30, | |
| 2008 | | | 2008 | | | 2008 | | | 2008 | | | 2008 | | | 2008 | | | 2008 | | | 2008 | |
| (Unaudited) | | | | | | (Unaudited) | | | | | | (Unaudited) | | | | | | (Unaudited) | | | | |
| | | | | | | | | | | | | | | | | | | | | | | | | | | | | | |
| $ | 432,564 | | | $ | 667,848 | | | $ | 483,604 | | | $ | 971,717 | | | $ | 2,806,439 | | | $ | 4,323,025 | | | $ | 603,556 | | | $ | 1,877,906 | |
| | (19,727,679 | ) | | | (3,357,393 | ) | | | (4,061,372 | ) | | | (660,976 | ) | | | (36,845,815 | ) | | | (1,205,950 | ) | | | (172,181 | ) | | | 3,559,026 | |
| | | | | | | |
| | (56,134,326 | ) | | | (3,367,261 | ) | | | (9,767,502 | ) | | | (12,527,611 | ) | | | (18,099,036 | ) | | | (39,474,739 | ) | | | (11,762,234 | ) | | | (6,673,752 | ) |
| | | | | | | | | | | | | | | | | | | | | | | | | | | | | | | |
| | | | | | | |
| | (75,429,441 | ) | | | (6,056,806 | ) | | | (13,345,270 | ) | | | (12,216,870 | ) | | | (52,138,412 | ) | | | (36,357,664 | ) | | | (11,330,859 | ) | | | (1,236,820 | ) |
| | | | | | | | | | | | | | | | | | | | | | | | | | | | | | | |
| | | | | | | |
| | | | | | | | | | | | | | | | | | | | | | | | | | | | | | |
| | (732,365 | ) | | | (501,206 | ) | | | (822,272 | ) | | | (935,231 | ) | | | (5,724,513 | ) | | | (2,216,904 | ) | | | (1,894,745 | ) | | | (1,132,035 | ) |
| | - | | | | - | | | | - | | | | (2,259,581 | ) | | | - | | | | - | | | | (2,727,783 | ) | | | - | |
| | | | | | | | | | | | | | | | | | | | | | | | | | | | | | | |
| | (732,365 | ) | | | (501,206 | ) | | | (822,272 | ) | | | (3,194,812 | ) | | | (5,724,513 | ) | | | (2,216,904 | ) | | | (4,622,528 | ) | | | (1,132,035 | ) |
| | | | | | | | | | | | | | | | | | | | | | | | | | | | | | | |
| | | | | | | |
| | | | | | | | | | | | | | | | | | | | | | | | | | | | | | |
| | 28,621,073 | | | | 85,463,022 | | | | 5,068,156 | | | | 15,647,493 | | | | 21,359,265 | | | | 223,052,529 | | | | 6,436,247 | | | | 21,256,530 | |
| | 670,001 | | | | 403,318 | | | | 795,525 | | | | 3,077,813 | | | | 5,416,570 | | | | 2,117,136 | | | | 4,416,669 | | | | 1,075,310 | |
| | (50,165,018 | ) | | | (42,633,298 | ) | | | (10,895,249 | ) | | | (35,265,212 | ) | | | (61,027,521 | ) | | | (34,689,544 | ) | | | (17,094,619 | ) | | | (31,601,455 | ) |
| | - | | | | - | | | | - | | | | - | | | | - | | | | - | | | | - | | | | - | |
| | | | | | | | | | | | | | | | | | | | | | | | | | | | | | | |
| | | | | | | |
| | (20,873,944 | ) | | | 43,233,042 | | | | (5,031,568 | ) | | | (16,539,906 | ) | | | (34,251,686 | ) | | | 190,480,121 | | | | (6,241,703 | ) | | | (9,269,615 | ) |
| | | | | | | | | | | | | | | | | | | | | | | | | | | | | | | |
| | | | | | | |
| | (97,035,750 | ) | | | 36,675,030 | | | | (19,199,110 | ) | | | (31,951,588 | ) | | | (92,114,611 | ) | | | 151,905,553 | | | | (22,195,090 | ) | | | (11,638,470 | ) |
| | | | | | | |
| | | | | | | | | | | | | | | | | | | | | | | | | | | | | | |
| | 174,812,603 | | | | 138,137,573 | | | | 54,143,588 | | | | 86,095,176 | | | | 250,987,852 | | | | 99,082,299 | | | | 75,417,277 | | | | 87,055,747 | |
| | | | | | | | | | | | | | | | | | | | | | | | | | | | | | | |
| $ | 77,776,853 | | | $ | 174,812,603 | | | $ | 34,944,478 | | | $ | 54,143,588 | | | $ | 158,873,241 | | | $ | 250,987,852 | | | $ | 53,222,187 | | | $ | 75,417,277 | |
| | | | | | | | | | | | | | | | | | | | | | | | | | | | | | | |
| | | | | | | |
| | | | | | | | | | | | | | | | | | | | | | | | | | | | | | |
| | 2,344,570 | | | | 5,974,190 | | | | 485,433 | | | | 986,625 | | | | 3,268,987 | | | | 27,202,745 | | | | 584,693 | | | | 1,647,886 | |
| | 80,432 | | | | 27,587 | | | | 80,846 | | | | 195,790 | | | | 983,044 | | | | 252,040 | | | | 456,739 | | | | 82,336 | |
| | (5,567,717 | ) | | | (3,047,431 | ) | | | (973,727 | ) | | | (2,255,334 | ) | | | (9,848,064 | ) | | | (4,267,847 | ) | | | (1,578,811 | ) | | | (2,457,847 | ) |
| | | | | | | | | | | | | | | | | | | | | | | | | | | | | | | |
| | (3,142,715 | ) | | | 2,954,346 | | | | (407,448 | ) | | | (1,072,919 | ) | | | (5,596,033 | ) | | | 23,186,938 | | | | (537,379 | ) | | | (727,625 | ) |
| | 12,734,962 | | | | 9,780,616 | | | | 3,971,053 | | | | 5,043,972 | | | | 34,819,731 | | | | 11,632,793 | | | | 5,994,007 | | | | 6,721,632 | |
| | | | | | | | | | | | | | | | | | | | | | | | | | | | | | | |
| | 9,592,247 | | | | 12,734,962 | | | | 3,563,605 | | | | 3,971,053 | | | | 29,223,698 | | | | 34,819,731 | | | | 5,456,628 | | | | 5,994,007 | |
| | | | | | | | | | | | | | | | | | | | | | | | | | | | | | | |
| | | | | | | |
| $ | (10,853 | ) | | $ | 288,948 | | | $ | 26,270 | | | $ | 364,938 | | | $ | (6,980 | ) | | $ | 2,911,094 | | | $ | 124,281 | | | $ | 1,415,470 | |
FINANCIAL HIGHLIGHTS
(for a share outstanding throughout the period indicated)
| | | | | | | | | | | | | | | |
| | | | | Income from
Investment Operations | |
| | | Net Asset
Value,
Beginning
of Period | | Net
Investment
Income (Loss)(a) | | | Net Realized
and Unrealized
Gain\ (Loss) | | | Total from
Investment
Operations | |
| | | | |
| AGGRESSIVE INVESTORS 1 | | | | | | | | | | | | | | | |
| | | | |
Period Ended December 31, 2008 (Unaudited) | | $ | 53.96 | | $ | 0.12 | | | $ | (28.80 | ) | | $ | (28.68 | ) |
Year Ended June 30, 2008 | | | 61.90 | | | (0.59 | ) | | | 3.14 | | | | 2.55 | |
Year Ended June 30, 2007 | | | 61.90 | | | (0.43 | ) | | | 6.41 | | | | 5.98 | |
Year Ended June 30, 2006 | | | 56.60 | | | (0.42 | ) | | | 12.23 | | | | 11.81 | |
Year Ended June 30, 2005 | | | 49.43 | | | (0.26 | ) | | | 7.43 | | | | 7.17 | |
Year Ended June 30, 2004 | | | 39.94 | | | (0.58 | ) | | | 10.07 | | | | 9.49 | |
| | | | |
| | | | | | | | | | | | | | | | |
| | | | |
| AGGRESSIVE INVESTORS 2 | | | | | | | | | | | | | | | |
| | | | |
Period Ended December 31, 2008 (Unaudited) | | | 20.67 | | | - | | | | (10.88 | ) | | | (10.88 | ) |
Year Ended June 30, 2008 | | | 20.05 | | | (0.08 | ) | | | 1.27 | | | | 1.19 | |
Year Ended June 30, 2007 | | | 17.55 | | | (0.07 | ) | | | 2.94 | | | | 2.87 | |
Year Ended June 30, 2006 | | | 14.72 | | | (0.05 | ) | | | 3.22 | | | | 3.17 | |
Year Ended June 30, 2005 | | | 12.75 | | | (0.04 | ) | | | 2.01 | | | | 1.97 | |
Year Ended June 30, 2004 | | | 10.28 | | | (0.09 | ) | | | 2.56 | | | | 2.47 | |
| | | | |
| | | | | | | | | | | | | | | | |
| | | | |
| ULTRA-SMALL COMPANY | | | | | | | | | | | | | | | |
| | | | |
Period Ended December 31, 2008 (Unaudited) | | | 24.59 | | | 0.22 | | | | (8.72 | ) | | | (8.50 | ) |
Year Ended June 30, 2008 | | | 37.65 | | | 0.03 | | | | (8.67 | ) | | | (8.64 | ) |
Year Ended June 30, 2007 | | | 42.42 | | | 0.12 | | | | 3.37 | | | | 3.49 | |
Year Ended June 30, 2006 | | | 38.44 | | | (0.15 | ) | | | 9.23 | | | | 9.08 | |
Year Ended June 30, 2005 | | | 40.97 | | | (0.10 | ) | | | 6.69 | | | | 6.59 | |
Year Ended June 30, 2004 | | | 32.93 | | | (0.33 | ) | | | 13.66 | | | | 13.33 | |
| | | | |
| | | | | | | | | | | | | | | | |
| | | | |
| ULTRA-SMALL COMPANY MARKET | | | | | | | | | | | | | | | |
| | | | |
Period Ended December 31, 2008 (Unaudited) | | | 15.33 | | | 0.11 | | | | (4.71 | ) | | | (4.60 | ) |
Year Ended June 30, 2008 | | | 20.36 | | | 0.14 | | | | (4.49 | ) | | | (4.35 | ) |
Year Ended June 30, 2007 | | | 18.94 | | | 0.10 | | | | 1.76 | | | | 1.86 | |
Year Ended June 30, 2006 | | | 16.96 | | | 0.05 | | | | 2.48 | | | | 2.53 | |
Year Ended June 30, 2005 | | | 16.14 | | | 0.02 | | | | 0.97 | | | | 0.99 | |
Year Ended June 30, 2004 | | | 10.98 | | | 0.02 | | | | 5.16 | | | | 5.18 | |
| | | | |
| | | | | | | | | | | | | | | | |
(a) | Per share amounts calculated based on the average daily shares outstanding during the period. |
(b) | Total returns and portfolio turnover for periods less than one year are not annualized. |
(c) | Annualized for periods less than one year |
(d) | Total return would have been lower had various fees not been waived during the period. |
See Notes to Financial Statements
| | |
| 132 | | Semi-Annual Report | December 31, 2008 (Unaudited) |
| | | | | | | | | | | | | | | | | | | | | | | | | | | | | | | | | | |
Less Distributions to
Shareholders from: | | | | | | | | | | Ratios & Supplemental Data | |
Net
Realized
Gain | | | Net
Investment
Income | | | Total
Distributions | | | Paid in Capital
from
Redemption
Fees(a) | | Net Asset
Value,
End of
Period | | Total
Return(b) | | | Net Assets
End of Period
(000’s) | | Expenses Before
Waivers and
Reimbursements(c) | | | Expenses After
Waivers and
Reimbursements(c) | | | Net Investment
Income (Loss)
After Waivers and
Reimbursements(c) | | | Portfolio
Turnover
Rate(b) | |
| | | | | | | | | | |
| $ | (0.33 | ) | | $ | - | | | $ | (0.33 | ) | | $ | - | | $ | 24.95 | | (53.13 | %) | | $ | 139,650 | | 0.52 | % | | 0.52 | % | | 0.66 | % | | 74 | % |
| | (10.49 | ) | | | - | | | | (10.49 | ) | | | - | | | 53.96 | | 3.54 | %(d) | | | 338,715 | | 1.78 | % | | 1.78 | % | | (1.03 | %) | | 142 | % |
| | (5.98 | ) | | | - | | | | (5.98 | ) | | | - | | | 61.90 | | 10.79 | % | | | 367,958 | | 1.72 | % | | 1.72 | % | | (0.75 | %) | | 115 | % |
| | (6.51 | ) | | | - | | | | (6.51 | ) | | | - | | | 61.90 | | 21.79 | % | | | 438,592 | | 1.58 | % | | 1.58 | % | | (0.69 | %) | | 128 | % |
| | - | | | | - | | | | - | | | | - | | | 56.60 | | 14.51 | % | | | 368,886 | | 1.58 | % | | 1.58 | % | | (0.51 | %) | | 155 | % |
| | - | | | | - | | | | - | | | | - | | | 49.43 | | 23.76 | % | | | 353,684 | | 1.74 | % | | 1.74 | % | | (1.24 | %) | | 151 | % |
| | | | | | | | | | |
| | | | | | | | | | | | | | | | | | | | | | | | | | | | | | | | | | | |
| | | | | | | | | | |
| | - | | | | - | | | | - | | | | - | | | 9.79 | | (52.64 | %) | | | 376,418 | | 1.17 | % | | 1.17 | % | | (0.03 | %) | | 68 | % |
| | (0.57 | ) | | | - | | | | (0.57 | ) | | | - | | | 20.67 | | 5.88 | %(d) | | | 885,076 | | 1.17 | % | | 1.17 | % | | (0.40 | %) | | 127 | % |
| | (0.37 | ) | | | - | | | | (0.37 | ) | | | - | | | 20.05 | | 16.68 | % | | | 650,939 | | 1.22 | % | | 1.22 | % | | (0.38 | %) | | 124 | % |
| | (0.34 | ) | | | - | | | | (0.34 | ) | | | - | | | 17.55 | | 21.65 | % | | | 585,262 | | 1.12 | % | | 1.12 | % | | (0.26 | %) | | 89 | % |
| | - | | | | - | | | | - | | | | - | | | 14.72 | | 15.45 | % | | | 156,053 | | 1.37 | % | | 1.37 | % | | (0.33 | %) | | 148 | % |
| | - | | | | - | | | | - | | | | - | | | 12.75 | | 24.03 | % | | | 110,395 | | 1.58 | % | | 1.58 | % | | (1.13 | %) | | 152 | % |
| | | | | | | | | | |
| | | | | | | | | | | | | | | | | | | | | | | | | | | | | | | | | | | |
| | | | | | | | | | |
| | - | | | | (0.03 | ) | | | (0.03 | ) | | | - | | | 16.06 | | (34.56 | %) | | | 59,820 | | 1.12 | % | | 1.12 | % | | 2.14 | % | | 45 | % |
| | (4.31 | ) | | | (0.11 | ) | | | (4.42 | ) | | | - | | | 24.59 | | (24.59 | %)(d) | | | 94,933 | | 1.07 | % | | 1.07 | % | | 0.10 | % | | 102 | % |
| | (8.26 | ) | | | - | | | | (8.26 | ) | | | - | | | 37.65 | | 9.12 | % | | | 137,236 | | 1.09 | % | | 1.09 | % | | 0.31 | % | | 106 | % |
| | (5.10 | ) | | | - | | | | (5.10 | ) | | | - | | | 42.42 | | 25.58 | % | | | 132,193 | | 1.09 | % | | 1.09 | % | | (0.37 | %) | | 101 | % |
| | (9.12 | ) | | | - | | | | (9.12 | ) | | | - | | | 38.44 | | 15.37 | % | | | 110,634 | | 1.12 | % | | 1.12 | % | | (0.25 | %) | | 86 | % |
| | (5.29 | ) | | | - | | | | (5.29 | ) | | | - | | | 40.97 | | 40.88 | % | | | 101,233 | | 1.15 | % | | 1.15 | % | | (0.84 | %) | | 71 | % |
| | | | | | | | | | |
| | | | | | | | | | | | | | | | | | | | | | | | | | | | | | | | | | | |
| | | | | | | | | | |
| | (0.89 | ) | | | (0.21 | ) | | | (1.10 | ) | | | - | | | 9.63 | | (29.81 | %)(d) | | | 323,496 | | 0.76 | % | | 0.75 | % | | 1.63 | % | | 19 | % |
| | (0.65 | ) | | | (0.04 | ) | | | (0.69 | ) | | | 0.01 | | | 15.33 | | (21.72 | %)(d) | | | 721,412 | | 0.66 | % | | 0.66 | % | | 0.79 | % | | 29 | % |
| | (0.37 | ) | | | (0.08 | ) | | | (0.45 | ) | | | 0.01 | | | 20.36 | | 10.08 | % | | | 1,162,416 | | 0.67 | % | | 0.67 | % | | 0.53 | % | | 34 | % |
| | (0.53 | ) | | | (0.03 | ) | | | (0.56 | ) | | | 0.01 | | | 18.94 | | 15.13 | % | | | 1,087,750 | | 0.65 | % | | 0.65 | % | | 0.27 | % | | 27 | % |
| | (0.15 | ) | | | (0.03 | ) | | | (0.18 | ) | | | 0.01 | | | 16.96 | | 6.12 | % | | | 593,883 | | 0.73 | % | | 0.73 | % | | 0.15 | % | | 13 | % |
| | (0.04 | ) | | | - | | | | (0.04 | ) | | | 0.02 | | | 16.14 | | 47.41 | % | | | 816,748 | | 0.67 | % | | 0.67 | % | | 0.11 | % | | 19 | % |
| | | | | | | | | | |
| | | | | | | | | | | | | | | | | | | | | | | | | | | | | | | | | | | |
FINANCIAL HIGHLIGHTS (continued)
(for a share outstanding throughout the period indicated)
| | | | | | | | | | | | | | | |
| | | | | Income from
Investment Operations | |
| | | Net Asset
Value,
Beginning
of Period | | Net
Investment
Income (Loss)(a) | | | Net Realized
and Unrealized
Gain\ (Loss) | | | Total from
Investment
Operations | |
| | | | |
| MICRO-CAP LIMITED | | | | | | | | | | | | | | | |
| | | | |
Period Ended December 31, 2008 (Unaudited) | | $ | 7.05 | | $ | 0.04 | | | $ | (2.37 | ) | | $ | (2.33 | ) |
Year Ended June 30, 2008 | | | 8.56 | | | 0.03 | | | | (1.53 | ) | | | (1.50 | ) |
Year Ended June 30, 2007 | | | 11.10 | | | (0.01 | ) | | | (0.32 | ) | | | (0.33 | ) |
Year Ended June 30, 2006 | | | 11.09 | | | (0.13 | ) | | | 1.81 | | | | 1.68 | |
Year Ended June 30, 2005 | | | 10.75 | | | (0.13 | ) | | | 2.45 | | | | 2.32 | |
Year Ended June 30, 2004 | | | 9.36 | | | (0.17 | ) | | | 2.49 | | | | 2.32 | |
| | | | |
| | | | | | | | | | | | | | | | |
| | | | |
| SMALL-CAP GROWTH | | | | | | | | | | | | | | | |
| | | | |
Period Ended December 31, 2008 (Unaudited) | | | 13.95 | | | 0.03 | | | | (5.36 | ) | | | (5.33 | ) |
Year Ended June 30, 2008 | | | 16.01 | | | (0.03 | ) | | | (2.03 | ) | | | (2.06 | ) |
Year Ended June 30, 2007 | | | 14.75 | | | (0.04 | ) | | | 1.30 | | | | 1.26 | |
Year Ended June 30, 2006 | | | 12.08 | | | (0.03 | ) | | | 2.70 | | | | 2.67 | |
Year Ended June 30, 2005 | | | 10.84 | | | (0.07 | ) | | | 1.31 | | | | 1.24 | |
Period Ended June 30, 2004(e) | | | 10.00 | | | (0.05 | ) | | | 0.89 | | | | 0.84 | |
| | | | |
| | | | | | | | | | | | | | | | |
| | | | |
| SMALL-CAP VALUE | | | | | | | | | | | | | | | |
| | | | |
Period Ended December 31, 2008 (Unaudited) | | | 15.86 | | | 0.05 | | | | (6.51 | ) | | | (6.46 | ) |
Year Ended June 30, 2008 | | | 18.74 | | | 0.03 | | | | (2.91 | ) | | | (2.88 | ) |
Year Ended June 30, 2007 | | | 16.02 | | | (0.03 | ) | | | 2.75 | | | | 2.72 | |
Year Ended June 30, 2006 | | | 12.78 | | | - | | | | 3.24 | | | | 3.24 | |
Year Ended June 30, 2005 | | | 10.46 | | | (0.02 | ) | | | 2.34 | | | | 2.32 | |
Period Ended June 30, 2004(e) | | | 10.00 | | | (0.03 | ) | | | 0.49 | | | | 0.46 | |
| | | | |
| | | | | | | | | | | | | | | | |
| | | | |
| LARGE-CAP GROWTH | | | | | | | | | | | | | | | |
| | | | |
Period Ended December 31, 2008 (Unaudited) | | | 13.73 | | | 0.03 | | | | (5.58 | ) | | | (5.55 | ) |
Year Ended June 30, 2008 | | | 14.12 | | | 0.06 | | | | (0.41 | ) | | | (0.35 | ) |
Year Ended June 30, 2007 | | | 12.11 | | | 0.03 | | | | 2.02 | | | | 2.05 | |
Year Ended June 30, 2006 | | | 11.00 | | | 0.04 | | | | 1.07 | | | | 1.11 | |
Year Ended June 30, 2005 | | | 10.63 | | | - | | | | 0.37 | | | | 0.37 | |
Period Ended June 30, 2004(e) | | | 10.00 | | | (0.01 | ) | | | 0.64 | | | | 0.63 | |
| | | | |
| | | | | | | | | | | | | | | | |
(a) | Per share amounts calculated based on the average daily shares outstanding during the period. |
(b) | Total returns and portfolio turnover for periods less than one year are not annualized. |
(c) | Annualized for periods less than one year |
(d) | Total return would have been lower had various fees not been waived during the period. |
(e) | Fund commenced operations on October 31, 2003 |
See Notes to Financial Statements
| | |
| 134 | | Semi-Annual Report | December 31, 2008 (Unaudited) |
| | | | | | | | | | | | | | | | | | | | | | | | | | | | | | | | | | |
Less Distributions to
Shareholders from: | | | | | | | | | | Ratios & Supplemental Data | |
Net
Realized
Gain | | | Net
Investment
Income | | | Total
Distributions | | | Paid in Capital
from
Redemption
Fees(a) | | Net Asset
Value,
End of
Period | | Total
Return(b) | | | Net Assets
End of Period
(000’s) | | Expenses Before
Waivers and
Reimbursements(c) | | | Expenses After
Waivers and
Reimbursements(c) | | | Net Investment
Income (Loss)
After Waivers and
Reimbursements(c) | | | Portfolio
Turnover
Rate(b) | |
| | | | | | | | | | |
| $ | - | | | $ | (0.01 | ) | | $ | (0.01 | ) | | $ | - | | $ | 4.71 | | (32.98 | %) | | $ | 25,269 | | 1.01 | % | | 1.01 | % | | 1.41 | % | | 82 | % |
| | - | | | | (0.01 | ) | | | (0.01 | ) | | | - | | | 7.05 | | (17.49 | %)(d) | | | 38,136 | | 0.75 | % | | 0.75 | % | | 0.36 | % | | 147 | % |
| | (2.21 | ) | | | - | | | | (2.21 | ) | | | - | | | 8.56 | | (3.37 | %) | | | 62,244 | | 0.84 | % | | 0.84 | % | | (0.09 | %) | | 133 | % |
| | (1.67 | ) | | | - | | | | (1.67 | ) | | | - | | | 11.10 | | 14.72 | % | | | 80,711 | | 1.60 | % | | 1.60 | % | | (1.05 | %) | | 125 | % |
| | (1.98 | ) | | | - | | | | (1.98 | ) | | | - | | | 11.09 | | 22.94 | % | | | 66,637 | | 1.75 | % | | 1.75 | % | | (1.27 | %) | | 87 | % |
| | (0.93 | ) | | | - | | | | (0.93 | ) | | | - | | | 10.75 | | 24.30 | % | | | 57,750 | | 1.79 | % | | 1.79 | % | | (1.50 | %) | | 98 | % |
| | | | | | | | | | |
| | | | | | | | | | | | | | | | | | | | | | | | | | | | | | | | | | | |
| | | | | | | | | | |
| | - | | | | - | | | | - | | | | - | | | 8.62 | | (38.21 | %) | | | 82,812 | | 0.87 | % | | 0.87 | % | | 0.60 | % | | 29 | % |
| | - | | | | - | | | | - | | | | - | | | 13.95 | | (12.87 | %)(d) | | | 144,668 | | 0.87 | % | | 0.87 | % | | (0.20 | %) | | 63 | % |
| | - | | | | - | | | | - | | | | - | | | 16.01 | | 8.54 | % | | | 172,395 | | 0.92 | % | | 0.92 | % | | (0.31 | %) | | 37 | % |
| | - | | | | - | | | | - | | | | - | | | 14.75 | | 22.10 | % | | | 275,278 | | 0.81 | % | | 0.81 | % | | (0.19 | %) | | 41 | % |
| | - | | | | - | | | | - | | | | - | | | 12.08 | | 11.44 | %(d) | | | 55,704 | | 1.08 | % | | 0.94 | % | | (0.68 | %) | | 51 | % |
| | - | | | | - | | | | - | | | | - | | | 10.84 | | 8.40 | %(d) | | | 37,968 | | 1.25 | % | | 0.94 | % | | (0.74 | %) | | 17 | % |
| | | | | | | | | | |
| | | | | | | | | | | | | | | | | | | | | | | | | | | | | | | | | | | |
| | | | | | | | | | |
| | - | | | | (0.07 | ) | | | (0.07 | ) | | | - | | | 9.33 | | (40.70 | %) | | | 161,589 | | 0.81 | % | | 0.81 | % | | 0.82 | % | | 30 | % |
| | - | | | | - | | | | - | | | | - | | | 15.86 | | (15.37 | %)(d) | | | 331,648 | | 0.83 | % | | 0.83 | % | | 0.18 | % | | 73 | % |
| | - | | | | - | | | | - | | | | - | | | 18.74 | | 16.98 | % | | | 280,177 | | 0.88 | % | | 0.88 | % | | (0.19 | %) | | 58 | % |
| | - | | | | - | | | | - | | | | - | | | 16.02 | | 25.35 | % | | | 360,120 | | 0.77 | % | | 0.77 | % | | (0.03 | %) | | 49 | % |
| | - | | | | - | | | | - | | | | - | | | 12.78 | | 22.18 | %(d) | | | 68,545 | | 1.07 | % | | 0.94 | % | | (0.32 | %) | | 57 | % |
| | - | | | | - | | | | - | | | | - | | | 10.46 | | 4.60 | %(d) | | | 28,193 | | 1.49 | % | | 0.94 | % | | (0.42 | %) | | 21 | % |
| | | | | | | | | | |
| | | | | | | | | | | | | | | | | | | | | | | | | | | | | | | | | | | |
| | | | | | | | | | |
| | - | | | | (0.07 | ) | | | (0.07 | ) | | | - | | | 8.11 | | (40.41 | %) | | | 77,777 | | 0.76 | % | | 0.76 | % | | 0.63 | % | | 25 | % |
| | - | | | | (0.04 | ) | | | (0.04 | ) | | | - | | | 13.73 | | (2.50 | %)(d) | | | 174,813 | | 0.71 | % | | 0.71 | % | | 0.39 | % | | 37 | % |
| | - | | | | (0.04 | ) | | | (0.04 | ) | | | - | | | 14.12 | | 16.98 | % | | | 138,138 | | 0.78 | % | | 0.78 | % | | 0.25 | % | | 39 | % |
| | - | | | | - | | | | - | | | | - | | | 12.11 | | 10.09 | % | | | 103,861 | | 0.82 | % | | 0.82 | % | | 0.31 | % | | 26 | % |
| | - | | | | - | | | | - | | | | - | | | 11.00 | | 3.48 | %(d) | | | 42,988 | | 1.03 | % | | 0.84 | % | | (0.04 | %) | | 20 | % |
| | - | | | | - | | | | - | | | | - | | | 10.63 | | 6.30 | %(d) | | | 39,532 | | 1.13 | % | | 0.84 | % | | (0.09 | %) | | 7 | % |
| | | | | | | | | | |
| | | | | | | | | | | | | | | | | | | | | | | | | | | | | | | | | | | |
FINANCIAL HIGHLIGHTS (continued)
(for a share outstanding throughout the period indicated)
| | | | | | | | | | | | | | |
| | | | | Income from
Investment Operations | |
| | | Net Asset
Value,
Beginning
of Period | | Net
Investment
Income (Loss)(a) | | Net Realized
and Unrealized
Gain\ (Loss) | | | Total from
Investment
Operations | |
| | | | |
| LARGE-CAP VALUE | | | | | | | | | | | | | | |
| | | | |
Period Ended December 31, 2008 (Unaudited) | | $ | 13.63 | | $ | 0.13 | | $ | (3.72 | ) | | $ | (3.59 | ) |
Year Ended June 30, 2008 | | | 17.07 | | | 0.22 | | | (2.94 | ) | | | (2.72 | ) |
Year Ended June 30, 2007 | | | 14.41 | | | 0.17 | | | 2.64 | | | | 2.81 | |
Year Ended June 30, 2006 | | | 12.70 | | | 0.17 | | | 1.69 | | | | 1.86 | |
Year Ended June 30, 2005 | | | 11.11 | | | 0.14 | | | 1.55 | | | | 1.69 | |
Period Ended June 30, 2004(e) | | | 10.00 | | | 0.03 | | | 1.08 | | | | 1.11 | |
| | | | |
| | | | | | | | | | | | | | | |
| | | | |
| BLUE CHIP 35 INDEX | | | | | | | | | | | | | | |
| | | | |
Period Ended December 31, 2008 (Unaudited) | | | 7.21 | | | 0.09 | | | (1.67 | ) | | | (1.58 | ) |
Year Ended June 30, 2008 | | | 8.52 | | | 0.19 | | | (1.39 | ) | | | (1.20 | ) |
Year Ended June 30, 2007 | | | 7.21 | | | 0.16 | | | 1.26 | | | | 1.42 | |
Year Ended June 30, 2006 | | | 6.86 | | | 0.14 | | | 0.32 | | | | 0.46 | |
Year Ended June 30, 2005 | | | 7.02 | | | 0.14 | | | (0.18 | ) | | | (0.04 | ) |
Year Ended June 30, 2004 | | | 6.14 | | | 0.10 | | | 0.83 | | | | 0.93 | |
| | | | |
| | | | | | | | | | | | | | | |
| | | | |
| BALANCED | | | | | | | | | | | | | | |
| | | | |
Period Ended December 31, 2008 (Unaudited) | | | 12.58 | | | 0.11 | | | (2.06 | ) | | | (1.95 | ) |
Year Ended June 30, 2008 | | | 12.95 | | | 0.29 | | | (0.49 | ) | | | (0.20 | ) |
Year Ended June 30, 2007 | | | 12.65 | | | 0.28 | | | 0.44 | | | | 0.72 | |
Year Ended June 30, 2006 | | | 11.92 | | | 0.22 | | | 0.73 | | | | 0.95 | |
Year Ended June 30, 2005 | | | 11.30 | | | 0.14 | | | 0.66 | | | | 0.80 | |
Year Ended June 30, 2004 | | | 10.05 | | | 0.06 | | | 1.24 | | | | 1.30 | |
| | | | |
| | | | | | | | | | | | | | | |
(a) | Per share amounts calculated based on the average daily shares outstanding during the period. |
(b) | Total returns and portfolio turnover for periods less than one year are not annualized. |
(c) | Annualized for periods less than one year |
(d) | Total return would have been lower had various fees not been waived during the period. |
(e) | Fund commenced operations on October 31, 2003 |
See Notes to Financial Statements
| | |
| 136 | | Semi-Annual Report | December 31, 2008 (Unaudited) |
| | | | | | | | | | | | | | | | | | | | | | | | | | | | | | | | | |
Less Distributions to
Shareholders from: | | | | | | | | | | Ratios & Supplemental Data | |
Net
Realized
Gain | | | Net
Investment
Income | | | Total
Distributions | | | Paid in Capital
from
Redemption
Fees(a) | | Net Asset
Value,
End of
Period | | Total
Return(b) | | | Net Assets
End of Period
(000’s) | | Expenses Before
Waivers and
Reimbursements(c) | | | Expenses After
Waivers and
Reimbursements(c) | | | Net Investment
Income (Loss)
After Waivers and
Reimbursements(c) | | | Portfolio
Turnover
Rate(b) | |
| | | | | | | | | | |
| $ | - | | | $ | (0.23 | ) | | $ | (0.23 | ) | | $ | - | | 9.81 | | (26.36 | %)(d) | | $ | 34,944 | | 0.91 | % | | 0.84 | % | | 2.24 | % | | 24 | % |
| | (0.51 | ) | | | (0.21 | ) | | | (0.72 | ) | | | - | | 13.63 | | (16.46 | %)(d) | | | 54,144 | | 0.80 | % | | 0.79 | % | | 1.38 | % | | 28 | % |
| | - | | | | (0.15 | ) | | | (0.15 | ) | | | - | | 17.07 | | 19.57 | % | | | 86,095 | | 0.79 | % | | 0.79 | % | | 1.08 | % | | 34 | % |
| | - | | | | (0.15 | ) | | | (0.15 | ) | | | - | | 14.41 | | 14.69 | %(d) | | | 87,718 | | 0.86 | % | | 0.84 | % | | 1.18 | % | | 23 | % |
| | - | | | | (0.10 | ) | | | (0.10 | ) | | | - | | 12.70 | | 15.22 | %(d) | | | 27,476 | | 1.10 | % | | 0.84 | % | | 1.24 | % | | 30 | % |
| | - | | | | - | | | | - | | | | - | | 11.11 | | 11.10 | %(d) | | | 20,598 | | 1.52 | % | | 0.84 | % | | 0.86 | % | | 11 | % |
| | | | | | | | | | |
| | | | | | | | | | | | | | | | | | | | | | | | | | | | | | | | | | |
| | | | | | | | | | |
| | - | | | | (0.19 | ) | | | (0.19 | ) | | | - | | 5.44 | | (21.93 | %)(d) | | | 158,873 | | 0.22 | % | | 0.15 | % | | 2.64 | % | | 43 | % |
| | - | | | | (0.11 | ) | | | (0.11 | ) | | | - | | 7.21 | | (14.28 | %)(d) | | | 250,988 | | 0.22 | % | | 0.15 | % | | 2.35 | % | | 12 | % |
| | - | | | | (0.11 | ) | | | (0.11 | ) | | | - | | 8.52 | | 19.81 | %(d) | | | 99,082 | | 0.35 | % | | 0.15 | % | | 1.98 | % | | 11 | % |
| | - | | | | (0.11 | ) | | | (0.11 | ) | | | - | | 7.21 | | 6.64 | %(d) | | | 42,471 | | 0.47 | % | | 0.15 | % | | 1.90 | % | | 41 | % |
| | - | | | | (0.12 | ) | | | (0.12 | ) | | | - | | 6.86 | | (0.59 | %)(d) | | | 34,612 | | 0.56 | % | | 0.15 | % | | 2.07 | % | | 20 | % |
| | - | | | | (0.05 | ) | | | (0.05 | ) | | | - | | 7.02 | | 15.20 | %(d) | | | 35,960 | | 0.58 | % | | 0.15 | % | | 1.64 | % | | 5 | % |
| | | | | | | | | | |
| | | | | | | | | | | | | | | | | | | | | | | | | | | | | | | | | | |
| | | | | | | | | | |
| | (0.52 | ) | | | (0.36 | ) | | | (0.88 | ) | | | - | | 9.75 | | (15.47 | %) | | | 53,222 | | 0.94 | % | | 0.94 | % | | 1.84 | % | | 28 | % |
| | - | | | | (0.17 | ) | | | (0.17 | ) | | | - | | 12.58 | | (1.57 | %)(d) | | | 75,417 | | 0.88 | % | | 0.88 | % | | 2.23 | % | | 44 | % |
| | (0.15 | ) | | | (0.27 | ) | | | (0.42 | ) | | | - | | 12.95 | | 5.87 | % | | | 87,056 | | 0.98 | % | | 0.94 | % | | 2.16 | % | | 27 | % |
| | (0.11 | ) | | | (0.11 | ) | | | (0.22 | ) | | | - | | 12.65 | | 8.01 | % | | | 85,340 | | 0.94 | % | | 0.94 | % | | 1.81 | % | | 51 | % |
| | (0.10 | ) | | | (0.08 | ) | | | (0.18 | ) | | | - | | 11.92 | | 7.15 | %(d) | | | 42,264 | | 1.19 | % | | 0.94 | % | | 1.20 | % | | 126 | % |
| | - | | | | (0.05 | ) | | | (0.05 | ) | | | - | | 11.30 | | 12.94 | %(d) | | | 23,212 | | 1.51 | % | | 0.94 | % | | 0.60 | % | | 124 | % |
| | | | | | | | | | |
| | | | | | | | | | | | | | | | | | | | | | | | | | | | | | | | | | |
NOTES TO FINANCIAL STATEMENTS
December 31, 2008 (Unaudited)
1. Organization:
Bridgeway Funds, Inc. (“Bridgeway”) was organized as a Maryland corporation on October 19, 1993, and is registered under the Investment Company Act of 1940, as amended (the “1940 Act”), as an open-end management investment company.
Bridgeway is organized as a series fund, which currently has 11 investment funds (collectively, the “Funds”): Aggressive Investors 1, Aggressive Investors 2, Ultra-Small Company, Ultra-Small Company Market, Micro-Cap Limited, Small-Cap Growth, Small-Cap Value, Large-Cap Growth, Large-Cap Value, Blue Chip 35 Index, and Balanced Funds.
Bridgeway is authorized to issue 1,000,000,000 shares of common stock at $0.001 per share. 15,000,000 shares have been classified into the Aggressive Investors 1 Fund. 130,000,000 shares each have been classified into the Aggressive Investors 2 and Blue Chip 35 Index Funds. 5,000,000 shares have been classified into the Ultra-Small Company Fund. 100,000,000 shares have been classified in the Ultra-Small Company Market Fund. 10,000,000 shares have been classified in the Micro-Cap Limited Fund. 100,000,000 shares each have been classified into the Small-Cap Growth, Small-Cap Value, Large-Cap Growth, and Large-Cap Value Funds. 50,000,000 shares have been classified into the Balanced Fund. All shares outstanding currently represent Class N shares.
The Aggressive Investors 1 Fund is closed to new investors. The Ultra-Small Company Fund is open to existing investors (direct only).
All of the Funds are no-load, diversified funds.
The Aggressive Investors 1 and 2 Funds seek to exceed the stock market total return (primarily through capital appreciation) at a level of total risk roughly equal to that of the stock market over longer periods of time (three years or more).
The Ultra-Small Company, Ultra-Small Company Market, Micro-Cap Limited, Small-Cap Growth, Small-Cap Value, and Large-Cap Growth Funds seek to provide a long-term total return of capital, primarily through capital appreciation.
The Blue Chip 35 Index and Large-Cap Value Funds seek to provide long-term total return of capital, primarily through capital appreciation but also some income.
The Balanced Fund seeks to provide a high current return with short-term risk less than or equal to 40% of the stock market.
Bridgeway Capital Management, Inc. (the “Adviser”) is the investment adviser for all of the Funds.
2 . Significant Accounting Policies:
The following summary of significant accounting policies, followed in the preparation of the financial statements of the Funds, are in conformity with accounting principles generally accepted in the United States of America.
Securities, Options, Futures and Other Investments Valuation Other than options, portfolio securities that are principally traded on a national securities exchange are valued at their last sale price on the principal exchange on which they are traded prior to the close of the New York Stock Exchange (“NYSE”), on each day the NYSE is open for business. Portfolio securities other than options that are principally traded on the National Association of Securities Dealers Automated Quotation System (“NASDAQ”) are valued at the NASDAQ Official Closing Price (“NOCP”). In the absence of recorded sales on their home exchange or NOCP in the case of NASDAQ traded securities, the security will be valued as follows: bid prices for long positions and ask prices for short positions.
Short-term fixed income securities having a remaining maturity of 60 days or less are valued at amortized cost, which approximates market value. Options are valued at the average of the best bid and best asked quotations. Other investments for which no sales are reported are valued at the latest bid price in accordance with the pricing policy established by the Board of Directors.
| | |
| 138 | | Semi-Annual Report | December 31, 2008 (Unaudited) |
NOTES TO FINANCIAL STATEMENTS (continued)
December 31, 2008 (Unaudited)
Investments in open-end registered investment companies and closed-end registered investment companies that do not trade on an exchange are valued at the end of day net asset value per share. Investments in closed-end registered investment companies that trade on an exchange are valued at the last sales price as of the close of the customary trading session on the exchange where the security is principally traded.
When market quotations are not readily available or when events occur that make established valuation methods unreliable, securities of the Funds may be valued at fair value as determined in good faith by or under the direction of the Board of Directors. The valuation assigned to fair valued securities for purposes of calculating the Funds’ NAVs may differ from the security’s most recent closing market price and from the prices used by other mutual funds to calculate their NAVs.
Effective July 1, 2008, the Funds adopted Statement of Financial Accounting Standards (“SFAS”) No. 157, “Fair Value Measurements.” There was no impact to the Funds’ net assets or results of operations upon adoption. This standard establishes a single authoritative definition of fair value, sets out a framework for measuring fair value and requires additional disclosures about fair value measurements.
One key component of the implementation of SFAS 157 includes the development of a three-tier fair value hierarchy. The basis of the tiers is dependant upon the various “inputs” used to determine the value of the Funds’ investments. These inputs are summarized in the three broad levels listed below:
| | • | | Level 1—quoted prices in active markets for identical assets |
| | • | | Level 2—other significant observable inputs (including quoted prices for similar securities, interest rates, prepayments speeds, credit risk, etc.) |
| | • | | Level 3—significant unobservable inputs (including the Fund’s own assumptions in determining the fair value of investments) |
The inputs or methodology used for valuing investments is not necessarily an indication of the risk associated with investing in those investments. For example, short-term debt securities maturing in sixty days or less are generally valued at amortized cost in accordance with rules under the 1940 Act. Generally, amortized cost approximates the current fair value of a security, but since the valuation is not obtained from a quoted price in an active market, such securities are reflected as Level 2.
The following is a summary of the valuation inputs used to value the following Fund’s investments as of December 31, 2008:
| | | | | | | | | | | | | | | | | | | | | |
| | | LEVEL 1—Quoted Prices | | | LEVEL 2—Other Significant
Observable Inputs | | | Total | |
| Bridgeway Fund | | Investment
Securities | | Other
Financial
Instruments* | | | Investment
Securities | | Other
Financial
Instruments* | | | Investment
Securities | | Other
Financial
Instruments* | |
| | | | | | | | | | | | | | | | | | | | | |
Aggressive Investors 1 | | $ | 138,858,503 | | $ | (151,000 | ) | | | - | | $ | 3,310 | | | $ | 138,858,503 | | $ | (147,690 | ) |
Aggressive Investors 2 | | | 375,476,058 | | | (245,350 | ) | | $ | 1,248,817 | | | - | | | | 376,724,875 | | | (245,350 | ) |
Ultra-Small Company | | | 57,522,610 | | | | | | | 3,502,365 | | | - | | | | 61,024,975 | | | - | |
Ultra-Small Company Market | | | 311,248,115 | | | | | | | 5,710,282 | | | - | | | | 316,958,397 | | | - | |
Micro-Cap Limited | | | 24,756,091 | | | | | | | 196,522 | | | - | | | | 24,952,613 | | | - | |
Small-Cap Growth | | | 82,750,876 | | | | | | | - | | | 13,328 | | | | 82,750,876 | | | 13,328 | |
Small-Cap Value | | | 161,959,199 | | | | | | | - | | | (22,859 | ) | | | 161,959,199 | | | (22,859 | ) |
Large-Cap Growth | | | 77,773,342 | | | | | | | - | | | - | | | | 77,773,342 | | | - | |
Large-Cap Value | | | 34,864,260 | | | | | | | 24,054 | | | - | | | | 34,888,314 | | | - | |
Blue Chip 35 Index | | | 159,004,472 | | | | | | | - | | | - | | | | 159,004,472 | | | - | |
Balanced | | | 34,819,987 | | | (1,080,663 | ) | | | 18,383,435 | | | - | | | | 53,203,422 | | | (1,080,663 | ) |
| * | Other financial instruments are derivative instruments not reflected in the schedules of portfolio investments, such as futures, forwards, options written, and swap contracts, which are valued at the unrealized appreciation/depreciation on the instrument. |
NOTES TO FINANCIAL STATEMENTS (continued)
December 31, 2008 (Unaudited)
Securities Lending Upon lending its securities to third parties, the Fund receives compensation in the form of fees. The Fund also continues to receive dividends on the securities loaned. The loans are secured by collateral at least equal to the fair value of the securities loaned plus accrued interest. Gain or loss in the fair value of the securities loaned that may occur during the term of the loan will be for the account of the Fund. The Fund has the right under the lending agreement to recover the securities from the borrower on demand. Additionally, the Fund does not have the right to sell or repledge collateral received in the form of securities unless the borrower goes into default. The risks to the Fund of securities lending are that the borrower may not provide additional collateral when required or return the securities when due.
As of December 31, 2008, the Funds had securities on loan and related collateral with values shown below
| | | | | | |
| Bridgeway Fund | | Securities on
Loan Value | | Value of
Securities
Received as
Collateral |
| | | | | | |
Aggressive Investors 1 | | $ | 38,667,815 | | $ | 39,335,574 |
Aggressive Investors 2 | | $ | 82,210,098 | | $ | 85,777,485 |
Ultra-Small Company | | $ | 7,823,129 | | $ | 8,118,071 |
Ultra-Small Company Market | | $ | 34,875,495 | | $ | 37,861,788 |
Micro-Cap Limited | | $ | 3,031,379 | | $ | 3,069,485 |
Small-Cap Growth | | $ | 24,594,643 | | $ | 25,255,166 |
Small-Cap Value | | $ | 22,107,190 | | $ | 22,526,261 |
Large-Cap Growth | | $ | 11,399,173 | | $ | 11,620,032 |
Large-Cap Value | | $ | 528,625 | | $ | 553,060 |
Blue Chip 35 Index | | $ | 10,767,911 | | $ | 10,834,770 |
Balanced | | $ | 3,791,244 | | $ | 3,878,144 |
It is the Fund’s policy to obtain additional collateral from or return excess collateral to the borrower by the end of the next business day, following the valuation date of the securities loaned. Therefore, the value of the collateral held may be temporarily less than that required under the lending contract.
Federal Income Taxes It is the Funds’ policy to continue to comply with the provisions of the Internal Revenue Code applicable to registered investment companies and to distribute income to the extent necessary so that the Funds are not subject to federal income tax. Therefore, no federal income tax provision is required.
Use of Estimates in Financial Statements In preparing financial statements in conformity with accounting principles generally accepted in the United States of America, management makes estimates and assumptions that affect the reported amounts of assets and liabilities at the date of the financial statements and the disclosure of contingent assets and liabilities at the date of the financial statements as well as the reported amounts of revenue and expenses during the reporting period. Actual results could differ from those estimates.
Risks and Uncertainties The Funds provide for various investment options, including stocks and call and put options. Such investments are exposed to various risks, such as interest rate, market and credit risks. Due to the risks involved, it is at least reasonably possible that changes in risks in the near term would materially affect shareholders’ account values and the amounts reported in the financial statements and financial highlights.
Security Transactions, Expenses, Gains and Losses and Allocations Fund expenses that are not series specific are allocated to each series based upon its relative proportion of net assets to the Funds’ total net assets or other appropriate basis.
Security transactions are accounted for as of the trade date, the date the order to buy or sell is executed. Realized gains and losses are computed on the identified cost basis. Dividend income is recorded on the ex-dividend date, and interest income is recorded on the accrual basis from settlement date. Particularly related to the Balanced Fund, discounts and premiums are accreted/amortized on the effective interest method.
| | |
| 140 | | Semi-Annual Report | December 31, 2008 (Unaudited) |
NOTES TO FINANCIAL STATEMENTS (continued)
December 31, 2008 (Unaudited)
Futures Contracts A futures contract is an agreement between two parties to buy or sell a financial instrument at a set price on a future date. Upon entering into such a contract a Fund is required to pledge to the broker an amount of cash or U.S. government securities equal to the minimum “initial margin” requirements of the exchange on which the futures contract is traded. The contract amount reflects the extent of a Fund’s exposure in these financial instruments. The Fund’s participation in the futures markets involves certain risks, including imperfect correlation between movements in the price of futures contracts and movements in the price of the securities hedged or used for cover. The Fund’s activities in the futures contracts are conducted through regulated exchanges that do not result in counterparty credit risks on a periodic basis. Pursuant to a contract, the Fund agrees to receive from or pay to the broker an amount of cash equal to the fluctuation in value of the contract. Such receipts or payments are known as “variation margin” and are recorded by the Fund as unrealized appreciation or depreciation. When a contract is closed, the Fund records a realized gain or loss equal to the difference between the value of the contract at the time it was opened and the value at the time it was closed. As of December 31, 2008, the Funds had no open futures contracts.
Options An option is a contract conveying a right to buy or sell a financial instrument at a specified price during a stipulated period. The premium paid by a Fund for the purchase of a call or a put option is included in the Fund’s Schedule of Investments as an investment and subsequently marked to market to reflect the current market value of the option. When a Fund writes a call or a put option, an amount equal to the premium received by the Fund is included in the Fund’s Statement of Assets and Liabilities as a liability and is subsequently marked to market to reflect the current market value of the option written. If an option which a Fund has written either expires on its stipulated expiration date, or if the Fund enters into a closing purchase transaction, the Fund realizes a gain (or a loss if the cost of a closing purchase transaction exceeds the premium received when the option was written) without regard to any unrealized gain or loss on the underlying security, and the liability related to such options is extinguished. If a call option that a Fund has written is assigned, the Fund realizes a gain or loss from the sale of the underlying security and the proceeds from such sale are increased by the premium originally received. If a put option that a Fund has written is assigned, the amount of the premium originally received reduces the cost of the security that the Fund purchased upon exercise of the option. Buying calls increases a Fund’s exposure to the underlying security to the extent of any premium paid. Buying puts on a stock market index tends to limit a Fund’s exposure to a stock market decline. All options purchased by the Funds were listed on exchanges and considered liquid positions with readily available market quotes.
Covered Call Options and Secured Puts The Aggressive Investors 1, Aggressive Investors 2, and Balanced Funds may write call options on a covered basis, that is, the Fund will own the underlying security, or the Fund may write secured puts. The principal reason for writing covered calls and secured puts on a security is to attempt to realize income, through the receipt of premiums. The option writer has, in return for the premium, given up the opportunity for profit from a substantial price increase in the underlying security so long as the obligation as a writer continues, but has retained the risk of loss should the price of the security decline. All options were listed on exchanges and considered liquid positions with readily available market quotes. As of December 31, 2008 the following funds had outstanding written options, Aggressive Investors 1, Aggressive Investor 2 and Balanced Funds.
A summary of the options transactions written by each of the Funds is as follows:
| | | | | | | | | | | | | | |
| | | Aggressive Investors 1 Fund
Written Call Options | | | Aggressive Investors 1 Fund
Written Put Options | |
| | | Contracts | | | Premiums | | | Contracts | | | Premiums | |
| | | | | | | | | | | | | | |
Outstanding, June 30, 2008 | | - | | | $ | - | | | - | | | $ | - | |
Positions Opened | | 3,924 | | | | 3,677,260 | | | 500 | | | | 65,805 | |
Exercised | | - | | | | - | | | (500 | ) | | | (65,805 | ) |
Expired | | (1,040 | ) | | | (674,494 | ) | | - | | | | - | |
Closed | | (2,684 | ) | | | (2,836,017 | ) | | - | | | | - | |
| | | | | | | | | | | | | | | |
Outstanding, December 31, 2008 | | 200 | | | $ | 166,749 | | | - | | | $ | - | |
| | | | | | | | | | | | | | | |
Market Value, December 31, 2008 | | | | | $ | 151,000 | | | | | | $ | - | |
| | | | | | | | | | | | | | | |
NOTES TO FINANCIAL STATEMENTS (continued)
December 31, 2008 (Unaudited)
| | | | | | | |
| | | Aggressive Investors 2 Fund
Written Call Options | |
| | | Contracts | | | Premiums | |
| | | | | | | |
Outstanding, June 30, 2008 | | - | | | $ | - | |
Positions Opened | | 4,900 | | | | 4,473,880 | |
Exercised | | - | | | | - | |
Expired | | (1,291 | ) | | | (648,216 | ) |
Closed | | (3,289 | ) | | | (3,555,326 | ) |
| | | | | | | | |
Outstanding, December 31, 2008 | | 320 | | | $ | 270,338 | |
| | | | | | | | |
Market Value, December 31, 2008 | | | | | $ | 245,350 | |
| | | | | | | | |
| | | | | | | | | | | | | | |
| | | Balanced Fund Written
Call Options | | | Balanced Fund Written
Put Options | |
| | | Contracts | | | Premiums | | | Contracts | | | Premiums | |
| | | | | | | | | | | | | | |
Outstanding, June 30, 2008 | | 4,223 | | | $ | 729,973 | | | 1,695 | | | $ | 594,878 | |
Positions Opened | | 9,454 | | | | 2,591,545 | | | 5,973 | | | | 1,767,335 | |
Exercised | | (1,005 | ) | | | (142,073 | ) | | (2,345 | ) | | | (861,685 | ) |
Expired | | (7,413 | ) | | | (1,944,785 | ) | | (1,295 | ) | | | (381,795 | ) |
Closed | | (884 | ) | | | (223,992 | ) | | (2,137 | ) | | | (648,690 | ) |
| | | | | | | | | | | | | | | |
Outstanding, December 31, 2008 | | 4,375 | | | $ | 1,010,668 | | | 1,891 | | | $ | 470,043 | |
| | | | | | | | | | | | | | | |
Market Value, December 31, 2008 | | | | | $ | 921,230 | | | | | | $ | 159,433 | |
| | | | | | | | | | | | | | | |
Swaps. Each Fund may enter into total return swaps. Total return swaps are agreements that provide a Fund with a return based on the performance of an underlying asset, in exchange for fee payments to a counterparty based on a specified rate. The difference in the value of these income streams is recorded daily by the Funds, and is settled in cash monthly. The fee paid by a Fund will typically be determined by multiplying the face value of the swap agreement by an agreed upon interest rate. In addition, if the underlying asset declines in value over the term of the swap, the Fund would also be required to pay the dollar value of that decline to the counterparty. Total return swaps could result in losses if the underlying asset does not perform as anticipated by the Adviser. A Fund may use its own net asset value as the underlying asset in a total return swap. This strategy serves to reduce cash drag (the impact of cash on a Fund’s overall return) by replacing it with the impact of market exposure based upon the Fund’s own investment holdings. The following total return swaps were open as of December 31, 2008:
| | | | | | | | | |
| Portfolio | | Swap
Counterparty | | Notional
Principal | | Maturity
Date | | Net Unrealized
Gain\(Loss) |
| | | | | | | | | |
Small-Cap Growth | | ReFlow Management Co. | | 229,267 | | January 1, 2009 | | $ | 13,328 |
Indemnification Under Bridgeway’s organizational documents, the Funds’ officers, directors, employees and agents are indemnified against certain liabilities that may arise out of the performance of their duties to the Funds. Additionally, in the normal course of business, the Funds enter into contracts that contain a variety of indemnification clauses. The Funds’ maximum exposure under these arrangements is unknown as this would involve future claims that may be made against the Funds that have not yet occurred. However, the Funds have not had prior claims or losses pursuant to these contracts.
| | |
| 142 | | Semi-Annual Report | December 31, 2008 (Unaudited) |
NOTES TO FINANCIAL STATEMENTS (continued)
December 31, 2008 (Unaudited)
| 3. | Management Fees, Other Related Party Transactions and Contingencies: |
The Funds have entered into management agreements with the Adviser. As compensation for the advisory services rendered, facilities furnished, and expenses borne by the Adviser, the Funds pay the Adviser a fee pursuant to each Fund’s management agreement, as described below.
Aggressive Investors 1: A total advisory fee is paid by the Fund to the Adviser that is comprised of a Base Fee and a Performance Adjustment. The Base Fee equals the Base Fee Rate times the average daily net assets of the Fund. The Base Fee Rate is based on the following annual rates: 0.90% of the first $250 million of the Fund’s average daily net assets, 0.875% of the next $250 million and 0.85% of any excess over $500 million.
The Performance Adjustment equals 4.67% times the difference in cumulative total return between the Fund and the Standard and Poor’s 500 Index with dividends reinvested (hereinafter “Index”) over a rolling five-year performance period. The Performance Adjustment Rate varies from a minimum of –0.70% to a maximum of +0.70%. However, the Performance Adjustment Rate is zero if the difference between the cumulative Fund performance and the Index performance is less than or equal to 2%.
Aggressive Investors 2: A total advisory fee is paid by the Fund to the Adviser that is comprised of a Base Fee and a Performance Adjustment. The Base Fee equals the Base Fee Rate times the average daily net assets of the Fund. The Base Fee rate is based on the following annual rates: 0.90% of the first $250 million of the Fund’s average daily net assets, 0.875% of the next $250 million, 0.85% from $500 million to $1 billion, and 0.80% over $1 billion.
The Performance Adjustment equals 2.00% times the difference in cumulative total return between the Fund and the Standard and Poor’s 500 Index with dividends reinvested (hereinafter “Index”) over a rolling five-year performance period. The Performance Adjustment Rate varies from a minimum of -0.30% to a maximum of +0.30%. However, the Performance Adjustment Rate is zero if the difference between the cumulative Fund performance and the Index performance is less than or equal to 2%.
Ultra-Small Company: The Fund pays management fees based on the following annual rates: 0.90% of the first $250 million of the Fund’s average daily net assets, 0.875% of the next $250 million and 0.85% of any excess over $500 million. The management fees are computed daily and are payable monthly. However, during any period that the Fund’s net assets range from $27,500,000 to $55,000,000, the advisory fee will be determined as if the Fund had $55,000,000 under management. This is limited to a maximum annualized expense ratio of 1.49% of average net assets.
Ultra-Small Company Market: The Fund’s management fee is a flat 0.50% of the value of the Fund’s average daily net assets, computed daily and payable monthly.
Micro-Cap Limited: A total advisory fee is paid by the Fund to the Adviser that is comprised of a Base Fee and a Performance Adjustment. The Base Fee equals the Base Fee Rate times the average daily net assets of the Fund. The Base Fee Rate is based on the following annual rates: 0.90% of the first $250 million of the Fund’s average daily net assets, 0.875% of the next $250 million and 0.85% of any excess over $500 million. However, during any quarter that the Fund’s net assets range from $27,500,000 to $55,000,000, the advisory fee will be determined as if the Fund had $55,000,000 under management. This is limited to a maximum annualized expense ratio of 1.49% of the net assets in the quarter the advisory fee is determined.
The Performance Adjustment equals 2.87% times the difference in cumulative total return between the Fund and the CRSP Cap-based Portfolio 9 Index with dividends reinvested (hereinafter “Index”) over a rolling five-year performance period. The Performance Adjustment Rate varies from a minimum of –0.70% to a maximum of +0.70%. However, the Performance Adjustment Rate is zero if the difference between the cumulative Fund performance and the Index performance is less than or equal to 2%.
Small-Cap Growth and Small-Cap Value: A total advisory fee is paid by each Fund to the Adviser that is comprised of a Base Fee and a Performance Adjustment. The Base Fee equals the Base Fee Rate times the average daily net assets of the Fund. The Base Fee Rate is based on the annual rate of 0.60% of the value of the Fund’s average daily net assets.
NOTES TO FINANCIAL STATEMENTS (continued)
December 31, 2008 (Unaudited)
The Performance Adjustment equals 0.33% times the difference in cumulative total return between the Fund and the Russell 2000 Growth Index for Small-Cap Growth Fund and the Russell 2000 Value Index for Small-Cap Value Fund, with dividends reinvested (hereinafter “Index”) over a rolling five-year performance period. The Performance Adjustment Rate varies from a minimum of -0.05% to a maximum of +0.05%. However, the Performance Adjustment Rate is zero if the difference between the cumulative Fund’s performance and the Index performance is less than or equal to 2%.
Large-Cap Growth and Large-Cap Value: A total advisory fee is paid by each Fund to the Adviser that is comprised of a Base Fee and a Performance Adjustment. The Base Fee equals the Base Fee Rate times the average daily net assets of the Fund. The Base Fee Rate is based on the annual rate of 0.50% of the value of the Fund’s average daily net assets.
The Performance Adjustment equals 0.33% times the difference in cumulative total return between the Fund and the Russell 1000 Growth Index for Large-Cap Growth Fund and the Russell 1000 Value Index for the Large-Cap Value Fund, with dividends reinvested (hereinafter “Index”) over a rolling five-year performance period. The Performance Adjustment Rate varies from a minimum of -0.05% to a maximum of +0.05%. However, the Performance Adjustment Rate is zero if the difference between the cumulative Fund’s performance and the Index performance is less than or equal to 2%.
Blue Chip 35 Index: The Fund’s management fee is a flat 0.08% of the value of the Fund’s average daily Net Assets, computed daily and payable monthly.
Balanced: The Fund’s management fee is a flat 0.60% of the value of the Funds average daily Net Assets, computed daily and payable monthly.
Expense limitations: At a special meeting on March 31, 2005, shareholders of the Funds approved amendments to the Management Agreements detailing expense limitations. The Adviser agrees to reimburse the Funds for operating expenses and management fees above the expense limitations, which are shown as a ratio of net expenses to average net assets, for each Fund, for the period ended December 31, 2008. All expense limitations and total reimbursements for the period ended December 31, 2008, are shown below.
| | | | | | |
| Bridgeway Fund | | Expense
Limitation | | | Total Waivers and
Reimbursements
for Period Ending
12/31/08 |
| | | | | | |
Aggressive Investors 1 | | 1.80 | % | | $ | - |
Aggressive Investors 2 | | 1.75 | % | | | - |
Ultra-Small Company | | 2.00 | % | | | - |
Ultra-Small Company Market | | 0.75 | % | | | 15,417 |
Micro-Cap Limited | | 1.85 | % | | | - |
Small-Cap Growth | | 0.94 | % | | | - |
Small-Cap Value | | 0.94 | % | | | - |
Large-Cap Growth | | 0.84 | % | | | - |
Large-Cap Value | | 0.84 | % | | | 16,533 |
Blue Chip 35 Index | | 0.15 | % | | | 74,986 |
Balanced | | 0.94 | % | | | - |
Other Related Party Transactions: The Adviser entered into an Administrative Services Agreement with Bridgeway Funds pursuant to which the Adviser provides various administrative services to the Funds including, but not limited to: (i) supervising and managing various aspects of the Funds’ business and affairs; (ii) selecting, overseeing and/or coordinating activities with other service providers to the Funds; (iii) providing reports to the Board as requested from time to time; (iv) assisting and/or reviewing amendments and updates to the Funds’ registration statement and other filings with the SEC; (v) providing certain shareholder services; (vi) providing administrative support in connection with meetings of the Board of Directors; and (vii) providing certain recordkeeping services. For its services to the Funds, the Adviser is paid an aggregate annual fee of $635,000 payable in equal monthly installments.
| | |
| 144 | | Semi-Annual Report | December 31, 2008 (Unaudited) |
NOTES TO FINANCIAL STATEMENTS (continued)
December 31, 2008 (Unaudited)
One director of the Funds, John Montgomery, is an owner and director of the Adviser. Another director of the Fund, Michael Mulcahy, is an executive and director of the Adviser. Under the 1940 Act, each is considered to be an “affiliated person” of the Adviser and an “interested person” of the Adviser and of the Funds. Compensation for Mr. Montgomery and Mr. Mulcahy is borne by the Adviser rather than the Funds.
Board of Directors Compensation Independent Directors are paid an annual retainer of $8,000 with an additional retainer of $2,500 paid to the Independent Chairman of the Board and an additional retainer of $1,000 paid to the Nominating and Corporate Governance Committee Chair. Independent Director meeting fees are $6,000 per meeting.
The Independent Directors receive this compensation in the form of shares of Bridgeway Funds, credited to his or her account. Such Directors are reimbursed for any expenses incurred in attending meetings and conferences and expenses for subscriptions or printed materials. During the period ended December 31, 2008, total reimbursements made, across all of the Funds, was $3,028. The amount of directors’ fees attributable to each Fund is disclosed in the Statements of Operations.
4. Distribution and Shareholder Servicing Fees:
Foreside Fund Services, LLC acts as distributor of the Funds’ shares pursuant to a restated and amended Distribution Agreement dated July 1, 2007. The Adviser pays all costs and expenses associated with distribution of the Funds’ shares pursuant to a protective plan adopted by shareholders pursuant to Rule 12b-1.
5. Purchases and Sales of Investment Securities:
Purchases and sales of investments, other than short-term securities, for each Bridgeway Fund for the fiscal period ended December 31, 2008 were as follows:
| | | | | | | | | | | | |
| | | Purchases | | Sales |
| Bridgeway Fund | | U.S. Government | | Other | | U.S. Government | | Other |
| | | | | | | | | | | | |
Aggressive Investors 1 | | | - | | $ | 177,463346 | | | - | | $ | 166,354,685 |
Aggressive Investors 2 | | | - | | $ | 444,442,301 | | | - | | $ | 403,322,954 |
Ultra-Small Company | | | - | | $ | 33,237,785 | | | - | | $ | 36,267,120 |
Ultra-Small Company Market | | | - | | $ | 294,786,234 | | | - | | $ | 88,975,498 |
Micro-Cap Limited | | | - | | $ | 26,078,284 | | | - | | $ | 25,888,673 |
Small-Cap Growth | | | - | | $ | 36,350,554 | | | - | | $ | 33,205,996 |
Small-Cap Value | | | - | | $ | 106,301,429 | | | - | | $ | 74,061,539 |
Large-Cap Growth | | | - | | $ | 51,501,367 | | | - | | $ | 34,439,135 |
Large-Cap Value | | | - | | $ | 15,980,740 | | | - | | $ | 10,527,855 |
Blue Chip 35 Index | | | - | | $ | 126,958,648 | | | - | | $ | 90,934,591 |
Balanced | | $ | 498,518 | | $ | 14,884,381 | | $ | 1,787,188 | | $ | 22,850,218 |
6. Federal Income Taxes
Unrealized Appreciation and Depreciation on Investments (Tax Basis) The amount of net unrealized appreciation/depreciation and the cost of investment securities for tax purposes, including short-term securities at December 31, 2008, were as follows:
| | | | | | | | | | | | |
| | | Aggressive Investors 1 | | | Aggressive Investors 2 | | | Ultra-Small Company | |
As of December 31, 2008 | | | | | | | | | | | | |
Gross appreciation (excess of value over tax cost) | | $ | 3,417,382 | | | $ | 8,358,642 | | | $ | 6,936,596 | |
Gross depreciation (excess of tax cost over value) | | | (66,933,771 | ) | | | (196,402,393 | ) | | | (23,659,443 | ) |
| | | | | | | | | | | | | |
Net unrealized appreciation (depreciation) | | $ | (63,516,389 | ) | | $ | (188,043,751 | ) | | $ | (16,722,847 | ) |
| | | | | | | | | | | | | |
Cost of investments for income tax purposes | | $ | 202,227,202 | | | $ | 564,523,276 | | | $ | 77,747,822 | |
| | | | | | | | | | | | | |
NOTES TO FINANCIAL STATEMENTS (continued)
December 31, 2008 (Unaudited)
| | | | | | | | | | | | | | | | |
| | | Ultra-Small
Company Market | | | Micro-Cap Limited | | | Small-Cap Growth | | | Small-Cap Value | |
As of December 31, 2008 | | | | | | | | | | | | | | | | |
Gross appreciation (excess of value over tax cost) | | $ | 73,153,445 | | | $ | 2,647,705 | | | $ | 6,901,306 | | | $ | 14,145,956 | |
Gross depreciation (excess of tax cost over value) | | | (96,587,505 | ) | | | (7,146,761 | ) | | | (29,130,079 | ) | | | (70,073,404 | ) |
| | | | | | | | | | | | | | | | | |
Net unrealized appreciation (depreciation) | | $ | (23,434,060 | ) | | $ | (4,499,056 | ) | | $ | (22,228,773 | ) | | $ | (55,927,448 | ) |
| | | | | | | | | | | | | | | | | |
Cost of investments for income tax purposes | | $ | 340,392,457 | | | $ | 29,451,669 | | | $ | 104,992,977 | | | $ | 217,863,788 | |
| | | | | | | | | | | | | | | | | |
| | | | |
| | | Large-Cap Growth | | | Large-Cap Value | | | Blue Chip 35 Index | | | Balanced | |
As of December 31, 2008 | | | | | | | | | | | | | | | | |
Gross appreciation (excess of value over tax cost) | | $ | 3,716,897 | | | $ | 2,889,668 | | | $ | 3,949,251 | | | $ | 5,041,081 | |
Gross depreciation (excess of tax cost over value) | | | (37,077,705 | ) | | | (5,573,616 | ) | | | (48,145,780 | ) | | | (11,924,676 | ) |
| | | | | | | | | | | | | | | | | |
Net unrealized appreciation (depreciation) | | $ | (33,360,808 | ) | | $ | (2,683,948 | ) | | $ | (44,196,529 | ) | | $ | (6,883,595 | ) |
| | | | | | | | | | | | | | | | | |
Cost of investments for income tax purposes | | $ | 111,134,150 | | | $ | 37,572,262 | | | $ | 203,201,001 | | | $ | 59,006,354 | |
| | | | | | | | | | | | | | | | | |
The differences between book and tax net unrealized appreciation are primarily due to wash sale loss deferrals.
Classifications of Distributions Net investment income (loss) and net realized gain (loss) may differ for financial statement and tax purposes. The character of distributions made during the year from net investment income or net realized gains may differ from its ultimate characterization for federal income tax purposes.
The difference between book and tax components of net assets and the resulting reclassifications were primarily a result of the differing book/tax treatment of net operating losses and certain expenses.
The tax character of the distributions paid by the Funds during the last two fiscal years ended June 30, 2008 and June 30, 2007, respectively are as follows:
| | | | | | | | | | | | |
| | | Aggressive Investors 1 | | Aggressive Investors 2 |
| | | Year
Ended
June 30, 2008 | | Year
Ended
June 30, 2007 | | Year
Ended
June 30, 2008 | | Year
Ended
June 30, 2007 |
Distributions paid from: | | | | | | | | | | | | |
Long Term Capital Gain | | $ | 59,135,745 | | $ | 38,922,847 | | $ | 21,016,161 | | $ | 12,277,639 |
| | | | | | | | | | | | | |
Total | | $ | 59,135,745 | | $ | 38,922,847 | | $ | 21,016,161 | | $ | 12,277,639 |
| | | | | | | | | | | | | |
| | |
| | | Ultra-Small Company | | Ultra-Small Company Market |
| | | Year
Ended
June 30, 2008 | | Year
Ended
June 30, 2007 | | Year
Ended
June 30, 2008 | | Year
Ended
June 30, 2007 |
Distributions paid from: | | | | | | | | | | | | |
Ordinary income | | $ | 394,104 | | $ | 1,877,630 | | $ | 2,258,281 | | $ | 4,933,248 |
Long Term Capital Gain | | | 15,085,219 | | | 23,500,754 | | | 34,714,496 | | | 22,318,728 |
| | | | | | | | | | | | | |
Total | | $ | 15,479,323 | | $ | 25,378,384 | | $ | 36,972,777 | | $ | 27,251,976 |
| | | | | | | | | | | | | |
| | |
| 146 | | Semi-Annual Report | December 31, 2008 (Unaudited) |
NOTES TO FINANCIAL STATEMENTS (continued)
December 31, 2008 (Unaudited)
| | | | | | | | | | | | |
| | | Micro-Cap Limited | | Large-Cap Growth |
| | | Year
Ended
June 30, 2008 | | Year
Ended
June 30, 2007 | | Year
Ended
June 30, 2008 | | Year
Ended
June 30, 2007 |
Distributions paid from: | | | | | | | | | | | | |
Ordinary income | | $ | 99,874 | | $ | 1,475 | | $ | 501,206 | | $ | 357,354 |
Long Term Capital Gain | | | - | | | 14,953,926 | | | - | | | - |
| | | | | | | | | | | | | |
Total | | $ | 99,874 | | $ | 14,955,401 | | $ | 501,206 | | $ | 357,354 |
| | | | | | | | | | | | | |
| | |
| | | Large-Cap Value | | Blue Chip 35 Index |
| | | Year
Ended
June 30, 2008 | | Year
Ended
June 30, 2007 | | Year
Ended
June 30, 2008 | | Year
Ended
June 30, 2007 |
Distributions paid from: | | | | | | | | | | | | |
Ordinary income | | $ | 935,266 | | $ | 819,616 | | $ | 2,216,904 | | $ | 1,021,236 |
Long Term Capital Gain | | | 2,259,546 | | | - | | | - | | | - |
| | | | | | | | | | | | | |
Total | | $ | 3,194,812 | | $ | 819,616 | | $ | 2,216,904 | | $ | 1,021,236 |
| | | | | | | | | | | | | |
| | |
| | | Balanced | | |
| | | Year
Ended
June 30, 2008 | | Year
Ended
June 30, 2007 | | | | |
Distributions paid from: | | | | | | | | | | | | |
Ordinary income | | $ | 1,132,035 | | $ | 2,182,831 | | | | | | |
Long Term Capital Gain | | | - | | | 719,840 | | | | | | |
| | | | | | | | | | | | | |
Total | | $ | 1,132,035 | | $ | 2,902,671 | | | | | | |
| | | | | | | | | | | | | |
At June 30, 2008, the Funds had available for tax purposes, capital loss carryovers as follows:
| | | | | | | | | | | | |
| | | Ultra-Small Company | | Micro-Cap Limited | | Small-Cap Growth | | Small-Cap Value |
| Expiring 6/30/2013 | | | - | | | - | | | - | | $ | 948,551 |
| 6/30/2015 | | | - | | $ | 1,910,229 | | $ | 9,909,411 | | | - |
| 6/30/2016 | | $ | 3,822,016 | | | 1,720,318 | | | - | | | 1,491,117 |
| | | | |
| | | Large-Cap Growth | | Blue Chip 35 Index | | Balanced | | |
| Expiring 6/30/2009 | | | - | | $ | 100,306 | | | - | | | |
| 6/30/2010 | | | - | | | 429,064 | | | - | | | |
| 6/30/2011 | | | - | | | 337,509 | | | - | | | |
| 6/30/2012 | | | - | | | 327,296 | | | - | | | |
| 6/30/2013 | | $ | 2,323,531 | | | 282,192 | | | - | | | |
| 6/30/2014 | | | 2,412,639 | | | 402,963 | | | - | | | |
| 6/30/2015 | | | - | | | 418,882 | | $ | 21,741 | | | |
| 6/30/2016 | | | 1,302,044 | | | 31,461 | | | - | | | |
NOTES TO FINANCIAL STATEMENTS (continued)
December 31, 2008 (Unaudited)
Components of Net Assets (Tax Basis) As of June 30, 2008, the components of net assets on a tax basis were:
| | | | | | | | | | | | |
| | | Aggressive Investors 1 | | | Aggressive Investors 2 | | | Ultra-Small Company | |
Accumulated net investment income (loss) | | $ | - | | | $ | - | | | $ | 113,762 | |
Accumulated net realized gain (loss) on investments | | | 1,868,083 | | | | (15,315,025 | )* | | | (7,037,178 | )* |
Net unrealized appreciation/depreciation of investments | | | 76,233,001 | | | | 172,856,316 | | | | 4,032,073 | |
| | | | | | | | | | | | | |
Total | | $ | 78,101,084 | | | $ | 157,541,291 | | | $ | (2,891,343 | ) |
| | | | | | | | | | | | | |
| | | |
| | | Ultra-Small
Company Market | | | Micro-Cap Limited | | | Small-Cap Growth | |
Accumulated net investment income (loss) | | $ | 6,894,753 | | | $ | 76,496 | | | $ | - | |
Accumulated net realized gain (loss) on investments | | | 28,745,392 | | | | (5,808,865 | )* | | | (9,909,411 | ) |
Net unrealized appreciation/depreciation of investments | | | 124,907,651 | | | | 2,801,384 | | | | 22,316,646 | |
Other book/tax differences | | | - | | | | - | | | | (346 | ) |
| | | | | | | | | | | | | |
Total | | $ | 160,547,796 | | | $ | (2,930,985 | ) | | $ | 12,406,889 | |
| | | | | | | | | | | | | |
| | | |
| | | Small-Cap Value | | | Large-Cap Growth | | | Large-Cap Value | |
Accumulated net investment income (loss) | | $ | 293,980 | | | $ | 289,288 | | | $ | 365,278 | |
Accumulated net realized gain (loss) on investments | | | (10,436,449 | )* | | | (8,093,563 | )* | | | (1,229,330 | )* |
Net unrealized appreciation/depreciation of investments | | | 40,626,453 | | | | 22,773,518 | | | | 7,198,981 | |
Other book/tax differences | | | (346 | ) | | | (340 | ) | | | (340 | ) |
| | | | | | | | | | | | | |
Total | | $ | 30,483,638 | | | $ | 14,968,903 | | | $ | 6,334,589 | |
| | | | | | | | | | | | | |
| | | |
| | | Blue Chip 35 Index | | | Balanced | | | | |
Accumulated net investment income (loss) | | $ | 2,911,094 | | | $ | 1,415,470 | | | | | |
Accumulated net realized gain (loss) on investments | | | (2,696,383 | )* | | | (21,743 | ) | | | | |
Net unrealized appreciation/depreciation of investments | | | (25,690,557 | ) | | | 4,984,509 | | | | | |
| | | | | | | | | | | | | |
Total | | $ | (25,475,846 | ) | | $ | 6,378,236 | | | | | |
| | | | | | | | | | | | | |
| * | Includes losses incurred in the period November 1, 2007 through June 30, 2008 which the Fund has elected to defer to its period ending June 30, 2009. Post October Losses—Under current tax law, capital losses realized after October 31 of a Fund’s period may be deferred and treated as occurring on the first business day of the following period for tax purposes. The Aggressive Investors 2 Fund, The Ultra-Small Company Fund, The Micro-Cap Limited Fund, The Small-Cap Value Fund, The Large-Cap Growth Fund, The Large-Cap Value Fund and The Blue-Chip 35 Index Fund had deferred post October losses of $15,315,025, $3,215,162, $2,178,318, $7,996,781, $2,055,350, $1,229,330, and $366,710 respectively. |
At December 31, 2008 the Funds did not record any liabilities for net unrecognized tax benefits relating to uncertain income tax positions they have taken or expect to take in future tax returns.
7. Bank Borrowings
Certain Bridgeway Funds established a line of credit agreement (“Facility”) with PNC Bank, N.A. (the “Bank” or “Lender”) which matures on October 6, 2009 and is renewable annually at the Bank’s option, to be used for temporary or emergency purposes, primarily for financing redemption payments. Any and all advances under this Facility would be at the sole discretion of the Lender based on the merits of the specific transaction. Advances under the Facility are limited to $5,000,000 in total for all Funds (except Aggressive Investors 1 and Aggressive Investors 2 Funds), or 33 1/3% of a Fund’s net assets. Borrowings under the line of credit bear interest based on the Lender’s Prime Rate. Principal is due fifteen days after each advance and at maturity. Interest is payable monthly in arrears. No Fund had borrowings under the Facility during the fiscal period ended December 31, 2008.
| | |
| 148 | | Semi-Annual Report | December 31, 2008 (Unaudited) |
NOTES TO FINANCIAL STATEMENTS (continued)
December 31, 2008 (Unaudited)
During the fiscal period ended December 31, 2008 each of the Funds engaged in short-term borrowings from PFPC Trust Company, the Funds’ Custodian. Interest on the borrowings was charged at 1.25 times the Federal Fund Rate. The average daily loan balance during the period for which loans were outstanding and the weighted average interest rate was:
| | | | | | | |
| Bridgeway Fund | | Average Borrowing | | | Average Rate | |
| | | | | | | |
Aggressive Investors 1 | | $ | (1,042,848 | ) | | 1.75 | % |
Aggressive Investors 2 | | | (5,286,037 | ) | | 1.37 | |
Ultra-Small Company Market | | | (4,411,054 | ) | | 1.38 | |
Micro-Cap Limited | | | (281,441 | ) | | 1.74 | |
Small-Cap Growth | | | (887,103 | ) | | 1.23 | |
Small-Cap Value | | | (1,653,781 | ) | | 0.92 | |
Large-Cap Growth | | | (1,648,978 | ) | | 1.00 | |
Large-Cap Value | | | (260,325 | ) | | 1.92 | |
Blue Chip 35 Index | | | (2,175,604 | ) | | 1.27 | |
Balanced | | | (1,115,684 | ) | | 0.90 | |
8. Redemption Fees:
In Ultra-Small Company Market Fund a 2.00% redemption fee may be charged on shares held less than six months or for redemptions in a down market, subject to a maximum combined redemption fee of 2%. In Blue Chip 35 Index Fund a 1.00% redemption fee may be charged on redemptions in a down market.
At a Board Meeting held on August 15, 2008, the Board of Directors elected to eliminate the redemption fee for redemptions in a down market for both the Ultra-Small Company Market Fund and Blue Chip 35 Index Fund effective October 31, 2008.
9. New Accounting Pronouncements
In March 2008, the Financial Accounting Standards Board issued the Statement of Financial Accounting Standards No. 161, “Disclosures about Derivative Instruments and Hedging Activities” (“SFAS No. 161”). SFAS No. 161 is effective for periods and interim periods beginning after November 15, 2008. SFAS No. 161 requires enhanced disclosures about the Funds’ derivative and hedging activities, including how such activities are accounted for and their effect on the Funds’ financial position, performance and cash flows. Management is currently evaluating the impact the adoption of SFAS No. 161 will have, if any, on the Funds’ financial statements and related disclosures.
OTHER INFORMATION
December 31, 2008 (Unaudited)
1. Proxy Voting
Fund policies and procedures used in determining how to vote proxies relating to Funds’ securities and a summary of proxies voted by the Funds for the period ended June 30, 2008 are available without a charge, upon request, by contacting Bridgeway Funds at 1-800-661-3550 and on the Securities and Exchange Commission’s (“SEC”) website at http://www.sec.gov.
2. Fund Holdings
The complete schedules of the Funds’ holdings for the second and fourth quarters of each fiscal year are contained in the Funds’ Semi-Annual and Annual shareholder reports, respectively.
The Bridgeway Funds file complete schedules of the Funds’ holdings with the SEC for the first and third quarters of each fiscal year on Form N-Q within 60 days after the end of the period. Copies of the Funds’ Form N-Q are available without charge, upon request, by contacting Bridgeway Funds at 1-800-661-3550 and on the SEC’s website at http://www.sec.gov. You may also review and copy Form N-Q at the SEC’s Public Reference Room in Washington, D.C. For more information about the operation of the Public Reference Room, please call 1-800-SEC-0330.
| | |
| 150 | | Semi-Annual Report | December 31, 2008 (Unaudited) |
DISCLOSURE OF FUND EXPENSES
December 31, 2008 (Unaudited)
As a shareholder of a Fund, you will not incur sales charges (loads) on purchases, on reinvested dividends, or on other distributions. There are no exchange fees. Shareholders are subject to redemption fees on the Ultra-Small Company Market and Blue Chip 35 Index Funds under certain circumstances. However, as a shareholder of the Fund, you will incur ongoing costs, including management fees and other Fund expenses. The following examples are intended to help you understand your ongoing costs (in dollars) of investing in the Fund and to compare these costs with ongoing costs of investing in other mutual funds. The examples are based on an investment of $1,000 invested on July 1, 2008 and held until December 31, 2008.
Actual Return. The first line of the table below provides information about actual account values and actual expenses. You may use the information in this line, together with the amount you invested, to estimate the expenses that you paid over the period. Simply divide you’re account value by $1,000 (for example, an $8,600 account value divided by $1,000 = 8.6), then multiply the result by the number in the first line under the heading “Expense Paid During the Period” to estimate the expenses you paid on your account during the period.
Hypothetical 5% Return. The second line of the table below provides information about hypothetical account values and hypothetical expenses based on the Fund’s actual expense ratio and an assumed rate of return of 5% per year before expenses, which is not the Fund’s actual return. The hypothetical account values and expenses may not be used to estimate the actual ending account balance or expenses you paid for the period. You may use this information to compare the ongoing costs of investing in a Fund and other mutual funds. To do so, compare this 5% hypothetical example with the 5% hypothetical examples that appear In the shareholder reports of other funds. The expenses shown in the table are meant to highlight ongoing Fund costs only. Therefore, the second line of the table is useful in comparing ongoing costs only, and will not help you determine the relative total costs of owning different funds, because other funds may also have transaction costs, such as sales charges, redemption fees or exchange fees.
| | | | | | | | | | | |
| | | Beginning Account
Value at 7/1/08 | | Ending Account
Value at 12/31/08 | | Expense
Ratio | | Expense Paid
During Period*
7/1/08 - 12/31/08 |
| | | | |
| Bridgeway Aggressive Investors 1 | | | | | | | | | | | |
| | | | | | | | | | | | |
Actual Fund Return | | $ | 1,000.00 | | $ | 468.70 | | 0.52% | | $ | 1.93 |
Hypothetical Fund Return | | $ | 1,000.00 | | $ | 1,022.28 | | 0.52% | | $ | 2.65 |
| | | | |
| Bridgeway Aggressive Investors 2 | | | | | | | | | | | |
| | | | | | | | | | | | |
Actual Fund Return | | $ | 1,000.00 | | $ | 473.60 | | 1.17% | | $ | 4.35 |
Hypothetical Fund Return | | $ | 1,000.00 | | $ | 1,019.10 | | 1.17% | | $ | 5.95 |
| | | | |
| Bridgeway Ultra Small Company Fund | | | | | | | | | | | |
| | | | | | | | | | | | |
Actual Fund Return | | $ | 1,000.00 | | $ | 654.40 | | 1.12% | | $ | 4.67 |
Hypothetical Fund Return | | $ | 1,000.00 | | $ | 1,019.35 | | 1.12% | | $ | 5.70 |
| | | |
| Bridgeway Ultra Small Company Market Fund | | | | | | | | |
| | | | | | | | | | | | |
Actual Fund Return | | $ | 1,000.00 | | $ | 701.90 | | 0.75% | | $ | 3.22 |
Hypothetical Fund Return | | $ | 1,000.00 | | $ | 1,021.22 | | 0.75% | | $ | 3.82 |
| | | | |
| Bridgeway Micro-Cap Limited Fund | | | | | | | | | | | |
| | | | | | | | | | | | |
Actual Fund Return | | $ | 1,000.00 | | $ | 670.20 | | 1.01% | | $ | 4.25 |
Hypothetical Fund Return | | $ | 1,000.00 | | $ | 1,019.91 | | 1.01% | | $ | 5.14 |
| | | | |
| Bridgeway Small-Cap Growth Fund | | | | | | | | | | | |
| | | | | | | | | | | | |
Actual Fund Return | | $ | 1,000.00 | | $ | 617.90 | | 0.87% | | $ | 3.55 |
Hypothetical Fund Return | | $ | 1,000.00 | | $ | 1020.61 | | 0.87% | | $ | 4.43 |
DISCLOSURE OF FUND EXPENSES (continued)
December 31, 2008 (Unaudited)
| | | | | | | | | | | |
| | | Beginning Account
Value at 7/1/08 | | Ending Account
Value at 12/31/08 | | Expense
Ratio | | Expense Paid
During Period*
7/1/08 - 12/31/08 |
| | | | |
| Bridgeway Small-Cap Value Fund | | | | | | | | | | | |
| | | | | | | | | | | | |
Actual Fund Return | | $ | 1,000.00 | | $ | 593.00 | | 0.81% | | $ | 3.25 |
Hypothetical Fund Return | | $ | 1,000.00 | | $ | 1,020.92 | | 0.81% | | $ | 4.13 |
| | | | |
| Bridgeway Large-Cap Growth Fund | | | | | | | | | | | |
| | | | | | | | | | | | |
Actual Fund Return | | $ | 1,000.00 | | $ | 595.90 | | 0.76% | | $ | 3.06 |
Hypothetical Fund Return | | $ | 1,000.00 | | $ | 1021.17 | | 0.76% | | $ | 3.87 |
| | | | |
| Bridgeway Large-Cap Value Fund | | | | | | | | | | | |
| | | | | | | | | | | | |
Actual Fund Return | | $ | 1,000.00 | | $ | 736.40 | | 0.84% | | $ | 3.68 |
Hypothetical Fund Return | | $ | 1,000.00 | | $ | 1,020.77 | | 0.84% | | $ | 4.28 |
| | | | |
| Bridgeway Blue Chip 35 Index Fund | | | | | | | | | | | |
| | | | | | | | | | | | |
Actual Fund Return | | $ | 1,000.00 | | $ | 780.70 | | 0.15% | | $ | 0.67 |
Hypothetical Fund Return | | $ | 1,000.00 | | $ | 1,024.24 | | 0.15% | | $ | 0.77 |
| | | | |
| Bridgeway Balanced Fund | | | | | | | | | | | |
| | | | | | | | | | | | |
Actual Fund Return | | $ | 1,000.00 | | $ | 845.30 | | 0.94% | | $ | 4.37 |
Hypothetical Fund Return | | $ | 1,000.00 | | $ | 1,020.26 | | 0.94% | | $ | 4.79 |
| * | Expenses are equal to the average account value times the Fund’s annualized expense ratio multiplied by the number of days in the most recent fiscal half-year divided by the number of days in the fiscal year. |
| | |
| 152 | | Semi-Annual Report | December 31, 2008 (Unaudited) |
BRIDGEWAY FUNDS, INC.
Citi Fund Services, LLC
PO Box 182218
Columbus, OH 43218-2218
(713) 661-3500 (800)-661-3550
CUSTODIAN
PNC Global Investment Services
8800 Tinicum Blvd., 4th Floor
Philadelphia, PA 19153
DISTRIBUTOR
Foreside Fund Services, LLC
Three Canal Plaza, Suite 100
Portland, ME 04101
You can review and copy information about our Funds (including the SAI) at the SEC’s Public Reference Room in Washington, D.C. To find out more about this public service, call the SEC at 800-SEC-0330. Reports and other information about the Funds is also available on the SEC’s website at www.sec.gov. You can receive copies of this information, for a fee, by writing the Public Reference Section, Securities and Exchange Commission, Washington, D.C. 20549-0102 or by sending an electronic request to the following email address: publicinfo@sec.gov
185-SR-1208
Item 2. Code of Ethics.
Not applicable
Item 3. Audit Committee Financial Expert.
Not applicable
Item 4. Principal Accountant Fees and Services.
Not applicable
Item 5. Audit Committee of Listed Registrants.
Not applicable.
Item 6. Investments.
(a)Schedule of investments is included as part of the Report to Stockholders filed under Item 1 of this form.
(b)The Registrant made no divestments of securities in accordance with section 13(a) of the Investment Company Act of 1940.
Item 7. Disclosure of Proxy Voting Policies and Procedures for Closed-End Management Investment Companies.
Not applicable.
Item 8. Portfolio Managers of Closed-End Management Investment Companies.
Not applicable.
Item 9. Purchases of Equity Securities by Closed-End Management Investment Company and Affiliated Purchasers.
Not applicable.
Item 10. Submission of Matters to a Vote of Security Holders.
Not applicable.
Item 11. Controls and Procedures.
(a)The registrant’s principal executive officer and principal financial officer have concluded, based on their evaluation of the registrant’s disclosure controls and procedures as conducted within 90 days of the filing date of this report, that these disclosure controls and procedures are adequately designed and are operating effectively to ensure that information required to be disclosed by the registrant on Form N-CSR is recorded, processed, summarized and reported within the time periods specified in the Securities and Exchange Commission’s rules and forms.
(b)There were no changes in the registrant’s internal control over financial reporting (as defined in Rule 30a-3(d) under the Act (17 CFR 270.30a-3(d)) that occurred during the second fiscal quarter of the period covered by this report that have materially affected or are reasonably likely to materially affect, the registrant’s internal control over financial reporting.
Item 12. Exhibits.
(a)(1)
Not applicable
(a)(2) Certifications pursuant to Rule 30a-2(a) are attached hereto.
(a)(3) Not applicable.
| (b) | Certifications pursuant to Rule 30a-2(b) are furnished herewith. |
SIGNATURES
Pursuant to the requirements of the Securities Exchange Act of 1934 and the Investment Company Act of 1940, the registrant has duly caused this report to be signed on its behalf by the undersigned, thereunto duly authorized.
(Registrant) BRIDGEWAY FUNDS, INC.
By (Signature and Title)*/s/ Michael D. Mulcahy
Michael D. Mulcahy
President and Principal Executive Officer
Date 3/5/2009
Pursuant to the requirements of the Securities Exchange Act of 1934 and the Investment Company Act of 1940, this report has been signed below by the following persons on behalf of the registrant and in the capacities and on the dates indicated.
By (Signature and Title)*/s/ Michael D. Mulcahy
Michael D. Mulcahy
President and Principal Executive Officer
Date 3/5/2009
By (Signature and Title)*/s/ Linda Giuffre
Linda Giuffre
Treasurer and Principal Financial Officer
Date 3/5/2009