UNITED STATES
SECURITIES AND EXCHANGE COMMISSION
Washington, D.C. 20549
FORM N-CSR
CERTIFIED SHAREHOLDER REPORT OF REGISTERED
MANAGEMENT INVESTMENT COMPANIES
Investment Company Act file number 811-08200
Bridgeway Funds, Inc.
(Exact name of registrant as specified in charter)
20 Greenway Plaza, Suite 450
Houston, Texas 77046
(Address of principal executive offices) (Zip code)
Michael D. Mulcahy, President
Bridgeway Funds, Inc.
20 Greenway Plaza, Suite 450
Houston, Texas 77046
(Name and address of agent for service)
Registrant’s telephone number, including area code: (713) 661-3500
Date of fiscal year end: June 30
Date of reporting period: July 1, 2011 through December 31, 2011
Form N-CSR is to be used by management investment companies to file reports with the Commission not later than 10 days after the transmission to stockholders of any report that is required to be transmitted to stockholders under Rule 30e-1 under the Investment Company Act of 1940 (17 CFR 270.30e-1). The Commission may use the information provided on Form N-CSR in its regulatory, disclosure review, inspection, and policymaking roles.
A registrant is required to disclose the information specified by Form N-CSR, and the Commission will make this information public. A registrant is not required to respond to the collection of information contained in Form N-CSR unless the Form displays a currently valid Office of Management and Budget (“OMB”) control number. Please direct comments concerning the accuracy of the information collection burden estimate and any suggestions for reducing the burden to Secretary, Securities and Exchange Commission, 100 F Street, NE, Washington, DC 20549. The OMB has reviewed this collection of information under the clearance requirements of 44 U.S.C. § 3507.
| Item 1. | Reports to Stockholders. |
The Report to Shareholders is attached herewith.
A no-load mutual fund family of domestic funds
Semi-Annual Report
December 31, 2011 (Unaudited)
AGGRESSIVE INVESTORS 1
BRAGX
AGGRESSIVE INVESTORS 2
BRAIX
ULTRA-SMALL COMPANY
BRUSX
(Open to Existing Investors — Direct Only)
ULTRA-SMALL COMPANY MARKET
BRSIX
MICRO-CAP LIMITED
BRMCX
SMALL-CAP MOMENTUM
BRSMX
SMALL-CAP GROWTH
BRSGX
SMALL-CAP VALUE
BRSVX
LARGE-CAP GROWTH
BRLGX
LARGE-CAP VALUE
BRLVX
BLUE CHIP 35 INDEX
BRLIX
MANAGED VOLATILITY
BRBPX
www.bridgeway.com
| TABLE OF CONTENTS |  |
| 1 | ||||
AGGRESSIVE INVESTORS 1 FUND | 16 | |||
| 12 | ||||
| 18 | ||||
AGGRESSIVE INVESTORS 2 FUND | ||||
| 21 | ||||
| 27 | ||||
ULTRA-SMALL COMPANY FUND | ||||
| 30 | ||||
| 36 | ||||
ULTRA-SMALL COMPANY MARKET FUND | ||||
| 41 | ||||
| 47 | ||||
MICRO-CAP LIMITED FUND | ||||
| 58 | ||||
| 63 | ||||
SMALL-CAP MOMENTUM FUND | ||||
| 67 | ||||
| 72 | ||||
SMALL-CAP GROWTH FUND | ||||
| 80 | ||||
| 85 | ||||
SMALL-CAP VALUE FUND | ||||
| 88 | ||||
| 93 | ||||
LARGE-CAP GROWTH FUND | ||||
| 96 | ||||
| 101 | ||||
LARGE-CAP VALUE FUND | ||||
| 104 | ||||
| 109 | ||||
BLUE CHIP 35 INDEX FUND | ||||
| 112 | ||||
| 117 | ||||
MANAGED VOLATILITY FUND | ||||
| 119 | ||||
| 123 | ||||
| 127 | ||||
| 131 | ||||
| 133 | ||||
| 135 | ||||
| 139 | ||||
| 145 | ||||
| 161 | ||||
| 162 | ||||
|
Bridgeway Funds Standardized Returns as of December 31, 2011*
| Annualized | ||||||||||||||||||||||||||||||||
| Fund | Quarter 10/1/11 to 12/31/11 | Six Months to 12/31/11 | 1 Year | 5 Years | 10 Years | Inception to Date | Inception Date | Gross Expense | ||||||||||||||||||||||||
Aggressive Investors 1 | 13.48% | -16.77% | -10.31% | -6.29% | 2.34% | 12.03% | 8/5/1994 | 1.25%3 | ||||||||||||||||||||||||
Aggressive Investors 2 | 10.64% | -18.26% | -11.59% | -5.23% | 2.62% | 2.98% | 10/31/2001 | 0.70% | ||||||||||||||||||||||||
Ultra-Small Company | 14.47% | -16.34% | -14.64% | -3.87% | 9.53% | 14.38% | 8/5/1994 | 1.18% | ||||||||||||||||||||||||
Ultra-Small Co Market | 14.94% | -11.28% | -7.86% | -3.67% | 8.09% | 9.06% | 7/31/1997 | 0.80%1 | ||||||||||||||||||||||||
Micro-Cap Limited | 19.10% | -13.58% | -9.48% | -5.31% | 3.34% | 8.70% | 6/30/1998 | 1.58%3 | ||||||||||||||||||||||||
Small-Cap Momentum | 18.80% | -8.15% | -0.92% | NA | NA | 10.84% | 5/28/2010 | 5.43%1 | ||||||||||||||||||||||||
Small-Cap Growth | 19.95% | -11.83% | -0.63% | -5.05% | NA | 1.19% | 10/31/2003 | 0.98%1 | ||||||||||||||||||||||||
Small-Cap Value | 16.69% | -8.70% | 1.05% | -2.74% | NA | 4.27% | 10/31/2003 | 0.87% | ||||||||||||||||||||||||
Large-Cap Growth | 12.41% | -7.84% | -0.71% | -0.02% | NA | 2.93% | 10/31/2003 | 0.86%1 | ||||||||||||||||||||||||
Large-Cap Value | 12.64% | -5.23% | 2.33% | -0.69% | NA | 5.77% | 10/31/2003 | 1.17%1 | ||||||||||||||||||||||||
Blue Chip 35 Index | 11.84% | -0.23% | 3.17% | 0.44% | 2.71% | 4.27% | 7/31/1997 | 0.27%1 | ||||||||||||||||||||||||
Managed Volatility | 8.98% | -0.43% | 1.94% | 0.74% | 3.77% | 3.36% | 6/30/2001 | 1.22%1 | ||||||||||||||||||||||||
Omni Small-Cap Value4 | 17.13% | NA | NA | NA | NA | 3.89% | 8/31/2011 | 1.00%1 | ||||||||||||||||||||||||
Omni Tax-Managed Small-Cap Value4 | 15.78% | -11.43% | -5.41% | NA | NA | -5.41% | 12/31/2010 | 1.56%1 | ||||||||||||||||||||||||
Bridgeway Funds Returns for Calendar Years 1998 through 2011*
| 1998 | 1999 | 2000 | 2001 | 2002 | 2003 | 2004 | 2005 | 2006 | 2007 | 2008 | 2009 | 2010 | 2011 | |||||||||||||||||||||||||||||||||||||||||||
Aggressive Investors 1 | 19.28% | 120.62% | 13.58% | -11.20% | -18.01% | 53.97% | 12.21% | 14.93% | 7.11% | 25.80% | -56.16% | 23.98% | 17.82% | -10.31% | ||||||||||||||||||||||||||||||||||||||||||
Aggressive Investors 2 | -19.02% | 44.01% | 16.23% | 18.59% | 5.43% | 32.19% | -55.07% | 29.84% | 12.10% | -11.59% | ||||||||||||||||||||||||||||||||||||||||||||||
Ultra-Small Company | -13.11% | 40.41% | 4.75% | 34.00% | 3.98% | 88.57% | 23.33% | 2.99% | 21.55% | -2.77% | -46.24% | 48.93% | 23.55% | -14.64% | ||||||||||||||||||||||||||||||||||||||||||
Ultra-Small Co Market | -1.81% | 31.49% | 0.67% | 23.98% | 4.90% | 79.43% | 20.12% | 4.08% | 11.48% | -5.40% | -39.49% | 25.95% | 24.86% | -7.86% | ||||||||||||||||||||||||||||||||||||||||||
Micro-Cap Limited | 49.55% | 6.02% | 30.20% | -16.61% | 66.97% | 9.46% | 22.55% | -2.34% | -4.97% | -41.74% | 17.65% | 29.11% | -9.48% | |||||||||||||||||||||||||||||||||||||||||||
Small-Cap Momentum | -0.92% | |||||||||||||||||||||||||||||||||||||||||||||||||||||||
Small-Cap Growth | 11.59% | 18.24% | 5.31% | 6.87% | -43.48% | 15.04% | 11.77% | -0.63% | ||||||||||||||||||||||||||||||||||||||||||||||||
Small-Cap Value | 17.33% | 18.92% | 12.77% | 6.93% | -45.57% | 26.98% | 16.55% | 1.05% | ||||||||||||||||||||||||||||||||||||||||||||||||
Large-Cap Growth | 6.77% | 9.33% | 4.99% | 19.01% | -45.42% | 36.66% | 13.34% | -0.71% | ||||||||||||||||||||||||||||||||||||||||||||||||
Large-Cap Value | 15.15% | 11.62% | 18.52% | 4.49% | -36.83% | 24.92% | 14.51% | 2.33% | ||||||||||||||||||||||||||||||||||||||||||||||||
Blue Chip 35 Index | 39.11% | 30.34% | -15.12% | -9.06% | -18.02% | 28.87% | 4.79% | 0.05% | 15.42% | 6.07% | -33.30% | 26.61% | 10.60% | 3.17% | ||||||||||||||||||||||||||||||||||||||||||
Managed Volatility | -3.51% | 17.82% | 7.61% | 6.96% | 6.65% | 6.58% | -19.38% | 12.39% | 5.41% | 1.94% | ||||||||||||||||||||||||||||||||||||||||||||||
Omni Small-Cap Value4,5 | NA | |||||||||||||||||||||||||||||||||||||||||||||||||||||||
Omni Tax-Managed | ||||||||||||||||||||||||||||||||||||||||||||||||||||||||
Small-Cap Value4 | -5.41% | |||||||||||||||||||||||||||||||||||||||||||||||||||||||
Performance figures quoted represent past performance and are no guarantee of future results. Current performance may be lower or higher than the performance data quoted. Investment return and principal value will fluctuate, so that an investor’s shares, when redeemed, may be worth more or less than original cost. To obtain performance current to the most recent month-end, please visit our website at www.bridgeway.com or call 1-800-661-3550. Total return figures include the reinvestment of dividends and capital gains.
1 Some of the Funds’ fees were waived or expenses reimbursed; otherwise, returns would have been lower. The Adviser has contractually agreed to waive fees and/or reimburse expenses. Any material change to this Fund policy would require a vote by shareholders.
2 Expense ratios are as stated in the current prospectus. Please see financial highlights for expense ratios as of December 31, 2011.
3 The management fee included in the gross expense ratio for the Aggressive Investors 1 and Micro-Cap Limited Funds has been restated to reflect only the base management fee payable under each Fund’s performance-based management fee structure. The total actual management fee for the fiscal year ended June 30, 2011 was -0.76% and -0.36%, respectively. The actual total management fee for the prior fiscal year was negative due to the negative performance adjustment of the investment management fee under each Fund’s performance-based management fee structure.
| i | www.bridgeway.com | |
| (continued) | |
4These funds are offered in a separate prospectus and their semi-annual reports are also in a separate book.
5Commenced operations on 8/31/11, therefore the Fund has no 1 year return as of 12/31/11.
* Numbers highlighted in green indicate periods when the Fund outperformed its primary benchmark.
This report is submitted for the general information of the shareholders of each Fund. It is not authorized for distribution to prospective investors unless preceded or accompanied by an effective prospectus, which includes information regarding a Fund’s risks, objectives, fees and expenses, experience of its management, and other information. Investors should read the prospectus carefully before investing in a Fund. For questions or other Fund information, call 1-800-661-3550 or visit the Funds’ website at www.bridgeway.com. Funds are available for purchase by residents of the United States, Puerto Rico, U.S. Virgin Islands and Guam only. Foreside Fund Services, LLC, Distributor.
The views expressed here are exclusively those of Fund management. These views, including those relating to the market, sectors or individual stocks are not meant as investment advice and should not be considered predictive in nature.
| ii | www.bridgeway.com | |
| LETTER FROM THE INVESTMENT MANAGEMENT TEAM | |
December 31, 2011
Dear Fellow Shareholders,
Ten of thirteen Bridgeway Funds beat their primary market benchmarks in the December quarter. The fourteenth, Managed Volatility, met its long-term target (more than 40% of the S&P 500 Index on the upside). On the heels of last quarter, which was characterized by the most macro-driven market on record — an environment particularly unfavorable to our Select Funds (see page 10 for a description of our Select Funds) and more growth leaning Funds — seven of twelve Funds with a full year of operation beat their primary market benchmarks for the full calendar year, with Managed Volatility also meeting its target return. Overall, it was a strong quarter, but mixed calendar year.
A review of the December quarter market environment appears on page 2. Following the steep decline of the September quarter, this was a “bounceback” market, with larger companies making a strong enough comeback at year end to eke out a small positive return for the calendar year. Meanwhile, smaller stocks ended the year with red ink and the smallest ones with quite a bit of red ink. Growth stocks (those growing sales and earnings at a faster clip) trumped value stocks (those that are cheap based on some economic metrics) for the third calendar year in a row, according to Russell Index metrics.
Page 3 presents more details of the characteristics of a macro-driven market, a topic we introduced last quarter. A Q&A follows on this topic, including the possibilities we see going forward. While we do not believe it is possible to predict whether or not the recent macro-dominated market will continue, the adviser has made incremental improvements to its models within the context of an unchanged investment process that it believes will help the relative performance of its Select Funds (defined on page 10) in either climate.
Bridgeway continues to believe that one of the most serious risks facing investors in the next three to five years is inflation risk. Page 7 presents some details as to what investors might expect when and if inflation kicks in, with a focus on stocks, fixed income, gold, real estate securities, and inflation-protected securities.
Each calendar year we have a friendly competition with Morningstar’s “Fund picks.” Indeed, this year Morningstar’s picks did prove to be a higher hurdle than our primary market benchmarks. In the macro-driven 2011 market that we consider unfavorable to a number of our stock picking models, Morningstar beat Bridgeway 8 to 5. See details on page 8.
The Aggressive Investors Funds continue to be a favorite of our founder and chief investment officer, John Montgomery. In spite of a recent track record of underperformance in three of the last four years, see why John still favors these Funds in his personal asset allocation (page 9).
Every Fund we manage at Bridgeway falls under the “statistically driven, evidence based investing” moniker. However, to help investors understand more of how we think of them, we have divided our Funds into two categories: “Select” and “Omni.” See page 10 for this delineation and where your Fund(s) fit in.
You may know that Bridgeway is committed to giving half of its own company profits to charitable and non-profit organizations — part of something we call transformative change. On page 11, our partner, Rebecca Hove, discusses what this means and gives some examples.
As always, we appreciate your feedback. We take your comments very seriously and regularly discuss them internally to help in managing our Funds and this company. Please keep your ideas coming — both favorable and critical. They provide us with a vital tool, helping us serve you better.
Sincerely,
Your Investment Management Team | ||||
 |  | |||
| John Montgomery | Christine Liang | |||
 |  | |||
| Michael Whipple | Elena Khoziaeva | |||
 |  ] ] | |||
| Dick Cancelmo | Rasool Shaik | |||
| 1 | Semi-Annual Report | December 31, 2011 (Unaudited) | |
LETTER FROM THE INVESTMENT MANAGEMENT TEAM (continued) | |
Market Review
The Short Version: Roaring back from an awful quarter ended September 30, 2011, stocks rallied enough to put many market segments slightly into the black for calendar year 2011.
Having endured some of the wildest volatility in years, investors were rewarded with a positive fourth quarter as optimism about the U.S. economy and corporate landscape reigned. Consumer confidence rose. Manufacturing appeared to be on the mend: the Institute for Supply Management Index depicted continued expansion, though flooding in Thailand raised new concerns. Housing starts and home sales rebounded late in the year, though any real sector recovery may be slow in coming. Labor showed signs of improvements as the unemployment rate fell to 8.3% in December. Inflation is not an issue for now, though investors cannot disregard future pressures with oil topping $100 per barrel amid new supply/demand worries. The Fed Funds rate is expected to remain at or near zero percent throughout 2012, and Chairman Bernanke and the Federal Reserve Board are focusing on an improved communications strategy to keep investors informed about plans for the future and the thought processes behind them.
Global geopolitical events continue to impact the U.S. stock market. Just when Europe has seemed to be taking positive steps to move past crisis mode, along come Spain, Italy, and Hungary to remind investors that the road to recovery will be paved with many bumps. Optimism returned at the end of the period, however, following an agreement among major central banks to act together to mitigate Europe’s debt crisis.
Among the various U.S. equity sectors, energy, real estate, consumer staples, and industrials were particularly strong with solid double-digit gains. Other strong performers included consumer discretionary, health care, financials, and materials.
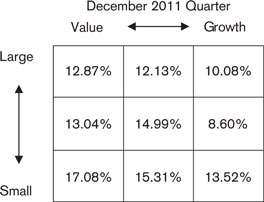
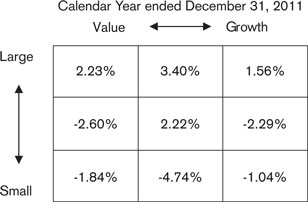
Looking at the market from a “style box” perspective (see below), returns for the quarter were strong across all styles and market capitalizations. According to Morningstar, small-cap value stocks were the strongest market segment in the December quarter, up 17.08% while mid-cap growth stocks were the weakest at 8.60%.
With significant gyrations of the overall market and various market segments, large-cap stocks made a strong enough comeback to achieve positive calendar year returns. Generally speaking, growth stocks beat value stocks — for the third year in a row — but this trend was not uniform. Small stocks lagged significantly (the Russell 2000 Index of small stocks was down 4.18%), and the smallest of the small, ultra-small stocks (as represented by the CRSP 10 Index), were down a whopping 13.98%.
Following are the stock market “style box” returns from Morningstar for the quarter and year:
 |  |
| www.bridgeway.com | 2 | |
LETTER FROM THE INVESTMENT MANAGEMENT TEAM (continued) | |
Follow up to (statistically) the Most Macro-Driven Market in History — August/September 2011
The Short Version: When Wall Street focuses on macro economic events rather than the underlying economic health of individual companies, the growth leaning models of our higher turnover “Select” Funds suffer mightily, typically giving back the strong performance of prior periods. This section examines the dynamics of macro-driven markets and analyzes the returns of one Fund, Aggressive Investors 1, centering on the issues of volatility, bear markets, and macro-driven markets. Within the context of an unchanged investment process, the adviser has made incremental changes to its stock picking models that we believe will help relative performance in future macro-driven markets without any cost to our performance in micro-driven markets, which historically comprise the vast majority of markets.
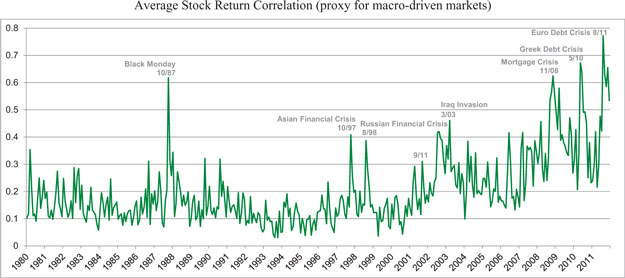
Last quarter, we introduced the concept of macro-driven markets, markets where investors focus on macro events instead of the fundamental economic health of individual companies. Statistically, we can measure macro-driven markets as peaks of stock correlation. Stock correlation is a measurement of the degree to which the returns of individual stocks go up and down in a linear (proportional) relationship to the market overall. When the correlation coefficient spikes up, it is due to some “macro” event — for example, the European banking crisis, recession, fiscal gridlock, or war, just to name a few — and investors tend to focus on this “macro” news. When this happens, investors take their eyes “off the ball” of the economic health of individual companies in favor of moving money into entire segments of the market (in the recent quarter ended September 30, 2011, into the perceived safety of utilities and staples) or into other asset classes altogether (such as U.S. Treasury securities, bonds, or gold).
Over the last eight decades there have been six very macro-driven markets, environments within which investors sell whole groups of stocks as they panic, and stop paying attention to the fundamental economic health of individual companies. These are not the same as bear markets, since, for example, the bear market of 2000-2002 was strongly “micro-driven.” It occurred because investors had become concerned with the exuberance surrounding large technology and internet stocks and began looking seriously at the health and actual earnings capacity of individual companies. That bear market environment was much more favorable to our growthier, higher turnover stock picking models. Our Funds that use stock picking models extensively and selectively (and thus focus on the economic health of individual companies) are at a significant disadvantage during macro-driven markets, such as the quarter ended September 30, 2011. Unfortunately, three of the biggest macro-driven markets in history have occurred in the last three and a half years, badly hurting the relative returns of some of our Funds in this recent period.
The graph below presents the average correlation coefficients among stock returns of Russell 1000 Index companies. As this graph indicates, nearly all of the biggest spikes (those above 0.5 in correlation) of the last few decades have occurred in the last three and a half year period. In fact, going back to 1926, there have been just six such spikes of volatility, and fully half have been in recent years.
| 3 | Semi-Annual Report | December 31, 2011 (Unaudited) | |
| LETTER FROM THE INVESTMENT MANAGEMENT TEAM (continued) | |
What are the implications of these correlation spikes or “macro-driven” market environments?
Most of Bridgeway’s stock picking models rely on company level data, such as economic data from income statements, balance sheets, and cash flow statements. These models seek to predict the relative attractiveness of one stock versus all the others in our universe of companies. When the stock market correlations spike, relative stock performance generally has little effect on individual stock prices, and our higher turnover growth leaning models tend to do more poorly. This is especially true if a spike follows a period of strong outperformance. Thus, our strong performance in the months and years leading up to June 2008 was followed by a particularly painful July 2008 through March 2009, when the mortage and banking crisis resulted in a macro-driven market. Similarly, a relatively strong fiscal year ending June 2011 was followed by a painful September quarter 2011, when stock correlations spiked up again.
Which Bridgeway Funds are most negatively affected by macro-driven markets?
Poorer returns in macro-driven markets tend to align with four factors: a) our “Select” Funds, those that hold a smaller number of “purer” stock picks, b) those with significant exposure to “growth” rather than “value” stocks, c) mid- and small-size rather than large companies, and d) higher turnover Funds. Thus, Aggressive Investors 1 and 2 Funds, Micro-Cap Limited Fund, Ultra-Small Company Fund, and Small-Cap Growth Fund have been the hardest hit over the last three and a half years. Large-Cap Growth Fund has also been hurt, due to its growth orientation and fewer (less than 100) holdings, although its lower turnover and larger company size have protected it to some degree. Relatively unaffected have been Large-Cap Value Fund, and our “Omni” or asset-class Funds that tend to hold many more stocks, Ultra-Small Company Market, Omni Small-Cap Value, Omni Tax-Managed Small-Cap Value, Blue Chip 35 Index, and Small-Cap Momentum Funds.
In order to demonstrate the effects of a macro-driven market on Fund returns, we will use Aggressive Investors 1 Fund in this Q&A, since it is a fund with an 18 year history and it exhibits all of the characteristics that would make it susceptible to the negative impacts of macro-driven markets.
How often does a macro-driven market occur?
Historically, it has been rare. In the last three and a half years it has been frequent.
To demonstrate how narrowly our Aggressive Investors 1 Fund returns have aligned with macro-driven markets (measured as spikes in the correlation of stock returns) we put the trailing three-month returns relative to the S&P 500 Index into ten equal “buckets” from very low correlation (“micro-driven”) markets to very high correlation (“macro-driven”) markets.
| www.bridgeway.com | 4 | |
| LETTER FROM THE INVESTMENT MANAGEMENT TEAM (continued) | |
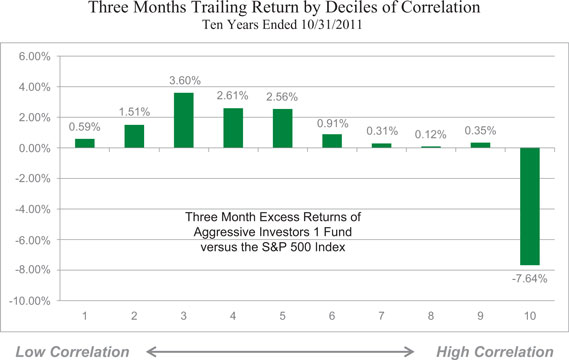
As this graph indicates, Aggressive Investors 1 Fund has tended to outperform the market over the full spectrum of correlation, except, very notably, the high correlation peaks. The implications of this graph are significant. High correlation markets in and of themselves are not a big problem to our models: it’s the spikes that are a big problem.
Don’t the last three years represent the “new normal” for the market?
It is noteworthy that from July 2010 through June 2011, stock return correlations dropped back down significantly to the range of 0.2 to 0.4. During that year, Aggressive Investors 1 Fund outperformed its market benchmark by 10%. So we have recently seen one year without a correlation spike, and it was good for our performance generally (though not uniformly). We don’t believe low correlation markets are dead.
More specifically, Bridgeway’s investment team believes that eventually, the market has to focus at the level of individual companies’ health. While stock prices may move in lock step (proportionally) for periods of time, the underlying health of our nation’s companies do not. Eventually, the prices must follow economic health at the individual corporate level.
Negative news and macro events have been present throughout history. Why do stock price movements focus very broadly on these events some of the time, as in the recent macro-driven market, but not most of the time?
One theory is that there are many more investment vehicles today that allow people to invest in broad sectors of the market that were not previously available. These include index funds, program trading (credited with the correlation spike in 1987), complex derivative contracts available to institutions, and exchange traded funds. The latter, in particular, are a relatively new phenomenon and make up a very significant portion of stock market trading today.
However, while these instruments make it easier to trade whole segments of the market, we do not believe that they are in and of themselves responsible for it. In a fascinating (ok, fascinating if you are a statistical economist) paper by Jonathan LeBarge (“The Bane of Investors’ Existence: Why is Correlation High and When Will it Fall?,” BCA Research, January 4, 2012) on the “whys” of high stock correlation, the authors make a compelling argument that the underlying cause is due, paradoxically, to “the previous moderation in economic volatility and the rise in financial leverage that resulted.” Thus, financial leverage (borrowing), in its many forms (individual, national, and especially in the banking system itself) makes the system less stable; that’s
| �� | ||
| 5 | Semi-Annual Report | December 31, 2011 (Unaudited) | |
| LETTER FROM THE INVESTMENT MANAGEMENT TEAM (continued) | |
the nature of leverage. We believe that it will take time to reduce this leverage, and that in the meantime the base level of stock correlation will remain high. However, the spikes in correlation are the real problem for certain of our Funds, rather than an elevated base level. It is much less clear whether we will continue to see the correlation spikes in the next few years.
What would lead to more correlation spikes?
Additional, very negative news on the financial front would be more likely to lead to another spike in correlation. These could include: further major declines in the U.S. real estate market, continued or accelerated national fiscal gridlock, a reversal of recent declining unemployment, and a true meltdown in Europe. The opposite would likely lead to declining correlation.
Isn’t the performance problem with Bridgeway select growth models just that they perform poorly in big down markets?
No; in fact, it is instructive to study the three major bear markets since inception of Aggressive Investors 1 Fund:
| “Normal Bear” | “Ideal Bear” | “Macro Driven Bear” | ||||||||||||||||||||||||||
| High Correl. | Low Correl. | Low Correl. | Low Correl. | High Correl. | High Correl. | |||||||||||||||||||||||
| Russian Default | Bouncebk. | “Internet Bust” | Bouncebk. | Bear Mkt | Junk Rally | |||||||||||||||||||||||
| (3/98-9/98) | (9/98-9/99) | (3/00-12/02) | (12/02-12/03) | (3/08-3/09) | (3/09-6/10*) | |||||||||||||||||||||||
Aggr. Investors 1 | -25.5 | % | 80.5 | % | -26.6 | % | 54.0 | % | -53.1 | % | 20.3 | % | ||||||||||||||||
S&P 500 Index | -7.0 | % | 27.8 | % | -39.0 | % | 28.7 | % | -38.1 | % | 32.7 | % | ||||||||||||||||
Difference | -18.5 | % | 52.7 | % | 12.4 | % | 25.3 | % | -15.0 | % | -12.4 | % | ||||||||||||||||
* Performance greater than one year is annualized.
During the high correlation bear market of mid-1998, our Fund performed much more poorly than the overall market. Fortunately, it was followed by a low correlation recovery period, within which our Fund performed excellently, more than making up for the prior downfall. This is what our team thinks of as a “normal” bear market. Of course, in reality each market has its own unique characteristics.
The extended and painful bear market of 2000-2002 was low correlation (micro-driven) and favorable to our Fund’s relative performance. You may recall that this was the period of the “internet bust,” during which investors specifically focused on the actual fundamentals of companies, rather than on the hope for future revenues and earnings or on macro-economic events. Thus, it was a “micro-driven” market, favorable to our Fund. We actually provided some nice “cushion” in this downturn. And when the market bounced back, we continued to do well.
The most recent bear market has been most unfavorable to our Fund. It was a precipitous fall driven by macro events that lead to a deep recession. But the recovery period has also been characterized by two more spikes of correlation, most recently as investors focus on the European Banking crisis, Italy and Greece, and the spectre of a “double dip” recession in the U.S.
Isn’t the performance problem with Bridgeway’s “growthier” select models just that they perform poorly in highly volatile market environments?
No. It is true that the recent correlation spikes line up with high volatility. But as the table above indicates, we have seen other high volatility markets during which we performed relatively well.
Overall, our relative performance has related much more to stock market correlation peaks than to the existence of a bull or a bear environment or low or high volatility.
If there is still risk of another correlation spike and it’s so detrimental to some of Bridgeway’s Funds, shouldn’t we just sell before they occur?
We believe that predicting future macro-economic events is a loser’s proposition. The best economists have a mediocre track record at best in this regard. Even if you forecast one or two pieces correctly, the full system is wildly complex. Further, you have to make two excellent calls: when to get out and when to get back in; one good call by itself can still leave you in a worse
| www.bridgeway.com | 6 | |
| LETTER FROM THE INVESTMENT MANAGEMENT TEAM (continued) | |
off situation. Finally, you may make two correct calls on the economy, but be off slightly on the timing of the market itself and still come out behind. Bridgeway’s investment team believes strongly that waiting for the market to come back “before you get back in” is a losing proposition for all of the reasons above, plus the fact that when it does bounce back it can do so very quickly. Overall, timing the economy, like timing the market itself, is a wildly risky business. As difficult as it may feel, we believe sticking with an appropriate long term plan is the best course of action.
If macro-driven markets represent such a problem for Bridgeway’s more growth-oriented select models and Funds, isn’t there anything Bridgeway can do to correct this?
Yes. Bridgeway has made strong ongoing investments in our research staff, data, and systems over the last few years. We have made incremental improvements to our models without changing anything about our investment philosophy or process. We believe these improvements, based on our backtesting and research, will help relative returns even in macro- and micro-driven markets. Improvements include adding more and higher quality data, testing of different data sources, a new proprietary valuation metric, testing of a new and exciting variable, calibrating some models for narrower market niches, better testing the “depth” (how many stocks in a ranking give strong returns) of our models, retiring some poorer performing models, and better modeling our sell rules.
While we believe that backtesting over multiple market and economic cycles is the best way to understand risks and potential return relationships, past performance, whether modeled or of a specific Fund, does not guarantee future returns.
Returns in a High Inflationary Environment — no place to hide?
The Short Version: With inflation at low single digit levels, people aren’t talking about it much. Yet Bridgeway’s investment management team believes this is one of the very significant investment risks on the horizon. In this section we present why we are worried, what investments historically provide the best hedge, and why they may not work so well this time. Taking a long term, disciplined, and diversified view is still probably one of the best antidotes.
Bridgeway studies stock market history going back many decades, primarily with a view toward understanding risks. Looking forward, one of the biggest risks we see in the two to five-year timefame is increasing inflation. Due to fiscal policy decisions, TARP in the context of a major recession, and war, the national debt as a percent of gross national product is near the highest level since the mid-1940’s. Historically, the U.S. has “inflated” its way out of high debt periods and we think that will likely be true this time. Here is our view of various asset classes:
Long-term bonds. With yields at very low levels, the probability for increasing rates appears much higher than normal. Inflation would accelerate this. When interest rates rise, bond prices fall. We think long-term U.S. treasuries are very risky for this reason. We would be less concerned about default risk, which was in the news last year when treasuries lost their AAA rating. Of higher concern to us is inflation risk. The risks of corporate bonds are similar, though somewhat moderated. Investors have been pulling money out of stock market mutual funds in favor of fixed income funds for four straight years now. We worry that this move is timed just wrong with respect to inflation risk.
Short-term treasuries, CD’s, and money market accounts. The advantage of short-term treasuries and money market accounts is that as inflation heats up and rates rise, investors get the benefit of rising rates. A thirty year bond holder is locked into the current low fixed yields for thirty years. Short-term fixed income holders are not. However, even short-term fixed income can be risky. From 1940 to 1950, for example, the purchase power of 90-day treasuries (with interest reinvested) declined a whopping 41% due to inflation.
Treasury inflation protected securities (TIPS). This has been one of Bridgeway’s favorites as a hedge against inflation for a fixed income investor. Unfortunately (looking forward), mid-term TIPS have had double digit returns in three of the last five years. This is unusual and not at all sustainable. Returns have skyrocketed because interest rates have declined and inflationary fears have heated up to some degree. This leave TIPS with a negative real yield. Thus, investors are paying a hefty premium for the inflation “insurance” feature of this instrument. We still like them as a good long term diversifier, but it seems late to get the full benefit of this investment over the next few years.
Gold. Gold is one traditional hedge against inflation. Over very long time periods, however, gold has been a poor investment. That’s what we dislike the most about it. Gold has very little commercial use and doesn’t tend to create value as stocks and
| 7 | Semi-Annual Report | December 31, 2011 (Unaudited) | |
| LETTER FROM THE INVESTMENT MANAGEMENT TEAM (continued) | |
bonds do. It glitters, and it could be useful as an international currency in time of war. With the almost six-fold increase in gold over the last five years, however, we would be very concerned that it may be fundamentally overpriced. Translate: risky.
Real estate. This is another classical hedge against inflation. Actual real estate is highly illiquid, and if purchased with debt, highly risky. REITs are a liquid alternative; that is, you can buy and sell them easily. But they have also had quite a run in the last three years. REITS are within about 10% of their early 2008 levels. Similar to gold and TIPS, it seems late to establish a new position.
Stocks. Stocks typically suffer as inflation heats up, but then recover as companies increase the prices for their goods and services to keep up with inflation. That’s what we like about stocks over the long term with respect to inflation.
Our conclusions? If you have overexposure to fixed income instruments: beware. The best solution is probably the same we recommend in any market environment: get a long term asset allocation plan consistent with your cash needs, investment horizon and risk tolerance. Put it in place and don’t deviate from it, especially when it feels most uncomfortable to stay the course.
Performance Versus Morningstar Analyst Picks
The Short Version: A close race: Bridgeway 5, Morningstar 8. While a majority of the Bridgeway Funds (7 of 13) outperformed their respective market benchmarks in calendar year 2011, Morningstar did slightly better and edged out Bridgeway’s record by three.
Morningstar, the Chicago-based independent research firm publishes a list of “analysts’ picks” every year for each asset class, as determined by its analysts. Each year in January, when the final tallies are in, we compare the performance of each of our Funds to the average returns of Morningstar’s top picks for the comparable asset class. How did we do in 2011?
In the face of the macro-driven market described on page 3, 2011 was a mediocre year relative to our market benchmarks —seven of thirteen Bridgeway Funds beat their primary market benchmarks. We fared worse against the “higher hurdle” —and it was a higher hurdle in 2011 — of Morningstar’s “top picks.”
The table below depicts the results by Morningstar category and relevant Bridgeway Fund.
| Bridgeway Funds | Morningstar Analyst “Picks” | |||||||||
| Name | 2011 Return | Morningstar Category | 2011 Return | |||||||
Aggressive Investors 1 | -10.31% | *Mid-cap growth | -4.58% | |||||||
Aggressive Investors 2 | -11.59% | *Mid-cap growth | -4.58% | |||||||
Ultra-Small Company | -14.64% | *Small growth | 0.03% | |||||||
Ultra-Small Company Market | -7.86% | *Small blend | -1.49% | |||||||
Micro-Cap Limited | -9.48% | *Small growth | 0.03% | |||||||
Small-Cap Growth | -0.63% | *Small growth | 0.03% | |||||||
*Small-Cap Value | 1.05% | Small value | -9.69% | |||||||
*Omni Tax-Managed | -5.41% | Small value | -9.69% | |||||||
Small-Cap Momentum | -0.92% | *Small growth | 0.03% | |||||||
*Large-Cap Growth | -0.71% | Large-cap growth | -2.84% | |||||||
*Large-Cap Value | 2.33% | Large-cap value | -7.27% | |||||||
*Blue Chip 35 Index | 3.17% | Large-cap blend | 1.87% | |||||||
Managed Volatility | 1.94% | *Long-Short Equity | 4.67% | |||||||
1This fund is offered in a separate prospectus and its semi-annual report is also in a separate book.
“*” means a “win” on that contest. Past performance is not an indicator of future results. The Bridgeway Funds’ adviser, Bridgeway Capital Management, Inc., does not have any influence on the selection of the funds chosen by Morningstar’s analysts. The number and specific funds used in the comparison are in the control and discretion of Morningstar and their analysts and are subject to change. Morningstar’s criteria for choosing Analyst Picks includes, but is not limited to, factors such as
| www.bridgeway.com | 8 | |
| LETTER FROM THE INVESTMENT MANAGEMENT TEAM (continued) | |
performance, expenses, and quality of fund management. In addition, the comparison of Bridgeway Funds to the Morningstar Analyst Picks is limited to performance only and does not take into consideration other factors that are considered by Morningstar when compiling their list of Analyst Picks.
Each Bridgeway Fund is compared to the average total return of the group of funds selected by Morningstar at the beginning of 2011 for the one-year period ended December 31, 2011. These averages in the table are comprised of between two and seventeen funds from within each category. In an effort to provide a complete and balanced assessment, all of the Bridgeway Funds are used in the comparison table shown above such that no attempt is made to cull out unfavorable results. The purpose of this comparison is to “raise the bar” on performance comparison as this analysis uses an arguably higher benchmark by comparing the Bridgeway Funds to other funds chosen by an independent source that specializes in investment research.
“One Star Fund” a Favorite
The Short Version: One of Bridgeway’s first funds has underperformed in three of the last four calendar years. That’s not a record we’re proud of, but John Montgomery is staying put and has even invested more. [As discussed in our June 2011 annual report; we are not suggesting that you simply copy John’s lead; his investment horizon and risk tolerance could be different from yours.] Here he discusses in Q&A format the reasons a data-driven investor such as himself would do that.
In our last annual report for the period ended June 30, 2011, Bridgeway’s founder and investment team leader, John Montgomery, disclosed his personal asset allocation targets. Fully half of the funds he expects to retire on are in the Aggressive Investors (1 and 2) style. The following is an interview with John about this holding:
Since Aggressive Investors 1 and 2 have been Bridgeway’s two poorest performing Funds over the last four years, but also your largest holding, isn’t it time to jettison them?
My long-term allocation includes a very healthy slice of Aggressive Investors 1 and 2. I “eat my own cooking.” I also take a long-term view, and if you think as I do that the strategy is viable, the worst time to sell it would be when it’s most out of favor. So no, I’m not selling it.
What do you mean by “long term view?”
First of all, although I’m 56, I don’t plan to retire anytime soon, so the long-term investment horizon, at least five years and preferably ten years or more, is appropriate for me. Second, I have a high tolerance for risk. “Aggressive” is in the name of the Fund for a reason. The main way I manage risks is to keep my expenses low relative to my income. That means I can save and invest more and give more away. The Aggressive Investors strategy has done very well for me over the long haul and for eight of the nine years leading up to 2008 — but not in the macro-driven markets that began in mid-2008. Sadly, some of our investors got in after a performance run (“buy high”) and bailed after the downturn (“sell low”). That’s a formula for financial disaster that we see too often.
How do you decide when to buy and sell?
I stay put and look at rebalancing annually or when I have more money to invest. If I were in net withdrawal mode, I’d be harvesting from what has done the best to get me back to my target. It’s a contrarian strategy that forces me to invest more in what has recently done poorly. That means I’ve been adding to Aggressive Investors 1 and 2, Ultra-Small Company, and Micro-Cap Limited Funds.
But when might an investor consider selling an underperforming fund?
The time to reconsider the appropriateness of an investment is when your own circumstances change or when the investment process or management changes. My financial circumstances haven’t changed, and our investment process has not changed, although we continue to update models, and no one has left our investment management team in eleven years. We have increasingly skilled and experienced people working on our performance just as we would whether we were outperforming or not. Also, it gives me comfort that we can explain our periods of under- and outperformance. For example, the worst time to sell a previously strong performing value fund with a solid investment process was in 1999, when growth had just had an amazing run, but was about to reverse.
| 9 | Semi-Annual Report | December 31, 2011 (Unaudited) | |
| LETTER FROM THE INVESTMENT MANAGEMENT TEAM (continued) | |
When will the aggressive investors style be back in favor?
We will never know the exact timing. We do know that macro-driven markets have presented an uphill performance terrain for Aggressive Investors 1 and 2 that relates to the investment process of the Funds. Specifically, the models that are the big engine of the Fund are focused on the economic health of individual companies, while the market has significantly ignored these factors during the correlation spikes. The macro-driven markets may continue into 2012 and 2013, but we don’t think they will continue forever, and it would not surprise me to see no more major spikes for a decade.
Can’t the investment team do anything to improve performance during these correlation spikes, or macro-driven markets?
Yes, we think we have enough data on these environments to reasonably address them — should they continue. But we’re doing this in such a way that it doesn’t change our process, and more importantly, based on our research, would not have hurt our returns in low correlation markets. The last thing we want to do is make changes to the Funds that address the last battle at the cost of most other market environments. The value managers who moved toward a growth process in 1999 didn’t fare too well in the first half of the 2000’s.
Introducing Bridgeway Omni and Bridgeway Select Fund Strategies
We have recently divided our Funds into two distinct styles, Omni and Select. While the two styles are very different, our basic investment philosophy continues to be the same statistically driven, evidence-based philosophy we have always used. We will describe the similarities and differences between the two styles in the following paragraphs.
Our Basic Investment Philosophy
If you have visited our website in the past year, you may have noticed that we have two new Funds with the Omni name attached. While the name is new, the concept within Bridgeway has been around for many years. Our investment philosophy of putting investors first and our passion for logic, data and evidence remain consistent throughout everything we do, as do our mission, values and commitment to transformational change for our company and the communities in which we live and work. Much of our investment process is similar through both investment styles. We use a statistically driven, evidence-based investment style that is grounded in academic theory. We have a rigorous testing process that starts with data quality. Our process is disciplined and seeks to avoid behavioral biases and to make continuous improvements through our investment in ongoing research. Risk management is embedded in the innovative design of each Fund that we manage. Our adherence to fund design and trading efficiencies highlight our execution expertise, regardless of the investment style. We strongly believe in maintaining a long-term investment horizon and sticking to your asset allocation through all types of market volatility.
Bridgeway Omni Style
The Omni style began with the Bridgeway Blue-Chip 35 Index Fund and the Ultra-Small Company Market Fund. Both were designed to give shareholders the ability to capture the returns of a particular asset class of stocks. We have recently added three more Funds to the Omni classification (Small-Cap Momentum, Omni Small-Cap Value and Omni Tax-Managed Small-Cap Value), although only Small-Cap Momentum Fund is available to the general public. Each of these Funds is meant to capture the risk premiums of their specific asset class while capitalizing on the concept of efficient markets. Each Fund has a focus on low tracking error to an unpublished index representing the Fund’s style and, with the exception of Small-Cap Momentum Fund, each is designed for low turnover. Also, with the exception of Blue Chip 35 Index, each Fund normally holds a basket of greater than 300 securities in order to gain exposure to an entire asset class.
Bridgeway Select Style
Our two original Funds (Aggressive Investors 1 and Ultra-Small Company Funds) were designed for alpha — market beating returns over the long term — through stock selection (rather than through, say, market timing or sector rotation). These two funds as well as Aggressive Investors 2, Micro-Cap Limited, Small-Cap Growth, Small-Cap Value, Large-Cap Growth, Large-Cap Value and Managed Volatility, fall into the classification now known as Select Funds. Each of these seeks to outperform its market benchmark through effective stock selection that is designed for greater upside capture and downside protection. We select stocks for these funds using multiple multi-factor models that are grounded in academic theory and based on extensive backtesting by Bridgeway’s team. We feed quality data into the models to provide what we call an “information premium” that allows for greater upside capture potential. We also add risk premium factors to focus on downside protection.
| www.bridgeway.com | 10 | |
| LETTER FROM THE INVESTMENT MANAGEMENT TEAM (continued) | |
Our numerous growth, value, momentum, growth at a reasonable price (GARP) (shares characteristics of both growth and value) and contrarian models allow a great deal of portfolio flexibility in order to generate alpha.
Omni or Select?
While the Omni style asset class exposure is quite distinct from the Select style alpha generation, both adhere to the basic investment philosophy Bridgeway has used for eighteen years. We haven’t reinvented ourselves, but we have redefined the way we will represent our Funds going forward. There are arguments and advantages for both investment styles, but it is up to individual investors or advisers to decide which style or combination of styles will satisfy their investment needs.
Transformational Change by Rebecca Hove, Bridgeway Partner and Leader in the Area
Each Bridgeway Partner engages in Transformative Change in a self-created way. These engagements are highly variegated, as is the nature of transformation. Though among this constant change, the foundation of our Transformative Change programs has a static, fundamental component: Service. We participate in Service Trips to the developing world and local Service Projects. We serve on these projects with our families, fellow Bridgeway Partners or our business partners, or with personal friends and even strangers who become friends! We serve by giving - of our personal time, our money and other resources, our mental capacities, our labor, and most importantly, our hearts.
You may be thinking, “But Bridgeway is in the financial management business....” Yes, and included in that, we are in the Transformation business. At Bridgeway, we see this as a both/and; not an either/or. Transformation- it’s a current buzz-word, but what does it really mean? More importantly, what does it mean to, and for, you?
Transformation is dynamic. Unbounded variety is intrinsic to the word and work itself; often producing radical results. Perhaps the most profound definition comes from medicine: “The genetic alteration of a cell by introduction of DNA from another cell.” This is indeed the marrow of transformation – to change from the inside and then outside from one ‘being’ into a different ‘being’ as a result of an introduction. You are not WHAT or WHO you used to be, after transformation. You are altered; you have a completely new make-up. That truly is radical... and at Bridgeway we are doing and experiencing it first-hand.
One of our Partners serves on the Board of Navidad en el Barrio, an organization local to Houston that provides disadvantaged kids with the opportunity to experience receiving gifts at Christmas. Due to generous gifts of in-kind and cash donations, volunteers who wrap presents and deliver gifts, as well as put on an event, kids are introduced to a Christmas experience they otherwise would not know. Parents receive grocery bags of fresh fruit, other food items, and a guide to available community resources.
In 2011 we partnered with YES Prep, a charter school in Houston, for a service day with Navidad en el Barrio. About 200 YES Prep middle school and high school students, many of whom could qualify for the Christmas program, served alongside Bridgeway volunteers – giving their time, talent, smiles and heart so others could receive.
The YES Prep students we served with, modeled another aspect of the gift of transformation and how unbounded it is. Regardless of what one does or does not have materially, we all have the ability to serve and give. Transformation can happen anytime, anywhere, and with anybody or anything. It is about giving and receiving - for all involved - two things which are also a constant presence within the variety of transformation.
You see, transformation is in Bridgeway’s DNA. We are transforming internally as individuals as we create and build these interactions. As we serve and give with others, we are changed by them and they are changed by us; together we are changing something external in our local and global community. Like those cells, separate and unique worlds collide, mix, team together, and then build something entirely new. Nothing is left the same as it was upon first introduction – not the people, not the place. For those interested in leverage, THIS is radical, too! We believe so strongly in this philosophy and its results we plan to share Transformative Change stories in every shareholder letter.
So, consider this your own “introduction”. Think about how you plan to invest in transformation personally, because we’re staying in the Transformation business. Its impact is unbeatable!
| 11 | Semi-Annual Report | December 31, 2011 (Unaudited) | |
|
(Unaudited)
December 31, 2011
Dear Fellow Aggressive Investors 1 Fund Shareholder,
The Bridgeway Funds Board of Directors has approved a plan of reorganization providing for the conversion of the Aggressive Investors 2 Fund into shares of the Aggressive Investors 1 Fund. The plan of reorganization providing for the conversion will require the approval of the Aggressive Investors 2 Fund shareholders. If approved, the conversion of shares is expected to take effect in the second quarter of 2012.
For the quarter ended December 31, 2011, Aggressive Investors 1 Fund returned 13.48%, outperforming our primary market benchmark, the S&P 500 Index (+11.82%) and our peer benchmark, the Lipper Capital Appreciation Funds Index (+7.64%). The Fund lagged the smaller-cap Russell 2000 Index (+15.47%) during the three month period. It was a mixed quarter. We would be more pleased, but for the prior quarter’s very poor performance.
For the six-month “semi-annual” period ended December 31, 2011, our Fund couldn’t overcome the “headwind” of the quarter ended September 30, 2011 — the most macro-driven market we have seen (see pages 3 to 7) and an environment not favorable to the Fund. The Fund declined 16.77%, lagging well behind our primary market benchmark, the S&P 500 Index (-3.69%), our peer benchmark, the Lipper Capital Appreciation Funds Index (-9.04%), and the Russell 2000 Index (-9.77%). We are disappointed with these results. We would like to emphasize that we have taken certain actions consistent with our (unchanged) investment philosophy and process to address our underperformance in macro-driven markets such as 2008, 2010, and 2011. See, for example, “If macro-driven markets represent such a problem for Bridgeway’s “growthier” select models and Funds, isn’t there anything Bridgeway can do to correct this?” on page 7 and, “Can’t the investment team do anything to improve performance during these correlation spikes, or macro-driven markets?” on page 10.
Similarly, the very poor September quarter performance overshadowed the positive performance in the first half of calendar year 2011. The Fund dropped 10.31% for the calendar year, underperforming our primary market benchmark, the S&P 500 Index (+2.11%), our peer benchmark, the Lipper Capital Appreciation Funds Index (-5.32%), and the Russell 2000 Index (-4.18%).
The table below presents our quarter, six-month, one-year, five-year, ten-year and life-to-date financial results. See the next page for a graph of performance since inception.
Annualized | ||||||||||||||||||||||||
| Quarter 10/1/11 to 12/31/11 | 6 Months 7/1/11 to 12/31/11 | 1 Year 1/1/11 to 12/31/11 | 5 Years 1/1/07 to 12/31/11 | 10 Years 1/1/02 to 12/31/11 | Life-to-Date to 12/31/11 | |||||||||||||||||||
Aggressive Investors 1 Fund | 13.48% | -16.77% | -10.31% | -6.29% | 2.34% | 12.03% | ||||||||||||||||||
S&P 500 Index (large companies) | 11.82% | -3.69% | 2.11% | -0.25% | 2.92% | 7.98% | ||||||||||||||||||
Lipper Capital Appreciation Funds Index | 7.64% | -9.04% | -5.32% | 1.23% | 3.48% | 6.95% | ||||||||||||||||||
Russell 2000 Index (small companies) | 15.47% | -9.77% | -4.18% | 0.15% | 5.62% | 8.03% | ||||||||||||||||||
Performance figures quoted in the table above and graph below represent past performance and are no guarantee of future results. Total return figures in the table above include the reinvestment of dividends and capital gains. The table above and the graph below do not reflect the deduction of taxes that a shareholder would pay on Fund distributions or the redemption of Fund shares. The recent growth rate in the stock market has helped to produce short-term returns that are not typical and may not continue in the future.
The S&P 500 Index is a broad-based, unmanaged measurement of changes in stock market conditions, based on the average of 500 widely held common stocks with dividends reinvested. The Russell 2000 Index is an unmanaged, market value weighted index that measures performance of the 2,000 companies that are between the 1,000th and 3,000th largest in the
| www.bridgeway.com | 12 | |
Aggressive Investors 1 Fund MANAGER’S COMMENTARY (continued) | |
(Unaudited)
market with dividends reinvested. The Lipper Capital Appreciation Funds Index reflects the record of the 30 largest funds in the category of more aggressive domestic growth mutual funds, as reported by Lipper, Inc. It is not possible to invest directly in an index.
According to data from Lipper, Inc. as of December 31, 2011, Aggressive Investors 1 Fund ranked 257th of 298 capital appreciation funds for the twelve months ending December 31, 2011, 231st of 232 over the last five years, 115th of 163 over the last ten years, and 3rd of 53 since inception in August, 1994. These long-term numbers and the graph below give two snapshots of our long-term success. Lipper, Inc. is an independent mutual fund rating service that ranks funds in various fund categories by making comparative calculations using total returns.
Aggressive Investors 1 Fund vs. S&P 500 Index, Lipper Capital Appreciation Funds Index & Russell 2000 Index
from Inception 8/5/94 to 12/31/11

Detailed Explanation of Quarterly Performance
The Short Version: Media and energy companies helped the most, while information technology stocks held our Fund back. The bounceback of smaller companies also helped.
Energy companies and media firms led the positive charge in the quarter as the cost of oil rose to $100/barrel and helped give a boost to exploration and production companies. The heated election campaign season meant significant advertising dollars for television stations. Three energy companies highlighted the best performers list for the December quarter, and two media holdings combined to contribute over one and one-half percent to the return of the Fund.
These are the Fund’s ten best-contributing stocks for the quarter ended December 31, 2011:
| Rank | Description | Industry | % Contribution to Return | |||
| 1 | Sinclair Broadcast Group, Inc. | Media | 1.1% | |||
| 2 | Amerco, Inc. | Road & Rail | 0.5% | |||
| 3 | W&T Offshore, Inc. | Oil, Gas & Consumable Fuels | 0.5% | |||
| 4 | CBS Corp. | Media | 0.4% | |||
| 5 | Stone Energy Corp. | Oil, Gas & Consumable Fuels | 0.4% | |||
| 6 | RLI Corp. | Insurance | 0.4% | |||
| 7 | Westlake Chemical Corp. | Chemicals | 0.4% | |||
| 8 | Newpark Resources, Inc. | Energy Equipment & Services | 0.4% | |||
| 9 | Credit Acceptance Corp. | Consumer Finance | 0.4% | |||
| 10 | Titan International, Inc. | Machinery | 0.4% |
| 13 | Semi-Annual Report | December 31, 2011 (Unaudited) | |
Aggressive Investors 1 Fund MANAGER’S COMMENTARY (continued) | |
(Unaudited) |
Although viewers complain about all of the negative political ads, they actually pay off quite well for broadcasting companies. One such company, Sinclair Broadcast Group, was the Fund’s top contributor for the quarter. Its stock price soared over 50% during the three-month period as the campaign season heated up and candidates started to air ads in major primary states. Sinclair has been in expansion mode and recently announced the acquisition of media companies with major markets in Florida and New York. In November, the holding posted better-than-expected quarterly results and rewarded shareholders with a cash dividend.
With interest rates at historically low levels, some income investors have sought out returns generated from dividend paying stocks. Amerco, parent of do-it-yourself moving and storage company U-Haul, announced a special dividend in December that translated into a yield in excess of that paid by the five-year treasury (at the time). The company does not currently pay a regular dividend, but with solid cash flow from operations, some analysts expect this move to be a sign of future shareholder rewards. Amerco has experienced favorable increases in profits and revenues from its three key segments (moving/storage, life insurance, property and casualty insurance), and sales have increased over 10% for six straight quarters. The holding contributed one-half of a percent to the Fund’s return for the quarter.
Though the economy has shown signs of rebounding as of late, businesses and consumers still do not appear to be stepping up their purchases of computers and electronics (unless they are manufactured by Apple). Three Information Technology holdings made the list of worst contributors. Combined, they hurt the Fund performance by almost three-fourths of a percent.
These are the Fund’s ten worst-contributing stocks for the quarter ended December 31, 2011:
| Rank | Description | Industry | % Contribution to Return | |||
| 1 | Green Mountain Coffee Roasters, Inc. | Food Products | -0.5% | |||
| 2 | Alcatel-Lucent - Sponsored ADR | Communications Equipment | -0.5% | |||
| 3 | Ultra Petroleum Corp. | Oil, Gas & Consumable Fuels | -0.2% | |||
| 4 | HCA Holdings, Inc. | Health Care Providers & Services | -0.2% | |||
| 5 | Walter Energy, Inc. | Metals & Mining | -0.2% | |||
| 6 | HollyFrontier Corp. | Oil, Gas & Consumable Fuels | -0.1% | |||
| 7 | Best Buy Co., Inc. | Specialty Retail | -0.1% | |||
| 8 | Electronic Arts, Inc. | Software | -0.1% | |||
| 9 | Helix Energy Solutions Group, Inc. | Energy Equipment & Services | -0.1% | |||
| 10 | Dell, Inc. | Computers & Peripherals | -0.1% |
David Einhorn, the hedge fund activist investor, confirmed in October 2011 that he had a significant “short” bet (he expected the stock to fall) on Green Mountain Coffee and he accused management of faulty accounting practices. A month later, Green Mountain posted a sizable earnings shortfall. The holding lost half of its value during the three month period and was the worst contributor to the Fund.
Alcatel-Lucent develops communications software for use in phones, Internet, and mobile devices. During the latter part of the year, fears began to set in that the ongoing economic crisis (domestically and in Europe) would hinder future revenues and margins. In November, the company missed its quarterly revenue expectations, and management offered a very disappointing financial outlook. The stock plunged during the quarter, lost over 40% in value, and was among the weakest holdings in the Fund.
Detailed Explanation of Calendar Year Performance
The Short Version: Unfortunately, our performance in a single quarter (September), the most macro-driven market on record, damaged our calendar year returns. Telecommunications companies and two coffee companies hurt the most.
As the recent holiday season seemed to confirm, consumers are spending more and more time on the Internet and are comfortable shopping and transacting business online. Three Internet-related companies (two retail) comprised the list of top performing holdings for the calendar year. Combined, they contributed over one percent to the Fund’s return.
| www.bridgeway.com | 14 | |
Aggressive Investors 1 Fund MANAGER’S COMMENTARY (continued) | |
| (Unaudited) |
These are the Fund’s ten best-contributing stocks for the calendar year ended December 31, 2011:
| Rank | Description | Industry | % Contribution to Return | |||
| 1 | ARM Holdings | Semiconductors & Semiconductor Equipment | 0.6% | |||
| 2 | RLI Corp. | Insurance | 0.6% | |||
| 3 | Netflix, Inc. | Internet & Catalog Retail | 0.6% | |||
| 4 | Domino’s Pizza, Inc. | Hotels, Restaurants & Leisure | 0.5% | |||
| 5 | Polaris Industries, Inc. | Leisure Equipment & Products | 0.4% | |||
| 6 | CBS Corp. | Media | 0.4% | |||
| 7 | Baidu, Inc. | Internet Software & Services | 0.3% | |||
| 8 | priceline.com, Inc. | Internet & Catalog Retail | 0.3% | |||
| 9 | Credit Acceptance Corp. | Consumer Finance | 0.3% | |||
| 10 | Unisys Corp. | IT Services | 0.3% |
Property and casualty insurer RLI Corp. has made a habit of rewarding shareholders for their confidence through dividends and share repurchases. In this environment of low interest rates, many investors appreciate such a philosophy and are willing to buy into these companies. Over the past five years, RLI has paid investors about $600 million through dividends and share buybacks. Late in the year, the board of directors announced both a special dividend and a regular dividend, due to its continued operational strength. In October, RLI reported earnings that beat analysts’ expectations on strong underwriting income. During the twelve month period, the stock was among the top contributors to the Fund.
Polaris Industries remained in expansion mode throughout the year, manufacturing snowmobiles, off-road vehicles and motorcycles. In June, the company closed on its acquisition of an electric vehicle maker from Chrysler and recently announced the purchase of a minority interest in Brammo—a deal that gives it greater exposure to the electric motorcycle business. Polaris was also awarded new government contracts to provide all-terrain vehicles to security forces in Afghanistan and Iraq. The company posted solid profit numbers in the third quarter, management revised its full-year earnings estimates and now expects sales growth in excess of 30% for the year.
Certain telecommunications companies struggled at various times over the course of the 12-month period, and four such holdings found their way onto the Fund’s worst contributors list for 2011. Combined, they cost the Fund over three percent in performance. Two coffee companies also detracted from the Fund’s return as the commodity’s price plunged to a nine-month low during the most recent quarter.
These are the Fund’s ten worst-contributing stocks for the calendar year ended December 31, 2011:
| Rank | Description | Industry | % Contribution to Return | |||
| 1 | GT Advanced Technologies, Inc. | Semiconductors & Semiconductor Equipment | -1.2% | |||
| 2 | Alcatel-Lucent - Sponsored ADR | Communications Equipment | -1.2% | |||
| 3 | Vonage Holdings Corp. | Diversified Telecommunication Services | -0.9% | |||
| 4 | TRW Automotive Holdings Corp. | Auto Components | -0.7% | |||
| 5 | Silvercorp Metals, Inc. | Metals & Mining | -0.6% | |||
| 6 | Coffee Holding Co., Inc. | Food Products | -0.6% | |||
| 7 | JDS Uniphase Corp. | Communications Equipment | -0.6% | |||
| 8 | Illumina, Inc. | Biotechnology | -0.6% | |||
| 9 | MetroPCS Communications Inc. | Wireless Telecommunication Services | -0.5% | |||
| 10 | Green Mountain Coffee Roasters, Inc. | Food Products | -0.5% |
GT Advanced Technologies provides energy efficient lighting and other equipment and services, primarily for the solar industry. During the year, many related stocks came under pressure as global demand for solar projects slowed and excess capacity prompted severe price cuts throughout the industry. Additionally, the US government began investigating certain Chinese companies within the industry, raising concerns about unfair business practices. GT Advanced Technologies supplies certain machinery and other equipment to China and fears that its operations could be impacted if a trade dispute ensues between the
| 15 | Semi-Annual Report | December 31, 2011 (Unaudited) | |
Aggressive Investors 1 Fund MANAGER’S COMMENTARY (continued) | |
| (Unaudited) |
two countries and causes the stock price to drop. The holding was the worst contributor for the calendar year and cost the Fund over one percent in return.
While Vonage has been all over the airwaves since it went public in 2006, the mass advertising does not appear to be translating into new customers (or bottom line profits) these days. As the competition picks up for Internet-based telephone communications, Vonage, the largest provider of such services, has been struggling with lower revenue growth and a declining subscriber base. Companies like Skype and Google Voice have made tremendous headways into the market, and Vonage is feeling the pinch. Additionally, some investors worry about the significant stock options and warrants that could potentially dilute its valuation should management not initiate a share buyback strategy at some point in the future. Late in the year, the company introduced a new subscription plan for customers who wish to add a second device (i.e. smart-phone) to their existing plans, hoping to stop the bleeding from customer departures. The holding cost the Fund almost one percent in return over the 12-month period.
Top Ten Holdings as of December 31, 2011
Five of the Fund’s top contributors for the December 2011 quarter were also among the largest holdings at the end of the calendar year: Sinclair, RLI, Credit Acceptance, CBS and Amerco. Two media-related companies made the Fund’s top ten holdings at year-end. Still, the Fund was broadly diversified and no single holding accounted for greater than 2.6% of the net assets. The ten largest positions represented just 20% of the total assets of the Fund.
| Rank | Description | Industry | % of Net Assets | |||
| 1 | Sinclair Broadcast Group, Inc. | Media | 2.6% | |||
| 2 | RPC, Inc. | Energy Equipment & Services | 2.6% | |||
| 3 | NeuStar, Inc. | IT Services | 2.2% | |||
| 4 | Apple, Inc. | Computers & Peripherals | 2.0% | |||
| 5 | Domino’s Pizza, Inc. | Hotels, Restaurants & Leisure | 1.8% | |||
| 6 | RLI Corp. | Insurance | 1.8% | |||
| 7 | Credit Acceptance Corp. | Consumer Finance | 1.8% | |||
| 8 | Dillard’s, Inc. | Multiline Retail | 1.8% | |||
| 9 | CBS Corp. | Media | 1.7% | |||
| 10 | Amerco, Inc. | Road & Rail | 1.7% | |||
| Total | 20.0% |
Industry Sector Representation as of December 31, 2011
The biggest disparity between the Fund and the S&P 500 Index was found in the Consumer Discretionary sector, which also contributed the most to Fund returns for the year. On the other end of the spectrum, we were most underrepresented in the Consumer Staples sector.
| www.bridgeway.com | 16 | |
Aggressive Investors 1 Fund MANAGER’S COMMENTARY (continued) | |
| (Unaudited) |
| % of Net Assets | % of S&P 500 Index | Difference | ||||
Consumer Discretionary | 18.8% | 10.3% | 8.5% | |||
Consumer Staples | 6.9% | 11.6% | -4.7% | |||
Energy | 13.6% | 12.4% | 1.2% | |||
Financials | 17.0% | 13.5% | 3.5% | |||
Health Care | 8.8% | 11.9% | -3.1% | |||
Industrials | 10.2% | 10.8% | -0.6% | |||
Information Technology | 15.1% | 19.2% | -4.1% | |||
Materials | 4.4% | 3.4% | 1.0% | |||
Telecommunication Services | 3.9% | 3.1% | 0.8% | |||
Utilities | 1.1% | 3.8% | -2.7% | |||
Cash & Other Assets | 0.2% | 0.0% | 0.2% | |||
Total | 100.0% | 100.0% |
Disclaimer
The views expressed here are exclusively those of Fund management. These views, including those related to market sectors or individual stocks, are not meant as investment advice and should not be considered predictive in nature. Any favorable (or unfavorable) description of a holding applies only as of December 31, 2011, unless otherwise stated. Security positions can and do change thereafter. Discussions of historical performance do not guarantee and may not be indicative of future performance.
Market volatility can significantly affect short-term performance. The Fund is not an appropriate investment for short-term investors. Investments in the small companies within this multi-cap fund generally carry greater risk than is customarily associated with larger companies. This additional risk is attributable to a number of factors, including the relatively limited financial resources that are typically available to small companies and the fact that small companies often have comparatively limited product lines. In addition, the stock of small companies tends to be more volatile than the stock of large companies, particularly in the short term and particularly in the early stages of an economic or market downturn. The Fund’s use of options, futures, and leverage can magnify the risk of loss in an unfavorable market, and the Fund’s use of short-sale positions can, in theory, expose shareholders to unlimited loss. Finally, the Fund exposes shareholders to “focus risk,” which may add to Fund volatility through the possibility that a single company could significantly affect total return. Shareholders of the Fund, therefore, are taking on more risk than they would if they invested in the stock market as a whole.
Conclusion
Thank you for your continued investment in Aggressive Investors 1 Fund. We encourage your feedback; your reactions and concerns are extremely important to us.
Sincerely,
The Investment Management Team
| 17 | Semi-Annual Report | December 31, 2011 (Unaudited) | |
Bridgeway Aggressive Investors 1 Fund | |
| Showing percentage of net assets as of December 31, 2011 (Unaudited) |
Industry | Company | Shares | Value | |||||||
COMMON STOCKS - 99.89% |
| |||||||||
Aerospace & Defense - 1.15% |
| |||||||||
Triumph Group, Inc. | 16,073 | $ | 939,467 | |||||||
Auto Components - 2.45% |
| |||||||||
Tenneco, Inc.* | 27,900 | 830,862 | ||||||||
TRW Automotive Holdings Corp.* | 36,200 | 1,180,120 | ||||||||
|
| |||||||||
| 2,010,982 | ||||||||||
Beverages - 3.62% |
| |||||||||
Coca-Cola Enterprises, Inc.# | 31,000 | 799,180 | ||||||||
Constellation Brands, Inc., Class A* | 43,300 | 895,011 | ||||||||
Hansen Natural Corp.* | 13,800 | 1,271,532 | ||||||||
|
| |||||||||
| 2,965,723 | ||||||||||
Capital Markets - 2.15% |
| |||||||||
Bank of New York Mellon Corp. (The) | 42,200 | 840,202 | ||||||||
Northern Trust Corp. | 23,300 | 924,078 | ||||||||
|
| |||||||||
| 1,764,280 | ||||||||||
Chemicals - 2.26% |
| |||||||||
CF Industries Holdings, Inc. | 7,400 | 1,072,852 | ||||||||
Westlake Chemical Corp. | 19,400 | 780,656 | ||||||||
|
| |||||||||
| 1,853,508 | ||||||||||
Commercial Services & Supplies - 1.02% |
| |||||||||
Consolidated Graphics, Inc.* | 17,400 | 840,072 | ||||||||
Communications Equipment - 0.56% |
| |||||||||
Alcatel-Lucent - Sponsored ADR* | 296,800 | 463,008 | ||||||||
Computers & Peripherals - 4.02% |
| |||||||||
Apple, Inc.* | 4,100 | 1,660,500 | ||||||||
Dell, Inc.* | 56,700 | 829,521 | ||||||||
Seagate Technology PLC | 49,500 | 811,800 | ||||||||
|
| |||||||||
| 3,301,821 | ||||||||||
Consumer Finance - 4.99% |
| |||||||||
Capital One Financial Corp. | 18,000 | 761,220 | ||||||||
Cash America International, Inc. | 15,900 | 741,417 | ||||||||
Credit Acceptance Corp.* | 17,700 | 1,456,356 | ||||||||
Discover Financial Services | 47,100 | 1,130,400 | ||||||||
|
| |||||||||
| 4,089,393 | ||||||||||
Industry Company | Shares | Value | ||||||||
Containers & Packaging - 1.15% |
| |||||||||
Crown Holdings, Inc.* | 28,200 | $ | 946,956 | |||||||
Diversified Financial Services - 2.45% |
| |||||||||
Interactive Brokers Group, | ||||||||||
Inc., Class A | 60,500 | 903,870 | ||||||||
Moody’s Corp. | 32,800 | 1,104,704 | ||||||||
|
| |||||||||
| 2,008,574 | ||||||||||
Diversified Telecommunication Services - 3.02% |
| |||||||||
Telecom Corp. of New | ||||||||||
Zealand, Ltd.—Sponsored ADR | 165,100 | 1,319,149 | ||||||||
Vonage Holdings Corp.* | 472,600 | 1,157,870 | ||||||||
|
| |||||||||
| 2,477,019 | ||||||||||
Electronic Equipment, Instruments & Components - 0.81% |
| |||||||||
Vishay Intertechnology, Inc.* | 73,900 | 664,361 | ||||||||
Energy Equipment & Services - 4.85% |
| |||||||||
Halliburton Co. | 30,000 | 1,035,300 | ||||||||
Helix Energy Solutions Group, Inc.* | 49,700 | 785,260 | ||||||||
RPC, Inc.+ | 118,050 | 2,154,412 | ||||||||
|
| |||||||||
| 3,974,972 | ||||||||||
Food & Staples Retailing - 1.19% |
| |||||||||
Casey’s General Stores, | ||||||||||
Inc. | 19,000 | 978,690 | ||||||||
Food Products - 0.93% |
| |||||||||
Coffee Holding Co., Inc.+ | 48,600 | 381,024 | ||||||||
Green Mountain Coffee | ||||||||||
Roasters, Inc.*+ | 8,600 | 385,710 | ||||||||
|
| |||||||||
| 766,734 | ||||||||||
Health Care Providers & Services - 5.51% |
| |||||||||
Aetna, Inc. | 22,200 | 936,618 | ||||||||
HCA Holdings, Inc.* | 33,300 | 733,599 | ||||||||
Health Management | ||||||||||
Associates, Inc., Class A* | 125,000 | 921,250 | ||||||||
Humana, Inc. | 11,300 | 989,993 | ||||||||
Kindred Healthcare, Inc.* | 80,000 | 941,600 | ||||||||
|
| |||||||||
| 4,523,060 | ||||||||||
Hotels, Restaurants & Leisure - 2.93% |
| |||||||||
Domino’s Pizza, Inc.* | 44,700 | 1,517,565 | ||||||||
Wynn Resorts, Ltd. | 8,000 | 883,920 | ||||||||
|
| |||||||||
| 2,401,485 | ||||||||||
| www.bridgeway.com | 18 | |
Bridgeway Aggressive Investors 1 Fund SCHEDULE OF INVESTMENTS (continued) | |
| Showing percentage of net assets as of December 31, 2011 (Unaudited) |
Industry | Company | Shares | Value | |||||||
Common Stocks (continued) |
| |||||||||
Insurance - 3.96% |
| |||||||||
Marsh & McLennan Cos., Inc. | 24,800 | $ | 784,176 | |||||||
Reinsurance Group of America, Inc. | 18,500 | 966,625 | ||||||||
RLI Corp. | 20,500 | 1,493,630 | ||||||||
|
| |||||||||
| 3,244,431 | ||||||||||
Internet Software & Services - 1.06% |
| |||||||||
j2 Global, Inc. | 31,000 | 872,340 | ||||||||
IT Services - 5.51% |
| |||||||||
Heartland Payment Systems, Inc. | 41,400 | 1,008,504 | ||||||||
Mastercard, Inc., Class A | 2,200 | 820,204 | ||||||||
NeuStar, Inc., Class A* | 52,000 | 1,776,840 | ||||||||
Western Union Co. (The) | 50,200 | 916,652 | ||||||||
|
| |||||||||
| 4,522,200 | ||||||||||
Leisure Equipment & Products - 1.56% |
| |||||||||
Polaris Industries, Inc. | 22,900 | 1,281,942 | ||||||||
Life Sciences Tools & Services - 1.09% |
| |||||||||
Agilent Technologies, Inc.* | 25,600 | 894,208 | ||||||||
Machinery - 5.02% |
| |||||||||
Actuant Corp., Class A | 39,000 | 884,910 | ||||||||
Caterpillar, Inc. | 9,500 | 860,700 | ||||||||
CNH Global N.V.* | 31,100 | 1,119,289 | ||||||||
Sauer-Danfoss, Inc.* | 34,500 | 1,249,245 | ||||||||
|
| |||||||||
| 4,114,144 | ||||||||||
Marine - 0.00% |
| |||||||||
Kirby Corp.* | 20 | 1,317 | ||||||||
Media- 6.61% |
| |||||||||
CBS Corp., Class B | ||||||||||
Non-Voting | 51,800 | 1,405,852 | ||||||||
DIRECTV, Class A* | 20,900 | 893,684 | ||||||||
DISH Network Corp., Class A | 33,700 | 959,776 | ||||||||
Sinclair Broadcast Group, Inc., Class A | 190,600 | 2,159,498 | ||||||||
|
| |||||||||
| 5,418,810 | ||||||||||
Metals & Mining - 0.94% |
| |||||||||
Walter Energy, Inc. | 12,700 | 769,112 | ||||||||
Multiline Retail - 2.94% |
| |||||||||
Dillard’s, Inc., Class A+ | 32,100 | 1,440,648 | ||||||||
Kohl’s Corp. | 19,600 | 967,260 | ||||||||
|
| |||||||||
| 2,407,908 | ||||||||||
Industry | Company | Shares | Value | |||||||
Multi-Utilities - 1.07% |
| |||||||||
CenterPoint Energy, Inc. | 43,600 | $ | 875,924 | |||||||
Oil, Gas & Consumable Fuels - 8.81% |
| |||||||||
Cabot Oil & Gas Corp. | 12,000 | 910,800 | ||||||||
Chevron Corp. | 11,500 | 1,223,600 | ||||||||
HollyFrontier Corp. | 29,400 | 687,960 | ||||||||
Murphy Oil Corp. | 15,700 | 875,118 | ||||||||
Stone Energy Corp.* | 34,700 | 915,386 | ||||||||
Ultra Petroleum Corp.* | 25,200 | 746,676 | ||||||||
Valero Energy Corp. | 39,800 | 837,790 | ||||||||
W&T Offshore, Inc. | 48,400 | 1,026,564 | ||||||||
|
| |||||||||
| 7,223,894 | ||||||||||
Personal Products - 1.17% |
| |||||||||
Herbalife, Ltd. | 18,600 | 961,062 | ||||||||
Pharmaceuticals - 2.21% |
| |||||||||
Perrigo Co. | 10,200 | 992,460 | ||||||||
Watson Pharmaceuticals, Inc.* | 13,600 | 820,624 | ||||||||
|
| |||||||||
| 1,813,084 | ||||||||||
Real Estate Investment Trusts (REITs) - 3.50% |
| |||||||||
BioMed Realty Trust, Inc. | 64,700 | 1,169,776 | ||||||||
Newcastle Investment Corp. | 147,500 | 685,875 | ||||||||
Weingarten Realty Investors | 46,600 | 1,016,812 | ||||||||
|
| |||||||||
| 2,872,463 | ||||||||||
Road & Rail - 3.01% |
| |||||||||
Amerco, Inc. | 15,800 | 1,396,720 | ||||||||
Werner Enterprises, Inc. | 44,400 | 1,070,040 | ||||||||
|
| |||||||||
| 2,466,760 | ||||||||||
Semiconductors & Semiconductor Equipment - 2.16% |
| |||||||||
Fairchild Semiconductor International, Inc.* | 60,200 | 724,808 | ||||||||
GT Advanced Technologies, Inc.* | 144,400 | 1,045,456 | ||||||||
|
| |||||||||
| 1,770,264 | ||||||||||
Software - 0.94% |
| |||||||||
Electronic Arts, Inc.* | 37,500 | 772,500 | ||||||||
Specialty Retail - 2.34% |
| |||||||||
Best Buy Co., Inc. | 29,400 | 687,078 | ||||||||
Genesco, Inc.* | 20,000 | 1,234,800 | ||||||||
|
| |||||||||
| 1,921,878 | ||||||||||
| 19 | Semi-Annual Report | December 31, 2011 (Unaudited) | |
Bridgeway Aggressive Investors 1 Fund SCHEDULE OF INVESTMENTS (continued) | |
| Showing percentage of net assets as of December 31, 2011 (Unaudited) |
Industry | Company | Shares | Value | |||
Common Stocks (continued) | ||||||
Wireless Telecommunication Services - 0.93% | ||||||
SK Telecom Co., Ltd. - ADR | 55,800 | $759,438 | ||||
| ||||||
TOTAL COMMON STOCKS - 99.89% | 81,933,784 | |||||
| ||||||
(Cost $83,665,942) | ||||||
Rate^ | Shares | Value | ||||
MONEY MARKET FUND - 0.00% | ||||||
BlackRock FedFund 0.01% | 2,744 | 2,744 | ||||
| ||||||
TOTAL MONEY MARKET FUND - 0.00% | 2,744 | |||||
| ||||||
(Cost $2,744) | ||||||
TOTAL INVESTMENTS - 99.89% | $81,936,528 | |||||
(Cost $83,668,686) | ||||||
Other Assets in Excess of Liabilities - 0.11% | 90,131 | |||||
| ||||||
NET ASSETS - 100.00% | $82,026,659 | |||||
| ||||||
* Non-income producing security. # Securities, or a portion thereof, segregated to cover the Fund’s potential obligation under swap agreements. The total value of segregated assets is $515,600. ^ Rate disclosed as of December 31, 2011. + This security or a portion of the security is out on loan at December 31, 2011. Total loaned securities had a value of $3,003,207 at December 31, 2011. ADR - American Depositary Receipt PLC - Public Limited Company | ||||||
Summary of inputs used to value the Fund’s investments as of 12/31/2011 is as follows (See Note 2 in Notes to Financial Statements):
| Valuation Inputs | ||||||||||||||||
| ||||||||||||||||
| Investment in Securities (Value) | ||||||||||||||||
| ||||||||||||||||
Level 1 Quoted | Level 2 Significant Observable Inputs | Level 3 Significant Unobservable Inputs | Total | |||||||||||||
| ||||||||||||||||
Common Stocks | $ | 81,933,784 | $ | — | $ | — | $ | 81,933,784 | ||||||||
Money Market Fund | — | 2,744 | — | 2,744 | ||||||||||||
|
|
|
|
|
|
|
| |||||||||
TOTAL | $ | 81,933,784 | $ | 2,744 | $ | — | $ | 81,936,528 | ||||||||
|
|
|
|
|
|
|
| |||||||||
See Notes to Financial Statements.
| www.bridgeway.com | 20 | |
| ||
(Unaudited)
December 31, 2011 | ||
Dear Fellow Aggressive Investors 2 Fund Shareholder,
The Bridgeway Funds Board of Directors has approved a plan of reorganization providing for the conversion of the Aggressive Investors 2 Fund into shares of the Aggressive Investors 1 Fund. The plan of reorganization providing for the conversion will require the approval of the Aggressive Investors 2 Fund shareholders. If approved, the conversion of shares is expected to take effect in the second quarter of 2012.
For the quarter ended December 31, 2011, Aggressive Investors 2 Fund returned 10.64%, underperforming its primary market benchmark, the S&P 500 Index (+11.82%) and the smaller-cap Russell 2000 Index (+15.47%). The Fund did outperform its peer benchmark, the Lipper Capital Appreciation Funds Index (+7.64%) during the three month period. It was a poor quarter.
For the six-month “semi-annual” period ended December 31, 2011, our Fund couldn’t overcome the “headwind” of the quarter ended September 30, 2011 — the most macro-driven market we have seen (see pages 3 to 7) and an environment not favorable to the Fund. The Fund declined 18.26%, lagging well behind our primary market benchmark, the S&P 500 Index (-3.69%), our peer benchmark, the Lipper Capital Appreciation Funds Index (-9.04%), and the Russell 2000 Index (-9.77%). We are disappointed with these results. We would like to emphasize that we have taken certain actions consistent with our (unchanged) investment philosophy and process to address our underperformance in macro-driven markets such as 2008, 2010, and 2011. See, for example, “If macro-driven markets represent such a problem for Bridgeway’s “growthier” select models and Funds, isn’t there anything Bridgeway can do to correct this?” on page 7 and “Can’t the investment team do anything to improve performance during these correlation spikes, or macro-driven markets?” on page 10.
Similarly, the very poor September quarter performance overshadowed the positive performance in the first half of calendar year 2011. The Fund dropped 11.59% for the calendar year, underperforming our primary market benchmark, the S&P 500 Index (+2.11%), our peer benchmark, the Lipper Capital Appreciation Funds Index (-5.32%), and the Russell 2000 Index (-4.18%).
The table below presents our quarter, six-month, one-year, five-year, ten-year and life-to-date financial results. See the next page for a graph of performance since inception.
| Annualized | ||||||||||||||||||||||||
| Quarter 10/1/11 to 12/31/11 | 6 Months 7/1/11 to 12/31/11 | 1 Year 1/1/11 to 12/31/11 | 5 Years 1/1/07 to 12/31/11 | 10 Years 1/1/02 to 12/31/11 | Life-to-Date to 12/31/11 | |||||||||||||||||||
Aggressive Investors 2 Fund | 10.64% | -18.26% | -11.59% | -5.23% | 2.62% | 2.98% | ||||||||||||||||||
S&P 500 Index (large companies) | 11.82% | -3.69% | 2.11% | -0.25% | 2.92% | 3.71% | ||||||||||||||||||
Lipper Capital Appreciation Funds Index | 7.64% | -9.04% | -5.32% | 1.23% | 3.48% | 4.42% | ||||||||||||||||||
Russell 2000 Index (small companies) | 15.47% | -9.77% | -4.18% | 0.15% | 5.62% | 6.93% | ||||||||||||||||||
Performance figures quoted in the table above and graph below represent past performance and are no guarantee of future results. Total return figures in the table above include the reinvestment of dividends and capital gains. The table above and the graph below do not reflect the deduction of taxes that a shareholder would pay on Fund distributions or the redemption of Fund shares. The recent growth rate in the stock market has helped to produce short-term returns that are not typical and may not continue in the future.
The S&P 500 Index is a broad-based, unmanaged measurement of changes in stock market conditions, based on the average of 500 widely held common stocks with dividends reinvested. The Russell 2000 Index is an unmanaged, market value weighted index that measures performance of the 2,000 companies that are between the 1,000th and 3,000th largest in the
| 21 | Semi-Annual Report | December 31, 2011 (Unaudited) | |
Aggressive Investors 2 Fund MANAGER’S COMMENTARY (continued) | |
| (Unaudited) |
market with dividends reinvested. The Lipper Capital Appreciation Funds Index reflects the record of the 30 largest funds in the category of more aggressive domestic growth mutual funds, as reported by Lipper, Inc. It is not possible to invest directly in an index.
According to data from Lipper, Inc. as of December 31, 2011, Aggressive Investors 2 Fund ranked 278th of 298 capital appreciation funds for the twelve months ending December 31, 2011, 228th of 232 over the last five years, 111th of 163 over the last ten years, and 118th of 162 since inception in October, 2001. Lipper, Inc. is an independent mutual fund rating service that ranks funds in various fund categories by making comparative calculations using total returns.
Aggressive Investors 2 Fund vs. S&P 500 Index, Lipper Capital Appreciation Funds Index & Russell 2000 Index
from Inception 10/31/01 to 12/31/11
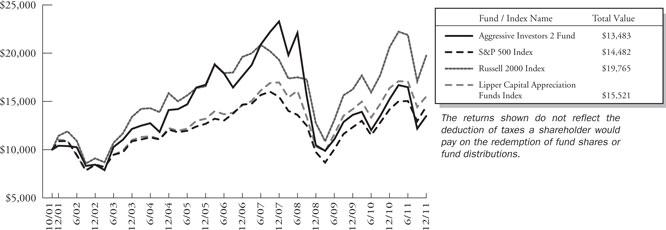
Detailed Explanation of Quarterly Performance
The Short Version: Energy companies helped the most, while information technology stocks held our Fund back. The bounceback of smaller companies also helped.
Energy companies led the positive charge in the quarter as the cost of oil rose to $100/barrel and gave a boost to exploration and production companies amid worries about a nuclear Iran and additional sanctions. Three related companies made the best contributors list for the December quarter; combined, they added over one and one-fourth percent to the return of the Fund.
These are the Fund’s ten best-contributing stocks for the quarter ended December 31, 2011:
| Rank | Description | Industry | % Contribution to Return | |||
1 | Titan International, Inc. | Machinery | 0.6% | |||
2 | CBS Corp. | Media | 0.5% | |||
3 | W&T Offshore, Inc. | Oil, Gas & Consumable Fuels | 0.5% | |||
4 | RLI Corp. | Insurance | 0.4% | |||
5 | Stone Energy Corp. | Oil, Gas & Consumable Fuels | 0.4% | |||
6 | BorgWarner, Inc. | Auto Components | 0.4% | |||
7 | CNH Global N.V. | Machinery | 0.4% | |||
8 | Newpark Resources, Inc. | Energy Equipment & Services | 0.4% | |||
9 | Westlake Chemical Corp. | Chemicals | 0.4% | |||
10 | Domino’s Pizza, Inc. | Hotels, Restaurants & Leisure | 0.4% |
| www.bridgeway.com | 22 | |
Aggressive Investors 2 Fund MANAGER’S COMMENTARY (continued) | | |
| (Unaudited) |
Oil and gas exploration company W&T Offshore rose over 50% in value during the December quarter and contributed about one-half of a percent to the Fund’s overall return. In October, the company posted earnings that almost doubled in the quarter on solid revenue growth from higher oil prices and enhanced production. Crude closed the year at around $100/barrel; some analysts believe it will remain at elevated levels as tensions in the Middle East (Iran) and pressures from OPEC keep a floor on prices. In December, management rewarded its shareholders with a special cash dividend.
Property and casualty insurer RLI has made a habit of rewarding shareholders for their confidence through dividends and share repurchases. In this environment of low interest rates, many investors appreciate such a philosophy and are willing to buy into these companies. Over the past five years, RLI has paid investors about $600 million through dividends and share buybacks. Late in the year, the board of directors announced both a special dividend and a regular dividend, due to the company’s continued operational strength. In October, RLI reported earnings that beat analysts’ expectations on strong underwriting income. The stock soared over 20% for the quarter and was among the top contributors to the Fund.
Although the economy has shown signs of rebounding as of late, businesses and consumers still do not appear to be stepping up their purchases of computers and electronics (unless they are manufactured by Apple). Three Information Technology holdings made the list of worst contributors. Combined, they hindered Fund performance by almost three-fourths of a percent.
These are the Fund’s ten worst-contributing stocks for the quarter ended December 31, 2011:
| Rank | Description | Industry | % Contribution to Return | |||
1 | Alcatel-Lucent -Sponsored ADR | Communications Equipment | -0.5% | |||
2 | Green Mountain Coffee Roasters, Inc. | Food Products | -0.5% | |||
3 | Ultra Petroleum Corp. | Oil, Gas & Consumable Fuels | -0.2% | |||
4 | HCA Holdings, Inc. | Health Care Providers & Services | -0.2% | |||
5 | Walter Energy, Inc. | Metals & Mining | -0.2% | |||
6 | HollyFrontier Corp. | Oil, Gas & Consumable Fuels | -0.1% | |||
7 | Best Buy Co., Inc. | Specialty Retail | -0.1% | |||
8 | Electronic Arts, Inc. | Software | -0.1% | |||
9 | Dell, Inc. | Computers & Peripherals | -0.1% | |||
10 | Banco Bradesco | Commercial Banks | -0.1% |
Alcatel-Lucent develops communications software for use in phones, Internet, and mobile devices. During the latter part of the year, fears began to set in that the ongoing economic crisis (domestically and in Europe) would hinder future revenues and margins. In November, the company missed its quarterly revenue expectations; management offered a very disappointing financial outlook. The stock plunged during the quarter and lost over 40% in value. It was among the weakest holdings in the Fund.
David Einhorn, the hedge fund activist investor, confirmed in October 2011 that he had a significant “short” bet (he expected the stock to fall) on Green Mountain Coffee and he accused management of faulty accounting practices. A month later, Green Mountain posted a sizable earnings shortfall. The holding lost half of its value during the three month period and was the second worst contributor to the Fund.
Detailed Explanation of Calendar Year Performance
The Short Version: Unfortunately, our performance in the third quarter of 2011, the most macro-driven market on record, badly damaged our calendar year returns. Information Technology and Telecommunications companies hurt the most.
As the recent holiday season seemed to confirm, consumers are spending more and more time on the Internet and are comfortable shopping and transacting business online. Two internet-related companies appear on the list of top contributing holdings for the calendar year. Combined, they contributed over one percent to the Fund’s return.
| 23 | Semi-Annual Report | December 31, 2011(Unaudited) | |
Aggressive Investors 2 Fund MANAGER’S COMMENTARY (continued) | |
(Unaudited)
These are the Fund’s ten best-contributing stocks for the calendar year ended December 31, 2011:
| Rank | Description | Industry | % Contribution to Return | |||
1 | Netflix, Inc. | Internet & Catalog Retail | 0.8% | |||
2 | RLI Corp. | Insurance | 0.6% | |||
3 | Polaris Industries, Inc. | Leisure Equipment & Products | 0.5% | |||
4 | Domino’s Pizza, Inc. | Hotels, Restaurants & Leisure | 0.5% | |||
5 | ARM Holdings | Semiconductors & Semiconductor Equipment | 0.5% | |||
6 | CBS Corp. | Media | 0.5% | |||
7 | Baidu, Inc. | Internet Software & Services | 0.4% | |||
8 | Cirrus Logic, Inc. | Semiconductors & Semiconductor Equipment | 0.3% | |||
9 | United Rentals, Inc. | Trading Companies & Distributors | 0.3% | |||
10 | Huntsman Corp. | Chemicals | 0.2% |
Polaris Industries remained in expansion mode throughout the year, manufacturing snowmobiles, off-road vehicles and motorcycles. In June, the company closed on its acquisition of an electric vehicle maker from Chrysler, and it recently announced the purchase of a minority interest in Brammo, a deal which gives it greater exposure to the electric motorcycle business. Polaris was also awarded new government contracts to provide all-terrain vehicles to security forces in Afghanistan and Iraq. The company posted solid profit numbers in the third quarter. Management revised its full-year earnings estimates and now expects sales growth in excess of 30% for the year.
Dominos is the second largest pizza chain (behind Pizza Hut) and operates over 9,000 delivery restaurants across the globe. In the mid-2000s, the company struggled and was losing out to better-run rivals. They introduced a new CEO and management team in 2010, a revamped, better tasting product, and a stronger reliance on technology. The company has reaped double-digit increases in same-store sales for the past few quarters and has benefited from on-line ordering via apps for the Apple iPhone and iPad. In fact, sales from mobile devices accounted for about 30% of Dominos orders in 2011. The company recognized a record week for online sales early in the holiday season (as consumers can now shop and order pizza at the same time). The stock price more than doubled during the twelve month period and closed near the 52-week high.
Certain telecommunications companies struggled at various times over the course of the 12-month period as four such holdings found their ways onto the Fund’s worst contributors list for 2011. Combined, they cost the Fund over three percent in performance.
These are the Fund’s ten worst-contributing stocks for the calendar year ended December 31, 2011:
| Rank | Description | Industry | % Contribution to Return | |||
1 | Alcatel-Lucent -Sponsored ADR | Communications Equipment | -1.3% | |||
2 | GT Advanced Technologies, Inc. | Semiconductors & Semiconductor Equipment | -1.2% | |||
3 | Vonage Holdings Corp. | Diversified Telecommunication Services | -0.9% | |||
4 | TRW Automotive Holdings Corp. | Auto Components | -0.9% | |||
5 | JDS Uniphase Corp. | Communications Equipment | -0.6% | |||
6 | Silvercorp Metals, Inc. | Metals & Mining | -0.6% | |||
7 | MetroPCS Communications, Inc. | Wireless Telecommunication Services | -0.5% | |||
8 | Vishay Intertechnology, Inc. | Electronic Equipment, Instruments & Components | -0.5% | |||
9 | Green Mountain Coffee Roasters, Inc. | Food Products | -0.5% | |||
10 | Illumina, Inc. | Biotechnology | -0.5% |
GT Advanced Technologies provides energy efficient lighting and other equipment and services, primarily for the solar industry. During the year, many related stocks came under pressures as global demand for solar projects slowed and excess capacity prompted severe price cuts throughout the industry. Additionally, the US government began investigating certain Chi-nese companies within the industry, raising concerns about unfair business practices. GT Advanced Technologies supplies
| www.bridgeway.com | 24 | |
Aggressive Investors 2 Fund MANAGER’S COMMENTARY (continued) | | |
| (Unaudited) |
certain machinery and other equipment to China. Fears that its operations could be impacted if a trade dispute ensues between the two countries caused the stock price to drop. The holding cost the Fund over 1% in return over the 12-month period.
While Vonage has been all over the airwaves since it went public in 2006, the mass advertising does not appear to be translating into new customers (or bottom line profits) these days. As the competition picks up for Internet-based telephone communications, the largest provider of such services, Vonage, has been struggling with lower revenue growth and a declining subscriber base. Companies like Skype and Google Voice have made tremendous headways into the market and Vonage is feeling the pinch. Additionally, some investors worry about significant stock options and warrants that could potentially dilute its valuation should management not initiate a share buyback strategy at some point in the future. Late in the year, the company introduced a new subscription plan for customers who wish to add a second device (i.e. smart-phone) to their existing plan; it hopes to stop the bleeding from customer departures. The holding cost the Fund almost 1% in return over the 12-month period.
Top Ten Holdings as of December 31, 2011
Three of the Fund’s top contributors for the December 2011 quarter were also among the largest holdings at the end of the calendar year: RLI, Dominos, CBS. The Fund was broadly diversified, and no single holding accounted for greater than 2.2% of the net assets. The ten largest positions represented just over 20% of the total assets of the Fund.
| Rank | Description | Industry | % of Net Assets | |||
1 | Apple, Inc. | Computers & Peripherals | 2.2% | |||
2 | NeuStar, Inc. | IT Services | 2.2% | |||
3 | RLI Corp. | Insurance | 2.2% | |||
4 | Domino’s Pizza, Inc. | Hotels, Restaurants & Leisure | 2.1% | |||
5 | RPC, Inc. | Energy Equipment & Services | 2.1% | |||
6 | CBS Corp. | Media | 2.0% | |||
7 | Sauer-Danfoss, Inc. | Machinery | 1.9% | |||
8 | BioMed Realty Trust, Inc. | Real Estate Investment Trusts (REITs) | 1.9% | |||
9 | Chevron Corp. | Oil, Gas & Consumable Fuels | 1.8% | |||
10 | Dillard’s, Inc. | Multiline Retail | 1.8% | |||
| Total | 20.2% |
Industry Sector Representation as of December 31, 2011
The biggest disparity between the Fund and the S&P 500 Index was found in the Consumer-Discretionary sector, which also had the best contribution to Fund returns for the year. On the other end of the spectrum, we were most underrepresented in the Consumer Staples sector.
| 25 | Semi-Annual Report | December 31, 2011 (Unaudited) | |
Aggressive Investors 2 Fund MANAGER’S COMMENTARY (continued) | |
| (Unaudited) |
| % of Net Assets | % of S&P 500 Index | Difference | ||||
Consumer Discretionary | 19.7% | 10.3% | 9.4% | |||
Consumer Staples | 7.0% | 11.6% | -4.6% | |||
Energy | 14.4% | 12.4% | 2.0% | |||
Financials | 16.7% | 13.5% | 3.2% | |||
Health Care | 9.1% | 11.9% | -2.8% | |||
Industrials | 8.7% | 10.8% | -2.1% | |||
Information Technology | 15.0% | 19.2% | -4.2% | |||
Materials | 4.7% | 3.4% | 1.3% | |||
Telecommunication Services | 3.3% | 3.1% | 0.2% | |||
Utilities | 1.1% | 3.8% | -2.7% | |||
Cash & Other Assets | 0.3% | 0.0% | 0.3% | |||
Total | 100.0% | 100.0% |
Disclaimer
The views expressed here are exclusively those of Fund management. These views, including those related to market sectors or individual stocks, are not meant as investment advice and should not be considered predictive in nature. Any favorable (or unfavorable) description of a holding applies only as of December 31, 2011, unless otherwise stated. Security positions can and do change thereafter. Discussions of historical performance do not guarantee and may not be indicative of future performance.
Market volatility can significantly affect short-term performance. The Fund is not an appropriate investment for short-term investors. Investments in the small companies within this multi-cap fund generally carry greater risk than is customarily associated with larger companies. This additional risk is attributable to a number of factors, including the relatively limited financial resources that are typically available to small companies and the fact that small companies often have comparatively limited product lines. In addition, the stock of small companies tends to be more volatile than the stock of large companies, particularly in the short term and particularly in the early stages of an economic or market downturn. The Fund’s use of options, futures, and leverage can magnify the risk of loss in an unfavorable market, and the Fund’s use of short-sale positions can, in theory, expose shareholders to unlimited loss. Finally, the Fund exposes shareholders to “focus risk,” which may add to Fund volatility through the possibility that a single company could significantly affect total return. Shareholders of the Fund, therefore, are taking on more risk than they would if they invested in the stock market as a whole.
Conclusion
Thank you for your continued investment in Aggressive Investors 2 Fund. We encourage your feedback; your reactions and concerns are extremely important to us.
Sincerely,
The Investment Management Team
| www.bridgeway.com | 26 | |
Bridgeway Aggressive Investors 2 Fund | |
| Showing percentage of net assets as of December 31, 2011 (Unaudited) |
Industry Company | Shares | Value | ||||||
COMMON STOCKS - 99.98% |
| |||||||
Aerospace & Defense - 1.35% |
| |||||||
Triumph Group, Inc. | 35,100 | $ | 2,051,595 | |||||
Auto Components - 3.02% |
| |||||||
Tenneco, Inc.* | 63,000 | 1,876,140 | ||||||
TRW Automotive Holdings | 82,800 | 2,699,280 | ||||||
|
| |||||||
| 4,575,420 | ||||||||
Beverages - 3.99% |
| |||||||
Coca-Cola Enterprises, Inc. | 76,500 | 1,972,170 | ||||||
Constellation Brands, Inc., | 82,200 | 1,699,074 | ||||||
Hansen Natural Corp.* | 25,800 | 2,377,212 | ||||||
|
| |||||||
| 6,048,456 | ||||||||
Capital Markets - 2.37% |
| |||||||
Bank of New York Mellon | 86,400 | 1,720,224 | ||||||
Northern Trust Corp. | 47,300 | 1,875,918 | ||||||
|
| |||||||
| 3,596,142 | ||||||||
Chemicals - 2.46% |
| |||||||
CF Industries Holdings, Inc. | 15,600 | 2,261,688 | ||||||
Westlake Chemical Corp.# | 36,300 | 1,460,712 | ||||||
|
| |||||||
| 3,722,400 | ||||||||
Communications Equipment - 0.65% |
| |||||||
Alcatel-Lucent—Sponsored | 626,900 | 977,964 | ||||||
Computers & Peripherals - 4.31% |
| |||||||
Apple, Inc.* | 8,400 | 3,402,000 | ||||||
Dell, Inc.* | 109,000 | 1,594,670 | ||||||
Seagate Technology PLC | 93,700 | 1,536,680 | ||||||
|
| |||||||
| 6,533,350 | ||||||||
Consumer Finance - 3.55% |
| |||||||
Capital One Financial Corp. | 34,000 | 1,437,860 | ||||||
Cash America International, | 32,600 | 1,520,138 | ||||||
Discover Financial Services | 100,600 | 2,414,400 | ||||||
|
| |||||||
| 5,372,398 | ||||||||
Containers & Packaging - 1.34% |
| |||||||
Crown Holdings, Inc.* | 60,500 | 2,031,590 | ||||||
Diversified Financial Services - 2.48% |
| |||||||
Interactive Brokers Group, | 114,200 | 1,706,148 | ||||||
Moody’s Corp. | 60,700 | 2,044,376 | ||||||
|
| |||||||
| 3,750,524 | ||||||||
Industry Company | Shares | Value | ||||
Diversified Telecommunication Services - 2.36% |
| |||||
Telecom Corp. of New | 165,900 | $ | 1,325,541 | |||
Vonage Holdings Corp.* | 919,500 | 2,252,775 | ||||
|
| |||||
| 3,578,316 | ||||||
Electronic Equipment, Instruments & Components - 1.03% |
| |||||
Vishay Intertechnology, Inc.* | 172,800 | 1,553,472 | ||||
Energy Equipment & Services - 3.78% |
| |||||
Halliburton Co. | 74,700 | 2,577,897 | ||||
RPC, Inc.+ | 172,200 | 3,142,650 | ||||
|
| |||||
| 5,720,547 | ||||||
Food & Staples Retailing - 1.27% |
| |||||
Casey’s General Stores, | 37,200 | 1,916,172 | ||||
Food Products - 0.75% |
| |||||
Coffee Holding Co., Inc.+ | 46,393 | 363,721 | ||||
Green Mountain Coffee | 17,300 | 775,905 | ||||
|
| |||||
| 1,139,626 | ||||||
Health Care Providers & Services - 5.67% |
| |||||
Aetna, Inc. | 42,200 | 1,780,418 | ||||
HCA Holdings, Inc.* | 62,800 | 1,383,484 | ||||
Health Management | 213,000 | 1,569,810 | ||||
Humana, Inc. | 23,200 | 2,032,552 | ||||
Kindred Healthcare, Inc.* | 154,000 | 1,812,580 | ||||
|
| |||||
| 8,578,844 | ||||||
Hotels, Restaurants & Leisure - 3.37% |
| |||||
Domino’s Pizza, Inc.* | 95,400 | 3,238,830 | ||||
Wynn Resorts, Ltd. | 16,900 | 1,867,281 | ||||
|
| |||||
| 5,106,111 | ||||||
Insurance - 4.15% |
| |||||
Marsh & McLennan Cos., | 29,400 | 929,628 | ||||
Reinsurance Group of | 39,000 | 2,037,750 | ||||
RLI Corp.+ | 45,500 | 3,315,130 | ||||
|
| |||||
| 6,282,508 | ||||||
Internet Software & Services - 1.21% | ||||||
j2 Global, Inc. | 65,000 | 1,829,100 | ||||
IT Services - 4.43% |
| |||||
Mastercard, Inc., Class A | 4,200 | 1,565,844 | ||||
| 27 | Semi-Annual | Report December 31, 2011 (Unaudited) | |
Bridgeway Aggressive Investors 2 Fund SCHEDULE OF INVESTMENTS (continued) | |
| Showing percentage of net assets as of December 31, 2011 (Unaudited) |
Industry Company | Shares | Value | ||||
Common Stocks (continued) | ||||||
IT Services (continued) | ||||||
NeuStar, Inc., Class A* | 97,900 | $ | 3,345,243 | |||
Western Union Co. (The) | 98,300 | 1,794,958 | ||||
|
| |||||
| 6,706,045 | ||||||
Leisure Equipment & Products - 1.74% |
| |||||
Polaris Industries, Inc. | 47,000 | 2,631,060 | ||||
Life Sciences Tools & Services - 1.18% |
| |||||
Agilent Technologies, Inc.* | 51,000 | 1,781,430 | ||||
Machinery - 5.89% |
| |||||
Actuant Corp., Class A | 76,800 | 1,742,592 | ||||
Caterpillar, Inc. | 19,500 | 1,766,700 | ||||
CNH Global N.V.* | 70,900 | 2,551,691 | ||||
Sauer-Danfoss, Inc.* | 79,000 | 2,860,590 | ||||
|
| |||||
| 8,921,573 | ||||||
Marine - 0.02% |
| |||||
Kirby Corp.* | 357 | 23,505 | ||||
Media - 4.29% |
| |||||
CBS Corp., Class B | 114,200 | 3,099,388 | ||||
DIRECTV, Class A* | 41,800 | 1,787,368 | ||||
DISH Network Corp., Class | 56,500 | 1,609,120 | ||||
|
| |||||
| 6,495,876 | ||||||
Metals & Mining - 0.96% |
| |||||
Walter Energy, Inc. | 24,000 | 1,453,440 | ||||
Multiline Retail - 3.11% | ||||||
Dillard’s, Inc., Class A+ | 61,100 | 2,742,168 | ||||
Kohl’s Corp. | 40,000 | 1,974,000 | ||||
|
| |||||
| 4,716,168 | ||||||
Multi-Utilities - 1.08% | ||||||
CenterPoint Energy, Inc. | 81,600 | 1,639,344 | ||||
Oil, Gas & Consumable Fuels - 10.62% |
| |||||
Cabot Oil & Gas Corp. | 24,700 | 1,874,730 | ||||
Chevron Corp. | 26,000 | 2,766,400 | ||||
EQT Corp. | 30,500 | 1,671,095 | ||||
HollyFrontier Corp. | 55,200 | 1,291,680 | ||||
Murphy Oil Corp. | 29,300 | 1,633,182 | ||||
Peabody Energy Corp. | 45,000 | 1,489,950 | ||||
Stone Energy Corp.* | 71,300 | 1,880,894 | ||||
Ultra Petroleum Corp.* | 46,600 | 1,380,758 | ||||
W&T Offshore, Inc. | 98,600 | 2,091,306 | ||||
|
| |||||
| 16,079,995 | ||||||
Personal Products - 0.99% | ||||||
Herbalife, Ltd. | 29,100 | 1,503,597 | ||||
Industry Company | Shares | Value | ||||
Pharmaceuticals - 2.26% |
| |||||
Perrigo Co. | 19,200 | $ | 1,868,160 | |||
Watson Pharmaceuticals, | 25,700 | 1,550,738 | ||||
|
| |||||
| 3,418,898 | ||||||
Real Estate Investment Trusts (REITs) - 4.17% |
| |||||
BioMed Realty Trust, Inc. | 156,400 | 2,827,712 | ||||
Newcastle Investment Corp. | 276,411 | 1,285,311 | ||||
Weingarten Realty Investors | 100,700 | 2,197,274 | ||||
|
| |||||
| 6,310,297 | ||||||
Road & Rail - 1.50% |
| |||||
Werner Enterprises, Inc. | 94,000 | 2,265,400 | ||||
Semiconductors & Semiconductor Equipment - 2.53% |
| |||||
Fairchild Semiconductor | ||||||
International, Inc.* | 133,500 | 1,607,340 | ||||
GT Advanced Technologies, | 307,200 | 2,224,128 | ||||
|
| |||||
| 3,831,468 | ||||||
Software - 0.95% |
| |||||
Electronic Arts, Inc.* | 69,800 | 1,437,880 | ||||
Specialty Retail - 4.20% |
| |||||
Best Buy Co., Inc. | 55,800 | 1,304,046 | ||||
DSW, Inc., Class A | 45,000 | 1,989,450 | ||||
Genesco, Inc.* | 26,700 | 1,648,458 | ||||
hhgregg, Inc.*+ | 97,800 | 1,413,210 | ||||
|
| |||||
| 6,355,164 | ||||||
Wireless Telecommunication Services - 0.95% |
| |||||
SK Telecom Co., Ltd. - | ||||||
Sponsored ADR | 106,000 | 1,442,660 | ||||
|
| |||||
TOTAL COMMON STOCKS - 99.98% | 151,378,335 | |||||
|
| |||||
(Cost $ 156,677,709) | ||||||
| www.bridgeway.com | 28 | |
Bridgeway Aggressive Investors 2 Fund SCHEDULE OF INVESTMENTS (continued) | |
| Showing percentage of net assets as of December 31, 2011 (Unaudited) |
Rate^ | Shares | Value | ||||
MONEY MARKET FUND - 0.00% | ||||||
BlackRock FedFund 0.01% | 508 | $508 | ||||
|
| |||||
TOTAL MONEY MARKET FUND - 0.00% | 508 | |||||
|
| |||||
(Cost $ 508) | ||||||
TOTAL INVESTMENTS - 99.98% | $ | 151,378,843 | ||||
(Cost $ 156,678,217) | ||||||
Other Assets in Excess of Liabilities - 0.02% | 37,191 | |||||
|
| |||||
NET ASSETS - 100.00% | $ | 151,416,034 | ||||
|
| |||||
* Non-income producing security. |
| |||||
# Securities, or a portion thereof, segregated to cover the Fund’s potential obligation under swap agreements. The total value of segregated assets is $804,800. |
| |||||
^ Rate disclosed as of December 31, 2011. |
| |||||
+ This security or a portion of the security is out on loan at December 31, 2011. Total loaned securities had a value of $9,334,745 at December 31, 2011. |
| |||||
| ADR - American Depositary Receipt | ||||||
| PLC - Public Limited Company | ||||||
Summary of inputs used to value the Fund’s investments as of 12/31/2011 is as follows (See Note 2 in Notes to Financial Statements):
| Valuation Inputs | ||||||||||||||||
| ||||||||||||||||
| Investment in Securities (Value) | ||||||||||||||||
| ||||||||||||||||
| Level 2 | Level 3 | |||||||||||||||
| Level 1 | Significant | Significant | ||||||||||||||
| Quoted | Observable | Unobservable | �� | |||||||||||||
| Prices | Inputs | Inputs | Total | |||||||||||||
| ||||||||||||||||
Common Stocks | $ | 151,378,335 | $ | — | $ | — | $ | 151,378,335 | ||||||||
Money Market Fund | — | 508 | — | 508 | ||||||||||||
|
|
|
|
|
|
|
| |||||||||
TOTAL | $ | 151,378,335 | $ | 508 | $ | — | $ | 151,378,843 | ||||||||
|
|
|
|
|
|
|
| |||||||||
See Notes to Financial Statements.
| 29 | Semi-Annual Report | December 31, 2011 (Unaudited) | |
(Unaudited)
December 31, 2011
Dear Fellow Ultra-Small Company Fund Shareholder,
The Bridgeway Funds Board of Directors has approved a plan of reorganization providing for the conversion of the Micro-Cap Limited Fund into shares of the Ultra-Small Company Fund. The plan of reorganization providing for the conversion will require the approval of the Micro-Cap Limited Fund shareholders. If approved, the conversion of shares is expected to take effect in the second quarter of 2012.
For the quarter ended December 31, 2011, our Fund appreciated 14.47%, outperforming our primary market benchmark, the CRSP Cap-Based Portfolio 10 Index (+10.36%), and the Russell Microcap Index (+13.83%). The Fund underperformed our peer benchmark, the Lipper Micro-Cap Stock Funds Index (+14.55%), and the Russell 2000 Index (+15.47%). It was a very good quarter on an absolute basis, but a mixed quarter on a relative basis, and we are generally pleased with the results.
For the six month semi-annual period ended December 31, 2011, our Fund couldn’t overcome a poor quarter ended September 30, 2011 — the most macro-driven market we have seen (see pages 3 to 7), and an environment not favorable to the Fund. The Fund declined 16.34%, lagging behind our primary market benchmark, the CRSP Cap-Based Portfolio 10 Index (-14.08%), our peer benchmark, the Lipper Micro-Cap Stock Funds Index (-10.72%), the Russell Microcap Index (-11.14%) and the Russell 2000 Index (-9.77%). We would like to emphasize we have taken certain actions consistent with our (unchanged) investment philosophy and process to address our underperformance in macro-driven markets such as 2008, 2010, and 2011. See, for example, “If macro-driven markets represent such a problem for Bridgeway’s “growthier” select models and Funds, isn’t there anything Bridgeway can do to correct this?” on page 7 and “Can’t the investment team do anything to improve performance during these correlation spikes, or macro-driven markets?” on page 10.
Similarly, for the calendar year ended December 31, 2011, our Fund’s strong first and fourth quarter relative performance couldn’t overcome the poor relative performance in the second and third quarters. The Fund declined 14.64%, lagging behind our primary market benchmark, the CRSP Cap-Based Portfolio 10 Index (-13.98%), our peer benchmark, the Lipper Micro-Cap Stock Funds Index (-5.59%), the Russell Microcap Index (-9.27%) and the Russell 2000 Index (-4.18%).
The table below presents our quarter, six-month, one-year, five-year, ten-year, and life-to-date financial results. See the next page for a graph of performance since inception.
| Annualized | ||||||||||||||||||||||||
| Quarter 10/1/11 to 12/31/11 | 6 Months 7/1/11 to 12/31/11 | 1 Year 1/1/11 to 12/31/11 | 5 Years 1/1/07 to 12/31/11 | 10 Years 1/1/02 to 12/31/11 | Life-to-Date to 12/31/11 | |||||||||||||||||||
Ultra-Small Company Fund | 14.47% | -16.34% | -14.64% | -3.87% | 9.53% | 14.38% | ||||||||||||||||||
CRSP Cap-Based Portfolio 10 Index | 10.36% | -14.08% | -13.98% | -0.86% | 10.11% | 11.32% | ||||||||||||||||||
Russell Microcap Index | 13.83% | -11.14% | -9.27% | -3.75% | 4.63% | N/A | ||||||||||||||||||
Russell 2000 Index (small companies) | 15.47% | -9.77% | -4.18% | 0.15% | 5.62% | 8.03% | ||||||||||||||||||
Lipper Micro-Cap Stock Funds Index | 14.55% | -10.72% | -5.59% | -0.90% | 5.09% | N/A | ||||||||||||||||||
Performance figures quoted in the table above and graph below represent past performance and are no guarantee of future results. Total return figures in the table above and the graph below include the reinvestment of dividends and capital gains. The table above and the graph below do not reflect the deduction of taxes that a shareholder would pay on Fund distributions or the redemption of Fund shares. The recent growth rate in the stock market has helped to produce short-term returns that are not typical and may not continue in the future.
The CRSP Cap-Based Portfolio 10 Index is an unmanaged index of 1,199 of the smallest publicly traded U.S. stocks (with dividends reinvested), as reported by the Center for Research on Security Prices. The Lipper Micro-Cap Stock Funds Index is an index of small-company funds compiled by Lipper, Inc. The Russell Microcap Index is an unmanaged, market value weighted index that measures performance of 1,000 of the smallest securities in the Russell 2000 Index. The Russell 2000
| www.bridgeway.com | 30 | |
Ultra-Small Company Fund MANAGER’S COMMENTARY (continued) | |
| (Unaudited) |
Index is an unmanaged, market value weighted index that measures performance of the 2,000 companies that are between the 1,000th and 3,000th largest in the market with dividends reinvested. It is not possible to invest directly in an index.
According to data from Lipper, Inc. as of December 31, 2011, Ultra-Small Company Fund ranked 73rd of 74 micro-cap funds for the twelve months ending December 31, 2011, 55th of 61 over the last five years, 2nd of 43 over the last ten years, and 1st of 9 since inception in August, 1994. These long-term numbers and the graph below give two snapshots of our long-term success. Lipper, Inc. is an independent mutual fund rating service that ranks funds in various fund categories by making comparative calculations using total returns.
Ultra-Small Company Fund vs. CRSP 10 Index, Lipper Micro-Cap Stock Funds Index*, Russell 2000 Index & Russell Microcap Index** from Inception 8/5/94 to 12/31/11
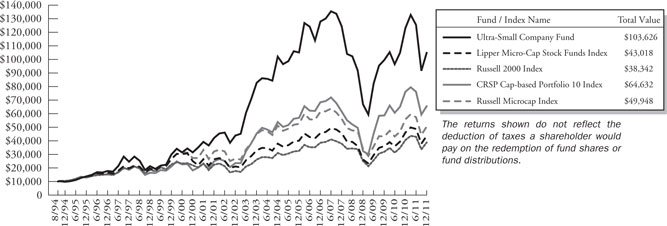
| * | The Lipper Micro-Cap Stock Funds Index began on 12/31/1995, and the line graph for the Index begins at the same value as the Fund on that date. |
| ** | The Russell Microcap Index began on 6/30/2000, and the line graph for the Index begins at the same value as the Fund on that date. |
Detailed Explanation of Quarterly Performance
The Short Version: In spite of double digit appreciation, the 10th decile (ultra-small stocks) was the worst performing size group for the quarter ended December 31, 2011. Nevertheless, our stock picking models performed particularly well among Consumer Discretionary and Health Care stocks, helping us make up the difference.
The table below presents index performance numbers of stocks by size for different time periods. It indicates that ultra-small stocks were at a severe disadvantage compared to micro-cap and small companies for the quarter, six-months, one-year and five-year periods, giving our Fund a headwind versus our peers and small company indexes.
| CRSP Decile1 | Quarter 10/1/11 to 12/31/11 | 6 Months to 12/31/11 | 1 Year 1/1/11 | 5 Years 1/1/07 | 10 Years 1/1/02 to 12/31/11 | 86 Years 1/1/1926 to 12/31/11 | ||||||
1 (ultra-large) | 11.43% | -2.21% | 2.22% | -0.24% | 2.23% | 9.02% | ||||||
2 | 11.36% | -7.19% | 0.25% | 1.09% | 6.46% | 10.36% | ||||||
3 | 11.10% | -10.67% | -2.10% | 1.66% | 6.33% | 10.74% | ||||||
4 | 14.34% | -8.86% | 1.18% | 3.38% | 7.48% | 10.73% | ||||||
5 | 15.30% | -10.02% | -0.98% | 5.14% | 8.37% | 11.28% | ||||||
6 | 15.80% | -9.04% | -1.60% | 2.24% | 6.48% | 11.21% | ||||||
7 | 14.41% | -11.33% | -4.75% | 2.51% | 7.25% | 11.19% | ||||||
8 | 15.95% | -10.03% | -6.70% | 2.39% | 8.24% | 11.41% | ||||||
9 | 15.72% | -10.00% | -7.12% | 1.27% | 7.16% | 11.44% | ||||||
10 (ultra-small) | 10.36% | -14.08% | -13.98% | -0.86% | 10.11% | 12.91% |
| 31 | Semi-Annual Report | December 31, 2011 (Unaudited) | |
Ultra-Small Company Fund MANAGER’S COMMENTARY (continued) | |
| (Unaudited) |
| 1 | The CRSP Cap-Based Portfolio Indexes are unmanaged indexes of the publicly traded U.S. stocks with dividends reinvested, grouped by market capitalization, as reported by the Center for Research in Security Prices. Past performance is no guarantee of future results. |
Nevertheless, our stock picking models picked up nicely in the quarter ended December 31, 2011. The quarter was marked by a “return of the consumer” as investors welcomed what many considered a solid holiday season. Four Consumer Discretionary stocks appear on the list of top contributors. Combined, they contributed almost two percent to the Fund’s return. Industrials were also well represented with three holdings as some manufacturers began to experience a rebound from the early-year slowdown caused by the Japan earthquake.
These are the Fund’s ten best-contributing stocks for the quarter ended December 31, 2011:
| Rank | Description | Industry | % Contribution to Return | |||
| 1 | Metropolitan Health Networks, Inc. | Health Care Providers & Services | 0.9% | |||
| 2 | Mitcham Industries, Inc. | Energy Equipment & Services | 0.7% | |||
| 3 | On Assignment, Inc. | Professional Services | 0.6% | |||
| 4 | Cost Plus, Inc. | Specialty Retail | 0.6% | |||
| 5 | Universal Stainless & Alloy | Metals & Mining | 0.6% | |||
| 6 | Smith & Wesson Holding Corp. | Leisure Equipment & Products | 0.6% | |||
| 7 | Multimedia Games Holding Co., Inc. | Hotels, Restaurants & Leisure | 0.5% | |||
| 8 | Conn’s, Inc. | Specialty Retail | 0.5% | |||
| 9 | Park-Ohio Holdings Corp. | Air Freight & Logistics | 0.4% | |||
| 10 | Carrols Restaurant Group, Inc. | Hotels, Restaurants & Leisure | 0.4% |
Mitcham Industries supplies seismic equipment to various companies within the energy sector. Late in the year, it posted quarterly earnings that beat analysts’ expectations by about 100%, with revenues increasing 40%. Management attributed the strong showing to enhanced international demand in Latin America and the Pacific Rim. The stock price virtually doubled during the three-month period, as improving company fundamentals were well rewarded by Wall Street. It was the second top contributor to the Fund’s return.
The December quarter was clearly a period of uncertainty in the economy and stock markets as many lingering issues at home and abroad (Europe, China, Thailand) contributed to a cautious mindset on the part of some investors. Seven different sectors were represented among the Fund’s worst contributors for the year. Three Financials are included on the list. Combined, they cost the Fund over one-half of a percent in return in spite of an up market quarter.
These are the Fund’s ten worst-contributing stocks for the quarter ended December 31, 2011:
| Rank | Description | Industry | % Contribution to Return | |||
1 | Gramercy Capital Corp. | Real Estate Investment Trusts (REITs) | -0.4% | |||
2 | Xerium Technologies, Inc. | Machinery | -0.3% | |||
3 | RadNet, Inc. | Health Care Providers & Services | -0.1% | |||
4 | Vanda Pharmaceuticals, Inc. | Biotechnology | -0.1% | |||
5 | Omega Protein Corp. | Food Products | -0.1% | |||
6 | TGC Industries, Inc. | Energy Equipment & Services | -0.1% | |||
7 | Verso Paper Corp. | Paper & Forest Products | -0.1% | |||
8 | Doral Financial Corp. | Thrifts & Mortgage Finance | -0.1% | |||
9 | Arlington Asset Investment Corp. | Capital Markets | -0.1% | |||
10 | Richardson Electronics, Ltd. | Electronic Equipment, Instruments & Components | -0.1% |
All is not well in the paper industry these days (to put it mildly). Raw material costs are rising, and global demand is declining. While paper companies have tried to manage the shock of the European debacle, many have been caught off guard by the reduced demand out of “stronger” markets like China. Verso Paper is one such paper producer that has been hurt by the global downturn and the increase in material costs. In October, management initiated cost-cutting measure by announcing that Verso will slash its workforce by 300 jobs and close down three mills. Investors sold on the news, and Verso received a
| www.bridgeway.com | 32 | |
Ultra-Small Company Fund MANAGER’S COMMENTARY (continued) | |
| (Unaudited) |
“notice of delisting” late in the year as the company was no longer in compliance with the standards of the New York Stock Exchange. The holding lost over 40% of its value during the December quarter.
Detailed Explanation of Calendar Year Performance
The Short Version: Consumer stocks contributed most to Fund returns this year. Industrials and Materials stocks were impacted by the floods in Thailand and were costly to Fund returns.
As was the case for the quarter, consumers began emerging out of hibernation during much of the calendar year. Three Consumer Discretionary stocks and one Consumer Staples stock appeared on the list of top contributors for 2011. Combined, they added just less than two percent to the Fund’s return. Two Health Care companies also made the list, despite the ongoing uncertainties of industry reform.
These are the Fund’s ten best-contributing stocks for the calendar year ended December 31, 2011:
| Rank | Description | Industry | % Contribution to Return | |||
1 | Metropolitan Health Networks, Inc. | Health Care Providers & Services | 0.9% | |||
2 | Astronics Corp. | Aerospace & Defense | 0.7% | |||
3 | Conn’s, Inc. | Specialty Retail | 0.5% | |||
4 | Multimedia Games Holding Co., Inc. | Hotels, Restaurants & Leisure | 0.5% | |||
5 | Carrols Restaurant Group, Inc. | Hotels, Restaurants & Leisure | 0.5% | |||
6 | Susser Holdings Corp. | Food & Staples Retailing | 0.4% | |||
7 | Ladenburg Thalmann Financial Services, Inc. | Capital Markets | 0.4% | |||
8 | 8x8, Inc. | Semiconductors & Semiconductor Equipment | 0.4% | |||
9 | Mitcham Industries, Inc. | Energy Equipment & Services | 0.4% | |||
10 | HealthStream, Inc. | Health Care Technology | 0.4% |
Over the past few years, politicos have debated the merits of health care reform; legislation currently awaits a decision by the Supreme Court and potential actions by Congress. As the largest Medicare and Medicaid provider in Florida, Metropolitan Health Networks will certainly be impacted by decisions of the powers-that-be. But in the meantime, investors have flocked to the company, despite the continued uncertainties. Analysts believe that changing demographics play a huge role in the future of the industry; regardless of the reform, a tremendous number of baby boomers will be joining the ranks of Medicare Advantage programs over the next few years. Some providers have been active acquirers, taking advantage of the mass influx of participants. Metropolitan closed on its purchase of Continucare in October, just a few months after a significant positive earnings surprise that caught the attention of analysts and investors alike. The holding was the top contributor for the calendar year and added almost one percent to the Fund’s return.
Early in the calendar year, the Japan earthquake had a dramatic effect on domestic manufacturing, as supply chains came to a virtual standstill. Just as the Asian country entered recovery mode, dramatic floods in Thailand served to slow the progress again, and many trading partners were impacted. Two Industrials sector holdings and one Materials sector holding were among the Fund’s worst contributors during the calendar year; together, they cost the Fund over two percent in performance.
These are the Fund’s ten worst-contributing stocks for the calendar year ended December 31, 2011:
| 33 | Semi-Annual Report | December 31, 2011 (Unaudited) | |
Ultra-Small Company Fund MANAGER’S COMMENTARY (continued) | |
| (Unaudited) |
| Rank | Description | Industry | % Contribution to Return | |||
1 | NN, Inc. | Machinery | -1.1% | |||
2 | Amtech Systems, Inc. | Semiconductors & Semiconductor Equipment | -0.9% | |||
3 | Five Star Quality Care, Inc. | Health Care Providers & Services | -0.8% | |||
4 | Gramercy Capital Corp. | Real Estate Investment Trusts (REITs) | -0.7% | |||
5 | Dot Hill Systems Corp. | Computers & Peripherals | -0.6% | |||
6 | RadNet, Inc. | Health Care Providers & Services | -0.6% | |||
7 | Xerium Technologies, Inc. | Machinery | -0.6% | |||
8 | Imperial Sugar Co. | Food Products | -0.5% | |||
9 | Verso Paper Corp. | Paper & Forest Products | -0.5% | |||
10 | Skilled Healthcare Group, Inc. | Health Care Providers & Services | -0.4% |
Amtech Systems manufactures various components for use in the solar and semiconductor industries. During the year, many related stocks came under pressure as global demand for solar projects slowed and excess capacity prompted severe price cuts throughout the industry. Amtech posted record revenue growth and solid earnings in August, but management added a very troubling outlook and reported that orders had fallen considerably (80%) during the quarter. Subsequently, investors overlooked the past (positive) numbers and focused instead on the uncertain (negative) future. The holding was the second worst contributor for the calendar year and cost the Fund just under one percent in return.
Top Ten Holdings as of December 31, 2011
Seven of the Fund’s top contributors for the December 2011 quarter were also among the largest holdings at the end of the calendar year: Metropolitan Health, Cost Plus, Universal Stainless, Carrols Restaurant, On Assignment, Mitcham Industries, and Smith & Wesson. The Fund was broadly diversified, and no single holding accounted for greater than 2.2% of the net assets. The ten largest positions represented just over 15% of the total assets of the Fund.
| Rank | Description | Industry | % of Net Assets | |||
1 | Metropolitan Health Networks, Inc. | Health Care Providers & Services | 2.2% | |||
2 | Town Sports International Holdings, Inc. | Hotels, Restaurants & Leisure | 1.6% | |||
3 | Cost Plus, Inc. | Specialty Retail | 1.6% | |||
4 | Universal Stainless & Alloy | Metals & Mining | 1.5% | |||
5 | Carrols Restaurant Group, Inc. | Hotels, Restaurants & Leisure | 1.5% | |||
6 | On Assignment, Inc. | Professional Services | 1.5% | |||
7 | Quality Distribution, Inc. | Road & Rail | 1.4% | |||
8 | Mitcham Industries, Inc. | Energy Equipment & Services | 1.4% | |||
9 | U.S. Physical Therapy, Inc. | Health Care Providers & Services | 1.4% | |||
10 | Smith & Wesson Holding Corp. | Leisure Equipment & Products | 1.3% | |||
| Total | 15.4% |
Industry Sector Representation as of December 31, 2011
Health Care was the most underweighted sector between the Fund and the CRSP 10 Index. At the other end of the spectrum, we maintained a larger allocation to Industrials than the Index. The Financials sector made up almost one-fourth of the Fund and the largest sector allocation.
| www.bridgeway.com | 34 | |
Ultra-Small Company Fund MANAGER’S COMMENTARY (continued) | |
| (Unaudited) |
| % of Net Assets | % of CRSP 10 Index | Difference | ||||
Consumer Discretionary | 18.4% | 17.1% | 1.3% | |||
Consumer Staples | 2.5% | 3.0% | -0.5% | |||
Energy | 5.5% | 6.9% | -1.4% | |||
Financials | 23.6% | 23.4% | 0.2% | |||
Health Care | 11.4% | 16.4% | -5.0% | |||
Industrials | 18.3% | 13.5% | 4.8% | |||
Information Technology | 11.7% | 15.2% | -3.5% | |||
Materials | 5.9% | 2.9% | 3.0% | |||
Telecommunication Services | 0.9% | 0.6% | 0.3% | |||
Utilities | 0.0% | 1.0% | -1.0% | |||
Cash & Other Assets | 1.8% | 0.0% | 1.8% | |||
Total | 100.0% | 100.0% |
Disclaimer
The views expressed here are exclusively those of Fund management. These views, including those related to market sectors or individual stocks, are not meant as investment advice and should not be considered predictive in nature. Any favorable (or unfavorable) description of a holding applies only as of December 31, 2011, unless otherwise stated. Security positions can and do change thereafter. Discussions of historical performance do not guarantee and are not indicative of future performance.
The Fund is subject to very high, above market risk (volatility) and is not an appropriate investment for short-term investors. Investments in ultra-small companies generally carry greater risk than is customarily associated with larger companies and even “small companies” for various reasons, such as narrower markets (fewer investors), limited financial resources and greater trading difficulty.
Conclusion
Ultra-Small Company Fund remains closed to new investors. We encourage your feedback; your reactions and concerns are important to us.
Sincerely,
Your Investment Management Team
| 35 | Semi-Annual Report | December 31, 2011 (Unaudited) | |
Bridgeway Ultra-Small Company Fund | |
| Showing percentage of net assets as of December 31, 2011 (Unaudited) |
Industry | Company | Shares | Value | |||||||
COMMON STOCKS - 98.12% |
| |||||||||
Aerospace & Defense - 1.50% |
| |||||||||
Astronics Corp.* | 26,500 | $948,965 | ||||||||
Astronics Corp., Class B* | 2,650 | 96,063 | ||||||||
SIFCO Industries, Inc. | 4,000 | 79,760 | ||||||||
|
| |||||||||
| 1,124,788 | ||||||||||
Air Freight & Logistics - 1.71% |
| |||||||||
Pacer International, Inc.* | 76,200 | 407,670 | ||||||||
Park-Ohio Holdings Corp.* | 49,000 | 874,160 | ||||||||
|
| |||||||||
| 1,281,830 | ||||||||||
Airlines - 0.42% |
| |||||||||
Republic Airways Holdings, Inc.* | 91,000 | 312,130 | ||||||||
Biotechnology - 0.80% |
| |||||||||
Cytori Therapeutics, Inc.* | 700 | 1,540 | ||||||||
Vanda Pharmaceuticals, Inc.* | 126,500 | 602,140 | ||||||||
|
| |||||||||
| 603,680 | ||||||||||
Building Products - 0.65% |
| |||||||||
NCI Building Systems, Inc.* | 39,500 | 429,365 | ||||||||
US Home Systems, Inc. | 8,700 | 57,855 | ||||||||
|
| |||||||||
| 487,220 | ||||||||||
Capital Markets - 3.17% |
| |||||||||
Arlington Asset Investment Corp., Class A+ | 43,600 | 929,988 | ||||||||
Calamos Asset | ||||||||||
Management, Inc., Class A | 66,600 | 833,166 | ||||||||
Ladenburg Thalmann Financial Services, Inc.*+ | 250,000 | 620,000 | ||||||||
|
| |||||||||
| 2,383,154 | ||||||||||
Chemicals - 1.21% |
| |||||||||
Arabian American Development Co.* | 12,000 | 101,760 | ||||||||
Core Molding Technologies, Inc.* | 14,800 | 119,288 | ||||||||
Spartech Corp.* | 146,000 | 690,580 | ||||||||
|
| |||||||||
| 911,628 | ||||||||||
Commercial Banks - 6.34% |
| |||||||||
Access National Corp. | 9,800 | 86,240 | ||||||||
Ameris Bancorp* | 58,800 | 604,464 | ||||||||
Bancorp, Inc. (The)* | 72,000 | 520,560 | ||||||||
CoBiz Financial, Inc. | 107,000 | 617,390 | ||||||||
Farmers Capital Bank Corp.* | 20,000 | 89,800 | ||||||||
First California Financial Group, Inc.* | 45,000 | 146,700 | ||||||||
Industry | Company | Shares | Value | |||||||
Commercial Banks (continued) |
| |||||||||
First Community | ||||||||||
Bancshares, Inc. | 30,400 | $ | 379,392 | |||||||
Green Bankshares, Inc.* | 40,200 | 50,652 | ||||||||
Macatawa Bank Corp.* | 67,800 | 154,584 | ||||||||
Mercantile Bank Corp.*+ | 20,900 | 204,820 | ||||||||
Merchants Bancshares, Inc. | 14,300 | 417,560 | ||||||||
Metro Bancorp, Inc.* | 38,700 | 324,306 | ||||||||
MetroCorp Bancshares, Inc.* | 16,000 | 101,600 | ||||||||
MidWestOne Financial Group, Inc. | 30,000 | 438,600 | ||||||||
Trico Bancshares | 22,000 | 312,840 | ||||||||
United Community Banks, Inc.* | 44,460 | 310,775 | ||||||||
|
| |||||||||
| 4,760,283 | ||||||||||
Commercial Services & Supplies - 2.92% |
| |||||||||
Casella Waste Systems, Inc., Class A* | 107,700 | 689,280 | ||||||||
CECO Environmental Corp. | 12,700 | 71,755 | ||||||||
Cenveo, Inc.* | 125,400 | 426,360 | ||||||||
Intersections, Inc. | 35,000 | 388,150 | ||||||||
Perma-Fix Environmental Services* | 100,000 | 155,000 | ||||||||
Standard Register Co. (The) | 100,000 | 233,000 | ||||||||
TRC Cos., Inc.* | 37,800 | 227,178 | ||||||||
|
| |||||||||
| 2,190,723 | ||||||||||
Communications Equipment - 2.44% |
| |||||||||
CalAmp Corp.* | 75,400 | 320,450 | ||||||||
Communications Systems, Inc. | 29,400 | 413,364 | ||||||||
Tessco Technologies, Inc. | 30,000 | 414,600 | ||||||||
UTStarcom Holdings Corp.* | 281,400 | 388,332 | ||||||||
ZST Digital Networks, Inc.* | 128,500 | 291,695 | ||||||||
|
| |||||||||
| 1,828,441 | ||||||||||
Computers & Peripherals - 0.93% |
| |||||||||
Datalink Corp.* | 84,200 | 695,492 | ||||||||
Construction & Engineering - 0.44% |
| |||||||||
Northwest Pipe Co.* | 14,500 | 331,470 | ||||||||
Consumer Finance - 1.38% |
| |||||||||
CompuCredit Holdings Corp.* | 200,000 | 740,000 | ||||||||
Nicholas Financial, Inc.+ | 12,100 | 155,122 | ||||||||
White River Capital, Inc. | 7,000 | 141,750 | ||||||||
|
| |||||||||
| 1,036,872 | ||||||||||
Containers & Packaging - 0.52% |
| |||||||||
AEP Industries, Inc.* | 14,000 | 394,100 | ||||||||
| www.bridgeway.com | 36 | |
Bridgeway Ultra-Small Company Fund SCHEDULE OF INVESTMENTS (continued) | |
| Showing percentage of net assets as of December 31, 2011 (Unaudited) |
Industry | Company | Shares | Value | |||||||
Common Stocks (continued) |
| |||||||||
Diversified Consumer Services - 1.48% |
| |||||||||
Collectors Universe | 40,000 | $582,800 | ||||||||
CPI Corp. | 30,878 | 55,889 | ||||||||
Mac-Gray Corp. | 29,000 | 399,910 | ||||||||
School Specialty, Inc.* | 28,233 | 70,583 | ||||||||
|
| |||||||||
| 1,109,182 | ||||||||||
Diversified Financial Services - 0.62% |
| |||||||||
Asset Acceptance Capital Corp.* | 26,000 | 101,660 | ||||||||
MicroFinancial, Inc. | 19,100 | 110,398 | ||||||||
Primus Guaranty, Ltd.*+ | 51,800 | 253,820 | ||||||||
|
| |||||||||
| 465,878 | ||||||||||
Diversified Telecommunication Services - 0.89% |
| |||||||||
Alaska Communications Systems Group, Inc. | 9,900 | 29,799 | ||||||||
HickoryTech Corp. | 32,800 | 363,424 | ||||||||
Multiband Corp.*+ | 86,000 | 277,780 | ||||||||
|
| |||||||||
| 671,003 | ||||||||||
Electrical Equipment -1.60% |
| |||||||||
Allied Motion Technologies, Inc. | 30,000 | 169,200 | ||||||||
Coleman Cable, Inc.* | 58,000 | 504,600 | ||||||||
Jinpan International, Ltd.+ | 50,400 | 410,508 | ||||||||
SL Industries, Inc.* | 7,000 | 113,400 | ||||||||
|
| |||||||||
| 1,197,708 | ||||||||||
Electronic Equipment, Instruments & Components - 3.75% |
| |||||||||
Agilysys, Inc.* | 106,800 | 849,060 | ||||||||
GTSI Corp.* | 35,000 | 147,000 | ||||||||
Micronetics, Inc.* | 9,300 | 73,284 | ||||||||
Netlist, Inc.* | 128,000 | 321,280 | ||||||||
PC Connection, Inc. | 27,100 | 300,539 | ||||||||
PC Mall, Inc.* | 62,500 | 392,500 | ||||||||
Richardson Electronics, Ltd. | 48,900 | 600,981 | ||||||||
Wayside Technology Group, Inc. | 10,500 | 127,575 | ||||||||
|
| |||||||||
| 2,812,219 | ||||||||||
Energy Equipment & Services - 2.03% |
| |||||||||
Mitcham Industries, Inc.* | 48,200 | 1,052,688 | ||||||||
TGC Industries, Inc.* | 65,500 | 467,670 | ||||||||
|
| |||||||||
| 1,520,358 | ||||||||||
Food & Staples Retailing - 1.72% |
| |||||||||
Pizza Inn Holdings, Inc.*+ | 62,500 | 343,750 | ||||||||
Susser Holdings Corp.* | 42,000 | 950,040 | ||||||||
|
| |||||||||
| 1,293,790 | ||||||||||
Food Products - 0.42% |
| |||||||||
Coffee Holding Co., Inc.+ | 40,000 | 313,600 | ||||||||
Industry | Company | Shares | Value | |||||||
Health Care Equipment & Supplies - 1.76% |
| |||||||||
DynaVox, Inc., Class A* | 70,000 | $ | 254,800 | |||||||
RTI Biologics, Inc.* | 115,000 | 510,600 | ||||||||
Synergetics USA, Inc.* | 58,900 | 434,682 | ||||||||
Theragenics Corp.* | 70,000 | 117,600 | ||||||||
|
| |||||||||
| 1,317,682 | ||||||||||
Health Care Providers & Services - 6.97% |
| |||||||||
Advocat, Inc. | 16,500 | 91,575 | ||||||||
Alliance HealthCare Services, Inc.* | 160,000 | 201,600 | ||||||||
Cross Country Healthcare, Inc.* | 76,100 | 422,355 | ||||||||
Five Star Quality Care, Inc.* | 188,900 | 566,700 | ||||||||
Metropolitan Health Networks, Inc.* | 224,300 | 1,675,521 | ||||||||
Providence Service Corp. (The)* | 50,000 | 688,000 | ||||||||
RadNet, Inc.* | 259,100 | 551,883 | ||||||||
U.S. Physical Therapy, Inc. | 52,500 | 1,033,200 | ||||||||
|
| |||||||||
| 5,230,834 | ||||||||||
Health Care Technology - 0.74% |
| |||||||||
HealthStream, Inc.* | 30,000 | 553,500 | ||||||||
Hotels, Restaurants & Leisure - 6.37% |
| |||||||||
Caribou Coffee Co., Inc.* | 48,400 | 675,180 | ||||||||
Carrols Restaurant Group, Inc.* | 100,000 | 1,157,000 | ||||||||
Great Wolf Resorts, Inc.* | 137,800 | 399,620 | ||||||||
Kona Grill, Inc.* | 20,000 | 122,400 | ||||||||
Luby’s, Inc.* | 35,700 | 161,007 | ||||||||
Multimedia Games Holding Co., Inc.* | 88,800 | 705,072 | ||||||||
O’Charleys, Inc.*+ | 64,600 | 354,654 | ||||||||
Town Sports International Holdings, Inc.* | 164,000 | 1,205,400 | ||||||||
|
| |||||||||
| 4,780,333 | ||||||||||
Household Durables - 1.59% |
| |||||||||
Bassett Furniture Industries, Inc. | 23,000 | 172,270 | ||||||||
CSS Industries, Inc. | 13,800 | 274,896 | ||||||||
Lifetime Brands, Inc. | 59,400 | 721,116 | ||||||||
Skyline Corp. | 5,446 | 23,690 | ||||||||
|
| |||||||||
| 1,191,972 | ||||||||||
Insurance - 1.68% |
| |||||||||
Crawford & Co., Class B | 77,400 | 476,784 | ||||||||
Hallmark Financial Services* | 46,100 | 322,239 | ||||||||
Universal Insurance Holdings, Inc. | 130,000 | 465,400 | ||||||||
|
| |||||||||
| 1,264,423 | ||||||||||
| 37 | Semi-Annual Report | December 31, 2011 (Unaudited) | |
Bridgeway Ultra-Small Company Fund SCHEDULE OF INVESTMENTS (continued) | |
| Showing percentage of net assets as of December 31, 2011 (Unaudited) |
Industry | Company | Shares | Value | |||||||
Common Stocks (continued) |
| |||||||||
Internet & Catalog Retail - 0.54% |
| |||||||||
1-800-Flowers.com, Inc., Class A* | 183,500 | $403,700 | ||||||||
Internet Software & Services - 0.42% |
| |||||||||
EasyLink Services | ||||||||||
International Corp., Class A* | 79,100 | 314,818 | ||||||||
Quepasa Corp.* | 100 | 332 | ||||||||
|
| |||||||||
| 315,150 | ||||||||||
IT Services - 2.32% |
| |||||||||
Analysts International Corp.* | 15,300 | 85,374 | ||||||||
Computer Task Group, Inc.* | 43,300 | 609,664 | ||||||||
Dynamics Research Corp.* | 19,000 | 215,460 | ||||||||
Innodata Isogen, Inc.* | 22,300 | 87,862 | ||||||||
LML Payment Systems, Inc.* | 56,000 | 130,480 | ||||||||
MoneyGram International, Inc.* | 34,550 | 613,262 | ||||||||
|
| |||||||||
| 1,742,102 | ||||||||||
Leisure Equipment & Products - 1.28% |
| |||||||||
Smith & Wesson Holding Corp.* | 220,700 | 962,252 | ||||||||
Life Sciences Tools & Services - 0.98% |
| |||||||||
Cambrex Corp.* | 101,900 | 731,642 | ||||||||
Complete Genomics, Inc.* | 2,055 | 6,021 | ||||||||
|
| |||||||||
| 737,663 | ||||||||||
Machinery - 3.10% |
| |||||||||
Hardinge, Inc. | 44,500 | 358,225 | ||||||||
Hurco Cos., Inc.* | 14,800 | 310,800 | ||||||||
Lydall, Inc.* | 53,700 | 509,613 | ||||||||
Miller Industries, Inc. | 50,000 | 786,500 | ||||||||
Xerium Technologies, Inc.*+ | 55,071 | 360,164 | ||||||||
|
| |||||||||
| 2,325,302 | ||||||||||
Marine - 0.90% | ||||||||||
International Shipholding Corp. | 28,000 | 523,320 | ||||||||
Star Bulk Carriers Corp. | 170,000 | 151,334 | ||||||||
|
| |||||||||
| 674,654 | ||||||||||
Media - 1.75% |
| |||||||||
Ballantyne Strong, Inc.* | 67,300 | 275,257 | ||||||||
Fisher Communications, Inc.* | 18,000 | 518,940 | ||||||||
Gray Television, Inc.* | 250,000 | 405,000 | ||||||||
Spanish Broadcasting System, Inc., Class A* | 38,700 | 116,100 | ||||||||
|
| |||||||||
| 1,315,297 | ||||||||||
Industry | Company | Shares | Value | |||||||
Metals & Mining - 3.12% |
| |||||||||
China Gerui Advanced Materials Group, Ltd.*+ | 91,400 | $306,190 | ||||||||
Friedman Industries, Inc. | 23,700 | 247,665 | ||||||||
Handy & Harman, Ltd.* | 55,000 | 544,500 | ||||||||
Rare Element Resources, Ltd.* | 27,010 | 87,783 | ||||||||
Universal Stainless & Alloy* | 31,000 | 1,158,160 | ||||||||
|
| |||||||||
| 2,344,298 | ||||||||||
Oil, Gas & Consumable Fuels - 3.43% |
| |||||||||
Adams Resources & Energy, Inc. | 6,400 | 185,472 | ||||||||
Callon Petroleum Co.* | 75,500 | 375,235 | ||||||||
Crimson Exploration, Inc.* | 127,800 | 365,508 | ||||||||
PostRock Energy Corp.* | 69,500 | 195,295 | ||||||||
REX American Resources Corp.* | 35,000 | 773,850 | ||||||||
SMF Energy Corp. | 65,000 | 185,900 | ||||||||
Warren Resources, Inc.* | 151,500 | 493,890 | ||||||||
|
| |||||||||
| 2,575,150 | ||||||||||
Paper & Forest Products - 1.04% |
| |||||||||
Mercer International, Inc.* | 77,400 | 472,140 | ||||||||
Orient Paper, Inc.* | 60,400 | 196,300 | ||||||||
Verso Paper Corp.* | 113,900 | 109,344 | ||||||||
|
| |||||||||
| 777,784 | ||||||||||
Personal Products - 0.35% |
| |||||||||
Natural Alternatives International, Inc.* | 15,800 | 139,356 | ||||||||
Nature’s Sunshine Products, Inc.*+ | 8,100 | 125,712 | ||||||||
|
| |||||||||
| 265,068 | ||||||||||
Pharmaceuticals - 0.12% |
| |||||||||
Heska Corp.* | 12,000 | 87,600 | ||||||||
Professional Services - 2.81% |
| |||||||||
Franklin Covey Co.* | 50,000 | 423,500 | ||||||||
GP Strategies Corp.* | 42,000 | 566,160 | ||||||||
On Assignment, Inc.* | 100,000 | 1,118,000 | ||||||||
|
| |||||||||
| 2,107,660 | ||||||||||
Real Estate Investment Trusts (REITs) - 6.54% |
| |||||||||
Agree Realty Corp. | 26,160 | 637,781 | ||||||||
ARMOUR Residential REIT, Inc.+ | 131,800 | 929,190 | ||||||||
Capital Trust, Inc., Class A*+ | 110,300 | 248,175 | ||||||||
Gramercy Capital Corp.* | 383,600 | 959,000 | ||||||||
MPG Office Trust, Inc.*+ | 283,700 | 564,563 | ||||||||
| www.bridgeway.com | 38 | |
Bridgeway Ultra-Small Company Fund SCHEDULE OF INVESTMENTS (continued) | |
| Showing percentage of net assets as of December 31, 2011 (Unaudited) |
Industry | Company | Shares | Value | |||||||
Common Stocks (continued) |
| |||||||||
Real Estate Investment Trusts (REITs) (continued) |
| |||||||||
One Liberty Properties, Inc. | 53,500 | $ | 882,750 | |||||||
Winthrop Realty Trust | 67,900 | 690,543 | ||||||||
|
| |||||||||
| 4,912,002 | ||||||||||
Road & Rail - 2.22% |
| |||||||||
Covenant Transportation | ||||||||||
Group, Inc., Class A* | 33,000 | 98,010 | ||||||||
Quality Distribution, Inc.* | 95,500 | 1,074,375 | ||||||||
Saia, Inc.* | 30,600 | 381,888 | ||||||||
Universal Truckload Services, Inc. | 6,300 | 114,345 | ||||||||
|
| |||||||||
| 1,668,618 | ||||||||||
Semiconductors & Semiconductor Equipment - 0.91% |
| |||||||||
Photronics, Inc.* | 112,200 | 682,176 | ||||||||
Software - 0.95% |
| |||||||||
Cinedigm Digital Cinema Corp., Class A* | 50,700 | 69,966 | ||||||||
Majesco Entertainment Co.*+ | 141,000 | 344,040 | ||||||||
QAD, Inc., Class A* | 13,400 | 140,700 | ||||||||
QAD, Inc., Class B* | 15,000 | 155,250 | ||||||||
|
| |||||||||
| 709,956 | ||||||||||
Specialty Retail - 4.31% |
| |||||||||
Cache, Inc.* | 14,600 | 90,374 | ||||||||
Conn’s, Inc.* | 86,000 | 954,600 | ||||||||
Cost Plus, Inc.*# | 122,100 | 1,190,475 | ||||||||
TravelCenters of America LLC* | 46,200 | 196,350 | ||||||||
Winmark Corp. | 4,500 | 258,165 | ||||||||
Zale Corp.* | 142,300 | 542,163 | ||||||||
|
| |||||||||
| 3,232,127 | ||||||||||
Textiles, Apparel & Luxury Goods - 1.14% |
| |||||||||
Delta Apparel, Inc.* | 22,500 | 429,525 | ||||||||
DGSE Cos., Inc.*+ | 14,900 | 108,174 | ||||||||
Rocky Brands, Inc.* | 35,000 | 315,700 | ||||||||
|
| |||||||||
| 853,399 | ||||||||||
Thrifts & Mortgage Finance - 3.84% |
| |||||||||
BankFinancial Corp. | 27,800 | 153,456 | ||||||||
Beacon Federal Bancorp, Inc. | 7,000 | 97,090 | ||||||||
BofI Holding, Inc.* | 29,300 | 476,125 | ||||||||
Doral Financial Corp.* | 529,000 | 505,724 | ||||||||
First Financial Holdings, Inc. | 36,700 | 327,731 | ||||||||
First Pactrust Bancorp, Inc.+ | 37,000 | 379,250 | ||||||||
Meridian Interstate Bancorp, Inc.* | 35,500 | 441,975 | ||||||||
Industry | Company | Shares | Value | |||||||||
Thrifts & Mortgage Finance (continued) |
| |||||||||||
United Financial Bancorp, Inc. | 31,200 | $ | 502,008 | |||||||||
|
| |||||||||||
| 2,883,359 | ||||||||||||
|
| |||||||||||
TOTAL COMMON STOCKS - 98.12% (Cost $ 72,156,651) |
| 73,639,610 | ||||||||||
|
| |||||||||||
| Rate^ | Shares | Value | ||||||||||
MONEY MARKET FUND - 2.02% |
| |||||||||||
BlackRock FedFund | 0.01% | 1,515,640 | 1,515,640 | |||||||||
|
| |||||||||||
TOTAL MONEY MARKET FUND - 2.02% |
| 1,515,640 | ||||||||||
|
| |||||||||||
(Cost $ 1,515,640) |
| |||||||||||
TOTAL INVESTMENTS - 100.14% | $75,155,250 | |||||||||||
(Cost $ 73,672,291) | ||||||||||||
Liabilities in Excess of Other Assets - (0.14%) |
| (102,745 | ) | |||||||||
|
| |||||||||||
NET ASSETS - 100.00% | $75,052,505 | |||||||||||
|
| |||||||||||
| * | Non-income producing security. |
| # | Securities, or a portion thereof, segregated to cover the Fund’s potential obligation under swap agreements. The total value of segregated assets is $1,190,475. |
| ^ | Rate disclosed as of December 31, 2011. |
| + | This security or a portion of the security is out on loan at December 31, 2011. Total loaned securities had a value of $3,870,055 at December 31, 2011. |
LLC - Limited Liability Company
| 39 | Semi-Annual Report | December 31, 2011 (Unaudited) | |
Bridgeway Ultra-Small Company Fund SCHEDULE OF INVESTMENTS (continued) |
|
Summary of inputs used to value the Fund’s investments as of 12/31/2011 is as follows (See Note 2 in Notes to Financial Statements): |
| |||||||||||||||
| Valuation Inputs | ||||||||||||||||
| ||||||||||||||||
| Investment in Securities (Value) | ||||||||||||||||
| ||||||||||||||||
| Level 1 Quoted Prices | Level 2 Significant Observable Inputs | Level 3 Unobservable Inputs | Total | |||||||||||||
| ||||||||||||||||
Common | $ | 73,639,610 | $ | — | $ | $ | 73,639,610 | |||||||||
Money | — | 1,515,640 | — | 1,515,640 | ||||||||||||
|
|
|
|
|
|
|
| |||||||||
TOTAL | $ | 73,639,610 | $ | 1,515,640 | $ | — | $ | 75,155,250 | ||||||||
|
|
|
|
|
|
|
| |||||||||
Other | ||||||||||||||||
Swaps | $ | — | $ | 92,099 | $ | — | $ | 92,099 | ||||||||
|
|
|
|
|
|
|
| |||||||||
TOTAL | $ | — | $ | 92,099 | $ | — | $ | 92,099 | ||||||||
|
|
|
|
|
|
|
| |||||||||
** Other financial instruments are derivative instruments not reflected in the Schedule of Investments, such as swap contracts, which are valued at the unrealized appreciation/depreciation on the investment. |
| |||||||||||||||
Following is a reconciliation of Level 3 investments for which significant unobservable inputs were used to determine fair value:
| Investment in Securities (Value) | ||||||||
| ||||||||
| Common Stocks | Total | |||||||
| ||||||||
Balance as of 06/30/2011 | $ | 124,650 | $ | 124,650 | ||||
Purchases | — | — | ||||||
Sales | (25,506) | (25,506) | ||||||
Realized gain/ (loss)1 | (254,813) | (254,813) | ||||||
Change in unrealized appreciation/ (depreciation)2 | 155,669 | 155,669 | ||||||
Transfers in3 | — | — | ||||||
Transfers out | — | — | ||||||
|
|
|
| |||||
Balance as of 12/31/2011 | $ | — | $ | — | ||||
|
|
|
| |||||
Net change in unrealized appreciation (depreciation) from investments held as of 12/31/20112 | $ | — | $ | — | ||||
|
|
|
| |||||
1Realized gain/(loss) from Level 3 securities is included on the Statements of Operations in the Realized Gain (Loss) on Investments.
2Change in unrealized appreciation/(depreciation) for Level 3 securities is included on the Statements of Operations in the Change in Unrealized Appreciation (Depreciation) on Investments.
3Transfers in represent the value as of the beginning of the reporting period, for any investment security where significant transfers in the pricing level occurred during the period. The purchase value is used in situations where the investment was not held as of the beginning of the period.
The security in the table above was considered a Level 3 security because it was fair valued under procedures adopted by the Board of Directors at June 30, 2011. There were no Level 3 securities that were fair valued under these procedures at December 31, 2011. Such valuation is based on a review of inputs such as, but not limited to, similar securities, company specific financial information and company specific news.
See Notes to Financial Statements.
|
|
|
| www.bridgeway.com | 40 | |
|
(Unaudited)
December 31, 2011
Dear Fellow Ultra-Small Company Market Fund Shareholder,
For the quarter ended December 31, 2011, our Fund appreciated 14.94%, outperforming our primary market benchmark, the CRSP Cap-Based Portfolio 10 Index (+10.36%), our peer benchmark, the Lipper Micro-Cap Stock Funds Index (+14.55%) and the Russell Microcap Index (+13.83%). The Fund underperformed the Russell 2000 Index (+15.47%). It was a very good quarter on an absolute and relative basis. We are pleased with the results.
For the six month semi-annual period ended December 31, 2011, our Fund declined 11.28%, outperforming our primary market benchmark, the CRSP Cap-Based Portfolio 10 Index (-14.08%). We trailed our peer benchmark, the Lipper Micro-Cap Stock Funds Index (-10.72%), the Russell Microcap Index (-11.14%) and the Russell 2000 Index (-9.77%).
For the calendar year ended December 31, 2011, our Fund declined 7.86%, leading our primary market benchmark, the CRSP Cap-Based Portfolio 10 Index (-13.98%), and the Russell Microcap Index (-9.27%). The Fund trailed our peer benchmark, the Lipper Micro-Cap Stock Funds Index (-5.59%), and the Russell 2000 Index (-4.18%). We gained some ground on the CRSP 10 Index for the longer five year and ten year periods.
The table below presents our quarter, six-month, one-year, five-year, ten-year, and life-to-date financial results. See the next page for a graph of performance since inception.
Annualized | ||||||||||||||||||||||||
Quarter to 12/31/11 | 6 Months to 12/31/11 | 1 Year 1/1/11 to 12/31/11 | 5 Years 1/1/07 to 12/31/11 | 10 Years 1/1/02 to 12/31/11 | Life-to-Date to 12/31/11 | |||||||||||||||||||
Ultra-Small Company Market Fund | 14.94% | -11.28% | -7.86% | -3.67% | 8.09% | 9.06% | ||||||||||||||||||
CRSP Cap-Based Portfolio 10 Index | 10.36% | -14.08% | -13.98% | -0.86% | 10.11% | 9.56% | ||||||||||||||||||
Russell Microcap Index | 13.83% | -11.14% | -9.27% | -3.75% | 4.63% | N/A | ||||||||||||||||||
Russell 2000 Index (small companies) | 15.47% | -9.77% | -4.18% | 0.15% | 5.62% | 5.46% | ||||||||||||||||||
Lipper Micro-Cap Stock Funds Index | 14.55% | -10.72% | -5.59% | -0.90% | 5.09% | 5.92% | ||||||||||||||||||
Performance figures quoted in the table above and graph below represent past performance and are no guarantee of future results. Total return figures in the table above and the graph below include the reinvestment of dividends and capital gains. The table above and the graph below do not reflect the deduction of taxes that a shareholder would pay on Fund distributions or the redemption of Fund shares.
The CRSP Cap-Based Portfolio 10 Index is an unmanaged index of 1,199 of the smallest publicly traded U.S. stocks (with dividends reinvested), as reported by the Center for Research on Security Prices. The Lipper Micro-Cap Stock Funds Index is an index of small-company funds compiled by Lipper, Inc. The Russell Microcap Index is an unmanaged, market value weighted index that measures performance of 1000 of the smallest securities in the Russell 2000 Index. The Russell 2000 Index is an unmanaged, market value weighted index that measures performance of the 2,000 companies that are between the 1,000th and 3,000th largest in the market with dividends reinvested. It is not possible to invest directly in an index.
According to data from Lipper, Inc. as of December 31, 2011, Ultra-Small Company Market Fund ranked 52nd of 74 micro-cap funds for the twelve months ending December 31, 2011, 53rd of 61 over the last five years, 14th of 43 over the last ten years, and 7th of 22 since inception in July 1997. These long-term numbers and the graph below give two snapshots of our long-term success. Lipper, Inc. is an independent mutual fund rating service that ranks funds in various fund categories by making comparative calculations using total returns.
| 41 | Semi-Annual Report | December 31, 2011 (Unaudited) | |
Ultra-Small Company Market Fund MANAGER’S COMMENTARY (continued) | | |
| (Unaudited) |
Ultra-Small Company Market Fund vs. CRSP 10 Index, Lipper Micro-Cap Stock Funds Index, Russell 2000 Index & Russell Microcap Index* from Inception 7/31/97 to 12/31/11
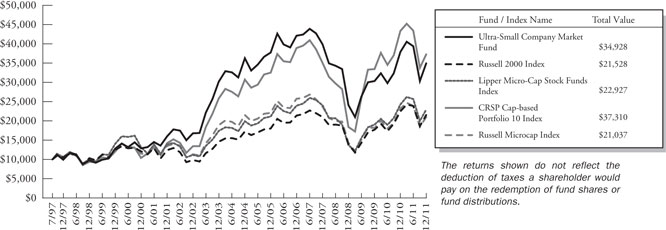
| * | The Russell Microcap Index began on 6/30/2000, and the line graph for the Index begins at the same value as the Fund on that date. |
Detailed Explanation of Quarterly Performance:
The Short Version: In spite of double digit appreciation, the 10th decile (ultra-small stocks) was the worst performing size group for the quarter ended December 31, 2011. Nevertheless, our “sidestepping models,” which tend to help most in market downturns, helped in this bounceback quarter as well.
The table below presents stock index performance numbers by company size for different time periods. It indicates that ultra-small stocks were at a severe disadvantage as compared to micro-cap and small companies for the quarter, six-months, one-year and five-year periods, giving our Fund a headwind versus our peers and small company indexes.
| CRSP Decile1 | Quarter 10/1/11 to 12/31/11 | 6 Months to 12/31/11 | 1 Year 1/1/11 to 12/31/11 | 5 Years 1/1/07 to 12/31/11 | 10 Years 1/1/02 to 12/31/11 | 86 Years 1/1/1926 to 12/31/11 | ||||||||
1 (ultra-large) | 11.43% | -2.21% | 2.22% | -0.24% | 2.23% | 9.02 | % | |||||||
2 | 11.36% | -7.19% | 0.25% | 1.09% | 6.46% | 10.36 | % | |||||||
3 | 11.10% | -10.67% | -2.10% | 1.66% | 6.33% | 10.74 | % | |||||||
4 | 14.34% | -8.86% | 1.18% | 3.38% | 7.48% | 10.73 | % | |||||||
5 | 15.30% | -10.02% | -0.98% | 5.14% | 8.37% | 11.28 | % | |||||||
6 | 15.80% | -9.04% | -1.60% | 2.24% | 6.48% | 11.21 | % | |||||||
7 | 14.41% | -11.33% | -4.75% | 2.51% | 7.25% | 11.19 | % | |||||||
8 | 15.95% | -10.03% | -6.70% | 2.39% | 8.24% | 11.41 | % | |||||||
9 | 15.72% | -10.00% | -7.12% | 1.27% | 7.16% | 11.44 | % | |||||||
10 (ultra-small) | 10.36% | -14.08% | -13.98% | -0.86% | 10.11% | 12.91 | % | |||||||
| 1 | The CRSP Cap-Based Portfolio Indexes are unmanaged indexes of the publicly traded U.S. stocks with dividends reinvested, grouped by market capitalization, as reported by the Center for Research in Security Prices. Past performance is no guarantee of future results. |
The recovery from the previous quarter downturn was broad based across industries, and our best performers reflected this. Three Heath Care companies were among the top contributors. Combined they added over one-half of a percent in return.
| www.bridgeway.com | 42 | |
Ultra-Small Company Market Fund MANAGER’S COMMENTARY (continued) | | |
| (Unaudited) |
These are the Fund’s ten best-contributing stocks for the quarter ended December 31, 2011:
| Rank | Description | Industry | % Contribution to Return | |||
| 1 | Mitcham Industries, Inc. | Energy Equipment & Services | 0.5% | |||
| 2 | Metropolitan Health Networks, Inc. | Health Care Providers & Services | 0.3% | |||
| 3 | On Assignment, Inc. | Professional Services | 0.3% | |||
| 4 | RAM Energy Resources, Inc. | Oil, Gas & Consumable Fuels | 0.2% | |||
| 5 | Greenbrier Cos., Inc. | Machinery | 0.2% | |||
| 6 | Curis, Inc. | Biotechnology | 0.2% | |||
| 7 | Magma Design Automation, Inc. | Software | 0.2% | |||
| 8 | ISTA Pharmaceuticals, Inc. | Pharmaceuticals | 0.2% | |||
| 9 | Multimedia Games Holding Co., Inc. | Hotels, Restaurants & Leisure | 0.2% | |||
| 10 | Lithia Motors, Inc. | Specialty Retail | 0.2% |
Mitcham Industries supplies seismic equipment to various companies within the energy sector. Late in the year, it posted quarterly earnings that beat analysts’ expectations by about 100%, with revenues increasing 40%. Management attributed the strong showing to enhanced international demand in Latin America and the Pacific Rim. Its stock price virtually doubled during the three-month period, as improving company fundamentals were well rewarded by Wall Street. The stock was the top contributor to the Fund’s quarterly performance.
Four Health Care holdings comprised the worst contributors list and they cost the Fund over one-fourth of a percent in performance. Bear in mind that the sector faces much uncertainty these days, given the controversial nature of healthcare reform legislation. Additionally, Biotech companies are often perceived as risky ventures, since positive trial results and FDA approvals are frequently in question.
These are the Fund’s ten worst-contributing stocks for the quarter ended December 31, 2011:
| Rank | Description | Industry | % Contribution to Return | |||
1 | BioSante Pharmaceuticals, Inc. | Biotechnology | -0.1% | |||
| 2 | Zagg, Inc. | Household Durables | -0.1% | |||
| 3 | Sangamo Biosciences, Inc. | Biotechnology | -0.1% | |||
| 4 | Furniture Brands International, Inc. | Household Durables | -0.1% | |||
| 5 | Intersections, Inc. | Commercial Services & Supplies | -0.1% | |||
| 6 | Federal Agricultural Mortgage Corp. | Thrifts & Mortgage Finance | -0.1% | |||
| 7 | Pinnacle Airlines Corp. | Airlines | -0.1% | |||
| 8 | Reddy Ice Holdings, Inc. | Food Products | -0.1% | |||
| 9 | AVI BioPharma, Inc. | Biotechnology | -0.1% | |||
| 10 | TranS1 Inc. | Health Care Equipment & Supplies | -0.1% |
Zagg (Zealous About Great Gadgets) manufactures accessories for smartphones, such as those plastic screen covers for Apple iPhones. The company has ridden the wave of the smartphone explosion (it now accounts for almost 60% of all mobile device accessories), but now is facing intense competition from others who are joining the game. Its recent acquisition of onetime rival iFrog helped revenues soar percentage-wise, but also weighed on overall profits. While Zagg gets over forty percent of its business through Best Buy, it does not have a long-term contract to ensure that business continuity. Its latest earnings report also raised some concern among analysts as inventories rose to higher-than-anticipated levels. The holding’s share price dropped over 25% during the latest three-month period.
Detailed Explanation of Calendar Year Performance
The Short Version: The Health Care sector proved to be a solid contributor for the calendar year. Information Technology stocks hurt Fund performance for the period.
| 43 | Semi-Annual Report | December 31, 2011 (Unaudited) | |||||
Ultra-Small Company Market Fund MANAGER’S COMMENTARY (continued) | |
(Unaudited)
As was the case for the quarter ended December 31, 2011, Health Care dominated the top contributors for the calendar year as five related holdings made the list and added about one percent to the overall return. Three of these were Health Care providers, indicating that many investors seem to be more focused on demographic changes (the aging of America’s baby boomers) than the political aspects of the reform.
These are the Fund’s ten best-contributing stocks for the calendar year ended December 31, 2011:
| Rank | Description | Industry | % Contribution to Return | |||
| 1 | Mitcham Industries, Inc. | Energy Equipment & Services | 0.4% | |||
| 2 | Curis, Inc. | Biotechnology | 0.3% | |||
| 3 | Metropolitan Health Networks, Inc. | Health Care Providers & Services | 0.3% | |||
| 4 | Globecomm Systems, Inc. | Communications Equipment | 0.2% | |||
| 5 | Ladenburg Thalmann Financial Services, Inc. | Capital Markets | 0.2% | |||
| 6 | HealthStream, Inc. | Health Care Technology | 0.2% | |||
| 7 | Akorn, Inc. | Pharmaceuticals | 0.2% | |||
| 8 | Synovis Life Technologies, Inc. | Health Care Equipment & Supplies | 0.2% | |||
| 9 | Web.com Group, Inc. | Internet Software & Services | 0.2% | |||
| 10 | Stamps.com, Inc. | Internet Software & Services | 0.2% |
Over the past few years, politicos have debated the merits of health care reform; legislation currently awaits a decision by the Supreme Court and potential action by Congress. As the largest Medicare and Medicaid provider in Florida, Metropolitan Health Networks will certainly be impacted by decisions of the powers-that-be. But in the meantime, investors have flocked to the company despite the continued uncertainties. Analysts believe that changing demographics play a huge role in the future of the industry; regardless of the reform, a tremendous number of baby boomers will be joining the ranks of Medicare Advantage programs over the next few years. Some providers have been active acquirers, taking advantage of the mass influx of participants. Metropolitan closed on its purchase of Continucare in October, just a few months after a significant positive earnings surprise that caught the attention of analysts and investors alike. The holding was among the top contributors for the calendar year, and its stock price rose over 60% over the past 12 months.
Although the economy has shown signs of rebounding as of late, businesses and consumers still do not appear to be stepping up their purchases of computers and electronics (unless they are manufactured by Apple). Four Information Technology holdings made the list of worst contributors and combined, they hindered Fund performance by about one and one-fourth percent.
These are the Fund’s ten worst-contributing stocks for the calendar year ended December 31, 2011:
| Rank | Description | Industry | % Contribution to Return | |||
| 1 | Support.com, Inc. | Internet Software & Services | -0.4% | |||
| 2 | Amtech Systems, Inc. | Semiconductors & Semiconductor Equipment | -0.4% | |||
| 3 | Cogo Group, Inc. | Communications Equipment | -0.3% | |||
| 4 | ValueVision Media, Inc. | Internet & Catalog Retail | -0.3% | |||
| 5 | Chindex International, Inc. | Health Care Providers & Services | -0.2% | |||
| 6 | GSI Technology, Inc. | Semiconductors & Semiconductor Equipment | -0.2% | |||
| 7 | Geokinetics, Inc | Energy Equipment & Services | -0.2% | |||
| 8 | Sangamo Biosciences, Inc. | Biotechnology | -0.2% | |||
| 9 | M/I Homes, Inc. | Household Durables | -0.2% | |||
| 10 | AVI BioPharma, Inc. | Biotechnology | -0.1% |
Amtech Systems manufactures various components for use in the solar and semiconductor industries. During the year, many related stocks came under pressures as global demand for solar projects slowed and excess capacity prompted severe price cuts throughout the industry. Amtech posted record revenue growth and solid earnings in August, but management added a very troubling outlook and reported that orders had fallen considerably (80%) during the quarter. Subsequently, investors overlooked the past (positive) numbers and focused instead on the uncertain (negative) future. The holding was the second worst contributor for the calendar year.
| www.bridgeway.com | 44 | |
Ultra-Small Company Market Fund MANAGER’S COMMENTARY (continued) | | |
| (Unaudited) |
Top Ten Holdings as of December 31, 2011
This passively managed fund is designed to model the CRSP 10 Index, and thus no single company comprises too high a percentage of its assets. In fact, the top ten holdings represent less than six percent of overall Fund net assets, and no stock accounts for greater than one percent. Bear in mind any stock with an allocation of greater than one-half of a percent has appreciated in value, as we never initiate any position in excess of that percentage.
| Rank | Description | Industry | % of Net Assets | |||
| 1 | Mitcham Industries, Inc. | Energy Equipment & Services | 0.9% | |||
| 2 | Metropolitan Health Networks, Inc. | Health Care Providers & Services | 0.6% | |||
| 3 | Globecomm Systems, Inc. | Communications Equipment | 0.6% | |||
| 4 | Federal Agricultural Mortgage Corp. | Thrifts & Mortgage Finance | 0.6% | |||
| 5 | Curis, Inc. | Biotechnology | 0.5% | |||
| 6 | Actuate Corp. | Software | 0.5% | |||
| 7 | AEP Industries, Inc. | Containers & Packaging | 0.5% | |||
| 8 | Famous Dave’s of America, Inc. | Hotels, Restaurants & Leisure | 0.5% | |||
| 9 | Spartan Motors, Inc. | Auto Components | 0.5% | |||
| 10 | Providence Service Corp. | Health Care Providers & Services | 0.5% | |||
| Total | 5.7% |
Industry Sector Representation as of December 31, 2011
The Financials, Health Care, and Consumer Discretionary sectors held the largest allocations at quarter-end. As a passively-managed fund, sector allocations will not vary dramatically from those of the CRSP 10 Index.
| % of Portfolio | % of CRSP 10 Index | Difference | ||||
| Consumer Discretionary | 16.7% | 17.1% | -0.4% | |||
| Consumer Staples | 3.3% | 3.0% | 0.3% | |||
| Energy | 6.8% | 6.9% | -0.1% | |||
| Financials | 23.0% | 23.4% | -0.4% | |||
| Health Care | 16.8% | 16.4% | 0.4% | |||
| Industrials | 12.8% | 13.5% | -0.7% | |||
| Information Technology | 14.5% | 15.2% | -0.7% | |||
| Materials | 2.9% | 2.9% | 0.0% | |||
| Telecommunication Services | 0.7% | 0.6% | 0.1% | |||
| Utilities | 1.2% | 1.0% | 0.2% | |||
| Cash & Other Assets | 1.3% | 0.0% | 1.3% | |||
Total | 100.0% | 100.0% |
Disclaimer
The views expressed here are exclusively those of Fund management. These views, including those related to market sectors or individual stocks, are not meant as investment advice and should not be considered predictive in nature. Any favorable (or unfavorable) description of a holding applies only as of December 31, 2011, unless otherwise stated. Security positions can and do change thereafter. Discussions of historical performance do not guarantee and are not indicative of future performance.
The Fund is subject to very high, above market risk (volatility) and is not an appropriate investment for short-term investors. Investments in ultra-small companies generally carry greater risk than is customarily associated with larger companies and even “small companies” for various reasons such as narrower markets (fewer investors), limited financial resources and greater trading difficulty.
| 45 | Semi-Annual Report | December 31, 2011 (Unaudited) | |
Ultra-Small Company Market Fund MANAGER’S COMMENTARY (continued) | | |
| (Unaudited) |
Conclusion
Thank you for your continued investment in Ultra-Small Company Market Fund. We encourage your feedback; your reactions and concerns are important to us.
Sincerely,
The Investment Management Team
| www.bridgeway.com | 46 | |
Bridgeway Ultra-Small Company Market Fund | |
| Showing percentage of net assets as of December 31, 2011 (Unaudited) | ||
Industry | Company | Shares | Value | |||||||
COMMON STOCKS - 99.01% |
| |||||||||
Aerospace & Defense - 1.13% |
| |||||||||
Astronics Corp.* | 22,700 | $ | 812,887 | |||||||
Astronics Corp., Class B* | 2,270 | 82,287 | ||||||||
Ducommun, Inc. | 29,900 | 381,225 | ||||||||
GenCorp, Inc.* | 152,600 | 811,832 | ||||||||
Innovative Solutions & Support, Inc.* | 63,454 | 218,282 | ||||||||
KEYW Holding Corp. (The)*+ | 45,100 | 333,740 | ||||||||
LMI Aerospace, Inc.* | 21,000 | 368,550 | ||||||||
Sparton Corp.* | 63,300 | 550,710 | ||||||||
|
| |||||||||
| 3,559,513 | ||||||||||
Air Freight & Logistics - 0.75% |
| |||||||||
Pacer International, Inc.* | 188,800 | 1,010,080 | ||||||||
Park-Ohio Holdings Corp.* | 46,000 | 820,640 | ||||||||
XPO Logistics, Inc.* | 44,800 | 553,280 | ||||||||
|
| |||||||||
| 2,384,000 | ||||||||||
Airlines - 0.09% |
| |||||||||
Pinnacle Airlines Corp.* | 77,759 | 63,762 | ||||||||
Republic Airways Holdings, Inc.* | 63,600 | 218,148 | ||||||||
|
| |||||||||
| 281,910 | ||||||||||
Auto Components - 1.11% |
| |||||||||
Amerigon, Inc.* | 42,200 | 601,772 | ||||||||
Motorcar Parts of America, Inc.*+ | 30,600 | 229,500 | ||||||||
Shiloh Industries, Inc.* | 39,600 | 331,848 | ||||||||
Spartan Motors, Inc. | 334,600 | 1,609,426 | ||||||||
Strattec Security Corp. | 24,100 | 480,795 | ||||||||
UQM Technologies, Inc.*+ | 183,522 | 253,260 | ||||||||
|
| |||||||||
| 3,506,601 | ||||||||||
Beverages - 0.31% |
| |||||||||
Craft Brewers Alliance, Inc.* | 89,100 | 536,382 | ||||||||
MGP Ingredients, Inc.+ | 39,900 | 201,096 | ||||||||
Primo Water Corp.* | 75,200 | 228,608 | ||||||||
|
| |||||||||
| 966,086 | ||||||||||
Biotechnology - 6.55% |
| |||||||||
ADVENTRX Pharmaceuticals, Inc.* | 92,500 | 53,650 | ||||||||
Affymax, Inc.* | 61,100 | 403,871 | ||||||||
Amicus Therapeutics, Inc.* | 115,991 | 399,009 | ||||||||
Arena Pharmaceuticals, Inc.*+ | 159,900 | 299,013 | ||||||||
ArQule, Inc.* | 131,300 | 740,532 | ||||||||
Array Biopharma, Inc.* | 160,100 | 345,816 | ||||||||
Astex Pharmaceuticals* | 274,600 | 518,994 | ||||||||
Industry | Company | Shares | Value | |||||||
Biotechnology (continued) |
| |||||||||
BioCryst Pharmaceuticals, Inc.* | 155,700 | $ | 384,579 | |||||||
BioMimetic Therapeutics, Inc.* | 100,900 | 287,565 | ||||||||
BioSpecifics Technologies Corp.*+ | 12,500 | 207,750 | ||||||||
Celldex Therapeutics, Inc.* | 71,400 | 185,640 | ||||||||
Codexis, Inc.*+ | 70,100 | 371,530 | ||||||||
Curis, Inc.*+ | 363,100 | 1,699,308 | ||||||||
Cytori Therapeutics, Inc.*+ | 183,300 | 403,260 | ||||||||
Dusa Pharmaceuticals, Inc.* | 181,000 | 792,780 | ||||||||
Dyax Corp.* | 388,200 | 527,952 | ||||||||
GTx, Inc.* | 146,624 | 492,657 | ||||||||
Immunomedics, Inc.*+ | 129,000 | 429,570 | ||||||||
Infinity Pharmaceuticals, Inc.*+ | 56,200 | 496,808 | ||||||||
Ligand Pharmaceuticals, Inc., Class B* | 57,133 | 678,169 | ||||||||
Maxygen, Inc.* | 49,850 | 280,656 | ||||||||
Metabolix, Inc.*+ | 90,900 | 413,595 | ||||||||
Myrexis, Inc.* | 98,700 | 264,516 | ||||||||
Nabi Biopharmaceuticals* | 70,200 | 131,976 | ||||||||
Neurocrine Biosciences, Inc.* | 129,200 | 1,098,200 | ||||||||
Novavax, Inc.*+ | 315,900 | 398,034 | ||||||||
Omeros Corp.* | 77,400 | 305,730 | ||||||||
Oncothyreon, Inc.*+ | 124,300 | 942,194 | ||||||||
Orexigen Therapeutics, Inc.* | 115,000 | 185,150 | ||||||||
Osiris Therapeutics, Inc.*+ | 80,200 | 429,070 | ||||||||
PharmAthene, Inc.*+ | 209,700 | 266,319 | ||||||||
Progenics Pharmaceuticals, Inc.* | 72,400 | 618,296 | ||||||||
PROLOR Biotech, Inc.*+ | 75,700 | 323,239 | ||||||||
Repligen Corp.* | 60,100 | 208,547 | ||||||||
Sangamo Biosciences, Inc.*+ | 127,436 | 361,918 | ||||||||
Sciclone Pharmaceuticals, Inc.* | 124,307 | 533,277 | ||||||||
Spectrum Pharmaceuticals, Inc.*+ | 43,700 | 639,331 | ||||||||
Synageva BioPharma Corp.*+ | 28,600 | 761,618 | ||||||||
Synta Pharmaceuticals Corp.*+ | 142,500 | 665,475 | ||||||||
Vanda Pharmaceuticals, Inc.* | 78,600 | 374,136 | ||||||||
Vical, Inc.* | 233,900 | 1,031,499 | ||||||||
Zalicus, Inc.*+ | 313,021 | 378,755 | ||||||||
Zogenix, Inc.* | 161,300 | 361,312 | ||||||||
|
| |||||||||
| 20,691,296 | ||||||||||
| 47 | Semi-Annual Report | December 31, 2011 (Unaudited) | |
Bridgeway Ultra-Small Company Market Fund SCHEDULE OF INVESTMENTS (continued) | |
| Showing percentage of net assets as of December 31, 2011 (Unaudited) | ||
Industry | Company | Shares | Value | |||||||
Common Stocks (continued) |
| |||||||||
Building Products - 0.45% |
| |||||||||
American Woodmark Corp. | 16,763 | $ | 228,983 | |||||||
Builders FirstSource, Inc.* | 194,500 | 396,780 | ||||||||
NCI Building Systems, Inc.* | 73,300 | 796,771 | ||||||||
|
| |||||||||
| 1,422,534 | ||||||||||
Capital Markets - 3.15% |
| |||||||||
Arlington Asset Investment Corp., Class A | 38,700 | 825,471 | ||||||||
Calamos Asset Management, Inc., Class A | 21,400 | 267,714 | ||||||||
Diamond Hill Investment Group, Inc. | 5,600 | 414,288 | ||||||||
Edelman Financial Group, Inc. | 51,000 | 335,070 | ||||||||
FBR & Co.* | 110,500 | 226,525 | ||||||||
Gladstone Capital Corp.+ | 76,600 | 584,458 | ||||||||
Gladstone Investment Corp. | 28,200 | 205,014 | ||||||||
Harris & Harris Group, Inc.* | 69,400 | 240,124 | ||||||||
HFF, Inc., Class A* | 56,300 | 581,579 | ||||||||
JMP Group, Inc. | 81,100 | 579,865 | ||||||||
Kohlberg Capital Corp. | 48,900 | 308,559 | ||||||||
Ladenburg Thalmann Financial Services, Inc.*+ | 493,000 | 1,222,640 | ||||||||
Medallion Financial Corp. | 86,711 | 986,771 | ||||||||
NGP Capital Resources Co. | 48,600 | 349,434 | ||||||||
Pzena Investment Management, Inc., Class A | 39,800 | 172,334 | ||||||||
TICC Capital Corp.+ | 82,300 | 711,895 | ||||||||
Triangle Capital Corp.+ | 57,212 | 1,093,893 | ||||||||
Westwood Holdings Group, Inc. | 23,025 | 841,564 | ||||||||
|
| |||||||||
| 9,947,198 | ||||||||||
Chemicals - 1.05% |
| |||||||||
American Vanguard Corp. | 75,100 | 1,001,834 | ||||||||
Chase Corp. | 27,800 | 386,420 | ||||||||
Core Molding Technologies, Inc.* | 18,600 | 149,916 | ||||||||
KMG Chemicals, Inc. | 58,800 | 1,015,476 | ||||||||
Landec Corp.* | 109,200 | 602,784 | ||||||||
Senomyx, Inc.* | 49,300 | 171,564 | ||||||||
|
| |||||||||
| 3,327,994 | ||||||||||
Commercial Banks - 11.37% |
| |||||||||
1st United Bancorp, Inc.* | 48,200 | 267,510 | ||||||||
Alliance Financial Corp. | 25,000 | 772,000 | ||||||||
American National Bankshares, Inc. | 28,600 | 557,414 | ||||||||
American River Bankshares* | 37,800 | 171,990 | ||||||||
Industry | Company | Shares | Value | |||||||
Commercial Banks (continued) |
| |||||||||
Ameris Bancorp* | 88,600 | $ | 910,808 | |||||||
Arrow Financial Corp.+ | 16,686 | 391,120 | ||||||||
Bancorp, Inc. (The)* | 36,600 | 264,618 | ||||||||
BancTrust Financial Group, Inc.* | 69,000 | 85,560 | ||||||||
Bank of Commerce Holdings | 41,100 | 137,685 | ||||||||
Bank of Kentucky Financial Corp. | 9,000 | 180,450 | ||||||||
Banner Corp. | 44,959 | 771,047 | ||||||||
Bar Harbor Bankshares | 6,000 | 180,000 | ||||||||
Bridge Bancorp, Inc.+ | 17,300 | 344,270 | ||||||||
Bryn Mawr Bank Corp. | 41,724 | 813,201 | ||||||||
Camden National Corp. | 11,800 | 384,680 | ||||||||
Capital City Bank Group, Inc.+ | 47,258 | 451,314 | ||||||||
Center Bancorp, Inc.+ | 72,217 | 705,560 | ||||||||
Century Bancorp, Inc., Class A | 23,272 | 657,201 | ||||||||
Citizens Holding Co. | 20,670 | 369,580 | ||||||||
CNB Financial Corp. | 40,800 | 643,824 | ||||||||
CoBiz Financial, Inc.+ | 155,800 | 898,966 | ||||||||
Eagle Bancorp, Inc.* | 5,964 | 86,716 | ||||||||
Encore Bancshares, Inc.* | 19,600 | 264,992 | ||||||||
Enterprise Financial Services Corp. | 85,700 | 1,268,360 | ||||||||
Farmers Capital Bank Corp.* | 67,149 | 301,499 | ||||||||
Financial Institutions, Inc. | 50,533 | 815,603 | ||||||||
First Bancorp | 51,900 | 578,685 | ||||||||
First Bancorp, Inc.+ | 33,300 | 511,821 | ||||||||
First California Financial Group, Inc.* | 67,400 | 219,724 | ||||||||
First Community Bancshares, Inc. | 17,500 | 218,400 | ||||||||
First Merchants Corp. | 95,000 | 804,650 | ||||||||
First South Bancorp, Inc.*+ | 14,300 | 45,760 | ||||||||
German American Bancorp, Inc.+ | 39,500 | 718,505 | ||||||||
Great Southern Bancorp, Inc.+ | 21,600 | 509,544 | ||||||||
Guaranty Bancorp* | 123,200 | 181,104 | ||||||||
Hampton Roads Bankshares, Inc.* | 85,300 | 233,722 | ||||||||
Hanmi Financial Corp.*+ | 42,150 | 311,910 | ||||||||
Heritage Commerce Corp.*+ | 70,000 | 331,800 | ||||||||
Heritage Financial Corp. | 39,260 | 493,106 | ||||||||
Home Bancorp, Inc.* | 41,600 | 643,552 | ||||||||
Lakeland Bancorp, Inc. | 97,860 | 843,553 | ||||||||
LNB Bancorp, Inc. | 20,000 | 93,800 | ||||||||
| www.bridgeway.com | 48 | |
Bridgeway Ultra-Small Company Market Fund SCHEDULE OF INVESTMENTS (continued) | |
| Showing percentage of net assets as of December 31, 2011 (Unaudited) | ||
| Industry Company | Shares | Value | ||||||||
Common Stocks (continued) |
| |||||||||
Commercial Banks (continued) |
| |||||||||
Macatawa Bank Corp.* | 103,000 | $ | 234,840 | |||||||
MainSource Financial Group, Inc. | 81,700 | 721,411 | ||||||||
Merchants Bancshares, Inc.+ | 27,800 | 811,760 | ||||||||
Metro Bancorp, Inc.* | 46,900 | 393,022 | ||||||||
MidSouth Bancorp, Inc. | 35,900 | 467,059 | ||||||||
MidWestOne Financial Group, Inc. | 54,200 | 792,404 | ||||||||
National Bankshares, Inc.+ | 14,300 | 399,256 | ||||||||
NewBridge Bancorp* | 28,287 | 109,471 | ||||||||
Northrim BanCorp, Inc. | 33,300 | 583,083 | ||||||||
Ohio Valley Banc Corp. | 19,500 | 363,285 | ||||||||
OmniAmerican Bancorp, Inc.* | 26,300 | 412,910 | ||||||||
Pacific Continental Corp. | 51,611 | 456,757 | ||||||||
Park Sterling Corp.* | 82,400 | 336,192 | ||||||||
Peapack Gladstone Financial Corp. | 39,130 | 420,256 | ||||||||
Penns Woods Bancorp, Inc.+ | 16,400 | 635,992 | ||||||||
Peoples Bancorp, Inc. | 28,400 | 420,604 | ||||||||
Preferred Bank* | 16,120 | 120,900 | ||||||||
QCR Holdings, Inc. | 13,200 | 120,120 | ||||||||
Republic First Bancorp, Inc.* | 60,000 | 89,400 | ||||||||
Seacoast Banking Corp. of Florida* | 314,814 | 478,517 | ||||||||
Shore Bancshares, Inc. | 42,600 | 219,390 | ||||||||
Sierra Bancorp | 42,900 | 377,520 | ||||||||
Southwest Bancorp, Inc.* | 34,200 | 203,832 | ||||||||
State Bancorp, Inc. | 95,900 | 1,169,980 | ||||||||
Sterling Bancorp | 22,000 | 190,080 | ||||||||
Suffolk Bancorp* | 27,400 | 295,646 | ||||||||
Taylor Capital Group, Inc.*+ | 25,908 | 251,826 | ||||||||
Tower Bancorp, Inc. | 35,700 | 1,018,878 | ||||||||
Trico Bancshares | 54,300 | 772,146 | ||||||||
Univest Corp. of Pennsylvania | 29,800 | 436,272 | ||||||||
Virginia Commerce Bancorp, Inc.* | 153,159 | 1,183,919 | ||||||||
VIST Financial Corp. | 15,000 | 90,750 | ||||||||
Washington Banking Co. | 71,900 | 856,329 | ||||||||
West Bancorporation, Inc. | 27,100 | 259,618 | ||||||||
Wilshire Bancorp, Inc.* | 184,000 | 667,920 | ||||||||
Yadkin Valley Financial Corp.* | 64,200 | 109,140 | ||||||||
|
| |||||||||
| 35,906,089 | ||||||||||
Commercial Services & Supplies - 1.69% |
| |||||||||
A.T. Cross Co., Class A* | 26,000 | 293,280 | ||||||||
American Reprographics Co.* | 73,300 | 336,447 | ||||||||
Industry | Company | Shares | Value | |||||||
Commercial Services & Supplies (continued) |
| |||||||||
Casella Waste Systems, | ||||||||||
Inc., Class A* | 81,800 | $ | 523,520 | |||||||
CECO Environmental Corp. | 42,600 | 240,690 | ||||||||
Courier Corp. | 25,000 | 293,250 | ||||||||
Heritage-Crystal Clean, Inc.* | 18,100 | 299,736 | ||||||||
Intersections, Inc. | 135,184 | 1,499,191 | ||||||||
Kimball International, Inc., Class B | 56,100 | 284,427 | ||||||||
Metalico, Inc.* | 110,800 | 364,532 | ||||||||
Multi-Color Corp. | 35,400 | 910,842 | ||||||||
Standard Register Co. (The) | 30,000 | 69,900 | ||||||||
TRC Cos., Inc.* | 35,000 | 210,350 | ||||||||
|
| |||||||||
| 5,326,165 | ||||||||||
Communications Equipment - 2.84% |
| |||||||||
Aviat Networks, Inc.* | 221,000 | 404,430 | ||||||||
Bel Fuse, Inc., Class B | 25,100 | 470,625 | ||||||||
Cogo Group, Inc.*+ | 69,600 | 125,280 | ||||||||
Communications Systems, Inc. | 29,100 | 409,146 | ||||||||
Digi International, Inc.* | 67,239 | 750,387 | ||||||||
Emcore Corp.* | 296,300 | 255,500 | ||||||||
Globecomm Systems, Inc.* | 143,400 | 1,961,712 | ||||||||
KVH Industries, Inc.* | 77,700 | 604,506 | ||||||||
Numerex Corp., Class A*+ | 30,000 | 246,900 | ||||||||
Oplink Communications, Inc.* | 73,100 | 1,203,957 | ||||||||
Opnext, Inc.* | 123,417 | 99,696 | ||||||||
ORBCOMM, Inc.* | 67,000 | 200,330 | ||||||||
PC-Tel, Inc. | 85,600 | 585,504 | ||||||||
Procera Networks, Inc.* | 31,600 | 492,328 | ||||||||
ShoreTel, Inc.* | 46,600 | 297,308 | ||||||||
Telestone Technologies Corp.*+ | 49,100 | 204,256 | ||||||||
Tessco Technologies, Inc. | 23,500 | 324,770 | ||||||||
Westell Technologies, Inc., Class A* | 102,800 | 228,216 | ||||||||
ZST Digital Networks, Inc.*+ | 50,000 | 113,500 | ||||||||
|
| |||||||||
| 8,978,351 | ||||||||||
Computers & Peripherals - 1.02% |
| |||||||||
Concurrent Computer | ||||||||||
Corp.* | 55,300 | 209,587 | ||||||||
Cray, Inc.* | 101,200 | 654,764 | ||||||||
Datalink Corp.* | 54,800 | 452,648 | ||||||||
Dot Hill Systems Corp.* | 526,600 | 700,378 | ||||||||
Immersion Corp.* | 104,100 | 539,238 | ||||||||
Novatel Wireless, Inc.* | 96,800 | 302,984 | ||||||||
Transact Technologies, Inc.* | 50,800 | 368,808 | ||||||||
|
| |||||||||
| 3,228,407 | ||||||||||
| 49 | Semi-Annual Report | December 31, 2011 (Unaudited) | |
Bridgeway Ultra-Small Company Market Fund SCHEDULE OF INVESTMENTS (continued) | |
| Showing percentage of net assets as of December 31, 2011 (Unaudited) | ||
Industry | Company | Shares | Value | |||||||
Common Stocks (continued) |
| |||||||||
Construction & Engineering - 0.89% |
| |||||||||
Argan, Inc.+ | 44,700 | $ | 679,887 | |||||||
Furmanite Corp.* | 75,400 | 475,774 | ||||||||
Michael Baker Corp.* | 24,900 | 488,289 | ||||||||
Northwest Pipe Co.* | 17,800 | 406,908 | ||||||||
Sterling Construction Co., Inc.* | 28,400 | 305,868 | ||||||||
UniTek Global Services, Inc.* | 100,200 | 453,906 | ||||||||
|
| |||||||||
| 2,810,632 | ||||||||||
Construction Materials - 0.10% |
| |||||||||
United States Lime & Minerals, Inc.* | 5,300 | 318,583 | ||||||||
Consumer Finance - 0.04% |
| |||||||||
CompuCredit Holdings Corp.* | 36,729 | 135,897 | ||||||||
Containers & Packaging - 0.52% |
| |||||||||
AEP Industries, Inc.* | 58,800 | 1,655,220 | ||||||||
Distributors - 0.24% |
| |||||||||
Amcon Distributing Co. | 1,000 | 64,400 | ||||||||
VOXX International Corp.* | 80,707 | 681,974 | ||||||||
|
| |||||||||
| 746,374 | ||||||||||
Diversified Consumer Services - 0.73% |
| |||||||||
Carriage Services, Inc. | 81,100 | 454,160 | ||||||||
Collectors Universe | 69,460 | 1,012,032 | ||||||||
CPI Corp.+ | 30,700 | 55,567 | ||||||||
Learning Tree International, Inc.* | 44,100 | 309,582 | ||||||||
Mac-Gray Corp. | 33,300 | 459,207 | ||||||||
|
| |||||||||
| 2,290,548 | ||||||||||
Diversified Financial Services - 0.68% |
| |||||||||
Asset Acceptance Capital Corp.* | 40,626 | 158,848 | ||||||||
Asta Funding, Inc. | 142,300 | 1,135,554 | ||||||||
Marlin Business Services Corp. | 28,300 | 359,410 | ||||||||
Resource America, Inc., Class A | 100,700 | 479,332 | ||||||||
|
| |||||||||
| 2,133,144 | ||||||||||
Diversified Telecommunication Services - 0.71% |
| |||||||||
HickoryTech Corp. | 43,495 | 481,925 | ||||||||
IDT Corp., Class B | 48,667 | 456,496 | ||||||||
Otelco, Inc.+ | 28,600 | 396,682 | ||||||||
SureWest Communications | 42,000 | 505,260 | ||||||||
Warwick Valley Telephone Co. | 30,200 | 398,338 | ||||||||
|
| |||||||||
| 2,238,701 | ||||||||||
Industry | Company | Shares | Value | |||||||
Electrical Equipment - 0.51% |
| |||||||||
Coleman Cable, Inc.* | 77,000 | $ | 669,900 | |||||||
LSI Industries, Inc. | 70,500 | 423,000 | ||||||||
Magnetek, Inc.* | 10,000 | 86,100 | ||||||||
Ocean Power Technologies, Inc.*+ | 76,087 | 205,435 | ||||||||
SL Industries, Inc.* | 13,200 | 213,840 | ||||||||
|
| |||||||||
| 1,598,275 | ||||||||||
Electronic Equipment, Instruments & Components - 2.23% |
| |||||||||
Agilysys, Inc.* | �� | 40,200 | 319,590 | |||||||
Clearfield, Inc.* | 30,270 | 230,355 | ||||||||
Comverge, Inc.* | 85,700 | 107,982 | ||||||||
DDi Corp. | 83,600 | 779,988 | ||||||||
eMagin Corp.* | 56,300 | 208,310 | ||||||||
Identive Group, Inc.* | 138,200 | 308,186 | ||||||||
IEC Electronics Corp.* | 64,500 | 306,375 | ||||||||
Iteris, Inc.* | 126,700 | 164,710 | ||||||||
LeCroy Corp.* | 56,000 | 470,960 | ||||||||
LoJack Corp.* | 44,100 | 135,387 | ||||||||
Netlist, Inc.* | 63,100 | 158,381 | ||||||||
PAR Technology Corp.* | 17,800 | 69,598 | ||||||||
PC Connection, Inc. | 30,000 | 332,700 | ||||||||
PC Mall, Inc.* | 74,200 | 465,976 | ||||||||
Pulse Electronics Corp. | 109,800 | 307,440 | ||||||||
RadiSys Corp.* | 134,100 | 678,546 | ||||||||
Richardson Electronics, Ltd. | 52,011 | 639,215 | ||||||||
SMTC Corp.* | 105,976 | 293,553 | ||||||||
Vishay Precision Group, Inc.* | 23,567 | 376,601 | ||||||||
Zygo Corp.* | 39,200 | 691,880 | ||||||||
|
| |||||||||
| 7,045,733 | ||||||||||
Energy Equipment & Services - 2.69% |
| |||||||||
Bolt Technology Corp. | 76,719 | 877,665 | ||||||||
Cal Dive International, Inc.* | 225,000 | 506,250 | ||||||||
Dawson Geophysical Co.* | 16,400 | 648,292 | ||||||||
ENGlobal Corp.* | 118,761 | 250,586 | ||||||||
Forbes Energy Services, Ltd.* | 49,800 | 317,226 | ||||||||
Geokinetics, Inc.* | 51,600 | 110,940 | ||||||||
Mitcham Industries, Inc.* | 131,934 | 2,881,439 | ||||||||
Natural Gas Services Group, Inc.* | 36,400 | 526,344 | ||||||||
OYO Geospace Corp.* | 6,900 | 533,577 | ||||||||
TGC Industries, Inc.* | 117,000 | 835,380 | ||||||||
Union Drilling, Inc.* | 88,300 | 550,992 | ||||||||
Willbros Group, Inc.* | 127,400 | 467,558 | ||||||||
|
| |||||||||
| 8,506,249 | ||||||||||
Food & Staples Retailing - 0.83% |
| |||||||||
Arden Group, Inc., Class A | 5,500 | 495,055 | ||||||||
| www.bridgeway.com | 50 | |
Bridgeway Ultra-Small Company Market Fund SCHEDULE OF INVESTMENTS (continued) | |
| Showing percentage of net assets as of December 31, 2011 (Unaudited) | ||
Industry | Company | Shares | Value | |||||||
Common Stocks (continued) |
| |||||||||
Food & Staples Retailing (continued) |
| |||||||||
Ingles Markets, Inc., Class A | 21,200 | $ | 319,272 | |||||||
Susser Holdings Corp.* | 48,900 | 1,106,118 | ||||||||
Village Super Market, Inc., Class A | 24,600 | 699,870 | ||||||||
|
| |||||||||
| 2,620,315 | ||||||||||
Food Products - 1.57% |
| |||||||||
Alico, Inc.+ | 21,000 | 406,770 | ||||||||
American Lorain Corp.* | 81,200 | 130,732 | ||||||||
Feihe International, Inc.* | 24,700 | 63,973 | ||||||||
Griffin Land & Nurseries, Inc. | 19,300 | 510,678 | ||||||||
Imperial Sugar Co. | 37,700 | 134,589 | ||||||||
John B. Sanfilippo & Son, Inc.* | 18,900 | 142,506 | ||||||||
Lifeway Foods, Inc.*+ | 156,302 | 1,506,751 | ||||||||
Omega Protein Corp.* | 72,900 | 519,777 | ||||||||
Overhill Farms, Inc.* | 102,100 | 378,791 | ||||||||
SkyPeople Fruit Juice, Inc.*+ | 48,200 | 89,652 | ||||||||
Smart Balance, Inc.* | 200,500 | 1,074,680 | ||||||||
|
| |||||||||
| 4,958,899 | ||||||||||
Gas Utilities - 0.28% |
| |||||||||
Chesapeake Utilities Corp. | 15,906 | 689,525 | ||||||||
Gas Natural, Inc. | 15,900 | 181,419 | ||||||||
|
| |||||||||
| 870,944 | ||||||||||
Health Care Equipment & Supplies - 3.46% |
| |||||||||
Alphatec Holdings, Inc.* | 164,740 | 283,353 | ||||||||
Anika Therapeutics, Inc.* | 98,639 | 966,662 | ||||||||
Antares Pharma, Inc.*+ | 197,000 | 433,400 | ||||||||
AtriCure, Inc.* | 133,200 | 1,478,520 | ||||||||
Cardica, Inc.* | 84,079 | 180,770 | ||||||||
Cardiovascular Systems, Inc.*+ | 56,400 | 555,540 | ||||||||
Cerus Corp.* | 193,304 | 541,251 | ||||||||
CryoLife, Inc.* | 107,270 | 514,896 | ||||||||
IRIS International, Inc.* | 44,100 | 412,335 | ||||||||
Kensey Nash Corp.* | 16,800 | 322,392 | ||||||||
Medical Action Industries, Inc.* | 14,700 | 76,881 | ||||||||
Palomar Medical Technologies, Inc.* | 40,600 | 377,580 | ||||||||
Rockwell Medical Technologies, Inc.*+ | 72,100 | 610,687 | ||||||||
RTI Biologics, Inc.* | 125,000 | 555,000 | ||||||||
Solta Medical, Inc.* | 158,400 | 497,376 | ||||||||
Spectranetics Corp.* | 29,948 | 216,225 | ||||||||
Theragenics Corp.* | 211,800 | 355,824 | ||||||||
TranS1, Inc.* | 129,500 | 242,165 | ||||||||
Utah Medical Products, Inc. | 44,900 | 1,212,300 | ||||||||
Vascular Solutions, Inc.* | 49,300 | 548,709 | ||||||||
Industry | Company | Shares | Value | |||||||
Health Care Equipment & Supplies (continued) |
| |||||||||
Young Innovations, Inc. | 18,126 | $ | 537,073 | |||||||
|
| |||||||||
| 10,918,939 | ||||||||||
Health Care Providers & Services - 3.44% |
| |||||||||
Almost Family, Inc.* | 11,600 | 192,328 | ||||||||
American Dental Partners, Inc.* | 32,400 | 610,092 | ||||||||
AMN Healthcare Services, Inc.* | 72,300 | 320,289 | ||||||||
Capital Senior Living Corp.* | 129,000 | 1,024,260 | ||||||||
CardioNet, Inc.* | 131,100 | 310,707 | ||||||||
Chindex International, Inc.* | 71,200 | 606,624 | ||||||||
Cross Country Healthcare, Inc.* | 58,700 | 325,785 | ||||||||
Five Star Quality Care, Inc.* | 121,600 | 364,800 | ||||||||
Medcath Corp. | 43,400 | 316,386 | ||||||||
Metropolitan Health Networks, Inc.* | 273,372 | 2,042,089 | ||||||||
National Research Corp. | 25,500 | 989,655 | ||||||||
Providence Service Corp. (The)* | 115,200 | 1,585,152 | ||||||||
RadNet, Inc.* | 176,300 | 375,519 | ||||||||
Skilled Healthcare Group, Inc., Class A* | 75,300 | 411,138 | ||||||||
Sunrise Senior Living, Inc.*+ | 85,695 | 555,303 | ||||||||
U.S. Physical Therapy, Inc. | 42,000 | 826,560 | ||||||||
|
| |||||||||
| 10,856,687 | ||||||||||
Health Care Technology - 0.28% |
| |||||||||
HealthStream, Inc.* | 25,805 | 476,102 | ||||||||
Transcend Services, Inc.* | 16,665 | 395,461 | ||||||||
|
| |||||||||
| 871,563 | ||||||||||
Hotels, Restaurants & Leisure - 3.71% |
| |||||||||
AFC Enterprises, Inc.* | 67,732 | 995,660 | ||||||||
Benihana, Inc.* | 26,200 | 268,026 | ||||||||
Bluegreen Corp.* | 57,203 | 160,741 | ||||||||
Caribou Coffee Co., Inc.* | 79,600 | 1,110,420 | ||||||||
Carrols Restaurant Group, Inc.* | 78,100 | 903,617 | ||||||||
Dover Downs Gaming & Entertainment, Inc. | 9,637 | 20,623 | ||||||||
Einstein Noah Restaurant Group, Inc. | 49,100 | 776,762 | ||||||||
Famous Dave’s of America, Inc.* | 158,800 | 1,648,344 | ||||||||
Frisch’s Restaurants, Inc. | 8,000 | 156,160 | ||||||||
Full House Resorts, Inc.* | 60,700 | 159,641 | ||||||||
Gaming Partners International Corp. | 56,300 | 349,060 | ||||||||
Great Wolf Resorts, Inc.* | 164,300 | 476,470 | ||||||||
Isle of Capri Casinos, Inc.* | 62,500 | 291,875 | ||||||||
| 51 | Semi-Annual Report | December 31, 2011 (Unaudited) | |
Bridgeway Ultra-Small Company Market Fund SCHEDULE OF INVESTMENTS (continued) | |
| Showing percentage of net assets as of December 31, 2011 (Unaudited) | ||
Industry | Company | Shares | Value | |||||||
Common Stocks (continued) |
| |||||||||
Hotels, Restaurants & Leisure (continued) |
| |||||||||
Jamba, Inc.* | 179,014 | $ | 234,508 | |||||||
Luby’s, Inc.* | 73,600 | 331,936 | ||||||||
Monarch Casino & Resort, Inc.* | 48,685 | 496,100 | ||||||||
Morgans Hotel Group Co.* | 84,300 | 497,370 | ||||||||
Multimedia Games Holding Co., Inc.* | 119,300 | 947,242 | ||||||||
Nathan’s Famous, Inc.* | 12,000 | 252,240 | ||||||||
O’Charleys, Inc.*+ | 54,900 | 301,401 | ||||||||
Premier Exhibitions, Inc.* | 142,500 | 349,125 | ||||||||
Ruth’s Hospitality Group, Inc.* | 86,700 | 430,899 | ||||||||
Town Sports International Holdings, Inc.* | 76,387 | 561,445 | ||||||||
|
| |||||||||
| 11,719,665 | ||||||||||
Household Durables - 1.61% |
| |||||||||
Bassett Furniture Industries, Inc. | 74,200 | 555,758 | ||||||||
Cavco Industries, Inc.* | 10,600 | 424,636 | ||||||||
CSS Industries, Inc. | 15,700 | 312,744 | ||||||||
Emerson Radio Corp.* | 204,300 | 324,837 | ||||||||
Furniture Brands International, Inc.* | 188,000 | 231,240 | ||||||||
Hooker Furniture Corp. | 13,767 | 157,908 | ||||||||
Kid Brands, Inc.* | 132,300 | 418,068 | ||||||||
Libbey, Inc.* | 29,000 | 369,460 | ||||||||
Lifetime Brands, Inc. | 63,300 | 768,462 | ||||||||
Sealy Corp.* | 378,800 | 651,536 | ||||||||
Skyline Corp. | 17,300 | 75,255 | ||||||||
Zagg, Inc.*+ | 114,300 | 808,101 | ||||||||
|
| |||||||||
| 5,098,005 | ||||||||||
Household Products - 0.13% |
| |||||||||
Oil-Dri Corp. of America+ | 19,800 | 400,752 | ||||||||
Independent Power Producers & Energy Traders - 0.26% |
| |||||||||
Genie Energy, Ltd., Class B | 48,667 | 385,929 | ||||||||
Synthesis Energy Systems, Inc.* | 272,471 | 422,330 | ||||||||
|
| |||||||||
| 808,259 | ||||||||||
Insurance - 1.58% |
| |||||||||
Crawford & Co., Class B | 30,948 | 190,640 | ||||||||
eHealth, Inc.*+ | 46,800 | 687,960 | ||||||||
First Acceptance Corp.* | 111,700 | 151,912 | ||||||||
Hallmark Financial Services* | 51,800 | 362,082 | ||||||||
Homeowners Choice, Inc. | 7,516 | 60,203 | ||||||||
Independence Holding Co.+ | 59,700 | 485,361 | ||||||||
Meadowbrook Insurance Group, Inc. | 95,200 | 1,016,736 | ||||||||
Phoenix Cos., Inc. (The)* | 210,067 | 352,912 | ||||||||
Industry | Company | Shares | Value | |||||||
Insurance (continued) |
| |||||||||
Presidential Life Corp. | 44,000 | $ | 439,560 | |||||||
SeaBright Holdings, Inc. | 10,700 | 81,855 | ||||||||
Stewart Information Services Corp. | 58,300 | 673,365 | ||||||||
Universal Insurance Holdings, Inc. | 139,200 | 498,336 | ||||||||
|
| |||||||||
| 5,000,922 | ||||||||||
Internet & Catalog Retail - 0.64% |
| |||||||||
1-800-Flowers.com, Inc., Class A* | 170,000 | 374,000 | ||||||||
dELiA*s, Inc.* | 80,000 | 81,600 | ||||||||
Gaiam, Inc., Class A* | 38,200 | 123,768 | ||||||||
Geeknet, Inc.* | 16,608 | 283,166 | ||||||||
PetMed Express, Inc. | 32,200 | 334,236 | ||||||||
US Auto Parts Network, Inc.* | 100,900 | 440,933 | ||||||||
ValueVision Media, Inc., Class A* | 206,986 | 389,134 | ||||||||
|
| |||||||||
| 2,026,837 | ||||||||||
Internet Software & Services - 2.02% |
| |||||||||
Globalscape, Inc.* | 59,700 | 95,520 | ||||||||
Internap Network Services Corp.* | 82,900 | 492,426 | ||||||||
Keynote Systems, Inc. | 44,400 | 911,976 | ||||||||
Marchex, Inc., Class B+ | 70,400 | 440,000 | ||||||||
Openwave Systems, Inc.* | 223,900 | 353,762 | ||||||||
Stamps.com, Inc.* | 39,700 | 1,037,361 | ||||||||
Support.com, Inc.* | 360,650 | 811,463 | ||||||||
TechTarget, Inc.* | 96,350 | 562,684 | ||||||||
TheStreet, Inc. | 149,700 | 251,496 | ||||||||
Web.com Group, Inc.* | 95,252 | 1,090,635 | ||||||||
Zix Corp.* | 112,782 | 318,045 | ||||||||
|
| |||||||||
| 6,365,368 | ||||||||||
IT Services - 1.50% |
| |||||||||
CIBER, Inc.* | 121,800 | 470,148 | ||||||||
Computer Task Group, Inc.* | 92,400 | 1,300,992 | ||||||||
Dynamics Research Corp.* | 41,058 | 465,598 | ||||||||
Echo Global Logistics, Inc.*+ | 35,200 | 568,480 | ||||||||
Global Cash Access Holdings, Inc.* | 130,900 | 582,505 | ||||||||
Hackett Group, Inc. (The)* | 66,389 | 248,295 | ||||||||
Information Services Group, Inc.*+ | 96,600 | 99,498 | ||||||||
Lionbridge Technologies, Inc.* | 116,595 | 267,002 | ||||||||
NCI, Inc., Class A* | 25,974 | 302,597 | ||||||||
Online Resources Corp.* | 60,000 | 145,200 | ||||||||
| www.bridgeway.com | 52 | |
Bridgeway Ultra-Small Company Market Fund SCHEDULE OF INVESTMENTS (continued) | |
| Showing percentage of net assets as of December 31, 2011 (Unaudited) | ||
Industry | Company | Shares | Value | |||||||
Common Stocks (continued) |
| |||||||||
IT Services (continued) |
| |||||||||
PRGX Global, Inc.* | 50,300 | $ | 299,285 | |||||||
|
| |||||||||
| 4,749,600 | ||||||||||
Leisure Equipment & Products - 1.55% |
| |||||||||
Arctic Cat, Inc.* | 55,500 | 1,251,525 | ||||||||
Black Diamond, Inc.* | 62,800 | 469,116 | ||||||||
Johnson Outdoors, Inc., Class A* | 34,800 | 534,180 | ||||||||
Leapfrog Enterprises, Inc.* | 97,000 | 542,230 | ||||||||
Marine Products Corp.* | 66,400 | 329,344 | ||||||||
Smith & Wesson Holding Corp.* | 162,100 | 706,756 | ||||||||
Sturm Ruger & Co., Inc. | 31,400 | 1,050,644 | ||||||||
|
| |||||||||
| 4,883,795 | ||||||||||
Life Sciences Tools & Services - 0.99% |
| |||||||||
Albany Molecular Research, Inc.* | 103,100 | 302,083 | ||||||||
BioClinica, Inc.* | 77,100 | 327,675 | ||||||||
Cambrex Corp.* | 104,100 | 747,438 | ||||||||
Enzo Biochem, Inc.* | 166,700 | 373,408 | ||||||||
Furiex Pharmaceuticals, Inc.* | 21,200 | 354,252 | ||||||||
Harvard Bioscience, Inc.* | 162,817 | 630,102 | ||||||||
Medtox Scientific, Inc.* | 29,000 | 407,450 | ||||||||
|
| |||||||||
| 3,142,408 | ||||||||||
Machinery - 4.27% |
| |||||||||
Alamo Group, Inc. | 21,800 | 587,074 | ||||||||
Ampco-Pittsburgh Corp. | 26,600 | 514,444 | ||||||||
Commercial Vehicle Group, Inc.* | 46,900 | 423,976 | ||||||||
Dynamic Materials Corp. | 34,000 | 672,520 | ||||||||
Energy Recovery, Inc.* | 117,000 | 301,860 | ||||||||
Flow International Corp.* | 185,551 | 649,429 | ||||||||
FreightCar America, Inc.* | 19,900 | 416,905 | ||||||||
Graham Corp. | 59,500 | 1,335,180 | ||||||||
Greenbrier Cos., Inc.* | 43,600 | 1,058,608 | ||||||||
Hardinge, Inc. | 62,600 | 503,930 | ||||||||
Hurco Cos., Inc.* | 60,234 | 1,264,914 | ||||||||
Kadant, Inc.* | 31,300 | 707,693 | ||||||||
Key Technology, Inc.* | 17,600 | 227,744 | ||||||||
L.S. Starrett Co., Class A (The) | 29,200 | 375,220 | ||||||||
Lydall, Inc.* | 74,200 | 704,158 | ||||||||
Met-Pro Corp.+ | 40,200 | 363,408 | ||||||||
Miller Industries, Inc. | 32,600 | 512,798 | ||||||||
NN, Inc.* | 83,800 | 502,800 | ||||||||
PMFG, Inc.*+ | 56,000 | 1,092,560 | ||||||||
Twin Disc, Inc. | 29,600 | 1,075,072 | ||||||||
Industry | Company | Shares | Value | |||||||
Machinery (continued) |
| |||||||||
Xerium Technologies, Inc.*+ | 29,200 | $ | 190,968 | |||||||
|
| |||||||||
| 13,481,261 | ||||||||||
Marine - 0.16% |
| |||||||||
International Shipholding Corp. | 27,400 | 512,106 | ||||||||
Media - 2.51% |
| |||||||||
AH Belo Corp., Class A | 100,000 | 475,000 | ||||||||
Ballantyne Strong, Inc.* | 45,500 | 186,095 | ||||||||
Carmike Cinemas, Inc.* | 51,800 | 356,384 | ||||||||
Dex One Corp.* | 207,100 | 343,786 | ||||||||
Entercom Communications Corp., Class A* | 57,600 | 354,240 | ||||||||
Entravision Communications Corp., Class A | 209,800 | 327,288 | ||||||||
Fisher Communications, Inc.* | 25,200 | 726,516 | ||||||||
Gray Television, Inc.* | 292,200 | 473,364 | ||||||||
Journal Communications, Inc., Class A* | 89,200 | 392,480 | ||||||||
Lee Enterprises, Inc.*+ | 99,100 | 70,361 | ||||||||
LIN TV Corp., Class A* | 131,060 | 554,384 | ||||||||
Martha Stewart Living Omnimedia, Class A+ | 95,900 | 421,960 | ||||||||
McClatchy Co., Class A (The)*+ | 173,000 | 413,470 | ||||||||
Media General, Inc., Class A*+ | 130,611 | 531,587 | ||||||||
Navarre Corp.* | 271,200 | 417,648 | ||||||||
Nexstar Broadcasting Group, Inc., Class A* | 41,400 | 324,576 | ||||||||
Outdoor Channel Holdings, Inc. | 67,100 | 500,566 | ||||||||
Radio One, Inc., Class D* | 100,000 | 100,000 | ||||||||
Rentrak Corp.* | 22,600 | 322,728 | ||||||||
Saga Communications, Inc., Class A* | 14,604 | 545,897 | ||||||||
SuperMedia, Inc.*+ | 30,300 | 79,992 | ||||||||
|
| |||||||||
| 7,918,322 | ||||||||||
Metals & Mining - 0.87% |
| |||||||||
China Direct Industries, Inc.*+ | 163,410 | 123,375 | ||||||||
Friedman Industries, Inc. | 67,000 | 700,150 | ||||||||
Great Northern Iron Ore Properties+ | 7,700 | 848,925 | ||||||||
Mines Management, Inc.*+ | 6,200 | 12,400 | ||||||||
Paramount Gold & Silver Corp.*+ | 178,300 | 381,562 | ||||||||
Synalloy Corp. | 19,400 | 199,238 | ||||||||
| 53 | Semi-Annual Report | December 31, 2011 (Unaudited) | |
Bridgeway Ultra-Small Company Market Fund SCHEDULE OF INVESTMENTS (continued) | |
| Showing percentage of net assets as of December 31, 2011 (Unaudited) | ||
Industry | Company | Shares | Value | |||||||
Common Stocks (continued) |
| |||||||||
Metals & Mining (continued) |
| |||||||||
Universal Stainless & Alloy* | 13,300 | $ | 496,888 | |||||||
|
| |||||||||
| 2,762,538 | ||||||||||
Multiline Retail - 0.29% |
| |||||||||
Bon-Ton Stores, Inc. (The)+ | 45,950 | 154,852 | ||||||||
Duckwall-ALCO Stores, Inc.* | 7,000 | 58,450 | ||||||||
Tuesday Morning Corp.* | 205,500 | 708,975 | ||||||||
|
| |||||||||
| 922,277 | ||||||||||
Oil, Gas & Consumable Fuels - 4.12% |
| |||||||||
Adams Resources & Energy, Inc. | 22,300 | 646,254 | ||||||||
Callon Petroleum Co.* | 179,700 | 893,109 | ||||||||
Cheniere Energy, Inc.*+ | 92,948 | 807,718 | ||||||||
CREDO Petroleum Corp.* | 25,300 | 260,590 | ||||||||
Crimson Exploration, Inc.* | 185,300 | 529,958 | ||||||||
Double Eagle Petroleum Co.* | 77,200 | 531,136 | ||||||||
Endeavour International Corp.*+ | 48,058 | 417,624 | ||||||||
Evolution Petroleum Corp.* | 110,000 | 885,500 | ||||||||
FX Energy, Inc.*+ | 105,800 | 507,840 | ||||||||
GMX Resources, Inc.*+ | 62,700 | 78,375 | ||||||||
HKN, Inc.* | 44,134 | 94,006 | ||||||||
L&L Energy, Inc.*+ | 95,000 | 246,050 | ||||||||
Miller Energy Resources, Inc.*+ | 193,800 | 540,702 | ||||||||
Panhandle Oil & Gas, Inc., Class A | 13,797 | 452,680 | ||||||||
PostRock Energy Corp.* | 73,500 | 206,535 | ||||||||
Pyramid Oil Co.* | 69,800 | 281,992 | ||||||||
RAM Energy Resources, Inc.*+ | 282,200 | 883,286 | ||||||||
REX American Resources Corp.* | 66,249 | 1,464,765 | ||||||||
Toreador Resources Corp.*+ | 71,900 | 370,285 | ||||||||
Triangle Petroleum Corp.* | 55,100 | 328,947 | ||||||||
Uranerz Energy Corp.*+ | 74,000 | 134,680 | ||||||||
Uranium Energy Corp.*+ | 133,100 | 407,286 | ||||||||
USEC, Inc.* | 400,000 | 456,000 | ||||||||
Verenium Corp.* | 39,900 | 86,982 | ||||||||
Voyager Oil & Gas, Inc.* | 141,100 | 362,627 | ||||||||
Warren Resources, Inc.* | 116,900 | 381,094 | ||||||||
Westmoreland Coal Co.* | 59,675 | 760,856 | ||||||||
|
| |||||||||
| 13,016,877 | ||||||||||
Paper & Forest Products - 0.37% |
| |||||||||
Mercer International, Inc.* | 64,400 | 392,840 | ||||||||
Industry | Company | Shares | Value | |||||||
Paper & Forest Products (continued) |
| |||||||||
Neenah Paper, Inc. | 30,000 | $ | 669,600 | |||||||
Verso Paper Corp.* | 103,400 | 99,264 | ||||||||
|
| |||||||||
| 1,161,704 | ||||||||||
Personal Products - 0.50% |
| |||||||||
CCA Industries, Inc. | 14,100 | 66,834 | ||||||||
Female Health Co. (The)+ | 43,200 | 194,832 | ||||||||
Natural Alternatives International, Inc.* | 17,500 | 154,350 | ||||||||
Nutraceutical International Corp.* | 35,800 | 405,256 | ||||||||
Physicians Formula Holdings, Inc.* | 93,000 | 297,600 | ||||||||
Schiff Nutrition International, Inc.* | 41,824 | 447,517 | ||||||||
|
| |||||||||
| 1,566,389 | ||||||||||
Pharmaceuticals - 2.10% |
| |||||||||
Akorn, Inc.* | 58,000 | 644,960 | ||||||||
Alexza Pharmaceuticals, Inc.* | 238,900 | 198,287 | ||||||||
Columbia Laboratories, Inc.* | 254,300 | 635,750 | ||||||||
Cumberland Pharmaceuticals, Inc.* | 53,600 | 288,368 | ||||||||
Depomed, Inc.* | 173,300 | 897,694 | ||||||||
Durect Corp.* | 449,760 | 530,717 | ||||||||
ISTA Pharmaceuticals, Inc.* | 75,400 | 531,570 | ||||||||
Lannett Co., Inc.* | 53,020 | 234,348 | ||||||||
Neostem, Inc.* | 123,500 | 62,615 | ||||||||
Obagi Medical Products, Inc.* | 56,000 | 568,960 | ||||||||
Pain Therapeutics, Inc.* | 83,699 | 318,056 | ||||||||
Pozen, Inc.* | 76,400 | 301,780 | ||||||||
Santarus, Inc.* | 143,872 | 476,216 | ||||||||
Sucampo Pharmaceuticals, Inc., Class A* | 104,000 | 460,720 | ||||||||
Transcept Pharmaceuticals, Inc.*+ | 44,100 | 345,303 | ||||||||
XenoPort, Inc.* | 38,200 | 145,542 | ||||||||
|
| |||||||||
| 6,640,886 | ||||||||||
Professional Services - 1.55% |
| |||||||||
Barrett Business Services, Inc. | 31,600 | 630,736 | ||||||||
CDI Corp. | 41,701 | 575,891 | ||||||||
CRA International, Inc.* | 27,200 | 539,648 | ||||||||
GP Strategies Corp.* | 76,500 | 1,031,220 | ||||||||
Hill International, Inc.* | 94,400 | 485,216 | ||||||||
Hudson Highland Group, Inc.* | 59,700 | 285,963 | ||||||||
| www.bridgeway.com | 54 | |
Bridgeway Ultra-Small Company Market Fund SCHEDULE OF INVESTMENTS (continued) | |
| Showing percentage of net assets as of December 31, 2011 (Unaudited) | ||
Industry | Company | Shares | Value | |||||||
Common Stocks (continued) |
| |||||||||
Professional Services (continued) |
| |||||||||
On Assignment, Inc.* | 97,000 | $ | 1,084,460 | |||||||
VSE Corp. | 11,100 | 269,508 | ||||||||
|
| |||||||||
| 4,902,642 | ||||||||||
Real Estate Management & Development - 0.40% |
| |||||||||
Consolidated-Tomoka Land Co. | 31,400 | 849,998 | ||||||||
Stratus Properties, Inc.* | 16,300 | 128,444 | ||||||||
Thomas Properties Group, Inc. | 88,700 | 295,371 | ||||||||
|
| |||||||||
| 1,273,813 | ||||||||||
Road & Rail - 0.62% |
| |||||||||
Quality Distribution, Inc.* | 88,000 | 990,000 | ||||||||
Saia, Inc.* | 51,900 | 647,712 | ||||||||
USA Truck, Inc.* | 40,061 | 309,672 | ||||||||
|
| |||||||||
| 1,947,384 | ||||||||||
Semiconductors & Semiconductor Equipment - 2.74% |
| |||||||||
Amtech Systems, Inc.*+ | 80,046 | 681,191 | ||||||||
AuthenTec, Inc.* | 394,200 | 1,265,382 | ||||||||
AXT, Inc.* | 80,000 | 333,600 | ||||||||
DSP Group, Inc.* | 81,300 | 423,573 | ||||||||
FSI International, Inc.* | 125,400 | 458,964 | ||||||||
GSI Technology, Inc.* | 201,417 | 942,631 | ||||||||
Integrated Silicon Solution, Inc.* | 77,641 | 709,639 | ||||||||
Kopin Corp.* | 150,143 | 582,555 | ||||||||
Mattson Technology, Inc.* | 125,900 | 173,742 | ||||||||
Nanometrics, Inc.* | 26,200 | 482,604 | ||||||||
PDF Solutions, Inc.* | 103,400 | 720,698 | ||||||||
Pericom Semiconductor Corp.* | 57,700 | 439,097 | ||||||||
Photronics, Inc.* | 81,070 | 492,906 | ||||||||
PLX Technology, Inc.* | 157,900 | 453,173 | ||||||||
Rudolph Technologies, Inc.* | 52,600 | 487,076 | ||||||||
|
| |||||||||
| 8,646,831 | ||||||||||
Software - 2.16% |
| |||||||||
Actuate Corp.* | 285,030 | 1,670,276 | ||||||||
American Software, Inc., Class A | 60,700 | 573,615 | ||||||||
Callidus Software, Inc.*+ | 109,200 | 701,064 | ||||||||
Digimarc Corp.* | 23,100 | 551,859 | ||||||||
ePlus, Inc.* | 19,559 | 553,128 | ||||||||
Glu Mobile, Inc.*# | 140,500 | 441,170 | ||||||||
Guidance Software, Inc.* | 63,000 | 408,240 | ||||||||
PROS Holdings, Inc.* | 46,900 | 697,872 | ||||||||
QAD, Inc., Class A* | 30,800 | 323,400 | ||||||||
QAD, Inc., Class B* | 7,700 | 79,695 | ||||||||
SRS Labs, Inc.* | 54,400 | 312,800 | ||||||||
Industry | Company | Shares | Value | |||||||
Software (continued) |
| |||||||||
TeleCommunication Systems, Inc., Class A* | 211,800 | $ | 497,730 | |||||||
|
| |||||||||
| 6,810,849 | ||||||||||
Specialty Retail - 3.28% |
| |||||||||
America’s Car-Mart, Inc.* | 30,000 | 1,175,400 | ||||||||
Big 5 Sporting Goods Corp. | 43,400 | 453,096 | ||||||||
Build-A-Bear Workshop, Inc.* | 59,500 | 503,370 | ||||||||
Casual Male Retail Group, Inc.* | 163,100 | 557,802 | ||||||||
Cost Plus, Inc.*+ | 79,800 | 778,050 | ||||||||
Destination Maternity Corp. | 45,400 | 759,088 | ||||||||
Haverty Furniture Cos., Inc. | 53,219 | 584,345 | ||||||||
Hot Topic, Inc. | 149,058 | 985,273 | ||||||||
Lithia Motors, Inc., Class A | 55,500 | 1,213,230 | ||||||||
MarineMax, Inc.* | 68,200 | 444,664 | ||||||||
New York & Co., Inc.* | 156,100 | 415,226 | ||||||||
TravelCenters of America LLC* | 76,200 | 323,850 | ||||||||
West Marine, Inc.* | 72,200 | 839,686 | ||||||||
Winmark Corp. | 10,200 | 585,174 | ||||||||
Zale Corp.*+ | 190,200 | 724,662 | ||||||||
|
| |||||||||
| 10,342,916 | ||||||||||
Textiles, Apparel & Luxury Goods - 1.04% |
| |||||||||
Charles & Colvard, Ltd.*+ | 60,900 | 156,513 | ||||||||
Cherokee, Inc. | 20,100 | 234,567 | ||||||||
Culp, Inc.* | 51,016 | 434,656 | ||||||||
DGSE Cos., Inc.*+ | 28,800 | 209,088 | ||||||||
Kenneth Cole Productions, Inc., Class A* | 33,600 | 355,824 | ||||||||
K-Swiss, Inc., Class A*+ | 68,400 | 199,728 | ||||||||
Lacrosse Footwear, Inc. | 13,729 | 173,260 | ||||||||
Lakeland Industries, Inc.* | 10,000 | 92,500 | ||||||||
Perry Ellis International, Inc.* | 28,396 | 403,791 | ||||||||
Rocky Brands, Inc.* | 52,200 | 470,844 | ||||||||
Unifi, Inc.* | 71,000 | 539,600 | ||||||||
|
| |||||||||
| 3,270,371 | ||||||||||
Thrifts & Mortgage Finance - 5.95% |
| |||||||||
Bank Mutual Corp. | 99,000 | 314,820 | ||||||||
BankFinancial Corp. | 115,779 | 639,100 | ||||||||
Beacon Federal Bancorp, Inc. | 35,800 | 496,546 | ||||||||
BofI Holding, Inc.* | 56,200 | 913,250 | ||||||||
Cape Bancorp, Inc.* | 42,100 | 330,485 | ||||||||
Chicopee Bancorp, Inc.* | 26,500 | 371,000 | ||||||||
Clifton Savings Bancorp, Inc.+ | 64,300 | 596,704 | ||||||||
ESB Financial Corp. | 69,000 | 970,830 | ||||||||
| 55 | Semi-Annual Report | December 31, 2011 (Unaudited) | |
Bridgeway Ultra-Small Company Market Fund SCHEDULE OF INVESTMENTS (continued) | |
| Showing percentage of net assets as of December 31, 2011 (Unaudited) | ||
Industry | Company | Shares | Value | |||||||
Common Stocks (continued) |
| |||||||||
Thrifts & Mortgage Finance (continued) |
| |||||||||
ESSA Bancorp, Inc. | 39,884 | $ | 417,585 | |||||||
Federal Agricultural Mortgage Corp., Class C | 104,800 | 1,888,496 | ||||||||
First Defiance Financial Corp. | 58,400 | 852,056 | ||||||||
First Financial Holdings, Inc. | 53,800 | 480,434 | ||||||||
First Financial Northwest, Inc.*+ | 31,600 | 186,124 | ||||||||
First Pactrust Bancorp, Inc.+ | 57,100 | 585,275 | ||||||||
Fox Chase Bancorp, Inc. | 57,932 | 731,681 | ||||||||
Guaranty Federal Bancshares, Inc.* | 20,856 | 118,879 | ||||||||
Hampden Bancorp, Inc.+ | 33,000 | 389,400 | ||||||||
Heritage Financial Group, Inc. | 17,100 | 189,981 | ||||||||
Home Federal Bancorp, Inc. | 32,200 | 334,880 | ||||||||
Kaiser Federal Financial Group, Inc. | 55,114 | 706,561 | ||||||||
Louisiana Bancorp, Inc.* | 18,000 | 285,300 | ||||||||
Meridian Interstate Bancorp, Inc.* | 52,100 | 648,645 | ||||||||
Meta Financial Group, Inc. | 12,100 | 196,020 | ||||||||
New Hampshire Thrift Bancshares, Inc. | 18,100 | 204,530 | ||||||||
Ocean Shore Holding Co. | 32,100 | 327,420 | ||||||||
OceanFirst Financial Corp. | 29,200 | 381,644 | ||||||||
Provident Financial Holdings, Inc. | 101,300 | 946,142 | ||||||||
Pulaski Financial Corp.+ | 43,500 | 309,285 | ||||||||
Riverview Bancorp, Inc.* | 17,406 | 41,252 | ||||||||
Rockville Financial, Inc. | 53,557 | 554,851 | ||||||||
SI Financial Group, Inc. | 17,276 | 170,169 | ||||||||
Territorial Bancorp, Inc. | 42,300 | 835,425 | ||||||||
Tree.com, Inc.* | 20,100 | 112,359 | ||||||||
United Community Financial Corp.* | 130,000 | 165,100 | ||||||||
United Financial Bancorp, Inc. | 86,641 | 1,394,054 | ||||||||
Westfield Financial, Inc. | 95,200 | 700,672 | ||||||||
|
| |||||||||
| 18,786,955 | ||||||||||
Trading Companies & Distributors - 0.74% |
| |||||||||
Aceto Corp. | 58,500 | 403,650 | ||||||||
CAI International, Inc.* | 13,238 | 204,659 | ||||||||
DXP Enterprises, Inc.* | 27,800 | 895,160 | ||||||||
Houston Wire & Cable Co. | 29,400 | 406,308 | ||||||||
Lawson Products, Inc. | 28,300 | 436,669 | ||||||||
|
| |||||||||
| 2,346,446 | ||||||||||
Industry | Company | Shares | Value | |||||||
Water Utilities - 0.64% |
| |||||||||
Artesian Resources Corp., Class A+ | 10,500 | $ | 197,715 | |||||||
Cadiz, Inc.*+ | 64,100 | 617,283 | ||||||||
York Water Co. | 68,550 | 1,209,222 | ||||||||
|
| |||||||||
| 2,024,220 | ||||||||||
|
| |||||||||
TOTAL COMMON STOCKS - 99.01% |
| 312,633,245 | ||||||||
|
| |||||||||
(Cost $247,695,584) | ||||||||||
EXCHANGE TRADED FUND - 1.01% |
| |||||||||
iShares Russell Microcap Index Fund+ | 71,825 | 3,206,986 | ||||||||
|
| |||||||||
TOTAL EXCHANGE TRADED FUND - 1.01% | 3,206,986 | |||||||||
|
| |||||||||
(Cost $2,024,535) | ||||||||||
| Rate^ | Shares | Value | ||||||||||||
MONEY MARKET FUND - 0.00% |
| |||||||||||||
BlackRock FedFund | 0.01% | 780 | 780 | |||||||||||
|
| |||||||||||||
TOTAL MONEY MARKET FUND - 0.00% |
| 780 | ||||||||||||
|
| |||||||||||||
(Cost $780) |
| |||||||||||||
TOTAL INVESTMENTS - 100.02% |
| $315,841,011 | ||||||||||||
(Cost $249,720,899) |
| |||||||||||||
Liabilities in Excess of Other Assets - (0.02%) |
| (77,865 | ) | |||||||||||
|
| |||||||||||||
NET ASSETS - 100.00% |
| $315,763,146 | ||||||||||||
|
| |||||||||||||
| * | Non-income producing security. |
| # | Securities, or a portion thereof, segregated to cover the Fund’s potential obligation under swap agreements. The total value of segregated assets is $441,170. |
| ^ | Rate disclosed as of December 31, 2011. |
| + | This security or a portion of the security is out on loan at December 31, 2011. Total loaned securities had a value of $29,893,263 at December 31, 2011. |
LLC - Limited Liability Company
| www.bridgeway.com | 56 | |
Bridgeway Ultra-Small Company Market Fund SCHEDULE OF INVESTMENTS (continued) | |
Summary of inputs used to value the Fund’s investments as of 12/31/2011 is as follows (See Note 2 in Notes to Financial Statements):
|
| |||||||||||||||
| Valuation Inputs | ||||||||||||||||
| ||||||||||||||||
| Investment in Securities (Value) | ||||||||||||||||
| ||||||||||||||||
| Level 1 Quoted Prices | Level 2 Significant Observable Inputs | Level 3 Unobservable | Total | |||||||||||||
| ||||||||||||||||
Common | $ | 312,633,245 | $ | — | $ | — | $ | 312,633,245 | ||||||||
Exchange-Traded Fund | 3,206,986 | — | — | 3,206,986 | ||||||||||||
Money Market | — | 780 | — | 780 | ||||||||||||
|
|
|
|
|
|
|
| |||||||||
TOTAL | $ | 315,840,231 | $ | 780 | $ | — | $ | 315,841,011 | ||||||||
|
|
|
|
|
|
|
| |||||||||
Following is a reconciliation of Level 3 investments for which significant unobservable inputs were used to determine fair value:
| Investment in Securities (Value) | ||||||||
| ||||||||
| Common Stocks | Total | |||||||
| ||||||||
Balance as of 06/30/2011 | $ | 234,354 | $ 234,354 | |||||
Purchases | — | — | ||||||
Sales | (21,122) | (21,122) | ||||||
Realized gain/(loss)1 | (385,489) | (385,489) | ||||||
Change in unrealized appreciation/ (depreciation)2 | 172,257 | 172,257 | ||||||
Transfers in3 | — | — | ||||||
Transfers out | — | — | ||||||
|
|
|
| |||||
Balance as of 12/31/2011 | $ | — | $ | — | ||||
|
|
|
| |||||
Net change in unrealized appreciation (depreciation) from investments held as of 12/31/20112 | $ | — | $ | — | ||||
|
|
|
| |||||
1Realized gain/(loss) from Level 3 securities is included on the Statements of Operations in the Realized Gain (Loss) on Investments.
2Change in unrealized appreciation/(depreciation) for Level 3 securities is included on the Statements of Operations in the Change in Unrealized Appreciation (Depreciation) on Investments.
3Transfers in represent the value as of the beginning of the reporting period, for any investment security where significant transfers in the pricing level occurred during the period. The purchase value is used in situations where the investment was not held as of the beginning of the period.
The security in the table above was considered a Level 3 security because it was fair valued under procedures adopted by the Board of Directors at June 30, 2011. There were no Level 3 securities that were fair valued under these procedures at Demember 31, 2011. Such valuation is based on a review of inputs such as, but not limited to, similiar securities, company specific financial information and company specific news.
See Notes to Financial Statements.
| 57 | Semi-Annual Report | December 31, 2011 (Unaudited) | |
|
(Unaudited)
December 31, 2011
Dear Fellow Micro-Cap Limited Fund Shareholder,
The Bridgeway Funds Board of Directors has approved a plan of reorganization providing for the conversion of the Micro-Cap Limited Fund into shares of the Ultra-Small Company Fund. The plan of reorganization providing for the conversion will require the approval of the Micro-Cap Limited Fund shareholders. If approved, the conversion of shares is expected to take effect in the second quarter of 2012.
For the quarter ended December 31, 2011, our Fund appreciated 19.10%, outperforming our primary market benchmark, the CRSP Cap-Based Portfolio 9 Index (+15.72%), our peer benchmark, the Lipper Micro-Cap Stock Funds Index (+14.55%), the Russell Microcap Index (+13.83%) and the Russell 2000 Index (+15.47%). It was a very good quarter on an absolute and relative basis, and we are pleased with the results.
For the six month semi-annual period ended December 31, 2011, our Fund couldn’t overcome a poor quarter ended September 30, 2011 — the most macro-driven market we have seen (see pages 3 to 7), and an environment not favorable to the Fund. The Fund declined 13.58%, lagging behind our primary market benchmark, the CRSP Cap-Based Portfolio 9 Index (-10.00%), our peer benchmark, the Lipper Micro-Cap Stock Funds Index (-10.72%), the Russell Microcap Index (-11.14%) and the Russell 2000 Index (-9.77%). We would like to emphasize that we have taken certain actions consistent with our (unchanged) investment philosophy and process to address our underperformance in macro-driven markets such as 2008, 2010, and 2011. See, for example, “If macro-driven markets represent such a problem for Bridgeway’s “growthier” select models and Funds, isn’t there anything Bridgeway can do to correct this?” on page 7 and, “Can’t the investment team do anything to improve performance during these correlation spikes, or macro-driven markets?” on page 10.
Similarly, for the calendar year ended December 31, 2011, our Fund’s strong first and fourth quarter relative performance couldn’t overcome the poor relative performance in the second and third quarters. The Fund declined 9.48%, lagging behind our primary market benchmark, the CRSP Cap-Based Portfolio 9 Index (-7.12%), our peer benchmark, the Lipper Micro-Cap Stock Funds Index (-5.59%), the Russell Microcap Index (-9.27%) and the Russell 2000 Index (-4.18%).
The table below presents our quarter, six-month, one-year, five-year, ten-year, and life-to-date financial results according to the formula required by the SEC. See the next page for a graph of performance since inception.
Annualized | ||||||||||||||||||||||||
| Quarter 10/1/11 to 12/31/11 | 6 Months 7/1/11 to 12/31/11 | 1 Year 1/1/11 to 12/31/11 | 5 Years 1/1/07 to 12/31/11 | 10 Years 1/1/02 to 12/31/11 | Life-to-Date to 12/31/11 | |||||||||||||||||||
Micro-Cap Limited Fund | 19.10% | -13.58% | -9.48% | -5.31% | 3.34% | 8.70% | ||||||||||||||||||
CRSP Cap-Based Portfolio 9 Index | 15.72% | -10.00% | -7.12% | 1.27% | 7.16% | 7.82% | ||||||||||||||||||
Russell Microcap Index | 13.83% | -11.14% | -9.27% | -3.75% | 4.63% | N/A | ||||||||||||||||||
Russell 2000 Index (small stocks) | 15.47% | -9.77% | -4.18% | 0.15% | 5.62% | 5.00% | ||||||||||||||||||
Lipper Micro-Cap Stock Funds Index | 14.55% | -10.72% | -5.59% | -0.90% | 5.09% | 5.55% | ||||||||||||||||||
Performance figures quoted in the table above and graph below represent past performance and are no guarantee of future results. Total return figures in the table above and the graph below include the reinvestment of dividends and capital gains. The table above and the graph below do not reflect the deduction of taxes that a shareholder would pay on Fund distributions or the redemption of Fund shares. The recent growth rate in the stock market has helped to produce short-term returns that are not typical and may not continue in the future.
The CRSP Cap-Based Portfolio 9 Index is an unmanaged index of 461 publicly traded U.S. micro-cap stocks (with dividends reinvested), as reported by the Center for Research on Security Prices. The Lipper Micro-Cap Stock Funds Index is an index of small-company funds compiled by Lipper, Inc. The Russell Microcap Index is an unmanaged, market value weighted index that measures performance of 1,000 of the smallest securities in the Russell 2000 Index. The Russell 2000 Index is an
| www.bridgeway.com | 58 | |
Micro-Cap Limited Fund MANAGER’S COMMENTARY (continued) | |
(Unaudited)
unmanaged, market value weighted index that measures performance of the 2,000 companies that are between the 1,000th and 3,000th largest in the market with dividends reinvested. It is not possible to invest directly in an index.
According to data from Lipper, Inc., for the period ended December 31, 2011, the Micro-Cap Limited Fund ranked 59th of 74 micro-cap funds for the last twelve months ended December 31, 2011, 59th of 61 such funds for the last five years, 40th of 43 funds for the last 10 years and 14th of 32 funds since inception in June, 1998. Lipper, Inc. is an independent mutual fund rating service that ranks funds in various fund categories by making comparative calculations using total returns.
Micro-Cap Limited Fund vs. CRSP 9 Index, Lipper Micro-Cap Stock Funds Index, Russell 2000 Index & Russell
Microcap Index* from Inception 6/30/98 to 12/31/11
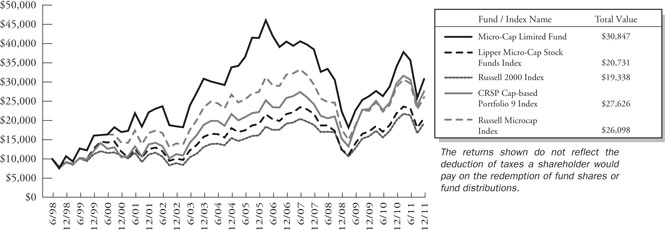
| * | The Russell Microcap Index began on 6/30/2000, and the line graph for the Index begins at the same value as the Fund on that date. |
Detailed Explanation of Quarterly Performance
The Short Version: The quarter was led by strong consumer related companies that overcame the weak performance of the Industrials sector.
The quarter could be considered a “return of the consumer” as investors welcomed what many considered a solid holiday season. Three Consumer Discretionary stocks were among the list of top holdings. Combined, they contributed over two percent to the Fund’s return. Additionally, one Consumer Staples holding also made the list of top contributors.
These are the Fund’s ten best-contributing stocks for the quarter ended December 31, 2011:
| Rank | Description | Industry | % Contribution to Return | |||
| 1 | Standard Motor Products, Inc. | Auto Components | 0.8% | |||
| 2 | DXP Enterprises, Inc. | Trading Companies & Distributors | 0.8% | |||
| 3 | Sinclair Broadcast Group, Inc. Media | 0.7% | ||||
| 4 | Select Comfort Corp. | Specialty Retail | 0.5% | |||
| 5 | HealthStream, Inc. | Health Care Technology | 0.5% | |||
| 6 | Elizabeth Arden, Inc. | Personal Products | 0.5% | |||
| 7 | On Assignment, Inc. | Professional Services | 0.5% | |||
| 8 | Photronics, Inc. | Semiconductors & Semiconductor Equipment | 0.5% | |||
| 9 | Republic Bancorp, Inc. | Commercial Banks | 0.4% | |||
| 10 | Twin Disc, Inc. | Machinery | 0.4% |
| 59 | Semi-Annual Report | December 31, 2011 (Unaudited) | |
Micro-Cap Limited Fund MANAGER’S COMMENTARY (continued) | |
(Unaudited)
You can put a price on a good night’s sleep. Select Comfort manufactures adjustable firmness mattresses that sell for prices ranging from $800 up to $5,000. The company’s earnings and revenues have grown by double digits over the past three quarters. In the third quarter of 2011, sales jumped by 25%, and profits soared by over 60%. The company initiated a national television ad campaign that has gained momentum of late and has proven to be quite successful in educating consumers about the advantages of their product for sleep. During the three-month period, its share price climbed by over 50% and contributed one-half of a percent to the Fund’s return.
The Japan earthquake had a dramatic effect early in the calendar year on domestic manufacturing as supply chains came to a virtual standstill. Just as the Asian country entered recovery mode, dramatic floods in Thailand served to slow progress again; many trading partners were impacted. Three industrial holdings were among the Fund’s biggest detractors during the quarter, costing the Fund over one-half of a percent in return.
These are the Fund’s ten worst-contributing stocks for the quarter ended December 31, 2011:
| Rank | Description | Industry | % Contribution to Return | |||
| 1 | Intersections, Inc. | Commercial Services & Supplies | -0.3% | |||
| 2 | Healthways, Inc. | Health Care Providers & Services | -0.2% | |||
| 3 | Miller Industries, Inc. | Machinery | -0.2% | |||
| 4 | IDT Corp. | Diversified Telecommunication Services | -0.2% | |||
| 5 | Alaska Communications Systems Group, Inc. | Diversified Telecommunication Services | -0.2% | |||
| 6 | Zagg, Inc. | Household Durables | -0.2% | |||
| 7 | Internet Initiative Japan, Inc. - Sponsored ADR | Internet Software & Services | -0.1% | |||
| 8 | Crosstex Energy, Inc. | Gas Utilities | -0.1% | |||
| 9 | Globecomm Systems, Inc. | Communications Equipment | -0.1% | |||
| 10 | EnergySolutions, Inc. | Commercial Services & Supplies | -0.1% |
Zagg (Zealous About Great Gadgets) manufactures accessories for smartphones such as those plastic screen covers for Apple iPhones. The company has ridden the wave of the smartphone explosion (it now accounts for almost 60% of all mobile device accessories), but now is facing intense competition from others who are joining the game. Its recent acquisition of onetime rival iFrog helped revenues soar percentage-wise, but also weighed on overall profits. While Zagg pulls in over forty percent of its business through Best Buy, it does not have a long-term contract to ensure that business continuity. Its latest earnings report also raised some concern as inventories rose to higher-than-anticipated levels. The holding’s share price dropped over 25% during the latest three-month period.
Detailed Explanation of Calendar Year Performance
The Short Version: Consumer stocks dominated both the best and worst contributors list for the calendar year.
As was the case for the December quarter, the consumer emerged from hibernation; many related stocks performed quite well for the overall calendar year. All told, five Consumer stocks (three Discretionary, two Staples) dominated the list of top contributors for the prior twelve months. Combined, they added two and three-fourths percent to the Fund’s return.
| www.bridgeway.com | 60 |
Micro-Cap Limited Fund MANAGER’S COMMENTARY (continued) | |
(Unaudited)
These are the Fund’s ten best-contributing stocks for the calendar year ended December 31, 2011:
| Rank | Description | Industry | % Contribution to Return | |||
1 | Standard Motor Products, Inc. | Auto Components | 0.8% | |||
2 | Sinclair Broadcast Group, Inc. | Media | 0.6% | |||
3 | Elizabeth Arden, Inc. | Personal Products | 0.5% | |||
4 | Sunrise Senior Living, Inc. | Health Care Providers & Services | 0.5% | |||
5 | Susser Holdings Corp. | Food & Staples Retailing | 0.5% | |||
6 | Basic Energy Services, Inc. | Energy Equipment & Services | 0.5% | |||
7 | HealthStream, Inc. | Health Care Technology | 0.5% | |||
8 | DXP Enterprises, Inc. | Trading Companies & Distributors | 0.4% | |||
9 | Powerwave Technologies, Inc. | Communications Equipment | 0.4% | |||
10 | Select Comfort Corp. | Specialty Retail | 0.4% |
Although viewers complain about all of the negative political ads, they actually pay off quite well for broadcasting companies. Sinclair Broadcast Group was the Fund’s second best contributor for the calendar year. As the political campaign season heated up, candidates began to air ads in major primary states. Sinclair has been in expansion mode and recently announced the acquisition of media companies with major markets in Florida and New York. In November, the holding posted better-than-expected quarterly results and rewarded shareholders with a cash dividend. For the year, the stock contributed over one-half of a percent to the Fund’s return.
Though certain retailers and media stocks performed well during the calendar year, not all was rosy in consumer land. Three other consumer discretionary stocks made the list of worst contributors for the year and they cost the Fund one and three-fourths percent in return. Following various moments of uncertainty in 2011 (Japan earthquake, Europe, US ratings cut), micro-cap stocks struggled as many investors looked to remove risk from their portfolios.
These are the Fund’s ten worst-contributing stocks for the calendar year ended December 31, 2011:
| Rank | Description | Industry | % Contribution to Return | |||
1 | NN, Inc. | Machinery | -0.7% | |||
2 | Zagg, Inc. | Household Durables | -0.7% | |||
3 | Red Robin Gourmet Burgers, Inc. | Hotels, Restaurants & Leisure | -0.6% | |||
4 | ValueVision Media, Inc. | Internet & Catalog Retail | -0.6% | |||
5 | Kindred Healthcare, Inc. | Health Care Providers & Services | -0.6% | |||
6 | Skilled Healthcare Group, Inc. | Health Care Providers & Services | -0.6% | |||
7 | Intersections, Inc. | Commercial Services & Supplies | -0.6% | |||
8 | Alaska Communications Systems Group, Inc. | Diversified Telecommunication Services | -0.5% | |||
9 | Lincoln Educational Services Corp. | Diversified Consumer Services | -0.5% | |||
10 | Materion Corp. | Metals & Mining | -0.5% |
In August 2011, ValueVision, the multi-channel retailer behind the home shopping network, ShopNBC, posted quarterly financial results that badly missed analysts’ sales expectations. Its stock plummeted over 30% in the days that followed and has not been able to recover. Investors also worried about the liquidation of a key supplier that could hinder future operations. The stock dropped over 50% during the calendar year and cost the Fund over one-half of a percent in return.
Top Ten Holdings as of December 31, 2011
Six of the Fund’s top contributors for the quarter ended December 31, 2011 were also among the largest holdings at the end of the calendar year: Standard Motor Products, Photronics, DXP Enterprises, HealthStream, Sinclair Broadcast Group, Republic Bancorp. The Fund was broadly diversified; no single holding accounted for greater than 2.1% of the net assets. The ten largest positions represented just over 17% of the total assets of the Fund.
| 61 | Semi-Annual Report | December 31, 2011 (Unaudited) | |
Micro-Cap Limited Fund MANAGER’S COMMENTARY (continued) | |
(Unaudited)
| Rank | Description | Industry | % of Net Assets | |||
1 | Standard Motor Products, Inc. | Auto Components | 2.1% | |||
2 | Photronics, Inc. | Semiconductors & Semiconductor Equipment | 1.9% | |||
3 | DXP Enterprises, Inc. | Trading Companies & Distributors | 1.8% | |||
4 | Trimas Corp. | Machinery | 1.8% | |||
5 | Ensign Group, Inc. (The) | Health Care Providers & Services | 1.7% | |||
6 | HealthStream, Inc. | Health Care Technology | 1.6% | |||
7 | Sinclair Broadcast Group, Inc. | Media | 1.6% | |||
8 | Republic Bancorp., Inc. | Commercial Banks | 1.6% | |||
9 | Brightpoint, Inc. | Electronic Equipment, Instruments & Components | 1.6% | |||
10 | Insight Enterprises, Inc. | Electronic Equipment, Instruments & Components | 1.5% | |||
| Total | 17.2% |
Industry Sector Representation as of December 31, 2011
The biggest disparity between the Fund and the Russell 2000 Index was found in the Consumer Discretionary sector. The Information Technology sector was the most underweighted.
| % of Net Assets | % of Russell 2000 Index | Difference | ||||
Consumer Discretionary | 19.1% | 13.1% | 6.0% | |||
Consumer Staples | 4.2% | 3.7% | 0.5% | |||
Energy | 4.7% | 6.7% | -2.0% | |||
Financials | 20.7% | 22.3% | -1.6% | |||
Health Care | 9.7% | 12.6% | -2.9% | |||
Industrials | 20.2% | 15.5% | 4.7% | |||
Information Technology | 12.8% | 17.1% | -4.3% | |||
Materials | 5.3% | 4.5% | 0.8% | |||
Telecommunication Services | 2.9% | 0.8% | 2.1% | |||
Utilities | 0.0% | 3.7% | -3.7% | |||
Cash & Other Assets | 0.4% | 0.0% | 0.4% | |||
Total | 100.0% | 100.0% |
Disclaimer
The views expressed here are exclusively those of Fund management. These views, including those related to market sectors or individual stocks, are not meant as investment advice and should not be considered predictive in nature. Any favorable (or unfavorable) description of a holding applies only as of December 31, 2011, unless otherwise stated. Security positions can and do change thereafter. Discussions of historical performance do not guarantee and are not indicative of future performance.
The Fund is subject to very high, above market risk (volatility) and is not an appropriate investment for short-term investors. Investments in micro-cap companies generally carry greater risk than is customarily associated with larger companies and even “small companies” for various reasons such as narrower markets (fewer investors), limited financial resources and greater trading difficulty.
Conclusion
Thank you for your continued investment in Micro-Cap Limited Fund. We encourage your feedback; your reactions and concerns are important to us.
Sincerely,
The Investment Management Team
| www.bridgeway.com | 62 | |
Bridgeway Micro-Cap Limited Fund | |
Showing percentage of net assets as of December 31, 2011 (Unaudited) | ||
Industry | Company | Shares | Value | |||||||
COMMON STOCKS - 99.57% |
| |||||||||
Air Freight & Logistics - 0.97% |
| |||||||||
Air Transport Services Group, Inc.* | 40,900 | $ | 193,048 | |||||||
Airlines - 0.52% |
| |||||||||
Hawaiian Holdings, Inc.* | 17,800 | 103,240 | ||||||||
Auto Components - 3.13% |
| |||||||||
American Axle & | ||||||||||
Manufacturing Holdings, Inc.* | 21,300 | 210,657 | ||||||||
Standard Motor Products, Inc. | 20,500 | 411,025 | ||||||||
|
| |||||||||
| 621,682 | ||||||||||
Capital Markets - 2.29% |
| |||||||||
Calamos Asset | ||||||||||
Management, Inc., Class A | 9,500 | 118,845 | ||||||||
GFI Group, Inc. | 33,400 | 137,608 | ||||||||
Investment Technology Group, Inc.* | 18,400 | 198,904 | ||||||||
|
| |||||||||
| 455,357 | ||||||||||
Chemicals - 2.25% |
| |||||||||
Innospec, Inc.* | 9,400 | 263,858 | ||||||||
Quaker Chemical Corp. | 3,100 | 120,559 | ||||||||
TPC Group, Inc.* | 2,700 | 62,991 | ||||||||
|
| |||||||||
| 447,408 | ||||||||||
Commercial Banks - 3.50% |
| |||||||||
BancFirst Corp. | 4,900 | 183,946 | ||||||||
Bancorp, Inc. (The)* | 13,300 | 96,159 | ||||||||
Enterprise Financial Services Corp. | 6,600 | 97,680 | ||||||||
Republic Bancorp, Inc., Class A | 13,900 | 318,310 | ||||||||
|
| |||||||||
| 696,095 | ||||||||||
Commercial Services & Supplies - 4.18% |
| |||||||||
Cenveo, Inc.* | 17,500 | 59,500 | ||||||||
Consolidated Graphics, Inc.* | 4,700 | 226,916 | ||||||||
EnergySolutions, Inc.* | 24,200 | 74,778 | ||||||||
Intersections, Inc. | 11,700 | 129,753 | ||||||||
Multi-Color Corp. | 8,200 | 210,986 | ||||||||
Team, Inc.* | 4,300 | 127,925 | ||||||||
|
| |||||||||
| 829,858 | ||||||||||
Communications Equipment - 1.00% |
| |||||||||
Ituran Location & Control, Ltd. | 14,500 | 198,215 | ||||||||
Industry | Company | Shares | Value | |||||||
Construction & Engineering - 2.96% |
| |||||||||
Dycom Industries, Inc.* | 10,800 | $ | 225,936 | |||||||
Layne Christensen Co.* | 9,200 | 222,640 | ||||||||
Pike Electric Corp.* | 19,300 | 138,767 | ||||||||
|
| |||||||||
| 587,343 | ||||||||||
Consumer Finance - 1.08% |
| |||||||||
Advance America Cash | ||||||||||
Advance Centers, Inc. | 11,700 | 104,715 | ||||||||
World Acceptance Corp.* | 1,500 | 110,250 | ||||||||
|
| |||||||||
| 214,965 | ||||||||||
Containers & Packaging - 0.51% |
| |||||||||
Myers Industries, Inc. | 8,200 | 101,188 | ||||||||
Distributors - 0.86% |
| |||||||||
Core-Mark Holding Co., Inc. | 4,300 | 170,280 | ||||||||
Diversified Consumer Services - 0.40% |
| |||||||||
Lincoln Educational Services Corp. | 10,100 | 79,790 | ||||||||
Diversified Financial Services - 0.82% |
| |||||||||
Interactive Brokers Group, Inc., Class A | 10,900 | 162,846 | ||||||||
Diversified Telecommunication Services - 1.28% |
| |||||||||
IDT Corp., Class B | 7,700 | 72,226 | ||||||||
Vonage Holdings Corp.* | 74,000 | 181,300 | ||||||||
|
| |||||||||
| 253,526 | ||||||||||
Electronic Equipment, Instruments & Components - 7.08% |
| |||||||||
Brightpoint, Inc.* | 29,500 | 317,420 | ||||||||
GSI Group, Inc.* | 12,700 | 129,921 | ||||||||
Insight Enterprises, Inc.* | 19,900 | 304,271 | ||||||||
NAM TAI Electronics, Inc. | 17,600 | 93,456 | ||||||||
PC Connection, Inc. | 19,600 | 217,364 | ||||||||
Sanmina-SCI Corp.* | 22,000 | 204,820 | ||||||||
Zygo Corp.* | 7,900 | 139,435 | ||||||||
|
| |||||||||
| 1,406,687 | ||||||||||
Energy Equipment & Services - 2.46% |
| |||||||||
Dawson Geophysical Co.* | 3,000 | 118,590 | ||||||||
Hercules Offshore, Inc.* | 43,800 | 194,472 | ||||||||
Pioneer Drilling Co.* | 18,100 | 175,208 | ||||||||
|
| |||||||||
| 488,270 | ||||||||||
Food & Staples Retailing - 2.32% |
| |||||||||
Pantry, Inc. (The)* | 7,000 | 83,790 | ||||||||
Spartan Stores, Inc. | 6,000 | 111,000 | ||||||||
| 63 | Semi-Annual Report | December 31, 2011 (Unaudited) | |
Bridgeway Micro-Cap Limited Fund SCHEDULE OF INVESTMENTS (continued) | |
Showing percentage of net assets as of December 31, 2011 (Unaudited)
Industry | Company | Shares | Value | |||||||
Common Stocks (continued) |
| |||||||||
Food & Staples Retailing (continued) |
| |||||||||
Susser Holdings Corp.* | 11,800 | $ | 266,916 | |||||||
|
| |||||||||
| 461,706 | ||||||||||
Food Products - 0.84% |
| |||||||||
Chiquita Brands International, Inc.* | 9,000 | 75,060 | ||||||||
Smart Balance, Inc.* | 17,000 | 91,120 | ||||||||
|
| |||||||||
| 166,180 | ||||||||||
Health Care Equipment & Supplies - 2.03% |
| |||||||||
Greatbatch, Inc.* | 4,900 | 108,290 | ||||||||
Orthofix International NV* | 2,700 | 95,121 | ||||||||
RTI Biologics, Inc.* | 45,000 | 199,800 | ||||||||
|
| |||||||||
| 403,211 | ||||||||||
Health Care Providers & Services - 6.05% |
| |||||||||
Ensign Group, Inc. (The) | 13,400 | 328,300 | ||||||||
Five Star Quality Care, Inc.* | 16,500 | 49,500 | ||||||||
Healthways, Inc.* | 13,000 | 89,180 | ||||||||
Kindred Healthcare, Inc.* | 17,400 | 204,798 | ||||||||
Metropolitan Health Networks, Inc.* | 20,300 | 151,641 | ||||||||
National Healthcare Corp. | 5,800 | 243,020 | ||||||||
Triple-S Management Corp., Class B* | 6,800 | 136,136 | ||||||||
|
| |||||||||
| 1,202,575 | ||||||||||
Health Care Technology - 1.62% |
| |||||||||
HealthStream, Inc.* | 17,500 | 322,875 | ||||||||
Hotels, Restaurants & Leisure - 3.47% |
| |||||||||
Ameristar Casinos, Inc. | 11,100 | 191,919 | ||||||||
Caribou Coffee Co., Inc.* | 7,400 | 103,230 | ||||||||
CEC Entertainment, Inc. | 3,300 | 113,685 | ||||||||
Isle of Capri Casinos, Inc.* | 12,900 | 60,243 | ||||||||
Papa John’s International, Inc.* | 3,300 | 124,344 | ||||||||
Red Robin Gourmet Burgers, Inc.* | 3,500 | 96,950 | ||||||||
|
| |||||||||
| 690,371 | ||||||||||
Household Durables - 1.03% |
| |||||||||
Libbey, Inc.* | 7,700 | 98,098 | ||||||||
Zagg, Inc.*+ | 15,200 | 107,464 | ||||||||
|
| |||||||||
| 205,562 | ||||||||||
Insurance - 6.40% |
| |||||||||
American Equity Investment Life Holding Co. | 19,000 | 197,600 | ||||||||
Crawford & Co., Class B | 33,200 | 204,512 | ||||||||
Industry | Company | Shares | Value | |||||||
Insurance (continued) |
| |||||||||
Employers Holdings, Inc. | 10,100 | $ | 182,709 | |||||||
Flagstone Reinsurance Holdings SA | 15,000 | 124,350 | ||||||||
Infinity Property & Casualty Corp. | 4,700 | 266,678 | ||||||||
Maiden Holdings, Ltd. | 16,400 | 143,664 | ||||||||
Meadowbrook Insurance Group, Inc. | 14,300 | 152,724 | ||||||||
|
| |||||||||
| 1,272,237 | ||||||||||
Internet & Catalog Retail - 0.62% |
| |||||||||
Nutrisystem, Inc.# | 9,600 | 124,128 | ||||||||
Internet Software & Services - 1.39% |
| |||||||||
Internet Initiative Japan, Inc. - Sponsored ADR | 9,100 | 80,535 | ||||||||
United Online, Inc. | 36,100 | 196,384 | ||||||||
|
| |||||||||
| 276,919 | ||||||||||
IT Services - 0.92% |
| |||||||||
Heartland Payment Systems, Inc. | 7,500 | 182,700 | ||||||||
Leisure Equipment & Products - 1.21% |
| |||||||||
Sturm Ruger & Co., Inc. | 7,200 | 240,912 | ||||||||
Machinery - 6.73% |
| |||||||||
Alamo Group, Inc. | 10,400 | 280,072 | ||||||||
Briggs & Stratton Corp. | 8,300 | 128,567 | ||||||||
Kadant, Inc.* | 5,000 | 113,050 | ||||||||
Miller Industries, Inc. | 10,200 | 160,446 | ||||||||
Trimas Corp.* | 19,900 | 357,205 | ||||||||
Twin Disc, Inc. | 8,200 | 297,824 | ||||||||
|
| |||||||||
| 1,337,164 | ||||||||||
Marine - 0.54% |
| |||||||||
Navios Maritime Holdings, Inc. | 30,100 | 107,457 | ||||||||
Media - 1.61% |
| |||||||||
Sinclair Broadcast Group, Inc., Class A | 28,200 | 319,506 | ||||||||
Metals & Mining - 1.29% |
| |||||||||
Materion Corp.* | 6,700 | 162,676 | ||||||||
Universal Stainless & Alloy* | 2,500 | 93,400 | ||||||||
|
| |||||||||
| 256,076 | ||||||||||
Oil, Gas & Consumable Fuels - 2.23% |
| |||||||||
Alon USA Energy, Inc. | 20,000 | 174,200 | ||||||||
| www.bridgeway.com | 64 | |
Bridgeway Micro-Cap Limited Fund SCHEDULE OF INVESTMENTS (continued) | |
| Showing percentage of net assets as of December 31, 2011 (Unaudited) |
Industry | Company | Shares | Value | |||||||
Common Stocks (continued) |
| |||||||||
Oil, Gas & Consumable Fuels (continued) |
| |||||||||
Delek US Holdings, Inc. | 23,500 | $ | 268,135 | |||||||
|
| |||||||||
| 442,335 | ||||||||||
Paper & Forest Products - 1.28% |
| |||||||||
Mercer International, Inc.* | 18,000 | 109,800 | ||||||||
Neenah Paper, Inc. | 6,500 | 145,080 | ||||||||
|
| |||||||||
| 254,880 | ||||||||||
Personal Products - 1.01% |
| |||||||||
Elizabeth Arden, Inc.* | 5,400 | 200,016 | ||||||||
Professional Services - 1.90% |
| |||||||||
Insperity, Inc. | 6,700 | 169,845 | ||||||||
On Assignment, Inc.* | 18,600 | 207,948 | ||||||||
|
| |||||||||
| 377,793 | ||||||||||
Real Estate Investment Trusts (REITs) - 4.77% | �� | |||||||||
ARMOUR Residential REIT, | ||||||||||
Inc.+ | 31,300 | 220,665 | ||||||||
iStar Financial, Inc.*+ | 21,900 | 115,851 | ||||||||
Newcastle Investment Corp. | 31,600 | 146,940 | ||||||||
RAIT Financial Trust+ | 26,633 | 126,507 | ||||||||
Retail Opportunity Investments Corp. | 21,700 | 256,928 | ||||||||
Sabra Health Care REIT, Inc. | 6,700 | 81,003 | ||||||||
|
| |||||||||
| 947,894 | ||||||||||
Real Estate Management & Development - 0.67% |
| |||||||||
IRSA Inversiones y Representaciones SA - Sponsored ADR | 12,800 | 132,736 | ||||||||
Road & Rail - 0.52% |
| |||||||||
Quality Distribution, Inc.* | 9,100 | 102,375 | ||||||||
Semiconductors & Semiconductor Equipment - 2.40% |
| |||||||||
IXYS Corp.* | 8,200 | 88,806 | ||||||||
Photronics, Inc.* | 63,700 | 387,296 | ||||||||
|
| |||||||||
| 476,102 | ||||||||||
Specialty Retail - 4.75% |
| |||||||||
America’s Car-Mart, Inc.* | 3,200 | 125,376 | ||||||||
Conn’s, Inc.*+ | 11,100 | 123,210 | ||||||||
hhgregg, Inc.*+ | 6,700 | 96,815 | ||||||||
Lithia Motors, Inc., Class A | 5,900 | 128,974 | ||||||||
Pep Boys-Manny, Moe & Jack (The) | 19,400 | 213,400 | ||||||||
Select Comfort Corp.* | 11,800 | 255,942 | ||||||||
|
| |||||||||
| 943,717 | ||||||||||
Textiles, Apparel & Luxury Goods - 2.03% |
| |||||||||
Movado Group, Inc. | 8,300 | 150,811 | ||||||||
Industry | Company | Shares | Value | |||||||||||
Textiles, Apparel & Luxury Goods (continued) |
| |||||||||||||
Oxford Industries, Inc. | 5,600 | $ | 252,672 | |||||||||||
|
| |||||||||||||
| 403,483 | ||||||||||||||
Thrifts & Mortgage Finance - 1.18% |
| |||||||||||||
ViewPoint Financial Group | 18,100 | 235,481 | ||||||||||||
Trading Companies & Distributors - 1.85% |
| |||||||||||||
DXP Enterprises, Inc.* | 11,400 | 367,080 | ||||||||||||
Wireless Telecommunication Services - 1.62% |
| |||||||||||||
Leap Wireless International, Inc.*+ | 18,100 | 168,149 | ||||||||||||
NTELOS Holdings Corp. | 7,500 | 152,850 | ||||||||||||
|
| |||||||||||||
| 320,999 | ||||||||||||||
|
| |||||||||||||
TOTAL COMMON STOCKS - 99.57% |
| 19,784,268 | ||||||||||||
|
| |||||||||||||
(Cost $19,601,993) | ||||||||||||||
| Rate^ | Shares | Value | ||||||||||||
|
| |||||||||||||
MONEY MARKET FUND - 0.33% |
| |||||||||||||
BlackRock FedFund | 0.01% | 66,086 | 66,086 | |||||||||||
|
| |||||||||||||
TOTAL MONEY MARKET FUND — 0.33% |
| 66,086 | ||||||||||||
|
| |||||||||||||
(Cost $66,086) |
| |||||||||||||
TOTAL INVESTMENTS—99.90% |
| $ | 19,850,354 | |||||||||||
(Cost $19,668,079) |
| |||||||||||||
Other Assets in Excess of Liabilities—0.10% |
| 20,615 | ||||||||||||
|
| |||||||||||||
NET ASSETS - 100.00% | $ | 19,870,969 | ||||||||||||
|
| |||||||||||||
| * | Non-income producing security. |
| # | Securities, or a portion thereof, segregated to cover the Fund’s potential obligation under swap agreements. The total value of segregated assets is $124,128. |
| ^ | Rate disclosed as of December 31, 2011. |
| + | This security or a portion of the security is out on loan at December 31, 2011. Total loaned securities had a value of $931,859 at December 31, 2011. |
ADR - American Depositary Receipt
| 65 | Semi-Annual Report | December 31, 2011 (Unaudited) | |
Bridgeway Micro-Cap Limited Fund SCHEDULE OF INVESTMENTS (continued) | | |
Summary of inputs used to value the Fund’s investments as of 12/31/2011 is as follows (See Note 2 in Notes to Financial Statements):
|
| |||||||||||||||
| Valuation Inputs | ||||||||||||||||
| ||||||||||||||||
| Investment in Securities (Value) | ||||||||||||||||
| ||||||||||||||||
| Level 1 Quoted Prices | Level 2 Significant Observable Inputs | Level 3 Significant Unobservable Inputs | Total | |||||||||||||
| ||||||||||||||||
Common Stocks | $ | 19,784,268 | $ | — | $ | — | $ | 19,784,268 | ||||||||
Money Market Fund | — | 66,086 | — | 66,086 | ||||||||||||
|
|
|
|
|
|
|
| |||||||||
TOTAL | $ | 19,784,268 | $ | 66,086 | $ | — | $ | 19,850,354 | ||||||||
|
|
|
|
|
|
|
| |||||||||
See Notes to Financial Statements. |
| |||||||||||||||
| www.bridgeway.com | 66 | |
|
(Unaudited) | ||
December 31, 2011
Dear Fellow Small-Cap Momentum Fund Shareholder,
For the quarter ended December 31, 2011, our Fund appreciated 18.80%, outperforming the 15.47% return of our peer benchmark, the Russell 2000 Index. We are very pleased with the results.
For the six month semi-annual period ended December 31, 2011 our Fund declined 8.15% outperforming the Russell 2000 Index, which declined 9.77%. For the calendar year, our Fund declined 0.92%, easily outperforming the 4.18% decline of the Russell 2000 Index.
The table below presents our quarter, six-month, one-year and life-to-date financial results. See the next page for a graph of performance since inception.
| Annualized | ||||||||||||||||
| Quarter 10/1/11 to 12/31/11 | 6 Months to 12/31/11 | 1 Year 1/1/11 to 12/31/11 | Life-to-Date to 12/31/11 | |||||||||||||
Small-Cap Momentum Fund | 18.80% | -8.15% | -0.92% | 10.84% | ||||||||||||
Russell 2000 Index | 15.47% | -9.77% | -4.18% | 8.78% | ||||||||||||
Performance figures quoted in the table above and graph below represent past performance and are no guarantee of future results. Total return figures in the table above and the graph below include the reinvestment of dividends and capital gains. The table above and the graph below do not reflect the deduction of taxes that a shareholder would pay on Fund distributions or the redemption of Fund shares.
The Russell 2000 Index is an unmanaged, market value weighted index that measures performance of the 2,000 companies that are between the 1,000th and 3,000th largest in the market with dividends reinvested. It is not possible to invest directly in an index.
According to data from Lipper, Inc. as of December 31, 2011, Small-Cap Momentum Fund ranked 177th of 698 small-cap core funds for the twelve-month period ended December 31, 2011, and 178th of 691 such funds since inception in May 2010. Lipper, Inc. is an independent mutual fund rating service that ranks funds in various fund categories by making comparative calculations using total returns.
| 67 | Semi-Annual Report | December 31, 2011 (Unaudited) | |
Small-Cap Momentum Fund MANAGER’S COMMENTARY (continued) | |
| (Unaudited) |
Small-Cap Momentum Fund vs. Russell 2000 Index from Inception 5/28/10 to 12/31/11
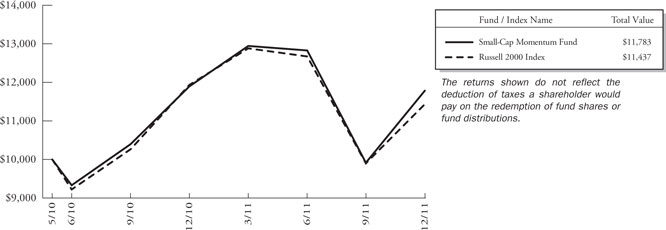
Detailed Explanation of Quarterly Performance
The Short Version: The best and worst contributor lists were well diversified for the quarter. No sector had more than two stocks on either list.
Though investors rejoiced over solid performance, the fourth quarter was still a period of uncertainty in the economy and stock markets as many lingering issues at home and abroad (Europe, China, Thailand, health care) resulted in a largely cautious mindset. Six different sectors were represented on the best contributors list for the quarter. Two Heath Care related companies were among the top three contributors. Combined, they added almost a percent in return.
These are the Fund’s ten best-contributing stocks for the quarter ended December 31, 2011:
| Rank | Description | Industry | % Contribution of Return | |||
| 1 | RSC Holdings, Inc. | Consumer Finance | 0.5% | |||
| 2 | Questcor Pharmaceuticals, Inc. | Pharmaceuticals | 0.5% | |||
| 3 | Inhibitex, Inc. | Biotechnology | 0.4% | |||
| 4 | Stone Energy Corp. | Oil, Gas & Consumable Fuels | 0.3% | |||
| 5 | ViaSat, Inc. | Communications Equipment | 0.3% | |||
| 6 | Carter’s, Inc. | Textiles, Apparel & Luxury Goods | 0.3% | |||
| 7 | Fair Isaac Corp. | Software | 0.2% | |||
| 8 | Helix Energy Solutions Group, Inc. | Energy Equipment & Services | 0.2% | |||
| 9 | Ultimate Software Group, Inc. | Software | 0.2% | |||
| 10 | Webster Financial Corp. | Commercial Banks | 0.2% |
Though merger and acquisition activity was sparse during the December quarter, investors welcomed the few deals that were announced. RSC Holdings is an equipment rental company that services the industrial and non-residential construction markets. In December, it agreed to be acquired by its competitor, United Rentals, in a $4.2 billion cash, stock, and debt deal. RSC soared over 50% on the news and soon faced the investigations over breach of fiduciary duty that often follows such announced transactions. Its stock price more than doubled during the three-month period; the holding was the top contributor to the Fund’s return.
| www.bridgeway.com | 68 | |
Small-Cap Momentum Fund MANAGER’S COMMENTARY (continued) | | |||
| (Unaudited) |
Seven sectors were represented on the worst contributors list for the quarter including two Health Care holdings that cost the Fund over one-quarter percent in performance. Two Consumer Staples also made the worst contributors list, costing the Fund over one-half of a percent of return.
These are the Fund’s ten worst-contributing stocks for the quarter ended December 31, 2011:
| Rank | Description | Industry | % Contribution of Return | |||
| 1 | Diamond Foods, Inc. | Food Products | -0.5% | |||
| 2 | Career Education Corp. | Diversified Consumer Services | -0.2% | |||
| 3 | Gran Tierra Energy, Inc. | Oil, Gas & Consumable Fuels | -0.1% | |||
| 4 | MAKO Surgical Corp. | Health Care Equipment & Supplies | -0.1% | |||
| 5 | Volcano Corp. | Health Care Equipment & Supplies | -0.1% | |||
| 6 | K12, Inc. | Diversified Consumer Services | -0.1% | |||
| 7 | RF Micro Devices, Inc. | Semiconductors & Semiconductor Equipment | -0.1% | |||
| 8 | First American Financial Corp. | Insurance | -0.1% | |||
| 9 | Cohen & Steers, Inc. | Diversified Financial Services | -0.1% | |||
| 10 | Dole Food Co., Inc. | Food Products | -0.1% |
In April 2011, Diamond Foods announced its intent to add the Pringles brand to its snack product line that already included Emerald nuts and Kettle chips. The $2.35 billion deal with giant Procter & Gamble was supposed to close by year-end 2011. In early November, the transaction was suddenly pushed back to a June 2012 expected closing. Diamond faced investigations and class action lawsuits over improper accounting for sales to walnut growers. Its stock price plunged on the news and lost over 60% in value during the period, putting the stock price significantly below pre-merger announcement levels. The holding cost the Fund one-half of a percent in return.
Detailed Explanation of Calendar Year Performance
The Short Version: Consumer related stocks were well represented on the best and worst contributors lists. The “risk-adjustment” feature of our Fund worked well in calendar 2011, adding more than 1 1/2% to returns (relative to a “pure price momentum strategy”) in a very volatile market.
Calendar year 2011 could be considered a “return of the consumer” as investors welcomed an improved labor market and what many considered a solid holiday season. Four Consumer Discretionary stocks made the list of top contributors. Combined, they contributed over one percent to the Fund’s return. As was the case for the quarter, Health Care was also well represented, with three stocks making the list.
These are the Fund’s ten best-contributing stocks for the calendar year ended December 31, 2011:
| Rank | Description | Industry | % Contribution to Return | |||
| 1 | Questcor Pharmaceuticals, Inc. | Pharmaceuticals | 0.5% | |||
| 2 | RSC Holdings, Inc. | Consumer Finance | 0.4% | |||
| 3 | International Coal Group, Inc. | Metals & Mining | 0.4% | |||
| 4 | Inhibitex, Inc. | Biotechnology | 0.4% | |||
| 5 | CVR Energy, Inc. | Oil, Gas & Consumable Fuels | 0.3% | |||
| 6 | Ariad Pharmaceuticals, Inc. | Biotechnology | 0.3% | |||
| 7 | Crocs, Inc. | Textiles, Apparel & Luxury Goods | 0.3% | |||
| 8 | PriceSmart, Inc. | Multiline Retail | 0.3% | |||
| 9 | Carter’s, Inc. | Textiles, Apparel & Luxury Goods | 0.2% | |||
| 10 | Domino’s Pizza, Inc. | Hotels, Restaurants & Leisure | 0.2% |
Domino’s is the second largest pizza chain (behind Pizza Hut) and operates over 9,000 delivery restaurants across the globe. In the mid-2000s, the company struggled and was losing out to better-run rivals. It introduced a new CEO and management team in 2010, a revamped, better tasting product, and a stronger reliance on technology. The company has reaped
| 69 | Semi-Annual Report | December 31, 2011 (Unaudited) | |
Small-Cap Momentum Fund MANAGER’S COMMENTARY (continued) | |
| (Unaudited) |
double-digit same-store sales for the past few quarters and has benefited significantly from on-line ordering via apps for the Apple iPhone and iPad. In fact, sales from mobile devices accounted for about 30% of Dominos orders in 2011, and the company recognized a record week for online sales early in the holiday season (consumers can now shop and order pizza at the same time). The stock price more than doubled during the twelve month period and closed near the 52-week high.
Two Consumer Discretionary and Consumer Staples stocks appeared on the list of worst contributors for the 2011 calendar year. These stocks cost the Fund over one percent in return.
These are the Fund’s ten worst-contributing stocks for the calendar year ended December 31, 2011:
| Rank | Description | Industry | % Contribution to Return | |||
| 1 | Diamond Foods, Inc. | Food Products | -0.4% | |||
| 2 | Career Education Corp. | Diversified Consumer Services | -0.3% | |||
| 3 | ION Geophysical Corp. | Energy Equipment & Services | -0.3% | |||
| 4 | Cohen & Steers, Inc. | Diversified Financial Services | -0.3% | |||
| 5 | Northern Oil & Gas, Inc. | Oil, Gas & Consumable Fuels | -0.2% | |||
| 6 | First American Financial Corp. | Insurance | -0.2% | |||
| 7 | Meritor, Inc. | Auto Components | -0.2% | |||
| 8 | W&T Offshore, Inc. | Oil, Gas & Consumable Fuels | -0.2% | |||
| 9 | WisdomTree Investments, Inc. | Diversified Financial Services | -0.2% | |||
| 10 | Dole Food Co., Inc. | Food Products | -0.2% |
For-profit colleges have come under great scrutiny over the past few years; regulators have claimed that more and more students are leaving with no jobs and excessive debt. Career Education is one such company that has faced tremendous pressures from regulators (and subsequently investors). In August, the New York Attorney General issued a subpoena and the company ultimately identified “improper practices” at over 90 campuses. In November, it reported that 49 schools potentially could lose their accreditation because of inaccurately reported job placement rates. Looking for a fresh start after a dismal earnings report, its CEO “unexpectedly” resigned late in the year. The holding dropped over 50% during 2011 and cost the Fund almost one-third of a percent in performance.
Top Ten Holdings as of December 31, 2011
Small-Cap Momentum was broadly diversified at calendar year-end; no industry was represented more than once on the list of top holdings. The top ten holdings represented less than seven percent of the overall portfolio, and no individual stock accounted for greater than three-fourths of a percent of the Fund’s net assets.
| Rank | Description | Industry | % of Net Assets | |||
| 1 | Thoratec Corp. | Health Care Equipment & Supplies | 0.7% | |||
| 2 | Ariad Pharmaceuticals, Inc. | Biotechnology | 0.7% | |||
| 3 | Life Time Fitness, Inc. | Hotels, Restaurants & Leisure | 0.7% | |||
| 4 | Ocwen Financial Corp. | Thrifts & Mortgage Finance | 0.7% | |||
| 5 | Viropharma, Inc. | Pharmaceuticals | 0.7% | |||
| 6 | Webster Financial Corp. | Commercial Banks | 0.7% | |||
| 7 | Generac Holdings, Inc. | Electrical Equipment | 0.7% | |||
| 8 | Silicon Laboratories, Inc. | Semiconductors & Semiconductor Equipment | 0.7% | |||
| 9 | Dana Holding Corp. | Auto Components | 0.7% | |||
| 10 | Cabela’s, Inc. | Specialty Retail | 0.6% | |||
| Total | 6.9% |
| www.bridgeway.com | 70 | |
Small-Cap Momentum Fund MANAGER’S COMMENTARY (continued) | |
| (Unaudited) | ||
Industry Sector Representation as of December 31, 2011
The Consumer Discretionary sector displayed the biggest disparity between the Fund and the Russell 2000 Index. The Utilities sector was the most underweighted sector compared to the Russell 2000 Index.
| % of Net Assets | % of Russell 2000 Index | Difference | ||||
Consumer Discretionary | 17.9% | 13.1% | 4.8% | |||
Consumer Staples | 3.2% | 3.7% | -0.5% | |||
Energy | 4.3% | 6.7% | -2.4% | |||
Financials | 23.4% | 22.3% | 1.1% | |||
Health Care | 11.3% | 12.6% | -1.3% | |||
Industrials | 17.3% | 15.5% | 1.8% | |||
Information Technology | 18.4% | 17.1% | 1.3% | |||
Materials | 2.7% | 4.5% | -1.8% | |||
Telecommunication Services | 0.8% | 0.8% | 0.0% | |||
Utilities | 0.7% | 3.7% | -3.0% | |||
Cash & Other Assets | 0.0% | 0.0% | 0.0% | |||
Total | 100.0% | 100.0% |
Disclaimer
The views expressed here are exclusively those of Fund management. These views, including those related to market sectors or individual stocks, are not meant as investment advice and should not be considered predictive in nature. Any favorable (or unfavorable) description of a holding applies only as of December 31, 2011, unless otherwise stated. Security positions can and do change thereafter. Discussions of historical performance do not guarantee and are not indicative of future performance.
Market volatility can significantly impact short-term performance. The Fund is not an appropriate investment for short-term investors. Investments in small companies generally carry greater risk than is customarily associated with larger companies. This additional risk is attributable to a number of factors, including the relatively limited financial resources that are typically available to small companies, and the fact that small companies often have comparatively limited product lines. In addition, the stock of small companies tends to be more volatile than the stock of large companies, particularly in the short term and particularly in the early stages of an economic or market downturn. Shareholders of the Fund, therefore, are taking on more risk than they would if they invested in the stock market as a whole.
Conclusion
Thank you for your continued investment in Small-Cap Momentum Fund. We encourage your feedback; your reactions and concerns are important to us.
Sincerely,
The Investment Management Team
| 71 | Semi-Annual Report | December 31, 2011 (Unaudited) | |
Bridgeway Small-Cap Momentum Fund | |
Showing percentage of net assets as of December 31, 2011 (Unaudited) | ||
Industry | Company | Shares | Value | |||||||
COMMON STOCKS - 96.81% |
| |||||||||
Aerospace & Defense - 1.22% |
| |||||||||
Astronics Corp.* | 150 | $ | 5,372 | |||||||
Cubic Corp. | 300 | 13,077 | ||||||||
Curtiss-Wright Corp. | 500 | 17,665 | ||||||||
|
| |||||||||
| 36,114 | ||||||||||
Air Freight & Logistics - 0.32% |
| |||||||||
Forward Air Corp. | 300 | 9,615 | ||||||||
Airlines - 0.11% |
| |||||||||
Hawaiian Holdings, Inc.* | 550 | 3,190 | ||||||||
Auto Components - 1.19% |
| |||||||||
Amerigon, Inc.* | 250 | 3,565 | ||||||||
Dana Holding Corp.* | 1,600 | 19,440 | ||||||||
Dorman Products, Inc.* | 200 | 7,386 | ||||||||
Standard Motor Products, Inc. | 250 | 5,013 | ||||||||
|
| |||||||||
| 35,404 | ||||||||||
Beverages - 1.10% |
| |||||||||
Boston Beer Co., Inc., | 150 | 16,284 | ||||||||
Heckmann Corp.*+ | 1,300 | 8,645 | ||||||||
National Beverage Corp.* | 475 | 7,633 | ||||||||
|
| |||||||||
| 32,562 | ||||||||||
Biotechnology - 2.71% |
| |||||||||
Anthera Pharmaceuticals, Inc.*+ | 400 | 2,456 | ||||||||
Ariad Pharmaceuticals, Inc.* | 1,725 | 21,131 | ||||||||
Dynavax Technologies Corp.*+ | 1,550 | 5,146 | ||||||||
Halozyme Therapeutics, Inc.* | 1,100 | 10,461 | ||||||||
Ironwood Pharmaceuticals, Inc.* | 1,200 | 14,364 | ||||||||
Ligand Pharmaceuticals, | ||||||||||
Inc., Class B* | 200 | 2,374 | ||||||||
Maxygen, Inc.* | 300 | 1,689 | ||||||||
Nymox Pharmaceutical Corp.* | 350 | 2,877 | ||||||||
Pharmacyclics, Inc.* | 750 | 11,115 | ||||||||
Spectrum Pharmaceuticals, Inc.*+ | 600 | 8,778 | ||||||||
|
| |||||||||
| 80,391 | ||||||||||
Building Products - 0.82% |
| |||||||||
AAON, Inc. | 262 | 5,368 | ||||||||
American Woodmark Corp. | 150 | 2,049 | ||||||||
Simpson Manufacturing Co., Inc. | 500 | 16,830 | ||||||||
|
| |||||||||
| 24,247 | ||||||||||
Industry | Company | Shares | Value | |||||||
Capital Markets - 0.81% |
| |||||||||
CIFC Corp.*+ | 250 | $ | 1,350 | |||||||
Epoch Holding Corp. | 250 | 5,558 | ||||||||
Gladstone Investment Corp. | 250 | 1,817 | ||||||||
Kohlberg Capital Corp. | 250 | 1,577 | ||||||||
Ladenburg Thalmann Financial Services, Inc.* | 1,950 | 4,836 | ||||||||
Medallion Financial Corp. | 200 | 2,276 | ||||||||
MVC Capital, Inc. | 250 | 2,898 | ||||||||
Westwood Holdings Group, Inc. | 100 | 3,655 | ||||||||
|
| |||||||||
| 23,967 | ||||||||||
Chemicals - 1.30% |
| |||||||||
Arabian American Development Co.* | 250 | 2,120 | ||||||||
Chase Corp. | 100 | 1,390 | ||||||||
Innophos Holdings, Inc. | 225 | 10,926 | ||||||||
Schulman (A.), Inc. | 300 | 6,354 | ||||||||
Stepan Co. | 100 | 8,016 | ||||||||
Tredegar Corp. | 350 | 7,777 | ||||||||
Yongye International, Inc.*+ | 550 | 1,931 | ||||||||
|
| |||||||||
| 38,514 | ||||||||||
Commercial Banks - 8.83% |
| |||||||||
1st Source Corp. | 250 | 6,332 | ||||||||
Alliance Financial Corp. | 50 | 1,544 | ||||||||
Ameris Bancorp* | 250 | 2,570 | ||||||||
Ames National Corp. | 100 | 1,950 | ||||||||
BancFirst Corp. | 150 | 5,631 | ||||||||
Bank of the Ozarks, Inc. | 350 | 10,370 | ||||||||
Banner Corp. | 200 | 3,430 | ||||||||
BBCN Bancorp, Inc.* | 850 | 8,032 | ||||||||
Boston Private Financial Holdings, Inc. | 850 | 6,749 | ||||||||
Bridge Capital Holdings* | 150 | 1,560 | ||||||||
Bryn Mawr Bank Corp. | 150 | 2,924 | ||||||||
Cardinal Financial Corp. | 300 | 3,222 | ||||||||
Chemical Financial Corp. | 300 | 6,396 | ||||||||
City Holding Co. | 150 | 5,084 | ||||||||
CNB Financial Corp. | 150 | 2,367 | ||||||||
Columbia Banking System, Inc. | 400 | 7,708 | ||||||||
Community Trust Bancorp, Inc. | 150 | 4,413 | ||||||||
CVB Financial Corp. | 1,100 | 11,033 | ||||||||
Eagle Bancorp, Inc.* | 200 | 2,908 | ||||||||
First Bancorp, Inc. | 100 | 1,537 | ||||||||
First Financial Bancorp | 600 | 9,984 | ||||||||
First Financial Corp. | 150 | 4,992 | ||||||||
First Interstate Bancsystem, Inc. | 450 | 5,864 | ||||||||
| www.bridgeway.com | 72 | |
Bridgeway Small-Cap Momentum Fund SCHEDULE OF INVESTMENTS (continued) | |
| Showing percentage of net assets as of December 31, 2011 (Unaudited) |
Industry | Company | Shares | Value | |||||||
Common Stocks (continued) |
| |||||||||
Commercial Banks (continued) |
| |||||||||
Great Southern Bancorp, Inc. | 150 | $ | 3,538 | |||||||
Heartland Financial USA, Inc. | 150 | 2,301 | ||||||||
International Bancshares Corp. | 700 | 12,835 | ||||||||
Lakeland Financial Corp. | 150 | 3,881 | ||||||||
Middleburg Financial Corp. | 50 | 712 | ||||||||
MidSouth Bancorp, Inc. | 100 | 1,301 | ||||||||
National Bankshares, Inc. | 50 | 1,396 | ||||||||
Old National Bancorp | 1,000 | 11,650 | ||||||||
OmniAmerican Bancorp, Inc.* | 125 | 1,963 | ||||||||
Pacific Continental Corp. | 200 | 1,770 | ||||||||
Pinnacle Financial Partners, Inc.* | 350 | 5,652 | ||||||||
Sandy Spring Bancorp, Inc. | 250 | 4,388 | ||||||||
SCBT Financial Corp. | 150 | 4,352 | ||||||||
Sierra Bancorp | 150 | 1,320 | ||||||||
Simmons First National Corp., Class A | 200 | 5,438 | ||||||||
Texas Capital Bancshares, Inc.* | 400 | 12,244 | ||||||||
Trico Bancshares | 150 | 2,133 | ||||||||
Trustmark Corp. | 700 | 17,003 | ||||||||
Umpqua Holdings Corp. | 1,200 | 14,868 | ||||||||
Univest Corp. of Pennsylvania | 200 | 2,928 | ||||||||
Washington Trust Bancorp, Inc. | 150 | 3,579 | ||||||||
Webster Financial Corp. | 975 | 19,880 | ||||||||
WesBanco, Inc. | 300 | 5,841 | ||||||||
West Bancorporation, Inc. | 200 | 1,916 | ||||||||
Wilshire Bancorp, Inc.* | 750 | 2,722 | ||||||||
|
| |||||||||
| 262,211 | ||||||||||
Commercial Services & Supplies - 2.89% |
| |||||||||
CompX International, Inc. | 150 | 2,210 | ||||||||
Consolidated Graphics, Inc.* | 100 | 4,828 | ||||||||
Deluxe Corp. | 550 | 12,518 | ||||||||
G&K Services, Inc., Class A | 200 | 5,822 | ||||||||
Healthcare Services Group, Inc. | 700 | 12,383 | ||||||||
HNI Corp. | 500 | 13,050 | ||||||||
Intersections, Inc. | 150 | 1,664 | ||||||||
Multi-Color Corp. | 200 | 5,146 | ||||||||
Standard Parking Corp.* | 150 | 2,680 | ||||||||
Tetra Tech, Inc.* | 650 | 14,033 | ||||||||
UniFirst Corp. | 200 | 11,348 | ||||||||
|
| |||||||||
| 85,682 | ||||||||||
Industry | Company | Shares | Value | |||||||
Communications Equipment - 1.30% |
| |||||||||
Black Box Corp. | 200 | $ | 5,608 | |||||||
Communications Systems, Inc. | 100 | 1,406 | ||||||||
Comtech Telecommunications Corp. | 250 | 7,155 | ||||||||
Digi International, Inc.* | 250 | 2,790 | ||||||||
Emulex Corp.* | 900 | 6,174 | ||||||||
Harmonic, Inc.* | 1,250 | 6,300 | ||||||||
Ixia* | 750 | 7,883 | ||||||||
PC-Tel, Inc. | 200 | 1,368 | ||||||||
|
| |||||||||
| 38,684 | ||||||||||
Computers & Peripherals - 0.57% | ||||||||||
Super Micro Computer, Inc.* | 400 | 6,272 | ||||||||
Synaptics, Inc.* | 350 | 10,552 | ||||||||
|
| |||||||||
| 16,824 | ||||||||||
Construction & Engineering - 1.42% | ||||||||||
Argan, Inc. | 150 | 2,282 | ||||||||
Comfort Systems USA, Inc. | 400 | 4,288 | ||||||||
Granite Construction, Inc. | 400 | 9,488 | ||||||||
MasTec, Inc.* | 900 | 15,633 | ||||||||
Northwest Pipe Co.* | 100 | 2,286 | ||||||||
Primoris Services Corp. | 550 | 8,211 | ||||||||
|
| |||||||||
| 42,188 | ||||||||||
Construction Materials - 0.10% | ||||||||||
United States Lime & Minerals, Inc.* | 50 | 3,006 | ||||||||
Consumer Finance - 1.04% | ||||||||||
Advance America Cash Advance Centers, Inc. | 650 | 5,818 | ||||||||
Cash America International, Inc. | 300 | 13,989 | ||||||||
World Acceptance Corp.* | 150 | 11,025 | ||||||||
|
| |||||||||
| 30,832 | ||||||||||
Containers & Packaging - 0.15% | ||||||||||
Myers Industries, Inc. | 350 | 4,319 | ||||||||
Distributors - 0.15% | ||||||||||
VOXX International Corp.* | 250 | 2,112 | ||||||||
Weyco Group, Inc. | 100 | 2,455 | ||||||||
|
| |||||||||
| 4,567 | ||||||||||
Diversified Consumer Services - 1.10% | ||||||||||
Ascent Capital Group, Inc., Class A* | 150 | 7,608 | ||||||||
Cambium Learning Group, Inc.* | 500 | 1,510 | ||||||||
| 73 | Semi-Annual Report | December 31, 2011 (Unaudited) | |
Bridgeway Small-Cap Momentum Fund SCHEDULE OF INVESTMENTS (continued) | |
| Showing percentage of net assets as of December 31, 2011 (Unaudited) | ||
Industry | Company | Shares | Value | |||||||
Common Stocks (continued) |
| |||||||||
Diversified Consumer Services (continued) |
| |||||||||
K12, Inc.* | 375 | $ | 6,728 | |||||||
Regis Corp. | 600 | 9,930 | ||||||||
Steiner Leisure, Ltd.* | 150 | 6,808 | ||||||||
|
| |||||||||
| 32,584 | ||||||||||
Diversified Financial Services - 0.47% |
| |||||||||
MarketAxess Holdings, Inc. | 400 | 12,044 | ||||||||
Primus Guaranty, Ltd.* | 400 | 1,960 | ||||||||
|
| |||||||||
| 14,004 | ||||||||||
Diversified Telecommunication Services - 0.82% |
| |||||||||
Atlantic Tele-Network, Inc. | 150 | 5,858 | ||||||||
Cogent Communications Group, Inc.* | 475 | 8,023 | ||||||||
Consolidated Communications Holdings, Inc. | 300 | 5,715 | ||||||||
Premiere Global Services, Inc.* | 550 | 4,658 | ||||||||
|
| |||||||||
| 24,254 | ||||||||||
Electric Utilities - 0.58% |
| |||||||||
PNM Resources, Inc. | �� | 950 | 17,318 | |||||||
Electrical Equipment - 1.36% |
| |||||||||
AZZ, Inc. | 150 | 6,816 | ||||||||
Franklin Electric Co., Inc. | 250 | 10,890 | ||||||||
Generac Holdings, Inc.* | 700 | 19,621 | ||||||||
Preformed Line Products Co. | 50 | 2,983 | ||||||||
|
| |||||||||
| 40,310 | ||||||||||
Electronic Equipment, Instruments & Components - 2.28% |
| |||||||||
DDi Corp. | 200 | 1,866 | ||||||||
Electro Rent Corp. | 250 | 4,288 | ||||||||
FARO Technologies, Inc.* | 175 | 8,050 | ||||||||
FEI Co.* | 400 | 16,312 | ||||||||
ID Systems, Inc.* | 150 | 709 | ||||||||
LeCroy Corp.* | 200 | 1,682 | ||||||||
Maxwell Technologies, Inc.* | 300 | 4,872 | ||||||||
Measurement Specialties, | ||||||||||
Inc.* | 150 | 4,194 | ||||||||
OSI Systems, Inc.* | 200 | 9,756 | ||||||||
Park Electrochemical Corp. | 200 | 5,124 | ||||||||
Scansource, Inc.* | 300 | 10,800 | ||||||||
|
| |||||||||
| 67,653 | ||||||||||
Energy Equipment & Services - 1.46% |
| |||||||||
Bristow Group, Inc. | 375 | 17,771 | ||||||||
Hornbeck Offshore Services, Inc.* | 350 | 10,857 | ||||||||
Newpark Resources, Inc.* | 950 | 9,025 | ||||||||
| Industry | Company | Shares | Value | |||||||
Energy Equipment & Services (continued) |
| |||||||||
OYO Geospace Corp.* | 75 | $ | 5,800 | |||||||
|
| |||||||||
| 43,453 | ||||||||||
Food & Staples Retailing - 0.37% |
| |||||||||
Arden Group, Inc., Class A | 25 | 2,250 | ||||||||
Susser Holdings Corp.* | 200 | 4,524 | ||||||||
Village Super Market, Inc., Class A | 150 | 4,268 | ||||||||
|
| |||||||||
| 11,042 | ||||||||||
Food Products - 1.02% |
| |||||||||
B&G Foods, Inc. | 500 | 12,035 | ||||||||
Calavo Growers, Inc. | 150 | 3,852 | ||||||||
Cal-Maine Foods, Inc. | 250 | 9,142 | ||||||||
Lifeway Foods, Inc.* | 200 | 1,928 | ||||||||
Smart Balance, Inc.* | 600 | 3,216 | ||||||||
|
| |||||||||
| 30,173 | ||||||||||
Health Care Equipment & Supplies - 3.30% |
| |||||||||
ABIOMED, Inc.* | 400 | 7,388 | ||||||||
Analogic Corp. | 125 | 7,165 | ||||||||
Antares Pharma, Inc.* | 1,100 | 2,420 | ||||||||
Atrion Corp. | 25 | 6,006 | ||||||||
Cantel Medical Corp. | 200 | 5,586 | ||||||||
Endologix, Inc.* | 600 | 6,888 | ||||||||
Exactech, Inc.* | 150 | 2,470 | ||||||||
Kensey Nash Corp.* | 100 | 1,919 | ||||||||
MAKO Surgical Corp.*+ | 425 | 10,714 | ||||||||
OraSure Technologies, Inc.* | 500 | 4,555 | ||||||||
Quidel Corp.* | 350 | 5,296 | ||||||||
RTI Biologics, Inc.* | 600 | 2,664 | ||||||||
Solta Medical, Inc.* | 650 | 2,041 | ||||||||
Spectranetics Corp.* | 350 | 2,527 | ||||||||
Synergetics USA, Inc.* | 250 | 1,845 | ||||||||
Thoratec Corp.* | 650 | 21,814 | ||||||||
Wright Medical Group, Inc.* | 400 | 6,600 | ||||||||
|
| |||||||||
| 97,898 | ||||||||||
Health Care Providers & Services - 2.92% |
| |||||||||
Air Methods Corp.* | 150 | 12,668 | ||||||||
Capital Senior Living Corp.* | 300 | 2,382 | ||||||||
Corvel Corp.* | 125 | 6,464 | ||||||||
Metropolitan Health Networks, Inc.* | 450 | 3,361 | ||||||||
National Healthcare Corp. | 150 | 6,285 | ||||||||
Providence Service Corp. (The)* | 150 | 2,064 | ||||||||
Select Medical Holdings Corp.* | 1,550 | 13,144 | ||||||||
Team Health Holdings, Inc.* | 700 | 15,449 | ||||||||
| www.bridgeway.com | 74 | |
Bridgeway Small-Cap Momentum Fund SCHEDULE OF INVESTMENTS (continued) | |
| Showing percentage of net assets as of December 31, 2011 (Unaudited) |
Industry | Company | Shares | Value | |||||||
Common Stocks (continued) |
| |||||||||
Health Care Providers & Services (continued) |
| |||||||||
Triple-S Management Corp., Class B* | 300 | $ | 6,006 | |||||||
VCA Antech, Inc.* | 950 | 18,762 | ||||||||
|
| |||||||||
| 86,585 | ||||||||||
Health Care Technology - 0.24% |
| |||||||||
HealthStream, Inc.* | 250 | 4,613 | ||||||||
Transcend Services, Inc.* | 100 | 2,373 | ||||||||
|
| |||||||||
| 6,986 | ||||||||||
Hotels, Restaurants & Leisure - 4.44% |
| |||||||||
Bally Technologies, Inc.* | 450 | 17,802 | ||||||||
BJ’s Restaurants, Inc.* | 300 | 13,596 | ||||||||
Bob Evans Farms, Inc. | 300 | 10,062 | ||||||||
Buffalo Wild Wings, Inc.* | 200 | 13,502 | ||||||||
Churchill Downs, Inc. | 200 | 10,426 | ||||||||
DineEquity, Inc.* | 200 | 8,442 | ||||||||
Jack in the Box, Inc.* | 450 | 9,405 | ||||||||
Life Time Fitness, Inc.* | 450 | 21,038 | ||||||||
Luby’s, Inc.* | 300 | 1,353 | ||||||||
Marcus Corp. | 350 | 4,413 | ||||||||
Nathan’s Famous, Inc.* | 50 | 1,051 | ||||||||
Papa John’s International, Inc.* | 250 | 9,420 | ||||||||
Peet’s Coffee & Tea, Inc.* | 150 | 9,402 | ||||||||
Ruth’s Hospitality Group, Inc.* | 400 | 1,988 | ||||||||
|
| |||||||||
| 131,900 | ||||||||||
Household Durables - 0.68% |
| |||||||||
Cavco Industries, Inc.* | 50 | 2,003 | ||||||||
CSS Industries, Inc. | 100 | 1,992 | ||||||||
Ethan Allen Interiors, Inc. | 300 | 7,113 | ||||||||
iRobot Corp.* | 300 | 8,955 | ||||||||
|
| |||||||||
| 20,063 | ||||||||||
Household Products - 0.20% |
| |||||||||
WD-40 Co. | 150 | 6,061 | ||||||||
Industrial Conglomerates - 0.59% |
| |||||||||
Raven Industries, Inc. | 200 | 12,380 | ||||||||
Standex International Corp. | 150 | 5,126 | ||||||||
|
| |||||||||
| 17,506 | ||||||||||
Insurance - 4.70% |
| |||||||||
American Safety Insurance Holdings, Ltd.* | 100 | 2,175 | ||||||||
AMERISAFE, Inc.* | 200 | 4,650 | ||||||||
Amtrust Financial Services, Inc.+ | 625 | 14,844 | ||||||||
Argo Group International Holdings, Ltd. | 350 | 10,136 | ||||||||
Industry | Company | Shares | Value | |||||||
Insurance (continued) |
| |||||||||
Baldwin & Lyons, Inc., Class B | 150 | $ | 3,270 | |||||||
Citizens, Inc.* | 550 | 5,330 | ||||||||
eHealth, Inc.* | 200 | 2,940 | ||||||||
EMC Insurance Group, Inc. | 150 | 3,085 | ||||||||
FBL Financial Group, Inc., Class A | 350 | 11,907 | ||||||||
Flagstone Reinsurance Holdings SA | 750 | 6,218 | ||||||||
Kansas City Life Insurance Co. | 100 | 3,282 | ||||||||
Meadowbrook Insurance Group, Inc. | 550 | 5,874 | ||||||||
National Interstate Corp. | 200 | 4,934 | ||||||||
OneBeacon Insurance Group, Ltd., Class A | 1,000 | 15,390 | ||||||||
Primerica, Inc. | 800 | 18,592 | ||||||||
RLI Corp. | 225 | 16,393 | ||||||||
Stewart Information Services Corp. | 200 | 2,310 | ||||||||
Tower Group, Inc. | 400 | 8,068 | ||||||||
|
| |||||||||
| 139,398 | ||||||||||
Internet Software & Services - 2.01% |
| |||||||||
DealerTrack Holdings, Inc.* | 450 | 12,267 | ||||||||
eGain Communications Corp.* | 250 | 1,728 | ||||||||
Liquidity Services, Inc.* | 300 | 11,070 | ||||||||
NIC, Inc. | 650 | 8,651 | ||||||||
SciQuest, Inc.* | 250 | 3,567 | ||||||||
SPS Commerce, Inc.* | 150 | 3,892 | ||||||||
Stamps.com, Inc.* | 150 | 3,920 | ||||||||
ValueClick, Inc.* | 900 | 14,661 | ||||||||
|
| |||||||||
| 59,756 | ||||||||||
IT Services - 2.38% |
| |||||||||
Acxiom Corp.* | 875 | 10,684 | ||||||||
Cardtronics, Inc.* | 450 | 12,177 | ||||||||
Cass Information Systems, Inc. | 100 | 3,639 | ||||||||
Echo Global Logistics, Inc.* | 250 | 4,037 | ||||||||
ExlService Holdings, Inc.* | 350 | 7,830 | ||||||||
Heartland Payment Systems, Inc. | 400 | 9,744 | ||||||||
MAXIMUS, Inc. | 350 | 14,472 | ||||||||
TNS, Inc.* | 250 | 4,430 | ||||||||
Virtusa Corp.* | 250 | 3,620 | ||||||||
|
| |||||||||
| 70,633 | ||||||||||
Leisure Equipment & Products - 0.98% |
| |||||||||
Brunswick Corp. | 950 | 17,157 | ||||||||
| 75 | Semi-Annual Report | December 31, 2011 (Unaudited) | |
Bridgeway Small-Cap Momentum Fund SCHEDULE OF INVESTMENTS (continued) | |
| Showing percentage of net assets as of December 31, 2011 (Unaudited) |
Industry | Company | Shares | Value | |||||||
Common Stocks (continued) |
| |||||||||
Leisure Equipment & Products (continued) |
| |||||||||
Johnson Outdoors, Inc., Class A* | 100 | $ | 1,535 | |||||||
Steinway Musical Instruments, Inc.* | 150 | 3,756 | ||||||||
Sturm Ruger & Co., Inc. | 200 | 6,692 | ||||||||
|
| |||||||||
| 29,140 | ||||||||||
Life Sciences Tools & Services - 0.37% |
| |||||||||
Luminex Corp.* | 450 | 9,553 | ||||||||
Medtox Scientific, Inc.* | 100 | 1,405 | ||||||||
|
| |||||||||
| 10,958 | ||||||||||
Machinery - 3.19% |
| |||||||||
Albany International Corp., Class A | 350 | 8,092 | ||||||||
Chart Industries, Inc.* | 325 | 17,573 | ||||||||
Colfax Corp.*+ | 450 | 12,816 | ||||||||
Douglas Dynamics, Inc. | 250 | 3,655 | ||||||||
Lydall, Inc.* | 200 | 1,898 | ||||||||
Middleby Corp.* | 200 | 18,808 | ||||||||
NACCO Industries, Inc., Class A | 100 | 8,922 | ||||||||
PMFG, Inc.* | 200 | 3,902 | ||||||||
RBC Bearings, Inc.* | 250 | 10,425 | ||||||||
Titan International, Inc.+ | 450 | 8,757 | ||||||||
|
| |||||||||
| 94,848 | ||||||||||
Media - 1.76% |
| |||||||||
Arbitron, Inc. | 275 | 9,463 | ||||||||
Belo Corp., Class A | 1,150 | 7,245 | ||||||||
Fisher Communications, Inc.* | 100 | 2,883 | ||||||||
Harte-Hanks, Inc. | 650 | 5,908 | ||||||||
Journal Communications, Inc., Class A* | 600 | 2,640 | ||||||||
LIN TV Corp., Class A* | 600 | 2,538 | ||||||||
Lions Gate Entertainment Corp.* | 1,475 | 12,272 | ||||||||
|
| |||||||||
Saga Communications, Inc., Class A* | 50 | 1,869 | ||||||||
World Wrestling Entertainment, Inc., Class A | 800 | 7,456 | ||||||||
|
| |||||||||
| 52,274 | ||||||||||
Metals & Mining - 0.33% |
| |||||||||
Haynes International, Inc. | 125 | 6,825 | ||||||||
Paramount Gold & Silver Corp.* | 1,400 | 2,996 | ||||||||
|
| |||||||||
| 9,821 | ||||||||||
Industry | Company | Shares | Value | |||||||
Multiline Retail - 0.55% |
| |||||||||
99 Cents Only Stores* | 750 | $ | 16,462 | |||||||
Oil, Gas & Consumable Fuels - 2.87% |
| |||||||||
CAMAC Energy, Inc.* | 1,600 | 1,616 | ||||||||
Contango Oil & Gas Co.* | 150 | 8,727 | ||||||||
CVR Energy, Inc.* | 950 | 17,794 | ||||||||
Delek US Holdings, Inc. | 600 | 6,846 | ||||||||
Gran Tierra Energy, Inc.* | 2,850 | 13,680 | ||||||||
Panhandle Oil & Gas, Inc., Class A | 100 | 3,281 | ||||||||
SemGroup Corp., Class A* | 450 | 11,727 | ||||||||
Targa Resources Corp. | 450 | 18,310 | ||||||||
Uranerz Energy Corp.*+ | 800 | 1,456 | ||||||||
Uranium Resources, Inc.* | 1,050 | 762 | ||||||||
Ur-Energy, Inc.* | 1,150 | 988 | ||||||||
|
| |||||||||
| 85,187 | ||||||||||
Paper & Forest Products - 0.80% |
| |||||||||
Buckeye Technologies, Inc. | 400 | 13,376 | ||||||||
PH Glatfelter Co. | 450 | 6,354 | ||||||||
Wausau Paper Corp. | 500 | 4,130 | ||||||||
|
| |||||||||
| 23,860 | ||||||||||
Personal Products - 0.53% |
| |||||||||
Elizabeth Arden, Inc.* | 300 | 11,112 | ||||||||
Female Health Co. (The) | 300 | 1,353 | ||||||||
Schiff Nutrition International, Inc.* | 300 | 3,210 | ||||||||
|
| |||||||||
| 15,675 | ||||||||||
Pharmaceuticals - 1.75% |
| |||||||||
Akorn, Inc.* | 975 | 10,842 | ||||||||
Cumberland Pharmaceuticals, Inc.* | 200 | 1,076 | ||||||||
Jazz Pharmaceuticals, Inc.* | 450 | 17,384 | ||||||||
Santarus, Inc.* | 650 | 2,152 | ||||||||
Viropharma, Inc.* | 750 | 20,542 | ||||||||
|
| |||||||||
| 51,996 | ||||||||||
Professional Services - 2.65% |
| |||||||||
Advisory Board Co. (The)* | 175 | 12,987 | ||||||||
Corporate Executive Board Co. (The) | 350 | 13,335 | ||||||||
Exponent, Inc.* | 150 | 6,895 | ||||||||
Franklin Covey Co.* | 200 | 1,694 | ||||||||
GP Strategies Corp.* | 200 | 2,696 | ||||||||
Huron Consulting Group, Inc.* | 250 | 9,685 | ||||||||
Kelly Services, Inc., Class A | 400 | 5,472 | ||||||||
Kforce, Inc.* | 400 | 4,932 | ||||||||
| www.bridgeway.com | 76 | |
Bridgeway Small-Cap Momentum Fund SCHEDULE OF INVESTMENTS (continued) | |
| Showing percentage of net assets as of December 31, 2011 (Unaudited) |
Industry | Company | Shares | Value | |||||||
Common Stocks (continued) |
| |||||||||
Professional Services (continued) |
| |||||||||
Korn/Ferry International* | 500 | $ | 8,530 | |||||||
Mistras Group, Inc.* | 275 | 7,010 | ||||||||
TrueBlue, Inc.* | 400 | 5,552 | ||||||||
|
| |||||||||
| 78,788 | ||||||||||
Real Estate Investment Trusts (REITs) - 1.98% |
| |||||||||
Agree Realty Corp. | 100 | 2,438 | ||||||||
Associated Estates Realty Corp. | 450 | 7,178 | ||||||||
Coresite Realty Corp. | 200 | 3,564 | ||||||||
Education Realty Trust, Inc. | 1,000 | 10,230 | ||||||||
Glimcher Realty Trust | 1,150 | 10,580 | ||||||||
Gyrodyne Co. of America, Inc.* | 15 | 1,524 | ||||||||
Pebblebrook Hotel Trust | 550 | 10,549 | ||||||||
Sovran Self Storage, Inc. | 300 | 12,801 | ||||||||
|
| |||||||||
| 58,864 | ||||||||||
Real Estate Management & Development - 0.24% |
| |||||||||
Consolidated-Tomoka Land Co. | 50 | 1,353 | ||||||||
Kennedy-Wilson Holdings, Inc.+ | 550 | 5,819 | ||||||||
|
| |||||||||
| 7,172 | ||||||||||
Road & Rail - 0.82% |
| |||||||||
Arkansas Best Corp. | 250 | 4,818 | ||||||||
Avis Budget Group, Inc.* | 1,100 | 11,792 | ||||||||
Roadrunner Transportation Systems, Inc.* | 350 | 4,946 | ||||||||
Universal Truckload Services, Inc. | 150 | 2,722 | ||||||||
|
| |||||||||
| 24,278 | ||||||||||
Semiconductors & Semiconductor Equipment - 3.75% |
| |||||||||
Brooks Automation, Inc. | 700 | 7,189 | ||||||||
Cirrus Logic, Inc.* | 700 | 11,095 | ||||||||
Cymer, Inc.* | 350 | 17,416 | ||||||||
Entegris, Inc.* | 1,450 | 12,651 | ||||||||
MKS Instruments, Inc. | 550 | 15,301 | ||||||||
PDF Solutions, Inc.* | 300 | 2,091 | ||||||||
Pericom Semiconductor Corp.* | 250 | 1,903 | ||||||||
PLX Technology, Inc.* | 500 | 1,435 | ||||||||
RF Micro Devices, Inc.* | 3,000 | 16,200 | ||||||||
Silicon Laboratories, Inc.* | 450 | 19,539 | ||||||||
Standard Microsystems Corp.* | 250 | 6,442 | ||||||||
|
| |||||||||
| 111,262 | ||||||||||
Software - 6.10% |
| |||||||||
ACI Worldwide, Inc.* | 350 | 10,024 | ||||||||
Industry | Company | Shares | Value | |||||||
Software (continued) |
| |||||||||
Aspen Technology, Inc.* | 1,000 | $ | 17,350 | |||||||
Blackbaud, Inc. | 450 | 12,465 | ||||||||
Deltek, Inc.* | 750 | 7,365 | ||||||||
EPIQ Systems, Inc. | 400 | 4,808 | ||||||||
Fair Isaac Corp. | 375 | 13,440 | ||||||||
JDA Software Group, Inc.* | 450 | 14,576 | ||||||||
Majesco Entertainment Co.* | 400 | 976 | ||||||||
Manhattan Associates, Inc.* | 200 | 8,096 | ||||||||
MicroStrategy, Inc., Class A* | 125 | 13,540 | ||||||||
Mitek Systems, Inc.* | 250 | 1,813 | ||||||||
Monotype Imaging Holdings, Inc.* | 375 | 5,846 | ||||||||
Opnet Technologies, Inc. | 225 | 8,251 | ||||||||
PROS Holdings, Inc.* | 300 | 4,464 | ||||||||
QAD, Inc., Class A* | 150 | 1,575 | ||||||||
Synchronoss Technologies, Inc.* | 400 | 12,084 | ||||||||
Taleo Corp., Class A* | 450 | 17,410 | ||||||||
Tyler Technologies, Inc.* | 300 | 9,033 | ||||||||
Ultimate Software Group, Inc.* | 275 | 17,908 | ||||||||
|
| |||||||||
| 181,024 | ||||||||||
Specialty Retail - 5.21% |
| |||||||||
America’s Car-Mart, Inc.* | 100 | 3,918 | ||||||||
Build-A-Bear Workshop, Inc.* | 200 | 1,692 | ||||||||
Cabela’s, Inc.* | 750 | 19,065 | ||||||||
Casual Male Retail Group, Inc.* | 500 | 1,710 | ||||||||
Genesco, Inc.* | 250 | 15,435 | ||||||||
Group 1 Automotive, Inc. | 250 | 12,950 | ||||||||
Hibbett Sports, Inc.* | 300 | 13,554 | ||||||||
Jos. A. Bank Clothiers, Inc.* | 300 | 14,628 | ||||||||
Lithia Motors, Inc., Class A | 275 | 6,011 | ||||||||
Penske Automotive Group, Inc. | 950 | 18,288 | ||||||||
Pier 1 Imports, Inc.* | 1,200 | 16,716 | ||||||||
Select Comfort Corp.* | 600 | 13,014 | ||||||||
Sonic Automotive, Inc., Class A | 550 | 8,146 | ||||||||
Systemax, Inc.* | 400 | 6,564 | ||||||||
Winmark Corp. | 50 | 2,868 | ||||||||
|
| |||||||||
| 154,559 | ||||||||||
Textiles, Apparel & Luxury Goods - 1.89% |
| |||||||||
Movado Group, Inc. | 275 | 4,997 | ||||||||
Oxford Industries, Inc. | 200 | 9,024 | ||||||||
Steven Madden, Ltd.* | 450 | 15,525 | ||||||||
True Religion Apparel, Inc.* | 250 | 8,645 | ||||||||
| 77 | Semi-Annual Report | December 31, 2011 (Unaudited) | |
Bridgeway Small-Cap Momentum Fund SCHEDULE OF INVESTMENTS (continued) | |
| Showing percentage of net assets as of December 31, 2011 (Unaudited) |
Industry | Company | Shares | Value | |||||||
Common Stocks (continued) |
| |||||||||
Textiles, Apparel & Luxury Goods (continued) |
| |||||||||
Wolverine World Wide, Inc. | 500 | $17,820 | ||||||||
|
| |||||||||
| 56,011 | ||||||||||
Thrifts & Mortgage Finance - 2.05% |
| |||||||||
Bank Mutual Corp. | 500 | 1,590 | ||||||||
Beacon Federal Bancorp, Inc. | 50 | 694 | ||||||||
First Defiance Financial Corp. | 100 | 1,459 | ||||||||
Kearny Financial Corp. | 700 | 6,650 | ||||||||
Meridian Interstate Bancorp, Inc.* | 225 | 2,801 | ||||||||
Ocwen Financial Corp.* | 1,425 | 20,634 | ||||||||
Oritani Financial Corp. | 500 | 6,385 | ||||||||
Provident Financial Holdings, Inc. | 100 | 934 | ||||||||
Rockville Financial, Inc. | 300 | 3,108 | ||||||||
Roma Financial Corp. | 300 | 2,952 | ||||||||
United Financial Bancorp, Inc. | 150 | 2,413 | ||||||||
ViewPoint Financial Group | 350 | 4,554 | ||||||||
Walker & Dunlop, Inc.* | 250 | 3,140 | ||||||||
WSFS Financial Corp. | 100 | 3,596 | ||||||||
|
| |||||||||
| 60,910 | ||||||||||
Trading Companies & Distributors - 1.44% |
| |||||||||
Aircastle, Ltd. | 750 | 9,540 | ||||||||
Applied Industrial Technologies, Inc. | 450 | 15,826 | ||||||||
SeaCube Container Leasing, Ltd. | 200 | 2,962 | ||||||||
Textainer Group Holdings, Ltd. | 500 | 14,560 | ||||||||
|
| |||||||||
| 42,888 | ||||||||||
Transportation Infrastructure - 0.47% |
| |||||||||
Macquarie Infrastructure Co. LLC | 500 | 13,975 | ||||||||
Water Utilities - 0.13% |
| |||||||||
Connecticut Water Service, Inc. | 100 | 2,713 | ||||||||
Consolidated Water Co., Ltd. | 150 | 1,287 | ||||||||
|
| |||||||||
| 4,000 | ||||||||||
TOTAL COMMON STOCKS - 96.81% |
| 2,873,846 | ||||||||
|
| |||||||||
(Cost $ 2,678,208) |
| |||||||||
Industry | Company | Shares | Value | |||||||
EXCHANGE TRADED FUND - 3.24% |
| |||||||||
iShares Russell 2000 Index Fund | 1,306 | $ | 96,239 | |||||||
|
| |||||||||
TOTAL EXCHANGE TRADED FUND - 3.24% |
| 96,239 | ||||||||
|
| |||||||||
(Cost $95,725) |
| |||||||||
WARRANTS - 0.00% |
| |||||||||
Magnum Hunter Resources Corp. Warrants*D | 115 | — | ||||||||
|
| |||||||||
TOTAL WARRANTS - 0.00% |
| — | ||||||||
|
| |||||||||
(Cost $–) |
| |||||||||
| Rate^ | Shares | Value | ||||||||||||
MONEY MARKET FUND - 0.23% |
| |||||||||||||
BlackRock FedFund | 0.01% | 6,823 | 6,823 | |||||||||||
|
| |||||||||||||
TOTAL MONEY MARKET FUND - 0.23% |
| 6,823 | ||||||||||||
|
| |||||||||||||
(Cost $6,823) |
| |||||||||||||
TOTAL INVESTMENTS - 100.28% |
| $ | 2,976,908 | |||||||||||
(Cost $2,780,756) |
| |||||||||||||
Liabilities in Excess of Other Assets - (0.28%) |
| (8,222 | ) | |||||||||||
|
| |||||||||||||
NET ASSETS - 100.00% |
| $ | 2,968,686 | |||||||||||
|
| |||||||||||||
| * | Non-income producing security. |
| ^ | Rate disclosed as of December 31, 2011. |
| D | Security was fair valued under procedures adopted by the Board of Directors (see Note 2). |
| + | This security or a portion of the security is out on loan at December 31, 2011. Total loaned securities had a value of $82,738 at December 31, 2011. |
LLC - Limited Liability Company
| www.bridgeway.com | 78 | |
Bridgeway Small-Cap Momentum Fund SCHEDULE OF INVESTMENTS (continued) | |
Summary of inputs used to value the Fund’s investments as of 12/31/2011 is as follows (See Note 2 in Notes to Financial Statements):
|
| |||||||||||||||
| Valuation Inputs | ||||||||||||||||
| Investment in Securities (Value) | ||||||||||||||||
Level 1 Prices | Level 2 Significant Observable Inputs | Level 3 Significant Unobservable Inputs | Total | |||||||||||||
Common Stocks | $2,873,846 | $ | — | $ | $ | 2,873,846 | ||||||||||
Exchange | ||||||||||||||||
Traded Fund | 96,239 | — | — | 96,239 | ||||||||||||
Warrants | — | — | — | — | ||||||||||||
Money Market Fund | — | 6,823 | — | 6,823 | ||||||||||||
|
|
|
|
|
|
|
| |||||||||
TOTAL | $ | 2,970,085 | $ | 6,823 | $ | — | $ | 2,976,908 | ||||||||
|
|
|
|
|
|
|
| |||||||||
See Notes to Financial Statements. |
| |||||||||||||||
| 79 | Semi-Annual Report | December 31, 2011 (Unaudited) | |
|
| (Unaudited) | ||
December 31, 2011
Dear Fellow Small-Cap Growth Fund Shareholder,
For the quarter ended December 31, 2011, our Fund was up 19.95%, outperforming our primary market benchmark, the Rus-sell 2000 Growth Index (+14.99%) and our peer benchmark, the Lipper Small-Cap Growth Funds Index (+12.88%). It was a good quarter on an absolute and relative basis, and we are quite pleased.
For the six month semi-annual period ended December 31, 2011, our Fund couldn’t overcome a poor quarter ended September 30, 2011 — the most macro-driven market we have seen (see pages 3 to 7), and an environment generally not favorable to the Fund. The Fund declined 11.83%, underperforming our primary market benchmark, the Russell 2000 Growth Index (-10.59%) and our peer benchmark, the Lipper Small-Cap Growth Funds Index (-11.43%).
Fortunately, the Fund did outperform its benchmarks in three of the four calendar quarters, giving us a lead for the calendar year ended December 31, 2011. Our Fund declined 0.63%, outperforming our primary market benchmark, the Russell 2000 Growth Index (-2.91%) and our peer benchmark, the Lipper Small-Cap Growth Funds Index (-3.40%). While we made good progress in the last quarter, we still have much catch-up to do for the five-year period.
The table below presents our quarter, six-month, one-year, five-year, and life-to-date financial results. See the next page for a graph of performance since inception.
| Annualized | ||||||||||
Quarter 10/1/11 to 12/31/11 | 6 Months 7/1/11 to 12/31/11 | 1 Year 1/1/11 to 12/31/11 | 5 Years 1/1/07 to 12/31/11 | Life-to-Date 10/31/03 to 12/31/11 | ||||||
| Small-Cap Growth Fund | 19.95% | -11.83% | -0.63% | -5.05% | 1.19% | |||||
Russell 2000 Growth Index | 14.99% | -10.59% | -2.91% | 2.09% | 5.53% | |||||
Lipper Small-Cap Growth Funds Index | 12.88% | -11.43% | -3.40% | 1.14% | 4.25% | |||||
Performance figures quoted in the table above and graph below represent past performance and are no guarantee of future results. Total return figures in the table above and the graph below include the reinvestment of dividends and capital gains. The table above and the graph below do not reflect the deduction of taxes that a shareholder would pay on Fund distributions or the redemption of Fund shares. The recent growth rate in the stock market has helped to produce short-term returns that are not typical and may not continue in the future.
The Russell 2000 Growth Index is an unmanaged index that consists of stocks in the Russell 2000 Index with higher price-to-book ratios and higher forecasted growth values with dividends reinvested. The Lipper Small-Cap Growth Funds Index is an index of small-company, growth-oriented funds compiled by Lipper, Inc. It is not possible to invest directly in an index.
According to data from Lipper, Inc. as of December 31, 2011, Small-Cap Growth Fund ranked 130th of 511 small-cap growth funds for the twelve-month period ended December 31, 2011, 385th of 388 over the last five years and 290th of 297 such funds since inception in October, 2003. Lipper, Inc. is an independent mutual fund rating service that ranks funds in various fund categories by making comparative calculations using total returns.
| www.bridgeway.com | 80 | |
Small-Cap Growth Fund MANAGER’S COMMENTARY (continued) | |
| (Unaudited) |
Small-Cap Growth Fund vs. Russell 2000 Growth Index & Lipper Small-Cap Growth Funds Index
from Inception 10/31/03 to 12/31/11
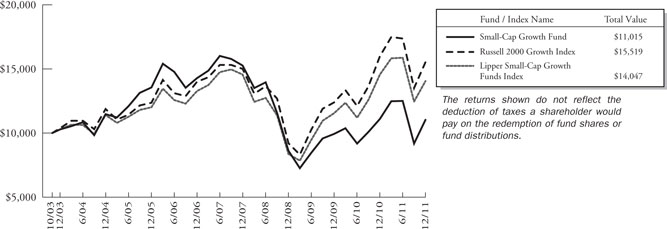
Detailed Explanation of Quarterly Performance
The Short Version: The Health Care sector played a big role in the positive performance for the quarter, while the Information Technology sector dominated the worst contributors list.
The Health Care sector has overcome the tremendous uncertainties of the ongoing reform debate. Four related firms were among the top contributors for the past three months. Combined, they added almost three percent to the Fund’s return. Consumer Discretionary stocks were also well represented as two holdings made the best contributors list for the quarter as well.
These are the Fund’s ten best-contributing stocks for the quarter ended December 31, 2011:
| Rank | Description | Industry | % Contribution to Return | |||
| 1 | Metropolitan Health Networks, Inc. | Health Care Providers & Services | 1.2% | |||
| 2 | Sinclair Broadcast Group, Inc. | Media | 1.1% | |||
| 3 | DXP Enterprises, Inc. | Trading Companies and Distributors | 1.1% | |||
| 4 | OSI Systems, Inc. | Electronic Equipment, Instruments & Components | 0.8% | |||
| 5 | FEI Co. | Electronic Equipment, Instruments & Components | 0.7% | |||
| 6 | Select Comfort Corp. | Specialty Retail | 0.7% | |||
| 7 | Consolidated Graphics, Inc. | Commercial Services & Supplies | 0.6% | |||
| 8 | Synergetics USA, Inc. | Health Care Equipment & Supplies | 0.6% | |||
| 9 | Align Technology, Inc. | Health Care Equipment & Supplies | 0.5% | |||
| 10 | HealthStream, Inc. | Health Care Technology | 0.5% |
You can put a price on a good night’s sleep. Select Comfort manufactures adjustable firmness mattresses that sell for prices ranging from $800 up to $5,000. The company’s earnings and revenues have grown by double-digits over the past three quarters. In the third quarter of 2011, sales jumped by 25% and profits soared by over 60%. The company initiated a national television ad campaign that has gained momentum of late and has proven to be quite successful in educating consumers about the advantages of their product for sleep. During the three-month period, its share price climbed by over 50% and contributed almost three-fourths of a percent to the Fund’s return.
| 81 | Semi-Annual Report | December 31, 2011 (Unaudited) | |
Small-Cap Growth Fund MANAGER’S COMMENTARY (continued) | |
| (Unaudited) |
Although the economy has shown signs of rebounding of late, businesses and consumers still do not appear to be stepping up their purchases of computers and electronics (unless they are manufactured by Apple). Four Information Technology holdings made the list of worst contributors. Combined, they hindered Fund performance by about one-half of a percent.
These are the Fund’s ten worst-contributing stocks for the quarter ended December 31, 2011:
| Rank | Description | Industry | % Contribution to Return | |||
1 | Crocs, Inc. | Textiles, Apparel & Luxury Goods | -0.6% | |||
2 | Alaska Communications Systems Group, Inc. | Diversified Telecommunication Services | -0.3% | |||
3 | Richardson Electronics, Ltd. | Electronic Equipment, Instruments & Components | -0.2% | |||
4 | Unisys Corp. | IT Services | -0.2% | |||
5 | Ezcorp, Inc. | Consumer Finance | -0.1% | |||
6 | RadNet, Inc. | Health Care Providers & Services | -0.1% | |||
7 | DFC Global Corp. | Consumer Finance | -0.1% | |||
8 | Darling International, Inc. | Food Products | -0.1% | |||
9 | Veeco Instruments, Inc. | Semiconductors & Semiconductor Equipment | -0.1% | |||
10 | Globecomm Systems, Inc. | Communications Equipment | -0.1% |
Though Crocs still has a loyal following and strong customer base of folks who like wearing its goofy-looking, colorful clogs, the company is not immune to difficulties in the current economic environment. In October 2011, management warned that revenue and earnings growth were slowing as the company deals with weakness in Europe and a cautious domestic consumer. Its share price plummeted close to 40% on the warning and never recovered, despite a later earnings report that showed solid sales out of China. The stock had been up over 50% year-to-date before the announcement. For the quarter, the holding dropped over 30% and cost the Fund over one-half of a percent in value.
Detailed Explanation of Calendar Year Performance
The Short Version: Consumer Discretionary stocks contribute the most to Fund returns. Industrials and Materials stocks were impacted by the floods in Thailand and were costly to Fund returns.
Despite numerous ongoing uncertainties, the calendar year could be considered a “return of the consumer” as investors welcomed some better labor statistics and what some considered a solid holiday season. Four Consumer Discretionary stocks made the list of top performers; combined, they contributed over three percent to the Fund’s return.
These are the Fund’s ten best-contributing stocks for the calendar year ended December 31, 2011:
| Rank | Description | Industry | % Contribution to Return | |||
1 | Metropolitan Health Networks, Inc. | Health Care Providers & Services | 1.1% | |||
2 | Ulta Salon Cosmetics & Fragrance, Inc. | Specialty Retail | 1.1% | |||
3 | Sinclair Broadcast Group, Inc. | Media | 0.9% | |||
4 | Nanometrics, Inc. | Semiconductors & Semiconductor Equipment | 0.9% | |||
5 | Polypore International, Inc. | Chemicals | 0.8% | |||
6 | Sally Beauty Holdings, Inc. | Specialty Retail | 0.7% | |||
7 | Select Comfort Corp. | Specialty Retail | 0.6% | |||
8 | OSI Systems, Inc. | Electronic Equipment, Instruments & Components | 0.6% | |||
9 | DXP Enterprises, Inc. | Trading Companies & Distributors | 0.6% | |||
10 | Synergetics USA, Inc. | Health Care Equipment & Supplies | 0.5% |
Although viewers complain about all of the negative political ads, they actually pay off quite well for broadcasting companies. One such company, Sinclair Broadcast Group, was among the Fund’s top contributors for the calendar year. As the political campaign season heated up, candidates began to air ads in major primary states. Sinclair has been in expansion mode and recently announced the acquisition of media companies with major markets in Florida and New York. In November, the holding
| www.bridgeway.com | 82 | |
Small-Cap Growth Fund MANAGER’S COMMENTARY (continued) | | |
| (Unaudited) | ||
posted better-than-expected quarterly results and rewarded shareholders with a cash dividend. For the year, the holding contributed almost one percent to the Fund’s return.
The Japan earthquake had a dramatic effect early in the year on domestic manufacturing as supply chains came to a virtual standstill. The Asian country entered slow recovery mode and its trading partners were impacted. Although signs of a rebound emerged later in the year, floods in Thailand served to slow the progress. The Industrials and Materials sectors each had two holdings among the Fund’s worst contributors during the calendar year.
These are the Fund’s ten worst-contributing stocks for the calendar year ended December 31, 2011:
| Rank | Description | Industry | % Contribution to Return | |||
| 1 | NN, Inc. | Machinery | -1.0% | |||
| 2 | Travelzoo, Inc. | Internet Software & Services | -0.8% | |||
| 3 | Alaska Communications Systems Group, Inc. | Diversified Telecommunication Services | -0.8% | |||
| 4 | Materion Corp. | Metals & Mining | -0.7% | |||
| 5 | LeCroy Corp. | Electronic Equipment, Instruments & Components | -0.7% | |||
| 6 | GT Advanced Technologies, Inc. | Semiconductors & Semiconductor Equipment | -0.7% | |||
| 7 | L&L Energy, Inc. | Metals & Mining | -0.6% | |||
| 8 | Flotek Industries, Inc. | Energy Equipment & Services | -0.6% | |||
| 9 | ION Geophysical Corp. | Energy Equipment & Services | -0.6% | |||
| 10 | Veeco Instruments, Inc. | Semiconductors & Semiconductor Equipment | -0.5% |
GT Advanced Technologies provides energy efficient lighting and other equipment and services, primarily for the solar industry. During the year, many related stocks came under pressure as global demand for solar projects slowed and excess capacity prompted severe price cuts throughout the industry. Additionally, the US government began investigating certain Chinese companies within the industry, raising concerns about unfair business practices. GT Advanced Technologies supplies certain machinery and other equipment to China. Fears that its operations could be impacted if a trade dispute ensues between the two countries caused the stock’s price drop. The holding was among the worst contributors for the calendar and cost the Fund almost three-fourths of a percent in return.
Top Ten Holdings as of December 31, 2011
Six of the Fund’s top contributors for the December 2011 quarter were also among the largest holdings at the end of the calendar year: Metropolitan Health Networks, Sinclair Broadcast Group, DXP Enterprises, OSI Systems, Consolidated Graphics, Select Comfort. The Fund was broadly diversified, and no single holding accounted for greater than 2.6% of the net assets. The ten largest positions represented just over 21% of the total assets of the Fund.
| Rank | Description | Industry | % of Net Assets | |||
1 | Metropolitan Health Networks, Inc. | Health Care Providers & Services | 2.6% | |||
2 | Sinclair Broadcast Group, Inc. | Media | 2.5% | |||
3 | DXP Enterprises, Inc. | Trading Companies & Distributors | 2.5% | |||
4 | OSI Systems, Inc. | Electronic Equipment, Instruments & Components | 2.2% | |||
5 | Richardson Electronics, Ltd. | Electronic Equipment, Instruments & Components | 2.1% | |||
6 | Consolidated Graphics, Inc. | Commercial Services & Supplies | 2.0% | |||
7 | RPC, Inc. | Energy Equipment & Services | 1.9% | |||
8 | Sauer-Danfoss, Inc. | Machinery | 1.9% | |||
9 | Select Comfort Corp. | Specialty Retail | 1.8% | |||
10 | Ulta Salon Cosmetics & Fragrance, Inc. | Specialty Retail | 1.8% | |||
| Total | 21.3% |
| 83 | Semi-Annual Report | December 31, 2011 (Unaudited) | |
Small-Cap Growth Fund MANAGER’S COMMENTARY (continued) | | |
| (Unaudited) | ||
Industry Sector Representation as of December 31, 2011
The Consumer Discretionary sector displayed the biggest disparity between the Fund and the Russell 2000 Growth Index. That sector also represented the Fund’s largest allocation at the end of the calendar year. At the other end of the spectrum, Information Technology was our most underrepresented sector relative to our primary market benchmark.
| % of Net Assets | % of Russell 2000 Growth Index | Difference | ||||
Consumer Discretionary | 20.8% | 14.4% | 6.4% | |||
Consumer Staples | 4.3% | 4.2% | 0.1% | |||
Energy | 5.5% | 8.8% | -3.3% | |||
Financials | 6.7% | 7.8% | -1.1% | |||
Health Care | 18.9% | 20.0% | -1.1% | |||
Industrials | 20.3% | 16.3% | 4.0% | |||
Information Technology | 18.2% | 23.3% | -5.1% | |||
Materials | 4.0% | 4.1% | -0.1% | |||
Telecommunication Services | 1.1% | 1.0% | 0.1% | |||
Utilities | 0.0% | 0.1% | -0.1% | |||
Cash & Other Assets | 0.2% | 0.0% | 0.2% | |||
Total | 100.0% | 100.0% |
Disclaimer
The views expressed here are exclusively those of Fund management. These views, including those related to market sectors or individual stocks, are not meant as investment advice and should not be considered predictive in nature. Any favorable (or unfavorable) description of a holding applies only as of December 31, 2011, unless otherwise stated. Security positions can and do change thereafter. Discussions of historical performance do not guarantee and are not indicative of future performance.
Market volatility can significantly impact short-term performance. The Fund is not an appropriate investment for short-term investors. Investments in small companies generally carry greater risk than is customarily associated with larger companies. This additional risk is attributable to a number of factors, including the relatively limited financial resources that are typically available to small companies and the fact that small companies often have comparatively limited product lines. In addition, the stock of small companies tends to be more volatile than the stock of large companies, particularly in the short term and particularly in the early stages of an economic or market downturn. Shareholders of the Fund, therefore, are taking on more risk than they would if they invested in the stock market as a whole.
Conclusion
Thank you for your continued investment in Small-Cap Growth Fund. We encourage your feedback; your reactions and concerns are important to us.
Sincerely,
The Investment Management Team
| www.bridgeway.com | 84 | |
Bridgeway Small-Cap Growth Fund | |
| Showing percentage of net assets as of December 31, 2011 (Unaudited) | ||
Industry | Company | Shares | Value | |||||||
COMMON STOCKS - 99.97% |
| |||||||||
Aerospace & Defense - 2.03% |
| |||||||||
Astronics Corp.* | 9,800 | $ | 350,938 | |||||||
Triumph Group, Inc. | 6,400 | 374,080 | ||||||||
|
| |||||||||
| 725,018 | ||||||||||
Air Freight & Logistics - 1.23% |
| |||||||||
Park-Ohio Holdings Corp.* | 24,600 | 438,864 | ||||||||
Airlines - 1.69% |
| |||||||||
Alaska Air Group, Inc.* | 8,000 | 600,720 | ||||||||
Auto Components - 2.34% |
| |||||||||
American Axle & Manufacturing Holdings, Inc.* | 47,100 | 465,819 | ||||||||
Tenneco, Inc.* | 12,400 | 369,272 | ||||||||
|
| |||||||||
| 835,091 | ||||||||||
Beverages - 0.85% |
| |||||||||
Coca-Cola Bottling Co. Consolidated | 5,200 | 304,460 | ||||||||
Capital Markets - 0.78% |
| |||||||||
Ladenburg Thalmann Financial Services, Inc.* | 111,700 | 277,016 | ||||||||
Chemicals - 1.71% |
| |||||||||
Innospec, Inc.* | 14,100 | 395,787 | ||||||||
TPC Group, Inc.* | 9,100 | 212,303 | ||||||||
|
| |||||||||
| 608,090 | ||||||||||
Commercial Services & Supplies - 3.23% |
| |||||||||
A.T. Cross Co., Class A* | 11,200 | 126,336 | ||||||||
Consolidated Graphics, Inc.* | 14,500 | 700,060 | ||||||||
Team, Inc.* | 10,900 | 324,275 | ||||||||
|
| |||||||||
| 1,150,671 | ||||||||||
Communications Equipment - 0.48% |
| |||||||||
Digi International, Inc.* | 15,400 | 171,864 | ||||||||
Construction & Engineering - 1.08% |
| |||||||||
MYR Group, Inc.* | 20,200 | 386,628 | ||||||||
Consumer Finance - 5.15% |
| |||||||||
Cash America International, Inc. | 3,200 | 149,216 | ||||||||
Credit Acceptance Corp.* | 6,400 | 526,592 | ||||||||
DFC Global Corp.* | 10,500 | 189,630 | ||||||||
Ezcorp, Inc., Class A* | 20,700 | 545,859 | ||||||||
World Acceptance Corp.* | 5,800 | 426,300 | ||||||||
|
| |||||||||
| 1,837,597 | ||||||||||
Industry | Company | Shares | Value | |||||||
Diversified Consumer Services - 1.23% |
| |||||||||
Bridgepoint Education, Inc.*+ | 19,000 | $ | 437,000 | |||||||
Diversified Telecommunication Services - 1.07% |
| |||||||||
SureWest Communications | 14,400 | 173,232 | ||||||||
Vonage Holdings Corp.* | 85,300 | 208,985 | ||||||||
|
| |||||||||
| 382,217 | ||||||||||
Electronic Equipment, Instruments & Components - 7.83% |
| |||||||||
Brightpoint, Inc.* | 31,600 | 340,016 | ||||||||
FEI Co.* | 13,400 | 546,452 | ||||||||
Insight Enterprises, Inc.* | 23,600 | 360,844 | ||||||||
OSI Systems, Inc.* | 16,300 | 795,114 | ||||||||
Richardson Electronics, Ltd. | 60,900 | 748,461 | ||||||||
|
| |||||||||
| 2,790,887 | ||||||||||
Energy Equipment & Services - 2.98% |
| |||||||||
Pioneer Drilling Co.* | 38,100 | 368,808 | ||||||||
RPC, Inc.+ | 38,050 | 694,412 | ||||||||
|
| |||||||||
| 1,063,220 | ||||||||||
Food & Staples Retailing - 1.91% |
| |||||||||
Casey’s General Stores, Inc. | 7,300 | 376,023 | ||||||||
Pricesmart, Inc. | 4,400 | 306,196 | ||||||||
|
| |||||||||
| 682,219 | ||||||||||
Food Products - 1.51% |
| |||||||||
Darling International, Inc.* | 27,400 | 364,146 | ||||||||
Smart Balance, Inc.* | 32,500 | 174,200 | ||||||||
|
| |||||||||
| 538,346 | ||||||||||
Health Care Equipment & Supplies - 4.98% |
| |||||||||
Align Technology, Inc.* | 21,900 | 519,578 | ||||||||
Orthofix International NV* | 11,000 | 387,530 | ||||||||
RTI Biologics, Inc.* | 56,100 | 249,084 | ||||||||
Synergetics USA, Inc.* | 83,900 | 619,182 | ||||||||
|
| |||||||||
| 1,775,374 | ||||||||||
Health Care Providers & Services - 12.19% |
| |||||||||
AMERIGROUP Corp.* | 8,000 | 472,640 | ||||||||
Centene Corp.* | 9,100 | 360,269 | ||||||||
Corvel Corp.* | 9,100 | 470,561 | ||||||||
Ensign Group, Inc. (The) | 14,300 | 350,350 | ||||||||
Metropolitan Health Networks, Inc.* | 122,626 | 916,016 | ||||||||
MWI Veterinary Supply, Inc.* | 4,800 | 318,912 | ||||||||
Providence Service Corp. (The)* | 36,600 | 503,616 | ||||||||
| 85 | Semi-Annual Report | December 31, 2011 (Unaudited) | |
Bridgeway Small-Cap Growth Fund SCHEDULE OF INVESTMENTS (continued) | |
| Showing percentage of net assets as of December 31, 2011(Unaudited) |
Industry | Company | Shares | Value | |||||||
Common Stocks (continued) |
| |||||||||
Health Care Providers & Services (continued) |
| |||||||||
RadNet, Inc.* | 100,000 | $ | 213,000 | |||||||
U.S. Physical Therapy, Inc. | 10,200 | 200,736 | ||||||||
WellCare Health Plans, Inc.* | 10,300 | 540,750 | ||||||||
|
| |||||||||
| 4,346,850 | ||||||||||
Health Care Technology - 1.74% |
| |||||||||
HealthStream, Inc.* | 33,600 | 619,920 | ||||||||
Hotels, Restaurants & Leisure - 3.58% |
| |||||||||
Caribou Coffee Co., Inc.* | 13,300 | 185,535 | ||||||||
CEC Entertainment, Inc.# | 7,800 | 268,710 | ||||||||
Domino’s Pizza, Inc.* | 16,900 | 573,755 | ||||||||
Krispy Kreme Doughnuts, Inc.* | 38,100 | 249,174 | ||||||||
|
| |||||||||
| 1,277,174 | ||||||||||
Insurance - 0.80% |
| |||||||||
Crawford & Co., Class B | 46,000 | 283,360 | ||||||||
Internet Software & Services - 1.40% |
| |||||||||
j2 Global, Inc. | 13,100 | 368,634 | ||||||||
Travelzoo, Inc.*+ | 5,300 | 130,274 | ||||||||
|
| |||||||||
| 498,908 | ||||||||||
IT Services - 5.33% |
| |||||||||
CACI International, Inc., | ||||||||||
Class A* | 7,700 | 430,584 | ||||||||
Cardtronics, Inc.* | 14,800 | 400,488 | ||||||||
Computer Task Group, Inc.* | 34,600 | 487,168 | ||||||||
Heartland Payment Systems, Inc. | 14,600 | 355,656 | ||||||||
Unisys Corp.* | 11,400 | 224,694 | ||||||||
|
| |||||||||
| 1,898,590 | ||||||||||
Leisure Equipment & Products - 1.23% |
| |||||||||
Sturm Ruger & Co., Inc. | 13,100 | 438,326 | ||||||||
Machinery - 6.12% |
| |||||||||
Sauer-Danfoss, Inc.* | 18,400 | 666,264 | ||||||||
Tennant Co. | 6,600 | 256,542 | ||||||||
Titan International, Inc.+ | 18,600 | 361,956 | ||||||||
Trimas Corp.* | 30,800 | 552,860 | ||||||||
Twin Disc, Inc. | 9,500 | 345,040 | ||||||||
|
| |||||||||
| 2,182,662 | ||||||||||
Media - 2.55% |
| |||||||||
Sinclair Broadcast Group, Inc., Class A | 80,100 | 907,533 | ||||||||
Metals & Mining - 2.33% |
| |||||||||
Haynes International, Inc. | 6,600 | 360,360 | ||||||||
Materion Corp.* | 19,400 | 471,032 | ||||||||
|
| |||||||||
| 831,392 | ||||||||||
Industry | Company | Shares | Value | |||||||||
Oil, Gas & Consumable Fuels - 2.54% |
| |||||||||||
Cheniere Energy, Inc.* | 42,900 | $ | 372,801 | |||||||||
Crosstex Energy, Inc. | 15,200 | 192,128 | ||||||||||
CVR Energy, Inc.* | 8,300 | 155,459 | ||||||||||
Westmoreland Coal Co.* | 14,400 | 183,600 | ||||||||||
|
| |||||||||||
| 903,988 | ||||||||||||
Professional Services - 1.24% |
| |||||||||||
Insperity, Inc. | 17,500 | 443,625 | ||||||||||
Semiconductors & Semiconductor Equipment - 1.96% |
| |||||||||||
GT Advanced Technologies, Inc.*+ | 71,700 | 519,108 | ||||||||||
Veeco Instruments, Inc.*+ | 8,700 | 180,960 | ||||||||||
|
| |||||||||||
| 700,068 | ||||||||||||
Software - 1.20% | ||||||||||||
ePlus, Inc.* | 8,900 | 251,692 | ||||||||||
QAD, Inc., Class A* | 16,600 | 174,300 | ||||||||||
|
| |||||||||||
| 425,992 | ||||||||||||
Specialty Retail - 9.96% |
| |||||||||||
America’s Car-Mart, Inc.* | 6,900 | 270,342 | ||||||||||
Cost Plus, Inc.*+ | 44,800 | 436,800 | ||||||||||
Destination Maternity Corp. | 10,800 | 180,576 | ||||||||||
Genesco, Inc.* | 6,200 | 382,788 | ||||||||||
Monro Muffler Brake, Inc. | 9,850 | 382,082 | ||||||||||
Sally Beauty Holdings, Inc.* | 18,000 | 380,340 | ||||||||||
Select Comfort Corp.* | 29,400 | 637,686 | ||||||||||
Ulta Salon Cosmetics & Fragrance, Inc.* | 9,700 | 629,724 | ||||||||||
Zumiez, Inc.* | 9,000 | 249,840 | ||||||||||
|
| |||||||||||
| 3,550,178 | ||||||||||||
Trading Companies & Distributors - 3.72% |
| |||||||||||
DXP Enterprises, Inc.* | 27,700 | 891,940 | ||||||||||
Kaman Corp. | 6,500 | 177,580 | ||||||||||
Titan Machinery, Inc.* | 11,800 | 256,414 | ||||||||||
|
| |||||||||||
| 1,325,934 | ||||||||||||
|
| |||||||||||
TOTAL COMMON STOCKS - 99.97% (Cost $32,649,151) |
| 35,639,782 | ||||||||||
|
| |||||||||||
| Rate^ | Shares | Value | ||||||||||
MONEY MARKET FUND - 0.42% |
| |||||||||||
BlackRock FedFund | 0.01% | 149,407 | 149,407 | |||||||||
|
| |||||||||||
TOTAL MONEY MARKET FUND - 0.42% (Cost $149,407) |
| 149,407 | ||||||||||
|
| |||||||||||
| www.bridgeway.com | 86 | |
Bridgeway Small-Cap Growth Fund SCHEDULE OF INVESTMENTS (continued) | |
| Showing percentage of net assets as of December 31, 2011 (Unaudited) |
| Value | ||||||||
TOTAL INVESTMENTS - 100.39% | $ | 35,789,189 | ||||||
(Cost $32,798,558) | ||||||||
Liabilities in Excess of Other Assets - (0.39%) | (139,010 | ) | ||||||
|
| |||||||
NET ASSETS - 100.00% | $ | 35,650,179 | ||||||
|
| |||||||
* Non-income producing security. # Securities, or a portion thereof, segregated to cover the Fund’s potential obligation under swap agreements. The total value of segregated assets is $268,710. ^ Rate disclosed as of December 31, 2011. + This security or a portion of the security is out on loan at December 31, 2011. Total loaned securities had a value of $2,221,186 at December 31, 2011. |
| |||||||
| Summary of inputs used to value the Fund’s investments as of 12/31/2011 is as follows (See Note 2 in Notes to Financial Statements): | ||||||||||||||||
| Valuation Inputs | ||||||||||||||||
| ||||||||||||||||
| Investment in Securities (Value) | ||||||||||||||||
| ||||||||||||||||
Level 1 Prices | Level 2 Significant Observable Inputs | Level 3 Significant Unobservable Inputs | Total | |||||||||||||
| ||||||||||||||||
Common Stocks | $ | 35,639,782 | $ | — | $ | — | $ | 35,639,782 | ||||||||
Money Market Fund | — | 149,407 | — | 149,407 | ||||||||||||
|
|
|
|
|
|
|
| |||||||||
TOTAL | $ | 35,639,782 | $ | 149,407 | $ | — | $ | 35,789,189 | ||||||||
|
|
|
|
|
|
|
| |||||||||
See Notes to Financial Statements.
| 87 | Semi-Annual Report | December 31, 2011 (Unaudited) | |
|
| (Unaudited) | ||
December 31, 2011
Dear Fellow Small-Cap Value Fund Shareholder,
For the quarter ended December 31, 2011, our Fund was up 16.69%, outperforming our primary market benchmark, the Russell 2000 Value Index (+15.97%), and our peer benchmark, the Lipper Small-Cap Value Funds Index (+16.03%). It was a good quarter on an absolute and relative basis and we are pleased.
For the six month semi-annual period ended December 31, 2011, our Fund declined 8.70%, slightly outperforming our primary market benchmark, the Russell 2000 Value Index (-8.94%), and our peer benchmark, the Lipper Small-Cap Value Funds Index (-8.91%).
Fortunately, the Fund did outperform its benchmarks in three of the four calendar quarters, giving us a lead for the calendar year ended December 31, 2011. Our Fund returned 1.05%, outperforming our primary market benchmark, the Russell 2000 Value Index (-5.50%), and our peer benchmark, the Lipper Small-Cap Value Funds Index (-4.82%). While we made good progress in the last quarter, we still have some significant catch-up to do for the five-year period.
The table below presents our quarter, six-month, one-year, five-year, and life-to-date financial results. See the next page for a graph of performance since inception.
| Annualized | ||||||||||||||||||||
Quarter 10/1/11 to 12/31/11 | 6 Months 7/1/11 to 12/31/11 | 1 Year 1/1/11 to | 5 Years 1/1/07 to 12/31/11 | Life-to-Date 10/31/03 to 12/31/11 | ||||||||||||||||
Small-Cap Value Fund | 16.69% | -8.70% | 1.05% | -2.74% | 4.27% | |||||||||||||||
Russell 2000 Value Index | 15.97% | -8.94% | -5.50% | -1.87% | 5.49% | |||||||||||||||
Lipper Small-Cap Value Funds Index | 16.03% | -8.91% | -4.82% | 0.41% | 6.53% | |||||||||||||||
Performance figures quoted in the table above and graph below represent past performance and are no guarantee of future results. Total return figures in the table above include the reinvestment of dividends and capital gains. The table above and the graph below do not reflect the deduction of taxes that a shareholder would pay on Fund distributions or the redemption of Fund shares. The recent growth rate in the stock market has helped to produce short-term returns that are not typical and may not continue in the future.
The Russell 2000 Value Index is an unmanaged index that consists of stocks in the Russell 2000 Index with lower price-to-book ratios and lower forecasted growth values with dividends reinvested. The Lipper Small-Cap Value Funds Index is an index of small-company, value-oriented funds compiled by Lipper, Inc. It is not possible to invest directly in an index.
According to data from Lipper, Inc. as of December 31, 2011, Small-Cap Value Fund ranked 20th of 305 small-cap value funds for the twelve-month period ended December 31, 2011, 209th of 232 over the last five years and 149th of 165 such funds since inception in October, 2003. Lipper, Inc. is an independent mutual fund rating service that ranks funds in various fund categories by making comparative calculations using total returns.
| www.bridgeway.com | 88 | |
Small-Cap Value Fund MANAGER’S COMMENTARY (continued) | |
(Unaudited)
Small-Cap Value Fund vs. Russell 2000 Value Index & Lipper Small-Cap Value Funds Index from Inception 10/31/03 to 12/31/11
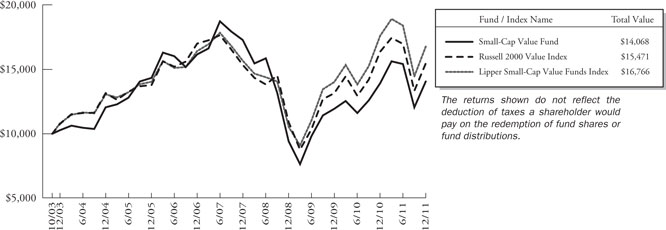
Detailed Explanation of Quarterly Performance
The Short Version: The best contributors list was well diversified with two Consumer Discretionary stocks making the list. The Financials sector dominated the worst contributors list.
The quarter could be considered a “return of the consumer” as investors welcomed what many considered a solid holiday season. Two Consumer Discretionary stocks (one media, one retail) highlighted the list of top contributors. Combined they added over one and one-half percent to the Fund’s return.
These are the Fund’s ten best-contributing stocks for the quarter ended December 31, 2011:
| Rank | Description | Industry | % Contribution to Return | |||
| 1 | Sinclair Broadcast Group, Inc. | Media | 1.1% | |||
| 2 | HealthSpring, Inc. | Health Care Providers & Services | 1.0% | |||
| 3 | OSI Systems, Inc. | Electronic Equipment, Instruments & Components | 0.8% | |||
| 4 | Hercules Offshore, Inc. | Energy Equipment & Services | 0.7% | |||
| 5 | First Industrial Realty Trust, Inc. | Real Estate Investment Trusts (REITs) | 0.7% | |||
| 6 | Quaker Chemical Corp. | Chemicals | 0.6% | |||
| 7 | Alaska Air Group, Inc. | Airlines | 0.6% | |||
| 8 | Amerco, Inc. | Road & Rail | 0.6% | |||
| 9 | Employers Holdings, Inc. | Insurance | 0.5% | |||
| 10 | Cost Plus, Inc. | Specialty Retail | 0.5% |
With interest rates at historically low levels, some income investors have sought out returns generated from dividend paying stocks. Amerco, parent of do-it-yourself moving and storage company U-Haul, announced a special dividend in December that translated into a yield in excess of that paid by the five-year treasury (at the time). The company does not currently pay a regular dividend, but with solid cash flow from operations, some analysts expect this move to be a sign of future shareholder rewards. Amerco has experienced favorable increases in profits and revenues from its three key segments (moving/storage, life insurance, property and casualty insurance) and sales have increased over 10% for six straight quarters. The holding rose over 40% and contributed over one-half of a percent to the Fund’s return for the quarter.
Five Financials sector stocks made the list of worst contributors for the quarter as small banks, REITs, and investments firms are still dealing with ongoing uncertainties in the economy. While the big banks are showing signs of rebounding and exhibit enhanced lending, the local and regional institutions continue to be impacted by a weak (but strengthening) labor market and
| 89 | Semi-Annual Report | December 31, 2011 (Unaudited) | |
Small-Cap Value Fund MANAGER’S COMMENTARY (continued) | |
(Unaudited)
cautious consumers. Additionally, some mortgage related holdings have struggled in terms of valuations because of the US rating downgrade and ongoing European sovereign debt mess.
These are the Fund’s ten worst-contributing stocks for the quarter ended December 31, 2011:
| Rank | Description | Industry | % Contribution to Return | |||
| 1 | IDT Corp. | Diversified Telecommunication Services | -0.3% | |||
| 2 | Gramercy Capital Corp. | Real Estate Investment Trusts (REITs) | -0.2% | |||
| 3 | Richardson Electronics, Ltd. | Electronic Equipment, Instruments & Components | -0.2% | |||
| 4 | Omega Protein Corp. | Food Products | -0.1% | |||
| 5 | United Community Banks, Inc. | Commercial Banks | -0.1% | |||
| 6 | Unisys Corp. | IT Services | -0.1% | |||
| 7 | Vanda Pharmaceuticals, Inc. | Biotechnology | -0.1% | |||
| 8 | MPG Office Trust, Inc. | Real Estate Investment Trusts (REITs) | -0.1% | |||
| 9 | Arlington Asset Investment Corp. | Real Estate Investment Trusts (REITs) | -0.1% | |||
| 10 | iStar Financial, Inc. | Real Estate Investment Trusts (REITs) | -0.1% |
Four real estate companies cost the Fund during the December quarter as uncertainty continued to reign over the related markets. While some data shows a rebound in housing and certain commercial property valuations, the ongoing worries about the European sovereign issues and even the US credit rating, have hurt debt related instruments that invest in real estate loans and related products. For example, iStar Financial is a REIT that owns senior and mezzanine commercial real estate debt. It posted third quarter earnings that significantly declined from the second quarter and badly missed analysts’ expectations. Although management pointed out that its provision for bad debt expenses fell, the damage had been done. Combined, the four real estate holdings cost the Fund about one-half of a percent for the quarter.
Detailed Explanation of Calendar Year Performance
The Short Version: The Industrials sector had three companies on both the best and worst contributors list for the calendar year.
Calendar year 2012 was clearly a period of uncertainty in the economy and stock markets as many lingering issues at home and abroad (Europe, China, Japan) brought a cautious mindset to investors. In what some may consider a “stock picker’s” market, winners and losers can be found from most sectors of the economy. Six different sectors were represented on the best contributors list for the calendar year. Three Industrials holdings contributed over one and one-half percent to the Fund’s return as some manufacturers overcame a slowdown from the Japanese earthquake and had a strong rebound later in the year.
These are the Fund’s ten best-contributing stocks for the calendar year ended December 31, 2011:
| Rank | Description | Industry | % Contribution to Return | |||
| 1 | HealthSpring, Inc. | Health Care Providers & Services | 1.7% | |||
| 2 | Sinclair Broadcast Group, Inc. | Media | 0.9% | |||
| 3 | International Coal Group, Inc. | Metals & Mining | 0.8% | |||
| 4 | Advance America Cash Advance Centers, Inc. | Consumer Finance | 0.7% | |||
| 5 | Sally Beauty Holdings, Inc. | Specialty Retail | 0.6% | |||
| 6 | Alaska Air Group, Inc. | Airlines | 0.6% | |||
| 7 | OSI Systems, Inc. | Electronic Equipment, Instruments & Components | 0.6% | |||
| 8 | World Acceptance Corp. | Consumer Finance | 0.6% | |||
| 9 | United Rentals, Inc. | Trading Companies & Distributors | 0.5% | |||
| 10 | Mueller Industries, Inc. | Machinery | 0.5% |
| www.bridgeway.com | 90 | |
Small-Cap Value Fund MANAGER’S COMMENTARY (continued) | |
(Unaudited)
Although viewers complain about all of the negative political ads, they actually pay off quite well for broadcasting companies. Sinclair Broadcast Group was the Fund’s second best contributor for the calendar year. As the political campaign season heated up, candidates began to air ads in major primary states. Sinclair has been in expansion mode and recently announced the acquisition of media companies with major markets in Florida and New York. In November, the holding posted better-than-expected quarterly results and rewarded shareholders with a cash dividend. For the year, the stock contributed over one percent to the Fund’s return.
A total of seven sectors were represented on the worst contributors list. Three Industrials companies cost the Fund over one and one-half percent return for the year. (Apparently, the Industrials sector had strong and weak performers in the challenging, uncertain marketplace we experienced in 2011.) During the 12-month period, four holdings lost over 50% of their values.
These are the Fund’s ten worst-contributing stocks for the calendar year ended December 31, 2011:
| Rank | Description | Industry | % Contribution to Return | |||
1 | EMCORE Corp. | Semiconductors & Semiconductor Equipment | -0.7% | |||
2 | ValueVision Media, Inc. | Internet & Catalog Retail | -0.7% | |||
3 | Republic Airways Holdings, Inc. | Airlines | -0.7% | |||
4 | Kindred Healthcare, Inc. | Health Care Providers & Services | -0.6% | |||
5 | IDT Corp. | Diversified Telecommunication Services | -0.6% | |||
6 | MPG Office Trust, Inc. | Real Estate Investment Trusts (REITs) | -0.5% | |||
7 | Great Lakes Dredge & Dock Corp. | Construction & Engineering | -0.5% | |||
8 | Omega Protein Corp. | Food Products | -0.4% | |||
9 | Ceradyne, Inc. | Aerospace & Defense | -0.4% | |||
10 | Gramercy Capital Corp. | Real Estate Investment Trusts (REITs) | -0.4% |
In August 2011, ValueVision, the multi-channel retailer behind the home shopping network, ShopNBC, posted quarterly financial results that badly missed analysts’ sales expectations. Its stock plummeted over 30% in the days that followed and has not been able to recover. Investors also worried about the liquidation of a key supplier that could hinder future operations. The stock dropped over 50% during the calendar year and cost the Fund almost three-fourths of a percent in returns.
Top Ten Holdings as of December 31, 2011
Six of the Fund’s top contributors for the December 2011 quarter were also among the largest holdings at the end of the calendar year: First Industrial, Sinclair, Alaska Air, Hercules Offshore, OSI Systems, Amerco. Three REITs highlighted the Fund’s top ten holdings at year-end. Still, the Fund was broadly diversified and no single holding accounted for greater than 2.7% of the net assets. The ten largest positions represented just less than 22% of the total assets of the Fund.
| Rank | Description | Industry | % of Net Assets | |||
1 | First Industrial Realty Trust, Inc. | Real Estate Investment Trusts (REITs) | 2.7% | |||
2 | SInclair Broadcast Group, Inc. | Media | 2.7% | |||
3 | Alaska Air Group, Inc. | Airlines | 2.3% | |||
4 | Meadowbrook Insurance Group, Inc. | Insurance | 2.2% | |||
5 | BioMed Realty Trust, Inc. | Real Estate Investment Trusts (REITs) | 2.1% | |||
6 | Hercules Offshore, Inc. | Energy Equipment & Services | 2.1% | |||
7 | OSI Systems, Inc. | Electronic Equipment, Instruments & Components | 2.0% | |||
8 | Photronics, Inc. | Semiconductors & Semiconductor Equipment | 1.9% | |||
9 | Amerco, Inc. | Road & Rail | 1.9% | |||
10 | Weingarten Realty Investors | Real Estate Investment Trusts (REITs) | 1.9% | |||
| Total | 21.8% |
| 91 | Semi-Annual Report | December 31, 2011 (Unaudited) | |
Small-Cap Value Fund MANAGER’S COMMENTARY (continued) | |
(Unaudited)
Industry Sector Representation as of December 31, 2011
The Fund was slightly overweighted in the Consumer Discretionary sector compared to Russell 2000 Value Index. The biggest disparity between the Fund and the Russell 2000 Value index was found in the Utilities sector which had a relatively small allocation.
| % of Net Assets | % of Russell 2000 Value Index | Difference | ||||
Consumer Discretionary | 14.3% | 11.7% | 2.6% | |||
Consumer Staples | 3.5% | 3.1% | 0.4% | |||
Energy | 4.9% | 4.6% | 0.3% | |||
Financials | 36.1% | 36.8% | -0.7% | |||
Health Care | 3.9% | 5.3% | -1.4% | |||
Industrials | 15.7% | 14.8% | 0.9% | |||
Information Technology | 9.3% | 10.9% | -1.6% | |||
Materials | 7.0% | 4.9% | 2.1% | |||
Telecommunication Services | 1.2% | 0.6% | 0.6% | |||
Utilities | 3.8% | 7.3% | -3.5% | |||
Cash & Other Assets | 0.3% | 0.0% | 0.3% | |||
Total | 100.0% | 100.0% |
Disclaimer
The views expressed here are exclusively those of Fund management. These views, including those related to market sectors or individual stocks, are not meant as investment advice and should not be considered predictive in nature. Any favorable (or unfavorable) description of a holding applies only as of December 31, 2011, unless otherwise stated. Security positions can and do change thereafter. Discussions of historical performance do not guarantee and are not indicative of future performance.
Market volatility can significantly impact short-term performance. The Fund is not an appropriate investment for short-term investors. Investments in small companies generally carry greater risk than is customarily associated with larger companies. This additional risk is attributable to a number of factors, including the relatively limited financial resources that are typically available to small companies, and the fact that small companies often have comparatively limited product lines. In addition, the stock of small companies tends to be more volatile than the stock of large companies, particularly in the short term and particularly in the early stages of an economic or market downturn. Shareholders of the Fund, therefore, are taking on more risk than they would if they invested in the stock market as a whole.
Conclusion
Thank you for your continued investment in Small-Cap Value Fund. We encourage your feedback; your reactions and concerns are important to us.
Sincerely,
The Investment Management Team
| www.bridgeway.com | 92 | |
Bridgeway Small-Cap Value Fund | |
| Showing percentage of net assets as of December 31, 2011 (Unaudited) |
Industry | Company | Shares | Value | |||||||
COMMON STOCKS - 99.81% |
| |||||||||
Aerospace & Defense - 2.81% |
| |||||||||
Ceradyne, Inc.* | 20,300 | $ | 543,634 | |||||||
Curtiss-Wright Corp. | 15,300 | 540,549 | ||||||||
Esterline Technologies Corp.* | 10,500 | 587,685 | ||||||||
Triumph Group, Inc. | 6,300 | 368,235 | ||||||||
|
| |||||||||
| 2,040,103 | ||||||||||
Airlines - 2.95% |
| |||||||||
Alaska Air Group, Inc.* | 22,200 | 1,666,998 | ||||||||
SkyWest, Inc. | 37,200 | 468,348 | ||||||||
|
| |||||||||
| 2,135,346 | ||||||||||
Auto Components - 0.44% |
| |||||||||
Standard Motor Products, Inc. | 15,900 | 318,795 | ||||||||
Biotechnology - 0.33% |
| |||||||||
Vanda Pharmaceuticals, Inc.* | 51,000 | 242,760 | ||||||||
Capital Markets - 1.55% |
| |||||||||
Arlington Asset Investment Corp., Class A | 32,700 | 697,491 | ||||||||
Calamos Asset Management, Inc., Class A | 34,100 | 426,591 | ||||||||
|
| |||||||||
| 1,124,082 | ||||||||||
Chemicals - 3.92% |
| |||||||||
American Vanguard Corp. | 37,100 | 494,914 | ||||||||
Quaker Chemical Corp. | 32,500 | 1,263,925 | ||||||||
Westlake Chemical Corp. | 27,000 | 1,086,480 | ||||||||
|
| |||||||||
| 2,845,319 | ||||||||||
Commercial Banks - 5.56% |
| |||||||||
BancFirst Corp. | 11,000 | 412,940 | ||||||||
Bancorp, Inc. (The)* | 47,200 | 341,256 | ||||||||
City Holding Co.+ | 39,100 | 1,325,099 | ||||||||
FNB Corp. | 33,300 | 376,623 | ||||||||
Merchants Bancshares, Inc. | 11,500 | 335,800 | ||||||||
Republic Bancorp, Inc., Class A | 19,700 | 451,130 | ||||||||
SVB Financial Group* | 8,400 | 400,596 | ||||||||
United Community Banks, Inc.*+ | 55,640 | 388,924 | ||||||||
|
| |||||||||
| 4,032,368 | ||||||||||
Commercial Services & Supplies - 1.11% |
| |||||||||
Multi-Color Corp. | 31,300 | 805,349 | ||||||||
Construction & Engineering - 2.71% |
| |||||||||
Dycom Industries, Inc.* | 31,500 | 658,980 | ||||||||
Industry | Company | Shares | Value | |||||||
Construction & Engineering (continued) |
| |||||||||
MasTec, Inc.* | 75,000 | $ | 1,302,750 | |||||||
|
| |||||||||
| 1,961,730 | ||||||||||
Consumer Finance - 4.48% |
| |||||||||
Advance America Cash | ||||||||||
Advance Centers, Inc. | 120,600 | 1,079,370 | ||||||||
Ezcorp, Inc., Class A* | 20,200 | 532,674 | ||||||||
Nelnet, Inc., Class A | 22,200 | 543,234 | ||||||||
World Acceptance Corp.*+ | 14,900 | 1,095,150 | ||||||||
|
| |||||||||
| 3,250,428 | ||||||||||
Diversified Financial Services - 0.75% |
| |||||||||
Interactive Brokers Group, Inc., Class A | 36,400 | 543,816 | ||||||||
Diversified Telecommunication Services - 1.23% |
| |||||||||
IDT Corp., Class B | 22,800 | 213,864 | ||||||||
Vonage Holdings Corp.* | 277,700 | 680,365 | ||||||||
|
| |||||||||
| 894,229 | ||||||||||
Electric Utilities - 2.86% |
| |||||||||
Cleco Corp. | 15,400 | 586,740 | ||||||||
El Paso Electric Co. | 31,500 | 1,091,160 | ||||||||
Unitil Corp. | 13,900 | 394,482 | ||||||||
|
| |||||||||
| 2,072,382 | ||||||||||
Electronic Equipment, Instruments & Components - 5.30% |
| |||||||||
Brightpoint, Inc.* | 59,500 | 640,220 | ||||||||
Insight Enterprises, Inc.* | 67,400 | 1,030,546 | ||||||||
OSI Systems, Inc.* | 30,200 | 1,473,156 | ||||||||
Richardson Electronics, Ltd. | 56,900 | 699,301 | ||||||||
|
| |||||||||
| 3,843,223 | ||||||||||
Energy Equipment & Services - 3.84% |
| |||||||||
Helix Energy Solutions Group, Inc.* | 34,800 | 549,840 | ||||||||
Hercules Offshore, Inc.* | 339,300 | 1,506,492 | ||||||||
Pioneer Drilling Co.* | 75,100 | 726,968 | ||||||||
|
| |||||||||
| 2,783,300 | ||||||||||
Food & Staples Retailing - 1.04% |
| |||||||||
Pantry, Inc. (The)* | 31,900 | 381,843 | ||||||||
Susser Holdings Corp.* | 16,300 | 368,706 | ||||||||
|
| |||||||||
| 750,549 | ||||||||||
Food Products-1.20% |
| |||||||||
Fresh Del Monte Produce, Inc. | 20,600 | 515,206 | ||||||||
Omega Protein Corp.* | 50,000 | 356,500 | ||||||||
|
| |||||||||
| 871,706 | ||||||||||
| 93 | Semi-Annual Report | December 31, 2011 (Unaudited) | |
Bridgeway Small-Cap Value Fund SCHEDULE OF INVESTMENTS (continued) | |
| Showing percentage of net assets as of December 31, 2011 (Unaudited) |
Industry | Company | Shares | Value | |||||||
Common Stocks (continued) |
| |||||||||
Gas Utilities - 0.95% |
| |||||||||
Laclede Group, Inc. (The) | 17,100 | $ | 692,037 | |||||||
Health Care Providers & Services - 2.38% |
| |||||||||
Kindred Healthcare, Inc.* | 67,100 | 789,767 | ||||||||
Triple-S Management Corp., Class B* | 26,100 | 522,522 | ||||||||
U.S. Physical Therapy, Inc. | 21,000 | 413,280 | ||||||||
|
| |||||||||
| 1,725,569 | ||||||||||
Hotels, Restaurants & Leisure - 2.73% |
| |||||||||
Caribou Coffee Co., Inc.* | 33,700 | 470,115 | ||||||||
Domino’s Pizza, Inc.* | 24,700 | 838,565 | ||||||||
Town Sports International Holdings, Inc.* | 91,500 | 672,525 | ||||||||
|
| |||||||||
| 1,981,205 | ||||||||||
Household Durables - 1.61% |
| |||||||||
Blyth, Inc. | 20,600 | 1,170,080 | ||||||||
Industrial Conglomerates - 0.56% |
| |||||||||
Standex International Corp. | 11,800 | 403,206 | ||||||||
Insurance - 9.90% |
| |||||||||
Argo Group International Holdings, Ltd. | 14,900 | 431,504 | ||||||||
CNO Financial Group, Inc.* | 130,000 | 820,300 | ||||||||
Employers Holdings, Inc. | 58,200 | 1,052,838 | ||||||||
Infinity Property & Casualty Corp. | 16,200 | 919,188 | ||||||||
Meadowbrook Insurance Group, Inc. | 149,800 | 1,599,864 | ||||||||
ProAssurance Corp. | 13,300 | 1,061,606 | ||||||||
RLI Corp. | 13,400 | 976,324 | ||||||||
Universal Insurance Holdings, Inc. | 87,491 | 313,218 | ||||||||
|
| |||||||||
| 7,174,842 | ||||||||||
Internet Software & Services - 0.48% |
| |||||||||
United Online, Inc. | 63,600 | 345,984 | ||||||||
IT Services - 1.62% |
| |||||||||
CACI International, Inc., Class A* | 15,800 | 883,536 | ||||||||
Unisys Corp.* | 14,900 | 293,679 | ||||||||
|
| |||||||||
| 1,177,215 | ||||||||||
Life Sciences Tools & Services - 0.39% |
| |||||||||
Cambrex Corp.* | 39,375 | 282,712 | ||||||||
Machinery - 1.25% |
| |||||||||
Lydall, Inc.* | 58,500 | 555,165 | ||||||||
Mueller Industries, Inc. | 9,100 | 349,622 | ||||||||
|
| |||||||||
| 904,787 | ||||||||||
Industry | Company | Shares | Value | |||||||
Marine - 1.03% |
| |||||||||
International Shipholding Corp. | 39,900 | $ | 745,731 | |||||||
Media - 2.68% |
| |||||||||
Sinclair Broadcast Group, Inc., Class A | 171,200 | 1,939,696 | ||||||||
Metals & Mining - 1.43% |
| |||||||||
Kaiser Aluminum Corp. | 14,700 | 674,436 | ||||||||
Universal Stainless & Alloy* | 9,700 | 362,392 | ||||||||
|
| |||||||||
| 1,036,828 | ||||||||||
Multiline Retail - 1.64% |
| |||||||||
Dillard’s, Inc., Class A+ | 26,500 | 1,189,320 | ||||||||
Oil, Gas & Consumable Fuels - 1.07% |
| |||||||||
Swift Energy Co.* | 13,500 | 401,220 | ||||||||
Westmoreland Coal Co.* | 29,300 | 373,575 | ||||||||
|
| |||||||||
| 774,795 | ||||||||||
Paper & Forest Products - 1.67% |
| |||||||||
PH Glatfelter Co. | 85,600 | 1,208,672 | ||||||||
Personal Products - 1.23% |
| |||||||||
Elizabeth Arden, Inc.* | 24,100 | 892,664 | ||||||||
Pharmaceuticals - 0.73% |
| |||||||||
Medicines Co. (The)* | 28,500 | 531,240 | ||||||||
Real Estate Investment Trusts (REITs) - 12.87% |
| |||||||||
ARMOUR Residential REIT, Inc.+ | 59,300 | 418,065 | ||||||||
BioMed Realty Trust, Inc. | 85,600 | 1,547,648 | ||||||||
First Industrial Realty Trust, Inc.*+ | 192,428 | 1,968,538 | ||||||||
Gramercy Capital Corp.* | 225,300 | 563,250 | ||||||||
iStar Financial, Inc.*+ | 81,300 | 430,077 | ||||||||
MPG Office Trust, Inc.*# | 392,700 | 781,473 | ||||||||
Newcastle Investment Corp. | 181,500 | 843,975 | ||||||||
Retail Opportunity Investments Corp. | 91,000 | 1,077,440 | ||||||||
Sabra Health Care REIT, Inc. | 27,400 | 331,266 | ||||||||
Weingarten Realty Investors | 62,940 | 1,373,351 | ||||||||
|
| |||||||||
| 9,335,083 | ||||||||||
Road & Rail - 2.44% |
| |||||||||
Amerco, Inc. | 15,700 | 1,387,880 | ||||||||
Arkansas Best Corp. | 19,800 | 381,546 | ||||||||
|
| |||||||||
| 1,769,426 | ||||||||||
Semiconductors & Semiconductor Equipment - 1.93% |
| |||||||||
Photronics, Inc.* | 230,300 | 1,400,224 | ||||||||
| www.bridgeway.com | 94 | |
Bridgeway Small-Cap Value Fund SCHEDULE OF INVESTMENTS (continued) | |
Showing percentage of net assets as of December 31, 2011 (Unaudited)
Industry | Company | Shares | Value | |||||||||||
| Common Stocks (continued) | ||||||||||||||
Specialty Retail - 5.22% |
| |||||||||||||
Cost Plus, Inc.* |
| 93,600 | $ | 912,600 | ||||||||||
Genesco, Inc.* |
| 18,800 | 1,160,712 | |||||||||||
Penske Automotive Group, Inc. |
| 27,500 | 529,375 | |||||||||||
Pep Boys-Manny, Moe & Jack (The) |
| 37,800 | 415,800 | |||||||||||
Sally Beauty Holdings, Inc.* |
| 36,200 | 764,906 | |||||||||||
|
| |||||||||||||
| 3,783,393 | ||||||||||||||
Thrifts & Mortgage Finance - 1.02% |
| |||||||||||||
Ocwen Financial Corp.* |
| 51,100 | 739,928 | |||||||||||
Trading Companies & Distributors - 0.90% |
| |||||||||||||
United Rentals, Inc.*+ |
| 22,200 | 656,010 | |||||||||||
|
| |||||||||||||
TOTAL COMMON STOCKS-99.81% |
| 72,376,132 | ||||||||||||
|
| |||||||||||||
(Cost $65,077,484) |
| |||||||||||||
| Rate^ | Shares | Value | ||||||||||||
MONEY MARKET FUND - 0.02% |
| |||||||||||||
BlackRock FedFund | 0.01% | 12,386 | 12,386 | |||||||||||
|
| |||||||||||||
TOTAL MONEY MARKET FUND - 0.02% |
| 12,386 | ||||||||||||
|
| |||||||||||||
(Cost $12,386) |
| |||||||||||||
TOTAL INVESTMENTS - 99.83% |
| $72,388,518 | ||||||||||||
(Cost $65,089,870) |
| |||||||||||||
Other Assets in Excess of Liabilities- (0.17%) |
| 121,427 | ||||||||||||
|
| |||||||||||||
NET ASSETS - 100.00% |
| $72,509,945 | ||||||||||||
|
| |||||||||||||
* Non-income producing security. # Securities, or a portion thereof, segregated to cover the Fund’s potential obligation under swap agreements. The total value of segregated assets is $781,473. ^ Rate disclosed as of December 31, 2011. + This security or a portion of the security is out on loan at December 31, 2011. Total loaned securities had a value of $4,646,143 at December 31, 2011. |
| |||||||||||||
Summary of inputs used to value the Fund’s investments as of 12/31/2011 is as follows (See Note 2 in Notes to Financial Statements):
| Valuation Inputs | ||||||||||||||||
| ||||||||||||||||
| Investment in Securities (Value) | ||||||||||||||||
| ||||||||||||||||
| Level 1 Quoted Prices | Level 2 Significant Observable Inputs | Level 3 Significant Unobservable Inputs | Total | |||||||||||||
| ||||||||||||||||
Common Stocks | $ | 72,376,132 | $ | — | $ | — | $ | 72,376,132 | ||||||||
Money Market Fund | — | 12,386 | — | 12,386 | ||||||||||||
|
|
|
|
|
|
|
| |||||||||
TOTAL | $ | 72,376,132 | $ | 12,386 | $ | — | $ | 72,388,518 | ||||||||
|
|
|
|
|
|
|
| |||||||||
See Notes to Financial Statements
| 95 | Semi-Annual Report | December 31, 2011 (Unaudited) | |
|
(Unaudited)
December 31, 2011
Dear Fellow Large-Cap Growth Fund Shareholder,
For the quarter ended December 31, 2011, our Fund returned 12.41%, beating our primary market benchmark, the Russell 1000 Growth Index (+10.61%), and our peer benchmark, the Lipper Large-Cap Growth Funds Index (+8.95%). It was a good quarter on an absolute and relative basis and we are pleased.
For the six-month semi-annual period ended December 31, 2011, our Fund couldn’t overcome a poor quarter ended September 30, 2011 – the most macro-driven market we have seen (see pages 3 to 7), and an environment not favorable to the Fund. The Fund declined 7.84%, lagging our primary market benchmark, the Russell 1000 Growth Index (-3.92%), and our peer benchmark, the Lipper Large-Cap Growth Funds Index (-7.74%). In the context of this performance, we would like to emphasize that we have taken certain actions consistent with our (unchanged) investment philosophy and process to address our underperformance in macro-driven markets such as 2008, 2010, and 2011. See, for example, “If macro-driven markets represent such a problem for Bridgeway’s “growthier” select models and Funds, isn’t there anything Bridgeway can do to correct this?” on page 7 and “Can’t the investment team do anything to improve performance during these correlation spikes, or macro-driven markets?” on page 10.
In spite of beating our primary market benchmark in three of the last four quarters, we didn’t overcome the large negative effect of the macro-driven market in the September quarter. For the calendar year ended December 31, 2011, our Fund declined 0.71%, underperforming our primary market benchmark, the Russell 1000 Growth Index (+2.64%), but outperforming our peer benchmark, the Lipper Large-Cap Growth Funds Index (-2.90%).
The table below presents our quarter, six-month, one-year, five-year, and life-to-date financial results. See the next page for a graph of performance since inception.
| Annualized | ||||||||||||||||||||
| Quarter 10/1/11 to 12/31/11 | 6 Months 7/1/11 to 12/31/11 | 1 Year 1/1/11 to 12/31/11 | 5 Years 1/1/07 to 12/31/11 | Life-to-Date to 12/31/11 | ||||||||||||||||
Large-Cap Growth Fund | 12.41% | -7.84% | -0.71% | -0.02% | 2.93% | |||||||||||||||
Russell 1000 Growth Index | 10.61% | -3.92% | 2.64% | 2.50% | 4.60% | |||||||||||||||
Lipper Large-Cap Growth Funds Index | 8.95% | -7.74% | -2.90% | 0.85% | 3.37% | |||||||||||||||
Performance figures quoted in the table above and graph below represent past performance and are no guarantee of future results. Total return figures in the table above include the reinvestment of dividends and capital gains. The table above and the graph below do not reflect the deduction of taxes that a shareholder would pay on Fund distributions or the redemption of Fund shares. The recent growth rate in the stock market has helped to produce short-term returns that are not typical and may not continue in the future.
The Russell 1000 Growth Index is an unmanaged index that consists of stocks in the Russell 1000 Index with higher price-to-book ratios and higher forecasted growth values with dividends reinvested. The Lipper Large-Cap Growth Funds Index is an index of large-company, growth-oriented funds compiled by Lipper, Inc. It is not possible to invest directly in an index.
According to data from Lipper, Inc. as of December 31, 2011, Large-Cap Growth Fund ranked 141st of 510 multi-cap growth funds for the twelve-month period ended December 31, 2011, 218th of 347 over the last five years and 240th of 278 such funds since inception in October, 2003. Lipper, Inc. is an independent mutual fund rating service that ranks funds in various fund categories by making comparative calculations using total returns.
| www.bridgeway.com | 96 | |
Large-Cap Growth Fund MANAGER’S COMMENTARY (continued) | | |
| (Unaudited) |
Large-Cap Growth Fund vs. Russell 1000 Growth Index & Lipper Large-Cap Growth Funds Index from Inception 10/31/03 to 12/31/11

Detailed Explanation of Quarterly Performance
The Short Version: Consumer related stocks were the positive story for the quarter. The Information Technology sector had four of the worst contributors, but they did relatively little damage.
The quarter could be considered a “return of the consumer” as investors welcomed what many considered a solid holiday season. Three Consumer Discretionary stocks (one media and two retail) made the list of top contributors. Combined, they contributed over one percent to the Fund’s return. With the addition of one Consumer Staple company on the list, the purchasing public was very well represented.
These are the Fund’s ten best-contributing stocks for the quarter ended December 31, 2011:
| Rank | Description | Industry | % Contribution to Return | |||
| 1 | F5 Networks, Inc. | Communications Equipment | 0.7 % | |||
| 2 | W.W. Grainger, Inc. | Trading Companies & Distributors | 0.5 % | |||
| 3 | Google, Inc. | Internet Software & Services | 0.5 % | |||
| 4 | Coach, Inc. | Textiles, Apparel & Luxury Goods | 0.4 % | |||
| 5 | Union Pacific Corp. | Road & Rail | 0.3 % | |||
| 6 | Ross Stores, Inc. | Specialty Retail | 0.3 % | |||
| 7 | Estee Lauder Cos., Inc. | Personal Products | 0.3 % | |||
| 8 | Sherwin-Williams Co. (The) | Chemicals | 0.3 % | |||
| 9 | Occidental Petroleum Corp. | Oil, Gas & Consumable Fuels | 0.3 % | |||
| 10 | Viacom, Inc. | Media | 0.3 % |
Union Pacific is the largest railroad in North America. It posted record third quarter earnings, easily beating analysts’ expectations, and has been steadily improving its cash flow numbers. In November, management announced a dividend increase of 28%, the second such favorable reward for investors during 2011. Railroads are often considered bellwethers for the economy, so the positive results and outlook for Union Pacific could bode well for the country as a whole. The stock rose over 30% during the three-month period and contributed over one-fourth of a percent to the Fund’s return.
Though the economy has shown signs of rebounding as of late, businesses and consumers still do not appear to be stepping up their purchases of computers and electronics (unless they are manufactured by Apple). Four Information Technology holdings made the list of worst contributors, but combined, they hindered Fund performance by less than one-fourth of a percent.
| 97 | Semi-Annual Report | December 31, 2011 (Unaudited) |
Large-Cap Growth Fund MANAGER’S COMMENTARY (continued) | |
(Unaudited)
These are the Fund’s ten worst-contributing stocks for the quarter ended December 31, 2011:
| Rank | Description | Industry | % Contribution to Return | |||
| 1 | Netflix, Inc. | Internet & Catalog Retail | -0.3 % | |||
| 2 | First Solar, Inc. | Semiconductors & Semiconductor Equipment | 0.0 % | |||
| 3 | Alcoa, Inc. | Metals & Mining | 0.0 % | |||
| 4 | Southwestern Energy Co. | Oil, Gas & Consumable Fuels | 0.0 % | |||
| 5 | Oracle Corp. | Software | 0.0 % | |||
| 6 | CR Bard, Inc. | Health Care Equipment & Supplies | 0.0 % | |||
| 7 | JDS Uniphase Corp. | Communications Equipment | 0.0 % | |||
| 8 | Lam Research Corp. | Semiconductors & Semiconductor Equipment | 0.0 % | |||
| 9 | Caterpillar, Inc. | Machinery | 0.0 % | |||
| 10 | MetroPCS Communications, Inc. | Wireless Telecommunication Services | 0.0 % |
Every quarter, investors look for Alcoa to report earnings, because it is normally the first major corporation to post quarterly results; its reading sets the tone for the season. Unfortunately, Alcoa was one of several high-profile companies to miss earnings expectations last quarter, and its stock suffered accordingly. The major aluminum producer has been severely hurt as a result of the continuing European economic crisis. Aluminum production is considered a cyclical industry that ebbs and flows with the global economy. As Europe struggles, demand for aluminum decreases as well. Management had expected China to pick up the slack that it lost in Europe, but production in that emerging market has also declined. In the meantime, Alcoa has slashed spending, reduced its dividend, and suspended its buyback program while it waits for a global economic rebound.
Detailed Explanation of Calendar Year Performance
The Short Version: Retail stocks performed well for the calendar year, while performance of the Information Technology sector was both good and bad.
Three Consumer Discretionary stocks, all retailers, were among the best contributors for the calendar year. Combined, they added over one and one-quarter percent to the Fund’s return. A fourth holding (Mastercard), is often considered a consumer-related company, because its profitability depends so much on consumer confidence and overall shopping activity. Three Information Technology companies also made the best contributors list.
These are the Fund’s ten best-contributing stocks for the calendar year ended December 31, 2011:
| Rank | Description | Industry | % Contribution to Return | |||
| 1 | W.W. Grainger, Inc. | Trading Companies & Distributors | 0.7 % | |||
| 2 | Ross Stores, Inc. | Specialty Retail | 0.6 % | |||
| 3 | Mastercard, Inc. | IT Services | 0.6 % | |||
| 4 | El Paso Corp. | Oil, Gas & Consumable Fuels | 0.5 % | |||
| 5 | Apple, Inc. | Computers & Peripherals | 0.5 % | |||
| 6 | Intuitive Surgical, Inc. | Health Care Equipment & Supplies | 0.5 % | |||
| 7 | International Business Machines Corp. | IT Services | 0.4 % | |||
| 8 | Bristol-Myers Squibb Co. | Pharmaceuticals | 0.4 % | |||
| 9 | TJX Cos., Inc. | Specialty Retail | 0.4 % | |||
| 10 | priceline.com, Inc. | Internet & Catalog Retail | 0.3 % |
| www.bridgeway.com | 98 |
Large-Cap Growth Fund MANAGER’S COMMENTARY (continued) | | |
| (Unaudited) |
Despite some uncertainties with some of its patents for the next few years, 2011 has been a banner time for pharmaceutical giant Bristol-Myers Squibb. The company received several key FDA approvals, including Yervoy, a drug that helps extend the life of skin cancer patients. In August, it received positive trial results from the FDA on a new blood thinner treatment. The news is significant because the patents on top sellers Plavix and Avapro are expected to expire next year. Bristol-Myers Squibb has looked to counter these expirations through expansion and partnerships. During the year, it acquired Amira, a private company that is developing new treatments for inflammatory diseases. For the year, the holding gained almost 40% and contributed just less than one-half of a percent return to the Fund.
As was the case for the quarter, four Information Technology companies made the worst contributors list for calendar year 2011. They cost the Fund almost two percent in performance. While smartphones and other mobile devices have dominated consumers’ wish lists over the past year, computer makers and many of their suppliers have struggled, with many failing to adapt.
These are the Fund’s ten worst-contributing stocks for the calendar year ended December 31, 2011:
| Rank | Description | Industry | % Contribution to Return | |||
1 | Freeport-McMoRan Copper & Gold, Inc. | Metals & Mining | -0.7 % | |||
2 | Atmel Corp. | Semiconductors & Semiconductor Equipment | -0.6 % | |||
3 | MetroPCS Communications, Inc. | Wireless Telecommunication Services | -0.6 % | |||
4 | TRW Automotive Holdings Corp. | Auto Components | -0.6 % | |||
5 | Netflix, Inc. | Internet & Catalog Retail | -0.5 % | |||
6 | JDS Uniphase Corp. | Communications Equipment | -0.5 % | |||
7 | Hewlett-Packard Co. | Computers & Peripherals | -0.5 % | |||
8 | Alcoa, Inc. | Metals & Mining | -0.4 % | |||
9 | Akamai Technologies, Inc. | Internet Software & Services | -0.4 % | |||
10 | Ford Motor Co. | Automobiles | -0.4 % |
MetroPCS Communications took a beating, losing over a third of its value after a weak earnings report and a very cautious outlook for the rest of the year. The wireless communications company appeals to cost-conscious consumers because it does not require them to lock into long-term contracts. In the sluggish economy, rivals have dropped prices, and MetroPCS has suffered from customer defections. For the year, the holding lost over 30% of its value and cost the Fund just over one-half of a percent of return.
Top Ten Holdings as of December 31, 2011
Five of the Fund’s top contributors for the December 2011 quarter were also among the largest holdings at the end of the calendar year: Google, WW Grainger, F5 Networks, Ross Stores and Viacom. Two oil and gas-related companies made the Fund’s top ten holdings at year-end. Still, the Fund was broadly diversified, and no single holding accounted for greater than 2.9% of the net assets. The ten largest positions represented just over 20% of the total assets of the Fund.
| 99 | Semi-Annual Report | December 31, 2011 (Unaudited) | |
Large-Cap Growth Fund MANAGER’S COMMENTARY (continued) | |
(Unaudited)
| Rank | Description | Industry | % of Net Assets | |||
| 1 | Apple, Inc. | Computers & Peripherals | 2.9% | |||
| 2 | Google, Inc. | Internet Software & Services | 2.5% | |||
| 3 | International Business Machines Corp. | IT Services | 2.5% | |||
| 4 | W.W. Grainger, Inc. | Trading Companies & Distributors | 2.4% | |||
| 5 | F5 Networks, Inc. | Communications Equipment | 2.0% | |||
| 6 | Ross Stores, Inc. | Specialty Retail | 1.9% | |||
| 7 | Viacom, Inc. | Media | 1.7% | |||
| 8 | Chevron Corp. | Oil, Gas & Consumable Fuels | 1.7% | |||
| 9 | AmerisourceBergen Corp. | Health Care Providers & Services | 1.7% | |||
| 10 | Southwestern Energy Co. | Oil, Gas & Consumable Fuels | 1.6% | |||
| Total | 20.9% |
Industry Sector Representation as of December 31, 2011
Consumer Discretionary stocks displayed the biggest sector disparity between the Fund and the Russell 1000 Growth Index. That sector represented the Fund’s second largest allocation at the end of the calendar year. The Fund’s most underweighted sector was Consumer Staples.
| % of Net Assets | % of Russell 1000 Growth Index | Difference | ||||
Consumer Discretionary | 20.7% | 14.2% | 6.5% | |||
Consumer Staples | 8.8% | 12.8% | -4.0% | |||
Energy | 10.9% | 11.1% | -0.2% | |||
Financials | 3.7% | 3.9% | -0.2% | |||
Health Care | 10.5% | 10.7% | -0.2% | |||
Industrials | 11.8% | 12.7% | -0.9% | |||
Information Technology | 26.3% | 28.0% | -1.7% | |||
Materials | 6.0% | 5.3% | 0.7% | |||
Telecommunication Services | 1.0% | 1.2% | -0.2% | |||
Utilities | 0.0% | 0.1% | -0.1% | |||
Cash & Other Assets | 0.3% | 0.0% | 0.3% | |||
Total | 100.0% | 100.0% |
Disclaimer
The views expressed here are exclusively those of Fund management. These views, including those related to market sectors or individual stocks, are not meant as investment advice and should not be considered predictive in nature. Any favorable (or unfavorable) description of a holding applies only as of December 31, 2011, unless otherwise stated. Security positions can and do change thereafter. Discussions of historical performance do not guarantee and are not indicative of future performance.
The Fund is subject to market risk (volatility) and is not an appropriate investment for short-term investors.
Conclusion
Thank you for your continued investment in Large-Cap Growth Fund. We encourage your feedback; your reactions and concerns are important to us.
Sincerely,
The Investment Management Team
www.bridgeway.com | 100 | |
Bridgeway Large-Cap Growth Fund | |
| Showing percentage of net assets as of December 31, 2011 (Unaudited) |
| Industry Company | Shares | Value | ||||||||
COMMON STOCKS - 99.91% |
| |||||||||
Aerospace & Defense - 2.74% |
| |||||||||
Boeing Co. (The) | 5,900 | $ | 432,765 | |||||||
Lockheed Martin Corp. | 5,800 | 469,220 | ||||||||
Northrop Grumman Corp. | 6,600 | 385,968 | ||||||||
|
| |||||||||
| 1,287,953 | ||||||||||
Auto Components - 0.76% |
| |||||||||
TRW Automotive Holdings | ||||||||||
Corp.* | 11,000 | 358,600 | ||||||||
Automobiles - 0.74% |
| |||||||||
Ford Motor Co.* | 32,300 | 347,548 | ||||||||
Beverages - 2.70% |
| |||||||||
Brown-Forman Corp., Class | ||||||||||
B | 4,600 | 370,346 | ||||||||
Coca-Cola Enterprises, Inc. | 20,200 | 520,756 | ||||||||
Dr. Pepper Snapple Group, | ||||||||||
Inc. | 9,600 | 379,008 | ||||||||
|
| |||||||||
| 1,270,110 | ||||||||||
Biotechnology - 1.26% |
| |||||||||
Biogen Idec, Inc.* | 5,400 | 594,270 | ||||||||
Chemicals - 2.04% |
| |||||||||
CF Industries Holdings, Inc. | 3,300 | 478,434 | ||||||||
Sherwin-Williams Co. (The) | 5,400 | 482,058 | ||||||||
|
| |||||||||
| 960,492 | ||||||||||
Communications Equipment - 3.14% |
| |||||||||
Cisco Systems, Inc. | 29,000 | 524,320 | ||||||||
F5 Networks, Inc.* | 9,000 | 955,080 | ||||||||
|
| |||||||||
| 1,479,400 | ||||||||||
Computers & Peripherals - 6.18% |
| |||||||||
Apple, Inc.* | 3,400 | 1,377,000 | ||||||||
Dell, Inc.* | 36,700 | 536,921 | ||||||||
Hewlett-Packard Co. | 14,200 | 365,792 | ||||||||
SanDisk Corp.* | 12,800 | 629,888 | ||||||||
|
| |||||||||
| 2,909,601 | ||||||||||
Consumer Finance - 0.73% |
| |||||||||
Discover Financial Services | 14,400 | 345,600 | ||||||||
Containers & Packaging - 1.01% |
| |||||||||
Crown Holdings, Inc.* | 14,100 | 473,478 | ||||||||
Diversified Financial Services - 1.05% |
| |||||||||
Moody’s Corp. | 14,600 | 491,728 | ||||||||
Energy Equipment & Services - 2.02% |
| |||||||||
Diamond Offshore Drilling, | ||||||||||
Inc. | 6,300 | 348,138 | ||||||||
| Industry Company | Shares | Value | ||||||||
Energy Equipment & Services (continued) |
| |||||||||
Halliburton Co. | 17,400 | $ | 600,474 | |||||||
|
| |||||||||
| 948,612 | ||||||||||
Food & Staples Retailing - 2.18% |
| |||||||||
CVS Caremark Corp. | 6,640 | 270,779 | ||||||||
Wal-Mart Stores, Inc. | 12,600 | 752,976 | ||||||||
|
| |||||||||
| 1,023,755 | ||||||||||
Health Care Equipment & Supplies - 3.01% |
| |||||||||
Becton Dickinson & Co. | 6,400 | 478,208 | ||||||||
CR Bard, Inc. | 7,900 | 675,450 | ||||||||
Medtronic, Inc. | 6,900 | 263,925 | ||||||||
|
| |||||||||
| 1,417,583 | ||||||||||
Health Care Providers & Services - 4.34% |
| |||||||||
AmerisourceBergen Corp. | 21,400 | 795,866 | ||||||||
DaVita, Inc.* | 6,800 | 515,508 | ||||||||
Quest Diagnostics, Inc.# | 12,600 | 731,556 | ||||||||
|
| |||||||||
| 2,042,930 | ||||||||||
Hotels, Restaurants & Leisure - 1.79% |
| |||||||||
International Game | ||||||||||
Technology | 23,800 | 409,360 | ||||||||
Wynn Resorts, Ltd. | 3,900 | 430,911 | ||||||||
|
| |||||||||
| 840,271 | ||||||||||
Hoausehold Products - 2.51% |
| |||||||||
Colgate-Palmolive Co. | 7,500 | 692,925 | ||||||||
Procter & Gamble Co. (The) | 7,300 | 486,983 | ||||||||
|
| |||||||||
| 1,179,908 | ||||||||||
Industrial Conglomerates - 2.25% |
| |||||||||
General Electric Co. | 30,300 | 542,673 | ||||||||
Tyco International, Ltd. | 11,000 | 513,810 | ||||||||
|
| |||||||||
| 1,056,483 | ||||||||||
Insurance - 1.96% |
| |||||||||
Axis Capital Holdings, Ltd. | 12,700 | 405,892 | ||||||||
Travelers Cos., Inc. (The) | 8,700 | 514,779 | ||||||||
|
| |||||||||
| 920,671 | ||||||||||
Internet & Catalog Retail - 0.89% |
| |||||||||
priceline.com, Inc.* | 900 | 420,939 | ||||||||
Internet Software & Services - 2.47% |
| |||||||||
Google, Inc., Class A* | 1,800 | 1,162,620 | ||||||||
IT Services - 6.89% |
| |||||||||
Alliance Data Systems | ||||||||||
Corp.* | 3,800 | 394,592 | ||||||||
101 | Semi-Annual Report | December 31, 2011 (Unaudited) | |
Bridgeway Large-Cap Growth Fund SCHEDULE OF INVESTMENTS (continued) | |
Showing percentage of net assets as of December 31, 2011 (Unaudited)
| Industry Company | Shares | Value | ||||||||
Common Stocks (continued) |
| |||||||||
IT Services (continued) | ||||||||||
Cognizant Technology | ||||||||||
Solutions Corp., Class A* | 3,600 | $ | 231,516 | |||||||
International Business | ||||||||||
Machines Corp. | 6,300 | 1,158,444 | ||||||||
Mastercard, Inc., Class A | 1,900 | 708,358 | ||||||||
NeuStar, Inc., Class A* | 7,700 | 263,109 | ||||||||
Western Union Co. (The) | 26,700 | 487,542 | ||||||||
|
| |||||||||
| 3,243,561 | ||||||||||
Leisure Equipment & Products - 0.52% |
| |||||||||
Polaris Industries, Inc. | 4,400 | 246,312 | ||||||||
Life Sciences Tools & Services - 0.79% |
| |||||||||
Agilent Technologies, Inc.* | 10,600 | 370,258 | ||||||||
Machinery - 2.05% |
| |||||||||
Caterpillar, Inc. | 5,500 | 498,300 | ||||||||
Cummins, Inc. | 5,300 | 466,506 | ||||||||
|
| |||||||||
| 964,806 | ||||||||||
Media - 4.38% |
| |||||||||
Comcast Corp., Class A | 20,000 | 474,200 | ||||||||
DIRECTV, Class A* | 8,600 | 367,736 | ||||||||
Omnicom Group, Inc. | 9,400 | 419,052 | ||||||||
Viacom, Inc., Class B | 17,600 | 799,216 | ||||||||
|
| |||||||||
| 2,060,204 | ||||||||||
Metals & Mining - 1.77% |
| |||||||||
Alcoa, Inc. | 26,700 | 230,955 | ||||||||
Freeport-McMoRan Copper | ||||||||||
& Gold, Inc. | 16,400 | 603,356 | ||||||||
|
| |||||||||
| 834,311 | ||||||||||
Multiline Retail - 2.85% |
| |||||||||
Dollar Tree, Inc.* | 3,200 | 265,952 | ||||||||
Macy’s, Inc. | 16,000 | 514,880 | ||||||||
Target Corp. | 10,900 | 558,298 | ||||||||
|
| |||||||||
| 1,339,130 | ||||||||||
Oil, Gas & Consumable Fuels - 8.96% |
| |||||||||
Chevron Corp. | 7,500 | 798,000 | ||||||||
Cimarex Energy Co. | 4,200 | 259,980 | ||||||||
ConocoPhillips | 5,900 | 429,933 | ||||||||
Exxon Mobil Corp. | 6,000 | 508,560 | ||||||||
Occidental Petroleum Corp. | 5,500 | 515,350 | ||||||||
Peabody Energy Corp. | 6,800 | 225,148 | ||||||||
SM Energy Co. | 4,200 | 307,020 | ||||||||
Southwestern Energy Co.* | 23,700 | 756,978 | ||||||||
| Industry Company | Shares | Value | ||||||||
Oil, Gas & Consumable Fuels (continued) |
| |||||||||
Williams Cos., Inc. (The) | 12,500 | $ | 412,750 | |||||||
|
| |||||||||
| 4,213,719 | ||||||||||
Paper & Forest Products - 1.16% |
| |||||||||
International Paper Co. | 18,400 | 544,640 | ||||||||
Personal Products - 1.46% | ||||||||||
Estee Lauder Cos., Inc., | ||||||||||
Class A (The) | 6,100 | 685,152 | ||||||||
Pharmaceuticals - 1.08% | ||||||||||
Bristol-Myers Squibb Co. | 14,453 | 509,324 | ||||||||
Road & Rail - 2.39% | ||||||||||
CSX Corp. | 22,200 | 467,532 | ||||||||
Union Pacific Corp. | 6,200 | 656,828 | ||||||||
|
| |||||||||
| 1,124,360 | ||||||||||
Semiconductors & Semiconductor Equipment - 4.21% |
| |||||||||
Atmel Corp.* | 71,600 | 579,960 | ||||||||
Intel Corp. | 24,300 | 589,275 | ||||||||
Lam Research Corp.* | 9,000 | 333,180 | ||||||||
Xilinx, Inc. | 14,900 | 477,694 | ||||||||
|
| |||||||||
| 1,980,109 | ||||||||||
Software - 3.39% | ||||||||||
Microsoft Corp. | 23,600 | 612,656 | ||||||||
Oracle Corp. | 15,200 | 389,880 | ||||||||
VMware, Inc., Class A* | 7,100 | 590,649 | ||||||||
|
| |||||||||
| 1,593,185 | ||||||||||
Specialty Retail - 7.80% | ||||||||||
Advance Auto Parts, Inc. | 7,100 | 494,373 | ||||||||
AutoZone, Inc.* | 2,000 | 649,940 | ||||||||
Bed Bath & Beyond, Inc.* | 11,000 | 637,670 | ||||||||
Gap, Inc. (The) | 18,800 | 348,740 | ||||||||
Limited Brands, Inc. | 6,900 | 278,415 | ||||||||
Ross Stores, Inc. | 18,800 | 893,564 | ||||||||
TJX Cos., Inc. | 5,700 | 367,935 | ||||||||
|
| |||||||||
| 3,670,637 | ||||||||||
Textiles, Apparel & Luxury Goods - 1.00% |
| |||||||||
Coach, Inc. | 7,700 | 470,008 | ||||||||
Trading Companies & Distributors - 2.43% |
| |||||||||
W.W. Grainger, Inc. | 6,100 | 1,141,859 | ||||||||
| www.bridgeway.com | 102 | |
Bridgeway Large-Cap Growth Fund SCHEDULE OF INVESTMENTS (continued) | |
| Showing percentage of net assets as of December 31, 2011 (Unaudited) |
Industry Company | Shares | Value | ||||||||
| Common Stocks (continued) | ||||||||||
Wireless Telecommunication Services - 1.01% |
| |||||||||
MetroPCS Communications, Inc.* | 54,600 | $ | 473,928 | |||||||
|
| |||||||||
TOTAL COMMON STOCKS - 99.91% | 46,998,055 | |||||||||
|
| |||||||||
(Cost $41,939,527) |
| |||||||||
TOTAL INVESTMENTS - 99.91% | $ | 46,998,055 | ||||||||
(Cost $41,939,527) |
| |||||||||
Other Assets in Excess of Liabilities - 0.09% | 42,604 | |||||||||
|
| |||||||||
NET ASSETS - 100.00% | $ | 47,040,659 | ||||||||
|
| |||||||||
* Non-income producing security. # Securities, or a portion thereof, segregated to cover the Fund’s potential obligation under swap agreements. The total value of segregated assets is $731,556. |
| |||||||||
Summary of inputs used to value the Fund’s investments as of 12/31/2011 is as follows (See Note 2 in Notes to Financial Statements):
| Valuation Inputs | ||||||||||||||||
| ||||||||||||||||
| Investment in Securities (Value) | ||||||||||||||||
| ||||||||||||||||
| Level 1 Quoted Prices | Level 2 Significant Observable Inputs | Level 3 Significant Unobservable Inputs | Total | |||||||||||||
| ||||||||||||||||
Common Stocks | $ | 46,998,055 | $ | — | $ | — | $ | 46,998,055 | ||||||||
|
|
|
|
|
|
|
| |||||||||
TOTAL | $ | 46,998,055 | $ | — | $ | — | $ | 46,998,055 | ||||||||
|
|
|
|
|
|
|
| |||||||||
See Notes to Financial Statements.
| 103 | Semi-Annual Report | December 31, 2011 (Unaudited) | |
| ||
| (Unaudited) |
December 31, 2011
Dear Fellow Large-Cap Value Fund Shareholder,
On February 3, 2012, Bridgeway Large-Cap Value Fund was merged into the American Beacon Bridgeway Large-Cap Value Fund. American Beacon now has management oversight of the Fund, and Bridgeway has been retained as the investment sub-adviser. We will continue using the same investment process as we currently do to buy and sell stocks of the Fund, but the Fund will be part of the American Beacon Funds complex.
For the quarter ended December 31, 2011, our Fund returned 12.64%, lagging our primary market benchmark, the Russell 1000 Value Index (+13.11%), but leading our peer benchmark, the Lipper Large-Cap Value Funds Index (+11.77). It was a mixed quarter on a relative basis, but we are pleased with the absolute results.
For the six month semi-annual period ended December 31, 2011, our Fund declined 5.23%, in a virtual tie with our primary market benchmark, the Russell 1000 Value Index (-5.22%), and leading our peer benchmark, the Lipper Large-Cap Value Funds Index (-7.24%). While negative returns don’t feel good, we are pleased with the relative results.
For the calendar year ended December 31, 2011, our Fund returned 2.33%, outperforming our primary market benchmark, the Russell 1000 Value Index (+0.39%), and our peer benchmark, the Lipper Large-Cap Value Funds Index (-2.17%).
The table below presents our quarter, six-month, one-year, five-year, and life-to-date financial results. See the next page for a graph of performance since inception.
| Annualized | ||||||||||||||||||||
| Quarter 10/1/11 to 12/31/11 | 6 Months to 12/31/11 | 1 Year 1/1/11 to 12/31/11 | 5 Years 1/1/07 to 12/31/11 | Life-to-Date to 12/31/11 | ||||||||||||||||
Large-Cap Value Fund | 12.64% | -5.23% | 2.33% | -0.69% | 5.77% | |||||||||||||||
Russell 1000 Value Index | 13.11% | -5.22% | 0.39% | -2.64% | 4.52% | |||||||||||||||
Lipper Large-Cap Value Funds Index | 11.77% | -7.24% | -2.17% | -2.26% | 3.73% | |||||||||||||||
Performance figures quoted in the table above and graph below represent past performance and are no guarantee of future results. Total return figures in the table above include the reinvestment of dividends and capital gains. The table above and the graph below do not reflect the deduction of taxes that a shareholder would pay on Fund distributions or the redemption of Fund shares. The recent growth rate in the stock market has helped to produce short-term returns that are not typical and may not continue in the future.
The Russell 1000 Value Index is an unmanaged index that consists of stocks in the Russell 1000 Index with lower price-to-book ratios and lower forecasted growth values with dividends reinvested. The Lipper Large-Cap Value Funds Index is an index of large-company, value-oriented funds compiled by Lipper, Inc. It is not possible to invest directly in an index.
According to data from Lipper, Inc. as of December 31, 2011, Large-Cap Value Fund ranked 32nd of 309 multi-cap value funds for the twelve-month period ended December 31, 2011, 54th of 219 over the last five years and 33rd of 154 such funds since inception in October, 2003. Lipper, Inc. is an independent mutual fund rating service that ranks funds in various fund categories by making comparative calculations using total returns.
| www.bridgeway.com | 104 | |
Large-Cap Value Fund MANAGER’S COMMENTARY (continued) | |
(Unaudited)
Large-Cap Value Fund vs. Russell 1000 Value Index & Lipper Large-Cap Value Funds Index from Inception 10/31/03 to 12/31/11
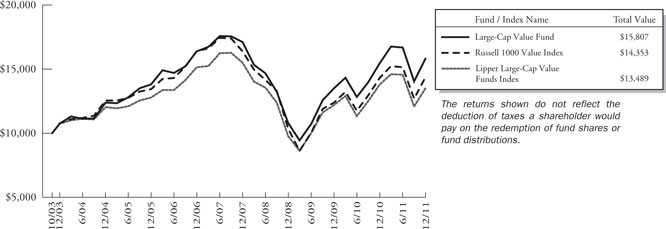
Detailed Explanation of Quarterly Performance
The Short Version: The Energy sector gave solid contributions to the Fund’s return for the quarter while the Financials sector had companies on both the best and worst contributors list.
Energy and Financials made the top Fund contributors for the quarter as these two sectors each placed four stocks on the list. Energy was helped by a surge in crude prices and prospects for even higher prices, as threats of a nuclear Iran cast uncertainty over future supply issues. Financials were led by two insurance giants. Combined they contributed over one-half of a percent to the Fund’s return.
These are the Fund’s ten best-contributing stocks for the quarter ended December 31, 2011:
| Rank | Description | Industry | % Contribution to Return | |||
| 1 | Union Pacific Corp. | Road & Rail | 0.6 % | |||
| 2 | Pfizer, Inc. | Pharmaceuticals | 0.5 % | |||
| 3 | Chevron Corp. | Oil, Gas & Consumable Fuels | 0.4 % | |||
| 4 | Exxon Mobil Corp. | Oil, Gas & Consumable Fuels | 0.3 % | |||
| 5 | Chubb Corp. (The) | Insurance | 0.3 % | |||
| 6 | Travelers Cos., Inc. (The) | Insurance | 0.3 % | |||
| 7 | Occidental Petroleum Corp. | Oil, Gas & Consumable Fuels | 0.3 % | |||
| 8 | ConocoPhillips | Oil, Gas & Consumable Fuels | 0.3 % | |||
| 9 | AvalonBay Communities, Inc. | Real Estate Investment Trusts (REITs) | 0.3 % | |||
| 10 | HCP, Inc. | Real Estate Investment Trusts (REITs) | 0.3 % |
Union Pacific is the largest railroad in North America. It posted record third quarter earnings, easily beating analysts’ expectations, and has been steadily improving its cash flow numbers. In November, management announced a dividend increase of 28%, the second such favorable reward for investors during 2011. Railroads are often considered bellwethers for the economy, so the positive results and outlook for Union Pacific could bode well for the country as a whole. The stock rose over 30% during the three-month period and contributed over one-half of a percent to the Fund’s return.
The fourth quarter was clearly a period of uncertainty in the economy and stock markets, as many lingering issues at home and abroad (Europe, China, Thailand) brought a cautious mindset to investors. Six different sectors were represented on the Fund’s worst contributors list for the quarter. In fact, while four Financials made the best contributors list, three also made the worst contributors list.
105 | Semi-Annual Report | December 31, 2011 (Unaudited) | |
Large-Cap Value Fund MANAGER’S COMMENTARY (continued) | |
(Unaudited)
These are the Fund’s ten worst-contributing stocks for the quarter ended December 31, 2011:
| Rank | Description | Industry | % Contribution to Return | |||
1 | Chesapeake Energy Corp. | Oil, Gas & Consumable Fuels | -0.1% | |||
2 | Alcoa, Inc. | Metals & Mining | -0.1% | |||
3 | CommonWealth REIT | Real Estate Investment Trusts (REITs) | 0.0% | |||
4 | MetroPCS Communications Inc. | Wireless Telecommunication Services | 0.0% | |||
5 | Western Digital Corp. | Computers & Peripherals | 0.0% | |||
6 | CME Group, Inc. | Diversified Financial Services | 0.0% | |||
7 | Torchmark Corp. | Insurance | 0.0% | |||
8 | Cigna Corp. | Health Care Providers & Services | 0.0% | |||
9 | Arrow Electronics, Inc. | Electronic Equipment, Instruments & Components | 0.0% | |||
10 | AmerisourceBergen Corp. | Health Care Providers & Services | 0.0% |
Every quarter, investors look for Alcoa to report earnings because it is normally the first major corporation to post quarterly results; its reading sets the tone for the season. Unfortunately, Alcoa was one of several high-profile companies to miss earnings expectations last quarter and its stock suffered accordingly. The major aluminum producer has been severely hurt as a result of the continuing European economic crisis. Aluminum production is considered a cyclical industry that ebbs and flows with the global economy. As Europe struggles, demand for aluminum decreases as well. Management had expected China to pick up the slack that it lost in Europe, but production in that emerging market has declined as well. In the meantime, Alcoa has slashed spending, reduced its dividend, and suspended its buyback program while it waits for a global economic rebound.
Detailed Explanation of Calendar Year Performance
The Short Version: The Health Care and Energy sectors contributed the most to Fund returns, while the Financials sector dominated the worst contributors list for the calendar year.
Health Care overcame the tremendous uncertainties of the ongoing reform debate; four related companies headlined the top contributors list for calendar year 2011. Combined, the holdings contributed almost two percent to the Fund’s return. Big oil was also well represented, as two Energy giants made the best contributors list as well.
These are the Fund’s ten best-contributing stocks for the calendar year ended December 31, 2011:
| Rank | Description | Industry | % Contribution to Return | |||
1 | Pfizer, Inc. | Pharmaceuticals | 0.7% | |||
2 | VF Corp. | Textiles, Apparel & Luxury Goods | 0.5% | |||
3 | Chevron Corp. | Oil, Gas & Consumable Fuels | 0.5% | |||
4 | Bristol-Myers Squibb Co. | Pharmaceuticals | 0.5% | |||
5 | UnitedHealth Group, Inc. | Health Care Providers & Services | 0.5% | |||
6 | Exxon Mobil Corp. | Oil, Gas & Consumable Fuels | 0.4% | |||
7 | Duke Energy Corp. | Electric Utilities | 0.3% | |||
8 | Union Pacific Corp. | Road & Rail | 0.3% | |||
9 | McKesson Corp. | Health Care Providers & Services | 0.3% | |||
10 | Chubb Corp. (The) | Insurance | 0.3% |
Despite some uncertainties with some of its patents for the next few years, 2011 has been a banner time for pharmaceutical giant Bristol-Myers Squibb. The company received several key FDA approvals, including Yervoy, a drug that helps extend the life of skin cancer patients. In August, it received positive trial results from the FDA on a new blood thinner treatment. The news is significant because the patents on top sellers Plavix and Avapro are expected to expire next year. Bristol-Myers Squibb has looked to counter these expirations through expansion and partnerships. During the year, it acquired Amira, a private company that is developing new treatments for inflammatory diseases. For the year, the holding gained almost 40% and contributed about one-half of a percent to Fund returns.
| www.bridgeway.com | 106 | |
Large-Cap Value Fund MANAGER’S COMMENTARY (continued) | |
(Unaudited)
Though lending seems to be picking up in certain regions of the country because of the low interest rate environment, other would-be profit centers within financial institutions have been hurting as of late. Mergers and Acquisitions (underwriting) came to a virtual standstill in the latter half of the year. Trading profits have been hard to come by as well. Four Financials were among the worst contributors for the year. Combined, they cost the Fund over one-and-a-quarter percent in return.
These are the Fund’s ten worst-contributing stocks for the calendar year ended December 31, 2011:
| Rank | Description | Industry | % Contribution to Return | |||
1 | TRW Automotive Holdings Corp. | Auto Components | -0.5 % | |||
2 | Alcoa, Inc. | Metals & Mining | -0.5 % | |||
3 | Morgan Stanley | Capital Markets | -0.5 % | |||
4 | MetroPCS Communications, Inc. | Wireless Telecommunication Services | -0.4 % | |||
5 | Vishay Intertechnology, Inc. | Electronic Equipment, Instruments & Components | -0.4 % | |||
6 | New York Community Bancorp, Inc. | Thrifts & Mortgage Finance | -0.3 % | |||
7 | CME Group, Inc. | Diversified Financial Services | -0.3 % | |||
8 | Nabors Industries, Ltd. | Energy Equipment & Services | -0.3 % | |||
9 | Aflac, Inc. | Insurance | -0.3 % | |||
10 | Atmel Corp. | Semiconductors & Semiconductor Equipment | -0.3 % |
In an uncertain economy, cautious investors are less likely to look the other way when companies badly miss earnings. MetroPCS Communications found that out the hard way when its stock lost over a third of its value after a weak earnings report and a very cautious outlook for the rest of the year. The wireless communications company appeals to cost-conscious consumers because it does not require them to lock into long-term contracts. In the sluggish economy, rivals have dropped prices, and MetroPCS has suffered from customer defections. For the year, the holding lost over 30% of its value and cost the Fund just less than one-half of a percent of return.
Top Ten Holdings as of December 31, 2011
Six of the Fund’s top contributors for the December 2011 quarter were also among the largest holdings at the end of the calendar year: Chevron, Pfizer, Union Pacific, Chubb, AvalonBay, and ConocoPhillips. Two holdings each from oil & gas, insurance, and real estate were among the Fund’s top ten holdings at year-end. Still, the Fund was broadly diversified; no single holding accounted for greater than 2.9% of net assets. The ten largest positions represented just over 20% of the total assets of the Fund.
| Rank | Description | Industry | % of Net Assets | |||
| 1 | Chevron Corp. | Oil, Gas & Consumable Fuels | 2.9 % | |||
| 2 | Pfizer, Inc. | Pharmaceuticals | 2.3 % | |||
| 3 | Union Pacific Corp. | Road & Rail | 2.1 % | |||
| 4 | AT&T, Inc. | Diversified Telecommunication Services | 2.0 % | |||
| 5 | Chubb Corp. (The) | Insurance | 2.0 % | |||
| 6 | Berkshire Hathaway, Inc. | Insurance | 1.9 % | |||
| 7 | AvalonBay Communities, Inc. | Real Estate Investment Trusts (REITs) | 1.9 % | |||
| 8 | ConocoPhillips | Oil, Gas & Consumable Fuels | 1.8 % | |||
| 9 | Lockheed Martin Corp. | Aerospace & Defense | 1.7 % | |||
| 10 | Ventas, Inc. | Real Estate Investment Trusts (REITs) | 1.6 % | |||
| Total | 20.2 % |
| 107 | Semi-Annual Report | December 31, 2011 (Unaudited) | |
Large-Cap Value Fund MANAGER’S COMMENTARY (continued) | |
(Unaudited)
Industry Sector Representation as of December 31, 2011
Overall, the Fund “hugged” the sector representation of the Russell 1000 Value Index more than we would expect in most market environments. At quarter end, we were slightly overweighted in Consumer Discretionary stocks, and slightly underweighted in the Utilities sector.
| % of Net Assets | % of Russell 1000 Value Index | Difference | ||||
Consumer Discretionary | 11.6 % | 8.9 % | 2.7 % | |||
Consumer Staples | 9.8 % | 8.2 % | 1.6 % | |||
Energy | 10.7 % | 12.3 % | -1.6 % | |||
Financials | 24.3 % | 24.4 % | -0.1 % | |||
Health Care | 14.6 % | 12.9 % | 1.7 % | |||
Industrials | 9.5 % | 9.2 % | 0.3 % | |||
Information Technology | 7.6 % | 8.9 % | -1.3 % | |||
Materials | 2.6 % | 2.6 % | 0.0 % | |||
Telecommunication Services | 3.2 % | 4.8 % | -1.6 % | |||
Utilities | 5.6 % | 7.8 % | -2.2 % | |||
Cash & Other Assets | 0.5 % | 0.0 % | 0.5 % | |||
Total | 100.0 % | 100.0 % |
Disclaimer
The views expressed here are exclusively those of Fund management. These views, including those related to market sectors or individual stocks, are not meant as investment advice and should not be considered predictive in nature. Any favorable (or unfavorable) description of a holding applies only as of December 31, 2011, unless otherwise stated. Security positions can and do change thereafter. Discussions of historical performance do not guarantee and are not indicative of future performance.
The Fund is subject to market risk (volatility) and is not an appropriate investment for short-term investors.
Conclusion
Thank you for your investment in Large-Cap Value Fund. We encourage your feedback; your reactions and concerns are important to us.
Sincerely,
Your Investment Management Team
| www.bridgeway.com | 108 | |
Bridgeway Large-Cap Value Fund | | |
Showing percentage of net assets as of December 31, 2011 (Unaudited) | ||
Industry | Company | Shares | Value | |||||||
COMMON STOCKS - 99.04% |
| |||||||||
Aerospace & Defense - 5.38% |
| |||||||||
L-3 Communications Holdings, Inc. | 4,300 | $ | 286,724 | |||||||
Lockheed Martin Corp. | 5,600 | 453,040 | ||||||||
Northrop Grumman Corp. | 6,100 | 356,728 | ||||||||
Raytheon Co. | 8,000 | 387,040 | ||||||||
|
| |||||||||
| 1,483,532 | ||||||||||
Auto Components - 0.86% | ||||||||||
TRW Automotive Holdings | ||||||||||
Corp.* | 7,300 | 237,980 | ||||||||
Beverages - 2.17% | ||||||||||
Brown-Forman Corp., Class B | 1,700 | 136,867 | ||||||||
Coca-Cola Enterprises, Inc. | 7,000 | 180,460 | ||||||||
Dr. Pepper Snapple Group, Inc. | 7,100 | 280,308 | ||||||||
|
| |||||||||
| 597,635 | ||||||||||
Biotechnology - 1.20% | ||||||||||
Biogen Idec, Inc.* | 3,000 | 330,150 | ||||||||
Capital Markets - 1.37% | ||||||||||
Ameriprise Financial, Inc. | 4,500 | 223,380 | ||||||||
Morgan Stanley | 10,100 | 152,813 | ||||||||
|
| |||||||||
| 376,193 | ||||||||||
Chemicals - 1.00% | ||||||||||
CF Industries Holdings, Inc. | 1,900 | 275,462 | ||||||||
Commercial Banks - 3.65% | ||||||||||
City National Corp. | 2,400 | 106,032 | ||||||||
M&T Bank Corp. | 1,800 | 137,412 | ||||||||
US Bancorp | 11,700 | 316,485 | ||||||||
Wells Fargo & Co. | 16,200 | 446,472 | ||||||||
|
| |||||||||
| 1,006,401 | ||||||||||
Computers & Peripherals - 3.49% | ||||||||||
Dell, Inc.* | 18,100 | 264,803 | ||||||||
Hewlett-Packard Co. | 10,800 | 278,208 | ||||||||
SanDisk Corp.* | 5,800 | 285,418 | ||||||||
Western Digital Corp.* | 4,300 | 133,085 | ||||||||
|
| |||||||||
| 961,514 | ||||||||||
Consumer Finance - 2.05% | ||||||||||
Capital One Financial Corp. | 5,900 | 249,511 | ||||||||
Discover Financial Services | 13,100 | 314,400 | ||||||||
|
| |||||||||
| 563,911 | ||||||||||
Diversified Financial Services - 1.06% | ||||||||||
CME Group, Inc. | 1,200 | 292,404 | ||||||||
Industry | Company | Shares | Value | |||||||
Diversified Telecommunication Services - 2.02% |
| |||||||||
AT&T, Inc. | 18,449 | $ | 557,898 | |||||||
Electric Utilities - 3.87% |
| |||||||||
American Electric Power Co., Inc. | 8,100 | 334,611 | ||||||||
Duke Energy Corp. | 17,400 | 382,800 | ||||||||
Southern Co. (The) | 7,550 | 349,490 | ||||||||
|
| |||||||||
| 1,066,901 | ||||||||||
Electronic Equipment, Instruments & Components - 0.65% |
| |||||||||
Vishay Intertechnology, Inc.* | 19,800 | 178,002 | ||||||||
Energy Equipment & Services - 0.84% |
| |||||||||
National Oilwell Varco, Inc. | 3,400 | 231,166 | ||||||||
Food & Staples Retailing - 2.85% |
| |||||||||
CVS Caremark Corp. | 3,580 | 145,992 | ||||||||
Safeway, Inc. | 13,000 | 273,520 | ||||||||
Wal-Mart Stores, Inc. | 6,100 | 364,536 | ||||||||
|
| |||||||||
| 784,048 | ||||||||||
Food Products - 0.89% |
| |||||||||
Campbell Soup Co. | 7,400 | 245,976 | ||||||||
Health Care Providers & Services - 7.34% |
| |||||||||
Aetna, Inc. | 8,000 | 337,520 | ||||||||
AmerisourceBergen Corp. | 6,800 | 252,892 | ||||||||
Cigna Corp. | 4,900 | 205,800 | ||||||||
McKesson Corp. | 3,400 | 264,894 | ||||||||
Quest Diagnostics, Inc. | 5,400 | 313,524 | ||||||||
UnitedHealth Group, Inc. | 7,400 | 375,032 | ||||||||
WellPoint, Inc. | 4,100 | 271,625 | ||||||||
|
| |||||||||
| 2,021,287 | ||||||||||
Household Products - 3.85% |
| |||||||||
Colgate-Palmolive Co. | 4,300 | 397,277 | ||||||||
Kimberly-Clark Corp. | 4,300 | 316,308 | ||||||||
Procter & Gamble Co. (The) | 5,200 | 346,892 | ||||||||
|
| |||||||||
| 1,060,477 | ||||||||||
Industrial Conglomerates - 2.02% |
| |||||||||
General Electric Co. | 16,400 | 293,724 | ||||||||
Tyco International, Ltd. | 5,600 | 261,576 | ||||||||
|
| |||||||||
| 555,300 | ||||||||||
Insurance - 10.78% |
| |||||||||
Aflac, Inc. | 7,300 | 315,798 | ||||||||
American International Group, Inc.* | 4,700 | 109,040 | ||||||||
Axis Capital Holdings, Ltd. | 3,900 | 124,644 | ||||||||
| 109 | Semi-Annual Report | December 31, 2011 (Unaudited) | |
Bridgeway Large-Cap Value Fund SCHEDULE OF INVESTMENTS (continued) | | |
| Showing percentage of net assets as of December 31, 2011 (Unaudited) | ||
Industry | Company | Shares | Value | |||||||
Common Stocks (continued) |
| |||||||||
Insurance (continued) | ||||||||||
Berkshire Hathaway, Inc., | ||||||||||
Class B* | 6,700 | $ | 511,210 | |||||||
Chubb Corp. (The) | 8,000 | 553,760 | ||||||||
Everest Re Group, Ltd. | 1,600 | 134,544 | ||||||||
Loews Corp. | 3,600 | 135,540 | ||||||||
PartnerRe, Ltd. | 1,700 | 109,157 | ||||||||
Prudential Financial, Inc. | 5,000 | 250,600 | ||||||||
Reinsurance Group of | ||||||||||
America, Inc. | 3,500 | 182,875 | ||||||||
Torchmark Corp. | 3,200 | 138,848 | ||||||||
Travelers Cos., Inc. (The) | 6,800 | 402,356 | ||||||||
|
| |||||||||
| 2,968,372 | ||||||||||
IT Services - 0.67% |
| |||||||||
Fidelity National Information Services, Inc. | 6,900 | 183,471 | ||||||||
Media - 4.90% |
| |||||||||
DIRECTV, Class A* | 6,200 | 265,112 | ||||||||
DISH Network Corp., Class A | 9,700 | 276,256 | ||||||||
Omnicom Group, Inc. | 4,800 | 213,984 | ||||||||
Time Warner, Inc. | 8,466 | 305,961 | ||||||||
Walt Disney Co. (The) | 7,700 | 288,750 | ||||||||
|
| |||||||||
| 1,350,063 | ||||||||||
Metals & Mining - 0.52% |
| |||||||||
Alcoa, Inc. | 16,500 | 142,725 | ||||||||
Multiline Retail - 3.21% |
| |||||||||
Dillard’s, Inc., Class A+ | 6,300 | 282,744 | ||||||||
Macy’s, Inc. | 9,000 | 289,620 | ||||||||
Target Corp. | 6,100 | 312,442 | ||||||||
|
| |||||||||
| 884,806 | ||||||||||
Multi-Utilities - 0.68% |
| |||||||||
OGE Energy Corp. | 3,300 | 187,143 | ||||||||
Oil, Gas & Consumable Fuels - 9.79% |
| |||||||||
Chesapeake Energy Corp. | 11,400 | 254,106 | ||||||||
Chevron Corp. | 7,514 | 799,490 | ||||||||
ConocoPhillips | 6,600 | 480,942 | ||||||||
Exxon Mobil Corp. | 5,100 | 432,276 | ||||||||
Hess Corp. | 1,700 | 96,560 | ||||||||
Occidental Petroleum Corp. | 3,000 | 281,100 | ||||||||
Valero Energy Corp. | 9,700 | 204,185 | ||||||||
Williams Cos., Inc. (The) | 4,500 | 148,590 | ||||||||
|
| |||||||||
| 2,697,249 | ||||||||||
Paper & Forest Products - 1.08% |
| |||||||||
International Paper Co. | 10,100 | 298,960 | ||||||||
Industry | Company | Shares | Value | |||||||
Pharmaceuticals - 6.02% |
| |||||||||
Bristol-Myers Squibb Co. | 12,172 | $ | 428,941 | |||||||
Eli Lilly & Co. | 5,300 | 220,268 | ||||||||
Merck & Co., Inc. | 10,100 | 380,770 | ||||||||
Pfizer, Inc. | 29,100 | 629,724 | ||||||||
|
| |||||||||
| 1,659,703 | ||||||||||
Real Estate Investment Trusts (REITs) - 5.31% |
| |||||||||
AvalonBay Communities, Inc. | 3,900 | 509,340 | ||||||||
CommonWealth REIT | 5,100 | 84,864 | ||||||||
HCP, Inc. | 10,165 | 421,136 | ||||||||
Ventas, Inc. | 8,100 | 446,553 | ||||||||
|
| |||||||||
| 1,461,893 | ||||||||||
Road & Rail - 2.08% |
| |||||||||
Union Pacific Corp. | 5,400 | 572,076 | ||||||||
Semiconductors & Semiconductor Equipment - 1.81% |
| |||||||||
Atmel Corp.* | 21,200 | 171,720 | ||||||||
Intel Corp. | 13,500 | 327,375 | ||||||||
|
| |||||||||
| 499,095 | ||||||||||
Software - 0.98% |
| |||||||||
Microsoft Corp.# | 10,400 | 269,984 | ||||||||
Specialty Retail - 0.99% |
| |||||||||
Gap, Inc. (The) | 14,700 | 272,685 | ||||||||
Textiles, Apparel & Luxury Goods - 1.52% |
| |||||||||
VF Corp. | 3,300 | 419,067 | ||||||||
Water Utilities - 0.98% |
| |||||||||
American Water Works Co., Inc. | 8,500 | 270,810 | ||||||||
Wireless Telecommunication Services - 1.16% |
| |||||||||
Telephone & Data Systems, Inc. | 6,100 | 157,929 | ||||||||
United States Cellular Corp.* | 3,700 | 161,431 | ||||||||
|
| |||||||||
| 319,360 | ||||||||||
|
| |||||||||
TOTAL COMMON STOCKS - 99.04% | 27,283,699 | |||||||||
|
| |||||||||
(Cost $22,970,318) | ||||||||||
| Rate^ | Shares | Value | ||||||||
MONEY MARKET FUND - 0.32% |
| |||||||||
BlackRock FedFund | 0.01 % | 88,383 | 88,383 | |||||||
|
| |||||||||
TOTAL MONEY MARKET FUND - 0.32% | 88,383 | |||||||||
|
| |||||||||
(Cost $88,383) | ||||||||||
| www.bridgeway.com | 110 | |
Bridgeway Large-Cap Value Fund SCHEDULE OF INVESTMENTS (continued) | |
| Showing percentage of net assets as of December 31, 2011 (Unaudited) |
| Value | ||||
TOTAL INVESTMENTS - 99.36% (Cost $23,058,701) | $ | 27,372,082 | ||
Other Assets in Excess of Liabilities - 0.64% | 175,947 | |||
NET ASSETS - 100.00% | $ | 27,548,029 | ||
* Non-income producing security. # Securities, or a portion thereof, segregated to cover the Fund’s potential obligation under swap agreements. The total value of segregated assets is $269,984. ^ Rate disclosed as of December 31, 2011. + This security or a portion of the security is out on loan at December 31, 2011. Total loaned securities had a value of $285,894 at December 31, 2011.
|
| |||
Summary of inputs used to value the Fund’s investments as of 12/31/2011 is as follows (See Note 2 in Notes to Financial Statements):
| Valuation Inputs | ||||||||||||||||
| ||||||||||||||||
| Investment in Securities (Value) | ||||||||||||||||
| ||||||||||||||||
| Level 1 Quoted Prices | Level 2 Significant Observable Inputs | Level 3 Significant Unobservable Inputs | Total | |||||||||||||
| ||||||||||||||||
Common Stocks | $ | 27,283,699 | $ | — | $ | — | $ | 27,283,699 | ||||||||
Money Market Fund | — | 88,383 | — | 88,383 | ||||||||||||
|
|
|
|
|
|
|
| |||||||||
TOTAL | $ | 27,283,699 | $ | 88,383 | $ | — | $ | 27,372,082 | ||||||||
|
|
|
|
|
|
|
| |||||||||
See Notes to Financial Statements.
| 111 | Semi-Annual Report | December 31, 2011 (Unaudited) | |
|
(Unaudited)
December 31, 2011
Dear Fellow Blue Chip 35 Index Fund Shareholder,
For the December quarter, our Fund gained 11.84%, edging out our primary market benchmark, the S&P 500 Index (+11.82%), the Russell Top 50 Index (+11.51%) and with a larger margin, our peer benchmark, the Lipper Large-Cap Core Funds Index (+10.93%). We are pleased with this “clean sweep.”
For the six month semi-annual period ending December 31, 2011, our Fund declined slightly (-0.23%), outperforming the S&P 500 Index (-3.69%), and the Lipper Large Cap Core Funds Index (-4.99%), due to cushioning effects of the market’s larger stocks. We lagged the Russell Top 50 Index due to the positive returns of the market’s largest Index stocks, which are very overweighted in this index.
For the calendar year (see table below), our Fund beat the S&P 500 Index and Lipper Large Cap Core Funds Index, while lagging the Russell Top 50 Index, all for the same reasons as the semi-annual period.
The table below presents our quarter, six-month, one-year, five-year, ten-year and life-to-date financial results. See the next page for a graph of performance from inception.
| Annualized | ||||||||||||||||||||||||
| Quarter 10/1/11 to 12/31/11 | 6 Months 7/1/11 to 12/31/11 | 1 Year 1/1/11 to 12/31/11 | 5 Years 1/1/07 to 12/31/11 | 10 Years to 12/31/11 | Life- to- Date to 12/31/11 | |||||||||||||||||||
Blue Chip 35 Index Fund | 11.84% | -0.23% | 3.17% | 0.44% | 2.71% | 4.27% | ||||||||||||||||||
S&P 500 Index | 11.82% | -3.69% | 2.11% | -0.25% | 2.92% | 3.75% | ||||||||||||||||||
Russell Top 50 Index | 11.51% | 1.11% | 4.35% | -0.91% | 1.26% | NA | ||||||||||||||||||
Bridgeway Ultra-Large 35 Index | 11.88% | 0.04% | 3.52% | 0.69% | 2.78% | 4.44% | ||||||||||||||||||
Lipper Large-Cap Core Funds Index | 10.93% | -4.99% | 0.09% | -0.60% | 2.16% | 3.04% | ||||||||||||||||||
Performance figures quoted in the table above and graph below represent past performance and are no guarantee of future results. Total return figures in the table above and the graph below include the reinvestment of dividends and capital gains. The table above and the graph below do not reflect the deduction of taxes that a shareholder would pay on Fund distributions or the redemption of Fund shares.
The S&P 500 Index is a broad-based, unmanaged measurement of changes in stock market conditions, based on the average of 500 widely held common stocks with dividends reinvested. The Russell Top 50 Index measures the performance of the largest companies in the Russell 3000 Index. It includes 50 of the largest securities, based on a combination of their market cap and current index membership, and represents approximately 40% of the total market capitalization of the Russell 3000 Index. The Bridgeway Ultra-Large 35 Index is an index comprised of very large, “blue chip” U.S. stocks, excluding tobacco; it is compiled by the adviser of the Fund. The Lipper Large-Cap Core Funds Index reflects the aggregate record of domestic large-cap core mutual funds as reported by Lipper, Inc. It is not possible to invest directly in an index.
According to data from Lipper, Inc. as of December 31, 2011, Blue-Chip 35 Index Fund ranked 183rd of 1,064 large-cap core funds for the twelve months ending December 31, 2011, 209th of 825 over the last five years, 206th of 498 over the last ten years, and 70th of 266 since inception in July 1997. Lipper, Inc. is an independent mutual fund rating service that ranks funds in various fund categories by making comparative calculations using total returns.
| www.bridgeway.com | 112 | |
Blue Chip 35 Index Fund MANAGER’S COMMENTARY (continued) | |
(Unaudited)
Blue Chip 35 Index Fund vs. S&P 500 Index, Russell Top 50 Index*, Bridgeway Ultra-Large 35 Index & Lipper Large-Cap Core Funds Index from Inception 7/31/97 to 12/31/11
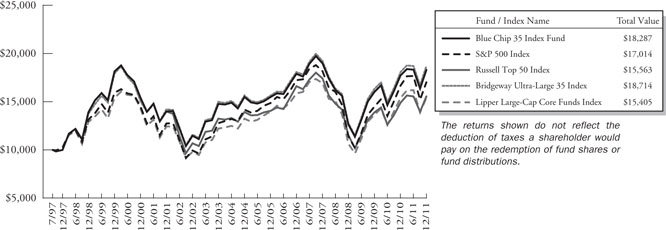
| * | The Russell Top 50 Index began on12/31/2001, and the line graph for the Index begins at the same value as the Fund on that date. |
Explanation of Quarterly Performance:
The Short Version: Our Fund’s “roughly equal weighting” strategy helped nicely in the bounceback December quarter. Occidental Petroleum is the poster child for the dynamics of this strategy.
As demonstrated in the table below, ultra-large stocks that are the staple of this Fund performed essentially in line with other large cap stocks in the December quarter. What gave us an edge for the quarter was our rebalancing, the process by which we periodically sell a portion of the Fund holdings that have appreciated the most and buy stocks that have declined the most. This has a “buy low, sell high” feel to it. Historically, over the long term — and not in every quarter or year — it has allowed our Fund to keep up with, or slightly exceed, the returns of the S&P 500 with less risk.
The poster child for this strategy in the recent period is Occidental Petroleum. Occidental declined a whopping 30.90% in the quarter ended September 30, 2011, much worse than the 10.79% decline of the Fund overall. Following our roughly equal weighting strategy, we added to this position, bringing it back up near the Fund average weight in the downturn. If it weren’t for the disciplined and mechanical nature of this Fund rebalancing, it might take a lot of “guts” to do so. But the discipline of our investment process ensures that we take this kind of emotion out of the process. It worked particularly well this quarter, as Occidental was our single best performer, up 31.67%. This one stock added a nice 0.41% to our performance relative to the S&P 500 Index in the quarter ended December 31, 2011.
| Annualized | ||||||||||||||||||||
| CRSP Decile1 | Quarter 10/1/11 to 12/31/11 | 1 Year 1/1/11 to 12/31/11 | 5 Years 1/1/07 to 12/31/11 | 10 Years to 12/31/11 | 86 Years 1/1/1926 to 12/31/11 | |||||||||||||||
1 (ultra-large) | 11.43% | 2.22% | -0.24% | 2.23% | 9.02% | |||||||||||||||
2 | 11.36% | 0.25% | 1.09% | 6.46% | 10.36% | |||||||||||||||
3 | 11.10% | -2.10% | 1.66% | 6.33% | 10.74% | |||||||||||||||
4 | 14.34% | 1.18% | 3.38% | 7.48% | 10.73% | |||||||||||||||
5 | 15.30% | -0.98% | 5.14% | 8.37% | 11.28% | |||||||||||||||
6 | 15.80% | -1.60% | 2.24% | 6.48% | 11.21% | |||||||||||||||
7 | 14.41% | -4.75% | 2.51% | 7.25% | 11.19% | |||||||||||||||
8 | 15.95% | -6.70% | 2.39% | 8.24% | 11.41% | |||||||||||||||
| 113 | Semi-Annual Report | December 31, 2011 (Unaudited) | |
Blue Chip 35 Index Fund MANAGER’S COMMENTARY (continued) | |
(Unaudited)
| Annualized | ||||||||||||||||||||
| CRSP Decile1 | Quarter 10/1/11 to 12/31/11 | 1 Year 1/1/11 to 12/31/11 | 5 Years 1/1/07 to 12/31/11 | 10 Years to 12/31/11 | 86 Years 1/1/1926 to 12/31/11 | |||||||||||||||
9 | 15.72% | -7.12% | 1.27% | 7.16% | 11.44% | |||||||||||||||
10 (ultra-small) | 10.36% | -13.98% | -0.86% | 10.11% | 12.91% | |||||||||||||||
1 The CRSP Cap-Based Portfolio Indexes are unmanaged indexes of the publicly traded U.S. stocks with dividends reinvested, grouped by market capitalization, as reported by the Center for Research in Security Prices. Past performance is no guarantee of future results.
Calendar Year Performance
The Short Version: In the midst of the European banking crisis, all of the Fund’s financial stocks finished the year in the red, creating a performance drag. Still, the market’s largest stocks carried the day, helping Blue Chip 35 Index Fund beat the S&P 500 Index for the 9th time in 14 calendar years since inception.
The markets largest stocks performed the best in 2011, providing a small, but welcome positive return. Since the inception of the Fund, every year that large companies have beaten small companies, our Fund has outperformed our primary market benchmark, the S&P 500 Index. The very largest companies shone the most, which actually created a headwind for the performance of our Fund relative to the Russell Top 50 Index. This market-cap weighted index has a tremendous weighting in the very largest names, adding to risk, but providing extra return in the recent market. For example, the largest three stocks, Exxon Mobil, Apple, and IBM recently accounted for almost 18% of the Russell Top 50 Index and about 2% of extra return relative to the more normal 8.5% weighting of these stocks in the Blue Chip 35 Index Fund.
The following are our Blue Chip stocks’ contributions to return for calendar year 2011:
| Rank | Company | Industry | % Contribution to Return | |||
1 | Visa, Inc. | IT Services | 1.2% | |||
| 2 | McDonald’s Corp. | Hotels, Restaurants & Leisure | 1.0% | |||
3 | Apple, Inc. | Computers & Peripherals | 0.8% | |||
| 4 | Pfizer, Inc. | Pharmaceuticals | 0.8% | |||
5 | International Business Machines Corp. | IT Services | 0.7% | |||
| 6 | Intel Corp. | Semiconductors & Semiconductor Equipment | 0.6% | |||
7 | Chevron Corp. | Oil, Gas & Consumable Fuels | 0.6% | |||
| 8 | Abbott Laboratories | Pharmaceuticals | 0.5% | |||
9 | Exxon Mobil Corp. | Oil, Gas & Consumable Fuels | 0.5% | |||
| 10 | Verizon Communications, Inc. | Diversified Telecommunication Services | 0.5% | |||
11 | CVS Caremark Corp. | Food & Staples Retailing | 0.5% | |||
| 12 | Wal-Mart Stores, Inc. | Food & Staples Retailing | 0.4% | |||
13 | ConocoPhillips | Oil, Gas & Consumable Fuels | 0.4% | |||
| 14 | Merck & Co., Inc. | Pharmaceuticals | 0.3% | |||
15 | Johnson & Johnson | Pharmaceuticals | 0.3% | |||
| 16 | AT&T, Inc. | Diversified Telecommunication Services | 0.2% | |||
17 | Coca-Cola Co. (The) | Beverages | 0.2% | |||
| 18 | Procter & Gamble Co. (The) | Household Products | 0.2% | |||
19 | Google, Inc. | Internet Software & Services | 0.2% | |||
| 20 | Monsanto Co. | Chemicals | 0.2% | |||
21 | United Parcel Service, Inc. | Air Freight & Logistics | 0.1% | |||
| 22 | Occidental Petroleum Corp. | Oil, Gas & Consumable Fuels | 0.1% |
| www.bridgeway.com | 114 | |
Blue Chip 35 Index Fund MANAGER’S COMMENTARY (continued) | |
(Unaudited)
| Rank | Company | Industry | % Contribution to Return | |||
23 | PepsiCo, Inc. | Food, Beverage & Tobacco | 0.1% | |||
24 | General Electric Co. | Capital Goods | 0.1% | |||
25 | 3M Co. | Capital Goods | 0.0% | |||
26 | Berkshire Hathaway, Inc. | Insurance | -0.1% | |||
27 | United Technologies Corp. | Capital Goods | -0.1% | |||
28 | Microsoft Corp. | Software & Services | -0.1% | |||
29 | Cisco Systems, Inc. | Technology, Hardware & Equipment | -0.2% | |||
30 | Wells Fargo & Co. | Banks | -0.2% | |||
31 | Oracle Corp. | Software & Services | -0.4% | |||
32 | Schlumberger Ltd. | Energy | -0.4% | |||
33 | JPMorgan Chase & Co. | Diversified Financial Services | -0.5% | |||
34 | Hewlett-Packard Co. | Technology, Hardware & Equipment | -1.2% | |||
35 | Goldman Sachs Group, Inc. | Diversified Financial Services | -1.6% | |||
36 | Bank of America Corp. | Diversified Financial Services | -2.1% |
What Worked
Is Visa a tech company? A financial company? A retail company? Actually, some analysts probably would say... Yes, Yes, and Yes. As the firm that operates the world’s largest retail electronic payments network, Visa wears many hats. Interestingly, folks may be surprised to learn that the company itself does not issue credit or debit cards or set any interest rates or transaction fees. Instead, its operations consists of facilitating business among financial institutions, retailers, consumers, and other corporate and government entities by allowing for the transfer of information and currency through its network. With the labor market improving and consumers emerging from hibernation during the calendar year, business at Visa has been pretty good. Its earnings have jumped in recent quarters by double digits and sales growth has also been solid. The company maintains attractive margins and virtually no debt. Some analysts worried about its transaction-driven operations, because of financial reform legislation. Banks and others investment institutions were impacted far more than credit/debit card companies. Visa continues to look to the future and has its eyes set on international expansion through its recent acquisition of Fundamo. It also stands to benefit from the growing global trend that shows consumers shifting to additional purchases with plastic (cards) as opposed to paper (cash). For the calendar year, Visa’s share price jumped over 40%; the holding contributed over a percent to the return of the Fund. It closed 2011 near the 52-week high.
What Didn’t Work
While many companies across various sectors have started to put the financial debacle and economic recession in the rear-view mirror, certain “too big to fail” financial institutions are struggling to rediscover themselves as enhanced regulations force them to change their business models. Once mighty Goldman Sachs looked in the mirror in calendar year 2011 and didn’t like what it saw. Its investment banking fees were down when underwriting came to a virtual standstill during the latter half of the year; additionally, Goldman’s mergers & acquisitions advisory business was off; market making revenues declined; and its own investment portfolio plummeted. It lost a cool $1 billion in its investment in Commercial Bank of China and its debt portfolio has performed almost as poorly. The ongoing issues in Europe are not helping matters. In October 2011, the company posted only its second quarterly loss since going public in 1999; some analysts expect more of the same in the coming year. After all, the Fed threatens to increase banks’ capital requirements and the proposed Volcker Rule looks to ban proprietary trading. Suddenly, Goldman Sachs, known for its successful risk-taking ventures, could find itself without some of its bread and butter operations. Throughout the year, management has taken steps to reverse the negative trend. It announced a major $1.2 billion cost-cutting campaign and bought back considerable shares of its stock. And for his troubles, CEO Blankfein was given a salary bump from $600,000 to $2 million. For the calendar year, Goldman Sachs’ share price dropped over 45% and cost the Fund about one and one-half percent in performance.
| 115 | Semi-Annual Report | December 31, 2011 (Unaudited) | |
Blue Chip 35 Index Fund MANAGER’S COMMENTARY (continued) | |
(Unaudited)
Industry Sector Representation as of December 31, 2011
The largest sector representation of our Fund is in Information Technology, which comprised 27.4% of the Fund at December quarter end, about 8% more than the S&P 500 Index. Consumer discretionary stocks were the most underweighted at a little less than 7%.
| % of Net Assets | % of S&P 500 Index | Difference | ||||
Consumer Discretionary | 3.7% | 10.3% | -6.6% | |||
Consumer Staples | 13.4% | 11.6% | 1.8% | |||
Energy | 13.4% | 12.4% | 1.0% | |||
Financials | 13.0% | 13.5% | -0.5% | |||
Health Care | 10.8% | 11.9% | -1.1% | |||
Industrials | 10.4% | 10.8% | -0.4% | |||
Information Technology | 27.4% | 19.2% | 8.2% | |||
Materials | 2.6% | 3.4% | -0.8% | |||
Telecommunication Services | 5.2% | 3.1% | 2.1% | |||
Utilities | 0.0% | 3.8% | -3.8% | |||
Cash & Other Assets | 0.1% | 0.0% | 0.1% | |||
Total | 100.0% | 100.0% |
Disclaimer
The views expressed here are exclusively those of Fund management. These views, including those related to market sectors or individual stocks, are not meant as investment advice and should not be considered predictive in nature. Any favorable (or unfavorable) description of a holding applies only as of December 31, 2011, unless otherwise stated. Security positions can and do change thereafter. Discussions of historical performance do not guarantee and are not indicative of future performance.
The Fund is subject to significant market risk (volatility) and is not an appropriate investment for short-term investors.
Conclusion
Thank you for your continued investment in Blue Chip 35 Index Fund. We encourage your feedback; your reactions and concerns are important to us.
Sincerely,
The Investment Management Team
| www.bridgeway.com | 116 | |
Bridgeway Blue Chip 35 Index Fund | |
| Showing percentage of net assets as of December 31, 2011 (Unaudited) |
Industry | Company | Shares | Value | |||||||
COMMON STOCKS - 99.84% |
| |||||||||
Aerospace & Defense - 2.60% |
| |||||||||
United Technologies Corp. | 118,580 | $ | 8,667,012 | |||||||
Air Freight & Logistics - 2.60% |
| |||||||||
United Parcel Service, Inc., Class B | 118,263 | 8,655,669 | ||||||||
Beverages - 5.28% |
| |||||||||
Coca-Cola Co. (The) | 125,057 | 8,750,238 | ||||||||
PepsiCo, Inc. | 133,250 | 8,841,138 | ||||||||
|
| |||||||||
| 17,591,376 | ||||||||||
Capital Markets - 2.59% |
| |||||||||
Goldman Sachs Group, Inc. (The) | 95,500 | 8,636,065 | ||||||||
Chemicals - 2.61% |
| |||||||||
Monsanto Co. | 124,350 | 8,713,205 | ||||||||
Commercial Banks - 2.63% |
| |||||||||
Wells Fargo & Co. | 318,059 | 8,765,706 | ||||||||
Communications Equipment - 2.59% |
| |||||||||
Cisco Systems, Inc. | 477,708 | 8,636,961 | ||||||||
Computers & Peripherals - 6.39% |
| |||||||||
Apple, Inc.* | 31,300 | 12,676,500 | ||||||||
Hewlett-Packard Co. | 335,300 | 8,637,328 | ||||||||
|
| |||||||||
| 21,313,828 | ||||||||||
Diversified Financial Services - 5.23% |
| |||||||||
Bank of America Corp. | 1,577,308 | 8,769,832 | ||||||||
JPMorgan Chase & Co. | 260,595 | 8,664,784 | ||||||||
| 17,434,616 | ||||||||||
Diversified Telecommunication Services - 5.22% |
| |||||||||
AT&T, Inc. | 286,125 | 8,652,420 | ||||||||
Verizon Communications, Inc. | 217,689 | 8,733,683 | ||||||||
|
| |||||||||
| 17,386,103 | ||||||||||
Energy Equipment & Services - 2.59% |
| |||||||||
Schlumberger, Ltd. | 126,500 | 8,641,215 | ||||||||
Food & Staples Retailing - 5.54% |
| |||||||||
CVS Caremark Corp. | 240,500 | 9,807,590 | ||||||||
Wal-Mart Stores, Inc. | 144,919 | 8,660,359 | ||||||||
|
| |||||||||
| 18,467,949 | ||||||||||
Hotels, Restaurants & Leisure - 3.66% |
| |||||||||
McDonald’s Corp. | 121,600 | 12,200,128 | ||||||||
Industry | Company | Shares | Value | |||||||
Household Products - 2.60% |
| |||||||||
Procter & Gamble Co. (The) | 129,826 | $ | 8,660,692 | |||||||
Industrial Conglomerates - 5.22% |
| |||||||||
3M Co. | 106,650 | 8,716,505 | ||||||||
General Electric Co. | 485,543 | 8,696,075 | ||||||||
|
| |||||||||
| 17,412,580 | ||||||||||
Insurance - 2.59% |
| |||||||||
Berkshire Hathaway, Inc., Class B* | 113,150 | 8,633,345 | ||||||||
Internet Software & Services - 2.96% |
| |||||||||
Google, Inc., Class A* | 15,280 | 9,869,352 | ||||||||
IT Services - 6.92% |
| |||||||||
International Business Machines Corp. | 57,067 | 10,493,480 | ||||||||
Visa, Inc., Class A | 123,850 | 12,574,490 | ||||||||
|
| |||||||||
| 23,067,970 | ||||||||||
Oil, Gas & Consumable Fuels - 10.77% |
| |||||||||
Chevron Corp. | 81,695 | 8,692,348 | ||||||||
ConocoPhillips | 120,515 | 8,781,928 | ||||||||
Exxon Mobil Corp. | 103,187 | 8,746,130 | ||||||||
Occidental Petroleum Corp. | 103,150 | 9,665,155 | ||||||||
|
| |||||||||
| 35,885,561 | ||||||||||
Pharmaceuticals - 10.77% |
| |||||||||
Abbott Laboratories | 155,600 | 8,749,388 | ||||||||
Johnson & Johnson | 131,152 | 8,600,948 | ||||||||
Merck & Co., Inc. | 231,235 | 8,717,560 | ||||||||
Pfizer, Inc. | 453,544 | 9,814,692 | ||||||||
|
| |||||||||
| 35,882,588 | ||||||||||
Semiconductors & Semiconductor Equipment - 3.26% |
| |||||||||
Intel Corp. | 448,543 | 10,877,168 | ||||||||
Software - 5.22% |
| |||||||||
Microsoft Corp. | 336,645 | 8,739,304 | ||||||||
Oracle Corp. | 337,413 | 8,654,644 | ||||||||
|
| |||||||||
| 17,393,948 | ||||||||||
|
| |||||||||
| TOTAL COMMON STOCKS - 99.84% | 332,793,037 | |||||||||
|
| |||||||||
| (Cost $269,535,726) | ||||||||||
| 117 | Semi-Annual Report | December 31, 2011 (Unaudited) | |
Bridgeway Blue Chip 35 Index Fund SCHEDULE OF INVESTMENTS (continued) | |
| Showing percentage of net assets as of December 31, 2011 (Unaudited) |
| Rate^ | Shares | Value | ||||||||
| MONEY MARKET FUND - 0.02% | ||||||||||
BlackRock FedFund | 0.01% | 71,039 | $ | 71,039 | ||||||
|
| |||||||||
TOTAL MONEY MARKET FUND - 0.02% |
| 71,039 | ||||||||
|
| |||||||||
(Cost $71,039) | ||||||||||
TOTAL INVESTMENTS - 99.86% | $ | 332,864,076 | ||||||||
(Cost $269,606,765) | ||||||||||
Other Assets in Excess of Liabilities - 0.14% | 472,991 | |||||||||
|
| |||||||||
NET ASSETS - 100.00% | $ | 333,337,067 | ||||||||
|
| |||||||||
* Non-income producing security. ^ Rate disclosed as of December 31, 2011. |
| |||||||||
Summary of inputs used to value the Fund’s investments as of 12/31/2011 is as follows (See Note 2 in Notes to Financial Statements):
|
| |||||||||||||||
| Valuation Inputs | ||||||||||||||||
| ||||||||||||||||
| Investment in Securities (Value) | ||||||||||||||||
| ||||||||||||||||
Level 1 Quoted Prices | Level 2 Significant Observable Inputs | Level 3 Significant Unobservable Inputs | Total | |||||||||||||
| ||||||||||||||||
Common | $ | 332,793,037 | $ | — | $ | — | $ | 332,793,037 | ||||||||
Money | — | 71,039 | — | 71,039 | ||||||||||||
|
|
|
|
|
|
|
| |||||||||
TOTAL | $ | 332,793,037 | $ | 71,039 | $ | — | $ | 332,864,076 | ||||||||
|
|
|
|
|
|
|
| |||||||||
See Notes to Financial Statements. |
| |||||||||||||||
| www.bridgeway.com | 118 | |
| ||
| (Unaudited) | ||
| December 31, 2011 | ||
Dear Fellow Managed Volatility Fund Shareholder:
For the quarter ended December 31, 2011, our Fund gained 8.98%, trailing the S&P 500 Index (+11.82%), but capturing 76% of the Index return, better than our 40+% target. The Fund outperformed our peer benchmark, the Lipper Balanced Funds Index (+6.50%), and the Bloomberg/EFFAS U.S. Government 1-3 Year Total Return Bond Index (+0.18%). It was a very good quarter on an absolute and relative basis, and we are quite pleased with the results.
For the six month semi-annual period ended December 31, 2011, our Fund declined 0.43%, outperforming the S&P 500 Index (-3.69%) and the Lipper Balanced Funds Index (-3.75%). The Fund underperformed the Bloomberg/EFFAS U.S. Government 1-3 Year Total Return Bond Index (+0.72%).
For the 2011 calendar year, our Fund appreciated 1.94%, trailing the S&P 500 Index (+2.11%), but capturing 92% of the Index return, better than our 40+% goal, with only 50% of the risk (as measured by the standard deviation of monthly returns). We outperformed each of our other benchmarks for the calendar year, as seen in the table below.
This hybrid Fund invests in both equity and fixed-income securities, while incorporating an options strategy designed to produce a conservative, lower-volatility Fund. We may look poor relative to the stock market during sharply rising markets and conversely, look good relative to a sharply declining market. In essence, we are “managing” volatility to provide the Fund with more stable returns over a wide range of fixed-income and equity market environments.
The table below presents our quarter, six-month, one-year, five-year, ten-year and life-to-date financial results. A graph of quarterly performance since inception appears on the following page.
| Annualized | ||||||||||||||||||||||||
| Quarter 10/1/11 to 12/31/11 | 6 Months to 12/31/11 | 1 Year 1/1/11 to 12/31/11 | 5 Years 1/1/07 to 12/31/11 | 10 Years 1/1/02 to 12/31/11 | Life-to-Date to 12/31/11 | |||||||||||||||||||
Managed Volatility Fund | 8.98% | -0.43% | 1.94% | 0.74% | 3.77% | 3.36% | ||||||||||||||||||
S&P 500 Index | 11.82% | -3.69% | 2.11% | -0.25% | 2.92% | 2.22% | ||||||||||||||||||
Bloomberg/EFFAS U.S. Government 1-3 | ||||||||||||||||||||||||
Year Total Return Bond Index | 0.18% | 0.72% | 1.74% | 3.77% | 3.30% | 3.55% | ||||||||||||||||||
Lipper Balanced Funds Index | 6.50% | -3.75% | 0.74% | 1.80% | 4.13% | 3.77% | ||||||||||||||||||
Performance figures quoted in the table above and graph below represent past performance and are no guarantee of future results. Total return figures in the table above include the reinvestment of dividends and capital gains. The table above and the graph below do not reflect the deduction of taxes that a shareholder would pay on Fund distributions or the redemption of Fund shares.
The S&P 500 Index is a broad-based, unmanaged measurement of changes in stock market conditions, based on the average of 500 widely held common stocks with dividends reinvested. The Bloomberg/ EFFAS U.S. Government 1-3 year Total Return Bond Index is a transparent benchmark for the total return of the 1-3 year U.S. Government bond market. The Lipper Balanced Funds Index is an index of balanced funds compiled by Lipper, Inc. It is not possible to invest directly in an index.
According to data from Lipper, Inc. as of December 31, 2011, the Managed Volatility Fund ranked 116th of 483 Mixed-Asset Target Allocation Moderate funds for the calendar year ended December 31, 2011, 307th of 398 for the past five years, 111th of 183 for the past ten years and 105th of 174 funds since inception on June 30, 2001. Lipper, Inc. is an independent mutual fund rating service that ranks funds in various fund categories by making comparative calculations using total returns.
| 119 | Semi-Annual Report | December 31, 2011 (Unaudited) | |
Managed Volatility Fund MANAGER’S COMMENTARY (continued) | |
| (Unaudited) | ||
According to data from Morningstar as of December 31, 2011, the Managed Volatility Fund ranked 35th of 145 Long-Short Equity funds for the calendar year ended December 31, 2011, 20th out of 50 funds for five years and 7th out of 14 funds for ten years. Morningstar ranks funds in various fund categories by making comparative calculations using total returns.
Managed Volatility Fund vs. S&P 500 Index, Bloomberg/EFFAS Bond Index & Lipper Balanced Funds Index
from Inception 6/30/01 to 12/31/11
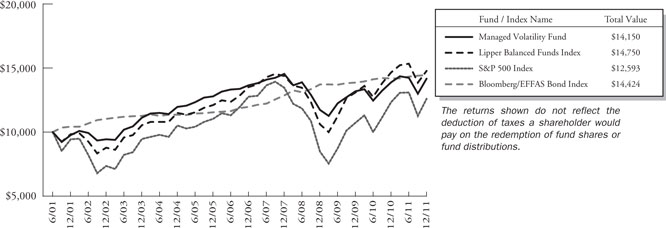
Detailed Explanation of Quarterly Performance
The Short Version: Energy and Industrial stocks added the most to Fund returns for the quarter. All sectors had a positive contribution to return for the quarter.
Energy companies led the positive charge in the quarter as the cost of oil rose to $100/barrel and helped give a boost to exploration and production companies. The surge in crude prices and prospects for even higher prices occurred as threats of a nuclear Iran cast uncertainty over future supplies. Some Industrials rebounded nicely after the third quarter.
Detailed Explanation of Calender Year Performance
The Short Version: Although 2011 was a rough year for the stock picking portion of our Fund, our option writing strategy worked very well and helped us exceed our target of more than 40% of Index returns in an up market.
Although the September quarter was not favorable to the growth oriented stock picking models used in 15% of this Fund, our options writing strategy added significant value, as expected in the environment of low returns (i.e. within the range of returns from negative 5% to positive 5%) of calendar year 2011.
Top Ten Holdings as of December 31, 2011
Energy and Insurance made up a majority of our Fund’s top ten holdings. However, this is a very diversified Fund, and added together, all ten positions only comprised 13% of total Fund net assets.
| www.bridgeway.com | 120 | |
Managed Volatility Fund MANAGER’S COMMENTARY (continued) | |
(Unaudited)
| Rank | Description | Industry | % of Net Assets | |||
| 1 | Berkshire Hathaway, Inc. | Insurance | 1.8% | |||
| 2 | Chubb Corp. (The) | Insurance | 1.7% | |||
| 3 | Exxon Mobil Corp. | Oil, Gas & Consumable Fuels | 1.7% | |||
| 4 | Chevron Corp. | Oil, Gas & Consumable Fuels | 1.4% | |||
| 5 | Apple, Inc. | Computers & Peripherals | 1.3% | |||
| 6 | Coca-Cola Enterprises, Inc. | Beverages | 1.2% | |||
| 7 | AutoZone, Inc. | Specialty Retail | 1.1% | |||
| 8 | Travelers Cos., Inc. (The) | Insurance | 1.0% | |||
| 9 | WellPoint, Inc. | Health Care Providers & Services | 1.0% | |||
| 10 | RPC, Inc. | Energy Equipment & Services | 1.0% | |||
Total | 13.2% |
Industry Sector Representation as of December 31, 2011
Our largest sector concentration was a low 10.3% of Fund net assets, further demonstrating the highly diversified nature of this Fund.
| Asset Type | % of Net Assets | |||||||
Common Stock | 57.2% | |||||||
Consumer Discretionary | 5.3% | |||||||
Consumer Staples | 6.8% | |||||||
Energy | 7.0% | |||||||
Financials | 9.5% | |||||||
Health Care | 5.5% | |||||||
Industrials | 6.8% | |||||||
Information Technology | 10.3% | |||||||
Materials | 2.6% | |||||||
Telecommunication Services | 1.1% | |||||||
Utilities | 2.3% | |||||||
U.S. Government Obligations | 35.9% | |||||||
Covered Call Options Written | -1.0% | |||||||
Put Options Written | -0.7% | |||||||
Money Market Funds | 8.5% | |||||||
Other Assets in Excess of Liabilities | 0.1% | |||||||
Total | 100.0% | |||||||
Disclaimer
The views expressed here are exclusively those of Fund management. These views, including those related to market sectors or individual stocks, are not meant as investment advice and should not be considered predictive in nature. Any favorable (or unfavorable) description of a holding applies only as of December 31, 2011, unless otherwise stated. Security positions can and do change thereafter. Discussions of historical performance do not guarantee and are not indicative of future performance.
Market volatility can significantly affect short-term performance. The Fund is not an appropriate investment for short-term investors. Investments in the small companies within this multi-cap fund generally carry greater risk than is customarily associated with larger companies. This additional risk is attributable to a number of factors, including the relatively limited financial resources that are typically available to small companies, and the fact that small companies often have comparatively limited product lines. In addition, the stock of small companies tends to be more volatile than the stock of large companies, particularly in the short term and particularly in the early stages of an economic or market downturn. The Fund’s use of options,
| 121 | Semi-Annual Report | December 31, 2011 (Unaudited) | |
Managed Volatility Fund MANAGER’S COMMENTARY (continued) | |
(Unaudited)
futures, and leverage can magnify the risk of loss in an unfavorable market, and the Fund’s use of short-sale positions can, in theory, expose shareholders to unlimited loss. Shareholders of the Fund, therefore, are taking on more risk than they would if they invested in the stock market as a whole. The Fund uses an option writing strategy in which the Fund may sell covered calls or secured put options. Up to 75% of Fund assets may be invested in options. Options are subject to special risks and may not fully protect the Fund against declines in the value of its stocks. In addition, an option writing strategy limits the upside profit potential normally associated with stocks. Finally, the Fund’s fixed-income holdings are subject to three types of risk. Interest rate risk is the chance that bond prices overall will decline as interest rates rise. Credit risk is the chance that a bond issuer will fail to pay interest and principal. Prepayment risk is the chance that a mortgage-backed bond issuer will repay a higher yielding bond, resulting in a lower paying yield.
Conclusion
In closing, we would like to thank you for your continued investment in the Managed Volatility Fund. We encourage your feedback; your reactions and concerns are important to us.
Sincerely,
Your Investment Management Team
| www.bridgeway.com | 122 | |
| Bridgeway Managed Volatility Fund | |
Showing percentage of net assets as of December 31, 2011 (Unaudited)
Industry | Company | Shares | Value | |||||||
COMMON STOCKS - 57.32% |
| |||||||||
Aerospace & Defense - 2.10% |
| |||||||||
Honeywell International, Inc. | 2,100 | $ | 114,135 | |||||||
L-3 Communications | ||||||||||
Holdings, Inc.# | 3,500 | 233,380 | ||||||||
Lockheed Martin Corp. | 870 | 70,383 | ||||||||
Northrop Grumman Corp.# | 800 | 46,784 | ||||||||
United Technologies Corp. | 940 | 68,705 | ||||||||
|
| |||||||||
| 533,387 | ||||||||||
Air Freight & Logistics - 0.39% |
| |||||||||
FedEx Corp. | 1,200 | 100,212 | ||||||||
Beverages - 2.78% |
| |||||||||
Brown-Forman Corp., Class B | 2,950 | 237,504 | ||||||||
Coca-Cola Co. (The)# | 2,500 | 174,925 | ||||||||
Coca-Cola Enterprises, Inc.# | 11,500 | 296,470 | ||||||||
|
| |||||||||
| 708,899 | ||||||||||
Biotechnology - 0.55% |
| |||||||||
Gilead Sciences, Inc.*# | 3,400 | 139,162 | ||||||||
Capital Markets - 0.89% |
| |||||||||
Ameriprise Financial, Inc.# | 2,080 | 103,251 | ||||||||
Bank of New York Mellon Corp. (The)# | 1,032 | 20,547 | ||||||||
Charles Schwab Corp. (The) | 3,500 | 39,410 | ||||||||
Morgan Stanley# | 800 | 12,104 | ||||||||
State Street Corp.# | 1,300 | 52,403 | ||||||||
|
| |||||||||
| 227,715 | ||||||||||
Chemicals - 1.75% |
| |||||||||
Dow Chemical Co. (The)# | 3,900 | 112,164 | ||||||||
Monsanto Co. | 500 | 35,035 | ||||||||
Sherwin-Williams Co. (The) | 600 | 53,562 | ||||||||
Sigma-Aldrich Corp. | 700 | 43,722 | ||||||||
Westlake Chemical Corp.# | 5,000 | 201,200 | ||||||||
|
| |||||||||
| 445,683 | ||||||||||
Commercial Banks - 1.31% |
| |||||||||
Comerica, Inc. | 1,600 | 41,280 | ||||||||
KeyCorp | 3,700 | 28,453 | ||||||||
US Bancorp# | 4,100 | 110,905 | ||||||||
Wells Fargo & Co.# | 5,571 | 153,537 | ||||||||
|
| |||||||||
| 334,175 | ||||||||||
Communications Equipment - 1.06% |
| |||||||||
Cisco Systems, Inc. | 14,100 | 254,928 | ||||||||
Juniper Networks, Inc.*# | 700 | 14,287 | ||||||||
|
| |||||||||
| 269,215 | ||||||||||
Industry | Company | Shares | Value | |||||||
Computers & Peripherals - 2.00% |
| |||||||||
Apple, Inc.* | 800 | $ | 324,000 | |||||||
Lexmark International, Inc., | ||||||||||
Class A# | 2,800 | 92,596 | ||||||||
SanDisk Corp.*# | 1,900 | 93,499 | ||||||||
|
| |||||||||
| 510,095 | ||||||||||
Consumer Finance - 0.81% |
| |||||||||
American Express Co. | 1,500 | 70,755 | ||||||||
Capital One Financial | ||||||||||
Corp.# | 3,200 | 135,328 | ||||||||
|
| |||||||||
| 206,083 | ||||||||||
Containers & Packaging - 0.49% |
| |||||||||
Ball Corp.# | 3,500 | 124,985 | ||||||||
Diversified Financial Services - 1.24% |
| |||||||||
Bank of America Corp. | 10,800 | 60,048 | ||||||||
Citigroup, Inc. | 510 | 13,418 | ||||||||
JPMorgan Chase & Co.# | 7,300 | 242,725 | ||||||||
|
| |||||||||
| 316,191 | ||||||||||
Diversified Telecommunication Services - 0.88% |
| |||||||||
AT&T, Inc. | 5,400 | 163,296 | ||||||||
Frontier Communications Corp. | 672 | 3,461 | ||||||||
Verizon Communications, | ||||||||||
Inc. | 1,400 | 56,168 | ||||||||
|
| |||||||||
| 222,925 | ||||||||||
Electric Utilities - 0.65% |
| |||||||||
American Electric Power | ||||||||||
Co., Inc. | 1,600 | 66,096 | ||||||||
Exelon Corp. | 1,100 | 47,707 | ||||||||
Progress Energy, Inc. | 900 | 50,418 | ||||||||
|
| |||||||||
| 164,221 | ||||||||||
Electrical Equipment - 0.20% |
| |||||||||
Emerson Electric Co. | 1,100 | 51,249 | ||||||||
Electronic Equipment, Instruments & Components - 0.17% |
| |||||||||
Corning, Inc.# | 1,000 | 12,980 | ||||||||
FLIR Systems, Inc. | 1,200 | 30,084 | ||||||||
|
| |||||||||
| 43,064 | ||||||||||
Energy Equipment & Services - 1.73% |
| |||||||||
Halliburton Co.# | 3,500 | 120,785 | ||||||||
National Oilwell Varco, Inc. | 800 | 54,392 | ||||||||
RPC, Inc.# | 14,500 | 264,625 | ||||||||
|
| |||||||||
| 439,802 | ||||||||||
| 123 | Semi-Annual Report | December 31, 2011 (Unaudited) | |
Bridgeway Managed Volatility Fund SCHEDULE OF INVESTMENTS (continued) | |
| Showing percentage of net assets as of December 31, 2011 (Unaudited) |
Industry | Company | Shares | Value | |||||||
Common Stocks (continued) |
| |||||||||
Food & Staples Retailing - 1.62% |
| |||||||||
CVS Caremark Corp.# | 2,900 | $ | 118,262 | |||||||
Kroger Co. (The) | 1,000 | 24,220 | ||||||||
Safeway, Inc.# | 2,900 | 61,016 | ||||||||
Wal-Mart Stores, Inc.# | 3,500 | 209,160 | ||||||||
|
| |||||||||
| 412,658 | ||||||||||
Food Products - 1.21% |
| |||||||||
Archer-Daniels-Midland Co.# | 2,500 | 71,500 | ||||||||
General Mills, Inc. | 2,400 | 96,984 | ||||||||
Mead Johnson Nutrition Co. | 2,016 | 138,560 | ||||||||
|
| |||||||||
| 307,044 | ||||||||||
Health Care Equipment & Supplies - 0.73% |
| |||||||||
Baxter International, Inc. | 1,300 | 64,324 | ||||||||
Becton Dickinson & Co. | 220 | 16,438 | ||||||||
CR Bard, Inc. | 500 | 42,750 | ||||||||
Stryker Corp.# | 1,260 | 62,635 | ||||||||
|
| |||||||||
| 186,147 | ||||||||||
Health Care Providers & Services - 2.15% |
| |||||||||
Express Scripts, Inc.*# | 1,500 | 67,035 | ||||||||
Laboratory Corp. of America Holdings* | 300 | 25,791 | ||||||||
Medco Health Solutions, Inc.*# | 1,400 | 78,260 | ||||||||
Quest Diagnostics, Inc.# | 800 | 46,448 | ||||||||
UnitedHealth Group, Inc. | 1,300 | 65,884 | ||||||||
WellPoint, Inc.# | 4,000 | 265,000 | ||||||||
|
| |||||||||
| 548,418 | ||||||||||
Hotels, Restaurants & Leisure - 0.35% |
| |||||||||
McDonald’s Corp. | 900 | 90,297 | ||||||||
Household Products - 1.28% |
| |||||||||
Colgate-Palmolive Co. | 1,500 | 138,585 | ||||||||
Kimberly-Clark Corp. | 1,000 | 73,560 | ||||||||
Procter & Gamble Co. (The)# | 1,700 | 113,407 | ||||||||
|
| |||||||||
| 325,552 | ||||||||||
Independent Power Producers & Energy Traders - 0.28% |
| |||||||||
AES Corp. (The)*# | 6,100 | 72,224 | ||||||||
Industrial Conglomerates - 1.19% |
| |||||||||
3M Co.# | 1,000 | 81,730 | ||||||||
Danaher Corp.# | 3,000 | 141,120 | ||||||||
General Electric Co. | 4,500 | 80,595 | ||||||||
|
| |||||||||
| 303,445 | ||||||||||
Insurance - 5.13% |
| |||||||||
Aflac, Inc. | 800 | 34,608 | ||||||||
Industry | Company | Shares | Value | |||||||
Insurance (continued) |
| |||||||||
Aon Corp.# | 1,700 | $ | 79,560 | |||||||
Berkshire Hathaway, Inc., Class B* | 6,000 | 457,800 | ||||||||
Chubb Corp. (The)# | 6,300 | 436,086 | ||||||||
Progressive Corp. (The)# | 1,620 | 31,606 | ||||||||
Travelers Cos., Inc. (The)# | 4,500 | 266,265 | ||||||||
|
| |||||||||
| 1,305,925 | ||||||||||
Internet & Catalog Retail - 0.34% |
| |||||||||
Amazon.com, Inc.*# | 500 | 86,550 | ||||||||
Internet Software & Services - 0.86% |
| |||||||||
eBay, Inc.*# | 3,000 | 90,990 | ||||||||
Google, Inc., Class A* | 200 | 129,180 | ||||||||
|
| |||||||||
| 220,170 | ||||||||||
IT Services - 2.89% |
| |||||||||
Fidelity National Information Services, Inc.# | 7,500 | 199,425 | ||||||||
International Business Machines Corp. | 1,200 | 220,656 | ||||||||
Teradata Corp.*# | 3,200 | 155,232 | ||||||||
Visa, Inc., Class A | 1,300 | 131,989 | ||||||||
Western Union Co. (The)# | 1,500 | 27,390 | ||||||||
|
| |||||||||
| 734,692 | ||||||||||
Leisure Equipment & Products - 0.19% |
| |||||||||
Hasbro, Inc.# | 1,500 | 47,835 | ||||||||
Life Sciences Tools & Services - 0.21% |
| |||||||||
Thermo Fisher Scientific, Inc.* | 1,200 | 53,964 | ||||||||
Machinery - 1.76% |
| |||||||||
Eaton Corp.# | 4,800 | 208,944 | ||||||||
Sauer-Danfoss, Inc.*# | 5,500 | 199,155 | ||||||||
Titan International, Inc.# | 2,000 | 38,920 | ||||||||
|
| |||||||||
| 447,019 | ||||||||||
Media - 1.50% |
| |||||||||
Comcast Corp., Class A# | 6,450 | 152,929 | ||||||||
News Corp., Class A# | 6,600 | 117,744 | ||||||||
Omnicom Group, Inc. | 1,000 | 44,580 | ||||||||
Time Warner, Inc.# | 1,833 | 66,245 | ||||||||
|
| |||||||||
| 381,498 | ||||||||||
Metals & Mining - 0.08% |
| |||||||||
United States Steel Corp.#+ | 800 | 21,168 | ||||||||
Multiline Retail - 0.31% |
| |||||||||
Big Lots, Inc.* | 2,100 | 79,296 | ||||||||
| www.bridgeway.com | 124 | |
Bridgeway Managed Volatility Fund SCHEDULE OF INVESTMENTS (continued) | |
| Showing percentage of net assets as of December 31, 2011 (Unaudited) |
Industry | Company | Shares | Value | |||||||
Common Stocks (continued) |
| |||||||||
Multi-Utilities - 1.34% |
| |||||||||
Dominion Resources, Inc. | 1,920 | $ | 101,914 | |||||||
Public Service Enterprise Group, Inc.# | 2,600 | 85,826 | ||||||||
Sempra Energy# | 2,800 | 154,000 | ||||||||
|
| |||||||||
| 341,740 | ||||||||||
Oil, Gas & Consumable Fuels - 5.30% |
| |||||||||
Anadarko Petroleum Corp. | 1,000 | 76,330 | ||||||||
Apache Corp. | 500 | 45,290 | ||||||||
Chesapeake Energy Corp. | 1,000 | 22,290 | ||||||||
Chevron Corp. | 3,378 | 359,419 | ||||||||
ConocoPhillips# | 1,687 | 122,932 | ||||||||
EOG Resources, Inc. | 1,500 | 147,765 | ||||||||
Exxon Mobil Corp.# | 5,000 | 423,800 | ||||||||
Occidental Petroleum Corp. | 1,200 | 112,440 | ||||||||
Peabody Energy Corp.# | 1,200 | 39,732 | ||||||||
|
| |||||||||
| 1,349,998 | ||||||||||
Paper & Forest Products - 0.23% |
| |||||||||
International Paper Co.# | 2,000 | 59,200 | ||||||||
Pharmaceuticals - 1.86% |
| |||||||||
Allergan, Inc.# | 1,200 | 105,288 | ||||||||
Bristol-Myers Squibb Co.# | 4,079 | 143,744 | ||||||||
Merck & Co., Inc. | 1,600 | 60,320 | ||||||||
Pfizer, Inc. | 7,600 | 164,464 | ||||||||
|
| |||||||||
| 473,816 | ||||||||||
Road & Rail - 0.83% |
| |||||||||
Union Pacific Corp.# | 2,000 | 211,880 | ||||||||
Semiconductors & Semiconductor Equipment - 1.84% |
| |||||||||
Broadcom Corp., Class A*# | 2,000 | 58,720 | ||||||||
GT Advanced Technologies, Inc.*# | 26,500 | 191,860 | ||||||||
Intel Corp. | 6,500 | 157,625 | ||||||||
Texas Instruments, Inc.# | 2,070 | 60,258 | ||||||||
|
| |||||||||
| 468,463 | ||||||||||
Software - 1.52% |
| |||||||||
BMC Software, Inc.* | 520 | 17,045 | ||||||||
Citrix Systems, Inc.* | 1,400 | 85,008 | ||||||||
Intuit, Inc. | 1,400 | 73,626 | ||||||||
Microsoft Corp.# | 3,300 | 85,668 | ||||||||
Oracle Corp. | 4,860 | 124,659 | ||||||||
|
| |||||||||
| 386,006 | ||||||||||
Specialty Retail - 2.02% |
| |||||||||
AutoZone, Inc.* | 900 | 292,473 | ||||||||
Gap, Inc. (The)# | 11,000 | 204,050 | ||||||||
Industry | Company | Shares | Value | |||||||
Specialty Retail (continued) |
| |||||||||
Staples, Inc. | 1,250 | $ | 17,362 | |||||||
|
| |||||||||
| 513,885 | ||||||||||
Textiles, Apparel & Luxury Goods - 0.57% |
| |||||||||
NIKE, Inc., Class B | 1,500 | 144,555 | ||||||||
Thrifts & Mortgage Finance - 0.12% |
| |||||||||
Hudson City Bancorp, Inc.# | 4,800 | 30,000 | ||||||||
Trading Companies & Distributors - 0.37% |
| |||||||||
W.W. Grainger, Inc. | 500 | 93,595 | ||||||||
Wireless Telecommunication Services - 0.24% |
| |||||||||
American Tower Corp., Class A | 800 | 48,008 | ||||||||
Sprint Nextel Corp.*# | 6,000 | 14,040 | ||||||||
|
| |||||||||
| 62,048 | ||||||||||
|
| |||||||||
TOTAL COMMON STOCKS - 57.32% | 14,596,151 | |||||||||
|
| |||||||||
(Cost $11,606,966) | ||||||||||
| Due Date | Discount Rate or Coupon Rate | Principal Amount | Value | |||||||
U.S. GOVERNMENT OBLIGATIONS - 35.20% |
| |||||||||
U.S. Treasury Bills - 27.49% |
| |||||||||
02/02/2012 | 0.010%(a) | $ | 1,500,000 | 1,499,994 | ||||||
03/01/2012 | 0.030%(a) | 1,000,000 | 999,971 | |||||||
03/01/2012 | 0.045%(a) | 1,500,000 | 1,499,956 | |||||||
03/29/2012 | 0.020%(a) | 2,000,000 | 1,999,904 | |||||||
05/31/2012 | 0.070%(a) | 1,000,000 | 999,834 | |||||||
|
| |||||||||
| 6,999,659 | ||||||||||
U.S. Treasury Notes - 7.71% |
| |||||||||
04/30/2012 | 4.500% | 300,000 | 304,324 | |||||||
07/15/2012 | 1.500% | 200,000 | 201,508 | |||||||
08/15/2012 | 1.750% | 300,000 | 303,047 | |||||||
11/30/2012 | 3.375% | 300,000 | 308,754 | |||||||
12/31/2012 | 3.625% | 200,000 | 206,891 | |||||||
01/31/2013 | 0.625% | 100,000 | 100,488 | |||||||
11/15/2013 | 4.250% | 200,000 | 214,797 | |||||||
03/15/2014 | 1.250% | 100,000 | 102,117 | |||||||
02/15/2015 | 4.000% | 200,000 | 222,125 | |||||||
|
| |||||||||
| 1,964,051 | ||||||||||
|
| |||||||||
TOTAL U.S. GOVERNMENT OBLIGATIONS - 35.20% | 8,963,710 | |||||||||
|
| |||||||||
(Cost $8,898,390) | ||||||||||
| 125 | Semi-Annual Report | December 31, 2011 (Unaudited) | |
Bridgeway Managed Volatility Fund SCHEDULE OF INVESTMENTS (continued) | |
| Showing percentage of net assets as of December 31, 2011 (Unaudited) |
| Rate^ | Shares | Value | ||||||||||
MONEY MARKET FUND - 8.51% |
| |||||||||||
BlackRock FedFund | 0.01% | 2,165,216 | $ | 2,165,216 | ||||||||
|
| |||||||||||
TOTAL MONEY MARKET FUND - 8.51% |
| 2,165,216 | ||||||||||
|
| |||||||||||
(Cost $2,165,216) |
| |||||||||||
TOTAL INVESTMENTS - 101.03% |
| $ | 25,725,077 | |||||||||
(Cost $22,670,572) |
| |||||||||||
Liabilities in Excess of Other Assets - (1.03%) |
| (261,168 | ) | |||||||||
|
| |||||||||||
NET ASSETS - 100.00% |
| $ | 25,463,909 | |||||||||
|
| |||||||||||
* Non-income producing security. # Security subject to call or put option written by the Fund. ^ Rate disclosed as of December 31, 2011. + This security or a portion of the security is out on loan at December 31, 2011. Total loaned securities had a value of $10,268 at December 31, 2011. (a) Rate represents the effective yield at purchase. PLC -Public Limited Company
See Notes to Financial Statements. |
| |||||||||||
| www.bridgeway.com | 126 | |
Bridgeway Managed Volatility Fund | |
| Showing percentage of net assets as of December 31, 2011 (Unaudited) |
| Company | | Number of Contracts | | Value | ||||||
CALL OPTIONS WRITTEN - (0.98%) |
| |||||||||
3M Co. | ||||||||||
Expiring January, 2012 at $77.50 | 10 | $ | (4,850 | ) | ||||||
AES Corp. (The) | ||||||||||
Expiring January, 2012 at $11.00 | 20 | (1,880 | ) | |||||||
Allergan, Inc. | ||||||||||
Expiring January, 2012 at $92.50 | 5 | (175 | ) | |||||||
Amazon.com, Inc. | ||||||||||
Expiring April, 2012 at $200.00 | 5 | (2,925 | ) | |||||||
Ameriprise Financial, Inc. | ||||||||||
Expiring March, 2012 at $47.00 | 10 | (5,400 | ) | |||||||
Aon Corp. | ||||||||||
Expiring January, 2012 at $47.50 | 7 | (455 | ) | |||||||
Archer-Daniels-Midland Co. | ||||||||||
Expiring January, 2012 at $26.00 | 10 | (2,760 | ) | |||||||
Ball Corp. | ||||||||||
Expiring February, 2012 at | ||||||||||
$35.00 | 35 | (6,125 | ) | |||||||
Bank of New York Mellon Corp. (The) | ||||||||||
Expiring January, 2012 at $22.50 | 5 | (30 | ) | |||||||
Bristol-Myers Squibb Co. | ||||||||||
Expiring January, 2012 at $34.00 | 10 | (1,310 | ) | |||||||
Broadcom Corp., Class A | ||||||||||
Expiring January, 2012 at $40.00 | 10 | (10 | ) | |||||||
Capital One Financial Corp. | ||||||||||
Expiring January, 2012 at $44.00 | 12 | (1,008 | ) | |||||||
Chubb Corp. (The) | ||||||||||
Expiring January, 2012 at $70.00 | 45 | (4,500 | ) | |||||||
Coca-Cola Co. (The) | ||||||||||
Expiring February, 2012 at | ||||||||||
$70.00 | 10 | (1,690 | ) | |||||||
Coca-Cola Enterprises, Inc. | ||||||||||
Expiring February, 2012 at | ||||||||||
$26.00 | 115 | (10,925 | ) | |||||||
Comcast Corp., Class A | ||||||||||
Expiring January, 2012 at $25.00 | 10 | (140 | ) | |||||||
Corning, Inc. | ||||||||||
Expiring January, 2012 at $12.50 | 10 | (750 | ) | |||||||
CVS Caremark Corp. | ||||||||||
Expiring January, 2012 at $35.00 | 15 | (8,850 | ) | |||||||
Danaher Corp. | ||||||||||
Expiring January, 2012 at $49.00 | 10 | (400 | ) | |||||||
Dow Chemical Co. (The) | ||||||||||
Expiring January, 2012 at $29.00 | 10 | (780 | ) | |||||||
Eaton Corp. | ||||||||||
Expiring January, 2012 at $45.00 | 15 | (900 | ) | |||||||
eBay, Inc. | ||||||||||
Expiring January, 2012 at $32.00 | 10 | (390 | ) | |||||||
Express Scripts, Inc. | ||||||||||
Expiring January, 2012 at $45.00 | 5 | (745 | ) | |||||||
Exxon Mobil Corp. | ||||||||||
Expiring January, 2012 at $77.50 | 15 | (11,100 | ) | |||||||
Company | | Number of Contracts | | Value | ||||||
Fidelity National Information Services, Inc. | ||||||||||
Expiring January, 2012 at $26.00 | 75 | $ | (7,800 | ) | ||||||
Gap, Inc. (The) | ||||||||||
Expiring January, 2012 at $17.50 | 110 | (14,410 | ) | |||||||
Gilead Sciences, Inc. | ||||||||||
Expiring January, 2012 at $42.00 | 10 | (410 | ) | |||||||
GT Advanced Technologies, Inc. | ||||||||||
Expiring March, 2012 at $7.50 | 265 | (22,525 | ) | |||||||
Halliburton Co. | ||||||||||
Expiring January, 2012 at $37.00 | 10 | (510 | ) | |||||||
Hasbro, Inc. | ||||||||||
Expiring January, 2012 at $37.50 | 7 | (70 | ) | |||||||
Hudson City Bancorp, Inc. | ||||||||||
Expiring January, 2012 at $6.00 | 25 | (1,125 | ) | |||||||
International Paper Co. | ||||||||||
Expiring January, 2012 at $27.00 | 10 | (2,830 | ) | |||||||
JPMorgan Chase & Co. | ||||||||||
Expiring January, 2012 at $33.00 | 25 | (3,175 | ) | |||||||
Juniper Networks, Inc. | ||||||||||
Expiring January, 2012 at $24.00 | 7 | (91 | ) | |||||||
L-3 Communications Holdings, Inc. | ||||||||||
Expiring April, 2012 at $70.00 | 35 | (8,225 | ) | |||||||
Lexmark International, Inc., Class A | ||||||||||
Expiring January, 2012 at $32.00 | 10 | (1,850 | ) | |||||||
Medco Health Solutions, Inc. | ||||||||||
Expiring April, 2012 at $55.00 | 5 | (2,750 | ) | |||||||
Microsoft Corp. | ||||||||||
Expiring March, 2012 at $26.00 | 10 | (1,040 | ) | |||||||
Morgan Stanley | ||||||||||
Expiring January, 2012 at $20.00 | 4 | (16 | ) | |||||||
News Corp., Class A | ||||||||||
Expiring January, 2012 at $17.50 | 20 | (1,400 | ) | |||||||
Northrop Grumman Corp. | ||||||||||
Expiring January, 2012 at $60.00 | 4 | (200 | ) | |||||||
Peabody Energy Corp. | ||||||||||
Expiring January, 2012 at $45.00 | 5 | (5 | ) | |||||||
Procter & Gamble Co. (The) | ||||||||||
Expiring January, 2012 at $67.50 | 5 | (200 | ) | |||||||
Progressive Corp. (The) | ||||||||||
Expiring January, 2012 at $19.00 | 8 | (600 | ) | |||||||
Public Service Enterprise Group, Inc. | ||||||||||
Expiring March, 2012 at $35.00 | 8 | (240 | ) | |||||||
Quest Diagnostics, Inc. | ||||||||||
Expiring January, 2012 at $55.00 | 4 | (1,440 | ) | |||||||
RPC, Inc. | ||||||||||
Expiring March, 2012 at $17.50 | 145 | (36,975 | ) | |||||||
Safeway, Inc. | ||||||||||
Expiring March, 2012 at $21.00 | 10 | (1,150 | ) | |||||||
SanDisk Corp. | ||||||||||
Expiring January, 2012 at $52.50 | 8 | (520 | ) | |||||||
| 127 | Semi-Annual Report | December 31, 2011 (Unaudited) | |
Bridgeway Managed Volatility Fund SCHEDULE OF OPTIONS WRITTEN (continued) | |
| Showing percentage of net assets as of December 31, 2011 (Unaudited) |
| Company | | Number of Contracts | | Value | ||||||
Call Options Written (continued) |
| |||||||||
Sauer-Danfoss, Inc. | ||||||||||
Expiring March, 2012 at $35.00 | 55 | $ | (26,400 | ) | ||||||
Sempra Energy | ||||||||||
Expiring January, 2012 at $55.00 | 9 | (855 | ) | |||||||
Sprint Nextel Corp. | ||||||||||
Expiring January, 2012 at $3.00 | 15 | (30 | ) | |||||||
State Street Corp. | ||||||||||
Expiring February, 2012 at $45.00 | 5 | (215 | ) | |||||||
Stryker Corp. | ||||||||||
Expiring March, 2012 at $55.00 | 5 | (310 | ) | |||||||
Teradata Corp. | ||||||||||
Expiring January, 2012 at $60.00 | 10 | (50 | ) | |||||||
Texas Instruments, Inc. | ||||||||||
Expiring January, 2012 at $30.00 | 10 | (430 | ) | |||||||
Expiring January, 2012 at $32.00 | 10 | (70 | ) | |||||||
|
| |||||||||
| (500 | ) | |||||||||
Time Warner, Inc. | ||||||||||
Expiring January, 2012 at $36.00 | 5 | (465 | ) | |||||||
Titan International, Inc. | ||||||||||
Expiring January, 2012 at $20.00 | 20 | (1,500 | ) | |||||||
Travelers Cos., Inc. (The) | ||||||||||
Expiring April, 2012 at $60.00 | 20 | (5,500 | ) | |||||||
Union Pacific Corp. | ||||||||||
Expiring February, 2012 at $105.00 | 5 | (2,450 | ) | |||||||
United States Steel Corp. | ||||||||||
Expiring January, 2012 at $30.00 | 4 | (160 | ) | |||||||
US Bancorp | ||||||||||
Expiring March, 2012 at $27.00 | 19 | (2,888 | ) | |||||||
Wal-Mart Stores, Inc. | ||||||||||
Expiring March, 2012 at $60.00 | 10 | (1,600 | ) | |||||||
WellPoint, Inc. | ||||||||||
Expiring March, 2012 at $65.00 | 40 | (17,000 | ) | |||||||
Wells Fargo & Co. | ||||||||||
Expiring January, 2012 at $26.00 | 10 | (2,050 | ) | |||||||
Expiring April, 2012 at $27.00 | 10 | (2,490 | ) | |||||||
|
| |||||||||
| (4,540 | ) | |||||||||
Westlake Chemical Corp. | ||||||||||
Expiring January, 2012 at $40.00 | 50 | (7,750 | ) | |||||||
|
| |||||||||
TOTAL CALL OPTIONS WRITTEN - (0.98%) |
| (249,868 | ) | |||||||
(Premiums received $(286,032)) | ||||||||||
PUT OPTIONS WRITTEN-(0.71%) | ||||||||||
Advanced Auto Parts, Inc. | ||||||||||
Expiring March, 2012 at $65.00 | 40 | (7,600 | ) | |||||||
Alaska Air Group, Inc. | ||||||||||
Expiring February, 2012 at | ||||||||||
$70.00 | 10 | (2,300 | ) | |||||||
Best Buy Co., Inc. | ||||||||||
Expiring January, 2012 at $25.00 | 100 | (18,500 | ) | |||||||
| Company | | Number of Contracts | | Value | ||||||
Brightpoint, Inc. | ||||||||||
Expiring January, 2012 at $10.00 | 160 | $ | (2,400 | ) | ||||||
Caterpillar, Inc. | ||||||||||
Expiring February, 2012 at |
| |||||||||
$87.50 | 20 | (7,100 | ) | |||||||
ConocoPhillips | ||||||||||
Expiring January, 2012 at $70.00 | 37 | (1,924 | ) | |||||||
Dycom Industries, Inc. | ||||||||||
Expiring March, 2012 at $17.50 | 50 | (4,000 | ) | |||||||
Gap, Inc. (The) | ||||||||||
Expiring January, 2012 at $17.50 | 35 | (805 | ) | |||||||
Helix Energy Solutions Group, Inc. | ||||||||||
Expiring January, 2012 at $15.00 | 120 | (5,400 | ) | |||||||
Hewlett-Packard Co. | ||||||||||
Expiring January, 2012 at $25.00 | 100 | (4,600 | ) | |||||||
Humana, Inc. | ||||||||||
Expiring February, 2012 at | ||||||||||
$80.00 | 60 | (9,300 | ) | |||||||
Kirby Corp. | ||||||||||
Expiring March, 2012 at $60.00 | 40 | (8,200 | ) | |||||||
Kohl’s Corp. | ||||||||||
Expiring January, 2012 at $52.50 | 45 | (15,750 | ) | |||||||
Macy’s, Inc. | ||||||||||
Expiring February, 2012 at | ||||||||||
$31.00 | 150 | (18,300 | ) | |||||||
Northrop Grumman Corp. | ||||||||||
Expiring May, 2012 at $52.50 | 25 | (4,625 | ) | |||||||
PartnerRe, Ltd. | ||||||||||
Expiring February, 2012 at | ||||||||||
$60.00 | 40 | (4,200 | ) | |||||||
Peabody Energy Corp. | ||||||||||
Expiring March, 2012 at $35.00 | 70 | (29,400 | ) | |||||||
Quest Diagnostics, Inc. | ||||||||||
Expiring January, 2012 at $45.00 | 15 | (150 | ) | |||||||
Seagate Technology PLC | ||||||||||
Expiring March, 2012 at $15.00 | 100 | (9,100 | ) | |||||||
Tesoro Corp. | ||||||||||
Expiring February, 2012 at | ||||||||||
$24.00 | 100 | (20,300 | ) | |||||||
Travelers Cos., Inc. (The) | ||||||||||
Expiring January, 2012 at $55.00 | 50 | (1,000 | ) | |||||||
Western Union Co. (The) | ||||||||||
Expiring February, 2012 at | ||||||||||
$17.00 | 150 | (5,250 | ) | |||||||
|
| |||||||||
TOTAL PUT OPTIONS WRITTEN - (0.71%) |
| (180,204 | ) | |||||||
|
| |||||||||
(Premiums received $(281,264)) | ||||||||||
TOTAL OPTIONS WRITTEN - (1.69%) | $ | (430,072 | ) | |||||||
|
| |||||||||
(Premiums received $(567,296)) | ||||||||||
| www.bridgeway.com | 128 | |
Bridgeway Managed Volatility Fund SCHEDULE OF OPTIONS WRITTEN (continued) | |
| Summary of inputs used to value the Fund’s investments as of 12/31/2011 is as follows (See Note 2 in Notes to Financial Statements): | ||||||||||||||||
| Assets Table | ||||||||||||||||
| Valuation Inputs | ||||||||||||||||
| Investment in Securities (Value) | ||||||||||||||||
| | Level 1 Quoted Prices | | | Level 2 Significant Observable Inputs | | | Level 3 Significant Unobservable Inputs | | Total | |||||||
Common | ||||||||||||||||
Stocks | $ | 14,596,151 | $ | — | $ | — | $ | 14,596,151 | ||||||||
U.S. Government Obligations | — | 8,963,710 | — | 8,963,710 | ||||||||||||
Money Market Fund | — | 2,165,216 | — | 2,165,216 | ||||||||||||
|
|
|
|
|
|
|
| |||||||||
TOTAL | $ | 14,596,151 | $ | 11,128,926 | $ | — | $ | 25,725,077 | ||||||||
|
|
|
|
|
|
|
| |||||||||
| Liabilities Table | ||||||||||||||||
| Valuation Inputs | ||||||||||||||||
| Investment in Securities (Value) | ||||||||||||||||
| | Level 1 Quoted Prices | | | Level 2 Significant Observable Inputs | | | Level 3 Significant Unobservable | | Total | |||||||
Written Options | $ | (430,072 | ) | $ | — | $ | — | $ | (430,072 | ) | ||||||
|
|
|
|
|
|
|
| |||||||||
TOTAL | $ | (430,072 | ) | $ | — | $ | — | $ | (430,072 | ) | ||||||
|
|
|
|
|
|
|
| |||||||||
See Notes to Financial Statements.
| 129 | Semi-Annual Report | December 31, 2011 (Unaudited) | |
THIS PAGE INTENTIONALLY LEFT BLANK
| www.bridgewayomni.com | 130 | |
STATEMENTS OF ASSETS AND LIABILITIES
| ||
| December 31, 2011 (Unaudited) |
| ASSETS | Aggressive Investors 1 | Aggressive Investors 2 | Ultra-Small Company | Ultra-Small Company Market | ||||||||||||
Investments at value | $ | 81,936,528 | $ | 151,378,843 | $ | 75,155,250 | $ | 315,841,011 | ||||||||
Receivables: | ||||||||||||||||
Portfolio securities sold. | - | 536,495 | - | 1,483,891 | ||||||||||||
Fund shares sold | 17,151 | 10,477 | 25,100 | 112,591 | ||||||||||||
Dividends and interest | 109,640 | 169,647 | 128,925 | 351,781 | ||||||||||||
Receivable from investment adviser | 50,498 | - | - | - | ||||||||||||
Deposits with brokers | - | - | - | - | ||||||||||||
Total return swap | 70,950 | 140,383 | 92,099 | - | ||||||||||||
Maturity receivable | - | - | - | - | ||||||||||||
Prepaid expenses. | 15,339 | 26,826 | 13,214 | 43,159 | ||||||||||||
Total assets | 82,200,106 | 152,262,671 | 75,414,588 | 317,832,433 | ||||||||||||
LIABILITIES | ||||||||||||||||
Payables: | ||||||||||||||||
Portfolio securities purchased | - | - | 276,793 | 650,214 | ||||||||||||
Fund shares redeemed | 125,896 | 387,435 | - | 839,342 | ||||||||||||
Total return swap | - | - | - | 11,380 | ||||||||||||
Due to custodian | - | - | - | - | ||||||||||||
Loan payable | - | 340,000 | - | 307,000 | ||||||||||||
Accrued Liabilities: | ||||||||||||||||
Investment adviser fees | - | 2,991 | 54,915 | 118,307 | ||||||||||||
Administration fees | 2,644 | 4,914 | 2,373 | 10,089 | ||||||||||||
Other | 44,907 | 111,297 | 28,002 | 132,955 | ||||||||||||
Call options written at value | - | - | - | - | ||||||||||||
Put options written at value | - | - | - | - | ||||||||||||
Total liabilities | 173,447 | 846,637 | 362,083 | 2,069,287 | ||||||||||||
NET ASSETS | $ | 82,026,659 | $ | 151,416,034 | $ | 75,052,505 | $ | 315,763,146 | ||||||||
NET ASSETS REPRESENT | ||||||||||||||||
Paid-in capital | $ | 152,881,861 | $ | 346,262,324 | $ | 79,106,961 | $ | 243,713,288 | ||||||||
Undistributed (distributions in excess of) net investment income | 990,325 | (56,836 | ) | 313,812 | 1,689,150 | |||||||||||
Accumulated net realized gain (loss) on investments | (70,113,369 | ) | (189,490,080 | ) | (5,943,326 | ) | 4,240,596 | |||||||||
Net unrealized appreciation (depreciation) on investments | (1,732,158 | ) | (5,299,374 | ) | 1,575,058 | 66,120,112 | ||||||||||
NET ASSETS | $ | 82,026,659 | $ | 151,416,034 | $ | 75,052,505 | $ | 315,763,146 | ||||||||
Shares of common stock outstanding of $.001 par value* | 2,635,028 | 12,255,941 | 3,064,738 | 24,516,635 | ||||||||||||
Net asset value, offering price and redemption price per share | $ | 31.13 | $ | 12.35 | $ | 24.49 | $ | 12.88 | ||||||||
Total investments at cost | $ | 83,668,686 | $ | 156,678,217 | $ | 73,672,291 | $ | 249,720,899 | ||||||||
Premiums received on call options written | $ | - | $ | - | $ | - | $ | - | ||||||||
Premiums received on put options written | $ | - | $ | - | $ | - | $ | - | ||||||||
| * | See Note 1 - Organization in the Notes to Financial Statements for shares authorized for each Fund. |
See Notes to Financial Statements.
| 131 | Semi-Annual Report | December 31, 2011 (Unaudited) | |
|
Micro-Cap Limited | Small-Cap Momentum | Small-Cap Growth | Small-Cap Value | Large-Cap Growth | Large-Cap Value | Blue Chip 35 Index | Managed Volatility | |||||||||||||||||||||||
| $ | 19,850,354 | $ | 2,976,908 | $ | 35,789,189 | $ | 72,388,518 | $ | 46,998,055 | $ | 27,372,082 | $ | 332,864,076 | $ | 25,725,077 | |||||||||||||||
| - | - | 55,420 | 511,007 | 259,961 | - | 9,520,657 | - | |||||||||||||||||||||||
| 600 | - | 1,806 | 569 | 350 | 157,634 | 349,890 | 4,210 | |||||||||||||||||||||||
| 24,211 | 2,419 | 15,044 | 111,419 | 41,588 | 47,793 | 446,539 | 31,681 | |||||||||||||||||||||||
| 4,759 | 8,622 | - | - | - | - | 18,110 | - | |||||||||||||||||||||||
| - | - | - | - | - | - | - | 100 | |||||||||||||||||||||||
| 4,647 | - | - | 5,159 | 7,025 | - | - | - | |||||||||||||||||||||||
| - | - | - | - | - | - | - | 200,000 | |||||||||||||||||||||||
| 8,289 | 9,669 | 17,176 | 21,406 | 18,452 | 16,829 | 32,058 | 10,970 | |||||||||||||||||||||||
| 19,892,860 | 2,997,618 | 35,878,635 | 73,038,078 | 47,325,431 | 27,594,338 | 343,231,330 | 25,972,038 | |||||||||||||||||||||||
| - | 7,384 | 110,809 | 327,046 | - | - | 2,729,917 | - | |||||||||||||||||||||||
| - | - | 65,640 | 115,061 | 72,784 | 23,399 | 128,631 | 47,459 | |||||||||||||||||||||||
| - | - | 3,913 | - | - | - | - | - | |||||||||||||||||||||||
| - | - | - | - | 43,161 | - | - | - | |||||||||||||||||||||||
| - | - | - | - | 120,000 | - | 6,993,000 | - | |||||||||||||||||||||||
| - | - | 11,379 | 31,683 | 14,012 | 6,659 | - | 4,518 | |||||||||||||||||||||||
| 628 | 91 | 1,146 | 2,302 | 1,525 | 872 | 10,800 | 818 | |||||||||||||||||||||||
| 21,263 | 21,457 | 35,569 | 52,041 | 33,290 | 15,379 | 31,915 | 25,262 | |||||||||||||||||||||||
| - | - | - | - | - | - | - | 249,868 | |||||||||||||||||||||||
| - | - | - | - | - | - | - | 180,204 | |||||||||||||||||||||||
| 21,891 | 28,932 | 228,456 | 528,133 | 284,772 | 46,309 | 9,894,263 | 508,129 | |||||||||||||||||||||||
| $ | 19,870,969 | $ | 2,968,686 | $ | 35,650,179 | $ | 72,509,945 | $ | 47,040,659 | $ | 27,548,029 | $ | 333,337,067 | $ | 25,463,909 | |||||||||||||||
| $ | 28,285,378 | $ | 2,920,377 | $ | 64,790,836 | $ | 127,773,395 | $ | 79,431,829 | $ | 26,559,704 | $ | 344,572,285 | $ | 28,750,922 | |||||||||||||||
| 165,674 | 5,665 | (28,046 | ) | 336,494 | (20,138 | ) | 61,177 | 88,622 | 53,840 | |||||||||||||||||||||
| (8,762,358 | ) | (153,508 | ) | (32,103,242 | ) | (62,898,592 | ) | (37,429,560 | ) | (3,386,233 | ) | (74,581,151 | ) | (6,532,582 | ) | |||||||||||||||
| 182,275 | 196,152 | 2,990,631 | 7,298,648 | 5,058,528 | 4,313,381 | 63,257,311 | 3,191,729 | |||||||||||||||||||||||
| $ | 19,870,969 | $ | 2,968,686 | $ | 35,650,179 | $ | 72,509,945 | $ | 47,040,659 | $ | 27,548,029 | $ | 333,337,067 | $ | 25,463,909 | |||||||||||||||
| 3,218,443 | 283,222 | 3,254,762 | 5,326,803 | 3,842,597 | 2,015,721 | 44,933,287 | 2,221,867 | |||||||||||||||||||||||
| $ | 6.17 | $ | 10.48 | $ | 10.95 | $ | 13.61 | $ | 12.24 | $ | 13.67 | $ | 7.42 | $ | 11.46 | |||||||||||||||
| $ | 19,668,079 | $ | 2,780,756 | $ | 32,798,558 | $ | 65,089,870 | $ | 41,939,527 | $ | 23,058,701 | $ | 269,606,765 | $ | 22,670,572 | |||||||||||||||
| $ | - | $ | - | $ | - | $ | - | $ | - | $ | - | $ | - | $ | 286,032 | |||||||||||||||
| $ | - | $ | - | $ | - | $ | - | $ | - | $ | - | $ | - | $ | 281,264 | |||||||||||||||
| www.bridgeway.com | 132 | |
| ||
| Six Months Ended December 31, 2011 (Unaudited) |
| Aggressive Investors 1 | Aggressive Investors 2 | Ultra-Small Company | Ultra-Small Company Market | |||||||||||||
INVESTMENT INCOME | ||||||||||||||||
Dividends | $ | 759,473 | $ | 1,601,537 | $ | 637,449 | $2,180,919 | |||||||||
Less: foreign taxes withheld | (446 | ) | (1,055 | ) | (363 | ) | - | |||||||||
Interest | - | - | - | 6,971 | ||||||||||||
Securities lending. | 68,902 | 72,618 | 171,960 | 741,224 | ||||||||||||
Total Investment Income | 827,929 | 1,673,100 | 809,046 | 2,929,114 | ||||||||||||
EXPENSES | ||||||||||||||||
Investment advisory fees - Base fees | 397,531 | 797,956 | 349,306 | 820,257 | ||||||||||||
Investment advisory fees - Performance adjustment | (709,293 | ) | (692,877 | ) | - | - | ||||||||||
Administration fees | 17,573 | 35,267 | 15,402 | �� | 65,125 | |||||||||||
Accounting fees | 27,771 | 33,628 | 28,856 | 55,494 | ||||||||||||
Transfer agent fees | 29,011 | 91,496 | 22,221 | 62,661 | ||||||||||||
Professional fees | 18,909 | 34,117 | 17,250 | 59,262 | ||||||||||||
Custody fees | 3,793 | 6,785 | 6,887 | 20,319 | ||||||||||||
Blue sky fees | 11,093 | 15,540 | 4,239 | 11,264 | ||||||||||||
Directors’ and officers’ fees | 8,140 | 16,537 | 7,175 | 30,205 | ||||||||||||
Shareholder servicing fees | 31,443 | 117,221 | 3,705 | 98,007 | ||||||||||||
Reports to shareholders | 10,403 | 25,364 | 6,235 | 34,760 | ||||||||||||
Miscellaneous expenses | 16,275 | 35,079 | 13,934 | 61,837 | ||||||||||||
Total Expenses | (137,351 | ) | 516,113 | 475,210 | 1,319,191 | |||||||||||
Less investment advisory fees waived | - | - | - | (84,721 | ) | |||||||||||
Less expense reimbursed by investment adviser | - | - | - | - | ||||||||||||
Net Expenses | (137,351 | ) | 516,113 | 475,210 | 1,234,470 | |||||||||||
NET INVESTMENT INCOME (LOSS) | 965,280 | 1,156,987 | 333,836 | 1,694,644 | ||||||||||||
NET REALIZED AND UNREALIZED GAIN (LOSS) ON INVESTMENTS | ||||||||||||||||
Realized Gain (Loss) on: | ||||||||||||||||
Investments | 2,560 | 601,751 | (2,132,858 | ) | 5,483,630 | |||||||||||
Written options | - | - | - | - | ||||||||||||
Futures contracts | - | - | - | - | ||||||||||||
Swaps | (13,624 | ) | 70,186 | (143,221 | ) | (185,824 | ) | |||||||||
Net Realized Gain (Loss) | (11,064 | ) | 671,937 | (2,276,079 | ) | 5,297,806 | ||||||||||
Change in Unrealized Appreciation (Depreciation) on: | ||||||||||||||||
Investments | (18,658,904 | ) | (41,387,595 | ) | (13,313,413 | ) | (51,763,161 | ) | ||||||||
Written options | - | - | - | - | ||||||||||||
Swaps | (3,655 | ) | (15,113 | ) | 65,397 | (7,993 | ) | |||||||||
Net Change in Unrealized Appreciation (Depreciation) | (18,662,559 | ) | (41,402,708 | ) | (13,248,016 | ) | (51,771,154 | ) | ||||||||
Net Realized and Unrealized Loss on Investments | (18,673,623 | ) | (40,730,771 | ) | (15,524,095 | ) | (46,473,348 | ) | ||||||||
DECREASE IN NET ASSETS RESULTING FROM OPERATIONS | $ | (17,708,343 | ) | $ | (39,573,784 | ) | $ | (15,190,259 | ) | $(44,778,704) | ||||||
See Notes to Financial Statements.
| 133 | Semi-Annual Report | December 31, 2011 (Unaudited) | |
|
Micro-Cap Limited | Small-Cap Momentum | Small-Cap Growth | Small-Cap Value | Large-Cap Growth | Large-Cap Value | Blue Chip 35 Index | Managed Volatility | |||||||||||||||||||||||
| $ | 173,375 | $ 15,209 | $ | 94,822 | $ | 813,288 | $ | 405,350 | $ | 356,824 | $ | 4,000,509 | $ | 140,412 | ||||||||||||||||
| - | (33 | ) | - | - | - | - | - | - | ||||||||||||||||||||||
| - | - | - | - | - | - | - | 35,616 | |||||||||||||||||||||||
| 45,161 | 2,316 | 61,825 | 112,934 | 4,441 | 24 | - | 2,270 | |||||||||||||||||||||||
| 218,536 | 17,492 | 156,647 | 926,222 | 409,791 | 356,848 | 4,000,509 | 178,298 | |||||||||||||||||||||||
| 90,912 | 7,532 | 112,519 | 229,256 | 124,065 | 67,988 | 130,643 | 79,433 | |||||||||||||||||||||||
| (122,578) | - | (24,429 | ) | (15,501 | ) | (23,262 | ) | 6,773 | - | - | ||||||||||||||||||||
| 4,015 | 544 | 7,453 | 15,193 | 9,878 | 5,417 | 65,063 | 5,275 | |||||||||||||||||||||||
| 24,056 | 28,364 | 24,395 | 27,171 | 25,303 | 23,704 | 42,559 | 27,855 | |||||||||||||||||||||||
| 19,976 | 15,893 | 25,145 | 34,814 | 26,259 | 21,261 | 22,757 | 18,218 | |||||||||||||||||||||||
| 7,643 | 4,527 | 10,261 | 16,593 | 12,221 | 8,450 | 55,011 | 10,802 | |||||||||||||||||||||||
| 2,434 | 6,570 | 2,352 | 3,360 | 1,711 | 1,334 | 3,466 | 4,794 | |||||||||||||||||||||||
| 10,341 | 7,618 | 8,990 | 9,409 | 9,005 | 9,426 | 15,430 | 9,988 | |||||||||||||||||||||||
| 1,878 | 246 | 3,469 | 7,089 | 4,538 | 2,750 | 29,134 | 2,383 | |||||||||||||||||||||||
| 4,498 | 146 | 15,848 | 28,236 | 16,661 | 7,517 | 20,248 | 6,652 | |||||||||||||||||||||||
| 2,302 | 139 | 5,557 | 10,627 | 6,797 | 3,181 | 22,447 | 2,496 | |||||||||||||||||||||||
| 3,957 | 695 | 7,217 | 14,882 | 8,937 | 4,622 | 55,586 | 4,659 | |||||||||||||||||||||||
| 49,434 | 72,274 | 198,777 | 381,129 | 222,113 | 162,423 | 462,344 | 172,555 | |||||||||||||||||||||||
| - | (7,532 | ) | (21,836 | ) | (20,522 | ) | (13,047 | ) | (48,080 | ) | (130,643 | ) | (48,110 | ) | ||||||||||||||||
| - | (52,417 | ) | - | - | - | - | (81,743 | ) | - | |||||||||||||||||||||
| 49,434 | 12,325 | 176,941 | 360,607 | 209,066 | 114,343 | 249,958 | 124,445 | |||||||||||||||||||||||
| 169,102 | 5,167 | (20,294 | ) | 565,615 | 200,725 | 242,505 | 3,750,551 | 53,853 | ||||||||||||||||||||||
| (331,944) | (150,672 | ) | 1,449,154 | 2,418,476 | 623,070 | 227,164 | (2,210,387 | ) | 1,101 | |||||||||||||||||||||
| - | - | - | - | - | - | - | 187,014 | |||||||||||||||||||||||
| - | - | - | - | - | - | - | 342,924 | |||||||||||||||||||||||
| (20,085) | - | (75,379 | ) | 4,522 | 12,295 | (54,089 | ) | - | - | |||||||||||||||||||||
| (352,029) | (150,672 | ) | 1,373,775 | 2,422,998 | 635,365 | 173,075 | (2,210,387 | ) | 531,039 | |||||||||||||||||||||
| (3,164,126) | (95,957 | ) | (6,841,864 | ) | (11,307,597 | ) | (5,470,087 | ) | (2,067,138 | ) | (1,621,645 | ) | (1,123,324 | ) | ||||||||||||||||
| - | - | - | - | - | - | - | 294,443 | |||||||||||||||||||||||
| (4,271) | - | (7,720 | ) | (9,894 | ) | (5,184 | ) | - | - | - | ||||||||||||||||||||
| (3,168,397) | (95,957 | ) | (6,849,584 | ) | (11,317,491 | ) | (5,475,271 | ) | (2,067,138 | ) | (1,621,645 | ) | (828,881 | ) | ||||||||||||||||
| (3,520,426) | (246,629 | ) | (5,475,809 | ) | (8,894,493 | ) | (4,839,906 | ) | (1,894,063 | ) | (3,832,032 | ) | (297,842 | ) | ||||||||||||||||
| $ | (3,351,324) | $ | (241,462 | ) | $ | (5,496,103 | ) | $ | (8,328,878 | ) | $ | (4,639,181 | ) | $ | (1,651,558 | ) | $ | (81,481 | ) | $ | (243,989 | ) | ||||||||
| www.bridgeway.com | 134 | |
STATEMENTS OF CHANGES IN NET ASSETS
|
| Aggressive Investors 1 | Aggressive Investors 2 | |||||||||||||||
|
|
|
| |||||||||||||
| Six Months Ended | Year Ended | Six Months Ended | Year Ended | |||||||||||||
| December 31, 2011 | June 30, 2011 | December 31, 2011 | June 30, 2011 | |||||||||||||
| (Unaudited) | (Unaudited) | |||||||||||||||
OPERATIONS | ||||||||||||||||
Net investment income | $ | 965,280 | $ | 1,573,138 | $ | 1,156,987 | $ | 927,875 | ||||||||
Net realized gain (loss) on investments | (11,064 | ) | 15,409,159 | 671,937 | 43,480,677 | |||||||||||
Net change in unrealized appreciation (depreciation) on investments | (18,662,559 | ) | 18,296,823 | (41,402,708 | ) | 37,071,527 | ||||||||||
Net increase (decrease) in net assets resulting from operations | (17,708,343 | ) | 35,279,120 | (39,573,784 | ) | 81,480,079 | ||||||||||
DISTRIBUTIONS: | ||||||||||||||||
From net investment income. | (1,648,519 | ) | (2,167,451 | ) | (1,285,073 | ) | (1,764,382 | ) | ||||||||
From net realized gains | - | - | - | - | ||||||||||||
Net decrease in net assets from distributions | (1,648,519 | ) | (2,167,451 | ) | (1,285,073 | ) | (1,764,382 | ) | ||||||||
SHARE TRANSACTIONS: | ||||||||||||||||
Proceeds from sale of shares | 2,041,025 | 4,009,344 | 2,716,961 | 25,828,087 | ||||||||||||
Reinvestment of distributions | 1,551,727 | 2,051,684 | 1,239,082 | 1,678,100 | ||||||||||||
Cost of shares redeemed | (8,966,439 | ) | (25,423,129 | ) | (37,900,733 | ) | (184,295,247 | ) | ||||||||
Redemption fees | - | - | - | - | ||||||||||||
Net increase (decrease) in net assets resulting from share transactions | (5,373,687 | ) | (19,362,101 | ) | (33,944,690 | ) | (156,789,060 | ) | ||||||||
Net increase (decrease) in net assets | (24,730,549 | ) | 13,749,568 | (74,803,547 | ) | (77,073,363 | ) | |||||||||
NET ASSETS: | ||||||||||||||||
Beginning of period | 106,757,208 | 93,007,640 | 226,219,581 | 303,292,944 | ||||||||||||
End of period* | $ | 82,026,659 | $ | 106,757,208 | $ | 151,416,034 | $ | 226,219,581 | ||||||||
SHARES ISSUED & REDEEMED | ||||||||||||||||
Issued | 63,586 | 111,901 | 208,692 | 2,017,158 | ||||||||||||
Distributions reinvested | 51,811 | 58,220 | 104,124 | 119,779 | ||||||||||||
Redeemed | (275,910 | ) | (735,719 | ) | (2,901,786 | ) | (14,365,022 | ) | ||||||||
Net increase (decrease) | (160,513 | ) | (565,598 | ) | (2,588,970 | ) | (12,228,085 | ) | ||||||||
Outstanding at beginning of period | 2,795,541 | 3,361,139 | 14,844,911 | 27,072,996 | ||||||||||||
Outstanding at end of period | 2,635,028 | 2,795,541 | 12,255,941 | 14,844,911 | ||||||||||||
* Including undistributed (distributions in excess of) net investment income of: | $ | 990,325 | $ | 1,673,564 | $ | (56,836 | ) | $ | 71,250 | |||||||
See Notes to Financial Statements.
| 135 | Semi-Annual Report | December 31, 2011 (Unaudited) | |
|
| Ultra-Small Company | Ultra-Small Company Market | Micro-Cap Limited | Small-Cap Momentum | |||||||||||||||||||||||||||
| Six Months Ended | Year Ended | Six Months Ended | Year Ended | Six Months Ended | Year Ended | Six Months Ended | Year Ended | |||||||||||||||||||||||
| December 31, 2011 | June 30, 2011 | December 31, 2011 | June 30, 2011 | December 31, 2011 | June 30, 2011 | December 31, 2011 | June 30, 2011 | |||||||||||||||||||||||
| (Unaudited) | (Unaudited) | (Unaudited) | (Unaudited) | |||||||||||||||||||||||||||
| $ 333,836 | $ 242,227 | $ 1,694,644 | $ 3,205,225 | $ 169,102 | $ 287,673 | $ 5,167 | $ ��19,560 | |||||||||||||||||||||||
| (2,276,079) | 13,651,385 | 5,297,806 | 24,835,564 | (352,029 | ) | 4,448,364 | (150,672 | ) | 283,835 | |||||||||||||||||||||
| (13,248,016) | 9,058,287 | (51,771,154 | ) | 79,001,816 | (3,168,397 | ) | 2,257,197 | (95,957 | ) | 427,560 | ||||||||||||||||||||
| (15,190,259) | 22,951,899 | (44,778,704 | ) | 107,042,605 | (3,351,324 | ) | 6,993,234 | (241,462 | ) | 730,955 | ||||||||||||||||||||
| (938,128) | (632,748 | ) | (3,451,142 | ) | (4,111,396 | ) | (398,507 | ) | (401,927 | ) | (1,842 | ) | (16,889 | ) | ||||||||||||||||
| - | - | (13,433,187 | ) | - | - | - | (287,704 | ) | - | |||||||||||||||||||||
| (938,128 | ) | (632,748 | ) | (16,884,329 | ) | (4,111,396 | ) | (398,507 | ) | (401,927 | ) | (289,546 | ) | (16,889 | ) | |||||||||||||||
| 591,842 | 1,235,133 | 21,985,709 | 54,560,870 | 541,194 | 1,983,842 | 279,158 | 420,997 | |||||||||||||||||||||||
| 886,661 | 608,040 | 15,234,587 | 3,618,063 | 379,234 | 387,792 | 289,325 | 16,889 | |||||||||||||||||||||||
| (4,731,147 | ) | (11,310,433 | ) | (53,696,090 | ) | (110,930,484 | ) | (2,443,650 | ) | (4,544,849 | ) | (71,176 | ) | (38,172 | ) | |||||||||||||||
| - | - | 19,217 | 34,909 | - | - | - | 498 | |||||||||||||||||||||||
| (3,252,644) | (9,467,260 | ) | (16,456,577 | ) | (52,716,642 | ) | (1,523,222 | ) | (2,173,215 | ) | 497,307 | 400,212 | ||||||||||||||||||
| (19,381,031) | 12,851,891 | (78,119,610 | ) | 50,214,567 | (5,273,053 | ) | 4,418,092 | (33,701 | ) | 1,114,278 | ||||||||||||||||||||
| 94,433,536 | 81,581,645 | 393,882,756 | 343,668,189 | 25,144,022 | 20,725,930 | 3,002,387 | 1,888,109 | |||||||||||||||||||||||
| $75,052,505 | $94,433,536 | $315,763,146 | $393,882,756 | $19,870,969 | $25,144,022 | $2,968,686 | $3,002,387 | |||||||||||||||||||||||
| 22,657 | 42,347 | 1,676,967 | 3,926,854 | 82,315 | 287,844 | 25,696 | 34,852 | |||||||||||||||||||||||
| 37,161 | 21,208 | 1,217,793 | 251,429 | 63,737 | 56,612 | 28,505 | 1,449 | |||||||||||||||||||||||
| (179,661 | ) | (435,555 | ) | (4,047,233 | ) | (7,841,213 | ) | (375,061 | ) | (684,486 | ) | (6,632 | ) | (3,022 | ) | |||||||||||||||
| (119,843 | ) | (372,000 | ) | (1,152,473 | ) | (3,662,930 | ) | (229,009 | ) | (340,030 | ) | 47,569 | 33,279 | |||||||||||||||||
| 3,184,581 | 3,556,581 | 25,669,108 | 29,332,038 | 3,447,452 | 3,787,482 | 235,653 | 202,374 | |||||||||||||||||||||||
| 3,064,738 | 3,184,581 | 24,516,635 | 25,669,108 | 3,218,443 | 3,447,452 | 283,222 | 235,653 | |||||||||||||||||||||||
| $ 313,812 | $ 918,104 | $ 1,689,150 | $ 3,445,648 | $ 165,674 | $ 395,079 | $ 5,665 | $ 2,340 | |||||||||||||||||||||||
| www.bridgeway.com | 136 | |
STATEMENTS OF CHANGES IN NET ASSETS (continued)
|
| Small-Cap Growth | Small-Cap Value | |||||||||||||||
|
|
|
| |||||||||||||
| Six Months Ended | Year Ended | Six Months Ended | Year Ended | |||||||||||||
| December 31, 2011 | June 30, 2011 | December 31, 2011 | June 30, 2011 | |||||||||||||
| (Unaudited) | (Unaudited) | |||||||||||||||
OPERATIONS | ||||||||||||||||
Net investment income (loss) | $ | (20,294 | ) | $ | (59,437 | ) | $ | 565,615 | $ | 1,079,251 | ||||||
Net realized gain (loss) on investments | 1,373,775 | 7,059,093 | 2,422,998 | 20,467,377 | ||||||||||||
Net change in unrealized appreciation (depreciation) on investments | (6,849,584 | ) | 8,701,251 | (11,317,491 | ) | 8,606,512 | ||||||||||
Net increase (decrease) in net assets resulting from operations | (5,496,103 | ) | 15,700,907 | (8,328,878 | ) | 30,153,140 | ||||||||||
DISTRIBUTIONS: | ||||||||||||||||
From net investment income. | (3,204 | ) | (107,719 | ) | (989,896 | ) | (557,827 | ) | ||||||||
Net decrease in net assets from distributions | (3,204 | ) | (107,719 | ) | (989,896 | ) | (557,827 | ) | ||||||||
SHARE TRANSACTIONS: | ||||||||||||||||
Proceeds from sale of shares | 1,050,180 | 3,223,456 | 2,152,569 | 5,959,606 | ||||||||||||
Reinvestment of distributions | 3,058 | 103,847 | 932,539 | 518,027 | ||||||||||||
Cost of shares redeemed | (6,620,254 | ) | (29,215,374 | ) | (14,970,141 | ) | (51,060,064 | ) | ||||||||
Net increase (decrease) in net assets resulting from share transactions | (5,567,016 | ) | (25,888,071 | ) | (11,885,033 | ) | (44,582,431 | ) | ||||||||
Net increase (decrease) in net assets | (11,066,323 | ) | (10,294,883 | ) | (21,203,807 | ) | (14,987,118 | ) | ||||||||
NET ASSETS: | ||||||||||||||||
Beginning of period | 46,716,502 | 57,011,385 | 93,713,752 | 108,700,870 | ||||||||||||
End of period* | $ | 35,650,179 | $ | 46,716,502 | $ | 72,509,945 | $ | 93,713,752 | ||||||||
SHARES ISSUED & REDEEMED | ||||||||||||||||
Issued | 94,640 | 298,349 | 162,846 | 436,595 | ||||||||||||
Distributions reinvested | 289 | 9,466 | 71,404 | 38,515 | ||||||||||||
Redeemed | (603,020 | ) | (2,779,197 | ) | (1,106,376 | ) | (3,769,962 | ) | ||||||||
Net increase (decrease) | (508,091 | ) | (2,471,382 | ) | (872,126 | ) | (3,294,852 | ) | ||||||||
Outstanding at beginning of period | 3,762,853 | 6,234,235 | 6,198,929 | 9,493,781 | ||||||||||||
Outstanding at end of period | 3,254,762 | 3,762,853 | 5,326,803 | 6,198,929 | ||||||||||||
* Including undistributed (distributions in excess of) net investment income of: | $ | (28,046 | ) | $ | (4,548 | ) | $ | 336,494 | $ | 760,775 | ||||||
See Notes to Financial Statements.
| 137 | Semi-Annual Report | December 31, 2011 (Unaudited) | |
|
| Large-Cap Growth | Large-Cap Value | Blue Chip 35 Index | Managed Volatility | |||||||||||||||||||||||||||
| Six Months Ended | Year Ended | Six Months Ended | Year Ended | Six Months Ended | Year Ended | Six Months Ended | Year Ended | |||||||||||||||||||||||
| December 31, 2011 | June 30, 2011 | December 31, 2011 | June 30, 2011 | December 31, 2011 | June 30, 2011 | December 31, 2011 | June 30, 2011 | |||||||||||||||||||||||
| (Unaudited) | (Unaudited) | (Unaudited) | (Unaudited) | |||||||||||||||||||||||||||
| $ 200,725 | $ 275,540 | $ 242,505 | $ 412,282 | $ 3,750,551 | $ 6,126,678 | $ 53,853 | $ 200,467 | |||||||||||||||||||||||
| 635,365 | 8,850,037 | 173,075 | 3,093,190 | (2,210,387) | (2,697,030) | 531,039 | 989,923 | |||||||||||||||||||||||
| (5,475,271) | 7,456,725 | (2,067,138) | 3,511,524 | (1,621,645) | 54,984,311 | (828,881) | 3,193,736 | |||||||||||||||||||||||
| (4,639,181) | 16,582,302 | (1,651,558) | 7,016,996 | (81,481) | 58,413,959 | (243,989) | 4,384,126 | |||||||||||||||||||||||
| (342,839) | (342,087) | (356,881) | (461,725) | (7,110,502) | (4,877,457) | (151,314) | (266,935) | |||||||||||||||||||||||
| (342,839) | (342,087) | (356,881) | (461,725) | (7,110,502) | (4,877,457) | (151,314) | (266,935) | |||||||||||||||||||||||
| 763,006 | 5,691,636 | 2,103,225 | 4,744,136 | 50,110,397 | 111,420,242 | 3,076,184 | 3,094,011 | |||||||||||||||||||||||
| 323,763 | 317,943 | 333,105 | 446,019 | 6,478,915 | 4,439,505 | 147,905 | 261,827 | |||||||||||||||||||||||
| (7,541,624) | (22,181,617) | (2,527,157) | (7,632,342) | (47,625,314) | (60,417,342) | (6,611,142) | (11,910,284) | |||||||||||||||||||||||
| (6,454,855) | (16,172,038) | (90,827) | (2,442,187) | 8,963,998 | 55,442,405 | (3,387,053) | (8,554,446) | |||||||||||||||||||||||
| (11,436,875) | 68,177 | (2,099,266) | 4,113,084 | 1,772,015 | 108,978,907 | (3,782,356) | (4,437,255) | |||||||||||||||||||||||
| 58,477,534 | 58,409,357 | 29,647,295 | 25,534,211 | 331,565,052 | 222,586,145 | 29,246,265 | 33,683,520 | |||||||||||||||||||||||
| $47,040,659 | $ 58,477,534 | $ 27,548,029 | $ 29,647,295 | $ 333,337,067 | $ 331,565,052 | $ 25,463,909 | $ 29,246,265 | |||||||||||||||||||||||
| 62,911 | 440,651 | 151,174 | 335,041 | 6,980,214 | 15,453,229 | 276,067 | 271,787 | |||||||||||||||||||||||
| 27,230 | 25,703 | 25,274 | 33,535 | 902,356 | 613,191 | 13,229 | 23,315 | |||||||||||||||||||||||
| (617,005) | (1,838,186) | (188,957) | (572,388) | (6,598,737) | (8,423,862) | (592,469) | (1,063,914) | |||||||||||||||||||||||
| (526,864) | (1,371,832) | (12,509) | (203,812) | 1,283,833 | 7,642,558 | (303,173) | (768,812) | |||||||||||||||||||||||
| 4,369,461 | 5,741,293 | 2,028,230 | 2,232,042 | 43,649,454 | 36,006,896 | 2,525,040 | 3,293,852 | |||||||||||||||||||||||
| 3,842,597 | 4,369,461 | 2,015,721 | 2,028,230 | 44,933,287 | 43,649,454 | 2,221,867 | 2,525,040 | |||||||||||||||||||||||
| $ (20,138) | $ 121,976 | $ 61,177 | $ 175,553 | $ 88,622 | $ 3,448,573 | $ 53,840 | $ 151,301 | |||||||||||||||||||||||
| www.bridgeway.com | 138 | |
(for a share outstanding throughout the period indicated) |
| Income from Investment Operations | ||||||||||||||||
| Net Asset Value, Beginning of Period | Net Investment | Net Realized and Unrealized Gain\(Loss) | Total from Investment Operations | |||||||||||||
AGGRESSIVE INVESTORS 1 | ||||||||||||||||
Period Ended December 31, 2011 (Unaudited) | $ | 38.19 | $ | 0.36 | $ | (6.79) | $ | (6.43) | ||||||||
Year Ended June 30, 2011 | 27.67 | 0.51 | 10.72 | 11.23 | ||||||||||||
Year Ended June 30, 2010 | 25.93 | 0.58 | 1.40 | 1.98 | ||||||||||||
Year Ended June 30, 2009 | 53.96 | 0.30 | (28.00) | (27.70) | ||||||||||||
Year Ended June 30, 2008 | 61.90 | (0.59) | 3.14 | 2.55 | ||||||||||||
Year Ended June 30, 2007 | 61.90 | (0.43) | 6.41 | 5.98 | ||||||||||||
AGGRESSIVE INVESTORS 2 | ||||||||||||||||
Period Ended December 31, 2011 (Unaudited) | 15.24 | 0.09 | (2.88) | (2.79) | ||||||||||||
Year Ended June 30, 2011 | 11.20 | 0.05 | 4.09 | 4.14 | ||||||||||||
Year Ended June 30, 2010 | 10.37 | 0.06 | 0.82 | 0.88 | ||||||||||||
Year Ended June 30, 2009 | 20.67 | 0.02 | (10.32) | (10.30) | ||||||||||||
Year Ended June 30, 2008 | 20.05 | (0.08) | 1.27 | 1.19 | ||||||||||||
Year Ended June 30, 2007 | 17.55 | (0.07) | 2.94 | 2.87 | ||||||||||||
ULTRA-SMALL COMPANY | ||||||||||||||||
Period Ended December 31, 2011 (Unaudited) | 29.65 | 0.11 | (4.96) | (4.85) | ||||||||||||
Year Ended June 30, 2011 | 22.94 | 0.07 | 6.83 | 6.90 | ||||||||||||
Year Ended June 30, 2010 | 19.76 | 0.19 | 3.22 | 3.41 | ||||||||||||
Year Ended June 30, 2009 | 24.59 | 0.23 | (5.03) | (4.80) | ||||||||||||
Year Ended June 30, 2008 | 37.65 | 0.03 | (8.67) | (8.64) | ||||||||||||
Year Ended June 30, 2007 | 42.42 | 0.12 | 3.37 | 3.49 | ||||||||||||
ULTRA-SMALL COMPANY MARKET | ||||||||||||||||
Period Ended December 31, 2011 (Unaudited) | 15.34 | 0.07 | (1.83) | (1.76) | ||||||||||||
Year Ended June 30, 2011 | 11.72 | 0.12 | 3.65 | 3.77 | ||||||||||||
Year Ended June 30, 2010 | 10.50 | 0.14 | 1.25 | 1.39 | ||||||||||||
Year Ended June 30, 2009 | 15.33 | 0.14 | (3.88) | (3.74) | ||||||||||||
Year Ended June 30, 2008 | 20.36 | 0.14 | (4.49) | (4.35) | ||||||||||||
Year Ended June 30, 2007 | 18.94 | 0.10 | 1.76 | 1.86 | ||||||||||||
| (a) | Per share amounts calculated based on the average daily shares outstanding during the period. |
| (b) | Annualized for periods less than one year. |
| (c) | For the years ended June 30, 2009, June 30, 2010 and June 30, 2011 and the period ended December 31, 2011, the expense ratio was significantly lower than past years due to a negative performance adjustment to the investment advisory fee. Please refer to the Statements of Operations and Note 3 of the Notes to Financial Statements for further information. The rate shown may not be indicative of the rate going forward. |
| (d) | Total return may have been lower had various fees not been waived during the period. |
| (e) | Amount represents less than $0.005. |
See Notes to Financial Statements.
| 139 | Semi-Annual Report | December 31, 2011 (Unaudited) | |
|
Less Distributions to Shareholders from: | Ratios & Supplemental Data | |||||||||||||||||||||||||||||||||||||||||
| Net Realized Gain | Net Investment Income | Total Distributions | Paid in from | Net Asset End of Period | Total Return | Net Assets End of Period (000’s) | Expenses Before | Expenses After | Net Investment and Reimburse- | Portfolio Rate | ||||||||||||||||||||||||||||||||
| $ - | $ (0.63) | $ (0.63) | $ - | $31.13 | (16.77%) | $82,027 | (0.31%)(c) | (0.31%) | 2.17% | 63% | ||||||||||||||||||||||||||||||||
| - | (0.71) | (0.71) | - | 38.19 | 40.81% | 106,757 | (0.41%)(c) | (0.41%) | 1.49% | 107% | ||||||||||||||||||||||||||||||||
| - | (0.24) | (0.24) | - | 27.67 | 7.56% | 93,008 | (0.51%)(c) | (0.51%) | 1.94% | 118% | ||||||||||||||||||||||||||||||||
| (0.33) | - | (0.33) | - | 25.93 | (51.31%) | 115,835 | 0.34%(c) | 0.34% | 0.97% | 134% | ||||||||||||||||||||||||||||||||
| (10.49) | - | (10.49) | - | 53.96 | 3.54%(d) | 338,715 | 1.78% | 1.78% | (1.03%) | 142% | ||||||||||||||||||||||||||||||||
| (5.98) | - | (5.98) | - | 61.90 | 10.79% | 367,958 | 1.72% | 1.72% | (0.75%) | 115% | ||||||||||||||||||||||||||||||||
| - | (0.10) | (0.10) | - | 12.35 | (18.26%) | 151,416 | 0.58% | 0.58% | 1.30% | 61% | ||||||||||||||||||||||||||||||||
| - | (0.10) | (0.10) | - | 15.24 | 37.05% | 226,220 | 0.70% | 0.70% | 0.36% | 93% | ||||||||||||||||||||||||||||||||
| - | (0.05) | (0.05) | - | 11.20 | 8.44% | 303,293 | 1.02% | 1.02% | 0.52% | 105% | ||||||||||||||||||||||||||||||||
| - | - | - | - | 10.37 | (49.83%) | 383,856 | 1.20% | 1.20% | 0.14% | 126% | ||||||||||||||||||||||||||||||||
| (0.57) | - | (0.57) | - | 20.67 | 5.88%(d) | 885,076 | 1.17% | 1.17% | (0.40%) | 127% | ||||||||||||||||||||||||||||||||
| (0.37) | - | (0.37) | - | 20.05 | 16.68% | 650,939 | 1.22% | 1.22% | (0.38%) | 124% | ||||||||||||||||||||||||||||||||
| - | (0.31) | (0.31) | - | 24.49 | (16.34%) | 75,053 | 1.22% | 1.22% | 0.86% | 29% | ||||||||||||||||||||||||||||||||
| - | (0.19) | (0.19) | - | 29.65 | 30.12% | 94,434 | 1.18% | 1.18% | 0.27% | 110% | ||||||||||||||||||||||||||||||||
| - | (0.23) | (0.23) | - | 22.94 | 17.26% | 81,582 | 1.17% | 1.17% | 0.83% | 133% | ||||||||||||||||||||||||||||||||
| - | (0.03) | (0.03) | - | 19.76 | (19.48%) | 73,708 | 1.16% | 1.16% | 1.23% | 90% | ||||||||||||||||||||||||||||||||
| (4.31) | (0.11) | (4.42) | - | 24.59 | (24.59%)(d) | 94,933 | 1.07% | 1.07% | 0.10% | 102% | ||||||||||||||||||||||||||||||||
| (8.26) | - | (8.26) | - | 37.65 | 9.12% | 137,236 | 1.09% | 1.09% | 0.31% | 106% | ||||||||||||||||||||||||||||||||
| (0.56) | (0.14) | (0.70) | - (e) | 12.88 | (11.28%)(d) | 315,763 | 0.80% | 0.75% | 1.03% | 14% | ||||||||||||||||||||||||||||||||
| - | (0.15) | (0.15) | - (e) | 15.34 | 32.22%(d) | 393,883 | 0.79% | 0.75% | 0.82% | 42% | ||||||||||||||||||||||||||||||||
| - | (0.17) | (0.17) | - (e) | 11.72 | 13.30%(d) | 343,668 | 0.77% | 0.75% | 1.18% | 48% | ||||||||||||||||||||||||||||||||
| (0.89) | (0.21) | (1.10) | 0.01 | 10.50 | (23.47%)(d) | 342,923 | 0.79% | 0.75% | 1.27% | 42% | ||||||||||||||||||||||||||||||||
| (0.65) | (0.04) | (0.69) | 0.01 | 15.33 | (21.72%)(d) | 721,412 | 0.66% | 0.66% | 0.79% | 29% | ||||||||||||||||||||||||||||||||
| (0.37) | (0.08) | (0.45) | 0.01 | 20.36 | 10.08% | 1,162,416 | 0.67% | 0.67% | 0.53% | 34% | ||||||||||||||||||||||||||||||||
| www.bridgeway.com | 140 | |
FINANCIAL HIGHLIGHTS (continued) | ||
| (for a share outstanding throughout the period indicated) | ||
| Income from Investment Operations | ||||||||||||||||
| Net Asset Value, Beginning of Period | Net Investment Income (Loss)(a) | Net Realized and Unrealized Gain\(Loss) | Total from Investment Operations | |||||||||||||
MICRO-CAP LIMITED | ||||||||||||||||
Period Ended December 31, 2011 (Unaudited) | $ | 7.29 | $ | 0.05 | $ | (1.04) | $ | (0.99) | ||||||||
Year Ended June 30, 2011 | 5.47 | 0.08 | 1.85 | 1.93 | ||||||||||||
Year Ended June 30, 2010 | 4.75 | 0.09 | 0.69 | 0.78 | ||||||||||||
Year Ended June 30, 2009 | 7.05 | 0.06 | (2.35) | (2.29) | ||||||||||||
Year Ended June 30, 2008 | 8.56 | 0.03 | (1.53) | (1.50) | ||||||||||||
Year Ended June 30, 2007 | 11.10 | (0.01) | (0.32) | (0.33) | ||||||||||||
SMALL-CAP MOMENTUM | ||||||||||||||||
Period Ended December 31, 2011 (Unaudited) | 12.74 | 0.02 | (1.09) | (1.07) | ||||||||||||
Year Ended June 30, 2011 | 9.33 | 0.09 | 3.40 | 3.49 | ||||||||||||
Period Ended June 30, 2010(f) | 10.00 | -(e) | (0.67) | (0.67) | ||||||||||||
SMALL-CAP GROWTH | ||||||||||||||||
Period Ended December 31, 2011 (Unaudited) | 12.42 | (0.01) | (1.46) | (1.47) | ||||||||||||
Year Ended June 30, 2011 | 9.14 | (0.01) | 3.31 | 3.30 | ||||||||||||
Year Ended June 30, 2010 | 8.46 | 0.02 | 0.70 | 0.72 | ||||||||||||
Year Ended June 30, 2009 | 13.95 | 0.03 | (5.52) | (5.49) | ||||||||||||
Year Ended June 30, 2008 | 16.01 | (0.03) | (2.03) | (2.06) | ||||||||||||
Year Ended June 30, 2007 | 14.75 | (0.04) | 1.30 | 1.26 | ||||||||||||
SMALL-CAP VALUE | ||||||||||||||||
Period Ended December 31, 2011 (Unaudited) | 15.12 | 0.10 | (1.42) | (1.32) | ||||||||||||
Year Ended June 30, 2011 | 11.45 | 0.14 | 3.60 | 3.74 | ||||||||||||
Year Ended June 30, 2010 | 9.73 | 0.07 | 1.72 | 1.79 | ||||||||||||
Year Ended June 30, 2009 | 15.86 | 0.08 | (6.14) | (6.06) | ||||||||||||
Year Ended June 30, 2008 | 18.74 | 0.03 | (2.91) | (2.88) | ||||||||||||
Year Ended June 30, 2007 | 16.02 | (0.03) | 2.75 | 2.72 | ||||||||||||
| (a) | Per share amounts calculated based on the average daily shares outstanding during the period. |
| (b) | Annualized for periods less than one year. |
| (c) | For the years ended June 30, 2010 and June 30, 2011 and the period ended December 31, 2011, the expense ratio was significantly lower than past years due to a negative performance adjustment to the investment advisory fee. Please refer to the Statements of Operations and Note 3 of the Notes to Financial Statements for further information. The rate shown may not be indicative of the rate going forward. |
| (d) | Total return may have been lower had various fees not been waived during the period. |
| (e) | Amount represents less than $0.005. |
| (f) | Commenced operations on May 28, 2010. |
See Notes to Financial Statements.
| 141 | Semi-Annual Report | December 31, 2011 (Unaudited) | |
|
Less Distributions to Shareholders from: | Ratios & Supplemental Data | |||||||||||||||||||||||||||||||||||||||||
| Net Realized Gain | Net Investment Income | Total Distributions | Paid in Capital from Redemption Fees(a) | Net Asset Value, End of Period | Total Return | Net Assets End of Period (000’s) | Expenses Before Waivers and Reimburse- ments(b) | Expenses After Waivers and Reimburse- ments(b) | Net Investment Income (Loss) After Waivers and Reimburse- ments(b) | Portfolio Turnover Rate | ||||||||||||||||||||||||||||||||
| $ - | $(0.13) | $ (0.13) | $ - | $ 6.17 | (13.58%) | $ 19,871 | 0.49%(c) | 0.49% | 1.66% | 41% | ||||||||||||||||||||||||||||||||
| - | (0.11) | (0.11) | - | 7.29 | 35.47% | 25,144 | 0.32%(c) | 0.32% | 1.19% | 111% | ||||||||||||||||||||||||||||||||
| - | (0.06) | (0.06) | - | 5.47 | 16.44% | 20,726 | 0.00%(c) | 0.00% | 1.73% | 123% | ||||||||||||||||||||||||||||||||
| - | (0.01) | (0.01) | - | 4.75 | (32.41%) | 24,719 | 0.87% | 0.87% | 1.13% | 151% | ||||||||||||||||||||||||||||||||
| - | (0.01) | (0.01) | - | 7.05 | (17.49%)(d) | 38,136 | 0.75% | 0.75% | 0.36% | 147% | ||||||||||||||||||||||||||||||||
| (2.21) | - | (2.21) | - | 8.56 | (3.37%) | 62,244 | 0.84% | 0.84% | (0.09%) | 133% | ||||||||||||||||||||||||||||||||
| (1.18) | (0.01) | (1.19) | - | 10.48 | (8.15%)(d) | 2,969 | 5.28% | 0.90% | 0.38% | 122% | ||||||||||||||||||||||||||||||||
| - | (0.08) | (0.08) | - (e) | 12.74 | 37.49%(d) | 3,002 | 5.43% | 0.90% | 0.79% | 272% | ||||||||||||||||||||||||||||||||
| - | - | - | - | 9.33 | (6.70%)(d) | 1,888 | 11.24% | 0.90% | 0.50% | 3% | ||||||||||||||||||||||||||||||||
| - | -(e) | - (e) | - | 10.95 | (11.83%)(d) | 35,650 | 1.06% | 0.94% | (0.11%) | 30% | ||||||||||||||||||||||||||||||||
| - | (0.02) | (0.02) | - | 12.42 | 36.17%(d) | 46,717 | 0.98% | 0.94% | (0.12%) | 87% | ||||||||||||||||||||||||||||||||
| - | (0.04) | (0.04) | - | 9.14 | 8.44% | 57,011 | 0.93% | 0.93% | 0.21% | 87% | ||||||||||||||||||||||||||||||||
| - | - | - | - | 8.46 | (39.35%) | 71,697 | 0.94% | 0.94% | 0.29% | 75% | ||||||||||||||||||||||||||||||||
| - | - | - | - | 13.95 | (12.87%)(d) | 144,668 | 0.87% | 0.87% | (0.20%) | 63% | ||||||||||||||||||||||||||||||||
| - | - | - | - | 16.01 | 8.54% | 172,395 | 0.92% | 0.92% | (0.31%) | 37% | ||||||||||||||||||||||||||||||||
| - | (0.19) | (0.19) | - | 13.61 | (8.70%)(d) | 72,510 | 0.99% | 0.94% | 1.47% | 19% | ||||||||||||||||||||||||||||||||
| - | (0.07) | (0.07) | - | 15.12 | 32.73% | 93,714 | 0.87% | 0.87% | 1.03% | 84% | ||||||||||||||||||||||||||||||||
| - | (0.07) | (0.07) | - | 11.45 | 18.35% | 108,701 | 0.91% | 0.91% | 0.64% | 81% | ||||||||||||||||||||||||||||||||
| - | (0.07) | (0.07) | - | 9.73 | (38.15%) | 132,229 | 0.92% | 0.92% | 0.75% | 83% | ||||||||||||||||||||||||||||||||
| - | - | - | - | 15.86 | (15.37%)(d) | 331,648 | 0.83% | 0.83% | 0.18% | 73% | ||||||||||||||||||||||||||||||||
| - | - | - | - | 18.74 | 16.98% | 280,177 | 0.88% | 0.88% | (0.19%) | 58% | ||||||||||||||||||||||||||||||||
| www.bridgeway.com | 142 | |
| FINANCIAL HIGHLIGHTS (continued) | |
(for a share outstanding throughout the period indicated) |
Income from Investment Operations | ||||||||||||||||
|
| |||||||||||||||
| Net Asset Value, Beginning of Period | Net Investment Income(a) | Net Realized and Unrealized Gain\(Loss) | Total from Investment Operations | |||||||||||||
LARGE-CAP GROWTH | ||||||||||||||||
Period Ended December 31, 2011 (Unaudited) | $13.38 | $0.05 | $ (1.10) | $(1.05) | ||||||||||||
Year Ended June 30, 2011 | 10.17 | 0.06 | 3.22 | 3.28 | ||||||||||||
Year Ended June 30, 2010 | 9.06 | 0.06 | 1.11 | 1.17 | ||||||||||||
Year Ended June 30, 2009 | 13.73 | 0.06 | (4.66) | (4.60) | ||||||||||||
Year Ended June 30, 2008 | 14.12 | 0.06 | (0.41) | (0.35) | ||||||||||||
Year Ended June 30, 2007 | 12.11 | 0.03 | 2.02 | 2.05 | ||||||||||||
LARGE-CAP VALUE | ||||||||||||||||
Period Ended December 31, 2011 (Unaudited) | 14.62 | 0.12 | (0.89) | (0.77) | ||||||||||||
Year Ended June 30, 2011 | 11.44 | 0.20 | 3.21 | 3.41 | ||||||||||||
Year Ended June 30, 2010 | 9.74 | 0.19 | 1.73 | 1.92 | ||||||||||||
Year Ended June 30, 2009 | 13.63 | 0.23 | (3.89) | (3.66) | ||||||||||||
Year Ended June 30, 2008 | 17.07 | 0.22 | (2.94) | (2.72) | ||||||||||||
Year Ended June 30, 2007 | 14.41 | 0.17 | 2.64 | 2.81 | ||||||||||||
BLUE CHIP 35 INDEX | ||||||||||||||||
Period Ended December 31, 2011 (Unaudited) | 7.60 | 0.08 | (0.10) | (0.02) | ||||||||||||
Year Ended June 30, 2011 | 6.18 | 0.15 | 1.39 | 1.54 | ||||||||||||
Year Ended June 30, 2010 | 5.66 | 0.13 | 0.52 | 0.65 | ||||||||||||
Year Ended June 30, 2009 | 7.21 | 0.15 | (1.51) | (1.36) | ||||||||||||
Year Ended June 30, 2008 | 8.52 | 0.19 | (1.39) | (1.20) | ||||||||||||
Year Ended June 30, 2007 | 7.21 | 0.16 | 1.26 | 1.42 | ||||||||||||
MANAGED VOLATILITY | ||||||||||||||||
Period Ended December 31, 2011 (Unaudited) | 11.58 | 0.02 | (0.07) | (0.05) | ||||||||||||
Year Ended June 30, 2011 | 10.23 | 0.07 | 1.37 | 1.44 | ||||||||||||
Year Ended June 30, 2010 | 10.19 | 0.10 | 0.08 | 0.18 | ||||||||||||
Year Ended June 30, 2009 | 12.58 | 0.18 | (1.69) | (1.51) | ||||||||||||
Year Ended June 30, 2008 | 12.95 | 0.29 | (0.49) | (0.20) | ||||||||||||
Year Ended June 30, 2007 | 12.65 | 0.28 | 0.44 | 0.72 | ||||||||||||
| (a) | Per share amounts calculated based on the average daily shares outstanding during the period. |
| (b) | Annualized for periods less than one year. |
| (c) | Total return may have been lower had various fees not been waived during the period. |
| (d) | Total return includes the effect of a reimbursement by the Adviser and the accounting agent due to a trading error. |
See Notes to Financial Statements.
| 143 | Semi-Annual Report | December 31, 2011 (Unaudited) | |
|
Less Distributions to Shareholders from | Ratios & Supplemental Data | |||||||||||||||||||||||||||||||||||||
|
|
|
| |||||||||||||||||||||||||||||||||||
| Net Realized Gain | Net Investment | Total Distributions | Net Asset Period | Total Return | Net Assets End of Period (000’s) | Expenses Before Waivers and Reimbursements(b) | Expenses After Reimbursements(b) | Net Investment After Waivers and Reimbursements(b) | Portfolio Turnover Rate | |||||||||||||||||||||||||||||
| $ - | $(0.09) | $(0.09) | $12.24 | (7.84%)(c) | $ 47,041 | 0.89% | 0.84% | 0.81% | 12% | |||||||||||||||||||||||||||||
| - | (0.07) | (0.07) | 13.38 | 32.31%(c) | 58,478 | 0.86% | 0.84% | 0.47% | 65% | |||||||||||||||||||||||||||||
| - | (0.06) | (0.06) | 10.17 | 12.89%(c) | 58,409 | 0.86% | 0.84% | 0.55% | 40% | |||||||||||||||||||||||||||||
| - | (0.07) | (0.07) | 9.06 | (33.43%) | 70,534 | 0.82% | 0.82% | 0.63% | 49% | |||||||||||||||||||||||||||||
| - | (0.04) | (0.04) | 13.73 | (2.50%)(c) | 174,813 | 0.71% | 0.71% | 0.39% | 37% | |||||||||||||||||||||||||||||
| - | (0.04) | (0.04) | 14.12 | 16.98% | 138,138 | 0.78% | 0.78% | 0.25% | 39% | |||||||||||||||||||||||||||||
| - | (0.18) | (0.18) | 13.67 | (5.23%)(c) | 27,548 | 1.19% | 0.84% | 1.78% | 11% | |||||||||||||||||||||||||||||
| - | (0.23) | (0.23) | 14.62 | 30.02%(c) | 29,647 | 1.17% | 0.84% | 1.50% | 43% | |||||||||||||||||||||||||||||
| - | (0.22) | (0.22) | 11.44 | 19.65%(c) | 25,534 | 1.11% | 0.84% | 1.58% | 49% | |||||||||||||||||||||||||||||
| - | (0.23) | (0.23) | 9.74 | (26.88%)(c) | 27,996 | 0.98% | 0.84% | 2.20% | 65% | |||||||||||||||||||||||||||||
| (0.51) | (0.21) | (0.72) | 13.63 | (16.46%)(c) | 54,144 | 0.80% | 0.79% | 1.38% | 28% | |||||||||||||||||||||||||||||
| - | (0.15) | (0.15) | 17.07 | 19.57% | 86,095 | 0.79% | 0.79% | 1.08% | 34% | |||||||||||||||||||||||||||||
| - | (0.16) | (0.16) | 7.42 | (0.23%)(c) | 333,337 | 0.28% | 0.15% | 2.30% | 15% | |||||||||||||||||||||||||||||
| - | (0.12) | (0.12) | 7.60 | 25.10%(c) | 331,565 | 0.27% | 0.15% | 2.09% | 19% | |||||||||||||||||||||||||||||
| - | (0.13) | (0.13) | 6.18 | 11.25%(c)(d) | 222,586 | 0.27% | 0.15% | 1.99% | 28% | |||||||||||||||||||||||||||||
| - | (0.19) | (0.19) | 5.66 | (18.77%)(c) | 188,012 | 0.25% | 0.15% | 2.58% | 86% | |||||||||||||||||||||||||||||
| - | (0.11) | (0.11) | 7.21 | (14.28%)(c) | 250,988 | 0.22% | 0.15% | 2.35% | 12% | |||||||||||||||||||||||||||||
| - | (0.11) | (0.11) | 8.52 | 19.81%(c) | 99,082 | 0.35% | 0.15% | 1.98% | 11% | |||||||||||||||||||||||||||||
| - | (0.07) | (0.07) | 11.46 | (0.43%)(c) | 25,464 | 1.30% | 0.94% | 0.41% | 17% | |||||||||||||||||||||||||||||
| - | (0.09) | (0.09) | 11.58 | 14.15%(c) | 29,246 | 1.22% | 0.94% | 0.63% | 34% | |||||||||||||||||||||||||||||
| - | (0.14) | (0.14) | 10.23 | 1.67%(c) | 33,684 | 1.05% | 0.94% | 0.91% | 33% | |||||||||||||||||||||||||||||
| (0.52) | (0.36) | (0.88) | 10.19 | (11.66%)(c) | 47,299 | 1.01% | 0.94% | 1.72% | 51% | |||||||||||||||||||||||||||||
| - | (0.17) | (0.17) | 12.58 | (1.57%)(c) | 75,417 | 0.88% | 0.88% | 2.23% | 44% | |||||||||||||||||||||||||||||
| (0.15) | (0.27) | (0.42) | 12.95 | 5.87%(c) | 87,056 | 0.98% | 0.94% | 2.16% | 27% | |||||||||||||||||||||||||||||
| www.bridgeway.com | 144 | |
| NOTES TO FINANCIAL STATEMENTS | |
December 31, 2011 (Unaudited)
1. Organization:
Bridgeway Funds, Inc. (“Bridgeway” or the “Company”) was organized as a Maryland corporation on October 19, 1993, and is registered under the Investment Company Act of 1940, as amended (the “1940 Act”), as an open-end management investment company.
Bridgeway is organized as a series fund, with 14 investment funds as of December 31, 2011 (each, a “Fund” and collectively, the “Funds”): Aggressive Investors 1, Aggressive Investors 2, Ultra-Small Company, Ultra-Small Company Market, Micro-Cap Limited, Small-Cap Momentum, Small-Cap Growth, Small-Cap Value, Large-Cap Growth, Large-Cap Value, Blue Chip 35 Index and Managed Volatility Funds are presented in this report. The Omni Tax-Managed Small-Cap Value Fund and the Omni Small-Cap Value Fund commenced operations on December 31, 2010 and August 31, 2011, respectively, and are included in a separate report.
Bridgeway is authorized to issue 2,000,000,000 shares of common stock at $0.001 per share. As of December 31, 2011, 15,000,000 shares have been classified into the Aggressive Investors 1 Fund. 130,000,000 shares each have been classified into the Aggressive Investors 2 and Blue Chip 35 Index Funds. 5,000,000 shares have been classified into the Ultra-Small Company Fund. 10,000,000 shares have been classified in the Micro-Cap Limited Fund. 100,000,000 shares each have been classified into the Ultra-Small Company Market, Omni Tax-Managed Small-Cap Value, Omni Small-Cap Value, Small-Cap Momentum, Small-Cap Growth, Small-Cap Value, Large-Cap Growth, and Large-Cap Value Funds. 50,000,000 shares have been classified into the Managed Volatility Fund. All shares outstanding currently represent Class N shares.
The Ultra-Small Company Fund is open to existing investors (direct only).
All of the Funds are no-load, diversified funds.
The Aggressive Investors 1 and 2 Funds seek to exceed the stock market total return (primarily through capital appreciation) at a level of total risk roughly equal to that of the stock market over longer periods of time (three years or more).
The Ultra-Small Company, Ultra-Small Company Market, Micro-Cap Limited, Small-Cap Momentum, Small-Cap Growth, Small-Cap Value and Large-Cap Growth Funds seek to provide a long-term total return of capital, primarily through capital appreciation.
The Blue Chip 35 Index and Large-Cap Value Funds seek to provide long-term total return of capital, primarily through capital appreciation but also some income.
The Managed Volatility Fund seeks to provide a high current return with short-term risk less than or equal to 40% of the stock market.
Bridgeway Capital Management, Inc. (the “Adviser”) is the investment adviser for all of the Funds.
2. Significant Accounting Policies:
The following summary of significant accounting policies, followed in the preparation of the financial statements of the Funds, are in conformity with accounting principles generally accepted in the United States of America (“GAAP”).
Securities, Options, Futures and Other Investments Valuation Other than options, portfolio securities that are principally traded on a national securities exchange are valued at their last sale price on the principal exchange on which they are traded prior to the close of the New York Stock Exchange (“NYSE”), on each day the NYSE is open for business. If there is no closing price on the NYSE, the portfolio security will be valued using a composite price, which is defined as the last price for the security on any exchange. Portfolio securities other than options that are principally traded on the National Association of Securities Dealers Automated Quotation System (“NASDAQ”) are valued at the NASDAQ Official Closing Price (“NOCP”). In the absence of recorded sales on their home exchange, or NOCP, in the case of NASDAQ traded securities, the security will be valued as follows: bid prices for long positions and ask prices for short positions.
| 145 | Semi-Annual Report | December 31, 2011 (Unaudited) | |
| NOTES TO FINANCIAL STATEMENTS (continued) | |
December 31, 2011 (Unaudited) |
Short-term fixed income securities having a remaining maturity of 60 days or less are valued at amortized cost, which approximates market value. Options are valued at the close if there is trading volume and if there is no trading volume, the bid on long positions and ask on the short positions. Other investments for which no sales are reported are valued at the latest bid price in accordance with the pricing policy established by the Board of Directors.
Investments in open-end registered investment companies and closed-end registered investment companies that do not trade on an exchange are valued at the end of day net asset value (“NAV”) per share.
Investments in closed-end registered investment companies that trade on an exchange are valued at the last sales price as of the close of the customary trading session on the exchange where the security is principally traded.
When market quotations are not readily available or when events occur that make established valuation methods unreliable, securities of the Funds may be valued at fair value as determined in good faith by or under the direction of the Board of Directors. The valuation assigned to fair valued securities for purposes of calculating the Funds’ NAVs may differ from the security’s most recent closing market price and from the prices used by other mutual funds to calculate their NAVs.
The inputs and valuation techniques used to determine the value of a Fund’s investments are summarized into three levels as described in the hierarchy below:
| • | Level 1 — quoted prices in active markets for identical assets |
Investments whose values are based on quoted market prices in active markets, and whose values are therefore classified as Level 1 prices, include active listed equity securities. The Funds do not adjust the quoted price for such investments, even in situations where the Funds hold a large position and a sale could reasonably impact the quoted price.
| • | Level 2 — other significant observable inputs (including quoted prices for similar securities, interest rates, prepayments speeds, credit risk, etc.) |
Investments that trade in markets that are not considered to be active, but whose values are based on quoted market prices, dealer quotations or valuations provided by alternative pricing sources supported by observable inputs are classified as Level 2 prices. These generally include certain U.S. government and sovereign obligations, most government agency securities, investment-grade corporate bonds and less liquid listed equity securities. As investments whose values are classified as Level 2 prices include positions that are not traded in active markets and/or are subject to transfer restrictions, valuations may be adjusted to reflect illiquidity and/or non-transferability, which are generally based on available market information.
Money market fund investments consist of mutual funds which invest primarily in securities that are valued at amortized cost, a Level 2 investment. Therefore, the money market funds are classified as Level 2 investments. The Funds’ total return swap values are derived by applying observable inputs to the outstanding notional values and are therefore classified as Level 2 investments also.
| • | Level 3 — significant unobservable inputs (including a Fund’s own assumptions in determining the fair value of investments) |
Investments whose values are classified as Level 3 prices have significant unobservable inputs, as they may trade infrequently or not at all. When observable prices are not available for these securities, the Funds use one or more valuation techniques for which sufficient and reliable data is available. The inputs used by the Funds in estimating the value of Level 3 prices may include the original transaction price, quoted prices for similar securities or assets in active markets, completed or pending third-party transactions in the underlying investment or comparable issuers, and changes in financial ratios or cash flows. Level 3 prices may also be adjusted to reflect illiquidity and/or non-transferability, with the amount of such discount estimated by the Funds in the absence of market information. Assumptions used by the Funds due to the lack of observable inputs may significantly impact the resulting value and therefore the Funds’ results of operations.
The inputs or methodology used for valuing investments are not necessarily an indication of the risk associated with investing in those investments. A summary of the inputs used to value the Funds’ investments as of December 31, 2011 is included with each Fund’s Schedule of Investments.
| www.bridgeway.com | 146 | |
| NOTES TO FINANCIAL STATEMENTS (continued) | |
December 31, 2011 (Unaudited) |
The Funds’ policy is to recognize transfers into, and transfers out of, each level of hierarchy as of the beginning of the reporting period. For the period ended December 31, 2011, there were no transfers between Level 1 and Level 2 for any of the Funds.
In May 2011, the Financial Accounting Standards Board (“FASB”) issued Accounting Standards Update (“ASU”) No. 2011-04 “Amendments to Achieve Common Fair Value Measurement and Disclosure Requirements in U.S. GAAP and International Financial Reporting Standards (“IFRSs”).” ASU No. 2011-04 includes common requirements for measurement of and disclosure about fair value between U.S. GAAP and IFRS. ASU No. 2011-04 will require reporting entities to disclose quantitative information about the unobservable inputs used in the fair value measurements categorized within Level 3 of the fair value hierarchy. In addition, ASU No. 2011-04 will require reporting entities to make disclosures about amounts and reasons for all transfers in and out of Level 1 and Level 2 fair value measurements. The new and revised disclosures are effective for interim and annual reporting periods beginning after December 15, 2011. Management is currently evaluating the implications of ASU No. 2011-04, and its impact on the financial statements has not been determined.
Securities Lending Upon lending its securities to third parties, each Fund receives compensation in the form of fees. A Fund also continues to receive dividends on the securities loaned. The loans are secured by collateral at least equal to the fair value of the securities loaned plus accrued interest. Gain or loss in the fair value of the securities loaned that may occur during the term of the loan will be for the account of a Fund. Each Fund has the right under the lending agreement to recover the securities from the borrower on demand. Additionally, a Fund does not have the right to sell or repledge collateral received in the form of securities unless the borrower goes into default. The risks to a Fund of securities lending are that the borrower may not provide additional collateral when required or return the securities when due.
As of December 31, 2011, the Funds had securities on loan and related collateral with values shown below:
| Securities on | Value of | |||||||
| Bridgeway Fund | Loan Value | Collateral | ||||||
Aggressive Investors 1 | $ 3,003,207 | $ 3,078,106 | ||||||
Aggressive Investors 2 | 9,334,745 | 9,612,173 | ||||||
Ultra-Small Company | 3,870,055 | 4,031,825 | ||||||
Ultra-Small Company Market | 29,893,263 | 31,074,240 | ||||||
Micro-Cap Limited | 931,859 | 969,142 | ||||||
Small-Cap Momentum | 82,738 | 85,130 | ||||||
Small-Cap Growth | 2,221,186 | 2,292,534 | ||||||
Small-Cap Value | 4,646,143 | 4,784,826 | ||||||
Large-Cap Value | 285,894 | 292,950 | ||||||
Managed Volatility | 10,268 | 10,500 | ||||||
It is each Fund’s policy to obtain additional collateral from or return excess collateral to the borrower by the end of the next business day, following the valuation date of the securities loaned. Therefore, the value of the collateral held may be temporarily less than that required under the lending contract. As of December 31, 2011 the collateral consisted of an institutional money market fund.
Use of Estimates in Financial Statements In preparing financial statements in conformity with GAAP, management makes estimates and assumptions that affect the reported amounts of assets and liabilities at the date of the financial statements and the disclosure of contingent assets and liabilities at the date of the financial statements as well as the reported amounts of revenue and expenses during the reporting period. Actual results could differ from those estimates.
Risks and Uncertainties The Funds provide for various investment options, including stocks and call and put options. Such investments are exposed to various risks, such as interest rate, market and credit risks. Due to the risks involved, it is at least reasonably possible that changes in risks in the near term would materially affect shareholders’ account values and the amounts reported in the financial statements.
Security Transactions, Investment Income and Expenses Security transactions are accounted for as of the trade date, the date the order to buy or sell is executed. Realized gains and losses are computed on the identified cost basis. Dividend
| 147 | Semi-Annual Report | December 31, 2011 (Unaudited) | |
| NOTES TO FINANCIAL STATEMENTS (continued) | |
December 31, 2011 (Unaudited) |
income is recorded on the ex-dividend date, and interest income is recorded on the accrual basis from settlement date. Particularly related to the Managed Volatility Fund, discounts and premiums are accreted/amortized on the effective interest method.
Fund expenses that are not series-specific are allocated to each series based upon its relative proportion of net assets to the Funds’ total net assets or other appropriate basis.
Distributions to Shareholders The Funds pay dividends from net investment income and distribute realized capital gains annually, usually in December.
Derivatives
The Funds’ use of derivatives for the period ended December 31, 2011 was limited to futures contracts, total return swaps, purchased options and written options. The following is a summary of how these derivatives are treated in the financial statements and their impact on the Funds.
Asset Derivatives | Liability Derivatives | |||||||||||||
Fund/Financial Instrument Type | Type of Derivative | Location on Statement of Assets and Liabilities | Fair Value | Location on Statement of Assets and Liabilities | Fair Value | |||||||||
Aggressive Investors 1 | ||||||||||||||
Other | Swap | Receivable, Total Return Swap | $ | 70,950 | $ | - | ||||||||
Aggressive Investors 2 | ||||||||||||||
Other | Swap | Receivable, Total Return Swap | 140,383 | - | ||||||||||
Ultra-Small Company | ||||||||||||||
Other | Swap | Receivable, Total Return Swap | 92,099 | - | ||||||||||
Ultra-Small Company Market | ||||||||||||||
Other | Swap | - | Payable, Total Return Swap | 11,380 | ||||||||||
Micro-Cap Limited | ||||||||||||||
Other | Swap | Receivable, Total Return Swap | 4,647 | - | ||||||||||
Small-Cap Growth | ||||||||||||||
Other | Swap | - | Payable, Total Return Swap | 3,913 | ||||||||||
Small-Cap Value | ||||||||||||||
Other | Swap | Receivable, Total Return Swap | 5,159 | - | ||||||||||
Large-Cap Growth | ||||||||||||||
Other | Swap | Receivable, Total Return Swap | 7,025 | - | ||||||||||
Managed Volatility | ||||||||||||||
Equity Contracts | Written Option | - | Call Options Written at value Put Options Written at value | | 249,868 180,204 | | ||||||||
| www.bridgeway.com | 148 | |
| NOTES TO FINANCIAL STATEMENTS (continued) | |
December 31, 2011 (Unaudited) |
Fund/Financial Instrument Type | Type of Derivative | Location of Gain (Loss) on Derivatives Recognized in Income | Amount of Realized Gain (Loss) | Amount of Unrealized Gain (Loss) | ||||||||
Aggressive Investors 1 | ||||||||||||
Other | Swap | Realized Gain (Loss) on Swaps | $ | (13,624 | ) | |||||||
Change in Unrealized Appreciation (Depreciation) on Swaps | $ | (3,655 | ) | |||||||||
Equity Contracts | Purchased Option | Realized Gain (Loss) on Investments | (119,097 | ) | ||||||||
Change in Unrealized Appreciation (Depreciation) on Investments | 25,097 | |||||||||||
Aggressive Investors 2 Other | Swap | Realized Gain (Loss) on Swaps | 70,186 | |||||||||
Change in Unrealized Appreciation (Depreciation) on Swaps | (15,113 | ) | ||||||||||
Equity Contracts | Purchased Option | Realized Gain (Loss) on Investments | (246,235 | ) | ||||||||
Change in Unrealized Appreciation (Depreciation) on Investments | 48,835 | |||||||||||
Ultra-Small Company Other | Swap | Realized Gain (Loss) on Swaps | (143,221 | ) | ||||||||
Change in Unrealized Appreciation (Depreciation) on Swaps | 65,397 | |||||||||||
Ultra-Small Company Market Other | Swap | Realized Gain (Loss) on Swaps | (185,824 | ) | ||||||||
Change in Unrealized Appreciation (Depreciation) on Swaps | (7,993 | ) | ||||||||||
Micro-Cap Limited Other | Swap | Realized Gain (Loss) on Swaps | (20,085 | ) | ||||||||
Change in Unrealized Appreciation (Depreciation) on Swaps | (4,271 | ) | ||||||||||
Small-Cap Growth Other | Swap | Realized Gain (Loss) on Swaps | (75,379 | ) | ||||||||
Change in Unrealized Appreciation (Depreciation) on Swaps | (7,720 | ) | ||||||||||
Small-Cap Value Other | Swap | Realized Gain (Loss) on Swaps | 4,522 | |||||||||
Change in Unrealized Appreciation (Depreciation) on Swaps | (9,894 | ) | ||||||||||
Large-Cap Growth Other | Swap | Realized Gain (Loss) on Swaps | 12,295 | |||||||||
Change in Unrealized Appreciation (Depreciation) on Swaps | (5,184 | ) | ||||||||||
Large-Cap Value Other | Swap | Realized Gain (Loss) on Swaps | (54,089 | ) | ||||||||
| 149 | Semi-Annual Report | December 31, 2011 (Unaudited) | |
| NOTES TO FINANCIAL STATEMENTS (continued) | |
December 31, 2011 (Unaudited) |
Fund/Financial Instrument Type | Type of Derivative | Location of Gain (Loss) on Derivatives Recognized in Income | Amount of Realized Gain (Loss) | Amount of Unrealized Gain (Loss) | ||||||||
Managed Volatility | ||||||||||||
Equity Contracts | Written | |||||||||||
| Option | Realized Gain (Loss) on Written Options | $187,014 | ||||||||||
Change in Unrealized Appreciation (Depreciation) on Written Options | $294,443 | |||||||||||
| Future | Realized Gain (Loss) on Futures Contracts | 342,924 | ||||||||||
| Purchased | ||||||||||||
| Option | Realized Gain (Loss) on Investments | 23,093 | ||||||||||
Change in Unrealized Appreciation (Depreciation) on Investments | 8,494 | |||||||||||
The derivative instruments outstanding as of December 31, 2011, as disclosed in the Notes to the Financial Statements, and the amounts of realized and changes in unrealized gains and losses on derivative instruments during the period, as disclosed in the Statement of Operations, serve as indicators of the volume of derivative activity for the Funds.
Futures Contracts The Funds may purchase or sell financial futures contracts to hedge cash positions, manage market risk and to dampen volatility in line with investment objectives. A futures contract is an agreement between two parties to buy or sell a financial instrument at a set price on a future date. Upon entering into such a contract, a Fund is required to pledge to the broker an amount of cash or U.S. government securities equal to the minimum “initial margin” requirements of the exchange on which the futures contract is traded. The contract amount reflects the extent of a Fund’s exposure in these financial instruments. A Fund’s participation in the futures markets involves certain risks, including imperfect correlation between movements in the price of futures contracts and movements in the price of the securities hedged or used for cover. Pursuant to a contract, such Fund agrees to receive from, or pay to, the broker an amount of cash equal to the fluctuation in value of the contract. Such receipts or payments are known as “variation margin” and are recorded by a Fund as unrealized appreciation or depreciation. When a contract is closed, a Fund records a realized gain or loss equal to the difference between the value of the contract at the time it was opened and the value at the time it was closed. With futures, there is minimal counterparty risk to the Funds since futures are exchange traded and the exchange’s clearinghouse, as counterparty to all exchange traded futures, guarantees the futures against default. As of December 31, 2011, the Funds had no open futures contracts.
Options The Aggressive Investors 1 and Aggressive Investors 2 Funds may buy and sell calls and puts to increase or decrease each Fund’s exposure to stock market risk or for purposes of diversification of risk. The Managed Volatility Fund may buy and sell calls and puts to reduce the Fund’s volatility and provide some cash flow. An option is a contract conveying a right to buy or sell a financial instrument at a specified price during a stipulated period. The premium paid by a Fund for the purchase of a call or a put option is included in such Fund’s Schedule of Investments as an investment and subsequently marked-to-market to reflect the current market value of the option. When a Fund writes a call or a put option, an amount equal to the premium received by such Fund is included in its Statement of Assets and Liabilities as a liability and is subsequently marked-to-market to reflect the current market value of the option written. If an option which a Fund has written either expires on its stipulated expiration date, or if such Fund enters into a closing purchase transaction, that Fund realizes a gain (or a loss if the cost of a closing purchase transaction exceeds the premium received when the option was written) without regard to any unrealized gain or loss on the underlying security, and the liability related to such options is extinguished. If a call option that a Fund has written is assigned, such Fund realizes a gain or loss from the sale of the underlying security and the proceeds from such sale are increased by the premium originally received. If a put option that a Fund has written is assigned, the amount of the premium originally received reduces the cost of the security that such Fund purchased upon exercise of the option. Buying calls increases a Fund’s exposure to the underlying security to the extent of any premium paid. Buying puts on a stock market index tends to limit a Fund’s exposure to a stock market decline. All options purchased by the Funds were listed on exchanges and considered liquid positions with readily available market quotes.
| www.bridgeway.com | 150 | |
| NOTES TO FINANCIAL STATEMENTS (continued) | |
December 31, 2011 (Unaudited) |
Covered Call Options and Secured Puts The Aggressive Investors 1, Aggressive Investors 2 and Managed Volatility Funds may write call options on a covered basis, that is, a Fund will own the underlying security, or a Fund may write secured puts. The principal reason for writing covered calls and secured puts on a security is to attempt to realize income through the receipt of premiums. The option writer has, in return for the premium, given up the opportunity for profit from a substantial price increase in the underlying security so long as the obligation as a writer continues, but has retained the risk of loss should the price of the security decline. All options were listed on exchanges and considered liquid positions with readily available market quotes. Transactions in options written during the period ended December 31, 2011 are as follows:
| Managed Volatility Fund | Managed Volatility Fund | |||||||||||||||||
| Written Call Options | Written Put Options | |||||||||||||||||
| Contracts | Premiums | Contracts | Premiums | |||||||||||||||
Outstanding, June 30, 2011 | 2,535 | $ 378,986 | 1,735 | $ 251,738 | ||||||||||||||
Positions Opened | 4,474 | 752,085 | 2,642 | 529,410 | ||||||||||||||
Exercised | (1,459) | (305,969) | (1,513) | (231,566) | ||||||||||||||
Expired | (3,894) | (517,219) | (1,012) | (166,327) | ||||||||||||||
Closed | (110) | (21,851) | (335) | (101,991) | ||||||||||||||
Outstanding, December 31, 2011 | 1,546 | $ 286,032 | 1,517 | $ 281,264 | ||||||||||||||
Market Value, December 31, 2011 | $ 249,868 | $ 180,204 | ||||||||||||||||
The Aggressive Investors 1 and Aggressive Investors 2 Funds had no transactions in written options during the period ended December 31, 2011.
Swaps. Each Fund may enter into total return swaps. Total return swaps are agreements that provide a Fund with a return based on the performance of an underlying asset, in exchange for fee payments to a counterparty based on a specified rate. The difference in the value of these income streams is recorded daily by the Funds and is settled in cash monthly.
The fee paid by a Fund will typically be determined by multiplying the face value of the swap agreement by an agreed upon interest rate. In addition, if the underlying asset declines in value over the term of the swap, a Fund would also be required to pay the dollar value of that decline to the counterparty. Total return swaps could result in losses if the underlying asset does not perform as anticipated by the Adviser. A Fund may use its own NAV as the underlying asset in a total return swap. This strategy serves to reduce cash drag (the impact of cash on a Fund’s overall return) by replacing it with the impact of market exposure based upon a Fund’s own investment holdings. The following total return swaps were open as of December 31, 2011:
| Bridgeway Fund | Swap Counterparty | Notional Principal | Maturity Date | Net Unrealized Gain\(Loss) | ||||||
Ultra-Small Company | ReFlow Management Co. | $ | 1,459,727 | January 3, 2012 | $92,099 | |||||
Indemnification Under the Company’s organizational documents, the Funds’ officers, directors, employees and agents are indemnified against certain liabilities that may arise out of the performance of their duties to the Funds. Additionally, in the normal course of business, the Funds enter into contracts that contain a variety of indemnification clauses. The Funds’ maximum exposure under these arrangements is unknown as this would involve future claims that may be made against the Funds that have not yet occurred. However, the Funds have not had prior claims or losses pursuant to these contracts.
3. Management Fees, Other Related Party Transactions and Contingencies:
The Funds have entered into management agreements with the Adviser. As compensation for the advisory services rendered, facilities furnished, and expenses borne by the Adviser, the Funds pay the Adviser a fee pursuant to each Fund’s management agreement, as described below.
| 151 | Semi-Annual Report | December 31, 2011 (Unaudited) | |
| NOTES TO FINANCIAL STATEMENTS (continued) | |
December 31, 2011 (Unaudited) |
Aggressive Investors 1: A total advisory fee is paid by the Fund to the Adviser that is comprised of a Base Fee and a Performance Adjustment. The Base Fee equals the Base Fee Rate times the average daily net assets of the Fund. The Base Fee Rate is based on the following annual rates: 0.90% of the first $250 million of the Fund’s average daily net assets, 0.875% of the next $250 million and 0.85% of any excess over $500 million.
The Performance Adjustment equals 4.67% times the difference in cumulative total return between the Fund and the Standard and Poor’s 500 Composite Stock Price Index with dividends reinvested (hereinafter “Index”) over a rolling five-year performance period. The Performance Adjustment Rate varies from a minimum of –0.70% to a maximum of +0.70%. However, the Performance Adjustment Rate is zero if the difference between the cumulative Fund performance and the Index performance is less than or equal to 2%.
Aggressive Investors 2: A total advisory fee is paid by the Fund to the Adviser that is comprised of a Base Fee and a Performance Adjustment. The Base Fee equals the Base Fee Rate times the average daily net assets of the Fund. The Base Fee rate is based on the following annual rates: 0.90% of the first $250 million of the Fund’s average daily net assets, 0.875% of the next $250 million, 0.85% from $500 million to $1 billion, and 0.80% over $1 billion.
The Performance Adjustment equals 2.00% times the difference in cumulative total return between the Fund and the Standard and Poor’s 500 Composite Stock Price Index with dividends reinvested (hereinafter “Index”) over a rolling five-year performance period. The Performance Adjustment Rate varies from a minimum of -0.30% to a maximum of +0.30%. However, the Performance Adjustment Rate is zero if the difference between the cumulative Fund performance and the Index performance is less than or equal to 2%.
Ultra-Small Company: The Fund pays management fees based on the following annual rates: 0.90% of the first $250 million of the Fund’s average daily net assets, 0.875% of the next $250 million and 0.85% of any excess over $500 million. The management fees are computed daily and are payable monthly. However, during any period that the Fund’s net assets range from $27,500,000 to $55,000,000, the advisory fee will be determined as if the Fund had $55,000,000 under management. This is limited to a maximum annualized expense ratio of 1.49% of average net assets.
Ultra-Small Company Market: The Fund’s management fee is a flat 0.50% of the value of the Fund’s average daily net assets, computed daily and payable monthly.
Micro-Cap Limited: A total advisory fee is paid by the Fund to the Adviser that is comprised of a Base Fee and a Performance Adjustment. The Base Fee equals the Base Fee Rate times the average daily net assets of the Fund. The Base Fee Rate is based on the following annual rates: 0.90% of the first $250 million of the Fund’s average daily net assets, 0.875% of the next $250 million and 0.85% of any excess over $500 million. However, during any quarter that the Fund’s net assets range from $27,500,000 to $55,000,000, the advisory fee will be determined as if the Fund had $55,000,000 under management. This is limited to a maximum annualized expense ratio of 1.49% of the net assets in the quarter the advisory fee is determined.
The Performance Adjustment equals 2.87% times the difference in cumulative total return between the Fund and the CRSP Cap-Based Portfolio 9 Index with dividends reinvested (hereinafter “Index”) over a rolling five-year performance period. The Performance Adjustment Rate varies from a minimum of –0.70% to a maximum of +0.70%. However, the Performance Adjustment Rate is zero if the difference between the cumulative Fund performance and the Index performance is less than or equal to 2%.
Small-Cap Momentum: The Fund’s management fee is a flat 0.55% of the value of the Fund’s average daily net assets, computed daily and payable monthly.
Small-Cap Growth and Small-Cap Value: A total advisory fee is paid by each Fund to the Adviser that is comprised of a Base Fee and a Performance Adjustment. The Base Fee equals the Base Fee Rate times the average daily net assets of the Fund. The Base Fee Rate is based on the annual rate of 0.60% of the value of the Fund’s average daily net assets.
The Performance Adjustment equals 0.33% times the difference in cumulative total return between the Fund and the Russell 2000 Growth Index for Small-Cap Growth Fund and the Russell 2000 Value Index for Small-Cap Value Fund, with dividends reinvested (hereinafter “Index”) over a rolling five-year performance period. The Performance Adjustment Rate varies from a
| www.bridgeway.com | 152 | |
| NOTES TO FINANCIAL STATEMENTS (continued) | |
December 31, 2011 (Unaudited) |
minimum of -0.05% to a maximum of +0.05%. However, the Performance Adjustment Rate is zero if the difference between the cumulative Fund’s performance and the Index performance is less than or equal to 2%.
Large-Cap Growth and Large-Cap Value: A total advisory fee is paid by each Fund to the Adviser that is comprised of a Base Fee and a Performance Adjustment. The Base Fee equals the Base Fee Rate times the average daily net assets of the Fund. The Base Fee Rate is based on the annual rate of 0.50% of the value of the Fund’s average daily net assets.
The Performance Adjustment equals 0.33% times the difference in cumulative total return between the Fund and the Russell 1000 Growth Index for Large-Cap Growth Fund and the Russell 1000 Value Index for the Large-Cap Value Fund, with dividends reinvested (hereinafter “Index”) over a rolling five-year performance period. The Performance Adjustment Rate varies from a minimum of -0.05% to a maximum of +0.05%. However, the Performance Adjustment Rate is zero if the difference between the cumulative Fund’s performance and the Index performance is less than or equal to 2%.
Blue Chip 35 Index: The Fund’s management fee is a flat 0.08% of the value of the Fund’s average daily net assets, computed daily and payable monthly.
Managed Volatility: The Fund’s management fee is a flat 0.60% of the value of the Fund’s average daily net assets, computed daily and payable monthly.
Expense limitations: At a special meeting on March 31, 2005, shareholders of the Funds (except for the Small-Cap Momentum Fund, which was launched on May 28, 2010) approved amendments to the Management Agreements detailing expense limitations. With regard to the Small-Cap Momentum Fund, the Board of Directors and sole initial shareholder approved an expense limitation beginning on May 28, 2010. The Adviser agrees to reimburse the Funds for operating expenses and management fees above the expense limitations, which are shown as a ratio of net expenses to average net assets, for each Fund, for the period ended December 31, 2011. Such expense limitations and total reimbursements for the period ended December 31, 2011, are shown below.
| Bridgeway Fund | Expense Limitation | Total Waivers and 12/31/11 | ||||||
Aggressive Investors 1 | 1.80 % | $ - | ||||||
Aggressive Investors 2 | 1.75 % | - | ||||||
Ultra-Small Company | 2.00 % | - | ||||||
Ultra-Small Company Market | 0.75 % | 84,721 | ||||||
Micro-Cap Limited | 1.85 % | - | ||||||
Small-Cap Momentum* | 0.90 % | 59,949 | ||||||
Small-Cap Growth | 0.94 % | 21,836 | ||||||
Small-Cap Value | 0.94 % | 20,522 | ||||||
Large-Cap Growth | 0.84 % | 13,047 | ||||||
Large-Cap Value | 0.84 % | 48,080 | ||||||
Blue Chip 35 Index | 0.15 % | 212,386 | ||||||
Managed Volatility | 0.94 % | 48,110 | ||||||
| *The Fund is authorized to reimburse the Adviser for management fees previously waived and/or for expenses previously paid by the Adviser, provided, however, that any reimbursements must be paid at a date not more than three years after the fiscal year in which the Adviser waived the fees or reimbursed the expenses and the reimbursements do not cause the Fund to exceed the expense limitation in the agreement. The Fund has recoupable expenses of $11,221, $101,196 and $59,949, which expire June 30, 2013, June 30, 2014 and June 30, 2015, respectively. | ||||||||
Other Related Party Transactions: On occasion, the Funds will engage in inter-portfolio trades when it is to the benefit of both parties. The Board of Directors reviews these trades quarterly. Inter-portfolio purchases and sales during the period ended December 31, 2011 were as follows:
| 153 | Semi-Annual Report | December 31, 2011 (Unaudited) | |
| NOTES TO FINANCIAL STATEMENTS (continued) | |
December 31, 2011 (Unaudited) |
| Bridgeway Fund | Inter-portfolio Purchases | Inter-portfolio Sales | ||
Aggressive Investors 1 | $ - | $ 44,160 | ||
Ultra-Small Company | 27,281 | 408,656 | ||
Ultra-Small Company Market | 396,973 | 2,567,172 | ||
Micro-Cap Limited | 430,461 | 105,972 | ||
Small-Cap Momentum | - | �� 249,463 | ||
Small-Cap Growth | 241,788 | 78,598 | ||
Small-Cap Value | 1,333,501 | 95,827 |
The Adviser entered into an Administrative Services Agreement with Bridgeway, pursuant to which the Adviser provides various administrative services to the Funds including, but not limited to: (i) supervising and managing various aspects of the Funds’ business and affairs; (ii) selecting, overseeing and/or coordinating activities with other service providers to the Funds; (iii) providing reports to the Board of Directors as requested from time to time; (iv) assisting and/or reviewing amendments and updates to the Funds’ registration statement and other filings with the Securities and Exchange Commission (“SEC”); (v) providing certain shareholder services; (vi) providing administrative support in connection with meetings of the Board of Directors; and (vii) providing certain record-keeping services. For its services to all of the Funds, the Adviser is paid an aggregate annual fee of $535,000 payable in equal monthly installments.
One director of Bridgeway, John Montgomery, is an owner and director of the Adviser. Another director of Bridgeway, Michael Mulcahy, is an executive and director of the Adviser. Under the 1940 Act definitions, each is considered to be an “affiliated person” of the Adviser and an “interested person” of the Adviser and of Bridgeway. Compensation for Mr. Montgomery and Mr. Mulcahy is borne by the Adviser rather than the Funds.
Board of Directors Compensation Independent Directors are paid an annual retainer of $14,000 with an additional retainer of $2,500 paid to the Independent Chairman of the Board and an additional retainer of $1,000 paid to the Nominating and Corporate Governance Committee Chair. Independent Directors are paid $6,000 per meeting for meeting fees. Such compensation is the total compensation from all Funds and is allocated among the Funds.
The Independent Directors receive this compensation in the form of shares of the Funds, credited to his or her account. Such Directors are reimbursed for any expenses incurred in attending meetings and conferences and expenses for subscriptions or printed materials. The amount of directors’ fees attributable to each Fund is disclosed in the Statements of Operations.
4. Distribution and Shareholder Servicing Fees:
Foreside Fund Services, LLC acts as distributor of the Funds’ shares pursuant to a Distribution Agreement dated November 12, 2010. The Adviser pays all costs and expenses associated with distribution of the Funds’ shares pursuant to a protective plan adopted by shareholders pursuant to Rule 12b-1.
5. Purchases and Sales of Investment Securities:
Purchases and sales of investments, other than short-term securities, for each Fund for the period ended December 31, 2011 were as follows:
| www.bridgeway.com | 154 | |
| NOTES TO FINANCIAL STATEMENTS (continued) | |
December 31,2011 (Unaudited) |
| Purchases | Sales | |||||||
| Bridgeway Fund | U.S. Government | Other | U.S. Government | Other | ||||
Aggressive Investors 1 | $ - | $ 55,956,274 | $ - | $61,833,356 | ||||
Aggressive Investors 2 | - | 109,959,554 | - | 142,598,623 | ||||
Ultra-Small Company | - | 22,376,550 | - | 25,898,772 | ||||
Ultra-Small Company Market | - | 47,261,536 | - | 77,952,830 | ||||
Micro-Cap Limited | - | 8,327,389 | - | 9,827,773 | ||||
Small-Cap Momentum | - | 3,651,304 | - | 3,433,308 | ||||
Small-Cap Growth | - | 11,605,707 | - | 17,199,652 | ||||
Small-Cap Value | - | 15,063,185 | - | 26,906,237 | ||||
Large-Cap Growth | - | 5,890,677 | - | 12,270,626 | ||||
Large-Cap Value | - | 2,930,838 | - | 3,312,791 | ||||
Blue Chip 35 Index | - | 54,120,193 | - | 49,423,692 | ||||
Managed Volatility | - | 3,993,494 | 500,000 | 5,102,015 | ||||
6. Federal Income Taxes
It is the Funds’ policy to continue to comply with the provisions of the Internal Revenue Code of 1986, as amended, applicable to regulated investment companies and distribute income to the extent necessary so that the Funds are not subject to federal income tax. Therefore, no federal income tax provision is required.
Unrealized Appreciation and Depreciation on Investments (Tax Basis) The amount of net unrealized appreciation/ depreciation and the cost of investment securities for tax purposes, including short-term securities at December 31, 2011, were as follows:
| Aggressive Investors 1 | Aggressive Investors 2 | Ultra-Small Company | Ultra-Small Company Market | |||||||||||
Gross appreciation (excess of value over tax cost) | $ 7,521,700 | $ 12,802,726 | $ 11,988,301 | $ 86,201,166 | ||||||||||
Gross depreciation (excess of tax cost over value) | (9,203,014) | (17,985,945) | (10,497,812) | (20,614,962) | ||||||||||
Net unrealized appreciation (depreciation) | $ (1,681,314) | $(5,183,219) | $ 1,490,489 | $ 65,586,204 | ||||||||||
Cost of investments for income tax purposes | $ 83,617,842 | $ 156,562,062 | $ 73,664,761 | $ 250,254,807 | ||||||||||
| Micro-Cap Limited | Small-Cap Momentum | Small-Cap Growth | Small-Cap Value | |||||||||||
Gross appreciation (excess of value over tax cost) | $ 2,328,796 | $ | 247,856 | $ | 5,517,486 | $ | 13,006,605 | |||||||
Gross depreciation (excess of tax cost over value) | (2,138,924) | (57,123 | ) | (2,526,855 | ) | (5,728,057 | ) | |||||||
Net unrealized appreciation (depreciation) | $ 189,872 | $ | 190,733 | $ | 2,990,631 | $ | 7,278,548 | |||||||
Cost of investments for income tax purposes | $ 19,660,482 | $ | 2,786,175 | $ | 32,798,558 | $ | 65,109,970 | |||||||
| Large-Cap Growth | Large-Cap Value | Blue Chip 35 Index | Managed Volatility | |||||||||||
Gross appreciation (excess of value over tax cost) | $ 7,937,823 | $ | 5,551,630 | $ | 73,709,395 | $ | 4,365,339 | |||||||
Gross depreciation (excess of tax cost over value) | (2,879,295) | (1,238,249 | ) | (17,681,898 | ) | (1,189,654 | ) | |||||||
Net unrealized appreciation (depreciation) | $ 5,058,528 | $ | 4,313,381 | $ | 56,027,497 | $ | 3,175,685 | |||||||
Cost of investments for income tax purposes | $ 41,939,527 | $ | 23,058,701 | $ | 276,836,579 | $ | 22,119,320 | |||||||
| 155 | Semi-Annual Report | December 31, 2011 (Unaudited) | |
| NOTES TO FINANCIAL STATEMENTS (continued) | |
December 31, 2011 (Unaudited) |
The differences between book and tax net unrealized appreciation (depreciation) are primarily due to wash sale loss deferrals, and adjustments to basis from investments in real estate investment trusts, business development companies and partnerships.
Classifications of Distributions Net investment income (loss) and net realized gain (loss) may differ for financial statement and tax purposes. The character of distributions made during the year from net investment income or net realized gains may differ from its ultimate characterization for federal income tax purposes.
The tax character of the distributions paid by the Funds during the last two fiscal years ended June 30, 2011 and June 30, 2010, respectively, are as follows:
| Aggressive Investors 1 | Aggressive Investors 2 | |||||||||||||||
Year Ended June 30, 2011 | Year Ended | Year Ended | Year Ended | |||||||||||||
Distributions paid from: | ||||||||||||||||
Ordinary income | $ | 2,167,451 | $ | 930,085 | $ | 1,764,382 | $ | 1,620,063 | ||||||||
Total | $ | 2,167,451 | $ | 930,085 | $ | 1,764,382 | $ | 1,620,063 | ||||||||
| Ultra-Small Company | Ultra-Small Company Market | |||||||||||||||
Year Ended | Year Ended | Year Ended | Year Ended | |||||||||||||
Distributions paid from: | ||||||||||||||||
Ordinary income | $ | 632,748 | $ | 837,589 | $ | 4,111,396 | $ | 5,060,400 | ||||||||
Total | $ | 632,748 | $ | 837,589 | $ | 4,111,396 | $ | 5,060,400 | ||||||||
| Micro-Cap Limited | Small-Cap Momentum | |||||||||||||||
Year Ended | Year Ended | Year Ended | Year Ended | |||||||||||||
Distributions paid from: | ||||||||||||||||
Ordinary income | $ | 401,927 | $ | 300,332 | $ | 16,889 | $ | — | ||||||||
Total | $ | 401,927 | $ | 300,332 | $ | 16,889 | $ | — | ||||||||
| Small-Cap Growth | Small-Cap Value | |||||||||||||||
Year Ended | Year Ended | Year Ended | Year Ended | |||||||||||||
Distributions paid from: | ||||||||||||||||
Ordinary income | $ | 107,719 | $ | 252,145 | $ | 557,827 | $ | 806,731 | ||||||||
Total | $ | 107,719 | $ | 252,145 | $ | 557,827 | $ | 806,731 | ||||||||
| Large-Cap Growth | Large-Cap Value | |||||||||||||||
Year Ended | Year Ended | Year Ended | Year Ended | |||||||||||||
Distributions paid from: | ||||||||||||||||
Ordinary income | $ | 342,087 | $ | 417,231 | $ | 461,725 | $ | 565,868 | ||||||||
Total | $ | 342,087 | $ | 417,231 | $ | 461,725 | $ | 565,868 | ||||||||
| www.bridgeway.com | 156 | |
| NOTES TO FINANCIAL STATEMENTS (continued) | |
December 31, 2011 (Unaudited) |
| Blue Chip 35 Index | Managed Volatility | |||||||||||||||
Year Ended | Year Ended | Year Ended | Year Ended | |||||||||||||
Distributions paid from: | ||||||||||||||||
Ordinary income | $ | 4,877,457 | $ | 4,072,171 | $ | 266,935 | $ | 612,394 | ||||||||
Total | $ | 4,877,457 | $ | 4,072,171 | $ | 266,935 | $ | 612,394 | ||||||||
| * | Commenced operations on May 28, 2010, and as a result, there were no distributions for the year ended June 30, 2010. |
At June 30, 2011, the Funds had available for tax purposes, capital loss carryovers as follows:
| Aggressive Investor 1 | Aggressive Investor 2 | Ultra-Small Company | |||||||||||||||
Expiring | 6/30/2017 | $ | - | $ | 12,816,562 | $ | 2,301,468 | ||||||||||
6/30/2018 | 70,102,305 | 177,345,455 | 1,365,778 | ||||||||||||||
| Micro-Cap Limited | Small-Cap Growth | Small-Cap Value | |||||||||||||||
Expiring | 6/30/2015 | $ | - | $ | 2,860,044 | $ | - | ||||||||||
| 6/30/2016 | - | - | - | ||||||||||||||
| 6/30/2017 | 3,902,694 | 7,823,854 | 14,748,497 | ||||||||||||||
| 6/30/2018 | 4,507,635 | 22,793,119 | 50,552,993 | ||||||||||||||
| Large-Cap Growth | Large-Cap Value | Blue Chip 35 Index | Managed Volatility | |||||||||||||||||||
Expiring | 6/30/2012 | $ | - | $ | - | $ | 327,296 | $ | - | |||||||||||||
| 6/30/2013 | - | - | 282,192 | - | ||||||||||||||||||
| 6/30/2014 | - | - | 402,963 | - | ||||||||||||||||||
| 6/30/2015 | - | - | 418,882 | - | ||||||||||||||||||
| 6/30/2016 | - | - | 31,461 | - | ||||||||||||||||||
| 6/30/2017 | 4,574,830 | 127,273 | 28,604,419 | - | ||||||||||||||||||
| 6/30/2018 | 33,490,095 | 3,361,989 | 34,451,339 | 7,043,873 | ||||||||||||||||||
| 6/30/2019 | - | - | 2,656,190 | - | ||||||||||||||||||
Under the Regulated Investment Company Modernization Act of 2010, capital losses incurred by a fund after June 30, 2011 will not be subject to expiration. In addition, such losses must be utilized prior to the losses incurred in the years preceding enactment.
There are no capital loss carryovers for Ultra-Small Company Market Fund and Small-Cap Momentum Fund as of June 30, 2011.
Capital loss carryovers utilized during the period June 30, 2011 were as follows:
| Bridgeway Fund | Capital Loss Carryover Utilized | |||
Aggressive Investors 1 | $ | 15,406,021 | ||
Aggressive Investors 2 | 43,447,188 | |||
Ultra-Small Company | 12,949,694 | |||
Ultra-Small Company Market | 8,675,110 | |||
Micro-Cap Limited | 4,376,827 | |||
| 157 | Semi-Annual Report | December 31, 2011 (Unaudited) | |
| NOTES TO FINANCIAL STATEMENTS (continued) | |
December 31, 2011 (Unaudited) |
| Capital Loss | ||||
| Carryover | ||||
| Bridgeway Fund | Utilized | |||
Small-Cap Growth | $ | 7,049,367 | ||
Small-Cap Value | 20,636,947 | |||
Large-Cap Growth | 8,849,005 | |||
Large-Cap Value | 3,045,462 | |||
Managed Volatility | 980,347 | |||
Capital loss carryovers of $337,509 expired for the Blue Chip 35 Index Fund during the period ended June 30, 2011.
Components of Accumulated Earnings (Deficit) As of June 30, 2011, the components of accumulated earnings (deficit) on a tax basis were:
| Aggressive Investors 1 | Aggressive Investors 2 | Ultra-Small Company | ||||||||||
Accumulated Net Investment Income (Loss) | $ | 1,648,496 | $ | 23,680 | $ | 938,111 | ||||||
Accumulated Net Realized Gain (Loss) on Investments* | (70,102,305 | ) | (190,162,017 | ) | (3,667,246 | ) | ||||||
Net Unrealized Appreciation/Depreciation of | ||||||||||||
Investments | 16,955,469 | 36,150,904 | 14,803,066 | |||||||||
Total | $ | (51,498,340 | ) | $ | (153,987,433 | ) | $ | 12,073,931 | ||||
| Ultra-Small Company Market | Micro-Cap Limited | Small-Cap Momentum | ||||||||||
Accumulated Net Investment Income (Loss) | $ | 3,451,116 | $ | 398,482 | $ | 280,420 | ||||||
Accumulated Net Realized Gain (Loss) on Investments* | 13,433,177 | (8,410,329 | ) | 9,122 | ||||||||
Net Unrealized Appreciation/Depreciation of | ||||||||||||
Investments | 116,828,598 | 3,347,269 | 289,775 | |||||||||
Total | $ | 133,712,891 | $ | (4,664,578 | ) | $ | 579,317 | |||||
| Small-Cap Growth | Small-Cap Value | Large-Cap Growth | ||||||||||
Accumulated Net Investment Income (Loss) | $ | 3,172 | $ | 724,448 | $ | 127,160 | ||||||
Accumulated Net Realized Gain (Loss) on Investments* | (33,477,017 | ) | (65,301,490 | ) | (38,064,925 | ) | ||||||
Net Unrealized Appreciation/Depreciation of | ||||||||||||
Investments | 9,832,495 | 18,632,366 | 10,528,615 | |||||||||
Total | $ | (23,641,350 | ) | $ | (45,944,676 | ) | $ | (27,409,150 | ) | |||
| Large-Cap Value | Blue Chip 35 Index | Managed Volatility | ||||||||||
Accumulated Net Investment Income (Loss) | $ | 168,714 | $ | 3,448,573 | $ | 151,301 | ||||||
Accumulated Net Realized Gain (Loss) on Investments* | (3,489,262 | ) | (67,514,690 | ) | (7,043,873 | ) | ||||||
Net Unrealized Appreciation/Depreciation of | ||||||||||||
Investments | 6,317,312 | 60,022,882 | 4,000,862 | |||||||||
Total | $ | 2,996,764 | $ | (4,043,235 | ) | $ | (2,891,710 | ) | ||||
| * | Includes losses incurred during the period November 1, 2010 through June 30, 2011, which a Fund has elected to defer to its fiscal year ending June 30, 2012. Post October Losses—Under current tax law, capital losses realized after October 31 of a Fund’s fiscal year may be deferred and treated as occurring on the first business day of the following fiscal year for tax purposes. The Blue-Chip 35 Index Fund has deferred post October losses of $339,948. |
Accounting for Uncertainty in Income Taxes sets forth a minimum threshold for financial statement recognition of the benefit of a tax position taken or expected to be taken in a tax return. Management has analyzed each Fund’s tax positions and has concluded that no provision for income tax is required in each Fund’s financial statements. The Funds are not aware of any tax position for which it is reasonably possible that the total amounts of unrecognized tax benefits will significantly change in the
| www.bridgeway.com | 158 | |
| NOTES TO FINANCIAL STATEMENTS (continued) | |
December 31, 2011 (Unaudited) |
next twelve months. Each Fund’s federal tax returns for the prior three fiscal years remains subject to examination by the Internal Revenue Service.
7. Line of Credit
Bridgeway established a line of credit agreement (“Facility”) with The Bank of New York Mellon effective November 5, 2010. The Facility is for temporary or emergency purposes, such as to provide liquidity for shareholder redemptions, and is cancellable by either party. Unless cancelled earlier, the Facility shall be held available until November 2, 2012. Advances under the Facility are limited to $10,000,000 in total for all Funds and advances to each Fund shall not exceed certain limits set forth in the credit agreement, including but not limited to, the maximum amount a Fund is permitted to borrow under the 1940 Act.
The Funds incur a commitment fee of 0.05% per annum on the unused portion of the Facility and interest expense to the extent of amounts borrowed under the Facility. Interest is based on the higher of (a) the Federal Funds rate, (b) the Overnight Eurodollar Rate, or (c) the One-month Eurodollar Rate, plus 1.25%. The commitment fees are payable quarterly in arrears and are allocated to all participating Funds. Interest expense is charged directly to a Fund based upon actual amounts borrowed by such Fund.
For the period ended December 31, 2011, borrowings by the Funds under this line of credit were as follows:
| Bridgeway Fund | Weighted Average Interest Rate | Weighted Average Loan Balance | Number of Days Outstanding | Interest Expense Incurred1 | Maximum Amount the Period | |||||||||||||||
Aggressive Investors 1 | 1.48% | $ 302,750 | 32 | $ 395 | $1,025,000 | |||||||||||||||
Aggressive Investors 2 | 1.47% | 741,373 | 59 | 1,656 | 2,835,000 | |||||||||||||||
Ultra-Small Company | 1.45% | 115,800 | 10 | 46 | 214,000 | |||||||||||||||
Ultra-Small Company Market | 1.49% | 1,857,167 | 54 | 4,098 | 6,069,000 | |||||||||||||||
Micro-Cap Limited | 1.44% | 332,000 | 5 | 67 | 567,000 | |||||||||||||||
Small-Cap Growth | 1.46% | 210,500 | 30 | 277 | 629,000 | |||||||||||||||
Small-Cap Value | 1.48% | 341,246 | 69 | 936 | 1,136,000 | |||||||||||||||
Large-Cap Growth | 1.47% | 185,085 | 59 | 316 | 630,000 | |||||||||||||||
Large-Cap Value | 1.50% | 116,000 | 4 | 19 | 116,000 | |||||||||||||||
Blue Chip 35 Index | 1.51% | 2,461,878 | 49 | 5,002 | 10,000,000 | |||||||||||||||
| 1 Interest expense is included on the Statements of Operations in Miscellaneous expenses. | ||||||||||||||||||||
At December 31, 2011, Aggressive Investors 2, Ultra-Small Company Market, Large-Cap Growth and Blue Chip 35 Index Funds had loans outstanding in the amounts of $340,000, $307,000, $120,000 and $6,993,000, respectively.
8. Redemption Fees
In Ultra-Small Company Market and Small-Cap Momentum Funds, a 2% redemption fee may be charged on shares held less than six months. The fee is charged for the benefit of the remaining shareholders and will be paid to the appropriate Fund to help offset transaction costs. The fee is accounted for as an addition to paid-in capital.
9. Subsequent Events
Management has evaluated the impact of all subsequent events on the Funds and has determined that the following subsequent event requires recognition or disclosure in the financial statements.
At close of business on February 3, 2012, the Bridgeway Large-Cap Value Fund was reorganized into the American Beacon Bridgeway Large Cap Value Fund (“American Beacon Fund”), a newly created series of the American Beacon Funds, pursuant to a Plan of Reorganization approved by the Board of Directors of the Bridgeway Large-Cap Value Fund at a meeting held on November 11, 2011, and by shareholders of the Bridgeway Large-Cap Value Fund at a meeting held on February 1, 2012. The purpose of the reorganization was to move the Bridgeway Large-Cap Value Fund into the American Beacon family of funds. Under the Plan of Reorganization, the Bridgeway Large-Cap Value Fund transferred substantially all of its assets and
| 159 | Semi-Annual Report | December 31, 2011 (Unaudited) | |
| NOTES TO FINANCIAL STATEMENTS (continued) | |
December 31, 2011 (Unaudited) |
liabilities to the American Beacon Fund in exchange solely for institutional class shares of the American Beacon Fund, which were distributed to shareholders of the Bridgeway Large-Cap Value Fund according to their interests held in the fund immediately prior to the reorganization.
On February 10, 2012, the Board of Directors of Bridgeway Funds, Inc., on behalf of the Aggressive Investors 2 Fund (“AI2 Fund”), approved a Plan of Reorganization, under which the AI2 Fund will be reorganized with and into the Aggressive Investors 1 Fund (“AI1 Fund”). Under the Plan of Reorganization, the AI2 Fund will transfer substantially all of its assets and liabilities to the AI1 Fund in exchange solely for shares of the AI1 Fund, which will be distributed to shareholders of the AI2 Fund according to their interests held in the fund immediately prior to the reorganization. The Plan of Reorganization is subject to approval by the shareholders of the AI2 Fund.
On February 10, 2012, the Board of Directors of Bridgeway Funds, Inc., on behalf of the Micro-Cap Limited Fund (“MCL Fund”), approved a Plan of Reorganization, under which the MCL Fund will be reorganized with and into the Ultra-Small Company Fund (“USC Fund”). Under the Plan of Reorganization, the MCL Fund will transfer substantially all of its assets and liabilities to the USC Fund in exchange solely for shares of the USC Fund, which will be distributed to shareholders of the MCL Fund according to their interests held in the fund immediately prior to the reorganization. The Plan of Reorganization is subject to approval by the shareholders of the MCL Fund.
Additionally, on February 10, 2012 the Bridgeway Funds’ Board of Directors approved the following items:
| • | Classifying an additional 85,000,000 shares into the Aggressive Investors 1 Fund and classifying an additional 10,000,000 shares into the Ultra-Small Company Fund. |
| • | The following two modifications to the Management Agreement between the Adviser and the Company, on behalf of the Aggressive Investors 1 Fund: (i) the addition of a new breakpoint for assets over $1 Billion at which the advisory fee would be decreased to 0.80%; and (ii) decreasing the total expense cap from 1.80% to 1.75%. |
| • | The following modification to the Management Agreement between the Adviser and the Company, on behalf of the Ultra-Small Company Fund: decreasing the total expense cap from 2.00% to 1.85%. |
| www.bridgeway.com | 160 | |
| OTHER INFORMATION | | |
| December 31, 2011 (unaudited) | ||
1. Proxy Voting
Fund policies and procedures used in determining how to vote proxies relating to the Funds’ securities and a summary of proxies voted by the Funds for the period ended June 30, 2011 are available without a charge, upon request, by contacting Bridgeway Funds at 1-800-661-3550 and on the SEC’s website at http://www.sec.gov.
2. Fund Holdings
The complete schedules of the Funds’ holdings for the second and fourth quarters of each fiscal year are contained in the Funds’ Semi-Annual and Annual shareholder reports, respectively.
The Bridgeway Funds file complete schedules of the Funds’ holdings with the SEC for the first and third quarters of each fiscal year on Form N-Q within 60 days after the end of the period. Copies of the Funds’ Form N-Q are available without charge, upon request, by contacting Bridgeway Funds at 1-800-661-3550 and on the SEC’s website at http://www.sec.gov. You may also review and copy Form N-Q at the SEC’s Public Reference Room in Washington, D.C. For more information about the operation of the Public Reference Room, please call 1-800-SEC-0330.
| 161 | Semi-Annual Report | December 31, 2011 (Unaudited) | |
| DISCLOSURE OF FUND EXPENSES | | |
| December 31, 2011 (unaudited) | ||
As a shareholder of a Fund, you will incur no transaction costs from such Fund, including sales charges (loads) on purchases, on reinvested dividends or on other distributions. There are no exchange fees. Shareholders are subject to redemption fees on the Ultra-Small Company Market and Small-Cap Momentum Funds under certain circumstances. However, as a shareholder of a Fund, you will incur ongoing costs, including management fees and other Fund expenses. The following examples are intended to help you understand your ongoing costs (in dollars) of investing in a Fund and to compare these costs with ongoing costs of investing in other mutual funds. The examples are based on an investment of $1,000 invested on July 1, 2011 and held until December 31, 2011.
Actual Expenses. The first line of the table below provides information about actual account values and actual expenses. You may use the information in this line, together with the amount you invested, to estimate the expenses that you paid over the period. Simply divide your account value by $1,000 (for example, an $8,600 account value divided by $1,000 = 8.6), then multiply the result by the number in the first line under the heading “Expenses Paid During Period” to estimate the expenses you paid on your account during the period.
Hypothetical Example for Comparison Purposes. The second line of the table below provides information about hypothetical account values and hypothetical expenses based on the Fund’s actual expense ratio and an assumed rate of return of 5% per year before expenses, which is not the Fund’s actual return. The hypothetical account values and expenses may not be used to estimate the actual ending account balance or expenses you paid for the period. You may use this information to compare the ongoing costs of investing in a Fund and other mutual funds. To do so, compare this 5% hypothetical example with the 5% hypothetical examples that appear in the shareholder reports of other funds.
The expenses shown in the table are meant to highlight ongoing Fund costs only. Therefore, the second line of the table is useful in comparing ongoing costs only and will not help you determine the relative total costs of owning different funds, because other funds may also have transaction costs, such as sales charges, redemption fees or exchange fees.
| Beginning Account Value at 7/1/11 | Ending Account Value at 12/31/11 | Expense Ratio | Expenses Paid During Period* 7/1/11 - 12/31/11 | |||||||
Bridgeway Aggressive Investors 1 | ||||||||||
Actual Fund Return | $1,000.00 | $ 832.30 | -0.31 | %** | $(1.42) | |||||
Hypothetical Fund Return | $1,000.00 | $1,026.55 | -0.31 | %** | $(1.57) | |||||
Bridgeway Aggressive Investors 2 | ||||||||||
Actual Fund Return | $1,000.00 | $ 817.40 | 0.58 | % | $2.64 | |||||
Hypothetical Fund Return | $1,000.00 | $1,022.10 | 0.58 | % | $2.93 | |||||
Bridgeway Ultra-Small Company Fund | ||||||||||
Actual Fund Return | $1,000.00 | $ 836.60 | 1.22 | % | $5.60 | |||||
Hypothetical Fund Return | $1,000.00 | $1,018.90 | 1.22 | % | $6.16 | |||||
Bridgeway Ultra-Small Company Market Fund | ||||||||||
Actual Fund Return | $1,000.00 | $ 887.20 | 0.75 | % | $3.54 | |||||
Hypothetical Fund Return | $1,000.00 | $1,021.25 | 0.75 | % | $3.79 | |||||
Bridgeway Micro-Cap Limited Fund | ||||||||||
Actual Fund Return | $1,000.00 | $ 864.20 | 0.49 | % | $2.28 | |||||
Hypothetical Fund Return | $1,000.00 | $1,022.55 | 0.49 | % | $2.48 | |||||
Bridgeway Small-Cap Momentum Fund | ||||||||||
Actual Fund Return | $1,000.00 | $ 918.50 | 0.90 | % | $4.32 | |||||
Hypothetical Fund Return | $1,000.00 | $1,020.50 | 0.90 | % | $4.55 | |||||
| www.bridgeway.com | 162 | |
| DISCLOSURE OF FUND EXPENSES (continued) | |
December 31, 2011 (unaudited) |
| Beginning Account Value at 7/1/11 | Ending Account Value at 12/31/11 | Expense Ratio | Expenses Paid During Period* 7/1/11 - 12/31/11 | |||||||||
Bridgeway Small-Cap Growth Fund | ||||||||||||
Actual Fund Return | $1,000.00 | $ 881.70 | 0.94% | $4.42 | ||||||||
Hypothetical Fund Return | $1,000.00 | $1,020.30 | 0.94% | $4.75 | ||||||||
Bridgeway Small-Cap Value Fund | ||||||||||||
Actual Fund Return | $1,000.00 | $ 913.00 | 0.94% | $4.50 | ||||||||
Hypothetical Fund Return | $1,000.00 | $1,020.30 | 0.94% | $4.75 | ||||||||
Bridgeway Large-Cap Growth Fund | ||||||||||||
Actual Fund Return | $1,000.00 | $ 921.60 | 0.84% | $4.04 | ||||||||
Hypothetical Fund Return | $1,000.00 | $1,020.80 | 0.84% | $4.24 | ||||||||
Bridgeway Large-Cap Value Fund | ||||||||||||
Actual Fund Return | $1,000.00 | $ 947.70 | 0.84% | $4.09 | ||||||||
Hypothetical Fund Return | $1,000.00 | $1,020.80 | 0.84% | $4.24 | ||||||||
Bridgeway Blue Chip 35 Index Fund | ||||||||||||
Actual Fund Return | $1,000.00 | $ 997.70 | 0.15% | $0.75 | ||||||||
Hypothetical Fund Return | $1,000.00 | $1,024.25 | 0.15% | $0.76 | ||||||||
Bridgeway Managed Volatility | ||||||||||||
Actual Fund Return | $1,000.00 | $ 995.70 | 0.94% | $4.69 | ||||||||
Hypothetical Fund Return | $1,000.00 | $1,020.30 | 0.94% | $4.75 | ||||||||
| * | Expenses are equal to the average account value times the Fund’s annualized expense ratio multiplied by the number of days in the most recent half-year divided by the number of days in the fiscal year. |
| ** | The expense ratio for Aggressive Investors 1 Fund is negative due to the negative performance adjustment of the investment advisory fee. The expense ratio for this period excluding the negative performance adjustment was 1.29%. |
| 163 | Semi-Annual Report | December 31, 2011 (Unaudited) | |
THIS PAGE INTENTIONALLY LEFT BLANK
THIS PAGE INTENTIONALLY LEFT BLANK
BRIDGEWAY FUNDS, INC.
BNY Mellon Investment Servicing (US) Inc.
301 Bellevue Parkway
Wilmington, DE 19809
CUSTODIAN
The Bank of New York Mellon
One Wall Street
New York, NY 10286
DISTRIBUTOR
Foreside Fund Services, LLC
Three Canal Plaza, Suite 100
Portland, ME 04101
You can review and copy information about our Funds (including the SAIs) at the SEC’s Public Reference Room in Washington, D.C. To find out more about this public service, call the SEC at 800-SEC-0330. Reports and other information about the Funds is also available on the SEC’s website at www.sec.gov. You can receive copies of this information, for a fee, by writing the Public Reference Section, Securities and Exchange Commission, Washington, D.C. 20549-1520 or by sending an electronic request to the following email address: publicinfo@sec.gov.
| TABLE OF CONTENTS |  | |
| 1 | ||||
| 2 | ||||
| 2 | ||||
| 5 | ||||
| 13 | ||||
| 13 | ||||
| 16 | ||||
| 30 | ||||
| 31 | ||||
| 32 | ||||
| 34 | ||||
| 36 | ||||
| 42 | ||||
| 44 | ||||
| ||
| Bridgeway Funds Standardized Returns as of December 31, 2011* | ||
| Annualized | ||||||||||||||||||||||
| Fund | Quarter 10/1/11 | Six Months 7/1/11 to 12/31/11 | 1 Year | 5 Years | 10 Years | Inception to Date | Inception Date | Gross Expense Ratio2 | ||||||||||||||
Omni Small-Cap Value | 17.13% | NA | NA | NA | NA | 3.89% | 8/31/2011 | 1.00%1 | ||||||||||||||
Omni Tax-Managed Small-Cap Value | 15.78% | -11.43% | -5.41% | NA | NA | -5.41% | 12/31/2010 | 1.56%1 | ||||||||||||||
1 Some of the Funds’ fees were waived or expenses reimbursed; otherwise, returns would have been lower. The Adviser has contractually agreed to waive fees and/or reimburse expenses. Any material change to this Fund policy would require a vote by shareholders.
2 Expense ratios are as stated in the current prospectus. Please see financial highlights for expense ratios as of December 31, 2011.
* Numbers highlighted in green indicate periods when the Fund outperformed its primary benchmark.
Performance figures quoted represent past performance and are no guarantee of future results. Current performance may be lower or higher than the performance data quoted. Investment return and principal value will fluctuate, so that an investor’s shares, when redeemed, may be worth more or less than original cost. To obtain performance current to the most recent month-end, please visit our website at www.bridgeway.com or call 1-800-661-3550. Total return figures include the reinvestment of dividends and capital gains.
This report is submitted for the general information of the shareholders of each Fund. It is not authorized for distribution to prospective investors unless preceded or accompanied by an effective prospectus, which includes information regarding a Fund’s risks, objectives, fees and expenses, experience of its management, and other information. Investors should read the prospectus carefully before investing in a Fund. For questions or other Fund information, call 1-800-661-3550 or visit the Funds’ website at www.bridgeway.com. Funds are available for purchase by residents of the United States, Puerto Rico, U.S. Virgin Islands and Guam only. Foreside Fund Services, LLC, Distributor.
The views expressed here are exclusively those of Fund management. These views, including those relating to the market, sectors or individual stocks are not meant as investment advice and should not be considered predictive in nature.
| i | www.bridgewayomni.com | |
| LETTER FROM THE INVESTMENT MANAGEMENT TEAM | | |
| December 31, 2011 |
Dear Fellow Shareholders,
At Bridgeway, we have a shared passion for applying logic, data, and evidence to develop investment solutions. Our Omni Small-Cap Value and Omni Tax-Managed Small-Cap Value Funds are constructed based on fundamental academic research that relies on market efficiency to better capture risk premiums. We manage these Funds to provide broad diversification within the small-cap value universe and to keep transaction fees and expenses low. Bridgeway offers the Omni Small-Cap Value and Omni Tax-Managed Small-Cap Value Funds through a select group of advisers. We are committed to advisers and their clients who take a long-term perspective and whose investment goals fit our unique expertise: delivering investment solutions that are statistically driven and grounded in academic theory.
Thank you for your investment in Bridgeway’s Omni Small-Cap Value and Omni Tax-Managed Small-Cap Value Funds.
Sincerely, | ||||
| Your Investment Management Team | ||||
|  |  | ||
John Montgomery | Rasool Shaik | Christine Liang | ||

Market Review
Having endured some of the wildest volatility in years, investors were rewarded with a positive fourth quarter as optimism about the U.S. economy and corporate landscape reigned. Consumer confidence rose and manufacturing appeared to be on the mend as the Institute for Supply Management Index depicted continued expansion. Housing starts and home sales rebounded late, though any real sector recovery may come slowly. Labor showed signs of improvements as the unemployment rate fell to 8.3% in December. Inflation is not an issue for now, though investors cannot disregard future pressures with oil topping $100 per barrel amid new supply/demand worries. With the Fed Funds rate expected to remain at or near zero percent throughout 2012, Chairman Bernanke and the Federal Reserve Board are focusing on an improved communications strategy to keep investors informed about plans for the future and the thought processes behind them.
Global geopolitical events continue to impact the U.S. stock market. Just when Europe seemed to be taking positive steps to move past crisis mode, Spain, Italy, and Hungary came along to remind investors that the road to recovery will include many bumps. Some optimism returned at the end of the period following an agreement among major central banks to act together to mitigate Europe’s debt crisis.
Among the various U.S. equity sectors, energy, industrials, business services and materials were strong with solid double-digit gains. Other strong performers included consumer discretionary, consumer staples, financials, and health care.
Looking at the market from a “style box” perspective, returns for the quarter were strong across all styles and market capitalizations. Small-cap value stocks were the strongest market segment in the quarter ended December 31, 2011, with the Russell 2000 Value Index returning 15.97%, while large-cap growth stocks were the weakest, returning 10.61% as represented by the Russell 1000 Growth Index.
| www.bridgewayomni.com | 1 | |
| Omni Small-Cap Value Fund | | |
| MANAGER’S COMMENTARY | ||
(Unaudited)
December 31, 2011 |
Dear Fellow Omni Small-Cap Value Fund Shareholder,
For the quarter ended December 31, 2011, total returns were 17.13% for the Fund and 15.97% for the Russell 2000 Value Index.
The table below presents our quarter and life-to-date financial results. See below for a graph of performance since inception.
Quarter 10/1/11 to 12/31/11 | Life-to-Date 8/31/11 to 12/31/11 | |||||||
Omni Small-Cap Value Fund | 17.13% | 3.89% | ||||||
Russell 2000 Value Index | 15.97% | 3.30% | ||||||
Performance figures quoted in the table above and graph below represent past performance and are no guarantee of future results. Total return figures in the table above include the reinvestment of dividends and capital gains. The table above and the graph below do not reflect the deduction of taxes that a shareholder would pay on Fund distributions or the redemption of Fund shares. The recent growth rate in the stock market has helped to produce short-term returns that are not typical and may not continue in the future.
The Russell 2000 Value Index is an unmanaged index that consists of stocks in the Russell 2000 Index with lower price-to-book ratios and lower forecasted growth values with dividends reinvested. It is not possible to invest directly in an index.
Omni Small-Cap Value Fund vs. Russell 2000 Value Index from Inception 8/31/11 to 12/31/11
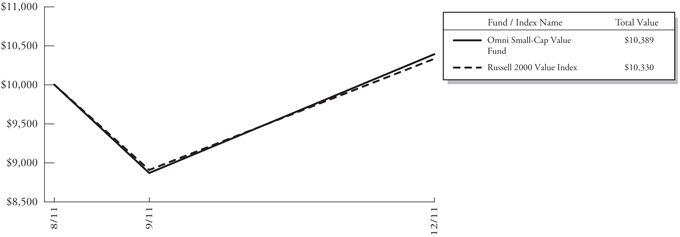
| 2 | Semi-Annual Report | December 31, 2011 (Unaudited) | |
| Omni Small-Cap Value Fund | | |
| MANAGER’S COMMENTARY (continued) | ||
| (Unaudited) |
Detailed Explanation of Quarterly Performance
The Omni Small-Cap Value Fund is designed to capture the returns of the small-cap value asset class through broad diversification of small company and value stocks. This approach is sometimes referred to as “passive, asset class investing.” As of December 31, 2011, we held 482 such stocks in a market cap weighted style. We make no attempt to track any particular index in either performance or statistics.
The Fund returns were driven by the fact that small stocks, and especially the value leaning stocks within the small universe, led the market as a whole.
Top Ten Holdings as of December 31, 2011
| Rank | Description | Industry | % of Net Assets | |||
1 | United Rentals, Inc. | Trading Companies & Distributors | 1.1% | |||
2 | Convergys Corp. | IT Services | 1.0% | |||
3 | Select Medical Holdings Corp. | Health Care Providers & Services | 0.9% | |||
4 | StanCorp Financial Group, Inc. Insurance | 0.9% | ||||
5 | Weis Markets, Inc. | Food & Staples Retailing | 0.9% | |||
6 | SYNNEX Corp. | Electronic Equipment, Instruments & Components | 0.9% | |||
7 | Meredith Corp. | Media | 0.8% | |||
8 | Brunswick Corp. | Leisure Equipment & Products | 0.8% | |||
9 | Group 1 Automotive, Inc. | Specialty Retail | 0.8% | |||
10 | Amerco, Inc. | Road & Rail | 0.8% | |||
| Total | 8.9% | |||||
Industry Sector Representation as of December 31, 2011
| % of Portfolio | % of Russell 2000 Value Index | Difference | ||||||||||
Consumer Discretionary | 26.5% | 11.7% | 14.8% | |||||||||
Consumer Staples | 5.0% | 3.1% | 1.9% | |||||||||
Energy | 6.6% | 4.6% | 2.0% | |||||||||
Financials | 17.5% | 36.8% | -19.3% | |||||||||
Health Care | 6.0% | 5.3% | 0.7% | |||||||||
Industrials | 17.5% | 14.8% | 2.7% | |||||||||
Information Technology | 13.0% | 10.9% | 2.1% | |||||||||
Materials | 5.4% | 4.9% | 0.5% | |||||||||
Telecommunication Services | 2.4% | 0.6% | 1.8% | |||||||||
Utilities | 0.1% | 7.3% | -7.2% | |||||||||
Cash & Other Assets | 0.0% | 0.0% | 0.0% | |||||||||
Total | 100.0% | 100.0% | ||||||||||
Disclaimer
The views expressed here are exclusively those of Fund management. These views, including those related to market sectors or individual stocks, are not meant as investment advice and should not be considered predictive in nature. Any favorable (or unfavorable) description of a holding applies only as of December 31, 2011, unless otherwise stated. Security positions can and do change thereafter. Discussions of historical performance do not guarantee and are not indicative of future performance.
Market volatility can significantly impact short-term performance. The Fund is not an appropriate investment for short-term investors. Investments in small companies generally carry greater risk than is customarily associated with larger companies.
| www.bridgewayomni.com | 3 | |
| Omni Small-Cap Value Fund | | |
| MANAGER’S COMMENTARY (continued) | ||
| (Unaudited) |
This additional risk is attributable to a number of factors, including the relatively limited financial resources that are typically available to small companies, and the fact that small companies often have comparatively limited product lines. In addition, the stock of small companies tends to be more volatile than the stock of large companies, particularly in the short term and particularly in the early stages of an economic or market downturn. Shareholders of the Fund, therefore, are taking on more risk than they would if they invested in the stock market as a whole.
Conclusion
Thank you for your investment in Omni Small-Cap Value Fund. We encourage your feedback; your reactions and concerns are important to us.
Sincerely,
Your Investment Management Team
| 4 | Semi-Annual Report | December 31, 2011 (Unaudited) | |
| Bridgeway Omni Small-Cap Value Fund | | |
| SCHEDULE OF INVESTMENTS | ||
| Showing percentage of net assets as of December 31, 2011 (Unaudited) |
| Industry Company | Shares Value Industry Company Shares Value |
COMMON STOCKS - 99.95% | ||||||||
Aerospace & Defense - 0.98% | ||||||||
AAR Corp. | 19,100 | $ | 366,147 | |||||
Orbital Sciences Corp.* | 28,150 | 409,019 | ||||||
Sparton Corp.* | 2,500 | 21,750 | ||||||
|
| |||||||
| 796,916 | ||||||||
Air Freight & Logistics - 0.56% | ||||||||
Air Transport Services Group, Inc.* | 23,200 | 109,504 | ||||||
Atlas Air Worldwide Holdings, Inc.* | 5,300 | 203,679 | ||||||
Pacer International, Inc.* | 12,600 | 67,410 | ||||||
Park-Ohio Holdings Corp.* | 4,400 | 78,496 | ||||||
|
| |||||||
| 459,089 | ||||||||
Airlines - 1.57% | ||||||||
Hawaiian Holdings, Inc.* | 19,100 | 110,780 | ||||||
JetBlue Airways Corp.* | 112,150 | 583,180 | ||||||
Pinnacle Airlines Corp.* | 7,350 | 6,027 | ||||||
Republic Airways Holdings, Inc.* | 34,000 | 116,620 | ||||||
SkyWest, Inc. | 19,400 | 244,246 | ||||||
US Airways Group, Inc.* | 41,900 | 212,433 | ||||||
|
| |||||||
| 1,273,286 | ||||||||
Auto Components - 1.20% | ||||||||
China XD Plastics Co., Ltd.* | 15,500 | 82,770 | ||||||
Cooper Tire & Rubber Co. | 27,900 | 390,879 | ||||||
Exide Technologies* | 35,000 | 92,050 | ||||||
Shiloh Industries, Inc.* | 4,700 | 39,386 | ||||||
Spartan Motors, Inc. | 14,950 | 71,909 | ||||||
Standard Motor Products, Inc. | 10,300 | 206,515 | ||||||
Strattec Security Corp. | 1,300 | 25,935 | ||||||
Tower International, Inc.* | 6,500 | 69,810 | ||||||
|
| |||||||
| 979,254 | ||||||||
Beverages - 0.30% | ||||||||
Coca-Cola Bottling Co. Consolidated | 4,100 | 240,055 | ||||||
Building Products - 0.54% | ||||||||
Gibraltar Industries, Inc.* | 11,250 | 157,050 | ||||||
Griffon Corp. | 28,800 | 262,944 | ||||||
US Home Systems, Inc. | 2,800 | 18,620 | ||||||
|
| |||||||
| 438,614 | ||||||||
Capital Markets - 1.08% | ||||||||
Calamos Asset Management, Inc., Class A | 13,000 | 162,630 | ||||||
Cowen Group, Inc., Class A* | 40,200 | 104,118 | ||||||
Capital Markets (continued) | ||||||||
GFI Group, Inc. | 54,350 | $ | 223,922 | |||||
Gleacher & Co., Inc.* | 57,300 | 96,264 | ||||||
Investment Technology Group, Inc.* | 18,350 | 198,364 | ||||||
SWS Group, Inc. | 13,200 | 90,684 | ||||||
|
| |||||||
| 875,982 | ||||||||
Chemicals - 2.55% | ||||||||
American Pacific Corp.* | 2,900 | 22,127 | ||||||
China Green Agriculture, Inc.* | 13,200 | 39,600 | ||||||
Ferro Corp.* | 45,000 | 220,050 | ||||||
Georgia Gulf Corp.* | 18,250 | 355,692 | ||||||
Koppers Holdings, Inc. | 10,700 | 367,652 | ||||||
Kraton Performance Polymers, Inc.* | 16,750 | 340,025 | ||||||
Material Sciences Corp.* | 5,200 | 42,432 | ||||||
Omnova Solutions, Inc.* | 20,350 | 93,813 | ||||||
Penford Corp.* | 5,100 | 25,959 | ||||||
Schulman (A.), Inc. | 6,700 | 141,906 | ||||||
TPC Group, Inc.* | 9,150 | 213,470 | ||||||
Zep, Inc. | 15,100 | 211,098 | ||||||
|
| |||||||
| 2,073,824 | ||||||||
Commercial Banks - 5.96% | ||||||||
Access National Corp. | 2,700 | 23,760 | ||||||
BancorpSouth, Inc.+ | 43,650 | 481,023 | ||||||
Bank of Commerce Holdings | 7,600 | 25,460 | ||||||
Banner Corp. | 7,550 | 129,482 | ||||||
C&F Financial Corp. | 1,200 | 31,920 | ||||||
Capital City Bank Group, Inc. | 7,650 | 73,058 | ||||||
Citizens Republic Bancorp, Inc.* | 18,000 | 205,200 | ||||||
CoBiz Financial, Inc. | 16,600 | 95,782 | ||||||
First BanCorp*+ | 87,300 | 304,677 | ||||||
First Bancorp | 7,600 | 84,740 | ||||||
First Business Financial Services, Inc. | 1,200 | 19,920 | ||||||
First Merchants Corp. | 11,500 | 97,405 | ||||||
Great Southern Bancorp, Inc. | 6,000 | 141,540 | ||||||
Guaranty Bancorp* | 24,000 | 35,280 | ||||||
Hampton Roads Bankshares, Inc.* | 22,300 | 61,102 | ||||||
Hanmi Financial Corp.* | 150 | 1,110 | ||||||
Heartland Financial USA, Inc. | 7,350 | 112,749 | ||||||
Horizon Bancorp | 2,100 | 36,582 | ||||||
Independent Bank Corp.* | 3,800 | 5,244 | ||||||
| www.bridgewayomni.com | 5 | |
| Bridgeway Omni Small-Cap Value Fund | | |
| SCHEDULE OF INVESTMENTS (continued) | ||
| Showing percentage of net assets as of December 31, 2011 (Unaudited) |
| Industry Company | Shares Value Industry Company Shares Value |
Common Stocks (continued) | ||||||||
Commercial Banks (continued) | ||||||||
Intervest Bancshares Corp., Class A* | 8,400 | $ | 22,932 | |||||
Macatawa Bank Corp.* | 13,200 | 30,096 | ||||||
MainSource Financial Group, Inc. | 9,050 | 79,912 | ||||||
Mercantile Bank Corp.* | 3,300 | 32,340 | ||||||
Metro Bancorp, Inc.* | 6,300 | 52,794 | ||||||
NewBridge Bancorp* | 7,000 | 27,090 | ||||||
Old Second Bancorp, Inc.* | 6,500 | 8,645 | ||||||
Orrstown Financial Services, Inc. | 5,600 | 46,200 | ||||||
Peoples Bancorp, Inc. | 4,800 | 71,088 | ||||||
PrivateBancorp, Inc. | 32,250 | 354,105 | ||||||
Republic Bancorp, Inc., Class A | 9,350 | 214,115 | ||||||
Savannah Bancorp, Inc. | 3,200 | 15,840 | ||||||
Susquehanna Bancshares, Inc. | 68,450 | 573,611 | ||||||
Synovus Financial Corp. | 328,750 | 463,538 | ||||||
Taylor Capital Group, Inc.* | 641 | 6,231 | ||||||
Union First Market Bankshares Corp. | 11,700 | 155,493 | ||||||
United Community Banks, Inc.*+ | 35,650 | 249,193 | ||||||
Virginia Commerce Bancorp, Inc.* | 13,350 | 103,195 | ||||||
VIST Financial Corp. | 3,000 | 18,150 | ||||||
Wintrust Financial Corp. | 12,800 | 359,040 | ||||||
|
| |||||||
| 4,849,642 | ||||||||
Commercial Services & Supplies - 4.19% |
| |||||||
ABM Industries, Inc. | 23,700 | 488,694 | ||||||
American Reprographics Co.* | 1,350 | 6,196 | ||||||
Brink’s Co. (The) | 18,950 | 509,376 | ||||||
Casella Waste Systems, Inc., Class A* | 12,250 | 78,400 | ||||||
Consolidated Graphics, Inc.* | 4,175 | 201,569 | ||||||
Courier Corp. | 9,200 | 107,916 | ||||||
Deluxe Corp. | 21,200 | 482,512 | ||||||
EnergySolutions, Inc.* | 39,800 | 122,982 | ||||||
Geo Group, Inc. (The)* | 6,300 | 105,525 | ||||||
Intersections, Inc. | 11,300 | 125,317 | ||||||
Kimball International, Inc., Class B | 16,100 | 81,627 | ||||||
Metalico, Inc.* | 34,600 | 113,834 | ||||||
Perma-Fix Environmental Services* | 41,000 | 63,550 | ||||||
Schawk, Inc. | 14,200 | 159,182 | ||||||
Commercial Services & Supplies (continued) |
| |||||||
Standard Parking Corp.* | 7,150 | $ | 127,771 | |||||
Standard Register Co. (The) | 11,450 | 26,678 | ||||||
TRC Cos., Inc.* | 12,550 | 75,426 | ||||||
United Stationers, Inc. | 16,200 | 527,472 | ||||||
|
| |||||||
| 3,404,027 | ||||||||
Communications Equipment - 0.55% |
| |||||||
Bel Fuse, Inc., Class B | 4,400 | 82,500 | ||||||
Black Box Corp. | 9,650 | 270,586 | ||||||
Network Engines, Inc.* | 19,200 | 18,472 | ||||||
Technical Communications Corp. | 900 | 6,660 | ||||||
Tessco Technologies, Inc. | 3,450 | 47,679 | ||||||
Tii Network Technologies, Inc.* | 16,100 | 23,667 | ||||||
|
| |||||||
| 449,564 | ||||||||
Computers & Peripherals - 0.65% |
| |||||||
Cray, Inc.* | 16,300 | 105,461 | ||||||
Dot Hill Systems Corp.* | 35,800 | 47,614 | ||||||
Imation Corp.* | 17,300 | 99,129 | ||||||
Xyratex, Ltd. | 20,900 | 278,388 | ||||||
|
| |||||||
| 530,592 | ||||||||
Construction & Engineering - 0.89% |
| |||||||
EMCOR Group, Inc. | 2,800 | 75,068 | ||||||
Great Lakes Dredge & Dock Corp. | 20,850 | 115,926 | ||||||
Layne Christensen Co.* | 5,050 | 122,210 | ||||||
Michael Baker Corp.* | 3,400 | 66,674 | ||||||
Primoris Services Corp. | 18,800 | 280,684 | ||||||
Sterling Construction Co., Inc.* | 6,150 | 66,236 | ||||||
|
| |||||||
| 726,798 | ||||||||
Consumer Finance - 1.13% |
| |||||||
Advance America Cash | ||||||||
Advance Centers, Inc. | 28,000 | 250,600 | ||||||
CompuCredit Holdings Corp.* | 10,100 | 37,370 | ||||||
Nelnet, Inc., Class A | 25,800 | 631,326 | ||||||
|
| |||||||
| 919,296 | ||||||||
Containers & Packaging - 0.88% |
| |||||||
AEP Industries, Inc.* | 2,450 | 68,967 | ||||||
Boise, Inc. | 61,950 | 441,084 | ||||||
Mod-Pac Corp.* | 1,500 | 10,035 | ||||||
Myers Industries, Inc. | 15,600 | 192,504 | ||||||
|
| |||||||
| 712,590 | ||||||||
| 6 | Semi-Annual Report | December 31, 2011 (Unaudited) | |
| Bridgeway Omni Small-Cap Value Fund | | |
| SCHEDULE OF INVESTMENTS (continued) | ||
| Showing percentage of net assets as of December 31, 2011 (Unaudited) |
| Industry Company | Shares Value Industry Company Shares Value |
Common Stocks (continued) | ||||||||
Distributors - 0.15% | ||||||||
Amcon Distributing Co. | 600 | $ | 38,640 | |||||
VOXX International Corp.* | 9,700 | 81,965 | ||||||
|
| |||||||
| 120,605 | ||||||||
Diversified Consumer Services - 1.60% |
| |||||||
Cambium Learning Group, Inc.* | 18,950 | 57,229 | ||||||
Career Education Corp.* | 42,000 | 334,740 | ||||||
Carriage Services, Inc. | 8,250 | 46,200 | ||||||
Coinstar, Inc.* | 250 | 11,410 | ||||||
Corinthian Colleges, Inc.* | 2,750 | 5,968 | ||||||
Lincoln Educational Services Corp. | 10,225 | 80,777 | ||||||
Mac-Gray Corp. | 6,400 | 88,256 | ||||||
Regis Corp. | 30,950 | 512,222 | ||||||
School Specialty, Inc.* | 8,550 | 21,375 | ||||||
Universal Technical Institute, Inc.* | 11,000 | 140,580 | ||||||
|
| |||||||
| 1,298,757 | ||||||||
Diversified Financial Services - 1.07% |
| |||||||
Asset Acceptance Capital Corp.* | 20,600 | 80,546 | ||||||
Gain Capital Holdings, Inc. | 12,500 | 83,750 | ||||||
Interactive Brokers Group, Inc., Class A | 21,150 | 315,981 | ||||||
PHH Corp.* | 29,150 | 311,905 | ||||||
Primus Guaranty, Ltd.*+ | 16,700 | 81,830 | ||||||
|
| |||||||
| 874,012 | ||||||||
Diversified Telecommunication |
| |||||||
Atlantic Tele-Network, Inc. | 8,100 | 316,305 | ||||||
Cbeyond, Inc.* | 13,750 | 110,137 | ||||||
General Communication, Inc., Class A* | 21,250 | 208,037 | ||||||
HickoryTech Corp. | 6,000 | 66,480 | ||||||
IDT Corp., Class B | 10,275 | 96,380 | ||||||
Iridium Communications, Inc.* | 29,800 | 229,758 | ||||||
Multiband Corp.* | 9,700 | 31,331 | ||||||
Premiere Global Services, Inc.* | 9,500 | 80,465 | ||||||
Primus Telecommunications Group, Inc.* | 6,100 | 77,226 | ||||||
SureWest Communications | 6,300 | 75,789 | ||||||
|
| |||||||
| 1,291,908 | ||||||||
Electrical Equipment - 0.25% |
| |||||||
China BAK Battery, Inc.* | 1,800 | 1,116 | ||||||
General Cable Corp.* | 3,900 | 97,539 | ||||||
Lihua International, Inc.+ | 10,750 | 51,170 | ||||||
Electrical Equipment (continued) | ||||||||
SL Industries, Inc.* | 1,650 | $ | 26,730 | |||||
Ultralife Corp.* | 7,350 | 29,547 | ||||||
|
| |||||||
| 206,102 | ||||||||
Electronic Equipment, Instruments & Components - 5.25% |
| |||||||
Agilysys, Inc.* | 14,400 | 114,480 | ||||||
Brightpoint, Inc.* | 41,750 | 449,230 | ||||||
DDi Corp. | 9,150 | 85,370 | ||||||
IEC Electronics Corp.* | 800 | 3,800 | ||||||
Insight Enterprises, Inc.* | 29,800 | 455,642 | ||||||
Kemet Corp.* | 19,750 | 139,238 | ||||||
LGL Group, Inc. (The)* | 100 | 721 | ||||||
LoJack Corp.* | 8,000 | 24,560 | ||||||
Multi-Fineline Electronix, Inc.* | 7,600 | 156,180 | ||||||
PC Connection, Inc. | 12,000 | 133,080 | ||||||
PC Mall, Inc.* | 5,600 | 35,168 | ||||||
Plexus Corp.* | 22,200 | 607,836 | ||||||
Power-One, Inc.* | 8,800 | 34,408 | ||||||
Pulse Electronics Corp. | 18,650 | 52,220 | ||||||
Sanmina-SCI Corp.* | 55,750 | 519,032 | ||||||
SMTC Corp.* | 10,700 | 29,639 | ||||||
SYNNEX Corp.* | 22,800 | 694,488 | ||||||
TTM Technologies, Inc.* | 51,050 | 559,508 | ||||||
Viasystems Group, Inc.* | 10,400 | 175,968 | ||||||
|
| |||||||
| 4,270,568 | ||||||||
Energy Equipment & Services - 2.57% |
| |||||||
Basic Energy Services, Inc.* | 15,400 | 303,380 | ||||||
Cal Dive International, Inc.* | 2,750 | 6,188 | ||||||
Exterran Holdings, Inc.*+ | 14,800 | 134,680 | ||||||
Global Geophysical | ||||||||
Services, Inc.* | 21,700 | 145,824 | ||||||
Hercules Offshore, Inc.* | 47,300 | 210,012 | ||||||
Matrix Service Co.* | 6,600 | 62,304 | ||||||
Parker Drilling Co.* | 52,450 | 376,066 | ||||||
PHI, Inc.* | 6,900 | 171,465 | ||||||
Pioneer Drilling Co.* | 17,100 | 165,528 | ||||||
Tetra Technologies, Inc.* | 30,600 | 285,804 | ||||||
TGC Industries, Inc.* | 11,100 | 79,254 | ||||||
Union Drilling, Inc.* | 11,300 | 70,512 | ||||||
Willbros Group, Inc.* | 21,800 | 80,006 | ||||||
|
| |||||||
| 2,091,023 | ||||||||
Food & Staples Retailing - 2.95% |
| |||||||
Andersons, Inc. (The) | 10,200 | 445,332 | ||||||
Ingles Markets, Inc., Class A | 11,000 | 165,660 | ||||||
Nash Finch Co. | 5,400 | 158,112 | ||||||
Pantry, Inc. (The)* | 14,600 | 174,762 | ||||||
Spartan Stores, Inc. | 10,300 | 190,550 | ||||||
| www.bridgewayomni.com | 7 | |
| Bridgeway Omni Small-Cap Value Fund | | |
| SCHEDULE OF INVESTMENTS (continued) | ||
| Showing percentage of net assets as of December 31, 2011 (Unaudited) |
| Industry Company | Shares Value Industry Company Shares Value |
Common Stocks (continued) | ||||||||
Food & Staples Retailing (continued) |
| |||||||
Susser Holdings Corp.* | 13,850 | $ | 313,287 | |||||
Village Super Market, Inc., Class A | 8,900 | 253,205 | ||||||
Weis Markets, Inc. | 17,500 | 698,950 | ||||||
|
| |||||||
| 2,399,858 | ||||||||
Food Products - 1.13% | ||||||||
American Lorain Corp.* | 13,300 | 21,413 | ||||||
Chiquita Brands | ||||||||
International, Inc.* | 20,350 | 169,719 | ||||||
Dole Food Co., Inc.* | 40,700 | 352,055 | ||||||
Feihe International, Inc.*+ | 13,800 | 35,742 | ||||||
John B. Sanfilippo & Son, Inc.* | 6,900 | 52,026 | ||||||
Omega Protein Corp.* | 8,850 | 63,101 | ||||||
Overhill Farms, Inc.* | 9,000 | 33,390 | ||||||
Seneca Foods Corp., Class A* | 5,200 | 134,264 | ||||||
Westway Group, Inc.* | 10,700 | 59,920 | ||||||
|
| |||||||
| 921,630 | ||||||||
Health Care Equipment & Supplies - 0.33% |
| |||||||
Dynatronics Corp.* | 6,000 | 3,966 | ||||||
Invacare Corp. | 14,350 | 219,412 | ||||||
RTI Biologics, Inc.* | 1,600 | 7,104 | ||||||
Theragenics Corp.* | 20,000 | 33,600 | ||||||
|
| |||||||
| 264,082 | ||||||||
Health Care Providers & Services - 5.52% |
| |||||||
Addus HomeCare Corp.* | 4,800 | 17,136 | ||||||
Advocat, Inc. | 2,600 | 14,430 | ||||||
Almost Family, Inc.* | 4,250 | 70,465 | ||||||
Amedisys, Inc.* | 13,150 | 143,467 | ||||||
American Dental Partners, Inc.* | 3,500 | 65,905 | ||||||
Amsurg Corp.* | 14,050 | 365,862 | ||||||
BioScrip, Inc.* | 24,550 | 134,043 | ||||||
CardioNet, Inc.* | 16,500 | 39,105 | ||||||
Chindex International, Inc.* | 8,500 | 72,420 | ||||||
Cross Country Healthcare, Inc.* | 14,050 | 77,978 | ||||||
Ensign Group, Inc. (The) | 9,450 | 231,525 | ||||||
Five Star Quality Care, Inc.* | 21,300 | 63,900 | ||||||
Gentiva Health Services, Inc.* | 950 | 6,412 | ||||||
Healthways, Inc.* | 15,150 | 103,929 | ||||||
Integramed America, Inc.* | 5,300 | 41,605 | ||||||
Kindred Healthcare, Inc.* | 23,400 | 275,418 | ||||||
LHC Group, Inc.* | 8,450 | 108,414 | ||||||
Molina Healthcare, Inc.* | 20,650 | 461,114 | ||||||
National Healthcare Corp. | 6,200 | 259,780 | ||||||
PharMerica Corp.* | 7,650 | 116,127 | ||||||
Health Care Providers & Services (continued) |
| |||||||
Providence Service Corp. (The)* | 3,400 | $ | 46,784 | |||||
Select Medical Holdings Corp.* | 86,900 | 736,912 | ||||||
Skilled Healthcare Group, Inc., Class A* | �� | 17,100 | 93,366 | |||||
Sunrise Senior Living, Inc.*+ | 36,950 | 239,436 | ||||||
Triple-S Management Corp., Class B* | 12,900 | 258,258 | ||||||
Universal American Corp. | 35,100 | 446,121 | ||||||
|
| |||||||
| 4,489,912 | ||||||||
Hotels, Restaurants & Leisure - 7.27% |
| |||||||
Ark Restaurants Corp. | 1,600 | 21,440 | ||||||
Benihana, Inc.* | 7,950 | 81,328 | ||||||
Biglari Holdings, Inc.* | 612 | 225,363 | ||||||
Bob Evans Farms, Inc. | 16,175 | 542,510 | ||||||
Boyd Gaming Corp.*+ | 39,150 | 292,059 | ||||||
Caribou Coffee Co., Inc.* | 13,300 | 185,535 | ||||||
Carrols Restaurant Group, Inc.* | 10,025 | 115,989 | ||||||
CEC Entertainment, Inc. | 8,850 | 304,882 | ||||||
Cracker Barrel Old Country Store, Inc. | 12,300 | 620,043 | ||||||
DineEquity, Inc.* | 10,300 | 434,763 | ||||||
Dover Downs Gaming & Entertainment, Inc. | 12,500 | 26,750 | ||||||
Einstein Noah Restaurant Group, Inc. | 7,625 | 120,628 | ||||||
Famous Dave’s of America, Inc.* | 3,400 | 35,292 | ||||||
Frisch’s Restaurants, Inc. | 2,200 | 42,944 | ||||||
Full House Resorts, Inc.* | 8,400 | 22,092 | ||||||
Great Wolf Resorts, Inc.* | 22,600 | 65,540 | ||||||
Isle of Capri Casinos, Inc.* | 17,400 | 81,258 | ||||||
J. Alexander’s Corp.* | 2,300 | 14,375 | ||||||
Jack in the Box, Inc.* | 24,850 | 519,365 | ||||||
Kona Grill, Inc.* | 4,100 | 25,092 | ||||||
Luby’s, Inc.* | 12,600 | 56,826 | ||||||
Marcus Corp. | 13,350 | 168,344 | ||||||
MTR Gaming Group, Inc.* | 8,700 | 16,269 | ||||||
Multimedia Games Holding Co., Inc.* | 11,900 | 94,486 | ||||||
Nevada Gold & Casinos, Inc.* | 7,800 | 8,970 | ||||||
O’Charleys, Inc.* | 9,850 | 54,076 | ||||||
PF Chang’s China Bistro, Inc. | 14,000 | 432,740 | ||||||
Pinnacle Entertainment, Inc.* | 29,250 | 297,180 | ||||||
Red Robin Gourmet Burgers, Inc.* | 6,800 | 188,360 | ||||||
Ruby Tuesday, Inc.* | 28,300 | 195,270 | ||||||
| 8 | Semi-Annual Report | December 31, 2011 (Unaudited) | |
| Bridgeway Omni Small-Cap Value Fund | | |
| SCHEDULE OF INVESTMENTS (continued) | ||
| Showing percentage of net assets as of December 31, 2011 (Unaudited) |
| Industry Company | Shares Value Industry Company Shares Value |
Common Stocks (continued) | ||||||||
Hotels, Restaurants & Leisure (continued) |
| |||||||
Ruth’s Hospitality Group, Inc.* | 15,700 | $ | 78,029 | |||||
Scientific Games Corp., Class A* | 41,350 | 401,095 | ||||||
Sonic Corp.* | 21,000 | 141,330 | ||||||
|
| |||||||
| 5,910,223 | ||||||||
Household Durables - 1.30% | ||||||||
American Greetings Corp., Class A | 17,000 | 212,670 | ||||||
CSS Industries, Inc. | 4,100 | 81,672 | ||||||
Emerson Radio Corp.* | 10,500 | 16,695 | ||||||
Ethan Allen Interiors, Inc. | 11,700 | 277,407 | ||||||
Flexsteel Industries, Inc. | 2,800 | 38,752 | ||||||
La-Z-Boy, Inc.* | 21,800 | 259,420 | ||||||
Libbey, Inc.* | 8,250 | 105,105 | ||||||
Lifetime Brands, Inc. | 5,100 | 61,914 | ||||||
|
| |||||||
| 1,053,635 | ||||||||
Household Products - 0.33% | ||||||||
Central Garden & Pet Co., Class A* | 24,250 | 201,760 | ||||||
Oil-Dri Corp. of America | 3,150 | 63,756 | ||||||
|
| |||||||
| 265,516 | ||||||||
Independent Power Producers & Energy Traders - 0.10% |
| |||||||
Genie Energy, Ltd., Class B | 10,275 | 81,481 | ||||||
Industrial Conglomerates - 0.14% | ||||||||
Standex International Corp. | 3,400 | 116,178 | ||||||
Insurance - 7.29% | ||||||||
American Equity Investment Life Holding Co. | 26,750 | 278,200 | ||||||
American Safety Insurance Holdings, Ltd.* | 4,700 | 102,225 | ||||||
Crawford & Co., Class B | 25,750 | 158,620 | ||||||
EMC Insurance Group, Inc. | 5,800 | 119,306 | ||||||
FBL Financial Group, Inc., Class A | 13,950 | 474,579 | ||||||
First American Financial Corp. | 28,875 | 365,846 | ||||||
Flagstone Reinsurance Holdings SA | 39,450 | 327,040 | ||||||
Hallmark Financial Services* | 8,600 | 60,114 | ||||||
Homeowners Choice, Inc. | 4,100 | 32,841 | ||||||
Horace Mann Educators Corp. | 17,900 | 245,409 | ||||||
Independence Holding Co. | 7,350 | 59,756 | ||||||
Maiden Holdings, Ltd. | 13,700 | 120,012 | ||||||
Meadowbrook Insurance Group, Inc. | 23,700 | 253,116 | ||||||
Insurance (continued) | ||||||||
National Financial Partners Corp.* | 19,150 | $ | 258,908 | |||||
National Western Life | ||||||||
Insurance Co., Class A | 1,625 | 221,260 | ||||||
Protective Life Corp. | 3,600 | 81,216 | ||||||
SeaBright Holdings, Inc. | 13,700 | 104,805 | ||||||
Selective Insurance Group, Inc. | 24,250 | 429,952 | ||||||
StanCorp Financial Group, Inc. | 19,950 | 733,163 | ||||||
State Auto Financial Corp. | 18,100 | 245,979 | ||||||
Stewart Information Services Corp. | 8,650 | 99,908 | ||||||
Symetra Financial Corp. | 53,150 | 482,071 | ||||||
Tower Group, Inc. | 18,450 | 372,136 | ||||||
United Fire & Casualty Co. | 11,600 | 234,088 | ||||||
Universal Insurance Holdings, Inc. | 17,900 | 64,082 | ||||||
|
| |||||||
| 5,924,632 | ||||||||
Internet & Catalog Retail - 0.39% |
| |||||||
1-800-Flowers.com, Inc., | 27,350 | 60,170 | ||||||
dELiA*s, Inc.* | 13,300 | 13,566 | ||||||
Orbitz Worldwide, Inc.* | 44,100 | 165,816 | ||||||
Overstock.com, Inc.* | 9,800 | 76,832 | ||||||
|
| |||||||
| 316,384 | ||||||||
Internet Software & Services - 0.55% | ||||||||
Earthlink, Inc. | 20,600 | 132,664 | ||||||
EasyLink Services | ||||||||
International Corp., Class A* | 24,300 | 96,714 | ||||||
United Online, Inc. | 39,800 | 216,512 | ||||||
|
| |||||||
| 445,890 | ||||||||
IT Services - 3.50% | ||||||||
Acxiom Corp.* | 36,550 | 446,276 | ||||||
CIBER, Inc.* | 32,350 | 124,871 | ||||||
Convergys Corp.* | 61,650 | 787,270 | ||||||
CSG Systems International, Inc.* | 250 | 3,678 | ||||||
Dynamics Research Corp.* | 4,600 | 52,164 | ||||||
Edgewater Technology, Inc.* | 5,600 | 15,400 | ||||||
Global Cash Access | ||||||||
Holdings, Inc.* | 29,000 | 129,050 | ||||||
Lender Processing Services, Inc. | 10,700 | 161,249 | ||||||
Mantech International Corp., Class A | 18,700 | 584,188 | ||||||
Mattersight Corp.* | 7,000 | 32,550 | ||||||
| www.bridgewayomni.com | 9 | |
| Bridgeway Omni Small-Cap Value Fund | | |
| SCHEDULE OF INVESTMENTS (continued) | ||
| Showing percentage of net assets as of December 31, 2011 (Unaudited) |
| Industry Company | Shares Value Industry Company Shares Value |
Common Stocks (continued) | ||||||||
IT Services (continued) | ||||||||
NCI, Inc., Class A* | 6,100 | $ | 71,065 | |||||
Online Resources Corp.* | 14,350 | 34,727 | ||||||
Pfsweb, Inc.* | 10,300 | 33,887 | ||||||
StarTek, Inc.* | 6,900 | 13,248 | ||||||
Stream Global Services, Inc.* | 36,300 | 120,153 | ||||||
TNS, Inc.* | 13,200 | 233,904 | ||||||
|
| |||||||
| 2,843,680 | ||||||||
Leisure Equipment & Products - 1.04% |
| |||||||
Brunswick Corp. | 37,100 | 670,026 | ||||||
Johnson Outdoors, Inc., Class A* | 4,000 | 61,400 | ||||||
Smith & Wesson Holding Corp.* | 26,500 | 115,540 | ||||||
|
| |||||||
| 846,966 | ||||||||
Life Sciences Tools & Services - 0.12% |
| |||||||
Cambrex Corp.* | 13,150 | 94,417 | ||||||
Machinery - 1.72% | ||||||||
Albany International Corp., Class A | 11,350 | 262,412 | ||||||
Ampco-Pittsburgh Corp. | 3,800 | 73,492 | ||||||
Briggs & Stratton Corp. | 24,300 | 376,407 | ||||||
Federal Signal Corp.* | 23,200 | 96,280 | ||||||
Key Technology, Inc.* | 2,100 | 27,174 | ||||||
L.S. Starrett Co., Class A (The) | 2,350 | 30,197 | ||||||
LB Foster Co., Class A | 3,900 | 110,331 | ||||||
Lydall, Inc.* | 8,200 | 77,818 | ||||||
NACCO Industries, Inc., Class A | 3,050 | 272,121 | ||||||
NN, Inc.* | 6,250 | 37,500 | ||||||
Xerium Technologies, Inc.* | 5,400 | 35,316 | ||||||
|
| |||||||
| 1,399,048 | ||||||||
Marine - 0.25% | ||||||||
Genco Shipping & Trading, Ltd.*+ | 23,200 | 156,832 | ||||||
International Shipholding Corp. | 2,650 | 49,528 | ||||||
|
| |||||||
| 206,360 | ||||||||
Media - 4.07% | ||||||||
Belo Corp., Class A | 28,550 | 179,865 | ||||||
E.W. Scripps Co., Class A (The)* | 26,500 | 212,265 | ||||||
Entercom Communications Corp., Class A* | 17,200 | 105,780 | ||||||
Entravision Communications Corp., Class A | 38,300 | 59,748 | ||||||
Media (continued) |
| |||||||
Gray Television, Inc.* | 25,250 | $ | 40,905 | |||||
Journal Communications, Inc., Class A* | 25,250 | 111,100 | ||||||
Knology, Inc.* | 15,600 | 221,520 | ||||||
Media General, Inc., Class A*+ | 15,300 | 62,271 | ||||||
Meredith Corp.+ | 20,950 | 684,018 | ||||||
Navarre Corp.* | 16,500 | 25,410 | ||||||
New York Times Co., Class A (The)* | 66,050 | 510,566 | ||||||
Radio One, Inc., Class D*+ | 23,100 | 23,100 | ||||||
Reading International, Inc., Class A* | 10,700 | 45,368 | ||||||
Saga Communications, Inc., Class A* | 1,900 | 71,022 | ||||||
Scholastic Corp. | 13,950 | 418,081 | ||||||
Valassis Communications, Inc.* | 28,100 | 540,363 | ||||||
|
| |||||||
| 3,311,382 | ||||||||
Metals & Mining - 0.51% |
| |||||||
Friedman Industries, Inc. | 3,000 | 31,350 | ||||||
Horsehead Holding Corp.* | 7,800 | 70,278 | ||||||
Noranda Aluminum Holding Corp. | 38,250 | 315,562 | ||||||
|
| |||||||
| 417,190 | ||||||||
Multiline Retail - 0.44% | ||||||||
Bon-Ton Stores, Inc. (The)+ | 8,350 | 28,139 | ||||||
Fred’s, Inc., Class A | 16,300 | 237,654 | ||||||
Tuesday Morning Corp.* | 26,100 | 90,045 | ||||||
|
| |||||||
| 355,838 | ||||||||
Oil, Gas & Consumable Fuels - 4.03% |
| |||||||
Adams Resources & Energy, Inc. | 1,900 | 55,062 | ||||||
Alon USA Energy, Inc. | 25,000 | 217,750 | ||||||
Andatee China Marine Fuel Services Corp.*+ | 7,800 | 24,648 | ||||||
Cloud Peak Energy, Inc.* | 30,500 | 589,260 | ||||||
Crimson Exploration, Inc.* | 20,250 | 57,915 | ||||||
Crosstex Energy, Inc. | 21,150 | 267,336 | ||||||
Delek US Holdings, Inc. | 29,800 | 340,018 | ||||||
DHT Holdings, Inc. | 34,500 | 25,530 | ||||||
GMX Resources, Inc.*+ | 33,100 | 41,375 | ||||||
Green Plains Renewable Energy, Inc.* | 9,000 | 87,840 | ||||||
James River Coal Co.*+ | 22,400 | 155,008 | ||||||
Longwei Petroleum Investment Holding, Ltd.* | 3,100 | 4,030 | ||||||
Patriot Coal Corp.* | 36,300 | 307,461 | ||||||
| 10 | Semi-Annual Report | December 31, 2011 (Unaudited) | |
| Bridgeway Omni Small-Cap Value Fund | | |
| SCHEDULE OF INVESTMENTS (continued) | ||
| Showing percentage of net assets as of December 31, 2011 (Unaudited) |
| Industry Company | �� Shares Value Industry Company Shares Value |
Common Stocks (continued) | ||||||||
Oil, Gas & Consumable Fuels (continued) |
| |||||||
PostRock Energy Corp.* | 12,000 | $ | 33,720 | |||||
RAM Energy Resources, Inc.* | 50,000 | 156,500 | ||||||
REX American Resources Corp.* | 4,200 | 92,862 | ||||||
SMF Energy Corp. | 13,000 | 37,180 | ||||||
Stone Energy Corp.* | 16,700 | 440,546 | ||||||
Western Refining, Inc.* | 25,800 | 342,882 | ||||||
|
| |||||||
| 3,276,923 | ||||||||
Paper & Forest Products - 1.51% | ||||||||
KapStone Paper & | ||||||||
Packaging Corp.* | 24,050 | 378,547 | ||||||
Mercer International, Inc.* | 25,550 | 155,855 | ||||||
Neenah Paper, Inc. | 6,700 | 149,544 | ||||||
Orient Paper, Inc.*+ | 8,200 | 26,650 | ||||||
PH Glatfelter Co. | 23,650 | 333,938 | ||||||
Wausau Paper Corp. | 22,100 | 182,546 | ||||||
|
| |||||||
| 1,227,080 | ||||||||
Personal Products - 0.29% | ||||||||
Medifast, Inc.* | 5,000 | 68,600 | ||||||
Nutraceutical International Corp.* | 4,600 | 52,072 | ||||||
USANA Health Sciences, Inc.*+ | 3,900 | 118,443 | ||||||
|
| |||||||
| 239,115 | ||||||||
Professional Services - 1.64% | ||||||||
Barrett Business Services, Inc. | 4,500 | 89,820 | ||||||
CBIZ, Inc.*+ | 22,975 | 140,377 | ||||||
Dolan Co. (The)* | 11,100 | 94,572 | ||||||
Heidrick & Struggles International, Inc. | 3,600 | 77,544 | ||||||
ICF International, Inc.* | 7,150 | 177,177 | ||||||
Insperity, Inc. | 9,700 | 245,895 | ||||||
Kelly Services, Inc., Class A | 13,600 | 186,048 | ||||||
Kforce, Inc.* | 19,150 | 236,120 | ||||||
RCM Technologies, Inc.* | 6,100 | 31,598 | ||||||
VSE Corp. | 2,300 | 55,844 | ||||||
|
| |||||||
| 1,334,995 | ||||||||
Road & Rail - 2.87% | ||||||||
Amerco, Inc. | 7,200 | 636,480 | ||||||
Arkansas Best Corp. | 9,100 | 175,357 | ||||||
Avis Budget Group, Inc.* | 38,050 | 407,896 | ||||||
Celadon Group, Inc. | 8,400 | 99,204 | ||||||
Con-way, Inc. | 21,000 | 612,360 | ||||||
Covenant Transportation Group, Inc., Class A* | 5,300 | 15,741 | ||||||
Marten Transport, Ltd. | 8,150 | 146,619 | ||||||
Road & Rail (continued) | ||||||||
P.A.M. Transportation | ||||||||
Services, Inc.* | 3,500 | $ | 33,250 | |||||
Saia, Inc.* | 5,950 | 74,256 | ||||||
Swift Transportation Co.* | 8,800 | 72,512 | ||||||
Universal Truckload Services, Inc. | 3,409 | 61,873 | ||||||
USA Truck, Inc.* | 300 | 2,319 | ||||||
|
| |||||||
| 2,337,867 | ||||||||
Semiconductors & Semiconductor |
| |||||||
Advanced Energy Industries, Inc.* | 11,800 | 126,614 | ||||||
Amkor Technology, Inc.* | 88,750 | 386,950 | ||||||
Amtech Systems, Inc.* | 4,300 | 36,593 | ||||||
DSP Group, Inc.* | 700 | 3,647 | ||||||
GT Advanced Technologies, Inc.*+ | 59,000 | 427,160 | ||||||
inTEST Corp.* | 4,700 | 13,066 | ||||||
Kulicke & Soffa Industries, Inc.* | 45,000 | 416,250 | ||||||
LTX-Credence Corp.* | 15,000 | 80,250 | ||||||
OmniVision Technologies, Inc.* | 19,400 | 237,359 | ||||||
Photronics, Inc.* | 26,850 | 163,248 | ||||||
|
| |||||||
| 1,891,137 | ||||||||
Software - 0.17% | ||||||||
Bsquare Corp.* | 4,800 | 16,416 | ||||||
Net 1 UEPS Technologies, Inc.* | 3,400 | 26,078 | ||||||
TeleCommunication | ||||||||
Systems, Inc., Class A* | 39,250 | 92,238 | ||||||
|
| |||||||
| 134,732 | ||||||||
Specialty Retail - 8.20% |
| |||||||
Aeropostale, Inc.* | 29,100 | 443,775 | ||||||
ANN, Inc.* | 20,300 | 503,034 | ||||||
Appliance Recycling Centers of America, Inc.* | 5,300 | 26,129 | ||||||
Asbury Automotive Group, Inc.* | 13,125 | 282,975 | ||||||
Barnes & Noble, Inc.*+ | 32,700 | 473,496 | ||||||
Brown Shoe Co., Inc. | 26,800 | 238,520 | ||||||
Build-A-Bear Workshop, Inc.* | 8,050 | 68,103 | ||||||
Casual Male Retail Group, Inc.* | 20,500 | 70,110 | ||||||
Charming Shoppes, Inc.* | 49,200 | 241,080 | ||||||
Childrens Place Retail | ||||||||
Stores, Inc. (The)* | 7,100 | 377,152 | ||||||
Citi Trends, Inc.* | 2,600 | 22,828 | ||||||
Collective Brands, Inc.* | 31,400 | 451,218 | ||||||
| www.bridgewayomni.com | 11 | |
| Bridgeway Omni Small-Cap Value Fund | | |
| SCHEDULE OF INVESTMENTS (continued) | ||
| Showing percentage of net assets as of December 31, 2011 (Unaudited) |
| Industry Company | Shares Value Industry Company Shares Value |
Common Stocks (continued) | ||||||||
Specialty Retail (continued) |
| |||||||
Conn’s, Inc.*+ | 13,450 | $ | 149,295 | |||||
Cost Plus, Inc.* | 9,400 | 91,650 | ||||||
Destination Maternity Corp. | 5,600 | 93,632 | ||||||
Group 1 Automotive, Inc. | 12,500 | 647,500 | ||||||
Haverty Furniture Cos., Inc. | 11,300 | 124,074 | ||||||
hhgregg, Inc.*+ | 12,100 | 174,845 | ||||||
Hot Topic, Inc. | 29,150 | 192,682 | ||||||
Kirkland’s, Inc.* | 8,550 | 113,715 | ||||||
New York & Co., Inc.* | 26,200 | 69,692 | ||||||
Pep Boys-Manny, Moe & Jack (The) | 22,200 | 244,200 | ||||||
RadioShack Corp. | 37,000 | 359,270 | ||||||
Sonic Automotive, Inc., | 26,900 | 398,389 | ||||||
Stage Stores, Inc. | 13,300 | 184,737 | ||||||
Stein Mart, Inc.* | 18,650 | 127,006 | ||||||
Systemax, Inc.* | 15,400 | 252,714 | ||||||
West Marine, Inc.* | 9,600 | 111,648 | ||||||
Wet Seal, Inc., Class A (The)* | 41,800 | 136,268 | ||||||
|
| |||||||
| 6,669,737 | ||||||||
Textiles, Apparel & Luxury Goods - 0.84% |
| |||||||
Alpha PRO Tech, Ltd.* | 12,400 | 14,880 | ||||||
Jones Group, Inc. (The) | 36,300 | 382,965 | ||||||
Movado Group, Inc. | 5,900 | 107,203 | ||||||
Quiksilver, Inc.* | 49,900 | 180,139 | ||||||
|
| |||||||
| 685,187 | ||||||||
Thrifts & Mortgage Finance - 0.96% |
| |||||||
Astoria Financial Corp. | 44,200 | 375,258 | ||||||
BankAtlantic Bancorp, Inc., Class A* | 11,000 | 37,180 | ||||||
Doral Financial Corp.* | 57,100 | 54,588 | ||||||
First Defiance Financial Corp. | 4,400 | 64,196 | ||||||
First Financial Holdings, Inc. | 11,900 | 106,267 | ||||||
Indiana Community Bancorp | 1,700 | 24,871 | ||||||
Meta Financial Group, Inc. | 1,400 | 22,680 | ||||||
NASB Financial, Inc.* | 1,800 | 19,278 | ||||||
Provident Financial Holdings, Inc. | 4,800 | 44,832 | ||||||
Pulaski Financial Corp.+ | 4,900 | 34,839 | ||||||
|
| |||||||
| 783,989 | ||||||||
Trading Companies & Distributors - 1.89% |
| |||||||
Aceto Corp. | 13,300 | 91,770 | ||||||
Aircastle, Ltd. | 24,600 | 312,912 | ||||||
Interline Brands, Inc.* | 12,350 | 192,290 | ||||||
KSW, Inc. | 2,300 | 7,659 | ||||||
United Rentals, Inc.*+ | 30,100 | 889,455 | ||||||
Trading Companies & Distributors (continued) |
| |||||||
Willis Lease Finance Corp.* | 3,500 | $ | 41,650 | |||||
|
| |||||||
| 1,535,736 | ||||||||
Wireless Telecommunication |
| |||||||
Leap Wireless International, Inc.* | 35,300 | 327,937 | ||||||
NTELOS Holdings Corp. | 5,800 | 118,204 | ||||||
Shenandoah | 5,600 | 58,688 | ||||||
USA Mobility, Inc. | 8,400 | 116,508 | ||||||
|
| |||||||
| 621,337 | ||||||||
|
| |||||||
TOTAL COMMON STOCKS - 99.95% |
| 81,284,641 | ||||||
|
| |||||||
(Cost $75,582,276) | ||||||||
TOTAL INVESTMENTS - 99.95% | $81,284,641 | |||||||
(Cost $75,582,276) | ||||||||
Other Assets in Excess of Liabilities - 0.05% |
| 41,560 | ||||||
|
| |||||||
NET ASSETS - 100.00% | $ | 81,326,201 | ||||||
|
| |||||||
| * | Non-income producing security. |
| + | This security or a portion of the security is out on loan at December 31, 2011. Total loaned securities had a value of $4,055,401 at December 31, 2011. |
Summary of inputs used to value the Fund’s investments as of 12/31/2011 is as follows (See Note 2 in Notes to Financial Statements):
| Valuation Inputs | ||||||||||||
| Investment in Securities (Value) | ||||||||||||
| Level 1 Quoted Prices | Level 2 Significant Observable Inputs | Level 3 Significant Unobservable Inputs | Total | |||||||||
Common | $ | 81,284,641 | $— | $— | $81,284,641 | |||||||
|
|
|
|
|
| |||||||
TOTAL | $ | 81,284,641 | $— | $— | $81,284,641 | |||||||
|
|
|
|
|
| |||||||
See Notes to Financial Statements.
| 12 | Semi-Annual Report | December 31, 2011 (Unaudited) | |
| Omni Tax-Managed Small-Cap Value Fund | | |
| MANAGER’S COMMENTARY | ||
| (Unaudited) |
December 31, 2011
Dear Fellow Omni Tax-Managed Small-Cap Value Fund Shareholder,
For the quarter ended December 31, 2011, total returns were 15.78% for the Fund and 15.97% for the Russell 2000 Value Index.
For the six-month “semi-annual” period, total returns were -11.43% for the Fund and -8.94% for the Russell 2000 Value Index. The strong fourth quarter performance couldn’t overcome the 21.76% decline in the Fund during a third quarter that represented the worst decline in equities since late 2008.
The table below presents our quarter, six-month, one-year and life-to-date financial results. See below for a graph of performance since inception.
Quarter 10/1/11 to 12/31/11 | 6 Months to 12/31/11 | 1 Year 1/1/11 to 12/31/11 | Life-to-Date to 12/31/11 | |||||||||||||||||
Omni Tax-Managed Small-Cap Value Fund | 15.78% | -11.43% | -5.41% | -5.41% | ||||||||||||||||
Russell 2000 Value Index | 15.97% | -8.94% | -5.50% | -5.50% | ||||||||||||||||
Performance figures quoted in the table above and graph below represent past performance and are no guarantee of future results. Total return figures in the table above include the reinvestment of dividends and capital gains. The table above and the graph below do not reflect the deduction of taxes that a shareholder would pay on Fund distributions or the redemption of Fund shares. The recent growth rate in the stock market has helped to produce short-term returns that are not typical and may not continue in the future.
The Russell 2000 Value Index is an unmanaged index that consists of stocks in the Russell 2000 Index with lower price-to-book ratios and lower forecasted growth values with dividends reinvested. It is not possible to invest directly in an index.
Omni Tax-Managed Small-Cap Value Fund vs. Russell 2000 Value from Inception 12/31/10 to 12/31/11
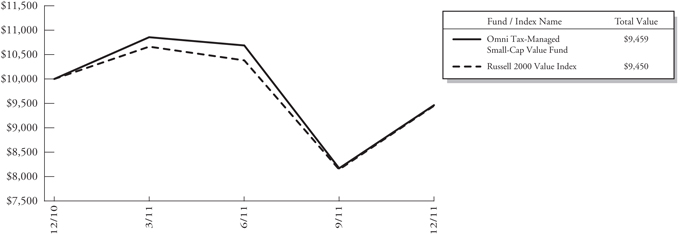
| www.bridgewayomni.com | 13 | |
| Omni Tax-Managed Small-Cap Value Fund | | |
| MANAGER’S COMMENTARY (continued) | ||
| (Unaudited) |
Detailed Explanation of Quarterly Performance
The Omni Tax-Managed Small-Cap Value Fund is designed to capture the returns of the small-cap value asset class through broad diversification of small company and value stocks. We also seek to minimize the distribution of capital gains within the constraints of the investment objective. This approach is sometimes referred to as “passive, asset class investing.” As of December 31, 2011, we held 862 such stocks in a market cap weighted style. We make no attempt to track any particular index in either performance or statistics.
The Fund returns were driven by the fact that small stocks, and especially the value leaning stocks within the small universe, led the market as a whole.
Top Ten Holdings as of December 31, 2011
| Rank | Description | Industry | % of Net Assets | |||
1 | Brunswick Corp. | Leisure Equipment & Products | 0.9% | |||
2 | Meredith Corp. | Media | 0.8% | |||
3 | Brink’s Co. (The) | Commercial Services & Supplies | 0.8% | |||
4 | Nelnet, Inc. | Consumer Finance | 0.8% | |||
5 | Symetra Financial Corp. | Insurance | 0.8% | |||
6 | Group 1 Automotive, Inc. | Specialty Retail | 0.8% | |||
7 | Mantech International Corp. | IT Services | 0.8% | |||
8 | Deluxe Corp. | Commercial Services & Supplies | 0.8% | |||
9 | Aeropostale, Inc. | Specialty Retail | 0.8% | |||
10 | United Rentals, Inc. | Trading Companies & Distributors | 0.8% | |||
| Total | 8.1% |
Industry Sector Representation as of December 31, 2011
| % of Portfolio | % of Russell 2000 Value Index | Difference | ||||||||||
Consumer Discretionary | 26.8% | 11.7% | 15.1% | |||||||||
Consumer Staples | 4.9% | 3.1% | 1.8% | |||||||||
Energy | 6.6% | 4.6% | 2.0% | |||||||||
Financials | 17.8% | 36.8% | -19.0% | |||||||||
Health Care | 5.7% | 5.3% | 0.4% | |||||||||
Industrials | 17.3% | 14.8% | 2.5% | |||||||||
Information Technology | 12.7% | 10.9% | 1.8% | |||||||||
Materials | 5.7% | 4.9% | 0.8% | |||||||||
Telecommunication Services | 2.1% | 0.6% | 1.5% | |||||||||
Utilities | 0.1% | 7.3% | -7.2% | |||||||||
Cash & Other Assets | 0.3% | 0.0% | 0.3% | |||||||||
Total | 100.0% | 100.0% | ||||||||||
Disclaimer
The views expressed here are exclusively those of Fund management. These views, including those related to market sectors or individual stocks, are not meant as investment advice and should not be considered predictive in nature. Any favorable (or unfavorable) description of a holding applies only as of December 31, 2011, unless otherwise stated. Security positions can and do change thereafter. Discussions of historical performance do not guarantee and are not indicative of future performance.
| 14 | Semi-Annual Report | December 31, 2011 (Unaudited) | |
| Omni Tax-Managed Small-Cap Value Fund | | |
| MANAGER’S COMMENTARY (continued) | ||
| (Unaudited) |
Market volatility can significantly impact short-term performance. The Fund is not an appropriate investment for short-term investors. Investments in small companies generally carry greater risk than is customarily associated with larger companies. This additional risk is attributable to a number of factors, including the relatively limited financial resources that are typically available to small companies, and the fact that small companies often have comparatively limited product lines. In addition, the stock of small companies tends to be more volatile than the stock of large companies, particularly in the short term and particularly in the early stages of an economic or market downturn. Shareholders of the Fund, therefore, are taking on more risk than they would if they invested in the stock market as a whole.
Conclusion
Thank you for your investment in Omni Tax-Managed Small-Cap Value Fund. We encourage your feedback; your reactions and concerns are important to us.
Sincerely,
The Investment Management Team
| www.bridgewayomni.com | 15 | |
| Bridgeway Omni Tax-Managed Small-Cap Value Fund | | |
| SCHEDULE OF INVESTMENTS | ||
| Showing percentage of net assets as of December 31, 2011 (Unaudited) |
| Industry Company | Shares Value Industry Company Shares Value |
COMMON STOCKS - 99.39% | ||||||||
Aerospace & Defense - 0.71% | ||||||||
AAR Corp. | 10,150 | $ | 194,576 | |||||
Astrotech Corp.* | 200 | 118 | ||||||
Ducommun, Inc. | 450 | 5,737 | ||||||
Kratos Defense & Security Solutions, Inc.* | 479 | 2,860 | ||||||
LMI Aerospace, Inc.* | 550 | 9,652 | ||||||
Moog, Inc., Class A* | 1,300 | 57,109 | ||||||
Orbital Sciences Corp.* | 12,900 | 187,437 | ||||||
Sparton Corp.* | 950 | 8,265 | ||||||
Teledyne Technologies, Inc.* | 150 | 8,227 | ||||||
Triumph Group, Inc. | 1,800 | 105,210 | ||||||
|
| |||||||
| 579,191 | ||||||||
Air Freight & Logistics - 0.79% | ||||||||
Air Transport Services Group, Inc.* | 25,250 | 119,180 | ||||||
Atlas Air Worldwide Holdings, Inc.* | 12,200 | 468,846 | ||||||
Pacer International, Inc.* | 1,600 | 8,560 | ||||||
Park-Ohio Holdings Corp.* | 2,450 | 43,708 | ||||||
|
| |||||||
| 640,294 | ||||||||
Airlines - 1.53% | ||||||||
Alaska Air Group, Inc.* | 100 | 7,509 | ||||||
Allegiant Travel Co.*+ | 1,400 | 74,676 | ||||||
Hawaiian Holdings, Inc.* | 10,100 | 58,580 | ||||||
JetBlue Airways Corp.*+ | 83,650 | 434,980 | ||||||
Pinnacle Airlines Corp.* | 4,497 | 3,688 | ||||||
Republic Airways Holdings, Inc.* | 9,600 | 32,928 | ||||||
SkyWest, Inc. | 22,500 | 283,275 | ||||||
US Airways Group, Inc.* | 68,950 | 349,576 | ||||||
|
| |||||||
| 1,245,212 | ||||||||
Auto Components - 1.38% | ||||||||
China Automotive Systems, Inc.* | 700 | 2,310 | ||||||
China XD Plastics Co., Ltd.* | 16,000 | 85,440 | ||||||
Cooper Tire & Rubber Co. | 24,550 | 343,945 | ||||||
Drew Industries, Inc.* | 700 | 17,171 | ||||||
Exide Technologies* | 35,800 | 94,154 | ||||||
Federal-Mogul Corp.* | 5,200 | 76,700 | ||||||
Fuel Systems Solutions, Inc.* | 700 | 11,543 | ||||||
Motorcar Parts of America, Inc.*+ | 350 | 2,625 | ||||||
Shiloh Industries, Inc.* | 6,950 | 58,241 | ||||||
SORL Auto Parts, Inc.* | 700 | 1,631 | ||||||
Spartan Motors, Inc. | 12,150 | 58,442 | ||||||
Standard Motor Products, Inc. | 9,200 | 184,460 | ||||||
Auto Components (continued) | ||||||||
Strattec Security Corp. | 100 | $ | 1,995 | |||||
Superior Industries International, Inc. | 6,600 | 109,164 | ||||||
Tower International, Inc.* | 6,400 | 68,736 | ||||||
|
| |||||||
| 1,116,557 | ||||||||
Automobiles - 0.01% | ||||||||
Winnebago Industries, Inc.* | 1,000 | 7,380 | ||||||
Beverages - 0.33% | ||||||||
Coca-Cola Bottling Co. Consolidated | 3,950 | 231,272 | ||||||
Cott Corp.* | 350 | 2,191 | ||||||
MGP Ingredients, Inc. | 650 | 3,276 | ||||||
National Beverage Corp.* | 2,150 | 34,551 | ||||||
|
| |||||||
| 271,290 | ||||||||
Building Products - 0.28% | ||||||||
Gibraltar Industries, Inc.* | 10,100 | 140,996 | ||||||
Griffon Corp. | 2,950 | 26,933 | ||||||
Quanex Building Products Corp. | 1,750 | 26,285 | ||||||
Universal Forest Products, Inc. | 1,200 | 37,044 | ||||||
|
| |||||||
| 231,258 | ||||||||
Capital Markets - 1.17% | ||||||||
Calamos Asset | ||||||||
Management, Inc., Class A | 700 | 8,757 | ||||||
CIFC Corp.*+ | 250 | 1,350 | ||||||
Cowen Group, Inc., Class A* | 23,500 | 60,865 | ||||||
Edelman Financial Group, Inc. | 1,000 | 6,570 | ||||||
GFI Group, Inc. | 63,600 | 262,032 | ||||||
Gleacher & Co., Inc.* | 49,500 | 83,160 | ||||||
INTL FCStone, Inc.* | 5,650 | 133,170 | ||||||
Investment Technology Group, Inc.* | 15,850 | 171,339 | ||||||
Oppenheimer Holdings, Inc., Class A | 850 | 13,685 | ||||||
Piper Jaffray Cos.* | 6,100 | 123,220 | ||||||
SWS Group, Inc. | 12,400 | 85,188 | ||||||
|
| |||||||
| 949,336 | ||||||||
Chemicals - 2.13% | ||||||||
American Pacific Corp.* | 3,900 | 29,757 | ||||||
American Vanguard Corp. | 900 | 12,006 | ||||||
Arabian American Development Co.* | 300 | 2,544 | ||||||
| 16 | Semi-Annual Report | December 31, 2011 (Unaudited) | |
| Bridgeway Omni Tax-Managed Small-Cap Value Fund | | |
| SCHEDULE OF INVESTMENTS (continued) | ||
| Showing percentage of net assets as of December 31, 2011 (Unaudited) |
| Industry Company | Shares Value Industry Company Shares Value |
Common Stocks (continued) | ||||||||
Chemicals (continued) | ||||||||
China Green Agriculture, Inc.* | 16,300 | $ | 48,900 | |||||
Core Molding Technologies, Inc.* | 4,800 | 38,688 | ||||||
Ferro Corp.* | 31,000 | 151,590 | ||||||
Georgia Gulf Corp.* | 17,300 | 337,177 | ||||||
Innospec, Inc.* | 800 | 22,456 | ||||||
Koppers Holdings, Inc. | 10,000 | 343,600 | ||||||
Kraton Performance Polymers, Inc.* | 5,775 | 117,232 | ||||||
Material Sciences Corp.* | 1,000 | 8,160 | ||||||
Minerals Technologies, Inc. | 1,375 | 77,729 | ||||||
OM Group, Inc.* | 1,900 | 42,541 | ||||||
Omnova Solutions, Inc.* | 2,100 | 9,681 | ||||||
Penford Corp.* | 4,850 | 24,686 | ||||||
PolyOne Corp. | 7,250 | 83,738 | ||||||
Schulman (A.), Inc. | 5,200 | 110,136 | ||||||
Shiner International, Inc.* | 800 | 320 | ||||||
Spartech Corp.* | 1,100 | 5,203 | ||||||
Stepan Co. | 350 | 28,056 | ||||||
TOR Minerals International, Inc.* | 200 | 3,132 | ||||||
TPC Group, Inc.* | 6,775 | 158,061 | ||||||
Tredegar Corp. | 2,800 | 62,216 | ||||||
Zep, Inc. | 600 | 8,388 | ||||||
|
| |||||||
| 1,725,997 | ||||||||
Commercial Banks - 6.05% | ||||||||
1st Source Corp. | 2,000 | 50,660 | ||||||
Access National Corp. | 600 | 5,280 | ||||||
Ameris Bancorp* | 1,400 | 14,392 | ||||||
Associated Banc-Corp. | 15,100 | 168,667 | ||||||
BancFirst Corp. | 1,300 | 48,802 | ||||||
BancorpSouth, Inc.+ | 41,300 | 455,126 | ||||||
Bank of Commerce Holdings | 200 | 670 | ||||||
Banner Corp. | 2,057 | 35,278 | ||||||
BBCN Bancorp, Inc.* | 2,950 | 27,877 | ||||||
Boston Private Financial Holdings, Inc. | 4,850 | 38,509 | ||||||
C&F Financial Corp. | 189 | 5,027 | ||||||
Capital City Bank Group, Inc. | 1,950 | 18,622 | ||||||
Cascade Bancorp*+ | 100 | 438 | ||||||
Citizens Republic Bancorp, Inc.* | 19,400 | 221,160 | ||||||
CoBiz Financial, Inc. | 2,200 | 12,694 | ||||||
Dearborn Bancorp, Inc.* | 350 | 53 | ||||||
Enterprise Financial Services Corp. | 550 | 8,140 | ||||||
First BanCorp*+ | 69,300 | 241,857 | ||||||
Commercial Banks (continued) | ||||||||
First Bancorp | 1,600 | $ | 17,840 | |||||
First Busey Corp. | 5,950 | 29,750 | ||||||
First Commonwealth Financial Corp. | 5,200 | 27,352 | ||||||
First Community Bancshares, Inc. | 1,100 | 13,728 | ||||||
First Financial Bancorp | 4,000 | 66,560 | ||||||
First Interstate Bancsystem, Inc. | 2,900 | 37,787 | ||||||
First Merchants Corp. | 3,500 | 29,645 | ||||||
First Midwest Bancorp, Inc. | 5,100 | 51,663 | ||||||
Great Southern Bancorp, Inc. | 5,550 | 130,924 | ||||||
Green Bankshares, Inc.* | 350 | 441 | ||||||
Guaranty Bancorp* | 2,900 | 4,263 | ||||||
Hanmi Financial Corp.* | 2,362 | 17,479 | ||||||
Heartland Financial USA, Inc. | 1,750 | 26,845 | ||||||
Horizon Bancorp | 909 | 15,835 | ||||||
Independent Bank Corp.* | 500 | 690 | ||||||
International Bancshares Corp. | 5,900 | 108,176 | ||||||
Intervest Bancshares Corp., | 4,000 | 10,920 | ||||||
Lakeland Bancorp, Inc. | 1,900 | 16,378 | ||||||
Macatawa Bank Corp.* | 12,550 | 28,614 | ||||||
MainSource Financial Group, Inc. | 2,300 | 20,309 | ||||||
MB Financial, Inc. | 3,500 | 59,850 | ||||||
Mercantile Bank Corp.* | 500 | 4,900 | ||||||
Metro Bancorp, Inc.* | 1,250 | 10,475 | ||||||
MetroCorp Bancshares, Inc.* | 450 | 2,858 | ||||||
Middleburg Financial Corp. | 400 | 5,700 | ||||||
NewBridge Bancorp* | 800 | 3,096 | ||||||
Old Second Bancorp, Inc.* | 5,800 | 7,714 | ||||||
PacWest Bancorp | 2,400 | 45,480 | ||||||
Peapack Gladstone Financial Corp. | 250 | 2,685 | ||||||
Peoples Bancorp, Inc. | 4,850 | 71,828 | ||||||
Pinnacle Financial Partners, Inc.* | 2,650 | 42,798 | ||||||
Porter Bancorp, Inc. | 400 | 1,160 | ||||||
PremierWest Bancorp* | 300 | 240 | ||||||
PrivateBancorp, Inc. | 29,200 | 320,616 | ||||||
Renasant Corp. | 1,700 | 25,500 | ||||||
Republic Bancorp, Inc., Class A | 3,400 | 77,860 | ||||||
Savannah Bancorp, Inc. (The)* | 200 | 990 | ||||||
SCBT Financial Corp. | 1,300 | 37,713 |
| www.bridgewayomni.com | 17 | |
| Bridgeway Omni Tax-Managed Small-Cap Value Fund | | |
| SCHEDULE OF INVESTMENTS (continued) | ||
| Showing percentage of net assets as of December 31, 2011 (Unaudited) |
| Industry Company | Shares Value Industry Company Shares Value |
Common Stocks (continued) | ||||||||
Commercial Banks (continued) | ||||||||
Seacoast Banking Corp. of Florida* | 4,300 | $ | 6,536 | |||||
Shore Bancshares, Inc. | 50 | 258 | ||||||
Sierra Bancorp | 450 | 3,960 | ||||||
Southwest Bancorp, Inc.* | 1,200 | 7,152 | ||||||
State Bancorp, Inc. | 550 | 6,710 | ||||||
StellarOne Corp. | 2,000 | 22,760 | ||||||
Sun Bancorp, Inc.* | 5,600 | 13,552 | ||||||
Susquehanna Bancshares, Inc. | 57,100 | 478,498 | ||||||
Synovus Financial Corp. | 347,700 | 490,257 | ||||||
Taylor Capital Group, Inc.* | 11,087 | 107,766 | ||||||
Trico Bancshares | 1,200 | 17,064 | ||||||
Union First Market Bankshares Corp. | 3,200 | 42,528 | ||||||
United Community Banks, Inc.*+ | 32,770 | 229,062 | ||||||
Virginia Commerce Bancorp, Inc.* | 4,000 | 30,920 | ||||||
VIST Financial Corp. | 3,200 | 19,360 | ||||||
Webster Financial Corp. | 6,500 | 132,535 | ||||||
WesBanco, Inc. | 1,800 | 35,046 | ||||||
West Bancorporation, Inc. | 1,100 | 10,538 | ||||||
Western Alliance Bancorp* | 7,300 | 45,479 | ||||||
Wintrust Financial Corp. | 17,000 | 476,850 | ||||||
|
| |||||||
| 4,906,745 | ||||||||
Commercial Services & Supplies - 4.76% |
| |||||||
A.T. Cross Co., Class A* | 550 | 6,204 | ||||||
ABM Industries, Inc. | 25,900 | 534,058 | ||||||
American Reprographics Co.* | 4,500 | 20,655 | ||||||
Brink’s Co. (The) | 23,900 | 642,432 | ||||||
Casella Waste Systems, Inc., Class A* | 2,950 | 18,880 | ||||||
Consolidated Graphics, Inc.* | 2,950 | 142,426 | ||||||
Corrections Corp. of America* | 2,300 | 46,851 | ||||||
Courier Corp. | 550 | 6,452 | ||||||
Covanta Holding Corp. | 11,900 | 162,911 | ||||||
Deluxe Corp. | 27,500 | 625,900 | ||||||
EnergySolutions, Inc.* | 14,600 | 45,114 | ||||||
Ennis, Inc. | 1,600 | 21,328 | ||||||
G&K Services, Inc., Class A | 1,350 | 39,298 | ||||||
Geo Group, Inc. (The)* | 35,400 | 592,950 | ||||||
Guanwei Recycling Corp.* | 200 | 162 | ||||||
HNI Corp. | 3,500 | 91,350 | ||||||
Intersections, Inc. | 1,450 | 16,080 | ||||||
KAR Auction Services, Inc.* | 10,950 | 147,825 | ||||||
Kimball International, Inc., Class B | 5,000 | 25,350 | ||||||
Commercial Services & Supplies (continued) |
| |||||||
Metalico, Inc.* | 32,600 | $ | 107,254 | |||||
Multi-Color Corp. | 550 | 14,152 | ||||||
Perma-Fix Environmental Services* | 1,400 | 2,170 | ||||||
Schawk, Inc. | 1,500 | 16,815 | ||||||
Standard Parking Corp.* | 2,250 | 40,208 | ||||||
Standard Register Co. (The) | 12,200 | 28,426 | ||||||
SYKES Enterprises, Inc.* | 2,850 | 44,631 | ||||||
Team, Inc.* | 1,250 | 37,187 | ||||||
TRC Cos., Inc.* | 9,950 | 59,800 | ||||||
UniFirst Corp. | 1,550 | 87,947 | ||||||
United Stationers, Inc. | 6,100 | 198,616 | ||||||
Viad Corp. | 2,200 | 38,456 | ||||||
|
| |||||||
| 3,861,888 | ||||||||
Communications Equipment - 0.76% | ||||||||
Arris Group, Inc.* | 500 | 5,410 | ||||||
Bel Fuse, Inc., Class B | 1,300 | 24,375 | ||||||
Black Box Corp. | 8,200 | 229,928 | ||||||
Brocade Communications Systems, Inc.* | 1,850 | 9,602 | ||||||
Comtech Telecommunications Corp. | 9,300 | 266,166 | ||||||
Network Engines, Inc.* | 200 | 192 | ||||||
Technical Communications Corp. | 200 | 1,480 | ||||||
Tessco Technologies, Inc. | 3,300 | 45,606 | ||||||
Tii Network Technologies, Inc.* | 15,600 | 22,932 | ||||||
Westell Technologies, Inc., Class A* | 3,200 | 7,104 | ||||||
Zoom Technologies, Inc.* | 150 | 154 | ||||||
ZST Digital Networks, Inc.* | 250 | 568 | ||||||
|
| |||||||
| 613,517 | ||||||||
Computers & Peripherals - 0.56% | ||||||||
Concurrent Computer Corp.* | 300 | 1,137 | ||||||
Cray, Inc.* | 10,300 | 66,641 | ||||||
Datalink Corp.* | 350 | 2,891 | ||||||
Dot Hill Systems Corp.* | 36,900 | 49,077 | ||||||
Hutchinson Technology, Inc.* | 300 | 450 | ||||||
Imation Corp.* | 13,800 | 79,074 | ||||||
Presstek, Inc.* | 1,700 | 918 | ||||||
Xyratex, Ltd. | 18,900 | 251,748 | ||||||
|
| |||||||
| 451,936 | ||||||||
Construction & Engineering - 1.41% | ||||||||
Argan, Inc. | 150 | 2,282 | ||||||
Dycom Industries, Inc.* | 6,850 | 143,302 | ||||||
EMCOR Group, Inc. | 6,500 | 174,265 | ||||||
| 18 | Semi-Annual Report | December 31, 2011 (Unaudited) | |
| Bridgeway Omni Tax-Managed Small-Cap Value Fund | | |
| SCHEDULE OF INVESTMENTS (continued) | ||
| Showing percentage of net assets as of December 31, 2011 (Unaudited) |
| Industry Company | Shares Value Industry Company Shares Value |
Common Stocks (continued) | ||||||||
Construction & Engineering (continued) |
| |||||||
Great Lakes Dredge & Dock Corp. | 11,800 | $ | 65,608 | |||||
Layne Christensen Co.* | 7,800 | 188,760 | ||||||
MasTec, Inc.* | 5,500 | 95,535 | ||||||
Michael Baker Corp.* | 350 | 6,863 | ||||||
MYR Group, Inc.* | 1,300 | 24,882 | ||||||
Orion Marine Group, Inc.* | 300 | 1,995 | ||||||
Pike Electric Corp.* | 6,551 | 47,102 | ||||||
Primoris Services Corp. | 21,300 | 318,009 | ||||||
Sterling Construction Co., Inc.* | 5,050 | 54,388 | ||||||
Tutor Perini Corp.* | 1,900 | 23,446 | ||||||
|
| |||||||
| 1,146,437 | ||||||||
Construction Materials - 0.01% | ||||||||
Headwaters, Inc.* | 4,700 | 10,434 | ||||||
Consumer Finance - 1.27% | ||||||||
Advance America Cash Advance Centers, Inc. | 23,900 | 213,905 | ||||||
Cash America International, Inc. | 1,900 | 88,597 | ||||||
CompuCredit Holdings Corp.* | 1,650 | 6,105 | ||||||
First Marblehead Corp. | 4,650 | 5,440 | ||||||
Nelnet, Inc., Class A | 25,900 | 633,773 | ||||||
White River Capital, Inc. | 100 | 2,025 | ||||||
World Acceptance Corp.* | 1,050 | 77,175 | ||||||
|
| |||||||
| 1,027,020 | ||||||||
Containers & Packaging - 1.02% | ||||||||
AEP Industries, Inc.* | 1,200 | 33,780 | ||||||
Boise, Inc. | 37,425 | 266,466 | ||||||
Graphic Packaging Holding Co.* | 800 | 3,408 | ||||||
Mod-Pac Corp.* | 598 | 4,001 | ||||||
Myers Industries, Inc. | 14,750 | 182,015 | ||||||
Silgan Holdings, Inc. | 2,000 | 77,280 | ||||||
Temple-Inland, Inc. | 8,100 | 256,851 | ||||||
UFP Technologies, Inc.* | 200 | 2,954 | ||||||
|
| |||||||
| 826,755 | ||||||||
Distributors - 0.19% | ||||||||
Amcon Distributing Co. | 400 | 25,760 | ||||||
Core-Mark Holding Co., Inc. | 850 | 33,660 | ||||||
Pool Corp. | 2,300 | 69,230 | ||||||
VOXX International Corp.* | 3,014 | 25,468 | ||||||
|
| |||||||
| 154,118 | ||||||||
Diversified Consumer Services - 2.15% |
| |||||||
Bridgepoint Education, Inc.*+ | 3,400 | $ | 78,200 | |||||
Cambium Learning Group, Inc.* | 10,400 | 31,408 | ||||||
Career Education Corp.* | 30,850 | 245,874 | ||||||
Carriage Services, Inc. | 6,550 | 36,680 | ||||||
Coinstar, Inc.*+ | 4,900 | 223,636 | ||||||
Corinthian Colleges, Inc.* | 950 | 2,062 | ||||||
CPI Corp.+ | 250 | 452 | ||||||
Education Management Corp.*+ | 8,550 | 239,315 | ||||||
ITT Educational Services, Inc.*+ | 2,250 | 128,002 | ||||||
Lincoln Educational Services Corp. | 5,125 | 40,488 | ||||||
Mac-Gray Corp. | 5,950 | 82,050 | ||||||
Regis Corp. | 34,050 | 563,528 | ||||||
School Specialty, Inc.* | 1,150 | 2,875 | ||||||
Universal Technical Institute, Inc.* | 5,200 | 66,456 | ||||||
|
| |||||||
| 1,741,026 | ||||||||
Diversified Financial Services - 1.13% |
| |||||||
Asset Acceptance Capital Corp.* | 20,500 | 80,155 | ||||||
Asta Funding, Inc. | 350 | 2,793 | ||||||
Gain Capital Holdings, Inc. | 20,700 | 138,690 | ||||||
Interactive Brokers Group, Inc., Class A | 18,150 | 271,161 | ||||||
PHH Corp.* | 31,000 | 331,700 | ||||||
Primus Guaranty, Ltd.* | 18,400 | 90,160 | ||||||
Resource America, Inc., | 700 | 3,332 | ||||||
|
| |||||||
| 917,991 | ||||||||
Diversified Telecommunication |
| |||||||
Atlantic Tele-Network, Inc. | 4,550 | 177,678 | ||||||
Cbeyond, Inc.* | 10,250 | 82,102 | ||||||
Consolidated Communications Holdings, Inc. | 2,300 | 43,815 | ||||||
General Communication, Inc., Class A* | 21,400 | 209,506 | ||||||
HickoryTech Corp. | 2,650 | 29,362 | ||||||
IDT Corp., Class B | 9,100 | 85,358 | ||||||
Iridium Communications, Inc.*+ | 5,200 | 40,092 | ||||||
Lumos Networks Corp. | 1,325 | 20,326 | ||||||
Multiband Corp.* | 1,200 | 3,876 | ||||||
| www.bridgewayomni.com | 19 | |
| Bridgeway Omni Tax-Managed Small-Cap Value Fund | | |
| SCHEDULE OF INVESTMENTS (continued) | ||
| Showing percentage of net assets as of December 31, 2011 (Unaudited) |
| Industry Company | Shares Value Industry Company Shares Value |
Common Stocks (continued) | ||||||||
Diversified Telecommunication Services (continued) |
| |||||||
Premiere Global Services, Inc.* | 6,000 | $ | 50,820 | |||||
Primus Telecommunications Group, Inc.* | 4,900 | 62,034 | ||||||
SureWest Communications | 3,630 | 43,669 | ||||||
Windstream Corp. | 27,807 | 326,454 | ||||||
|
| |||||||
| 1,175,092 | ||||||||
Electrical Equipment - 0.15% | ||||||||
Allied Motion Technologies, Inc. | 250 | 1,410 | ||||||
China BAK Battery, Inc.* | 2,950 | 1,829 | ||||||
General Cable Corp.* | 2,000 | 50,020 | ||||||
Lihua International, Inc.+ | 4,300 | 20,468 | ||||||
New Energy Systems Group* | 550 | 330 | ||||||
Powell Industries, Inc.* | 350 | 10,948 | ||||||
SL Industries, Inc.* | 400 | 6,480 | ||||||
Ultralife Corp.* | 7,150 | 28,743 | ||||||
|
| |||||||
| 120,228 | ||||||||
Electronic Equipment, Instruments & |
| |||||||
ADDvantage Technologies Group, Inc.* | 300 | 642 | ||||||
Agilysys, Inc.* | 13,800 | 109,710 | ||||||
Anixter International, Inc.* | 50 | 2,982 | ||||||
Brightpoint, Inc.* | 30,750 | 330,870 | ||||||
Celestica, Inc.* | 850 | 6,230 | ||||||
DDi Corp. | 4,200 | 39,186 | ||||||
GTSI Corp.* | 150 | 630 | ||||||
IEC Electronics Corp.* | 250 | 1,188 | ||||||
Insight Enterprises, Inc.* | 29,880 | 456,865 | ||||||
Iteris, Inc.* | 1,600 | 2,080 | ||||||
Kemet Corp.* | 20,900 | 147,345 | ||||||
LoJack Corp.* | 3,650 | 11,206 | ||||||
Multi-Fineline Electronix, Inc.* | 7,300 | 150,015 | ||||||
NAM TAI Electronics, Inc. | 150 | 796 | ||||||
PAR Technology Corp.* | 550 | 2,150 | ||||||
PC Connection, Inc. | 7,000 | 77,630 | ||||||
PC Mall, Inc.* | 6,450 | 40,506 | ||||||
Plexus Corp.* | 21,800 | 596,884 | ||||||
Power-One, Inc.* | 4,950 | 19,354 | ||||||
Pulse Electronics Corp. | 8,300 | 23,240 | ||||||
RadiSys Corp.* | 800 | 4,048 | ||||||
RF Monolithics, Inc.* | 300 | 324 | ||||||
Richardson Electronics, Ltd. | 650 | 7,989 | ||||||
Sanmina-SCI Corp.* | 52,400 | 487,844 | ||||||
SMTC Corp.* | 4,750 | 13,158 | ||||||
SYNNEX Corp.* | 19,700 | 600,062 | ||||||
Electronic Equipment, Instruments & Components (continued) |
| |||||||
TTM Technologies, Inc.* | 45,075 | $ | 494,022 | |||||
Viasystems Group, Inc.* | 13,984 | 236,609 | ||||||
Vishay Intertechnology, Inc.* | 11,450 | 102,936 | ||||||
Wayside Technology Group, Inc. | 100 | 1,215 | ||||||
|
| |||||||
| 3,967,716 | ||||||||
Energy Equipment & Services - 2.20% |
| |||||||
Basic Energy Services, Inc.* | 13,700 | 269,890 | ||||||
Cal Dive International, Inc.* | 4,350 | 9,788 | ||||||
Energy Services of America Corp.* | 400 | 1,076 | ||||||
ENGlobal Corp.* | 900 | 1,899 | ||||||
Exterran Holdings, Inc.*+ | 25,500 | 232,050 | ||||||
Geokinetics, Inc.* | 650 | 1,398 | ||||||
Global Geophysical Services, Inc.* | 17,900 | 120,288 | ||||||
Helix Energy Solutions Group, Inc.* | 7,000 | 110,600 | ||||||
Hercules Offshore, Inc.* | 32,950 | 146,298 | ||||||
Hornbeck Offshore Services, Inc.* | 900 | 27,918 | ||||||
Matrix Service Co.* | 13,300 | 125,552 | ||||||
Mitcham Industries, Inc.* | 350 | 7,644 | ||||||
Newpark Resources, Inc.* | 350 | 3,325 | ||||||
North American Energy Partners, Inc.* | 450 | 2,898 | ||||||
Parker Drilling Co.* | 23,300 | 167,061 | ||||||
PHI, Inc.* | 3,750 | 93,187 | ||||||
Pioneer Drilling Co.* | 16,100 | 155,848 | ||||||
Tetra Technologies, Inc.* | 22,100 | 206,414 | ||||||
TGC Industries, Inc.* | 450 | 3,213 | ||||||
Union Drilling, Inc.* | 14,000 | 87,360 | ||||||
Willbros Group, Inc.* | 3,300 | 12,111 | ||||||
|
| |||||||
| 1,785,818 | ||||||||
Food & Staples Retailing - 2.49% | ||||||||
Andersons, Inc. (The) | 7,100 | 309,986 | ||||||
Arden Group, Inc., Class A | 956 | 86,050 | ||||||
Casey’s General Stores, Inc. | 2,450 | 126,200 | ||||||
Ingles Markets, Inc., Class A | 10,100 | 152,106 | ||||||
Nash Finch Co. | 3,150 | 92,232 | ||||||
Pantry, Inc. (The)* | 10,000 | 119,700 | ||||||
Pricesmart, Inc. | 2,200 | 153,098 | ||||||
Ruddick Corp. | 3,700 | 157,768 | ||||||
Spartan Stores, Inc. | 6,500 | 120,250 | ||||||
SUPERVALU, Inc. | 850 | 6,902 | ||||||
Susser Holdings Corp.* | 7,650 | 173,043 | ||||||
| 20 | Semi-Annual Report | December 31, 2011 (Unaudited) | |
| Bridgeway Omni Tax-Managed Small-Cap Value Fund | | |
| SCHEDULE OF INVESTMENTS (continued) | ||
| Showing percentage of net assets as of December 31, 2011 (Unaudited) |
| Industry Company | Shares Value Industry Company Shares Value |
Common Stocks (continued) | ||||||||
Food & Staples Retailing (continued) |
| |||||||
Village Super Market, Inc., Class A | 4,450 | $ | 126,602 | |||||
Weis Markets, Inc. | 10,000 | 399,400 | ||||||
|
| |||||||
| 2,023,337 | ||||||||
Food Products - 1.56% | ||||||||
B&G Foods, Inc. | 2,400 | 57,768 | ||||||
Cal-Maine Foods, Inc. | 1,400 | 51,198 | ||||||
Chiquita Brands International, Inc.* | 9,800 | 81,732 | ||||||
Dole Food Co., Inc.* | 41,550 | 359,408 | ||||||
Farmer Brothers Co. | 400 | 3,056 | ||||||
Feihe International, Inc.*+ | 300 | 777 | ||||||
Fresh Del Monte Produce, Inc. | 4,650 | 116,296 | ||||||
Imperial Sugar Co. | 2,200 | 7,854 | ||||||
Inventure Foods, Inc.* | 650 | 2,431 | ||||||
John B. Sanfilippo & Son, Inc.* | 150 | 1,131 | ||||||
Omega Protein Corp.* | 3,750 | 26,738 | ||||||
Overhill Farms, Inc.* | 5,650 | 20,961 | ||||||
Pilgrim’s Pride Corp.* | 850 | 4,896 | ||||||
Sanderson Farms, Inc.+ | 7,100 | 355,923 | ||||||
Seneca Foods Corp., Class A* | 1,350 | 34,857 | ||||||
Snyders-Lance, Inc. | 1,950 | 43,875 | ||||||
SunOpta, Inc.* | 250 | 1,205 | ||||||
Westway Group, Inc.* | 3,841 | 21,510 | ||||||
Zhongpin, Inc.* | 8,500 | 72,420 | ||||||
|
| |||||||
| 1,264,036 | ||||||||
Health Care Equipment & Supplies - 0.42% |
| |||||||
Angeion Corp.* | 100 | 522 | ||||||
CryoLife, Inc.* | 300 | 1,440 | ||||||
Greatbatch, Inc.* | 1,400 | 30,940 | ||||||
Invacare Corp. | 12,650 | 193,418 | ||||||
Medical Action Industries, Inc.* | 150 | 784 | ||||||
RTI Biologics, Inc.* | 10,000 | 44,400 | ||||||
Synergetics USA, Inc.* | 300 | 2,214 | ||||||
Teleflex, Inc. | 150 | 9,194 | ||||||
Theragenics Corp.* | 18,250 | 30,660 | ||||||
Wright Medical Group, Inc.* | 1,800 | 29,700 | ||||||
|
| |||||||
| 343,272 | ||||||||
Health Care Providers & Services - 5.12% |
| |||||||
Addus HomeCare Corp.* | 700 | 2,499 | ||||||
Advocat, Inc. | 2,700 | 14,985 | ||||||
Alliance HealthCare Services, Inc.* | 20,450 | 25,767 | ||||||
Almost Family, Inc.* | 2,050 | 33,989 | ||||||
Health Care Providers & Services (continued) |
| |||||||
Amedisys, Inc.* | 12,250 | $ | 133,648 | |||||
American Dental Partners, Inc.* | 2,050 | 38,602 | ||||||
AMERIGROUP Corp.* | 150 | 8,862 | ||||||
Amsurg Corp.* | 11,100 | 289,044 | ||||||
BioScrip, Inc.* | 9,500 | 51,870 | ||||||
Capital Senior Living Corp.* | 300 | 2,382 | ||||||
CardioNet, Inc.* | 14,700 | 34,839 | ||||||
Centene Corp.* | 3,800 | 150,442 | ||||||
Chindex International, Inc.* | 8,000 | 68,160 | ||||||
Cross Country Healthcare, Inc.* | 7,200 | 39,960 | ||||||
Ensign Group, Inc. (The) | 10,200 | 249,900 | ||||||
Five Star Quality Care, Inc.* | 9,700 | 29,100 | ||||||
Gentiva Health Services, Inc.* | 11,600 | 78,300 | ||||||
Hanger Orthopedic Group, Inc.* | 850 | 15,886 | ||||||
Health Management Associates, Inc., Class A* | 19,300 | 142,241 | ||||||
Healthways, Inc.* | 6,421 | 44,048 | ||||||
Hooper Holmes, Inc.* | 4,200 | 2,520 | ||||||
InfuSystems Holdings, Inc.* | 700 | 1,113 | ||||||
Integramed America, Inc.* | 350 | 2,748 | ||||||
Kindred Healthcare, Inc.* | 21,750 | 255,997 | ||||||
LHC Group, Inc.* | 9,250 | 118,678 | ||||||
Magellan Health Services, Inc.* | 1,750 | 86,572 | ||||||
Medcath Corp. | 700 | 5,103 | ||||||
Metropolitan Health Networks, Inc.* | 1,916 | 14,313 | ||||||
Molina Healthcare, Inc.* | 19,600 | 437,668 | ||||||
National Healthcare Corp. | 850 | 35,615 | ||||||
PDI, Inc.* | 5,200 | 33,540 | ||||||
PharMerica Corp.* | 5,300 | 80,454 | ||||||
Providence Service Corp. | 2,550 | 35,088 | ||||||
PSS World Medical, Inc.* | 2,350 | 56,846 | ||||||
Select Medical Holdings Corp.* | 68,250 | 578,760 | ||||||
Skilled Healthcare Group, Inc., | 14,650 | 79,989 | ||||||
SRI/Surgical Express, Inc.* | 50 | 212 | ||||||
Sunrise Senior Living, Inc.*+ | 34,900 | 226,152 | ||||||
Triple-S Management Corp., Class B* | 9,500 | 190,190 | ||||||
U.S. Physical Therapy, Inc. | 350 | 6,888 | ||||||
Universal American Corp. | 22,525 | 286,293 | ||||||
WellCare Health Plans, Inc.* | 3,100 | 162,750 | ||||||
|
| |||||||
| 4,152,013 | ||||||||
| www.bridgewayomni.com | 21 | |
| Bridgeway Omni Tax-Managed Small-Cap Value Fund | | |
| SCHEDULE OF INVESTMENTS (continued) | ||
| Showing percentage of net assets as of December 31, 2011 (Unaudited) |
| Industry Company | Shares Value Industry Company Shares Value |
Common Stocks (continued) | ||||||||
Hotels, Restaurants & Leisure - 7.23% | ||||||||
Ameristar Casinos, Inc. | 11,500 | $ | 198,835 | |||||
Ark Restaurants Corp. | 200 | 2,680 | ||||||
Benihana, Inc.* | 18,545 | 189,715 | ||||||
Biglari Holdings, Inc.* | 399 | 146,928 | ||||||
Bluegreen Corp.* | 10,500 | 29,505 | ||||||
Bob Evans Farms, Inc. | 17,225 | 577,727 | ||||||
Boyd Gaming Corp.*+ | 38,150 | 284,599 | ||||||
Caribou Coffee Co., Inc.* | 11,300 | 157,635 | ||||||
Carrols Restaurant Group, Inc.* | 7,825 | 90,535 | ||||||
CEC Entertainment, Inc. | 8,500 | 292,825 | ||||||
Cracker Barrel Old Country Store, Inc. | 11,600 | 584,756 | ||||||
DineEquity, Inc.* | 8,575 | 361,951 | ||||||
Dover Downs Gaming & Entertainment, Inc. | 800 | 1,712 | ||||||
Einstein Noah Restaurant Group, Inc. | 6,050 | 95,711 | ||||||
Famous Dave’s of America, Inc.* | 1,650 | 17,127 | ||||||
Frisch’s Restaurants, Inc. | 2,400 | 46,848 | ||||||
Full House Resorts, Inc.* | 1,550 | 4,076 | ||||||
Granite City Food & Brewery, Ltd.* | 200 | 472 | ||||||
Great Wolf Resorts, Inc.* | 10,350 | 30,015 | ||||||
Isle of Capri Casinos, Inc.* | 16,350 | 76,354 | ||||||
Jack in the Box, Inc.* | 24,550 | 513,095 | ||||||
Kona Grill, Inc.* | 300 | 1,836 | ||||||
Luby’s, Inc.* | 5,500 | 24,805 | ||||||
Marcus Corp. | 8,800 | 110,968 | ||||||
Monarch Casino & Resort, Inc.* | 500 | 5,095 | ||||||
MTR Gaming Group, Inc.* | 9,900 | 18,513 | ||||||
Multimedia Games Holding Co., Inc.* | 6,575 | 52,206 | ||||||
Nevada Gold & Casinos, Inc.* | 7,000 | 8,050 | ||||||
O’Charleys, Inc.* | 5,200 | 28,548 | ||||||
Papa John’s International, Inc.* | 1,600 | 60,288 | ||||||
PF Chang’s China Bistro, Inc. | 9,100 | 281,281 | ||||||
Pinnacle Entertainment, Inc.* | 28,100 | 285,496 | ||||||
Red Lion Hotels Corp.* | 650 | 4,504 | ||||||
Red Robin Gourmet Burgers, Inc.* | 5,250 | 145,425 | ||||||
Ruby Tuesday, Inc.* | 34,500 | 238,050 | ||||||
Ruth’s Hospitality Group, Inc.* | 8,750 | 43,488 | ||||||
Scientific Games Corp., Class A* | 42,150 | 408,855 | ||||||
Hotels, Restaurants & Leisure (continued) |
| |||||||
Sonic Corp.* | 19,850 | $ | 133,590 | |||||
Speedway Motorsports, Inc. | 1,950 | 29,894 | ||||||
Universal Travel Group*D+ | 700 | 1,862 | ||||||
Vail Resorts, Inc. | 2,500 | 105,900 | ||||||
Wendy’s Co. (The) | 32,250 | 172,860 | ||||||
|
| |||||||
| 5,864,615 | ||||||||
Household Durables - 0.73% | ||||||||
American Greetings Corp., Class A | 12,950 | 162,004 | ||||||
Bassett Furniture Industries, Inc. | 400 | 2,996 | ||||||
Beazer Homes USA, Inc.*+ | 1,900 | 4,712 | ||||||
Blyth, Inc. | 250 | 14,200 | ||||||
Brookfield Residential Properties, Inc.* | 764 | 5,967 | ||||||
Comstock Homebuilding Cos., Inc., Class A* | 700 | 728 | ||||||
CSS Industries, Inc. | 1,950 | 38,844 | ||||||
Emerson Radio Corp.* | 700 | 1,113 | ||||||
Ethan Allen Interiors, Inc. | 5,800 | 137,518 | ||||||
Flexsteel Industries, Inc. | 150 | 2,076 | ||||||
Furniture Brands International, Inc.* | 1,400 | 1,722 | ||||||
Kid Brands, Inc.* | 700 | 2,212 | ||||||
La-Z-Boy, Inc.* | 4,300 | 51,170 | ||||||
Libbey, Inc.* | 8,305 | 105,806 | ||||||
Lifetime Brands, Inc. | 2,350 | 28,529 | ||||||
Meritage Homes Corp.* | 850 | 19,712 | ||||||
Ryland Group, Inc. (The)+ | 150 | 2,364 | ||||||
Universal Electronics, Inc.* | 600 | 10,122 | ||||||
|
| |||||||
| 591,795 | ||||||||
Household Products - 0.16% | ||||||||
Central Garden & Pet Co., Class A* | 14,000 | 116,480 | ||||||
Oil-Dri Corp. of America | 450 | 9,108 | ||||||
Orchids Paper Products Co. | 50 | 910 | ||||||
|
| |||||||
| 126,498 | ||||||||
Independent Power Producers & Energy Traders - 0.09% |
| |||||||
Genie Energy, Ltd., Class B | 9,100 | 72,163 | ||||||
Insurance - 7.16% | ||||||||
American Equity Investment Life Holding Co. | 24,850 | 258,440 | ||||||
American Safety Insurance Holdings, Ltd.* | 2,050 | 44,588 | ||||||
Argo Group International Holdings, Ltd. | 800 | 23,168 | ||||||
| 22 | Semi-Annual Report | December 31, 2011 (Unaudited) | |
| Bridgeway Omni Tax-Managed Small-Cap Value Fund | | |
| SCHEDULE OF INVESTMENTS (continued) | ||
| Showing percentage of net assets as of December 31, 2011 (Unaudited) |
| Industry Company | Shares Value Industry Company Shares Value |
Common Stocks (continued) | ||||||||
Insurance (continued) | ||||||||
Aspen Insurance Holdings, Ltd. | 5,150 | $ | 136,475 | |||||
Baldwin & Lyons, Inc., Class B | 850 | 18,530 | ||||||
Citizens, Inc.* | 3,900 | 37,791 | ||||||
CNO Financial Group, Inc.* | 17,600 | 111,056 | ||||||
Crawford & Co., Class B | 2,350 | 14,476 | ||||||
EMC Insurance Group, Inc. | 2,850 | 58,624 | ||||||
Endurance Specialty Holdings, Ltd. | 5,800 | 221,850 | ||||||
FBL Financial Group, Inc., Class A | 15,866 | 539,761 | ||||||
First American Financial Corp. | 9,575 | 121,315 | ||||||
Flagstone Reinsurance | 28,500 | 236,265 | ||||||
Hallmark Financial Services* | 4,000 | 27,960 | ||||||
Harleysville Group, Inc. | 2,100 | 118,797 | ||||||
Homeowners Choice, Inc. | 4,000 | 32,040 | ||||||
Horace Mann Educators Corp. | 23,050 | 316,016 | ||||||
Independence Holding Co. | 7,100 | 57,723 | ||||||
Infinity Property & Casualty Corp. | 3,600 | 204,264 | ||||||
Maiden Holdings, Ltd. | 37,550 | 328,938 | ||||||
Meadowbrook Insurance Group, Inc. | 11,250 | 120,150 | ||||||
Montpelier Re Holdings, Ltd. | 4,450 | 78,988 | ||||||
National Financial Partners Corp.* | 13,610 | 184,007 | ||||||
National Interstate Corp. | 1,200 | 29,604 | ||||||
National Western Life Insurance Co., Class A | 1,050 | 142,968 | ||||||
Navigators Group, Inc. (The)* | 1,250 | 59,600 | ||||||
Protective Life Corp. | 6,100 | 137,616 | ||||||
SeaBright Holdings, Inc. | 5,200 | 39,780 | ||||||
Selective Insurance Group, Inc. | 26,300 | 466,299 | ||||||
StanCorp Financial Group, Inc. | 1,600 | 58,800 | ||||||
State Auto Financial Corp. | 18,350 | 249,376 | ||||||
Stewart Information Services Corp. | 1,450 | 16,748 | ||||||
Symetra Financial Corp. | 69,750 | 632,633 | ||||||
Tower Group, Inc. | 20,050 | 404,408 | ||||||
United Fire & Casualty Co. | 12,500 | 252,250 | ||||||
Universal Insurance Holdings, Inc. | 8,350 | 29,893 | ||||||
|
| |||||||
| 5,811,197 |
Internet & Catalog Retail - 0.32% | ||||||||
1-800-Flowers.com, Inc., Class A* | 23,200 | $ | 51,040 | |||||
dELiA*s, Inc.* | 14,700 | 14,994 | ||||||
Nutrisystem, Inc. | 900 | 11,637 | ||||||
Orbitz Worldwide, Inc.* | 38,450 | 144,572 | ||||||
Overstock.com, Inc.* | 4,600 | 36,064 | ||||||
|
| |||||||
| 258,307 | ||||||||
Internet Software & Services - 0.66% | ||||||||
Earthlink, Inc. | 49,000 | 315,560 | ||||||
EasyLink Services International Corp., Class A* | 1,000 | 3,980 | ||||||
InfoSpace, Inc.* | 1,650 | 18,133 | ||||||
Internap Network Services Corp.* | 600 | 3,564 | ||||||
Inuvo, Inc.* | 200 | 142 | ||||||
Local.com Corp.*+ | 600 | 1,284 | ||||||
Looksmart, Ltd.* | 600 | 774 | ||||||
ModusLink Global Solutions, Inc. | 150 | 810 | ||||||
United Online, Inc. | 35,300 | 192,032 | ||||||
|
| |||||||
| 536,279 | ||||||||
IT Services - 3.39% | ||||||||
Acxiom Corp.* | 31,800 | 388,278 | ||||||
Analysts International Corp.* | 4,300 | 23,994 | ||||||
Broadridge Financial Solutions, Inc. | 10,800 | 243,540 | ||||||
CACI International, Inc., Class A* | 2,200 | 123,024 | ||||||
Cardtronics, Inc.* | 1,100 | 29,766 | ||||||
CIBER, Inc.* | 27,401 | 105,768 | ||||||
Convergys Corp.* | 22,575 | 288,283 | ||||||
CSG Systems International, Inc.* | 1,600 | 23,536 | ||||||
DST Systems, Inc. | 250 | 11,380 | ||||||
Dynamics Research Corp.* | 2,050 | 23,247 | ||||||
Edgewater Technology, Inc.* | 5,500 | 15,125 | ||||||
Euronet Worldwide, Inc.* | 2,350 | 43,428 | ||||||
Global Cash Access Holdings, Inc.* | 11,950 | 53,178 | ||||||
Hackett Group, Inc. (The)* | 2,800 | 10,472 | ||||||
Heartland Payment Systems, Inc. | 1,600 | 38,976 | ||||||
Information Services Group, Inc.* | 350 | 360 | ||||||
Lender Processing Services, Inc. | 18,700 | 281,809 | ||||||
| www.bridgewayomni.com | 23 | |
| Bridgeway Omni Tax-Managed Small-Cap Value Fund | | |
| MANAGER’S COMMENTARY (continued) | ||
| Showing percentage of net assets as of December 31, 2011 (Unaudited) |
| Industry Company | Shares Value Industry Company Shares Value |
Common Stocks (continued) | ||||||||
IT Services (continued) | ||||||||
Lionbridge Technologies, Inc.* | 2,750 | $ | 6,298 | |||||
Mantech International Corp., Class A | 20,100 | 627,924 | ||||||
NCI, Inc., Class A* | 9,700 | 113,005 | ||||||
Online Resources Corp.* | 9,774 | 23,653 | ||||||
Pfsweb, Inc.* | 450 | 1,480 | ||||||
PRGX Global, Inc.* | 800 | 4,760 | ||||||
StarTek, Inc.* | 3,050 | 5,856 | ||||||
Stream Global Services, Inc.* | 13,155 | 43,543 | ||||||
TeleTech Holdings, Inc.* | 4,150 | 67,230 | ||||||
Tier Technologies, Inc.* | 600 | 2,616 | ||||||
TNS, Inc.* | 8,700 | 154,164 | ||||||
|
| |||||||
| 2,754,693 | ||||||||
Leisure Equipment & Products - 1.10% |
| |||||||
Arctic Cat, Inc.* | 450 | 10,148 | ||||||
Brunswick Corp. | 38,400 | 693,504 | ||||||
Callaway Golf Co. | 250 | 1,383 | ||||||
Escalade, Inc. | 300 | �� | 1,332 | |||||
Jakks Pacific, Inc. | 5,500 | 77,605 | ||||||
Johnson Outdoors, Inc., Class A* | 3,950 | 60,632 | ||||||
Smith & Wesson Holding Corp.* | 4,117 | 17,950 | ||||||
Steinway Musical Instruments, Inc.* | 450 | 11,268 | ||||||
Sturm Ruger & Co., Inc. | 450 | 15,057 | ||||||
|
| |||||||
| 888,879 | ||||||||
Life Sciences Tools & Services - 0.08% |
| |||||||
Affymetrix, Inc.* | 5,800 | 23,722 | ||||||
Bioanalytical Systems, Inc.* | 100 | 125 | ||||||
Cambrex Corp.* | 5,800 | 41,644 | ||||||
Harvard Bioscience, Inc.* | 700 | 2,709 | ||||||
|
| |||||||
| 68,200 | ||||||||
Machinery - 1.48% | ||||||||
Alamo Group, Inc. | 550 | 14,812 | ||||||
Albany International Corp., Class A | 9,200 | 212,704 | ||||||
Ampco-Pittsburgh Corp. | 3,700 | 71,558 | ||||||
Briggs & Stratton Corp. | 21,450 | 332,260 | ||||||
Cleantech Solutions International, Inc.* | 250 | 78 | ||||||
Federal Signal Corp.* | 2,900 | 12,035 | ||||||
Greenbrier Cos., Inc.* | 100 | 2,428 | ||||||
Hardinge, Inc. | 400 | 3,220 | ||||||
Harsco Corp. | 6,300 | 129,654 | ||||||
Machinery (continued) | ||||||||
Hurco Cos., Inc.* | 200 | $ | 4,200 | |||||
John Bean Technologies Corp. | 1,820 | 27,973 | ||||||
Key Technology, Inc.* | 300 | 3,882 | ||||||
L.S. Starrett Co., Class A (The) | 2,650 | 34,052 | ||||||
LB Foster Co., Class A | 1,750 | 49,507 | ||||||
Lydall, Inc.* | 550 | 5,220 | ||||||
MFRI, Inc.* | 200 | 1,388 | ||||||
Miller Industries, Inc. | 150 | 2,359 | ||||||
Mueller Water Products, Inc., Class A | 7,200 | 17,568 | ||||||
NACCO Industries, Inc., Class A | 1,350 | 120,447 | ||||||
NN, Inc.* | 3,100 | 18,600 | ||||||
Sauer-Danfoss, Inc.* | 2,950 | 106,820 | ||||||
Trimas Corp.* | 1,600 | 28,720 | ||||||
WSI Industries, Inc. | 100 | 550 | ||||||
Xerium Technologies, Inc.* | 150 | 981 | ||||||
|
| |||||||
| 1,201,016 | ||||||||
Marine - 0.08% | ||||||||
Danaos Corp.* | 1,250 | 4,188 | ||||||
Eagle Bulk Shipping, Inc.* | 1,650 | 1,554 | ||||||
Excel Maritime Carriers, Ltd.*+ | 3,900 | 5,655 | ||||||
Genco Shipping & Trading, Ltd.*+ | 450 | 3,042 | ||||||
Global Ship Lease, Inc., Class A* | 200 | 362 | ||||||
Horizon Lines, Inc., Class A* | 248 | 1,079 | ||||||
International Shipholding Corp. | 1,450 | 27,100 | ||||||
Navios Maritime Holdings, Inc. | 400 | 1,428 | ||||||
Rand Logistics, Inc.* | 300 | 1,953 | ||||||
Star Bulk Carriers Corp. | 650 | 579 | ||||||
Ultrapetrol Bahamas, Ltd.*+ | 6,000 | 17,880 | ||||||
|
| |||||||
| 64,820 | ||||||||
Media - 3.61% | ||||||||
AH Belo Corp., Class A | 700 | 3,325 | ||||||
Beasley Broadcasting Group, Inc., Class A* | 8,129 | 25,688 | ||||||
Belo Corp., Class A | 4,750 | 29,925 | ||||||
Carmike Cinemas, Inc.* | 450 | 3,096 | ||||||
ChinaNet Online Holdings, Inc.* | 600 | 648 | ||||||
Cinemark Holdings, Inc. | 1,650 | 30,508 | ||||||
Dex One Corp.*+ | 600 | 996 | ||||||
| 24 | Semi-Annual Report | December 31, 2011 (Unaudited) | |
| Bridgeway Omni Tax-Managed Small-Cap Value Fund | | |
| SCHEDULE OF INVESTMENTS (continued) | ||
| Showing percentage of net assets as of December 31, 2011 (Unaudited) |
| Industry Company | Shares Value Industry Company Shares Value |
Common Stocks (continued) |
| |||||||
Media (continued) |
| |||||||
E.W. Scripps Co., Class A (The)* | 14,600 | $ | 116,946 | |||||
Entercom Communications Corp., Class A* | 16,350 | 100,552 | ||||||
Entravision Communications Corp., Class A | 36,350 | 56,706 | ||||||
Fisher Communications, Inc.* | 50 | 1,442 | ||||||
Gray Television, Inc.* | 19,450 | 31,509 | ||||||
Harris Interactive, Inc.* | 600 | 336 | ||||||
Harte-Hanks, Inc. | 18,550 | 168,620 | ||||||
Journal Communications, Inc., Class A* | 23,950 | 105,380 | ||||||
Knology, Inc.* | 9,400 | 133,480 | ||||||
Lee Enterprises, Inc.*+ | 4,050 | 2,875 | ||||||
McClatchy Co., Class A | 32,950 | 78,750 | ||||||
Media General, Inc., | 800 | 3,256 | ||||||
Meredith Corp.+ | 20,000 | 653,000 | ||||||
Navarre Corp.* | 17,900 | 27,566 | ||||||
New York Times Co., Class A (The)* | 60,550 | 468,051 | ||||||
Radio One, Inc., Class D*+ | 21,650 | 21,650 | ||||||
Reading International, Inc., Class A* | 9,900 | 41,976 | ||||||
Saga Communications, Inc., Class A* | 1,752 | 65,490 | ||||||
Scholastic Corp. | 13,800 | 413,586 | ||||||
Valassis Communications, Inc.* | 17,700 | 340,371 | ||||||
|
| |||||||
| 2,925,728 | ||||||||
Metals & Mining - 1.34% |
| |||||||
A.M. Castle & Co.* | 4,500 | 42,570 | ||||||
China Gerui Advanced Materials Group, Ltd.* | 500 | 1,675 | ||||||
Friedman Industries, Inc. | 3,500 | 36,575 | ||||||
Horsehead Holding Corp.* | 8,900 | 80,189 | ||||||
Noranda Aluminum Holding Corp. | 35,600 | 293,700 | ||||||
Schnitzer Steel Industries, Inc., Class A | 12,400 | 524,272 | ||||||
Sutor Technology Group, Ltd.* | 450 | 491 | ||||||
Worthington Industries, Inc. | 6,700 | 109,746 | ||||||
|
| |||||||
| 1,089,218 | ||||||||
Multiline Retail - 0.42% |
| |||||||
Bon-Ton Stores, Inc. (The)+ | 9,250 | 31,172 | ||||||
Duckwall-ALCO Stores, Inc.* | 200 | 1,670 | ||||||
Multiline Retail (continued) |
| |||||||
Fred’s, Inc., Class A | 16,250 | $ | 236,925 | |||||
Saks, Inc.*+ | 7,450 | 72,638 | ||||||
Tuesday Morning Corp.* | 450 | 1,553 | ||||||
|
| |||||||
| 343,958 | ||||||||
Oil, Gas & Consumable Fuels - 4.42% |
| |||||||
Adams Resources & Energy, Inc. | 400 | 11,592 | ||||||
Alon USA Energy, Inc. | 23,000 | 200,330 | ||||||
Barnwell Industries, Inc.* | 300 | 810 | ||||||
BioFuel Energy Corp.* | 350 | 238 | ||||||
Callon Petroleum Co.* | 1,750 | 8,698 | ||||||
China North East Petroleum Holdings, Ltd.*+ | 300 | 615 | ||||||
Cloud Peak Energy, Inc.* | 29,700 | 573,804 | ||||||
Crimson Exploration, Inc.* | 11,200 | 32,032 | ||||||
Crosstex Energy, Inc. | 11,500 | 145,360 | ||||||
CVR Energy, Inc.* | 2,950 | 55,254 | ||||||
Delek US Holdings, Inc. | 22,900 | 261,289 | ||||||
Double Eagle Petroleum Co.* | 250 | 1,720 | ||||||
Equal Energy, Ltd.* | 300 | 1,347 | ||||||
Frontline, Ltd.+ | 4,500 | 19,305 | ||||||
GeoMet, Inc.* | 1,850 | 1,720 | ||||||
GMX Resources, Inc.*+ | 15,700 | 19,625 | ||||||
Green Plains Renewable Energy, Inc.* | 950 | 9,272 | ||||||
James River Coal Co.*+ | 21,500 | 148,780 | ||||||
L&L Energy, Inc.* | 1,100 | 2,849 | ||||||
Longwei Petroleum Investment Holding, Ltd.* | 73,100 | 95,030 | ||||||
Patriot Coal Corp.* | 38,300 | 324,401 | ||||||
PostRock Energy Corp.* | 12,000 | 33,720 | ||||||
PrimeEnergy Corp.* | 200 | 4,518 | ||||||
RAM Energy Resources, Inc.* | 3,650 | 11,424 | ||||||
REX American Resources Corp.* | 1,850 | 40,904 | ||||||
SemGroup Corp., Class A* | 18,700 | 487,322 | ||||||
SMF Energy Corp. | 300 | 858 | ||||||
StealthGas, Inc.* | 200 | 772 | ||||||
Stone Energy Corp.* | 16,000 | 422,080 | ||||||
Tsakos Energy Navigation, Ltd. | 500 | 2,390 | ||||||
USEC, Inc.* | 2,950 | 3,363 | ||||||
W&T Offshore, Inc. | 5,300 | 112,413 | ||||||
Western Refining, Inc.* | 41,500 | 551,535 | ||||||
|
| |||||||
| 3,585,370 | ||||||||
Paper & Forest Products - 1.17% |
| |||||||
Buckeye Technologies, Inc. | 1,800 | 60,192 | ||||||
| www.bridgewayomni.com | 25 | |
| Bridgeway Omni Tax-Managed Small-Cap Value Fund | | |
| SCHEDULE OF INVESTMENTS (continued) | ||
Showing percentage of net assets as of December 31, 2011 (Unaudited) |
| Industry Company | Shares Value Industry Company Shares Value |
Common Stocks (continued) |
| |||||||
Paper & Forest Products (continued) |
| |||||||
Clearwater Paper Corp.* | 9,500 | $ | 338,295 | |||||
KapStone Paper & Packaging Corp.* | 9,675 | 152,284 | ||||||
Mercer International, Inc.* | 15,050 | 91,805 | ||||||
Neenah Paper, Inc. | 3,100 | 69,192 | ||||||
Orient Paper, Inc.*+ | 6,150 | 19,988 | ||||||
PH Glatfelter Co. | 9,200 | 129,904 | ||||||
Verso Paper Corp.* | 2,450 | 2,352 | ||||||
Wausau Paper Corp. | 9,850 | 81,361 | ||||||
|
| |||||||
| 945,373 | ||||||||
Personal Products - 0.32% |
| |||||||
China Sky One Medical, Inc.*+ | 150 | 148 | ||||||
Elizabeth Arden, Inc.* | 1,700 | 62,968 | ||||||
Inter Parfums, Inc. | 1,400 | 21,784 | ||||||
Natural Alternatives International, Inc.* | 50 | 441 | ||||||
Nutraceutical International Corp.* | 2,550 | 28,866 | ||||||
Parlux Fragrances, Inc.* | 700 | 3,570 | ||||||
Physicians Formula Holdings, Inc.* | 350 | 1,120 | ||||||
USANA Health Sciences, Inc.*+ | 4,700 | 142,739 | ||||||
|
| |||||||
| 261,636 | ||||||||
Pharmaceuticals - 0.08% |
| |||||||
Biostar Pharmaceuticals, Inc.* | 700 | 434 | ||||||
China Shenghuo Pharmaceutical Holdings, Inc.* | 700 | 238 | ||||||
Cornerstone Therapeutics, Inc.* | 900 | 5,040 | ||||||
Par Pharmaceutical Cos., Inc.* | 1,700 | 55,641 | ||||||
Tianyin Pharmaceutical Co., Inc.* | 300 | 177 | ||||||
|
| |||||||
| 61,530 | ||||||||
Professional Services - 1.08% |
| |||||||
Barrett Business Services, Inc. | 900 | 17,964 | ||||||
CBIZ, Inc.*+ | 5,275 | 32,230 | ||||||
Dolan Co. (The)* | 3,000 | 25,560 | ||||||
FTI Consulting, Inc.* | 3,400 | 144,228 | ||||||
GP Strategies Corp.* | 650 | 8,762 | ||||||
Heidrick & Struggles International, Inc. | 1,050 | 22,617 | ||||||
Huron Consulting Group, Inc.* | 1,700 | 65,858 | ||||||
Professional Services (continued) |
| |||||||
ICF International, Inc.* | 2,200 | $ | 54,516 | |||||
Insperity, Inc. | 6,700 | 169,845 | ||||||
Kelly Services, Inc., Class A | 8,800 | 120,384 | ||||||
Kforce, Inc.* | 8,200 | 101,106 | ||||||
National Technical Systems, Inc.* | 150 | 938 | ||||||
Navigant Consulting, Inc.* | 2,300 | 26,243 | ||||||
On Assignment, Inc.* | 2,800 | 31,304 | ||||||
RCM Technologies, Inc.* | 400 | 2,072 | ||||||
TrueBlue, Inc.* | 3,400 | 47,192 | ||||||
VSE Corp. | 330 | 8,012 | ||||||
|
| |||||||
| 878,831 | ||||||||
Real Estate Management & |
| |||||||
China Housing & Land | ||||||||
Development, Inc.* | 350 | 347 | ||||||
FirstService Corp.* | 100 | 2,649 | ||||||
|
| |||||||
| 2,996 | ||||||||
Road & Rail - 2.62% |
| |||||||
Amerco, Inc. | 6,700 | 592,280 | ||||||
Arkansas Best Corp. | 8,500 | 163,795 | ||||||
Avis Budget Group, Inc.* | 49,700 | 532,784 | ||||||
Celadon Group, Inc. | 4,400 | 51,964 | ||||||
Con-way, Inc. | 7,100 | 207,036 | ||||||
Covenant Transportation Group, Inc., Class A* | 2,950 | 8,762 | ||||||
Frozen Food Express Industries* | 650 | 838 | ||||||
Marten Transport, Ltd. | 8,644 | 155,506 | ||||||
P.A.M. Transportation Services, Inc.* | 250 | 2,375 | ||||||
RailAmerica, Inc.* | 4,600 | 68,494 | ||||||
Saia, Inc.* | 3,150 | 39,312 | ||||||
Swift Transportation Co.* | 24,000 | 197,760 | ||||||
Universal Truckload Services, Inc. | 5,765 | 104,635 | ||||||
USA Truck, Inc.* | 450 | 3,478 | ||||||
|
| |||||||
| 2,129,019 | ||||||||
Semiconductors & Semiconductor |
| |||||||
Advanced Energy Industries, Inc.* | 11,800 | 126,614 | ||||||
Amkor Technology, Inc.* | 86,600 | 377,576 | ||||||
Amtech Systems, Inc.* | 500 | 4,255 | ||||||
DSP Group, Inc.* | 5,200 | 27,092 | ||||||
GT Advanced Technologies, Inc.*+ | 50,800 | 367,792 | ||||||
inTEST Corp.* | 1,950 | 5,421 | ||||||
Kulicke & Soffa Industries, Inc.* | 24,700 | 228,475 | ||||||
| 26 | Semi-Annual Report | December 31, 2011 (Unaudited) | |
| Bridgeway Omni Tax-Managed Small-Cap Value Fund | | |
| SCHEDULE OF INVESTMENTS (continued) | ||
| Showing percentage of net assets as of December 31, 2011 (Unaudited) |
| Industry Company | Shares Value Industry Company Shares Value |
Common Stocks (continued) | ||||||||
Semiconductors & Semiconductor Equipment (continued) |
| |||||||
LTX-Credence Corp.* | 3,400 | $ | 18,190 | |||||
MEMC Electronic Materials, Inc.* | 3,500 | 13,790 | ||||||
Mindspeed Technologies, Inc.*+ | 850 | 3,893 | ||||||
OmniVision Technologies, Inc.* | 25,600 | 313,216 | ||||||
Photronics, Inc.* | 37,500 | 228,000 | ||||||
Pixelworks, Inc.* | 450 | 1,093 | ||||||
Ramtron International Corp.* | 900 | 1,755 | ||||||
Sigma Designs, Inc.* | 2,700 | 16,200 | ||||||
SunPower Corp.*+ | 408 | 2,542 | ||||||
|
| |||||||
| 1,735,904 | ||||||||
Software - 0.32% |
| |||||||
Bsquare Corp.* | 4,700 | 16,074 | ||||||
Cinedigm Digital Cinema Corp., Class A* | 2,200 | 3,036 | ||||||
GSE Systems, Inc.* | 250 | 488 | ||||||
Net 1 UEPS Technologies, Inc.* | 15,700 | 120,419 | ||||||
QAD, Inc., Class B* | 150 | 1,552 | ||||||
Rosetta Stone, Inc.*+ | 700 | 5,341 | ||||||
Take-Two Interactive Software, Inc.* | 2,150 | 29,132 | ||||||
TeleCommunication Systems, Inc., Class A* | 35,000 | 82,250 | ||||||
|
| |||||||
| 258,292 | ||||||||
Specialty Retail - 8.64% |
| |||||||
Aeropostale, Inc.* | 40,750 | 621,438 | ||||||
ANN, Inc.* | 9,100 | 225,498 | ||||||
Appliance Recycling Centers of America, Inc.* | 4,300 | 21,199 | ||||||
Asbury Automotive Group, Inc.* | 16,075 | 346,577 | ||||||
Barnes & Noble, Inc.*+ | 33,600 | 486,528 | ||||||
Big 5 Sporting Goods Corp. | 700 | 7,308 | ||||||
Books-A-Million, Inc.+ | 550 | 1,314 | ||||||
Brown Shoe Co., Inc. | 25,150 | 223,835 | ||||||
Build-A-Bear Workshop, Inc.* | 3,800 | 32,148 | ||||||
Cabela’s, Inc.* | 250 | 6,355 | ||||||
Casual Male Retail Group, Inc.* | 31,500 | 107,730 | ||||||
Cato Corp., Class A (The) | 1,000 | 24,200 | ||||||
Charming Shoppes, Inc.* | 50,200 | 245,980 | ||||||
Childrens Place Retail Stores, Inc. (The)* | 10,800 | 573,696 | ||||||
Christopher & Banks Corp. | 1,650 | 3,861 | ||||||
Citi Trends, Inc.* | 50 | 439 | ||||||
Collective Brands, Inc.* | 30,400 | 436,848 | ||||||
Specialty Retail (continued) |
| |||||||
Conn’s, Inc.*+ | 6,200 | $ | 68,820 | |||||
Cost Plus, Inc.* | 4,225 | 41,194 | ||||||
Destination Maternity Corp. | 2,028 | 33,908 | ||||||
Express, Inc.* | 350 | 6,979 | ||||||
Finish Line, Inc., Class A (The) | 2,450 | 47,248 | ||||||
Genesco, Inc.* | 1,800 | 111,132 | ||||||
Group 1 Automotive, Inc. | 12,200 | 631,960 | ||||||
Hastings Entertainment, Inc.* | 250 | 400 | ||||||
Haverty Furniture Cos., Inc. | 5,000 | 54,900 | ||||||
hhgregg, Inc.*+ | 15,950 | 230,478 | ||||||
Hot Topic, Inc. | 28,050 | 185,410 | ||||||
Kirkland’s, Inc.* | 3,900 | 51,870 | ||||||
MarineMax, Inc.* | 800 | 5,216 | ||||||
Men’s Wearhouse, Inc. (The) | 2,450 | 79,405 | ||||||
Midas, Inc.* | 450 | 3,866 | ||||||
New York & Co., Inc.* | 26,300 | 69,958 | ||||||
Office Depot, Inc.* | 12,800 | 27,520 | ||||||
OfficeMax, Inc.* | 3,950 | 17,933 | ||||||
Pacific Sunwear of California, Inc.* | 3,050 | 5,216 | ||||||
Pep Boys-Manny, Moe & Jack (The) | 24,450 | 268,950 | ||||||
Pier 1 Imports, Inc.* | 5,450 | 75,918 | ||||||
RadioShack Corp. | 62,550 | 607,360 | ||||||
Select Comfort Corp.* | 2,550 | 55,310 | ||||||
Shoe Carnival, Inc.* | 450 | 11,565 | ||||||
Sonic Automotive, Inc., | 24,650 | 365,066 | ||||||
Stage Stores, Inc. | 10,100 | 140,289 | ||||||
Stein Mart, Inc.* | 8,900 | 60,609 | ||||||
Systemax, Inc.* | 11,000 | 180,510 | ||||||
TravelCenters of America LLC* | 650 | 2,762 | ||||||
West Marine, Inc.* | 8,079 | 93,959 | ||||||
Wet Seal, Inc., Class A (The)* | 31,450 | 102,527 | ||||||
Zale Corp.* | 1,500 | 5,715 | ||||||
|
| |||||||
| 7,008,907 | ||||||||
Textiles, Apparel & Luxury |
| |||||||
American Apparel, Inc.* | 1,800 | 1,296 | ||||||
Culp, Inc.* | 5,650 | 48,138 | ||||||
Delta Apparel, Inc.* | 250 | 4,772 | ||||||
Jones Group, Inc. (The) | 36,400 | 384,020 | ||||||
Kenneth Cole Productions, Inc., Class A* | 650 | 6,883 | ||||||
Lacrosse Footwear, Inc. | 150 | 1,893 | ||||||
Lakeland Industries, Inc.* | 200 | 1,850 | ||||||
| www.bridgewayomni.com | 27 | |
| Bridgeway Omni Tax-Managed Small-Cap Value Fund | | |
| SCHEDULE OF INVESTMENTS (continued) | ||
| Showing percentage of net assets as of December 31, 2011 (Unaudited) |
| Industry Company | Shares Value Industry Company Shares Value |
Common Stocks (continued) | ||||||||
Textiles, Apparel & Luxury Goods (continued) |
| |||||||
Liz Claiborne, Inc.*+ | 2,450 | $ | 21,144 | |||||
Movado Group, Inc. | 2,300 | 41,791 | ||||||
Oxford Industries, Inc. | 550 | 24,816 | ||||||
Perry Ellis International, Inc.* | 450 | 6,399 | ||||||
Quiksilver, Inc.* | 43,100 | 155,591 | ||||||
R.G. Barry Corp. | 400 | 4,832 | ||||||
Rocky Brands, Inc.* | 3,150 | 28,413 | ||||||
|
| |||||||
| 731,838 | ||||||||
Thrifts & Mortgage Finance - 0.98% |
| |||||||
Astoria Financial Corp. | 49,600 | 421,104 | ||||||
Bank Mutual Corp. | 32,000 | 101,760 | ||||||
BankAtlantic Bancorp, Inc., | 590 | 1,994 | ||||||
Beacon Federal Bancorp, Inc. | 200 | 2,774 | ||||||
Doral Financial Corp.* | 56,100 | 53,632 | ||||||
First Defiance Financial Corp. | 1,250 | 18,238 | ||||||
First Federal Bancshares of | ||||||||
Arkansas, Inc.*+ | 1,240 | 5,357 | ||||||
First Financial Holdings, Inc. | 1,450 | 12,948 | ||||||
First Financial Northwest, Inc.* | 200 | 1,178 | ||||||
First Pactrust Bancorp, Inc. | 100 | 1,025 | ||||||
Flushing Financial Corp. | 2,700 | 34,101 | ||||||
Indiana Community Bancorp | 1,500 | 21,945 | ||||||
Meta Financial Group, Inc. | 300 | 4,860 | ||||||
NASB Financial, Inc.* | 500 | 5,355 | ||||||
Parkvale Financial Corp. | 300 | 7,374 | ||||||
Provident Financial Holdings, Inc. | 5,400 | 50,436 | ||||||
Pulaski Financial Corp.+ | 800 | 5,688 | ||||||
Radian Group, Inc. | 7,900 | 18,486 | ||||||
Riverview Bancorp, Inc.* | 600 | 1,422 | ||||||
Timberland Bancorp, Inc.* | 200 | 770 | ||||||
Tree.com, Inc.* | 4,900 | 27,391 | ||||||
|
| |||||||
| 797,838 | ||||||||
Trading Companies & Distributors - 2.32% |
| |||||||
Aceto Corp. | 13,900 | 95,910 | ||||||
AerCap Holdings NV* | 600 | 6,774 | ||||||
AeroCentury Corp.* | 200 | 1,254 | ||||||
Aircastle, Ltd. | 32,700 | 415,944 | ||||||
Applied Industrial Technologies, Inc. | 2,150 | 75,615 | ||||||
Beacon Roofing Supply, Inc.* | 9,200 | 186,116 | ||||||
China Armco Metals, Inc.* | 500 | 145 | ||||||
DXP Enterprises, Inc.* | 450 | 14,490 | ||||||
GATX Corp. | 3,000 | 130,980 | ||||||
Interline Brands, Inc.* | 6,750 | 105,098 | ||||||
Trading Companies & Distributors (continued) |
| |||||||
KSW, Inc. | 2,800 | $ | 9,324 | |||||
Rush Enterprises, Inc., | 10,700 | 223,844 | ||||||
United Rentals, Inc.*+ | 20,875 | 616,856 | ||||||
Willis Lease Finance Corp.* | 250 | 2,975 | ||||||
|
| |||||||
| 1,885,325 | ||||||||
Wireless Telecommunication |
| |||||||
Leap Wireless International, Inc.*+ | 32,400 | 300,996 | ||||||
NTELOS Holdings Corp. | 1,325 | 27,003 | ||||||
Shenandoah Telecommunications Co. | 15,700 | 164,536 | ||||||
USA Mobility, Inc. | 1,300 | 18,031 | ||||||
|
| |||||||
| 510,566 | ||||||||
|
| |||||||
TOTAL COMMON STOCKS - 99.39% |
| 80,646,685 | ||||||
|
| |||||||
(Cost $81,086,085) | ||||||||
| Rate^ | Shares | Value | ||||||||||
| MONEY MARKET FUND - 0.59% | ||||||||||||
BlackRock FedFund | 0.01 | % | 477,633 | 477,633 | ||||||||
|
| |||||||||||
TOTAL MONEY MARKET FUND - 0.59% |
| 477,633 | ||||||||||
|
| |||||||||||
(Cost $477,633) |
| |||||||||||
TOTAL INVESTMENTS - 99.98% |
| $81,124,318 | ||||||||||
(Cost $81,563,718) |
| |||||||||||
Other Assets in Excess of Liabilities - 0.02% |
| 16,756 | ||||||||||
|
| |||||||||||
NET ASSETS - 100.00% |
| $81,141,074 | ||||||||||
|
| |||||||||||
| * | Non-income producing security. |
| ^ | Rate disclosed as of December 31, 2011. |
| D | Security was fair valued under procedures adopted by the Board of Directors (see Note 2). |
| + | This security or a portion of the security is out on loan at December 31, 2011. Total loaned securities had a value of $4,908,851 at December 31, 2011. |
LLC - Limited Liability Company
| 28 | Semi-Annual Report | December 31, 2011 (Unaudited) | |
| Bridgeway Omni Tax-Managed Small-Cap Value Fund | | |
| SCHEDULE OF INVESTMENTS (continued) | ||
| Summary of inputs used to value the Fund’s investments as of 12/31/2011 is as follows (See Note 2 in Notes to Financial Statements): | ||||||||||||||||
| Valuation Inputs | ||||||||||||||||
| Investment in Securities (Value) | ||||||||||||||||
Level 1 Quoted Prices | Level 2 Significant Observable Inputs | Level 3 Significant Unobservable Inputs | Total | |||||||||||||
Common Stocks | $80,644,823 | $ | — | $1,862 | $80,646,685 | |||||||||||
Money Market Fund | — | 477,633 | — | 477,633 | ||||||||||||
|
|
|
|
|
|
|
| |||||||||
TOTAL | $80,644,823 | $477,633 | $1,862 | $81,124,318 | ||||||||||||
|
|
|
|
|
|
|
| |||||||||
| Following is a reconciliation of Level 3 investments for which significant unobservable inputs were used to determine fair value: | ||||||||||||||||
| Investment in Securities (Value) | ||||||||||||||||
| Common Stocks | Total | |||||||||||||||
Balance as of 06/30/2011 | $10,070 | $10,070 | ||||||||||||||
Purchases | — | — | ||||||||||||||
Sales | (2,970) | (2,970) | ||||||||||||||
Realized gain/(loss)1 | (17,605) | (17,605) | ||||||||||||||
Change in unrealized appreciation/ (depreciation)2 | 12,367 | 12,367 | ||||||||||||||
Transfers in3 | — | — | ||||||||||||||
Transfers out | — | — | ||||||||||||||
|
|
|
| |||||||||||||
Balance as of 12/31/2011 | $1,862 | $1,862 | ||||||||||||||
|
|
|
| |||||||||||||
Net change in unrealized appreciation (depreciation) from investments held as of 12/31/20112 | $ (384) | $ (384) | ||||||||||||||
|
|
|
| |||||||||||||
1Realized gain/(loss) from Level 3 securities is included on the Statements of Operations in the Realized Gain (Loss) on Investments.
2Change in unrealized appreciation/(depreciation) for Level 3 securities is included on the Statements of Operations in the Change in Unrealized Appreciation (Depreciation) on Investments.
3Transfers in represent the value as of the beginning of the reporting period, for any investment security where significant transfers in the pricing level occurred during the period. The purchase value is used in situations where the investment was not held as of the beginning of the period.
The security in the table above was considered a Level 3 security because it was fair valued under procedures adopted by the Board of Directors at December 31, 2011. Such valuation is based on a review of inputs such as, but not limited to, similar securities, company specific financial information and company specific news.
See Notes to Financial Statements.
| www.bridgewayomni.com | 29 | |
| STATEMENTS OF ASSETS AND LIABILITIES | | |
| December 31, 2011 (Unaudited) |
| ASSETS | Omni Small-Cap Value | Omni Tax-Managed Small-Cap Value | ||||||||
Investments at value | $81,284,641 | $81,124,318 | ||||||||
Receivables: | ||||||||||
Portfolio securities sold | 47,969 | 3,317 | ||||||||
Fund shares sold | 68,144 | 482,064 | ||||||||
Dividends and interest | 61,138 | 76,805 | ||||||||
Prepaid expenses | 1,870 | 29,426 | ||||||||
Total assets | 81,463,762 | 81,715,930 | ||||||||
LIABILITIES | ||||||||||
Payables: | ||||||||||
Portfolio securities purchased | 72,115 | 533,397 | ||||||||
Due to custodian | 9,230 | - | ||||||||
Accrued Liabilities: | ||||||||||
Investment advisory fees | 16,791 | 17,028 | ||||||||
Administration fees | 2,516 | 2,423 | ||||||||
Other | 36,909 | 22,008 | ||||||||
Total liabilities | 137,561 | 574,856 | ||||||||
NET ASSETS | $81,326,201 | $81,141,074 | ||||||||
NET ASSETS REPRESENT | ||||||||||
Paid-in capital | $75,383,510 | $82,759,646 | ||||||||
Undistributed (distributions in excess of) net investment income | 8,001 | (6,398 | ) | |||||||
Accumulated net realized gain (loss) on investments | 232,325 | (1,172,774 | ) | |||||||
Net unrealized appreciation (depreciation) on investments | 5,702,365 | (439,400 | ) | |||||||
NET ASSETS | $81,326,201 | $81,141,074 | ||||||||
Shares of common stock outstanding of $.001 par value* | 7,853,390 | 8,625,364 | ||||||||
Net asset value per share | $ 10.36 | $ 9.41 | ||||||||
Total investments at cost | $75,582,276 | $81,563,718 | ||||||||
| * | See Note 1 - Organization in the Notes to Financial Statements for shares authorized for each Fund. |
See Notes to Financial Statements.
| 30 | Semi-Annual Report | December 31, 2011 (Unaudited) | |
| STATEMENTS OF OPERATIONS | | |
| Period Ended December 31, 2011 (Unaudited) |
Omni Small-Cap Value1 | Omni Tax-Managed Small-Cap Value | |||||||||
INVESTMENT INCOME | ||||||||||
Dividends | $ 328,967 | $ 406,607 | ||||||||
Securities lending. | 23,834 | 82,067 | ||||||||
Total Investment Income | 352,801 | 488,674 | ||||||||
EXPENSES | ||||||||||
Investment advisory fees | 105,376 | 141,957 | ||||||||
Administration fees. | 8,496 | 11,361 | ||||||||
Accounting fees | 27,085 | 41,929 | ||||||||
Transfer agent fees | 7,537 | 6,352 | ||||||||
Professional fees | 9,193 | 11,938 | ||||||||
Custody fees | 15,921 | 10,272 | ||||||||
Blue sky fees | 4,975 | 7,481 | ||||||||
Directors’ and officers’ fees | 3,902 | 4,748 | ||||||||
Shareholder servicing fees | 3,907 | 2,288 | ||||||||
Reports to shareholders | 2,828 | 3,481 | ||||||||
Miscellaneous expenses | 2,802 | 5,944 | ||||||||
Total Expenses | 192,022 | 247,751 | ||||||||
Less investment advisory fees waived. | (52,785 | ) | (77,307 | ) | ||||||
Less other fees waived. | (12,766 | ) | - | |||||||
Net Expenses | 126,471 | 170,444 | ||||||||
NET INVESTMENT INCOME | 226,330 | 318,230 | ||||||||
NET REALIZED AND UNREALIZED GAIN (LOSS) ON INVESTMENTS | ||||||||||
Realized Gain (Loss) on: | ||||||||||
Investments | 232,325 | (1,144,611 | ) | |||||||
Net Realized Gain (Loss) | 232,325 | (1,144,611 | ) | |||||||
Change in Unrealized Appreciation (Depreciation) on: | ||||||||||
Investments | 5,702,365 | (876,203 | ) | |||||||
Net Change in Unrealized Appreciation (Depreciation) | 5,702,365 | (876,203 | ) | |||||||
Net Realized and Unrealized Gain (Loss) on Investments | 5,934,690 | (2,020,814 | ) | |||||||
INCREASE (DECREASE) IN NET ASSETS RESULTING FROM OPERATIONS | $6,161,020 | $(1,702,584) | ||||||||
| 1 | For the period August 31, 2011 (commencement of operations) through December 31, 2011. |
See Notes to Financial Statements.
| www.bridgewayomni.com | 31 | |
| STATEMENTS OF CHANGES IN NET ASSETS | | |
Omni Small-Cap Value | Omni Tax-Managed Small-Cap Value | ||||||||||||||
For the Period August 31, 20111 through December 31, 2011 | Six Months Ended December 31, 2011 | For the Period December 31, 20101 through June 30, 2011 | |||||||||||||
| (Unaudited) | (Unaudited) | ||||||||||||||
OPERATIONS | |||||||||||||||
Net investment income | $ 226,330 | $ 318,230 | $ 57,746 | ||||||||||||
Net realized loss on investments | 232,325 | (1,144,611 | ) | (28,163 | ) | ||||||||||
Net change in unrealized appreciation (depreciation) on investments | 5,702,365 | (876,203 | ) | 436,803 | |||||||||||
Net increase (decrease) in net assets resulting from operations | 6,161,020 | (1,702,584 | ) | 466,386 | |||||||||||
DISTRIBUTIONS: | |||||||||||||||
From net investment income. | (218,329 | ) | (379,007 | ) | - | ||||||||||
Net decrease in net assets resulting from distributions | (218,329 | ) | (379,007 | ) | - | ||||||||||
SHARE TRANSACTIONS: | |||||||||||||||
Proceeds from sale of shares | 79,628,800 | 60,437,642 | 39,874,315 | ||||||||||||
Reinvestment of distributions | 218,329 | 379,007 | - | ||||||||||||
Cost of shares redeemed | (4,463,619 | ) | (15,538,704 | ) | (2,395,981 | ) | |||||||||
Net increase in net assets resulting from share transactions | 75,383,510 | 45,277,945 | 37,478,334 | ||||||||||||
Net increase in net assets | 81,326,201 | 43,196,354 | 37,944,720 | ||||||||||||
NET ASSETS: | |||||||||||||||
Beginning of period | - | 37,944,720 | - | ||||||||||||
End of period* | $81,326,201 | $81,141,074 | $37,944,720 | ||||||||||||
SHARES ISSUED & REDEEMED | |||||||||||||||
Issued | 8,288,223 | 6,764,054 | 3,784,388 | ||||||||||||
Distributions reinvested | 21,943 | 41,833 | - | ||||||||||||
Redeemed | (456,776 | ) | (1,733,069 | ) | (231,842 | ) | |||||||||
Net increase in shares | 7,853,390 | 5,072,818 | 3,552,546 | ||||||||||||
Outstanding at beginning of period | - | 3,552,546 | - | ||||||||||||
Outstanding at end of period | 7,853,390 | 8,625,364 | 3,552,546 | ||||||||||||
* Including undistributed (distributions in excess of) net investment income of: | $ 8,001 | $ (6,398) | $ 54,379 | ||||||||||||
1Commencement of operations.
See Notes to Financial Statements.
| 32 | Semi-Annual Report | December 31, 2011 (Unaudited) | |
THIS PAGE INTENTIONALLY LEFT BLANK
| www.bridgewayomni.com | 33 | |
| FINANCIAL HIGHLIGHTS | ||
| (for a share outstanding throughout the period indicated) |
Income from Investment Operations | ||||||||||
| Net Asset Value, Beginning of Period | Net Investment Income (Loss)(a) | Net Realized and Unrealized Gain\(Loss) | Total from Investment Operations | |||||||
OMNI SMALL-CAP VALUE | ||||||||||
Period Ended December 31, 2011 (Unaudited)(c) | 10.00 | 0.04 | 0.35 | 0.39 | ||||||
OMNI TAX-MANAGED SMALL-CAP VALUE | ||||||||||
Period Ended December 31, 2011 (Unaudited) | $10.68 | $0.05 | $(1.27) | $(1.22) | ||||||
Period Ended June 30, 2011(e) | 10.00 | 0.03 | 0.65 | 0.68 | ||||||
| (a) | Per share amounts calculated based on the average daily shares outstanding during the period. |
| (b) | Annualized for periods less than one year. |
| (c) | Commenced operations on August 31, 2011. |
| (d) | Total return may have been lower had various fees not been waived during the period. |
| (e) | Commenced operations on December 31, 2010. |
See Notes to Financial Statements.
| 34 | Semi-Annual Report | December 31, 2011 (Unaudited) | |
| ||
Less Distributions to Shareholders from: | Ratios & Supplemental Data | |||||||||||||||||||||||||||||
| Net Realized Gain | Net Investment Income | Total Distributions | Net Asset Value, End of Period | Total Return | Net Assets End of Period (000’s) | Expenses Before Waivers and Reimbursements(b) | Expenses After Waivers and Reimbursements(b) | Net Investment After Waivers and | Portfolio Turnover Rate | |||||||||||||||||||||
| - | (0.03 | ) | (0.03 | ) | 10.36 | 3.89 | %(d) | 81,326 | 0.91% | 0.60% | 1.07% | 3% | ||||||||||||||||||
| $ | - | $(0.05 | ) | $(0.05 | ) | $ 9.41 | (11.43 | %)(d) | $81,141 | 0.87% | 0.60% | 1.12% | 23% | |||||||||||||||||
| - | - | - | 10.68 | 6.80 | %(d) | 37,945 | 1.56% | 0.60% | 0.57% | 7% | ||||||||||||||||||||
| www.bridgewayomni.com | 35 | |
| NOTES TO FINANCIAL STATEMENTS | | |
| December 31, 2011 (Unaudited) |
1. Organization:
Bridgeway Funds, Inc. (“Bridgeway” or the “Company”) was organized as a Maryland corporation on October 19, 1993, and is registered under the Investment Company Act of 1940, as amended (the “1940 Act”), as an open-end management investment company.
Bridgeway is organized as a series fund, with 14 investment funds as of December 31, 2011 (each, a “Bridgeway Fund” and collectively, the “Bridgeway Funds”). Aggressive Investors 1, Aggressive Investors 2, Ultra-Small Company, Ultra-Small Company Market, Micro-Cap Limited, Small-Cap Momentum, Small-Cap Growth, Small-Cap Value, Large-Cap Growth, Large-Cap Value, Blue Chip 35 Index and Managed Volatility Funds are presented in a separate report. The Omni Small-Cap Value Fund and the Omni Tax-Managed Small-Cap Value Fund (each a “Fund” and together, the “Funds”) commenced operations on August 31, 2011 and December 31, 2010, respectively, and are presented in this report.
Bridgeway is authorized to issue 2,000,000,000 shares of common stock at $0.001 per share. 15,000,000 shares have been classified into the Aggressive Investors 1 Fund. 130,000,000 shares each have been classified into the Aggressive Investors 2 and Blue Chip 35 Index Funds. 5,000,000 shares have been classified into the Ultra-Small Company Fund. 10,000,000 shares have been classified in the Micro-Cap Limited Fund. 100,000,000 shares each have been classified into the Ultra-Small Company Market, Omni Small-Cap Value, Omni Tax-Managed Small-Cap Value, Small-Cap Momentum, Small-Cap Growth, Small-Cap Value, Large-Cap Growth, and Large-Cap Value Funds. 50,000,000 shares have been classified into the Managed Volatility Fund. All shares outstanding currently represent Class N shares.
All of the Bridgeway Funds are no-load, diversified funds.
The Funds seek to provide long-term total return on capital, primarily through capital appreciation.
Bridgeway Capital Management, Inc. (the “Adviser”) is the investment adviser for all of the Bridgeway Funds.
2. Significant Accounting Policies:
The following summary of significant accounting policies, followed in the preparation of the financial statements of the Funds, are in conformity with accounting principles generally accepted in the United States of America (“GAAP”).
Securities, Options, Futures and Other Investments Valuation Other than options, portfolio securities that are principally traded on a national securities exchange are valued at their last sale price on the principal exchange on which they are traded prior to the close of the New York Stock Exchange (“NYSE”), on each day the NYSE is open for business. If there is no closing price on the NYSE, the portfolio security will be valued using a composite price, which is defined as the last price for the security on any exchange. Portfolio securities other than options that are principally traded on the National Association of Securities Dealers Automated Quotation System (“NASDAQ”) are valued at the NASDAQ Official Closing Price (“NOCP”). In the absence of recorded sales on their home exchange, or NOCP, in the case of NASDAQ traded securities, the security will be valued as follows: bid prices for long positions and ask prices for short positions. Other investments for which no sales are reported are valued at the latest bid price in accordance with the pricing policy established by the Board of Directors.
Investments in open-end registered investment companies and closed-end registered investment companies that do not trade on an exchange are valued at the end of day net asset value (“NAV”) per share.
Investments in closed-end registered investment companies that trade on an exchange are valued at the last sales price as of the close of the customary trading session on the exchange where the security is principally traded.
When market quotations are not readily available or when events occur that make established valuation methods unreliable, securities of the Funds may be valued at fair value as determined in good faith by or under the direction of the Board of Directors. The valuation assigned to fair valued securities for purposes of calculating the Funds’ NAV may differ from the security’s most recent closing market price and from the prices used by other mutual funds to calculate their NAVs.
| 36 | Semi-Annual Report | December 31, 2011 (Unaudited) | |
| NOTES TO FINANCIAL STATEMENTS (continued) | | |
| December 31, 2011 (Unaudited) |
The inputs and valuation techniques used to determine the value of a Fund’s investments are summarized into three levels as described in the hierarchy below:
— Level 1 — quoted prices in active markets for identical assets
Investments whose values are based on quoted market prices in active markets, and whose values are therefore classified as Level 1 prices, include active listed equity securities. The Funds do not adjust the quoted price for such investments, even in situations where the Funds hold a large position and a sale could reasonably impact the quoted price.
— Level 2 — other significant observable inputs (including quoted prices for similar securities, interest rates, prepayments speeds, credit risk, etc.)
Investments that trade in markets that are not considered to be active, but whose values are based on quoted market prices, dealer quotations or valuations provided by alternative pricing sources supported by observable inputs are classified as Level 2 prices. These generally include certain U.S. government and sovereign obligations, most government agency securities, investment-grade corporate bonds and less liquid listed equity securities. As investments whose values are classified as Level 2 prices include positions that are not traded in active markets and/or are subject to transfer restrictions, valuations may be adjusted to reflect illiquidity and/or non-transferability, which are generally based on available market information.
Money market fund investments consist of mutual funds which invest primarily in securities that are valued at amortized cost, a Level 2 investment. Therefore, the money market funds are classified as Level 2 investments.
— Level 3 — significant unobservable inputs (including a Fund’s own assumptions in determining the fair value of investments)
Investments whose values are classified as Level 3 prices have significant unobservable inputs, as they may trade infrequently or not at all. When observable prices are not available for these securities, the Funds use one or more valuation techniques for which sufficient and reliable data is available. The inputs used by the Funds in estimating the value of Level 3 prices may include the original transaction price, quoted prices for similar securities or assets in active markets, completed or pending third-party transactions in the underlying investment or comparable issuers, and changes in financial ratios or cash flows. Level 3 prices may also be adjusted to reflect illiquidity and/or non-transferability, with the amount of such discount estimated by the Funds in the absence of market information. Assumptions used by the Funds due to the lack of observable inputs may significantly impact the resulting value and therefore the Funds’ results of operations.
The inputs or methodology used for valuing investments are not necessarily an indication of the risk associated with investing in those investments. A summary of the inputs used to value the Funds’ investments as of December 31, 2011 is included with each Fund’s Schedule of Investments.
The Funds’ policy is to recognize transfers into, and transfers out of, each level of hierarchy as of the beginning of the reporting period. For the period ended December 31, 2011, there were no transfers between Level 1 and Level 2 for any of the Funds.
In May 2011, the Financial Accounting Standards Board (“FASB”) issued Accounting Standards Update (“ASU”) No. 2011-04 “Amendments to Achieve Common Fair Value Measurement and Disclosure Requirements in U.S. GAAP and International Financial Reporting Standards (“IFRSs”).” ASU No. 2011-04 includes common requirements for measurement of and disclosure about fair value between U.S. GAAP and IFRSs. ASU No. 2011-04 will require reporting entities to disclose quantitative information about the unobservable inputs used in the fair value measurements categorized within Level 3 of the fair value hierarchy. In addition, ASU No. 2011-04 will require reporting entities to make disclosures about amounts and reasons for all transfers in and out of Level 1 and Level 2 fair value measurements. The new and revised disclosures are effective for interim and annual reporting periods beginning after December 15, 2011. Management is currently evaluating the implications of ASU No. 2011-04, and its impact on the financial statements has not been determined.
Securities Lending Upon lending its securities to third parties, each Fund receives compensation in the form of fees. A Fund also continues to receive dividends on the securities loaned. The loans are secured by collateral at least equal to the fair value of the securities loaned plus accrued interest. Gain or loss in the fair value of the securities loaned that may occur during the
| www.bridgewayomni.com | 37 | |
| NOTES TO FINANCIAL STATEMENTS (continued) | | |
| December 31, 2011 (Unaudited) |
term of the loan will be for the account of a Fund. Each Fund has the right under the lending agreement to recover the securities from the borrower on demand. Additionally, a Fund does not have the right to sell or repledge collateral received in the form of securities unless the borrower goes into default. The risks to a Fund of securities lending are that the borrower may not provide additional collateral when required or return the securities when due.
As of December 31, 2011, the Funds had securities on loan and related collateral with values shown below:
| Bridgeway Fund | Securities on Loan Value | Value of Collateral | ||||||
Omni Small-Cap Value | $4,055,401 | $4,188,259 | ||||||
Omni Tax-Managed Small-Cap Value | 4,908,851 | 5,076,758 | ||||||
It is each Fund’s policy to obtain additional collateral from or return excess collateral to the borrower by the end of the next business day, following the valuation date of the securities loaned. Therefore, the value of the collateral held may be temporarily less than that required under the lending contract. As of December 31, 2011, the collateral consisted of an institutional money market fund.
Use of Estimates in Financial Statements In preparing financial statements in conformity with GAAP, management makes estimates and assumptions that affect the reported amounts of assets and liabilities at the date of the financial statements and the disclosure of contingent assets and liabilities at the date of the financial statements as well as the reported amounts of revenue and expenses during the reporting period. Actual results could differ from those estimates.
Risks and Uncertainties The Funds provide for various investment options, including stocks. Such investments are exposed to various risks, such as interest rate, market and credit risks. Due to the risks involved, it is at least reasonably possible that changes in risks in the near term would materially affect shareholders’ account values and the amounts reported in the financial statements.
Security Transactions, Investment Income and Expenses Security transactions are accounted for as of the trade date, the date the order to buy or sell is executed. Realized gains and losses are computed on the identified cost basis. Dividend income is recorded on the ex-dividend date, and interest income is recorded on the accrual basis from settlement date.
Bridgeway Funds’ expenses that are not series-specific are allocated to each series based upon its relative proportion of net assets to the Bridgeway Funds’ total net assets or other appropriate basis.
Distributions to Shareholders The Funds pay dividends from net investment income and distribute realized capital gains annually, usually in December.
Indemnification Under the Company’s organizational documents, the Funds’ officers, directors, employees and agents are indemnified against certain liabilities that may arise out of the performance of their duties to the Funds. Additionally, in the normal course of business, the Funds enter into contracts that contain a variety of indemnification clauses. The Funds’ maximum exposure under these arrangements is unknown as this would involve future claims that may be made against the Funds that have not yet occurred. However, the Funds have not had prior claims or losses pursuant to these contracts.
3. Management Fees, Other Related Party Transactions and Contingencies:
The Funds have entered into a management agreement with the Adviser. As compensation for the advisory services rendered, facilities furnished, and expenses borne by the Adviser, the Funds pay the Adviser a fee of 0.50% of the value of each Fund’s average daily net assets, computed daily and payable monthly.
Expense limitations: The Board of Directors and sole initial shareholder approved an expense limitation beginning on August 31, 2011 for the Omni Small-Cap Value Fund. The Board of Directors and sole initial shareholder approved an expense limitation beginning on December 31, 2010 for the Omni Tax-Managed Small-Cap Value Fund. The Adviser agrees to reimburse the Funds for operating expenses and management fees above the expense limitations, which are shown as a ratio of net expenses to average net assets, for each Fund, for the period ended December 31, 2011. Such expense limitations and total reimbursements for the period ended December 31, 2011, are shown in the following table:
| 38 | Semi-Annual Report | December 31, 2011 (Unaudited) | |
| NOTES TO FINANCIAL STATEMENTS (continued) | | |
| December 31, 2011 (Unaudited) |
| Bridgeway Fund | Expense Limitation | Total Waivers and Reimbursements for Period Ending 12/31/11 | ||
Omni Small-Cap Value* | 0.60% | $52,785 | ||
Omni Tax-Managed Small-Cap Value* | 0.60% | 77,307 | ||
| *The Funds are authorized to reimburse the Adviser for management fees previously waived and/or for expenses previously paid by the Adviser, provided, however, that any reimbursements must be paid at a date not more than three years after the fiscal year in which the Adviser waived the fees or reimbursed the expenses and the reimbursements do not cause the Funds to exceed the expense limitation in the agreement. | ||||
Other Waivers and Reimbursements: BNY Mellon Asset Servicing, the Funds’ accounting agent and transfer agent, at its discretion, voluntarily waived a portion of its accounting and transfer agent fees for the Omni Small-Cap Value Fund. For the period ended December 31, 2011, BNY Mellon Asset Servicing waived $9,766 in accounting fees and $3,000 in transfer agent fees for the Omni Small-Cap Value Fund.
Other Related Party Transactions: On occasion, the Bridgeway Funds will engage in inter-portfolio trades between funds when it is to the benefit of both parties. The Board of Directors reviews these trades quarterly. Inter-portfolio purchases and sales for the Funds during the period ended December 31, 2011 were as follows:
| Bridgeway Fund | Inter-portfolio Purchases | Inter-portfolio Sales | ||
Omni Small-Cap Value | $524,180 | $ - | ||
Omni Tax-Managed Small-Cap Value | 595,664 | - |
The Adviser entered into an Administrative Services Agreement with Bridgeway, pursuant to which the Adviser provides various administrative services to the Funds including, but not limited to: (i) supervising and managing various aspects of the Funds’ business and affairs; (ii) selecting, overseeing and/or coordinating activities with other service providers to the Funds; (iii) providing reports to the Board of Directors as requested from time to time; (iv) assisting and/or reviewing amendments and updates to the Funds’ registration statement and other filings with the Securities and Exchange Commission (“SEC”); (v) providing certain shareholder services; (vi) providing administrative support in connection with meetings of the Board of Directors; and (vii) providing certain record-keeping services. For its services to all of the Bridgeway Funds, the Adviser is paid an aggregate annual fee of $535,000 payable in equal monthly installments. During the period ended December 31, 2011, the allocation of this expense to the Omni Small-Cap Value and Omni Tax-Managed Small-Cap Value Funds was $8,496 and $11,361, respectively.
One director of Bridgeway, John Montgomery, is an owner and director of the Adviser. Another director of Bridgeway, Michael Mulcahy, is an executive and director of the Adviser. Under the 1940 Act definitions, each is considered to be an “affiliated person” of the Adviser and an “interested person” of the Adviser and of Bridgeway. Compensation for Mr. Montgomery and Mr. Mulcahy is borne by the Adviser rather than the Bridgeway Funds.
Board of Directors Compensation Independent Directors are paid an annual retainer of $14,000 with an additional retainer of $2,500 paid to the Independent Chairman of the Board and an additional retainer of $1,000 paid to the Nominating and Corporate Governance Committee Chair. Independent Directors are paid $6,000 per meeting for meeting fees. Such compensation is the total compensation from all Bridgeway Funds and is allocated among the Bridgeway Funds.
The Independent Directors receive this compensation in the form of shares of the Bridgeway Funds, credited to his or her account. Such Directors are reimbursed for any expenses incurred in attending meetings and conferences and expenses for subscriptions or printed materials. The amount of Directors’ fees attributable to each Fund is disclosed in the Statement of Operations.
| www.bridgewayomni.com | 39 | |
| NOTES TO FINANCIAL STATEMENTS (continued) | | |
| December 31, 2011 (Unaudited) |
4. Distribution and Shareholder Servicing Fees:
Foreside Fund Services, LLC acts as distributor of the Funds’ shares pursuant to a Distribution Agreement dated November 12, 2010. The Adviser pays all costs and expenses associated with distribution of the Funds’ shares pursuant to a protective plan adopted by shareholders pursuant to Rule 12b-1.
5. Purchases and Sales of Investment Securities:
Purchases and sales of investments, other than short-term securities, for each Fund for the period ended December 31, 2011 were as follows:
| Purchases | Sales | |||||||
| U.S. Government | Other | U.S. Government | Other | |||||
| ||||||||
Omni Small-Cap Value | $ - | $77,180,970 | $ - | $ 1,829,683 | ||||
Omni Tax-Managed Small-Cap Value | - | 57,949,877 | - | 13,226,769 | ||||
6. Federal Income Taxes
It is the Funds’ policy to continue to comply with the provisions of the Internal Revenue Code of 1986, as amended (“Internal Revenue Code”), applicable to regulated investment companies and distribute income to the extent necessary so that such Fund is not subject to federal income tax. Therefore, no federal income tax provision is required.
Unrealized Appreciation and Depreciation on Investments (Tax Basis) The amount of net unrealized appreciation/ depreciation and the cost of investment securities for tax purposes, including short-term securities at December 31, 2011, were as follows:
Omni Small-Cap Value | Omni Tax-Managed Small-Cap Value | |||||||
Gross appreciation (excess of value over tax cost) | $ 9,123,258 | $ 6,171,867 | ||||||
Gross depreciation (excess of tax cost over value) | (3,420,893 | ) | (6,655,169 | ) | ||||
Net unrealized appreciation (depreciation) | $ 5,702,365 | $ (483,302 | ) | |||||
Cost of investments for income tax purposes | $75,582,276 | $81,607,620 | ||||||
The differences between book and tax net unrealized appreciation (depreciation) are due to wash sale loss deferrals.
Classifications of Distributions Net investment income (loss) and net realized gain (loss) may differ for financial statement and tax purposes. The character of distributions made during the year from net investment income or net realized gains may differ from its ultimate characterization for federal income tax purposes.
The Omni Small-Cap Value Fund commenced operations on August 31, 2011 and the Omni Tax-Managed Small-Cap Value Fund commenced operations on December 31, 2010. There were no cash distributions paid during the period ended June 30, 2011.
Components of Accumulated Earnings (Deficit) As of June 30, 2011, the components of accumulated earnings (deficit) on a tax basis were:
| Omni Tax-Managed Small-Cap Value | ||||
Undistributed Net Investment Income | $ 54,379 | |||
Accumulated Net Realized Loss on Investments* | (20,954 | ) | ||
Net Unrealized Appreciation of Investments | 429,594 | |||
Total | $463,019 | |||
| * | Includes losses incurred from commencement, December 31, 2010, through June 30, 2011, which the Omni Tax-Managed Small-Cap Value Fund has |
| 40 | Semi-Annual Report | December 31, 2011 (Unaudited) | |
| NOTES TO FINANCIAL STATEMENTS (continued) | | |
| December 31, 2011 (Unaudited) |
| elected to defer to its fiscal year ending June 30, 2012. Post October Losses - Under current tax law, capital losses realized after October 31 of a Fund’s fiscal year may be deferred and treated as occurring on the first business day of the following fiscal year for tax purposes. The Omni Tax-Managed Small-Cap Value Fund has deferred post October losses of $20,954. |
Accounting for Uncertainty in Income Taxes sets forth a minimum threshold for financial statement recognition of the benefit of a tax position taken or expected to be taken in a tax return. Management has analyzed each Fund’s tax positions and has concluded that no provision for income tax is required in each Fund’s financial statements. The Funds are not aware of any tax position for which it is reasonably possible that the total amounts of unrecognized tax benefits will significantly change in the next twelve months.
7. Line of Credit
Bridgeway established a line of credit agreement (“Facility”) with The Bank of New York Mellon effective
November 5, 2010. The Facility is for temporary or emergency purposes, such as to provide liquidity for shareholder redemptions, and is cancellable by either party. Unless cancelled earlier, the Facility shall be held available until November 2, 2012. Advances under the Facility are limited to $10,000,000 in total for all Bridgeway Funds and advances to each Bridgeway Fund shall not exceed certain limits set forth in the credit agreement, including but not limited to, the maximum amount a Bridgeway Fund is permitted to borrow under the 1940 Act.
The Bridgeway Funds incur a commitment fee of 0.05% per annum on the unused portion of the Facility and interest expense to the extent of amounts borrowed under the Facility. Interest is based on the higher of (a) the Federal Funds rate, (b) the Overnight Eurodollar Rate, or (c) the One-month Eurodollar Rate, plus 1.25%. The commitment fees are payable quarterly in arrears and are allocated to all participating Bridgeway Funds. Interest expense is charged directly to a Bridgeway Fund based upon actual amounts borrowed by such Bridgeway Fund.
For the period ended December 31, 2011, borrowings by the Funds under this line of credit were as follows:
| Bridgeway Fund | Weighted Average Interest Rate | Weighted Average Loan Balance | Number of Days Outstanding | Interest Expense Incurred1 | Maximum Amount Borrowed During the Period | |||||
Omni Tax-Managed Small-Cap Value | 1.52% | $340,600 | 10 | $95 | $620,000 |
1Interest expense is included on the Statements of Operations in Miscellaneous expenses.
There were no outstanding borrowings by the Funds under this line of credit as of December 31, 2011.
7. Subsequent Events
Management has evaluated the impact of all subsequent events on the Funds and has determined that there were no subsequent events requiring recognition or disclosure in the financial statements.
| www.bridgewayomni.com | 41 | |
| OTHER INFORMATION | | |
| December 31, 2011 (unaudited) |
1. Proxy Voting
Fund policies and procedures used in determining how to vote proxies relating to the Funds’ securities and a summary of proxies voted by the Funds for the period ended June 30, 2011 are available without a charge, upon request, by contacting Bridgeway Funds at 1-800-661-3550 and on the SEC���s website at http://www.sec.gov. There were no proxies voted by the Omni Small-Cap Value Fund for the period ended June 30, 2011 since the Fund commenced operations on August 31, 2011.
2. Fund Holdings
The complete schedule of the Funds’ holdings for the second and fourth quarters of each fiscal year are contained in the Funds’ Semi-Annual and Annual shareholder reports, respectively.
The Bridgeway Funds file complete schedules of the Funds’ holdings with the SEC for the first and third quarters of each fiscal year on Form N-Q within 60 days after the end of the period. Copies of the Funds’ Form N-Q are available without charge, upon request, by contacting Bridgeway Funds at 1-800-661-3550 and on the SEC’s website at http://www.sec.gov. You may also review and copy Form N-Q at the SEC’s Public Reference Room in Washington, D.C. For more information about the operation of the Public Reference Room, please call 1-800-SEC-0330.
3. Approval of Investment Management Agreement For Omni Small-Cap Value Fund
The Board of Directors (“Board”), including a majority of the non-interested or independent Directors (hereinafter, “Directors”), met in person on May 13, 2011 (the “Meeting”) to consider, among other things, the creation of the Omni Small-Cap Value Fund (the “Fund”), and to consider whether to approve an investment management agreement (the “Advisory Agreement”) between Bridgeway Capital Management, Inc. (the “Adviser”) and the Fund.
In reaching its decision to approve the new Advisory Agreement for the Fund, the Board considered information provided specifically in relation to the approval of the Advisory Agreement for the Meeting including the following: (1) the proposed management fees and total expenses of the Fund as compared to a comparable group of funds (the “peer funds”); (2) the nature, extent and quality of services to be provided by the Adviser to the Fund, including investment advisory and administrative services to the Fund; (3) the costs of providing services to the Fund; (4) the extent to which economies of scale may be present and if so, whether they would be shared with the Fund’s shareholders; and (5) any “fall out” or ancillary benefits that may accrue to the Adviser as a result of the relationship with the Fund. In addition to evaluating, among other things, the written information provided by the Adviser, the Board also evaluated the answers to questions posed by the independent Directors to representatives of the Adviser at the Meeting. In considering the information and materials described above, the independent Directors received assistance from independent legal counsel.
Because the Fund is new, the Board could not consider comparative information regarding Fund performance or the level of profitability (or lack thereof) that the Adviser would receive for its investment management services to the Fund. The Board considered the Fund’s proposed investment objective, strategy and proposed performance benchmarks. The Board considered that the proposed management fee for the Fund is comparable to that of peer funds and the Fund’s projected total annual operating expenses, after taking into account waivers/reimbursements, also was projected to be comparable to that of peer funds. The Board also noted that the proposed management fee for the Fund is less than the management fee the Adviser plans to charge for managing a similar mandate for separate accounts. The Board also considered that the Adviser agreed to waive fees and reimburse expenses so that the total operating expenses do not exceed a cap for the Fund. Although the Fund does not have fee breakpoints in its management fee schedule, the Adviser indicated that the Fund was priced low in anticipation of future growth to be competitive with the largest peer funds. The Board also considered its satisfactory experience with the nature, extent and quality of the services the Adviser has provided to other funds in the complex and this experience supported approval of the Advisory Agreement with the Fund. In terms of potential “fall out” or ancillary benefits to the Adviser due to its position as manager of the Fund, the Board noted that the Adviser continues to use no soft dollars and its fees for administrative services to the Fund are structured to approximate an at-cost relationship.
Based on all of the information presented, the Board, including a majority of its independent Directors, approved the Advisory Agreement for the Fund and determined that the fees to be charged under the Advisory Agreement are reasonable in relation
| 42 | Semi-Annual Report | December 31, 2011 (Unaudited) | |
| OTHER INFORMATION (continued) | | |
| December 31, 2011 (unaudited) |
to the services to be provided under the Advisory Agreement. In view of the broad scope and variety of factors and information, the Directors did not identify any single factor as being of paramount importance in reaching their conclusions and determination to approve the Advisory Agreement for the Fund. Rather, the approval determination was made on the basis of each Director’s business judgment after consideration of all of the factors taken in their entirety.
| www.bridgewayomni.com | 43 | |
| DISCLOSURE OF FUND EXPENSES | | |
| December 31, 2011 (unaudited) |
As a shareholder of a Fund, you will incur no transaction costs from such Fund, including sales charges (loads) on purchases, on reinvested dividends, or on other distributions. There are no exchange fees. However, as a shareholder of a Fund, you will incur ongoing costs, including management fees and other Fund expenses. The following examples are intended to help you understand your ongoing costs (in dollars) of investing in a Fund and to compare these costs with ongoing costs of investing in other mutual funds. The examples are based on an investment of $1,000 invested on
July 1, 2011 and held until December 31, 2011.
Actual Expenses. The first line of the table below provides information about actual account values and actual expenses. You may use the information in this line, together with the amount you invested, to estimate the expenses that you paid over the period. Simply divide your account value by $1,000 (for example, an $8,600 account value divided by $1,000 = 8.6), then multiply the result by the number in the first line under the heading “Expenses Paid During Period” to estimate the expenses you paid on your account during the period.
Hypothetical Example for Comparison Purposes. The second line of the table below provides information about hypothetical account values and hypothetical expenses based on the Fund’s actual expense ratio and an assumed rate of return of 5% per year before expenses, which is not the Fund’s actual return. The hypothetical account values and expenses may not be used to estimate the actual ending account balance or expenses you paid for the period. You may use this information to compare the ongoing costs of investing in a Fund and other mutual funds. To do so, compare this 5% hypothetical example with the 5% hypothetical examples that appear in the shareholder reports of other funds.
The expenses shown in the table are meant to highlight ongoing Fund costs only. Therefore, the second line of the table is useful in comparing ongoing costs only and will not help you determine the relative total costs of owning different funds, because other funds may also have transaction costs, such as sales charges, redemption fees or exchange fees.
| Beginning Account Value at 7/1/11 | Ending Account Value at 12/31/11 | Expense Ratio | Expenses Paid During Period* 7/1/11 - 12/31/11 | |||||
Bridgeway Omni Small-Cap Value** | ||||||||
Actual Fund Return | $1,000.00 | $1,038.90 | 0.60% | $2.02 | ||||
Hypothetical Fund Return | $1,000.00 | $1,022.00 | 0.60% | $3.03 | ||||
Bridgeway Omni Tax-Managed Small-Cap Value | ||||||||
Actual Fund Return | $1,000.00 | $885.70 | 0.60% | $2.83 | ||||
Hypothetical Fund Return | $1,000.00 | $1,022.00 | 0.60% | $3.03 | ||||
| * | Expenses are equal to the average account value times the Fund’s annualized expense ratio multiplied by the number of days in the most recent half-year divided by the number of days in the fiscal year. |
| ** | Commenced operations on August 31, 2011. For purposes of the “Hypothetical 5% Return”, the annualized expense ratio was applied to the period July 1, 2011 through December 31, 2011. The “Actual Fund Return” information reflects the performance and expenses since inception. |
| 44 | Semi-Annual Report | December 31, 2011 (Unaudited) | |
THIS PAGE INTENTIONALLY LEFT BLANK
THIS PAGE INTENTIONALLY LEFT BLANK

| Item 2. | Code of Ethics. |
Not applicable.
| Item 3. | Audit Committee Financial Expert. |
Not applicable.
| Item 4. | Principal Accountant Fees and Services. |
Not applicable.
| Item 5. | Audit Committee of Listed registrants. |
Not applicable.
| Item 6. | Investments. |
| (a) | Schedule of Investments in securities of unaffiliated issuers as of the close of the reporting period is included as part of the report to shareholders filed under Item 1 of this form. |
| (b) | The Registrant made no divestments of securities in accordance with section 13(c) of the Investment Company Act of 1940. |
| Item 7. | Disclosure of Proxy Voting Policies and Procedures for Closed-End Management Investment Companies. |
Not applicable.
| Item 8. | Portfolio Managers of Closed-End Management Investment Companies. |
Not applicable.
| Item 9. | Purchases of Equity Securities by Closed-End Management Investment Company and Affiliated Purchasers. |
Not applicable.
| Item 10. | Submission of Matters to a Vote of Security Holders. |
There have been no material changes to the procedures by which the shareholders may recommend nominees to the Registrant’s Board of Directors, where those changes were implemented after the registrant last provided disclosure in response to the requirements of Item 407(c)(2)(iv) of Regulation S-K (17 CFR 229.407) (as required by Item 22(b)(15) of Schedule 14A (17 CFR 240.14a-101)), or this Item.
| Item 11. | Controls and Procedures. |
| (a) | The registrant’s principal executive officer and principal financial officer, or persons performing similar functions, have concluded that the registrant’s disclosure controls and procedures (as defined in Rule 30a-3(c) under the Investment Company Act of 1940, as amended (the “1940 Act”) (17 CFR 270.30a-3(c))) are effectively designed, as of a date within 90 days of the filing date of the report that includes the disclosure required by this paragraph, based on their evaluation of these controls and procedures required by Rule 30a-3(b) under the 1940 Act (17 CFR 270.30a-3(b)) and Rules 13a-15(b) or 15d-15(b) under the Securities Exchange Act of 1934, as amended (17 CFR 240.13a-15(b) or 240.15d-15(b)). |
| (b) | There were no changes in the registrant’s internal control over financial reporting (as defined in Rule 30a-3(d) under the Act (17 CFR 270.30a-3(d)) that occurred during the second fiscal quarter of the period covered by this report that have materially affected or are reasonably likely to materially affect, the registrant’s internal control over financial reporting. |
| Item 12. | Exhibits. |
| (a)(1) | Not applicable |
| (a)(2) | Certifications pursuant to Rule 30a-2(a) under the 1940 Act and Section 302 of the Sarbanes-Oxley Act of 2002 are attached hereto. |
| (a)(3) | Not applicable. |
| (b) | Certifications pursuant to Rule 30a-2(b) under the 1940 Act and Section 906 of the Sarbanes- Oxley Act of 2002 are attached hereto. |
SIGNATURES
Pursuant to the requirements of the Securities Exchange Act of 1934 and the Investment Company Act of 1940, the registrant has duly caused this report to be signed on its behalf by the undersigned, thereunto duly authorized.
(registrant) | Bridgeway Funds, Inc. | |||
By (Signature and Title)* | /s/ Michael D. Mulcahy | |||
Michael D. Mulcahy, President and Principal Executive Officer | ||||
(principal executive officer) | ||||
Date March 5, 2012 | ||||
Pursuant to the requirements of the Securities Exchange Act of 1934 and the Investment Company Act of 1940, this report has been signed below by the following persons on behalf of the registrant and in the capacities and on the dates indicated.
By (Signature and Title)* | /s/ Michael D. Mulcahy | |||
| Michael D. Mulcahy, President and Principal Executive Officer | ||||
(principal executive officer) | ||||
Date March 5, 2012 | ||||
By (Signature and Title)* | /s/ Linda G. Giuffré | |||
| Linda G. Giuffré, Treasurer and Principal Financial Officer | ||||
(principal financial officer) | ||||
Date March 5, 2012 | ||||
| * | Print the name and title of each signing officer under his or her signature. |