MASSMUTUAL SELECT FUNDS
This Prospectus describes the following Funds:
| | |
Fixed Income | | Sub-Advised by: |
| MassMutual Select Strategic Bond Fund | | Western Asset Management Company/Western Asset Management Company Limited |
| |
Large Cap Value | | |
| MassMutual Select Diversified Value Fund | | AllianceBernstein L.P. |
| MassMutual Select Fundamental Value Fund | | Wellington Management Company, LLP |
| MassMutual Select Value Equity Fund | | Fidelity Management & Research Company |
| MassMutual Select Large Cap Value Fund | | Davis Selected Advisers, L.P. |
| |
Large Cap Core | | |
| MassMutual Select Indexed Equity Fund | | Northern Trust Investments, N.A. |
| MassMutual Select Core Opportunities Fund | | Victory Capital Management Inc. |
| |
Large Cap Growth | | |
| MassMutual Select Blue Chip Growth Fund | | T. Rowe Price Associates, Inc. |
| MassMutual Select Large Cap Growth Fund | | AllianceBernstein L.P. |
| MassMutual Select Growth Equity Fund | | Grantham, Mayo, Van Otterloo & Co. LLC |
| MassMutual Select Aggressive Growth Fund | | Sands Capital Management, LLC/Delaware Management Company |
| MassMutual Select OTC 100 Fund | | Northern Trust Investments, N.A. |
| |
Mid/Small Cap Value | | |
| MassMutual Select Focused Value Fund | | Harris Associates L.P./Cooke & Bieler, L.P. |
| MassMutual Select Mid-Cap Value Fund | | Cooke & Bieler, L.P. |
| MassMutual Select Small Cap Value Equity Fund | | SSgA Funds Management, Inc. |
| MassMutual Select Small Company Value Fund | | Clover Capital Management, Inc./T. Rowe Price Associates, Inc./EARNEST Partners, LLC |
| |
Small Cap Core | | |
| MassMutual Select Small Cap Core Equity Fund | | Goldman Sachs Asset Management, L.P. |
| |
Mid/Small Cap Growth | | |
| MassMutual Select Mid Cap Growth Equity Fund | | Navellier & Associates, Inc. |
| MassMutual Select Mid Cap Growth Equity II Fund | | T. Rowe Price Associates, Inc. |
| MassMutual Select Small Cap Growth Equity Fund | | Waddell & Reed Investment Management Company/ Wellington Management Company, LLP |
| MassMutual Select Small Company Growth Fund | | Mazama Capital Management, Inc./Eagle Asset Management, Inc |
| MassMutual Select Emerging Growth Fund | | Delaware Management Company/Insight Capital Research & Management, Inc. |
| |
International/Global | | |
| MassMutual Select Diversified International Fund | | AllianceBernstein L.P. |
| MassMutual Select Overseas Fund | | Harris Associates L.P./Massachusetts Financial Services Company |
| |
Lifestyle/Asset Allocation | | |
| MassMutual Select Strategic Balanced Fund | | ClearBridge Advisors, LLC/Western Asset Management Company/Western Asset Management Company Limited |
| MassMutual Select Destination Retirement Income Fund | | |
| MassMutual Select Destination Retirement 2010 Fund | | |
| MassMutual Select Destination Retirement 2020 Fund | | |
| MassMutual Select Destination Retirement 2030 Fund | | |
| MassMutual Select Destination Retirement 2040 Fund | | |
The Securities and Exchange Commission has not approved or disapproved these securities or passed upon the adequacy of this Prospectus. Any statement to the contrary is a crime.
PROSPECTUS
April 2, 2007
– 1 –
| | |
| Table Of Contents | | Page |
| |
Summary Information | | 4 |
About the Funds | | |
MassMutual Select Strategic Bond Fund | | 6 |
MassMutual Select Strategic Balanced Fund | | 10 |
MassMutual Select Diversified Value Fund | | 14 |
MassMutual Select Fundamental Value Fund | | 16 |
MassMutual Select Value Equity Fund | | 20 |
MassMutual Select Large Cap Value Fund | | 22 |
MassMutual Select Indexed Equity Fund | | 26 |
MassMutual Select Core Opportunities Fund | | 28 |
MassMutual Select Blue Chip Growth Fund | | 30 |
MassMutual Select Large Cap Growth Fund | | 34 |
MassMutual Select Growth Equity Fund | | 38 |
MassMutual Select Aggressive Growth Fund | | 42 |
MassMutual Select OTC 100 Fund | | 46 |
MassMutual Select Focused Value Fund | | 48 |
MassMutual Select Mid-Cap Value Fund | | 52 |
MassMutual Select Small Cap Value Equity Fund | | 54 |
MassMutual Select Small Company Value Fund | | 56 |
MassMutual Select Small Cap Core Equity Fund | | 60 |
MassMutual Select Mid Cap Growth Equity Fund | | 62 |
MassMutual Select Mid Cap Growth Equity II Fund | | 66 |
MassMutual Select Small Cap Growth Equity Fund | | 70 |
MassMutual Select Small Company Growth Fund | | 74 |
MassMutual Select Emerging Growth Fund | | 78 |
MassMutual Select Diversified International Fund | | 82 |
MassMutual Select Overseas Fund | | 86 |
MassMutual Select Destination Retirement Funds | | 90 |
MassMutual Select Destination Retirement Income Fund | | 90 |
MassMutual Select Destination Retirement 2010 Fund | | 90 |
MassMutual Select Destination Retirement 2020 Fund | | 90 |
MassMutual Select Destination Retirement 2030 Fund | | 90 |
MassMutual Select Destination Retirement 2040 Fund | | 91 |
Summary of Principal Risks | | 100 |
About the Investment Adviser and Sub-Advisers | | |
Massachusetts Mutual Life Insurance Company | | 107 |
AllianceBernstein L.P. | | 107 |
ClearBridge Advisors, LLC | | 109 |
Clover Capital Management, Inc. | | 109 |
Cooke & Bieler, L.P. | | 110 |
Davis Selected Advisers, L.P. | | 111 |
Delaware Management Company | | 111 |
Eagle Asset Management, Inc. | | 113 |
EARNEST Partners, LLC | | 113 |
Fidelity Management & Research Company | | 113 |
Goldman Sachs Asset Management, L.P. | | 113 |
Grantham, Mayo, Van Otterloo & Co. LLC | | 114 |
Harris Associates L.P. | | 114 |
Insight Capital Research & Management, Inc. | | 115 |
Massachusetts Financial Services Company | | 115 |
Mazama Capital Management, Inc. | | 115 |
Navellier & Associates, Inc. | | 116 |
Northern Trust Investments, N.A. | | 116 |
Sands Capital Management, LLC | | 116 |
SSgA Funds Management, Inc. | | 117 |
T. Rowe Price Associates, Inc. | | 117 |
– 2 –
– 3 –
Summary Information
MassMutual Select Funds (the “Funds” or the “Trust”) provides a broad range of investment choices across the risk/return spectrum. The summary pages that follow describe each Fund’s:
| · | Principal Investment Strategies and Risks. A “Summary of Principal Risks” of investing in the Funds begins on page 100. |
| · | Investment return over the past ten years, or since inception if the Fund is less than ten years old. |
| · | Average annual total returns for the last one-, five- and ten-year periods (or, shorter periods for newer Funds) and how the Fund’s performance compares to that of a comparable broad-based index. |
A description of the Trust’s policies and procedures with respect to the disclosure of each Fund’s portfolio securities is available in the Funds’ Statement of Additional Information.
Past Performance is not an indication of future performance. There is no assurance that a Fund’s investment objective will be achieved, and you can lose money by investing in the Funds.
Important Notes about performance information for the Funds.
Where indicated, average annual total returns for Class A, Class L and Class Y shares of a Fund are based on the performance of Class S Shares, adjusted for class specific expenses, and average annual total returns for Class N shares of a Fund is based on the performance of Class A Shares, adjusted for class specific expenses.
Performance information provided for some of the Funds is based on either a composite of all portfolios managed by the Fund’s sub-adviser, or on a mutual fund managed by the Fund’s sub-adviser, with investment objectives, policies and investment strategies substantially similar to those of the Funds and without material client-imposed restrictions, and is provided solely to illustrate the sub-adviser’s performance in managing such a portfolio. In such cases, the performance provided does not show the particular Fund’s performance. For the composites, some of these portfolios are mutual funds registered with the Securities and Exchange Commission (“SEC”) and some are private accounts. The performance provided reflects the sub-adviser’s composite or mutual fund performance, adjusted for estimated expenses of each class of the relevant Fund. The investment returns assume the reinvestment of dividends and capital gains distributions. The performance provided does not reflect fees that may be paid by investors for administrative services or group annuity contract charges. The composites of portfolios were not subject to all of the investment restrictions to which the Funds will be subject, including restrictions imposed by the Investment Company Act of 1940 and the Internal Revenue Code of 1986, each as amended. No assurance can be given that the Funds’ performance would not have been lower had it been in operation during the periods for which composite or mutual fund performance is provided. The Funds’ performance may have differed due to factors such as differences in cash flows into and out of the Funds, differences in fees and expenses, and differences in portfolio size and investments. Prior performance of the sub-advisers is not indicative of future rates of return and is no indication of future performance of the Funds.
In all cases, investment returns assume the reinvestment of dividends and capital gains distributions. Performance shown does not reflect fees that may be paid by investors for administrative services or group annuity contract charges.
– 4 –
Important Note about Fees and Expenses.
As an investor, you pay certain fees and expenses in connection with your investment. These fees and expenses will vary depending on the Fund in which you invest and the class of shares that you purchase. The fee tables shown on the following pages under “Expense Information” are meant to assist you in understanding these fees and expenses. Each fee table shows, in addition to any shareholder fees, a Fund’s “Total Annual Fund Operating Expenses” and, in some cases, “Net Fund Expenses.” These costs are deducted from a Fund’s assets, which means you pay them indirectly.
Important Information about the Focused Value Fund
Massachusetts Mutual Life Insurance Company (“MassMutual”) will gradually change the allocation of assets between the Focused Value Fund’s two sub-advisers, Harris Associates L.P. (“Harris”) and Cooke & Bieler, L.P. (“Cooke & Bieler”), with the ultimate goal of removing Cooke & Bieler as co-Sub-Adviser to the Fund. This action is intended to bring the Fund back to its original roots as a concentrated portfolio of securities that span the stock capitalization range, managed solely by Harris. While the investment objective of the Fund will not change, the removal of Cooke & Bieler may increase the volatility of the Fund because the Fund will ultimately hold fewer securities. Neither the Management Fees nor the Total Fund Expenses are expected to change due to this sub-adviser change.
– 5 –
MassMutual Select Strategic Bond Fund
Investment Objective
This Fund seeks a superior total rate of return by investing in fixed income instruments.
Principal Investment Strategies and Risks
The Fund normally invests at least 80% of its net assets in U.S. dollar-denominated fixed income securities and other debt instruments of domestic and foreign entities, including corporate bonds, securities issued or guaranteed by the U.S. government, its agencies or instrumentalities, mortgage-backed securities and money market instruments. The Fund may invest up to 20% of its total assets in non-U.S. dollar-denominated securities.
The Fund’s Sub-Adviser, Western Asset Management Company’s (“Western Asset”) opportunistic approach seeks to capitalize on inefficiencies in fixed income markets to add incremental value to the Fund’s portfolio. Western Asset places significant emphasis on risk management since the general objective is to exceed benchmark returns while approximating benchmark risk. When making investment decisions, Western Asset focuses on such critical areas as sector allocation, issue selection, duration weighting and term structure. Western Asset Management Company Limited (“WAML”), an affiliate of Western Asset, has sub-advisory responsibility for Western Asset’s non-U.S. dollar denominated investments. Western Asset will determine the portion of the Fund’s assets to be allocated to non-U.S. dollar denominated securities from time to time. WAML will select the foreign country and currency composition based on its evaluation of relative interest rates, inflation rates, exchange rates, monetary and fiscal policies, trade and current account balances and any other specific factors WAML believes relevant.
The Fund emphasizes diversification, the use of multiple strategies and identification of long-term trends. The three key factors that determine the allocation decisions for the Fund are: the construction of an outlook for fundamental economic activity, the review of historical yield spreads or corporate debt versus Treasuries and the evaluation of changes in credit quality and its impact on prices.
The Fund’s target average modified duration is expected to range within 30% of the duration of the domestic bond market as a whole. “Duration” refers to the range within which the average modified duration of a portfolio is expected to fluctuate. Modified duration measures the expected sensitivity of market price to changes in interest rates, taking into account the effects of structural complexities (for example, some bonds can be prepaid by the issuer).
The Principal Risks of investing in the Fund are Market Risk, Credit Risk, Management Risk, Prepayment Risk, Liquidity Risk, Derivative Risk, Foreign Investment Risk, Emerging Markets Risk, Currency Risk, Leveraging Risk and Portfolio Turnover Risk.
These Risks are described beginning on page 100.
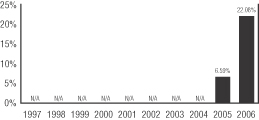
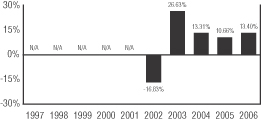
Annual Performance(1)
The bar chart shows the risks of investing in the Fund by showing changes in the Fund’s performance from year to year. Sales charges and taxes are not included in the calculations of returns in this bar chart. If those charges and taxes were included, the returns would be lower than those shown.
Class S Shares
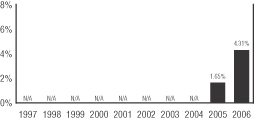
During the period shown above, the highest quarterly return for the Fund was 4.30% for the quarter ended September 30, 2006 and the lowest quarterly return was -0.90% for the quarter ended March 31, 2006.
Average Annual Total Returns(1)
(for the periods ended December 31, 2006)
The table shows the risk of investing in the Fund by comparing the Fund’s returns with a broad measure of market performance over different time periods.
| | | | | |
| | | One
Year | | Since
Inception
(12/31/04) |
Return Before Taxes – Class S | | | 4.31% | | 2.97% |
Return After Taxes on Distributions – Class S | | | 2.91% | | 1.97% |
Return After Taxes on Distributions and Sale of Fund Shares – Class S | | | 2.81% | | 1.95% |
Return Before Taxes – Class Y | | | 4.38% | | 2.96% |
Return Before Taxes – Class L | | | 4.31% | | 2.93% |
Return Before Taxes – Class A+ | | - | 0.95% | | 0.20% |
Return Before Taxes – Class N+ | | | 2.73% | | 2.35% |
| | | | | | |
Lehman Brothers® Aggregate Bond Index^ | | | 4.33% | | 3.48% |
(1) Performance shown does not reflect fees that may be paid by investors for administrative services or group annuity contract charges.
+ Performance for Class A and Class N shares of the Fund reflects any applicable sales charge.
^ The Lehman Brothers® Aggregate Bond Index is an unmanaged index of fixed rate investment grade securities with at least one year to maturity combining the Lehman Brothers Government/Credit Index and the Lehman Brothers Mortgage-Backed Securities Index. The Index does not incur expenses or reflect any deduction for taxes and cannot be purchased directly by investors.
After-tax returns are calculated using the historical highest individual federal marginal income tax rates and do not reflect the impact of state and local taxes.
Actual after-tax returns depend on an investor’s tax situation and may differ from those shown, and after-tax returns shown are not relevant to investors who hold their Fund shares through tax-deferred arrangements, such as 401(k) plans or individual retirement accounts.
After-tax returns are shown for only Class S and after-tax returns for other classes will vary.
– 6 –
Expense Information
| | | | | | | | | | | | | |
| | | Class S | | Class Y | | Class L | | | Class A | | | Class N | |
Shareholder Fees
(fees paid directly from your investment) | | | | | | | | | | | | | |
Maximum Sales Charge (Load) on purchases (as a % of offering price) | | None | | None | | None | | | 4.75% | | | None | |
Maximum Deferred Sales Charge (Load) (as a % of the lower of the original offering price or redemption proceeds) | | None | | None | | None | | | None | (1) | | 1.00% | (2) |
| Annual Fund Operating Expenses (expenses that are deducted from Fund assets) (% of average net assets) | | | | | | | | | | | | | |
Management Fees | | .55% | | .55% | | .55% | | | .55% | | | .55% | |
Distribution and Service (Rule 12b-1) Fees | | None | | None | | None | | | .25% | | | .50% | |
Other Expenses(3) | | .10% | | .16% | | .31% | | | .31% | | | .36% | |
| Total Annual Fund Operating Expenses(4) | | .65% | | .71% | | .86% | | | 1.11% | | | 1.41% | |
| | | | | | | | | | | | | |
Less Expense Reimbursement | | — | | — | | (.11% | ) | | (.11% | ) | | (.11% | ) |
| Net Fund Expenses(5)(6) | | .65% | | .71% | | .75% | | | 1.00% | | | 1.30% | |
Examples
These examples are intended to help you compare the cost of investing in the Fund with the cost of investing in other mutual funds. The examples assume that you invest $10,000 in each share class of the Fund for the time periods indicated and then redeem all of your shares at the end of those periods. For Class A shares, the examples include the initial sales charge. The examples also assume that your investment earns a 5% return each year and that the Fund’s operating expenses remain the same. Although your actual costs may be higher or lower, based on these assumptions your costs would be:
| | | | | | | | | | | | |
| | | 1 Year | | 3 Years | | 5 Years | | 10 Years |
Class S | | $ | 66 | | $ | 208 | | $ | 362 | | $ | 810 |
Class Y | | $ | 73 | | $ | 227 | | $ | 395 | | $ | 883 |
Class L | | $ | 77 | | $ | 263 | | $ | 466 | | $ | 1,051 |
Class A | | $ | 572 | | $ | 801 | | $ | 1,047 | | $ | 1,753 |
Class N | | $ | 236 | | $ | 435 | | $ | 761 | | $ | 1,681 |
Except for Class N shares, the figures shown above would be the same whether you sold your shares at the end of a period or kept them. For Class N shares, you would pay the following expenses if you did not redeem your shares:
| | | | | | | | | | | | |
| | | 1 Year | | 3 Years | | 5 Years | | 10 Years |
Class N | | $ | 132 | | $ | 435 | | $ | 761 | | $ | 1,681 |
| (1) | | A contingent deferred sales charge may apply to shares redeemed within 18 months of purchase from initial investments of $1 million or more. |
| (2) | | Applies to shares redeemed within 18 months of purchase. |
| (3) | | Other Expenses include Acquired Fund fees and expenses, which represent approximate expenses borne indirectly by the Fund in its most recent fiscal year through investments in other pooled investment vehicles. The amount of Acquired Fund fees and expenses may change in the coming year due to a number of factors including, among others, a change in allocation of the Fund’s investments among other pooled investment vehicles. |
| (4) | | Because Total Annual Fund Operating Expenses include Acquired Fund fees and expenses, they may not correspond to the ratios of expenses to average daily net assets shown in the “Financial Highlights” tables in this prospectus, which reflect the operating expenses of the Fund and do not include Acquired Fund fees and expenses. |
| (5) | | The expenses in the above table reflect a written agreement by MassMutual to cap the fees and expenses of the Fund (other than extraordinary litigation and legal expenses, or other non-recurring or unusual expenses), excluding Acquired Fund fees and expenses, through March 31, 2008 to the extent that Net Fund Expenses would otherwise exceed .70%, .75%, .75%, 1.00% and 1.30% for classes S, Y, L, A and N, respectively. The agreement cannot be terminated unilaterally by MassMutual. |
| (6) | | Employee benefit plans which invest in the Fund through MassMutual separate investment accounts may pay additional charges under their group annuity contract or services agreement. Investors who purchase shares directly from the Fund may also be subject to charges imposed in their administrative services or other agreement with MassMutual or MassMutual affiliate. None of these charges are deducted from Fund assets. |
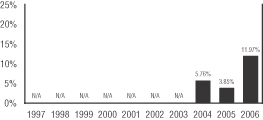
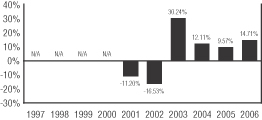
Western Asset Prior Performance for
Similar Accounts*
The bar chart illustrates the variability of returns achieved by Western Asset for all accounts with investment objectives, policies and investment strategies similar to that of the Fund. The composite performance does not represent the historical performance of the Fund and should not be interpreted as being indicative of future performance of the Fund.
During the periods shown above, the highest quarterly return was 4.40% for the quarter ended June 30, 2003 and the lowest was -2.18% for the quarter ended June 30, 2004.
– 7 –
Western Asset Average Annual Total Returns for
Similar Accounts*
(for the periods ended December 31, 2006)
The table compares Western Asset’s investment results for all accounts with investment objectives, policies and investment strategies similar to that of the Fund to an index measuring the broad market over different time periods.
| | | | | | | |
| | | One Year | | Five Years | | Ten Years |
Western Asset Composite | | | | | | | |
Class S* | | | 5.20% | | 6.42% | | 7.14% |
Class Y* | | | 5.15% | | 6.37% | | 7.09% |
Class L* | | | 5.14% | | 6.37% | | 7.09% |
Class A* | | - | 0.09% | | 5.09% | | 6.32% |
Class N* | | | 3.59% | | 5.82% | | 6.54% |
| | | | | | | | |
Lehman Brothers Aggregate
Bond Index^ | | | 4.33% | | 5.06% | | 6.24% |
* Western Asset’s Similar Account performance is a composite of all portfolios managed by Western Asset with substantially similar investment objectives, policies and investment strategies as the Fund, and without significant client-imposed restrictions, adjusted to reflect the fees and expenses of each of the Fund’s share classes, including sales loads. The bar chart is based on Class S expenses. The composite performance does not represent the historical performance of the MassMutual Select Strategic Bond Fund and should not be interpreted as being indicative of the future performance of the Fund. For additional information, please refer to “Investment Performance” in this Prospectus. Performance shown does not reflect fees that may be paid by investors for administrative services or group annuity contract charges.
^ The Lehman Brothers Aggregate Bond Index is an unmanaged index of fixed rate investment grade securities with at least one year to maturity combining the Lehman Brothers Government/Credit Index and the Lehman Brothers Mortgage-Backed Securities Index. The Index does not incur expenses or reflect any deduction for taxes and cannot be purchased directly by investors.
– 8 –
[THIS PAGE INTENTIONALLY LEFT BLANK]
MassMutual Select Strategic Balanced Fund
Investment Objective
This Fund seeks long-term capital growth, consistent with preservation of capital and balanced by current income.
Principal Investment Strategies and Risks
To obtain its objective, the Fund takes a multi-managed approach whereby two Sub-Advisers independently manage their own portion of the Fund’s assets. ClearBridge Advisors, LLC (“ClearBridge”) manages the equity component and Western Asset Management Company (“Western Asset”) manages the fixed income component.
The equity component will invest primarily in common stocks and common stock equivalents, such as preferred stocks and securities convertible into common stocks, of companies that ClearBridge believes are undervalued in the marketplace. While ClearBridge selects investments primarily for their capital appreciation potential, secondary consideration is given to a company’s dividend record and the potential for an improved dividend return. The equity component generally invests in securities of large, well-known companies but may also invest a significant portion of its assets in securities of small to medium-sized companies when ClearBridge believes smaller companies offer more attractive value opportunities.
The fixed income component will invest in a wide variety of investment-grade fixed-income sectors, including government, corporate, mortgage-backed, asset-backed, and cash equivalents, in both U.S. dollars and local currencies. It also allows for opportunistic use of non-dollar, high-yield, and emerging market securities to enhance portfolio returns and lower volatility. Western Asset Management Company Limited (“WAML”), an affiliate of Western Asset, has sub-advisory responsibility for Western Asset’s non-U.S. dollar denominated investments. Western Asset will determine the portion of the Fund’s assets to be allocated to non-U.S. dollar denominated securities from time to time. WAML will select the foreign country and currency composition based on its evaluation of relative interest rates, inflation rates, exchange rates, monetary and fiscal policies, trade and current account balances and any other specific factors WAML believes relevant.
The Fund’s target allocation is 60% equity securities and 40% fixed income securities but may fluctuate based on cash-flow activity or market performance. Additionally, the Fund’s Adviser may change the allocation of the Fund’s assets between the Fund’s Sub-Advisers on a basis determined by the Fund’s Adviser to be in the best interest of shareholders. In unusual circumstances the Fund may, for temporary defensive purposes, invest up to 100% of its total assets in money market instruments.
The Principal Risks of investing in the Fund are Market Risk, Credit Risk, Management Risk, Prepayment Risk, Liquidity Risk, Derivative Risk, Foreign Investment Risk, Emerging Markets Risk, Currency Risk, Smaller Company Risk, Leveraging Risk and Portfolio Turnover Risk.
These Risks are described beginning on page 100.
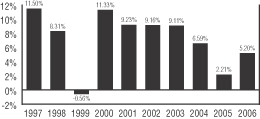
Annual Performance(1)
The bar chart shows the risks of investing in the Fund by showing changes in the Fund’s performance from year to year. Sales charges and taxes are not included in the calculations of returns in this bar chart. If those charges and taxes were included, the returns would be lower than those shown.
Class S Shares
During the periods shown above, the highest quarterly return for the Fund was 5.40% for the quarter ended December 31, 2006 and the lowest quarterly return was -2.19% for the quarter ended March 31, 2005.
Average Annual Total Returns(1)
(for the periods ended December 31, 2006)
The table shows the risk of investing in the Fund by comparing the Fund’s returns with a broad measure of market performance over different time periods.
| | | | |
| | | One
Year | | Since Inception (12/31/03) |
Return Before Taxes – Class S | | 11.97% | | 7.13% |
Return After Taxes on Distributions – Class S | | 11.14% | | 6.57% |
Return After Taxes on Distributions and Sale of Fund Shares – Class S | | 8.26% | | 5.91% |
Return Before Taxes – Class Y | | 11.90% | | 7.07% |
Return Before Taxes – Class L | | 11.73% | | 6.93% |
Return Before Taxes – Class A+ | | 5.13% | | 4.59% |
Return Before Taxes – Class N+ | | 10.21% | | 6.35% |
| | | | | |
Russell 3000® Index^ | | 15.72% | | 11.19% |
Lipper Balanced Fund Index^^ | | 11.60% | | 8.59% |
Lehman Brothers® Aggregate Bond Index^^^ | | 4.33% | | 3.73% |
– 10 –
(1) Performance shown does not reflect fees that may be paid by investors for administrative services or group annuity contract charges.
+ Performance for Class A and Class N shares of the Fund reflects any applicable sales charge.
^ The Russell 3000® Index measures the performance of the 3,000 largest U.S. companies based on total market capitalization. The Index does not incur expenses or reflect any deduction for taxes and cannot be purchased directly by investors.
^^ The Lipper Balanced Fund Index is an unmanaged, equally weighted index of the 30 largest mutual funds within the Lipper Balanced Category. The Index does not incur expenses or reflect any deduction for taxes and cannot be purchased directly by investors.
^^^ The Lehman Brothers® Aggregate Bond Index is an unmanaged index of fixed rate investment grade securities with at least one year to maturity combining the Lehman Brothers Government/Credit Index and the Lehman Brothers Mortgage-Backed Securities Index. The Index does not incur expenses or reflect any deduction for taxes and cannot be purchased directly by investors.
After-tax returns are calculated using the historical highest individual federal marginal income tax rates and do not reflect the impact of state and local taxes.
Actual after-tax returns depend on an investor’s tax situation and may differ from those shown, and after-tax returns shown are not relevant to investors who hold their Fund shares through tax-deferred arrangements, such as 401(k) plans or individual retirement accounts.
After-tax returns are shown for only Class S and after-tax returns for other classes will vary.
Expense Information
| | | | | | | | | | | | |
| | | Class S | | Class Y | | Class L | | Class A | | | Class N | |
| Shareholder Fees (fees paid directly from your investment) | | | | | | | | | | | | |
Maximum Sales Charge (Load) on purchases (as a % of offering price) | | None | | None | | None | | 5.75% | | | None | |
Maximum Deferred Sales Charge (Load) (as a % of the lower of the original offering price or redemption proceeds) | | None | | None | | None | | None | (1) | | 1.00% | (2) |
Annual Fund Operating Expenses (expenses that are deducted from Fund assets) (% of average net assets) | | | | | | | | | | | | |
Management Fees | | .60% | | .60% | | .60% | | .60% | | | .60% | |
Distribution and Service (Rule 12b-1) Fees | | None | | None | | None | | .25% | | | .50% | |
Other Expenses(3) | | .18% | | .23% | | .38% | | .38% | | | .43% | |
| Total Annual Fund Operating Expenses(4)(5) | | .78% | | .83% | | .98% | | 1.23% | | | 1.53% | |
Examples
These examples are intended to help you compare the cost of investing in the Fund with the cost of investing in other mutual funds. The examples assume that you invest $10,000 in each share class of the Fund for the time periods indicated and then redeem all of your shares at the end of those periods. For Class A shares, the examples include the initial sales charge. The examples also assume that your investment earns a 5% return each year and that the Fund’s operating expenses remain the same. Although your actual costs may be higher or lower, based on these assumptions your costs would be:
| | | | | | | | | | | | |
| | | 1 Year | | 3 Years | | 5 Years | | 10 Years |
Class S | | $ | 80 | | $ | 249 | | $ | 433 | | $ | 966 |
Class Y | | $ | 85 | | $ | 265 | | $ | 460 | | $ | 1,025 |
Class L | | $ | 100 | | $ | 312 | | $ | 542 | | $ | 1,201 |
Class A | | $ | 693 | | $ | 943 | | $ | 1,212 | | $ | 1,978 |
Class N | | $ | 259 | | $ | 483 | | $ | 834 | | $ | 1,824 |
Except for Class N shares, the figures shown above would be the same whether you sold your shares at the end of a period or kept them. For Class N shares, you would pay the following expenses if you did not redeem your shares:
| | | | | | | | | | | | |
| | | 1 Year | | 3 Years | | 5 Years | | 10 Years |
Class N | | $ | 156 | | $ | 483 | | $ | 834 | | $ | 1,824 |
| (1) | | A contingent deferred sales charge may apply to shares redeemed within 18 months of purchase from initial investments of $1 million or more. |
| (2) | | Applies to shares redeemed within 18 months of purchase. |
| (3) | | Other Expenses include Acquired Fund fees and expenses, which represent approximate expenses borne indirectly by the Fund in its most recent fiscal year through investments in other pooled investment vehicles. The amount of Acquired Fund fees and expenses may change in the coming year due to a number of factors including, among others, a change in allocation of the Fund’s investments among other pooled investment vehicles. |
| (4) | | Because Total Annual Fund Operating Expenses include Acquired Fund fees and expenses, they may not correspond to the ratios of expenses to average daily net assets shown in the “Financial Highlights” tables in this prospectus, which reflect the operating expenses of the Fund and do not include Acquired Fund fees and expenses. |
| (5) | | Employee benefit plans which invest in the Fund through MassMutual separate investment accounts may pay additional charges under their group annuity contract or services agreement. Investors who purchase shares directly from the Fund may also be subject to charges imposed in their administrative services or other agreement with MassMutual or MassMutual affiliate. None of these charges are deducted from Fund assets. |
– 11 –
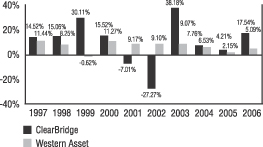
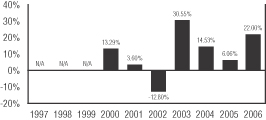
ClearBridge and Western Asset Prior Performance for Similar Accounts*
The bar chart illustrates the variability of returns achieved by each Sub-Adviser for accounts with investment objectives, policies and investment strategies similar to that of the portion of the Fund managed by each Sub-Adviser. The performance does not represent the historical performance of the Fund and should not be interpreted as being indicative of future performance of the Fund.
| | | | |
| | | Highest Quarter | | Lowest Quarter |
ClearBridge Mutual Fund | | 21.81%, 2Q 2003 | | -22.06%, 3Q 2002 |
Western Asset Composite | | 4.38%, 2Q 2003 | | -2.19%, 2Q 2004 |
ClearBridge and Western Asset Average Annual
Total Returns for Similar Accounts*
(for the periods ended December 31, 2006)
The table compares each Sub-Adviser’s investment results for accounts with investment objectives, policies and investment strategies similar to that of the portion of the Fund managed by each Sub-Adviser to an index measuring the broad market over different time periods.
| | | | | | |
| | | One Year | | Five Years | | Ten Years |
ClearBridge Mutual Fund | | | | | | |
Class S* | | 17.54% | | 5.81% | | 9.34% |
Class Y* | | 17.49% | | 5.76% | | 9.29% |
Class L* | | 17.34% | | 5.61% | | 9.14% |
Class A* | | 10.36% | | 4.11% | | 8.24% |
Class N* | | 15.79% | | 5.05% | | 8.58% |
| | | | | | | |
Lipper Balanced Fund Index^ | | 11.60% | | 6.51% | | 7.44% |
Russell 3000 Index^^ | | 15.72% | | 7.17% | | 8.64% |
| | | | | | |
| | | One Year | | Five Years | | Ten
Years |
Western Asset Composite | | | | | | |
Class S* | | 5.09% | | 6.35% | | 7.08% |
Class Y* | | 5.04% | | 6.30% | | 7.03% |
Class L* | | 4.89% | | 6.15% | | 6.88% |
Class A* | | -1.38% | | 4.54% | | 5.79% |
Class N* | | 3.34% | | 5.72% | | 6.54% |
| | | | | | | |
Lipper Balanced Fund Index^ | | 11.60% | | 6.51% | | 7.44% |
Lehman Brothers Aggregate Bond Index^^^ | | 4.33% | | 5.06% | | 6.24% |
* Western Asset’s Similar Account performance is a composite of all portfolios managed by Western Asset with substantially similar investment objectives, policies and investment strategies as the portion of the Fund managed by Western Asset, and without significant client-imposed restrictions, adjusted to reflect the fees and expenses of each of the Fund’s share classes, including sales loads. ClearBridge’s Similar Account performance is from a mutual fund managed by ClearBridge (the Legg Mason Partners Fundamental Value Fund) with substantially similar investment objectives, policies and investment strategies as the portion of the Fund managed by ClearBridge, and without significant client-imposed restrictions, adjusted to reflect the fees and expenses of each of the Fund’s share classes. The bar chart is based on Class S expenses. Each Sub-Adviser’s Similar Account performance does not represent the historical performance of the MassMutual Select Strategic Balanced Fund and should not be interpreted as being indicative of the future performance of the Fund. For additional information, please refer to “Investment Performance” in this Prospectus. Performance shown does not reflect fees that may be paid by investors for administrative services or group annuity contract charges.
^ The Lipper Balanced Fund Index is an unmanaged, equally weighted index of the 30 largest mutual funds within the Lipper Balanced Category. The Index does not incur expenses or reflect any deduction for taxes and cannot be purchased directly by investors.
^^ The Russell 3000 Index measures the performance of the 3,000 largest U.S. companies based on total market capitalization. The Index does not incur expenses or reflect any deduction for taxes and cannot be purchased directly by investors.
^^^ The Lehman Brothers Aggregate Bond Index is an unmanaged index of fixed rate investment grade securities with at least one year to maturity combining the Lehman Brothers Government/Credit Index and the Lehman Brothers Mortgage-Backed Securities Index. The Index does not incur expenses or reflect any deduction for taxes and cannot be purchased directly by investors.
– 12 –
[THIS PAGE INTENTIONALLY LEFT BLANK]
MassMutual Select Diversified Value Fund
Investment Objective
This Fund seeks to achieve long-term growth of capital and income by investing primarily in a diversified portfolio of equity securities of larger, well-established companies.
Principal Investment Strategies and Risks
The Fund normally invests at least 80% of its net assets in stocks, securities convertible into stocks, and other securities, such as warrants and stock rights, whose value is based on stock prices.
The Fund’s Sub-Adviser, AllianceBernstein L.P. (“AllianceBernstein”) through the investment professionals of its Bernstein Investment Research and Management unit, takes a “bottom-up” investment approach that is value-based and price-driven, and it relies on the intensive fundamental research of its internal research staff to identify these buying opportunities in the marketplace. The investment process begins with a broad universe of about 650 stocks encompassing most of the S&P 500 and the Russell 1000® Value Index. AllianceBernstein will invest the Fund’s assets in the common stocks of large companies that it identifies as having earnings growth potential that may not be recognized by the market at large. AllianceBernstein seeks to identify compelling buying opportunities created when companies are undervalued on the basis of investor reactions to near-term problems or circumstances even though their long-term prospects remain sound. In addition, to moderate risk, AllianceBernstein may buy companies among the largest in the benchmark (the Russell 1000 Value Index) even if such companies are not attractive from a risk-adjusted return basis. In such cases, AllianceBernstein will underweight these companies versus their weight in the benchmark. Portfolio holdings will be primarily in U.S. issuers although ADRs and securities of foreign issuers that trade on domestic exchanges and in the over-the-counter markets also may be purchased. AllianceBernstein uses a risk factor model to control risk. This model includes broad industry sectors and various measures of financial and valuation characteristics. AllianceBernstein looks at a measure of earnings quality. The measure of earnings quality compares changes in the balance-sheet accrual component of reported earnings for each stock to the market average. All else being equal, AllianceBernstein prefers stocks with lower accruals. In addition, earnings revisions and momentum tools are incorporated into the portfolio management process to optimize the timing of purchases and sales. To limit stock-specific risk relative to the benchmark, AllianceBernstein employs constraints on security and sector over/underweights.
The Principal Risks of investing in the Fund are Market Risk, Credit Risk, Management Risk, Derivative Risk, Foreign Investment Risk, Value Company Risk and Leveraging Risk.
These Risks are described beginning on page 100.
Annual Performance(1)
The bar chart shows the risks of investing in the Fund by showing changes in the Fund’s performance from year to year. Sales charges and taxes are not included in the calculations of returns in this bar chart. If those charges and taxes were included, the returns would be lower than those shown.
Class S Shares
During the period shown above, the highest quarterly return for the Fund was 8.05% for the quarter ended December 31, 2006 and the lowest quarterly return was -0.27% for the quarter ended March 31, 2005.
Average Annual Total Returns(1)
(for the periods ended December 31, 2006)
The table shows the risk of investing in the Fund by comparing the Fund’s returns with a broad measure of market performance over different time periods.
| | | | |
| | | One
Year | | Since Inception (10/15/04) |
Return Before Taxes – Class S | | 22.08% | | 17.60% |
Return After Taxes on Distributions – Class S | | 21.24% | | 16.91% |
Return After Taxes on Distributions and Sale of Fund Shares – Class S | | 15.45% | | 15.09% |
Return Before Taxes – Class Y | | 21.92% | | 17.49% |
Return Before Taxes – Class L | | 21.82% | | 17.38% |
Return Before Taxes – Class A+ | | 14.43% | | 13.94% |
Return Before Taxes – Class N+ | | 20.11% | | 16.68% |
| | | | | |
Russell 1000® Value Index^ | | 22.25% | | 18.32% |
(1) Performance shown does not reflect fees that may be paid by investors for administrative services or group annuity contract charges.
+ Performance for Class A and Class N shares of the Fund reflects any applicable sales charge.
^ The Russell 1000® Value Index is an unmanaged index representative of stocks with a greater than average value orientation among the stocks of the largest 1000 U.S. companies based on capitalization. The Index does not incur expenses or reflect any deduction for taxes and cannot be purchased directly by investors.
After-tax returns are calculated using the historical highest individual federal marginal income tax rates and do not reflect the impact of state and local taxes.
Actual after-tax returns depend on an investor’s tax situation and may differ from those shown, and after-tax returns shown are not relevant to investors who hold their Fund shares through tax-deferred arrangements, such as 401(k) plans or individual retirement accounts.
After-tax returns are shown for only Class S and after-tax returns for other classes will vary.
– 14 –
Expense Information
| | | | | | | | | | | | |
| | | Class S | | Class Y | | Class L | | Class A | | | Class N | |
| Shareholder Fees (fees paid directly from your investment) | | | | | | | | | | | | |
Maximum Sales Charge (Load) on purchases (as a % of offering price) | | None | | None | | None | | 5.75% | | | None | |
Maximum Deferred Sales Charge (Load) (as a % of the lower of the original offering price or redemption proceeds) | | None | | None | | None | | None | (1) | | 1.00% | (2) |
| Annual Fund Operating Expenses (expenses that are deducted from Fund assets) (% of average net assets) | | | | | | | | | | | | |
Management Fees | | .50% | | .50% | | .50% | | .50% | | | .50% | |
Distribution and Service (Rule 12b-1) Fees | | None | | None | | None | | .25% | | | .50% | |
Other Expenses(3) | | .08% | | .18% | | .29% | | .33% | | | .39% | |
| Total Annual Fund Operating Expenses(4)(5) | | .58% | | .68% | | .79% | | 1.08% | | | 1.39% | |
Examples
These examples are intended to help you compare the cost of investing in the Fund with the cost of investing in other mutual funds. The examples assume that you invest $10,000 in each share class of the Fund for the time periods indicated and then redeem all of your shares at the end of those periods. For Class A shares, the examples include the initial sales charge. The examples also assume that your investment earns a 5% return each year and that the Fund’s operating expenses remain the same. Although your actual costs may be higher or lower, based on these assumptions your costs would be:
| | | | | | | | | | | | |
| | | 1 Year | | 3 Years | | 5 Years | | 10 Years |
Class S | | $ | 59 | | $ | 186 | | $ | 324 | | $ | 726 |
Class Y | | $ | 69 | | $ | 218 | | $ | 379 | | $ | 847 |
Class L | | $ | 81 | | $ | 252 | | $ | 439 | | $ | 978 |
Class A | | $ | 679 | | $ | 899 | | $ | 1,136 | | $ | 1,816 |
Class N | | $ | 245 | | $ | 440 | | $ | 761 | | $ | 1,669 |
Except for Class N shares, the figures shown above would be the same whether you sold your shares at the end of a period or kept them. For Class N shares, you would pay the following expenses if you did not redeem your shares:
| | | | | | | | | | | | |
| | | 1 Year | | 3 Years | | 5 Years | | 10 Years |
Class N | | $ | 142 | | $ | 440 | | $ | 761 | | $ | 1,669 |
| (1) | | A contingent deferred sales charge may apply to shares redeemed within 18 months of purchase from initial investments of $1 million or more. |
| (2) | | Applies to shares redeemed within 18 months of purchase. |
| (3) | | Other Expenses include Acquired Fund fees and expenses, which represent approximate expenses borne indirectly by the Fund in its most recent fiscal year through investments in other pooled investment vehicles. The amount of Acquired Fund fees and expenses may change in the coming year due to a number of factors including, among others, a change in allocation of the Fund’s investments among other pooled investment vehicles. |
| (4) | | Because Total Annual Fund Operating Expenses include Acquired Fund fees and expenses, they may not correspond to the ratios of expenses to average daily net assets shown in the “Financial Highlights” tables in this prospectus, which reflect the operating expenses of the Fund and do not include Acquired Fund fees and expenses. |
| (5) | | Employee benefit plans which invest in the Fund through MassMutual separate investment accounts may pay additional charges under their group annuity contract or services agreement. Investors who purchase shares directly from the Fund may also be subject to charges imposed in their administrative services or other agreement with MassMutual or MassMutual affiliate. None of these charges are deducted from Fund assets. |
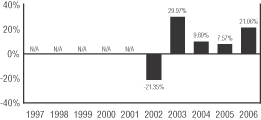
AllianceBernstein Prior Performance for Similar Accounts*
The bar chart illustrates the variability of returns achieved by AllianceBernstein for accounts with investment objectives, policies and investment strategies similar to that of the Fund. The composite performance does not represent the historical performance of the Fund and should not be interpreted as being indicative of future performance of the Fund.
During the periods shown above, the highest quarterly return was 16.48% for the quarter ended June 30, 2003 and the lowest was -18.82% for the quarter ended September 30, 2002.
AllianceBernstein Average Annual Total Returns for Similar Accounts*
(for the periods ended December 31, 2006)
The table compares AllianceBernstein’s investment results for accounts with investment objectives, policies and investment strategies similar to that of the Fund to an index measuring the broad market over different time periods.
| | | | | | |
| | | One
Year | | Five
Years | | Since
Inception
(4/1/99) |
AllianceBernstein Composite | | | | | | |
Class S* | | 22.00% | | 11.03% | | 9.46% |
Class Y* | | 21.90% | | 10.93% | | 9.36% |
Class L* | | 21.79% | | 10.81% | | 9.25% |
Class A* | | 14.51% | | 9.22% | | 8.12% |
Class N* | | 20.19% | | 10.21% | | 8.64% |
| | | | | | | |
Russell 1000 Value Index^ | | 22.25% | | 10.86% | | 7.81% |
* Performance shown is the composite of all portfolios with about 150 stocks managed by AllianceBernstein with substantially similar investment objectives, policies and investment strategies and without significant client-imposed restrictions, adjusted to reflect the fees and expenses of each of the Fund’s share classes, including sales loads. The bar chart is based on Class S expenses. The composite performance does not represent the historical performance of the MassMutual Select Diversified Value Fund and should not be interpreted as being indicative of the future performance of the Fund. For additional information, please refer to “Investment Performance” in this Prospectus. Performance shown does not reflect fees that may be paid by investors for administrative services or group annuity contract charges.
^ The Russell 1000 Value Index is an unmanaged index representative of stocks with a greater than average value orientation among the stocks of the largest 1000 U.S. companies based on capitalization. The Index does not incur expenses or reflect any deduction for taxes and cannot be purchased directly by investors.
– 15 –
MassMutual Select Fundamental Value Fund
Investment Objective
The Fund seeks long-term total return.
Principal Investment Strategies and Risks
Under normal circumstances, the Fund invests at least 80% of its net assets in equity securities. Although the Fund may invest in companies with a broad range of market capitalizations, the Fund will tend to focus on companies with large capitalizations (generally having market capitalizations above $2 billion). The Fund may invest up to 20% of its total assets in the securities of foreign issuers.
The investment approach of the Fund’s Sub-Adviser, Wellington Management Company, LLP (“Wellington Management”), is based on the fundamental analysis of companies with large market capitalizations and estimated below-average projected price-to-earnings ratio. Fundamental analysis involves the assessment of company-specific factors such as its business environment, management, balance sheet, income statement, cash flow, anticipated earnings, hidden or undervalued assets, dividends, and other related measures of value. The typical purchase candidate may be characterized as an overlooked or misunderstood company with sound fundamentals. Holdings are frequently in viable, growing businesses with good financial strength in industries that are temporarily out of favor and under-researched by institutions, but provide the potential for above-average total returns and which sell at estimated below-average price-to-earnings multiples. Portfolio construction is driven primarily by security selection. Market timing is not employed, and limited consideration is given to macroeconomic analysis in establishing sector and industry weightings. This process of stock selection is sometimes referred to as a “bottom-up” process and frequently leads to contrarian industry weightings. Existing holdings are sold as they approach their price targets.
The Principal Risks of investing in the Fund are Market Risk, Credit Risk, Management Risk, Liquidity Risk, Derivative Risk, Foreign Investment Risk, Emerging Markets Risk, Currency Risk, Value Company Risk and Leveraging Risk.
These Risks are described beginning on page 100.
Annual Performance(1)
The bar chart shows the risks of investing in the Fund by showing changes in the Fund’s performance from year to year. Sales charges and taxes are not included in the calculations of returns in this bar chart. If those charges and taxes were included, the returns would be lower than those shown.
Class S Shares
During the periods shown above, the highest quarterly return for the Fund was 17.18% for the quarter ended June 30, 2003 and the lowest quarterly return was -20.11% for the quarter ended September 30, 2002.
Average Annual Total Returns(1)
(for the periods ended December 31, 2006)
The table shows the risk of investing in the Fund by comparing the Fund’s returns with a broad measure of market performance over different time periods.
| | | | | | |
| | | One
Year | | Five Years | | Since Inception (12/31/01) |
Return Before Taxes – Class S | | 21.06% | | 7.89% | | 7.88% |
Return After Taxes on Distributions – Class S | | 19.39% | | 7.31% | | 7.31% |
Return After Taxes on Distributions and Sale of Fund Shares – Class S | | 15.75% | | 6.75% | | 6.74% |
Return Before Taxes – Class Y | | 21.05% | | 7.84% | | 7.83% |
Return Before Taxes – Class L | | 20.90% | | 7.69% | | 7.69% |
Return Before Taxes – Class A+ | | 13.61% | | 6.16% | | 6.16% |
Return Before Taxes – Class N+ | | 19.09% | | 7.12% | | 7.12% |
| | | | | | | |
Russell 1000® Value Index^ | | 22.25% | | 10.86% | | 10.70% |
S&P 500® Index^^ | | 15.78% | | 6.19% | | 5.94% |
(1) Performance shown does not reflect fees that may be paid by investors for administrative services or group annuity contract charges.
+ Performance for Class A shares of the Fund reflects any applicable sales charge. Performance for Class N shares of the Fund prior to December 31, 2002 is based on Class A shares, adjusted to reflect Class N expenses, and also reflects any applicable sales charge.
^ The Russell 1000® Value Index is an unmanaged index representative of stocks with a greater than average value orientation among the stocks of the largest 1000 U.S. companies based on capitalization. The Index does not incur expenses or reflect any deduction for taxes and cannot be purchased directly by investors.
^^ The S&P 500® Index is a widely recognized, unmanaged index representative of common stocks of larger capitalized U.S. companies. The Index does not incur expenses or reflect any deduction for taxes and cannot be purchased directly by investors.
Going forward, the Fund’s performance will be compared to the Russell 1000 Value Index rather than the S&P 500 Index because the Russell 1000 Value Index more closely represents the Fund’s investment strategy.
After-tax returns are calculated using the historical highest individual federal marginal income tax rates and do not reflect the impact of state and local taxes.
Actual after-tax returns depend on an investor’s tax situation and may differ from those shown, and after-tax returns shown are not relevant to investors who hold their Fund shares through tax-deferred arrangements, such as 401(k) plans or individual retirement accounts.
After-tax returns are shown for only Class S and after-tax returns for other classes will vary.
– 16 –
Expense Information
| | | | | | | | | | | | |
| | | Class S | | Class Y | | Class L | | Class A | | | Class N | |
| Shareholder Fees (fees paid directly from your investment) | | | | | | | | | | | | |
Maximum Sales Charge (Load) on purchases (as a % of offering price) | | None | | None | | None | | 5.75% | | | None | |
Maximum Deferred Sales Charge (Load) (as a % of the lower of the original offering price or redemption proceeds) | | None | | None | | None | | None | (1) | | 1.00% | (2) |
| Annual Fund Operating Expenses (expenses that are deducted from Fund assets) (% of average net assets) | | | | | | | | | | | | |
Management Fees | | .65% | | .65% | | .65% | | .65% | | | .65% | |
Distribution and Service (Rule 12b-1) Fees | | None | | None | | None | | .25% | | | .50% | |
Other Expenses(3) | | .14% | | .18% | | .33% | | .33% | | | .38% | |
Total Annual Fund Operating Expenses(4)(5) | | .79% | | .83% | | .98% | | 1.23% | | | 1.53% | |
Examples
These examples are intended to help you compare the cost of investing in the Fund with the cost of investing in other mutual funds. The examples assume that you invest $10,000 in each share class of the Fund for the time periods indicated and then redeem all of your shares at the end of those periods. For Class A shares, the examples include the initial sales charge. The examples also assume that your investment earns a 5% return each year and that the Fund’s operating expenses remain the same. Although your actual costs may be higher or lower, based on these assumptions your costs would be:
| | | | | | | | | | | | |
| | | 1 Year | | 3 Years | | 5 Years | | 10 Years |
Class S | | $ | 81 | | $ | 252 | | $ | 439 | | $ | 978 |
Class Y | | $ | 85 | | $ | 265 | | $ | 460 | | $ | 1,025 |
Class L | | $ | 100 | | $ | 312 | | $ | 542 | | $ | 1,201 |
Class A | | $ | 693 | | $ | 943 | | $ | 1,212 | | $ | 1,978 |
Class N | | $ | 259 | | $ | 483 | | $ | 834 | | $ | 1,824 |
Except for Class N shares, the figures shown above would be the same whether you sold your shares at the end of a period or kept them. For Class N shares, you would pay the following expenses if you did not redeem your shares:
| | | | | | | | | | | | |
| | | 1 Year | | 3 Years | | 5 Years | | 10 Years |
Class N | | $ | 156 | | $ | 483 | | $ | 834 | | $ | 1,824 |
| (1) | | A contingent deferred sales charge may apply to shares redeemed within 18 months of purchase from initial investments of $1 million or more. |
| (2) | | Applies to shares redeemed within 18 months of purchase. |
| (3) | | Other Expenses include Acquired Fund fees and expenses, which represent approximate expenses borne indirectly by the Fund in its most recent fiscal year through investments in other pooled investment vehicles. The amount of Acquired Fund fees and expenses may change in the coming year due to a number of factors including, among others, a change in allocation of the Fund’s investments among other pooled investment vehicles. |
| (4) | | Because Total Annual Fund Operating Expenses include Acquired Fund fees and expenses, they may not correspond to the ratios of expenses to average daily net assets shown in the “Financial Highlights” tables in this prospectus, which reflect the operating expenses of the Fund and do not include Acquired Fund fees and expenses. |
| (5) | | Employee benefit plans which invest in the Fund through MassMutual separate investment accounts may pay additional charges under their group annuity contract or services agreement. Investors who purchase shares directly from the Fund may also be subject to charges imposed in their administrative services or other agreement with MassMutual or MassMutual affiliate. None of these charges are deducted from Fund assets. |
Wellington Management
Prior Performance for Similar Accounts*
The bar chart illustrates the variability of returns achieved by Wellington Management for accounts with investment objectives, policies and investment strategies similar to that of the Fund. The composite performance does not represent the historical performance of the Fund and should not be interpreted as being indicative of future performance of the Fund.
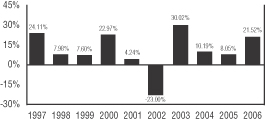
During the periods shown above, the highest quarterly return was 17.33% for the quarter ended June 30, 2003 and the lowest was -20.03% for the quarter ended September 30, 2002.
– 17 –
Wellington Management Average Annual Total
Returns for Similar Accounts*
(for the periods ended December 31, 2006)
The table compares Wellington Management’s investment results for accounts with investment objectives, policies and investment strategies similar to that of the Fund to an index measuring the broad market over different time periods.
| | | | | | |
| | | One Year | | Five Years | | Ten Years |
Wellington Management Composite | | | | | | |
Class S* | | 21.52% | | 7.69% | | 10.35% |
Class Y* | | 21.48% | | 7.65% | | 10.31% |
Class L* | | 21.33% | | 7.50% | | 10.16% |
Class A* | | 14.12% | | 5.98% | | 9.26% |
Class N* | | 19.78% | | 6.94% | | 9.60% |
| | | | | | | |
Russell 1000 Value Index^ | | 22.25% | | 10.86% | | 11.00% |
S&P 500 Index^^ | | 15.78% | | 6.19% | | 8.42% |
* Performance shown is the composite of all portfolios managed by Wellington Management with substantially similar investment objectives, policies and investment strategies and without significant client-imposed restrictions, adjusted to reflect the fees and expenses of each of the Fund’s share classes, including sales loads. The bar chart is based on Class S expenses. The composite performance does not represent the historical performance of the MassMutual Select Fundamental Value Fund and should not be interpreted as being indicative of the future performance of the Fund. For additional information, please refer to “Investment Performance” in this Prospectus. Performance shown does not reflect fees that may be paid by investors for administrative services or group annuity contract charges.
^ The Russell 1000 Value Index is an unmanaged index representative of stocks with a greater than average value orientation among the stocks of the largest 1000 U.S. companies based on capitalization. The Index does not incur expenses or reflect any deduction for taxes and cannot be purchased directly by investors.
^ ^ The S&P 500 Index is a widely recognized, unmanaged index representative of common stocks of larger capitalized U.S. companies. The Index does not incur expenses or reflect any deduction for taxes and cannot be purchased directly by investors.
– 18 –
[THIS PAGE INTENTIONALLY LEFT BLANK]
MassMutual Select Value Equity Fund
Investment Objective
The Fund seeks long-term growth of capital.
Principal Investment Strategies and Risks
The Fund’s Sub-Adviser, Fidelity Management & Research Company (“FMR”), invests in securities of companies that it believes are undervalued in the marketplace in relation to factors such as the company’s assets, sales, earnings, growth potential, or cash flow, or in relation to securities of other companies in the same industry. FMR considers traditional and other measures of value such as price/earnings (P/E), price/sales (P/S), or price/book (P/B) ratios, earnings relative to enterprise value (the total value of a company’s outstanding equity and debt), and the discounted value of a company’s projected future free cash flows. The types of companies in which the Fund may invest include companies experiencing positive fundamental change, such as a new management team or product launch, a significant cost-cutting initiative, a merger or acquisition, or a reduction in industry capacity that should lead to improved pricing; companies whose earnings potential has increased or is expected to increase more than generally perceived; and companies that have enjoyed recent market popularity but which appear to have temporarily fallen out of favor for reasons that are considered non-recurring or short-term.
FMR normally invests at least 80% of the Fund’s net assets in equity securities. FMR normally invests the Fund’s assets primarily in common stocks. FMR may invest the Fund’s assets in securities of foreign issuers in addition to securities of domestic issuers. In buying and selling securities for the Fund, FMR relies on fundamental analysis of each issuer and its potential for success in light of its current financial condition, its industry position, and economic and market factors. Factors considered include growth potential, earnings estimates, and management. FMR may use various techniques, such as buying and selling futures contracts and exchange traded funds, to increase or decrease the Fund’s exposure to changing security prices or other factors that affect security values. If FMR’s strategies do not work as intended, the Fund may not achieve its objective.
In response to market, economic, political or other conditions, FMR may temporarily use a different investment strategy for defensive purposes. If FMR does so, different factors could affect the Fund’s performance and the Fund may not achieve its investment objective.
The Principal Risks of investing in the Fund are Market Risk, Credit Risk, Management Risk, Liquidity Risk, Derivative Risk, Non-Diversification Risk, Foreign Investment Risk, Emerging Markets Risk, Currency Risk, Value Company Risk, Leveraging Risk and Portfolio Turnover Risk.
These Risks are described beginning on page 100.
Note that although the Fund was originally registered as a non-diversified fund, under a position of the SEC, the Fund is currently required to operate as a diversified fund and will not operate as a non-diversified fund in the future until it obtains any necessary shareholder approval.
Annual Performance(1)
The bar chart shows the risks of investing in the Fund by showing changes in the Fund’s performance from year to year. Sales charges and taxes are not included in the calculations of returns in this bar chart. If those charges and taxes were included, the returns would be lower than those shown.
Class S Shares
During the periods shown above, the highest quarterly return for the Fund was 15.56% for the quarter ended June 30, 2003 and the lowest quarterly return was -18.23% for the quarter ended September 30, 2002.
– 20 –
Average Annual Total Returns(1)
(for the periods ended December 31, 2006)
The table shows the risk of investing in the Fund by comparing the Fund’s returns with a broad measure of market performance over different time periods.
| | | | | | |
| | | One
Year | | Five
Years | | Since Inception (5/1/01) |
Return Before Taxes – Class S | | 13.40% | | 8.41% | | 6.20% |
Return After Taxes on Distributions – Class S | | 10.00% | | 7.09% | | 5.02% |
Return After Taxes on Distributions and Sale of Fund Shares – Class S | | 11.37% | | 6.91% | | 5.00% |
Return Before Taxes – Class Y | | 13.33% | | 8.35% | | 6.13% |
Return Before Taxes – Class L | | 13.06% | | 8.18% | | 5.97% |
Return Before Taxes – Class A+ | | 6.34% | | 6.63% | | 4.62% |
Return Before Taxes – Class N+ | | 11.63% | | 7.59% | | 5.42% |
| | | | | | | |
Russell 1000® Value Index^ | | 22.25% | | 10.86% | | 8.66% |
(1) Performance shown does not reflect fees that may be paid by investors for administrative services or group annuity contract charges.
+ Performance for Class A shares of the Fund reflects any applicable sales charge. Performance for Class N shares of the Fund prior to December 31, 2002 is based on Class A shares, adjusted to reflect Class N expenses, and also reflects any applicable sales charge.
^ The Russell 1000® Value Index is an unmanaged index representative of stocks with a greater than average value orientation among the stocks of the largest 1000 U.S. companies based on capitalization. The Index does not incur expenses or reflect any deduction for taxes and cannot be purchased directly by investors.
After-tax returns are calculated using the historical highest individual federal marginal income tax rates and do not reflect the impact of state and local taxes.
Actual after-tax returns depend on an investor’s tax situation and may differ from those shown, and after-tax returns shown are not relevant to investors who hold their Fund shares through tax-deferred arrangements, such as 401(k) plans or individual retirement accounts.
After-tax returns are shown for only Class S and after-tax returns for other classes will vary.
Expense Information
| | | | | | | | | | | | |
| | | Class S | | Class Y | | Class L | | Class A | | | Class N | |
| Shareholder Fees (fees paid directly from your investment) | | | | | | | | | | | | |
Maximum Sales Charge (Load) on purchases (as a % of offering price) | | None | | None | | None | | 5.75% | | | None | |
Maximum Deferred Sales Charge (Load) (as a % of the lower of the original offering price or redemption proceeds) | | None | | None | | None | | None | (1) | | 1.00% | (2) |
| | | | | | | | | | |
| | | Class S | | Class Y | | Class L | | Class A | | Class N |
| Annual Fund Operating Expenses (expenses that are deducted from Fund assets) (% of average net assets) | | | | | | | | | | |
Management Fees | | .70% | | .70% | | .70% | | .70% | | .70% |
Distribution and Service (Rule 12b-1) Fees | | None | | None | | None | | .25% | | .50% |
Other Expenses(3) | | .16% | | .21% | | .36% | | .36% | | .41% |
| Total Annual Fund Operating Expenses(4)(5) | | .86% | | .91% | | 1.06% | | 1.31% | | 1.61% |
Examples
These examples are intended to help you compare the cost of investing in the Fund with the cost of investing in other mutual funds. The examples assume that you invest $10,000 in each share class of the Fund for the time periods indicated and then redeem all of your shares at the end of those periods. For Class A shares, the examples include the initial sales charge. The examples also assume that your investment earns a 5% return each year and that the Fund’s operating expenses remain the same. Although your actual costs may be higher or lower, based on these assumptions your costs would be:
| | | | | | | | |
| | | 1 Year | | 3 Years | | 5 Years | | 10 Years |
Class S | | $ 88 | | $274 | | $ 477 | | $1,061 |
Class Y | | $ 93 | | $290 | | $ 504 | | $1,120 |
Class L | | $108 | | $337 | | $ 585 | | $1,294 |
Class A | | $701 | | $966 | | $1,252 | | $2,063 |
Class N | | $267 | | $508 | | $ 876 | | $1,911 |
Except for Class N shares, the figures shown above would be the same whether you sold your shares at the end of a period or kept them. For Class N shares, you would pay the following expenses if you did not redeem your shares:
| | | | | | | | |
| | | 1 Year | | 3 Years | | 5 Years | | 10 Years |
Class N | | $164 | | $508 | | $876 | | $1,911 |
| (1) | | A contingent deferred sales charge may apply to shares redeemed within 18 months of purchase from initial investments of $1 million or more. |
| (2) | | Applies to shares redeemed within 18 months of purchase. |
| (3) | | Other Expenses include Acquired Fund fees and expenses, which represent approximate expenses borne indirectly by the Fund in its most recent fiscal year through investments in other pooled investment vehicles. The amount of Acquired Fund fees and expenses may change in the coming year due to a number of factors including, among others, a change in allocation of the Fund’s investments among other pooled investment vehicles. |
| (4) | | Because Total Annual Fund Operating Expenses include Acquired Fund fees and expenses, they may not correspond to the ratios of expenses to average daily net assets shown in the “Financial Highlights” tables in this prospectus, which reflect the operating expenses of the Fund and do not include Acquired Fund fees and expenses. |
| (5) | | Employee benefit plans which invest in the Fund through MassMutual separate investment accounts may pay additional charges under their group annuity contract or services agreement. Investors who purchase shares directly from the Fund may also be subject to charges imposed in their administrative services or other agreement with MassMutual or MassMutual affiliate. None of these charges are deducted from Fund assets. |
– 21 –
MassMutual Select Large Cap Value Fund
Investment Objective
This Fund seeks both capital growth and income.
Principal Investment Strategies and Risks
The Fund seeks to achieve its investment objective by selecting businesses that possess characteristics that the Fund’s Sub-Adviser, Davis Selected Advisers, L.P. (“Davis”) believes foster the creation of long-term value, such as proven management, a durable franchise and business model, and sustainable competitive advantages. Davis will normally invest at least 80% of the Fund’s net assets in common stock of companies with market capitalizations, at the time of purchase, of at least $5 billion. The Fund’s investment strategy is to select these companies for the long-term. In the current market environment, we expect that current income will be low.
Using intensive research into company fundamentals, the Sub-Adviser looks for factors, both quantitative and qualitative, that it believes foster sustainable long-term business growth. While few companies will exhibit all of these qualities, the Sub-Adviser believes that nearly every company in which it invests has a majority and appropriate mix of these traits:
| · | First-Class Management: Proven track record; Significant personal ownership stake in business; Intelligent allocators of capital; Smart appliers of technology to improve business and lower costs; |
| · | Strong Financial Condition and Profitability: Strong balance sheets; Low cost structure/low debt; High after-tax returns on capital; High quality of earnings; |
| · | Strategic Positioning for the Long-Term: Non-obsolescent products/industries; Dominant position in a growing market; Global presence and brand names. |
The Fund may also invest in foreign securities and may, but generally does not, use derivatives as a hedge against currency risks.
The Principal Risks of investing in the Fund are Market Risk, Credit Risk, Management Risk, Derivative Risk, Foreign Investment Risk, Currency Risk, Value Company Risk and Leveraging Risk.
These Risks are described beginning on page 100.
Annual Performance(1)
The bar chart shows the risks of investing in the Fund by showing changes in the Fund’s performance from year to year. Sales charges and taxes are not included in the calculations of returns in this bar chart. If those charges and taxes were included, the returns would be lower than those shown.
Class S Shares
During the periods shown above, the highest quarterly return for the Fund was 17.32% for the quarter ended June 30, 2003 and the lowest quarterly return was -13.42% for the quarter ended September 30, 2001.
Average Annual Total Returns(1)
(for the periods ended December 31, 2006)
The table shows the risk of investing in the Fund by comparing the Fund’s returns with a broad measure of market performance over different time periods.
| | | | | | |
| | | One
Year | | Five
Years | | Since Inception (5/1/00) |
Return Before Taxes – Class S | | 14.71% | | 8.90% | | 4.71% |
Return After Taxes on Distributions – Class S | | 14.57% | | 8.73% | | 4.52% |
Return After Taxes on Distributions and Sale of Fund Shares – Class S | | 9.73% | | 7.68% | | 3.98% |
Return Before Taxes – Class Y | | 14.65% | | 8.81% | | 4.61% |
Return Before Taxes – Class L | | 14.42% | | 8.65% | | 4.45% |
Return Before Taxes – Class A+ | | 7.65% | | 7.13% | | 3.29% |
Return Before Taxes – Class N+ | | 12.87% | | 8.05% | | 3.87% |
| | | | | | | |
S&P 500® Index^ | | 15.78% | | 6.19% | | 1.30% |
Russell 1000® Value Index^^ | | 22.25% | | 10.86% | | 8.32% |
(1) Performance shown does not reflect fees that may be paid by investors for administrative services or group annuity contract charges.
+ Performance for Class A shares of the Fund reflects any applicable sales charge. Performance for Class N shares of the Fund prior to December 31, 2002 is based on Class A shares, adjusted to reflect Class N expenses, and also reflects any applicable sales charge.
^ The S&P 500® Index is a widely recognized, unmanaged index representative of common stocks of larger capitalized U.S. companies. The Index does not incur expenses or reflect any deduction for taxes and cannot be purchased directly by investors.
^ ^ The Russell 1000® Value Index is an unmanaged index representative of stocks with a greater than average value orientation among the stocks of the largest 1000 U.S. companies based on capitalization. The Index does not incur expenses or reflect any deduction for taxes and cannot be purchased directly by investors.
After-tax returns are calculated using the historical highest individual federal marginal income tax rates and do not reflect the impact of state and local taxes.
Actual after-tax returns depend on an investor’s tax situation and may differ from those shown, and after-tax returns shown are not relevant to investors who hold their Fund shares through tax-deferred arrangements, such as 401(k) plans or individual retirement accounts.
After-tax returns are shown for only Class S and after-tax returns for other classes will vary.
– 22 –
Expense Information
| | | | | | | | | | | | |
| | | Class S | | Class Y | | Class L | | Class A | | | Class N | |
| Shareholder Fees (fees paid directly from your investment) | | | | | | | | | | | | |
Maximum Sales Charge (Load) on purchases (as a % of offering price) | | None | | None | | None | | 5.75% | | | None | |
Maximum Deferred Sales Charge (Load) (as a % of the lower of the original offering price or redemption proceeds) | | None | | None | | None | | None | (1) | | 1.00% | (2) |
| Annual Fund Operating Expenses (expenses that are deducted from Fund assets) (% of average net assets) | | | | | | | | | | | | |
Management Fees | | .65% | | .65% | | .65% | | .65% | | | .65% | |
Distribution and Service (Rule 12b-1) Fees | | None | | None | | None | | .25% | | | .50% | |
Other Expenses(3) | | .11% | | .20% | | .35% | | .35% | | | .40% | |
| Total Annual Fund Operating Expenses(4)(5) | | .76% | | .85% | | 1.00% | | 1.25% | | | 1.55% | |
Examples
These examples are intended to help you compare the cost of investing in the Fund with the cost of investing in other mutual funds. The examples assume that you invest $10,000 in each share class of the Fund for the time periods indicated and then redeem all of your shares at the end of those periods. For Class A shares, the examples include the initial sales charge. The examples also assume that your investment earns a 5% return each year and that the Fund’s operating expenses remain the same. Although your actual costs may be higher or lower, based on these assumptions your costs would be:
| | | | | | | | |
| | | 1 Year | | 3 Years | | 5 Years | | 10 Years |
Class S | | $ 78 | | $243 | | $ 422 | | $ 942 |
Class Y | | $ 87 | | $271 | | $ 471 | | $1,049 |
Class L | | $102 | | $318 | | $ 552 | | $1,225 |
Class A | | $695 | | $949 | | $1,222 | | $1,999 |
Class N | | $261 | | $490 | | $ 845 | | $1,845 |
Except for Class N shares, the figures shown above would be the same whether you sold your shares at the end of a period or kept them. For Class N shares, you would pay the following expenses if you did not redeem your shares:
| | | | | | | | |
| | | 1 Year | | 3 Years | | 5 Years | | 10 Years |
Class N | | $158 | | $490 | | $845 | | $1,845 |
| (1) | | A contingent deferred sales charge may apply to shares redeemed within 18 months of purchase from initial investments of $1 million or more. |
| (2) | | Applies to shares redeemed within 18 months of purchase. |
| (3) | | Other Expenses include Acquired Fund fees and expenses, which represent approximate expenses borne indirectly by the Fund in its most recent fiscal year through investments in other pooled investment vehicles. The amount of Acquired Fund fees and expenses may change in the coming year due to a number of factors including, among others, a change in allocation of the Fund’s investments among other pooled investment vehicles. |
| (4) | | Because Total Annual Fund Operating Expenses include Acquired Fund fees and expenses, they may not correspond to the ratios of expenses to average daily net assets shown in the “Financial Highlights” tables in this prospectus, which reflect the operating expenses of the Fund and do not include Acquired Fund fees and expenses. |
| (5) | | Employee benefit plans which invest in the Fund through MassMutual separate investment accounts may pay additional charges under their group annuity contract or services agreement. Investors who purchase shares directly from the Fund may also be subject to charges imposed in their administrative services or other agreement with MassMutual or MassMutual affiliate. None of these charges are deducted from Fund assets. |
Davis Prior Performance for Similar Accounts*
The bar chart illustrates the variability of returns achieved by Davis for accounts with investment objectives, policies and investment strategies similar to that of the Fund. The composite performance does not represent the historical performance of the Fund and should not be interpreted as being indicative of future performance of the Fund.
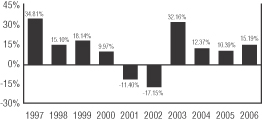
During the periods shown above, the highest quarterly return was 21.46% for the quarter ended December 31, 1998 and the lowest was -14.48% for the quarter ended September 30, 1998.
– 23 –
Davis Average Annual Total Returns
for Similar Accounts*
(for the periods ended December 31, 2006)
The table compares Davis’ investment results for accounts with investment objectives, policies and investment strategies similar to that of the Fund to that of an index measuring the broad market over different time periods.
| | | | | | |
| | | One Year | | Five Years | | Ten Years |
Davis Composite | | | | | | |
Class S* | | 15.19% | | 9.37% | | 10.82% |
Class Y* | | 15.10% | | 9.27% | | 10.73% |
Class L* | | 14.95% | | 9.12% | | 10.58% |
Class A* | | 8.11% | | 7.59% | | 9.68% |
Class N* | | 13.40% | | 8.56% | | 10.02% |
| | | | | | | |
S&P 500 Index^ | | 15.78% | | 6.19% | | 8.42% |
Russell 1000 Value Index^^ | | 22.25% | | 10.86% | | 11.00% |
* Performance shown is a composite of all portfolios managed by Davis with substantially similar investment objectives, policies and investment strategies and without significant client-imposed restrictions, adjusted to reflect the fees and expenses of each of the Fund’s share classes, including sales loads. The bar chart is based on Class S expenses. Davis’ composite includes performance of the Selected American Shares and Davis New York Venture Fund, which are registered under the Investment Company Act of 1940. The composite performance does not represent the historical performance of the MassMutual Select Large Cap Value Fund and should not be interpreted as being indicative of the future performance of the Fund. For additional information, please refer to “Investment Performance” in this Prospectus. Performance shown does not reflect fees that may be paid by investors for administrative services or group annuity contract charges.
^ The S&P 500 Index is a widely recognized, unmanaged index representative of common stocks of larger capitalized U.S. companies. The Index does not incur expenses or reflect any deduction for taxes and cannot be purchased directly by investors.
^ ^ The Russell 1000 Value Index is an unmanaged index representative of stocks with a greater than average value orientation among the stocks of the largest 1000 U.S. companies based on capitalization. The Index does not incur expenses or reflect any deduction for taxes and cannot be purchased directly by investors.
– 24 –
[THIS PAGE INTENTIONALLY LEFT BLANK]
MassMutual Select Indexed Equity Fund
Investment Objective
The Fund seeks to approximate as closely as practicable (before fees and expenses) the capitalization-weighted total rate of return of that portion of the U.S. market for publicly-traded common stocks composed of larger-capitalized companies.
Principal Investment Strategies and Risks
This Fund seeks to achieve its objective by investing at least 80% of its net assets in the equity securities of companies that make up the S&P 500® Index1. The Fund generally purchases securities in proportions that match their index weights. This is the primary strategy used by the Fund to achieve a capitalization-weighted total rate of return. Each company’s shares contribute to the Fund’s overall return in the same proportion as the value of the Company’s shares contributes to the S&P 500 Index. However, the Fund’s Sub-Adviser, Northern Trust Investments, N.A., uses a process known as “optimization,” which is a statistical sampling technique. (See discussion of “Optimization” on page 217). Therefore, the Fund may not hold every stock in the Index. The Sub-Adviser believes that this approach allows the Fund to run an efficient and effective strategy to maximize the Fund’s liquidity while minimizing transaction costs. The Fund may also invest in other instruments whose performance is expected to correspond to the Index. The Fund may also use derivatives such as index futures and options, as described in “Additional Investment Policies and Risk Considerations.” The Sub-Adviser believes that these investments help the Fund approach the returns of a fully invested portfolio, while keeping cash on hand for liquidity purposes. The Sub-Adviser seeks a correlation between the performance of the Fund, before expenses, and the S&P 500 Index of 98% or better.
Prior to May 1, 2000, the Fund was a “feeder” fund. It sought to obtain its investment objective by investing all its assets in the S&P 500 Index Master Portfolio (“the Master Portfolio”) managed by Barclays Global Fund Advisers. The Fund terminated the master-feeder structure effective April 30, 2000.
The Principal Risks of investing in the Fund are Market Risk, Credit Risk, Tracking Error Risk, Derivative Risk,
Foreign Investment Risk, Currency Risk, Growth Company Risk and Leveraging Risk.
These Risks are described beginning on page 100.
1 “Standard & Poor’s®”, “S&P®”, “S&P 500®”, “Standard & Poor’s 500” and “500” are trademarks of The McGraw-Hill Companies, Inc. and have been licensed for use by the Fund. The Fund is not sponsored, endorsed, sold or promoted by Standard & Poor’s and Standard & Poor’s makes no representation regarding the advisability of investing in the Fund.
Annual Performance(1)
The bar chart shows the risks of investing in the Fund by showing changes in the Fund’s performance from year to year. Sales charges and taxes are not included in the calculations of returns in this bar chart. If those charges and taxes were included, the returns would be lower than those shown.
Class S Shares
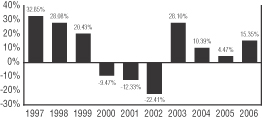
During the periods shown above, the highest quarterly return for the Fund was 21.23% for the quarter ended December 31, 1998 and the lowest was -17.29% for the quarter ended September 30, 2002.
Average Annual Total Returns(1)
(for the periods ended December 31, 2006)
The table shows the risk of investing in the Fund by comparing the Fund’s returns with a broad measure of market performance over different time periods.
| | | | | | |
| Return Before Taxes | | One
Year | | Five Years | | Since Inception (5/01) |
Class Z | | 15.59% | | 5.99% | | 3.86% |
| | | | | | | Ten
Years |
Class S | | 15.35% | | 5.74% | | 7.96% |
Class Y+ | | 15.27% | | 5.70% | | 7.88% |
Class L+ | | 15.28% | | 5.62% | | 7.81% |
Class A+ | | 8.34% | | 4.11% | | 6.86% |
Class N+ | | 13.67% | | 5.04% | | 7.19% |
| | | | | | | |
S&P 500® Index^ | | 15.78% | | 6.19% | | 8.42% |
(1) The Fund commenced operations on March 1, 1998. The performance for periods prior to March 1, 1998 is calculated by including the corresponding total return of the Master Portfolio in which the Fund previously invested, adjusted to reflect the Fund’s fees and expenses. Performance shown does not reflect fees that may be paid by investors for administrative services or group annuity contract charges.
+ Performance for Class Y and Class A shares of the Fund prior to March 1, 1998 is based on Class S shares adjusted to reflect Class Y and Class A expenses, and for Class A shares also reflects any applicable sales charge. Performance for Class L shares of the Fund prior to July 1, 1999 is based on Class S shares adjusted to reflect Class L expenses. Performance for Class N shares of the Fund prior to December 31, 2002 is based on Class A shares, adjusted to reflect Class N expenses, and also reflects any applicable sales charge.
– 26 –
^ The S&P 500® Index is a widely recognized, unmanaged index representative of common stocks of larger capitalized U.S. companies. The Index does not incur expenses or reflect any deduction for taxes and cannot be purchased directly by investors.
| | | | | | |
| | | One Year | | Five
Years | | Since Inception (3/1/98) |
Return Before Taxes –Class S | | 15.35% | | 5.74% | | 4.66% |
Return After Taxes on Distributions –
Class S | | 15.10% | | 5.49% | | 4.30% |
Return After Taxes on Distributions and Sale of Fund Shares –Class S | | 10.29% | | 4.87% | | 3.88% |
| | | | | | | |
S&P 500 Index^ | | 15.78% | | 6.19% | | 5.11% |
After-tax returns are calculated using the historical highest individual federal marginal income tax rates and do not reflect the impact of state and local taxes.
Actual after-tax returns depend on an investor’s tax situation and may differ from those shown, and after-tax returns shown are not relevant to investors who hold their Fund shares through tax-deferred arrangements, such as 401(k) plans or individual retirement accounts.
After-tax returns are shown for only Class S and after-tax returns for other classes will vary.
Expense Information
| | | | | | | | | | | | |
| | | Class S | | Class Y | | Class L | | Class A | | | Class N | |
| Shareholder Fees (fees paid directly from your investment) | | | | | | | | | | | | |
Maximum Sales Charge (Load) on purchases (as a % of offering price) | | None | | None | | None | | 5.75% | | | None | |
Maximum Deferred Sales Charge (Load) (as a % of the lower of the original offering price or redemption proceeds) | | None | | None | | None | | None | (1) | | 1.00% | (2) |
| | | | | | | | | | | | | | | |
| | | Class Z | | Class S | | Class Y | | Class L | | | Class A | | | Class N | |
| Annual Fund Operating Expenses (expenses that are deducted from Fund Assets) (% of average net assets) | | | | | | | | | | | | | | | |
Management Fees | | .10% | | .10% | | .10% | | .10% | | | .10% | | | .10% | |
Distribution and Service (Rule 12b-1) Fees | | None | | None | | None | | None | | | .25% | | | .50% | |
Other Expenses(3) | | .10% | | .32% | | .35% | | .50% | | | .50% | | | .55% | |
Total Annual Fund Operating Expenses(4) | | .20% | | .42% | | .45% | | .60% | | | .85% | | | 1.15% | |
| | | | | | | | | | | | | | | |
Less Expense Reimbursement(5) | | — | | — | | — | | (.20% | ) | | (.20% | ) | | (.20% | ) |
Net Fund Expenses(6) | | .20% | | .42% | | .45% | | .40% | | | .65% | | | .95% | |
Examples
These examples are intended to help you compare the cost of investing in the Fund with the cost of investing in other mutual funds. The examples assume that you invest $10,000 in each share class of the Fund for the time periods indicated and then redeem all of your shares at the end of those periods. For Class A shares, the examples include the initial sales charge. The examples also assume that your investment earns a 5% return each year and that the Fund’s operating expenses remain the same. Although your actual costs may be higher or lower, based on these assumptions your costs would be:
| | | | | | | | | |
| | | 1 Year | | 3 Years | | 5 Years | | 10 Years |
Class Z | | $ 20 | | $ 64 | | $ 113 | | $ | 255 |
Class S | | $ 43 | | $135 | | $ 235 | | $ | 530 |
Class Y | | $ 46 | | $144 | | $ 252 | | $ | 567 |
Class L | | $ 41 | | $172 | | $ 315 | | $ | 731 |
Class A | | $638 | | $812 | | $1,001 | | $ | 1,546 |
Class N | | $201 | | $346 | | $ 614 | | $ | 1,380 |
Except for Class N shares, the figures shown above would be the same whether you sold your shares at the end of a period or kept them. For Class N shares, you would pay the following expenses if you did not redeem your shares:
| | | | | | | | |
| | | 1 Year | | 3 Years | | 5 Years | | 10 Years |
Class N | | $97 | | $346 | | $614 | | $1,380 |
| (1) | | A contingent deferred sales charge may apply to shares redeemed within 18 months of purchase from initial investments of $1 million or more. |
| (2) | | Applies to shares redeemed within 18 months of purchase. |
| (3) | | Other Expenses include Acquired Fund fees and expenses, which represent approximate expenses borne indirectly by the Fund in its most recent fiscal year through investments in other pooled investment vehicles. The amount of Acquired Fund fees and expenses may change in the coming year due to a number of factors including, among others, a change in allocation of the Fund’s investments among other pooled investment vehicles. |
| (4) | | Because Total Annual Fund Operating Expenses include Acquired Fund fees and expenses, they may not correspond to the ratios of expenses to average daily net assets shown in the “Financial Highlights” tables in this prospectus, which reflect the operating expenses of the Fund and do not include Acquired Fund fees and expenses. |
| (5) | | The expenses in the above table reflect a written agreement by MassMutual to waive .20% of other expenses for Class L, Class A and Class N of the Fund through March 31, 2008. The agreement cannot be terminated unilaterally by MassMutual. |
| (6) | | Employee benefit plans which invest in the Fund through MassMutual separate investment accounts may pay additional charges under their group annuity contract or services agreement. Investors who purchase shares directly from the Fund may also be subject to charges imposed in their administrative services or other agreement with MassMutual or MassMutual affiliate. None of these charges are deducted from Fund assets. |
– 27 –
MassMutual Select Core Opportunities Fund
Investment Objective
This Fund seeks long-term growth of capital.
Principal Investment Strategies and Risks
The Fund seeks to achieve its objective by normally investing at least 80% of its net assets in equity securities and securities convertible into common stocks traded on U.S. exchanges and issued by large, established companies. The Fund’s Sub-Adviser, Victory Capital Management Inc. (“Victory”), seeks to invest in both growth and value securities.
| · | Growth stocks are stocks of companies that the Sub-Adviser believes will experience earnings growth; and |
| · | Value stocks are stocks that the Sub-Adviser believes are intrinsically worth more than their market value. |
In making investment decisions, the Sub-Adviser may consider cash flow, book value, dividend yield, growth potential, quality of management, adequacy of revenues, earnings, capitalization, relation to historical earnings, the value of the issuer’s underlying assets, and expected future relative earnings growth. The Sub-Adviser will pursue investments that provide above average dividend yield or potential for appreciation.
The Principal Risks of investing in the Fund are Market Risk, Credit Risk, Management Risk, Derivative Risk, Foreign Investment Risk, Currency Risk, Growth Company Risk, Value Company Risk and Leveraging Risk.
These Risks are described beginning on page 100.
Annual Performance
The Fund began operations March 31, 2006, and does not have a full calendar year of returns. There will be risks of investing in the Fund because the returns can be expected to vary from year to year.
Average Annual Total Returns
Because this Fund does not have a full calendar year of returns, there is no table which shows how the Fund’s returns have deviated from the broad market.
Expense Information
| | | | | | | | | | | | | | | |
| | | Class S | | | Class Y | | | Class L | | | Class A | | | Class N | |
| Shareholder Fees (fees paid directly from your investment) | | | | | | | | | | | | | | | |
Maximum Sales Charge (Load) on purchases (as a % of offering price) | | None | | | None | | | None | | | 5.75% | | | None | |
Maximum Deferred Sales Charge (Load) (as a % of the lower of the original offering price or redemption proceeds) | | None | | | None | | | None | | | None | (1) | | 1.00% | (2) |
| Annual Fund Operating Expenses (expenses that are deducted from Fund assets) (% of average net assets) | | | | | | | | | | | | | | | |
Management Fees | | .70% | | | .70% | | | .70% | | | .70% | | | .70% | |
Distribution and Service (Rule 12b-1) Fees | | None | | | None | | | None | | | .25% | | | .50% | |
Other Expenses(3) | | .47% | | | .57% | | | .72% | | | .72% | | | .77% | |
| Total Annual Fund Operating Expenses(4) | | 1.17% | | | 1.27% | | | 1.42% | | | 1.67% | | | 1.97% | |
| | | | | | | | | | | | | | | |
Less Expense Reimbursement | | (.27% | ) | | (.32% | ) | | (.32% | ) | | (.32% | ) | | (.32% | ) |
Net Fund Expenses(5)(6) | | .90% | | | .95% | | | 1.10% | | | 1.35% | | | 1.65% | |
Examples
These examples are intended to help you compare the cost of investing in the Fund with the cost of investing in other mutual funds. The examples assume that you invest $10,000 in each share class of the Fund for the time periods indicated and then redeem all of your shares at the end of those periods. For Class A shares, the examples include the initial sales charge. The examples also assume that your investment earns a 5% return each year and that the Fund’s operating expenses remain the same.
– 28 –
Although your actual costs may be higher or lower, based on these assumptions your costs would be:
| | | | | | |
| | | 1 Year | | 3 Years |
Class S | | $ | 92 | | $ | 345 |
Class Y | | $ | 97 | | $ | 371 |
Class L | | $ | 112 | | $ | 418 |
Class A | | $ | 705 | | $ | 1,042 |
Class N | | $ | 271 | | $ | 587 |
Except for Class N shares, the figures shown above would be the same whether you sold your shares at the end of a period or kept them. For Class N shares, you would pay the following expenses if you did not redeem your shares:
| | | | | | |
| | | 1 Year | | 3 Years |
Class N | | $ | 168 | | $ | 587 |
| (1) | | A contingent deferred sales charge may apply to shares redeemed within 18 months of purchase from initial investments of $1 million or more. |
| (2) | | Applies to shares redeemed within 18 months of purchase. |
| (3) | | Other Expenses include Acquired Fund fees and expenses, which represent approximate expenses borne indirectly by the Fund in its most recent fiscal year through investments in other pooled investment vehicles. The amount of Acquired Fund fees and expenses may change in the coming year due to a number of factors including, among others, a change in allocation of the Fund’s investments among other pooled investment vehicles. |
| (4) | | Because Total Annual Fund Operating Expenses include Acquired Fund fees and expenses, they may not correspond to the ratios of expenses to average daily net assets shown in the “Financial Highlights” tables in this prospectus, which reflect the operating expenses of the Fund and do not include Acquired Fund fees and expenses. |
| (5) | | The expenses in the above table reflect a written agreement by MassMutual to cap the fees and expenses of the Fund (other than extraordinary litigation and legal expenses, or other non-recurring or unusual expenses), excluding Acquired Fund fees and expenses, through March 31, 2008 to the extent that Net Fund Expenses would otherwise exceed .90%, .95%, 1.10%, 1.35% and 1.65% for Classes S, Y, L, A and N, respectively. The agreement cannot be terminated unilaterally by MassMutual. |
| (6) | | Employee benefit plans which invest in the Fund through MassMutual separate investment accounts may pay additional charges under their group annuity contract or services agreement. Investors who purchase shares directly from the Fund may also be subject to charges imposed in their administrative services or other agreement with MassMutual or MassMutual affiliate. None of these charges are deducted from Fund assets. |
Victory Prior Performance for Similar Accounts*
The bar chart illustrates the variability of returns achieved by Victory for all accounts with investment objectives, policies and investment strategies similar to that of the Fund. The composite performance does not represent the historical performance of the Fund and should not be interpreted as being indicative of future performance of the Fund.
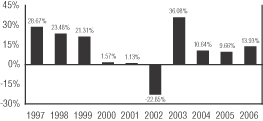
During the periods shown above, the highest quarterly return was 19.90% for the quarter ended June 30, 2003 and the lowest was -19.00% for the quarter ended September 30, 2002.
Victory Average Annual Total Returns for Similar Accounts*
(for the periods ended December 31, 2006)
The table compares Victory’s investment results for all accounts with investment objectives, policies and investment strategies similar to that of the Fund to an index measuring the broad market over different time periods.
| | | | | | |
| | | One
Year | | Five
Years | | Ten
Years |
Victory Composite | | | | | | |
Class S* | | 13.93% | | 7.73% | | 11.13% |
Class Y* | | 13.88% | | 7.68% | | 11.08% |
Class L* | | 13.73% | | 7.53% | | 10.93% |
Class A* | | 6.96% | | 6.01% | | 10.02% |
Class N* | | 12.18% | | 6.97% | | 10.37% |
| | | | | | | |
S&P 500® Index^ | | 15.78% | | 6.19% | | 8.42% |
* Performance shown is a composite of all portfolios managed by Victory with substantially similar investment objectives, policies and investment strategies as the Fund, and without significant client-imposed restrictions, adjusted to reflect the fees and expenses of each of the Fund’s share classes, including sales loads. The bar chart is based on Class S expenses. The composite performance does not represent the historical performance of the MassMutual Select Core Opportunities Fund and should not be interpreted as being indicative of the future performance of the Fund. For additional information, please refer to “Investment Performance” in this Prospectus. Performance shown does not reflect fees that may be paid by investors for administrative services or group annuity contract charges.
^ The S&P 500® Index is a widely recognized, unmanaged index representative of common stocks of larger capitalized U.S. companies. The Index does not incur expenses or reflect any deduction for taxes and cannot be purchased directly by investors.
– 29 –
MassMutual Select Blue Chip Growth Fund
Investment Objective
This Fund seeks growth of capital over the long term.
Principal Investment Strategies and Risks
The Fund seeks to achieve its objective by normally investing at least 80% of net assets in the common stocks of large and medium-sized blue chip growth companies. These are firms that, in the view of the Fund’s Sub-Adviser, T. Rowe Price Associates, Inc. (“T. Rowe Price”), are well established in their industries and have the potential for above-average earnings growth. The Sub-Adviser focuses on companies with leading market position, seasoned management, and strong financial fundamentals. The investment approach reflects the Sub-Adviser’s belief that solid company fundamentals (with emphasis on strong growth in earnings per share or operating cash flow) combined with a positive industry outlook will ultimately reward investors with strong investment performance. Some of the companies targeted will have good prospects for dividend growth.
In pursuing its investment objective, the Fund’s Sub-Adviser has the discretion to purchase some securities that do not meet its normal investment criteria, as described above, when it perceives an unusual opportunity for gain. These special situations might arise when the Fund’s Sub-Adviser believes a security could increase in value for a variety of reasons, including a change in management, an extraordinary corporate event, or a temporary imbalance in the supply of or demand for the securities.
While most assets will be invested in U.S. common stocks, other securities may also be purchased, including foreign stocks, futures, and options, in keeping with Fund objectives. The Fund’s investments in foreign securities are limited to 20% of its total assets.
The Fund may sell securities for a variety of reasons, such as to secure gains, limit losses, or redeploy assets into more promising opportunities.
The Principal Risks of investing in the Fund are Market Risk, Credit Risk, Management Risk, Derivative Risk, Foreign Investment Risk, Currency Risk, Growth Company Risk and Leveraging Risk.
These Risks are described beginning on page 100.
Annual Performance(1)
The bar chart shows the risks of investing in the Fund by showing changes in the Fund’s performance from year to year. Sales charges and taxes are not included in the calculations of returns in this bar chart. If those charges and taxes were included, the returns would be lower than those shown.
Class S Shares
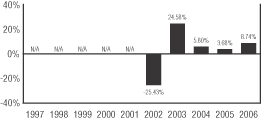
During the periods shown above, the highest quarterly return for the Fund was 13.21% for the quarter ended June 30, 2003 and the lowest quarterly return was -16.12% for the quarter ended September 30, 2002.
Average Annual Total Returns(1)
(for the periods ended December 31, 2006)
The table shows the risk of investing in the Fund by comparing the Fund’s returns with a broad measure of market performance over different time periods.
| | | | | | | |
| | | One
Year | | Five
Years | | Since Inception (6/1/01) |
Return Before Taxes –
Class S | | 8.74% | | 2.07% | | | 0.15% |
Return After Taxes on Distributions –
Class S | | 8.69% | | 2.02% | | | 0.10% |
Return After Taxes on Distributions and Sale of Fund Shares – Class S | | 5.74% | | 1.76% | | | 0.12% |
Return Before Taxes –
Class Y | | 8.64% | | 1.93% | | | 0.02% |
Return Before Taxes –
Class L | | 8.52% | | 1.81% | | - | 0.10% |
Return Before Taxes –
Class A+ | | 1.99% | | 0.36% | | - | 1.42% |
Return Before Taxes –
Class N+ | | 6.96% | | 1.24% | | - | 0.68% |
| | | | | | | | |
Russell 1000® Growth Index^ | | 9.07% | | 2.69% | | | 0.62% |
S&P 500® Index^^ | | 15.78% | | 6.19% | | | 3.99% |
– 30 –
(1) Performance shown does not reflect fees that may be paid by investors for administrative services or group annuity contract charges.
+ Performance for Class A shares of the Fund reflects any applicable sales charge. Performance for Class N shares of the Fund prior to December 31, 2002 is based on Class A shares, adjusted to reflect Class N expenses, and also reflects any applicable sales charge.
^ The Russell 1000® Growth Index is an unmanaged index consisting of those Russell 1000 securities (representing the 1000 largest U.S. companies based on market capitalization) with greater than average growth orientation that tend to exhibit higher price-to-book ratios and forecasted growth values than securities in the value universe. The Index does not incur expenses or reflect any deduction for taxes and cannot be purchased directly by investors.
^^ The S&P 500® Index is a widely recognized, unmanaged index representative of common stocks of larger capitalized U.S. companies. The Index does not incur expenses or reflect any deduction for taxes and cannot be purchased directly by investors.
Going forward, the Fund’s performance will be compared to the Russell 1000 Growth Index rather than the S&P 500 Index because the Russell 1000 Growth Index more closely represents the Fund’s investment strategy. The Fund will retain the S&P 500 Index as its supplemental benchmark for performance comparisons.
After-tax returns are calculated using the historical highest individual federal marginal income tax rates and do not reflect the impact of state and local taxes.
Actual after-tax returns depend on an investor’s tax situation and may differ from those shown, and after-tax returns shown are not relevant to investors who hold their Fund shares through tax-deferred arrangements, such as 401(k) plans or individual retirement accounts.
After-tax returns are shown for only Class S and after-tax returns for other classes will vary.
Expense Information
| | | | | | | | | | | | |
| | | Class S | | Class Y | | Class L | | Class A | | | Class N | |
| Shareholder Fees (fees paid directly from your investment) | | | | | | | | | | | | |
Maximum Sales Charge (Load) on purchases (as a % of offering price) | | None | | None | | None | | 5.75% | | | None | |
Maximum Deferred Sales Charge (Load) (as a % of the lower of the original offering price or redemption proceeds) | | None | | None | | None | | None | (1) | | 1.00% | (2) |
| | | | | | | | | | | | | | | |
| | | Class S | | | Class Y | | | Class L | | | Class A | | | Class N | |
| Annual Fund Operating Expenses (expenses that are deducted from Fund assets) (% of average net assets) | | | | | | | | | | | | | | | |
Management Fees | | .70% | | | .70% | | | .70% | | | .70% | | | .70% | |
Distribution and Service (Rule 12b-1) Fees | | None | | | None | | | None | | | .25% | | | .50% | |
Other Expenses(3) | | .19% | | | .30% | | | .44% | | | .44% | | | .49% | |
| Total Annual Fund Operating Expenses(4) | | .89% | | | 1.00% | | | 1.14% | | | 1.39% | | | 1.69% | |
| | | | | | | | | | | | | | | |
Less Expense Reimbursement(5) | | (.10% | ) | | (.10% | ) | | (.10% | ) | | (.10% | ) | | (.10% | ) |
Net Fund Expenses(6) | | .79% | | | .90% | | | 1.04% | | | 1.29% | | | 1.59% | |
Examples
These examples are intended to help you compare the cost of investing in the Fund with the cost of investing in other mutual funds. The examples assume that you invest $10,000 in each share class of the Fund for the time periods indicated and then redeem all of your shares at the end of those periods. For Class A shares, the examples include the initial sales charge. The examples also assume that your investment earns a 5% return each year and that the Fund’s operating expenses remain the same. Although your actual costs may be higher or lower, based on these assumptions your costs would be:
| | | | | | | | |
| | | 1 Year | | 3 Years | | 5 Years | | 10 Years |
Class S | | $ 81 | | $274 | | $ 483 | | $1,087 |
Class Y | | $ 92 | | $308 | | $ 543 | | $1,216 |
Class L | | $106 | | $352 | | $ 618 | | $1,377 |
Class A | | $699 | | $980 | | $1,283 | | $2,139 |
Class N | | $265 | | $523 | | $ 908 | | $1,989 |
Except for Class N shares, the figures shown above would be the same whether you sold your shares at the end of a period or kept them. For Class N shares, you would pay the following expenses if you did not redeem your shares:
| | | | | | | | |
| | | 1 Year | | 3 Years | | 5 Years | | 10 Years |
Class N | | $162 | | $523 | | $908 | | $1,989 |
| (1) | | A contingent deferred sales charge may apply to shares redeemed within 18 months of purchase from initial investments of $1 million or more. |
| (2) | | Applies to shares redeemed within 18 months of purchase. |
| (3) | | Other Expenses include Acquired Fund fees and expenses, which represent approximate expenses borne indirectly by the |
– 31 –
| | Fund in its most recent fiscal year through investments in other pooled investment vehicles. The amount of Acquired Fund fees and expenses may change in the coming year due to a number of factors including, among others, a change in allocation of the Fund’s investments among other pooled investment vehicles. |
| (4) | | Because Total Annual Fund Operating Expenses include Acquired Fund fees and expenses, they may not correspond to the ratios of expenses to average daily net assets shown in the “Financial Highlights” tables in this prospectus, which reflect the operating expenses of the Fund and do not include Acquired Fund fees and expenses. |
| (5) | | The expenses in the above table reflect a written agreement by MassMutual to waive .10% of the management fee through March 31, 2008. The agreement cannot be terminated unilaterally by MassMutual. |
| (6) | | Employee benefit plans which invest in the Fund through MassMutual separate investment accounts may pay additional charges under their group annuity contract or services agreement. Investors who purchase shares directly from the Fund may also be subject to charges imposed in their administrative services or other agreement with MassMutual or MassMutual affiliate. None of these charges are deducted from Fund assets. |
T. Rowe Price Prior Performance for Similar Accounts*
The bar chart illustrates the variability of returns achieved by T. Rowe Price for accounts with investment objectives, policies and investment strategies similar to that of the Fund. The composite performance does not represent the historical performance of the Fund and should not be interpreted as being indicative of future performance of the Fund.
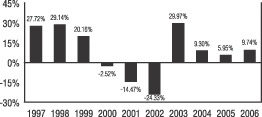
During the periods shown above, the highest quarterly return was 24.79% for the quarter ended December 31, 1998 and the lowest was -17.18% for the quarter ended March 31, 2001.
T. Rowe Price Average Annual Total Returns for Similar Accounts*
(for the periods ended December 31, 2006)
The table compares T. Rowe Price’s investment results for accounts with investment objectives, policies and investment strategies similar to that of the Fund to that of an index measuring the broad market over different time periods.
| | | | | | |
| | | One
Year | | Five
Years | | Ten
Years |
T. Rowe Price Composite | | | | | | |
Class S* | | 9.74% | | 4.56% | | 7.52% |
Class Y* | | 9.63% | | 4.45% | | 7.41% |
Class L* | | 9.50% | | 4.32% | | 7.28% |
Class A* | | 2.97% | | 2.84% | | 6.39% |
Class N* | | 7.95% | | 3.76% | | 6.72% |
| | | | | | | |
Russell 1000 Growth Index^ | | 9.07% | | 2.69% | | 5.44% |
S&P 500 Index^^ | | 15.78% | | 6.19% | | 8.42% |
* Performance shown is from a composite of all discretionary, fee paying portfolios managed by T. Rowe Price with substantially similar investment objectives, policies and investment strategies and without significant client-imposed restrictions, adjusted to reflect the fees and expenses of each of the Fund’s share classes, including sales loads. The bar chart is based on Class S expenses. T. Rowe Price replaced Fidelity Management & Research Company as the Fund’s Sub-Adviser on February 16, 2006. The composite performance does not represent the historical performance of the MassMutual Select Blue Chip Growth Fund and should not be interpreted as being indicative of the future performance of the Fund. For additional information, please refer to “Investment Performance” in this Prospectus. Performance shown does not reflect fees that may be paid by investors for administrative services or group annuity contract charges.
^ The Russell 1000 Growth Index is an unmanaged index consisting of those Russell 1000 securities (representing the 1000 largest U.S. companies based on market capitalization) with greater than average growth orientation that tend to exhibit higher price-to-book ratios and forecasted growth values than securities in the value universe. The Index does not incur expenses or reflect any deduction for taxes and cannot be purchased directly by investors.
^^ The S&P 500 Index is a widely recognized, unmanaged index representative of common stocks of larger capitalized U.S. companies. The Index does not incur expenses or reflect any deduction for taxes and cannot be purchased directly by investors.
– 32 –
[THIS PAGE INTENTIONALLY LEFT BLANK]
MassMutual Select Large Cap Growth Fund
Investment Objective
The Fund seeks long-term growth of capital and future income.
Principal Investment Strategies and Risks
The Fund seeks to achieve its objective by normally investing at least 80% of its net assets in the common stocks and securities convertible into common stocks of companies which the Fund’s Sub-Adviser, AllianceBernstein L.P. (“AllianceBernstein”), believes offer prospects for long-term growth and which, at the time of purchase, have market capitalizations of at least approximately $10 billion. AllianceBernstein may invest the Fund’s assets in securities of foreign issuers in addition to securities of domestic issuers.
AllianceBernstein’s investment strategy focuses on a relatively small number of intensively researched companies. AllianceBernstein selects the Fund’s investments from a research universe of more than 500 companies that have strong management, superior industry positions, excellent balance sheets and superior earnings growth. Normally, AllianceBernstein invests in about 40-60 companies, with the 25 most highly regarded of these companies usually constituting approximately 70% of the Fund’s net assets. AllianceBernstein will also add and trim core positions on market weakness or strength, assessing the optimal price range for each stock. This disciplined strategy may add value over time, particularly in volatile markets, and may provide some protection in poor performing markets.
The Principal Risks of investing in the Fund are Market Risk, Credit Risk, Management Risk, Liquidity Risk, Derivative Risk, Foreign Investment Risk, Emerging Markets Risk, Currency Risk, Growth Company Risk and Leveraging Risk.
These Risks are described beginning on page 100.
Annual Performance(1)
The bar chart shows the risks of investing in the Fund by showing changes in the Fund’s performance from year to year. Sales charges and taxes are not included in the calculations of returns in this bar chart. If those charges and taxes were included, the returns would be lower than those shown.
Class S Shares
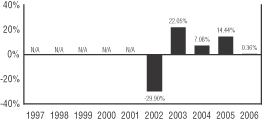
During the periods shown above, the highest quarterly return for the Fund was 12.39% for the quarter ended June 30, 2003 and the lowest quarterly return was -17.39% for the quarter ended June 30, 2002.
Average Annual Total Returns(1)
(for the periods ended December 31, 2006)
The table shows the risk of investing in the Fund by comparing the Fund’s returns with a broad measure of market performance over different time periods.
| | | | | | |
| | | One
Year | | Five Years | | Since Inception (12/31/01) |
Return Before Taxes –Class S | | 0.36% | | 1.02% | | 1.02% |
Return After Taxes on Distributions – Class S | | -0.22% | | 0.90% | | 0.90% |
Return After Taxes on Distributions and Sale of Fund Shares – Class S | | 1.01% | | 0.87% | | 0.87% |
Return Before Taxes –Class Y | | 0.37% | | 0.97% | | 0.96% |
Return Before Taxes –Class L | | 0.17% | | 1.08% | | 1.08% |
Return Before Taxes – Class A+ | | -5.77% | | -0.61% | | -0.61% |
Return Before Taxes – Class N+ | | -1.37% | | 0.26% | | 0.26% |
| | | | | | | |
Russell 1000® Growth Index^ | | 9.07% | | 2.69% | | 2.38% |
S&P 500® Index^^ | | 15.78% | | 6.19% | | 5.94% |
(1) Performance shown does not reflect fees that may be paid by investors for administrative services or group annuity contract charges.
+ Performance for Class A shares of the Fund reflects any applicable sales charge. Performance for Class N shares of the Fund prior to December 31, 2002 is based on Class A shares, adjusted to reflect Class N expenses, and also reflects any applicable sales charge.
– 34 –
^ The Russell 1000® Growth Index is an unmanaged index consisting of those Russell 1000 securities (representing the 1000 largest U.S. companies based on market capitalization) with greater than average growth orientation that tend to exhibit higher price-to-book ratios and forecasted growth values than securities in the value universe. The Index does not incur expenses or reflect any deduction for taxes and cannot be purchased directly by investors.
^^ The S&P 500® Index is a widely recognized, unmanaged index representative of common stocks of larger capitalized U.S. companies. The Index does not incur expenses or reflect any deduction for taxes and cannot be purchased directly by investors.
Going forward, the Fund’s performance will be compared to the Russell 1000 Growth Index rather than the S&P 500 Index because the Russell 1000 Growth Index more closely represents the Fund’s investment strategy.
After-tax returns are calculated using the historical highest individual federal marginal income tax rates and do not reflect the impact of state and local taxes.
Actual after-tax returns depend on an investor’s tax situation and may differ from those shown, and after-tax returns shown are not relevant to investors who hold their Fund shares through tax-deferred arrangements, such as 401(k) plans or individual retirement accounts.
After-tax returns are shown for only Class S and after-tax returns for other classes will vary.
Expense Information
| | | | | | | | | | | | |
| | | Class S | | Class Y | | Class L | | Class A | | | Class N | |
| Shareholder Fees (fees paid directly from your investment) | | | | | | | | | | | | |
Maximum Sales Charge (Load) on purchases (as a % of offering price) | | None | | None | | None | | 5.75% | | | None | |
Maximum Deferred Sales Charge (Load) (as a % of the lower of the original offering price or redemption proceeds) | | None | | None | | None | | None | (1) | | 1.00% | (2) |
| Annual Fund Operating Expenses (expenses that are deducted from Fund assets) (% of average net assets) | | | | | | | | | | | | |
Management Fees | | .65% | | .65% | | .65% | | .65% | | | .65% | |
Distribution and Service (Rule 12b-1) Fees | | None | | None | | None | | .25% | | | .50% | |
Other Expenses(3) | | .29% | | .33% | | .50% | | .49% | | | .54% | |
| Total Annual Fund Operating Expenses(4)(5) | | .94% | | .98% | | 1.15% | | 1.39% | | | 1.69% | |
Examples
These examples are intended to help you compare the cost of investing in the Fund with the cost of investing in other mutual funds. The examples assume that you invest $10,000 in each share class of the Fund for the time periods indicated and then redeem all of your shares at the end of those periods. For Class A shares, the examples include the initial sales charge. The examples also assume that your investment earns a 5% return each year and that the Fund’s operating expenses remain the same. Although your actual costs may be higher or lower, based on these assumptions your costs would be:
| | | | | | | | | | | | |
| | | 1 Year | | 3 Years | | 5 Years | | 10 Years |
Class S | | $ | 96 | | $ | 300 | | $ | 520 | | $ | 1,155 |
Class Y | | $ | 100 | | $ | 312 | | $ | 542 | | $ | 1,201 |
Class L | | $ | 117 | | $ | 365 | | $ | 633 | | $ | 1,398 |
Class A | | $ | 708 | | $ | 990 | | $ | 1,292 | | $ | 2,148 |
Class N | | $ | 275 | | $ | 533 | | $ | 918 | | $ | 1,998 |
Except for Class N shares, the figures shown above would be the same whether you sold your shares at the end of a period or kept them. For Class N shares, you would pay the following expenses if you did not redeem your shares:
| | | | | | | | |
| | | 1 Year | | 3 Years | | 5 Years | | 10 Years |
Class N | | $172 | | $533 | | $ 918 | | $1,998 |
| (1) | | A contingent deferred sales charge may apply to shares redeemed within 18 months of purchase from initial investments of $1 million or more. |
| (2) | | Applies to shares redeemed within 18 months of purchase. |
| (3) | | Other Expenses include Acquired Fund fees and expenses, which represent approximate expenses borne indirectly by the Fund in its most recent fiscal year through investments in other pooled investment vehicles. The amount of Acquired Fund fees and expenses may change in the coming year due to a number of factors including, among others, a change in allocation of the Fund’s investments among other pooled investment vehicles. |
| (4) | | Because Total Annual Fund Operating Expenses include Acquired Fund fees and expenses, they may not correspond to the ratios of expenses to average daily net assets shown in the “Financial Highlights” tables in this prospectus, which reflect the operating expenses of the Fund and do not include Acquired Fund fees and expenses. |
| (5) | | Employee benefit plans which invest in the Fund through MassMutual separate investment accounts may pay additional charges under their group annuity contract or services agreement. Investors who purchase shares directly from the Fund may also be subject to charges imposed in their administrative services or other agreement with MassMutual or MassMutual affiliate. None of these charges are deducted from Fund assets. |
– 35 –
AllianceBernstein Prior Performance for
Similar Accounts*
The bar chart illustrates the variability of returns achieved by AllianceBernstein for accounts with investment objectives, policies and investment strategies similar to that of the Fund. The composite performance does not represent the historical performance of the Fund and should not be interpreted as being indicative of future performance of the Fund.
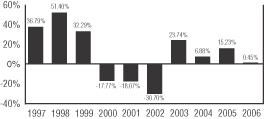
During the periods shown above, the highest quarterly return was 30.94% for the quarter ended December 31, 1998 and the lowest was -17.53% for the quarter ended September 30, 2001.
AllianceBernstein Average Annual
Total Returns for Similar Accounts*
(for the periods ended December 31, 2006)
The table compares AllianceBernstein’s investment results for accounts with investment objectives, policies and investment strategies similar to that of the Fund to an index measuring the broad market over different time periods.
| | | | | | | |
| | | One
Year | | Five
Years | | Ten
Years |
| AllianceBernstein Composite | | | | | | | |
Class S* | | | 0.45% | | 1.19% | | 6.95% |
Class Y* | | | 0.41% | | 1.15% | | 6.91% |
Class L* | | | 0.24% | | 1.00% | | 6.76% |
Class A* | | - | 5.75% | | -0.45% | | 5.87% |
Class N* | | - | 1.30% | | 0.43% | | 6.19% |
| | | | | | | | |
Russell 1000 Growth Index^ | | | 9.07% | | 2.69% | | 5.44% |
S&P 500 Index^^ | | | 15.78% | | 6.19% | | 8.42% |
* Performance shown is the composite of all fee-paying discretionary tax-exempt accounts with assets over $10 million managed by AllianceBernstein with substantially similar investment objectives, policies and investment strategies and without significant client-imposed restrictions, adjusted to reflect the fees and expenses of each of the Fund’s share classes, including sales loads. The bar chart is based on Class S expenses. The composite performance does not represent the historical performance of the MassMutual Select Large Cap Growth Fund and should not be interpreted as being indicative of the future performance of the Fund. For additional information, please refer to “Investment Performance” in this Prospectus. Performance shown does not reflect fees that may be paid by investors for administrative services or group annuity contract charges.
^ The Russell 1000 Growth Index is an unmanaged index consisting of those Russell 1000 securities (representing the 1000 largest U.S. companies based on market capitalization) with greater than average growth orientation that tend to exhibit higher price-to-book ratios and forecasted growth values than securities in the value universe. The Index does not incur expenses or reflect any deduction for taxes and cannot be purchased directly by investors.
^^ The S&P 500 Index is a widely recognized, unmanaged index representative of common stocks of larger capitalized U.S. companies. The Index does not incur expenses or reflect any deduction for taxes and cannot be purchased directly by investors.
– 36 –
[THIS PAGE INTENTIONALLY LEFT BLANK]
MassMutual Select Growth Equity Fund
Investment Objective
This Fund seeks long-term growth of capital and future income.
Principal Investment Strategies and Risks
The Fund seeks to achieve its objective by normally investing at least 80% of its net assets in the common stocks and securities convertible into common stocks of companies which the Fund’s Sub-Adviser, Grantham, Mayo, Van Otterloo & Co. LLC (“GMO”), believes offer prospects for long-term growth.
GMO uses proprietary research and multiple quantitative models to identify stocks it believes are undervalued and stocks in the growth universe it believes have improving fundamentals. Generally, these stocks are trading at prices below what GMO believes to be their intrinsic value. GMO also uses proprietary techniques to adjust the portfolio for factors such as stock selection discipline, industry and sector weight, and market capitalization. The factors considered by GMO and the models may change over time.
The Fund intends to be fully invested, and generally will not take temporary defensive positions through investment in cash and high quality money market instruments. In pursuing its investment strategy, the Fund may (but is not obligated to) use a wide variety of exchange-traded and over-the-counter derivative instruments, including options, futures, and swap contracts to (i) hedge equity exposure; (ii) replace direct investing (e.g., creating equity exposure through the use of futures contracts or other derivative instruments); and (iii) manage risk by implementing shifts in investment exposure.
The Principal Risks of investing in the Fund are Market Risk, Credit Risk, Management Risk, Derivative Risk, Growth Company Risk, Leveraging Risk and Portfolio Turnover Risk.
These Risks are described beginning on page 100.
Annual Performance(1)
The bar chart shows the risks of investing in the Fund by showing changes in the Fund’s performance from year to year. Sales charges and taxes are not included in the calculations of returns in this bar chart. If those charges and taxes were included, the returns would be lower than those shown.
Class S Shares
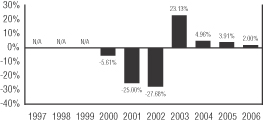
During the periods shown above, the highest quarterly return for the Fund was 14.88% for the quarter ended June 30, 2003 and the lowest quarterly return was -21.36% for the quarter ended September 30, 2001.
Average Annual Total Returns(1)
(for the periods ended December 31, 2006)
The table shows the risk of investing in the Fund by comparing the Fund’s returns with a broad measure of market performance over different time periods.
| | | | | | |
| | | One Year | | Five
Years | | Since Inception (5/3/99) |
Return Before Taxes – Class S | | 2.00% | | -0.19% | | -1.24% |
Return After Taxes on Distributions – Class S | | 1.90% | | -0.24% | | -1.66% |
Return After Taxes on Distributions and Sale of Fund Shares – Class S | | 1.43% | | -0.16% | | -1.25% |
Return Before Taxes – Class Y | | 1.88% | | -0.26% | | -1.32% |
Return Before Taxes – Class L | | 1.80% | | -0.40% | | -1.44% |
Return Before Taxes – Class A+ | | -4.33% | | -1.82% | | -2.44% |
Return Before Taxes – Class N+ | | 0.27% | | -0.95% | | -2.00% |
| | | | | | | |
Russell 1000® Growth Index^ | | 9.07% | | 2.69% | | -1.63% |
S&P 500® Index^^ | | 15.78% | | 6.19% | | 2.41% |
– 38 –
(1) Performance shown does not reflect fees that may be paid by investors for administrative services or group annuity contract charges.
+ Performance for Class A shares of the Fund reflects any applicable sales charge. Performance for Class N shares of the Fund prior to December 31, 2002 is based on Class A shares, adjusted to reflect Class N expenses, and also reflects any applicable sales charge.
^ The Russell 1000® Growth Index is an unmanaged index consisting of those Russell 1000 securities (representing the 1000 largest U.S. companies based on market capitalization) with greater than average growth orientation that tend to exhibit higher price-to-book ratios and forecasted growth values than securities in the value universe. The Index does not incur expenses or reflect any deduction for taxes and cannot be purchased directly by investors.
^^ The S&P 500® Index is a widely recognized, unmanaged index representative of common stocks of larger capitalized U.S. companies. The Index does not incur expenses or reflect any deduction for taxes and cannot be purchased directly by investors.
Going forward, the Fund’s performance will be compared to the Russell 1000 Growth Index rather than the S&P 500 Index because the Russell 1000 Growth Index more closely represents the Fund’s investment strategy.
After-tax returns are calculated using the historical highest individual federal marginal income tax rates and do not reflect the impact of state and local taxes.
Actual after-tax returns depend on an investor’s tax situation and may differ from those shown, and after-tax returns shown are not relevant to investors who hold their Fund shares through tax-deferred arrangements, such as 401(k) plans or individual retirement accounts.
After-tax returns are shown for only Class S and after-tax returns for other classes will vary.
Expense Information
| | | | | | | | | | | | |
| | | Class S | | Class Y | | Class L | | Class A | | | Class N | |
| Shareholder Fees (fees paid directly from your investment) | | | | | | | | | | | | |
Maximum Sales Charge (Load) on purchases (as a % of offering price) | | None | | None | | None | | 5.75% | | | None | |
Maximum Deferred Sales Charge (Load) (as a % of the lower of the original offering price or redemption proceeds) | | None | | None | | None | | None | (1) | | 1.00% | (2) |
| | | | | | | | | | |
| | | Class S | | Class Y | | Class L | | Class A | | Class N |
| Annual Fund Operating Expenses (expenses that are deducted from Fund assets) (% of average net assets) | | | | | | | | | | |
Management Fees | | .68% | | .68% | | .68% | | .68% | | .68% |
Distribution and Service (Rule 12b-1) Fees | | None | | None | | None | | .25% | | .50% |
Other Expenses(3) | | .11% | | .17% | | .32% | | .32% | | .37% |
| Total Annual Fund Operating Expenses(4)(5) | | .79% | | .85% | | 1.00% | | 1.25% | | 1.55% |
Examples
These examples are intended to help you compare the cost of investing in the Fund with the cost of investing in other mutual funds. The examples assume that you invest $10,000 in each share class of the Fund for the time periods indicated and then redeem all of your shares at the end of those periods. For Class A shares, the examples include the initial sales charge. The examples also assume that your investment earns a 5% return each year and that the Fund’s operating expenses remain the same. Although your actual costs may be higher or lower, based on these assumptions your costs would be:
| | | | | | | | |
| | | 1 Year | | 3 Years | | 5 Years | | 10 Years |
Class S | | $ 81 | | $252 | | $ 439 | | $ 978 |
Class Y | | $ 87 | | $271 | | $ 471 | | $1,049 |
Class L | | $102 | | $318 | | $ 552 | | $1,225 |
Class A | | $695 | | $949 | | $1,222 | | $1,999 |
Class N | | $261 | | $490 | | $ 845 | | $1,845 |
Except for Class N shares, the figures shown above would be the same whether you sold your shares at the end of a period or kept them. For Class N shares, you would pay the following expenses if you did not redeem your shares:
| | | | | | | | |
| | | 1 Year | | 3 Years | | 5 Years | | 10 Years |
Class N | | $158 | | $490 | | $845 | | $1,845 |
| (1) | | A contingent deferred sales charge may apply to shares redeemed within 18 months of purchase from initial investments of $1 million or more. |
| (2) | | Applies to shares redeemed within 18 months of purchase. |
| (3) | | Other Expenses include Acquired Fund fees and expenses, which represent approximate expenses borne indirectly by the Fund in its most recent fiscal year through investments in other |
– 39 –
| | pooled investment vehicles. The amount of Acquired Fund fees and expenses may change in the coming year due to a number of factors including, among others, a change in allocation of the Fund’s investments among other pooled investment vehicles. |
| (4) | | Because Total Annual Fund Operating Expenses include Acquired Fund fees and expenses, they may not correspond to the ratios of expenses to average daily net assets shown in the “Financial Highlights” tables in this prospectus, which reflect the operating expenses of the Fund and do not include Acquired Fund fees and expenses. |
| (5) | | Employee benefit plans which invest in the Fund through MassMutual separate investment accounts may pay additional charges under their group annuity contract or services agreement. Investors who purchase shares directly from the Fund may also be subject to charges imposed in their administrative services or other agreement with MassMutual or MassMutual affiliate. None of these charges are deducted from Fund assets. |
GMO Prior Performance for
Similar Accounts*
The bar chart illustrates the variability of returns achieved by GMO for accounts with investment objectives, policies and investment strategies similar to that of the Fund. The composite performance does not represent the historical performance of the Fund and should not be interpreted as being indicative of future performance of the Fund.
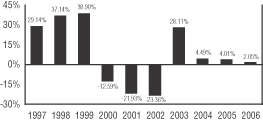
During the periods shown above, the highest quarterly return was 27.43% for the quarter ended December 31, 1998 and the lowest was -21.50% for the quarter ended March 31, 2001.
GMO Average Annual Total Returns for
Similar Accounts*
(for the periods ended December 31, 2006)
The table compares GMO’s investment results for accounts with investment objectives, policies and investment strategies similar to that of the Fund to that of an index measuring the broad market over different time periods.
| | | | | | |
| | | One Year | | Five Years | | Ten Years |
GMO Composite | | | | | | |
Class S* | | 2.05% | | 1.72% | | 6.22% |
Class Y* | | 1.99% | | 1.66% | | 6.16% |
Class L* | | 1.84% | | 1.51% | | 6.00% |
Class A* | | -4.25% | | 0.06% | | 5.12% |
Class N* | | 0.29% | | 0.95% | | 5.44% |
| | | | | | | |
Russell 1000 Growth Index^ | | 9.07% | | 2.69% | | 5.44% |
S&P 500 Index^^ | | 15.78% | | 6.19% | | 8.42% |
* Performance shown is the composite of all portfolios managed by GMO with substantially similar investment objectives, policies and investment strategies and without significant client-imposed restrictions, adjusted to reflect the fees and expenses of each of the Fund’s share classes, including sales loads. The bar chart is based on Class S expenses. GMO replaced Massachusetts Financial Services Company as the Fund’s Sub-Adviser on June 1, 2004. The composite performance does not represent the historical performance of the MassMutual Select Growth Equity Fund and should not be interpreted as being indicative of the future performance of the Fund. For additional information, please refer to “Investment Performance” in this Prospectus. Performance shown does not reflect fees that may be paid by investors for administrative services or group annuity contract charges.
^ The Russell 1000 Growth Index is an unmanaged index consisting of those Russell 1000 securities (representing the 1000 largest U.S. companies based on market capitalization) with greater than average growth orientation that tend to exhibit higher price-to-book ratios and forecasted growth values than securities in the value universe. The Index does not incur expenses or reflect any deduction for taxes and cannot be purchased directly by investors.
^^ The S&P 500 Index is a widely recognized, unmanaged index representative of common stocks of larger capitalized U.S. companies. The Index does not incur expenses or reflect any deduction for taxes and cannot be purchased directly by investors.
– 40 –
[THIS PAGE INTENTIONALLY LEFT BLANK]
MassMutual Select Aggressive Growth Fund
Investment Objective
This Fund seeks long-term capital appreciation.
Principal Investment Strategies and Risks
This Fund seeks to achieve its objective by investing primarily in U.S. common stocks and other equity securities. Under normal market conditions, the Fund invests at least 80% of its net assets in equity securities. Two Sub-Advisers manage the Fund, each being responsible for a portion of the portfolio, but not necessarily equal weighted.
Sands Capital Management, LLC (“Sands Capital”), generally seeks stocks with above average potential for growth in revenue and earnings, and with capital appreciation potential. In addition, the Sub-Adviser looks for companies that have a leadership position or proprietary niche that appears to be sustainable, that demonstrate a clear mission in an understandable business, that exhibit financial strength and that are valued rationally in relation to comparable companies in the market. Sands Capital emphasizes investments in large capitalization growth companies. Sands Capital does not typically invest in companies that have market capitalizations of less than $1 billion. Sands Capital may invest up to 20% of its portion of the portfolio in securities issued by non-U.S. companies.
Delaware Management Company (“DMC”), invests primarily in common stocks of large capitalization growth-oriented companies that DMC believes have long-term capital appreciation potential and are expected to grow faster than the U.S. economy. Using a bottom up approach, DMC seeks to select securities of companies that it believes have attractive end market potential, dominant business models and strong free cash flow generation that are attractively priced compared to the intrinsic value of the securities. DMC also considers a company’s operational efficiencies, management’s plans for capital allocation and the company’s shareholder orientation. DMC currently defines large capitalization companies as those that, at the time of investment, have market capitalizations within the range of market capitalizations of companies in the Russell 1000® Growth Index. While the market capitalization of companies in the Russell 1000 Growth Index ranged from approximately $1.18 billion to $424.52 billion as of January 31, 2007, DMC will normally invest in common stocks of companies with market capitalizations of at least $3 billion at the time of purchase.
The Fund is non-diversified, which means that it may hold larger positions in a smaller number of stocks than a diversified fund. As a result, an increase or decrease in value of a single stock could have a greater impact on the Fund’s net asset value and its total return. See “Non-Diversification Risk” on page 102.
The Principal Risks of investing in the Fund are Market Risk, Credit Risk, Management Risk, Liquidity Risk, Derivative Risk, Non-Diversification Risk, Foreign Investment Risk, Emerging Markets Risk, Currency Risk, Smaller Company Risk, Growth Company Risk and Leveraging Risk.
These Risks are described beginning on page 100.
Annual Performance(1)
The bar chart shows the risks of investing in the Fund by showing changes in the Fund’s performance from year to year. Sales charges and taxes are not included in the calculations of returns in this bar chart. If those charges and taxes were included, the returns would be lower than those shown.
Class S Shares
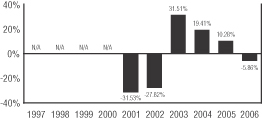
During the periods shown above, the highest quarterly return for the Fund was 20.09% for the quarter ended December 31, 2001 and the lowest quarterly return was -26.25% for the quarter ended March 31, 2001.
Average Annual Total Returns(1)
(for the periods ended December 31, 2006)
The table shows the risk of investing in the Fund by comparing the Fund’s returns with a broad measure of market performance over different time periods.
| | | | | | |
| | | One
Year | | Five
Years | | Since Inception (5/1/00) |
Return Before Taxes – Class S | | -5.86% | | 3.31% | | -6.73% |
Return After Taxes on
Distributions – Class S | | -5.86% | | 3.31% | | -6.75% |
Return After Taxes on Distributions and Sale of Fund Shares – Class S | | -3.81% | | 2.84% | | -5.55% |
Return Before Taxes – Class Y | | -5.90% | | 3.21% | | -6.83% |
Return Before Taxes – Class L | | -5.95% | | 3.05% | | -6.95% |
Return Before Taxes – Class A+ | | -11.72% | | 1.58% | | -8.02% |
Return Before Taxes – Class N+ | | -7.37% | | 2.53% | | -7.48% |
| | | | | | | |
Russell 1000® Growth Index^ | | 9.07% | | 2.69% | | -5.39% |
S&P 500® Index^^ | | 15.78% | | 6.19% | | 1.30% |
– 42 –
(1) Performance shown does not reflect fees that may be paid by investors for administrative services or group annuity contract charges.
+ Performance for Class A shares of the Fund reflects any applicable sales charge. Performance for Class N shares of the Fund prior to December 31, 2002 is based on Class A shares, adjusted to reflect Class N expenses, and also reflects any applicable sales charge.
^ The Russell 1000® Growth Index is an unmanaged index consisting of those Russell 1000 securities (representing the 1000 largest U.S. companies based on market capitalization) with greater than average growth orientation that tend to exhibit higher price-to-book ratios and forecasted growth values than securities in the value universe. The Index does not incur expenses or reflect any deduction for taxes and cannot be purchased directly by investors.
^^ The S&P 500® Index is a widely recognized, unmanaged index representative of common stocks of larger capitalized U.S. companies. The Index does not incur expenses or reflect any deduction for taxes and cannot be purchased directly by investors.
Going forward, the Fund’s performance will be compared to the Russell 1000 Growth Index rather than the S&P 500 Index because the Russell 1000 Growth Index more closely represents the Fund’s investment strategy.
After-tax returns are calculated using the historical highest individual federal marginal income tax rates and do not reflect the impact of state and local taxes.
Actual after-tax returns depend on an investor’s tax situation and may differ from those shown, and after-tax returns shown are not relevant to investors who hold their Fund shares through tax-deferred arrangements, such as 401(k) plans or individual retirement accounts.
After-tax returns are shown for only Class S and after-tax returns for other classes will vary.
Expense Information
| | | | | | | | | | | | |
| | | Class S | | Class Y | | Class L | | Class A | | | Class N | |
| Shareholder Fees (fees paid directly from your investment) | | | | | | | | | | | | |
Maximum Sales Charge (Load) on purchases (as a % of offering price) | | None | | None | | None | | 5.75% | | | None | |
Maximum Deferred Sales Charge (Load) (as a % of the lower of the original offering price or redemption proceeds) | | None | | None | | None | | None | (1) | | 1.00% | (2) |
| Annual Fund Operating Expenses (expenses that are deducted from Fund assets) (% of average net assets) | | | | | | | | | | | | |
Management Fees | | .73% | | .73% | | .73% | | .73% | | | .73% | |
Distribution and Service (Rule 12b-1) Fees | | None | | None | | None | | .25% | | | .50% | |
Other Expenses(3) | | .12% | | .22% | | .37% | | .37% | | | .42% | |
| Total Annual Fund Operating Expenses(4)(5) | | .85% | | .95% | | 1.10% | | 1.35% | | | 1.65% | |
Examples
These examples are intended to help you compare the cost of investing in the Fund with the cost of investing in other mutual funds. The examples assume that you invest $10,000 in each share class of the Fund for the time periods indicated and then redeem all of your shares at the end of those periods. For Class A shares, the examples include the initial sales charge. The examples also assume that your investment earns a 5% return each year and that the Fund’s operating expenses remain the same. Although your actual costs may be higher or lower, based on these assumptions your costs would be:
| | | | | | | | | | | | |
| | | 1 Year | | 3 Years | | 5 Years | | 10 Years |
Class S | | $ | 87 | | $ | 271 | | $ | 471 | | $ | 1,049 |
Class Y | | $ | 97 | | $ | 303 | | $ | 525 | | $ | 1,166 |
Class L | | $ | 112 | | $ | 350 | | $ | 606 | | $ | 1,340 |
Class A | | $ | 705 | | $ | 978 | | $ | 1,272 | | $ | 2,105 |
Class N | | $ | 271 | | $ | 520 | | $ | 897 | | $ | 1,955 |
Except for Class N shares, the figures shown above would be the same whether you sold your shares at the end of a period or kept them. For Class N shares, you would pay the following expenses if you did not redeem your shares:
| | | | | | | | | | | | |
| | | 1 Year | | 3 Years | | 5 Years | | 10 Years |
Class N | | $ | 168 | | $ | 520 | | $ | 897 | | $ | 1,955 |
| (1) | | A contingent deferred sales charge may apply to shares redeemed within 18 months of purchase from initial investments of $1 million or more. |
| (2) | | Applies to shares redeemed within 18 months of purchase. |
| (3) | | Other Expenses include Acquired Fund fees and expenses, which represent approximate expenses borne indirectly by the Fund in its most recent fiscal year through investments in other pooled investment vehicles. The amount of Acquired Fund fees and expenses may change in the coming year due to a number of factors including, among others, a change in allocation of the Fund’s investments among other pooled investment vehicles. |
| (4) | | Because Total Annual Fund Operating Expenses include Acquired Fund fees and expenses, they may not correspond to the ratios of expenses to average daily net assets shown in the “Financial Highlights” tables in this prospectus, which reflect the operating expenses of the Fund and do not include Acquired Fund fees and expenses. |
| (5) | | Employee benefit plans which invest in the Fund through MassMutual separate investment accounts may pay additional charges under their group annuity contract or services agreement. Investors who purchase shares directly from the Fund may also be subject to charges imposed in their administrative services or other agreement with MassMutual or MassMutual affiliate. None of these charges are deducted from Fund assets. |
– 43 –
Prior Performance for Similar Accounts managed by Sands Capital and DMC or certain of its affiliates*
The bar chart illustrates the variability of returns achieved by Sands Capital and DMC or certain of its affiliates for accounts with investment objectives, policies and investment strategies similar to that of the Fund. The composite performance does not represent the historical performance of the Fund and should not be interpreted as being indicative of future performance of the Fund.
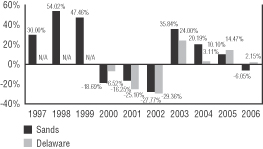
| | | | |
| | | Highest Quarter | | Lowest Quarter |
Sands Capital Composite | | 32.75%, 4Q 1998 | | -23.31%, 3Q 2001 |
DMC Composite | | 14.69%, 1Q 2000 | | -21.40%, 3Q 2001 |
Average Annual Total Returns for
Similar Accounts managed by Sands Capital and DMC or certain of its affiliates*
(for the periods ended December 31, 2006)
The table compares investment results for accounts managed by Sands Capital and DMC or certain of its affiliates with investment objectives, policies and investment strategies similar to that of the Fund to that of an index measuring the broad market over different time periods.
| | | | | | |
| | | One
Year | | Five
Years | | Ten
Years |
Sands Capital Composite | | | | | | |
Class S* | | -6.05% | | 4.05% | | 9.39% |
Class Y* | | -6.15% | | 3.95% | | 9.28% |
Class L* | | -6.30% | | 3.80% | | 9.13% |
Class A* | | -11.93% | | 2.32% | | 8.23% |
Class N* | | -7.85% | | 3.23% | | 8.55% |
| | | | | | | |
Russell 1000 Growth Index^ | | 9.07% | | 2.69% | | 5.44% |
S&P 500 Index^^ | | 15.78% | | 6.19% | | 8.42% |
| | | | | | |
| | | One
Year | | Five
Years | | Since
Inception (1/1/00) |
DMC Composite | | | | | | |
Class S* | | 2.15% | | 1.10% | | -4.22% |
Class Y* | | 2.05% | | 0.99% | | -4.32% |
Class L* | | 1.90% | | 0.84% | | -4.48% |
Class A* | | -4.19% | | -0.60% | | -5.53% |
Class N* | | 0.35% | | 0.28% | | -5.04% |
| | | | | | | |
Russell 1000 Growth Index^ | | 9.07% | | 2.69% | | -4.87% |
S&P 500 Index^^ | | 15.78% | | 6.19% | | 1.12% |
* Each Sub-Adviser’s Similar Account performance is a composite of all portfolios managed by that Sub-Adviser or, in the case of DMC, certain of its affiliates, with substantially similar investment objectives, policies and investment strategies and without significant client imposed restrictions, adjusted to reflect the fees and expenses of each of the Fund’s share classes, including sales loads. For DMC, the composite includes portfolios that are registered investment companies whose performance has been calculated gross of fees and adheres to Global Investment Performance Standards. The bar chart is based on Class S expenses. The portfolio management team responsible for the portfolios in the DMC composite changed to the team led by Mr. Van Harte on April 4, 2005. Certain changes were made to the investment policies and strategies of the portfolios in the DMC composite in connection with the changes to the portfolio management team. Sands Capital replaced Janus Capital Management LLC as the Fund’s Sub-Adviser on January 5, 2004. DMC became a co-Sub-Adviser of the Fund on June 6, 2006. The composite performance does not represent the historical performance of the MassMutual Select Aggressive Growth Fund and should not be interpreted as being indicative of the future performance of the Fund. For additional information, please refer to “Investment Performance” in this Prospectus. Performance shown does not reflect fees that may be paid by investors for administrative services or group annuity contract charges.
^ The Russell 1000 Growth Index is an unmanaged index consisting of those Russell 1000 securities (representing the 1000 largest U.S. companies based on market capitalization) with greater than average growth orientation that tend to exhibit higher price-to-book ratios and forecasted growth values than securities in the value universe. The Index does not incur expenses or reflect any deduction for taxes and cannot be purchased directly by investors.
^^ The S&P 500 Index is a widely recognized, unmanaged index representative of common stocks of larger capitalized U.S. companies. The Index does not incur expenses or reflect any deduction for taxes and cannot be purchased directly by investors.
– 44 –
[THIS PAGE INTENTIONALLY LEFT BLANK]
MassMutual Select OTC 100 Fund
Investment Objective
This Fund seeks to approximate as closely as practicable (before fees and expenses) the total return of the 100 largest publicly traded over-the-counter common stocks.
Principal Investment Strategies and Risks
This Fund seeks to achieve its objective by investing at least 80% of its net assets in the equity securities of companies included in the NASDAQ 100 Index®, which is generally recognized as representative of the over-the-counter market. The NASDAQ 100 Index is a modified capitalization-weighted index composed of the 100 largest non-financial companies listed on the National Association of Securities Dealers Automated Quotations System (“NASDAQ”). The NASDAQ 100 Index does not incur expenses and cannot be purchased directly by investors.
The Fund generally purchases securities in proportions that match their index weights. This is the primary strategy used by the Fund to achieve a capitalization-weighted total rate of return. Each company’s shares contribute to the Fund’s overall return in the same proportion as the value of the Company’s shares contributes to the NASDAQ 100 Index. However, the Fund’s Sub-Adviser, Northern Trust Investments, N.A., uses a process known as “optimization,” which is a statistical sampling technique. (See discussion of “Optimization” on page 217. Therefore, the Fund may not hold every stock in the Index. The Sub-Adviser believes that this approach allows the Fund to run an efficient and effective strategy to maximize the Fund’s liquidity while minimizing transaction costs. The Fund may also invest in other instruments whose performance is expected to correspond to the Index. The Fund may also use derivatives such as index futures and options, as described in “Additional Investment Policies and Risk Considerations.” The Sub-Adviser believes that these investments help the Fund approach the returns of a fully invested portfolio, while keeping cash on hand for liquidity purposes.
The Fund is non-diversified, which means that it may hold larger positions in a smaller number of stocks than a diversified fund. As a result, an increase or decrease in value of a single stock could have a greater impact on the Fund’s net asset value and its total return.
The Principal Risks of investing in the Fund are Market Risk, Credit Risk, Tracking Error Risk, Liquidity Risk, Derivative Risk, Non-Diversification Risk, Smaller Company Risk, Growth Company Risk, Over-the-Counter Risk and Leveraging Risk.
These Risks are described beginning on page 100.
Annual Performance(1)
The bar chart shows the risks of investing in the Fund by showing changes in the Fund’s performance from year to year. Sales charges and taxes are not included in the calculations of returns in this bar chart. If those charges and taxes were included, the returns would be lower than those shown.
Class S Shares
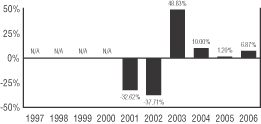
During the periods shown above, the highest quarterly return for the Fund was 34.75% for the quarter ended December 31, 2001 and the lowest quarterly return was -36.33% for the quarter ended September 30, 2001.
– 46 –
Average Annual Total Returns(1)
(for the periods ended December 31, 2006)
The table shows the risk of investing in the Fund by comparing the Fund’s returns with a broad measure of market performance over different time periods.
| | | | | | | |
| | | One
Year | | Five
Years | | Since Inception (5/1/00) |
Return Before Taxes –Class S | | 6.87% | | 1.98% | | - | 11.18% |
Return After Taxes on Distributions – Class S | | 6.87% | | 1.96% | | - | 11.19% |
Return After Taxes on Distributions and Sale of Fund Shares – Class S | | 4.47% | | 1.69% | | - | 8.94% |
Return Before Taxes –Class Y | | 6.68% | | 1.78% | | - | 11.31% |
Return Before Taxes –Class L | | 6.47% | | 1.66% | | - | 11.43% |
Return Before Taxes –Class A+ | | 0.20% | | 0.26% | | - | 12.41% |
Return Before Taxes –Class N+ | | 4.90% | | 1.10% | | - | 11.97% |
| | | | | | | | |
NASDAQ 100 Index®^ | | 6.79% | | 2.18% | | - | 10.83% |
(1) Performance shown does not reflect fees that may be paid by investors for administrative services or group annuity contract charges.
+ Performance for Class A shares of the Fund reflects any applicable sales charge. Performance for Class N shares of the Fund prior to December 31, 2002 is based on Class A shares, adjusted to reflect Class N expenses, and also reflects any applicable sales charge.
^ NASDAQ 100 Index® is a registered service mark of the NASDAQ Stock Market, Inc. (“NASDAQ”). The NASDAQ 100 Index is composed and calculated by NASDAQ without regard to the Fund. NASDAQ makes no warranty, express or implied, regarding, and bears no liability with respect to, the NASDAQ 100 Index or its use of any data included therein. The Index does not incur expenses or reflect any deduction for taxes and cannot be purchased directly by investors.
After-tax returns are calculated using the historical highest individual federal marginal income tax rates and do not reflect the impact of state and local taxes.
Actual after-tax returns depend on an investor’s tax situation and may differ from those shown, and after-tax returns shown are not relevant to investors who hold their Fund shares through tax-deferred arrangements, such as 401(k) plans or individual retirement accounts.
After-tax returns are shown for only Class S and after-tax returns for other classes will vary.
Expense Information
| | | | | | | | | | |
| | | Class S | | Class Y | | Class L | | Class A | | Class N |
| Shareholder Fees (fees paid directly from your investment) | | | | | | | | | | |
Maximum Sales Charge (Load) on purchases (as a % of offering price) | | None | | None | | None | | 5.75% | | None |
| | | | | | | | | | | | |
| | | Class S | | Class Y | | Class L | | Class A | | | Class N | |
Maximum Deferred Sales Charge (Load) (as a % of the lower of the original offering price or redemption proceeds) | | None | | None | | None | | None | (1) | | 1.00% | (2) |
| Annual Fund Operating Expenses (expenses that are deducted from Fund assets) (% of average net assets) | | | | | | | | | | | | |
Management Fees | | .15% | | .15% | | .15% | | .15% | | | .15% | |
Distribution and Service (Rule 12b-1) Fees | | None | | None | | None | | .25% | | | .50% | |
Other Expenses(3) | | .50% | | .60% | | .75% | | .75% | | | .81% | |
| Total Annual Fund Operating Expenses(4)(5) | | .65% | | .75% | | .90% | | 1.15% | | | 1.46% | |
Examples
These examples are intended to help you compare the cost of investing in the Fund with the cost of investing in other mutual funds. The examples assume that you invest $10,000 in each share class of the Fund for the time periods indicated and then redeem all of your shares at the end of those periods. For Class A shares, the examples include the initial sales charge. The examples also assume that your investment earns a 5% return each year and that the Fund’s operating expenses remain the same. Although your actual costs may be higher or lower, based on these assumptions your costs would be:
| | | | | | | | | | | | |
| | | 1 Year | | 3 Years | | 5 Years | | 10 Years |
Class S | | $ | 66 | | $ | 208 | | $ | 362 | | $ | 810 |
Class Y | | $ | 77 | | $ | 240 | | $ | 417 | | $ | 930 |
Class L | | $ | 92 | | $ | 287 | | $ | 498 | | $ | 1,108 |
Class A | | $ | 685 | | $ | 919 | | $ | 1,172 | | $ | 1,892 |
Class N | | $ | 252 | | $ | 462 | | $ | 797 | | $ | 1,746 |
Except for Class N shares, the figures shown above would be the same whether you sold your shares at the end of a period or kept them. For Class N shares, you would pay the following expenses if you did not redeem your shares:
| | | | | | | | | | | | |
| | | 1 Year | | 3 Years | | 5 Years | | 10 Years |
Class N | | $ | 149 | | $ | 462 | | $ | 797 | | $ | 1,746 |
| (1) | | A contingent deferred sales charge may apply to shares redeemed within 18 months of purchase from initial investments of $1 million or more. |
| (2) | | Applies to shares redeemed within 18 months of purchase. |
| (3) | | Other Expenses include Acquired Fund fees and expenses, which represent approximate expenses borne indirectly by the Fund in its most recent fiscal year through investments in other pooled investment vehicles. The amount of Acquired Fund fees and expenses may change in the coming year due to a number of factors including, among others, a change in allocation of the Fund’s investments among other pooled investment vehicles. |
| (4) | | Because Total Annual Fund Operating Expenses include Acquired Fund fees and expenses, they may not correspond to the ratios of expenses to average daily net assets shown in the “Financial Highlights” tables in this prospectus, which reflect the operating expenses of the Fund and do not include Acquired Fund fees and expenses. |
| (5) | | Employee benefit plans which invest in the Fund through MassMutual separate investment accounts may pay additional charges under their group annuity contract or services agreement. Investors who purchase shares directly from the Fund may also be subject to charges imposed in their administrative services or other agreement with MassMutual or MassMutual affiliate. None of these charges are deducted from Fund assets. |
– 47 –
MassMutual Select Focused Value Fund
Investment Objective
This Fund seeks growth of capital over the long-term.
Principal Investment Strategies and Risks
The Fund seeks to achieve its objective by investing primarily in a non-diversified portfolio of U.S. equity securities.
As a “non-diversified” fund, the Fund is not limited in the percentage of its assets that it may invest in any one company. This means that it may hold larger positions in a smaller number of stocks than a diversified fund. As a result, an increase or decrease in value of a single stock could have a greater impact on the Fund’s net asset value and its total return. See “Non-Diversification Risk” described on page 102.
The Fund is managed by two Sub-Advisers, each being responsible for a portion of the portfolio, but not necessarily equal weighted.
Harris Associates L.P. (“Harris”) seeks out companies that it believes are trading at significant discounts to their underlying value. Harris utilizes a fundamental, bottom-up investment strategy, focusing on companies with market capitalizations over $1 billion and which have significant profit potential.
Sell targets are generally set when a stock is first purchased. The Sub-Adviser generally sells a stock when it believes the stock has achieved 90-100% of its fair value or when it is determined that management is no longer a steward of shareholder interests.
Harris intends to invest primarily in U.S. companies, but may invest up to 25% of its portion of the portfolio (valued at the time of investment) in securities of non-U.S. issuers. These may include foreign government obligations and foreign equity and debt securities that are traded over-the-counter or on foreign exchanges. There are no geographic limits on the Fund’s foreign investments, but the Fund does not expect to invest more than 5% of its total assets in securities of issuers based in emerging markets.
Cooke & Bieler, L.P. (“Cooke & Bieler”) invests primarily in the common stocks of companies with middle market capitalizations (companies with market capitalizations in the range of $500 million to $5 billion) or in common stocks of companies whose market capitalizations are within the range of companies contained in the Russell Midcap® Value Index.
Cooke & Bieler seeks out companies that it believes are undervalued and possess strong financial positions. Cooke & Bieler utilizes a fundamental, bottom-up investment strategy, selecting equity securities for the Fund based on its analysis of a company’s financial characteristics, assessment of the quality of a company’s management and the implementation of valuation discipline. Generally, Cooke & Bieler will hold between 30 to 50 securities in its portion of the portfolio. Cooke & Bieler believes that its assessment of business quality and emphasis on valuation will protect the Fund’s assets in down markets, while its insistence on financial strength, leadership position and strong cash flow will produce competitive results in all but the most speculative markets. Cooke & Bieler generally sells a stock when it believes the stock has achieved its fair value, when it is determined that the long-term quality of the company has diminished or when more attractive alternatives are available.
The Principal Risks of investing in the Fund are Market Risk, Credit Risk, Management Risk, Liquidity Risk, Derivative Risk, Non-Diversification Risk, Foreign Investment Risk, Smaller Company Risk, Value Company Risk and Leveraging Risk.
These Risks are described beginning on page 100.
Annual Performance(1)
The bar chart shows the risks of investing in the Fund by showing changes in the Fund’s performance from year to year. Sales charges and taxes are not included in the calculations of returns in this bar chart. If those charges and taxes were included, the returns would be lower than those shown.
Class S Shares
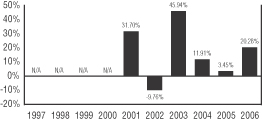
During the periods shown above, the highest quarterly return for the Fund was 23.23% for the quarter ended June 30, 2003 and the lowest quarterly return was –14.23% for the quarter ended September 30, 2002.
– 48 –
Average Annual Total Returns(1)
(for the periods ended December 31, 2006)
The table shows the risk of investing in the Fund by comparing the Fund’s returns with a broad measure of market performance over different time periods.
| | | | | | |
| | | One Year | | Five
Years | | Since Inception (5/1/00) |
Return Before Taxes –Class S | | 20.28% | | 12.89% | | 15.10% |
Return After Taxes on Distributions – Class S | | 18.36% | | 11.73% | | 14.01% |
Return After Taxes on Distributions and Sale of Fund Shares – Class S | | 15.33% | | 10.95% | | 13.03% |
Return Before Taxes –Class Y | | 20.12% | | 12.78% | | 14.97% |
Return Before Taxes –Class L | | 19.94% | | 12.61% | | 14.80% |
Return Before Taxes – Class A+ | | 12.77% | | 11.00% | | 13.51% |
Return Before Taxes –Class N+ | | 18.35% | | 11.99% | | 14.20% |
| | | | | | | |
Russell 1000® Index^ | | 15.46% | | 6.82% | | 1.62% |
Russell 2500 Index^^ | | 16.17% | | 12.19% | | 9.22% |
(1) Performance shown does not reflect fees that may be paid by investors for administrative services or group annuity contract charges.
+ Performance for Class A shares of the Fund reflects any applicable sales charge. Performance for Class N shares of the Fund prior to December 31, 2002 is based on Class A shares, adjusted to reflect Class N expenses, and also reflects any applicable sales charge.
^ The Russell 1000® Index is a widely recognized, unmanaged index representing the performance of common stocks of larger capitalized U.S. companies. The Index does not incur expenses or reflect any deduction for taxes and cannot be purchased directly by investors.
^^ The Russell 2500 Index is a widely recognized, unmanaged index representative of common stocks of mid-capitalized U.S. companies. The Index does not incur expenses or reflect any deduction for taxes and cannot be purchased directly by investors.
Going forward, the Fund’s performance will be compared to the Russell 1000 Index rather than the Russell 2500 Index because the Russell 1000 Index more closely represents the Fund’s investment strategy.
After-tax returns are calculated using the historical highest individual federal marginal income tax rates and do not reflect the impact of state and local taxes.
Actual after-tax returns depend on an investor’s tax situation and may differ from those shown, and after-tax returns shown are not relevant to investors who hold their Fund shares through tax-deferred arrangements, such as 401(k) plans or individual retirement accounts.
After-tax returns are shown for only Class S and after-tax returns for other classes will vary.
Expense Information
| | | | | | | | | | | | |
| | | Class S | | Class Y | | Class L | | Class A | | | Class N | |
| Shareholder Fees (fees paid directly from your investment) | | | | | | | | | | | | |
Maximum Sales Charge (Load) on purchases (as a % of offering price) | | None | | None | | None | | 5.75% | | | None | |
Maximum Deferred Sales Charge (Load) (as a % of the lower of the original offering price or redemption proceeds) | | None | | None | | None | | None | (1) | | 1.00% | (2) |
| Annual Fund Operating Expenses (expenses that are deducted from Fund assets) (% of average net assets) | | | | | | | | | | | | |
Management Fees | | .69% | | .69% | | .69% | | .69% | | | .69% | |
Distribution and Service (Rule 12b-1) Fees | | None | | None | | None | | .25% | | | .50% | |
Other Expenses(3) | | .11% | | .21% | | .36% | | .36% | | | .41% | |
| Total Annual Fund Operating Expenses(4)(5) | | .80% | | .90% | | 1.05% | | 1.30% | | | 1.60% | |
Examples
These examples are intended to help you compare the cost of investing in the Fund with the cost of investing in other mutual funds. The examples assume that you invest $10,000 in each share class of the Fund for the time periods indicated and then redeem all of your shares at the end of those periods. For Class A shares, the examples include the initial sales charge. The examples also assume that your investment earns a 5% return each year and that the Fund’s operating expenses remain the same. Although your actual costs may be higher or lower, based on these assumptions your costs would be:
| | | | | | | | | | | | |
| | | 1 Year | | 3 Years | | 5 Years | | 10 Years |
Class S | | $ | 82 | | $ | 255 | | $ | 444 | | $ | 990 |
Class Y | | $ | 92 | | $ | 287 | | $ | 498 | | $ | 1,108 |
Class L | | $ | 107 | | $ | 334 | | $ | 579 | | $ | 1,283 |
Class A | | $ | 700 | | $ | 963 | | $ | 1,247 | | $ | 2,053 |
Class N | | $ | 266 | | $ | 505 | | $ | 871 | | $ | 1,900 |
– 49 –
Except for Class N shares, the figures shown above would be the same whether you sold your shares at the end of a period or kept them. For Class N shares, you would pay the following expenses if you did not redeem your shares:
| | | | | | | | | | | | |
| | | 1 Year | | 3 Years | | 5 Years | | 10 Years |
Class N | | $ | 163 | | $ | 505 | | $ | 871 | | $ | 1,900 |
| (1) | | A contingent deferred sales charge may apply to shares redeemed within 18 months of purchase from initial investments of $1 million or more. |
| (2) | | Applies to shares redeemed within 18 months of purchase. |
| (3) | | Other Expenses include Acquired Fund fees and expenses, which represent approximate expenses borne indirectly by the Fund in its most recent fiscal year through investments in other pooled investment vehicles. The amount of Acquired Fund fees and expenses may change in the coming year due to a number of factors including, among others, a change in allocation of the Fund’s investments among other pooled investment vehicles. |
| (4) | | Because Total Annual Fund Operating Expenses include Acquired Fund fees and expenses, they may not correspond to the ratios of expenses to average daily net assets shown in the “Financial Highlights” tables in this prospectus, which reflect the operating expenses of the Fund and do not include Acquired Fund fees and expenses. |
| (5) | | Employee benefit plans which invest in the Fund through MassMutual separate investment accounts may pay additional charges under their group annuity contract or services agreement. Investors who purchase shares directly from the Fund may also be subject to charges imposed in their administrative services or other agreement with MassMutual or MassMutual affiliate. None of these charges are deducted from Fund assets. |
Harris and Cooke & Bieler Prior Performance for Similar Accounts*
The bar chart illustrates the variability of returns achieved by each Sub-Adviser for accounts with investment objectives, policies and investment strategies similar to that of the Fund. The composite performance does not represent the historical performance of the Fund and should not be interpreted as being indicative of future performance of the Fund.
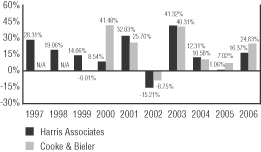
| | | | |
| | | Highest Quarter | | Lowest Quarter |
Harris Composite | | 24.73%, 2Q 2003 | | -18.24%, 3Q 2002 |
Cooke & Bieler Composite | | 20.84%, 2Q 1999 | | -20.72%, 3Q 2002 |
Harris and Cooke & Bieler Average Annual Total Returns for Similar Accounts*
(for the periods ended December 31, 2006)
The table compares each Sub-Adviser’s investment results for accounts with investment objectives, policies and investment strategies similar to that of the Fund to that of an index measuring the broad market over different time periods.
| | | | | | |
| | | One Year | | Five Years | | Ten Years |
Harris Composite | | | | | | |
Class S* | | 16.37% | | 9.62% | | 14.73% |
Class Y* | | 16.27% | | 9.52% | | 14.63% |
Class L* | | 16.12% | | 9.36% | | 14.48% |
Class A* | | 9.21% | | 7.82% | | 13.55% |
Class N* | | 14.56% | | 8.80% | | 13.92% |
| | | | | | | |
Russell 1000 Index^ | | 15.46% | | 6.82% | | 8.64% |
Russell 2500 Index^^ | | 16.17% | | 12.19% | | 11.26% |
| | | | | | | Since
Inception (3/1/98) |
Cooke & Bieler Composite | | | | | | |
Class S* | | 24.83% | | 13.59% | | 14.55% |
Class Y* | | 24.73% | | 13.49% | | 14.44% |
Class L* | | 24.58% | | 13.34% | | 14.29% |
Class A* | | 17.18% | | 11.76% | | 13.28% |
Class N* | | 23.02% | | 12.78% | | 13.74% |
| | | | | | | |
Russell 1000 Index^ | | 15.46% | | 6.82% | | 5.45% |
Russell 2500 Index^^ | | 16.17% | | 12.19% | | 9.41% |
Russell Midcap® Value Index^^^ | | 20.22% | | 15.88% | | 11.22% |
* Each Sub-Adviser’s Similar Account performance is a composite of all portfolios managed by that Sub-Adviser with substantially similar investment objectives, policies and investment strategies and without significant client-imposed restrictions, adjusted to reflect the fees and expenses of each of the Fund’s share classes, including sales loads. The bar chart is based on Class S expenses. The composite performance does not represent the historical performance of the MassMutual Select Focused Value Fund and should not be interpreted as being indicative of the future performance of the Fund. For additional information, please refer to “Investment Performance” in this Prospectus. Performance shown does not reflect fees that may be paid by investors for administrative services or group annuity contract charges.
^ The Russell 1000 Index is a widely recognized, unmanaged index representing the performance of common stocks of larger capitalized U.S. companies. The Index does not incur expenses or reflect any deduction for taxes and cannot be purchased directly by investors.
^^ The Russell 2500 Index is a widely recognized, unmanaged index representative of common stocks of mid-capitalized U.S. companies. The Index does not incur expenses or reflect any deduction for taxes and cannot be purchased directly by investors.
^^^ The Russell Midcap® Value Index is an unmanaged index that measures the performance of those companies in the Russell Midcap Index with lower price-to-book ratios and lower forecasted growth values. The Russell Midcap Index measures the performance of the 800 smallest companies in the Russell 1000® Index, a capitalization-weighted index of the 1,000 U.S. companies with the largest market capitalization. The Index does not incur expenses or reflect any deduction for taxes and cannot be purchased directly by investors.
– 50 –
[THIS PAGE INTENTIONALLY LEFT BLANK]
MassMutual Select Mid-Cap Value Fund
Investment Objective
This Fund seeks growth of capital over the long-term.
Principal Investment Strategies and Risks
The Fund seeks to achieve its objective by investing, under normal conditions, at least 80% of its net assets in the stocks of mid-cap companies. “Mid-cap” companies are defined as those with market capitalizations in the range of $500 million to $5 billion at the time of purchase or whose market capitalizations, at the time of purchase, fall within the range of companies in the Russell Midcap® Value Index – as of January 31, 2007, between $1.18 billion and $21.76 billion. The range of capitalization of companies included in the Russell Mid Cap Value Index will fluctuate as market prices increase or decrease. However, the Fund is not required to sell the stock of a company it already owns just because the company’s market capitalization has fallen outside these ranges.
The Fund’s Sub-Adviser, Cooke & Bieler, L.P. (“Cooke & Bieler”), seeks out companies that it believes are undervalued and possess strong financial positions. Cooke & Bieler utilizes a fundamental, bottom-up investment strategy, selecting equity securities for the Fund based on its analysis of a company’s financial characteristics, assessment of the quality of a company’s management and the implementation of valuation discipline. Generally, Cooke & Bieler will hold between 30 to 50 securities in its portion of the portfolio. Cooke & Bieler believes that its assessment of business quality and emphasis on valuation will protect the Fund’s assets in down markets, while its insistence on financial strength, leadership position and strong cash flow will produce competitive results in all but the most speculative markets. Cooke & Bieler generally sells a stock when it believes the stock has achieved its fair value, when it is determined that the long-term quality of the company has diminished or when more attractive alternatives are available.
The Principal Risks of investing in the Fund are Market Risk, Credit Risk, Management Risk, Liquidity Risk, Derivative Risk, Foreign Investment Risk, Smaller Company Risk, Value Company Risk and Leveraging Risk.
These Risks are described beginning on page 100.
Annual Performance
The Fund began operations August 29, 2006, and does not have a full calendar year of returns. There will be risks of investing in the Fund because the returns can be expected to vary from year to year.
Average Annual Total Returns
Because this Fund does not have a full calendar year of returns, there is no table which shows how the Fund’s returns have deviated from the broad market.
Expense Information
| | | | | | | | | | | | |
| | | Class S | | Class Y | | Class L | | Class A | | | Class N | |
| Shareholder Fees (fees paid directly from your investment) | | | | | | | | | | | | |
Maximum Sales Charge (Load) on purchases (as a % of offering price) | | None | | None | | None | | 5.75% | | | None | |
Maximum Deferred Sales Charge (Load) (as a % of the lower of the original offering price or redemption proceeds) | | None | | None | | None | | None | (1) | | 1.00% | (2) |
| Annual Fund Operating Expenses (expenses that are deducted from Fund assets) (% of average net assets) | | | | | | | | | | | | |
Management Fees | | .70% | | .70% | | .70% | | .70% | | | .70% | |
Distribution and Service (Rule 12b-1) Fees | | None | | None | | None | | .25% | | | .50% | |
Other Expenses(3) | | .36% | | .46% | | .61% | | .61% | | | .66% | |
Total Annual Fund Operating Expenses | | 1.06% | | 1.16% | | 1.31% | | 1.56% | | | 1.86% | |
| | | | | | | | | | | | |
Less Expense Reimbursement | | (.18%) | | (.18%) | | (.18%) | | (.18%) | | | (.18%) | |
Net Fund Expenses(4)(5) | | .88% | | .98% | | 1.13% | | 1.38% | | | 1.68% | |
– 52 –
Examples
These examples are intended to help you compare the cost of investing in the Fund with the cost of investing in other mutual funds. The examples assume that you invest $10,000 in each share class of the Fund for the time periods indicated and then redeem all of your shares at the end of those periods. For Class A shares, the examples include the initial sales charge. The examples also assume that your investment earns a 5% return each year and that the Fund’s operating expenses remain the same. Although your actual costs may be higher or lower, based on these assumptions your costs would be:
| | | | | | |
| | | 1 Year | | 3 Years |
Class S | | $ | 90 | | $ | 319 |
Class Y | | $ | 100 | | $ | 351 |
Class L | | $ | 115 | | $ | 397 |
Class A | | $ | 707 | | $ | 1,023 |
Class N | | $ | 274 | | $ | 567 |
Except for Class N shares, the figures shown above would be the same whether you sold your shares at the end of a period or kept them. For Class N shares, you would pay the following expenses if you did not redeem your shares:
| | | | | | |
| | | 1 Year | | 3 Years |
Class N | | $ | 171 | | $ | 567 |
| (1) | | A contingent deferred sales charge may apply to shares redeemed within 18 months of purchase from initial investments of $1 million or more. |
| (2) | | Applies to shares redeemed within 18 months of purchase. |
| (3) | | Other Expenses are based on estimated amounts for the first fiscal year of the Fund. |
| (4) | | The expenses in the above table reflect a written agreement by MassMutual to cap the fees and expenses of the Fund (other than extraordinary litigation and legal expenses, or other non-recurring or unusual expenses) at these amounts through March 31, 2008. The agreement cannot be terminated unilaterally by MassMutual. |
| (5) | | Employee benefit plans which invest in the Fund through MassMutual separate investment accounts may pay additional charges under their group annuity contract or services agreement. Investors who purchase shares directly from the Fund may also be subject to charges imposed in their administrative services or other agreement with MassMutual or MassMutual affiliate. None of these charges are deducted from Fund assets. |
Cooke & Bieler Prior Performance for Similar Accounts*
The bar chart illustrates the variability of returns achieved by Cooke & Bieler for accounts with investment objectives, policies and investment strategies similar to that of the Fund. The composite performance does not represent the historical performance of the Fund and should not be interpreted as being indicative of future performance of the Fund.
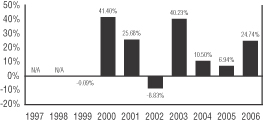
During the periods shown above, the highest quarterly return was 20.81% for the quarter ended June 30, 1999 and the lowest was -20.74% for the quarter ended September 30, 2002.
Cooke & Bieler Average Annual Total Returns for Similar Accounts*
(for the periods ended December 31, 2006)
The table compares Cooke & Bieler’s investment results for accounts with investment objectives, policies and investment strategies similar to that of the Fund to that of an index measuring the broad market over different time periods.
| | | | | | | |
| | | One
Year | | Five
Years | | Since
Inception
(3/1/98) | |
Cooke & Bieler Composite | | | | | | | |
Class S* | | 24.74% | | 13.51% | | 14.46 | % |
Class Y* | | 24.64% | | 13.41% | | 14.36 | % |
Class L* | | 24.49% | | 13.26% | | 14.21 | % |
Class A* | | 17.10% | | 11.68% | | 13.20 | % |
Class N* | | 22.94% | | 12.70% | | 13.66 | % |
| | | | | | | | |
Russell Midcap® Value Index^ | | 20.22% | | 15.88% | | 11.22 | % |
* Performance shown is a composite of all portfolios managed by Cooke & Bieler with substantially similar investment objectives, policies and investment strategies and without significant client-imposed restrictions, adjusted to reflect the fees and expenses of each of the Fund’s share classes, including sales loads. The bar chart is based on Class S expenses. The composite performance does not represent the historical performance of the MassMutual Select Mid-Cap Value Fund and should not be interpreted as being indicative of the future performance of the Fund. For additional information, please refer to “Investment Performance” in this Prospectus. Performance shown does not reflect fees that may be paid by investors for administrative services or group annuity contract charges.
^The Russell Midcap® Value Index is an unmanaged index that measures the performance of those companies in the Russell Midcap Index with lower price-to-book ratios and lower forecasted growth values. The Russell Midcap Index measures the performance of the 800 smallest companies in the Russell 1000 Index, a capitalization-weighted index of the 1,000 U.S. companies with the largest market capitalization. The Index does not incur expenses or reflect any deduction for taxes and cannot be purchased directly by investors.
– 53 –
MassMutual Select Small Cap Value Equity Fund
Investment Objective
This Fund seeks to maximize total return through investment primarily in small capitalization equity securities.
Principal Investment Strategies and Risks
The Fund invests, under normal circumstances, at least 80% of its net assets in small capitalization securities. Small capitalization securities are securities of companies with a market capitalization less than or equal to the largest capitalization stock in the Russell 2000® Value Index – as of January 31, 2007, $3.49 billion. The Fund’s investment strategy is designed to provide a bridge between passive investments and actively managed investments where the Fund’s Sub-Adviser, SSgA Funds Management, Inc. (“SSgA FM”) , uses research and analytical modeling to selectively choose securities for investment. SSgA FM will not automatically sell the stock of a company it already owns just because the company’s market capitalization grows outside the range of companies in the Russell 2000 Value Index.
The Principal Risks of investing in the Fund are Market Risk, Credit Risk, Management Risk, Liquidity Risk, Derivative Risk, Foreign Investment Risk, Currency Risk, Smaller Company Risk, Value Company Risk and Leveraging Risk.
These Risks are described beginning on page 100.
Annual Performance
The Fund began operations March 31, 2006, and therefore does not have a full calendar year of returns. There will be risks of investing in the Fund because the returns can be expected to vary from year to year.
Average Annual Total Returns
Because this Fund does not have a full calendar year of returns, there is no table which shows how the Fund’s returns have deviated from the broad market.
Expense Information
| | | | | | | | | | | | |
| | | Class S | | Class Y | | Class L | | Class A | | | Class N | |
| Shareholder Fees (fees paid directly from your investment) | | | | | | | | | | | | |
Maximum Sales Charge (Load) on purchases (as a % of offering price) | | None | | None | | None | | 5.75% | | | None | |
Maximum Deferred Sales Charge (Load) (as a % of the lower of the original offering price or redemption proceeds) | | None | | None | | None | | None | (1) | | 1.00% | (2) |
| Annual Fund Operating Expenses (expenses that are deducted from Fund assets) (% of average net assets) | | | | | | | | | | | | |
Management Fees | | .75% | | .75% | | .75% | | .75% | | | .75% | |
Distribution and Service (Rule 12b-1) Fees | | None | | None | | None | | .25% | | | .50% | |
Other Expenses(3) | | .47% | | .57% | | .72% | | .72% | | | .77% | |
| Total Annual Fund Operating Expenses(4) | | 1.22% | | 1.32% | | 1.47% | | 1.72% | | | 2.02% | |
| | | | | | | | | | | | |
Less Expense Reimbursement | | (.27%) | | (.32%) | | (.32%) | | (.32%) | | | (.32%) | |
Net Fund Expenses(5)(6) | | .95% | | 1.00% | | 1.15% | | 1.40% | | | 1.70% | |
Examples
These examples are intended to help you compare the cost of investing in the Fund with the cost of investing in other mutual funds. The examples assume that you invest $10,000 in each share class of the Fund for the time periods indicated and then redeem all of your shares at the end of those periods. For Class A shares, the examples include the initial sales charge. The examples also assume that your investment earns a 5% return each year and that the Fund’s operating expenses remain the same. Although your actual costs may be higher or lower, based on these assumptions your costs would be:
| | | | | | |
| | | 1 Year | | 3 Years |
Class S | | $ | 97 | | $ | 360 |
Class Y | | $ | 102 | | $ | 387 |
Class L | | $ | 117 | | $ | 433 |
Class A | | $ | 709 | | $ | 1,056 |
Class N | | $ | 276 | | $ | 603 |
– 54 –
Except for Class N shares, the figures shown above would be the same whether you sold your shares at the end of a period or kept them. For Class N shares, you would pay the following expenses if you did not redeem your shares:
| | | | | | |
| | | 1 Year | | 3 Years |
Class N | | $ | 173 | | $ | 603 |
| (1) | | A contingent deferred sales charge may apply to shares redeemed within 18 months of purchase from initial investments of $1 million or more. |
| (2) | | Applies to shares redeemed within 18 months of purchase. |
| (3) | | Other Expenses include Acquired Fund fees and expenses, which represent approximate expenses borne indirectly by the Fund in its most recent fiscal year through investments in other pooled investment vehicles. The amount of Acquired Fund fees and expenses may change in the coming year due to a number of factors including, among others, a change in allocation of the Fund’s investments among other pooled investment vehicles. |
| (4) | | Because Total Annual Fund Operating Expenses include Acquired Fund fees and expenses, they may not correspond to the ratios of expenses to average daily net assets shown in the “Financial Highlights” tables in this prospectus, which reflect the operating expenses of the Fund and do not include Acquired Fund fees and expenses. |
| (5) | | The expenses in the above table reflect a written agreement by MassMutual to cap the fees and expenses of the Fund (other than extraordinary litigation and legal expenses, or other non-recurring or unusual expenses), excluding Acquired Fund fees and expenses, through March 31, 2008 to the extent that Net Fund Expenses would otherwise exceed .95%, 1.00%, 1.15%, 1.40% and 1.70% for classes S, Y, L, A and N, respectively. The agreement cannot be terminated unilaterally by MassMutual. |
| (6) | | Employee benefit plans which invest in the Fund through MassMutual separate investment accounts may pay additional charges under their group annuity contract or services agreement. Investors who purchase shares directly from the Fund may also be subject to charges imposed in their administrative services or other agreement with MassMutual or MassMutual affiliate. None of these charges are deducted from Fund assets. |
SSgA FM Prior Performance for Similar Accounts*
The bar chart illustrates the variability of returns achieved by SSgA FM for all accounts with investment objectives, policies and investment strategies similar to that of the Fund. The composite performance does not represent the historical performance of the Fund and should not be interpreted as being indicative of future performance of the Fund.
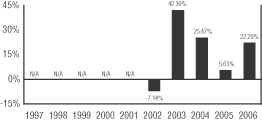
During the periods shown above, the highest quarterly return was 21.33% for the quarter ended June 30, 2003 and the lowest was -20.29% for the quarter ended September 30, 2002.
SSgA FM Average Annual Total Returns for Similar Accounts*
(for the periods ended December 31, 2006)
The table compares SSgA FM’s investment results for all accounts with investment objectives, policies and investment strategies similar to that of the Fund to an index measuring the broad market over different time periods.
| | | | | | |
| | | One
Year | | Five
Years | | Since
Inception
(1/1/02) |
SSgA FM Composite | | | | | | |
Class S* | | 22.29% | | 16.45% | | 16.45% |
Class Y* | | 22.24% | | 16.40% | | 16.40% |
Class L* | | 22.09% | | 16.25% | | 16.25% |
Class A* | | 14.83% | | 14.63% | | 14.63% |
Class N* | | 20.54% | | 15.69% | | 15.69% |
| | | | | | | |
Russell 2000® Value Index^ | | 23.48% | | 15.37% | | 15.37% |
* Performance shown is a composite of all portfolios managed by SSgA FM with substantially similar investment objectives, policies and investment strategies as the Fund, and without significant client-imposed restrictions, adjusted to reflect the fees and expenses of each of the Fund’s share classes, including sales loads. The bar chart is based on Class S expenses. The composite performance does not represent the historical performance of the MassMutual Select Small Cap Value Equity Fund and should not be interpreted as being indicative of the future performance of the Fund. For additional information, please refer to “Investment Performance” in this Prospectus. Performance shown does not reflect fees that may be paid by investors for administrative services or group annuity contract charges.
^ The Russell 2000® Value Index is a widely recognized, unmanaged index that measures the performance of those Russell 2000 Index Companies with lower price-to-book ratios and lower forecasted growth rates. The Index does not incur expenses or reflect any deduction for taxes and cannot be purchased directly by investors.
– 55 –
MassMutual Select Small Company Value Fund
Investment Objective
The Fund seeks to achieve long-term growth of capital by investing primarily in a diversified portfolio of equity securities of smaller companies.
Principal Investment Strategies and Risks
The Fund invests primarily in stocks, securities convertible into stocks and other securities, such as warrants and stock rights, whose value is based on stock prices. Normally, the Fund invests at least 80% of its net assets in the securities of companies whose market capitalizations, at the time of purchase, are included in the range of companies in the Russell 2000® Index or the S&P SmallCap 600 Index – as of January 31, 2007, between $33.03 million and $3.82 billion. The range of capitalizations of companies included in each index will fluctuate as market prices increase or decrease. The Fund is managed by three Sub-Advisers, each being responsible for a portion of the portfolio, but not necessarily equal weighted. Each Sub-Adviser will not automatically sell the stock of a company it already owns just because the company’s market capitalization grows or falls outside the range of companies in either Index. While most assets will be invested in U.S. common stocks, other securities may also be purchased such as foreign stocks, futures and options, in keeping with Fund objectives.
Clover Capital Management, Inc. (“Clover”) invests in stocks of companies that it believes have low valuations relative to the market or to their historical valuation. Quantitative analysis is employed to identify attractive small cap stocks, then fundamental analysis is employed to identify catalysts for beneficial change. Clover invests in securities of companies operating in a broad range of industries based primarily on value characteristics such as price-cash flow, price-earnings and price-book value ratios. In selecting specific securities for the Fund, Clover seeks to identify companies whose stock is out of favor with investors.
Reflecting a value approach to investing, T. Rowe Price Associates, Inc. (“T. Rowe Price”) seeks to purchase the stocks of companies whose current stock prices do not appear to adequately reflect their underlying value as measured by assets, earnings, cash flow, or business franchises. Utilizing fundamental research, T. Rowe Price seeks to identify companies that appear to be undervalued by various measures, and may be temporarily out of favor, but have good prospects for capital appreciation.
EARNEST Partners, LLC (“Earnest Partners”) employs a value based investment style by seeking to identify companies with stocks trading at prices below what it believes are their intrinsic values. Earnest Partners uses a bottom-up approach, employing fundamental and qualitative criteria to identify individual companies for potential investment in the Fund’s portfolio. Earnest Partners utilizes relationships with key analysts and industry perspectives. Earnest Partners uses a statistical approach designed to measure and control the prospect of substantially underperforming the benchmark to seek to limit company specific risk in the Fund’s portfolio. Earnest Partners expects to invest in approximately 60 companies. The portfolio’s sector weightings are a result of, and secondary to, individual stock selections.
The Principal Risks of investing in the Fund are Market Risk, Credit Risk, Management Risk, Liquidity Risk, Derivative Risk, Foreign Investment Risk, Currency Risk, Smaller Company Risk, Value Company Risk and Leveraging Risk.
These Risks are described beginning on page 100.
Annual Performance(1)
The bar chart shows the risks of investing in the Fund by showing changes in the Fund’s performance from year to year. Sales charges and taxes are not included in the calculations of returns in this bar chart. If those charges and taxes were included, the returns would be lower than those shown.
Class S Shares
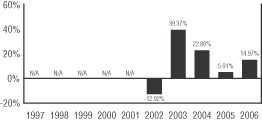
During the periods shown above, the highest quarterly return for the Fund was 20.17% for the quarter ended June 30, 2003 and the lowest quarterly return was -19.75% for the quarter ended September 30, 2002.
– 56 –
Average Annual Total Returns(1)
(for the periods ended December 31, 2006)
The table shows the risk of investing in the Fund by comparing the Fund’s returns with a broad measure of market performance over different time periods.
| | | | | | |
| | | One
Year | | Five
Years | | Since Inception (12/31/01) |
Return Before Taxes – Class S | | 14.97% | | 12.48% | | 12.47% |
Return After Taxes on Distributions – Class S | | 13.86% | | 11.94% | | 11.93% |
Return After Taxes on Distributions and Sale of Fund Shares – Class S | | 11.10% | | 10.82% | | 10.82% |
Return Before Taxes – Class Y | | 14.93% | | 12.41% | | 12.40% |
Return Before Taxes – Class L | | 14.75% | | 12.23% | | 12.22% |
Return Before Taxes – Class A+ | | 7.88% | | 10.65% | | 10.65% |
Return Before Taxes – Class N+ | | 13.14% | | 11.67% | | 11.67% |
| | | | | | | |
Russell 2000® Value Index^ | | 23.48% | | 15.37% | | 15.16% |
Russell 2000 Index^^ | | 18.37% | | 11.39% | | 11.15% |
(1) Performance shown does not reflect fees that may be paid by investors for administrative services or group annuity contract charges.
+ Performance for Class A shares of the Fund reflects any applicable sales charge. Performance for Class N shares of the Fund prior to December 31, 2002 is based on Class A shares, adjusted to reflect Class N expenses, and also reflects any applicable sales charge.
^ The Russell 2000® Value Index is a widely recognized, unmanaged index that measures the performance of those Russell 2000 Index Companies with lower price-to-book ratios and lower forecasted growth rates. The Index does not incur expenses or reflect any deduction for taxes and cannot be purchased directly by investors.
^^ The Russell 2000 Index is a widely recognized, unmanaged index representative of common stocks of smaller capitalized U.S. companies. The Index does not incur expenses or reflect any deduction for taxes and cannot be purchased directly by investors.
Going forward, the Fund’s performance will be compared to the Russell 2000 Value Index rather than the Russell 2000 Index because the Russell 2000 Value Index more closely represents the Fund’s investment strategy. The Fund will retain the Russell 2000 Index as its supplemental benchmark for performance comparisons.
After-tax returns are calculated using the historical highest individual federal marginal income tax rates and do not reflect the impact of state and local taxes.
Actual after-tax returns depend on an investor’s tax situation and may differ from those shown, and after-tax returns shown are not relevant to investors who hold their Fund shares through tax-deferred arrangements, such as 401(k) plans or individual retirement accounts.
After-tax returns are shown for only Class S and after-tax returns for other classes will vary.
Expense Information
| | | | | | | | | | | | |
| | | Class S | | Class Y | | Class L | | Class A | | | Class N | |
| Shareholder Fees (fees paid directly from your investment) | | | | | | | | | | | | |
Maximum Sales Charge (Load) on purchases (as a % of offering price) | | None | | None | | None | | 5.75% | | | None | |
Maximum Deferred Sales Charge (Load) (as a % of the lower of the original offering price or redemption proceeds) | | None | | None | | None | | None | (1) | | 1.00% | (2) |
| Annual Fund Operating Expenses (expenses that are deducted from Fund assets) (% of average net assets) | | | | | | | | | | | | |
Management Fees | | .85% | | .85% | | .85% | | .85% | | | .85% | |
Distribution and Service (Rule 12b-1) Fees | | None | | None | | None | | .25% | | | .50% | |
Other Expenses(3) | | .20% | | .24% | | .39% | | .39% | | | .44% | |
| Total Annual Fund Operating Expenses(4)(5) | | 1.05% | | 1.09% | | 1.24% | | 1.49% | | | 1.79% | |
Examples
These examples are intended to help you compare the cost of investing in the Fund with the cost of investing in other mutual funds. The examples assume that you invest $10,000 in each share class of the Fund for the time periods indicated and then redeem all of your shares at the end of those periods. For Class A shares, the examples include the initial sales charge. The examples also assume that your investment earns a 5% return each year and that the Fund’s operating expenses remain the same. Although your actual costs may be higher or lower, based on these assumptions your costs would be:
| | | | | | | | | | | | |
| | | 1 Year | | 3 Years | | 5 Years | | 10 Years |
Class S | | $ | 107 | | $ | 334 | | $ | 579 | | $ | 1,283 |
Class Y | | $ | 111 | | $ | 347 | | $ | 601 | | $ | 1,329 |
Class L | | $ | 126 | | $ | 393 | | $ | 681 | | $ | 1,500 |
Class A | | $ | 718 | | $ | 1,019 | | $ | 1,341 | | $ | 2,252 |
Class N | | $ | 285 | | $ | 563 | | $ | 970 | | $ | 2,105 |
Except for Class N shares, the figures shown above would be the same whether you sold your shares at
– 57 –
the end of a period or kept them. For Class N shares, you would pay the following expenses if you did not redeem your shares:
| | | | | | | | | | | | |
| | | 1 Year | | 3 Years | | 5 Years | | 10 Years |
Class N | | $ | 182 | | $ | 563 | | $ | 970 | | $ | 2,105 |
| (1) | | A contingent deferred sales charge may apply to shares redeemed within 18 months of purchase from initial investments of $1 million or more. |
| (2) | | Applies to shares redeemed within 18 months of purchase. |
| (3) | | Other Expenses include Acquired Fund fees and expenses, which represent approximate expenses borne indirectly by the Fund in its most recent fiscal year through investments in other pooled investment vehicles. The amount of Acquired Fund fees and expenses may change in the coming year due to a number of factors including, among others, a change in allocation of the Fund’s investments among other pooled investment vehicles. |
| (4) | | Because Total Annual Fund Operating Expenses include Acquired Fund fees and expenses, they may not correspond to the ratios of expenses to average daily net assets shown in the “Financial Highlights” tables in this prospectus, which reflect the operating expenses of the Fund and do not include Acquired Fund fees and expenses. |
| (5) | | Employee benefit plans which invest in the Fund through MassMutual separate investment accounts may pay additional charges under their group annuity contract or services agreement. Investors who purchase shares directly from the Fund may also be subject to charges imposed in their administrative services or other agreement with MassMutual or MassMutual affiliate. None of these charges are deducted from Fund assets. |
Clover, T. Rowe Price and Earnest Partners Performance for Similar Accounts*
The bar chart illustrates the variability of returns achieved by each Sub-Adviser for accounts with investment objectives, policies and investment strategies similar to that of the Fund. The composite performance does not represent the historical performance of the Fund and should not be interpreted as being indicative of future performance of the Fund.
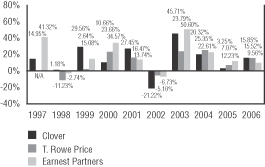
| | | | |
| | | Highest Quarter | | Lowest Quarter |
Clover Composite | | 26.50%, 2Q 1999 | | -22.35%, 3Q 2002 |
T. Rowe Price Composite | | 19.85%, 2Q 1999 | | -19.82%, 3Q 1998 |
Earnest Partners Composite | | 24.38%, 2Q 1997 | | -14.23%, 3Q 2002 |
Clover, T. Rowe Price and Earnest Partners Average Annual Total
Returns for Similar Accounts*
(for the periods ended December 31, 2006)
The table compares each Sub-Adviser’s investment results for accounts with investment objectives, policies and investment strategies similar to that of the Fund to an index measuring the broad market over different time periods.
| | | | | | |
| | | One Year | | Five Years | | Ten
Years |
Clover Composite | | | | | | |
Class S* | | 15.85% | | 10.56% | | 13.38% |
Class Y* | | 15.81% | | 10.52% | | 13.34% |
Class L* | | 15.66% | | 10.37% | | 13.19% |
Class A* | | 8.78% | | 8.82% | | 12.27% |
Class N* | | 14.11% | | 9.81% | | 12.63% |
| | | | | | | |
Russell 2000 Value Index^ | | 23.48% | | 15.37% | | 13.27% |
Russell 2000 Index^^ | | 18.37% | | 11.39% | | 9.44% |
| | | |
| | | | | | | Since
Inception |
T. Rowe Price Composite | | | | | | (4/1/97) |
Class S* | | 15.52% | | 12.74% | | 12.80% |
Class Y* | | 15.48% | | 12.70% | | 12.76% |
Class L* | | 15.33% | | 12.55% | | 12.60% |
Class A* | | 8.46% | | 10.98% | | 11.66% |
Class N* | | 13.78% | | 12.00% | | 12.03% |
| | | | | | | |
Russell 2000 Value Index^ | | 23.48% | | 15.37% | | 13.66% |
Russell 2000 Index^^ | | 18.37% | | 11.39% | | 10.29% |
| | | |
Earnest Partners Composite | | | | | | Ten
Years |
Class S* | | 9.56% | | 16.19% | | 17.76% |
Class Y* | | 9.52% | | 16.15% | | 17.72% |
Class L* | | 9.37% | | 16.00% | | 17.57% |
Class A* | | 2.85% | | 14.39% | | 16.62% |
Class N* | | 7.82% | | 15.44% | | 17.01% |
| | | | | | | |
Russell 2000 Value Index^ | | 23.48% | | 15.37% | | 13.27% |
Russell 2000 Index^^ | | 18.37% | | 11.39% | | 9.44% |
* Each Sub-Adviser’s Similar Account performance is a composite of all portfolios managed by that Sub-Adviser, or in the case of T. Rowe Price, all discretionary, fee paying portfolios managed by T. Rowe Price, with substantially similar investment objectives, policies and investment strategies and without significant client-imposed restrictions, adjusted to reflect the fees and expenses of each of the Fund’s share classes, including sales loads. The bar chart is based on Class S expenses. The composite performance does not represent the historical performance of the MassMutual Select Small Company Value Fund and should not be interpreted as being indicative of the future performance of the Fund. For additional information, please refer to “Investment Performance” in this Prospectus. Performance shown does not reflect fees that may be paid by investors for administrative services or group annuity contract charges.
^ The Russell 2000 Value Index is a widely recognized, unmanaged index that measures the performance of those Russell 2000 Index Companies with lower price-to-book ratios and lower forecasted growth rates. The Index does not incur expenses or reflect any deduction for taxes and cannot be purchased directly by investors.
^^ The Russell 2000 Index is a widely recognized, unmanaged index representative of common stocks of smaller capitalized U.S. companies. The Index does not incur expenses or reflect any deduction for taxes and cannot be purchased directly by investors.
– 58 –
[THIS PAGE INTENTIONALLY LEFT BLANK]
MassMutual Select Small Cap Core Equity Fund
Investment Objective
This Fund seeks long-term growth of capital through investment primarily in small capitalization equity securities.
Principal Investment Strategies and Risks
The Fund invests, under normal circumstances, at least 80% of its net assets in a broadly diversified portfolio of equity investments in small capitalization issuers, including foreign issuers that are traded in the United States. These issuers will have public market capitalizations similar to that of the range of market capitalizations of companies constituting the Russell 2000® Index at the time of investment – as of January 31, 2007, between $33.03 million and $1.04 billion. The range of capitalizations included in the index will fluctuate as market prices increase or decrease. The Fund’s investments are selected by the Fund’s Sub-Adviser, Goldman Sachs Asset Management, L.P. (“GSAM”) , using quantitative techniques to evaluate companies’ fundamental characteristics and seeking to maximize the Fund’s expected return, while maintaining style, capitalization and industry characteristics similar to the Russell 2000 Index. The Fund seeks to create a portfolio consisting of companies with similar market capitalizations, but better momentum, profitability, valuation and other fundamental characteristics than the Russell 2000 Index. GSAM will not automatically sell the stock of a company it already owns just because the company’s market capitalization grows or falls outside the range of companies in the Russell 2000 Index.
The Principal Risks of investing in the Fund are Market Risk, Credit Risk, Management Risk, Liquidity Risk, Derivative Risk, Foreign Investment Risk, Currency Risk, Smaller Company Risk, Growth Company Risk, Value Company Risk and Leveraging Risk.
These Risks are described beginning on page 100.
Annual Performance
The Fund began operations March 31, 2006, and does not have a full calendar year of returns. There will be risks of investing in the Fund because the returns can be expected to vary from year to year.
Average Annual Total Returns
Because this Fund does not have a full calendar year of returns, there is no table which shows how the Fund’s returns have deviated from the broad market.
Expense Information
| | | | | | | | | | | | |
| | | Class S | | Class Y | | Class L | | Class A | | | Class N | |
| Shareholder Fees (fees paid directly from your investment) | | | | | | | | | | | | |
Maximum Sales Charge (Load) on purchases (as a % of offering price) | | None | | None | | None | | 5.75% | | | None | |
Maximum Deferred Sales Charge (Load) (as a % of the lower of the original offering price or redemption proceeds) | | None | | None | | None | | None | (1) | | 1.00% | (2) |
| Annual Fund Operating Expenses (expenses that are deducted from Fund assets) (% of average net assets) | | | | | | | | | | | | |
Management Fees | | .75% | | .75% | | .75% | | .75% | | | .75% | |
Distribution and Service (Rule 12b-1) Fees | | None | | None | | None | | .25% | | | .50% | |
Other Expenses(3) | | .75% | | .85% | | 1.00% | | 1.00% | | | 1.05% | |
| Total Annual Fund Operating Expenses(4) | | 1.50% | | 1.60% | | 1.75% | | 2.00% | | | 2.30% | |
| | | | | | | | | | | | |
Less Expense Reimbursement | | (.54%) | | (.59%) | | (.59%) | | (.59%) | | | (.59%) | |
Net Fund Expenses(5)(6) | | .96% | | 1.01% | | 1.16% | | 1.41% | | | 1.71% | |
Examples
These examples are intended to help you compare the cost of investing in the Fund with the cost of investing in other mutual funds. The examples assume that you invest $10,000 in each share class of the Fund for the time periods indicated and then redeem all of your shares at the end of those periods. For Class A shares, the examples include the initial sales charge. The examples also assume that your
– 60 –
investment earns a 5% return each year and that the Fund’s operating expenses remain the same. Although your actual costs may be higher or lower, based on these assumptions your costs would be:
| | | | | | |
| | | 1 Year | | 3 Years |
Class S | | $ | 98 | | $ | 421 |
Class Y | | $ | 103 | | $ | 447 |
Class L | | $ | 118 | | $ | 494 |
Class A | | $ | 710 | | $ | 1,113 |
Class N | | $ | 277 | | $ | 662 |
Except for Class N shares, the figures shown above would be the same whether you sold your shares at the end of a period or kept them. For Class N shares, you would pay the following expenses if you did not redeem your shares:
| | | | | | |
| | | 1 Year | | 3 Years |
Class N | | $ | 174 | | $ | 662 |
| (1) | | A contingent deferred sales charge may apply to shares redeemed within 18 months of purchase from initial investments of $1 million or more. |
| (2) | | Applies to shares redeemed within 18 months of purchase. |
| (3) | | Other Expenses include Acquired Fund fees and expenses, which represent approximate expenses borne indirectly by the Fund in its most recent fiscal year through investments in other pooled investment vehicles. The amount of Acquired Fund fees and expenses may change in the coming year due to a number of factors including, among others, a change in allocation of the Fund’s investments among other pooled investment vehicles. |
| (4) | | Because Total Annual Fund Operating Expenses include Acquired Fund fees and expenses, they may not correspond to the ratios of expenses to average daily net assets shown in the “Financial Highlights” tables in this prospectus, which reflect the operating expenses of the Fund and do not include Acquired Fund fees and expenses. |
| (5) | | The expenses in the above table reflect a written agreement by MassMutual to cap the fees and expenses of the Fund (other than extraordinary litigation and legal expenses, or other non-recurring or unusual expenses), excluding Acquired Fund fees and expenses, through March 31, 2008 to the extent that Net Fund expenses would otherwise exceed .95%, 1.00%, 1.15%, 1.40% and 1.70% for Classes S, Y, L, A and N, respectively. The agreement cannot be terminated unilaterally by MassMutual. |
| (6) | | Employee benefit plans which invest in the Fund through MassMutual separate investment accounts may pay additional charges under their group annuity contract or services agreement. Investors who purchase shares directly from the Fund may also be subject to charges imposed in their administrative services or other agreement with MassMutual or MassMutual affiliate. None of these charges are deducted from Fund assets. |
GSAM Prior Performance for Similar Accounts*
The bar chart illustrates the variability of returns achieved by GSAM for all accounts with investment objectives, policies and investment strategies similar to that of the Fund. The composite performance does not represent the historical performance of the Fund and should not be interpreted as being indicative of future performance of the Fund.
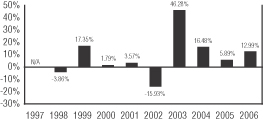
During the periods shown above, the highest quarterly return was 21.32% for the quarter ended June 30, 2003 and the lowest was -22.88% for the quarter ended September 30, 1998.
GSAM Average Annual
Total Returns for Similar Accounts*
(for the periods ended December 31, 2006)
The table compares GSAM’s investment results for all accounts with investment objectives, policies and investment strategies similar to that of the Fund to an index measuring the broad market over different time periods.
| | | | | | |
| | | One
Year | | Five
Years | | Since
Inception
(9/1/97) |
GSAM Composite | | | | | | |
Class S* | | 12.99% | | 11.38% | | 8.52% |
Class Y* | | 12.94% | | 11.33% | | 8.47% |
Class L* | | 12.79% | | 11.17% | | 8.32% |
Class A* | | 6.07% | | 9.61% | | 7.32% |
Class N* | | 11.24% | | 10.61% | | 7.76% |
| | | | | | | |
Russell 2000® Index^ | | 18.37% | | 11.39% | | 8.21% |
* Performance shown is a composite of all portfolios managed by GSAM with substantially similar investment objectives, policies and investment strategies as the Fund, and without significant client-imposed restrictions, adjusted to reflect the fees and expenses of each of the Fund’s share classes, including sales loads. The bar chart is based on Class S expenses. The composite performance does not represent the historical performance of the MassMutual Select Small Cap Core Equity Fund and should not be interpreted as being indicative of the future performance of the Fund. For additional information, please refer to “Investment Performance” in this Prospectus. Performance shown does not reflect fees that may be paid by investors for administrative services or group annuity contract charges.
^ The Russell 2000® Index is a widely recognized, unmanaged index representative of common stocks of smaller capitalized U.S. companies. The Index does not incur expenses or reflect any deduction for taxes and cannot be purchased directly by investors.
– 61 –
MassMutual Select Mid Cap Growth Equity Fund
Investment Objective
This Fund seeks long-term capital growth.
Principal Investment Strategies and Risks
The Fund seeks to achieve its objective by investing, under normal conditions, at least 80% of its net assets in stocks of companies with market capitalizations, at the time of purchase, that fall within the range of companies in either the S&P MidCap 400 Index or the Russell Midcap® Growth Index – as of January 31, 2007, between $597.69 million and $21.76 billion. The remaining 20% may be invested in other types of securities such as bonds, cash, or cash equivalents, for temporary defensive purposes, if the Fund’s Sub-Adviser, Navellier & Associates, Inc. (“Navellier”) believes it will help protect the Fund from potential losses, or to meet shareholder redemptions. Up to 15% of the Fund’s net assets may be invested in foreign securities traded on the U.S. market.
The Fund is designed to achieve the highest possible returns while minimizing risk. Navellier’s selection process focuses on fast growing companies that offer innovative products, services, or technologies to a rapidly expanding marketplace. Navellier uses an objective, “bottom-up,” quantitative screening process designed to identify and select inefficiently priced growth stocks with superior returns compared to their risk characteristics.
Navellier mainly buys stocks of companies which it believes are poised to rise in price. The investment process focuses on “growth” variables including, but not limited to, earnings growth, reinvestment rate, and operating margin expansion.
Navellier attempts to uncover stocks with strong return potential and acceptable risk characteristics. To do this, Navellier uses a proprietary computer model to calculate and analyze a “reward/risk ratio.” The reward/risk ratio is designed to identify stocks with above market average returns and risk levels which are reasonable for higher return rates. Navellier’s research team then applies two or more sets of criteria to identify the most attractive stocks. Examples of these criteria include earnings growth, profit margins, reasonable price/earnings ratios based on expected future earnings, and various other fundamental criteria.
The Principal Risks of investing in the Fund are Market Risk, Credit Risk, Management Risk, Liquidity Risk, Derivative Risk, Foreign Investment Risk, Currency Risk, Smaller Company Risk, Growth Company Risk, Leveraging Risk and Portfolio Turnover Risk.
These Risks are described beginning on page 100.
Annual Performance(1)
The bar chart shows the risks of investing in the Fund by showing changes in the Fund’s performance from year to year. Sales charges and taxes are not included in the calculations of returns in this bar chart. If those charges and taxes were included, the returns would be lower than those shown.
Class S Shares
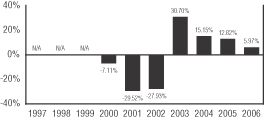
During the periods shown above, the highest quarterly return was 17.81% for the quarter ended December 31, 2001 and the lowest was -27.38% for the quarter ended September 30, 2001.
Average Annual Total Returns(1)
(for the periods ended December 31, 2006)
The table shows the risks of investing in the Fund by comparing the Fund’s returns with a broad measure of market performance over different time periods.
| | | | | | |
| | | One
Year | | Five
Years | | Since Inception (5/3/99) |
Return Before Taxes – Class S | | 5.97% | | 5.34% | | 2.22% |
Return After Taxes on Distributions – Class S | | 5.86% | | 5.31% | | 1.71% |
Return After Taxes on Distributions and Sale of Fund Shares – Class S | | 4.03% | | 4.60% | | 1.62% |
Return Before Taxes – Class Y | | 5.90% | | 5.28% | | 2.16% |
Return Before Taxes – Class L | | 5.74% | | 5.11% | | 2.02% |
Return Before Taxes – Class A+ | | -0.60% | | 3.62% | | 0.98% |
Return Before Taxes – Class N+ | | 4.15% | | 4.55% | | 1.44% |
| | | | | | | |
Russell Midcap® Growth Index^ | | 10.66% | | 8.22% | | 5.09% |
Russell 2500 Index^^ | | 16.17% | | 12.19% | | 11.11% |
(1) Performance shown does not reflect fees that may be paid by investors for administrative services or group annuity contract charges.
+ Performance for Class A shares of the Fund reflects any applicable sales charge. Performance for Class N shares of the Fund prior to December 31, 2002 is based on Class A shares, adjusted to reflect Class N expenses, and also reflects any applicable sales charge.
^ The Russell Midcap® Growth Index is a widely recognized, unmanaged index that measures the performance of those Russell Midcap companies (representing mid-capitalization U.S. common stocks) with higher price-to-book ratios and forecasted growth rates. The Index does not incur expenses or reflect any deduction for taxes and cannot be purchased directly by investors.
^^ The Russell 2500 Index is a widely recognized, unmanaged index representative of common stocks of mid-capitalized U.S. companies. The Index does not incur expenses or reflect any deduction for taxes and cannot be purchased directly by investors.
Going forward, the Fund’s performance will be compared to the Russell Midcap Growth Index rather than the Russell 2500 Index because the Russell Midcap Growth Index more closely represents the Fund’s investment strategy.
After-tax returns are calculated using the historical highest individual federal marginal income tax rates and do not reflect the impact of state and local taxes.
Actual after-tax returns depend on an investor’s tax situation and may differ from those shown, and after-tax returns shown are not relevant to investors who hold their Fund shares through tax-deferred arrangements, such as 401(k) plans or individual retirement accounts.
After-tax returns are shown for only Class S and after-tax returns for other classes will vary.
– 62 –
Expense Information
| | | | | | | | | | | | |
| | | Class S | | Class Y | | Class L | | Class A | | | Class N | |
| Shareholder Fees (fees paid directly from your investment) | | | | | | | | | | | | |
Maximum Sales Charge (Load) on purchases (as a % of offering price) | | None | | None | | None | | 5.75% | | | None | |
Maximum Deferred Sales Charge (Load) (as a % of the lower of the original offering price or redemption proceeds) | | None | | None | | None | | None | (1) | | 1.00% | (2) |
| Annual Fund Operating Expenses (expenses that are deducted from Fund assets) (% of average net assets) | | | | | | | | | | | | |
Management Fees | | .70% | | .70% | | .70% | | .70% | | | .70% | |
Distribution and Service (Rule 12b-1) Fees | | None | | None | | None | | .25% | | | .50% | |
Other Expenses(3) | | .14% | | .21% | | .36% | | .36% | | | .41% | |
| Total Annual Fund Operating Expenses(4)(5) | | .84% | | .91% | | 1.06% | | 1.31% | | | 1.61% | |
Examples
These examples are intended to help you compare the cost of investing in the Fund with the cost of investing in other mutual funds. The examples assume that you invest $10,000 in each share class of the Fund for the time periods indicated and then redeem all of your shares at the end of those periods. For Class A shares, the examples include the initial sales charge. The examples also assume that your investment earns a 5% return each year and that the Fund’s operating expenses remain the same. Although your actual costs may be higher or lower, based on these assumptions your costs would be:
| | | | | | | | | | | | |
| | | 1 Year | | 3 Years | | 5 Years | | 10 Years |
Class S | | $ | 86 | | $ | 268 | | $ | 466 | | $ | 1,037 |
Class Y | | $ | 93 | | $ | 290 | | $ | 504 | | $ | 1,120 |
Class L | | $ | 108 | | $ | 337 | | $ | 585 | | $ | 1,294 |
Class A | | $ | 701 | | $ | 966 | | $ | 1,252 | | $ | 2,063 |
Class N | | $ | 267 | | $ | 508 | | $ | 876 | | $ | 1,911 |
Except for Class N shares, the figures shown above would be the same whether you sold your shares at the end of a period or kept them. For Class N shares, you would pay the following expenses if you did not redeem your shares:
| | | | | | | | | | | | |
| | | 1 Year | | 3 Years | | 5 Years | | 10 Years |
Class N | | $ | 164 | | $ | 508 | | $ | 876 | | $ | 1,911 |
| (1) | | A contingent deferred sales charge may apply to shares redeemed within 18 months of purchase from initial investments of $1 million or more. |
| (2) | | Applies to shares redeemed within 18 months of purchase. |
| (3) | | Other Expenses include Acquired Fund fees and expenses, which represent approximate expenses borne indirectly by the Fund in its most recent fiscal year through investments in other pooled investment vehicles. The amount of Acquired Fund fees and expenses may change in the coming year due to a number of factors including, among others, a change in allocation of the Fund’s investments among other pooled investment vehicles. |
| (4) | | Because Total Annual Fund Operating Expenses include Acquired Fund fees and expenses, they may not correspond to the ratios of expenses to average daily net assets shown in the “Financial Highlights” tables in this prospectus, which reflect the operating expenses of the Fund and do not include Acquired Fund fees and expenses. |
| (5) | | Employee benefit plans which invest in the Fund through MassMutual separate investment accounts may pay additional charges under their group annuity contract or services agreement. Investors who purchase shares directly from the Fund may also be subject to charges imposed in their administrative services or other agreement with MassMutual or MassMutual affiliate. None of these charges are deducted from Fund assets. |
Navellier Prior Performance for Similar Accounts*
The bar chart illustrates the variability of returns achieved by Navellier for accounts with investment objectives, policies and investment strategies similar to that of the Fund. The composite performance does not represent the historical performance of the Fund and should not be interpreted as being indicative of future performance of the Fund.
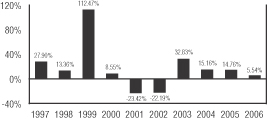
During the periods shown above, the highest quarterly return was 46.15% for the quarter ended December 31, 1999 and the lowest was -20.81% for the quarter ended March 31, 2001.
– 63 –
Navellier Average Annual Total Returns for Similar Accounts*
(for the periods ended December 31, 2006)
The table compares Navellier’s investment results for accounts with investment objectives, policies and investment strategies similar to that of the Fund to that of an index measuring the broad market over different time periods.
| | | | | | |
| | | One Year | | Five Years | | Ten
Years |
Navellier Similar Accounts | | | | | | |
Class S* | | 5.54% | | 7.59% | | 13.95% |
Class Y* | | 5.47% | | 7.52% | | 13.88% |
Class L* | | 5.32% | | 7.36% | | 13.72% |
Class A* | | -0.97% | | 5.85% | | 12.80% |
Class N* | | 3.77% | | 6.81% | | 13.15% |
| | | | | | | |
Russell MidCap Growth Index^ | | 10.66% | | 8.22% | | 8.62% |
Russell 2500 Index^^ | | 16.17% | | 12.19% | | 11.26% |
* Navellier’s Similar Account performance is a composite of all portfolios managed by Navellier with substantially similar investment objectives, policies and investment strategies and without significant client imposed restrictions, adjusted to reflect the fees and expenses of each of the Fund’s share classes, including sales loads. The bar chart is based on Class S expenses. Navellier replaced Morgan Stanley Investments, LP as the Fund’s Sub-Adviser on May 1, 2002. The composite performance does not represent the historical performance of the MassMutual Select Mid Cap Growth Equity Fund and should not be interpreted as being indicative of the future performance of the Fund. For additional information, please refer to “Investment Performance” in this Prospectus. Performance shown does not reflect fees that may be paid by investors for administrative services or group annuity contract charges.
^ The Russell Midcap Growth Index is a widely recognized, unmanaged index that measures the performance of those Russell Midcap companies (representing mid-capitalization U.S. common stocks) with higher price-to-book ratios and forecasted growth rates. The Index does not incur expenses or reflect any deduction for taxes and cannot be purchased directly by investors.
^^ The Russell 2500 Index is a widely recognized, unmanaged index representative of common stocks of mid-capitalized U.S. companies. The Index does not incur expenses or reflect any deduction for taxes and cannot be purchased directly by investors.
– 64 –
[THIS PAGE INTENTIONALLY LEFT BLANK]
MassMutual Select Mid Cap Growth Equity II Fund
Investment Objective
This Fund seeks growth of capital over the long-term.
Principal Investment Strategies and Risks
This Fund seeks to achieve its objective by investing, under normal conditions, at least 80% of its net assets in a broadly diversified portfolio of common stocks of mid-cap companies whose earnings the Fund’s Sub-Adviser, T. Rowe Price Associates, Inc. (“T. Rowe Price”), expects to grow at a faster rate than the average company. “Mid-cap” companies are defined as those whose market capitalizations, at the time of purchase, fall within the range of companies in either the S&P MidCap 400 Index or the Russell Midcap® Growth Index – as of January 31, 2007, between $597.69 million and $21.76 billion. However, the Fund is not required to sell the stock of a company it already owns just because the company’s market capitalization has fallen outside that range.
Stock selection is based on a combination of fundamental, bottom-up analysis and top-down quantitative strategies in an effort to identify companies with superior long-term appreciation prospects. Proprietary quantitative models are used to identify, measure, and evaluate the characteristics of companies in the mid-cap growth sector that can influence stock returns. In addition, a portion of the Fund’s portfolio will be invested using active stock selection and fundamental research. The Fund’s portfolio will be broadly diversified, and this helps to mitigate the downside risk attributable to any single poorly-performing security.
As Sub-Adviser to the Fund, T. Rowe Price generally selects stocks using a growth approach and looks for companies that have:
| · | A demonstrated ability to consistently increase revenues, earnings, and cash flow; |
| · | Attractive business niches and operate in industries experiencing increasing demand; |
| · | A sustainable competitive advantage; |
| · | Proven products or services; or |
| · | Stock prices that appear to undervalue their growth prospects. |
In pursuing its investment objective, the Fund’s Sub-Adviser has the discretion to purchase some securities that do not meet its normal investment criteria, as described above, when it perceives an unusual opportunity for gain. These special situations might arise when the Fund’s Sub-Adviser believes a security could increase in value for a variety of reasons, including a change in management, an extraordinary corporate event, or a temporary imbalance in the supply of, or demand for, the securities.
The Fund will generally invest its assets in U.S. common stocks. It may also invest in other securities, including foreign securities and derivatives. The Fund may sell securities for a variety of reasons, such as to secure gains, limit losses or redeploy assets into more promising opportunities.
The Principal Risks of investing in the Fund are Market Risk, Credit Risk, Management Risk, Liquidity Risk, Derivative Risk, Foreign Investment Risk, Currency Risk, Smaller Company Risk, Growth Company Risk and Leveraging Risk.
These Risks are described beginning on page 100.
Annual Performance(1)
The bar chart shows the risks of investing in the Fund by showing changes in the Fund’s performance from year to year. Sales charges and taxes are not included in the calculations of returns in this bar chart. If those charges and taxes were included, the returns would be lower than those shown.
Class S Shares
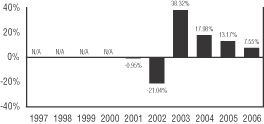
During the periods shown above, the highest quarterly return for the Fund was 20.91% for the quarter ended December 31, 2001 and the lowest quarterly return was -18.86% for the quarter ended September 30, 2002.
– 66 –
Average Annual Total Returns(1)
(for the periods ended December 31, 2006)
The table shows the risk of investing in the Fund by comparing the Fund’s returns with a broad measure of market performance over different time periods.
| | | | | | |
| | | One Year | | Five
Years | | Since Inception (6/1/00) |
Return Before Taxes – Class S | | 7.55% | | 9.42% | | 7.73% |
Return After Taxes on Distributions – Class S | | 6.33% | | 9.03% | | 7.44% |
Return After Taxes on Distributions and Sale of Fund Shares – Class S | | 6.42% | | 8.18% | | 6.74% |
Return Before Taxes – Class Y | | 7.45% | | 9.33% | | 7.65% |
Return Before Taxes – Class L | | 7.28% | | 9.16% | | 7.47% |
Return Before Taxes – Class A+ | | 0.82% | | 7.59% | | 6.23% |
Return Before Taxes – Class N+ | | 5.69% | | 8.54% | | 6.87% |
| | | | | | | |
Russell Midcap® Growth Index^ | | 10.66% | | 8.22% | | 0.47% |
S&P MidCap 400 Index^^ | | 10.31% | | 10.88% | | 9.55% |
(1) Performance shown does not reflect fees that may be paid by investors for administrative services or group annuity contract charges.
+ Performance for Class A shares of the Fund reflects any applicable sales charge. Performance for Class N shares of the Fund prior to December 31, 2002 is based on Class A shares, adjusted to reflect Class N expenses, and also reflects any applicable sales charge.
^ The Russell Midcap® Growth Index is a widely recognized, unmanaged index that measures the performance of those Russell Midcap companies (representing mid-capitalization U.S. common stocks) with higher price-to-book ratios and forecasted growth rates. The Index does not incur expenses or reflect any deduction for taxes and cannot be purchased directly by investors.
^^ The S&P MidCap 400 Index is a widely recognized, unmanaged index representative of common stocks of mid-capitalized U.S. companies. The Index does not incur expenses or reflect any deduction for taxes and cannot be purchased directly by investors.
Going forward, the Fund’s performance will be compared to the Russell Midcap Growth Index rather than the S&P MidCap 400 Index because the Russell Midcap Growth Index more closely represents the Fund’s investment strategy. The Fund will retain the S&P MidCap 400 Index as its supplemental benchmark for performance comparisons.
After-tax returns are calculated using the historical highest individual federal marginal income tax rates and do not reflect the impact of state and local taxes.
Actual after-tax returns depend on an investor’s tax situation and may differ from those shown, and after-tax returns shown are not relevant to investors who hold their Fund shares through tax-deferred arrangements, such as 401(k) plans or individual retirement accounts.
After-tax returns are shown for only Class S and after-tax returns for other classes will vary.
Expense Information
| | | | | | | | | | | | |
| | | Class S | | Class Y | | Class L | | Class A | | | Class N | |
| Shareholder Fees (fees paid directly from your investment) | | | | | | | | | | | | |
Maximum Sales Charge (Load) on purchases (as a % of offering price) | | None | | None | | None | | 5.75% | | | None | |
Maximum Deferred Sales Charge (Load) (as a % of the lower of the original offering price or redemption proceeds) | | None | | None | | None | | None | (1) | | 1.00% | (2) |
| Annual Fund Operating Expenses (expenses that are deducted from Fund assets) (% of average net assets) | | | | | | | | | | | | |
Management Fees | | .75% | | .75% | | .75% | | .75% | | | .75% | |
Distribution and Service (Rule 12b-1) Fees | | None | | None | | None | | .25% | | | .50% | |
Other Expenses(3) | | .11% | | .20% | | .35% | | .35% | | | .40% | |
| Total Annual Fund Operating Expenses(4)(5) | | .86% | | .95% | | 1.10% | | 1.35% | | | 1.65% | |
Examples
These examples are intended to help you compare the cost of investing in the Fund with the cost of investing in other mutual funds. The examples assume that you invest $10,000 in each share class of the Fund for the time periods indicated and then redeem all of your shares at the end of those periods. For Class A shares, the examples include the initial sales charge. The examples also assume that your investment earns a 5% return each year and that the Fund’s operating expenses remain the same. Although your actual costs may be higher or lower, based on these assumptions your costs would be:
| | | | | | | | | | | | |
| | | 1 Year | | 3 Years | | 5 Years | | 10 Years |
Class S | | $ | 88 | | $ | 274 | | $ | 477 | | $ | 1,061 |
Class Y | | $ | 97 | | $ | 303 | | $ | 525 | | $ | 1,166 |
Class L | | $ | 112 | | $ | 350 | | $ | 606 | | $ | 1,340 |
Class A | | $ | 705 | | $ | 978 | | $ | 1,272 | | $ | 2,105 |
Class N | | $ | 271 | | $ | 520 | | $ | 897 | | $ | 1,955 |
– 67 –
Except for Class N shares, the figures shown above would be the same whether you sold your shares at the end of a period or kept them. For Class N shares, you would pay the following expenses if you did not redeem your shares:
| | | | | | | | | | | | |
| | | 1 Year | | 3 Years | | 5 Years | | 10 Years |
Class N | | $ | 168 | | $ | 520 | | $ | 897 | | $ | 1,955 |
| (1) | | A contingent deferred sales charge may apply to shares redeemed within 18 months of purchase from initial investments of $1 million or more. |
| (2) | | Applies to shares redeemed within 18 months of purchase. |
| (3) | | Other Expenses include Acquired Fund fees and expenses, which represent approximate expenses borne indirectly by the Fund in its most recent fiscal year through investments in other pooled investment vehicles. The amount of Acquired Fund fees and expenses may change in the coming year due to a number of factors including, among others, a change in allocation of the Fund’s investments among other pooled investment vehicles. |
| (4) | | Because Total Annual Fund Operating Expenses include Acquired Fund fees and expenses, they may not correspond to the ratios of expenses to average daily net assets shown in the “Financial Highlights” tables in this prospectus, which reflect the operating expenses of the Fund and do not include Acquired Fund fees and expenses. |
| (5) | | Employee benefit plans which invest in the Fund through MassMutual separate investment accounts may pay additional charges under their group annuity contract or services agreement. Investors who purchase shares directly from the Fund may also be subject to charges imposed in their administrative services or other agreement with MassMutual or MassMutual affiliate. None of these charges are deducted from Fund assets. |
T. Rowe Price
Prior Performance for Similar Accounts*
The bar chart illustrates the variability of returns achieved by T. Rowe Price for accounts with investment objectives, policies and investment strategies similar to that of the Fund. The composite performance does not represent the historical performance of the Fund and should not be interpreted as being indicative of future performance of the Fund.
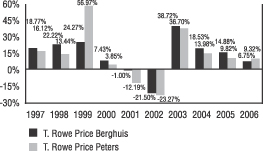
| | | | |
| | | Highest Quarter | | Lowest Quarter |
T. Rowe Price Composite (for Brian Berghuis’ approach) | | 27.08%, 4Q 1998 | | -19.04%, 3Q 2002 |
T. Rowe Price Composite (for Donald Peters’ approach) | | 39.80%, 4Q 1999 | | -25.15%, 3Q 2001 |
T. Rowe Price Average Annual Total
Returns for Similar Accounts*
(for the periods ended December 31, 2006)
The table compares T. Rowe Price’s investment results for accounts with investment objectives, policies and investment strategies similar to that of the Fund to that of an index measuring the broad market over different time periods.
| | | | | | |
| | | One Year | | Five Years | | Ten Years |
T. Rowe Price Composite (Berghuis) | | | | | | |
Class S* | | 6.75% | | 9.62% | | 11.75% |
Class Y* | | 6.66% | | 9.53% | | 11.66% |
Class L* | | 6.51% | | 9.38% | | 11.51% |
Class A* | | 0.15% | | 7.84% | | 10.60% |
Class N* | | 4.96% | | 8.81% | | 10.95% |
| | | | | | | |
Russell Midcap Growth Index^ | | 10.66% | | 8.22% | | 8.62% |
S&P MidCap 400 Index^^ | | 10.31% | | 10.88% | | 13.47% |
| | | |
T. Rowe Price Composite (Peters) | | | | | | |
Class S* | | 9.32% | | 7.50% | | 10.47% |
Class Y* | | 9.23% | | 7.39% | | 10.36% |
Class L* | | 9.08% | | 7.25% | | 10.22% |
Class A* | | 2.57% | | 5.73% | | 9.32% |
Class N* | | 7.53% | | 6.69% | | 9.66% |
| | | | | | | |
Russell Midcap Growth Index^ | | 10.66% | | 8.22% | | 8.62% |
S&P MidCap 400 Index^^ | | 10.31% | | 10.88% | | 13.47% |
* Performance shown is from composites of all discretionary, fee paying portfolios managed by T. Rowe Price with substantially similar investment objectives, policies and investment strategies and without significant client-imposed restrictions, adjusted to reflect the fees and expenses of each of the Fund’s share classes, including sales loads. The bar chart is based on Class S expenses. The composite performance does not represent the historical performance of the MassMutual Select Mid Cap Growth Equity II Fund and should not be interpreted as being indicative of the future performance of the Fund. For additional information, please refer to “Investment Performance” in this Prospectus. Performance shown does not reflect fees that may be paid by investors for administrative services or group annuity contract charges.
^ The Russell Midcap Growth Index is a widely recognized, unmanaged index that measures the performance of those Russell Midcap companies (representing mid-capitalization U.S. common stocks) with higher price-to-book ratios and forecasted growth rates. The Index does not incur expenses or reflect any deduction for taxes and cannot be purchased directly by investors.
^^ The S&P MidCap 400 Index is a widely recognized, unmanaged index representative of common stocks of mid-capitalized U.S. companies. The Index does not incur expenses or reflect any deduction for taxes and cannot be purchased directly by investors.
– 68 –
[THIS PAGE INTENTIONALLY LEFT BLANK]
MassMutual Select Small Cap Growth Equity Fund
Investment Objective
This Fund seeks long-term capital appreciation.
Principal Investment Strategies and Risks
The Fund seeks to achieve its objective by investing primarily in common stocks and equity securities of smaller companies which the managers believe offer potential for long-term growth. The Fund may maintain cash reserves for liquidity and defensive purposes. Normally, the Fund invests at least 80% of its net assets in the securities of companies whose market capitalizations, at the time of purchase, fall within the range of companies in the Russell 2000® Index or the S&P SmallCap 600 Index – as of January 31, 2007, between $33.03 million and $3.82 billion. The range of capitalizations of companies included in each index will fluctuate as market prices increase or decrease. Two Sub-Advisers manage the Fund, each being responsible for a portion of the portfolio, but not necessarily equal weighted. Each Sub-Adviser will not automatically sell the stock of a company it already owns just because the company’s market capitalization grows or falls outside the range of companies in either index.
Wellington Management Company, LLP (“Wellington Management”) employs two investment approaches: one used by Kenneth Abrams and one used by Steven Angeli.
Wellington Management’s investment approach used by Mr. Abrams emphasizes its own proprietary fundamental research and bottom-up stock selection to identify what it believes to be the best small-capitalization companies. These companies generally share several common characteristics: financial strength; top market share; significant insider ownership; a high level of focus on core businesses; favorable industry dynamics; and significant potential appreciation over a three year time horizon.
Wellington Management’s investment approach used by Mr. Angeli employs its own proprietary fundamental research and bottom-up stock selection to identify small-capitalization growth companies with significant appreciation potential. This approach looks at both the life-cycle of a company and its fundamental characteristics. Companies whose stocks are purchased for the Fund generally share several common characteristics: sustainable revenue growth; superior market position; positive financial trends; and high quality management.
Both of the investment approaches employed by Wellington Management will generally sell companies from the Fund when: target prices are reached; detailed evaluation suggests that future upside potential is limited; company fundamentals are no longer attractive; superior purchase candidates are identified; or market capitalization ceilings are exceeded.
Waddell & Reed Investment Management Company (“Waddell & Reed”) uses a bottom-up process, generally emphasizing long-term growth potential and superior financial characteristics, such as: annual revenue and earnings growth rate of 15-20%+, pre-tax margins of 20%+, and low-debt capital structure. Generally, companies also are considered which are strong niche players with a defensible market position, have active involvement of the founder-entrepreneur and demonstrate commitment to their employees, customers, suppliers and shareholders.
Waddell & Reed buys companies with an anticipated 3-5 year holding period, and therefore expects this portion of the Fund’s portfolio to typically have lower than 50% annual turnover.
The Principal Risks of investing in the Fund are Market Risk, Credit Risk, Management Risk, Liquidity Risk, Derivative Risk, Foreign Investment Risk, Emerging Markets Risk, Currency Risk, Smaller Company Risk, Growth Company Risk, Over-the-Counter Risk and Leveraging Risk.
These Risks are described beginning on page 100.
Annual Performance(1)
The bar chart shows the risks of investing in the Fund by showing changes in the Fund’s performance from year to year. Sales charges and taxes are not included in the calculations of returns in this bar chart. If those charges and taxes were included, the returns would be lower than those shown.
Class S Shares
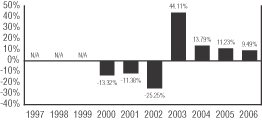
During the periods shown above, the highest quarterly return was 22.76% for the quarter ended December 31, 2001 and the lowest was -24.73% for the quarter ended September 30, 2001.
Average Annual Total Returns(1)
(for the periods ended December 31, 2006)
The table shows the risks of investing in the Fund by comparing the Fund’s returns with a broad measure of market performance over different time periods.
| | | | | | |
| | | One Year | | Five
Years | | Since Inception (5/3/99) |
Return Before Taxes – Class S | | 9.49% | | 8.34% | | 8.32% |
Return After Taxes on Distributions – Class S | | 8.44% | | 8.13% | | 7.98% |
Return After Taxes on Distributions and Sale of Fund Shares – Class S | | 7.57% | | 7.24% | | 7.18% |
Return Before Taxes – Class Y | | 9.32% | | 8.19% | | 8.17% |
Return Before Taxes – Class L | | 9.15% | | 8.03% | | 8.00% |
Return Before Taxes – Class A+ | | 2.65% | | 6.48% | | 6.91% |
Return Before Taxes – Class N+ | | 7.51% | | 7.44% | | 7.41% |
| | | | | | | |
Russell 2000® Growth Index^ | | 13.35% | | 6.93% | | 3.65% |
Russell 2000 Index^^ | | 18.37% | | 11.39% | | 9.50% |
– 70 –
(1) Performance shown does not reflect fees that may be paid by investors for administrative services or group annuity contract charges.
+ Performance for Class A shares of the Fund reflects any applicable sales charge. Performance for Class N shares of the Fund prior to December 31, 2002 is based on Class A shares, adjusted to reflect Class N expenses, and also reflects any applicable sales charge.
^ The Russell 2000® Growth Index is a widely recognized, unmanaged index that measures the performance of those Russell 2000 Index companies (representing small-capitalization U.S. common stocks) with higher price-to-book ratios and forecasted growth rates. The Index does not incur expenses or reflect any deduction for taxes and cannot be purchased directly by investors.
^^ The Russell 2000 Index is a widely recognized, unmanaged index representative of common stocks of smaller capitalized U.S. companies. The Index does not incur expenses or reflect any deduction for taxes and cannot be purchased directly by investors.
Going forward, the Fund’s performance will be compared to the Russell 2000 Growth Index rather than the Russell 2000 Index because the Russell 2000 Growth Index more closely represents the Fund’s investment strategy. The Fund will retain the Russell 2000 Index as its supplemental benchmark for performance comparisons.
After-tax returns are calculated using the historical highest individual federal marginal income tax rates and do not reflect the impact of state and local taxes.
Actual after-tax returns depend on an investor’s tax situation and may differ from those shown, and after-tax returns shown are not relevant to investors who hold their Fund shares through tax-deferred arrangements, such as 401(k) plans or individual retirement accounts.
After-tax returns are shown for only Class S and after-tax returns for other classes will vary.
Expense Information
| | | | | | | | | | | | |
| | | Class S | | Class Y | | Class L | | Class A | | | Class N | |
| Shareholder Fees (fees paid directly from your investment) | | | | | | | | | | | | |
Maximum Sales Charge (Load) on purchases (as a % of offering price) | | None | | None | | None | | 5.75% | | | None | |
Maximum Deferred Sales Charge (Load) (as a % of the lower of the original offering price or redemption proceeds) | | None | | None | | None | | None | (1) | | 1.00% | (2) |
Annual Fund Operating Expenses (expenses that are deducted from Fund assets) (% of average net assets) | | | | | | | | | | | | |
Management Fees | | .82% | | .82% | | .82% | | .82% | | | .82% | |
Distribution and Service (Rule 12b-1) Fees | | None | | None | | None | | .25% | | | .50% | |
Other Expenses(3) | | .16% | | .30% | | .45% | | .45% | | | .50% | |
| Total Annual Fund Operating Expenses(4)(5) | | .98% | | 1.12% | | 1.27% | | 1.52% | | | 1.82% | |
Examples
These examples are intended to help you compare the cost of investing in the Fund with the cost of investing in other mutual funds. The examples assume that you invest $10,000 in each share class of the Fund for the time periods indicated and then redeem all of your shares at the end of those periods. For Class A shares, the examples include the initial sales charge. The examples also assume that your investment earns a 5% return each year and that the Fund’s operating expenses remain the same. Although your actual costs may be higher or lower, based on these assumptions your costs would be:
| | | | | | | | | | | | |
| | | 1 Year | | 3 Years | | 5 Years | | 10 Years |
Class S | | $ | 100 | | $ | 312 | | $ | 542 | | $ | 1,201 |
Class Y | | $ | 114 | | $ | 356 | | $ | 617 | | $ | 1,363 |
Class L | | $ | 129 | | $ | 403 | | $ | 697 | | $ | 1,534 |
Class A | | $ | 721 | | $ | 1,028 | | $ | 1,356 | | $ | 2,283 |
Class N | | $ | 288 | | $ | 573 | | $ | 985 | | $ | 2,137 |
Except for Class N shares, the figures shown above would be the same whether you sold your shares at the end of a period or kept them. For Class N shares, you would pay the following expenses if you did not redeem your shares:
| | | | | | | | | | | | |
| | | 1 Year | | 3 Years | | 5 Years | | 10 Years |
Class N | | $ | 185 | | $ | 573 | | $ | 985 | | $ | 2,137 |
| (1) | | A contingent deferred sales charge may apply to shares redeemed within 18 months of purchase from initial investments of $1 million or more. |
| (2) | | Applies to shares redeemed within 18 months of purchase. |
| (3) | | Other Expenses include Acquired Fund fees and expenses, which represent approximate expenses borne indirectly by the Fund in its most recent fiscal year through investments in other pooled investment vehicles. The amount of Acquired Fund fees and expenses may change in the coming year due to a number of factors including, among others, a change in allocation of the Fund’s investments among other pooled investment vehicles. |
| (4) | | Because Total Annual Fund Operating Expenses include Acquired Fund fees and expenses, they may not correspond to the ratios of expenses to average daily net assets shown in the “Financial Highlights” tables in this prospectus, which reflect the operating expenses of the Fund and do not include Acquired Fund fees and expenses. |
| (5) | | Employee benefit plans which invest in the Fund through MassMutual separate investment accounts may pay additional charges under their group annuity contract or services agreement. Investors who purchase shares directly from the Fund may also be subject to charges imposed in their administrative services or other agreement with MassMutual or MassMutual affiliate. None of these charges are deducted from Fund assets. |
– 71 –
Wellington Management and Waddell & Reed
Prior Performance for Similar Accounts*
The bar chart illustrates the variability of returns achieved by each Sub-Adviser for accounts with investment objectives, policies and investment strategies similar to that of the Fund. The composite performance does not represent the historical performance of the Fund and should not be interpreted as being indicative of future performance of the Fund.
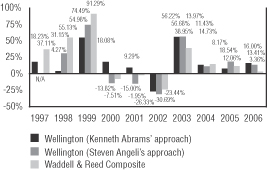
| | | | |
| | | Highest Quarter | | Lowest Quarter |
| Wellington Management Composite (for Kenneth Abrams’ approach) | | 35.19%, 4Q 1999 | | -22.18%, 3Q 2001 |
| Wellington Management Composite (for Steven Angeli’s approach) | | 42.25%, 4Q 1999 | | -24.13%, 3Q 2001 |
Waddell & Reed Composite | | 44.12%, 4Q 1999 | | -22.21%, 3Q 2001 |
Wellington Management and Waddell & Reed
Average Annual Total Returns for Similar Accounts*
(for the periods ended December 31, 2006)
The table compares each Sub-Adviser’s investment results for accounts with investment objectives, policies and investment strategies similar to that of the Fund to that of an index measuring the broad market over different time periods.
| | | | | | |
| | | One Year | | Five Years | | Ten Years |
Wellington Management Composite
(for Kenneth Abrams’ approach) | | | | | | |
Class S* | | 16.00% | | 10.48% | | 15.03% |
Class Y* | | 15.86% | | 10.33% | | 14.89% |
Class L* | | 15.71% | | 10.18% | | 14.74% |
Class A* | | 8.82% | | 8.63% | | 13.81% |
Class N* | | 14.16% | | 9.61% | | 14.18% |
| | | | | | | |
Russell 2000 Growth Index^ | | 13.35% | | 6.93% | | 4.88% |
Russell 2000 Index^^ | | 18.37% | | 11.39% | | 9.44% |
| | | | | | |
| | | One Year | | Five Years | | Since
Inception
(1/1/98) |
Wellington Management Composite
(for Steven Angeli’s approach) | | | | | | |
Class S* | | 13.41% | | 10.22% | | 11.79% |
Class Y* | | 13.27% | | 10.07% | | 11.64% |
Class L* | | 13.12% | | 9.92% | | 11.49% |
Class A* | | 6.38% | | 8.37% | | 10.49% |
Class N* | | 11.57% | | 9.35% | | 10.91% |
| | | | | | | |
Russell 2000 Growth Index^ | | 13.35% | | 6.93% | | 4.02% |
Russell 2000 Index^^ | | 18.37% | | 11.39% | | 8.09% |
| | | |
| | | | | | | Ten Years |
Waddell & Reed Composite | | | | | | |
Class S* | | 3.36% | | 7.17% | | 17.96% |
Class Y* | | 3.22% | | 7.02% | | 17.81% |
Class L* | | 3.07% | | 6.87% | | 17.66% |
Class A* | | –3.09% | | 5.36% | | 16.71% |
Class N* | | 1.52% | | 6.31% | | 17.09% |
| | | | | | | |
Russell 2000 Growth Index^ | | 13.35% | | 6.93% | | 4.88% |
Russell 2000 Index^^ | | 18.37% | | 11.39% | | 9.44% |
* Each Sub-Adviser’s Similar Account performance is a composite of all separately managed institutional accounts managed by that Sub-Adviser with substantially similar investment objectives, policies and investment strategies and without significant client-imposed restrictions, adjusted to reflect the fees and expenses of each of the Fund’s share classes, including sales loads. The bar chart is based on Class S expenses. Wellington Management replaced J.P. Morgan Investment Management Inc. as a co-Sub-Adviser of the Fund on December 3, 2001. Each Sub-Adviser’s composite performance does not represent the historical performance of the MassMutual Select Small Cap Growth Equity Fund and should not be interpreted as being indicative of the future performance of the Fund. For additional information, please refer to “Investment Performance” in this Prospectus. Performance shown does not reflect fees that may be paid by investors for administrative services or group annuity contract charges.
^ The Russell 2000 Growth Index is a widely recognized, unmanaged index that measures the performance of those Russell 2000 Index companies (representing small-capitalization U.S. common stocks) with higher price-to-book ratios and forecasted growth rates. The Index does not incur expenses or reflect any deduction for taxes and cannot be purchased directly by investors.
^^ The Russell 2000 Index is a widely recognized, unmanaged index representative of common stocks of smaller capitalized U.S. companies. The Index does not incur expenses or reflect any deduction for taxes and cannot be purchased directly by investors.
– 72 –
[THIS PAGE INTENTIONALLY LEFT BLANK]
MassMutual Select Small Company Growth Fund
Investment Objective
The Fund seeks long-term capital appreciation.
Principal Investment Strategies and Risks
The Fund seeks to achieve its objective by investing primarily in common stocks and equity securities of smaller companies which the Fund’s Sub-Advisers believe offer potential for long-term growth. The Fund may maintain cash reserves for liquidity and defensive purposes. Normally, the Fund invests at least 80% of its net assets in the securities of companies whose market capitalizations, at the time of purchase, are included in the range of companies in the Russell 2000® Index or the S&P SmallCap 600 Index – as of January 31, 2007, between $33.03 million and $3.82 billion. The range of capitalizations of companies included in each index will fluctuate as market prices increase or decrease. The Fund is managed by two Sub-Advisers, each being responsible for a portion of the portfolio, but not necessarily equal weighted. Each Sub-Adviser will not automatically sell the stock of a company it already owns just because the company’s market capitalization grows or falls outside the range of companies in the Russell 2000 Index.
In selecting securities, Mazama Capital Management, Inc. (“Mazama”) seeks undiscovered and/or underappreciated companies that have one or all of the following characteristics: strong management team, the ability to attract talented employees, the best or one of the best in their industry, strong financials and financial trends and significant ownership by officers and directors. Mazama utilizes a proprietary Price Performance Model to assist it in identifying securities in which to invest.
Eagle Asset Management, Inc. (“Eagle”) uses extensive fundamental research to seek out rapidly growing, under-researched small cap companies trading at reasonable valuations. Such companies typically have accelerating earnings growth, a high or expanding return on equity, a competent management team with a strong ownership incentive and a positive catalyst such as an exciting new product, a management change or other restructuring. Securities will be sold if they reach what is believed to be an unsustainable valuation, if their fundamentals deteriorate, if the original investment thesis proved incorrect or if the industry dynamics have negatively changed.
The Principal Risks of investing in the Fund are Market Risk, Credit Risk, Management Risk, Liquidity Risk, Derivative Risk, Foreign Investment Risk, Emerging Markets Risk, Currency Risk, Smaller Company Risk, Growth Company Risk, Leveraging Risk and Portfolio Turnover Risk.
These Risks are described beginning on page 100.
Annual Performance(1)
The bar chart shows the risks of investing in the Fund by showing changes in the Fund’s performance from year to year. Sales charges and taxes are not included in the calculations of returns in this bar chart. If those charges and taxes were included, the returns would be lower than those shown.
Class S Shares
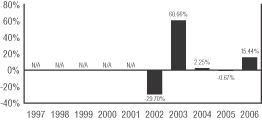
During the periods shown above, the highest quarterly return for the Fund was 29.89% for the quarter ended June 30, 2003 and the lowest quarterly return was -19.88% for the quarter ended September 30, 2002.
– 74 –
Average Annual Total Returns(1)
(for the periods ended December 31, 2006)
The table shows the risk of investing in the Fund by comparing the Fund’s returns with a broad measure of market performance over different time periods.
| | | | | | |
| | | One
Year | | Five
Years | | Since Inception (12/31/01) |
Return Before Taxes – Class S | | 15.44% | | 5.78% | | 5.77% |
Return After Taxes on Distributions – Class S | | 14.31% | | 4.70% | | 4.70% |
Return After Taxes on Distributions and Sale of Fund Shares – Class S | | 11.47% | | 4.49% | | 4.49% |
Return Before Taxes – Class Y | | 15.39% | | 5.71% | | 5.71% |
Return Before Taxes – Class L | | 15.28% | | 5.57% | | 5.57% |
Return Before Taxes – Class A+ | | 8.34% | | 4.04% | | 4.04% |
Return Before Taxes – Class N+ | | 13.66% | | 4.97% | | 4.97% |
| | | | | | | |
Russell 2000® Growth Index^ | | 13.35% | | 6.93% | | 6.67% |
Russell 2000 Index^^ | | 18.37% | | 11.39% | | 11.15% |
(1) Performance shown does not reflect fees that may be paid by investors for administrative services or group annuity contract charges.
+ Performance for Class A shares of the Fund reflects any applicable sales charge. Performance for Class N shares of the Fund prior to December 31, 2002 is based on Class A shares, adjusted to reflect Class N expenses, and also reflects any applicable sales charge.
^ The Russell 2000® Growth Index is a widely recognized, unmanaged index that measures the performance of those Russell 2000 Index companies (representing small-capitalization U.S. common stocks) with higher price-to-book ratios and forecasted growth rates. The Index does not incur expenses or reflect any deduction for taxes and cannot be purchased directly by investors.
^ The Russell 2000 Index is a widely recognized, unmanaged index representative of common stocks of smaller capitalized U.S. companies. The Index does not incur expenses or reflect any deduction for taxes and cannot be purchased directly by investors.
Going forward, the Fund’s performance will be compared to the Russell 2000 Growth Index rather than the Russell 2000 Index because the Russell 2000 Growth Index more closely represents the Fund’s investment strategy.
After-tax returns are calculated using the historical highest individual federal marginal income tax rates and do not reflect the impact of state and local taxes.
Actual after-tax returns depend on an investor’s tax situation and may differ from those shown, and after-tax returns shown are not relevant to investors who hold their Fund shares through tax-deferred arrangements, such as 401(k) plans or individual retirement accounts.
After-tax returns are shown for only Class S and after-tax returns for other classes will vary.
Expense Information
| | | | | | | | | | | | |
| | | Class S | | Class Y | | Class L | | Class A | | | Class N | |
Shareholder Fees (fees paid directly from your investment) | | | | | | | | | | | | |
Maximum Sales Charge (Load) on purchases (as a % of offering price) | | None | | None | | None | | 5.75% | | | None | |
Maximum Deferred Sales Charge (Load) (as a % of the lower of the original offering price or redemption proceeds) | | None | | None | | None | | None | (1) | | 1.00% | (2) |
| Annual Fund Operating Expenses (expenses that are deducted from Fund assets) (% of average net assets) | | | | | | | | | | | | |
Management Fees | | .85% | | .85% | | .85% | | .85% | | | .85% | |
Distribution and Service (Rule 12b-1) Fees | | None | | None | | None | | .25% | | | .50% | |
Other Expenses(3) | | .26% | | .30% | | .45% | | .45% | | | .50% | |
Total Annual
Fund Operating Expenses(4)(5) | | 1.11% | | 1.15% | | 1.30% | | 1.55% | | | 1.85% | |
Examples
These examples are intended to help you compare the cost of investing in the Fund with the cost of investing in other mutual funds. The examples assume that you invest $10,000 in each share class of the Fund for the time periods indicated and then redeem all of your shares at the end of those periods. For Class A shares, the examples include the initial sales charge. The examples also assume that your investment earns a 5% return each year and that the Fund’s operating expenses remain the same. Although your actual costs may be higher or lower, based on these assumptions your costs would be:
| | | | | | | | | | | | |
| | | 1 Year | | 3 Years | | 5 Years | | 10 Years |
Class S | | $ | 113 | | $ | 353 | | $ | 612 | | $ | 1,352 |
Class Y | | $ | 117 | | $ | 365 | | $ | 633 | | $ | 1,398 |
Class L | | $ | 132 | | $ | 412 | | $ | 713 | | $ | 1,568 |
Class A | | $ | 724 | | $ | 1,036 | | $ | 1,371 | | $ | 2,314 |
Class N | | $ | 291 | | $ | 582 | | $ | 1,001 | | $ | 2,169 |
Except for Class N shares, the figures shown above would be the same whether you sold your shares at the end of a period or kept them. For Class N shares, you would pay the following expenses if you did not redeem your shares:
| | | | | | | | | | | | |
| | | 1 Year | | 3 Years | | 5 Years | | 10 Years |
Class N | | $ | 188 | | $ | 582 | | $ | 1,001 | | $ | 2,169 |
– 75 –
| (1) | | A contingent deferred sales charge may apply to shares redeemed within 18 months of purchase from initial investments of $1 million or more. |
| (2) | | Applies to shares redeemed within 18 months of purchase. |
| (3) | | Other Expenses include Acquired Fund fees and expenses, which represent approximate expenses borne indirectly by the Fund in its most recent fiscal year through investments in other pooled investment vehicles. The amount of Acquired Fund fees and expenses may change in the coming year due to a number of factors including, among others, a change in allocation of the Fund’s investments among other pooled investment vehicles. |
| (4) | | Because Total Annual Fund Operating Expenses include Acquired Fund fees and expenses, they may not correspond to the ratios of expenses to average daily net assets shown in the “Financial Highlights” tables in this prospectus, which reflect the operating expenses of the Fund and do not include Acquired Fund fees and expenses. |
| (5) | | Employee benefit plans which invest in the Fund through MassMutual separate investment accounts may pay additional charges under their group annuity contract or services agreement. Investors who purchase shares directly from the Fund may also be subject to charges imposed in their administrative services or other agreement with MassMutual or MassMutual affiliate. None of these charges are deducted from Fund assets. |
Mazama and Eagle Prior Performance for Similar Accounts*
The bar chart illustrates the variability of returns achieved by each Sub-Adviser for accounts with investment objectives, policies and investment strategies similar to that of the Fund. The composite performance does not represent the historical performance of the Fund and should not be interpreted as being indicative of future performance of the Fund.
| | | | |
| | | Highest Quarter | | Lowest
Quarter |
Mazama Composite | | 41.59%, 4Q 2001 | | -34.82%, 3Q 2001 |
Eagle Composite | | 27.10%, 2Q 1999 | | -25.69%, 3Q 1998 |
Mazama and Eagle Average Annual Total Returns for Similar Accounts*
(for the periods ended December 31, 2006)
The table compares each Sub-Adviser’s investment results for accounts with investment objectives, policies and investment strategies similar to that of the Fund to an index measuring the broad market over different time periods.
| | | | | | |
| | | One Year | | Five Years | | Ten
Years |
Mazama Composite | | | | | | |
Class S* | | 10.05% | | 3.89% | | 10.40% |
Class Y* | | 10.01% | | 3.85% | | 10.35% |
Class L* | | 9.86% | | 3.69% | | 10.20% |
Class A* | | 3.30% | | 2.21% | | 9.29% |
Class N* | | 8.31% | | 3.11% | | 9.63% |
| | | | | | | |
Russell 2000 Growth Index^ | | 13.35% | | 6.93% | | 4.88% |
Russell 2000 Index^^ | | 18.37% | | 11.39% | | 9.44% |
Eagle Composite | | | | | | |
Class S* | | 20.85% | | 10.07% | | 7.93% |
Class Y* | | 20.81% | | 10.03% | | 7.89% |
Class L* | | 20.66% | | 9.87% | | 7.74% |
Class A* | | 13.49% | | 8.33% | | 6.85% |
Class N* | | 19.11% | | 9.31% | | 7.18% |
| | | | | | | |
Russell 2000 Growth Index^ | | 13.35% | | 6.93% | | 4.88% |
Russell 2000 Index^^ | | 18.37% | | 11.39% | | 9.44% |
* Each Sub-Adviser’s Similar Account performance is a composite of all portfolios managed by that Sub-Adviser with substantially similar investment objectives, policies and investment strategies and without significant client-imposed restrictions, adjusted to reflect the fees and expenses of each of the Fund’s share classes, including sales loads. The bar chart is based on Class S expenses. The composite performance does not represent the historical performance of the MassMutual Select Small Company Growth Fund and should not be interpreted as being indicative of the future performance of the Fund. For additional information, please refer to “Investment Performance” in this Prospectus. Performance shown does not reflect fees that may be paid by investors for administrative services or group annuity contract charges.
^ The Russell 2000 Growth Index is a widely recognized, unmanaged index that measures the performance of those Russell 2000 Index companies (representing small-capitalization U.S. common stocks) with higher price-to-book ratios and forecasted growth rates. The Index does not incur expenses or reflect any deduction for taxes and cannot be purchased directly by investors.
^^ The Russell 2000 Index is a widely recognized, unmanaged index representative of common stocks of smaller capitalized U.S. companies. The Index does not incur expenses or reflect any deduction for taxes and cannot be purchased directly by investors.
– 76 –
[THIS PAGE INTENTIONALLY LEFT BLANK]
MassMutual Select Emerging Growth Fund
Investment Objective
This Fund seeks capital appreciation.
Principal Investment Strategies and Risks
The Fund seeks to achieve its objective by investing primarily in smaller, rapidly growing emerging growth companies. For this Fund, emerging growth companies are those whose market capitalizations, at the time of purchase, are less than or equal to the capitalization of the company with the largest capitalization in the Russell 2000® Index or the S&P SmallCap 600 Index – as of January 31, 2007, $3.82 billion. The identity or capitalization of the company with the largest capitalization in either index will fluctuate as market prices increase or decrease. The Fund is not required to sell the stock of a company it already owns just because the company’s market capitalization grows outside the range of companies in either index. Under normal circumstances, the Fund will invest at least 80% of its net assets in equity securities (primarily common stocks) of these emerging growth companies. The Fund will generally invest in industry segments experiencing rapid growth and will likely have a portion of its assets in technology and technology-related stocks. The Fund may invest in both domestic and foreign securities. The Fund is managed by two Sub-Advisers, each being responsible for a portion of the portfolio, but not necessarily equal weighted.
Delaware Management Company (“DMC”) uses a bottom-up approach to security selection that seeks companies with high-expected growth in earnings and revenues, which are believed to be leaders, or are expected to be leaders, in their respective industries. DMC searches for outstanding performance of individual stocks before considering the impact of economic trends. DMC looks at estimated growth rates, price-to-earnings ratios, market capitalization and cash flows as DMC strives to determine how attractive a company is relative to other companies.
DMC researches individual companies and analyzes economic and market conditions, seeking to identify the securities or market sectors DMC thinks are best for the Fund. Once DMC identifies securities that have attractive characteristics, it further evaluates the company. DMC looks at the capability of the management team, the strength of the company’s position within its industry, the potential for the company to develop new products or markets, how high the company’s return on equity is, and how stringent the company’s financial and accounting polices are.
DMC relies on its own research in selecting securities for the portfolio. That research may include one-on-one meetings with executives, company competitors, industry experts and customers. DMC’s goal is to select companies that are likely to perform well over an extended time frame.
Insight Capital Research & Management, Inc. (“Insight Capital”) uses a disciplined, three-step process to evaluate the investable domestic universe of actively traded public companies. The process includes quantitative analysis, fundamental analysis, and a stock price performance analysis. Insight Capital’s approach to portfolio construction is based entirely on a “bottom-up” approach. Insight Capital typically invests in a portfolio containing 40-60 stocks.
Insight Capital considers companies that:
| · | | are rapidly growing Sales and Earnings; |
| · | | show attractive relative risk/return characteristics; |
| · | | have highly defensible competitive advantages; |
| · | | have strong management teams; and |
| · | | have stocks with good relative performance |
Insight Capital may sell a security when its performance deteriorates relative to the market. A security may also be sold if the company’s fundamental attractiveness weakens – this may include slowing earnings growth, or a prospective slowing of earnings growth.
The Principal Risks of investing in the Fund are Market Risk, Credit Risk, Management Risk, Liquidity Risk, Derivative Risk, Foreign Investment Risk, Emerging Markets Risk, Currency Risk, Smaller Company Risk, Growth Company Risk, Leveraging Risk and Portfolio Turnover Risk.
These Risks are described beginning on page 100.
Annual Performance(1)
The bar chart shows the risks of investing in the Fund by showing changes in the Fund’s performance from year to year. Sales charges and taxes are not included in the calculations of returns in this bar chart. If those charges and taxes were included, the returns would be lower than those shown.
Class S Shares
During the periods shown above, the highest quarterly return for the Fund was 30.30% for the quarter ended December 31, 2001 and the lowest quarterly return was -30.49% for the quarter ended September 30, 2001.
– 78 –
Average Annual Total Returns(1)
(for the periods ended December 31, 2006)
The table shows the risk of investing in the Fund by comparing the Fund’s returns with a broad measure of market performance over different time periods.
| | | | | | |
| | | One
Year | | Five
Years | | Since Inception (5/1/00) |
Return Before Taxes – Class S | | 5.91% | | 0.96% | | -6.36% |
Return After Taxes on Distributions – Class S | | 5.91% | | 0.96% | | -6.36% |
Return After Taxes on Distributions and Sale of Fund Shares – Class S | | 3.84% | | 0.82% | | -5.24% |
Return Before Taxes – Class Y | | 6.13% | | 0.83% | | -6.45% |
Return Before Taxes – Class L | | 5.51% | | 0.61% | | -6.65% |
Return Before Taxes – Class A+ | | -0.64% | | -0.82% | | -7.69% |
Return Before Taxes – Class N+ | | 3.97% | | 0.04% | | -7.18% |
| | | | | | | |
Russell 2000® Growth Index^ | | 13.35% | | 6.93% | | 0.03% |
Russell 2000 Index^^ | | 18.37% | | 11.39% | | 8.22% |
(1) Performance shown does not reflect fees that may be paid by investors for administrative services or group annuity contract charges.
+ Performance for Class A shares of the Fund reflects any applicable sales charge. Performance for Class N shares of the Fund prior to December 31, 2002 based on Class A shares, adjusted to reflect Class N expenses, and also reflects any applicable sales charge.
^ The Russell 2000® Growth Index is a widely recognized, unmanaged index that measures the performance of those Russell 2000 Index companies (representing small-capitalization U.S. common stocks) with higher price-to-book ratios and forecasted growth rates. The Index does not incur expenses or reflect any deduction for taxes and cannot be purchased directly by investors.
^^ The Russell 2000 Index is a widely recognized, unmanaged index representative of common stocks of smaller capitalized U.S. companies. The Index does not incur expenses or reflect any deduction for taxes and cannot be purchased directly by investors.
Going forward, the Fund’s performance will be compared to the Russell 2000 Growth Index rather than the Russell 2000 Index because the Russell 2000 Growth Index more closely represents the Fund’s investment strategy.
After-tax returns are calculated using the historical highest individual federal marginal income tax rates and do not reflect the impact of state and local taxes.
Actual after-tax returns depend on an investor’s tax situation and may differ from those shown, and after-tax returns shown are not relevant to investors who hold their Fund shares through tax-deferred arrangements, such as 401(k) plans or individual retirement accounts.
After-tax returns are shown for only Class S and after-tax returns for other classes will vary.
Expense Information
| | | | | | | | | | | | |
| | | Class S | | Class Y | | Class L | | Class A | | | Class N | |
| Shareholder Fees (fees paid directly from your investment) | | | | | | | | | | | | |
Maximum Sales Charge (Load) on purchases (as a % of offering price) | | None | | None | | None | | 5.75% | | | None | |
Maximum Deferred Sales Charge (Load) (as a % of the lower of the original offering price or redemption proceeds) | | None | | None | | None | | None | (1) | | 1.00% | (2) |
Annual Fund Operating Expenses (expenses that are deducted from Fund assets) (% of average net assets) | | | | | | | | | | | | |
Management Fees | | .79% | | .79% | | .79% | | .79% | | | .79% | |
Distribution and Service (Rule 12b-1) Fees | | None | | None | | None | | .25% | | | .50% | |
Other Expenses(3) | | .17% | | .27% | | .42% | | .42% | | | .47% | |
| Total Annual Fund Operating Expenses(4)(5) | | .96% | | 1.06% | | 1.21% | | 1.46% | | | 1.76% | |
Examples
These examples are intended to help you compare the cost of investing in the Fund with the cost of investing in other mutual funds. The examples assume that you invest $10,000 in each share class of the Fund for the time periods indicated and then redeem all of your shares at the end of those periods. For Class A shares, the examples include the initial sales charge. The examples also assume that your investment earns a 5% return each year and that the Fund’s operating expenses remain the same. Although your actual costs may be higher or lower, based on these assumptions your costs would be:
| | | | | | | | | | | | |
| | | 1 Year | | 3 Years | | 5 Years | | 10 Years |
Class S | | $ | 98 | | $ | 306 | | $ | 531 | | $ | 1,178 |
Class Y | | $ | 108 | | $ | 337 | | $ | 585 | | $ | 1,294 |
Class L | | $ | 123 | | $ | 384 | | $ | 665 | | $ | 1,466 |
Class A | | $ | 715 | | $ | 1,010 | | $ | 1,327 | | $ | 2,221 |
Class N | | $ | 282 | | $ | 554 | | $ | 954 | | $ | 2,073 |
Except for Class N shares, the figures shown above would be the same whether you sold your shares at the end of a period or kept them. For Class N shares, you would pay the following expenses if you did not redeem your shares:
| | | | | | | | | | | | |
| | | 1 Year | | 3 Years | | 5 Years | | 10 Years |
Class N | | $ | 179 | | $ | 554 | | $ | 954 | | $ | 2,073 |
| (1) | | A contingent deferred sales charge may apply to shares redeemed within 18 months of purchase from initial investments of $1 million or more. |
| (2) | | Applies to shares redeemed within 18 months of purchase. |
| (3) | | Other Expenses include Acquired Fund fees and expenses, which represent approximate expenses borne indirectly by the Fund in its most recent fiscal year through investments in other |
– 79 –
| | pooled investment vehicles. The amount of Acquired Fund fees and expenses may change in the coming year due to a number of factors including, among others, a change in allocation of the Fund’s investments among other pooled investment vehicles. |
| (4) | | Because Total Annual Fund Operating Expenses include Acquired Fund fees and expenses, they may not correspond to the ratios of expenses to average daily net assets shown in the “Financial Highlights” tables in this prospectus, which reflect the operating expenses of the Fund and do not include Acquired Fund fees and expenses. |
| (5) | | Employee benefit plans which invest in the Fund through MassMutual separate investment accounts may pay additional charges under their group annuity contract or services agreement. Investors who purchase shares directly from the Fund may also be subject to charges imposed in their administrative services or other agreement with MassMutual or MassMutual affiliate. None of these charges are deducted from Fund assets. |
Prior Performance for Similar Accounts managed by Insight Capital and DMC or certain of its affiliates*
The bar chart illustrates the variability of returns achieved by Insight Capital and DMC or certain of its affiliates for accounts with investment objectives, policies and investment strategies similar to that of the Fund. The composite performance does not represent the historical performance of the Fund and should not be interpreted as being indicative of future performance of the Fund.
| | | | |
| | | Highest Quarter | | Lowest Quarter |
DMC Composite | | 27.26%, 4Q 2001 | | -28.67%, 3Q 2001 |
Insight Capital Composite | | 51.63%, 4Q 1999 | | -30.75%, 4Q 2000 |
Average Annual Total Returns for Similar Accounts managed by Insight Capital and DMC or certain of its affiliates*
(for the periods ended December 31, 2006)
The table compares investment results for accounts managed by Insight Capital and DMC or certain of its affiliates with investment objectives, policies and investment strategies similar to that of the Fund to that of an index measuring the broad market over different time periods.
| | | | | | |
| | | One
Year | | Five
Years | | Since Inception (7/1/00) |
DMC Composite | | | | | | |
Class S* | | 9.68% | | 7.55% | | 3.12% |
Class Y* | | 9.58% | | 7.45% | | 3.02% |
Class L* | | 9.43% | | 7.30% | | 2.87% |
Class A* | | 2.90% | | 5.78% | | 1.68% |
Class N* | | 7.88% | | 6.74% | | 2.31% |
| | | | | | | |
Russell 2000 Growth Index^ | | 13.35% | | 6.93% | | -0.43% |
Russell 2000 Index^^ | | 18.37% | | 11.39% | | 8.05% |
| | | |
| | | | | | | Ten Years |
Insight Capital Composite | | | | | | |
Class S* | | 19.19% | | 16.51% | | 14.84% |
Class Y* | | 19.09% | | 16.40% | | 14.74% |
Class L* | | 18.94% | | 16.24% | | 14.58% |
Class A* | | 11.86% | | 14.61% | | 13.64% |
Class N* | | 17.39% | | 15.66% | | 14.00% |
| | | | | | | |
Russell 2000 Growth Index^ | | 13.35% | | 6.93% | | 4.88% |
Russell 2000 Index^^ | | 18.37% | | 11.39% | | 9.44% |
* Each Sub-Adviser’s Similar Account performance is a composite of all portfolios managed by that Sub-Adviser or, in the case of DMC, certain of its affiliates, with substantially similar investment objectives, policies and investment strategies and without significant client imposed restrictions, adjusted to reflect the fees and expenses of each of the Fund’s share classes, including sales loads. For DMC, the composite includes portfolios that are registered investment companies whose performance has been calculated gross of fees and adheres to Global Investment Performance Standards. The bar chart is based on Class S expenses. DMC and Insight Capital replaced RS Investment Management, L.P. as co-sub-advisers of the Fund in July 2006. The composite performance does not represent the historical performance of the MassMutual Select Emerging Growth Fund and should not be interpreted as being indicative of the future performance of the Fund. For additional information, please refer to “Investment Performance” in this Prospectus. Performance shown does not reflect fees that may be paid by investors for administrative services or group annuity contract charges.
^ The Russell 2000 Growth Index is a widely recognized, unmanaged index that measures the performance of those Russell 2000 Index companies (representing small-capitalization U.S. common stocks) with higher price-to-book ratios and forecasted growth rates. The Index does not incur expenses or reflect any deduction for taxes and cannot be purchased directly by investors.
^^ The Russell 2000 Index is a widely recognized, unmanaged index representative of common stocks of smaller capitalized U.S. companies. The Index does not incur expenses or reflect any deduction for taxes and cannot be purchased directly by investors.
– 80 –
[THIS PAGE INTENTIONALLY LEFT BLANK]
MassMutual Select Diversified International Fund
Investment Objective
This Fund seeks growth of capital over the long-term.
Principal Investment Strategies and Risks
The Fund seeks to achieve its objective by investing primarily in a diversified portfolio of equity securities of established companies selected from more than 40 industries and more than 40 developed and emerging market countries. The Fund normally invests in companies in at least three countries other than United States. These countries currently include the developed nations in Europe and the Far East, Canada, Australia and emerging market countries worldwide. The Fund invests in companies that are determined by the Fund’s Sub-Adviser, AllianceBernstein L.P. (“AllianceBernstein”), through the investment professionals of its Bernstein unit, to be undervalued, using a fundamental value approach. In selecting securities for the Fund’s portfolio, AllianceBernstein uses its fundamental and quantitative research to identify companies whose long-term earnings power is not reflected in the current market price of their securities. AllianceBernstein’s fundamental value approach to equity investing generally defines value as the relationship between a security’s current price and its intrinsic economic value, as measured by long-term earnings prospects. In each market, this approach seeks to identify a universe of securities that are considered to be undervalued because they are attractively priced relative to their future earnings power. Accordingly, forecasting corporate earnings and dividend paying capability is the heart of the fundamental value approach. AllianceBernstein’s fundamental analysis depends heavily upon its large internal research staff. The research staff begins with a global research universe of approximately 2,500 international and emerging market companies. Teams within the research staff cover a given industry worldwide, to better understand each company’s competitive position in a global context.
AllianceBernstein’s staff of company and industry analysts develop earnings estimates and financial models for each company analyzed. AllianceBernstein identifies and quantifies the critical variables that influence a business’s performance and uses this research insight to forecast each company’s long-term prospects and expected returns. As one of the largest multinational investment firms, AllianceBernstein has global access to considerable information concerning all of the companies followed, an in-depth understanding of the products, services, markets and competition of these companies and a good knowledge of the management of most of the companies in the research universe. A company’s financial performance is typically projected over a full economic cycle, including a trough and a peak, within the context of forecasts for real economic growth, inflation and interest rate changes. As a result, forecasts of near-term economic events are generally not of major consequence.
Senior investment professionals, including the Fund’s portfolio managers, carefully review the research process to ensure that the analysts have appropriately considered key issues facing each company, that forecasts of a company’s future are compatible with its history, and that all forecasts use consistent analytic frameworks and economic assumptions. Once AllianceBernstein has applied its fundamental analysis to determine the intrinsic economic value of each of the companies in its research universe, the companies are ranked in order of the highest to lowest risk-adjusted expected return.
The Fund does not simply purchase the top-ranked securities. Rather, AllianceBernstein considers aggregate portfolio characteristics when deciding how much of each security to purchase for the Fund. AllianceBernstein’s quantitative analysts build valuation and risk models to ensure that the Fund’s portfolio is constructed to obtain an effective balance of risk and return. By evaluating overall regional, country and currency exposures, sector concentration, degree of undervaluation and other subtle similarities among investments, AllianceBernstein selects those top-ranked securities that also tend to diversify the Fund’s risk.
A disparity between a company’s current stock price and the assessment of intrinsic value can arise, at least in part, as a result of adverse, short-term market reactions to recent events or trends. In order to reduce the risk that an undervalued security will be purchased before such an adverse market reaction has run its course, AllianceBernstein also analyzes relative return trends (also called “momentum”) so as to better time new purchases and sales of securities.
– 82 –
Currencies can have a dramatic impact on equity returns, significantly adding to returns in some years and greatly diminishing them in others. Currency and equity positions are evaluated separately. AllianceBernstein may seek to hedge the currency exposure resulting from securities positions when it finds the currency exposure unattractive. To hedge a portion of its currency risk, the Fund may from time to time invest in currency futures contracts or currency forward contracts. Currency forward contracts may be purchased, such that net exposure to an individual currency exceeds the underlying stock investments in that country.
A security generally will be sold when it reaches fair value. The Fund may enter into derivatives transactions, such as options, futures, forwards, and swap agreements and the Fund may invest in depositary receipts and equity linked notes.
The Principal Risks of investing in the Fund are Market Risk, Credit Risk, Management Risk, Liquidity Risk, Derivative Risk, Foreign Investment Risk, Emerging Markets Risk, Currency Risk, Value Company Risk and Leveraging Risk.
These Risks are described beginning on page 100.
Annual Performance
The Fund began operations December 14, 2006, and does not have a full calendar year of returns. There will be risks of investing in the Fund because the returns can be expected to vary from year to year.
Average Annual Total Returns
Because this Fund does not have a full calendar year of returns, there is no table which shows how the Fund’s returns have deviated from the broad market.
Expense Information
| | | | | | | | | | | | |
| | | Class S | | Class Y | | Class L | | Class A | | | Class N | |
| Shareholder Fees (fees paid directly from your investment) | | | | | | | | | | | | |
Maximum Sales Charge (Load) on purchases (as a % of offering price) | | None | | None | | None | | 5.75% | | | None | |
Maximum Deferred Sales Charge (Load) (as a % of the lower of the original offering price or redemption proceeds) | | None | | None | | None | | None | (1) | | 1.00% | (2) |
| | | | | | | | | | | | | |
| | | Class S | | Class Y | | Class L | | | Class A | | | Class N | |
| Annual Fund Operating Expenses (expenses that are deducted from Fund assets) (% of average net assets) | | | | | | | | | | | | | |
Management Fees | | .90% | | .90% | | .90% | | | .90% | | | .90% | |
Distribution and Service (Rule 12b-1) Fees | | None | | None | | None | | | .25% | | | .50% | |
Other Expenses(3) | | .09% | | .19% | | .34% | | | .34% | | | .39% | |
| Total Annual Fund Operating Expenses | | .99% | | 1.09% | | 1.24% | | | 1.49% | | | 1.79% | |
| | | | | | | | | | | | | |
Less Expense Reimbursement | | – | | – | | (.07% | ) | | (.07% | ) | | (.07% | ) |
Net Fund Expenses(4)(5) | | .99% | | 1.09% | | 1.17% | | | 1.42% | | | 1.72% | |
Examples
These examples are intended to help you compare the cost of investing in the Fund with the cost of investing in other mutual funds. The examples assume that you invest $10,000 in each share class of the Fund for the time periods indicated and then redeem all of your shares at the end of those periods. For Class A shares, the examples include the initial sales charge. The examples also assume that your investment earns a 5% return each year and that the Fund’s operating expenses remain the same. Although your actual costs may be higher or lower, based on these assumptions your costs would be:
| | | | | | |
| | | 1 Year | | 3 Years |
Class S | | $ | 101 | | $ | 315 |
Class Y | | $ | 111 | | $ | 347 |
Class L | | $ | 119 | | $ | 387 |
Class A | | $ | 711 | | $ | 1,012 |
Class N | | $ | 278 | | $ | 557 |
Except for Class N shares, the figures shown above would be the same whether you sold your shares at the end of a period or kept them. For Class N shares, you would pay the following expenses if you did not redeem your shares:
| | | | | | |
| | | 1 Year | | 3 Years |
Class N | | $ | 175 | | $ | 557 |
| (1) | | A contingent deferred sales charge may apply to shares redeemed within 18 months of purchase from initial investments of $1 million or more. |
| (2) | | Applies to shares redeemed within 18 months of purchase. |
| (3) | | Other Expenses are based on estimated amounts for the first fiscal year of the Fund. |
| (4) | | The expenses in the above table reflect a written agreement by MassMutual to cap the fees and expenses of the Fund (other than extraordinary litigation and legal expenses, or other non-recurring or unusual expenses) at these amounts through March 31, 2008. The agreement cannot be terminated unilaterally by MassMutual. |
– 83 –
| (5) | | Employee benefit plans which invest in the Fund through MassMutual separate investment accounts may pay additional charges under their group annuity contract or services agreement. Investors who purchase shares directly from the Fund may also be subject to charges imposed in their administrative services or other agreement with MassMutual or MassMutual affiliate. None of these charges are deducted from Fund assets. |
AllianceBernstein
Prior Performance for Similar Accounts*
The bar chart illustrates the variability of returns achieved by AllianceBernstein for accounts with investment objectives, policies and investment strategies similar to that of the Fund. The composite performance does not represent the historical performance of the Fund and should not be interpreted as being indicative of future performance of the Fund.
During the periods shown above, the highest quarterly return was 22.72% for the quarter ended June 30, 2003 and the lowest was -18.71% for the quarter ended September 30, 2002.
AllianceBernstein Average Annual
Total Returns for Similar Accounts*
(for the periods ended December 31, 2006)
The table compares AllianceBernstein’s investment results for accounts with investment objectives, policies and investment strategies similar to that of the Fund to that of an index measuring the broad market over different time periods.
| | | | | | |
| | | One
Year | | Five
Years | | Since
Inception
(4/1/99) |
AllianceBernstein Composite | | | | | | |
Class S* | | 31.48% | | 23.07% | | 13.96% |
Class Y* | | 31.38% | | 22.97% | | 13.86% |
Class L* | | 31.30% | | 22.89% | | 13.78% |
Class A* | | 23.52% | | 21.20% | | 12.65% |
Class N* | | 29.75% | | 22.34% | | 13.21% |
| | | | | | | |
| | | |
| | | | | | | Since
Inception
(1/1/01) |
MSCI® ACWI® ex US^ | | 26.65% | | 16.42% | | 9.43% |
* Performance shown is a composite of all fee-paying institutional discretionary accounts managed by AllianceBernstein with substantially similar investment objectives, policies and investment strategies and without significant client-imposed restrictions, adjusted to reflect the fees and expenses of each of the Fund’s share classes, including sales loads. The bar chart is based on Class S expenses. The composite performance does not represent the historical performance of the MassMutual Select Diversified International Fund and should not be interpreted as being indicative of the future performance of the Fund. For additional information, please refer to “Investment Performance” in this Prospectus. Performance shown does not reflect fees that may be paid by investors for administrative services or group annuity contract charges.
^ The Morgan Stanley Capital International All Country World Index (MSCI® ACWI®) ex US is an unmanaged index representative of stocks domiciled in global developed and emerging markets, excluding the United States. The Index does not incur expenses or reflect any deduction for taxes and cannot be purchased directly by investors.
– 84 –
[THIS PAGE INTENTIONALLY LEFT BLANK]
MassMutual Select Overseas Fund
Investment Objective
The Fund seeks growth of capital over the long-term by investing in both foreign and domestic equity securities.
Principal Investment Strategies and Risks
The Fund seeks to achieve its objective by investing at least 80% of its net assets in stocks of foreign companies, including companies located in Europe, Latin America and Asia. The Fund’s two Sub-Advisers, Massachusetts Financial Services Company (MFS®1) and Harris Associates L.P. (“Harris”), are each responsible for a portion of the portfolio, but not necessarily equal weighted. Each focuses on well-positioned, well-managed businesses that have strong revenue growth, sustainable profit margins and/or capital efficiency. The Sub-Advisers also consider the macroeconomic outlook for various regional economies.
For MFS, a company’s principal activities are determined to be located in a particular country if the company (a) is organized under the laws of, and maintains a principal office in, a country, (b) has its principal securities trading markets in a country, (c) derives 50% of its total revenues from goods sold or services performed in the country, or (d) has 50% or more of its assets in the country.
In selecting investments for the Fund, MFS is not constrained to any particular investment style. MFS may invest the Fund’s assets in the stock of companies it believes to have above average earnings growth potential compared to other companies (growth companies), in the stock of companies it believes are undervalued compared to their perceived worth (value companies), or in a combination of growth and value companies.
MFS may invest the Fund’s assets in companies of any size.
MFS uses a bottom-up investment approach in buying and selling investments for the Fund. Investments are selected primarily based on fundamental analysis of issuers and their potential in light of their current financial condition and industry position, and market, economic, political, and regulatory conditions. Factors considered may include analysis of earnings, cash flows, competitive position, and management ability. Quantitative analysis of these and other factors may also be considered.
Harris utilizes a fundamental, bottom-up investment strategy. Harris seeks out companies that it believes to be trading in the market at significant discounts to their underlying values. These businesses must offer, in Harris’ opinion, significant profit potential and be run by managers who think and act as owners. Harris’ research analysts are generalists and search for value in the stock market wherever it may be, regardless of industry, as well as in both established and emerging markets. This structure provides analysts with a much broader perspective and allows them to assess relative values among companies in different industry sectors.
Harris’ portfolio managers and analysts also look for value based on a company’s normalized earnings (after adjusting for cyclical influences) and asset value. A company must be selling at 30% or greater discount to its value to be a candidate for purchase. Stocks are analyzed in terms of financial strength, the position of the company in its industry, and the attractiveness of the industry.
The Principal Risks of investing in the Fund are Market Risk, Credit Risk, Management Risk, Liquidity Risk, Derivative Risk, Foreign Investment Risk, Emerging Markets Risk, Currency Risk, Growth Company Risk, Over-the-Counter Risk and Leveraging Risk.
These Risks are described beginning on page 100.
1MFS® is a registered trademark of Massachusetts Financial Services Company.
Annual Performance(1)
The bar chart shows the risks of investing in the Fund by showing changes in the Fund’s performance from year to year. Sales charges and taxes are not included in the calculations of returns in this bar chart. If those charges and taxes were included, the returns would be lower than those shown.
Class S Shares
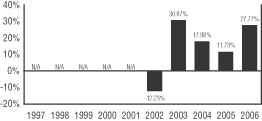
During the periods shown above, the highest quarterly return for the Fund was 20.76% for the quarter ended June 30, 2003 and the lowest quarterly return was -21.22% for the quarter ended September 30, 2002.
– 86 –
Average Annual Total Returns(1)
(for the periods ended December 31, 2006)
The table shows the risk of investing in the Fund by comparing the Fund’s returns with a broad measure of market performance over different time periods.
| | | | | | |
| | | One
Year | | Five Years | | Since Inception (5/1/01) |
Return Before Taxes – Class S | | 27.77% | | 14.11% | | 9.01% |
Return After Taxes on Distributions –Class S | | 26.17% | | 13.32% | | 8.34% |
Return After Taxes on Distributions and Sale of Fund Shares – Class S | | 20.20% | | 12.27% | | 7.75% |
Return Before Taxes – Class Y | | 27.67% | | 14.03% | | 8.94% |
Return Before Taxes – Class L | | 27.66% | | 13.90% | | 8.81% |
Return Before Taxes – Class A+ | | 20.06% | | 12.28% | | 7.42% |
Return Before Taxes – Class N+ | | 25.91% | | 13.28% | | 8.23% |
| | | | | | | |
MSCI® EAFE®^ | | 26.34% | | 14.98% | | 9.93% |
(1) Performance shown does not reflect fees that may be paid by investors for administrative services or group annuity contract charges.
+ Performance for Class A shares of the Fund reflects any applicable sales charge. Performance for Class N shares of the Fund prior to December 31, 2002 is based on Class A shares, adjusted to reflect Class N expenses, and also reflects any applicable sales charge.
^ MSCI® EAFE® is a widely recognized, unmanaged index representative of foreign securities in the major non-U.S. markets of Europe, Australia and the Far East. The Index does not incur expenses or reflect any deduction for taxes and cannot be purchased directly by investors.
After-tax returns are calculated using the historical highest individual federal marginal income tax rates and do not reflect the impact of state and local taxes.
Actual after-tax returns depend on an investor’s tax situation and may differ from those shown, and after-tax returns shown are not relevant to investors who hold their Fund shares through tax-deferred arrangements, such as 401(k) plans or individual retirement accounts.
After-tax returns are shown for only Class S and after-tax returns for other classes will vary.
Expense Information
| | | | | | | | | | |
| | | Class S | | Class Y | | Class L | | Class A | | Class N |
| Shareholder Fees (fees paid directly from your investment) | | | | | | | | | | |
Maximum Sales Charge (Load) on purchases (as a % of offering price) | | None | | None | | None | | 5.75% | | None |
| | | | | | | | | | | | | |
| | | Class S | | Class Y | | Class L | | | Class A | | | Class N | |
Maximum Deferred Sales Charge (Load) (as a % of the lower of the original offering price or redemption proceeds) | | None | | None | | None | | | None | (1) | | 1.00% | (2) |
| Annual Fund Operating Expenses (expenses that are deducted from Fund assets) | | | | | | | | | | | | | |
| (% of average net assets) | | | | | | | | | | | | | |
Management Fees | | 1.00% | | 1.00% | | 1.00% | | | 1.00% | | | 1.00% | |
Distribution and Service (Rule 12b-1) Fees | | None | | None | | None | | | .25% | | | .50% | |
Other Expenses(3) | | .16% | | .21% | | .36% | | | .36% | | | .41% | |
| Total Annual Fund Operating Expenses(4) | | 1.16% | | 1.21% | | 1.36% | | | 1.61% | | | 1.91% | |
| | | | | | | | | | | | | |
Less Expense Reimbursement(5) | | – | | – | | (.10% | ) | | (.10% | ) | | (.10% | ) |
Net Fund Expenses(6) | | 1.16% | | 1.21% | | 1.26% | | | 1.51% | | | 1.81% | |
Examples
These examples are intended to help you compare the cost of investing in the Fund with the cost of investing in other mutual funds. The examples assume that you invest $10,000 in each share class of the Fund for the time periods indicated and then redeem all of your shares at the end of those periods. For Class A shares, the examples include the initial sales charge. The examples also assume that your investment earns a 5% return each year and that the Fund’s operating expenses remain the same. Although your actual costs may be higher or lower, based on these assumptions your costs would be:
| | | | | | | | | | | | |
| | | 1 Year | | 3 Years | | 5 Years | | 10 Years |
Class S | | $ | 118 | | $ | 368 | | $ | 638 | | $ | 1,409 |
Class Y | | $ | 123 | | $ | 384 | | $ | 665 | | $ | 1,466 |
Class L | | $ | 128 | | $ | 421 | | $ | 735 | | $ | 1,626 |
Class A | | $ | 720 | | $ | 1,045 | | $ | 1,392 | | $ | 2,368 |
Class N | | $ | 287 | | $ | 590 | | $ | 1,022 | | $ | 2,225 |
Except for Class N shares, the figures shown above would be the same whether you sold your shares at the end of a period or kept them. For Class N shares, you would pay the following expenses if you did not redeem your shares:
| | | | | | | | | | | | |
| | | 1 Year | | 3 Years | | 5 Years | | 10 Years |
Class N | | $ | 184 | | $ | 590 | | $ | 1,022 | | $ | 2,225 |
| (1) | | A contingent deferred sales charge may apply to shares redeemed within 18 months of purchase from initial investments of $1 million or more. |
– 87 –
| (2) | | Applies to shares redeemed within 18 months of purchase. |
| (3) | | Other Expenses include Acquired Fund fees and expenses, which represent approximate expenses borne indirectly by the Fund in its most recent fiscal year through investments in other pooled investment vehicles. The amount of Acquired Fund fees and expenses may change in the coming year due to a number of factors including, among others, a change in allocation of the Fund’s investments among other pooled investment vehicles. |
| (4) | | Because Total Annual Fund Operating Expenses include Acquired Fund fees and expenses, they may not correspond to the ratios of expenses to average daily net assets shown in the “Financial Highlights” tables in this prospectus, which reflect the operating expenses of the Fund and do not include Acquired Fund fees and expenses. |
| (5) | | The expenses in the above table reflect a written agreement by MassMutual to waive .10% of other expenses for Class L, Class A and Class N of the Fund through March 31, 2008. The agreement cannot be terminated unilaterally by MassMutual. |
| (6) | | Employee benefit plans which invest in the Fund through MassMutual separate investment accounts may pay additional charges under their group annuity contract or services agreement. Investors who purchase shares directly from the Fund may also be subject to charges imposed in their administrative services or other agreement with MassMutual or MassMutual affiliate. None of these charges are deducted from Fund assets. |
Harris and MFS Prior Performance for Similar Accounts*
The bar chart illustrates the variability of returns achieved by each Sub-Adviser for accounts with investment objectives, policies and investment strategies similar to that of the Fund. The composite performance does not represent the historical performance of the Fund and should not be interpreted as being indicative of future performance of the Fund.
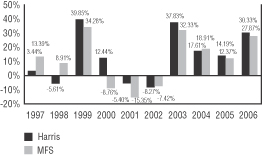
| | | | |
| | | Highest Quarter | | Lowest Quarter |
Harris Composite | | 25.65%, 2Q 2003 | | -22.99%, 3Q 2002 |
MFS Composite | | 26.43%, 4Q 1999 | | -15.96%, 3Q 1998 |
Harris and MFS Average Annual Total Returns for Similar Accounts*
(for the periods ended December 31, 2006)
The table compares each Sub-Adviser’s investment results for accounts with investment objectives, policies and investment strategies similar to that of the Fund to an index measuring the broad market over different time periods.
| | | | | | |
| | | One Year | | Five Years | | Ten Years |
Harris Composite | | | | | | |
Class S* | | 30.33% | | 17.22% | | 12.39% |
Class Y* | | 30.28% | | 17.17% | | 12.33% |
Class L* | | 30.21% | | 17.05% | | 12.20% |
Class A* | | 22.49% | | 15.42% | | 11.29% |
Class N* | | 28.66% | | 16.50% | | 11.64% |
| | | | | | | |
MSCI EAFE^ | | 26.34% | | 14.98% | | 7.71% |
MFS Composite | | | | | | |
Class S* | | 27.87% | | 15.92% | | 10.37% |
Class Y* | | 27.82% | | 15.87% | | 10.32% |
Class L* | | 27.75% | | 15.82% | | 10.26% |
Class A* | | 20.17% | | 14.20% | | 9.36% |
Class N* | | 26.20% | | 15.26% | | 9.71% |
| | | | | | | |
MSCI EAFE^ | | 26.34% | | 14.98% | | 7.71% |
* Each Sub-Adviser’s Similar Account performance is a composite of all portfolios managed by that Sub-Adviser with substantially similar investment objectives, policies and investment strategies and without significant client-imposed restrictions, adjusted to reflect the fees and expenses of each of the Fund’s share classes, including sales loads. The bar chart is based on Class S expenses. MFS replaced American Century Global Investment Management, Inc. as one of the Fund’s Sub-Advisers on September 13, 2005. The composite performance does not represent the historical performance of the MassMutual Select Overseas Fund and should not be interpreted as being indicative of the future performance of the Fund. For additional information, please refer to “Investment Performance” in this Prospectus. Performance shown does not reflect fees that may be paid by investors for administrative services or group annuity contract charges.
^ MSCI EAFE is a widely recognized, unmanaged index representative of foreign securities in the major non-U.S. markets of Europe, Australia and the Far East. The Index does not incur expenses or reflect any deduction for taxes and cannot be purchased directly by investors.
– 88 –
[THIS PAGE INTENTIONALLY LEFT BLANK]
MassMutual Select Destination Retirement Funds
MassMutual Select Destination Retirement Income Fund
Investment Objective
The Fund seeks to achieve high current income and, as a secondary objective, capital appreciation.
Principal Investment Strategies and Risks
The Fund seeks to achieve its investment objective by investing in a combination of equity, fixed income and money market funds advised by MassMutual or a control affiliate of MassMutual (“Underlying Funds”)1 using an asset allocation strategy designed for investors already in retirement.
| · | Assets are allocated among Underlying Funds according to a stable target asset allocation strategy that emphasizes fixed income and money market funds but also includes a smaller allocation to equity funds. |
The Principal Risks of investing in the Fund are Market Risk, Credit Risk, Management Risk, Prepayment Risk, Liquidity Risk, Derivative Risk, Foreign Investment Risk, Emerging Markets Risk, Currency Risk, Smaller Company Risk, Growth Company Risk, Value Company Risk, Over-the-Counter Risk and Leveraging Risk.
These Risks are described beginning on page 100.
MassMutual Select Destination Retirement 2010 Fund
Investment Objective
The Fund seeks to achieve as high a total rate of return on an annual basis as is considered consistent with prudent investment risk and the preservation of capital.
Principal Investment Strategies and Risks
The Fund seeks to achieve its investment objective by investing in a combination of equity, fixed income and money market funds advised by MassMutual or a control affiliate of MassMutual (“Underlying Funds”)1 using an asset allocation strategy designed for investors expecting to retire around the year 2010.
| · | Assets are allocated among Underlying Funds according to an asset allocation strategy that becomes increasingly conservative until it reaches 25% in equity funds and 75% in fixed-income funds, including money market funds (approximately five to ten years after the year 2010). |
The Principal Risks of investing in the Fund are Market Risk, Credit Risk, Management Risk, Prepayment Risk, Liquidity Risk, Derivative Risk, Foreign Investment Risk, Emerging Markets Risk, Currency Risk, Smaller Company Risk, Growth Company Risk, Value Company Risk, Over-the-Counter Risk and Leveraging Risk.
These Risks are described beginning on page 100.
| (1) | | Underlying Funds can include MassMutual Select Funds, MassMutual Premier Funds and Oppenheimer Funds, which are advised by OppenheimerFunds, Inc. (“OFI”). OFI is a majority owned, indirect subsidiary of MassMutual. MassMutual Premier Funds and Oppenheimer Funds are offered in separate prospectuses. |
MassMutual Select Destination Retirement 2020 Fund
Investment Objective
The Fund seeks to achieve as high a total rate of return on an annual basis as is considered consistent with prudent investment risk and the preservation of capital.
Principal Investment Strategies and Risks
The Fund seeks to achieve its investment objective by investing in a combination of equity, fixed income and money market funds advised by MassMutual or a control affiliate of MassMutual (“Underlying Funds”)1 using an asset allocation strategy designed for investors expecting to retire around the year 2020.
| · | Assets are allocated among Underlying Funds according to an asset allocation strategy that becomes increasingly conservative until it reaches 25% in equity funds and 75% in fixed-income funds, including money market funds (approximately five to ten years after the year 2020). |
The Principal Risks of investing in the Fund are Market Risk, Credit Risk, Management Risk, Prepayment Risk, Liquidity Risk, Derivative Risk, Foreign Investment Risk, Emerging Markets Risk, Currency Risk, Smaller Company Risk, Growth Company Risk, Value Company Risk, Over-the-Counter Risk and Leveraging Risk.
These Risks are described beginning on page 100.
MassMutual Select Destination Retirement 2030 Fund
Investment Objective
The Fund seeks to achieve as high a total rate of return on an annual basis as is considered consistent with prudent investment risk and the preservation of capital.
Principal Investment Strategies and Risks
The Fund seeks to achieve its investment objective by investing in a combination of equity, fixed income and money market funds advised by MassMutual or a control affiliate of MassMutual (“Underlying Funds”)1 using an asset allocation strategy designed for investors expecting to retire around the year 2030.
| · | Assets are allocated among Underlying Funds according to an asset allocation strategy that becomes increasingly conservative until it reaches 25% in equity funds and 75% in fixed-income funds, including money market funds (approximately five to ten years after the year 2030). |
– 90 –
The Principal Risks of investing in the Fund are Market Risk, Credit Risk, Management Risk, Prepayment Risk, Liquidity Risk, Derivative Risk, Foreign Investment Risk, Emerging Markets Risk, Currency Risk, Smaller Company Risk, Growth Company Risk, Value Company Risk, Over-the-Counter Risk and Leveraging Risk.
These Risks are described beginning on page 100.
MassMutual Select Destination Retirement 2040 Fund
Investment Objective
The Fund seeks to achieve as high a total rate of return on an annual basis as is considered consistent with prudent investment risk and the preservation of capital.
Principal Investment Strategies and Risks
The Fund seeks to achieve its investment objective by investing in a combination of equity, fixed income and money market funds advised by MassMutual or a control affiliate of MassMutual (“Underlying Funds”)1 using an asset allocation strategy designed for investors expecting to retire around the year 2040.
| · | Assets are allocated among Underlying Funds according to an asset allocation strategy that becomes increasingly conservative until it reaches 25% in equity funds and 75% in fixed-income funds, including money market funds (approximately five to ten years after the year 2040). |
The Principal Risks of investing in the Fund are Market Risk, Credit Risk, Management Risk, Prepayment Risk, Liquidity Risk, Derivative Risk, Foreign Investment Risk, Emerging Markets Risk, Currency Risk, Smaller Company Risk, Growth Company Risk, Value Company Risk, Over-the-Counter Risk and Leveraging Risk.
These Risks are described beginning on page 100.
More Principal Investment Strategies and Risks
MassMutual invests each Destination Retirement Fund’s assets in a combination of domestic and international Underlying Funds. The Destination Retirement Funds differ primarily due to their asset allocations among these fund types.
MassMutual allocates the assets of each Destination Retirement Fund with a target retirement date (Destination Retirement 2010, Destination Retirement 2020, Destination Retirement 2030, and Destination Retirement 2040) among Underlying Funds according to an asset allocation strategy that becomes increasingly conservative over time. Each fund’s name refers to the approximate retirement year of the investors for whom the fund’s asset
| (1) | | Underlying Funds can include MassMutual Select Funds, MassMutual Premier Funds and Oppenheimer Funds, which are advised by OppenheimerFunds, Inc. (“OFI”). OFI is a majority owned, indirect subsidiary of MassMutual. MassMutual Premier Funds and Oppenheimer Funds are offered in separate prospectuses. |
allocation strategy is designed. For example, Destination Retirement 2030, which is designed for investors planning to retire around the year 2030, currently has an aggressive target asset allocation (relative to the other Destination Retirement Funds), with a substantial portion of its assets invested in equity funds and a modest portion of its assets invested in fixed-income funds. By contrast, Destination Retirement 2010 currently has a more conservative target asset allocation, with less than half of its assets invested in equity funds and the majority of its assets invested in fixed-income and money market funds.
Destination Retirement Income is designed for investors in their retirement years. MassMutual allocates the fund’s assets according to a stable target asset allocation that emphasizes fixed-income and money market funds but also includes a smaller allocation to equity funds.
When the target asset allocation of another Destination Retirement Fund matches Destination Retirement Income’s target asset allocation (approximately five to ten years after the fund’s retirement date), it is expected that the fund will be combined with Destination Retirement Income and the fund’s shareholders will become shareholders of Destination Retirement Income. This may be done without a vote of shareholders if the Trust’s Board of Trustees determines at the time of the proposed combination that combining the funds is in the best interests of the funds and their shareholders. The objectives and policies stated above are non-fundamental and therefore may be changed by the Board of Trustees of the Trust without the consent of shareholders.
MassMutual intends to manage each Destination Retirement Fund according to its target asset allocation strategy, and does not intend to trade actively among Underlying Funds or intend to attempt to capture short-term market opportunities. However, MassMutual may modify the target asset allocation strategy for any Destination Retirement Fund and modify the selection of Underlying Funds for any Destination Retirement Fund from time to time.
The following table contains guidelines designed to help investors select an appropriate Destination Retirement Fund. The guidelines are based on the year in which the investor anticipates his or her retirement to begin and assume a retirement age of 65.
| | |
Retirement Year | | Fund |
Retired before 2006 | | Destination Retirement Income |
2006-2015 | | Destination Retirement 2010 |
2016-2025 | | Destination Retirement 2020 |
2026-2035 | | Destination Retirement 2030 |
2036-2045 | | Destination Retirement 2040 |
– 91 –
The following table lists each Destination Retirement Fund’s approximate asset allocation among equity and fixed income & short term/money market funds as of March 16, 2007. The table also lists the approximate asset allocation, as of March 16, 2007, to certain Underlying Funds in which a Destination Retirement Fund currently invests 5% or more. Other Underlying Funds in which the Destination Retirement Funds currently invest are listed below the table. MassMutual may change these percentages at any time and may invest in any other Underlying Funds, including any Underlying Funds that may be created in the future.
| | | | | | | | | | |
| Investment Option Categories | | Destination
Retirement
Income | | Destination
Retirement
2010 | | Destination
Retirement 2020 | | Destination
Retirement
2030 | | Destination
Retirement
2040 |
| | | | | |
Equity | | 25.1% | | 37.0% | | 56.0% | | 80.0% | | 97.0% |
Domestic Equity | | | | | | | | | | |
Select Fundamental Value (Wellington) | | 1.4% | | 1.8% | | 4.0% | | 7.6% | | 9.9% |
Select Large Cap Value (Davis) | | 0.5% | | 1.0% | | 2.2% | | 4.1% | | 5.3% |
Select Diversified Value (AllianceBernstein) | | 1.0% | | 1.0% | | 2.3% | | 4.2% | | 5.5% |
Premier Enhanced Index Value (Babson Capital) | | 2.9% | | 5.9% | | 5.8% | | 4.9% | | 5.9% |
Select Growth Equity (GMO) | | 3.1% | | 4.3% | | 4.2% | | 6.6% | | 7.6% |
Select Aggressive Growth (Sands Capital/DMC) | | 1.1% | | 1.4% | | 3.0% | | 6.1% | | 7.5% |
Premier Enhanced Index Growth (Babson Capital) | | 0.6% | | 2.6% | | 3.8% | | 4.6% | | 6.0% |
Select Mid-Cap Value (Cooke & Bieler) | | 1.0% | | 2.1% | | 4.1% | | 4.1% | | 5.1% |
| | | | | |
| International Equity | | | | | | | | | | |
Select Overseas (Harris/MFS) | | 2.6% | | 3.7% | | 2.6% | | 8.2% | | 9.7% |
Select Diversified International (AllianceBernstein) | | 1.2% | | 1.8% | | 5.8% | | 3.9% | | 4.6% |
| | | | | |
Fixed Income & Short Term/Money Market | | 74.9% | | 63.0% | | 44.0% | | 20.0% | | 3.0% |
Premier Core Bond (Babson Capital) | | 18.0% | | 16.1% | | 12.4% | | 4.4% | | 0.6% |
Premier Diversified Bond (Babson Capital) | | 14.4% | | 12.8% | | 10.0% | | 4.4% | | 0.6% |
Premier Inflation-Protected Bond (Babson Capital) | | 19.0% | | 15.1% | | 13.1% | | 8.0% | | 1.0% |
Premier Short-Duration Bond (Babson Capital) | | 15.0% | | 11.0% | | 6.0% | | 1.0% | | 0.0% |
Premier Money Market (Babson Capital) | | 5.0% | | 5.0% | | 0.0% | | 0.0% | | 0.0% |
Note: The allocation percentages have been rounded to one decimal place. The allocation among equity and fixed income & short term/money market funds may therefore not equal 100%.
Other underlying MassMutual Funds in which the Destination Retirement Funds currently invest include: Premier Value (OFI Institutional), Select Blue Chip Growth (T. Rowe Price), Premier Capital Appreciation (OFI), Select Focused Value (Harris/Cooke & Bieler), Select Mid Cap Growth Equity (Navellier), Select Mid Cap Growth Equity II (T. Rowe Price), Select Small Company Value (Clover/T. Rowe Price/Earnest Partners), Select Small Cap Value Equity (SSgA FM), Select Emerging Growth (DMC/Insight Capital), Select Small Cap Growth Equity (Waddell & Reed/Wellington), Select Small Company Growth (Mazama/Eagle), Select Small Cap Core Equity (GSAM), Premier Main Street Small Cap (OFI Institutional), Premier International Equity (OFI Institutional) and Premier Strategic Income (OFI Institutional).
– 92 –
The following chart illustrates each Destination Retirement Fund’s approximate target asset allocation among equity and fixed-income funds as of the date of this prospectus. The Destination Retirement Funds’ target asset allocations may differ from this illustration. MassMutual periodically reviews the target allocations and underlying investment options and may, at any time, change the target allocations or deem it appropriate to deviate from the target allocations. The chart below is presented only as an illustration of how the process of re-allocation occurs as each Fund approaches its target date.
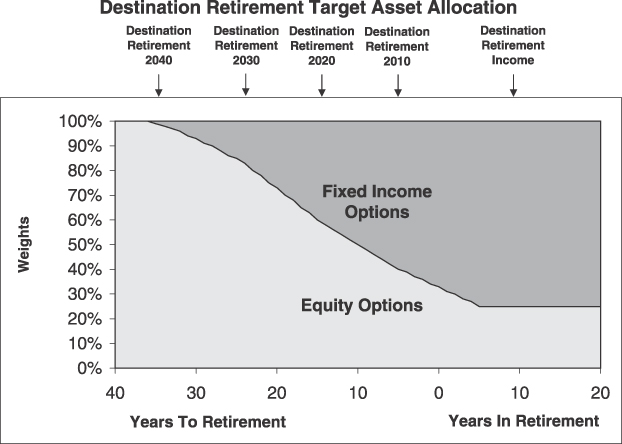
– 93 –
MassMutual Select Destination Retirement Income Fund
Annual Performance(1)
The bar chart shows the risks of investing in the Fund by showing changes in the Fund’s performance from year to year. Sales charges and taxes are not included in the calculations of returns in this bar chart. If those charges and taxes were included, the returns would be lower than those shown.
Class S Shares
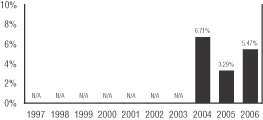
During the periods shown above, the highest quarterly return for the Fund was 3.91% for the quarter ended December 31, 2004 and the lowest quarterly return was -1.07% for the quarter ended June 30, 2004.
Average Annual Total Returns(1)
(for the periods ended December 31, 2006)
The table shows the risk of investing in the Fund by comparing the Fund’s returns with a broad measure of market performance over different time periods.
| | | | |
| | | One
Year | | Since Inception (12/31/03) |
Return Before Taxes – Class S | | 5.47% | | 5.14% |
Return After Taxes on Distributions – Class S | | 4.57% | | 4.00% |
Return After Taxes on Distributions and Sale of Fund Shares – Class S | | 4.41% | | 3.88% |
Return Before Taxes – Class Y | | 5.45% | | 5.12% |
Return Before Taxes – Class L | | 5.34% | | 5.02% |
Return Before Taxes – Class A+ | | -0.91% | | 2.72% |
Return Before Taxes – Class N+ | | 3.83% | | 4.44% |
| | | | | |
Custom Destination Income Index^ | | 7.71% | | 6.15% |
Lipper Balanced Fund Index^^ | | 11.60% | | 8.59% |
Lehman Brothers® Aggregate Bond Index^^^ | | 4.33% | | 3.73% |
S&P 500® Index^^^^ | | 15.78% | | 10.50% |
MassMutual Select Destination Retirement 2010 Fund
Annual Performance(1)
The bar chart shows the risks of investing in the Fund by showing changes in the Fund’s performance from year to year. Sales charges and taxes are not included in the calculations of returns in this bar chart. If those charges and taxes were included, the returns would be lower than those shown.
Class S Shares
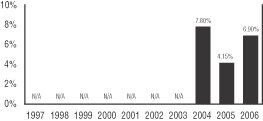
During the periods shown above, the highest quarterly return for the Fund was 5.06% for the quarter ended December 31, 2004 and the lowest quarterly return was -0.93% for the quarter ended June 30, 2006.
Average Annual Total Returns(1)
(for the periods ended December 31, 2006)
The table shows the risk of investing in the Fund by comparing the Fund’s returns with a broad measure of market performance over different time periods.
| | | | |
| | | One
Year | | Since Inception (12/31/03) |
Return Before Taxes – Class S | | 6.90% | | 6.27% |
Return After Taxes on Distributions – Class S | | 5.61% | | 5.22% |
Return After Taxes on Distributions and Sale of Fund Shares – Class S | | 4.88% | | 4.84% |
Return Before Taxes – Class Y | | 6.77% | | 6.21% |
Return Before Taxes – Class L | | 6.69% | | 6.11% |
Return Before Taxes – Class A+ | | 0.28% | | 3.78% |
Return Before Taxes – Class N+ | | 5.14% | | 5.53% |
| | | | | |
Custom Destination 2010 Index^ | | 9.30% | | 7.30% |
Lipper Balanced Fund Index^^ | | 11.60% | | 8.59% |
Lehman Brothers® Aggregate Bond Index^^^ | | 4.33% | | 3.73% |
S&P 500® Index^^^^ | | 15.78% | | 10.50% |
– 94 –
MassMutual Select Destination Retirement 2020 Fund
Annual Performance(1)
The bar chart shows the risks of investing in the Fund by showing changes in the Fund’s performance from year to year. Sales charges and taxes are not included in the calculations of returns in this bar chart. If those charges and taxes were included, the returns would be lower than those shown.
Class S Shares
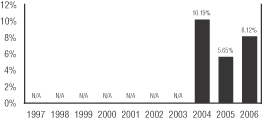
During the periods shown above, the highest quarterly return for the Fund was 7.08% for the quarter ended December 31, 2004 and the lowest quarterly return was -1.76% for the quarter ended March 31, 2005.
Average Annual Total Returns(1)
(for the periods ended December 31, 2006)
The table shows the risk of investing in the Fund by comparing the Fund’s returns with a broad measure of market performance over different time periods.
| | | | |
| | | One
Year | | Since Inception (12/31/03) |
Return Before Taxes – Class S | | 8.12% | | 7.96% |
Return After Taxes on Distributions – Class S | | 6.91% | | 6.96% |
Return After Taxes on Distributions and Sale of Fund Shares – Class S | | 5.94% | | 6.40% |
Return Before Taxes – Class Y | | 8.08% | | 7.91% |
Return Before Taxes – Class L | | 7.87% | | 7.79% |
Return Before Taxes – Class A+ | | 1.53% | | 5.45% |
Return Before Taxes – Class N+ | | 6.31% | | 7.21% |
| | | | | |
Custom Destination 2020 Index^ | | 11.68% | | 9.03% |
Lipper Balanced Fund Index^^ | | 11.60% | | 8.59% |
Lehman Brothers® Aggregate Bond Index^^^ | | 4.33% | | 3.73% |
S&P 500® Index^^^^ | | 15.78% | | 10.50% |
MassMutual Select Destination Retirement 2030 Fund
Annual Performance(1)
The bar chart shows the risks of investing in the Fund by showing changes in the Fund’s performance from year to year. Sales charges and taxes are not included in the calculations of returns in this bar chart. If those charges and taxes were included, the returns would be lower than those shown.
Class S Shares
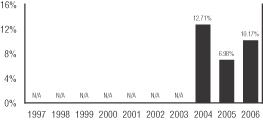
During the periods shown above, the highest quarterly return for the Fund was 9.64% for the quarter ended December 31, 2004 and the lowest quarterly return was -2.51% for the quarter ended March 31, 2005.
Average Annual Total Returns(1)
(for the periods ended December 31, 2006)
The table shows the risk of investing in the Fund by comparing the Fund’s returns with a broad measure of market performance over different time periods.
| | | | |
| | | One
Year | | Since Inception (12/31/03) |
Return Before Taxes – Class S | | 10.17% | | 9.92% |
Return After Taxes on Distributions – Class S | | 9.20% | | 9.22% |
Return After Taxes on Distributions and Sale of Fund Shares – Class S | | 7.45% | | 8.31% |
Return Before Taxes – Class Y | | 10.05% | | 9.84% |
Return Before Taxes – Class L | | 9.93% | | 9.75% |
Return Before Taxes – Class A+ | | 3.39% | | 7.33% |
Return Before Taxes – Class N+ | | 8.39% | | 9.12% |
| | | | | |
Custom Destination 2030 Index^ | | 14.80% | | 11.26% |
Lipper Balanced Fund Index^^ | | 11.60% | | 8.59% |
Lehman Brothers® Aggregate Bond Index^^^ | | 4.33% | | 3.73% |
S&P 500® Index^^^^ | | 15.78% | | 10.50% |
– 95 –
MassMutual Select Destination Retirement 2040 Fund
Annual Performance(1)
The bar chart shows the risks of investing in the Fund by showing changes in the Fund’s performance from year to year. Sales charges and taxes are not included in the calculations of returns in this bar chart. If those charges and taxes were included, the returns would be lower than those shown.
Class S Shares
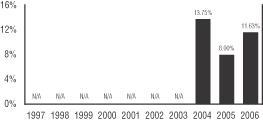
During the periods shown above, the highest quarterly return for the Fund was 10.87% for the quarter ended December 31, 2004 and the lowest quarterly return was -2.75% for the quarters ended September 30, 2004 and March 31, 2005.
Average Annual Total Returns(1)
(for the periods ended December 31, 2006)
The table shows the risk of investing in the Fund by comparing the Fund’s returns with a broad measure of market performance over different time periods.
| | | | |
| | | One
Year | | Since Inception (12/31/03) |
Return Before Taxes – Class S | | 11.63% | | 11.09% |
Return After Taxes on Distributions – Class S | | 10.65% | | 10.47% |
Return After Taxes on Distributions and Sale of Fund Shares – Class S | | 8.76% | | 9.44% |
Return Before Taxes – Class Y | | 11.60% | | 11.04% |
Return Before Taxes – Class L | | 11.58% | | 10.95% |
Return Before Taxes – Class A+ | | 4.87% | | 8.51% |
Return Before Taxes – Class N+ | | 9.91% | | 10.31% |
| | | | | |
Custom Destination 2040 Index^ | | 16.94% | | 12.64% |
Lipper Balanced Fund Index^^ | | 11.60% | | 8.59% |
Lehman Brothers® Aggregate Bond Index^^^ | | 4.33% | | 3.73% |
S&P 500® Index^^^^ | | 15.78% | | 10.50% |
(1) Performance shown does not reflect fees that may be paid by investors for administrative services or group annuity contract charges.
+ Performance for Class A and Class N shares of the Fund reflects any applicable sales charge.
^ The Custom Destination Income Index comprises the MSCI® EAFE®, Dow Jones Wilshire 5000 (full cap), Lehman Brothers® Aggregate Bond and T-Bill indexes. The weightings of each index can vary depending on the weightings of the underlying mutual funds composing the Destination Retirement Income Fund.
The Custom Destination 2010 Index comprises the MSCI EAFE, Dow Jones Wilshire 5000 (full cap), Lehman Brothers Aggregate Bond and T-Bill indexes. The weightings of each index can vary depending on the weightings of the underlying mutual funds composing the Destination Retirement 2010 Fund.
The Custom Destination 2020 Index comprises the MSCI EAFE, Dow Jones Wilshire 5000 (full cap) and Lehman Brothers Aggregate Bond indexes. The weightings of each index can vary depending on the weightings of the underlying mutual funds composing the Destination Retirement 2020 Fund.
The Custom Destination 2030 Index comprises the MSCI EAFE, Dow Jones Wilshire 5000 (full cap) and Lehman Brothers Aggregate Bond indexes. The weightings of each index can vary depending on the weightings of the underlying mutual funds composing the Destination Retirement 2030 Fund.
The Custom Destination 2040 Index comprises the MSCI EAFE and Dow Jones Wilshire 5000 (full cap) indexes. The weightings of each index can vary depending on the weightings of the underlying mutual funds composing the Destination Retirement 2040 Fund.
The MSCI EAFE is a widely recognized, unmanaged index representative of foreign securities in the major non-U.S. markets of Europe, Australia and the Far East. The Index does not incur expenses or reflect any deduction for taxes and cannot be purchased directly by investors.
The Dow Jones Wilshire 5000 Total Market Index measures the performance of all U.S. headquartered equity securities with readily available price data. Over 5,000 capitalization weighted security returns are used to adjust the index. The Index does not incur expenses or reflect any deduction for taxes and cannot be purchased directly by investors.
91-day Treasury Bills are unmanaged and do not incur expenses or reflect any deduction for taxes. Treasury Bills are backed by the full faith and credit of the United States government and offer a fixed rate of interest.
^^ The Lipper Balanced Fund Index is an unmanaged, equally weighted index of the 30 largest mutual Funds within the Lipper Balanced Category. The Index does not incur expenses or reflect any deduction for taxes and cannot be purchased directly by investors.
^^^ The Lehman Brothers Aggregate Bond Index is an unmanaged index of fixed rate investment grade securities with at least one year to maturity combining the Lehman Brothers Government/Credit Index and the Lehman Brothers Mortgage-Backed Securities Index. The Index does not incur expenses or reflect any deduction for taxes and cannot be purchased directly by investors.
^^^^ The S&P 500® Index is a widely recognized, unmanaged index representative of common stocks of larger capitalized U.S. companies. The Index does not incur expenses or reflect any deduction for taxes and cannot be purchased directly by investors.
After-tax returns are calculated using the historical highest individual federal marginal income tax rates and do not reflect the impact of state and local taxes.
Actual after-tax returns depend on an investor’s tax situation and may differ from those shown, and after-tax returns shown are not relevant to investors who hold their Fund shares through tax-deferred arrangements, such as 401(k) plans or individual retirement accounts.
After-tax returns are shown for only Class S and after-tax returns for other classes will vary.
– 96 –
Expense Information
| | | | | | | | | | | | |
| | | Class S | | Class Y | | Class L | | Class A | | | Class N | |
| Shareholder Fees (fees paid directly from your investment) | | | | | | | | | | | | |
Maximum Sales Charge (Load) on purchases (as a % of offering price) | | None | | None | | None | | 5.75% | | | None | |
Maximum Deferred Sales Charge (Load) (as a % of the lower of the original offering price or redemption proceeds) | | None | | None | | None | | None | (1) | | 1.00% | (2) |
Destination Retirement Income
| | | | | | | | | | |
| | | Class S | | Class Y | | Class L | | Class A | | Class N |
| Annual Fund Operating Expenses (expenses that are deducted from Fund assets) (% of average net assets) | | | | | | | | | | |
Management Fees | | .05% | | .05% | | .05% | | .05% | | .05% |
Distribution and Service (Rule 12b-1) Fees | | None | | None | | None | | .25% | | 50% |
Other Expenses | | .05% | | .07% | | .17% | | .17% | | .22% |
| Acquired Fund Fees and Expenses(3) | | .65% | | .65% | | .65% | | .65% | | .65% |
| Total Annual Fund Operating Expenses(4)(5) | | .75% | | .77% | | .87% | | 1.12% | | 1.42% |
Destination Retirement 2010
| | | | | | | | | | |
| | | Class S | | Class Y | | Class L | | Class A | | Class N |
| Annual Fund Operating Expenses (expenses that are deducted from Fund assets) (% of average net assets) | | | | | | | | | | |
Management Fees | | .05% | | .05% | | .05% | | .05% | | .05% |
Distribution and Service (Rule 12b-1) Fees | | None | | None | | None | | .25% | | .50% |
Other Expenses | | .07% | | .12% | | .22% | | .22% | | .27% |
| Acquired Fund Fees and Expenses(3) | | .69% | | .69% | | .69% | | .69% | | .69% |
| Total Annual Fund Operating Expenses(4)(5) | | .81% | | .86% | | .96% | | 1.21% | | 1.51% |
Destination Retirement 2020
| | | | | | | | | | |
| | | Class S | | Class Y | | Class L | | Class A | | Class N |
| Annual Fund Operating Expenses (expenses that are deducted from Fund assets) (% of average net assets) | | | | | | | | | | |
Management Fees | | .05% | | .05% | | .05% | | .05% | | .05% |
Distribution and Service (Rule 12b-1) Fees | | None | | None | | None | | .25% | | .50% |
Other Expenses | | .05% | | .10% | | .19% | | .20% | | .25% |
| Acquired Fund Fees and Expenses(3) | | .74% | | .74% | | .74% | | .74% | | .74% |
| Total Annual Fund Operating Expenses(4)(5) | | .84% | | .89% | | .98% | | 1.24% | | 1.54% |
Destination Retirement 2030
| | | | | | | | | | |
| | | Class S | | Class Y | | Class L | | Class A | | Class N |
| Annual Fund Operating Expenses (expenses that are deducted from Fund assets) (% of average net assets) | | | | | | | | | | |
Management Fees | | .05% | | .05% | | .05% | | .05% | | .05% |
Distribution and Service (Rule 12b-1) Fees | | None | | None | | None | | .25% | | .50% |
Other Expenses | | .05% | | .10% | | .20% | | .20% | | .25% |
| Acquired Fund Fees and Expenses(3) | | .84% | | .84% | | .84% | | .84% | | .84% |
| Total Annual Fund Operating Expenses(4)(5) | | .94% | | .99% | | 1.09% | | 1.34% | | 1.64% |
Destination Retirement 2040
| | | | | | | | | | |
| | | Class S | | Class Y | | Class L | | Class A | | Class N |
| Annual Fund Operating Expenses (expenses that are deducted from Fund assets) (% of average net assets) | | | | | | | | | | |
Management Fees | | .05% | | .05% | | .05% | | .05% | | .05% |
Distribution and Service (Rule 12b-1) Fees | | None | | None | | None | | .25% | | .50% |
Other Expenses | | .05% | | .10% | | .20% | | .20% | | .25% |
| Acquired Fund Fees and Expenses(3) | | .88% | | .88% | | .88% | | .88% | | .88% |
| Total Annual Fund Operating Expenses(4)(5) | | .98% | | 1.03% | | 1.13% | | 1.38% | | 1.68% |
– 97 –
Examples
These examples are intended to help you compare the cost of investing in the Destination Retirement Funds with the cost of investing in other mutual funds. The examples assume that you invest $10,000 in each share class of a Fund for the time periods indicated and then redeem all of your shares at the end of those periods. For Class A shares, the examples include the initial sales charge. The examples also assume that your investment earns a 5% return each year and that the Fund’s net operating expenses, which include the weighted average of the net operating expenses of each of the underlying MassMutual Funds, remain the same. Although your actual costs may be higher or lower, based on these assumptions your costs would be:
Destination Retirement Income
| | | | | | | | | | | | |
| | | 1 Year | | 3 Years | | 5 Years | | 10 Years |
Class S | | $ | 77 | | $ | 240 | | $ | 417 | | $ | 930 |
Class Y | | $ | 79 | | $ | 246 | | $ | 428 | | $ | 954 |
Class L | | $ | 89 | | $ | 278 | | $ | 482 | | $ | 1,073 |
Class A | | $ | 683 | | $ | 911 | | $ | 1,156 | | $ | 1,860 |
Class N | | $ | 248 | | $ | 449 | | $ | 776 | | $ | 1,702 |
Except for Class N shares, the figures shown above would be the same whether you sold your shares at the end of a period or kept them. For Class N shares, you would pay the following expenses if you did not redeem your shares:
| | | | | | | | | | | | |
| | | 1 Year | | 3 Years | | 5 Years | | 10 Years |
Class N | | $ | 145 | | $ | 449 | | $ | 776 | | $ | 1,702 |
Destination Retirement 2010
| | | | | | | | | | | | |
| | | 1 Year | | 3 Years | | 5 Years | | 10 Years |
Class S | | $ | 83 | | $ | 259 | | $ | 450 | | $ | 1,002 |
Class Y | | $ | 88 | | $ | 274 | | $ | 477 | | $ | 1,061 |
Class L | | $ | 98 | | $ | 306 | | $ | 531 | | $ | 1,178 |
Class A | | $ | 691 | | $ | 937 | | $ | 1,202 | | $ | 1,957 |
Class N | | $ | 257 | | $ | 477 | | $ | 824 | | $ | 1,802 |
Except for Class N shares, the figures shown above would be the same whether you sold your shares at the end of a period or kept them. For Class N shares, you would pay the following expenses if you did not redeem your shares:
| | | | | | | | | | | | |
| | | 1 Year | | 3 Years | | 5 Years | | 10 Years |
Class N | | $ | 154 | | $ | 477 | | $ | 824 | | $ | 1,802 |
Destination Retirement 2020
| | | | | | | | | | | | |
| | | 1 Year | | 3 Years | | 5 Years | | 10 Years |
Class S | | $ | 86 | | $ | 268 | | $ | 466 | | $ | 1,037 |
Class Y | | $ | 91 | | $ | 284 | | $ | 493 | | $ | 1,096 |
Class L | | $ | 100 | | $ | 312 | | $ | 542 | | $ | 1,201 |
Class A | | $ | 694 | | $ | 946 | | $ | 1,217 | | $ | 1,989 |
Class N | | $ | 260 | | $ | 486 | | $ | 839 | | $ | 1,834 |
Except for Class N shares, the figures shown above would be the same whether you sold your shares at the end of a period or kept them. For Class N shares, you would pay the following expenses if you did not redeem your shares:
| | | | | | | | | | | | |
| | | 1 Year | | 3 Years | | 5 Years | | 10 Years |
Class N | | $ | 157 | | $ | 486 | | $ | 839 | | $ | 1,834 |
Destination Retirement 2030
| | | | | | | | | | | | |
| | | 1 Year | | 3 Years | | 5 Years | | 10 Years |
Class S | | $ | 96 | | $ | 300 | | $ | 520 | | $ | 1,155 |
Class Y | | $ | 101 | | $ | 315 | | $ | 547 | | $ | 1,213 |
Class L | | $ | 111 | | $ | 347 | | $ | 601 | | $ | 1,329 |
Class A | | $ | 704 | | $ | 975 | | $ | 1,267 | | $ | 2,095 |
Class N | | $ | 270 | | $ | 517 | | $ | 892 | | $ | 1,944 |
Except for Class N shares, the figures shown above would be the same whether you sold your shares at the end of a period or kept them. For Class N shares, you would pay the following expenses if you did not redeem your shares:
| | | | | | | | | | | | |
| | | 1 Year | | 3 Years | | 5 Years | | 10 Years |
Class N | | $ | 167 | | $ | 517 | | $ | 892 | | $ | 1,944 |
Destination Retirement 2040
| | | | | | | | | | | | |
| | | 1 Year | | 3 Years | | 5 Years | | 10 Years |
Class S | | $ | 100 | | $ | 312 | | $ | 542 | | $ | 1,201 |
Class Y | | $ | 105 | | $ | 328 | | $ | 569 | | $ | 1,259 |
Class L | | $ | 115 | | $ | 359 | | $ | 622 | | $ | 1,375 |
Class A | | $ | 707 | | $ | 987 | | $ | 1,287 | | $ | 2,137 |
Class N | | $ | 274 | | $ | 530 | | $ | 913 | | $ | 1,987 |
Except for Class N shares, the figures shown above would be the same whether you sold your shares at the end of a period or kept them. For Class N shares, you would pay the following expenses if you did not redeem your shares:
| | | | | | | | | | | | |
| | | 1 Year | | 3 Years | | 5 Years | | 10 Years |
Class N | | $ | 171 | | $ | 530 | | $ | 913 | | $ | 1,987 |
| (1) | | A contingent deferred sales charge may apply to shares redeemed within 18 months of purchase from initial investments of $1 million or more. |
| (2) | | Applies to shares redeemed within 18 months of purchase. |
– 98 –
| (3) | | Acquired Fund fees and expenses represent approximate expenses borne indirectly by the Fund in its most recent fiscal year through investments in other pooled investment vehicles. The amount of Acquired Fund fees and expenses may change in the coming year due to a number of factors including, among others, a change in allocation of the Fund’s investments among other pooled investment vehicles. |
| (4) | | Because Total Annual Fund Operating Expenses include Acquired Fund fees and expenses, they may not correspond to the ratios of expenses to average daily net assets shown in the “Financial Highlights” tables in this prospectus, which reflect the operating expenses of the Fund and do not include Acquired Fund fees and expenses. |
| (5) | | Employee benefit plans which invest in the Fund through MassMutual separate investment accounts may pay additional charges under their group annuity contract or services agreement. Investors who purchase shares directly from the Fund may also be subject to charges imposed in their administrative services or other agreement with MassMutual or MassMutual affiliate. None of these charges are deducted from Fund assets. |
– 99 –
Summary of Principal Risks
The value of your investment in a Fund changes with the values of the investments in a Fund’s portfolio. Many things can affect those values. Factors that may have an important or significant effect on a particular Fund’s portfolio as a whole are called “Principal Risks.” These Principal Risks are summarized in this section. All Funds could be subject to additional risks. Although the Funds strive to reach their stated goals, they cannot offer guaranteed results. You have the potential to make money in these Funds, but you can also lose money.
| · | | Market Risk – Bond Funds |
All the Funds are subject to market risk, which is the general risk of unfavorable market-induced changes in the value of a security. The Strategic Bond Fund and the Destination Retirement Funds are subject to market risk because they invest some or all of their assets in debt securities. Debt securities are obligations of an issuer to pay principal and/or interest at a specified interest rate over a predetermined period. If interest rates rise close to or higher than the specified rate, those securities are likely to be worth less and the value of the Funds will likely fall. If interest rates fall, most securities held by Funds paying higher rates of interest will likely be worth more, and the Fund’s value will likely increase.
This kind of market risk, also called interest rate risk, is generally greater for debt securities with longer maturities and portfolios with longer durations. “Duration” is the average of the periods remaining for payments of principal and interest on a Fund’s debt securities, weighted by the dollar amount of each payment. Even the highest quality debt securities are subject to interest rate risk. Market risk is generally greater for lower-rated securities or comparable unrated securities.
| · | | Market Risk – Equity Funds |
Except for the Strategic Bond Fund, all of the Funds are subject to market risk. Market risk arises since stock prices can fall for any number of factors, including general economic and market conditions, real or perceived changes in the prospects of the security’s issuer, changing interest rates and real or perceived economic and competitive industry conditions.
These Funds maintain substantial exposure to equities and do not attempt to time the market. Because of this exposure, the possibility that stock market prices in general will decline over short or even extended periods subjects these Funds to unpredictable declines in the value of their shares, as well as periods of poor performance. Market risk also includes specific risks affecting the companies whose shares are purchased by the Fund, such as management performance, financial leverage, industry problems and reduced demand for the issuer’s goods or services.
| · | Credit Risk. All the Funds are subject to credit risk. This is the risk that the issuer or the guarantor of a debt security, or the counterparty to a derivatives contract or securities loan, will be unable or unwilling to make timely principal and/or interest payments, or to otherwise honor its obligations. There are varying degrees of credit risk, which are often reflected in credit ratings. Credit risk is particularly significant for the Strategic Bond Fund to the extent it invests in below investment grade securities. These debt securities and similar unrated securities, which are commonly known as “junk bonds,” either have speculative elements or are predominantly speculative investments. Junk bonds may be subject to greater market fluctuations and greater risks of loss of income and principal than investment grade securities. The Strategic Bond Fund invests in foreign debt securities and, accordingly, is also subject to increased credit risk because of the difficulties of requiring foreign entities, including issuers of sovereign debt, to honor their contractual commitments, and because a number of foreign governments and other issuers are already in default. |
Terms appearing in bold type are discussed in greater detail under “Additional Investment Policies and Risk Considerations.” Those sections also include more information about the funds, their investments and the related risks.
– 100 –
| · | Management Risk. All the Funds, other than the Indexed Equity Fund and the OTC 100 Fund, are subject to management risk because those Funds are actively managed investment portfolios. Management risk is the chance that poor security selection will cause the Fund to underperform other Funds with similar investment objectives. Each Fund’s Sub-Adviser manages the Fund according to the traditional methods of active investment management, which involves the buying and selling of securities based upon economic, financial and market analysis and investment judgment. Each Fund’s Sub-Adviser applies its investment techniques and risk analyses in making investment decisions for the Fund, but there can be no guarantee that they will produce the desired result. |
| · | Tracking Error Risk. There are several reasons that the Indexed Equity Fund’s or the OTC 100 Fund’s performance may not track the relevant Index exactly. Unlike the Index, each Fund incurs administrative expenses and transaction costs in trading stocks. The composition of the Index and the stocks held by the Fund may occasionally diverge. The timing and magnitude of cash inflows from investors buying shares could create balances of uninvested cash. Conversely, the timing and magnitude of cash outflows to investors selling shares could require ready reserves of uninvested cash. Either situation would likely cause the Fund’s performance to deviate from the “fully invested” Index. |
| · | Prepayment Risk. Prepayment risk is the risk that principal will be repaid at a different rate than anticipated, causing the return on securities to be less than expected when purchased. The interest rate risk described above may be compounded for the Strategic Bond Fund to the extent the Fund invests to a material extent in mortgage-related or other asset-backed securities that may be prepaid. These securities have variable maturities that tend to lengthen when interest rates are rising, which typically is the least desirable time for maturities to lengthen. The Fund is also subject to reinvestment risk, which is the chance that cash flows from securities (including securities that are prepaid) will be reinvested at lower rates if interest rates fall. |
| · | Liquidity Risk. Liquidity risk exists when particular investments are difficult to sell. A Fund may not be able to sell these illiquid securities at the best prices. Investments in derivatives, foreign securities and securities having small market capitalization, substantial market and/or credit risk, and unregistered or restricted securities tend to involve greater liquidity risk. Accordingly, the Strategic Bond Fund, the Strategic Balanced Fund, the Fundamental Value Fund, the Value Equity Fund, the Large Cap Growth Fund, the Aggressive Growth Fund, the OTC 100 Fund, the Focused Value Fund, the Mid-Cap Value Fund, the Small Cap Value Equity Fund, the Small Company Value Fund, the Small Cap Core Equity Fund, the Mid Cap Growth Equity Fund, the Mid Cap Growth Equity II Fund, the Small Cap Growth Equity Fund, the Small Company Growth Fund, the Emerging Growth Fund, the Diversified International Fund, the Overseas Fund and the Destination Retirement Funds may be subject to liquidity risk. |
| · | Derivative Risk. All Funds may, but will not necessarily, use derivatives, which are financial contracts whose values depend upon, or are derived from, the value of an underlying asset, reference rate or index. Derivatives may relate to stocks, bonds, interest rates, currencies, credit exposures, currency exchange rates, commodities, related indexes or other assets. The use of derivative instruments may involve risks different from, or greater than, the risks associated with investing directly in securities and other more traditional investments. Derivatives are subject to a number of potential risks. Derivative products are highly specialized instruments that may require investment techniques and risk analyses different from those associated with stocks and bonds. The use of a derivative requires an understanding not only of the underlying instrument or index but also of the derivative itself, without the benefit of observing the performance of the derivative under all possible market conditions. (For example, successful use of a credit default swap may require, among other things, an understanding of both the credit of the company to which it relates and of the way the swap is likely to respond to changes in various market conditions and to factors specifically affecting the company.) The use of derivatives involves the risk that a loss may be sustained as a result of the failure of another party to the contract (typically referred to as a “counterparty”) to make required payments or otherwise to comply |
– 101 –
| | with the contract’s terms. Derivative transactions can create investment leverage and may be highly volatile. When a Fund uses a derivative instrument, it could lose more than the principal amount invested. Since the values of derivatives are calculated and derived from the values of other assets, reference rates, or indexes, there is greater risk that derivatives will be improperly valued. Derivatives also involve the risk that changes in the value of the derivative may not correlate perfectly with the relevant assets, rates or indexes they are designed to hedge or to track closely, and the risk that a derivative transaction may not have the effect the Fund’s investment adviser anticipated. Also, suitable derivative transactions may not be available in all circumstances, and there can be no assurance that a Fund will engage in these transactions to reduce exposure to other risks when that would be beneficial. A liquid secondary market may not always exist for the Fund’s derivative positions at any time. If a derivative transaction is particularly large or if the relevant market is illiquid (as is the case with many privately negotiated derivatives), it may not be possible to initiate a transaction or liquidate a position at an advantageous price. Use of derivatives may increase the amount of taxes payable by shareholders. Although the use of derivatives is intended to enhance a Fund’s performance, it may instead reduce returns and increase volatility. |
| · | Non-Diversification Risk. Diversification is a way for a Fund to reduce its risk. It means that the Fund invests in securities of a broad range of companies. A “non-diversified” fund may purchase larger positions in a smaller number of issuers. Therefore, the increase or decrease in the value of each single stock will have a greater impact on the Fund’s net asset value. In addition, the Fund’s net asset value can be expected to fluctuate more than a comparable diversified fund. This fluctuation can also affect the Fund’s performance. The Value Equity Fund, the Aggressive Growth Fund and the Focused Value Fund are actively managed non-diversified funds. Each Fund’s Sub-Adviser uses a strategy of limiting the number of companies which the Fund will hold. The OTC 100 Fund also is considered a non-diversified fund. It attempts to satisfy its investment objective of replicating a particular index by purchasing the securities in the index without regard to how much of each security the Fund buys. |
| · | Foreign Investment Risk. Funds investing in foreign securities may experience more rapid and extreme changes in value than Funds which invest solely in U.S. companies. This is because the securities markets of many foreign countries are relatively small, with a limited number of companies representing a small number of industries. In addition, foreign companies are usually not subject to the same degree of regulation as U.S. companies. Reporting, accounting and auditing standards of foreign countries differ, in some cases significantly, from U.S. standards. Also, nationalization, expropriation or confiscatory taxation, currency blockage, political changes or diplomatic developments could adversely affect a Fund’s non-U.S. investments. In the event of nationalization, expropriation or other confiscation, a Fund could lose its entire investment. Economic downturns in certain regions, such as Southeast Asia, can also adversely affect other countries whose economies appear to be unrelated. The Strategic Bond Fund, the Strategic Balanced Fund, the Diversified Value Fund, the Fundamental Value Fund, the Value Equity Fund, the Large Cap Value Fund, the Indexed Equity Fund, the Core Opportunities Fund, the Blue Chip Growth Fund, the Large Cap Growth Fund, the Aggressive Growth Fund, the Focused Value Fund, the Mid-Cap Value Fund, the Small Cap Value Equity Fund, the Small Company Value Fund, the Small Cap Core Equity Fund, the Mid Cap Growth Equity Fund, the Mid Cap Growth Equity II Fund, the Small Cap Growth Equity Fund, the Small Company Growth Fund, the Emerging Growth Fund, the Diversified International Fund, the Overseas Fund and the Destination Retirement Funds, are subject to foreign investment risk. |
These Funds may also invest in foreign securities known as American Depositary Receipts (“ADRs”), Global Depositary Receipts (“GDRs”) and European Depositary Receipts (“EDRs”). ADRs, GDRs and EDRs represent securities or a pool of securities of an underlying foreign or, in the case of GDRs and EDRs, U.S. or non-U.S. issuer. They are subject to many of the same risks as foreign securities. ADRs, GDRs and EDRs are more completely described in the Statement of Additional Information.
– 102 –
| · | Emerging Markets Risk. The Strategic Bond Fund, the Strategic Balanced Fund, the Fundamental Value Fund, the Value Equity Fund, the Large Cap Growth Fund, the Aggressive Growth Fund, the Small Cap Growth Equity Fund, the Small Company Growth Fund, the Emerging Growth Fund, the Diversified International Fund, the Overseas Fund and the Destination Retirement Funds may invest in issuers located in emerging markets, subject to the applicable restrictions on foreign investments, when the Sub-Adviser deems those investments are consistent with the Fund’s investment objectives and policies. Emerging markets are generally considered to be the countries having “emerging market economies” based on factors such as the country’s foreign currency debt rating, its political and economic stability, the development of its financial and capital markets and the level of its economy. Investing in securities from emerging markets involves special risks, including less liquidity and more price volatility than securities of comparable domestic issuers or in established foreign markets. Emerging markets also may be concentrated towards particular industries. There may also be different clearing and settlement procedures, or an inability to handle large volumes of transactions. These factors could result in settlement delays and temporary periods when a portion of a Fund’s assets is not invested and could cause a loss in value due to illiquidity. |
| · | Currency Risk. The Strategic Bond Fund, the Strategic Balanced Fund, the Fundamental Value Fund, the Value Equity Fund, the Large Cap Value Fund, the Indexed Equity Fund, the Core Opportunities Fund, the Blue Chip Growth Fund, the Large Cap Growth Fund, the Aggressive Growth Fund, the Small Cap Value Equity Fund, the Small Company Value Fund, the Small Cap Core Equity Fund, the Mid Cap Growth Equity Fund, the Mid Cap Growth Equity II Fund, the Small Cap Growth Equity Fund, the Small Company Growth Fund, the Emerging Growth Fund, the Diversified International Fund, the Overseas Fund and the Destination Retirement Funds are subject to currency risk to the extent that they invest in securities of foreign companies that are traded in, and receive revenues in, foreign currencies or for the Diversified International Fund to the extent it buys currencies in excess of underlying equities. Currency risk is caused by uncertainty in foreign currency exchange rates. Fluctuations in the value of the U.S. dollar relative to foreign currencies may enhance or diminish returns that a U.S. investor would receive on foreign investments. The Funds may, but will not necessarily, engage in foreign currency transactions in order to protect against fluctuations in the value of holdings denominated in or exposed to other currencies or for the Diversified International Fund to generate additional returns by buying currencies in excess of underlying equities when opportunities arise. Those currencies can decline in value relative to the U.S. dollar, or, in the case of hedging positions, the U.S. dollar can decline in value relative to the currency hedged. A Fund’s investment in foreign currencies may increase the amount of ordinary income recognized by the Fund. |
| · | Smaller Company Risk. Market risk and liquidity risk are particularly pronounced for stocks of smaller companies. These companies may have limited product lines, markets or financial resources or they may depend on a few key employees. The Strategic Balanced Fund, Aggressive Growth Fund, the OTC 100 Fund, the Focused Value Fund, the Mid-Cap Value Fund, the Small Cap Value Equity Fund, the Small Company Value Fund, the Small Cap Core Equity Fund, the Mid Cap Growth Equity Fund, the Mid Cap Growth Equity II Fund, the Small Cap Growth Equity Fund, the Small Company Growth Fund, the Emerging Growth Fund and the Destination Retirement Funds generally have the greatest exposure to this risk. |
| · | Growth Company Risk. Market risk is also particularly pronounced for “growth” companies. The prices of growth company securities may fall to a greater extent than the overall equity markets (represented by the S&P 500 Index) due to changing economic, political or market factors. Growth company securities tend to be more volatile in terms of price swings and trading volume. The Indexed Equity Fund, the Core Opportunities Fund, the Blue Chip Growth Fund, the Large Cap Growth Fund, the Growth Equity Fund, the Aggressive Growth Fund, the OTC 100 Fund, the Small Cap Core Equity Fund, the Mid Cap Growth Equity Fund, the Mid Cap Growth Equity II Fund, the Small Cap |
– 103 –
| | Growth Equity Fund, the Small Company Growth Fund, the Emerging Growth Fund, the Overseas Fund and the Destination Retirement Funds generally have the greatest exposure to this risk. Growth companies, especially technology related companies, have seen dramatic rises and falls in stock valuations. These Funds have the risk that the market may deem their stock prices over-valued, which could cause steep and/or volatile price swings. Also, since investors buy these stocks because of their expected superior earnings growth, earnings disappointments often result in sharp price declines. |
| · | Value Company Risk. The value investment approach carries the risk that the market will not recognize a security’s intrinsic value for a long time, or that a stock judged to be undervalued may actually be appropriately priced. The Diversified Value Fund, the Fundamental Value Fund, the Value Equity Fund, the Large Cap Value Fund, the Core Opportunities Fund, the Focused Value Fund, the Mid-Cap Value Fund, the Small Cap Value Equity Fund, the Small Company Value Fund, the Small Cap Core Equity Fund, the Diversified International Fund and the Destination Retirement Funds generally have the greatest exposure to this risk. |
| · | Over-the-Counter Risk. OTC transactions involve risks in addition to those associated with transactions in securities traded on exchanges. OTC-listed companies may have limited product lines, markets or financial resources. Many OTC stocks trade less frequently and in smaller volume than exchange-listed stocks. The values of these stocks may be more volatile than exchange-listed stocks, and funds that invest in these stocks may experience difficulty in purchasing or selling these securities at a fair price. |
| · | Leveraging Risk. When a Fund borrows money or otherwise leverages its portfolio, the value of an investment in that Fund will be more volatile and all other risks will tend to be compounded. All of the Funds may take on leveraging risk by investing collateral from securities loans, by using derivatives and by borrowing money to repurchase shares or to meet redemption requests. Leveraging may increase the assets on which the investment adviser’s fee is based. |
| · | Portfolio Turnover Risk. Changes are made in a Fund’s portfolio whenever the Sub-Adviser believes such changes are desirable. Short-term transactions may result from liquidity needs, securities having reached a price objective, purchasing securities in anticipation of relatively short-term price gains, changes in the outlook for a particular company or by reason of economic or other developments not foreseen at the time of the investment decision. Portfolio turnover rates are generally not a factor in making buy and sell decisions. Consequently, a Fund’s portfolio turnover may be high. Increased portfolio turnover rates will result in higher costs from brokerage commissions, dealer-mark-ups and other transaction costs and may also result in a higher percentage of short-term capital gains and a lower percentage of long-term capital gains as compared to a fund that trades less frequently. Because short-term capital gains are distributed as ordinary income, this generally increases tax liability unless shares are held through a tax-deferred or exempt account. Higher costs associated with increased portfolio turnover may offset gains in a Fund’s performance. |
– 104 –
Principal Risks by Fund
The following chart summarizes the Principal Risks of each Fund. A particular Fund may, however, still have non-Principal risks not identified in this chart.
| | | | | | | | | | | | | | | | | | | | | | | | | | | | | | | | | | |
| Fund | | Market Risk | | Credit Risk | | Manage- ment Risk | | Tracking Error Risk | | Pre- payment Risk | | Liquidity Risk | | Derivative Risk | | Non- Diversi- fication Risk | | Foreign Invest- ment Risk | | Emerging Markets Risk | | Currency Risk | | Smaller Company Risk | | Growth Company Risk | | Value Company Risk | | Over-
the-
Counter
Risk | | Lever-
aging Risk | | Portfolio
Turnover
Risk |
| | | | | | | | | | | | | | | | | |
Strategic Bond Fund | | X | | X | | X | | | | X | | X | | X | | | | X | | X | | X | | | | | | | | | | X | | X |
| | | | | | | | | | | | | | | | | |
Strategic Balanced Fund | | X | | X | | X | | | | X | | X | | X | | | | X | | X | | X | | X | | | | | | | | X | | X |
| | | | | | | | | | | | | | | | | |
Diversified Value Fund | | X | | X | | X | | | | | | | | X | | | | X | | | | | | | | | | X | | | | X | | |
| | | | | | | | | | | | | | | | | |
Fundamental
Value Fund | | X | | X | | X | | | | | | X | | X | | | | X | | X | | X | | | | | | X | | | | X | | |
| | | | | | | | | | | | | | | | | |
Large Cap
Value Fund | | X | | X | | X | | | | | | | | X | | | | X | | | | X | | | | | | X | | | | X | | |
| | | | | | | | | | | | | | | | | |
Value Equity Fund | | X | | X | | X | | | | | | X | | X | | X | | X | | X | | X | | | | | | X | | | | X | | X |
| | | | | | | | | | | | | | | | | |
Indexed Equity Fund | | X | | X | | | | X | | | | | | X | | | | X | | | | X | | | | X | | | | | | X | | |
| | | | | | | | | | | | | | | | | |
Core Opportunities Fund | | X | | X | | X | | | | | | | | X | | | | X | | | | X | | | | X | | X | | | | X | | |
| | | | | | | | | | | | | | | | | |
Blue Chip
Growth Fund | | X | | X | | X | | | | | | | | X | | | | X | | | | X | | | | X | | | | | | X | | |
| | | | | | | | | | | | | | | | | |
Large Cap
Growth Fund | | X | | X | | X | | | | | | X | | X | | | | X | | X | | X | | | | X | | | | | | X | | |
| | | | | | | | | | | | | | | | | |
Growth Equity Fund | | X | | X | | X | | | | | | | | X | | | | | | | | | | | | X | | | | | | X | | X |
| | | | | | | | | | | | | | | | | |
Aggressive
Growth Fund | | X | | X | | X | | | | | | X | | X | | X | | X | | X | | X | | X | | X | | | | | | X | | |
| | | | | | | | | | | | | | | | | |
OTC 100 Fund | | X | | X | | | | X | | | | X | | X | | X | | | | | | | | X | | X | | | | X | | X | | |
| | | | | | | | | | | | | | | | | |
Focused Value Fund | | X | | X | | X | | | | | | X | | X | | X | | X | | | | | | X | | | | X | | | | X | | |
| | | | | | | | | | | | | | | | | |
Mid-Cap Value Fund | | X | | X | | X | | | | | | X | | X | | | | X | | | | | | X | | | | X | | | | X | | |
| | | | | | | | | | | | | | | | | |
Small Cap Value Equity Fund | | X | | X | | X | | | | | | X | | X | | | | X | | | | X | | X | | | | X | | | | X | | |
| | | | | | | | | | | | | | | | | |
Small Company Value Fund | | X | | X | | X | | | | | | X | | X | | | | X | | | | X | | X | | | | X | | | | X | | |
| | | | | | | | | | | | | | | | | |
Small Cap Core Equity Fund | | X | | X | | X | | | | | | X | | X | | | | X | | | | X | | X | | X | | X | | | | X | | |
| | | | | | | | | | | | | | | | | |
Mid Cap Growth Equity Fund | | X | | X | | X | | | | | | X | | X | | | | X | | | | X | | X | | X | | | | | | X | | X |
– 105 –
| | | | | | | | | | | | | | | | | | | | | | | | | | | | | | | | | | |
| Fund | | Market Risk | | Credit Risk | | Manage- ment Risk | | Tracking Error Risk | | Pre- payment Risk | | Liquidity Risk | | Derivative Risk | | Non- Diversi- fication Risk | | Foreign Invest- ment Risk | | Emerging Markets Risk | | Currency Risk | | Smaller Company Risk | | Growth Company Risk | | Value Company Risk | | Over-
the-
Counter
Risk | | Lever-
aging Risk | | Portfolio
Turnover
Risk |
| | | | | | | | | | | | | | | | | |
Mid Cap Growth Equity II Fund | | X | | X | | X | | | | | | X | | X | | | | X | | | | X | | X | | X | | | | | | X | | |
| | | | | | | | | | | | | | | | | |
Small Cap Growth Equity Fund | | X | | X | | X | | | | | | X | | X | | | | X | | X | | X | | X | | X | | | | X | | X | | |
| | | | | | | | | | | | | | | | | |
Small Company Growth Fund | | X | | X | | X | | | | | | X | | X | | | | X | | X | | X | | X | | X | | | | | | X | | X |
| | | | | | | | | | | | | | | | | |
Emerging Growth Fund | | X | | X | | X | | | | | | X | | X | | | | X | | X | | X | | X | | X | | | | | | X | | X |
| | | | | | | | | | | | | | | | | |
Diversified International Fund | | X | | X | | X | | | | | | X | | X | | | | X | | X | | X | | | | | | X | | | | X | | |
| | | | | | | | | | | | | | | | | |
Overseas Fund | | X | | X | | X | | | | | | X | | X | | | | X | | X | | X | | | | X | | | | X | | X | | |
| | | | | | | | | | | | | | | | | |
Destination Retirement Income Fund | | X | | X | | X | | | | X | | X | | X | | | | X | | X | | X | | X | | X | | X | | X | | X | | |
| | | | | | | | | | | | | | | | | |
Destination Retirement 2010 Fund | | X | | X | | X | | | | X | | X | | X | | | | X | | X | | X | | X | | X | | X | | X | | X | | |
| | | | | | | | | | | | | | | | | |
Destination Retirement 2020 Fund | | X | | X | | X | | | | X | | X | | X | | | | X | | X | | X | | X | | X | | X | | X | | X | | |
| | | | | | | | | | | | | | | | | |
Destination Retirement 2030 Fund | | X | | X | | X | | | | X | | X | | X | | | | X | | X | | X | | X | | X | | X | | X | | X | | |
| | | | | | | | | | | | | | | | | |
Destination Retirement 2040 Fund | | X | | X | | X | | | | X | | X | | X | | | | X | | X | | X | | X | | X | | X | | X | | X | | |
– 106 –
About the Investment Adviser and Sub-Advisers
Massachusetts Mutual Life Insurance Company (“MassMutual”) located at 1295 State Street, Springfield, Massachusetts 01111, is the Funds’ investment adviser and is responsible for providing all necessary investment management and administrative services. Founded in 1851, MassMutual is a mutual life insurance company that provides a broad range of insurance, money management, retirement and asset accumulation products and services for individuals and businesses. As of December 31, 2006, MassMutual, together with its subsidiaries, had assets under management in excess of $455 billion.
MassMutual will be paid an investment management fee based on a percentage of each Fund’s average daily net assets as follows: .55% for the Strategic Bond Fund; .60% for the Strategic Balanced Fund; .50% for the Diversified Value Fund; .65% for the Fundamental Value Fund; .70% for the Value Equity Fund; .65% for the Large Cap Value Fund; .10% for the Indexed Equity Fund; .70% for the Core Opportunities Fund; ..70% for the Blue Chip Growth Fund; .65% for the Large Cap Growth Fund; .68% for the Growth Equity Fund; .73% for the Aggressive Growth Fund; .15% for the OTC 100 Fund; .69% for the Focused Value Fund; .70% for the Mid-Cap Value Fund; .75% for the Small Cap Value Equity Fund; .85% for the Small Company Value Fund; .75% for the Small Cap Core Equity Fund; .70% for the Mid Cap Growth Equity Fund; .75% for the Mid Cap Growth Equity II Fund; .82% for the Small Cap Growth Equity Fund; .85% for the Small Company Growth Fund; .79% for the Emerging Growth Fund; .90% for the Diversified International Fund; 1.00% for the Overseas Fund; and .05% for each of the Destination Retirement Funds.
A discussion regarding the basis for the board of trustees approving any investment advisory contract of the Funds is available in either the Funds’ semi-annual report to shareholders dated June 30, 2006 or in the Funds’ annual report to shareholders dated December 31, 2006.
Each Fund also pays MassMutual an administrative and shareholder service fee at an annual rate based on a percentage of daily net assets for the applicable class of shares. The fee ranges for each share class of the Funds are .0116% to .3744% for Class S shares; .0459% to .4744% for Class Y shares; .1459% to .6244% for Class L and Class A shares; and .1959% to .6744% for Class N shares.
MassMutual, as each Destination Retirement Fund’s investment adviser, administers the asset allocation program for each Destination Retirement Fund. This function is performed by MassMutual’s Asset Allocation Committee, led by Kristin Bushard, CFA. Ms. Bushard joined MassMutual in 2003 as Managing Director for the MassMutual Retirement Services Investment Services Group. She leads a team of investment professionals who conduct money manager research for the MassMutual Investment Program. Prior to joining MassMutual, Ms. Bushard worked in various positions at Allmerica Financial, including investment consulting for the company’s variable and group retirement products, and stable value risk analysis. In addition to Ms. Bushard, the regular members of MassMutual’s Asset Allocation Committee include Bruce Picard Jr., CFA and Frederick (Rick) Schulitz. Mr. Schulitz joined MassMutual in 2006 as an Investment Consultant. Prior to joining MassMutual, Mr. Schulitz held Director positions at Prudential Retirement and ING, covering retirement and investment marketing, communications and strategic alliances. Mr. Picard joined MassMutual in 2005 as Investment Consultant. Prior to joining MassMutual, Mr. Picard was a Vice President at Loomis, Sayles & Co. LP, where he worked in various positions covering research, portfolio analysis and product development for the company’s Specialty Growth and mutual fund units.
Ms. Bushard and the MassMutual Retirement Services Investment Services Group are also responsible for determining the allocation of portfolio assets and/or cash flows among Sub-Advisers for those Funds with multiple sub-advisers.
MassMutual contracts with the following Sub-Advisers to help manage the Funds:
AllianceBernstein L.P. (“AllianceBernstein”), located at 1345 Avenue of the Americas, New York, New York 10105, manages the investments of the Diversified Value Fund, the Large Cap Growth Fund and the Diversified International Fund. AllianceBernstein is a limited partnership, the majority ownership interests in which are held
– 107 –
by its affiliates: AllianceBernstein Holding L.P., a publicly traded partnership; and AXA Financial, Inc. (“AXA Financial”) together with certain wholly-owned subsidiaries of AXA Financial. AXA Financial is a wholly-owned subsidiary of AXA. As of December 31, 2006, AllianceBernstein managed approximately $717 billion in assets.
Marilyn G. Fedak
is a portfolio manager of the Diversified Value Fund and the Diversified International Fund, which are managed on a team basis. Ms. Fedak joined Bernstein in 1984 as a senior portfolio manager. An Executive Vice President of AllianceBernstein since 2000, she is Head of Global Value Equities and chair of the US Large Cap Value Equity Investment Policy Group. From 1993 – 2000, Ms. Fedak was Chief Investment Officer for U.S. Value Equities. In 2003, she named John Mahedy, a Senior Vice President, her co-CIO. Ms. Fedak serves on AllianceBernstein’s Management Executive Committee, a group of senior professionals responsible for managing the firm, enacting key strategic initiatives and allocating resources. Ms. Fedak is also a Director of SCB Inc. Ms. Fedak had served on the board of directors of Sanford C. Bernstein & Co., Inc. from 1994 until the combination with Alliance Capital in 2000. Early in her career at Bernstein, she played a key role in developing its US Diversified Value service. Prior to joining Bernstein, Ms. Fedak was a portfolio manager and research analyst at Morgan Guaranty Trust Company from 1972 to 1983.
John P. Mahedy
is a portfolio manager of the Diversified Value Fund and the Diversified International Fund, which are managed on a team basis. Mr. Mahedy was named Co-CIO – US Value equities in 2003. He continues to serve as director of research – US Value Equities, a position he has held since 2001. Previously, Mr. Mahedy was a senior research analyst in Bernstein’s institutional research and brokerage unit, covering the domestic and international energy industry from 1995 to 2001 and the oil-services industry from 1988 to 1991. He also covered oil services briefly at Morgan Stanley for three years in the early 1990s.
Christopher W. Marx
is a portfolio manager of the Diversified Value Fund, which is managed on a team basis. Mr. Marx is a senior portfolio manager and member of the US Value Equities Investment Policy Group. He joined the firm in 1997 as a research analyst. He covered a variety of industries both domestically and internationally, including chemicals, food, supermarkets, beverages and tobacco. Prior to that, he spent six years as a consultant for Deloitte & Touche and the Boston Consulting Group.
John D. Phillips, Jr.
is a portfolio manager of the Diversified Value Fund, which is managed on a team basis. Mr. Phillips is a senior portfolio manager and member of the US Value Equities Investment Policy Group. He is also chairman of Bernstein’s Proxy Voting Committee. Before joining Bernstein in 1994, he was chairman of the Investment Committee and chief equity officer at Investment Advisers, Inc. in Minneapolis from 1992 to 1993. Previously, he was at State Street Research and Management Co. in Boston from 1972 to 1992, where he progressed from investment research analyst to vice chairman of the Equity Investment Committee.
Jason P. Ley
is a portfolio manager of the Large Cap Growth Fund. Mr. Ley, a Senior Vice President, was also a portfolio manager on the Global/International Large Cap Growth teams from 2002 through September 2004. Prior to joining the US Large Cap Growth team at AllianceBernstein in 2000, Mr. Ley was a senior market analyst for Medtronic Corporation in Minneapolis. In addition, Mr. Ley previously developed and operated a chain of retail stores in southern Arizona for five years.
Stephanie Simon
is a portfolio manager of the Large Cap Growth Fund. Ms. Simon, a Senior Vice President, joined AllianceBernstein in 1998 as a member of the US Large Cap Growth portfolio management team after serving as chief investment officer for Sargent Management Company, a private investment firm in Minneapolis. Previously Ms. Simon was with First American Asset Management, the investment arm of
– 108 –
US Bancorp, for four years. Prior to moving to Minneapolis, Ms. Simon was with Citicorp in New York, where she provided corporate finance for media and communications companies for four years.
Henry S. D’Auria
is a portfolio manager of the Diversified International Fund, which is managed on a team basis. Mr. D’Auria, a Chartered Financial Analyst, was named co-CIO – International Value equities in 2003, adding to his responsibilities as CIO – Emerging Markets Value equities, which he assumed in 2002. Mr. D’Auria was one of the chief architects of Bernstein’s global research department, which he managed from 1998 through 2002. Over the years, he has also served as director of research – Small Cap Value equities and director of research – Emerging Markets Value equities. Mr. D’Auria joined the firm in 1991 as a research analyst covering consumer and natural-gas companies, and he later covered the financial-services industry.
Sharon E. Fay
is a portfolio manager of the Diversified International Fund, which is managed on a team basis. Ms. Fay, a Chartered Financial Analyst, joined Bernstein in 1990 as a research analyst, following the airline, lodging, trucking and retail industries, and has been Executive Vice President and Chief Investment Officer-Global Value Equities of AllianceBernstein since 2003, overseeing all portfolio management and research activities relating to cross-border and non-US value investment portfolios and chairing the Global Value Investment Policy Group. Until January 2006, Ms. Fay was Co-CIO – European and UK Value Equities. She also serves on AllianceBernstein’s Management Executive Committee, the group of senior professionals responsible for managing the firm, enacting key strategic initiatives and allocating resources.
Kevin F. Simms
is a portfolio manager of the Diversified International Fund, which is managed on a team basis. Mr. Simms was named co-CIO – International Value equities in 2003, which he has assumed in addition to his role as director of research – Global and International Value equities, a position he has held since 1999. Between 1998 and 2000, Mr. Simms served as director of research – Emerging Markets Value equities. He joined Bernstein in 1992 as a research analyst, and his industry coverage over the next six years included financial services, telecommunications and utilities.
ClearBridge Advisors, LLC (“ClearBridge”), located at 399 Park Avenue, New York, NY 10022, manages a portion of the portfolio of the Strategic Balanced Fund. ClearBridge is a recently-organized investment adviser that has been formed to succeed to the equity securities portfolio management business of Citigroup Asset Management, which was acquired by Legg Mason, Inc. (“Legg Mason”) in December 2005. ClearBridge is a wholly-owned subsidiary of Legg Mason. As of December 31, 2006, ClearBridge had $115.8 billion in assets under management.
John G. Goode and Peter Hable
serve as co-portfolio managers and are responsible for the day-to-day management of a portion of the portfolio of the Strategic Balanced Fund. Mr. Goode is the Chairman and Chief Investment Officer of Davis Skaggs Investment Management (“Davis Skaggs”), a division of ClearBridge, and a managing director of ClearBridge. He has 37 years of investment experience. Mr. Hable is the President of Davis Skaggs and a managing director of ClearBridge. He has 23 years of investment experience.
Clover Capital Management, Inc. (“Clover”), located at 400 Meridian Centre, Suite 200, Rochester, New York 14618, manages a portion of the portfolio of the Small Company Value Fund. As of December 31, 2006, Clover, founded in 1984, managed approximately $2.6 billion in assets for individuals, employee benefit plans, endowments and foundations.
Lawrence R. Creatura
is a portfolio manager of a portion of the Small Company Value Fund. Mr. Creatura, a Chartered Financial Analyst, is a specialist in portfolio construction and risk control. Mr. Creatura conducts investment research in real estate related industries and contributes to Clover’s quantitative research work. Prior to joining Clover in 1994, Mr. Creatura spent several years in laser research for medical applications.
– 109 –
Michael E. Jones
is a portfolio manager of a portion of the Small Company Value Fund. Mr. Jones, a Chartered Financial Analyst, is the Chief Executive Officer and a co-founder of Clover. Mr. Jones’ primary role is Director of Investment Strategy, where he oversees Clover’s portfolio management effort. In addition to his strategy and portfolio management responsibilities, Mr. Jones conducts equity research in the Health Care sector.
Stephen K. Gutch
is a portfolio manager of a portion of the Small Company Value Fund. Mr. Gutch, a Chartered Financial Analyst, conducts investment research in both the Financial Services and Consumer Discretionary sectors. Prior to joining Clover in 2003, Mr. Gutch worked as an analyst for Continental Advisors, LLC where he co-managed and conducted research for the firm’s financial services hedge fund. Previous to this, he spent five years with Fulcrum Investment Group, LLC in Chicago where he managed their financial services portfolio.
Cooke & Bieler, L.P. (“Cooke & Bieler”), located at 1700 Market Street, Suite 3222, Philadelphia, Pennsylvania 19103, manages the investments of the Mid-Cap Value Fund and a portion of the portfolio of the Focused Value Fund. As of December 31, 2006, Cooke & Bieler had approximately $9.2 billion in assets under management.
Michael M. Meyer
is the co-lead portfolio manager of the Mid-Cap Value Fund and a portion of the Focused Value Fund. Mr. Meyer, a Chartered Financial Analyst, began his career at Sterling Capital Management as an equity analyst and head equity trader. He joined Cooke & Bieler in 1993 where he is currently a Partner, Portfolio Manager and Research Analyst.
James R. Norris
is the co-lead portfolio manager of the Mid-Cap Value Fund and a portion of the Focused Value Fund. Mr. Norris spent nearly ten years with Sterling Capital Management as Senior Vice President of Equity Portfolio Management. He joined Cooke & Bieler in 1998 where he is currently a Partner, Portfolio Manager and Research Analyst.
Kermit S. Eck
is a portfolio manager of the Mid-Cap Value Fund and a portion of the Focused Value Fund. Mr. Eck, a Chartered Financial Analyst, joined Cooke & Bieler in 1980 and left in 1984 to become Director of Product Marketing for Eczel Corp. From 1987 to 1992, he served as Executive Vice President of Keystone Natural Water. He rejoined Cooke & Bieler in 1992 and currently is a Partner, Portfolio Manager and Research Analyst.
Edward W. O’Connor
is a portfolio manager of the Mid-Cap Value Fund and a portion of the Focused Value Fund. Mr. O’Connor, a Chartered Financial Analyst, spent three years at Cambiar Investors in Denver, Colorado where he served as an equity analyst and portfolio manager and participated in Cambiar’s 2001 management buyout. He joined Cooke & Bieler in 2002 where he is currently a Portfolio Manager and Research Analyst.
R. James O’Neil
is a portfolio manager of the Mid-Cap Value Fund and a portion of the Focused Value Fund. Mr. O’Neil, a Chartered Financial Analyst, served as an Investment Officer in the Capital Markets Department at Mellon Bank beginning in 1984. He joined Cooke & Bieler in 1988 where he is currently a Partner, Portfolio Manager and Research Analyst.
Mehul Trivedi
is a portfolio manager of the Mid-Cap Value Fund and a portion of the Focused Value Fund. Mr. Trivedi, a Chartered Financial Analyst, was a fixed income analyst at Blackrock Financial Management and then a product manager at PNC Asset Management. He joined Cooke & Bieler in 1998 where he is currently a Partner, Portfolio Manager and Research Analyst.
– 110 –
Daren C. Heitman
is a portfolio manager of the Mid-Cap Value Fund and a portion of the Focused Value Fund. Mr, Heitman, a Chartered Financial Analyst, worked as an analyst and a portfolio manager at Skyline Asset Management from 1995 to 2000, when he joined Schneider Capital Management as a senior analyst until 2005. He joined Cooke & Bieler in 2005 where he is currently a Portfolio Manager.
Davis Selected Advisers, L.P. (“Davis”), located at 2949 East Elvira Road, Suite 101, Tucson, Arizona 85706 manages the investments of the Large Cap Value Fund. As of December 31, 2006, Davis had approximately $98 billion in assets under management.
Christopher C. Davis ��
is a portfolio manager of the Large Cap Value Fund. Mr. Davis serves as portfolio manager for a number of equity funds managed by Davis. Mr. Davis has served as a portfolio manager since 1995. Previously, Mr. Davis served as a research analyst at Davis beginning in 1989.
Kenneth C. Feinberg
is a portfolio manager of the Large Cap Value Fund. Mr. Feinberg serves as portfolio manager for a number of equity funds managed by Davis. Mr. Feinberg has served as a portfolio manager since 1998. Previously, Mr. Feinberg served as a research analyst at Davis, beginning in 1994.
Delaware Management Company (“DMC”), a series of Delaware Management Business Trust, located at 2005 Market Street, Philadelphia, Pennsylvania 19103, manages a portion of the portfolio of the Aggressive Growth Fund and the Emerging Growth Fund. DMC is an indirect, wholly-owned subsidiary of Delaware Management Holdings, Inc. (“Delaware Investments”). As of December 31, 2006, Delaware Investments had more than $150 billion in assets under management.
Jeffrey S. Van Harte
is a portfolio manager of a portion of the Aggressive Growth Fund. Mr. Van Harte, a Chartered Financial Analyst, is a Senior Vice President and Chief Investment Officer – Focus Growth Equity. He joined Delaware Investments in April 2005 and is the chief investment officer for the firm’s Focus Growth Equity team responsible for large-cap growth, all-cap growth and one smid-cap growth portfolio. Most recently, he was a principal and executive vice president at Transamerica Investment Management. Mr. Van Harte has been managing portfolios for more than 20 years. Before becoming a portfolio manager, Mr. Van Harte was a securities analyst and trader for Transamerica Investment Services, which he joined in 1980.
Christopher J. Bonavico
is a portfolio manager of a portion of the Aggressive Growth Fund. Mr. Bonavico, a Chartered Financial Analyst, is a Vice President, Senior Portfolio Manager and Equity Analyst. He joined Delaware Investments in April 2005 and is a senior portfolio manager on the firm’s Focus Growth Equity team. He was most recently a principal and portfolio manager at Transamerica Investment Management. Before joining Transamerica in 1993, he was a research analyst for Salomon Brothers.
Christopher M. Ericksen
is a portfolio manager of a portion of the Aggressive Growth Fund. Mr. Ericksen, a Chartered Financial Analyst, is a Vice President, Portfolio Manager and Equity Analyst. He joined Delaware Investments in April 2005 as a portfolio manager on the firm’s Focus Growth Equity team. He was most recently a portfolio manager at Transamerica Investment Management. Before joining Transamerica in 2004, he was a vice president at Goldman Sachs. During his 10 years there, he worked in investment banking as well as investment management.
Daniel J. Prislin
is a portfolio manager of a portion of the Aggressive Growth Fund. Mr. Prislin, a Chartered Financial Analyst, is a Vice President, Senior Portfolio Manager and Equity Analyst. He joined Delaware Investments in April 2005 as a senior portfolio manager on the firm’s Focus Growth Equity team. He was
– 111 –
most recently a principal and portfolio manager at Transamerica Investment Management. Prior to joining Transamerica in 1998, he was a portfolio manager with The Franklin Templeton Group.
Marshall T. Bassett
is a portfolio manager of a portion of the Emerging Growth Fund. Mr. Bassett, a Senior Vice President and Chief Investment Officer – Emerging Growth Equity, joined Delaware Investments in 1997 and leads the firm’s Emerging Growth team, which focuses on small-, mid-, and smid-cap investment products and strategies. Prior to taking over leadership of the Emerging Growth team, Mr. Bassett spent eight years as a portfolio manager and analyst, focusing on consumer and retail stocks in the growth area. From 1989 to 1997, he worked at Morgan Stanley Asset Management Group, where he most recently served as a vice president in its Emerging Growth group, analyzing small-cap companies. Before that, he worked at a community bank in Hopkinsville, Ky., which eventually became part of The Sovran Bank and Trust Company.
Steven G. Catricks
is a portfolio manager of a portion of the Emerging Growth Fund. Mr. Catricks, a Chartered Financial Analyst, is a Vice President and Portfolio Manager. He joined Delaware Investments in 2001 and handles research and analysis in the technology sector for the firm’s Emerging Growth Equity team. Previously, he was an equity analyst at BlackRock Financial from 1999 to 2000, where he specialized in small-capitalization growth stocks. He also worked as a systems engineer at Dow Jones/Factiva, and as a senior systems engineer at GE Aerospace/Lockheed Martin. He started his career as a systems engineer at the Naval Air Development Center, where he spent 15 years.
Barry S. Gladstein
is a portfolio manager of a portion of the Emerging Growth Fund. Mr. Gladstein, a Chartered Financial Analyst, is a Vice President and Portfolio Manager. He joined Delaware Investments in 1995 and is a portfolio manager in the energy, industrials and materials sector of the firm’s Emerging Growth Equity team. Prior to joining Delaware Investments, he was director of operational planning at CIGNA Corporation from 1991 to 1995 and a senior accountant with Arthur Young.
Christopher M. Holland
is a portfolio manager of a portion of the Emerging Growth Fund. Mr. Holland, a Vice President and Portfolio Manager, joined Delaware Investments in 2001 and is a portfolio manager in the business services sector of the firm’s Emerging Growth Equity team. Prior to joining Delaware Investments, Mr. Holland worked for three years as a municipal fixed income analyst at BlackRock and in private client services at J.P. Morgan Chase for another year.
Steven T. Lampe
is a portfolio manager of a portion of the Emerging Growth Fund. Mr. Lampe, a Certified Public Accountant, is a Vice President and Portfolio Manager. He joined Delaware Investments in 1995 and is a portfolio manager in the business and financial services and healthcare sectors of the firm’s Emerging Growth Equity team. He previously served as a manager at Pricewaterhouse, specializing in financial services firms.
Rudy D. Torrijos III
is a portfolio manager of a portion of the Emerging Growth Fund. Mr. Torrijos, a Vice President and Portfolio Manager, joined Delaware Investments in July 2005 where he serves as a portfolio manager with a focus on the technology sector for the firm’s Emerging Growth Equity team. He spent the prior two years as a technology analyst at Fiduciary Trust, where he was responsible for sector management of technology stocks for small-cap equity products. From 1997 to 2002 he worked for Neuberger Berman Growth Group, first as an analyst and then as fund manager. Mr. Torrijos worked as a technology analyst at Hellman Jordan Management for three years and he began his career as a marketing/strategic financial planning analyst at Unocal in Los Angeles.
– 112 –
Lori P. Wachs
is a portfolio manager of a portion of the Emerging Growth Fund. Ms. Wachs, a Chartered Financial Analyst, is a Vice President and Portfolio Manager. She joined Delaware Investments in 1992 and is a portfolio manager and analyst for the consumer sector in the firm’s Emerging Growth Equity group. She joined Delaware Investments after serving in the equity-risk arbitrage department of Goldman Sachs from 1990 to 1992.
Eagle Asset Management, Inc. (“Eagle”), located at 880 Carillon Parkway, St. Petersburg, Florida 33716, manages a portion of the portfolio of the Small Company Growth Fund. Eagle is a wholly-owned subsidiary of Raymond James Financial, Inc., a St. Petersburg, Florida-based financial services company. As of December 31, 2006, Eagle managed approximately $13.03 billion in assets.
Bert L. Boksen
is the portfolio manager of a portion of the Small Company Growth Fund. Mr. Boksen is a Managing Director at Eagle and has over 27 years of investment experience. He has portfolio management responsibilities for all of Eagle’s small cap growth equity accounts. Prior to joining Eagle in 1995, Mr. Boksen was employed for 16 years by Raymond James & Associates, Inc. in its institutional research and sales department. While employed by Raymond James & Associates, Inc., Mr. Boksen served as co-head of Research, Chief Investment Officer and Chairman of the Raymond James & Associates, Inc. Focus List Committee. Mr. Boksen began his investing career as an analyst at Standard and Poor’s.
EARNEST Partners, LLC (“Earnest Partners”), located at 1180 Peachtree Street, Suite 2300, Atlanta, Georgia 30309, manages a portion of the portfolio of the Small Company Value Fund. Earnest Partners manages small-, mid- and large-cap equity investment products as well as fixed income products. As of December 31, 2006, Earnest Partners advised approximately $25.9 billion in assets.
Paul E. Viera ��
is a portfolio manager of a portion of the Small Company Value Fund. Mr. Viera is the founder of Earnest Partners, an investment firm responsible for overseeing over $25 billion. In 1993, he developed Return Pattern Recognition®, the investment methodology used to select equities at Earnest Partners. Previously, Mr. Viera was a Vice President at Bankers Trust in both New York and London. He later joined Invesco, where he became a Global Partner and senior member of its Investment Committee. Mr. Viera is a member of the Atlanta Society of Financial Analysts and has over twenty-five years of investment experience.
Fidelity Management & Research Company (“FMR”), located at 82 Devonshire Street, Boston, Massachusetts 02109, manages the investments of the Value Equity Fund. FMR Corp., organized in 1972, is the ultimate parent company of FMR. In addition, FMR Co., Inc. (“FMRC”) serves as sub-subadviser for the Fund. FMRC will be primarily responsible for choosing investments for the Fund. FMRC is a wholly-owned subsidiary of FMR. As of December 31, 2006, FMR managed $1,234.0 billion in mutual fund assets.
Ciaran O’Neill
is the portfolio manager of the Value Equity Fund, which he has managed since August 2006. Since joining Fidelity Investments in 1995, Mr. O’Neill has worked as a research analyst and since 2001, he has served as a portfolio manager for mutual funds and other accounts. Mr. O’Neill left Fidelity briefly in April of 2005 to work as a portfolio manager for the Bank of Ireland. Mr. O’Neill returned to Fidelity in May of 2005 as a portfolio manager of mutual funds and separate accounts.
Goldman Sachs Asset Management, L.P. (“GSAM”), located at 32 Old Slip, New York, New York 10005, manages the investments of the Small Cap Core Equity Fund. As of December 31, 2006, the Investment Management Division of Goldman, Sachs & Co., which includes GSAM as a business unit, had $664.4 billion in total assets under management (excludes seed capital and assets under supervision). GSAM reported $627.6 billion in total assets under management and/or distribution as of December 31, 2006 (including seed capital and excluding assets under supervision).
Robert C. Jones
is a portfolio manager of the Small Cap Core Equity Fund. Mr. Jones, a Chartered Financial Analyst, is a Managing Director of GSAM and the Chief Investment Officer of the Global Quantitative Equity (“GQE”)
– 113 –
Group. He has over 25 years of investment experience and developed the original model and investment process for GQE in the late 1980s and has been responsible for overseeing their continuing development and evolution ever since. Prior to joining GSAM in 1989, Mr. Jones was the Senior Quantitative Analyst in the Investment Research Department and the author of the monthly Stock Selection publication. Before joining Goldman Sachs in 1987, he conducted quantitative research for both a major investment banking firm and an options consulting firm.
Melissa R. Brown
is a portfolio manager of the Small Cap Core Equity Fund. Ms. Brown, a Chartered Financial Analyst, is a Managing Director of GSAM and a Senior Portfolio Manager of the GQE Group where she is responsible for US and Global portfolios. As a member of the GQE Investment Policy Committee, she is involved with all aspects of the portfolio management process. Ms. Brown has 24 years of industry experience and joined GSAM in 1998. For the 15 years prior to joining GSAM, she was the Director of Quantitative Equity Research for Prudential Securities, where her primary function was to research, develop and deliver stock valuation analysis and ratings as well as an overall quantitative market perspective. She also served on the firm’s Investment Policy Committee.
Grantham, Mayo, Van Otterloo & Co. LLC (“GMO”), located at 40 Rowes Wharf, Boston, Massachusetts 02110, manages the investments of the Growth Equity Fund. As of December 31, 2006, GMO had approximately $141 billion in assets under management.
Day-to-day management of the Growth Equity Fund is the responsibility of the Quantitative Division comprised of several investment professionals associated with GMO, and no one person is primarily responsible for day-to-day management of the Fund. The Division’s team members work collaboratively to manage the Fund’s portfolio. Sam Wilderman is the Director of the Division and the senior member of the Division responsible for managing the implementation and monitoring the overall portfolio management of the portfolio. Mr. Wilderman joined the Division as co-director in 2005. Prior to joining the U.S. Quantitative Division in 2005, Mr. Wilderman was responsible for research and portfolio management for GMO’s Emerging Markets Division.
Harris Associates L.P. (“Harris”), located at 2 North LaSalle Street, Chicago, Illinois 60602, manages the investments of the Focused Value Fund and a portion of the portfolio of the Overseas Fund. Harris developed and has been investing under the Focused Value strategy since Harris was organized in 1995 to succeed to the business of a previous limited partnership, also named Harris Associates L.P. (the “Former Adviser”), that together with its predecessor, had advised and managed mutual funds since 1970. Harris is a wholly-owned subsidiary of IXIS Asset Management US Group L.P. (“IXIS US Group”). IXIS US Group is a wholly-owned subsidiary of IXIS Asset Management. Harris managed approximately $68.5 billion in assets as of December 31, 2006.
Robert Levy
is primarily responsible for the day-to-day management of a portion of the Focused Value Fund. Mr. Levy, a Chartered Financial Analyst, is the Chairman and Chief Investment Officer of Harris. He has managed other investment portfolios under the focused value strategy since 1985. Prior to that, he was a portfolio manager and director of Gofen and Glossberg, Inc.
Michael J. Mangan
assists Mr. Levy in the day-to-day management of a portion of the Focused Value Fund. Mr. Mangan, a Chartered Financial Analyst and Certified Public Accountant with over 17 years of investment experience, is a partner of Harris and joined the firm in 1997.
David G. Herro
is a portfolio manager of a portion of the Overseas Fund. Mr. Herro, a Chartered Financial Analyst, is the Chief Investment Officer, International Equities. Prior to joining Harris in 1992, Mr. Herro worked as a portfolio manager for The Principal Financial Group from 1986 to 1989 and as a portfolio manager for The State of Wisconsin Investment Board from 1989 to 1992.
– 114 –
Chad M. Clark
is a portfolio manager of a portion of the Overseas Fund. Mr. Clark, a Chartered Financial Analyst, joined Harris as an analyst in 1995. Prior to joining Harris, Mr. Clark worked as a financial analyst for William Blair & Company from 1994-1995.
Insight Capital Research & Management, Inc. (“Insight Capital”), located at 2121 N. California Blvd., Suite 560, Walnut Creek, California 94596, manages a portion of the portfolio of the Emerging Growth Fund. Insight Capital is an employee-owned investment firm. As of December 31, 2006, Insight Capital had approximately $916.44 million in assets under management.
Lee Molendyk
is a portfolio manager of a portion of the Emerging Growth Fund. Mr. Molendyk, a Chartered Financial Analyst, is a Vice President and Portfolio Manager. He is a Co-Portfolio Manager and Equity Analyst for the All-Cap Growth/Small-Cap Growth Portfolio Team. He is also a member of Insight Capital’s Investment Committee. Prior to joining Insight Capital in 1999, he worked as a Financial Advisor at Morgan Stanley.
Lance Swanson
is a portfolio manager of a portion of the Emerging Growth Fund. Mr. Swanson, a Vice President and Portfolio Manager, is a Co-Portfolio Manager and Equity Analyst for the All-Cap Growth/Small-Cap Growth Portfolio team. He is also a member of Insight’s Investment Committee. Mr. Swanson first joined Insight in 1996. From late 2000 until early 2002, he worked for Thomas Weisel Partners in San Francisco and then rejoined Insight in 2002.
Massachusetts Financial Services Company (MFS), located at 500 Boylston Street, Boston, Massachusetts 02116, manages a portion of the portfolio of the Overseas Fund. MFS had approximately $187 billion in assets under management as of December 31, 2006. MFS is a subsidiary of Sun Life of Canada (U.S.) Financial Services Holdings, Inc., which in turn is an indirect wholly owned subsidiary of Sun Life Financial Inc. (a diversified financial services organization).
David R. Mannheim
is a portfolio manager of a portion of the Overseas Fund. Mr. Mannheim, a Senior Vice President of MFS, is a Director of Equity Portfolio Management and serves on MFS’ Investment Management Committee. Mr. Mannheim joined MFS in 1988 as an equity research analyst following non-U.S. securities before becoming a portfolio manager in 1992. Prior to joining MFS, Mr. Mannheim worked as a lending officer for Midatlantic National Bank.
Marcus L. Smith
is a portfolio manager of a portion of the Overseas Fund. Mr. Smith, a Senior Vice President of MFS, is a Director of Asian Research. Mr. Smith joined MFS in 1994 as an equity research analyst following European securities before becoming a portfolio manager in 2001. Prior to joining MFS, Mr. Smith was a Senior Consultant for Andersen Consulting.
Mazama Capital Management, Inc. (“Mazama”), located at One SW Columbia Street, Suite 1500, Portland, Oregon 97258, manages a portion of the portfolio of the Small Company Growth Fund. The firm focuses solely on small cap investing and has managed small cap portfolios since 1993. As of December 31, 2006, Mazama had approximately $7.3 billion in assets under management.
Ronald A. Sauer
is the senior portfolio manager of a portion of the Small Company Growth Fund. Mr. Sauer has been the President of Mazama and a Senior Portfolio Manager since 1997. Previously, Mr. Sauer was the President and Director of Research of Black & Company, Inc. from 1983 to 1997 and managed the small cap growth product that Mazama purchased from 1993-1997.
– 115 –
Stephen C. Brink
is a portfolio manager of a portion of the Small Company Growth Fund. Mr. Brink, a Senior Vice President of Mazama and a Chartered Financial Analyst, joined Mazama in 1997. Previously, Mr. Brink was the Chief Investment Officer of U.S. Trust Company of the Pacific Northwest, where he worked from 1984 to 1997.
Navellier & Associates, Inc. (“Navellier”), located at One East Liberty, Third Floor, Reno, Nevada 89501 manages the investments of the Mid Cap Growth Equity Fund. Navellier was organized in 1987 and, as of December 31, 2006, managed approximately $4.89 billion in investor funds, including other mutual funds. Navellier is owned and controlled by its sole shareholder, Louis G. Navellier.
Michael Borgen
is the portfolio manager primarily responsible for the day-to-day management of the Mid Cap Growth Equity Fund. He has 12 years experience in the securities industry and joined Navellier in 1995 as a Quantitative Research Analyst. In addition, Mr. Borgen conducts ongoing research enhancements of Navellier’s quantitative investment process and works on product development.
Louis G. Navellier
is the Chairman and CEO of Navellier. He sets the strategies and guidelines for the Mid Cap Growth Equity Fund and oversees the Fund’s portfolio management activities. Mr. Navellier refined the Modern Portfolio Theory investment strategy which is applied in managing the assets of the Fund. Mr. Navellier has the final decision making authority on stock purchases and sales and is ultimately responsible for all decisions regarding the Fund.
Northern Trust Investments, N.A. (“NTI”), located at 50 South LaSalle Street, Chicago, IL 60603, manages the investments of the Indexed Equity Fund and the OTC 100 Fund. NTI is an investment adviser registered under the Investment Advisers Act of 1940, as amended. NTI primarily manages assets for defined contribution and benefit plans, investment companies and other institutional investors. NTI is a subsidiary of The Northern Trust Company (“TNTC”), an Illinois state chartered banking organization and a member of the Federal Reserve System. Formed in 1889, TNTC administers and manages assets for individuals, personal trusts, defined contribution and benefit plans and other institutional and corporate clients. TNTC is the principal subsidiary of Northern Trust Corporation, a bank holding company. Northern Trust Corporation, through its subsidiaries, has for more than 100 years managed the assets of individuals, charitable organizations, foundations and large corporate investors. As of December 31, 2006, NTI and its affiliates had assets under custody of $3.5 trillion, and assets under investment management of $697 billion.
Brent Reeder
is primarily responsible for the day-to-day management of the Indexed Equity Fund and the OTC 100 Fund. Mr. Reeder is a Vice President of NTI where he is responsible for the management of various equity and equity index portfolios. Mr. Reeder joined NTI in 1993, and has been a member of the quantitative management group for domestic index products and manages quantitative equity portfolios.
Sands Capital Management, LLC (“Sands Capital”), located at 1100 Wilson Boulevard, Suite 3050, Arlington, Virginia 22209, manages a portion of the portfolio of the Aggressive Growth Fund. As of December 31, 2006, Sands Capital had approximately $19.63 billion in assets under management.
Frank M. Sands, Sr.
is a portfolio manager of a portion of the Aggressive Growth Fund. Mr. Sands, Sr., Chairman, CEO, and co-founder of Sands Capital, has been the portfolio manager for Sands Capital’s large capitalization growth stock strategy since the firm was formed in 1992. He has 37 years of investment management experience and is a Chartered Financial Analyst.
David E. Levanson
is a portfolio manager of a portion of the Aggressive Growth Fund. Mr. Levanson, Senior Portfolio Manager and Director of U.S. Mutual Funds, re-joined Sands Capital in September 2002. Before re-joining
– 116 –
the firm, Mr. Levanson was a Research Analyst for MFS Investment Management. Mr. Levanson is a Chartered Financial Analyst.
Frank M. Sands, Jr.
is a portfolio manager of a portion of the Aggressive Growth Fund. Mr. Sands, Jr., President, Director of Research, and Senior Portfolio Manager, has been with Sands Capital since June 2000. Before joining Sands Capital, he was a Research Analyst, Portfolio Manager, and Principal at Fayez Sarofim & Co. from August 1994 to June 2000. Mr. Sands, Jr. is a Chartered Financial Analyst.
A. Michael Sramek
is a portfolio manager of a portion of the Aggressive Growth Fund. Mr. Sramek, Portfolio Manager and Research Analyst, has been with Sands Capital since April 2001. Before joining Sands Capital, he was a Research Analyst with Mastrapasqua & Associates and previously an Associate in Plan Sponsor Services with BARRA/RogersCasey from 1995 to 1998. Mr. Sramek is a Chartered Financial Analyst.
SSgA Funds Management, Inc. (“SSgA FM”), located at One Lincoln Street, 33rd Floor, Boston, Massachusetts 02111, manages the investments of the Small Cap Value Equity Fund. SSgA FM is registered with the SEC as an investment adviser under the Investment Advisers Act of 1940 and is a wholly-owned subsidiary of State Street Corporation, a publicly held bank holding company. As of December 31, 2006, SSgA FM had over $123.4 billion in assets under management. This strategy is managed by the SSgA Global Enhanced Equity Team. The portfolio managers identified below jointly and primarily have the most significant day-to-day responsibility for management of the strategy:
Ric Thomas
is a Principal of State Street Global Advisors and SSgA FM where he is a Deputy Department Head in the Enhanced Equity Group. Mr. Thomas, a Chartered Financial Analyst, focuses on managing both large-cap and small-cap strategies, as well as providing research on SSgA’s stock-ranking models. Prior to joining SSgA in 1998, he was a quantitative analyst on the portfolio construction team at Putnam Investments. Previously, he was an assistant economist at the Federal Reserve Bank of Kansas City where he operated the Bank’s econometric forecasting model and reported to the senior staff on national economic conditions. Mr. Thomas has been working in the investment management field since 1990.
Chuck Martin
is a Principal of State Street Global Advisors and SSgA FM. Mr. Martin, a Chartered Financial Analyst, is a portfolio manager in the firm’s Global Enhanced Equities group. He provides research and portfolio management support for multiple investment strategies. Prior to joining SSgA, Mr. Martin was an equity analyst at SunTrust Equitable Securities where he covered technology companies. He has also held various positions at Scudder and Putnam Investments. Mr. Martin has worked in the investment industry since 1993.
T. Rowe Price Associates, Inc. (“T. Rowe Price”), located at 100 East Pratt Street, Baltimore, Maryland 21202, manages the investments of the Blue Chip Growth Fund, the Mid Cap Growth Equity II Fund and a portion of the portfolio of the Small Company Value Fund. T. Rowe Price, a wholly-owned subsidiary of T. Rowe Price Group, Inc., a publicly-traded financial services holding company, has been managing assets since 1937. As of December 31, 2006, T. Rowe Price had approximately $334.7 billion in assets under management.
Larry J. Puglia
is the portfolio manager for the Blue Chip Growth Fund. Mr. Puglia, investment advisory committee chairman, has day-to-day responsibility for managing the portfolio and works with the committee in developing and executing the portfolio’s investment program. He is a Chartered Financial Analyst and a Certified Public Accountant, and a Vice President of T. Rowe Price Associates, Inc. Mr. Puglia has been the lead portfolio manager for the U.S. Large-Cap Core Growth Strategy for T. Rowe Price since 1997 and has been managing its Large-Cap Core Growth Portfolios since 1993. He also serves on the investment advisory committee of T. Rowe Price’s Institutional U.S. Large-Cap Growth Strategy. Mr. Puglia joined T. Rowe Price in 1990.
– 117 –
Brian W.H. Berghuis
is a co-portfolio manager for the Mid Cap Growth Equity II Fund. Mr. Berghuis, investment advisory committee co-chairman, shares day-to-day responsibility for managing the portfolio and works with the committee in developing and executing the portfolio’s investment program. He is a Chartered Financial Analyst and a Vice President and Equity Portfolio Manager for T. Rowe Price Associates. He joined T. Rowe Price in 1985.
Donald J. Peters
is a co-portfolio manager for the Mid Cap Growth Equity II Fund. Mr. Peters, investment advisory committee co-chairman, shares day-to-day responsibility for managing the portfolio and works with the committee in developing and executing the portfolio’s investment program. He is also a portfolio manager for major institutional relationships with T. Rowe Price’s structured active and tax-efficient strategies, including the T. Rowe Price Tax-Efficient Balanced, Growth, and Multi-Cap Funds. Mr. Peters is a Vice President and Equity Portfolio Manager for T. Rowe Price Associates. He joined T. Rowe Price in 1993.
Preston G. Athey
is the portfolio manager of a portion of the Small Company Value Fund. Mr. Athey, investment advisory committee chairman, has day-to-day responsibility for managing T. Rowe Price’s portion of the portfolio and works with the committee in developing and executing the portfolio’s investment program. He is a Chartered Financial Analyst and a Chartered Investment Counselor, and a Vice President and Equity Portfolio Manager for T. Rowe Price Associates. Mr. Athey has been managing investments since 1982.
Victory Capital Management Inc. (“Victory”), located at 127 Public Square, Cleveland, Ohio 44114, manages the investments of the Core Opportunities Fund. Victory, a New York corporation registered as an investment adviser with the SEC, is a second-tier subsidiary of KeyCorp. As of December 31, 2006, Victory and its affiliates managed approximately $60.9 billion of assets for individual and institutional clients.
Lawrence G. Babin
is the lead portfolio manager of the Core Opportunities Fund. Mr. Babin, a Chartered Financial Analyst Charter Holder, is a Chief Investment Officer and Senior Managing Director of Victory and has been with Victory or an affiliate since 1982.
Paul D. Danes
is the portfolio manager of the Core Opportunities Fund. Mr. Danes is a Senior Portfolio Manager and Managing Director of Victory and has been associated with Victory or an affiliate since 1987.
Carolyn M. Rains
is the associate portfolio manager of the Core Opportunities Fund. Ms. Rains is a Portfolio Manager and a Managing Director of Victory and has been with Victory or an affiliate since 1998.
Waddell & Reed Investment Management Company (“Waddell & Reed”), located at 6300 Lamar, Overland Park, Kansas 66202, manages a portion of the portfolio of the Small Cap Growth Equity Fund. As of December 31, 2006, Waddell & Reed had more than $47 billion in assets under management.
Mark G. Seferovich
is responsible, along with Mr. McQuade, for the day-to-day management of a portion of the Small Cap Growth Equity Fund. Mr. Seferovich, a Chartered Financial Analyst, is a senior vice president of Waddell & Reed and the lead portfolio manager of its small cap style. He joined Waddell & Reed in February 1989 as manager of small capitalization growth equity funds. From 1982 to 1988 he was a portfolio manager for Security Management Company and prior to that was security analyst/portfolio manager with Reimer & Koger Associates.
Kenneth G. McQuade
A vice president and assistant portfolio manager for Waddell & Reed, Mr. McQuade, along with Mr. Seferovich, is responsible for the day-to-day management of a portion of the Small Cap Growth Equity Fund. Mr. McQuade is also portfolio manager of the Waddell & Reed Target Small Cap Growth Portfolio and assistant portfolio manager of Waddell & Reed’s small cap style. He joined Waddell & Reed in 1997 as an investment analyst. Prior to joining Waddell & Reed, Mr. McQuade worked as an associate healthcare investment analyst at A.G. Edwards & Sons.
– 118 –
Wellington Management Company, LLP (“Wellington Management”), located at 75 State Street, Boston, Massachusetts 02109, manages the investments of the Fundamental Value Fund and a portion of the portfolio of the Small Cap Growth Equity Fund. Wellington Management is a professional investment counseling firm which provides investment services to investment companies, employee benefit plans, endowments, foundations and other institutions. As of December 31, 2006, Wellington Management had investment management authority with respect to approximately $575 billion in assets.
John R. Ryan
has served as portfolio manager of the Fundamental Value Fund since 2001. Mr. Ryan, a Chartered Financial Analyst, is a Senior Vice President and Equity Portfolio Manager of Wellington Management and joined the firm as an investment professional in 1981.
Kenneth L. Abrams
has served as portfolio manager of the portion of the Small Cap Growth Equity Fund managed in the small capitalization opportunities style since 2001. Mr. Abrams is a Senior Vice President and Equity Portfolio Manager of Wellington Management and joined the firm as an investment professional in 1986.
Daniel J. Fitzpatrick
has been involved in portfolio investment and securities analysis for the portion of the Small Cap Growth Equity Fund managed in the small capitalization opportunities style since 2001. Mr. Fitzpatrick, a Chartered Financial Analyst, is a Vice President and Equity Research Analyst of Wellington Management and joined the firm as an investment professional in 1998.
Steven C. Angeli
has served as portfolio manager of the portion of the Small Cap Growth Equity Fund managed in the small capitalization growth style since 2004. Mr. Angeli, a Chartered Financial Analyst, is a Senior Vice President and Equity Portfolio Manager of Wellington Management and joined the firm as an investment professional in 1994.
Mario E. Abularach
has been involved in portfolio management and securities analysis for the portion of the Small Cap Growth Equity Fund managed in the small capitalization growth style since 2006. Mr. Abularach, a Chartered Financial Analyst, is a Vice President and Equity Research Analyst of Wellington Management and joined the firm as an investment professional in 2001.
Stephen C. Mortimer
has been involved in portfolio management and securities analysis for the portion of the Small Cap Growth Equity Fund managed in the small capitalization growth style since 2006. Mr. Mortimer is a Vice President and Equity Portfolio Manager of Wellington Management and joined the firm as an investment professional in 2001.
Western Asset Management Company (“Western Asset”), located at 385 East Colorado Blvd, Pasadena, California 91101, manages the investments of the Strategic Bond Fund and a portion of the portfolio of the Strategic Balanced Fund. Western Asset, which concentrates exclusively on fixed-income investments, is a wholly-owned subsidiary of Legg Mason, Inc., a NYSE-listed, diversified financial services company based in Baltimore, Maryland. As of December 31, 2006, Western Asset managed $574.6 billion in total fixed-income assets. Western Asset’s fixed-income discipline emphasizes a team approach that unites groups of specialists dedicated to different market sectors. The investment responsibilities of each sector team are distinct, yet success is derived from the constant interaction that unites the specialty groups into a cohesive whole. This structure ensures that client portfolios benefit from a consensus that draws on the expertise of all team members. As of December 31, 2006, this team consisted of 139 professionals, led by:
S. Kenneth Leech
is Western’s Chief Investment Officer. Mr. Leech has 29 years of industry experience, 16 of them with the Firm, and prior to becoming CIO was Director of Portfolio Management. Previously, he worked as a
– 119 –
portfolio manager at Greenwich Capital Markets, The First Boston Corporation, and the National Bank of Detroit.
Stephen A. Walsh
is Western’s Deputy Chief Investment Officer. Mr. Walsh has 25 years of industry experience, 15 of them with the Firm, and prior to becoming Deputy CIO was Director of Portfolio Management (after Mr. Leech). Previously, he worked as a portfolio manager at Security Pacific Investment Managers, Inc., and the Atlantic Richfield Company.
Carl L. Eichstaedt ��
is also a portfolio manager of the Funds. Mr. Eichstaedt has 20 years of industry experience, 12 of them with the Firm. Previously, he worked as a portfolio manager at Harris Investment Management and Pacific Investment Management Company.
Edward A. Moody
is also a portfolio manager of the Funds. Mr. Moody has 30 years of industry experience, 21 of them with the Firm. Previously, he worked as a portfolio manager at the National Bank of Detroit.
Mark S. Lindbloom
is also a portfolio manager of the Funds. Mr. Lindbloom has 28 years of industry experience, 1 of them with the firm. Previously, he worked as a portfolio manager at Citigroup Asset Management and Brown Brothers Harriman & Co.
Western Asset Management Company Limited (“WAML”), a United Kingdom corporation, is located at 10 Exchange Square, London, UK EC2A 2EN. WAML manages the non-U.S. dollar denominated investments of the Strategic Bond Fund and of the portion of the portfolio of the Strategic Balanced Fund managed by Western Asset. WAML provides investment advice to mutual funds and other entities and is a wholly owned subsidiary of Legg Mason, Inc. As of December 31, 2006 WAML managed approximately $91.3 billion in assets and had 25 investment professionals.
S. Kenneth Leech
is Western’s Chief Investment Officer. Mr. Leech has 29 years of industry experience, 16 of them with the Firm, and prior to becoming CIO was Director of Portfolio Management. Previously, he worked as a portfolio manager at Greenwich Capital Markets, The First Boston Corporation, and the National Bank of Detroit.
Stephen A. Walsh
is Western’s Deputy Chief Investment Officer. Mr. Walsh has 25 years of industry experience, 15 of them with the Firm, and prior to becoming Deputy CIO was Director of Portfolio Management (after Mr. Leech). Previously, he worked as a portfolio manager at Security Pacific Investment Managers, Inc., and the Atlantic Richfield Company.
The Trust’s Statement of Additional Information (“SAI”) provides additional information about each portfolio manager’s compensation, other accounts managed by the portfolio managers and each portfolio manager’s ownership of securities in the relevant Fund.
MassMutual has received exemptive relief from the SEC to permit MassMutual to change sub-advisers or hire new sub-advisers for one or more Funds from time to time without obtaining shareholder approval. Normally, shareholders are required to approve investment sub-advisory agreements. Several other mutual fund companies have received similar relief. MassMutual believes having this authority is important, because it allows MassMutual to remove and replace a sub-adviser in a quick, efficient and cost-effective fashion when, for example, its performance is inadequate or the sub-adviser no longer is able to meet a Fund’s investment objective and strategies. The shareholders of each Fund have previously approved this arrangement. Pursuant to the exemptive relief, MassMutual will provide to a Fund’s shareholders, within 90 days of the hiring of a new sub-adviser, an information statement describing the new sub-adviser.
– 120 –
About the Classes of Shares – Multiple Class Information
Each Fund offers five Classes of shares: Class S, Class Y, Class L, Class A and Class N. The Indexed Equity Fund also offers a sixth Class of shares (Class Z). Class A shares have up-front sales charges and Class N shares have contingent deferred sales charges. Only Class A and Class N shares charge Rule 12b-1 fees.
Class S, Class Y, Class L and Class Z shares are primarily offered to institutional investors through institutional distribution channels, such as employer-sponsored retirement plans or through broker-dealers, financial institutions or insurance companies. Class A and N shares are primarily offered through other distribution channels, such as broker-dealers or financial institutions. The different Classes have different fees, expenses and/or minimum investor size requirements. The difference in the fee structures among the Classes is the result of their separate arrangements for shareholder and distribution services and is not the result of any difference in amounts charged by MassMutual for investment advisory services. Accordingly, management fees do not vary by Class. Different fees and expenses of a Class will affect performance of that Class. For actual past expenses of each share class, see the fund-by-fund information earlier in this prospectus. Investors may receive different levels of service in connection with investments in different classes of shares and intermediaries may receive different levels of compensation in connection with each share class. For additional information, call us toll free at 1-888-309-3539 or contact a sales representative or financial intermediary who offers the Classes.
Except as described below, all Classes of shares of a Fund have identical voting, dividend, liquidation and other rights, preferences, terms and conditions. The only differences among the various Classes are: (a) each Class may be subject to different expenses specific to that Class; (b) each Class has a different Class designation; (c) each Class has exclusive voting rights with respect to matters solely affecting such Class; (d) each Class offered in connection with a Rule 12b-1 Plan will bear the expense of the payments that would be made pursuant to that Rule 12b-1 Plan, and only that Class will be entitled to vote on matters pertaining to that Rule 12b-1 Plan; and (e) each Class will have different exchange privileges.
Each Class of a Fund’s shares invests in the same portfolio of securities. Because each Class will have different expenses, they will likely have different share prices. All Classes of shares are available for purchase by insurance company separate investment accounts.
Each Class of shares of the Funds may also be purchased by the following Eligible Purchasers:
| · | Qualified plans under Section 401(a) of the Internal Revenue Code of 1986 as amended (the “Code”), Code Section 403(b) plans, Code Section 457 plans and non-qualified deferred compensation plans, where plan assets of the employer generally exceed or are expected to exceed $50 million for Class S shares, $25 million for Class Z shares (Indexed Equity Fund only), $5 million for Class Y shares and $1 million for Class L shares. |
Class S shares may also be purchased by:
| · | Registered mutual funds and collective trust funds; and |
| · | Other institutional investors with assets generally in excess of $50 million. |
Class Z shares (Indexed Equity Fund only) may also be purchased by:
| · | Registered mutual funds and collective trust funds; and |
| · | Other institutional investors with assets generally in excess of $25 million. |
Class Y shares may also be purchased by:
| · | Registered mutual funds and collective trust funds; and |
| · | Other institutional investors with assets generally in excess of $5 million. |
Class L shares may also be purchased by:
| · | Other institutional investors with assets generally in excess of $1 million. |
Class A and Class N shares may also be purchased by:
| · | Individual retirement accounts described in Code Section 408; |
| · | Voluntary employees’ beneficiary associations described in Code Section 501(c)(9); and |
| · | Other institutional investors. |
– 121 –
Additional Information.
An institutional investor or plan may be permitted to purchase shares of a class even if the institutional investor or plan does not meet the minimum investment amounts set forth above, if the Distributor or Adviser, as applicable, determines that the expected size (over time), servicing needs, or distribution or servicing costs for the institutional investor or plan are comparable to those of institutional investors or plans eligible to purchase shares of that class.
Eligible Purchasers must have an agreement with MassMutual or a MassMutual affiliate to purchase shares. Class L shares are generally sold in connection with the use of an intermediary performing third party administration and/or other shareholder services. There is no minimum plan or institutional investor size to purchase Class A or Class N shares.
Class A and Class N shares may be offered to present or former officers, directors, trustees and employees (and their spouses, parents, children and siblings) of the Funds, MassMutual and its affiliates and retirement plans established by them for their employees.
Shareholder and Distribution Fees. Class S, Z, Y and L shares of each Fund are purchased directly from the Trust without a front-end sales charge. Therefore, 100% of an Investor’s money is invested in the Fund or Funds of its choice. Class S, Z, Y and L shares do not have deferred sales charges or any Rule 12b-1 fees.
Distribution and Service (Rule 12b-1) Fees. Class A shares are sold at net asset value per share plus an initial sales charge. Class N shares are sold at net asset value per share without an initial sales charge. Therefore, for Class N shares, 100% of an Investor’s money is invested in the Fund or Funds of its choice. The Funds have adopted Rule 12b-1 Plans for Class A and Class N shares of the Funds.
Under the Class A Rule 12b-1 Plans, each Fund is permitted to pay distribution and service fees at the annual rate of .25%, in the aggregate, of that Fund’s average daily net assets attributable to Class A shares. Distribution fees may be paid to brokers or other financial intermediaries for providing services in connection with the distribution and marketing of Class A shares and for related expenses. Services fees may be paid to brokers or other financial intermediaries for providing personal services to Class A shareholders and/or maintaining Class A shareholder accounts and for related expenses. Compensation under the Class A Rule 12b-1 Plans for service fees will be paid to MassMutual, through MML Distributors, LLC (the “Distributor”), and compensation under the Plans for distribution fees will be paid to the Distributor. MassMutual and the Distributor will be entitled to retain a portion of the fees generated by an account, or may reallow the full amount to the brokers or other intermediaries. MassMutual may pay any Class A Rule 12b-1 service fees to brokers or other financial intermediaries in advance for the first year after the shares are sold. After the shares have been held for a year, MassMutual will pay the service fees on a quarterly basis.
Under the Class N Rule 12b-1 Plans, each Fund pays the Distributor an annual distribution fee of .25%. Each Fund also pays .25% in services fees to MassMutual each year under the Class N Rule 12b-1 Plans. MassMutual will be entitled to retain a portion of the fees generated by an account, or may reallow the full amount to brokers or other financial intermediaries for providing personal services to Class N shareholders and/or maintaining Class N shareholder accounts and for related expenses. MassMutual may pay the .25% service fees to brokers or other financial intermediaries in advance for the first year after the shares are sold. After the shares have been held for a year, MassMutual pays the service fees on a quarterly basis. The Distributor will be entitled to retain a portion of the fees generated by an account, or may reallow the full amount to brokers or other financial intermediaries for providing services in connection with the distribution and marketing of Class N shares and for related expenses.
Because these fees are paid out of a Fund’s assets on an on-going basis, over time these fees will increase the costs of your investment in the Class A and Class N shares and may cost you more than other types of sales charges.
Compensation to Intermediaries
The Distributor may directly, or through MassMutual, pay a sales concession of up to 1.00% of the purchase price of Class N, Class A and Class L shares to brokers or other financial intermediaries from its own resources at the time of sale. However, the total amount paid to brokers or other financial
– 122 –
intermediaries at the time of sale of Class N and Class A shares, including any advance of Rule 12b-1 service fees by MassMutual, may be only 1.00% of the purchase price. In addition, MassMutual may directly, or through the Distributor, pay up to .25% of the amount invested to intermediaries who provide services on behalf of Class S, Class Y, Class L, Class A or Class N shares. This compensation is paid by MassMutual, not from Fund assets. The payments on account of Class S, Class Y, Class L, Class A or Class N shares will be based on criteria established by MassMutual. In the event that amounts paid by the Funds to MassMutual as administrative or management fees are deemed indirect financing of distribution or servicing costs for Class S, Class Y or Class L shares, the Funds have adopted distribution and servicing plans (i.e., Rule 12b-1 Plans) authorizing such payments. No additional fees are paid by the Funds under these plans. Compensation paid by the Funds to brokers or other intermediaries for providing services on account of Class A or Class N shares is described above under “Distribution and Service (Rule 12b-1) Fees.” Annual compensation paid on account of Class S, Class Y, Class L, Class A or Class N shares will be paid quarterly, in arrears.
MassMutual may also make payments, out of its own assets, to intermediaries, including broker-dealers, insurance agents and other service providers, that relate to the sale of the Funds or certain of MassMutual’s variable annuity contracts for which the Funds are underlying investment options.
This compensation may take the form of:
| · | Payments to administrative service providers that provide enrollment, recordkeeping and other services to pension plans; |
| · | Cash and non-cash benefits, such as bonuses and allowances or prizes and awards, for certain brokers, administrative service providers and MassMutual insurance agents; |
| · | Payments to intermediaries for, among other things, training of sales personnel, conference support, marketing or other services provided to promote awareness of MassMutual’s products; |
| · | Payments to broker-dealers and other intermediaries that enter into agreements providing the Distributor with access to representatives of those firms or with other marketing or administrative services; and |
| · | Payments under agreements with MassMutual not directly related to the sale of specific variable annuity contracts or the Funds, such as educational seminars and training or pricing services. |
These compensation arrangements are not offered to all intermediaries and the terms of the arrangements may differ among intermediaries. These arrangements may provide an intermediary with an incentive to recommend one mutual fund over another, one share class over another, or one insurance or annuity contract over another. You may want to take these compensation arrangements into account when evaluating any recommendations regarding the Funds or any contract using the Funds as investment options. You may contact your intermediary to find out more information about the compensation they may receive in connection with your investment.
– 123 –
Investing In The Funds
Buying, Redeeming and Exchanging Shares
The Funds sell their shares at a price equal to their net asset value (“NAV”) plus any initial sales charge that applies. The Funds generally determine their NAV at the market close (usually 4:00 p.m. Eastern Time) every day the New York Stock Exchange (“NYSE”) is open (“Business Day”). Your purchase order will be priced at the next NAV calculated after the order is received and accepted by the transfer agent, MassMutual or another intermediary authorized for this purpose. The Funds will suspend selling their shares during any period when the determination of NAV is suspended. The Funds can reject any purchase order and can suspend purchases if it is in their best interest.
The Funds redeem their shares at their next NAV computed after your redemption request is received and accepted by the transfer agent, MassMutual or another intermediary. You will usually receive payment for your shares within 7 days after your redemption request is received and accepted. If, however, you request redemption of shares recently purchased by check, you may not receive payment until the check has been collected, which may take up to 15 days from time of purchase. The Funds can also suspend or postpone payment, when permitted by applicable law and regulations.
You can exchange shares of one Fund for the same class of shares of another Fund. An exchange is treated as a sale of shares in one Fund and a purchase of shares in another Fund at the NAV next determined after the exchange request is received and accepted by the transfer agent, MassMutual or another intermediary. Exchange requests involving a purchase into the Diversified International Fund or Overseas Fund, however, will not be accepted if received by the transfer agent, MassMutual or another intermediary after the earlier of 2:30 p.m. Eastern Time or the market close, on any Business Day. Furthermore, exchange requests involving a purchase into the Diversified International Fund or Overseas Fund will not be accepted if you have already made a purchase followed by a redemption involving the same Fund within the last 30 days. Your right to exchange shares is subject to applicable regulatory requirements or contractual obligations. The Funds may limit, restrict or refuse exchanges, if, in the opinion of MassMutual:
| · | you have engaged in excessive trading; |
| · | a Fund receives or expects simultaneous orders affecting significant portions of the Fund’s assets; |
| · | a pattern of exchanges occurs which coincides with a market timing strategy; or |
| · | the Fund would be unable to invest the funds effectively based on its investment objectives and policies, or if the Fund would be adversely affected. |
Purchases and exchanges of shares of the Funds should be made for investment purposes only. Excessive trading and/or market timing activity involving the Funds can disrupt the management of the Funds. These disruptions can result in increased expenses and can have an adverse effect on fund performance.
MassMutual has adopted policies and procedures to help identify those individuals or entities MassMutual determines may be engaging in excessive trading and/or market timing trading activities. MassMutual monitors trading activity to enforce these procedures. However, those who engage in such activities may employ a variety of techniques to avoid detection. Therefore, despite MassMutual’s efforts to prevent excessive trading and/or market timing trading activities, there can be no assurance that MassMutual will be able to identify all those who trade excessively or employ a market timing strategy and curtail their trading in every instance.
The monitoring process involves scrutinizing transactions in fund shares that exceed certain monetary thresholds or numerical limits within a specified period of time. Trading activity identified by either, or a combination, of these factors, or as a result of any other information actually available at the time, will be evaluated to determine whether such activity might constitute excessive trading and/or market timing activity. When trading activity is determined by a Fund or MassMutual, in their sole discretion, to be excessive in nature, certain account-related privileges, such as the ability to place purchase, redemption and exchange orders over the internet, may be suspended for such account.
The Funds reserve the right to modify or terminate the exchange privilege as described above on 60 days written notice.
– 124 –
The Funds do not accept purchase, redemption or exchange orders or compute their NAVs on days when the NYSE is closed. This includes: weekends, Good Friday and all federal holidays other than Columbus Day and Veterans Day. Certain foreign markets may be open on days when the Funds do not accept orders or price their shares. As a result, the NAV of a Fund’s shares may change on days when you will not be able to buy or sell shares.
Initial Sales Charges
Class A shares are sold at their offering price, which is normally NAV plus an initial sales charge. However, in some cases, as described below, purchases are not subject to an initial sales charge, and the offering price will be the NAV. In other cases, reduced sales charges may be available, as described below. Out of the amount you invest, the Fund receives the net asset value to invest for your account.
The sales charge varies depending on the amount of your purchase. A portion of the sales charge may be retained by the Distributor or allocated to your dealer as a concession. The Distributor reserves the right to reallow the entire sales charge as a concession to dealers. The current sales charge rates and concessions paid to dealers and brokers are as follows:
| | | | | | |
Front-End Sales Charge (As a Percentage of Offering Price) /
Front-End Sales Charge (As a Percentage of Net Amount
Invested)/Concession (As a Percentage of Offering Price) for
Different Purchase Amounts: |
Price
Breakpoints | | General
Equity | | General
Taxable
Bond | | Shorter-
Term Bond |
Less than
$25,000 | | 5.75%/
6.10%/
4.75% | | 4.75%/
4.99%/
4.00% | | 3.50%/
3.63%/
3.00% |
$25,000-
$49,999 | | 5.50%/
5.82%/
4.75% | | 4.75%/
4.99%/
4.00% | | 3.50%/
3.63%/
3.00% |
$50,000-
$99,999 | | 4.75%/
4.99%/
4.00% | | 4.50%/
4.71%/
3.75% | | 3.50%/
3.63%/
3.00% |
$100,000-
$249,999 | | 3.75%/
3.90%/
3.00% | | 3.50%/
3.63%/
2.75% | | 3.00%/
3.09%/
2.50% |
$250,000-
$499,999 | | 2.50%/
2.56%/
2.00% | | 2.00%/
2.04%/
2.25% | | 2.50%/
2.56%/
2.00% |
$500,000-
$999,999 | | 2.00%/
2.04%/
1.60% | | 2.00%/
2.04%/
1.60% | | 2.00%/
2.04%/
1.50% |
$1,000,000
or more | | None/
None/
1.00% | | None/
None/
1.00% | | None/
None/
.50% |
A reduced sales charge may be obtained for Class A shares under the Funds’ “Rights of Accumulation” because of the economies of sales efforts and reduction in expenses realized by the Distributor, dealers and brokers making such sales.
To qualify for the lower sales charge rates that apply to larger purchases of Class A shares, you can add together:
| · | Current purchases of Class A shares of more than one Fund subject to an initial sales charge to reduce the sales charge rate that applies to current purchases of Class A shares; and |
| · | Class A shares of Funds you previously purchased subject to an initial or contingent deferred sales charge to reduce the sales charge rate for current purchases of Class A shares, provided that you still hold your investment in the previously purchased Funds. |
The Distributor will add the value, at current offering price, of the Class A shares you previously purchased and currently own to the value of current purchases to determine the sales charge rate that applies. The reduced sales charge will apply only to current purchases. You must request the reduced sales charge when you buy Class A shares and inform your broker-dealer or other financial intermediary of Class A shares of any other Funds that you own. Information regarding reduced sales charges can be found on the MassMutual website at http://www.massmutual.com/retire.
There is an initial sales charge on the purchase of Class A shares of each of the MassMutual Select Funds.
Contingent Deferred Sales Charges
There is no initial sales charge on purchases of Class A shares of any one or more of the Funds aggregating $1 million or more. The Distributor pays dealers of record concessions in an amount equal to 1.0%, or .50% of purchases of $1 million or more, as shown in the above table. The concession will not be paid on purchases of shares by exchange or that were previously subject to a front-end sales charge and dealer concession.
If you redeem any of those shares within a holding period of 18 months from the date of their purchase, a contingent deferred sales charge of 1.0% will be deducted from the redemption proceeds (unless you are eligible for a waiver of that sales charge based on
– 125 –
the categories listed below and you advise the transfer agent, MassMutual or another intermediary of your eligibility for the waiver when you place your redemption request).
If Class N shares are redeemed within a holding period of 18 months from the date of their purchase, a contingent deferred sales charge of 1.0% will be deducted from the redemption proceeds (unless you are eligible for a waiver of that sales charge based on the categories listed below and you advise the transfer agent, MassMutual or another intermediary of your eligibility for the waiver when you place your redemption request). The Class N contingent deferred sales charge is paid to compensate the Distributor for its expenses of providing distribution-related services to the Funds in connection with the sale of Class N shares.
All contingent deferred sales charges will be based on the lesser of the NAV of the redeemed shares at the time of redemption or the original net asset value. A contingent deferred sales charge is not imposed on:
| · | the amount of your account value represented by an increase in net asset value over the initial purchase price, |
| · | shares purchased by the reinvestment of dividends or capital gains distributions, or |
| · | shares redeemed in the special circumstances described below. |
To determine whether a contingent deferred sales charge applies to a redemption, the Fund redeems shares in the following order:
| 1. | shares acquired by reinvestment of dividends and capital gains distributions, and |
| 2. | shares held the longest. |
Contingent deferred sales charges are not charged when you exchange shares of the Fund for shares of any other Fund. However, if you exchange them within the applicable contingent deferred sales charge holding period, the holding period will carry over to the Fund whose shares you acquire. Similarly, if you acquire shares of a Fund by exchanging shares of another Fund that are still subject to a contingent deferred sales charge holding period, that holding period will carry over to the acquired Fund.
Waivers of Class A Initial Sales Charges
The Class A sales charges will be waived for shares purchased in the following types of transactions:
| · | Purchases into insurance company separate investment accounts. |
| · | Purchases into Retirement Plans or other employee benefit plans. |
| · | Purchases of Class A shares aggregating $1 million or more of any one or more of the Funds. |
| · | Purchases into accounts for which the broker-dealer of record has entered into a special agreement with the Distributor allowing this waiver. |
| · | Purchases into accounts for which no sales concession is paid to any broker-dealer or other financial intermediary at the time of sale. |
| · | Shares sold to MassMutual or its affiliates. |
| · | Shares sold to registered management investment companies or separate accounts of insurance companies having an agreement with MassMutual or the Distributor for that purpose. |
| · | Shares issued in plans of reorganization to which the Fund is a party. |
· | Shares sold to present or former officers, directors, trustees or employees (and their “immediate families1”) of the Fund, MassMutual and its affiliates. |
| · | Shares sold to a portfolio manager of the Fund. |
Waivers of Class A and Class N Contingent Deferred Sales Charges
The Class A and Class N contingent deferred sales charges will not be applied to shares purchased in certain types of transactions or redeemed in certain circumstances described below.
| A. | | Waivers for Redemptions in Certain Cases. |
The Class A and Class N contingent deferred sales charges will be waived for redemptions of shares in the following cases:
| · | Redemptions from insurance company separate investment accounts. |
1 | The term “immediate family” refers to one’s spouse, children, grandchildren, grandparents, parents, parents-in-law, brothers and sisters, sons- and daughters-in-law, a sibling’s spouse, a spouse’s siblings, aunts, uncles, nieces and nephews; relatives by virtue of a remarriage (step-children, step-parents, etc.) are included. |
– 126 –
| · | Redemptions from Retirement Plans or other employee benefit plans. |
| · | Redemptions from accounts other than Retirement Plans following the death or disability of the last surviving shareholder, including a trustee of a grantor trust or revocable living trust for which the trustee is also the sole beneficiary. The death or disability must have occurred after the account was established, and for disability you must provide evidence of a determination of disability by the Social Security Administration. |
| · | Redemptions from accounts for which the broker-dealer of record has entered into a special agreement with the Distributor allowing this waiver. |
| · | Redemptions from accounts for which no sales concession was paid to any broker-dealer or other financial intermediary at the time of sale. |
| · | Redemptions of Class A and Class N shares under an Automatic Withdrawal Plan from an account other than a Retirement Plan if the aggregate value of the redeemed shares does not exceed 10% of the account’s value annually. |
| · | In the case of an IRA, to make distributions required under a divorce or separation agreement described in Section 71(b) of the Internal Revenue Code. |
| B. | | Waivers for Shares Sold or Issued in Certain Transactions. |
The contingent deferred sales charge is also waived on Class A and Class N shares sold or issued in the following cases:
| · | Shares sold to MassMutual or its affiliates. |
| · | Shares sold to registered management investment companies or separate accounts of insurance companies having an agreement with MassMutual or the Distributor for that purpose. |
| · | Shares issued in plans of reorganization to which the Fund is a party. |
· | Shares sold to present or former officers, directors, trustees or employees (and their “immediate families1”) of the Fund, MassMutual and its affiliates. |
| · | Shares sold to a present or former portfolio manager of the Fund. |
Determining Net Asset Value
The Trust calculates the NAV of each class of shares of each Fund separately. The NAV for shares of a class of a Fund is determined by adding the current value of all of the Fund’s assets attributable to that class, subtracting the liabilities attributable to that class and then dividing the resulting number by the total outstanding shares of the class. The assets of each Destination Retirement Fund consist primarily of shares of the underlying MassMutual Funds, which are valued at their respective NAVs.
Each Fund’s assets are valued based on market value of the Fund’s total portfolio. Securities are typically valued on the basis of valuations furnished by a pricing service. However, valuation methods approved by the Fund’s Board of Trustees which are intended to reflect fair value may be used when pricing service information is not readily available or when a security’s value is believed to have been materially affected by a significant event, such as a natural disaster, an economic event like a bankruptcy filing, or a substantial fluctuation in domestic or foreign markets, that has occurred after the close of the exchange or market on which the security is principally traded (for example, a foreign exchange or market). In such a case, a Fund’s value for a security is likely to be different from the last quoted market price or pricing service information. In addition, for each of the Trust’s foreign funds, a fair value pricing service is used to assist in the pricing of foreign securities. Due to the subjective and variable nature of fair value pricing, it is possible that the value determined for a particular asset may be materially different from the value realized upon such asset’s sale.
The Funds’ valuation methods are more fully described in the Statement of Additional Information.
How to Invest
When you buy shares of a Fund through an agreement with MassMutual, your agreement will describe how you need to submit buy, sell and exchange orders. Purchase orders must be accompanied by sufficient funds. You can pay by check or Federal Funds wire transfer. You must submit any buy, sell or exchange orders in “good form” as described in your agreement.
Taxation and Distributions
Each Fund intends to continue to qualify as a regulated investment company under Subchapter M
– 127 –
of the Internal Revenue Code. As a regulated investment company, a Fund will not be subject to Federal income taxes on its ordinary income and net realized capital gain distributed to its shareholders. However, the Fund’s failure to qualify as a regulated investment company would result in corporate level taxation, and consequently, a reduction in income available for distribution to shareholders. In general, a Fund that fails to distribute at least 98% of such income and gain in the one-year period ending October 31 (or later if the Fund is permitted to elect and so elects) in which earned will be subject to a 4% excise tax on the undistributed amount. Many investors, including most tax qualified plan investors, may be eligible for preferential Federal income tax treatment on distributions received from a Fund and dispositions of Fund shares. This Prospectus does not attempt to describe in any respect such preferential tax treatment. Any prospective investor that is a trust or other entity eligible for special tax treatment under the Code that is considering purchasing shares of a Fund, including either directly or indirectly through a life insurance company separate investment account, should consult its tax advisers about the Federal, state, local and foreign tax consequences particular to it, as should persons considering whether to have amounts held for their benefit by such trusts or other entities investing in shares of a Fund.
Investors are generally subject to Federal income taxes on distributions received in respect of their shares. Taxes on distributions of capital gains are determined by how long a Fund owned the investments that generated them, rather than by how long the shareholder held the shares. Distributions of a Fund’s ordinary income and short-term capital gains (i.e. gains from capital assets held for one year or less) are taxable to the shareholder as ordinary income whether received in cash or additional shares. Certain designated dividends may be eligible for the dividends-received deduction for corporate shareholders. Designated capital gain dividends (relating to gains from capital assets held by a Fund for more than one year) are taxable as long-term capital gains in the hands of the investor whether distributed in cash or additional shares. For taxable years beginning on or before December 31, 2010, distributions of investment income designated by a Fund as derived from “qualified dividend income” will be taxed in the hands of individuals at the rates applicable to long-term capital gain provided holding period and other requirements are met at both the shareholder and Fund level. Fixed income funds generally do not expect a significant portion of their distributions to be derived from qualified dividend income. Long-term capital gain rates applicable to individuals have been temporarily reduced, in general, to 15% with lower rates applying to taxpayers in the 10% and 15% rate brackets for taxable years beginning on or before December 31, 2010.
The nature of each Fund’s distributions will be affected by its investment strategies. A Fund whose investment return consists largely of interest, dividends and capital gains from short-term holdings
will distribute largely ordinary income. A Fund whose return comes largely from the sale of long-term holdings will distribute largely capital gain dividends. Distributions are taxable to a shareholder even though they are paid from income or gains earned by a Fund prior to the shareholder’s investment and thus were included in the NAV paid by the shareholder.
Each Fund intends to pay out as dividends substantially all of its net investment income (which comes from dividends and any interest it receives from its investments). Each Fund also intends to distribute substantially all of its net realized long- and short-term capital gains, if any, after giving effect to any available capital loss carryovers. For each Fund distributions, if any, are declared and paid at least annually. Distributions may be taken either in cash or in additional shares of the respective Fund at the Fund’s net asset value on the first business day after the record date for the distribution, at the option of the shareholder.
Any gain resulting from the exchange or redemption of an investor’s shares in a Fund will generally be subject to tax. A loss incurred with respect to shares of a Fund held for six months or less will be treated as a long-term capital loss to the extent of long-term capital gains dividends with respect to such shares.
A Fund’s investments in foreign securities may be subject to foreign withholding taxes. In that case, such Fund’s yield on those securities would be decreased. Shareholders of the Funds other than the Diversified International Fund and the Overseas Fund, however, generally will not be entitled to claim a credit or deduction with respect to foreign taxes. Each of the Diversified International Fund and the Overseas Fund may be able to elect to “pass through” to its shareholders foreign income taxes that it pays, in which case a shareholder must include its share of those taxes in gross income as a distribution from the Fund and the shareholder will be allowed to claim a
– 128 –
credit (or a deduction, if the shareholder itemizes deductions) for such amounts on its federal tax return subject to certain limitations. Shareholders of these funds may be entitled to claim a credit or deduction with respect to foreign taxes.
In addition, a Fund’s investments in foreign securities (including fixed income securities and derivatives) or foreign currencies may increase or accelerate the Fund’s recognition of ordinary income and may affect the timing, amount, or character of the Fund’s distributions.
Under current law, dividends (other than capital gain dividends) paid by a Fund to a person who is not a “U.S. person” within the meaning of the Code (a “foreign person”) are generally subject to withholding of U.S. federal income tax at a rate of 30% (or lower applicable treaty rate). However, effective for taxable years of a Fund beginning before January 1, 2008, a Fund is not required to withhold any amounts with respect to (i) distributions of net short-term capital gains in excess of net long-term capital losses, and (ii) distributions of U.S.-source interest income that would not be subject to U.S. federal income tax if earned directly by a foreign person, in each case to the extent that the Fund properly designates such distributions.
The discussion above is very general. Shareholders should consult their tax adviser for more information about the effect that an investment in a Fund could have on their own tax situation, including possible state, local and foreign taxes. Also, this discussion does not apply to Fund shares held through tax-exempt retirement plans.
– 129 –
Investment Performance
Similar account performance for some of the Sub-Advisers is provided solely to illustrate that Sub-Adviser’s performance in managing portfolios with investment objectives, policies and investment strategies substantially similar to the portion of the Fund managed by the Sub-Adviser. The Funds’ performance would have differed due to factors such as differences in cash flows into and out of each Fund, differences in fees and expenses, and differences in portfolio size and investments. Similar account performance is not indicative of future rates of return. Prior performance of the Sub-Advisers is no indication of future performance of any of the Funds. In addition, for all of the Sub-Advisers, as applicable, the private account portfolios are not registered with the SEC and therefore are not subject to the limitations, diversification requirements and other restrictions to which the Funds, as registered mutual funds, are subject. The performance of the private accounts may have been adversely affected if they had been registered with the SEC.
The following chart summarizes the composite performance of each Sub-Adviser’s investment results for accounts with investment objectives similar to that of the Funds. Each Sub-Adviser’s similar account performance has been adjusted to reflect the fees and expenses of each of the Funds’ share classes.
| | | | | | | | | | | | | | |
| Sub-Adviser/Fund | | Share
Class | | 1 Year Return (%) as of 12/31/06 | | | 3 Year Return (%) as of 12/31/06 | | | 5 Year Return (%) as of 12/31/06 | | | 10 Year Return (%) as of 12/31/06 | |
| | | | | |
Western Asset Management Company/ | | S | | 5.20 | % | | 4.65 | % | | 6.42 | % | | 7.14 | % |
Strategic Bond Fund | | Y | | 5.15 | % | | 4.60 | % | | 6.37 | % | | 7.09 | % |
| | L | | 5.14 | % | | 4.60 | % | | 6.37 | % | | 7.09 | % |
| | A | | -0.09 | % | | 2.67 | % | | 5.09 | % | | 6.32 | % |
| | N | | 3.59 | % | | 4.05 | % | | 5.82 | % | | 6.54 | % |
| | | | | |
ClearBridge Advisors, LLC/ | | S | | 17.54 | % | | 9.69 | % | | 5.81 | % | | 9.34 | % |
Strategic Balanced Fund | | Y | | 17.49 | % | | 9.64 | % | | 5.76 | % | | 9.29 | % |
| | L | | 17.34 | % | | 9.49 | % | | 5.61 | % | | 9.14 | % |
| | A | | 10.36 | % | | 7.11 | % | | 4.11 | % | | 8.24 | % |
| | N | | 15.79 | % | | 8.94 | % | | 5.05 | % | | 8.58 | % |
| | | | | |
Western Asset Management Company/ | | S | | 5.09 | % | | 4.57 | % | | 6.35 | % | | 7.08 | % |
Strategic Balanced Fund | | Y | | 5.04 | % | | 4.52 | % | | 6.30 | % | | 7.03 | % |
| | L | | 4.89 | % | | 4.37 | % | | 6.15 | % | | 6.88 | % |
| | A | | -1.38 | % | | 2.09 | % | | 4.54 | % | | 5.79 | % |
| | N | | 3.34 | % | | 3.82 | % | | 5.72 | % | | 6.54 | % |
| | | | | |
AllianceBernstein L.P./ | | S | | 22.00 | % | | 14.01 | % | | 11.03 | % | | N/A | |
Diversified Value Fund | | Y | | 21.90 | % | | 13.91 | % | | 10.93 | % | | N/A | |
| | L | | 21.79 | % | | 13.80 | % | | 10.81 | % | | N/A | |
| | A | | 14.51 | % | | 11.29 | % | | 9.22 | % | | N/A | |
| | N | | 20.19 | % | | 13.20 | % | | 10.21 | % | | N/A | |
| | | | | |
Wellington Management Company, LLP/ | | S | | 21.52 | % | | 13.10 | % | | 7.69 | % | | 10.35 | % |
Fundamental Value Fund | | Y | | 21.48 | % | | 13.06 | % | | 7.65 | % | | 10.31 | % |
| | L | | 21.33 | % | | 12.91 | % | | 7.50 | % | | 10.16 | % |
| | A | | 14.12 | % | | 10.46 | % | | 5.98 | % | | 9.26 | % |
| | N | | 19.78 | % | | 12.36 | % | | 6.94 | % | | 9.60 | % |
| | | | | |
Davis Selected Advisers, L.P./ | | S | | 15.19 | % | | 12.63 | % | | 9.37 | % | | 10.82 | % |
Large Cap Value Fund | | Y | | 15.10 | % | | 12.54 | % | | 9.27 | % | | 10.73 | % |
| | L | | 14.95 | % | | 12.39 | % | | 9.12 | % | | 10.58 | % |
| | A | | 8.11 | % | | 9.95 | % | | 7.59 | % | | 9.68 | % |
| | N | | 13.40 | % | | 11.84 | % | | 8.56 | % | | 10.02 | % |
– 130 –
| | | | | | | | | | |
| Sub-Adviser/Fund | | Share
Class | | 1 Year Return (%) as of 12/31/06 | | 3 Year Return (%) as of 12/31/06 | | 5 Year Return (%) as of 12/31/06 | | 10 Year Return (%) as of 12/31/06 |
| | | | | |
Victory Capital Management Inc./ | | S | | 13.93% | | 11.40% | | 7.73% | | 11.13% |
Core Opportunities Fund | | Y | | 13.88% | | 11.35% | | 7.68% | | 11.08% |
| | L | | 13.73% | | 11.20% | | 7.53% | | 10.93% |
| | A | | 6.96% | | 8.78% | | 6.01% | | 10.02% |
| | N | | 12.18% | | 10.65% | | 6.97% | | 10.37% |
| | | | | |
T. Rowe Price Associates, Inc./ | | S | | 9.74% | | 8.32% | | 4.56% | | 7.52% |
Blue Chip Growth Fund | | Y | | 9.63% | | 8.21% | | 4.45% | | 7.41% |
| | L | | 9.50% | | 8.08% | | 4.32% | | 7.28% |
| | A | | 2.97% | | 5.72% | | 2.84% | | 6.39% |
| | N | | 7.95% | | 7.53% | | 3.76% | | 6.72% |
| | | | | |
AllianceBernstein L.P./ | | S | | 0.45% | | 7.35% | | 1.19% | | 6.95% |
Large Cap Growth Fund | | Y | | 0.41% | | 7.31% | | 1.15% | | 6.91% |
| | L | | 0.24% | | 7.17% | | 1.00% | | 6.76% |
| | A | | -5.75% | | 4.82% | | -0.45% | | 5.87% |
| | N | | -1.30% | | 6.61% | | 0.43% | | 6.19% |
| | | | | |
Grantham, Mayo, Van Otterloo & Co. LLC/ | | S | | 2.05% | | 3.51% | | 1.72% | | 6.22% |
Growth Equity Fund | | Y | | 1.99% | | 3.45% | | 1.66% | | 6.16% |
| | L | | 1.84% | | 3.30% | | 1.51% | | 6.00% |
| | A | | -4.25% | | 1.04% | | 0.06% | | 5.12% |
| | N | | 0.29% | | 2.75% | | 0.95% | | 5.44% |
| | | | | |
Sands Capital Management, LLC/ | | S | | -6.05% | | 7.53% | | 4.05% | | 9.39% |
Aggressive Growth Fund | | Y | | -6.15% | | 7.43% | | 3.95% | | 9.28% |
| | L | | -6.30% | | 7.27% | | 3.80% | | 9.13% |
| | A | | -11.93% | | 4.93% | | 2.32% | | 8.23% |
| | N | | -7.85% | | 6.72% | | 3.23% | | 8.55% |
| | | | | |
Delaware Management Company/ | | S | | 2.15% | | 6.43% | | 1.10% | | N/A |
Aggressive Growth Fund | | Y | | 2.05% | | 6.33% | | 0.99% | | N/A |
| | L | | 1.90% | | 6.18% | | 0.84% | | N/A |
| | A | | -4.19% | | 3.86% | | -0.60% | | N/A |
| | N | | 0.35% | | 5.63% | | 0.28% | | N/A |
| | | | | |
Harris Associates L.P./ | | S | | 16.37% | | 9.72% | | 9.62% | | 14.73% |
Focused Value Fund | | Y | | 16.27% | | 9.62% | | 9.52% | | 14.63% |
| | L | | 16.12% | | 9.47% | | 9.36% | | 14.48% |
| | A | | 9.21% | | 7.08% | | 7.82% | | 13.55% |
| | N | | 14.56% | | 8.91% | | 8.80% | | 13.92% |
| | | | | |
Cooke & Bieler, L.P./ | | S | | 24.83% | | 13.89% | | 13.59% | | N/A |
Focused Value Fund | | Y | | 24.73% | | 13.79% | | 13.49% | | N/A |
| | L | | 24.58% | | 13.64% | | 13.34% | | N/A |
| | A | | 17.18% | | 11.17% | | 11.76% | | N/A |
| | N | | 23.02% | | 13.09% | | 12.78% | | N/A |
| | | | | |
Cooke & Bieler, L.P./ | | S | | 24.74% | | 13.81% | | 13.51% | | N/A |
Mid-Cap Value Fund | | Y | | 24.64% | | 13.71% | | 13.41% | | N/A |
| | L | | 24.49% | | 13.56% | | 13.26% | | N/A |
| | A | | 17.10% | | 11.09% | | 11.68% | | N/A |
| | N | | 22.94% | | 13.01% | | 12.70% | | N/A |
| | | | | |
SSgA Funds Management, Inc./ | | S | | 22.29% | | 17.46% | | 16.45% | | N/A |
Small Cap Value Equity Fund | | Y | | 22.24% | | 17.41% | | 16.40% | | N/A |
| | L | | 22.09% | | 17.26% | | 16.25% | | N/A |
| | A | | 14.83% | | 14.73% | | 14.63% | | N/A |
| | N | | 20.54% | | 16.71% | | 15.69% | | N/A |
– 131 –
| | | | | | | | | | | | | | |
| Sub-Adviser/Fund | | Share
Class | | 1 Year Return (%) as of 12/31/06 | | | 3 Year Return (%) as of 12/31/06 | | | 5 Year Return (%) as of 12/31/06 | | | 10 Year Return (%) as of 12/31/06 | |
| | | | | |
Clover Capital Management, Inc./ | | S | | 15.85 | % | | 12.90 | % | | 10.56 | % | | 13.38% | |
Small Company Value Fund | | Y | | 15.81 | % | | 12.86 | % | | 10.52 | % | | 13.34% | |
| | L | | 15.66 | % | | 12.71 | % | | 10.37 | % | | 13.19% | |
| | A | | 8.78 | % | | 10.27 | % | | 8.82 | % | | 12.27% | |
| | N | | 14.11 | % | | 12.16 | % | | 9.81 | % | | 12.63% | |
| | | | | |
T. Rowe Price Associates, Inc./ | | S | | 15.52 | % | | 15.74 | % | | 12.74 | % | | N/A | |
Small Company Value Fund | | Y | | 15.48 | % | | 15.70 | % | | 12.70 | % | | N/A | |
| | L | | 15.33 | % | | 15.55 | % | | 12.55 | % | | N/A | |
| | A | | 8.46 | % | | 13.05 | % | | 10.98 | % | | N/A | |
| | N | | 13.78 | % | | 15.00 | % | | 12.00 | % | | N/A | |
| | | | | |
EARNEST Partners, LLC/ | | S | | 9.56 | % | | 14.67 | % | | 16.19 | % | | 17.76 | % |
Small Company Value Fund | | Y | | 9.52 | % | | 14.63 | % | | 16.15 | % | | 17.72 | % |
| | L | | 9.37 | % | | 14.48 | % | | 16.00 | % | | 17.57 | % |
| | A | | 2.85 | % | | 11.99 | % | | 14.39 | % | | 16.62 | % |
| | N | | 7.82 | % | | 13.93 | % | | 15.44 | % | | 17.01 | % |
| | | | | |
Goldman Sachs Asset Management, L.P./ | | S | | 12.99 | % | | 11.70 | % | | 11.38 | % | | N/A | |
Small Cap Core Equity Fund | | Y | | 12.94 | % | | 11.65 | % | | 11.33 | % | | N/A | |
| | L | | 12.79 | % | | 11.50 | % | | 11.17 | % | | N/A | |
| | A | | 6.07 | % | | 9.07 | % | | 9.61 | % | | N/A | |
| | N | | 11.24 | % | | 10.95 | % | | 10.61 | % | | N/A | |
| | | | | |
Navellier & Associates, Inc./ | | S | | 5.54 | % | | 11.73 | % | | 7.59 | % | | 13.95% | |
Mid Cap Growth Equity Fund | | Y | | 5.47 | % | | 11.66 | % | | 7.52 | % | | 13.88% | |
| | L | | 5.32 | % | | 11.51 | % | | 7.36 | % | | 13.72% | |
| | A | | -0.97 | % | | 9.09 | % | | 5.85 | % | | 12.80% | |
| | N | | 3.77 | % | | 10.96 | % | | 6.81 | % | | 13.15% | |
| | | | | |
T. Rowe Price Associates, Inc./ | | S | | 6.75 | % | | 13.28 | % | | 9.62 | % | | 11.75 | % |
(Brian Berghuis’ approach) | | Y | | 6.66 | % | | 13.19 | % | | 9.53 | % | | 11.66 | % |
Mid Cap Growth Equity II Fund | | L | | 6.51 | % | | 13.04 | % | | 9.38 | % | | 11.51 | % |
| | A | | 0.15 | % | | 10.58 | % | | 7.84 | % | | 10.60 | % |
| | N | | 4.96 | % | | 12.49 | % | | 8.81 | % | | 10.95 | % |
| | | | | |
T. Rowe Price Associates, Inc./ | | S | | 9.32 | % | | 11.02 | % | | 7.50 | % | | 10.47 | % |
(Donald Peters’ approach) | | Y | | 9.23 | % | | 10.93 | % | | 7.39 | % | | 10.36 | % |
Mid Cap Growth Equity II Fund | | L | | 9.08 | % | | 10.78 | % | | 7.25 | % | | 10.22 | % |
| | A | | 2.57 | % | | 8.37 | % | | 5.73 | % | | 9.32 | % |
| | N | | 7.53 | % | | 10.23 | % | | 6.69 | % | | 9.66 | % |
| | | | | |
Waddell & Reed Investment Management Company/ | | S | | 3.36 | % | | 9.94 | % | | 7.17 | % | | 17.96 | % |
Small Cap Growth Equity Fund | | Y | | 3.22 | % | | 9.80 | % | | 7.02 | % | | 17.81 | % |
| | L | | 3.07 | % | | 9.65 | % | | 6.87 | % | | 17.66 | % |
| | A | | -3.09 | % | | 7.26 | % | | 5.36 | % | | 16.71 | % |
| | N | | 1.52 | % | | 9.10 | % | | 6.31 | % | | 17.09 | % |
| | | | | |
Wellington Management Company, LLP/ | | S | | 16.00 | % | | 12.66 | % | | 10.48 | % | | 15.03 | % |
(Kenneth Abrams’ approach) | | Y | | 15.86 | % | | 12.52 | % | | 10.33 | % | | 14.89 | % |
Small Cap Growth Equity Fund | | L | | 15.71 | % | | 12.37 | % | | 10.18 | % | | 14.74 | % |
| | A | | 8.82 | % | | 9.93 | % | | 8.63 | % | | 13.81 | % |
| | N | | 14.16 | % | | 11.82 | % | | 9.61 | % | | 14.18 | % |
| | | | | |
Wellington Management Company, LLP/ | | S | | 13.41 | % | | 14.42 | % | | 10.22 | % | | N/A | |
(Steven Angeli’s approach) | | Y | | 13.27 | % | | 14.28 | % | | 10.07 | % | | N/A | |
Small Cap Growth Equity Fund | | L | | 13.12 | % | | 14.13 | % | | 9.92 | % | | N/A | |
| | A | | 6.38 | % | | 11.66 | % | | 8.37 | % | | N/A | |
| | N | | 11.57 | % | | 13.58 | % | | 9.35 | % | | N/A | |
– 132 –
| | | | | | | | | | | | | | |
| Sub-Adviser/Fund | | Share
Class | | 1 Year Return (%) as of 12/31/06 | | | 3 Year Return (%) as of 12/31/06 | | | 5 Year Return (%) as of 12/31/06 | | | 10 Year Return (%) as of 12/31/06 | |
| | | | | |
Eagle Asset Management, Inc./ | | S | | 20.85 | % | | 13.87 | % | | 10.07 | % | | 7.93 | % |
Small Company Growth Fund | | Y | | 20.81 | % | | 13.83 | % | | 10.03 | % | | 7.89 | % |
| | L | | 20.66 | % | | 13.68 | % | | 9.87 | % | | 7.74 | % |
| | A | | 13.49 | % | | 11.21 | % | | 8.33 | % | | 6.85 | % |
| | N | | 19.11 | % | | 13.13 | % | | 9.31 | % | | 7.18 | % |
| | | | | |
Mazama Capital Management, Inc./ | | S | | 10.05 | % | | 3.96 | % | | 3.89 | % | | 10.40 | % |
Small Company Growth Fund | | Y | | 10.01 | % | | 3.92 | % | | 3.85 | % | | 10.35 | % |
| | L | | 9.86 | % | | 3.77 | % | | 3.69 | % | | 10.20 | % |
| | A | | 3.30 | % | | 1.50 | % | | 2.21 | % | | 9.29 | % |
| | N | | 8.31 | % | | 3.22 | % | | 3.11 | % | | 9.63 | % |
| | | | | |
Delaware Management Company/ | | S | | 9.68 | % | | 8.19 | % | | 7.55 | % | | N/A | |
Emerging Growth Fund | | Y | | 9.58 | % | | 8.09 | % | | 7.45 | % | | N/A | |
| | L | | 9.43 | % | | 7.94 | % | | 7.30 | % | | N/A | |
| | A | | 2.90 | % | | 5.58 | % | | 5.78 | % | | N/A | |
| | N | | 7.88 | % | | 7.39 | % | | 6.74 | % | | N/A | |
| | | | | |
Insight Capital Research & Management, Inc./ | | S | | 19.19 | % | | 14.26 | % | | 16.51 | % | | 14.84 | % |
Emerging Growth Fund | | Y | | 19.09 | % | | 14.16 | % | | 16.40 | % | | 14.74 | % |
| | L | | 18.94 | % | | 14.01 | % | | 16.24 | % | | 14.58 | % |
| | A | | 11.86 | % | | 11.53 | % | | 14.61 | % | | 13.64 | % |
| | N | | 17.39 | % | | 13.45 | % | | 15.66 | % | | 14.00 | % |
| | | | | |
AllianceBernstein L.P./ | | S | | 31.48 | % | | 26.10 | % | | 23.07 | % | | N/A | |
Diversified International Fund | | Y | | 31.38 | % | | 26.00 | % | | 22.97 | % | | N/A | |
| | L | | 31.30 | % | | 25.92 | % | | 22.89 | % | | N/A | |
| | A | | 23.52 | % | | 23.21 | % | | 21.20 | % | | N/A | |
| | N | | 29.75 | % | | 25.37 | % | | 22.34 | % | | N/A | |
| | | | | |
Harris Associates L.P./ | | S | | 30.33 | % | | 20.51 | % | | 17.22 | % | | 12.39 | % |
Overseas Fund | | Y | | 30.28 | % | | 20.46 | % | | 17.17 | % | | 12.33 | % |
| | L | | 30.21 | % | | 20.37 | % | | 17.05 | % | | 12.20 | % |
| | A | | 22.49 | % | | 17.78 | % | | 15.42 | % | | 11.29 | % |
| | N | | 28.66 | % | | 19.82 | % | | 16.50 | % | | 11.64 | % |
| | | | | |
Massachusetts Financial Services Company/ | | S | | 27.87 | % | | 19.55 | % | | 15.92 | % | | 10.37% | |
Overseas Fund | | Y | | 27.82 | % | | 19.50 | % | | 15.87 | % | | 10.32% | |
| | L | | 27.75 | % | | 19.44 | % | | 15.82 | % | | 10.26% | |
| | A | | 20.17 | % | | 16.86 | % | | 14.20 | % | | 9.36% | |
| | N | | 26.20 | % | | 18.89 | % | | 15.26 | % | | 9.71% | |
– 133 –
Financial Highlights
The financial highlights tables are intended to help you understand the Funds’ financial performance for the past 5 years (or shorter periods for newer Funds). Certain information reflects financial results for a single Fund share. The total returns in the tables represent the rate that an investor would have earned on an investment in the Fund (assuming reinvestment of all dividends and distributions). This information has been audited by Deloitte & Touche LLP, whose report, along with the Funds’ financial statements, is included in the Funds’ Annual Report, which is available on request.
MASSMUTUAL SELECT STRATEGIC BOND FUND
| | | | | | | | | | | | |
| | | Class A | |
| | | Year ended
12/31/06 | | | Year ended
12/31/05 | | | Period ended
12/31/04+ | |
Net asset value, beginning of year | | $ | 9.97 | | | $ | 10.00 | | | $ | 10.00 | |
| | | | | | | | | | | | |
Income (loss) from investment operations: | | | | | | | | | | | | |
Net investment income (loss) | | | 0.43 | *** | | | 0.33 | *** | | | - | |
Net realized and unrealized gain (loss) on investments | | | (0.03 | ) | | | (0.19 | ) | | | - | |
| | | | | | | | | | | | |
Total income from investment operations | | | 0.40 | | | | 0.14 | | | | - | |
| | | | | | | | | | | | |
Less distributions to shareholders: | | | | | | | | | | | | |
From net investment income | | | (0.38 | ) | | | (0.17 | ) | | | - | |
| | | | | | | | | | | | |
Net asset value, end of year | | $ | 9.99 | | | $ | 9.97 | | | $ | 10.00 | |
| | | | | | | | | | | | |
Total Return(a) | | | 3.99% | (b) | | | 1.37% | (b) | | | 0.00% | ‡ |
Ratios / Supplemental Data: | | | | | | | | | | | | |
Net assets, end of year (000’s) | | $ | 39,420 | | | $ | 20,689 | | | $ | 101 | |
Ratio of expenses to average daily net assets: | | | | | | | | | | | | |
Before expense waiver | | | 1.11% | | | | 1.21% | | | | - | ‡ |
After expense waiver | | | 0.96% | # | | | 1.00% | # | | | N/A | ‡ |
Net investment income (loss) to average daily net assets | | | 4.28% | | | | 3.25% | | | | 0.00% | ‡ |
Portfolio turnover rate | | | 162% | | | | 566% | | | | N/A | |
| |
| | | Class L | |
| | | Year ended
12/31/06 | | | Year ended
12/31/05 | | | Period ended
12/31/04+ | |
Net asset value, beginning of year | | $ | 9.98 | | | $ | 10.00 | | | $ | 10.00 | |
| | | | | | | | | | | | |
Income (loss) from investment operations: | | | | | | | | | | | | |
Net investment income (loss) | | | 0.46 | *** | | | 0.39 | *** | | | - | |
Net realized and unrealized gain (loss) on investments | | | (0.03 | ) | | | (0.23 | ) | | | - | |
| | | | | | | | | | | | |
Total income from investment operations | | | 0.43 | | | | 0.16 | | | | - | |
| | | | | | | | | | | | |
Less distributions to shareholders: | | | | | | | | | | | | |
From net investment income | | | (0.40 | ) | | | (0.18 | ) | | | - | |
| | | | | | | | | | | | |
Net asset value, end of year | | $ | 10.01 | | | $ | 9.98 | | | $ | 10.00 | |
| | | | | | | | | | | | |
Total Return(a) | | | 4.31% | | | | 1.57% | | | | 0.00% | ‡ |
Ratios / Supplemental Data: | | | | | | | | | | | | |
Net assets, end of year (000’s) | | $ | 17,942 | | | $ | 3,933 | | | $ | 101 | |
Ratio of expenses to average daily net assets: | | | | | | | | | | | | |
Before expense waiver | | | 0.86% | | | | 0.96% | | | | - | ‡ |
After expense waiver | | | 0.71% | # | | | 0.75% | # | | | N/A | ‡ |
Net investment income (loss) to average daily net assets | | | 4.53% | | | | 3.82% | | | | 0.00% | ‡ |
Portfolio turnover rate | | | 162% | | | | 566% | | | | N/A | |
| *** | Per share amount calculated on the average shares method. |
| # | Computed after giving effect to an agreement by MassMutual to waive certain fees and expenses of the Fund. |
| (a) | Employee retirement benefit plans that invest plan assets in the Separate Investment Accounts (SIAs) may be subject to certain charges as set forth in their respective Plan Documents. Total return figures would be lower for the period presented if they reflected these charges. |
| (b) | Total Return excludes a front-end sales charge and would be lower for the period presented if it reflected these charges. |
| + | The Fund commenced operations on December 31, 2004. |
| ‡ | Amounts are de minimus due to the short period of operations. |
– 134 –
MASSMUTUAL SELECT STRATEGIC BOND FUND
| | | | | | | | | | | | |
| | | Class Y | |
| | | Year ended
12/31/06 | | | Year ended
12/31/05 | | | Period ended
12/31/04+ | |
Net asset value, beginning of year | | $ | 9.98 | | | $ | 10.00 | | | $ | 10.00 | |
| | | | | | | | | | | | |
Income (loss) from investment operations: | | | | | | | | | | | | |
Net investment income (loss) | | | 0.46 | *** | | | 0.37 | *** | | | - | |
Net realized and unrealized gain (loss) on investments | | | (0.03 | ) | | | (0.21 | ) | | | - | |
| | | | | | | | | | | | |
Total income from investment operations | | | 0.43 | | | | 0.16 | | | | - | |
| | | | | | | | | | | | |
Less distributions to shareholders: | | | | | | | | | | | | |
From net investment income | | | (0.39 | ) | | | (0.18 | ) | | | - | |
| | | | | | | | | | | | |
Net asset value, end of year | | $ | 10.02 | | | $ | 9.98 | | | $ | 10.00 | |
| | | | | | | | | | | | |
Total Return(a) | | | 4.38% | | | | 1.57% | | | | 0.00% | ‡ |
Ratios / Supplemental Data: | | | | | | | | | | | | |
Net assets, end of year (000’s) | | $ | 109,603 | | | $ | 59,396 | | | $ | 101 | |
Ratio of expenses to average daily net assets: | | | | | | | | | | | | |
Before expense waiver | | | 0.70% | | | | 0.81% | | | | - | ‡ |
After expense waiver | | | N/A | | | | 0.75% | # | | | N/A | ‡ |
Net investment income (loss) to average daily net assets | | | 4.53% | | | | 3.64% | | | | 0.00% | ‡ |
Portfolio turnover rate | | | 162% | | | | 566% | | | | N/A | |
| |
| | | Class S | |
| | | Year ended
12/31/06 | | | Year ended
12/31/05 | | | Period ended
12/31/04+ | |
Net asset value, beginning of year | | $ | 9.99 | | | $ | 10.00 | | | $ | 10.00 | |
| | | | | | | | | | | | |
Income (loss) from investment operations: | | | | | | | | | | | | |
Net investment income (loss) | | | 0.46 | *** | | | 0.33 | *** | | | - | |
Net realized and unrealized gain (loss) on investments | | | (0.03 | ) | | | (0.16 | ) | | | - | |
| | | | | | | | | | | | |
Total income from investment operations | | | 0.43 | | | | 0.17 | | | | - | |
| | | | | | | | | | | | |
Less distributions to shareholders: | | | | | | | | | | | | |
From net investment income | | | (0.40 | ) | | | (0.18 | ) | | | - | |
| | | | | | | | | | | | |
Net asset value, end of year | | $ | 10.02 | | | $ | 9.99 | | | $ | 10.00 | |
| | | | | | | | | | | | |
Total Return(a) | | | 4.31% | | | | 1.65% | | | | 0.00% | ‡ |
Ratios / Supplemental Data: | | | | | | | | | | | | |
Net assets, end of year (000’s) | | $ | 71,375 | | | $ | 62,533 | | | $ | 49,596 | |
Ratio of expenses to average daily net assets: | | | | | | | | | | | | |
Before expense waiver | | | 0.65% | | | | 0.76% | | | | - | ‡ |
After expense waiver | | | N/A | | | | 0.70% | # | | | N/A | ‡ |
Net investment income (loss) to average daily net assets | | | 4.56% | | | | 3.23% | | | | 0.00% | ‡ |
Portfolio turnover rate | | | 162% | | | | 566% | | | | N/A | |
| *** | Per share amount calculated on the average shares method. |
| # | Computed after giving effect to an agreement by MassMutual to waive certain fees and expenses of the Fund. |
| (a) | Employee retirement benefit plans that invest plan assets in the Separate Investment Accounts (SIAs) may be subject to certain charges as set forth in their respective Plan Documents. Total return figures would be lower for the period presented if they reflected these charges. |
| + | The Fund commenced operations on December 31, 2004. |
| ‡ | Amounts are de minimus due to the short period of operations. |
– 135 –
MASSMUTUAL SELECT STRATEGIC BOND FUND
| | | | | | | | | | | | |
| | | Class N | |
| | | Year ended
12/31/06 | | | Year ended
12/31/05 | | | Period ended
12/31/04+ | |
Net asset value, beginning of year | | $ | 9.96 | | | $ | 10.00 | | | $ | 10.00 | |
| | | | | | | | | | | | |
Income (loss) from investment operations: | | | | | | | | | | | | |
Net investment income (loss) | | | 0.40 | *** | | | 0.28 | *** | | | - | |
Net realized and unrealized gain (loss) on investments | | | (0.03 | ) | | | (0.18 | ) | | | - | |
| | | | | | | | | | | | |
Total income from investment operations | | | 0.37 | | | | 0.10 | | | | - | |
| | | | | | | | | | | | |
Less distributions to shareholders: | | | | | | | | | | | | |
From net investment income | | | (0.37 | ) | | | (0.14 | ) | | | - | |
| | | | | | | | | | | | |
Net asset value, end of year | | $ | 9.96 | | | $ | 9.96 | | | $ | 10.00 | |
| | | | | | | | | | | | |
Total Return(a) | | | 3.73% | (b) | | | 0.99% | (b) | | | 0.00% | ‡ |
Ratios / Supplemental Data: | | | | | | | | | | | | |
Net assets, end of year (000’s) | | $ | 2,040 | | | $ | 208 | | | $ | 101 | |
Ratio of expenses to average daily net assets: | | | | | | | | | | | | |
Before expense waiver | | | 1.41% | | | | 1.51% | | | | - | ‡ |
After expense waiver | | | 1.26% | # | | | 1.30% | # | | | N/A | ‡ |
Net investment income (loss) to average daily net assets | | | 3.99% | | | | 2.78% | | | | 0.00% | ‡ |
Portfolio turnover rate | | | 162% | | | | 566% | | | | N/A | |
| *** | Per share amount calculated on the average shares method. |
| # | Computed after giving effect to an agreement by MassMutual to waive certain fees and expenses of the Fund. |
| (a) | Employee retirement benefit plans that invest plan assets in the Separate Investment Accounts (SIAs) may be subject to certain charges as set forth in their respective Plan Documents. Total return figures would be lower for the period presented if they reflected these charges. |
| (b) | Total Return excludes a contingent deferred sales charge and would be lower for the period presented if it reflected these charges. |
| + | The Fund commenced operations on December 31, 2004. |
| ‡ | Amounts are de minimus due to the short period of operations. |
– 136 –
MASSMUTUAL SELECT STRATEGIC BALANCED FUND
| | | | | | | | | | | | | | | | |
| | | Class A | |
| | | Year ended
12/31/06 | | | Year ended
12/31/05† | | | Year ended
12/31/04 | | | Period ended
12/31/03+ | |
Net asset value, beginning of year | | $ | 10.56 | | | $ | 10.45 | | | $ | 10.00 | | | $ | 10.00 | |
| | | | | | | | | | | | | | | | |
Income (loss) from investment operations: | | | | | | | | | | | | | | | | |
Net investment income (loss) | | | 0.24 | *** | | | 0.15 | *** | | | 0.11 | *** | | | - | |
Net realized and unrealized gain (loss) on investments | | | 0.97 | | | | 0.20 | | | | 0.42 | | | | - | |
| | | | | | | | | | | | | | | | |
Total income from investment operations | | | 1.21 | | | | 0.35 | | | | 0.53 | | | | - | |
| | | | | | | | | | | | | | | | |
Less distributions to shareholders: | | | | | | | | | | | | | | | | |
From net investment income | | | (0.24 | ) | | | (0.18 | ) | | | (0.08 | ) | | | - | |
From net realized gains | | | (0.11 | ) | | | (0.06 | ) | | | - | | | | - | |
| | | | | | | | | | | | | | | | |
Total distributions | | | (0.35 | ) | | | (0.24 | ) | | | (0.08 | ) | | | - | |
| | | | | | | | | | | | | | | | |
Net asset value, end of year | | $ | 11.42 | | | $ | 10.56 | | | $ | 10.45 | | | $ | 10.00 | |
| | | | | | | | | | | | | | | | |
Total Return(a) | | | 11.54% | (b) | | | 3.33% | (b) | | | 5.34% | (b) | | | - | ‡ |
Ratios / Supplemental Data: | | | | | | | | | | | | | | | | |
Net assets, end of year (000’s) | | $ | 32,130 | | | $ | 26,267 | | | $ | 32,987 | | | $ | 1 | |
Ratio of expenses to average daily net assets: | | | | | | | | | | | | | | | | |
Before expense waiver | | | 1.23% | | | | 1.23% | | | | 1.24% | | | | - | ‡ |
After expense waiver | | | 1.21% | # | | | 1.21% | # | | | 1.21% | (c)# | | | - | ‡ |
Net investment income (loss) to average daily net assets | | | 2.16% | | | | 1.40% | | | | 1.10% | | | | - | ‡ |
Portfolio turnover rate | | | 85% | | | | 211% | | | | 129% | | | | N/A | |
| | | Class L | |
| | | Year ended
12/31/06 | | | Year ended
12/31/05† | | | Year ended
12/31/04 | | | Period ended
12/31/03+ | |
Net asset value, beginning of year | | $ | 10.58 | | | $ | 10.48 | | | $ | 10.00 | | | $ | 10.00 | |
| | | | | | | | | | | | | | | | |
Income (loss) from investment operations: | | | | | | | | | | | | | | | | |
Net investment income (loss) | | | 0.26 | *** | | | 0.18 | *** | | | 0.13 | *** | | | - | |
Net realized and unrealized gain (loss) on investments | | | 0.98 | | | | 0.20 | | | | 0.43 | | | | - | |
| | | | | | | | | | | | | | | | |
Total income from investment operations | | | 1.24 | | | | 0.38 | | | | 0.56 | | | | - | |
| | | | | | | | | | | | | | | | |
Less distributions to shareholders: | | | | | | | | | | | | | | | | |
From net investment income | | | (0.26 | ) | | | (0.22 | ) | | | (0.08 | ) | | | - | |
From net realized gains | | | (0.11 | ) | | | (0.06 | ) | | | - | | | | - | |
| | | | | | | | | | | | | | | | |
Total distributions | | | (0.37 | ) | | | (0.28 | ) | | | (0.08 | ) | | | - | |
| | | | | | | | | | | | | | | | |
Net asset value, end of year | | $ | 11.45 | | | $ | 10.58 | | | $ | 10.48 | | | $ | 10.00 | |
| | | | | | | | | | | | | | | | |
Total Return(a) | | | 11.73% | | | | 3.63% | | | | 5.62% | | | | - | ‡ |
Ratios / Supplemental Data: | | | | | | | | | | | | | | | | |
Net assets, end of year (000’s) | | $ | 94,872 | | | $ | 101,151 | | | $ | 104,995 | | | $ | 1 | |
Ratio of expenses to average daily net assets: | | | | | | | | | | | | | | | | |
Before expense waiver | | | 0.98% | | | | 0.98% | | | | 0.98% | | | | - | ‡ |
After expense waiver | | | 0.96% | # | | | 0.96% | # | | | 0.96% | (c)# | | | - | ‡ |
Net investment income (loss) to average daily net assets | | | 2.39% | | | | 1.68% | | | | 1.28% | | | | - | ‡ |
Portfolio turnover rate | | | 85% | | | | 211% | | | | 129% | | | | N/A | |
| *** | Per share amount calculated on the average shares method. |
| † | Effective January 1, 2005, brokerage commissions are included with realized gain or loss on investment transactions. Prior to January 1, 2005, these amounts were presented as a reduction of expenses. Prior year amounts have not been restated to reflect this change due to immateriality. (See Note 3) |
| + | The Fund commenced operations on December 31, 2003. |
| ‡ | Amounts are de minimis due to the short period of operations. |
| # | Computed after giving effect to an agreement by MassMutual to waive certain fees and expenses of the Fund. |
| (a) | Employee retirement benefit plans that invest plan assets in the Separate Investment Accounts (SIAs) may be subject to certain charges as set forth in their respective Plan Documents. Total return figures would be lower for the periods presented if they reflected these charges. |
| (b) | Total Return excludes a front-end sales charge and would be lower for the years presented if it reflected these charges. |
| (c) | The Fund has entered into an agreement with certain brokers to rebate a portion of brokerage commissions. The rebated commissions are used to reduce operating expenses of the Fund. |
– 137 –
MASSMUTUAL SELECT STRATEGIC BALANCED FUND
| | | | | | | | | | | | | | | | |
| | | Class Y | |
| | | Year ended
12/31/06 | | | Year ended
12/31/05† | | | Year ended
12/31/04 | | | Period ended
12/31/03+ | |
Net asset value, beginning of year | | $ | 10.58 | | | $ | 10.48 | | | $ | 10.00 | | | $ | 10.00 | |
| | | | | | | | | | | | | | | | |
Income (loss) from investment operations: | | | | | | | | | | | | | | | | |
Net investment income (loss) | | | 0.28 | *** | | | 0.19 | *** | | | 0.14 | *** | | | - | |
Net realized and unrealized gain (loss) on investments | | | 0.98 | | | | 0.20 | | | | 0.43 | | | | - | |
| | | | | | | | | | | | | | | | |
Total income from investment operations | | | 1.26 | | | | 0.39 | | | | 0.57 | | | | - | |
| | | | | | | | | | | | | | | | |
Less distributions to shareholders: | | | | | | | | | | | | | | | | |
From net investment income | | | (0.28 | ) | | | (0.23 | ) | | | (0.09 | ) | | | - | |
From net realized gains | | | (0.11 | ) | | | (0.06 | ) | | | - | | | | - | |
| | | | | | | | | | | | | | | | |
Total distributions | | | (0.39 | ) | | | (0.29 | ) | | | (0.09 | ) | | | - | |
| | | | | | | | | | | | | | | | |
Net asset value, end of year | | $ | 11.45 | | | $ | 10.58 | | | $ | 10.48 | | | $ | 10.00 | |
| | | | | | | | | | | | | | | | |
Total Return(a) | | | 11.90% | | | | 3.76% | | | | 5.74% | | | | - | ‡ |
Ratios / Supplemental Data: | | | | | | | | | | | | | | | | |
Net assets, end of year (000’s) | | $ | 95,028 | | | $ | 78,145 | | | $ | 99,246 | | | $ | 1 | |
Ratio of expenses to average daily net assets: | | | | | | | | | | | | | | | | |
Before expense waiver | | | 0.83% | | | | 0.83% | | | | 0.83% | | | | - | ‡ |
After expense waiver | | | 0.81% | # | | | 0.81% | # | | | 0.81% | (b)# | | | - | ‡ |
Net investment income (loss) to average daily net assets | | | 2.54% | | | | 1.82% | | | | 1.41% | | | | - | ‡ |
Portfolio turnover rate | | | 85% | | | | 211% | | | | 129% | | | | N/A | |
| | | Class S | |
| | | Year ended
12/31/06 | | | Year ended
12/31/05† | | | Year ended
12/31/04 | | | Period ended
12/31/03+ | |
Net asset value, beginning of year | | $ | 10.58 | | | $ | 10.49 | | | $ | 10.00 | | | $ | 10.00 | |
| | | | | | | | | | | | | | | | |
Income (loss) from investment operations: | | | | | | | | | | | | | | | | |
Net investment income (loss) | | | 0.29 | *** | | | 0.20 | *** | | | 0.12 | *** | | | - | |
Net realized and unrealized gain (loss) on investments | | | 0.98 | | | | 0.19 | | | | 0.47 | | | | - | |
| | | | | | | | | | | | | | | | |
Total income from investment operations | | | 1.27 | | | | 0.39 | | | | 0.59 | | | | - | |
| | | | | | | | | | | | | | | | |
Less distributions to shareholders: | | | | | | | | | | | | | | | | |
From net investment income | | | (0.29 | ) | | | (0.24 | ) | | | (0.10 | ) | | | - | |
From net realized gains | | | (0.11 | ) | | | (0.06 | ) | | | - | | | | - | |
| | | | | | | | | | | | | | | | |
Total distributions | | | (0.40 | ) | | | (0.30 | ) | | | (0.10 | ) | | | - | |
| | | | | | | | | | | | | | | | |
Net asset value, end of year | | $ | 11.45 | | | $ | 10.58 | | | $ | 10.49 | | | $ | 10.00 | |
| | | | | | | | | | | | | | | | |
Total Return(a) | | | 11.97% | | | | 3.85% | | | | 5.76% | | | | - | ‡ |
Ratios / Supplemental Data: | | | | | | | | | | | | | | | | |
Net assets, end of year (000’s) | | $ | 23,044 | | | $ | 15,026 | | | $ | 13,159 | | | $ | 10,001 | |
Ratio of expenses to average daily net assets: | | | | | | | | | | | | | | | | |
Before expense waiver | | | 0.78% | | | | 0.78% | | | | 0.84% | | | | - | ‡ |
After expense waiver | | | 0.76% | # | | | 0.76% | # | | | 0.76% | (b)# | | | - | ‡ |
Net investment income (loss) to average daily net assets | | | 2.60% | | | | 1.90% | | | | 1.18% | | | | - | ‡ |
Portfolio turnover rate | | | 85% | | | | 211% | | | | 129% | | | | N/A | |
| *** | Per share amount calculated on the average share method. |
| † | Effective January 1, 2005, brokerage commissions are included with realized gain or loss on investment transactions. Prior to January 1, 2005, these amounts were presented as a reduction of expenses. Prior year amounts have not been restated to reflect this change due to immateriality. (See Note 3) |
| + | The Fund commenced operations on December 31, 2003. |
| ‡ | Amounts are de minimis due to the short period of operations. |
| # | Computed after giving effect to an agreement by MassMutual to waive certain fees and expenses of the Fund. |
| (a) | Employee retirement benefit plans that invest plan assets in the Separate Investment Accounts (SIAs) may be subject to certain charges as set forth in their respective Plan Documents. Total return figures would be lower for the periods presented if they reflected these charges. |
| (b) | The Fund has entered into an agreement with certain brokers to rebate a portion of brokerage commissions. The rebated commissions are used to reduce operating expenses of the Fund. |
– 138 –
MASSMUTUAL SELECT STRATEGIC BALANCED FUND
| | | | | | | | | | | | | | | | |
| | | Class N | |
| | | Year ended
12/31/06 | | | Year ended
12/31/05† | | | Year ended
12/31/04 | | | Period ended
12/31/03+ | |
Net asset value, beginning of year | | $ | 10.56 | | | $ | 10.46 | | | $ | 10.00 | | | $ | 10.00 | |
| | | | | | | | | | | | | | | | |
Income (loss) from investment operations: | | | | | | | | | | | | | | | | |
Net investment income (loss) | | | 0.20 | *** | | | 0.12 | *** | | | 0.08 | *** | | | - | |
Net realized and unrealized gain (loss) on investments | | | 0.97 | | | | 0.21 | | | | 0.42 | | | | - | |
| | | | | | | | | | | | | | | | |
Total income from investment operations | | | 1.17 | | | | 0.33 | | | | 0.50 | | | | - | |
| | | | | | | | | | | | | | | | |
Less distributions to shareholders: | | | | | | | | | | | | | | | | |
From net investment income | | | (0.21 | ) | | | (0.17 | ) | | | (0.04 | ) | | | - | |
From net realized gains | | | (0.11 | ) | | | (0.06 | ) | | | - | | | | - | |
| | | | | | | | | | | | | | | | |
Total distributions | | | (0.32 | ) | | | (0.23 | ) | | | (0.04 | ) | | | - | |
| | | | | | | | | | | | | | | | |
Net asset value, end of year | | $ | 11.41 | | | $ | 10.56 | | | $ | 10.46 | | | $ | 10.00 | |
| | | | | | | | | | | | | | | | |
Total Return(a) | | | 11.21% | (b) | | | 3.02% | (b) | | | 5.02% | (b) | | | - | ‡ |
Ratios / Supplemental Data: | | | | | | | | | | | | | | | | |
Net assets, end of year (000’s) | | $ | 572 | | | $ | 419 | | | $ | 422 | | | $ | 1 | |
Ratio of expenses to average daily net assets: | | | | | | | | | | | | | | | | |
Before expense waiver | | | 1.53% | | | | 1.53% | | | | 1.55% | | | | - | ‡ |
After expense waiver | | | 1.51% | # | | | 1.51% | # | | | 1.51% | (c)# | | | - | ‡ |
Net investment income (loss) to average daily net assets | | | 1.83% | | | | 1.13% | | | | 0.78% | | | | - | ‡ |
Portfolio turnover rate | | | 85% | | | | 211% | | | | 129% | | | | N/A | |
| *** | Per share amount calculated on the average share method. |
| † | Effective January 1, 2005, brokerage commissions are included with realized gain or loss on investment transactions. Prior to January 1, 2005, these amounts were presented as a reduction of expenses. Prior year amounts have not been restated to reflect this change due to immateriality. (See Note 3) |
| + | The Fund commenced operations on December 31, 2003. |
| ‡ | Amounts are de minimis due to the short period of operations. |
| # | Computed after giving effect to an agreement by MassMutual to waive certain fees and expenses of the Fund. |
| (a) | Employee retirement benefit plans that invest plan assets in the Separate Investment Accounts (SIAs) may be subject to certain charges as set forth in their respective Plan Documents. Total return figures would be lower for the periods presented if they reflected these charges. |
| (b) | Total Return excludes a contingent deferred sales charge and would be lower for the period presented if it reflected these charges. |
| (c) | The Fund has entered into an agreement with certain brokers to rebate a portion of brokerage commissions. The rebated commissions are used to reduce operating expenses of the Fund. |
– 139 –
MASSMUTUAL SELECT DIVERSIFIED VALUE FUND
| | | | | | | | | | | | |
| | | Class A | |
| | | Year ended
12/31/06 | | | Year ended
12/31/05 | | | Period ended
12/31/04† | |
Net asset value, beginning of year | | $ | 11.26 | | | $ | 10.93 | | | $ | 10.00 | |
| | | | | | | | | | | | |
Income (loss) from investment operations: | | | | | | | | | | | | |
Net investment income (loss) | | | 0.20 | *** | | | 0.14 | *** | | | 0.04 | *** |
Net realized and unrealized gain (loss) on investments | | | 2.20 | | | | 0.54 | | | | 0.94 | |
| | | | | | | | | | | | |
Total income from investment operations | | | 2.40 | | | | 0.68 | | | | 0.98 | |
| | | | | | | | | | | | |
Less distributions to shareholders: | | | | | | | | | | | | |
From net investment income | | | (0.17 | ) | | | (0.12 | ) | | | (0.04 | ) |
From net realized gains | | | (0.41 | ) | | | (0.23 | ) | | | (0.01 | ) |
| | | | | | | | | | | | |
Total distributions | | | (0.58 | ) | | | (0.35 | ) | | | (0.05 | ) |
| | | | | | | | | | | | |
Net asset value, end of year | | $ | 13.08 | | | $ | 11.26 | | | $ | 10.93 | |
| | | | | | | | | | | | |
Total Return(a) | | | 21.41% | (b) | | | 6.23% | (b) | | | 9.83% | **(b) |
Ratios / Supplemental Data: | | | | | | | | | | | | |
Net assets, end of year (000’s) | | $ | 82,361 | | | $ | 29,953 | | | $ | 4,998 | |
Ratio of expenses to average daily net assets: | | | | | | | | | | | | |
Before expense waiver | | | 1.08% | | | | 1.09% | | | | 1.15% | * |
After expense waiver | | | N/A | | | | N/A | | | | 1.09% | *# |
Net investment income (loss) to average daily net assets | | | 1.58% | | | | 1.27% | | | | 1.99% | * |
Portfolio turnover rate | | | 15% | | | | 16% | | | | 5% | ** |
| |
| | | Class L | |
| | | Year ended
12/31/06 | | | Year ended
12/31/05 | | | Period ended
12/31/04† | |
Net asset value, beginning of year | | $ | 11.28 | | | $ | 10.93 | | | $ | 10.00 | |
| | | | | | | | | | | | |
Income (loss) from investment operations: | | | | | | | | | | | | |
Net investment income (loss) | | | 0.23 | *** | | | 0.17 | *** | | | 0.05 | *** |
Net realized and unrealized gain (loss) on investments | | | 2.22 | | | | 0.54 | | | | 0.94 | |
| | | | | | | | | | | | |
Total income from investment operations | | | 2.45 | | | | 0.71 | | | | 0.99 | |
| | | | | | | | | | | | |
Less distributions to shareholders: | | | | | | | | | | | | |
From net investment income | | | (0.19 | ) | | | (0.13 | ) | | | (0.05 | ) |
From net realized gains | | | (0.41 | ) | | | (0.23 | ) | | | (0.01 | ) |
| | | | | | | | | | | | |
Total distributions | | | (0.60 | ) | | | (0.36 | ) | | | (0.06 | ) |
| | | | | | | | | | | | |
Net asset value, end of year | | $ | 13.13 | | | $ | 11.28 | | | $ | 10.93 | |
| | | | | | | | | | | | |
Total Return(a) | | | 21.82% | | | | 6.42% | | | | 9.99% | ** |
Ratios / Supplemental Data: | | | | | | | | | | | | |
Net assets, end of year (000’s) | | $ | 57,853 | | | $ | 29,455 | | | $ | 20,480 | |
Ratio of expenses to average daily net assets: | | | | | | | | | | | | |
Before expense waiver | | | 0.79% | | | | 0.80% | | | | 0.86% | * |
After expense waiver | | | N/A | | | | N/A | | | | 0.80% | *# |
Net investment income (loss) to average daily net assets | | | 1.84% | | | | 1.55% | | | | 2.28% | * |
Portfolio turnover rate | | | 15% | | | | 16% | | | | 5% | ** |
| ** | Percentages represent results for the period and are not annualized. |
| *** | Per share amount calculated on the average share method. |
| † | For the period October 15, 2004 (commencement of operations) through December 31, 2004. |
| # | Computed after giving effect to an agreement by MassMutual to waive certain fees and expense of the Fund. |
| (a) | Employee retirement benefit plans that invest plan assets in the Separate Investment Accounts (SIAs) may be subject to certain charges as set forth in their respective Plan Documents. Total return figures would be lower for the period presented if they reflected these charges. |
| (b) | Total return excludes a front end sales charge and would be lower for the period presented if they reflected these charges. |
– 140 –
MASSMUTUAL SELECT DIVERSIFIED VALUE FUND
| | | | | | | | | | | | |
| | | Class Y | |
| | | Year ended
12/31/06 | | | Year ended
12/31/05 | | | Period ended
12/31/04† | |
Net asset value, beginning of year | | $ | 11.27 | | | $ | 10.93 | | | $ | 10.00 | |
| | | | | | | | | | | | |
Income (loss) from investment operations: | | | | | | | | | | | | |
Net investment income (loss) | | | 0.24 | *** | | | 0.19 | *** | | | 0.05 | *** |
Net realized and unrealized gain (loss) on investments | | | 2.22 | | | | 0.53 | | | | 0.94 | |
| | | | | | | | | | | | |
Total income from investment operations | | | 2.46 | | | | 0.72 | | | | 0.99 | |
| | | | | | | | | | | | |
Less distributions to shareholders: | | | | | | | | | | | | |
From net investment income | | | (0.20 | ) | | | (0.15 | ) | | | (0.05 | ) |
From net realized gains | | | (0.41 | ) | | | (0.23 | ) | | | (0.01 | ) |
| | | | | | | | | | | | |
Total distributions | | | (0.61 | ) | | | (0.38 | ) | | | (0.06 | ) |
| | | | | | | | | | | | |
Net asset value, end of year | | $ | 13.12 | | | $ | 11.27 | | | $ | 10.93 | |
| | | | | | | | | | | | |
Total Return(a) | | | 21.92% | | | | 6.61% | | | | 9.91% | ** |
Ratios / Supplemental Data: | | | | | | | | | | | | |
Net assets, end of year (000’s) | | $ | 142,836 | | | $ | 56,761 | | | $ | 1,273 | |
Ratio of expenses to average daily net assets: | | | | | | | | | | | | |
Before expense waiver | | | 0.68% | | | | 0.69% | | | | 0.75% | * |
After expense waiver | | | N/A | | | | N/A | | | | 0.69% | *# |
Net investment income (loss) to average daily net assets | | | 1.95% | | | | 1.70% | | | | 2.39% | * |
Portfolio turnover rate | | | 15% | | | | 16% | | | | 5% | ** |
| | | Class S | |
| | | Year ended
12/31/06 | | | Year ended
12/31/05 | | | Period ended
12/31/04† | |
Net asset value, beginning of year | | $ | 11.28 | | | $ | 10.94 | | | $ | 10.00 | |
| | | | | | | | | | | | |
Income (loss) from investment operations: | | | | | | | | | | | | |
Net investment income (loss) | | | 0.25 | *** | | | 0.19 | *** | | | 0.06 | *** |
Net realized and unrealized gain (loss) on investments | | | 2.23 | | | | 0.53 | | | | 0.94 | |
| | | | | | | | | | | | |
Total income from investment operations | | | 2.48 | | | | 0.72 | | | | 1.00 | |
| | | | | | | | | | | | |
Less distributions to shareholders: | | | | | | | | | | | | |
From net investment income | | | (0.21 | ) | | | (0.15 | ) | | | (0.05 | ) |
From net realized gains | | | (0.41 | ) | | | (0.23 | ) | | | (0.01 | ) |
| | | | | | | | | | | | |
Total distributions | | | (0.62 | ) | | | (0.38 | ) | | | (0.06 | ) |
| | | | | | | | | | | | |
Net asset value, end of year | | $ | 13.14 | | | $ | 11.28 | | | $ | 10.94 | |
| | | | | | | | | | | | |
Total Return(a) | | | 22.08% | | | | 6.59% | | | | 10.03% | ** |
Ratios / Supplemental Data: | | | | | | | | | | | | |
Net assets, end of year (000’s) | | $ | 246,598 | | | $ | 186,641 | | | $ | 173,341 | |
Ratio of expenses to average daily net assets: | | | | | | | | | | | | |
Before expense waiver | | | 0.58% | | | | 0.59% | | | | 0.65% | * |
After expense waiver | | | N/A | | | | N/A | | | | 0.59% | *# |
Net investment income (loss) to average daily net assets | | | 2.02% | | | | 1.75% | | | | 2.49% | * |
Portfolio turnover rate | | | 15% | | | | 16% | | | | 5% | ** |
| ** | Percentages represent results for the period and are not annualized. |
| *** | Per share amount calculated on the average share method. |
| † | For the period October 15, 2004 (commencement of operations) through December 31, 2004. |
| # | Computed after giving effect to an agreement by MassMutual to waive certain fees and expense of the Fund. |
| (a) | Employee retirement benefit plans that invest plan assets in the Separate Investment Accounts (SIAs) may be subject to certain charges as set forth in their respective Plan Documents. Total return figures would be lower for the period presented if they reflected these charges. |
– 141 –
MASSMUTUAL SELECT DIVERSIFIED VALUE FUND
| | | | | | | | | | | | |
| | | Class N | |
| | | Year ended
12/31/06 | | | Year ended
12/31/05 | | | Year ended
12/31/04† | |
Net asset value, beginning of year | | $ | 11.28 | | | $ | 10.94 | | | $ | 10.00 | |
| | | | | | | | | | | | |
Income (loss) from investment operations: | | | | | | | | | | | | |
Net investment income (loss) | | | 0.16 | *** | | | 0.11 | *** | | | 0.04 | *** |
Net realized and unrealized gain (loss) on investments | | | 2.21 | | | | 0.52 | | | | 0.94 | |
| | | | | | | | | | | | |
Total income from investment operations | | | 2.37 | | | | 0.63 | | | | 0.98 | |
| | | | | | | | | | | | |
Less distributions to shareholders: | | | | | | | | | | | | |
From net investment income | | | (0.15 | ) | | | (0.06 | ) | | | (0.03 | ) |
From net realized gains | | | (0.41 | ) | | | (0.23 | ) | | | (0.01 | ) |
| | | | | | | | | | | | |
Total distributions | | | (0.56 | ) | | | (0.29 | ) | | | (0.04 | ) |
| | | | | | | | | | | | |
Net asset value, end of year | | $ | 13.09 | | | $ | 11.28 | | | $ | 10.94 | |
| | | | | | | | | | | | |
Total Return(a) | | | 21.11% | (b) | | | 5.77% | (b) | | | 9.84% | **(b) |
Ratios / Supplemental Data: | | | | | | | | | | | | |
Net assets, end of year (000’s) | | $ | 1,547 | | | $ | 147 | | | $ | 187 | |
Ratio of expenses to average daily net assets: | | | | | | | | | | | | |
Before expense waiver | | | 1.39% | | | | 1.40% | | | | 1.46% | * |
After expense waiver | | | N/A | | | | N/A | | | | 1.40% | *# |
Net investment income (loss) to average daily net assets | | | 1.30% | | | | 0.95% | | | | 1.63% | * |
Portfolio turnover rate | | | 15% | | | | 16% | | | | 5% | ** |
| ** | Percentages represent results for the period and are not annualized. |
| *** | Per share amount calculated on the average share method. |
| † | For the period October 15, 2004 (commencement of operations) through December 31, 2004. |
| # | Computed after giving effect to an agreement by MassMutual to waive certain fees and expenses of the Fund. |
| (a) | Employee retirement benefit plans that invest plan assets in the Separate Investment Accounts (SIAs) may be subject to certain charges as set forth in their respective Plan Documents. Total return figures would be lower for the period presented if they reflected these charges. |
| (b) | Total return excludes a contingent deferred sales charge and would be lower for the period presented if they reflected these charges. |
– 142 –
MASSMUTUAL SELECT FUNDAMENTAL VALUE FUND
| | | | | | | | | | | | | | | | | | | | |
| | | Class A | |
| | | Year ended
12/31/06 | | | Year ended
12/31/05† | | | Year ended
12/31/04 | | | Year ended
12/31/03 | | | Year ended
12/31/02 | |
Net asset value, beginning of year | | $ | 11.14 | | | $ | 10.75 | | | $ | 10.01 | | | $ | 7.79 | | | $ | 10.00 | |
| | | | | | | | | | | | | | | | | | | | |
Income (loss) from investment operations: | | | | | | | | | | | | | | | | | | | | |
Net investment income (loss) | | | 0.11 | *** | | | 0.11 | *** | | | 0.10 | *** | | | 0.10 | *** | | | 0.08 | *** |
Net realized and unrealized gain (loss) on investments | | | 2.16 | | | | 0.65 | | | | 0.84 | | | | 2.19 | | | | (2.25 | ) |
| | | | | | | | | | | | | | | | | | | | |
Total income (loss) from investment operations | | | 2.27 | | | | 0.76 | | | | 0.94 | | | | 2.29 | | | | (2.17 | ) |
| | | | | | | | | | | | | | | | | | | | |
Less distributions to shareholders: | | | | | | | | | | | | | | | | | | | | |
From net investment income | | | (0.11 | ) | | | (0.11 | ) | | | (0.09 | ) | | | (0.07 | ) | | | (0.04 | ) |
From net realized gains | | | (1.02 | ) | | | (0.26 | ) | | | (0.11 | ) | | | - | | | | - | |
| | | | | | | | | | | | | | | | | | | | |
Total distributions | | | (1.13 | ) | | | (0.37 | ) | | | (0.20 | ) | | | (0.07 | ) | | | (0.04 | ) |
| | | | | | | | | | | | | | | | | | | | |
Net asset value, end of year | | $ | 12.28 | | | $ | 11.14 | | | $ | 10.75 | | | $ | 10.01 | | | $ | 7.79 | |
| | | | | | | | | | | | | | | | | | | | |
Total Return(a) | | | 20.54% | (c) | | | 7.08% | (c) | | | 9.34% | (c) | | | 29.43% | | | | (21.67 | )% |
Ratios / Supplemental Data: | | | | | | | | | | | | | | | | | | | | |
Net assets, end of year (000’s) | | $ | 310,438 | | | $ | 252,362 | | | $ | 214,886 | | | $ | 129,552 | | | $ | 37,973 | |
Ratio of expenses to average daily net assets: | | | | | | | | | | | | | | | | | | | | |
Before expense waiver | | | 1.23% | | | | 1.23% | | | | 1.23% | | | | 1.24% | | | | 1.27% | |
After expense waiver | | | N/A | | | | N/A | | | | 1.22% | (b)# | | | 1.22% | (b)# | | | 1.20% | (b)# |
Net investment income (loss) to average daily net assets | | | 0.92% | | | | 0.97% | | | | 0.96% | | | | 1.18% | | | | 1.00% | |
Portfolio turnover rate | | | 43% | | | | 33% | | | | 31% | | | | 28% | | | | 38% | |
| | | Class L | |
| | | Year ended
12/31/06 | | | Year ended
12/31/05† | | | Year ended
12/31/04 | | | Year ended
12/31/03 | | | Year ended
12/31/02 | |
Net asset value, beginning of year | | $ | 11.17 | | | $ | 10.78 | | | $ | 10.03 | | | $ | 7.81 | | | $ | 10.00 | |
| | | | | | | | | | | | | | | | | | | | |
Income (loss) from investment operations: | | | | | | | | | | | | | | | | | | | | |
Net investment income (loss) | | | 0.14 | *** | | | 0.14 | *** | | | 0.12 | *** | | | 0.13 | *** | | | 0.10 | *** |
Net realized and unrealized gain (loss) on investments | | | 2.18 | | | | 0.64 | | | | 0.85 | | | | 2.18 | | | | (2.24 | ) |
| | | | | | | | | | | | | | | | | | | | |
Total income (loss) from investment operations | | | 2.32 | | | | 0.78 | | | | 0.97 | | | | 2.31 | | | | (2.14 | ) |
| | | | | | | | | | | | | | | | | | | | |
Less distributions to shareholders: | | | | | | | | | | | | | | | | | | | | |
From net investment income | | | (0.14 | ) | | | (0.13 | ) | | | (0.11 | ) | | | (0.09 | ) | | | (0.05 | ) |
From net realized gains | | | (1.02 | ) | | | (0.26 | ) | | | (0.11 | ) | | | - | | | | - | |
| | | | | | | | | | | | | | | | | | | | |
Total distributions | | | (1.16 | ) | | | (0.39 | ) | | | (0.22 | ) | | | (0.09 | ) | | | (0.05 | ) |
| | | | | | | | | | | | | | | | | | | | |
Net asset value, end of year | | $ | 12.33 | | | $ | 11.17 | | | $ | 10.78 | | | $ | 10.03 | | | $ | 7.81 | |
| | | | | | | | | | | | | | | | | | | | |
Total Return(a) | | | 20.90% | | | | 7.28% | | | | 9.65% | | | | 29.56% | | | | (21.40)% | |
Ratios / Supplemental Data: | | | | | | | | | | | | | | | | | | | | |
Net assets, end of year (000’s) | | $ | 298,276 | | | $ | 231,639 | | | $ | 236,583 | | | $ | 133,178 | | | $ | 44,235 | |
Ratio of expenses to average daily net assets: | | | | | | | | | | | | | | | | | | | | |
Before expense waiver | | | 0.98% | | | | 0.98% | | | | 0.98% | | | | 0.99% | | | | 1.02% | |
After expense waiver | | | N/A | | | | N/A | | | | 0.97% | (b)# | | | 0.97% | (b)# | | | 0.95% | (b)# |
Net investment income (loss) to average daily net assets | | | 1.18% | | | | 1.23% | | | | 1.21% | | | | 1.44% | | | | 1.24% | |
Portfolio turnover rate | | | 43% | | | | 33% | | | | 31% | | | | 28% | | | | 38% | |
| *** | Per share amount calculated on the average shares method. |
| † | Effective January 1, 2005, rebated brokerage commissions are included with realized gain or loss on investment transactions. Prior to January 1, 2005, these amounts were presented as a reduction of expenses. Prior year amounts have not been restated to reflect this change due to immateriality. (See Note 3) |
| # | Computed after giving effect to an agreement by MassMutual to waive certain fees and expenses of the Fund. |
| (a) | Employee benefit plans that invest plan assets in the Separate Investment Accounts (SIAs) may be subject to certain charges as set forth in their respective Plan Documents. Total return figures would be lower for the periods presented if they reflected these charges. |
| (b) | The Fund has entered into an agreement with certain brokers to rebate a portion of brokerage commissions. The rebated commissions are used to reduce operating expenses of the Fund. |
| (c) | Total Return excludes a front-end sales charge and would be lower for the periods presented if it reflected these charges. |
– 143 –
MASSMUTUAL SELECT FUNDAMENTAL VALUE FUND
| | | | | | | | | | | | | | | | | | | | |
| | | Class Y | |
| | | Year ended
12/31/06 | | | Year ended
12/31/05† | | | Year ended
12/31/04 | | | Year ended
12/31/03 | | | Year ended
12/31/02 | |
Net asset value, beginning of year | | $ | 11.19 | | | $ | 10.78 | | | $ | 10.03 | | | $ | 7.80 | | | $ | 10.00 | |
| | | | | | | | | | | | | | | | | | | | |
Income (loss) from investment operations: | | | | | | | | | | | | | | | | | | | | |
Net investment income (loss) | | | 0.16 | *** | | | 0.15 | *** | | | 0.14 | *** | | | 0.14 | *** | | | 0.12 | *** |
Net realized and unrealized gain (loss) on investments | | | 2.17 | | | | 0.66 | | | | 0.84 | | | | 2.19 | | | | (2.26 | ) |
| | | | | | | | | | | | | | | | | | | | |
Total income (loss) from investment operations | | | 2.33 | | | | 0.81 | | | | 0.98 | | | | 2.33 | | | | (2.14 | ) |
| | | | | | | | | | | | | | | | | | | | |
Less distributions to shareholders: | | | | | | | | | | | | | | | | | | | | |
From net investment income | | | (0.16 | ) | | | (0.14 | ) | | | (0.12 | ) | | | (0.10 | ) | | | (0.06 | ) |
From net realized gains | | | (1.02 | ) | | | (0.26 | ) | | | (0.11 | ) | | | - | | | | - | |
| | | | | | | | | | | | | | | | | | | | |
Total distributions | | | (1.18 | ) | | | (0.40 | ) | | | (0.23 | ) | | | (0.10 | ) | | | (0.06 | ) |
| | | | | | | | | | | | | | | | | | | | |
Net asset value, end of year | | $ | 12.34 | | | $ | 11.19 | | | $ | 10.78 | | | $ | 10.03 | | | $ | 7.80 | |
| | | | | | | | | | | | | | | | | | | | |
Total Return(a) | | | 21.05% | | | | 7.55% | | | | 9.78% | | | | 29.82% | | | | (21.41)% | |
Ratios / Supplemental Data: | | | | | | | | | | | | | | | | | | | | |
Net assets, end of year (000’s) | | $ | 134,485 | | | $ | 85,569 | | | $ | 120,769 | | | $ | 82,989 | | | $ | 40,511 | |
Ratio of expenses to average daily net assets: | | | | | | | | | | | | | | | | | | | | |
Before expense waiver | | | 0.83% | | | | 0.83% | | | | 0.83% | | | | 0.84% | | | | 0.87% | |
After expense waiver | | | N/A | | | | N/A | | | | 0.82% | (b)# | | | 0.82% | (b)# | | | 0.81% | (b)# |
Net investment income (loss) to average daily net assets | | | 1.32% | | | | 1.35% | | | | 1.35% | | | | 1.60% | | | | 1.44% | |
Portfolio turnover rate | | | 43% | | | | 33% | | | | 31% | | | | 28% | | | | 38% | |
| | | Class S | |
| | | Year ended
12/31/06 | | | Year ended
12/31/05† | | | Year ended
12/31/04 | | | Year ended
12/31/03 | | | Year ended
12/31/02 | |
Net asset value, beginning of year | | $ | 11.20 | | | $ | 10.80 | | | $ | 10.05 | | | $ | 7.81 | | | $ | 10.00 | |
| | | | | | | | | | | | | | | | | | | | |
Income (loss) from investment operations: | | | | | | | | | | | | | | | | | | | | |
Net investment income (loss) | | | 0.17 | *** | | | 0.16 | *** | | | 0.14 | *** | | | 0.14 | *** | | | 0.12 | *** |
Net realized and unrealized gain (loss) on investments | | | 2.17 | | | | 0.66 | | | | 0.85 | | | | 2.20 | | | | (2.25 | ) |
| | | | | | | | | | | | | | | | | | | | |
Total income (loss) from investment operations | | | 2.34 | | | | 0.82 | | | | 0.99 | | | | 2.34 | | | | (2.13 | ) |
| | | | | | | | | | | | | | | | | | | | |
Less distributions to shareholders: | | | | | | | | | | | | | | | | | | | | |
From net investment income | | | (0.16 | ) | | | (0.16 | ) | | | (0.13 | ) | | | (0.10 | ) | | | (0.06 | ) |
From net realized gains | | | (1.02 | ) | | | (0.26 | ) | | | (0.11 | ) | | | - | | | | - | |
| | | | | | | | | | | | | | | | | | | | |
Total distributions | | | (1.18 | ) | | | (0.42 | ) | | | (0.24 | ) | | | (0.10 | ) | | | (0.06 | ) |
| | | | | | | | | | | | | | | | | | | | |
Net asset value, end of year | | $ | 12.36 | | | $ | 11.20 | | | $ | 10.80 | | | $ | 10.05 | | | $ | 7.81 | |
| | | | | | | | | | | | | | | | | | | | |
Total Return(a) | | | 21.06% | | | | 7.57% | | | | 9.80% | | | | 29.97% | | | | (21.35)% | |
Ratios / Supplemental Data: | | | | | | | | | | | | | | | | | | | | |
Net assets, end of year (000’s) | | $ | 540,185 | | | $ | 418,271 | | | $ | 325,701 | | | $ | 228,535 | | | $ | 101,228 | |
Ratio of expenses to average daily net assets: | | | | | | | | | | | | | | | | | | | | |
Before expense waiver | | | 0.79% | | | | 0.79% | | | | 0.79% | | | | 0.80% | | | | 0.83% | |
After expense waiver | | | N/A | | | | N/A | | | | 0.78% | (b)# | | | 0.78% | (b)# | | | 0.77% | (b)# |
Net investment income (loss) to average daily net assets | | | 1.37% | | | | 1.41% | | | | 1.40% | | | | 1.63% | | | | 1.36% | |
Portfolio turnover rate | | | 43% | | | | 33% | | | | 31% | | | | 28% | | | | 38% | |
| *** | Per share amount calculated on the average shares method. |
| † | Effective January 1, 2005, rebated brokerage commissions are included with realized gain or loss on investment transactions. Prior to January 1, 2005, these amounts were presented as a reduction of expenses. Prior year amounts have not been restated to reflect this change due to immateriality. (See Note 3) |
| # | Computed after giving effect to an agreement by MassMutual to waive certain fees and expenses of the Fund. |
| (a) | Employee benefit plans that invest plan assets in the Separate Investment Accounts (SIAs) may be subject to certain charges as set forth in their respective Plan Documents. Total return figures would be lower for the periods presented if they reflected these charges. |
| (b) | The Fund has entered into an agreement with certain brokers to rebate a portion of brokerage commissions. The rebated commissions are used to reduce operating expenses of the Fund. |
– 144 –
MASSMUTUAL SELECT FUNDAMENTAL VALUE FUND
| | | | | | | | | | | | | | | | | | | | |
| | | Class N | |
| | | Year ended
12/31/06 | | | Year ended
12/31/05† | | | Year ended
12/31/04 | | | Year ended
12/31/03 | | | Year ended
12/31/02++ | |
Net asset value, beginning of year | | $ | 11.07 | | | $ | 10.69 | | | $ | 9.94 | | | $ | 7.76 | | | $ | 7.76 | |
| | | | | | | | | | | | | | | | | | | | |
Income (loss) from investment operations: | | | | | | | | | | | | | | | | | | | | |
Net investment income (loss) | | | 0.07 | *** | | | 0.07 | *** | | | 0.07 | *** | | | 0.08 | *** | | | (0.00 | )***†† |
Net realized and unrealized gain (loss) on investments | | | 2.14 | | | | 0.65 | | | | 0.84 | | | | 2.17 | | | | (0.00 | )†† |
| | | | | | | | | | | | | | | | | | | | |
Total income (loss) from investment operations | | | 2.21 | | | | 0.72 | | | | 0.91 | | | | 2.25 | | | | - | |
| | | | | | | | | | | | | | | | | | | | |
Less distributions to shareholders: | | | | | | | | | | | | | | | | | | | | |
From net investment income | | | (0.06 | ) | | | (0.08 | ) | | | (0.05 | ) | | | (0.07 | ) | | | - | |
From net realized gains | | | (1.02 | ) | | | (0.26 | ) | | | (0.11 | ) | | | - | | | | - | |
| | | | | | | | | | | | | | | | | | | | |
Total distributions | | | (1.08 | ) | | | (0.34 | ) | | | (0.16 | ) | | | (0.07 | ) | | | - | |
| | | | | | | | | | | | | | | | | | | | |
Net asset value, end of year | | $ | 12.20 | | | $ | 11.07 | | | $ | 10.69 | | | $ | 9.94 | | | $ | 7.76 | |
| | | | | | | | | | | | | | | | | | | | |
Total Return(a) | | | 20.09% | (c) | | | 6.76% | (c) | | | 9.10% | (c) | | | 29.03% | (c) | | | - | ‡ |
Ratios / Supplemental Data: | | | | | | | | | | | | | | | | | | | | |
Net assets, end of year (000’s) | | $ | 1,667 | | | $ | 1,998 | | | $ | 1,644 | | | $ | 1,968 | | | $ | 101 | |
Ratio of expenses to average daily net assets: | | | | | | | | | | | | | | | | | | | | |
Before expense waiver | | | 1.53% | | | | 1.53% | | | | 1.53% | | | | 1.54% | | | | - | ‡ |
After expense waiver | | | N/A | | | | N/A | | | | 1.52% | (b)# | | | 1.52% | (b)# | | | - | ‡ |
Net investment income (loss) to average daily net assets | | | 0.62% | | | | 0.67% | | | | 0.65% | | | | 0.83% | | | | - | ‡ |
Portfolio turnover rate | | | 43% | | | | 33% | | | | 31% | | | | 28% | | | | 38% | |
| *** | Per share amount calculated on the average shares method. |
| † | Effective January 1, 2005, rebated brokerage commissions are included with realized gain or loss on investment transactions. Prior to January 1, 2005, these amounts were presented as a reduction of expenses. Prior year amounts have not been restated to reflect this change due to immateriality. (See Note 3) |
| †† | Net investment loss and net realized and unrealized gain(loss) on investments are less than $0.01 per share. |
| ++ | Class N commenced operations on December 31, 2002. |
| ‡ | Amounts are de minimis due to the short period of operations. |
| # | Computed after giving effect to an agreement by MassMutual to waive certain fees and expenses of the Fund. |
| (a) | Employee benefit plans that invest plan assets in the Separate Investment Accounts (SIAs) may be subject to certain charges as set forth in their respective Plan Documents. Total return figures would be lower for the periods presented if they reflected these charges. |
| (b) | The Fund has entered into an agreement with certain brokers to rebate a portion of brokerage commissions. The rebated commissions are used to reduce operating expenses of the Fund. |
| (c) | Total Return excludes contingent deferred sales charge and would be lower for the periods presented if they reflected these charges. |
– 145 –
MASSMUTUAL SELECT VALUE EQUITY FUND
| | | | | | | | | | | | | | | | | | | | |
| | | Class A | |
| | | Year ended
12/31/06 | | | Year ended
12/31/05† | | | Year ended
12/31/04 | | | Year ended
12/31/03 | | | Year ended
12/31/02 | |
Net asset value, beginning of year | | $ | 10.49 | | | $ | 10.48 | | | $ | 9.55 | | | $ | 7.66 | | | $ | 9.34 | |
| | | | | | | | | | | | | | | | | | | | |
Income (loss) from investment operations: | | | | | | | | | | | | | | | | | | | | |
Net investment income (loss) | | | 0.07 | *** | | | 0.04 | *** | | | 0.07 | *** | | | 0.08 | *** | | | 0.07 | *** |
Net realized and unrealized gain (loss) on investments | | | 1.25 | | | | 1.02 | | | | 1.16 | | | | 1.91 | | | | (1.68 | ) |
| | | | | | | | | | | | | | | | | | | | |
Total income (loss) from investment operations | | | 1.32 | | | | 1.06 | | | | 1.23 | | | | 1.99 | | | | (1.61 | ) |
| | | | | | | | | | | | | | | | | | | | |
Less distributions to shareholders: | | | | | | | | | | | | | | | | | | | | |
From net investment income | | | (0.06 | ) | | | (0.04 | ) | | | (0.07 | ) | | | (0.10 | ) | | | (0.07 | ) |
From net realized gains | | | (1.68 | ) | | | (1.01 | ) | | | (0.23 | ) | | | - | | | | - | |
| | | | | | | | | | | | | | | | | | | | |
Total distributions | | | (1.74 | ) | | | (1.05 | ) | | | (0.30 | ) | | | (0.10 | ) | | | (0.07 | ) |
| | | | | | | | | | | | | | | | | | | | |
Net asset value, end of year | | $ | 10.07 | | | $ | 10.49 | | | $ | 10.48 | | | $ | 9.55 | | | $ | 7.66 | |
| | | | | | | | | | | | | | | | | | | | |
Total Return(a) | | | 12.83% | (c) | | | 10.16% | (c) | | | 12.91% | (c) | | | 25.96% | | | | (17.28)% | |
Ratios / Supplemental Data: | | | | | | | | | | | | | | | | | | | | |
Net assets, end of year (000’s) | | $ | 28,143 | | | $ | 28,829 | | | $ | 25,523 | | | $ | 21,341 | | | $ | 15,852 | |
Ratio of expenses to average daily net assets: | | | | | | | | | | | | | | | | | | | | |
Before expense waiver | | | 1.31% | | | | 1.30% | | | | 1.33% | | | | 1.29% | | | | 1.30% | |
After expense waiver | | | N/A | | | | N/A | | | | 1.29% | (b)# | | | 1.27% | (b)# | | | 1.29% | # |
Net investment income (loss) to average daily net assets | | | 0.65% | | | | 0.36% | | | | 0.69% | | | | 0.99% | | | | 0.79% | |
Portfolio turnover rate | | | 177% | | | | 94% | | | | 161% | | | | 66% | | | | 105% | |
| | | Class L | |
| | | Year ended
12/31/06 | | | Year ended
12/31/05† | | | Year ended
12/31/04 | | | Year ended
12/31/03 | | | Year ended
12/31/02 | |
Net asset value, beginning of year | | $ | 10.51 | | | $ | 10.50 | | | $ | 9.57 | | | $ | 7.67 | | | $ | 9.34 | |
| | | | | | | | | | | | | | | | | | | | |
Income (loss) from investment operations: | | | | | | | | | | | | | | | | | | | | |
Net investment income (loss) | | | 0.10 | *** | | | 0.06 | *** | | | 0.09 | *** | | | 0.10 | *** | | | 0.09 | *** |
Net realized and unrealized gain (loss) on investments | | | 1.25 | | | | 1.02 | | | | 1.17 | | | | 1.92 | | | | (1.67 | ) |
| | | | | | | | | | | | | | | | | | | | |
Total income (loss) from investment operations | | | 1.35 | | | | 1.08 | | | | 1.26 | | | | 2.02 | | | | (1.58 | ) |
| | | | | | | | | | | | | | | | | | | | |
Less distributions to shareholders: | | | | | | | | | | | | | | | | | | | | |
From net investment income | | | (0.10 | ) | | | (0.06 | ) | | | (0.10 | ) | | | (0.12 | ) | | | (0.09 | ) |
From net realized gains | | | (1.68 | ) | | | (1.01 | ) | | | (0.23 | ) | | | - | | | | - | |
| | | | | | | | | | | | | | | | | | | | |
Total distributions | | | (1.78 | ) | | | (1.07 | ) | | | (0.33 | ) | | | (0.12 | ) | | | (0.09 | ) |
| | | | | | | | | | | | | | | | | | | | |
Net asset value, end of year | | $ | 10.08 | | | $ | 10.51 | | | $ | 10.50 | | | $ | 9.57 | | | $ | 7.67 | |
| | | | | | | | | | | | | | | | | | | | |
Total Return(a) | | | 13.06% | | | | 10.39% | | | | 13.16% | | | | 26.34% | | | | (16.97)% | |
Ratios / Supplemental Data: | | | | | | | | | | | | | | | | | | | | |
Net assets, end of year (000’s) | | $ | 12,075 | | | $ | 8,753 | | | $ | 7,461 | | | $ | 6,313 | | | $ | 4,727 | |
Ratio of expenses to average daily net assets: | | | | | | | | | | | | | | | | | | | | |
Before expense waiver | | | 1.06% | | | | 1.05% | | | | 1.08% | | | | 1.04% | | | | 1.05% | |
After expense waiver | | | N/A | | | | N/A | | | | 1.04% | (b)# | | | 1.02% | (b)# | | | 1.04% | # |
Net investment income (loss) to average daily net assets | | | 0.93% | | | | 0.60% | | | | 0.94% | | | | 1.24% | | | | 1.07% | |
Portfolio turnover rate | | | 177% | | | | 94% | | | | 161% | | | | 66% | | | | 105% | |
| *** | Per share amount calculated on the average shares method. |
| † | Effective January 1, 2005, brokerage commissions are included with realized gain or loss on investment transactions. Prior to January 1, 2005, these amounts were presented as a reduction of expenses. Prior year amounts have not been restated to reflect this change due to immateriality. (See Note 3) |
| # | Computed after giving effect to an agreement by MassMutual to waive certain fees and expenses of the Fund. |
| (a) | Employee retirement benefit plans that invest plan assets in the Separate Investment Accounts (SIAs) may be subject to certain charges as set forth in their Plan Documents. Total return figures would be lower for the periods presented if they reflected these charges. |
| (b) | The Fund has entered into an agreement with certain brokers to rebate a portion of brokerage commissions. The rebated commissions are used to reduce operating expenses of the Fund. |
| (c) | Total Return excludes a front-end sales charge and would be lower for the periods presented if it reflected these charges. |
– 146 –
MASSMUTUAL SELECT VALUE EQUITY FUND
| | | | | | | | | | | | | | | | | | | | |
| | | Class Y | |
| | | Year ended
12/31/06 | | | Year ended
12/31/05† | | | Year ended
12/31/04 | | | Year ended
12/31/03 | | | Year ended
12/31/02 | |
Net asset value, beginning of year | | $ | 10.55 | | | $ | 10.54 | | | $ | 9.59 | | | $ | 7.68 | | | $ | 9.35 | |
| | | | | | | | | | | | | | | | | | | | |
Income (loss) from investment operations: | | | | | | | | | | | | | | | | | | | | |
Net investment income (loss) | | | 0.12 | *** | | | 0.08 | *** | | | 0.10 | *** | | | 0.12 | *** | | | 0.10 | *** |
Net realized and unrealized gain (loss) on investments | | | 1.26 | | | | 1.02 | | | | 1.19 | | | | 1.91 | | | | (1.67 | ) |
| | | | | | | | | | | | | | | | | | | | |
Total income (loss) from investment operations | | | 1.38 | | | | 1.10 | | | | 1.29 | | | | 2.03 | | | | (1.57 | ) |
| | | | | | | | | | | | | | | | | | | | |
Less distributions to shareholders: | | | | | | | | | | | | | | | | | | | | |
From net investment income | | | (0.11 | ) | | | (0.08 | ) | | | (0.11 | ) | | | (0.12 | ) | | | (0.10 | ) |
From net realized gains | | | (1.68 | ) | | | (1.01 | ) | | | (0.23 | ) | | | - | | | | - | |
| | | | | | | | | | | | | | | | | | | | |
Total distributions | | | (1.79 | ) | | | (1.09 | ) | | | (0.34 | ) | | | (0.12 | ) | | | (0.10 | ) |
| | | | | | | | | | | | | | | | | | | | |
Net asset value, end of year | | $ | 10.14 | | | $ | 10.55 | | | $ | 10.54 | | | $ | 9.59 | | | $ | 7.68 | |
| | | | | | | | | | | | | | | | | | | | |
Total Return(a) | | | 13.33% | | | | 10.49% | | | | 13.47% | | | | 26.40% | | | | (16.87)% | |
Ratios / Supplemental Data: | | | | | | | | | | | | | | | | | | | | |
Net assets, end of year (000’s) | | $ | 5,136 | | | $ | 4,110 | | | $ | 2,891 | | | $ | 3,378 | | | $ | 7,543 | |
Ratio of expenses to average daily net assets: | | | | | | | | | | | | | | | | | | | | |
Before expense waiver | | | 0.91% | | | | 0.90% | | | | 0.93% | | | | 0.88% | | | | 0.90% | |
After expense waiver | | | N/A | | | | N/A | | | | 0.88% | (b)# | | | 0.86% | (b)# | | | 0.89% | # |
Net investment income (loss) to average daily net assets | | | 1.06% | | | | 0.75% | | | | 1.06% | | | | 1.42% | | | | 1.18% | |
Portfolio turnover rate | | | 177% | | | | 94% | | | | 161% | | | | 66% | | | | 105% | |
| | | Class S | |
| | | Year ended
12/31/06 | | | Year ended
12/31/05† | | | Year ended
12/31/04 | | | Year ended
12/31/03 | | | Year ended
12/31/02 | |
Net asset value, beginning of year | | $ | 10.54 | | | $ | 10.52 | | | $ | 9.59 | | | $ | 7.68 | | | $ | 9.35 | |
| | | | | | | | | | | | | | | | | | | | |
Income (loss) from investment operations: | | | | | | | | | | | | | | | | | | | | |
Net investment income (loss) | | | 0.12 | *** | | | 0.09 | *** | | | 0.11 | *** | | | 0.12 | *** | | | 0.10 | *** |
Net realized and unrealized gain (loss) on investments | | | 1.26 | | | | 1.02 | | | | 1.17 | | | | 1.92 | | | | (1.68 | ) |
| | | | | | | | | | | | | | | | | | | | |
Total income (loss) from investment operations | | | 1.38 | | | | 1.11 | | | | 1.28 | | | | 2.04 | | | | (1.58 | ) |
| | | | | | | | | | | | | | | | | | | | |
Less distributions to shareholders: | | | | | | | | | | | | | | | | | | | | |
From net investment income | | | (0.12 | ) | | | (0.08 | ) | | | (0.12 | ) | | | (0.13 | ) | | | (0.09 | ) |
From net realized gains | | | (1.68 | ) | | | (1.01 | ) | | | (0.23 | ) | | | - | | | | - | |
| | | | | | | | | | | | | | | | | | | | |
Total distributions | | | (1.80 | ) | | | (1.09 | ) | | | (0.35 | ) | | | (0.13 | ) | | | (0.09 | ) |
| | | | | | | | | | | | | | | | | | | | |
Net asset value, end of year | | $ | 10.12 | | | $ | 10.54 | | | $ | 10.52 | | | $ | 9.59 | | | $ | 7.68 | |
| | | | | | | | | | | | | | | | | | | | |
Total Return(a) | | | 13.40% | | | | 10.66% | | | | 13.31% | | | | 26.63% | | | | (16.83)% | |
Ratios / Supplemental Data: | | | | | | | | | | | | | | | | | | | | |
Net assets, end of year (000’s) | | $ | 52,627 | | | $ | 55,895 | | | $ | 51,940 | | | $ | 67,536 | | | $ | 60,499 | |
Ratio of expenses to average daily net assets: | | | | | | | | | | | | | | | | | | | | |
Before expense waiver | | | 0.86% | | | | 0.85% | | | | 0.88% | | | | 0.84% | | | | 0.85% | |
After expense waiver | | | N/A | | | | N/A | | | | 0.84% | (b)# | | | 0.82% | (b)# | | | 0.84% | # |
Net investment income (loss) to average daily net assets | | | 1.11% | | | | 0.81% | | | | 1.12% | | | | 1.45% | | | | 1.22% | |
Portfolio turnover rate | | | 177% | | | | 94% | | | | 161% | | | | 66% | | | | 105% | |
| *** | Per share amount calculated on the average shares method. |
| † | Effective January 1, 2005, brokerage commissions are included with realized gain or loss on investment transactions. Prior to January 1, 2005, these amounts were presented as a reduction of expenses. Prior year amounts have not been restated to reflect this change due to immateriality. (See Note 3) |
| # | Computed after giving effect to an agreement by MassMutual to waive certain fees and expenses of the Fund. |
| (a) | Employee retirement benefit plans that invest plan assets in the Separate Investment Accounts (SIAs) may be subject to certain charges as set forth in their Plan Documents. Total return figures would be lower for the periods presented if they reflected these charges. |
| (b) | The Fund has entered into an agreement with certain brokers to rebate a portion of brokerage commissions. The rebated commissions are used to reduce operating expenses of the Fund. |
– 147 –
MASSMUTUAL SELECT VALUE EQUITY FUND
| | | | | | | | | | | | | | | | | | | | |
| | | Class N | |
| | | Year ended
12/31/06 | | | Year ended
12/31/05† | | | Year ended
12/31/04 | | | Year ended
12/31/03 | | | Year ended
12/31/02++ | |
Net asset value, beginning of year | | $ | 10.51 | | | $ | 10.50 | | | $ | 9.56 | | | $ | 7.63 | | | $ | 7.62 | |
| | | | | | | | | | | | | | | | | | | | |
Income (loss) from investment operations: | | | | | | | | | | | | | | | | | | | | |
Net investment income (loss) | | | 0.04 | *** | | | 0.01 | *** | | | 0.04 | *** | | | 0.06 | *** | | | 0.00 | ***†† |
Net realized and unrealized gain (loss) on investments | | | 1.26 | | | | 1.01 | | | | 1.15 | | | | 1.90 | | | | 0.01 | |
| | | | | | | | | | | | | | | | | | | | |
Total income from investment operations | | | 1.30 | | | | 1.02 | | | | 1.19 | | | | 1.96 | | | | 0.01 | |
| | | | | | | | | | | | | | | | | | | | |
Less distributions to shareholders: | | | | | | | | | | | | | | | | | | | | |
From net investment income | | | (0.04 | ) | | | (0.00 | )†† | | | (0.02 | ) | | | (0.03 | ) | | | - | |
From net realized gains | | | (1.68 | ) | | | (1.01 | ) | | | (0.23 | ) | | | - | | | | - | |
| | | | | | | | | | | | | | | | | | | | |
Total distributions | | | (1.72 | ) | | | (1.01 | ) | | | (0.25 | ) | | | (0.03 | ) | | | - | |
| | | | | | | | | | | | | | | | | | | | |
Net asset value, end of year | | $ | 10.09 | | | $ | 10.51 | | | $ | 10.50 | | | $ | 9.56 | | | $ | 7.63 | |
| | | | | | | | | | | | | | | | | | | | |
Total Return(a) | | | 12.59% | (c) | | | 9.83% | (c) | | | 12.51% | (c) | | | 25.73% | (c) | | | - | ‡ |
Ratios / Supplemental Data: | | | | | | | | | | | | | | | | | | | | |
Net assets, end of year (000’s) | | $ | 142 | | | $ | 140 | | | $ | 282 | | | $ | 315 | | | $ | 101 | |
Ratio of expenses to average daily net assets: | | | | | | | | | | | | | | | | | | | | |
Before expense waiver | | | 1.61% | | | | 1.59% | | | | 1.63% | | | | 1.58% | | | | - | ‡ |
After expense waiver | | | N/A | | | | N/A | | | | 1.58% | (b)# | | | 1.56% | (b)# | | | - | ‡ |
Net investment income (loss) to average daily net assets | | | 0.36% | | | | 0.06% | | | | 0.39% | | | | 0.70% | | | | - | ‡ |
Portfolio turnover rate | | | 177% | | | | 94% | | | | 161% | | | | 66% | | | | 105% | |
| *** | Per share amount calculated on the average shares method. |
| † | Effective January 1, 2005, brokerage commissions are included with realized gain or loss on investment transactions. Prior to January 1, 2005, these amounts were presented as a reduction of expenses. Prior year amounts have not been restated to reflect this change due to immateriality. (See Note 3) |
| †† | Net investment income is less than $0.01 per share. |
| ++ | Class N commenced operations on December 31, 2002. |
| ‡ | Amounts are de minimis due to the short period of operations. |
| # | Computed after giving effect to an agreement by MassMutual to waive certain fees and expenses of the Fund. |
| (a) | Employee retirement benefit plans that invest plan assets in the Separate Investment Accounts (SIAs) may be subject to certain charges as set forth in their Plan Documents. Total return figures would be lower for the periods presented if they reflected these charges. |
| (b) | The Fund has entered into an agreement with certain brokers to rebate a portion of brokerage commissions. The rebated commissions are used to reduce operating expenses of the Fund. |
| (c) | Total Return excludes contingent deferred sales charge and would be lower for the periods presented if it reflected these charges. |
– 148 –
MASSMUTUAL SELECT LARGE CAP VALUE FUND
| | | | | | | | | | | | | | | | | | | | |
| | | Class A | |
| | | Year ended
12/31/06 | | | Year ended
12/31/05† | | | Year ended
12/31/04 | | | Year ended
12/31/03 | | | Year ended
12/31/02 | |
Net asset value, beginning of year | | $ | 11.28 | | | $ | 10.39 | | | $ | 9.35 | | | $ | 7.24 | | | $ | 8.74 | |
| | | | | | | | | | | | | | | | | | | | |
Income (loss) from investment operations: | | | | | | | | | | | | | | | | | | | | |
Net investment income (loss) | | | 0.04 | *** | | | 0.05 | *** | | | 0.04 | *** | | | 0.04 | *** | | | 0.02 | *** |
Net realized and unrealized gain (loss) on investments | | | 1.56 | | | | 0.89 | | | | 1.04 | | | | 2.10 | | | | (1.49 | ) |
| | | | | | | | | | | | | | | | | | | | |
Total income (loss) from investment operations | | | 1.60 | | | | 0.94 | | | | 1.08 | | | | 2.14 | | | | (1.47 | ) |
| | | | | | | | | | | | | | | | | | | | |
Less distributions to shareholders: | | | | | | | | | | | | | | | | | | | | |
From net investment income | | | (0.04 | ) | | | (0.05 | ) | | | (0.04 | ) | | | (0.03 | ) | | | (0.03 | ) |
| | | | | | | | | | | | | | | | | | | | |
Net asset value, end of year | | $ | 12.84 | | | $ | 11.28 | | | $ | 10.39 | | | $ | 9.35 | | | $ | 7.24 | |
| | | | | | | | | | | | | | | | | | | | |
Total Return(a) | | | 14.21% | (c) | | | 9.05% | (c) | | | 11.55% | (c) | | | 29.61% | | | | (16.86)% | |
Ratios / Supplemental Data: | | | | | | | | | | | | | | | | | | | | |
Net assets, end of year (000’s) | | $ | 401,790 | | | $ | 354,647 | | | $ | 266,753 | | | $ | 153,918 | | | $ | 92,001 | |
Ratio of expenses to average daily net assets: | | | | | | | | | | | | | | | | | | | | |
Before expense waiver | | | 1.25% | | | | 1.25% | | | | 1.25% | | | | 1.25% | | | | 1.24% | |
After expense waiver | | | N/A | | | | N/A | | | | 1.25% | (b)# | | | 1.24% | (b)# | | | 1.23% | (b)# |
Net investment income (loss) to average daily net assets | | | 0.37% | | | | 0.44% | | | | 0.41% | | | | 0.45% | | | | 0.29% | |
Portfolio turnover rate | | | 18% | | | | 7% | | | | 3% | | | | 7% | | | | 25% | |
| | | Class L | |
| | | Year ended
12/31/06 | | | Year ended
12/31/05† | | | Year ended
12/31/04 | | | Year ended
12/31/03 | | | Year ended
12/31/02 | |
Net asset value, beginning of year | | $ | 11.32 | | | $ | 10.43 | | | $ | 9.37 | | | $ | 7.26 | | | $ | 8.76 | |
| | | | | | | | | | | | | | | | | | | | |
Income (loss) from investment operations: | | | | | | | | | | | | | | | | | | | | |
Net investment income (loss) | | | 0.07 | *** | | | 0.07 | *** | | | 0.06 | *** | | | 0.06 | *** | | | 0.04 | *** |
Net realized and unrealized gain (loss) on investments | | | 1.56 | | | | 0.90 | | | | 1.06 | | | | 2.10 | | | | (1.50 | ) |
| | | | | | | | | | | | | | | | | | | | |
Total income (loss) from investment operations | | | 1.63 | | | | 0.97 | | | | 1.12 | | | | 2.16 | | | | (1.46 | ) |
| | | | | | | | | | | | | | | | | | | | |
Less distributions to shareholders: | | | | | | | | | | | | | | | | | | | | |
From net investment income | | | (0.07 | ) | | | (0.08 | ) | | | (0.06 | ) | | | (0.05 | ) | | | (0.04 | ) |
| | | | | | | | | | | | | | | | | | | | |
Net asset value, end of year | | $ | 12.88 | | | $ | 11.32 | | | $ | 10.43 | | | $ | 9.37 | | | $ | 7.26 | |
| | | | | | | | | | | | | | | | | | | | |
Total Return(a) | | | 14.42% | | | | 9.25% | | | | 11.94% | | | | 29.79% | | | | (16.64)% | |
Ratios / Supplemental Data: | | | | | | | | | | | | | | | | | | | | |
Net assets, end of year (000’s) | | $ | 397,105 | | | $ | 369,858 | | | $ | 316,841 | | | $ | 207,025 | | | $ | 114,417 | |
Ratio of expenses to average daily net assets: | | | | | | | | | | | | | | | | | | | | |
Before expense waiver | | | 1.00% | | | | 1.00% | | | | 1.00% | | | | 1.00% | | | | 1.00% | |
After expense waiver | | | N/A | | | | N/A | | | | 1.00% | (b)# | | | 0.99% | (b)# | | | 0.98% | (b)# |
Net investment income (loss) to average daily net assets | | | 0.63% | | | | 0.69% | | | | 0.65% | | | | 0.70% | | | | 0.53% | |
Portfolio turnover rate | | | 18% | | | | 7% | | | | 3% | | | | 7% | | | | 25% | |
| *** | Per share amount calculated on the average shares method. |
| † | Effective January 1, 2005, rebated brokerage commissions are included with realized gain or loss on investment transactions. Prior to January 1, 2005, these amounts were presented as a reduction of expenses. Prior year amounts have not been restated to reflect this change. (See Note 3) |
| # | Computed after giving effect to an agreement by MassMutual to waive certain fees and expenses of the Fund. |
| (a) | Employee retirement benefit plans that invest plan assets in the Separate Investment Accounts (SIAs) may be subject to certain charges as set forth by their respective Plan Documents. Total return figures would be lower for the periods presented if they reflected these charges. |
| (b) | The Fund has entered into agreements with certain brokers to rebate a portion of brokerage commissions. The rebated commissions are used to reduce operating expenses of the Fund. |
| (c) | Total Return excludes a front-end sales charge and would be lower for the period presented if it reflected these charges. |
– 149 –
MASSMUTUAL SELECT LARGE CAP VALUE FUND
| | | | | | | | | | | | | | | | | | | | |
| | | Class Y | |
| | | Year ended
12/31/06 | | | Year ended
12/31/05† | | | Year ended
12/31/04 | | | Year ended
12/31/03 | | | Year ended
12/31/02 | |
Net asset value, beginning of year | | $ | 11.34 | | | $ | 10.45 | | | $ | 9.39 | | | $ | 7.27 | | | $ | 8.77 | |
| | | | | | | | | | | | | | �� | | | | | | |
Income (loss) from investment operations: | | | | | | | | | | | | | | | | | | | | |
Net investment income (loss) | | | 0.09 | *** | | | 0.09 | *** | | | 0.08 | *** | | | 0.07 | *** | | | 0.05 | *** |
Net realized and unrealized gain (loss) on investments | | | 1.57 | | | | 0.89 | | | | 1.05 | | | | 2.11 | | | | (1.50 | ) |
| | | | | | | | | | | | | | | | | | | | |
Total income (loss) from investment operations | | | 1.66 | | | | 0.98 | | | | 1.13 | | | | 2.18 | | | | (1.45 | ) |
| | | | | | | | | | | | | | | | | | | | |
Less distributions to shareholders: | | | | | | | | | | | | | | | | | | | | |
From net investment income | | | (0.09 | ) | | | (0.09 | ) | | | (0.07 | ) | | | (0.06 | ) | | | (0.05 | ) |
| | | | | | | | | | | | | | | | | | | | |
Net asset value, end of year | | $ | 12.91 | | | $ | 11.34 | | | $ | 10.45 | | | $ | 9.39 | | | $ | 7.27 | |
| | | | | | | | | | | | | | | | | | | | |
Total Return(a) | | | 14.65% | | | | 9.37% | | | | 12.06% | | | | 30.04% | | | | (16.52)% | |
Ratios / Supplemental Data: | | | | | | | | | | | | | | | | | | | | |
Net assets, end of year (000’s) | | $ | 218,268 | | | $ | 146,699 | | | $ | 127,223 | | | $ | 78,751 | | | $ | 39,762 | |
Ratio of expenses to average daily net assets: | | | | | | | | | | | | | | | | | | | | |
Before expense waiver | | | 0.85% | | | | 0.85% | | | | 0.85% | | | | 0.85% | | | | 0.84% | |
After expense waiver | | | N/A | | | | N/A | | | | 0.85% | (b)# | | | 0.84% | (b)# | | | 0.83% | (b)# |
Net investment income (loss) to average daily net assets | | | 0.78% | | | | 0.84% | | | | 0.81% | | | | 0.85% | | | | 0.66% | |
Portfolio turnover rate | | | 18% | | | | 7% | | | | 3% | | | | 7% | | | | 25% | |
| | | Class S | |
| | | Year ended
12/31/06 | | | Year ended
12/31/05† | | | Year ended
12/31/04 | | | Year ended
12/31/03 | | | Year ended 12/31/02 | |
Net asset value, beginning of year | | $ | 11.36 | | | $ | 10.46 | | | $ | 9.40 | | | $ | 7.27 | | | $ | 8.78 | |
| | | | | | | | | | | | | | | | | | | | |
Income (loss) from investment operations: | | | | | | | | | | | | | | | | | | | | |
Net investment income (loss) | | | 0.10 | *** | | | 0.10 | *** | | | 0.09 | *** | | | 0.08 | *** | | | 0.06 | *** |
Net realized and unrealized gain (loss) on investments | | | 1.57 | | | | 0.90 | | | | 1.05 | | | | 2.12 | | | | (1.51 | ) |
| | | | | | | | | | | | | | | | | | | | |
Total income (loss) from investment operations | | | 1.67 | | | | 1.00 | | | | 1.14 | | | | 2.20 | | | | (1.45 | ) |
| | | | | | | | | | | | | | | | | | | | |
Less distributions to shareholders: | | | | | | | | | | | | | | | | | | | | |
From net investment income | | | (0.10 | ) | | | (0.10 | ) | | | (0.08 | ) | | | (0.07 | ) | | | (0.06 | ) |
| | | | | | | | | | | | | | | | | | | | |
Net asset value, end of year | | $ | 12.93 | | | $ | 11.36 | | | $ | 10.46 | | | $ | 9.40 | | | $ | 7.27 | |
| | | | | | | | | | | | | | | | | | | | |
Total Return(a) | | | 14.71% | | | | 9.57% | | | | 12.11% | | | | 30.24% | | | | (16.53)% | |
Ratios / Supplemental Data: | | | | | | | | | | | | | | | | | | | | |
Net assets, end of year (000’s) | | $ | 615,354 | | | $ | 546,331 | | | $ | 436,983 | | | $ | 339,287 | | | $ | 233,510 | |
Ratio of expenses to average daily net assets: | | | | | | | | | | | | | | | | | | | | |
Before expense waiver | | | 0.76% | | | | 0.76% | | | | 0.76% | | | | 0.76% | | | | 0.75% | |
After expense waiver | | | N/A | | | | N/A | | | | 0.76% | (b)# | | | 0.75% | (b)# | | | 0.74% | (b)# |
Net investment income (loss) to average daily net assets | | | 0.86% | | | | 0.93% | | | | 0.88% | | | | 0.94% | | | | 0.76% | |
Portfolio turnover rate | | | 18% | | | | 7% | | | | 3% | | | | 7% | | | | 25% | |
| *** | Per share amount calculated on the average shares method. |
| † | Effective January 1, 2005, rebated brokerage commissions are included with realized gain or loss on investment transactions. Prior to January 1, 2005, these amounts were presented as a reduction of expenses. Prior year amounts have not been restated to reflect this change. (See Note 3) |
| # | Computed after giving effect to an agreement by MassMutual to waive certain fees and expenses of the Fund. |
| (a) | Employee retirement benefit plans that invest plan assets in the Separate Investment Accounts (SIAs) may be subject to certain charges as set forth by their respective Plan Documents. Total return figures would be lower for the periods presented if they reflected these charges. |
| (b) | The Fund has entered into agreements with certain brokers to rebate a portion of brokerage commissions. The rebated commissions are used to reduce operating expenses of the Fund. |
– 150 –
MASSMUTUAL SELECT LARGE CAP VALUE FUND
| | | | | | | | | | | | | | | | | | | | |
| | | Class N | |
| | | Year ended
12/31/06 | | | Year ended
12/31/05† | | | Year ended
12/31/04 | | | Year ended
12/31/03 | | | Period ended
12/31/02++ | |
Net asset value, beginning of year | | $ | 11.17 | | | $ | 10.29 | | | $ | 9.25 | | | $ | 7.21 | | | $ | 7.19 | |
| | | | | | | | | | | | | | | | | | | | |
Income (loss) from investment operations: | | | | | | | | | | | | | | | | | | | | |
Net investment income (loss) | | | 0.01 | *** | | | 0.02 | *** | | | 0.01 | *** | | | 0.03 | *** | | | 0.00 | ***†† |
Net realized and unrealized gain (loss) on investments | | | 1.54 | | | | 0.87 | | | | 1.03 | | | | 2.07 | | | | 0.02 | |
| | | | | | | | | | | | | | | | | | | | |
Total income from investment operations | | | 1.55 | | | | 0.89 | | | | 1.04 | | | | 2.10 | | | | 0.02 | |
| | | | | | | | | | | | | | | | | | | | |
Less distributions to shareholders: | | | | | | | | | | | | | | | | | | | | |
From net investment income | | | (0.01 | ) | | | (0.01 | ) | | | - | | | | (0.06 | ) | | | - | |
| | | | | | | | | | | | | | | | | | | | |
Net asset value, end of year | | $ | 12.71 | | | $ | 11.17 | | | $ | 10.29 | | | $ | 9.25 | | | $ | 7.21 | |
| | | | | | | | | | | | | | | | | | | | |
Total Return(a) | | | 13.87% | (c) | | | 8.65% | (c) | | | 11.24% | (c) | | | 29.18% | (c) | | | - | ‡ |
Ratios / Supplemental Data: | | | | | | | | | | | | | | | | | | | | |
Net assets, end of year (000’s) | | $ | 2,596 | | | $ | 2,279 | | | $ | 2,911 | | | $ | 2,891 | | | $ | 101 | |
Ratio of expenses to average daily net assets: | | | | | | | | | | | | | | | | | | | | |
Before expense waiver | | | 1.55% | | | | 1.55% | | | | 1.55% | | | | 1.57% | | | | - | ‡ |
After expense waiver | | | N/A | | | | N/A | | | | 1.55% | # | | | 1.56% | (b)# | | | N/A | ‡ |
Net investment income (loss) to average daily net assets | | | 0.08% | | | | 0.15% | | | | 0.08% | | | | 0.33% | | | | 0.00% | ‡ |
Portfolio turnover rate | | | 18% | | | | 7% | | | | 3% | | | | 7% | | | | 25% | |
| *** | Per share amount calculated on the average shares method. |
| † | Effective January 1, 2005, rebated brokerage commissions are included with realized gain or loss on investment transactions. Prior to January 1, 2005, these amounts were presented as a reduction of expenses. Prior year amounts have not been restated to reflect this change. (See Note 3) |
| †† | Net investment income is less than $0.01 per share. |
| ++ | Class N commenced operations on December 31, 2002. |
| ‡ | Amounts are de minimis due to the short period of operations. |
| # | Computed after giving effect to an agreement by MassMutual to waive certain fees and expenses of the Fund. |
| (a) | Employee retirement benefit plans that invest plan assets in the Separate Investment Accounts (SIAs) may be subject to certain charges as set forth by their respective Plan Documents. Total return figures would be lower for the periods presented if they reflected these charges. |
| (b) | The Fund has entered into agreements with certain brokers to rebate a portion of brokerage commissions. The rebated commissions are used to reduce operating expenses of the Fund. |
| (c) | Total Return excludes contingent deferred sales charge and would be lower for the periods presented if they reflected these charges. |
– 151 –
MASSMUTUAL SELECT INDEXED EQUITY FUND
| | | | | | | | | | | | | | | | | | | | |
| | | Class A | |
| | | Year ended
12/31/06 | | | Year ended
12/31/05 | | | Year ended
12/31/04 | | | Year ended
12/31/03 | | | Year ended
12/31/02 | |
Net asset value, beginning of year | | $ | 11.47 | | | $ | 11.12 | | | $ | 10.23 | | | $ | 8.09 | | | $ | 10.55 | |
| | | | | | | | | | | | | | | | | | | | |
Income (loss) from investment operations: | | | | | | | | | | | | | | | | | | | | |
Net investment income (loss) | | | 0.16 | *** | | | 0.13 | *** | | | 0.13 | *** | | | 0.08 | *** | | | 0.07 | *** |
Net realized and unrealized gain (loss) on investments | | | 1.55 | | | | 0.33 | | | | 0.89 | | | | 2.14 | | | | (2.47 | ) |
| | | | | | | | | | | | | | | | | | | | |
Total income (loss) from investment operations | | | 1.71 | | | | 0.46 | | | | 1.02 | | | | 2.22 | | | | (2.40 | ) |
| | | | | | | | | | | | | | | | | | | | |
Less distributions to shareholders: | | | | | | | | | | | | | | | | | | | | |
From net investment income | | | (0.15 | ) | | | (0.11 | ) | | | (0.13 | ) | | | (0.08 | ) | | | (0.06 | ) |
Tax return of capital | | | (0.00 | )† | | | - | | | | - | | | | - | | | | - | |
| | | | | | | | | | | | | | | | | | | | |
Total distribution | | | (0.15 | ) | | | (0.11 | ) | | | (0.13 | ) | | | (0.08 | ) | | | (0.06 | ) |
| | | | | | | | | | | | | | | | | | | | |
Net asset value, end of year | | $ | 13.03 | | | $ | 11.47 | | | $ | 11.12 | | | $ | 10.23 | | | $ | 8.09 | |
| | | | | | | | | | | | | | | | | | | | |
Total Return(a) | | | 14.95% | (b) | | | 4.17% | (b) | | | 10.01% | (b) | | | 27.49% | | | | (22.74 | )% |
Ratios / Supplemental Data: | | | | | | | | | | | | | | | | | | | | |
Net assets, end of year (000’s) | | $ | 297,468 | | | $ | 271,778 | | | $ | 275,920 | | | $ | 160,470 | | | $ | 70,695 | |
Ratio of expenses to average daily net assets: | | | | | | | | | | | | | | | | | | | | |
Before expense waiver | | | 0.85% | | | | 0.85% | | | | 0.85% | | | | 0.85% | | | | 0.85% | |
After expense waiver | | | 0.67% | # | | | 0.75% | # | | | 0.78% | # | | | N/A | | | | N/A | |
Net investment income (loss) to average daily net assets | | | 1.30% | | | | 1.13% | | | | 1.32% | | | | 0.94% | | | | 0.78% | |
Portfolio turnover rate | | | 4% | | | | 6% | | | | 3% | | | | 2% | | | | 5% | |
| | | Class L | |
| | | Year ended
12/31/06 | | | Year ended
12/31/05 | | | Year ended
12/31/04 | | | Year ended
12/31/03 | | | Year ended
12/31/02 | |
Net asset value, beginning of year | | $ | 11.50 | | | $ | 11.16 | | | $ | 10.26 | | | $ | 8.11 | | | $ | 10.58 | |
| | | | | | | | | | | | | | | | | | | | |
Income (loss) from investment operations: | | | | | | | | | | | | | | | | | | | | |
Net investment income (loss) | | | 0.19 | *** | | | 0.15 | *** | | | 0.16 | *** | | | 0.11 | *** | | | 0.10 | *** |
Net realized and unrealized gain (loss) on investments | | | 1.57 | | | | 0.34 | | | | 0.89 | | | | 2.15 | | | | (2.48 | ) |
| | | | | | | | | | | | | | | | | | | | |
Total income (loss) from investment operations | | | 1.76 | | | | 0.49 | | | | 1.05 | | | | 2.26 | | | | (2.38 | ) |
| | | | | | | | | | | | | | | | | | | | |
Less distributions to shareholders: | | | | | | | | | | | | | | | | | | | | |
From net investment income | | | (0.19 | ) | | | (0.15 | ) | | | (0.15 | ) | | | (0.11 | ) | | | (0.09 | ) |
Tax return of capital | | | (0.00 | )† | | | - | | | | - | | | | - | | | | - | |
| | | | | | | | | | | | | | | | | | | | |
Total distribution | | | (0.19 | ) | | | (0.15 | ) | | | (0.15 | ) | | | (0.11 | ) | | | (0.09 | ) |
| | | | | | | | | | | | | | | | | | | | |
Net asset value, end of year | | $ | 13.07 | | | $ | 11.50 | | | $ | 11.16 | | | $ | 10.26 | | | $ | 8.11 | |
| | | | | | | | | | | | | | | | | | | | |
Total Return(a) | | | 15.28% | | | | 4.41% | | | | 10.25% | | | | 27.88% | | | | (22.53)% | |
Ratios / Supplemental Data: | | | | | | | | | | | | | | | | | | | | |
Net assets, end of year (000’s) | | $ | 337,639 | | | $ | 282,034 | | | $ | 218,755 | | | $ | 176,247 | | | $ | 54,756 | |
Ratio of expenses to average daily net assets: | | | | | | | | | | | | | | | | | | | | |
Before expense waiver | | | 0.60% | | | | 0.60% | | | | 0.60% | | | | 0.60% | | | | 0.60% | |
After expense waiver | | | 0.42% | # | | | 0.50% | # | | | 0.53% | # | | | N/A | | | | N/A | |
Net investment income (loss) to average daily net assets | | | 1.56% | | | | 1.38% | | | | 1.52% | | | | 1.21% | | | | 1.05% | |
Portfolio turnover rate | | | 4% | | | | 6% | | | | 3% | | | | 2% | | | | 5% | |
| *** | Per share amount calculated on the average shares method. |
| # | Computed after giving effect to an agreement by MassMutual to waive certain fees and expenses of the Fund. |
| (a) | Employee retirement benefit plans that invest plan assets in the Separate Investment Accounts (SIAs) may be subject to certain charges as set forth in their respective Plan Documents. Total return figures would be lower for the periods presented if they reflected these charges. |
| (b) | Total Return excludes a front-end sales charge and would be lower for the periods presented if it reflected these charges. |
| † | Tax return of capital is less than $0.01 per share. |
– 152 –
MASSMUTUAL SELECT INDEXED EQUITY FUND
| | | | | | | | | | | | | | | | | | | | |
| | | Class Y | |
| | | Year ended
12/31/06 | | | Year ended
12/31/05 | | | Year ended
12/31/04 | | | Year ended
12/31/03 | | | Year ended
12/31/02 | |
Net asset value, beginning of year | | $ | 11.54 | | | $ | 11.19 | | | $ | 10.29 | | | $ | 8.12 | | | $ | 10.60 | |
| | | | | | | | | | | | | | | | | | | | |
Income (loss) from investment operations: | | | | | | | | | | | | | | | | | | | | |
Net investment income (loss) | | | 0.19 | *** | | | 0.16 | *** | | | 0.17 | *** | | | 0.12 | *** | | | 0.11 | *** |
Net realized and unrealized gain (loss) on investments | | | 1.57 | | | | 0.34 | | | | 0.89 | | | | 2.16 | | | | (2.49 | ) |
| | | | | | | | | | | | | | | | | | | | |
Total income (loss) from investment operations | | | 1.76 | | | | 0.50 | | | | 1.06 | | | | 2.28 | | | | (2.38 | ) |
| | | | | | | | | | | | | | | | | | | | |
Less distributions to shareholders: | | | | | | | | | | | | | | | | | | | | |
From net investment income | | | (0.18 | ) | | | (0.15 | ) | | | (0.16 | ) | | | (0.11 | ) | | | (0.10 | ) |
Tax return of capital | | | (0.00 | )† | | | - | | | | - | | | | - | | | | - | |
| | | | | | | | | | | | | | | | | | | | |
Total distribution | | | (0.18 | ) | | | (0.15 | ) | | | (0.16 | ) | | | (0.11 | ) | | | (0.10 | ) |
| | | | | | | | | | | | | | | | | | | | |
Net asset value, end of year | | $ | 13.12 | | | $ | 11.54 | | | $ | 11.19 | | | $ | 10.29 | | | $ | 8.12 | |
| | | | | | | | | | | | | | | | | | | | |
Total Return(a) | | | 15.27% | | | | 4.49% | | | | 10.31% | | | | 28.10% | | | | (22.47)% | |
Ratios / Supplemental Data: | | | | | | | | | | | | | | | | | | | | |
Net assets, end of year (000’s) | | $ | 494,849 | | | $ | 467,422 | | | $ | 419,366 | | | $ | 299,713 | | | $ | 198,240 | |
Net expenses to average daily net assets | | | 0.45% | | | | 0.45% | | | | 0.45% | | | | 0.45% | | | | 0.45% | |
Net investment income (loss) to average daily net assets | | | 1.53% | | | | 1.43% | | | | 1.63% | | | | 1.34% | | | | 1.18% | |
Portfolio turnover rate | | | 4% | | | | 6% | | | | 3% | | | | 2% | | | | 5% | |
| |
| | | Class S | |
| | | Year ended
12/31/06 | | | Year ended
12/31/05 | | | Year ended
12/31/04 | | | Year ended
12/31/03 | | | Year ended
12/31/02 | |
Net asset value, beginning of year | | $ | 11.65 | | | $ | 11.30 | | | $ | 10.38 | | | $ | 8.19 | | | $ | 10.68 | |
| | | | | | | | | | | | | | | | | | | | |
Income (loss) from investment operations: | | | | | | | | | | | | | | | | | | | | |
Net investment income (loss) | | | 0.19 | *** | | | 0.16 | *** | | | 0.17 | *** | | | 0.12 | *** | | | 0.11 | *** |
Net realized and unrealized gain (loss) on investments | | | 1.60 | | | | 0.35 | | | | 0.91 | | | | 2.18 | | | | (2.50 | ) |
| | | | | | | | | | | | | | | | | | | | |
Total income (loss) from investment operations | | | 1.79 | | | | 0.51 | | | | 1.08 | | | | 2.30 | | | | (2.39 | ) |
| | | | | | | | | | | | | | | | | | | | |
Less distributions to shareholders: | | | | | | | | | | | | | | | | | | | | |
From net investment income | | | (0.19 | ) | | | (0.16 | ) | | | (0.16 | ) | | | (0.11 | ) | | | (0.10 | ) |
Tax return of capital | | | (0.00 | )† | | | - | | | | - | | | | - | | | | - | |
| | | | | | | | | | | | | | | | | | | | |
Total distribution | | | (0.19 | ) | | | (0.16 | ) | | | (0.16 | ) | | | (0.11 | ) | | | (0.10 | ) |
| | | | | | | | | | | | | | | | | | | | |
Net asset value, end of year | | $ | 13.25 | | | $ | 11.65 | | | $ | 11.30 | | | $ | 10.38 | | | $ | 8.19 | |
| | | | | | | | | | | | | | | | | | | | |
Total Return(a) | | | 15.35% | | | | 4.47% | | | | 10.39% | | | | 28.10% | | | | (22.41)% | |
Ratios / Supplemental Data: | | | | | | | | | | | | | | | | | | | | |
Net assets, end of year (000’s) | | $ | 751,170 | | | $ | 677,171 | | | $ | 724,614 | | | $ | 710,691 | | | $ | 567,426 | |
Net expenses to average daily net assets | | | 0.42% | | | | 0.42% | | | | 0.42% | | | | 0.42% | | | | 0.42% | |
Net investment income (loss) to average daily net assets | | | 1.56% | | | | 1.45% | | | | 1.62% | | | | 1.37% | | | | 1.20% | |
Portfolio turnover rate | | | 4% | | | | 6% | | | | 3% | | | | 2% | | | | 5% | |
| *** | Per share amount calculated on the average shares method. |
| (a) | Employee retirement benefit plans that invest plan assets in the Separate Investment Accounts (SIAs) may be subject to certain charges as set forth in their respective Plan Documents. Total return figures would be lower for the periods presented if they reflected these charges. |
| † | Tax return of capital is less than $0.01 per share. |
– 153 –
MASSMUTUAL SELECT INDEXED EQUITY FUND
| | | | | | | | | | | | | | | | | | | | |
| | | Class Z | |
| | | Year ended
12/31/06 | | | Year ended
12/31/05 | | | Year ended
12/31/04 | | | Year ended
12/31/03 | | | Year ended
12/31/02 | |
Net asset value, beginning of year | | $ | 11.65 | | | $ | 11.30 | | | $ | 10.38 | | | $ | 8.19 | | | $ | 10.68 | |
| | | | | | | | | | | | | | | | | | | | |
Income (loss) from investment operations: | | | | | | | | | | | | | | | | | | | | |
Net investment income (loss) | | | 0.22 | *** | | | 0.19 | *** | | | 0.21 | *** | | | 0.15 | *** | | | 0.13 | *** |
Net realized and unrealized gain (loss) on investments | | | 1.59 | | | | 0.34 | | | | 0.90 | | | | 2.17 | | | | (2.50 | ) |
| | | | | | | | | | | | | | | | | | | | |
Total income (loss) from investment operations | | | 1.81 | | | | 0.53 | | | | 1.11 | | | | 2.32 | | | | (2.37 | ) |
| | | | | | | | | | | | | | | | | | | | |
Less distributions to shareholders: | | | | | | | | | | | | | | | | | | | | |
From net investment income | | | (0.21 | ) | | | (0.18 | ) | | | (0.19 | ) | | | (0.13 | ) | | | (0.12 | ) |
Tax return of capital | | | (0.00 | )† | | | - | | | | - | | | | - | | | | - | |
| | | | | | | | | | | | | | | | | | | | |
Total distribution | | | (0.21 | ) | | | (0.18 | ) | | | (0.19 | ) | | | (0.13 | ) | | | (0.12 | ) |
| | | | | | | | | | | | | | | | | | | | |
Net asset value, end of year | | $ | 13.25 | | | $ | 11.65 | | | $ | 11.30 | | | $ | 10.38 | | | $ | 8.19 | |
| | | | | | | | | | | | | | | | | | | | |
Total Return(a) | | | 15.59% | | | | 4.72% | | | | 10.68% | | | | 28.39% | | | | (22.23)% | |
Ratios / Supplemental Data: | | | | | | | | | | | | | | | | | | | | |
Net assets, end of year (000’s) | | $ | 373,069 | | | $ | 251,403 | | | $ | 130,164 | | | $ | 42,906 | | | $ | 16,821 | |
Net expenses to average daily net assets | | | 0.20% | | | | 0.20% | | | | 0.20% | | | | 0.21% | | | | 0.20% | |
Net investment income (loss) to average daily net assets | | | 1.78% | | | | 1.68% | | | | 1.93% | | | | 1.59% | | | | 1.42% | |
Portfolio turnover rate | | | 4% | | | | 6% | | | | 3% | | | | 2% | | | | 5% | |
| | | Class N | |
| | | Year ended
12/31/06 | | | Year ended
12/31/05 | | | Year ended
12/31/04 | | | Year ended
12/31/03 | | | Year ended
12/31/02++ | |
Net asset value, beginning of year | | $ | 11.35 | | | $ | 11.02 | | | $ | 10.15 | | | $ | 8.05 | | | $ | 8.05 | |
| | | | | | | | | | | | | | | | | | | | |
Income (loss) from investment operations: | | | | | | | | | | | | | | | | | | | | |
Net investment income (loss) | | | 0.12 | *** | | | 0.09 | *** | | | 0.10 | *** | | | 0.06 | *** | | | 0.00 | † |
Net realized and unrealized gain (loss) on investments | | | 1.54 | | | | 0.34 | | | | 0.87 | | | | 2.14 | | | | (0.00 | )† |
| | | | | | | | | | | | | | | | | | | | |
Total income (loss) from investment operations | | | 1.66 | | | | 0.43 | | | | 0.97 | | | | 2.20 | | | | - | |
| | | | | | | | | | | | | | | | | | | | |
Less distributions to shareholders: | | | | | | | | | | | | | | | | | | | | |
From net investment income | | | (0.11 | ) | | | (0.10 | ) | | | (0.10 | ) | | | (0.10 | ) | | | - | |
Tax return of capital | | | (0.00 | )† | | | - | | | | - | | | | - | | | | - | |
| | | | | | | | | | | | | | | | | | | | |
Total distribution | | | (0.11 | ) | | | (0.10 | ) | | | (0.10 | ) | | | (0.10 | ) | | | - | |
| | | | | | | | | | | | | | | | | | | | |
Net asset value, end of year | | $ | 12.90 | | | $ | 11.35 | | | $ | 11.02 | | | $ | 10.15 | | | $ | 8.05 | |
| | | | | | | | | | | | | | | | | | | | |
Total Return(a) | | | 14.67% | (b) | | | 3.86% | (b) | | | 9.59% | (b) | | | 27.34% | (b) | | | 0.00% | ‡ |
Ratios / Supplemental Data: | | | | | | | | | | | | | | | | | | | | |
Net assets, end of year (000’s) | | $ | 5,079 | | | $ | 4,757 | | | $ | 3,710 | | | $ | 2,487 | | | $ | 101 | |
Ratio of expenses to average daily net assets: | | | | | | | | | | | | | | | | | | | | |
Before expense waiver | | | 1.15% | | | | 1.15% | | | | 1.15% | | | | 1.15% | | | | - | ‡ |
After expense waiver | | | 0.97% | # | | | 1.05% | # | | | 1.07% | # | | | N/A | | | | N/A | |
Net investment income (loss) to average daily net assets | | | 1.00% | | | | 0.84% | | | | 1.00% | | | | 0.64% | | | | 0.00% | ‡ |
Portfolio turnover rate | | | 4% | | | | 6% | | | | 3% | | | | 2% | | | | 5% | |
| *** | Per share amount calculated on the average shares method. |
| † | Net investment income, net realized and unrealized gain (loss) on investments and tax return of capital are less than $0.01 per share. |
| ++ | Class N commenced operations on December 31, 2002. |
| ‡ | Amounts are de minimis due to the short period of operations. |
| # | Computed after giving effect to an agreement by MassMutual to waive certain fees and expenses of the Fund. |
| (a) | Employee retirement benefit plans that invest plan assets in the Separate Investment Accounts (SIAs) may be subject to certain charges as set forth in their respective Plan Documents. Total return figures would be lower for the periods presented if they reflected these charges. |
| (b) | Total Return excludes contingent deferred sales charge and would be lower for the periods presented if they reflected these charges. |
– 154 –
MASSMUTUAL SELECT CORE OPPORTUNITIES FUND
| | | | | | | | | | | | | | | | | | | | |
| | | Class A | | | Class L | | | Class Y | | | Class S | | | Class N | |
| | | Period ended
12/31/06+ | | | Period ended
12/31/06+ | | | Period ended
12/31/06+ | | | Period ended
12/31/06+ | | | Period ended
12/31/06+ | |
Net asset value, beginning of period | | $ | 10.00 | | | $ | 10.00 | | | $ | 10.00 | | | $ | 10.00 | | | $ | 10.00 | |
| | | | | | | | | | | | | | | | | | | | |
Income (loss) from investment operations: | | | | | | | | | | | | | | | | | | | | |
Net investment income (loss) | | | 0.01 | *** | | | 0.03 | *** | | | (0.01 | )*** | | | 0.04 | *** | | | (0.02 | )*** |
Net realized and unrealized gain (loss) on investments | | | 0.74 | | | | 0.74 | | | | 0.79 | | | | 0.75 | | | | 0.75 | |
| | | | | | | | | | | | | | | | | | | | |
Total income from investment operations | | | 0.75 | | | | 0.77 | | | | 0.78 | | | | 0.79 | | | | 0.73 | |
| | | | | | | | | | | | | | | | | | | | |
Less distributions to shareholders: | | | | | | | | | | | | | | | | | | | | |
From net investment income | | | (0.01 | ) | | | (0.02 | ) | | | (0.02 | ) | | | (0.03 | ) | | | - | |
From net realized gains | | | (0.02 | ) | | | (0.02 | ) | | | (0.02 | ) | | | (0.02 | ) | | | (0.02 | ) |
| | | | | | | | | | | | | | | | | | | | |
Total distributions | | | (0.03 | ) | | | (0.04 | ) | | | (0.04 | ) | | | (0.05 | ) | | | (0.02 | ) |
| | | | | | | | | | | | | | | | | | | | |
Net asset value, end of period | | $ | 10.72 | | | $ | 10.73 | | | $ | 10.74 | | | $ | 10.74 | | | $ | 10.71 | |
| | | | | | | | | | | | | | | | | | | | |
Total Return(a) | | | 7.55% | (b)** | | | 7.76% | ** | | | 7.86% | ** | | | 7.90% | ** | | | 7.33% | (b)** |
Ratios / Supplemental Data: | | | | | | | | | | | | | | | | | | | | |
Net assets, end of period (000’s) | | $ | 9,179 | | | $ | 8,000 | | | $ | 4,436 | | | $ | 10,349 | | | $ | 107 | |
Ratio of expenses to average daily net assets: | | | | | | | | | | | | | | | | | | | | |
Before expense waiver | | | 1.67% | * | | | 1.42% | * | | | 1.27% | * | | | 1.17% | * | | | 1.97% | * |
After expense waiver | | | 1.35% | *# | | | 1.10% | *# | | | 0.95% | *# | | | 0.90% | *# | | | 1.65% | *# |
Net investment income (loss) to average daily net assets | | | 0.13% | * | | | 0.43% | * | | | (0.08)% | * | | | 0.53% | * | | | (0.22)% | * |
Portfolio turnover rate | | | 79% | ** | | | 79% | ** | | | 79% | ** | | | 79% | ** | | | 79% | ** |
| ** | Percentage represents results for the period and are not annualized. |
| *** | Per share amount calculated on the average shares method. |
| # | Computed after giving effect to an agreement by MassMutual to waive certain fees and expenses of the Fund. |
| + | For the period March 31, 2006 (commencement of operations) through December 31, 2006. |
| (a) | Employee retirement benefit plans that invest plan assets in the Separate Investment Accounts (SIAs) may be subject to certain charges as set forth by their respective Plan Documents. Total return figures would be lower for the periods presented if they reflected these charges. |
| (b) | Total return excludes a front-end sales charge for Class A and a contingent deferred sales charge for Class N and would be lower for the period presented if it reflected these charges. |
– 155 –
MASSMUTUAL SELECT BLUE CHIP GROWTH FUND
| | | | | | | | | | | | | | | | | | | | |
| | | Class A | |
| | | Year ended
12/31/06 | | | Year ended
12/31/05††† | | | Year ended
12/31/04 | | | Year ended
12/31/03 | | | Year ended
12/31/02 | |
Net asset value, beginning of year | | $ | 9.01 | | | $ | 8.74 | | | $ | 8.33 | | | $ | 6.72 | | | $ | 9.07 | |
| | | | | | | | | | | | | | | | | | | | |
Income (loss) from investment operations: | | | | | | | | | | | | | | | | | | | | |
Net investment income (loss) | | | (0.01 | )*** | | | (0.02 | )*** | | | 0.03 | *** | | | (0.01 | )*** | | | (0.01 | )*** |
Net realized and unrealized gain (loss) on investments | | | 0.75 | | | | 0.29 | | | | 0.41 | | | | 1.63 | | | | (2.34 | ) |
| | | | | | | | | | | | | | | | | | | | |
Total income (loss) from investment operations | | | 0.74 | | | | 0.27 | | | | 0.44 | | | | 1.62 | | | | (2.35 | ) |
| | | | | | | | | | | | | | | | | | | | |
Less distributions to shareholders: | | | | | | | | | | | | | | | | | | | | |
From net investment income | | | - | | | | - | | | | (0.03 | ) | | | (0.01 | ) | | | (0.00 | )†† |
| | | | | | | | | | | | | | | | | | | | |
Net asset value, end of year | | $ | 9.75 | | | $ | 9.01 | | | $ | 8.74 | | | $ | 8.33 | | | $ | 6.72 | |
| | | | | | | | | | | | | | | | | | | | |
Total Return(a) | | | 8.21% | (c) | | | 3.09% | (c) | | | 5.32% | (c) | | | 24.09% | | | | (25.91)% | |
Ratios / Supplemental Data: | | | | | | | | | | | | | | | | | | | | |
Net assets, end of year (000’s) | | $ | 39,055 | | | $ | 36,742 | | | $ | 37,377 | | | $ | 26,955 | | | $ | 4,914 | |
Ratio of expenses to average daily net assets: | | | | | | | | | | | | | | | | | | | | |
Before expense waiver | | | 1.39% | | | | 1.39% | | | | 1.38% | | | | 1.39% | | | | 1.38% | |
After expense waiver | | | 1.31% | # | | | N/A | | | | 1.38% | (b)# | | | 1.38% | (b)# | | | 1.38% | # |
Net investment income (loss) to average daily net assets | | | (0.12)% | | | | (0.20)% | | | | 0.37% | | | | (0.13)% | | | | (0.20)% | |
Portfolio turnover rate | | | 98% | | | | 28% | | | | 22% | | | | 23% | | | | 30% | |
| | | Class L | |
| | | Year ended
12/31/06 | | | Year ended
12/31/05††† | | | Year ended
12/31/04 | | | Year ended
12/31/03 | | | Year ended
12/31/02 | |
Net asset value, beginning of year | | $ | 9.10 | | | $ | 8.81 | | | $ | 8.39 | | | $ | 6.76 | | | $ | 9.09 | |
| | | | | | | | | | | | | | | | | | | | |
Income (loss) from investment operations: | | | | | | | | | | | | | | | | | | | | |
Net investment income (loss) | | | 0.01 | ***† | | | 0.00 | ***† | | | 0.05 | *** | | | 0.01 | *** | | | (0.00 | )***† |
Net realized and unrealized gain (loss) on investments | | | 0.77 | | | | 0.29 | | | | 0.42 | | | | 1.63 | | | | (2.33 | ) |
| | | | | | | | | | | | | | | | | | | | |
Total income (loss) from investment operations | | | 0.78 | | | | 0.29 | | | | 0.47 | | | | 1.64 | | | | (2.33 | ) |
| | | | | | | | | | | | | | | | | | | | |
Less distributions to shareholders: | | | | | | | | | | | | | | | | | | | | |
From net investment income | | | (0.01 | ) | | | - | | | | (0.05 | ) | | | (0.01 | ) | | | - | |
| | | | | | | | | | | | | | | | | | | | |
Net asset value, end of year | | $ | 9.87 | | | $ | 9.10 | | | $ | 8.81 | | | $ | 8.39 | | | $ | 6.76 | |
| | | | | | | | | | | | | | | | | | | | |
Total Return(a) | | | 8.52% | | | | 3.32% | | | | 5.58% | | | | 24.25% | | | | (25.63)% | |
Ratios / Supplemental Data: | | | | | | | | | | | | | | | | | | | | |
Net assets, end of year (000’s) | | $ | 280,094 | | | $ | 270,082 | | | $ | 301,734 | | | $ | 302,292 | | | $ | 217,427 | |
Ratio of expenses to average daily net assets: | | | | | | | | | | | | | | | | | | | | |
Before expense waiver | | | 1.14% | | | | 1.14% | | | | 1.13% | | | | 1.13% | | | | 1.13% | |
After expense waiver | | | 1.06% | # | | | N/A | | | | 1.13% | (b)# | | | 1.12% | (b)# | | | 1.13% | # |
Net investment income (loss) to average daily net assets | | | 0.13% | | | | 0.05% | | | | 0.54% | | | | 0.14% | | | | (0.05)% | |
Portfolio turnover rate | | | 98% | | | | 28% | | | | 22% | | | | 23% | | | | 30% | |
| *** | Per share amount calculated on the average shares method. |
| † | Net investment income (loss) is less than $0.01 per share. |
| †† | Distributions from net investment income is less than $0.01 per share. |
| ††† | Effective January 1, 2005, brokerage commissions are included with realized gain or loss on investment transactions. Prior to January 1, 2005, these amounts were presented as a reduction of expenses. Prior year amounts have not been restated to reflect this change due to immateriality. (See Note 3) |
| # | Computed after giving effect to an agreement by MassMutual to waive certain fees and expenses of the Fund. |
| (a) | Employee retirement benefit plans that invest plan assets in the Separate Investment Accounts (SIAs) may be subject to certain charges as set forth in their respective Plan Documents. Total return figures would be lower for the periods presented if they reflected these charges. |
| (b) | The Fund has entered into agreements with certain brokers to rebate a portion of brokerage commissions. The rebated commissions are used to reduce operating expenses of the Fund. |
| (c) | Total Return excludes a front-end sales charge and would be lower for the periods presented if it reflected these charges. |
– 156 –
MASSMUTUAL SELECT BLUE CHIP GROWTH FUND
| | | | | | | | | | | | | | | | | | | | |
| | | Class Y | |
| | | Year ended
12/31/06 | | | Year ended
12/31/05††† | | | Year ended
12/31/04 | | | Year ended
12/31/03 | | | Year ended
12/31/02 | |
Net asset value, beginning of year | | $ | 9.11 | | | $ | 8.82 | | | $ | 8.39 | | | $ | 6.77 | | | $ | 9.10 | |
| | | | | | | | | | | | | | | | | | | | |
Income (loss) from investment operations: | | | | | | | | | | | | | | | | | | | | |
Net investment income (loss) | | | 0.03 | *** | | | 0.01 | *** | | | 0.06 | *** | | | 0.02 | *** | | | 0.01 | *** |
Net realized and unrealized gain (loss) on investments | | | 0.76 | | | | 0.30 | | | | 0.43 | | | | 1.62 | | | | (2.34 | ) |
| | | | | | | | | | | | | | | | | | | | |
Total income (loss) from investment operations | | | 0.79 | | | | 0.31 | | | | 0.49 | | | | 1.64 | | | | (2.33 | ) |
| | | | | | | | | | | | | | | | | | | | |
Less distributions to shareholders: | | | | | | | | | | | | | | | | | | | | |
From net investment income | | | (0.03 | ) | | | (0.02 | ) | | | (0.06 | ) | | | (0.02 | ) | | | (0.00 | )†† |
| | | | | | | | | | | | | | | | | | | | |
Net asset value, end of year | | $ | 9.87 | | | $ | 9.11 | | | $ | 8.82 | | | $ | 8.39 | | | $ | 6.77 | |
| | | | | | | | | | | | | | | | | | | | |
Total Return(a) | | | 8.64% | | | | 3.46% | | | | 5.83% | | | | 24.26% | | | | (25.56)% | |
Ratios / Supplemental Data: | | | | | | | | | | | | | | | | | | | | |
Net assets, end of year (000’s) | | $ | 44,656 | | | $ | 4,732 | | | $ | 4,331 | | | $ | 3,626 | | | $ | 827 | |
Ratio of expenses to average daily net assets: | | | | | | | | | | | | | | | | | | | | |
Before expense waiver | | | 1.00% | | | | 1.02% | | | | 1.01% | | | | 1.01% | | | | 1.01% | |
After expense waiver | | | 0.93% | # | | | N/A | | | | 1.01% | (b)# | | | 1.01% | (b)# | | | 1.01% | # |
Net investment income (loss) to average daily net assets | | | 0.29% | | | | 0.17% | | | | 0.68% | | | | 0.26% | | | | 0.12% | |
Portfolio turnover rate | | | 98% | | | | 28% | | | | 22% | | | | 23% | | | | 30% | |
| |
| | | Class S | |
| | | Year ended
12/31/06 | | | Year ended
12/31/05††† | | | Year ended
12/31/04 | | | Year ended
12/31/03 | | | Year ended
12/31/02 | |
Net asset value, beginning of year | | $ | 9.14 | | | $ | 8.84 | | | $ | 8.42 | | | $ | 6.78 | | | $ | 9.10 | |
| | | | | | | | | | | | | | | | | | | | |
Income (loss) from investment operations: | | | | | | | | | | | | | | | | | | | | |
Net investment income (loss) | | | 0.03 | *** | | | 0.03 | *** | | | 0.07 | *** | | | 0.03 | *** | | | 0.02 | *** |
Net realized and unrealized gain (loss) on investments | | | 0.77 | | | | 0.30 | | | | 0.42 | | | | 1.64 | | | | (2.33 | ) |
| | | | | | | | | | | | | | | | | | | | |
Total income (loss) from investment operations | | | 0.80 | | | | 0.33 | | | | 0.49 | | | | 1.67 | | | | (2.31 | ) |
| | | | | | | | | | | | | | | | | | | | |
Less distributions to shareholders: | | | | | | | | | | | | | | | | | | | | |
From net investment income | | | (0.03 | ) | | | (0.03 | ) | | | (0.07 | ) | | | (0.03 | ) | | | (0.01 | ) |
| | | | | | | | | | | | | | | | | | | | |
Net asset value, end of year | | $ | 9.91 | | | $ | 9.14 | | | $ | 8.84 | | | $ | 8.42 | | | $ | 6.78 | |
| | | | | | | | | | | | | | | | | | | | |
Total Return(a) | | | 8.74% | | | | 3.68% | | | | 5.80% | | | | 24.58% | | | | (25.43)% | |
Ratios / Supplemental Data: | | | | | | | | | | | | | | | | | | | | |
Net assets, end of year (000’s) | | $ | 66,864 | | | $ | 71,627 | | | $ | 79,072 | | | $ | 91,674 | | | $ | 72,210 | |
Ratio of expenses to average daily net assets: | | | | | | | | | | | | | | | | | | | | |
Before expense waiver | | | 0.89% | | | | 0.88% | | | | 0.88% | | | | 0.88% | | | | 0.88% | |
After expense waiver | | | 0.82% | # | | | N/A | | | | 0.87% | (b)# | | | 0.87% | (b)# | | | 0.88% | # |
Net investment income (loss) to average daily net assets | | | 0.37% | | | | 0.30% | | | | 0.77% | | | | 0.39% | | | | 0.20% | |
Portfolio turnover rate | | | 98% | | | | 28% | | | | 22% | | | | 23% | | | | 30% | |
| *** | Per share amount calculated on the average shares method. |
| †† | Distributions from net investment income is less than $0.01 per share. |
| ††† | Effective January 1, 2005, brokerage commissions are included with realized gain or loss on investment transactions. Prior to January 1, 2005, these amounts were presented as a reduction of expenses. Prior year amounts have not been restated to reflect this change due to immateriality. (See Note 3) |
| # | Computed after giving effect to an agreement by MassMutual to waive certain fees and expenses of the fund. |
| (a) | Employee retirement benefit plans that invest plan assets in the Separate Investment Accounts (SIAs) may be subject to certain charges as set forth in their respective Plan Documents. Total return figures would be lower for the periods presented if they reflected these charges. |
| (b) | The Fund has entered into agreements with certain brokers to rebate a portion of brokerage commissions. The rebated commissions are used to reduce operating expenses of the Fund. |
– 157 –
MASSMUTUAL SELECT BLUE CHIP GROWTH FUND
| | | | | | | | | | | | | | | | | | | | |
| | | Class N | |
| | | Year ended
12/31/06 | | | Year ended
12/31/05††† | | | Year ended
12/31/04 | | | Year ended
12/31/03 | | | Year ended
12/31/02++ | |
Net asset value, beginning of year | | $ | 8.92 | | | $ | 8.68 | | | $ | 8.27 | | | $ | 6.69 | | | $ | 6.69 | |
| | | | | | | | | | | | | | | | | | | | |
Income (loss) from investment operations: | | | | | | | | | | | | | | | | | | | | |
Net investment income (loss) | | | (0.04 | )*** | | | (0.04 | )*** | | | 0.01 | *** | | | (0.03 | )*** | | | 0.00 | ***† |
Net realized and unrealized gain (loss) on investments | | | 0.75 | | | | 0.28 | | | | 0.41 | | | | 1.61 | | | | (0.00 | )† |
| | | | | | | | | | | | | | | | | | | | |
Total income from investment operations | | | 0.71 | | | | 0.24 | | | | 0.42 | | | | 1.58 | | | | - | |
| | | | | | | | | | | | | | | | | | | | |
Less distributions to shareholders: | | | | | | | | | | | | | | | | | | | | |
From net investment income | | | - | | | | - | | | | (0.01 | ) | | | (0.00 | )†† | | | - | |
| | | | | | | | | | | | | | | | | | | | |
Net asset value, end of year | | $ | 9.63 | | | $ | 8.92 | | | $ | 8.68 | | | $ | 8.27 | | | $ | 6.69 | |
| | | | | | | | | | | | | | | | | | | | |
Total Return(a) | | | 7.96% | (c) | | | 2.77% | (c) | | | 5.05% | (c) | | | 23.64% | (c) | | | 0.00% | ‡ |
Ratios / Supplemental Data: | | | | | | | | | | | | | | | | | | | | |
Net assets, end of year (000’s) | | $ | 3,509 | | | $ | 1,957 | | | $ | 2,185 | | | $ | 1,493 | | | $ | 101 | |
Ratio of expenses to average daily net assets: | | | | | | | | | | | | | | | | | | | | |
Before expense waiver | | | 1.69% | | | | 1.69% | | | | 1.68% | | | | 1.69% | | | | - | ‡ |
After expense waiver | | | 1.61% | # | | | N/A | | | | 1.68% | (b)# | | | 1.69% | (b)# | | | N/A | ‡ |
Net investment income (loss) to average daily net assets | | | (0.41)% | | | | (0.50)% | | | | 0.08% | | | | (0.45)% | | | | 0.00% | ‡ |
Portfolio turnover rate | | | 98% | | | | 28% | | | | 22% | | | | 23% | | | | 30% | |
| *** | Per share amount calculated on the average shares method. |
| † | Net investment income and net realized and unrealized loss on investments are less than $0.01 per share. |
| †† | Distributions from net investment income is less than $0.01 per share. |
| ††† | Effective January 1, 2005, brokerage commissions are included with realized gain or loss on investment transactions. Prior to January 1, 2005, these amounts were presented as a reduction of expenses. Prior year amounts have not been restated to reflect this change due to immateriality. (See Note 3) |
| ++ | Class N commenced operations on December 31, 2002. |
| ‡ | Amounts are de minimis due to the short period of operations. |
| # | Computed after giving effect to an agreement by MassMutual to waive certain fees and expenses of the Fund. |
| (a) | Employee retirement benefit plans that invest plan assets in the Separate Investment Accounts (SIAs) may be subject to certain charges as set forth in their respective Plan Documents. Total return figures would be lower for the periods presented if they reflected these charges. |
| (b) | The Fund has entered into agreements with certain brokers to rebate a portion of brokerage commissions. The rebated commissions are used to reduce operating expenses of the Fund. |
| (c) | Total Return excludes contingent deferred sales charge and would be lower for the periods presented if they reflected these charges. |
– 158 –
MASSMUTUAL SELECT LARGE CAP GROWTH FUND
| | | | | | | | | | | | | | | | | | | | |
| | | Class A | |
| | | Year ended
12/31/06 | | | Year ended
12/31/05†† | | | Year ended
12/31/04 | | | Year ended
12/31/03 | | | Year ended
12/31/02 | |
Net asset value, beginning of year | | $ | 10.29 | | | $ | 9.03 | | | $ | 8.48 | | | $ | 6.97 | | | $ | 10.00 | |
| | | | | | | | | | | | | | | | | | | | |
Income (loss) from investment operations: | | | | | | | | | | | | | | | | | | | | |
Net investment income (loss) | | | (0.05 | )*** | | | (0.06 | )*** | | | (0.02 | )*** | | | (0.03 | )*** | | | (0.04 | )*** |
Net realized and unrealized gain (loss) on investments | | | 0.05 | | | | 1.32 | | | | 0.57 | | | | 1.54 | | | | (2.99 | ) |
| | | | | | | | | | | | | | | | | | | | |
Total income (loss) from investment operations | | | 0.00 | | | | 1.26 | | | | 0.55 | | | | 1.51 | | | | (3.03 | ) |
| | | | | | | | | | | | | | | | | | | | |
Less distributions to shareholders: | | | | | | | | | | | | | | | | | | | | |
From net realized gains | | | (0.41 | ) | | | - | | | | - | | | | - | | | | - | |
| | | | | | | | | | | | | | | | | | | | |
Net asset value, end of year | | $ | 9.88 | | | $ | 10.29 | | | $ | 9.03 | | | $ | 8.48 | | | $ | 6.97 | |
| | | | | | | | | | | | | | | | | | | | |
Total Return(a) | | | (0.02)% | (c) | | | 13.95% | (c) | | | 6.49% | (c) | | | 21.66% | | | | (30.30)% | |
Ratios / Supplemental Data: | | | | | | | | | | | | | | | | | | | | |
Net assets, end of year (000’s) | | $ | 8,278 | | | $ | 3,452 | | | $ | 1,997 | | | $ | 1,374 | | | $ | 826 | |
Ratio of expenses to average daily net assets: | | | | | | | | | | | | | | | | | | | | |
Before expense waiver | | | 1.39% | | | | 1.38% | | | | 1.37% | | | | 1.34% | | | | 1.40% | |
After expense waiver | | | N/A | | | | 1.35% | # | | | 1.25% | (b)# | | | 1.25% | (b)# | | | 1.22% | (b)# |
Net investment income (loss) to average daily net assets | | | (0.55)% | | | | (0.65)% | | | | (0.20)% | | | | (0.34)% | | | | (0.48)% | |
Portfolio turnover rate | | | 98% | | | | 83% | | | | 68% | | | | 47% | | | | 56% | |
| | | Class L | |
| | | Year ended
12/31/06 | | | Year ended
12/31/05†† | | | Year ended
12/31/04 | | | Year ended
12/31/03 | | | Year ended
12/31/02 | |
Net asset value, beginning of year | | $ | 10.53 | | | $ | 9.09 | | | $ | 8.52 | | | $ | 6.99 | | | $ | 10.00 | |
| | | | | | | | | | | | | | | | | | | | |
Income (loss) from investment operations: | | | | | | | | | | | | | | | | | | | | |
Net investment income (loss) | | | (0.03 | )*** | | | (0.05 | )*** | | | 0.00 | ***††† | | | (0.01 | )*** | | | (0.01 | )*** |
Net realized and unrealized gain (loss) on investments | | | 0.05 | | | | 1.49 | | | | 0.57 | | | | 1.54 | | | | (3.00 | ) |
| | | | | | | | | | | | | | | | | | | | |
Total income (loss) from investment operations | | | 0.02 | | | | 1.44 | | | | 0.57 | | | | 1.53 | | | | (3.01 | ) |
| | | | | | | | | | | | | | | | | | | | |
Less distributions to shareholders: | | | | | | | | | | | | | | | | | | | | |
From net investment income | | | - | | | | - | | | | (0.00 | )† | | | - | | | | - | |
From net realized gains | | | (0.41 | ) | | | - | | | | - | | | | - | | | | - | |
| | | | | | | | | | | | | | | | | | | | |
Net asset value, end of year | | $ | 10.14 | | | $ | 10.53 | | | $ | 9.09 | | | $ | 8.52 | | | $ | 6.99 | |
| | | | | | | | | | | | | | | | | | | | |
Total Return(a) | | | 0.17% | | | | 15.84% | | | | 6.72% | | | | 21.89% | | | | (30.10)% | |
Ratios / Supplemental Data: | | | | | | | | | | | | | | | | | | | | |
Net assets, end of year (000’s) | | $ | 1,630 | | | $ | 1,032 | | | $ | 9,272 | | | $ | 7,628 | | | $ | 3,883 | |
Ratio of expenses to average daily net assets: | | | | | | | | | | | | | | | | | | | | |
Before expense waiver | | | 1.15% | | | | 1.09% | | | | 1.12% | | | | 1.09% | | | | 1.15% | |
After expense waiver | | | N/A | | | | 1.06% | # | | | 1.00% | (b)# | | | 1.00% | (b)# | | | 0.98% | (b)# |
Net investment income (loss) to average daily net assets | | | (0.30)% | | | | (0.55)% | | | | 0.04% | | | | (0.08)% | | | | (0.20)% | |
Portfolio turnover rate | | | 98% | | | | 83% | | | | 68% | | | | 47% | | | | 56% | |
| *** | Per share amount calculated on the average shares method. |
| † | Distributions from net investment income was less than $0.01 per share. |
| †† | Effective January 1, 2005, rebated brokerage commissions are included with realized gain or loss on investment transactions. Prior to January 1, 2005, these amounts were presented as a reduction of expenses. Prior year amounts have not been restated to reflect this change due to immateriality. (See Note 3) |
| ††† | Net investment income was less than $0.01 per share. |
| # | Computed after giving effect to an agreement by MassMutual to waive certain fees and expenses of the Fund. |
| (a) | Employee retirement benefit plans that invest plan assets in the Separate Investment Accounts (SIAs) may be subject to certain charges as set forth by their respective Plan Documents. Total return figures would be lower for the periods presented if they reflected these charges. |
| (b) | The Fund has entered into agreements with certain brokers to rebate a portion of brokerage commissions. The rebated commissions are used to reduce operating expenses of the Fund. |
| (c) | Total Return excludes a front-end sales charge and would be lower for the period presented if it reflected these charges. |
– 159 –
MASSMUTUAL SELECT LARGE CAP GROWTH FUND
| | | | | | | | | | | | | | | | | | | | |
| | | Class Y | |
| | | Year ended
12/31/06 | | | Year ended
12/31/05†† | | | Year ended
12/31/04 | | | Year ended
12/31/03 | | | Year ended
12/31/02 | |
Net asset value, beginning of year | | $ | 10.42 | | | $ | 9.10 | | | $ | 8.53 | | | $ | 7.00 | | | $ | 10.00 | |
| | | | | | | | | | | | | | | | | | | | |
Income (loss) from investment operations: | | | | | | | | | | | | | | | | | | | | |
Net investment income (loss) | | | (0.02 | )*** | | | (0.02 | )*** | | | 0.02 | *** | | | 0.01 | *** | | | (0.01 | )*** |
Net realized and unrealized gain (loss) on investments | | | 0.06 | | | | 1.34 | | | | 0.57 | | | | 1.53 | | | | (2.99 | ) |
| | | | | | | | | | | | | | | | | | | | |
Total income (loss) from investment operations | | | 0.04 | | | | 1.32 | | | | 0.59 | | | | 1.54 | | | | (3.00 | ) |
| | | | | | | | | | | | | | | | | | | | |
Less distributions to shareholders: | | | | | | | | | | | | | | | | | | | | |
From net investment income | | | - | | | | - | | | | (0.02 | ) | | | (0.01 | ) | | | - | |
From net realized gains | | | (0.41 | ) | | | - | | | | - | | | | - | | | | - | |
| | | | | | | | | | | | | | | | | | | | |
Net asset value, end of year | | $ | 10.05 | | | $ | 10.42 | | | $ | 9.10 | | | $ | 8.53 | | | $ | 7.00 | |
| | | | | | | | | | | | | | | | | | | | |
Total Return(a) | | | 0.37% | | | | 14.51% | | | | 6.86% | | | | 22.04% | | | | (30.00)% | |
Ratios / Supplemental Data: | | | | | | | | | | | | | | | | | | | | |
Net assets, end of year (000’s) | | $ | 10,043 | | | $ | 12,099 | | | $ | 9,052 | | | $ | 7,697 | | | $ | 78 | |
Ratio of expenses to average daily net assets: | | | | | | | | | | | | | | | | | | | | |
Before expense waiver | | | 0.98% | | | | 0.98% | | | | 0.97% | | | | 0.94% | | | | 1.00% | |
After expense waiver | | | N/A | | | | 0.95% | # | | | 0.85% | (b)# | | | 0.86% | (b)# | | | 0.82% | (b)# |
Net investment income (loss) to average daily net assets | | | (0.19)% | | | | (0.26)% | | | | 0.19% | | | | 0.08% | | | | (0.11)% | |
Portfolio turnover rate | | | 98% | | | | 83% | | | | 68% | | | | 47% | | | | 56% | |
| | | Class S | |
| | | Year ended
12/31/06 | | | Year ended
12/31/05†† | | | Year ended
12/31/04 | | | Year ended
12/31/03 | | | Year ended
12/31/02 | |
Net asset value, beginning of year | | $ | 10.46 | | | $ | 9.14 | | | $ | 8.55 | | | $ | 7.01 | | | $ | 10.00 | |
| | | | | | | | | | | | | | | | | | | | |
Income (loss) from investment operations: | | | | | | | | | | | | | | | | | | | | |
Net investment income (loss) | | | (0.02 | )*** | | | (0.02 | )*** | | | 0.01 | *** | | | 0.01 | *** | | | (0.00 | )***† |
Net realized and unrealized gain (loss) on investments | | | 0.06 | | | | 1.34 | | | | 0.59 | | | | 1.54 | | | | (2.99 | ) |
| | | | | | | | | | | | | | | | | | | | |
Total income (loss) from investment operations | | | 0.04 | | | | 1.32 | | | | 0.60 | | | | 1.55 | | | | (2.99 | ) |
| | | | | | | | | | | | | | | | | | | | |
Less distributions to shareholders: | | | | | | | | | | | | | | | | | | | | |
From net investment income | | | - | | | | - | | | | (0.01 | ) | | | (0.01 | ) | | | - | |
From net realized gains | | | (0.41 | ) | | | - | | | | - | | | | - | | | | - | |
| | | | | | | | | | | | | | | | | | | | |
Net asset value, end of year | | $ | 10.09 | | | $ | 10.46 | | | $ | 9.14 | | | $ | 8.55 | | | $ | 7.01 | |
| | | | | | | | | | | | | | | | | | | | |
Total Return(a) | | | 0.36% | | | | 14.44% | | | | 7.08% | | | | 22.05% | | | | (29.90)% | |
Ratios / Supplemental Data: | | | | | | | | | | | | | | | | | | | | |
Net assets, end of year (000’s) | | $ | 20,909 | | | $ | 26,241 | | | $ | 18,791 | | | $ | 33,787 | | | $ | 28,029 | |
Ratio of expenses to average daily net assets: | | | | | | | | | | | | | | | | | | | | |
Before expense waiver | | | 0.94% | | | | 0.94% | | | | 0.93% | | | | 0.90% | | | | 0.96% | |
After expense waiver | | | N/A | | | | 0.91% | # | | | 0.81% | (b)# | | | 0.81% | (b)# | | | 0.77% | (b)# |
Net investment income (loss) to average daily net assets | | | (0.15)% | | | | (0.21)% | | | | 0.16% | | | | 0.11% | | | | (0.05)% | |
Portfolio turnover rate | | | 98% | | | | 83% | | | | 68% | | | | 47% | | | | 56% | |
| *** | Per share amount calculated on the average shares method. |
| † | Net investment loss is less than $0.01 per share. |
| †† | Effective January 1, 2005, rebated brokerage commissions are included with realized gain or loss on investment transactions. Prior to January 1, 2005, these amounts were presented as a reduction of expenses. Prior year amounts have not been restated to reflect this change due to immateriality. (See Note 3) |
| # | Computed after giving effect to an agreement by MassMutual to waive certain fees and expenses of the Fund. |
| (a) | Employee retirement benefit plans that invest plan assets in the Separate Investment Accounts (SIAs) may be subject to certain charges as set forth by their respective Plan Documents. Total return figures would be lower for the periods presented if they reflected these charges. |
| (b) | The Fund has entered into agreements with certain brokers to rebate a portion of brokerage commissions. The rebated commissions are used to reduce operating expenses of the Fund. |
– 160 –
MASSMUTUAL SELECT LARGE CAP GROWTH FUND
| | | | | | | | | | | | | | | | | | | | |
| | | Class N | |
| | | Year ended
12/31/06 | | | Year ended
12/31/05†† | | | Year ended
12/31/04 | | | Year ended
12/31/03 | | | Year ended
12/31/02++ | |
Net asset value, beginning of year | | $ | 10.31 | | | $ | 9.07 | | | $ | 8.42 | | | $ | 6.94 | | | $ | 6.95 | |
| | | | | | | | | | | | | | | | | | | | |
Income (loss) from investment operations: | | | | | | | | | | | | | | | | | | | | |
Net investment income (loss) | | | (0.09 | )*** | | | (0.09 | )*** | | | (0.07 | )*** | | | (0.05 | )*** | | | (0.00 | )***† |
Net realized and unrealized gain (loss) on investments | | | 0.05 | | | | 1.33 | | | | 0.72 | | | | 1.53 | | | | (0.01 | ) |
| | | | | | | | | | | | | | | | | | | | |
Total income from investment operations | | | (0.04 | ) | | | 1.24 | | | | 0.65 | | | | 1.48 | | | | (0.01 | ) |
| | | | | | | | | | | | | | | | | | | | |
Less distributions to shareholders: | | | | | | | | | | | | | | | | | | | | |
From net realized gains | | | (0.41 | ) | | | - | | | | - | | | | - | | | | - | |
| | | | | | | | | | | | | | | | | | | | |
Net asset value, end of year | | $ | 9.86 | | | $ | 10.31 | | | $ | 9.07 | | | $ | 8.42 | | | $ | 6.94 | |
| | | | | | | | | | | | | | | | | | | | |
Total Return(a) | | | (0.41)% | (c) | | | 13.67% | (c) | | | 7.72% | (c) | | | 21.33% | (c) | | | - | ‡ |
Ratios / Supplemental Data: | | | | | | | | | | | | | | | | | | | | |
Net assets, end of year (000’s) | | $ | 1 | | | $ | 1 | | | $ | 5 | | | $ | 125 | | | $ | 101 | |
Ratio of expenses to average daily net assets: | | | | | | | | | | | | | | | | | | | | |
Before expense waiver | | | 1.69% | | | | 1.66% | | | | 1.67% | | | | 1.64% | | | | - | ‡ |
After expense waiver | | | N/A | | | | 1.63% | # | | | 1.56% | (b)# | | | 1.55% | (b)# | | | - | ‡ |
Net investment income (loss) to average daily net assets | | | (0.93)% | | | | (0.94)% | | | | (0.83)% | | | | (0.63)% | | | | - | ‡ |
Portfolio turnover rate | | | 98% | | | | 83% | | | | 68% | | | | 47% | | | | 56% | |
| *** | Per share amount calculated on the average shares method. |
| † | Net investment loss is less than $0.01 per share. |
| †† | Effective January 1, 2005, rebated brokerage commissions are included with realized gain or loss on investment transactions. Prior to January 1, 2005, these amounts were presented as a reduction of expenses. Prior year amounts have not been restated to reflect this change due to immateriality. (See Note 3) |
| ++ | Class N commenced operations on December 31, 2002. |
| ‡ | Amounts are de minimis due to the short period of operations. |
| # | Computed after giving effect to an agreement by MassMutual to waive certain fees and expenses of the Fund. |
| (a) | Employee retirement benefit plans that invest plan assets in the Separate Investment Accounts (SIAs) may be subject to certain charges as set forth by their respective Plan Documents. Total return figures would be lower for the periods presented if they reflected these charges. |
| (b) | The Fund has entered into agreements with certain brokers to rebate a portion of brokerage commissions. The rebated commissions are used to reduce operating expenses of the Fund. |
| (c) | Total Return excludes contingent deferred sales charge and would be lower for the periods presented if they reflected these charges. |
– 161 –
MASSMUTUAL SELECT GROWTH EQUITY FUND
| | | | | | | | | | | | | | | | | | | | |
| | | Class A | |
| | | Year ended
12/31/06 | | | Year ended
12/31/05† | | | Year ended
12/31/04 | | | Year ended
12/31/03 | | | Year ended
12/31/02 | |
Net asset value, beginning of year | | $ | 8.00 | | | $ | 7.74 | | | $ | 7.40 | | | $ | 6.04 | | | $ | 8.39 | |
| | | | | | | | | | | | | | | | | | | | |
Income (loss) from investment operations: | | | | | | | | | | | | | | | | | | | | |
Net investment income (loss) | | | 0.01 | *** | | | 0.00 | ***†† | | | 0.00 | ***†† | | | (0.02 | )*** | | | (0.03 | )*** |
Net realized and unrealized gain (loss) on investments | | | 0.11 | | | | 0.26 | | | | 0.34 | | | | 1.38 | | | | (2.32 | ) |
| | | | | | | | | | | | | | | | | | | | |
Total income from investment operations | | | 0.12 | | | | 0.26 | | | | 0.34 | | | | 1.36 | | | | (2.35 | ) |
| | | | | | | | | | | | | | | | | | | | |
Less distributions to shareholders: | | | | | | | | | | | | | | | | | | | | |
From net investment income | | | (0.00 | )††† | | | (0.00 | )††† | | | (0.00 | )††† | | | - | | | | - | |
| | | | | | | | | | | | | | | | | | | | |
Net asset value, end of year | | $ | 8.12 | | | $ | 8.00 | | | $ | 7.74 | | | $ | 7.40 | | | $ | 6.04 | |
| | | | | | | | | | | | | | | | | | | | |
Total Return(a) | | | 1.51% | (c) | | | 3.39% | (c) | | | 4.60% | (c) | | | 22.52% | | | | (28.01)% | |
Ratios / Supplemental Data: | | | | | | | | | | | | | | | | | | | | |
Net assets, end of year (000’s) | | $ | 119,863 | | | $ | 229,120 | | | $ | 224,998 | | | $ | 206,097 | | | $ | 79,267 | |
Ratio of expenses to average daily net assets: | | | | | | | | | | | | | | | | | | | | |
Before expense waiver | | | 1.25% | | | | 1.25% | | | | 1.26% | | | | 1.26% | | | | 1.26% | |
After expense waiver | | | N/A | | | | N/A | | | | 1.24% | (b)# | | | 1.18% | (b)# | | | 1.22% | (b)# |
Net investment income (loss) to average daily net assets | | | 0.11% | | | | 0.05% | | | | 0.01% | | | | (0.31)% | | | | (.41)% | |
Portfolio turnover rate | | | 114% | | | | 92% | | | | 181% | | | | 260% | | | | 224% | |
| | | Class L | |
| | | Year ended
12/31/06 | | | Year ended
12/31/05† | | | Year ended
12/31/04 | | | Year ended
12/31/03 | | | Year ended
12/31/02 | |
Net asset value, beginning of year | | $ | 8.09 | | | $ | 7.83 | | | $ | 7.49 | | | $ | 6.10 | | | $ | 8.45 | |
| | | | | | | | | | | | | | | | | | | | |
Income (loss) from investment operations: | | | | | | | | | | | | | | | | | | | | |
Net investment income (loss) | | | 0.03 | *** | | | 0.02 | *** | | | 0.02 | *** | | | (0.00 | )***†† | | | (0.01 | )*** |
Net realized and unrealized gain (loss) on investments | | | 0.12 | | | | 0.26 | | | | 0.34 | | | | 1.39 | | | | (2.34 | ) |
| | | | | | | | | | | | | | | | | | | | |
Total income from investment operations | | | 0.15 | | | | 0.28 | | | | 0.36 | | | | 1.39 | | | | (2.35 | ) |
| | | | | | | | | | | | | | | | | | | | |
Less distributions to shareholders: | | | | | | | | | | | | | | | | | | | | |
From net investment income | | | (0.04 | ) | | | (0.02 | ) | | | (0.02 | ) | | | - | | | | - | |
| | | | | | | | | | | | | | | | | | | | |
Net asset value, end of year | | $ | 8.20 | | | $ | 8.09 | | | $ | 7.83 | | | $ | 7.49 | | | $ | 6.10 | |
| | | | | | | | | | | | | | | | | | | | |
Total Return(a) | | | 1.80% | | | | 3.61% | | | | 4.82% | | | | 22.79% | | | | (27.81)% | |
Ratios / Supplemental Data: | | | | | | | | | | | | | | | | | | | | |
Net assets, end of year (000’s) | | $ | 319,548 | | | $ | 291,037 | | | $ | 276,387 | | | $ | 201,623 | | | $ | 99,822 | |
Ratio of expenses to average daily net assets: | | | | | | | | | | | | | | | | | | | | |
Before expense waiver | | | 1.00% | | | | 1.00% | | | | 1.01% | | | | 1.01% | | | | 1.01% | |
After expense waiver | | | N/A | | | | N/A | | | | 0.99% | (b)# | | | 0.92% | (b)# | | | 0.97% | (b)# |
Net investment income (loss) to average daily net assets | | | 0.36% | | | | 0.30% | | | | 0.29% | | | | (0.05)% | | | | (.17)% | |
Portfolio turnover rate | | | 114% | | | | 92% | | | | 181% | | | | 260% | | | | 224% | |
| *** | Per share amount calculated on the average shares method. |
| † | Effective January 1, 2005, rebated brokerage commissions are included with realized gain or loss on investment transactions. Prior to January 1, 2005, these amounts were presented as a reduction of expenses. Prior year amounts have not been restated to reflect this change due to immateriality. (See Note 3) |
| †† | Net investment income (loss) is less than $0.01 per share. |
| ††† | Distribution from net investment income is less than $0.01 per share. |
| # | Computed after giving effect to an agreement by MassMutual to waive certain fees and expenses of the Fund. |
| (a) | Employee retirement benefit plans that invest plan assets in the Separate Investment Accounts (SIAs) may be subject to certain charges as set forth in their respective Plan Documents. Total return figures would be lower for all periods shown if they reflected these charges. |
| (b) | The Fund has entered into agreements with certain brokers to rebate a portion of brokerage commissions. The rebated commissions are used to reduce operating expenses of the Fund. |
| (c) | Total Return excludes a front-end sales charge and would be lower for the periods presented if they reflected these charges. |
– 162 –
MASSMUTUAL SELECT GROWTH EQUITY FUND
| | | | | | | | | | | | | | | | | | | | |
| | | Class Y | |
| | | Year ended
12/31/06 | | | Year ended
12/31/05† | | | Year ended
12/31/04 | | | Year ended
12/31/03 | | | Year ended
12/31/02 | |
Net asset value, beginning of year | | $ | 8.14 | | | $ | 7.88 | | | $ | 7.54 | | | $ | 6.12 | | | $ | 8.47 | |
| | | | | | | | | | | | | | | | | | | | |
Income (loss) from investment operations: | | | | | | | | | | | | | | | | | | | | |
Net investment income (loss) | | | 0.04 | *** | | | 0.04 | *** | | | 0.03 | *** | | | 0.01 | *** | | | (0.00 | )***†† |
Net realized and unrealized gain (loss)on investments | | | 0.11 | | | | 0.25 | | | | 0.34 | | | | 1.41 | | | | (2.35 | ) |
| | | | | | | | | | | | | | | | | | | | |
Total income from investment operations | | | 0.15 | | | | 0.29 | | | | 0.37 | | | | 1.42 | | | | (2.35 | ) |
| | | | | | | | | | | | | | | | | | | | |
Less distributions to shareholders: | | | | | | | | | | | | | | | | | | | | |
From net investment income | | | (0.04 | ) | | | (0.03 | ) | | | (0.03 | ) | | | - | | | | - | |
| | | | | | | | | | | | | | | | | | | | |
Net asset value, end of year | | $ | 8.25 | | | $ | 8.14 | | | $ | 7.88 | | | $ | 7.54 | | | $ | 6.12 | |
| | | | | | | | | | | | | | | | | | | | |
Total Return(a) | | | 1.88% | | | | 3.72% | | | | 4.92% | | | | 23.20% | | | | (27.75)% | |
Ratios / Supplemental Data: | | | | | | | | | | | | | | | | | | | | |
Net assets, end of year (000’s) | | $ | 63,323 | | | $ | 115,290 | | | $ | 112,683 | | | $ | 101,937 | | | $ | 70,469 | |
Ratio of expenses to average daily net assets: | | | | | | | | | | | | | | | | | | | | |
Before expense waiver | | | 0.85% | | | | 0.85% | | | | 0.86% | | | | 0.86% | | | | 0.86% | |
After expense waiver | | | N/A | | | | N/A | | | | 0.84% | (b)# | | | 0.77% | (b)# | | | 0.82% | (b)# |
Net investment income (loss) to average daily net assets | | | 0.54% | | | | 0.45% | | | | 0.42% | | | | 0.10% | | | | (.03)% | |
Portfolio turnover rate | | | 114% | | | | 92% | | | | 181% | | | | 260% | | | | 224% | |
| |
| | | Class S | |
| | | Year ended
12/31/06 | | | Year ended
12/31/05† | | | Year ended
12/31/04 | | | Year ended
12/31/03 | | | Year ended
12/31/02 | |
Net asset value, beginning of year | | $ | 8.17 | | | $ | 7.90 | | | $ | 7.56 | | | $ | 6.14 | | | $ | 8.49 | |
| | | | | | | | | | | | | | | | | | | | |
Income (loss) from investment operations: | | | | | | | | | | | | | | | | | | | | |
Net investment income (loss) | | | 0.05 | *** | | | 0.04 | *** | | | 0.04 | *** | | | 0.01 | *** | | | (0.00 | )***†† |
Net realized and unrealized gain loss) on investments | | | 0.11 | | | | 0.27 | | | | 0.34 | | | | 1.41 | | | | (2.35 | ) |
| | | | | | | | | | | | | | | | | | | | |
Total income from investment operations | | | 0.16 | | | | 0.31 | | | | 0.38 | | | | 1.42 | | | | (2.35 | ) |
| | | | | | | | | | | | | | | | | | | | |
Less distributions to shareholders: | | | | | | | | | | | | | | | | | | | | |
From net investment income | | | (0.05 | ) | | | (0.04 | ) | | | (0.04 | ) | | | - | | | | - | |
| | | | | | | | | | | | | | | | | | | | |
Net asset value, end of year | | $ | 8.28 | | | $ | 8.17 | | | $ | 7.90 | | | $ | 7.56 | | | $ | 6.14 | |
| | | | | | | | | | | | | | | | | | | | |
Total Return(a) | | | 2.00% | | | | 3.91% | | | | 4.96% | | | | 23.13% | | | | (27.68)% | |
Ratios / Supplemental Data: | | | | | | | | | | | | | | | | | | | | |
Net assets, end of year (000’s) | | $ | 258,838 | | | $ | 269,166 | | | $ | 229,407 | | | $ | 217,508 | | | $ | 130,165 | |
Ratio of expenses to average daily net assets: | | | | | | | | | | | | | | | | | | | | |
Before expense waiver | | | 0.79% | | | | 0.79% | | | | 0.80% | | | | 0.80% | | | | 0.80% | |
After expense waiver | | | N/A | | | | N/A | | | | 0.78% | (b)# | | | 0.71% | (b)# | | | 0.76% | (b)# |
Net investment income (loss) to average daily net assets | | | 0.58% | | | | 0.51% | | | | 0.48% | | | | 0.16% | | | | (.04)% | |
Portfolio turnover rate | | | 114% | | | | 92% | | | | 181% | | | | 260% | | | | 224% | |
| *** | Per share amount calculated on the average shares method. |
| † | Effective January 1, 2005, rebated brokerage commissions are included with realized gain or loss on investment transactions. Prior to January 1, 2005, these amounts were presented as a reduction of expenses. Prior year amounts have not been restated to reflect this change due to immateriality. (See Note 3) |
| †† | Net investment income (loss) is less than $.01 per share. |
| # | Computed after giving effect to an agreement by MassMutual to waive certain fees and expenses of the Fund. |
| (a) | Employee retirement benefit plans that invest plan assets in the Separate Investment Accounts (SIAs) may be subject to certain charges as set forth in their respective Plan Documents. Total return figures would be lower for all periods shown if they reflected these charges. |
| (b) | The Fund has entered into agreements with certain brokers to rebate a portion of brokerage commissions. The rebated commissions are used to reduce operating expenses of the Fund. |
– 163 –
MASSMUTUAL SELECT GROWTH EQUITY FUND
| | | | | | | | | | | | | | | | | | | | |
| | | Class N | |
| | | Year ended
12/31/06 | | | Year ended
12/31/05† | | | Year ended
12/31/04 | | | Year ended
12/31/03 | | | Period ended
12/31/02++ | |
Net asset value, beginning of year | | $ | 7.89 | | | $ | 7.65 | | | $ | 7.34 | | | $ | 6.01 | | | $ | 6.01 | |
| | | | | | | | | | | | | | | | | | | | |
Income (loss) from investment operations: | | | | | | | | | | | | | | | | | | | | |
Net investment income (loss) | | | (0.01 | )*** | | | (0.02 | )*** | | | (0.02 | )*** | | | (0.05 | )*** | | | (0.00 | )***†† |
Net realized and unrealized gain (loss) on investments | | | 0.11 | | | | 0.26 | | | | 0.33 | | | | 1.38 | | | | (0.00 | )†† |
| | | | | | | | | | | | | | | | | | | | |
Total income from investment operations | | | 0.10 | | | | 0.24 | | | | 0.31 | | | | 1.33 | | | | 0.00 | |
| | | | | | | | | | | | | | | | | | | | |
Net asset value, end of year | | $ | 7.99 | | | $ | 7.89 | | | $ | 7.65 | | | $ | 7.34 | | | $ | 6.01 | |
| | | | | | | | | | | | | | | | | | | | |
Total Return(a) | | | 1.27% | (c) | | | 3.14% | (c) | | | 4.22% | (c) | | | 22.13% | (c) | | | - | ‡ |
Ratios / Supplemental Data: | | | | | | | | | | | | | | | | | | | | |
Net assets, end of year (000’s) | | $ | 79 | | | $ | 1,294 | | | $ | 1,472 | | | $ | 1,661 | | | $ | 101 | ‡ |
Ratio of expenses to average daily net assets: | | | | | | | | | | | | | | | | | | | | |
Before expense waiver | | | 1.55% | | | | 1.55% | | | | 1.56% | | | | 1.57% | | | | - | ‡ |
After expense waiver | | | N/A | | | | N/A | | | | 1.54% | (b)# | | | 1.52% | (b)# | | | - | ‡ |
Net investment income (loss) to average daily net assets | | | (0.12)% | | | | (0.25)% | | | | (0.31)% | | | | (0.65)% | | | | - | ‡ |
Portfolio turnover rate | | | 114% | | | | 92% | | | | 181% | | | | 260% | | | | 224% | |
| *** | Per share amount calculated on the average shares method. |
| † | Effective January 1, 2005, rebated brokerage commissions are included with realized gain or loss on investment transactions. Prior to January 1, 2005, these amounts were presented as a reduction of expenses. Prior year amounts have not been restated to reflect this change due to immateriality. (See Note 3) |
| †† | Net investment income and net realized and unrealized loss on investments are less than $.01 per share. |
| ‡ | Amounts are de minimis due to the short period of operations. |
| # | Computed after giving effect to an agreement by MassMutual to waive certain fees and expenses of the Fund. |
| (a) | Employee retirement benefit plans that invest plan assets in the Separate Investment Accounts (SIAs) may be subject to certain charges as set forth in their respective Plan Documents. Total return figures would be lower for all periods shown if they reflected these charges. |
| (b) | The Fund has entered into agreements with certain brokers to rebate a portion of brokerage commissions. The rebated commissions are used to reduce operating expenses of the Fund. |
| (c) | Total Return excludes a contingent deferred sales charge and would be lower for the periods presented if they reflected these charges. |
| ++ | Class N commenced operations on December 31, 2002. |
– 164 –
MASSMUTUAL SELECT AGGRESSIVE GROWTH FUND
| | | | | | | | | | | | | | | | | | | | |
| | | Class A | |
| | | Year ended
12/31/06 | | | Year ended
12/31/05†† | | | Year ended
12/31/04 | | | Year ended
12/31/03 | | | Year ended
12/31/02 | |
Net asset value, beginning of year | | $ | 6.47 | | | $ | 5.89 | | | $ | 4.96 | | | $ | 3.80 | | | $ | 5.28 | |
| | | | | | | | | | | | | | | | | | | | |
Income (loss) from investment operations: | | | | | | | | | | | | | | | | | | | | |
Net investment income (loss) | | | (0.06 | )*** | | | (0.06 | )*** | | | (0.04 | )*** | | | (0.02 | )*** | | | (0.02 | )*** |
Net realized and unrealized gain (loss) on investments | | | (0.35 | ) | | | 0.64 | | | | 0.97 | | | | 1.18 | | | | (1.46 | ) |
| | | | | | | | | | | | | | | | | | | | |
Total income (loss) from investment operations | | | (0.41 | ) | | | 0.58 | | | | 0.93 | | | | 1.16 | | | | (1.48 | ) |
| | | | | | | | | | | | | | | | | | | | |
Net asset value, end of year | | $ | 6.06 | | | $ | 6.47 | | | $ | 5.89 | | | $ | 4.96 | | | $ | 3.80 | |
| | | | | | | | | | | | | | | | | | | | |
Total Return(a) | | | (6.34)% | (c) | | | 9.85% | (c) | | | 18.75% | (c) | | | 30.53% | | | | (28.03)% | |
Ratios / Supplemental Data: | | | | | | | | | | | | | | | | | | | | |
Net assets, end of year (000’s) | | $ | 114,139 | | | $ | 137,756 | | | $ | 117,232 | | | $ | 65,012 | | | $ | 37,203 | |
Ratio of expenses to average daily net assets: | | | | | | | | | | | | | | | | | | | | |
Before expense waiver | | | 1.35% | | | | 1.35% | | | | 1.36% | | | | 1.37% | | | | 1.37% | |
After expense waiver | | | 1.33% | # | | | 1.27% | # | | | 1.30% | (b)# | | | 1.33% | (b)# | | | 1.34% | (b)# |
Net investment income (loss) to average daily net assets | | | (1.01)% | | | | (1.02)% | | | | (0.67)% | | | | (0.56)% | | | | (0.56)% | |
Portfolio turnover rate | | | 49% | | | | 24% | | | | 85% | | | | 93% | | | | 112% | |
| |
| | | Class L | |
| | | Year ended
12/31/06 | | | Year ended
12/31/05†† | | | Year ended
12/31/04 | | | Year ended
12/31/03 | | | Year ended
12/31/02 | |
Net asset value, beginning of year | | $ | 6.56 | | | $ | 5.97 | | | $ | 5.01 | | | $ | 3.82 | | | $ | 5.31 | |
| | | | | | | | | | | | | | | | | | | | |
Income (loss) from investment operations: | | | | | | | | | | | | | | | | | | | | |
Net investment income (loss) | | | (0.05 | )*** | | | (0.05 | )*** | | | (0.02 | )*** | | | (0.01 | )*** | | | (0.01 | )*** |
Net realized and unrealized gain (loss) on investments | | | (0.34 | ) | | | 0.64 | | | | 0.98 | | | | 1.20 | | | | (1.48 | ) |
| | | | | | | | | | | | | | | | | | | | |
Total income (loss) from investment operations | | | (0.39 | ) | | | 0.59 | | | | 0.96 | | | | 1.19 | | | | (1.49 | ) |
| | | | | | | | | | | | | | | | | | | | |
Net asset value, end of year | | $ | 6.17 | | | $ | 6.56 | | | $ | 5.97 | | | $ | 5.01 | | | $ | 3.82 | |
| | | | | | | | | | | | | | | | | | | | |
Total Return(a) | | | (5.95)% | | | | 9.88% | | | | 19.16% | | | | 31.15% | | | | (28.06)% | |
Ratios / Supplemental Data: | | | | | | | | | | | | | | | | | | | | |
Net assets, end of year (000’s) | | $ | 192,839 | | | $ | 193,605 | | | $ | 152,518 | | | $ | 76,120 | | | $ | 31,012 | |
Ratio of expenses to average daily net assets: | | | | | | | | | | | | | | | | | | | | |
Before expense waiver | | | 1.10% | | | | 1.10% | | | | 1.11% | | | | 1.12% | | | | 1.12% | |
After expense waiver | | | 1.08% | # | | | 1.02% | # | | | 1.05% | (b)# | | | 1.08% | (b)# | | | 1.09% | (b)# |
Net investment income (loss) to average daily net assets | | | (0.76)% | | | | (0.77)% | | | | (0.42)% | | | | (0.32)% | | | | (0.31)% | |
Portfolio turnover rate | | | 49% | | | | 24% | | | | 85% | | | | 93% | | | | 112% | |
| *** | Per share amount calculated on the average shares method. |
| †† | Effective January 1, 2005, rebated brokerage commissions are included with realized gain or loss on investment transactions. Prior to January 1, 2005, these amounts were presented as a reduction of expenses. Prior year amounts have not been restated to reflect this change due to immateriality. (See Note 3) |
| # | Computed after giving effect to an agreement by MassMutual to waive certain fees and expenses of the Fund. |
| (a) | Employee retirement benefit plans that invest plan assets in the Separate Investment Accounts (SIAs) may be subject to certain charges as set forth in their respective Plan Documents. Total return figures would be lower for all periods presented if they reflected these charges. |
| (b) | The Fund has entered into agreements with certain brokers to rebate a portion of brokerage commissions. The rebated commissions are used to reduce operating expenses of the Fund. |
| (c) | Total Return excludes a front-end sales charge and would be lower for the periods presented if they reflected these charges. |
– 165 –
MASSMUTUAL SELECT AGGRESSIVE GROWTH FUND
| | | | | | | | | | | | | | | | | | | | |
| | | Class Y | |
| | | Year ended
12/31/06 | | | Year ended
12/31/05†† | | | Year ended
12/31/04 | | | Year ended
12/31/03 | | | Year ended
12/31/02 | |
Net asset value, beginning of year | | $ | 6.61 | | | $ | 6.00 | | | $ | 5.03 | | | $ | 3.83 | | | $ | 5.31 | |
| | | | | | | | | | | | | | | | | | | | |
Income (loss) from investment operations: | | | | | | | | | | | | | | | | | | | | |
Net investment income (loss) | | | (0.04 | )*** | | | (0.04 | )*** | | | (0.01 | )*** | | | (0.01 | )*** | | | (0.01 | )*** |
Net realized and unrealized gain (loss) on investments | | | (0.35 | ) | | | 0.65 | | | | 0.98 | | | | 1.21 | | | | (1.47 | ) |
| | | | | | | | | | | | | | | | | | | | |
Total income (loss) from investment operations | | | (0.39 | ) | | | 0.61 | | | | 0.97 | | | | 1.20 | | | | (1.48 | ) |
| | | | | | | | | | | | | | | | | | | | |
Net asset value, end of year | | $ | 6.22 | | | $ | 6.61 | | | $ | 6.00 | | | $ | 5.03 | | | $ | 3.83 | |
| | | | | | | | | | | | | | | | | | | | |
Total Return(a) | | | (5.90)% | | | | 10.17% | | | | 19.28% | | | | 31.33% | | | | (27.87)% | |
Ratios / Supplemental Data: | | | | | | | | | | | | | | | | | | | | |
Net assets, end of year (000’s) | | $ | 53,940 | | | $ | 41,705 | | | $ | 32,242 | | | $ | 17,333 | | | $ | 10,145 | |
Ratio of expenses to average daily net assets: | | | | | | | | | | | | | | | | | | | | |
Before expense waiver | | | 0.95% | | | | 0.95% | | | | 0.96% | | | | 0.97% | | | | 0.97% | |
After expense waiver | | | 0.93% | # | | | 0.87% | # | | | 0.90% | (b)# | | | 0.93% | (b)# | | | 0.94% | (b)# |
Net investment income (loss) to average daily net assets | | | (0.61)% | | | | (0.62)% | | | | (0.27)% | | | | (0.16)% | | | | (0.16)% | |
Portfolio turnover rate | | | 49% | | | | 24% | | | | 85% | | | | 93% | | | | 112% | |
| |
| | | Class S | |
| | | Year ended
12/31/06 | | | Year ended
12/31/05†† | | | Year ended
12/31/04 | | | Year ended
12/31/03 | | | Year ended
12/31/02 | |
Net asset value, beginning of year | | $ | 6.65 | | | $ | 6.03 | | | $ | 5.05 | | | $ | 3.84 | | | $ | 5.32 | |
| | | | | | | | | | | | | | | | | | | | |
Income (loss) from investment operations: | | | | | | | | | | | | | | | | | | | | |
Net investment income (loss) | | | (0.03 | )*** | | | (0.03 | )*** | | | (0.01 | )*** | | | (0.00 | )***† | | | (0.01 | )*** |
Net realized and unrealized gain (loss) on investments | | | (0.36 | ) | | | 0.65 | | | | 0.99 | | | | 1.21 | | | | (1.47 | ) |
| | | | | | | | | | | | | | | | | | | | |
Total income (loss) from investment operations | | | (0.39 | ) | | | 0.62 | | | | 0.98 | | | | 1.21 | | | | (1.48 | ) |
| | | | | | | | | | | | | | | | | | | | |
Net asset value, end of year | | $ | 6.26 | | | $ | 6.65 | | | $ | 6.03 | | | $ | 5.05 | | | $ | 3.84 | |
| | | | | | | | | | | | | | | | | | | | |
Total Return(a) | | | (5.86)% | | | | 10.28% | | | | 19.41% | | | | 31.51% | | | | (27.82)% | |
Ratios / Supplemental Data: | | | | | | | | | | | | | | | | | | | | |
Net assets, end of year (000’s) | | $ | 239,162 | | | $ | 240,002 | | | $ | 198,154 | | | $ | 108,281 | | | $ | 46,026 | |
Ratio of expenses to average daily net assets: | | | | | | | | | | | | | | | | | | | | |
Before expense waiver | | | 0.85% | | | | 0.85% | | | | 0.86% | | | | 0.87% | | | | 0.87% | |
After expense waiver | | | 0.83% | # | | | 0.77% | # | | | 0.80% | (b)# | | | 0.83% | (b)# | | | 0.84% | (b)# |
Net investment income (loss) to average daily net assets | | | (0.51)% | | | | (0.51)% | | | | (0.17)% | | | | (0.06)% | | | | (0.07)% | |
Portfolio turnover rate | | | 49% | | | | 24% | | | | 85% | | | | 93% | | | | 112% | |
| *** | Per share amount calculated on the average shares method. |
| † | Net investment loss is less than $0.01 per share. |
| †† | Effective January 1, 2005, rebated brokerage commissions are included with realized gain or loss on investment transactions. Prior to January 1, 2005, these amounts were presented as a reduction of expenses. Prior year amounts have not been restated to reflect this change due to immateriality. (See Note 3) |
| # | Computed after giving effect to an agreement by MassMutual to waive certain fees and expenses of the Fund. |
| (a) | Employee retirement benefit plans that invest plan assets in the Separate Investment Accounts (SIAs) may be subject to certain charges as set forth by their respective Plan Documents. Total return figures would be lower for the periods presented if they reflected these charges. |
| (b) | The Fund has entered into agreements with certain brokers to rebate a portion of brokerage commissions. The rebated commissions are used to reduce operating expenses of the Fund. |
– 166 –
MASSMUTUAL SELECT AGGRESSIVE GROWTH FUND
| | | | | | | | | | | | | | | | | | | | |
| | | Class N | |
| | | Year ended
12/31/06 | | | Year ended
12/31/05†† | | | Year ended
12/31/04 | | | Year ended
12/31/03 | | | Period ended
12/31/02++ | |
Net asset value, beginning of year | | $ | 6.37 | | | $ | 5.83 | | | $ | 4.92 | | | $ | 3.77 | | | $ | 3.77 | |
| | | | | | | | | | | | | | | | | | | | |
Income (loss) from investment operations: | | | | | | | | | | | | | | | | | | | | |
Net investment income (loss) | | | (0.08 | )*** | | | (0.08 | )*** | | | (0.05 | )*** | | | (0.04 | )*** | | | 0.00 | ***† |
Net realized and unrealized gain (loss) on investments | | | (0.33 | ) | | | 0.62 | | | | 0.96 | | | | 1.19 | | | | (0.00 | )† |
| | | | | | | | | | | | | | | | | | | | |
Total income from investment operations | | | (0.41 | ) | | | 0.54 | | | | 0.91 | | | | 1.15 | | | | 0.00 | |
| | | | | | | | | | | | | | | | | | | | |
Net asset value, end of year | | $ | 5.96 | | | $ | 6.37 | | | $ | 5.83 | | | $ | 4.92 | | | $ | 3.77 | |
| | | | | | | | | | | | | | | | | | | | |
Total Return(a) | | | (6.44)% | (c) | | | 9.26% | (c) | | | 18.50% | (c) | | | 30.50% | (c) | | | - | ‡ |
Ratios / Supplemental Data: | | | | | | | | | | | | | | | | | | | | |
Net assets, end of year (000’s) | | $ | 1,203 | | | $ | 1,034 | | | $ | 1,144 | | | $ | 636 | | | $ | 101 | |
Ratio of expenses to average daily net assets: | | | | | | | | | | | | | | | | | | | | |
Before expense waiver | | | 1.65% | | | | 1.65% | | | | 1.66% | | | | 1.68% | | | | - | ‡ |
After expense waiver | | | 1.63% | # | | | 1.57% | # | | | 1.59% | (b)# | | | 1.64% | (b)# | | | - | ‡ |
Net investment income (loss) to average daily net assets | | | (1.31)% | | | | (1.32)% | | | | (0.99)% | | | | (0.91)% | | | | - | ‡ |
Portfolio turnover rate | | | 49% | | | | 24% | | | | 85% | | | | 93% | | | | 112% | |
| *** | Per share amount calculated on the average shares method. |
| † | Net investment income and net realized and unrealized losses on investments are less than $0.01 per share. |
| †† | Effective January 1, 2005, rebated brokerage commissions are included with realized gain or loss on investment transactions. Prior to January 1, 2005, these amounts were presented as a reduction of expenses. Prior year amounts have not been restated to reflect this change due to immateriality. (See Note 3) |
| ++ | Class N commenced operations on December 31, 2002. |
| ‡ | Amounts are de minimis due to the short period of operations. |
| # | Computed after giving effect to an agreement by MassMutual to waive certain fees and expenses of the Fund. |
| (a) | Employee retirement benefit plans that invest plan assets in the Separate Investment Accounts (SIAs) may be subject to certain charges as set forth by their respective Plan Documents. Total return figures would be lower for the periods presented if they reflected these charges. |
| (b) | The Fund has entered into agreements with certain brokers to rebate a portion of brokerage commissions. The rebated commissions are used to reduce operating expenses of the Fund. |
| (c) | Total Return excludes contingent deferred sales charge and would be lower for the periods presented if they reflected these charges. |
– 167 –
MASSMUTUAL SELECT OTC 100 FUND
| | | | | | | | | | | | | | | | | | | | |
| | | Class A | |
| | | Year ended
12/31/06 | | | Year ended
12/31/05 | | | Year ended
12/31/04 | | | Year ended
12/31/03 | | | Year ended
12/31/02 | |
Net asset value, beginning of year | | $ | 4.12 | | | $ | 4.09 | | | $ | 3.74 | | | $ | 2.53 | | | $ | 4.08 | |
| | | | | | | | | | | | | | | | | | | | |
Income (loss) from investment operations: | | | | | | | | | | | | | | | | | | | | |
Net investment income (loss) | | | (0.02 | )*** | | | (0.02 | )*** | | | 0.00 | ***† | | | (0.03 | )*** | | | (0.03 | )*** |
Net realized and unrealized gain (loss) on investments | | | 0.27 | | | | 0.05 | | | | 0.35 | | | | 1.24 | | | | (1.52 | ) |
| | | | | | | | | | | | | | | | | | | | |
Total income (loss) from investment operations | | | 0.25 | | | | 0.03 | | | | 0.35 | | | | 1.21 | | | | (1.55 | ) |
| | | | | | | | | | | | | | | | | | | | |
Less distributions to shareholders: | | | | | | | | | | | | | | | | | | | | |
From net investment income | | | - | | | | - | | | | (0.00 | )† | | | - | | | | - | |
| | | | | | | | | | | | | | | | | | | | |
Net asset value, end of year | | $ | 4.37 | | | $ | 4.12 | | | $ | 4.09 | | | $ | 3.74 | | | $ | 2.53 | |
| | | | | | | | | | | | | | | | | | | | |
Total Return(a) | | | 6.31% | (b) | | | 0.73% | (b) | | | 9.47% | (b) | | | 47.83% | | | | (37.99)% | |
Ratios / Supplemental Data: | | | | | | | | | | | | | | | | | | | | |
Net assets, end of year (000’s) | | $ | 21,627 | | | $ | 26,216 | | | $ | 32,176 | | | $ | 30,349 | | | $ | 11,644 | |
Ratio of expenses to average daily net assets: | | | | | | | | | | | | | | | | | | | | |
Before expense waiver | | | 1.15% | | | | 1.11% | | | | 1.12% | | | | 1.17% | | | | 1.18% | |
After expense waiver | | | N/A | | | | N/A | | | | N/A | | | | 1.12% | # | | | 1.04% | # |
Net investment income (loss) to average daily net assets | | | (0.50)% | | | | (0.50)% | | | | 0.12% | | | | (0.86)% | | | | (0.90)% | |
Portfolio turnover rate | | | 7% | | | | 17% | | | | 30% | | | | 66% | | | | 65% | |
| |
| | | Class L | |
| | | Year ended
12/31/06 | | | Year ended
12/31/05 | | | Year ended
12/31/04 | | | Year ended
12/31/03 | | | Year ended
12/31/02 | |
Net asset value, beginning of year | | $ | 4.17 | | | $ | 4.13 | | | $ | 3.77 | | | $ | 2.54 | | | $ | 4.10 | |
| | | | | | | | | | | | | | | | | | | | |
Income (loss) from investment operations: | | | | | | | | | | | | | | | | | | | | |
Net investment income (loss) | | | (0.01 | )*** | | | (0.01 | )*** | | | 0.01 | *** | | | (0.02 | )*** | | | (0.02 | )*** |
Net realized and unrealized gain (loss) on investments | | | 0.28 | | | | 0.05 | | | | 0.36 | | | | 1.25 | | | | (1.54 | ) |
| | | | | | | | | | | | | | | | | | | | |
Total income (loss) from investment operations | | | 0.27 | | | | 0.04 | | | | 0.37 | | | | 1.23 | | | | (1.56 | ) |
| | | | | | | | | | | | | | | | | | | | |
Less distributions to shareholders: | | | | | | | | | | | | | | | | | | | | |
From net investment income | | | - | | | | - | | | | (0.01 | ) | | | - | | | | - | |
| | | | | | | | | | | | | | | | | | | | |
Net asset value, end of year | | $ | 4.44 | | | $ | 4.17 | | | $ | 4.13 | | | $ | 3.77 | | | $ | 2.54 | |
| | | | | | | | | | | | | | | | | | | | |
Total Return(a) | | | 6.47% | | | | 0.97% | | | | 9.82% | | | | 48.43% | | | | (38.05)% | |
Ratios / Supplemental Data: | | | | | | | | | | | | | | | | | | | | |
Net assets, end of year (000’s) | | $ | 9,960 | | | $ | 13,000 | | | $ | 13,101 | | | $ | 15,508 | | | $ | 6,389 | |
Ratio of expenses to average daily net assets: | | | | | | | | | | | | | | | | | | | | |
Before expense waiver | | | 0.90% | | | | 0.86% | | | | 0.87% | | | | 0.91% | | | | 0.93% | |
After expense waiver | | | N/A | | | | N/A | | | | N/A | | | | 0.87% | # | | | 0.79% | # |
Net investment income (loss) to average daily net assets | | | (0.26)% | | | | (0.24)% | | | | 0.26% | | | | (0.61)% | | | | (0.65)% | |
Portfolio turnover rate | | | 7% | | | | 17% | | | | 30% | | | | 66% | | | | 65% | |
| *** | Per share amount calculated on the average shares method. |
| † | Net investment income and distributions from net investment income are less than $0.01 per share. |
| # | Computed after giving effect to an agreement by MassMutual to waive certain fees and expenses of the Fund. |
| (a) | Employee retirement benefit plans that invest plan assets in the Separate Investment Accounts (SIAs) may be subject to certain charges as set forth in their respective Plan Documents. Total return figures would be lower for the periods presented if they reflected these charges. |
| (b) | Total Return excludes a front-end sales charge and would be lower for the periods presented if it reflected these charges. |
– 168 –
MASSMUTUAL SELECT OTC 100 FUND
| | | | | | | | | | | | | | | | | | | | |
| | | Class Y | |
| | | Year ended
12/31/06 | | | Year ended
12/31/05 | | | Year ended
12/31/04 | | | Year ended
12/31/03 | | | Year ended
12/31/02 | |
Net asset value, beginning of year | | $ | 4.19 | | | $ | 4.15 | | | $ | 3.79 | | | $ | 2.54 | | | $ | 4.11 | |
| | | | | | | | | | | | | | | | | | | | |
Income (loss) from investment operations: | | | | | | | | | | | | | | | | | | | | |
Net investment income (loss) | | | (0.01 | )*** | | | (0.00 | )***† | | | 0.02 | *** | | | (0.01 | )*** | | | (0.01 | )*** |
Net realized and unrealized gain (loss) on investments | | | 0.29 | | | | 0.04 | | | | 0.36 | | | | 1.26 | | | | (1.56 | ) |
| | | | | | | | | | | | | | | | | | | | |
Total income (loss) from investment operations | | | 0.28 | | | | 0.04 | | | | 0.38 | | | | 1.25 | | | | (1.57 | ) |
| | | | | | | | | | | | | | | | | | | | |
Less distributions to shareholders: | | | | | | | | | | | | | | | | | | | | |
From net investment income | | | - | | | | - | | | | (0.02 | ) | | | - | | | | - | |
| | | | | | | | | | | | | | | | | | | | |
Net asset value, end of year | | $ | 4.47 | | | $ | 4.19 | | | $ | 4.15 | | | $ | 3.79 | | | $ | 2.54 | |
| | | | | | | | | | | | | | | | | | | | |
Total Return(a) | | | 6.68% | | | | 0.96% | | | | 9.98% | | | | 48.63% | | | | (37.96)% | |
Ratios / Supplemental Data: | | | | | | | | | | | | | | | | | | | | |
Net assets, end of year (000’s) | | $ | 1,495 | | | $ | 2,628 | | | $ | 3,777 | | | $ | 3,827 | | | $ | 998 | |
Ratio of expenses to average daily net assets: | | | | | | | | | | | | | | | | | | | | |
Before expense waiver | | | 0.75% | | | | 0.71% | | | | 0.72% | | | | 0.77% | | | | 0.78% | |
After expense waiver | | | N/A | | | | N/A | | | | N/A | | | | 0.73% | # | | | 0.64% | # |
Net investment income (loss) to average daily net assets | | | (0.12)% | | | | (0.11)% | | | | 0.49% | | | | (0.45)% | | | | (0.50)% | |
Portfolio turnover rate | | | 7% | | | | 17% | | | | 30% | | | | 66% | | | | 65% | |
| |
| | | Class S | |
| | | Year ended
12/31/06 | | | Year ended
12/31/05 | | | Year ended
12/31/04 | | | Year ended
12/31/03 | | | Year ended
12/31/02 | |
Net asset value, beginning of year | | $ | 4.22 | | | $ | 4.17 | | | $ | 3.81 | | | $ | 2.56 | | | $ | 4.12 | |
| | | | | | | | | | | | | | | | | | | | |
Income (loss) from investment operations: | | | | | | | | | | | | | | | | | | | | |
Net investment income (loss) | | | (0.00 | )***† | | | (0.00 | )***† | | | 0.02 | *** | | | (0.01 | )*** | | | (0.01 | )*** |
Net realized and unrealized gain (loss) on investments | | | 0.29 | | | | 0.05 | | | | 0.36 | | | | 1.26 | | | | (1.55 | ) |
| | | | | | | | | | | | | | | | | | | | |
Total income (loss) from investment operations | | | 0.29 | | | | 0.05 | | | | 0.38 | | | | 1.25 | | | | (1.56 | ) |
| | | | | | | | | | | | | | | | | | | | |
Less distributions to shareholders: | | | | | | | | | | | | | | | | | | | | |
From net investment income | | | - | | | | - | | | | (0.02 | ) | | | - | | | | - | |
| | | | | | | | | | | | | | | | | | | | |
Net asset value, end of year | | $ | 4.51 | | | $ | 4.22 | | | $ | 4.17 | | | $ | 3.81 | | | $ | 2.56 | |
| | | | | | | | | | | | | | | | | | | | |
Total Return(a) | | | 6.87% | | | | 1.20% | | | | 10.00% | | | | 48.83% | | | | (37.71)% | |
Ratios / Supplemental Data: | | | | | | | | | | | | | | | | | | | | |
Net assets, end of year (000’s) | | $ | 16,179 | | | $ | 19,404 | | | $ | 25,880 | | | $ | 26,424 | | | $ | 7,211 | |
Ratio of expenses to average daily net assets: | | | | | | | | | | | | | | | | | | | | |
Before expense waiver | | | 0.65% | | | | 0.61% | | | | 0.62% | | | | 0.67% | | | | 0.68% | |
After expense waiver | | | N/A | | | | N/A | | | | N/A | | | | 0.63% | # | | | 0.54% | # |
Net investment income (loss) to average daily net assets | | | (0.00)% | | | | (0.01)% | | | | 0.45% | | | | (0.36)% | | | | (0.41)% | |
Portfolio turnover rate | | | 7% | | | | 17% | | | | 30% | | | | 66% | | | | 65% | |
| *** | Per share amount calculated on the average shares method. |
| † | Net investment income (loss) is less than $0.01 per share. |
| # | Computed after giving effect to an agreement by MassMutual to waive certain fees and expenses of the Fund. |
| (a) | Employee retirement benefit plans that invest plan assets in the Separate Investment Accounts (SIAs) may be subject to certain charges as set forth in their respective Plan Documents. Total return figures would be lower for the periods presented if they reflected these charges. |
– 169 –
MASSMUTUAL SELECT OTC 100 FUND
| | | | | | | | | | | | | | | | | | | | |
| | | Class N | |
| | | Year ended
12/31/06 | | | Year ended
12/31/05 | | | Year ended
12/31/04 | | | Year ended
12/31/03 | | | Period ended
12/31/02++ | |
Net asset value, beginning of year | | $ | 4.07 | | | $ | 4.05 | | | $ | 3.71 | | | $ | 2.52 | | | $ | 2.53 | |
| | | | | | | | | | | | | | | | | | | | |
Income (loss) from investment operations: | | | | | | | | | | | | | | | | | | | | |
Net investment income (loss) | | | (0.03 | )*** | | | (0.03 | )*** | | | 0.00 | ***† | | | (0.04 | )*** | | | (0.00 | )***† |
Net realized and unrealized gain (loss) on investments | | | 0.27 | | | | 0.05 | | | | 0.34 | | | | 1.23 | | | | (0.01 | ) |
| | | | | | | | | | | | | | | | | | | | |
Total income from investment operations | | | 0.24 | | | | 0.02 | | | | 0.34 | | | | 1.19 | | | | (0.01 | ) |
| | | | | | | | | | | | | | | | | | | | |
Less distributions to shareholders: | | | | | | | | | | | | | | | | | | | | |
From net investment income | | | - | | | | - | | | | (0.00 | )†† | | | - | | | | - | |
| | | | | | | | | | | | | | | | | | | | |
Net asset value, end of year | | $ | 4.31 | | | $ | 4.07 | | | $ | 4.05 | | | $ | 3.71 | | | $ | 2.52 | |
| | | | | | | | | | | | | | | | | | | | |
Total Return(a) | | | 5.90% | (b) | | | 0.49% | (b) | | | 9.25% | (b) | | | 47.22% | (b) | | | - | ‡ |
Ratios / Supplemental Data: | | | | | | | | | | | | | | | | | | | | |
Net assets, end of year (000’s) | | $ | 445 | | | $ | 451 | | | $ | 432 | | | $ | 150 | | | $ | 100 | |
Ratio of expenses to average daily net assets: | | | | | | | | | | | | | | | | | | | | |
Before expense waiver | | | 1.45% | | | | 1.41% | | | | 1.41% | | | | 1.46% | | | | - | ‡ |
After expense waiver | | | N/A | | | | N/A | | | | N/A | | | | 1.42% | # | | | - | ‡ |
Net investment income (loss) to average daily net assets | | | (0.79)% | | | | (0.79)% | | | | 0.11% | | | | (1.15)% | | | | - | ‡ |
Portfolio turnover rate | | | 7% | | | | 17% | | | | 30% | | | | 66% | | | | 65% | |
| *** | Per share amount calculated on the average shares method. |
| † | Net investment income (loss) is less than $0.01 per share. |
| †† | Distributions from net investment income are less than $0.01 per share. |
| ++ | Class N commenced operations on December 31, 2002. |
| ‡ | Amounts are de minimis due to the short period of operations. |
| # | Computed after giving effect to an agreement by MassMutual to waive certain fees and expenses of the Fund. |
| (a) | Employee retirement benefit plans that invest plan assets in the Separate Investment Accounts (SIAs) may be subject to certain charges as set forth in their respective Plan Documents. Total return figures would be lower for the periods presented if they reflected these charges. |
| (b) | Total Return excludes contingent deferred sales charge and would be lower for the periods presented if they reflected these charges. |
– 170 –
MASSMUTUAL SELECT FOCUSED VALUE FUND
| | | | | | | | | | | | | | | | | | | | |
| | | Class A | |
| | | Year ended
12/31/06 | | | Year ended
12/31/05†† | | | Year ended
12/31/04 | | | Year ended
12/31/03 | | | Year ended
12/31/02 | |
Net asset value, beginning of year | | $ | 16.70 | | | $ | 17.78 | | | $ | 16.92 | | | $ | 11.94 | | | $ | 13.41 | |
| | | | | | | | | | | | | | | | | | | | |
Income (loss) from investment operations: | | | | | | | | | | | | | | | | | | | | |
Net investment income (loss) | | | 0.25 | *** | | | (0.00 | )***† | | | (0.07 | )*** | | | (0.06 | )*** | | | (0.04 | )*** |
Net realized and unrealized gain (loss) on investments | | | 3.02 | | | | 0.53 | | | | 1.96 | | | | 5.45 | | | | (1.33 | ) |
| | | | | | | | | | | | | | | | | | | | |
Total income (loss) from investment operations | | | 3.27 | | | | 0.53 | | | | 1.89 | | | | 5.39 | | | | (1.37 | ) |
| | | | | | | | | | | | | | | | | | | | |
Less distributions to shareholders: | | | | | | | | | | | | | | | | | | | | |
From net investment income | | | (0.26 | ) | | | (0.01 | ) | | | - | | | | (0.00 | )† | | | - | |
From net realized gains | | | (1.63 | ) | | | (1.60 | ) | | | (1.03 | ) | | | (0.41 | ) | | | (0.10 | ) |
| | | | | | | | | | | | | | | | | | | | |
Total distributions | | | (1.89 | ) | | | (1.61 | ) | | | (1.03 | ) | | | (0.41 | ) | | | (0.10 | ) |
| | | | | | | | | | | | | | | | | | | | |
Net asset value, end of year | | $ | 18.08 | | | $ | 16.70 | | | $ | 17.78 | | | $ | 16.92 | | | $ | 11.94 | |
| | | | | | | | | | | | | | | | | | | | |
Total Return(a) | | | 19.65% | (c) | | | 2.98% | (c) | | | 11.33% | (c) | | | 45.13% | | | | (10.18)% | |
Ratios / Supplemental Data: | | | | | | | | | | | | | | | | | | | | |
Net assets, end of year (000’s) | | $ | 275,925 | | | $ | 252,047 | | | $ | 228,871 | | | $ | 158,981 | | | $ | 54,319 | |
Ratio of expenses to average daily net assets: | | | | | | | | | | | | | | | | | | | | |
Before expense waiver | | | 1.29% | | | | 1.30% | | | | 1.30% | | | | 1.30% | | | | 1.30% | |
After expense waiver | | | N/A | | | | N/A | | | | 1.28% | (b)# | | | 1.29% | (b)# | | | 1.30% | (b)# |
Net investment income (loss) to average daily net assets | | | 1.39% | | | | (0.01)% | | | | (0.40)% | | | | (0.40)% | | | | (0.33)% | |
Portfolio turnover rate | | | 36% | | | | 31% | | | | 32% | | | | 31% | | | | 78% | |
| | | Class L | |
| | | Year ended
12/31/06 | | | Year ended
12/31/05†† | | | Year ended
12/31/04 | | | Year ended
12/31/03 | | | Year ended
12/31/02 | |
Net asset value, beginning of year | | $ | 16.91 | | | $ | 17.98 | | | $ | 17.05 | | | $ | 12.00 | | | $ | 13.45 | |
| | | | | | | | | | | | | | | | | | | | |
Income (loss) from investment operations: | | | | | | | | | | | | | | | | | | | | |
Net investment income (loss) | | | 0.30 | *** | | | 0.05 | *** | | | (0.03 | )*** | | | (0.02 | )*** | | | (0.01 | )*** |
Net realized and unrealized gain (loss) on investments | | | 3.06 | | | | 0.53 | | | | 1.99 | | | | 5.48 | | | | (1.34 | ) |
| | | | | | | | | | | | | | | | | | | | |
Total income (loss) from investment operations | | | 3.36 | | | | 0.58 | | | | 1.96 | | | | 5.46 | | | | (1.35 | ) |
| | | | | | | | | | | | | | | | | | | | |
Less distributions to shareholders: | | | | | | | | | | | | | | | | | | | | |
From net investment income | | | (0.30 | ) | | | (0.05 | ) | | | - | | | | (0.00 | )† | | | - | |
From net realized gains | | | (1.63 | ) | | | (1.60 | ) | | | (1.03 | ) | | | (0.41 | ) | | | (0.10 | ) |
| | | | | | | | | | | | | | | | | | | | |
Total distributions | | | (1.93 | ) | | | (1.65 | ) | | | (1.03 | ) | | | (0.41 | ) | | | (0.10 | ) |
| | | | | | | | | | | | | | | | | | | | |
Net asset value, end of year | | $ | 18.34 | | | $ | 16.91 | | | $ | 17.98 | | | $ | 17.05 | | | $ | 12.00 | |
| | | | | | | | | | | | | | | | | | | | |
Total Return(a) | | | 19.94% | | | | 3.26% | | | | 11.65% | | | | 45.49% | | | | (10.00)% | |
Ratios / Supplemental Data: | | | | | | | | | | | | | | | | | | | | |
Net assets, end of year (000’s) | | $ | 203,635 | | | $ | 180,827 | | | $ | 163,742 | | | $ | 114,730 | | | $ | 39,942 | |
Ratio of expenses to average daily net assets: | | | | | | | | | | | | | | | | | | | | |
Before expense waiver | | | 1.04% | | | | 1.05% | | | | 1.05% | | | | 1.05% | | | | 1.05% | |
After expense waiver | | | N/A | | | | N/A | | | | 1.03% | (b)# | | | 1.04% | (b)# | | | 1.05% | (b)# |
Net investment income (loss) to average daily net assets | | | 1.66% | | | | 0.26% | | | | (0.16)% | | | | (0.16)% | | | | (0.11)% | |
Portfolio turnover rate | | | 36% | | | | 31% | | | | 32% | | | | 31% | | | | 78% | |
| *** | Per share amount calculated on the average shares method. |
| † | Net investment income (loss) and distributions from net investment income are less than $0.01 per share. |
| †† | Effective January 1, 2005, rebated brokerage commissions are included with realized gain or loss on investment transactions. Prior to January 1, 2005, these amounts were presented as a reduction of expenses. Prior year amounts have not been restated to reflect this change due to immateriality. (See Note 3) |
| # | Computed after giving effect to an agreement by MassMutual to waive certain fees and expenses of the Fund. |
| (a) | Employee retirement benefit plans that invest plan assets in the Separate Investment Accounts (SIAs) may be subject to certain charges as set forth in their respective Plan Documents. Total return figures would be lower for the periods presented if they reflected these charges. |
| (b) | The Fund has entered into agreements with certain brokers to rebate a portion of brokerage commissions. The rebated commissions are used to reduce operating expense of the Fund. |
| (c) | Total Return excludes a front-end sales charge and would be lower for the period presented if it reflected these charges. |
– 171 –
MASSMUTUAL SELECT FOCUSED VALUE FUND
| | | | | | | | | | | | | | | | | | | | |
| | | Class Y | |
| | | Year ended
12/31/06 | | | Year ended
12/31/05†† | | | Year ended
12/31/04 | | | Year ended
12/31/03 | | | Year ended
12/31/02 | |
Net asset value, beginning of year | | $ | 17.02 | | | $ | 18.08 | | | $ | 17.12 | | | $ | 12.03 | | | $ | 13.46 | |
| | | | | | | | | | | | | | | | | | | | |
Income (loss) from investment operations: | | | | | | | | | | | | | | | | | | | | |
Net investment income (loss) | | | 0.32 | *** | | | 0.07 | *** | | | (0.00 | )***† | | | (0.00 | )***† | | | 0.03 | *** |
Net realized and unrealized gain (loss) on investments | | | 3.09 | | | | 0.55 | | | | 1.99 | | | | 5.50 | | | | (1.36 | ) |
| | | | | | | | | | | | | | | | | | | | |
Total income (loss) from investment operations | | | 3.41 | | | | 0.62 | | | | 1.99 | | | | 5.50 | | | | (1.33 | ) |
| | | | | | | | | | | | | | | | | | | | |
Less distributions to shareholders: | | | | | | | | | | | | | | | | | | | | |
From net investment income | | | (0.33 | ) | | | (0.08 | ) | | | - | | | | (0.00 | )† | | | - | |
From net realized gains | | | (1.63 | ) | | | (1.60 | ) | | | (1.03 | ) | | | (0.41 | ) | | | (0.10 | ) |
| | | | | | | | | | | | | | | | | | | | |
Total distributions | | | (1.96 | ) | | | (1.68 | ) | | | (1.03 | ) | | | (0.41 | ) | | | (0.10 | ) |
| | | | | | | | | | | | | | | | | | | | |
Net asset value, end of year | | $ | 18.47 | | | $ | 17.02 | | | $ | 18.08 | | | $ | 17.12 | | | $ | 12.03 | |
| | | | | | | | | | | | | | | | | | | | |
Total Return(a) | | | 20.12% | | | | 3.44% | | | | 11.78% | | | | 45.71% | | | | (9.85)% | |
Ratios / Supplemental Data: | | | | | | | | | | | | | | | | | | | | |
Net assets, end of year (000’s) | | $ | 144,555 | | | $ | 116,392 | | | $ | 94,538 | | | $ | 78,549 | | | $ | 45,302 | |
Ratio of expenses to average daily net assets: | | | | | | | | | | | | | | | | | | | | |
Before expense waiver | | | 0.89% | | | | 0.90% | | | | 0.90% | | | | 0.89% | | | | 0.90% | |
After expense waiver | | | N/A | | | | N/A | | | | 0.88% | (b)# | | | 0.89% | (b)# | | | 0.90% | (b)# |
Net investment income (loss) to average daily net assets | | | 1.79% | | | | 0.40% | | | | (0.01)% | | | | (0.01)% | | | | 0.24% | |
Portfolio turnover rate | | | 36% | | | | 31% | | | | 32% | | | | 31% | | | | 78% | |
| | | Class S | |
| | | Year ended
12/31/06 | | | Year ended
12/31/05†† | | | Year ended
12/31/04 | | | Year ended
12/31/03 | | | Year ended
12/31/02 | |
Net asset value, beginning of year | | $ | 17.11 | | | $ | 18.18 | | | $ | 17.19 | | | $ | 12.06 | | | $ | 13.48 | |
| | | | | | | | | | | | | | | | | | | | |
Income (loss) from investment operations: | | | | | | | | | | | | | | | | | | | | |
Net investment income (loss) | | | 0.34 | *** | | | 0.09 | *** | | | 0.01 | *** | | | 0.01 | *** | | | 0.02 | *** |
Net realized and unrealized gain (loss) on investments | | | 3.12 | | | | 0.54 | | | | 2.01 | | | | 5.53 | | | | (1.34 | ) |
| | | | | | | | | | | | | | | | | | | | |
Total income (loss) from investment operations | | | 3.46 | | | | 0.63 | | | | 2.02 | | | | 5.54 | | | | (1.32 | ) |
| | | | | | | | | | | | | | | | | | | | |
Less distributions to shareholders: | | | | | | | | | | | | | | | | | | | | |
From net investment income | | | (0.35 | ) | | | (0.10 | ) | | | - | | | | (0.00 | )† | | | - | |
From net realized gains | | | (1.63 | ) | | | (1.60 | ) | | | (1.03 | ) | | | (0.41 | ) | | | (0.10 | ) |
| | | | | | | | | | | | | | | | | | | | |
Total distributions | | | (1.98 | ) | | | (1.70 | ) | | | (1.03 | ) | | | (0.41 | ) | | | (0.10 | ) |
| | | | | | | | | | | | | | | | | | | | |
Net asset value, end of year | | $ | 18.59 | | | $ | 17.11 | | | $ | 18.18 | | | $ | 17.19 | | | $ | 12.06 | |
| | | | | | | | | | | | | | | | | | | | |
Total Return(a) | | | 20.28% | | | | 3.45% | | | | 11.91% | | | | 45.94% | | | | (9.76)% | |
Ratios / Supplemental Data: | | | | | | | | | | | | | | | | | | | | |
Net assets, end of year (000’s) | | $ | 384,859 | | | $ | 354,769 | | | $ | 326,445 | | | $ | 293,759 | | | $ | 114,178 | |
Ratio of expenses to average daily net assets: | | | | | | | | | | | | | | | | | | | | |
Before expense waiver | | | 0.79% | | | | 0.80% | | | | 0.80% | | | | 0.80% | | | | 0.80% | |
After expense waiver | | | N/A | | | | N/A | | | | 0.78% | (b)# | | | 0.79% | (b)# | | | 0.80% | (b)# |
Net investment income (loss) to average daily net assets | | | 1.89% | | | | 0.50% | | | | 0.08% | | | | 0.09% | | | | 0.13% | |
Portfolio turnover rate | | | 36% | | | | 31% | | | | 32% | | | | 31% | | | | 78% | |
| *** | Per share amount calculated on the average shares method. |
| † | Net investment loss and distributions from net investment income are less than $0.01 per share. |
| †† | Effective January 1, 2005, rebated brokerage commissions are included with realized gain or loss on investment transactions. Prior to January 1, 2005, these amounts were presented as a reduction of expenses. Prior year amounts have not been restated to reflect this change due to immateriality. (See Note 3) |
| # | Computed after giving effect to an agreement by MassMutual to waive certain fees and expenses of the Fund. |
| (a) | Employee retirement benefit plans that invest plan assets in the Separate Investment Accounts (SIAs) may be subject to certain charges as set forth in their respective Plan Documents. Total return figures would be lower for the periods presented if they reflected these charges. |
| (b) | The Fund has entered into agreements with certain brokers to rebate a portion of brokerage commissions. The rebated commissions are used to reduce operating expense of the Fund. |
– 172 –
MASSMUTUAL SELECT FOCUSED VALUE FUND
| | | | | | | | | | | | | | | | | | | | |
| | | Class N | |
| | | Year ended
12/31/06 | | | Year ended
12/31/05†† | | | Year ended
12/31/04 | | | Year ended
12/31/03 | | | Period ended
12/31/02++ | |
Net asset value, beginning of year | | $ | 16.48 | | | $ | 17.60 | | | $ | 16.81 | | | $ | 11.90 | | | $ | 11.77 | |
| | | | | | | | | | | | | | | | | | | | |
Income (loss) from investment operations: | | | | | | | | | | | | | | | | | | | | |
Net investment income (loss) | | | 0.18 | *** | | | (0.05 | )*** | | | (0.12 | )*** | | | (0.11 | )*** | | | (0.00 | )***† |
Net realized and unrealized gain (loss) on investments | | | 2.99 | | | | 0.53 | | | | 1.94 | | | | 5.43 | | | | 0.13 | |
| | | | | | | | | | | | | | | | | | | | |
Total income from investment operations | | | 3.17 | | | | 0.48 | | | | 1.82 | | | | 5.32 | | | | 0.13 | |
| | | | | | | | | | | | | | | | | | | | |
Less distributions to shareholders: | | | | | | | | | | | | | | | | | | | | |
From net investment income | | | (0.23 | ) | | | - | | | | - | | | | (0.00 | )† | | | - | |
Tax return of capital | | | - | | | | - | | | | - | | | | (0.41 | ) | | | - | |
From net realized gains | | | (1.63 | ) | | | (1.60 | ) | | | (1.03 | ) | | | - | | | | - | |
| | | | | | | | | | | | | | | | | | | | |
Total distributions | | | (1.86 | ) | | | (1.60 | ) | | | (1.03 | ) | | | (0.41 | ) | | | - | |
| | | | | | | | | | | | | | | | | | | | |
Net asset value, end of year | | $ | 17.79 | | | $ | 16.48 | | | $ | 17.60 | | | $ | 16.81 | | | $ | 11.90 | |
| | | | | | | | | | | | | | | | | | | | |
Total Return(a) | | | 19.35% | (c) | | | 2.61% | (c) | | | 11.05% | (c) | | | 44.70% | (c) | | | - | ‡ |
Ratios / Supplemental Data: | | | | | | | | | | | | | | | | | | | | |
Net assets, end of year (000’s) | | $ | 2,567 | | | $ | 1,820 | | | $ | 1,006 | | | $ | 904 | | | $ | 102 | |
Ratio of expenses to average daily net assets: | | | | | | | | | | | | | | | | | | | | |
Before expense waiver | | | 1.60% | | | | 1.60% | | | | 1.60% | | | | 1.61% | | | | - | ‡ |
After expense waiver | | | N/A | | | | N/A | | | | 1.58% | (b)# | | | 1.60% | (b)# | | | - | ‡ |
Net investment income (loss) to average daily net assets | | | 1.03% | | | | (0.27)% | | | | (0.72)% | | | | (0.70)% | | | | - | ‡ |
Portfolio turnover rate | | | 36% | | | | 31% | | | | 32% | | | | 31% | | | | 78% | |
| *** | Per share amount calculated on the average shares method. |
| † | Net investment loss and distributions from net investment income are less than $0.01 per share. |
| †† | Effective January 1, 2005, rebated brokerage commissions are included with realized gain or loss on investment transactions. Prior to January 1, 2005, these amounts were presented as a reduction of expenses. Prior year amounts have not been restated to reflect this change due to immateriality. (See Note 3) |
| ++ | Class N commenced operations on December 31, 2002. |
| ‡ | Amounts are de minimis due to the short period of operations. |
| # | Computed after giving effect to an agreement by MassMutual to waive certain fees and expenses of the Fund. |
| (a) | Employee retirement benefit plans that invest plan assets in the Separate Investment Accounts (SIAs) may be subject to certain charges as set forth in their respective Plan Documents. Total return figures would be lower for the periods presented if they reflected these charges. |
| (b) | The Fund has entered into agreements with certain brokers to rebate a portion of brokerage commissions. The rebated commissions are used to reduce operating expense of the Fund. |
| (c) | Total Return excludes contingent deferred sales charge and would be lower for the periods presented if it reflected these charges. |
– 173 –
MASSMUTUAL SELECT MID-CAP VALUE FUND
| | | | | | | | | | | | | | | | | | | | |
| | | Class A | | | Class L | | | Class Y | | | Class S | | | Class N | |
| | | Period ended
12/31/06+ | | | Period ended
12/31/06+ | | | Period ended
12/31/06+ | | | Period ended
12/31/06+ | | | Period ended
12/31/06+ | |
Net asset value, beginning of period | | $ | 10.00 | | | $ | 10.00 | | | $ | 10.00 | | | $ | 10.00 | | | $ | 10.00 | |
| | | | | | | | | | | | | | | | | | | | |
Income (loss) from investment operations: | | | | | | | | | | | | | | | | | | | | |
Net investment income (loss) | | | 0.02 | *** | | | 0.05 | *** | | | 0.03 | *** | | | 0.06 | *** | | | (0.00 | )† |
Net realized and unrealized gain (loss) on investments | | | 1.41 | | | | 1.39 | | | | 1.40 | | | | 1.39 | | | | 1.41 | |
| | | | | | | | | | | | | | | | | | | | |
Total income from investment operations | | | 1.43 | | | | 1.44 | | | | 1.43 | | | | 1.45 | | | | 1.41 | |
| | | | | | | | | | | | | | | | | | | | |
Less distributions to shareholders: | | | | | | | | | | | | | | | | | | | | |
From net investment income | | | (0.02 | ) | | | (0.01 | ) | | | - | | | | (0.02 | ) | | | - | |
From net realized gains | | | (0.01 | ) | | | (0.01 | ) | | | - | ‡ | | | (0.01 | ) | | | - | ‡ |
| | | | | | | | | | | | | | | | | | | | |
Total distributions | | | (0.03 | ) | | | (0.02 | ) | | | - | | | | (0.03 | ) | | | - | |
| | | | | | | | | | | | | | | | | | | | |
Net asset value, end of period | | $ | 11.40 | | | $ | 11.42 | | | $ | 11.43 | | | $ | 11.42 | | | $ | 11.41 | |
| | | | | | | | | | | | | | | | | | | | |
Total Return(a) | | | 14.27% | (b)** | | | 14.47% | ** | | | 14.42% | ** | | | 14.50% | ** | | | 14.22% | (b)** |
Ratios / Supplemental Data: | | | | | | | | | | | | | | | | | | | | |
Net assets, end of period (000’s) | | $ | 497 | | | $ | 1,628 | | | $ | - | | | $ | 60,708 | | | $ | - | |
Ratio of expenses to average daily net assets: | | | | | | | | | | | | | | | | | | | | |
Before expense waiver | | | 2.02% | * | | | 1.77% | * | | | 1.62% | * | | | 1.52% | * | | | 2.32% | * |
After expense waiver | | | 1.38% | *# | | | 1.13% | *# | | | 0.98% | *# | | | 0.88% | *# | | | 1.68% | *# |
Net investment income (loss) to average daily net assets | | | 0.45% | * | | | 1.31% | * | | | 0.68% | * | | | 1.51% | * | | | (0.02)% * | |
Portfolio turnover rate | | | 7% | ** | | | 7% | ** | | | 7% | ** | | | 7% | ** | | | 7% | ** |
| ** | Percentages represent results for the period and are not annualized. |
| *** | Per share amount calculated on the average shares method. |
| + | For the period August 29, 2006 (commencement of operations) through December 31, 2006. |
| † | Net investment income (loss) is less than $0.01 per share. |
| # | Computed after giving effect to an agreement by MassMutual to waive certain fees and expenses of the fund. |
| (a) | Employee retirement benefit plans that invest plan assets in the Separate Investment Accounts (SIAs) may be subject to certain charges as set forth by their respective Plan Documents. Total return figures would be lower for the period presented if they reflected these charges. |
| (b) | Total return excludes a front-end sales charge for Class A and a contingent deferred sales charge for Class N and would be lower for the period presented if it reflected these charges. |
| ‡ | Amounts are de minimis due to the short period of operations. |
– 174 –
MASSMUTUAL SELECT SMALL CAP VALUE EQUITY FUND
| | | | | | | | | | | | | | | | | | | | |
| | | Class A | | | Class L | | | Class Y | | | Class S | | | Class N | |
| | | Period ended
12/31/06† | | | Period ended
12/31/06† | | | Period ended
12/31/06† | | | Period ended
12/31/06† | | | Period ended
12/31/06† | |
Net asset value, beginning of period | | $ | 10.00 | | | $ | 10.00 | | | $ | 10.00 | | | $ | 10.00 | | | $ | 10.00 | |
| | | | | | | | | | | | | | | | | | | | |
Income (loss) from investment operations: | | | | | | | | | | | | | | | | | | | | |
Net investment income (loss) | | | 0.10 | *** | | | 0.13 | *** | | | 0.10 | *** | | | 0.11 | *** | | | 0.04 | *** |
Net realized and unrealized gain (loss) on investments | | | 0.84 | | | | 0.83 | | | | 0.86 | | | | 0.85 | | | | 0.87 | |
| | | | | | | | | | | | | | | | | | | | |
Total income from investment operations | | | 0.94 | | | | 0.96 | | | | 0.96 | | | | 0.96 | | | | 0.91 | |
| | | | | | | | | | | | | | | | | | | | |
Less distributions to shareholders: | | | | | | | | | | | | | | | | | | | | |
From net investment income | | | (0.04 | ) | | | (0.05 | ) | | | (0.05 | ) | | | (0.05 | ) | | | - | |
| | | | | | | | | | | | | | | | | | | | |
Net asset value, end of period | | $ | 10.90 | | | $ | 10.91 | | | $ | 10.91 | | | $ | 10.91 | | | $ | 10.91 | |
| | | | | | | | | | | | | | | | | | | | |
Total Return(a) | | | 9.32% | (b)** | | | 9.61% | ** | | | 9.61% | ** | | | 9.74% | ** | | | 9.10% | (b)** |
Ratios / Supplemental Data: | | | | | | | | | | | | | | | | | | | | |
Net assets, end of period (000’s) | | $ | 3,653 | | | $ | 1,041 | | | $ | 2,402 | | | $ | 29,939 | | | $ | 109 | |
Ratio of expenses to average daily net assets: | | | | | | | | | | | | | | | | | | | | |
Before expense waiver | | | 1.72% | * | | | 1.47% | * | | | 1.32% | * | | | 1.22% | * | | | 2.02% | * |
After expense waiver | | | 1.40% | *# | | | 1.15% | *# | | | 1.00% | *# | | | 0.95% | *# | | | 1.70% | *# |
Net investment income (loss) to average daily net assets | | | 1.23% | * | | | 1.69% | * | | | 1.34% | * | | | 1.40% | * | | | 0.50% | * |
Portfolio turnover rate | | | 63% | ** | | | 63% | ** | | | 63% | ** | | | 63% | ** | | | 63% | ** |
| ** | Percentage represents results for the period and are not annualized. |
| *** | Per share amount calculated on the average shares method. |
| # | Computed after giving effect to an agreement by MassMutual to waive certain fees and expenses of the Fund. |
| † | For the period March 31, 2006 (commencement of operations) through December 31, 2006. |
| (a) | Employee retirement benefit plans that invest plan assets in the Separate Investment Accounts (SIAs) may be subject to certain charges as set forth by their respective Plan Documents. Total return figures would be lower for the periods presented if they reflected these charges. |
| (b) | Total return excludes a front-end sales charge for Class A and a contingent deferred sales charge for Class N and would be lower for the period presented if it reflected these charges. |
– 175 –
MASSMUTUAL SELECT SMALL COMPANY VALUE FUND
| | | | | | | | | | | | | | | | | | | | |
| | | Class A | |
| | | Year ended
12/31/06 | | | Year ended
12/31/05† | | | Year ended
12/31/04 | | | Year ended
12/31/03 | | | Year ended
12/31/02 | |
Net asset value, beginning of year | | $ | 14.28 | | | $ | 14.28 | | | $ | 11.96 | | | $ | 8.66 | | | $ | 10.00 | |
| | | | | | | | | | | | | | | | | | | | |
Income (loss) from investment operations: | | | | | | | | | | | | | | | | | | | | |
Net investment income (loss) | | | (0.03 | )*** | | | (0.03 | )*** | | | 0.00 | ***†† | | | 0.02 | *** | | | 0.05 | *** |
Net realized and unrealized gain (loss) on investments | | | 2.07 | | | | 0.68 | | | | 2.65 | | | | 3.31 | | | | (1.37 | ) |
| | | | | | | | | | | | | | | | | | | | |
Total income (loss) from investment operations | | | 2.04 | | | | 0.65 | | | | 2.65 | | | | 3.33 | | | | (1.32 | ) |
| | | | | | | | | | | | | | | | | | | | |
Less distributions to shareholders: | | | | | | | | | | | | | | | | | | | | |
From net investment income | | | - | | | | - | | | | - | | | | (0.01 | ) | | | (0.02 | ) |
From net realized gains | | | (1.00 | ) | | | (0.65 | ) | | | (0.33 | ) | | | (0.02 | ) | | | - | |
| | | | | | | | | | | | | | | | | | | | |
Total distributions | | | (1.00 | ) | | | (0.65 | ) | | | (0.33 | ) | | | (0.03 | ) | | | (0.02 | ) |
| | | | | | | | | | | | | | | | | | | | |
Net asset value, end of year | | $ | 15.32 | | | $ | 14.28 | | | $ | 14.28 | | | $ | 11.96 | | | $ | 8.66 | |
| | | | | | | | | | | | | | | | | | | | |
Total Return(a) | | | 14.46% | (c) | | | 4.56% | (c) | | | 22.30% | (c) | | | 38.66% | | | | (13.27)% | |
Ratios / Supplemental Data: | | | | | | | | | | | | | | | | | | | | |
Net assets, end of year (000’s) | | $ | 174,732 | | | $ | 136,675 | | | $ | 115,807 | | | $ | 44,754 | | | $ | 8,602 | |
Ratio of expenses to average daily net assets: | | | | | | | | | | | | | | | | | | | | |
Before expense waiver | | | 1.49% | | | | 1.49% | | | | 1.49% | | | | 1.51% | | | | 1.64% | |
After expense waiver | | | N/A | | | | N/A | | | | 1.44% | (b)# | | | 1.41% | (b)# | | | 1.37% | (b)# |
Net investment income (loss) to average daily net assets | | | (0.18)% | | | | (0.24)% | | | | (0.02)% | | | | 0.17% | | | | 0.52% | |
Portfolio turnover rate | | | 50% | | | | 56% | | | | 36% | | | | 58% | | | | 69% | |
| | | Class L | |
| | | Year ended
12/31/06 | | | Year ended
12/31/05† | | | Year ended
12/31/04 | | | Year ended
12/31/03 | | | Year ended
12/31/02 | |
Net asset value, beginning of year | | $ | 14.34 | | | $ | 14.31 | | | $ | 11.96 | | | $ | 8.65 | | | $ | 10.00 | |
| | | | | | | | | | | | | | | | | | | | |
Income (loss) from investment operations: | | | | | | | | | | | | | | | | | | | | |
Net investment income (loss) | | | 0.01 | *** | | | 0.00 | ***†† | | | 0.03 | *** | | | 0.05 | *** | | | 0.08 | *** |
Net realized and unrealized gain (loss) on investments | | | 2.08 | | | | 0.68 | | | | 2.67 | | | | 3.31 | | | | (1.39 | ) |
| | | | | | | | | | | | | | | | | | | | |
Total income (loss) from investment operations | | | 2.09 | | | | 0.68 | | | | 2.70 | | | | 3.36 | | | | (1.31 | ) |
| | | | | | | | | | | | | | | | | | | | |
Less distributions to shareholders: | | | | | | | | | | | | | | | | | | | | |
From net investment income | | | - | | | | - | | | | (0.02 | ) | | | (0.03 | ) | | | (0.04 | ) |
From net realized gains | | | (1.00 | ) | | | (0.65 | ) | | | (0.33 | ) | | | (0.02 | ) | | | - | |
| | | | | | | | | | | | | | | | | | | | |
Total distributions | | | (1.00 | ) | | | (0.65 | ) | | | (0.35 | ) | | | (0.05 | ) | | | (0.04 | ) |
| | | | | | | | | | | | | | | | | | | | |
Net asset value, end of year | | $ | 15.43 | | | $ | 14.34 | | | $ | 14.31 | | | $ | 11.96 | | | $ | 8.65 | |
| | | | | | | | | | | | | | | | | | | | |
Total Return(a) | | | 14.75% | | | | 4.76% | | | | 22.68% | | | | 38.92% | | | | (13.10)% | |
Ratios / Supplemental Data: | | | | | | | | | | | | | | | | | | | | |
Net assets, end of year (000’s) | | $ | 163,441 | | | $ | 125,631 | | | $ | 116,485 | | | $ | 37,776 | | | $ | 3,252 | |
Ratio of expenses to average daily net assets: | | | | | | | | | | | | | | | | | | | | |
Before expense waiver | | | 1.24% | | | | 1.24% | | | | 1.24% | | | | 1.26% | | | | 1.39% | |
After expense waiver | | | N/A | | | | N/A | | | | 1.19% | (b)# | | | 1.17% | (b)# | | | 1.11% | (b)# |
Net investment income (loss) to average daily net assets | | | 0.07% | | | | 0.00% | | | | 0.24% | | | | 0.45% | | | | 0.86% | |
Portfolio turnover rate | | | 50% | | | | 56% | | | | 36% | | | | 58% | | | | 69% | |
| *** | Per share amount calculated on the average shares method. |
| † | Effective January 1, 2005, rebated brokerage commissions are included with realized gain or loss on investment transactions. Prior to January 1, 2005, these amounts were presented as a reduction of expenses. Prior year amounts have not been restated to reflect this change due to immateriality. (See Note 3) |
| †† | Net investment income is less than $0.01 per share. |
| # | Computed after giving effect to an agreement by MassMutual to waive certain fees and expenses of the Fund. |
| (a) | Employee retirement benefit plans that invest plan assets in the Separate Investment Accounts (SIAs) may be subject to certain charges as set forth in their respective Plan Documents. Total return figures would be lower for the period presented if they reflected these charges. |
| (b) | The Fund has entered into an agreement with certain brokers to rebate a portion of brokerage commissions. The rebated commissions are used to reduce operating expenses of the Fund. |
| (c) | Total Return excludes a front-end sales charge and would be lower for the periods presented if it reflected these charges. |
– 176 –
MASSMUTUAL SELECT SMALL COMPANY VALUE FUND
| | | | | | | | | | | | | | | | | | | | |
| | | Class Y | |
| | | Year ended
12/31/06 | | | Year ended
12/31/05† | | | Year ended
12/31/04 | | | Year ended
12/31/03 | | | Year ended
12/31/02 | |
Net asset value, beginning of year | | $ | 14.41 | | | $ | 14.35 | | | $ | 11.99 | | | $ | 8.66 | | | $ | 10.00 | |
| | | | | | | | | | | | | | | | | | | | |
Income (loss) from investment operations: | | | | | | | | | | | | | | | | | | | | |
Net investment income (loss) | | | 0.04 | *** | | | 0.02 | *** | | | 0.05 | *** | | | 0.06 | *** | | | 0.11 | *** |
Net realized and unrealized gain (loss) on investments | | | 2.09 | | | | 0.69 | | | | 2.67 | | | | 3.33 | | | | (1.40 | ) |
| | | | | | | | | | | | | | | | | | | | |
Total income (loss) from investment operations | | | 2.13 | | | | 0.71 | | | | 2.72 | | | | 3.39 | | | | (1.29 | ) |
| | | | | | | | | | | | | | | | | | | | |
Less distributions to shareholders: | | | | | | | | | | | | | | | | | | | | |
From net investment income | | | (0.01 | ) | | | - | | | | (0.03 | ) | | | (0.04 | ) | | | (0.05 | ) |
From net realized gains | | | (1.00 | ) | | | (0.65 | ) | | | (0.33 | ) | | | (0.02 | ) | | | - | |
| | | | | | | | | | | | | | | | | | | | |
Total distributions | | | (1.01 | ) | | | (0.65 | ) | | | (0.36 | ) | | | (0.06 | ) | | | (0.05 | ) |
| | | | | | | | | | | | | | | | | | | | |
Net asset value, end of year | | $ | 15.53 | | | $ | 14.41 | | | $ | 14.35 | | | $ | 11.99 | | | $ | 8.66 | |
| | | | | | | | | | | | | | | | | | | | |
Total Return(a) | | | 14.93% | | | | 4.96% | | | | 22.80% | | | | 39.16% | | | | (12.92)% | |
Ratios / Supplemental Data: | | | | | | | | | | | | | | | | | | | | |
Net assets, end of year (000’s) | | $ | 174,630 | | | $ | 98,126 | | | $ | 100,488 | | | $ | 46,409 | | | $ | 19,708 | |
Ratio of expenses to average daily net assets: | | | | | | | | | | | | | | | | | | | | |
Before expense waiver | | | 1.09% | | | | 1.09% | | | | 1.09% | | | | 1.11% | | | | 1.24% | |
After expense waiver | | | N/A | | | | N/A | | | | 1.04% | (b)# | | | 1.01% | (b)# | | | 0.92% | (b)# |
Net investment income (loss) to average daily net assets | | | 0.22% | | | | 0.13% | | | | 0.37% | | | | 0.58% | | | | 1.32% | |
Portfolio turnover rate | | | 50% | | | | 56% | | | | 36% | | | | 58% | | | | 69% | |
| | | | | | | | | | | | | | | | | | | | |
| | | Class S | |
| | | Year ended
12/31/06 | | | Year ended
12/31/05† | | | Year ended
12/31/04 | | | Year ended
12/31/03 | | | Year ended
12/31/02 | |
Net asset value, beginning of year | | $ | 14.46 | | | $ | 14.39 | | | $ | 12.02 | | | $ | 8.67 | | | $ | 10.00 | |
| | | | | | | | | | | | | | | | | | | | |
Income (loss) from investment operations: | | | | | | | | | | | | | | | | | | | | |
Net investment income (loss) | | | 0.04 | *** | | | 0.03 | *** | | | 0.05 | *** | | | 0.06 | *** | | | 0.07 | *** |
Net realized and unrealized gain (loss) on investments | | | 2.09 | | | | 0.69 | | | | 2.68 | | | | 3.35 | | | | (1.36 | ) |
| | | | | | | | | | | | | | | | | | | | |
Total income (loss) from investment operations | | | 2.13 | | | | 0.72 | | | | 2.73 | | | | 3.41 | | | | (1.29 | ) |
| | | | | | | | | | | | | | | | | | | | |
Less distributions to shareholders: | | | | | | | | | | | | | | | | | | | | |
From net investment income | | | (0.01 | ) | | | - | | | | (0.03 | ) | | | (0.04 | ) | | | (0.04 | ) |
From net realized gains | | | (1.00 | ) | | | (0.65 | ) | | | (0.33 | ) | | | (0.02 | ) | | | - | |
| | | | | | | | | | | | | | | | | | | | |
Total distributions | | | (1.01 | ) | | | (0.65 | ) | | | (0.36 | ) | | | (0.06 | ) | | | (0.04 | ) |
| | | | | | | | | | | | | | | | | | | | |
Net asset value, end of year | | $ | 15.58 | | | $ | 14.46 | | | $ | 14.39 | | | $ | 12.02 | | | $ | 8.67 | |
| | | | | | | | | | | | | | | | | | | | |
Total Return(a) | | | 14.97% | | | | 5.01% | | | | 22.86% | | | | 39.37% | | | | (12.92)% | |
Ratios / Supplemental Data: | | | | | | | | | | | | | | | | | | | | |
Net assets, end of year (000’s) | | $ | 288,826 | | | $ | 221,271 | | | $ | 188,743 | | | $ | 80,661 | | | $ | 44,356 | |
Ratio of expenses to average daily net assets: | | | | | | | | | | | | | | | | | | | | |
Before expense waiver | | | 1.05% | | | | 1.05% | | | | 1.05% | | | | 1.07% | | | | 1.20% | |
After expense waiver | | | N/A | | | | N/A | | | | 1.00% | (b)# | | | 0.97% | (b)# | | | 0.96% | (b)# |
Net investment income (loss) to average daily net assets | | | 0.26% | | | | 0.20% | | | | 0.40% | | | | 0.58% | | | | 0.76% | |
Portfolio turnover rate | | | 50% | | | | 56% | | | | 36% | | | | 58% | | | | 69% | |
| *** | Per share amount calculated on the average shares method. |
| † | Effective January 1, 2005, rebated brokerage commissions are included with realized gain or loss on investment transactions. Prior to January 1, 2005, these amounts were presented as a reduction of expenses. Prior year amounts have not been restated to reflect this change due to immateriality. (See Note 3) |
| # | Computed after giving effect to an agreement by MassMutual to waive certain fees and expenses of the Fund. |
| (a) | Employee retirement benefit plans that invest plan assets in the Separate Investment Accounts (SIAs) may be subject to certain charges as set forth in their respective Plan Documents. Total return figures would be lower for the period presented if they reflected these charges. |
| (b) | The Fund has entered into an agreement with certain brokers to rebate a portion of brokerage commissions. The rebated commissions are used to reduce operating expenses of the Fund. |
– 177 –
MASSMUTUAL SELECT SMALL COMPANY VALUE FUND
| | | | | | | | | | | | | | | | | | | | |
| | | Class N | |
| | | Year ended
12/31/06 | | | Year ended
12/31/05† | | | Year ended
12/31/04 | | | Year ended
12/31/03 | | | Year ended
12/31/02+ | |
Net asset value, beginning of year | | $ | 14.11 | | | $ | 14.16 | | | $ | 11.90 | | | $ | 8.63 | | | $ | 8.59 | |
| | | | | | | | | | | | | | | | | | | | |
Income (loss) from investment operations: | | | | | | | | | | | | | | | | | | | | |
Net investment income (loss) | | | (0.07 | )*** | | | (0.08 | )*** | | | (0.05 | )*** | | | (0.01 | )*** | | | 0.00 | ***†† |
Net realized and unrealized gain (loss) on investments | | | 2.04 | | | | 0.68 | | | | 2.64 | | | | 3.30 | | | | 0.04 | |
| | | | | | | | | | | | | | | | | | | | |
Total income from investment operations | | | 1.97 | | | | 0.60 | | | | 2.59 | | | | 3.29 | | | | 0.04 | |
| | | | | | | | | | | | | | | | | | | | |
Less distributions to shareholders: | | | | | | | | | | | | | | | | | | | | |
From net investment income | | | - | | | | - | | | | - | | | | (0.00 | )††† | | | - | |
From net realized gains | | | (1.00 | ) | | | (0.65 | ) | | | (0.33 | ) | | | (0.02 | ) | | | - | |
| | | | | | | | | | | | | | | | | | | | |
Total distributions | | | (1.00 | ) | | | (0.65 | ) | | | (0.33 | ) | | | (0.02 | ) | | | - | |
| | | | | | | | | | | | | | | | | | | | |
Net asset value, end of year | | $ | 15.08 | | | $ | 14.11 | | | $ | 14.16 | | | $ | 11.90 | | | $ | 8.63 | |
| | | | | | | | | | | | | | | | | | | | |
Total Return(a) | | | 14.14% | (c) | | | 4.25% | (c) | | | 21.91% | (c) | | | 38.20% | (c) | | | - | ‡ |
Ratios / Supplemental Data: | | | | | | | | | | | | | | | | | | | | |
Net assets, end of year (000’s) | | $ | 1,398 | | | $ | 1,251 | | | $ | 916 | | | $ | 564 | | | $ | 101 | |
Ratio of expenses to average daily net assets: | | | | | | | | | | | | | | | | | | | | |
Before expense waiver | | | 1.79% | | | | 1.79% | | | | 1.79% | | | | 1.81% | | | | - | ‡ |
After expense waiver | | | N/A | | | | N/A | | | | 1.74% | (b)# | | | 1.72% | (b)# | | | - | ‡ |
Net investment income (loss) to average daily net assets | | | (0.48)% | | | | (0.54)% | | | | (0.37)% | | | | (0.08)% | | | | - | ‡ |
Portfolio turnover rate | | | 50% | | | | 56% | | | | 36% | | | | 58% | | | | 69% | |
| *** | Per share amount calculated on the average shares method. |
| † | Effective January 1, 2005, rebated brokerage commissions are included with realized gain or loss on investment transactions. Prior to January 1, 2005, these amounts were presented as a reduction of expenses. Prior year amounts have not been restated to reflect this change due to immateriality. (See Note 3) |
| †† | Net investment income is less than $0.01 per share. |
| ††† | Distributions from net investment income are less than $0.01 per share. |
| + | Class N commenced operations on December 31, 2002. |
| ‡ | Amounts are de minimis due to the short period of operations. |
| # | Computed after giving effect to an agreement by MassMutual to waive certain fees and expenses of the Fund. |
| (a) | Employee retirement benefit plans that invest plan assets in the Separate Investment Accounts (SIAs) may be subject to certain charges as set forth in their respective Plan Documents. Total return figures would be lower for the period presented if they reflected these charges. |
| (b) | The Fund has entered into an agreement with certain brokers to rebate a portion of brokerage commissions. The rebated commissions are used to reduce operating expenses of the Fund. |
| (c) | Total Return excludes contingent deferred sales charge and would be lower for the periods presented if it reflected these charges. |
– 178 –
MASSMUTUAL SELECT SMALL CAP CORE EQUITY FUND
| | | | | | | | | | | | | | | | | | | | |
| | | Class A | | | Class L | | | Class Y | | | Class S | | | Class N | |
| | | Period ended
12/31/06+ | | | Period ended
12/31/06+ | | | Period ended
12/31/06+ | | | Period ended
12/31/06+ | | | Period ended
12/31/06+ | |
Net asset value, beginning of period | | $ | 10.00 | | | $ | 10.00 | | | $ | 10.00 | | | $ | 10.00 | | | $ | 10.00 | |
| | | | | | | | | | | | | | | | | | | | |
Income (loss) from investment operations: | | | | | | | | | | | | | | | | | | | | |
Net investment income (loss) | | | 0.02 | *** | | | 0.04 | *** | | | 0.05 | *** | | | 0.05 | *** | | | (0.02 | )*** |
Net realized and unrealized gain (loss) on investments | | | 0.32 | | | | 0.32 | | | | 0.33 | | | | 0.32 | | | | 0.34 | |
| | | | | | | | | | | | | | | | | | | | |
Total income from investment operations | | | 0.34 | | | | 0.36 | | | | 0.38 | | | | 0.37 | | | | 0.32 | |
| | | | | | | | | | | | | | | | | | | | |
Less distributions to shareholders: | | | | | | | | | | | | | | | | | | | | |
From net investment income | | | (0.01 | ) | | | (0.02 | ) | | | (0.02 | ) | | | (0.02 | ) | | | - | |
| | | | | | | | | | | | | | | | | | | | |
Net asset value, end of period | | $ | 10.33 | | | $ | 10.34 | | | $ | 10.36 | | | $ | 10.35 | | | $ | 10.32 | |
| | | | | | | | | | | | | | | | | | | | |
Total Return(a) | | | 3.37% | (b)** | | | 3.56% | ** | | | 3.78% | ** | | | 3.71% | ** | | | 3.20% | (b)** |
Ratios / Supplemental Data: | | | | | | | | | | | | | | | | | | | | |
Net assets, end of period (000’s) | | $ | 792 | | | $ | 2,559 | | | $ | 1,707 | | | $ | 20,755 | | | $ | 103 | |
Ratio of expenses to average daily net assets: | | | | | | | | | | | | | | | | | | | | |
Before expense waiver | | | 1.99% | * | | | 1.74% | * | | | 1.59% | * | | | 1.49% | * | | | 2.29% | * |
After expense waiver | | | 1.40% | *# | | | 1.15% | *# | | | 1.00% | *# | | | 0.95% | *# | | | 1.70% | *# |
Net investment income (loss) to average daily net assets | | | 0.23% | * | | | 0.57% | * | | | 0.63% | * | | | 0.63% | * | | | (0.27)% | * |
Portfolio turnover rate | | | 99% | ** | | | 99% | ** | | | 99% | ** | | | 99% | ** | | | 99% | ** |
| ** | Percentage represents the results for the period and are not annualized. |
| *** | Per share amount calculated on the average shares method. |
| # | Computed after giving effect to an agreement by MassMutual to waive certain fees and expenses of the Fund. |
| + | For the period March 31, 2006 (commencement of operations) through December 31, 2006. |
| (a) | Employee retirement benefit plans that invest plan assets in the Separate Investment Accounts (SIAs) may be subject to certain charges as set forth by their respective Plan Documents. Total return figures would be lower for the periods presented if they reflected these charges. |
| (b) | Total return excludes a front-end sales charge for Class A and a contingent deferred sales charge for Class N and would be lower for the period presented if it reflected these charges. |
– 179 –
MASSMUTUAL SELECT MID CAP GROWTH EQUITY FUND
| | | | | | | | | | | | | | | | | | | | |
| | | Class A | |
| | | Year ended
12/31/06 | | | Year ended
12/31/05† | | | Year ended
12/31/04 | | | Year ended
12/31/03 | | | Year ended
12/31/02 | |
Net asset value, beginning of year | | $ | 9.82 | | | $ | 8.74 | | | $ | 7.64 | | | $ | 5.87 | | | $ | 8.18 | |
| | | | | | | | | | | | | | | | | | | | |
Income (loss) from investment operations: | | | | | | | | | | | | | | | | | | | | |
Net investment income (loss) | | | 0.02 | *** | | | (0.05 | )*** | | | (0.05 | )*** | | | (0.05 | )*** | | | (0.06 | )*** |
Net realized and unrealized gain (loss) on investments | | | 0.53 | | | | 1.13 | | | | 1.15 | | | | 1.82 | | | | (2.25 | ) |
| | | | | | | | | | | | | | | | | | | | |
Total income (loss) from investment operations | | | 0.55 | | | | 1.08 | | | | 1.10 | | | | 1.77 | | | | (2.31 | ) |
| | | | | | | | | | | | | | | | | | | | |
Less distributions to shareholders: | | | | | | | | | | | | | | | | | | | | |
From net investment income | | | (0.02 | ) | | | - | | | | - | | | | - | | | | - | |
| | | | | | | | | | | | | | | | | | | | |
Net asset value, end of year | | $ | 10.35 | | | $ | 9.82 | | | $ | 8.74 | | | $ | 7.64 | | | $ | 5.87 | |
| | | | | | | | | | | | | | | | | | | | |
Total Return(a) | | | 5.47% | (c) | | | 12.47% | (c) | | | 14.40% | (c) | | | 30.15% | | | | (28.24)% | |
Ratios / Supplemental Data: | | | | | | | | | | | | | | | | | | | | |
Net assets, end of year (000’s) | | $ | 30,406 | | | $ | 34,053 | | | $ | 29,642 | | | $ | 37,976 | | | $ | 23,351 | |
Ratio of expenses to average daily net assets: | | | | | | | | | | | | | | | | | | | | |
Before expense waiver | | | 1.31% | | | | 1.30% | | | | 1.30% | | | | 1.30% | | | | 1.30% | |
After expense waiver | | | N/A | | | | N/A | | | | 1.27% | (b)# | | | 1.26% | (b)# | | | 1.29% | # |
Net investment income (loss) to average daily net assets | | | 0.18% | | | | (0.59)% | | | | (0.68)% | | | | (0.78)% | | | | (0.90)% | |
Portfolio turnover rate | | | 130% | | | | 117% | | | | 93% | | | | 128% | | | | 284% | |
| |
| | | Class L | |
| | | Year ended
12/31/06 | | | Year ended
12/31/05† | | | Year ended
12/31/04 | | | Year ended
12/31/03 | | | Year ended
12/31/02 | |
Net asset value, beginning of year | | $ | 10.00 | | | $ | 8.87 | | | $ | 7.73 | | | $ | 5.93 | | | $ | 8.24 | |
| | | | | | | | | | | | | | | | | | | | |
Income (loss) from investment operations: | | | | | | | | | | | | | | | | | | | | |
Net investment income (loss) | | | 0.05 | *** | | | (0.03 | )*** | | | (0.03 | )*** | | | (0.04 | )*** | | | (0.04 | )*** |
Net realized and unrealized gain (loss) on investments | | | 0.52 | | | | 1.16 | | | | 1.17 | | | | 1.84 | | | | (2.27 | ) |
| | | | | | | | | | | | | | | | | | | | |
Total income (loss) from investment operations | | | 0.57 | | | | 1.13 | | | | 1.14 | | | | 1.80 | | | | (2.31 | ) |
| | | | | | | | | | | | | | | | | | | | |
Less distributions to shareholders: | | | | | | | | | | | | | | | | | | | | |
From net investment income | | | (0.04 | ) | | | - | | | | - | | | | - | | | | - | |
| | | | | | | | | | | | | | | | | | | | |
Net asset value, end of year | | $ | 10.53 | | | $ | 10.00 | | | $ | 8.87 | | | $ | 7.73 | | | $ | 5.93 | |
| | | | | | | | | | | | | | | | | | | | |
Total Return(a) | | | 5.74% | | | | 12.74% | | | | 14.75% | | | | 30.35% | | | | (28.03)% | |
Ratios / Supplemental Data: | | | | | | | | | | | | | | | | | | | | |
Net assets, end of year (000’s) | | $ | 33,742 | | | $ | 42,353 | | | $ | 39,546 | | | $ | 35,668 | | | $ | 24,204 | |
Ratio of expenses to average daily net assets: | | | | | | | | | | | | | | | | | | | | |
Before expense waiver | | | 1.06% | | | | 1.05% | | | | 1.06% | | | | 1.05% | | | | 1.05% | |
After expense waiver | | | N/A | | | | N/A | | | | 1.02% | (b)# | | | 1.01% | (b)# | | | 1.04% | # |
Net investment income (loss) to average daily net assets | | | 0.43% | | | | (0.35)% | | | | (0.44)% | | | | (0.54)% | | | | (0.65)% | |
Portfolio turnover rate | | | 130% | | | | 117% | | | | 93% | | | | 128% | | | | 284% | |
| *** | Per share amount calculated on the average shares method. |
| † | Effective January 1, 2005, rebated brokerage commissions are included with realized gain or loss on investment transactions. Prior to January 1, 2005, these amounts were presented as a reduction of expenses. Prior year amounts have not been restated to reflect this change due to immateriality. (See Note 3) |
| # | Computed after giving effect to an agreement by MassMutual to waive certain fees and expenses of the Fund. |
| (a) | Employee retirement benefit plans that invest plan assets in the Separate Investment Accounts (SIAs) may be subject to certain charges as set forth in their respective Plan Documents. Total return figures would be lower for the periods presented if they reflected these charges. |
| (b) | The Fund has entered into an agreement with certain brokers to rebate a portion of brokerage commissions. The rebated commissions are used to reduce the operating expenses of the Fund. |
| (c) | Total Return excludes a front-end sales charge and would be lower for the period presented if it reflected these charges. |
– 180 –
MASSMUTUAL SELECT MID CAP GROWTH EQUITY FUND
| | | | | | | | | | | | | | | | | | | | |
| | | Class Y | |
| | | Year ended
12/31/06 | | | Year ended
12/31/05† | | | Year ended
12/31/04 | | | Year ended
12/31/03 | | | Year ended
12/31/02 | |
Net asset value, beginning of year | | $ | 10.08 | | | $ | 8.94 | | | $ | 7.78 | | | $ | 5.95 | | | $ | 8.26 | |
| | | | | | | | | | | | | | | | | | | | |
Income (loss) from investment operations: | | | | | | | | | | | | | | | | | | | | |
Net investment income (loss) | | | 0.06 | *** | | | (0.02 | )*** | | | (0.02 | )*** | | | (0.03 | )*** | | | (0.03 | )*** |
Net realized and unrealized gain (loss) on investments | | | 0.54 | | | | 1.16 | | | | 1.18 | | | | 1.86 | | | | (2.28 | ) |
| | | | | | | | | | | | | | | | | | | | |
Total income (loss) from investment operations | | | 0.60 | | | | 1.14 | | | | 1.16 | | | | 1.83 | | | | (2.31 | ) |
| | | | | | | | | | | | | | | | | | | | |
Less distributions to shareholders: | | | | | | | | | | | | | | | | | | | | |
From net investment income | | | (0.06 | ) | | | - | | | | - | | | | - | | | | - | |
| | | | | | | | | | | | | | | | | | | | |
Net asset value, end of year | | $ | 10.62 | | | $ | 10.08 | | | $ | 8.94 | | | $ | 7.78 | | | $ | 5.95 | |
| | | | | | | | | | | | | | | | | | | | |
Total Return(a) | | | 5.90% | | | | 12.86% | | | | 14.91% | | | | 30.76% | | | | (27.97)% | |
Ratios / Supplemental Data: | | | | | | | | | | | | | | | | | | | | |
Net assets, end of year (000’s) | | $ | 19,475 | | | $ | 21,345 | | | $ | 15,791 | | | $ | 16,202 | | | $ | 9,379 | |
Ratio of expenses to average daily net assets: | | | | | | | | | | | | | | | | | | | | |
Before expense waiver | | | 0.91% | | | | 0.90% | | | | 0.90% | | | | 0.90% | | | | 0.90% | |
After expense waiver | | | N/A | | | | N/A | | | | 0.87% | (b)# | | | 0.86% | (b)# | | | 0.89% | # |
Net investment income (loss) to average daily net assets | | | 0.55% | | | | (0.19)% | | | | (0.29)% | | | | (0.38)% | | | | (0.50)% | |
Portfolio turnover rate | | | 130% | | | | 117% | | | | 93% | | | | 128% | | | | 284% | |
| | | | | | | | | | | | | | | | | | | | |
| |
| | | Class S | |
| | | Year ended
12/31/06 | | | Year ended
12/31/05† | | | Year ended
12/31/04 | | | Year ended
12/31/03 | | | Year ended
12/31/02 | |
Net asset value, beginning of year | | $ | 10.12 | | | $ | 8.97 | | | $ | 7.79 | | | $ | 5.96 | | | $ | 8.27 | |
| | | | | | | | | | | | | | | | | | | | |
Income (loss) from investment operations: | | | | | | | | | | | | | | | | | | | | |
Net investment income (loss) | | | 0.06 | *** | | | (0.01 | )*** | | | (0.02 | )*** | | | (0.02 | )*** | | | (0.03 | )*** |
Net realized and unrealized gain (loss) on investments | | | 0.54 | | | | 1.16 | | | | 1.20 | | | | 1.85 | | | | (2.28 | ) |
| | | | | | | | | | | | | | | | | | | | |
Total income (loss) from investment operations | | | 0.60 | | | | 1.15 | | | | 1.18 | | | | 1.83 | | | | (2.31 | ) |
| | | | | | | | | | | | | | | | | | | | |
Less distributions to shareholders: | | | | | | | | | | | | | | | | | | | | |
From net investment income | | | (0.07 | ) | | | - | | | | - | | | | - | | | | - | |
| | | | | | | | | | | | | | | | | | | | |
Net asset value, end of year | | $ | 10.65 | | | $ | 10.12 | | | $ | 8.97 | | | $ | 7.79 | | | $ | 5.96 | |
| | | | | | | | | | | | | | | | | | | | |
Total Return(a) | | | 5.97% | | | | 12.82% | | | | 15.15% | | | | 30.70% | | | | (27.93)% | |
Ratios / Supplemental Data: | | | | | | | | | | | | | | | | | | | | |
Net assets, end of year (000’s) | | $ | 68,251 | | | $ | 70,676 | | | $ | 50,160 | | | $ | 68,504 | | | $ | 47,443 | |
Ratio of expenses to average daily net assets: | | | | | | | | | | | | | | | | | | | | |
Before expense waiver | | | 0.84% | | | | 0.83% | | | | 0.83% | | | | 0.83% | | | | 0.83% | |
After expense waiver | | | N/A | | | | N/A | | | | 0.80% | (b)# | | | 0.79% | (b)# | | | 0.82% | # |
Net investment income (loss) to average daily net assets | | | 0.59% | | | | (0.12)% | | | | (0.22)% | | | | (0.32)% | | | | (0.43)% | |
Portfolio turnover rate | | | 130% | | | | 117% | | | | 93% | | | | 128% | | | | 284% | |
| *** | Per share amount calculated on the average shares method. |
| † | Effective January 1, 2005, rebated brokerage commissions are included with realized gain or loss on investment transactions. Prior to January 1, 2005, these amounts were presented as a reduction of expenses. Prior year amounts have not been restated to reflect this change due to immateriality. (See Note 3) |
| # | Computed after giving effect to an agreement by MassMutual to waive certain fees and expenses of the Fund. |
| (a) | Employee retirement benefit plans that invest plan assets in the Separate Investment Accounts (SIAs) may be subject to certain charges as set forth in their respective Plan Documents. Total return figures would be lower for the periods presented if they reflected these charges. |
| (b) | The Fund has entered into an agreement with certain brokers to rebate a portion of brokerage commissions. The rebated commissions are used to reduce the operating expenses of the Fund. |
– 181 –
MASSMUTUAL SELECT MID CAP GROWTH EQUITY FUND
| | | | | | | | | | | | | | | | | | | | |
| | | Class N | |
| | | Year ended
12/31/06 | | | Year ended
12/31/05† | | | Year ended
12/31/04 | | | Year ended
12/31/03 | | | Year ended
12/31/02++ | |
Net asset value, beginning of year | | $ | 9.71 | | | $ | 8.67 | | | $ | 7.59 | | | $ | 5.85 | | | $ | 5.86 | |
| | | | | | | | | | | | | | | | | | | | |
Income (loss) from investment operations: | | | | | | | | | | | | | | | | | | | | |
Net investment income (loss) | | | (0.00 | )***†† | | | (0.08 | )*** | | | (0.08 | )*** | | | (0.07 | )*** | | | (0.00 | )***†† |
Net realized and unrealized gain (loss) on investments | | | 0.50 | | | | 1.12 | | | | 1.16 | | | | 1.81 | | | | (0.01 | ) |
| | | | | | | | | | | | | | | | | | | | |
Total income from investment operations | | | 0.50 | | | | 1.04 | | | | 1.08 | | | | 1.74 | | | | (0.01 | ) |
| | | | | | | | | | | | | | | | | | | | |
Net asset value, end of year | | $ | 10.21 | | | $ | 9.71 | | | $ | 8.67 | | | $ | 7.59 | | | $ | 5.85 | |
| | | | | | | | | | | | | | | | | | | | |
Total Return(a) | | | 5.15% | (c) | | | 12.00% | (c) | | | 14.23% | (c) | | | 29.74% | (c) | | | - | ‡ |
Ratios / Supplemental Data: | | | | | | | | | | | | | | | | | | | | |
Net assets, end of year (000’s) | | $ | 246 | | | $ | 167 | | | $ | 149 | | | $ | 137 | | | $ | 100 | |
Ratio of expenses to average daily net assets: | | | | | | | | | | | | | | | | | | | | |
Before expense waiver | | | 1.61% | | | | 1.60% | | | | 1.60% | | | | 1.60% | | | | - | ‡ |
After expense waiver | | | N/A | | | | N/A | | | | 1.57% | (b) | | | 1.56% | (b) | | | - | ‡ |
Net investment income (loss) to average daily net assets | | | (0.01)% | | | | (0.89)% | | | | (0.99)% | | | | (1.09)% | | | | - | ‡ |
Portfolio turnover rate | | | 130% | | | | 117% | | | | 93% | | | | 128% | | | | 284% | |
| *** | Per share amount calculated on the average shares method. |
| † | Effective January 1, 2005, rebated brokerage commissions are included with realized gain or loss on investment transactions. Prior to January 1, 2005, these amounts were presented as a reduction of expenses. Prior year amounts have not been restated to reflect this change due to immateriality. (See Note 3) |
| †† | Net investment loss is less than $0.01 per share. |
| ++ | Class N commenced operations on December 31, 2002. |
| ‡ | Amounts are de minimis due to the short period of operations. |
| (a) | Employee retirement benefit plans that invest plan assets in the Separate Investment Accounts (SIAs) may be subject to certain charges as set forth in their respective Plan Documents. Total return figures would be lower for the periods presented if they reflected these charges. |
| (b) | The Fund has entered into an agreement with certain brokers to rebate a portion of brokerage commissions. The rebated commissions are used to reduce the operating expenses of the Fund. |
| (c) | Total Return excludes contingent deferred sales charge and would be lower for the periods presented if they reflected these charges. |
– 182 –
MASSMUTUAL SELECT MID CAP GROWTH EQUITY II FUND
| | | | | | | | | | | | | | | | | | | | |
| | | Class A | |
| | | Year ended
12/31/06 | | | Year ended
12/31/05† | | | Year ended
12/31/04 | | | Year ended
12/31/03 | | | Year ended
12/31/02 | |
Net asset value, beginning of year | | $ | 14.13 | | | $ | 13.09 | | | $ | 11.17 | | | $ | 8.12 | | | $ | 10.33 | |
| | | | | | | | | | | | | | | | | | | | |
Income (loss) from investment operations: | | | | | | | | | | | | | | | | | | | | |
Net investment income (loss) | | | (0.04 | )*** | | | (0.09 | )*** | | | (0.10 | )*** | | | (0.09 | )*** | | | (0.08 | )*** |
Net realized and unrealized gain (loss) on investments | | | 1.01 | | | | 1.74 | | | | 2.04 | | | | 3.14 | | | | (2.13 | ) |
| | | | | | | | | | | | | | | | | | | | |
Total income (loss) from investment operations | | | 0.97 | | | | 1.65 | | | | 1.94 | | | | 3.05 | | | | (2.21 | ) |
| | | | | | | | | | | | | | | | | | | | |
Less distributions to shareholders: | | | | | | | | | | | | | | | | | | | | |
From net realized gains | | | (1.05 | ) | | | (0.61 | ) | | | (0.02 | ) | | | - | | | | - | |
| | | | | | | | | | | | | | | | | | | | |
Net asset value, end of year | | $ | 14.05 | | | $ | 14.13 | | | $ | 13.09 | | | $ | 11.17 | | | $ | 8.12 | |
| | | | | | | | | | | | | | | | | | | | |
Total Return(a) | | | 6.97% | (c) | | | 12.63% | (c) | | | 17.41% | (c) | | | 37.56% | | | | (21.39)% | |
Ratios / Supplemental Data: | | | | | | | | | | | | | | | | | | | | |
Net assets, end of year (000’s) | | $ | 318,260 | | | $ | 310,072 | | | $ | 208,278 | | | $ | 93,526 | | | $ | 30,968 | |
Ratio of expenses to average daily net assets: | | | | | | | | | | | | | | | | | | | | |
Before expense waiver | | | 1.35% | | | | 1.35% | | | | 1.35% | | | | 1.35% | | | | 1.36% | |
After expense waiver | | | N/A | | | | N/A | | | | 1.34% | (b)# | | | 1.34% | (b)# | | | 1.35% | (b)# |
Net investment income (loss) to average daily net assets | | | (0.29)% | | | | (0.68)% | | | | (0.89)% | | | | (0.93)% | | | | (0.96)% | |
Portfolio turnover rate | | | 42% | | | | 28% | | | | 42% | | | | 54% | | | | 61% | |
| |
| | | Class L | |
| | | Year ended
12/31/06 | | | Year ended
12/31/05† | | | Year ended
12/31/04 | | | Year ended
12/31/03 | | | Year ended
12/31/02 | |
Net asset value, beginning of year | | $ | 14.34 | | | $ | 13.24 | | | $ | 11.27 | | | $ | 8.17 | | | $ | 10.37 | |
| | | | | | | | | | | | | | | | | | | | |
Income (loss) from investment operations: | | | | | | | | | | | | | | | | | | | | |
Net investment income (loss) | | | (0.01 | )*** | | | (0.06 | )*** | | | (0.08 | )*** | | | (0.07 | )*** | | | (0.07 | )*** |
Net realized and unrealized gain (loss) on investments | | | 1.04 | | | | 1.77 | | | | 2.07 | | | | 3.17 | | | | (2.13 | ) |
| | | | | | | | | | | | | | | | | | | | |
Total income (loss) from investment operations | | | 1.03 | | | | 1.71 | | | | 1.99 | | | | 3.10 | | | | (2.20 | ) |
| | | | | | | | | | | | | | | | | | | | |
Less distributions to shareholders: | | | | | | | | | | | | | | | | | | | | |
From net realized gains | | | (1.09 | ) | | | (0.61 | ) | | | (0.02 | ) | | | - | | | | - | |
| | | | | | | | | | | | | | | | | | | | |
Net asset value, end of year | | $ | 14.28 | | | $ | 14.34 | | | $ | 13.24 | | | $ | 11.27 | | | $ | 8.17 | |
| | | | | | | | | | | | | | | | | | | | |
Total Return(a) | | | 7.28% | | | | 12.94% | | | | 17.70% | | | | 37.94% | | | | (21.22)% | |
Ratios / Supplemental Data: | | | | | | | | | | | | | | | | | | | | |
Net assets, end of year (000’s) | | $ | 531,194 | | | $ | 508,296 | | | $ | 403,972 | | | $ | 225,279 | | | $ | 116,835 | |
Ratio of expenses to average daily net assets: | | | | | | | | | | | | | | | | | | | | |
Before expense waiver | | | 1.10% | | | | 1.10% | | | | 1.10% | | | | 1.10% | | | | 1.11% | |
After expense waiver | | | N/A | | | | N/A | | | | 1.09% | (b)# | | | 1.09% | (b)# | | | 1.09% | (b)# |
Net investment income (loss) to average daily net assets | | | (0.05)% | | | | (0.43)% | | | | (0.65)% | | | | (0.68)% | | | | (0.72)% | |
Portfolio turnover rate | | | 42% | | | | 28% | | | | 42% | | | | 54% | | | | 61% | |
| *** | Per share amount calculated on the average shares method. |
| † | Effective January 1, 2005, rebated brokerage commissions are included with realized gain or loss on investment transactions. Prior to January 1, 2005, these amounts were presented as a reduction of expenses. Prior year amounts have not been restated to reflect this change due to immateriality. (See Note 3) |
| # | Computed after giving effect to an agreement by MassMutual to waive certain fees and expenses of the Fund. |
| (a) | Employee retirement benefit plans that invest plan assets in the Separate Investment Accounts (SIAs) may be subject to certain charges as set forth in their respective Plan Documents. Total return figures would be lower for the periods presented if they reflected these charges. |
| (b) | The Fund has entered into an agreement with the certain brokers to rebate a portion of brokerage commissions. The rebated commissions are used to reduce operating expenses of the Fund. |
| (c) | Total Return excludes a front-end sales charge and would be lower for the periods presented if it reflected these charges. |
– 183 –
MASSMUTUAL SELECT MID CAP GROWTH EQUITY II FUND
| | | | | | | | | | | | | | | | | | | | |
| | | Class Y | |
| | | Year ended
12/31/06 | | | Year ended
12/31/05† | | | Year ended
12/31/04 | | | Year ended
12/31/03 | | | Year ended
12/31/02 | |
Net asset value, beginning of year | | $ | 14.48 | | | $ | 13.35 | | | $ | 11.34 | | | $ | 8.21 | | | $ | 10.40 | |
| | | | | | | | | | | | | | | | | | | | |
Income (loss) from investment operations: | | | | | | | | | | | | | | | | | | | | |
Net investment income (loss) | | | 0.01 | *** | | | (0.04 | )*** | | | (0.06 | )*** | | | (0.05 | )*** | | | (0.04 | )*** |
Net realized and unrealized gain (loss) on investments | | | 1.06 | | | | 1.78 | | | | 2.09 | | | | 3.18 | | | | (2.15 | ) |
| | | | | | | | | | | | | | | | | | | | |
Total income (loss) from investment operations | | | 1.07 | | | | 1.74 | | | | 2.03 | | | | 3.13 | | | | (2.19 | ) |
| | | | | | | | | | | | | | | | | | | | |
Less distributions to shareholders: | | | | | | | | | | | | | | | | | | | | |
From net realized gains | | | (1.12 | ) | | | (0.61 | ) | | | (0.02 | ) | | | - | | | | - | |
| | | | | | | | | | | | | | | | | | | | |
Net asset value, end of year | | $ | 14.43 | | | $ | 14.48 | | | $ | 13.35 | | | $ | 11.34 | | | $ | 8.21 | |
| | | | | | | | | | | | | | | | | | | | |
Total Return(a) | | | 7.45% | | | | 13.06% | | | | 17.94% | | | | 38.12% | | | | (21.06)% | |
Ratios / Supplemental Data: | | | | | | | | | | | | | | | | | | | | |
Net assets, end of year (000’s) | | $ | 178,542 | | | $ | 139,779 | | | $ | 99,126 | | | $ | 51,284 | | | $ | 27,835 | |
Ratio of expenses to average daily net assets: | | | | | | | | | | | | | | | | | | | | |
Before expense waiver | | | 0.95% | | | | 0.95% | | | | 0.95% | | | | 0.95% | | | | 0.98% | |
After expense waiver | | | N/A | | | | N/A | | | | 0.94% | (b)# | | | 0.94% | (b)# | | | 0.96% | (b)# |
Net investment income (loss) to average daily net assets | | | 0.10% | | | | (0.28)% | | | | (0.49)% | | | | (0.53)% | | | | (0.51)% | |
Portfolio turnover rate | | | 42% | | | | 28% | | | | 42% | | | | 54% | | | | 61% | |
| | | Class S | |
| | | Year ended
12/31/06 | | | Year ended
12/31/05† | | | Year ended
12/31/04 | | | Year ended
12/31/03 | | | Year ended
12/31/02 | |
Net asset value, beginning of year | | $ | 14.54 | | | $ | 13.39 | | | $ | 11.37 | | | $ | 8.22 | | | $ | 10.41 | |
| | | | | | | | | | | | | | | | | | | | |
Income (loss) from investment operations: | | | | | | | | | | | | | | | | | | | | |
Net investment income (loss) | | | 0.03 | *** | | | (0.03 | )*** | | | (0.05 | )*** | | | (0.04 | )*** | | | (0.04 | )*** |
Net realized and unrealized gain (loss) on investments | | | 1.05 | | | | 1.79 | | | | 2.09 | | | | 3.19 | | | | (2.15 | ) |
| | | | | | | | | | | | | | | | | | | | |
Total income (loss) from investment operations | | | 1.08 | | | | 1.76 | | | | 2.04 | | | | 3.15 | | | | (2.19 | ) |
| | | | | | | | | | | | | | | | | | | | |
Less distributions to shareholders: | | | | | | | | | | | | | | | | | | | | |
From net realized gains | | | (1.12 | ) | | | (0.61 | ) | | | (0.02 | ) | | | - | | | | - | |
| | | | | | | | | | | | | | | | | | | | |
Net asset value, end of year | | $ | 14.50 | | | $ | 14.54 | | | $ | 13.39 | | | $ | 11.37 | | | $ | 8.22 | |
| | | | | | | | | | | | | | | | | | | | |
Total Return(a) | | | 7.55% | | | | 13.17% | | | | 17.98% | | | | 38.32% | | | | (21.04)% | |
Ratios / Supplemental Data: | | | | | | | | | | | | | | | | | | | | |
Net assets, end of year (000’s) | | $ | 229,547 | | | $ | 273,591 | | | $ | 206,865 | | | $ | 125,907 | | | $ | 72,595 | |
Ratio of expenses to average daily net assets: | | | | | | | | | | | | | | | | | | | | |
Before expense waiver | | | 0.86% | | | | 0.86% | | | | 0.86% | | | | 0.86% | | | | 0.87% | |
After expense waiver | | | N/A | | | | N/A | | | | 0.85% | (b)# | | | 0.85% | (b)# | | | 0.85% | (b)# |
Net investment income (loss) to average daily net assets | | | 0.21% | | | | (0.19)% | | | | (0.41)% | | | | (0.44)% | | | | (0.48)% | |
Portfolio turnover rate | | | 42% | | | | 28% | | | | 42% | | | | 54% | | | | 61% | |
| *** | Per share amount calculated on the average shares method. |
| † | Effective January 1, 2005, rebated brokerage commissions are included with realized gain or loss on investment transactions. Prior to January 1, 2005, these amounts were presented as a reduction of expenses. Prior year amounts have not been restated to reflect this change due to immateriality. (See Note 3) |
| # | Computed after giving effect to an agreement by MassMutual to waive certain fees and expenses of the Fund. |
| (a) | Employee retirement benefit plans that invest plan assets in the Separate Investment Accounts (SIAs) may be subject to certain charges as set forth in their respective Plan Documents. Total return figures would be lower for the periods presented if they reflected these charges. |
| (b) | The Fund has entered into an agreement with the certain brokers to rebate a portion of brokerage commissions. The rebated commissions are used to reduce operating expenses of the Fund. |
– 184 –
MASSMUTUAL SELECT MID CAP GROWTH EQUITY II FUND
| | | | | | | | | | | | | | | | | | | | |
| | | Class N | |
| | | Year ended
12/31/06 | | | Year ended
12/31/05† | | | Year ended
12/31/04 | | | Year ended
12/31/03 | | | Year ended
12/31/02++ | |
Net asset value, beginning of year | | $ | 13.95 | | | $ | 12.97 | | | $ | 11.10 | | | $ | 8.09 | | | $ | 8.05 | |
| | | | | | | | | | | | | | | | | | | | |
Income (loss) from investment operations: | | | | | | | | | | | | | | | | | | | | |
Net investment income (loss) | | | (0.09 | )*** | | | (0.13 | )*** | | | (0.14 | )*** | | | (0.12 | )*** | | | (0.00 | )***†† |
Net realized and unrealized gain (loss) on investments | | | 1.01 | | | | 1.72 | | | | 2.03 | | | | 3.13 | | | | 0.04 | |
| | | | | | | | | | | | | | | | | | | | |
Total income (loss) from investment operations | | | 0.92 | | | | 1.59 | | | | 1.89 | | | | 3.01 | | | | 0.04 | |
| | | | | | | | | | | | | | | | | | | | |
Less distributions to shareholders: | | | | | | | | | | | | | | | | | | | | |
From net realized gains | | | (1.03 | ) | | | (0.61 | ) | | | (0.02 | ) | | | - | | | | - | |
| | | | | | | | | | | | | | | | | | | | |
Net asset value, end of year | | $ | 13.84 | | | $ | 13.95 | | | $ | 12.97 | | | $ | 11.10 | | | $ | 8.09 | |
| | | | | | | | | | | | | | | | | | | | |
Total Return(a) | | | 6.68% | (c) | | | 12.28% | (c) | | | 17.07% | (c) | | | 37.21% | (c) | | | - | ‡ |
Ratios / Supplemental Data: | | | | | | | | | | | | | | | | | | | | |
Net assets, end of year (000’s) | | $ | 2,674 | | | $ | 1,755 | | | $ | 1,096 | | | $ | 617 | | | $ | 101 | |
Ratio of expenses to average daily net assets: | | | | | | | | | | | | | | | | | | | | |
Before expense waiver | | | 1.65% | | | | 1.65% | | | | 1.65% | | | | 1.66% | | | | - | ‡ |
After expense waiver | | | N/A | | | | N/A | | | | 1.64% | (b)# | | | 1.65% | (b)# | | | - | ‡ |
Net investment income (loss) to average daily net assets | | | (0.63)% | | | | (0.97)% | | | | (1.19)% | | | | (1.22)% | | | | - | ‡ |
Portfolio turnover rate | | | 42% | | | | 28% | | | | 42% | | | | 54% | | | | 61% | |
| *** | Per share amount calculated on the average shares method. |
| † | Effective January 1, 2005, rebated brokerage commissions are included with realized gain or loss on investment transactions. Prior to January 1, 2005, these amounts were presented as a reduction of expenses. Prior year amounts have not been restated to reflect this change due to immateriality. (See Note 3) |
| †† | Net investment income (loss) is less than $0.01 per share. |
| ‡ | Amounts are de minimis due to the short period of operations. |
| ++ | Class N commenced operations on December 31, 2002. |
| # | Computed after giving effect to an agreement by MassMutual to waive certain fees and expenses of the Fund. |
| (a) | Employee retirement benefit plans that invest plan assets in the Separate Investment Accounts (SIAs) may be subject to certain charges as set forth in their respective Plan Documents. Total return figures would be lower for the periods presented if they reflected these charges. |
| (b) | The Fund has entered into an agreement with certain brokers to rebate a portion of brokerage commissions. The rebated commissions are used to reduce operating expenses of the Fund. |
| (c) | Total Return excludes contingent deferred sales charge and would be lower for the periods presented if they reflected these charges. |
– 185 –
MASSMUTUAL SELECT SMALL CAP GROWTH EQUITY FUND
| | | | | | | | | | | | | | | | | | | | |
| | | Class A | |
| | | Year ended
12/31/06 | | | Year ended
12/31/05† | | | Year ended
12/31/04 | | | Year ended
12/31/03 | | | Year ended
12/31/02 | |
Net asset value, beginning of year | | $ | 15.72 | | | $ | 14.22 | | | $ | 12.56 | | | $ | 8.76 | | | $ | 11.79 | |
| | | | | | | | | | | | | | | | | | | | |
Income (loss) from investment operations: | | | | | | | | | | | | | | | | | | | | |
Net investment income (loss) | | | (0.13 | )*** | | | (0.12 | )*** | | | (0.13 | )*** | | | (0.12 | )*** | | | (0.11 | )*** |
Net realized and unrealized gain (loss) on investments | | | 1.53 | | | | 1.62 | | | | 1.79 | | | | 3.92 | | | | (2.92 | ) |
| | | | | | | | | | | | | | | | | | | | |
Total income (loss) from investment operations | | | 1.40 | | | | 1.50 | | | | 1.66 | | | | 3.80 | | | | (3.03 | ) |
| | | | | | | | | | | | | | | | | | | | |
Less distributions to shareholders: | | | | | | | | | | | | | | | | | | | | |
From net realized gains | | | (1.14 | ) | | | - | | | | - | | | | - | | | | - | |
| | | | | | | | | | | | | | | | | | | | |
Net asset value, end of year | | $ | 15.98 | | | $ | 15.72 | | | $ | 14.22 | | | $ | 12.56 | | | $ | 8.76 | |
| | | | | | | | | | | | | | | | | | | | |
Total Return(a) | | | 8.91% | (c) | | | 10.55% | (c) | | | 13.22% | (c) | | | 43.38% | | | | (25.70)% | |
Ratios / Supplemental Data: | | | | | | | | | | | | | | | | | | | | |
Net assets, end of year (000’s) | | $ | 114,136 | | | $ | 98,945 | | | $ | 77,739 | | | $ | 67,686 | | | $ | 35,509 | |
Ratio of expenses to average daily net assets: | | | | | | | | | | | | | | | | | | | | |
Before expense waiver | | | 1.51% | | | | 1.51% | | | | 1.52% | | | | 1.51% | | | | 1.51% | |
After expense waiver | | | N/A | | | | N/A | | | | 1.48% | (b)# | | | 1.49% | (b)# | | | 1.50% | (b)# |
Net investment income (loss) to average daily net assets | | | (0.80)% | | | | (0.83)% | | | | (1.01)% | | | | (1.11)% | | | | (1.08)% | |
Portfolio turnover rate | | | 84% | | | | 59% | | | | 64% | | | | 56% | | | | 51% | |
| |
| | | Class L | |
| | | Year ended
12/31/06 | | | Year ended
12/31/05† | | | Year ended
12/31/04 | | | Year ended
12/31/03 | | | Year ended
12/31/02 | |
Net asset value, beginning of year | | $ | 15.97 | | | $ | 14.41 | | | $ | 12.70 | | | $ | 8.83 | | | $ | 11.85 | |
| | | | | | | | | | | | | | | | | | | | |
Income (loss) from investment operations: | | | | | | | | | | | | | | | | | | | | |
Net investment income (loss) | | | (0.09 | )*** | | | (0.08 | )*** | | | (0.10 | )*** | | | (0.09 | )*** | | | (0.08 | )*** |
Net realized and unrealized gain (loss) on investments | | | 1.55 | | | | 1.64 | | | | 1.81 | | | | 3.96 | | | | (2.94 | ) |
| | | | | | | | | | | | | | | | | | | | |
Total income (loss) from investment operations | | | 1.46 | | | | 1.56 | | | | 1.71 | | | | 3.87 | | | | (3.02 | ) |
| | | | | | | | | | | | | | | | | | | | |
Less distributions to shareholders: | | | | | | | | | | | | | | | | | | | | |
From net realized gains | | | (1.14 | ) | | | - | | | | - | | | | - | | | | - | |
| | | | | | | | | | | | | | | | | | | | |
Net asset value, end of year | | $ | 16.29 | | | $ | 15.97 | | | $ | 14.41 | | | $ | 12.70 | | | $ | 8.83 | |
| | | | | | | | | | | | | | | | | | | | |
Total Return(a) | | | 9.15% | | | | 10.83% | | | | 13.46% | | | | 43.83% | | | | (25.49)% | |
Ratios / Supplemental Data: | | | | | | | | | | | | | | | | | | | | |
Net assets, end of year (000’s) | | $ | 92,914 | | | $ | 108,840 | | | $ | 90,941 | | | $ | 85,885 | | | $ | 44,419 | |
Ratio of expenses to average daily net assets: | | | | | | | | | | | | | | | | | | | | |
Before expense waiver | | | 1.26% | | | | 1.26% | | | | 1.26% | | | | 1.26% | | | | 1.26% | |
After expense waiver | | | N/A | | | | N/A | | | | 1.23% | (b)# | | | 1.24% | (b)# | | | 1.25% | (b)# |
Net investment income (loss) to average daily net assets | | | (0.55)% | | | | (0.58)% | | | | (0.76)% | | | | (0.86)% | | | | (0.83)% | |
Portfolio turnover rate | | | 84% | | | | 59% | | | | 64% | | | | 56% | | | | 51% | |
| *** | Per share amount calculated on the average shares method. |
| † | Effective January 1, 2005, rebated brokerage commissions are included with realized gain or loss on investment transactions. Prior to January 1, 2005, these amounts were presented as a reduction of expenses. Prior year amounts have not been restated to reflect this change due to immateriality. (See Note 3) |
| # | Computed after giving effect to an agreement by MassMutual to waive certain fees and expenses of the Fund. |
| (a) | Employee retirement benefit plans that invest plan assets in the Separate Investment Accounts (SIAs) may be subject to certain charges as set forth in their respective Plan Documents. Total return figures would be lower for the period presented if they reflected these charges. |
| (b) | The Fund has entered into an agreement with certain brokers to rebate a portion of brokerage commissions. The rebated commissions are used to reduce operating expenses of the Fund. |
| (c) | Total Return excludes a front-end sales charge and would be lower for the period presented if it reflected these charges. |
– 186 –
MASSMUTUAL SELECT SMALL CAP GROWTH EQUITY FUND
| | | | | | | | | | | | | | | | | | | | |
| | | Class Y | |
| | | Year ended
12/31/06 | | | Year ended
12/31/05† | | | Year ended
12/31/04 | | | Year ended
12/31/03 | | | Year ended
12/31/02 | |
Net asset value, beginning of year | | $ | 16.11 | | | $ | 14.52 | | | $ | 12.77 | | | $ | 8.87 | | | $ | 11.89 | |
| | | | | | | | | | | | | | | | | | | | |
Income (loss) from investment operations: | | | | | | | | | | | | | | | | | | | | |
Net investment income (loss) | | | (0.07 | )*** | | | (0.06 | )*** | | | (0.08 | )*** | | | (0.08 | )*** | | | (0.07 | )*** |
Net realized and unrealized gain (loss) on investments | | | 1.58 | | | | 1.65 | | | | 1.83 | | | | 3.98 | | | | (2.95 | ) |
| | | | | | | | | | | | | | | | | | | | |
Total income (loss) from investment operations | | | 1.51 | | | | 1.59 | | | | 1.75 | | | | 3.90 | | | | (3.02 | ) |
| | | | | | | | | | | | | | | | | | | | |
Less distributions to shareholders: | | | | | | | | | | | | | | | | | | | | |
From net realized gains | | | (1.14 | ) | | | - | | | | - | | | | - | | | | - | |
| | | | | | | | | | | | | | | | | | | | |
Net asset value, end of year | | $ | 16.48 | | | $ | 16.11 | | | $ | 14.52 | | | $ | 12.77 | | | $ | 8.87 | |
| | | | | | | | | | | | | | | | | | | | |
Total Return(a) | | | 9.32% | | | | 11.02% | | | | 13.70% | | | | 43.97% | | | | (25.40)% | |
Ratios / Supplemental Data: | | | | | | | | | | | | | | | | | | | | |
Net assets, end of year (000’s) | | $ | 133,777 | | | $ | 95,822 | | | $ | 92,812 | | | $ | 87,801 | | | $ | 43,123 | |
Ratio of expenses to average daily net assets: | | | | | | | | | | | | | | | | | | | | |
Before expense waiver | | | 1.11% | | | | 1.11% | | | | 1.12% | | | | 1.11% | | | | 1.11% | |
After expense waiver | | | N/A | | | | N/A | | | | 1.08% | (b)# | | | 1.09% | (b)# | | | 1.10% | (b)# |
Net investment income (loss) to average daily net assets | | | (0.41)% | | | | (0.44)% | | | | (0.61)% | | | | (0.71)% | | | | (0.68)% | |
Portfolio turnover rate | | | 84% | | | | 59% | | | | 64% | | | | 56% | | | | 51% | |
| |
| | | Class S | |
| | | Year ended
12/31/06 | | | Year ended
12/31/05† | | | Year ended
12/31/04 | | | Year ended
12/31/03 | | | Year ended
12/31/02 | |
Net asset value, beginning of year | | $ | 16.24 | | | $ | 14.61 | | | $ | 12.84 | | | $ | 8.91 | | | $ | 11.92 | |
| | | | | | | | | | | | | | | | | | | | |
Income (loss) from investment operations: | | | | | | | | | | | | | | | | | | | | |
Net investment income (loss) | | | (0.04 | )*** | | | (0.04 | )*** | | | (0.06 | )*** | | | (0.06 | )*** | | | (0.06 | )*** |
Net realized and unrealized gain (loss) on investments | | | 1.58 | | | | 1.67 | | | | 1.83 | | | | 3.99 | | | | (2.95 | ) |
| | | | | | | | | | | | | | | | | | | | |
Total income (loss) from investment operations | | | 1.54 | | | | 1.63 | | | | 1.77 | | | | 3.93 | | | | (3.01 | ) |
| | | | | | | | | | | | | | | | | | | | |
Less distributions to shareholders: | | | | | | | | | | | | | | | | | | | | |
From net realized gains | | | (1.14 | ) | | | - | | | | - | | | | - | | | | - | |
| | | | | | | | | | | | | | | | | | | | |
Net asset value, end of year | | $ | 16.64 | | | $ | 16.24 | | | $ | 14.61 | | | $ | 12.84 | | | $ | 8.91 | |
| | | | | | | | | | | | | | | | | | | | |
Total Return(a) | | | 9.49% | | | | 11.23% | | | | 13.79% | | | | 44.11% | | | | (25.25)% | |
Ratios / Supplemental Data: | | | | | | | | | | | | | | | | | | | | |
Net assets, end of year (000’s) | | $ | 284,413 | | | $ | 288,954 | | | $ | 241,673 | | | $ | 243,909 | | | $ | 123,762 | |
Ratio of expenses to average daily net assets: | | | | | | | | | | | | | | | | | | | | |
Before expense waiver | | | 0.97% | | | | 0.97% | | | | 0.97% | | | | 0.97% | | | | 0.97% | |
After expense waiver | | | N/A | | | | N/A | | | | 0.94% | (b)# | | | 0.95% | (b)# | | | 0.96% | (b)# |
Net investment income (loss) to average daily net assets | | | (0.26)% | | | | (0.29)% | | | | (0.47)% | | | | (0.57)% | | | | (0.54)% | |
Portfolio turnover rate | | | 84% | | | | 59% | | | | 64% | | | | 56% | | | | 51% | |
| *** | Per share amount calculated on the average shares method. |
| † | Effective January 1, 2005, rebated brokerage commissions are included with realized gain or loss on investment transactions. Prior to January 1, 2005, these amounts were presented as a reduction of expenses. Prior year amounts have not been restated to reflect this change due to immateriality. (See Note 3) |
| # | Computed after giving effect to an agreement by MassMutual to waive certain fees and expenses of the Fund. |
| (a) | Employee retirement benefit plans that invest plan assets in the Separate Investment Account (SIAs) may be subject to certain charges as set forth in their respective Plan Documents. Total return figures would be lower for the period presented if they reflected these charges. |
| (b) | The Fund has entered into an agreement with certain brokers to rebate a portion of brokerage commissions. The rebated commissions are used to reduce operating expenses of the Fund. |
– 187 –
MASSMUTUAL SELECT SMALL CAP GROWTH EQUITY FUND
| | | | | | | | | | | | | | | | | | | | |
| | | Class N | |
| | | Year ended
12/31/06 | | | Year ended
12/31/05†† | | | Year ended
12/31/04 | | | Year ended
12/31/03 | | | Period ended
12/31/02+ | |
Net asset value, beginning of year | | $ | 15.51 | | | $ | 14.07 | | | $ | 12.47 | | | $ | 8.72 | | | $ | 8.68 | |
| | | | | | | | | | | | | | | | | | | | |
Income (loss) from investment operations: | | | | | | | | | | | | | | | | | | | | |
Net investment income (loss) | | | (0.18 | )*** | | | (0.16 | ) | | | (0.16 | ) | | | (0.15 | )*** | | | (0.00 | )***† |
Net realized and unrealized gain (loss) on investments | | | 1.51 | | | | 1.60 | | | | 1.76 | | | | 3.90 | | | | 0.04 | |
| | | | | | | | | | | | | | | | | | | | |
Total income from investment operations | | | 1.33 | | | | 1.44 | | | | 1.60 | | | | 3.75 | | | | 0.04 | |
| | | | | | | | | | | | | | | | | | | | |
Less distributions to shareholders: | | | | | | | | | | | | | | | | | | | | |
From net realized gains | | | (1.14 | ) | | | - | | | | - | | | | - | | | | - | |
| | | | | | | | | | | | | | | | | | | | |
Net asset value, end of year | | $ | 15.70 | | | $ | 15.51 | | | $ | 14.07 | | | $ | 12.47 | | | $ | 8.72 | |
| | | | | | | | | | | | | | | | | | | | |
Total Return(a) | | | 8.51% | (c) | | | 10.31% | (c) | | | 12.83% | (c) | | | 43.00% | (c) | | | - | ‡ |
Ratios / Supplemental Data: | | | | | | | | | | | | | | | | | | | | |
Net assets, end of year (000’s) | | $ | 990 | | | $ | 930 | | | $ | 816 | | | $ | 149 | | | $ | 101 | |
Ratio of expenses to average daily net assets: | | | | | | | | | | | | | | | | | | | | |
Before expense waiver | | | 1.81% | | | | 1.81% | | | | 1.82% | | | | 1.81% | | | | - | ‡ |
After expense waiver | | | N/A | | | | N/A | | | | 1.78% | (b)# | | | 1.79% | (b)# | | | - | ‡ |
Net investment income (loss) to average daily net assets | | | (1.11)% | | | | (1.13)% | | | | (1.31)% | | | | (1.41)% | | | | - | ‡ |
Portfolio turnover rate | | | 84% | | | | 59% | | | | 64% | | | | 56% | | | | 51% | |
| *** | Per share amount calculated on the average shares method. |
| † | Net investment loss is less than $0.01 per share. |
| †† | Effective January 1, 2005, rebated brokerage commissions are included with realized gain or loss on investment transactions. Prior to January 1, 2005, these amounts were presented as a reduction of expenses. Prior year amounts have not been restated to reflect this change due to immateriality. (See Note 3) |
| + | Class N commenced operations on December 31, 2002. |
| ‡ | Amounts are de minimis due to the short period of operations. |
| # | Computed after giving effect to an agreement by MassMutual to waive certain fees and expenses of the Fund. |
| (a) | Employee retirement benefit plans that invest plan assets in the Separate Investment Accounts (SIAs) may be subject to certain charges set forth in their respective Plan Documents. Total return figures would be lower for the period presented if they reflected these charges. |
| (b) | The Fund has entered into an agreement with certain brokers to rebate a portion of brokerage commissions. The rebated commissions are used to reduce operating expenses of the Fund. |
| (c) | Total Return excludes contingent deferred sales charge and would be lower for the periods presented if they reflected these changes. |
– 188 –
MASSMUTUAL SELECT SMALL COMPANY GROWTH FUND
| | | | | | | | | | | | | | | | | | | | |
| | | Class A | |
| | | Year ended
12/31/06 | | | Year ended
12/31/05†† | | | Year ended
12/31/04 | | | Year ended
12/31/03 | | | Year ended
12/31/02 | |
Net asset value, beginning of year | | $ | 9.69 | | | $ | 10.05 | | | $ | 10.67 | | | $ | 6.99 | | | $ | 10.00 | |
| | | | | | | | | | | | | | | | | | | | |
Income (loss) from investment operations: | | | | | | | | | | | | | | | | | | | | |
Net investment income (loss) | | | (0.12 | )*** | | | (0.11 | )*** | | | (0.08 | )*** | | | (0.10 | )*** | | | (0.06 | )*** |
Net realized and unrealized gain (loss) on investments | | | 1.54 | | | | (0.02 | ) | | | 0.20 | † | | | 4.30 | | | | (2.95 | ) |
| | | | | | | | | | | | | | | | | | | | |
Total income (loss) from investment operations | | | 1.42 | | | | (0.13 | ) | | | 0.12 | | | | 4.20 | | | | (3.01 | ) |
| | | | | | | | | | | | | | | | | | | | |
Less distributions to shareholders: | | | | | | | | | | | | | | | | | | | | |
From net realized gains | | | (0.71 | ) | | | (0.23 | ) | | | (0.74 | ) | | | (0.52 | ) | | | - | |
| | | | | | | | | | | | | | | | | | | | |
Net asset value, end of year | | $ | 10.40 | | | $ | 9.69 | | | $ | 10.05 | | | $ | 10.67 | | | $ | 6.99 | |
| | | | | | | | | | | | | | | | | | | | |
Total Return(a) | | | 14.95% | (c) | | | (1.09)% | (c) | | | 1.70% | (c) | | | 60.01% | | | | (30.10)% | |
Ratios / Supplemental Data: | | | | | | | | | | | | | | | | | | | | |
Net assets, end of year (000’s) | | $ | 69,380 | | | $ | 62,461 | | | $ | 66,985 | | | $ | 54,038 | | | $ | 5,038 | |
Ratio of expenses to average daily net assets: | | | | | | | | | | | | | | | | | | | | |
Before expense waiver | | | 1.55% | | | | 1.54% | | | | 1.52% | | | | 1.58% | | | | 1.83% | |
After expense waiver | | | N/A | | | | 1.52% | # | | | 1.35% | (b)# | | | 1.37% | (b)# | | | 1.16% | (b)# |
Net investment income (loss) to average daily net assets | | | (1.15)% | | | | (1.18)% | | | | (0.77)% | | | | (1.00)% | | | | (0.80)% | |
Portfolio turnover rate | | | 102% | | | | 149% | | | | 220% | | | | 141% | | | | 150% | |
| |
| | | Class L | |
| | | Year ended
12/31/06 | | | Year ended
12/31/05†† | | | Year ended
12/31/04 | | | Year ended
12/31/03 | | | Year ended
12/31/02 | |
Net asset value, beginning of year | | $ | 9.81 | | | $ | 10.14 | | | $ | 10.74 | | | $ | 7.01 | | | $ | 10.00 | |
| | | | | | | | | | | | | | | | | | | | |
Income (loss) from investment operations: | | | | | | | | | | | | | | | | | | | | |
Net investment income (loss) | | | (0.09 | )*** | | | (0.09 | )*** | | | (0.05 | )*** | | | (0.07 | )*** | | | (0.04 | )*** |
Net realized and unrealized gain (loss) on investments | | | 1.56 | | | | (0.01 | ) | | | 0.19 | † | | | 4.32 | | | | (2.95 | ) |
| | | | | | | | | | | | | | | | | | | | |
Total income (loss) from investment operations | | | 1.47 | | | | (0.10 | ) | | | 0.14 | | | | 4.25 | | | | (2.99 | ) |
| | | | | | | | | | | | | | | | | | | | |
Less distributions to shareholders: | | | | | | | | | | | | | | | | | | | | |
From net realized gains | | | (0.71 | ) | | | (0.23 | ) | | | (0.74 | ) | | | (0.52 | ) | | | - | |
| | | | | | | | | | | | | | | | | | | | |
Net asset value, end of year | | $ | 10.57 | | | $ | 9.81 | | | $ | 10.14 | | | $ | 10.74 | | | $ | 7.01 | |
| | | | | | | | | | | | | | | | | | | | |
Total Return(a) | | | 15.28% | | | | (0.88)% | | | | 1.97% | | | | 60.55% | | | | (29.90)% | |
Ratios / Supplemental Data: | | | | | | | | | | | | | | | | | | | | |
Net assets, end of year (000’s) | | $ | 31,256 | | | $ | 28,468 | | | $ | 43,008 | | | $ | 35,948 | | | $ | 10,319 | |
Ratio of expenses to average daily net assets: | | | | | | | | | | | | | | | | | | | | |
Before expense waiver | | | 1.30% | | | | 1.29% | | | | 1.27% | | | | 1.33% | | | | 1.58% | |
After expense waiver | | | N/A | | | | 1.26% | # | | | 1.10% | (b)# | | | 1.10% | (b)# | | | 0.92% | (b)# |
Net investment income (loss) to average daily net assets | | | (0.89)% | | | | (0.91)% | | | | (0.54)% | | | | (0.72)% | | | | (0.59)% | |
Portfolio turnover rate | | | 102% | | | | 149% | | | | 220% | | | | 141% | | | | 150% | |
| *** | Per share amount calculated on the average shares method. |
| † | The amount shown for a share outstanding does not correspond with the aggregate net realized and unrealized gain (loss) for the period due to the timing of purchases and redemptions of Fund shares in relation to the fluctuating market values of the Fund. |
| †† | Effective January 1, 2005, rebated brokerage commissions are included with realized gain or loss on investment transactions. Prior to January 1, 2005, these amounts were presented as a reduction of expenses. Prior year amounts have not been restated to reflect this change due to immateriality. (See Note 3) |
| # | Computed after giving effect to an agreement by MassMutual to waive certain fees and expenses of the Fund. |
| (a) | Employee retirement benefit plans that invest plan assets in the Separate Investment Accounts (SIAs) may be subject to certain charges as set forth in their respective Plan Documents. Total return figures would be lower for the periods presented if they reflected these charges. |
| (b) | The Fund has entered into an agreement with certain brokers to rebate a portion of brokerage commissions. The rebated commissions are used to reduce operating expenses of the Fund. |
| (c) | Total Return excludes a front-end sales charge and would be lower for the periods presented if it reflected these charges. |
– 189 –
MASSMUTUAL SELECT SMALL COMPANY GROWTH FUND
| | | | | | | | | | | | | | | | | | | | |
| | | Class Y | |
| | | Year ended
12/31/06 | | | Year ended
12/31/05†† | | | Year ended
12/31/04 | | | Year ended
12/31/03 | | | Year ended
12/31/02 | |
Net asset value, beginning of year | | $ | 9.87 | | | $ | 10.19 | | | $ | 10.77 | | | $ | 7.02 | | | $ | 10.00 | |
| | | | | | | | | | | | | | | | | | | | |
Income (loss) from investment operations: | | | | | | | | | | | | | | | | | | | | |
Net investment income (loss) | | | (0.08 | )*** | | | (0.07 | )*** | | | (0.04 | )*** | | | (0.05 | )*** | | | (0.04 | )*** |
Net realized and unrealized gain (loss) on investments | | | 1.57 | | | | (0.02 | ) | | | 0.20 | † | | | 4.32 | | | | (2.94 | ) |
| | | | | | | | | | | | | | | | | | | | |
Total income (loss) from investment operations | | | 1.49 | | | | (0.09 | ) | | | 0.16 | | | | 4.27 | | | | (2.98 | ) |
| | | | | | | | | | | | | | | | | | | | |
Less distributions to shareholders: | | | | | | | | | | | | | | | | | | | | |
From net realized gains | | | (0.71 | ) | | | (0.23 | ) | | | (0.74 | ) | | | (0.52 | ) | | | - | |
| | | | | | | | | | | | | | | | | | | | |
Net asset value, end of year | | $ | 10.65 | | | $ | 9.87 | | | $ | 10.19 | | | $ | 10.77 | | | $ | 7.02 | |
| | | | | | | | | | | | | | | | | | | | |
Total Return(a) | | | 15.39% | | | | (0.68)% | | | | 2.06% | | | | 60.75% | | | | (29.80)% | |
Ratios / Supplemental Data: | | | | | | | | | | | | | | | | | | | | |
Net assets, end of year (000’s) | | $ | 20,226 | | | $ | 27,617 | | | $ | 40,990 | | | $ | 37,730 | | | $ | 10,545 | |
Ratio of expenses to average daily net assets: | | | | | | | | | | | | | | | | | | | | |
Before expense waiver | | | 1.15% | | | | 1.14% | | | | 1.12% | | | | 1.18% | | | | 1.43% | |
After expense waiver | | | N/A | | | | 1.12% | # | | | 0.95% | (b)# | | | 0.95% | (b)# | | | 0.83% | (b)# |
Net investment income (loss) to average daily net assets | | | (0.73)% | | | | (0.77)% | | | | (0.40)% | | | | (0.60)% | | | | (0.52)% | |
Portfolio turnover rate | | | 102% | | | | 149% | | | | 220% | | | | 141% | | | | 150% | |
| |
| | | Class S | |
| | | Year ended
12/31/06 | | | Year ended
12/31/05†† | | | Year ended
12/31/04 | | | Year ended
12/31/03 | | | Year ended
12/31/02 | |
Net asset value, beginning of year | | $ | 9.90 | | | $ | 10.21 | | | $ | 10.78 | | | $ | 7.02 | | | $ | 10.00 | |
| | | | | | | | | | | | | | | | | | | | |
Income (loss) from investment operations: | | | | | | | | | | | | | | | | | | | | |
Net investment income (loss) | | | (0.07 | )*** | | | (0.07 | )*** | | | (0.04 | )*** | | | (0.05 | )*** | | | (0.03 | )*** |
Net realized and unrealized gain (loss) on investments | | | 1.57 | | | | (0.01 | ) | | | 0.21 | † | | | 4.33 | | | | (2.95 | ) |
| | | | | | | | | | | | | | | | | | | | |
Total income (loss) from investment operations | | | 1.50 | | | | (0.08 | ) | | | 0.17 | | | | 4.28 | | | | (2.98 | ) |
| | | | | | | | | | | | | | | | | | | | |
Less distributions to shareholders: | | | | | | | | | | | | | | | | | | | | |
From net realized gains | | | (0.71 | ) | | | (0.23 | ) | | | (0.74 | ) | | | (0.52 | ) | | | - | |
| | | | | | | | | | | | | | | | | | | | |
Net asset value, end of year | | $ | 10.69 | | | $ | 9.90 | | | $ | 10.21 | | | $ | 10.78 | | | $ | 7.02 | |
| | | | | | | | | | | | | | | | | | | | |
Total Return(a) | | | 15.44% | | | | (0.67)% | | | | 2.25% | | | | 60.66% | | | | (29.70)% | |
Ratios / Supplemental Data: | | | | | | | | | | | | | | | | | | | | |
Net assets, end of year (000’s) | | $ | 39,194 | | | $ | 24,869 | | | $ | 28,081 | | | $ | 30,181 | | | $ | 8,763 | |
Ratio of expenses to average daily net assets: | | | | | | | | | | | | | | | | | | | | |
Before expense waiver | | | 1.11% | | | | 1.10% | | | | 1.08% | | | | 1.14% | | | | 1.39% | |
After expense waiver | | | N/A | | | | 1.08% | # | | | 0.92% | (b)# | | | 0.92% | (b)# | | | 0.80% | (b)# |
Net investment income (loss) to average daily net assets | | | (0.70)% | | | | (0.74)% | | | | (0.34)% | | | | (0.55)% | | | | (0.41)% | |
Portfolio turnover rate | | | 102% | | | | 149% | | | | 220% | | | | 141% | | | | 150% | |
| *** | Per share amount calculated on the average shares method. |
| † | The amount shown for a share outstanding does not correspond with the aggregate net realized and unrealized gain (loss) for the period due to the timing of purchases and redemptions of Fund shares in relation to the fluctuating market values of the Fund. |
| †† | Effective January 1, 2005, rebated brokerage commissions are included with realized gain or loss on investment transactions. Prior to January 1, 2005, these amounts were presented as a reduction of expenses. Prior year amounts have not been restated to reflect this change due to immateriality. (See Note 3) |
| # | Computed after giving effect to an agreement by MassMutual to waive certain fees and expenses of the Fund. |
| (a) | Employee retirement benefit plans that invest plan assets in the Separate Investment Accounts (SIAs) may be subject to certain charges as set forth in their respective Plan Documents. Total return figures would be lower for the periods presented if they reflected these charges. |
| (b) | The Fund has entered into an agreement with certain brokers to rebate a portion of brokerage commissions. The rebated commissions are used to reduce operating expenses of the Fund. |
– 190 –
MASSMUTUAL SELECT SMALL COMPANY GROWTH FUND
| | | | | | | | | | | | | | | | | | | | |
| | | Class N | |
| | | Year ended
12/31/06 | | | Year ended
12/31/05††† | | | Year ended
12/31/04 | | | Year ended
12/31/03 | | | Period ended
12/31/02++ | |
Net asset value, beginning of year | | $ | 9.54 | | | $ | 9.93 | | | $ | 10.59 | | | $ | 6.95 | | | $ | 6.90 | |
| | | | | | | | | | | | | | | | | | | | |
Income (loss) from investment operations: | | | | | | | | | | | | | | | | | | | | |
Net investment income (loss) | | | (0.15 | )*** | | | (0.14 | )*** | | | (0.11 | )*** | | | (0.13 | )*** | | | 0.00 | ***†† |
Net realized and unrealized gain (loss) on investments | | | 1.52 | | | | (0.02 | ) | | | 0.19 | † | | | 4.29 | | | | 0.05 | |
| | | | | | | | | | | | | | | | | | | | |
Total income from investment operations | | | 1.37 | | | | (0.16 | ) | | | 0.08 | | | | 4.16 | | | | 0.05 | |
| | | | | | | | | | | | | | | | | | | | |
Less distributions to shareholders: | | | | | | | | | | | | | | | | | | | | |
From net realized gains | | | (0.71 | ) | | | (0.23 | ) | | | (0.74 | ) | | | (0.52 | ) | | | - | |
| | | | | | | | | | | | | | | | | | | | |
Net asset value, end of year | | $ | 10.20 | | | $ | 9.54 | | | $ | 9.93 | | | $ | 10.59 | | | $ | 6.95 | |
| | | | | | | | | | | | | | | | | | | | |
Total Return(a) | | | 14.66% | (c) | | | (1.41 | )% (c) | | | 1.33% | (c) | | | 59.78% | (c) | | | - | ‡ |
Ratios / Supplemental Data: | | | | | | | | | | | | | | | | | | | | |
Net assets, end of year (000’s) | | $ | 786 | | | $ | 931 | | | $ | 910 | | | $ | 953 | | | $ | 101 | |
Ratio of expenses to average daily net assets: | | | | | | | | | | | | | | | | | | | | |
Before expense waiver | | | 1.85% | | | | 1.84% | | | | 1.82% | | | | 1.88% | | | | - | ‡ |
After expense waiver | | | N/A | | | | 1.82% | # | | | 1.65% | (b)# | | | 1.68% | (b)# | | | - | ‡ |
Net investment income (loss) to average daily net assets | | | (1.44)% | | | | (1.49)% | | | | (1.06)% | | | | (1.31)% | | | | - | ‡ |
Portfolio turnover rate | | | 102% | | | | 149% | | | | 220% | | | | 141% | | | | 150% | |
| *** | Per share amount calculated on the average shares method. |
| † | The amount shown for a share outstanding does not correspond with the aggregate net realized and unrealized gain (loss) for the period due to the timing of purchases and redemptions of Fund shares in relation to the fluctuating market values of the Fund. |
| †† | Net investment income is less than $0.01 per share. |
| ††† | Effective January 1, 2005, rebated brokerage commissions are included with realized gain or loss on investment transactions. Prior to January 1, 2005, these amounts were presented as a reduction of expenses. Prior year amounts have not been restated to reflect this change due to immateriality. (See Note 3) |
| ++ | Class N commenced operations on December 31, 2002. |
| ‡ | Amounts are de minimis due to the short period of operations. |
| # | Computed after giving effect to an agreement by MassMutual to waive certain fees and expenses of the Fund. |
| (a) | Employee retirement benefit plans that invest plan assets in the Separate Investment Accounts (SIAs) may be subject to certain charges as set forth in their respective Plan Documents. Total return figures would be lower for the periods presented if they reflected these charges. |
| (b) | The Fund has entered into an agreement with certain brokers to rebate a portion of brokerage commissions. The rebated commissions are used to reduce operating expenses of the Fund. |
| (c) | Total Return excludes contingent deferred sales charge and would be lower for the periods presented if they reflected these charges. |
– 191 –
MASSMUTUAL SELECT EMERGING GROWTH FUND
| | | | | | | | | | | | | | | | | | | | |
| | | Class A | |
| | | Year ended
12/31/06 | | | Year ended
12/31/05 | | | Year ended
12/31/04 | | | Year ended
12/31/03 | | | Year ended
12/31/02 | |
Net asset value, beginning of year | | $ | 5.90 | | | $ | 5.88 | | | $ | 5.13 | | | $ | 3.53 | | | $ | 6.11 | |
| | | | | | | | | | | | | | | | | | | | |
Income (loss) from investment operations: | | | | | | | | | | | | | | | | | | | | |
Net investment income (loss) | | | (0.06 | )*** | | | (0.06 | )*** | | | (0.07 | )*** | | | (0.06 | )*** | | | (0.05 | )*** |
Net realized and unrealized gain (loss) on investments | | | 0.38 | | | | 0.08 | | | | 0.82 | | | | 1.66 | | | | (2.53 | ) |
| | | | | | | | | | | | | | | | | | | | |
Total income (loss) from investment operations | | | 0.32 | | | | 0.02 | | | | 0.75 | | | | 1.60 | | | | (2.58 | ) |
| | | | | | | | | | | | | | | | | | | | |
Net asset value, end of year | | $ | 6.22 | | | $ | 5.90 | | | $ | 5.88 | | | $ | 5.13 | | | $ | 3.53 | |
| | | | | | | | | | | | | | | | | | | | |
Total Return(a) | | | 5.42% | (b) | | | 0.34% | (b) | | | 14.62% | (b) | | | 45.33% | | | | (42.23)% | |
Ratios / Supplemental Data: | | | | | | | | | | | | | | | | | | | | |
Net assets, end of year (000’s) | | $ | 13,650 | | | $ | 14,956 | | | $ | 27,052 | | | $ | 26,130 | | | $ | 10,153 | |
Ratio of expenses to average daily net assets: | | | | | | | | | | | | | | | | | | | | |
Before expense waiver | | | 1.46% | | | | 1.45% | | | | 1.47% | | | | 1.48% | | | | 1.46% | |
After expense waiver | | | N/A | | | | N/A | | | | N/A | | | | 1.45% | # | | | 1.39% | # |
Net investment income (loss) to average daily net assets | | | (0.97)% | | | | (1.09)% | | | | (1.32)% | | | | (1.32)% | | | | (1.23)% | |
Portfolio turnover rate | | | 288% | | | | 124% | | | | 176% | | | | 198% | | | | 175% | |
| |
| | | Class L | |
| | | Year ended
12/31/06 | | | Year ended
12/31/05 | | | Year ended
12/31/04 | | | Year ended
12/31/03 | | | Year ended
12/31/02 | |
Net asset value, beginning of year | | $ | 5.99 | | | $ | 5.94 | | | $ | 5.18 | | | $ | 3.55 | | | $ | 6.13 | |
| | | | | | | | | | | | | | | | | | | | |
Income (loss) from investment operations: | | | | | | | | | | | | | | | | | | | | |
Net investment income (loss) | | | (0.04 | )*** | | | (0.05 | )*** | | | (0.06 | )*** | | | (0.05 | )*** | | | (0.04 | )*** |
Net realized and unrealized gain (loss) on investments | | | 0.37 | | | | 0.10 | | | | 0.82 | | | | 1.68 | | | | (2.54 | ) |
| | | | | | | | | | | | | | | | | | | | |
Total income (loss) from investment operations | | | 0.33 | | | | 0.05 | | | | 0.76 | | | | 1.63 | | | | (2.58 | ) |
| | | | | | | | | | | | | | | | | | | | |
Net asset value, end of year | | $ | 6.32 | | | $ | 5.99 | | | $ | 5.94 | | | $ | 5.18 | | | $ | 3.55 | |
| | | | | | | | | | | | | | | | | | | | |
Total Return(a) | | | 5.51% | | | | 0.84% | | | | 14.67% | | | | 45.92% | | | | (42.09)% | |
Ratios / Supplemental Data: | | | | | | | | | | | | | | | | | | | | |
Net assets, end of year (000’s) | | $ | 44,933 | | | $ | 63,777 | | | $ | 65,342 | | | $ | 49,424 | | | $ | 20,924 | |
Ratio of expenses to average daily net assets: | | | | | | | | | | | | | | | | | | | | |
Before expense waiver | | | 1.21% | | | | 1.21% | | | | 1.22% | | | | 1.23% | | | | 1.21% | |
After expense waiver | | | N/A | | | | N/A | | | | N/A | | | | 1.20% | # | | | 1.14% | # |
Net investment income (loss) to average daily net assets | | | (0.73)% | | | | (0.84)% | | | | (1.06)% | | | | (1.07)% | | | | (0.98)% | |
Portfolio turnover rate | | | 288% | | | | 124% | | | | 176% | | | | 198% | | | | 175% | |
| *** | Per share amount calculated on the average shares method. |
| # | Computed after giving effect to an agreement by MassMutual to waive certain fees and expenses of the Fund. |
| (a) | Employee retirement benefit plans that invest assets in the Separate Investment Accounts (SIAs) may be subject to certain charges as set forth by their respective Plan Documents. Total return figures would be lower for the periods presented if they reflected these charges. |
| (b) | Total Return excludes a front-end sales charge and would be lower for the periods presented if it reflected these charges. |
– 192 –
MASSMUTUAL SELECT EMERGING GROWTH FUND
| | | | | | | | | | | | | | | | | | | | |
| | | Class Y | |
| | | Year ended
12/31/06 | | | Year ended
12/31/05 | | | Year ended
12/31/04 | | | Year ended
12/31/03 | | | Year ended
12/31/02 | |
Net asset value, beginning of year | | $ | 6.05 | | | $ | 5.99 | | | $ | 5.21 | | | $ | 3.57 | | | $ | 6.15 | |
| | | | | | | | | | | | | | | | | | | | |
Income (loss) from investment operations: | | | | | | | | | | | | | | | | | | | | |
Net investment income (loss) | | | (0.04 | )*** | | | (0.04 | )*** | | | (0.05 | )*** | | | (0.04 | )*** | | | (0.04 | )*** |
Net realized and unrealized gain (loss) on investments | | | 0.39 | | | | 0.10 | | | | 0.83 | | | | 1.68 | | | | (2.54 | ) |
| | | | | | | | | | | | | | | | | | | | |
Total income (loss) from investment operations | | | 0.35 | | | | 0.06 | | | | 0.78 | | | | 1.64 | | | | (2.58 | ) |
| | | | | | | | | | | | | | | | | | | | |
Net asset value, end of year | | $ | 6.40 | | | $ | 6.05 | | | $ | 5.99 | | | $ | 5.21 | | | $ | 3.57 | |
| | | | | | | | | | | | | | | | | | | | |
Total Return(a) | | | 6.13% | | | | 0.83% | | | | 14.97% | | | | 45.94% | | | | (41.95)% | |
Ratios / Supplemental Data: | | | | | | | | | | | | | | | | | | | | |
Net assets, end of year (000’s) | | $ | 980 | | | $ | 4,760 | | | $ | 4,427 | | | $ | 3,051 | | | $ | 1,664 | |
Ratio of expenses to average daily net assets: | | | | | | | | | | | | | | | | | | | | |
Before expense waiver | | | 1.06% | | | | 1.05% | | | | 1.07% | | | | 1.08% | | | | 1.06% | |
After expense waiver | | | N/A | | | | N/A | | | | N/A | | | | 1.04% | # | | | 0.99% | # |
Net investment income (loss) to average daily net assets | | | (0.57)% | | | | (0.68)% | | | | (0.91)% | | | | (0.91)% | | | | (0.83)% | |
Portfolio turnover rate | | | 288% | | | | 124% | | | | 176% | | | | 198% | | | | 175% | |
| |
| | | Class S | |
| | | Year ended
12/31/06 | | | Year ended
12/31/05 | | | Year ended
12/31/04 | | | Year ended
12/31/03 | | | Year ended
12/31/02 | |
Net asset value, beginning of year | | $ | 6.09 | | | $ | 6.03 | | | $ | 5.24 | | | $ | 3.58 | | | $ | 6.15 | |
| | | | | | | | | | | | | | | | | | | | |
Income (loss) from investment operations: | | | | | | | | | | | | | | | | | | | | |
Net investment income (loss) | | | (0.03 | )*** | | | (0.03 | )*** | | | (0.04 | )*** | | | (0.04 | )*** | | | (0.03 | )*** |
Net realized and unrealized gain (loss) on investments | | | 0.39 | | | | 0.09 | | | | 0.83 | | | | 1.70 | | | | (2.54 | ) |
| | | | | | | | | | | | | | | | | | | | |
Total income (loss) from investment operations | | | 0.36 | | | | 0.06 | | | | 0.79 | | | | 1.66 | | | | (2.57 | ) |
| | | | | | | | | | | | | | | | | | | | |
Net asset value, end of year | | $ | 6.45 | | | $ | 6.09 | | | $ | 6.03 | | | $ | 5.24 | | | $ | 3.58 | |
| | | | | | | | | | | | | | | | | | | | |
Total Return(a) | | | 5.91% | | | | 1.00% | | | | 15.08% | | | | 46.37% | | | | (41.79)% | |
Ratios / Supplemental Data: | | | | | | | | | | | | | | | | | | | | |
Net assets, end of year (000’s) | | $ | 50,464 | | | $ | 42,591 | | | $ | 39,812 | | | $ | 41,306 | | | $ | 24,658 | |
Ratio of expenses to average daily net assets: | | | | | | | | | | | | | | | | | | | | |
Before expense waiver | | | 0.96% | | | | 0.96% | | | | 0.97% | | | | 0.98% | | | | 0.96% | |
After expense waiver | | | N/A | | | | N/A | | | | N/A | | | | 0.94% | # | | | 0.89% | # |
Net investment income (loss) to average daily net assets | | | (0.46)% | | | | (0.59)% | | | | 0.81% | | | | (0.81)% | | | | (0.73)% | |
Portfolio turnover rate | | | 288% | | | | 124% | | | | 176% | | | | 198% | | | | 175% | |
| *** | Per share amount calculated on the average shares method. |
| # | Computed after giving effect to an agreement by MassMutual to waive certain fees and expenses of the Fund. |
| (a) | Employee retirement benefit plans that invest assets in the Separate Investment Accounts (SIAs) may be subject to certain charges as set forth by their respective Plan Documents. Total return figures would be lower for the periods presented if they reflected these charges. |
– 193 –
MASSMUTUAL SELECT EMERGING GROWTH FUND
| | | | | | | | | | | | | | | | | | | | |
| | | Class N | |
| | | Year ended
12/31/06 | | | Year ended
12/31/05 | | | Year ended
12/31/04 | | | Year ended
12/31/03 | | | Year ended
12/31/02++ | |
Net asset value, beginning of year | | $ | 5.83 | | | $ | 5.82 | | | $ | 5.09 | | | $ | 3.51 | | | $ | 3.50 | |
| | | | | | | | | | | | | | | | | | | | |
Income (loss) from investment operations: | | | | | | | | | | | | | | | | | | | | |
Net investment income (loss) | | | (0.08 | )*** | | | (0.08 | )*** | | | (0.08 | )*** | | | (0.07 | )*** | | | (0.00 | )***† |
Net realized and unrealized gain (loss) on investments | | | 0.37 | | | | 0.09 | | | | 0.81 | | | | 1.65 | | | | 0.01 | |
| | | | | | | | | | | | | | | | | | | | |
Total income from investment operations | | | 0.29 | | | | 0.01 | | | | 0.73 | | | | 1.58 | | | | 0.01 | |
| | | | | | | | | | | | | | | | | | | | |
Net asset value, end of year | | $ | 6.12 | | | $ | 5.83 | | | $ | 5.82 | | | $ | 5.09 | | | $ | 3.51 | |
| | | | | | | | | | | | | | | | | | | | |
Total Return(a) | | | 4.97% | (b) | | | 0.17% | (b) | | | 14.34% | (b) | | | 45.01% | (b) | | | - | ‡ |
Ratios / Supplemental Data: | | | | | | | | | | | | | | | | | | | | |
Net assets, end of year (000’s) | | $ | 177 | | | $ | 168 | | | $ | 168 | | | $ | 147 | | | $ | 101 | |
Ratio of expenses to average daily net assets: | | | | | | | | | | | | | | | | | | | | |
Before expense waiver | | | 1.76% | | | | 1.76% | | | | 1.77% | | | | 1.78% | | | | - | ‡ |
After expense waiver | | | N/A | | | | N/A | | | | N/A | | | | 1.74% | # | | | - | ‡ |
Net investment income (loss) to average daily net assets | | | (1.27)% | | | | (1.39)% | | | | (1.61)% | | | | (1.61)% | | | | - | ‡ |
Portfolio turnover rate | | | 288% | | | | 124% | | | | 176% | | | | 198% | | | | 175% | |
| *** | Per share amount calculated on the average shares method. |
| † | Net investment loss is less than $0.01 per share. |
| ++ | Class N commenced operations on December 31, 2002. |
| ‡ | Amounts are de minimis due to the short period of operations. |
| # | Computed after giving effect to an agreement by MassMutual to waive certain fees and expenses of the Fund. |
| (a) | Employee retirement benefit plans that invest assets in the Separate Investment Accounts (SIAs) may be subject to certain charges as set forth by their respective Plan Documents. Total return figures would be lower for the periods presented if they reflected these charges. |
| (b) | Total Return excludes contingent deferred sales charge and would be lower for the periods presented if they reflected these charges. |
– 194 –
MASSMUTUAL SELECT DIVERSIFIED INTERNATIONAL FUND
| | | | | | | | | | | | | | | | | | | | |
| | | Class A | | | Class L | | | Class Y | | | Class S | | | Class N | |
| | | Period ended
12/31/06+ | | | Period ended
12/31/06+ | | | Period ended
12/31/06+ | | | Period ended
12/31/06+ | | | Period ended
12/31/06+ | |
Net asset value, beginning of period | | $ | 10.00 | | | $ | 10.00 | | | $ | 10.00 | | | $ | 10.00 | | | $ | 10.00 | |
| | | | | | | | | | | | | | | | | | | | |
Income (loss) from investment operations: | | | | | | | | | | | | | | | | | | | | |
Net investment income (loss) | | | 0.00 | † | | | 0.01 | *** | | | 0.01 | *** | | | 0.01 | *** | | | 0.00 | † |
Net realized and unrealized gain (loss) on investments | | | 0.07 | | | | 0.06 | | | | 0.06 | | | | 0.06 | | | | 0.07 | |
| | | | | | | | | | | | | | | | | | | | |
Total income from investment operations | | | 0.07 | | | | 0.07 | | | | 0.07 | | | | 0.07 | | | | 0.07 | |
| | | | | | | | | | | | | | | | | | | | |
Less distributions to shareholders: | | | | | | | | | | | | | | | | | | | | |
From net investment income | | | (0.01 | ) | | | (0.01 | ) | | | (0.01 | ) | | | (0.01 | ) | | | (0.01 | ) |
| | | | | | | | | | | | | | | | | | | | |
Net asset value, end of period | | $ | 10.06 | | | $ | 10.06 | | | $ | 10.06 | | | $ | 10.06 | | | $ | 10.06 | |
| | | | | | | | | | | | | | | | | | | | |
Total Return(a) | | | 0.68% | (b)** | | | 0.70% | ** | | | 0.70% | ** | | | 0.70% | ** | | | 0.67% | (b)** |
Ratios / Supplemental Data: | | | | | | | | | | | | | | | | | | | | |
Net assets, end of period (000’s) | | $ | 101 | | | $ | 101 | | | $ | 101 | | | $ | 11,404 | | | $ | 101 | |
Ratio of expenses to average daily net assets: | | | | | | | | | | | | | | | | | | | | |
Before expense waiver | | | 8.81% | * | | | 8.56% | * | | | 8.41% | * | | | 8.30% | * | | | 9.11% | * |
After expense waiver | | | 1.42% | *# | | | 1.17% | *# | | | 1.09% | *# | | | 0.99% | *# | | | 1.72% | *# |
Net investment income (loss) to average daily net assets | | | 0.97% | * | | | 1.23% | * | | | 1.32% | * | | | 1.40% | * | | | 0.67% | * |
Portfolio turnover rate | | | 0% | | | | 0% | | | | 0% | | | | 0% | | | | 0% | |
| ** | Percentages represent results for the period and are not annualized. |
| *** | Per share amount calculated on the average shares method. |
| † | Net investment income (loss) is less than $0.01 per share. |
| + | For the period December 14, 2006 (commencement of operations) through December 31, 2006. |
| # | Computed after giving effect to an agreement by MassMutual to waive certain fees and expenses of the Fund. |
| (a) | Employee retirement benefit plans that invest plan assets in the Separate Investment Accounts (SIAs) may be subject to certain charges as set forth by their respective Plan Documents. Total return figures would be lower for the period presented if they reflected these charges. |
| (b) | Total return excludes a front-end sales charge for Class A and a contingent deferred sales charge for Class N and would be lower for the period presented if it reflected these charges. |
– 195 –
MASSMUTUAL SELECT OVERSEAS FUND
| | | | | | | | | | | | | | | | | | | | |
| | | Class A | |
| | | Year ended
12/31/06 | | | Year ended
12/31/05†† | | | Year ended
12/31/04 | | | Year ended
12/31/03 | | | Year ended
12/31/02 | |
Net asset value, beginning of year | | $ | 10.95 | | | $ | 10.94 | | | $ | 9.55 | | | $ | 7.36 | | | $ | 8.41 | |
| | | | | | | | | | | | | | | | | | | | |
Income (loss) from investment operations: | | | | | | | | | | | | | | | | | | | | |
Net investment income (loss) | | | 0.21 | *** | | | 0.08 | *** | | | 0.05 | *** | | | 0.02 | *** | | | 0.01 | *** |
Net realized and unrealized gain (loss) on investments | | | 2.78 | | | | 1.15 | | | | 1.63 | | | | 2.18 | | | | (1.05 | ) |
| | | | | | | | | | | | | | | | | | | | |
Total income (loss) from investment operations | | | 2.99 | | | | 1.23 | | | | 1.68 | | | | 2.20 | | | | (1.04 | ) |
| | | | | | | | | | | | | | | | | | | | |
Less distributions to shareholders: | | | | | | | | | | | | | | | | | | | | |
From net investment income | | | (0.19 | ) | | | (0.18 | ) | | | (0.06 | ) | | | (0.01 | ) | | | (0.01 | ) |
Tax return of capital | | | - | | | | - | | | | - | | | | - | | | | (0.00 | ) † |
From net realized gains | | | (0.95 | ) | | | (1.04 | ) | | | (0.23 | ) | | | - | | | | - | |
| | | | | | | | | | | | | | | | | | | | |
Total distributions | | | (1.14 | ) | | | (1.22 | ) | | | (0.29 | ) | | | (0.01 | ) | | | (0.01 | ) |
| | | | | | | | | | | | | | | | | | | | |
Net asset value, end of year | | $ | 12.80 | | | $ | 10.95 | | | $ | 10.94 | | | $ | 9.55 | | | $ | 7.36 | |
| | | | | | | | | | | | | | | | | | | | |
Total Return(a) | | | 27.38% | (c) | | | 11.17% | (c) | | | 17.53% | (c) | | | 30.27% | | | | (12.66)% | |
Ratios / Supplemental Data: | | | | | | | | | | | | | | | | | | | | |
Net assets, end of year (000’s) | | $ | 299,546 | | | $ | 198,300 | | | $ | 134,927 | | | $ | 65,012 | | | $ | 18,674 | |
Ratio of expenses to average daily net assets: | | | | | | | | | | | | | | | | | | | | |
Before expense waiver | | | 1.61% | | | | 1.62% | | | | 1.64% | | | | 1.74% | | | | 2.13% | |
After expense waiver | | | 1.53% | # | | | N/A | | | | 1.63% | (b)# | | | 1.64% | (b)# | | | 1.63% | (b)# |
Net investment income (loss) to average daily net assets | | | 1.66% | | | | 0.69% | | | | 0.49% | | | | 0.22% | | | | 0.09% | |
Portfolio turnover rate | | | 36% | | | | 88% | | | | 66% | | | | 92% | | | | 138% | |
| | | Class L | |
| | | Year ended
12/31/06 | | | Year ended
12/31/05†† | | | Year ended
12/31/04 | | | Year ended
12/31/03 | | | Year ended
12/31/02 | |
Net asset value, beginning of year | | $ | 11.00 | | | $ | 10.99 | | | $ | 9.59 | | | $ | 7.35 | | | $ | 8.42 | |
| | | | | | | | | | | | | | | | | | | | |
Income (loss) from investment operations: | | | | | | | | | | | | | | | | | | | | |
Net investment income (loss) | | | 0.24 | *** | | | 0.11 | *** | | | 0.08 | *** | | | 0.04 | *** | | | 0.02 | *** |
Net realized and unrealized gain (loss) on investments | | | 2.80 | | | | 1.14 | | | | 1.63 | | | | 2.23 | | | | (1.08 | ) |
| | | | | | | | | | | | | | | | | | | | |
Total income (loss) from investment operations | | | 3.04 | | | | 1.25 | | | | 1.71 | | | | 2.27 | | | | (1.06 | ) |
| | | | | | | | | | | | | | | | | | | | |
Less distributions to shareholders: | | | | | | | | | | | | | | | | | | | | |
From net investment income | | | (0.21 | ) | | | (0.20 | ) | | | (0.08 | ) | | | (0.03 | ) | | | (0.01 | ) |
Tax return of capital | | | - | | | | - | | | | - | | | | - | | | | (0.00 | )† |
From net realized gains | | | (0.95 | ) | | | (1.04 | ) | | | (0.23 | ) | | | - | | | | - | |
| | | | | | | | | | | | | | | | | | | | |
Total distributions | | | (1.16 | ) | | | (1.24 | ) | | | (0.31 | ) | | | (0.03 | ) | | | (0.01 | ) |
| | | | | | | | | | | | | | | | | | | | |
Net asset value, end of year | | $ | 12.88 | | | $ | 11.00 | | | $ | 10.99 | | | $ | 9.59 | | | $ | 7.35 | |
| | | | | | | | | | | | | | | | | | | | |
Total Return(a) | | | 27.66% | | | | 11.44% | | | | 17.77% | | | | 30.68% | | | | (12.44)% | |
Ratios / Supplemental Data: | | | | | | | | | | | | | | | | | | | | |
Net assets, end of year (000’s) | | $ | 283,387 | | | $ | 210,428 | | | $ | 175,493 | | | $ | 81,542 | | | $ | 19,236 | |
Ratio of expenses to average daily net assets: | | | | | | | | | | | | | | | | | | | | |
Before expense waiver | | | 1.36% | | | | 1.37% | | | | 1.39% | | | | 1.49% | | | | 1.88% | |
After expense waiver | | | 1.28% | # | | | N/A | | | | 1.38% | (b)# | | | 1.39% | (b)# | | | 1.37% | (b)# |
Net investment income (loss) to average daily net assets | | | 1.90% | | | | 0.94% | | | | 0.75% | | | | 0.44% | | | | 0.20% | |
Portfolio turnover rate | | | 36% | | | | 88% | | | | 66% | | | | 92% | | | | 138% | |
| *** | Per share amount calculated on the average shares method. |
| † | Tax return of capital is less than $0.01 per share. |
| †† | Effective January 1, 2005, brokerage commissions are included with realized gain or loss on investment transactions. Prior to January 1, 2005, these amounts were presented as a reduction of expenses. Prior year amounts have not been restated to reflect this change due to immateriality. (See Note 3) |
| # | Computed after giving effect to an agreement by MassMutual to waive certain fees and expenses of the Fund. |
| (a) | Employee retirement benefit plans that invest plan assets in the Separate Investment Accounts (SIAs) may be subject to certain charges as set forth in their respective Plan Documents. Total return figures would be lower for the periods presented if they reflected these charges. |
| (b) | The Fund has entered into agreements with certain brokers to rebate a portion of brokerage commissions. The rebated commissions are used to reduce operating expenses of the Fund. |
| (c) | Total Return excludes a front-end sales charge and would be lower for the periods presented if it reflected these charges. |
– 196 –
MASSMUTUAL SELECT OVERSEAS FUND
| | | | | | | | | | | | | | | | | | | | |
| | | Class Y | |
| | | Year ended
12/31/06 | | | Year ended
12/31/05†† | | | Year ended
12/31/04 | | | Year ended
12/31/03 | | | Year ended
12/31/02 | |
Net asset value, beginning of year | | $ | 11.03 | | | $ | 11.01 | | | $ | 9.61 | | | $ | 7.36 | | | $ | 8.43 | |
| | | | | | | | | | | | | | | | | | | | |
Income (loss) from investment operations: | | | | | | | | | | | | | | | | | | | | |
Net investment income (loss) | | | 0.24 | *** | | | 0.12 | *** | | | 0.09 | *** | | | 0.04 | *** | | | (0.00 | )***† |
Net realized and unrealized gain (loss) on investments | | | 2.81 | | | | 1.16 | | | | 1.63 | | | | 2.25 | | | | (1.05 | ) |
| | | | | | | | | | | | | | | | | | | | |
Total income (loss) from investment operations | | | 3.05 | | | | 1.28 | | | | 1.72 | | | | 2.29 | | | | (1.05 | ) |
| | | | | | | | | | | | | | | | | | | | |
Less distributions to shareholders: | | | | | | | | | | | | | | | | | | | | |
From net investment income | | | (0.22 | ) | | | (0.22 | ) | | | (0.09 | ) | | | (0.04 | ) | | | (0.02 | ) |
Tax return of capital | | | - | | | | - | | | | - | | | | - | | | | (0.00 | )† |
From net realized gains | | | (0.95 | ) | | | (1.04 | ) | | | (0.23 | ) | | | - | | | | - | |
| | | | | | | | | | | | | | | | | | | | |
Total distributions | | | (1.17 | ) | | | (1.26 | ) | | | (0.32 | ) | | | (0.04 | ) | | | (0.02 | ) |
| | | | | | | | | | | | | | | | | | | | |
Net asset value, end of year | | $ | 12.91 | | | $ | 11.03 | | | $ | 11.01 | | | $ | 9.61 | | | $ | 7.36 | |
| | | | | | | | | | | | | | | | | | | | |
Total Return(a) | | | 27.67% | | | | 11.69% | | | | 17.84% | | | | 30.88% | | | | (12.34)% | |
Ratios / Supplemental Data: | | | | | | | | | | | | | | | | | | | | |
Net assets, end of year (000’s) | | $ | 248,042 | | | $ | 130,666 | | | $ | 93,675 | | | $ | 72,650 | | | $ | 19,204 | |
Ratio of expenses to average daily net assets: | | | | | | | | | | | | | | | | | | | | |
Before expense waiver | | | 1.21% | | | | 1.22% | | | | 1.24% | | | | 1.34% | | | | 1.73% | |
After expense waiver | | | N/A | | | | N/A | | | | 1.23% | (b)# | | | 1.24% | (b)# | | | 1.22% | (b)# |
Net investment income (loss) to average daily net assets | | | 1.95% | | | | 1.05% | | | | 0.91% | | | | 0.50% | | | | (0.02)% | |
Portfolio turnover rate | | | 36% | | | | 88% | | | | 66% | | | | 92% | | | | 138% | |
| | | Class S | |
| | | Year ended
12/31/06 | | | Year ended
12/31/05†† | | | Year ended
12/31/04 | | | Year ended
12/31/03 | | | Year ended
12/31/02 | |
Net asset value, beginning of year | | $ | 11.05 | | | $ | 11.03 | | | $ | 9.62 | | | $ | 7.37 | | | $ | 8.43 | |
| | | | | | | | | | | | | | | | | | | | |
Income (loss) from investment operations: | | | | | | | | | | | | | | | | | | | | |
Net investment income (loss) | | | 0.26 | *** | | | 0.13 | *** | | | 0.10 | *** | | | 0.06 | *** | | | 0.05 | *** |
Net realized and unrealized gain (loss) on investments | | | 2.81 | | | | 1.16 | | | | 1.63 | | | | 2.23 | | | | (1.09 | ) |
| | | | | | | | | | | | | | | | | | | | |
Total income (loss) from investment operations | | | 3.07 | | | | 1.29 | | | | 1.73 | | | | 2.29 | | | | (1.04 | ) |
| | | | | | | | | | | | | | | | | | | | |
Less distributions to shareholders: | | | | | | | | | | | | | | | | | | | | |
From net investment income | | | (0.23 | ) | | | (0.23 | ) | | | (0.09 | ) | | | (0.04 | ) | | | (0.02 | ) |
Tax return of capital | | | - | | | | - | | | | - | | | | - | | | | (0.00 | )† |
From net realized gains | | | (0.95 | ) | | | (1.04 | ) | | | (0.23 | ) | | | - | | | | - | |
| | | | | | | | | | | | | | | | | | | | |
Total distributions | | | (1.18 | ) | | | (1.27 | ) | | | (0.32 | ) | | | (0.04 | ) | | | (0.02 | ) |
| | | | | | | | | | | | | | | | | | | | |
Net asset value, end of year | | $ | 12.94 | | | $ | 11.05 | | | $ | 11.03 | | | $ | 9.62 | | | $ | 7.37 | |
| | | | | | | | | | | | | | | | | | | | |
Total Return(a) | | | 27.77% | | | | 11.73% | | | | 17.98% | | | | 30.87% | | | | (12.23)% | |
Ratios / Supplemental Data: | | | | | | | | | | | | | | | | | | | | |
Net assets, end of year (000’s) | | $ | 458,067 | | | $ | 308,301 | | | $ | 211,818 | | | $ | 134,965 | | | $ | 54,437 | |
Ratio of expenses to average daily net assets: | | | | | | | | | | | | | | | | | | | | |
Before expense waiver | | | 1.16% | | | | 1.17% | | | | 1.19% | | | | 1.29% | | | | 1.68% | |
After expense waiver | | | N/A | | | | N/A | | | | 1.18% | (b)# | | | 1.19% | (b)# | | | 1.18% | (b)# |
Net investment income (loss) to average daily net assets | | | 2.05% | | | | 1.11% | | | | 0.96% | | | | 0.69% | | | | 0.68% | |
Portfolio turnover rate | | | 36% | | | | 88% | | | | 66% | | | | 92% | | | | 138% | |
| *** | Per share amount calculated on the average shares method. |
| † | Net investment income (loss) and tax return of capital are less than $0.01 per share. |
| †† | Effective January 1, 2005, brokerage commissions are included with realized gain or loss on investment transactions. Prior to January 1, 2005, these amounts were presented as a reduction of expenses. Prior year amounts have not been restated to reflect this change due to immateriality. (See Note 3) |
| # | Computed after giving effect to an agreement by MassMutual to waive certain fees and expenses of the Fund. |
| (a) | Employee retirement benefit plans that invest plan assets in the Separate Investment Accounts (SIAs) may be subject to certain charges as set forth in their respective Plan Documents. Total return figures would be lower for the periods presented if they reflected these charges. |
| (b) | The Fund has entered into agreement with certain brokers to rebate a portion of brokerage commissions. The rebated commissions are used to reduce operating expenses of the Fund. |
– 197 –
MASSMUTUAL SELECT OVERSEAS FUND
| | | | | | | | | | | | | | | | | | | | |
| | | Class N | |
| | | Year ended
12/31/06 | | | Year ended
12/31/05†† | | | Year ended
12/31/04 | | | Year ended
12/31/03 | | | Year ended
12/31/02++ | |
Net asset value, beginning of year | | $ | 10.86 | | | $ | 10.86 | | | $ | 9.50 | | | $ | 7.31 | | | $ | 7.24 | |
| | | | | | | | | | | | | | | | | | | | |
Income (loss) from investment operations: | | | | | | | | | | | | | | | | | | | | |
Net investment income (loss) | | | 0.17 | *** | | | 0.05 | *** | | | 0.02 | *** | | | (0.02 | )*** | | | (0.00 | )***† |
Net realized and unrealized gain (loss) on investments | | | 2.74 | | | | 1.13 | | | | 1.61 | | | | 2.21 | | | | 0.07 | |
| | | | | | | | | | | | | | | | | | | | |
Total income from investment operations | | | 2.91 | | | | 1.18 | | | | 1.63 | | | | 2.19 | | | | 0.07 | |
| | | | | | | | | | | | | | | | | | | | |
Less distributions to shareholders: | | | | | | | | | | | | | | | | | | | | |
From net investment income | | | (0.15 | ) | | | (0.14 | ) | | | (0.04 | ) | | | - | | | | - | |
From net realized gains | | | (0.95 | ) | | | (1.04 | ) | | | (0.23 | ) | | | - | | | | - | |
| | | | | | | | | | | | | | | | | | | | |
Total distributions | | | (1.10 | ) | | | (1.18 | ) | | | (0.27 | ) | | | - | | | | - | |
| | | | | | | | | | | | | | | | | | | | |
Net asset value, end of year | | $ | 12.67 | | | $ | 10.86 | | | $ | 10.86 | | | $ | 9.50 | | | $ | 7.31 | |
| | | | | | | | | | | | | | | | | | | | |
Total Return(a) | | | 26.91% | (c) | | | 10.86% | (c) | | | 17.12% | (c) | | | 29.96% | (c) | | | - | ‡ |
Ratios / Supplemental Data: | | | | | | | | | | | | | | | | | | | | |
Net assets, end of year (000’s) | | $ | 2,462 | | | $ | 1,693 | | | $ | 884 | | | $ | 255 | | | $ | 102 | |
Ratio of expenses to average daily net assets: | | | | | | | | | | | | | | | | | | | | |
Before expense waiver | | | 1.91% | | | | 1.92% | | | | 1.94% | | | | 2.04% | | | | - | ‡ |
After expense waiver | | | 1.83% | # | | | N/A | | | | 1.93% | (b)# | | | 1.94% | (b)# | | | - | ‡ |
Net investment income (loss) to average daily net assets | | | 1.40% | | | | 0.44% | | | | 0.17% | | | | (0.22)% | | | | - | ‡ |
Portfolio turnover rate | | | 36% | | | | 88% | | | | 66% | | | | 92% | | | | 138% | |
| *** | Per share amount calculated on the average shares method. |
| † | Net investment loss is less than $0.01 per share. |
| †† | Effective January 1, 2005, brokerage commissions are included with realized gain or loss on investment transactions. Prior to January 1, 2005, these amounts were presented as a reduction of expenses. Prior year amounts have not been restated to reflect this change due to immateriality. (See Note 3) |
| ++ | Class N commenced operations on December 31, 2002. |
| ‡ | Amounts are de minimis due to the short period of operations. |
| # | Computed after giving effect to an agreement by MassMutual to waive certain fees and expenses of the Fund. |
| (a) | Employee retirement benefit plans that invest plan assets in the Separate Investment Accounts (SIAs) may be subject to certain charges as set forth in their respective Plan Documents. Total return figures would be lower for the periods presented if they reflected these charges. |
| (b) | The Fund has entered into agreement with certain brokers to rebate a portions of brokerage commissions. The rebated commissions are used to reduce operating expenses of the Fund. |
| (c) | Total Return excludes contingent deferred sales charge and would be lower for the periods presented if they reflected these charges. |
– 198 –
MASSMUTUAL SELECT DESTINATION RETIREMENT INCOME FUND
| | | | | | | | | | | | | | | | |
| | | Class A | |
| | | Year ended
12/31/06 | | | Year ended
12/31/05 | | | Year ended
12/31/04 | | | Period ended
12/31/03† | |
Net asset value, beginning of year | | $ | 10.18 | | | $ | 10.32 | | | $ | 10.00 | | | $ | 10.00 | |
| | | | | | | | | | | | | | | | |
Income (loss) from investment operations: | | | | | | | | | | | | | | | | |
Net investment income (loss) | | | 0.33 | *** | | | 0.51 | *** | | | 0.62 | *** | | | - | |
Net realized and unrealized gain (loss) on investments | | | 0.20 | | | | (0.22 | ) | | | 0.01 | | | | - | |
| | | | | | | | | | | | | | | | |
Total income from investment operations | | | 0.53 | | | | 0.29 | | | | 0.63 | | | | - | |
| | | | | | | | | | | | | | | | |
Less distributions to shareholders: | | | | | | | | | | | | | | | | |
From net investment income | | | (0.33 | ) | | | (0.35 | ) | | | (0.27 | ) | | | - | |
From net realized gains | | | (0.15 | ) | | | (0.08 | ) | | | (0.04 | ) | | | - | |
| | | | | | | | | | | | | | | | |
Total distributions | | | (0.48 | ) | | | (0.43 | ) | | | (0.31 | ) | | | - | |
| | | | | | | | | | | | | | | | |
Net asset value, end of year | | $ | 10.23 | | | $ | 10.18 | | | $ | 10.32 | | | $ | 10.00 | |
| | | | | | | | | | | | | | | | |
Total Return(a) | | | 5.14% | (b) | | | 2.85% | (b) | | | 6.35% | (b) | | | - | ‡ |
Ratios / Supplemental Data: | | | | | | | | | | | | | | | | |
Net assets, end of year (000’s) | | $ | 51,843 | | | $ | 40,457 | | | $ | 11,819 | | | $ | 101 | |
Ratio of expenses to average daily net assets: | | | | | | | | | | | | | | | | |
Before expense waiver | | | 0.47% | | | | 0.47% | | | | 0.50% | | | | - | ‡ |
After expense waiver | | | N/A | | | | N/A | | | | 0.50% | # | | | - | ‡ |
Net investment income (loss) to average daily net assets | | | 3.22% | | | | 4.92% | | | | 6.00% | | | | - | ‡ |
Portfolio turnover rate | | | 27% | | | | 15% | | | | 33% | | | | N/A | |
| |
| | | Class L | |
| | | Year ended
12/31/06 | | | Year ended
12/31/05 | | | Year ended
12/31/04 | | | Period ended
12/31/03† | |
Net asset value, beginning of year | | $ | 10.22 | | | $ | 10.34 | | | $ | 10.00 | | | $ | 10.00 | |
| | | | | | | | | | | | | | | | |
Income (loss) from investment operations: | | | | | | | | | | | | | | | | |
Net investment income (loss) | | | 0.32 | *** | | | 0.33 | *** | | | 0.34 | *** | | | - | |
Net realized and unrealized gain (loss) on investments | | | 0.23 | | | | (0.01 | ) | | | 0.32 | | | | - | |
| | | | | | | | | | | | | | | | |
Total income from investment operations | | | 0.55 | | | | 0.32 | | | | 0.66 | | | | - | |
| | | | | | | | | | | | | | | | |
Less distributions to shareholders: | | | | | | | | | | | | | | | | |
From net investment income | | | (0.35 | ) | | | (0.36 | ) | | | (0.28 | ) | | | - | |
From net realized gains | | | (0.15 | ) | | | (0.08 | ) | | | (0.04 | ) | | | - | |
| | | | | | | | | | | | | | | | |
Total distributions | | | (0.50 | ) | | | (0.44 | ) | | | (0.32 | ) | | | - | |
| | | | | | | | | | | | | | | | |
Net asset value, end of year | | $ | 10.27 | | | $ | 10.22 | | | $ | 10.34 | | | $ | 10.00 | |
| | | | | | | | | | | | | | | | |
Total Return(a) | | | 5.34% | | | | 3.15% | | | | 6.62% | | | | - | ‡ |
Ratios / Supplemental Data: | | | | | | | | | | | | | | | | |
Net assets, end of year (000’s) | | $ | 94,347 | | | $ | 102,343 | | | $ | 97,859 | | | $ | 101 | |
Ratio of expenses to average daily net assets: | | | | | | | | | | | | | | | | |
Before expense waiver | | | 0.22% | | | | 0.22% | | | | 0.23% | | | | - | ‡ |
After expense waiver | | | N/A | | | | N/A | | | | 0.23% | # | | | - | ‡ |
Net investment income (loss) to average daily net assets | | | 3.13% | | | | 3.19% | | | | 3.36% | | | | - | ‡ |
Portfolio turnover rate | | | 27% | | | | 15% | | | | 33% | | | | N/A | |
| *** | Per share amount calculated on the average shares method. |
| † | The Fund commenced operations on December 31, 2003. |
| ‡ | Amounts are de minimus due to the short period of operations. |
| # | Computed after giving effect to an agreement by MassMutual to waive certain fees and expenses of the Fund. |
| (a) | Employee retirement benefit plans that invest plan assets in the Separate Investment Accounts (SIAs) may be subject to certain charges as set forth in their respective Plan Documents. Total return figures would be lower for the periods presented if they reflected these charges. |
| (b) | Total Return excludes a front-end sales charge and would be lower for the periods presented if they reflected these charges. |
– 199 –
MASSMUTUAL SELECT DESTINATION RETIREMENT INCOME FUND
| | | | | | | | | | | | | | | | |
| | | Class Y | |
| | | Year ended
12/31/06 | | | Year ended
12/31/05 | | | Year ended
12/31/04 | | | Period ended
12/31/03† | |
Net asset value, beginning of year | | $ | 10.22 | | | $ | 10.35 | | | $ | 10.00 | | | $ | 10.00 | |
| | | | | | | | | | | | | | | | |
Income (loss) from investment operations: | | | | | | | | | | | | | | | | |
Net investment income (loss) | | | 0.38 | *** | | | 0.40 | *** | | | 0.45 | *** | | | - | |
Net realized and unrealized gain (loss) on investments | | | 0.18 | | | | (0.07 | ) | | | 0.23 | | | | - | |
| | | | | | | | | | | | | | | | |
Total income from investment operations | | | 0.56 | | | | 0.33 | | | | 0.68 | | | | - | |
| | | | | | | | | | | | | | | | |
Less distributions to shareholders: | | | | | | | | | | | | | | | | |
From net investment income | | | (0.36 | ) | | | (0.38 | ) | | | (0.29 | ) | | | - | |
From net realized gains | | | (0.15 | ) | | | (0.08 | ) | | | (0.04 | ) | | | - | |
| | | | | | | | | | | | | | | | |
Total distributions | | | (0.51 | ) | | | (0.46 | ) | | | (0.33 | ) | | | - | |
| | | | | | | | | | | | | | | | |
Net asset value, end of year | | $ | 10.27 | | | $ | 10.22 | | | $ | 10.35 | | | $ | 10.00 | |
| | | | | | | | | | | | | | | | |
Total Return(a) | | | 5.45% | | | | 3.16% | | | | 6.80% | | | | - | ‡ |
Ratios / Supplemental Data: | | | | | | | | | | | | | | | | |
Net assets, end of year (000’s) | | $ | 125,831 | | | $ | 105,478 | | | $ | 80,590 | | | $ | 101 | |
Ratio of expenses to average daily net assets: | | | | | | | | | | | | | | | | |
Before expense waiver | | | 0.12% | | | | 0.12% | | | | 0.13% | | | | - | ‡ |
After expense waiver | | | N/A | | | | N/A | | | | 0.13% | # | | | - | ‡ |
Net investment income (loss) to average daily net assets | | | 3.62% | | | | 3.84% | | | | 4.38% | | | | - | ‡ |
Portfolio turnover rate | | | 27% | | | | 15% | | | | 33% | | | | N/A | |
| |
| | | Class S | |
| | | Year ended
12/31/06 | | | Year ended
12/31/05 | | | Year ended
12/31/04 | | | Period ended
12/31/03† | |
Net asset value, beginning of year | | $ | 10.22 | | | $ | 10.34 | | | $ | 10.00 | | | $ | 10.00 | |
| | | | | | | | | | | | | | | | |
Income (loss) from investment operations: | | | | | | | | | | | | | | | | |
Net investment income (loss) | | | 0.35 | *** | | | 0.61 | *** | | | 0.37 | *** | | | - | |
Net realized and unrealized gain (loss) on investments | | | 0.21 | | | | (0.27 | ) | | | 0.30 | | | | - | |
| | | | | | | | | | | | | | | | |
Total income from investment operations | | | 0.56 | | | | 0.34 | | | | 0.67 | | | | - | |
| | | | | | | | | | | | | | | | |
Less distributions to shareholders: | | | | | | | | | | | | | | | | |
From net investment income | | | (0.36 | ) | | | (0.38 | ) | | | (0.29 | ) | | | - | |
From net realized gains | | | (0.15 | ) | | | (0.08 | ) | | | (0.04 | ) | | | - | |
| | | | | | | | | | | | | | | | |
Total distributions | | | (0.51 | ) | | | (0.46 | ) | | | (0.33 | ) | | | - | |
| | | | | | | | | | | | | | | | |
Net asset value, end of year | | $ | 10.27 | | | $ | 10.22 | | | $ | 10.34 | | | $ | 10.00 | |
| | | | | | | | | | | | | | | | |
Total Return(a) | | | 5.47% | | | | 3.29% | | | | 6.71% | | | | - | ‡ |
Ratios / Supplemental Data: | | | | | | | | | | | | | | | | |
Net assets, end of year (000’s) | | $ | 8,773 | | | $ | 4,445 | | | $ | 1,195 | | | $ | 601 | |
Ratio of expenses to average daily net assets: | | | | | | | | | | | | | | | | |
Before expense waiver | | | 0.10% | | | | 0.09% | | | | 0.71% | | | | - | ‡ |
After expense waiver | | | N/A | | | | N/A | | | | 0.12% | # | | | - | ‡ |
Net investment income (loss) to average daily net assets | | | 3.41% | | | | 5.82% | | | | 3.64% | | | | - | ‡ |
Portfolio turnover rate | | | 27% | | | | 15% | | | | 33% | | | | N/A | |
| *** | Per share amount calculated on the average shares method. |
| † | The Fund commenced operations on December 31, 2003. |
| ‡ | Amounts are de minimus due to the short period of operations. |
| # | Computed after giving effect to an agreement by MassMutual to waive certain fees and expenses of the Fund. |
| (a) | Employee retirement benefit plans that invest plan assets in the Separate Investment Accounts (SIAs) may be subject to certain charges as set forth in their respective Plan Documents. Total return figures would be lower for the periods presented if they reflected these charges. |
– 200 –
MASSMUTUAL SELECT DESTINATION RETIREMENT INCOME FUND
| | | | | | | | | | | | | | | | |
| | | Class N | |
| | | Year ended
12/31/06 | | | Year ended
12/31/05 | | | Year ended
12/31/04 | | | Period ended
12/31/03† | |
Net asset value, beginning of year | | $ | 10.21 | | | $ | 10.34 | | | $ | 10.00 | | | $ | 10.00 | |
| | | | | | | | | | | | | | | | |
Income (loss) from investment operations: | | | | | | | | | | | | | | | | |
Net investment income (loss) | | | 0.30 | *** | | | 0.30 | *** | | | 0.15 | *** | | | - | |
Net realized and unrealized gain (loss) on investments | | | 0.20 | | | | (0.04 | ) | | | 0.45 | | | | - | |
| | | | | | | | | | | | | | | | |
Total income from investment operations | | | 0.50 | | | | 0.26 | | | | 0.60 | | | | - | |
| | | | | | | | | | | | | | | | |
Less distributions to shareholders: | | | | | | | | | | | | | | | | |
From net investment income | | | (0.30 | ) | | | (0.31 | ) | | | (0.22 | ) | | | - | |
From net realized gains | | | (0.15 | ) | | | (0.08 | ) | | | (0.04 | ) | | | - | |
| | | | | | | | | | | | | | | | |
Total distributions | | | (0.45 | ) | | | (0.39 | ) | | | (0.26 | ) | | | - | |
| | | | | | | | | | | | | | | | |
Net asset value, end of year | | $ | 10.26 | | | $ | 10.21 | | | $ | 10.34 | | | $ | 10.00 | |
| | | | | | | | | | | | | | | | |
Total Return(a) | | | 4.83% | (b) | | | 2.50% | (b) | | | 6.02% | (b) | | | 0.00% | ‡ |
Ratios / Supplemental Data: | | | | | | | | | | | | | | | | |
Net assets, end of year (000’s) | | $ | 121 | | | $ | 105 | | | $ | 104 | | | $ | 101 | |
Ratio of expenses to average daily net assets: | | | | | | | | | | | | | | | | |
Before expense waiver | | | 0.77% | | | | 0.77% | | | | 1.53% | | | | - | ‡ |
After expense waiver | | | N/A | | | | N/A | | | | 0.80% | # | | | N/A | ‡ |
Net investment income (loss) to average daily net assets | | | 2.95% | | | | 2.85% | | | | 1.52% | | | | 0.00% | ‡ |
Portfolio turnover rate | | | 27% | | | | 15% | | | | 33% | | | | N/A | |
| *** | Per share amount calculated on the average shares method. |
| † | The Fund commenced operations on December 31, 2003. |
| ‡ | Amounts are de minimus due to the short period of operations. |
| # | Computed after giving effect to an agreement by MassMutual to waive certain fees and expenses of the Fund. |
| (a) | Employee retirement benefit plans that invest plan assets in the Separate Investment Accounts (SIAs) may be subject to certain charges as set forth in their respective Plan Documents. Total return figures would be lower for the periods presented if they reflected these charges. |
| (b) | Total Return excludes a contingent deferred sales charge and would be lower for the periods presented if they reflected these charges. |
– 201 –
MASSMUTUAL SELECT DESTINATION RETIREMENT 2010 FUND
| | | | | | | | | | | | | | | | |
| | | Class A | |
| | | Year ended
12/31/06 | | | Year ended
12/31/05 | | | Year ended
12/31/04 | | | Period ended
12/31/03+ | |
Net asset value, beginning of year | | $ | 10.57 | | | $ | 10.54 | | | $ | 10.00 | | | $ | 10.00 | |
| | | | | | | | | | | | | | | | |
Income (loss) from investment operations: | | | | | | | | | | | | | | | | |
Net investment income (loss) | | | 0.33 | *** | | | 0.45 | *** | | | 0.56 | *** | | | - | |
Net realized and unrealized gain (loss) on investments | | | 0.34 | | | | (0.05 | ) | | | 0.18 | | | | - | |
| | | | | | | | | | | | | | | | |
Total income from investment operations | | | 0.67 | | | | 0.40 | | | | 0.74 | | | | - | |
| | | | | | | | | | | | | | | | |
Less distributions to shareholders: | | | | | | | | | | | | | | | | |
From net investment income | | | (0.31 | ) | | | (0.31 | ) | | | (0.18 | ) | | | - | |
From net realized gains | | | (0.16 | ) | | | (0.06 | ) | | | (0.02 | ) | | | - | |
| | | | | | | | | | | | | | | | |
Total distributions | | | (0.47 | ) | | | (0.37 | ) | | | (0.20 | ) | | | - | |
| | | | | | | | | | | | | | | | |
Net asset value, end of year | | $ | 10.77 | | | $ | 10.57 | | | $ | 10.54 | | | $ | 10.00 | |
| | | | | | | | | | | | | | | | |
Total Return(a) | | | 6.39% | (b) | | | 3.82% | (b) | | | 7.36% | (b) | | | - | ‡ |
Ratios / Supplemental Data: | | | | | | | | | | | | | | | | |
Net assets, end of year (000’s) | | $ | 54,312 | | | $ | 30,338 | | | $ | 7,272 | | | $ | 101 | |
Ratio of expenses to average daily net assets: | | | | | | | | | | | | | | | | |
Before expense waiver | | | 0.52% | | | | 0.54% | | | | 1.13% | | | | - | ‡ |
After expense waiver | | | 0.50% | # | | | 0.50% | # | | | 0.50% | # | | | - | ‡ |
Net investment income (loss) to average daily net assets | | | 3.10% | | | | 4.24% | | | | 5.34% | | | | - | ‡ |
Portfolio turnover rate | | | 34% | | | | 17% | | | | 28% | | | | N/A | |
| |
| | | Class L | |
| | | Year ended
12/31/06 | | | Year ended
12/31/05 | | | Year ended
12/31/04 | | | Period ended
12/31/03+ | |
Net asset value, beginning of year | | $ | 10.60 | | | $ | 10.56 | | | $ | 10.00 | | | $ | 10.00 | |
| | | | | | | | | | | | | | | | |
Income (loss) from investment operations: | | | | | | | | | | | | | | | | |
Net investment income (loss) | | | 0.36 | *** | | | 0.36 | *** | | | 1.25 | *** | | | - | |
Net realized and unrealized gain (loss) on investments | | | 0.35 | | | | 0.07 | | | | (0.48 | ) | | | - | |
| | | | | | | | | | | | | | | | |
Total income from investment operations | | | 0.71 | | | | 0.43 | | | | 0.77 | | | | - | |
| | | | | | | | | | | | | | | | |
Less distributions to shareholders: | | | | | | | | | | | | | | | | |
From net investment income | | | (0.33 | ) | | | (0.33 | ) | | | (0.19 | ) | | | - | |
From net realized gains | | | (0.16 | ) | | | (0.06 | ) | | | (0.02 | ) | | | - | |
| | | | | | | | | | | | | | | | |
Total distributions | | | (0.49 | ) | | | (0.39 | ) | | | (0.21 | ) | | | - | |
| | | | | | | | | | | | | | | | |
Net asset value, end of year | | $ | 10.82 | | | $ | 10.60 | | | $ | 10.56 | | | $ | 10.00 | |
| | | | | | | | | | | | | | | | |
Total Return(a) | | | 6.69% | | | | 4.03% | | | | 7.68% | | | | 0.00% | ‡ |
Ratios / Supplemental Data: | | | | | | | | | | | | | | | | |
Net assets, end of year (000’s) | | $ | 47,387 | | | $ | 35,621 | | | $ | 22,880 | | | $ | 101 | |
Ratio of expenses to average daily net assets: | | | | | | | | | | | | | | | | |
Before expense waiver | | | 0.27% | | | | 0.29% | | | | 0.88% | | | | - | ‡ |
After expense waiver | | | 0.25% | # | | | 0.25% | # | | | 0.25% | # | | | - | ‡ |
Net investment income (loss) to average daily net assets | | | 3.35% | | | | 3.37% | | | | 12.10% | | | | - | ‡ |
Portfolio turnover rate | | | 34% | | | | 17% | | | | 28% | | | | N/A | |
| *** | Per share amount calculated on the average shares method. |
| + | The Fund commenced operations on December 31, 2003. |
| ‡ | Amounts are de minimis due to the short period of operations. |
| # | Computed after giving effect to an agreement by MassMutual to waive certain fees and expenses of the Fund. |
| (a) | Employee retirement benefit plans that invest plan assets in the Separate Investment Accounts (SIAs) may be subject to certain charges as set forth in their respective Plan Documents. Total return figures would be lower for the period presented if they reflected these charges. |
| (b) | Total Return excludes a front-end sales charge and would be lower for the periods presented if they reflected these charges. |
– 202 –
MASSMUTUAL SELECT DESTINATION RETIREMENT 2010 FUND
| | | | | | | | | | | | | | | | |
| | | Class Y | |
| | | Year ended
12/31/06 | | | Year ended
12/31/05 | | | Year ended
12/31/04 | | | Period ended
12/31/03+ | |
Net asset value, beginning of year | | $ | 10.61 | | | $ | 10.56 | | | $ | 10.00 | | | $ | 10.00 | |
| | | | | | | | | | | | | | | | |
Income (loss) from investment operations: | | | | | | | | | | | | | | | | |
Net investment income (loss) | | | 0.39 | *** | | | 0.52 | *** | | | 0.85 | *** | | | - | |
Net realized and unrealized gain (loss) on investments | | | 0.32 | | | | (0.07 | ) | | | (0.08 | ) | | | - | |
| | | | | | | | | | | | | | | | |
Total income from investment operations | | | 0.71 | | | | 0.45 | | | | 0.77 | | | | - | |
| | | | | | | | | | | | | | | | |
Less distributions to shareholders: | | | | | | | | | | | | | | | | |
From net investment income | | | (0.34 | ) | | | (0.34 | ) | | | (0.19 | ) | | | - | |
From net realized gains | | | (0.16 | ) | | | (0.06 | ) | | | (0.02 | ) | | | - | |
| | | | | | | | | | | | | | | | |
Total distributions | | | (0.50 | ) | | | (0.40 | ) | | | (0.21 | ) | | | - | |
| | | | | | | | | | | | | | | | |
Net asset value, end of year | | $ | 10.82 | | | $ | 10.61 | | | $ | 10.56 | | | $ | 10.00 | |
| | | | | | | | | | | | | | | | |
Total Return(a) | | | 6.77% | | | | 4.22% | | | | 7.69% | | | | - | ‡ |
Ratios / Supplemental Data: | | | | | | | | | | | | | | | | |
Net assets, end of year (000’s) | | $ | 57,929 | | | $ | 30,365 | | | $ | 5,605 | | | $ | 101 | |
Ratio of expenses to average daily net assets: | | | | | | | | | | | | | | | | |
Before expense waiver | | | 0.17% | | | | 0.19% | | | | 0.78% | | | | - | ‡ |
After expense waiver | | | 0.15% | # | | | 0.15% | # | | | 0.15% | # | | | - | ‡ |
Net investment income (loss) to average daily net assets | | | 3.62% | | | | 4.80% | | | | 8.17% | | | | - | ‡ |
Portfolio turnover rate | | | 34% | | | | 17% | | | | 28% | | | | N/A | |
| |
| | | Class S | |
| | | Year ended
12/31/06 | | | Year ended
12/31/05 | | | Year ended
12/31/04 | | | Period ended
12/31/03+ | |
Net asset value, beginning of year | | $ | 10.61 | | | $ | 10.57 | | | $ | 10.00 | | | $ | 10.00 | |
| | | | | | | | | | | | | | | | |
Income (loss) from investment operations: | | | | | | | | | | | | | | | | |
Net investment income (loss) | | | 0.40 | *** | | | 0.61 | *** | | | 0.36 | *** | | | - | |
Net realized and unrealized gain (loss) on investments | | | 0.33 | | | | (0.17 | ) | | | 0.42 | | | | - | |
| | | | | | | | | | | | | | | | |
Total income from investment operations | | | 0.73 | | | | 0.44 | | | | 0.78 | | | | - | |
| | | | | | | | | | | | | | | | |
Less distributions to shareholders: | | | | | | | | | | | | | | | | |
From net investment income | | | (0.35 | ) | | | (0.34 | ) | | | (0.19 | ) | | | - | |
From net realized gains | | | (0.16 | ) | | | (0.06 | ) | | | (0.02 | ) | | | - | |
| | | | | | | | | | | | | | | | |
Total distributions | | | (0.51 | ) | | | (0.40 | ) | | | (0.21 | ) | | | - | |
| | | | | | | | | | | | | | | | |
Net asset value, end of year | | $ | 10.83 | | | $ | 10.61 | | | $ | 10.57 | | | $ | 10.00 | |
| | | | | | | | | | | | | | | | |
Total Return(a) | | | 6.90% | | | | 4.15% | | | | 7.80% | | | | - | ‡ |
Ratios / Supplemental Data: | | | | | | | | | | | | | | | | |
Net assets, end of year (000’s) | | $ | 17,935 | | | $ | 12,104 | | | $ | 2,319 | | | $ | 601 | |
Ratio of expenses to average daily net assets: | | | | | | | | | | | | | | | | |
Before expense waiver | | | 0.12% | | | | 0.14% | | | | 0.73% | | | | - | ‡ |
After expense waiver | | | 0.10% | # | | | 0.10% | # | | | 0.10% | # | | | - | ‡ |
Net investment income (loss) to average daily net assets | | | 3.66% | | | | 5.69% | | | | 3.49% | | | | - | ‡ |
Portfolio turnover rate | | | 34% | | | | 17% | | | | 28% | | | | N/A | |
| *** | Per share amount calculated on the average shares method. |
| + | The Fund commenced operations on December 31, 2003. |
| ‡ | Amounts are de minimis due to the short period of operations. |
| # | Computed after giving effect to an agreement by MassMutual to waive certain fees and expenses of the Fund. |
| (a) | Employee retirement benefit plans that invest plan assets in the Separate Investment Accounts (SIAs) may be subject to certain charges as set forth in their respective Plan Documents. Total return figures would be lower for the period presented if they reflected these charges. |
– 203 –
MASSMUTUAL SELECT DESTINATION RETIREMENT 2010 FUND
| | | | | | | | | | | | | | | | |
| | | Class N | |
| | | Year ended
12/31/06 | | | Year ended
12/31/05 | | | Year ended
12/31/04 | | | Year ended
12/31/03+ | |
Net asset value, beginning of year | | $ | 10.60 | | | $ | 10.56 | | | $ | 10.00 | | | $ | 10.00 | |
| | | | | | | | | | | | | | | | |
Income (loss) from investment operations: | | | | | | | | | | | | | | | | |
Net investment income (loss) | | | 0.32 | *** | | | 0.27 | *** | | | (0.00 | )† | | | - | |
Net realized and unrealized gain (loss) on investments | | | 0.32 | | | | 0.10 | | | | 0.70 | | | | - | |
| | | | | | | | | | | | | | | | |
Total income from investment operations | | | 0.64 | | | | 0.37 | | | | 0.70 | | | | - | |
| | | | | | | | | | | | | | | | |
Less distributions to shareholders: | | | | | | | | | | | | | | | | |
From net investment income | | | (0.28 | ) | | | (0.27 | ) | | | (0.12 | ) | | | - | |
From net realized gains | | | (0.16 | ) | | | (0.06 | ) | | | (0.02 | ) | | | - | |
| | | | | | | | | | | | | | | | |
Total distributions | | | (0.44 | ) | | | (0.33 | ) | | | (0.14 | ) | | | - | |
| | | | | | | | | | | | | | | | |
Net asset value, end of year | | $ | 10.80 | | | $ | 10.60 | | | $ | 10.56 | | | $ | 10.00 | |
| | | | | | | | | | | | | | | | |
Total Return(a) | | | 6.14% | (b) | | | 3.51% | (b) | | | 6.98% | (b) | | | 0.00% | ‡ |
Ratios / Supplemental Data: | | | | | | | | | | | | | | | | |
Net assets, end of year (000’s) | | $ | 249 | | | $ | 134 | | | $ | 107 | | | $ | 101 | |
Ratio of expenses to average daily net assets: | | | | | | | | | | | | | | | | |
Before expense waiver | | | 0.82% | | | | 0.84% | | | | 1.43% | | | | - | ‡ |
After expense waiver | | | 0.80% | # | | | 0.80% | # | | | 0.80% | # | | | N/A | ‡ |
Net investment income (loss) to average daily net assets | | | 3.00% | | | | 2.50% | | | | 0.02% | | | | 0.00% | ‡ |
Portfolio turnover rate | | | 34% | | | | 17% | | | | 28% | | | | N/A | |
| *** | Per share amount calculated on the average shares method. |
| † | Net investment loss is less than $0.01 per share. |
| + | The Fund commenced operations on December 31, 2003. |
| ‡ | Amounts are de minimis due to the short period of operations. |
| # | Computed after giving effect to an agreement by MassMutual to waive certain fees and expenses of the Fund. |
| (a) | Employee retirement benefit plans that invest plan assets in the Separate Investment Accounts (SIAs) may be subject to certain charges as set forth in their respective Plan Documents. Total return figures would be lower for the period presented if they reflected these charges. |
| (b) | Total Return excludes a contingent deferred sales charge and would be lower for the periods presented if they reflected these charges. |
– 204 –
MASSMUTUAL SELECT DESTINATION RETIREMENT 2020 FUND
| | | | | | | | | | | | | | | | |
| | | Class A | |
| | | Year ended
12/31/06 | | | Year ended
12/31/05 | | | Year ended
12/31/04 | | | Period ended
12/31/03+ | |
Net asset value, beginning of year | | $ | 10.91 | | | $ | 10.75 | | | $ | 10.00 | | | $ | 10.00 | |
| | | | | | | | | | | | | | | | |
Income (loss) from investment operations: | | | | | | | | | | | | | | | | |
Net investment income (loss) | | | 0.26 | *** | | | 0.37 | *** | | | 0.64 | *** | | | - | |
Net realized and unrealized gain (loss) on investments | | | 0.57 | | | | 0.19 | | | | 0.34 | | | | - | |
| | | | | | | | | | | | | | | | |
Total income from investment operations | | | 0.83 | | | | 0.56 | | | | 0.98 | | | | - | |
| | | | | | | | | | | | | | | | |
Less distributions to shareholders: | | | | | | | | | | | | | | | | |
From net investment income | | | (0.25 | ) | | | (0.27 | ) | | | (0.19 | ) | | | - | |
From net realized gains | | | (0.29 | ) | | | (0.13 | ) | | | (0.04 | ) | | | - | |
| | | | | | | | | | | | | | | | |
Total distributions | | | (0.54 | ) | | | (0.40 | ) | | | (0.23 | ) | | | - | |
| | | | | | | | | | | | | | | | |
Net asset value, end of year | | $ | 11.20 | | | $ | 10.91 | | | $ | 10.75 | | | $ | 10.00 | |
| | | | | | | | | | | | | | | | |
Total Return(a) | | | 7.72% | (b) | | | 5.23% | (b) | | | 9.76% | (b) | | | - | ‡ |
Ratios / Supplemental Data: | | | | | | | | | | | | | | | | |
Net assets, end of year (000’s) | | $ | 144,228 | | | $ | 89,351 | | | $ | 21,577 | | | $ | 101 | |
Ratio of expenses to average daily net assets: | | | | | | | | | | | | | | | | |
Before expense waiver | | | 0.50% | | | | 0.50% | | | | 0.52% | | | | - | ‡ |
After expense waiver | | | N/A | | | | N/A | | | | 0.50% | # | | | - | ‡ |
Net investment income (loss) to average daily net assets | | | 2.32% | | | | 3.43% | | | | 6.11% | | | | - | ‡ |
Portfolio turnover rate | | | 32% | | | | 23% | | | | 19% | | | | N/A | |
| |
| | | Class L | |
| | | Year ended
12/31/06 | | | Year ended
12/31/05 | | | Year ended
12/31/04 | | | Period ended
12/31/03+ | |
Net asset value, beginning of year | | $ | 10.96 | | | $ | 10.77 | | | $ | 10.00 | | | $ | 10.00 | |
| | | | | | | | | | | | | | | | |
Income (loss) from investment operations: | | | | | | | | | | | | | | | | |
Net investment income (loss) | | | 0.25 | *** | | | 0.25 | *** | | | 0.21 | *** | | | - | |
Net realized and unrealized gain (loss) on investments | | | 0.60 | | | | 0.35 | | | | 0.79 | | | | - | |
| | | | | | | | | | | | | | | | |
Total income from investment operations | | | 0.85 | | | | 0.60 | | | | 1.00 | | | | - | |
| | | | | | | | | | | | | | | | |
Less distributions to shareholders: | | | | | | | | | | | | | | | | |
From net investment income | | | (0.27 | ) | | | (0.28 | ) | | | (0.19 | ) | | | - | |
From net realized gains | | | (0.29 | ) | | | (0.13 | ) | | | (0.04 | ) | | | - | |
| | | | | | | | | | | | | | | | |
Total distributions | | | (0.56 | ) | | | (0.41 | ) | | | (0.23 | ) | | | - | |
| | | | | | | | | | | | | | | | |
Net asset value, end of year | | $ | 11.25 | | | $ | 10.96 | | | $ | 10.77 | | | $ | 10.00 | |
| | | | | | | | | | | | | | | | |
Total Return(a) | | | 7.87% | | | | 5.50% | | | | 10.07% | | | | - | ‡ |
Ratios / Supplemental Data: | | | | | | | | | | | | | | | | |
Net assets, end of year (000’s) | | $ | 273,584 | | | $ | 237,433 | | | $ | 212,094 | | | $ | 101 | |
Ratio of expenses to average daily net assets: | | | | | | | | | | | | | | | | |
Before expense waiver | | | 0.24% | | | | 0.25% | | | | 0.26% | | | | - | ‡ |
After expense waiver | | | N/A | | | | N/A | | | | 0.25% | # | | | - | ‡ |
Net investment income (loss) to average daily net assets | | | 2.19% | | | | 2.31% | | | | 1.99% | | | | - | ‡ |
Portfolio turnover rate | | | 32% | | | | 23% | | | | 19% | | | | N/A | |
| *** | Per share amount calculated on the average shares method. |
| + | The Fund commenced operations on December 31, 2003. |
| ‡ | Amounts are de minimis due to the short period of operations. |
| # | Computed after giving effect to an agreement by MassMutual to waive certain fees and expenses of the Fund. |
| (a) | Employee retirement benefit plans that invest assets in the Separate Investment Accounts (SIAs) may be subject to certain charges as set forth in their respective Plan Documents. Total return would be lower for the periods presented if they reflected these charges. |
| (b) | Total return excludes a front-end sales charge and would be lower for the periods presented if it reflected these charges. |
– 205 –
MASSMUTUAL SELECT DESTINATION RETIREMENT 2020 FUND
| | | | | | | | | | | | | | | | |
| | | Class Y | |
| | | Year ended
12/31/06 | | | Year ended
12/31/05 | | | Year ended
12/31/04 | | | Period ended
12/31/03+ | |
Net asset value, beginning of year | | $ | 10.95 | | | $ | 10.77 | | | $ | 10.00 | | | $ | 10.00 | |
| | | | | | | | | | | | | | | | |
Income (loss) from investment operations: | | | | | | | | | | | | | | | | |
Net investment income (loss) | | | 0.30 | *** | | | 0.45 | *** | | | 0.81 | *** | | | - | |
Net realized and unrealized gain (loss) on investments | | | 0.58 | | | | 0.16 | | | | 0.20 | | | | - | |
| | | | | | | | | | | | | | | | |
Total income from investment operations | | | 0.88 | | | | 0.61 | | | | 1.01 | | | | - | |
| | | | | | | | | | | | | | | | |
Less distributions to shareholders: | | | | | | | | | | | | | | | | |
From net investment income | | | (0.29 | ) | | | (0.30 | ) | | | (0.20 | ) | | | - | |
From net realized gains | | | (0.29 | ) | | | (0.13 | ) | | | (0.04 | ) | | | - | |
| | | | | | | | | | | | | | | | |
Total distributions | | | (0.58 | ) | | | (0.43 | ) | | | (0.24 | ) | | | - | |
| | | | | | | | | | | | | | | | |
Net asset value, end of year | | $ | 11.25 | | | $ | 10.95 | | | $ | 10.77 | | | $ | 10.00 | |
| | | | | | | | | | | | | | | | |
Total Return(a) | | | 8.08% | | | | 5.63% | | | | 10.07% | | | | - | ‡ |
Ratios / Supplemental Data: | | | | | | | | | | | | | | | | |
Net assets, end of year (000’s) | | $ | 105,565 | | | $ | 65,716 | | | $ | 10,249 | | | $ | 101 | |
Ratio of expenses to average daily net assets: | | | | | | | | | | | | | | | | |
Before expense waiver | | | 0.15% | | | | 0.14% | | | | 0.19% | | | | - | ‡ |
After expense waiver | | | N/A | | | | N/A | | | | 0.15% | # | | | - | ‡ |
Net investment income (loss) to average daily net assets | | | 2.66% | | | | 4.04% | | | | 7.69% | | | | - | ‡ |
Portfolio turnover rate | | | 32% | | | | 23% | | | | 19% | | | | N/A | |
| |
| | | Class S | |
| | | Year ended
12/31/06 | | | Year ended
12/31/05 | | | Year ended
12/31/04 | | | Period ended
12/31/03+ | |
Net asset value, beginning of year | | $ | 10.96 | | | $ | 10.78 | | | $ | 10.00 | | | $ | 10.00 | |
| | | | | | | | | | | | | | | | |
Income (loss) from investment operations: | | | | | | | | | | | | | | | | |
Net investment income (loss) | | | 0.30 | *** | | | 0.38 | *** | | | 0.52 | *** | | | - | |
Net realized and unrealized gain (loss) on investments | | | 0.58 | | | | 0.23 | | | | 0.50 | | | | - | |
| | | | | | | | | | | | | | | | |
Total income from investment operations | | | 0.88 | | | | 0.61 | | | | 1.02 | | | | - | |
| | | | | | | | | | | | | | | | |
Less distributions to shareholders: | | | | | | | | | | | | | | | | |
From net investment income | | | (0.29 | ) | | | (0.30 | ) | | | (0.20 | ) | | | - | |
From net realized gains | | | (0.29 | ) | | | (0.13 | ) | | | (0.04 | ) | | | - | |
| | | | | | | | | | | | | | | | |
Total distributions | | | (0.58 | ) | | | (0.43 | ) | | | (0.24 | ) | | | - | |
| | | | | | | | | | | | | | | | |
Net asset value, end of year | | $ | 11.26 | | | $ | 10.96 | | | $ | 10.78 | | | $ | 10.00 | |
| | | | | | | | | | | | | | | | |
Total Return(a) | | | 8.12% | | | | 5.65% | | | | 10.19% | | | | - | ‡ |
Ratios / Supplemental Data: | | | | | | | | | | | | | | | | |
Net assets, end of year (000’s) | | $ | 66,802 | | | $ | 35,933 | | | $ | 12,389 | | | $ | 601 | |
Ratio of expenses to average daily net assets: | | | | | | | | | | | | | | | | |
Before expense waiver | | | 0.10% | | | | 0.10% | | | | 0.21% | | | | - | ‡ |
After expense waiver | | | N/A | | | | N/A | | | | 0.10% | # | | | - | ‡ |
Net investment income (loss) to average daily net assets | | | 2.69% | | | | 3.45% | | | | 5.00% | | | | - | ‡ |
Portfolio turnover rate | | | 32% | | | | 23% | | | | 19% | | | | N/A | |
| *** | Per share amount calculated on the average shares method. |
| + | The Fund commenced operations on December 31, 2003. |
| ‡ | Amounts are de minimis due to the short period of operations. |
| # | Computed after giving effect to an agreement by MassMutual to waive certain fees and expenses of the Fund. |
| (a) | Employee retirement benefit plans that invest assets in the Separate Investment Accounts (SIAs) may be subject to certain charges as set forth in their respective Plan Documents. Total return would be lower for the periods presented if they reflected these charges. |
– 206 –
MASSMUTUAL SELECT DESTINATION RETIREMENT 2020 FUND
| | | | | | | | | | | | | | | | |
| | | Class N | |
| | | Year ended
12/31/06 | | | Year ended
12/31/05 | | | Year ended
12/31/04 | | | Period ended
12/31/03+ | |
Net asset value, beginning of year | | $ | 10.94 | | | $ | 10.77 | | | $ | 10.00 | | | $ | 10.00 | |
| | | | | | | | | | | | | | | | |
Income (loss) from investment operations: | | | | | | | | | | | | | | | | |
Net investment income (loss) | | | 0.21 | *** | | | 0.27 | *** | | | 0.06 | *** | | | - | |
Net realized and unrealized gain (loss) on investments | | | 0.58 | | | | 0.27 | | | | 0.88 | | | | - | |
| | | | | | | | | | | | | | | | |
Total income from investment operations | | | 0.79 | | | | 0.54 | | | | 0.94 | | | | - | |
| | | | | | | | | | | | | | | | |
Less distributions to shareholders: | | | | | | | | | | | | | | | | |
From net investment income | | | (0.22 | ) | | | (0.24 | ) | | | (0.13 | ) | | | - | |
From net realized gains | | | (0.29 | ) | | | (0.13 | ) | | | (0.04 | ) | | | - | |
| | | | | | | | | | | | | | | | |
Total distributions | | | (0.51 | ) | | | (0.37 | ) | | | (0.17 | ) | | | - | |
| | | | | | | | | | | | | | | | |
Net asset value, end of year | | $ | 11.22 | | | $ | 10.94 | | | $ | 10.77 | | | $ | 10.00 | |
| | | | | | | | | | | | | | | | |
Total Return(a) | | | 7.31% | **(b) | | | 4.99% | (b) | | | 9.39% | (b) | | | 0.00% | ‡ |
Ratios / Supplemental Data: | | | | | | | | | | | | | | | | |
Net assets, end of year (000’s) | | $ | 309 | | | $ | 238 | | | $ | 113 | | | $ | 101 | |
Ratio of expenses to average daily net assets: | | | | | | | | | | | | | | | | |
Before expense waiver | | | 0.80% | | | | 0.80% | | | | 1.57% | | | | - | ‡ |
After expense waiver | | | N/A | | | | N/A | | | | 0.80% | # | | | N/A | ‡ |
Net investment income (loss) to average daily net assets | | | 1.93% | | | | 2.46% | | | | 0.55% | | | | 0.00% | ‡ |
Portfolio turnover rate | | | 32% | | | | 23% | | | | 19% | | | | N/A | |
| *** | Per share amount calculated on the average shares method. |
| + | The Fund commenced operations on December 31, 2003. |
| ‡ | Amounts are de minimis due to the short period of operations. |
| # | Computed after giving effect to an agreement by MassMutual to waive certain fees and expenses of the Fund. |
| (a) | Employee retirement benefit plans that invest assets in the Separate Investment Accounts (SIAs) may be subject to certain charges as set forth in their respective Plan Documents. Total return would be lower for the periods presented if they reflected these charges. |
| (b) | Total return excludes a contingent deferred sales charge and would be lower for the periods presented if it reflected these charges. |
– 207 –
MASSMUTUAL SELECT DESTINATION RETIREMENT 2030 FUND
| | | | | | | | | | | | | | | | |
| | | Class A | |
| | | Year ended
12/31/06 | | | Year ended
12/31/05 | | | Year ended
12/31/04 | | | Period ended
12/31/03+ | |
Net asset value, beginning of year | | $ | 11.50 | | | $ | 11.11 | | | $ | 10.00 | | | $ | 10.00 | |
| | | | | | | | | | | | | | | | |
Income (loss) from investment operations: | | | | | | | | | | | | | | | | |
Net investment income (loss) | | | 0.15 | *** | | | 0.21 | *** | | | 0.27 | *** | | | - | |
Net realized and unrealized gain (loss) on investments | | | 0.95 | | | | 0.52 | | | | 0.95 | | | | - | |
| | | | | | | | | | | | | | | | |
Total income from investment operations | | | 1.10 | | | | 0.73 | | | | 1.22 | | | | - | |
| | | | | | | | | | | | | | | | |
Less distributions to shareholders: | | | | | | | | | | | | | | | | |
From net investment income | | | (0.18 | ) | | | (0.18 | ) | | | (0.10 | ) | | | - | |
From net realized gains | | | (0.37 | ) | | | (0.16 | ) | | | (0.01 | ) | | | - | |
| | | | | | | | | | | | | | | | |
Total distributions | | | (0.55 | ) | | | (0.34 | ) | | | (0.11 | ) | | | - | |
| | | | | | | | | | | | | | | | |
Net asset value, end of year | | $ | 12.05 | | | $ | 11.50 | | | $ | 11.11 | | | $ | 10.00 | |
| | | | | | | | | | | | | | | | |
Total Return(a) | | | 9.70% | (b) | | | 6.56% | (b) | | | 12.24% | (b) | | | - | ‡ |
Ratios / Supplemental Data: | | | | | | | | | | | | | | | | |
Net assets, end of year (000’s) | | $ | 112,499 | | | $ | 63,024 | | | $ | 21,459 | | | $ | 101 | |
Ratio of expenses to average daily net assets: | | | | | | | | | | | | | | | | |
Before expense waiver | | | 0.50% | | | | 0.50% | | | | 0.52% | | | | - | ‡ |
After expense waiver | | | N/A | | | | N/A | | | | 0.50% | # | | | N/A | ‡ |
Net investment income (loss) to average daily net assets | | | 1.31% | | | | 1.89% | | | | 2.58% | | | | 0.00% | ‡ |
Portfolio turnover rate | | | 34% | | | | 17% | | | | 10% | | | | N/A | |
| |
| | | Class L | |
| | | Year ended
12/31/06 | | | Year ended
12/31/05 | | | Year ended
12/31/04 | | | Period ended
12/31/03+ | |
Net asset value, beginning of year | | $ | 11.55 | | | $ | 11.13 | | | $ | 10.00 | | | $ | 10.00 | |
| | | | | | | | | | | | | | | | |
Income (loss) from investment operations: | | | | | | | | | | | | | | | | |
Net investment income (loss) | | | 0.15 | *** | | | 0.14 | *** | | | 0.10 | *** | | | - | |
Net realized and unrealized gain (loss) on investments | | | 0.98 | | | | 0.63 | | | | 1.15 | | | | - | |
| | | | | | | | | | | | | | | | |
Total income from investment operations | | | 1.13 | | | | 0.77 | | | | 1.25 | | | | - | |
| | | | | | | | | | | | | | | | |
Less distributions to shareholders: | | | | | | | | | | | | | | | | |
From net investment income | | | (0.20 | ) | | | (0.19 | ) | | | (0.11 | ) | | | - | |
From net realized gains | | | (0.37 | ) | | | (0.16 | ) | | | (0.01 | ) | | | - | |
| | | | | | | | | | | | | | | | |
Total distributions | | | (0.57 | ) | | | (0.35 | ) | | | (0.12 | ) | | | - | |
| | | | | | | | | | | | | | | | |
Net asset value, end of year | | $ | 12.11 | | | $ | 11.55 | | | $ | 11.13 | | | $ | 10.00 | |
| | | | | | | | | | | | | | | | |
Total Return(a) | | | 9.93% | | | | 6.92% | | | | 12.49% | | | | - | ‡ |
Ratios / Supplemental Data: | | | | | | | | | | | | | | | | |
Net assets, end of year (000’s) | | $ | 211,382 | | | $ | 180,837 | | | $ | 168,132 | | | $ | 101 | |
Ratio of expenses to average daily net assets: | | | | | | | | | | | | | | | | |
Before expense waiver | | | 0.25% | | | | 0.25% | | | | 0.26% | | | | - | ‡ |
After expense waiver | | | N/A | | | | N/A | | | | 0.25% | # | | | N/A | ‡ |
Net investment income (loss) to average daily net assets | | | 1.28% | | | | 1.26% | | | | 0.93% | | | | 0.00% | ‡ |
Portfolio turnover rate | | | 34% | | | | 17% | | | | 10% | | | | N/A | |
| *** | Per share amount calculated on the average share method. |
| + | The Fund commenced operations on December 31, 2003. |
| ‡ | Amounts are de minimis due to the short period of operations. |
| # | Computed after giving effect to an agreement by MassMutual to waive certain fees and expenses of the Fund. |
| (a) | Employee retirement benefit plans that invest plan assets in the Separate Investment Accounts (SIAs) may be subject to certain charges as set forth in their respective Plan Documents. Total return figures would be lower for the period presented if they reflected these charges. |
| (b) | Total Return excludes a front-end sales charge and would be lower for the periods presented if they reflected these charges. |
– 208 –
MASSMUTUAL SELECT DESTINATION RETIREMENT 2030 FUND
| | | | | | | | | | | | | | | | |
| | | Class Y | |
| | | Year ended
12/31/06 | | | Year ended
12/31/05 | | | Year ended
12/31/04 | | | Period ended
12/31/03+ | |
Net asset value, beginning of year | | $ | 11.54 | | | $ | 11.13 | | | $ | 10.00 | | | $ | 10.00 | |
| | | | | | | | | | | | | | | | |
Income (loss) from investment operations: | | | | | | | | | | | | | | | | |
Net investment income (loss) | | | 0.22 | *** | | | 0.32 | *** | | | 0.43 | *** | | | - | |
Net realized and unrealized gain (loss) on investments | | | 0.93 | | | | 0.46 | | | | 0.83 | | | | - | |
| | | | | | | | | | | | | | | | |
Total income from investment operations | | | 1.15 | | | | 0.78 | | | | 1.26 | | | | - | |
| | | | | | | | | | | | | | | | |
Less distributions to shareholders: | | | | | | | | | | | | | | | | |
From net investment income | | | (0.22 | ) | | | (0.21 | ) | | | (0.12 | ) | | | - | |
From net realized gains | | | (0.37 | ) | | | (0.16 | ) | | | (0.01 | ) | | | - | |
| | | | | | | | | | | | | | | | |
Total distributions | | | (0.59 | ) | | | (0.37 | ) | | | (0.13 | ) | | | - | |
| | | | | | | | | | | | | | | | |
Net asset value, end of year | | $ | 12.10 | | | $ | 11.54 | | | $ | 11.13 | | | $ | 10.00 | |
| | | | | | | | | | | | | | | | |
Total Return(a) | | | 10.05% | | | | 6.97% | | | | 12.60% | | | | - | ‡ |
Ratios / Supplemental Data: | | | | | | | | | | | | | | | | |
Net assets, end of year (000’s) | | $ | 68,388 | | | $ | 33,819 | | | $ | 3,169 | | | $ | 101 | |
Ratio of expenses to average daily net assets: | | | | | | | | | | | | | | | | |
Before expense waiver | | | 0.15% | | | | 0.15% | | | | 0.23% | | | | - | ‡ |
After expense waiver | | | N/A | | | | N/A | | | | 0.15% | # | | | N/A | ‡ |
Net investment income (loss) to average daily net assets | | | 1.82% | | | | 2.77% | | | | 4.01% | | | | 0.00% | ‡ |
Portfolio turnover rate | | | 34% | | | | 17% | | | | 10% | | | | N/A | |
| |
| | | Class S | |
| | | Year ended
12/31/06 | | | Year ended
12/31/05 | | | Year ended
12/31/04 | | | Period ended
12/31/03+ | |
Net asset value, beginning of year | | $ | 11.55 | | | $ | 11.14 | | | $ | 10.00 | | | $ | 10.00 | |
| | | | | | | | | | | | | | | | |
Income (loss) from investment operations: | | | | | | | | | | | | | | | | |
Net investment income (loss) | | | 0.20 | *** | | | 0.27 | *** | | | 0.33 | *** | | | - | |
Net realized and unrealized gain (loss) on investments | | | 0.95 | | | | 0.51 | | | | 0.94 | | | | - | |
| | | | | | | | | | | | | | | | |
Total income from investment operations | | | 1.15 | | | | 0.78 | | | | 1.27 | | | | - | |
| | | | | | | | | | | | | | | | |
Less distributions to shareholders: | | | | | | | | | | | | | | | | |
From net investment income | | | (0.22 | ) | | | (0.21 | ) | | | (0.12 | ) | | | - | |
From net realized gains | | | (0.37 | ) | | | (0.16 | ) | | | (0.01 | ) | | | - | |
| | | | | | | | | | | | | | | | |
Total distributions | | | (0.59 | ) | | | (0.37 | ) | | | (0.13 | ) | | | - | |
| | | | | | | | | | | | | | | | |
Net asset value, end of year | | $ | 12.11 | | | $ | 11.55 | | | $ | 11.14 | | | $ | 10.00 | |
| | | | | | | | | | | | | | | | |
Total Return(a) | | | 10.17% | | | | 6.98% | | | | 12.71% | | | | - | ‡ |
Ratios / Supplemental Data: | | | | | | | | | | | | | | | | |
Net assets, end of year (000’s) | | $ | 42,835 | | | $ | 18,300 | | | $ | 4,245 | | | $ | 601 | |
Ratio of expenses to average daily net assets: | | | | | | | | | | | | | | | | |
Before expense waiver | | | 0.10% | | | | 0.10% | | | | 0.45% | | | | - | ‡ |
After expense waiver | | | N/A | | | | N/A | | | | 0.10% | # | | | N/A | ‡ |
Net investment income (loss) to average daily net assets | | | 1.66% | | | | 2.42% | | | | 3.16% | | | | 0.00% | ‡ |
Portfolio turnover rate | | | 34% | | | | 17% | | | | 10% | | | | N/A | |
| *** | Per share amount calculated on the average share method. |
| + | The Fund commenced operations on December 31, 2003. |
| ‡ | Amounts are de minimis due to the short period of operations. |
| # | Computed after giving effect to an agreement by MassMutual to waive certain fees and expenses of the Fund. |
| (a) | Employee retirement benefit plans that invest plan assets in the Separate Investment Accounts (SIAs) may be subject to certain charges as set forth in their respective Plan Documents. Total return figures would be lower for the period presented if they reflected these charges. |
– 209 –
MASSMUTUAL SELECT DESTINATION RETIREMENT 2030 FUND
| | | | | | | | | | | | | | | | |
| | | Class N | |
| | | Year ended
12/31/06 | | | Year ended
12/31/05 | | | Year ended
12/31/04 | | | Period ended
12/31/03+ | |
Net asset value, beginning of year | | $ | 11.52 | | | $ | 11.13 | | | $ | 10.00 | | | $ | 10.00 | |
| | | | | | | | | | | | | | | | |
Income (loss) from investment operations: | | | | | | | | | | | | | | | | |
Net investment income (loss) | | | 0.09 | *** | | | 0.14 | *** | | | (0.02 | )*** | | | - | |
Net realized and unrealized gain (loss) on investments | | | 0.98 | | | | 0.55 | | | | 1.21 | | | | - | |
| | | | | | | | | | | | | | | | |
Total income from investment operations | | | 1.07 | | | | 0.69 | | | | 1.19 | | | | - | |
| | | | | | | | | | | | | | | | |
Less distributions to shareholders: | | | | | | | | | | | | | | | | |
From net investment income | | | (0.15 | ) | | | (0.14 | ) | | | (0.05 | ) | | | - | |
From net realized gains | | | (0.37 | ) | | | (0.16 | ) | | | (0.01 | ) | | | - | |
| | | | | | | | | | | | | | | | |
Total distributions | | | (0.52 | ) | | | (0.30 | ) | | | (0.06 | ) | | | - | |
| | | | | | | | | | | | | | | | |
Net asset value, end of year | | $ | 12.07 | | | $ | 11.52 | | | $ | 11.13 | | | $ | 10.00 | |
| | | | | | | | | | | | | | | | |
Total Return(a) | | | 9.39% | (b) | | | 6.20% | (b) | | | 11.89% | (b) | | | 0.00% | ‡ |
Ratios / Supplemental Data: | | | | | | | | | | | | | | | | |
Net assets, end of year (000’s) | | $ | 209 | | | $ | 162 | | | $ | 113 | | | $ | 101 | |
Ratio of expenses to average daily net assets: | | | | | | | | | | | | | | | | |
Before expense waiver | | | 0.80% | | | | 0.80% | | | | 1.47% | | | | - | ‡ |
After expense waiver | | | N/A | | | | N/A | | | | 0.80% | # | | | N/A | ‡ |
Net investment income (loss) to average daily net assets | | | 0.78% | | | | 1.26% | | | | (0.24 | )% | | | 0.00% | ‡ |
Portfolio turnover rate | | | 34% | | | | 17% | | | | 10% | | | | N/A | |
| *** | Per share amount calculated on the average share method. |
| + | The Fund commenced operations on December 31, 2003. |
| ‡ | Amounts are de minimis due to the short period of operations. |
| # | Computed after giving effect to an agreement by MassMutual to waive certain fees and expenses of the Fund. |
| (a) | Employee retirement benefit plans that invest plan assets in the Separate Investment Accounts (SIAs) may be subject to certain charges as set forth in their respective Plan Documents. Total return figures would be lower for the period presented if they reflected these charges. |
| (b) | Total Return excludes contingent deferred sales charge and would be lower for the periods presented if they reflected these charges. |
– 210 –
MASSMUTUAL SELECT DESTINATION RETIREMENT 2040 FUND
| | | | | | | | | | | | | | | | |
| | | Class A | |
| | | Year ended
12/31/06 | | | Year ended
12/31/05 | | | Year ended
12/31/04 | | | Period ended
12/31/03+ | |
Net asset value, beginning of year | | $ | 11.77 | | | $ | 11.26 | | | $ | 10.00 | | | $ | 10.00 | |
| | | | | | | | | | | | | | | | |
Income (loss) from investment operations: | | | | | | | | | | | | | | | | |
Net investment income (loss) | | | 0.07 | *** | | | 0.10 | *** | | | 0.20 | *** | | | - | |
Net realized and unrealized gain (loss) on investments | | | 1.24 | | | | 0.73 | | | | 1.14 | | | | - | |
| | | | | | | | | | | | | | | | |
Total income from investment operations | | | 1.31 | | | | 0.83 | | | | 1.34 | | | | - | |
| | | | | | | | | | | | | | | | |
Less distributions to shareholders: | | | | | | | | | | | | | | | | |
From net investment income | | | (0.13 | ) | | | (0.11 | ) | | | (0.06 | ) | | | - | |
From net realized gains | | | (0.56 | ) | | | (0.21 | ) | | | (0.02 | ) | | | - | |
| | | | | | | | | | | | | | | | |
Total distributions | | | (0.69 | ) | | | (0.32 | ) | | | (0.08 | ) | | | - | |
| | | | | | | | | | | | | | | | |
Net asset value, end of year | | $ | 12.39 | | | $ | 11.77 | | | $ | 11.26 | | | $ | 10.00 | |
| | | | | | | | | | | | | | | | |
Total Return(a) | | | 11.26% | (b) | | | 7.47% | (b) | | | 13.39% | (b) | | | - | ‡ |
Ratios / Supplemental Data: | | | | | | | | | | | | | | | | |
Net assets, end of year (000’s) | | $ | 46,934 | | | $ | 26,913 | | | $ | 6,414 | | | $ | 101 | |
Ratio of expenses to average daily net assets: | | | | | | | | | | | | | | | | |
Before expense waiver | | | 0.50% | | | | 0.50% | | | | 0.55% | | | | - | ‡ |
After expense waiver | | | N/A | | | | 0.50% | # | | | 0.50% | # | | | - | ‡ |
Net investment income (loss) to average daily net assets | | | 0.59% | | | | 0.85% | | | | 1.92% | | | | - | ‡ |
Portfolio turnover rate | | | 42% | | | | 18% | | | | 13% | | | | N/A | |
| |
| | | Class L | |
| | | Year ended
12/31/06 | | | Year ended
12/31/05 | | | Year ended
12/31/04 | | | Period ended
12/31/03+ | |
Net asset value, beginning of year | | $ | 11.81 | | | $ | 11.28 | | | $ | 10.00 | | | $ | 10.00 | |
| | | | | | | | | | | | | | | | |
Income (loss) from investment operations: | | | | | | | | | | | | | | | | |
Net investment income (loss) | | | 0.08 | *** | | | 0.07 | *** | | | 0.04 | *** | | | - | |
Net realized and unrealized gain (loss) on investments | | | 1.27 | | | | 0.80 | | | | 1.33 | | | | - | |
| | | | | | | | | | | | | | | | |
Total income from investment operations | | | 1.35 | | | | 0.87 | | | | 1.37 | | | | - | |
| | | | | | | | | | | | | | | | |
Less distributions to shareholders: | | | | | | | | | | | | | | | | |
From net investment income | | | (0.15 | ) | | | (0.13 | ) | | | (0.07 | ) | | | - | |
From net realized gains | | | (0.56 | ) | | | (0.21 | ) | | | (0.02 | ) | | | - | |
| | | | | | | | | | | | | | | | |
Total distributions | | | (0.71 | ) | | | (0.34 | ) | | | (0.09 | ) | | | - | |
| | | | | | | | | | | | | | | | |
Net asset value, end of year | | $ | 12.45 | | | $ | 11.81 | | | $ | 11.28 | | | $ | 10.00 | |
| | | | | | | | | | | | | | | | |
Total Return(a) | | | 11.58% | | | | 7.75% | | | | 13.63% | | | | - | ‡ |
Ratios / Supplemental Data: | | | | | | | | | | | | | | | | |
Net assets, end of year (000’s) | | $ | 134,968 | | | $ | 107,540 | | | $ | 101,487 | | | $ | 101 | |
Ratio of expenses to average daily net assets: | | | | | | | | | | | | | | | | |
Before expense waiver | | | 0.25% | | | | 0.25% | | | | 0.27% | | | | - | ‡ |
After expense waiver | | | N/A | | | | 0.25% | # | | | 0.25% | # | | | - | ‡ |
Net investment income (loss) to average daily net assets | | | 0.68% | | | | 0.60% | | | | 0.41% | | | | - | ‡ |
Portfolio turnover rate | | | 42% | | | | 18% | | | | 13% | | | | N/A | |
| *** | Per share amount calculated on the average shares method. |
| + | The Fund commenced operations on December 31, 2003. |
| ‡ | Amounts are de minimis due to the short period of operations. |
| # | Computed after giving effect to an agreement by MassMutual to waive certain fees and expenses of the Fund. |
| (a) | Employee retirement benefit plans that invest plan assets in the Separate Investment Accounts (SIAs) may be subject to certain charges as set forth in their respective Plan Documents. Total return figures would be lower for the period presented if they reflected these charges. |
| (b) | Total Return excludes a front-end sales charge and would be lower for the periods presented if they reflected these charges. |
– 211 –
MASSMUTUAL SELECT DESTINATION RETIREMENT 2040 FUND
| | | | | | | | | | | | | | | | |
| | | Class Y | |
| | | Year ended
12/31/06 | | | Year ended
12/31/05 | | | Year ended
12/31/04 | | | Period ended
12/31/03+ | |
Net asset value, beginning of year | | $ | 11.81 | | | $ | 11.28 | | | $ | 10.00 | | | $ | 10.00 | |
| | | | | | | | | | | | | | | | |
Income (loss) from investment operations: | | | | | | | | | | | | | | | | |
Net investment income (loss) | | | 0.12 | *** | | | 0.16 | *** | | | 0.27 | *** | | | - | |
Net realized and unrealized gain (loss) on investments | | | 1.23 | | | | 0.72 | | | | 1.11 | | | | - | |
| | | | | | | | | | | | | | | | |
Total income from investment operations | | | 1.35 | | | | 0.88 | | | | 1.38 | | | | - | |
| | | | | | | | | | | | | | | | |
Less distributions to shareholders: | | | | | | | | | | | | | | | | |
From net investment income | | | (0.16 | ) | | | (0.14 | ) | | | (0.08 | ) | | | - | |
From net realized gains | | | (0.56 | ) | | | (0.21 | ) | | | (0.02 | ) | | | - | |
| | | | | | | | | | | | | | | | |
Total distributions | | | (0.72 | ) | | | (0.35 | ) | | | (0.10 | ) | | | - | |
| | | | | | | | | | | | | | | | |
Net asset value, end of year | | $ | 12.44 | | | $ | 11.81 | | | $ | 11.28 | | | $ | 10.00 | |
| | | | | | | | | | | | | | | | |
Total Return(a) | | | 11.60% | | | | 7.88% | | | | 13.74% | | | | - | ‡ |
Ratios / Supplemental Data: | | | | | | | | | | | | | | | | |
Net assets, end of year (000’s) | | $ | 31,379 | | | $ | 8,379 | | | $ | 596 | | | $ | 101 | |
Ratio of expenses to average daily net assets: | | | | | | | | | | | | | | | | |
Before expense waiver | | | 0.15% | | | | 0.15% | | | | 0.54% | | | | - | ‡ |
After expense waiver | | | N/A | | | | 0.15% | # | | | 0.15% | # | | | - | ‡ |
Net investment income (loss) to average daily net assets | | | 0.96% | | | | 1.41% | | | | 2.55% | | | | - | ‡ |
Portfolio turnover rate | | | 42% | | | | 18% | | | | 13% | | | | N/A | |
| |
| | | Class S | |
| | | Year ended
12/31/06 | | | Year ended
12/31/05 | | | Year ended
12/31/04 | | | Period ended
12/31/03+ | |
Net asset value, beginning of year | | $ | 11.82 | | | $ | 11.28 | | | $ | 10.00 | | | $ | 10.00 | |
| | | | | | | | | | | | | | | | |
Income (loss) from investment operations: | | | | | | | | | | | | | | | | |
Net investment income (loss) | | | 0.08 | *** | | | 0.27 | *** | | | 0.09 | *** | | | - | |
Net realized and unrealized gain (loss) on investments | | | 1.28 | | | | 0.63 | | | | 1.29 | | | | - | |
| | | | | | | | | | | | | | | | |
Total income from investment operations | | | 1.36 | | | | 0.90 | | | | 1.38 | | | | - | |
| | | | | | | | | | | | | | | | |
Less distributions to shareholders: | | | | | | | | | | | | | | | | |
From net investment income | | | (0.17 | ) | | | (0.15 | ) | | | (0.08 | ) | | | - | |
From net realized gains | | | (0.56 | ) | | | (0.21 | ) | | | (0.02 | ) | | | - | |
| | | | | | | | | | | | | | | | |
Total distributions | | | (0.73 | ) | | | (0.36 | ) | | | (0.10 | ) | | | - | |
| | | | | | | | | | | | | | | | |
Net asset value, end of year | | $ | 12.45 | | | $ | 11.82 | | | $ | 11.28 | | | $ | 10.00 | |
| | | | | | | | | | | | | | | | |
Total Return(a) | | | 11.63% | | | | 8.00% | | | | 13.75% | | | | - | ‡ |
Ratios / Supplemental Data: | | | | | | | | | | | | | | | | |
Net assets, end of year (000’s) | | $ | 27,944 | | | $ | 27,274 | | | $ | 1,741 | | | $ | 601 | |
Ratio of expenses to average daily net assets: | | | | | | | | | | | | | | | | |
Before expense waiver | | | 0.10% | | | | 0.10% | | | | 0.66% | | | | - | ‡ |
After expense waiver | | | N/A | | | | 0.10% | # | | | 0.10% | # | | | - | ‡ |
Net investment income (loss) to average daily net assets | | | 0.67% | | | | 2.37% | | | | 0.85% | | | | - | ‡ |
Portfolio turnover rate | | | 42% | | | | 18% | | | | 13% | | | | N/A | |
| *** | Per share amount calculated on the average shares method. |
| + | The Fund commenced operations on December 31, 2003. |
| ‡ | Amounts are de minimis due to the short period of operations. |
| # | Computed after giving effect to an agreement by MassMutual to waive certain fees and expenses of the Fund. |
| (a) | Employee retirement benefit plans that invest plan assets in the Separate Investment Accounts (SIAs) may be subject to certain charges as set forth in their respective Plan Documents. Total return figures would be lower for the period presented if they reflected these charges. |
– 212 –
MASSMUTUAL SELECT DESTINATION RETIREMENT 2040 FUND
| | | | | | | | | | | | | | | | |
| | | Class N | |
| | | Year ended
12/31/06 | | | Year ended
12/31/05 | | | Year ended
12/31/04 | | | Period ended
12/31/03+ | |
Net asset value, beginning of year | | $ | 11.79 | | | $ | 11.28 | | | $ | 10.00 | | | $ | 10.00 | |
| | | | | | | | | | | | | | | | |
Income (loss) from investment operations: | | | | | | | | | | | | | | | | |
Net investment income (loss) | | | 0.02 | *** | | | 0.07 | *** | | | (0.07 | )*** | | | 0.00 | |
Net realized and unrealized gain (loss) on investments | | | 1.25 | | | | 0.73 | | | | 1.38 | | | | 0.00 | |
| | | | | | | | | | | | | | | | |
Total income from investment operations | | | 1.27 | | | | 0.80 | | | | 1.31 | | | | 0.00 | |
| | | | | | | | | | | | | | | | |
Less distributions to shareholders: | | | | | | | | | | | | | | | | |
From net investment income | | | (0.09 | ) | | | (0.08 | ) | | | (0.01 | ) | | | - | |
From net realized gains | | | (0.56 | ) | | | (0.21 | ) | | | (0.02 | ) | | | - | |
| | | | | | | | | | | | | | | | |
Total distributions | | | (0.65 | ) | | | (0.29 | ) | | | (0.03 | ) | | | - | |
| | | | | | | | | | | | | | | | |
Net asset value, end of year | | $ | 12.41 | | | $ | 11.79 | | | $ | 11.28 | | | $ | 10.00 | |
| | | | | | | | | | | | | | | | |
Total Return(a) | | | 10.91% | (b) | | | 7.11% | (b) | | | 13.03% | (b) | | | 0.00% | |
Ratios / Supplemental Data: | | | | | | | | | | | | | | | | |
Net assets, end of year (000’s) | | $ | 189 | | | $ | 142 | | | $ | 114 | | | $ | 101 | |
Ratio of expenses to average daily net assets: | | | | | | | | | | | | | | | | |
Before expense waiver | | | 0.80% | | | | 0.80% | | | | 1.54% | | | | - | ‡ |
After expense waiver | | | N/A | | | | 0.80% | # | | | 0.80% | # | | | N/A | ‡ |
Net investment income (loss) to average daily net assets | | | 0.18% | | | | 0.59% | | | | (0.63)% | | | | 0.00% | ‡ |
Portfolio turnover rate | | | 42% | | | | 18% | | | | 13% | | | | N/A | |
| *** | Per share amount calculated on the average shares method. |
| + | The Fund commenced operations on December 31, 2003. |
| ‡ | Amounts are de minimis due to the short period of operations. |
| # | Computed after giving effect to an agreement by MassMutual to waive certain fees and expenses of the Fund. |
| (a) | Employee retirement benefit plans that invest plan assets in the Separate Investment Accounts (SIAs) may be subject to certain charges as set forth in their respective Plan Documents. Total return figures would be lower for the period presented if they reflected these charges. |
| (b) | Total Return excludes a contingent deferred sales charge and would be lower for the periods presented if they reflected these charges. |
– 213 –
ADDITIONAL INVESTMENT POLICIES
AND RISK CONSIDERATIONS
The Funds may invest in a wide range of investments and engage in various investment-related transactions and practices. These practices are pursuant to non-fundamental policies and therefore may be changed by the Board of Trustees of the Trust without the consent of shareholders. Some of the more significant practices and some associated risks are discussed below.
Repurchase Agreements and Reverse Repurchase Agreements
Each Fund may engage in repurchase agreements and reverse repurchase agreements. A repurchase agreement is a contract pursuant to which a Fund agrees to purchase a security and simultaneously agrees to resell it at an agreed-upon price at a stated time, thereby determining the yield during the Fund’s holding period. A reverse repurchase agreement is a contract pursuant to which a Fund agrees to sell a security and simultaneously agrees to repurchase it at an agreed-upon price at a stated time. The Statement of Additional Information provides a detailed description of repurchase agreements, reverse repurchase agreements and related risks.
Securities Lending
Each Fund may seek additional income by making loans of portfolio securities of not more than 33% of its total assets taken at current value. Although lending portfolio securities may involve the risk of delay in recovery of the securities loaned or possible loss of rights in the collateral should the borrower fail financially, loans will be made only to borrowers deemed by MassMutual and the Funds’ custodian to be in good standing.
Under applicable regulatory requirements and securities lending agreements (which are subject to change), the loan collateral received by a Fund when it lends portfolio securities must, on each business day, be at least equal to the value of the loaned securities. Cash collateral received by a Fund will be reinvested by the Fund’s securities lending agent in high quality, short term instruments, including bank obligations, U.S. Government securities, repurchase agreements, money market funds and U.S. dollar denominated corporate instruments with an effective
maturity of one-year or less, including variable rate and floating rate securities, insurance company funding agreements and asset-backed securities. All investments of cash collateral by a Fund are for the account and risk of that Fund.
Hedging Instruments and Derivatives
Each Fund may buy or sell forward contracts and other similar instruments and may engage in foreign currency transactions (collectively referred to as “hedging instruments” or “derivatives”), as more fully discussed in the Statement of Additional Information.
The portfolio managers may normally use derivatives:
| · | to protect against possible declines in the market value of a Fund’s portfolio resulting from downward trends in the markets (for example, in the debt securities markets generally due to increasing interest rates); |
| · | to protect a Fund’s unrealized gains or limit its unrealized losses; and |
| · | to manage a Fund’s exposure to changing securities prices; and |
| · | to generate additional investment returns for the Diversified International Fund. |
Portfolio managers may also use derivatives to establish a position in the debt or equity securities markets as a temporary substitute for purchasing or selling particular securities and to manage the effective maturity or duration of fixed income securities in a Fund’s portfolio.
| (1) | Forward Contracts – Each Fund may purchase or sell securities on a “when issued” or delayed delivery basis or may purchase or sell securities on a forward commitment basis (“forward contracts”). When such transactions are negotiated, the price is fixed at the time of commitment, but delivery and payment for the securities can take place a month or more after the commitment date. The securities so purchased or sold are subject to market |
– 214 –
| | fluctuations and no interest accrues to the purchaser during this period. While a Fund also may enter into forward contracts with the initial intention of acquiring securities for its portfolio, it may dispose of a commitment prior to settlement if MassMutual or the Fund’s Sub-Adviser deems it appropriate to do so. |
| (2) | Currency Transactions – The Strategic Bond Fund, the Strategic Balanced Fund, the Fundamental Value Fund, the Value Equity Fund, the Large Cap Value Fund, the Core Opportunities Fund, the Blue Chip Growth Fund, the Large Cap Growth Fund, the Growth Equity Fund, the Aggressive Growth Fund, the Focused Value Fund, the Mid-Cap Value Fund, the Small Cap Value Equity Fund, the Small Company Value Fund, the Small Cap Core Equity Fund, the Mid Cap Growth Equity Fund, the Mid Cap Growth Equity II Fund, the Small Cap Growth Equity Fund, the Small Company Growth Fund, the Emerging Growth Fund, the Diversified International Fund, the Overseas Fund, and the Destination Retirement Funds may, but will not necessarily, engage in foreign currency transactions with counterparties in order to hedge the value of portfolio holdings denominated in or exposed to particular currencies against fluctuations in relative value or for the Diversified International Fund to generate additional returns by buying currencies in excess of underlying equities when opportunities arise. |
For more information about forward contracts and currency transactions and the extent to which tax considerations may limit a Fund’s use of such instruments, see the Statement of Additional Information.
There can be no assurance that the use of hedging instruments and derivatives by a Fund will assist it in achieving its investment objective. Risks inherent in the use of these instruments include the following:
| · | the risk that interest rates and securities prices will not move in the direction anticipated; |
| · | the imperfect correlation between the prices of a forward contract and the price of the securities being hedged; and |
| · | the Fund’s portfolio manager may not have the skills needed to manage these strategies. |
As to forward contracts, the risk exists that the counterparty to the transaction will be incapable of meeting or unwilling to meet its commitment, in which case the desired hedging protection may not be obtained and the Fund may be exposed to risk of loss. As to currency transactions, risks exist that purchases and sales of currency and related instruments can be negatively affected by government exchange controls, blockages, and manipulations or exchange restrictions imposed by governments which could result in losses to the Fund if it is unable to deliver or receive currency or funds in settlement of obligations. It also could cause hedges it has entered into to be rendered useless, resulting in full currency exposure as well as incurring transaction costs.
In addition, the Strategic Bond Fund can buy “structured” notes, which are specially-designed debt investments with principal payments or interest payments that are linked to the value of an index (such as a currency or securities index) or commodity. The terms of the instrument may be “structured” by the purchaser (the Fund) and the borrower issuing the note. The values of these notes will fall or rise in response to the changes in the values of the underlying security or index. They are subject to both credit and interest rate risks. Therefore the Fund could receive more or less than it originally invested when a note matures, or it might receive less interest than the stated coupon payment if the underlying investment or index does not perform as anticipated. The prices of these notes may be very volatile and they may have a limited trading market, making it difficult for the Fund to value them or to sell its investment quickly at an acceptable price.
Options and Futures Contracts
The Funds may engage in options transactions, such as writing covered put and call options on securities and purchasing put and call options on securities. These strategies are designed to increase a Fund’s portfolio return, or to protect the value of the portfolio, by offsetting a decline in portfolio value through the options purchased. Writing options, however, can only constitute a partial hedge, up to the amount of the premium, and due to transaction costs.
The Funds may also write covered call and put options and purchase call and put options on stock indexes in order to increase portfolio income or to protect the Fund against declines in the value of
– 215 –
portfolio securities. In addition, the Funds may also purchase and write options on foreign currencies to protect against declines in the dollar value of portfolio securities and against increases in the dollar cost of securities to be acquired.
The Strategic Balanced Fund, the Diversified Value Fund, the Fundamental Value Fund, the Value Equity Fund, the Large Cap Growth Fund, the Indexed Equity Fund, the Core Opportunities Fund, the Blue Chip Growth Fund, the Growth Equity Fund, the Aggressive Growth Fund, the OTC 100 Fund, the Focused Value Fund, the Mid-Cap Value Fund, the Small Cap Value Equity Fund, the Small Company Value Fund, the Small Cap Core Equity Fund, the Mid Cap Growth Equity Fund, the Mid Cap Growth Equity II Fund, the Small Cap Growth Equity Fund, the Small Company Growth Fund, the Emerging Growth Fund, the Diversified International Fund, the Overseas Fund and the Destination Retirement Funds may also enter into stock index futures contracts. These Funds and the Strategic Bond Fund may enter into foreign currency futures contracts. These transactions are hedging strategies. They are designed to protect a Fund’s current or intended investments from the effects of changes in exchange rates or market declines. They may also be used for other purposes, such as an efficient means of adjusting a Fund’s exposure to certain markets; in an effort to enhance income; and as a cash management tool. A Fund will incur brokerage fees when it purchases and sells futures contracts. Futures contracts entail risk of loss in portfolio value if the Sub-Adviser is incorrect in anticipating the direction of exchange rates or the securities markets.
These Funds may also purchase and write options on these futures contracts. This strategy also is intended to protect against declines in the values of portfolio securities or against increases in the costs of securities to be acquired. Like other options, options on futures contracts constitute only a partial hedge up to the amount of the premium, and due to transaction costs.
While these strategies will generally be used by a Fund for hedging purposes, there are risks. For example, the Sub-Adviser may incorrectly forecast the direction of exchange rates or of the underlying securities index or markets. When these transactions are unsuccessful, the Fund may experience losses. When a Fund enters into these transactions to increase portfolio value (i.e., other than for hedging purposes), there is a liquidity risk that no market will arise for resale and the Fund could also experience losses. Options and Futures Contracts strategies and risks are described more fully in the Statement of Additional Information.
Illiquid Securities
Each Fund may invest up to 15% of its net assets in illiquid securities. These policies do not limit the purchase of securities eligible for resale to qualified institutional buyers pursuant to Rule 144A under the Securities Act of 1933, as amended, provided that such securities are determined to be liquid by MassMutual or the Sub-Adviser pursuant to Board-approved guidelines. If there is a lack of trading interest in particular Rule 144A securities, a Fund’s holdings of those securities may be illiquid, resulting in the possibility of undesirable delays in selling these securities at prices representing fair value.
Foreign Securities
Investments in foreign securities offer potential benefits not available from investing solely in securities of domestic issuers, such as the opportunity to invest in foreign issuers that appear to offer growth potential, or to invest in foreign countries with economic policies or business cycles different from those of the United States or foreign stock markets that do not move in a manner parallel to U.S. markets, thereby diversifying risks of fluctuations in portfolio value.
Investments in foreign securities, however, entail certain risks, such as: the imposition of dividend or interest withholding or confiscatory taxes; currency blockages or transfer restrictions; expropriation, nationalization, military coups or other adverse political or economic developments; less government supervision and regulation of securities exchanges, brokers and listed companies; and the difficulty of enforcing obligations in other countries. Certain markets may require payment for securities before delivery. A Fund’s ability and decision to purchase and sell portfolio securities may be affected by laws or regulations relating to the convertibility of currencies and repatriation of assets. Further, it may be more difficult for a Fund’s agents to keep currently informed about corporate actions which may affect the prices of portfolio securities. Communications between the United States and foreign countries may be less reliable than within the United States, thus increasing the risk of delayed settlements of portfolio transactions or loss of certificates for portfolio securities.
– 216 –
Trading
A Fund’s Sub-Adviser may use trading as a means of managing the portfolios of the Fund in seeking to achieve their investment objectives. Transactions will occur when the Sub-Adviser believes that the trade, net of transaction costs, will improve interest income or capital appreciation potential, or will lessen capital loss potential. Whether the goals discussed above will be achieved through trading depends on the Sub-Adviser’s ability to evaluate particular securities and anticipate relevant market factors, including interest rate trends and variations from such trends. If such evaluations and expectations prove to be incorrect, a Fund’s income or capital appreciation could fall and its capital losses could increase. In addition, high portfolio turnover in any Fund can result in additional brokerage commissions to be paid by the Fund and can reduce a Fund’s return. It may also result in higher short-term capital gains that are taxable to shareholders.
Indexing v. Active Management
Active management involves the Sub-Adviser buying and selling securities based on research and analysis. Unlike Funds that are actively managed, the Indexed Equity Fund and the OTC 100 Fund are “index” funds – they try to match, as closely as possible, the performance of a target index by generally holding either all, or a representative sample of, the securities in the index. Indexing provides simplicity because it is a straightforward market-matching strategy. Index funds generally provide diversification by investing in a wide variety of companies and industries (although the OTC 100 Fund is technically non-diversified for purposes of the 1940 Act – see Non-Diversification Risk on page 102). An index fund’s performance is predictable in that the fund’s value is expected to move in the same direction, up or down, as the target index. Index funds also tend to have lower costs because they do not have many of the expenses of actively managed funds such as research; index funds usually have relatively low trading activity and therefore brokerage commissions tend to be lower; and index funds generally realize lower capital gains.
Optimization
To attempt to match the risk and return characteristics of the S&P 500 Index as closely as possible for the Indexed Equity Fund and the NASDAQ 100 Index for the OTC 100 Fund, NTI, the Funds’ Sub-Adviser, generally invests in a statistically selected sample of the securities found in the S&P 500 Index or NASDAQ 100 Index, as the case may be, using a process known as “optimization.” Each Fund may not hold every one of the stocks in its target Index. The Funds utilize “optimization,” a statistical sampling technique, in an effort to run an efficient and effective strategy.
Optimization will be most pronounced for the OTC 100 Fund when the Fund does not have enough assets to be fully invested in all securities in the NASDAQ 100 Index. Optimization entails that the Funds first buy the stocks that make up the larger portions of the relevant index’s value in roughly the same proportion as the index. Second, smaller stocks are analyzed and selected. In selecting smaller stocks, the Sub-Adviser tries to match the industry and risk characteristics of all of the smaller companies in the index without buying all of those stocks. This approach attempts to maximize the Fund’s liquidity and returns while minimizing its costs.
Cash Positions/Temporary Defensive Positions
Each Fund may hold cash or cash equivalents to provide for expenses and anticipated redemption payments and so that an orderly investment program may be carried out in accordance with the Fund’s investment policies. In certain market conditions, a Fund’s Sub-Adviser, or in the case of the Destination Retirement Funds, the Fund’s Adviser, except for the Value Equity Fund’s Sub-Adviser, may for temporary defensive purposes, invest in investment grade debt securities, government obligations, or money market instruments or cash equivalents. The Value Equity Fund reserves the right to invest for temporary or defensive purposes, without limitation in preferred stock and investment grade debt instruments. These temporary defensive positions may cause the Fund not to achieve its investment objective. These investments may also give the Fund liquidity and allow it to achieve an investment return during such periods, although the Fund still has the possibility of losing money.
Under normal circumstances, a Fund will comply with its 80% investment requirement. However, a Fund may (but is not required to), from time to time, depart temporarily from its 80% investment requirement to avoid losses in response to adverse market, economic, political or other conditions, as well as other limited, appropriate circumstances, such as, but not limited to, unusually large cash flows or
– 217 –
redemptions. Keep in mind that a temporary defensive strategy still has the possibility of losing money and may prevent the Fund from achieving its investment objective.
Industry Concentration
A Fund will not acquire securities of issuers in any one industry (as determined by the Board of Trustees of the Trust) if as a result 25% or more of the value of the total assets of the Fund would be invested in such industry, with the following exception:
| (1) | There is no limitation for securities issued or guaranteed by the U.S. government or its agencies and instrumentalities. |
Issuer Diversification
The Value Equity Fund, the OTC 100 Fund, the Aggressive Growth Fund and the Focused Value Fund are classified as non-diversified, which means that the proportion of each Fund’s assets that may be invested in the securities of a single issuer is not limited by the 1940 Act. A “diversified” investment company is generally required by the 1940 Act, with respect to 75% of its total assets, to invest not more than 5% of such assets in the securities of a single issuer or own more than 10% of the outstanding voting securities of a single issuer. Since a relatively high percentage of each Fund’s assets may be invested in the securities of a limited number of issuers, some of which may be within the same economic sector, the Fund’s portfolio may be more sensitive to the changes in market value of a single issuer or industry. However, to meet Federal tax requirements, at the close of each quarter the Fund may not have more than 25% of its total assets invested in any one issuer and, with respect to 50% of total assets, not more than 5% of its total assets invested in any one issuer, and not hold more than 10% of the outstanding voting securities of that issuer. These limitations do not apply to U.S. government securities.
Mortgage-Backed Securities and CMOs
The Funds may invest in mortgage-backed securities and collateralized mortgage obligations (“CMOs”). These securities represent participation interests in pools of residential mortgage loans made by lenders such as banks and savings and loan associations. The pools are assembled for sale to investors (such as the Funds) by government agencies and private issuers, which issue or guarantee the securities relating to the pool. Such securities differ from conventional debt securities which generally provide for periodic payment of interest in fixed or determinable amounts (usually semi-annually) with principal payments at maturity or specified call dates. Some mortgage-backed securities in which a Fund may invest may be backed by the full faith and credit of the U.S. Treasury (e.g., direct pass-through certificates of the Government National Mortgage Association); some are supported by the right of the issuer to borrow from the U.S. Government (e.g., obligations of the Federal Home Loan Mortgage Corporation); and some are backed by only the credit of the issuer itself (e.g., private issuer securities). Those guarantees do not extend to the value or yield of the mortgage-backed securities themselves or to the NAV of a Fund’s shares. These issuers may also issue derivative mortgage backed securities such as CMOs.
The expected yield on mortgage-backed securities is based on the average expected life of the underlying pool of mortgage loans. The actual life of any particular pool will be shortened by any unscheduled or early payments of principal. Principal prepayments generally result from the sale of the underlying property or the refinancing or foreclosure of underlying mortgages. The occurrence of prepayments is affected by a wide range of economic, demographic and social factors and, accordingly, it is not possible to predict accurately the average life of a particular pool. Yield on such pools is usually computed by using the historical record of prepayments for that pool, or, in the case of newly-issued mortgages, the prepayment history of similar pools. The actual prepayment experience of a pool of mortgage loans may cause the yield realized by a Fund to differ from the yield calculated on the basis of the expected average life of the pool.
Prepayments tend to increase during periods of falling interest rates, while during periods of rising interest rates prepayments may likely decline. When prevailing interest rates rise, the value of a pass-through security may decrease as do the values of other debt securities, but, when prevailing interest rates decline, the value of a pass-through security is not likely to rise to the extent that the values of other debt securities rise, because of the risk of prepayment. A Fund’s reinvestment of scheduled principal payments and unscheduled prepayments it receives may occur at times when available investments offer higher or lower rates than the
– 218 –
original investment, thus affecting the yield of the Fund. Monthly interest payments received by the Fund have a compounding effect which may increase the yield to the Fund more than debt obligations that pay interest semi-annually. Because of these factors, mortgage-backed securities may be less effective than bonds of similar maturity at maintaining yields during periods of declining interest rates. A Fund may purchase mortgage-backed securities at a premium or at a discount. Accelerated prepayments adversely affect yields for pass-through securities purchased at a premium (i.e., at a price in excess of their principal amount) and may involve additional risk of loss of principal because the premium may not have been fully amortized at the time the obligation is repaid. The opposite is true for pass-through securities purchased at a discount.
Asset-Backed Securities
These securities, issued by trusts and special purpose entities, are backed by pools of assets, such as automobile and credit-card receivables and home equity loans, which pass through the payments on the underlying obligations to the security holders (less servicing fees paid to the originator or fees for any credit enhancement). The value of an asset-backed security is affected by changes in the market’s perception of the asset backing the security, the creditworthiness of the servicing agent for the loan pool, the originator of the loans and the financial institution providing any credit enhancement. Value is also affected if any credit enhancement has been exhausted. Payments of principal and interest passed through to holders of asset-backed securities are typically supported by some form of credit enhancement, such as a letter of credit, surety bond, limited guarantee by another entity or by having a priority to certain of the borrower’s other assets. The degree of credit enhancement varies, and generally applies to only a fraction of the asset-backed security’s par value until exhausted. If the credit enhancement of an asset-backed security held by a Fund has been exhausted, and, if any required payments of principal and interest are not made with respect to the underlying loans, the Fund may experience losses or delays in receiving payment. The risks of investing in asset-backed securities are ultimately dependent upon payment of consumer loans by the individual borrowers. As a purchaser of an asset-backed security, the Fund would generally have no recourse to the entity that originated the loans in the event of default by a borrower. The underlying loans are subject to prepayments, which shorten the weighted average life of asset-backed securities and may lower their return, in the same manner as described above for prepayments of a pool of mortgage loans underlying mortgage-backed securities. However, asset-backed securities do not have the benefit of the same security interest in the underlying collateral as do mortgage-backed securities.
Dollar Roll Transactions
To take advantage of attractive financing opportunities in the mortgage market and to enhance current income, each of the Funds may engage in dollar roll transactions. A dollar roll transaction involves a sale by a Fund of a GNMA certificate or other mortgage backed securities to a financial institution, such as a bank or broker-dealer, concurrent with an agreement by the Fund to repurchase a similar security from the institution at a later date at an agreed upon price. The securities that are repurchased will bear the same interest rate as those sold, but generally will be collateralized by different pools of mortgages with different prepayment histories than those sold. Dollar roll transactions involve potential risks of loss which are different from those related to the securities underlying the transaction. The Statement of Additional Information gives a more detailed description of dollar roll transactions and related risks.
Lower Rated Debt Securities
While the Funds may invest in investment grade debt securities that are rated in the fourth highest rating category by at least one nationally recognized statistical rating organization (e.g., Baa3 by Moody’s Investors Service, Inc.) or, if unrated, are judged by the Fund’s Sub-Adviser to be of equivalent quality, such securities have speculative characteristics, are subject to greater credit risk, and may be subject to greater market risk than higher rated investment grade securities.
When Issued Securities
The Funds may purchase securities on a “when-issued” or on a “forward delivery” basis, which means securities will be delivered to the Fund at a future date beyond the settlement date. A Fund will not have to pay for securities until they are delivered. While waiting for delivery of the securities, the Fund will segregate sufficient liquid assets to cover its
– 219 –
commitments. Although the Funds do not intend to make such purchases for speculative purposes, there are risks related to liquidity and market fluctuations prior to the Fund taking delivery.
Net Assets
For purposes of clarifying the term as used in this Prospectus, “Net Assets” includes any borrowings for investment purposes.
– 220 –
MASSMUTUAL SELECT FUNDS
1295 State Street
Springfield, Massachusetts 01111
Learning More About the Funds
You can learn more about the Funds by reading the Funds’ Annual and Semiannual Reports and the Statement of Additional Information (SAI). This information is available free upon request. In the Annual and Semiannual Reports, you will find a discussion of market conditions and investment strategies that significantly affected each Fund’s performance during the period covered by the Report and a listing of each Fund’s portfolio securities as of the end of such period. The SAI provides additional information about the Funds and will provide you with more detail regarding the organization and operation of the Funds, including their investment strategies. The SAI is incorporated by reference into this Prospectus and is therefore legally considered a part of this Prospectus.
How to Obtain Information
From MassMutual Select Funds: You may request information about the Funds (including the Annual/Semiannual Reports and the SAI) or make shareholder inquiries by calling 1-888-309-3539 or by writing MassMutual Select Funds c/o Massachusetts Mutual Life Insurance Company, 1295 State Street, Springfield, Massachusetts 01111-0111, Attention: Retirement Services Marketing. You may also obtain copies of the Annual/Semiannual Reports and the SAI free of charge at http://www.massmutual.com/retire.
From the SEC: You may review and copy information about the Funds (including the SAI) at the SEC’s Public Reference Room in Washington, D.C. (call 1-202-942-8090 for information regarding the operation of the SEC’s public reference room). You can get copies of this information, upon payment of a copying fee, by writing to the SEC’s Public Reference Section, Washington, D.C. 20549-0102 or by electronic request at publicinfo@sec.gov. Alternatively, if you have access to the Internet, you may obtain information about the Funds from the SEC’s EDGAR database on its Internet site at http://www.sec.gov.
When obtaining information about the Funds from the SEC, you may find it useful to reference the Funds’ SEC file number: 811-8274.

MASSMUTUAL SELECT FUNDS
1295 State Street
Springfield, Massachusetts 01111
STATEMENT OF ADDITIONAL INFORMATION
THIS STATEMENT OF ADDITIONAL INFORMATION (“SAI”) IS NOT A PROSPECTUS. IT SHOULD BE READ IN CONJUNCTION WITH THE PROSPECTUS OF MASSMUTUAL SELECT FUNDS (THE “TRUST”) DATED APRIL 2, 2007, AS AMENDED FROM TIME TO TIME (THE “PROSPECTUS”). THIS SAI INCORPORATES HEREIN THE FINANCIAL STATEMENTS OF THE FUNDS BY REFERENCE TO THE FUNDS’ ANNUAL REPORT AS OF DECEMBER 31, 2006 (THE “ANNUAL REPORT”). TO OBTAIN A PROSPECTUS OR AN ANNUAL REPORT, CALL TOLL-FREE 1-888-309-3539, OR WRITE THE TRUST AT THE ABOVE ADDRESS.
This SAI relates to the following Funds:
| | • | | MassMutual Select Strategic Bond Fund |
| | • | | MassMutual Select Strategic Balanced Fund |
| | • | | MassMutual Select Diversified Value Fund |
| | • | | MassMutual Select Fundamental Value Fund |
| | • | | MassMutual Select Value Equity Fund |
| | • | | MassMutual Select Large Cap Value Fund |
| | • | | MassMutual Select Indexed Equity Fund |
| | • | | MassMutual Select Core Opportunities Fund |
| | • | | MassMutual Select Blue Chip Growth Fund |
| | • | | MassMutual Select Large Cap Growth Fund |
| | • | | MassMutual Select Growth Equity Fund |
| | • | | MassMutual Select Aggressive Growth Fund |
| | • | | MassMutual Select OTC 100 Fund |
| | • | | MassMutual Select Focused Value Fund |
| | • | | MassMutual Select Mid-Cap Value Fund |
| | • | | MassMutual Select Small Cap Value Equity Fund |
| | • | | MassMutual Select Small Company Value Fund |
| | • | | MassMutual Select Small Cap Core Equity Fund |
| | • | | MassMutual Select Mid Cap Growth Equity Fund |
| | • | | MassMutual Select Mid Cap Growth Equity II Fund |
| | • | | MassMutual Select Small Cap Growth Equity Fund |
| | • | | MassMutual Select Small Company Growth Fund |
| | • | | MassMutual Select Emerging Growth Fund |
| | • | | MassMutual Select Diversified International Fund |
| | • | | MassMutual Select Overseas Fund |
| | • | | MassMutual Select Destination Retirement Income Fund |
| | • | | MassMutual Select Destination Retirement 2010 Fund |
| | • | | MassMutual Select Destination Retirement 2020 Fund |
| | • | | MassMutual Select Destination Retirement 2030 Fund |
| | • | | MassMutual Select Destination Retirement 2040 Fund |
No dealer, salesman or any other person has been authorized to give any information or to make any representations, other than those contained in this SAI or in the related Prospectus, in connection with the offer contained herein, and, if given or made, such other information or representation must not be relied upon as having been authorized by the Trust or MML Distributors, LLC (the “Distributor”). This SAI and the related Prospectus do not constitute an offer by the Trust or by the Distributor to sell or a solicitation of any offer to buy any of the securities offered hereby in any jurisdiction to any person to whom it is unlawful to make such offer in such jurisdiction.
Dated April 2, 2007
B-1
TABLE OF CONTENTS
B-2
GENERAL INFORMATION
MassMutual Select Funds (the “Trust”) is a professionally managed, open-end investment company. This SAI describes the following thirty separate series of the Trust: (1) MassMutual Select Strategic Bond Fund (“Strategic Bond Fund”), (2) MassMutual Select Strategic Balanced Fund (“Strategic Balanced Fund”), (3) MassMutual Select Diversified Value Fund (“Diversified Value Fund”), (4) MassMutual Select Fundamental Value Fund (“Fundamental Value Fund”), (5) MassMutual Select Value Equity Fund (“Value Equity Fund”), (6) MassMutual Select Large Cap Value Fund (“Large Cap Value Fund”) (7) MassMutual Select Indexed Equity Fund (“Indexed Equity Fund”), (8) MassMutual Select Core Opportunities Fund (“Core Opportunities Fund”), (9) MassMutual Select Blue Chip Growth Fund (“Blue Chip Growth Fund”), (10) MassMutual Select Large Cap Growth Fund (“Large Cap Growth Fund”), (11) MassMutual Select Growth Equity Fund (“Growth Equity Fund”), (12) MassMutual Select Aggressive Growth Fund (“Aggressive Growth Fund”), (13) MassMutual Select OTC 100 Fund (“OTC 100 Fund”), (14) MassMutual Select Focused Value Fund (“Focused Value Fund”), (15) MassMutual Select Mid-Cap Value Fund (“Mid-Cap Value Fund”), (16) MassMutual Select Small Cap Value Equity Fund (“Small Cap Value Equity Fund”), (17) MassMutual Select Small Company Value Fund (“Small Company Value Fund”), (18) MassMutual Select Small Cap Core Equity Fund (“Small Cap Core Equity Fund”), (19) MassMutual Select Mid Cap Growth Equity Fund (“Mid Cap Growth Equity Fund”), (20) MassMutual Select Mid Cap Growth Equity II Fund (“Mid Cap Growth Equity II Fund”), (21) MassMutual Select Small Cap Growth Equity Fund (“Small Cap Growth Equity Fund”), (22) MassMutual Select Small Company Growth Fund (“Small Company Growth Fund”), (23) MassMutual Select Emerging Growth Fund (“Emerging Growth Fund”), (24) MassMutual Select Diversified International Fund (“Diversified International Fund”), (25) MassMutual Select Overseas Fund (“Overseas Fund”), (26) MassMutual Select Destination Retirement Income Fund (“Destination Retirement Income Fund”), (27) MassMutual Select Destination Retirement 2010 Fund (“Destination Retirement 2010 Fund”), (28) MassMutual Select Destination Retirement 2020 Fund (“Destination Retirement 2020 Fund”), (29) MassMutual Select Destination Retirement 2030 Fund (“Destination Retirement 2030 Fund”) and (30) MassMutual Select Destination Retirement 2040 Fund (“Destination Retirement 2040 Fund”) (each individually referred to as a “Fund” or collectively as the “Funds”). Currently, the Trustees have authorized a total of thirty-four separate series. Additional series may be created by the Trustees from time-to-time.
The Trust is organized under the laws of The Commonwealth of Massachusetts as a Massachusetts business trust pursuant to an Agreement and Declaration of Trust dated May 28, 1993, as amended from time to time (the “Declaration of Trust”). The investment adviser for each of the Funds is Massachusetts Mutual Life Insurance Company (“MassMutual” or the “Adviser”). The sub-advisers for the Strategic Bond Fund are Western Asset Management Company (“Western Asset”), located at 385 East Colorado Blvd, Pasadena, California 91101 and Western Asset Management Company Limited (“WAML”), located at 10 Exchange Square, London, UK EC2A2EN. The sub-adviser for the Diversified Value Fund is AllianceBernstein L.P. (“AllianceBernstein”), located at 1345 Avenue of the Americas, New York, New York 10105. The sub-adviser for the Growth Equity Fund is Grantham, Mayo, Van Otterloo & Co. LLC (“GMO”), located at 40 Rowes Wharf, Boston, Massachusetts 02110. The sub-adviser for the Mid Cap Growth Equity Fund is Navellier & Associates, Inc. (“Navellier”), located at One East Liberty, Third Floor, Reno, Nevada 89501. The sub-advisers for the Small Cap Growth Equity Fund are Wellington Management Company, LLP (“Wellington Management”) located at 75 State Street, Boston, Massachusetts 02109 and Waddell & Reed Investment Management Company (“Waddell & Reed”), located at 6300 Lamar, Overland Park, Kansas 66202. The sub-adviser for the Large Cap Value Fund is Davis Selected Advisers, L.P. (“Davis”) located at 2949 East Elvira Road, Suite 101, Tucson, Arizona 85706. The sub-advisers for the Focused Value Fund are Harris Associates LP (“Harris”) located at 2 North La Salle Street, Chicago, Illinois 60602 and Cooke & Bieler, L.P. (“Cooke & Bieler”), located at 1700 Market Street, Suite 3222, Philadelphia, Pennsylvania 19103. The sub-advisers for the Aggressive Growth Fund are Sands Capital Management, LLC (“Sands Capital”), located at 1100 Wilson Boulevard, Suite 3050, Arlington, Virginia 22209 and Delaware Management Company (“DMC”), located at 2005 Market Street, Philadelphia, Pennsylvania 19103. The investment sub-adviser for the Mid Cap Growth Equity II Fund is T. Rowe Price Associates, Inc. (“T. Rowe Price”), located at 100 East Pratt Street, Baltimore, Maryland 21202. The sub-advisers for the Emerging Growth Fund are Insight Capital Research & Management, Inc. (“Insight Capital”),
B-3
located at 2121 N. California Blvd., Suite 560, Walnut Creek, California 94956 and DMC. The sub-adviser for the Indexed Equity Fund and the OTC 100 Fund is Northern Trust Investments, N.A. (“NTI”), located at 50 South LaSalle Street, Chicago, Illinois 60603. The sub-adviser for the Value Equity Fund is Fidelity Management & Research Company (“FMR”), located at 82 Devonshire Street, Boston, Massachusetts 02109. The sub-adviser for the Blue Chip Growth Fund is T. Rowe Price. The sub-advisers for the Overseas Fund are Massachusetts Financial Services Company (MFS®1), located at 500 Boylston Street, Boston, Massachusetts 02116 and Harris. The sub-adviser for the Fundamental Value Fund is Wellington Management. The sub-adviser for the Large Cap Growth Fund is AllianceBernstein. The sub-advisers for the Small Company Value Fund are Clover Capital Management, Inc. (“Clover”), located at 400 Meridian Centre, Suite 200, Rochester, New York 14618, T. Rowe Price and EARNEST Partners, LLC (“Earnest Partners”), located at 1180 Peachtree Street, Suite 2300, Atlanta, Georgia 30309. The sub-advisers for the Small Company Growth Fund are Eagle Asset Management, Inc. (“Eagle”), located at 880 Carillon Parkway, St. Petersburg, Florida 33733 and Mazama Capital Management, Inc. (“Mazama”), located at One SW Columbia Street, Suite 1500, Portland, Oregon 97258. The sub-advisers for the Strategic Balanced Fund are ClearBridge Advisors, LLC (“ClearBridge”), located at 399 Park Avenue, New York, NY 10022, Western Asset and WAML. The sub-adviser for the Core Opportunities Fund is Victory Capital Management Inc. (“Victory”), located at 127 Public Square, Cleveland, Ohio 44114. The sub-adviser for the Small Cap Value Equity Fund is SSgA Funds Management, Inc. (“SSgA FM”), located at One Lincoln Street, 33rd Floor, Boston, Massachusetts 02111. The sub-adviser for the Small Cap Core Equity Fund is Goldman Sachs Asset Management, L.P. (“GSAM”), located at 32 Old Slip, New York, New York 10005. The sub-adviser for the Mid-Cap Value Fund is Cooke & Bieler. The sub-adviser for the Diversified International Fund is AllianceBernstein.
ADDITIONAL INVESTMENT POLICIES
Each Fund has a distinct investment objective which it pursues through separate investment policies, as described in the Prospectus and below. The investment objective, fundamental investment policies and fundamental investment restrictions of a Fund may not be changed without the vote of a majority of that Fund’s outstanding shares (which, under the Investment Company Act of 1940, as amended (the “1940 Act”) and the rules thereunder and as used in this Statement of Additional Information and in the Prospectus, means the lesser of (l) 67% of the shares of that Fund present at a meeting if the holders of more than 50% of the outstanding shares of that Fund are present in person or by proxy, or (2) more than 50% of the outstanding shares of that Fund). The Board of Trustees of the Trust may adopt new or amend or delete existing non-fundamental investment policies and restrictions without shareholder approval. There is no guarantee that any Fund will achieve its investment objective.
The following discussion elaborates on the presentation of each Fund’s investment policies contained in the Prospectus. Investment policies and restrictions described below are non-fundamental and may be changed by the Trustees without shareholder approval, unless otherwise noted. For a description of the ratings of corporate debt securities and money market instruments in which the various Funds may invest, reference should be made to the Appendix.
General. Each of the Funds with “Equity” in its name will generally invest at least 80% of its assets in equity securities, generally common stock or securities convertible into common stock. Each of the Funds with “Bond” in its name will generally invest at least 80% of its assets in fixed income instruments for which the Fund receives payments of interest and principal.
Strategic Balanced Fund
While the Fund’s target allocation is 60% equity securities and 40% fixed income securities, the Fund expects to maintain, under normal circumstances, a minimum of 25% equity securities and 25% fixed income securities.
(1) | MFS® is a registered trademark of Massachusetts Financial Services Company. |
B-4
Indexed Equity Fund and OTC 100 Fund
The Indexed Equity Fund and the OTC 100 Fund each attempts to match the risk and return characteristics of the S&P 500® Index or the NASDAQ 100 Index®, respectively, as closely as possible. With respect to the Indexed Equity Fund, the Fund invests in securities of the companies in the S&P 500 Index in proportion to their index weightings. The Fund’s sub-adviser, NTI, seeks a correlation between the performance of the Fund, before expenses, and the S&P 500 Index of 98% or better. A figure of 100% would indicate perfect correlation.
Optimization. The Indexed Equity Fund may not hold every one of the stocks in the S&P 500 Index and the OTC 100 Fund may not hold every one of the stocks in the NASDAQ 100 Index. In an effort to run an efficient and effective strategy, each Fund may use the process of “optimization,” a statistical sampling technique. This will be most pronounced for the OTC 100 Fund when the Fund does not have enough assets to be fully invested in all securities in the NASDAQ 100 Index. Optimization entails that the Funds first buy the stocks that make up the larger portions of the relevant Index’s value in roughly the same proportion as the Index. Second, smaller stocks are analyzed and selected. In selecting smaller stocks, the sub-adviser tries to match the industry and risk characteristics of all of the smaller companies in the Index without buying all of those stocks. This approach attempts to maximize the Fund’s liquidity and returns while minimizing its costs.
Each of the Indexed Equity Fund and the OTC 100 Fund will generally invest at least 80% of its assets in stocks of companies included in the S&P 500 Index or the NASDAQ 100 Index, respectively. These Funds may hold up to 20% of their assets in short-term debt securities, money market instruments and stock index futures and options. Futures and options are considered derivatives because they “derive” their value from a traditional security (like a stock or bond), asset or index. The Indexed Equity Fund and the OTC 100 Fund intend to buy futures in anticipation of buying stocks. Futures and options on futures contracts are used as a low-cost method of gaining exposure to a particular securities market without investing directly in those securities. The Indexed Equity Fund and the OTC 100 Fund also invest in derivatives to keep cash on hand to meet shareholder redemptions or other needs while maintaining exposure to the stock market.
Tracking Error. There are several reasons that the performance of the Indexed Equity Fund and the OTC 100 Fund may not track its respective Index exactly. Unlike an Index, these Funds incur administrative expenses and transaction costs in trading stocks. The composition of the Indexes and the stocks held by these Funds may occasionally diverge. The timing and magnitude of cash inflows from investors buying shares could create balances of uninvested cash. Conversely, the timing and magnitude of cash outflows to investors selling shares could require ready reserves of uninvested cash. Either situation would likely cause the Funds’ performance to deviate from the “fully invested” Index.
Fixed Income Securities
Certain of the debt securities in which the Funds may invest may not offer as high a yield as may be achieved from lower quality instruments having less safety. If a Fund disposes of an obligation prior to maturity, it may realize a loss or a gain. An increase in interest rates will generally reduce the value of portfolio investments, and a decline in interest rates will generally increase the value of portfolio investments. In addition, investments are subject to the ability of the issuer to make payment at maturity.
Although the Strategic Bond Fund may invest in investment grade securities, it may also invest in securities below investment grade. In addition, the Strategic Balanced Fund may also invest to some extent in securities below investment grade. All Funds may invest to a limited extent in debt securities that are rated below investment grade or, if unrated, are considered by the Adviser or the Fund’s sub-adviser to be of comparable quality. Lower-grade debt securities, which also are known as “junk bonds,” may be subject to greater market fluctuations and greater risks of loss of income and principal than investment-grade securities. Securities that are (or have fallen) below investment grade are exposed to a greater risk that the issuers of those securities might not meet their debt obligations. These risks can reduce the Fund’s share prices and the income it earns.
B-5
As discussed, a decline in prevailing levels of interest rates generally increases the value of debt securities in a Fund’s portfolio, while an increase in rates usually reduces the value of those securities. As a result, to the extent that a Fund invests in debt securities, interest rate fluctuations will affect its net asset value, but not the income it receives from its debt securities. In addition, if the debt securities contain call, prepayment or redemption provisions, during a period of declining interest rates, those securities are likely to be redeemed, and a Fund would probably be unable to replace them with securities having as great a yield.
Investment in medium- or lower-grade debt securities involves greater investment risk, including the possibility of issuer default or bankruptcy. An economic downturn could severely disrupt this market and adversely affect the value of outstanding bonds and the ability of the issuers to repay principal and interest. In addition, lower-quality bonds are less sensitive to interest rate changes than higher-quality instruments and generally are more sensitive to adverse economic changes or individual corporate developments. During a period of adverse economic changes, including a period of rising interest rates, issuers of such bonds may experience difficulty in servicing their principal and interest payment obligations. Furthermore, medium- and lower-grade debt securities tend to be less marketable than higher-quality debt securities because the market for them is less broad. The market for unrated debt securities is even narrower. During periods of thin trading in these markets, the spread between bid and asked prices is likely to increase significantly, and a Fund may have greater difficulty selling its portfolio securities. The market value of these securities and their liquidity may be affected by adverse publicity and investor perceptions.
All Funds (except for the Aggressive Growth Fund, which is limited to 35% of its total assets) may invest up to 25% of their total assets in these types of securities. Please note that the equity segment of the Strategic Balanced Fund is permitted to invest, to a lesser extent, in investment grade bonds and other debt instruments.
Common and Preferred Stocks
Stocks represent shares of ownership in a company. Generally, preferred stock has a specified dividend and ranks after bonds and before common stocks in its claim on income for dividend payments and on assets should the company be liquidated. After other claims are satisfied, common stockholders participate in company profits on a pro-rata basis. Profits may be paid out in dividends or reinvested in the company to help it grow. Increases and decreases in earnings are usually reflected in a company’s stock price, so common stocks generally have the greatest appreciation and depreciation potential of all corporate securities. While most preferred stocks pay a dividend, preferred stocks may be purchased where the issuer as omitted, or is in the danger of omitting, payment of its dividend. Such investments would be made primarily for their capital appreciation.
Warrants and Rights
A warrant typically gives the holder the right to purchase underlying stock at a specified price for a designated period of time. Warrants may be relatively volatile investments. The holder of a warrant takes the risk that the market price of the underlying stock may never equal or exceed the exercise price of the warrant. A warrant will expire without value if it is not exercised or sold during its exercise period. Rights are similar to warrants, but normally have a short duration and are distributed directly by the issuer to its shareholders. Warrants and rights have no voting rights, receive no dividends, and have no rights to the assets of the issuer.
Real Estate Investment Trusts
Real estate investment trusts (“REITs”) that may be purchased by a Fund include equity REITs, which own real estate directly, mortgage REITs, which make construction, development or long-term mortgage loans, and hybrid REITs, which share characteristics of equity REITs and mortgage REITs. Equity REITs will be affected by, among other things, changes in the value of the underlying property owned by the REITs, while mortgage REITs will be affected by, among other things, the value of the properties to which they have extended credit.
B-6
Factors affecting the performance of real estate may include excess supply of real property in certain markets, changes in zoning laws, completion of construction, changes in real estate value and property taxes, sufficient level of occupancy, adequate rent to cover operating expenses, and local and regional markets for competing assets. The performance of real estate may also be affected by changes in interest rates, prudent management of insurance risks and social and economic trends. In addition, REITs are dependent upon the skill of each REIT’s management.
A Fund could, under certain circumstances, own real estate directly as a result of a default on debt securities it owns or from an in-kind distribution of real estate from a REIT. Risks associated with such ownership could include potential liabilities under environmental laws and the costs of other regulatory compliance. If a Fund has rental income or income from the direct disposition of real property, the receipt of such income may adversely affect its ability to retain its tax status as a regulated investment company and thus its ability to avoid taxation on its income and gains distributed to its shareholders. REITs are also subject to substantial cash flow dependency, defaults by borrowers, self-liquidation and the risk of failing to qualify for tax-free pass-through of income under the Internal Revenue Code of 1986 and the regulations thereunder (the “Code”), and/or to maintain exempt status under the 1940 Act. If a Fund invests in REITs, investors would bear not only a proportionate share of the expenses of that Fund, but also, indirectly, expenses of the REITs.
Convertible Securities
The Funds may invest in debt or preferred equity securities convertible into, or exchangeable for, equity securities. Traditionally, convertible securities have paid dividends or interest at rates higher than common stocks but lower than nonconvertible securities. They generally participate in the appreciation or depreciation of the underlying stock into which they are convertible, but to a lesser degree. In recent years, convertibles have been developed which combine higher or lower current income with options and other features.
Repurchase and Reverse Repurchase Agreements
In a repurchase agreement transaction, a Fund acquires a security from, and simultaneously resells it to, an approved vendor (a U.S. commercial bank or the U.S. branch of a foreign bank, or a broker-dealer which has been designated a primary dealer in government securities and which must meet the credit requirements, if any, set by the Trust’s Board of Trustees from time to time) for delivery on an agreed-upon future date. The resale price exceeds the purchase price by an amount that reflects an agreed-upon interest rate effective for the period during which the repurchase agreement is in effect. The majority of these agreements run from day to day, and delivery pursuant to the resale agreement typically will occur within one to five days of the purchase. Repurchase agreements are considered “loans” under the 1940 Act, collateralized by the underlying security. A Fund’s repurchase agreements require that at all times while the repurchase agreement is in effect, the value of the collateral must equal or exceed the repurchase price to fully collateralize the loan. Additionally, the Adviser or the Fund’s sub-adviser will impose creditworthiness requirements to confirm that the vendor is financially sound and will continuously monitor the collateral’s value. However, if the seller defaults, the Fund could realize a loss on the sale of the underlying security. In addition, if the seller should be involved in bankruptcy or insolvency proceedings, a Fund may incur delays and costs in selling the underlying security or may suffer a loss of principal and interest if the Fund is treated as an unsecured creditor and required to return the underlying securities to the seller’s bankruptcy estate.
A reverse repurchase agreement is a contract pursuant to which a Fund agrees to sell a security and simultaneously agrees to repurchase it at an agreed-upon price at a stated time. If a Fund engages in reverse repurchase agreements it will maintain a segregated account with its custodian containing cash or liquid securities, having a current market value at all times in an amount sufficient to repurchase securities pursuant to outstanding reverse repurchase agreements.
B-7
Dollar Roll Transactions
To take advantage of attractive financing opportunities in the mortgage market and to enhance current income, each of the Funds may engage in dollar roll transactions. A dollar roll transaction involves a sale by a Fund of a Government National Mortgage Association (“GNMA”) Certificate or other mortgage-backed securities to a financial institution, such as a bank or broker-dealer, concurrently with an agreement by the Fund to repurchase a similar security from the institution at a later date at an agreed upon price. The securities that are repurchased will bear the same interest rate as those sold, but generally will be collateralized by different pools of mortgages with different prepayment histories than those sold. During the period between the sale and repurchase, the Fund will not be entitled to receive the interest and principal payments on the securities sold. Proceeds of the sale will be invested in additional instruments for the Fund. A Fund is compensated for agreeing to repurchase the security by the difference between the current sales price and the price for the future purchase (often referred to as the “drop”) as well as by the interest earned on the cash proceeds of the initial sale. Dollar rolls may be renewed over a period of several months with a different repurchaser or repurchase price and a cash settlement made at each renewal without physical delivery of securities. Moreover, a Fund may enter into a dollar roll transaction involving a security not then in the Fund’s portfolio.
A Fund will segregate cash or other liquid securities in an amount sufficient to meet its obligations under dollar roll transactions or otherwise cover its obligations as permitted by applicable law. Dollar roll transactions involve potential risks of loss which are different from those related to the securities underlying the transaction. For example, if the counterparty were to become insolvent, the Fund’s right to purchase from the counterparty may be restricted. Additionally, the market value of the securities sold by the Fund may decline below the repurchase price of those securities to be purchased.
Short-Term Debt Securities
Money Market Instruments Generally. The Funds may invest in money market securities. Money market securities are high-quality, short-term debt instruments that may be issued by the U.S. Government, corporations, banks or other entities. They may have fixed, variable or floating interest rates. Some money market securities in which the Funds may invest are described below.
Bank Obligations. The Funds may invest in bank obligations, including certificates of deposit, time deposits, banker’s acceptances and other short-term obligations of domestic banks, foreign subsidiaries of domestic banks, foreign branches of domestic banks, and domestic and foreign branches of foreign banks, domestic savings and loan associations and other banking institutions.
Certificates of deposit (“CD’s”) are negotiable certificates evidencing the obligations of a bank to repay funds deposited with it for a specified period of time. Time deposits are non-negotiable deposits maintained in a banking institution for a specified period of time at a stated interest rate. Time deposits which may be held by the Funds will not benefit from insurance from the Bank Insurance Fund or the Savings Association Insurance Fund administered by the Federal Deposit Insurance Corporation. Bankers’ acceptances are credit instruments evidencing the obligation of a bank to pay a draft drawn on it by a customer. These instruments reflect the obligation both of the bank and the drawer to pay the face amount of the instrument upon maturity. The other short-term obligations may include uninsured, direct obligations, bearing fixed, floating- or variable-interest rates.
Exceptions. The restrictions and limitations on the types of short-term instruments, temporary investments, commercial paper and short-term corporate debt instruments described in the following paragraphs are not applicable to the Value Equity Fund, the Large Cap Value Fund, the Core Opportunities Fund, the Blue Chip Growth Fund, the Large Cap Growth Fund, the Growth Equity Fund, the Aggressive Growth Fund, the Focused Value Fund, the Small Cap Value Equity Fund, the Small Cap Core Equity Fund, the Mid Cap Growth Equity Fund, the Mid Cap Growth Equity II Fund, the Small Cap Growth Equity Fund, the Small Company Growth Fund and the Emerging Growth Fund.
B-8
For the Value Equity Fund, for temporary or defensive purposes the Fund may invest up to 100% of its total assets in investment grade short-term fixed income securities or preferred stocks.
Short-Term Instruments and Temporary Investments. The Funds may invest in high-quality money market instruments on an ongoing basis to provide liquidity when there is an unexpected level of shareholder purchases or redemptions. In addition, in adverse market conditions, the Funds may invest in these short-term instruments for temporary, defensive purposes. The instruments in which the Funds may invest include: (i) short-term obligations issued or guaranteed by the U.S. Government, its agencies or instrumentalities (including government-sponsored enterprises); (ii) CDs, bankers’ acceptances, fixed time deposits and other obligations of domestic banks (including foreign branches) that have more than $1 billion in total assets at the time of investment and that are members of the Federal Reserve System or are examined by the Comptroller of the Currency or whose deposits are insured by the FDIC; (iii) commercial paper rated at the date of purchase “Prime-1” by Moody’s or “A-1+” or “A-1” by S&P (“Prime-3” by Moody’s or “A-3” by S&P for the Strategic Bond Fund and Strategic Balanced Fund), or, if unrated, of comparable quality as determined by the investment sub-advisers; (iv) non-convertible corporate debt securities (e.g., bonds and debentures) with remaining maturities at the date of purchase of not more than one year that are rated, except for the Strategic Bond Fund and the Strategic Balanced Fund, at least “Aa” by Moody’s or “AA” by S&P; (v) repurchase agreements; and (vi) short-term, U.S. dollar-denominated obligations of foreign banks (including U.S. branches) that, at the time of investment have more than $1 billion, or the equivalent in other currencies, in total assets and in the opinion of the relevant sub-adviser are of comparable quality to obligations of U.S. banks which may be purchased by the Funds.
Commercial Paper and Short-Term Corporate Debt Instruments. The Funds may invest in commercial paper (including variable amount master demand notes) consisting of short-term, unsecured promissory notes issued by corporations to finance short-term credit needs. Commercial paper is usually sold on a discount basis and has a maturity at the time of issuance not exceeding nine months. Variable amount master demand notes are demand obligations that permit the investment of fluctuating amounts at varying market rates of interest pursuant to arrangements between the issuer and a commercial bank acting as agent for the payee of such notes whereby both parties have the right to vary the amount of the outstanding indebtedness on the notes. The sub-advisers monitor on an ongoing basis the ability of an issuer of a demand instrument to pay principal and interest on demand. The Funds also may invest in non-convertible corporate debt securities (e.g., bonds and debentures) with not more than one year remaining to maturity at the date of settlement.
The Funds may also invest in obligations issued or guaranteed by U.S., local, city and state governments and agencies.
The Funds will limit their investments in certificates of deposit and bankers’ acceptances to U.S. dollar-denominated obligations of U.S. banks and savings and loan associations, London branches of U.S. banks (“Eurodollar obligations”) and U.S. branches of foreign banks (“Yankeedollar obligations”). In the case of foreign banks, the $1 billion deposit requirement will be computed using exchange rates in effect at the time of the banks’ most recently published financial statements. Eurodollar obligations and Yankeedollar obligations will not be acquired if as a result more than 25% of a Fund’s net assets would be invested in such obligations. Obligations of foreign banks and of foreign branches of U.S. banks may be affected by foreign governmental action, including imposition of currency controls, interest limitations, withholding taxes, seizure of assets or the declaration of a moratorium or restriction on payments of principal or interest. Foreign banks and foreign branches of U.S. banks may provide less public information than, and may not be subject to the same accounting, auditing and financial recordkeeping standards as, domestic banks.
Letters of Credit. Certain of the debt obligations (including municipal securities, certificates of participation, commercial paper and other short-term obligations) which the Funds may purchase may be backed by an unconditional and irrevocable letter of credit of a bank, savings and loan association or insurance company which assumes the obligation for payment of principal and interest in the event of default by the issuer. Only banks, savings and loan associations and insurance companies which, in the opinion of the Adviser or a Fund’s Sub-adviser, are of comparable quality to issuers of other permitted investments of the Fund may be used for letter of credit-backed investments.
B-9
Zero-Coupon, Step Coupon and Pay-In-Kind Securities
Other debt securities in which the Funds may invest include zero coupon, step coupon and pay-in-kind securities. Zero coupon bonds are issued and traded at a discount from their face value. They do not entitle the holder to any periodic payment of interest prior to maturity. Step coupon bonds trade at a discount from their face value and pay coupon interest. The coupon rate is low for an initial period and then increases to a higher coupon rate thereafter. The discount from the face amount or par value depends on the time remaining until cash payments begin, prevailing interest rates, liquidity of the security and the perceived credit quality of the issue. Pay-in-kind bonds normally give the issuer an option to pay cash at a coupon payment date or give the holder of the security a similar bond with the same coupon rate and a face value equal to the amount of the coupon payment that would have been made.
Current federal income tax law requires holders of zero coupon and step coupon securities to report the portion of the original issue discount on such securities that accrues during a given year as interest income, even though holders receive no cash payments of interest during the year. In order to qualify as a regulated investment company under the Code, a Fund must distribute its investment company taxable income, including the original issue discount accrued on zero coupon or step coupon bonds. Because a Fund will not receive cash payments on a current basis in respect of accrued original issue discount on zero coupon or step coupon bonds during the period before interest payments begin, in some years that Fund may have to distribute cash obtained from other sources in order to satisfy the distribution requirements under the Code. A Fund might obtain such cash from selling other portfolio holdings which might cause the Fund to incur capital gains or losses on the sale. Additionally, these actions are likely to reduce the assets to which Fund expenses could be allocated and to reduce the rate of return for a Fund. In some circumstances, such sales might be necessary in order to satisfy cash distribution requirements even though investment considerations might otherwise make it undesirable for a Fund to sell the securities at the time.
Generally, the market prices of zero coupon, step coupon and pay-in-kind securities are more volatile than the prices of securities that pay interest periodically and in cash and are likely to respond to changes in interest rates to a greater degree than other types of debt securities.
Pass-Through Securities
The Funds may invest in various types of pass-through securities, such as mortgage-backed securities, asset-backed securities and participation interests. A pass-through security is a share or certificate of interest in a pool of debt obligations that have been repackaged by an intermediary, such as a bank or broker-dealer. The purchaser of a pass-through security receives an undivided interest in the underlying pool of securities. The issuers of the underlying securities make interest and principal payments to the intermediary which are passed through to purchasers, such as the Funds. The most common type of pass-through securities are mortgage-backed securities. GNMA Certificates are mortgage-backed securities that evidence an undivided interest in a pool of mortgage loans. GNMA Certificates differ from bonds in that principal is paid back monthly by the borrowers over the term of the loan rather than returned in a lump sum at maturity. The Funds may purchase modified pass-through GNMA Certificates, which entitle the holder to receive a share of all interest and principal payments paid and owned on the mortgage pool, net of fees paid to the issuer and GNMA, regardless of whether or not the mortgagor actually makes the payment. GNMA Certificates are backed as to the timely payment of principal and interest by the full faith and credit of the U.S. Government.
The Federal Home Loan Mortgage Corporation (“FHLMC”) issues two types of mortgage pass-through securities: mortgage participation certificates and guaranteed mortgage certificates. Participation certificates resemble GNMA Certificates in that the participation certificates represent a pro rata share of all interest and principal payments made and owned on the underlying pool. FHLMC guarantees timely payments of interest on the participation certificates and the full return of principal. Guaranteed mortgage certificates also represent a pro rata interest in a pool of mortgages. However, these instruments pay interest semi-annually and return principal once a year in guaranteed minimum payments. This type of security is guaranteed by FHLMC as to timely payment of principal and interest but is not backed by the full faith and credit of the U.S. Government.
B-10
The Federal National Mortgage Association (“FNMA”) issues guaranteed mortgage pass-through certificates. FNMA Certificates resemble GNMA Certificates in that each FNMA Certificate represents a pro rata share of all interest and principal payments made and owned on the underlying pool. This type of security is guaranteed by the FNMA as to timely payment of principal and interest but is not backed by the full faith and credit of the U.S. Government.
Except for guaranteed mortgage certificates, each of the mortgage-backed securities described above is characterized by monthly payments to the holder, reflecting the monthly payments made by the borrowers who received the underlying mortgage loans. The payments to the securities holders, such as the Funds, like the payments on the underlying loans, represent both principal and interest. Although the underlying mortgage loans are for specified periods of time, such as 20 or 30 years, the borrowers can, and typically do, pay them off sooner. Thus, the security holders frequently receive prepayments of principal in addition to the principal that is part of the regular monthly payments. If applicable, a portfolio manager will consider estimated prepayment rates in calculation of the average weighted maturity of a Fund which owns these securities. A borrower is more likely to prepay a mortgage that bears a relatively high rate of interest. This means that in times of declining interest rates, higher yielding mortgage-backed securities held by a Fund might be converted to cash and the Fund will be forced to accept lower interest rates when that cash is used to purchase additional securities in the mortgage-backed securities sector or in other investment sectors. Additionally, prepayments during such periods will limit a Fund’s ability to participate in as large a market gain as may be experienced with a comparable security not subject to prepayment.
The Funds may also invest in Collateralized Loan Obligations, Collateralized Debt Obligations and Collateralized Bond Obligations.
Asset-backed securities represent interests in pools of consumer loans and are backed by paper or accounts receivables originated by banks, credit card companies or other providers of credit. Generally, the originating bank or credit provider is neither the obligor nor the guarantor of the security, and interest and principal payments ultimately depend upon payment of the underlying loans by individuals.
Other Income-Producing Securities
Other types of income-producing securities the Funds may purchase, include, but are not limited to, the following:
| | • | | Variable and floating rate obligations. These types of securities have variable or floating rates of interest and, under certain limited circumstances, may have varying principal amounts. These securities pay interest at rates that are adjusted periodically according to a specified formula, usually with reference to some interest rate index or market interest rate. The floating rate tends to decrease the security’s price sensitivity to changes in interest rates. These types of securities are relatively long-term instruments that often carry demand features permitting the holder to demand payment of principal at any time or at specified intervals prior to maturity. |
| | | In order to use these investments most effectively, a Fund’s sub-adviser must correctly assess probable movements in interest rates. This involves different skills than those used to select most portfolio securities. If the sub-adviser incorrectly forecasts such movements, a Fund could be adversely affected by the use of variable or floating rate obligations. |
| | • | | Standby commitments. These instruments, which are similar to a put, give a Fund the option to obligate a broker, dealer or bank to repurchase a security held by the Fund at a specified price. |
| | • | | Tender option bonds. Tender option bonds are relatively long-term bonds that are coupled with the agreement of a third party, such as a broker, dealer or bank, to grant the holders of such securities the option to tender the securities to the institution at periodic intervals. |
B-11
| | • | | Inverse floaters. These are debt instruments whose interest bears an inverse relationship to the interest rate on another security. Similar to variable and floating rate obligations, effective use of inverse floaters requires skills different from those needed to select most portfolio securities. If movements in interest rates are incorrectly anticipated, a Fund could lose money or the net asset value of its shares could decline by the use of inverse floaters. |
| | • | | Strip bonds. Strip bonds are debt securities that are stripped of their interest, usually by a financial intermediary, after the securities are issued. The market value of these securities generally fluctuates more in response to changes in interest rates than interest-paying securities of comparable maturities. |
Standby commitments, tender option bonds and instruments with demand features are primarily used by the Funds for the purpose of increasing the liquidity of a Fund’s portfolio.
Securities Lending
Each Fund may seek additional income by making loans of portfolio securities of not more than 33% of its total assets taken at current market value although this amount may change if applicable regulatory requirements change. The risks in lending portfolio securities, as with other extensions of credit, consist of possible delay in recovery of the securities or possible loss of rights in the collateral should the borrower fail financially. Under applicable regulatory requirements and securities lending agreements (which are subject to change), the loan collateral must, on each business day, be at least equal to the value of the loaned securities and must consist of cash (which may be invested by the Fund in any investment not otherwise prohibited by the Prospectus or this SAI), bank letters of credit or securities of the U.S. Government (or its agencies or instrumentalities), or other cash equivalents in which the Funds are permitted to invest. The borrower pays to the lending Fund an amount equal to any dividends or interest received on the securities lent. The Funds may invest the cash collateral received or may receive a fee from the borrower. All investments of cash collateral by a Fund are for the account and risk of that Fund. Although voting rights or rights to consent with respect to the loaned securities pass to the borrower, each Fund retains the right to call the loans at any time on reasonable notice. The Funds may also call such loans in order to sell the securities involved. The Funds pay various fees in connection with such loans, including shipping fees and reasonable custodian, securities lending agent and placement fees. The terms of a Fund’s loans must also meet certain tests under the Code and must permit the Fund to reacquire loaned securities on five business days’ notice or in time to vote on any important matter.
Hedging Instruments And Derivatives
Subject to the Fundamental Investment Restrictions described below under “Investment Restrictions of the Funds—Fundamental Investment Restrictions of the Funds” each Fund currently may use the hedging instruments and derivatives discussed below. In the future, each Fund may employ hedging instruments and strategies that are not currently contemplated but which may be developed, to the extent such investment methods are consistent with the Fund’s investment objective and are legally permissible.
(1) Forward Contracts—Each Fund may purchase or sell securities on a forward commitment basis (“forward contracts”). When such transactions are negotiated, the price is fixed at the time of commitment, but delivery and payment for the securities can take place a month or more after the commitment date. The securities so purchased or sold are subject to market fluctuations and no interest accrues to the purchaser during this period. At the time of delivery the securities may be worth more or less than the purchase or sale price. While a Fund also may enter into forward contracts with the initial intention of acquiring securities for its portfolio, it may dispose of a commitment prior to settlement if the Fund’s sub-adviser deems it appropriate to do so. The Funds may realize short-term gains or losses upon the sale of forward contracts. If a Fund enters into a forward contract, it will establish a segregated account with its custodian consisting of cash or liquid securities, having a current market value equal to or greater than the aggregate amount of that Fund’s commitment under forward contracts (that is, the purchase price of the underlying security on the delivery date). As one of several alternatives to maintaining all or part of the segregated account, a Fund could buy call or put options to “cover” the forward contracts.
B-12
(2) Currency Transactions—Each Fund may engage in currency transactions with counterparties in order to convert foreign denominated securities or obligations (or obligations exposed to foreign currency fluctuation) to U.S. dollar-denominated investments. The Funds may also engage in currency transactions to hedge the value of portfolio holdings denominated in or exposed to particular currencies against fluctuations in relative value or for the Diversified International Fund to generate additional returns by buying currencies in excess of underlying equities when opportunities arise.
Currency transactions include forward currency contracts, exchange listed currency futures, exchange listed and OTC options on currencies, and currency swaps. A forward currency contract involves a privately negotiated obligation to purchase or sell (with delivery generally required) a specific currency at a future date, which may be any fixed number of days from the date of the contract agreed upon by the parties, at a price set at the time of the contract. A currency swap is an agreement to exchange cash flows based on the notional difference among two or more currencies and operates similarly to an interest rate swap. Except for the Value Equity Fund, a Fund may enter into currency transactions with counterparties which have received (or the guarantors of the obligations of which have received) a credit rating of A-I or P-1 by Standard & Poor’s Ratings Group (“S&P”) or Moody’s Investors Service, Inc. (“Moody’s”), respectively, or that have an equivalent rating from a nationally recognized statistical rating organization (“NRSRO”) or (except for OTC currency options) are determined to be of equivalent credit quality by the Adviser or the Fund’s sub-adviser.
The Strategic Bond Fund, the Strategic Balanced Fund, the Diversified Value Fund, the Fundamental Value Fund, the Value Equity Fund, the Large Cap Value Fund, the Core Opportunities Fund, the Blue Chip Growth Fund, the Large Cap Growth Fund, the Growth Equity Fund, the Aggressive Growth Fund, the Focused Value Fund, the Mid-Cap Value Fund, the Small Cap Value Equity Fund, the Small Company Value Fund, the Small Cap Core Equity Fund, the Mid Cap Growth Equity Fund, the MidCap Growth Equity II Fund, the Small Cap Growth Equity Fund, the Small Company Growth Fund, the Emerging Growth Fund, the Diversified International Fund and the Overseas Fund may deal in forward currency contracts and other currency transactions such as futures, options, options on futures, and swaps, but will be limited to hedging involving either specific transactions or portfolio positions. Transaction hedging is entering into a currency transaction with respect to specific assets or liabilities of a Fund, which will generally arise in connection with the purchase or sale of its portfolio securities or the receipt of income therefrom. Position hedging is entering into a currency transaction with respect to portfolio security positions denominated or generally quoted in that currency. For example, if the Fund believes that a foreign currency may suffer a substantial decline against the U.S. dollar, it may enter into a forward sale contract to sell an amount of that foreign currency approximating the value of some or all of the Fund’s portfolio securities denominated in or exposed to such foreign currency. The Funds may also cross-hedge currencies by entering into transactions to purchase or sell one or more currencies that are expected to decline in value relative to other currencies to which the Fund has or in which the Fund expects to have portfolio exposure. In addition, the Diversified International Fund may cross-hedge currencies by entering into transactions to purchase or sell one or more currencies that are expected to appreciate or decline in value relative to other currencies to which the Fund has or in which the Fund expects to have portfolio exposure, such that net exposure to an individual country’s currency may exceed (or more than offset) the underlying stock exposure in a particular country.
To reduce the effect of currency fluctuations on the value of existing or anticipated holdings of portfolio securities, the Funds may also engage in proxy hedging. Proxy hedging is often used when the currency to which the Fund’s portfolio is exposed is difficult to hedge or to hedge against the dollar. Proxy hedging entails entering into a forward contract to sell a currency whose changes in value are generally considered to be linked to a currency or currencies in which some or all of the Fund’s portfolio securities are or are expected to be denominated, and to buy U.S. dollars. Currency hedging involves some of the same risks and considerations as other transactions with similar instruments. Currency transactions can result in losses to the Fund if the currency being hedged fluctuates in value to a degree or in a direction that is not anticipated. Further, there is the risk that the perceived linkage between various currencies may not be present during the particular time that the Fund is engaging in proxy hedging.
B-13
(3) Risks Regarding Hedging Instruments and Derivatives—Some of the general risks associated with hedging and the use of derivatives include: (a) the possible absence of a liquid secondary market for any particular hedging instrument at any time; (b) these instruments can be highly volatile; and (c) the possible need to defer closing out certain positions to avoid adverse tax consequences. More specific risks are set forth below.
(i) Forward Contracts: Forward contracts involve a risk of loss if the value of the security to be purchased declines prior to the settlement date, which risk is in addition to the risk of decline in value of the Funds’ other assets.
(ii) Currency Transactions: Currency transactions are subject to risks different from those of other portfolio transactions. Because currency control is of great importance to the issuing governments and influences economic planning and policy, purchases and sales of currency and related instruments can be negatively affected by government exchange controls, blockages, and manipulations or exchange restrictions imposed by governments. These can result in losses to a Fund if it is unable to deliver or receive currency or funds in settlement of obligations and could also cause hedges it has entered into to be rendered useless, resulting in full currency exposure as well as incurring transaction costs. Buyers and sellers of currency futures are subject to the same risks that apply to the use of futures generally. Further, settlement of a currency futures contract for the purchase of most currencies must occur at a bank based in the issuing nation. Trading options on currency futures is relatively new, and the ability to establish and close out positions on such options is subject to the maintenance of a liquid market which may not always be available. Currency exchange rates may fluctuate based on factors extrinsic to that country’s economy.
Derivatives
(1) Options and Futures Transactions. While all Funds are permitted to use derivatives, the Strategic Bond Fund, Strategic Balanced Fund, Diversified Value Fund, Large Cap Growth Fund, Growth Equity Fund, Indexed Equity Fund, Core Opportunities Fund, Blue Chip Growth Fund, Value Equity Fund, Aggressive Growth Fund, OTC 100 Fund, Mid Cap Growth Equity Fund, Mid Cap Growth Equity II Fund, Emerging Growth Fund, Small Cap Growth Equity Fund, Small Company Growth Fund, Focused Value Fund, Mid-Cap Value Fund, Small Cap Value Equity Fund, Small Company Value Fund, Small Cap Core Equity Fund and Diversified International Fund are more likely to utilize the following types of “Derivative” instruments, in varying degrees, subject to each Fund’s respective investment objective. The Funds, may (a) purchase and sell exchange traded and over-the-counter (OTC) put and call options on equity securities, fixed income securities or indexes of interest rates (i.e. Eurodollar options), equity or fixed income securities, (b) purchase and sell futures contracts on fixed income securities or indexes of interest rates, equity or fixed income securities, and (c) purchase and sell put and call options on futures contracts on fixed income securities or indexes of interest rates, equity or fixed income securities. Each of these instruments is a derivative instrument as its value derives from the underlying asset or index.
The Funds, except the Value Equity Fund, may purchase put and call options on securities, indexes of securities and futures contracts, or purchase and sell futures contracts, if (i) the aggregate premiums paid on all such options which are held at any time do not exceed 20% of a Fund’s net assets, and (ii) the aggregate margin deposits required on all such futures or options thereon held at any time do not exceed 5% of a Fund’s total assets.
The Value Equity Fund will not: (a) sell futures contracts, purchase put options, or write call options if, as a result, more than 25% of the Fund’s total assets would be hedged with futures and options under normal conditions; (b) purchase futures contracts or write put options if, as a result, the Fund’s total obligations upon settlement or exercise of purchased futures contracts and written put options would exceed 25% of the Fund’s total assets under normal conditions; or (c) purchase call options if, as a result, the current value of option premiums for call options purchased by the Fund would exceed 5% of its total assets. These limitations do not apply to options attached to or acquired or traded together with their underlying securities, and do not apply to securities that incorporate features similar to options.
B-14
The Funds may utilize options and futures contracts for various reasons, including to manage exposure to changing interest rates and/or security prices. Some options and futures strategies, including selling futures contracts and buying puts, tend to hedge a Fund’s investments against price fluctuations. Other strategies, including buying futures contracts, writing puts and calls, and buying calls, tend to increase market exposure. Options and futures contracts may be combined with each other or with forward contracts in order to adjust the risk and return characteristics of a Fund’s overall strategy in a manner deemed appropriate to the Fund’s sub-adviser and consistent with a Fund’s objective and policies. Because combined options positions involve multiple trades, they result in higher transaction costs and may be more difficult to open and close out.
The use of options and futures is a highly specialized activity which involves investment strategies and risks different from those associated with ordinary portfolio securities transactions, and there can be no guarantee that their use will increase a Fund’s return. While the use of these instruments by a Fund may reduce certain risks associated with owning its portfolio securities, these techniques themselves entail certain other risks. If the Fund’s sub-adviser applies a strategy at an inappropriate time or judges market conditions or trends incorrectly, options and futures strategies may lower a Fund’s return. Certain strategies limit a Fund’s possibilities to realize gains as well as limiting its exposure to losses. A Fund could also experience losses if the prices of its options and futures positions were poorly correlated with its other investments, or if it could not close out its positions because of an illiquid secondary market. In addition, a Fund will incur transaction costs, including trading commissions and option premiums, in connection with its futures and options transactions, and these transactions could significantly increase a Fund’s turnover rate.
(2) Purchasing Put and Call Options. The Funds may purchase put and call options. By purchasing a put option, a Fund obtains the right (but not the obligation) to sell the instrument underlying the option at a fixed strike price. In return for this right, a Fund pays the current market price for the option (known as the option premium). Options have various types of underlying instruments, including specific securities, indexes of securities, indexes of securities prices, indexes of interest rates, futures contracts and swap agreements. A Fund may terminate its position in a put option it has purchased by allowing it to expire or by exercising the option. A Fund may also close out a put option position by entering into an offsetting transaction, if a liquid market exists. If the option is allowed to expire, a Fund will lose the entire premium it paid. If a Fund exercises a put option on a security, it will sell the instrument underlying the option at the strike price. If a Fund exercises an option on an index, settlement is in cash and does not involve the actual sale of securities. If an option is American style, it may be exercised on any day up to its expiration date. A European style option may be exercised only on its expiration date.
The buyer of a typical put option can expect to realize a gain if the price of the underlying instrument falls substantially. However, if the price of the instrument underlying the option does not fall enough to offset the cost of purchasing the option, a put buyer can expect to suffer a loss (limited to the amount of the premium paid, plus related transaction costs).
The features of call options are essentially the same as those of put options, except that the purchaser of a call option obtains the right to purchase, rather than sell, the instrument underlying the option at the option’s strike price. A call buyer typically attempts to participate in potential price increases of the instrument underlying the option with risk limited to the cost of the option if security prices fall. At the same time, the buyer can expect to suffer a loss if security prices do not rise sufficiently to offset the cost of the option.
(3) Selling (Writing) Put and Call Options. The Funds may also “write” put and call options. When a Fund writes a put option, it takes the opposite side of the transaction from the option’s purchaser. In return for receipt of the premium, a Fund assumes the obligation to pay the strike price for the instrument underlying the option if the other party to the option chooses to exercise it. A Fund may seek to terminate its position in a put option it writes before exercise by purchasing an offsetting option in the market at its current price. If the market is not liquid for a put option a Fund has written, however, a Fund must continue to be prepared to pay the strike price while the option is outstanding, regardless of price changes, and, if applicable, must continue to post margin as discussed below.
B-15
If the price of the underlying instrument rises, a put writer would generally expect to profit, although its gain would be limited to the amount of the premium it received. If security prices remain the same over time, it is likely that the writer will also profit, because it should be able to close out the option at a lower price. If security prices fall, the put writer would expect to suffer a loss. This loss should be less than the loss from purchasing and holding the underlying instrument directly, however, because the premium received for writing the option should offset a portion of the decline.
Writing a call option obligates a Fund to sell or deliver the option’s underlying instrument in return for the strike price upon exercise of the option. The characteristics of writing call options are similar to those of writing put options, except that writing calls generally is a profitable strategy if prices remain the same or fall. Through receipt of the option premium a call writer offsets part of the effect of a price decline. At the same time, because a call writer must be prepared to deliver the underlying instrument in return for the strike price, even if its current value is greater, a call writer gives up some ability to participate in security price increases.
The writer of an exchange traded put or call option on a security, an index of securities or a futures contract is required to deposit cash or securities or a letter of credit as margin and to make mark to market payments of variation margin as the position becomes unprofitable.
(4) Options on Indexes. The Funds may also purchase options on indexes. Options on securities indexes are similar to options on securities, except that the exercise of securities index options is settled by cash payment and does not involve the actual purchase or sale of securities. In addition, these options are designed to reflect price fluctuations in a group of securities or segment of the securities market rather than price fluctuations in a single security. A Fund, in purchasing or selling index options, is subject to the risk that the value of its portfolio securities may not change as much as an index because a Fund’s investments generally will not match the composition of an index. The Funds may also invest in futures and options on commodity indices.
For a number of reasons, a liquid market may not exist and thus a Fund may not be able to close out an option position that it has previously entered into. When a Fund purchases an OTC option, it will be relying on its counterparty to perform its obligations, and a Fund may incur additional losses if the counterparty is unable to perform.
(5) Exchange Traded and OTC Options. All options purchased or sold by the Funds will be traded on a securities exchange or will be purchased or sold by securities dealers or other parties (OTC options) that meet creditworthiness standards, if any, approved by the Trust’s Board of Trustees. While exchange-traded options are obligations of the Options Clearing Corporation, in the case of OTC options, a Fund relies on the dealer from which it purchased the option to perform if the option is exercised. Thus, when a Fund purchases an OTC option, it relies on the dealer from which it purchased the option to make or take delivery of the underlying securities. Failure by the dealer to do so would result in the loss of the premium paid by a Fund as well as loss of the expected benefit of the transaction. In addition, OTC options are considered illiquid by the Securities and Exchange Commission (“SEC”).
(6) Futures Contracts and Options on Futures Contracts. The Funds may purchase or sell (write) futures contracts and purchase or sell put and call options on futures contracts. Futures contracts obligate the buyer to take and the seller to make delivery at a future date of a specified quantity of a financial instrument or an amount of cash based on the value of a securities index. Currently, futures contracts are available on, among other things, various types of fixed income securities including, but not limited to, U.S. Treasury bonds, notes and bills, Eurodollar certificates of deposit and on indexes of fixed income securities and indexes of equity securities.
The Funds may use futures contracts as a hedge against the effects of interest rate changes or, with respect to the Indexed Equity Fund and the OTC 100 Fund, changes in the market value of stocks comprising the index in which the applicable Fund invests. In managing cash flows, those Funds may use futures contracts as a substitute for holding the designated securities underlying the futures contract. The Indexed Equity and OTC 100 Funds may also use futures contracts as a substitute for a comparable market position in the underlying securities or for any other purpose permitted by its investment policies and by applicable law.
B-16
Transactions by the Funds in futures contracts involve certain risks. For the Indexed Equity Fund and OTC 100 Fund, one risk in employing futures contracts as a hedge against cash market price volatility is the possibility that futures prices will correlate imperfectly with the behavior of the prices of the securities in these Funds’ investment portfolios. Similarly, in employing futures contracts as a substitute for purchasing the designated underlying securities, there is a risk that the performance of the futures contract may correlate imperfectly with the performance of the direct investments for which the futures contract is a substitute. Also, no assurance can be given that a liquid market will exist for any particular contract at any particular time. Many futures exchanges and boards of trade limit the amount of fluctuation permitted in futures contract prices during a single trading day. Once the daily limit has been reached in a particular contract, no trades may be made that day at a price beyond that limit or trading may be suspended for specified periods during the trading day. Futures contract prices could move to the limit for several consecutive trading days with little or no trading, thereby preventing prompt liquidation of futures positions and potentially subjecting the Funds to substantial losses. If it is not possible, or if the Funds determine not to close a futures position in anticipation of adverse price movements, the Funds will be required to make daily cash payments on variation margin.
Unlike a futures contract, which requires the parties to buy and sell a security or make a cash settlement payment based on changes in a financial instrument or securities index on an agreed date, an option on a futures contract entitles its holder to decide on or before a future date whether to enter into such a contract. If the holder decides not to exercise its option, the holder may close out the option position by entering into an offsetting transaction or may decide to let the option expire and forfeit the premium thereon. The purchaser of an option on a futures contract pays a premium for the option but makes no initial margin payments or daily payments of cash in the nature of “variation” margin payments to reflect the change in the value of the underlying contract as does a purchaser or seller of a futures contract.
The seller of an option on a futures contract receives the premium paid by the purchaser and may be required to pay initial margin. Amounts equal to the initial margin and any additional collateral required on any options on futures contracts sold by a Fund are paid by a Fund into a segregated account, in the name of the futures commission merchant, as required by the 1940 Act and the SEC interpretations thereunder. The use of futures or options on futures for purposes other than hedging may be regarded as speculative. Certain regulatory requirements may also limit a Fund’s ability to engage in futures and related options transactions.
Stock Index Futures and Options on Stock Index Futures. The Diversified Value Fund, the Fundamental Value Fund, the Value Equity Fund, the Large Cap Growth Fund, the Indexed Equity Fund, the Core Opportunities Fund, the Blue Chip Growth Fund, the Growth Equity Fund, the Aggressive Growth Fund, the OTC 100 Fund, the Focused Value Fund, the Mid-Cap Value Fund, the Small Cap Value Equity Fund, the Small Company Value Fund, the Small Cap Core Equity Fund, the Mid Cap Growth Equity Fund, the Mid Cap Growth Equity II Fund, the Small Cap Growth Equity Fund, the Small Company Growth Fund, the Emerging Growth Fund, the Diversified International Fund, the Overseas Fund and the Destination Retirement Funds may invest in stock index futures contracts and options on stock index futures contracts as a substitute for a comparable market position in the underlying securities comprising the index which the Fund is seeking to replicate. The Strategic Balanced Fund may also buy stock index futures. A stock index future obligates the seller to deliver (and the purchaser to take), effectively, an amount of cash equal to a specific dollar amount times the difference between the value of a specific stock index at the close of the last trading day of the contract and the price at which the agreement is made. No physical delivery of the underlying stocks in the index is made. There can be no assurance that a liquid market will exist at the time when the Funds seek to close out a futures contract or a futures option position. Lack of a liquid market may prevent liquidation of an unfavorable position.
Future Developments. All Funds which are permitted to invest in these types of instruments may take advantage of opportunities in the area of options and futures contracts and options on futures contracts and any other derivative investments which are not presently contemplated for use by the Funds or which are not currently available but which may be developed, to the extent such opportunities are both consistent with the Fund’s investment objective and legally permissible for the Fund.
B-17
(7) Combined Positions. The Funds are permitted to purchase and write options in combination with each other, or in combination with futures or forward contracts, to adjust the risk and return characteristics of the overall position. For example, a Fund may purchase a put option and write a call option on the same underlying instrument, in order to construct a combined position whose risk and return characteristics are similar to selling a futures contract. Another possible combined position would involve writing a call option at one strike price and buying a call option at a lower price, in order to reduce the risk of the written call option in the event of a substantial price increase. Because combined options positions involve multiple trades, they result in higher transaction costs and may be more difficult to open and close out.
(8) Risks Regarding Options and Futures Transactions. Some of the general risks associated with the use of options and futures include:
(a) Correlation of Price Changes. Because there are a limited number of types of exchange-traded options and futures contracts, it is likely that the standardized options and futures contracts available will not match a Fund’s current or anticipated investments exactly (to the extent options and futures contracts are used for such purpose). The Funds may invest in options and futures contracts based on securities with different issuers, maturities, or other characteristics from the securities in which it typically invests, which involves a risk that the options or futures position will not track the performance of a Fund’s other investments.
Options and futures contracts prices can also diverge from the prices of their underlying instruments, even if the underlying instruments match a Fund’s investments well. Options and futures contracts prices are affected by such factors as current and anticipated short term interest rates, changes in volatility of the underlying instrument, and the time remaining until expiration of the contract, which may not affect security prices the same way. Imperfect correlation may also result from differing levels of demand in the options and futures markets and the securities markets, from structural differences in how options and futures and securities are traded, or from imposition of daily price fluctuation limits or trading halts. A Fund may purchase or sell options and futures contracts with a greater or lesser value than the securities it wishes to hedge or intends to purchase in order to attempt to compensate for differences in volatility between the contract and the securities, although this may not be successful in all cases. If price changes in a Fund’s options or futures positions are poorly correlated with its other investments, the positions may fail to produce anticipated gains or result in losses that are not offset by gains in other investments.
(b) Liquidity of Options and Futures Contracts. There is no assurance a liquid market will exist for any particular option or futures contract at any particular time even if the contract is traded on an exchange. In addition, exchanges may establish daily price fluctuation limits for options and futures contracts and may halt trading if a contract’s price moves up or down more than the limit in a given day. On volatile trading days when the price fluctuation limit is reached or a trading halt is imposed, it may be impossible for a Fund to enter into new positions or close out existing positions. If the market for a contract is not liquid because of price fluctuation limits or otherwise, it could prevent prompt liquidation of unfavorable positions, and could potentially require a Fund to continue to hold a position until delivery or expiration regardless of changes in its value. As a result, a Fund’s access to other assets held to cover its options or futures positions could also be impaired. (See “Exchange Traded and OTC Options” above for a discussion of the liquidity of options not traded on an exchange.)
(c) Position Limits. Futures exchanges can limit the number of futures and options on futures contracts that can be held or controlled by an entity. If an adequate exemption cannot be obtained, the Fund or its sub-adviser may be required to reduce the size of their futures and options positions or may not be able to trade a certain futures or options contract in order to avoid exceeding such limits.
(d) Asset Coverage for Futures Contracts and Options Positions. The Funds will comply with guidelines established by the SEC with respect to coverage of options and futures contracts by mutual funds, and if the guidelines so require, will set aside appropriate liquid assets in the amount prescribed. Assets set aside for such purpose cannot be sold while the futures or options strategy is outstanding, unless they are replaced with other suitable assets. As a result, there is a possibility that segregation of a large percentage of
B-18
a Fund’s assets could impede portfolio management or a Fund’s ability to meet redemption requests or other current obligations.
(e) Status Under the Commodity Exchange Act. The Funds are operated by a person who has claimed an exclusion from the definition of the term “commodity pool operator” under the Commodity Exchange Act (“CEA”), and therefore, such person is not subject to registration or regulation as a pool operator under the CEA.
(9) Swaps and Related Swap Products: The Funds may engage in swap transactions, including, but not limited to, interest rate, currency, credit default, indices, basket, specific security and commodity swaps, interest rate caps, floors and collars and options on swaps (collectively defined as “swap transactions”).
Each Fund may enter into swap transactions for any legal purpose consistent with its investment objective and policies, such as for the purpose of attempting to obtain or preserve a particular return or spread at a lower cost than obtaining that return or spread through purchases and/or sales of instruments in cash markets, to protect against currency fluctuations, as a duration management technique, to protect against any increase in the price of securities a Fund anticipates purchasing at a later date, or to gain exposure to certain markets in the most economical way possible.
Swap agreements are two-party contracts entered into primarily by institutional counterparties for periods ranging from a few weeks to several years. In a standard swap transaction, two parties agree to exchange the returns (or differentials in rates of return) that would be earned or realized on specified notional investments or instruments. The gross returns to be exchanged or “swapped” between the parties are calculated by reference to a “notional amount,” i.e., the return on or increase in value of a particular dollar amount invested at a particular interest rate, in a particular foreign currency or commodity, or in a “basket” of securities representing a particular index. The purchaser of an interest rate cap or floor, upon payment of a fee, has the right to receive payments (and the seller of the cap is obligated to make payments) to the extent a specified interest rate exceeds (in the case of a cap) or is less than (in the case of a floor) a specified level over a specified period of time or at specified dates. The purchaser of an interest rate collar, upon payment of a fee, has the right to receive payments (and the seller of the collar is obligated to make payments) to the extent that a specified interest rate falls outside an agreed upon range over a specified period of time or at specified dates. The purchaser of an option on an interest rate swap, upon payment of a fee (either at the time of purchase or in the form of higher payments or lower receipts within an interest rate swap transaction) has the right, but not the obligation, to initiate a new swap transaction of a pre-specified notional amount with pre-specified terms with the seller of the option as the counterparty.
The “notional amount” of a swap transaction is the agreed upon basis for calculating the payments that the parties have agreed to exchange. For example, one swap counterparty may agree to pay a floating rate of interest (e.g., 3 month LIBOR) calculated based on a $10 million notional amount on a quarterly basis in exchange for receipt of payments calculated based on the same notional amount and a fixed rate of interest on a semi-annual basis. In the event a Fund is obligated to make payments more frequently than it receives payments from the other party, it will incur incremental credit exposure to that swap counterparty. This risk may be mitigated somewhat by the use of swap agreements which call for a net payment to be made by the party with the larger payment obligation when the obligations of the parties fall due on the same date. Under most swap agreements entered into by a Fund, payments by the parties will be exchanged on a “net basis,” and a Fund will receive or pay, as the case may be, only the net amount of the two payments.
The amount of a Fund’s potential gain or loss on any swap transaction is not subject to any fixed limit. Nor is there any fixed limit on a Fund’s potential loss if it sells a cap or collar. If the Fund buys a cap, floor or collar, however, the Fund’s potential loss is limited to the amount of the fee that it has paid. When measured against the initial amount of cash required to initiate the transaction, which is typically zero in the case of most conventional swap transactions, swaps, caps, floors and collars tend to be more volatile than many other types of instruments.
B-19
The use of swap transactions, caps, floors and collars involves investment techniques and risks which are different from those associated with portfolio security transactions. If a Fund’s sub-adviser is incorrect in its forecasts of market values, interest rates, and other applicable factors, the investment performance of a Fund will be less favorable than if these techniques had not been used. These instruments are typically not traded on exchanges. Accordingly, there is a risk that the other party to certain of these instruments will not perform its obligations to a Fund or that a Fund may be unable to enter into offsetting positions to terminate its exposure or liquidate its position under certain of these instruments when it wishes to do so. Such occurrences could result in losses to a Fund.
A Fund’s sub-adviser will, however, consider such risks and will enter into swap and other derivatives transactions only when it believes that the risks are not unreasonable.
Each Fund will maintain cash or liquid assets in an amount sufficient at all times to cover its current obligations under its swap transactions, caps, floors and collars. If a Fund enters into a swap agreement on a net basis, it will segregate assets with a daily value at least equal to the excess, if any, of a Fund’s accrued obligations under the swap agreement over the accrued amount a Fund is entitled to receive under the agreement. If a Fund enters into a swap agreement on other than a net basis, or sells a cap, floor or collar, it will segregate assets with a daily value at least equal to the full amount of a Fund’s accrued obligations under the agreement. In addition to those techniques mentioned above, a Fund may cover its obligations under a swap agreement by using any other technique permitted by applicable law.
The Funds will not enter into any swap transaction, cap, floor, or collar, unless the counterparty to the transaction is deemed creditworthy by the Adviser and/or the sub-adviser. If a counterparty defaults, a Fund may have contractual remedies pursuant to the agreements related to the transaction. The swap markets in which many types of swap transactions are traded have grown substantially in recent years, with a large number of banks and investment banking firms acting both as principals and as agents utilizing standardized swap documentation. As a result, the markets for certain types of swaps (e.g., interest rate swaps) have become relatively liquid. The markets for some types of caps, floors and collars are less liquid.
During the term of a swap, cap, floor or collar, changes in the value of the instrument are recognized as unrealized gains or losses by marking to market to reflect the market value of the instrument. When the instrument is terminated, a Fund will record a realized gain or loss equal to the difference, if any, between the proceeds from (or cost of) the closing transaction and a Fund’s basis in the contract.
During the term of a swap, cap, floor or collar, the periodic net payments can be made for a set period of time or may be triggered by a predetermined credit event. The net periodic payments may be based on a fixed or variable interest rate; the change in the market value of a specified security, basket of securities or index; or the return generated by a security.
The federal income tax treatment with respect to swap transactions, caps, floors, and collars may impose limitations on the extent to which the Funds may engage in such transactions.
(10) Structured Notes and Hybrid Instruments: Structured notes are derivative debt securities, the interest rate or principal of which is determined by an unrelated indicator. Indexed securities include structured notes as well as securities other than debt securities, the interest rate or principal of which is determined by an unrelated indicator. Indexed securities may include a multiplier that multiplies the indexed element by a specified factor and, therefore, the value of such securities may be very volatile.
A hybrid instrument can combine the characteristics of securities, futures, and options. For example, the principal amount or interest rate of a hybrid could be tied (positively or negatively) to the price of some commodity, currency or securities index or another interest rate (each a “benchmark”). The interest rate or (unlike most fixed income securities) the principal amount payable at maturity of a hybrid security may be increased or decreased, depending on changes in the value of the benchmark.
B-20
Hybrids can be used as an efficient means of pursuing a variety of investment goals, including currency hedging, duration management, and increased total return. Hybrids may not bear interest or pay dividends. The value of a hybrid or its interest rate may be a multiple of a benchmark and, as a result, may be leveraged and move (up or down) more steeply and rapidly than the benchmark. These benchmarks may be sensitive to economic and political events, such as commodity shortages and currency devaluations, which cannot be readily foreseen by the purchaser of a hybrid. Under certain conditions, the redemption value of a hybrid could be zero. Thus, an investment in a hybrid may entail significant market risks that are not associated with a similar investment in a traditional, U.S. dollar-denominated bond that has a fixed principal amount and pays a fixed rate or floating rate of interest. The purchase of hybrids also exposes a Fund to the credit risk of the issuer of the hybrids. These risks may cause significant fluctuations in the net asset value of the Fund.
Illiquid Securities
Each Fund may invest not more than 15% of its net assets in “illiquid securities,” which are securities that are not readily marketable, including securities whose disposition is restricted by contract or under federal securities laws. A Fund may not be able to dispose of such securities in a timely fashion and for a fair price, which could result in losses to a Fund. In addition, illiquid securities are generally more difficult to value. Illiquid securities may include repurchase agreements with maturities greater than seven days, futures contracts and options thereon for which a liquid secondary market does not exist, time deposits maturing in more than seven calendar days and securities of new and early stage companies whose securities are not publicly traded. The Funds may also purchase securities eligible for resale to qualified institutional buyers pursuant to Rule 144A under the Securities Act of 1933. Such securities may be determined to be liquid by the Board of Trustees, the Adviser and/or the sub-adviser, if such determination by the Adviser or the sub-adviser is pursuant to Board-approved guidelines. Such guidelines shall take into account trading activity for such securities and the availability of reliable pricing information, among other factors. If there is a lack of trading interest in particular Rule 144A securities, a Fund’s holdings of those securities may be illiquid, resulting in undesirable delays in selling these securities at prices representing fair value.
Investments may be illiquid because there is no active trading market for them, making it difficult to value them or dispose of them promptly at an acceptable price. The sub-advisers monitor holdings of illiquid securities on an ongoing basis to determine whether to sell any holding to maintain adequate liquidity.
Foreign Securities
The Diversified International Fund, the Overseas Fund, the Fundamental Value Fund, the Large Cap Value Fund, the Indexed Equity Fund, the Core Opportunities Fund, the Value Equity Fund, the Blue Chip Growth Fund, the Large Cap Growth Fund, the Growth Equity Fund, the Aggressive Growth Fund, the Focused Value Fund, the Mid-Cap Value Fund, the Small Cap Value Equity Fund, the Small Company Value Fund, the Small Cap Core Equity Fund, the Mid Cap Growth Equity Fund, the Mid Cap Growth Equity II Fund, the Emerging Growth Fund, the Small Company Growth Fund, the Small Cap Growth Equity Fund, the Strategic Bond Fund and the Strategic Balanced Fund and, to a lesser extent, each of the other Funds, are permitted to invest in foreign securities. Foreign securities include securities of foreign companies and foreign governments (or agencies or subdivisions thereof). The equity segment of the Strategic Balanced Fund does not intend to invest more than 25% of its assets in foreign securities. With the exception of the Funds specifically identified in the preceding sentence, each Fund will normally invest in foreign securities only if: (i) such securities are U.S. dollar-denominated; or (ii) if such securities are not U.S. dollar-denominated, the Fund contemporaneously enters into a foreign currency transaction to hedge the currency risk associated with the particular foreign security. If a Fund’s securities are held abroad, the countries in which such securities may be held and the sub-custodian holding them must be approved by the Board of Trustees or its delegate under applicable rules adopted by the SEC. In buying foreign securities, a Fund may convert U.S. dollars into foreign currency.
B-21
The globalization and integration of the world economic system and related financial markets have made it increasingly difficult to define issuers geographically. Accordingly, the Funds intend to construe geographic terms such as “foreign,” “non-U.S.,” “European, “ “Latin American,” “Asian,” and “emerging markets” in the manner that affords to the Funds the greatest flexibility in seeking to achieve the investment objective(s) of the relevant Fund. Specifically, in circumstances where the investment objective and/or strategy is to invest (a) exclusively in “foreign securities,” “non-U.S. securities” “European securities,” “Latin American securities,” “Asian securities,” or “emerging markets” (or similar directions) or (b) at least some percentage of the Fund’s assets in foreign securities, etc., the Fund will take the view that a security meets this description so long as the issuer of a security is tied economically to the particular country or geographic region indicated by words of the relevant investment objective and/or strategy (the “Relevant Language”). For these purposes the issuer of a security is deemed to have that tie if:
(i) the issuer is organized under the laws of the country or a country within the geographic region suggested by the Relevant Language or maintains its principal place of business in that country or region; or
(ii) the securities are traded principally in the country or region suggested by the Relevant Language; or
(iii) the issuer, during its most recent fiscal year, derived at least 50% of its revenues or profits from goods produced or sold, investments made, or services performed in the country or region suggested by the Relevant Language or has at least 50% of its assets in that country or region.
In addition, the Funds intend to treat derivative securities (e.g., call options) by reference to the underlying security. Conversely, if the investment objective and/or strategy of a Fund limits the percentage of assets that may be invested in “foreign securities,” etc. or prohibits such investments altogether, a Fund intends to categorize securities as “foreign,” etc. only if the security possesses all of the attributes described above in clauses (i), (ii) and (iii).
Foreign securities also include securities of foreign issuers represented by American Depositary Receipts (“ADRs”). ADRs are issued by a U.S. depository institution, but they represent a specified quantity of shares of a non-U.S. stock company. In addition to ADRs, a Fund may invest in sponsored or unsponsored Global Depositary Receipts (“GDRs”) and European Depositary Receipts (“EDRs”) to the extent they become available. GDRs and EDRs are typically issued by foreign depositaries and evidence ownership interests in a security or pool of securities issued by either a foreign or a U.S. corporation. Holders of unsponsored GDRs and EDRs generally bear all the costs associated with establishing them. The depositary of an unsponsored GDR or EDR is under no obligation to distribute shareholder communications received from the underlying issuer or to pass through to the GDR or EDR holders any voting rights with respect to the securities or pools of securities represented by the GDR or EDR. GDRs and EDRs also may not be denominated in the same currency as the underlying securities. Registered GDRs and EDRs are generally designed for use in U.S. securities markets, while bearer form GDRs and EDRs are generally designed for non-U.S. securities markets. Each of the Funds will treat the underlying securities of a GDR or EDR as the investment for purposes of its investment policies and restrictions.
Investments in foreign securities involve special risks and considerations. As foreign companies are not generally subject to uniform accounting, auditing and financial reporting standards, practices and requirements comparable to those applicable to domestic companies, there may be less publicly available information about a foreign company than about a domestic company. For example, foreign markets have different clearance and settlement procedures. Delays in settlement could result in temporary periods when assets of a Fund are uninvested. The inability of a Fund to make intended security purchases due to settlement problems could cause it to miss certain investment opportunities. Foreign securities may also entail certain other risks, such as the possibility of one or more of the following: imposition of dividend or interest withholding or confiscatory taxes, higher brokerage costs, thinner trading markets, currency blockages or transfer restrictions, expropriation, nationalization, military coups or other adverse political or economic developments; less government supervision
B-22
and regulation of securities exchanges, brokers and listed companies; and the difficulty of enforcing obligations in other countries. Purchases of foreign securities are usually made in foreign currencies and, as a result, a Fund may incur currency conversion costs and may be affected favorably or unfavorably by changes in the value of foreign currencies against the U.S. dollar. Further, it may be more difficult for a Fund’s agents to keep currently informed about corporate actions which may affect the prices of portfolio securities. Communications between the United States and foreign countries may be less reliable than within the United States, thus increasing the risk of delayed settlements of portfolio transactions or loss of certificates for portfolio securities. Certain markets may require payment for securities before delivery. A Fund’s ability and decisions to purchase and sell portfolio securities may be affected by laws or regulations relating to the convertibility of currencies and repatriation of assets.
A number of current significant political, demographic and economic developments may affect investments in foreign securities and in securities of companies with operations overseas. The course of any one or more of these events and the effect on trade barriers, competition and markets for consumer goods and services are uncertain. Similar considerations are of concern with respect to developing countries. For example, the possibility of revolution and the dependence on foreign economic assistance may be greater in these countries than in developed countries. Management seeks to mitigate the risks associated with these considerations through diversification and active professional management.
In addition to the general risks of investing in foreign securities, investments in emerging markets involve special risks. Securities of many issuers in emerging markets may be less liquid and more volatile than securities of comparable domestic issuers. Emerging markets may have different clearance and settlement procedures, and in certain markets there have been times when settlements have been unable to keep pace with the volume of securities transactions, making it difficult to conduct such transactions. Delays in settlement could result in temporary periods when a portion of the assets of a Fund is uninvested and no return is earned thereon. The inability of a Fund to make intended security purchases due to settlement problems could cause a Fund to miss attractive investment opportunities. Inability to dispose of portfolio securities due to settlement problems could result in losses to a Fund due to subsequent declines in values of the portfolio securities, decrease in the level of liquidity in a Fund’s portfolio, or, if a Fund has entered into a contract to sell the security, possible liability to the purchaser. Certain markets may require payment for securities before delivery, and in such markets a Fund bears the risk that the securities will not be delivered and that the Fund’s payments will not be returned. Securities prices in emerging markets can be significantly more volatile than in the more developed nations of the world, reflecting the greater uncertainties of investing in less established markets and economies. In particular, countries with emerging markets may have relatively unstable governments, present the risk of nationalization of businesses, or may have restrictions on foreign ownership or prohibitions of repatriation of assets, and may have less protection of property rights than more developed countries. The economies of countries with emerging markets may be predominantly based on only a few industries, may be highly vulnerable to changes in local or global trade conditions, and may suffer from extreme and volatile debt burdens or inflation rates. Local securities markets may trade a small number of securities and may be unable to respond effectively to increases in trading volume, potentially making prompt liquidation of substantial holdings difficult or impossible at times. Securities of issuers located in countries with emerging markets may have limited marketability and may be subject to more abrupt or erratic price movements.
Certain emerging markets may require governmental approval for the repatriation of investment income, capital or the proceeds of sales of securities by foreign investors. In addition, if a deterioration occurs in an emerging market’s balance of payments or for other reasons, a country could impose temporary restrictions on foreign capital remittances. A Fund could be adversely affected by delays in, or a refusal to grant, any required governmental approval for repatriation of capital, as well as by the application to that Fund of any restrictions on investments.
Investment in certain foreign emerging market debt obligations may be restricted or controlled to varying degrees. These restrictions or controls may at times preclude investment in certain foreign emerging market debt obligations and increase the expenses of a Fund.
B-23
When-Issued Securities
Each Fund may purchase securities on a “when-issued” or on a “forward delivery” basis. When such transactions are negotiated, the price is fixed at the time of commitment, but delivery and payment for the securities can take place a month or more after the commitment date. The securities so purchased or sold are subject to market fluctuations, and no interest accrues to the purchaser during this period. At the time of delivery, the securities may be worth more or less than the purchase or sales price. Generally, under normal circumstances, a Fund is expected to take delivery of securities purchased. When a Fund commits to purchase a security on a “when-issued” or on a “forward delivery” basis, it will take actions consistent with SEC policies, which currently recommend that an amount of the Fund’s assets consisting of cash or high-quality debt instruments equal to the amount of the purchase be held aside or segregated to be used to pay for the commitment. Therefore, a Fund would have liquid assets sufficient to cover any commitments. However, there are risks. For example, a Fund may have to sell assets which have been set aside in order to meet redemptions and the Fund may be unable to meet its current obligations. Also, if a Fund determines it necessary to sell the “when-issued” or “forward delivery” securities before delivery, the Fund may incur a loss because of market fluctuations since the time the commitment to purchase the securities was made.
Portfolio Management
The Funds’ sub-advisers use trading as a means of managing the portfolios of the Funds in seeking to achieve their investment objectives. Transactions will occur when a Fund’s sub-adviser believes that the trade, net of transaction costs, will improve interest income or capital appreciation potential, or will lessen capital loss potential. Whether the goals discussed above will be achieved through trading depends on the Fund’s sub-adviser’s ability to evaluate particular securities and anticipate relevant market factors, including interest rate trends and variations from such trends. If such evaluations and expectations prove to be incorrect, a Fund’s income or capital appreciation may be reduced and its capital losses may be increased. In addition, high turnover in a Fund could result in additional brokerage commissions to be paid by that Fund. See also “Taxation” below.
The Funds may pay brokerage commissions to affiliates of one or more affiliates of the Funds’ sub-advisers.
Non-diversification of OTC 100 Fund, Focused Value Fund, Value Equity Fund and Aggressive Growth Fund
As “non-diversified” funds, the OTC 100 Fund, the Focused Value Fund, the Value Equity Fund and the Aggressive Growth Fund are not limited under the 1940 Act in the percentage of its assets that they may invest in any one issuer. However, each Fund intends to comply with the diversification standards applicable to regulated investment companies under the Code. In order to meet those standards, among other requirements, at the close of each quarter of its taxable year (a) at least 50% of the value of the Fund’s total assets must be represented by one or more of the following: (i) cash and cash items, including receivables; (ii) Government securities; (iii) securities of other regulated investment companies; and (iv) securities (other than those in items (ii) and (iii) above) of any one or more issuers as to which the Fund’s investment in an issuer does not exceed 5% of the value of the Fund’s total assets (valued at the time of investment); and does not exceed 10% of the outstanding voting securities of that issuer and (b) not more than 25% of its total assets (valued at the time of investment) may be invested in the securities of any one issuer (other than Government securities or securities of other regulated investment companies).
Since each of these Funds may invest more than 5% of its assets in a single portfolio security, the appreciation or depreciation of such a security will have a greater impact on the net asset value of the Fund, and the net asset value per share of the Fund can be expected to fluctuate more than would the net asset value of a comparable “diversified” fund. The OTC 100 Fund is deemed “non-diversified” because its investment objective is to replicate a particular index, and the Fund will purchase each company in the index in proportion to its proportionate representation in the index.
B-24
Concentration Policy
For purposes of each Fund’s concentration limitation as disclosed in the Prospectus, the Funds apply such policy to direct investments in the securities of issuers in a particular industry, as determined by each Fund’s sub-adviser. Each Fund’s sub-adviser may analyze the characteristics of a particular issuer and security and assign an industry or sector classification consistent with those characteristics in the event that the third party classification provider used by the sub-adviser does not assign a classification or the sub-adviser, in consultation with the Fund’s Chief Compliance Officer, determines that another industry or sector classification is more appropriate.
Other Investment Companies
Certain markets are closed in whole or in part to equity investments by foreigners. A Fund may be able to invest in such markets solely or primarily through governmentally authorized investment vehicles or companies. Each Fund generally may invest up to 10% of its total assets in the aggregate in shares of other investment companies and up to 5% of its assets in any one investment company, as long as no investment represents more than 3% of the outstanding voting stock of the acquired investment company at the time of investment; provided that this provision does not apply, however, to any of the Funds relying on Section 12(d)(1)(F) or Section 12(d)(1)(G) of the 1940 Act. Investment in another investment company may involve the payment of a premium above the value of such issuers’ portfolio securities, and is subject to market availability. The Funds do not intend to invest in such vehicles or funds unless, in the judgment of the Adviser or a Fund’s sub-adviser, and subject to a Fund’s investment restrictions set forth in its Prospectus and Statement of Additional Information, the potential benefits of the investment justify the payment of any applicable premium or sales charge. As a shareholder in an investment company, Fund shareholders would indirectly pay a portion of that investment company’s expenses, including its advisory administration, brokerage, shareholder servicing and other expenses. At the same time a Fund would continue to pay its own management fees and other expenses. This section shall not prevent FMR or T. Rowe Price from investing the assets of the Value Equity Fund, Blue Chip Growth Fund, Mid Cap Growth Equity II Fund or Small Company Value Fund, respectively, into money market funds managed by the Fund’s sub-adviser pursuant to applicable SEC exemptive orders.
Exchange Traded Funds (ETFs)
These are a type of investment company bought and sold on a securities exchange. An ETF represents a fixed portfolio of securities designed to track a particular market index. A Fund could purchase an ETF to temporarily gain exposure to a portion of the U.S. or a foreign market while awaiting purchase of underlying securities. The risks of owning an ETF generally reflect the risks of owning the underlying securities they are designed to track, although lack of liquidity in an ETF could result in it being more volatile and ETFs have management fees which increase their costs. As a shareholder in an ETF, Fund shareholders would indirectly pay a portion of that ETF’s expenses, including its advisory, administration, brokerage, shareholder servicing and other expenses. At the same time a Fund would continue to pay its own management fees and other expenses.
Index-Related Securities (Equity Equivalents)
The Funds may invest in certain types of securities that enable investors to purchase or sell shares in a portfolio of securities that seeks to track the performance of an underlying index or a portion of an index. Such Equity Equivalents include, among others, DIAMONDS (interests in a portfolio of securities that seeks to track the performance of the Dow Jones Industrial Average), SPDRs or Standard & Poor’s Depositary Receipts (interests in a portfolio of securities that seeks to track the performance of the S&P 500 Index), WEBS or World Equity Benchmark Shares (interests in a portfolio of securities that seeks to track the performance of a benchmark index of a particular foreign country’s stocks), and the Nasdaq-100 Trust (interests in a portfolio of securities of the largest and most actively traded non-financial companies listed on the Nasdaq Stock Market). Such securities are similar to index mutual funds, but they are traded on various stock exchanges or secondary
B-25
markets. The value of these securities is dependent upon the performance of the underlying index on which they are based. Thus, these securities are subject to the same risks as their underlying indexes as well as the securities that make up those indices. For example, if the securities comprising an index that an index-related security seeks to track perform poorly, the index-related security will lose value.
Equity Equivalents may be used for several purposes, including to simulate full investment in the underlying index while retaining a cash balance for fund management purposes, to facilitate trading, to reduce transaction costs or to seek higher investment returns where an Equity Equivalent is priced more attractively than securities in the underlying index. Because the expense associated with an investment in Equity Equivalents may be substantially lower than the expense of small investments directly in the securities comprising the indices they seek to track, investments in Equity Equivalents may provide a cost-effective means of diversifying the fund’s assets across a broad range of equity securities.
The prices of Equity Equivalents are derived and based upon the securities held by the particular investment company. Accordingly, the level of risk involved in the purchase or sale of an Equity Equivalent is similar to the risk involved in the purchase or sale of traditional common stock, with the exception that the pricing mechanism for such instruments is based on a basket of stocks. The market prices of Equity Equivalents are expected to fluctuate in accordance with both changes in the net asset values of their underlying indices and the supply and demand for the instruments on the exchanges on which they are traded. Substantial market or other disruptions affecting an Equity Equivalent could adversely affect the liquidity and value of the shares of the fund investing in such instruments.
Cash Positions
Each Fund may hold cash or cash equivalents to provide for expenses and anticipated redemption payments and so that an orderly investment program may be carried out in accordance with the Fund’s investment policies. To provide liquidity, for temporary defensive purposes and to receive a return on uninvested cash during such periods, each Fund may invest in investment grade debt securities, government obligations, or money market instruments or money market mutual funds. In addition to investing for temporary defensive purposes, the equity segment of the Strategic Balanced Fund is permitted to temporarily invest all or a portion of its assets in short-term corporate and government money market instruments, including repurchase agreements with respect to those instruments, when opportunities for capital growth do not appear attractive.
Short Sales Against-the-box
Selling short “against-the-box” refers to the sale of securities actually owned by the seller but held in safekeeping. In such short sales, while the short position is open, a Fund must own an equal amount of such securities, or by virtue of ownership of securities have the right, without payment of further consideration, to obtain an equal amount of securities sold short. Short sales against-the-box generally produce current recognition of gain (but not loss) for federal income tax purposes on the constructive sale of securities “in the box” prior to the time the short position is closed out. None of the Funds currently intends to engage in short sales against-the-box but is permitted to do so.
U.S. Government Securities
The Funds may invest in U.S. Government securities. These include obligations issued or guaranteed by the U.S. Government or any of its agencies or instrumentalities. Payment of principal and interest on U.S. Government obligations (i) may be backed by the full faith and credit of the United States (as with U.S. Treasury obligations and GNMA certificates) or (ii) may be backed solely by the issuing or guaranteeing agency or instrumentality itself (as with FNMA notes). In the latter case, the investor must look principally to the agency or instrumentality issuing or guaranteeing the obligation for ultimate repayment. Such agency or instrumentality may be privately owned. There can be no assurance that the U.S. Government would provide financial support to
B-26
its agencies or instrumentalities where it is not obligated to do so. U.S. Government securities are subject to interest rate risk, and, in some cases, may be subject to credit risk. As a general matter, the value of debt instruments, including U.S. Government obligations, declines when market interest rates increase and rises when market interest rates decrease. Certain types of U.S. Government obligations are subject to fluctuations in yield or value due to their structure or contract terms.
Investment Basket
Notwithstanding any Fund’s fundamental investment restrictions (except those imposed as a matter of law), the Board of Trustees may authorize one or more of the Funds to invest in any type of security or instrument, or to engage in any type of transaction or practice, such as newly developed debt securities, hedging programs or derivatives, so long that the Board of Trustees has determined that to do so is consistent with the Fund’s investment objectives and policies and has adopted reasonable guidelines for use by the Fund’s investment sub-advisers, and provided further that at the time of making such investment or entering into such transaction, such investments or instruments account for not more than 10% of the Fund’s total assets. The Trust has no current intention of using this investment basket authority but is permitted to do so.
Banking Relationships
NTI and its affiliates, including its parent Northern Trust Corporation, deal, trade and invest for their own account in the types of securities in which the Indexed Equity Fund and OTC 100 Fund may invest and may have deposit, loan and commercial banking relationships with the issuers of securities purchased by these Funds.
Disclaimer
The Indexed Equity Fund is not sponsored, endorsed, sold or promoted by Standard & Poor’s® (“S&P®”). S&P makes no representation or warranty, express or implied, to the Fund or any member of the public regarding the advisability of investing in securities generally or in the Fund particularly or the ability of the S&P 500 Index to track general stock market performance. S&P’s only relationship to the Fund is the licensing of certain trademarks and trade names of S&P without regard to the Fund. S&P has no obligation to take the needs of the Fund into consideration in determining, composing or calculating the S&P 500 Index. S&P is not responsible for and has not participated in the determination of the prices and amount of the Fund’s shares or the timing of the issuance or sale of the Fund’s shares or in the determination or calculation of the equation by which the Fund’s shares are to be converted into cash. S&P has no obligation or liability in connection with the administration, marketing or trading of the Fund’s shares.
S&P does not guarantee the accuracy and/or the completeness of the S&P 500 Index or any data included therein and S&P shall have no liability for any errors, omissions, or interruptions therein. S&P makes no warranty, express or implied, as to results to be obtained by the Fund, or any other person or entity from the use of the S&P 500 Index or any data included therein. S&P makes no express or implied warranties, and expressly disclaims all warranties of merchantability or fitness for a particular purpose or use with respect to the S&P 500 Index or any data included therein. Without limiting any of the foregoing, in no event shall S&P have any liability for any special, punitive, indirect, or consequential damages (including lost profits), even if notified of the possibility of such damages.
The OTC 100 Fund is not sponsored, endorsed, sold or promoted by the NASDAQ Stock Market, Inc. (together with its affiliates, “NASDAQ”). NASDAQ has not passed on the legality or suitability of, or the accuracy or adequacy of descriptions and disclosures relating to, the Fund contained in the prospectus or this statement of additional information. NASDAQ makes no representation or warranty, express or implied, to the owners of the Fund or any member of the public regarding the advisability of investing in securities generally or in the Fund particularly, or the ability of the NASDAQ 100 Index to track general stock market performance. NASDAQ’s only relationship to the Fund is in the licensing of the NASDAQ 100®, NASDAQ 100 Index, and
B-27
NASDAQ® trademarks or service marks, and certain trade names of NASDAQ and the use of the NASDAQ 100 Index. The NASDAQ 100 Index is determined, composed and calculated by NASDAQ without regard to the Fund. NASDAQ has no obligation to take the needs of the Fund into consideration in determining, composing or calculating the NASDAQ 100 Index. NASDAQ is not responsible and has no liability for, and has not participated in, the determination of the timing of, prices at, or quantities of the Fund to be issued or in the determination or calculation of the net asset value of the Fund’s shares or in connection with the administration, marketing or trading of the product(s).
NASDAQ does not guarantee the accuracy or completeness of the NASDAQ 100 Index or of the data used to calculate the index or determine the index components, or the uninterrupted or un-delayed calculation or dissemination of the index. NASDAQ does not guarantee that the index accurately reflects past, present, or future market performance. NASDAQ is not responsible for any manipulation or attempted manipulation of the index by members of the NASD. NASDAQ is free to pick and alter the components and method of calculation without consideration of the Fund or the consent of the adviser or sub-adviser. NASDAQ makes no warranty, express or implied, as to results to be obtained by the Fund, owners of the Fund’s shares, or any other person or entity from the use of the NASDAQ 100 Index or any data included therein. NASDAQ makes no express or implied warranties, and expressly disclaims all warranties of merchantability or fitness for a particular purpose or use with respect to the NASDAQ 100 Index or any data included therein. Without limiting any of the foregoing, in no event shall NASDAQ have any liability for any lost profits or special, incidental, punitive, indirect, or consequential damages, even if notified of the possibility of such damages.
DISCLOSURE OF PORTFOLIO HOLDINGS
The Trustees of the Funds, including a majority of directors who are not “interested persons” of the Funds (as defined in the Investment Company Act of 1940, as amended (the “1940 Act”)), have adopted policies and procedures with respect to the disclosure of the Funds’ portfolio holdings. These policies and procedures generally provide that no disclosure of portfolio holdings information may be made unless publicly disclosed as described below or made to the Funds’ adviser, sub-advisers, or any of their affiliates who provide services to the Funds. Certain limited exceptions pursuant to the Funds’ policies and procedures are described below. The Funds’ portfolio holdings information may not be disseminated for compensation. Any exceptions to the Funds’ policies and procedures may be made only if approved in writing by the Funds’ Principal Executive Officer and the Chief Compliance Officer as being in the best interests of the relevant Fund, and then only if the recipients are subject to a confidentiality agreement as described below. Any such exceptions must be reported to the Funds’ Board of Trustees at its next regularly scheduled meeting.
MassMutual and the Funds’ sub-advisers are primarily responsible for compliance with these policies and procedures, which includes maintaining such internal informational barriers (e.g., “Chinese walls”) as each believes are reasonably necessary for preventing the unauthorized disclosure of portfolio holdings information. Pursuant to Rule 38a-1 under the 1940 Act, the Trustees will periodically (at least annually) receive reports from the Funds’ Chief Compliance Officer regarding the operation of these policies and procedures, including a confirmation by the Chief Compliance Officer that MassMutual’s and the sub-advisers’ policies, procedures and/or processes are reasonably designed to comply with the Funds’ policies and procedures in this regard.
Public Disclosures
The Funds’ portfolio holdings are currently disclosed to the public through required filings with the SEC and as described below. The Funds file their portfolio holdings with the SEC for each fiscal quarter on Form N-CSR (with respect to each annual period and semi-annual period) and Form N-Q (with respect to the first and third quarters of the Funds’ fiscal year) no later than 60 days after the end of the applicable quarter. Shareholders may obtain the Funds’ Form N-CSR and N-Q filings on the SEC’s Web site at http://www.sec.gov. In addition, the Funds’ Form N-CSR and N-Q filings may be reviewed and copied at the SEC’s public reference room in Washington, D.C. You may call the SEC at 1-800-SEC-0330 for information about the SEC’s Web site or the operation of the public reference room.
B-28
The Funds’ most recent portfolio holdings as of the end of February, May, August and November are available on http://www.massmutual.com/retire no earlier than 30 days after the end of each of these respective months. In addition, each Fund’s top ten holdings are made available in quarterly reports and on http://www.massmutual.com/retire as soon as possible after each calendar quarter-end.
Other Disclosures
To the extent permitted under applicable law, MassMutual and the Funds’ sub-advisers may distribute (or authorize the Funds’ custodian to distribute) information regarding the Funds’ portfolio holdings more frequently than as provided above on a confidential basis to various service providers and others who require such information in order to fulfill their contractual duties with respect to the Funds. These service providers include the Funds’ custodian and sub-administrator (Investors Bank & Trust Company), the Funds’ independent registered public accounting firm (Deloitte & Touche LLP), legal counsel (Ropes & Gray LLP), financial printer (R.R. Donnelley), any proxy voting service employed by the Funds, MassMutual, or any of the Funds’ sub-advisers, and any pricing services employed by the Funds. The Funds may also periodically provide non-public information about their portfolio holdings to rating and ranking organizations, such as Lipper Inc. and Morningstar Inc., in connection with those firms’ research on and classification of the Funds and in order to gather information about how the Funds’ attributes (such as volatility, turnover, and expenses) compared with those of peer funds.
Such disclosures may be made only if (i) the recipients of such information are subject to a written confidentiality agreement specifying that the Funds’ portfolio holdings information is the confidential property of the Funds and may not be used for any purpose except in connection with the provision of services to the Funds and, in particular, that such information may not be traded upon; and (ii) if the Funds’ Chief Compliance Officer (or a person designated by the Chief Compliance Officer) determines that, under the circumstances, disclosure is in the best interests of the relevant Fund’s shareholders. The information distributed is limited to the information that MassMutual or the relevant sub-adviser believes is reasonably necessary in connection with the services provided by the service provider receiving the information.
INVESTMENT RESTRICTIONS OF THE FUNDS
FUNDAMENTAL INVESTMENT RESTRICTIONS OF THE FUNDS
(other than the Indexed Equity Fund, Value Equity Fund and Blue Chip Growth Fund)
Each Fund is subject to certain fundamental restrictions on its investments, which may not be changed without the affirmative vote of a majority of the outstanding shares of that Fund. Investment restrictions that appear below or elsewhere in this SAl and in the Prospectus which involve a maximum percentage of securities or assets shall not be considered to be violated unless an excess over the percentage occurs immediately after, and is caused by, an acquisition or encumbrance of securities or assets of, or borrowings by or on behalf of, a Fund. The Trust may not, on behalf of any Fund:
(1) Purchase any security (other than U.S. Treasury securities or U.S. Government Securities) if as a result, with respect to 75% of the Fund’s assets, more than 5% of the value of the total assets (determined at the time of investment) of a Fund would be invested in the securities of a single issuer. This restriction is not applicable to the OTC 100 Fund, the Aggressive Growth Fund and the Focused Value Fund.
(2) Borrow money, except from banks for temporary or emergency purposes not in excess of one-third of the value of a Fund’s assets, except that a Fund may enter into reverse repurchase agreements or roll transactions. For purposes of calculating this limitation, entering into portfolio lending agreements shall not be deemed to constitute borrowing money. A Fund would not make any additional investments while its borrowings exceeded 5% of its assets.
(3) Issue senior securities (as defined in the 1940 Act) except for securities representing indebtedness not prevented by paragraph (2) above.
B-29
(4) Make short sales, except for sales “against-the-box.”
(5) Act as an underwriter, except to the extent that, in connection with the disposition of portfolio securities, a Fund may be deemed an underwriter under applicable laws.
(6) Invest in oil, gas or other mineral leases, rights, royalty contracts or exploration or development programs, real estate or real estate mortgage loans. This restriction does not prevent a Fund from purchasing readily marketable securities secured or issued by companies investing or dealing in real estate and by companies that are not principally engaged in the business of buying and selling such leases, rights, contracts or programs.
(7) Purchase physical commodities or commodity contracts (except futures contracts, including but not limited to contracts for the future delivery of securities and futures contracts based on securities indices).
(8) Make loans other than by investing in obligations in which a Fund may invest consistent with its investment objective and policies and other than repurchase agreements and loans of portfolio securities.
(9) Pledge, mortgage or hypothecate assets taken at market to an extent greater than 15% of the total assets of the Fund except in connection with permitted transactions in options, futures contracts and options on futures contracts, reverse repurchase agreements and securities lending.
(10) With the exception of the Strategic Bond Fund, the Strategic Balanced Fund, the Diversified Value Fund, the Core Opportunities Fund, the Large Cap Growth Fund, the Growth Equity Fund, the Aggressive Growth Fund, the Mid-Cap Value Fund, the Small Cap Value Equity Fund, the Small Cap Core Equity Fund, the Mid Cap Growth Equity Fund, the Mid Cap Growth Equity II Fund, the Emerging Growth Fund, the Small Cap Growth Equity Fund, the Small Company Growth Fund, the Diversified International Fund, the Overseas Fund and the Destination Retirement Funds, purchase any security (other than securities issued, guaranteed or sponsored by the U.S. Government or its agencies or instrumentalities) if, as a result, a Fund would hold more than 10% of the outstanding voting securities of an issuer. This restriction is applicable to 75% of the assets of the excepted Funds.
(11) With the exception of the Strategic Bond Fund, the Strategic Balanced Fund, the Diversified Value Fund, the Core Opportunities Fund, the Large Cap Growth Fund, the Growth Equity Fund, the Aggressive Growth Fund, the Mid-Cap Value Fund, the Small Cap Value Equity Fund, the Small Cap Core Equity Fund, the Mid Cap Growth Equity Fund, the Mid Cap Growth Equity II Fund, the Emerging Growth Fund, the Small Cap Growth Equity Fund, the Small Company Growth Fund, the Diversified International Fund and the Destination Retirement Funds, purchase or retain securities of any issuer if, to the knowledge of the Trust, more than 5% of such issuer’s securities are beneficially owned by officers and trustees of the Trust or officers and directors of its adviser who individually beneficially own more than 1/2 of 1% of the securities of such issuer.
Reverse repurchase agreements and dollar roll transactions are borrowings subject to limitation (2) above.
Notwithstanding any fundamental investment restriction set forth above or in the Prospectus, each Fund may: (1) engage in hedging transactions, techniques, and practices using forward contracts and similar instruments, to the extent and in a manner permitted by law; and (2) invest in any security or investment-related instrument, or engage in any investment-related transaction or practice, provided that the Board of Trustees has determined that to do so is consistent with the investment objective and policies of the Fund and has adopted reasonable guidelines for use by the Fund’s Adviser and/or sub-adviser, and provided further that at the time of entering into such investment or transaction, such investments or instruments account for no more than 10% of the Fund’s total assets. This does not apply to the Destination Retirement Funds’ investments in underlying funds.
B-30
NON-FUNDAMENTAL INVESTMENT RESTRICTIONS OF THE FUNDS
(other than the Indexed Equity Fund, Value Equity Fund and Blue Chip Growth Fund)
In addition to the fundamental investment restrictions described above, the Board of Trustees of the Trust has voluntarily adopted certain policies and restrictions which are observed in the conduct of the affairs of the Funds. These represent intentions of the Trustees based upon current circumstances. They differ from fundamental investment restrictions in that the following additional investment restrictions may be changed or amended by action of the Trustees without requiring prior notice to or approval of shareholders.
In accordance with such policies and guidelines, each Fund may not:
(1) Invest for the purpose of exercising control over, or management of, any company.
(2) With the exception of the Destination Retirement Funds, invest in securities of other investment companies, except by purchase in the open market where no commission or profit to a sponsor or dealer results from such purchase other than the customary broker’s commission, except when such purchase is part of a plan of merger, consolidation, reorganization or acquisition or except shares of money market funds advised by MassMutual or an affiliate thereof. It is expected that a Fund would purchase shares of such money market funds only if arrangements are made to eliminate duplicate advisory and distribution fees, except this restriction shall not prohibit the investment by the Mid Cap Growth Equity II Fund or the Small Company Value Fund in money market funds managed by T. Rowe Price pursuant to an exemptive order.
(3) To the extent that shares of the Fund are purchased or otherwise acquired by other series of the Trust, acquire any securities of registered open-end investment companies or registered unit investment trusts in reliance on Section 12(d)(1)(F) or Section 12(d)(1)(G) of the 1940 Act, except this restriction shall not prohibit the investment by the Mid Cap Growth Equity II Fund or the Small Company Value Fund in money market funds managed by T. Rowe Price pursuant to an exemptive order.
In addition, the Strategic Balanced Fund may not:
(1) Invest more than 5.00% of the value of the Fund’s total assets in the securities of any issuer which has been in continuous operation for less than three years. This restriction does not apply to U.S. government securities.
(2) Purchase warrants if, thereafter, more than 2.00% of the value of the Fund’s net assets would consist of such warrants, but warrants attached to other securities acquired in units by the Fund are not subject to this restriction.
Notwithstanding the foregoing investment limitations, the underlying funds in which the Destination Retirement Funds may invest have adopted certain investment limitations that may be more or less restrictive than those listed above, thereby permitting a Destination Retirement Fund to engage indirectly in investment strategies that are prohibited under the investment limitations listed above.
In accordance with each Destination Retirement Fund’s investment program as set forth in the prospectus, a Destination Retirement Fund may invest more than 25% of its assets in any one underlying fund. While each Destination Retirement Fund does not intend to concentrate its investments in a particular industry, a Destination Retirement Fund may indirectly concentrate in a particular industry or group of industries through its investments in one or more underlying funds.
B-31
FUNDAMENTAL INVESTMENT RESTRICTIONS OF THE INDEXED EQUITY FUND
The Indexed Equity Fund is subject to certain fundamental restrictions on its investments, which may not be changed without the affirmative vote of a majority of the outstanding shares of the Fund. Investment restrictions that appear below or elsewhere in this Statement of Additional Information and in the Prospectus which involve a maximum percentage of securities or assets shall not be considered to be violated (except with respect to restriction No. 7 below) unless an excess over the percentage occurs immediately after, and is caused by, an acquisition or encumbrance of securities or assets of, or borrowings by or on behalf of, the Fund. The Trust may not, on behalf of the Fund:
(1) purchase the securities of issuers conducting their principal business activity in the same industry if, immediately after the purchase and as a result thereof, the value of the Fund’s investments in that industry would be 25% or more of the current value of the Fund’s total assets, provided that there is no limitation with respect to investments in (i) obligations of the U.S. Government, its agencies of instrumentalities, and (ii) any industry in which the S&P 500® Index becomes concentrated to the same degree during the same period and provided further, that the Fund may invest all its assets in a diversified open-end management investment company, or series thereof, with substantially the same investment objective, policies and restrictions as the Fund, without regard for the limitations set forth in this paragraph (1);
(2) purchase or sell real estate or real estate limited partnerships (other than securities secured by real estate or interests therein or securities issued by companies that invest in real estate or interests therein);
(3) purchase commodities or commodity contracts, except that the Fund may purchase securities of an issuer which invests or deals in commodities or commodity contracts, and except that the Fund may purchase and sell (i.e., write) options, forward contracts, futures contracts, including those relating to indexes, and options on futures contracts or indexes;
(4) purchase securities on margin (except for short-term credit necessary for the clearance of transactions and except for margin deposits in connection with options, forward contracts, futures contracts, including those related to indexes, and options on futures contracts or indexes);
(5) act as an underwriter of securities of other issuers, except to the extent that the Fund may be deemed an underwriter under the Securities Act of 1933, as amended (the “1933 Act”), by virtue of disposing of portfolio securities and provided further, that the purchase buy the Fund of securities issued by a diversified, open-end management investment company, or its series thereof, with substantially the same investment objective, policies and restrictions as the Fund shall not constitute acting as an underwriter for purposes of this paragraph (5);
(6) issue senior securities, except as permitted by the 1940 Act;
(7) borrow money, except as permitted by the 1940 Act. The 1940 Act currently permits the Fund to borrow from any bank; provided, that immediately after any such borrowing there is an asset coverage of at least 300 per centum for all borrowings of the Fund; and provided further, that in the event that such asset coverage shall at any time fall below 300 per centum the Fund shall, within three days thereafter (not including Sundays and holidays) or such longer period as the SEC may prescribe by rules and regulations, reduce the amount of its borrowings to an extent that the asset coverage of such borrowings shall be at least 300 per centum. For purposes of this investment restriction, the Fund’s entry into options, forward contracts, futures contracts, including those relating to indexes, and options on futures contracts or indexes shall not constitute borrowing to the extent certain segregated accounts are established and maintained by the Fund;
(8) purchase securities of any issuer (except securities issued or guaranteed by the U.S. Government, its agencies and instrumentalities or other investment companies) if, as a result, with respect to 75% of its total assets (i) more than 5% of the value of the Fund’s total assets would be invested in the securities of that issuer or (ii) the Fund’s ownership would be more than 10% of the outstanding voting securities of such issuer; or
(9) make loans, except that the Fund may purchase or hold debt instruments or lend its portfolio securities in accordance with its investment policies, and may enter into repurchase agreements.
B-32
NON-FUNDAMENTAL INVESTMENT RESTRICTIONS OF THE INDEXED EQUITY FUND
In addition to the fundamental investment restrictions described above, the Trustees of the Trust have voluntarily adopted certain policies and restrictions which are observed in the conduct of the affairs of the Indexed Equity Fund. These represent intentions of the Trustees based upon current circumstances. They differ from fundamental investment restrictions in that the following additional investment restrictions may be changed or amended by action of the Trustees without requiring prior notice to or approval of shareholders.
In accordance with such policies and guidelines, the Fund:
(1) may not, unless required by its investment strategy of replicating the composition of a published market index, purchase securities of issuers who, with their predecessors, have been in existence less than three years, unless the securities are fully guaranteed or insured by the U.S. Government, a state, commonwealth, possession, territory, the District of Columbia or by an entity in existence at least three years, or the securities are backed by the assets and revenues of any of the foregoing if, by reason thereof, the value of its aggregate investments in such securities will exceed 5% of its total assets;
(2) reserves the right to invest up to 15% of the current value of its net assets in fixed time deposits that are subject to withdrawal penalties and that have maturities of more than seven days, repurchase agreements maturing in more than seven days, and other illiquid securities, provided that in circumstances where fluctuations in value result in the Fund’s investment in illiquid securities constituting more than 15% of the current value of its net assets, the Fund will take reasonable steps to reduce its investments in illiquid securities until such investments constitute no more than 15% of the Fund’s net assets;
(3) may not purchase, sell or write puts, calls or combinations thereof, except as may be described in this Statement of Additional Information and the Fund’s Prospectus; and
(4) may invest in shares of other open-end, management investment companies, subject to the limitations of Section 12(d)(1) of the 1940 Act.
FUNDAMENTAL INVESTMENT RESTRICTIONS OF
THE BLUE CHIP GROWTH FUND
The following policies and limitations supplement those set forth in the prospectus. Unless otherwise noted, whenever an investment policy or limitation states a maximum percentage of the Blue Chip Growth Fund’s assets that may be invested in any security or other asset, or sets forth a policy regarding quality standards, such standard or percentage limitation will be determined immediately after and as a result of the Fund’s acquisition of such security or other asset. Accordingly, any subsequent change in values, net assets, or other circumstances will not be considered when determining whether the investment complies with the Fund’s investment policies and limitations.
A Fund’s fundamental investment policies and limitations cannot be changed without approval by a “majority of the outstanding voting securities” (as defined in the Investment Company Act of 1940 (the 1940 Act)) of the Fund. However, except for the fundamental investment limitations listed below, the investment policies and limitations described in this SAI are not fundamental and may be changed without shareholder approval.
The Fund may not:
(1) with respect to 75% of the Fund’s total assets, purchase the securities of any issuer (other than securities issued or guaranteed by the U.S. Government or any of its agencies or instrumentalities, or securities of other investment companies) if, as a result, (a) more than 5% of the Fund’s total assets would be invested in the securities of that issuer, or (b) the Fund would hold more than 10% of the voting securities of that issuer;
B-33
(2) issue senior securities, except as permitted under the Investment Company Act of 1940, as amended;
(3) borrow money, except that the Fund may borrow money for temporary or emergency purposes (not for leveraging or investment) in an amount not exceeding 33 1/3 of its total assets (including the amount borrowed) less liabilities (other than borrowings). Any borrowings that come to exceed this amount will be reduced within three days (not including Sundays and holidays) to the extent necessary to comply with the 33 1/3% limitation;
(4) underwrite securities issued by others, except to the extent that the Fund may be considered an underwriter within the meaning of the Securities Act of 1933 in the disposition of restricted securities or in connection with investments in other investment companies;
(5) purchase the securities of any issuer (other than securities issued or guaranteed by the U.S. government or any of its agencies or instrumentalities), if, as a result, more than 25% of the Fund’s total assets would be invested in companies whose principal business activities are in the same industry;
(6) purchase or sell real estate unless acquired as a result of ownership of securities or other instruments (but this shall not prevent the Fund from investing in securities or other instruments backed by real estate or securities of companies engaged in the real estate business);
(7) purchase or sell physical commodities unless acquired as a result of ownership of securities or other instruments (but this shall not prevent the Fund from purchasing or selling options and futures contracts or from investing in securities or other instruments backed by physical commodities); and
(8) lend any security or make any loan if, as a result, more than 33 1/3% of its total assets would be lent to other parties, but this limitation does not apply to purchases of debt securities or to repurchase agreements, or to acquisitions of loans, loan participations or other forms of debt instruments.
(9) The Fund may, notwithstanding any other fundamental policy or limitation, invest all of its assets in the securities of a single open-end management investment company managed by the Fund’s sub-adviser or an affiliate or successor with substantially the same fundamental investment objective, policies and limitations as the Fund.
NON-FUNDAMENTAL INVESTMENT RESTRICTIONS OF
THE BLUE CHIP GROWTH FUND
In addition to the fundamental investment restrictions described above, the Trustees of the Trust have voluntarily adopted certain policies and restrictions which are observed in the conduct of the affairs of the Blue Chip Growth Fund. These represent intentions of the Trustees based upon current circumstances. They differ from fundamental investment restrictions in that the following additional investment restrictions may be changed or amended by action of the Trustees without requiring prior notice to or approval of shareholders.
In accordance with such policies and guidelines, the Fund:
(1) does not currently intend to sell securities short, unless it owns or has the right to obtain securities equivalent in kind and amount to the securities sold short, and provided that transactions in futures contracts and options are not deemed to constitute selling securities short.
(2) does not currently intend to purchase securities on margin, except that the Fund may obtain such short-term credits as are necessary for the clearance of transactions, and provided that margin payments in connection with futures contracts and options on futures contracts shall not constitute purchasing securities on margin.
(3) may borrow money only (a) from a bank or (b) by engaging in reverse repurchase agreements with any party (reverse repurchase agreements are treated as borrowings for purposes of fundamental investment limitation (3)).
B-34
(4) does not currently intend to purchase any security if, as a result, more than 15% of its net assets would be invested in securities that are deemed to be illiquid because they are subject to legal or contractual restrictions on resale or because they cannot be sold or disposed of in the ordinary course of business at approximately the prices at which they are valued.
(5) does not currently intend to lend assets other than securities to other parties, except by assuming any unfunded commitments in connection with the acquisition of loans, loan participations or other forms of direct debt instruments. (This limitation does not apply to purchases of debt securities, to repurchase agreements, or to acquisitions of loans, loan participations or other forms of debt instruments.)
(6) does not currently intend to invest all of its assets in the securities of a single open-end management investment company managed by the Fund’s sub-adviser or an affiliate or successor with substantially the same fundamental investment objective, policies and limitations as the Fund.
With respect to limitation (4), if, through a change in values, net assets, or other circumstances, the Fund were in a position where more than 15% of its net assets was invested in illiquid securities, it would consider appropriate steps to protect liquidity.
FUNDAMENTAL INVESTMENT RESTRICTIONS OF THE VALUE EQUITY FUND
The following policies and limitations supplement those set forth in the prospectus. Unless otherwise noted, whenever an investment policy or limitation states a maximum percentage of the Value Equity Fund’s assets that may be invested in any security or other asset, or sets forth a policy regarding quality standards, such standard or percentage limitation will be determined immediately after and as a result of the Fund’s acquisition of such security or other asset. Accordingly, any subsequent change in values, net assets, or other circumstances will not be considered when determining whether the investment complies with the Fund’s investment policies and limitations.
A Fund’s fundamental investment policies and limitations cannot be changed without approval by a “majority of the outstanding voting securities” (as defined in the Investment Company Act of 1940 (the 1940 Act)) of the Fund. However, except for the fundamental investment limitations listed below, the investment policies and limitations described in this SAI are not fundamental and may be changed without shareholder approval.
The Fund may not:
(1) issue senior securities, except as permitted under the Investment Company Act of 1940, as amended;
(2) borrow money, except that the Fund may borrow money for temporary or emergency purposes (not for leveraging or investment) in an amount not exceeding 33 1/3% of its total assets (including the amount borrowed) less liabilities (other than borrowings). Any borrowings that come to exceed this amount will be reduced within three days (not including Sundays and holidays) to the extent necessary to comply with the 33 1/3% limitation;
(3) underwrite securities issued by others, except to the extent that the Fund may be considered an underwriter within the meaning of the Securities Act of 1933 in the disposition of restricted securities or in connection with investments in other investment companies.
(4) purchase the securities of any issuer (other than securities issued or guaranteed by the U.S. government or any of its agencies or instrumentalities), if, as a result, more than 25% of the Fund’s total assets would be invested in companies whose principal business activities are in the same industry;
(5) purchase or sell real estate unless acquired as a result of ownership of securities or other instruments (but this shall not prevent the Fund from investing in securities or other instruments backed by real estate or securities of companies engaged in the real estate business);
B-35
(6) purchase or sell physical commodities unless acquired as a result of ownership of securities or other instruments (but this shall not prevent the Fund from purchasing or selling options and futures contracts or from investing in securities or other instruments backed by physical commodities); and
(7) lend any security or make any loan if, as a result, more than 33 1/3% of its total assets would be lent to other parties, but this limitation does not apply to purchases of debt securities or to repurchase agreements, or to acquisitions of loans, loan participations or other forms of debt instruments.
(8) The Fund may, notwithstanding any other fundamental policy or limitation, invest all of its assets in the securities of a single open-end management investment company managed by the Fund’s sub-adviser or an affiliate or successor with substantially the same fundamental investment objective, policies and limitations as the Fund.
NON-FUNDAMENTAL INVESTMENT RESTRICTIONS OF THE VALUE EQUITY FUND
In addition to the fundamental investment restrictions described above, the Trustees of the Trust have voluntarily adopted certain policies and restrictions which are observed in the conduct of the affairs of the Value Equity Fund. These represent intentions of the Trustees based upon current circumstances. They differ from fundamental investment restrictions in that the following additional investment restrictions may be changed or amended by action of the Trustees without requiring prior notice to or approval of shareholders.
In accordance with such policies and guidelines, the Fund:
(1) in order to qualify as a “regulated investment company” under Subchapter M of the Internal Revenue Code of 1986, as amended, currently intends to comply with certain diversification limits imposed by Subchapter M.
(2) does not currently intend to sell securities short, unless it owns or has the right to obtain securities equivalent in kind and amount to the securities sold short, and provided that transactions in futures contracts and options are not deemed to constitute selling securities short.
(3) does not currently intend to purchase securities on margin, except that the Fund may obtain such short-term credits as are necessary for the clearance of transactions, and provided that margin payments in connection with futures contracts and options on futures contracts shall not constitute purchasing securities on margin.
(4) may borrow money only (a) from a bank or from a registered investment company or fund for which the Fund’s sub-adviser or an affiliate serves as investment adviser or (b) by engaging in reverse repurchase agreements with any party (reverse repurchase agreements are treated as borrowings for purposes of fundamental investment limitation (2)).
(5) does not currently intend to purchase any security if, as a result, more than 15% of its net assets would be invested in securities that are deemed to be illiquid because they are subject to legal or contractual restrictions on resale or because they cannot be sold or disposed of in the ordinary course of business at approximately the prices at which they are valued.
(6) does not currently intend to lend assets other than securities to other parties, except by (a) lending money (up to 15% of the Fund’s net assets) to a registered investment company or portfolio for which the Fund’s sub-adviser or an affiliate serves as investment adviser or (b) assuming any unfunded commitments in connection with the acquisition of loans, loan participations or other forms of direct debt instruments. (This limitation does not apply to purchases of debt securities, to repurchase agreements, or to acquisitions of loans, loan participations or other forms of debt instruments.)
For purposes of limitation (1), Subchapter M generally requires the Fund to invest no more than 25% of its total assets in securities of any one issuer and to invest at least 50% of its total assets so that (a) no more than 5%
B-36
of the Fund’s total assets are invested in the securities of any one issuer, and (b) the Fund does not hold more than 10% of the outstanding voting securities of that issuer. However, Subchapter M allows unlimited investments in cash, cash items and government securities (as defined by Subchapter M) and securities of other investment companies. These tax requirements are generally applied at the end of each quarter of the Fund’s taxable year.
With respect to limitation (5), if, through a change in values, net assets, or other circumstances, the Fund were in a position where more than 15% of its net assets was invested in illiquid securities, it would consider appropriate steps to protect liquidity.
MANAGEMENT OF THE TRUST
The Trust has a Board of Trustees, a majority of which must not be “interested persons” (as defined in the 1940 Act) of the Trust. The Board of Trustees of the Trust is generally responsible for management of the business and affairs of the Trust. The Trustees formulate the general policies of the Trust and the Funds, approve contracts and authorize Trust officers to carry out the decisions of the Board. To assist them in this role, the Trustees who are not “interested persons” of the Trust (“Disinterested Trustees”) have retained independent legal counsel. As Adviser and sub-advisers to the Funds, respectively, MassMutual, AllianceBernstein, ClearBridge, Clover, Cooke & Bieler, Davis, DMC, Eagle, EARNEST Partners, FMR, GMO, GSAM, Harris, Insight Capital, Mazama, MFS, Navellier, NTI, Sands Capital, SSgA FM, T. Rowe Price, Victory, Waddell & Reed, Wellington Management, Western Asset and WAML may be considered part of the management of the Trust. The Trustees and principal officers of the Trust are listed below together with information on their positions with the Trust, address, age, principal occupations during the past five years and other principal business affiliations.
Disinterested Trustees
| | |
Richard H. Ayers | | Trustee of the Trust |
1295 State Street | | |
Springfield, MA 01111 | | |
Age: 64 | | |
Trustee since 1996 | | |
Trustee of 49 portfolios in fund complex | | |
Retired; former adviser to Chairman (1997), Chairman and Chief Executive Officer (1989-1996) and Director (1985-1996), The Stanley Works (manufacturer of tools, hardware and specialty hardware products); Director, Applera Corporation; Trustee (since 1999), Advisory Board Member (1996-1999), MML Series Investment Fund (open-end investment company).
| | |
Allan W. Blair | | Trustee of the Trust |
1295 State Street | | |
Springfield, MA 01111 | | |
Age: 58 | | |
Trustee since 2003 | | |
Trustee of 49 portfolios in fund complex | | |
President and Chief Executive Officer (since 1996), Economic Development Council of Western Massachusetts; President and Chief Executive Officer (1993-2006), Westmass Area Development Corporation; President and Chief Executive Officer (since 1984), Westover Metropolitan Development Corporation; Director (since 2001), Future Works, Inc.; Trustee (since 2003), MML Series Investment Fund (open-end investment company).
B-37
| | |
Mary E. Boland | | Trustee of the Trust |
1295 State Street | | |
Springfield, MA 01111 | | |
Age: 67 | | |
Trustee since 1994 | | |
Trustee of 49 portfolios in fund complex | | |
Attorney-at-Law (since 2004); Attorney-at-Law (1965-2004), Egan, Flanagan and Cohen, P.C. (law firm), Springfield, MA; Director (since 1999), BankNorth Massachusetts; Trustee (since 1973), MML Series Investment Fund (open-end investment company).
| | |
Richard W. Greene | | Chairman and Trustee of the Trust |
1295 State Street | | |
Springfield, MA 01111 | | |
Age: 71 | | |
Trustee since 1996 | | |
Trustee of 49 portfolios in fund complex | | |
Retired; Vice President for Investments and Treasurer (1998-2000), Executive Vice President and Treasurer (1986-1998), University of Rochester (private university); Chairman (since 2005), Trustee (since 1999), Advisory Board Member (1996-1999), MML Series Investment Fund (open-end investment company).
| | |
R. Alan Hunter, Jr.1 | | Trustee of the Trust |
1295 State Street | | |
Springfield, MA 01111 | | |
Age: 60 | | |
Trustee since 2003 | | |
Trustee of 49 portfolios in fund complex | | |
Retired; President and Chief Operating Officer (1993-1997), The Stanley Works (manufacturer of tools, hardware and specialty hardware products); Trustee (since 2003), MML Series Investment Fund (open-end investment company).
| | |
F. William Marshall, Jr. | | Trustee of the Trust |
1295 State Street | | |
Springfield, MA 01111 | | |
Age: 64 | | |
Trustee since 1996 | | |
Trustee of 86 portfolios in fund complex2 | | |
Consultant (since 1999); Chairman (1999), Family Bank, F.S.B. (formerly SIS Bank); Executive Vice President (1999), Peoples Heritage Financial Group; President, Chief Executive Officer and Director (1993-1999), SIS Bancorp, Inc. and SIS Bank (formerly, Springfield Institution for Savings); Trustee (since 2000), Board II Oppenheimer Funds; Trustee (since 1996), MML Series Investment Fund (open-end investment company).
| (1) | Mr. Hunter is an “Interested Person,” as that term is defined in the 1940 Act, of the Small Cap Core Equity Fund through his ownership of common stock of Goldman Sachs. GSAM, an affiliate of Goldman Sachs, serves as the sub-adviser to the Small Cap Core Equity Fund. |
| (2) | Board II Oppenheimer Funds is deemed to be part of the Fund Complex because it is managed by OppenheimerFunds, Inc., an indirect subsidiary of the Adviser. |
B-38
Interested Trustees
| | |
Frederick C. Castellani3 | | Trustee and President of the Trust |
1295 State Street | | |
Springfield, MA 01111 | | |
Age: 60 | | |
Trustee since 2001 | | |
Trustee of 80 portfolios in fund complex | | |
Executive Vice President (since 2001), Senior Vice President (1996-2001), MassMutual; Trustee (since 2001), Vice President (since 2006), MML Series Investment Fund (open-end investment company); Trustee, Vice Chairman and President (since 2006), Vice President (2004-2006), MassMutual Premier Funds (open-end investment company); Trustee, Vice Chairman and Vice President (since 2006), MML Series Investment Fund II (open-end investment company).
| | |
Robert E. Joyal4 | | Vice Chairman and Trustee of the Trust |
1295 State Street | | |
Springfield, MA 01111 | | |
Age: 62 | | |
Trustee since 2003 | | |
Trustee of 51 portfolios in fund complex5 | | |
Retired; President (2001-2003), Managing Director (2000-2001) and Executive Director (1999-2000), David L. Babson & Company Inc.; Trustee (since 2003), President (1999-2003), MassMutual Corporate Investors (closed-end investment company); Director (since 2003), Pemco Aviation Group, Inc.; Trustee (since 2003), President (1999-2003), MassMutual Participation Investors (closed-end investment company); Vice Chairman (since 2005), Trustee (since 2003), MML Series Investment Fund (open-end investment company); Director (since 2005), York Enhanced Strategies Fund (closed-end investment company); Director (since 2006), Jefferies Group, Inc. (investment bank).
| (3) | Mr. Castellani is an Interested Person through his employment with MassMutual. |
| (4) | Mr. Joyal is an Interested Person through his position as a director of Jefferies Group, Inc., a broker-dealer that may execute portfolio transactions and/or engage in principal transactions with the Funds, other investment companies advised by MassMutual or holding themselves out to investors as related companies for purposes of investment or investor services, or any other advisory accounts over which MassMutual has brokerage placement discretion. |
| (5) | MassMutual Participation Investors and MassMutual Corporate Investors are deemed to be a part of the Fund Complex because they are managed by Babson Capital Management LLC, an indirect subsidiary of the Adviser. |
B-39
Principal Officers
| | |
Philip S. Wellman 1295 State Street Springfield, MA 01111 Age: 42 Officer since 2007 Officer of 80 portfolios in fund complex | | Vice President and Chief Compliance Officer of the Trust |
Vice President, Compliance (since 2007), Assistant Vice President and Associate General Counsel (2006-2007), MassMutual; Director, Office of General Counsel (2005-2006), Merrill Lynch, Pierce, Fenner & Smith Incorporated; Senior Vice President and Assistant General Counsel (2000-2006), Advest, Inc.; Vice President and Chief Compliance Officer (since 2007), MassMutual Premier Funds (open-end investment company); Vice President and Chief Compliance Officer (since 2007), MML Series Investment Fund (open-end investment company); Vice President and Chief Compliance Officer (since 2007), MML Series Investment Fund II (open-end investment company).
| | |
Nicholas H. Palmerino 1295 State Street Springfield, MA 01111 Age: 41 Officer since 2006 Officer of 80 portfolios in fund complex | | Chief Financial Officer and Treasurer of the Trust |
Assistant Vice President (since 2006), MassMutual; Vice President (2006), Consultant (2005-2006), JP Morgan Chase Worldwide Securities Services; Senior Vice President (2003-2004), CDC IXIS Asset Management Services, Inc. and CDC IXIS Asset Management Advisers, L.P.; Vice President (1996-2003), Loomis Sayles & Company, L.P.; Chief Financial Officer and Treasurer (since 2006), MML Series Investment Fund (open-end investment company); Chief Financial Officer and Treasurer (since 2006), MassMutual Premier Funds (open-end investment company); Chief Financial Officer and Treasurer (since 2006), MML Series Investment Fund II (open-end investment company).
| | |
Eric H. Wietsma 1295 State Street Springfield, MA 01111 Age: 40 Officer since 2006 Officer of 80 portfolios in fund complex | | Vice President of the Trust |
Vice President (since 2005), MassMutual; Vice President (1999-2005), Hartford Life Insurance Company; Vice President (since 2006), MML Series Investment Fund (open-end investment company); Vice President (since 2006), MassMutual Premier Funds (open-end investment company); Vice President (since 2006), MML Series Investment Fund II (open-end investment company).
B-40
| | |
Kristin L. Bushard 1295 State Street Springfield, MA 01111 Age: 40 Officer since 2005 Officer of 80 portfolios in fund complex | | Vice President of the Trust |
Assistant Vice President (since 2005), Managing Director (2003-2005), MassMutual; Assistant Vice President (2000-2003), Allmerica Asset Management; Vice President (since 2005), MassMutual Premier Funds (open-end investment company); Vice President (since 2005), MML Series Investment Fund (open-end investment company); Vice President (since 2005), MML Series Investment Fund II (open-end investment company).
| | |
John E. Deitelbaum 1295 State Street Springfield, MA 01111 Age: 38 Officer since 2006 Officer of 80 portfolios in fund complex | | Vice President, Secretary and Chief Legal Officer of the Trust |
Vice President and Associate General Counsel (since 2006), Second Vice President and Associate General Counsel (2000-2006), MassMutual; Vice President, Clerk and Chief Legal Officer (since 2006), MassMutual Premier Funds (open-end investment company); Vice President, Secretary and Chief Legal Officer (since 2006), MML Series Investment Fund (open-end investment company); Vice President, Clerk and Chief Legal Officer (since 2006), MML Series Investment Fund II (open-end investment company).
The table below sets forth information regarding the Trustees’ beneficial ownership of Fund shares, based on the value of such shares as of December 31, 2006.
| | | | |
Name of Trustee
| | The Dollar Range of Equity
Securities Beneficially Owned
in the Trust
| | Aggregate Dollar Range of Equity
Securities in All Registered
Investment Companies
Overseen by Trustee in Family of
Investment Companies
|
Disinterested Trustees | | | | |
Richard H. Ayers | | None | | None |
Allan W. Blair | | None | | $50,001-$100,000 |
Mary E. Boland | | None | | None |
Richard W. Greene | | None | | None |
R. Alan Hunter, Jr. | | None | | None |
F. William Marshall, Jr. | | None | | None |
Interested Trustees | | | | |
Frederick C. Castellani | | None | | None |
Robert E. Joyal | | None | | None |
As of December 31, 2006, the Trustees and officers of the Trust, individually and as a group, beneficially owned less than 1% of the outstanding shares of any of the Funds.
Except as noted below, to the knowledge of the Trust, as of December 31, 2006, the Disinterested Trustees and their immediate family members did not own beneficially or of record securities of an investment adviser or sponsoring insurance company of the Funds or a person (other than a registered investment company) directly or indirectly controlling, controlled by, or under common control with an investment adviser or sponsoring insurance company of the Funds.
B-41
As of December 31, 2006, R. Alan Hunter, Jr. owned 1,000 shares of common stock of Goldman Sachs, with a value of approximately $199,350. GSAM, an affiliate of Goldman Sachs, serves as sub-adviser to the Small Cap Core Equity Fund.
Each Trustee of the Trust serves until the next meeting of shareholders called for the purpose of electing Trustees and until the election and qualification of his successor or until he dies, resigns or is removed. Notwithstanding the foregoing, unless the Trustees determine that it is desirable and in the best interest of the Trust than an exception to the retirement policy of the Trust be made, a Trustee shall retire and cease to serve as a Trustee as of the first board meeting following the date on which the Trustee attains the age of seventy-two years.
The Board of Trustees had four regularly scheduled meetings in 2006 and one special meeting.
The Trust has an Audit Committee, consisting of Trustees who are not “interested persons” (as defined in the 1940 Act) of the Trust. The Audit Committee, whose members are Messrs. Ayers and Hunter and Ms. Boland, makes recommendations to the Trustees as to the engagement or discharge of the Trust’s independent auditors, supervises investigations into matters relating to audit functions, reviews with the Trust’s independent auditors the results of the audit engagement, and considers the audit fees. In 2006, the Audit Committee met three times.
The Trust has a Nominating Committee, consisting of each Trustee who is not an “interested person” of the Trust. There are no regular meetings of the Nominating Committee but rather meetings are held as appropriate. The Nominating Committee met once during 2006. The Nominating Committee evaluates the qualifications of Trustee candidates and nominates candidates to the full Board of Trustees. The Nominating Committee will consider nominees for the position of Trustee recommended by shareholders. Recommendations should be submitted to the Nominating Committee in care of the Secretary of the Trust at 1295 State Street, Springfield, MA 01111. The Nominating Committee also considers candidates from among the Trustees to serve as Chairperson of the Board of Trustees and periodically reviews the compensation of the Trust’s independent trustees.
The Nominating Committee will consider and evaluate nominee candidates properly submitted by shareholders of the Trust in the same manner as it considers and evaluates candidates recommended by other sources. A recommendation of a shareholder of the Trust must be submitted as described below to be considered properly submitted for purposes of the Nominating Committee’s consideration. The shareholders of the Trust must submit any such recommendation (a “Shareholder Recommendation”) in writing to the Trust’s Nominating Committee, to the attention of the Secretary, at the address of the principal executive offices of the Trust, which is 1295 State Street, Springfield, MA 01111. The Shareholder Recommendation must be delivered to or mailed and received at the principal executive offices of the Trust at least 60 calendar days before the date of the meeting at which the Nominating Committee is to select a nominee for Independent Trustee. The Shareholder Recommendation must include: (i) a statement in writing setting forth: (A) the name, age, date of birth, phone number, business address, residence address and nationality of the person recommended by the shareholder (the “Shareholder Candidate”); (B) the class or series and number of all shares of the Trust owned of record or beneficially by the Shareholder Candidate, as reported to such shareholder by the Shareholder Candidate; (C) any other information regarding the Shareholder Candidate called for with respect to director nominees by paragraphs (a), (d), (e) and (f) of Item 401 of Regulation S-K or paragraph (b) of Item 22 of Rule 14a-101 (Schedule 14A) under the Securities Exchange Act of 1934, as amended (the “Exchange Act”), adopted by the SEC (or the corresponding provisions of any regulation or rule subsequently adopted by the SEC or any successor agency applicable to the Trust); (D) any other information regarding the Shareholder Candidate that would be required to be disclosed if the Shareholder Candidate were a nominee in a proxy statement or other filing required to be made in connection with solicitation of proxies for election of trustees or directors pursuant to Section 14 of the Exchange Act and the rules and regulations promulgated thereunder; and (E) whether the recommending shareholder believes that the Shareholder Candidate is or will be an “interested person” of the Trust (as defined in Section 2(a)(19) of the 1940 Act) and, if not an “interested person,” information regarding the Shareholder Candidate that will be sufficient for the Trust to make such determination; (ii) the written and signed consent of
B-42
the Shareholder Candidate to be named as a nominee, consenting to (1) the disclosure, as may be necessary or appropriate, of such Shareholder Candidate’s information submitted in accordance with (i) above and (2) service as a Trustee if elected; (iii) the recommending shareholder’s name as it appears on the Trust’s books, the number of all shares of each series of the Trust owned beneficially and of record by the recommending shareholder; (iv) a description of all arrangements or understandings between the recommending shareholder and the Shareholder Candidate and any other person or persons (including their names) pursuant to which the Shareholder Recommendation is being made by the recommending shareholder; and (v) such other information as the Nominating Committee may require the Shareholder Candidate to furnish as it may reasonably require or deem necessary to determine the eligibility of such Shareholder Candidate to serve as a Trustee or to satisfy applicable law.
The Trust has a Contract Committee, consisting of each Trustee who is not an “interested person” of the Trust. The Contract Committee met twice during 2006. The Contract Committee performs the specific tasks assigned to independent trustees by the 1940 Act, including the periodic consideration of the Trust’s investment management agreements and sub-advisory agreements.
The Trust has a Governance Committee, whose members are Messrs. Blair, Castellani, Joyal and Marshall and Ms. Boland. The Governance Committee met twice during 2006. The Governance Committee oversees board governance issues including, but not limited to, the following: (i) to evaluate the board and committee structure and the performance of Trustees, (ii) to consider and address any conflicts and (iii) to consider the retirement policies of the Board.
The Trust has an Investment Pricing Committee, consisting of the Chairman, President, Treasurer, Assistant Treasurers, Vice Presidents (except for the CCO), Secretary and Assistant Secretaries of the Trust. The Investment Pricing Committee determines whether market quotations are readily available for securities held by each series of the Trust, determines the fair value of securities held by each series of the Trust for which market quotations are not readily available, and determines the fair value of assets of each series of the Trust which are not held in the form of securities. There are no regular meetings of the Investment Pricing Committee but rather meetings are held as appropriate.
B-43
COMPENSATION
The Trust, on behalf of each Fund, pays each of its Trustees who is not an officer or employee of MassMutual a fee of $6,800 per quarter plus $3,600 per meeting attended in-person or $1,400 per meeting attended by telephone. Such Trustees who serve on the Audit Committee or the Contract Committee of the Trust are paid an additional fee of $1,400 per meeting attended. Such Trustees who serve on the Nominating Committee or the Governance Committee are paid an additional fee of $700 per meeting attended. The Chairperson of the Board of Trustees is paid an additional fee of $3,425 per quarter. The Chairperson of the Audit Committee is paid an additional fee of $1,400 annually. The Chairpersons of each of the Contract Committee, the Nominating Committee and the Governance Committee are paid an additional fee of $700 annually. In addition, the Trust reimburses out-of-pocket business travel expenses to such Trustees. Trustees who are officers or employees of MassMutual receive no fees from the Trust.
The following table discloses actual compensation paid to Trustees of the Trust during the 2006 fiscal year. The Trust has no pension or retirement plan, but does have a deferred compensation plan. The plan provides for amounts deferred to be credited a rate of interest set by the Board of Trustees from time to time, currently eight percent (8%). Each of the Trustees also serves as Trustee of one other registered investment company managed by MassMutual, MML Series Investment Fund.
| | | | | | | | | |
Name/Position
| | Aggregate Compensation
from the Trust
| | Deferred Compensation and
Interest accrued as part of
Fund Expenses
| | Total Compensation
from the Trust
and Fund Complex
|
Richard H. Ayers | | $ | — | | $ | 50,106 | | $ | 72,249 |
Trustee | | | | | | | | | |
Allan W. Blair | | $ | 42,700 | | | — | | $ | 61,500 |
Trustee | | | | | | | | | |
Mary E. Boland | | | — | | $ | 62,952 | | $ | 97,646 |
Trustee | | | | | | | | | |
Richard W. Greene | | $ | 53,075 | | | — | | $ | 76,750 |
Trustee | | | | | | | | | |
R. Alan Hunter, Jr. | | $ | — | | $ | 51,801 | | $ | 77,027 |
Trustee | | | | | | | | | |
Robert E. Joyal | | | — | | $ | 48,380 | | $ | 72,613 |
Trustee | | | | | | | | | |
F. William Marshall, Jr. | | $ | 43,400 | | | — | | $ | 205,500 |
Trustee | | | | | | | | | |
Mr. Castellani did not receive compensation.
The Trust’s shareholders have the right, upon the declaration in writing or vote of at least two-thirds of the votes represented by its outstanding shares, to remove a Trustee. The Trustees shall call a meeting of shareholders to vote on the removal of a Trustee upon the written request of the record holders of shares representing at least 10% of all of the votes represented by all outstanding shares of the Trust. In addition, whenever ten or more shareholders of record who have been such for at least six months preceding the date of application, and who hold in the aggregate either shares having a net asset value of at least $25,000 or at least 1% of the Trust’s outstanding shares, whichever is less, shall apply to the Trustees in writing, stating that they wish to communicate with other shareholders with a view to obtaining signatures for a request for a meeting for the purpose of voting upon the question of removal of any Trustee or Trustees and accompanied by the form of communication and request which they wish to transmit, the Trustees shall within five business days after receipt of such application either: (1) afford to such applicants access to a list of the names and addresses of all shareholders as recorded on the books of the Trust; or (2) inform such applicants as to the approximate number of shareholders of record, and the approximate cost of mailing to them the proposed communication and form of request. If the Trustees elect to follow the latter course, the Trustees, upon the written request of such applicants, accompanied by a tender of the material to be mailed and of the reasonable expenses of mailing, shall, with reasonable promptness, mail such material to all shareholders of record at their addresses as recorded on the
B-44
books of the Trust, unless within five business days after such tender the Trustees shall mail to such applicants and file with the SEC, together with a copy of the material to be mailed, a written statement signed by at least a majority of the Trustees to the effect that in their opinion either such material contains untrue statements of fact or omits to state facts necessary to make the statements contained therein not misleading, or would be in violation of applicable law, and specifying the basis of such opinion.
After opportunity for hearing regarding the objections specified in the written statement so filed, the SEC may, and if demanded by the Trustees or by such applicants shall, enter an order either sustaining one or more of such objections, or refusing to sustain any of them. If the SEC shall enter an order refusing to sustain any such objections or if, after the entry of an order sustaining one or more of such objections, the SEC shall find, after notice and opportunity for hearing, that all objections so sustained have been met, and shall enter an order so declaring, the Trustees shall mail copies of such material to all shareholders with reasonable promptness after the entry of such order and the renewal of such tender.
On any matters submitted to a vote of shareholders, all shares of the Trust then entitled to vote shall be voted in the aggregate as a single class without regard to series or class, except that: (i) when required by the 1940 Act or when the Trustees shall have determined that the matter affects one or more of the series or classes materially differently, shares will be voted by individual series or class; and (ii) when the Trustees have determined that any matter affects only the interests of one or more series or classes, then only shareholders of such series or class shall be entitled to vote thereon. Shareholder inquiries should be directed to MassMutual Select Funds, Attn: B379, 1295 State Street, Springfield, Massachusetts 01111.
CONTROL PERSONS AND PRINCIPAL HOLDERS OF SECURITIES
Massachusetts Mutual Life Insurance Co. (MassMutual), 1295 State St., Springfield, MA 01111 may be deemed a control person (as that term is defined in the 1940 Act) of the Trust in that certain of its separate investment accounts and its provision of seed money for the Trust together constituted 100% of the shares of the Class L shares of each Fund of the Trust as of March 2, 2007, with the exception of the following Funds. MassMutual may also be deemed a control person (as defined in the Act) of the Trust in that it beneficially owns more than 25% of the Class L shares of the following Funds. As of March 2, 2007, MassMutual owned 93.25% of the Class L shares of the Aggressive Growth Fund, 99.00% of the Class L shares of the Blue Chip Growth Fund, 78.94% of the Class L shares of the Core Opportunities Fund, 89.90% of the Class L shares of the Destination Retirement 2010 Fund, 95.40% of the Class L shares of the Destination Retirement 2020 Fund, 91.21% of the Class L shares of the Destination Retirement 2030 Fund, 92.50% of the Class L shares of the Destination Retirement 2040 Fund, 97.73% of the Class L shares of the Destination Retirement Income Fund, 99.78% of the Class L shares of the Diversified International Fund, 94.45% of the Class L shares of the Diversified Value Fund, 99.99% of the Class L shares of the Emerging Growth Fund, 91.85% of the Class L shares of the Focused Value Fund, 87.29% of the Class L shares of the Fundamental Value Fund, 94.99% of the Class L shares of the Growth Equity Fund, 93.21% of the Class L shares of the Indexed Equity Fund, 75.92% of the Class L shares of the Large Cap Value Fund, 99.99% of the Class L shares of the Mid Cap Growth Equity Fund, 77.68% of the Class L shares of the Mid Cap Growth Equity II Fund, 96.32% of the Class L shares of the Mid Cap Value Fund, 91.27% of the Class L shares of the OTC 100 Fund, 93.80% of the Class L shares of the Overseas Fund, 98.44% of the Class L shares of the Small Cap Core Equity Fund, 97.80% of the Class L shares of the Small Cap Growth Equity Fund, 99.54% of the Class L shares of the Small Cap Value Equity Fund, 89.98% of the Class L shares of the Small Company Growth Fund, 74.70% of the Class L shares of the Small Company Value Fund, 95.20% of the Class L shares of the Strategic Balanced Fund, 89.79% of the Class L shares of the Strategic Bond Fund and 97.47% of the Class L shares of the Value Equity Fund.
MassMutual may be deemed a control person (as that term is defined in the 1940 Act) of the Trust in that certain of its separate investment accounts and its provision of seed money for the Trust together constituted 100% of the shares of the Class A shares of each Fund of the Trust as of March 2, 2007, with the exception of the
B-45
following Funds. MassMutual may also be deemed a control person (as defined in the Act) of the Trust in that it beneficially owns more than 25% of the Class A shares of the following Funds. As of March 2, 2007, MassMutual owned 93.07% of the Class A shares of the Aggressive Growth Fund, 89.13% of the Class A shares of the Blue Chip Growth Fund, 78.02% of the Class A shares of the Core Opportunities Fund, 47.22% of the Class A shares of the Destination Retirement 2010 Fund, 50.91% of the Class A shares of the Destination Retirement 2020 Fund, 58.21% of the Class A shares of the Destination Retirement 2030 Fund, 64.15% of the Class A shares of the Destination Retirement 2040 Fund, 27.32% of the Class A shares of the Destination Retirement Income Fund, 99.99% of the Class A shares of the Diversified International Fund, 75.59% of the Class A shares of the Diversified Value Fund, 95.81% of the Class A shares of the Emerging Growth Fund, 80.28% of the Class A shares of the Focused Value Fund, 92.28% of the Class A shares of the Fundamental Value Fund, 93.42% of the Class A shares of the Growth Equity Fund, 77.60% of the Class A shares of the Indexed Equity Fund, 59.91% of the Class A shares of the Large Cap Growth Fund, 83.16% of the Class A shares of the Large Cap Value Fund, 92.79% of the Class A shares of the Mid Cap Growth Equity Fund, 82.06% of the Class A shares of the Mid Cap Growth Equity II Fund, 32.03% of the Class A shares of the Mid Cap Value Fund, 88.04% of the Class A shares of the OTC 100 Fund, 89.62% of the Class A shares of the Overseas Fund, 94.58% of the Class A shares of the Small Cap Core Equity Fund, 83.35% of the Class A shares of the Small Cap Growth Equity Fund, 86.65% of the Class A shares of the Small Cap Value Equity Fund, 87.41% of the Class A shares of the Small Company Growth Fund, 78.33% of the Class A shares of the Small Company Value Fund, 64.20% of the Class A shares of the Strategic Balanced Fund, 76.08% of the Class A shares of the Strategic Bond Fund and 83.84% of the Class L shares of the Value Equity Fund.
MassMutual may be deemed a control person (as that term is defined in the 1940 Act) of the Trust in that certain of its separate investment accounts and its provision of seed money for the Trust together constituted 100% of the shares of the Class S shares of each Fund of the Trust as of March 2, 2007, with the exception of the following Funds. MassMutual may also be deemed a control person (as defined in the Act) of the Trust in that it beneficially owns more than 25% of the Class S shares of the following Funds. As of March 2, 2007, MassMutual owned 99.99% of the Class S shares of the Aggressive Growth Fund, 98.82% of the Class S shares of the Blue Chip Growth Fund, 99.27% of the Class S shares of the Core Opportunities Fund, 94.64% of the Class S shares of the Destination Retirement 2010 Fund, 82.19% of the Class S shares of the Destination Retirement 2020 Fund, 87.25% of the Class S shares of the Destination Retirement 2030 Fund, 78.05% of the Class S shares of the Destination Retirement 2040 Fund, 94.18% of the Class S shares of the Destination Retirement Income Fund, 99.99% of the Class S shares of the Diversified International Fund, 94.69% of the Class S shares of the Diversified Value Fund, 99.99% of the Class S shares of the Emerging Growth Fund, 98.02% of the Class S shares of the Focused Value Fund, 96.69% of the Class S shares of the Fundamental Value Fund, 99.98% of the Class S shares of the Growth Equity Fund, 90.47% of the Class S shares of the Indexed Equity Fund, 99.99% of the Class S shares of the Large Cap Growth Fund, 98.10% of the Class S shares of the Large Cap Value Fund, 99.99% of the Class S shares of the Mid Cap Growth Equity Fund, 92.22% of the Class S shares of the Mid Cap Growth Equity II Fund, 99.99% of the Class S shares of the Mid Cap Value Fund, 99.49% of the Class S shares of the Overseas Fund, 99.99% of the Class S shares of the Small Cap Core Equity Fund, 96.49% of the Class S shares of the Small Cap Growth Equity Fund, 99.99% of the Class S shares of the Small Cap Value Equity Fund, 99.90% of the Class S shares of the Small Company Growth Fund, 94.06% of the Class S shares of the Small Company Value Fund, 99.99% of the Class S shares of the Strategic Balanced Fund and 99.99% of the Class S shares of the Strategic Bond Fund.
MassMutual may be deemed a control person (as that term is defined in the 1940 Act) of the Trust in that certain of its separate investment accounts and its provision of seed money for the Trust together constituted 100% of the shares of the Class Y shares of each Fund of the Trust as of March 2, 2007, with the exception of the following Funds. MassMutual may also be deemed a control person (as that term is defined in the 1940 Act) of the Trust in that it beneficially owns more than 25% of the Class Y shares of the following Funds. As of March 2, 2007, MassMutual owned 71.63% of the Class Y shares of the Aggressive Growth Fund, 97.61% of the Class Y shares of the Blue Chip Growth Fund, 79.84% of the Class Y shares of the Core Opportunities Fund, 66.03% of the Class Y shares of the Destination Retirement 2010 Fund, 73.07% of the Class Y shares of the Destination
B-46
Retirement 2020 Fund, 71.49% of the Class Y shares of the Destination Retirement 2030 Fund, 50.85% of the Class Y shares of the Destination Retirement 2040 Fund, 99.90% of the Class Y shares of the Diversified International Fund, 75.37% of the Class Y shares of the Diversified Value Fund, 99.65% of the Class Y shares of the Emerging Growth Fund, 86.62% of the Class Y shares of the Focused Value Fund, 85.81% of the Class Y shares of the Fundamental Value Fund, 97.11% of the Class Y shares of the Growth Equity Fund, 73.20% of the Class Y shares of the Indexed Equity Fund, 82.38% of the Class Y shares of the Large Cap Value Fund, 97.95% of the Class Y shares of the Mid Cap Growth Equity Fund, 76.63% of the Class Y shares of the Mid Cap Growth Equity II Fund, 81.56% of the Class Y shares of the Mid Cap Value Fund, 99.61% of the Class Y shares of the OTC 100 Fund, 95.76% of the Class Y shares of the Overseas Fund, 99.72% of the Class Y shares of the Small Cap Core Equity Fund, 94.78% of the Class Y shares of the Small Cap Growth Equity Fund, 99.99% of the Class Y shares of the Small Cap Value Equity Fund, 92.05% of the Class Y shares of the Small Company Growth Fund, 86.89% of the Class Y shares of the Small Company Value Fund, 78.80% of the Class Y shares of the Strategic Balanced Fund, 84.82% of the Class Y shares of the Strategic Bond Fund and 93.66% of the Class Y shares of the Value Equity Fund.
MassMutual may be deemed a control person (as that term is defined in the 1940 Act) of the Trust in that it beneficially owns more than 25% of the Class Z shares of the Indexed Equity Fund of the Trust as of March 2, 2007. As of March 2, 2007, MassMutual owned 82.71% of the Class Z shares of the Indexed Equity Fund.
MassMutual may be deemed a control person (as that term is defined in the 1940 Act) of the Trust in that certain of its separate investment accounts and its provision of seed money for the Trust together constituted 100% of the shares of the Class N shares of each Fund of the Trust as of March 2, 2007, with the exception of the following Funds. MassMutual may also be deemed a control person (as that term is defined in the 1940 Act) of the Trust in that it beneficially owns more than 25% of the Class N shares of the following Funds. As of March 2, 2007, MassMutual owned 99.89% of the Class N shares of the Core Opportunities Fund, 99.99% of the Class N shares of the Destination Retirement 2010 Fund, 99.99% of the Class N shares of the Destination Retirement 2020 Fund, 99.99% of the Class N shares of the Destination Retirement 2030 Fund, 99.99% of the Class N shares of the Destination Retirement 2040 Fund, 99.99% of the Class N shares of the Destination Retirement Income Fund, 99.90% of the Class N shares of the Diversified International Fund, 99.10% of the Class N shares of the Diversified Value Fund, 99.01% of the Class N shares of the Emerging Growth Fund, 99.99% of the Class N shares of the Mid Cap Growth Equity Fund, 99.99% of the Class N shares of the OTC 100 Fund, 99.90% of the Class N shares of the Small Cap Core Equity Fund, 99.99% of the Class N shares of the Small Cap Growth Equity Fund, 99.90% of the Class N shares of the Small Cap Value Equity Fund, 99.99% of the Class N shares of the Small Company Growth Fund, 99.99% of the Class N shares of the Small Company Value Fund, 99.99% of the Class N shares of the Strategic Balanced Fund, 99.99% of the Class N shares of the Strategic Bond Fund and 99.99% of the Class N shares of the Value Equity Fund.
The following shareholders may be deemed a control persons (as that term is defined in the 1940 Act) of the Trust in that it beneficially owns more than 25% of the Class A shares of certain Funds as of March 2, 2007: Taynik & Co., c/o Investors Bank & Trust, PO Box 9130, FPG 90, Boston, MA 02116 owned 29.73% of the Class A shares of the Destination Retirement Income Fund and 67.96% of the Class A shares of the Mid Cap Value Fund and Jupiter & Co., c/o Investors Bank & Trust Company, PO Box 9130, FPG 90, Boston, MA 02116 owned 33.20% of the Class A shares of the Large Cap Growth Fund.
The following shareholder may be deemed a control person (as that term is defined in the 1940 Act) of the Trust in that it beneficially owns more than 25% of the Class Y shares of certain Funds as of March 2, 2007: Taynik & Co., c/o Investors Bank & Trust, PO Box 9130, FPG 90, Boston, MA 02116 owned 26.95% of the Class Y shares of the Destination Retirement 2010 Fund, 25.38% of the Class Y shares of the Destination Retirement 2030 Fund, 46.05% of the Class Y shares of the Destination Retirement 2040 Fund and 76.81% of the Class Y shares of the Destination Retirement Income Fund.
MassMutual may be deemed a principal holder of the Trust because of its beneficial ownership of more than 5% of the Class Y shares of a Fund. Certain of its separate investment accounts and its provision of seed money for the Trust together constituted 22.52% of the Class Y shares of the Destination Retirement Income Fund.
B-47
The following shareholders may be deemed principal holders of the Trust because of their beneficial ownership of more than 5% of the Class L shares of certain Funds as of March 2, 2007: Taynik & Co., c/o Investors Bank & Trust, PO Box 9130, FPG 90, Boston, MA 02117 owned 6.35% of the Class L shares of the Aggressive Growth Fund, 21.05% of the Class L shares of the Core Opportunities Fund, 10.09% of the Class L shares of the Destination Retirement 2010 Fund, 8.78% of the Class L shares of the Destination Retirement 2030 Fund, 7.49% of the Class L shares of the Destination Retirement 2040 Fund, 5.25% of the Class L shares of the Focused Value Fund, 6.15% of the Class L shares of the Fundamental Value Fund, 6.46% of the Class L shares of the Indexed Equity Fund, 15.32% of the Class L shares of the Large Cap Value Fund, 18.10% of the Class L shares of the Mid Cap Growth Equity II Fund, 7.78% of the Class L shares of the OTC 100 Fund, 5.23% of the Class L shares of the Overseas Fund, 8.86% of the Class L shares of the Small Company Growth Fund, 24.46% of Class L shares of the Small Company Value Fund and 5.88% of the Class L shares of the Strategic Bond Fund; Investors Bank & Trust Company as trustee for Engineers Local 39Annuity Trust, 337 Valencia Street, San Francisco, CA 94103 owned 5.19% of the Class L shares of the Fundamental Value Fund and Investors Bank & Trust as trustee for Edwards & Angell LLP, 200 Clarendon Street, MML 37, Boston, MA 02117 owned 6.44% of the Class L shares of the Large Cap Value Fund.
The following shareholders may be deemed a principal holder of the Trust because of its beneficial ownership of more than 5% of the Class A shares of certain Funds as of March 2, 2007: Taynik & Co., c/o Investors Bank & Trust, PO Box 9130, FPG 90, Boston, MA 02116 owned 16.97% of the Class A shares of Core Opportunities Fund, 14.31% of the Class A shares of the Destination Retirement 2010 Fund, 18.55% of the Class A shares of the Destination Retirement 2020 Fund, 21.48% of the Class A shares of the Destination Retirement 2030 Fund, 20.68% of the Class A shares of the Destination Retirement 2040 Fund, 17.90% of the Class A shares of the Diversified Value Fund, 8.55% of the Class A shares of the Focused Value Fund, 16.40% of the Class A shares of the Indexed Equity Fund, 13.56% of the Class A shares of the Large Cap Value Fund, 11.74% of the Class A shares of the Mid Cap Growth Equity II Fund, 8.53% of the Class A shares of the OTC 100 Fund, 6.12% of the Class A shares of the Overseas Fund, 9.28% of the Class A shares of the Small Cap Growth Equity Fund, 7.04% of the Class A shares of the Small Cap Value Equity Fund, 10.15% of the Class A shares of the Small Company Growth Fund, 13.51% of the Class A shares of the Small Company Value Fund, 17.17% of the Class A shares of the Strategic Balanced Fund and 14.62% of the Class A shares of the Strategic Bond Fund and Jupiter & Co., c/o Investors Bank & Trust, PO Box 9130, FPG 90, Boston, MA 02116 owned 8.18% of the Class A shares of the Value Equity Fund.
The following shareholder may be deemed a principal holder of the Trust because of its beneficial ownership of more than 5% of the Class S shares of certain Funds as of March 2, 2007: Taynik & Co., c/o Investors Bank & Trust, PO Box 9130, FPG 90, Boston, MA 02116 owned 17.59% of the Class S shares of the Destination Retirement 2020 Fund, 12.62% of the Class S shares of the Destination Retirement 2030 Fund, 21.63% of the Class S shares of the Destination Retirement 2040 Fund, 5.80% of the Class S shares of the Destination Retirement Income Fund, 6.81% of the Class S shares of the Mid Cap Growth Equity II Fund and 5.07% of the Class S shares of the Small Company Value Fund and Northwest Bank Colorado Trust, 8515 E. Orchard Road, Englewood, CO 80111 owned 6.98% of the Class S shares of the Indexed Equity Fund.
The following shareholders may be deemed principal holders of the Trust because of their beneficial ownership of more than 5% of the Class Y shares of certain Funds as of March 2, 2007: Taynik & Co., c/o Investors Bank & Trust, PO Box 9130, FPG 90, Boston, MA 02116 owned 24.79% of the Class Y shares of the Aggressive Growth Fund, 20.15% of the Class Y shares of the Core Opportunities Fund, 22.45% of the Class Y shares of the Destination Retirement 2020 Fund, 24.61% of the Class Y shares of the Diversified Value Fund, 11.44% of the Class Y shares of the Focused Value Fund, 8.14% of the Class Y shares of the Fundamental Value Fund, 18.97% of the Class Y shares of the Indexed Equity Fund, 10.65% of the Class Y shares of the Large Cap Value Fund, 15.69% of the Class Y shares of the Mid Cap Growth Equity II Fund, 11.40% of the Class Y shares of the Small Cap Growth Equity Fund, 6.63% of the Class Y shares of the Small Company Growth Fund, 9.49% of the Class Y shares of the Small Company Value Fund, 21.18% of the Class Y shares of the Strategic Balanced Fund and 14.65% of the Class Y shares of the Strategic Bond Fund; Jupiter & Co., c/o Investors Bank & Trust,
B-48
PO Box 9130, FPG 90, Boston, MA 02116 owned 18.43% of the Class Y shares of Mid Cap Value Fund and 6.33% of the Class Y shares of the Value Equity Fund; and Greif Brothers Corporation Plans, c/o Investors Bank & Trust, 200 Clarendon St., Boston, MA 02117 owned 6.96% of the Class Y shares of the Destination Retirement 2010 Fund.
The following shareholder may be deemed a principal holder of the Trust because of its beneficial ownership of more than 5% of the Class Z shares of the Indexed Equity Fund as of March 2, 2007: Taynik & Co., c/o Investors Bank & Trust, PO Box 9130, FPG 90, Boston, MA 02117 owned 17.28% of the Class Z shares of the Indexed Equity Fund.
INVESTMENT ADVISER AND SUB-ADVISERS
Investment Adviser
MassMutual serves as investment adviser to each Fund pursuant to Investment Management Agreements with the Trust on behalf of the Growth Equity Fund, Mid Cap Growth Equity Fund and Small Cap Growth Equity Fund, each dated as of May 3, 1999, on behalf of the Indexed Equity Fund, Large Cap Value Fund, OTC 100 Fund, Aggressive Growth Fund, Focused Value Fund, and Emerging Growth Fund, each dated as of May 1, 2000, on behalf of the Mid Cap Growth Equity II Fund dated as of June 1, 2000, on behalf of the Value Equity Fund and Overseas Fund, each dated as of May 1, 2001, on behalf of the Blue Chip Growth Fund dated as of June 1, 2001, on behalf of the Fundamental Value Fund, Large Cap Growth Fund, Small Company Value Fund and Small Company Growth Fund, each dated as of December 31, 2001, on behalf of the Strategic Balanced Fund, Destination Retirement Income Fund, Destination Retirement 2010 Fund, Destination Retirement 2020 Fund, Destination Retirement 2030 Fund and Destination Retirement 2040 Fund, each dated as of December 31, 2003, on behalf of the Diversified Value Fund dated as of October 11, 2004, on behalf of the Strategic Bond Fund dated as of December 31, 2004, on behalf of the Core Opportunities Fund, Small Cap Value Equity Fund and Small Cap Core Equity Fund, each dated as of March 31, 2006, on behalf of the Mid-Cap Value Fund dated as of August 29, 2006, and on behalf of the Diversified International Fund dated as of December 14, 2006 (collectively the “Advisory Agreements”). Under each Advisory Agreement, MassMutual is obligated to provide for the management of each Fund’s portfolio of securities, subject to policies established by the Trustees of the Trust and in accordance with each Fund’s investment objective, policies and restrictions as set forth herein and in the Prospectus, and has the right to select sub-advisers to the Funds pursuant to investment sub-advisory agreements (the “Sub-Advisory Agreements”).
Each Advisory Agreement may be terminated at any time without the payment of any penalty by the Trustees, or by vote of a majority of the outstanding shares of the Fund, or by MassMutual, on sixty days’ written notice. In addition, each Advisory Agreement automatically terminates if it is assigned or if its continuance is not specifically approved at least annually (after its initial 2 year period): (1) by the affirmative vote of a majority of the Trustees or by the affirmative vote of a majority of the Fund’s shares, and (2) by an affirmative vote of a majority of the Trustees who are not “interested persons” (as defined in the 1940 Act) of the Trust. Under the terms of each Advisory Agreement, each Fund recognizes MassMutual’s control of the name “MassMutual” and the Trust agrees that its right to use such name is nonexclusive and can be terminated by MassMutual at any time. MassMutual’s liability regarding its investment management obligations and duties is limited to situations involving its willful misfeasance, bad faith, gross negligence or reckless disregard of such obligations and duties.
MassMutual also serves as investment adviser to: MassMutual Premier Value Fund, MassMutual Premier Core Bond Fund, MassMutual Premier Small Company Opportunities Fund, MassMutual Premier Balanced Fund, MassMutual Premier Diversified Bond Fund, MassMutual Premier Short-Duration Bond Fund, MassMutual Premier Money Market Fund, MassMutual Premier Inflation-Protected Bond Fund, MassMutual Premier International Equity Fund, MassMutual Premier Core Growth Fund, MassMutual Premier Enhanced Index Core Equity Fund, MassMutual Premier Enhanced Index Growth Fund, MassMutual Premier Enhanced Index Value Fund, MassMutual Premier Enhanced Index Value Fund II, MassMutual Premier High Yield Fund,
B-49
MassMutual Premier Small Capitalization Value Fund, MassMutual Premier Strategic Income Fund, MassMutual Premier Main Street Fund, MassMutual Premier Capital Appreciation Fund, MassMutual Premier Global Fund, MassMutual Premier Discovery Value Fund, MassMutual Premier Focused International Fund and MassMutual Premier Main Street Small Cap Fund, which are series of MassMutual Premier Funds, an open-end management investment company; MML Large Cap Value Fund, MML Equity Index Fund, MML Growth Equity Fund, MML OTC 100 Fund, MML Small Cap Growth Equity Fund, MML Emerging Growth Fund, MML Asset Allocation Fund, MML Blue Chip Growth Fund, MML Concentrated Growth Fund, MML Equity Income Fund, MML Foreign Fund, MML Global Fund, MML Growth & Income Fund, MML Income & Growth Fund, MML Large Cap Growth Fund, MML Mid Cap Growth Fund, MML Mid Cap Value Fund, MML Small Cap Index Fund and MML Small Cap Value Fund, which are series of MML Series Investment Fund, an open-end management investment company; MML Money Market Fund, MML Inflation-Protected Bond Fund, MML Managed Bond Fund, MML Blend Fund, MML Equity Fund, MML Enhanced Index Core Equity Fund, MML Small Cap Equity Fund and MML Small Company Opportunities Fund, which are series of MML Series Investment Fund II, an open-end management investment company; certain wholly owned subsidiaries of MassMutual; and various employee benefit plans and separate investment accounts in which employee benefit plans invest.
The Trust, on behalf of each Fund, pays MassMutual an investment advisory fee monthly, at an annual rate based upon the average daily net assets of that Fund as follows: .55% for the Strategic Bond Fund, .60% for the Strategic Balanced Fund, .50% for the Diversified Value Fund, .65% for the Fundamental Value Fund, .70% for the Value Equity Fund, .65% for the Large Cap Value Fund, .10% for the Indexed Equity Fund, .70% for the Core Opportunities Fund, .70% for the Blue Chip Growth Fund, .65% for the Large Cap Growth Fund, .69% for the Focused Value Fund, .70% for the Mid-Cap Value Fund, .75% for the Small Cap Value Equity Fund, .68% for the Growth Equity Fund, .85% for the Small Company Value Fund, .75% for the Small Cap Core Equity Fund, .73% for the Aggressive Growth Fund, .15% for the OTC 100 Fund, .70% for the Mid Cap Growth Equity Fund, .75% for the Mid Cap Growth Equity II Fund, .82% for the Small Cap Growth Equity Fund, .85% for the Small Company Growth Fund, .79% for the Emerging Growth Fund, .90% for the Diversified International Fund, 1.00% for the Overseas Fund and .05% for each of the Destination Retirement Funds.
For the last three fiscal years, the Funds have paid the following amounts as investment advisory fees to MassMutual pursuant to each Advisory Agreement:
| | | | | | | |
| | | Management
Fee Paid
| | Other
Expenses
Reimbursed
| |
Strategic Bond Fund3 | | | | | | | |
Year ended 12/31/05 | | $ | 394,896 | | $ | (45,151 | ) |
Year ended 12/31/06 | | $ | 1,090,605 | | $ | (59,864 | ) |
Strategic Balanced Fund | | | | | | | |
Year ended 12/31/04 | | $ | 1,050,036 | | $ | (39,468 | ) |
Year ended 12/31/05 | | $ | 1,423,352 | | $ | (46,556 | ) |
Year ended 12/31/06 | | $ | 1,376,843 | | $ | (49,498 | ) |
Diversified Value Fund1 | | | | | | | |
Period ended 12/31/04 | | $ | 198,541 | | $ | (23,144 | ) |
Year ended 12/31/05 | | $ | 1,116,442 | | | — | |
Year ended 12/31/06 | | $ | 2,031,423 | | | — | |
Fundamental Value Fund | | | | | | | |
Year ended 12/31/04 | | $ | 4,845,076 | | | — | |
Year ended 12/31/05 | | $ | 6,069,055 | | | — | |
Year ended 12/31/06 | | $ | 7,539,122 | | | — | |
Value Equity Fund | | | | | | | |
Year ended 12/31/04 | | $ | 602,111 | | | — | |
Year ended 12/31/05 | | $ | 635,177 | | | — | |
Year ended 12/31/06 | | $ | 699,304 | | | — | |
B-50
| | | | | | | |
| | | Management
Fee Paid
| | Other
Expenses
Reimbursed
| |
Large Cap Value Fund | | | | | | | |
Year ended 12/31/04 | | $ | 6,119,461 | | | — | |
Year ended 12/31/05 | | $ | 8,388,723 | | | — | |
Year ended 12/31/06 | | $ | 9,933,662 | | | — | |
Indexed Equity Fund | | | | | | | |
Year ended 12/31/04 | | $ | 1,552,955 | | | — | |
Year ended 12/31/05 | | $ | 1,840,394 | | | — | |
Year ended 12/31/06 | | $ | 2,046,600 | | | — | |
Core Opportunities Fund4 | | | | | | | |
Period ended 12/31/06 | | $ | 86,970 | | $ | (36,282 | ) |
Blue Chip Growth Fund | | | | | | | |
Year ended 12/31/04 | | $ | 2,968,629 | | | — | |
Year ended 12/31/05 | | $ | 2,765,227 | | | — | |
Year ended 12/31/06 | | $ | 2,807,887 | | $ | (309,219 | ) |
Large Cap Growth Fund | | | | | | | |
Year ended 12/31/04 | | $ | 255,147 | | $ | (34,160 | ) |
Year ended 12/31/05 | | $ | 215,317 | | $ | (10,175 | ) |
Year ended 12/31/06 | | $ | 253,487 | | | — | |
Growth Equity Fund | | | | | | | |
Year ended 12/31/04 | | $ | 5,412,145 | | | — | |
Year ended 12/31/05 | | $ | 5,853,561 | | | — | |
Year ended 12/31/06 | | $ | 5,826,509 | | | — | |
Aggressive Growth Fund2 | | | | | | | |
Year ended 12/31/04 | | $ | 2,761,420 | | $ | (221,170 | ) |
Year ended 12/31/05 | | $ | 3,730,336 | | $ | (408,792 | ) |
Year ended 12/31/06 | | $ | 4,589,362 | | $ | (125,569 | ) |
OTC 100 Fund | | | | | | | |
Year ended 12/31/04 | | $ | 103,368 | | | — | |
Year ended 12/31/05 | | $ | 95,693 | | | — | |
Year ended 12/31/06 | | $ | 81,295 | | | — | |
Focused Value Fund | | | | | | | |
Year ended 12/31/04 | | $ | 5,018,581 | | | — | |
Year ended 12/31/05 | | $ | 5,964,112 | | | — | |
Year ended 12/31/06 | | $ | 6,411,570 | | | — | |
Mid-Cap Value Fund5 | | | | | | | |
Period ended 12/31/06 | | $ | 32,530 | | $ | (29,649 | ) |
Small Cap Value Equity Fund4 | | | | | | | |
Period ended 12/31/06 | | $ | 98,736 | | $ | (37,219 | ) |
Small Company Value Fund | | | | | | | |
Year ended 12/31/04 | | $ | 2,814,327 | | $ | (12,339 | ) |
Year ended 12/31/05 | | $ | 4,570,377 | | | — | |
Year ended 12/31/06 | | $ | 6,283,098 | | | — | |
Small Cap Core Equity Fund4 | | | | | | | |
Period ended 12/31/06 | | $ | 69,995 | | $ | (51,651 | ) |
Mid Cap Growth Equity Fund | | | | | | | |
Year ended 12/31/04 | | $ | 981,124 | | | — | |
Year ended 12/31/05 | | $ | 1,028,234 | | | — | |
Year ended 12/31/06 | | $ | 1,264,977 | | | — | |
B-51
| | | | | | | |
| | | Management
Fee Paid
| | Other
Expenses
Reimbursed
| |
Mid Cap Growth Equity II Fund | | | | | | | |
Year ended 12/31/04 | | $ | 4,986,405 | | | — | |
Year ended 12/31/05 | | $ | 7,533,832 | | | — | |
Year ended 12/31/06 | | $ | 9,800,532 | | | — | |
Small Cap Growth Equity Fund | | | | | | | |
Year ended 12/31/04 | | $ | 3,932,225 | | | — | |
Year ended 12/31/05 | | $ | 4,275,351 | | | — | |
Year ended 12/31/06 | | $ | 5,261,469 | | | — | |
Small Company Growth Fund | | | | | | | |
Year ended 12/31/04 | | $ | 1,496,079 | | $ | (58,891 | ) |
Year ended 12/31/05 | | $ | 1,253,994 | | $ | (35,014 | ) |
Year ended 12/31/06 | | $ | 1,372,570 | | | — | |
Emerging Growth Fund | | | | | | | |
Year ended 12/31/04 | | $ | 1,010,882 | | | — | |
Year ended 12/31/05 | | $ | 1,016,628 | | | — | |
Year ended 12/31/06 | | $ | 976,952 | | | — | |
Diversified International Fund6 | | | | | | | |
Period ended 12/31/06 | | $ | 4,564 | | $ | (37,105 | ) |
Overseas Fund | | | | | | | |
Year ended 12/31/04 | | $ | 4,706,152 | | $ | (24,601 | ) |
Year ended 12/31/05 | | $ | 7,079,399 | | | — | |
Year ended 12/31/06 | | $ | 10,838,918 | | | — | |
Destination Retirement Income Fund | | | | | | | |
Year ended 12/31/04 | | $ | 59,044 | | $ | (5,214 | ) |
Year ended 12/31/05 | | $ | 110,817 | | | — | |
Year ended 12/31/06 | | $ | 131,038 | | | — | |
Destination Retirement 2010 Fund | | | | | | | |
Year ended 12/31/04 | | $ | 3,657 | | $ | (46,358 | ) |
Year ended 12/31/05 | | $ | 35,284 | | $ | (28,461 | ) |
Year ended 12/31/06 | | $ | 71,076 | | $ | (25,119 | ) |
Destination Retirement 2020 Fund | | | | | | | |
Year ended 12/31/04 | | $ | 78,697 | | $ | (21,162 | ) |
Year ended 12/31/05 | | $ | 165,457 | | | — | |
Year ended 12/31/06 | | $ | 253,286 | | | — | |
Destination Retirement 2030 Fund | | | | | | | |
Year ended 12/31/04 | | $ | 62,228 | | $ | (22,322 | ) |
Year ended 12/31/05 | | $ | 116,134 | | | — | |
Year ended 12/31/06 | | $ | 181,617 | | | — | |
Destination Retirement 2040 Fund | | | | | | | |
Year ended 12/31/04 | | $ | 37,536 | | $ | (20,210 | ) |
Year ended 12/31/05 | | $ | 63,874 | | $ | (944 | ) |
Year ended 12/31/06 | | $ | 105,843 | | | — | |
1 | Commenced operations on October 15, 2004. |
2 | MassMutual agreed to waive .08% of the investment advisory fee, effective May 1, 2004. |
3 | Commenced operations on December 31, 2004. |
4 | Commenced operations on March 31, 2006. |
5 | Commenced operations on August 29, 2006. |
6 | Commenced operations on December 14, 2006. |
B-52
Investment Sub-Advisers
AllianceBernstein acts as a sub-adviser for the Diversified Value Fund, Large Cap Growth Fund and Diversified International Fund. AllianceBernstein is a leading global investment management firm providing investment management services for many of the largest U.S. public and private employee benefit plans, foundations, public employee retirement funds, pension funds, endowments, banks, insurance companies and high-net-worth individuals worldwide. AllianceBernstein is also one of the largest mutual fund sponsors, with a diverse family of globally distributed mutual fund portfolios. Through its subsidiary, Sanford C. Bernstein & Co., LLC, AllianceBernstein provides in-depth research, portfolio strategy and trade execution to the institutional investment community.
At December 31, 2006, AllianceBernstein Holding owned approximately 33.1% of the issued and outstanding AllianceBernstein Units. AXA Financial was the beneficial owner of approximately 59.9% of the AllianceBernstein Units at December 31, 2006 (including those held indirectly through its ownership of approximately 1.7% of the issued and outstanding Holding Units) which, including the general partnership interests in AllianceBernstein and Holding, represent an approximate 60.3% economic interest in AllianceBernstein. AllianceBernstein also provides sub-advisory services for the MML Large Cap Growth Fund, a series of MML Series Investment Fund, a registered, open-end investment company for which MassMutual serves as investment adviser, and MML Equity Fund, a series of MML Series Investment Fund II, a registered, open-end investment company for which MassMutual serves as investment adviser.
ClearBridge and Western Asset both act as sub-advisers for the Strategic Balanced Fund. ClearBridge and Western Asset are each wholly-owned subsidiaries of Legg Mason, Inc.
Western Asset also serves as sub-adviser for the Strategic Bond Fund.
GMO serves as sub-adviser for the Growth Equity Fund. GMO also provides sub-advisory services for the MML Growth Equity Fund, a series of MML Series Investment Fund, a registered, open-end investment company for which MassMutual serves as investment adviser.
Navellier is owned and controlled by its sole shareholder, Louis G. Navellier. Navellier is sub-adviser for the Mid Cap Growth Equity Fund.
Wellington Management and Waddell & Reed both act as sub-advisers for the Small Cap Growth Equity Fund and both are registered with the SEC as investment advisers. Each sub-adviser will manage a portion of the net assets of the Fund’s portfolio. Wellington Management and Waddell & Reed also both provide sub-advisory services for the MML Small Cap Growth Equity Fund, a series of MML Series Investment Fund, a registered, open-end investment company for which MassMutual serves as investment adviser.
Wellington Management also serves as sub-adviser for the Fundamental Value Fund.
FMR serves as the sub-adviser for the Value Equity Fund. FMR Co., Inc. (“FMRC”) serves as a sub-subadviser and is primarily responsible for choosing investments. FMR Corp., organized in 1972, is the ultimate parent company of FMR and FMRC. The voting common stock of FMR Corp. is divided into two classes. Class B is held predominantly by members of the Edward C. Johnson 3d family and is entitled to 49% of the vote on any matter acted upon by the voting common stock. The Johnson family group and all other Class B shareholders have entered into a shareholders’ voting agreement under which all Class B shares will be voted in accordance with the majority vote of Class B shares. Under the Investment Company Act of 1940, control of a company is presumed where one individual or group of individuals owns more than 25% of the voting stock of that company. Therefore, through their ownership of voting common stock and the execution of the shareholders’ voting agreement, members of the Johnson family may be deemed, under the 1940 Act, to form a controlling group with respect to FMR Corp.
B-53
NTI serves as sub-adviser for the Indexed Equity Fund and the OTC 100 Fund. NTI is an investment adviser registered under the Investment Advisers Act of 1940. It primarily manages assets for defined contribution and benefit plans, investment companies and other institutional investors. NTI is a subsidiary of The Northern Trust Company (“TNTC”), an Illinois state chartered banking organization and a member of the Federal Reserve System. Formed in 1889, TNTC administers and manages assets for individuals, personal trusts, defined contribution and benefit plans and other institutional and corporate clients. TNTC is the principal subsidiary of Northern Trust Corporation, a bank holding company. NTI also provides sub-advisory services for the MML Equity Index Fund, the MML OTC 100 Fund and the MML Small Cap Index Fund, each of which are series of MML Series Investment Fund, a registered, open-end investment company for which MassMutual serves as investment adviser.
Victory serves as sub-adviser for the Core Opportunities Fund. Victory is a second-tier subsidiary of KeyCorp.
Davis serves as sub-adviser for the Large Cap Value Fund. Davis is controlled by Davis Investments, LLC. Davis also provides sub-advisory services for the MML Large Cap Value Fund, a series of MML Series Investment Fund, a registered, open-end investment company for which MassMutual serves as investment adviser.
Harris and Cooke & Bieler both act as sub-advisers for the Focused Value Fund. Harris is a wholly-owned subsidiary of IXIS Asset Management US Group L.P. (“IXIS US Group”). IXIS US Group is a wholly-owned subsidiary of IXIS Asset Management. Harris also provides sub-advisory services for the Overseas Fund.
Cooke & Bieler also serves as sub-adviser for the Mid-Cap Value Fund.
Sands Capital and DMC both act as sub-advisers for the Aggressive Growth Fund. DMC, a series of Delaware Management Business Trust, is an indirect subsidiary of Delaware Management Holdings, Inc. (“DMH”), DMH is an indirect, wholly-owned subsidiary, and subject to the ultimate control, of Lincoln National Corporation (“Lincoln”). Lincoln, with headquarters in Philadelphia, Pennsylvania, is a diversified organization with operations in many aspects of the financial services industry, including insurance and investment management. Delaware Investments is the marketing name for DMH and its subsidiaries.
DMC and Insight Capital both act as sub-advisers for the Emerging Growth Fund. DMC and Insight Capital also both provide sub-advisory services for the MML Emerging Growth Fund, a series of MML Series Investment Fund, a registered, open-end investment company for which MassMutual serves as investment adviser.
T. Rowe Price serves as sub-adviser for the Blue Chip Growth Fund and Mid Cap Growth Equity II Fund. T. Rowe Price is a wholly-owned subsidiary of T. Rowe Price Group, Inc., a publicly traded financial services holding company.
T. Rowe Price also provides sub-advisory services for the MML Equity Income Fund, the MML Blue Chip Growth Fund and the MML Mid Cap Growth Fund, each of which are series of MML Series Investment Fund, a registered, open-end investment company for which MassMutual serves as investment adviser.
Clover, T. Rowe Price, and Earnest Partners each act as sub-advisers for the Small Company Value Fund.
SSgA FM serves as sub-adviser for the Small Cap Value Equity Fund. SSgA FM is registered with the SEC as an investment adviser under the Investment Advisers Act of 1940 and is a wholly-owned subsidiary of State Street Corporation, a publicly held bank holding company. As of December 31, 2006, SSgA FM had over $123.4 billion in assets under management. SSgA FM, State Street and other advisory affiliates of State Street make up State Street Global Advisors (“SSgA”), the investment management arm of State Street Corporation. With over
B-54
$1.7 trillion under management as of December 31, 2006, SSgA provides complete global investment management services from offices in North America, South America, Europe, Asia, Australia and the Middle East. State Street, a 200-year old pioneer and leader in the world of financial services, is one of the largest providers of securities processing and record keeping services for U.S. mutual funds and pension funds.
GSAM serves as sub-adviser for the Small Cap Core Equity Fund. Established in 1989, GSAM offers investment solutions to institutions and individuals worldwide. Its clients include pension plans, corporations, insurance companies, central banks, financial institutions, endowments, foundations, Taft-Hartley organizations/unions and high net worth individuals. GSAM is a part of the Investment Management Division of Goldman, Sachs & Co. GSAM also provides sub-advisory services for the MML Small Cap Value Fund, a series of MML Series Investment Fund, a registered, open-end investment company for which MassMutual serves as investment adviser.
Mazama and Eagle both act as sub-advisers for the Small Company Growth Fund. Eagle is a wholly-owned subsidiary of Raymond James Financial, Inc., a St. Petersburg, Florida-based financial services company.
Harris and MFS both act as sub-advisers for the Overseas Fund. MFS is a subsidiary of Sun Life of Canada (U.S.) Financial Services Holdings, Inc., which in turn is an indirect wholly owned subsidiary of Sun Life Financial Inc. (a diversified financial services organization).
For the last three fiscal years, MassMutual paid the following amounts for investment sub-advisory services provided to the Funds:
| | | |
Strategic Bond Fund2 | | | |
Year ended 12/31/05 | | $ | 162,888 |
Year ended 12/31/06 | | $ | 431,540 |
Strategic Balanced Fund | | | |
Year ended 12/31/04 | | $ | 523,540 |
Year ended 12/31/05 | | $ | 721,935 |
Year ended 12/31/06 | | $ | 733,977 |
Diversified Value Fund1 | | | |
Period ended 12/31/04 | | $ | 92,227 |
Year ended 12/31/05 | | $ | 501,875 |
Year ended 12/31/06 | | $ | 880,207 |
Fundamental Value Fund | | | |
Year ended 12/31/04 | | $ | 2,292,715 |
Year ended 12/31/05 | | $ | 2,857,358 |
Year ended 12/31/06 | | $ | 3,507,675 |
Value Equity Fund | | | |
Year ended 12/31/04 | | $ | 429,921 |
Year ended 12/31/05 | | $ | 453,827 |
Year ended 12/31/06 | | $ | 499,508 |
Large Cap Value Fund | | | |
Year ended 12/31/04 | | $ | 2,891,509 |
Year ended 12/31/05 | | $ | 4,018,917 |
Year ended 12/31/06 | | $ | 4,754,332 |
Indexed Equity Fund | | | |
Year ended 12/31/04 | | $ | 134,924 |
Year ended 12/31/05 | | $ | 156,701 |
Year ended 12/31/06 | | $ | 171,839 |
Core Opportunities Fund3 | | | |
Period ended 12/31/06 | | $ | 52,213 |
B-55
| | | |
Blue Chip Growth Fund | | | |
Year ended 12/31/04 | | $ | 2,245,457 |
Year ended 12/31/05 | | $ | 2,099,600 |
Year ended 12/31/06 | | $ | 1,517,369 |
Large Cap Growth Fund | | | |
Year ended 12/31/04 | | $ | 163,897 |
Year ended 12/31/05 | | $ | 130,162 |
Year ended 12/31/06 | | $ | 154,192 |
Growth Equity Fund | | | |
Year ended 12/31/04 | | $ | 2,613,001 |
Year ended 12/31/05 | | $ | 2,598,190 |
Year ended 12/31/06 | | $ | 2,579,854 |
Aggressive Growth Fund | | | |
Year ended 12/31/04 | | $ | 1,208,633 |
Year ended 12/31/05 | | $ | 1,588,342 |
Year ended 12/31/06 | | $ | 2,567,045 |
OTC 100 Fund | | | |
Year ended 12/31/04 | | $ | 34,019 |
Year ended 12/31/05 | | $ | 31,518 |
Year ended 12/31/06 | | $ | 26,836 |
Focused Value Fund | | | |
Year ended 12/31/04 | | $ | 3,116,664 |
Year ended 12/31/05 | | $ | 3,727,149 |
Year ended 12/31/06 | | $ | 4,044,793 |
Mid-Cap Value Fund4 | | | |
Period ended 12/31/06 | | $ | 20,385 |
Small Cap Value Equity Fund3 | | | |
Period ended 12/31/06 | | $ | 62,250 |
Small Company Value Fund | | | |
Year ended 12/31/04 | | $ | 1,881,917 |
Year ended 12/31/05 | | $ | 3,020,407 |
Year ended 12/31/06 | | $ | 4,083,613 |
Small Cap Core Equity Fund3 | | | |
Period ended 12/31/06 | | $ | 46,750 |
Mid Cap Growth Equity Fund | | | |
Year ended 12/31/04 | | $ | 465,333 |
Year ended 12/31/05 | | $ | 475,634 |
Year ended 12/31/06 | | $ | 579,943 |
Mid Cap Growth Equity II Fund | | | |
Year ended 12/31/04 | | $ | 3,199,992 |
Year ended 12/31/05 | | $ | 4,859,905 |
Year ended 12/31/06 | | $ | 6,363,190 |
Small Cap Growth Equity Fund | | | |
Year ended 12/31/04 | | $ | 2,937,842 |
Year ended 12/31/05 | | $ | 3,108,734 |
Year ended 12/31/06 | | $ | 3,876,272 |
Small Company Growth Fund | | | |
Year ended 12/31/04 | | $ | 1,074,617 |
Year ended 12/31/05 | | $ | 925,432 |
Year ended 12/31/06 | | $ | 1,013,781 |
B-56
| | | |
Emerging Growth Fund | | | |
Year ended 12/31/04 | | $ | 787,840 |
Year ended 12/31/05 | | $ | 777,851 |
Year ended 12/31/06 | | $ | 771,199 |
Diversified International Fund5 | | | |
Period ended 12/31/06 | | $ | 1,546 |
Overseas Fund | | | |
Year ended 12/31/04 | | $ | 2,378,498 |
Year ended 12/31/05 | | $ | 3,527,678 |
Year ended 12/31/06 | | $ | 5,246,454 |
1Commenced | operations on October 15, 2004. |
2Commenced | operations on December 31, 2004. |
3Commenced | operations on March 31, 2006. |
4Commenced | operations on August 29, 2006. |
5Commenced | operations on December 14, 2006. |
ADMINISTRATOR AND SUB-ADMINISTRATOR
MassMutual has entered into an administrative services agreement (the “Administrative Services Agreement”) with the Trust, on behalf of each Fund, pursuant to which MassMutual is obligated to provide all necessary administrative and shareholder services and to bear some expenses of the Funds, such as federal and state registration fees. MassMutual may, at its expense, employ others to supply all or any part of the services to be provided to the Funds pursuant to the Administrative Services Agreement. The Trust, on behalf of each Fund, pays MassMutual an administrative services fee monthly at an annual rate based upon the average daily net assets of the applicable class of shares of the Funds which range from ..1959% to .6744% for Class N shares; .1459% to .6244% for Class A shares; .0459% to .4744% for Class Y shares; .0116% to .3744% for Class S shares; .1459% to .6244% for Class L shares and .0855% for Class Z shares of the Indexed Equity Fund. MassMutual has entered into a sub-administration agreement with Investors Bank & Trust Company (“IBT”). As sub-administrator, IBT generally assists in all aspects of fund administration and is compensated by MassMutual for providing administrative services to the Funds.
For the last three fiscal years, the Trust, on behalf of the Funds, has paid the following amounts as administrative services fees to MassMutual pursuant to each Administrative Services Agreement:
| | | | | | | | | | |
| | | Gross
| | Waiver
| | | Net
|
Strategic Bond Fund2 | | | | | | | | | | |
Year ended 12/31/05 | | $ | 59,208 | | $ | (12,433 | ) | | $ | 46,775 |
Year ended 12/31/06 | | $ | 226,491 | | | — | | | $ | 226,491 |
Strategic Balanced Fund | | | | | | | | | | |
Year ended 12/31/04 | | $ | 441,053 | | | — | | | $ | 441,053 |
Year ended 12/31/05 | | $ | 615,784 | | | — | | | $ | 615,784 |
Year ended 12/31/06 | | $ | 583,840 | | | — | | | $ | 583,840 |
Diversified Value Fund1 | | | | | | | | | | |
Period ended 12/31/04 | | $ | 34,425 | | | — | | | $ | 34,425 |
Year ended 12/31/05 | | $ | 233,481 | | | — | | | $ | 233,481 |
Year ended 12/31/06 | | $ | 563,010 | | | — | | | $ | 563,010 |
Fundamental Value Fund | | | | | | | | | | |
Year ended 12/31/04 | | $ | 1,663,242 | | | — | | | $ | 1,663,242 |
Year ended 12/31/05 | | $ | 2,059,054 | | | — | | | $ | 2,059,054 |
Year ended 12/31/06 | | $ | 2,526,758 | | | — | | | $ | 2,526,758 |
B-57
| | | | | | | | | | |
| | | Gross
| | Waiver
| | | Net
|
Value Equity Fund | | | | | | | | | | |
Year ended 12/31/04 | | $ | 129,421 | | | — | | | $ | 129,421 |
Year ended 12/31/05 | | $ | 142,952 | | | — | | | $ | 142,952 |
Year ended 12/31/06 | | $ | 160,091 | | | — | | | $ | 160,091 |
Large Cap Value Fund | | | | | | | | | | |
Year ended 12/31/04 | | $ | 1,993,162 | | | — | | | $ | 1,993,162 |
Year ended 12/31/05 | | $ | 2,794,249 | | | — | | | $ | 2,794,249 |
Year ended 12/31/06 | | $ | 3,257,298 | | | — | | | $ | 3,257,298 |
Indexed Equity Fund | | | | | | | | | | |
Year ended 12/31/04 | | $ | 5,378,957 | | $ | (287,889 | ) | | $ | 5,091,068 |
Year ended 12/31/05 | | $ | 6,240,360 | | $ | (533,153 | ) | | $ | 5,707,207 |
Year ended 12/31/06 | | $ | 6,688,233 | | $ | (1,040,906 | ) | | $ | 5,647,327 |
Core Opportunities Fund3 | | | | | | | | | | |
Period ended 12/31/06 | | $ | 19,011 | | | — | | | $ | 19,011 |
Blue Chip Growth Fund | | | | | | | | | | |
Year ended 12/31/04 | | $ | 1,511,853 | | | — | | | $ | 1,511,853 |
Year ended 12/31/05 | | $ | 1,426,432 | | | — | | | $ | 1,426,432 |
Year ended 12/31/06 | | $ | 1,450,443 | | | — | | | $ | 1,450,443 |
Large Cap Growth Fund | | | | | | | | | | |
Year ended 12/31/04 | | $ | 86,336 | | | — | | | $ | 86,336 |
Year ended 12/31/05 | | $ | 64,906 | | | — | | | $ | 64,906 |
Year ended 12/31/06 | | $ | 82,784 | | | — | | | $ | 82,784 |
Growth Equity Fund | | | | | | | | | | |
Year ended 12/31/04 | | $ | 1,743,505 | | | — | | | $ | 1,743,505 |
Year ended 12/31/05 | | $ | 1,879,317 | | | — | | | $ | 1,879,317 |
Year ended 12/31/06 | | $ | 1,825,838 | | | — | | | $ | 1,825,838 |
Aggressive Growth Fund | | | | | | | | | | |
Year ended 12/31/04 | | $ | 899,439 | | | — | | | $ | 899,439 |
Year ended 12/31/05 | | $ | 1,217,016 | | | — | | | $ | 1,217,016 |
Year ended 12/31/06 | | $ | 1,473,216 | | | — | | | $ | 1,473,216 |
OTC 100 Fund | | | | | | | | | | |
Year ended 12/31/04 | | $ | 371,419 | | | — | | | $ | 371,419 |
Year ended 12/31/05 | | $ | 342,149 | | | — | | | $ | 342,149 |
Year ended 12/31/06 | | $ | 292,366 | | | — | | | $ | 292,366 |
Focused Value Fund | | | | | | | | | | |
Year ended 12/31/04 | | $ | 1,537,312 | | | — | | | $ | 1,537,312 |
Year ended 12/31/05 | | $ | 1,875,074 | | | — | | | $ | 1,875,074 |
Year ended 12/31/06 | | $ | 2,027,079 | | | — | | | $ | 2,027,079 |
Mid-Cap Value Fund4 | | | | | | | | | | |
Period ended 12/31/06 | | $ | 3,078 | | | — | | | $ | 3,078 |
Small Cap Value Equity Fund3 | | | | | | | | | | |
Period ended 12/31/06 | | $ | 10,587 | | | — | | | $ | 10,587 |
Small Company Value Fund | | | | | | | | | | |
Year ended 12/31/04 | | $ | 855,376 | | | — | | | $ | 855,376 |
Year ended 12/31/05 | | $ | 1,415,350 | | | — | | | $ | 1,415,350 |
Year ended 12/31/06 | | $ | 1,892,662 | | | — | | | $ | 1,892,662 |
Small Cap Core Equity Fund3 | | | | | | | | | | |
Period ended 12/31/06 | | $ | 7,843 | | | — | | | $ | 7,843 |
Mid Cap Growth Equity Fund | | | | | | | | | | |
Year ended 12/31/04 | | $ | 283,558 | | | — | | | $ | 283,558 |
Year ended 12/31/05 | | $ | 293,403 | | | — | | | $ | 293,403 |
Year ended 12/31/06 | | $ | 347,942 | | | — | | | $ | 347,942 |
B-58
| | | | | | | | | | |
| | | Gross
| | Waiver
| | | Net
|
Mid Cap Growth Equity II Fund | | | | | | | | | | |
Year ended 12/31/04 | | $ | 1,676,040 | | | — | | | $ | 1,676,040 |
Year ended 12/31/05 | | $ | 2,576,893 | | | — | | | $ | 2,576,893 |
Year ended 12/31/06 | | $ | 3,325,918 | | | — | | | $ | 3,325,918 |
Small Cap Growth Equity Fund | | | | | | | | | | |
Year ended 12/31/04 | | $ | 1,143,631 | | | — | | | $ | 1,143,631 |
Year ended 12/31/05 | | $ | 1,264,126 | | | — | | | $ | 1,264,126 |
Year ended 12/31/06 | | $ | 1,536,184 | | | — | | | $ | 1,536,184 |
Small Company Growth Fund | | | | | | | | | | |
Year ended 12/31/04 | | $ | 495,092 | | | — | | | $ | 495,092 |
Year ended 12/31/05 | | $ | 426,387 | | | — | | | $ | 426,387 |
Year ended 12/31/06 | | $ | 463,982 | | | — | | | $ | 463,982 |
Emerging Growth Fund | | | | | | | | | | |
Year ended 12/31/04 | | $ | 326,418 | | | — | | | $ | 326,418 |
Year ended 12/31/05 | | $ | 322,716 | | | — | | | $ | 322,716 |
Year ended 12/31/06 | | $ | 283,690 | | | — | | | $ | 283,690 |
Diversified International Fund5 | | | | | | | | | | |
Period ended 12/31/06 | | $ | 298 | | | — | | | $ | 298 |
Overseas Fund | | | | | | | | | | |
Year ended 12/31/04 | | $ | 698,420 | | | — | | | $ | 698,420 |
Year ended 12/31/05 | | $ | 1,075,400 | | | — | | | $ | 1,075,400 |
Year ended 12/31/06 | | $ | 1,602,881 | | $ | (407,413 | ) | | $ | 1,195,468 |
Destination Retirement Income Fund | | | | | | | | | | |
Year ended 12/31/04 | | $ | 125,014 | | | — | | | $ | 125,014 |
Year ended 12/31/05 | | $ | 229,612 | | | — | | | $ | 229,612 |
Year ended 12/31/06 | | $ | 259,907 | | | — | | | $ | 259,907 |
Destination Retirement 2010 Fund | | | | | | | | | | |
Year ended 12/31/04 | | $ | 9,650 | | | — | | | $ | 9,650 |
Year ended 12/31/05 | | $ | 92,986 | | | — | | | $ | 92,986 |
Year ended 12/31/06 | | $ | 175,189 | | | — | | | $ | 175,189 |
Destination Retirement 2020 Fund | | | | | | | | | | |
Year ended 12/31/04 | | $ | 267,208 | | | — | | | $ | 267,208 |
Year ended 12/31/05 | | $ | 512,292 | | | — | | | $ | 512,292 |
Year ended 12/31/06 | | $ | 729,167 | | | — | | | $ | 729,167 |
Destination Retirement 2030 Fund | | | | | | | | | | |
Year ended 12/31/04 | | $ | 212,947 | | | — | | | $ | 212,947 |
Year ended 12/31/05 | | $ | 374,127 | | | — | | | $ | 374,127 |
Year ended 12/31/06 | | $ | 533,437 | | | — | | | $ | 533,437 |
Destination Retirement 2040 Fund | | | | | | | | | | |
Year ended 12/31/04 | | $ | 119,931 | | | — | | | $ | 119,931 |
Year ended 12/31/05 | | $ | 193,292 | | | — | | | $ | 193,292 |
Year ended 12/31/06 | | $ | 275,279 | | | — | | | $ | 275,279 |
1 | Commenced operations on October 15, 2004 |
2 | Commenced operations on December 31, 2004. |
3 | Commenced operations on March 31, 2006. |
4 | Commenced operations on August 29, 2006. |
5 | Commenced operations on December 14, 2006. |
B-59
THE DISTRIBUTOR
The Funds’ shares are continuously distributed by MML Distributors, LLC (the “Distributor”), located at 1295 State Street, Springfield, Massachusetts 01111-0001, pursuant to a Principal Underwriter Agreement with the Trust dated as of February 6, 2006 (the “Distribution Agreement”). The Distributor pays commissions to its selling dealers as well as the costs of printing and mailing Prospectuses to potential investors and of any advertising incurred by it in connection with distribution of shares of the Funds. The Distributor is a wholly-owned subsidiary of MassMutual.
The Distribution Agreement will continue in effect for an initial two-year period, and thereafter for successive one-year periods, provided that each such continuance is specifically approved (i) by the vote of a majority of the Trustees or by a vote of a majority of the shares of the Trust; and (ii) by a majority of the Trustees who are not parties to the Distribution Agreement or interested persons (as defined in the 1940 Act) of any such person, cast in person at a meeting called for the purpose of voting on such approval.
The Distributor has also entered into a Sub-Distributor’s Agreement with OppenheimerFunds Distributor, Inc. (the “Sub-Distributor”) dated as of February 7, 2003. The Sub-Distributor is an affiliate of the Distributor and an indirect majority-owned subsidiary of MassMutual.
MassMutual may make payments, out of its own assets, to securities dealers and other firms that enter into agreements providing the Distributor with access to representatives of those firms for the sale of shares of the Funds or with other marketing or administrative services with respect to the Funds. These payments may be a specific dollar amount, may be based on the number of customer accounts maintained by a firm, or may be based on a percentage of the value of shares of the Funds sold to, or held by, customers of the firm.
CLASS A AND CLASS N DISTRIBUTION AND SERVICE PLANS
The Trust has adopted, with respect to the Class A and Class N shares of each of the Funds, a Distribution and Service Plan and Agreement (the “Plans”) pursuant to Rule 12b-1 under the 1940 Act. The Trustees of the Trust, including a majority of the Trustees who are not interested persons of the Trust and who have no direct or indirect financial interest in the operation of the Plans, by vote cast in person at a meeting called for the purpose of voting on the Plans, approved the Class A Plans on May 3, 1999 for the Funds (other than the OTC 100 Fund, the Aggressive Growth Fund, the Large Cap Value Fund, the Focused Value Fund, the Mid Cap Growth Equity II Fund and the Emerging Growth Fund which were approved February 14, 2000, the Value Equity Fund, Blue Chip Growth Fund and Overseas Fund which were approved April 19, 2001, the Fundamental Value Fund, Large Cap Growth Fund, Small Company Value Fund and Small Company Growth Fund which were approved November 5, 2001, the Strategic Balanced Fund, Destination Retirement Income Fund, Destination Retirement 2010 Fund, Destination Retirement 2020 Fund, Destination Retirement 2030 Fund and Destination Retirement 2040 Fund which were approved November 3, 2003, the Diversified Value Fund which was approved August 9, 2004, the Strategic Bond Fund which was approved November 8, 2004, the Core Opportunities Fund, Small Cap Value Equity Fund and Small Cap Core Equity Fund which were approved February 6, 2006, the Mid-Cap Value Fund which was approved August 7, 2006 and the Diversified International Fund which was approved November 6, 2006). The Class N Plans were approved on November 11, 2002 for the Funds (other than the Strategic Balanced Fund, Destination Retirement Income Fund, Destination Retirement 2010 Fund, Destination Retirement 2020 Fund, Destination Retirement 2030 Fund and Destination Retirement 2040 Fund which were approved November 3, 2003, the Diversified Value Fund which was approved August 9, 2004, the Strategic Bond Fund which was approved November 8, 2004, the Core Opportunities Fund, Small Cap Value Equity Fund and Small Cap Core Equity Fund which were approved February 6, 2006, the Mid-Cap Value Fund which was approved August 7, 2006 and the Diversified International Fund which was approved November 6, 2006). Under the terms of each of the Class A Plans, the Trust is permitted to compensate, out of the assets attributable to the Class A shares of a Fund, in an amount up to .25%, in the aggregate, on an annual basis of the average daily net
B-60
assets attributable to that Class, (i) the Distributor for services provided and expenses incurred by it in connection with the distribution of Class A shares of a Fund (“Distribution Fee”) and (ii) MassMutual for services provided and expenses incurred by it for purposes of maintaining or providing personal services (the “Servicing Fee”) to Class A shareholders. Under the terms of each of the Class N Plans, the Trust is permitted to compensate, out of the assets attributable to the Class N shares of a Fund, (i) a Distribution Fee in an amount up to .25%, in the aggregate, on an annual basis of the average daily net assets attributable to that Class and (ii) a Servicing Fee in an amount up to .25%, in the aggregate, on an annual basis of the average daily net assets attributable to that Class. The Distribution Fee may be spent by the Distributor on any activities or expenses primarily intended to result in the sale of Class A or Class N shares of the Fund, respectively, including, but not limited to, compensation to, and expenses (including overhead and telephone expenses) of, financial consultants or other employees of the Distributor or of participating or introducing brokers who engage in the distribution of Class A or Class N shares, preparing, printing and delivering prospectuses and reports for other than existing Class A or Class N shareholders, providing facilities to answer questions from other than existing Class A or Class N shareholders, advertising and preparation, printing and distribution of sales literature, receiving and answering correspondence, including requests for prospectuses and statements of additional information, and complying with Federal and state securities laws pertaining to the sale of Class A or Class N shares. The Servicing Fee may be spent by MassMutual on personal services rendered to Class A or Class N shareholders of a Fund and/or maintenance of Class A or Class N shareholder accounts. MassMutual’s Servicing Fee expenditures may include, but shall not be limited to, compensation to, and expenses (including telephone and overhead expenses) of agents or employees of MassMutual or the Distributor, pension consultants or participating or introducing brokers and other financial intermediaries who assist investors in completing account forms and selecting dividend and other account options; who aid in the processing of redemption requests for Class A or Class N shares or the processing of dividend payments with respect to Class A or Class N shares; who prepare, print and deliver prospectuses and shareholder reports to Class A or Class N shareholders; who oversee compliance with federal and state laws pertaining to the sale of Class A or Class N shares; who provide information periodically to Class A or Class N shareholders showing their position in Class A or Class N shares; who issue account statements to Class A or Class N shareholders; who furnish shareholder sub-accounting; who forward communications from a Fund to Class A or Class N shareholders; who render advice regarding particular shareholder account options offered by a Fund in light of shareholder needs; who provide and maintain elective shareholder services; who provide and maintain pre-authorized investment plans for Class A or Class N shareholders; who respond to inquiries from Class A or Class N shareholders relating to such services; and/or who provide such similar services as permitted under applicable statutes, rules or regulations.
Each Plan provides that it may not be amended to materially increase the costs which Class A or Class N shareholders may bear under the Plan without the approval of a majority of the outstanding Class A or Class N shares of the Fund.
Each Plan provides that it may not take effect until approved by vote of a majority of both (i) the Trustees of the Trust and (ii) the Trustees of the Trust who are not interested persons of the Trust and have no direct or indirect financial interest in the operation of the Plan or any agreements related to it. Each Plan provides that it shall continue in effect so long as such continuance is specifically approved at least annually by (i) the Trustees of the Trust and (ii) the Trustees of the Trust who are not interested persons of the Trust and have no direct or indirect financial interest in the operation of the Plan or any agreements related to it. Each Plan provides that MassMutual shall provide to the Trustees, and the Board shall review at least quarterly, a written report of the amounts so expended and the purposes for which such expenditures were made.
B-61
The following table approximately discloses the 12b-1 fees paid in 2006 by the Trust under its 12b-1 plans for Class A and Class N shares of the Funds:
| | | | | | | | | |
| | | Class A
12b-1
Servicing
Fees
| | Class N
12b-1
Servicing
Fees
| | Class N
12b-1
Distribution
Fees
|
Strategic Bond Fund | | $ | 73,189 | | $ | 2,619 | | $ | 2,619 |
Strategic Balanced Fund | | | 70,806 | | | 1,208 | | | 1,208 |
Diversified Value Fund | | | 125,315 | | | 2,184 | | | 2,184 |
Fundamental Value Fund | | | 678,586 | | | 4,290 | | | 4,290 |
Value Equity Fund | | | 73,708 | | | 368 | | | 368 |
Large Cap Value Fund | | | 935,401 | | | 5,934 | | | 5,934 |
Indexed Equity Fund | | | 701,307 | | | 12,276 | | | 12,276 |
Core Opportunities Fund1 | | | 7,279 | | | 189 | �� | | 189 |
Blue Chip Growth Fund | | | 93,171 | | | 7,317 | | | 7,317 |
Large Cap Growth Fund | | | 14,724 | | | 3 | | | 3 |
Growth Equity Fund | | | 399,117 | | | 1,338 | | | 1,338 |
Aggressive Growth Fund | | | 307,687 | | | 2,552 | | | 2,552 |
OTC 100 Fund | | | 58,219 | | | 1,102 | | | 1,102 |
Focused Value Fund | | | 620,547 | | | 5,107 | | | 5,107 |
Mid-Cap Value Fund2 | | | 114 | | | 80 | | | 80 |
Small Cap Value Equity Fund1 | | | 2,303 | | | 189 | | | 189 |
Small Company Value Fund | | | 383,936 | | | 3,410 | | | 3,410 |
Small Cap Core Equity Fund1 | | | 594 | | | 184 | | | 184 |
Mid Cap Growth Equity Fund | | | 88,665 | | | 606 | | | 606 |
Mid Cap Growth Equity II Fund | | | 806,118 | | | 5,687 | | | 5,687 |
Small Cap Growth Equity Fund | | | 277,701 | | | 2,481 | | | 2,481 |
Small Company Growth Fund | | | 168,322 | | | 2,222 | | | 2,222 |
Emerging Growth Fund | | | 38,191 | | | 428 | | | 428 |
Diversified International Fund3 | | | 13 | | | 12 | | | 12 |
Overseas Fund | | | 629,753 | | | 5,164 | | | 5,165 |
Destination Retirement Income Fund | | | 114,049 | | | 289 | | | 289 |
Destination Retirement 2010 Fund | | | 111,147 | | | 412 | | | 412 |
Destination Retirement 2020 Fund | | | 289,184 | | | 666 | | | 666 |
Destination Retirement 2030 Fund | | | 217,731 | | | 441 | | | 441 |
Destination Retirement 2040 Fund | | | 89,759 | | | 419 | | | 419 |
| | |
|
| |
|
| |
|
|
| | | $ | 7,376,636 | | $ | 69,177 | | $ | 69,178 |
| | |
|
| |
|
| |
|
|
1 | Commenced operations on March 31, 2006. |
2 | Commenced operations on August 29, 2006. |
3 | Commenced operations on December 14, 2006. |
CUSTODIAN, DIVIDEND DISBURSING AGENT AND TRANSFER AGENT
IBT, located at 200 Clarendon Street, Boston, Massachusetts 02116, is the custodian of the Funds’ investments (the “Custodian”) and is the Funds’ transfer agent and dividend disbursing agent (the “Transfer Agent”). As custodian, IBT has custody of the Funds’ securities and maintains certain financial and accounting books and records. The Custodian and the Transfer Agent do not assist in, and are not responsible for, the investment decisions and policies of the Funds.
B-62
INDEPENDENT REGISTERED PUBLIC ACCOUNTING FIRM
Deloitte & Touche LLP, located at 200 Berkeley Street, Boston, Massachusetts 02116, is the Trust’s independent registered public accounting firm.
CODES OF ETHICS
The Trust, MassMutual, the Distributor, AllianceBernstein, ClearBridge, Clover, Cooke & Bieler, Davis, DMC, Eagle, EARNEST Partners, FMR, GMO, GSAM, Harris, Insight Capital, Mazama, MFS, Navellier, NTI, Sands Capital, SSgA FM, T. Rowe Price, Victory Waddell & Reed, Wellington Management, Western Asset and WAML have each adopted a code of ethics (the “Codes of Ethics”) pursuant to Rule 17j-1 under the 1940 Act and Rule 204A-1 under the Investment Advisers Act of 1940. The Codes of Ethics permit Fund personnel to invest in securities, including securities that may be purchased or held by a Fund, for their own accounts, but require compliance with various pre-clearance requirements (with certain exceptions). The Codes of Ethics are on public file with, and are available from, the SEC.
PORTFOLIO TRANSACTIONS AND BROKERAGE
For the Destination Retirement Funds, all orders for the purchase or sale of portfolio securities (normally, shares of funds advised by MassMutual or a control affiliate of MassMutual (“Underlying Funds”)1) are placed on behalf of each Destination Retirement Fund by MassMutual, pursuant to authority contained in each Destination Retirement Fund’s management contract. A Destination Retirement Fund will not incur any commissions or sales charges when it invests in Underlying Funds, but it may incur such costs if it invests directly in other types of securities.
Purchases and sales of securities on a securities exchange are effected by brokers, and each Fund which purchases or sells securities on a securities exchange pays a brokerage commission for this service. In transactions on stock exchanges in the United States, these commissions are negotiated, whereas on many foreign stock exchanges these commissions are fixed. In the over-the-counter markets, securities are generally traded on a “net” basis with dealers acting as principal for their own accounts without a stated commission, although the price of the security usually includes a profit to the dealer. In underwritten offerings, securities are purchased at a fixed price which includes an amount of compensation to the underwriter, generally referred to as the underwriter’s concession or discount. On occasion, certain money market instruments may be purchased directly from an issuer, in which case no commissions or discounts are paid.
The primary consideration in placing portfolio security transactions with broker-dealers for execution is to obtain and maintain the availability of execution at the most favorable prices and in the most effective manner possible. Each of the Fund’s sub-advisers attempts to achieve this result by selecting broker-dealers to execute portfolio transactions on the basis of their professional capability, the value and quality of their brokerage services, including anonymity and trade confidentiality, and the level of their brokerage commissions.
Under each Sub-Advisory Agreement and as permitted by Section 28(e) of the Securities Exchange Act of 1934, sub-adviser may cause a Fund to pay a broker-dealer that provides brokerage and research services to the sub-adviser an amount of commission for effecting a securities transaction for a Fund in excess of the amount other broker-dealers would have charged for the transaction if the sub-adviser determines in good faith that the greater commission is reasonable in relation to the value of the brokerage and research services provided by the
(1) | Underlying Funds can include MassMutual Select Funds, MassMutual Premier Funds and Oppenheimer Funds, which are advised by Oppenheimer Funds, Inc. (“OFI”). OFI is a majority owned, indirect subsidiary of MassMutual. |
B-63
executing broker-dealer viewed in terms of either a particular transaction or the sub-adviser’s overall responsibilities to the Trust and to its other clients. The term “brokerage and research services” includes: providing advice as to the value of securities, the advisability of investing in, purchasing, or selling securities, and the availability of securities or of purchasers or sellers of securities; furnishing analyses and reports concerning issuers, industries, securities, economic factors and trends, portfolio strategy and the performance of accounts; and effecting securities transactions and performing functions incidental thereto such as clearance and settlement.
Research provided by brokers is used for the benefit of all of the sub-adviser’s clients and not solely or necessarily for the benefit of the Trust. The sub-advisers attempt to evaluate the quality of Research provided by brokers. Results of this effort are sometimes used by the sub-advisers as a consideration in the selection of brokers to execute portfolio transactions.
The investment advisory fee that the Trust pays on behalf of each Fund to MassMutual will not be reduced as a consequence of a sub-adviser’s receipt of brokerage and research services. To the extent the Trust’s portfolio transactions are used to obtain such services, the brokerage commissions paid by the Trust will exceed those that might otherwise be paid, by an amount which cannot now be determined, provided that the sub-adviser determines in good faith that such excess amounts are reasonable in relation to the services provided. Such services would be useful and of value to a sub-adviser in serving both the Trust and other clients and, conversely, such services obtained by the placement of brokerage business of other clients would be useful to a sub-adviser in carrying out its obligations to the Trust.
Subject to the overriding objective of obtaining the best execution of orders, the Funds may use broker-dealer affiliates of their respective sub-advisers to effect portfolio brokerage transactions under procedures adopted by the Trustees. Pursuant to these procedures, the commission rates and other remuneration paid to the affiliated broker-dealer must be fair and reasonable in comparison to those of other broker-dealers for comparable transactions involving similar securities being purchased or sold during a comparable time period. This standard would allow the affiliated broker or dealer to receive no more than the remuneration which would be expected to be received by an unaffiliated broker.
The Funds may allocate brokerage transactions to broker-dealers (including affiliates of their respective sub-advisers) who have entered into arrangements with the Trust under which the broker-dealer allocates a portion of the commissions paid back to the Fund. The transaction quality must, however, be comparable to that of other qualified broker-dealers.
From time to time the Board of Trustees for the Value Equity Fund will review whether the recapture for the benefit of the Funds of some portion of the compensation paid by the Funds on portfolio transactions is legally permissible and advisable. The Board of Trustees intend to continue to review whether recapture opportunities are available and are legally permissible and, if so, to determine in the exercise of their business judgment whether it would be advisable for the Funds to participate, or continue to participate, in the commission recapture program.
B-64
The following table discloses the broker commissions paid by the Funds for the fiscal years ended December 31, 2006, December 31, 2005 and December 31, 2004:
| | | | | | | | | |
| | | Year ended
December 31, 2006
| | Year ended
December 31, 2005
| | Year ended
December 31, 2004
|
Strategic Bond Fund2 | | $ | 24,975 | | $ | 11,317 | | $ | — |
Strategic Balanced Fund | | | 108,471 | | | 204,017 | | | 174,992 |
Diversified Value Fund1 | | | 24,931 | | | 89,954 | | | 30,251 |
Fundamental Value Fund | | | 910,380 | | | 590,988 | | | 630,809 |
Value Equity Fund | | | 168,636 | | | 213,625 | | | 380,164 |
Large Cap Value Fund | | | 348,550 | | | 336,552 | | | 289,225 |
Indexed Equity Fund | | | 24,717 | | | 91,190 | | | 192,195 |
Core Opportunities Fund3 | | | 36,010 | | | — | | | — |
Blue Chip Growth Fund | | | 343,524 | | | 283,565 | | | 244,159 |
Large Cap Growth Fund | | | 59,094 | | | 54,185 | | | 82,968 |
Growth Equity Fund | | | 913,135 | | | 679,463 | | | 1,887,381 |
Aggressive Growth Fund | | | 294,289 | | | 165,373 | | | 299,864 |
OTC 100 Fund | | | 12,531 | | | 15,676 | | | 31,585 |
Focused Value Fund | | | 771,124 | | | 744,086 | | | 827,971 |
Mid-Cap Value Fund4 | | | 49,214 | | | — | | | — |
Small Cap Value Equity Fund3 | | | 41,952 | | | — | | | — |
Small Company Value Fund | | | 1,229,365 | | | 1,176,221 | | | 991,857 |
Small Cap Core Equity Fund3 | | | 17,494 | | | — | | | — |
Mid Cap Growth Equity Fund | | | 249,575 | | | 203,681 | | | 257,364 |
Mid Cap Growth Equity II Fund | | | 1,306,643 | | | 621,421 | | | 719,475 |
Small Cap Growth Equity Fund | | | 1,277,223 | | | 849,585 | | | 1,104,775 |
Small Company Growth Fund | | | 628,162 | | | 1,756,846 | | | 1,112,989 |
Emerging Growth Fund | | | 541,358 | | | 486,994 | | | 838,560 |
Diversified International Fund5 | | | 9,062 | | | — | | | — |
Overseas Fund | | | 1,469,927 | | | 1,721,125 | | | 1,218,044 |
| | |
|
| |
|
| |
|
|
| | | $ | 10,860,342 | | $ | 10,295,864 | | $ | 11,314,628 |
| | |
|
| |
|
| |
|
|
1 | Commenced operations on October 15, 2004. |
2 | Commenced operations on December 31, 2004. |
3 | Commenced operations on March 31, 2006. |
4 | Commenced operations on August 29, 2006. |
5 | Commenced operations on December 14, 2006. |
The Strategic Balanced Fund paid $4,522 and $2,720 to Citigroup Global Markets for the fiscal years ended December 31, 2005 and 2004, respectively. Citigroup Global Markets is an affiliate of one of the Fund’s sub-advisers.
The Diversified Value Fund paid $14,765, $68,338 and $29,273 to Sanford C. Bernstein for the fiscal years ended December 31, 2006, 2005 and 2004, respectively. Sanford C. Bernstein is an affiliate of the Fund’s sub-adviser.
The Fundamental Value Fund paid $413 and $413 to Jefferies and Company for the fiscal years ended December 31, 2006 and 2004, respectively. Jefferies and Company is an affiliate of the Fund’s investment adviser.
The Value Equity Fund paid $2,589, $7,019 and $12,361 to Fidelity Capital Markets for the fiscal years ended December 31, 2006, 2005 and 2004, respectively. Fidelity Capital Markets is an affiliate of the Fund’s sub-adviser.
The Blue Chip Growth Fund paid $4,078 and $2,562 to Fidelity Capital Markets for the fiscal years ended December 31, 2005 and 2004, respectively. Fidelity Capital Markets is an affiliate of the Fund’s former sub-adviser.
B-65
The Growth Equity Fund paid $15,216, $956 and $420 to Jefferies and Company for the fiscal years ended December 31, 2006, 2005 and 2004, respectively. Jefferies and Company is an affiliate of the Fund’s investment adviser.
The Focused Value Fund paid $93,000 to Harris and its affiliates for the fiscal year ended December 31, 2004.
The Mid Cap Growth Equity Fund paid $4,200 and $3,966 to Jefferies and Company for the fiscal years ended December 31, 2005 and 2004, respectively. Jefferies and Company is an affiliate of the Fund’s investment adviser.
The Mid Cap Growth Equity II Fund paid $3,851 and $552 to Jefferies and Company for the fiscal years ended December 31, 2006 and 2005, respectively. Jefferies and Company is an affiliate of the Fund’s investment adviser.
The Small Cap Growth Equity Fund paid $15,629, $10,990 and $5,212 to Jefferies and Company for the fiscal years ended December 31, 2006, 2005 and 2004, respectively. Jefferies and Company is an affiliate of the Fund’s investment adviser.
The Small Company Growth Fund paid $28,710, $18,414 and $1,259 to Jefferies and Company for the fiscal years ended December 31, 2006, 2005 and 2004, respectively. Jefferies and Company is an affiliate of the Fund’s investment adviser.
The Overseas Fund paid $15,497 and $37,803 to J.P. Morgan for the fiscal years ended December 31, 2005 and 2004, respectively. J.P. Morgan is an affiliate of one of the Fund’s sub-advisers.
The Small Cap Core Equity Fund paid $548 to Goldman Sachs & Company for the fiscal year ended December 31, 2006. Goldman Sachs is an affiliate of the Fund’s sub-adviser.
The Emerging Growth Fund paid $19,705 to Jefferies and Company for the fiscal year ended December 31, 2006. Jefferies and Company is an affiliate of the Fund’s investment adviser.
The Small Company Value Fund paid $1,112 to Jefferies and Company for the fiscal year ended December 31, 2006. Jefferies and Company is an affiliate of the Fund’s investment adviser.
The following table discloses, for those Funds that had trades directed to a third party soft dollar broker during the fiscal year ended December 31, 2006, the dollar value of transactions placed by each such Fund with such soft dollar brokers and dealers during the fiscal year ended December 31, 2006 to recognize “brokerage and research” services, and commissions paid for such transactions:
| | | | | | |
| | | Dollar Value of Those
Transactions
| | Amount of
Commissions
|
Strategic Balanced Fund | | $ | 3,215,767 | | $ | 4,697 |
Diversified Value Fund | | | 85,767,633 | | | 39,192 |
Fundamental Value Fund | | | 27,505,049 | | | 31,202 |
Value Equity Fund | | | 193,517,443 | | | 123,590 |
Blue Chip Growth Fund | | | 74,244,241 | | | 64,829 |
Large Cap Growth Fund | | | 12,311,618 | | | 8,556 |
Aggressive Growth Fund | | | 34,729,070 | | | 28,915 |
Focused Value Fund | | | 118,278,746 | | | 207,409 |
Small Company Value Fund | | | 247,910,183 | | | 127,599 |
Mid Cap Growth Equity Fund | | | 40,912,400 | | | 38,561 |
Small Cap Growth Equity Fund | | | 15,360,726 | | | 22,039 |
Small Company Growth Fund | | | 12,303,949 | | | 30,219 |
Emerging Growth Fund | | | 24,644,998 | | | 54,624 |
Overseas Fund | | | 44,710,671 | | | 65,887 |
Mid Cap Value Fund | | | 2,531,877 | | | 3,566 |
Core Opportunities Fund | | | 347,028 | | | 2,874 |
B-66
SHAREHOLDER INVESTMENT ACCOUNT
A Shareholder Investment Account is established for each investor in the Funds. Each account contains a record of the shares of each Fund maintained by the Transfer Agent. No share certificate will be issued. Whenever a transaction takes place in the Shareholder Investment Account, the investor will be mailed a statement showing the transaction and the status of the account.
DESCRIPTION OF SHARES
The Trust is a series company. The Trust may issue an unlimited number of shares of multiple classes, in one or more series as the Trustees may authorize, with or without par value as the Trustees may prescribe. Each share of a particular class of a series represents an equal proportionate interest in that series with each other share of the same class, none having priority or preference over another. Each series is preferred over all other series in respect of the assets allocated to that series. Each share of a particular class of a series is entitled to a pro rata share of any distributions declared in respect of that class and, in the event of liquidation, a pro rata share of the net assets of that class remaining after satisfaction of outstanding liabilities. When issued, shares are fully paid and nonassessable and have no preemptive or subscription rights. Under the Trust’s Declaration of Trust, the Board of Trustees is authorized to create new series and classes without shareholder approval. To date shares of thirty-four separate series have been authorized, all of which constitute the interests in the Funds described in the Prospectus. Shares of each Fund entitle their holder to one vote for each dollar (or proportionate fractional vote for each fraction of a dollar) of net asset value per share of each Fund or class for each share held as to any matter on which such shareholders are entitled to vote.
Under Massachusetts law, shareholders could, under certain circumstances, be held personally liable for the obligations of the Trust. However, the Trust’s Declaration of Trust disclaims liability of the shareholders, Trustees, or officers of the Trust for acts or obligations of the Trust, which are binding only on the assets and property of the Trust, and requires that notice of such disclaimer be given in each agreement, obligation, or instrument entered into or executed by the Trust or the Trustees. The Trust’s Declaration of Trust provides for indemnification out of the Trust property for all loss and expense of any shareholder held personally liable for the obligations of the Trust. Thus, the risk of a shareholder incurring financial loss on account of shareholder liability is considered remote since it is limited to circumstances in which the disclaimer is inoperative and the Trust itself is unable to meet its obligations.
REDEMPTION OF SHARES
With respect to each Fund, the Trustees may suspend the right of redemption, postpone the date of payment or suspend the determination of net asset value (a) for any period during which the New York Stock Exchange (“NYSE”) is closed (other than for customary weekend and holiday closing), (b) for any period during which trading in the markets the Fund normally uses is restricted, (c) when an emergency exists as determined by the SEC so that disposal of the Fund’s investments or a determination of its net asset value is not reasonably practicable, or (d) for such other periods as the SEC by order may permit for the protection of the Trust’s shareholders. While the Trust’s Declaration of Trust would permit it to redeem shares in cash or other assets of the Fund or both, the Trust has filed an irrevocable election with the SEC to pay in cash all requests for redemption received from any shareholder if the aggregate amount of such requests in any 90-day period does not exceed the lesser of $250,000 or 1% of a Fund’s net assets.
VALUATION OF PORTFOLIO SECURITIES
The net asset value per share of each Fund is determined by the Custodian at the market close (usually 4:00 p.m. Eastern Time), on each day the NYSE is open for trading and the Custodian is open for business. The NYSE currently is not open for trading on New Year’s Day, Martin Luther King, Jr. Day, President’s Day, Good Friday, Memorial Day, Independence Day, Labor Day, Thanksgiving Day and Christmas Day and on occasion is closed early or entirely due to weather or other conditions.
B-67
Equity securities are valued on the basis of valuations furnished by a pricing service, authorized by the Board of Trustees, which provides the last reported sale price for securities listed on a national securities exchange or the official closing price on the NASDAQ National Market System, or in the case of over-the-counter securities not so listed, the last reported bid price. Debt securities (other than short-term obligations with a remaining maturity of sixty days or less) are valued on the basis of valuations furnished by a pricing service, authorized by the Board of Trustees, which determines valuations taking into account appropriate factors such as institutional-size trading in similar groups of securities, yield, quality, coupon rate, maturity, type of issue, trading characteristics and other market data. Money market obligations with a remaining maturity of sixty days or less are valued at amortized cost unless such value does not represent fair value. All other securities and other assets, including futures, options, swaps and debt securities for which the prices supplied by a pricing agent are deemed by MassMutual not to be representative of market values, but excluding money market instruments with a remaining maturity of sixty days or less and including some restricted securities and securities for which no market quotation is available, are valued at fair value in accordance with procedures approved by and determined in good faith by the Trustees, although the actual calculation may be done by others. Securities are typically valued on the basis of valuations furnished by a primary pricing service or, if no such valuation is available, from a secondary pricing service. However, valuation methods approved by the Board of Trustees which are intended to reflect fair value may be used when pricing service information is not readily available or when a security’s value is believed to have been materially affected by a significant event, such as a natural disaster, an economic event like a bankruptcy filing, or a substantial fluctuation in domestic or foreign markets, that has occurred after the close of the exchange or market on which the security is principally traded (for example, a foreign exchange or market). In such a case, the Fund’s value for a security is likely to be different from the last quoted market price or pricing service information. In addition, for each of the Trust’s foreign funds, a fair value pricing service is used to assist in the pricing of foreign securities. Due to the subjective and variable nature of fair value pricing, it is possible that the value determined for a particular asset may be materially different from the value realized upon such asset’s sale.
Portfolio securities traded on more than one U.S. national securities exchange or foreign securities exchange are valued at the last price on the business day as of which such value is being determined at the close of the exchange representing the principal market for such securities. All assets and liabilities expressed in foreign currencies will be converted into U.S. dollars at the mean between the buying and selling rates of such currencies against U.S. dollars last quoted by any major bank. If such quotations are not available, the rate of exchange will be determined in accordance with policies established by the Trustees.
Foreign Securities: Because of time zone differences, foreign exchanges and securities markets will usually be closed before the closing of the NYSE. Therefore, the Trust will determine the value of foreign securities as of the closing of those exchanges and securities markets. Events affecting the values of foreign securities, however, may occasionally occur between the closings of such exchanges and securities markets and the time a Fund determines its net asset value. If an event occurs that a Fund determines materially affects the value of foreign securities during this period, then the Trust will value such securities at fair value as determined in good faith in accordance with procedures adopted by the Trustees. In addition, the Funds may hold portfolio securities that are primarily listed on foreign exchanges that trade on weekends or other days when the Funds do not accept orders or price their shares. As a result, the value of any such securities held by a Fund may change on days when you will not be able to purchase or redeem that Fund’s shares.
The prices of foreign securities are quoted in foreign currencies. The Trust converts the values of foreign currencies into U.S. dollars at the rate of exchange prevailing at the time it determines net asset value. Changes in the exchange rate, therefore, if applicable, will affect the net asset value of shares of a Fund even when there has been no change in the values of the foreign securities measured in terms of the currency in which they are denominated.
The proceeds received by each Fund for each issue or sale of its shares, all net investment income, and realized and unrealized gain will be specifically allocated to such Fund and constitute the underlying assets of that Fund. The underlying assets of each Fund will be segregated on the books of account, and will be charged with the liabilities in respect of such Fund and with a share of the general liabilities of the Trust. Expenses with respect to any two or more
B-68
Funds are to be allocated in proportion to the net asset values of the respective Funds except where allocations of direct expenses can otherwise be fairly made. Each class of shares of a Fund will be charged with liabilities directly attributable to such class, and other Fund expenses are to be allocated in proportion to the net asset values of the respective classes.
TAXATION
Each Fund intends to qualify each year and elect to be taxed as a regulated investment company under Subchapter M of the Code. In order to qualify as a “regulated investment company,” a Fund must, among other things: (a) derive at least 90% of its gross income for each taxable year from (i) dividends, interest, payments with respect to securities loans, gains from the sale or other disposition of stock, securities, or foreign currencies, and other income (including, but not limited to, gains from options, futures, or forward contracts) derived with respect to its business of investing in such stock, securities, or currencies and (ii) net income derived from interests in “qualified publicly traded partnerships” (as defined below); (b) distribute with respect to each taxable year at least 90% of the sum of its taxable net investment income, its net tax-exempt income, and the excess, if any, of net short-term capital gains over net long-term capital losses for such year; and (c) diversify its holdings so that, at the close of each quarter of its taxable year, (i) at least 50% of the value of its total assets consists of cash, cash items, U.S. Government securities, securities of other regulated investment companies, and other securities limited generally with respect to any one issuer to not more than 5% of the total assets of the Fund and not more than 10% of the outstanding voting securities of such issuer, and (ii) not more than 25% of the value of its total assets is invested in (x) the securities of any one issuer or two or more issuers which the Fund controls and that are engaged in the same, similar or related trades or businesses (other than U.S. Government securities), or (y) in the securities of one or more qualified publicly traded partnerships (as defined below). If a Fund fails to qualify as a regulated investment company, it will be treated as an ordinary corporation for Federal income tax purposes.
In general, for purposes of the 90% gross income requirement described in (a) above, income derived from a partnership will be treated as qualifying income only to the extent such income is attributable to items of income of the partnership which would be qualifying income if realized by the regulated investment company. However, 100% of the net income derived from an interest in a “qualified publicly traded partnership” (defined as a partnership (x) interests in which are traded on an established securities market or readily tradable on a secondary market or the substantial equivalent thereof; and (y) that derives at least 90% of its income from passive income sources defined in Code Section 7704(d); and (z) that derives less than 90% of its income from the qualifying income described in (a)(i) above) will be treated as qualifying income. In addition, although in general the passive loss rules of the Code do not apply to regulated investment companies, such rules do apply to a regulated investment company with respect to items attributable to an interest in a qualified publicly traded partnership.
In addition, for purposes of meeting the diversification requirement described in (c) above, in the case of a Fund’s investment in loan participations, each Fund shall treat both the financial intermediary and the issuer of the underlying loan participation as an issuer. Finally, for purposes of (c) above, the term “outstanding voting securities of such issuer” will include the equity securities of a qualified publicly traded partnership.
If a Fund qualifies as a regulated investment company that is accorded special tax treatment, that Fund will not be subject to federal income tax on income paid to its shareholders in the form of dividends (including capital gain dividends). As a series of a Massachusetts business trust, a Fund under present law will not be subject to any excise or income taxes imposed by Massachusetts.
If a Fund were to fail to qualify as a regulated investment company accorded special tax treatment in any taxable year, that Fund would be subject to tax on its taxable income at corporate rates, and all distributions from earnings and profits, including any distributions of net tax-exempt income and net long-term capital gains, would be taxable to shareholders as ordinary income. Some portions of such distributions may be eligible for the
B-69
dividends received deduction in the case of corporate shareholders. In addition, that Fund could be required to recognize unrealized gains, pay substantial taxes and interest and make substantial distributions before requalifying as a regulated investment company that is accorded special tax treatment.
Each Fund intends to distribute at least annually to its shareholders all or substantially all of its investment company taxable income (computed without regard to the dividends-paid deduction) and may distribute its net capital gain. Investment company taxable income (which is retained by the Fund) will be subject to tax at regular corporate rates. Each Fund may also retain for investment its net capital gain. If a Fund retains any net capital gain, it will be subject to tax at regular corporate rates on the amount retained, but may designate the retained amount as undistributed capital gains in a notice to its shareholders who (i) will be required to include in income for federal income tax purposes, as long-term capital gain, their shares of such undistributed amount, and (ii) will be entitled to credit their proportionate shares of the tax paid by the Fund on such undistributed amount against their federal income tax liabilities, if any, and to claim refunds to the extent the credit exceeds such liabilities. For federal income tax purposes, the tax basis of shares owned by a shareholder of a Fund will be increased by an amount equal under current law to the difference between the amount of undistributed capital gains included in the shareholder’s gross income and the tax deemed paid by the shareholder under clause (ii) of the preceding sentence.
Treasury regulations permit a regulated investment company, in determining its investment company taxable income and net capital gain, to elect to treat all or part of any net capital loss, any net long-term capital loss, or any net foreign currency loss incurred after October 31 as if it had been incurred in the next year.
A nondeductible excise tax at the rate of 4% will be imposed on the excess, if any, of each Fund’s “required distribution” over its actual distributions in any calendar year. Generally, the “required distribution” is 98% of the Fund’s ordinary income for the calendar year plus 98% of its capital gain net income recognized during the one-year period ending on October 31 (or later, if the Fund is permitted to elect and so elects) plus undistributed amounts from prior years. Each Fund intends to make distributions sufficient to avoid imposition of the excise tax. Distributions declared by a Fund during October, November or December to shareholders of record on a date in any such month and paid by the Fund during the following January will be treated for federal tax purposes as paid by the Fund and received by shareholders on December 31 of the year in which declared.
Each Fund distributes its net investment income and capital gains to shareholders as dividends annually to the extent required to qualify as a regulated investment company under the Code and generally to avoid federal income or excise tax. Under current law, a Fund may treat the portion of redemption proceeds paid to redeeming shareholders that represents the redeeming shareholders’ portion of the undistributed investment company taxable income and net capital gain of the Fund as a distribution of investment company taxable income and net capital gain on the Fund’s tax return. This practice, which involves the use of equalization accounting, will have the effect of reducing the amount of income and gains that the Fund is required to distribute as dividends to shareholders in order for the Fund to avoid federal income tax and excise tax. This practice may also reduce the amount of distributions required to be made to non-redeeming shareholders and the amount of any undistributed income will be reflected in the value of the shares of the Fund; the total return on a shareholder’s investment will not be reduced as a result of the distribution policy. Investors who purchase shares shortly before the record date of a distribution will pay the full price for the shares and then receive some portion of the price back as a taxable distribution.
Distributions are taxable to shareholders even if they are paid from income or gains earned by the Fund before a shareholder’s investment (and thus were included in the price the shareholder paid). Distributions are taxable whether shareholders receive them in cash or reinvest them in additional shares through a dividend reinvestment plan. A shareholder whose distributions are reinvested in shares will be treated as having received a dividend equal to the fair market value of the new shares issued to the shareholder.
Dividends and distributions on a Fund’s shares are generally subject to federal income tax as described herein to the extent they do not exceed the Fund’s realized income and gains, even though such dividends and
B-70
distributions may economically represent a return of a particular shareholder’s investment. Such distributions are likely to occur in respect of shares purchased at a time when a Fund’s net asset value reflects gains that are either unrealized, or realized but not distributed. Such realized gains may be required to be distributed even when the Fund’s net asset value also reflects unrealized losses.
Except in the case of certain shareholders eligible for preferential tax treatment, e.g., qualified retirement or pension trusts, shareholders of each Fund will be subject to federal income taxes on distributions made by the Fund whether received in cash or additional shares of the Fund. Distributions by each Fund of investment income generally will be taxable to shareholders as ordinary income. Taxes on distributions of capital gains are determined by how long the Fund owned the investments that generated them, rather than by how long a shareholder has owned his or her shares. Distributions of gains from the sale of investments that the Fund owned for one year or less will be taxable as ordinary income. Properly designated distributions of long-term capital gains, if any, will be taxable to shareholders as long-term capital gains. Long-term capital gains applicable to individuals have temporarily been reduced—in general, to 15% with lower rates applying to taxpayers in the 10% and 15% brackets—for taxable years beginning before January 1, 2011. For taxable years beginning before January 1, 2011, distributions of investment income designated by the Fund as derived from “qualified dividend income” will be taxed in the hands of individuals at the rates applicable to long-term capital gains, provided holding period and other requirements are met at both the shareholder and Fund level.
In order for some portion of the dividends received by a Fund shareholder to be “qualified dividend income,” the Fund must meet holding period and other requirements with respect to some portion of the dividend-paying stocks in its portfolio and the shareholder must meet holding period and other requirements with respect to the Fund’s shares. A dividend will not be treated as qualified dividend income (at either the Fund or shareholder level) (1) if the dividend is received with respect to any share of stock held for fewer than 61 days during the 121-day period beginning on the date which is 60 days before the date on which such share becomes ex-dividend with respect to such dividend (or, in the case of certain preferred stock, 91 days during the 181-day period beginning 90 days before such date), (2) to the extent that the recipient is under an obligation (whether pursuant to a short sale or otherwise) to make related payments with respect to positions in substantially similar or related property, (3) if the recipient elects to have the dividend income treated as investment income for purposes of the limitation on deductibility of investment interest, or (4) if the dividend is received from a foreign corporation that is (a) not eligible for the benefits of a comprehensive income tax treaty with the United States (with the exception of dividends paid on stock of such a foreign corporation readily tradable on an established securities market in the United States) or (b) treated as a passive foreign investment company.
In general, distributions of investment income designated by each Fund as derived from qualified dividend income will be treated as qualified dividend income by a shareholder taxed as an individual, provided the shareholder meets the holding period and other requirements described above with respect to the Fund’s shares. If the aggregate dividends received by a Fund during any taxable year are 95% or more of its gross income (excluding net long-term capital gain over net short-term capital loss), then 100% of the Fund’s dividends (other than dividends properly designated as Capital Gain Dividends) will be eligible to be treated as qualified dividend income.
Dividends of net investment income received by corporate shareholders of each Fund will qualify for the 70% dividends received deduction generally available to corporations to the extent of the amount of qualifying dividends received by the Fund from domestic corporations for the taxable year. A dividend received by a Fund will not be treated as a qualifying dividend (1) if the stock on which the dividend is paid is considered to be “debt-financed” (generally, acquired with borrowed funds), (2) if it has been received with respect to any share of stock that the Fund has held for less than 46 days (91 days in the case of certain preferred stock) during the 91-day period beginning on the date which is 45 days before the date on which such share becomes ex-dividend with respect to such dividend (during the 181-day period beginning 90 days before such date in the case of certain preferred stock) or (3) to the extent that the Fund is under an obligation (pursuant to a short sale or otherwise) to make related payments with respect to positions in substantially similar or related property.
B-71
Moreover, the dividends received deduction may be disallowed or reduced (1) if the corporate shareholder fails to satisfy the foregoing requirements with respect to its shares of a Fund or (2) by application of the Code.
A portion of the interest paid or accrued on certain high yield discount obligations owned by a Fund may not (and interest paid on debt obligations, if any, that are considered for tax purposes to be payable in the equity of the issuer or a related party will not) be deductible to the issuer. This may affect the cash flow of the issuer. If a portion of the interest paid or accrued on certain high yield discount obligations is not deductible, that portion will be treated as a dividend for purposes of the corporate dividends received deduction. In such cases, if the issuer of the high yield discount obligations is a domestic corporation, dividend payments by a Fund may be eligible for the dividends received deduction to the extent of the deemed dividend portion of such accrued interest.
Some debt obligations with a fixed maturity date of more than one year from the date of issuance (and all zero-coupon debt obligations with a fixed maturity date of more than one year from the date of issuance) that are acquired by a Fund will be treated as debt obligations that are issued originally at a discount. Generally, the amount of the original issue discount (“OID”) is treated as interest income and is included in taxable income (and required to be distributed) over the term of the debt security, even though payment of that amount is not received until a later time, usually when the debt security matures. In addition, payment-in-kind securities will give rise to income which is required to be distributed and is taxable even though a Fund holding the security receives no interest payment in cash on the security during the year.
Some debt obligations with a fixed maturity date of more than one year from the date of issuance that are acquired by the Fund in the secondary market may be treated as having market discount. Generally, any gain recognized on the disposition of, and any partial payment of principal on, a debt security having market discount is treated as ordinary income to the extent the gain, or principal payment, does not exceed the “accrued market discount” on such debt security. Market discount generally accrues in equal daily installments. The Fund may make one or more of the elections applicable to debt obligations having market discount, which could affect the character and timing of recognition of income.
Some debt obligations with a fixed maturity date of one year or less from the date of issuance that are acquired by the Fund may be treated as having acquisition discount, or OID in the case of certain types of debt obligations. Generally, the Fund will be required to include the acquisition discount, or OID, in income over the term of the debt security, even though payment of that amount is not received until a later time, usually when the debt security matures. The Fund may make one or more of the elections applicable to debt obligations having acquisition discount, or OID, which could affect the character and timing of recognition of income.
A Fund that invests in certain debt instruments may required to pay out as an income distribution each year an amount which is greater than the total amount of cash interest the Fund actually received. Such distributions may be made from the cash assets of the Fund or by liquidation of portfolio securities, if necessary. The Fund may realize gains or losses from such liquidations. In the event the Fund realizes net capital gains from such transactions, its shareholders may receive a larger capital gain distribution than they would in the absence of such transactions.
Investments in debt obligations that are at risk of or in default present special tax issues for a Fund. Tax rules are not entirely clear about issues such as when the Fund may cease to accrue interest, original issue discount or market discount, when and to what extent deductions may be taken for bad debts or worthless securities and how payments received on obligations in default should be allocated between principal and income. These and other related issues will be addressed by the Fund when, and if, it invests in such securities, in order to seek to ensure that it distributes sufficient income to preserve its status as a regulated investment company and does not become subject to U.S. federal income or excise tax.
Each Fund generally is required to withhold and remit to the U.S. Treasury a percentage of the taxable dividends and other distributions paid to and proceeds of share sales, exchanges, or redemptions made by any
B-72
individual shareholder who fails to furnish the Fund with a correct taxpayer identification number (TIN), who has under-reported dividends or interest income, or who fails to certify to the Fund that he or she is a United States person and is not subject to such withholding. The backup withholding tax rate is 28% for amounts paid through 2010. The backup withholding tax rate will be 31% for amounts paid after December 31, 2010.
Dividends and distributions on Fund shares received shortly after their purchase, although in effect a return of capital, are subject to federal income taxes. Investment income and gains received by a Fund from sources outside the United States might be subject to foreign taxes which are withheld at the source. The effective rate of these foreign taxes cannot be determined in advance because it depends on the specific countries in which its assets will be invested, the amount of the assets invested in each such country and the possible applicability of treaty relief. A Fund’s transactions in foreign currencies, foreign currency-denominated debt obligations and certain foreign currency options, futures contracts and forward contracts (and similar instruments) may give rise to ordinary income or loss to the extent such income or loss results from fluctuations in the value of the foreign currency concerned.
The Diversified International Fund and Overseas Fund may be eligible to make an election under Section 853 of the Code so that any of their shareholders subject to federal income taxes will be able to claim a credit or deduction on their income tax returns for, and will be required to treat as part of the amounts distributed to them, their pro rata portion of qualified taxes paid by the Fund to foreign countries. The ability of shareholders of the Fund to claim a foreign tax credit is subject to certain limitations imposed by the Code, which in general limits the amount of foreign tax that may be used to reduce a shareholder’s U.S. tax liability to that amount of U.S. tax which would be imposed on the amount and type of income in respect of which the foreign tax was paid. In addition, the ability of shareholders to claim a foreign tax credit is subject to a holding period requirement. A shareholder who for U.S. income tax purposes claims a foreign tax credit in respect of Fund distributions may not claim a deduction for foreign taxes paid by the Fund, regardless of whether the shareholder itemizes deductions. Also, no deduction for foreign taxes may be claimed by shareholders who do not itemize deductions on their federal income tax returns. It should also be noted that a tax-exempt shareholder, like other shareholders, will be required to treat as part of the amounts distributed to it a pro rata portion of the income taxes paid by the Fund to foreign countries. However, that income will generally be exempt from U.S. taxation by virtue of such shareholder’s tax-exempt status and such a shareholder will not be entitled to either a tax credit or a deduction with respect to such income. The Diversified International Fund and Overseas Fund will notify their shareholders each year of the amount of dividends and distributions and the shareholder’s pro rata share of qualified taxes paid by the Fund to foreign countries. Investment by a Fund in “passive foreign investment companies” could subject the Fund to a U.S. federal income tax or other charge on the proceeds from the sale of its investment in such a company. This tax cannot be eliminated by making distributions by Fund shareholders. However, a Fund may elect to avoid the imposition of that tax. For example, a Fund may elect to treat a PFIC as a “qualified electing fund” (a “QEF election”), in which case the Fund will be required to include its share of the company’s income and net capital gains annually, regardless of whether it receives any distribution from the company. A Fund also may make an election to mark the gains (and to a limited extent losses) in such holdings “to the market” as though it had sold and repurchased its holdings in those PFICs on the last day of the Fund’s taxable year. Such gains and losses are treated as ordinary income and loss. The QEF and mark-to-market elections may accelerate the recognition of income (without the receipt of cash) and increase the amount required to be distributed by a Fund to avoid taxation. Making either of these elections therefore may require a Fund to liquidate other investments (including when it is not advantageous to do so) to meet its distribution requirement, which also may accelerate the recognition of gain and affect a Fund’s total return. Dividends paid by PFICs will not be eligible to be treated as “qualified dividend income.”
Sales, redemptions and exchanges of each Fund’s shares are taxable events and, accordingly, shareholders subject to federal income taxes may realize gains and losses on these transactions. If shares have been held for more than one year, gain or loss realized will be long-term capital gain or loss, provided the shareholder holds the shares as a capital asset. Otherwise, the gain or loss on the taxable disposition of Fund shares will be treated as short-term capital gain or loss. However, a loss on the sale of shares held for six months or less will be treated
B-73
as a long-term capital loss to the extent of any long-term capital gain dividend paid to the shareholder with respect to such shares. Furthermore, no loss will be allowed on the sale of Fund shares to the extent the shareholder acquired identical shares of the same Fund within 30 days prior to the sale of the loss shares or 30 days after such sale. In such case, the basis of the newly purchased shares will be adjusted to reflect the disallowed loss. The state and local tax effects of distributions received from a Fund, and any special tax considerations associated with foreign investments of the Fund, should be examined by investors with regard to their own tax situation. Under Treasury regulations, if a shareholder recognizes a loss [with respect to Common Shares] of $2 million or more for an individual shareholder or $10 million or more for a corporate shareholder, the shareholder must file with the Internal Revenue Service a disclosure statement on Form 8886. Direct shareholders of portfolio securities are in many cases excepted from this reporting requirement, but under current guidance, shareholders of a regulated investment company are not excepted. Future guidance may extend the current exception from this reporting requirement to shareholders of most or all regulated investment companies. The fact that a loss is reportable under these regulations does not affect the legal determination of whether the taxpayer’s treatment of the loss is proper. Shareholders should consult their tax advisers to determine the applicability of these regulations in light of their individual circumstances.
If a Fund makes a distribution to you in excess of its current and accumulated “earning and profits” in any taxable year, the excess distribution will be treated as a return of capital to the extent of your tax basis in your shares, and thereafter as capital gain. A return of capital is not taxable, but it reduces your tax basis in your shares, thus reducing any loss or increasing any gain on a subsequent taxable disposition by you of your shares.
Dividends and distributions on a Fund’s shares are generally subject to federal income tax as described herein to the extent they do not exceed a Fund’s realized income and gains, even though such dividends and distributions may economically represent a return of a particular shareholder’s investment. Such distributions are likely to occur in respect of shares purchased at a time when a Fund’s net asset value reflects gains that are either unrealized, or realized but not distributed.
If a Fund engages in hedging transactions, including hedging transactions in options, futures contracts, forward contracts, swap agreements, foreign currencies, and straddles, or other similar transactions, it will be subject to special tax rules (including constructive sale, mark-to- market, straddle, wash sale, and short sale rules), the effect of which may be to accelerate income to the Fund, defer losses to the Fund, cause adjustments in the holding periods of the Fund’s securities, convert long-term capital gains into short-term capital gains or convert short-term capital losses into long-term capital losses. These rules could therefore affect the amount, timing and character of distributions to shareholders. Each Fund will endeavor to make any available elections pertaining to such transactions in a manner believed to be in the best interests of the Fund and will make appropriate entries in its books and records in order to mitigate the effect of these rules.
A Fund’s transactions in foreign currency-denominated debt instruments and its hedging activities will likely produce a difference between its book income and its taxable income. If a Fund’s book income exceeds its taxable income, the distribution (if any) of such excess generally will be treated as (i) a dividend to the extent of the Fund’s remaining earnings and profits (including earnings and profits arising from tax-exempt income), (ii) thereafter, as a return of capital to the extent of the recipient’s basis in its shares, and (iii) thereafter, as gain from the sale or exchange of a capital asset. If a Fund’s book income is less than taxable income, the Fund could be required to make distributions exceeding book income to qualify as a regulated investment company that is accorded special tax treatment.
Investment by a Fund in “passive foreign investment companies” could subject the Fund to a U.S. federal income tax or other charge on the proceeds from the sale of its investment in such a company; however, this tax can be avoided by making an election to mark such investments to market annually or to treat the passive foreign investment company as a “qualified electing Fund.”
A “passive foreign investment company” is any foreign corporation: (i) 75 percent or more of the income of which for the taxable year is passive income, or (ii) the average percentage of the assets of which (generally by
B-74
value, but by adjusted tax basis in certain cases) that produce or are held for the production of passive income is at least 50 percent. Generally, passive income for this purpose means dividends, interest (including income equivalent to interest), royalties, rents, annuities, the excess of gain over losses from certain property transactions and commodities transactions, and foreign currency gains. Passive income for this purpose does not include rents and royalties received by the foreign corporation from active business and certain income received from related persons.
Under federal income tax law, a portion of the difference between the purchase price of securities purchased at a discount in which a Fund has invested and their face value (“original issue discount”) is considered to be income to the Fund each year even though the Fund will not receive cash interest payments from these securities. This original issue discount (imputed income) will make up a part of the net investment income of the Fund which must be distributed to shareholders in order to maintain the qualification of the Fund as a regulated investment company and to avoid federal income tax at the level of the Fund.
Special tax rules apply to investments though defined contribution plans and other tax-qualified plans. Shareholders should consult their tax adviser to determine the suitability of shares of a Fund as an investment through such plans and the precise effect of and investment on their particular tax situation.
For taxable years beginning before January 1, 2008, a Fund will not be required to withhold any amounts with respect to distributions of net short-term capital gains in excess of net long-term capital losses that the Fund properly designates nor with respect to distributions of U.S. source interest income that would not be subject to U.S. federal income tax if earned directly by a foreign person. In addition, distributions that are attributable to gain from U.S. real property interests (including interests in REITs that are not “domestically controlled” and U.S. real property holding companies) will be subject to withholding of U.S. federal income tax when paid to a foreign shareholder and will give rise to an obligation on the part of the foreign shareholder to file a U.S. tax return. Gain from the sale of shares of a REIT or RIC that is domestically controlled (generally, a REIT or RIC that is less than 50% owned by foreign persons) or from interests representing 5% or less of a publicly-traded class of shares, however, will not be considered gain from a U.S. real property interest. These provisions will first apply to a Fund in its taxable year beginning November 1, 2005.
The foregoing discussion of the U.S. federal income tax consequences of investment in the Funds is a general and abbreviated summary based on the applicable provisions of the Code, U.S. Treasury regulations, and other applicable authority currently in effect. For the complete provisions, reference should be made to the pertinent Code sections and regulations. The Code and regulations are subject to change by legislative or administrative action, possibly with retroactive effect. This discussion of the federal income tax treatment of the Funds and their shareholders does not describe in any respect the tax treatment of any particular arrangement, e.g., tax-exempt trusts or insurance products, pursuant to which or by which investments in the Funds may be made. Shareholders should consult their tax advisers as to their own tax situation, including possible foreign, state and local taxes.
EXPERTS
Ropes & Gray LLP, One International Place, Boston, Massachusetts 02110 serves as counsel to the Trust.
The audited financial statements of each of the Funds are set forth in the Trust’s Annual Report as of December 31, 2006, and are incorporated herein by reference in reliance on the report of Deloitte & Touche LLP, independent registered public accounting firm, given on the authority of that firm as experts in accounting and auditing. A copy of the Trust’s Annual Report as of December 31, 2006 is available, without charge, upon request by calling 888-309-3539.
B-75
GLOSSARY
Currency Transactions: include forward currency contracts, exchange listed currency futures, exchange listed and OTC options on currencies, and currency swaps. A forward currency contract involves a privately negotiated obligation to purchase or sell (with delivery generally required) a specific currency at a future date, which may be any fixed number of days from the date of the contract agreed upon by the parties, at a price set at the time of the contract. A currency swap is an agreement to exchange cash flows based on the notional difference among two or more currencies and operates similarly to an interest rate swap.
Duration: indicates how interest rate changes will affect a debt instrument’s price. As a measure of a fixed-income security’s cash flow, duration is an alternative to the concept of “term to maturity” in assessing the price volatility associated with changes in interest rates. Generally, the longer the duration, the more volatility an investor should expect. For example, the market price of a bond with a duration of two years would be expected to decline 2% if interest rates rose 1%. Conversely, the market price of the same bond would be expected to increase 2% if interest rates fell 1%. The market price of a bond with a duration of four years would be expected to increase or decline twice as much as the market price of a bond with a two-year duration. Duration measures a security’s maturity in terms of the average time required to receive the present value of all interest and principal payments as opposed to its term to maturity. The maturity of a security measures only the time until final payment is due; it does not take account of the pattern of a security’s cash flow over time, which would include how cash flow is affected by prepayments and by changes in interest rates. Incorporating a security’s yield, coupon interest payments, final maturity and option features into one measure, duration is computed by determining the weighted average maturity of a bond’s cash flows, where the present values of the cash flows serve as weights. Determining duration may involve a Fund’s sub-adviser’s estimates of future economic parameters, which may vary from actual future values.
NRSRO: means a nationally recognized statistical rating organization. For a description of the ratings of three NRSROs, Standard & Poor’s Ratings Group (“S&P”), Moody’s Investors Service, Inc. (“Moody’s”) and Fitch Ratings (“Fitch”), see the Appendix to the SAI. For example, the four investment grade ratings in descending order for debt securities as rated by Moody’s are Aaa, Aa, A and Baa- including Baa3. The four investment grade ratings for debt securities as rated by S&P are AAA, AA, A and BBB- including BBB-. For commercial paper, Moody’s two highest ratings are P-1 and P-2 and S&P’s two highest ratings are A-1 and A-2.
U.S. Government Securities: include obligations issued, sponsored, assumed and guaranteed as to principal and interest by the Government of the United States, its agencies and instrumentalities, and securities backed by such obligations, including FHA/VA guaranteed mortgages.
The name MassMutual Select Funds is the designation of the Trustees under a Declaration of Trust dated May 28, 1993, as amended from time to time. The obligations of such Trust are not personally binding upon, nor shall resort be had to the property of any of the Trustees, shareholders, officers, employees or agents of such Trust, but only the property of the relevant Fund shall be bound.
B-76
APPENDIX A—DESCRIPTION OF SECURITIES RATINGS
Although the ratings of fixed-income securities by S&P, Moody’s and Fitch are a generally accepted measurement of credit risk, they are subject to certain limitations. For example, ratings are based primarily upon historical events and do not necessarily reflect the future. Furthermore, there is a period of time between the issuance of a rating and the update of the rating, during which time a published rating may be inaccurate.
The descriptions of the S&P, Moody’s and Fitch’s commercial paper and bond ratings are set forth below.
Commercial Paper Ratings:
S&P commercial paper ratings are graded into four categories, ranging from A for the highest quality obligations to D for the lowest. Issues assigned the highest rating of A are regarded as having the greatest capacity for timely payment. Issues in this category are further refined with the designations 1, 2, and 3 to indicate the relative degree of safety. The A-1 and A-2 categories are described as follows:
| | A-1 | | This designation indicates that the degree of safety regarding timely payment is strong. Those issues determined to possess extremely strong safety characteristics will be noted with a plus (+) sign designation. |
| | A-2 | | Capacity for timely payment on issues with this designation is satisfactory. However, the relative degree of safety is not as high as for issues designated A-1. |
Moody’s employs three designations, all judged to be investment grade, to indicate the relative repayment ability of rated issuers. The two highest designations are as follows:
Issuers (or supporting institutions) rated Prime-1 (or P-1) have a superior ability for repayment of senior short-term debt obligations. Prime-1 (or P-1) repayment ability will normally be evidenced by many of the following characteristics:
| | • | | Leading market positions in well-established industries. |
| | • | | High rates of return on funds employed. |
| | • | | Conservative capitalization structure with moderate reliance on debt and ample asset protection. |
| | • | | Broad margins in earnings coverage of fixed financial charges and high internal cash generation. |
| | • | | Well-established access to a range of financial markets and assured sources of alternate liquidity. |
Issuers (or supporting institutions) rated Prime-2 (or P-2) have a strong ability for repayment of senior short-term debt obligations. This will normally be evidenced by many of the characteristics cited above but to a lesser degree. Earnings trends and coverage ratios, while sound, may be more subject to variation. Capitalization characteristics, while still appropriate, may be more affected by external conditions. Ample alternate liquidity is maintained.
Fitch’s Short-Term Credit Ratings are graded into six categories, ranging from ‘F-1’ for the highest quality obligations to ‘D’ for the lowest. The F-1 and F-2 categories are described as follows:
“F-1”: Indicates the strongest capacity for timely payment of financial commitments; may have an added “+” to denote any exceptionally strong credit feature.
“F-2”: A satisfactory capacity for timely payment of financial commitments, but the margin of safety is not as great as in the case of the higher ratings.
B-77
Bond Ratings:
S&P describes its four highest ratings for corporate debt as follows:
AAA Debt rated AAA has the highest rating assigned by S&P. Capacity to pay interest and repay principal is extremely strong.
AA Debt rated AA has a very strong capacity to pay interest and repay principal and differs from the higher rated issues only in a small degree.
A Debt rated A has a strong capacity to pay interest and repay principal although it is somewhat more susceptible to the adverse effects of changes in circumstances and economic conditions than debt in higher rated categories.
BBB Debt rated BBB is regarded as having an adequate capacity to pay interest and repay principal. Whereas such debt normally exhibits adequate protection parameters, adverse economic conditions or changing circumstances are more likely to lead to a weakened capacity to pay interest and repay principal for debt in this category than in higher rated categories.
The ratings from AA to CCC may be modified by the addition of a plus or minus sign to show relative standing within the major rating categories.
Moody’s describes its four highest corporate bond ratings as follows:
Aaa Bonds which are rated Aaa are judged to be of the best quality. They carry the smallest degree of investment risk and are generally referred to as “gilt-edged.” Interest payments are protected by a large or by an exceptionally stable margin and principal is secure. While the various protective elements are likely to change, such changes as can be visualized are most unlikely to impair the fundamentally strong position of such issues.
Aa Bonds which are rated Aa are judged to be of high quality by all standards. Together with the Aaa group they compose what are generally known as high grade bonds. They are rated lower than the best bonds because margins of protection may not be as large as in Aaa securities or fluctuation of protective elements may be of greater amplitude or there may be other elements present which make the long-term risks appear somewhat larger than in Aaa securities.
A Bonds which are rated A possess many favorable investment attributes and may be considered as upper medium grade obligations. Factors giving security to principal and interest are considered adequate but elements may be present which suggest a susceptibility to impairment in the future.
Baa Bonds which are rated Baa are considered as medium grade obligations, i.e., they are neither highly protected nor poorly secured. Interest payments and principal security appear adequate for the present but certain protective elements may be lacking or may be characteristically unreliable over any great length of time. Such bonds lack outstanding investment characteristics and in fact have speculative characteristics as well.
Moody’s applies numerical modifiers 1, 2 and 3 in each generic rating classification from Aa through Caa in its corporate bond rating system. The modifier 1 indicates that the security ranks in the higher end of its generic rating category; the modifier 2 indicates a mid-range ranking; and the modifier 3 indicates that the issue ranks in the lower end of its generic rating category.
Fitch describes its four highest long-term credit ratings as follows:
AAA—“AAA” ratings denote the lowest expectation of credit risk. They are assigned only in case of exceptionally strong capacity for timely payment of financial commitments. This capacity is highly unlikely to be adversely affected by foreseeable events.
B-78
AA—“AA” ratings denote a very low expectation of credit risk. They indicate very strong capacity for timely payment of financial commitments. This capacity is not significantly vulnerable to foreseeable events.
A—“A” ratings denote a low expectation of credit risk. The capacity for timely payment of financial commitments is considered strong. This capacity may, nevertheless, be more vulnerable to changes in circumstances or in economic conditions than is the case for higher ratings.
BBB—“BBB” ratings indicate that there is currently a low expectation of credit risk. The capacity for timely payment of financial commitments is considered adequate, but adverse changes in circumstances and in economic conditions are more likely to impair this capacity. This is the lowest investment-grade category.
A “+” or “–” may be appended to a rating to denote relative status within major rating categories. Such suffixes are not added to the “AAA” category or to categories below “CCC”.
S&P describes its below investment grade ratings for corporate debt as follows:
BB, B, CCC, CC, C—Debt rated “BB”, “B”, “CCC”, “CC” and “C” is regarded, on balance, as predominantly speculative with respect to capacity to pay interest and repay principal in accordance with the terms of the obligation, “BB” indicates the lowest degree of speculation and “C” the highest degree of speculation. While such debt will likely have some quality and protective characteristics, these are outweighed by large uncertainties or major risk exposures to adverse conditions.
BB—Debt rated “BB” has less near-term vulnerability to default than other speculative issues. However, it faces major ongoing uncertainties or exposure to adverse business, financial, or economic conditions which could lead to inadequate capacity to meet timely interest and principal payments. The “BB” rating category is also used for debt subordinated to senior debt that is assigned an actual or implied “BBB–” rating.
B—Debt rated “B” has a greater vulnerability to default but currently has the capacity to meet interest payments and principal repayments. Adverse business, financial, or economic conditions will likely impair capacity or willingness to pay interest and repay principal. The “B” rating category is also used for debt subordinated to senior debt that is assigned an actual or implied “BB” or “BB–” rating.
CCC—Debt rated “CCC” has a currently identifiable vulnerability to default, and is dependent upon favorable business, financial, and economic conditions to meet timely payment of interest and repayment of principal. In the event of adverse business, financial, or economic conditions, it is not likely to have the capacity to pay interest and repay principal. The “CCC” rating category is also used for debt subordinated to senior debt that is assigned an actual or implied “B” or “B–” rating.
CC—The rating “CC” is typically applied to debt subordinated to senior debt that is assigned an actual or implied “CCC” rating.
C—The rating “C” is typically applied to debt subordinated to senior debt which is assigned an actual or implied “CCC–” debt rating. The “C” rating may be used to cover a situation where a bankruptcy petition has been filed, but debt service payments are continued.
D—Debt rated “D” is in payment default. The “D” rating category is used when interest payments or principal payments are not made on the date due even if the applicable grace period has not expired, unless S&P believes that such payments will be made during such grace period. The “D” rating also will be used upon the filing of a bankruptcy petition if debt service payments are jeopardized.
Moody’s describes its below investment grade corporate bond ratings as follows:
Ba—Bonds which are rated Ba are judged to have speculative elements; their future cannot be considered as well assured. Often the protection of interest and principal payments may be very moderate and thereby not well safeguarded during other good and bad times over the future. Uncertainty of position characterizes bonds in this class.
B-79
B—Bonds which are rated B generally lack characteristics of the desirable investment. Assurance of interest and principal payments or of maintenance of other terms of the contract over any long period of time may be small.
Caa—Bonds which are rated Caa are of poor standing. Such issues may be in default or there may be present elements of danger with respect to principal or interest.
Ca—Bonds which are rated Ca represent obligations which are speculative in a high degree. Such issues are often in default or have other marked shortcomings.
C—Bonds which are rated C are the lowest rated class of bonds and issues so rated can be regarded as having extremely poor prospects of ever attaining any real investment standing.
Fitch describes its below investment grade long-term credit ratings as follows:
BB—“BB” ratings indicate that there is a possibility of credit risk developing, particularly as the result of adverse economic change over time; however, business or financial alternatives may be available to allow financial commitments to be met. Securities rated in this category are not investment grade.
B—“B” ratings indicate that significant credit risk is present, but a limited margin of safety remains. Financial commitments are currently being met; however, capacity for continued payment is contingent upon a sustained, favorable business and economic environment.
CCC, CC, C—Default is a real possibility. Capacity for meeting financial commitments is solely reliant upon sustained, favorable business or economic developments. A “CC” rating indicates that default of some kind appears probable. “C” ratings signal imminent default.
DDD, DD, D—The ratings of obligations in this category are based on their prospects for achieving partial or full recovery in a reorganization or liquidation of the obligor. While expected recovery values are highly speculative and cannot be estimated with any precision, the following serve as general guidelines. “DDD” obligations have the highest potential for recovery, around 90%-100% of outstanding amounts and accrued interest. “DD” indicates potential recoveries in the range of 50%-90% and “D” the lowest recovery potential, i.e., below 50%.
Entities rated in this category have defaulted on some or all of their obligations. Entities rated “DDD” have the highest prospect for resumption of performance or continued operation with or without a formal reorganization process. Entities rated “DD” and “D” are generally undergoing a formal reorganization or liquidation process; those rated “DD” are likely to satisfy a higher portion of their outstanding obligations, while entities rated “D” have a poor prospect of repaying all obligations.
B-80
APPENDIX B—PROXY VOTING POLICIES
The following represents the proxy voting policies (the “Policies”) of the MassMutual Select Funds (the “Funds”) with respect to the voting of proxies on behalf of each series of the Funds (the “Series”). It is the general policy of the Funds, and Massachusetts Mutual Life Insurance Company (“MassMutual”) as investment manager to the Series, to delegate voting responsibilities and duties with respect to all proxies to the investment sub-advisers (the “Sub-Advisers”) of the Series.
I. GENERAL PRINCIPLES
In voting proxies, the Sub-Advisers shall be guided by general fiduciary principles and their respective written proxy voting policies. The Sub-Advisers shall act prudently and solely in the best interest of the beneficial owners of the accounts they respectively manage, and for the exclusive purpose of providing benefit to such persons.
II. SUB-ADVISERS
1. The Sub-Advisers shall each have the duty to provide a copy of their written proxy voting policies to MassMutual and the Funds annually. The Sub-Advisers’ written proxy voting policies shall maintain procedures that address potential conflicts of interest.
2. The Sub-Advisers shall each maintain a record of all proxy votes exercised on behalf of each series of the Funds for which they act as investment sub-adviser and shall furnish such records to MassMutual and the Funds annually.
3. The Sub-Advisers shall report any exceptions to their respective proxy voting policies to MassMutual quarterly.
4. The Sub-Advisers shall provide the Funds and MassMutual with all such information and documents relating to the Sub-Adviser’s proxy voting in a timely manner, as shall be necessary for the Funds and MassMutual to comply with applicable laws and regulations.
III. THE FUNDS AND MASSMUTUAL
1. The officers of the Funds shall annually update the Trustees after a review of the Sub-Advisers’ proxy voting policies and actual voting records.
2. The Trustees of the Funds shall not vote proxies on behalf of the Funds or the Series.
3. MassMutual shall not vote proxies on behalf of the Funds or the Series.
Information regarding how the Funds voted proxies relating to portfolio securities during the most recent 12-month period ended June 30 is available, without charge, upon request, on the MassMutual website at http://www.massmutual.com/retire and on the Securities and Exchange Commission’s website at http://www.sec.gov.
B-81
October 2005
ALLIANCEBERNSTEIN L.P.
Statement of Policies and Procedures for Proxy Voting
Introduction
As a registered investment adviser, AllianceBernstein L.P. (“AllianceBernstein”, “we” or “us”) has a fiduciary duty to act solely in the best interests of our clients. We recognize that this duty requires us to vote client securities in a timely manner and make voting decisions that are in the best interests of our clients. Consistent with these obligations, we will disclose our clients’ voting records only to them and as required by mutual fund vote disclosure regulations. In addition, the proxy committees may, after careful consideration, choose to respond to surveys regarding past votes.
This statement is intended to comply with Rule 206(4)-6 of the Investment Advisers Act of 1940. It sets forth our policies and procedures for voting proxies for our discretionary investment advisory clients, including investment companies registered under the Investment Company Act of 1940. This statement applies to AllianceBernstein’s growth and value investment groups investing on behalf of clients in both US and non-US securities.
Proxy Policies
This statement is designed to be responsive to the wide range of proxy voting subjects that can have a significant effect on the investment value of the securities held in our clients’ accounts. These policies are not exhaustive due to the variety of proxy voting issues that we may be required to consider. AllianceBernstein reserves the right to depart from these guidelines in order to avoid voting decisions that we believe may be contrary to our clients’ best interests. In reviewing proxy issues, we will apply the following general policies:
Corporate Governance: AllianceBernstein’s proxy voting policies recognize the importance of good corporate governance in ensuring that management and the board of directors fulfill their obligations to the shareholders. We favor proposals promoting transparency and accountability within a company. We will vote for proposals providing for equal access to the proxy materials so that shareholders can express their views on various proxy issues. We also support the appointment of a majority of independent directors on key committees and separating the positions of chairman and chief executive officer. Finally, because we believe that good corporate governance requires shareholders to have a meaningful voice in the affairs of the company, we will support non-binding shareholder proposals that request that companies amend their by-laws to provide that director nominees be elected by an affirmative vote of a majority of the votes cast.
Elections of Directors: Unless there is a proxy fight for seats on the Board or we determine that there are other compelling reasons for withholding votes for directors, we will vote in favor of the management proposed slate of directors. That said, we believe that directors have a duty to respond to shareholder actions that have received significant shareholder support. We may withhold votes for directors that fail to act on key issues such as failure to implement proposals to declassify boards, failure to implement a majority vote requirement, failure to submit a rights plan to a shareholder vote or failure to act on tender offers where a majority of shareholders have tendered their shares. In addition, we will withhold votes for directors who fail to attend at least seventy-five percent of board meetings within a given year without a reasonable excuse. Finally, we may withhold votes for directors of non-U.S. issuers where there is insufficient information about the nominees disclosed in the proxy statement.
Appointment of Auditors: AllianceBernstein believes that the company remains in the best position to choose the auditors and will generally support management’s recommendation. However, we recognize that there may be inherent conflicts when a company’s independent auditor performs substantial non-audit related services
B-82
for the company. Although we recognize that there may be special circumstances that could lead to high levels of non-audit fees in some years, we would normally consider non-audit fees in excess of 70% of total fees paid to the auditing firm to be disproportionate. Therefore, absent unique circumstances, we may vote against the appointment of auditors if the fees for non-audit related services exceed 70% of the total fees paid by the company to the auditing firm or there are other reasons to question the independence of the company’s auditors.
Changes in Legal and Capital Structure: Changes in a company’s charter, articles of incorporation or by-laws are often technical and administrative in nature. Absent a compelling reason to the contrary, AllianceBernstein will cast its votes in accordance with the company’s management on such proposals. However, we will review and analyze on a case-by-case basis any non-routine proposals that are likely to affect the structure and operation of the company or have a material economic effect on the company. For example, we will generally support proposals to increase authorized common stock when it is necessary to implement a stock split, aid in a restructuring or acquisition or provide a sufficient number of shares for an employee savings plan, stock option or executive compensation plan. However, a satisfactory explanation of a company’s intentions must be disclosed in the proxy statement for proposals requesting an increase of greater than one hundred percent of the shares outstanding. We will oppose increases in authorized common stock where there is evidence that the shares will be used to implement a poison pill or another form of anti-takeover device.
Corporate Restructurings, Mergers and Acquisitions: AllianceBernstein believes proxy votes dealing with corporate reorganizations are an extension of the investment decision. Accordingly, we will analyze such proposals on a case-by-case basis, weighing heavily the views of our research analysts that cover the company and our investment professionals managing the portfolios in which the stock is held.
Proposals Affecting Shareholder Rights: AllianceBernstein believes that certain fundamental rights of shareholders must be protected. We will generally vote in favor of proposals that give shareholders a greater voice in the affairs of the company and oppose any measure that seeks to limit those rights. However, when analyzing such proposals we will weigh the financial impact of the proposal against the impairment of shareholder rights.
Anti-Takeover Measures: AllianceBernstein believes that measures that impede corporate transactions such as takeovers or entrench management not only infringe on the rights of shareholders but may also have a detrimental effect on the value of the company. We will generally oppose proposals, regardless of whether they are advanced by management or shareholders, the purpose or effect of which is to entrench management or excessively or inappropriately dilute shareholder ownership. Conversely, we support proposals that would restrict or otherwise eliminate anti-takeover or anti-shareholder measures that have already been adopted by corporate issuers. For example, we will support shareholder proposals that seek to require the company to submit a shareholder rights plan to a shareholder vote. We will evaluate, on a case-by-case basis, proposals to completely redeem or eliminate such plans. Furthermore, we will generally oppose proposals put forward by management (including the authorization of blank check preferred stock, classified boards and supermajority vote requirements) that appear to be anti-shareholder or intended as management entrenchment mechanisms.
Executive Compensation: AllianceBernstein believes that company management and the compensation committee of the board of directors should, within reason, be given latitude to determine the types and mix of compensation and benefit awards offered to company employees. Whether proposed by a shareholder or management, we will review proposals relating to executive compensation plans on a case-by-case basis to ensure that the long-term interests of management and shareholders are properly aligned. In general, we will analyze the proposed plans to ensure that shareholder equity will not be excessively diluted. With regard to stock award or option plans, we consider whether the option exercise prices are below the market price on the date of grant and whether an acceptable number of employees are eligible to participate in such programs. We will generally oppose plans that have below market value exercise prices on the date of issuance or permit repricing of underwater stock options without shareholder approval. Other factors such as the company’s performance and industry practice will generally be factored into our analysis. We will support proposals requiring managements
B-83
to submit severance packages that exceed 2.99 times the sum of an executive officer’s base salary plus bonus that are triggered by a change in control to a shareholder vote. Finally, we will support shareholder proposals requiring companies to expense stock options because we view them as a large corporate expense that should be appropriately accounted for.
Social and Corporate Responsibility: AllianceBernstein will review and analyze on a case-by-case basis proposals relating to social, political and environmental issues to determine whether they will have a financial impact on shareholder value. We will vote against proposals that are unduly burdensome or result in unnecessary and excessive costs to the company. We may abstain from voting on social proposals that do not have a readily determinable financial impact on shareholder value.
Proxy Voting Procedures
Proxy Voting Committees
Our growth and value investment groups have formed separate proxy voting committees to establish general proxy policies for AllianceBernstein and consider specific proxy voting matters as necessary. These committees periodically review these policies and new types of corporate governance issues, and decide how we should vote on proposals not covered by these policies. When a proxy vote cannot be clearly decided by an application of our stated policy, the proxy committee will evaluate the proposal. In addition, the committees, in conjunction with the analyst that covers the company, may contact corporate management and interested shareholder groups and others as necessary to discuss proxy issues. Members of the committee include senior investment personnel and representatives of the Legal and Compliance Department. The committees may also evaluate proxies where we face a potential conflict of interest (as discussed below). Finally, the committees monitor adherence to these policies.
Conflicts of Interest
AllianceBernstein recognizes that there may be a potential conflict of interest when we vote a proxy solicited by an issuer whose retirement plan we manage, or we administer, who distributes AllianceBernstein sponsored mutual funds, or with whom we or an employee has another business or personal relationship that may affect how we vote on the issuer’s proxy. Similarly, AllianceBernstein may have a potential material conflict of interest when deciding how to vote on a proposal sponsored or supported by a shareholder group that is a client. We believe that centralized management of proxy voting, oversight by the proxy voting committees and adherence to these policies ensures that proxies are voted with only our clients’ best interests in mind. Additionally, we have implemented procedures to ensure that our votes are not the product of a material conflict of interests, including: (i) on an annual basis, the proxy committees will take reasonable steps to evaluate the nature of AllianceBernstein’s and our employees’ material business and personal relationships (and those of our affiliates) with any company whose equity securities are held in client accounts and any client that has sponsored or has material interest in a proposal upon which we will be eligible to vote; (ii) requiring anyone involved in the decision making process to disclose to the chairman of the appropriate proxy committee any potential conflict that they are aware of (including personal relationships) and any contact that they have had with any interested party regarding a proxy vote; (iii) prohibiting employees involved in the decision making process or vote administration from revealing how we intend to vote on a proposal in order to reduce any attempted influence from interested parties; and (iv) where a material conflict of interests exists, reviewing our proposed vote by applying a series of objective tests and, where necessary, considering the views of third party research services to ensure that our voting decision is consistent with our clients’ best interests.
Because under certain circumstances AllianceBernstein considers the recommendation of third party research services, the proxy committees will take reasonable steps to verify that any third party research service is in fact independent based on all of the relevant facts and circumstances. This includes reviewing the third party research service’s conflict management procedures and ascertaining, among other things, whether the third party
B-84
research service (i) has the capacity and competency to adequately analyze proxy issues; and (ii) can make such recommendations in an impartial manner and in the best interests of our clients.
Proxies of Certain Non-US Issuers
Proxy voting in certain countries requires “share blocking.” Shareholders wishing to vote their proxies must deposit their shares shortly before the date of the meeting (usually one-week) with a designated depositary. During this blocking period, shares that will be voted at the meeting cannot be sold until the meeting has taken place and the shares are returned to the clients’ custodian banks. Absent compelling reasons to the contrary, AllianceBernstein believes that the benefit to the client of exercising the vote does not outweigh the cost of voting (i.e. not being able to sell the shares during this period). Accordingly, if share blocking is required we generally abstain from voting those shares.
In addition, voting proxies of issuers in non-US markets may give rise to a number of administrative issues that may prevent AllianceBernstein from voting such proxies. For example, AllianceBernstein may receive meeting notices without enough time to fully consider the proxy or after the cut-off date for voting. Other markets require AllianceBernstein to provide local agents with power of attorney prior to implementing AllianceBernstein’s voting instructions. Although it is AllianceBernstein’s policy to seek to vote all proxies for securities held in client accounts for which we have proxy voting authority, in the case of non-US issuers, we vote proxies on a best efforts basis.
Loaned Securities
Many clients of AllianceBernstein have entered into securities lending arrangements with agent lenders to generate additional revenue. AllianceBernstein will not be able to vote securities that are on loan under these types of arrangements. However, under rare circumstances, for voting issues that may have a significant impact on the investment, we may request that clients recall securities that are on loan if we determine that the benefit of voting outweighs the costs and lost revenue to the client or fund and the administrative burden of retrieving the securities.
Proxy Voting Records
Clients may obtain information about how we voted proxies on their behalf by contacting their AllianceBernstein administrative representative. Alternatively, clients may make a written request for proxy voting information to: Mark R. Manley, Senior Vice President & Chief Compliance Officer, AllianceBernstein L.P., 1345 Avenue of the Americas, New York, NY 10105.
B-85
PROXY VOTING GUIDELINES & PROCEDURES SUMMARY
Concerning ClearBridge Advisors1 (Clearbridge)
Proxy Voting Policies and Procedures
The following is a brief overview of the Proxy Voting Policies and Procedures (the “Policies”) that ClearBridge has adopted to seek to ensure that ClearBridge votes proxies relating to equity securities in the best interest of clients.
ClearBridge votes proxies for each client account with respect to which it has been authorized to vote proxies. In voting proxies, ClearBridge is guided by general fiduciary principles and seeks to act prudently and solely in the best interest of clients. ClearBridge attempts to consider all factors that could affect the value of the investment and will vote proxies in the manner that it believes will be consistent with efforts to maximize shareholder values. ClearBridge may utilize an external service provider to provide it with information and/or a recommendation with regard to proxy votes. However, the ClearBridge adviser (business unit) continues to retain responsibility for the proxy vote.
In the case of a proxy issue for which there is a stated position in the Policies, ClearBridge generally votes in accordance with such stated position. In the case of a proxy issue for which there is a list of factors set forth in the Policies that ClearBridge considers in voting on such issue, ClearBridge votes on a case-by-case basis in accordance with the general principles set forth above and considering such enumerated factors. In the case of a proxy issue for which there is no stated position or list of factors that ClearBridge considers in voting on such issue, ClearBridge votes on a case-by-case basis in accordance with the general principles set forth above. Issues for which there is a stated position set forth in the Policies or for which there is a list of factors set forth in the Policies that ClearBridge considers in voting on such issues fall into a variety of categories, including election of directors, ratification of auditors, proxy and tender offer defenses, capital structure issues, executive and director compensation, mergers and corporate restructurings, and social and environmental issues. The stated position on an issue set forth in the Policies can always be superseded, subject to the duty to act solely in the best interest of the beneficial owners of accounts, by the investment management professionals responsible for the account whose shares are being voted. Issues applicable to a particular industry may cause ClearBridge to abandon a policy that would have otherwise applied to issuers generally. As a result of the independent investment advisory services provided by distinct ClearBridge business units, there may be occasions when different business units or different portfolio managers within the same business unit vote differently on the same issue. A ClearBridge business unit or investment team (e.g. ClearBridge’s Social Awareness Investment team) may adopt proxy voting policies that supplement these policies and procedures. In addition, in the case of Taft-Hartley clients, ClearBridge will comply with a client direction to vote proxies in accordance with Institutional Shareholder Services’ (ISS) PVS Voting Guidelines, which ISS represents to be fully consistent with AFL-CIO guidelines.
1 | ClearBridge Advisors comprises ClearBridge Advisors, LLC (formerly CAM North America, LLC), ClearBridge Asset Management Inc, Smith Barney Fund Management LLC, and other affiliated investment advisory firms. On December 1, 2005, Citigroup Inc. (“Citigroup”) sold substantially all of its worldwide asset management business, Citigroup Asset Management, to Legg Mason, Inc. (“Legg Mason”). As part of this transaction, ClearBridge Advisors, LLC, ClearBridge Asset Management Inc and Smith Barney Fund Management LLC became wholly-owned subsidiaries of Legg Mason. Under a licensing agreement between Citigroup and Legg Mason, the name of Smith Barney Fund Management LLC and its affiliated advisory entities, as well as all logos, trademarks, and service marks related to Citigroup or any of its affiliates (“Citi Marks”) are licensed for use by Legg Mason. Citi Marks include, but are not limited to, “Citigroup Asset Management,” “Salomon Brothers Asset Management” and “CAM”. All Citi Marks are owned by Citigroup, and are licensed for use until no later than one year after the date of the licensing agreement. Legg Mason and its subsidiaries, including CAM North America, LLC, ClearBridge Asset Management Inc, and Smith Barney Fund Management LLC are not affiliated with Citigroup. |
B-86
In furtherance of ClearBridge’s goal to vote proxies in the best interest of clients, ClearBridge follows procedures designed to identify and address material conflicts that may arise between ClearBridge’s interests and those of its clients before voting proxies on behalf of such clients. To seek to identify conflicts of interest, ClearBridge periodically notifies ClearBridge employees in writing that they are under an obligation (i) to be aware of the potential for conflicts of interest on the part of ClearBridge with respect to voting proxies on behalf of client accounts both as a result of their personal relationships and due to special circumstances that may arise during the conduct of ClearBridge’s business, and (ii) to bring conflicts of interest of which they become aware to the attention of ClearBridge’s compliance personnel. ClearBridge also maintains and considers a list of significant ClearBridge relationships that could present a conflict of interest for ClearBridge in voting proxies. ClearBridge is also sensitive to the fact that a significant, publicized relationship between an issuer and a non-ClearBridge Legg Mason affiliate might appear to the public to influence the manner in which ClearBridge decides to vote a proxy with respect to such issuer. Absent special circumstances or a significant, publicized non-ClearBridge Legg Mason affiliate relationship that ClearBridge for prudential reasons treats as a potential conflict of interest because such relationship might appear to the public to influence the manner in which ClearBridge decides to vote a proxy, ClearBridge generally takes the position that relationships between a non-ClearBridge Legg Mason affiliate and an issuer (e.g. investment management relationship between an issuer and a non-ClearBridge Legg Mason affiliate) do not present a conflict of interest for ClearBridge in voting proxies with respect to such issuer. Such position is based on the fact that ClearBridge is operated as an independent business unit from other Legg Mason business units as well as on the existence of information barriers between ClearBridge and certain other Legg Mason business units.
ClearBridge maintains a Proxy Voting Committee to review and address conflicts of interest brought to its attention by ClearBridge compliance personnel. A proxy issue that will be voted in accordance with a stated ClearBridge position on such issue or in accordance with the recommendation of an independent third party is not brought to the attention of the Proxy Voting Committee for a conflict of interest review because ClearBridge’s position is that to the extent a conflict of interest issue exists, it is resolved by voting in accordance with a pre-determined policy or in accordance with the recommendation of an independent third party. With respect to a conflict of interest brought to its attention, the Proxy Voting Committee first determines whether such conflict of interest is material. A conflict of interest is considered material to the extent that it is determined that such conflict is likely to influence, or appear to influence, ClearBridge’s decision-making in voting proxies. If it is determined by the Proxy Voting Committee that a conflict of interest is not material, ClearBridge may vote proxies notwithstanding the existence of the conflict.
If it is determined by the Proxy Voting Committee that a conflict of interest is material, the Proxy Voting Committee is responsible for determining an appropriate method to resolve such conflict of interest before the proxy affected by the conflict of interest is voted. Such determination is based on the particular facts and circumstances, including the importance of the proxy issue and the nature of the conflict of interest.
B-87
CLOVER CAPITAL MANAGEMENT, INC.
PROXY VOTING
Policy
Clover Capital Management, Inc., as a matter of policy and as a fiduciary to our clients, has responsibility for voting proxies for portfolio securities consistent with the best economic interests of the clients. Our firm maintains written policies and procedures as to the handling, research, voting and reporting of proxy voting and makes appropriate disclosures about our firm’s proxy policies and practices. Our policy and practice includes the responsibility to monitor corporate actions, receive and vote client proxies and disclose any potential conflicts of interest as well as making information available to clients about the voting of proxies for their portfolio securities and maintaining relevant and required records.
Clover Capital Management, Inc. (“Clover Capital”) votes the proxies received by it on behalf of its client shareholders unless the client has specifically instructed it otherwise.
Clover Capital shall vote proxies related to securities held by any client in a manner solely in the interest of the client. Clover Capital shall consider only those factors that relate to the client’s investment, including how its vote will economically impact and affect the value of the client’s investment. Proxy votes generally will be cast in favor of proposals that maintain or strengthen the shared interests of shareholders and management, increase shareholder value, maintain or increase shareholder influence over the issuer’s board of directors and management, and maintain or increase the rights of shareholders; proxy votes generally will be cast against proposals having the opposite effect. As part of the process, Clover Capital subscribes to an outside proxy consultant, Institutional Shareholder Services “ISS”, and utilizes its data and analysis to augment the work done by Clover Capital’s relevant analyst (i.e. the analyst responsible for that particular security). However, in voting on each and every issue, the relevant analyst will be ultimately responsible for voting proxies in the best interests of Clover Capital’s clients and shall vote in a prudent, diligent fashion and only after a careful evaluation of the issue presented on the ballot.
Background
Proxy voting is an important right of shareholders and reasonable care and diligence must be undertaken to ensure that such rights are properly and timely exercised.
Investment advisers registered with the SEC, and which exercise voting authority with respect to client securities, are required by Rule 206(4)-6 of the Advisers Act to (a) adopt and implement written policies and procedures that are reasonably designed to ensure that client securities are voted in the best interests of clients, which must include how an adviser addresses material conflicts that may arise between an adviser’s interests and those of its clients; (b) to disclose to clients how they may obtain information from the adviser with respect to the voting of proxies for their securities; (c) to describe to clients a summary of its proxy voting policies and procedures and, upon request, furnish a copy to its clients; and (d) maintain certain records relating to the adviser’s proxy voting activities when the adviser does have proxy voting authority.
Responsibility
Tracy Kern has the responsibility for the implementation and monitoring of our proxy voting policy, practices, disclosures and record keeping, including outlining our voting guidelines in our procedures.
Procedure
Clover Capital Management, Inc. has adopted procedures to implement the firm’s policy and reviews to monitor and insure the firm’s policy is observed, implemented properly and amended or updated, as appropriate, which include the following:
B-88
Voting Procedures
Unless the power to vote proxies for a client is reserved to that client (or in the case of an employee benefit plan, the plan’s trustee or other fiduciaries), Clover Capital, through its relevant analysts, will be responsible for voting the proxies related to that account.
All proxies and ballots will be logged in upon receipt and the materials, which include ISS’s proxy voting recommendations, will be forwarded to the appropriate analyst for review. The analyst then votes the proxies which may or may not correspond to the ISS recommendations. In practice, the ISS recommendations correspond with most of Clover Capital’s analysts’ proxy voting decisions.
Clover Capital has standard reasons for and against proposals, which have been approved by the Clover Compliance Department. After reviewing the proxy, the analyst will report how he/she wants to vote along with the rationale to be used when voting.
Should an analyst respond with a new rationale, it will be approved by the Clover Compliance Department before the vote is cast.
Proxies received will be voted promptly in a manner consistent with the Proxy Voting Policies and Procedures stated and guidelines (if any) issued by client (or in the case of an employee benefit plan, the plan’s trustee or other fiduciaries).
Records are kept on how each proxy is voted. Such records may be maintained by a third party proxy consultant that will provide a copy of the documents promptly upon request.
On an ongoing basis, the analysts will monitor corporate management of issuers for securities they cover and for which are held in clients’ accounts and where appropriate will communicate with the management of such issuers.
Periodically, or at least annually, the Clover Compliance Department will:
| | • | | Review our proxy voting process and verify that it is being implemented in a manner consistent with the Proxy Voting Policies and Procedures and the guidelines (if any) issued by the client (or in the case of an employee benefit plan, the plan’s trustee or other fiduciaries); |
| | • | | When requested by client, report to the client how each proxy sent to Company on behalf of the client was voted, by forwarding a copy of the completed ballot card or in some other written matter; |
| | • | | Review the files to verify that records of the voting of the proxies have been properly maintained, which is keeping records on site for 2 years and off site in storage thereafter; and |
| | • | | When requested, prepare a written report for a client regarding compliance with the Proxy Voting Policies and Procedures. |
| | • | | Review the Proxy Voting Policies and Procedures to insure they are up-to-date. |
Disclosure
| | • | | Clover Capital Management, Inc. will provide conspicuously displayed information in its Disclosure Document summarizing this proxy voting policy and procedures, including a statement that clients may request information regarding how Clover Capital Management, Inc. voted a client’s proxies, and that clients may request a copy of these policies and procedures. |
| | • | | Clover Capital Management, Inc. has also sent a Proxy Voting Policy summary to all existing clients who have previously received Clover Capital Management, Inc.’s Disclosure Document; or Clover |
B-89
| | Capital Management, Inc. may send each client the amended Disclosure Document. Either mailing shall highlight the inclusion of information regarding proxy voting. |
Client Requests for Information
| | • | | All client requests for information regarding proxy votes, or policies and procedures, received by any employee should be forwarded to the Compliance Manager. |
| | • | | In response to any request Clover Capital will prepare a written response to the client with the information requested, and as applicable will include the name of the issuer, the proposal voted upon, and how Clover Capital Management, Inc. voted the client’s proxy with respect to each proposal about which client inquired. |
Voting Guidelines
In the interest of good corporate governance and the best interest of our clients, the following general guidelines will be employed when voting corporate proxies on behalf of Clover Capital’s clients. Clover Capital does, however, recognize that unusual circumstances may merit occasional deviation from these guidelines, but it expects those situations to be the rare exception to the following rules:
| | • | | Clover Capital will vote against the authorization of new stock options if the sum of the newly authorized option package and all existing options outstanding unreasonably dilute existing shares. While Clover Capital recognizes the incentive benefits that options can provide, Clover Capital believes that an excessively dilutive effort offsets the benefits. |
| | • | | Clover Capital will favor the annual election of directors. |
| | • | | Clover Capital will oppose the re-incorporation of domestic companies into other nations. |
| | • | | Clover Capital will oppose shareholder resolutions that are motivated by the social beliefs of the resolution’s sponsor rather than designed to maximize shareholder value or improve a company’s governance practices. |
| | • | | Clover Capital will vote to retain a company’s current public auditor unless we have reason to believe the shareholder will benefit from an auditor change. |
| | • | | Clover Capital will vote against the creation of so called “poison pills” and for shareholder resolutions calling for their removal. |
| | • | | Clover Capital will generally favor shareholder proposals which separate the position of Board Chair and Chief Executive Officer. |
| | • | | Clover Capital will vote in favor of shareholder proposals calling for the expensing of stock options, because failure to do so results in chronic overstatement of earnings, which is not helpful to shareholders. |
| | • | | Clover Capital will vote in favor of shareholder proposals calling for the replacement of “super majority” vote thresholds with simple majority vote requirements. |
Conflicts of Interest
Clover Capital stock is not publicly traded, and Clover Capital is not otherwise affiliated with any issuer whose shares are available for purchase by client accounts. Further, no Clover Capital affiliate currently provides brokerage, underwriting , insurance, banking or other financial services to issuers whose shares are available for purchase by client accounts.
Where a client of Clover Capital is a publicly traded company in its own right, Clover Capital may be restricted from acquiring that company’s securities for the client’s benefit. Further, while Clover Capital believes
B-90
that any particular proxy issues involving companies that engage Clover Capital, either directly or through their pension committee or otherwise, to manage assets on their behalf, generally will not present conflict of interest dangers for the firm or its clients, in order to avoid even the appearance of a conflict of interest, Clover Compliance will determine, by surveying the Firm’s employees or otherwise, whether Clover Capital, an affiliate or any of their officers has a business, familial or personal relationship with the issuer itself or the issuer’s pension plan, corporate directors or candidates for directorships. In the event that any such conflict of interest is found to exist, Clover Capital will ensure that any such conflict of interest does not influence Clover Capital’s vote by adhering to all recommendations made by the outside proxy consultant that Clover Capital utilizes. Clover Capital will seek to resolve any conflicts of interests that may arise prior to voting proxies in a manner that reflects the best interests of its clients.
Recordkeeping
The proxy coordinator(s) shall retain the following proxy records in accordance with the SEC’s five-year retention requirement.
| | • | | These policies and procedures and any amendments; |
| | • | | Each proxy statement that Clover Capital Management, Inc. receives; |
| | • | | A record of each vote that Clover Capital Management, Inc. casts; |
| | • | | Any document Clover Capital Management, Inc. created that was material to making a decision how to vote proxies, or that memorializes that decision; |
| | • | | A copy of each written request from a client for information on how Clover Capital Management, Inc. voted such client’s proxies, and a copy of any written response. |
B-91
Cooke & Bieler, L.P.
Proxy Voting Policies and Procedures
Proxy Background
On January 31, 2003, the SEC adopted a new rule and rule amendments under the Investment Advisers Act of 1940 that address an adviser’s fiduciary obligation to clients who have given the adviser authority to vote their proxies. Rule 206(4)-6 requires an adviser that exercises voting authority over client proxies to adopt and implement policies and procedures that are reasonably designed to ensure that the adviser votes proxies in the best interest of the client.
Statement of Policies and Procedures
Pursuant to this new rule and in accordance with our fiduciary duties, Cooke & Bieler has adopted and implemented written policies and procedures that we believe are reasonably designed to ensure that proxies are voted in the best interest of our clients for which we have voting authority. Our authority is initially established by our advisory contracts or comparable documents. Clients, however, may change their proxy voting direction at any time.
Any material conflicts of interest between Cooke & Bieler and our clients with respect to proxy voting are resolved in the best interest of clients. If any of our clients utilize a securities lending program, we will not vote proxies for those securities that are out on loan.
Cooke & Bieler utilizes the services of an outside proxy firm, Institutional Shareholder Services (ISS), to act as agent for the proxy process and to maintain records on proxy votes for our clients. Proxy statements are thoroughly reviewed by the portfolio manager most familiar with the company to ensure that proxies are voted in the best interest of our clients. Cooke & Bieler defines the best interest of the client to mean the best economic interest of the shareholders of the company.
The compliance officer is responsible for monitoring corporate actions and ensuring that the custodian receives timely notification of our responses.
In determining how to vote on a particular issue, the firm may from time to time consider the voting recommendations of third parties, such as proxy services firms or other organizations or associations (e.g., the AFL-CIO or ISS), but these recommendations are not determinative. Further, the firm may consider the views of third parties when revising its proxy voting policies, procedures or guidelines.
Cooke & Bieler will generally take the following position on each issue listed below. While we follow these guidelines, each vote is ultimately cast on a case-by-case basis, taking into consideration all the relevant facts and circumstances at the time of the vote.
Summary of Positions on Common Issues:
| | | | |
Board of Directors
| | |
A.) | | Director Nominees in Uncontested Elections | | Case-by-Case |
B.) | | Separation of Chairman and CEO | | For |
C.) | | Majority of Independent Directors | | For |
D.) | | Stock Ownership Requirements | | Against |
E.) | | Limit Tenure of Outside Directors | | Against |
F.) | | Director and Officer Indemnification and Liability Protection | | Case-by-Case |
G.) | | Eliminate or Restrict Charitable Contributions | | Against |
B-92
| | | | |
| | |
| | | Proxy Contests
| | |
A.) | | Voting for Director Nominees in Contested Election | | Case-by-Case |
B.) | | Reimburse Proxy Solicitation | | Case-by-Case |
| | |
| | | Auditors
| | |
A.) | | Ratifying Auditors | | Case-by-Case |
| | |
| | | Proxy Contest Defenses
| | |
| | | Board Structure—Classified Board | | Against |
B.) | | Cumulative Voting | | For |
C.) | | Shareholder Ability to Call Special Meetings | | For |
| | |
| | | Tender Offer Defenses
| | |
A.) | | Submit Poison Pill for shareholder ratification | | For |
B.) | | Fair Price Provisions | | For |
C.) | | Supermajority Shareholder Vote Requirement To Amend the Charter or Bylaws | | Against |
D.) | | Supermajority Shareholder Vote Requirement To Approve Mergers | | Against |
| | |
| | | Miscellaneous Governance Provisions | | |
A.) | | Confidential Voting | | For |
B.) | | Equal Access | | Case-by-Case |
C.) | | Bundled Proposals | | Case-by-Case |
| | |
| | | Capital Structure | | |
A.) | | Common Stock Authorization | | Case-by-Case |
B.) | | Stock Splits | | For |
C.) | | Reverse Stock Splits | | Case-by-Case |
D.) | | Preemptive Rights | | Case-by-Case |
E.) | | Share Repurchase Programs | | For |
| | |
| | | Executive and Director Compensation | | |
A.) | | Shareholder Proposals to Limit Executive and Directors Pay | | Case-by-Case |
B.) | | Shareholder Ratification of Golden and Tin Parachutes | | For |
C.) | | Employee Stock Ownership Plans | | Case-by-Case |
D.) | | 401(k) Employee Benefit Plans | | For |
| | |
| | | State of Incorporation | | |
A.) | | Voting on State Takeover Plans | | Case-by-Case |
B.) | | Voting on Reincorporation Proposals | | Case-by-Case |
| | |
| | | Mergers and Corporate Restructurings | | |
A.) | | Mergers and Acquisitions | | Case-by-Case |
B.) | | Corporate Restructuring | | Case-by-Case |
C.) | | Spin-Offs | | Case-by-Case |
D.) | | Liquidations | | Case-by-Case |
| | |
| | | Social and Environmental Issues | | |
A.) | | Issues with Social/Moral Implications | | Case-by-Case |
Proxy Voting Process:
When a new account is opened and the contract states Cooke & Bieler is responsible for voting proxies, a letter is sent to the custodian informing them that ISS will act as our proxy voting agent for that account. Cooke & Bieler then notifies ISS of the new client and sends them an updated holdings file for each client account. On an ongoing basis, ISS generates reports to identify missing proxies. These proxies are tracked down
B-93
by contacting the custodian bank. This procedure is very successful in accounting for missing proxies. ISS also provides quarterly reports showing how each individual client’s proxies were voted. This information is sent to those clients who have requested a copy.
ISS is responsible for: notifying Cooke & Bieler in advance of the meeting; providing the appropriate proxies to be voted; and for maintaining records of proxy statements received and votes cast.
The compliance officer is responsible for: maintaining the proxy policies and procedures; determining when a potential conflict of interest exists (see examples below); maintaining records of all communications received from clients requesting information on how their proxies were voted; and notifying clients how they can obtain voting records and polices and procedures.
The compliance department is responsible for: determining which accounts Cooke & Bieler has proxy voting responsibilities for; obtaining the appropriate guidance from the portfolio manager on how to vote; and maintaining documents created that were material to the voting decision.
Resolving Potential Conflicts of Interest:
The compliance officer is responsible for identifying potential conflicts of interest in regard to the proxy voting process. Examples of potential conflicts of interest include:
| | • | | managing a pension plan for a company whose management is soliciting proxies; |
| | • | | significant business relationship—having a material business relationship with a proponent of a proxy proposal in which this business relationship may influence how the proxy vote is cast; |
| | • | | significant personal / family relationship—adviser or principals have a business or personal relationship with participants in a proxy contest, corporate directors or candidates for directorships. |
In instances where a material conflict of interest exists, it will be Cooke & Bieler’s policy to delegate responsibility for voting these proxies to an independent third party (currently ISS). If it is determined that the independent third party also has a conflict, we will identify another unaffiliated third party to vote the specific proposals. This will ensure that all proxies are voted in the best interests of clients and not the product of the conflict.
B-94
Summary of Davis Advisors’
Proxy Voting Policies and Procedures
June 2006
Davis Selected Advisers, L.P. (“Davis Advisors”) votes on behalf of its clients in matters of corporate governance through the proxy voting process. Davis Advisors takes its ownership responsibilities very seriously and believes the right to vote proxies for its clients’ holdings is a significant asset of the clients. Davis Advisors exercises its voting responsibilities as a fiduciary, solely with the goal of maximizing the value of its clients’ investments.
Davis Advisors votes proxies with a focus on the investment implications of each issue. For each proxy vote, Davis Advisors takes into consideration its duty to clients and all other relevant facts known to Davis Advisors at the time of the vote. Therefore, while these guidelines provide a framework for voting, votes are ultimately cast on a case-by-case basis.
Davis Advisors has adopted written Proxy Voting Policies and Procedures and established a Proxy Oversight Group to oversee voting policies and deal with potential conflicts of interest. In evaluating issues, the Proxy Oversight Group may consider information from many sources, including the portfolio manager for each client account, management of a company presenting a proposal, shareholder groups, and independent proxy research services.
Clients may obtain a copy of Davis Advisors’ Proxy Voting Policies and Procedures, and/or a copy of how their own proxies were voted, by writing to:
Davis Selected Advisers, L.P.
Attn: Chief Compliance Officer
2949 East Elvira Road, Suite 101
Tucson, Arizona, 85706
Guiding Principles
Creating Value for Existing Shareholders. The most important factors that we consider in evaluating proxy issues are: (i) the Company’s or management’s long-term track record of creating value for shareholders. In general, we will consider the recommendations of a management with a good record of creating value for shareholders as more credible than the recommendations of managements with a poor record; (ii) whether, in our estimation, the current proposal being considered will significantly enhance or detract from long-term value for existing shareholders; and (iii) whether a poor record of long term performance resulted from poor management or from factors outside of managements control.
Other factors which we consider may include:
(a) Shareholder Oriented Management. One of the factors that Davis Advisors considers in selecting stocks for investment is the presence of shareholder-oriented management. In general, such managements will have a large ownership stake in the company. They will also have a record of taking actions and supporting policies designed to increase the value of the company’s shares and thereby enhance shareholder wealth. Davis Advisors’ research analysts are active in meeting with top management of portfolio companies and in discussing their views on policies or actions which could enhance shareholder value. Whether management shows evidence of responding to reasonable shareholder suggestions, and otherwise improving general corporate governance, is a factor which may be taken into consideration in proxy voting.
(b) Allow responsible management teams to run the business. Because we try generally to invest with “owner oriented” managements (see above), we vote with the recommendation of management on most routine matters, unless circumstances such as long standing poor performance or a change from our initial assessment
B-95
indicate otherwise. Examples include the election of directors and ratification of auditors. Davis Advisors supports policies, plans and structures that give management teams appropriate latitude to run the business in the way that is most likely to maximize value for owners. Conversely, Davis Advisors opposes proposals that limit management’s ability to do this. Davis Advisors will generally vote with management on shareholder social and environmental proposals on the basis that their impact on share value is difficult to judge and is therefore best done by management.
(c) Preserve and expand the power of shareholders in areas of corporate governance. Equity shareholders are owners of the business, and company boards and management teams are ultimately accountable to them. Davis Advisors supports policies, plans and structures that promote accountability of the board and management to owners, and align the interests of the board and management with owners. Examples include: annual election of all board members and incentive plans that are contingent on delivering value to shareholders. Davis Advisors generally opposes proposals that reduce accountability or misalign interests, including but not limited to classified boards, poison pills, excessive option plans, and repricing of options.
(d) Support compensation policies that reward management teams appropriately for performance. We believe that well thought out incentives are critical to driving long-term shareholder value creation. Management incentives ought to be aligned with the goals of long-term owners. In our view, the basic problem of skyrocketing executive compensation is not high pay for high performance, but high pay for mediocrity or worse. In situations where we feel that the compensation practices at companies we own are not acceptable, we will exercise our discretion to vote against compensation committee members and specific compensation proposals.
Davis Advisors exercises its professional judgment in applying these principles to specific proxy votes. Davis Advisors Proxy Procedures and Policies provides additional explanation of the analysis which Davis Advisors may conduct when applying these guiding principles to specific proxy votes.
Conflicts of Interest
A potential conflict of interest arises when Davis Advisors has business interests that may not be consistent with the best interests of its client. Davis Advisors’ Proxy Oversight Group is charged with resolving material potential conflicts of interest which it becomes aware of. It is charged with resolving conflicts in a manner that is consistent with the best interests of clients. There are many acceptable methods of resolving potential conflicts, and the Proxy Oversight Group exercises its judgment and discretion to determine an appropriate means of resolving a potential conflict in any given situation:
| | (1) | Votes consistent with the “General Proxy Voting Policies,” are presumed to be consistent with the best interests of clients; |
| | (2) | Davis Advisors may disclose the conflict to the client and obtain the client’s consent prior to voting the proxy; |
| | (3) | Davis Advisors may obtain guidance from an independent third party; |
| | (4) | The potential conflict may be immaterial; or |
| | (5) | Other reasonable means of resolving potential conflicts of interest which effectively insulate the decision on how to vote client proxies from the conflict. |
B-96
DELAWARE MANAGEMENT
BUSINESS TRUST
Proxy Voting Policies and Procedures
(January 2007)
Introduction
Delaware Management Business Trust (“DMBT”) is a registered investment adviser with the U.S. Securities and Exchange Commission (“SEC”) pursuant to the Investment Advisers Act of 1940, as amended, (the “Advisers Act”). DMBT consists of the following series of entities: Delaware Management Company, Delaware Investment Advisers, Delaware Capital Management, Delaware Asset Advisers and Delaware Lincoln Cash Management (each an “Adviser”, and together with DMBT, the “Advisers”). The Advisers provide investment advisory services to various types of clients such as registered and unregistered commingled funds, defined benefit plans, defined contribution plans, private and public pension funds, foundations, endowment funds and other types of institutional investors. Pursuant to the terms of an investment management agreement between an Adviser and its client or as a result of some other type of specific delegation by the client, the Advisers are often given the authority and discretion to vote proxy statements relating to the underlying securities which are held on behalf of such client. Also, clients sometimes ask the Advisers to give voting advice on certain proxies without delegating full responsibility to the Advisers to vote proxies on behalf of the client. DMBT has developed the following Proxy Voting Policies and Procedures (the “Procedures”) in order to ensure that each Adviser votes proxies or gives proxy voting advice that is in the best interests of its clients.
Procedures for Voting Proxies
To help make sure that the Advisers vote client proxies in accordance with the Procedures and in the best interests of clients, DMBT has established a Proxy Voting Committee (the “Committee”) which is responsible for overseeing each Adviser’s proxy voting process. The Committee consists of the following persons in DMBT: (i) one representative from the legal department; (ii) one representative from the compliance department; (iii) one representative from the client services department; and (iv) two representatives from the portfolio management department. The person(s) representing each department on the Committee may change from time to time. The Committee will meet as necessary to help DMBT fulfill its duties to vote proxies for clients, but in any event, will meet at least quarterly to discuss various proxy voting issues.
One of the main responsibilities of the Committee is to review and approve the Procedures on a yearly basis. The Procedures are usually reviewed during the first quarter of the calendar year before the beginning of the “proxy voting season” and may also be reviewed at other times of the year, as necessary. When reviewing the Procedures, the Committee looks to see if the Procedures are designed to allow the Adviser to vote proxies in a manner consistent with the goals of voting in the best interests of clients and maximizing the value of the underlying shares being voted on by the Adviser. The Committee will also review the Procedures to make sure that they comply with any new rules promulgated by the SEC or other relevant regulatory bodies. After the Procedures are approved by the Committee, DMBT will vote proxies or give advice on voting proxies generally in accordance with such Procedures.
In order to facilitate the actual process of voting proxies, DMBT has contracted with Institutional Shareholder Services (“ISS”), a Delaware corporation. Both ISS and the client’s custodian monitor corporate events for DMBT. DMBT gives an authorization and letter of instruction to the client’s custodian who then forwards proxy materials it receives to ISS so that ISS may vote the proxies. On approximately a monthly basis, DMBT will send ISS an updated list of client accounts and security holdings in those accounts, so that ISS can update its database and is aware of which proxies it will need to vote on behalf of DMBT’s clients. If needed, the Committee has access to these records.
After receiving the proxy statements, ISS will review the proxy issues and vote them in accordance with DMBT’s Procedures. When the Procedures state that a proxy issue will be decided on a case-by-case basis, ISS
B-97
will look at the relevant facts and circumstances and research the issue to determine how the proxy should be voted, so that the proxy is voted in the best interests of the client and in accordance with the parameters described in these Procedures generally and specifically with the Proxy Voting Guidelines (the “Guidelines”) below. If the Procedures do not address a particular proxy issue, ISS will similarly look at the relevant facts and circumstances and research the issue to determine how the proxy should be voted, so that the proxy is voted in the best interests of the client and pursuant to the spirit of the Procedures. After a proxy has been voted, ISS will create a record of the vote in order to help the Advisers comply with their duties listed under “Availability of Proxy Voting Records and Recordkeeping” below. If a client provides DMBT with its own proxy voting guidelines, DMBT will forward the client’s guidelines to ISS who will follow the steps above to vote the client’s proxies pursuant to the client’s guidelines.
The Committee is responsible for overseeing ISS’s proxy voting activities for DMBT’s clients and will attempt to ensure that ISS is voting proxies pursuant to the Procedures. As part of the Committee’s oversight of ISS, the Committee will periodically review ISS’s conflict of interest procedures and any other pertinent procedures or representations from ISS in an attempt to ensure that ISS will make recommendations for voting proxies in an impartial manner and in the best interests of the Adviser’s clients. There may be times when one of the Advisers believes that the best interests of the client will be better served if the Adviser votes a proxy counter to ISS’s recommended vote on that proxy. In those cases, the Committee will generally review the research provided by ISS on the particular issue, and it may also conduct its own research or solicit additional research from another third party on the issue. After gathering this information and possibly discussing the issue with other relevant parties, the Committee will use the information gathered to determine how to vote on the issue in a manner which the Committee believes is consistent with DMBT’s Procedures and in the best interests of the client.
The Advisers will attempt to vote every proxy which they or their agents receive when a client has given the Adviser the authority and direction to vote such proxies. However, there are situations in which the Adviser may not be able to process a proxy. For example, an Adviser may not have sufficient time to process a vote because the Adviser or its agents received a proxy statement in an untimely manner, or the Adviser may in certain situations be unable to vote a proxy in relation to a security that is on loan pursuant to a securities lending program. Use of a third party service, such as ISS, and relationships with multiple custodians help avoid a situation where an Adviser is unable to vote a proxy.
Company Management Recommendations
When determining whether to invest in a particular company, one of the factors the Advisers may consider is the quality and depth of the company’s management. As a result, DMBT believes that recommendations of management on any issue (particularly routine issues) should be given a fair amount of weight in determining how proxy issues should be voted. Thus, on many issues, DMBT’s votes are cast in accordance with the recommendations of the company’s management. However, DMBT will normally vote against management’s position when it runs counter to the Guidelines, and DMBT will also vote against management’s recommendation when such position is not in the best interests of DMBT’s clients.
Conflicts of Interest
As a matter of policy, the Committee and any other officers, directors, employees and affiliated persons of DMBT may not be influenced by outside sources who have interests which conflict with the interests of DMBT’s clients when voting proxies for such clients. However, in order to ensure that DMBT votes proxies in the best interests of the client, DMBT has established various systems described below to properly deal with a material conflict of interest.
Most of the proxies which DMBT receives on behalf of its clients are voted by ISS in accordance with these pre-determined, pre-approved Procedures. As stated above, these Procedures are reviewed and approved by the
B-98
Committee at least annually normally during the first quarter of the calendar year and at other necessary times. The Procedures are then utilized by ISS going forward to vote client proxies. The Committee approves the Procedures only after it has determined that the Procedures are designed to help DMBT vote proxies in a manner consistent with the goal of voting in the best interests of its clients. Because the majority of client proxies are voted by ISS pursuant to the pre-determined Procedures, it normally will not be necessary for DMBT to make a real-time determination of how to vote a particular proxy, thereby largely eliminating conflicts of interest for DMBT from the proxy voting process.
In the limited instances where DMBT is considering voting a proxy contrary to ISS’s recommendation, the Committee will first assess the issue to see if there is any possible conflict of interest involving DMBT or affiliated persons of DMBT. If there is no perceived conflict of interest, the Committee will then vote the proxy according to the process described in “Procedures for Voting Proxies” above. If at least one member of the Committee has actual knowledge of a conflict of interest, the Committee will normally use another independent third party to do additional research on the particular issue in order to make a recommendation to the Committee on how to vote the proxy in the best interests of the client. The Committee will then review the proxy voting materials and recommendation provided by ISS and the independent third party to determine how to vote the issue in a manner which the Committee believes is consistent with DMBT’s Procedures and in the best interests of the client. In these instances, the Committee must come to a unanimous decision regarding how to vote the proxy or they will be required to vote the proxy in accordance with ISS’s original recommendation. Documentation of the reasons for voting contrary to ISS’s recommendation will generally be retained by DMBT.
Availability of Proxy Voting Information and Recordkeeping
Clients of DMBT will be directed to their client service representative to obtain information from DMBT on how their securities were voted. At the beginning of a new relationship with a client, DMBT will provide clients with a concise summary of DMBT’s proxy voting process and will inform clients that they can obtain a copy of the complete Procedures upon request. The information described in the preceding two sentences will be included in Part II of DMBT’s Form ADV which is delivered to each new client prior to the commencement of investment management services. Existing clients will also be provided with the above information.
DMBT will also retain extensive records regarding proxy voting on behalf of clients. DMBT will keep records of the following items: (i) the Procedures; (ii) proxy statements received regarding client securities (via hard copies held by ISS or electronic filings from the SEC’s EDGAR filing system); (iii) records of votes cast on behalf of DMBT’s clients (via ISS); (iv) records of a client’s written request for information on how DMBT voted proxies for the client, and any DMBT written response to an oral or written client request for information on how DMBT voted proxies for the client; and (v) any documents prepared by DMBT that were material to making a decision as to how to vote or that memorialized the basis for that decision. These records will be maintained in an easily accessible place for at least five years from the end of the fiscal year during which the last entry was made on such record. For the first two years, such records will be stored at the offices of DMBT.
Proxy Voting Guidelines
The following Guidelines summarize DMBT’s positions on various issues and give a general indication as to how the Advisers will vote shares on each issue. The Proxy Committee has reviewed the Guidelines and determined that voting proxies pursuant to the Guidelines should be in the best interests of the client and should facilitate the goal of maximizing the value of the client’s investments. Although the Advisers will usually vote proxies in accordance with these Guidelines, the Advisers reserve the right to vote certain issues counter to the Guidelines if, after a thorough review of the matter, the Adviser determines that a client’s best interests would be served by such a vote. Moreover, the list of Guidelines below may not include all potential voting issues. To the extent that the Guidelines do not cover potential voting issues, the Advisers will vote on such issues in a manner that is consistent with the spirit of the Guidelines below and that promotes the best interests of the client.
B-99
DMBT’s Guidelines are listed immediately below and are organized by votes on proxies for underlying U.S. and non-U.S. portfolio securities, and by the types of issues that could potentially be brought up in a proxy statement:
U.S. Portfolio Security Voting Issues
Adjourn Meeting
Generally vote AGAINST proposals to provide management with the authority to adjourn an annual or special meeting absent compelling reasons to support the proposal.
Generally vote FOR proposals that relate specifically to soliciting votes for a merger or transaction if supporting that merger or transaction. Generally vote AGAINST proposals if the wording is too vague or if the proposal includes “other business.”
Amend Quorum Requirements
Generally vote AGAINST proposals to reduce quorum requirements for shareholder meetings below a majority of the shares outstanding unless there are compelling reasons to support the proposal.
Amend Minor Bylaws
Generally vote FOR bylaw or charter changes that are of a housekeeping nature (updates or corrections).
Change Company Name
Generally vote FOR proposals to change the corporate name.
Change Date, Time, or Location of Annual Meeting
Generally vote FOR management proposals to change the date/time/location of the annual meeting unless the proposed change is unreasonable.
Generally vote AGAINST shareholder proposals to change the date/time/location of the annual meeting unless the current scheduling or location is unreasonable.
Auditor Indemnification and Limitation of Liability
Consider the issue of auditor indemnification and limitation of liability on a CASE-BY-CASE basis. Factors to be assessed include, but are not limited to:
| | • | | The terms of the auditor agreement- the degree to which these agreements impact shareholders’ rights; |
| | • | | Motivation and rationale for establishing the agreements; |
| | • | | Quality of disclosure; and |
| | • | | Historical practices in the audit area. |
Generally WITHHOLD against members of an audit committee in situations where there is persuasive evidence that the audit committee entered into an inappropriate indemnification agreement with its auditor that limits the ability of the company, or its shareholders, to pursue legitimate legal recourse against the audit firm.
Auditor Ratification
Generally vote FOR proposals to ratify auditors, unless any of the following apply:
| | • | | An auditor has a financial interest in or association with the company, and is therefore not independent |
B-100
| | • | | Fees for non-audit services are excessive, or |
| | • | | There is reason to believe that the independent auditor has rendered an opinion which is neither accurate nor indicative of the company’s financial position. |
Vote CASE-BY-CASE on shareholder proposals asking companies to prohibit or limit their auditors from engaging in non-audit services.
Vote CASE-BY-CASE on shareholder proposals asking for audit firm rotation, taking into account the tenure of the audit firm, the length of rotation specified in the proposal, any significant audit-related issues at the company, the number of audit committee meetings held each year, the number of financial experts serving on the committee, and whether the company has a periodic renewal process where the auditor is evaluated for both audit quality and competitive price.
Transact Other Business
Generally vote AGAINST proposals to approve other business when it appears as voting item.
Voting on Director Nominees in Uncontested Elections
Vote CASE-BY-CASE on director nominees, examining, but not limited to, the following factors:
| | • | | Composition of the board and key board committees; |
| | • | | Attendance at board and committee meetings; |
| | • | | Corporate governance provisions and takeover activity; |
| | • | | Disclosures under Section 404 of Sarbanes-Oxley Act; |
| | • | | Long-term company performance relative to a market and peer index; |
| | • | | Extent of the director’s investment in the company; |
| | • | | Existence of related party transactions; |
| | • | | Whether the chairman is also serving as CEO; |
| | • | | Whether a retired CEO sits on the board; |
| | • | | Number of outside boards at which a director serves; |
| | • | | Majority vote standard for director elections without a provision to allow for plurality voting when there are more nominees than seats. |
Generally WITHHOLD from individual directors who:
| | • | | Attend less than 75 percent of the board and committee meetings without a valid excuse (such as illness, service to the nation, work on behalf of the company); |
| | • | | Sit on more than six public company boards; |
| | • | | Are CEOs of public companies who sit on the boards of more than two public companies besides their own—withhold only at their outside boards. |
Generally WITHHOLD from the entire board of directors (except from new nominees, who should be considered on a CASE-BY-CASE basis) if:
| | • | | The company’s proxy indicates that not all directors attended 75% of the aggregate of their board and committee meetings, but fails to provide the required disclosure of the names of the directors involved. If this information cannot be obtained, withhold from all incumbent directors; |
| | • | | The company’s poison pill has a dead-hand or modified dead-hand feature. Generally withhold every year until this feature is removed; |
| | • | | The board adopts or renews a poison pill without shareholder approval since the beginning of 2005, does not commit to putting it to shareholder vote within 12 months of adoption, or reneges on a commitment to put the pill to a vote, and has not yet received a withhold recommendation for this issue; |
B-101
| | • | | The board failed to act on a shareholder proposal that received approval by a majority of the shares outstanding the previous year; |
| | • | | The board failed to act on a shareholder proposal that received approval of the majority of shares cast for the previous two consecutive years; |
| | • | | The board failed to act on takeover offers where the majority of the shareholders tendered their shares; |
| | • | | At the previous board election, any director received more than 50 percent withhold votes of the shares cast and the company has failed to address the issue(s) that caused the high withhold rate; |
| | • | | The company is a Russell 3000 company that has underperformed its industry group (GICS group) under certain company performance measurement criteria. |
Generally WITHHOLD from inside directors and affiliated outside directors when:
| | • | | The inside or affiliated outside director serves on any of the three key committees: audit, compensation, or nominating; |
| | • | | The company lacks an audit, compensation, or nominating committee so that the full board functions as that committee; |
| | • | | The company lacks a formal nominating committee, even if board attests that the independent directors fulfill the functions of such a committee; |
| | • | | The full board is less than majority independent. |
Generally WITHHOLD from the members of the Audit Committee if:
| | • | | The non -audit fees paid to the auditor are excessive; |
| | • | | A material weakness identified in the Section 404 Sarbanes-Oxley Act disclosures rises to a level of serious concern; there are chronic internal control issues and an absence of established effective control mechanisms; |
| | • | | There is persuasive evidence that the audit committee entered into an inappropriate indemnification agreement with its auditor that limits the ability of the company, or its shareholders, to pursue legitimate legal recourse against the audit firm. |
Generally WITHHOLD from the members of the Compensation Committee if:
| | • | | There is a negative correlation between chief executive pay and company performance; |
| | • | | The company reprices underwater options for stock, cash or other consideration without prior shareholder approval, even if allowed in their equity plan; |
| | • | | The company fails to submit one-time transfers of stock options to a shareholder vote; |
| | • | | The company fails to fulfill the terms of a burn rate commitment they made to shareholders; |
| | • | | The company has backdated options (see details on this subject that follow); |
| | • | | The company has poor compensation practices (see details on this subject that follow). Poor pay practices may warrant withholding votes from the CEO and potentially the entire board as well. |
Generally WITHHOLD from directors, individually or the entire board for egregious actions or failure to replace management as appropriate.
Age Limits
Generally vote AGAINST shareholder or management proposals to limit the tenure of outside directors through mandatory retirement ages.
Board Size
Generally vote FOR proposals seeking to fix the board size or designate a range for the board size.
Generally vote AGAINST proposals that give management the ability to alter the size of the board outside of a specified range without shareholder approval.
B-102
Classification/Declassification of the Board
Generally vote AGAINST proposals to classify the board.
Generally vote FOR proposals to repeal classified boards and to elect all directors annually.
Cumulative Voting
Generally vote AGAINST proposals to eliminate cumulative voting.
Generally vote FOR proposals to restore or provide for cumulative voting unless the company meets all of the following criteria:
| | • | | Majority vote standard in director elections, including a carve-out for plurality voting in contested situations; |
| | • | | Annually elected board; |
| | • | | Two-thirds of the board composed of independent directors; |
| | • | | Nominating committee composed solely of independent directors; |
| | • | | Confidential voting; however, there may be a provision for suspending confidential voting during proxy contests; |
| | • | | Ability of shareholders to call special meetings or act by written consent with 90 days’ notice; |
| | • | | Absence of superior voting rights for one or more classes of stock; |
| | • | | Board does not have the right to change the size of the board beyond a stated range that has been approved by shareholders; |
| | • | | The company has not under-performed both its appropriate industry peers and index on both a one-year and three-year total shareholder returns basis, unless there has been a change in the CEO position within the last three years; and |
| | • | | No director received a WITHHOLD vote level of 35% or more of the votes cast in the previous election. |
Director and Officer Indemnification and Liability Protection
Proposals on director and officer indemnification and liability protection should be evaluated on a CASE-BY-CASE basis, using Delaware law as the standard.
Generally vote AGAINST proposals to eliminate entirely directors’ and officers’ liability for monetary damages for violating the duty of care.
Generally vote AGAINST indemnification proposals that would expand coverage beyond just legal expenses to liability for acts, such as negligence, that are more serious violations of fiduciary obligation than mere carelessness.
Generally Vote AGAINST proposals that would expand the scope of indemnification to provide for mandatory indemnification of company officials in connection with acts that previously the company was permitted to provide indemnification for at the discretion of the company’s board (i.e. “permissive indemnification”) but that previously the company was not required to indemnify.
Generally vote FOR only those proposals providing such expanded coverage in cases when a director’s or officer’s legal defense was unsuccessful if both of the following apply:
| | • | | If the director was found to have acted in good faith and in a manner that he reasonably believed was in the best interests of the company, and |
| | • | | If only the director’s legal expenses would be covered. |
B-103
Establish/Amend Nominee Qualifications
Vote CASE-BY-CASE on proposals that establish or amend director qualifications. Votes should be based on how reasonable the criteria are and to what degree they may preclude dissident nominees from joining the board.
Generally vote AGAINST shareholder proposals requiring two candidates per board seat.
Filling Vacancies/Removal of Directors
Generally vote AGAINST proposals that provide that directors may be removed only for cause.
Generally vote FOR proposals to restore shareholder ability to remove directors with or without cause.
Generally vote AGAINST proposals that provide that only continuing directors may elect replacements to fill board vacancies.
Generally vote FOR proposals that permit shareholders to elect directors to fill board vacancies.
Independent Chair (Separate Chair/CEO)
Generally vote FOR shareholder proposals requiring the position of chair be filled by an independent director unless there are compelling reasons to recommend against the proposal, such as a counterbalancing governance structure. This should generally include all of the following:
| | • | | Designated lead director, elected by and from the independent board members with clearly delineated and comprehensive duties. (The role may alternatively reside with a presiding director, vice chairman, or rotating lead director; however the director must serve a minimum of one year in order to qualify as a lead director.) At a minimum these should include: |
| | - | Presides at all meetings of the board at which the chairman is not present, including executive sessions of the independent directors, |
| | - | Serves as liaison between the chairman and the independent directors, |
| | - | Approves information sent to the board, |
| | - | Approves meeting agendas for the board, |
| | - | Approves meetings schedules to assure that there is sufficient time for discussion of all agenda items, |
| | - | Has the authority to call meetings of the independent directors, |
| | - | If requested by major shareholders, ensures that he is available for consultation and direct communication; |
| | • | | Two-thirds independent board; |
| | • | | All-independent key committees; |
| | • | | Established governance guidelines; |
| | • | | The company should not have underperformed both its appropriate industry peers and index on both a one-year and three-year total shareholder returns basis, unless there has been a change in the Chairman/CEO position within that time; |
| | • | | The company does not have any problematic governance issues. |
Majority of Independent Directors/Establishment of Committees
Generally vote FOR shareholder proposals asking that a majority or more of directors be independent unless the board composition already meets the proposed threshold by ISS’s definition of independent outsider.
Generally vote FOR shareholder proposals asking that board audit, compensation, and/or nominating committees be composed exclusively of independent directors if they currently do not meet that standard.
B-104
Majority Vote Shareholder Proposals
Generally vote FOR precatory and binding resolutions requesting that the board change the company’s bylaws to stipulate that directors need to be elected with an affirmative majority of votes cast, provided it does not conflict with the state law where the company is incorporated. Binding resolutions need to allow for a carve-out for a plurality vote standard when there are more nominees than board seats.
Companies are strongly encouraged to also adopt a post-election policy (also know as a director resignation policy) that will provide guidelines so that the company will promptly address the situation of a holdover director.
Office of the Board
Generally vote FOR shareholders proposals requesting that the board establish an Office of the Board of Directors in order to facilitate direct communications between shareholders and non-management directors, unless the company has all of the following:
| | • | | Established a communication structure that goes beyond the exchange requirements to facilitate the exchange of information between shareholders and members of the board; |
| | • | | Effectively disclosed information with respect to this structure to its shareholders; |
| | • | | Company has not ignored majority supported shareholder proposals or a majority withhold vote on a director nominee; and |
| | • | | The company has an independent chairman or a lead/presiding director. This individual must be made available for periodic consultation and direct communication with major shareholders. |
Open Access
Generally vote FOR reasonably crafted shareholder proposals providing shareholders with the ability to nominate director candidates to be included on management’s proxy card, provided the proposal substantially mirrors the SEC’s proposed two-trigger formulation (see the proposed “Security Holder Director Nominations” rule (http://www.sec.gov/rules/proposed/34-48626.htm).
Stock Ownership Requirements
Generally vote AGAINST shareholder proposals that mandate a minimum amount of stock that directors must own in order to qualify as a director or to remain on the board. While stock ownership on the part of directors is desired, the company should determine the appropriate ownership requirement.
Vote CASE-BY-CASE on shareholder proposals asking that the company adopt a holding or retention period for its executives (for holding stock after the vesting or exercise of equity awards), taking into account any stock ownership requirements or holding period/retention ratio already in place and the actual ownership level of executives.
Term Limits
Generally vote AGAINST shareholder or management proposals to limit the tenure of outside directors through term limits. However, scrutinize boards where the average tenure of all directors exceeds 15 years for independence from management and for sufficient turnover to ensure that new perspectives are being added to the board.
B-105
Voting for Director Nominees in Contested Elections
Vote CASE-BY-CASE on the election of directors in contested elections, considering the following factors:
| | • | | Long-term financial performance of the target company relative to its industry; |
| | • | | Management’s track record; |
| | • | | Background to the proxy contest; |
| | • | | Qualifications of director nominees (both slates); |
| | • | | Strategic plan of dissident slate and quality of critique against management; |
| | • | | Likelihood that the proposed goals and objectives can be achieved (both slates); |
| | • | | Stock ownership positions. |
Reimbursing Proxy Solicitation Expenses
Vote CASE-BY-CASE on proposals to reimburse proxy solicitation expenses. When voting in conjunction with support of a dissident slate, generally vote FOR the reimbursement of all appropriate proxy solicitation expenses associated with the election.
Confidential Voting
Generally vote FOR shareholder proposals requesting that corporations adopt confidential voting, use independent vote tabulators and use independent inspectors of election, as long as the proposal includes a provision for proxy contests as follows: In the case of a contested election, management should be permitted to request that the dissident group honor its confidential voting policy. If the dissidents agree, the policy remains in place. If the dissidents will not agree, the confidential voting policy is waived.
Generally vote FOR management proposals to adopt confidential voting.
| 4. | | Antitakeover Defenses and Voting Related Issues |
Advance Notice Requirements for Shareholder Proposals/Nominations
Vote CASE-BY-CASE on advance notice proposals, supporting those proposals which allow shareholders to submit proposals as close to the meeting date as reasonably possible and within the broadest window possible.
Amend Bylaws without Shareholder Consent
Generally vote AGAINST proposals giving the board exclusive authority to amend the bylaws.
Generally vote FOR proposals giving the board the ability to amend the bylaws in addition to shareholders.
Poison Pills
Generally vote FOR shareholder proposals requesting that the company submit its poison pill to a shareholder vote or redeem it UNLESS the company has: (1) A shareholder approved poison pill in place; or (2) The company has adopted a policy concerning the adoption of a pill in the future specifying that the board will only adopt a shareholder rights plan if either:
| | • | | Shareholders have approved the adoption of the plan; or |
| | • | | The board, in its exercise of its fiduciary responsibilities, determines that it is in the best interest of shareholders under the circumstances to adopt a pill without the delay in adoption that would result from seeking stockholder approval (i.e. the “fiduciary out” provision). A poison pill adopted under this fiduciary out will be put to a shareholder ratification vote within twelve months of adoption or expire. If the pill is not approved by a majority of the votes cast on this issue, the plan will immediately terminate. |
B-106
Generally vote FOR shareholder proposals calling for poison pills to be put to a vote within a time period of less than one year after adoption. If the company has no non-shareholder approved poison pill in place and has adopted a policy with the provisions outlined above, generally vote AGAINST the proposal. If these conditions are not met, generally vote FOR the proposal, but with the caveat that a vote within twelve months would be considered sufficient.
Vote CASE-by-CASE on management proposals on poison pill ratification, focusing on the features of the shareholder rights plan. Rights plans should generally contain the following attributes:
| | • | | No lower than a 20% trigger, flip-in or flip-over; |
| | • | | A term of no more than three years; |
| | • | | No dead-hand, slow-hand, no-hand or similar feature that limits the ability of a future board to redeem the pill; |
| | • | | Shareholder redemption feature (qualifying offer clause); if the board refuses to redeem the pill 90 days after a qualifying offer is announced, ten percent of the shares may call a special meeting or seek a written consent to vote on rescinding the pill. |
Shareholder Ability to Act by Written Consent
Generally vote AGAINST proposals to restrict or prohibit shareholder ability to take action by written consent.
Generally vote FOR proposals to allow or make easier shareholder action by written consent.
Shareholder Ability to Call Special Meetings
Generally vote AGAINST proposals to restrict or prohibit shareholder ability to call special meetings.
Generally vote FOR proposals that remove restrictions on the right of shareholders to act independently of management.
Supermajority Vote Requirements
Generally vote AGAINST proposals to require a supermajority shareholder vote.
Generally vote FOR proposals to lower supermajority vote requirements.
| 5. | | Mergers and Corporate Restructurings |
Overall Approach
For mergers and acquisitions, review and evaluate the merits and drawbacks of the proposed transaction, balancing various and sometimes countervailing factors generally including:
| | • | | Valuation—Is the value to be received by the target shareholders (or paid by the acquirer) reasonable? While the fairness opinion may provide an initial starting point for assessing valuation reasonableness, emphasis is placed on the offer premium, market reaction and strategic rationale. |
| | • | | Market reaction—How has the market responded to the proposed deal? A negative market reaction should cause closer scrutiny of a deal. |
| | • | | Strategic rationale—Does the deal make sense strategically? From where is the value derived? Cost and revenue synergies should not be overly aggressive or optimistic, but reasonably achievable. Management should also have a favorable track record of successful integration of historical acquisitions. |
B-107
| | • | | Negotiations and process—Were the terms of the transaction negotiated at arm’s-length? Was the process fair and equitable? A fair process helps to ensure the best price for shareholders. Significant negotiation “wins” can also signify the deal makers’ competency. The comprehensiveness of the sales process (e.g., full auction, partial auction, no auction) can also affect shareholder value. |
| | • | | Conflicts of interest—Are insiders benefiting from the transaction disproportionately and inappropriately as compared to non-insider shareholders? As the result of potential conflicts, the directors and officers of the company may be more likely to vote to approve a merger than if they did not hold these interests. Consider whether these interests may have influenced these directors and officers to support or recommend the merger. The CIC figure presented in the “ISS Transaction Summary” section of this report is an aggregate figure that can in certain cases be a misleading indicator of the true value transfer from shareholders to insiders. Where such figure appears to be excessive, analyze the underlying assumptions to determine whether a potential conflict exists. |
| | • | | Governance—Will the combined company have a better or worse governance profile than the current governance profiles of the respective parties to the transaction? If the governance profile is to change for the worse, the burden is on the company to prove that other issues (such as valuation) outweigh any deterioration in governance. |
Appraisal Rights
Generally vote FOR proposals to restore, or provide shareholders with, rights of appraisal.
Asset Purchases
Vote CASE-BY-CASE on asset purchase proposals, considering the following factors:
| | • | | Financial and strategic benefits |
| | • | | How the deal was negotiated |
| | • | | Other alternatives for the business |
Asset Sales
Votes on asset sales should be determined on a CASE-BY-CASE basis, considering the following factors:
| | • | | Impact on the balance sheet/working capital |
| | • | | Potential elimination of diseconomies |
| | • | | Anticipated financial and operating benefits |
| | • | | Anticipated use of funds |
| | • | | Value received for the asset |
| | • | | How the deal was negotiated |
Bundled Proposals
Review on a CASE-BY-CASE basis bundled or “conditional” proxy proposals. In the case of items that are conditioned upon each other, examine the benefits and costs of the packaged items. In instances when the joint effect of the conditioned items is not in shareholders’ best interests, generally vote AGAINST the proposals. If the combined effect is positive, generally support such proposals.
B-108
Conversion of Securities
Votes on proposals regarding conversion of securities are determined on a CASE-BY-CASE basis. When evaluating these proposals the investor should review the dilution to existing shareholders, the conversion price relative to market value, financial issues, control issues, termination penalties, and conflicts of interest.
Generally vote FOR the conversion if it is expected that the company will be subject to onerous penalties or will be forced to file for bankruptcy if the transaction is not approved.
Corporate Reorganization/Debt Restructuring/Prepackaged Bankruptcy Plans/Reverse Leveraged Buyouts/Wrap Plans
Votes on proposals to increase common and/or preferred shares and to issue shares as part of a debt restructuring plan are determined on a CASE-BY-CASE basis, taking into consideration the following:
| | • | | Dilution to existing shareholders’ position |
| | • | | Management’s efforts to pursue other alternatives |
Generally vote FOR the debt restructuring if it is expected that the company will file for bankruptcy if the transaction is not approved.
Formation of Holding Company
Votes on proposals regarding the formation of a holding company should be determined on a CASE-BY-CASE basis, taking into consideration the following:
| | • | | The reasons for the change |
| | • | | Any financial or tax benefits |
| | • | | Increases in capital structure |
| | • | | Changes to the articles of incorporation or bylaws of the company. |
Absent compelling financial reasons to recommend the transaction, generally vote AGAINST the formation of a holding company if the transaction would include either of the following:
| | • | | Increases in common or preferred stock in excess of the allowable maximum as calculated by the ISS Capital Structure model |
| | • | | Adverse changes in shareholder rights |
Going Private Transactions (LBOs, Minority Squeezeouts and GoingDark)
Vote going private transactions on a CASE-BY-CASE basis, taking into account the following: offer price/premium, fairness opinion, how the deal was negotiated, conflicts of interest, other alternatives/offers considered, and noncompletion risk.
Vote CASE-BY-CASE on “going dark” transactions, determining whether the transaction enhances shareholder value by taking into consideration:
| | • | | Whether the company has attained benefits from being publicly-traded (examination of trading volume, liquidity, and market research of the stock); |
| | • | | Whether the interests of continuing and cashed-out shareholders are balanced; and |
| | • | | The market reaction to public announcement of transaction. |
B-109
Joint Ventures
Votes CASE-BY-CASE on proposals to form joint ventures, taking into account the following: percentage of assets/business contributed, percentage ownership, financial and strategic benefits, governance structure, conflicts of interest, other alternatives, and noncompletion risk.
Liquidations
Votes on liquidations should be made on a CASE-BY-CASE basis after reviewing management’s efforts to pursue other alternatives, appraisal value of assets, and the compensation plan for executives managing the liquidation.
Generally vote FOR the liquidation if the company will file for bankruptcy if the proposal is not approved.
Mergers and Acquisitions/ Issuance of Shares to Facilitate Merger or Acquisition
Votes on mergers and acquisitions should be considered on a CASE-BY-CASE basis, determining whether the transaction enhances shareholder value by giving consideration to items listed under “Mergers and Corporate Restructurings: Overall Approach”.
Private Placements/Warrants/Convertible Debentures
Votes on proposals regarding private placements should be determined on a CASE-BY-CASE basis, taking into consideration: dilution to existing shareholders’ position, terms of the offer, financial issues, management’s efforts to pursue other alternatives, control issues, and conflicts of interest.
Generally vote FOR the private placement if it is expected that the company will file for bankruptcy if the transaction is not approved.
Spinoffs
Votes on spinoffs should be considered on a CASE-BY-CASE basis considering:
| | • | | Tax and regulatory advantages |
| | • | | Planned use of the sale proceeds |
| | • | | Benefits to the parent company |
| | • | | Corporate governance changes |
| | • | | Changes in the capital structure. |
Value Maximization Proposals
Vote CASE-BY-CASE on shareholder proposals seeking to maximize shareholder value by hiring a financial advisor to explore strategic alternatives, selling the company or liquidating the company and distributing the proceeds to shareholders. These proposals should be evaluated based on the following factors: prolonged poor performance with no turnaround in sight, signs of entrenched board and management, strategic plan in place for improving value, likelihood of receiving reasonable value in a sale or dissolution, and whether company is actively exploring its strategic options, including retaining a financial advisor.
B-110
| 6. | | State of Incorporation |
Control Share Acquisition Provisions
Generally vote FOR proposals to opt out of control share acquisition statutes unless doing so would enable the completion of a takeover that would be detrimental to shareholders.
Generally vote AGAINST proposals to amend the charter to include control share acquisition provisions.
Generally vote FOR proposals to restore voting rights to the control shares.
Control Share Cashout Provisions
Generally vote FOR proposals to opt out of control share cashout statutes.
Disgorgement Provisions
Generally vote FOR proposals to opt out of state disgorgement provisions.
Fair Price Provisions
Vote proposals to adopt fair price provisions on a CASE-BY-CASE basis, evaluating factors such as the vote required to approve the proposed acquisition, the vote required to repeal the fair price provision, and the mechanism for determining the fair price.
Generally vote AGAINST fair price provisions with shareholder vote requirements greater than a majority of disinterested shares.
Freezeout Provisions
Generally vote FOR proposals to opt out of state freezeout provisions.
Greenmail
Generally vote for proposals to adopt antigreenmail charter of bylaw amendments or otherwise restrict a company’s ability to make greenmail payments.
Vote on a CASE-BY-CASE basis antigreenmail proposals when they are bundled with other charter or bylaw amendments.
Reincorporation Proposals
Proposals to change a company’s state of incorporation should be evaluated on a CASE-BY-CASE basis, giving consideration to both financial and corporate governance concerns, including the reasons for reincorporating, a comparison of the governance provisions, comparative economic benefits, and a comparison of the jurisdictional laws.
Generally vote FOR reincorporation when the economic factors outweigh any neutral or negative governance changes.
Stakeholder Provisions
Generally vote AGAINST proposals that ask the board to consider nonshareholder constituencies or other nonfinancial effects when evaluating a merger or business combination.
B-111
State Antitakeover Statutes
Vote on a CASE-BY-CASE basis proposals to opt in or out of state takeover statutes (including control share acquisition statutes, control share cash-out statutes, freezeout provisions, fair price provisions, stakeholder laws, poison pill endorsements, severance pay and labor contract provisions, antigreenmail provisions, and disgorgement provisions).
Adjustments to Par Value of Common Stock
Generally vote FOR management proposals to reduce the par value of common stock.
Common Stock Authorization
Votes on proposals to increase the number of shares of common stock authorized for issuance are determined on a CASE-BY-CASE basis using a model developed by ISS.
Generally vote FOR proposals to approve increases beyond the allowable increase when a company’s shares are in danger of being delisted or if a company’s ability to continue to operate as a going concern is uncertain.
In addition, for capital requests less than or equal to 300 percent of the current authorized shares that marginally fail the calculated allowable cap (i.e., exceed the allowable cap by no more than 5 percent), on a CASE-BY-CASE basis, generally vote FOR the increase based on the company’s performance and whether the company’s ongoing use of shares has shown prudence. Factors should include, at a minimum, the following:
| | • | | Good performance with respect to peers and index on a five-year total shareholder return basis; |
| | • | | Absence of non-shareholder approved poison pill; |
| | • | | Reasonable equity compensation burn rate; |
| | • | | No non-shareholder approved pay plans; and |
| | • | | Absence of egregious equity compensation practices. |
Dual-class Stock
Generally vote AGAINST proposals to create a new class of common stock with superior voting rights.
Generally vote AGAINST proposals at companies with dual-class capital structures to increase the number of authorized shares of the class of stock that has superior voting rights.
Generally vote FOR proposals to create a new class of nonvoting or subvoting common stock if:
| | • | | It is intended for financing purposes with minimal or no dilution to current shareholders |
| | • | | It is not designed to preserve the voting power of an insider or significant shareholder |
Issue Stock for Use with Rights Plan
Generally vote AGAINST proposals that increase authorized common stock for the explicit purpose of implementing a non-shareholder approved shareholder rights plan (poison pill).
Preemptive Rights
Review on a CASE-BY-CASE basis shareholder proposals that seek preemptive rights. In evaluating proposals on preemptive rights, consider the size of a company, the characteristics of its shareholder base, and the liquidity of the stock.
B-112
Preferred Stock
Generally vote AGAINST proposals authorizing the creation of new classes of preferred stock with unspecified voting, conversion, dividend distribution, and other rights (“blank check” preferred stock).
Generally vote FOR proposals to create “declawed” blank check preferred stock (stock that cannot be used as a takeover defense).
Generally vote FOR proposals to authorize preferred stock in cases where the company specifies the voting, dividend, conversion, and other rights of such stock and the terms of the preferred stock appear reasonable.
Generally vote AGAINST proposals to increase the number of blank check preferred stock authorized for issuance when no shares have been issued or reserved for a specific purpose.
Vote CASE-BY-CASE on proposals to increase the number of blank check preferred shares after analyzing the number of preferred shares available for issue given a company’s industry and performance in terms of shareholder returns.
Recapitalization
Votes CASE-BY-CASE on recapitalizations (reclassifications of securities), taking into account the following: more simplified capital structure, enhanced liquidity, fairness of conversion terms, impact on voting power and dividends, reasons for the reclassification, conflicts of interest, and other alternatives considered.
Reverse Stock Splits
Generally vote FOR management proposals to implement a reverse stock split when the number of authorized shares will be proportionately reduced.
Generally vote FOR management proposals to implement a reverse stock split to avoid delisting.
Votes on proposals to implement a reverse stock split that do not proportionately reduce the number of shares authorized for issue should be determined on a CASE-BY-CASE basis using a model developed by ISS.
Share Repurchase Programs
Generally vote FOR management proposals to institute open-market share repurchase plans in which all shareholders may participate on equal terms.
Stock Distributions: Splits and Dividends
Generally vote FOR management proposals to increase the common share authorization for a stock split or share dividend, provided that the increase in authorized shares would not result in an excessive number of shares available for issuance as determined using a model developed by ISS.
Tracking Stock
Votes on the creation of tracking stock are determined on a CASE-BY-CASE basis, weighing the strategic value of the transaction against such factors as: adverse governance changes, excessive increases in authorized capital stock, unfair method of distribution, diminution of voting rights, adverse conversion features, negative impact on stock option plans, and other alternatives such as spinoff.
B-113
| 8. | | Executive and Director Compensation |
Equity Compensation Plans
Vote CASE-BY-CASE on equity-based compensation plans. Generally vote AGAINST the equity plan if any of the following factors apply:
| | • | | The total cost of the company’s equity plans is unreasonable; |
| | • | | The plan expressly permits the repricing of stock options without prior shareholder approval; |
| | • | | There is a disconnect between CEO pay and the company’s performance; |
| | • | | The company’s three year burn rate exceeds the greater of 2% and the mean plus 1 standard deviation of its industry group; or |
| | • | | The plan is a vehicle for poor pay practices. |
Each of these factors is further described below:
Cost of Equity Plans
Generally vote AGAINST equity plans if the cost is unreasonable. For non-employee director plans, generally vote FOR the plan if certain factors are met (see Director Compensation section).
Repricing Provisions
Generally vote AGAINST plans that expressly permit the repricing of underwater stock options without shareholder approval, even if the cost of the plan is reasonable. Also, generally WITHHOLD from members of the Compensation Committee who approved and/or implemented an option exchange program by repricing and buying out underwater options for stock, cash or other consideration or canceling underwater options and regranting options with a lower exercise price without prior shareholder approval, even if such repricings are allowed in their equity plan.
Generally vote AGAINST plans if the company has a history of repricing options without shareholder approval, and the applicable listing standards would not preclude them from doing so.
Pay-for Performance Disconnect
Generally vote AGAINST plans in which:
| | • | | there is a disconnect between the CEO’s pay and company performance (an increase in pay and a decrease in performance); |
| | • | | the main source of the pay increase (over half) is equity-based, and |
| | • | | the CEO is a participant of the equity proposal. |
Generally WITHHOLD votes from the Compensation Committee members when the company has a pay for performance disconnect.
On a CASE-BY-CASE basis, generally vote for equity plans and for compensation committee members with a pay-for-performance disconnect if compensation committee members can present strong and compelling evidence of improved committee performance. This evidence must go beyond the usual compensation committee report disclosure. This additional evidence necessary generally includes all of the following:
| | • | | The compensation committee has reviewed all components of the CEO’s compensation, including the following: |
| | – | Base salary, bonus, long-term incentives; |
| | – | Accumulative realized and unrealized stock option and restricted stock gains; |
| | – | Dollar value of perquisites and other personal benefits to the CEO and the total cost to the company; |
| | – | Earnings and accumulated payment obligations under the company’s nonqualified deferred compensation program; |
B-114
| | – | Actual projected payment obligations under the company’s supplemental executive retirement plan (SERPs). |
| | • | | The compensation committee is committed to providing additional information on the named executives’ annual cash bonus program and/or long-term incentive cash plan for the current fiscal year. The compensation committee will provide full disclosure of the qualitative and quantitative performance criteria and hurdle rates used to determine the payouts of the cash program. From this disclosure, shareholders will know the minimum level of performance required for any cash bonus to be delivered, as well as the maximum cash bonus payable for superior performance. |
The repetition of the compensation committee report does not meet ISS’ requirement of compelling and strong evidence of improved disclosure. The level of transparency and disclosure is at the highest level where shareholders can understand the mechanics of the annual cash bonus and/or long-term incentive cash plan based on the additional disclosure.
| | • | | The compensation committee is committed to granting a substantial portion of performance-based equity awards to the named executive officers. A substantial portion of performance-based awards would be at least 50 percent of the shares awarded to each of the named executive officers. Performance-based equity awards are earned or paid out based on the achievement of company performance targets. The company will disclose the details of the performance criteria (e.g., return on equity) and the hurdle rates (e.g., 15 percent) associated with the performance targets. From this disclosure, shareholders will know the minimum level of performance required for any equity grants to be made. The performance-based equity awards do not refer to non-qualified stock options1 or performance-accelerated grants.2 Instead, performance-based equity awards are performance-contingent grants where the individual will not receive the equity grant by not meeting the target performance and vice versa. |
The level of transparency and disclosure is at the highest level where shareholders can understand the mechanics of the performance-based equity awards based on the additional disclosure.
| | • | | The compensation committee has the sole authority to hire and fire outside compensation consultants. The role of the outside compensation consultant is to assist the compensation committee to analyze executive pay packages or contracts and understand the company’s financial measures. |
Three-Year Burn Rate/Burn Rate Commitment
Generally vote AGAINST plans if the company’s most recent three-year burn rate exceeds one standard deviation in excess of the industry mean and is over two percent of common shares outstanding. The three-year burn rate policy does not apply to non-employee director plans unless outside directors receive a significant portion of shares each year.
However, generally vote FOR equity plans if the company fails this burn rate test but the company commits in a public filing to a three-year average burn rate equal to its GICS group burn rate mean plus one standard deviation (or 2%, whichever is greater), assuming all other conditions for voting FOR the plan have been met.
If a company fails to fulfill its burn rate commitment, generally vote to WITHHOLD from the compensation committee.
1 Non-qualified stock options are not performance-based awards unless the grant or the vesting of the stock options is tied to the achievement of a pre-determined and disclosed performance measure. A rising stock market will generally increase share prices of all companies, despite of the company’s underlying performance.
2 Performance-accelerated grants are awards that vest earlier based on the achievement of a specified measure. However, these grants will ultimately vest over time even without the attainment of the goal(s).
B-115
Poor Pay Practices
Generally vote AGAINST equity plans if the plan is a vehicle for poor compensation practices.
Generally WITHHOLD from compensation committee members, CEO, and potentially the entire board, if the company has poor compensation practices. The following practices, while not exhaustive, are examples of poor compensation practices that may warrant withholding votes:
| | • | | Egregious employment contracts (e.g., those containing multi-year guarantees for bonuses and grants); |
| | • | | Excessive perks that dominate compensation (e.g., tax gross-ups for personal use of corporate aircraft); |
| | • | | Huge bonus payouts without justifiable performance linkage or proper disclosure; |
| | • | | Performance metrics that are changed (e.g., canceled or replaced during the performance period without adequate explanation of the action and the link to performance); |
| | • | | Egregious pension/SERP (supplemental executive retirement plan) payouts (e.g., the inclusion of additional years of service not worked or inclusion of performance-based equity awards in the pension calculation); |
| | • | | New CEO awarded an overly generous new hire package (e.g., including excessive “make whole” provisions or any of the poor pay practices listed in this policy); |
| | • | | Excessive severance provisions (e.g., including excessive change in control payments); |
| | • | | Change in control payouts without loss of job or substantial diminution of job duties; |
| | • | | Internal pay disparity; |
| | • | | Options backdating (covered in a separate policy); and |
| | • | | Other excessive compensation payouts or poor pay practices at the company. |
401(k) Employee Benefit Plans
Generally vote FOR proposals to implement a 401(k) savings plan for employees.
Director Compensation
Vote CASE-BY-CASE on compensation plans for non-employee directors, based on the cost of the plans against the company’s allowable cap.
On occasion, director stock plans that set aside a relatively small number of shares when combined with employee or executive stock compensation plans exceed the allowable cap. Generally vote for the plan if ALL of the following qualitative factors in the board’s compensation are met and disclosed in the proxy statement:
| | • | | Director stock ownership guidelines with a minimum of three times the annual cash retainer. |
| | • | | Vesting schedule or mandatory holding/deferral period: |
| | – | A minimum vesting of three years for stock options or restricted stock; or |
| | – | Deferred stock payable at the end of a three-year deferral period. |
| | • | | Mix between cash and equity: |
| | – | A balanced mix of cash and equity, for example 40% cash/60% equity or 50% cash/50% equity; or |
| | – | If the mix is heavier on the equity component, the vesting schedule or deferral period should be more stringent, with the lesser of five years or the term of directorship. |
| | • | | No retirement/benefits and perquisites provided to non-employee directors; and |
| | • | | Detailed disclosure provided on cash and equity compensation delivered to each non-employee director for the most recent fiscal year in a table. The column headers for the table may include the following: name of each non-employee director, annual retainer, board meeting fees, committee retainer, committee-meeting fees, and equity grants. |
Director Retirement Plans
Generally vote AGAINST retirement plans for non-employee directors.
Generally vote FOR shareholder proposals to eliminate retirement plans for non-employee directors.
B-116
Employee Stock Ownership Plans (ESOPs)
Generally vote FOR proposals to implement an ESOP or increase authorized shares for existing ESOPs, unless the number of shares allocated to the ESOP is excessive (more than five percent of outstanding shares).
Employee Stock Purchase Plans—Qualified Plans
Vote CASE-BY-CASE on qualified employee stock purchase plans. Generally vote FOR employee stock purchase plans where all of the following apply:
| | • | | Purchase price is at least 85 percent of fair market value; |
| | • | | Offering period is 27 months or less; and |
| | • | | The number of shares allocated to the plan is ten percent or less of the outstanding shares. |
Generally vote AGAINST qualified employee stock purchase plans where any of the following apply:
| | • | | Purchase price is less than 85 percent of fair market value; or |
| | • | | Offering period is greater than 27 months; or |
| | • | | The number of shares allocated to the plan is more than ten percent of the outstanding shares. |
Employee Stock Purchase Plans—Non-Qualified Plans
Vote CASE-by-CASE on nonqualified employee stock purchase plans. Generally vote FOR nonqualified employee stock purchase plans with all the following features:
| | • | | Broad-based participation (i.e., all employees of the company with the exclusion of individuals with 5 percent or more of beneficial ownership of the company); |
| | • | | Limits on employee contribution, which may be a fixed dollar amount or expressed as a percent of base salary; |
| | • | | Company matching contribution up to 25 percent of employee’s contribution, which is effectively a discount of 20 percent from market value; |
| | • | | No discount on the stock price on the date of purchase since there is a company matching contribution. |
Generally vote AGAINST nonqualified employee stock purchase plans when any of the plan features do not meet the above criteria. If the company matching contribution exceeds 25 percent of employee’s contribution, evaluate the cost of the plan against its allowable cap.
Incentive Bonus Plans and Tax Deductibility Proposals (OBRA-Related Compensation Proposals)
Generally vote FOR proposals that simply amend shareholder-approved compensation plans to include administrative features or place a cap on the annual grants any one participant may receive to comply with the provisions of Section 162(m).
Generally vote FOR proposals to add performance goals to existing compensation plans to comply with the provisions of Section 162(m) unless they are clearly inappropriate.
Vote CASE-BY-CASE on amendments to existing plans to increase shares reserved and to qualify for favorable tax treatment under the provisions of Section 162(m) as long as the plan does not exceed the allowable cap and the plan does not violate any of the supplemental policies.
Generally vote FOR cash or cash and stock bonus plans that are submitted to shareholders for the purpose of exempting compensation from taxes under the provisions of Section 162(m) if no increase in shares is requested.
Options Backdating
In cases where a company has practiced options backdating, WITHHOLD on a CASE-BY-CASE basis from the members of the compensation committee, depending on the severity of the practices and the subsequent
B-117
corrective actions on the part of the board. Generally WITHHOLD from the compensation committee members who oversaw the questionable options grant practices or from current compensation committee members who fail to respond to the issue proactively, depending on several factors, including, but not limited to:
| | • | | Reason and motive for the options backdating issue, such as inadvertent vs. deliberate grant date changes; |
| | • | | Length of time of options backdating; |
| | • | | Size of restatement due to options backdating; |
| | • | | Corrective actions taken by the board or compensation committee, such as canceling or repricing backdated options, or recoupment of option gains on backdated grants; |
| | • | | Adoption of a grant policy that prohibits backdating, and creation of a fixed grant schedule or window period for equity grants going forward. |
Option Exchange Programs/Repricing Options
Vote CASE-by-CASE on management proposals seeking approval to exchange/reprice options taking into consideration:
| | • | | Historic trading patterns—the stock price should not be so volatile that the options are likely to be back “in-the-money” over the near term; |
| | • | | Rationale for the re-pricing—was the stock price decline beyond management’s control? |
| | • | | Is this a value-for-value exchange? |
| | • | | Are surrendered stock options added back to the plan reserve? |
| | • | | Option vesting—does the new option vest immediately or is there a black-out period? |
| | • | | Term of the option—the term should remain the same as that of the replaced option; |
| | • | | Exercise price—should be set at fair market or a premium to market; |
| | • | | Participants—executive officers and directors should be excluded. |
If the surrendered options are added back to the equity plans for re-issuance, then also take into consideration the company’s three-year average burn rate. In addition to the above considerations, evaluate the intent, rationale, and timing of the repricing proposal.
Generally vote FOR shareholder proposals to put option repricings to a shareholder vote.
Stock Plans in Lieu of Cash
Vote CASE-by-CASE on plans which provide participants with the option of taking all or a portion of their cash compensation in the form of stock.
Generally vote FOR non-employee director only equity plans which provide a dollar-for-dollar cash for stock exchange.
Vote CASE-by-CASE on plans which do not provide a dollar-for-dollar cash for stock exchange. In cases where the exchange is not dollar-for-dollar, the request for new or additional shares for such equity program will be considered using the binomial option pricing model. In an effort to capture the total cost of total compensation, ISS will not make any adjustments to carve out the in-lieu-of cash compensation.
Transfer Programs of Stock Options
One-time Transfers: generally WITHHOLD votes from compensation committee members if they fail to submit one-time transfers for to shareholders for approval.
Vote CASE-BY-CASE on one-time transfers. Generally vote FOR if:
| | • | | Executive officers and non-employee directors are excluded from participating; |
| | • | | Stock options are purchased by third-party financial institutions at a discount to their fair value using option pricing models such as Black-Scholes or a Binomial Option Valuation or other appropriate financial models; |
| | • | | There is a two-year minimum holding period for sale proceeds (cash or stock) for all participants. |
B-118
Additionally, management should provide a clear explanation of why options are being transferred and whether the events leading up to the decline in stock price were beyond management’s control. A review of the company’s historic stock price volatility should indicate if the options are likely to be back “in-the-money” over the near term.
Advisory Vote on Executive Compensation (Say-on-Pay)
Generally vote FOR shareholder proposals that call for non-binding shareholder ratification of the compensation of the named Executive Officers and the accompanying narrative disclosure of material factors provided to understand the Summary Compensation Table.
Compensation Consultants- Disclosure of Board or Company’s Utilization
Generally vote FOR shareholder proposals seeking disclosure regarding the Company, Board, or Board committee’s use of compensation consultants, such as company name, business relationship(s) and fees paid.
Disclosure/Setting Levels or Types of Compensation for Executives and Directors
Generally vote FOR shareholder proposals seeking additional disclosure of executive and director pay information, provided the information requested is relevant to shareholders’ needs, would not put the company at a competitive disadvantage relative to its industry, and is not unduly burdensome to the company.
Generally vote AGAINST shareholder proposals seeking to set absolute levels on compensation or otherwise dictate the amount or form of compensation.
Generally vote AGAINST shareholder proposals requiring director fees be paid in stock only.
Vote CASE-BY-CASE on all other shareholder proposals regarding executive and director pay, taking into account company performance, pay level versus peers, pay level versus industry, and long term corporate outlook.
Option Repricing
Generally vote FOR shareholder proposals to put option repricings to a shareholder vote.
Pay for Superior Performance
Generally vote FOR shareholder proposals based on a case-by-case analysis that requests the board establish a pay-for-superior performance standard in the company’s executive compensation plan for senior executives. The proposals call for:
| | • | | the annual incentive component of the plan should utilize financial performance criteria that can be benchmarked against peer group performance, and provide that no annual bonus be awarded based on financial performance criteria unless the company exceeds the median or mean performance of a disclosed group of peer companies on the selected financial criteria; |
| | • | | the long-term equity compensation component of the plan should utilize financial and/or stock price performance criteria that can be benchmarked against peer group performance, and any options, restricted shares, or other equity compensation used should be structured so that compensation is received only when company performance exceeds the median or mean performance of the peer group companies on the selected financial and stock price performance criteria; and |
| | • | | the plan disclosure should allow shareholders to monitor the correlation between pay and performance. |
B-119
Generally consider the following factors in evaluating this proposal:
| | • | | What aspects of the company’s annual and long -term equity incentive programs are performance driven? |
| | • | | If the annual and long-term equity incentive programs are performance driven, are the performance criteria and hurdle rates disclosed to shareholders or are they benchmarked against a disclosed peer group? |
| | • | | Can shareholders assess the correlation between pay and performance based on the current disclosure? |
| | • | | What type of industry and stage of business cycle does the company belong to? |
Pension Plan Income Accounting
Generally vote FOR shareholder proposals to exclude pension plan income in the calculation of earnings used in determining executive bonuses/compensation.
Performance-Based Awards
Vote CASE-BY-CASE on shareholder proposal requesting that a significant amount of future long-term incentive compensation awarded to senior executives shall be performance-based and requesting that the board adopt and disclose challenging performance metrics to shareholders, based on the following analytical steps:
| | • | | First, generally vote FOR shareholder proposals advocating the use of performance-based equity awards, such as performance contingent options or restricted stock, indexed options or premium-priced options, unless the proposal is overly restrictive or if the company has demonstrated that it is using a “substantial” portion of performance-based awards for its top executives. Standard stock options and performance-accelerated awards do not meet the criteria to be considered as performance-based awards. Further, premium-priced options should have a premium of at least 25 percent and higher to be considered performance-based awards. |
| | • | | Second, assess the rigor of the company’s performance-based equity program. If the bar set for the performance-based program is too low based on the company’s historical or peer group comparison, generally vote FOR the proposal. Furthermore, if target performance results in an above target payout, generally vote FOR the shareholder proposal due to program’s poor design. If the company does not disclose the performance metric of the performance-based equity program, generally vote FOR the shareholder proposal regardless of the outcome of the first step to the test. |
Generally vote FOR the shareholder proposal if the company does not meet both of the above two steps.
Severance Agreements for Executives/Golden Parachutes
Generally vote FOR shareholder proposals to require golden parachutes or executive severance agreements to be submitted for shareholder ratification, unless the proposal requires shareholder approval prior to entering into employment contracts.
Vote on a CASE-BY-CASE basis on proposals to ratify or cancel golden parachutes. An acceptable parachute should include, but is not limited to, the following:
| | • | | The triggering mechanism should be beyond the control of management; |
| | • | | The amount should not exceed three times base amount (defined as the average annual taxable W-2 compensation during the five years prior to the year in which the change of control occurs; |
| | • | | Change-in-control payments should be double-triggered, i.e., (1) after a change in control has taken place, and (2) termination of the executive as a result of the change in control. Change in control is defined as a change in the company ownership structure. |
Supplemental Executive Retirement Plans (SERPs)
Generally vote FOR shareholder proposals requesting to put extraordinary benefits contained in SERP agreements to a shareholder vote unless the company’s executive pension plans do not contain excessive benefits beyond what is offered under employee-wide plans.
B-120
Generally vote FOR shareholder proposals requesting to limit the executive benefits provided under the company’s supplemental executive retirement plan (SERP) by limiting covered compensation to a senior executive’s annual salary and excluding of all incentive or bonus pay from the plan’s definition of covered compensation used to establish such benefits.
| 9. | | Corporate Responsibility |
Consumer Issues and Public Safety
Animal Rights
Generally vote AGAINST proposals to phase out the use of animals in product testing unless:
| | • | | The company is conducting animal testing programs that are unnecessary or not required by regulation; |
| | • | | The company is conducting animal testing when suitable alternatives are accepted and used at peer firms; |
| | • | | The company has been the subject of recent, significant controversy related to its testing programs. |
Generally vote FOR proposals seeking a report on the company’s animal welfare standards unless:
| | • | | The company has already published a set of animal welfare standards and monitors compliance |
| | • | | The company’s standards are comparable to or better than those of peer firms, and |
| | • | | There are no serious controversies surrounding the company’s treatment of animals |
Drug Pricing
Generally vote AGAINST proposals requesting that companies implement specific price restraints on pharmaceutical products unless the company fails to adhere to legislative guidelines or industry norms in its product pricing.
Vote CASE-BY-CASE on proposals requesting that the company evaluate their product pricing considering:
| | • | | The existing level of disclosure on pricing policies; |
| | • | | Deviation from established industry pricing norms; |
| | • | | The company’s existing initiatives to provide its products to needy consumers; |
| | • | | Whether the proposal focuses on specific products or geographic regions. |
Genetically Modified Foods
Generally vote AGAINST proposals asking companies to voluntarily label genetically engineered (GE) ingredients in their products or alternatively to provide interim labeling and eventually eliminate GE ingredients due to the costs and feasibility of labeling and/or phasing out the use of GE ingredients.
Vote CASE-BY-CASE on proposals asking for a report on the feasibility of labeling products containing GE ingredients taking into account:
| | • | | The relevance of the proposal in terms of the company’s business and the proportion of it affected by the resolution |
| | • | | The quality of the company’s disclosure on GE product labeling and related voluntary initiatives and how this disclosure compares with peer company disclosure |
| | • | | Company’s current disclosure on the feasibility of GE product labeling, including information on the related costs |
| | • | | Any voluntary labeling initiatives undertaken or considered by the company. |
Vote CASE-BY-CASE on proposals asking for the preparation of a report on the financial, legal, and environmental impact of continued use of GE ingredients/seeds. Evaluate the following:
| | • | | The relevance of the proposal in terms of the company’s business and the proportion of it affected by the resolution |
B-121
| | • | | The quality of the company’s disclosure on risks related to GE product use and how this disclosure compares with peer company disclosure |
| | • | | The percentage of revenue derived from international operations, particularly in Europe, where GE products are more regulated and consumer backlash is more pronounced. |
Generally vote AGAINST proposals seeking a report on the health and environmental effects of genetically modified organisms (GMOs). Health studies of this sort are better undertaken by regulators and the scientific community.
Generally vote AGAINST proposals to completely phase out GE ingredients from the company’s products or proposals asking for reports outlining the steps necessary to eliminate GE ingredients from the company’s products. Such resolutions presuppose that there are proven health risks to GE ingredients (an issue better left to federal regulators) that outweigh the economic benefits derived from biotechnology.
Handguns
Generally vote AGAINST requests for reports on a company’s policies aimed at curtailing gun violence in the United States unless the report is confined to product safety information. Criminal misuse of firearms is beyond company control and instead falls within the purview of law enforcement agencies.
HIV/AIDS
Vote CASE-BY-CASE on requests for reports outlining the impact of the health pandemic (HIV/AIDS, malaria and tuberculosis) on the company’s Sub-Saharan operations and how the company is responding to it, taking into account:
| | • | | The nature and size of the company’s operations in Sub-Saharan Africa and the number of local employees |
| | • | | The company’s existing healthcare policies, including benefits and healthcare access for local workers |
| | • | | Company donations to healthcare providers operating in the region |
| | • | | Generally vote against proposals asking companies to establish, implement, and report on a standard of response to the HIV/AIDS, TB and malaria health pandemic in Africa and other developing countries, unless the company has significant operations in these markets and has failed to adopt policies and/or procedures to address these issues comparable to those of industry peers |
Predatory Lending
Vote CASE-BY CASE on requests for reports on the company’s procedures for preventing predatory lending, including the establishment of a board committee for oversight, taking into account:
| | • | | Whether the company has adequately disclosed mechanisms in place to prevent abusive lending practices |
| | • | | Whether the company has adequately disclosed the financial risks of its subprime business |
| | • | | Whether the company has been subject to violations of lending laws or serious lending controversies |
| | • | | Peer companies’ policies to prevent abusive lending practices. |
Tobacco
Most tobacco-related proposals should be evaluated on a CASE-BY-CASE basis, taking into account the following factors:
| | • | | Whether the company complies with all local ordinances and regulations |
| | • | | The degree that voluntary restrictions beyond those mandated by law might hurt the company’s competitiveness |
| | • | | The risk of any health-related liabilities. |
B-122
| | • | | Whether the company complies with federal, state, and local laws on the marketing of tobacco or if it has been fined for violations |
| | • | | Whether the company has gone as far as peers in restricting advertising |
| | • | | Whether the company entered into the Master Settlement Agreement, which restricts marketing of tobacco to youth |
| | • | | Whether restrictions on marketing to youth extend to foreign countries |
| | Cease | production of tobacco-related products or avoid selling products to tobacco companies: |
| | • | | The percentage of the company’s business affected |
| | • | | The economic loss of eliminating the business versus any potential tobacco-related liabilities. |
| | Spinoff | tobacco-related businesses: |
| | • | | The percentage of the company’s business affected |
| | • | | The feasibility of a spinoff |
| | • | | Potential future liabilities related to the company’s tobacco business. |
| | Stronger | product warnings: |
Generally vote AGAINST proposals seeking stronger product warnings. Such decisions are better left to public health authorities.
| | Investment | in tobacco stocks: |
Generally vote AGAINST proposals prohibiting investment in tobacco equities. Such decisions are better left to portfolio managers.
Toxic Chemicals
Generally vote FOR resolutions requesting that a company discloses its policies related to toxic chemicals.
Vote CASE-BY-CASE on resolutions requesting that companies evaluate and disclose the potential financial and legal risks associated with utilizing certain chemicals, considering:
| | • | | Current regulations in the markets in which the company operates; |
| | • | | Recent significant controversy, litigation, or fines stemming from toxic chemicals or ingredients at the company; and |
| | • | | The current level of disclosure on this topic. |
Generally vote AGAINST resolutions requiring that a company reformulate its products within a certain timeframe unless such actions are required by law in specific markets.
Environment and Energy
Arctic National Wildlife Refuge
Generally vote AGAINST request for reports outlining potential environmental damage from drilling in the Arctic National Wildlife Refuge (ANWR), unless:
| | • | | New legislation is adopted allowing development and drilling in the ANWR region; |
| | • | | The company intends to pursue operations in the ANWR; and |
| | • | | The company does not currently disclose an environmental risk report for their operations in the ANWR. |
CERES Principles
Vote CASE-BY-CASE on proposals to adopt the CERES Principles, taking into account:
| | • | | The company’s current environmental disclosure beyond legal requirements, including environmental health and safety (EHS) audits and reports that may duplicate CERES |
B-123
| | • | | The company’s environmental performance record, including violations of federal and state regulations, level of toxic emissions, and accidental spills |
| | • | | Environmentally conscious practices of peer companies, including endorsement of CERES |
| | • | | Costs of membership and implementation. |
Climate Change
Generally vote FOR resolutions requesting that a company disclose information on the impact of climate change on the company’s operations unless:
| | • | | The company already provides current, publicly-available information on the perceived impact that climate change may have on the company as well as associated policies and procedures to address such risks and/or opportunities; |
| | • | | The company’s level of disclosure is comparable to or better than information provided by industry peers; and |
| | • | | There are no significant fines, penalties, or litigation associated with the company’s environmental performance. |
Concentrated Area Feeding Operations (CAFOs)
Generally vote FOR resolutions requesting that companies report to shareholders on the risks and liabilities associated with CAFOs unless:
| | • | | The company has publicly disclosed guidelines for its corporate and contract farming operations, including compliance monitoring; or |
| | • | | The company does not directly source from CAFOs. |
Environmental-Economic Risk Report
Vote CASE-BY-CASE on proposals requesting an economic risk assessment of environmental performance considering:
| | • | | The feasibility of financially quantifying environmental risk factors, |
| | • | | The company’s compliance with applicable legislation and/or regulations regarding environmental performance, |
| | • | | The costs associated with implementing improved standards, |
| | • | | The potential costs associated with remediation resulting from poor environmental performance, and |
| | • | | The current level of disclosure on environmental policies and initiatives. |
Environmental Reports
Generally vote FOR requests for reports disclosing the company’s environmental policies unless it already has well-documented environmental management systems that are available to the public.
Global Warming
Generally vote FOR proposals requesting a report on greenhouse gas emissions from company operations and/or products unless this information is already publicly disclosed or such factors are not integral to the company’s line of business.
Generally vote AGAINST proposals that call for reduction in greenhouse gas emissions by specified amounts or within a restrictive time frame unless the company lags industry standards and has been the subject of recent, significant fines or litigation resulting from greenhouse gas emissions.
B-124
Kyoto Protocol Compliance
Generally vote FOR resolutions requesting that companies outline their preparations to comply with standards established by Kyoto Protocol signatory markets unless:
| | • | | The company does not maintain operations in Kyoto signatory markets; |
| | • | | The company already evaluates and substantially discloses such information; or, |
| | • | | Greenhouse gas emissions do not significantly impact the company’s core businesses. |
Land Use
Generally vote AGAINST resolutions that request the disclosure of detailed information on a company’s policies related to land use or development unless the company has been the subject of recent, significant fines or litigation stemming from its land use.
Nuclear Safety
Generally vote AGAINST resolutions requesting that companies report on risks associated with their nuclear reactor designs and/or the production and interim storage of irradiated fuel rods unless:
| | • | | The company does not have publicly disclosed guidelines describing its policies and procedures for addressing risks associated with its operations; |
| | • | | The company is non-compliant with Nuclear Regulatory Commission (NRC) requirements; or |
| | • | | The company stands out amongst its peers or competitors as having significant problems with safety or environmental performance related to its nuclear operations. |
Operations in Protected Areas
Generally vote FOR requests for reports outlining potential environmental damage from operations in protected regions, including wildlife refuges unless:
| | • | | The company does not currently have operations or plans to develop operations in these protected regions; or, |
| | • | | The company provides disclosure on its operations and environmental policies in these regions comparable to industry peers. |
Recycling
Vote CASE-BY-CASE on proposals to adopt a comprehensive recycling strategy, taking into account:
| | • | | The nature of the company’s business and the percentage affected |
| | • | | The extent that peer companies are recycling |
| | • | | The timetable prescribed by the proposal |
| | • | | The costs and methods of implementation |
| | • | | Whether the company has a poor environmental track record, such as violations of federal and state regulations. |
Renewable Energy
Generally vote FOR requests for reports on the feasibility of developing renewable energy sources unless the report is duplicative of existing disclosure or irrelevant to the company’s line of business.
Generally vote AGAINST proposals requesting that the company invest in renewable energy sources. Such decisions are best left to management’s evaluation of the feasibility and financial impact that such programs may have on the company.
B-125
Sustainability Report
Generally vote FOR proposals requesting the company to report on policies and initiatives related to social, economic, and environmental sustainability, unless:
| | • | | The company already discloses similar information through existing reports or policies such as an Environment, Health, and Safety (EHS) report; comprehensive Code of Corporate Conduct; and/or Diversity Report; or |
| | • | | The company has formally committed to the implementation of a reporting program based on Global Reporting Initiative (GRI) guidelines or a similar standard within a specified time frame. |
General Corporate Issues
Charitable/Political Contributions
Generally vote AGAINST proposals asking the company to affirm political nonpartisanship in the workplace so long as:
| | • | | The company is in compliance with laws governing corporate political activities, and |
| | • | | The company has procedures in place to ensure that employee contributions to company-sponsored political action committees (PACs) are strictly voluntary and not coercive. |
Generally vote AGAINST proposals to publish in newspapers and public media the company’s political contributions as such publications could present significant cost to the company without providing commensurate value to shareholders.
Vote CASE-BY-CASE on proposals to improve the disclosure of a company’s political contributions considering:
| | • | | Recent significant controversy or litigation related to the company’s political contributions or governmental affairs; and |
| | • | | The public availability of a policy on political contributions. |
Generally vote AGAINST proposals barring the company from making political contributions. Businesses are affected by legislation at the federal, state, and local level and barring contributions can put the company at a competitive disadvantage.
Generally vote AGAINST proposals restricting the company from making charitable contributions. Charitable contributions are generally useful for assisting worthwhile causes and for creating goodwill in the community. In the absence of bad faith, self-dealing, or gross negligence, management should determine which contributions are in the best interests of the company.
Generally vote AGAINST proposals asking for a list of company executives, directors, consultants, legal counsels, lobbyists, or investment bankers that have prior government service and whether such service had a bearing on the business of the company. Such a list would be burdensome to prepare without providing any meaningful information to shareholders.
Disclosure of Lobbying Expenditures/Initiatives
Vote CASE-BY-CASE on proposals requesting information on a company’s lobbying initiatives, considering any significant controversy or litigation surrounding a company’s public policy activities, the current level of disclosure on lobbying strategy, and the impact that the policy issue may have on the company’s business operations.
Link Executive Compensation to Social Performance
Vote CASE-BY-CASE on proposals to review ways of linking executive compensation to social factors, such as corporate downsizings, customer or employee satisfaction, community involvement, human rights,
B-126
environmental performance, predatory lending, and executive/employee pay disparities. Such resolutions should be evaluated in the context of:
| | • | | The relevance of the issue to be linked to pay; |
| | • | | The degree that social performance is already included in the company’s pay structure and disclosed; |
| | • | | The degree that social performance is used by peer companies in setting pay; |
| | • | | Violations or complaints filed against the company relating to the particular social performance measure; |
| | • | | Artificial limits sought by the proposal, such as freezing or capping executive pay |
| | • | | Independence of the compensation committee; |
| | • | | Current company pay levels. |
Outsourcing/Offshoring
Vote CASE-BY-CASE on proposals calling for companies to report on the risks associated with outsourcing, considering:
| | • | | Risks associated with certain international markets; |
| | • | | The utility of such a report to shareholders; |
| | • | | The existence of a publicly available code of corporate conduct that applies to international operations. |
Labor Standards And Human Rights
China Principles
Generally vote AGAINST proposals to implement the China Principles unless:
| | • | | There are serious controversies surrounding the company’s China operations, and |
| | • | | The company does not have a code of conduct with standards similar to those promulgated by the International Labor Organization (ILO). |
Country-specific human rights reports
Vote CASE-BY-CASE on requests for reports detailing the company’s operations in a particular country and steps to protect human rights, based on:
| | • | | The nature and amount of company business in that country |
| | • | | The company’s workplace code of conduct |
| | • | | Proprietary and confidential information involved |
| | • | | Company compliance with U.S. regulations on investing in the country |
| | • | | Level of peer company involvement in the country. |
International Codes of Conduct/Vendor Standards
Vote CASE-BY-CASE on proposals to implement certain human rights standards at company facilities or those of its suppliers and to commit to outside, independent monitoring. In evaluating these proposals, the following should be considered:
| | • | | The company’s current workplace code of conduct or adherence to other global standards and the degree they meet the standards promulgated by the proponent |
| | • | | Agreements with foreign suppliers to meet certain workplace standards |
| | • | | Whether company and vendor facilities are monitored and how |
| | • | | Company participation in fair labor organizations |
| | • | | Proportion of business conducted overseas |
| | • | | Countries of operation with known human rights abuses |
| | • | | Whether the company has been recently involved in significant labor and human rights controversies or violations |
B-127
| | • | | Peer company standards and practices |
| | • | | Union presence in company’s international factories |
Generally vote FOR reports outlining vendor standards compliance unless any of the following apply:
| | • | | The company does not operate in countries with significant human rights violations |
| | • | | The company has no recent human rights controversies or violations, or |
| | • | | The company already publicly discloses information on its vendor standards compliance. |
MacBride Principles
Vote CASE-BY-CASE on proposals to endorse or increase activity on the MacBride Principles, taking into account:
| | • | | Company compliance with or violations of the Fair Employment Act of 1989 |
| | • | | Company antidiscrimination policies that already exceed the legal requirements |
| | • | | The cost and feasibility of adopting all nine principles |
| | • | | The cost of duplicating efforts to follow two sets of standards (Fair Employment and the MacBride Principles) |
| | • | | The potential for charges of reverse discrimination |
| | • | | The potential that any company sales or contracts in the rest of the United Kingdom could be negatively impacted |
| | • | | The level of the company’s investment in Northern Ireland |
| | • | | The number of company employees in Northern Ireland |
| | • | | The degree that industry peers have adopted the MacBride Principles |
| | • | | Applicable state and municipal laws that limit contracts with companies that have not adopted the MacBride Principles. |
Military Business
Foreign Military Sales/Offsets
Generally vote AGAINST reports on foreign military sales or offsets. Such disclosures may involve sensitive and confidential information. Moreover, companies must comply with government controls and reporting on foreign military sales.
Landmines and Cluster Bombs
Vote CASE-BY-CASE on proposals asking a company to renounce future involvement in antipersonnel landmine production, taking into account:
| | • | | Whether the company has in the past manufactured landmine components |
| | • | | Whether the company’s peers have renounced future production |
Vote CASE-BY-CASE on proposals asking a company to renounce future involvement in cluster bomb production, taking into account:
| | • | | What weapons classifications the proponent views as cluster bombs |
| | • | | Whether the company currently or in the past has manufactured cluster bombs or their components |
| | • | | The percentage of revenue derived from cluster bomb manufacture |
| | • | | Whether the company’s peers have renounced future production |
Nuclear Weapons
Generally vote AGAINST proposals asking a company to cease production of nuclear weapons components and delivery systems, including disengaging from current and proposed contracts. Components and delivery
B-128
systems serve multiple military and non-military uses, and withdrawal from these contracts could have a negative impact on the company’s business.
Operations in Nations Sponsoring Terrorism (eg. Iran)
Vote CASE-BY-CASE on requests for a board committee review and report outlining the company’s financial and reputational risks from its operations in a terrorism-sponsoring state, taking into account current disclosure on:
| | • | | The nature and purpose of the operations and the amount of business involved (direct and indirect revenues and expenses) that could be affected by political disruption |
| | • | | Compliance with U.S. sanctions and laws |
Spaced-Based Weaponization
Generally vote FOR reports on a company’s involvement in spaced-based weaponization unless:
| | • | | The information is already publicly available or |
| | • | | The disclosures sought could compromise proprietary information. |
Workplace Diversity
Board Diversity
Generally vote FOR reports on the company’s efforts to diversify the board, unless:
| | • | | The board composition is reasonably inclusive in relation to companies of similar size and business or |
| | • | | The board already reports on its nominating procedures and diversity initiatives. |
Generally vote AGAINST proposals that would call for the adoption of specific committee charter language regarding diversity initiatives unless the company fails to publicly disclose existing equal opportunity or non-discrimination policies.
Vote CASE-BY-CASE on proposals asking the company to increase the representation of women and minorities on the board, taking into account:
| | • | | The degree of board diversity |
| | • | | Comparison with peer companies |
| | • | | Established process for improving board diversity |
| | • | | Existence of independent nominating committee |
| | • | | Use of outside search firm |
| | • | | History of EEO violations. |
Equal Employment Opportunity (EEO)
Generally vote FOR reports outlining the company’s affirmative action initiatives unless all of the following apply:
| | • | | The company has well-documented equal opportunity programs |
| | • | | The company already publicly reports on its company-wide affirmative initiatives and provides data on its workforce diversity, and |
| | • | | The company has no recent EEO-related violations or litigation. |
Generally vote AGAINST proposals seeking information on the diversity efforts of suppliers and service providers, which can pose a significant cost and administration burden on the company.
B-129
Glass Ceiling
Generally vote FOR reports outlining the company’s progress towards the Glass Ceiling Commission’s business recommendations, unless:
| | • | | The composition of senior management and the board is fairly inclusive |
| | • | | The company has well-documented programs addressing diversity initiatives and leadership development |
| | • | | The company already issues public reports on its company-wide affirmative initiatives and provides data on its workforce diversity, and |
| | • | | The company has had no recent, significant EEO-related violations or litigation |
Sexual Orientation
Generally vote FOR proposals seeking to amend a company’s EEO statement in order to prohibit discrimination based on sexual orientation, unless the change would result in excessive costs for the company.
Generally vote AGAINST proposals to extend company benefits to or eliminate benefits from domestic partners. Benefit decisions should be left to the discretion of the company.
Election of Directors
Vote CASE-BY-CASE on the election of directors and trustees, following the same guidelines for uncontested directors for public company shareholder meetings. However, mutual fund boards do not usually have compensation committees, so generally do not withhold for the lack of this committee.
Converting Closed-end Fund to Open-end Fund
Vote CASE-BY-CASE on conversion proposals, considering the following factors:
| | • | | Past performance as a closed-end fund; |
| | • | | Market in which the fund invests; |
| | • | | Measures taken by the board to address the discount; and |
| | • | | Past shareholder activism, board activity, and votes on related proposals. |
Proxy Contests
Votes on proxy contests should be determined on a CASE-BY-CASE basis, considering the following factors:
| | • | | Past performance relative to its peers |
| | • | | Market in which fund invests |
| | • | | Measures taken by the board to address the issues |
| | • | | Past shareholder activism, board activity, and votes on related proposals |
| | • | | Strategy of the incumbents versus the dissidents |
| | • | | Independence of directors |
| | • | | Experience and skills of director candidates |
| | • | | Governance profile of the company |
| | • | | Evidence of management entrenchment |
Investment Advisory Agreements
Votes on investment advisory agreements should be determined on a CASE-BY-CASE basis, considering the following factors:
| | • | | Proposed and current fee schedules |
| | • | | Fund category/investment objective |
B-130
| | • | | Share price performance compared to peers |
| | • | | Resulting fees relative to peers |
| | • | | Assignments (where the advisor undergoes a change of control). |
Approving New Classes or Series of Shares
Generally vote FOR the establishment of new classes or series of shares.
Preferred Stock Proposals
Votes on the authorization for or increase in preferred shares should be determined on a CASE-BY-CASE basis, considering the following factors:
| | • | | Stated specific financing purpose |
| | • | | Possible dilution for common shares |
| | • | | Whether the shares can be used for antitakeover purposes. |
1940 Act Policies
Votes on 1940 Act policies should be determined on a CASE-BY-CASE basis, considering the following factors:
| | • | | Potential competitiveness |
| | • | | Regulatory developments |
| | • | | Current and potential returns |
| | • | | Current and potential risk. |
Generally vote FOR these amendments as long as the proposed changes do not fundamentally alter the investment focus of the fund and do comply with the current SEC interpretation.
Change Fundamental Restriction to Nonfundamental Restriction
Proposals to change a fundamental restriction to a nonfundamental restriction should be evaluated on a CASE-BY-CASE basis, considering the following factors:
| | • | | The fund’s target investments |
| | • | | The reasons given by the fund for the change |
| | • | | The projected impact of the change on the portfolio. |
Change Fundamental Investment Objective to Nonfundamental
Proposals to change a fund’s fundamental investment objective to nonfundamental should be evaluated on a CASE-BY-CASE basis.
Name Change Proposals
Votes on name change proposals should be determined on a CASE-BY-CASE basis, considering the following factors:
| | • | | Political/economic changes in the target market |
| | • | | Consolidation in the target market |
| | • | | Current asset composition |
Change in Fund’s Subclassification
Votes on changes in a fund’s subclassification should be determined on a CASE-BY-CASE basis, considering the following factors:
| | • | | Potential competitiveness |
| | • | | Current and potential returns |
B-131
| | • | | Consolidation in target industry |
Disposition of Assets/Termination/Liquidation
Vote these proposals on a CASE-BY-CASE basis, considering the following factors:
| | • | | Strategies employed to salvage the company |
| | • | | The fund’s past performance |
| | • | | Terms of the liquidation. |
Changes to the Charter Document
Votes on changes to the charter document should be determined on a CASE-BY-CASE basis, considering the following factors:
| | • | | The degree of change implied by the proposal |
| | • | | The efficiencies that could result |
| | • | | The state of incorporation |
| | • | | Regulatory standards and implications. |
Vote on a CASE-BY-CASE basis for any of the following changes after considering appropriate factors in connection therewith:
| | • | | Removal of shareholder approval requirement to reorganize or terminate the trust or any of its series |
| | • | | Removal of shareholder approval requirement for amendments to the new declaration of trust |
| | • | | Removal of shareholder approval requirement to amend the fund’s management contract, allowing the contract to be modified by the investment manager and the trust management, as permitted by the 1940 Act |
| | • | | Allow the trustees to impose other fees in addition to sales charges on investment in a fund, such as deferred sales charges and redemption fees that may be imposed upon redemption of a fund’s shares |
| | • | | Removal of shareholder approval requirement to engage in and terminate subadvisory arrangements |
| | • | | Removal of shareholder approval requirement to change the domicile of the fund |
Change the Fund’s Domicile
Vote reincorporations on a CASE-BY-CASE basis, considering the following factors:
| | • | | Regulations of both states |
| | • | | Required fundamental policies of both states |
| | • | | Increased flexibility available. |
Authorize the Board to Hire and Terminate Subadvisors Without Shareholder Approval
Vote on a CASE-BY-CASE basis for proposals authorizing the board to hire/terminate subadvisors without shareholder approval after considering appropriate factors in connection therewith.
Distribution Agreements
Vote these proposals on a CASE-BY-CASE basis, considering the following factors:
| | • | | Fees charged to comparably sized funds with similar objectives |
| | • | | The proposed distributor’s reputation and past performance |
| | • | | The competitiveness of the fund in the industry |
| | • | | Terms of the agreement. |
Master-Feeder Structure
Generally vote FOR the establishment of a master-feeder structure.
B-132
Mergers
Vote merger proposals on a CASE-BY-CASE basis, considering the following factors:
| | • | | Resulting fee structure |
| | • | | Performance of both funds |
| | • | | Continuity of management personnel |
| | • | | Changes in corporate governance and their impact on shareholder rights. |
Shareholder Proposals to Establish Director Ownership Requirement
Generally vote AGAINST shareholder proposals that mandate a specific minimum amount of stock that directors must own in order to qualify as a director or to remain on the board.
Reimburse Shareholder for Expenses Incurred
Vote CASE-BY-CASE on shareholder proposals to reimburse proxy solicitation expenses. When supporting the dissidents, generally vote FOR the reimbursement of the proxy solicitation expenses.
Shareholder Proposals to Terminate Investment Advisor
Vote to terminate the investment advisor on a CASE-BY-CASE basis, considering the following factors:
| | • | | Performance of the fund’s NAV |
| | • | | The fund’s history of shareholder relations |
| | • | | The performance of other funds under the advisor’s management. |
Non-U.S. Portfolio Security Voting Issues
Financial Results/Director and Auditor Reports
Generally vote FOR approval of financial statements and director and auditor reports, unless:
| | • | | There are concerns about the accounts presented or audit procedures used; or |
| | • | | The company is not responsive to shareholder questions about specific items that should be publicly disclosed. |
Appointment of Auditors and Auditor Fees
Generally vote FOR the reelection of auditors and proposals authorizing the board to fix auditor fees, unless:
| | • | | There are serious concerns about the accounts presented or the audit procedures used; |
| | • | | The auditors are being changed without explanation; or |
| | • | | Nonaudit-related fees are substantial or are routinely in excess of standard annual audit-related fees. |
Generally vote AGAINST the appointment of external auditors if they have previously served the company in an executive capacity or can otherwise be considered affiliated with the company.
Appointment of Internal Statutory Auditors
Generally vote FOR the appointment or reelection of statutory auditors, unless:
| | • | | There are serious concerns about the statutory reports presented or the audit procedures used; |
| | • | | Questions exist concerning any of the statutory auditors being appointed; or |
| | • | | The auditors have previously served the company in an executive capacity or can otherwise be considered affiliated with the company. |
B-133
Allocation of Income
Generally vote FOR approval of the allocation of income, unless:
| | • | | The dividend payout ratio has been consistently below 30 percent without adequate explanation; or |
| | • | | The payout is excessive given the company’s financial position. |
Stock (Scrip) Dividend Alternative
Generally vote FOR most stock (scrip) dividend proposals.
Generally vote AGAINST proposals that do not allow for a cash option unless management demonstrates that the cash option is harmful to shareholder value.
Amendments to Articles of Association
Vote amendments to the articles of association on a CASE-BY-CASE basis.
Change in Company Fiscal Term
Generally vote FOR resolutions to change a company’s fiscal term unless a company’s motivation for the change is to postpone its AGM.
Lower Disclosure Threshold for Stock Ownership
Generally vote AGAINST resolutions to lower the stock ownership disclosure threshold below five percent unless specific reasons exist to implement a lower threshold.
Amend Quorum Requirements
Vote proposals to amend quorum requirements for shareholder meetings on a CASE-BY-CASE basis.
Transact Other Business
Generally vote AGAINST other business when it appears as a voting item.
Director Elections
Generally vote FOR management nominees in the election of directors, unless:
| | • | | Adequate disclosure has not been provided in a timely manner; |
| | • | | There are clear concerns over questionable finances or restatements; |
| | • | | There have been questionable transactions with conflicts of interest; |
| | • | | There are any records of abuses against minority shareholder interests; and |
| | • | | The board fails to meet minimum corporate governance standards. |
Generally vote FOR individual nominees unless there are specific concerns about the individual, such as criminal wrongdoing or breach of fiduciary responsibilities.
Generally vote AGAINST shareholder nominees unless they demonstrate a clear ability to contribute positively to board deliberations.
Generally vote AGAINST individual directors if repeated absences at board meetings have not been explained (in countries where this information is disclosed).
B-134
Generally vote AGAINST labor representatives if they sit on either the audit or compensation committee, as they are not required to be on those committees.
Director Compensation
Generally vote FOR proposals to award cash fees to nonexecutive directors unless the amounts are excessive relative to other companies in the country or industry.
Vote nonexecutive director compensation proposals that include both cash and share-based components on a CASE-BY-CASE basis.
Vote proposals that bundle compensation for both nonexecutive and executive directors into a single resolution on a CASE-BY-CASE basis.
Generally vote AGAINST proposals to introduce retirement benefits for nonexecutive directors.
Discharge of Board and Management
Generally vote FOR discharge of the board and management, unless:
| | • | | There are serious questions about actions of the board or management for the year in question; or |
| | • | | Legal action is being taken against the board by other shareholders. |
Generally vote AGAINST proposals to remove approval of discharge of board and management from the agenda.
Director, Officer, and Auditor Indemnification and Liability Provisions
Vote proposals seeking indemnification and liability protection for directors and officers on a CASE-BY-CASE basis.
Generally vote AGAINST proposals to indemnify auditors.
Board Structure
Generally vote FOR proposals to fix board size.
Generally vote AGAINST the introduction of classified boards and mandatory retirement ages for directors.
Generally vote AGAINST proposals to alter board structure or size in the context of a fight for control of the company or the board.
Share Issuance Requests
General Issuances:
Generally vote FOR issuance requests with preemptive rights to a maximum of 100 percent over currently issued capital.
Generally vote FOR issuance requests without preemptive rights to a maximum of 20 percent of currently issued capital.
Specific Issuances:
Vote on a CASE-BY-CASE basis on all requests, with or without preemptive rights.
B-135
Increases in Authorized Capital
Generally vote FOR nonspecific proposals to increase authorized capital up to 100 percent over the current authorization unless the increase would leave the company with less than 30 percent of its new authorization outstanding.
Generally vote FOR specific proposals to increase authorized capital to any amount, unless:
| | • | | The specific purpose of the increase (such as a share-based acquisition or merger) does not meet ISS guidelines for the purpose being proposed; or |
| | • | | The increase would leave the company with less than 30 percent of its new authorization outstanding after adjusting for all proposed issuances. |
Generally vote AGAINST proposals to adopt unlimited capital authorizations.
Reduction of Capital
Generally vote FOR proposals to reduce capital for routine accounting purposes unless the terms are unfavorable to shareholders.
Vote proposals to reduce capital in connection with corporate restructuring on a CASE-BY-CASE basis.
Capital Structures
Generally vote FOR resolutions that seek to maintain or convert to a one share, one vote capital structure.
Generally vote AGAINST requests for the creation or continuation of dual class capital structures or the creation of new or additional supervoting shares.
Preferred Stock
Generally vote FOR the creation of a new class of preferred stock or for issuances of preferred stock up to 50 percent of issued capital unless the terms of the preferred stock would adversely affect the rights of existing shareholders.
Generally vote FOR the creation/issuance of convertible preferred stock as long as the maximum number of common shares that could be issued upon conversion meets ISS’s guidelines on equity issuance requests.
Generally vote AGAINST the creation of a new class of preference shares that would carry superior voting rights to the common shares.
Generally vote AGAINST the creation of blank check preferred stock unless the board clearly states that the authorization will not be used to thwart a takeover bid.
Vote proposals to increase blank check preferred authorizations on a CASE-BY-CASE basis.
Debt Issuance Requests
Vote nonconvertible debt issuance requests on a CASE-BY-CASE basis, with or without preemptive rights.
Generally vote FOR the creation/issuance of convertible debt instruments as long as the maximum number of common shares that could be issued upon conversion meets ISS’s guidelines on equity issuance requests.
Generally vote FOR proposals to restructure existing debt arrangements unless the terms of the restructuring would adversely affect the rights of shareholders.
B-136
Pledging of Assets for Debt
Vote proposals to approve the pledging of assets for debt on a CASE-BY-CASE basis.
Increase in Borrowing Powers
Vote proposals to approve increases in a company’s borrowing powers on a CASE-BY-CASE basis.
Share Repurchase Plans
Generally vote FOR share repurchase plans, unless:
| | • | | Clear evidence of past abuse of the authority is available; or |
| | • | | The plan contains no safeguards against selective buybacks. |
Reissuance of Shares Repurchased
Generally vote FOR requests to reissue any repurchased shares unless there is clear evidence of abuse of this authority in the past.
Capitalization of Reserves for Bonus Issues/Increase In Par Value
Generally vote FOR requests to capitalize reserves for bonus issues of shares or to increase par value.
Reorganizations/Restructurings
Vote reorganizations and restructurings on a CASE-BY-CASE basis.
Mergers and Acquisitions
Vote CASE-BY-CASE on mergers and acquisitions generally taking into account the following:
Evaluate the merits and drawbacks of the proposed transaction, balancing various and sometimes countervailing factors including:
| | • | | Valuation—Is the value to be received by the target shareholders (or paid by the acquirer) reasonable? While the fairness opinion may provide an initial starting point for assessing valuation reasonableness, place emphasis on the offer premium, market reaction, and strategic rationale. |
| | • | | Market reaction—How has the market responded to the proposed deal? A negative market reaction will cause closer scrutiny of a deal. |
| | • | | Strategic rationale—Does the deal make sense strategically? From where is the value derived? Cost and revenue synergies should not be overly aggressive or optimistic, but reasonably achievable. Management should also have a favorable track record of successful integration of historical acquisitions. |
| | • | | Conflicts of interest—Are insiders benefiting from the transaction disproportionately and inappropriately as compared to non-insider shareholders? Consider whether any special interests may have influenced these directors and officers to support or recommend the merger. |
| | • | | Governance—Will the combined company have a better or worse governance profile than the current governance profiles of the respective parties to the transaction? If the governance profile is to change for the worse, the burden is on the company to prove that other issues (such as valuation) outweigh any deterioration in governance. |
Generally vote AGAINST if the companies do not provide sufficient information upon request to make an informed voting decision.
Mandatory Takeover Bid Waivers
Vote proposals to waive mandatory takeover bid requirements on a CASE-BY-CASE basis.
B-137
Reincorporation Proposals
Vote reincorporation proposals on a CASE-BY-CASE basis.
Expansion of Business Activities
Generally vote FOR resolutions to expand business activities unless the new business takes the company into risky areas.
Related-Party Transactions
Vote related-party transactions on a CASE-BY-CASE basis.
Compensation Plans
Vote compensation plans on a CASE-BY-CASE basis.
Antitakeover Mechanisms
Generally vote AGAINST all antitakeover proposals unless they are structured in such a way that they give shareholders the ultimate decision on any proposal or offer.
Shareholder Proposals
Vote all shareholder proposals on a CASE-BY-CASE basis.
Generally vote FOR proposals that would improve the company’s corporate governance or business profile at a reasonable cost.
Generally vote AGAINST proposals that limit the company’s business activities or capabilities or result in significant costs being incurred with little or no benefit.
B-138
EAGLE ASSET MANAGEMENT, INC.
PROXY VOTING POLICY AND GUIDELINES
The exercise of proxy voting rights is an important element in the successful management of clients’ investments. Eagle Asset Management recognizes its fiduciary responsibility to vote proxies solely in the best interests of both its ERISA and non-ERISA clients. We have therefore adopted the following proxy voting guidelines as a part of our overall goal of maximizing the growth of our clients’ assets.
Eagle generally votes proxies in furtherance of the long-term economic value of the underlying securities. We consider each proxy proposal on its own merits, and we make an independent determination of the advisability of supporting or opposing management’s position. We believe that the recommendations of management should be given substantial weight, but we will not support management proposals which we believe are detrimental to the underlying value of our clients’ positions.
We usually oppose proposals which dilute the economic interest of shareholders, and we also oppose those that reduce shareholders’ voting rights or otherwise limit their authority. With respect to takeover offers, Eagle calculates a “going concern” value for every holding. If the offer approaches or exceeds our value estimate, we will generally vote for the merger, acquisition or leveraged buy-out.
The following guidelines deal with a number of specific issues, particularly in the area of corporate governance. While they are not exhaustive, they do provide a good indication of Eagle’s general approach to a wide range of issues. A list of Eagle’s detailed voting guidelines is attached as appendix A and incorporates routine and non-routine proxy issues. On occasion we may vote a proxy otherwise than suggested by the guidelines, but departures from the guidelines will be rare, and we will explain the basis for such votes in our reports to clients.
If you have any questions about these guidelines, or about how we voted, or may vote, on a particular issue, please contact our Compliance Department at 1-800-237-3101.
I. Directors and Auditors
Eagle generally supports the management slate of directors, although we may withhold our votes if the board has adopted excessive anti-takeover measures. (App. R1)
We favor inclusion of the selection of auditors on the proxy as a matter for shareholder ratification. As a general rule, in the absence of any apparent conflict of interest, we will support management’s selection of auditors. (App. R8)
II. Corporate Governance
In the area of corporate governance, Eagle will generally support proxy measures which we believe tend to increase shareholder rights.
| | A. | Confidential Voting. We generally support proposals to adopt confidential voting and independent vote tabulation practices, which we believe lessen potential management pressure on shareholders and thus allow shareholders to focus on the merits of proxy proposals. (App S31) |
| | B. | Greenmail. Unless they are part of anti-takeover provisions, we usually support anti-greenmail proposals because greenmail tends to discriminate against shareholders other than the greenmailer and may result in a decreased stock price. (App S23) |
| | C. | Indemnification of Directors. We usually vote in favor of charter or by-law amendments which expand the indemnification of directors or limit their liability for breaches of care, because we believe such measures are important in attracting competent directors and officers. (App R4) |
B-139
| | D. | Cumulative Voting Rights. We usually support cumulative voting as an effective method of guaranteeing minority representation on a board. (App N17, S24) |
| | E. | Opt Out of Delaware. We usually support by-law amendments requiring a company to opt out of the Delaware takeover statute because it is undemocratic and contrary to the principle that shareholders should have the final decision on merger or acquisition. (App S15, S46) |
| | F. | Increases in Common Stock. We will generally support an increase in common stock of up to three times the number of shares outstanding and scheduled to be issued, including stock options, provided the increase is not intended to implement a poison pill defense. (App R18) |
Eagle generally votes against the following anti-takeover proposals, as we believe they diminish shareholder rights.
| | A. | Fair Price Amendments. We generally oppose fair price amendments because they may deter takeover bids, but we will support those that consider only a two year price history and are not accompanied by a supermajority vote requirement. (App N3) |
| | B. | Classified Boards. We generally oppose classified boards because they limit shareholder control. (App N4) |
| | C. | Blank Check Preferred Stock. We generally oppose the authorization of blank check preferred stock because it limits shareholder rights and allows management to implement anti-takeover policies without shareholder approval. (App N2) |
| | D. | Supermajority Provisions. We usually oppose supermajority-voting requirements because they often detract from the majority’s rights to enforce its will. (App N5, S32) |
| | E. | Golden Parachutes. We generally oppose golden parachutes, as they tend to be excessive and self-serving, and we favor proposals which require shareholder approval of golden parachutes and similar arrangements. (App S18) |
| | F. | Poison Pills. We believe poison pill defenses tend to depress the value of shares. Therefore, we will vote for proposals requiring (1) shareholder ratification of poison pills, (2) sunset provision for existing poison pills, and (3) shareholder vote on redemption of poison pills. (App N1) |
| | G. | Reincorporation. We oppose reincorporation in another state in order to take advantage of a stronger anti-takeover statute. (App S15) |
| | H. | Shareholder Rights. We oppose proposals which would eliminate, or limit, the rights of shareholders to call special meetings and to act by written consent because they detract from basic shareholder authority. (App S26-S30) |
Eagle generally votes on other corporate governance issues as follows:
| | A. | Other Business. Absent any compelling grounds, we usually authorize management to vote in its discretion. (App R22) |
| | B. | Differential Voting Rights. We usually vote against the issuance of new classes of stock with differential voting rights, because such rights can dilute the rights of existing shares. (App N27) |
| | C. | Directors—Share Ownership. While we view some share ownership by directors as having a positive effect, we will usually vote against proposals requiring directors to own a specific number of shares. (App S5) |
| | D. | Independent Directors. While we oppose proposals which would require that a board consist of a majority of independent directors, we may support proposals which call for some independent positions on the board. (App S11) |
| | E. | Preemptive Rights. We generally vote against preemptive rights proposals, as they may tend to limit share ownership, and they limit management’s flexibility to raise capital. (App N21, S25) |
B-140
| | F. | Employee Stock Ownership Plans (ESOPs). We evaluate ESOPs on a case-by-case basis. We usually vote for unleveraged ESOPs if they provide for gradual accumulation of moderate levels of stock. For leveraged ESOPs, we examine the company’s state of incorporation, existence of supermajority vote rules in the charter, number of shares authorized for ESOP and number of shares held by insiders. We may also examine where the ESOP shares are purchased and the dilutive effect of the purchase. We vote against leveraged ESOPs if all outstanding loans are due immediately upon a change in control or if the ESOP appears to be primarily designed as an anti-takeover device. (App R21) |
III. Compensation and Stock Option Plans
We review compensation plan proposals on a case-by-case basis. We believe that strong compensation programs are needed to attract, hold and motivate good executives and outside directors, and so we generally tend to vote with management on these issues. However, if the proposals appear excessive, or bear no rational relation to company performance, we may vote in opposition.
With respect to compensation plans which utilize stock options or stock incentives, our analyses generally have lead us to vote with management. However, if the awards of options appear excessive, or if the plans reserve an unusually large percentage of the company’s stock for the award of options, we may oppose them because of concerns regarding the dilution of shareholder value. Compensation plans that come within the purview of this guideline include long-range compensation plans, deferred compensation plans, long-term incentive plans, performance stock plans, and restricted stock plans and share option arrangements. (App N7)
IV. Social Issues
Eagle has a fiduciary duty to vote on all proxy issues in furtherance of the long-term economic value of the underlying shares. Consistent with that duty, we will vote on social issues with a view toward promoting good corporate citizenship, but also with the realization that we cannot require a company to go beyond applicable legal requirements or put itself in a noncompetitive position.
We have found that management generally analyzes such issues on the same basis, and so we generally support management’s recommendations on social issue proposals. However, if our analysis shows that adoption of such a proposal would have a positive impact on the share value, we may vote in favor.
Examples of proposals in this category include:
| | b. | Animal Experimentation. |
| | b. | Environmental Protection. |
B-141
| | b. | Nuclear Energy Business. |
| | 15. | Planned Parenthood Funding. |
| | 16. | Political Contributions. |
| | 19. | Tobacco-Related Products. |
VII. Conflicts of Interest
Investment advisers who vote client proxies may, from time to time, be faced with situations which present the adviser with a potential conflict of interest. For example, a conflict of interest could exist where Eagle, or an affiliate, provides investment advisory services, or brokerage or underwriting services, to a company whose management is soliciting proxies, and a vote against management could harm Eagle’s, or the affiliate’s, business relationship with that company. Potential conflicts of interest may also arise where Eagle has business or personal relationships with other proponents of proxy proposals, participants in proxy contests, or corporate directors or candidates for directorships.
Eagle addresses the potential conflict of interest issue primary by voting proxies in accordance with the predetermined set of Guidelines described above. With very few exceptions, Eagle’s proxy votes are cast as prescribed by our guidelines. On the rare occasion where a portfolio manager may recommend a vote contrary to Eagle’s Guidelines, Eagle’s Compliance Department will review the proxy issue and the recommended vote to ensure that the vote is cast in compliance with Eagle’s overriding obligation to vote proxies in the best interests of clients and to avoid conflicts of interest. By limiting the discretionary factor in the proxy voting process, Eagle is confident that potential conflicts of interest will not affect the manner in which proxy voting rights are exercised.
VIII. Record Keeping
The following documents related to Proxy Voting are kept by Eagle Compliance in accordance with Rule 204-2 of the Investment Advisers Act.
| | Ø | Copy of each proxy statement received. |
| | Ø | Record of each vote cast. |
| | Ø | Copy of any documents created by Eagle that was material to making a decision how to vote proxies on behalf of a client or that memorializes the basis for that decision. |
| | Ø | Copy of each written client request for information on how Eagle voted proxies on behalf of the client. |
| | Ø | Copy of all written responses by Eagle to client who requested (written or oral) information on how the Eagle voted proxies on behalf of the client. |
B-142
EARNEST Partners, LLC
Proxy Policies
The best interest of clients and plan participants (the “Client”) will be the sole consideration of EARNEST Partners when voting proxies of portfolio companies. Each proxy issue will receive individual consideration based on the relevant facts and circumstances. As a general rule, EARNEST Partners will vote against actions which would reduce the rights or options of shareholders, reduce shareholder influence over the board of directors and management, reduce the alignment of interests between management and shareholders, or reduce the value of shareholders’ investments. Following is a partial list of issues that require special attention: classified boards, change of state of incorporation, poison pills, unequal voting rights plans, provisions requiring supermajority approval of a merger, executive severance agreements, and provisions limiting shareholder rights.
In addition, the following will be adhered to unless EARNEST Partners is instructed otherwise in writing by the Client:
| | • | | EARNEST Partners will not actively engage in conduct that involves an attempt to change or influence the control of a portfolio company. |
| | • | | EARNEST Partners will not announce its voting intentions or the reasons for a particular vote. |
| | • | | The Advisor will not participate in a proxy solicitation or otherwise seek proxy voting authority from any other portfolio company shareholder. |
| | • | | EARNEST Partners will not act in concert with any other portfolio company shareholders in connection with any proxy issue or other activity involving the control or management of a portfolio company. |
| | • | | All communications with portfolio companies or fellow shareholders will be for the sole purpose of expressing and discussing EARNEST Partners’ concerns for its Clients’ interests and not in an attempt to influence the control of management. |
With respect to ERISA accounts, EARNEST Partners will act prudently, solely in the interest of plan participants and beneficiaries and for the exclusive purpose of providing benefits to them. It is EARNEST Partners’ policy to fully comply with all ERISA provisions regarding proxy voting for ERISA accounts and to the extent possible, amend its policies and procedures from time to time to reflect the Department of Labor’s views of the proxy voting duties and obligations imposed by ERISA with respect to ERISA accounts.
Proxy Procedures
EARNEST Partners has designated a Proxy Director. The Proxy Director will consider each issue presented on each portfolio company proxy. The circumstances underlying each proxy issue will be given careful individual attention. The Proxy Director will also use all available resources, including proxy evaluation services, to assist in the analysis of proxy issues. Proxy issues presented to the Proxy Director will be voted in accordance with the judgment of the Proxy Director, taking into account the general policies outlined above and EARNEST Partners’ Proxy Voting Guidelines. Therefore, it is possible that actual votes may differ from these general policies and EARNEST Partners’ Proxy Voting Guidelines. In the case where EARNEST Partners has a material conflict of interest with a Client, the Proxy Director will utilize the services of outside third party professionals (such as Institutional Shareholder Services) to assist in its analysis of voting issues and the actual voting of proxies to ensure that a decision to vote the proxies was based on the Client’s best interest and was not the product of a conflict of interest. In the event the services of an outside third party professional are not available in connection with a conflict of interest, EARNEST Partners will seek the advice of the Client.
A detailed description of EARNEST Partners’ specific Proxy Voting Guidelines will be furnished upon request. You may also obtain information about how EARNEST Partners has voted with respect to portfolio company securities by calling, writing, or emailing us at:
EARNEST Partners
1180 Peachtree Street NE, Suite 2300
Atlanta, GA 30309
invest@earnestpartners.com
404-815-8772
EARNEST Partners reserves the right to change these policies and procedures at any time without notice.
B-143
Fidelity Fund Proxy Voting Guidelines
March 2007
I. General Principles
A. Voting of shares will be conducted in a manner consistent with the best interests of mutual fund shareholders as follows: (i) securities of a portfolio company will generally be voted in a manner consistent with the guidelines; and (ii) voting will be done without regard to any other Fidelity companies’ relationship, business or otherwise, with that portfolio company.
B. The FMR Investment & Advisor Compliance Department votes proxies. In the event an Investment & Advisor Compliance employee has a personal conflict with a portfolio company or an employee or director of a portfolio company, that employee will withdraw from making any proxy voting decisions with respect to that portfolio company. A conflict of interest arises when there are factors that may prompt one to question whether a Fidelity employee is acting solely on the best interests of Fidelity and its customers. Employees are expected to avoid situations that could present even the appearance of a conflict between their interests and the interests of Fidelity and its customers.
C. Except as set forth herein, FMR will generally vote in favor of routine management proposals.
D. Non-routine proposals will generally be voted in accordance with the guidelines.
E. Non-routine proposals not covered by the guidelines or involving other special circumstances will be evaluated on a case-by-case basis with input from the appropriate FMR analyst or portfolio manager, as applicable, subject to review by an attorney within FMR’s General Counsel’s office and a member of senior management within FMR’s Investment and Advisor Compliance Department. A significant pattern of such proposals or other special circumstances will be referred to the Fund Board Proxy Voting Committee or its designee.
F. FMR will vote on shareholder proposals not specifically addressed by the guidelines based on an evaluation of a proposal’s likelihood to enhance the economic returns or profitability of the portfolio company or to maximize shareholder value. Where information is not readily available to analyze the economic impact of the proposal, FMR will generally abstain.
G. Many Fidelity Funds invest in voting securities issued by companies that are domiciled outside the United States and are not listed on a U.S. securities exchange. Corporate governance standards, legal or regulatory requirements and disclosure practices in foreign countries can differ from those in the United States. When voting proxies relating to non-U.S. securities, FMR will generally evaluate proposals in the context of these guidelines, but FMR may, where applicable and feasible, take into consideration differing laws and regulations in the relevant foreign market in determining how to vote shares.
H. In certain non-U.S. jurisdictions, shareholders voting shares of a portfolio company may be restricted from trading the shares for a period of time around the shareholder meeting date. Because such trading restrictions can hinder portfolio management and could result in a loss of liquidity for a fund, FMR will generally not vote proxies in circumstances where such restrictions apply. In addition, certain non-U.S. jurisdictions require voting shareholders to disclose current share ownership on a fund-by-fund basis. When such disclosure requirements apply, FMR will generally not vote proxies in order to safeguard fund holdings information.
I. Where a management-sponsored proposal is inconsistent with the guidelines, FMR may receive a company’s commitment to modify the proposal or its practice to conform to the guidelines, and FMR will generally support management based on this commitment. If a company subsequently does not abide by its commitment, FMR will generally withhold authority for the election of directors at the next election.
B-144
II. Definitions (as used in this document)
A. Anti-Takeover Provision—includes fair price amendments; classified boards; “blank check” preferred stock; golden and tin parachutes; supermajority provisions; Poison Pills; and any other provision that eliminates or limits shareholder rights.
B. Golden parachute—accelerated options and/or employment contracts for officers and directors that will result in a lump sum payment of more than three times annual compensation (salary and bonus) in the event of termination.
C. Tin Parachute—accelerated options and/or employment contracts for employees beyond officers and directors that will result in a lump sum payment in the event of termination.
D. Greenmail—payment of a premium to repurchase shares from a shareholder seeking to take over a company through a proxy contest or other means.
E. Sunset Provision—a condition in a charter or plan that specifies an expiration date.
F. Permitted Bid Feature—a provision suspending the application of a Poison Pill, by shareholder referendum, in the event a potential acquirer announces a bona fide offer for all outstanding shares.
G. Poison Pill—a strategy employed by a potential take-over / target company to make its stock less attractive to an acquirer. Poison Pills are generally designed to dilute the acquirer’s ownership and value in the event of a take-over.
H. Large Capitalization Company— a company included in the Russell 1000 stock index.
I. Small Capitalization Company—a company not included in the Russell 1000 stock index that is not a Micro-Capitalization Company.
J. Micro-Capitalization Company—a company with market capitalization under US $300 million.
III. Directors
A. Incumbent Directors
FMR will generally vote in favor of incumbent and nominee directors except where one or more such directors clearly appear to have failed to exercise reasonable judgment.
FMR will also generally withhold authority for the election of all directors or directors on responsible committees if:
1. An Anti-Takeover Provision was introduced, an Anti-Takeover Provision was extended, or a new Anti-Takeover Provision was adopted upon the expiration of an existing Anti-Takeover Provision, without shareholder approval except as set forth below.
With respect to Poison Pills, however, FMR will consider not withholding authority on the election of directors if all of the following conditions are met when a Poison Pill is introduced, extended, or adopted:
a. The Poison Pill includes a Sunset Provision of less than 5 years;
b. The Poison Pill includes a Permitted Bid Feature;
B-145
c. The Poison Pill is linked to a business strategy that will result in greater value for the shareholders, and
d. Shareholder approval is required to reinstate the Poison Pill upon expiration.
FMR will also consider not withholding authority on the election of directors when one or more of the conditions above are not met if a board is willing to strongly consider seeking shareholder ratification of, or adding above conditions noted a. and b. to an existing Poison Pill. In such a case, if the company does not take appropriate action prior to the next annual shareholder meeting, FMR will withhold authority on the election of directors.
2. The company refuses, upon request by FMR, to amend the Poison Pill to allow Fidelity to hold an aggregate position of up to 20% of a company’s total voting securities and of any class of voting securities.
3. Within the last year and without shareholder approval, a company’s board of directors or compensation committee has repriced outstanding options.
4. The company failed to act in the best interests of shareholders when approving executive compensation, taking into accounts such factors as: (i) whether the company used an independent compensation committee; (ii) whether the compensation committee engaged independent compensation consultants; and (iii) whether the company has admitted to or settled a regulatory proceeding relating to options backdating.
5. To gain FMR’s support on a proposal, the company made a commitment to modify a proposal or practice to conform to these guidelines and the company has failed to act on that commitment.
6. The director attended fewer than 75% of the aggregate number of meetings of the board or its committees on which the director served during the company’s prior fiscal year, absent extenuating circumstances.
B. Indemnification
FMR will generally vote in favor of charter and by-law amendments expanding the indemnification of directors and/or limiting their liability for breaches of care unless FMR is otherwise dissatisfied with the performance of management or the proposal is accompanied by Anti-Takeover Provisions.
C. Independent Chairperson
FMR will generally vote against shareholder proposals calling for or recommending the appointment of a non-executive or independent chairperson. However, FMR will consider voting for such proposals in limited cases if, based upon particular facts and circumstances, appointment of a non-executive or independent chairperson appears likely to further the interests of shareholders and to promote effective oversight of management by the board of directors.
D. Majority Director Elections
FMR will generally vote in favor of proposals calling for directors to be elected by an affirmative majority of votes cast in a board election, provided that the proposal allows for plurality voting standard in the case of contested elections (i.e., where there are more nominees than board seats). FMR may consider voting against such shareholder proposals where a company’s board has adopted an alternative measure, such as a director resignation policy, that provides a meaningful alternative to the majority voting standard and appropriately addresses situations where an incumbent director fails to receive the support of a majority of the votes cast in an uncontested election.
B-146
IV. Compensation
A. Equity Award Plans (including stock options, restricted stock awards, and other stock awards).
FMR will generally vote against Equity Award Plans or amendments to authorize additional shares under such plans if:
1. (a) The dilution effect of the shares outstanding and available for issuance pursuant to all plans, plus any new share requests is greater than 10% for a Large Capitalization Company, 15% for a Small Capitalization Company or 20% for a Micro-Capitalization Company; and (b) there were no circumstances specific to the company or the plans that lead FMR to conclude that the level of dilution in the plan or the amendments is acceptable.
2. In the case of stock option plans, (a) the offering price of options is less than 100% of fair market value on the date of grant, except that the offering price may be as low as 85% of fair market value if the discount is expressly granted in lieu of salary or cash bonus; (b) the plan’s terms allow repricing of underwater options; or (c) the board/committee has repriced options outstanding under the plan in the past two years.
3. The plan may be materially altered without shareholder approval, including increasing the benefits accrued to participants under the plan; increasing the number of securities which may be issued under the plan; modifying the requirements for participation in the plan; or including a provision allowing the Board to lapse or waive restrictions at its discretion.
4. Awards to non-employee directors are subject to management discretion.
5. In the case of stock awards, the restriction period, or holding period after exercise, is less than 3 years for non-performance-based awards, and less than 1 year for performance-based awards.
FMR will consider approving an Equity Award Plan or an amendment to authorize additional shares under such plan if, without complying with the guidelines immediately above, the following two conditions are met:
1. The shares are granted by a compensation committee composed entirely of independent directors; and
2. The shares are limited to 5% (large capitalization company) and 10% (small capitalization company) of the shares authorized for grant under the plan.
B. Equity Exchanges and Repricing
FMR will generally vote in favor of a management proposal to exchange shares or reprice outstanding options if the proposed exchange or repricing is consistent with the interests of shareholders, taking into account such factors as:
1. Whether the proposal excludes senior management and directors;
2. Whether the equity proposed to be exchanged or repriced exceeded FMR’s dilution thresholds when initially granted;
3. Whether the exchange or repricing proposal is value neutral to shareholders based upon an acceptable pricing model;
4. The company’s relative performance compared to other companies within the relevant industry or industries;
5. Economic and other conditions affecting the relevant industry or industries in which the company competes; and
6. Any other facts or circumstances relevant to determining whether an exchange or repricing proposal is consistent with the interests of shareholders.
B-147
C. Employee Stock Purchase Plans
FMR will generally vote against employee stock purchase plans if the plan violates any of the criteria in section IV(A) above, except that the minimum stock purchase price may be equal to or greater than 85% of the stock’s fair market value if the plan constitutes a reasonable effort to encourage broad based participation in the company’s equity. In the case of non-U.S. company stock purchase plans, FMR may permit a lower minimum stock purchase price equal to the prevailing “best practices” in the relevant non-U.S. market, provided that the minimum stock purchase price must be at least 75% of the stock’s fair market value.
D. Employee Stock Ownership Plans (ESOPs)
FMR will generally vote in favor of non-leveraged ESOPs. For leveraged ESOPs, FMR may examine the company’s state of incorporation, existence of supermajority vote rules in the charter, number of shares authorized for the ESOP, and number of shares held by insiders. FMR may also examine where the ESOP shares are purchased and the dilution effect of the purchase. FMR will generally vote against leveraged ESOPs if all outstanding loans are due immediately upon change in control.
E. Executive Compensation
FMR will generally vote against management proposals on stock-based compensation plans or other compensation plans if such proposals are inconsistent with the interests of shareholders, taking into account such factors as: (i) whether the company has an independent compensation committee; and (ii) whether the compensation committee has authority to engage independent compensation consultants.
F. Bonus Plans and Tax Deductibility Proposals
FMR will generally vote in favor of cash and stock incentive plans that are submitted for shareholder approval in order to qualify for favorable tax treatment under Section 162(m) of the Internal Revenue Code, provided that the plan includes well defined and appropriate performance criteria, and with respect to any cash component, that the maximum award per participant is clearly stated and is not unreasonable or excessive.
V. Anti-Takeover Provisions
FMR will generally vote against a proposal to adopt or approve the adoption of an Anti-Takeover Provision unless:
A. The Poison Pill includes the following features:
1. A sunset provision of no greater than 5 years;
2. Linked to a business strategy that is expected to result in greater value for the shareholders;
3. Requires shareholder approval to be reinstated upon expiration or if amended;
4. Contains a Permitted Bid Feature; and
5. Allows the Fidelity funds to hold an aggregate position of up to 20% of a company’s total voting securities and of any class of voting securities.
B. An Anti-Greenmail proposal that does not include other Anti-Takeover Provisions; or
C. It is a fair price amendment that considers a two-year price history or less.
FMR will generally vote in favor of proposals to eliminate Anti-Takeover Provisions. In the case of proposals to declassify a board of directors, FMR will generally vote against such a proposal if the issuer’s Articles of Incorporation or applicable statutes include a provision whereby a majority of directors may be removed at any time, with or without cause, by written consent, or other reasonable procedures, by a majority of shareholders entitled to vote for the election of directors.
B-148
VI. Capital Structure / Incorporation
A. Increases in Common Stock
FMR will generally vote against a provision to increase a Company’s common stock if such increase will result in a total number of authorized shares greater than 3 times the current number of outstanding and scheduled to be issued shares, including stock options, except in the case of real estate investment trusts, where an increase that will result in a total number of authorized shares up to 5 times the current number of outstanding and scheduled to be issued shares is generally acceptable.
B. New Classes of Shares
FMR will generally vote against the introduction of new classes of stock with differential voting rights.
C. Cumulative Voting Rights
FMR will generally vote against the introduction and in favor of the elimination of cumulative voting rights.
D. Acquisition or Business Combination Statutes
FMR will generally vote in favor of proposed amendments to a company’s certificate of incorporation or by-laws that enable the company to opt out of the control shares acquisition or business combination statutes.
E. Incorporation or Reincorporation in Another State or Country
FMR will generally vote against shareholder proposals calling for, or recommending that, a portfolio company reincorporate in the United States and vote in favor of management proposals to reincorporate in a jurisdiction outside the United States if (i) it is lawful under United States, state and other applicable law for the company to be incorporated under the laws of the relevant foreign jurisdiction and to conduct its business and (ii) reincorporating or maintaining a domicile in the United States would likely give rise to adverse tax or other economic consequences detrimental to the interests of the company and its shareholders. However, FMR will consider supporting such shareholder proposals and opposing such management proposals in limited cases if, based upon particular facts and circumstances, reincorporating in or maintaining a domicile in the relevant foreign jurisdiction gives rise to significant risks or other potential adverse consequences that appear reasonably likely to be detrimental to the interests of the company or its shareholders.
VII. Auditors
A. FMR will generally vote against shareholder proposals calling for or recommending periodic rotation of a portfolio company’s auditor. FMR will consider voting for such proposals in limited cases if, based upon particular facts and circumstances, a company’s board of directors and audit committee clearly appear to have failed to exercise reasonable business judgment in the selection of the company’s auditor.
B. FMR will generally vote against shareholder proposals calling for or recommending the prohibition or limitation of the performance of non-audit services by a portfolio company’s auditor. FMR will also generally vote against shareholder proposals calling for or recommending removal of a company’s auditor due to, among other reasons, the performance of non-audit work by the auditor. FMR will consider voting for such proposals in limited cases if, based upon particular facts and circumstances, a company’s board of directors and audit committee clearly appear to have failed to exercise reasonable business judgment in the oversight of the performance of the auditor for audit or non-audit services for the company.
B-149
VIII. Shares of Investment Companies
A. When a Fidelity Fund invests in an underlying Fidelity fund, FMR will vote in the same proportion as all other shareholders of such underlying fund or class (“echo voting”).
B. Certain Fidelity Funds may invest in shares of Fidelity Central Funds. Central Fund shares, which are held exclusively by Fidelity funds or accounts managed by an FMR affiliate, will be voted in favor of proposals recommended by the Central Funds’ Board of Trustees.
IX. Other
A. Voting Process
FMR will generally vote in favor of proposals to adopt confidential voting and independent vote tabulation practices.
B. Regulated Industries
Voting of shares in securities of any regulated industry (e.g., U.S. banking) organization shall be conducted in a manner consistent with conditions that may be specified by the industry’s regulator (e.g., the Federal Reserve Board) for a determination under applicable law (e.g., federal banking law) that no Fund or group of Funds has acquired control of such organization.
B-150
GOLDMAN SACHS ASSET MANAGEMENT
POLICY ON PROXY VOTING
FOR INVESTMENT ADVISORY CLIENTS
Goldman Sachs Asset Management (“GSAM”) has adopted the policies and procedures set out below regarding the voting of proxies on securities held in client accounts (the “Policy”). These policies and procedures are designed to ensure that where GSAM has the authority to vote proxies, GSAM complies with its legal, fiduciary, and contractual obligations.
Guiding Principles
Proxy voting and the analysis of corporate governance issues in general are important elements of the portfolio management services we provide to our advisory clients who have authorized us to address these matters on their behalf. Our guiding principles in performing proxy voting are to make decisions that (i) favor proposals that tend to maximize a company’s shareholder value and (ii) are not influenced by conflicts of interest. These principles reflect GSAM’s belief that sound corporate governance will create a framework within which a company can be managed in the interests of its shareholders.
Public Equity Investments
To implement these guiding principles for investments in publicly-traded equities, we follow the Institutional Shareholder Services (“ISS”) Standard Proxy Voting Guidelines (the “Guidelines”), except in circumstances as described below. The Guidelines embody the positions and factors GSAM generally considers important in casting proxy votes. They address a wide variety of individual topics, including, among other matters, shareholder voting rights, anti-takeover defenses, board structures, the election of directors, executive and director compensation, reorganizations, mergers, and various shareholder proposals. Recognizing the complexity and fact-specific nature of many corporate governance issues, the Guidelines often do not direct a particular voting outcome, but instead identify factors ISS considers in determining how the vote should be cast.
In connection with each proxy vote, ISS prepares a written analysis and recommendation (an “ISS Recommendation”) that reflects ISS’s application of Guidelines to the particular \proxy issues. Where the Guidelines do not direct a particular response and instead list relevant factors, the ISS Recommendation will reflect ISS’s own evaluation of the factors.
As explained more fully below, however, each GSAM equity portfolio management team (“Portfolio Management Team”) may on any particular proxy vote decide to diverge from the Guidelines or an ISS Recommendation. In such cases, our procedures require: (i) the requesting Portfolio Management Team to set forth the reasons for their decision; (ii) the approval of the Local Chief Investment Officer for the requesting Portfolio Management Team; (iii) notification to the Global Chief Investment Officer and other appropriate GSAM personnel; (iv) a determination that the decision is not influenced by any conflict of interest; and (v) the creation of a written record reflecting the process.
The principles and positions reflected in this Policy are designed to guide us in voting proxies, and not necessarily in making investment decisions. Portfolio Management Teams base their determinations of whether to invest in a particular company on a variety of factors, and while corporate governance may be one such factor, it may not be the primary consideration.
Senior management of GSAM periodically reviews this Policy, including our use of the Guidelines, to ensure it continues to be consistent with our guiding principles.
B-151
Implementation by Portfolio Management Teams
General Overview
While it is GSAM’s policy generally to follow the Guidelines and the ISS Recommendations, the active-equity and quantitative-equity Portfolio Management Teams have developed different approaches for using the Guidelines and ISS Recommendations in light of their different investment philosophies and processes.
Active Equity
Our active-equity Portfolio Management Teams view the analysis of corporate governance practices as an integral part of the investment research and stock valuation process. Therefore, on a case-by-case basis and subject to the approval process described above, each active-equity Portfolio Management Team may vote differently from the Guidelines or a particular ISS Recommendation. In forming their views on particular matters, our active-equity Portfolio Management Teams are permitted to consider applicable regional rules and practices, including codes of conduct and other guides, regarding proxy voting, in addition to the Guidelines and ISS Recommendations. In our active-equity investment research process, responsibility for analyzing corporate board structures and the corporate governance practices of portfolio companies in connection with proxy voting decisions lies with the relevant Portfolio Management Team.
Accordingly, each active-equity Portfolio Management Team is charged with performing these functions for the portfolio companies as part of the team’s research efforts. As part of that research process, each active-equity Portfolio Management Team has regular internal research meetings to discuss the companies held in a particular team’s investment portfolio. Among the topics that may be discussed at these meetings are issues pertaining to a portfolio company’s record and policies on corporate governance practices that may affect shareholder value.
Each active-equity Portfolio Management Team determines how to allocate responsibility for analyzing corporate governance issues and proxy voting decisions among the team’s members. Under each arrangement, the work related to proxy voting is integrated into our research process. Each active-equity Portfolio Management Team remains responsible for ensuring that corporate governance issues are analyzed and proxy votes are cast in a manner consistent with our guiding principles.
Quantitative Equity
Our quantitative-equity Portfolio Management Teams, by contrast, have decided to follow the Guidelines and ISS Recommendations exclusively, based on such Portfolio Management Teams’ investment philosophy and approach to portfolio construction, as well as the evaluation of ISS’s services and methodology in analyzing shareholder and corporate governance matters. Nevertheless, our quantitative-equity Portfolio Management Teams retain the authority to revisit this position, with respect to both their general approach to proxy voting (subject to the approval of GSAM senior management) and any specific shareholder vote (subject to the approval process described above).
Use of Third-Party Service Providers
We utilize independent service providers, such as ISS, to assist us in developing substantive proxy voting positions. ISS also updates and revises the Guidelines on a periodic basis, and any such revisions are reviewed by GSAM to determine whether they are consistent with our guiding principles. In addition, ISS assists us in the proxy voting process by providing operational, recordkeeping and reporting services. GSAM’s decision to retain ISS to perform the services described in this Policy is based principally on the view the services ISS provides will result in proxy voting decisions that are consistent with our guiding principles. GSAM management is responsible for reviewing our relationship with ISS and for evaluating the quality and effectiveness of the various services provided by ISS to assist us in satisfying our proxy voting responsibilities.
B-152
GSAM may hire other service providers to replace or supplement ISS with respect to any of the services GSAM currently receives from ISS. In addition, individual Portfolio Management Teams may supplement the information and analyses ISS provides from other sources.
Conflicts of Interest
Pursuant to this Policy, GSAM has implemented procedures designed to prevent conflicts of interest from influencing its proxy voting decisions. These procedures include our use of the Guidelines and ISS Recommendations. Proxy votes cast by GSAM in accordance with the Guidelines and ISS Recommendations will not present any conflicts of interest because GSAM casts such votes in accordance with a pre-determined policy based upon the recommendations of an independent third party.
Our procedures also prohibit the influence of conflicts of interest where an active-equity Portfolio Management Team decides to vote against an ISS Recommendation. In general, conflicts of interest between GSAM and other businesses within Goldman Sachs should not affect GSAM in light of the information barrier policies separating GSAM from those other businesses. In addition, in any particular case, the approval process for a decision to vote against an ISS Recommendation, as described above, includes an inquiry into potential conflicts of interest, and GSAM senior management will not approve decisions that are based on the influence of such conflicts.
Fixed Income and Private Investments
Voting decisions with respect to client investments in fixed income securities and the securities of privately-held issuers generally will be made by the relevant portfolio managers based on their assessment of the particular transactions or other matters at issue.
External Managers
Where GSAM places client assets with managers outside of GSAM, whether through separate accounts, funds-of-funds or other structures, such external managers generally will be responsible for voting proxies in accordance with the managers’ own policies. GSAM may, however, retain such responsibilities where it deems appropriate.
Client Direction
Clients may choose to vote proxies themselves, in which case they must arrange for their custodians to send proxy materials directly to them. GSAM can also accommodate individual clients that have developed their own guidelines with ISS or another proxy service. Clients may also discuss with GSAM the possibility of receiving individualized reports or other individualized services regarding proxy voting conducted on their behalf.
B-153
GRANTHAM, MAYO, VAN OTTERLOO & CO. LLC
GMO AUSTRALASIA LLC
(TOGETHER “GMO”)
PROXY VOTING POLICIES AND PROCEDURES
I. Introduction and General Principles
GMO provides investment advisory services primarily to institutional, including both ERISA and non-ERISA clients, and commercial clients. GMO understands that proxy voting is an integral aspect of security ownership. Accordingly, in cases where GMO has been delegated authority to vote proxies, that function must be conducted with the same degree of prudence and loyalty accorded any fiduciary or other obligation of an investment manager.
This policy permits clients of GMO to: (1) delegate to GMO the responsibility and authority to vote proxies on their behalf according to GMO’s proxy voting polices and guidelines; (2) delegate to GMO the responsibility and authority to vote proxies on their behalf according to the particular client’s own proxy voting policies and guidelines; or (3) elect to vote proxies themselves. In instances where clients elect to vote their own proxies, GMO shall not be responsible for voting proxies on behalf of such clients.
GMO believes that the following policies and procedures are reasonably designed to ensure that proxy matters are conducted in the best interest of its clients, in accordance with GMO’s fiduciary duties, applicable rules under the Investment Advisers Act of 1940 and fiduciary standards and responsibilities for ERISA clients set out in the Department of Labor interpretations.
II. Proxy Voting Guidelines
GMO has engaged Institutional Shareholder Services, Inc. (“ISS”) as its proxy voting agent to:
| | (1) | research and make voting recommendations or, for matters for which GMO has so delegated, to make the voting determinations; |
| | (2) | ensure that proxies are voted and submitted in a timely manner; |
| | (3) | handle other administrative functions of proxy voting; |
| | (4) | maintain records of proxy statements received in connection with proxy votes and provide copies of such proxy statements promptly upon request; |
| | (5) | maintain records of votes cast; and |
| | (6) | provide recommendations with respect to proxy voting matters in general. |
Proxies will be voted in accordance with the voting recommendations contained in the applicable domestic or global ISS Proxy Voting Manual, as in effect from time to time.
Copies of the current domestic and global ISS proxy voting guidelines are attached to these Voting Policies and Procedures as Exhibit A. GMO reserves the right to amend any of ISS’s guidelines in the future. If any such changes are made an amended Proxy Voting Policies and Procedures will be made available for clients.
Except in instances where a GMO client retains voting authority, GMO will instruct custodians of client accounts to forward all proxy statements and materials received in respect of client accounts to ISS.
III. Proxy Voting Procedures
GMO has a Corporate Actions Group with responsibility for administering the proxy voting process, including:
B-154
| | 1. | Implementing and updating the applicable domestic and global ISS proxy voting guidelines; |
| | 2. | Overseeing the proxy voting process; and |
| | 3. | Providing periodic reports to GMO’s Compliance Department and clients as requested. |
There may be circumstances under which a portfolio manager or other GMO investment professional (“GMO Investment Professional”) believes that it is in the best interest of a client or clients to vote proxies in a manner inconsistent with the recommendation of ISS. In such an event, the GMO Investment Professional will inform GMO’s Corporate Actions Group of its decision to vote such proxy in a manner inconsistent with the recommendation of ISS. GMO’s Corporate Actions Group will report to GMO’s Compliance Department no less than quarterly any instance where a GMO Investment Professional has decided to vote a proxy on behalf of a client in that manner.
IV. Conflicts of Interest
As ISS will vote proxies in accordance with the proxy voting guidelines described in Section II, GMO believes that this process is reasonably designed to address conflicts of interest that may arise between GMO and a client as to how proxies are voted.
In instances where GMO has the responsibility and authority to vote proxies on behalf of its clients for shares of GMO Trust, a registered mutual fund for which GMO serves as the investment adviser, there may be instances where a conflict of interest exists. Accordingly, GMO will (i) vote such proxies in the best interests of its clients with respect to routine matters, including proxies relating to the election of Trustees; and (ii) with respect to matters where a conflict of interest exists between GMO and GMO Trust, such as proxies relating to a new or amended investment management contract between GMO Trust and GMO, or a re-organization of a series of GMO Trust, GMO will either (a) vote such proxies in the same proportion as the votes cast with respect to that proxy, or (b) seek instructions from its clients.
In addition, if GMO is aware that one of the following conditions exists with respect to a proxy, GMO shall consider such event a potential material conflict of interest:
| | 1. | GMO has a business relationship or potential relationship with the issuer; |
| | 2. | GMO has a business relationship with the proponent of the proxy proposal; or |
| | 3. | GMO members, employees or consultants have a personal or other business relationship with the participants in the proxy contest, such as corporate directors or director candidates. |
In the event of a potential material conflict of interest, GMO will (i) vote such proxy according to the specific recommendation of ISS; (ii) abstain; or (iii) request that the client votes such proxy. All such instances shall be reported to GMO’s Compliance Department at least quarterly.
V. Recordkeeping
GMO will maintain records relating to the implementation of these proxy voting policies and procedures, including:
| | (1) | a copy of these policies and procedures which shall be made available to clients, upon request; |
| | (2) | a record of each vote cast (which ISS maintains on GMO’s behalf); and |
| | (3) | each written client request for proxy records and GMO’s written response to any client request for such records. |
Such proxy voting records shall be maintained for a period of five years.
B-155
VI. Reporting
GMO’s Compliance Department will provide GMO’s Conflict of Interest Committee with periodic reports that include a summary of instances where GMO has (i) voted proxies in a manner inconsistent with the recommendation of ISS, (ii) voted proxies in circumstances in which a material conflict of interest may exist as set forth in Section IV, and (iii) voted proxies of shares of GMO Trust on behalf of its clients.
VII. Disclosure
Except as otherwise required by law, GMO has a general policy of not disclosing to any issuer or third party how GMO or its voting delegate voted a client’s proxy.
Effective: August 6, 2003
B-156
Harris Associates L.P.
Approved by the Proxy Voting Committee on February 21, 2006
PROXY VOTING POLICIES, GUIDELINES, AND PROCEDURES
Harris Associates L.P. (“Harris”, “the Firm” or “we”) believes that proxy voting rights are valuable portfolio assets and an important part of our investment process, and we exercise our voting responsibilities as a fiduciary solely with the goal of serving the best interests of our clients in their capacity as shareholders of a company. As an investment manager, Harris is primarily concerned with maximizing the value of its clients’ investment portfolios. Harris has long been active in voting proxies on behalf of shareholders in the belief that the proxy voting process is a significant means of addressing crucial corporate governance issues and encouraging corporate actions that are believed to enhance shareholder value. We have a Proxy Committee comprised of investment professionals that reviews and recommends policies and procedures regarding our proxy voting and ensures compliance with those policies.
The proxy voting guidelines below summarize Harris’ position on various issues of concern to investors and give a general indication of how proxies on portfolio securities will be voted on proposals dealing with particular issues. We will generally vote proxies in accordance with these guidelines, except as otherwise determined by the Proxy Committee, unless the client has specifically instructed us to vote otherwise. These guidelines are not exhaustive and do not include all potential voting issues. Because proxy issues and the circumstances of individual companies vary, there may be instances when Harris may not vote in strict adherence to these guidelines. Our investment professionals, as part of their ongoing review and analysis of all portfolio holdings, are responsible for monitoring significant corporate developments, including proxy proposals submitted to shareholders, and notifying the Proxy Committee if they believe the economic interests of shareholders may warrant a vote contrary to these guidelines. In such cases, the Proxy Committee will determine how the proxies will be voted.
In determining the vote on any proposal, the Proxy Committee will consider the proposal’s expected impact on shareholder value and will not consider any benefit to Harris, its employees, its affiliates or any other person, other than benefits to the owners of the securities to be voted, as shareholders.
Harris considers the reputation, experience and competence of a company’s management when it evaluates the merits of investing in a particular company, and we invest in companies in which we believe management goals and shareholder goals are aligned. When this happens, by definition, voting with management is generally the same as voting to maximize the expected value of our investment. Accordingly, on most issues, our votes are cast in accordance with management’s recommendations. This does not mean that we do not care about corporate governance. Rather, it is confirmation that our process of investing with shareholder aligned management is working. Proxy voting is not always black and white, however, and reasonable people can disagree over some matters of business judgment. When we believe management’s position on a particular issue is not in the best interests of our clients, we will vote contrary to management’s recommendation.
The following guidelines are grouped according to the types of proposals generally presented to shareholders.
Board of Directors Issues
Harris believes that boards should have a majority of independent directors and that audit, compensation and nominating committees should generally consist solely of independent directors.
B-157
Harris Associates L.P.
Approved by the Proxy Voting Committee on February 21, 2006
| | 1. | Harris will normally vote in favor of the slate of directors recommended by the issuer’s board provided that a majority of the directors would be independent. |
| | 2. | Harris will normally vote in favor of proposals to require a majority of directors to be independent. |
| | 3. | Harris will normally vote in favor of proposals that audit, compensation and nominating committees consist solely of independent directors, and will vote against the election of non-independent directors who serve on those committees. |
| | 4. | Harris will normally vote in favor of proposals regarding director indemnification arrangements. |
| | 5. | Harris will normally vote against proposals advocating classified or staggered boards of directors. |
| | 6. | Harris will normally vote in favor of cumulative voting for directors. |
Auditors
Harris believes that the relationship between an issuer and its auditors should be limited primarily to the audit engagement, although it may include certain closely related activities such as financial statement preparation and tax-related services that do not raise any appearance of impaired independence.
| | 1. | Harris will normally vote in favor of ratification of auditors selected by the board or audit committee, subject to the above. |
| | 2. | Harris will normally vote against proposals to prohibit or limit fees paid to auditors for all non-audit services, subject to the above. |
| | 3. | Harris will normally vote in favor of proposals to prohibit or limit fees paid to auditors for general management consulting services other than auditing, financial statement preparation and controls, and tax-related services. |
Equity Based Compensation Plans
Harris believes that appropriately designed equity-based compensation plans approved by shareholders can be an effective way to align the interests of long-term shareholders and the interests of management, employees and directors. However, we are opposed to plans that substantially dilute our ownership interest in the company, provide participants with excessive awards or have inherently objectionable structural features.
| | 1. | Harris will normally vote against such plans where total potential dilution (including all equity-based plans) exceeds 15% of shares outstanding. |
| | 2. | Harris will normally vote in favor of plans where total potential dilution (including all equity-based plans) does not exceed 15% of shares outstanding. |
| | 3. | Harris will normally vote in favor of proposals to require expensing of options. |
| | 4. | Harris will normally vote against proposals to permit repricing of underwater options. |
| | 5. | Harris will normally vote against proposals to require that all option plans have a performance-based strike price or performance-based vesting. |
| | 6. | Harris will normally vote against shareholder proposals that seek to limit directors’ compensation to common stock. |
| | 7. | Harris will normally vote in favor of proposals for employee stock purchase plans, so long as shares purchased through such plans are sold at no less than 85% of current market value. |
B-158
Harris Associates L.P.
Approved by the Proxy Voting Committee on February 21, 2006
Corporate Structure and Shareholder Rights
Harris generally believes that all shareholders should have an equal voice and that barriers which limit the ability of shareholders to effect change and to realize full value are not desirable.
| | 1. | Harris will normally vote in favor of proposals to increase authorized shares. |
| | 2. | Harris will normally vote in favor of proposals to authorize the repurchase of shares. |
| | 3. | Harris will normally vote against proposals creating or expanding supermajority voting rights. |
| | 4. | Harris will normally vote against the issuance of poison pill preferred shares. |
| | 5. | Harris will normally vote in favor of proposals for stock splits and reverse stock splits. |
| | 6. | Harris will normally vote against proposals to authorize different classes of stock with different voting rights. |
Routine Corporate Matters
Harris will generally vote in favor of routine business matters such as approving a motion to adjourn the meeting, declaring final payment of dividends, approving a change in the annual meeting date and location, approving the minutes of a previously held meeting, receiving consolidated financial statements, change of corporate name and similar matters.
Social Responsibility Issues
Harris believes that matters related to a company’s day-to-day business operations are primarily the responsibility of management and should be reviewed and supervised solely by the company’s board of directors. Harris is focused on maximizing long-term shareholder value and will typically vote against shareholder proposals requesting that a company disclose or amend certain business practices unless we believe a proposal would have a substantial positive economic impact on the company.
| III. | VOTING SHARES OF FOREIGN ISSUERS |
Because foreign issuers are incorporated under the laws of countries outside the United States, protection for shareholders may vary significantly from jurisdiction to jurisdiction. Laws governing foreign issuers may, in some cases, provide substantially less protection for shareholders. As a result, the foregoing guidelines, which are premised on the existence of a sound corporate governance and disclosure framework, may not be appropriate under some circumstances for foreign issuers. Harris will generally vote proxies of foreign issuers in accordance with the foregoing guidelines where appropriate.
In some non-U.S. jurisdictions, sales of securities voted may be prohibited for some period of time, usually between the record and meeting dates (“share blocking”). Since these time periods are usually relatively short in light of our long-term investment strategy, in most cases, share blocking will not impact our voting decisions. However, there may be occasions where the loss of investment flexibility resulting from share blocking will outweigh the benefit to be gained by voting.
The Proxy Committee, in consultation with the Legal and Compliance Departments, is responsible for monitoring and resolving possible material conflicts of interest with respect to proxy voting. A conflict of interest
B-159
Harris Associates L.P.
Approved by the Proxy Voting Committee on February 21, 2006
may exist, for example, when: (i) proxy votes regarding non-routine matters are solicited by an issuer who has an institutional separate account relationship with Harris or Harris is actively soliciting business from the issuer; (ii) when we are aware that a proponent of a proxy proposal has a business relationship with Harris or Harris is actively soliciting such business (e.g., an employee group for which Harris manages money); (iii) when we are aware that Harris has business relationships with participants in proxy contests, corporate directors or director candidates; or (iv) when we are aware that a Harris employee has a personal interest in the outcome of a particular matter before shareholders (e.g., a Harris executive has an immediate family member who serves as a director of a company). Any employee with knowledge of any conflict of interest relating to a particular proxy vote shall disclose that conflict to the Proxy Committee. In addition, if any member of the Proxy Committee has a conflict of interest, he or she will recuse himself or herself from any consideration of the matter, and an alternate member of the committee will act in his or her place.
Harris is committed to resolving any such conflicts in its clients’ collective best interest, and accordingly, we will vote pursuant to the Guidelines set forth in this Proxy Voting Policy when conflicts of interest arise. When there are proxy voting proposals that give rise to a conflict of interest and are not addressed by the Guidelines, Harris will vote in accordance with the guidance of Institutional Shareholder Services (“ISS”). If ISS has not provided guidance with respect to the proposal or if we believe the recommendation of ISS is not in the best interests of our clients, the Proxy Committee will refer the matter to (1) the Executive Committee of the Board of Trustees of Harris Associates Investment Trust for a determination of how shares held in The Oakmark Family of Funds will be voted, and (2) the Proxy Voting Conflicts Committee consisting of Harris’ General Counsel, Chief Compliance Officer and Chief Financial Officer for a determination of how shares held in all other client accounts will be voted. Each of those committees will keep a written record of the basis for its decision.
The following procedures have been established with respect to the voting of proxies on behalf of all clients, including mutual funds advised by Harris, for which Harris has voting responsibility.
Proxy Voting Committee. The Proxy Voting Committee (the “Committee”) is responsible for recommending proxy voting guidelines, establishing and maintaining policies and procedures for proxy voting, and ensuring compliance with these policies and procedures. The Committee consists of three investment professionals: one domestic portfolio manager, one domestic research analyst, and one international research analyst. Committee members serve for three years with members replaced on a rotating basis. New Committee members are nominated by the Committee and confirmed in writing by Harris’ Chief Executive Officer. The Committee also has two alternate members (one domestic analyst and one international analyst) either of who may serve in the absence of a regular member of the Committee.
Proxy Administrator. The Proxy Administrator is an employee of Harris reporting to the Chief Compliance Officer and is responsible for ensuring that all votes are placed with the proxy voting service provider and that all necessary records, as appropriate, are maintained reflecting such voting.
Proxy Voting Service Provider. Harris has engaged an independent proxy voting service provider to assist in voting proxies. This proxy voting service provides the Firm with information concerning shareholder meetings, electronic voting, recordkeeping and reporting services, research with respect to companies, and proxy voting guidance and recommendations.
Voting Decisions. As described in the Proxy Voting Policy above, the Firm has established proxy voting guidelines on various issues. We will generally vote proxies in accordance with these guidelines except as
B-160
Harris Associates L.P.
Approved by the Proxy Voting Committee on February 21, 2006
otherwise determined by the Proxy Committee. The Proxy Administrator is responsible for alerting the Firm’s research analyst who follows the company about the proxy proposals. If the analyst believes the proxy should be voted in accordance with the guidelines, he or she will vote the proposal accordingly and indicate their initials in the appropriate location of the electronic ballot and submit the vote for further processing by the Proxy Administrator. If the analyst believes the proxy should be voted contrary to the guidelines or if the guidelines do not address the issue presented, he or she will submit the proposal and his or her recommended vote to the Proxy Committee, which reviews the proposal and the analyst’s recommendation and makes a voting decision by majority vote. That Proxy Committee decision is reflected in the electronic ballot by a majority of the Proxy Committee.
In the case where securities that are not on the Firm’s Approved Lists of domestic, international or small cap securities are held in managed accounts, the Proxy Administrator will vote all shares in accordance with the Firm’s guidelines or, if the guidelines do not address the particular issue, in accordance with the guidance of Institutional Shareholder Services, the Firm’s proxy service provider.
In the case of a conflict of interest, the Proxy Administrator will vote in accordance with the procedures set forth in the Conflicts of Interest provisions described above.
Voting Ballots. For shares held in The Oakmark Funds and other client accounts, the MIS Department sends a holdings file to the proxy voting service detailing the holdings in the Funds and other client accounts. The proxy voting service is responsible for reconciling this information with the information it receives from the custodians and escalating any discrepancies to the attention of the Proxy Administrator. The Proxy Administrator works with the proxy voting service and custodians to resolve any discrepancies to ensure that all shares entitled to vote are voted.
Recordkeeping and Reporting. Much of Harris’ recordkeeping and reporting is maintained electronically on the proxy voting service provider’s systems. In the event that records are not held electronically within the proxy voting service provider’s system, Harris will maintain records of proxy voting proposals received, records of votes cast on behalf of clients, and any documentation material to a proxy voting decision as required by law. Upon request, or on an annual basis for ERISA accounts, Harris will provide clients with the proxy voting record for that client’s account. Beginning in August 2004, on an annual basis, Harris will make available the voting record for The Oakmark Funds for the previous one-year period ended June 30th.
B-161
INSIGHT CAPITAL RESEARCH & MANAGEMENT, INC.
STATEMENT OF POLICIES AND PROCEDURES REGARDING PROXY VOTING
Set forth below are the policies and procedures of the Firm with respect to proxy voting. This Statement does not attempt to describe every regulatory and compliance requirement applicable to proxy voting, but rather summarizes some of the issues involved and establishes general rules and procedures. Although this Statement expressly addresses proxy voting, the policies and procedures set forth herein apply to any solicitation of votes with respect to securities held in a Discretionary Account (as defined below), such as, for example, the solicitation of the consent of the holders of fixed income securities to a proposed restructuring.
Some of the terms used herein regarding proxy voting have the following definitions:
“Discretionary Account” means any Client Account with respect to which that client has granted the Firm (a) discretionary proxy voting authority, or (b) discretionary investment authority without expressly retaining proxy voting authority, unless the Client has instructed the Client Account’s custodian not to send proxy statements to the Firm.
“Non-Discretionary Account” means any Client Account with respect to which that client (a) has granted the Firm discretionary investment authority but has expressly retained proxy voting authority, (b) has not granted the Firm discretionary investment authority or discretionary proxy voting authority, or (c) has instructed the Client Account’s custodian not to send proxy statements to the Firm. Any specific securities in an otherwise Discretionary Account over which a client has retained discretion are considered to be in a Non-Discretionary Account.
“Proxy Control Officer” means Lisa Miller.
| A. | Discretionary Accounts. |
The Firm will vote all proxies on behalf of Discretionary Accounts after carefully considering all proxy solicitation materials and other available facts. The Firm’s Equity Analyst responsible for coverage of the security for which a proxy is received will make all voting decisions on behalf of a Discretionary Account based solely on the voting guidelines established by the Firm’s Investment Committee in the best interests of that Discretionary Account. The Firm will use reasonable efforts to respond to each proxy solicitation by the deadline for such response.
The Proxy Control Officer may designate an appropriate employee of the Firm to be responsible for insuring that all proxy statements are received and that the Firm responds to them in a timely manner.
1. Company Information. The Firm will review all proxy solicitation materials it receives concerning securities held in a Discretionary Account. The Firm will evaluate all such information and may seek additional information from the party soliciting the proxy and independent corroboration of such information when the Firm considers it appropriate and when it is reasonably available.
2. Proxy Voting Policies.
a. The Firm will vote FOR a proposal when it believes that the proposal serves the best interests of the Discretionary Account whose proxy is solicited because, on balance, the following factors predominate:
(i) the proposal has a positive economic effect on shareholder value;
(ii) the dilution, if any, of existing shares that would result from approval of the proposal is warranted by the benefits of the proposal; and
(iii) the proposal does not limit or impair accountability to shareholders on the part of management and the board of directors.
B-162
b. The Firm will vote AGAINST a proposal if it believes that, on balance, the following factors predominate:
(i) the proposal has an adverse economic effect on shareholder value;
(ii) the proposal limits the rights of shareholders in a manner or to an extent that is not warranted by the benefits of the proposal;
(iii) the proposal causes significant dilution of shares that is not warranted by the benefits of the proposal;
(iv) the proposal limits or impairs accountability to the shareholders on the part of management or the board of directors; or
(v) the proposal is a shareholder initiative that the Firm believes wastes time and resources of the company or reflects the grievance of one individual.
c. The Firm will ABSTAIN from voting proxies when the Firm believes that it is appropriate. Usually, this occurs when the Firm believes that a proposal holds negative but nonquantifiable implications for shareholder value but may express a legitimate concern.
d. From time to time, the Firm adopts more detailed proxy voting guidelines in accordance with this section 2, the most recent version of which is attached to this Statement.
3. Conflicts of Interest. Due to the size and nature of the Firm’s operations and the Firm’s limited affiliations in the securities industry, the Firm does not expect that material conflicts of interest will arise between the Firm and a Discretionary Account over proxy voting. The Firm recognizes, however, that such conflicts may arise from time to time, such as, for example, when the Firm or one of its affiliates has a business arrangement that could be affected by the outcome of a proxy vote or has a personal or business relationship with a person seeking appointment or re-appointment as a director of a company. If a material conflict of interest arises, the Firm will vote all proxies in accordance with section 2. Under no circumstances will the Firm place its own interests ahead of the interests of its Discretionary Accounts in voting proxies.
If the Firm determines that the proxy voting policies in section 2 do not adequately address a material conflict of interest related to a proxy, the Firm will provide the affected client with copies of all proxy solicitation materials received by the Firm with respect to that proxy, notify that client of the actual or potential conflict of interest and of the Firm’s intended response to the proxy request (which response will be in accordance with the policies set forth in section 2(b)), and request that the client consent to the Firm’s intended response. If the client consents to the Firm’s intended response or fails to respond to the notice within a reasonable period of time specified in the notice, the Firm will vote the proxy as described in the notice. If the client objects to the Firm’s intended response, the Firm will vote the proxy as directed by the client.
4. Proxy Vote Summaries. At the request of a Discretionary Account client, the Firm will provide that client with a report summarizing all proxy solicitations the Firm received with respect to that Discretionary Account during the period requested by the client and action taken by the Firm on each such proxy.
| B. | Non-Discretionary Accounts. |
The Firm promptly will forward any proxy solicitation materials concerning securities held in a Non-Discretionary Account that the Firm receives as soon as reasonably practicable to the appropriate client. The Firm will vote any such proxy as directed by that client. At a client’s request, the Firm may, but is not obligated to, advise that client with respect to the voting of any proxy. No advice concerning the voting of any proxy may be provided to any client unless such advice has been approved by the Proxy Control Officer.
The Firm will keep a copy of (1) each proxy statement it receives regarding securities held in Discretionary Accounts, (2) a record of each vote cast by the Firm with respect to securities in each Discretionary Account,
B-163
(3) any document created by the Firm that is material to the Firm’s decision on voting a proxy or that describes the basis for that decision, (4) each written request from a Discretionary Account client for information about how the Firm votes proxies and (5) each written response by the Firm to any oral or written request from a Discretionary Account client for such information. The Firm may delegate to a third party the duty to keep the records identified in clauses (1) and (2) of the preceding sentence, if that third party agrees to furnish such records to the Firm promptly on request. Each such record will be maintained by the Firm or such third party for at least five years from the end of the fiscal year during which the last entry is made in that record, and for the first two years in the Firm’s office. The Firm may elect not to keep a copy of a proxy statement if it can obtain such statement electronically via the SEC’s EDGAR system.
PROXY VOTING GUIDELINES
INSIGHT CAPITAL RESEARCH & MANAGEMENT, INC.
| 1. | WITHHOLD votes from director nominees IF 51% or more of the directors are employees of the company. |
| 2. | WITHHOLD votes from director nominees IF 20% or more of the directors are individuals with financial or other ties to the company as reported in the proxy statement. |
| 3. | WITHHOLD votes from director nominees IF 51% or more of directors serving on the board’s nominating committee are employees of the company. |
| 4. | WITHHOLD votes from director nominees IF 20% or more of directors serving on the board’s nominating committee are individuals with reported financial or other ties to the company as reported in the proxy statement. |
| 5. | WITHHOLD votes from director nominees IF 51% or more of directors serving and voting on the board’s compensation committee are employees of the company. |
| 6. | WITHHOLD votes from director nominees IF 20% or more of directors serving and voting on the board’s compensation committee are individuals with financial ties or other links as reported in the proxy statement. |
| 7. | WITHHOLD votes from director nominees IF the board will consist of less than 5 directors after the election. |
| 8. | Vote FOR management proposals to increase authorized preferred stock. |
| 9. | Vote FOR management proposals to add shares to stock option plans for non-employee directors IF 10% stock appreciation + base = <$75,000. |
| 10. | Vote AGAINST proposals to add shares to stock option plans for non-employee directors IF the plan allows nonqualified options to be priced at less than 100% of the fair market value on the grant date. |
| 11. | Vote AGAINST proposals to add shares to stock option plans for non-employee directors IF dilution represented by this proposal is more than 5% of the outstanding voting power. |
| 12. | Vote AGAINST proposals to add shares to stock option plans for non-employee directors IF minimum potential dilution of all plans, as calculated by IRRC and including this proposal, is more than 5% of the total outstanding voting power. |
| 13. | Oppose option plans that in total offer dilution of greater than 10%. |
| 14. | Oppose option plans that allow for immediate vesting. |
| 15. | Oppose option plans if an insider sits on the Compensation Committee. |
| 16. | Oppose option plans deemed as excessive or improper in the voting analyst’s opinion. |
B-164
MASSACHUSETTS FINANCIAL SERVICES COMPANY
PROXY VOTING POLICIES AND PROCEDURES
March 1, 2007
Massachusetts Financial Services Company, MFS Institutional Advisors, Inc. and MFS’ other investment adviser subsidiaries (collectively, “MFS”) have adopted proxy voting policies and procedures, as set forth below (“MFS Proxy Voting Policies and Procedures”), with respect to securities owned by the clients for which MFS serves as investment adviser and has the power to vote proxies, including the registered investment companies sponsored by MFS, other than the MFS Union Standard Equity Fund (the “MFS Funds”). References to “clients” in these policies and procedures include the MFS Funds and other clients of MFS, such as funds organized offshore, sub-advised funds and separate account clients, to the extent these clients have delegated to MFS the responsibility to vote proxies on their behalf under the MFS Proxy Voting Policies and Procedures.
The MFS Proxy Voting Policies and Procedures include:
| | B. | Administrative Procedures; |
A. VOTING GUIDELINES
1. General Policy; Potential Conflicts of Interest
MFS’ policy is that proxy voting decisions are made in what MFS believes to be the best long-term economic interests of MFS’ clients, and not in the interests of any other party or in MFS’ corporate interests, including interests such as the distribution of MFS Fund shares, administration of 401(k) plans, and institutional relationships.
MFS periodically reviews matters that are presented for shareholder vote by either management or shareholders of public companies. Based on the overall principle that all votes cast by MFS on behalf of its clients must be in what MFS believes to be the best long-term economic interests of such clients, MFS has adopted proxy voting guidelines, set forth below, that govern how MFS generally will vote on specific matters presented for shareholder vote. In all cases, MFS will exercise its discretion in voting on these matters in accordance with this overall principle. In other words, the underlying guidelines are simply that—guidelines. Proxy items of significance are often considered on a case-by-case basis, in light of all relevant facts and circumstances, and in certain cases MFS may vote proxies in a manner different from these guidelines.
As a general matter, MFS maintains a consistent voting position on similar proxy proposals with respect to various issuers. In addition, MFS generally votes consistently on the same matter when securities of an issuer are held by multiple client accounts. However, MFS recognizes that there are gradations in certain types of proposals that might result in different voting positions being taken with respect to different proxy statements. There also may be situations involving matters presented for shareholder vote that are not governed by the guidelines. Some items that otherwise would be acceptable will be voted against the proponent when it is seeking extremely broad flexibility without offering a valid explanation. MFS reserves the right to override the guidelines with respect to a particular shareholder vote when such an override is, in MFS’ best judgment, consistent with the overall principle of voting proxies in the best long-term economic interests of MFS’ clients.
From time to time, MFS receives comments on these guidelines as well as regarding particular voting issues from its clients. These comments are carefully considered by MFS when it reviews these guidelines each year and revises them as appropriate.
B-165
These policies and procedures are intended to address any potential material conflicts of interest on the part of MFS or its affiliates that are likely to arise in connection with the voting of proxies on behalf of MFS’ clients. If such potential material conflicts of interest do arise, MFS will analyze, document and report on such potential material conflicts of interest (see Sections B.2 and E below), and shall ultimately vote the relevant proxies in what MFS believes to be the best long-term economic interests of its clients. The MFS Proxy Voting Committee is responsible for monitoring and reporting with respect to such potential material conflicts of interest.
2. MFS’ Policy on Specific Issues
Election of Directors
MFS believes that good governance should be based on a board with at least a simple majority of directors who are “independent” of management, and whose key committees (e.g., compensation, nominating, and audit committees) are comprised entirely of “independent” directors. While MFS generally supports the board’s nominees in uncontested elections, we will withhold our vote for, or vote against, as applicable, a nominee to a board of a U.S. issuer if, as a result of such nominee being elected to the board, the board would be comprised of a majority of members who are not “independent” or, alternatively, the compensation, nominating or audit committees would include members who are not “independent.”
MFS will also withhold its vote for, or vote against, as applicable, a nominee to a board if we can determine that he or she failed to attend at least 75% of the board and/or relevant committee meetings in the previous year without a valid reason stated in the proxy materials. In addition, MFS will withhold its vote for, or vote against, as applicable, all nominees standing for re-election to a board if we can determine: (1) since the last annual meeting of shareholders and without shareholder approval, the board or its compensation committee has re-priced underwater stock options; or (2) since the last annual meeting, the board has either implemented a poison pill without shareholder approval or has not taken responsive action to a majority shareholder approved resolution recommending that the “poison pill” be rescinded. Responsive action would include the rescission of the “poison pill”(without a broad reservation to reinstate the “poison pill” in the event of a hostile tender offer), or assurance in the proxy materials that the terms of the “poison pill” would be put to a binding shareholder vote within the next five to seven years.
MFS will also withhold its vote for, or vote against, as applicable, a nominee (other than a nominee who serves as the issuer’s Chief Executive Officer) standing for re-election if such nominee participated (as a director or committee member) in the approval of a senior executive compensation package MFS deems to be “excessive.” In the event that MFS determines that an issuer has adopted an “excessive” executive compensation package, MFS will withhold its vote for, or vote against, as applicable, the re-election of the issuer’s Chief Executive Officer as director regardless of whether the Chief Executive Officer participated in the approval of the package. MFS will determine whether a senior executive compensation package is excessive on a case by case basis. Examples of “excessive” executive compensation packages include packages that contain egregious employment contract terms or pension payouts, backdated stock options, overly generous hiring bonuses for chief executive officers or packages which include excessive perks.
MFS evaluates a contested election of directors on a case-by-case basis considering the long-term financial performance of the company relative to its industry, management’s track record, the qualifications of the nominees for both slates and an evaluation of what each side is offering shareholders.
MFS votes for reasonably crafted proposals calling for directors to be elected with an affirmative majority of votes cast and/or the elimination of the plurality standard for electing directors (including binding resolutions requesting that the board amend the company’s bylaws), provided the proposal includes a carve-out for a plurality voting standard when there are more director nominees than board seats (e.g., contested elections) (“Majority Vote Proposals”).
MFS considers voting against Majority Vote Proposals if the company has adopted, or has proposed to adopt in the proxy statement, formal corporate governance principles that present a meaningful alternative to the
B-166
majority voting standard and provide an adequate response to both new nominees as well as incumbent nominees who fail to receive a majority of votes cast.
MFS believes that a company’s election policy should address the specific circumstances at that company. MFS considers whether a company’s election policy articulates the following elements to address each director nominee who fails to receive an affirmative majority of votes cast in an election:
| | • | | Establish guidelines for the process by which the company determines the status of nominees who fail to receive an affirmative majority of votes cast and disclose the guidelines in the annual proxy statement; |
| | • | | Guidelines should include a reasonable timetable for resolution of the nominee’s status and a requirement that the resolution be disclosed together with the reasons for the resolution; |
| | • | | Vest management of the process in the company’s independent directors, other than the nominee in question; and |
| | • | | Outline the range of remedies that the independent directors may consider concerning the nominee. |
Classified Boards
MFS opposes proposals to classify a board (e.g., a board in which only one-third of board members are elected each year). MFS supports proposals to declassify a board.
Non-Salary Compensation Programs
MFS votes against stock option programs for officers, employees or non-employee directors that do not require an investment by the optionee, that give “free rides” on the stock price, or that permit grants of stock options with an exercise price below fair market value on the date the options are granted.
MFS also opposes stock option programs that allow the board or the compensation committee, without shareholder approval, to reprice underwater options or to automatically replenish shares (i.e., evergreen plans). MFS will consider on a case-by-case basis proposals to exchange existing options for newly issued options (taking into account such factors as whether there is a reasonable value-for-value exchange).
MFS opposes stock option programs and restricted stock plans that provide unduly generous compensation for officers, directors or employees, or could result in excessive dilution to other shareholders. As a general guideline, MFS votes against restricted stock plans, stock option, non-employee director, omnibus stock plans and any other stock plan if all such plans for a particular company involve potential dilution, in the aggregate, of more than 15%. However, MFS may accept a higher percentage (up to 20%) in the case of startup or small companies which cannot afford to pay large salaries to executives, or in the case where MFS, based upon the issuer’s public disclosures, believes that the issuer has been responsible with respect to its recent compensation practices, including the mix of the issuance of restricted stock and options.
Expensing of Stock Options
MFS supports shareholder proposals to expense stock options because we believe that the expensing of options presents a more accurate picture of the company’s financial results to investors. We also believe that companies are likely to be more disciplined when granting options if the value of stock options were treated as an expense item on the company’s income statements.
Executive Compensation
MFS believes that competitive compensation packages are necessary to attract, motivate and retain executives. Therefore, except as provided in paragraph 2 above with respect to “excessive compensation” and the election of directors, MFS opposes shareholder proposals that seek to set restrictions on executive compensation.
B-167
MFS also opposes shareholder requests for disclosure on executive compensation beyond regulatory requirements because we believe that current regulatory requirements for disclosure of executive compensation are appropriate and that additional disclosure is often unwarranted and costly. Although we support linking executive stock option grants to a company’s performance, MFS opposes shareholder proposals that mandate a link of performance-based options to a specific industry or peer group stock index. MFS believes that compensation committees should retain the flexibility to propose the appropriate index or other criteria by which performance-based options should be measured.
MFS supports reasonably crafted shareholder proposals that (i) require the issuer to adopt a policy to recover the portion of performance-based bonuses and awards paid to senior executives that were not earned based upon a significant negative restatement of earnings unless the company already has adopted a clearly satisfactory policy on the matter, or (ii) expressly prohibit any future backdating of stock options.
Employee Stock Purchase Plans
MFS supports the use of a broad-based employee stock purchase plans to increase company stock ownership by employees, provided that shares purchased under the plan are acquired for no less than 85% of their market value and do not result in excessive dilution.
“Golden Parachutes”
From time to time, shareholders of companies have submitted proxy proposals that would require shareholder approval of severance packages for executive officers that exceed certain predetermined thresholds. MFS votes in favor of such shareholder proposals when they would require shareholder approval of any severance package for an executive officer that exceeds a certain multiple of such officer’s annual compensation that is not determined in MFS’ judgment to be excessive.
Anti-Takeover Measures
In general, MFS votes against any measure that inhibits capital appreciation in a stock, including proposals that protect management from action by shareholders. These types of proposals take many forms, ranging from “poison pills” and “shark repellents” to super-majority requirements.
MFS will vote for proposals to rescind existing “poison pills” and proposals that would require shareholder approval to adopt prospective “poison pills.” Nevertheless, MFS will consider supporting the adoption of a prospective “poison pill” or the continuation of an existing “poison pill” if we can determine that the following two conditions are met: (1) the “poison pill” allows MFS clients to hold an aggregate position of up to 15% of a company’s total voting securities (and of any class of voting securities); and (2) either (a) the “poison pill” has a term of not longer than five years, provided that MFS will consider voting in favor of the “poison pill” if the term does not exceed seven years and the “poison pill” is linked to a business strategy or purpose that MFS believes is likely to result in greater value for shareholders; or (b) the terms of the “poison pill” allow MFS clients the opportunity to accept a fairly structured and attractively priced tender offer (e.g., a “chewable poison pill” that automatically dissolves in the event of an all cash, all shares tender offer at a premium price).
MFS will consider on a case-by-case basis proposals designed to prevent tenders which are disadvantageous to shareholders such as tenders at below market prices and tenders for substantially less than all shares of an issuer.
Reincorporation and Reorganization Proposals
When presented with a proposal to reincorporate a company under the laws of a different state, or to effect some other type of corporate reorganization, MFS considers the underlying purpose and ultimate effect of such a proposal in determining whether or not to support such a measure. While MFS generally votes in favor of
B-168
management proposals that it believes are in the best long-term economic interests of its clients, MFS may oppose such a measure if, for example, the intent or effect would be to create additional inappropriate impediments to possible acquisitions or takeovers.
Issuance of Stock
There are many legitimate reasons for the issuance of stock. Nevertheless, as noted above under “Non-Salary Compensation Programs,” when a stock option plan (either individually or when aggregated with other plans of the same company) would substantially dilute the existing equity (e.g. by approximately 15% or more), MFS generally votes against the plan. In addition, MFS votes against proposals where management is asking for authorization to issue common or preferred stock with no reason stated (a “blank check”) because the unexplained authorization could work as a potential anti-takeover device. MFS may also vote against the authorization or issuance of common or preferred stock if MFS determines that the requested authorization is not warranted.
Repurchase Programs
MFS supports proposals to institute share repurchase plans in which all shareholders have the opportunity to participate on an equal basis. Such plans may include a company acquiring its own shares on the open market, or a company making a tender offer to its own shareholders.
Confidential Voting
MFS votes in favor of proposals to ensure that shareholder voting results are kept confidential. For example, MFS supports proposals that would prevent management from having access to shareholder voting information that is compiled by an independent proxy tabulation firm.
Cumulative Voting
MFS opposes proposals that seek to introduce cumulative voting and for proposals that seek to eliminate cumulative voting. In either case, MFS will consider whether cumulative voting is likely to enhance the interests of MFS’ clients as minority shareholders. In our view, shareholders should provide names of qualified candidates to a company’s nominating committee, which (for U.S. listed companies) must be comprised solely of “independent” directors.
Written Consent and Special Meetings
Because the shareholder right to act by written consent (without calling a formal meeting of shareholders) can be a powerful tool for shareholders, MFS generally opposes proposals that would prevent shareholders from taking action without a formal meeting or would take away a shareholder’s right to call a special meeting of company shareholders.
Independent Auditors
MFS believes that the appointment of auditors for U.S. issuers is best left to the board of directors of the company and therefore supports the ratification of the board’s selection of an auditor for the company. Some shareholder groups have submitted proposals to limit the non-audit activities of a company’s audit firm or prohibit any non-audit services by a company’s auditors to that company. MFS opposes proposals recommending the prohibition or limitation of the performance of non-audit services by an auditor, and proposals recommending the removal of a company’s auditor due to the performance of non-audit work for the company by its auditor. MFS believes that the board, or its audit committee, should have the discretion to hire the company’s auditor for specific pieces of non-audit work in the limited situations permitted under current law.
B-169
Other Corporate Governance, Corporate Responsibility and Social Issues
There are many groups advocating social change or changes to corporate governance or corporate responsibility standards, and many have chosen the publicly-held corporation as a vehicle for advancing their agenda. Generally, MFS votes with management on such proposals unless MFS can determine that the benefit to shareholders will outweigh any costs or disruptions to the business if the proposal were adopted. Common among the shareholder proposals that MFS generally votes against are proposals requiring the company to use corporate resources to further a particular social objective outside the business of the company, to refrain from investing or conducting business in certain countries, to adhere to some list of goals or principles (e.g., environmental standards), to disclose political contributions made by the issuer, to separate the Chairman and Chief Executive Officer positions, or to promulgate special reports on various activities or proposals for which no discernible shareholder economic advantage is evident.
The laws of various states may regulate how the interests of certain clients subject to those laws (e.g., state pension plans) are voted with respect to social issues. Thus, it may be necessary to cast ballots differently for certain clients than MFS might normally do for other clients.
Foreign Issuers
Many of the items on foreign proxies involve repetitive, non-controversial matters that are mandated by local law. Accordingly, the items that are generally deemed routine and which do not require the exercise of judgment under these guidelines (and therefore voted in favor) for foreign issuers include the following: (i) receiving financial statements or other reports from the board; (ii) approval of declarations of dividends; (iii) appointment of shareholders to sign board meeting minutes; (iv) discharge of management and supervisory boards; and (v) approval of share repurchase programs.
MFS generally supports the election of a director nominee standing for re-election in uncontested elections unless it can be determined that (1) he or she failed to attend at least 75% of the board and/or relevant committee meetings in the previous year without a valid reason given in the proxy materials; (2) since the last annual meeting of shareholders and without shareholder approval, the board or its compensation committee has re-priced underwater stock options; or (3) since the last annual meeting, the board has either implemented a poison pill without shareholder approval or has not taken responsive action to a majority shareholder approved resolution recommending that the “poison pill” be rescinded. MFS will also withhold its vote for, or vote against, as applicable, a director nominee standing for re-election of an issuer that has adopted an excessive compensation package for its senior executives as described above in the section entitled “Voting Guidelines-MFS’ Policy on Specific Issues-Election of Directors.”
MFS generally supports the election of auditors, but may determine to vote against the election of a statutory auditor in certain markets if MFS reasonably believes that the statutory auditor is not truly independent. MFS will evaluate all other items on proxies for foreign companies in the context of the guidelines described above, but will generally vote against an item if there is not sufficient information disclosed in order to make an informed voting decision
In accordance with local law or business practices, many foreign companies prevent the sales of shares that have been voted for a certain period beginning prior to the shareholder meeting and ending on the day following the meeting (“share blocking”). Depending on the country in which a company is domiciled, the blocking period may begin a stated number of days prior to the meeting (e.g., one, three or five days) or on a date established by the company. While practices vary, in many countries the block period can be continued for a longer period if the shareholder meeting is adjourned and postponed to a later date. Similarly, practices vary widely as to the ability of a shareholder to have the “block” restriction lifted early (e.g., in some countries shares generally can be “unblocked” up to two days prior to the meeting whereas in other countries the removal of the block appears to be discretionary with the issuer’s transfer agent). Due to these restrictions, MFS must balance the benefits to its clients of voting proxies against the potentially serious portfolio management consequences of a reduced
B-170
flexibility to sell the underlying shares at the most advantageous time. For companies in countries with share blocking periods, the disadvantage of being unable to sell the stock regardless of changing conditions generally outweighs the advantages of voting at the shareholder meeting for routine items. Accordingly, MFS will not vote those proxies in the absence of an unusual, significant vote.
B. ADMINISTRATIVE PROCEDURES
1. MFS Proxy Voting Committee
The administration of these MFS Proxy Voting Policies and Procedures is overseen by the MFS Proxy Voting Committee, which includes senior personnel from the MFS Legal and Global Investment Support Departments. The MFS Proxy Voting Committee:
| | a. | Reviews these MFS Proxy Voting Policies and Procedures at least annually and recommends any amendments considered to be necessary or advisable; |
| | b. | Determines whether any potential material conflicts of interest exist with respect to instances in which (i) MFS seeks to override these MFS Proxy Voting Policies and Procedures and (ii) votes on ballot items not clearly governed by these MFS Proxy Voting Policies and Procedures; and |
| | c. | Considers special proxy issues as they may arise from time to time. |
2. Potential Conflicts of Interest
The MFS Proxy Voting Committee is responsible for monitoring potential material conflicts of interest on the part of MFS or its affiliates that could arise in connection with the voting of proxies on behalf of MFS’ clients. Any significant attempt to influence MFS’ voting on a particular proxy matter should be reported to the MFS Proxy Voting Committee.
In cases where proxies are voted in accordance with these MFS Proxy Voting Policies and Procedures, no material conflict of interest will be deemed to exist. In cases where (i) MFS is considering overriding these MFS Proxy Voting Policies and Procedures, or (ii) matters presented for vote are not governed by these MFS Proxy Voting Policies and Procedures, the MFS Proxy Voting Committee, or delegees, will follow these procedures:
| | a. | Compare the name of the issuer of such proxy against a list of significant current and potential (i) distributors of MFS Fund shares, (ii) retirement plans administered by MFS or its affiliate MFS Retirement Services, Inc. (“RSI”), and (iii) MFS institutional clients (the “MFS Significant Client List”); |
| | b. | If the name of the issuer does not appear on the MFS Significant Client List, then no material conflict of interest will be deemed to exist, and the proxy will be voted as otherwise determined by the MFS Proxy Voting Committee; |
| | c. | If the name of the issuer appears on the MFS Significant Client List, then the MFS Proxy Voting Committee will be apprised of that fact and each member of the MFS Proxy Voting Committee will carefully evaluate the proposed vote in order to ensure that the proxy ultimately is voted in what MFS believes to be the best long-term economic interests of MFS’ clients, and not in MFS’ corporate interests; and |
| | d. | For all potential material conflicts of interest identified under clause (c) above, the MFS Proxy Voting Committee will document: the name of the issuer, the issuer’s relationship to MFS, the analysis of the matters submitted for proxy vote, the votes as to be cast and the reasons why the MFS Proxy Voting Committee determined that the votes were cast in the best long-term economic interests of MFS’ clients, and not in MFS’ corporate interests. A copy of the foregoing documentation will be provided to MFS’ Conflicts Officer. |
B-171
The members of the MFS Proxy Voting Committee are responsible for creating and maintaining the MFS Significant Client List, in consultation with MFS’ distribution, institutional business units and RSI. The MFS Significant Client List will be reviewed and updated periodically, as appropriate.
3. Gathering Proxies
Most proxies received by MFS and its clients originate at Automatic Data Processing Corp. (“ADP”) although a few proxies are transmitted to investors by corporate issuers through their custodians or depositories. ADP and issuers send proxies and related material directly to the record holders of the shares beneficially owned by MFS’ clients, usually to the client’s custodian or, less commonly, to the client itself. This material will include proxy cards, reflecting the shareholdings of Funds and of clients on the record dates for such shareholder meetings, as well as proxy statements with the issuer’s explanation of the items to be voted upon.
MFS, on behalf of itself and the Funds, has entered into an agreement with an independent proxy administration firm, Institutional Shareholder Services, Inc. (the “Proxy Administrator”), pursuant to which the Proxy Administrator performs various proxy vote related administrative services, such as vote processing and recordkeeping functions for MFS’ Funds and institutional client accounts. The Proxy Administrator receives proxy statements and proxy cards directly or indirectly from various custodians, logs these materials into its database and matches upcoming meetings with MFS Fund and client portfolio holdings, which are input into the Proxy Administrator’s system by an MFS holdings datafeed. Through the use of the Proxy Administrator system, ballots and proxy material summaries for all upcoming shareholders’ meetings are available on-line to certain MFS employees and the MFS Proxy Voting Committee.
4. Analyzing Proxies
Proxies are voted in accordance with these MFS Proxy Voting Policies and Procedures. The Proxy Administrator at the prior direction of MFS automatically votes all proxy matters that do not require the particular exercise of discretion or judgment with respect to these MFS Proxy Voting Policies and Procedures as determined by the MFS Proxy Voting Committee. With respect to proxy matters that require the particular exercise of discretion or judgment, MFS considers and votes on those proxy matters. MFS receives research from ISS which it may take into account in deciding how to vote. In addition, MFS expects to rely on ISS to identify circumstances in which a board may have approved excessive executive compensation. Representatives of the MFS Proxy Voting Committee review, as appropriate, votes cast to ensure conformity with these MFS Proxy Voting Policies and Procedures.
As a general matter, portfolio managers and investment analysts have little or no involvement in specific votes taken by MFS. This is designed to promote consistency in the application of MFS’ voting guidelines, to promote consistency in voting on the same or similar issues (for the same or for multiple issuers) across all client accounts, and to minimize the potential that proxy solicitors, issuers, or third parties might attempt to exert inappropriate influence on the vote. In limited types of votes (e.g., corporate actions, such as mergers and acquisitions), a representative of MFS Proxy Voting Committee may consult with or seek recommendations from portfolio managers or analysts.1 However, the MFS Proxy Voting Committee would ultimately determine the manner in which all proxies are voted.
As noted above, MFS reserves the right to override the guidelines when such an override is, in MFS’ best judgment, consistent with the overall principle of voting proxies in the best long-term economic interests of MFS’ clients. Any such override of the guidelines shall be analyzed, documented and reported in accordance with the procedures set forth in these policies.
1 | From time to time, due to travel schedules and other commitments, an appropriate portfolio manager or research analyst is not available to provide a recommendation on a merger or acquisition proposal. If such a recommendation cannot be obtained prior to the cut-off date of the shareholder meeting, certain members of the MFS Proxy Voting Committee may determine to abstain from voting. |
B-172
5. Voting Proxies
In accordance with its contract with MFS, the Proxy Administrator also generates a variety of reports for the MFS Proxy Voting Committee, and makes available on-line various other types of information so that the MFS Proxy Voting Committee may review and monitor the votes cast by the Proxy Administrator on behalf of MFS’ clients.
C. MONITORING SYSTEM
It is the responsibility of the Proxy Administrator and MFS’ Proxy Voting Committee to monitor the proxy voting process. When proxy materials for clients are received, they are forwarded to the Proxy Administrator and are input into the Proxy Administrator’s system. Through an interface with the portfolio holdings database of MFS, the Proxy Administrator matches a list of all MFS Funds and clients who hold shares of a company’s stock and the number of shares held on the record date with the Proxy Administrator’s listing of any upcoming shareholder’s meeting of that company.
When the Proxy Administrator’s system “tickler” shows that the voting cut-off date of a shareholders’ meeting is approaching, a Proxy Administrator representative checks that the vote for MFS Funds and clients holding that security has been recorded in the computer system. If a proxy card has not been received from the client’s custodian, the Proxy Administrator calls the custodian requesting that the materials be forwarded immediately. If it is not possible to receive the proxy card from the custodian in time to be voted at the meeting, MFS may instruct the custodian to cast the vote in the manner specified and to mail the proxy directly to the issuer.
D. RECORDS RETENTION
MFS will retain copies of these MFS Proxy Voting Policies and Procedures in effect from time to time and will retain all proxy voting reports submitted to the Board of Trustees, Board of Directors and Board of Managers of the MFS Funds for the period required by applicable law. Proxy solicitation materials, including electronic versions of the proxy cards completed by representatives of the MFS Proxy Voting Committee, together with their respective notes and comments, are maintained in an electronic format by the Proxy Administrator and are accessible on-line by the MFS Proxy Voting Committee. All proxy voting materials and supporting documentation, including records generated by the Proxy Administrator’s system as to proxies processed, including the dates when proxy ballots were received and submitted, and the votes on each company’s proxy issues, are retained as required by applicable law.
E. REPORTS
MFS Funds
MFS will report the results of its voting to the Board of Trustees, Board of Directors and Board of Managers of the MFS Funds. These reports will include: (i) a summary of how votes were cast; (ii) a review of situations where MFS did not vote in accordance with the guidelines and the rationale therefore; (iii) a review of the procedures used by MFS to identify material conflicts of interest; and (iv) a review of these policies and the guidelines and, as necessary or appropriate, any proposed modifications thereto to reflect new developments in corporate governance and other issues. Based on these reviews, the Trustees, Directors and Managers of the MFS Funds will consider possible modifications to these policies to the extent necessary or advisable.
All MFS Advisory Clients
At any time, a report can be printed by MFS for each client who has requested that MFS furnish a record of votes cast. The report specifies the proxy issues which have been voted for the client during the year and the position taken with respect to each issue.
Generally, MFS will not divulge actual voting practices to any party other than the client or its representatives (unless required by applicable law) because we consider that information to be confidential and proprietary to the client.
B-173
Mazama Capital Management, Inc.
Proxy Voting
Policy
Mazama Capital Management, Inc. (“Mazama”), as a matter of policy and as a fiduciary to our clients, has responsibility for voting proxies for portfolio securities consistent with the best economic interests of the clients. Our firm maintains written policies and procedures as to the handling, research, voting and reporting of proxy voting and makes appropriate disclosures about our firm’s proxy policies and practices. Our policy and practice includes the responsibility to monitor corporate actions, receive and vote client proxies and disclose any potential conflicts of interest as well as making information available to clients about the voting of proxies for their portfolio securities and maintaining relevant and required records.
Background
Proxy voting is an important right of shareholders and reasonable care and diligence must be undertaken to ensure that such rights are properly and timely exercised. Investment advisers registered with the SEC, and which exercise voting authority with respect to client securities, are required by Rule 206(4)-6 of the Advisers Act to (a) adopt and implement written policies and procedures that are reasonably designed to ensure that client securities are voted in the best interests of clients, which must include how an adviser addresses material conflicts that may arise between an adviser’s interests and those of its clients; (b) to disclose to clients how they may obtain information from the adviser with respect to the voting of proxies for their securities; (c) to describe to clients a summary of its proxy voting policies and procedures and, upon request, furnish a copy to its clients; and (d) maintain certain records relating to the adviser’s proxy voting activities when the adviser does have proxy voting authority.
Guiding Principles
Proxy voting procedures must adhere to the following broad principles:
| | 1. | Voting rights have economic value and must be treated accordingly. This means the fiduciary (Mazama) has a duty to vote proxies in those cases where fiduciary responsibility has been delegated to Mazama. |
| | 2. | Fiduciaries must maintain documented voting policies or guidelines to govern proxy voting decisions. |
| | 3. | Fiduciaries should keep records of proxy voting. |
Proxy Administration
The Chief Compliance Officer (“CCO”) has the responsibility for the implementation and monitoring of our proxy voting policy, practices, disclosures and record keeping, including outlining our voting guidelines in our procedures. The Director of Research, Portfolio Manager (“Director of Research”) is responsible for determining our firm’s positions on all major corporate issues, creates guidelines and oversees the voting process.
Mazama takes an active role in voting proxies on behalf of all accounts for which the firm has been hired as investment manager, unless proxy voting responsibility has been retained by the client. Generally, routine proxies will be voted with management as indicated on the proxy.
Mazama has retained Glass Lewis (“GL”), an expert in the proxy voting and corporate governance area, to provide proxy advisory and voting services. These services include in-depth research, analysis, and voting recommendations as well as vote execution, reporting, auditing and consulting assistance for the handling of
B-174
proxy voting responsibility and corporate governance-related efforts. GL provides administrative assistance to the proxy voting process by electronically executing the votes while allowing Mazama to retain voting authority.
Voting Policies
All proxy materials received on behalf of clients are forwarded to Glass Lewis (GL).
| | 1. | Absent material conflicts, the Director of Research will determine how Mazama should vote the proxy in accordance with applicable voting guidelines. |
| | 2. | Proxy ballots for securities no longer held in client accounts will not be voted. |
Mazama generally votes in favor of routine issues. Such issues may include but are not limited to:
| | 3. | Eliminate preemptive rights |
| | 4. | Increase authorized shares issued |
With regard to non-routine issues, Mazama considers many things including, but not limited to:
| | 1. | Management’s recommendation; |
| | 2. | The recommendation of GL; and |
| | 3. | Mazama’s assessment as to what is best for shareholders |
With regard to issues which are often included in proxies, Mazama believes as follows:
Executive Compensation
Mazama’s goal is to assure that a company’s equity-based compensation plan is aligned with shareholders’ long-term interests. While we evaluate most plans on a case-by case basis, Mazama generally opposes compensation packages that provide what we view as excessive awards to a few senior executives or that contain excessively dilutive stock option plans. We generally oppose plans that give a company the ability to re-price options.
Anti-takeover and Corporate Governance Issues
Mazama generally opposes anti-takeover measures and other proposals designed to limit the ability of shareholders to act on possible transactions. Mazama strongly favors having only independent board members in all sub-committees (compensation, nominating, audit, etc.) and may vote against certain board members if they are affiliated with the company and also members of the sub-committees. When voting on corporate governance proposals, we will consider the dilutive impact to shareholders and the effect on shareholder rights.
Social and Corporate Responsibility Issues
Mazama generally votes with a company’s management on social issues unless they have substantial economic implications for the company’s business and operations and have not been adequately addressed by management.
Procedure
Mazama has adopted procedures to implement the firm’s policy and reviews to monitor and ensure the firm’s policy is observed, implemented properly and amended or updated, as appropriate, which include the following:
B-175
Voting Procedures
| | 1. | All employees will forward any proxy materials received on behalf of clients to the Director of Research; |
| | 2. | The Director of Research will determine which client accounts hold the security to which the proxy relates; |
| | 3. | Absent material conflicts, the Director of Research will determine how Mazama should vote the proxy in accordance with applicable voting guidelines, complete the proxy and vote the proxy in a timely and appropriate manner. |
Disclosure
| | 1. | Mazama will provide conspicuously displayed information in its ADV Part II summarizing this proxy voting policy and procedures, including a statement that clients may request information regarding how Mazama voted a client’s proxies, and that clients may request a copy of these policies and procedures. |
| | 2. | The Chief Compliance Officer (“CCO”) will also send a copy of this summary to all existing clients who have previously received Mazama’s ADV Part II; or the CCO may send each client the amended ADV Part II. Either mailing shall highlight the inclusion of information regarding proxy voting. |
Client Requests for Information
| | 1. | All client requests for information regarding proxy votes, or policies and procedures, received by any employee should be forwarded to the CCO. |
| | 2. | In response to any request the CCO will prepare a written response to the client with the information requested, and as applicable will include the name of the issuer, the proposal voted upon, and how Mazama voted the client’s proxy with respect to each proposal about which client inquired. |
Conflicts of Interest
| | 1. | Mazama will identify any conflicts that exist between the interests of the adviser and the client by reviewing the relationship of Mazama with the issuer of each security to determine if Mazama or any of its employees has any financial, business or personal relationship with the issuer. |
| | 2. | If a material conflict of interest exists, Director of Research will determine whether it is appropriate to disclose the conflict to the affected clients, to give the clients an opportunity to vote the proxies themselves, or to address the voting issue through other objective means such as voting in a manner consistent with a predetermined voting policy or receiving an independent third party voting recommendation. |
| | 3. | Mazama will maintain a record of the voting resolution of any conflict of interest. |
Recordkeeping
The CCO shall retain the following proxy records in accordance with the SEC’s five-year retention requirement.
These policies and procedures and any amendments;
| | 1. | A record of each vote that Mazama casts; |
| | 2. | Any document Mazama created that was material to making a decision how to vote proxies, or that memorializes that decision including period reports to the General Manager; |
| | 3. | A copy of each written request from a client for information on how Mazama voted such client’s proxies, and a copy of any written response. |
B-176
NAVELLIER & ASSOCIATES, INC.
PROXY VOTING POLICIES AND PROCEDURES
1. Background
The act of managing assets of clients may include the voting of proxies related to such managed assets. Where the power to vote in person or by proxy has been delegated, directly or indirectly, to the investment adviser, the investment adviser has the fiduciary responsibility for (a) voting in a manner that is in the best interests of the client, and (b) properly dealing with potential conflicts of interest arising from proxy proposals being voted upon.
The policies and procedures of Navellier & Associates, Inc. (“the Adviser”) for voting proxies received for accounts managed by the Adviser are set forth below and are applicable if:
| | • | | The underlying advisory agreement entered into with the client expressly provides that the Adviser shall be responsible to vote proxies received in connection with the client’s account; or |
| | • | | The underlying advisory agreement entered into with the client is silent as to whether or not the Adviser shall be responsible to vote proxies received in connection with the client’s account and the Adviser has discretionary authority over investment decisions for the client’s account; or |
| | • | | In case of an employee benefit plan, the client (or any plan trustee or other fiduciary) has not reserved the power to vote proxies in either the underlying advisory agreement entered into with the client or in the client’s plan documents. |
These Proxy Voting Policies and Procedures are designed to ensure that proxies are voted in an appropriate manner and should complement the Adviser’s investment policies and procedures regarding its general responsibility to monitor the performance and/or corporate events of companies which are issuers of securities held in managed accounts. Any questions about these policies and procedures should be directed to the Compliance Department.
2. Proxy Voting Policies
In the absence of specific voting guidelines from a client, Navellier & Associates, Inc. will vote proxies in a manner that is in the best interest of the client, which may result in different voting results for proxies for the same issuer. The Adviser shall consider only those factors that relate to the client’s investment or dictated by the client’s written instructions, including how its vote will economically impact and affect the value of the client’s investment (keeping in mind that, after conducting an appropriate cost-benefit analysis, not voting at all on a presented proposal may be in the best interest of the client). Navellier & Associates, Inc. believes that voting proxies in accordance with the following policies is in the best interests of its clients.
| A. | Specific Voting Policies |
| | • | | The Adviser will generally vote for the election of directors (where no corporate governance issues are implicated). |
| | • | | The Adviser will generally vote for the selection of independent auditors. |
| | • | | The Adviser will generally vote for increases in or reclassification of common stock. |
| | • | | The Adviser will generally vote for management recommendations adding or amending indemnification provisions in charter or by-laws. |
| | • | | The Adviser will generally vote for changes in the board of directors. |
| | • | | The Adviser will generally vote for outside director compensation. |
B-177
| | • | | The Adviser will generally vote for proposals that maintain or strengthen the shared interests of shareholders and management. |
| | • | | The Adviser will generally vote for proposals that increase shareholder value. |
| | • | | The Adviser will generally vote for proposals that will maintain or increase shareholder influence over the issuer’s board of directors and management. |
| | • | | The Adviser will generally vote for proposals that maintain or increase the rights of shareholders. |
| | 2. | Non-Routine and Conflict of Interest Items: |
| | • | | The Adviser will generally vote for management proposals for merger or reorganization if the transaction appears to offer fair value. |
| | • | | The Adviser will generally vote against shareholder resolutions that consider non-financial impacts of mergers. |
| | • | | The Adviser will generally vote against anti-greenmail provisions. |
If the proxy includes a Routine Item that implicates corporate governance changes, a Non-Routine Item where no specific policy applies or a Conflict of Interest Item where no specific policy applies, then the Adviser may engage an independent third party to determine how the proxies should be voted.
In voting on each and every issue, the Adviser and its employees shall vote in a prudent and timely fashion and only after a careful evaluation of the issue(s) presented on the ballot.
In exercising its voting discretion, the Adviser and its employees shall avoid any direct or indirect conflict of interest raised by such voting decision. The Adviser will provide adequate disclosure to the client if any substantive aspect or foreseeable result of the subject matter to be voted upon raises an actual or potential conflict of interest to the Adviser or:
| | • | | any affiliate of the Adviser. For purposes of these Proxy Voting Policies and Procedures, an affiliate means: |
| | (i) | any person directly, or indirectly through one or more intermediaries, controlling, controlled by or under common control with the Adviser; |
| | (ii) | any officer, director, principal, partner, employer, or direct or indirect beneficial owner of any 10% or greater equity or voting interest of the Adviser; or |
| | (iii) | any other person for which a person described in clause (ii) acts in any such capacity; |
| | • | | any issuer of a security for which the Adviser (or any affiliate of the Adviser) acts as a sponsor, advisor, manager, custodian, distributor, underwriter, broker, or other similar capacity; or |
| | • | | any any person with whom the Adviser (or any affiliate of the Adviser) has an existing, material contract or business relationship that was not entered into in the ordinary course of the Adviser’s (or its affiliate’s) business. |
(Each of the above persons being an “Interested Person.”)
After informing the client of any potential conflict of interest, the Adviser will take other appropriate action as required under these Proxy Voting Policies and Procedures, as provided below.
The Adviser shall keep certain records required by applicable law in connection with its proxy voting activities for clients and shall provide proxy-voting information to clients upon their written or oral request.
Consistent with SEC Rule 206(4)-6, as amended, the Adviser shall take reasonable measures to inform its clients of (1) its proxy voting policies and procedures, and (2) the process or procedures clients must
B-178
follow to obtain information regarding how the Adviser voted with respect to assets held in their accounts. This information may be provided to clients through the Adviser’s Form ADV (Part II or Schedule H) disclosure or by separate notice to the client (or in the case of an employee benefit plan, the plan’s trustee or other fiduciaries).
3. PROXY VOTING PROCEDURES
A. Institutional Shareholder Services, Inc. (ISS) (the “Responsible Party”) shall be designated by the Adviser to make discretionary investment decisions for the clients account and will be responsible for voting the proxies related to that account. The Responsible Party should assume that he or she has the power to vote all proxies related to the client’s account if any one of the three circumstances set forth in Section 1 above regarding proxy voting powers is applicable.
B. All proxies and ballots received by Navellier & Associates, Inc. will be forwarded to the Responsible Party and then logged in upon receipt in the “Receipt of Proxy Voting Material” log. (see attached).
C. Prior to voting, the Responsible Party will verify whether his or her voting power is subject to any limitations or guidelines issued by the client (or in the case of an employee benefit plan, the plan’s trustee or other fiduciaries).
D. Prior to voting, the Responsible Party will verify whether an actual or potential conflict of interest with the Adviser or any Interested Person exists in connection with the subject proposal(s) to be voted upon. The determination regarding the presence or absence of any actual or potential conflict of interest shall be adequately documented by the Responsible Party (i.e., comparing the apparent parties affected by the proxy proposal being voted upon against the Adviser’s internal list of Interested Persons and, for any matches found, describing the process taken to determine the anticipated magnitude and possible probability of any conflict of interest being present), which shall be reviewed and signed off on by the Responsible Party’s direct supervisor (and if none, by the board of directors or a committee of the board of directors of the Adviser).
E. If an actual or potential conflict is found to exist, written notification of the conflict (the “Conflict Notice”) shall be given to the client or the client’s designee (or in the case of an employee benefit plan, the plan’s trustee or other fiduciary) in sufficient detail and with sufficient time to reasonably inform the client (or in the case of an employee benefit plan, the plan’s trustee or other fiduciary) of the actual or potential conflict involved.
Specifically, the Conflict Notice should describe:
| | • | | the proposal to be voted upon; |
| | • | | the actual or potential conflict of interest involved; |
| | • | | the Adviser’s vote recommendation (with a summary of material factors supporting the recommended vote); and |
| | • | | if applicable, the relationship between the Adviser and any Interested Person. |
The Conflict Notice will either request the client’s consent to the Adviser’s vote recommendation or may request the client to vote the proxy directly or through another designee of the client. The Conflict Notice and consent thereto may be sent or received, as the case may be, by mail, fax, electronic transmission or any other reliable form of communication that may be recalled, retrieved, produced, or printed in accordance with the recordkeeping policies and procedures of the Adviser. If the client (or in the case of an employee benefit plan, the plan’s trustee or other fiduciary) is unreachable or has not affirmatively responded before the response deadline for the matter being voted upon, the Adviser may:
| | • | | engage a non-Interested Party to independently review the Adviser’s vote recommendation if the vote recommendation would fall in favor of the Adviser’s interest (or the interest of an Interested Person) to |
B-179
| | confirm that the Adviser’s vote recommendation is in the best interest of the client under the circumstances; |
| | • | | cast its vote as recommended if the vote recommendation would fall against the Adviser’s interest (or the interest of an Interested Person) and such vote recommendation is in the best interest of the client under the circumstances; or |
| | • | | abstain from voting if such action is determined by the Adviser to be in the best interest of the client under the circumstances. |
F. The Responsible Party will promptly vote proxies received in a manner consistent with the Proxy Voting Policies and Procedures stated above and guidelines (if any) issued by client (or in the case of an employee benefit plan, the plan’s trustee or other fiduciaries if such guidelines are consistent with ERISA).
G. In accordance with SEC Rule 204-2(c)(2), as amended, the Responsible Party shall retain in the respective client’s file, the following:
| | • | | A copy of the proxy statement received (unless retained by a third party for the benefit of the Adviser or the proxy statement is available from the SEC’s Electronic Data Gathering, Analysis, and Retrieval (EDGAR) system); |
| | • | | A record of the vote cast (unless this record is retained by a third party for the benefit of the Adviser and the third party is able to promptly provide the Adviser with a copy of the voting record upon its request); |
| | • | | A record memorializing the basis for the vote cast; |
| | • | | A copy of any document created by the Adviser or its employees that was material in making the decision on how to vote the subject proxy; and, |
| | • | | A copy of any Conflict Notice, conflict consent or any other written communication (including emails or other electronic communications) to or from the client (or in the case of an employee benefit plan, the plan’s trustee or other fiduciaries) regarding the subject proxy vote cast by, or the vote recommendation of, the Adviser. |
The above copies and records shall be retained in the client’s file for a period not less than five (5) years (or in the case of an employee benefit plan, no less than six (6) years), which shall be maintained at the appropriate office of the Adviser.
H. Periodically, but no less than annually, the Adviser will:
| | 1. | Verify that all annual proxies for the securities held in the client’s account have been received; |
| | 2. | Verify that each proxy received has been voted in a manner consistent with the Proxy Voting Policies and Procedures and the guidelines (if any) issued by the client (or in the case of an employee benefit plan, the plan’s trustee or other fiduciaries); |
| | 3. | Review the files to verify that records of the voting of the proxies have been properly maintained; |
| | 4. | Prepare a written report for each client regarding compliance with the Proxy Voting Policies and Procedures; and |
| | 5. | Maintain an internal list of Interested Persons. |
B-180
NORTHERN TRUST
PROXY VOTING
The Trust, on behalf of the Funds, has delegated the voting of portfolio securities to Northern Trust Investments, N.A. (“NTI”) in its capacity as Investment Sub-Adviser. NTI has adopted proxy voting policies and procedures (the “Proxy Voting Policy”) for the voting of proxies on behalf of client accounts for which NTI has voting discretion, including the Funds. Under the Proxy Voting Policy, shares are to be voted in the best interests of the Funds.
A Proxy Committee comprised of senior NTI investment and compliance officers has adopted certain guidelines (the “Proxy Guidelines”) concerning various corporate governance issues. The Proxy Committee has the responsibility for the content, interpretation and application of the Proxy Guidelines and may apply these Proxy Guidelines with a measure of flexibility. NTI has retained an independent third party (the “Service Firm”) to review proxy proposals and to make voting recommendations to the Proxy Committee in a manner consistent with the Proxy Guidelines.
The Proxy Guidelines provide that NTI will generally vote for or against various proxy proposals, usually based upon certain specified criteria. As an example, the Proxy Guidelines provide that NTI will generally vote in favor of proposals to: (1) repeal existing classified boards and elect directors on an annual basis; (2) adopt a written majority voting or withhold policy (in situations in which a company has not previously adopted such a policy); (3) lower supermajority shareholder vote requirements for charter and bylaw amendments; (4) lower supermajority shareholder vote requirements for mergers and other business combinations; (5) increase common share authorizations for a stock split; (6) implement a reverse stock split; and (7) approve an ESOP or other broad based employee stock purchase or ownership plan, or increase authorized shares for existing plans. The Proxy Guidelines also provide that NTI will generally vote against proposals to: (1) classify the board of directors; (2) require that poison pill plans be submitted for shareholder ratification; (3) adopt dual class exchange offers or dual class recapitalizations; (4) require a supermajority shareholder vote to approve mergers and other significant business combinations; (5) require a supermajority shareholder vote to approve charter and bylaw amendments; and (6) adopt certain social and environmental proposals. In certain circumstances, the Proxy Guidelines provide that proxy proposals will be addressed on a case-by-case, including those regarding executive and director compensation plans, mergers and acquisitions, poison pills, a change in the company’s state of incorporation and an increase in authorized common stock.
Except as otherwise provided in the Proxy Voting Policy, the Proxy Committee may vote proxies contrary to the recommendations of the Service Firm if it determines that such action is in the best interests of a Fund. In exercising its discretion, the Proxy Committee may take into account a variety of factors relating to the matter under consideration, the nature of the proposal and the company involved. As a result, the Proxy Committee may vote in one manner in the case of one company and in a different manner in the case of another where, for example, the past history of the company, the character and integrity of its management, the role of outside directors, and the company’s record of producing performance for investors justifies a high degree of confidence in the company and the effect of the proposal on the value of the investment. Similarly, poor past performance, uncertainties about management and future directions, and other factors may lead the Proxy Committee to conclude that particular proposals present unacceptable investment risks and should not be supported. The Proxy Committee also evaluates proposals in context. A particular proposal may be acceptable standing alone, but objectionable when part of an existing or proposed package. Special circumstances may also justify casting different votes for different clients with respect to the same proxy vote.
NTI may occasionally be subject to conflicts of interest in the voting of proxies due to business or personal relationships with persons having an interest in the outcome of certain votes. For example, NTI may provide trust, custody, investment management, brokerage, underwriting, banking and related services to accounts owned or controlled by companies whose management is soliciting proxies. Occasionally, NTI may also have business
B-181
or personal relationships with other proponents of proxy proposals, participants in proxy contests, corporate directors or candidates for directorships. NTI may also be required to vote proxies for securities issued by Northern Trust Corporation or its affiliates or on matters in which NTI has a direct financial interest, such as shareholder approval of a change in the advisory fees paid by a Fund. NTI seeks to address such conflicts of interest through various measures, including the establishment, composition and authority of the Proxy Committee and the retention of the Service Firm to perform proxy review and vote recommendation functions. The Proxy Committee has the responsibility to determine whether a proxy vote involves a potential conflict of interest and how the conflict should be addressed in conformance with the Proxy Voting Policy. The Proxy Committee may resolve such conflicts in any of a variety of ways, including the following: voting in accordance with the Proxy Guideline based recommendation of the Service Firm; voting in accordance with the recommendation of an independent fiduciary appointed for that purpose; voting pursuant to client direction by seeking instructions from the Board of Trustees of the Trust; or by voting pursuant to a “mirror voting” arrangement under which shares are voted in the same manner and proportion as shares over which NTI does not have voting discretion. The method selected by the Proxy Committee may vary depending upon the facts and circumstances of each situation.
NTI may choose not to vote proxies in certain situations or for a Fund. This may occur, for example, in situations where the exercise of voting rights could restrict the ability to freely trade the security in question (as is the case, for example, in certain foreign jurisdictions known as “blocking markets”). In circumstances in which the Service Firm does not provide recommendations for a particular proxy, the Proxy Committee may obtain recommendations from analysts at NTI who review the issuer in question or the industry in general. The Proxy Committee will apply the Proxy Guidelines as discussed above to any such recommendation.
The foregoing is only a summary of the Proxy Voting Policy and Proxy Voting Guidelines. You may obtain, upon request and without charge, a full-version paper copy of the Proxy Voting Policy and Proxy Voting Guidelines by calling 800/595-9111.
B-182
SANDS CAPITAL MANAGEMENT, LLC
PROXY VOTING POLICY AND PROCEDURES
Implementation Date: November 2006
Issue
Rule 206(4)-6 under the Advisers Act requires every investment adviser to adopt and implement written policies and procedures, reasonably designed to ensure that the adviser votes proxies in the best interest of its clients. The procedures must address material conflicts that may arise in connection with proxy voting. The Rule further requires the adviser to provide a concise summary of the adviser’s proxy voting process and offer to provide copies of the complete proxy voting policy and procedures to clients upon request. Lastly, the Rule requires that the adviser disclose to clients how they may obtain information on how the adviser voted their proxies.
SCM votes proxies for a great majority of its clients, and therefore has adopted and implemented this Proxy Voting Policy and Procedures.
Policy
It is the policy of SCM to vote client proxies in the best interest of our clients. Proxies are an asset of a client account, which should be treated by SCM with the same care, diligence, and loyalty as any asset belonging to a client. Consideration will be given to both the short and long term implications of the proposal to be voted on when considering the optimal vote.
Any general or specific proxy voting guidelines provided by an advisory client or its designated agent in writing will supersede this policy. Clients may wish to have their proxies voted by an independent third party or other named fiduciary or agent, at the client’s cost.
Procedures for SCM’s Receipt of Class Actions
The following procedures outline SCM’s receipt of “Class Action” documents from clients and custodians. It is SCM’s position not to file these “Class Action” documents, but if received will follow these guidelines:
If “Class Action” documents are received by SCM from the Client, SCM will gather, at the client’s request, any requisite information it has and forward to the client, to enable the client to file the “Class Action” at the client’s discretion. SCM will not file “Class Actions” on behalf of any client.
Proxy Committee
SCM has established a Proxy Committee. The Proxy Committee consists of three permanent members (the Chief Operating Officer, Director of Client Services, Compliance Operations Manager) and one or more rotating members (Portfolio Managers). The Proxy Committee meets at least annually and as necessary to fulfill its responsibilities. A majority of the members of the Proxy Committee constitutes a quorum for the transaction of business. The Director of Client Services acts as secretary of the Proxy Committee and maintains a record of Proxy Committee meetings and actions.
The Proxy Committee is responsible for (i) the oversight and administration of proxy voting on behalf of the Adviser’s clients, including developing, authorizing, implementing and updating the Adviser’s proxy voting policies and procedures; (ii) overseeing the proxy voting process; and (iii) engaging and overseeing any third party service provider as voting agent to receive proxy statements and/or to provide information, research or other services intended to facilitate the proxy voting decisions made by the Adviser. The Proxy Committee
B-183
typically reviews reports on the Adviser’s proxy voting activity at least annually and as necessary to fulfill its responsibilities.
The Proxy Committee has developed a set of criteria for evaluating proxy issues. These criteria and general voting guidelines are set forth in the Adviser’s Proxy Voting Guidelines (the “Guidelines”), a copy of which is attached hereto as Attachment C. The Proxy Committee may amend or supplement the Guidelines from time to time. All Guidelines are to be applied generally and not absolutely, such that the Adviser’s evaluation of each proposal will be performed in the context of the Guidelines giving appropriate consideration to the circumstances of the company whose proxy is being voted.
Procedures for Identification and Voting of Proxies
These proxy voting procedures are designed to enable SCM to resolve material conflicts of interest with clients before voting their proxies.
| | 1. | SCM shall maintain a list of all clients for which it votes proxies. The list will be maintained either in hard copy or electronically and updated by the Director of Client Services or a designee who will obtain proxy voting information from client agreements. |
As part of the account opening procedure, The Director of Client Services will note whether or not SCM is responsible for voting client proxies for the new client.
| | 2. | In cases where SCM has been designated to vote client proxies, we shall work with the client to ensure that SCM is the designated party to receive proxy voting materials from companies or intermediaries. |
| | 3. | The Director of Client Services shall receive all proxy voting materials and will be responsible for ensuring that proxies are voted and submitted in a timely manner. |
| | 4. | Prior to a proxy voting deadline, the appropriate Research Analyst will make a determination as to how to vote each proxy proposal based on his or her analysis of the proposal and the Guidelines. In evaluating a proxy proposal, an analyst may consider information from many sources, including management of the company, shareholder groups and independent proxy research services. |
| | 5. | SCM Staff Members will reasonably try to assess any material conflicts between SCM’s interests and those of its clients with respect to proxy voting by considering the situations identified in the Conflicts of Interest section of this document. |
| | 6. | So long as there are no material conflicts of interest identified, SCM will vote proxies according to the policy. SCM may also elect to abstain from voting if it deems such abstinence in its clients’ best interests. The rationale for “abstain” votes will be documented and the documentation will be maintained in the permanent file. |
| | 7. | Upon detection of a conflict of interest, the conflict will be brought to the attention of the Proxy Committee for resolution. See Conflicts of Interest section for additional information. |
| | 8. | SCM is not required to vote every client proxy and such should not necessarily be construed as a violation of SCM’s fiduciary obligations. SCM shall at no time ignore or neglect its proxy voting responsibilities. However, there may be times when refraining from voting is in the client’s best interest, such as when an adviser’s analysis of a particular client proxy reveals that the cost of voting the proxy may exceed the expected benefit to the client. |
| | 9. | The Director of Client Services and the Research Analyst will report any attempts by SCM’s personnel to influence the voting of client proxies in a manner that is inconsistent with SCM’s Proxy Policy, as well as, any attempts by persons or entitles outside SCM seeking to influence the voting of client proxies. Such report shall be made to SCM’s CCO, or if the CCO is the person attempting to influence the voting, then to SCM’s CEO. |
| | 10. | All proxy votes will be recorded and the following information will be maintained: |
B-184
| | • | | The name of the issuer of the portfolio security; |
| | • | | The exchange ticker symbol of the portfolio security; |
| | • | | The Council on Uniform Securities Identification Procedures (“CUSIP”) number for the portfolio security; |
| | • | | The shareholder meeting date; |
| | • | | The number of shares SCM is voting on firm-wide; |
| | • | | A brief identification of the matter voted on; |
| | • | | Whether the matter was proposed by the issuer or by a security holder; |
| | • | | Whether or not SCM cast its vote on the matter; |
| | • | | How SCM cast its vote (e.g., for or against proposal, or abstain; for or withhold regarding election of directors); |
| | • | | Whether SCM cast its vote with or against management; and |
| | • | | Whether any client requested an alternative vote of its proxy. |
In the event that SCM votes the same proxy in two directions, it shall maintain documentation to support its voting (this may occur if a client requires SCM to vote a certain way on an issue, while SCM deems it beneficial to vote in the opposite direction for its other clients) in the permanent file.
Conflicts of Interest
Although SCM has not currently identified any material conflicts of interest that would affect its proxy voting decisions, it is aware of the following potential conflicts that could exist in the future:
| | • | | Conflict: SCM is retained by an institutional client, or is in the process of retaining an institutional client that is affiliated with an issuer that is held in SCM’s client portfolios. |
| | • | | Conflict: SCM retains a client, or is in the process of retaining a client that is an officer or director of an issuer that is held in SCM’s client portfolios. The similar conflicts of interest exist in this relationship as discussed above. |
| | • | | Conflict: SCM’s Staff Members maintain a personal and/or business relationship (not an advisory relationship) with issuers or individuals that serve as officers or directors of issuers. For example, the spouse of an SCM Staff Member may be a high-level executive of an issuer that is held in SCM’s client portfolios. The spouse could attempt to influence SCM to vote in favor of management. |
| | • | | Conflict: SCM or a Staff Member(s) personally owns a significant number of an issuer’s securities that are also held in SCM’s client portfolios. For any number of reasons, a Staff Member(s) may seek to vote proxies in a different direction for his/her personal holdings than would otherwise be warranted by the proxy voting policy. The Staff Member(s) could oppose voting the proxies according to the policy and successfully influence SCM to vote proxies in contradiction to the policy. |
Resolution:
SCM realizes that due to the difficulty of predicting and identifying all material conflicts, it must rely on its Staff Members to notify the Director of Client Services and/or the CCO of any material conflict that may impair SCM’s ability to vote proxies in an objective manner. Upon such notification, the Director of Client Services and or the CCO will notify the Proxy Committee of the conflict.
In the event that the Proxy Committee determines that the SCM has a conflict of interest with respect to a proxy proposal, the Proxy Committee shall also determine whether the conflict is “material” to that proposal. The
B-185
Proxy Committee may determine on a case-by-case basis that a particular proposal does not involve a material conflict of interest. To make this determination, the Proxy Committee must conclude that the proposal is not directly related to the Adviser’s conflict with the issuer. If the Proxy Committee determines that a conflict is not material, then the Adviser may vote the proxy in accordance with the recommendation of the analyst.
In the event that the Proxy Committee determines that SCM has a material conflict of interest with respect to a proxy proposal, SCM will vote on the proposal in accordance with the determination of the Proxy Committee. Prior to voting on the proposal, the Adviser may (i) contact an independent third party (such as another plan fiduciary) to recommend how to vote on the proposal and vote in accordance with the recommendation of such third party (or have the third party vote such proxy); or (ii) with respect to client accounts that are not subject to ERISA, fully disclose the nature of the conflict to the client and obtain the client’s consent as to how the Adviser will vote on the proposal (or otherwise obtain instructions from the client as to how the proxy should be voted).
Recordkeeping
SCM must maintain the documentation described in the following section for a period of not less than five (5) years, the first two (2) years at its principal place of business. Director of Client Services will be responsible for the following procedures and for ensuring that the required documentation is retained.
Client request to review proxy votes:
| | • | | Any request, whether written (including e-mail) or oral, received by any Staff Member of SCM, must be promptly reported to the Director of Client Services. All written requests must be retained in the permanent file. |
| | • | | The Director of Client Services will record the identity of the client, the date of the request, and the disposition (e.g., provided a written or oral response to client’s request, referred to third party, not a proxy voting client, other dispositions, etc.) in a suitable place. |
| | • | | Clients are permitted to request the proxy voting record for the 5 year period prior to their request. |
Proxy statements received regarding client securities:
| | • | | Upon receipt of a proxy, copy or print a sample of the proxy statement or card and maintain the copy in a central file along with a sample of the proxy solicitation instructions. |
Note: SCM is permitted to rely on proxy statements filed on the SEC’s EDGAR system instead of keeping its own copies.
Proxy voting records:
| | • | | Documents prepared or created by SCM that were material to making a decision on how to vote, or that memorialized the basis for the decision. |
| | • | | Documentation or notes or any communications received from third parties, other industry analysts, third party service providers, company’s management discussions, etc. that were material in the basis for the decision. |
Disclosure
| | • | | SCM will ensure that Part II of Form ADV is updated as necessary to reflect: (i) all material changes to the Proxy Voting Policy and Procedures; and (ii) information about how clients may obtain information on how SCM voted their securities. |
B-186
Proxy Solicitation
As a matter of practice, it is SCM’s policy to not reveal or disclose to any client how SCM may have voted (or intends to vote) on a particular proxy until after such proxies have been counted at a shareholder’s meeting.
The Director of Client Services is to be promptly informed of the receipt of any solicitation from any person to vote proxies on behalf of clients. At no time may any Staff Member accept any remuneration in the solicitation of proxies. The Director of Client Services shall handle all responses to such solicitations.
Responsibility
The Director of Client Services is responsible for overseeing and implementing this policy.
B-187
Attachment C
PROXY VOTING GUIDELINES
One of the primary factors SCM considers when determining the desirability of investing in a particular company is the quality and depth of its management. Accordingly, SCM believes that the recommendation of management on any issue should be given substantial weight in determining how proxy issues are resolved. As a matter of practice, SCM will vote on most issues presented in a portfolio company proxy statement in accordance with the position of the company’s management, unless SCM determines that voting in accordance with management’s recommendation would adversely affect the investment merits of owning the stock. However, SCM will consider each issue on its own merits, and will not support the position of the company’s management in any situation where, in SCM’s judgment, it would not be in the best interests of the client to do so.
I. The Board of Directors
A. Voting on Director Nominees in Uncontested Elections
Votes on director nominees are made on a case-by-case basis, and may consider the following factors:
| | • | | Long-term corporate performance record relative to a market index; |
| | • | | Composition of board and key board committees; |
| | • | | Corporate governance provisions and takeover activity; |
| | • | | Board decisions regarding executive pay; |
B. Director and Officer Indemnification and Liability Protection
Proposals concerning director and officer indemnification and liability protection are evaluated on a case-by-case basis.
C. Voting for Director Nominees in Contest Elections
Votes in a contested election of directors are evaluated on a case-by-case basis, and may consider the following factors:
| | • | | long-term financial performance of the target company relative to its industry; |
| | • | | management’s track record; |
| | • | | background to the proxy contest; |
| | • | | qualifications of director nominees (both slates); |
| | • | | evaluation of what each side is offering shareholders as well as the likelihood that the proposed objectives and goals can be met; and |
| | • | | stock ownership positions. |
D. Size of the Board
Proposals to limit the size of the Board should be evaluated on a case-by-case basis.
B-188
II. Auditors
Ratifying Auditors
We generally vote for proposals to ratify auditors, unless: an auditor has a financial interest in or association with the company, and is therefore not independent; or there is reason to believe that the independent auditor has rendered an opinion which is neither accurate nor indicative of the company’s financial position.
III. Proxy Contest Defenses
Cumulative Voting
We vote against proposals to eliminate cumulative voting.
We vote for proposals to permit cumulative voting.
IV. Anti-Takeover Issues
We generally oppose anti-takeover measures because they reduce shareholder rights. However, as with all proxy issues, we conduct and independent review of each anti-takeover proposal. On occasion, we may vote with management when it is concluded that the proposal is not onerous and would not harm clients’ interests as shareholders. Anti-takeover issues include the following:
A. Poison Pills
The “poison pill” entitles shareholders to purchase certain securities at discount prices in the event of a change in corporate control. Such a measure would make a potential takeover prohibitively expensive to the acquirer.
We review on a case-by-case basis management proposals to ratify a poison pill.
B. Fair Price Provisions
Fair price provisions attempt to ensure approximately equal treatment for all shareholders in the event of a full-scale takeover. Typically, such a provision requires would-be acquirers that have established threshold positions in target companies at given per-share prices to pay at least as much if they opt for complete control, unless certain conditions are met.
We vote for fair price proposals, as long as the shareholder vote requirement embedded in the provision is no more than a majority of disinterested shares.
We vote for shareholder proposals to lower the shareholder vote requirement in existing fair price provisions.
C. Greenmail
Proposals relating to the prohibition of “greenmail” are designed to disallow the repurchase of stock from a person or group owning 5% or more of the company’s common stock, unless approved by the disinterested holders of two-thirds or more of the outstanding stock. They could also prevent the company from repurchasing
B-189
any class of stock at a price more than 5% above the current fair market price, unless an offer is made to all shareholders.
We vote for proposals to adopt anti-greenmail charter or bylaw amendments or otherwise restrict a company’s ability to make greenmail payments.
We review on a case-by-case basis anti-greenmail proposals when they are bundled with other charter or bylaw amendments.
D. Superstock
Another takeover defense is superstock, i.e., shares that give holders disproportionate voting rights. For example, one company proposed authorizing a class of preferred stock which “could be issued in a private placement with one or more institutional investors” and “could be designated as having voting rights which might dilute or limit the present voting rights of the holders of common stock….” The purpose of this additional class of stock would be to give insiders an edge in fending off an unsolicited or hostile takeover attempt.
We will review on case-by-case basis proposals that would authorize the creation of new classes of “superstock”.
E. Supermajority Rules
Supermajority provisions require approval by holders of minimum amounts of the common shares (usually 75% to 80%). While applied mainly to merger bids, supermajority rules also may be extended to cover substantive transfers of corporate assets, liquidations, reverse splits and removal of directors for reasons other than cause. A supermajority provision would make it nearly impossible in some cases for shareholders to benefit from a takeover attempt.
1. Supermajority Shareholder Vote Requirement to Approve Mergers
We vote against management proposals to require a supermajority shareholder vote to approve mergers and other significant business combinations.
We vote for shareholder proposals to lower supermajority shareholder vote requirements for mergers and other significant business combinations.
2. Supermajority Shareholder Vote Requirement to Amend the Charter or Bylaws
We vote against management proposals to require a supermajority shareholder vote to approve charter and bylaw amendments.
We vote for shareholder proposals to lower supermajority shareholder vote requirements for charter and bylaw amendments.
F. Board Classification
High on the agenda of defense-minded corporate executives are staggered terms for directors, whereby only some (typically one-third) of the directors are elected each year. The “staggered board” acts as a bar to unwelcome takeover bids. An aggressive, affluent acquirer would need two years to gain a working majority of directors at a company whose board members are elected to staggered three-year terms of office.
We vote against proposals to classify the board.
We vote for proposals to repeal classified boards and elect all directors annually.
B-190
IV. Miscellaneous Governance Provision
Bundled Proposals
We review on a case-by-case basis bundled or “conditioned” proxy proposals. In this case where items are conditioned upon each other, we examine the benefits and costs of the packages items. In instances when the joint effect of the conditioned items is not in shareholder’s best interests, we vote against the proposals. If the combined effect is positive, we support such proposals.
V. Capital Structure
A. Common Stock Authorization
We review on a case-by-case basis proposals to increase the number of shares of common stock authorized for issue.
B. Debt Restructuring
We review on a case-by-case basis proposals to increase common and/or preferred shares and to issue shares as part of a debt restructuring plan.
VI. Executive and Director Compensation
In general, we vote on a case-by-case basis on executive and director compensation plans, including stock option plans, with the view that viable compensation programs reward the creation of stockholder wealth.
VII. State of Incorporation
A. Voting on State Takeover Statutes
We review on a case-by-case basis proposals to opt in or out of state takeover statutes (including control share acquisition statutes, control share cash-out statutes, freeze-out provisions, fair price provisions, stakeholder laws, poison pill endorsements, severance pay and labor contract provisions, anti-greenmail provisions and disgorgement provisions).
B. Voting on Reincorporation Proposals
Proposals to change a company’s state of incorporation are examined on a case-by-case basis.
VIII. Mergers and Corporate Restructurings
A. Mergers and Acquisitions
Votes on mergers and acquisitions are considered on a case-by-case basis.
B. Corporate Restructuring
Votes on corporate restructuring proposals, including minority squeezeouts, leveraged buyout, spin-offs, liquidations and asset sales are considered on a case-by-case basis.
C. Spin-offs
Votes on spin-offs are considered on a case-by-case basis.
B-191
D. Changing Corporate Name
We generally vote for changing the corporate name.
IX. Social and Environmental Issues
Consistent with its fiduciary duty to clients, SCM will vote on social issues with a view toward promoting good corporate citizenship. However, SCM realizes that it cannot require a portfolio company to go beyond applicable legal requirements or put itself in a non-competitive position. Social responsibility issues may include proposals regarding the following:
| | • | | Ecological issues, including toxic hazards and pollution of the air and water; |
| | • | | Employment practices, such as the hiring of women and minority groups; |
| | • | | Product quality and safety; |
| | • | | Animal rights, including testing, experimentation and factory farming; |
| | • | | Military and nuclear issues; and |
| | • | | International politics and operations, including the world debt crisis, infant formula, U.S. corporate activity in Northern Ireland, and the policy of apartheid in South Africa. |
We review on a case-by-case basis proposals regarding social or environmental issues.
B-192
SSgA FUNDS MANAGEMENT, INC.
Proxy Voting Policy
Introduction
SSgA Funds Management, Inc. (“FM”) seeks to vote proxies in the best interests of its clients. In the ordinary course, this entails voting proxies in a way which FM believes will maximize the monetary value of each portfolio’s holdings. FM takes the view that this will benefit our direct clients (e.g. investment funds) and, indirectly, the ultimate owners and beneficiaries of those clients (e.g. fund shareholders).
Oversight of the proxy voting process is the responsibility of the State Street Global Advisors (SSgA) Investment Committee. The SSgA Investment Committee reviews and approves amendments to the FM Proxy Voting Policy and delegates authority to vote in accordance with this policy to Proxy Voting Services. FM retains the final authority and responsibility for voting. In addition to voting proxies, FM:
| | 1) | describes its proxy voting procedures to its clients in Part II of its Form ADV; |
| | 2) | provides the client with this written proxy policy, upon request; |
| | 3) | discloses to its clients how they may obtain information on how FM voted the client’s proxies; |
| | 4) | matches proxies received with holdings as of record date; |
| | 5) | reconciles holdings as of record date and rectifies any discrepancies; |
| | 6) | generally applies its proxy voting policy consistently and keeps records of votes for each client; |
| | 7) | documents the reason(s) for voting for all non-routine items; and |
| | 8) | keeps records of such proxy voting available for inspection by the client or governmental agencies. |
Process
The SSgA FM Manager of Corporate Governance is responsible for monitoring proxy voting. As stated above, oversight of the proxy voting process is the responsibility of the SSgA Investment Committee, which retains oversight responsibility for all investment activities of all State Street Corporation investment firms.
In order to facilitate our proxy voting process, FM retains a firm with expertise in the proxy voting and corporate governance fields to assist in the due diligence process. The Manager of Corporate Governance is responsible, working with this firm, for ensuring that proxies are submitted in a timely manner.
All proxies received on behalf of FM clients are forwarded to our proxy voting firm. If (i) the request falls within one of the guidelines listed below, and (ii) there are no special circumstances relating to that company or proxy which come to our attention (as discussed below), the proxy is voted according to our guidelines.
However, from time to time, proxy votes will be solicited which (i) involve special circumstances and require additional research and discussion or (ii) are not directly addressed by our policies. These proxies are identified through a number of methods, including but not limited to notification from our third party proxy voting specialist, concerns of clients, review by internal proxy specialists, and questions from consultants.
In instances of special circumstances or issues not directly addressed by our policies, the Chairman of the Investment Committee is consulted for a determination of the proxy vote. The first determination is whether there is a material conflict of interest between the interests of our client and those of FM. If the Manager of Corporate Governance and the Chairman of the Investment Committee determine that there is a material conflict, the process detailed below under “Potential Conflicts” is followed. If there is no material conflict, we examine each of the issuer’s proposals in detail in seeking to determine what vote would be in the best interests of our
B-193
clients. At this point, the Chairman of the Investment Committee makes a voting decision based on maximizing the monetary value of each portfolios’ holdings. However, the Chairman of the Investment Committee may determine that a proxy involves the consideration of particularly significant issues and present the proxy to the entire Investment Committee for a decision on voting the proxy.
FM also endeavors to show sensitivity to local market practices when voting proxies of non-U.S. issuers. SSgA votes in all markets where it is feasible to do so. Note that certain custodians utilized by our clients do not offer proxy voting in every foreign jurisdiction. In such a case, FM will be unable to vote such a proxy.
Voting
For most issues and in most circumstances, we abide by the following general guidelines. However, as discussed above, in certain circumstances, we may determine that it would be in the best interests of our clients to deviate from these guidelines.
Management Proposals
I. Generally, SSgA votes in support of management on the following ballot items, which are fairly common management sponsored initiatives.
| | • | | Elections of directors who do not appear to have been remiss in the performance of their oversight responsibilities and who do not simultaneously serve on an unreasonable (as determined by SSgA based on the particular facts and circumstances) number of other boards (other than those affiliated with the issuers) |
| | • | | Directors’ and auditors’ compensation |
| | • | | Directors’ liability and indemnification |
| | • | | Discharge of board members and auditors |
| | • | | Financial statements and allocation of income |
| | • | | Dividend payouts that are greater than or equal to country and industry standards |
| | • | | Authorization of share repurchase programs |
| | • | | General updating of or corrective amendments to charter |
| | • | | Change in Corporation Name |
| | • | | Elimination of cumulative voting |
II. Generally, SSgA votes in support of management on the following items, which have potentially substantial financial or best-interest impact:
| | • | | Capitalization changes which eliminate other classes of stock and voting rights |
| | • | | Changes in capitalization authorization for stock splits, stock dividends, and other specified needs which are no more than 50% of the existing authorization for U.S. companies and no more than 100% of existing authorization for non-U.S. companies |
| | • | | Elimination of pre-emptive rights for share issuance of less than a given percentage (country specific—ranging from 5% to 20%) of the outstanding shares |
| | • | | Elimination of “poison pill” rights |
| | • | | Stock purchase plans with an exercise price of not less that 85% of fair market value |
| | • | | Stock option plans which are incentive based and not excessive |
B-194
| | • | | Other stock-based plans which are appropriately structured |
| | • | | Reductions in super-majority vote requirements |
| | • | | Adoption of anti-”greenmail” provisions |
III. Generally, SSgA votes against management on the following items, which have potentially substantial financial or best interest impact:
| | • | | Capitalization changes that add “blank check” classes of stock or classes that dilute the voting interests of existing shareholders |
| | • | | Changes in capitalization authorization where management does not offer an appropriate rationale or which are contrary to the best interest of existing shareholders |
| | • | | Anti-takeover and related provisions that serve to prevent the majority of shareholders from exercising their rights or effectively deter appropriate tender offers and other offers |
| | • | | Amendments to bylaws which would require super-majority shareholder votes to pass or repeal certain provisions |
| | • | | Elimination of Shareholders’ Right to Call Special Meetings |
| | • | | Establishment of classified boards of directors |
| | • | | Reincorporation in a state which has more stringent anti-takeover and related provisions |
| | • | | Shareholder rights plans that allow the board of directors to block appropriate offers to shareholders or which trigger provisions preventing legitimate offers from proceeding |
| | • | | Change-in-control provisions in non-salary compensation plans, employment contracts, and severance agreements which benefit management and would be costly to shareholders if triggered |
| | • | | Adjournment of Meeting to Solicit Additional Votes |
| | • | | “Other business as properly comes before the meeting” proposals which extend “blank check” powers to those acting as proxy |
| | • | | Proposals requesting re-election of insiders or affiliated directors who serve on audit, compensation, and nominating committees. |
IV. SSgA evaluates Mergers and Acquisitions on a case-by-case basis. Consistent with our proxy policy, we support management in seeking to achieve their objectives for shareholders. However, in all cases, SSgA uses its discretion in order to maximize shareholder value. SSgA generally votes as follows:
| | • | | Against offers with potentially damaging consequences for minority shareholders because of illiquid stock, especially in some non-US markets |
| | • | | For offers that concur with index calculators treatment and our ability to meet our clients return objectives for passive funds |
| | • | | Against offers when there are prospects for an enhanced bid or other bidders |
| | • | | For proposals to restructure or liquidate closed end investment funds in which the secondary market price is substantially lower than the net asset value |
Shareholder Proposals
Traditionally, shareholder proposals have been used to encourage management and other shareholders to address socio-political issues. SSgA believes that it is inappropriate to use client assets to attempt to affect such issues. Thus, we examine shareholder proposals primarily to determine their economic impact on shareholders.
B-195
I. Generally, SSgA votes in support of shareholders on the following ballot items, which are fairly common shareholder-sponsored initiatives:
| | • | | Requirements that auditors attend the annual meeting of shareholders |
| | • | | The establishment of annual elections of the board of directors unless the board is composed by a majority of independent directors, the board’s key committees (auditing, nominating and compensation) are composed of independent directors, and there are no other material governance issues or performance issues |
| | • | | Mandates requiring a majority of independent directors on the Board of Directors and the audit, nominating, and compensation committees |
| | • | | Mandates that amendments to bylaws or charters have shareholder approval |
| | • | | Mandates that shareholder-rights plans be put to a vote or repealed |
| | • | | Establishment of confidential voting |
| | • | | Expansions to reporting of financial or compensation-related information, within reason |
| | • | | Repeals of various anti-takeover related provisions |
| | • | | Reduction or elimination of super-majority vote requirements |
| | • | | Repeals or prohibitions of “greenmail” provisions |
| | • | | “Opting-out” of business combination provisions |
| | • | | Proposals requiring the disclosure of executive retirement benefits if the issuer does not have an independent compensation committee |
| | • | | Disclosure of Auditor and Consulting relationships when the same or related entities are conducting both activities |
| | • | | Establishment of selection committee responsible for the final approval of significant management consultant contract awards where existing firms are already acting in an auditing function |
| | • | | Mandates that Audit, Compensation and Nominating Committee members should all be independent directors |
| | • | | Mandates giving the Audit Committee the sole responsibility for the selection and dismissal of the auditing firm and any subsequent result of audits are reported to the audit committee |
II. SSgA votes against shareholders on the following initiatives, which are fairly common shareholder-sponsored initiatives:
| | • | | Limits to tenure of directors |
| | • | | Requirements that candidates for directorships own large amounts of stock before being eligible to be elected |
| | • | | Restoration of cumulative voting in the election of directors |
| | • | | Requirements that the company provide costly, duplicative, or redundant reports; or reports of a non-business nature |
| | • | | Restrictions related to social, political, or special interest issues which affect the ability of the company to do business or be competitive and which have significant financial or best-interest impact |
| | • | | Proposals which require inappropriate endorsements or corporate actions |
| | • | | Requiring the company to expense stock options unless already mandated by FASB (or similar body) under regulations that supply a common valuation model |
B-196
| | • | | Proposal asking companies to adopt full tenure holding periods for their executives |
| | • | | Proposals requiring the disclosure of executive retirement benefits if the issuer has an independent compensation committee |
Shareholder Activism
We at FM agree entirely with the United States Department of Labor’s position that “where proxy voting decisions may have an effect on the economic value of the plan’s underlying investment, plan fiduciaries should make proxy voting decisions with a view to enhancing the value of the shares of stock” (IB 94-2). Our proxy voting policy and procedures are designed to ensure that our clients receive the best possible returns on their investments. We meet directly with corporation representatives and participate in conference calls and third-party inquiries in order to ensure our processes are as fully informed as possible.
Through our membership in the Council of Institutional Investors as well as our contact with corporate pension plans, public funds, and unions, we are also able to communicate extensively with other shareholders regarding events and issues relevant to individual corporations, general industry, and current shareholder concerns.
In addition, FM monitors “target” lists of underperforming companies prepared by various shareholder groups, including: California Public Employee Retirement System, The City of New York—Office of the Comptroller, International Brotherhood of Teamsters, and Council of Institutional Investors. Companies, so identified, receive an individual, systematic review by the Corporate Governance Subcommittee of SSgA’s Investment Committee.
As an active shareholder, FM’s role is to ensure that corporate policies serve the best interests of the corporation’s investor-owners. Though we do not seek involvement in the day-to-day operations of an organization, we recognize the need for conscientious oversight of and input into management decisions that may affect a company’s value. To that end, our monitoring of corporate management and industry events is substantially more detailed than that of the typical voter. We have demonstrated our willingness to vote against management-sponsored initiatives and to support shareholder proposals when appropriate. To date we have not filed proposals or initiated letter-writing or other campaigns, but have used our active participation in the corporate governance process—especially the proxy voting process—as the most effective means by which to communicate our and our clients’ legitimate shareholder concerns. Should an issue arise in conjunction with a specific corporation that cannot be satisfactorily resolved through these means, we shall consider other approaches.
Through the consistent, conscientious execution of our responsibilities as both fiduciary and shareholder, FM is able to promote the best interests of its fellow shareholders and its clients. The SSgA Funds Management, Inc. Proxy Voting Policy provides for this active, informed participation in the management of those corporations in which we hold shares.
Potential Conflicts
As discussed above under Process, from time to time, FM will review a proxy which presents a potential material conflict. For example, FM or its affiliates may provide services to a company whose management is soliciting proxies, or to another entity which is a proponent of a particular proxy proposal. Another example could arise when FM has business or other relationships with participants involved in proxy contests, such as a candidate for a corporate directorship.
As a fiduciary to its clients, FM takes these potential conflicts very seriously. While FM’s only goal in addressing any such potential conflict is to ensure that proxy votes are cast in the clients’ best interests and are
B-197
not affected by FM’s potential conflict, there are a number of courses FM may take. The final decision as to which course to follow shall be made by the Investment Committee.
When the matter falls clearly within one of the proposals enumerated above, casting a vote which simply follows FM’s pre-determined policy would eliminate FM’s discretion on the particular issue and hence avoid the conflict.
In other cases, where the matter presents a potential material conflict and is not clearly within one of the enumerated proposals, or is of such a nature that FM believes more active involvement is necessary, the Chairman of the Investment Committee shall present the proxy to the Investment Committee, who will follow one of two courses of action. First, FM may employ the services of a third party, wholly independent of FM, its affiliates and those parties involved in the proxy issue, to determine the appropriate vote.
Second, in certain situations the Investment Committee may determine that the employment of a third party is unfeasible, impractical or unnecessary. In such situations, the Investment Committee shall make a decision as to the voting of the proxy. The basis for the voting decision, including the basis for the determination that the decision is in the best interests of FM’s clients, shall be formalized in writing as a part of the minutes to the Investment Committee. As stated above, which action is appropriate in any given scenario would be the decision of the Investment Committee in carrying out its duty to ensure that the proxies are voted in the clients’, and not FM’s, best interests.
Recordkeeping
In accordance with applicable law, FM shall retain the following documents for not less than five years from the end of the year in which the proxies were voted, the first two years in FM’s office:
| | 1) | FM’s Proxy Voting Policy and any additional procedures created pursuant to such Policy; |
| | 2) | a copy of each proxy statement FM receives regarding securities held by its clients (note: this requirement may be satisfied by a third party who has agreed in writing to do so or by obtaining a copy of the proxy statement from the EDGAR database); |
| | 3) | a record of each vote cast by FM (note: this requirement may be satisfied by a third party who has agreed in writing to do so); |
| | 4) | a copy of any document created by FM that was material in making its voting decision or that memorializes the basis for such decision; and |
| | 5) | a copy of each written request from a client, and response to the client, for information on how FM voted the client’s proxies. |
Disclosure of Client Voting Information
Any client who wishes to receive information on how its proxies were voted should contact its FM client service officer.
B-198
T. ROWE PRICE PROXY VOTING—PROCESS AND POLICIES
T. Rowe Price Associates, Inc. and T. Rowe Price International, Inc. recognize and adhere to the principle that one of the privileges of owning stock in a company is the right to vote on issues submitted to shareholder vote—such as election of directors and important matters affecting a company’s structure and operations. As an investment adviser with a fiduciary responsibility to its clients, T. Rowe Price analyzes the proxy statements of issuers whose stock is owned by the investment companies that it sponsors and serves as investment adviser. T. Rowe Price also is involved in the proxy process on behalf of its institutional and private counsel clients who have requested such service. For those private counsel clients who have not delegated their voting responsibility but who request advice, T. Rowe Price makes recommendations regarding proxy voting.
Proxy Administration
The T. Rowe Price Proxy Committee develops our firm’s positions on all major corporate issues, creates guidelines, and oversees the voting process. The Proxy Committee, composed of portfolio managers, investment operations managers, and internal legal counsel, analyzes proxy policies based on whether they would adversely affect shareholders’ interests and make a company less attractive to own. In evaluating proxy policies each year, the Proxy Committee relies upon our own fundamental research, independent proxy research provided by third parties such as Institutional Shareholder Services and Glass Lewis, and information presented by company managements and shareholder groups.
Once the Proxy Committee establishes its recommendations, they are distributed to the firm’s portfolio managers as voting guidelines. Ultimately, the portfolio manager decides how to vote on the proxy proposals of companies in his or her portfolio. Because portfolio managers may have differences of opinion on portfolio companies and their proxies, or their portfolios may have different investment objectives, these factors, among others, may lead to different votes between portfolios on the same proxies. When portfolio managers cast votes that are counter to the Proxy Committee’s guidelines, they are required to document their reasons in writing to the Proxy Committee. Annually, the Proxy Committee reviews T. Rowe Price’s proxy voting process, policies, and voting records.
T. Rowe Price has retained Institutional Shareholder Services, an expert in the proxy voting and corporate governance area, to provide proxy advisory and voting services. These services include in-depth research, analysis, and voting recommendations as well as vote execution, reporting, auditing and consulting assistance for the handling of proxy voting responsibility and corporate governance-related efforts. While the Proxy Committee relies upon ISS research in establishing T. Rowe Price’s voting guidelines—many of which are consistent with ISS positions—T. Rowe Price occasionally may deviate from ISS recommendations on general policy issues or specific proxy proposals.
Fiduciary Considerations
T. Rowe Price’s decisions with respect to proxy issues are made in light of the anticipated impact of the issue on the desirability of investing in the portfolio company. Proxies are voted solely in the interests of the client, Price Fund shareholders or, where employee benefit plan assets are involved, in the interests of plan participants and beneficiaries. Practicalities and costs involved with international investing may make it impossible at times, and at other times disadvantageous, to vote proxies in every instance. For example, we might refrain from voting if we or our agents are required to appear in person at a shareholder meeting or if the exercise of voting rights results in the imposition of trading or other ownership restrictions.
Consideration Given Management Recommendations
When determining whether to invest in a particular company, one of the key factors T. Rowe Price considers is the quality and depth of its management. As a result, T. Rowe Price believes that recommendations of management on most issues should be given weight in determining how proxy issues should be voted.
B-199
T. Rowe Price Voting Policies
Specific voting guidelines have been established by the Proxy Committee for recurring issues that appear on proxies, which are available to clients upon request. The following is a summary of the more significant T. Rowe Price policies:
Election of Directors
T. Rowe Price generally supports slates with a majority of independent directors. We withhold votes for outside directors that do not meet certain criteria relating to their independence or their inability to dedicate sufficient time to their board duties due to their commitment to other boards. We also withhold votes for inside directors serving on compensation, nominating and audit committees and for directors who miss more than one-fourth of the scheduled board meetings. We may also withhold votes from inside directors for the failure to establish a formal nominating committee. T. Rowe Price supports shareholder proposals calling for a majority vote threshold for the election of directors.
Executive Compensation
Our goal is to assure that a company’s equity-based compensation plan is aligned with shareholders’ long-term interests. While we evaluate most plans on a case-by-case basis, T. Rowe Price generally opposes compensation packages that provide what we view as excessive awards to a few senior executives or that contain excessively dilutive stock option plans. We base our review on criteria such as the costs associated with the plan, plan features, burn rates which are excessive in relation to the company’s peers, dilution to shareholders and comparability to plans in the company’s peer group. We generally oppose plans that give a company the ability to reprice options or to grant options at below market prices. For companies with particularly egregious pay practices we may withhold votes from compensation committee members, the CEO, or even the entire board.
Mergers and Acquisitions—T. Rowe Price considers takeover offers, mergers, and other extraordinary corporate transactions on a case-by-case basis to determine if they are beneficial to shareholders’ current and future earnings stream and to ensure that our Price Funds and clients are receiving fair compensation in exchange for their investment.
Anti-takeover, Capital Structure and Corporate Governance Issues
T. Rowe Price generally opposes anti-takeover measures and other proposals designed to limit the ability of shareholders to act on possible transactions. Such anti-takeover mechanisms include classified boards, supermajority voting requirements, dual share classes and poison pills. We also oppose proposals which give management a “blank check” to create new classes of stock with disparate rights and privileges. We generally support proposals to permit cumulative voting and those that seek to prevent potential acquirers from receiving a takeover premium for their shares. When voting on corporate governance proposals, we will consider the dilutive impact to shareholders and the effect on shareholder rights. We generally support shareholder proposals that call for the separation of the Chairman and CEO positions unless there are sufficient governance safeguards already in place. With respect to proposals for the approval of a company’s auditor, we typically oppose auditors who have a significant non-audit relationship with the company.
Social and Corporate Responsibility Issues
T. Rowe Price generally votes with a company’s management on social, environmental and corporate responsibility issues unless they have substantial economic implications for the company’s business and operations that have not been adequately addressed by management.
Monitoring and Resolving Conflicts of Interest
The Proxy Committee is also responsible for monitoring and resolving possible material conflicts between the interests of T. Rowe Price and those of its clients with respect to proxy voting. We believe that due to the
B-200
client-focused nature of our investment management business that the potential for conflicts of interests are relatively infrequent. Nevertheless, we have adopted safeguards to ensure that our proxy voting is not influenced by interests other than those of our clients. While membership on the Proxy Committee is diverse, it does not include individuals whose primary duties relate to client relationship management, marketing or sales. Since our voting guidelines are pre-determined by the Proxy Committee using recommendations from ISS, an independent third party, application of the T. Rowe Price guidelines to vote clients’ proxies should in most instances adequately address any possible conflicts of interest. However, for proxy votes inconsistent with T. Rowe Price guidelines, the Proxy Committee reviews all such proxy votes in order to determine whether the portfolio manager’s voting rationale appears reasonable. The Proxy Committee also assesses whether any business or other relationships between T. Rowe Price and a portfolio company could have influenced an inconsistent vote on that company’s proxy. Issues raising possible conflicts of interest are referred to designated members of the Proxy Committee for immediate resolution prior to the time T. Rowe Price casts its vote. With respect to personal conflicts of interest, T. Rowe Price’s Code of Ethics requires all employees to avoid placing themselves in a “compromising position” where their interests may conflict with those of our clients and restricts their ability to engage in certain outside business activities. Portfolio managers or Proxy Committee members with a personal conflict of interest regarding a particular proxy vote must recuse themselves and not participate in the voting decisions with respect to that proxy.
B-201
VICTORY CAPITAL MANAGEMENT
Effective Date: August 18, 2003
Revised Date: June 30, 2006
Proxy Voting Policy
B-202
TABLE OF CONTENTS
B-203
PROXY VOTING POLICY
When Victory client accounts hold stock that Victory is obligated to vote, the voting authority will be exercised in accordance with:
| | • | | the direction and guidance, if any, provided by the document establishing the account relationship |
| | • | | principles of fiduciary law and Rule 206(4)-6 under the Investment Advisers Act of 1940, as amended. Both require Victory to act in the best interests of the account. In voting such stock, Victory will exercise the care, skill, prudence, and diligence a prudent person would use, considering the aims, objectives, and guidance provided by the documents governing the account |
Victory votes client securities in the best interests of the client. In general, this entails voting client proxies with the objective of increasing the long-term economic value of client assets.* In determining the best interests of the account, Victory considers, among other things, the effect of the proposal on the underlying value of the securities (including the effect on marketability of the securities and the effect of the proposal on future prospects of the issuer), the composition and effectiveness of the issuer’s board of directors, the issuer’s corporate governance practices, and the quality of communications from the issuer to its shareholders.
Where Victory has an obligation to vote client proxies:
| | • | | reasonable efforts will be made to monitor and keep abreast of corporate actions |
| | • | | all stock, whether by proxy or in person, will be voted, provided there is sufficient time and information available |
| | • | | a written record of such voting will be kept by Victory or its designated affiliate |
| | • | | the Proxy and Corporate Activities Committee (the “Proxy Committee”) will supervise the voting of client securities (subject to the review of Victory’s appropriate Chief Investment Officer) |
Note: “Clients” include, without limitation, separately managed accounts, mutual funds, and other accounts and funds for which Victory serves as investment adviser or sub-adviser.
Victory’s entire Policy and Procedures are available upon request via our website at www.victoryconnect.com, or by e-mailing us at Compliance_Victory@victoryconnect.com.
STATEMENT OF CORPORATE GOVERNANCE
The rights associated with stock ownership are as valuable as any other financial assets. As such, they must be managed in the same manner. Victory has established voting guidelines that seek to protect these rights while attempting to maximize the value of the underlying securities.
PROXY VOTING PROCEDURE
The Proxy Committee determines how proxies will be voted, or in those instances where Victory has sole or shared voting authority over client securities, recommendations will be made. Proxy’s are presented to the committee through the Corporate Actions Department. Actual votes are submitted by the Corporate Actions Department and/or the Proxy Committee. Decisions are based exclusively with the best interest with the shareholders in mind.
Voting may be executed through administrative screening per established guidelines with oversight by the Proxy Committee or upon vote by a quorum of the Proxy Committee.
Victory’s investment research department’s opinion concerning the management and prospects of the issuer may be taken into account in determining whether a vote for or against a proposal is in the client’s best interests.
B-204
Insufficient information, onerous requests or vague, ambiguous wording may indicate that a vote against a proposal is appropriate, even when the general principal appears to be reasonable.
The Proxy Committee is comprised of at least the following: Chief Administration Officer, a Senior Equity Analyst, a Senior Portfolio Manager, and Head of Fund Administration. Quorum exists when at least three voting committee members are either in attendance or participate remotely via video or teleconference. Approval is based on majority votes of committee.
VOTING GUIDELINES
The following guidelines are intended to assist in voting proxies and are not to be considered rigid rules. The Proxy Committee is directed to apply these guidelines as appropriate. On occasion, however, a contrary vote may be warranted when such action is in the best interests of the account or if it is required under the documents governing the account.
The committee may also take into account independent third-party, general industry guidance or other governance board review sources when making decisions. The committee may additionally seek guidance from other senior internal sources with special expertise on a given topic, where it is appropriate.
When the Proxy Committee decides to vote against a proposal which is generally approved, or votes in favor of a proposal which is generally opposed, the reason for the exception will be recorded.
The following is a discussion of selected proxy proposals which are considered periodically at annual meetings. Victory’s general position with regard to such proposals is also included.
CORPORATE GOVERNANCE
Confidential Voting Generally Approved
Confidential voting eliminates the possibility for management to apply pressure to institutional shareholders with which a business relationship exists. It should be noted that the Department of Labor’s “Avon Letter” and the investigation of proxy voting violations in 1988 may have lessened the need for confidential voting.
Equal Access Proposals Generally Approved
As owners of the company, shareholders should have access to a company’s proxy in order to vote on issues of importance.
Cumulative Voting Generally Opposed
Cumulative voting may prevent the majority of shareholders from electing a majority of the board. Cumulative voting requires fewer votes to obtain a board seat, therefore, it promotes single interest representation on the board which may not be representative of the interests and concerns of all shareholders.
Unequal Voting Rights Generally Opposed
Victory would vote against any provisions that would dilute the current voting power of shareholders, since one of the assets of a shareholder is the ability to effect change through proxy voting. Victory firmly believes all shareholders should be treated equitably. One share, one vote.
Super-Majority Vote Requirements Generally Opposed
Victory is opposed to proposals requiring a vote of more than two-thirds of the shareholders to amend any bylaws or charter provisions, or to approve a merger or other business combination. Super-majority vote provisions may stifle bidder interest in the issuer and thereby devalue its stock.
B-205
Majority Voting Proposals Review Case-by-Case
Victory generally supports reasonably crafted shareholder proposals calling for directors to be elected through an affirmative majority of votes cast and/or the elimination of the plurality standard in uncontested elections, unless the company has adopted meaningful alternatives within their formal corporate governance process.
By-Laws Amended By Board Of Directors Without Shareholder Approval Generally Opposed
Since one of the rights of a shareholder is the ability to effect change through proxy voting, it would not be in their best interest to allow the board to influence policy and change the by-laws of the company without shareholder input. Victory would vote against any action taken by the board to prevent shareholders from deciding policy.
Amendments To By-Laws Or Charters Case-by-Case
In general, Victory approves technical amendments for companies with a solid track record of good corporate governance. However, Victory reserves the right to oppose issues for companies with questionable practices relating to governance issues.
Blank-Check Preferred Stock Generally Opposed
Blank-check preferred stock provides flexibility in financing, and can be used as an entrenchment device. The issuing company can use this tactic as a poison pill when distributed to stockholders with rights attached, or it can be issued with superior voting rights to friendly parties.
Pre-Emptive Rights Generally Approved
Pre-emptive rights provide existing shareholders with the first opportunity to purchase shares or new issues of company stock. Victory may not recommend exercising the rights for several reasons, including lack of liquidity or the transaction may not be in the best interest of client’s accounts. However, in certain cases the rights are transferable and Victory may recommend selling. The primary reason for the approval of rights offerings is to limit the amount of dilution new shares cause current shareholders.
Expensing Options Generally Approved
Victory believes shareholders should have an accurate picture of a company’s financial picture, therefore, the company should fully account for stock options.
Eliminate Shareholders’ Right To Call A Special Meeting Generally Opposed
In general, Victory opposes proposals to eliminate the right of shareholders to call a special meeting or the position that a minimum of 25% of the shareholders are required to call a special meeting. Reason: shareholders may lose the right to remove directors or initiate a shareholder resolution without waiting for the next regularly scheduled meeting, especially if shareholders do not have the right to act by written consent.
Restriction of Shareholder Action By Written Consent Generally Opposed
Victory generally opposes proposals to restrict or prohibit a shareholders’ ability to take action by written consent. Shareholders may lose the ability to remove directors or initiate a shareholder resolution if they must wait for the next scheduled meeting.
Appointment Of Auditors Generally Approved
Victory expects a company to have completed its due diligence on the auditors; therefore, selection is approved. However, in cases where auditors have failed to render accurate financial statements, votes are
B-206
withheld. A favorable position is given to auditors who receive more compensation from their audit engagement than other services with the company.
Receiving and/or Approving Financial Reports Generally Approved
Typically, it is customary for international firms to approve audited financial reports prior to the annual meeting.
Corporate Name Change Generally Approved
A name change often is used to reflect the brand and image of the business. Under most circumstances, this change is a marketing initiative, has no effect on governance and does not infringe on shareholders’ rights.
Expansion of Business Activity Review Case-by-Case
Existing shareholders should approve any restatement of the business purposes or fundamental change in operations. In addition, shareholders should review any expansion or development of company objectives and activities.
Change In The Date Or Location Of Annual Meetings Generally Approved
Victory supports provisions that encourage changes in the date and location of annual meetings. A rotating schedule enables shareholders across the nation to attend the meetings and express their views.
Change In Investment Company Agreements With Advisors Generally Approved
Victory approves a change in the investment company’s agreement with the advisor when it is in the long-term best economic interest of the shareholders.
For Investment Companies, Continuation Of Company Management, Administration or Investment Advisor Generally Approved
Victory supports contracts when performance of the investment companies is relatively close to the appropriate benchmark.
Converting Closed-end Fund To Open-end Fund Review Case-by-Case
Victory supports such conversions when it is in the long-term best economic interest of the shareholders. Some of the factors reviewed would include: past performance, the level of discount or premium compared to the NAV, expense structure and the overall effect on competitiveness and future prospects within the market that the fund invests.
Changing Investment Company Fundamental Investment Restrictions Review Case-by-Case
Victory generally reviews such proposals based on factors that include, but are not limited to: the nature of the restriction to be changed, reasons given for such a change, the likely impact to the overall portfolio and long-term best economic interests of the shareholders.
Transaction Of Such Other Business As May Properly Come Before The Meeting Generally Opposed
Victory generally opposes proposals requesting voting approval in the form of other business.
B-207
BOARD OF DIRECTORS
Required Majority Of Independent Directors Generally Approved
Victory believes shareholders are best served when the Board of Directors includes a significant number (preferably a majority) of individuals who are independent and outside of the firm. Independent directors can bring the most objective and fresh perspective to the issues facing the company. Independent directors are less hampered when fulfilling their obligations to monitor top management performance and responsiveness to shareholders and are less likely to be involved in conflict of interest situations.
Change In The Number Of Directors Generally Approved
Victory approves a change in the number of directors as long as a satisfactory explanation is provided and the number of directors is reasonable.
Classified Boards Review Case-by-Case
Classified boards do provide stability and continuity. However, Victory may oppose this position under the certain circumstance, such as: a proxy fight is won and one-third of the directors are replaced. Running the company with a board that is one-third hostile is very difficult and the vote would be perceived as a loss of confidence in management.
Outside Director Stock Option Plan Review Case-by-Case
The interest of outside directors should be aligned with both shareholders and inside directors. Victory supports the position whereby directors hold a minimum level of stock in the company. Another way to ensure the interests of shareholders are matched with those of the outside directors is to award options as a part of compensation. However, Victory would vote against any plan that awards any director excessively.
Election of Management’s Nominees for Directors Generally Approved
Victory supports management’s recommendation for any qualified individual to represent the shareholders. Factors considered include: attendance at meetings, company performance, stock ownership, and the independence of each director.
Corporate Board Diversity Review Case-by-Case
Victory supports voluntary efforts by shareholders and board members to increase diversity on corporate boards. Support also is given to the appointment of qualified directors with diverse backgrounds; however, the issue of quotas is not supported.
Indemnification Of Directors Generally Approved
In general, indemnification is necessary to attract qualified board nominees in today’s litigious environment; however, monetary liability generally is not eliminated, or limited, for breach of duty, lack of loyalty, acts or omissions not performed in good faith, or any transaction in which the director derived an improper benefit.
Removal Of A Director Only For Cause Generally Approved
In cases such as gross negligence or fraud, dismissal from the board is warranted. Victory fully supports this position.
Severance Packages Review Case-by-Case
Severance packages for outside directors may be appropriate when a merger is planned for the best interest of shareholders; however, severance packages tailored solely as incentives to approve a merger generally are not
B-208
approved. Since severance packages for outside directors could be viewed as buying their vote and not sound corporate governance, Victory will generally oppose these issues.
Share Ownership Generally Approved
Directors are encouraged to be shareholders in order to better align their goals with those of the rest of the shareholders; however, an absolute level of ownership is not supported. Given the tenure and financial position of the director, reasonable efforts to hold the shares should be expected.
Advisory Committee Review Case-by-Case
A major privilege of a shareholder is the right to express one’s views to management and the board of directors. If communication between shareholders and management does not take place effectively, an advisory committee can effectively express the equity holder’s views. The scope of responsibility of the advisory committee should be limited to subjects involving corporate governance issues. Victory rejects measures that would allow the advisory committee input into the day-to-day management of the company.
Director Liability Generally Approved
Without the assurance a director’s personal assets will be protected in case of legal action, companies may have a difficult time retaining and attracting good directors. Victory favors proposals that expand coverage where directors were found to have acted in good faith; however, directors should be held accountable for their actions, and Victory would be against any proposals that reduce or eliminate personal liability when current litigation is pending against the board.
Limit Director Tenure Generally Opposed
Term limits could result in the dismissal of directors who significantly contribute to the company’s success and represent shareholder’s interests effectively. Victory recognizes the position may take a director a number of years to fully understand the details of the company and the nuances of serving on the board.
Minimum Stock Ownership Generally Approved
Victory believes stock ownership requirements more closely align the director’s interests with those of the shareholders they were elected to represent.
Separate Chair Person and CEO Review Case-by-Case
Victory may support proposals requiring that the position of chair be filled by an independent director, depending upon the particular circumstance and relevant considerations. Examples of considerations include, but are not limited to, having: a designated independent lead director, a two-thirds independent board, key committees that are comprised of independent directors and a company that does not materially under-perform its peers.
Approve Directors Fees Paid In Stock and Cash Generally Approved
Victory supports proposals that allow directors to have their annual fees paid in both cash and stock. Directors also should be shareholders in order to align their interests with those they represent.
TAKEOVER DEFENSE AND RELATED ACTIONS
Mergers Or Other Combinations Review Case-by-Case
Victory votes in the best long-term economic interest of the shareholders. When making recommendations, the following considerations are made: the premium received, the trend of the stock, prior to the announcement,
B-209
for both sides of the transaction, the leverage, the effects on the credit rating of the merger and the reasons for the merger. Also, a number of ratios and factors are reviewed prior to making our recommendation.
Leverage Buyout Review Case-by-Case
Victory would support a buyout if the shareholders receive the appropriate premium and/or it was in the best long-term economic interest of the company.
Fair Price Provisions Generally Opposed
In general, Victory opposes the following when accompanied by a super-majority provision: a clause requiring a super-majority shareholder vote to alter or repeal the fair price provision, in excess of two-thirds. Victory also generally opposes if the pricing formula is such that the price required is unreasonably high and/or designed to prevent a two-tier, front-end-loaded hostile tender offer. Since shareholders do not want to get caught in the second tier, they act selfishly and tender their shares in the first tier so that, effectively, all shareholders are coerced into accepting the offer.
Change In The Number Of Authorized Common Shares Generally Approved
It is important for companies to have a cushion for acquisitions, for public offerings, fund stock splits and dividends and for other ordinary business purposes.However, the authorization could raise a corporate governance issue such as targeted share placement. Victory is opposed to this issue if the targeted share placement was for the sole purpose of defeating an appropriately valued offer.
Anti-Greenmail Provision Review Case-by-Case
Victory favors equal treatment for all shareholders, but anti-greenmail provisions may severely limit management’s flexibility (for example, share repurchase programs Class shares with special features.) Victory may approve if it is determined that the Greenmail may prevent an acquisition that would be detrimental to the long-term interests of shareholders.
Approval of Poison Pills Review Case-by-Case
Victory generally opposes poison pills used to prevent takeover bids that are in the best interest of shareholders. Certain shareholder rights plans, however, protect the interest of shareholders by enabling the board to respond to unsolicited bids.
Proposals To Opt Out Of State Anti-Takeover Laws Review Case-by-Case
Victory approves measures that benefit current shareholders. Proposals that are overwhelmingly in favor of the board at the expense of shareholders would be opposed.
Reincorporation Generally Approved
In general, Victory approves reincorporation actions; however, when a change of state of incorporation increases the capacity of management to resist hostile takeovers, the action should be closely examined.
COMPENSATION PLAN
Executive Stock Option Plans Generally Approved
Generally, Victory supports the adoption of Executive Stock Option Plans. Provisions that accelerate option plans in the event of change of control are also generally approved. Victory will, however, oppose plans where
B-210
the exercise price drops below market price and/or the dilution is greater than 10%, particularly if the company is mature or executive compensation is excessive. In the case of rapidly growth, cash-short companies with reasonable executive salaries, Victory may approve a plan where dilution exceeds 10%.
Adopt Restricted Stock Plan Review Case-by-Case
Restricted stock plans should be kept at minimum levels because they cost more when compared to traditional stock option plans. Additionally, incentives are less than the established plans.
Repricing Of Outstanding Options Generally Opposed
Generally, Victory opposes any proposal that would reprice outstanding stock options. Such actions are not in the best interest of shareholders, because it is not appropriate to allow option holders to profit from stock underperformance.
Equity Based Compensation Plan Review Case-by-Case
Awards other than stock options and RSAs (Restricted Stock Award) should be identified as being granted to officers/directors and the number of shares awarded should be reasonable.
Golden Parachutes Review Case-by-Case
When a takeover is considered likely, it would be difficult for a company to attract and retain top managers without severance payments for involuntary termination or significant reduction in compensation, duties, or relocation after a change in control. However, parachutes in excess of 2.99 times the previous year’s salary and bonus combined are considered exorbitant and generally would be opposed.
Cap On Executive Pay Review Case-by-Case
Victory would vote against any absolute limit on executive compensation. However, compensation that better matches management and shareholder interests is supported. Additionally, executive compensation needs to be linked to the overall performance of the company.
Link Pay To Performance Review Case-by-Case
Victory supports plans that align compensation with operational and financial performance. Proposals that link compensation to performance measurements such as peer groups are generally approved. Plans that reward executives regularly and excessively for company underperformance compared to its peer group are not supported.
Loans Or Guarantees Of Loans To Officers And Directors Generally Opposed
In the wake of a number of different scandals involving loans to officer and directors, Victory believes it is in the best interest of shareholders to vote against any loans or guarantees to officers or directors.
CAPITAL STRUCTURE, CLASSES OF STOCK AND RECAPITALIZATION
Restructure/Recapitalize Review Case-by-Case
Generally, Victory approves proposals that are in a company’s best long-term economic interest, as well as those that protect a client’s position. These proposals involve the alteration of a corporation’s capital structure, such as an exchange of bonds for stock.
Spin-Offs Review Case-by-Case
In cases of spin-offs, Victory reviews whether the transaction is in the best long-term economic interest of the shareholder.
B-211
Tracking Stock Review Case-by-Case
Victory would consider the compensation shareholders receive in the event a tracking stock is released. If the company is trying to unlock or spin-off segments that are underperforming or inhibit overall performance, the transaction is reviewed to determine whether value is created for our positions. If the subsidiary has little corporate governance, excessive dilution to current shareholders is present, or any other signs of malfeasance is present, Victory would take an opposing position.
Changes To Preferred Stock Review Case-by-Case
Preferred stock can be used as a sound management tool to raise capital and/or increase financial flexibility. However, in instances where it is being used as a part of an anti-takeover package, Victory would oppose the changes.
Share Buyback Generally Approved
Generally, Victory approves buybacks that are “at or above” the current market price. However, when management uses this as an entrenching tool to prevent hostile takeovers, or in cases where management uses buyback to prevent acquisitions, Victory would take an opposing position.
Authority To Issue Additional Debt Review Case-by-Case
The issuance of additional debt may be beneficial to a company under certain circumstances. However, Victory may vote against any excessive issuance of debt that would cause, for example, a drop in the rating of the company’s debt and the company itself.
Stock Splits And Stock Dividends Generally Approved
Victory supports stock splits and stock dividends if they are in the best long-term economic interest of the shareholders. Splits are considered positive because they increase liquidity and allow a greater number of people to hold the shares. Dividends are considered positive because they return capital and enhance returns for shareholders.
SOCIAL ISSUES
Social Issues In General Review Case-by-Case
When evaluating social issues such as human rights, labor and employment, the environment, and tobacco, Victory considers such proposals based on the expected impact to the shareholder and their long-term economic best interest. As applicable, Victory may additionally factor corporate governance concerns, reasonableness of each request and related business exposure to the company when analyzing the expected potential impact to shareholders.
Equal Opportunity Review Case-by-Case
Victory will generally support reports outlining a company’s affirmative action initiatives unless the requests are considered excessive or costly beyond their expected benefit to shareholders. However, Victory may vote against such proposals if relevant actions are already reasonably being met. A few examples would be that the company has well documented equal opportunity programs or the company already publicly reports on its initiatives and provides data on workforce diversity.
Sustainability Reporting Review Case-by-Case
Victory will generally support proposals requesting that a company report on policies and initiatives related to relevant social, economic, and environmental sustainability, unless such proposals are considered excessive or
B-212
costly beyond their expected benefit to shareholders. However, Victory may vote against such proposals if relevant actions are already reasonably being met. A few examples would be: that the company already discloses similar information through existing reports, policies or codes of conduct; or, the company has formally committed to the implementation of a reporting program based on industry accepted guidelines within a reasonable timeframe.
Political Contributions Review Case-by-Case
Victory may support proposals that are reasonable in request, cost and information availability, related to the disclosure of corporate contributions. Victory will generally not support political contribution proposals considered excessive, costly or structured to require disclosure beyond political action committee regulations.
ADDITIONAL TOPICS
Any issue not covered within the guidelines will be evaluated by the Proxy Committee on a case-by-case basis.
MATERIAL CONFLICTS OF INTEREST
In the event a material conflict of interest arises between Victory’s interests and those of a client during the course of voting client’s proxies, the Proxy Committee shall:
| | • | | We vote the proxy in accordance with the Proxy Voting Guidelines unless such guidelines are judged by the Proxy Committee to be inapplicable to the proxy matter at issue |
| | • | | In the event that the Proxy Voting Guidelines are inapplicable, determine whether a vote for, or against, the proxy is in the best interest of the client’s account |
| | • | | document the nature of the conflict and the rationale for the recommended vote |
| | • | | solicit the opinions of KeyCorp’s Chief Risk Officer, Chief Compliance Officer, or their designee, or consult an external, independent adviser |
| | • | | If a member of the Proxy Committee has a conflict (e.g. – family member on board of company) – he/she will not vote (or recuse themselves from voting). |
| | • | | Report to the Board any proxy votes that took place with a material conflict situation present, including the nature of the conflict and the basis or rationale for the voting decision made. Such a report should be given at the next scheduled Board Meeting or other appropriate timeframe as determined by the Board. |
RECORDKEEPING
In accordance with Rule 204-2(c)(2) under the Investment Advisers Act of 1940, as amended, Victory will retain the following records with respect to proxy voting:
| | • | | copies of all policies and procedures required by Rule 206(4)-6 |
| | • | | a written record of votes cast on behalf of clients |
| | • | | any documents prepared by Victory or the Proxy Committee germane to the voting decision |
| | • | | a copy of each written client request for information on how Victory voted proxies on such client’s behalf |
| | • | | a copy of any written response by Victory to any written or verbal client request for information on how Victory voted such client’s proxies |
B-213
GLOSSARY
Blank Check Preferred Stock—A popular term for preferred stock in which the board of directors is given broad discretion to establish voting, conversion, dividend and other rights of preferred stock at the time the board issues the stock. Some boards that have authority to issue blank check preferred stock have used it to create takeover defenses.
Bylaw—Bylaws supplement each company’s charter, spelling out in more specific detail general provisions contained in the charter. Board of Directors often have the power to change bylaw provisions without shareholder approval.
Charter—Also known as the articles of incorporation, the charter sets forth the respective rights and duties of shareholders, officers, and directors. The charter constitutes the fundamental governing rules for each corporation. Shareholder approval is required to amend a company’s charter.
Classified Board—A classified board is a board that is divided into separate classes, with directors serving overlapping terms. A company with a classified board usually divides the board into three classes; each year, one-third of the directors stand for election. A classified board makes it difficult to change control of the board through a proxy contest, since it would normally take two years to gain control of a majority of board seats.
Confidential Voting—Also known as closed voting or voting by secret ballot, under confidential voting procedures, all proxies, ballots and voting tabulations that identify shareholders are kept confidential. Independent vote tabulators and inspectors of election are responsible for examining individual ballots, while management and shareholders are only told vote totals.
Corporate Governance—Corporate governance is the framework within which corporations exist. Its focus is the relationship among officers, directors, shareholders, stakeholders and government regulators, and how these parties interact to oversee the operations of a company.
Cumulative Voting—Normally, shareholders cast one vote for each director for each share of stock owned. Cumulative voting permits shareholders to apportion the total number of votes they have in any way they wish among candidates for the board. Where cumulative voting is in effect, a minority of shares may be able to elect one or more directors by giving all of their votes to one or several candidates.
Fair Price Requirements—Fair price requirements compel anyone acquiring control of a corporation to pay all shareholders the highest price that the acquirer pays to any shareholder during a specified period of time. Fair price requirements are intended to deter two-tier tender offers in which shareholders who tender their shares first receive a higher price for their shares than other shareholders.
Greenmail—Greenmail refers to the practice of repurchasing shares from a bidder at an above-market price in exchange for the bidder’s agreement not to acquire the target company. Greenmail is widely considered to a form of blackmail. Some companies have attempted to deter greenmail by adding anti-greenmail provisions to their chargers.
Indemnification—Indemnification permits corporations to reimburse officers and directors for expenses they incur as a result of being named as defendants in lawsuits brought against the corporation. Indemnification often covers judgment awards and settlements as well as expenses. Without indemnifications, or directors’ liability insurance, most companies would be unable to attract outside directors to serve on their boards.
Majority Voting—The standard whereby a director or nominee will be elected only if receiving an affirmative majority of votes cast, even if running unopposed for an open seat. In contrast, the plurality standard
B-214
holds that a nominee or director will be elected based on having received the most votes, whether or not having received an affirmative majority of votes cast.
Poison Pill—The popular term for a takeover defense that permits all shareholders other than an acquirer to purchase shares in a company at a discount if the company becomes a takeover target. A company with a pill (also known as a shareholder rights plan) usually distributes warrants or purchase rights that become exercisable when a triggering event occurs. The triggering event occurs when an acquirer buys more than a specified amount of a target company’s stock without permission of the target company’s board. Once the pill is triggered, shareholders (except for the acquirer) usually have the right to purchase shares directly from the target company at a 50 percent discount, diluting both ownership interest and voting rights. Most pills have provisions that permit the board to cancel the pill by redeeming the outstanding warrants or rights at nominal cost. Pills can force acquirers to bargain directly with a target company’s board, but they can also be used to deter or to block acquisition bids altogether. Corporations are not required by law to submit their poison pills for shareholder approval, and very few companies have chosen to seek shareholder approval.
Pre-emptive Rights—pre-emptive rights are intended to allow existing shareholders to maintain their proportionate level of ownership by giving them the opportunity to purchase additional shares pro rata before they are offered to the public. pre-emptive rights are something of an anachronism today because shareholders of publicly traded companies who want to maintain their proportionate ownership interest may do so by purchasing shares in the open market. Many companies whose charters have pre-emptive rights provisions have asked shareholders to amend their charters to abolish pre-emptive rights.
Proxy—The granting of authority by shareholders to others, most often corporate management, to vote their shares at an annual or special shareholders’ meeting.
Proxy Contest—Proxy contests take different forms. The most common type of proxy contest is an effort by dissident shareholders to elect their own directors. A contest may involve the entire board, in which case the goal is to oust incumbent management and take control of the company. Or, it may involve a minority of board seats, in which case dissidents seek a foothold position to change corporate strategy without necessarily changing control. Proxy contests may also be fought over corporate policy questions; dissidents may, for example, wage a proxy contest in support of a proposal to restructure or sell a corporation. Many proxy contests are today waged in conjunction with tender offers as a means of putting pressure on a target company’s board to accept the tender offer. In a well-financed proxy contest, dissidents usually print and distribute their own proxy materials, including their own proxy card. Proxy contests usually feature letter writing and advertisement campaigns to win shareholder support.
Proxy Statement—A document in which parties soliciting shareholder proxies provide shareholders with information on the issues to be voted on at an annual or special shareholder’s meeting. The soliciting party generally presents arguments as to why shareholders should grant them their proxy. The information that must be disclosed to shareholders is set forth in Schedule 14A of the Securities Exchange Act of 1934 for a proxy solicited by the company and in Schedule 14B for the act for proxies solicited by others.
Recapitalization Plan—A recapitalization plan is any plan in which a company changes its capital structure. Recapitalization can result in larger or smaller numbers of shares outstanding, or in creation of new classes of stock in addition to common stock. Recapitalization plans must be approved by shareholders.
Reincorporation—Reincorporation refers to changing the state of incorporation. A company that reincorporates must obtain shareholder approval for the move and for the new charter it adopts when it shifts its state of incorporation. Many reincorporations involve moves to Delaware to take advantage of Delaware’s flexible corporate laws.
Restricted Stock—Stock that must be traded in compliance with special SEC regulations concerning its purchase and resale from affiliate ownership, M&A activity and underwriting activity.
B-215
Restructuring Plan—A restructuring plan is any plan that involves a significant change in a company’s capital structure. This would include a recapitalization plan, a leveraged buyout, or a major sale of assets. Restructuring plans after shareholder approval before they can be implemented.
Rights of Appraisal—Rights of appraisal provide shareholders who do not approve of the terms of certain corporate transactions the right to demand a judicial review in order to determine the fair value for their shares. The right of appraisal generally applies to mergers, sales of essentially all assets of the corporation, and charter amendments that may have a materially adverse effect on the rights of dissenting shareholders.
Stakeholder Laws—In essence, stakeholder laws state that corporate directors owe a duty to a host of constituencies beyond shareholders: local communities, employees, suppliers, creditors, and others. This is in contrast to the traditional model of the publicly held corporation in law and economics which says that corporate directors have a legally enforceable duty to one constituency—their shareowners.
Street Name/Nominee Name—Holding a customer’s stock ‘in street name’ is when broker-dealers, banks, or voting trustees register the shares held for customer accounts in their own names. Such a system makes it more difficult to obtain shareholder information. Note that often the legal owners are not the beneficial owners of the stock and therefore may not have the power to vote or direct the voting of the stock. The beneficial owners direct the brokers and banks as to whether their identity may be disclosed.
Supermajority—Most state corporation laws require that mergers, acquisitions and amendments to the corporate charter be approved by a majority of the outstanding shares. A company may, however, set a higher requirement by obtaining shareholder approval for a higher threshold. Some supermajority requirements apply to mergers and acquisitions. Others apply to amendments to the charter itself—that is, the charter, or certain parts of it, may be amended in the future only if the amendments receive the specified supermajority level of support.
Sustainability Report—A company report on policies and initiatives related to social, economic or environmental issues.
Unequal Voting—Corporations with dual class capitalization plans usually have two classes of stock with different voting and dividend rights. Typically, one class of stock has higher voting rights and lower dividend rights. Insiders owning the higher voting shares are able to maintain control, even though they usually own only a fraction of the outstanding shares.
Written Consent—The ability to act by written consent to allow shareholders to take action collectively without a shareholders’ meeting. The written consent procedure was developed originally to permit closely held corporations to act quickly by obtaining consents from their shareholders. The procedure is, however, available in many states to publicly traded companies as well, unless prohibited or restricted in a company’s charter. Many companies have sought shareholder approval to restrict or abolish the written consent procedure; their principal reason for doing so is to prevent takeovers opposed by the incumbent board and management.
EXECUTIVE COMPENSATION TERMS
At-the-Money Option—An option with exercise price equal to the current market price.
Bonus Shares—Share awards which in some cases may not vest until various performance goals are met or the employee has remained with the company for a minimum number of years.
Call Option—The right, but not the obligation, to buy shares at a predetermined exercise price before a predetermined expiration date. Holders are rewarded when the option has a ‘positive’ spread, or difference between its exercise price and its market price.
B-216
Change-in-Control Provision—A provision in a stock option plan that allows for immediate vesting of outstanding options if certain events take place which may be deemed a change in control, such as the purchase of a majority of the company’s outstanding shares by a third party.
Cliff Vesting—A plan feature providing that all awards vest in full after a specified date. If the employee leaves the company’s employ prior to the vesting date, no partial vesting will occur.
Deferred Stock—A share grant in which the participant receives a specified amount of shares, granted at no cost, if he remain employed with the company for a certain period of time. The participant does not have voting or dividend rights prior to vesting, though dividends typically accumulate until vesting.
Employee Stock Purchase Plan—A plan qualified under Section 423 of the IRS Code, which allows employees to purchase shares of stock through payroll deductions.
Employee Stock Ownership Plan (ESOP)—A qualified defined contribution plan under the IRS Code which allows the ESOP plan trustees to invest up to 100 percent of the plan’s assets in shares or its own company stock. Variants of these plans include the stock bonus plan, the leveraged stock bonus plan (where the trust can borrow money from lending sources to buy more stock), and matching ESOP’s (in which employees match the contribution that the company makes). ESOP’s offer employees tax deferral benefits and companies a tax deduction.
Evergreen Plan—A plan provision that typically increases the number of shares available for the issue under the plan on an annual basis by a predetermined percentage of the company’s common stock outstanding. Such plans often have no termination date and permit the plan to operate indefinitely without further shareholder approval.
Exercise Price—Sometimes referred to as the strike price, this is the price at which shares may be exercised under a plan. Exercise prices may be fixed, variable or tied to a formula.
Formula-Based Stock Incentive Plan—A plan where the participant receives phantom stock or stock-based units, the value of which is based on a formula. This type of plan is similar to a performance share or performance unit plan.
Gun-Jumping Grants—Grants of awards made under a plan or plan amendment prior to shareholder approval of the plan or amendment.
Incentive Stock Options (ISO’s)—Also referred to as qualified stock options, these rights permit the participant to buy shares before the expiration date at a predetermined exercise price set at or above fair market value at grant date. The term of such awards may be ten years or longer. The company is not allowed to take a tax deduction for ISO’s unless a disqualifying disposition takes place.
Indexed Option—The right, but not the obligation, to purchase shares at an exercise price that periodically adjusts upward or downward in relation to a market or industry indicator
In-the-Money Option—An option with an exercise price below the current market price.
Limited Stock Appreciation Rights (LSAR’s)—These rights are triggered by a change in the ownership or control and are generally granted in tandem with ISO’s or NSO’s. The rights permit the holder to receive a cash payment equal to the difference between the exercise price and the market price without having to make a person cash outlay to exercise the option. The design of these rights permits the holder to receive the higher offer in a two-tier tender offer.
Nonqualified Stock Options (NSO’s)—Also referred to as discounted stock options, these rights permit the participant to buy shares before the expiration date at a predetermined exercise price set at or below fair market
B-217
value at grant date. The term of such awards may be longer or shorter than ten years. The company receives the tax deduction at the time the executive receives income.
Omnibus Plan—A stock-based incentive plan providing significant flexibility by authorizing the issue of a number of award types, which may include incentive stock options, nonqualified stock options, SAR’s, restricted stock, performance shares, performance units, stock grants, and cash.
Out-of-the-Money Option—An option with an exercise price above the current market price.
Performance Shares—Stock grants contingent upon the achievement of specified performance goals. The number of shares available typically varies with performance as measured over a specified period. Few companies clearly identify the criteria used to select performance measures or the specific hurdle rates that must be met. Performance periods typically extend for a three- to five-year period.
Performance Units—Cash awards contingent upon the achievement of specified performance goals. The amount of cash payable typically varies with performance as measured over a specified period. Few companies clearly identify the criteria used to select performance measures or the specific hurdle rates that must be met. Performance periods typically extend for a three- to five-year period.
Phantom Stock—An award ‘unit’ corresponding in number and value to a specified number of shares of the company’s stock. These units do not represent an ownership interest. The grant of units entitles the employee to a bonus based on any corresponding increase in the value of the stock.
Premium-Priced Options—An option whose exercise price is set above fair market value on grant date.
Put Option—The right, but not the obligation, to sell shares at a predetermined exercise price before a predetermined expiration date.
Pyramiding—A cashless exercise method whereby a portion of the shares under option is used as payment for the exercise price of other options.
Reload Options—Options granted to replace shares owned outright that have been swapped as payment of the option exercise price. At the time of the swap, the company grants a new stock option equal to the number of shares swapped. The reloaded options generally have a new vesting period and the same expiration date as the original options.
Repricing—An amendment to a previously granted stock option contract that reduces the option exercise price. Options can also be repriced through cancellations and regrants. The typical new grant would have a ten-year term, new vesting restrictions, and a lower exercise price reflecting the current lower market price.
Restricted Stock—A grant of stock, subject to restrictions, with little or not cost to the participant. Such shares are usually subject to forfeiture if the holder leaves the company before a specified period of time; thus, the awards are often used to retain employees. The restrictions usually lapse after three to five years, during which time the holder cannot sell the shares. Typically, the holder is entitled to vote the stock and receives dividends on the shares.
Section 162(m)—The IRS Code Section that limits the deductibility of compensation in excess of $1 million to a named executive officer unless certain prescribed actions are taken.
Shareholder Value Transfer (SVT)—A dollar-based cost which measures the amount of shareholders’ equity flowing out of the company to executives as options are exercised. The strike price of an option is paid at the time of exercise and flows back to the company. The profit spread, or the difference between the exercise
B-218
price and the market price, represents a transfer of shareholders’ equity to the executive. The time value of money is also a significant cost impacting shareholders’ equity.
Stock Appreciation Rights (SARs)—An award paid in cash or shares to the employee equal to the stock price appreciation from the time of grant to the exercise date. When granted in tandem with options, the exercise of the SAR cancels the option.
Stock Purchase Right—The right to purchase shares of stock at a discount for a set period of time.
Vesting Schedule—A holding period following grant date during which time options may not be exercised.
Volatility—The potential dispersion of a company’s stock price over the life on an option.
Voting Power Dilution (VPD)—The relative reduction in voting power as stock-based incentives are exercised and existing shareholders’ proportional ownership in the company is diluted.
B-219
PROXY VOTING POLICY
The Fund has delegated all proxy voting responsibilities to WRIMCO. WRIMCO has established guidelines that reflect what it believes are desirable principles of corporate governance.
Listed below are several reoccurring issues and WRIMCO’s corresponding positions.
Board of Directors Issues:
WRIMCO generally supports proposals requiring that a majority of the board of directors consist of outside, or independent, directors.
WRIMCO generally votes against proposals to limit or eliminate liability for monetary damages for violating the duty of care.
WRIMCO generally votes against indemnification proposals that would expand coverage to more serious acts such as negligence, willful or intentional misconduct, derivation of improper personal benefit, absence of good faith, reckless disregard for duty, and unexcused pattern of inattention. The success of a corporation in attracting and retaining qualified directors and officers, in the best interest of shareholders, is partially dependent on its ability to provide some satisfactory level of protection from personal financial risk. WRIMCO will support such protection so long as it does not exceed reasonable standards.
WRIMCO generally votes against proposals requiring the provision for cumulative voting in the election of directors as cumulative voting may allow a minority group of shareholders to cause the election of one or more directors.
Corporate Governance Issues:
WRIMCO generally supports proposals to ratify the appointment of independent accountants/auditors unless reasons exist which cause it to vote against the appointment.
WRIMCO generally votes against proposals to restrict or prohibit the right of shareholders to call special meetings.
WRIMCO generally votes against proposals which include a provision to require a supermajority vote to amend any charter or bylaw provision, or to approve mergers or other significant business combinations.
WRIMCO generally votes for proposals to authorize an increase in the number of authorized shares of common stock.
WRIMCO generally votes against proposals for the adoption of a Shareholder Rights Plan (sometimes referred to as “Purchase Rights Plan”). It believes that anti-takeover proposals are generally not in the best interest of shareholders. Such a Plan gives the board of directors virtual veto power over acquisition offers which may well offer material benefits to shareholders.
Executive/Employee Issues:
WRIMCO will generally vote for proposals to establish an Employee Stock Ownership Plan (ESOP) as long as the size of the ESOP is reasonably limited.
Political Activity:
WRIMCO will generally vote against proposals requiring the publication of reports on political activity or contributions made by political action committees (PACs) sponsored or supported by the corporation. PAC
B-220
contributions are generally made with funds contributed voluntarily by employees, and provide positive individual participation in the political process of a democratic society. In addition, Federal and most state laws require full disclosure of political contributions made by PACs. This is public information and available to all interested parties. Requiring reports in newspaper publications results in added expense without commensurate benefit to shareholders.
Conflicts of Interest Between WRIMCO and the Fund:
WRIMCO will use the following three-step process to address conflicts of interest: (1) WRIMCO will attempt to identify any potential conflicts of interest; (2) WRIMCO will then determine if the conflict as identified is material; and (3) WRIMCO will follow the procedures established below to ensure that its proxy voting decisions are based on the best interests of the Fund and are not the product of a material conflict.
I. Identifying Conflicts of Interest: WRIMCO will evaluate the nature of its relationships to assess which, if any, might place its interests, as well as those of its affiliates, in conflict with those of the Fund’s shareholders on a proxy voting matter. WRIMCO will review any potential conflicts that involve the following four general categories to determine if there is a conflict and if so, if the conflict is material:
| | • | | Business Relationships—WRIMCO will review any situation for a material conflict where WRIMCO provides investment advisory services for a company or an employee group, manages pension assets, administers employee benefit plans, leases office space from a company, or provides brokerage, underwriting, insurance, banking or consulting services to a company or if it is determined that WRIMCO (or an affiliate) otherwise has a similar significant relationship with a third party such that the third party might have an incentive to encourage WRIMCO to vote in favor of management. |
| | • | | Personal Relationships—WRIMCO will review any situation where it (or an affiliate) has a personal relationship with other proponents of proxy proposals, participants in proxy contests, corporate directors, or candidates for directorships to determine if a material conflict exists. |
| | • | | Familial Relationships—WRIMCO will review any situation where it (or an affiliate) has a known familial relationship relating to a company (for example, a spouse or other relative who serves as a director of a public company or is employed by the company) to determine if a material conflict exists. |
WRIMCO will designate an individual or committee to review and identify proxies for potential conflicts of interest on an ongoing basis.
II. “Material Conflicts”: WRIMCO will review each relationship identified as having a potential conflict based on the individual facts and circumstances. For purposes of this review, WRIMCO will attempt to detect those relationships deemed material based on the reasonable likelihood that they would be viewed as important by the average shareholder.
III. Procedures to Address Material Conflicts: WRIMCO will use the following techniques to vote proxies that have been determined to present a “Material Conflict.”
| | • | | Use a Proxy Voting Service for Specific Proposals—As a primary means of voting material conflicts, WRIMCO will vote in accordance with the recommendation of an independent proxy voting service (Institutional Shareholder Services (ISS) or another independent third party if a recommendation from ISS is unavailable). |
| | • | | Client directed—If the Material Conflict arises from WRIMCO’s management of a third party account and the client provides voting instructions on a particular vote, WRIMCO will vote according to the directions provided by the client. |
| | • | | Use a Predetermined Voting Policy—If no directives are provided by either ISS or the client, WRIMCO may vote material conflicts pursuant to the pre-determined Proxy Voting Policies, |
B-221
| | established herein, should such subject matter fall sufficiently within the identified subject matter. If the issue involves a material conflict and WRIMCO chooses to use a predetermined voting policy, WRIMCO will not be permitted to vary from the established voting policies established herein. |
| | • | | Seek Board Guidance—If the Material Conflict does not fall within one of the situations referenced above, WRIMCO may seek guidance from the Board on matters involving a conflict. Under this method, WRIMCO will disclose the nature of the conflict to the Board and obtain the Board’s consent or direction to vote the proxies. WRIMCO may use the Board guidance to vote proxies for its non-mutual fund clients. |
B-222
Wellington Management Company, llp
Global Proxy Policies and Procedures
Introduction Wellington Management Company, llp (“Wellington Management”) has adopted and implemented policies and procedures that it believes are reasonably designed to ensure that proxies are voted in the best economic interests of its clients around the world.
Wellington Management’s Global Proxy Voting Guidelines, included as pages 6-12 of these Global Proxy Policies and Procedures, set forth the guidelines that Wellington Management uses in voting specific proposals presented by the boards of directors or shareholders of companies whose securities are held in client portfolios for which Wellington Management has voting discretion. While the Global Proxy Voting Guidelines set forth general guidelines for voting proxies, it should be noted that these are guidelines and not rigid rules. Many of the guidelines are accompanied by explanatory language that describes criteria that may affect our vote decision. The criteria as described are to be read as part of the guideline, and votes cast according to the criteria will be considered within guidelines. In some circumstances, the merits of a particular proposal may cause us to enter a vote that differs from the Global Proxy Voting Guidelines.
Statement of Policies
As a matter of policy, Wellington Management:
| | 1 | Takes responsibility for voting client proxies only upon a client’s written request. |
| | 2 | Votes all proxies in the best interests of its clients as shareholders, i.e., to maximize economic value. |
| | 3 | Develops and maintains broad guidelines setting out positions on common proxy issues, but also considers each proposal in the context of the issuer, industry, and country or countries in which its business is conducted. |
| | 4 | Evaluates all factors it deems relevant when considering a vote, and may determine in certain instances that it is in the best interest of one or more clients to refrain from voting a given proxy ballot. |
| | 5 | Identifies and resolves all material proxy-related conflicts of interest between the firm and its clients in the best interests of the client. |
| | 6 | Believes that sound corporate governance practices can enhance shareholder value and therefore encourages consideration of an issuer’s corporate governance as part of the investment process. |
| | 7 | Believes that proxy voting is a valuable tool that can be used to promote sound corporate governance to the ultimate benefit of the client as shareholder. |
| | 8 | Provides all clients, upon request, with copies of these Global Proxy Policies and Procedures, the Global Proxy Voting Guidelines, and related reports, with such frequency as required to fulfill obligations under applicable law or as reasonably requested by clients. |
| | 9 | Reviews regularly the voting record to ensure that proxies are voted in accordance with these Global Proxy Policies and Procedures and the Global Proxy Voting Guidelines; and ensures that procedures, documentation, and reports relating to the voting of proxies are promptly and properly prepared and disseminated. |
Responsibility and Oversight
Wellington Management has a Corporate Governance Committee, established by action of the firm’s Executive Committee, that is responsible for the review and approval of the firm’s written Global Proxy Policies and Procedures and its Global Proxy Voting Guidelines, and for providing advice and guidance on specific proxy votes for individual issuers. The firm’s Legal Services Department monitors regulatory requirements with respect
B-223
to proxy voting on a global basis and works with the Corporate Governance Committee to develop policies that implement those requirements. Day-to-day administration of the proxy voting process at Wellington Management is the responsibility of the Corporate Governance Group within the Corporate Operations Department. In addition, the Corporate Governance Group acts as a resource for portfolio managers and research analysts on proxy matters, as needed.
Statement of Procedures
Wellington Management has in place certain procedures for implementing its proxy voting policies.
General Proxy Voting
Authorization to Vote. Wellington Management will vote only those proxies for which its clients have affirmatively delegated proxy-voting authority.
Receipt of Proxy. Proxy materials from an issuer or its information agent are forwarded to registered owners of record, typically the client’s custodian bank. If a client requests that Wellington Management votes proxies on its behalf, the client must instruct its custodian bank to deliver all relevant voting material to Wellington Management or its voting agent. Wellington Management, or its voting agent, may receive this voting information by mail, fax, or other electronic means.
Reconciliation. To the extent reasonably practicable, each proxy received is matched to the securities eligible to be voted and a reminder is sent to any custodian or trustee that has not forwarded the proxies as due.
Research. In addition to proprietary investment research undertaken by Wellington Management investment professionals, the firm conducts proxy research internally, and uses the resources of a number of external sources to keep abreast of developments in corporate governance around the world and of current practices of specific companies.
Proxy Voting. Following the reconciliation process, each proxy is compared against Wellington Management’s Global Proxy Voting Guidelines, and handled as follows:
| | • | | Generally, issues for which explicit proxy voting guidance is provided in the Global Proxy Voting Guidelines (i.e., “For”, “Against”, “Abstain”) are reviewed by the Corporate Governance Group and voted in accordance with the Global Proxy Voting Guidelines. |
| | • | | Issues identified as “case-by-case” in the Global Proxy Voting Guidelines are further reviewed by the Corporate Governance Group. In certain circumstances, further input is needed, so the issues are forwarded to the relevant research analyst and/or portfolio manager(s) for their input. |
| | • | | Absent a material conflict of interest, the portfolio manager has the authority to decide the final vote. Different portfolio managers holding the same securities may arrive at different voting conclusions for their clients’ proxies. |
Material Conflict of Interest Identification and Resolution Processes. Wellington Management’s broadly diversified client base and functional lines of responsibility serve to minimize the number of, but not prevent, material conflicts of interest it faces in voting proxies. Annually, the Corporate Governance Committee sets standards for identifying material conflicts based on client, vendor, and lender relationships, and publishes those standards to individuals involved in the proxy voting process. In addition, the Corporate Governance Committee encourages all personnel to contact the Corporate Governance Group about apparent conflicts of interest, even if the apparent conflict does not meet the published materiality criteria. Apparent conflicts are reviewed by designated members of the Corporate Governance Committee to determine if there is a conflict, and if so whether the conflict is material.
If a proxy is identified as presenting a material conflict of interest, the matter must be reviewed by designated members of the Corporate Governance Committee, who will resolve the conflict and direct the vote.
B-224
In certain circumstances, the designated members may determine that the full Corporate Governance Committee should convene. Any Corporate Governance Committee member who is himself or herself subject to the identified conflict will not participate in the decision on whether and how to vote the proxy in question.
Other Considerations
In certain instances, Wellington Management may be unable to vote or may determine not to vote a proxy on behalf of one or more clients. While not exhaustive, the following list of considerations highlights some potential instances in which a proxy vote might not be entered.
Securities Lending. Wellington Management may be unable to vote proxies when the underlying securities have been lent out pursuant to a client’s securities lending program. In general, Wellington Management does not know when securities have been lent out and are therefore unavailable to be voted. Efforts to recall loaned securities are not always effective, but, in rare circumstances, Wellington Management may recommend that a client attempt to have its custodian recall the security to permit voting of related proxies.
Share Blocking and Re-registration. Certain countries require shareholders to stop trading securities for a period of time prior to and/or after a shareholder meeting in that country (i.e., share blocking). When reviewing proxies in share blocking countries, Wellington Management evaluates each proposal in light of the trading restrictions imposed and determines whether a proxy issue is sufficiently important that Wellington Management would consider the possibility of blocking shares. The portfolio manager retains the final authority to determine whether to block the shares in the client’s portfolio or to pass on voting the meeting.
In certain countries, re-registration of shares is required to enter a proxy vote. As with share blocking, re-registration can prevent Wellington Management from exercising its investment discretion to sell shares held in a client’s portfolio for a substantial period of time. The decision process in blocking countries as discussed above is also employed in instances where re-registration is necessary.
Lack of Adequate Information, Untimely Receipt of Proxy Materials, or Excessive Costs. Wellington Management may be unable to enter an informed vote in certain circumstances due to the lack of information provided in the proxy statement or by the issuer or other resolution sponsor, and may abstain from voting in those instances. Proxy materials not delivered in a timely fashion may prevent analysis or entry of a vote by voting deadlines. In addition, Wellington Management’s practice is to abstain from voting a proxy in circumstances where, in its judgment, the costs exceed the expected benefits to clients.
Additional Information
Wellington Management maintains records of proxies voted pursuant to Section 204-2 of the Investment Advisers Act of 1940 (the “Advisers Act”), the Employee Retirement Income Security Act of 1974, as amended (“ERISA”), and other applicable laws.
Wellington Management’s Global Proxy Policies and Procedures may be amended from time to time by Wellington Management. Wellington Management provides clients with a copy of its Global Proxy Policies and Procedures, including the Global Proxy Voting Guidelines, upon written request. In addition, Wellington Management will make specific client information relating to proxy voting available to a client upon reasonable written request.
B-225
Global Proxy Voting Guidelines
Introduction
Upon a client’s written request, Wellington Management Company, llp (“Wellington Management”) votes securities that are held in the client’s account in response to proxies solicited by the issuers of such securities. Wellington Management established these Global Proxy Voting Guidelines to document positions generally taken on common proxy issues voted on behalf of clients.
These Guidelines are based on Wellington Management’s fiduciary obligation to act in the best economic interest of its clients as shareholders. Hence, Wellington Management examines and votes each proposal so that the long-term effect of the vote will ultimately increase shareholder value for our clients. Wellington Management’s experience in voting proposals has shown that similar proposals often have different consequences for different companies. Moreover, while these Global Proxy Voting Guidelines are written to apply globally, differences in local practice and law make universal application impractical. Therefore, each proposal is evaluated on its merits, taking into account its effects on the specific company in question, and on the company within its industry. It should be noted that the following are guidelines, and not rigid rules, and Wellington Management reserves the right in all cases to vote contrary to guidelines where doing so is judged to represent the best economic interest of its clients.
Following is a list of common proposals and the guidelines on how Wellington Management anticipates voting on these proposals. The “(SP)” after a proposal indicates that the proposal is usually presented as a Shareholder Proposal.
Voting Guidelines Composition and Role of the Board of Directors
| | • | | Election of Directors: Case-by-Case |
Wellington Management believes that shareholders’ ability to elect directors annually is the most important right shareholders have. We generally support management nominees, but will withhold votes from any director who is demonstrated to have acted contrary to the best economic interest of shareholders. We may withhold votes from directors who failed to implement shareholder proposals that received majority support, implemented dead-hand or no-hand poison pills, or failed to attend at least 75% of scheduled board meetings.
| | • | | Classify Board of Directors: Against |
We will also vote in favor of shareholder proposals seeking to declassify boards.
| | • | | Adopt Director Tenure/Retirement Age (SP): Against |
| | • | | Adopt Director & Officer Indemnification: For |
We generally support director and officer indemnification as critical to the attraction and retention of qualified candidates to the board. Such proposals must incorporate the duty of care.
| | • | | Allow Special Interest Representation to Board (SP): Against |
| | • | | Require Board Independence: For |
Wellington Management believes that, in the absence of a compelling counter-argument or prevailing market norms, at least 65% of a board should be comprised of independent directors, with independence defined by the local market regulatory authority. Our support for this level of independence may include withholding approval for non-independent directors, as well as votes in support of shareholder proposals calling for independence.
| | • | | Require Key Board Committees to be Independent. For |
Key board committees are the Nominating, Audit, and Compensation Committees. Exceptions will be made, as above, in respect of local market conventions.
B-226
| | • | | Require a Separation of Chair and CEO or Require a Lead Director: For |
| | • | | Approve Directors’ Fees: For |
| | • | | Approve Bonuses for Retiring Directors: Case-by-Case |
| | • | | Elect Supervisory Board/Corporate Assembly: For |
| | • | | Elect/Establish Board Committee: For |
| | • | | Adopt Shareholder Access/Majority Vote on Election of Directors (SP): Case-by-Case |
Wellington Management believes that the election of directors by a majority of votes cast is the appropriate standard for companies to adopt and therefore generally will support those proposals that seek to adopt such a standard. Our support for such proposals will extend typically to situations where the relevant company has an existing resignation policy in place for directors that receive a majority of “withhold” votes. We believe that it is important for majority voting to be defined within the company’s charter and not simply within the company’s corporate governance policy.
Generally we will not support proposals that fail to provide for the exceptional use of a plurality standard in the case of contested elections. Further, we will not support proposals that seek to adopt a majority of votes outstanding (i.e., total votes eligible to be cast as opposed to actually cast) standard.
Management Compensation
| | • | | Adopt/Amend Stock Option Plans: Case-by-Case |
| | • | | Adopt/Amend Employee Stock Purchase Plans: For |
| | • | | Approve/Amend Bonus Plans: Case-by-Case |
In the US, Bonus Plans are customarily presented for shareholder approval pursuant to Section 162(m) of the Omnibus Budget Reconciliation Act of 1992 (“OBRA”). OBRA stipulates that certain forms of compensation are not tax-deductible unless approved by shareholders and subject to performance criteria. Because OBRA does not prevent the payment of subject compensation, we generally vote “for” these proposals. Nevertheless, occasionally these proposals are presented in a bundled form seeking 162 (m) approval and approval of a stock option plan. In such cases, failure of the proposal prevents the awards from being granted. We will vote against these proposals where the grant portion of the proposal fails our guidelines for the evaluation of stock option plans.
| | • | | Approve Remuneration Policy: Case-by-Case |
| | • | | Exchange Underwater Options: Case-by-Case |
Wellington Management may support value-neutral exchanges in which senior management is ineligible to participate.
| | • | | Eliminate or Limit Severance Agreements (Golden Parachutes): Case-by-Case |
We will oppose excessively generous arrangements, but may support agreements structured to encourage management to negotiate in shareholders’ best economic interest.
| | • | | Shareholder Approval of Future Severance Agreements Covering Senior Executives (SP): Case-by-Case |
We believe that severance arrangements require special scrutiny, and are generally supportive of proposals that call for shareholder ratification thereof. But, we are also mindful of the board’s need for flexibility in recruitment and retention and will therefore oppose limitations on board compensation policy where respect for industry practice and reasonable overall levels of compensation have been demonstrated.
| | • | | Expense Future Stock Options (SP): For |
| | • | | Shareholder Approval of All Stock Option Plans (SP): For |
| | • | | Disclose All Executive Compensation (SP): For |
B-227
Reporting of Results
| | • | | Approve Financial Statements: For |
| | • | | Set Dividends and Allocate Profits: For |
| | • | | Limit Non-Audit Services Provided by Auditors (SP): Case-by-Case |
We follow the guidelines established by the Public Company Accounting Oversight Board regarding permissible levels of non-audit fees payable to auditors.
| | • | | Ratify Selection of Auditors and Set Their Fees: Case-by-Case |
Wellington Management will generally support management’s choice of auditors, unless the auditors have demonstrated failure to act in shareholders’ best economic interest.
| | • | | Elect Statutory Auditors: Case-by-Case |
| | • | | Shareholder Approval of Auditors (SP): For |
Shareholder Voting Rights
| | • | | Adopt Cumulative Voting (SP): Against |
We are likely to support cumulative voting proposals at “controlled” companies (i.e., companies with a single majority shareholder), or at companies with two-tiered voting rights.
| | • | | Shareholder Rights Plans Case-by-Case |
Also known as Poison Pills, these plans can enable boards of directors to negotiate higher takeover prices on behalf of shareholders. However, these plans also may be misused to entrench management. The following criteria are used to evaluate both management and shareholder proposals regarding shareholder rights plans.
– We generally support plans that include:
– Shareholder approval requirement
– Sunset provision
– Permitted bid feature (i.e., bids that are made for all shares and demonstrate evidence of financing must be submitted to a shareholder vote).
Because boards generally have the authority to adopt shareholder rights plans without shareholder approval, we are equally vigilant in our assessment of requests for authorization of blank check preferred shares (see below).
| | • | | Authorize Blank Check Preferred Stock: Case-by-Case |
We may support authorization requests that specifically proscribe the use of such shares for anti-takeover purposes.
| | • | | Eliminate Right to Call a Special Meeting: Against |
| | • | | Increase Supermajority Vote Requirement: Against |
We likely will support shareholder and management proposals to remove existing supermajority vote requirements.
| | • | | Adopt Anti-Greenmail Provision: For |
| | • | | Adopt Confidential Voting (SP): Case-by-Case |
We require such proposals to include a provision to suspend confidential voting during contested elections so that management is not subject to constraints that do not apply to dissidents.
| | • | | Remove Right to Act by Written Consent: Against |
B-228
Capital Structure
| | • | | Increase Authorized Common Stock: Case-by-Case |
We generally support requests for increases up to 100% of the shares currently authorized. Exceptions will be made when the company has clearly articulated a reasonable need for a greater increase.
| | • | | Approve Merger or Acquisition: Case-by-Case |
| | • | | Approve Technical Amendments to Charter: Case-by-Case |
| | • | | Opt Out of State Takeover Statutes: For |
| | • | | Authorize Share Repurchase: For |
| | • | | Authorize Trade in Company Stock: For |
| | • | | Approve Stock Splits: Case-by-Case |
We approve stock splits and reverse stock splits that preserve the level of authorized, but unissued shares.
| | • | | Approve Recapitalization/Restructuring: Case-by-Case |
| | • | | Issue Stock with or without Preemptive Rights: For |
| | • | | Issue Debt Instruments: Case-by-Case |
Social Issues
| | • | | Endorse the Ceres Principles (SP): Case-by-Case |
| | • | | Disclose Political and PAC Gifts (SP): Case-by-Case |
Wellington Management generally does not support imposition of disclosure requirements on management of companies in excess of regulatory requirements.
| | • | | Require Adoption of International Labor Organization’s Fair Labor Principles (SP): Case-by-Case |
| | • | | Report on Sustainability (SP): Case-by-Case |
Miscellaneous
| | • | | Approve Other Business: Against |
| | • | | Approve Reincorporation: Case-by-Case |
| | • | | Approve Third-Party Transactions: Case-by-Case |
Dated: August 1, 2006
B-229
Western Asset
PROXY VOTING
BACKGROUND
Western Asset Management Company (“WA”) and Western Asset Management Company Limited (“WAML”) (together “Western Asset”) have adopted and implemented policies and procedures that we believe are reasonably designed to ensure that proxies are voted in the best interest of clients, in accordance with our fiduciary duties and SEC Rule 206(4)-6 under the Investment Advisers Act of 1940 (“Advisers Act”). Our authority to vote the proxies of our clients is established through investment management agreements or comparable documents, and our proxy voting guidelines have been tailored to reflect these specific contractual obligations. In addition to SEC requirements governing advisers, our proxy voting policies reflect the long-standing fiduciary standards and responsibilities for ERISA accounts. Unless a manager of ERISA assets has been expressly precluded from voting proxies, the Department of Labor has determined that the responsibility for these votes lies with the Investment Manager.
In exercising its voting authority, Western Asset will not consult or enter into agreements with officers, directors or employees of Legg Mason Inc. or any of its affiliates (except that WA and WAML may so consult and agree with each other) regarding the voting of any securities owned by its clients.
POLICY
Western Asset’s proxy voting procedures are designed and implemented in a way that is reasonably expected to ensure that proxy matters are handled in the best interest of our clients. While the guidelines included in the procedures are intended to provide a benchmark for voting standards, each vote is ultimately cast on a case-by-case basis, taking into consideration Western Asset’s contractual obligations to our clients and all other relevant facts and circumstances at the time of the vote (such that these guidelines may be overridden to the extent Western Asset deems appropriate).
The Western Asset Compliance Department (“Compliance Department”) is responsible for administering and overseeing the proxy voting process. The gathering of proxies is coordinated through the Corporate Actions area of Investment Support (“Corporate Actions”). Research analysts and portfolio managers are responsible for determining appropriate voting positions on each proxy utilizing any applicable guidelines contained in these procedures.
Client Authority
Prior to August 1, 2003, all existing client investment management agreements (“IMAs”) will be reviewed to determine whether Western Asset has authority to vote client proxies. At account start-up, or upon amendment of an IMA, the applicable client IMA are similarly reviewed. If an agreement is silent on proxy voting, but contains an overall delegation of discretionary authority or if the account represents assets of an ERISA plan, Western Asset will assume responsibility for proxy voting. The Client Account Transition Team maintains a matrix of proxy voting authority.
Proxy Gathering
Registered owners of record, client custodians, client banks and trustees (“Proxy Recipients”) that receive proxy materials on behalf of clients should forward them to Corporate Actions. Prior to August 1, 2003, Proxy Recipients of existing clients will be reminded of the appropriate routing to Corporate Actions for proxy materials received and reminded of their responsibility to forward all proxy materials on a timely basis. Proxy Recipients for new clients (or, if Western Asset becomes aware that the applicable Proxy Recipient for an
B-230
existing client has changed, the Proxy Recipient for the existing client) are notified at start-up of appropriate routing to Corporate Actions of proxy materials received and reminded of their responsibility to forward all proxy materials on a timely basis. If Western Asset personnel other than Corporate Actions receive proxy materials, they should promptly forward the materials to Corporate Actions.
Proxy Voting
Once proxy materials are received by Corporate Actions, they are forwarded to the Compliance Department for coordination and the following actions:
| | a. | Proxies are reviewed to determine accounts impacted. |
| | b. | Impacted accounts are checked to confirm Western Asset voting authority. |
| | c. | Compliance Department staff reviews proxy issues to determine any material conflicts of interest. (See conflicts of interest section of these procedures for further information on determining material conflicts of interest.) |
| | d. | If a material conflict of interest exists, (i) to the extent reasonably practicable and permitted by applicable law, the client is promptly notified, the conflict is disclosed and Western Asset obtains the client’s proxy voting instructions, and (ii) to the extent that it is not reasonably practicable or permitted by applicable law to notify the client and obtain such instructions (e.g., the client is a mutual fund or other commingled vehicle or is an ERISA plan client), Western Asset seeks voting instructions from an independent third party. |
| | e. | Compliance Department staff provides proxy material to the appropriate research analyst or portfolio manager to obtain their recommended vote. Research analysts and portfolio managers determine votes on a case-by-case basis taking into account the voting guidelines contained in these procedures. For avoidance of doubt, depending on the best interest of each individual client, Western Asset may vote the same proxy differently for different clients. The analyst’s or portfolio manager’s basis for their decision is documented and maintained by the Compliance Department. |
| | f. | Compliance Department staff votes the proxy pursuant to the instructions received in (d) or (e) and returns the voted proxy as indicated in the proxy materials. |
Timing
Western Asset personnel act in such a manner to ensure that, absent special circumstances, the proxy gathering and proxy voting steps noted above can be completed before the applicable deadline for returning proxy votes.
Recordkeeping
Western Asset maintains records of proxies voted pursuant to Section 204-2 of the Advisers Act and ERISA DOL Bulletin 94-2. These records include:
| | a. | A copy of Western Asset’s policies and procedures. |
| | b. | Copies of proxy statements received regarding client securities. |
| | c. | A copy of any document created by Western Asset that was material to making a decision how to vote proxies. |
| | d. | Each written client request for proxy voting records and Western Asset’s written response to both verbal and written client requests. |
B-231
| | 2. | Exchange ticker symbol of the issuer’s shares to be voted; |
| | 3. | Council on Uniform Securities Identification Procedures (“CUSIP”) number for the shares to be voted; |
| | 4. | A brief identification of the matter voted on; |
| | 5. | Whether the matter was proposed by the issuer or by a shareholder of the issuer; |
| | 6. | Whether a vote was cast on the matter; |
| | 7. | A record of how the vote was cast; and |
| | 8. | Whether the vote was cast for or against the recommendation of the issuer’s management team. |
Records are maintained in an easily accessible place for five years, the first two in Western Asset’s offices.
Disclosure
Part II of both the WA Form ADV and the WAML Form ADV contain a description of Western Asset’s proxy policies. Prior to August 1, 2003, Western Asset will deliver Part II of its revised Form ADV to all existing clients, along with a letter identifying the new disclosure. Clients will be provided a copy of these policies and procedures upon request. In addition, upon request, clients may receive reports on how their proxies have been voted.
Conflicts of Interest
All proxies are reviewed by the Compliance Department for material conflicts of interest. Issues to be reviewed include, but are not limited to:
| | 1. | Whether Western Asset (or, to the extent required to be considered by applicable law, its affiliates) manages assets for the company or an employee group of the company or otherwise has an interest in the company; |
| | 2. | Whether Western Asset or an officer or director of Western Asset or the applicable portfolio manager or analyst responsible for recommending the proxy vote (together, “Voting Persons”) is a close relative of or has a personal or business relationship with an executive, director or person who is a candidate for director of the company or is a participant in a proxy contest; and |
| | 3. | Whether there is any other business or personal relationship where a Voting Person has a personal interest in the outcome of the matter before shareholders. |
Voting Guidelines
Western Asset’s substantive voting decisions turn on the particular facts and circumstances of each proxy vote and are evaluated by the designated research analyst or portfolio manager. The examples outlined below are meant as guidelines to aid in the decision making process.
Guidelines are grouped according to the types of proposals generally presented to shareholders. Part I deals with proposals which have been approved and are recommended by a company’s board of directors; Part II deals with proposals submitted by shareholders for inclusion in proxy statements; Part III addresses issues relating to voting shares of investment companies; and Part IV addresses unique considerations pertaining to foreign issuers.
I. Board Approved Proposals
The vast majority of matters presented to shareholders for a vote involve proposals made by a company itself that have been approved and recommended by its board of directors. In view of the enhanced corporate
B-232
governance practices currently being implemented in public companies, Western Asset generally votes in support of decisions reached by independent boards of directors. More specific guidelines related to certain board-approved proposals are as follows:
1. Matters relating to the Board of Directors
Western Asset votes proxies for the election of the company’s nominees for directors and for board-approved proposals on other matters relating to the board of directors with the following exceptions:
| | a. | Votes are withheld for the entire board of directors if the board does not have a majority of independent directors or the board does not have nominating, audit and compensation committees composed solely of independent directors. |
| | b. | Votes are withheld for any nominee for director who is considered an independent director by the company and who has received compensation from the company other than for service as a director. |
| | c. | Votes are withheld for any nominee for director who attends less than 75% of board and committee meetings without valid reasons for absences. |
| | d. | Votes are cast on a case-by-case basis in contested elections of directors. |
2. Matters relating to Executive Compensation
Western Asset generally favors compensation programs that relate executive compensation to a company’s long-term performance. Votes are cast on a case-by-case basis on board-approved proposals relating to executive compensation, except as follows:
| | a. | Except where the firm is otherwise withholding votes for the entire board of directors, Western Asset votes for stock option plans that will result in a minimal annual dilution. |
| | b. | Western Asset votes against stock option plans or proposals that permit replacing or repricing of underwater options. |
| | c. | Western Asset votes against stock option plans that permit issuance of options with an exercise price below the stock’s current market price. |
| | d. | Except where the firm is otherwise withholding votes for the entire board of directors, Western Asset votes for employee stock purchase plans that limit the discount for shares purchased under the plan to no more than 15% of their market value, have an offering period of 27 months or less and result in dilution of 10% or less. |
3. Matters relating to Capitalization
The management of a company’s capital structure involves a number of important issues, including cash flows, financing needs and market conditions that are unique to the circumstances of each company. As a result, Western Asset votes on a case-by-case basis on board-approved proposals involving changes to a company’s capitalization except where Western Asset is otherwise withholding votes for the entire board of directors.
| | a. | Western Asset votes for proposals relating to the authorization of additional common stock. |
| | b. | Western Asset votes for proposals to effect stock splits (excluding reverse stock splits). |
| | c. | Western Asset votes for proposals authorizing share repurchase programs. |
4. Matters relating to Acquisitions, Mergers, Reorganizations and Other Transactions
Western Asset votes these issues on a case-by-case basis on board-approved transactions.
5. Matters relating to Anti-Takeover Measures
Western Asset votes against board-approved proposals to adopt anti-takeover measures except as follows:
B-233
| | a. | Western Asset votes on a case-by-case basis on proposals to ratify or approve shareholder rights plans. |
| | b. | Western Asset votes on a case-by-case basis on proposals to adopt fair price provisions. |
6. Other Business Matters
Western Asset votes for board-approved proposals approving such routine business matters such as changing the company’s name, ratifying the appointment of auditors and procedural matters relating to the shareholder meeting.
| | a. | Western Asset votes on a case-by-case basis on proposals to amend a company’s charter or bylaws. |
| | b. | Western Asset votes against authorization to transact other unidentified, substantive business at the meeting. |
II. Shareholder Proposals
SEC regulations permit shareholders to submit proposals for inclusion in a company’s proxy statement. These proposals generally seek to change some aspect of a company’s corporate governance structure or to change some aspect of its business operations. Western Asset votes in accordance with the recommendation of the company’s board of directors on all shareholder proposals, except as follows:
| | 1. | Western Asset votes for shareholder proposals to require shareholder approval of shareholder rights plans. |
| | 2. | Western Asset votes for shareholder proposals that are consistent with Western Asset’s proxy voting guidelines for board-approved proposals. |
| | 3. | Western Asset votes on a case-by-case basis on other shareholder proposals where the firm is otherwise withholding votes for the entire board of directors. |
III. Voting Shares of Investment Companies
Western Asset may utilize shares of open or closed-end investment companies to implement its investment strategies. Shareholder votes for investment companies that fall within the categories listed in Parts I and II above are voted in accordance with those guidelines.
| | 1. | Western Asset votes on a case-by-case basis on proposals relating to changes in the investment objectives of an investment company taking into account the original intent of the fund and the role the fund plays in the clients’ portfolios. |
| | 2. | Western Asset votes on a case-by-case basis all proposals that would result in increases in expenses (e.g., proposals to adopt 12b-1 plans, alter investment advisory arrangements or approve fund mergers) taking into account comparable expenses for similar funds and the services to be provided. |
IV. Voting Shares of Foreign Issuers
In the event Western Asset is required to vote on securities held in foreign issuers – i.e. issuers that are incorporated under the laws of a foreign jurisdiction and that are not listed on a U.S. securities exchange or the NASDAQ stock market, the following guidelines are used, which are premised on the existence of a sound corporate governance and disclosure framework. These guidelines, however, may not be appropriate under some circumstances for foreign issuers and therefore apply only where applicable.
| | 1. | Western Asset votes for shareholder proposals calling for a majority of the directors to be independent of management. |
| | 2. | Western Asset votes for shareholder proposals seeking to increase the independence of board nominating, audit and compensation committees. |
B-234
| | 3. | Western Asset votes for shareholder proposals that implement corporate governance standards similar to those established under U.S. federal law and the listing requirements of U.S. stock exchanges, and that do not otherwise violate the laws of the jurisdiction under which the company is incorporated. |
| | 4. | Western Asset votes on a case-by-case basis on proposals relating to (1) the issuance of common stock in excess of 20% of a company’s outstanding common stock where shareholders do not have preemptive rights, or (2) the issuance of common stock in excess of 100% of a company’s outstanding common stock where shareholders have preemptive rights. |
B-235
APPENDIX C—ADDITIONAL PORTFOLIO MANAGER INFORMATION
AllianceBernstein L.P.
Diversified Value Fund
Team Description:
The management of and investment decisions for the Fund’s portfolio are made by the US Value Investment Policy Group, comprised of senior US Value Investment Team members. The US Value Investment Policy Group relies heavily on the fundamental analysis and research of AllianceBernstein’s large internal research staff. No one person is principally responsible for making recommendations for the Fund’s portfolio. The members of the US Value Investment Policy Group with the most significant responsibility for the day-to-day management of the Fund’s portfolio are: Marilyn Fedak, John Mahedy, John Phillips and Chris Marx.
Marilyn Fedak
Registered Investment Companies:*
| | | |
Total Number of Accounts: | | | 91 |
Total Assets in Accounts: | | $ | 51,030,000,000 |
Number of Performance-Based Accounts: | | | 3 |
Total Assets in Performance-Based Accounts: | | $ | 11,259,000,000 |
| |
Other Pooled Investment Vehicles:* | | | |
Total Number of Accounts: | | | 115 |
Total Assets in Accounts: | | $ | 26,283,000,000 |
Number of Performance-Based Accounts: | | | 2 |
Total Assets in Performance-Based Accounts: | | $ | 987,000,000 |
| |
Other Accounts:* | | | |
Total Number of Accounts: | | | 39,610 |
Total Assets in Accounts: | | $ | 156,696,000,000 |
Number of Performance-Based Accounts: | | | 88 |
Total Assets in Performance-Based Accounts: | | $ | 14,633,000,000 |
| |
| John Mahedy | | | |
| |
| Registered Investment Companies:* | | | |
Total Number of Accounts: | | | 88 |
Total Assets in Accounts: | | $ | 50,038,000,000 |
Number of Performance-Based Accounts: | | | 3 |
Total Assets in Performance-Based Accounts: | | $ | 11,259,000,000 |
| |
Other Pooled Investment Vehicles:* | | | |
Total Number of Accounts: | | | 114 |
Total Assets in Accounts: | | $ | 26,202,000,000 |
Number of Performance-Based Accounts: | | | 2 |
Total Assets in Performance-Based Accounts: | | $ | 987,000,000 |
B-236
| | | |
Other Accounts:* | | | |
Total Number of Accounts: | | | 39,592 |
Total Assets in Accounts: | | $ | 154,526,000,000 |
Number of Performance-Based Accounts: | | | 83 |
Total Assets in Performance-Based Accounts: | | $ | 14,039,000,000 |
| |
| John Phillips | | | |
| |
| Registered Investment Companies:* | | | |
Total Number of Accounts: | | | 38 |
Total Assets in Accounts: | | $ | 21,432,000,000 |
Number of Performance-Based Accounts: | | | 1 |
Total Assets in Performance-Based Accounts: | | $ | 7,089,000,000 |
| |
Other Pooled Investment Vehicles:* | | | |
Total Number of Accounts: | | | 19 |
Total Assets in Accounts: | | $ | 3,841,000,000 |
Number of Performance-Based Accounts: | | | 0 |
Total Assets in Performance-Based Accounts: | | $ | 0 |
| |
Other Accounts:* | | | |
Total Number of Accounts: | | | 38,991 |
Total Assets in Accounts: | | $ | 59,700,000,000 |
Number of Performance-Based Accounts: | | | 13 |
Total Assets in Performance-Based Accounts: | | $ | 3,350,000,000 |
| |
| Chris Marx | | | |
| |
| Registered Investment Companies:* | | | |
Total Number of Accounts: | | | 38 |
Total Assets in Accounts: | | $ | 21,432,000,000 |
Number of Performance-Based Accounts: | | | 1 |
Total Assets in Performance-Based Accounts: | | $ | 7,089,000,000 |
| |
Other Pooled Investment Vehicles:* | | | |
Total Number of Accounts: | | | 19 |
Total Assets in Accounts: | | $ | 3,841,000,000 |
Number of Performance-Based Accounts: | | | 0 |
Total Assets in Performance-Based Accounts: | | $ | 0 |
| |
Other Accounts:* | | | |
Total Number of Accounts: | | | 38,991 |
Total Assets in Accounts: | | $ | 59,700,000,000 |
Number of Performance-Based Accounts: | | | 13 |
Total Assets in Performance-Based Accounts: | | $ | 3,350,000,000 |
| * | Information as of 12/31/06. |
Ownership of Securities: The portfolio managers do not own any shares of the Diversified Value Fund.
B-237
Large Cap Growth Fund
Team Description:
The management of and investment decisions for the Fund’s portfolio are made by AllianceBernstein’s US Large Cap Growth Team, which is responsible for management of all of the Adviser’s US Large Cap Growth accounts. The US Large Cap Growth Investment Team relies heavily on the fundamental analysis and research of AllianceBernstein’s large internal research staff. While all members of the team work jointly to determine the investment strategy, including security selection, Ms. Stephanie Simon and Mr. Jason Ley are responsible for day-to-day management of the Fund’s portfolio.
Stephanie Simon
Registered Investment Companies:*
| | | |
Total Number of Accounts: | | | 0 |
Total Assets in Accounts: | | $ | 0 |
Number of Performance-Based Accounts: | | | 0 |
Total Assets in Performance-Based Accounts: | | $ | 0 |
Other Pooled Investment Vehicles:*
| | | |
Total Number of Accounts: | | | 0 |
Total Assets in Accounts: | | $ | 0 |
Number of Performance-Based Accounts: | | | 0 |
Total Assets in Performance-Based Accounts: | | $ | 0 |
Other Accounts:*
| | | |
Total Number of Accounts: | | | 8 |
Total Assets in Accounts: | | $ | 482,000,000 |
Number of Performance-Based Accounts: | | | 0 |
Total Assets in Performance-Based Accounts: | | $ | 0 |
Jason Ley
Registered Investment Companies:*
| | | |
Total Number of Accounts: | | | 0 |
Total Assets in Accounts: | | $ | 0 |
Number of Performance-Based Accounts: | | | 0 |
Total Assets in Performance-Based Accounts: | | $ | 0 |
Other Pooled Investment Vehicles:*
| | | |
Total Number of Accounts: | | | 0 |
Total Assets in Accounts: | | $ | 0 |
Number of Performance-Based Accounts: | | | 0 |
Total Assets in Performance-Based Accounts: | | $ | 0 |
Other Accounts:*
| | | |
Total Number of Accounts: | | | 16 |
Total Assets in Accounts: | | $ | 611,000,000 |
Number of Performance-Based Accounts: | | | 1 |
Total Assets in Performance-Based Accounts: | | $ | 28,000,000 |
| * | Information as of 12/31/06. |
Ownership of Securities: The portfolio managers do not own any shares of the Large Cap Growth Fund.
B-238
Diversified International Fund
Team Description:
The management of and investment decisions for the Fund’s portfolio are made by the Global Value Investment Policy Group, comprised of senior Global Value Investment Team members. The Global Value Investment Policy Group relies heavily on the fundamental analysis and research of AllianceBernstein’s large internal research staff. No one person is principally responsible for making recommendations for the Fund’s portfolio. The members of the Global Value Investment Policy Group with the most significant responsibility for the day-to-day management of the Fund’s portfolio are: Henry D’Auria, Sharon Fay, Marilyn Fedak, John Mahedy and Kevin Simms.
Henry D’Auria
Registered Investment Companies:*
| | | |
Total Number of Accounts: | | | 56 |
Total Assets in Accounts: | | $ | 31,411,000,000 |
Number of Performance-Based Accounts: | | | 2 |
Total Assets in Performance-Based Accounts: | | $ | 4,170,000,000 |
Other Pooled Investment Vehicles:*
| | | |
Total Number of Accounts: | | | 105 |
Total Assets in Accounts: | | $ | 26,615,000,000 |
Number of Performance-Based Accounts: | | | 5 |
Total Assets in Performance-Based Accounts: | | $ | 892,000,000 |
Other Accounts:*
| | | |
Total Number of Accounts: | | | 699 |
Total Assets in Accounts: | | $ | 120,036,000,000 |
Number of Performance-Based Accounts: | | | 105 |
Total Assets in Performance-Based Accounts: | | $ | 21,986,000,000 |
Sharon Fay
Registered Investment Companies:*
| | | |
Total Number of Accounts: | | | 98 |
Total Assets in Accounts: | | $ | 53,591,000,000 |
Number of Performance-Based Accounts: | | | 3 |
Total Assets in Performance-Based Accounts: | | $ | 11,259,000,000 |
Other Pooled Investment Vehicles:*
| | | |
Total Number of Accounts: | | | 125 |
Total Assets in Accounts: | | $ | 31,461,000,000 |
Number of Performance-Based Accounts: | | | 5 |
Total Assets in Performance-Based Accounts: | | $ | 892,000,000 |
Other Accounts:*
| | | |
Total Number of Accounts: | | | 39,694 |
Total Assets in Accounts: | | $ | 179,930,000,000 |
Number of Performance-Based Accounts: | | | 118 |
Total Assets in Performance-Based Accounts: | | $ | 25,337,000,000 |
B-239
Marilyn Fedak
Registered Investment Companies:*
| | | |
Total Number of Accounts: | | | 91 |
Total Assets in Accounts: | | $ | 51,545,000,000 |
Number of Performance-Based Accounts: | | | 3 |
Total Assets in Performance-Based Accounts: | | $ | 11,259,000,000 |
Other Pooled Investment Vehicles:*
| | | |
Total Number of Accounts: | | | 115 |
Total Assets in Accounts: | | $ | 26,283,000,000 |
Number of Performance-Based Accounts: | | | 2 |
Total Assets in Performance-Based Accounts: | | $ | 987,000,000 |
Other Accounts:*
| | | |
Total Number of Accounts: | | | 39,610 |
Total Assets in Accounts: | | $ | 156,696,000,000 |
Number of Performance-Based Accounts: | | | 88 |
Total Assets in Performance-Based Accounts: | | $ | 14,633,000,000 |
John Mahedy
Registered Investment Companies:*
| | | |
Total Number of Accounts: | | | 88 |
Total Assets in Accounts: | | $ | 50,554,000,000 |
Number of Performance-Based Accounts: | | | 3 |
Total Assets in Performance-Based Accounts: | | $ | 11,259,000,000 |
Other Pooled Investment Vehicles:*
| | | |
Total Number of Accounts: | | | 114 |
Total Assets in Accounts: | | $ | 26,202,000,000 |
Number of Performance-Based Accounts: | | | 2 |
Total Assets in Performance-Based Accounts: | | $ | 987,000,000 |
Other Accounts:*
| | | |
Total Number of Accounts: | | | 39,592 |
Total Assets in Accounts: | | $ | 154,526,000,000 |
Number of Performance-Based Accounts: | | | 83 |
Total Assets in Performance-Based Accounts: | | $ | 14,039,000,000 |
B-240
Kevin Simms
Registered Investment Companies:*
| | | |
Total Number of Accounts: | | | 98 |
Total Assets in Accounts: | | $ | 53,591,000,000 |
Number of Performance-Based Accounts: | | | 3 |
Total Assets in Performance-Based Accounts: | | $ | 11,259,000,000 |
Other Pooled Investment Vehicles:*
| | | |
Total Number of Accounts: | | | 126 |
Total Assets in Accounts: | | $ | 31,510,000,000 |
Number of Performance-Based Accounts: | | | 8 |
Total Assets in Performance-Based Accounts: | | $ | 6,842,000,000 |
Other Accounts:*
| | | |
Total Number of Accounts: | | | 39,694 |
Total Assets in Accounts: | | $ | 179,930,000,000 |
Number of Performance-Based Accounts: | | | 118 |
Total Assets in Performance-Based Accounts: | | $ | 25,337,000,000 |
| * | Information as of 12/31/06. |
Ownership of Securities: The portfolio managers do not own any shares of the Diversified International Fund.
Investment Professional Conflict of Interest Disclosure.
As an investment adviser and fiduciary, Alliance owes its clients and shareholders an undivided duty of loyalty. We recognize that conflicts of interest are inherent in our business and accordingly have developed policies and procedures (including oversight monitoring) reasonably designed to detect, manage and mitigate the effects of actual or potential conflicts of interest in the area of employee personal trading, managing multiple accounts for multiple clients, including AllianceBernstein Mutual Funds, and allocating investment opportunities. Investment professionals, including portfolio managers and research analysts, are subject to the above-mentioned policies and oversight monitoring to ensure that all clients are treated equitably. We place the interests of our clients first and expect all of our employees to meet their fiduciary duties.
Employee Personal Trading.
Alliance has adopted a Code of Business Conduct and Ethics that is designed to detect and prevent conflicts of interest when investment professionals and other personnel of Alliance own, buy or sell securities which may be owned by, or bought or sold for, clients. Personal securities transactions by an employee may raise a potential conflict of interest when an employee owns or trades in a security that is owned or considered for purchase or sale by a client, or recommended for purchase or sale by an employee to a client. Subject to the reporting requirements and other limitations of its Code of Business Conduct and Ethics, Alliance permits its employees to engage in personal securities transactions, and also allows them to acquire investments in the AllianceBernstein Mutual Funds through direct purchase, 401K/profit sharing plan investment and/or notionally in connection with deferred incentive compensation awards. Alliance’s Code of Business Conduct and Ethics requires disclosure of all personal accounts and maintenance of brokerage accounts with designated broker-dealers approved by Alliance. The Code also requires preclearance of all securities transactions and imposes a one-year holding period for securities purchased by employees to discourage short-term trading.
Managing Multiple Accounts for Multiple Clients.
Alliance has compliance policies and oversight monitoring in place to address conflicts of interest relating to the management of multiple accounts for multiple clients. Conflicts of interest may arise when an investment professional has responsibilities for the investments of more than one account because the investment
B-241
professional may be unable to devote equal time and attention to each account. The investment professional or investment professional teams for each client may have responsibilities for managing all or a portion of the investments of multiple accounts with a common investment strategy, including other registered investment companies, unregistered investment vehicles, such as hedge funds, pension plans, separate accounts, collective trusts and charitable foundations. Among other things, Alliance’s policies and procedures provide for the prompt dissemination to investment professionals of initial or changed investment recommendations by analysts so that investment professionals are better able to develop investment strategies for all accounts they manage. In addition, investment decisions by investment professionals are reviewed for the purpose of maintaining uniformity among similar accounts and ensuring that accounts are treated equitably. No investment professional that manages client accounts carrying performance fees is compensated directly or specifically for the performance of those accounts. Investment professional compensation reflects a broad contribution in multiple dimensions to long-term investment success for our clients and is not tied specifically to the performance of any particular client’s account, nor is it directly tied to the level or change in level of assets under management.
Allocating Investment Opportunities.
Alliance has policies and procedures intended to address conflicts of interest relating to the allocation of investment opportunities. These policies and procedures are designed to ensure that information relevant to investment decisions is disseminated promptly within its portfolio management teams and investment opportunities are allocated equitably among different clients. The investment professionals at Alliance routinely are required to select and allocate investment opportunities among accounts. Portfolio holdings, position sizes, and industry and sector exposures tend to be similar across similar accounts, which minimizes the potential for conflicts of interest relating to the allocation of investment opportunities. Nevertheless, investment opportunities may be allocated differently among accounts due to the particular characteristics of an account, such as size of the account, cash position, tax status, risk tolerance and investment restrictions or for other reasons.
Alliance’s procedures are also designed to prevent potential conflicts of interest that may arise when Alliance has a particular financial incentive, such as a performance-based management fee, relating to an account. An investment professional may perceive that he or she has an incentive to devote more time to developing and analyzing investment strategies and opportunities or allocating securities preferentially to accounts for which Alliance could share in investment gains.
To address these conflicts of interest, Alliance’s policies and procedures require, among other things, the prompt dissemination to investment professionals of any initial or changed investment recommendations by analysts; the aggregation of orders to facilitate best execution for all accounts; price averaging for all aggregated orders; objective allocation for limited investment opportunities (e.g., on a rotational basis) to ensure fair and equitable allocation among accounts; and limitations on short sales of securities. These procedures also require documentation and review of justifications for any decisions to make investments only for select accounts or in a manner disproportionate to the size of the account.
Portfolio Manager Compensation.
Alliance’s compensation program for investment professionals is designed to be competitive and effective in order to attract and retain the highest caliber employees. The compensation program for investment professionals is designed to reflect their ability to generate long-term investment success for our clients, including shareholders of the AllianceBernstein Mutual Funds. Investment professionals do not receive any direct compensation based upon the investment returns of any individual client account, nor is compensation tied directly to the level or change in level of assets under management. Investment professionals’ annual compensation is comprised of the following:
| | (i) | Fixed base salary: This is generally the smallest portion of compensation. The base salary is a relatively low, fixed salary within a similar range for all investment professionals. The base salary is determined at the outset of employment based on level of experience, does not change significantly from year-to-year and hence, is not particularly sensitive to performance. |
B-242
| | (ii) | Discretionary incentive compensation in the form of an annual cash bonus: Alliance’s overall profitability determines the total amount of incentive compensation available to investment professionals. This portion of compensation is determined subjectively based on qualitative and quantitative factors. In evaluating this component of an investment professional’s compensation, Alliance considers the contribution to his/her team or discipline as it relates to that team’s overall contribution to the long-term investment success, business results and strategy of Alliance. Quantitative factors considered include, among other things, relative investment performance (e.g., by comparison to competitor or peer group funds or similar styles of investments, and appropriate, broad-based or specific market indices), and consistency of performance. There are no specific formulas used to determine this part of an investment professional’s compensation and the compensation is not tied to any pre-determined or specified level of performance. Alliance also considers qualitative factors such as the complexity and risk of investment strategies involved in the style or type of assets managed by the investment professional; success of marketing/business development efforts and client servicing; seniority/length of service with the firm; management and supervisory responsibilities; and fulfillment of Alliance’s leadership criteria. |
| | (iii) | Discretionary incentive compensation in the form of awards under Alliance’s Partners Compensation Plan (“deferred awards”): Alliance’s overall profitability determines the total amount of deferred awards available to investment professionals. The deferred awards are allocated among investment professionals based on criteria similar to those used to determine the annual cash bonus. There is no fixed formula for determining these amounts. Deferred awards, for which there are various investment options, vest over a four-year period and are generally forfeited if the employee resigns or Alliance terminates his/her employment. Investment options under the deferred awards plan include many of the same AllianceBernstein Mutual Funds offered to mutual fund investors, thereby creating a close alignment between the financial interests of the investment professionals and those of Alliance’s clients and mutual fund shareholders with respect to the performance of those mutual funds. Alliance also permits deferred award recipients to allocate up to 50% of their award to investments in Alliance’s publicly traded equity securities.1 |
| | (iv) | Contributions under Alliance’s Profit Sharing/401(k) Plan: The contributions are based on Alliance’s overall profitability. The amount and allocation of the contributions are determined at the sole discretion of Alliance. |
1 | Prior to 2002, investment professional compensation also included discretionary long-term incentive in the form of restricted grants of AllianceBernstein’s Master Limited Partnership Units. |
B-243
ClearBridge Advisors, LLC
The portfolio managers for the Strategic Balanced Fund are John G. Goode and Peter Hable.
Other Accounts Managed (as of 12/31/06):
| | | | | |
| | | Number Of
Accounts
| | Total Assets
|
John Goode | | | | | |
Registered investment companies: | | 17 | | $ | 8.77 billion |
Other pooled investment vehicles: | | 2 | | $ | 400 million |
Other accounts: | | 79,734 | | $ | 12.38 billion |
There is one managed account included above with advisory fees based on performance with $10,000 in total assets.
| | | | | |
| | | Number Of
Accounts
| | Total Assets
|
Peter Hable | | | | | |
Registered investment companies: | | 19 | | $ | 10.16 billion |
Other pooled investment vehicles: | | 2 | | $ | 400 million |
Other accounts: | | 79,734 | | $ | 12.38 billion |
There is one managed account included above with advisory fees based on performance with $10,000 in total assets.
Portfolio Manager Compensation
ClearBridge Advisors, LLC (“ClearBridge”) investment professionals receive base salary and other employee benefits and are eligible to receive incentive compensation. Base salary is fixed and typically determined based on market factors and the skill and experience of individual investment personnel.
ClearBridge has implemented an investment management incentive and deferred compensation plan (the “Plan”) for its investment professionals, including the fund’s portfolio manager(s). Each investment professional works as a part of an investment team. The Plan is designed to align the objectives of ClearBridge investment professionals with those of fund shareholders and other ClearBridge clients. Under the Plan a “base incentive pool” is established for each team each year as a percentage of ClearBridge’s revenue attributable to the team (largely management and related fees generated by funds and other accounts). A team’s revenues are typically expected to increase or decrease depending on the effect that the team’s investment performance as well as inflows and outflows have on the level of assets in the investment products managed by the team. The “base incentive pool” of a team is reduced by base salaries paid to members of the team and other employee expenses attributable to the team.
The investment team’s incentive pool is then adjusted to reflect its ranking among a “peer group” of non-ClearBridge investment managers and the team’s pre-tax investment performance against the applicable product benchmark (e.g. a securities index and, with respect to a fund, the benchmark set forth in the fund’s prospectus to which the fund’s average annual total returns are compared or, if none, the benchmark set forth in the fund’s annual report). Longer-term (5- year) performance will be more heavily weighted than shorter-term (1- year) performance in the calculation of the performance adjustment factor. The incentive pool for a team may also be adjusted based on other qualitative factors by the applicable ClearBridge Chief Investment Officer.). The incentive pool will be allocated by the applicable ClearBridge chief investment officer to the team leader and, based on the recommendations of the team leader, to the other members of the team.
Up to 20% of an investment professional’s annual incentive compensation is subject to deferral. Of that principal deferred award amount, 25% will accrue a return based on the hypothetical returns of the investment
B-244
fund or product that is the primary focus of the investment professional’s business activities with the Firm, 25% will accrue a return based on the hypothetical returns of an employee chosen composite fund, and 50% may be received in the form of Legg Mason restricted stock shares.
Potential Conflicts of Interest
Potential conflicts of interest may arise when a Fund’s portfolio manager has day-to-day management responsibilities with respect to one or more other funds or other accounts, as is the case for the portfolio managers listed in the table above.
The investment adviser and the fund(s) have adopted compliance policies and procedures that are designed to address various conflicts of interest that may arise for the investment adviser and the individuals that it employs. For example, ClearBridge seeks to minimize the effects of competing interests for the time and attention of portfolio managers by assigning portfolio managers to manage funds and accounts that share a similar investment style. ClearBridge has also adopted trade allocation procedures that are designed to facilitate the fair allocation of limited investment opportunities among multiple funds and accounts. There is no guarantee, however, that the policies and procedures adopted by ClearBridge and the fund(s) will be able to detect and/or prevent every situation in which an actual or potential conflict may appear.
These potential conflicts include:
Allocation of Limited Time and Attention. A portfolio manager who is responsible for managing multiple funds and/or accounts may devote unequal time and attention to the management of those funds and/or accounts. As a result, the portfolio manager may not be able to formulate as complete a strategy or identify equally attractive investment opportunities for each of those accounts as might be the case if he or she were to devote substantially more attention to the management of a single fund. The effects of this potential conflict may be more pronounced where funds and/or accounts overseen by a particular portfolio manager have different investment strategies.
Allocation of Limited Investment Opportunities. If a portfolio manager identifies a limited investment opportunity that may be suitable for multiple funds and/or accounts, the opportunity may be allocated among these several funds or accounts, which may limit a fund’s ability to take full advantage of the investment opportunity.
Pursuit of Differing Strategies. At times, a portfolio manager may determine that an investment opportunity may be appropriate for only some of the funds and/or accounts for which he or she exercises investment responsibility, or may decide that certain of the funds and/or accounts should take differing positions with respect to a particular security. In these cases, the portfolio manager may place separate transactions for one or more funds or accounts which may affect the market price of the security or the execution of the transaction, or both, to the detriment or benefit of one or more other funds and/or accounts.
Variation in Compensation. A conflict of interest may arise where the financial or other benefits available to the portfolio manager differ among the funds and/or accounts that he or she manages. If the structure of the investment adviser’s management fee and/or the portfolio manager’s compensation differs among funds and/or accounts (such as where certain funds or accounts pay higher management fees or performance-based management fees), the portfolio manager might be motivated to help certain funds and/or accounts over others. The portfolio manager might be motivated to favor funds and/or accounts in which he or she has an interest or in which the investment advisor and/or its affiliates have interests. Similarly, the desire to maintain or raise assets under management or to enhance the portfolio manager’s performance record or to derive other rewards, financial or otherwise, could influence the portfolio manager to lend preferential treatment to those funds and/or accounts that could most significantly benefit the portfolio manager.
Selection of Broker/Dealers. Portfolio managers may be able to select or influence the selection of the brokers and dealers that are used to execute securities transactions for the funds and/or accounts that they
B-245
supervise. In addition to executing trades, some brokers and dealers provide brokerage and research services (as those terms are defined in Section 28(e) of the Securities Exchange Act of 1934), which may result in the payment of higher brokerage fees than might otherwise be available. These services may be more beneficial to certain funds or accounts than to others. Although the payment of brokerage commissions is subject to the requirement that the sub-adviser determines in good faith that the commissions are reasonable in relation to the value of the brokerage and research services provided to the fund, a decision as to the selection of brokers and dealers could yield disproportionate costs and benefits among the funds and/or accounts managed. For this reason, the sub-adviser has formed a brokerage committee that reviews, among other things, the allocation of brokerage to broker/dealers, best execution and soft dollar usage.
Related Business Opportunities. The investment adviser or its affiliates may provide more services (such as distribution or recordkeeping) for some types of funds or accounts than for others. In such cases, a portfolio manager may benefit, either directly or indirectly, by devoting disproportionate attention to the management of fund and/or accounts that provide greater overall returns to the investment manager and its affiliates.
Portfolio Manager Securities Ownership:
The portfolio managers do not own any shares of the Fund.
B-246
Clover Capital Management, Inc.
The portfolio managers of the Small Company Value Fund are Michael E. Jones, Lawrence R. Creatura and Stephen K. Gutch.
Compensation:
As Chief Executive Officer, Mr. Jones is compensated with a base salary and he earns dividends through his ownership of Clover Capital Management, Inc. stock.
As Portfolio Manager, Mr. Creatura is compensated with a base salary and participates in a bonus plan. The bonus varies based on performance of their respective strategy(s) against the product’s stated benchmark. The bonus amount is calculated and paid at the end of each calendar quarter. Mr. Creatura is also a shareholder of Clover Capital Management, Inc. in which he earns dividends based upon his percentage of ownership of the Firm. Additionally, Mr. Creatura is entitled to a cash bonus based upon a combination of net revenues and Fund performance for a limited partnership managed by Clover.
As Portfolio Manager, Mr. Gutch is compensated with a base salary and participates in a bonus plan. The bonus varies based on performance of their respective strategy(s) against the product’s stated benchmark. The bonus amount is calculated and paid at the end of each calendar quarter. Mr. Gutch is also a shareholder of Clover Capital Management, Inc. in which he earns dividends based upon his percentage of ownership of the Firm.
Ownership of Securities: The portfolio managers do not own any shares of the Small Company Value Fund.
Other accounts managed as of December 31, 2006:
| | |
Michael E. Jones | | |
| |
Registered investment companies | | 1 |
Total Assets | | $102 Million |
| |
Other pooled investment vehicles | | 6 |
Total Assets | | $ 67 Million |
Other Accounts
Please note there are other privately managed accounts for which Mr. Jones is only responsible for creating the investment model, but we employ a team of portfolio coordinators who are charged with the day-to-day management of these other privately managed accounts.
The advisory fees on all of the accounts referenced above are based on assets under management. There are three accounts included above with assets of approximately $48.5 million that pay Clover Capital an additional fee based upon the performance of the account.
Other accounts managed as of December 31, 2006:
| | | |
Lawrence R. Creatura | | | |
| |
Registered investment companies | | | 1 |
Total Assets | | $ | 102 Million |
| |
Other pooled investment vehicles | | | 3 |
Total Assets | | $ | 31 Million |
B-247
Other Accounts
Please note there are other privately managed accounts for which Mr. Creatura is only responsible for creating the investment model, but we employ a team of portfolio coordinators who are charged with the day-to-day management of these other privately managed accounts.
The advisory fees on all of the accounts referenced above are based on assets under management. There is one account included above with assets of approximately $19 million that pays Clover Capital an additional fee based upon the performance of the account.
| | | |
Stephen K. Gutch | | | |
| |
Registered investment companies | | | 0 |
Total Assets | | $ | 0 |
| |
Other pooled investment vehicles | | | 2 |
Total Assets | | $ | 9 Million |
Other Accounts
Please note there are other privately managed accounts for which Mr. Gutch is only responsible for creating the investment model, but we employ a team of portfolio coordinators who are charged with the day-to-day management of these other privately managed accounts.
The advisory fees on all of the accounts referenced above are based on assets under management.
Conflicts of Interest: With respect to potential conflicts between various types of portfolios managed by Clover Capital, the Firm avoids such conflict since its portfolios are broken out by capitalization ranges, and the investment opportunities are allocated accordingly. With respect to potential conflicts among accounts within a specific portfolio, the Firm utilizes a rotational trading system among the accounts, thereby ensuring fair and impartial treatment of the accounts.
B-248
Cooke & Bieler, L.P.
The portfolio managers of the Focused Value Fund and the Mid-Cap Value Fund are: Michael M. Meyer, James R. Norris, Kermit S. Eck, Edward W. O’Connor, R. James O’Neil, Mehul Trivedi and Daren C. Heitman.
Information below is as of 12/31/06.
| | | | | | | | | |
| | | # of
Registered
Investment
Companies
Managed
| | # of Other
Pooled
Investment
Vehicles
Managed
| | # of Other
Accounts
Managed
|
The Portfolio Managers listed above manage the following types of accounts: | | | 5 | | | 1 | | | 257 |
Total assets of above accounts ($) | | $ | 1.9 billion | | $ | 45.9 million | | $ | 6.3 billion |
| | | | | | | | | |
| | | Registered
Investment
Companies
| | Other Pooled
Investment
Vehicles
| | Other
Accounts
|
Advisory fee is based on performance for: | | | | | | | | | |
Number of above accounts | | | 0 | | | 0 | | | 3 |
Total assets of above accounts ($) | | $ | 0 | | $ | 0 | | $ | 554.8 million |
There are no material conflicts that may arise in connection with Cooke & Bieler’s management of each Fund’s investments and the other accounts. The Portfolio Managers manage accounts on a team basis. Performance and allocation of securities are closely monitored to ensure equal treatment. Accordingly, the Portfolio Managers have not experienced material conflicts of interest in managing multiple accounts.
| | | | | | | | | | |
Type of compensation How compensation is determined
| | Salary
| | Bonus
| | Deferred
Compensation
| | Pension and
Retirement
Plan
| | Other (explain)
|
Fixed | | X | | ¨ | | X | | ¨ | | X |
Pre-Tax Performance | | ¨ | | X | | ¨ | | ¨ | | ¨ |
After-Tax Performance | | ¨ | | ¨ | | ¨ | | ¨ | | ¨ |
Cash | | ¨ | | ¨ | | ¨ | | ¨ | | ¨ |
Non-Cash | | ¨ | | ¨ | | ¨ | | ¨ | | ¨ |
Current Performance Benchmarks:
Russell Midcap Value Index
Compensation is based on the following:
base salary
annual bonus based upon performance from the bonus pool
partners of Cooke & Bieler receive a return proportionate to their investment based upon the firm’s overall success.
Bonus allocations are determined by an annual peer review process conducted by the investment team. Allocations vary, depending primarily on the 4 year rolling investment results attributed to each individual.
Securities Ownership of Portfolio Managers:
| | | | | | | | | | | | | | | | | | | | | | | |
| | | None
| | $1 -
$10,000
| | $10,001-
$50,000
| | $50,001-
$100,000
| | $100,001-
$500,000
| | $100,001-
$500,000
| | $500,001-
$1,000,000
| | Over
$1,000,000
|
Fund Name | | | | | | | | | | | | | | | | | | | | | | | |
Focused Value Fund | | X | | ¨ | | | ¨ | | | ¨ | | | ¨ | | | ¨ | | | ¨ | | | ¨ | |
Mid-Cap Value Fund | | X | | ¨ | | | ¨ | | | ¨ | | | ¨ | | | ¨ | | | ¨ | | | ¨ | |
B-249
Davis Selected Advisers, L.P.
The Portfolio Managers of the Large Cap Value Fund are Christopher Davis and Kenneth Feinberg. They are the persons primarily responsible for investing the Fund’s assets on a daily basis.
Other Accounts Managed: As of December 31, 2006 Christopher Davis served as portfolio manager for (i) 31 registered investment companies with approximately $76 billion in total net assets, (ii) 12 other pooled investment vehicles with approximately $1.5 billion in total net assets, and approximately 47 thousand other accounts (primarily managed money/wrap accounts) with approximately $15.1 billion in total net assets. None of these accounts pays Davis Advisors a performance fee.
As of December 31, 2006 Kenneth Feinberg served as portfolio manager for (i) 28 registered investment companies with approximately $76.6 billion in total net assets, (ii) 12 other pooled investment vehicles with approximately $1.5 billion in total net assets, and approximately 47 thousand other accounts (primarily managed money/wrap accounts) with approximately $15.1 billion in total net assets. None of these accounts pays Davis Advisors a performance fee.
Potential Conflicts of Interest: Actual or apparent conflicts of interest may arise when a portfolio manager has day-to-day management responsibilities with respect to more than one portfolio or other account. More specifically, portfolio managers who manage multiple portfolios and /or other accounts are presented with the following potential conflicts:
| | Ø | The management of multiple portfolios and/or other accounts may result in a portfolio manager devoting unequal time and attention to the management of each portfolio and/or other account. Davis Advisors seeks to manage such competing interests for the time and attention of portfolio managers by having portfolio managers focus on a particular investment discipline. Most other accounts managed by a portfolio manager are managed using the same investment models that are used in connection with the management of the portfolios. |
| | Ø | If a portfolio manager identifies a limited investment opportunity which may be suitable for more than one portfolio or other account, a portfolio may not be able to take full advantage of that opportunity due to an allocation of filled purchase or sale orders across all eligible portfolios and other accounts. To deal with these situations, Davis Advisors has adopted procedures for allocating portfolio transactions across multiple accounts. |
| | Ø | With respect to securities transactions for the portfolios, Davis Advisors determines which broker to use to execute each order, consistent with its duty to seek best execution of the transaction. However, with respect to certain other accounts (such as mutual funds for which Davis Advisors other pooled investment vehicles that are not registered mutual funds, and other accounts managed for organizations and individuals), Davis Advisors may be limited by the client with respect to the selection of brokers or may be instructed to direct trades through a particular broker. In these cases, Davis Advisors may place separate, non-simultaneous, transactions for a portfolio and another account which may temporarily affect the market price of the security or the execution of the transaction, or both, to the detriment of the portfolio or the other account. |
| | Ø | Finally, substantial investment of Davis Advisor or Davis Family assets in certain mutual funds may lead to conflicts of interest. To mitigate these potential conflicts of interest, Davis Advisors has adopted policies and procedures intended to ensure that all clients are treated fairly overtime. Davis Advisors does not receive an incentive based fee on any account. |
Structure of Compensation: Kenneth Feinberg’s compensation as a Davis Advisors employee consists of (i) a base salary, (ii) an annual bonus equal to a percentage of growth in Davis Advisors’ profits, (iii) awards of equity (“Units”) in Davis Advisors including Units, options on Units, and/or phantom Units, and (iv) an incentive plan whereby Davis Advisors purchases shares in selected funds managed by Davis Advisors. At the end of
B-250
specified periods, generally five-years following the date of purchase, some, all, or none of the fund shares will be registered in the employee’s name based on fund performance after expenses on a pre-tax basis versus the S&P 500 Index and versus peer groups as defined by Morningstar or Lipper. Davis Advisors’ portfolio managers are provided benefits packages including life insurance, health insurance, and participation in company 401(k) plan comparable to that received by other company employees.
Christopher Davis’ annual compensation as an employee and general partner of Davis Advisors consists of a base salary. Davis Advisors’ portfolio managers are provided benefits packages including life insurance, health insurance, and participation in company 401(k) plan comparable to that received by other company employees.
Ownership of Fund Shares: Neither Christopher Davis nor Kenneth Feinberg own any shares of the Large Cap Value Fund. However, both portfolio managers have over $1 million invested in the Davis Funds which are managed in a similar style.
B-251
Delaware Management Company
The portfolio managers of the Aggressive Growth Fund are Jeffrey S. Van Harte, CFA, Christopher J. Bonavico, CFA, Christopher M. Ericksen, CFA and Daniel J. Prislin, CFA. They are the persons primarily responsible for investing the Fund’s assets on a daily basis.
The portfolio managers of the Emerging Growth Fund are Marshall T. Bassett, Steven G. Catricks, CFA, Barry S. Gladstein, CFA, Christopher M. Holland, Steven T. Lampe, Rudy D. Torrijos III, and Lori P. Wachs, CFA. They are the persons primarily responsible for investing the Fund’s assets on a daily basis.
Other Accounts Managed
| I. | Portfolio Managers—Delaware Management Company |
| | A. | Except as noted, the following chart lists certain information about types of other accounts for which each portfolio manager is primarily responsible as of December 31, 2006. |
| | | | | | | | | | |
| | | No. of Accounts
| | Total Assets
Managed
| | No. of Accounts with
Performance-Based
Fees
| | Total Assets in
Accounts with
Performance-
Based Fees
|
Jeffrey S. Van Harte | | | | | | | | | | |
Registered Investment Companies | | 22 | | $ | 5.1 billion | | 0 | | $ | 0 |
Other Pooled Investment Vehicles | | 0 | | $ | 0 | | 0 | | $ | 0 |
Other Accounts | | 52 | | $ | 10.6 billion | | 1 | | $ | 678.7 million |
Christopher J. Bonavico | | | | | | | | |
Registered Investment Companies | | 23 | | $ | 5.1 billion | | 0 | | $ | 0 |
Other Pooled Investment Vehicles | | 0 | | $ | 0 | | 0 | | $ | 0 |
Other Accounts | | 52 | | $ | 10.6 billion | | 1 | | $ | 678.7 million |
Christopher M. Ericksen | | | | | | | | |
Registered Investment Companies | | 19 | | $ | 4.6 billion | | 0 | | $ | 0 |
Other Pooled Investment Vehicles | | 0 | | $ | 0 | | 0 | | $ | 0 |
Other Accounts | | 50 | | $ | 10.6 billion | | 1 | | $ | 678.7 million |
Daniel J. Prislin | | | | | | | | | | |
Registered Investment Companies | | 22 | | $ | 5.1 billion | | 0 | | $ | 0 |
Other Pooled Investment Vehicles | | 0 | | $ | 0 | | 0 | | $ | 0 |
Other Accounts | | 52 | | $ | 10.6 billion | | 1 | | $ | 678.7 million |
Marshall T. Bassett | | | | | | | | | | |
Registered Investment Companies | | 23 | | $ | 4 billion | | 0 | | $ | 0 |
Other Pooled Investment Vehicles | | 1 | | $ | 4.1 million | | 0 | | $ | 0 |
Other Accounts | | 26 | | $ | 1.7 billion | | 1 | | $ | 98.5 million |
Steven G. Catricks | | | | | | | | | | |
Registered Investment Companies | | 23 | | $ | 4 billion | | 0 | | $ | 0 |
Other Pooled Investment Vehicles | | 1 | | $ | 4.1 million | | 0 | | $ | 0 |
Other Accounts | | 16 | | $ | 1.7 billion | | 1 | | $ | 98.5 million |
Barry S. Gladstein | | | | | | | | | | |
Registered Investment Companies | | 23 | | $ | 4 billion | | 0 | | $ | 0 |
Other Pooled Investment Vehicles | | 1 | | $ | 4.1 million | | 0 | | $ | 0 |
Other Accounts | | 15 | | $ | 1.7 billion | | 1 | | $ | 98.5 million |
Christopher M. Holland | | | | | | | | |
Registered Investment Companies | | 23 | | $ | 4 billion | | 0 | | $ | 0 |
Other Pooled Investment Vehicles | | 1 | | $ | 4.1 million | | 0 | | $ | 0 |
Other Accounts | | 17 | | $ | 1.7 billion | | 1 | | $ | 98.5 million |
B-252
| | | | | | | | | | |
Steven T. Lampe | | | | | | | | | | |
Registered Investment Companies | | 23 | | $ | 4 billion | | 0 | | $ | 0 |
Other Pooled Investment Vehicles | | 1 | | $ | 4.1 million | | 0 | | $ | 0 |
Other Accounts | | 16 | | $ | 1.7 billion | | 1 | | $ | 98.5 million |
Rudy D. Torrijos III | | | | | | | | | | |
Registered Investment Companies | | 23 | | $ | 4 billion | | 0 | | $ | 0 |
Other Pooled Investment Vehicles | | 1 | | $ | 4.1 million | | 0 | | $ | 0 |
Other Accounts | | 14 | | $ | 1.7 billion | | 1 | | $ | 98.5 million |
Lori P. Wachs | | | | | | | | | | |
Registered Investment Companies | | 23 | | $ | 4 billion | | 0 | | $ | 0 |
Other Pooled Investment Vehicles | | 1 | | $ | 4.1 million | | 0 | | $ | 0 |
Other Accounts | | 15 | | $ | 1.7 billion | | 1 | | $ | 98.5 million |
Potential Conflicts of Interest
Individual portfolio managers may perform investment management services for other accounts similar to those provided to the Fund and the investment action for each account and fund may differ. For example, an account or fund may be selling a security, while another account or fund may be purchasing or holding the same security. As a result, transactions executed for one account and fund may adversely affect the value of securities held by another account. Additionally, the management of multiple accounts and funds may give rise to potential conflicts of interest, as a portfolio manager must allocate time and effort to multiple accounts and funds. A portfolio manager may discover an investment opportunity that may be suitable for more than one account or fund. The investment opportunity may be limited, however, so that all accounts and funds for which the investment would be suitable may not be able to participate. Delaware Investments has adopted procedures designed to allocate investments fairly across multiple accounts.
One of the accounts managed by the portfolio managers has a performance-based fee. This compensation structure presents a potential conflict of interest. The portfolio manager has an incentive to manage this account so as to enhance its performance, to the possible detriment of other accounts for which the investment manager does not receive the performance-based fee.
A portfolio manager’s management of personal accounts also may present certain conflicts of interest. While the sub-adviser’s code of ethics is designed to address these potential conflicts, there is no guarantee that it will do so.
Compensation
Each portfolio manager’s compensation consists of the following:
BASE SALARY—Each named portfolio manager receives a fixed base salary. Salaries are determined by a comparison to industry data prepared by third parties to ensure that portfolio manager salaries are in line with salaries paid at peer investment advisory firms.
BONUS—Each named portfolio manager is eligible to receive an annual cash bonus, which is based upon quantitative and qualitative factors. Generally of the total potential cash compensation for a portfolio manager, fifty percent or more is in the form of a bonus and is therefore at risk. The total amount available for payment of bonuses is based on the revenues associated with the products managed by the portfolio manager’s team. The amount of this “bonus pool” is determined by taking a pre-determined percentage of such revenues (minus appropriate expenses associated with this product and the investment management team).
Various members of the team have the ability to earn a percentage of the bonus pool with the most senior contributors having the largest share. The pool is allotted based on subjective factors (50%) and objective factors
B-253
(50%). The subjective portion of the pool is allocated to team members within the discretion of senior management. There is a minimum guaranteed fixed payout amount associated with this portion of the pool for the years ending December 31, 2005 and December 31, 2006.
The allocation of the remaining fifty percent of the pool is based upon objective factors. Performance is measured as a result of the team’s standing relative to a large cap growth composite of a nationally recognized publicly available database, for five successive calendar years. Performance rankings are in quartiles as follows: top decile, top quartile, second quartile, third quartile and bottom quartile. An average is taken of the five year relative performance data to determine the multiplier to be applied in calculating the portion of the pool that will be paid out. To the extent there was less than a complete payout of the “objective” portion of the bonus pool over the previous five years, there is an opportunity to recoup these amounts if the multiplier is in excess of 100% in the years that follow, in the discretion of senior management. Individual allocations of the bonus pool are based on individual performance measurements, both objective and subjective, as determined by senior management.
DEFERRED COMPENSATION—Each named portfolio manager is eligible to participate in the Lincoln National Corporation Executive Deferred Compensation Plan, which is available to all employees whose income exceeds a designated threshold. The Plan is a non-qualified unfunded deferred compensation plan that permits participating employees to defer the receipt of a portion of their cash compensation.
STOCK OPTION INCENTIVE PLAN/EQUITY COMPENSATION PLAN—Portfolio managers may be awarded options to purchase common shares of Delaware Investments U.S., Inc. pursuant to the terms of the Delaware Investments U.S., Inc. Stock Option Plan (non-statutory or “non-qualified” stock options). In addition, certain managers may be awarded restricted stock units, or “performance shares,” in Lincoln. Delaware Investments U.S., Inc., is an indirect subsidiary of Delaware Management Holdings, Inc. Delaware Management Holdings, Inc., is in turn an indirect subsidiary of Lincoln.
The Delaware Investments U.S., Inc. Stock Option Plan was established in 2001 in order to provide certain investment personnel of Delaware Investments with a more direct means of participating in the growth of the investment manager. Under the terms of the plan, stock options typically vest in 25% increments on a four-year schedule and expire ten years after issuance. The investment manager in its full discretion awards options from time to time. Option awards may be based in part on seniority.
Portfolio managers who do not participate in the Delaware Investments U.S., Inc. Stock Option Plan are eligible to participate in Lincoln’s Long-Term Incentive Plan, which is designed to provide a long-term incentive to officers of Lincoln. Under the plan, a specified number of performance shares are allocated to each unit and are awarded to participants in the discretion of their managers in accordance with recommended targets related to the number of employees in a unit that may receive an award and the number of shares to be awarded. The performance shares have a three year vesting schedule and, at the end of the three years, the actual number of shares distributed to those who received awards may be equal to, greater than or less than the amount of the award based on Lincoln’s achievement of certain performance goals relative to a pre-determined peer group.
OTHER COMPENSATION—Portfolio managers may also participate in benefit plans and programs available generally to all employees.
Ownership of Securities
The portfolio managers do not own any shares of the Aggressive Growth Fund or the Emerging Growth Fund.
B-254
Eagle Asset Management, Inc.
The portfolio manager of the Small Company Growth Fund is Bert Boksen.
Other Accounts Managed and Potential Conflicts of Interest:
Bert Boksen
| | | | | |
| | | Number of Accounts*
| | Total Assets*
|
Ø registered investment companies: | | 11 | | $ | 980,969,321 |
| | |
| |
|
|
Ø other pooled investment vehicles: | | 1 | | $ | 32,647,449 |
| | |
| |
|
|
Ø other accounts: | | 2371 | | $ | 1,069,272,694 |
| | |
| |
|
|
Potential Conflicts
Eagle currently holds a 51% ownership interest in EB Management I, LLC, which acts as the general partner to a limited partnership formed for investment purposes. Bert Boksen is a 49% owner of EB Management and the Portfolio Manager for the Eagle Aggressive Growth Partners Fund I L.P. Eagle also provides administrative and investment research services for the general partner. Certain officers and employees of Eagle have investment interests in the limited partnership.
On occasion, orders for the securities transactions of the limited partnership may be aggregated with orders for Eagle’s client accounts. In such instances, Eagle will ensure that the allocation of securities among Eagle’s clients and the partnership is equitable; price averaging may be used for trades executed in a series of transactions on the same day.
Eagle does not invest assets of clients’ accounts in such limited partnership. Officers and employees of Raymond James Financial, Inc. and it’s subsidiaries may have investment interest in such investment partnership.
Conflicts of Interest
Eagle’s portfolio manager manages other accounts with investment strategies similar to the Portfolio. Certain conflicts of interest may arise in connection with the management of multiple portfolios. As noted above, fees vary among these accounts and the portfolio manager may personally invest in some of these accounts. This could create potential conflicts of interest where a portfolio manager may favor certain accounts over others, resulting in other accounts outperforming the Portfolio. Other potential conflicts include conflicts in the allocation of investment opportunities and aggregated trading. However, Eagle has developed and implemented policies and procedures designed to ensure that all clients are treated equitably. In addition, compliance oversight and monitoring ensures adherence to policies designed to avoid conflicts. Also, as indicated in Eagle’s Code of Ethics, there are certain procedures in place to avoid conflicts of interest when the Manager and other investment personnel of Eagle buy or sell securities also owned by, or bought or sold for Clients.
Securities Ownership of Portfolio Manager:
| | | | | | | | | | | | | | | |
Portfolio Manager
| | none
| | $1-$10,000
| | $10,001-
$50,000
| | $50,001-
$100,000
| | $100,001-
$500,000
| | $500,001-
$1,000,000
| | over $1,000,000
|
Bert Boksen | | ü | | | | | | | | | | | | | |
B-255
Information about the Portfolio Manager’s compensation:
Mr. Boksen is paid a base salary that is competitive with other portfolio managers in the industry, based on industry surveys;
Mr. Boksen, along with other Portfolio managers, participates in a revenue-sharing program that provides incentives to build a successful investment program over the long term;
Additional deferred compensation plans are provided to key investment professionals;
Mr. Boksen, along with all employees, receives benefits from Eagle’s parent company including a 401(k) plan, profit sharing, and Employee Stock Purchase Plan.
There is no difference between the method used to determine Mr. Boksen’s compensation with respect to the Fund and other Funds managed by Mr. Boksen.
Mr. Boksen’s additional compensation includes receipt of 50% of the net profits generated by the General Partner EB Management I.
Mr. Boksen also receives Stock option awards as part of his annual Bonus. These stock option awards vest over a three year period.
Mr. Boksen’s compensation is based upon all accounts managed and performance is evaluated annually. Performance is evaluated on the entire composite of accounts and is pre-tax and account weighted.
Mr. Boksen’s benchmarks for evaluation purposes include LipperFund Index for Mutual Fund performance and the Russell 2000 Index for separate accounts, along with peer group rankings such as Callan Associates and Mercer Investment Consulting.
B-256
EARNEST Partners, LLC
The portfolio manager for the Small Company Value Fund is Paul Viera.
The following table sets forth certain additional information with respect to the portfolio manager for the Fund. Unless noted otherwise, all information is provided as of December 31, 2006.
A. Other Accounts Managed by Portfolio Manager. The table below identifies, for the portfolio manager, the number of accounts managed and the total assets in such accounts, within each of the following categories: registered investment companies, other pooled investment vehicles, and other accounts. For each category, the number of accounts and total assets in the accounts whose fees are based on performance is indicated in italics typeface.
| | | | | | | | |
Portfolio
| | Portfolio Manager
| | Registered Investment Companies
| | Other Pooled Investment Vehicles
| | Other Accounts
|
| | | Paul E. Viera | | 12 Registered
Mutual Funds
with $2,830.2
million in total
assets under
management. | | 8 Unregistered
Pooled
Investment
Vehicles with
$25.6 million in
assets under
management. | | 298 Other
Accounts with
$19,357.3
million in total
assets under
management. |
| | | | | None | | 1 Unregistered
Pooled
Investment
Vehicle with $2.7
million in assets
under
management. | | 12 Other
Accounts with
$772.9 million in
total assets under
management. |
Compensation:
All EARNEST Partners personnel are paid a salary and a discretionary bonus. A portion of the bonus may consist of profit sharing and/or deferred compensation. The Company also matches a portion of employees’ 401(k) contributions, if any. The bonus is a function of client satisfaction with respect to investment results and service.
Equity ownership is another component of compensation for the portfolio manager. The Firm is employee-owned.
Conflicts of Interest:
No material conflicts of interest have been identified. All accounts are managed to model portfolios that are approved by the investment committee, and trades are allocated pro-rata to all accounts so that no one account is advantaged over another pursuant to trade allocation policies and procedures.
Ownership of Securities: The portfolio manager does not own any shares of the Fund.
B-257
Fidelity Management & Research Company
Ciaran O’Neill is the portfolio manager of the Value Equity Fund and receives compensation for his services. As of December 31, 2006, portfolio manager compensation generally consists of a fixed base salary determined periodically (typically annually), a bonus and, in certain cases, participation in several types of equity-based compensation plans. A portion of the portfolio manager’s compensation may be deferred based on criteria established by FMR or at the election of the portfolio manager.
The portfolio manager’s base salary is determined by level of responsibility and tenure at FMR or its affiliates. The portfolio manager’s bonus is based on several components. The primary components of the portfolio manager’s bonus are based on the pre-tax investment performance of the portfolio manager’s fund(s) and account(s) relative to a benchmark index and within a defined peer group assigned to each fund or account. The pre-tax investment performance of the portfolio manager’s fund(s) and account(s) is weighted according to his tenure on those fund(s) and account(s) and the average asset size of those fund(s) and account(s) over his tenure. Each component is calculated separately over the portfolio manager’s tenure on those fund(s) and account(s) over a measurement period that initially is contemporaneous with his tenure, but that eventually encompasses rolling periods of up to five years for the comparison to a benchmark index, rolling periods of up to five years for the comparison to a Lipper peer group, and rolling periods of up to three years for the comparison to a Morningstar peer group. A smaller, subjective component of the portfolio manager’s bonus is based on the portfolio manager’s overall contribution to management of FMR. The portion of the portfolio manager’s bonus that is linked to the investment performance of the fund is based on the fund’s pre-tax investment performance measured against the Russell 1000 Value Index, the fund’s pre-tax investment performance within the U.S. Equity Large Cap Value universe and the fund’s pre-tax investment performance within the Morningstar Large Cap Value Category. The portfolio manager also is compensated under equity-based compensation plans linked to increases or decreases in the net asset value of the stock of FMR Corp., FMR’s parent company. FMR Corp. is a diverse financial services company engaged in various activities that include fund management, brokerage, retirement, and employer administrative services.
The portfolio manager’s compensation plan may give rise to potential conflicts of interest. The portfolio manager’s base pay tends to increase with additional and more complex responsibilities that include increased assets under management and a portion of the bonus relates to marketing efforts, which together indirectly link compensation to sales. When a portfolio manager takes over a fund or an account, the time period over which performance is measured may be adjusted to provide a transition period in which to assess the portfolio. The management of multiple funds and accounts (including proprietary accounts) may give rise to potential conflicts of interest if the funds and accounts have different objectives, benchmarks, time horizons, and fees as the portfolio manager must allocate his time and investment ideas across multiple funds and accounts. In addition, the fund’s trade allocation policies and procedures may give rise to conflicts of interest if the fund’s orders do not get fully executed due to being aggregated with those of other accounts managed by FMR or an affiliate. The portfolio manager may execute transactions for another fund or account that may adversely impact the value of securities held by the fund. Securities selected for funds or accounts other than the fund may outperform the securities selected for the fund. Personal accounts may give rise to potential conflicts of interest; trading in personal accounts is restricted by the fund’s Code of Ethics.
B-258
The following table provides information relating to other accounts managed by Mr. O’Neill as of December 31, 2006:
| | | | | | |
| | | Registered
Investment
Companies
| | Other Pooled
Investment
Vehicles
| | Other Accounts
|
Number of Accounts Managed | | 2 | | 2 | | 7 |
Number of Accounts Managed with Performance-Based Advisory Fees | | None | | None | | None |
Assets Managed (in millions) | | $1,648 | | $484 | | $1,671 |
Assets Managed with Performance-Based Advisory Fees (in millions) | | None | | None | | None |
The dollar range of shares of the Value Equity Fund beneficially owned by Mr. O’Neill as of December 31, 2006 was $0.
B-259
Goldman Sachs Asset Management, L.P.
Robert C. Jones and Melissa R. Brown are the portfolio managers of the Small Cap Core Equity Fund.
Other Accounts Managed:
| | | | | | | | | | | | | | | | |
| | | Number of Other Accounts Managed
and Total Assets (in millions) by Account Type *
| | Number of Accounts and Total Assets
(in millions) for Which Advisory Fee
is Performance-Based*
|
Name of
Portfolio
Manager
| | Registered Investment Companies
| | Other Pooled
Investment
Vehicles
| | Other Accounts
| | Registered Investment Companies
| | Other
Pooled
Investment
Vehicles
| | Other Accounts
|
Melissa Brown | | $ | 24,207(66) | | $ | 19,122(42) | | $ | 71,742(641) | | | | | | $ | 14,373(47) |
| | | | | | |
Robert C. Jones | | $ | 24,207(66) | | $ | 19,122(42) | | $ | 71,742(641) | | | | | | $ | 14,373(47) |
| *The | information is provided as of 12/31/06. |
Quantitative Domestic Equity Portfolio Management Team Base Salary and Performance Bonus:
Goldman Sachs Asset Management (“GSAM”) provides generous compensation packages for its investment professionals, which are comprised of a base salary and a performance bonus. The year-end performance bonus is a function of each professional’s individual performance; his or her contribution to the overall performance of the group; the performance of GSAM; the profitability of Goldman Sachs; and anticipated compensation levels among competitor firms.
Portfolio management teams are rewarded for their ability to outperform a benchmark while managing risk exposure. An individual’s compensation depends on his/her contribution to the team as well as his/her ability to work as a member of the team.
The portfolio management team’s performance measures are aligned with GSAM’s goals to:
(1) Exceed benchmark over one-year and three-year periods;
(2) Manage portfolios within a defined range around a targeted tracking error;
(3) Perform consistently with objectives and client commitments;
(4) Achieve top tier rankings and ratings; and
(5) Manage all similarly mandated accounts in a consistent manner.
Performance-related remuneration for portfolio managers is significantly influenced by the following criteria:
(1) Overall portfolio performance and consistency of performance over time;
(2) Consistency of performance across accounts with similar profiles;
(3) Compliance with risk budgets; and
(4) Communication with other portfolio managers within the research process.
In addition, detailed portfolio attribution is critical to the measurement process.
The benchmark for this Fund is the Russell 2000 Index.
B-260
Other Compensation:
In addition to base salary and performance bonus, GSAM has a number of additional benefits/deferred compensation programs for all portfolio managers in place including (i) a 401(k) program that enables employees to direct a percentage of their pretax salary and bonus income into a tax-qualified retirement plan; (ii) a profit sharing program to which Goldman, Sachs & Co. makes a pretax contribution; and (iii) investment opportunity programs in which certain professionals are eligible to participate subject to certain net worth requirements. Portfolio managers may also receive grants of restricted stock units and/or stock options as part of their compensation.
Certain GSAM portfolio managers may also participate in the firm’s Partner Compensation Plan, which covers many of the firm’s senior executives. In general, under the Partner Compensation Plan, participants receive a base salary and a bonus (which may be paid in cash or in the form of an equity-based award) that is linked to Goldman Sachs’ overall financial performance.
Conflicts of Interest:
GSAM’s portfolio managers are often responsible for managing one or more of the Funds as well as other accounts, including proprietary accounts, separate accounts and other pooled investment vehicles, such as unregistered hedge funds. A portfolio manager may manage a separate account or other pooled investment vehicle which may have materially higher fee arrangements than the Fund and may also have a performance-based fee. The side-by-side management of these funds may raise potential conflicts of interest relating to cross trading, the allocation of investment opportunities and the aggregation and allocation of trades.
GSAM has a fiduciary responsibility to manage all client accounts in a fair and equitable manner. It seeks to provide best execution of all securities transactions and aggregate and then allocate securities to client accounts in a fair and timely manner. To this end, GSAM has developed policies and procedures designed to mitigate and manage the potential conflicts of interest that may arise from side-by-side management. In addition, GSAM has adopted policies limiting the circumstances under which cross-trades may be effected between the Fund and another client account. GSAM conducts periodic reviews of trades for consistency with these policies.
Securities Ownership of Portfolio Managers:
None of the portfolio managers own shares of the Fund.
B-261
Grantham, Mayo, Van Otterloo & Co. LLC
The senior member of the portfolio management team of the Growth Equity Fund is Sam Wilderman.
Information below is as of 12/31/06.
| | | | | |
Portfolio management
team
Select Growth
Equity Fund
| | Other registered investment
companies managed (including other
non-GMO mutual fund subadvisory
relationships)
|
| | | Number of
accounts | | Total assets |
Sam Wilderman | | 24 | | $ | 23,681,521,486.74 |
| |
| | | Other registered investment
companies managed for which GMO
receives a performance-based fee
(including other non-GMO mutual
fund subadvisory relationships)
|
| | | Number of
accounts* | | Total assets* |
Sam Wilderman | | 3 | | $ | 5,010,724,378.20 |
| * | Subset of accounts and assets noted above |
| | | | | |
Portfolio management
team Select Growth
Equity Fund
| | Other pooled investment vehicles
managed (world-wide)
|
| | | Number of
accounts | | Total assets |
Sam Wilderman | | 6 | | $ | 2,021,443,906.40 |
| |
| | | Other pooled investment vehicles
managed (world-wide) for which
GMO receives a performance-
based fee
|
| | | Number of
accounts* | | Total assets* |
Sam Wilderman | | 5 | | $ | 1,998,638,373.74 |
| * | Subset of accounts and assets noted above |
| | | | | |
Portfolio management
team Select Growth
Equity Fund
| | Separate accounts managed (world-wide)
|
| | | Number of
accounts | | Total assets |
Sam Wilderman | | 22 | | $ | 3,688,142,154.71 |
| |
| | | Separate accounts managed
(world-wide) for which GMO
receives a performance-based fee
|
| | | Number of
accounts* | | Total assets* |
Sam Wilderman | | 6 | | $ | 1,607,760,244.97 |
| * | Subset of accounts and assets noted above |
Description of material conflicts: Whenever a portfolio manager manages other accounts, including accounts that pay higher fees or accounts that pay performance-based fees, potential conflicts of interest exist, including potential conflicts between the investment strategy of the fund and the investment strategy of the other accounts and potential conflicts in the allocation of investment opportunities between the fund and such other
B-262
accounts. GMO believes several factors limit the conflicts between the Fund and other similar stock accounts managed by the Fund’s portfolio management team or individual members of the team. First, discipline and constraints are imposed because the investment programs of the Fund and other similar accounts are determined based on quantitative models. Second, all portfolio management team members are aware of and abide by GMO’s trade allocation procedures, which seek to ensure fair allocation of investment opportunities among all accounts. Performance attribution with full transparency of holdings and identification of contributors to gains and losses act as important controls on conflicts that might otherwise exist. Performance dispersion among accounts employing the same investment strategy but with different fee structures is periodically examined by the Fund’s portfolio management team and GMO’s Investment Analysis team to ensure that any divergence in expected performance is adequately explained by differences in the client’s investment guidelines and timing of cash flows.
Description of the structure of, and the method used to determine, the compensation of each member of the Fund’s portfolio management team: The senior member of the Fund’s portfolio management team is a member (partner) of GMO. Compensation for the senior member consists of a base salary, a partnership interest in the firm’s profits and possibly an additional, discretionary, bonus. Compensation does not disproportionately reward out-performance by higher fee/performance fee products. GMO’s Compensation Committee sets the senior member’s base salary taking into account current industry norms and market data to ensure that the base salary is competitive. The Compensation Committee also determines the senior member’s partnership interest, taking into account the senior member’s contribution to GMO and GMO’s mission statement. A discretionary bonus may be paid to recognize specific business contributions and to ensure that the total level of compensation is competitive with the market. Because each member’s compensation is based on his individual performance, GMO does not have a typical percentage split among base salary, bonus and other compensation. Partnership interests in GMO are the primary incentive for senior level persons to continue employment at GMO. GMO believes that partnership interests provide the best incentive to maintain stability of portfolio management personnel.
Dollar range of fund securities owned by each member of the fund’s portfolio management team: As of the Fund’s most recently completed fiscal year, the senior member of the team has no beneficial interest in the Fund’s shares.
B-263
Harris Associates L.P.
Robert M. Levy and Michael J. Mangan are portfolio managers of the Focused Value Fund, and David G. Herro and Chad M. Clark are portfolio managers of the Overseas Fund (collectively, the “Funds”).
Portfolio Managers’ Management of Other Accounts:
The Portfolio Managers of the Funds managed other accounts in addition to managing the Funds. The following table sets forth the number and total assets of the mutual funds and other accounts managed by each Portfolio Manager as of December 31, 2006. None of these accounts has an advisory fee based on the performance of the account.
| | | | | | | | | | | | | | | | | | |
Fund
| | Name of Portfolio
Manager
| | Registered Investment
Companies (other than
Mass Mutual Funds)
| | Other Pooled Investment
Vehicles
| | Other Accounts1
|
| | | Number
of
Accounts
| | Total Assets
| | Number
of
Accounts
| | Total Assets
| | Number
of
Accounts
| | | Total Assets
|
Mass Mutual Select Focused Value | | Robert M. Levy | | 8 | | $ | 3,999,945,585 | | 2 | | $ | 118,034,925 | | 458 | 2 | | $ | 4,044,068,892 |
| | | | | | | |
| | | Michael J.
Mangan | | 11 | | $ | 4,423,295,156 | | 3 | | $ | 164,010,376 | | 146 | | | $ | 2,679,899,114 |
Mass Mutual Select Overseas | | David Herro | | 9 | | $ | 14,091,404,576 | | 2 | | $ | 1,944,759,237 | | 13 | | | $ | 3,487,443,011 |
| | | | | | | |
| | | Chad Clark | | 5 | | $ | 2,920,002,443 | | 2 | | $ | 1,944,759,237 | | 10 | | | $ | 2,504,526,376 |
Material Conflicts of Interest:
Conflicts of interest may arise in the allocation of investment opportunities and the allocation of aggregated orders among the Funds and the other accounts managed by the portfolio managers. A portfolio manager potentially could give favorable treatment to some accounts for a variety of reasons, including favoring larger accounts, accounts that have a different advisory fee arrangement (including any accounts that pay performance-based fees), accounts of affiliated companies, or accounts in which the portfolio manager has a personal investment. With respect to the allocation of investment opportunities, Harris makes decisions to recommend, purchase, sell or hold securities for all of its client accounts, including the Funds, based on the specific investment objectives, guidelines, restrictions and circumstances of each account. It is Harris’ policy to allocate investment opportunities to each account, including the Funds, over a period of time on a fair and equitable basis relative to its other accounts. With respect to the allocation of aggregated orders, each account that participates in the aggregated order will participate at the average share price, and where the order has not been completely filled, each institutional account, including the Funds, will generally participate on a pro rata basis.
1 | Personal investment accounts of portfolio managers and their families are not reflected. |
2 | This number includes approximately 340 accounts that are managed pursuant to a “model portfolio” and involve no direct client communications. It also includes many client relationships with multiple accounts, and therefore the number of accounts greatly exceeds the number of relationships. |
B-264
Harris has compliance policies and procedures in place that it believes are reasonably designed to mitigate these conflicts. However, there is no guarantee that such procedures will detect each and every situation in which an actual or potential conflict may arise.
Portfolio Manager Compensation Structure:
Each of the Funds’ portfolio managers is compensated solely by Harris Associates L.P. (the “Firm”), a sub-adviser. Compensation for each of the portfolio managers is based on the Firm’s assessment of the individual’s long-term contribution to the investment success of the Firm and is structured as follows:
| | (1) | Base salary. The base salary is a fixed amount, and each portfolio manager receives the same base salary. |
| | (2) | Participation in a discretionary bonus pool. A discretionary bonus pool for each of the Firm’s domestic and international investment groups is divided among the senior level employees of each group and is paid out annually. |
| | (3) | Participation in a long-term compensation plan that provides current compensation to certain key employees of the Firm and deferred compensation to both current and former key employees. The compensation plan consists of bonus units awarded to participants that vest and pay out over a period of time. |
The determination of the amount of each portfolio manager’s participation in the discretionary bonus pool and the compensation plan is based on a variety of qualitative and quantitative factors. The factor given the most significant weight is the subjective assessment of the individual’s contribution to the overall investment results of the Firm’s domestic or international investment group, whether as a portfolio manager, a research analyst, or both.
The quantitative factors considered in evaluating the contribution of a portfolio manager include the performance of the portfolios managed by that individual relative to benchmarks, peers and other portfolio managers, as well as the assets under management in the accounts managed by the portfolio manager. The portfolio managers’ compensation is not based solely on an evaluation of the performance of the funds or the amount of fund assets. Performance is measured in a number of ways, including by accounts and by strategy, and is compared to one or more of the following benchmarks: S&P500, Russell Mid-Cap Value, Russell 1000 Value, Lipper Balanced, 60/40 S&P/Lehman (60% S&P500 and 40% Lehman Bond Index), Morgan Stanley Capital International (“MSCI”) World Index, MSCI World ex-U.S. Index and the Firm’s approved lists of stocks, depending on whether the portfolio manager manages accounts in the particular strategy to which these benchmarks would be applicable. Performance is measured over shorter- and longer-term periods, including one year, three years, five years, ten years, since a funds’ inception or since a portfolio manager has been managing a fund, as applicable. Performance is measured on a pre-tax and after-tax basis to the extent such information is available.
If a portfolio manager also serves as a research analyst, then his compensation is also based on the contribution made to the Firm in that role. The specific quantitative and qualitative factors considered in evaluating a research analyst’s contributions include, among other things, new investment ideas, the performance of investment ideas covered by the analyst during the current year as well as over longer-term periods, the portfolio impact of the analyst’s investment ideas, other contributions to the research process, and an assessment of the quality of analytical work. In addition, an individual’s other contributions to the Firm, such as a role in investment thought leadership and management, are taken into account in the overall compensation process.
Ownership of Securities: Robert M. Levy owns over $1,000,000 of the Funds.
B-265
Insight Capital Research & Management, Inc.
The portfolio managers of the Emerging Growth Fund are Lee Molendyk, CFA and Lance Swanson.
Other Accounts Managed (as of 12/31/06)
| | | | | | | | | | |
Name
| | No. of
Accounts
| | Total Assets
Managed
| | No. of
Accounts with
Performance-
Based Fees
| | Total Assets in
Accounts with
Performance-
Based Fees
|
Lee Molendyk and Lance Swanson | | | | | | | | | | |
Registered Investment Companies | | 1 | | $ | 8.7 million | | 0 | | $ | 0 |
Other Pooled Investment Vehicles | | 0 | | $ | 0 | | 0 | | $ | 0 |
Other Accounts | | 1020 | | $ | 625.6 million | | 0 | | $ | 0 |
Compensation
Portfolio Manager Compensation is primarily a combination of base salary and bonus. Insight has used third party consultants to assist in evaluating our compensation levels. The goal is to provide a competitive compensation package. The majority of a PM’s bonus is based upon the performance of client portfolios, which should be in the top quartile of “like managed styles” for a significant portion of their bonus.
Conflicts of Interest
Because Insight engages in an investment advisory business and manages more than one advisory account, including Insight’s own proprietary accounts, there may be conflicts of interest over Insight’s time devoted to managing any one account or over Insight’s allocation of investment opportunities among all accounts it manages. Insight attempts to resolve all such conflicts in a manner that is generally fair to all of its clients’ accounts.
Due to the nature of Insight’s investment selection process, significant overlaps in securities held in various accounts may occur, even for accounts using different investment strategies. However, Insight’s decisions to use a security for any one investment strategy versus another investment strategy are based on, among other things, the particulars of the various strategies, analyses of the security and the attractiveness of the security versus existing holdings in the accounts using the different investment strategies, and may result in investment timing differences between strategies and accounts (i.e., different purchase or sell dates for the same security).
In addition, as appropriate to the investment strategy and upon the recommendations of Insight’s investment committee, certain accounts whose investment strategy focus on investments in small cap securities may have priority for investment opportunities in small cap securities over other accounts whose investment strategies do not focus on small cap securities, e.g., a mid-cap strategy. Furthermore, due to the unique investment and trading strategy and potentially much shorter investment horizon of Insight’s Concentrated Emerging Growth strategy (in which Insight’s employees may invest), Insight’s decision to invest in or sell a security for this strategy may or may not occur before other investment strategies, including even before Insight includes it on other investment strategies’ buy lists.
In the allocation of investment opportunities among all accounts managed by Insight, Insight may give advice and take action with respect to any of its clients’ or its proprietary accounts that may differ from advice given or the timing or nature of action taken with respect to any other account so long as it is Insight’s policy, to the extent practicable, to allocate investment opportunities over a period of time on a fair and equitable basis relative to other accounts. Procedures to implement fair and equitable allocation of investment opportunities include but are not limited to periodic investment management team meetings to identify and maintain buying opportunities as they arise (reviewing opportunities for accounts based on factors such as the overall market,
B-266
price of the security and Insight’s research), preparing written allocations of trade orders in advance of execution and with best execution principles in mind, averaging prices over block trade orders and allocating partially filled trade orders to accounts on a pro rata basis or on a statistically random basis, and documenting the reasons for any non-pro-rata allocations.
Ownership of Securities
The portfolio managers do not own any shares of the Emerging Growth Fund.
B-267
Massachusetts Financial Services Company
The portfolio managers for the Overseas Fund (the “Fund”) are David Mannheim and Marcus Smith.
Other Accounts Managed*:
| | | | | | | | | | | | | |
| David Mannheim | | | | | | | | | | |
‘40 Act
#Funds
| | TNA
| | Other
Pooled
#Funds
| | TNA
| | Non-Pooled
#Funds
| | TNA
|
| 17 | | $ | 11,750,893,649 | | 5 | | $ | 2,143,149,544 | | 97 | | $ | 22,896,322,910 |
| | | | |
Performance Based: | | | | | | | 7 | | $ | 1,296,474,902 |
| | | | |
Marcus Smith | | | | | | | | | | |
‘40 Act
#Funds
| | TNA
| | Other
Pooled
#Funds
| | TNA
| | Non-Pooled
#Funds
| | TNA
|
| | | | | |
| 13 | | $ | 10,153,488,724 | | 0 | | $ | 0 | | 29 | | $ | 6,699,223,209 |
| | | | |
Performance Based: | | | | | | | 1 | | $ | 28,570,122 |
| ** | Includes the assets of the Fund |
TNA = Total Net Assets
Compensation:
Portfolio manager total cash compensation is a combination of base salary and performance bonus:
| | • | | Base Salary—Base salary represents a smaller percentage of portfolio manager total cash compensation (generally below 33%) than incentive compensation. |
| | • | | Performance Bonus—Generally, incentive compensation represents a majority of portfolio manager total cash compensation. The performance bonus is based on a combination of quantitative and qualitative factors, with more weight given to the former (generally over 60%) and less weight given to the latter. |
| | — | The quantitative portion is based on pre-tax performance of all of the accounts managed by the portfolio manager (which includes the Fund and any other accounts managed by the portfolio manager) over a one-, three- and five-year period relative to the appropriate Lipper peer group universe and/or one or more benchmark indices, with respect to each account. Primary weight is given to portfolio performance over a three-year time period with lesser consideration given to portfolio performance over one- and five-year periods (adjusted as appropriate if the portfolio manager has served for shorter periods). |
| | — | The qualitative portion is based on the results of an annual internal peer review process (conducted by other portfolio managers, analysts and traders) and management’s assessment of overall portfolio manager contributions to investor relations and the investment process (distinct from portfolio and other account performance). |
Portfolio managers also typically benefit from the opportunity to participate in the MFS Equity Plan. Equity interests and/or options to acquire equity interests in MFS or its parent company are awarded by management, on a discretionary basis, taking into account tenure at MFS, contribution to the investment process and other factors.
Finally, portfolio managers are provided with a benefits package including a defined contribution plan, health coverage and other insurance, which are available to other employees of MFS on substantially similar
B-268
terms. The percentage such benefits represent of any portfolio manager’s compensation depends upon the length of the individual’s tenure at MFS and salary level as well as other factors.
Ownership of Fund Shares:
None
Potential Conflicts of Interest:
MFS seeks to identify potential conflicts of interest resulting from a portfolio manager’s management of both the Fund and other accounts and has adopted policies and procedures designed to address such potential conflicts. The management of multiple funds and accounts (including proprietary accounts) may give rise to potential conflicts of interest if the funds and accounts have different objectives and strategies, benchmarks, time horizons and fees as a portfolio manager must allocate his or her time and investment ideas across multiple funds and accounts. In certain instances there may be securities which are suitable for the Fund’s portfolio as well as for accounts of MFS or its subsidiaries with similar investment objectives. A Fund’s trade allocation policies may give rise to conflicts of interest if the Fund’s orders do not get fully executed or are delayed in getting executed due to being aggregated with those of other accounts of MFS or its subsidiaries. A portfolio manager may execute transactions for another fund or account that may adversely impact the value of the Fund’s investments. Investments selected for funds or accounts other than the Fund may outperform investments selected for the Fund.
When two or more clients are simultaneously engaged in the purchase or sale of the same security, the securities are allocated among clients in a manner believed by MFS to be fair and equitable to each. It is recognized that in some cases this system could have a detrimental effect on the price or volume of the security as far as the Fund is concerned. In most cases, however, MFS believes that the Fund’s ability to participate in volume transactions will produce better executions for the Fund. MFS does not receive a performance fee for its management of the Fund. MFS and/or a portfolio manager may have an incentive to allocate favorable or limited opportunity investments or structure the timing of investments to favor accounts other than the Fund — for instance, those that pay a higher advisory fee and/or have a performance fee.
B-269
Mazama Capital Management, Inc.
The portfolio managers of the Small Company Growth Fund are Ronald A. Sauer and Stephen C. Brink.
Other accounts managed (as of 12/31/06):
Registered investment companies
| | |
Number of accounts: | | 10 |
Total assets: | | $1,420,927,923.93 |
Other pooled investment vehicles
| | |
| | | |
Number of accounts: | | None |
Total assets: | | None |
Other accounts
| | |
Number of accounts: | | 75 |
Total assets: | | $5,792,460,534.62 |
For the accounts listed above, two accounts with total assets of $238,681,625.12 have an advisory fee which is based on the performance of the account.
Mazama’s Investment Team consists of the two primary Portfolio Managers (Messrs. Sauer and Brink) noted above, four Sector Portfolio Managers and four Research Analysts, each of whom conducts research and plays an active role in portfolio decision making for the Fund. The primary Portfolio Managers oversee investment decision making across all industry groups and sectors, while each Sector Portfolio Manager is responsible for one or more of the five primary sectors in the portfolio (Technology, Financial Services, Consumer Discretionary, Healthcare and Producer Durables). The additional Research Analysts support the primary Portfolio Managers and Sector Portfolio Managers in identifying investments for the Fund. Each member of the Investment Team utilizes the firm’s proprietary Price Performance Model (“PPM”) to evaluate investments as part of the day-to-day management of the Fund.
Compensation
Mazama’s compensation structure is designed to attract and retain highly skilled investment professionals. The compensation is structured to maximize performance and keep the interests of each member of our portfolio management team aligned with those of our clients.
The incentive compensation structure keeps each member of the team focused on the relative performance of each strategy versus its respective benchmark. Each Portfolio Manager and Research Analyst receives a base salary representing 20-30% of cash compensation and a performance based incentive representing 70-80% of cash compensation. The performance based incentive compensation is based on the portfolio management fees received by Mazama for all accounts under management. The Investment Team does not distinguish between different accounts within each investment style/strategy with respect to compensation. Cash compensation increases as assets under management increase, whether by appreciation or by attracting new clients, both of which are accomplished by achieving higher than average excess returns. Excess returns are measured as the difference between our portfolio returns and the returns of the benchmark for the portion of the Fund managed by Mazama (i.e. Russell 2000 Growth Index, Russell 2500 Growth Index, Russell Mid Cap Growth or Russell 3000 Growth Index).
Equity based incentives have been a significant part of Mazama’s compensation plan since the firm’s inception. In total, our Investment Team represents over 70% of the equity of the firm on a fully diluted basis. Every member of the Investment Team is either a direct equity owner or an option holder or both.
B-270
Conflicts of Interest
As every member of the Investment Team has day-to-day management responsibilities with respect to more than one account and more than one investment strategy, actual or apparent conflicts may arise.
The compensation paid to Mazama for managing the Fund is based on a percentage of assets under management rather than a share of the gains. As described above, members of the Investment Team, as equity owners and by receiving a share of portfolio management fees, benefit from Mazama’s revenues and profitability. Conflicts of interest can arise to the extent that larger client accounts generate more fees and potentially larger profits for Mazama compared to small accounts. Two accounts pay fees based on a percentage of assets that can increase and decrease based on performance against a benchmark index. These two accounts are managed consistently with their stated investment strategy. Despite these differences, Mazama believes that its trade allocation and other compliance procedures effectively address any related conflicts of interest. Otherwise, no member of the Investment Team is compensated in a way that would add to those conflicts of interest by creating an incentive to favor particular accounts over other accounts.
Execution and research services provided by brokers may not always be utilized in connection with the Fund or with other client accounts that may have paid the commission or a portion of the commission to the broker providing the services. Mazama allocates brokerage commissions for these services in a manner that it believes is fair and equitable and consistent with its fiduciary obligations to each of its clients.
If a member of the Investment Team identifies a limited investment opportunity that may be suitable for more than just the Fund or another client account, the Fund may not be able to take full advantage of that opportunity. To mitigate this conflict of interest, Mazama aggregates orders for the Fund with orders from each of its other client accounts participating in the same strategy in order to ensure that clients are treated fairly and equitably over time and consistent with its fiduciary obligations to each of its clients.
Mazama has adopted policies and procedures to address and prevent the above conflicts of interest; however there is no guarantee that such procedures will detect each and every situation in which a conflict arises.
Ownership of Securities: Neither Ronald Sauer nor Stephen Brink own any shares of the Small Company Growth Fund.
B-271
Navellier & Associates, Inc.
Michael Borgen is the lead portfolio manager for the Mid Cap Growth Equity Fund and is primarily responsible for the day-to-day management of the Fund.
Louis G. Navellier sets the strategies and guidelines for the Mid Cap Growth Equity Fund and oversees the Funds’ portfolio management activities. Mr. Navellier has the final decision making authority on stock purchases and sales and is ultimately responsible for all decisions regarding the Fund.
Other Accounts Managed (as of 12/31/06):
(1) Michael Borgen
(2) The number of other accounts managed within each of the following categories and the total assets in the accounts managed within each category:
(A) Registered investment companies;
(B) Other pooled investment vehicles
Micro-to-Small Cap Growth Strategy—1 account (mutual fund); $22.33 million
(C) Other accounts
Micro-to-Small Cap Growth Strategy—1 account; $0.11 million
Small Cap Growth Strategy—36 accounts; $9.28 million
(1) Louis Navellier
(2) The number of other accounts managed within each of the following categories and the total assets in the accounts managed within each category:
(A) Registered investment companies;
(B) Other pooled investment vehicles
(C) Other accounts
Small to Mid Cap Growth Strategy—1,565 accounts; $718.26 million. Accounts include wrap accounts.
In the Small to Mid Cap Growth Portfolio, 117 accounts ($85 million) have advisory fees based on the performance of the account.
Conflicts of Interest:
Although liquidity constraints are unlikely to impede Navelliers’ ability to manage the Fund and other Mid Cap Growth investment products managed by Navellier, in the event that an investment has limited liquidity, Navellier will follow its policies for aggregation and allocation of transactions.
Aggregation and Allocation of Transactions Policy
Although each client account is individually managed, Navellier often purchases and/or sells the same securities for many accounts. When possible, Navellier aggregates the same transactions in the same securities for many clients who have the same brokerage firm or custodian. Similarly, when possible, Navellier aggregates the same transactions in the same securities for many clients for whom Navellier has discretion to direct brokerage. Clients in an aggregated transaction each receive the same price per share of unit, but, if they have directed brokerage to a particular broker, they may pay different commissions.
If more than one price is paid for securities in an aggregated transaction, each client in the aggregated transaction will typically receive the average price paid for the securities in the same aggregate transaction on
B-272
that day. If Navellier is unable to fill an aggregated transaction completely, but receives a partial fill of the aggregated transaction, Navellier will normally allocate the partially filled transaction to clients based on an equitable rotational system.
Navellier may place orders for transactions in certain securities initially only for those accounts which are custodied at the Banks or at brokerage firms that permit Navellier to place trades for accounts custodied at that firm with other brokerage firms. Accounts custodied at brokerage firms which do not permit Navellier to place transactions with other brokerage firms may not be able to participate in the initial transaction, and may not be able to participate in the same gains or losses as other clients whose accounts are not so restricted.
After Navellier has determined which client accounts are able to participate in an aggregated transaction, typically the trading sequence follows a rotational system (by custodian) so that clients of each brokerage firm, bank custodian, or trust company will have their opportunity to participate in a transaction first. The actual client trade allocation sequence within each custodial group in the rotation is usually made on a pro rata basis. This rotational trading mechanism and allocation process of client transactions aims to provide, over the long-run, for fair treatment for each client account.
Compensation:
Portfolio managers receive a base salary and incentive compensation based upon performance and asset growth of the portfolio(s) for which they are responsible. Incentive compensation takes the form of a significant percentage of the revenues associated with portfolios for which they are responsible.
Navellier has established an options program to retain senior management and investment management personnel. Options allow key employees to have an equity stake in the firm. Options are granted to key employees dependent upon various measures such as asset growth and performance. Key employees all participate in incentive compensation plans. All other employees are eligible for participation in an annual bonus based on firm profitability.
Prior to January 1, 2005, key employees received bonuses based on asset growth in the form Equity Appreciation Rights (EARs). EARs are revalued each quarter; as total firm wide assets increase or decline, so does the share price for the EARs. Navellier employees are able to liquidate EARs on a quarterly basis. Navellier curtailed this program due to changes in the U.S. tax code that were focused on deferred compensation programs. Employees may continue to hold EARs granted prior to the changes to the U.S. tax code, but no new EARs may be granted.
Medical insurance is provided at virtually no cost to all employees and their families as well disability insurance and optional dental plans. In addition, Navellier has an established 401k plan to assist employees with retirement savings.
Mr. Borgen and Mr. Navellier do not receive any special compensation related to the Fund.
Ownership of Securities: The portfolio managers do not own any shares of the Fund.
B-273
Northern Trust Investments, N.A.
Brent Reeder is primarily responsible for the day-to-day management of the Indexed Equity Fund and the OTC 100 Fund.
Other Accounts Managed by Brent Reeder:
The table below discloses other accounts for which Brent Reeder was jointly and primarily responsible for the day-to-day portfolio management as of December 31, 2006.
| | | | | | | | | | |
Type of Accounts
| | Total # of
Accounts
Managed
| | Total Assets
| | # of Accounts
Managed that
Advisory Fee
Based on
Performance
| | Total Assets that
Advisory Fee
Based on
Performance
|
Registered Investment Companies: | | 19 | | $ | 9,546,973,698 | | 0 | | $ | 0 |
Other Pooled Investment Vehicles: | | 19 | | $ | 72,662,796,144 | | 0 | | $ | 0 |
Other Accounts: | | 88 | | $ | 50,691,778,761 | | 0 | | $ | 0 |
Conflicts of Interest:
NTI’s portfolio managers are often responsible for managing one or more Funds and other accounts; including proprietary accounts, separate accounts and other pooled investment vehicles like unregistered hedge funds. A portfolio manager may manage a separate account or other pooled investment vehicle which may have materially higher fee arrangements than a Fund and may also have a performance-based fee. The side-by-side management of the Funds, separate accounts and pooled investment vehicles may raise potential conflicts of interest relating to the allocation of investment opportunities and the aggregation and allocation of trades. In addition, certain trading practices like cross trading between a Fund and another account raise conflicts of interest issues. NTI has developed policies and procedures that are intended to mitigate those conflicts.
Compensation:
The compensation for the index portfolio managers is based on the competitive marketplace and consists of a fixed base salary plus a variable annual cash incentive award. In addition, non-cash incentives, such as stock options or restricted stock of Northern Trust Corporation, may be awarded from time to time. The annual incentive award is discretionary and is based on the overall financial performance of The Northern Trust Company, the overall performance of the investment management unit plus a qualitative evaluation of each portfolio manager’s performance and contribution to his or her respective team. For the index funds’ portfolio managers, the variable incentive award is not based on performance of the Funds or the amount of assets held in the funds. Moreover, no material differences exist between the compensation structure for mutual fund accounts and other types of accounts.
Disclosure of Securities Ownership:
| A. | For the most recently completed fiscal year ended December 31, 2006, please provide in the table below beneficial ownership of shares of the Portfolio by you. Please note that the Portfolio’s Statement of Additional Information will only provide a dollar range of each individual’s holdings in each investment portfolio ($1-$10,000, $10,001-$50,000, $50,001-$100,000, $100,001 to $500,000, $500,001 to $1,000,000, or over $1,000,000). |
Beneficial ownership of shares exists where a person either: (a) has a direct or indirect pecuniary interest (i.e., the opportunity to profit from a transaction) in such securities (including securities held in a partnership of which the person is a general partner, securities held in a revocable trust and securities that may be acquired upon exercise of an option or other right, or through conversion); or (b) directly or indirectly, through any contract, arrangement,
B-274
understanding, relationship or otherwise, has or shares voting power (i.e. the power to vote or direct the vote) or investment power (i.e. the power to buy or sell or direct the purchase or sale) with respect to such securities.
| | | | | | | | |
| | | Shares
Beneficially
Owned
| | Dollar ($) Value of
Shares Beneficially
Owned by You Because
You Had a Direct or
Indirect Pecuniary
Interest
| | Dollar ($) Value of Shares in
Which You Did Not Have a
Direct or Indirect Pecuniary
Interest but Were Beneficially
Owned by You Because You
Had Sole or Shared Voting or
Investment Power or Had the
Right to Acquire Sole or Shared
Voting or Investment Power
|
Brent Reeder | | 0 | | $ | 0 | | $ | 0 |
B-275
Sands Capital Management, LLC
I. Identification of Portfolio Managers or Management Team Members—Members who are jointly and primarily responsible for the day-to-day management of the Aggressive Growth Fund’s portfolio:
| | | | | | |
Name
| | Title
| | Length of Service
| | Business Experience
Past 5 Years
|
Frank M. Sands, Sr., CFA | | CEO, Chief Investment Officer | | 15 years | | |
| | | |
David E. Levanson, CFA | | Senior Research Analyst, Senior Portfolio Manager & Director of U.S. Mutual Funds | | 5 years | | Before re-joining Sands Capital in 2002, Mr. Levanson was a research analyst for MFS Investment Management. |
| | | |
Frank M. Sands, Jr., CFA | | President, Senior Portfolio Manager, Director of Research | | 7 years | | |
| | | |
A. Michael Sramek, CFA | | Research Analyst, Portfolio Manager | | 6 years | | |
II. Description of Role of Portfolio Managers or Management Team Members: Describe below the role of each Portfolio Manager or Management Team Member identified above in Section I. Clarify each member’s role on team, including any limitations on, and relationships among, roles.
Frank M. Sands, Sr., CFA
Chief Investment Officer and Member of Investment Team. Final decision maker in portfolio decisions for the target portfolio for the firm.
David E. Levanson, CFA
Senior Research Analyst, Portfolio Manager, Director of U.S. Mutual Funds, and member of Investment Team that makes portfolio decisions with regards to firm’s target portfolio. Responsible for day-to-day management of U.S. Mutual Funds to the firm’s target portfolio and investment of daily cash flows.
Frank M. Sands, Jr., CFA
President, Director of Research, Senior Portfolio Manager, and member of Investment Team that makes portfolio decisions with regards to firm’s target portfolio. Is back-up portfolio manager to David Levanson on the day-to-day management of U.S. Mutual Funds to the firm’s target portfolio.
A. Michael Sramek, CFA
Research Analyst, Portfolio Manager, and member of Investment Team that makes portfolio decisions with regards to the firm’s target portfolio. Is back-up portfolio manager to David Levanson on the day-to-day management of U.S. Mutual Funds to the firm’s target portfolio and investment of daily cash flows.
B-276
III. Other Accounts Managed by Portfolio Manager or Management Team Member: Disclose other accounts for which a Portfolio Manager or Management Team Member was jointly and primarily responsible for the day-to-day portfolio management.
| | | | | | | | | | |
Name of Portfolio Manager or
Team Member
| | Type of Accounts
| | Total # of
Accounts
Managed
| | Total Assets
| | # of Accounts
Managed that
Advisory Fee
Based on
Performance*
| | Total Assets
that Advisory
Fee Based on
Performance*
|
1. Frank M. Sands, Sr., CFA | | Registered Investment Companies: | | 5 | | $2,373 mil | | 1 | | $546 mil |
| | | Other Pooled Investment Vehicles: | | 13 | | $737 mil | | 0 | | 0 |
| | | Other Accounts: | | 1,349 | | $16,009 mil | | 6 | | $1,019 mil |
| | | | | |
2. David E. Levanson, CFA | | Registered Investment Companies: | | 5 | | $2,373 mil | | 1 | | $546 mil |
| | | Other Pooled Investment Vehicles: | | 13 | | $737 mil | | 0 | | 0 |
| | | Other Accounts: | | 1,349 | | $16,009 mil | | 6 | | $1,019 mil |
| | | | | |
3. Frank M. Sands, Jr., CFA | | Registered Investment Companies: | | 5 | | $2,373 mil | | 1 | | $546 mil |
| | | Other Pooled Investment Vehicles: | | 13 | | $737 mil | | 0 | | 0 |
| | | Other Accounts: | | 1,349 | | $16,009 mil | | 6 | | $1,019 mil |
| | | | | |
4. A. Michael Sramek, CFA | | Registered Investment Companies: | | 5 | | $2,373 mil | | 1 | | $546 mil |
| | | Other Pooled Investment Vehicles: | | 13 | | $737 mil | | 0 | | 0 |
| | | Other Accounts: | | 1,349 | | $16,009 mil | | 6 | | $1,019 mil |
| * | Please note: advisory fee is not solely based on performance. Fees are made up of a base fee that can be adjusted based on the accounts’ out performance of a relevant index. |
Description of any material conflict of interest that may arise in connection with a Portfolio Manger’s or Management Team Member’s management of Fund investments and investments of other accounts. Includes, for example, material conflicts between the investment strategy of the Fund and investment strategy of other accounts managed by the Portfolio Manager or Team Member and material conflicts in allocation of investment opportunities between the Fund and other accounts managed by the Portfolio Manager or Team Member.
As an investment adviser to a variety of clients, Sands Capital recognizes there are actual or potential conflicts of interest inherent in our business. For example, conflicts of interest could result from a portfolio managers’ management of multiple accounts for multiple clients, the allocation and execution of investment opportunities, multiple fee arrangements, and personal trading. Sands Capital has addressed these conflicts by developing policies and procedures it believes are reasonably designed to treat all clients in a fair and equitable manner over time. Sands Capital’s policies and procedures address such issues as execution of portfolio transactions, aggregation and allocation of trades, directed brokerage and soft dollars. Additionally, Sands Capital maintains a Code of Ethics that addresses rules on personal trading and insider information.
IV. Compensation Structure of Portfolio Manager(s) or Management Team Members
Employees receive a base salary commensurate with their level of experience. Sands Capital’s goal is to maintain competitive base salaries through an ongoing review of industry standards, market conditions, and salary surveys. Employees also receive a qualitative bonus based on an annual evaluation of the employee’s individual performance, based on their job responsibilities. In addition, employees are eligible for equity ownership; equity owners share in the profits of Sands Capital’s profits. Employees also may participate in a
B-277
401(k)/profit sharing plan. The 401(k)/profit sharing plan is a discretionary vehicle funded by both the individual and Sands Capital.
Investment professionals may also receive an investment results bonus. The investment results bonus is based upon one, three and five-year components, calculated by reference to the relative performance of Sands Capital’s Tax Exempt Institutional Equity Composite and the Russell 1000 Growth index over rolling one, three and five year periods.
V. Disclosure of Securities Ownership: None of the portfolio managers or management team members own any shares of the Fund.
B-278
SSgA Funds Management, Inc.
The Small Cap Value Equity Fund is managed by the SSgA Global Enhanced Equity Team. Portfolio managers Ric Thomas and Chuck Martin jointly and primarily have the most significant day-to-day responsibility for management of the Fund.
Accounts Managed as of December 31, 2006:
| | | | | | | | | | | | |
Portfolio Manager*
| | Number and Total Assets of Other
Registered Investment Company
Accounts
| | Number and Total Assets of Other
Pooled Investment Vehicle Accounts
| | Number and Total Assets of Other
Accounts
|
| | | Based on
Performance
| | Not Based on
Performance
| | Based on
Performance
| | Not Based on
Performance
| | Based on
Performance
| | Not Based on
Performance
|
Team Managed | | 0 accounts $0MM | | 8 accounts $1.17B | | 37 pooled vehicles** $50.72B | | 42 pooled vehicles $51.86B | | 27 Accounts $17.06B | | 63 Accounts $32.08B |
| * | Please note that our enhanced assets are managed on a team basis. This table refers to SSgA, comprised of all of the investment management affiliates of State Street Corporation, including SSgA Funds Management, Inc. |
| ** | Includes those pooled investment vehicles in which SSgA’s advisory fee from at least one investor is based on the account’s performance. |
Compensation:
The compensation of SSgA FM’s investment professionals is based on a number of factors. The first factor considered is external market. Through extensive compensation survey process, SSgA FM seeks to understand what its competitors are paying people to perform similar roles. This data is then used to determine a competitive baseline in the areas of base pay, bonus, and long term incentive (i.e. equity). The second factor taken into consideration is the size of the pool available for this compensation. SSgA FM is a part of State Street Corporation, and therefore works within its corporate environment on determining the overall level of its incentive compensation pool. Once determined, this pool is then allocated to the various locations and departments of SSgA and SSgA FM. The discretionary determination of the allocation amounts to these locations and departments is influenced by the competitive market data, as well as the overall performance of the group. The pool is then allocated on a discretionary basis to individual employees based on their individual performance. There is no fixed formula, benchmark or identifiable criteria for determining these amounts, nor is anyone’s compensation directly tied to the investment performance or asset value of a product or strategy. The same process is followed in determining equity incentive allocations.
Conflicts of Interest:
A Portfolio Manager may be subject to potential conflicts of interest because he or she is responsible for other accounts in addition to the Fund. Potential conflicts may arise out of (a) the Portfolio Manager’s execution of different investment strategies for various accounts or (b) the allocation of investment opportunities among the Portfolio Manager’s accounts with the same strategy.
A potential conflict of interest may arise as a result of the Portfolio Manager’s responsibility for multiple accounts with similar investment guidelines. Under these circumstances, a potential investment may be suitable for more than one of the Portfolio Manager’s accounts, but the quantity of the investment available for purchase is less than the aggregate amount the accounts would ideally devote to the opportunity. Similar conflicts may arise when multiple accounts seek to dispose of the same investment. The Portfolio Manager may also manage accounts whose objectives and policies differ from that of the Fund. These differences may be such that under certain circumstances, trading activity appropriate for one account managed by the Portfolio Manager may have adverse consequences for another account managed by the Portfolio Manager. For example, an account may sell
B-279
a significant position in a security, which could cause the market price of that security to decrease, while the Fund maintained its position in that security.
A potential conflict may arise when the Portfolio Manager is responsible for accounts that have different advisory fees — the difference in fees could create an incentive for the Portfolio Manager to favor one account over another, for example, in terms of access to investment opportunities. This conflict may be heightened if an account is subject to a performance-based fee. Another potential conflict may arise when the Portfolio Manager has an investment in one or more accounts that participates in transactions with other accounts. His or her investment(s) may create an incentive for the Portfolio Manager to favor one account over another. SSgA FM has adopted policies and procedures reasonably designed to address these potential material conflicts. For instance, portfolio managers within SSgA FM are normally responsible for all accounts within a certain investment discipline, and do not, absent special circumstances, differentiate among the various accounts when allocating resources. Special circumstances refers to specific guidelines and prohibitions applicable to one account, but not others. Additionally, SSgA FM and its advisory affiliates utilize a system for allocating investment opportunities among portfolios that is designed to provide a fair and equitable allocation.
The potential conflicts described are applicable to SSgA/SSgA FM as our Portfolio Managers manage several accounts with similar guidelines and differing fee schedules.
Ownership of Securities:
None of the portfolio managers own shares of the Fund.
B-280
T. Rowe Price Associates, Inc.
Information below is as of 12/31/06.
The portfolio manager of the Small Company Value Fund is Preston G. Athey.
Preston G. Athey:
| | | | | |
| | | Number of
Accounts
| | Total Assets
|
Ø registered investment companies: | | 6 | | $ | 7,891.2 million |
| | |
| |
|
|
Ø other pooled investment vehicles: | | 2 | | $ | 3.9 million |
| | |
| |
|
|
Ø other accounts: | | 9 | | $ | 759.1 million |
| | |
| |
|
|
Please note that the Small Company Value Fund is not included in the information listed above.
None of the accounts listed above have performance-based fees.
Conflicts of Interest:
Portfolio managers at T. Rowe Price typically manage multiple accounts. These accounts may include, among others, mutual funds, separate accounts (assets managed on behalf of institutions such as pension funds, colleges and universities, foundations), and commingled trust accounts. Portfolio managers make investment decisions for each portfolio based on the investment objectives, policies, practices and other relevant investment considerations that the managers believe are applicable to that portfolio. Consequently, portfolio managers may purchase (or sell) securities for one portfolio and not another portfolio. T. Rowe Price has adopted brokerage and trade allocation policies and procedures which it believes are reasonably designed to address any potential conflicts associated with managing multiple accounts for multiple clients. Also, as disclosed under the “Portfolio Manager’s Compensation” section, our portfolio managers’ compensation is determined in the same manner with respect to all portfolios managed by the portfolio manager.
Compensation:
Portfolio manager compensation consists primarily of a base salary, a cash bonus, and an equity incentive that usually comes in the form of a stock option grant. Occasionally, portfolio managers will also have the opportunity to participate in venture capital partnerships. Compensation is variable and is determined based on the following factors.
Investment performance over one-, three-, five-, and 10-year periods is the most important input. We evaluate performance in absolute, relative, and risk-adjusted terms. Relative performance and risk-adjusted performance are determined with reference to the broad based index (ex. S&P 500) and an applicable Lipper index (ex. Large-Cap Growth), though other benchmarks may be used as well. Investment results are also compared to comparably managed funds of competitive investment management firms.
Performance is primarily measured on a pre-tax basis though tax-efficiency is considered and is especially important for tax efficient funds. It is important to note that compensation is viewed with a long term time horizon. The more consistent a manager’s performance over time, the higher the compensation opportunity. The increase or decrease in a fund’s assets due to the purchase or sale of fund shares is not considered a material factor.
Contribution to our overall investment process is an important consideration as well. Sharing ideas with other portfolio managers, working effectively with and mentoring our younger analysts, and being good corporate citizens are important components of our long term success and are highly valued.
B-281
All employees of T. Rowe Price, including portfolio managers, participate in a 401(k) plan sponsored by T. Rowe Price Group. In addition, all employees are eligible to purchase T. Rowe Price common stock through an employee stock purchase plan that features a limited corporate matching contribution. Eligibility for and participation in these plans is on the same basis as for all employees. Finally, all vice presidents of T. Rowe Price Group, including all portfolio managers, receive supplemental medical/hospital reimbursement benefits.
This compensation structure is used for all portfolios managed by the portfolio manager.
Ownership of Securities:
| | | | |
Portfolio Manager
| | MassMutual Fund
Sub-Advised/Managed
| | Dollar Range of
Equity Securities Beneficially Owned
|
Preston Athey | | MassMutual Select Small Company Value Fund | | None |
The portfolio managers of the Mid Cap Growth Equity II Fund are Brian Berghuis and Donald Peters.
Brian Berghuis:
| | | | | |
| | | Number of
Accounts
| | Total Assets
|
Ø registered investment companies: | | 7 | | $ | 18,237.6 million |
| | |
| |
|
|
Ø other pooled investment vehicles: | | 1 | | $ | 276.9 million |
| | |
| |
|
|
Ø other accounts: | | 5 | | $ | 952.5 million |
| | |
| |
|
|
Please note that the Mid Cap Growth Equity II Fund is not included in the information listed above.
Donald Peters:
| | | | | |
| | | Number of
Accounts
| | Total Assets
|
Ø registered investment companies: | | 14 | | $ | 2,508.1 million |
| | |
| |
|
|
Ø other pooled investment vehicles: | | 0 | | | — |
| | |
| |
|
|
Ø other accounts: | | 36 | | $ | 2,140.9 million |
| | |
| |
|
|
Please note that the Mid Cap Growth Equity II Fund is not included in the information listed above.
None of the accounts listed above have performance-based fees.
Conflicts of Interest:
Portfolio managers at T. Rowe Price typically manage multiple accounts. These accounts may include, among others, mutual funds, separate accounts (assets managed on behalf of institutions such as pension funds, colleges and universities, foundations), and commingled trust accounts. Portfolio managers make investment decisions for each portfolio based on the investment objectives, policies, practices and other relevant investment considerations that the managers believe are applicable to that portfolio. Consequently, portfolio managers may purchase (or sell) securities for one portfolio and not another portfolio. T. Rowe Price has adopted brokerage and trade allocation policies and procedures which it believes are reasonably designed to address any potential conflicts associated with managing multiple accounts for multiple clients. Also, as disclosed under the “Portfolio Manager’s Compensation” section, our portfolio managers’ compensation is determined in the same manner with respect to all portfolios managed by the portfolio manager.
B-282
Compensation:
Portfolio manager compensation consists primarily of a base salary, a cash bonus, and an equity incentive that usually comes in the form of a stock option grant. Occasionally, portfolio managers will also have the opportunity to participate in venture capital partnerships. Compensation is variable and is determined based on the following factors.
Investment performance over one-, three-, five-, and 10-year periods is the most important input. We evaluate performance in absolute, relative, and risk-adjusted terms. Relative performance and risk-adjusted performance are determined with reference to the broad based index (ex. S&P 500) and an applicable Lipper index (ex. Large-Cap Growth), though other benchmarks may be used as well. Investment results are also compared to comparably managed funds of competitive investment management firms.
Performance is primarily measured on a pre-tax basis though tax-efficiency is considered and is especially important for tax efficient funds. It is important to note that compensation is viewed with a long term time horizon. The more consistent a manager’s performance over time, the higher the compensation opportunity. The increase or decrease in a fund’s assets due to the purchase or sale of fund shares is not considered a material factor.
Contribution to our overall investment process is an important consideration as well. Sharing ideas with other portfolio managers, working effectively with and mentoring our younger analysts, and being good corporate citizens are important components of our long term success and are highly valued.
All employees of T. Rowe Price, including portfolio managers, participate in a 401(k) plan sponsored by T. Rowe Price Group. In addition, all employees are eligible to purchase T. Rowe Price common stock through an employee stock purchase plan that features a limited corporate matching contribution. Eligibility for and participation in these plans is on the same basis as for all employees. Finally, all vice presidents of T. Rowe Price Group, including all portfolio managers, receive supplemental medical/hospital reimbursement benefits.
This compensation structure is used for all portfolios managed by the portfolio manager.
Ownership of Securities:
| | | | |
Portfolio Manager
| | MassMutual Fund
Sub-Advised/Managed
| | Dollar Range of
Equity Securities Beneficially Owned
|
Brian Berghuis | | MassMutual Select Mid Cap Growth Equity II Fund | | None |
Donald Peters | | MassMutual Select Mid Cap Growth Equity II Fund | | None |
The portfolio manager of the Blue Chip Growth Fund is Larry J. Puglia.
| | | | |
| | | Number of
Accounts
| | Total Assets
|
Larry J. Puglia | | | | |
Registered investment companies | | 8 | | $14,676.2 million |
Other pooled investment vehicles | | 3 | | $577.6 million |
Other accounts | | 12 | | $7,164.9 million |
Please note that the Blue Chip Growth Fund is not included in the information listed above.
None of the accounts listed above have performance-based fees.
Conflicts of Interest:
Portfolio managers at T. Rowe Price typically manage multiple accounts. These accounts may include, among others, mutual funds, separate accounts (assets managed on behalf of institutions such as pension funds,
B-283
colleges and universities, foundations), and commingled trust accounts. Portfolio managers make investment decisions for each portfolio based on the investment objectives, policies, practices and other relevant investment considerations that the managers believe are applicable to that portfolio. Consequently, portfolio managers may purchase (or sell) securities for one portfolio and not another portfolio. T. Rowe Price has adopted brokerage and trade allocation policies and procedures which it believes are reasonably designed to address any potential conflicts associated with managing multiple accounts for multiple clients. Also, as disclosed under the “Portfolio Manager’s Compensation” section, our portfolio managers’ compensation is determined in the same manner with respect to all portfolios managed by the portfolio manager.
Compensation:
Portfolio manager compensation consists primarily of a base salary, a cash bonus, and an equity incentive that usually comes in the form of a stock option grant. Occasionally, portfolio managers will also have the opportunity to participate in venture capital partnerships. Compensation is variable and is determined based on the following factors.
Investment performance over one-, three-, five-, and 10-year periods is the most important input. We evaluate performance in absolute, relative, and risk-adjusted terms. Relative performance and risk-adjusted performance are determined with reference to the broad based index (ex. S&P500) and an applicable Lipper index (ex. Large-Cap Growth), though other benchmarks may be used as well. Investment results are also compared to comparably managed funds of competitive investment management firms.
Performance is primarily measured on a pre-tax basis though tax-efficiency is considered and is especially important for tax efficient funds. It is important to note that compensation is viewed with a long term time horizon. The more consistent a manager’s performance over time, the higher the compensation opportunity. The increase or decrease in a fund’s assets due to the purchase or sale of fund shares is not considered a material factor.
Contribution to our overall investment process is an important consideration as well. Sharing ideas with other portfolio managers, working effectively with and mentoring our younger analysts, and being good corporate citizens are important components of our long term success and are highly valued.
All employees of T. Rowe Price, including portfolio managers, participate in a 401(k) plan sponsored by T. Rowe Price Group. In addition, all employees are eligible to purchase T. Rowe Price common stock through an employee stock purchase plan that features a limited corporate matching contribution. Eligibility for and participation in these plans is on the same basis as for all employees. Finally, all vice presidents of T. Rowe Price Group, including all portfolio managers, receive supplemental medical/hospital reimbursement benefits.
This compensation structure is used for all portfolios managed by the portfolio manager.
Ownership of Securities:
| | | | |
Portfolio Manager
| | MassMutual Fund
Sub-Advised/Managed
| | Dollar Range of
Equity Securities
Beneficially Owned
|
Larry J. Puglia | | MassMutual Select Blue Chip
Growth Fund | | None |
B-284
Victory Capital Management Inc.
Portfolio Managers.
The portfolio managers for the Core Opportunities Fund are Lawrence Babin, Paul Danes and Carolyn Rains.
This section includes information about the Fund’s portfolio managers, including information concerning other accounts they manage, the dollar range of Fund shares they own and how they are compensated. The portfolio managers listed below manage all of the accounts indicated as a team.
Other Accounts
| | | | |
Portfolio Management Team
| | Number of Other Accounts (Total Assets)* as of December 31, 2006
| | Number of Other Accounts (Total Assets)* Subject to a Performance
Fee as of December 31, 2006
|
Mr. Lawrence G. Babin, Mr. Paul D. Danes and Ms. Carolyn M. Rains |
Other Investment Companies | | 5 ($4.9 billion) | | None |
Other Pooled Investment Vehicles | | 5 ($1.4 billion) | | None |
Other Accounts | | 2,329 ($5.9 billion) | | 5 ($1.0 billion) |
| * | Rounded to the nearest billion, or million, as relevant |
In managing other investment companies, other pooled investment vehicles and other accounts, Victory Capital may employ strategies similar to those employed by the Fund. As a result, these other accounts may invest in the same securities as the Fund.
Compensation
The portfolio managers of the Fund each receives a base salary plus an annual incentive bonus for managing the Fund, other investment companies, other pooled investment vehicles and other accounts (including other accounts for which Victory Capital receives a performance fee). A manager’s base salary is dependent on the manager’s level of experience and expertise. Victory Capital monitors each manager’s base salary relative to salaries paid for similar positions with peer firms by reviewing data provided by various consultants that specialize in competitive salary information.
A portfolio manager’s annual incentive bonus is based on the manager’s individual and investment performance results. Victory Capital establishes a “target” incentive for each portfolio manager based on the manager’s level of experience and expertise in the manager’s investment style. This target is set at a percentage of base salary, generally ranging from 40% to 150%. Individual performance is based on balanced scorecard objectives established annually during the first quarter of the fiscal year, and is assigned a 50% weighting. Individual performance metrics include portfolio structure and positioning as determined by a consultant, research, asset growth, client retention, presentation skills, marketing to prospective clients and contribution to KeyCorp’s corporate philosophy and values, such as leadership and teamwork. Investment performance is based on investment performance of each portfolio manager’s portfolio or Fund relative to a selected peer group(s), and is assigned a 50% weighting. The overall performance results of the Fund and all similarly-managed investment companies, pooled investment vehicles and other accounts are compared to the performance information of a peer group of similarly-managed competitors, as supplied by third party analytical agencies. The manager’s performance versus the peer group then determines the final incentive amount, which generally ranges from zero to 150% of the “target,” depending on results. For example, performance in an upper decile may result in an incentive bonus that is 150% of the “target” while below-average performance may result in an incentive bonus as low as zero. Performance results for a manager are based on the composite performance of all accounts
B-285
managed by that manager on a combination of one and three year rolling performance. Composite performance is calculated on a pre-tax basis and does not reflect applicable fees.
The Fund’s portfolio managers participate in Victory Capital’s long-term incentive plan, the results for which are based on the Victory Capital’s business results (the “Adviser Incentive Plan”). In addition to the Adviser Incentive Plan, each of the Fund’s portfolio managers may earn long-term incentive compensation based on a percentage of the incremental, year-over-year growth in revenue to Victory Capital attributable to fees paid by all investment companies, other pooled investment vehicles and other accounts that employ strategies similar to those employed by the Fund.
B-286
Waddell & Reed Investment Management Company
The portfolio managers for the Small Cap Growth Equity Fund are Mark Seferovich and Kenneth McQuade.
Other Accounts managed by Mark Sefereovich and Kenneth McQuade as of December 31, 2006:
Breakdown of Assets Under Management for 12/31/06
| | | | | | |
| | | Number of
Accounts
| | | Total Assets
|
Mark Seferovich | | | | | | |
Registered Investment Companies: | | 4 | | | $ | 581,391,108 |
Other Pooled Investment Vehicles | | 4 | * | | $ | 94,462,579 |
Other Accounts | | 31 | | | $ | 1,320,303,926 |
| | |
| | | Number of
Accounts
| | | Total Assets
|
Kenneth McQuade | | | | | | |
Registered Investment Companies: | | 5 | | | $ | 1,135,951,542 |
Other Pooled Investment Vehicles | | 4 | * | | $ | 94,462,579 |
Other Accounts | | 30 | | | $ | 1,320,114,910 |
| * | The four accounts listed under ‘other pooled’ are foreign sub advised mutual funds. |
Compensation:
Integral to the retention of investment professionals are: a) a competitive base salary, that is commensurate with the individual’s level of experience and responsibility; b) an attractive bonus structure linked to investment performance, described below; c) eligibility for a stock incentive plan in shares of Waddell & Reed Financial, Inc. that rewards teamwork; and d) paying for the cost of a leased automobile. Awards of equity-based compensation typically vest over time, so as to create an incentive to retain key talent; and e) to the extent a portfolio manager also manages institutional separate accounts, he or she will share in a percentage of the revenues earned, on behalf of such accounts, by the firm.
Portfolio managers can receive significant annual performance-based bonuses. The better the pre-tax performance of portfolios managed by the portfolio manager relative to an appropriate benchmark, the more bonus compensation the manager receives. The primary benchmark is the portfolio manager’s percentile ranking against the performance of managers who manage with the same investment style at other firms. The secondary benchmark is an index of securities matched to the portfolio manager’s investment style. Half of each portfolio manager’s bonus is based upon a three-year period and half is based upon a one-year period. For truly exceptional results, bonuses can be several multiples of base salary. In cases where portfolio managers have more than one portfolio to manage, all the portfolios are similar in investment style and all are taken into account in determining bonuses. Thirty percent of annual performance-based bonuses are deferred for a three-year period. During that time, the deferred portion of bonuses are invested in mutual funds managed by Waddell & Reed, with a minimum of 50% of the deferred bonus required to be invested in a mutual fund managed by the portfolio manager. In addition to the deferred portion of bonuses being invested in Waddell & Reed managed mutual funds, the WDR’s 401(k) plan offers Waddell & Reed managed mutual funds as investment options. No bonus compensation is based upon the amount of the mutual fund assets under management.
Conflicts of Interest:
Actual or apparent conflicts of interest may arise when a portfolio manager has day-to-day management responsibilities with respect to more than one Fund or account, such as the following:
B-287
| | • | | The management of multiple Funds and/or other accounts may result in a portfolio manager devoting unequal time and attention to the management of each Fund and/or other account. |
| | • | | Simultaneous transactions in the same security are likely when a Fund and other funds and/or accounts are managed by the same portfolio manager. In that situation, the transactions are allocated, both as to amount and price, to the Fund and other funds and/or accounts pursuant to WRIMCO’s Allocation Procedures. In some cases, this method of allocation may adversely affect the price paid or received by the Fund and the size of the security position obtainable for the Fund. |
WRIMCO and the Funds have adopted certain compliance procedures, including the Code of Ethics, which are designed to address these types of conflicts. However, there is no guarantee that such procedures will detect each and every situation in which a conflict arises.
Securities Ownership of the Fund: None
B-288
Wellington Management Company, LLP
The portfolio manager for the Fundamental Value Fund is John R. Ryan.
Other Accounts Managed (as of 12/31/06):
| | | | | |
| | | Number Of
Accounts
| | Total Assets
|
John R. Ryan | | | | | |
Registered investment companies: | | 11 | | $ | 11,279,404,918 |
Other pooled investment vehicles: | | 2 | | $ | 44,241,001 |
Other accounts: | | 20 | | $ | 3,686,392,779 |
| | | | | |
| | | Number Of
Accounts Where
Advisory Fee
is Based
on Fund
Performance
| | Total Assets
|
John R. Ryan | | | | | |
Registered investment companies: | | 3 | | $ | 8,230,599,459 |
Other pooled investment vehicles: | | 0 | | $ | 0 |
Other accounts: | | 0 | | $ | 0 |
The portfolio managers for the Small Cap Growth Equity Fund are Kenneth L. Abrams, Daniel J. Fitzpatrick, Steven C. Angeli, Mario E. Abularach and Stephen C. Mortimer.
Other Accounts Managed:
| | | | | |
| | | Number Of
Accounts
| | Total Assets
|
Kenneth L. Abrams | | | | | |
Registered investment companies: | | 3 | | $ | 1,640,644,253 |
Other pooled investment vehicles: | | 3 | | $ | 969,098,540 |
Other accounts: | | 9 | | $ | 1,940,884,177 |
| | | | | |
| | | Number Of
Accounts Where
Advisory Fee
is Based
on Fund
Performance
| | Total Assets
|
Kenneth L. Abrams | | | | | |
Registered investment companies: | | 2 | | $ | 1,601,849,863 |
Other pooled investment vehicles: | | 0 | | $ | 0 |
Other accounts: | | 1 | | $ | 327,313,058 |
| | | | | |
| | | Number Of
Accounts
| | Total Assets
|
Daniel J. Fitzpatrick | | | | | |
Registered investment companies: | | 3 | | $ | 1,640,644,253 |
Other pooled investment vehicles: | | 3 | | $ | 969,098,540 |
Other accounts: | | 9 | | $ | 1,940,884,177 |
| | | | | |
| | | Number Of
Accounts Where
Advisory Fee
is Based
on Fund
Performance
| | Total Assets
|
Daniel J. Fitzpatrick | | | | | |
Registered investment companies: | | 2 | | $ | 1,601,849,863 |
Other pooled investment vehicles: | | 0 | | $ | 0 |
Other accounts: | | 1 | | $ | 327,313,058 |
B-289
| | | | | |
| | | Number Of
Accounts
| | Total Assets
|
Steven C. Angeli | | | | | |
Registered investment companies: | | 5 | | $ | 1,923,049,505 |
Other pooled investment vehicles: | | 12 | | $ | 835,118,713 |
Other accounts: | | 27 | | $ | 1,373,190,379 |
| | | | | |
| | | Number Of
Accounts Where
Advisory Fee
is Based
on Fund
Performance
| | Total Assets
|
Steven C. Angeli | | | | | |
Registered investment companies: | | 0 | | $ | 0 |
Other pooled investment vehicles: | | 4 | | $ | 335,342,407 |
Other accounts: | | 1 | | $ | 149,276,451 |
| | | | | |
| | | Number Of
Accounts
| | Total Assets
|
Mario E. Abularach | | | | | |
Registered investment companies | | 9 | | $ | 6,014,599,103 |
Other pooled investment vehicles | | 2 | | $ | 97,003,577 |
Other accounts | | 7 | | $ | 832,398,112 |
| | | | | |
| | | Number Of
Accounts Where
Advisory Fee
is Based
on Fund
Performance
| | Total Assets
|
Mario E. Abularach | | | | | |
Registered investment companies | | 0 | | $ | 0 |
Other pooled investment vehicles | | 0 | | $ | 0 |
Other accounts | | 1 | | $ | 149,276,451 |
| | | | | |
| | | Number Of
Accounts
| | Total Assets
|
Stephen C. Mortimer | | | | | |
Registered investment companies | | 6 | | $ | 3,508,333,047 |
Other pooled investment vehicles | | 1 | | $ | 95,001,521 |
Other accounts | | 5 | | $ | 691,945,074 |
| | | | | |
| | | Number Of
Accounts Where
Advisory Fee
is Based
on Fund
Performance
| | Total Assets
(millions)
|
Stephen C. Mortimer | | | | | |
Registered investment companies | | 0 | | $ | 0 |
Other pooled investment vehicles | | 0 | | $ | 0 |
Other accounts | | 1 | | $ | 149,276,451 |
Securities Ownership of Portfolio Managers:
None of the portfolio managers owns shares of the Funds.
B-290
Description of Compensation:
Each Fund pays Wellington Management a fee based on the assets under management of each Fund as set forth in the Investment Sub-Advisory Agreements between Wellington Management and Massachusetts Mutual Life Insurance Company with respect to each Fund. Wellington Management pays its investment professionals out of its total revenues and other resources, including the advisory fees earned with respect to each Fund. The following information relates to the fiscal year ended December 31, 2006.
Wellington Management’s compensation structure is designed to attract and retain high-caliber investment professionals necessary to deliver high quality investment management services to its clients. Wellington Management’s compensation of the investment professionals primarily responsible for the day-to-day management of each Fund (“Investment Professionals”) includes a base salary and incentive components. The base salary for each Investment Professional who is a partner of Wellington Management is determined by the Managing Partners of the firm. A partner’s base salary is generally a fixed amount that may change as a result of an annual review. The base salary for the other Investment Professionals is determined by the Investment Professional’s experience and performance in their role as a Investment Professional. Base salaries for employees are reviewed annually and may be adjusted based on the recommendation of the Investment Professional’s business manager, using guidelines established by Wellington Management’s Compensation Committee, which has final oversight responsibility for base salaries for employees of the firm. Each Investment Professional is eligible to receive an incentive payment based on the revenues earned by Wellington Management from the relevant Fund managed by that Investment Professional and generally each other portfolio managed by such Investment Professional. Each Investment Professional’s incentive payment relating to the relevant Fund is linked to the gross pre-tax performance of the Fund compared to the benchmark and/or peer group identified below over one and three year periods, with an emphasis on three year results. Wellington Management applies similar incentive structures (although the benchmarks or peer groups, time periods and rates may differ) to other portfolios managed by these Investment Professionals, including portfolios with performance fees. Portfolio incentives across all portfolios managed by an Investment Professional can, and typically do, represent a significant portion of an Investment Professional’s overall compensation; incentive compensation varies significantly by individual and can vary significantly from year to year. Some Investment Professionals are also eligible for bonus payments based on their overall contribution to Wellington Management’s business operations. Senior management at Wellington Management may reward individuals as it deems appropriate based on factors other than portfolio performance. Each partner of Wellington Management is also eligible to participate in a partner-funded tax qualified retirement plan the contributions to which are made pursuant to an actuarial formula. Messrs. Abrams, Angeli and Ryan are partners of the firm.
| | |
Fund
| | Benchmark and/or Peer Group
|
Fundamental Value Fund | | Russell 1000 Value Index |
Small Cap Growth Equity Fund (portfolio managed by Messrs. Abrams and Fitzpatrick) | | Russell 2000 Index |
Small Cap Growth Equity Fund (portfolio managed by Messrs. Angeli, Abularach and Mortimer) | | Russell 2000 Growth Index |
Description of Material Conflicts:
Individual investment professionals at Wellington Management manage multiple portfolios for multiple clients. These accounts may include mutual funds, separate accounts (assets managed on behalf of institutions such as pension funds, insurance companies, foundations, or separately managed account programs sponsored by financial intermediaries), bank common trust accounts, and hedge funds. The Investment Professionals generally manage portfolios in several different investment styles. These portfolios may have investment objectives, strategies, time horizons, tax considerations, and risk profiles that differ from those of the relevant Fund. The Investment Professionals make investment decisions for the relevant Fund based on the investment objectives, policies, practices, benchmarks, cash flows, tax and other relevant investment considerations applicable to that
B-291
portfolio. Consequently, the Investment Professionals may purchase or sell securities, including IPOs, for one portfolio and not another portfolio, and the performance of securities purchased for the relevant Fund may vary from the performance of securities purchased for other portfolios. Alternatively, these accounts may be managed in a similar fashion to the relevant Fund and thus the accounts may have similar, and in some cases nearly identical, objectives, strategies and/or holdings to that of the relevant Fund.
The Investment Professionals or other investment professionals at Wellington Management may place transactions on behalf of other accounts that are directly or indirectly contrary to investment decisions made on behalf of the relevant Fund, or make investment decisions that are similar to those made for the relevant Fund, both of which have the potential to adversely impact the Fund depending on market conditions. For example, the Investment Professionals may purchase a security in one portfolio while appropriately selling that same security in another portfolio. Similarly, an Investment Professional may purchase the same security for the relevant Fund and one or more other accounts at or about the same time, and in those instances the other accounts will have access to their respective holdings prior to the public disclosure of the relevant Funds’ holdings. In addition, some of these portfolios have fee structures, including performance fees, that are or have the potential to be higher, in some cases significantly higher, than the fees paid by the relevant Fund to Wellington Management. Because incentive payments are tied to revenues earned by Wellington Management, and where noted, to the performance achieved by the manager in each account, the incentives associated with any given fund may be significantly higher or lower than those associated with other accounts managed by a given Investment Professional. Finally, the Investment Professionals may hold shares or investments in the other pooled investment vehicles and/or other accounts identified above.
Wellington Management’s goal is to meet its fiduciary obligation to treat all clients fairly and provide high quality investment services to all of its clients. Wellington Management has adopted and implemented policies and procedures, including brokerage and trade allocation policies and procedures that it believes address the conflicts associated with managing multiple accounts for multiple clients. In addition, Wellington Management monitors a variety of areas, including compliance with primary fund guidelines, the allocation of IPOs, and compliance with the firm’s Code of Ethics, and places additional investment restrictions on Portfolio Managers who manage hedge funds and certain other accounts. Furthermore, senior investment and business personnel at Wellington Management periodically review the performance of Wellington Management’s Investment Professionals. Although Wellington Management does not track the time an Investment Professional spends on a single portfolio, Wellington Management does periodically assess whether an Investment Professional has adequate time and resources to effectively manage the Investment Professional’s various client mandates.
B-292
Western Asset Management Company
A team of investment professionals at Western Asset Management Company (“Western Asset”), led by Chief Investment Officer S. Kenneth Leech, Deputy Chief Investment Officer Stephen A. Walsh and Portfolio Managers Edward A. Moody, Mark S. Lindbloom and Carl L. Eichstaedt, manages the Strategic Bond Fund’s and the Strategic Balanced Fund’s assets.
Messrs. Leech, Walsh, Moody and Eichstaedt have each served as portfolio managers for Western Asset for over 10 years.
The Funds are managed by a team of portfolio managers, sector specialists and other investment professionals. Mr. Leech and Mr. Walsh serve as co-team leaders responsible for day-to-day strategic oversight of each Fund’s investments and for supervising the day-to-day operations of the various sector specialist teams dedicated to the specific asset classes in which the Funds invest. Mr. Moody, Mr. Lindbloom and Mr. Eichstaedt are responsible for portfolio structure, including sector allocation, duration weighting and term structure decisions.
Other Accounts:
As of December 31, 2006, in addition to the Funds, the Portfolio Managers were responsible for the day-to-day management of certain other accounts, as follows:
S. Kenneth Leech
| | | | | | | | |
Type of Account
| | Number of
Accounts
Managed
| | Total Assets Managed
| | Number of
Accounts
Managed for
which Advisory
Fee is
Performance-
Based
| | Assets Managed for
which Advisory Fee is
Performance-Based
|
Registered Investment Companies | | 133 | | 101,451,399,212.73 | | 0 | | 0 |
Other pooled investment vehicles | | 119 | | 125,569,214,102.84 | | 0 | | 0 |
Other accounts | | 953 | | 274,000,744,331.03 | | 96 | | 31,138,791,430.44 |
Stephen A. Walsh
| | | | | | | | |
Type of Account
| | Number of
Accounts
Managed
| | Total Assets Managed
| | Number of
Accounts
Managed for
which Advisory
Fee is
Performance-
Based
| | Assets Managed for
which Advisory Fee is
Performance-Based
|
Registered Investment Companies | | 133 | | 101,451,399,212.73 | | 0 | | 0 |
Other pooled investment vehicles | | 119 | | 125,569,214,102.84 | | 0 | | 0 |
Other accounts | | 953 | | 274,000,744,331.03 | | 96 | | 31,138,791,430.44 |
Edward A. Moody
| | | | | | | | |
Type of Account
| | Number of
Accounts
Managed
| | Total Assets
Managed
| | Number of
Accounts
Managed for
which Advisory
Fee is
Performance-
Based
| | Assets Managed for
which Advisory Fee
is Performance-
Based
|
Registered Investment Companies | | 1 | | 372,148,183.77 | | 0 | | 0 |
Other pooled investment vehicles | | 1 | | 51,626,641.00 | | 0 | | 0 |
Other accounts | | 109 | | 19,929,991,008.40 | | 10 | | 3,093,605,874.62 |
B-293
Mark S. Lindbloom
| | | | | | | | |
Type of Account
| | Number of
Accounts
Managed
| | Total Assets
Managed
| | Number of
Accounts
Managed for
which Advisory
Fee is
Performance-
Based
| | Assets Managed for
which Advisory Fee
is Performance-
Based
|
Registered Investment Companies | | 6 | | 2,851,164,935.27 | | 0 | | 0 |
Other pooled investment vehicles | | 4 | | 353,548,697.45 | | 0 | | 0 |
Other accounts | | 23 | | 4,689,457,295.60 | | 2 | | 1,020,908,948.40 |
Carl L. Eichstaedt
| | | | | | | | |
Type of Account
| | Number of
Accounts
Managed
| | Total Assets
Managed
| | Number of
Accounts
Managed for
which Advisory
Fee is
Performance-
Based
| | Assets Managed for
which Advisory Fee
is Performance-
Based
|
Registered Investment Companies | | 14 | | 3,904,877,718.89 | | 0 | | 0 |
Other pooled investment vehicles | | 1 | | 333,971,708.70 | | 0 | | 0 |
Other accounts | | 99 | | 22,987,499,508.73 | | 2 | | 1,070,799,719.45 |
Note: The numbers above reflect the overall number of portfolios managed by Western Asset. Mr. Leech and Mr. Walsh are involved in the management of all the Firm’s portfolios, but they are not solely responsible for particular portfolios. Western’s investment discipline emphasizes a team approach that combines the efforts of groups of specialists working in different market sectors. The individuals that have been identified are responsible for overseeing implementation of the Firm’s overall investment ideas and coordinating the work of the various sector teams. This structure ensures that client portfolios benefit from a consensus that draws on the expertise of all team members.
Potential Conflicts of Interest:
Potential conflicts of interest may arise in connection with the management of multiple accounts (including accounts managed in a personal capacity). These could include potential conflicts of interest related to the knowledge and timing of a Portfolio’s trades, investment opportunities and broker selection. Portfolio managers may be privy to the size, timing and possible market impact of a Portfolio’s trades.
It is possible that an investment opportunity may be suitable for both a Portfolio and other accounts managed by a portfolio manager, but may not be available in sufficient quantities for both the Portfolio and the other accounts to participate fully. Similarly, there may be limited opportunity to sell an investment held by a Portfolio and another account. A conflict may arise where the portfolio manager may have an incentive to treat an account preferentially as compared to a Portfolio because the account pays a performance-based fee or the portfolio manager, Western Asset or an affiliate has an interest in the account. Western Asset has adopted procedures for allocation of portfolio transactions and investment opportunities across multiple client accounts on a fair and equitable basis over time. All eligible accounts that can participate in a trade share the same price on a pro-rata allocation basis in an attempt to mitigate any conflict of interest. Trades are allocated among similarly managed accounts to maintain consistency of portfolio strategy, taking into account cash availability, investment restrictions and guidelines, and portfolio composition versus strategy.
With respect to securities transactions for the Portfolios, Western Asset determines which broker or dealer to use to execute each order, consistent with their duty to seek best execution of the transaction. However, with respect to certain other accounts (such as pooled investment vehicles that are not registered investment
B-294
companies and other accounts managed for organizations and individuals), Western Asset may be limited by the client with respect to the selection of brokers or dealers or may be instructed to direct trades through a particular broker or dealer. In these cases, trades for a Portfolio in a particular security may be placed separately from, rather than aggregated with, such other accounts. Having separate transactions with respect to a security may temporarily affect the market price of the security or the execution of the transaction, or both, to the possible detriment of a Portfolio or the other account(s) involved. Additionally, the management of multiple Portfolios and/or other accounts may result in a portfolio manager devoting unequal time and attention to the management of each Portfolio and/or other account.
It is theoretically possible that portfolio managers could use information to the advantage of other accounts they manage and to the possible detriment of a Portfolio. For example, a portfolio manager could short sell a security for an account immediately prior to a Portfolio’s sale of that security. To address this conflict, Western Asset has adopted procedures for reviewing and comparing selected trades of alternative investment accounts (which may make directional trades such as short sales) with long only accounts (which include the Portfolios) for timing and pattern related issues. Trading decisions for alternative investment and long only accounts may not be identical even though the same Portfolio Manager may manage both types of accounts. Whether Western Asset allocates a particular investment opportunity to only alternative investment accounts or to alternative investment and long only accounts will depend on the investment strategy being implemented. If, under the circumstances, an investment opportunity is appropriate for both its alternative investment and long only accounts, then it will be allocated to both on a pro-rata basis.
A portfolio manager may also face other potential conflicts of interest in managing a Portfolio, and the description above is not a complete description of every conflict of interest that could be deemed to exist in managing both a Portfolio and the other accounts listed above.
Compensation of Portfolio Managers:
With respect to the compensation of the portfolio managers, Western Asset’s compensation system assigns each employee a total compensation “target” and a respective cap, which are derived from annual market surveys that benchmark each role with their job function and peer universe. This method is designed to reward employees with total compensation reflective of the external market value of their skills, experience, and ability to produce desired results.
Standard compensation includes competitive base salaries, generous employee benefits, and a retirement plan.
In addition, employees are eligible for bonuses. These are structured to closely align the interests of employees with those of Western Asset, and are determined by the professional’s job function and performance as measured by a formal review process. All bonuses are completely discretionary. One of the principal factors considered is a portfolio manager’s investment performance versus appropriate peer groups and benchmarks. Because portfolio managers are generally responsible for multiple accounts (including the Portfolio) with similar investment strategies, they are compensated on the performance of the aggregate group of similar accounts, rather than a specific account. A smaller portion of a bonus payment is derived from factors that include client service, business development, length of service to Western Asset, management or supervisory responsibilities, contributions to developing business strategy and overall contributions to Western Asset’s business.
Finally, in order to attract and retain top talent, all professionals are eligible for additional incentives in recognition of outstanding performance. These are determined based upon the factors described above and include Legg Mason, Inc. stock options and long-term incentives that vest over a set period of time past the award date.
B-295
Portfolio Manager Ownership of Portfolio Securities:
The following table provides the dollar range of securities beneficially owned by each portfolio manager as of December 31, 2006:
| | |
Portfolio Manager
| | Dollar Range of Portfolio Securities Beneficially Owned
|
S. Kenneth Leech | | None |
Stephen A. Walsh | | None |
Edward A. Moody | | None |
Mark S. Lindbloom | | None |
Carl L. Eichstaedt | | None |
B-296
Western Asset Management Company Limited
A team of investment professionals at Western Asset Management Company (“Western Asset”), led by Chief Investment Officer S. Kenneth Leech and Deputy Chief Investment Officer Stephen A. Walsh, manages the Strategic Bond Fund’s and the Strategic Balanced Fund’s assets.
Messrs. Leech and Walsh have each served as portfolio managers for Western Asset for over 10 years.
The Funds are managed by a team of portfolio managers, sector specialists and other investment professionals. Mr. Leech and Mr. Walsh serve as co-team leaders responsible for day-to-day strategic oversight of each Fund’s investments and for supervising the day-to-day operations of the various sector specialist teams dedicated to the specific asset classes in which the Funds invest.
Other Accounts:
As of December 31, 2006, in addition to the Funds, the Portfolio Managers were responsible for the day-to-day management of certain other accounts, as follows:
S. Kenneth Leech
| | | | | | | | |
Type of Account
| | Number of
Accounts
Managed
| | Total Assets Managed
| | Number of
Accounts
Managed for
which Advisory
Fee is
Performance-
Based
| | Assets Managed for
which Advisory Fee is
Performance-Based
|
Registered Investment Companies | | 133 | | 101,451,399,212.73 | | 0 | | 0 |
Other pooled investment vehicles | | 119 | | 125,569,214,102.84 | | 0 | | 0 |
Other accounts | | 953 | | 274,000,744,331.03 | | 96 | | 31,138,791,430.44 |
Stephen A. Walsh
| | | | | | | | |
Type of Account
| | Number of
Accounts
Managed
| | Total Assets Managed
| | Number of
Accounts
Managed for
which Advisory
Fee is
Performance-
Based
| | Assets Managed for
which Advisory Fee is
Performance-Based
|
Registered Investment Companies | | 133 | | 101,451,399,212.73 | | 0 | | 0 |
Other pooled investment vehicles | | 119 | | 125,569,214,102.84 | | 0 | | 0 |
Other accounts | | 953 | | 274,000,744,331.03 | | 96 | | 31,138,791,430.44 |
Potential Conflicts of Interest:
Potential conflicts of interest may arise in connection with the management of multiple accounts (including accounts managed in a personal capacity). These could include potential conflicts of interest related to the knowledge and timing of a Portfolio’s trades, investment opportunities and broker selection. Portfolio managers may be privy to the size, timing and possible market impact of a Portfolio’s trades.
It is possible that an investment opportunity may be suitable for both a Portfolio and other accounts managed by a portfolio manager, but may not be available in sufficient quantities for both the Portfolio and the other accounts to participate fully. Similarly, there may be limited opportunity to sell an investment held by a Portfolio and another account. A conflict may arise where the portfolio manager may have an incentive to treat an account preferentially as compared to a Portfolio because the account pays a performance-based fee or the portfolio manager, the Advisers or an affiliate has an interest in the account. The Advisers have adopted
B-297
procedures for allocation of portfolio transactions and investment opportunities across multiple client accounts on a fair and equitable basis over time. All eligible accounts that can participate in a trade share the same price on a pro-rata allocation basis in an attempt to mitigate any conflict of interest. Trades are allocated among similarly managed accounts to maintain consistency of portfolio strategy, taking into account cash availability, investment restrictions and guidelines, and portfolio composition versus strategy.
With respect to securities transactions for the Portfolios, the Advisers determine which broker or dealer to use to execute each order, consistent with their duty to seek best execution of the transaction. However, with respect to certain other accounts (such as pooled investment vehicles that are not registered investment companies and other accounts managed for organizations and individuals), the Advisers may be limited by the client with respect to the selection of brokers or dealers or may be instructed to direct trades through a particular broker or dealer. In these cases, trades for a Portfolio in a particular security may be placed separately from, rather than aggregated with, such other accounts. Having separate transactions with respect to a security may temporarily affect the market price of the security or the execution of the transaction, or both, to the possible detriment of a Portfolio or the other account(s) involved. Additionally, the management of multiple Portfolios and/or other accounts may result in a portfolio manager devoting unequal time and attention to the management of each Portfolio and/or other account.
It is theoretically possible that portfolio managers could use information to the advantage of other accounts they manage and to the possible detriment of a Portfolio. For example, a portfolio manager could short sell a security for an account immediately prior to a Portfolio’s sale of that security. To address this conflict, the Advisers have adopted procedures for reviewing and comparing selected trades of alternative investment accounts (which may make directional trades such as short sales) with long only accounts (which include the Portfolios) for timing and pattern related issues. Trading decisions for alternative investment and long only accounts may not be identical even though the same Portfolio Manager may manage both types of accounts. Whether the Adviser allocates a particular investment opportunity to only alternative investment accounts or to alternative investment and long only accounts will depend on the investment strategy being implemented. If, under the circumstances, an investment opportunity is appropriate for both its alternative investment and long only accounts, then it will be allocated to both on a pro-rata basis.
A portfolio manager may also face other potential conflicts of interest in managing a Portfolio, and the description above is not a complete description of every conflict of interest that could be deemed to exist in managing both a Portfolio and the other accounts listed above.
Compensation of Portfolio Managers:
With respect to the compensation of the portfolio managers, the Advisers’ compensation system assigns each employee a total compensation “target” and a respective cap, which are derived from annual market surveys that benchmark each role with their job function and peer universe. This method is designed to reward employees with total compensation reflective of the external market value of their skills, experience, and ability to produce desired results.
Standard compensation includes competitive base salaries, generous employee benefits, and a retirement plan.
In addition, employees are eligible for bonuses. These are structured to closely align the interests of employees with those of the Advisers, and are determined by the professional’s job function and performance as measured by a formal review process. All bonuses are completely discretionary. One of the principal factors considered is a portfolio manager’s investment performance versus appropriate peer groups and benchmarks. Because portfolio managers are generally responsible for multiple accounts (including the Portfolio) with similar investment strategies, they are compensated on the performance of the aggregate group of similar accounts, rather than a specific account. A smaller portion of a bonus payment is derived from factors that include client
B-298
service, business development, length of service to the Adviser, management or supervisory responsibilities, contributions to developing business strategy and overall contributions to the Adviser’s business.
Finally, in order to attract and retain top talent, all professionals are eligible for additional incentives in recognition of outstanding performance. These are determined based upon the factors described above and include Legg Mason, Inc. stock options and long-term incentives that vest over a set period of time past the award date.
Portfolio Manager Ownership of Portfolio Securities:
The following table provides the dollar range of securities beneficially owned by the portfolio managers as of December 31, 2006:
| | |
Portfolio Manager
| | Dollar Range of Portfolio Securities Beneficially Owned
|
S. Kenneth Leech | | None |
Stephen A. Walsh | | None |
B-299