|
| OMB APPROVAL | ||
|
| OMB Number: | 3235-0570 | |
|
| Expires: | September 30, 2007 | |
| UNITED STATES | Estimated average burden hours per response. . . . . . . . . . . . . . . . .19.3 | ||
| SECURITIES AND EXCHANGE COMMISSION |
| ||
| Washington, D.C. 20549 |
| ||
FORM N-CSR
CERTIFIED SHAREHOLDER REPORT OF REGISTERED
MANAGEMENT INVESTMENT COMPANIES
Investment Company Act file number | 811-8220 | ||||||||
| |||||||||
ING Variable Products Trust | |||||||||
(Exact name of registrant as specified in charter) | |||||||||
| |||||||||
7337 E. Doubletree Ranch Rd., Scottsdale, AZ |
| 85258 | |||||||
(Address of principal executive offices) |
| (Zip code) | |||||||
| |||||||||
CT Corporation System, 101 Federal Street, Boston, MA 02110 | |||||||||
(Name and address of agent for service) | |||||||||
| |||||||||
Registrant’s telephone number, including area code: | 1-800-992-0180 |
| |||||||
| |||||||||
Date of fiscal year end: | December 31 |
| |||||||
| |||||||||
Date of reporting period: | January 1, 2006 to December 31, 2006 |
| |||||||
Item 1. Reports to Stockholders.
The following is a copy of the report transmitted to stockholders pursuant to Rule 30e-1 under the Act (17 CFR 270.30e-1):

Funds
Annual Report
December 31, 2006
Classes ADV, I and S
ING Variable Products Trust
Domestic Equity and Income Portfolio
n ING VP Real Estate Portfolio
Domestic Equity Growth Portfolios
n ING VP MidCap Opportunities Portfolio
n ING VP SmallCap Opportunities Portfolio
Domestic Equity Value Portfolios
n ING VP Financial Services Portfolio
Fixed-Income Portfolio
n ING VP High Yield Bond Portfolio
International Equity Portfolio
n ING VP International Value Portfolio
This report is submitted for general information to shareholders of the ING Funds. It is not authorized for distribution to prospective shareholders unless accompanied or preceded by a prospectus which includes details regarding the funds' investment objectives, risks, charges, expenses and other information. This information should be read carefully.

TABLE OF CONTENTS
| President's Letter | 1 | ||||||
| Market Perspective | 2 | ||||||
| Portfolio Managers' Reports | 4 | ||||||
| Shareholder Expense Examples | 16 | ||||||
| Report of Independent Registered Public Accounting Firm | 18 | ||||||
| Statements of Assets and Liabilities | 19 | ||||||
| Statements of Operations | 21 | ||||||
| Statements of Changes in Net Assets | 23 | ||||||
| Financial Highlights | 26 | ||||||
| Notes to Financial Statements | 32 | ||||||
| Portfolios of Investments | 46 | ||||||
| Tax Information | 61 | ||||||
| Trustee and Officer Information | 62 | ||||||
| Advisory Contract Approval Discussion | 66 | ||||||
PROXY VOTING INFORMATION
A description of the policies and procedures that the Portfolios use to determine how to vote proxies related to portfolio securities is available (1) without charge, upon request, by calling Shareholder Services toll-free at 1-800-992-0180; (2) on the ING Funds' website at www.ingfunds.com; and (3) on the SEC's website at www.sec.gov. Information regarding how the Portfolios voted proxies related to portfolio securities during the most recent 12-month period ended June 30 is available without charge on the ING Funds' website at www.ingfunds.com and on the SEC's website at www.sec.gov.
QUARTERLY PORTFOLIO HOLDINGS
The Portfolios file their complete schedule of portfolio holdings with the SEC for the first and third quarters of each fiscal year on Form N-Q. The Portfolios' Forms N-Q are available on the SEC's website at www.sec.gov. The Portfolios' Forms N-Q may be reviewed and copied at the SEC's Public Reference Room in Washington, DC, and information on the operation of the Public Reference Room may be obtained by calling 1-800-SEC-0330; and is available upon request from the Portfolio by calling Shareholder Services toll-free at 1-800-992-0180.
(THIS PAGE INTENTIONALLY LEFT BLANK)
PRESIDENT'S LETTER

Dear Shareholder,
In its recent meetings, the U.S. Federal Reserve Board (the "Fed") ceased what was a two-year trend. That trend — a string of 17 consecutive interest rate hikes that ended last fall — was seen by many analysts as a sign that the Fed was concerned about containing inflation.
Now, the Fed is neither raising nor lowering interest rates, which puts us in the midst of what economists refer to as a "plateau." Historically, there have been six similar plateaus since 1982 and during four of those periods the Standard & Poor's 500® Composite Stock Price Index(1) ("S&P 500® Index") rose significantly.
Of course, the Fed's actions impact economies and market performance around the world. For instance, the current interest rate climate has been cited as one reason for a decline in the value of the dollar. Last year, that drop in the dollar meant that international stocks — which are often determined in foreign currencies — generally experienced strong performance as foreign currencies climbed and world stock markets continued to produce strong results.
Meanwhile, here at home, 2006 was an interesting year for equity investors. In May of 2006, the S&P 500® Index hit a five-year high followed by a market correction and several months of non-directional returns. A strong rally occurred in the second half of the year driven in part by the aforementioned dollar decline and the interest rate plateau. The good news is many economists believe that these conditions may continue in the months to come.
At ING Funds, we are committed to providing you, the investor, with an array of investment choices that enables you to build a diversified portfolio across a variety of asset classes. We do so, with a view that the globalization of markets is an initial consideration in the products we offer.
We take the confidence you place in us with your investments very seriously — everyone in our firm is committed to renewing this trust each and every day.

Shaun Mathews
President
ING Funds
January 31, 2007
The views expressed in the President's Letter reflect those of the President as of the date of the letter. Any such views are subject to change at any time based upon market or other conditions and ING Funds disclaims any responsibility to update such views. These views may not be relied on as investment advice and because investment decisions for an ING Fund are based on numerous factors, may not be relied on as an indication of investment intent on behalf of any ING Fund. Reference to specific company securities should not be construed as recommendations or investment advice.
(1) The S&P 500® Index is an unmanaged index that measures the performance of the securities of approximately 500 of the largest companies in the U.S.
1
MARKET PERSPECTIVE: YEAR ENDED DECEMBER 31, 2006
In our semi-annual report, we described how the feast of the first quarter had turned to famine in the second quarter for global equity markets on concerns that rising interest rates would freeze out global growth. Indeed as late as June 27, 2006, the year-to-date return on the Morgan Stanley Capital International ("MSCI") World IndexSM(1) measured in local currencies, including net reinvested dividends had been precisely 0%. However, the second half of the year ended December 31, 2006, was much healthier and the same index powered ahead 12.3% and for the year ended December 31, 2006, returned 20.07%. The return to dollar based in vestors was a little better at 13.2%, as late in the year a slowing economy and hints that central banks would be diversifying out of dollars weighed on that currency. For the six months ended December 31, 2006, the dollar fell 3.1% against the euro and 5.6% against the pound, but gained 4.1% on the yen due to stumbling growth and miniscule interest rates in Japan. For the year ended December 31, 2006, the dollar fell 10.6% against the euro and 12.4% against the pound, but gained 1.3% against the yen.
As the first half of 2006 ended, the Federal Open Market Committee ("FOMC") had just raised the federal funds rate for the seventeenth time since June 2004, to 5.25%. The relatively mild accompanying language led many in the fixed income market to hope that the tightening cycle was now over. Not everyone believed it, especially when new Middle East conflict pushed the price of oil to another record on July 14, 2006. But data, especially on housing, had mostly pointed to cooling demand and a tame employment report on August 4, 2006 probably decided the matter. Four days later the FOMC met and left rates unchanged. The booming housing market had been a powerful driver of growth in recent years through new construction and demand created by mortgage loan refinancing. This boom was deteriorating a ppreciably with housing prices and the key new building permits measure falling sharply. Only in the last few days of 2006 did the slump show some signs of bottoming out with unexpectedly good new and existing home sales figures reported, along with rebounding consumer confidence. For the six months ended December 31, 2006, the Lehman Brothers® Aggregate Bond ("LBAB") Index(2) of investment grade bonds gained 5.09% and for the year ended December 31, 2006 it gained 4.33%. The most important dynamic was the broad yield curve inversion, suggestive of an expected fall in interest rates and a further economic slow down. The ten-year Treasury yield fell 43 basis points (0.43%) to 4.71%, while the yield on the three-month Bill rose by 3 basis points (0.03%) to 4.89%. Since mid-August, with the exception of two days, bond investors had been prepare d to lend money to the government for ten years at a lower interest rate than for three months.
Faced with fading business activity, as the key housing engine seized up, and a yield curve inverted to the point of recession according to some commentators, investors in U.S. equities must have been in the mood to sell. Not so fast. Those investors saw things differently and indeed the apparent "disagreement" between the bond market and global stock markets was a well discussed feature of the second half of the year. For one thing, the oil price, having hit its record, fell back, as surly calm returned to the Middle East, as the summer driving and hurricane seasons came and went and as winter got off to a mild start in the key North East region. The price of oil averaged 22% less in the fourth quarter than at its peak, boosting consumers' spending power and confidence. And if longer-term int erest rates were falling then stocks looked more attractive as bonds provided less competition and the present value of future corporate profits rose. Speaking of which, Standard & Poor's 500® Composite Stock Price ("S&P 500®") Index(3) companies duly reported their 13th straight double-digit quarterly percentage earnings gain. Gross domestic product ("GDP") growth may have slowed, but the share of corporate profits, reported at 12.4%, was the highest since the 1950's. The next merger or acquisition to get investors in the mood never seemed far away. Five of them were even announced in one day on November 6, 2006, sending markets up about 1%. For the six months ended December 31, 2006, the S&P 500® Index, including dividends, rose 12.7% and for the year ended December 31, 2006, the S&P 500&r eg; Index, including dividends, rose 15.8%. All but 30 basis points (0.30%) of the gain came after August 8, 2006, making six-year highs as the year ended.
International markets, based on MSCI local currency indices, as in the U.S., finished near their best levels for the year. In Japan the market advanced 8.7%, in 2006, after a late surge. The long awaited increase in interest rates from 0.0% to 0.25% took place in July just as the economic recovery was losing impetus. Third quarter growth was estimated at only 0.8% and generated by exports and capital spending alone. Consumer spending was lagging despite low
2
MARKET PERSPECTIVE: YEAR ENDED DECEMBER 31, 2006
unemployment and almost flat prices, yet business confidence remained high and profit growth healthy. Elsewhere, Asian markets ex Japan rose 28.2% in 2006, but with wide disparities, ranging from –2.0% in Thailand to 83.4% in China. In Thailand the uncertainty caused by a military coup was compounded when the junta imposed exchange controls to hold back the strong baht, only to rescind them the next day. China's market soared in surely speculative excess, and in the absence of attractive alternatives, as investors sought a piece of the world's fourth largest economy. By the end of 2006 the Chinese market had become the third biggest emerging market after South Korea and Taiwan. European ex UK markets surged 16.1%, in 2006. The Eurozone's GDP growth had recorded its best first half of a year since 2000, 1.7%, and the lowest unemployment rate, 7.8%, since the start of the Eurozone itself. But as the second half of 2006, wore on there were signs that the best news was behind it and the third quarter's annualized growth fell to 2.0%. Business confidence, however, stayed buoyant and cheered by extensive merger and acquisition activity despite headwinds in the form of a strengthening euro, a hawkish European Central Bank that raised rates three times and the looming rise in German sales tax. UK equities added 8.6% in the six months ended December 31, 2006. The Bank of England raised rates twice as GDP growth accelerated to 2.9% year over year, inflation climbed above target and house prices, an import ant demand generator, continued their recovery with average prices up more than 10% in 2006. Again, however, it was widespread, large scale mergers and acquisitions energizing the market.
(1) The MSCI World IndexSM is an unmanaged index that measures the performance of over 1,400 securities listed on exchanges in the U.S., Europe, Canada, Australia, New Zealand and the Far East.
(2) The LBAB Index is a widely recognized, unmanaged index of publicly issued investment grade U.S. Government, mortgage-backed, asset-backed and corporate debt securities.
(3) The S&P 500® Index is an unmanaged index that measures the performance of securities of approximately 500 of the largest companies in the U.S.
All indices are unmanaged and investors cannot invest directly in an index.
Past performance does not guarantee future results. The performance quoted represents past performance. Investment return and principal value of an investment will fluctuate, and shares, when redeemed, may be worth more or less than their original cost. The Portfolios' performance is subject to change since the period's end and may be lower or higher than the performance data shown. Please call (800) 992-0180 or log on to www.ingfunds.com to obtain performance data current to the most recent month end.
Market Perspective reflects the views of the Chief Investment Risk Officer only through the end of the period, and is subject to change based on market and other conditions.
3
ING VP REAL ESTATE PORTFOLIO
PORTFOLIO MANAGERS' REPORT
The ING VP Real Estate Portfolio (the "Portfolio") seeks total return. The Portfolio is managed by T. Ritson Ferguson, CFA, Chief Investment Officer and Managing Director and Joseph P. Smith, CFA, Managing Director, of ING Clarion Real Estate Securities L.P. — the Sub-Adviser.
Performance: For the year ended December 31, 2006, the Portfolio's Class I shares provided a total return of 36.17% compared to the Morgan Stanley Capital International ("MSCI") U.S. REIT® Index(1) and the Dow Jones Wilshire ("DJW") Real Estate Securities Index(2), which returned 35.92% and 35.88% for the same period.
Portfolio Specifics: The Portfolio's performance was driven by positive stock selection, especially in the office and mall sectors. The Portfolio's holdings in the office sector was the largest contributor to performance in 2006, as several of the Portfolio's investments in the office sector were targets of M&A activity, and were acquired at attractive premiums to their pre-announcement trading prices. An overweight in the office sector also added value for the year. Stock selection within the hotel sector, combined with the Portfolio's slight overweight to the hotel sector which underperformed the market during the second half of the year, detracted from relative performance.
Real estate asset values continued to grow in 2006 because of two factors — cash flow growth and cap rate compression. Buoyed by a strong economy, demand from tenants helped improve occupancies and rental rates, resulting in higher cash flows from real estate assets. Simultaneously, the desire by many investors to increase their exposure to the real estate asset class helped drive up the price paid for the real estate cash flows. In other words, investors were willing to accept lower initial yields (i.e., cap rates) and lower expected rates of return (IRR's) to invest in real estate. The combination of higher cash flows and lower yields helped explain both the growth in real asset values, as well as the outsized capital appreciation for REIT share prices in 2006.
Current Strategy and Outlook: We believe overall earnings growth for real estate companies to accelerate in 2007 to 9.5%, driven by improving real estate fundamentals. As with 2006, we believe, earnings growth will occur from increases in occupancy, rent gains and expense containment. We continue to favor property companies in the office and apartment sectors and maintain an underweight to the hotel, industrial, and retail sectors of the market. We continue to find value in companies across all sectors of the market, especially in companies that exhibit market leadership, are run by strong management teams and are able to consistently grow their earnings.
In our opinion, there are two broad fundamental reasons to stay positive about REIT return potential: 1) the economic forecast for the U.S. is for moderating economic growth with stable interest rates (i.e., real estate returns remain competitive versus other asset classes in a moderating economy), and 2) real estate stocks are priced at reasonable levels relative to private market values (i.e., net asset value ("NAV")), which historically has portended good relative returns for REITs.
Low interest rates by historical standards and a moderately growing economy form an ideal environment for real estate investors. We look for another such year in 2007. The U.S. economy is making a graceful mid-business cycle transition from a period of above-average growth to more moderate and sustainable growth. Inflation is expected to settle down to about 2.5%, interest rates should stabilize at current levels, which represent a slightly restrictive monetary policy, and we believe GDP growth should slow to approximately 3%. Corporate profits are high, and consumers are still relatively well-off and confident, which bodes well for the demand side of the real estate equation.
Currently, we estimate that public company valuations represent a premium of only 2% to the private market values (i.e.,NAV) for equivalent real estate portfolios. Historically, REITs have traded in a band of -10% to +10%. The significant private market appetite for real estate, which led to a flurry of public company acquisition announcements throughout the year, suggests that our NAV estimates may be slightly conservative.
All-in-all, we expect a good backdrop for real estate again this year. In the assumed context of a growing economy and improving real estate market conditions, we expect investors to still embrace real estate. We believe earnings growth of 9.5% plus a dividend yield of 3.7% suggest low double-digit returns are possible. REITs are not unique in looking a bit expensive relative to historic valuation levels. With few, if any, obvious options for getting double-digit returns, investors are likely to maintain a positive view about investing in real estate, which bodes well for REITs holding their current multiples.
Portfolio holdings and characteristics are subject to change and may not be representative of current holdings and characteristics. The outlook for this Portfolio may differ from that presented for other ING Funds. Performance for the different classes of shares will vary based on differences in fees associated with each class.

Top Ten Holdings
as of December 31, 2006
(as a percent of net assets)
| Simon Property Group, Inc. | 6.4 | % | |||||
| Boston Properties, Inc. | 5.2 | % | |||||
| Equity Office Properties Trust | 5.0 | % | |||||
| Archstone-Smith Trust | 5.0 | % | |||||
| Vornado Realty Trust | 4.9 | % | |||||
| Prologis | 4.7 | % | |||||
| Equity Residential | 4.1 | % | |||||
| Public Storage, Inc. | 4.0 | % | |||||
| AvalonBay Communities, Inc. | 4.0 | % | |||||
| Host Hotels & Resorts, Inc. | 3.9 | % | |||||
Portfolio holdings are subject to change daily.
4
PORTFOLIO MANAGERS' REPORT
ING VP REAL ESTATE PORTFOLIO

Average Annual Total Returns for the Periods Ended December 31, 2006
| 1 Year | Since Inception of Class I May 3, 2004 | Since Inception of Class S May 13, 2005 | |||||||||||||
| Class I | 36.17 | % | 33.18 | % | — | ||||||||||
| Class S | 35.84 | % | — | 32.30 | % | ||||||||||
| MSCI U.S. REIT® Index(1) | 35.92 | % | 32.07 | %(3) | 30.29 | %(4) | |||||||||
| DJW Real Estate Securities Index(2) | 35.88 | % | 33.58 | %(3) | 31.54 | %(4) | |||||||||
Based on a $10,000 initial investment, the graph and table above illustrate the total return of ING VP Real Estate Portfolio against the indices indicated. An index is unmanaged and has no cash in its portfolio, imposes no sales charge and incurs no operating expense. An investor cannot invest directly in an index. The Portfolio's performance is shown without the imposition of any expenses or charges which are, or may be, imposed under your annuity contract or life insurance policy. Total returns would have been lower if such expenses or charges were included.
The performance graph and table do not reflect the deduction of taxes that a shareholder will pay on Portfolio distributions or the redemption of Portfolio shares.
The performance shown may include the effect of fee waivers and/or expense reimbursements by the Investment Adviser and/or other service providers, which have the effect of increasing total return. Had all fees and expenses been considered, the total returns would have been lower.
The performance update illustrates performance for a variable investment option available through a variable annuity contract and/or a variable universal life policy. The performance shown indicates past performance and is not a projection or prediction of future results. Actual investment returns and principal value will fluctuate so that shares and/or units, at redemption, may be worth more or less than their original cost. For variable annuity contracts, please call (800) 992-0180 to get performance through the most recent month end. For variable universal life policies, please log on to www.ing.com/us to get performance through the most recent month end.
This report contains statements that may be "forward-looking" statements. Actual results may differ materially from those projected in the "forward-looking" statements.
The views expressed in this report reflect those of the portfolio managers, only through the end of the period as stated on the cover. The portfolio managers' views are subject to change at any time based on market and other conditions.
Portfolio holdings are subject to change daily.
(1) The MSCI U.S. REIT® Index is a free float-adjusted market capitalization weighted index that is comprised of equity real estate investment trusts that are included in the MSCI U.S. Investable Market 2500 Index (with the exception of specialty REITs that do not generate a majority of their revenue and income from real estate rental and leasing obligations). The Index represents approximately 85% of the U.S. REIT market. The MSCI U.S. REIT® Index more closely tracks the type of securities in which the Fund invests than the DJW Real Estate Securities Index.
(2) The DJW Real Estate Securities Index is an unmanaged, market capitalization weighted index of publicly traded real estate securities, such as REITs, real estate operating companies ("REOCs") and partnerships. The index is comprised of companies whose charter is the equity ownership and operation of commercial real estate.
(3) Since inception performance for the indices is shown from May 1, 2004.
(4) Since inception performance for the indices is shown from May 1, 2005.
5
ING VP MIDCAP OPPORTUNITIES PORTFOLIO
PORTFOLIO MANAGERS' REPORT
The ING VP MidCap Opportunities Portfolio (the "Portfolio") seeks long-term capital appreciation. The Portfolio is managed by Richard Welsh, Portfolio Manager and Jeff Bianchi, Portfolio Manager of ING Investment Management Co. — the Sub-Adviser.
Performance: For the year ended December 31, 2006, the Portfolio's Class I shares provided a total return of 7.79% compared to the Russell Midcap® Growth Index(1) and the Russell Midcap® Index(2), which returned 10.66% and 15.26%, respectively, for the same period.
Portfolio Specifics: The market responded favorably to stronger-than-expected economic and earnings growth. Valuations were helped during the latter half of the year by a sharp decline in commodity prices, which tempered inflation and interest rate fears.
All economic sectors, with the exception of energy, generated positive returns for the year. The market was led by sectors typically associated with value investing such as telecommunication services and financials. The energy sector performed the worst, reflecting ample oil and gas supplies as well as warmer-than-expected weather. Healthcare and information technology performed poorly as well. Mid-cap growth stocks generally underperformed mid-cap value stocks by almost 10%, which acted as a drag on the Portfolio's performance due to our overweight in growth stocks. We believe that as economic and earnings growth slows further, growth stocks will outperform value.
Sector Allocation accounted for the majority of the underperformance for the year, as our underweights in sectors that are not typically associated with growth, including energy, materials, and financials, hurt relative results.
Stock selection was least favorable in information technology and financials. Citrix Systems, Inc., a supplier of access information software and services, was one of our worst performing stocks last year, as it reported disappointing results due to weak licensing growth in its core presentation products. It was victim to a market that failed to reward companies with the highest expected growth. We sold our position in Citrix Systems, Inc. The shares of Micros Systems, Inc., which provides software solutions to the hospitality industry, underperformed. Slowing hotel software roll-out at a large customer as well as concerns about rising gasoline prices and weaker consumer spending trends hurting its restaurant software business pressured the stock. In financials, Legg Mason, Inc., a global asset manager, underperformed due to an earnings shortfall from weaker-than-expected asset flows and a delay in merger-related savings from the acquisition of Citigroup's asset management business. We also sold our Legg Mason, Inc. holding.
Stock selection within the energy and industrials sectors added the most to returns. Veritas DGC, Inc., a seismic data collection company for the discovery of oil, was acquired by a French company, Compagnie Generale de Geophysique-Veritas. In the industrials sector, Wesco International, Inc. and McDermott International, Inc. performed well. Wesco International, Inc., an electrical equipment distributor, was helped by strong demand from commercial construction, the utility industry and the overall industrial economy. McDermott International, Inc., which provides energy services, experienced stronger–than-expected bookings and as a result earnings expectations were revised significantly higher.
Current Strategy and Outlook: We believe that economic growth will continue albeit at a moderating pace. We believe that inflation will remain in check and that should have favorable interest rate implications for equity valuations. Consistent with an economy transitioning to slower growth, we are focusing intently on companies whose business momentum prospects are both attractive and reasonably certain. We continue to concentrate on stocks with above average business momentum, market recognition and appropriate valuations.
Portfolio holdings and characteristics are subject to change and may not be representative of current holdings and characteristics. The outlook for this Portfolio may differ from that presented for other ING Funds. Performance for the different classes of shares will vary based on differences in fees associated with each class.

Top Ten Holdings*
as of December 31, 2006
(as a percent of net assets)
| Coach, Inc. | 3.2 | % | |||||
| Roper Industries, Inc. | 2.8 | % | |||||
| Cameron International Corp. | 2.6 | % | |||||
| Nordstrom, Inc. | 2.4 | % | |||||
| Gen-Probe, Inc. | 2.3 | % | |||||
| Akamai Technologies, Inc. | 2.3 | % | |||||
| Dun & Bradstreet Corp. | 2.2 | % | |||||
| Harman International Industries, Inc. | �� | 2.1 | % | ||||
| McDermott International, Inc. | 2.1 | % | |||||
| Digital River, Inc. | 2.1 | % | |||||
* Excludes short-term investments related to repurchase agreement and securities lending collateral.
Portfolio holdings are subject to change daily.
6
PORTFOLIO MANAGERS' REPORT
ING VP MIDCAP OPPORTUNITIES PORTFOLIO

Average Annual Total Returns for the Periods Ended December 31, 2006*
| 1 Year | 5 Year | Since Inception of Class I May 5, 2000 | Since Inception of Class S May 7, 2001 | ||||||||||||||||
| Class I | 7.79 | % | 6.09 | % | (2.98 | )% | — | ||||||||||||
| Class S | 7.62 | % | 5.91 | % | — | 2.25 | % | ||||||||||||
| Russell Midcap® Growth Index(1) | 10.66 | % | 8.22 | % | (0.67 | )%(3) | 5.52 | %(4) | |||||||||||
| Russell Midcap® Index(2) | 15.26 | % | 12.88 | % | 9.08 | %(3) | 10.71 | %(4) | |||||||||||
Based on a $10,000 initial investment, the graph and table above illustrate the total return of ING VP MidCap Opportunities Portfolio against the indices indicated. An index is unmanaged and has no cash in its portfolios, imposes no sales charges and incurs no operating expenses. An investor cannot invest directly in an index. The Portfolio's performance is shown without the imposition of any expenses or charges which are, or may be, imposed under your annuity contract or life insurance policy. Total returns would have been lower if such expenses or charges were included.
The performance shown may include the effect of fee waivers and/or expense reimbursements by the Investment Adviser and/or other service providers, which have the effect of increasing total return. Had all fees and expenses been considered, the total returns would have been lower.
Total returns reflect that the Investment Adviser may have waived or recouped fees and expenses otherwise payable by the Portfolio.
The performance update illustrates performance for a variable investment option available through a variable annuity contract and/or a variable universal life policy. The performance shown indicates past performance and is not a projection or prediction of future results. Actual investment returns and principal value will fluctuate so that shares and/or units, at redemption, may be worth more or less than their original cost. For variable annuity contract, please call (800) 992-0180 to get performance through the most recent month end. For variable universal life policies, please log on to www.ing.com/us to get performance through the most recent month end.
This report contains statements that may be "forward-looking" statements. Actual results may differ materially from those projected in the "forward-looking" statements.
The views expressed in this report reflect those of the portfolio managers, only through the end of the period as stated on the cover. The portfolio managers' views are subject to change at any time based on market and other conditions.
Portfolio holdings are subject to change daily.
* ADV Class commenced operations on December 29, 2006, therefore, there is no performance information for the period ended December 31, 2006.
(1) The Russell Midcap® Growth Index is an unmanaged index that measures the performance of those companies included in the Russell Midcap® Index with relatively higher price-to-book ratios and higher forecasted growth values.
(2) The Russell Midcap® Index is an unmanaged index that measures the performance of the 800 smallest companies in the Russell 1000® Index, which represent approximately 26% of the total market capitalization of the Russell 1000® Index.
(3) Since inception performance for the indices is shown from May 1, 2000.
(4) Since inception performance for the indices is shown from May 1, 2001.
7
ING VP SMALLCAP OPPORTUNITIES PORTFOLIO
PORTFOLIO MANAGERS' REPORT
The ING VP SmallCap Opportunities Portfolio (the "Portfolio") seeks long-term capital appreciation. The Portfolio is managed by Steve Salopek, Portfolio Manager of ING Investment Management Co. — the Sub-Adviser.
Performance: For the year ended December 31, 2006, the Portfolio's Class I shares provided a total return of 12.57%, compared to the Russell 2000® Growth Index(1) and the Russell 2000® Index(2), which returned 13.35% and 18.37%, respectively, for the same period.
Portfolio Specifics: Small-cap stocks generally performed well in 2006, out-performing both mid- and large-caps. The Russell 2000® Index gained 18.4% in 2006, outperforming the large-cap Russell 1000® Index for the seventh year out of eight. Economic strength propelled small-cap corporate earnings to record highs, and acquisitions of smaller firms by private equity buyers also aided results. Despite strong overall performance, this year proved to be a volatile ride for small-caps. During the first quarter, the market favored mid- and small-sized companies within the small-cap universe, and this trend continued as the market sold off during the summer. Larger sized companies declined, with the highest liquidity stocks selling down the most. Larger capitalization companies declined the most, with the highest liquidity stocks suf fering the most. During the third quarter, cyclical companies corrected significantly, affecting the transportation, energy and capital goods areas. During this sell-off, financials showed resiliency, which provided support for the Russell 2000® Index. Although volatility was at an all time low, it was a difficult year for stock selection, as the market did not differentiate between high- and low-quality companies.
Strong stock selection in industrials, materials and financials contributed most to results. Our overweight in industrials and underweight in health care also added to performance. Stock selection in health care, technology and consumer discretionary hurt results. Our underweight position in consumer staples and materials also negatively impacted performance.
Wesco International, Inc. and Albemarle Corp. added significantly to relative performance over the period. Wesco International, Inc., a distributor of electrical supplies and equipment and provider of procurement solutions, was the greatest contributor. Strength in Wesco International, Inc.'s commercial construction end markets, as well as utility company spending on the upgrading of electricity transmission and distribution (i.e., the power grid), helped fuel strong organic growth and margin performance. Albemarle Corp. is in the catalyst and specialty chemicals businesses. Favorable performance can be attributed to a significant improvement in the operations of both of these businesses, as well as leverage from increased pricing, which led to higher cash flow growth than was expected.
Chemed Corp. and Parallel Petroleum Corp. were two of the largest detractors from performance over the period. The former is primarily a hospice provider with meaningful exposure to Medicare reimbursement. Chemed Corp. lowered earnings estimates as a result of Medicare reimbursement issues that capped revenue from certain markets and the company was unable to offset this negative development with a reduction in costs to service patients. Parallel Petroleum Corp. is an exploration and production company with a focus on natural gas. The company's performance was negatively impacted by lower natural gas prices and missed production estimates during the third quarter. As a result, earnings estimates were cut and questions were raised about the value of the company's properties and their ability to develop and exploit them.
Current Strategy and Outlook: We believe that economic growth will continue to slow. We continue to focus on companies with strong balance sheets and cash flow generation capabilities that can show stable growth despite a moderating economy. Our largest overweight in the Portfolio is energy. The valuations of the companies in this sector are at or below long-term averages. Also, the implied volatility from futures contracts for oil and gas are low, which is beneficial for smaller, less liquid shares. Our largest underweight is consumer discretionary, as this sector is heavily reliant on consumer spending. Although the impact of rising interest rates and gas prices have been somewhat alleviated, we believe that the weakness in the housing market and the absence of mortgage equity withdrawals will continue to be a headwind for the consumer. In capital goods we have positioned the Portfolio away from deeply cyclical companies. We are likely to increase our weighting in consumer services, especially in companies that can show stable growth despite a slowing economy.
Portfolio holdings and characteristics are subject to change and may not be representative of current holdings and characteristics. The outlook for this Portfolio may differ from that presented for other ING Funds. Performance for the different classes of shares will vary based on differences in fees associated with each class.

Top Ten Holdings*
as of December 31, 2006
(as a percent of net assets)
| iShares Russell 2000 Growth Index Fund | 2.6 | % | |||||
| Ansys, Inc. | 1.5 | % | |||||
| Psychiatric Solutions, Inc. | 1.3 | % | |||||
| NewAlliance Bancshares, Inc. | 1.3 | % | |||||
| Toro Co. | 1.2 | % | |||||
| UAP Holding Corp. | 1.2 | % | |||||
| Valueclick, Inc. | 1.2 | % | |||||
| Micros Systems, Inc. | 1.2 | % | |||||
| Life Time Fitness, Inc. | 1.2 | % | |||||
| Entegris, Inc. | 1.1 | % | |||||
* Excludes short-term investments related to repurchase agreement and securities lending collateral.
Portfolio holdings are subject to change daily.
8
PORTFOLIO MANAGERS' REPORT
ING VP SMALLCAP OPPORTUNITIES PORTFOLIO

Average Annual Total Returns for the Periods Ended December 31, 2006
| 1 Year | 5 Year | 10 Year | Since Inception of Class S May 3, 2001 | ||||||||||||||||
| Class I | 12.57 | % | 1.13 | % | 9.49 | % | — | ||||||||||||
| Class S | 12.35 | % | 0.92 | % | — | (1.82 | )% | ||||||||||||
| Russell 2000® Growth Index(1) | 13.35 | % | 6.93 | % | 4.88 | % | 5.21 | %(3) | |||||||||||
| Russell 2000® Index(2) | 18.37 | % | 11.39 | % | 9.44 | % | 10.30 | %(3) | |||||||||||
Based on a $10,000 initial investment, the graph and table above illustrate the total return of ING VP SmallCap Opportunities Portfolio against the indices indicated. An index is unmanaged and has no cash in its portfolios, imposes no sales charges and incurs no operating expenses. An investor cannot invest directly in an index. The Portfolio's performance is shown without the imposition of any expenses or charges which are, or may be, imposed under your annuity contract or life insurance policy. Total returns would have been lower if such expenses or charges were included.
The performance shown may include the effect of fee waivers and/or expense reimbursements by the Investment Adviser and/or other service providers, which have the effect of increasing total return. Had all fees and expenses been considered, the total returns would have been lower.
Total returns reflect that the Investment Adviser may have waived or recouped fees and expenses otherwise payable by the Portfolio.
The performance update illustrates performance for a variable investment option available through a variable annuity contract and/or a variable universal life policy. The performance shown indicates past performance and is not a projection or prediction of future results. Actual investment returns and principal value will fluctuate so that shares and/or units, at redemption, may be worth more or less than their original cost. For variable annuity contracts, please call (800) 992-0180 to get performance through the most recent month end. For variable universal life policies, please log on to www.ing.com/us to get performance through the most recent month end.
This report contains statements that may be "forward-looking" statements. Actual results may differ materially from those projected in the "forward-looking" statements.
The views expressed in this report reflect those of the portfolio manager, only through the end of the period as stated on the cover. The portfolio manager's views are subject to change at any time based on market and other conditions.
Portfolio holdings are subject to change daily.
(1) The Russell 2000® Growth Index is an unmanaged index that measures the performance of securities of smaller U.S. companies with greater-than-average growth orientation.
(2) The Russell 2000® Index is an unmanaged index that measures the performance of securities of small U.S. companies.
(3) Since inception performance for the indices is shown from May 1, 2001.
9
ING VP FINANCIAL SERVICES PORTFOLIO
PORTFOLIO MANAGERS' REPORT
The ING VP Financial Services Portfolio (the "Portfolio") seeks long term capital appreciation. The Portfolio is managed by Steven L. Rayner, Portfolio Manager and Robert M. Kloss, Portfolio Manager of ING Investment Management Co. — the Sub-Adviser.
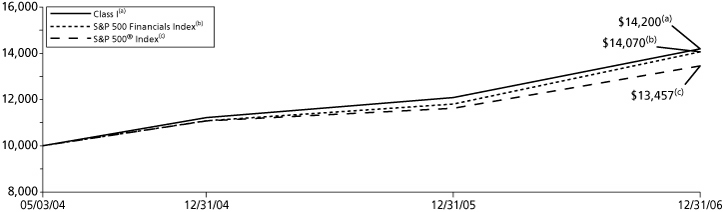
Performance: For the year ended December 31, 2006, the Portfolio's Class I shares provided a total return of 17.47% compared to the Standard & Poor's 500 Financials Index(1) ("S&P 500 Financials Index") and the Standard & Poor's 500® Composite Stock Price Index(2) ("S&P 500® Index"), which returned 19.21% and 15.79%, respectively, for the same period.
Portfolio Specifics: With the U.S. Federal Reserve Board ("Fed") on hold, the equity markets and financial stocks in general rallied during the second half of the year. A procession of mixed economic news kept investors hopeful that the Fed might even cut rates sometime in 2007. However, deterioration in the housing market, which took its toll on selected areas in financials, served to quell this thinking. Gross domestic product growth forecasts have also come down, but still imply a soft landing. The yield curve has remained flat or inverted, acting as a headwind for spread-based income.
Over the past twelve months, we have shifted the Portfolio's tilt from economically sensitive cyclical stocks to a more defensive stance. The shape of the yield curve and credit concerns have kept us underweight bank stocks, though we remain alert for the opportunity to take advantage of the Fed easing if and when it comes.
Capital markets stocks, including brokers, asset managers, and trust banks, were the largest contributors to performance for the period as both our overweight positioning and individual stock selection benefited the Portfolio. A variety of insurance stocks paid off, in terms of allocation and selection in part due to a benign hurricane season. In addition, a number of our life insurance companies produced solid earnings and proved more resilient to spread pressures than banks. Our underweight position in banks continued to benefit the Portfolio, as it underperformed.
Consolidation activity in the richly-valued real estate investment trust ("REIT") market continued to attract new money, and our valuation-driven underweight position acted as a drag even though the REIT names we did own performed well. The relatively small consumer finance industry group performed poorly. While we maintained a neutral weight, our individual stock selections were hurt by credit concerns, which produced slightly negative returns. REITs produced good absolute results, but underperformed the benchmark.
Merrill Lynch & Co., Inc., Morgan Stanley, and Goldman Sachs Group, Inc. all performed well. All three brokerages benefited from trading, merger and acquisition and security issuance activity. Strong equity markets and fund flows contributed to returns from asset managers Affiliated Managers Group and Franklin Resources. Capital markets and transaction flow exposure also aided JPMorgan Chase, Citigroup, and The Bank of New York. Strong pricing and a lack of catastrophes proved helpful for property/casualty holdings Axis Capital Holdings Ltd., Endurance Specialty Holdings Ltd., and St. Paul Travelers Co., Inc. Commercial banks Wells Fargo & Co., Bank of America Corp. and US Bancorp made positive contributions, as did REITs KKR Financial Corp. and Douglas Emmett, Inc.
In contrast, life/health insurer Conseco, Inc. did not earn the debt rating upgrade we expected, and the stock declined after a weak quarter, prompting the sale of our position. Credit card giant Capital One Financial Corp. fell on concerns of consumer credit and their acquisition of North Fork Bank. We continue to like the stock and believe investors will be well-rewarded as North Fork Bank is integrated and the market gains respect for the merged company's more stable risk profile.
Health insurer Aflac, Inc. was weak due to a sales shortfall in their key Japanese market. As the year progressed, we saw an increase in the risk level for many areas in financials, and reacted by positioning the Portfolio more defensively. This included reducing our broker overweight, toning down our property and casualty insurance allocation, as the stocks reacted positively to earnings, and eliminating positions in companies with weaker balance sheets.
Current Strategy and Outlook: In the face of an inverted yield curve and credit concerns, we remain underweight banks, though recent price weakening and the possibility of Fed easing in 2007 make us somewhat more constructive on this segment. We have also maintained our REIT underweight, though we continue to scour the group for opportunities that meet our valuation parameters.
Portfolio holdings and characteristics are subject to change and may not be representative of current holdings and characteristics. The outlook for this Portfolio may differ from that presented for other ING Funds. Performance for the different classes of shares will vary based on differences in fees associated with each class.

Top Ten Holdings*
as of December 31, 2006
(as a percent of net assets)
| Citigroup, Inc. | 6.0 | % | |||||
| Bank of America Corp. | 5.4 | % | |||||
| JPMorgan Chase & Co. | 4.8 | % | |||||
| American International Group, Inc. | 4.7 | % | |||||
| Wells Fargo & Co. | 4.5 | % | |||||
| US Bancorp. | 4.0 | % | |||||
| Bank of New York Co., Inc. | 3.4 | % | |||||
| Wachovia Corp. | 3.4 | % | |||||
| Merrill Lynch & Co., Inc. | 3.2 | % | |||||
| Affiliated Managers Group, Inc. | 3.0 | % | |||||
* Excludes short-term investments related to repurchase agreement.
Portfolio holdings are subject to change daily.
10
PORTFOLIO MANAGERS' REPORT
ING VP FINANCIAL SERVICES PORTFOLIO
Average Annual Total Returns for the Periods Ended December 31, 2006
| 1 Year | Since Inception of Class I and S May 3, 2004 | ||||||||||
| Class I | 17.47 | % | 14.07 | % | |||||||
| Class S | 17.11 | % | 13.80 | % | |||||||
| S&P 500 Financials Index(1) | 19.21 | % | 13.67 | %(3) | |||||||
| S&P 500® Index(2) | 15.79 | % | 11.78 | %(3) | |||||||
Based on a $10,000 initial investment, the graph and table above illustrate the total return of ING VP Financial Services against the indices indicated. An index is unmanaged and has no cash in its portfolio, imposes no sales charges and incurs no operating expenses. An investor cannot invest directly in an index. The Portfolio's performance is shown without the imposition of any expenses or charges which are, or may be, imposed under your annuity contract. Total returns would have been lower if such expenses or charges were included.
The performance graph and table do not reflect the deduction of taxes that a shareholder will pay on Portfolio distributions or the redemption of Portfolio shares.
The performance shown may include the effect of fee waivers and/or expense reimbursements by the Investment Adviser and/or other service providers, which have the effect of increasing total return. Had all fees and expenses been considered, the total returns would have been lower.
The performance update illustrates performance for a variable investment option available through a variable annuity contract. The performance shown indicates past performance and is not a projection or prediction of future results. Actual investment returns and principal value will fluctuate so that shares and/or units, at redemption, may be worth more or less than their original cost. Please call (800) 992-0180 to get performance through the most recent month end.
This report contains statements that may be "forward-looking" statements. Actual results may differ materially from those projected in the "forward-looking" statements.
The views expressed in this report reflect those of the portfolio managers, only through the end of the period as stated on the cover. The portfolio managers' views are subject to change at any time based on market and other conditions.
Portfolio holdings are subject to change daily.
(1) The S&P 500 Financials Index is a capitalization-weighted index of all stocks designed to measure the performance of the financial sector of the S&P 500® Index.
(2) The S&P 500® Index is an unmanaged index that measures the performance of the securities of approximately 500 of the largest companies in the U.S.
(3) Since inception performance for the indices is shown from May 1, 2004.
11
ING VP HIGH YIELD BOND PORTFOLIO
PORTFOLIO MANAGERS' REPORT
The ING VP High Yield Bond Portfolio (the "Portfolio") seeks to provide investors with a high level of current income and total return by investing at least 80% of its assets in high yield (high risk) bonds, that are unrated or rated below investment grade. The Portfolio is managed by Greg Jacobs*, Portfolio Manager and Kurt Kringelis*, Portfolio Manager of ING Investment Management Co. — the Sub-Adviser.
Performance: For the year ended December 31, 2006, the Portfolio's Class I shares provided a total return of 9.78% compared to the Lehman Brothers® High Yield Bond Index(1) and the Lehman Brothers® High Yield Bond Index-2% Issuer Constrained Composite Index(2), which returned 11.85% and 10.76%, respectively, for the same period.
Portfolio Specifics: 2006 was supposed to be the year that synchronized global growth led to capacity constraints in labor and manufacturing and rising commodity prices. This combination was expected to produce inflation rates that would have been unacceptable to the U.S. Federal Reserve Board ("Fed") and global investors in general. A repudiation of U.S. dollar-based assets and a Fed bent on draining liquidity from the market was expected to lead to rising interest rates and a decline in prices of high risk assets relative to their low risk counterparts. As the carry trade was unwound, volatility was expected to re-emerge. Investors were also expected to come to the realization that the Fed was behind this steepening of the yield curve and that it could not control inflation.
However, capital markets rarely serve up what is expected. Although, we did in fact experience the greatest surge in global growth since the 1970s, and the longest string of 6% plus gross domestic product ("GDP") growth since the 1980s, the economy could not deal with a simultaneous slowdown in housing and manufacturing. Even though there was a brief inflation scare as the core consumer price index reached a peak of 2.9%, a level not seen since 1996, unit labor cost increases were offset by falling goods prices. The market correctly predicted that growth and inflation would moderate and these robust economic statistics would be fleeting.
Overall, last year's high yield bond market can best be described as a battle of two halves. In the first half of 2006, the market faced inflation and oil fears, giving up most of its gains through April in the May-June period. In the second half of the year, investors shrugged off weakness in housing and focused on a benign Fed as sufficient reason to buy riskier assets. While the investment grade bond market worried about the re-levering of corporate balance sheets, the high yield market gladly financed these transactions and ended the year searching for similar deals.
Investing in riskier assets was the theme of 2006 as investors searched for yield and higher returns. The Portfolio underperformed its index in the first half of the year due to its conservative credit profile and underweight in the automotive sector. Performance rebounded in the second half as the Portfolio increased its overweight in single-B rated bonds and its exposure to Ford and General Motors Corp. On the strength of the performance in these two issuers, the automotive industry outperformed the benchmark by more than 11.0% for the year. An overweight in the cable industry acted as a positive contributor to performance, as it outperformed the benchmark by more than 8.0%.
Current Strategy and Outlook: Our basic outlook for high yield remains unchanged. Fundamentally, the outlook remains healthy, with strong profit growth and low interest rates, while the asset class continues to attract capital from investors searching for yield. While the strong second half 2006 returns certainly limit the potential upside for 2007, as long as defaults remain low and risk appetite is high, it is difficult to envision a meaningful reversal to this trend. As a result, we believe the market is likely to continue to outperform, with spreads remaining at historically tight levels. The increase in lower quality issuance over the past couple years will eventually cause an increase in defaults, but we continue to believe that occurrence is still several quarters away.
* Effective March 1, 2007, Randall Parrish will be named Portfolio Manager to the Portfolio and Greg Jacobs and Kurt Kringelis are removed as Portfolio Managers to the Portfolio.
Portfolio holdings and characteristics are subject to change and may not be representative of current holdings and characteristics. The outlook for this Portfolio may differ from that presented for other ING Funds. Performance for the different classes of shares will vary based on differences in fees associated with each class.
Industry Allocation
as of December 31, 2006
(as a percent of net assets)
| Diversified Financial Services | 13.3 | % | |||||
| Media | 13.2 | % | |||||
| Telecommunications | 8.4 | % | |||||
| Chemicals | 6.5 | % | |||||
| Retail | 5.6 | % | |||||
| Commercial Services | 5.4 | % | |||||
| Forest Products & Paper | 4.9 | % | |||||
| Healthcare-Services | 4.5 | % | |||||
| Oil & Gas | 4.2 | % | |||||
| Entertainment | 3.9 | % | |||||
| Electric | 2.9 | % | |||||
| Leisure Time | 2.2 | % | |||||
| Industries between 1.3% - 2.0%(1) | 12.8 | % | |||||
| Industries less than 1.3%(2) | 12.3 | % | |||||
| Other Assets and Liabilities, Net* | (0.1 | )% | |||||
| Net Assets | 100.0 | % | |||||
* Includes short-term investments related to repurchase agreement.
(1) Includes eight industries, which each represents 1.3% - 2.0% of net assets.
(2) Includes twenty nine industries, which each represents less than 1.3% of net assets.
Portfolio holdings are subject to change daily.
Top Ten Holdings
as of December 31, 2006
(as a percent of net assets)
| HCA, Inc., 9.250%, due 11/15/16 | 1.9 | % | |||||
| Ford Motor Credit Co., 9.750%, due 09/15/10 | 1.5 | % | |||||
| Ford Motor Credit Co., 9.875%, due 08/10/11 | 1.5 | % | |||||
| Charter Communications Operating, LLC, 8.375%, due 04/30/14 | 1.4 | % | |||||
| Ashtead Capital, Inc., 9.000%, due 08/15/16 | 1.3 | % | |||||
| CCH I, LLC, 11.000%, due 10/01/15 | 1.2 | % | |||||
| PolyOne Corp., 8.875%, due 05/01/12 | 1.1 | % | |||||
| Idearc, Inc., 8.000%, due 11/15/16 | 1.1 | % | |||||
| Lyondell Chemical Co., 8.000%, due 09/15/14 | 1.1 | % | |||||
| Neiman-Marcus Group, Inc., 9.000%, due 10/15/15 | 1.1 | % | |||||
Portfolio holdings are subject to change daily.
12
PORTFOLIO MANAGERS' REPORT
ING VP HIGH YIELD BOND PORTFOLIO

Average Annual Total Returns for the Periods Ended December 31, 2006*
| 1 Year | 5 Year | 10 Year | Since Inception of Class S April 29, 2005† | ||||||||||||||||
| Class I | 9.78 | % | 6.84 | % | 2.82 | % | — | ||||||||||||
| Class S | 9.60 | % | — | — | 8.20 | % | |||||||||||||
| Lehman Brothers® High Yield Bond Index(1) | 11.85 | % | 10.18 | % | 6.59 | % | 10.40 | %(3) | |||||||||||
| Lehman Brothers® High Yield Bond Index - 2% Issuer Constrained Composite Index(2) | 10.76 | % | 10.20 | % | 6.63 | % | 9.77 | %(3) | |||||||||||
Based on a $10,000 initial investment, the graph and table above illustrate the total return of ING VP High Yield Bond Portfolio against the indices indicated. An index is unmanaged and has no cash in its portfolio, imposes no sales charges and incurs no operating expenses. An investor cannot invest directly in an index. The Portfolio's performance is shown without the imposition of any expenses or charges which are, or may be, imposed under your annuity contract or life insurance policy. Total returns would have been lower if such expenses or charges were included.
The performance graph and table do not reflect the deduction of taxes that a shareholder will pay on Portfolio distributions or the redemption of Portfolio shares.
The performance shown may include the effect of fee waivers and/or expense reimbursements by the Investment Adviser and/or other service providers, which have the effect of increasing total return. Had all fees and expenses been considered, the total returns would have been lower.
The performance update illustrates performance for a variable investment option available through a variable annuity contract and/or a variable universal life policy. The performance shown indicates past performance and is not a projection or prediction of future results. Actual investment returns and principal value will fluctuate so that shares and/or units, at redemption, may be worth more or less than their original cost. For variable annuity contracts, please call (800) 992-0180 to get performance through the most recent month end. For variable universal life policies, please log on to www.ing.com/us to get performance through the most recent month end.
This report contains statements that may be "forward-looking" statements. Actual results may differ materially from those projected in the "forward-looking" statements.
The views expressed in this report reflect those of the portfolio managers, only through the end of the period as stated on the cover. The portfolio managers' views are subject to change at any time based on market and other conditions.
Portfolio holdings are subject to change daily.
* Class ADV commenced operations on December 29, 2006, therefore, there is no performance information for the period ended December 31, 2006. Class S commenced operations on April 29, 2005.
† On May 1, 2006, all outstanding shares of Class S were fully redeemed. On December 29, 2006, Class S recommenced operations. The returns for Class S include the performance of Class I, adjusted to reflect the higher expenses of Class S, for the period of May 2, 2006 to December 28, 2006.
(1) The Lehman Brothers® High Yield Bond Index is an unmanaged index that measures the performance of fixed-income securities generally representative of corporate bonds rated below investment grade.
(2) The Lehman Brothers® High Yield Bond — 2% Issuer Constrained Composite Index is an unmanaged index that measures the performance of fixed-income securities. The Composite Index more closely tracks the types of securities in which the Fund invests than the Lehman Brothers High Yield Bond Index.
(3) Since inception performance of the index is shown from May 1, 2005.
13
ING VP INTERNATIONAL VALUE PORTFOLIO
PORTFOLIO MANAGERS' REPORT
The ING VP International Value Portfolio (the "Portfolio") seeks long-term capital appreciation. The Portfolio is managed by Philip A. Schwartz*, CFA, Senior Vice President and Director of International Investment Strategy of ING Investment Management Co. — the Sub-Adviser.
Performance: For the year ended December 31, 2006, the Portfolio's Class I shares provided a total return of 29.44% compared to the Morgan Stanley Capital International — Europe, Australasia and Far East ("MSCI EAFE®") Index(1), which returned 26.34% for the same period.
Portfolio Specifics: International markets got off to a great start during the first five months of the year, but certain markets corrected in May and June. In particular, emerging markets suffered as riskier assets sold off. Most of the losses were recovered during the third quarter amid an increase in merger and acquisition activity, a decline in oil prices and improved consumer sentiment across Europe. The resurgence of the markets continued through the end of the year and was driven by improved consumer spending and industrial production figures.
Stock selection helped performance overall, particularly in materials, financials, industrials and telecommunications services. Underweight positions in healthcare and energy, coupled with an overweight in telecommunications services and utilities contributed positively. An underweight position in Japan and an allocation to non-benchmark emerging markets also benefited the Portfolio.
In contrast, while security selection in materials boosted performance, an underweight allocation acted as a slight drag. Further, our holdings in energy and consumer staples negatively impacted the Portfolio. Our allocation to the European region and non-benchmark North America hurt the strategy.
China Mobile Ltd, a Hong Kong-based mobile phone service provider, rose due to a record number of subscribers. Severn Trent PLC, a UK waste, water and utilities service provider, benefited from increased profits and net income, both of which beat estimates. Heineken NV, a Dutch international beer brewer, performed well due to the introduction of new beers and their entry into the Russian market.
SGL Carbon AG, a German manufacturer of carbon and graphite materials, suffered from a decrease in cash flow from its operations. The German telecommunications provider, Deutsche Telekom AG was negatively impacted after several mid-year cuts to its ratings, which stemmed from disappointing first-half results. Swedish high tech engineering group Sandvik AB similarly suffered when several analysts cut their mid-year rating.
Current Strategy and Outlook: We remain positive about 2007. With growth well underpinned in foreign economies and retreating oil prices, the outlook for international markets has improved in recent months. Consequently we remain overweight emerging markets. We also increased our position in Japan, as positive economic growth and attractive values provide opportunities. We continue to maintain an underweight to consumer discretionary, a modest underweight in financials and an overweight in energy. Major risk factors include a potential slowdown in global growth, stemming from central banks further tightening, and a potential for investors to become more risk averse.
* Effective December 31, 2006, Richard T. Saler is no longer a portfolio manager to the Portfolio.
Portfolio holdings and characteristics are subject to change and may not be representative of current holdings and characteristics. The outlook for this Portfolio may differ from that presented for other ING Funds. Performance for the different classes of shares will vary based on differences in fees associated with each class.

Top Ten Holdings*
as of December 31, 2006
(as a percent of net assets)
| Bombardier, Inc. - Class B | 3.0 | % | |||||
| PetroChina Co., Ltd. | 2.9 | % | |||||
| Kirin Brewery Co., Ltd. | 2.8 | % | |||||
| Fortum OYJ | 2.6 | % | |||||
| Royal Bank of Scotland Group PLC | 2.6 | % | |||||
| Toyota Motor Corp. | 2.5 | % | |||||
| Yamaha Motor Co., Ltd. | 2.5 | % | |||||
| Vodafone Group PLC | 2.5 | % | |||||
| Allianz AG | 2.5 | % | |||||
| Nippon Telegraph & Telephone Corp. | 2.4 | % | |||||
* Excludes short-term investments related to repurchase agreement and securities lending collateral.
Portfolio holdings are subject to change daily.
14
PORTFOLIO MANAGERS' REPORT
ING VP INTERNATIONAL VALUE PORTFOLIO

Average Annual Total Returns for the Periods Ended December 31, 2006*
| 1 Year | 5 Year | Since Inception of Class I August 8, 1997 | Since Inception of Class S March 19, 2002 | ||||||||||||||||
| Class I | 29.44 | % | 12.80 | % | 12.25 | % | — | ||||||||||||
| Class S | 28.81 | % | — | — | 12.09 | % | |||||||||||||
| MSCI EAFE® Index(1) | 26.34 | % | 14.98 | % | 6.81 | %(2) | 15.70 | %(3) | |||||||||||
Based on a $10,000 initial investment, the graph and table above illustrate the total return of ING VP International Value Portfolio against the index indicated. An index is unmanaged and has no cash in its portfolio, imposes no sales charges and incurs no operating expenses. An investor cannot invest directly in an index. The Portfolio's performance is shown without the imposition of any expenses or charges which are, or may be, imposed under your annuity contract or life insurance policy. Total returns would have been lower if such expenses or charges were included.
The performance graph and table do not reflect the deduction of taxes that a shareholder will pay on Portfolio distributions or the redemption of Portfolio shares.
The performance shown may include the effect of fee waivers and/or expense reimbursements by the Investment Adviser and/or other service providers, which have the effect of increasing total return. Had all fees and expenses been considered, the total returns would have been lower.
The performance update illustrates performance for a variable investment option available through a variable annuity contract and/or a variable universal life policy. The performance shown indicates past performance and is not a projection or prediction of future results. Actual investment returns and principal value will fluctuate so that shares and/or units, at redemption, may be worth more or less than their original cost. For variable annuity contracts, please call (800) 992-0180 to get performance through the most recent month end. For variable universal life policies, please log on to www.ing.com/us to get performance through the most recent month end.
This report contains statements that may be "forward-looking" statements. Actual results may differ materially from those projected in the "forward-looking" statements.
The views expressed in this report reflect those of the portfolio managers only through the end of the period as stated on the cover. The portfolio managers' views are subject to change at any time based on market and other conditions.
Portfolio holdings are subject to change daily.
* ADV Class commenced operations on December 29, 2006, therefore, there is no performance information for the period ended December 31, 2006.
(1) The MSCI EAFE® Index is an unmanaged index that measures the performance of securities listed on exchanges in markets in Europe, Australasia and the Far East. It includes the reinvestment of dividends net of withholding taxes, but does not reflect fees, brokerage commissions or other expenses of investing.
(2) Since inception performance for the index is shown from August 1, 1997.
(3) Since inception performance for the index is shown from April 1, 2002.
Prior to July 1, 2002, the portfolio was sub-advised by a different sub-adviser.
15
SHAREHOLDER EXPENSE EXAMPLES (UNAUDITED)
As a shareholder of a Portfolio, you incur two types of costs: (1) transaction costs, including redemption fees; and exchange fees; and (2) ongoing costs, including management fees; distribution and/or service (12b-1) fees; and other Portfolio expenses. These Examples are intended to help you understand your ongoing costs (in dollars) of investing in a Portfolio and to compare these costs with the ongoing costs of investing in other mutual funds.
The Examples are based on an investment of $1,000 invested at the beginning of the period and held for the entire period from July 1, 2006 to December 31, 2006. The Portfolios' expenses are shown without the imposition of any charges which are, or may be, imposed under your annuity contract. Expenses would have been higher if such charges were included.
Actual Expenses
The first section of the table shown, "Actual Portfolio Return," provides information about actual account values and actual expenses. You may use the information in this section, together with the amount you invested, to estimate the expenses that you paid over the period. Simply divide your account value by $1,000 (for example, an $8,600 account value divided by $1,000 = 8.6), then multiply the result by the number in the first section under the heading entitled "Expenses Paid During Period" to estimate the expenses you paid on your account during this period.
Hypothetical Example for Comparison Purposes
The second section of the table shown, "Hypothetical 5% Return," provides information about hypothetical account values and hypothetical expenses based on the Portfolio's actual expense ratio and an assumed rate of return of 5% per year before expenses, which is not the Portfolio's actual return. The hypothetical account values and expenses may not be used to estimate the actual ending account balance or expenses you paid for the period. You may use this information to compare the ongoing costs of investing in the Portfolio and other mutual funds. To do so, compare this 5% hypothetical example with the 5% hypothetical examples that appear in the shareholder reports of the other mutual funds.
Please note that the expenses shown in the table are meant to highlight your ongoing costs only and do not reflect any transactional costs, such as redemption fees or exchange fees. Therefore, the hypothetical lines of the table are useful in comparing ongoing costs only, and will not help you determine the relative total costs of owning different mutual funds. In addition, if these transactional costs were included, your costs would have been higher.
| ING VP Real Estate Portfolio | Beginning Account Value July 1, 2006 | Ending Account Value December 31, 2006 | Annualized Expense Ratio | Expenses Paid During the Six Months Ended December 31, 2006* | |||||||||||||||
| Actual Portfolio Return | |||||||||||||||||||
| Class I | $ | 1,000.00 | $ | 1,182.00 | 0.93 | % | $ | 5.11 | |||||||||||
| Class S | 1,000.00 | 1,180.90 | 1.18 | 6.49 | |||||||||||||||
| Hypothetical (5% return before expenses) | |||||||||||||||||||
| Class I | $ | 1,000.00 | $ | 1,020.52 | 0.93 | % | $ | 4.74 | |||||||||||
| Class S | 1,000.00 | 1,019.26 | 1.18 | 6.01 | |||||||||||||||
| ING VP MidCap Opportunities Portfolio | |||||||||||||||||||
| Actual Portfolio Return | |||||||||||||||||||
| Class ADV(a) | $ | 1,000.00 | $ | 1,000.00 | 1.40 | % | $ | 0.12 | |||||||||||
| Class I | 1,000.00 | 1,029.00 | 0.90 | 4.60 | |||||||||||||||
| Class S | 1,000.00 | 1,028.10 | 1.10 | 5.62 | |||||||||||||||
| Hypothetical (5% return before expenses) | |||||||||||||||||||
| Class ADV | $ | 1,000.00 | $ | 1,018.15 | 1.40 | % | $ | 7.12 | |||||||||||
| Class I | 1,000.00 | 1,020.67 | 0.90 | 4.58 | |||||||||||||||
| Class S | 1,000.00 | 1,019.66 | 1.10 | 5.60 | |||||||||||||||
* Expenses are equal to each Portfolio's respective annualized expense ratios multiplied by the average account value over the period, multiplied by 184/365 to reflect the most recent fiscal half-year (except "Actual Portfolio Return" information for all share classes footnoted above).
(a) Commencement of operations for Class ADV or Class S was December 29, 2006. Expenses paid reflect the three day period ended December 31, 2006 with 0.00% return.
16
SHAREHOLDER EXPENSE EXAMPLES (UNAUDITED) (CONTINUED)
| ING VP SmallCap Opportunities Portfolio | Beginning Account Value July 1, 2006 | Ending Account Value December 31, 2006 | Annualized Expense Ratio | Expenses Paid During the Six Months Ended December 31, 2006* | |||||||||||||||
| Actual Portfolio Return | |||||||||||||||||||
| Class I | $ | 1,000.00 | $ | 1,063.90 | 0.90 | % | $ | 4.68 | |||||||||||
| Class S | 1,000.00 | 1,063.00 | 1.10 | 5.72 | |||||||||||||||
| Hypothetical (5% return before expenses) | |||||||||||||||||||
| Class I | $ | 1,000.00 | $ | 1,020.67 | 0.90 | % | $ | 4.58 | |||||||||||
| Class S | 1,000.00 | 1,019.66 | 1.10 | 5.60 | |||||||||||||||
| ING VP Financial Services Portfolio | |||||||||||||||||||
| Actual Portfolio Return | |||||||||||||||||||
| Class I | $ | 1,000.00 | $ | 1,149.70 | 0.80 | % | $ | 4.33 | |||||||||||
| Class S | 1,000.00 | 1,147.90 | 1.05 | 5.68 | |||||||||||||||
| Hypothetical (5% return before expenses) | |||||||||||||||||||
| Class I | $ | 1,000.00 | $ | 1,021.17 | 0.80 | % | $ | 4.08 | |||||||||||
| Class S | 1,000.00 | 1,019.91 | 1.05 | 5.35 | |||||||||||||||
| ING VP High Yield Bond Portfolio | |||||||||||||||||||
| Actual Portfolio Return | |||||||||||||||||||
| Class ADV(a) | $ | 1,000.00 | $ | 1,000.00 | 1.21 | % | $ | 0.10 | |||||||||||
| Class I | 1,000.00 | 1,076.30 | 0.72 | 3.77 | |||||||||||||||
| Class S(a) | 1,000.00 | 1,000.00 | 0.91 | 0.07 | |||||||||||||||
| Hypothetical (5% return before expenses) | |||||||||||||||||||
| Class ADV | $ | 1,000.00 | $ | 1,019.11 | 1.21 | % | $ | 6.16 | |||||||||||
| Class I | 1,000.00 | 1,021.58 | 0.72 | 3.67 | |||||||||||||||
| Class S | 1,000.00 | 1,020.62 | 0.91 | 4.63 | |||||||||||||||
| ING VP International Value Portfolio | |||||||||||||||||||
| Actual Portfolio Return | |||||||||||||||||||
| Class ADV(a) | $ | 1,000.00 | $ | 1,000.00 | 1.50 | % | $ | 0.12 | |||||||||||
| Class I | 1,000.00 | 1,165.00 | 1.00 | 5.46 | |||||||||||||||
| Class S | 1,000.00 | 1,161.40 | 1.20 | 6.54 | |||||||||||||||
| Hypothetical (5% return before expenses) | |||||||||||||||||||
| Class ADV | $ | 1,000.00 | $ | 1,017.64 | 1.50 | % | $ | 7.63 | |||||||||||
| Class I | 1,000.00 | 1,020.16 | 1.00 | 5.09 | |||||||||||||||
| Class S | 1,000.00 | 1,019.16 | 1.20 | 6.11 | |||||||||||||||
* Expenses are equal to each Portfolio's respective annualized expense ratios multiplied by the average account value over the period, multiplied by 184/365 to reflect the most recent fiscal half-year (except "Actual Portfolio Return" information for all share classes footnoted above).
(a) Commencement of operations for Class ADV and Class S was December 29, 2006. Expenses paid reflect the three day period ended December 31, 2006 with 0.00% return.
17
REPORT OF INDEPENDENT REGISTERED PUBLIC ACCOUNTING FIRM
The Shareholders and Board of Trustees
ING Variable Products Trust
We have audited the accompanying statements of assets and liabilities, including the portfolios of investments, of ING VP Real Estate Portfolio, ING VP MidCap Opportunities Portfolio, ING VP SmallCap Opportunities Portfolio, ING VP Financial Services Portfolio, ING VP High Yield Bond Portfolio, and ING VP International Value Portfolio, each a series of ING Variable Products Trust, as of December 31, 2006, and the related statements of operations for the year then ended, the statements of changes in net assets for each of the years in the two-year period then ended, and the financial highlights for each of the years or periods in the five-year period then ended. These financial statements and financial highlights are the responsibility of management. Our responsibility is to express an opinion on these financial statements and financial highlights based on our audits.
We conducted our audits in accordance with the standards of the Public Company Accounting Oversight Board (United States). Those standards require that we plan and perform the audits to obtain reasonable assurance about whether the financial statements and financial highlights are free of material misstatement. An audit includes examining, on a test basis, evidence supporting the amounts and disclosures in the financial statements. Our procedures included confirmation of securities owned as of December 31, 2006 by correspondence with the custodian and brokers, or by other appropriate auditing procedures when replies from brokers were not received. An audit also includes assessing the accounting principles used and significant estimates made by management, as well as evaluating the overall financial statement presentation. We believe that our audits provide a reasonable basis for our opinion.
In our opinion, the financial statements and financial highlights referred to above present fairly, in all material respects, the financial position of the aforementioned portfolios as of December 31, 2006, the results of their operations, the changes in their net assets, and the financial highlights for the period specified in the first paragraph above, in conformity with U.S. generally accepted accounting principles.

Boston, Massachusetts
February 26, 2007
18
STATEMENTS OF ASSETS AND LIABILITIES AS OF DECEMBER 31, 2006
| ING VP Real Estate Portfolio | ING VP MidCap Opportunities Portfolio | ING VP SmallCap Opportunities Portfolio | ING VP Financial Services Portfolio | ||||||||||||||||
| ASSETS: | |||||||||||||||||||
| Investments in securities at value+* | $ | 172,046,903 | $ | 102,459,114 | $ | 198,691,697 | $ | 95,564,559 | |||||||||||
| Short-term investments at amortized cost | 2,101,463 | 30,630,637 | 60,458,865 | 3,055,000 | |||||||||||||||
| Cash | 591,512 | 63 | 6,216,367 | 720 | |||||||||||||||
| Receivables: | |||||||||||||||||||
| Investment securities sold | 236,740 | 1,287,823 | 2,668,253 | — | |||||||||||||||
| Fund shares sold | 641,090 | 8,655 | 12,939 | 189,962 | |||||||||||||||
| Dividends and interest | 1,072,186 | 29,787 | 44,814 | 92,500 | |||||||||||||||
| Prepaid expenses | 1,508 | 1,286 | 2,347 | 944 | |||||||||||||||
| Reimbursement due from manager | — | — | — | 8,578 | |||||||||||||||
| Total assets | $ | 176,691,402 | $ | 134,417,365 | $ | 268,095,282 | $ | 98,912,263 | |||||||||||
| LIABILITIES: | |||||||||||||||||||
| Payable for investment securities purchased | 1,308,667 | 901,316 | 9,141,521 | — | |||||||||||||||
| Payable for fund shares redeemed | 123,623 | 84,496 | 692,562 | — | |||||||||||||||
| Payable upon receipt of securities loaned | — | 28,278,637 | 54,242,865 | — | |||||||||||||||
| Payable to affiliates | 134,721 | 91,354 | 173,629 | 90,446 | |||||||||||||||
| Payable for trustee fees | 687 | 2,502 | 4,308 | 949 | |||||||||||||||
| Other accrued expenses and liabilities | 25,546 | 94,149 | 104,689 | 42,235 | |||||||||||||||
| Total liabilities | 1,593,244 | 29,452,454 | 64,359,574 | 133,630 | |||||||||||||||
| NET ASSETS | $ | 175,098,158 | $ | 104,964,911 | $ | 203,735,708 | $ | 98,778,633 | |||||||||||
| NET ASSETS WERE COMPRISED OF: | |||||||||||||||||||
| Paid-in capital | 135,447,389 | 142,866,870 | 187,993,617 | 80,977,119 | |||||||||||||||
| Undistributed net investment income | 5,802 | — | 2,444 | 39,809 | |||||||||||||||
| Accumulated net realized gain (loss) on investments | 7,330,225 | (48,147,811 | ) | (4,892,569 | ) | 4,631,777 | |||||||||||||
| Net unrealized appreciation on investments | 32,314,742 | 10,245,852 | 20,632,216 | 13,129,928 | |||||||||||||||
| NET ASSETS | $ | 175,098,158 | $ | 104,964,911 | $ | 203,735,708 | $ | 98,778,633 | |||||||||||
| + Including securities loaned at value | $ | — | $ | 27,450,856 | $ | 52,237,167 | $ | — | |||||||||||
| * Cost of investments in securities | $ | 139,732,161 | $ | 92,213,262 | $ | 178,059,481 | $ | 82,434,631 | |||||||||||
| Class ADV: | |||||||||||||||||||
| Net assets | n/a | $ | 1,000 | n/a | n/a | ||||||||||||||
| Shares authorized | n/a | unlimited | n/a | n/a | |||||||||||||||
| Par value | n/a | $ | 0.01 | n/a | n/a | ||||||||||||||
| Shares outstanding | n/a | 122 | n/a | n/a | |||||||||||||||
| Net asset value and redemption price per share | n/a | $ | 8.20 | n/a | n/a | ||||||||||||||
| Class I: | |||||||||||||||||||
| Net assets | $ | 132,519,960 | $ | 71,153,939 | $ | 81,209,911 | $ | 4,882,572 | |||||||||||
| Shares authorized | unlimited | unlimited | unlimited | unlimited | |||||||||||||||
| Par value | $ | 0.01 | $ | 0.01 | $ | 0.01 | $ | 0.01 | |||||||||||
| Shares outstanding | 6,754,228 | 8,720,203 | 4,067,049 | 365,566 | |||||||||||||||
| Net asset value and redemption price per share | $ | 19.62 | $ | 8.16 | $ | 19.97 | $ | 13.36 | |||||||||||
| Class S: | |||||||||||||||||||
| Net assets | $ | 42,578,198 | $ | 33,809,972 | $ | 122,525,797 | $ | 93,896,061 | |||||||||||
| Shares authorized | unlimited | unlimited | unlimited | unlimited | |||||||||||||||
| Par value | $ | 0.01 | $ | 0.01 | $ | 0.01 | $ | 0.01 | |||||||||||
| Shares outstanding | 2,172,549 | 4,200,338 | 6,207,820 | 7,036,649 | |||||||||||||||
| Net asset value and redemption price per share | $ | 19.60 | $ | 8.05 | $ | 19.74 | $ | 13.34 | |||||||||||
See Accompanying Notes to Financial Statements
19
STATEMENTS OF ASSETS AND LIABILITIES AS OF DECEMBER 31, 2006
| ING VP High Yield Bond Portfolio | ING VP International Value Portfolio | ||||||||||
| ASSETS: | |||||||||||
| Investments in securities at value+* | $ | 103,645,576 | $ | 448,370,891 | |||||||
| Investment in affiliate** | 791,685 | — | |||||||||
| Short-term investments at amortized cost | 335,000 | 29,047,231 | |||||||||
| Short-term investment in affiliate at amortized cost | — | 6,000,000 | |||||||||
| Cash | 1,102,011 | — | |||||||||
| Foreign currencies at value*** | — | 252,295 | |||||||||
| Receivables: | |||||||||||
| Investment securities sold | 2,023 | 1,954,644 | |||||||||
| Fund shares sold | 33,454 | 45,107 | |||||||||
| Dividends and interest | 2,107,470 | 638,353 | |||||||||
| Unrealized appreciation on swap agreements | 36,802 | — | |||||||||
| Prepaid expenses | 206 | 4,932 | |||||||||
| Reimbursement due from manager | 22,230 | 83,955 | |||||||||
| Total assets | $ | 108,076,457 | $ | 486,397,408 | |||||||
| LIABILITIES: | |||||||||||
| Payable for investment securities purchased | 1,100,000 | 2,683,280 | |||||||||
| Payable for fund shares redeemed | 521,824 | 807,363 | |||||||||
| Payable upon receipt of securities loaned | — | 13,061,231 | |||||||||
| Unrealized depreciation on swap agreements | 39,296 | — | |||||||||
| Income distribution payable | 1,931,432 | — | |||||||||
| Payable to affiliates | 60,826 | 428,381 | |||||||||
| Payable to custodian due to bank overdraft | — | 1,882,808 | |||||||||
| Payable for trustee fees | 4,829 | 11,268 | |||||||||
| Other accrued expenses and liabilities | 32,562 | 134,677 | |||||||||
| Total liabilities | 3,690,769 | 19,009,008 | |||||||||
| NET ASSETS | $ | 104,385,688 | $ | 467,388,400 | |||||||
| NET ASSETS WERE COMPRISED OF: | |||||||||||
| Paid-in capital | 109,245,791 | 337,340,567 | |||||||||
| Undistributed net investment income | 2,494 | 112,467 | |||||||||
| Accumulated net realized gain (loss) on investments, foreign currency related transactions, futures, and swaps | (7,364,972 | ) | 84,816,924 | ||||||||
| Net unrealized appreciation on investments, foreign currency related transactions, and swaps | 2,502,375 | 45,118,442 | |||||||||
| NET ASSETS | $ | 104,385,688 | $ | 467,388,400 | |||||||
| + Including securities loaned at value | $ | — | $ | 12,585,492 | |||||||
| * Cost of investments in securities | $ | 101,165,970 | $ | 403,277,148 | |||||||
| ** Cost of investment in affiliate | $ | 766,422 | $ | — | |||||||
| *** Cost of foreign currencies | $ | — | $ | 269,182 | |||||||
| Class ADV: | |||||||||||
| Net assets | $ | 1,000 | $ | 1,000 | |||||||
| Shares authorized | unlimited | unlimited | |||||||||
| Par value | $ | 0.01 | $ | 0.01 | |||||||
| Shares outstanding | 328 | 65 | |||||||||
| Net asset value and redemption price per share | $ | 3.05 | $ | 15.38 | |||||||
| Class I: | |||||||||||
| Net assets | $ | 104,383,688 | $ | 460,380,546 | |||||||
| Shares authorized | unlimited | unlimited | |||||||||
| Par value | $ | 0.01 | $ | 0.01 | |||||||
| Shares outstanding | 34,213,835 | 30,168,876 | |||||||||
| Net asset value and redemption price per share | $ | 3.05 | $ | 15.26 | |||||||
| Class S: | |||||||||||
| Net assets | $ | 1,000 | $ | 7,006,854 | |||||||
| Shares authorized | unlimited | unlimited | |||||||||
| Par value | $ | 0.01 | $ | 0.01 | |||||||
| Shares outstanding | 328 | 454,577 | |||||||||
| Net asset value and redemption price per share | $ | 3.05 | $ | 15.41 | |||||||
See Accompanying Notes to Financial Statements
20
STATEMENTS OF OPERATIONS FOR THE YEAR ENDED DECEMBER 31, 2006
| ING VP Real Estate Portfolio | ING VP MidCap Opportunities Portfolio | ING VP SmallCap Opportunities Portfolio | ING VP Financial Services Portfolio | ||||||||||||||||
| INVESTMENT INCOME: | |||||||||||||||||||
| Dividends | $ | 2,485,302 | $ | 450,109 | $ | 661,321 | $ | 1,710,656 | |||||||||||
| Interest | 103,187 | 171,480 | 315,719 | 145,815 | |||||||||||||||
| Securities lending income | — | 47,841 | 168,575 | — | |||||||||||||||
| Total investment income | 2,588,489 | 669,430 | 1,145,615 | 1,856,471 | |||||||||||||||
| EXPENSES: | |||||||||||||||||||
| Investment management fees | 921,461 | 873,220 | 1,570,669 | 606,567 | |||||||||||||||
| Distribution and service fees: | |||||||||||||||||||
| Class S | 68,292 | 96,797 | 313,782 | 196,416 | |||||||||||||||
| Transfer agent fees | 439 | 378 | 274 | 230 | |||||||||||||||
| Administrative service fees | 117,993 | 116,429 | 209,421 | 80,875 | |||||||||||||||
| Shareholder reporting expense | 24,267 | 55,754 | 83,480 | 11,125 | |||||||||||||||
| Registration fees | 448 | 857 | 1,396 | 490 | |||||||||||||||
| Professional fees | 15,957 | 28,648 | 37,730 | 18,769 | |||||||||||||||
| Custody and accounting expense | 14,904 | 20,900 | 29,225 | 11,104 | |||||||||||||||
| Trustee fees | 698 | 1,500 | 4,300 | 1,210 | |||||||||||||||
| Miscellaneous expense | 5,522 | 9,973 | 14,041 | 4,583 | |||||||||||||||
| Interest Expense | 77 | — | — | 274 | |||||||||||||||
| Total expenses | 1,170,058 | 1,204,456 | 2,264,318 | 931,643 | |||||||||||||||
| Net waived and reimbursed fees | — | (79,148 | ) | (126,992 | ) | (88,652 | ) | ||||||||||||
| Net expenses | 1,170,058 | 1,125,308 | 2,137,326 | 842,991 | |||||||||||||||
| Net investment income (loss) | 1,418,431 | (455,878 | ) | (991,711 | ) | 1,013,480 | |||||||||||||
| REALIZED AND UNREALIZED GAIN (LOSS) ON INVESTMENTS: | |||||||||||||||||||
| Net realized gain on investments | 8,663,777 | 19,751,909 | 35,122,013 | 5,148,836 | |||||||||||||||
| Net change in unrealized appreciation or depreciation on investments | 25,599,147 | (10,692,866 | ) | (10,794,870 | ) | 7,170,129 | |||||||||||||
| Net realized and unrealized gain on investments | 34,262,924 | 9,059,043 | 24,327,143 | 12,318,965 | |||||||||||||||
| Increase in net assets resulting from operations | $ | 35,681,355 | $ | 8,603,165 | $ | 23,335,432 | $ | 13,332,445 | |||||||||||
See Accompanying Notes to Financial Statements
21
STATEMENTS OF OPERATIONS FOR THE YEAR ENDED DECEMBER 31, 2006
| ING VP High Yield Bond Portfolio | ING VP International Value Portfolio | ||||||||||
| INVESTMENT INCOME: | |||||||||||
| Dividends, net of foreign taxes withheld* | $ | 66,506 | $ | 12,653,059 | |||||||
| Interest(1) | 8,041,449 | 1,171,433 | |||||||||
| Securities lending income | — | 468,838 | |||||||||
| Total investment income | 8,107,955 | 14,293,330 | |||||||||
| EXPENSES: | |||||||||||
| Investment management fees | 608,725 | 4,203,472 | |||||||||
| Distribution and service fees: | |||||||||||
| Class S | 59,801 | 10,417 | |||||||||
| Transfer agent fees | 392 | 477 | |||||||||
| Administrative service fees | 102,744 | 420,343 | |||||||||
| Shareholder reporting expense | 38,030 | 127,075 | |||||||||
| Registration fees | 521 | 2,415 | |||||||||
| Professional fees | 24,170 | 79,777 | |||||||||
| Custody and accounting expense | 23,725 | 145,645 | |||||||||
| Trustee fees | 2,555 | 14,965 | |||||||||
| Miscellaneous expense | 7,572 | 16,957 | |||||||||
| Interest Expense | 4,023 | 2,386 | |||||||||
| Total expenses | 872,258 | 5,023,929 | |||||||||
| Net waived and reimbursed fees | (65,769 | ) | (810,242 | ) | |||||||
| Net expenses | 806,489 | 4,213,687 | |||||||||
| Net investment income | 7,301,466 | 10,079,643 | |||||||||
| REALIZED AND UNREALIZED GAIN (LOSS) ON INVESTMENTS, FOREIGN CURRENCY RELATED TRANSACTIONS AND SWAPS: | |||||||||||
| Net realized gain (loss) on: | |||||||||||
| Investments | (390,006 | ) | 85,928,170 | ||||||||
| Foreign currency related transactions | — | (849,015 | ) | ||||||||
| Swaps | (72,132 | ) | — | ||||||||
| Net realized gain (loss) on investments, foreign currency related transactions and swaps | (462,138 | ) | 85,079,155 | ||||||||
| Net change in unrealized appreciation or depreciation on: | |||||||||||
| Investments | 2,757,796 | 10,743,883 | |||||||||
| Foreign currency related transactions | — | 20,688 | |||||||||
| Swaps | (2,494 | ) | — | ||||||||
| Net change in unrealized appreciation or depreciation on investments, foreign currency related transactions and swaps | 2,755,302 | 10,764,571 | |||||||||
| Net realized and unrealized gain on investments, foreign currency related transactions and swaps | 2,293,164 | 95,843,726 | |||||||||
| Increase in net assets resulting from operations | $ | 9,594,630 | $ | 105,923,369 | |||||||
| * Foreign taxes withheld | $ | — | $ | 1,143,087 | |||||||
| (1) Affiliated income | $ | 46,045 | $ | 63,454 | |||||||
See Accompanying Notes to Financial Statements
22
STATEMENTS OF CHANGES IN NET ASSETS
| ING VP Real Estate Portfolio | ING VP MidCap Opportunities Portfolio | ||||||||||||||||||
| Year Ended December 31, 2006 | Year Ended December 31, 2005 | Year Ended December 31, 2006 | Year Ended December 31, 2005 | ||||||||||||||||
| FROM OPERATIONS: | |||||||||||||||||||
| Net investment income (loss) | $ | 1,418,431 | $ | 812,002 | $ | (455,878 | ) | $ | (463,652 | ) | |||||||||
| Net realized gain on investments | 8,663,777 | 3,159,593 | 19,751,909 | 19,470,895 | |||||||||||||||
| Net change in unrealized appreciation or depreciation on investments | 25,599,147 | 2,992,010 | (10,692,866 | ) | (7,425,127 | ) | |||||||||||||
| Net increase in net assets resulting from operations | 35,681,355 | 6,963,605 | 8,603,165 | 11,582,116 | |||||||||||||||
| FROM DISTRIBUTIONS TO SHAREHOLDERS: | |||||||||||||||||||
| Net investment income: | |||||||||||||||||||
| Class I | (2,155,267 | ) | (1,198,708 | ) | — | — | |||||||||||||
| Class S | (597,987 | ) | (205,264 | ) | — | — | |||||||||||||
| Net realized gains: | |||||||||||||||||||
| Class I | (1,985,151 | ) | — | — | — | ||||||||||||||
| Class S | (635,843 | ) | — | — | — | ||||||||||||||
| Total distributions | (5,374,248 | ) | (1,403,972 | ) | — | — | |||||||||||||
| FROM CAPITAL SHARE TRANSACTIONS: | |||||||||||||||||||
| Net proceeds from sale of shares | 89,052,807 | 44,408,684 | 4,456,652 | 13,136,203 | |||||||||||||||
| Dividends reinvested | 5,372,086 | 1,403,972 | — | — | |||||||||||||||
| 94,424,893 | 45,812,656 | 4,456,652 | 13,136,203 | ||||||||||||||||
| Cost of shares redeemed | (23,087,490 | ) | (9,273,329 | ) | (28,844,785 | ) | (30,745,080 | ) | |||||||||||
| Net increase (decrease) in net assets resulting from capital share transactions | 71,337,403 | 36,539,327 | (24,388,133 | ) | (17,608,877 | ) | |||||||||||||
| Net increase (decrease) in net assets | 101,644,510 | 42,098,960 | (15,784,968 | ) | (6,026,761 | ) | |||||||||||||
| NET ASSETS: | |||||||||||||||||||
| Beginning of year | 73,453,648 | 31,354,688 | 120,749,879 | 126,776,640 | |||||||||||||||
| End of year | $ | 175,098,158 | $ | 73,453,648 | $ | 104,964,911 | $ | 120,749,879 | |||||||||||
| Undistributed net investment income at end of year | $ | 5,802 | $ | 31,901 | $ | — | $ | — | |||||||||||
See Accompanying Notes to Financial Statements
23
STATEMENTS OF CHANGES IN NET ASSETS
| ING VP SmallCap Opportunities Portfolio | ING VP Financial Services Portfolio | ||||||||||||||||||
| Year Ended December 31, 2006 | Year Ended December 31, 2005 | Year Ended December 31, 2006 | Year Ended December 31, 2005 | ||||||||||||||||
| FROM OPERATIONS: | |||||||||||||||||||
| Net investment income (loss) | $ | (991,711 | ) | $ | (1,204,494 | ) | $ | 1,013,480 | $ | 452,896 | |||||||||
| Net realized gain on investments | 35,122,013 | 43,519,507 | 5,148,836 | 1,121,903 | |||||||||||||||
| Net change in unrealized appreciation or depreciation on investments | (10,794,870 | ) | (25,971,536 | ) | 7,170,129 | 4,517,755 | |||||||||||||
| Net increase in net assets resulting from operations | 23,335,432 | 16,343,477 | 13,332,445 | 6,092,554 | |||||||||||||||
| FROM DISTRIBUTIONS TO SHAREHOLDERS: | |||||||||||||||||||
| Net investment income: | |||||||||||||||||||
| Class I | — | — | (35,296 | ) | (61,257 | ) | |||||||||||||
| Class S | — | — | (936,372 | ) | (386,587 | ) | |||||||||||||
| Net realized gains: | |||||||||||||||||||
| Class I | — | — | (10,932 | ) | (123,490 | ) | |||||||||||||
| Class S | — | — | (207,459 | ) | (1,139,818 | ) | |||||||||||||
| Total distributions | — | — | (1,190,059 | ) | (1,711,152 | ) | |||||||||||||
| FROM CAPITAL SHARE TRANSACTIONS: | |||||||||||||||||||
| Net proceeds from sale of shares | 22,202,369 | 33,836,903 | 31,596,730 | 66,566,848 | |||||||||||||||
| Dividends reinvested | — | — | 1,190,059 | 1,549,401 | |||||||||||||||
| 22,202,369 | 33,836,903 | 32,786,789 | 68,116,249 | ||||||||||||||||
| Cost of shares redeemed | (41,811,182 | ) | (45,635,097 | ) | (23,586,981 | ) | (14,759,010 | ) | |||||||||||
| Net increase (decrease) in net assets resulting from capital share transactions | (19,608,813 | ) | (11,798,194 | ) | 9,199,808 | 53,357,239 | |||||||||||||
| Net increase in net assets | 3,726,619 | 4,545,283 | 21,342,194 | 57,738,641 | |||||||||||||||
| NET ASSETS: | |||||||||||||||||||
| Beginning of year | 200,009,089 | 195,463,806 | 77,436,439 | 19,697,798 | |||||||||||||||
| End of year | $ | 203,735,708 | $ | 200,009,089 | $ | 98,778,633 | $ | 77,436,439 | |||||||||||
| Undistributed net investment income at end of year | $ | 2,444 | $ | — | $ | 39,809 | $ | 5,634 | |||||||||||
See Accompanying Notes to Financial Statements
24
STATEMENTS OF CHANGES IN NET ASSETS
| ING VP High Yield Bond Portfolio | ING VP International Value Portfolio | ||||||||||||||||||
| Year Ended December 31, 2006 | Year Ended December 31, 2005 | Year Ended December 31, 2006 | Year Ended December 31, 2005 | ||||||||||||||||
| FROM OPERATIONS: | |||||||||||||||||||
| Net investment income | $ | 7,301,466 | $ | 3,165,305 | $ | 10,079,643 | $ | 4,486,636 | |||||||||||
| Net realized gain (loss) on investments, investments in underlying affiliated funds, foreign currency related transactions, futures, and swaps | (462,138 | ) | (28,711 | ) | 85,079,155 | 27,776,886 | |||||||||||||
| Net change in unrealized appreciation or depreciation on investments, foreign currency related transactions, and swaps | 2,755,302 | (924,805 | ) | 10,764,571 | (1,594,581 | ) | |||||||||||||
| Net increase in net assets resulting from operations | 9,594,630 | 2,211,789 | 105,923,369 | 30,668,941 | |||||||||||||||
| FROM DISTRIBUTIONS TO SHAREHOLDERS: | |||||||||||||||||||
| Net investment income: | |||||||||||||||||||
| Class I | (5,704,848 | ) | (1,169,783 | ) | (10,301,690 | ) | (7,228,013 | ) | |||||||||||
| Class S | (1,523,577 | ) | (1,996,274 | ) | (91,548 | ) | (38,217 | ) | |||||||||||
| Net realized gains: | |||||||||||||||||||
| Class I | — | — | (23,505,140 | ) | (17,792,010 | ) | |||||||||||||
| Class S | — | — | (351,608 | ) | (90,682 | ) | |||||||||||||
| Total distributions | (7,228,425 | ) | (3,166,057 | ) | (34,249,986 | ) | (25,148,922 | ) | |||||||||||
| FROM CAPITAL SHARE TRANSACTIONS: | |||||||||||||||||||
| Net proceeds from sale of shares | 205,293,277 | 89,345,713 | 113,005,548 | 103,338,958 | |||||||||||||||
| Dividends reinvested | 6,262,441 | 2,127,774 | 34,249,986 | 25,148,922 | |||||||||||||||
| 211,555,718 | 91,473,487 | 147,255,534 | 128,487,880 | ||||||||||||||||
| Cost of shares redeemed | (200,367,224 | ) | (21,471,278 | ) | (102,713,680 | ) | (46,753,345 | ) | |||||||||||
| Net increase in net assets resulting from capital share transactions | 11,188,494 | 70,002,209 | 44,541,854 | 81,734,535 | |||||||||||||||
| Net increase in net assets | 13,554,699 | 69,047,941 | 116,215,237 | 87,254,554 | |||||||||||||||
| NET ASSETS: | |||||||||||||||||||
| Beginning of year | 90,830,989 | 21,783,048 | 351,173,163 | 263,918,609 | |||||||||||||||
| End of year | $ | 104,385,688 | $ | 90,830,989 | $ | 467,388,400 | $ | 351,173,163 | |||||||||||
| Undistributed net investment income at end of year | $ | 2,494 | $ | 13,142 | $ | 112,467 | $ | 977,009 | |||||||||||
See Accompanying Notes to Financial Statements
25
ING VP REAL ESTATE PORTFOLIO
FINANCIAL HIGHLIGHTS
Selected data for a share of beneficial interest outstanding throughout each period.
| Class I | |||||||||||||||
| Year Ended December 31, | May 3, 2004(1) to December 31, | ||||||||||||||
| 2006 | 2005 | 2004 | |||||||||||||
| Per Share Operating Performance: | |||||||||||||||
| Net asset value, beginning of the period | $ | 14.96 | 13.62 | 10.00 | |||||||||||
| Income from investment operations: | |||||||||||||||
| Net investment income | $ | 0.24 | 0.21 | * | 0.34 | * | |||||||||
| Net realized and unrealized gain on investments | $ | 5.12 | 1.47 | 3.64 | |||||||||||
| Total from investment operations | $ | 5.36 | 1.68 | 3.98 | |||||||||||
| Less distributions from: | |||||||||||||||
| Net investment income | $ | 0.40 | 0.34 | 0.14 | |||||||||||
| Net realized gains on investments | $ | 0.30 | — | 0.15 | |||||||||||
| Return of capital | $ | — | — | 0.07 | |||||||||||
| Total distributions | $ | 0.70 | 0.34 | 0.36 | |||||||||||
| Net asset value, end of the period | $ | 19.62 | 14.96 | 13.62 | |||||||||||
| Total Return(2) | % | 36.17 | 12.49 | 40.01 | |||||||||||
| Ratios and Supplemental Data: | |||||||||||||||
| Net assets, end of the period (000s) | $ | 132,520 | 57,410 | 31,355 | |||||||||||
| Ratios to average net assets: | |||||||||||||||
| Net expenses after expense reimbursement/recoupment(3)(4) | % | 0.93 | 1.04 | 1.05 | |||||||||||
| Gross expenses prior to expense reimbursement/recoupment(4) | % | 0.93 | 0.96 | 1.53 | |||||||||||
| Net investment income after expense reimbursement/recoupment(3)(4) | % | 1.25 | 1.49 | † | 4.79 | ||||||||||
| Portfolio turnover rate | % | 37 | 48 | 30 | |||||||||||
| Class S | |||||||||||
| Year Ended December 31, 2006 | May 13, 2005(1) to December 31, 2005 | ||||||||||
| Per Share Operating Performance: | |||||||||||
| Net asset value, beginning of the period | $ | 14.95 | 13.11 | ||||||||
| Income from investment operations: | |||||||||||
| Net investment income | $ | 0.22 | 0.28 | * | |||||||
| Net realized and unrealized gain on investments | $ | 5.09 | 1.86 | ||||||||
| Total from investment operations | $ | 5.31 | 2.14 | ||||||||
| Less distributions from: | |||||||||||
| Net investment income | $ | 0.36 | 0.30 | ||||||||
| Net realized gains on investments | 0.30 | — | |||||||||
| Total distributions | $ | 0.66 | 0.30 | ||||||||
| Net asset value, end of the period | $ | 19.60 | 14.95 | ||||||||
| Total Return(2) | % | 35.84 | 16.35 | ||||||||
| Ratios and Supplemental Data: | |||||||||||
| Net assets, end of the period (000s) | $ | 42,578 | 16,043 | ||||||||
| Ratios to average net assets: | |||||||||||
| Net expenses after expense reimbursement/recoupment(3)(4) | % | 1.18 | 1.29 | ||||||||
| Gross expenses prior to expense reimbursement/recoupment(4) | % | 1.18 | 1.21 | ||||||||
| Net investment income after expense reimbursement/recoupment(3)(4) | % | 1.05 | 2.97 | † | |||||||
| Portfolio turnover rate | % | 37 | 48 | ||||||||
(1) Commencement of operations.
(2) Total return is calculated assuming reinvestment of all dividends and capital gain distributions at net asset value and does not reflect the effect of insurance contract charges. Total return for periods less than one year is not annualized.
(3) The Investment Adviser has agreed to limit expenses (excluding interest, taxes, brokerage and extraordinary expenses) subject to possible recoupment by ING Investments, LLC within three years of being incurred.
(4) Annualized for periods less than one year.
* Per share data calculated using average number of shares outstanding throughout the period.
† Effective January 1, 2005, the Portfolio adopted a policy to reduce cost of investments for financial statement purposes by the distributions received in excess of income from Real Estate Investment Trusts. The effect of this change for the twelve months ended December 31, 2005 was to decrease net investment income per share by $0.26 and $0.17 and increase net realized and unrealized gain on investments $0.26 and $0.17 and decrease the ratio of net investment to average net assets from 3.38% to 1.58% and 4.78% to 1.96% on Class I and Class S, respectively.
See Accompanying Notes to Financial Statements
26
ING VP MIDCAP OPPORTUNITIES PORTFOLIO
FINANCIAL HIGHLIGHTS
Selected data for a share of beneficial interest outstanding throughout each period.
| Class ADV | Class I | ||||||||||||||||||||||||||
| December 29, 2006(1) to December 31, | Year Ended December 31, | ||||||||||||||||||||||||||
| 2006 | 2006 | 2005 | 2004 | 2003 | 2002 | ||||||||||||||||||||||
| Per Share Operating Performance: | |||||||||||||||||||||||||||
| Net asset value, beginning of the period | $ | 8.20 | 7.57 | 6.86 | 6.15 | 4.50 | 6.07 | ||||||||||||||||||||
| Income (loss) from investment operations: | |||||||||||||||||||||||||||
| Net investment loss | $ | (0.00 | )* | (0.03 | ) | (0.02 | ) | (0.02 | ) | (0.02 | ) | (0.02 | ) | ||||||||||||||
| Net realized and unrealized gain (loss) on investments | $ | — | 0.62 | 0.73 | 0.73 | 1.67 | (1.55 | ) | |||||||||||||||||||
| Total from investment operations | $ | (0.00 | )* | 0.59 | 0.71 | 0.71 | 1.65 | (1.57 | ) | ||||||||||||||||||
| Net asset value, end of the period | $ | 8.20 | 8.16 | 7.57 | 6.86 | 6.15 | 4.50 | ||||||||||||||||||||
| Total Return(2) | % | — | 7.79 | 10.35 | 11.54 | 36.67 | (25.86 | ) | |||||||||||||||||||
| Ratios and Supplemental Data: | |||||||||||||||||||||||||||
| Net assets, end of the period (000's) | $ | 1 | 71,154 | 78,760 | 83,969 | 13,496 | 4,683 | ||||||||||||||||||||
| Ratios to average net assets: | |||||||||||||||||||||||||||
| Net expenses after expense reimbursement(3)(4) | % | 1.40 | 0.90 | 0.90 | 0.94 | 0.90 | 0.88 | ||||||||||||||||||||
| Gross expenses prior to expense reimbursement(4) | % | 1.45 | 0.95 | 0.97 | 0.96 | 1.21 | 1.53 | ||||||||||||||||||||
| Net investment loss after expense reimbursement(3)(4) | % | (1.40 | ) | (0.32 | ) | (0.31 | ) | (0.47 | ) | (0.53 | ) | (0.42 | ) | ||||||||||||||
| Portfolio turnover rate | % | 139 | 139 | 90 | 73 | 162 | 387 | ||||||||||||||||||||
| Class S | |||||||||||||||||||||||
| Year Ended December 31, | |||||||||||||||||||||||
| 2006 | 2005 | 2004 | 2003 | 2002 | |||||||||||||||||||
| Per Share Operating Performance: | |||||||||||||||||||||||
| Net asset value, beginning of year | $ | 7.48 | 6.79 | 6.11 | 4.47 | 6.04 | |||||||||||||||||
| Income (loss) from investment operations: | |||||||||||||||||||||||
| Net investment loss | $ | (0.05 | ) | (0.04 | ) | (0.03 | ) | (0.03 | ) | (0.02 | ) | ||||||||||||
| Net realized and unrealized gain (loss) on investments | $ | 0.62 | 0.73 | 0.71 | 1.67 | (1.55 | ) | ||||||||||||||||
| Total from investment operations | $ | 0.57 | 0.69 | 0.68 | 1.64 | (1.57 | ) | ||||||||||||||||
| Net asset value, end of year | $ | 8.05 | 7.48 | 6.79 | 6.11 | 4.47 | |||||||||||||||||
| Total Return(2) | % | 7.62 | 10.16 | 11.13 | 36.69 | (25.99 | ) | ||||||||||||||||
| Ratios and Supplemental Data: | |||||||||||||||||||||||
| Net assets, end of year (000's) | $ | 33,810 | 41,989 | 42,808 | 7,089 | 2,595 | |||||||||||||||||
| Ratios to average net assets: | |||||||||||||||||||||||
| Net expenses after expense reimbursement(3) | % | 1.10 | 1.10 | 1.14 | 1.10 | 1.12 | |||||||||||||||||
| Gross expenses prior to expense reimbursement | % | 1.20 | 1.22 | 1.21 | 1.45 | 1.75 | |||||||||||||||||
| Net investment loss after expense reimbursement(3) | % | (0.53 | ) | (0.51 | ) | (0.68 | ) | (0.73 | ) | (0.67 | ) | ||||||||||||
| Portfolio turnover rate | % | 139 | 90 | 73 | 162 | 387 | |||||||||||||||||
(1) Commencement of operations.
(2) Total return is calculated assuming reinvestment of all dividends and capital gain distributions at net asset value and does not reflect the effect of contract insurance charges. Total return for periods less than one year are not annualized.
(3) The Investment Adviser has agreed to limit expenses (excluding interest, taxes, brokerage and extraordinary expenses) subject to possible recoupment by ING Investments, LLC within three years of being incurred.
(4) Annualized for periods less than one year.
* Amount is more than ($0.005).
See Accompanying Notes to Financial Statements
27
ING VP SMALLCAP OPPORTUNITIES PORTFOLIO
FINANCIAL HIGHLIGHTS
Selected data for a share of beneficial interest outstanding throughout each year.
| Class I | |||||||||||||||||||||||
| Year Ended December 31, | |||||||||||||||||||||||
| 2006 | 2005 | 2004 | 2003 | 2002 | |||||||||||||||||||
| Per Share Operating Performance: | |||||||||||||||||||||||
| Net asset value, beginning of the year | $ | 17.74 | 16.26 | 14.76 | 10.64 | 18.88 | |||||||||||||||||
| Income (loss) from investment operations: | |||||||||||||||||||||||
| Net investment loss | $ | (0.07 | ) | (0.08 | ) | (0.09 | ) | (0.07 | ) | (0.10 | ) | ||||||||||||
| Net realized and unrealized gain (loss) on investments | $ | 2.30 | 1.56 | 1.59 | 4.19 | (8.14 | ) | ||||||||||||||||
| Total from investment operations | $ | 2.23 | 1.48 | 1.50 | 4.12 | (8.24 | ) | ||||||||||||||||
| Net asset value, end of the year | $ | 19.97 | 17.74 | 16.26 | 14.76 | 10.64 | |||||||||||||||||
| Total Return(1) | % | 12.57 | 9.10 | 10.16 | 38.72 | (43.64 | ) | ||||||||||||||||
| Ratios and Supplemental Data: | |||||||||||||||||||||||
| Net assets, end of the year (000s) | $ | 81,210 | 81,155 | 86,218 | 91,031 | 64,767 | |||||||||||||||||
| Ratios to average net assets: | |||||||||||||||||||||||
| Net expenses after expense reimbursement(2) | % | 0.90 | 0.90 | 0.90 | 0.90 | 0.90 | |||||||||||||||||
| Gross expenses prior to expense reimbursement | % | 0.93 | 0.96 | 0.94 | 1.07 | 1.23 | |||||||||||||||||
| Net investment loss after expense reimbursement(2) | % | (0.35 | ) | (0.52 | ) | (0.58 | ) | (0.63 | ) | (0.75 | ) | ||||||||||||
| Portfolio turnover rate | % | 84 | 83 | 67 | 168 | 414 | |||||||||||||||||
| Class S | |||||||||||||||||||||||
| Year Ended December 31, | |||||||||||||||||||||||
| 2006 | 2005 | 2004 | 2003 | 2002 | |||||||||||||||||||
| Per Share Operating Performance: | |||||||||||||||||||||||
| Net asset value, beginning of year | $ | 17.57 | 16.14 | 14.68 | 10.61 | 18.86 | |||||||||||||||||
| Income (loss) from investment operations: | |||||||||||||||||||||||
| Net investment loss | $ | (0.11 | ) | (0.12 | ) | (0.11 | ) | (0.10 | )* | (0.08 | ) | ||||||||||||
| Net realized and unrealized gain (loss) on investments | $ | 2.28 | 1.55 | 1.57 | 4.17 | (8.17 | ) | ||||||||||||||||
| Total from investment operations | $ | 2.17 | 1.43 | 1.46 | 4.07 | (8.25 | ) | ||||||||||||||||
| Net asset value, end of year | $ | 19.74 | 17.57 | 16.14 | 14.68 | 10.61 | |||||||||||||||||
| Total Return(1) | % | 12.35 | 8.86 | 9.95 | 38.36 | (43.74 | ) | ||||||||||||||||
| Ratios and Supplemental Data: | |||||||||||||||||||||||
| Net assets, end of year (000's) | $ | 122,526 | 118,854 | 109,246 | 95,039 | 31,914 | |||||||||||||||||
| Ratios to average net assets: | |||||||||||||||||||||||
| Net expenses after expense reimbursement(2) | % | 1.10 | 1.10 | 1.10 | 1.10 | 1.10 | |||||||||||||||||
| Gross expenses prior to expense reimbursement | % | 1.18 | 1.21 | 1.19 | 1.32 | 1.4 | |||||||||||||||||
| Net investment loss after expense reimbursement(2) | % | (0.55 | ) | (0.72 | ) | (0.78 | ) | (0.82 | ) | (0.97 | ) | ||||||||||||
| Portfolio turnover rate | % | 84 | 83 | 67 | 168 | 414 | |||||||||||||||||
(1) Total return is calculated assuming reinvestment of all dividends and capital gain distributions at net asset value and does not reflect the effect of contract insurance charges.
(2) The Investment Adviser has agreed to limit expenses (excluding interest, taxes, brokerage and extraordinary expenses) subject to possible recoupment by ING Investments, LLC within three years of being incurred.
* Per share data is calculated using average number of shares outstanding throughout the period.
See Accompanying Notes to Financial Statements
28
ING VP FINANCIAL SERVICES PORTFOLIO
FINANCIAL HIGHLIGHTS
Selected data for a share of beneficial interest outstanding throughout each period.
| Class I | |||||||||||||||
| Year Ended December 31, | May 3, 2004(1) to December 31, | ||||||||||||||
| 2006 | 2005 | 2004 | |||||||||||||
| Per Share Operating Performance: | |||||||||||||||
| Net asset value, beginning of the period | $ | 11.56 | 11.06 | 10.00 | |||||||||||
| Income from investment operations: | |||||||||||||||
| Net investment income | $ | 0.18 | 0.14 | * | 0.06 | * | |||||||||
| Net realized and unrealized gain on investments | $ | 1.83 | 0.70 | 1.15 | |||||||||||
| Total from investment operations | $ | 2.01 | 0.84 | 1.21 | |||||||||||
| Less distributions from: | |||||||||||||||
| Net investment income | $ | 0.18 | 0.11 | 0.04 | |||||||||||
| Net realized gains on investments | $ | 0.03 | 0.23 | 0.11 | |||||||||||
| Total distributions | $ | 0.21 | 0.34 | 0.15 | |||||||||||
| Net asset value, end of the period | $ | 13.36 | 11.56 | 11.06 | |||||||||||
| Total Return(2) | % | 17.47 | 7.74 | 12.18 | |||||||||||
| Ratios and Supplemental Data: | |||||||||||||||
| Net assets, end of the period (000's) | $ | 4,883 | 1,040 | 5,493 | |||||||||||
| Ratios to average net assets: | |||||||||||||||
| Net expenses after expense reimbursement(3)(4) | % | 0.80 | 0.80 | 0.80 | |||||||||||
| Gross expenses prior to expense reimbursement(4) | % | 0.91 | 1.00 | 1.71 | |||||||||||
| Net investment income after expense reimbursement(3)(4) | % | 1.58 | 1.29 | 0.87 | |||||||||||
| Portfolio turnover rate | % | 48 | 100 | 95 | |||||||||||
| Class S | |||||||||||||||
| Year Ended December 31, | May 3, 2004(1) to December 31, | ||||||||||||||
| 2006 | 2005 | 2004 | |||||||||||||
| Per Share Operating Performance: | |||||||||||||||
| Net asset value, beginning of period | $ | 11.55 | 11.05 | 10.00 | |||||||||||
| Income from investment operations: | |||||||||||||||
| Net investment income | $ | 0.15 | 0.13 | * | 0.05 | * | |||||||||
| Net realized and unrealized gain on investments | $ | 1.82 | 0.69 | 1.15 | |||||||||||
| Total from investment operations | $ | 1.97 | 0.82 | 1.20 | |||||||||||
| Less distributions from: | |||||||||||||||
| Net investment income | $ | 0.15 | 0.09 | 0.04 | |||||||||||
| Net realized gains on investments | $ | 0.03 | 0.23 | 0.11 | |||||||||||
| Total distributions | $ | 0.18 | 0.32 | 0.15 | |||||||||||
| Net asset value, end of period | $ | 13.34 | 11.55 | 11.05 | |||||||||||
| Total Return(2) | % | 17.11 | 7.55 | 12.03 | |||||||||||
| Ratios and Supplemental Data: | |||||||||||||||
| Net assets, end of period (000's) | $ | 93,896 | 76,397 | 14,205 | |||||||||||
| Ratios to average net assets: | |||||||||||||||
| Net expenses after expense reimbursement(3)(4) | % | 1.05 | 1.05 | 1.05 | |||||||||||
| Gross expenses prior to expense reimbursement(4) | % | 1.16 | 1.25 | 1.96 | |||||||||||
| Net investment income after expense reimbursement(3)(4) | % | 1.24 | 1.17 | 0.73 | |||||||||||
| Portfolio turnover rate | % | 48 | 100 | 95 | |||||||||||
(1) Commencement of operations.
(2) Total return is calculated assuming reinvestment of all dividends and capital gain distributions at net asset value and does not reflect the effect of insurance contract charges.
(3) The Investment Manager has agreed to limit expenses (excluding interest, taxes, brokerage and extraordinary expenses) subject to possible recoupment by ING Investments, LLC within three years of being incurred.
(4) Annualized for periods less than one year.
* Per share data calculated using average number of shares outstanding throughout the period.
See Accompanying Notes to Financial Statements
29
ING VP HIGH YIELD BOND PORTFOLIO
FINANCIAL HIGHLIGHTS
Selected data for a share of beneficial interest outstanding throughout each period.
| Class ADV | Class I | Class S | |||||||||||||||||||||||||||||||||||||
| December 29, 2006(1) to December 31 | Year Ended December 31, | December 29, 2006(2) to December 31, | January 1, 2006 to April 30, | April 29, 2005(1) to December 31, | |||||||||||||||||||||||||||||||||||
| 2006 | 2006 | 2005 | 2004 | 2003 | 2002 | 2006 | 2006(2) | 2005 | |||||||||||||||||||||||||||||||
| Per Share Operating Performance: | |||||||||||||||||||||||||||||||||||||||
| Net asset value, beginning of the period | $ | 3.05 | 2.98 | 3.13 | 3.09 | 2.83 | 3.16 | 3.05 | 2.98 | 2.98 | |||||||||||||||||||||||||||||
| Income (loss) from investment operations: | |||||||||||||||||||||||||||||||||||||||
| Net investment income (loss) | $ | (0.00 | )** | 0.22 | * | 0.19 | * | 0.20 | 0.16 | 0.35 | (0.00 | )** | 0.06 | 0.07 | |||||||||||||||||||||||||
| Net realized and unrealized gain (loss) on investments | $ | — | 0.06 | (0.15 | ) | 0.04 | 0.27 | (0.33 | ) | — | 0.02 | — | |||||||||||||||||||||||||||
| Total from investment operations | $ | (0.00 | )** | 0.28 | 0.04 | 0.24 | 0.43 | 0.02 | (0.00 | )** | 0.08 | 0.07 | |||||||||||||||||||||||||||
| Less distributions from: | |||||||||||||||||||||||||||||||||||||||
| Net investment income | $ | — | 0.21 | 0.19 | 0.20 | 0.17 | 0.35 | — | 0.06 | 0.07 | |||||||||||||||||||||||||||||
| Total distributions | $ | — | 0.21 | 0.19 | 0.20 | 0.17 | 0.35 | — | 0.06 | 0.07 | |||||||||||||||||||||||||||||
| Net asset value, end of the year | $ | 3.05 | 3.05 | 2.98 | 3.13 | 3.09 | 2.83 | 3.05 | 3.00 | 2.98 | |||||||||||||||||||||||||||||
| Total Return(3) | % | — | 9.78 | 1.45 | 7.89 | 15.37 | 0.46 | — | 2.81 | 2.46 | |||||||||||||||||||||||||||||
| Ratios and Supplemental Data: | |||||||||||||||||||||||||||||||||||||||
| Net assets, end of the period (000's) | $ | 1 | 104,384 | 27,419 | 21,783 | 23,260 | 9,761 | 1 | 80,808 | 63,412 | |||||||||||||||||||||||||||||
| Ratios to average net assets: | |||||||||||||||||||||||||||||||||||||||
| Net expenses after expense reimbursement(4)(5) | % | 1.21 | 0.72 | 0.75 | 0.81 | 0.81 | 0.80 | 0.91 | 1.00 | 1.00 | |||||||||||||||||||||||||||||
| Gross expenses prior to expense reimbursement(5) | % | 1.30 | 0.80 | 0.85 | 1.00 | 1.24 | 1.46 | 1.05 | 1.02 | 1.10 | |||||||||||||||||||||||||||||
| Net investment income (loss) after expense reimbursement(4)(5) | % | (1.21 | ) | 7.31 | 6.39 | 6.31 | 6.90 | 9.57 | (0.91 | ) | 6.42 | 6.07 | |||||||||||||||||||||||||||
| Portfolio turnover rate | % | 141 | 141 | 133 | 158 | 243 | 77 | 141 | 141 | 133 | |||||||||||||||||||||||||||||
(1) Commencement of operations.
(2) Class S was fully redeemed on May 1, 2006 and recommenced operations on December 29, 2006.
(3) Total return is calculated assuming reinvestment of all dividends and capital gain distributions at net asset value and does not reflect the effect of contract insurance charges.
(4) The Investment Adviser has agreed to limit expenses (excluding interest, taxes, brokerage and extraordinary expenses) subject to possible recoupment by the Investment Adviser within three years of being incurred.
(5) Annualized for periods less than one year.
* Per share data calculated using average number of shares outstanding throughout the period.
** Amount is more than $(0.005).
See Accompanying Notes to Financial Statements
30
ING VP INTERNATIONAL VALUE PORTFOLIO
FINANCIAL HIGHLIGHTS
Selected data for a share of beneficial interest outstanding throughout each period.
| Class ADV | Class I | ||||||||||||||||||||||||||
| December 29, 2006(1) to December 31, | Year Ended December 31, | ||||||||||||||||||||||||||
| 2006 | 2006 | 2005 | 2004 | 2003 | 2002 | ||||||||||||||||||||||
| Per Share Operating Performance: | |||||||||||||||||||||||||||
| Net asset value, beginning of the period | $ | 15.38 | 12.73 | 12.76 | 11.01 | 8.60 | 10.27 | ||||||||||||||||||||
| Income (loss) from investment operations: | |||||||||||||||||||||||||||
| Net investment income (loss) | $ | (0.00 | )** | 0.34 | 0.18 | * | 0.16 | 0.14 | 0.08 | ||||||||||||||||||
| Net realized and unrealized gain (loss) on investments | $ | — | 3.36 | 0.89 | 1.74 | 2.40 | (1.66 | ) | |||||||||||||||||||
| Total from investment operations | $ | (0.00 | )** | 3.70 | 1.07 | 1.90 | 2.54 | (1.58 | ) | ||||||||||||||||||
| Less distributions from: | |||||||||||||||||||||||||||
| Net investment income | $ | — | 0.35 | 0.30 | 0.15 | 0.13 | 0.09 | ||||||||||||||||||||
| Net realized gain on investments | $ | — | 0.82 | 0.80 | — | — | — | ||||||||||||||||||||
| Total distributions | $ | — | 1.17 | 1.10 | 0.15 | 0.13 | 0.09 | ||||||||||||||||||||
| Net asset value, end of the period | $ | 15.38 | 15.26 | 12.73 | 12.76 | 11.01 | 8.60 | ||||||||||||||||||||
| Total Return(2) | % | — | 29.44 | 9.43 | 17.41 | 29.92 | (15.46 | ) | |||||||||||||||||||
| Ratios and Supplemental Data: | |||||||||||||||||||||||||||
| Net assets, end of the period (000's) | $ | 1 | 460,381 | 348,326 | 262,694 | 162,602 | 64,042 | ||||||||||||||||||||
| Ratios to average net assets: | |||||||||||||||||||||||||||
| Net expenses after expense reimbursement and brokerage commission recapture(3)(4) | % | 1.50 | (5) | 1.00 | (5) | 1.00 | 1.00 | 1.00 | 1.00 | ||||||||||||||||||
| Net expenses after expense reimbursement and prior to brokerage commission recapture(3)(4) | % | 1.50 | (5) | 1.00 | (5) | 1.00 | 1.00 | 1.00 | 1.00 | ||||||||||||||||||
| Gross expenses prior to expense reimbursement and brokerage commission recapture(4) | % | 1.69 | 1.19 | 1.22 | 1.22 | 1.45 | 1.58 | ||||||||||||||||||||
| Net investment income after expense reimbursement and brokerage commission recapture(3)(4) | % | (1.50 | )(5) | 2.40 | (5) | 1.50 | 1.48 | 1.51 | 0.79 | ||||||||||||||||||
| Portfolio turnover rate | % | 146 | 146 | 125 | 98 | 89 | 164 | ||||||||||||||||||||
| Class S | |||||||||||||||||||||||
| Year Ended December 31, | March 19, 2002(1) to December 31, | ||||||||||||||||||||||
| 2006 | 2005 | 2004 | 2003 | 2002 | |||||||||||||||||||
| Per Share Operating Performance: | |||||||||||||||||||||||
| Net asset value, beginning of period | $ | 12.88 | 12.92 | 11.16 | 8.68 | 10.80 | |||||||||||||||||
| Income (loss) from investment operations: | |||||||||||||||||||||||
| Net investment income | $ | 0.28 | 0.13 | * | 0.13 | 0.11 | 0.05 | ||||||||||||||||
| Net realized and unrealized gain (loss) on investments | $ | 3.39 | 0.92 | 1.76 | 2.45 | (2.10 | ) | ||||||||||||||||
| Total from investment operations | $ | 3.67 | 1.05 | 1.89 | 2.56 | (2.05 | ) | ||||||||||||||||
| Less distributions from: | |||||||||||||||||||||||
| Net investment income | $ | 0.32 | 0.29 | 0.13 | 0.08 | 0.07 | |||||||||||||||||
| Net realized gains on investments | $ | 0.82 | 0.80 | — | — | — | |||||||||||||||||
| Total distributions | $ | 1.14 | 1.09 | 0.13 | 0.08 | 0.07 | |||||||||||||||||
| Net asset value, end of period | $ | 15.41 | 12.88 | 12.92 | 11.16 | 8.68 | |||||||||||||||||
| Total Return(2) | % | 28.81 | 9.04 | 17.03 | 29.79 | (19.04 | ) | ||||||||||||||||
| Ratios and Supplemental Data: | |||||||||||||||||||||||
| Net assets, end of period (000's) | $ | 7,007 | 2,847 | 1,225 | 534 | 42 | |||||||||||||||||
| Ratios to average net assets: | |||||||||||||||||||||||
| Net expenses after expense reimbursement and brokerage commission recapture(3)(4) | % | 1.20 | (5) | 1.20 | 1.20 | 1.20 | 1.20 | ||||||||||||||||
| Net expenses after expense reimbursement and prior to brokerage commission recapture(3)(4) | % | 1.20 | (5) | 1.20 | 1.20 | 1.20 | 1.20 | ||||||||||||||||
| Gross expenses prior to expense reimbursement and brokerage commission recapture(4) | % | 1.44 | 1.47 | 1.47 | 1.38 | 1.83 | |||||||||||||||||
| Net investment income after expense reimbursement and brokerage commission recapture(3)(4) | % | 2.00 | (5) | 1.05 | 1.14 | 1.31 | 0.56 | ||||||||||||||||
| Portfolio turnover rate | % | 146 | 125 | 98 | 89 | 164 | |||||||||||||||||
(1) Commencement of operations.
(2) Total return is calculated assuming reinvestment of all dividends and capital gain distributions at net asset value and does not reflect the effect of contract insurance charges.
(3) The Investment Adviser has agreed to limit expenses (excluding interest, taxes, brokerage and extraordinary expenses) subject to possible recoupment by ING Investments, LLC within three years of being incurred.
(4) Annualized for periods less than one year.
(5) Impact of waiving the advisory fee for the ING Institutional Prime Money Market Fund holding has less than 0.005% impact on the expense ratio.
* Per share data calculated using average number of shares outstanding throughout the period.
** Amount is more than $(0.005).
See Accompanying Notes to Financial Statements
31
NOTES TO FINANCIAL STATEMENTS AS OF DECEMBER 31, 2006
NOTE 1 — ORGANIZATION
Organization. The ING Variable Products Trust (the "Trust") is a business trust organized under the laws of the Commonwealth of Massachusetts on December 17, 1993 and registered under the Investment Company Act of 1940, as amended ("1940 Act"), as a diversified, open-end management investment company, with the exception of ING VP Real Estate Portfolio, which is non-diversified. There are six investment series which comprise the Trust. The names of the Portfolios are ING VP Real Estate Portfolio ("Real Estate"), ING VP MidCap Opportunities Portfolio ("MidCap Opportunities"), ING VP SmallCap Opportunities Portfolio ("SmallCap Opportunities"), ING VP Financial Services Portfolio ("Financial Services"), ING VP High Yield Bond Portfolio ("High Yield Bond") and ING VP International Value Portfolio ("International Value"); each a "Portfolio" and collectively, the "Portfo lios."
The following is a brief description of each Portfolio's investment objective:
• Real Estate seeks total return;
• MidCap Opportunities seeks long-term capital appreciation;
• SmallCap Opportunities seeks long-term capital appreciation;
• Financial Services seeks long-term capital appreciation;
• High Yield Bond seeks to provide a high level of current income and total return; and
• International Value seeks long-term capital appreciation.
Each Portfolio offers Class I shares and Class S shares. MidCap Opportunities, High Yield Bond and International Value also offer Adviser Class ("ADV Class") shares. The classes differ principally in the applicable distribution and shareholder service fees. Shareholders of each class also bear certain expenses that pertain to that particular class. All shareholders bear the common expenses of the Portfolio and earn income and realized gains/losses from the portfolio pro rata based on the average daily net assets of each class, without distinction between share classes. Dividends are determined separately for each class based on income and expenses allocable to each class. Differences in per share dividend rates generally result from the differences in separate class expenses, including shareholder servicing fees.
Shares of the Portfolios may be offered to segregated asset accounts of insurance companies as investment options under variable annuity contracts and variable life insurance policies ("Variable Contracts"). Shares may also be offered to qualified pension and retirement plans outside the Variable Contract and to certain investment advisers and their affiliates. Class I shares may be made available to other investment companies, including series of the Trust under fund-of-funds arrangements.
Participating insurance companies and other designated organizations are authorized to receive purchase orders on the Portfolio's behalf.
ING Investments, LLC ("ING Investments" or the "Investment Adviser"), an Arizona limited liability company, serves as the investment adviser to the Portfolios. ING Investments has engaged ING Investment Management Co. ("ING IM"), a Connecticut corporation, to serve as the sub-adviser to each Portfolio with the exception of Real Estate. ING Clarion Real Estate Securities L.P. ("INGCRES"), a Delaware limited partnership serve as sub-adviser to the Real Estate. ING Investments, ING IM and INGCRES are indirect, wholly-owned subsidiaries of ING Groep N.V. ("ING Groep"). ING Groep is one of the largest financial services organizations in the world, and offers an array of banking, insurance and asset management services to both individuals and investors.
NOTE 2 — SIGNIFICANT ACCOUNTING POLICIES
The following significant accounting policies are consistently followed by the Portfolios in the preparation of their financial statements, and such policies are in conformity with U.S. generally accepted accounting principles for investment companies.
A. Security Valuation. Investments in equity securities traded on a national securities exchange are valued at the last reported sale price. Securities reported by NASDAQ are valued at the NASDAQ official closing prices. Securities traded on an exchange or NASDAQ for which there has been no sale and securities traded in the over-the-counter market are valued at the mean between the last reported bid and ask prices. All investments quoted in foreign currencies will be valued daily in U.S. dollars on the basis of the foreign currency exchange rates prevailing at that time. Debt securities are valued at prices obtained from independent services or from one or more dealers making markets in the securities and may be adjusted based on the Portfolios' valuation procedures. U.S. government obligations are valued by using market quotations or independent pricing services that uses prices
32
NOTES TO FINANCIAL STATEMENTS AS OF DECEMBER 31, 2006 (CONTINUED)
NOTE 2 — SIGNIFICANT ACCOUNTING POLICIES (continued)
provided by market-makers or estimates of market values obtained from yield data relating to instruments or securities with similar characteristics.
Securities and assets for which market quotations are not readily available (which may include certain restricted securities which are subject to limitations as to their sale) are valued at their fair values as determined in good faith by or under the supervision of the Portfolios' Board of Trustees ("Board"), in accordance with methods that are specifically authorized by the Board. Securities traded on exchanges, including foreign exchanges, which close earlier than the time that a Portfolio calculates its net asset value ("NAV") may also be valued at their fair values as determined in good faith by or under the supervision of a Portfolio's Board, in accordance with methods that are specifically authorized by the Board. The value of a foreign security traded on an exchange outside the United States is generally based on its price on the principal foreign exchange where it trades as of the time the Portfolio determines its NAV or if the fore ign exchange closes prior to the time the Portfolio determines its NAV, the most recent closing price of the foreign security on its principal exchange. Trading in certain non-U.S. securities may not take place on all days on which the New York Stock Exchange ("NYSE") is open. Further, trading takes place in various foreign markets on days on which the NYSE is not open. Consequently, the calculation of a Portfolio's NAV may not take place contemporaneously with the determination of the prices of securities held by the Portfolio in foreign securities markets. Further, the value of a Portfolio's assets may be significantly affected by foreign trading on days when a shareholder cannot purchase or redeem shares of the Portfolio. In calculating a Portfolio's NAV, foreign securities denominated in foreign currency are converted to U.S. dollar equivalents. If an event occurs after the time at which the market for foreign securities held by a Portfolio closes but before the time that the Portfolio's NAV is calculate d, such event may cause the closing price on the foreign exchange to not represent a readily available reliable market value quotation for such securities at the time the Portfolio determines its NAV. In such a case, the Portfolio will use the fair value of such securities as determined under the Portfolio's valuation procedures. Events after the close of trading on a foreign market that could require a Portfolio to fair value some or all of its foreign securities include, among others, securities trading in the U.S. and other markets, corporate announcements, natural and other disasters, and political and other events. Among other elements of analysis in the determination of a security's fair value, the Board has authorized the use of one or more independent research services to assist with such determinations. An independent research service may use statistical analyses and quantitative models to help determine fair value as of the tim e a Portfolio calculates its NAV. There can be no assurance that such models accurately reflect the behavior of the applicable markets or the effect of the behavior of such markets on the fair value of securities, or that such markets will continue to behave in a fashion that is consistent with such models. Unlike the closing price of a security on an exchange, fair value determinations employ elements of judgment. Consequently, the fair value assigned to a security may not represent the actual value that a Portfolio could obtain if it were to sell the security at the time of the close of the NYSE. Pursuant to procedures adopted by the Board, a Portfolio is not obligated to use the fair valuations suggested by any research service, and valuation recommendations provided by such research services may be overridden if other events have occurred or if other fair valuations are determined in good faith to be more accurate. Unless an event is such that it causes a Portfolio to determine that the closing prices fo r one or more securities do not represent readily available reliable market value quotations at the time the Portfolio determines its NAV, events that occur between the time of the close of the foreign market on which they are traded and the close of regular trading on the NYSE will not be reflected in the Portfolio's NAV. Investments in securities maturing in 60 days or less are valued at amortized cost, which, when combined with accrued interest, approximates market value.
B. Security Transactions and Revenue Recognition. Security transactions are accounted for on the trade date. Realized gains and losses are reported on the basis of identified cost of securities sold. Interest income is recorded on an accrual basis. Dividend income is recorded on the ex-dividend date, or for certain foreign securities, when the information becomes available to the Portfolios. Premium amortization and discount accretion are determined by the effective yield method and included in interest income.
33
NOTES TO FINANCIAL STATEMENTS AS OF DECEMBER 31, 2006 (CONTINUED)
NOTE 2 — SIGNIFICANT ACCOUNTING POLICIES (continued)
Real Estate estimates components of distributions from real estate investment trust ("REITs"). Distributions received in excess of income are recorded as a reduction of cost of the related investments. If the Portfolio no longer owns the applicable securities, any distributions received in excess of income are recorded as realized gains.
C. Foreign Currency Translation. The books and records of the Portfolios are maintained in U.S. dollars. Any foreign currency amounts are translated into U.S. dollars on the following basis:
(1) Market value of investment securities, other assets and liabilities — at the exchange rates prevailing at the end of the day.
(2) Purchases and sales of investment securities, income and expenses — at the rates of exchange prevailing on the respective dates of such transactions.
Although the net assets and the market values are presented at the foreign exchange rates at the end of the day, the Portfolios do not isolate the portion of the results of operations resulting from changes in foreign exchange rates on investments from the fluctuations arising from changes in market prices of securities held. Such fluctuations are included with the net realized and unrealized gains or losses from investments. For securities which are subject to foreign withholding tax upon disposition, liabilities are recorded on the Statements of Assets and Liabilities for the estimated tax withholding based on the securities' current market value. Upon disposition, realized gains or losses on such securities are recorded net of foreign withholding tax.
Reported net realized foreign exchange gains or losses arise from sales of foreign currencies, currency gains or losses realized between the trade and settlement dates on securities transactions, the difference between the amounts of dividends, interest, and foreign withholding taxes recorded on the Portfolios' books, and the U.S. dollar equivalent of the amounts actually received or paid. Net unrealized foreign exchange gains and losses arise from changes in the value of assets and liabilities other than investments in securities at fiscal year end, resulting from changes in the exchange rate. Foreign security and currency transactions may involve certain considerations and risks not typically associated with investing in U.S. companies and the U.S. government securities. These risks include, but are not limited to, revaluation of currencies and future adverse political and economic developments which could cause securities and their markets to be less liquid and prices more volatile than those of comparable U.S. companies and U.S. government securities.
D. Foreign Currency Transactions and Futures Contracts. Each portfolio may enter into foreign currency exchange transactions to convert to and from different foreign currencies and to and from the U.S. dollar in connection with the planned purchases or sales of securities. When entering into a currency forward contract, a Portfolio agrees to receive or deliver a fixed quantity of foreign currency for an agreed-upon price on an agreed future date. The Portfolios either enter into these transactions on a spot basis at the spot rate prevailing in the foreign currency exchange market or use forward foreign currency contracts to purchase or sell foreign currencies. When the contract is fulfilled or closed, gains or losses are realized. Until then, the gain or loss is included in unrealiz ed appreciation or depreciation. Risks may arise upon entering into forward contracts from the potential inability of counterparties to meet the terms of their forward contracts and from unanticipated movements in the value of foreign currencies relative to the U.S. dollar.
Each Portfolio may enter into futures contracts involving foreign currency, interest rates, securities and securities indices. A futures contract obligates the seller of the contract to deliver and the purchaser of the contract to take delivery of the type of foreign currency, financial instrument or security called for in the contract at a specified future time for a specified price. Upon entering into such a contract, a Portfolio is required to deposit and maintain as collateral such initial margin as required by the exchange on which the contract is traded. Pursuant to the contract, a Portfolio agrees to receive from or pay to the broker an amount equal to the daily fluctuations in the value of the contract. Such receipts or payments are known as variation margins and are recorded as unrealized gains or losses by the Portfolios. When the contract is closed, the Portfolio records a realized gain or loss equal to the difference between the value of the contract at the time it was opened and the value at the time it was closed.
E. Distributions to Shareholders. The Portfolios record distributions to their shareholders on the ex-dividend date. Dividends from net investment income are declared and paid quarterly by each Portfolio, with the exception of High Yield Bond Portfolio, which declares dividends daily and pays dividends quarterly. Each Portfolio distributes capital gains, if any, annually. The Portfolios may make distributions on a more frequent basis to comply with the distribution requirements of the
34
NOTES TO FINANCIAL STATEMENTS AS OF DECEMBER 31, 2006 (CONTINUED)
NOTE 2 — SIGNIFICANT ACCOUNTING POLICIES (continued)
Internal Revenue Code. The characters of income and gains to be distributed are determined in accordance with income tax regulations, which may differ from U.S. generally accepted accounting principals for investment companies.
F. Federal Income Taxes. It is the policy of the Portfolios to comply with the requirements of subchapter M of the Internal Revenue Code that are applicable to regulated investment companies and to distribute substantially all of their net investment income and any net realized capital gains to their shareholders. Therefore, no federal income tax provision is required. No capital gain distributions shall be made until the capital loss carryforwards have been fully utilized or expired.
G. Use of Estimates. The preparation of financial statements in conformity with U.S. generally accepted accounting principles requires management to make estimates and assumptions that affect the reported amounts of assets and liabilities and disclosure of contingent assets and liabilities at the date of the financial statements and the reported amounts of increases and decreases in net assets from operations during the reporting period. Actual results could differ from those estimates.
H. Repurchase Agreements. Each Portfolio may invest in repurchase agreements only with government securities dealers recognized by the Board of Governors of the Federal Reserve System. Under such agreements, the seller of the security agrees to repurchase it at a mutually agreed upon time and price. The resale price is in excess of the purchase price and reflects an agreed upon interest rate for the period of time the agreement is outstanding. The period of the repurchase agreements is usually short, from overnight to one week, while the underlying securities generally have longer maturities. Each Portfolio will receive as collateral securities acceptable to it whose market value is equal to at least 100% of the carrying amount of the repurchase agreement, plus accrued interest, bei ng invested by the Portfolio. The underlying collateral is valued daily on a mark-to-market basis to assure that the value, including accrued interest is at least equal to the repurchase price. There would be potential loss to the Portfolio in the event the Portfolio is delayed or prevented from exercising its right to dispose of the collateral, and it might incur disposition costs in liquidating the collateral.
I. Securities Lending. Each Portfolio has the option to temporarily loan up to 30% of its total assets to brokers, dealers or other financial institutions in exchange for a negotiated lender's fee. The borrower is required to fully collateralize the loans with cash or U.S. government securities. Generally, in the event of counterparty default, the Portfolio has the right to use collateral to offset losses incurred. There would be potential loss to the Portfolio in the event the Portfolio is delayed or prevented from exercising its right to dispose of the collateral. The Portfolio bears the risk of loss with respect to the investment of collateral. Engaging in securities lending could have a leveraging effect, wh ich may intensify the credit, market and other risks associated with investing in a Portfolio.
J. Illiquid and Restricted Securities. Each Portfolio may not invest more than 15% of its net assets in illiquid securities. Illiquid securities are not readily marketable. Disposing of illiquid investments may involve time-consuming negotiation and legal expenses, and it may be difficult or impossible for the Portfolio to sell them promptly at an acceptable price. Restricted securities are those sold under Rule 144A of the Securities Act of 1933 ("1933 Act") or are securities offered pursuant to Section 4(2) of the 1933 Act, and are subject to legal or contractual restrictions on resale and may not be publicly sold without registration under the 1933 Act. Certain restricted securities may be considered liquid pursuant to guidelines approved by the Board or may be deemed to be illiq uid because they may not be readily marketable. Illiquid and restricted securities are valued using market quotations when readily available. In the absence of market quotations, the securities are valued based upon their fair value determined under procedures approved by the Board.
K. Delayed Delivery Transactions. A Portfolio may purchase or sell securities on a when-issued or forward commitment basis. The price of the underlying securities and date when the securities will be delivered and paid for are fixed at the time the transaction is negotiated. The market value of these securities is identified in each Portfolio's Portfolio of Investments. Losses may arise due to changes in the market value of the securities or from the inability of counterparties to meet the terms of the contract. In connection with such purchases, the Portfolios are required to segregate liquid assets sufficient to cover the purchase price.
L. Organization Expenses and Offering Costs. Costs incurred with the organization of the Portfolios are expensed as incurred. Costs incurred with the offering of shares of the Portfolios are deferred
35
NOTES TO FINANCIAL STATEMENTS AS OF DECEMBER 31, 2006 (CONTINUED)
NOTE 2 — SIGNIFICANT ACCOUNTING POLICIES (continued)
and amortized over a twelve-month period on a straight-line basis starting at the commencement of operations.
M. Indemnifications. In the normal course of business, the Trust may enter into contracts that provide certain indemnifications. The Trust's maximum exposure under these arrangements is dependent on future claims that may be made against the Portfolios and, therefore, cannot be estimated; however, based on experience, the risk of loss from such claims is considered remote.
NOTE 3 — INVESTMENT TRANSACTIONS
For the year ended December 31, 2006, the cost of purchases and the proceeds from the sales of securities, excluding short-term securities and U.S. government securities, were as follows:
| Purchases | Sales | ||||||||||
| Real Estate | $ | 110,734,718 | $ | 43,123,858 | |||||||
| MidCap Opportunities | 156,881,573 | 182,339,835 | |||||||||
| SmallCap Opportunities | 170,863,519 | 190,078,322 | |||||||||
| Financial Services | 44,500,480 | 37,852,231 | |||||||||
| High Yield Bond | 155,310,481 | 135,403,141 | |||||||||
| International Value | 599,304,869 | 592,416,967 | |||||||||
U.S. government securities not included above were as follows:
| Purchases | Sales | ||||||||||
| High Yield Bond | $ | 855,360 | $ | 854,989 | |||||||
NOTE 4 — INVESTMENT MANAGEMENT AND ADMINISTRATIVE FEES
The Portfolios entered into an investment management agreement ("Investment Management Agreement") with the Investment Adviser. The Investment Management Agreement compensates the Investment Adviser with a fee, computed daily and payable monthly, based on the average daily net assets of each Portfolio. The Investment Adviser receives an investment advisory fee calculated at an annual rate of 0.75% for MidCap Opportunities. The fee for Real Estate is 0.80% on the first $100 million and 0.70% in excess of $100 million of average daily net assets. For SmallCap Opportunities, the Investment Adviser receives an investment advisory fee of 0.75% on the first $250 million, 0.70% on the next $250 million, 0.65% on the next $250 million, 0.60% on the next $250 million, and 0.55% in excess of $1 billion of average daily net assets. The fee for the High Yield Bond(1) is 0.58% on the first $200 million, 0.55% on the next $300 million, 0.50% on the next $500 million, and 0.45% in excess of $1 billion of average daily net assets. For Financial Services, the Investment Adviser receives an investment advisory fee of 0.75% on the first $500 million and 0.70% in excess of $500 million. The Investment Adviser receives an investment advisory fee of 1.00% of average daily net assets from the International Value Portfolio.
The Investment Adviser has engaged ING IM to serve as sub-adviser to all of the Portfolios with the exception of Real Estate.
INGCRES serves as sub-adviser to the Real Estate pursuant to a sub-advisory agreement with the Investment Adviser.
Effective November 1, 2006, all ING Portfolios sub-advised by ING IM are permitted to invest end-of-day cash balances into affiliated ING Money Market Funds, including ING Institutional Prime Money Market Fund. Investment management fees paid by the Portfolios will be reduced by an amount equal to the management fees paid indirectly to the ING Institutional Prime Money Market Fund with respect to assets invested by the Portfolios. As of December 31, 2006, International Value waived $934. These fees are not subject to recoupment.
ING Funds Services, LLC (the "Administrator"), an indirect, wholly-owned subsidiary of ING Groep, acts as administrator and provides certain administrative and shareholder services necessary for each Portfolio's operations and is responsible for the supervision of other service providers. For its services, the Administrator is entitled to receive from each Portfolio a fee at an annual rate of 0.10% of the Portfolio's average daily net assets.
In placing equity security transactions, the Investment Adviser or Sub-Adviser is required to use its best efforts to choose a broker capable of providing brokerage services necessary to obtain the best execution for each transaction. Subject to this requirement, the Investment Adviser or Sub-Adviser may allocate equity security transactions through certain designated broker-dealers. Some of these broker-dealers participate in commission recapture programs that have been established for the benefit of the Portfolios. Under these programs, the participating broker-dealers will return to the Portfolio a portion of the brokerage commissions (in the form of a credit to the Portfolio) paid to the broker-dealers to pay certain expenses of the Portfolio. These commission recapture
(1) Prior to April 28, 2006, the investment advisory fee for High Yield Bond was 0.62% on the first $200 million, 0.55% on the next $300 million, 0.50% on the next $500 million, and 0.45% in excess of $1 billion.
36
NOTES TO FINANCIAL STATEMENTS AS OF DECEMBER 31, 2006 (CONTINUED)
NOTE 4 — INVESTMENT MANAGEMENT AND ADMINISTRATIVE FEES (continued)
payments benefit the Portfolios and not the Investment Adviser or Sub-Adviser. Any amount credited to the Portfolio is reflected as brokerage commission recapture in the Statements of Operations.
NOTE 5 — SHAREHOLDER SERVICE AND DISTRIBUTION FEES
Each ADV Class shares of the respective Portfolios are subject to a Shareholder Service and Distribution Plan (the "Plan"). Under the Plan, the Distributor is paid an annual shareholder service fee at the rate of 0.25% and an annual distribution fee at the rate of 0.25% of the average daily net assets attributable to its ADV Class shares.
Class S shares of each Portfolio are subject to a Shareholder Services Plan (the "Plan"). Under the Plan, each Portfolio pays the Administrator a fee calculated at an annual rate of 0.25% of average daily net assets attributable to its Class S shares. The Administrator is entitled to use the proceeds from the Plan to pay for services including, but not limited to, providing information about the Portfolios and delivering Portfolio documents.
During the year ended December 31, 2006, the Administrator voluntarily waived 0.05% of average daily net assets of Class S related to the service shareholder fee for MidCap Opportunities, SmallCap Opportunities, High Yield Bond and International Value.
NOTE 6 — OTHER TRANSACTIONS WITH AFFILIATED AND RELATED PARTIES
At December 31, 2006, the Portfolios had the following amounts recorded in payable to affiliates on the accompanying Statements of Assets and Liabilities (see Notes 4 and 5):
| Accrued Investment Management Fees | Accrued Administrative Fees | Accrued Shareholder Service and Distribution Fees | Accrued Reimbursements | Total | |||||||||||||||||||
| Real Estate | $ | 111,300 | $ | 14,687 | $ | 8,734 | $ | — | $ | 134,721 | |||||||||||||
| MidCap Opportunities | 68,065 | 9,075 | 5,847 | 8,367 | 91,354 | ||||||||||||||||||
| SmallCap Opportunites | 131,503 | 17,534 | 20,986 | 3,606 | 173,629 | ||||||||||||||||||
| Financial Services | 62,380 | 8,317 | 19,749 | — | 90,446 | ||||||||||||||||||
| High Yield Bond | 51,881 | 8,945 | — | — | 60,826 | ||||||||||||||||||
| International Value | 388,385 | 38,901 | 1,095 | — | 428,381 | ||||||||||||||||||
At December 31, 2006, the following ING Portfolios or indirect, wholly-owned subsidiaries of ING Groep owned more than 5% of the following Portfolios:
ING Life Insurance and Annuity Company — Real Estate (59.43%); MidCap Opportunities (16.59%); SmallCap Opportunities (13.86%); High Yield Bond (35.08%); International Value (84.32%).
Reliastar Life Insurance Company — MidCap Opportunities (54.13%); SmallCap Opportunities (23.11%); High Yield Bond (35.91%); International Value (13.91%).
Security Life Insurance of Denver — Real Estate (12.72%); High Yield Bond (27.80%).
ING USA Annuity and Life Insurance — MidCap Opportunities (24.93%); SmallCap Opportunities (57.41%); Financial Services (93.98%).
Each Portfolio has adopted a Retirement Policy ("Policy") covering all independent trustees of the Portfolio who will have served as an independent trustee for at least five years at the time of retirement. Benefits under this Policy are based on an annual rate as defined in the Policy agreement.
NOTE 7 — OTHER ACCRUED EXPENSES AND LIABILITIES
At December 31, 2006, the Portfolio had the following payables included in Other Accrued Expenses and Liabilities on the Statements of Assets and Liabilities that exceeded 5% of total liabilities:
| Accrued Audit Fees | Accrued Postage Fees | Accrued Printing Fees | |||||||||||||
| Financial Services | $ | 12,300 | $ | 9,165 | $ | 7,918 | |||||||||
NOTE 8 — EXPENSE LIMITATIONS
The Investment Adviser has entered into a written expense limitation agreement ("Expense Limitation Agreement") with the Portfolios under which it will limit the expenses of each Portfolio, excluding interest, taxes, brokerage and extraordinary expenses to the levels listed below:
| Class ADV | Class I | Class S | |||||||||||||
| Real Estate | N/A | 1.05 | % | 1.30 | % | ||||||||||
| MidCap Opportunities | 1.40 | % | 0.90 | % | 1.10 | % | |||||||||
| SmallCap Opportunities | N/A | 0.90 | % | 1.10 | % | ||||||||||
| Financial Services | N/A | 0.80 | % | 1.05 | % | ||||||||||
| High Yield Bond(1) | 1.21 | % | 0.71 | % | 0.91 | % | |||||||||
| International Value | 1.50 | % | 1.00 | % | 1.20 | % | |||||||||
(1) Prior to April 28, 2006, the expense limits for High Yield Bond were 0.80% and 1.00% for Class I and Class S, respectively.
The Investment Adviser may at a later date recoup from a Portfolio management fees waived and other expenses assumed by the Investment Adviser during the previous 36 months, but only if, after such reimbursement, the Portfolios expense ratio does not exceed the percentage described above. Waived and reimbursed fees and any recoupment by the Investment Adviser of such waived and reimbursed fees are reflected on the accompanying Statements of Operations for each Portfolio.
37
NOTES TO FINANCIAL STATEMENTS AS OF DECEMBER 31, 2006 (CONTINUED)
NOTE 8 — EXPENSE LIMITATIONS (continued)
As of December 31, 2006, the amounts of waived and reimbursed fees that are subject to possible recoupment by the Investment Adviser, and the related expiration dates are as follows:
| December 31, | |||||||||||||||||||
| 2007 | 2008 | 2009 | Total | ||||||||||||||||
| MidCap Opportunities | $ | 18,327 | $ | 83,405 | $ | 59,788 | $ | 161,520 | |||||||||||
| SmallCap Opportunities | 78,459 | 105,489 | 64,234 | 248,182 | |||||||||||||||
| Financial Services | 59,999 | 76,005 | 88,652 | 224,656 | |||||||||||||||
| High Yield Bond | 31,352 | 38,944 | 65,769 | 136,065 | |||||||||||||||
| International Value | 524,608 | 656,890 | 807,225 | 1,988,723 | |||||||||||||||
These amounts do not include shareholding servicing fees voluntary waived by the administrator.
The Expense Limitation Agreement is contractual and shall renew automatically for one-year terms unless ING Investments provides written notice of the termination of the Expense Limitation Agreement within 90 days of the end of the then current term.
NOTE 9 — LINE OF CREDIT
All of the Portfolios included in this report, in addition to certain other funds managed by the Investment Manager, have entered into an unsecured committed revolving line of credit agreement (the "Credit Agreement") with The Bank of New York for an aggregate amount of $125,000,000. The proceeds may be used to: (1) temporarily finance the purchase and sale of securities; (2) finance the redemption of shares of an investor in the Portfolios; and (3) enable the Portfolios to meet other emergency expenses as defined in the Credit Agreement. The Portfolios to which the line of credit is available pay a commitment fee equal to 0.09% per annum on the daily unused portion of the committed line amount payable quarterly in arrears.
The following Portfolios utilized the line of credit during the year ended December 31, 2006:
| Portfolio | Days Utilized | Approximate Average Daily Balance | Approximate Weighted Average Interest Rate | ||||||||||||
| Real Estate | 1 | $ | 510,000 | 5.50 | % | ||||||||||
| Financial Services | 4 | 520,000 | 4.80 | % | |||||||||||
| High Yield Bond | 15 | 1,785,000 | 5.48 | % | |||||||||||
| International Value | 2 | 7,595,000 | 5.73 | % | |||||||||||
NOTE 10 — CAPITAL SHARE TRANSACTIONS
Transactions in capital shares and dollars were as follows:
| Class I | Class S | ||||||||||||||||||||||
| Year Ended December 31, 2006 | Year Ended December 31, 2005 | Year Ended December 31, 2006 | May 13, 2005(1) to December 31, 2005 | ||||||||||||||||||||
| Real Estate (Number of Shares) | |||||||||||||||||||||||
| Shares sold | 3,311,180 | 2,040,738 | 1,704,526 | 1,133,601 | |||||||||||||||||||
| Dividends reinvested | 222,569 | 82,856 | 66,094 | 13,790 | |||||||||||||||||||
| Shares redeemed | (617,872 | ) | (587,812 | ) | (671,444 | ) | (74,018 | ) | |||||||||||||||
| Net increase in shares outstanding | 2,915,877 | 1,535,782 | 1,099,176 | 1,073,373 | |||||||||||||||||||
| Real Estate ($) | |||||||||||||||||||||||
| Shares sold | $ | 58,672,361 | $ | 28,171,293 | $ | 30,380,446 | $ | 16,237,391 | |||||||||||||||
| Dividends reinvested | 4,140,418 | 1,198,708 | 1,231,668 | 205,264 | |||||||||||||||||||
| Shares redeemed | (11,163,938 | ) | (8,191,166 | ) | (11,923,552 | ) | (1,082,163 | ) | |||||||||||||||
| Net increase | $ | 51,648,841 | $ | 21,178,835 | $ | 19,688,562 | $ | 15,360,492 | |||||||||||||||
| Class ADV | Class I | Class S | |||||||||||||||||||||
| December 29, 2006(1) to December 31, 2006 | Year Ended December 31, 2006 | Year Ended December 31, 2005 | Year Ended December 31, 2006 | Year Ended December 31, 2005 | |||||||||||||||||||
| MidCap Opportunities (Number of Shares) | |||||||||||||||||||||||
| Shares sold | 122 | 535,364 | 1,531,420 | 16,708 | 411,019 | ||||||||||||||||||
| Shares redeemed | — | (2,221,494 | ) | (3,369,563 | ) | (1,428,960 | ) | (1,100,898 | ) | ||||||||||||||
| Net increase (decrease) in shares outstanding | 122 | (1,686,130 | ) | (1,838,143 | ) | (1,412,252 | ) | (689,879 | ) | ||||||||||||||
| MidCap Opportunities ($) | |||||||||||||||||||||||
| Shares sold | $ | 1,000 | $ | 4,324,755 | $ | 10,394,142 | $ | 130,897 | $ | 2,742,061 | |||||||||||||
| Shares redeemed | — | (17,649,365 | ) | (23,073,409 | ) | (11,195,420 | ) | (7,671,671 | ) | ||||||||||||||
| Net increase (decrease) | $ | 1,000 | $ | (13,324,610 | ) | $ | (12,679,267 | ) | $ | (11,064,523 | ) | $ | (4,929,610 | ) | |||||||||
(1) Commencement of operations.
38
NOTES TO FINANCIAL STATEMENTS AS OF DECEMBER 31, 2006 (CONTINUED)
NOTE 10 — CAPITAL SHARE TRANSACTIONS (continued)
| Class I | Class S | ||||||||||||||||||||||
| Year Ended December 31, 2006 | Year Ended December 31, 2005 | Year Ended December 31, 2006 | Year Ended December 31, 2005 | ||||||||||||||||||||
| SmallCap Opportunities (Number of Shares) | |||||||||||||||||||||||
| Shares sold | 379,261 | 930,427 | 780,357 | 1,159,247 | |||||||||||||||||||
| Shares redeemed | (887,158 | ) | (1,657,776 | ) | (1,337,311 | ) | (1,164,276 | ) | |||||||||||||||
| Net decrease in shares outstanding | (507,897 | ) | (727,349 | ) | (556,954 | ) | (5,029 | ) | |||||||||||||||
| SmallCap Opportunities ($) | |||||||||||||||||||||||
| Shares sold | $ | 7,316,174 | $ | 14,952,359 | $ | 14,886,195 | $ | 18,884,544 | |||||||||||||||
| Shares redeemed | (16,905,628 | ) | (26,622,719 | ) | (24,905,554 | ) | (19,012,378 | ) | |||||||||||||||
| Net decrease | $ | (9,589,454 | ) | $ | (11,670,360 | ) | $ | (10,019,359 | ) | $ | (127,834 | ) | |||||||||||
| Class I | Class S | ||||||||||||||||||||||
| Year Ended December 31, 2006 | Year Ended December 31, 2005 | Year Ended December 31, 2006 | Year Ended December 31, 2005 | ||||||||||||||||||||
| Financial Services (Number of Shares) | |||||||||||||||||||||||
| Shares sold | 436,726 | 113,154 | 2,091,924 | 5,979,482 | |||||||||||||||||||
| Dividends reinvested | 3,580 | 2,028 | 90,480 | 133,381 | |||||||||||||||||||
| Shares redeemed | (164,681 | ) | (521,953 | ) | (1,760,446 | ) | (783,689 | ) | |||||||||||||||
| Net increase (decrease) in shares outstanding | 275,625 | (406,771 | ) | 421,958 | 5,329,174 | ||||||||||||||||||
| Financial Services ($) | |||||||||||||||||||||||
| Shares sold | $ | 5,468,630 | $ | 1,259,261 | $ | 26,128,100 | $ | 65,307,587 | |||||||||||||||
| Dividends reinvested | 46,229 | 22,996 | 1,143,830 | 1,526,405 | |||||||||||||||||||
| Shares redeemed | (2,057,715 | ) | (6,049,007 | ) | (21,529,266 | ) | (8,710,003 | ) | |||||||||||||||
| Net increase (decrease) | $ | 3,457,144 | $ | (4,766,750 | ) | $ | 5,742,664 | $ | 58,123,989 | ||||||||||||||
| Class ADV | Class I | Class S | |||||||||||||||||||||
| December 29, 2006(1) to December 31, 2006 | Year Ended December 31, 2006 | Year Ended December 31, 2005 | Year Ended December 31, 2006(2) | Year Ended December 31, 2005 | |||||||||||||||||||
| High Yield Bond (Number of Shares) | |||||||||||||||||||||||
| Shares sold | 328 | 63,308,856 | 8,332,743 | 5,240,709 | 21,482,771 | ||||||||||||||||||
| Dividends reinvested | — | 1,415,842 | 337,919 | 687,225 | 363,922 | ||||||||||||||||||
| Shares redeemed | — | (39,697,716 | ) | (6,453,303 | ) | (27,201,633 | ) | (572,666 | ) | ||||||||||||||
| Net increase (decrease) in shares outstanding | 328 | 25,026,982 | 2,217,359 | (21,273,699 | ) | 21,274,027 | |||||||||||||||||
| High Yield Bond ($) | |||||||||||||||||||||||
| Shares sold | $ | 1,000 | $ | 189,618,653 | $ | 25,112,771 | $ | 15,673,624 | $ | 64,232,942 | |||||||||||||
| Dividends reinvested | — | 4,210,770 | 1,031,023 | 2,051,671 | 1,096,751 | ||||||||||||||||||
| Shares redeemed | — | (118,763,910 | ) | (19,767,938 | ) | (81,603,314 | ) | (1,703,340 | ) | ||||||||||||||
| Net increase (decrease) | $ | 1,000 | $ | 75,065,513 | $ | 6,375,856 | $ | (63,878,019 | ) | $ | 63,626,353 | ||||||||||||
| Class ADV | Class I | Class S | |||||||||||||||||||||
| December 29, 2006(1) to December 31, 2006 | Year Ended December 31, 2006 | Year Ended December 31, 2005 | Year Ended December 31, 2006 | Year Ended December 31, 2005 | |||||||||||||||||||
| International Value (Number of Shares) | |||||||||||||||||||||||
| Shares sold | 65 | 7,729,262 | 8,445,063 | 238,041 | 159,262 | ||||||||||||||||||
| Dividends reinvested | — | 2,260,111 | 2,166,396 | 29,113 | 11,004 | ||||||||||||||||||
| Shares redeemed | — | (7,179,581 | ) | (3,844,026 | ) | (33,559 | ) | (44,052 | ) | ||||||||||||||
| Net increase in shares outstanding | 65 | 2,809,792 | 6,767,433 | 233,595 | 126,214 | ||||||||||||||||||
| International Value ($) | |||||||||||||||||||||||
| Shares sold | $ | 1,000 | $ | 109,477,708 | $ | 101,423,586 | $ | 3,526,840 | $ | 1,915,372 | |||||||||||||
| Dividends reinvested | — | 33,806,829 | 25,020,025 | 443,157 | 128,897 | ||||||||||||||||||
| Shares redeemed | — | (102,234,486 | ) | (46,210,447 | ) | (479,194 | ) | (542,898 | ) | ||||||||||||||
| Net increase | $ | 1,000 | $ | 41,050,051 | $ | 80,233,164 | $ | 3,490,803 | $ | 1,501,371 | |||||||||||||
(1) Commencement of operations.
(2) Class S fully liquidated May 1, 2006 and recommenced operations on December 29, 2006.
39
NOTES TO FINANCIAL STATEMENTS AS OF DECEMBER 31, 2006 (CONTINUED)
NOTE 11 — SECURITIES LENDING
Under an agreement with The Bank of New York ("BNY"), the Portfolios can lend their securities to approved brokers, dealers and other financial institutions. Loans are collateralized by cash and U.S. Government securities. The collateral must be in an amount equal to at least 105% of the market value of non-U.S. securities loaned and 102% of the market value of U.S. securities loaned. The cash collateral received is invested in approved investments as defined in the Securities Lending Agreement with BNY (the "Agreement"). The securities purchased with cash collateral received are reflected in the Portfolio of Investments. Generally, in the event of counterparty default, the Portfolios have the right to use the collateral to offset losses incurred. The Agreement contains certain guarantees by BNY in the event of counterparty default and/or a borrower's failure to return a loaned security; however, there would be a potential loss to the Portfo lios in the event the Portfolios are delayed or prevented from exercising their right to dispose of the collateral. The Portfolios bear the risk of loss with respect to the investment of collateral. Engaging in securities lending could have a leveraging effect, which may intensify the credit, market and other risks associated with investing in a Portfolio. At December 31, 2006, the Portfolios had securities on loan with the following market values:
| Value of Securities Loaned | Value of Collateral | ||||||||||
| MidCap Opportunities | $ | 27,450,856 | $ | 28,278,637 | |||||||
| SmallCap Opportunities | 52,237,167 | 54,242,865 | |||||||||
| International Value | 12,585,492 | 13,061,231 | |||||||||
NOTE 12 — CONCENTRATION OF INVESTMENT RISKS
Non-Diversified (Real Estate). Real Estate is classified as a non-diversified investment company under the 1940 Act, which means that the Portfolio is not limited in the proportion of its assets in a single issuer. The investment of a large percentage of a Portfolio's assets in the securities of a small number of issuers may cause the Portfolio's share price to fluctuate more than that of a diversified investment company.
Concentration (Real Estate and Financial Services). Each Portfolio concentrates (for purposes of the 1940 Act) its assets in securities related to a particular industry, which means that at least 25% of its assets will be invested in that particular industry at all times. As a result, each Portfolio may be subject to greater market fluctuation than a portfolio which has securities representing a broader range of investment alternatives.
Foreign Securities (MidCap Opportunities, High Yield Bond and International Value). Investments in foreign securities may entail risks not present in domestic investments. Since securities in which the Portfolios may invest are denominated in foreign currencies, changes in the relationship of these foreign currencies to the U.S. dollar can significantly affect the value of the investments and earnings of the Portfolios. Foreign investments may also subject the Portfolios to foreign government exchange restrictions, expropriation, taxation or other political, social or economic developments, as well as changes vis-a-vis the U.S. dollar from movements in currency, and changes in security value and interest rate, all of which could affect the market and/or credit risk of the Portfolios' investmen ts.
Emerging Markets Investments (High Yield Bond and International Value). Because of less developed markets and economies and, in some countries, less mature governments and governmental institutions, the risks of investing in foreign securities can be intensified in the case of investments in issuers domiciled or doing substantial business in emerging market countries.
NOTE 13 — CREDIT RISK AND DEFAULTED SECURITIES
Although each Portfolio, except Real Estate, has a diversified portfolio, High Yield Bond invests substantially in lower rated and comparable quality unrated high yield securities. Investments in high yield securities are accompanied by a greater degree of credit risk and such lower rated securities tend to be more sensitive to economic conditions than higher rated securities.
The risk of loss due to default by the issuer may be significantly greater for the holders of high yielding securities, because such securities are generally unsecured and are often subordinated to other creditors of the issuer. It is each Portfolio's accounting practice to discontinue accrual of income and provide an estimate for probable losses due to unpaid interest income on defaulted securities for the current reporting period.
NOTE 14 — FEDERAL INCOME TAXES AND OTHER TAX MATTERS
The amount of distributions from net investment income and net realized capital gains are determined in accordance with federal income tax regulations, which may differ from U.S. generally accepted accounting principles for investment companies. These book/tax differences may be either temporary or permanent. Permanent differences are reclassified within the capital accounts based on their federal tax-basis treatment; temporary differences are not reclassified. Key differences include the treatment of short-term capital gains, foreign currency transactions, and wash sale deferrals. Distributions in excess of net investment income and/or net realized capital gains for tax purposes are reported as distributions of paid-in capital.
40
NOTES TO FINANCIAL STATEMENTS AS OF DECEMBER 31, 2006 (CONTINUED)
| NOTE 14 — FEDERAL INCOME TAXES AND OTHER TAX MATTERS (continued) | |||
The following permanent tax differences have been reclassified as of December 31, 2006:
| Paid-in Capital | Undistributed Net Investment Income On Investments | Accumulated Net Realized Gains/ (Losses) | |||||||||||||
| Real Estate | $ | — | $ | 1,308,724 | $ | (1,308,724 | ) | ||||||||
| MidCap Opportunities | (455,878 | ) | 455,878 | — | |||||||||||
| SmallCap Opportunities | (1,030,115 | ) | 994,155 | 35,960 | |||||||||||
| Financial Services | 142,914 | (7,637 | ) | (135,277 | ) | ||||||||||
| High Yield Bond | (61,075 | ) | (83,689 | ) | 144,764 | ||||||||||
| International Value | — | (550,947 | ) | 550,947 | |||||||||||
Dividends paid by the Portfolios from net investment income and distributions of net realized short-term capital gains are, for federal income tax purposes, taxable as ordinary income to shareholders.
The tax composition of dividends and distributions to shareholders was as follows:
| Year Ended December 31, 2006 | Year Ended December 31, 2005 | ||||||||||||||||||
| Ordinary Income | Long-Term Capital Gains | Ordinary Income | Long-Term Capital Gains | ||||||||||||||||
| Real Estate | $ | 4,004,421 | $ | 1,369,827 | $ | 1,403,972 | $ | — | |||||||||||
| Financial Services | 994,463 | 195,596 | 1,510,808 | 200,344 | |||||||||||||||
| High Yield Bond | 7,228,425 | — | 3,166,057 | — | |||||||||||||||
| International Value | 16,514,740 | 17,735,246 | 12,838,438 | 12,310,484 | |||||||||||||||
The tax-basis components of distributable earnings and the expiration dates of the capital loss
carryforwards which may be used to offset future realized capital gains for federal income tax purposes
as of December 31, 2006 were:
| Undistributed Ordinary Income | Undistributed Long Term Capital Gains | Unrealized Appreciation/ Depreciation | Post-October Capital Losses Deferred | Post-October Currency Losses Deferred | Capital Loss Carryforwards | Expiration Dates | |||||||||||||||||||||||||
| Real Estate | $ | — | $ | 7,335,733 | $ | 32,315,036 | $ | — | $ | — | $ | — | — | ||||||||||||||||||
| MidCap Opportunities | — | — | 10,242,414 | — | — | $ | (20,102,111 | ) | 2008 | ||||||||||||||||||||||
| (26,720,122 | ) | 2009 | |||||||||||||||||||||||||||||
| (1,322,139 | ) | 2010 | |||||||||||||||||||||||||||||
| $ | (48,144,372 | )* | |||||||||||||||||||||||||||||
| SmallCap Opportunities | — | — | 20,470,023 | — | — | $ | (4,287,887 | ) | 2010 | ||||||||||||||||||||||
| (440,045 | ) | 2011 | |||||||||||||||||||||||||||||
| $ | (4,727,932 | ) | |||||||||||||||||||||||||||||
| Financial Services | 2,197,470 | 2,648,279 | 12,955,765 | — | — | — | — | ||||||||||||||||||||||||
| High Yield Bond | — | — | 2,481,275 | (74,753 | ) | — | $ | (986,921 | ) | 2007 | |||||||||||||||||||||
| (1,985,982 | ) | 2008 | |||||||||||||||||||||||||||||
| (2,658,631 | ) | 2009 | |||||||||||||||||||||||||||||
| (1,198,181 | ) | 2010 | |||||||||||||||||||||||||||||
| (436,910 | ) | 2014 | |||||||||||||||||||||||||||||
| $ | (7,266,625 | ) | |||||||||||||||||||||||||||||
| International Value | 46,294,591 | 38,924,677 | 45,030,578 | — | (202,014 | ) | — | — | |||||||||||||||||||||||
* Utilization of these capital losses is subject to annual limitations under Section 382 of the Internal Revenue Code.
Under U.S. federal income tax law, as specified in the Internal Revenue Code (the "Code") and U.S. Treasury regulations, the Portfolios must meet various technical requirements relating to fund administration, portfolio investments, and "eligible investors" in the Portfolios. Complying with these requirements is a condition for beneficial tax treatment of certain insurance products that offer the Portfolios as investment options. The failure of the Portfolios to meet any of these complex requirements could result in an excise tax, administrative penalties imposed by the Internal Revenue Service, potential liability to insurers whose products include the Portfolios as investment options, and unanticipated costs associated with remedying a failure. We are aware that an affiliate of a Portfolio's investment adviser may have failed to limit the availability of ING VP Real Estate Portfolio for investment to "eligible investors" under the Code. Th e legal and tax consequences, if any, of this are currently under active review, but we do not believe that it is probable that any liability has been incurred by the Portfolio.
41
NOTES TO FINANCIAL STATEMENTS AS OF DECEMBER 31, 2006 (CONTINUED)
| NOTE 14 — FEDERAL INCOME TAXES AND OTHER TAX MATTERS (continued) | |||
Although it is not probable that any liability has been incurred, ING has agreed to indemnify the Portfolio from and against economic consequences of any such failure incurred either (i) directly or (ii) by virtue of any indemnification by the Portfolio resulting from such failure.
NOTE 15 — ILLIQUID SECURITIES
Pursuant to guidelines adopted by the Portfolios' Board, the following securities held in High Yield Bond have been deemed to be illiquid. The Portfolio currently limits investment in illiquid securities to 15% of the Portfolio's net assets, at market value, at time of purchase. Fair value for these securities was determined by ING Funds Valuation Committee appointed by the Portfolios' Board.
| Security | Shares | Initial Acquisition Date | Cost | Value | Percent of Net Assets | ||||||||||||||||||
| Dayton Superior Corp. | 195 | 8/07/00 | $ | 2,792 | $ | 2 | 0.0 | % | |||||||||||||||
| Jordan Telecommunications | 150 | 1/31/00 | — | 3,243 | 0.0 | % | |||||||||||||||||
| Travelcenters of America, Inc. | 20 | 9/23/05 | 25 | 24 | 0.0 | % | |||||||||||||||||
NOTE 16 — OTHER ACCOUNTING PRONOUNCEMENTS
In June 2006, the Financial Accounting Standards Board ("FASB") issued FASB Interpretation No. 48 ("FIN 48"), "Accounting for Uncertainty in Income Taxes." This standard defines the threshold for recognizing the benefits of tax-return positions in the financial statements as "more-likely-than-not" to be sustained upon challenge by the taxing authority and requires measurement of a tax position meeting the more-likely-than-not criterion, based on the largest benefit that is more than 50 percent likely to be realized. FIN 48 is effective for fiscal years beginning after December 15, 2006, with early application permitted if no interim financial statements have been issued. However, acknowledging the unique issues that FIN 48 presents for investment companies that calculate NAVs, the Securities and Exchange Commission (the "SEC") has indicated that they would not object if a fund implements FIN 48 in its NAV calculation as late as its last NAV calculation in the first required financial statement reporting period for its fiscal year beginning after December 15, 2006. For calendar-year open-end funds, this would be no later than their June 29, 2007 NAV and the effects of FIN 48 would be reflected in the funds' semi-annual financial statements contained in their Form N-CSR filing. At adoption, companies must adjust their financial statements to reflect only those tax positions that are more likely-than-not to be sustained as of the adoption date. Management is currently analyzing the tax positions of the Portfolios. To date, this analysis reflects an uncertain tax position in ING VP Real Estate Portfolio that has the potential to result in a liability upon adoption of FIN 48. Management of the Portfolio is presently determining whether the tax benefits recorded by the Portfolio is more likely-than-not to be sustained if challenged by taxing authorities. To the extent that, in Ma nagement's judgment, the more likely-than-not threshold cannot be achieved, ING has agreed to indemnify the Portfolio and will bear any taxes and other costs related to this position that may occur. As a result, in Management's opinion, the adoption of FIN 48 is not expected to have a material impact on the financial statements of the Portfolios.
On September 15, 2006, the FASB issued Statement of Financial Accounting Standards No. 157 ("SFAS No. 157"), "Fair Value Measurements." The new accounting statement defines fair value, establishes a framework for measuring fair value in generally accepted accounting principles ("GAAP"), and expands disclosures about fair value measurements. SFAS No. 157 defines fair value as the price that would be received to sell an asset or paid to transfer a liability in an orderly transaction between market participants at the measurement date (an exit price). SFAS No. 157 also stipulates that, as a market-based measurement, fair value measurement should be determined based on the assumptions that market participants would use in pricing the asset or liability, and establishes a fair value hierarchy that disting uishes between (a) market participant assumptions developed based on market data obtained from sources independent of the reporting entity (observable inputs) and (b) the reporting entity's own assumptions about market participant assumptions developed based on the best information available in the circumstances (unobservable inputs). SFAS No. 157 is effective for financial statements issued for fiscal years beginning after November 15, 2007. As of December 31, 2006, management of the Portfolios is currently assessing the impact, if any, that will result from adopting SFAS No. 157.
42
NOTES TO FINANCIAL STATEMENTS AS OF DECEMBER 31, 2006 (CONTINUED)
NOTE 17 — INFORMATION REGARDING TRADING OF ING'S U.S. MUTUAL FUNDS (continued)
In 2004, ING Investments reported to the Boards of Directors/Trustees (the "Boards") of the ING Funds that, like many U.S. financial services companies, ING Investments and certain of its U.S. affiliates have received informal and formal requests for information since September 2003 from various governmental and self-regulatory agencies in connection with investigations related to mutual funds and variable insurance products. ING Investments has advised the Boards that it and its affiliates have cooperated fully with each request.
In addition to responding to regulatory and governmental requests, ING Investments reported that management of U.S. affiliates of ING Groep, including ING Investments (collectively, "ING"), on their own initiative, have conducted, through independent special counsel and a national accounting firm, an extensive internal review of trading in ING insurance, retirement, and mutual fund products. The goal of this review was to identify any instances of inappropriate trading in those products by third parties or by ING investment professionals and other ING personnel. ING's internal review related to mutual fund trading is now substantially completed. ING has reported that, of the millions of customer relationships that ING maintains, the internal review identified several isolated arrangements allowing third parties to engage in frequent trading of mutual funds within ING's variable insurance and mutual fund products, and identified other circums tances where frequent trading occurred, despite measures taken by ING intended to combat market timing. ING further reported that each of these arrangements has been terminated and fully disclosed to regulators. The results of the internal review were also reported to the independent members of the Boards.
ING Investments has advised the Boards that most of the identified arrangements were initiated prior to ING's acquisition of the businesses in question in the U.S. ING Investments further reported that the companies in question did not receive special benefits in return for any of these arrangements, which have all been terminated.
Based on the internal review, ING Investments has advised the Boards that the identified arrangements do not represent a systemic problem in any of the companies that were involved.
In September 2005, ING Funds Distributor, LLC ("IFD"), the distributor of certain ING Funds, settled an administrative proceeding with the NASD regarding three arrangements, dating from 1995, 1996 and 1998, under which the administrator to the then-Pilgrim Funds, which subsequently became part of the ING Funds, entered into formal and informal arrangements that permitted frequent trading. Under the terms of the Letter of Acceptance, Waiver and Consent ("AWC") with the NASD, under which IFD neither admitted nor denied the allegations or findings, IFD consented to the following sanctions: (i) a censure; (ii) a fine of $1.5 million; (iii) restitution of approximately $1.44 million to certain ING Funds for losses attributable to excessive trading described in the AWC; and (iv) agreement to make certification to NASD regarding the review and establishment of certain procedures.
In addition to the arrangements discussed above, in 2004 ING Investments reported to the Board that, at that time, these instances include the following, in addition to the arrangements subject to the AWC discussed above:
• Aeltus Investment Management, Inc. (a predecessor entity to ING Investment Management Co.) identified two investment professionals who engaged in extensive frequent trading in certain ING Funds. One was subsequently terminated for cause and incurred substantial financial penalties in connection with this conduct and the second has been disciplined.
• ReliaStar Life Insurance Company ("ReliaStar") entered into agreements seven years ago permitting the owner of policies issued by the insurer to engage in frequent trading and to submit orders until 4pm Central Time. In 2001 ReliaStar also entered into a selling agreement with a broker-dealer that engaged in frequent trading. Employees of ING affiliates were terminated and/or disciplined in connection with these matters.
• In 1998, Golden American Life Insurance Company entered into arrangements permitting a broker-dealer to frequently trade up to certain specific limits in a fund available in an ING variable annuity product. No employee responsible for this arrangement remains at the company.
For additional information regarding these matters, you may consult the Form 8-K and Form 8-K/A for each of four life insurance companies, ING USA Annuity and Life Insurance Company, ING Life Insurance and Annuity Company, ING Insurance Company of America, and ReliaStar Life Insurance Company of New York, each filed with the Securities and Exchange
43
NOTES TO FINANCIAL STATEMENTS AS OF DECEMBER 31, 2006 (CONTINUED)
NOTE 17 — INFORMATION REGARDING TRADING OF ING'S U.S. MUTUAL FUNDS (continued)
Commission (the "SEC") on October 29, 2004 and September 8, 2004. These Forms 8-K and Forms 8-K/A can be accessed through the SEC's Web site at http://www.sec.gov. Despite the extensive internal review conducted through independent special counsel and a national accounting firm, there can be no assurance that the instances of inappropriate trading reported to the Boards are the only instances of such trading respecting the ING Funds.
ING Investments reported to the Boards that ING is committed to conducting its business with the highest standards of ethical conduct with zero tolerance for noncompliance. Accordingly, ING Investments advised the Boards that ING management was disappointed that its voluntary internal review identified these situations. Viewed in the context of the breadth and magnitude of its U.S. business as a whole, ING management does not believe that ING's acquired companies had systemic ethical or compliance issues in these areas. Nonetheless, ING Investments reported that given ING's refusal to tolerate any lapses, it has taken the steps noted below, and will continue to seek opportunities to further strengthen the internal controls of its affiliates.
• ING has agreed with the ING Funds to indemnify and hold harmless the ING Funds from all damages resulting from wrongful conduct by ING or its employees or from ING's internal investigation, any investigations conducted by any governmental or self-regulatory agencies, litigation or other formal proceedings, including any proceedings by the Securities and Exchange Commission. ING Investments reported to the Boards that ING management believes that the total amount of any indemnification obligations will not be material to ING or its U.S. business.
• ING updated its Code of Conduct for employees reinforcing its employees' obligation to conduct personal trading activity consistent with the law, disclosed limits, and other requirements.
• The ING Funds, upon a recommendation from ING, updated their respective Codes of Ethics applicable to investment professionals with ING entities and certain other fund personnel, requiring such personnel to pre-clear any purchases or sales of ING Funds that are not systematic in nature (i.e., dividend reinvestment), and imposing minimum holding periods for shares of ING Funds.
• ING instituted excessive trading policies for all customers in its variable insurance and retirement products and for shareholders of the ING Funds sold to the public through financial intermediaries. ING does not make exceptions to these policies.
• ING reorganized and expanded its U.S. Compliance Department, and created an Enterprise Compliance team to enhance controls and consistency in regulatory compliance.
Other Regulatory Matters
The New York Attorney General (the "NYAG") and other federal and state regulators are also conducting broad inquiries and investigations involving the insurance industry. These initiatives currently focus on, among other things, compensation and other sales incentives; potential conflicts of interest; potential anti-competitive activity; reinsurance; marketing practices (including suitability); specific product types (including group annuities and indexed annuities); fund selection for investment products and brokerage sales; and disclosure. It is likely that the scope of these industry investigations will further broaden before they conclude. ING has received formal and informal requests in connection with such investigations, and is cooperating fully with each request. In connection with one such investigation, affiliates of ING Investments were named in a petition for relief and cease and desist order filed by the New Hampshire Bureau of Securities Regulation (the "NH Bureau") concerning their administration of the New Hampshire state employees deferred compensation plan.
On October 10, 2006, an affiliate of ING Investments entered into an assurance of discontinuance with the NYAG (the "NYAG Agreement") regarding the endorsement of its products by the New York State United Teachers Union Member Benefits Trust ("NYSUT") and the sale of their products to NYSUT members. Under the terms of the NYAG Agreement, the affiliate of ING Investments, without admitting or denying the NYAG's findings, will distribute $30 million to NYSUT members, and/or former NYSUT members, who participated in the NYSUT-endorsed products at any point between January 1, 2001 and June 30, 2006. The affiliate also agreed with the NYAG's office to develop a one-page disclosure that will further improve transparency and disclosure regarding retirement product fees (the "One-Page Disclosure"). Pursuant to the terms of the NYAG Agreement, the affiliate has agreed for a five year period to provide its retirement product customers with the One-Pag e Disclosure.
In addition, on the same date, these affiliates of ING Investments entered into a consent agreement with the NH Bureau (the "NH Agreement") to resolve this petition for relief and cease and desist order. Under the terms of the NH Agreement, these affiliates of ING
44
NOTES TO FINANCIAL STATEMENTS AS OF DECEMBER 31, 2006 (UNAUDITED) (CONTINUED)
NOTE 17 — INFORMATION REGARDING TRADING OF ING'S U.S. MUTUAL FUNDS (continued)
Investments, without admitting or denying the NH Bureau's claims, have agreed to pay $3 million to resolve the matter, and for a five year period to provide their retirement product customers with the One-Page Disclosure described above.
Other federal and state regulators could initiate similar actions in this or other areas of ING's businesses.
These regulatory initiatives may result in new legislation and regulation that could significantly affect the financial services industry, including businesses in which ING is engaged.
In light of these and other developments, ING continuously reviews whether modifications to its business practices are appropriate.
At this time, in light of the current regulatory factors, ING U.S. is actively engaged in reviewing whether any modifications in our practices are appropriate for the future.
There can be no assurance that these matters, or the adverse publicity associated with them, will not result in increased fund redemptions, reduced sale of fund shares, or other adverse consequences to ING Funds.
NOTE 18 — SUBSEQUENT EVENTS
Subsequent to December 31, 2006, the following Portfolio declared dividends from net investment income:
| Per Share Amount | Payable Date | Record Date | |||||||||||||
| High Yield Bond | |||||||||||||||
| Class ADV | $ | 0.0170 | February 1, 2007 | Daily | |||||||||||
| Class I | $ | 0.0199 | February 1, 2007 | Daily | |||||||||||
| Class S | $ | 0.0180 | February 1, 2007 | Daily | |||||||||||
45
PORTFOLIO OF INVESTMENTS
ING VP REAL ESTATE PORTFOLIO AS OF DECEMBER 31, 2006
| Shares | Value | ||||||||||||||
| REAL ESTATE INVESTMENT TRUSTS: 97.7% | |||||||||||||||
| Apartments: 21.2% | |||||||||||||||
| 149,900 | Archstone-Smith Trust | $ | 8,725,679 | ||||||||||||
| 53,810 | AvalonBay Communities, Inc. | 6,997,991 | |||||||||||||
| 62,500 | BRE Properties, Inc. | 4,063,750 | |||||||||||||
| 51,480 | Camden Property Trust | 3,801,798 | |||||||||||||
| 141,200 | Equity Residential | 7,165,900 | |||||||||||||
| 29,100 | Home Properties, Inc. | 1,724,757 | |||||||||||||
| 25,800 | Post Properties, Inc. | 1,179,060 | |||||||||||||
| 108,500 | United Dominion Realty Trust, Inc. | 3,449,215 | |||||||||||||
| 37,108,150 | |||||||||||||||
| Diversified: 7.3% | |||||||||||||||
| 51,800 | Liberty Property Trust | 2,545,452 | |||||||||||||
| 71,000 | Vornado Realty Trust | 8,626,500 | |||||||||||||
| 37,500 | Washington Real Estate Investment Trust | 1,500,000 | |||||||||||||
| 12,671,952 | |||||||||||||||
| Health Care: 7.0% | |||||||||||||||
| 105,300 | Health Care Property Investors, Inc. | 3,877,146 | |||||||||||||
| 92,300 | Nationwide Health Properties, Inc. | 2,789,306 | |||||||||||||
| 100,100 | Omega Healthcare Investors, Inc. | 1,773,772 | |||||||||||||
| 89,100 | Ventas, Inc. | 3,770,712 | |||||||||||||
| 12,210,936 | |||||||||||||||
| Hotels: 6.8% | |||||||||||||||
| 279,901 | Host Hotels & Resorts, Inc. | 6,871,569 | |||||||||||||
| 37,100 | LaSalle Hotel Properties | 1,701,035 | |||||||||||||
| 77,600 | Strategic Hotel Capital, Inc. | 1,690,904 | |||||||||||||
| 61,500 | Sunstone Hotel Investors, Inc. | 1,643,895 | |||||||||||||
| 11,907,403 | |||||||||||||||
| Office Property: 20.9% | |||||||||||||||
| 76,000 | BioMed Realty Trust, Inc. | 2,173,600 | |||||||||||||
| 81,800 | Boston Properties, Inc. | 9,151,784 | |||||||||||||
| 52,350 | Corporate Office Properties Trust SBI MD | 2,642,105 | |||||||||||||
| 66,200 | @ | Douglas Emmett, Inc. | 1,760,258 | ||||||||||||
| 182,100 | Equity Office Properties Trust | 8,771,757 | |||||||||||||
| 86,100 | Highwoods Properties, Inc. | 3,509,436 | |||||||||||||
| 21,700 | Kilroy Realty Corp. | 1,692,600 | |||||||||||||
| 30,200 | Maguire Properties, Inc. | 1,208,000 | |||||||||||||
| 42,900 | SL Green Realty Corp. | 5,696,262 | |||||||||||||
| 36,605,802 | |||||||||||||||
| Regional Malls: 12.9% | |||||||||||||||
| 64,200 | General Growth Properties, Inc. | 3,353,166 | |||||||||||||
| 61,700 | Macerich Co. | 5,341,369 | |||||||||||||
| 111,200 | Simon Property Group, Inc. | 11,263,448 | |||||||||||||
| 51,500 | Taubman Centers, Inc. | 2,619,290 | |||||||||||||
| 22,577,273 | |||||||||||||||
| Shopping Centers: 10.3% | |||||||||||||||
| 69,600 | Acadia Realty Trust | 1,741,392 | |||||||||||||
| 68,100 | Developers Diversified Realty Corp. | 4,286,895 | |||||||||||||
| 61,600 | Federal Realty Investment Trust | 5,236,000 | |||||||||||||
| 74,857 | Kimco Realty Corp. | 3,364,822 | |||||||||||||
| 44,000 | Regency Centers Corp. | 3,439,480 | |||||||||||||
| 18,068,589 | |||||||||||||||
| Shares | Value | ||||||||||||||
| Storage: 4.5% | |||||||||||||||
| 47,400 | Extra Space Storage, Inc. | $ | 865,524 | ||||||||||||
| 71,786 | Public Storage, Inc. | 6,999,135 | |||||||||||||
| 7,864,659 | |||||||||||||||
| Warehouse: 6.8% | |||||||||||||||
| 63,400 | AMB Property Corp. | 3,715,874 | |||||||||||||
| 135,700 | Prologis | 8,246,489 | |||||||||||||
| 11,962,363 | |||||||||||||||
| Total Real Estate Investment Trusts (Cost $138,698,561) | 170,977,127 | ||||||||||||||
| COMMON STOCK: 0.6% | |||||||||||||||
| Real Estate Development: 0.6% | |||||||||||||||
| 27,200 | Brookfield Properties Co. | 1,069,776 | |||||||||||||
| Total Common Stock (Cost $1,033,600) | 1,069,776 | ||||||||||||||
| Total Long-Term Investments (Cost $139,732,161) | 172,046,903 | ||||||||||||||
| Principal Amount | Value | ||||||||||
| SHORT-TERM INVESTMENTS: 1.2% | |||||||||||
| U.S. Government Agency Obligations: 1.2% | |||||||||||
| $ | 2,102,000 | Federal Home Loan Bank, 4.600%, due 01/02/07 | 2,101,463 | ||||||||
| Total Short-Term Investments (Cost $2,101,463) | 2,101,463 | ||||||||||
| Total Investments in Securities (Cost $141,833,624)* | 99.5 | % | $ | 174,148,366 | |||||||
| Other Assets and Liabilities - Net | 0.5 | 949,792 | |||||||||
| Net Assets | 100.0 | % | $ | 175,098,158 | |||||||
@ Non-income producing security
* Cost for federal income tax purposes is $141,833,330.
Net unrealized appreciation consists of:
| Gross Unrealized Appreciation | $ | 32,443,993 | |||||
| Gross Unrealized Depreciation | (128,957 | ) | |||||
| Net Unrealized Appreciation | $ | 32,315,036 | |||||
See Accompanying Notes to Financial Statements
46
PORTFOLIO OF INVESTMENTS
ING VP MIDCAP OPPORTUNITIES PORTFOLIO AS OF DECEMBER 31, 2006
| Shares | Value | ||||||||||||||
| COMMON STOCK: 97.6% | |||||||||||||||
| Advertising: 1.1% | |||||||||||||||
| 10,900 | Omnicom Group | $ | 1,139,486 | ||||||||||||
| 1,139,486 | |||||||||||||||
| Aerospace/Defense: 2.7% | |||||||||||||||
| 21,900 | L-3 Communications Holdings, Inc. | 1,790,982 | |||||||||||||
| 57,000 | @,L | Orbital Sciences Corp. | 1,051,080 | ||||||||||||
| 2,842,062 | |||||||||||||||
| Agriculture: 1.2% | |||||||||||||||
| 20,100 | Loews Corp. | 1,300,872 | |||||||||||||
| 1,300,872 | |||||||||||||||
| Airlines: 1.5% | |||||||||||||||
| 34,900 | @,L | AMR Corp. | 1,055,027 | ||||||||||||
| 9,100 | @,L | US Airways Group, Inc. | 490,035 | ||||||||||||
| 1,545,062 | |||||||||||||||
| Apparel: 5.8% | |||||||||||||||
| 77,200 | @ | Coach, Inc. | 3,316,512 | ||||||||||||
| 22,747 | @,@@,L | Gildan Activewear, Inc. | 1,060,693 | ||||||||||||
| 34,900 | Phillips-Van Heusen | 1,750,933 | |||||||||||||
| 6,128,138 | |||||||||||||||
| Commercial Services: 6.3% | |||||||||||||||
| 24,300 | @ | Corrections Corp. of America | 1,099,089 | ||||||||||||
| 82,600 | @ | Gartner, Inc. | 1,634,654 | ||||||||||||
| 12,000 | @ | ITT Educational Services, Inc. | 796,440 | ||||||||||||
| 30,700 | McKesson Corp. | 1,556,490 | |||||||||||||
| 33,500 | Watson Wyatt Worldwide, Inc. | 1,512,525 | |||||||||||||
| 6,599,198 | |||||||||||||||
| Computers: 1.8% | |||||||||||||||
| 31,000 | @ | CACI International, Inc. | 1,751,500 | ||||||||||||
| 6,400 | @,L | Isilon Systems, Inc. | 176,640 | ||||||||||||
| 1,928,140 | |||||||||||||||
| Diversified Financial Services: 4.1% | |||||||||||||||
| 59,100 | Charles Schwab Corp. | 1,142,994 | |||||||||||||
| 78,600 | @ | E*Trade Financial Corp. | 1,762,212 | ||||||||||||
| 9,700 | @,L | GFI Group, Inc. | 603,922 | ||||||||||||
| 18,900 | @ | Investment Technology Group, Inc. | 810,432 | ||||||||||||
| 4,319,560 | |||||||||||||||
| Electrical Components & Equipment: 2.8% | |||||||||||||||
| 54,900 | Ametek, Inc. | 1,748,016 | |||||||||||||
| 26,200 | @,L | General Cable Corp. | 1,145,202 | ||||||||||||
| 2,893,218 | |||||||||||||||
| Electronics: 3.5% | |||||||||||||||
| 57,600 | @,L | Dolby Laboratories, Inc. | 1,786,752 | ||||||||||||
| 20,500 | @,L | Itron, Inc. | 1,062,720 | ||||||||||||
| 18,300 | @ | Thermo Electron Corp. | 828,807 | ||||||||||||
| 3,678,279 | |||||||||||||||
| Engineering & Construction: 2.1% | |||||||||||||||
| 43,400 | @ | McDermott International, Inc. | 2,207,324 | ||||||||||||
| 2,207,324 | |||||||||||||||
| Shares | Value | ||||||||||||||
| Entertainment: 5.1% | |||||||||||||||
| 46,400 | International Game Technology | $ | 2,143,680 | ||||||||||||
| 38,000 | @ | Macrovision Corp. | 1,073,880 | ||||||||||||
| 65,500 | L | Regal Entertainment Group | 1,396,460 | ||||||||||||
| 31,700 | Warner Music Group Corp. | 727,515 | |||||||||||||
| 5,341,535 | |||||||||||||||
| Exchange Traded Fund: 1.3% | |||||||||||||||
| 13,205 | @@,L | iShares Russell Midcap Growth Index Fund | 1,361,039 | ||||||||||||
| 1,361,039 | |||||||||||||||
| Food: 1.8% | |||||||||||||||
| 54,200 | L | Supervalu, Inc. | 1,937,650 | ||||||||||||
| 1,937,650 | |||||||||||||||
| Healthcare-Products: 6.1% | |||||||||||||||
| 46,832 | @ | Gen-Probe, Inc. | 2,452,592 | ||||||||||||
| 42,100 | @,L | Hologic, Inc. | 1,990,488 | ||||||||||||
| 31,000 | @ | Respironics, Inc. | 1,170,250 | ||||||||||||
| 10,400 | @ | Zimmer Holdings, Inc. | 815,152 | ||||||||||||
| 6,428,482 | |||||||||||||||
| Healthcare-Services: 2.5% | |||||||||||||||
| 15,320 | @ | Coventry Health Care, Inc. | 766,766 | ||||||||||||
| 24,900 | @,L | Laboratory Corp. of America Holdings | 1,829,403 | ||||||||||||
| 2,596,169 | |||||||||||||||
| Home Furnishings: 2.1% | |||||||||||||||
| 22,300 | Harman International Industries, Inc. | 2,227,993 | |||||||||||||
| 2,227,993 | |||||||||||||||
| Insurance: 2.1% | |||||||||||||||
| 12,700 | Ambac Financial Group, Inc. | 1,131,189 | |||||||||||||
| 21,900 | @,L | ProAssurance Corp. | 1,093,248 | ||||||||||||
| 2,224,437 | |||||||||||||||
| Internet: 6.9% | |||||||||||||||
| 44,800 | @,L | Akamai Technologies, Inc. | 2,379,776 | ||||||||||||
| 39,500 | @,L | Digital River, Inc. | 2,203,705 | ||||||||||||
| 17,200 | @,L | Nutri/System, Inc. | 1,090,308 | ||||||||||||
| 66,800 | @,L | VeriSign, Inc. | 1,606,540 | ||||||||||||
| 7,280,329 | |||||||||||||||
| Metal Fabricate/Hardware: 1.4% | |||||||||||||||
| 18,200 | Precision Castparts Corp. | 1,424,696 | |||||||||||||
| 1,424,696 | |||||||||||||||
| Miscellaneous Manufacturing: 4.6% | |||||||||||||||
| 32,800 | ITT Corp. | 1,863,696 | |||||||||||||
| 58,900 | Roper Industries, Inc. | 2,959,136 | |||||||||||||
| 4,822,832 | |||||||||||||||
| Oil & Gas: 2.0% | |||||||||||||||
| 34,800 | @ | Newfield Exploration Co. | 1,599,060 | ||||||||||||
| 14,900 | @,L | Southwestern Energy Co. | 522,245 | ||||||||||||
| 2,121,305 | |||||||||||||||
| Oil & Gas Services: 2.6% | |||||||||||||||
| 51,900 | @,L | Cameron International Corp. | 2,753,295 | ||||||||||||
| 2,753,295 | |||||||||||||||
See Accompanying Notes to Financial Statements
47
PORTFOLIO OF INVESTMENTS
ING VP MIDCAP OPPORTUNITIES PORTFOLIO AS OF DECEMBER 31, 2006 (CONTINUED)
| Shares | Value | ||||||||||||||
| Pharmaceuticals: 5.0% | |||||||||||||||
| 7,100 | Allergan, Inc. | $ | 850,154 | ||||||||||||
| 22,000 | Caremark Rx, Inc. | 1,256,420 | |||||||||||||
| 26,800 | @ | Medco Health Solutions, Inc. | 1,432,192 | ||||||||||||
| 30,800 | Medicis Pharmaceutical Corp. | 1,082,004 | |||||||||||||
| 14,000 | @ | NBTY, Inc. | 581,980 | ||||||||||||
| 5,202,750 | |||||||||||||||
| Real Estate Investment Trusts: 0.9% | |||||||||||||||
| 21,200 | Ventas, Inc. | 897,184 | |||||||||||||
| 897,184 | |||||||||||||||
| Retail: 4.7% | |||||||||||||||
| 19,800 | @,L | Chipotle Mexican Grill, Inc. | 1,128,600 | ||||||||||||
| 51,400 | L | Nordstrom, Inc. | 2,536,076 | ||||||||||||
| 26,300 | @ | Pantry, Inc. | 1,231,892 | ||||||||||||
| 4,896,568 | |||||||||||||||
| Semiconductors: 3.2% | |||||||||||||||
| 58,000 | @,@@,L | ASML Holding NV | 1,428,540 | ||||||||||||
| 51,300 | @ | Nvidia Corp. | 1,898,613 | ||||||||||||
| 3,327,153 | |||||||||||||||
| Software: 7.5% | |||||||||||||||
| 30,900 | @ | Ansys, Inc. | 1,343,841 | ||||||||||||
| 20,900 | @,L | Commvault Systems, Inc. | 418,209 | ||||||||||||
| 28,400 | @ | Dun & Bradstreet Corp. | 2,351,236 | ||||||||||||
| 23,400 | @ | Fiserv, Inc. | 1,226,628 | ||||||||||||
| 83,500 | @,L | Informatica Corp. | 1,019,535 | ||||||||||||
| 48,900 | @ | Intuit, Inc. | 1,491,939 | ||||||||||||
| 7,851,388 | |||||||||||||||
| Telecommunications: 4.4% | |||||||||||||||
| 90,800 | @ | Arris Group, Inc. | 1,135,908 | ||||||||||||
| 32,600 | @,L | NII Holdings, Inc. | 2,100,744 | ||||||||||||
| 44,200 | @,L | Polycom, Inc. | 1,366,222 | ||||||||||||
| 4,602,874 | |||||||||||||||
| Toys/Games/Hobbies: 0.5% | |||||||||||||||
| 25,600 | Mattel, Inc. | 580,096 | |||||||||||||
| 580,096 | |||||||||||||||
| Total Common Stock (Cost $92,213,262) | 102,459,114 | ||||||||||||||
| Principal Amount | Value | ||||||||||
| SHORT-TERM INVESTMENTS: 29.2% | |||||||||||
| Repurchase Agreement: 2.2% | |||||||||||
| $ | 2,352,000 | Goldman Sachs Repurchase Agreement dated 12/29/06, 5.220%, due 01/02/07, $2,353,364 to be received upon repurchase (Collateralized by $2,375,000 Federal Home Loan Bank, 4.625%, Market Value plus accrued interest $2,403,178, due 02/08/08) | $ | 2,352,000 | |||||||
| Total Repurchase Agreement (Cost $2,352,000) | 2,352,000 | ||||||||||
| Securities Lending Collateralcc: 27.0% | |||||||||||
| 28,278,637 | The Bank of New York Institutional Cash Reserves Fund | 28,278,637 | |||||||||
| Total Securities Lending Collateral (Cost $28,278,637) | 28,278,637 | ||||||||||
| Total Short-Term Investments (Cost $30,630,637) | 30,630,637 | ||||||||||
| Total Investments in Securities (Cost $122,843,899)* | 126.8 | % | $ | 133,089,751 | |||||||
| Other Assets and Liabilities - Net | (26.8 | ) | (28,124,840 | ) | |||||||
| Net Assets | 100.0 | % | $ | 104,964,911 | |||||||
@ Non-income producing security
@@ Foreign Issuer
cc Securities purchased with cash collateral for securities loaned.
L Loaned security, a portion or all of the security is on loan at December 31, 2006.
* Cost for federal income tax purposes is $122,847,337.
Net unrealized appreciation consists of:
| Gross Unrealized Appreciation | $ | 11,373,278 | |||||
| Gross Unrealized Depreciation | (1,130,864 | ) | |||||
| Net Unrealized Appreciation | $ | 10,242,414 | |||||
See Accompanying Notes to Financial Statements
48
PORTFOLIO OF INVESTMENTS
ING VP SMALLCAP OPPORTUNITIES PORTFOLIO AS OF DECEMBER 31, 2006
| Shares | Value | ||||||||||||||
| COMMON STOCK: 97.5% | |||||||||||||||
| Advertising: 0.5% | |||||||||||||||
| 79,700 | @,L | Gaiam, Inc. | $ | 1,090,296 | |||||||||||
| 1,090,296 | |||||||||||||||
| Aerospace/Defense: 2.1% | |||||||||||||||
| 28,600 | DRS Technologies, Inc. | 1,506,648 | |||||||||||||
| 26,700 | @,L | Esterline Technologies Corp. | 1,074,141 | ||||||||||||
| 45,500 | @ | Moog, Inc. | 1,737,645 | ||||||||||||
| 4,318,434 | |||||||||||||||
| Apparel: 3.4% | |||||||||||||||
| 67,700 | @ | Carter's, Inc. | 1,726,350 | ||||||||||||
| 39,700 | @,@@,L | Gildan Activewear, Inc. | 1,851,211 | ||||||||||||
| 33,800 | Phillips-Van Heusen | 1,695,746 | |||||||||||||
| 46,300 | @ | Steven Madden Ltd. | 1,624,667 | ||||||||||||
| 6,897,974 | |||||||||||||||
| Banks: 1.5% | |||||||||||||||
| 54,285 | L | Boston Private Financial Holdings, Inc. | 1,531,380 | ||||||||||||
| 13,300 | @,L | SVB Financial Group | 620,046 | ||||||||||||
| 28,900 | Whitney Holding Corp. | 942,718 | |||||||||||||
| 3,094,144 | |||||||||||||||
| Biotechnology: 2.0% | |||||||||||||||
| 33,400 | @,L | Alexion Pharmaceuticals, Inc. | 1,349,026 | ||||||||||||
| 105,800 | @,L | Human Genome Sciences, Inc. | 1,316,152 | ||||||||||||
| 31,000 | @,L | Integra LifeSciences Holdings Corp. | 1,320,290 | ||||||||||||
| 3,985,468 | |||||||||||||||
| Chemicals: 2.3% | |||||||||||||||
| 29,200 | Albemarle Corp. | 2,096,560 | |||||||||||||
| 99,000 | UAP Holding Corp. | 2,492,820 | |||||||||||||
| 4,589,380 | |||||||||||||||
| Commercial Services: 6.0% | |||||||||||||||
| 36,400 | @ | Advisory Board Co. | 1,948,856 | ||||||||||||
| 41,900 | Arbitron, Inc. | 1,820,136 | |||||||||||||
| 90,942 | Diamond Management & Technology Consultants, Inc. | 1,131,318 | |||||||||||||
| 47,400 | @,L | FTI Consulting, Inc. | 1,321,986 | ||||||||||||
| 53,750 | @ | Geo Group, Inc. | 2,016,700 | ||||||||||||
| 53,950 | L | Healthcare Services Group | 1,562,392 | ||||||||||||
| 27,500 | @ | Huron Consulting Group, Inc. | 1,246,850 | ||||||||||||
| 25,771 | @ | Kendle International, Inc. | 810,498 | ||||||||||||
| 21,600 | @,L | Navigant Consulting, Inc. | 426,816 | ||||||||||||
| 12,285,552 | |||||||||||||||
| Computers: 5.4% | |||||||||||||||
| 29,000 | @ | CACI International, Inc. | 1,638,500 | ||||||||||||
| 59,700 | @,L | Electronics for Imaging | 1,586,826 | ||||||||||||
| 48,200 | @,L | Komag, Inc. | 1,825,816 | ||||||||||||
| 23,500 | @,L | Kronos, Inc. | 863,390 | ||||||||||||
| 46,858 | @,L | Micros Systems, Inc. | 2,469,417 | ||||||||||||
| 61,700 | @,@@ | Ness Technologies, Inc. | 879,842 | ||||||||||||
| 90,900 | @,L | Palm, Inc. | 1,280,781 | ||||||||||||
| 16,300 | @ | SRA International, Inc. | 435,862 | ||||||||||||
| 10,980,434 | |||||||||||||||
| Cosmetics/Personal Care: 0.5% | |||||||||||||||
| 59,600 | @,L | Physicians Formula Holdings | 1,113,924 | ||||||||||||
| 1,113,924 | |||||||||||||||
| Shares | Value | ||||||||||||||
| Distribution/Wholesale: 2.3% | |||||||||||||||
| 114,700 | @ | Brightpoint, Inc. | $ | 1,542,715 | |||||||||||
| 46,125 | @,L | Nuco2, Inc. | 1,134,214 | ||||||||||||
| 50,523 | L | Pool Corp. | 1,978,986 | ||||||||||||
| 4,655,915 | |||||||||||||||
| Diversified Financial Services: 2.7% | |||||||||||||||
| 42,551 | @,L | CompuCredit Corp. | 1,693,955 | ||||||||||||
| 15,129 | @ | GFI Group, Inc. | 941,932 | ||||||||||||
| 30,200 | @ | Investment Technology Group, Inc. | 1,294,976 | ||||||||||||
| 85,000 | @,L | Newstar Financial, Inc. | 1,568,250 | ||||||||||||
| 5,499,113 | |||||||||||||||
| Electrical Components & Equipment: 0.4% | |||||||||||||||
| 21,000 | @ | General Cable Corp. | 917,910 | ||||||||||||
| 917,910 | |||||||||||||||
| Electronics: 3.7% | |||||||||||||||
| 14,000 | @,L | Cymer, Inc. | 615,300 | ||||||||||||
| 34,000 | @,L | Itron, Inc. | 1,762,560 | ||||||||||||
| 82,100 | Keithley Instruments, Inc. | 1,079,615 | |||||||||||||
| 38,263 | @,L | Measurement Specialties, Inc. | 828,011 | ||||||||||||
| 37,900 | @ | Thomas & Betts Corp. | 1,791,912 | ||||||||||||
| 31,900 | @ | Varian, Inc. | 1,428,801 | ||||||||||||
| 7,506,199 | |||||||||||||||
| Engineering & Construction: 0.7% | |||||||||||||||
| 25,600 | @ | EMCOR Group, Inc. | 1,455,360 | ||||||||||||
| 1,455,360 | |||||||||||||||
| Entertainment: 0.8% | |||||||||||||||
| 54,400 | @,L | Macrovision Corp. | 1,537,344 | ||||||||||||
| 1,537,344 | |||||||||||||||
| Exchange Traded Fund: 2.6% | |||||||||||||||
| 66,893 | @@,L | iShares Russell 2000 Growth Index Fund | 5,261,134 | ||||||||||||
| 5,261,134 | |||||||||||||||
| Healthcare-Products: 3.7% | |||||||||||||||
| 44,700 | @,L | Arthrocare Corp. | 1,784,424 | ||||||||||||
| 47,400 | @ | DJO, Inc. | 2,029,668 | ||||||||||||
| 19,800 | @ | Haemonetics Corp. | 891,396 | ||||||||||||
| 16,900 | @,L | Hologic, Inc. | 799,032 | ||||||||||||
| 25,804 | @,L | Kyphon, Inc. | 1,042,482 | ||||||||||||
| 53,452 | @,L | PSS World Medical, Inc. | 1,043,918 | ||||||||||||
| 7,590,920 | |||||||||||||||
| Healthcare-Services: 5.1% | |||||||||||||||
| 49,285 | @,L | Amedisys, Inc. | 1,619,998 | ||||||||||||
| 33,200 | @,L | Healthways, Inc. | 1,583,972 | ||||||||||||
| 42,900 | @ | Magellan Health Services, Inc. | 1,854,138 | ||||||||||||
| 45,300 | @ | Pediatrix Medical Group, Inc. | 2,215,170 | ||||||||||||
| 70,700 | @,L | Psychiatric Solutions, Inc. | 2,652,664 | ||||||||||||
| 7,700 | @ | WellCare Health Plans, Inc. | 530,530 | ||||||||||||
| 10,456,472 | |||||||||||||||
| Housewares: 1.2% | |||||||||||||||
| 53,700 | Toro Co. | 2,504,031 | |||||||||||||
| 2,504,031 | |||||||||||||||
See Accompanying Notes to Financial Statements
49
PORTFOLIO OF INVESTMENTS
ING VP SMALLCAP OPPORTUNITIES PORTFOLIO AS OF DECEMBER 31, 2006 (CONTINUED)
| Shares | Value | ||||||||||||||
| Insurance: 2.5% | |||||||||||||||
| 69,400 | @@ | Aspen Insurance Holdings Ltd. | $ | 1,829,384 | |||||||||||
| 26,100 | PMI Group, Inc. | 1,231,137 | |||||||||||||
| 11,947 | @ | ProAssurance Corp. | 596,394 | ||||||||||||
| 25,400 | Radian Group, Inc. | 1,369,314 | |||||||||||||
| 5,026,229 | |||||||||||||||
| Internet: 5.7% | |||||||||||||||
| 68,100 | @,L | 24/7 Real Media, Inc. | 616,305 | ||||||||||||
| 53,800 | @,L | aQuantive, Inc. | 1,326,708 | ||||||||||||
| 10,562 | @,L | Digital Insight Corp. | 406,531 | ||||||||||||
| 12,900 | @ | F5 Networks, Inc. | 957,309 | ||||||||||||
| 28,400 | @,L | Nutri/System, Inc. | 1,800,276 | ||||||||||||
| 133,300 | @,L | Sapient Corp. | 731,817 | ||||||||||||
| 55,535 | @,L | Trizetto Group | 1,020,178 | ||||||||||||
| 104,700 | @,L | Valueclick, Inc. | 2,474,061 | ||||||||||||
| 62,600 | @,L | WebEx Communications, Inc. | 2,184,114 | ||||||||||||
| 11,517,299 | |||||||||||||||
| Iron/Steel: 0.8% | |||||||||||||||
| 35,400 | L | Cleveland-Cliffs, Inc. | 1,714,776 | ||||||||||||
| 1,714,776 | |||||||||||||||
| Leisure Time: 1.2% | |||||||||||||||
| 50,700 | @,L | Life Time Fitness, Inc. | 2,459,457 | ||||||||||||
| 2,459,457 | |||||||||||||||
| Lodging: 0.7% | |||||||||||||||
| 112,700 | @ | Red Lion Hotels Corp. | 1,435,798 | ||||||||||||
| 1,435,798 | |||||||||||||||
| Machinery-Diversified: 2.0% | |||||||||||||||
| 6,000 | @ | Middleby Corp. | 628,020 | ||||||||||||
| 32,500 | Nordson Corp. | 1,619,475 | |||||||||||||
| 60,500 | Wabtec Corp. | 1,837,990 | |||||||||||||
| 4,085,485 | |||||||||||||||
| Mining: 0.3% | |||||||||||||||
| 129,500 | @,L | Coeur d'Alene Mines Corp. | 641,025 | ||||||||||||
| 641,025 | |||||||||||||||
| Oil & Gas: 4.4% | |||||||||||||||
| 62,300 | @,L | Carrizo Oil & Gas, Inc. | 1,807,946 | ||||||||||||
| 93,300 | @,L | EXCO Resources, Inc. | 1,577,703 | ||||||||||||
| 120,900 | @,L | McMoRan Exploration Co. | 1,719,198 | ||||||||||||
| 98,700 | @ | Parallel Petroleum Corp. | 1,734,159 | ||||||||||||
| 69,900 | @,L | Petroquest Energy, Inc. | 890,526 | ||||||||||||
| 33,800 | @,L | Southwestern Energy Co. | 1,184,690 | ||||||||||||
| 8,914,222 | |||||||||||||||
| Oil & Gas Services: 2.8% | |||||||||||||||
| 47,400 | @,L | Dresser-Rand Group, Inc. | 1,159,878 | ||||||||||||
| 26,100 | @,L | FMC Technologies, Inc. | 1,608,543 | ||||||||||||
| 23,900 | @,L | Oil States International, Inc. | 770,297 | ||||||||||||
| 64,400 | @,L | Superior Energy Services | 2,104,592 | ||||||||||||
| 5,643,310 | |||||||||||||||
| Packaging & Containers: 1.0% | |||||||||||||||
| 16,450 | Greif, Inc. | 1,947,680 | |||||||||||||
| 1,947,680 | |||||||||||||||
| Shares | Value | ||||||||||||||
| Pharmaceuticals: 4.5% | |||||||||||||||
| 66,600 | @,L | Alkermes, Inc. | $ | 890,442 | |||||||||||
| 99,200 | @,L | BioMarin Pharmaceuticals, Inc. | 1,625,888 | ||||||||||||
| 72,300 | @,L | Cubist Pharmaceuticals, Inc. | 1,309,353 | ||||||||||||
| 73,100 | @ | HealthExtras, Inc. | 1,761,710 | ||||||||||||
| 62,800 | @,L | Sciele Pharma, Inc. | 1,507,200 | ||||||||||||
| 27,700 | @ | Theravance, Inc. | 855,653 | ||||||||||||
| 21,300 | @,L | United Therapeutics Corp. | 1,158,081 | ||||||||||||
| 9,108,327 | |||||||||||||||
| Real Estate Investment Trusts: 0.9% | |||||||||||||||
| 17,000 | Digital Realty Trust, Inc. | 581,910 | |||||||||||||
| 38,300 | L | Nationwide Health Properties, Inc. | 1,157,426 | ||||||||||||
| 1,739,336 | |||||||||||||||
| Retail: 5.5% | |||||||||||||||
| 81,500 | Casey's General Stores, Inc. | 1,919,325 | |||||||||||||
| 18,734 | Cash America International, Inc. | 878,625 | |||||||||||||
| 60,300 | @,L | Jos A Bank Clothiers, Inc. | 1,769,805 | ||||||||||||
| 87,200 | @ | Morton's Restaurant Group, Inc. | 1,451,880 | ||||||||||||
| 24,800 | Ruby Tuesday, Inc. | 680,512 | |||||||||||||
| 61,800 | @,L | Sonic Corp. | 1,480,110 | ||||||||||||
| 32,500 | @,L | Tractor Supply Co. | 1,453,075 | ||||||||||||
| 41,500 | @ | Tween Brands, Inc. | 1,657,095 | ||||||||||||
| 11,290,427 | |||||||||||||||
| Savings & Loans: 1.6% | |||||||||||||||
| 53,411 | Flagstar Bancorp., Inc. | 792,619 | |||||||||||||
| 155,400 | NewAlliance Bancshares, Inc. | 2,548,560 | |||||||||||||
| 3,341,179 | |||||||||||||||
| Semiconductors: 5.6% | |||||||||||||||
| 37,600 | @ | Actel Corp. | 682,816 | ||||||||||||
| 167,500 | @ | Axcelis Technologies, Inc. | 976,525 | ||||||||||||
| 206,300 | @ | Entegris, Inc. | 2,232,166 | ||||||||||||
| 83,100 | @ | Fairchild Semiconductor International, Inc. | 1,396,911 | ||||||||||||
| 46,300 | @,L | Formfactor, Inc. | 1,724,675 | ||||||||||||
| 89,800 | @ | Micrel, Inc. | 968,044 | ||||||||||||
| 28,300 | @ | Microsemi Corp. | 556,095 | ||||||||||||
| 112,900 | @ | Semtech Corp. | 1,475,603 | ||||||||||||
| 82,900 | @,@@ | Verigy Ltd. | 1,471,475 | ||||||||||||
| 11,484,310 | |||||||||||||||
| Software: 4.3% | |||||||||||||||
| 69,600 | @ | Ansys, Inc. | 3,026,904 | ||||||||||||
| 41,400 | Blackbaud, Inc. | 1,076,400 | |||||||||||||
| 167,600 | @,L | Informatica Corp. | 2,046,396 | ||||||||||||
| 22,900 | @ | Progress Software Corp. | 639,597 | ||||||||||||
| 60,900 | @ | THQ, Inc. | 1,980,468 | ||||||||||||
| 8,769,765 | |||||||||||||||
| Storage/Warehousing: 1.0% | |||||||||||||||
| 79,000 | @,L | Mobile Mini, Inc. | 2,128,260 | ||||||||||||
| 2,128,260 | |||||||||||||||
See Accompanying Notes to Financial Statements
50
PORTFOLIO OF INVESTMENTS
ING VP SMALLCAP OPPORTUNITIES PORTFOLIO AS OF DECEMBER 31, 2006 (CONTINUED)
| Shares | Value | ||||||||||||||
| Telecommunications: 3.5% | |||||||||||||||
| 52,100 | L | Adtran, Inc. | $ | 1,182,670 | |||||||||||
| 136,000 | @ | Arris Group, Inc. | 1,701,360 | ||||||||||||
| 112,580 | @,L | Powerwave Technologies, Inc. | 726,141 | ||||||||||||
| 51,200 | @ | RCN Corp. | 1,543,680 | ||||||||||||
| 68,400 | @,L | SBA Communications Corp. | 1,881,000 | ||||||||||||
| 7,034,851 | |||||||||||||||
| Transportation: 2.3% | |||||||||||||||
| 22,000 | Forward Air Corp. | 636,460 | |||||||||||||
| 72,600 | @,L | HUB Group, Inc. | 2,000,130 | ||||||||||||
| 70,500 | L | Knight Transportation, Inc. | 1,202,025 | ||||||||||||
| 25,400 | @ | PHI, Inc. | 831,342 | ||||||||||||
| 4,669,957 | |||||||||||||||
| Total Common Stock (Cost $178,059,481) | 198,691,697 | ||||||||||||||
| Principal Amount | Value | ||||||||||
| SHORT-TERM INVESTMENTS: 29.7% | |||||||||||
| Repurchase Agreement: 3.1% | |||||||||||
| $ | 6,216,000 | Morgan Stanley Repurchase Agreement dated 12/29/06, 5.250%, due 01/02/07, $6,219,626 to be received upon repurchase (Collateralized by $19,805,000 Resolution Funding Corporation, Discount Note, Market Value $6,341,165, due 01/15/30) | 6,216,000 | ||||||||
| Total Repurchase Agreement (Cost $6,216,000) | 6,216,000 | ||||||||||
| Securities Lending Collateralcc: 26.6% | |||||||||||
| 54,242,865 | The Bank of New York Institutional Cash Reserves Fund | 54,242,865 | |||||||||
| Total Securities Lending Collateral (Cost $54,242,865) | 54,242,865 | ||||||||||
| Total Short-Term Investments (Cost $60,458,865) | 60,458,865 | ||||||||||
| Total Investments in Securities (Cost $238,518,346)* | 127.2 | % | $ | 259,150,562 | |||||||
| Other Assets and Liabilities - Net | (27.2 | ) | (55,414,854 | ) | |||||||
| Net Assets | 100.0 | % | $ | 203,735,708 | |||||||
@ Non-income producing security
@@ Foreign Issuer
cc Securities purchased with cash collateral for securities loaned.
L Loaned security, a portion or all of the security is on loan at December 31, 2006.
* Cost for federal income tax purposes is $238,680,539.
Net unrealized appreciation consists of:
| Gross Unrealized Appreciation | $ | 26,017,106 | |||||
| Gross Unrealized Depreciation | (5,547,083 | ) | |||||
| Net Unrealized Appreciation | $ | 20,470,023 | |||||
See Accompanying Notes to Financial Statements
51
PORTFOLIO OF INVESTMENTS
ING VP FINANCIAL SERVICES PORTFOLIO AS OF DECEMBER 31, 2006
| Shares | Value | ||||||||||||||
| COMMON STOCK: 96.7% | |||||||||||||||
| Banks: 29.6% | |||||||||||||||
| 30,100 | Associated Banc Corp. | $ | 1,049,888 | ||||||||||||
| 100,748 | Bank of America Corp. | 5,378,936 | |||||||||||||
| 85,523 | Bank of New York Co., Inc. | 3,367,041 | |||||||||||||
| 32,567 | Capital One Financial Corp. | 2,501,797 | |||||||||||||
| 21,500 | Marshall & Ilsley Corp. | 1,034,365 | |||||||||||||
| 14,200 | PNC Financial Services Group, Inc. | 1,051,368 | |||||||||||||
| 50,505 | Prosperity Bancshares, Inc. | 1,742,928 | |||||||||||||
| 109,318 | US Bancorp. | 3,956,218 | |||||||||||||
| 58,917 | Wachovia Corp. | 3,355,323 | |||||||||||||
| 125,008 | Wells Fargo & Co. | 4,445,282 | |||||||||||||
| 16,434 | Zions Bancorp. | 1,354,819 | |||||||||||||
| 29,237,965 | |||||||||||||||
| Commercial Services: 0.6% | |||||||||||||||
| 29,277 | Western Union Co. | 656,390 | |||||||||||||
| 656,390 | |||||||||||||||
| Diversified Financial Services: 33.3% | |||||||||||||||
| 27,759 | @ | Affiliated Managers Group, Inc. | 2,918,304 | ||||||||||||
| 29,945 | American Express Co. | 1,816,763 | |||||||||||||
| 18,973 | CIT Group, Inc. | 1,058,124 | |||||||||||||
| 105,717 | Citigroup, Inc. | 5,888,437 | |||||||||||||
| 56,422 | Countrywide Financial Corp. | 2,395,114 | |||||||||||||
| 48,728 | @ | E*Trade Financial Corp. | 1,092,482 | ||||||||||||
| 22,923 | Fannie Mae | 1,361,397 | |||||||||||||
| 15,642 | Franklin Resources, Inc. | 1,723,279 | |||||||||||||
| 17,595 | Freddie Mac | 1,194,701 | |||||||||||||
| 7,990 | Goldman Sachs Group, Inc. | 1,592,807 | |||||||||||||
| 98,566 | JPMorgan Chase & Co. | 4,760,738 | |||||||||||||
| 12,852 | Lehman Brothers Holdings, Inc. | 1,003,998 | |||||||||||||
| 34,016 | Merrill Lynch & Co., Inc. | 3,166,890 | |||||||||||||
| 19,265 | Morgan Stanley | 1,568,749 | |||||||||||||
| 86,200 | @ | TD Ameritrade Holding Corp. | 1,394,716 | ||||||||||||
| 32,936,499 | |||||||||||||||
| Home Builders: 1.3% | |||||||||||||||
| 47,356 | D.R. Horton, Inc. | 1,254,460 | |||||||||||||
| 1,254,460 | |||||||||||||||
| Insurance: 29.1% | |||||||||||||||
| 33,594 | @@ | ACE Ltd. | 2,034,789 | ||||||||||||
| 31,759 | Aflac, Inc. | 1,460,914 | |||||||||||||
| 64,732 | American International Group, Inc. | 4,638,695 | |||||||||||||
| 42,800 | AON Corp. | 1,512,552 | |||||||||||||
| 40,600 | @@ | Axis Capital Holdings Ltd. | 1,354,822 | ||||||||||||
| 39,400 | @@ | Endurance Specialty Holdings Ltd. | 1,441,252 | ||||||||||||
| 38,893 | Genworth Financial, Inc. | 1,330,530 | |||||||||||||
| 15,785 | Hartford Financial Services Group, Inc. | 1,472,898 | |||||||||||||
| 17,939 | Lincoln National Corp. | 1,191,150 | |||||||||||||
| 46,500 | Metlife, Inc. | 2,743,965 | |||||||||||||
| 23,001 | PMI Group, Inc. | 1,084,957 | |||||||||||||
| 21,700 | Protective Life Corp. | 1,030,750 | |||||||||||||
| 22,385 | Prudential Financial, Inc. | 1,921,976 | |||||||||||||
| 53,100 | @@ | Security Capital Assurance Ltd. | 1,477,773 | ||||||||||||
| 49,788 | St. Paul Travelers Cos., Inc. | 2,673,118 | |||||||||||||
| 30,200 | Stancorp Financial Group, Inc. | 1,360,510 | |||||||||||||
| 28,730,651 | |||||||||||||||
| Shares | Value | ||||||||||||||
| Internet: 1.2% | |||||||||||||||
| 29,800 | @ | Checkfree Corp. | $ | 1,196,768 | |||||||||||
| 1,196,768 | |||||||||||||||
| Real Estate Investment Trusts: 1.6% | |||||||||||||||
| 21,400 | @ | Douglas Emmett, Inc. | 569,026 | ||||||||||||
| 20,000 | Liberty Property Trust | 982,800 | |||||||||||||
| 1,551,826 | |||||||||||||||
| Total Common Stock (Cost $82,434,631) | 95,564,559 | ||||||||||||||
| Principal Amount | Value | ||||||||||||||
| SHORT-TERM INVESTMENTS: 3.1% | |||||||||||||||
| Repurchase Agreement: 3.1% | |||||||||||
| $ | 3,055,000 | Goldman Sachs Repurchase Agreement dated 12/29/06, 5.220%, due 01/02/07, $3,056,772 to be received upon repurchase (Collateralized by $3,080,000 Federal Home Loan Bank, 4.625%, Market Value plus accrued interest $3,116,543, due 02/08/08) | 3,055,000 | ||||||||
| Total Short-Term Investments (Cost $3,055,000) | 3,055,000 | ||||||||||
| Total Investments in Securities (Cost $85,489,631)* | 99.8 | % | $ | 98,619,559 | |||||||
| Other Assets and Liabilities - Net | 0.2 | 159,074 | |||||||||
| Net Assets | 100.0 | % | $ | 98,778,633 | |||||||
@ Non-income producing security
@@ Foreign Issuer
* Cost for federal income tax purposes is $85,663,794.
Net unrealized appreciation consists of:
| Gross Unrealized Appreciation | $ | 13,331,678 | |||||
| Gross Unrealized Depreciation | (375,913 | ) | |||||
| Net Unrealized Appreciation | $ | 12,955,765 | |||||
See Accompanying Notes to Financial Statements
52
PORTFOLIO OF INVESTMENTS
ING VP HIGH YIELD BOND PORTFOLIO AS OF DECEMBER 31, 2006
| Principal Amount | Value | ||||||||||||||
| CORPORATE BONDS/NOTES: 99.0% | |||||||||||||||
| Advertising: 1.4% | |||||||||||||||
| $ | 27,000 | C | Lamar Media Corp., 6.625%, due 08/15/15 | $ | 26,899 | ||||||||||
| 640,000 | C | R.H. Donnelley Corp., 6.875%, due 01/15/13 | 616,800 | ||||||||||||
| 245,000 | C | R.H. Donnelley Corp., 8.875%, due 01/15/16 | 258,475 | ||||||||||||
| 535,000 | C | Visant Corp., 7.625%, due 10/01/12 | 544,363 | ||||||||||||
| 1,446,537 | |||||||||||||||
| Aerospace/Defense: 0.5% | |||||||||||||||
| 516,000 | C | DRS Technologies, Inc., 6.875%, due 11/01/13 | 522,450 | ||||||||||||
| 522,450 | |||||||||||||||
| Airlines: 1.0% | |||||||||||||||
| 390,000 | AMR Corp., 8.608%, due 04/01/11 | 414,619 | |||||||||||||
| 313,494 | C | Continental Airlines, Inc., 7.461%, due 04/01/15 | 326,229 | ||||||||||||
| 310,000 | United AirLines, Inc., 6.932%, due 09/01/11 | 348,944 | |||||||||||||
| 1,089,792 | |||||||||||||||
| Apparel: 0.9% | |||||||||||||||
| 435,000 | C | Levi Strauss & Co., 10.110%, due 04/01/12 | 448,594 | ||||||||||||
| 53,000 | C | Perry Ellis International, Inc., 8.875%, due 09/15/13 | 53,265 | ||||||||||||
| 435,000 | C | Phillips-Van Heusen, 8.125%, due 05/01/13 | 458,925 | ||||||||||||
| 960,784 | |||||||||||||||
| Auto Manufacturers: 1.4% | |||||||||||||||
| 600,000 | C | General Motors Corp., 7.125%, due 07/15/13 | 567,000 | ||||||||||||
| 965,000 | C | General Motors Corp., 8.375%, due 07/15/33 | 897,450 | ||||||||||||
| 1,464,450 | |||||||||||||||
| Auto Parts & Equipment: 1.4% | |||||||||||||||
| 660,000 | #,C | Lear Corp., 8.750%, due 12/01/16 | 641,025 | ||||||||||||
| 840,000 | C | Visteon Corp., 8.250%, due 08/01/10 | 823,200 | ||||||||||||
| 1,464,225 | |||||||||||||||
| Building Materials: 1.4% | |||||||||||||||
| 52,000 | @@,C | Ainsworth Lumber Co., Ltd., 6.750%, due 03/15/14 | 39,000 | ||||||||||||
| 360,000 | C | Goodman Global Holding Co., Inc., 7.875%, due 12/15/12 | 355,500 | ||||||||||||
| 85,000 | C | Goodman Global Holdings, Inc., 8.360%, due 06/15/12 | 86,488 | ||||||||||||
| 550,000 | C | Interline Brands, Inc., 8.125%, due 06/15/14 | 567,875 | ||||||||||||
| 515,000 | C | Ply Gem Industries, Inc., 9.000%, due 02/15/12 | 440,325 | ||||||||||||
| 6,000 | C | Texas Industries, Inc., 7.250%, due 07/15/13 | 6,120 | ||||||||||||
| 1,495,308 | |||||||||||||||
| Principal Amount | Value | ||||||||||||||
| Chemicals: 6.5% | |||||||||||||||
| $ | 290,000 | C | Equistar Chemicals LP, 10.625%, due 05/01/11 | $ | 310,300 | ||||||||||
| 575,000 | #,C | Huntsman International, LLC, 7.875%, due 11/15/14 | 582,188 | ||||||||||||
| 1,060,000 | @@,#,C | Ineos Group Holdings PLC, 8.500%, due 02/15/16 | 1,017,600 | ||||||||||||
| 1,075,000 | C | Lyondell Chemical Co., 8.000%, due 09/15/14 | 1,120,688 | ||||||||||||
| 1,000,000 | C | Lyondell Chemical Co., 8.250%, due 09/15/16 | 1,055,000 | ||||||||||||
| 225,000 | #,C | Mosaic Co., 7.375%, due 12/01/14 | 232,031 | ||||||||||||
| 275,000 | #,C | Mosaic Co., 7.625%, due 12/01/16 | 286,344 | ||||||||||||
| 700,000 | @@,C | Nova Chemicals Corp., 8.502%, due 11/15/13 | 703,500 | ||||||||||||
| 67,000 | C | OM Group, Inc., 9.250%, due 12/15/11 | 70,434 | ||||||||||||
| 1,185,000 | C | PolyOne Corp., 8.875%, due 05/01/12 | 1,187,939 | ||||||||||||
| 237,000 | C | Rockwood Specialties Group, Inc., 10.625%, due 05/15/11 | 253,590 | ||||||||||||
| 6,819,614 | |||||||||||||||
| Commercial Services: 5.4% | |||||||||||||||
| 1,285,000 | #,C | Ashtead Capital, Inc., 9.000%, due 08/15/16 | 1,381,375 | ||||||||||||
| 655,000 | #,C | Avis Budget Car Rental, LLC, 7.625%, due 05/15/14 | 641,900 | ||||||||||||
| 400,000 | #,C | Avis Budget Car Rental, LLC, 7.750%, due 05/15/16 | 387,000 | ||||||||||||
| 24,000 | C | Concentra Operating Corp., 9.125%, due 06/01/12 | 25,320 | ||||||||||||
| 515,000 | C | Corrections Corp. of America, 7.500%, due 05/01/11 | 533,025 | ||||||||||||
| 37,000 | C | Geo Group, Inc., 8.250%, due 07/15/13 | 38,295 | ||||||||||||
| 465,000 | C | H&E Equipment Services, Inc., 8.375%, due 07/15/16 | 489,413 | ||||||||||||
| 580,000 | #,C | Hertz Corp., 8.875%, due 01/01/14 | 610,450 | ||||||||||||
| 870,000 | #,C | Hertz Corp., 10.500%, due 01/01/16 | 961,350 | ||||||||||||
| 580,000 | #,C | Rental Service Corp., 9.500%, due 12/01/14 | 601,750 | ||||||||||||
| 5,669,878 | |||||||||||||||
| Computers: 0.6% | |||||||||||||||
| 550,000 | C | Sungard Data Systems, Inc., 9.125%, due 08/15/13 | 580,250 | ||||||||||||
| 580,250 | |||||||||||||||
| Cosmetics/Personal Care: 0.0% | |||||||||||||||
| 20,000 | C | Revlon Consumer Products Corp., 8.625%, due 02/01/08 | 19,850 | ||||||||||||
| 19,850 | |||||||||||||||
| Distribution/Wholesale: 1.1% | |||||||||||||||
| 1,070,000 | C | VWR International, Inc., 8.000%, due 04/15/14 | 1,107,450 | ||||||||||||
| 1,107,450 | |||||||||||||||
See Accompanying Notes to Financial Statements
53
PORTFOLIO OF INVESTMENTS
ING VP HIGH YIELD BOND PORTFOLIO AS OF DECEMBER 31, 2006 (CONTINUED)
| Principal Amount | Value | ||||||||||||||
| Diversified Financial Services: 13.2% | |||||||||||||||
| $ | 884 | C | AES Red Oak, LLC, 8.540%, due 11/30/19 | $ | 965 | ||||||||||
| 595,000 | # | Astoria Depositor Corp., 8.144%, due 05/01/21 | 650,511 | ||||||||||||
| 426,000 | C | BCP Crystal US Holdings Corp., 9.625%, due 06/15/14 | 472,860 | ||||||||||||
| 455,000 | C | Crystal US Holdings 3, LLC, 1.880%, due 10/01/14 | 393,575 | ||||||||||||
| 41,000 | C | E*Trade Financial Corp., 7.375%, due 09/15/13 | 42,845 | ||||||||||||
| 1,100,000 | Ford Motor Credit Co., 0.000%, due 11/29/13 | 1,103,526 | |||||||||||||
| 1,425,000 | # | Ford Motor Credit Co., 9.750%, due 09/15/10 | 1,517,102 | ||||||||||||
| 620,000 | Ford Motor Credit Co., 9.824%, due 04/15/12 | 657,855 | |||||||||||||
| 1,415,000 | Ford Motor Credit Co., 9.875%, due 08/10/11 | 1,514,776 | |||||||||||||
| 500,000 | General Motors Acceptance Corp., 5.125%, due 05/09/08 | 494,813 | |||||||||||||
| 625,000 | General Motors Acceptance Corp., 6.750%, due 12/01/14 | 642,937 | |||||||||||||
| 895,000 | General Motors Acceptance Corp., 6.875%, due 09/15/11 | 918,914 | |||||||||||||
| 495,000 | General Motors Acceptance Corp., 8.000%, due 11/01/31 | 569,944 | |||||||||||||
| 240,000 | #,C | GNC Parent Corp., 0.000%, due 12/01/11 | 241,200 | ||||||||||||
| 420,000 | #,C | Hexion US Finance Corp., 9.750%, due 11/15/14 | 427,875 | ||||||||||||
| 1,110,000 | #,C | Idearc, Inc., 8.000%, due 11/15/16 | 1,132,200 | ||||||||||||
| 400,000 | #,C | Momentive Performance, 9.750%, due 12/01/14 | 402,000 | ||||||||||||
| 280,000 | #,C | Momentive Performance, 11.500%, due 12/01/16 | 275,800 | ||||||||||||
| 742,575 | #,C | Piper Jaffray Equipment Trust Securities, 6.750%, due 04/01/11 | 738,862 | ||||||||||||
| 332,000 | #,C | Rainbow National Services, LLC, 8.750%, due 09/01/12 | 350,675 | ||||||||||||
| 20,000 | C | Standard Aero Holdings, Inc., 8.250%, due 09/01/14 | 20,300 | ||||||||||||
| 615,000 | C | Universal City Florida Holding Co., 10.121%, due 05/01/10 | 638,063 | ||||||||||||
| 560,000 | #,C | Wimar Opco, LLC, 9.625%, due 12/15/14 | 557,200 | ||||||||||||
| 13,764,798 | |||||||||||||||
| Electric: 2.9% | |||||||||||||||
| 620,000 | #,C | AES Corp., 8.750%, due 05/15/13 | 667,275 | ||||||||||||
| 71,000 | C | Allegheny Energy Supply, 7.800%, due 03/15/11 | 76,503 | ||||||||||||
| 575,000 | C | CMS Energy Corp., 8.500%, due 04/15/11 | 628,188 | ||||||||||||
| 58,650 | C | Homer City Funding, LLC, 8.734%, due 10/01/26 | 67,741 | ||||||||||||
| 644,640 | C | Midwest Generation, LLC, 8.300%, due 07/02/09 | 663,576 | ||||||||||||
| 106,020 | C | Midwest Generation, LLC, 8.560%, due 01/02/16 | 116,953 | ||||||||||||
| Principal Amount | Value | ||||||||||||||
| $ | 510,000 | C | Mirant North America, LLC, 7.375%, due 12/31/13 | $ | 520,200 | ||||||||||
| 8,061 | #,C | South Point Energy Center, LLC, 8.400%, due 05/30/12 | 7,784 | ||||||||||||
| 310,000 | C | TECO Energy, Inc., 7.500%, due 06/15/10 | 331,700 | ||||||||||||
| 3,079,920 | |||||||||||||||
| Electrical Components & Equipment: 0.0% | |||||||||||||||
| 42,000 | C | Superior Essex Communications, LLC, 9.000%, due 04/15/12 | 43,890 | ||||||||||||
| 43,890 | |||||||||||||||
| Electronics: 0.6% | |||||||||||||||
| 600,000 | Sanmina-Sci Corp., 7.880%, due 01/31/08 | 602,436 | |||||||||||||
| 602,436 | |||||||||||||||
| Engineering & Construction: 0.0% | |||||||||||||||
| 13,000 | C | Ahern Rentals, Inc., 9.250%, due 08/15/13 | 13,618 | ||||||||||||
| 13,618 | |||||||||||||||
| Entertainment: 3.9% | |||||||||||||||
| 25,000 | C | AMC Entertainment, Inc., 8.000%, due 03/01/14 | 24,938 | ||||||||||||
| 300,000 | C | AMC Entertainment, Inc., 8.625%, due 08/15/12 | 315,375 | ||||||||||||
| 700,000 | C | AMC Entertainment, Inc., 11.000%, due 02/01/16 | 789,250 | ||||||||||||
| 835,000 | C | American Casino & Entertainment Properties, LLC, 7.850%, due 02/01/12 | 856,919 | ||||||||||||
| 737,000 | C | Pinnacle Entertainment, Inc., 8.250%, due 03/15/12 | 748,055 | ||||||||||||
| 95,000 | C | Six Flags Theme Parks, Inc., 8.875%, due 02/01/10 | 92,388 | ||||||||||||
| 665,000 | C | Six Flags Theme Parks, Inc., 9.625%, due 06/01/14 | 620,113 | ||||||||||||
| 662,000 | C | Warner Music Group - Old, 7.375%, due 04/15/14 | 658,690 | ||||||||||||
| 4,105,728 | |||||||||||||||
| Environmental Control: 2.0% | |||||||||||||||
| 415,000 | #,C | Aleris International, Inc., 9.000%, due 12/15/14 | 419,150 | ||||||||||||
| 326,000 | C | Allied Waste North America, Inc., 8.500%, due 12/01/08 | 344,338 | ||||||||||||
| 825,000 | C | Waste Services, Inc., 9.500%, due 04/15/14 | 864,188 | ||||||||||||
| 425,000 | C | WCA Waste Corp., 9.250%, due 06/15/14 | 446,250 | ||||||||||||
| 2,073,926 | |||||||||||||||
| Food: 1.9% | |||||||||||||||
| 25,000 | C | Ahold Finance USA, Inc., 8.250%, due 07/15/10 | 27,219 | ||||||||||||
| 530,000 | C | Albertson's, Inc., 7.450%, due 08/01/29 | 520,459 | ||||||||||||
| 660,000 | C | Albertson's, Inc., 7.500%, due 02/15/11 | 689,019 | ||||||||||||
| 28,000 | C | Del Monte Corp., 8.625%, due 12/15/12 | 29,680 | ||||||||||||
See Accompanying Notes to Financial Statements
54
PORTFOLIO OF INVESTMENTS
ING VP HIGH YIELD BOND PORTFOLIO AS OF DECEMBER 31, 2006 (CONTINUED)
| Principal Amount | Value | ||||||||||||||
| Food (continued) | |||||||||||||||
| $ | 43,000 | Smithfield Foods, Inc., 7.000%, due 08/01/11 | $ | 43,645 | |||||||||||
| 615,000 | C | Stater Brothers Holdings, 8.125%, due 06/15/12 | 627,300 | ||||||||||||
| 1,937,322 | |||||||||||||||
| Forest Products & Paper: 4.9% | |||||||||||||||
| 1,090,000 | C | Abitibi-Consolidated Finance LP, 7.875%, due 08/01/09 | 1,068,200 | ||||||||||||
| 655,000 | C | Appleton Papers, Inc., 8.125%, due 06/15/11 | 671,375 | ||||||||||||
| 450,000 | @@,C | Catalyst Paper Corp., 8.625%, due 06/15/11 | 457,875 | ||||||||||||
| 485,000 | @@,C | Domtar, Inc., 7.875%, due 10/15/11 | 505,613 | ||||||||||||
| 23,000 | @@,#,C | Fraser Papers, Inc., 8.750%, due 03/15/15 | 21,160 | ||||||||||||
| 280,000 | #,C | Georgia-Pacific Corp., 7.000%, due 01/15/15 | 280,700 | ||||||||||||
| 350,000 | #,C | Georgia-Pacific Corp., 7.125%, due 01/15/17 | 350,875 | ||||||||||||
| 240,000 | C | Georgia-Pacific Corp., 7.750%, due 11/15/29 | 240,600 | ||||||||||||
| 31,000 | C | Neenah Paper, Inc., 7.375%, due 11/15/14 | 29,760 | ||||||||||||
| 415,000 | C | NewPage Corp., 12.000%, due 05/01/13 | 440,938 | ||||||||||||
| 135,000 | #,C | Verso Paper Holdings, LLC, 9.121%, due 08/01/14 | 137,700 | ||||||||||||
| 450,000 | #,C | Verso Paper Holdings, LLC, 9.125%, due 08/01/14 | 471,375 | ||||||||||||
| 385,000 | #,C | Verso Paper Holdings, LLC, 11.375%, due 08/01/16 | 406,175 | ||||||||||||
| 5,082,346 | |||||||||||||||
| Gas: 0.0% | |||||||||||||||
| 15,000 | C | SEMCO Energy, Inc., 7.125%, due 05/15/08 | 15,060 | ||||||||||||
| 17,000 | C | SEMCO Energy, Inc., 7.750%, due 05/15/13 | 17,245 | ||||||||||||
| 32,305 | |||||||||||||||
| Healthcare-Products: 0.4% | |||||||||||||||
| 420,000 | #,C | CDRV Investors, Inc., 0.000%, due 12/01/11 | 411,600 | ||||||||||||
| 40,000 | C | Inverness Medical Innovations, Inc., 8.750%, due 02/15/12 | 41,800 | ||||||||||||
| 453,400 | |||||||||||||||
| Healthcare-Services: 4.5% | |||||||||||||||
| 400,000 | C | Community Health Systems, Inc., 6.500%, due 12/15/12 | 396,000 | ||||||||||||
| 490,000 | C | DaVita, Inc., 7.250%, due 03/15/15 | 502,250 | ||||||||||||
| 1,850,000 | #,C | HCA, Inc., 9.250%, due 11/15/16 | 1,986,438 | ||||||||||||
| 495,000 | #,C | HCA, Inc., 9.625%, due 11/15/16 | 533,363 | ||||||||||||
| 535,000 | C | Psychiatric Solutions, Inc., 7.750%, due 07/15/15 | 536,338 | ||||||||||||
| Principal Amount | Value | ||||||||||||||
| $ | 240,000 | C | Tenet Healthcare Corp., 6.375%, due 12/01/11 | $ | 220,800 | ||||||||||
| 525,000 | C | Triad Hospitals, Inc., 7.000%, due 11/15/13 | 530,906 | ||||||||||||
| 4,706,095 | |||||||||||||||
| Holding Companies-Diversified: 0.5% | |||||||||||||||
| 470,000 | C | Atlantic Broadband Finance, LLC, 9.375%, due 01/15/14 | 477,638 | ||||||||||||
| 477,638 | |||||||||||||||
| Home Builders: 1.2% | |||||||||||||||
| 545,000 | C | Standard-Pacific Corp., 6.500%, due 08/15/10 | 535,463 | ||||||||||||
| 310,000 | C | Stanley-Martin Communities, LLC, 9.750%, due 08/15/15 | 246,450 | ||||||||||||
| 450,000 | C | Technical Olympic USA, Inc., 9.000%, due 07/01/10 | 445,500 | ||||||||||||
| 1,227,413 | |||||||||||||||
| Home Furnishings: 0.4% | |||||||||||||||
| 395,000 | C | Norcraft Cos. LP, 9.000%, due 11/01/11 | 410,800 | ||||||||||||
| 410,800 | |||||||||||||||
| Household Products/Wares: 1.0% | |||||||||||||||
| 465,000 | C | American Achievement Corp., 8.250%, due 04/01/12 | 478,369 | ||||||||||||
| 27,000 | C | Gregg Appliances, Inc., 9.000%, due 02/01/13 | 25,920 | ||||||||||||
| 615,000 | C | Visant Holding Corp., 1.730%, due 12/01/13 | 545,813 | ||||||||||||
| 1,050,102 | |||||||||||||||
| Leisure Time: 2.2% | |||||||||||||||
| 798,000 | Cedar Fair LP, 0.000%, due 01/00/00 | 806,977 | |||||||||||||
| 369,000 | @@,C | NCL Corp., 10.625%, due 07/15/14 | 370,845 | ||||||||||||
| 40,000 | @@ | Royal Caribbean Cruises Ltd., 7.500%, due 10/15/27 | 39,390 | ||||||||||||
| 314,000 | @@ | Royal Caribbean Cruises Ltd., 8.000%, due 05/15/10 | 334,845 | ||||||||||||
| 750,000 | #,C | TDS Investor Corp., 11.875%, due 09/01/16 | 772,500 | ||||||||||||
| 2,324,557 | |||||||||||||||
| Lodging: 1.3% | |||||||||||||||
| 330,000 | #,C | French Lick Resorts & Casino, LLC, 10.750%, due 04/15/14 | 310,200 | ||||||||||||
| 600,000 | C | MGM Mirage, 5.875%, due 02/27/14 | 558,000 | ||||||||||||
| 145,000 | C | MGM Mirage, 6.625%, due 07/15/15 | 138,838 | ||||||||||||
| 450,000 | C | Station Casinos, Inc., 6.500%, due 02/01/14 | 402,188 | ||||||||||||
| 1,409,226 | |||||||||||||||
| Machinery-Diversified: 0.1% | |||||||||||||||
| 27,000 | C | Columbus McKinnon Corp., 8.875%, due 11/01/13 | 28,620 | ||||||||||||
| 28,000 | C | Manitowoc Co., 10.500%, due 08/01/12 | 30,205 | ||||||||||||
| 58,825 | |||||||||||||||
See Accompanying Notes to Financial Statements
55
PORTFOLIO OF INVESTMENTS
ING VP HIGH YIELD BOND PORTFOLIO AS OF DECEMBER 31, 2006 (CONTINUED)
| Principal Amount | Value | ||||||||||||||
| Media: 13.2% | |||||||||||||||
| $ | 435,000 | C | American Media Operations, Inc., 10.250%, due 05/01/09 | $ | 422,494 | ||||||||||
| 25,000 | Cablevision Systems Corp., 9.870%, due 04/01/09 | 26,500 | |||||||||||||
| 540,000 | C | CBD Media, Inc., 8.625%, due 06/01/11 | 556,200 | ||||||||||||
| 1,201,001 | C | CCH I, LLC, 11.000%, due 10/01/15 | 1,237,328 | ||||||||||||
| 608,000 | C | CCH II, LLC, 10.250%, due 10/01/13 | 650,560 | ||||||||||||
| 500,000 | C | Charter Communications Holdings II, LLC, 10.250%, due 09/15/10 | 525,625 | ||||||||||||
| 902,000 | #,C | Charter Communications Operating, LLC, 8.000%, due 04/30/12 | 941,463 | ||||||||||||
| 1,365,000 | #,C | Charter Communications Operating, LLC, 8.375%, due 04/30/14 | 1,431,544 | ||||||||||||
| 525,000 | #,C | CMP Susquehanna Corp., 9.875%, due 05/15/14 | 525,000 | ||||||||||||
| 178,000 | CSC Holdings, Inc., 7.625%, due 04/01/11 | 182,228 | |||||||||||||
| 405,000 | CSC Holdings, Inc., 7.625%, due 07/15/18 | 396,394 | |||||||||||||
| 850,000 | CSC Holdings, Inc., 8.125%, due 07/15/09 | 885,063 | |||||||||||||
| 672,000 | C | Dex Media West, LLC, 9.875%, due 08/15/13 | 735,840 | ||||||||||||
| 230,000 | C | Dex Media, Inc., 8.000%, due 11/15/13 | 238,050 | ||||||||||||
| 495,000 | C | Insight Communications Co., Inc., 12.250%, due 02/15/11 | 519,750 | ||||||||||||
| 720,000 | #,C | ION Media Networks, Inc., 11.624%, due 01/15/13 | 732,600 | ||||||||||||
| 425,000 | #,C | Mediacom Broadband, LLC, 8.500%, due 10/15/15 | 432,438 | ||||||||||||
| 460,000 | C | Nexstar Finance, Inc., 7.000%, due 01/15/14 | 434,700 | ||||||||||||
| 500,000 | #,C | Nielsen Finance, LLC, 10.000%, due 08/01/14 | 544,375 | ||||||||||||
| 1,015,000 | C | Primedia, Inc., 10.749%, due 05/15/10 | 1,060,675 | ||||||||||||
| 485,000 | C | Radio One, Inc., 6.375%, due 02/15/13 | 455,900 | ||||||||||||
| 795,000 | C | Vertis, Inc., 9.750%, due 04/01/09 | 822,825 | ||||||||||||
| 13,757,552 | |||||||||||||||
| Metal Fabricate/Hardware: 0.1% | |||||||||||||||
| 24,000 | C | Autocam Corp., 10.875%, due 06/15/14 | 7,080 | ||||||||||||
| 36,000 | C | Valmont Industries, Inc., 6.875%, due 05/01/14 | 35,865 | ||||||||||||
| 44,000 | #,C | Wolverine Tube, Inc., 7.375%, due 08/01/08 | 34,980 | ||||||||||||
| 77,925 | |||||||||||||||
| Mining: 0.1% | |||||||||||||||
| 27,000 | C | Century Aluminum Co., 7.500%, due 08/15/14 | 27,506 | ||||||||||||
| 27,000 | C | Southern Copper Corp., 7.500%, due 07/27/35 | 29,411 | ||||||||||||
| 56,917 | |||||||||||||||
| Principal Amount | Value | ||||||||||||||
| Miscellaneous Manufacturing: 0.5% | |||||||||||||||
| $ | 58,000 | C | Park-Ohio Industries, Inc., 8.375%, due 11/15/14 | $ | 54,375 | ||||||||||
| 325,000 | #,C | RBS Global, Inc. and Rexnord Corp., 9.500%, due 08/01/14 | 339,625 | ||||||||||||
| 130,000 | #,C | RBS Global, Inc. and Rexnord Corp., 11.750%, due 08/01/16 | 136,500 | ||||||||||||
| 530,500 | |||||||||||||||
| Oil & Gas: 4.2% | |||||||||||||||
| 715,000 | C | Chesapeake Energy Corp., 6.625%, due 01/15/16 | 714,106 | ||||||||||||
| 45,000 | C | El Paso Production Holding Co., 7.750%, due 06/01/13 | 47,306 | ||||||||||||
| 555,000 | @@,#,C | Griffin Coal Mining Co., 9.500%, due 12/01/16 | 574,425 | ||||||||||||
| 780,000 | #,C | Hilcorp Energy I LP, 9.000%, due 06/01/16 | 828,750 | ||||||||||||
| 545,000 | @@,#,C | Opti Canada, Inc., 8.250%, due 12/15/14 | 562,713 | ||||||||||||
| 39,000 | @@,C | Paramount Resources Ltd., 8.500%, due 01/31/13 | 38,903 | ||||||||||||
| 57,000 | C | Parker Drilling Co., 10.119%, due 09/01/10 | 58,568 | ||||||||||||
| 540,000 | C | Petrohawk Energy Corp., 9.125%, due 07/15/13 | 569,700 | ||||||||||||
| 23,000 | C | Premcor Refining Group, Inc., 7.500%, due 06/15/15 | 24,075 | ||||||||||||
| 450,000 | # | Sabine Pass LP, 7.500%, due 11/30/16 | 449,438 | ||||||||||||
| 500,000 | C | Whiting Petroleum Corp., 7.250%, due 05/01/13 | 503,750 | ||||||||||||
| 4,371,734 | |||||||||||||||
| Oil & Gas Services: 0.7% | |||||||||||||||
| 545,000 | #,C | Complete Production Services, Inc., 8.000%, due 12/15/16 | 561,350 | ||||||||||||
| 120,000 | C | Hanover Equipment Trust, 8.750%, due 09/01/11 | 125,700 | ||||||||||||
| 687,050 | |||||||||||||||
| Packaging & Containers: 0.8% | |||||||||||||||
| 28,000 | C | Constar International, Inc., 11.000%, due 12/01/12 | 26,040 | ||||||||||||
| 410,000 | C | Graham Packaging Co., Inc., 8.500%, due 10/15/12 | 416,150 | ||||||||||||
| 400,000 | C | Owens Brockway Glass Container, Inc., 6.750%, due 12/01/14 | 390,000 | ||||||||||||
| 832,190 | |||||||||||||||
| Pharmaceuticals: 0.0% | |||||||||||||||
| 14,000 | @@,C | Elan Finance PLC, 7.750%, due 11/15/11 | 13,738 | ||||||||||||
| 13,738 | |||||||||||||||
| Pipelines: 2.0% | |||||||||||||||
| 715,000 | C | Colorado Interstate Gas Co., 5.950%, due 03/15/15 | 709,040 | ||||||||||||
| 128,000 | C | Sonat, Inc., 7.625%, due 07/15/11 | 136,320 | ||||||||||||
See Accompanying Notes to Financial Statements
56
PORTFOLIO OF INVESTMENTS
ING VP HIGH YIELD BOND PORTFOLIO AS OF DECEMBER 31, 2006 (CONTINUED)
| Principal Amount | Value | ||||||||||||||
| Pipelines (continued) | |||||||||||||||
| $ | 560,000 | C | Southern Natural Gas Co., 8.000%, due 03/01/32 | $ | 657,161 | ||||||||||
| 7,000 | C | Southern Natural Gas Co., 8.875%, due 03/15/10 | 7,379 | ||||||||||||
| 130,000 | C | Transcontinental Gas Pipe Line Corp., 7.250%, due 12/01/26 | 134,713 | ||||||||||||
| 39,000 | C | Williams Cos., Inc., 7.125%, due 09/01/11 | 40,755 | ||||||||||||
| 350,000 | # | Williams Partners LP, 7.250%, due 02/01/17 | 358,750 | ||||||||||||
| 2,044,118 | |||||||||||||||
| Real Estate Investment Trusts: 0.1% | |||||||||||||||
| 54,000 | C | iStar Financial, Inc., 6.500%, due 12/15/13 | 55,285 | ||||||||||||
| 20,000 | C | Ventas Realty LP, 8.750%, due 05/01/09 | 21,350 | ||||||||||||
| 76,635 | |||||||||||||||
| Retail: 5.6% | |||||||||||||||
| 582,000 | C | Blockbuster, Inc., 9.000%, due 09/01/12 | 565,995 | ||||||||||||
| 550,000 | C | Bon-Ton Stores, Inc., 10.250%, due 03/15/14 | 565,125 | ||||||||||||
| 505,000 | #,C | Buffets, Inc., 12.500%, due 11/01/14 | 511,313 | ||||||||||||
| 34,000 | C | Couche-Tard US LP, 7.500%, due 12/15/13 | 34,935 | ||||||||||||
| 400,000 | C | Dominos, Inc., 8.250%, due 07/01/11 | 416,500 | ||||||||||||
| 135,000 | C | Duane Reade, Inc., 9.860%, due 12/15/10 | 140,400 | ||||||||||||
| 355,000 | C | General Nutrition Centers, Inc., 8.500%, due 12/01/10 | 366,538 | ||||||||||||
| 745,000 | C | General Nutrition Centers, Inc., 8.625%, due 01/15/11 | 787,838 | ||||||||||||
| 535,000 | C | GSC Holdings Corp., 8.000%, due 10/01/12 | 561,750 | ||||||||||||
| 39,000 | C | Landry's Restaurants, Inc., 7.500%, due 12/15/14 | 38,318 | ||||||||||||
| 535,000 | #,C | Michaels Stores, Inc., 11.375%, due 11/01/16 | 560,413 | ||||||||||||
| 1,020,000 | C | Neiman-Marcus Group, Inc., 9.000%, due 10/15/15 | 1,118,175 | ||||||||||||
| 75,000 | C | Pantry, Inc., 7.750%, due 02/15/14 | 75,844 | ||||||||||||
| 63,000 | C | PEP Boys-Manny Moe & Jack, 7.500%, due 12/15/14 | 57,881 | ||||||||||||
| 5,801,025 | |||||||||||||||
| Savings & Loans: 0.0% | |||||||||||||||
| 34,000 | C | Western Financial Bank, 9.625%, due 05/15/12 | 37,167 | ||||||||||||
| 37,167 | |||||||||||||||
| Semiconductors: 0.8% | |||||||||||||||
| 385,000 | #,C | Freescale Semiconductor, 8.875%, due 12/15/14 | 385,481 | ||||||||||||
| 14,000 | @@,C | MagnaChip Semiconductor SA, 8.000%, due 12/15/14 | 9,450 | ||||||||||||
| 433,000 | @@,C | STATS ChipPAC Ltd., 7.500%, due 07/19/10 | 438,413 | ||||||||||||
| 833,344 | |||||||||||||||
| Principal Amount | Value | ||||||||||||||
| Telecommunications: 8.2% | |||||||||||||||
| $ | 196,000 | C | American Tower Corp., 7.125%, due 10/15/12 | $ | 202,370 | ||||||||||
| 497,000 | C | Centennial Cellular Operating Co., 10.125%, due 06/15/13 | 538,003 | ||||||||||||
| 255,000 | C | Centennial Communications Corp., 10.000%, due 01/01/13 | 272,531 | ||||||||||||
| 955,000 | C | Cincinnati Bell, Inc., 8.375%, due 01/15/14 | 986,038 | ||||||||||||
| 515,000 | C | Citizens Communications Co., 9.000%, due 08/15/31 | 561,350 | ||||||||||||
| 180,000 | C | Citizens Communications Co., 9.250%, due 05/15/11 | 200,025 | ||||||||||||
| 595,000 | C | Dobson Cellular Systems, 9.875%, due 11/01/12 | 651,525 | ||||||||||||
| 137,000 | C | Dobson Communications Corp., 9.624%, due 10/15/12 | 140,425 | ||||||||||||
| 54,000 | @@ | Empresa Brasileira de Telecom SA, 11.000%, due 12/15/08 | 59,400 | ||||||||||||
| 990,000 | @@,#,C | Intelsat Bermuda Ltd., 11.250%, due 06/15/16 | 1,091,475 | ||||||||||||
| 950,000 | @@,C | Intelsat Ltd., 5.250%, due 11/01/08 | 928,625 | ||||||||||||
| 620,000 | @@,C | Intelsat Subsidiary Holding Co., Ltd., 8.625%, due 01/15/15 | 647,900 | ||||||||||||
| 29,000 | C | iPCS, Inc., 11.500%, due 05/01/12 | 32,335 | ||||||||||||
| 166,000 | C | LCI International, Inc., 7.250%, due 06/15/07 | 167,245 | ||||||||||||
| 500,000 | #,C | MetroPCS Wireless, Inc., 9.250%, due 11/01/14 | 525,000 | ||||||||||||
| 435,000 | #,C | PanAmSat Corp., 9.000%, due 06/15/16 | 462,731 | ||||||||||||
| 544,000 | C | Qwest Capital Funding, Inc., 6.375%, due 07/15/08 | 548,080 | ||||||||||||
| 207,000 | C | Qwest Capital Funding, Inc., 7.000%, due 08/03/09 | 211,658 | ||||||||||||
| 20,000 | C | Qwest Capital Funding, Inc., 7.250%, due 02/15/11 | 20,525 | ||||||||||||
| 100,000 | Qwest Corp., 8.610%, due 06/15/13 | 108,750 | |||||||||||||
| 200,000 | @@,C | Rogers Wireless, Inc., 7.250%, due 12/15/12 | 213,000 | ||||||||||||
| 30,000 | #,C | Telcordia Technologies, Inc., 10.000%, due 03/15/13 | 26,550 | ||||||||||||
| 8,595,541 | |||||||||||||||
| Textiles: 0.0% | |||||||||||||||
| 45,000 | #,C | Invista, 9.250%, due 05/01/12 | 48,488 | ||||||||||||
| 48,488 | |||||||||||||||
| Transportation: 0.1% | |||||||||||||||
| 55,000 | @@,C | CHC Helicopter Corp., 7.375%, due 05/01/14 | $ | 53,281 | |||||||||||
| 53,281 | |||||||||||||||
| Total Corporate Bonds/Notes (Cost $100,906,541) | 103,312,138 | ||||||||||||||
See Accompanying Notes to Financial Statements
57
PORTFOLIO OF INVESTMENTS
ING VP HIGH YIELD BOND PORTFOLIO AS OF DECEMBER 31, 2006 (CONTINUED)
| Shares | Value | ||||||||||||||
| COMMON STOCK: 0.9% | |||||||||||||||
| Closed-end Funds: 0.8% | |||||||||||||||
| 109,500 | ** | ING Prime Rate Trust | $ | 791,685 | |||||||||||
| 791,685 | |||||||||||||||
| Telecommunications: 0.1% | |||||||||||||||
| 1,107 | @ | iPCS, Inc. | 61,284 | ||||||||||||
| 150 | @,I,X | Jordan Tellecommunications | 3,243 | ||||||||||||
| 1,315 | NTL, Inc. | 33,191 | |||||||||||||
| 97,718 | |||||||||||||||
| Total Common Stock (Cost $825,327) | 889,403 | ||||||||||||||
| PREFERRED STOCK: 0.1% | |||||||||||||||
| Diversified Financial Services: 0.1% | |||||||||||||||
| 2,545 | P | AES Trust VII | 126,614 | ||||||||||||
| 126,614 | |||||||||||||||
| Media: 0.0% | |||||||||||||||
| 2 | P | ION Media Networks, Inc. | 15,943 | ||||||||||||
| 15,943 | |||||||||||||||
| Total Preferred Stock (Cost $140,977) | 142,557 | ||||||||||||||
| WARRANTS: 0.1% | |||||||||||||||
| Building Materials: 0.0% | |||||||||||||||
| 195 | @,#,I,X | Dayton Superior Corp. | 2 | ||||||||||||
| 2 | |||||||||||||||
| Commercial Services: 0.0% | |||||||||||||||
| 20 | @,I | Travelcenters of America, Inc. | 24 | ||||||||||||
| 62 | @ | Travelcenters of America, Inc. | 74 | ||||||||||||
| 98 | |||||||||||||||
| Communications: 0.0% | |||||||||||||||
| 48 | @ | XM Satellite Radio Holdings, Inc. | 343 | ||||||||||||
| 343 | |||||||||||||||
| Telecommunications: 0.1% | |||||||||||||||
| 176 | @ | American Tower Corp. | 92,720 | ||||||||||||
| 218 | @ | Ntelos, Inc. | — | ||||||||||||
| 92,720 | |||||||||||||||
| Total Warrants (Cost $59,547) | 93,163 | ||||||||||||||
| Total Long-Term Investments (Cost $101,932,392) | 104,437,261 | ||||||||||||||
| Principal Amount | Value | ||||||
| SHORT-TERM INVESTMENTS: 0.3% | |||||||
| Repurchase Agreement: 0.3% | |||||||||||
| $ | 335,000 | Morgan Stanley Repurchase Agreement dated 12/29/06, 5.250%, due 01/02/07, $335,195 to be received upon repurchase (Collateralized by $1,070,000 Resolution Funding Corporation, Discount Note, Market Value $342,593, due 01/15/30) | $ | 335,000 | |||||||
| Total Short-Term Investments (Cost $335,000) | 335,000 | ||||||||||
| Total Investments in Securities (Cost $102,267,392)* | 100.4 | % | $ | 104,772,261 | |||||||
| Other Assets and Liabilities - Net | (0.4 | ) | (386,573 | ) | |||||||
| Net Assets | 100.0 | % | $ | 104,385,688 | |||||||
@ Non-income producing security
@@ Foreign Issuer
# Securities with purchases pursuant to Rule 144A, under the Securities Act of 1933 and may not be resold subject to that rule except to qualified institutional buyers. These securities have been determined to be liquid under the guidelines established by the Funds' Board of Directors/Trustees.
C Bond may be called prior to maturity date.
P Preferred Stock may be called prior to convertible date.
I Illiquid Security
X Fair value determined by ING Funds Valuation Committee appointed by the Funds' Board of Directors/Trustees.
** Investment in affiliate
* Cost for federal income tax purposes is $102,290,986.
Net unrealized appreciation consists of:
| Gross Unrealized Appreciation | $ | 2,953,046 | |||||
| Gross Unrealized Depreciation | (471,771 | ) | |||||
| Net Unrealized Appreciation | $ | 2,481,275 | |||||
ING VP High Yield Bond Portfolio Credit Default Swap Agreements Outstanding on December 31, 2006:
| Counterparty | Reference Entity/Obligation | Buy/Sell Protection | (Pay)/Receive Fixed Rate | Termination Date | Notional Amount | Unrealized Appreciation/ (Depreciation) | |||||||||||||||||||||
| Bear Stearns Credit Products Inc. | Idearc Inc. 8.000%, due 11/15/2016 | Buy | (1.66 | )% | 12/20/11 | USD | 1,100,000 | $ | (13,764 | ) | |||||||||||||||||
| Merrill Lynch International | Idearc Inc. 8.000%, due 11/15/2016 | Buy | (1.73 | )% | 12/20/11 | USD | 1,100,000 | (17,052 | ) | ||||||||||||||||||
| Citibank N.A., New York | R.H. Donnelley Corporation 8.875%, due 1/15/2016 | Sell | 2.35 | % | 12/20/11 | USD | 1,100,000 | 14,424 | |||||||||||||||||||
| Goldman Sachs International | R.H. Donnelley Corporation 8.875%, due 1/15/2016 | Sell | 2.45 | % | 12/20/11 | USD | 1,100,000 | 22,378 | |||||||||||||||||||
| Citibank N.A., New York | United States Steel Corporation 9.75%, due 5/15/2010 | Buy | (1.70 | )% | 12/20/16 | USD | 750,000 | (8,480 | ) | ||||||||||||||||||
| $ | (2,494 | ) | |||||||||||||||||||||||||
See Accompanying Notes to Financial Statements
58
PORTFOLIO OF INVESTMENTS
ING VP INTERNATIONAL VALUE PORTFOLIO AS OF DECEMBER 31, 2006
| Shares | Value | ||||||||||||||
| COMMON STOCK: 95.9% | |||||||||||||||
| Australia: 1.7% | |||||||||||||||
| 1,046,500 | Santos Ltd. | $ | 8,144,263 | ||||||||||||
| 8,144,263 | |||||||||||||||
| Brazil: 5.7% | |||||||||||||||
| 39,052,000 | Cia de Gas de Sao Paulo | 6,470,586 | |||||||||||||
| 132,700 | L | CPFL Energia SA ADR | 5,438,046 | ||||||||||||
| 412,800 | Petroleo Brasileiro SA | 10,528,187 | |||||||||||||
| 280,000 | Tele Norte Leste Participacoes SA ADR | 4,177,600 | |||||||||||||
| 26,614,419 | |||||||||||||||
| Canada: 4.0% | |||||||||||||||
| 4,078,900 | @ | Bombardier, Inc. - Class B | 13,816,109 | ||||||||||||
| 891,500 | @ | Eldorado Gold Corp. | 4,823,878 | ||||||||||||
| 18,639,987 | |||||||||||||||
| China: 4.5% | |||||||||||||||
| 7,952,000 | @ | Aluminum Corp. of China LTD. | 7,438,695 | ||||||||||||
| 9,565,000 | PetroChina Co., Ltd. | 13,480,692 | |||||||||||||
| 20,919,387 | |||||||||||||||
| Colombia: 1.2% | |||||||||||||||
| 174,660 | L | BanColombia SA ADR | 5,440,659 | ||||||||||||
| 5,440,659 | |||||||||||||||
| Developed Markets: 1.6% | |||||||||||||||
| 102,694 | iShares MSCI EAFE Index Fund | 7,519,255 | |||||||||||||
| 7,519,255 | |||||||||||||||
| Finland: 3.8% | |||||||||||||||
| 431,200 | Fortum OYJ | 12,246,248 | |||||||||||||
| 211,900 | UPM-Kymmene OYJ | 5,338,678 | |||||||||||||
| 17,584,926 | |||||||||||||||
| France: 8.5% | |||||||||||||||
| 159,290 | AXA SA | 6,421,199 | |||||||||||||
| 38,800 | L | BNP Paribas | 4,220,985 | ||||||||||||
| 115,176 | Sanofi-Aventis | 10,619,305 | |||||||||||||
| 44,388 | Societe Generale | 7,509,122 | |||||||||||||
| 150,280 | Total SA | 10,813,759 | |||||||||||||
| 39,584,370 | |||||||||||||||
| Germany: 4.7% | |||||||||||||||
| 56,644 | Allianz AG | 11,524,432 | |||||||||||||
| 173,389 | DaimlerChrysler AG | 10,681,627 | |||||||||||||
| 22,206,059 | |||||||||||||||
| Greece: 3.0% | |||||||||||||||
| 102,193 | Alpha Bank AE | 3,081,060 | |||||||||||||
| 286,700 | OPAP SA | 11,071,625 | |||||||||||||
| 14,152,685 | |||||||||||||||
| Hong Kong: 7.0% | |||||||||||||||
| 775,000 | Cheung Kong Holdings Ltd. | 9,520,334 | |||||||||||||
| 1,095,000 | CLP Holdings Ltd. | 8,082,611 | |||||||||||||
| 1,258,000 | @ | Hongkong Electric Holdings | 6,151,485 | ||||||||||||
| 889,000 | @ | Hutchison Whampoa Ltd. | 9,012,816 | ||||||||||||
| 32,767,246 | �� | ||||||||||||||
| Shares | Value | ||||||||||||||
| Italy: 2.9% | |||||||||||||||
| 256,600 | L | Banco Popolare di Verona e Novara Scrl | $ | 7,351,198 | |||||||||||
| 710,100 | UniCredito Italiano S.p.A. | 6,207,497 | |||||||||||||
| 13,558,695 | |||||||||||||||
| Japan: 24.2% | |||||||||||||||
| 436,014 | iShares MSCI Japan Index Fund | 6,195,759 | |||||||||||||
| 824,000 | Kirin Brewery Co., Ltd. | 12,947,175 | |||||||||||||
| 67,400 | Kyocera Corp. | 6,371,501 | |||||||||||||
| 529,800 | Mitsubishi Corp. | 9,954,284 | |||||||||||||
| 270 | Mitsubishi UFJ Financial Group, Inc. | 3,349,566 | |||||||||||||
| 542,000 | @ | Mitsui Trust Holdings, Inc. | 6,192,183 | ||||||||||||
| 2,320 | Nippon Telegraph & Telephone Corp. | 11,441,051 | |||||||||||||
| 463,300 | Nomura Holdings, Inc. | 8,740,040 | |||||||||||||
| 386,978 | Ricoh Co., Ltd. | 7,880,923 | |||||||||||||
| 118,500 | Takeda Pharmaceutical Co., Ltd. | 8,121,518 | |||||||||||||
| 252,400 | Tokyo Electric Power Co., Inc. | 8,154,116 | |||||||||||||
| 177,400 | Toyota Motor Corp. | 11,872,850 | |||||||||||||
| 375,900 | Yamaha Motor Co., Ltd. | 11,815,943 | |||||||||||||
| 113,036,909 | |||||||||||||||
| Netherlands: 0.9% | |||||||||||||||
| 92,742 | Heineken NV | 4,406,446 | |||||||||||||
| 4,406,446 | |||||||||||||||
| Sweden: 3.4% | |||||||||||||||
| 610,400 | @ | SAS AB | 10,340,128 | ||||||||||||
| 671,300 | TeliaSonera AB | 5,494,287 | |||||||||||||
| 15,834,415 | |||||||||||||||
| Switzerland: 8.1% | |||||||||||||||
| 17,289 | Barry Callebaut AG | 8,713,953 | |||||||||||||
| 14,880 | Nestle SA | 5,278,043 | |||||||||||||
| 572,904 | STMicroelectronics NV | 10,576,890 | |||||||||||||
| 23,800 | Swiss Life Holding | 5,941,221 | |||||||||||||
| 84,510 | Swiss Reinsurance | 7,162,299 | |||||||||||||
| 37,672,406 | |||||||||||||||
| United Kingdom: 10.7% | |||||||||||||||
| 114,400 | Anglo American PLC | 5,567,533 | |||||||||||||
| 541,987 | BP PLC | 6,043,743 | |||||||||||||
| 442,301 | HBOS PLC | 9,777,694 | |||||||||||||
| 1,735,083 | Legal & General Group PLC | 5,332,402 | |||||||||||||
| 306,300 | Royal Bank of Scotland Group PLC | 11,920,640 | |||||||||||||
| 4,217,288 | Vodafone Group PLC | 11,646,752 | |||||||||||||
| 50,288,764 | |||||||||||||||
| Total Common Stock (Cost $403,277,148) | 448,370,891 | ||||||||||||||
See Accompanying Notes to Financial Statements
59
PORTFOLIO OF INVESTMENTS
ING VP INTERNATIONAL VALUE PORTFOLIO AS OF DECEMBER 31, 2006 (CONTINUED)
| Principal Amount | Value | ||||||||||||||
| SHORT-TERM INVESTMENTS: 7.5% | |||||||||||||||
| Mutual Fund: 1.3% | |||||||||||||||
| $ | 6,000,000 | ** | ING Institutional Prime Money Market Fund | $ | 6,000,000 | ||||||||||
| Total Mutual Fund (Cost $6,000,000) | 6,000,000 | ||||||||||||||
| Repurchase Agreement: 3.4% | |||||||||||||||
| 15,986,000 | Goldman Sachs Repurchase Agreement dated 12/29/06, 5.220%, due 01/02/07, $15,995,272 to be received upon repurchase (Collateralized by $16,897,000 Federal National Mortgage Association, 4.000%, Market Value plus accrued interest $16,306,394, due 12/23/10) | 15,986,000 | |||||||||||||
| Total Repurchase Agreement (Cost $15,986,000) | 15,986,000 | ||||||||||||||
| Securities Lending Collateralcc: 2.8% | |||||||||||||||
| 13,061,231 | The Bank of New York Institutional Cash Reserves Fund | 13,061,231 | |||||||||||||
| Total Securities Lending Collateral (Cost $13,061,231) | 13,061,231 | ||||||||||||||
| Total Short-Term Investments (Cost $35,047,231) | 35,047,231 | ||||||||||||||
| Total Investments in Securities (Cost $438,324,379)* | 103.4 | % | $ | 483,418,122 | |||||||
| Other Assets and Liabilities - Net | (3.4 | ) | (16,029,722 | ) | |||||||
| Net Assets | 100.0 | % | $ | 467,388,400 | |||||||
@ Non-income producing security
ADR American Depositary Receipt
cc Securities purchased with cash collateral for securities loaned.
L Loaned security, a portion or all of the security is on loan at December 31, 2006.
** Investment in affiliate
* Cost for federal income tax purposes is $438,430,778.
Net unrealized appreciation consists of:
| Gross Unrealized Appreciation | $ | 47,033,306 | |||||
| Gross Unrealized Depreciation | (2,045,962 | ) | |||||
| Net Unrealized Appreciation | $ | 44,987,344 | |||||
| Industry | Percentage of Net Assets | ||||||
| Airlines | 2.2 | % | |||||
| Auto Manufacturers | 4.8 | ||||||
| Banks | 13.9 | ||||||
| Beverages | 3.7 | ||||||
| Distribution/Wholesale | 2.1 | ||||||
| Diversified Financial Services | 1.9 | ||||||
| Electric | 8.6 | ||||||
| Electronics | 1.4 | ||||||
| Entertainment | 2.4 | ||||||
| Food | 3.0 | ||||||
| Forest Products & Paper | 1.1 | ||||||
| Gas | 1.4 | ||||||
| Holding Companies - Diversified | 1.9 | ||||||
| Insurance | 7.8 | ||||||
| Leisure Time | 2.5 | ||||||
| Mining | 3.8 | ||||||
| Miscellaneous Manufacturing | 3.0 | ||||||
| Office/Business Equipment | 1.7 | ||||||
| Oil & Gas | 10.5 | ||||||
| Pharmaceuticals | 4.0 | ||||||
| Real Estate | 2.0 | ||||||
| Semiconductors | 2.3 | ||||||
| Telecommunications | 7.0 | ||||||
| Other Long-Term Investments | 2.9 | ||||||
| Short-Term Investments | 7.5 | ||||||
| Other Assets and Liabilities - Net | (3.4 | ) | |||||
| Net Assets | 100.0 | % | |||||
See Accompanying Notes to Financial Statements
60
TAX INFORMATION (UNAUDITED)
Dividends paid during the year ended December 31, 2006 were as follows:
| Fund Name | Type | Per Share Amount | |||||||||
| ING VP Real Estate Portfolio | |||||||||||
| Class I | NII | $ | 0.3121 | ||||||||
| Class S | NII | $ | 0.2730 | ||||||||
| All Classes | STCG | $ | 0.1434 | ||||||||
| All Classes | LTCG | $ | 0.2422 | ||||||||
| ING VP Financial Services Portfolio | |||||||||||
| Class I | NII | $ | 0.1763 | ||||||||
| Class S | NII | $ | 0.1458 | ||||||||
| All Classes | STCG | $ | 0.0031 | ||||||||
| All Classes | LTCG | $ | 0.0266 | ||||||||
| ING VP High Yield Bond Portfolio | |||||||||||
| Class I | NII | $ | 0.2118 | ||||||||
| Class S(1) | NII | $ | 0.0631 | ||||||||
| Fund Name | Type | Per Share Amount | |||||||||
| ING VP International Value Portfolio | |||||||||||
| Class I | NII | $ | 0.3506 | ||||||||
| Class S | NII | $ | 0.3180 | ||||||||
| All Classes(2) | STCG | $ | 0.2111 | ||||||||
| All Classes(2) | LTCG | $ | 0.6116 | ||||||||
NII - Net investment income
STCG - Short-term capital gain
LTCG - Long-term capital gain
(1) Class S liquidated May 1, 2006 and recommenced operations on December 29, 2006.
(2) Except Class ADV which commenced operations after the distribution occurred.
Of the ordinary distributions made during the year ended December 31, 2006, the following percentages qualify for the dividends received deduction (DRD) available to corporate shareholders:
| ING VP Real Estate Portfolio | 0.21 | % | |||||
| ING VP Financial Services Portfolio | 49.50 | % | |||||
| ING VP High Yield Bond Portfolio | 0.73 | % | |||||
| ING VP International Value Portfolio | 0.27 | % | |||||
Pursuant to Section 853 of the Internal Revenue Code, the following Portfolio designates the following amounts as foreign
taxes paid for the year ended December 31, 2006:
Foreign Per Share
Taxes Paid Amount
| ING VP International Value Portfolio | $ | 1,034,923 | $ | 0.0337 | |||||||
Listed below are the gross income earned and foreign taxes paid by country for ING VP International Value Portfolio. Foreign taxes paid for purposes of Section 853 may be less than actual foreign taxes paid for financial statement purposes.
| Country | Gross Income Earned | Foreign Tax Withheld | |||||||||
| Australia | $ | 44,605 | $ | — | |||||||
| Belgium | 276,227 | 41,434 | |||||||||
| Brazil | 414,216 | — | |||||||||
| Canada | 36,721 | 5,476 | |||||||||
| China | 34,924 | — | |||||||||
| Colombia | 38,834 | 13,592 | |||||||||
| Finland | 291,566 | 43,735 | |||||||||
| France | 1,451,546 | 216,390 | |||||||||
| Germany | 2,044,313 | 303,363 | |||||||||
| Greece | 78,914 | — | |||||||||
| Hong Kong | 879,129 | — | |||||||||
| Italy | 971,942 | 145,791 | |||||||||
| Japan | 1,060,703 | 74,249 | |||||||||
| Netherlands | 357,769 | 53,665 | |||||||||
| Singapore | 180,315 | — | |||||||||
| South Africa | 71,810 | — | |||||||||
| South Korea | 22,611 | 3,731 | |||||||||
| Spain | 30,193 | 4,529 | |||||||||
| Sweden | 359,134 | 53,870 | |||||||||
| Switzerland | 500,643 | 75,097 | |||||||||
| Thailand | 267,059 | — | |||||||||
| United Kingdom | 4,463,141 | — | |||||||||
| Subtotal | 13,876,314 | 1,034,923 | |||||||||
| United States | 1,583,446 | — | |||||||||
| Total | $ | 15,459,760 | $ | 1,034,923 | |||||||
Foreign taxes paid or withheld should be included in taxable income with an offsetting deduction from gross income or as a credit for taxes paid to foreign governments. Shareholders are strongly advised to consult their own tax advisors regarding the appropriate treatment of foreign taxes paid.
Above figures may differ from those cited elsewhere in this report due to differences in the calculation of income and gains under U.S. generally accepted accounting principles (book) purposes and Internal Revenue Service (tax) purposes.
Shareholders are strongly advised to consult their own tax advisers with respect to the tax consequences of their investments in the Portfolios. In January, shareholders, excluding corporate shareholders, receive an IRS 1099-DIV regarding the federal tax status of the dividends and distributions they received in the calendar year.
61
TRUSTEE AND OFFICER INFORMATION (UNAUDITED)
The business and affairs of the Trust are managed under the direction of the Trust's Board. A Trustee who is not an interested person of the Trust, as defined in the 1940 Act, is an independent trustee ("Independent Trustee"). The Trustees and Officers of the Trust are listed below. The Statement of Additional Information includes additional information about trustees of the Trust and is available, without charge, upon request at 1-800-992-0180.
| Name, Address and Age | Position(s) Held with Trust | Term of Office and Length of Time Served(1) | Principal Occupation(s) During the Past Five Years | Number of Portfolios in Fund Complex Overseen by Trustee | Other Directorships Held by Trustee | ||||||||||||||||||
| Independent Trustees: | |||||||||||||||||||||||
| John V. Boyer(3) 7337 E. Doubletree Ranch Rd. Scottsdale, Arizona 85258 Age: 53 | Trustee | January 2005 - Present | President and Chief Executive Officer, Franklin and Eleanor Roosevelt Institute (March 2006 - Present). Formerly, Executive Director, The Mark Twain House & Museum(2) (September 1989 - November 2005). | 180 | None | ||||||||||||||||||
| Patricia W. Chadwick(3) 7337 E. Doubletree Ranch Rd. Scottsdale, Arizona 85258 Age: 58 | Trustee | January 2006 - Present | Consultant and President of self-owned company, Ravengate Partners LLC (January 2000 - Present). | 180 | None | ||||||||||||||||||
| J. Michael Earley(4) 7337 E. Doubletree Ranch Rd. Scottsdale, Arizona 85258 Age: 61 | Trustee | February 2002 - Present | President and Chief Executive Officer, Bankers Trust Company, N.A. (June 1992 - Present). | 180 | None | ||||||||||||||||||
| R. Barbara Gitenstein(3) 7337 E. Doubletree Ranch Rd. Scottsdale, Arizona 85258 Age: 58 | Trustee | February 2002 - Present | President, College of New Jersey (January 1999 - Present). | 180 | None | ||||||||||||||||||
| Patrick W. Kenny(4) 7337 E. Doubletree Ranch Rd. Scottsdale, Arizona 85258 Age: 63 | Trustee | January 2005 - Present | President and Chief Executive Officer, International Insurance Society (June 2001 - Present). | 180 | Assured Guaranty Ltd. (November 2003 - Present). | ||||||||||||||||||
| Jock Patton(3) 7337 E. Doubletree Ranch Rd. Scottsdale, Arizona 85258 Age: 61 | Chairman and Trustee | October 1999 - Present | Private Investor (June 1997 - Present). Formerly, Director and Chief Executive Officer, Rainbow Multimedia Group, Inc. (January 1999 - December 2001). | 180 | JDA Software Group, Inc. (January 1999 - Present); and Swift Transportation Co. (March 2004 - Present). | ||||||||||||||||||
| Sheryl K. Pressler(4) 7337 E. Doubletree Ranch Rd. Scottsdale, Arizona 85258 Age: 56 | Trustee | January 2006 - Present | Consultant (May 2001 - Present). Formerly, Chief Executive Officer, Lend Lease Real Estate Investments, Inc. (March 2000 - April 2001). | 180 | Stillwater Mining Company (May 2002 - Present); California HealthCare Foundation (June 1999 - Present); and Romanian- American Enterprise Fund (February 2004 - Present). | ||||||||||||||||||
62
TRUSTEE AND OFFICER INFORMATION (UNAUDITED) (CONTINUED)
| Name, Address and Age | Position(s) Held with Trust | Term of Office and Length of Time Served(1) | Principal Occupation(s) During the Past Five Years | Number of Portfolios in Fund Complex Overseen by Trustee | Other Directorships Held by Trustee | ||||||||||||||||||
| David W.C. Putnam(4) 7337 E. Doubletree Ranch Rd. Scottsdale, Arizona 85258 Age: 67 | Trustee | October 1999 - Present | President and Director, F.L. Putnam Securities Company, Inc. (June 1978 - Present). | 180 | Principled Equity Market Trust (December 1996 - Present); and Asian American Bank and Trust Company (June 1993 - Present). | ||||||||||||||||||
| Roger B. Vincent(4) 7337 E. Doubletree Ranch Rd. Scottsdale, Arizona 85258 Age: 61 | Trustee | February 2002 - Present | President, Springwell Corporation (March 1989 - Present). | 180 | AmeriGas Propane, Inc. (January 1998 - Present) and UGI Corporation (February 2006 - Present). | ||||||||||||||||||
| Trustee who is an "Interested Person": | |||||||||||||||||||||||
| John G. Turner(5) 7337 E. Doubletree Ranch Rd. Scottsdale, Arizona 85258 Age: 67 | Trustee | October 1999 - Present | Retired. Formerly, Vice Chairman of ING Americas (September 2000 - January 2002); Director of ReliaStar Life Insurance Company of New York (April 1975 - December 2001); and Chairman and Trustee of the Northstar affiliated investment companies (May 1993 - December 2001). | 180 | Hormel Foods Corporation (March 2000 - Present); ShopKo Stores, Inc. (August 1999 - Present); and Conseco, Inc. (September 2003 - Present). | ||||||||||||||||||
(1) Trustees serve until their successors are duly elected and qualified, subject to the Board's retirement policy.
(2) Shaun Mathews, President, ING USFS Mutual Funds and Investment Products, has held a seat on the board of directors of The Mark Twain House & Museum since September 19, 2002. ING Groep makes non-material, charitable contributions to The Mark Twain House & Museum.
(3) Valuation, Proxy and Brokerage Committee member.
(4) Audit Committee member.
(5) Mr. Turner is an "interested person," as defined under the 1940 Act, because of his affiliation with ING Groep, the parent corporation of the Investment Adviser, ING Investments, LLC and the Distributor, ING Funds Distributor, LLC.
63
TRUSTEE AND OFFICER INFORMATION (UNAUDITED) (CONTINUED)
| Name, Address and Age | Position(s) Held with the Trust | Term of Office and Length of Time Served(1) | Principal Occupation(s) during the Past Five Years | ||||||||||||
| Officers: | |||
| Shaun P. Mathews 7337 E. Doubletree Ranch Rd. Scottsdale, Arizona 85258 Age: 51 | President and Chief Executive Officer | November 2006 - Present | President and Chief Executive Officer, ING Investments, LLC and ING Funds Services, LLC (November 2006 - Present); and Head of ING USFS Mutual Funds and Investment Products (October 2004 - Present). Formerly, CMO, ING USFS (April 2002 - October 2004); and Head of Rollover/Payout (October 2001 - December 2003). | ||||||||||||
| Michael J. Roland 7337 E. Doubletree Ranch Rd. Scottsdale, Arizona 85258 Age: 48 | Executive Vice President | February 2002 - Present | Executive Vice President, ING Investments, LLC (December 2001 - Present). Formerly, Chief Compliance Officer, ING Investments, LLC and Directed Services, LLC (October 2004 - December 2005); Chief Financial Officer and Treasurer, ING Investments, LLC (December 2001 - March 2005); and Senior Vice President, ING Investments, LLC (June 1998 - December 2001). | ||||||||||||
| Stanley D. Vyner 7337 E. Doubletree Ranch Rd. Scottsdale, Arizona 85258 Age: 56 | Executive Vice President | November 1999 - Present | Executive Vice President, ING Investments, LLC (July 2000 - Present), and Chief Investment Risk Officer, ING Investments, LLC (January 2003 - Present). Formerly, Chief Investment Officer of the International Portfolios, ING Investments, LLC (August 2000 - January 2003). | ||||||||||||
| Joseph M. O'Donnell 7337 E. Doubletree Ranch Rd. Scottsdale, Arizona 85258 Age: 52 | Chief Compliance Officer Executive Vice President | November 2004 - Present March 2006 - Present | Chief Compliance Officer of the ING Funds (November 2004 - Present); ING Investments, LLC and Directed Services, LLC (March 2006 - Present); and Executive Vice President of the ING Funds (March 2006 - Present). Formerly, Vice President, Chief Legal Counsel, Chief Compliance Officer and Secretary of Atlas Securities, Inc., Atlas Advisers, Inc. and Atlas Funds (October 2001 October 2004); and Chief Operating Officer and General Counsel of Matthews International Capital Management LLC and Vice President and Secretary of Matthews International Funds (August 1999 - May 2001). | ||||||||||||
| Robert S. Naka 7337 E. Doubletree Ranch Rd. Scottsdale, Arizona 85258 Age: 43 | Executive Vice President and Chief Operating Officer Assistant Secretary | March 2006 - Present November 1999 - Present | Executive Vice President and Chief Operating Officer, ING Funds Services, LLC and ING Investments, LLC (March 2006 - Present); and Assistant Secretary, ING Funds Services, LLC (October 2001 - Present). Formerly, Senior Vice President, ING Investments, LLC (August 1999 - March 2006). | ||||||||||||
| Todd Modic 7337 E. Doubletree Ranch Rd. Scottsdale, Arizona 85258 Age: 39 | Senior Vice President, Chief/Principal Financial Officer and Assistant Secretary | March 2005 - Present | Senior Vice President, ING Funds Services, LLC (April 2005 - Present). Formerly, Vice President, ING Funds Services, LLC (September 2002 - March 2005); and Director of Financial Reporting, ING Investments, LLC (March 2001 - September 2002). | ||||||||||||
| Kimberly A. Anderson 7337 E. Doubletree Ranch Rd. Scottsdale, Arizona 85258 Age: 42 | Senior Vice President | November 2003 - Present | Senior Vice President, ING Investments, LLC (October 2003 - Present). Formerly, Vice President and Assistant Secretary, ING Investments, LLC (January 2001 - October 2003). | ||||||||||||
| Ernest J. C'DeBaca 7337 E. Doubletree Ranch Rd. Scottsdale, Arizona 85258 Age: 37 | Senior Vice President | May 2006 - Present | Senior Vice President, ING Funds Services, LLC (April 2006 - Present). Formerly, Counsel, ING Americas, U.S. Legal Services (January 2004 - March 2006); and Attorney-Adviser, U.S. Securities and Exchange Commission (May 2001 - December 2003). | ||||||||||||
64
TRUSTEE AND OFFICER INFORMATION (UNAUDITED) (CONTINUED)
| Name, Address and Age | Position(s) Held with the Trust | Term of Office and Length of Time Served(1) | Principal Occupation(s) during the Past Five Years | ||||||||||||
| Robert Terris 7337 E. Doubletree Ranch Rd. Scottsdale, Arizona 85258 Age: 36 | Senior Vice President | May 2006 - Present | Senior Vice President of Operations, ING Funds Services, LLC (May 2006 - Present). Formerly, Vice President of Administration, ING Funds Services, LLC (September 2001 - May 2006). | ||||||||||||
| Robyn L. Ichilov 7337 E. Doubletree Ranch Rd. Scottsdale, Arizona 85258 Age: 39 | Vice President and Treasurer | November 1999 - Present | Vice President and Treasurer, ING Funds Services, LLC (October 2001 - Present) and ING Investments, LLC (August 1997 - Present). | ||||||||||||
| Lauren D. Bensinger 7337 E. Doubletree Ranch Rd. Scottsdale, Arizona 85258 Age: 52 | Vice President | February 2003 - Present | Vice President and Chief Compliance Officer, ING Funds Distributor, LLC (July 1995 - Present); and Vice President (February 1996 - Present); and Director of Compliance, ING Investments, LLC (October 2004 - Present). Formerly, Chief Compliance Officer, ING Investments, LLC (October 2001 - October 2004). | ||||||||||||
| Maria M. Anderson 7337 E. Doubletree Ranch Rd. Scottsdale, Arizona 85258 Age: 48 | Vice President | September 2004 - Present | Vice President, ING Funds Services, LLC (September 2004 - Present). Formerly, Assistant Vice President, ING Funds Services, LLC (October 2001 - September 2004); and Manager Fund Accounting and Fund Compliance, ING Investments, LLC (September 1999 - October 2001). | ||||||||||||
| Denise Lewis 7337 E. Doubletree Ranch Rd. Scottsdale, Arizona 85258 Age: 43 | Vice President | January 2007 - Present | Vice President, ING Funds Services, LLC (December 2006 - Present). Formerly, Senior Vice President, UMB Investment Services Group, LLC (November 2003 - December 2006); and Vice President, Wells Fargo Funds Management, LLC (December 2000 - August 2003). | ||||||||||||
| Kimberly K. Palmer 7337 E. Doubletree Rand Rd. Scottsdale, Arizona 85258 Age: 49 | Vice President | March 2006 - Present | Vice President, ING Funds Services, LLC (March 2006 - Present). Formerly, Assistant Vice President, ING Funds Services, LLC (August 2004 - March 2006); Manager, Registration Statements, ING Funds Services, LLC (May 2003 - August 2004); Associate Partner, AMVESCAP PLC (October 2000 - May 2003); and Director of Federal Filings and Blue Sky Filings, INVESCO Funds Group, Inc. (March 1994 - May 2003). | ||||||||||||
| Susan P. Kinens 7337 E. Doubletree Ranch Rd. Scottsdale, Arizona 85258 Age: 30 | Assistant Vice President | February 2003 - Present | Assistant Vice President, ING Funds Services, LLC (December 2002 - Present); and has held various other positions with ING Funds Services, LLC for more than the last five years. | ||||||||||||
| Huey P. Falgout, Jr. 7337 E. Doubletree Ranch Rd. Scottsdale, Arizona 85258 Age: 43 | Secretary | August 2003 - Present | Chief Counsel, ING Americas, U.S. Legal Services (September 2003 - Present). Formerly, Counsel, ING Americas, U.S. Legal Services (November 2002 - September 2003); and Associate General Counsel of AIG American General (January 1999 - November 2002). | ||||||||||||
| Theresa K. Kelety 7337 E. Doubletree Ranch Rd. Scottsdale, Arizona 85258 Age: 43 | Assistant Secretary | August 2003 - Present | Counsel, ING Americas, U.S. Legal Services (April 2003 - Present). Formerly, Senior Associate with Shearman & Sterling (February 2000 - April 2003). | ||||||||||||
(1) The officers hold office until the next annual meeting of the Trustees and until their successors have been elected and qualified.
65
ADVISORY CONTRACT APPROVAL DISCUSSION (UNAUDITED)
Board Consideration and Re-Approval of Investment Advisory and Sub-Advisory Contracts
Section 15(c) of the 1940 Act provides that, after an initial period, the Portfolios' existing investment advisory and sub-advisory contracts remain in effect only if the Board of Trustees (the "Board") of ING Variable Products Trust (the "Trust"), including a majority of the Trustees who have no direct or indirect interest in the advisory and sub-advisory contracts, and who are not "interested persons" of the Portfolios, as such term is defined under the 1940 Act (the "Independent Trustees"), annually review and renew them. In this regard, at a meeting held on November 9, 2006 the Board, including a majority of the Independent Trustees, considered whether to renew the investment advisory contracts (the "Advisory Contracts") between ING Investments, LLC (the "Adviser") and the Portfolios and the sub-advisory contracts ("Sub-Advisory Contracts") with the sub-adviser to each Portfolio (the "Sub-Advisers").
The Independent Trustees also held separate meetings on October 12, 2006 and November 7, 2006 to consider renewals of the Advisory Contracts and Sub-Advisory Contracts. Thus, references herein to factors considered and determinations made by the Independent Trustees include, as applicable, factors considered and determinations made on those earlier dates.
At the November 9, 2006 meeting, the Board voted to renew the Advisory and Sub-Advisory Contracts for the Portfolios. In reaching these decisions, the Board took into account information furnished throughout the year at regular Board meetings, as well as information prepared specifically in connection with the annual review process. The Board's determination took into account a number of factors that its members believed, in light of the legal advice furnished to them by Kirkpatrick & Lockhart Preston Gates Ellis LLP ("K&L Gates"), their independent legal counsel, and their own business judgment, to be relevant. Further, while the Advisory Contracts and Sub-Advisory Contracts for all the Portfolios were considered at the same Board meeting, the Trustees considered each Portfolio's advisory and sub-advisory relationships separately.
Provided below is an overview of the Board's contract approval process in general, as well as a discussion of certain of the specific factors the Board considered at the November 9, 2006 meeting. While the Board gave its attention to the information furnished, at its request, that was most relevant to its consideration, discussed below are a number of the primary factors relevant to the Board's consideration as to whether to renew the Advisory and Sub-Advisory Contracts for the one-year period ending November 30, 2007. Each Trustee may have accorded different weight to the various factors in reaching his or her conclusions with respect to the Portfolios' advisory and sub-advisory arrangements.
Overview of the Contract Renewal and Approval Process
In 2003, the Independent Trustees determined to undertake steps to further enhance the process under which the Board determines whether to renew existing advisory and sub-advisory arrangements for the funds in the ING Funds complex, including the Trust's existing Advisory and Sub-Advisory Contracts, and to approve new advisory and sub-advisory arrangements. Among these measures, the Board: retained the services of an independent consultant with experience in the mutual fund industry to assist the Independent Trustees in working with the personnel employed by the Adviser or its affiliates who administer the Portfolios ("Management") to identify the types of information presented to the Board to inform its deliberations with respect to advisory and sub-advisory relationships; established the format in which the information requested by the Board is provided to the Board; and determined the process for reviewing such information in connection w ith the Advisory and Sub-Advisory Contract renewal process. The end result was the implementation of the current process relied upon by the Board to review and analyze information in connection with the annual renewal of the Portfolios' Advisory and Sub-Advisory Contracts, as well as its review and approval of new advisory relationships.
Since the foregoing approval and renewal process was implemented, the Board regularly has reviewed and refined the process. In addition, the Board established a Contracts Committee and two Investment Review Committees. The type and format of the information provided to the Board or its counsel to inform its approval and annual review and renewal process has been codified in the Portfolios' "15(c) Methodology Guide" (the "Methodology Guide"). The Methodology Guide was developed under the direction of the Independent Trustees, and sets out a written blueprint under which the Independent Trustees request certain information necessary to facilitate a thorough and informed review in connection with the annual Advisory and Sub-Advisory Contract
66
ADVISORY CONTRACT APPROVAL DISCUSSION (UNAUDITED) (CONTINUED)
renewal process. Management provides Portfolio-specific information to the Independent Trustees based on the Methodology Guide through "Fund Analysis and Comparison Tables" or "FACT" sheets prior to the Independent Trustees' review of Advisory and Sub-Advisory Contracts. In 2005, the Independent Trustees retained an independent firm to verify and test the accuracy of certain of this information for a representative sample of funds in the ING Funds complex. The Independent Trustees have determined to conduct such testing periodically.
As part of a regular on-going process, the Board's Contracts Committee recommends or considers recommendations from Management for refinements and other changes to the Methodology Guide and other aspects of the review process, and the Board's Investment Review Committees review benchmarks used to assess the performance of each Portfolio. The Investment Review Committees also meet regularly with the Adviser and periodically with the Portfolios' Sub-Advisers. The Investment Review Committees may apply a heightened level of scrutiny in cases where performance has lagged a Portfolio's relevant benchmark and/or peer group of investment companies.
The Board employed its process for reviewing contracts when considering the renewals of the Advisory and Sub-Advisory Contracts that would be effective through November 30, 2007. A number of the Board's primary considerations and conclusions resulting from this process are discussed below.
Nature, Extent and Quality of Service
In determining whether to approve the Advisory Contracts and Sub-Advisory Contracts for the Portfolios for the year ending November 30, 2007, the Independent Trustees received and evaluated such information as they deemed necessary regarding the nature, extent and quality of services provided to the Portfolios by the Adviser and Sub-Advisers. This included information regarding the Adviser and Sub-Advisers to the Portfolios provided throughout the year at regular Board meetings, as well as information furnished for the November 9, 2006 Board meeting, which was held specifically to consider contracts renewals for the period ending November 30, 2007. In addition, the Board's Independent Trustees also held meetings on October 12 and November 7, prior to the November 9, 2006 meeting of the full Board, to consider the annual renewal of the Advisory and Sub-Advisory Contracts.
The materials requested by and provided to the Board and/or to K&L Gates prior to the November 2006 Board meeting included the following items: (1) FACT sheets for each Portfolio that provided information about the performance and expenses of the Portfolio and other similarly managed funds in a selected peer group ("Selected Peer Group"), as well as information about the Portfolio's investment portfolio, objectives and strategies; (2) the Methodology Guide, which describes how the FACT sheets were prepared, including the manner in which benchmarks and Selected Peer Groups were selected and how profitability was determined; (3) responses from the Advisers and Sub-Advisers to a detailed series of questions posed by K&L Gates; (4) copies of each form of Advisory Contract and Sub-Advisory Contract; (5) copies of the Forms ADV for the Adviser and each Sub-Adviser to the Portfolios; (6) financial statements for the Adviser and each Sub-Adv iser; (7) drafts of narrative summaries addressing key factors the Board customarily considers in evaluating the renewals of Advisory Contracts and Sub-Advisory Contracts, including a written analysis for each Portfolio of how performance and fees compare to its Selected Peer Group and/or designated benchmarks; and (8) other information relevant to the Board's evaluations.
Each Portfolio's Class I shares were used for purposes of certain comparisons to the funds in its Selected Peer Group. Class I shares were selected, as general matter, so that the Portfolio's class with the longest performance history was compared to the analogous class of shares for each fund in the Selected Peer Group. The mutual funds chosen for inclusion in a Portfolio's Selected Peer Group were selected based upon criteria designed to mirror the Portfolio's class being compared to the Selected Peer Group.
In arriving at its conclusions with respect to the Advisory Contracts, the Board was mindful of the "manager-of-managers" platform of the ING Funds. The Board also considered the techniques that the Adviser developed, at the Board's direction, to screen and perform due diligence on Sub-Advisers that are recommended to the Board to manage the Portfolios' portfolios. The Board noted the resources that the Adviser has committed to the Board and its Investment Review Committees to assist the Board and members of the Committees with their assessment of the investment performance of the Portfolios on an ongoing basis throughout the year. This includes the
67
ADVISORY CONTRACT APPROVAL DISCUSSION (UNAUDITED) (CONTINUED)
appointment of a Chief Investment Risk Officer and his staff, who report directly to the Board and who have developed attribution analyses and other metrics used by the Investment Review Committees to analyze the key factors underlying investment performance for the Portfolios.
The Board also noted the techniques used by the Adviser to monitor the performance of the Sub-Advisers and took note of the pro-active approach that the Adviser, working in cooperation with the Board's Investment Review Committees, has taken to advocate or recommend, when it believed appropriate, changes intended to assist in improving the performance of the Portfolios. These changes have historically included modifications in personnel responsible for managing a Portfolio.
In considering the Portfolios' Advisory Contracts, the Board also considered the extent of benefits provided to the Portfolios' shareholders, beyond advisory services, from being part of the ING family of Funds. This includes, in most cases, the right to exchange or transfer investments, without a sales charge, between the same class of shares of such Portfolios or among ING Funds available on a product platform, and the wide variety in the types of ING Funds available for exchange or transfer.
The Board also took into account the Adviser's extensive efforts in recent years to reduce the expenses of the ING Funds through re-negotiated arrangements with the ING Funds' service providers. In addition, the Board considered the extensive efforts of the Adviser and expense it incurred in recent years to help make the ING Funds complex more efficient by reducing the number of funds through combinations of similar funds.
Further, the Board received periodic reports showing that the investment policies and restrictions for each Portfolio were consistently complied with and other periodic reports covering matters such as compliance by Adviser and Sub-Adviser personnel with codes of ethics. The Board considered reports from the Portfolios' Chief Compliance Officer ("CCO") evaluating the regulatory compliance systems of the Adviser and each Sub-Adviser and procedures reasonably designed by them to assure compliance with the federal securities laws, including those related to late trading and market timing, best execution, fair value pricing, proxy voting procedures, and trade allocation, among others. The Board considered the implementation by the Adviser and certain Sub-Advisers of enhanced compliance policies and procedures in response to SEC rule changes and other regulatory initiatives. The Board also took into account the CCO's annual and periodic reports w ith respect to service provider compliance and his recommendations regarding service providers' compliance programs. In this regard, the Board also considered the policies and procedures developed by the CCO in consultation with the Board's Compliance Committee that guide the CCO's compliance oversight function.
The Board reviewed the level of staffing, quality and experience of each Portfolio's portfolio management team. The Board took into account the respective resources and reputations of the Adviser and the Sub-Advisers, and evaluated the ability of the Adviser and the Sub-Advisers to attract and retain qualified investment advisory personnel. The Board also considered the adequacy of the resources committed to the Portfolios (and other relevant funds in the ING Funds complex) by the Adviser and the Sub-Advisers, and whether those resources are commensurate with the needs of the Portfolios and are appropriate to attempt to sustain expected levels of performance, compliance, and other needs.
Based on their deliberations and the materials presented to them, the Board concluded that the advisory and related services provided by the Adviser and Sub-Advisers are appropriate in light of the Portfolios' operations, the competitive landscape of the investment company business, and investor needs, and that the nature and quality of the overall services provided by the Adviser and Sub-Advisers were appropriate.
Portfolio Performance
In assessing advisory and sub-advisory relationships, the Board placed emphasis on the investment performance of each Portfolio, taking into account the importance of such performance to Portfolio shareholders. While the Board considered the performance reports and discussions with portfolio managers at Board and Committee meetings during the year, particular attention in assessing performance was given to the Fund FACT sheets furnished in advance of the November meeting of the Independent Trustees. The FACT sheet prepared for each Portfolio included its investment performance compared to the Morningstar category median, Lipper category median, Selected Peer Group and the Portfolio's primary benchmark. The Board's findings specific to each Portfolio's performance are discussed under "Portfolio-by-Portfolio Analysis," below.
68
ADVISORY CONTRACT APPROVAL DISCUSSION (UNAUDITED) (CONTINUED)
Economies of Scale
In considering the reasonableness of advisory fees, the Board also considered whether economies of scale will be realized by the Adviser as a Portfolio grows larger and the extent to which this is reflected in the level of management fee rates charged. In this regard, the Board noted any breakpoints in advisory fee schedules that resulted in a lower advisory fee because a Portfolio achieved sufficient asset levels to receive a breakpoint discount. In the case of sub-advisory fees, the Board considered that breakpoints would inure to the benefit of the Adviser, except to the extent that these savings are passed through in the form of breakpoints on advisory fees that resulted in savings to the Portfolios. For a Portfolio that did not have breakpoint discounts on advisory fees, but did benefit from waivers to or reimbursements of advisory or other fees, the Board also considered the extent to which economies of scale could effectively be reali zed through such waivers, reimbursements, or expense reductions.
In evaluating economies of scale, the Independent Trustees considered a management report presented to them and also considered an evaluation and analysis presented to them on November 8, 2006 by an independent consultant regarding fee breakpoint arrangements.
Information about Services to Other Clients
The Board requested, and if received considered, information about the nature of services and fee rates offered by the Adviser and the Sub-Advisers to other clients, including other registered investment companies and institutional accounts. When rates offered to other clients differed materially from those charged to the Portfolios, the Board considered the underlying rationale provided by the Adviser and/or Sub-Advisers for these differences. For the unaffiliated Sub-Advisers, the Board did not view this information as imperative to its deliberations because of the arms-length nature of the negotiations between the Adviser and unaffiliated Sub-Advisers with respect to sub-advisory fees. The Board also noted that the fee rates charged to the Portfolios and similar institutional clients may differ materially due to the different services and additional regulatory overlay associated with registered investment companies, such as the Portfolios .
Fee Rates and Profitability
The Board reviewed and considered each contractual investment advisory fee rate, combined with the administrative fee rate, payable by each Portfolio to the Adviser. The Board also considered the contractual sub-advisory fee rates payable by the Adviser to each Sub-Adviser for sub-advisory services. In addition, the Board reviewed and took into account existing and proposed fee waivers and expense limitations applicable to the fees payable by the Portfolios.
The Board considered the fee structures of the Portfolios as they relate to the services provided under the Contracts, and the potential fall-out benefits to the Adviser and Sub-Advisers, and their respective affiliates, from their association with the Portfolios. For each Portfolio, the Board determined that the fees payable to the Adviser and Sub-Advisers are reasonable for the services that each performs, which were considered in light of the nature and quality of the services that each has performed and is expected to perform through the year ending November 30, 2007.
For each Portfolio, the Board considered information on revenues, costs and profits realized by the Adviser, which was prepared by Management in accordance with the allocation methodology (including assumptions) specified in the Methodology Guide. In analyzing the profitability of the Adviser in connection with its services to a Portfolio, the Board took into account the sub-advisory fee rate payable by the Adviser to the Sub-Adviser to that Portfolio. The Board also considered information that it requested and was provided by Management with respect to the profitability of service providers affiliated with the Adviser, as well as information provided by certain Sub-Advisers with respect to their profitability. In the case of non-affiliated Sub-Advisers, the Board gave less weight to profitability considerations, or did not view this data as imperative to its deliberations, given the arms-length nature of the relationship between the Adviser and these Sub-Advisers with respect to the negotiation of sub-advisory fees.
The Board determined that it had requested and received sufficient information to gain a reasonable understanding regarding the Adviser's and affiliated Sub-Advisers' profitability. The Board also recognized that
69
ADVISORY CONTRACT APPROVAL DISCUSSION (UNAUDITED) (CONTINUED)
profitability analysis is not an exact science and there is no uniform methodology for determining profitability for this purpose. In this context, the Board realized that Management's calculations regarding its costs incurred in establishing the infrastructure necessary for the Portfolios' operations may not be fully reflected in the expenses allocated to each Portfolio in determining profitability, and that the information presented may not portray all of the costs borne by Management nor capture Management's entrepreneurial risk associated with offering and managing a mutual fund complex in today's regulatory environment.
In their review of advisory fee rates, the Independent Trustees have, from time to time, requested the Adviser, and the Adviser has agreed, to implement remedial actions for certain Portfolios. These remedial actions have included, among others: reductions in expense caps or management fee rates; reductions in 12b-1 fees payable by a Portfolio; changes to the portfolio manager managing a Portfolio; and enhancements to the resources available to a Sub-Adviser when managing a Portfolio. The Independent Trustees have requested these adjustments primarily on the basis of: (a) a Portfolio's performance, as compared to its Selected Peer Group; (b) the performance of a Portfolio, as compared to its benchmark; or (c) a Portfolio's expenses in relation to its Selected Peer Group.
Based on the information on revenues, costs, and profitability considered by the Board, after considering the factors described in this section, as well as any remedial actions requested by the Independent Trustees and agreed to by the Adviser, the Board concluded that the profits, if any, realized by the Adviser and Sub-Advisers were not excessive. In making its determinations, the Board considered that the Adviser had incentives to negotiate the most favorable fees from unaffiliated Sub-Advisers, and it based its conclusions on the reasonableness of the sub-advisory fees of the Sub-Advisers primarily on the factors described for each Portfolio below and, in the case of non-affiliated Sub-Advisers, in reliance on the arms-length nature of the negotiations between the Adviser and Sub-Advisers with respect to sub-advisory fees.
Portfolio-by-Portfolio Analysis
The following paragraphs outline certain of the specific factors that the Board considered, and the conclusions reached, at its November 2006 meeting in relation to renewing each Portfolio's current Advisory Contract and its Sub-Advisory Contract for the year ending November 30, 2007. These specific factors are in addition to those considerations discussed above. In each case, the Portfolio's performance was compared to its Morningstar category median and its primary benchmark, a broad-based securities market index that appears in the Portfolio's prospectus. Each Portfolio's management fee and expense ratio were compared to the fees and expense ratios of the funds in its Selected Peer Group.
ING VP Real Estate Portfolio
In considering whether to approve the renewal of the Advisory and Sub-Advisory Contracts for ING VP Real Estate Portfolio, the Board considered that, based on performance data for the periods ended June 30, 2006: (1) the Portfolio outperformed its Morningstar category median and its primary benchmark for all periods presented; and (2) the Portfolio is ranked in the first (highest) quintile of its Morningstar category for the year-to-date period, and in the second quintile for the most recent calendar quarter and one-year periods.
In considering the fees payable under the Advisory and Sub-Advisory Contracts for ING VP Real Estate Portfolio, the Board took into account the factors described above and also considered: (1) the economies of scale benefits to the Portfolio and its shareholders from breakpoint discounts applicable to the Portfolio's advisory fees, which result in lower fees at higher asset levels; and (2) the pricing structure (including the expense ratio to be borne by shareholders) of the Portfolio, as compared to its Selected Peer Group, including that: (a) the management fee (inclusive of the advisory fee and a 0.10% administration fee) for the Portfolio is above the median and the average management fees of the funds in its Selected Peer Group; and (b) the expense ratio for the Portfolio is below the median and the average expense ratios of the funds in its Selected Peer Group.
After its deliberation, the Board reached the following conclusions: (1) the Portfolio's management fee rate is reasonable in the context of all factors considered by the Board; (2) the Portfolio's expense ratio is reasonable in the context of all factors considered by the Board; (3) the Portfolio's performance is reasonable in the context of all factors considered by the Board; and (4) the sub-advisory fee rate payable by the Adviser to the Sub-Adviser is reasonable in the context of all factors considered by the Board. Based on these conclusions and other factors, the
70
ADVISORY CONTRACT APPROVAL DISCUSSION (UNAUDITED) (CONTINUED)
Board voted to renew the Advisory and Sub-Advisory Contracts for the Portfolio for the year ending November 30, 2007. During this renewal process, different Board members may have given different weight to different individual factors and related conclusions.
ING VP MidCap Opportunities Portfolio
In considering whether to approve the renewal of the Advisory and Sub-Advisory Contracts for ING VP MidCap Opportunities Portfolio, the Board considered that, based on performance data for the periods ended June 30, 2006: (1) the Portfolio outperformed its Morningstar category median for the year-to-date, one- and five-year periods, but underperformed for the most recent calendar quarter and three-year periods; (2) the Portfolio outperformed its primary benchmark for the year-to-date and one-year periods, but underperformed for the most recent calendar quarter, three- and five-year periods; and (3) the Portfolio is ranked in the second quintile of its Morningstar category for the year-to-date and one-year periods, and in the third quintile for the most recent calendar quarter, three- and five-year periods.
In analyzing this performance data, the Board also considered Management's representations that in July 2005 there was a change in portfolio managers in order to address the Board's concerns about the Portfolio's performance, and performance has improved since this change was implemented.
In considering the fees payable under the Advisory and Sub-Advisory Contracts for ING VP MidCap Opportunities Portfolio, the Board took into account the factors described above and also considered: (1) the fairness of the compensation under an Advisory Contract with level fees that does not include breakpoints; and (2) the pricing structure (including the expense ratio to be borne by shareholders) of ING VP MidCap Opportunities Portfolio, as compared to its Selected Peer Group, including that: (a) the management fee (inclusive of the advisory fee and a 0.10% administration fee) for the Portfolio is equal to the median and above the average management fees of the funds in its Selected Peer Group; and (b) the expense ratio for the Portfolio is below the median and the average expense ratios of the funds in its Selected Peer Group.
After its deliberation, the Board reached the following conclusions: (1) the Portfolio's management fee rate is reasonable in the context of all factors considered by the Board; (2) the Portfolio's expense ratio is reasonable in the context of all factors considered by the Board; (3) the Portfolio's more recent performance has improved, and it is reasonable to permit the Sub-Adviser to continue to manage the Portfolio to appropriately assess the longer-term performance of the new portfolio management team; and (4) the sub-advisory fee rate payable by the Adviser to the Sub-Adviser is reasonable in the context of all factors considered by the Board. Based on these conclusions and other factors, the Board voted to renew the Advisory and Sub-Advisory Contracts for the Portfolio for the year ending November 30, 2007. During this renewal process, different Board members may have given different weight to different individual factors and related c onclusions.
ING VP SmallCap Opportunities Portfolio
In considering whether to approve the renewal of the Advisory and Sub-Advisory Contracts for ING VP SmallCap Opportunities Portfolio, the Board considered that, based on performance data for the periods ended June 30, 2006: (1) the Portfolio outperformed its Morningstar category median for the year-to-date, one-, three- and ten-year periods, but underperformed for the most recent calendar quarter and five-year periods; (2) the Portfolio outperformed its primary benchmark for the most recent calendar quarter and ten-year periods, but underperformed for the year-to-date, one-, three- and five-year periods; and (3) the Portfolio is ranked in the second quintile of its Morningstar category for the one- and ten-year periods, in the third quintile for the most recent calendar quarter, year-to-date and three-year periods, and in the fifth (lowest) quintile for the five-year period.
In analyzing this performance data, the Board also considered Management's representations that, in July 2005, there was a change in portfolio managers in order to address the Board's concerns about performance.
In considering the fees payable under the Advisory and Sub-Advisory Contracts for ING VP SmallCap Opportunities Portfolio, the Board took into account the factors described above and also considered: (1) the fairness of the compensation under an Advisory Contract with a breakpoint fee schedule where the asset level necessary to achieve a breakpoint discount had not been reached by the Portfolio; and (2) the pricing structure (including the expense ratio to be borne by shareholders) of ING VP SmallCap Opportunities Portfolio, as compared to its
71
ADVISORY CONTRACT APPROVAL DISCUSSION (UNAUDITED) (CONTINUED)
Selected Peer Group, including that: (a) the management fee (inclusive of the advisory fee and a 0.10% administration fee) for the Portfolio is equal to the median and the average management fees of the funds in its Selected Peer Group; and (b) the expense ratio for the Portfolio is below the median and the average expense ratios of the funds in its Selected Peer Group.
After its deliberation, the Board reached the following conclusions: (1) the Portfolio's management fee rate is reasonable in the context of all factors considered by the Board; (2) the Portfolio's expense ratio is reasonable in the context of all factors considered by the Board; (3) the sub-advisory fee rate payable by the Adviser to the Sub-Adviser is reasonable in the context of all factors considered by the Board; and (4) there was a change in portfolio managers in July 2005, and it is reasonable to permit the Sub-Adviser to continue to manage the Portfolio to appropriately assess the longer-term performance of the new portfolio management team. Based on these conclusions and other factors, the Board voted to renew the Advisory and Sub-Advisory Contracts for the Portfolio for the year ending November 30, 2007. During this renewal process, different Board members may have given different weight to different individual factors and related conclusions.
ING VP Financial Services Portfolio
In considering whether to approve the renewal of the Advisory and Sub-Advisory Contracts for ING VP Financial Services Portfolio, the Board considered that, based on performance data for the periods ended June 30, 2006: (1) the Portfolio underperformed its Morningstar category median and its primary benchmark for all periods presented; and (2) the Portfolio is ranked in the fourth quintile for all periods presented.
In analyzing this performance data, the Board also considered: (1) Management's analysis regarding the Sub-Adviser's rationale for underperformance, including its discussion of the negative effect of sector allocation and stock selection on the Portfolio's performance; (2) Management's representations that the Sub-Adviser had historically achieved reasonable performance utilizing the strategy employed by the Portfolio; and (3) Management's expectation that the Sub-Adviser will deliver reasonable longer-term performance in the future.
In considering the fees payable under the Advisory and Sub-Advisory Contracts for ING VP Financial Services Portfolio, the Board took into account the factors described above and also considered: (1) the fairness of the compensation under an Advisory Contract with a breakpoint fee schedule where the asset level necessary to achieve a breakpoint discount had not been reached by the Portfolio; and (2) the pricing structure (including the expense ratio to be borne by shareholders) of the Portfolio, as compared to its Selected Peer Group, including that: (a) the management fee (inclusive of the advisory fee and a 0.10% administration fee) for the Portfolio is equal to the median and above the average management fees of the funds in its Selected Peer Group; and (b) the expense ratio for the Portfolio is below the median and average expense ratios of the funds in its Selected Peer Group.
After its deliberation, the Board reached the following conclusions: (1) the Portfolio's management fee rate is reasonable in the context of all factors considered by the Board; (2) the Portfolio's expense ratio is reasonable in the context of all factors considered by the Board; (3) it is reasonable to allow the Sub-Adviser to continue managing the Portfolio to meet Management's expectation of more favorable longer-term performance; and (4) the sub-advisory fee rate payable by the Adviser to the Sub-Adviser is reasonable in the context of all factors considered by the Board. Based on these conclusions and other factors, the Board voted to renew the Advisory and Sub-Advisory Contracts for the Portfolio for the year ending November 30, 2007. During this renewal process, different Board members may have given different weight to different individual factors and related conclusions.
ING VP High Yield Bond Portfolio
In considering whether to approve the renewal of the Advisory and Sub-Advisory Contracts for ING VP High Yield Bond Portfolio, the Board considered that, based on performance data for the periods ended June 30, 2006: (1) the Portfolio underperformed its Morningstar category median and its primary benchmark for all periods presented; and (2) the Portfolio is ranked in the fifth (lowest) quintile of its Morningstar category for all periods presented.
In analyzing this performance data, the Board took into account: (1) Management's analysis regarding the measures implemented by the Sub-Adviser to address the Board's concerns about the Portfolio's performance, including the Sub-Adviser's modifying its asset allocation process; its seeking to improve certain securities selection processes; and the Sub-Adviser's making available additional resources to the Portfolio's portfolio management team; and (2) Management representations that the Adviser would continue to monitor, and the Board or its
72
ADVISORY CONTRACT APPROVAL DISCUSSION (UNAUDITED) (CONTINUED)
Investment Review Committee would periodically review, the Portfolio's investment performance to determine if performance improves as a result of the implementation of the new measures.
In considering the fees payable under the Advisory and Sub-Advisory Contracts for the Portfolio, the Board took into account the factors described above and also considered: (1) the fairness of compensation under an Advisory Contract with a breakpoint fee schedule where the asset level necessary to achieve a breakpoint discount had not been reached by the Portfolio; (2) the pricing structure (including the expense ratio to be borne by shareholders) of the Portfolio, as compared to its Selected Peer Group, including that: (a) the management fee (inclusive of the advisory fee and a 0.10% administration fee) for the Portfolio is above the median and the average management fees of the funds in its Selected Peer Group; and (b) the expense ratio for the Portfolio is below the median and equal to average expense ratios of the funds in its Selected Peer Group. In analyzing this fee data, the Board took into account that in April 2006 Management redu ced the Portfolio's advisory fee breakpoints as well as its expense limit.
After its deliberation, the Board reached the following conclusions: (1) the Portfolio's management fee rate is reasonable in the context of all factors considered by the Board; (2) the Portfolio's expense ratio is reasonable in the context of all factors considered by the Board; (3) it is reasonable to permit the Sub-Adviser to continue to manage the Portfolio in order to assess whether performance improves as a result of the changes implemented by the Sub-Adviser; and (4) the sub-advisory fee rate payable by the Adviser to the Sub-Adviser is reasonable in the context of all factors considered by the Board. Based on these conclusions and other factors, the Board determined to renew the Advisory and Sub-Advisory Contracts for the Portfolio for the year ending November 30, 2007. During this renewal process, different Board members may have given different weight to different individual factors and related conclusions.
ING VP International Value Portfolio
In considering whether to approve the renewal of the Advisory and Sub-Advisory Contracts for ING VP International Portfolio, the Board considered that, based on performance data for the periods ended June 30, 2006: (1) the Portfolio outperformed its Morningstar Category median for the most recent calendar quarter and the year-to-date periods, but underperformed for one-, three-, and five-year periods; (2) the Portfolio underperformed its primary benchmark for all periods presented, except it outperformed for the year-to-date period; and (3) the Portfolio is ranked in the first (highest) quintile of its Morningstar category for the most recent calendar quarter and the year-to-date periods, in the third quintile for the one- and five-year periods, and in the fourth quintile for the three-year period.
In analyzing this performance data, the Board took into account that, in April 2006, the portfolio managers to the Portfolio were changed to address the Board's concerns about the Portfolio's underperformance. The Board also took into account that, in conjunction with the portfolio manager change, the portfolio management team's investment process also was modified.
In considering the fees payable under the Advisory and Sub-Advisory Contracts for ING VP International Value Portfolio, the Board took into account the factors described above and also considered: (1) the fairness of the compensation under an Advisory Contract with level fees that does not include breakpoints; and (2) the pricing structure (including the expense ratio to be borne by shareholders) of ING VP International Value Portfolio, as compared to its Selected Peer Group, including that: (a) the management fee for the Portfolio is above the median and the average management fees of the funds in its Selected Peer Group; and (b) the expense ratio for the Portfolio is above the median and the average expense ratios of the funds in its Selected Peer Group. In analyzing this fee data, the Board noted that the Adviser is waiving a portion of its advisory fee, resulting in a lower, "effective" management fee rate.
After its deliberation, the Board reached the following conclusions: (1) the Portfolio's management fee rate is reasonable in the context of all factors considered by the Board; (2) the Portfolio's expense ratio is reasonable in the context of all factors considered by the Board; (3) there was a change in the Portfolio's portfolio managers in April 2006, and it is reasonable to allow the Sub-Adviser to continue to manage the Portfolio to assess whether performance improves as a result of the changes that have been implemented; and (4) the sub-advisory fee rate payable by the Adviser to the Sub-Adviser is reasonable in the context of all factors considered by the Board. Based on these conclusions and other factors, the Board voted to renew the Advisory and Sub-Advisory Contracts for the Portfolio for the year ending November 30, 2007. During this renewal process, different Board members may have given different weight to different individual factors and related conclusions.
73
(THIS PAGE INTENTIONALLY LEFT BLANK)
Investment Adviser
ING Investments, LLC
7337 East Doubletree Ranch Road
Scottsdale, Arizona 85258
Administrator
ING Funds Services, LLC
7337 East Doubletree Ranch Road
Scottsdale, Arizona 85258
Transfer Agent
DST Systems, Inc.
P.O. Box 419368
Kansas City, Missouri 64141
Independent Registered Public Accounting Firm
KPMG LLP
99 High Street
Boston, Massachusetts 02110
Custodian
The Bank of New York
One Wall Street
New York, New York 10286
Legal Counsel
Dechert LLP
1775 I Street, N.W.
Washington, D.C. 20006
Before investing, carefully consider the investment objectives, risks, charges and expenses of the variable universal life insurance policy or variable annuity contract and the underlying variable investment options. This and other information is contained in the prospectus for the variable universal life policy or variable annuity contract and the underlying variable investment options. Obtain these prospectuses from your agent/registered representative and read them carefully before investing.

VPAR-UVPTADVIS (1206-022607)
Item 2. Code of Ethics.
As of the end of the period covered by this report, Registrant had adopted a code of ethics, as defined in Item 2 of Form N-CSR, that applies to the Registrant’s principal executive officer and principal financial officer. There were no amendments to the Code during the period covered by the report. The Registrant did not grant any waivers, including implicit waivers, from any provisions of the Code during the period covered by this report. The code of ethics is filed herewith pursuant to Item 10(a)(1), Exhibit 99.CODE ETH.
Item 3. Audit Committee Financial Expert.
The Board of Trustees has determined that Patrick W. Kenny is an audit committee financial expert, as defined in Item 3 of Form N-CSR. Mr. Kenny is “independent” for purposes of Item 3 of Form N-CSR.
Item 4. Principal Accountant Fees and Services.
(a) | Audit Fees: The aggregate fees billed for each of the last two fiscal years for professional services rendered by KPMG LLP (“KPMG”), the principal accountant for the audit of the registrant’s annual financial statements, for services that are normally provided by the accountant in connection with statutory and regulatory filings or engagements for those fiscal years were $97,000 for year ended December 31, 2006 and $122,000 for year ended December 31, 2005. |
|
|
(b) | Audit-Related Fees: The aggregate fees billed in each of the last two fiscal years for assurance and related services by KPMG that are reasonably related to the performance of the audit of the registrant’s financial statements and are not reported under paragraph (a) of this Item were $13,825 for year ended December 31, 2006 and $19,250 for year ended December 31, 2005. |
|
|
(c) | Tax Fees: The aggregate fees billed in each of the last two fiscal years for professional services rendered by KPMG for tax compliance, tax advice, and tax planning were $31,870 in the year ended December 31, 2006 and $17,750 in the year ended December 31, 2005. Such services included review of excise distribution calculations (if applicable), preparation of the Funds’ federal, state and excise tax returns, tax services related to mergers and routine consulting. |
|
|
(d) | All Other Fees: The aggregate fees billed in each of the last two fiscal years for products and services provided by KPMG, other than the services reported in paragraphs (a) through (c) of this Item. |
|
|
| None |
|
|
| (e)(1) Audit Committee Pre-Approval Policies and Procedures |
2
AUDIT AND NON-AUDIT SERVICES
PRE-APPROVAL POLICY
I. Statement of Principles
Under the Sarbanes-Oxley Act of 2002 (the “Act”), the Audit Committee of the Board of Directors or Trustees (the “Committee”) of the ING Funds (each a “Fund,” collectively, the “Funds”) set out on Exhibit A to this Audit and Non-Audit Services Pre-Approval Policy (“Policy”) is responsible for the oversight of the work of the Funds’ independent auditors. As part of its responsibilities, the Committee must pre-approve the audit and non-audit services performed by the auditors in order to assure that the provision of these services does not impair the auditors’ independence from the Funds. The Committee has adopted, and the Board has ratified, this Policy, which sets out the procedures and conditions under which the services of the independent auditors may be pre-approved.
Under Securities and Exchange Commission (“SEC”) rules promulgated in accordance with the Act, the Funds may establish two different approaches to pre-approving audit and non-audit services. The Committee may approve services without consideration of specific case-by-case services (“general pre-approval”) or it may pre-approve specific services (“specific pre-approval”). The Committee believes that the combination of these approaches contemplated in this Policy results in an effective and efficient method for pre-approving audit and non-audit services to be performed by the Funds’ independent auditors. Under this Policy, services that are not of a type that may receive general pre-approval require specific pre-approval by the Committee. Any proposed services that exceed pre-approved cost levels or budgeted amounts will also require the Committee’s specific pre-approval.
For both types of approval, the Committee considers whether the subject services are consistent with the SEC’s rules on auditor independence and that such services are compatible with maintaining the auditors independence. The Committee also considers whether a particular audit firm is in the best position to provide effective and efficient services to the Funds. Reasons that the auditors are in the best position include the auditors’ familiarity with the Funds’ business, personnel, culture, accounting systems, risk profile, and other factors, and whether the services will enhance the Funds’ ability to manage and control risk or improve audit quality. Such factors will be considered as a whole, with no one factor being determinative.
The appendices attached to this Policy describe the audit, audit-related, tax-related, and other services that have the Committee’s general pre-approval. For any service that has been approved through general pre-approval, the general pre-approval will remain in place for a period 12 months from the date of pre-approval, unless the Committee determines that a different period is appropriate. The Committee will annually review and pre-approve the services that may be provided by the independent auditors without specific pre-approval. The Committee will revise the list of services subject to general pre-approval as appropriate. This Policy does not serve as a delegation to Fund management of the Committee’s duty to pre-approve services performed by the Funds’ independent auditors.
II. Audit Services
The annual audit services engagement terms and fees are subject to the Committee’s specific pre-approval. Audit services are those services that are normally provided by auditors in connection with statutory and regulatory filings or engagements or those that generally only independent auditors can reasonably provide. They include the Funds’ annual financial statement audit and procedures that the independent auditors must perform in order to form an opinion on the Funds’ financial statements (e.g., information systems and procedural reviews and testing). The Committee will monitor the audit services engagement and approve any changes in terms, conditions or fees deemed by the Committee to be necessary or appropriate.
The Committee may grant general pre-approval to other audit services, such as statutory audits and services associated with SEC registration statements, periodic reports and other documents filed with the SEC or issued in connection with securities offerings.
The Committee has pre-approved the audit services listed on Appendix A. The Committee must specifically approve all audit services not listed on Appendix A.
III. Audit-related Services
Audit-related services are assurance and related services that are reasonably related to the performance of the audit or the review of the Funds’ financial statements or are traditionally performed by the independent auditors. The Committee believes that the provision of audit-related services will not impair the independent auditors’ independence, and therefore may grant pre-approval to audit-related services. Audit-related services include accounting consultations related to accounting, financial reporting or disclosure matters not classified as “audit services;” assistance with understanding and implementing new accounting and financial reporting guidance from rulemaking authorities; agreed-upon or expanded audit procedures relating to accounting and/or billing records required to respond to or comply with financial, accounting or regulatory reporting matters; and assistance with internal control reporting requirements under Form N-SAR or Form N-CSR.
The Committee has pre-approved the audit-related services listed on Appendix B. The Committee must specifically approve all audit-related services not listed on Appendix B.
IV. Tax Services
The Committee believes the independent auditors can provide tax services to the Funds, including tax compliance, tax planning, and tax advice, without compromising the auditors’ independence. Therefore, the Committee may grant general pre-approval with respect to tax services historically provided by the Funds’ independent auditors that do not, in the Committee’s view, impair auditor independence and that are consistent with the SEC’s rules on auditor independence.
The Committee will not grant pre-approval if the independent auditors initially recommends a transaction the sole business purpose of which is tax avoidance and the tax treatment of which may not be supported in the Internal Revenue Code and related regulations. The Committee may consult
2
outside counsel to determine that tax planning and reporting positions are consistent with this Policy.
The Committee has pre-approved the tax-related services listed on Appendix C. The Committee must specifically approve all tax-related services not listed on Appendix C.
V. Other Services
The Committee believes it may grant approval of non-audit services that are permissible services for independent auditors to a Fund. The Committee has determined to grant general pre-approval to other services that it believes are routine and recurring, do not impair auditor independence, and are consistent with SEC rules on auditor independence.
The Committee has pre-approved the non-audit services listed on Appendix D. The Committee must specifically approve all non-audit services not listed on Appendix D.
A list of the SEC’s prohibited non-audit services is attached to this Policy as Appendix E. The SEC’s rules and relevant guidance should be consulted to determine the precise definitions of these impermissible services and the applicability of exceptions to certain of the SEC’s prohibitions.
VI. Pre-approval of Fee levels and Budgeted Amounts
The Committee will annually establish pre-approval fee levels or budgeted amounts for audit, audit-related, tax and non-audit services to be provided to the Funds by the independent auditors. Any proposed services exceeding these levels or amounts require the Committee’s specific pre-approval. The Committee considers fees for audit and non-audit services when deciding whether to pre-approve services. The Committee may determine, for a pre-approval period of 12 months, the appropriate ratio between the total amount of fees for the Fund’s audit, audit-related, and tax services (including fees for services provided to Fund affiliates that are subject to pre-approval), and the total amount of fees for certain permissible non-audit services for the Fund classified as other services (including any such services provided to Fund affiliates that are subject to pre-approval).
VII. Procedures
Requests or applications for services to be provided by the independent auditors will be submitted to management. If management determines that the services do not fall within those services generally pre-approved by the Committee and set out in the appendices to these procedures, management will submit the services to the Committee or its delagee. Any such submission will include a detailed description of the services to be rendered. Notwithstanding this paragraph, the Committee will, on a quarterly basis, receive from the independent auditors a list of services provided for the previous calendar quarter on a cumulative basis by the auditors during the Pre-Approval Period.
3
VIII. Delegation
The Committee may delegate pre-approval authority to one or more of the Committee’s members. Any member or members to whom such pre-approval authority is delegated must report any pre-approval decisions, including any pre-approved services, to the Committee at its next scheduled meeting. The Committee will identify any member to whom pre-approval authority is delegated in writing. The member will retain such authority for a period of 12 months from the date of pre-approval unless the Committee determines that a different period is appropriate. The period of delegated authority may be terminated by the Committee or at the option of the member.
IX. Additional Requirements
The Committee will take any measures the Committee deems necessary or appropriate to oversee the work of the independent auditors and to assure the auditors’ independence from the Funds. This may include reviewing a formal written statement from the independent auditors delineating all relationships between the auditors and the Funds, consistent with Independence Standards Board No. 1, and discussing with the auditors their methods and procedures for ensuring independence.
Amended: November 9, 2005
4
Appendix A
Pre-Approved Audit Services for the Pre-Approval Period January 1, 2006 through December 31, 2006
Service
|
| The Fund(s) |
| Fee Range |
Statutory audits or financial audits (including tax services associated with audit services) |
| X |
| As presented to Audit Committee(1) |
|
|
|
|
|
Services associated with SEC registration statements, periodic reports and other documents filed with the SEC or other documents issued in connection with securities offerings (e.g., consents), and assistance in responding to SEC comment letters. |
| X |
| Not to exceed $9,300 per filing |
|
|
|
|
|
Consultations by Fund management with respect to accounting or disclosure treatment of transactions or events and/or the actual or potential effect of final or proposed rules, standards or interpretations by the SEC, Financial Accounting Standards Board, or other regulatory or standard setting bodies. |
| X |
| Not to exceed $8,000 during the Pre-Approval Period |
|
|
|
|
|
Seed capital audit and related review and issuance of consent on the N-2 registration statement |
| X |
| Not to exceed $12,000 per audit |
(1) | For new Funds launched during the Pre-Approval Period, the fee ranges pre-approved will be the same as those for existing Funds, pro-rated in accordance with inception dates as provided in the auditors’ Proposal or any Engagement Letter covering the period at issue. Fees in the Engagement Letter will be controlling. |
5
Appendix B
Pre-Approved Audit-Related Services for the Pre-Approval Period January 1, 2006 through December 31, 2006
Service
|
| The Fund(s) |
| Fund Affiliates |
| Fee Range |
Services related to Fund mergers (Excludes tax services — See Appendix C for tax services associated with Fund mergers) |
| X |
| X |
| Not to exceed $10,000 per merger |
|
|
|
|
|
|
|
Consultations by Fund management with respect to accounting or disclosure treatment of transactions or events and/or the actual or potential effect of final or proposed rules, standards or interpretations by the SEC, Financial Accounting Standards Board, or other regulatory or standard setting bodies. [Note: Under SEC rules some consultations may be “audit” services and others may be “audit-related” services.] |
| X |
|
|
| Not to exceed $5,000 per occurrence during the Pre-Approval Period |
|
|
|
|
|
|
|
Review of the Funds’ semi-annual financial statements |
| X |
|
|
| Not to exceed $2,100 per set of financial statements per fund |
|
|
|
|
|
|
|
Reports to regulatory or government agencies related to the annual engagement |
| X |
|
|
| Up to $5,000 per occurrence during the Pre-Approval Period |
|
|
|
|
|
|
|
Regulatory compliance assistance |
| X |
| X |
| Not to exceed $5,000 per quarter |
|
|
|
|
|
|
|
Training courses |
| X |
| X |
| Not to exceed $2,000 per course |
|
|
|
|
|
|
|
For Prime Rate Trust, agreed upon procedures for quarterly reports to rating agencies |
| X |
|
|
| Not to exceed $9,000 per quarter |
|
|
|
|
|
|
|
For Prime Rate Trust and Senior Income Fund, agreed upon procedures for the Revolving Credit and Security Agreement with Citigroup |
| X |
|
|
| Not to exceed $20,000 per fund per year |
6
Appendix C
Pre-Approved Tax Services for the Pre-Approval Period January 1, 2006 through December 31, 2006
Service
|
| The Fund(s) |
| Fund Affiliates |
| Fee Range |
Preparation of federal and state income tax returns and federal excise tax returns for the Funds including assistance and review with excise tax distributions |
| X |
|
|
| As presented to Audit Committee(2) |
|
|
|
|
|
|
|
Review of IRC Sections 851(b) and 817(h) diversification testing on a real-time basis |
| X |
|
|
| As presented to Audit Committee(2) |
|
|
|
|
|
|
|
Assistance and advice regarding year-end reporting for 1099’s |
| X |
|
|
| As presented to Audit Committee(2) |
|
|
|
|
|
|
|
Tax assistance and advice regarding statutory, regulatory or administrative developments |
| X |
| X |
| Not to exceed $5,000 for the Funds or for the Funds’ investment adviser during the Pre-Approval Period |
(2) For new Funds launched during the Pre-Approval Period, the fee ranges pre-approved will be the same as those for existing Funds, pro-rated in accordance with inception dates as provided in the auditors’ Proposal or any Engagement Letter covering the period at issue. Fees in the Engagement Letter will be controlling.
7
Service
|
| The Fund(s) |
| Fund Affiliates |
| Fee Range |
Tax training courses |
| X |
| X |
| Not to exceed $2,000 per course during the Pre-Approval Period |
|
|
|
|
|
|
|
Tax services associated with Fund mergers |
| X |
| X |
| Not to exceed $4,000 per fund per merger during the Pre-Approval Period |
|
|
|
|
|
|
|
Loan Staff Services |
|
|
| X |
| Not to exceed $15,000 during the Pre-Approval Period |
|
|
|
|
|
|
|
Other tax-related assistance and consultation, including, without limitation, assistance in evaluating derivative financial instruments and international tax issues, qualification and distribution issues, and similar routine tax consultations. |
| X |
|
|
| Not to exceed $120,000 during the Pre-Approval Period |
8
Appendix D
Pre-Approved Other Services for the Pre-Approval Period January 1, 2006 through December 31, 2006
Service
|
| The Fund(s) |
| Fund Affiliates |
| Fee Range |
Agreed-upon procedures for Class B share 12b-1 programs |
|
|
| X |
| Not to exceed $50,000 during the Pre-Approval Period |
|
|
|
|
|
|
|
Security counts performed pursuant to Rule 17f-2 of the 1940 Act (i.e., counts for Funds holding securities with affiliated sub-custodians) |
| X |
|
|
| Not to exceed $5,000 per Fund during the Pre-Approval Period |
|
|
|
|
|
|
|
Agreed upon procedures for 15 (c) FACT Books |
| X |
|
|
| Not to exceed $35,000 during the Pre-Approval Period |
9
Appendix E
Prohibited Non-Audit Services
Dated: January 1, 2006
· Bookkeeping or other services related to the accounting records or financial statements of the Funds
· Financial information systems design and implementation
· Appraisal or valuation services, fairness opinions, or contribution-in-kind reports
· Actuarial services
· Internal audit outsourcing services
· Management functions
· Human resources
· Broker-dealer, investment adviser, or investment banking services
· Legal services
· Expert services unrelated to the audit
· Any other service that the Public Company Accounting Oversight Board determines, by regulation, is impermissible
10
EXHIBIT A
ING EQUITY TRUST
ING FUNDS TRUST
ING INVESTMENT FUNDS, INC.
ING INVESTORS TRUST
ING MAYFLOWER TRUST
ING MUTUAL FUNDS
ING PRIME RATE TRUST
ING SENIOR INCOME FUND
ING VARIABLE INSURANCE TRUST
ING VARIABLE PRODUCTS TRUST
ING VP NATURAL RESOURCES TRUST
ING CORPORATE LEADERS TRUST FUND
ING PARTNERS, INC.
ING GLOBAL EQUITY DIVIDEND AND PREMIUM OPPORTUNITY FUND
ING GLOBAL ADVANTAGE AND PREMIUM OPPORTUNITY FUND
ING RISK MANAGED NATURAL RESOURCES FUND
(e)(2) | Percentage of services referred to in 4(b) — (4)(d) that were approved by the audit committee |
|
|
| 100% of the services were approved by the audit committee. |
|
|
(f) | Percentage of hours expended attributable to work performed by other than full time employees of KPMG if greater than 50%. |
|
|
| Not applicable. |
|
|
(g) | Non-Audit Fees: The non-audit fees billed by the registrant’s accountant for services rendered to the registrant, and rendered to the registrant’s investment adviser, and any entity controlling, controlled by, or under common control with the adviser that provides ongoing services to the registrant for each of the last two fiscal years of the registrant were $833,920 for year ended December 31, 2006 and $294,389 for year ended December 31, 2005. |
|
|
(h) | Principal Accountants Independence: The Registrant’s Audit committee has considered whether the provision of non-audit services that were rendered to the registrant’s investment adviser and any entity controlling, controlled by, or under common control with the investment adviser that provides ongoing services to the registrant that were not pre-approved pursuant to Rule 2-01(c)(7)(ii) of Regulation S-X is compatible with maintaining KPMG’s independence. |
3
Item 5. Audit Committee of Listed Registrants.
Not applicable.
Item 6. Schedule of Investments
Schedule is included as part of the report to shareholders filed under Item 1 of this Form.
Item 7. Disclosure of Proxy Voting Policies and Procedures for Closed-End Management Investment Companies.
Not applicable.
Item 8. Portfolio Managers of Closed-End Management Investment Companies.
Not applicable.
Item 9. Purchases of Equity Securities by Closed-End Management Investment Company and Affiliated Purchasers
Not applicable.
Item 10. Submission of Matters to a Vote of Security Holders.
The Board has a Nominating Committee for the purpose of considering and presenting to the Board candidates it proposes for nomination to fill Independent Trustee vacancies on the Board. The Committee currently consists of all Independent Trustees of the Board (6 individuals). The Nominating Committee operates pursuant to a Charter approved by the Board. The primary purpose of the Nominating Committee is to consider and present to the Board the candidates it proposes for nomination to fill vacancies on the Board. In evaluating candidates, the Nominating Committee may consider a variety of factors, but it has not at this time set any specific minimum qualifications that must be met. Specific qualifications of candidates for Board membership will be based on the needs of the Board at the time of nomination.
The Nominating Committee is willing to consider nominations received from shareholders and shall assess shareholder nominees in the same manner as it reviews its own nominees. A shareholder nominee for director should be submitted in writing to the Fund’s Secretary. Any such shareholder nomination should include at a minimum the following information as to each individual proposed for nomination as trustee: such individual’s written consent to be named in the proxy statement as a nominee (if nominated) and to serve as a trustee (if elected), and all information relating to such individual that is required to be disclosed in the solicitation of proxies for election of trustees, or is otherwise required, in each case under applicable federal securities laws, rules and regulations.
The Secretary shall submit all nominations received in a timely manner to the Nominating Committee. To be timely, any such submission must be delivered to the Fund’s Secretary not earlier than the 90th day prior to such meeting and not later than the close of business on the later of the 60th day prior to such meeting or the 10th day following the day on which public announcement of the date of the meeting is first made, by either disclosure in a press release or in a document publicly filed by the Fund with the Securities and Exchange Commission.
Item 11. Controls and Procedures.
(a) | Based on our evaluation conducted within 90 days of the filing date, hereof, the design and operation of the registrant’s disclosure controls and procedures are effective to ensure that material information relating to the registrant is made known to the certifying officers by others within the appropriate entities, particularly during the period in which Forms N-CSR are being prepared, and the registrant’s disclosure controls and procedures allow timely preparation and review of the information for the registrant’s Form N-CSR and the officer certifications of such Form N-CSR. |
|
|
(b) | There were no significant changes in the registrant’s internal controls that occurred during the second fiscal quarter of the period covered by this report that has materially affected, or is reasonably likely to materially affect, the registrant’s internal control over financial reporting. |
Item 12. Exhibits.
(a)(1) | Code of Ethics pursuant to Item 2 of Form N-CSR is filed and attached hereto as EX-99.CODE ETH. |
|
|
(a)(2) | A separate certification for each principal executive officer and principal financial officer of the |
4
registrant as required by Rule 30a-2 under the Act (17 CFR 270.30a-2) is attached hereto as EX-99.CERT. | |
|
|
(b) | The officer certifications required by Section 906 of the Sarbanes-Oxley Act of 2002 are attached hereto as EX-99.906CERT. |
|
|
(3) | Not applicable. |
5
SIGNATURES
Pursuant to the requirements of the Securities Exchange Act of 1934 and the Investment Company Act of 1940, the registrant has duly caused this report to be signed on its behalf by the undersigned, thereunto duly authorized.
(Registrant): | ING Variable Products Trust |
| ||
| ||||
By | /s/ Shaun P. Mathews |
| ||
|
| |||
| Shaun P. Mathews | |||
| President and Chief Executive Officer | |||
|
| |||
Date: | March 8, 2007 |
| ||
Pursuant to the requirements of the Securities Exchange Act of 1934 and the Investment Company Act of 1940, this report has been signed below by the following persons on behalf of the registrant and in the capacities and on the dates indicated.
By | /s/ Shaun P. Mathews |
|
|
| |
| Shaun P. Mathews | |
| President and Chief Executive Officer | |
|
| |
Date: | March 8, 2007 |
|
| ||
By | /s/ Todd Modic |
|
|
| |
| Todd Modic Senior Vice President and | |
|
| |
Date: | March 8, 2007 |
|
6