|
| OMB APPROVAL | ||
|
| OMB Number: | 3235-0570 | |
|
| Expires: | August 31, 2011 | |
| UNITED STATES | Estimated average burden hours per response. . . . . . . . . . . . . . . . .18.9 | ||
| SECURITIES AND EXCHANGE COMMISSION |
| ||
| Washington, D.C. 20549 |
| ||
FORM N-CSR
CERTIFIED SHAREHOLDER REPORT OF REGISTERED
MANAGEMENT INVESTMENT COMPANIES
Investment Company Act file number | 811-8220 | ||||||||
| |||||||||
ING Variable Products Trust | |||||||||
(Exact name of registrant as specified in charter) | |||||||||
| |||||||||
7337 E. Doubletree Ranch Rd., Scottsdale, AZ |
| 85258 | |||||||
(Address of principal executive offices) |
| (Zip code) | |||||||
| |||||||||
CT Corporation System, 101 Federal Street, Boston, MA 02110 | |||||||||
(Name and address of agent for service) | |||||||||
| |||||||||
Registrant’s telephone number, including area code: | 1-800-992-0180 |
| |||||||
| |||||||||
Date of fiscal year end: | December 31 |
| |||||||
| |||||||||
Date of reporting period: | January 1, 2008 to December 31, 2008 |
| |||||||
ITEM 1. REPORTS TO STOCKHOLDERS.
The following is a copy of the report transmitted to stockholders pursuant to Rule 30e-1 under the Act (17 CFR 270.30e-1):

Annual Report
December 31, 2008
Classes ADV, I and S
ING Variable Products Trust
Domestic Equity Growth Portfolios
n ING VP MidCap Opportunities Portfolio
n ING VP SmallCap Opportunities Portfolio
International Equity Portfolio
n ING VP International Value Portfolio
This report is submitted for general information to shareholders of the ING Funds. It is not authorized for distribution to prospective shareholders unless accompanied or preceded by a prospectus which includes details regarding the funds' investment objectives, risks, charges, expenses and other information. This information should be read carefully.
MUTUAL FUNDS

TABLE OF CONTENTS
| President's Letter | 1 | ||||||
| Market Perspective | 2 | ||||||
| Portfolio Managers' Reports | 4 | ||||||
| Shareholder Expense Examples | 10 | ||||||
| Report of Independent Registered Public Accounting Firm | 11 | ||||||
| Statements of Assets and Liabilities | 12 | ||||||
| Statements of Operations | 13 | ||||||
| Statements of Changes in Net Assets | 14 | ||||||
| Financial Highlights | 16 | ||||||
| Notes to Financial Statements | 18 | ||||||
| Portfolios of Investments | 32 | ||||||
| Tax Information | 40 | ||||||
| Trustee and Officer Information | 41 | ||||||
| Advisory Contract Approval Discussion | 46 | ||||||
PROXY VOTING INFORMATION
A description of the policies and procedures that the Portfolios use to determine how to vote proxies related to portfolio securities is available: (1) without charge, upon request, by calling Shareholder Services toll-free at (800) 992-0180; (2) on the ING Funds' website at www.ingfunds.com; and (3) on the U.S. Securities and Exchange Commission's ("SEC") website at www.sec.gov. Information regarding how the Portfolios voted proxies related to portfolio securities during the most recent 12-month period ended June 30 is available without charge on the ING Funds' website at www.ingfunds.com and on the SEC's website at www.sec.gov.
QUARTERLY PORTFOLIO HOLDINGS
The Portfolios file their complete schedule of portfolio holdings with the SEC for the first and third quarters of each fiscal year on Form N-Q. The Portfolios' Forms N-Q are available on the SEC's website at www.sec.gov. The Portfolios' Forms N-Q may be reviewed and copied at the SEC's Public Reference Room in Washington, DC, and information on the operation of the Public Reference Room may be obtained by calling (800) SEC-0330; and is available upon request from the Portfolio by calling Shareholder Services toll-free at (800) 992-0180.
PRESIDENT'S LETTER

Dear Shareholders,
We are in the midst of one of the most challenging periods ever faced by investors, and we at ING Funds are aware of the anxiety that you may be feeling at this time.
I want to assure you that we are actively engaged in monitoring the situation and are committed to keeping you fully informed of how the rapidly unfolding events around us may impact your investments with our company.
We recognize that the confidence of many investors is being tested, perhaps as never before. It is understandable that some of you may be second guessing your investment strategy due to these recent events. We encourage you to work with your investment professional and seek out their advice about your portfolio in light of the current conditions. But we also urge investors not to make rash decisions. ING Funds still believes that a well-diversified, globally allocated portfolio remains the most effective investment strategy of all. We ask that investors not lose sight of their commitment to the long-term.
We thank you for your support and confidence and we look forward to continuing to do business with you in the future.
Sincerely,

Shaun Mathews
President & Chief Executive Officer
ING Funds
January 23, 2009
The views expressed in the President's Letter reflect those of the President as of the date of the letter. Any such views are subject to change at any time based upon market or other conditions and ING Funds disclaims any responsibility to update such views. These views may not be relied on as investment advice and because investment decisions for an ING Fund are based on numerous factors, may not be relied on as an indication of investment intent on behalf of any ING Fund. Reference to specific company securities should not be construed as recommendations or investment advice. Consider the fund's investment objectives, risks, and charges and expenses carefully before investing. The prospectus contains this information and other information about the fund.
International investing poses special risks including currency fluctuation, economic and political risks not found in investments that are solely domestic.
1
MARKET PERSPECTIVE: YEAR ENDED DECEMBER 31, 2008
In our semi-annual report, we described a failed second quarter rally that fizzled when investors realized that borderline recessionary conditions and a credit crunch had not gone away. By year-end, governments were committing previously unimaginable sums of taxpayer money to prevent systemic collapse. Global equities in the form of the MSCI World® Index(1) measured in local currencies, including net reinvested dividends ("MSCI" for regions discussed below) plunged 29.70% in the six months ended December 31, 2008 (down 38.70% for the entire fiscal year). (The MSCI World® Index plunged 40.71% for the entire fiscal year, measured in U.S. dollars.) In currencies, the dollar at first drifted near record lows against the euro. But the tide turned in mid-July and for the six months ended December 31, 2008, the dollar strengthened by 12.10% (4.50% for the entire fiscal year). The dollar also soared 37.80% against the pound for the six months ended December 31, 2008 (37.90% for the entire fiscal year). But the yen advanced as carry trades (essentially short yen positions) were unwound and the dollar fell 14.90% for the six months ended December 31, 2008 (down 19.60% for the entire fiscal year).
Even more dramatic was the price of oil which marched to an all-time high of around $147 per barrel in mid-July, only to lose more than two thirds of that price by December 31, 2008.
The economic statistics remained bleak. By the end of October, the Standard & Poor's ("S&P")/Case-Shiller National U.S. Home Price Index(2) of house prices had fallen a record 18% over the year. New home sales were at 1991 levels. Some 45% of existing home sales were distressed.
Payrolls declined in every month of 2008, as the number of people claiming unemployment reached 4.1 million, a 26-year high. Gross domestic product ("GDP") fell at an annualized rate of 0.50% in the third quarter, and the National Bureau of Economic Research announced that the recession had actually started in December 2007.
Yet these were side-shows to the fireworks display in the financial sector, where major institutions — hanging by a thread through problems rooted in unwise mortgage borrowing, lending and investment — met different fates in September 2008 at the hands of the U.S. government.
The Federal National Mortgage Association ("Fannie Mae") and the Federal Home Loan Mortgage Corporation ("Freddie Mac") were taken into "conservatorship." Merrill Lynch was acquired by the Bank of America with a wink from the authorities. AIG received an $85 billion loan from a reluctant government, which also took a 79.90% equity stake in AIG. But Lehman Brothers having sought capital, then a buyer, found neither and was left to file for Chapter 11 bankruptcy protection.
The U.S. government was now in the position of choosing winners and losers among financial institutions: none too successfully, for it quickly became obvious that by pointedly leaving Lehman Brothers to go under, a credit crisis had become a credit market collapse. Lending all but seized up.
Policy response was huge but at least initially muddled. A Troubled Asset Relief Plan ("TARP") would set up a $700 billion fund to buy illiquid mortgage securities from financial institutions. But on November 12, 2008 with half of the money already used to recapitalize banks, Treasury Secretary Paulson announced that the rest of the funds would not be used to buy illiquid mortgage securities after all. This merely renewed the pressure on the holders of such securities like Citigroup, which within two weeks received guarantees from the government against losses and another $20 billion in capital.
Other programs were of more practical use, like support for the commercial paper market and a guarantee facility for money market funds. Arguably the most effective measure was the announced intention to buy vast quantities of agency mortgage-backed securities and debentures. This had the effect of driving down rates on the 30-year mortgage towards 5.00%, a record low. In the meantime, the newly-elected president promised a stimulus package worth approximately $1 trillion. And by year end, the Federal Open Market Committee ("FOMC") reduced interest rates to a range of between 0% and 0.25%.
2008 ended with much gloom and bad news still to come, but the platform for recovery was perhaps taking shape.
In U.S. fixed-income markets, yields on the 90-day Treasury Bills briefly turned negative in December 2008, while the yield on the ten-year Treasury Note fell below 2.50%, something we had not seen in 50 years. The Barclays Capital U.S. Aggregate Bond Index(3), formerly known as the Lehman Brothers U.S. Aggregate Bond Index, of investment grade bonds returned 4.10% for the six months ended December 31, 2008, (5.20% for the entire fiscal year). By contrast, high yield bonds, represented by the Barclays Capital High Yield Bond — 2% Issuer Constrained Composite Index(4), formerly known as
2
MARKET PERSPECTIVE: YEAR ENDED DECEMBER 31, 2008
the Lehman Brothers High Yield Bond — 2% Issuer Constrained Composite Index, behaved more like a stock index and returned (25.10)% for the six months ended December 31, 2008 (down 25.90% for the entire fiscal year).
U.S. equities, represented by the S&P 500® Composite Stock Price ("S&P 500®") Index(5), including dividends, returned (28.50)% for the six months ended December 31, 2008, (down 37.00% for the entire fiscal year), increasingly unimpressed by sharply falling oil prices. Profits for S&P 500® Index companies suffered their fifth straight quarter of decline, led again by the financials sector, although taxpayer money was also potentially committed to save the big three auto makers from bankruptcy. On November 20, 2008, the S&P 500® Index plumbed a level not seen since April 1997, before a December recovery.
In international markets, plainly entering recession, the MSCI Japan® Index(6) slumped 35.90% for the six months ended December 31, 2008, (down 42.60% for the entire fiscal year). The strengthening yen hit exports in an export-dependent economy even as global demand slowed for other reasons. The MSCI Europe ex UK® Index(7) sagged 29.40% for the six months ended December 31, 2008 (down 43.20% for the entire fiscal year), beset by sharply falling economic activity and a European Central Bank in denial that inflation was falling fast. Finally, rates were reduced by an unprecedented 175 basis points (or 1.75%) in two months near the end of the year while governments, one after the other, proposed large stimulus packages. In the UK, the MSCI UK® Index(8) fell 19.40% for the six months ended December 31, 2008 (down 28.50% for the entire fiscal year). The UK had allowed a bigger ho using bubble than the United States and deeper personal indebtedness in an economy more dependent on the financial sector. Rates were reduced to 1951 levels as venerable banks ceased to exist as independent entities.
(1) The MSCI World® Index is an unmanaged index that measures the performance of over 1,400 securities listed on exchanges in the U.S., Europe, Canada, Australia, New Zealand and the Far East.
(2) The S&P/Case-Shiller National U.S. Home Price Index tracks the value of single-family housing within the United States. The index is a composite of single-family home price indices for the nine U.S. Census divisions and is calculated quarterly.
(3) The Barclays Capital U.S. Aggregate Bond Index is an unmanaged index of publicly issued investment grade U.S. Government, mortgage-backed, asset-backed and corporate debt securities.
(4) The Barclays Capital High Yield Bond — 2% Issuer Constrained Composite Index is an unmanaged index that measures the performance of non-investment grade fixed-income securities.
(5) The S&P 500® Index is an unmanaged index that measures the performance of securities of approximately 500 of the largest companies in the United States.
(6) The MSCI Japan® Index is a free float-adjusted market capitalization index that is designed to measure developed market equity performance in Japan.
(7) The MSCI Europe ex UK® Index is a free float-adjusted market capitalization index that is designed to measure developed market equity performance in Europe, excluding the UK.
(8) The MSCI UK® Index is a free float-adjusted market capitalization index that is designed to measure developed market equity performance in the UK.
All indices are unmanaged and investors cannot invest directly in an index.
Past performance does not guarantee future results. The performance quoted represents past performance. Investment return and principal value of an investment will fluctuate, and shares, when redeemed, may be worth more or less than their original cost. The Portfolios' performance is subject to change since the period's end and may be lower or higher than the performance data shown. Please call (800) 992-0180 or log on to www.ingfunds.com to obtain performance data current to the most recent month end.
Market Perspective reflects the views of ING's Chief Investment Risk Officer only through the end of the period, and is subject to change based on market and other conditions.
3
ING VP MIDCAP OPPORTUNITIES PORTFOLIO
PORTFOLIO MANAGERS' REPORT
ING VP MidCap Opportunities Portfolio (the "Portfolio") seeks long-term capital appreciation. The Portfolio is managed by Uri Landesman, Senior Vice President and Head of International Equities* and Jeff Bianchi, Portfolio Managers of ING Investment Management Co. — the Sub-Adviser.
Performance: For the year ended December 31, 2008, the Portfolio's Class I shares provided a total return of (37.62)% compared to the Russell Midcap® Growth Index(1) and the Russell Midcap® Index(2), which returned (44.32)% and (41.46)%, respectively, for the same period.
Portfolio Specifics: The Russell Midcap® Growth Index declined steeply during the twelve months ended December 31, 2008. Needless to say, all economic sectors within the index experienced significant double-digit declines. The main causes were a global financial crisis unlike any other since the Great Depression and a subsequent global economic slowdown that has brought recessionary conditions to several regions of the world. In addition to plummeting equity market valuations, housing prices, oil and a broad range of other commodities fell precipitously, creating fears of deflation.
Given the weak pricing backdrop, coupled with demand destruction, the energy sector experienced the sharpest decline of 56%. The equipment and services and oil gas and consumable fuels sub-sectors were down roughly equivalent amounts. The utilities sector slid 53%, led lower by independent power producers. The financials sector was the third worst performer with a decline of 49%. The consumer finance industry was particularly weak.
Not surprisingly, defensive sectors had relatively better results. The consumer staples sector had the smallest decline, 29%, partially due to a moderate sell-off in the food products industry. The healthcare sector was off 33%, with biotechnology stocks being nearly flat. A 40% decline in the telecommunication services sector was still better than the performance of the Russell Midcap® Growth Index.
The Portfolio's excess return relative to the benchmark was entirely attributable to stock selection, which was especially strong in the information technology, healthcare, consumer staples, industrials, materials and financials sectors.
Millennium Pharmaceuticals, Inc. made a significant contribution to the relative return. During the second quarter, the stock was acquired by Takeda Pharmaceutical Co., Ltd. The Portfolio benefited from lower than benchmark exposure to Intuitive Surgical, Inc. The biggest net contribution to return was derived from not owning Electronic Arts, Inc.
Two energy stocks, Key Energy Services, Inc. ("Key Energy") and National Oilwell Varco, Inc. ("National Oilwell") hurt performance the most. Key Energy's 3rd Quarter 2008 earnings were disappointing due to hurricanes in the Gulf Coast. Also, because of market uncertainties, the company retracted 4th Quarter 2008 guidance and refused to confirm prior full-year guidance. Shares of National Oilwell were affected by weak commodity prices, resulting in fears of reduced drilling. Shares of SPX Corp., a diversified manufacturer, were impacted by concerns regarding lower power consumption and the credit crisis.
Current Strategy and Outlook: Although credit spreads have recently narrowed as governments have injected funds into banks and slashed interest rates, credit availability and counterparty risk aversion remain concerns. Meanwhile, the real economy seems likely to incur more damage than previously indicated. We believe stock market volatility will remain elevated. We believe stock picking will prove important in 2009. Many good companies with relatively strong business momentum were treated indifferently in the 2008 market. In addition, market sentiment seems to have been buoyed by the late November $800 billion lending program and massive stimulus plans of the incoming Obama administration.
Narrowing credit spreads could eventually lead to increased credit availability and improvement in perceived counterparty risk. We continuously seek companies that we believe exhibit strong business momentum and market recognition at appropriate valuation levels.
Top Ten Holdings*
as of December 31, 2008
(as a percent of net assets)
| iShares Russell Midcap Growth Index Fund | 3.7 | % | |||||
| St. Jude Medical, Inc. | 3.2 | % | |||||
| Invesco Ltd. | 2.3 | % | |||||
| Ecolab, Inc. | 2.0 | % | |||||
| Intuit, Inc. | 2.0 | % | |||||
| Fiserv, Inc. | 1.9 | % | |||||
| ITT Corp. | 1.9 | % | |||||
| BMC Software, Inc. | 1.9 | % | |||||
| Murphy Oil Corp. | 1.8 | % | |||||
| Ross Stores, Inc. | 1.8 | % | |||||
* Excludes short-term investments related to ING Institutional Prime Money Market Fund — Class I and securities lending collateral.
Portfolio holdings are subject to change daily.
* Effective August 13, 2008, Mr. Landesman replaced Richard Welsh as a portfolio manager to the Portfolio.
Portfolio holdings and characteristics are subject to change and may not be representative of current holdings and characteristics. The outlook for this Portfolio may differ from that presented for other ING Funds. Performance for the different classes of shares will vary based on differences in fees associated with each class.
4
PORTFOLIO MANAGERS' REPORT
ING VP MIDCAP OPPORTUNITIES PORTFOLIO

| Average Annual Total Returns for the Periods Ended December 31, 2008 | |||||||||||||||||||||||
| 1 Year | 5 Year | Since Inception of Class ADV December 29, 2006 | Since Inception of Class I May 5, 2000 | Since Inception of Class S May 7, 2001 | |||||||||||||||||||
| Class ADV | (38.04 | )% | — | (11.95 | )% | — | — | ||||||||||||||||
| Class I | (37.62 | )% | 0.80 | % | — | (5.00 | )% | — | |||||||||||||||
| Class S | (37.72 | )% | 0.58 | % | — | — | (1.57 | )% | |||||||||||||||
| Russell Midcap® Growth Index(1) | (44.32 | )% | (2.33 | )% | (21.24 | )%(3) | (5.85 | )%(4) | (2.23 | )%(5) | |||||||||||||
| Russell Midcap® Index(2) | (41.46 | )% | (0.71 | )% | (21.38 | )%(3) | 1.14 | %(4) | 1.25 | %(5) | |||||||||||||
Based on a $10,000 initial investment, the graph and table above illustrate the total return of ING VP MidCap Opportunities Portfolio against the indices indicated. An index is unmanaged and has no cash in its portfolios, imposes no sales charges and incurs no operating expenses. An investor cannot invest directly in an index. The Portfolio's performance is shown without the imposition of any expenses or charges which are, or may be, imposed under your annuity contract or life insurance policy. Total returns would have been lower if such expenses or charges were included.
The performance graph and table do not reflect the deduction of taxes that a shareholder will pay on Portfolio distributions or the redemption of Portfolio shares.
The performance shown may include the effect of fee waivers and/or expense reimbursements by the Investment Adviser and/or other service providers, which have the effect of increasing total return. Had all fees and expenses been considered, the total returns would have been lower.
Total returns reflect that the Investment Adviser may have waived or recouped fees and expenses otherwise payable by the Portfolio.
The performance update illustrates performance for a variable investment option available through a variable annuity contract and/or a variable universal life policy. The performance shown indicates past performance and is not a projection or prediction of future results. Actual investment returns and principal value will fluctuate so that shares and/or units, at redemption, may be worth more or less than their original cost. For variable annuity contract, please call (800) 992-0180 to get performance through the most recent month end. For variable universal life policies, please log on to www.ing.com/us to get performance through the most recent month end.
This report contains statements that may be "forward-looking" statements. Actual results may differ materially from those projected in the "forward-looking" statements.
The views expressed in this report reflect those of the portfolio managers, only through the end of the period as stated on the cover. The portfolio managers' views are subject to change at any time based on market and other conditions.
Portfolio holdings are subject to change daily.
(1) The Russell Midcap® Growth Index is an unmanaged index that measures the performance of those companies included in the Russell Midcap® Index with relatively higher price-to-book ratios and higher forecasted growth values.
(2) The Russell Midcap® Index is an unmanaged index that measures the performance of the 800 smallest companies in the Russell 1000® Index, which represent approximately 26% of the total market capitalization of the Russell 1000® Index.
(3) Since inception performance for the indices is shown from January 1, 2007.
(4) Since inception performance for the indices is shown from May 1, 2000.
(5) Since inception performance for the indices is shown from May 1, 2001.
5
ING VP SMALLCAP OPPORTUNITIES PORTFOLIO
PORTFOLIO MANAGERS' REPORT
ING VP SmallCap Opportunities Portfolio (the "Portfolio") seeks long-term capital appreciation. The Portfolio is managed by Steve Salopek and James Hasso*, Portfolio Managers of ING Investment Management Co. — the Sub-Adviser.
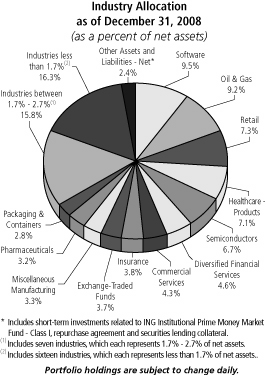
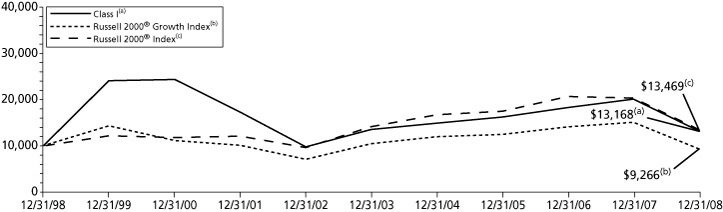
Performance: For the year ended December 31, 2008, the Portfolio's Class I shares provided a total return of (34.48)%, compared to the Russell 2000® Growth Index(1) and the Russell 2000® Index(2), which returned (38.54)% and (33.79)%, respectively, for the same period.
Portfolio Specifics: Despite the recent rally of over 28% for the Russell 2000® Growth Index, it was down more than 38% for the year. This past year was the worst since 1973 for small-cap stocks. There were few places to hide and returns were negative across all sectors. Small-cap growth held up well relative to large-cap growth, underperforming by only 0.10% (as measured by the Russell 2000® Growth and Russell 1000® Growth, respectively). Energy was down almost 50% for the year due to the significant decline in the price of oil and the fact that the current economic environment is unfavorable for energy.
Stock selection within industrials, consumer discretionary, technology and utilities benefited the Portfolio during the period. Notable outperformance versus the benchmark within industrials was due to strong stock selection within commercial services and supplies, as well as our slight underweight in electrical equipment. Consumer discretionary benefited most from stock selection within hotels, restaurants and leisure.
Stock selection coupled with our slight underweight positions within energy and healthcare detracted most from performance. Within energy, a modest overweight in energy equipment and services negatively impacted performance. Underperformance in healthcare is attributable to our underweight in biotechnology as well as stock selection within the industry. Stock selection within pharmaceuticals also detracted from results.
Greatbatch, Inc. ("Greatbatch") and Capella Education Co. ("Capella Education") contributed significantly to performance over the period. Capella Education, an online post-secondary education company, outperformed due to the less cyclical nature of the education business, as the number of people going back to school increases during an economic downturn. Also, the company has had good execution, seen an increase in the student body and margins have improved.
Greatbatch is a leading developer and manufacturer of critical components used in medical devices for the cardiac rhythm management, neurostimulation, vascular and interventional radiology markets. The company executed well on its acquisition strategy, which helped it diversify from its Cardiac Rhythm Management franchise and provide greater stability/visibility to its operating earnings. Also, the street was initially skeptical of the company's ability to diversify and execute on the diversification strategy. As each quarter passed, the company's execution proved to be flawless and the firm gained substantial momentum as evidenced by increasing earnings and expanded margins.
Abritron, Inc. ("Arbitron") and Xyratex Ltd. ("Xyratex") were two of the largest detractors from performance over the period. Arbitron, which measures the listening audience for radio and provides this data to both radio stations and advertisers, recently lost market share to a competitor. We continue to hold this name, as the company remains the market leader, expectations have been reset and we believe the valuation is reasonable. Xyratex designs and manufactures technology that supports storage and data communication networks. The company provided guidance that revenue and earnings would be significantly below expectations for its November quarter, due to weakness in customer orders. We continue to hold the stock mainly due to valuation, as nearly 50% of its market cap is in cash.
Current Strategy and Outlook: We continue to focus on companies with strong balance sheets and cash flow generation capabilities. We are conscious of the difficulties in the current economic environment. We believe, however, that the economy will begin to improve in 2009 due to the massive amount of monetary stimulus being pumped into the system globally.
Accordingly, we have begun to increase our exposure to more early cyclical companies. Within financials, we continue to mitigate risk through diversification and are invested across the financial sector, in banks, diversified financials, insurance companies and real estate investment trusts ("REITS"). The banks that we own are typically over-capitalized and have higher reserves than industry averages. We continue to take advantage of the volatility in the market to acquire attractively valued companies whose share prices we believe are not trading on fundamentals.

Top Ten Holdings*
as of December 31, 2008
(as a percent of net assets)
| iShares Russell 2000 Growth Index Fund | 2.0 | % | |||||
| Waste Connections, Inc. | 1.3 | % | |||||
| Solera Holdings, Inc. | 1.3 | % | |||||
| Parametric Technology Corp. | 1.2 | % | |||||
| Chattem, Inc. | 1.2 | % | |||||
| WMS Industries, Inc. | 1.1 | % | |||||
| Bio-Rad Laboratories, Inc. | 1.1 | % | |||||
| Watson Wyatt Worldwide, Inc. | 1.1 | % | |||||
| Interwoven, Inc. | 1.1 | % | |||||
| Varian, Inc. | 1.1 | % | |||||
* Excludes short-term investments related to ING Institutional Prime Money Market Fund — Class I and securities lending collateral.
Portfolio holdings are subject to change daily.
* Mr. Hasso was added as portfolio manager to the Portfolio effective October 1, 2008.
Portfolio holdings and characteristics are subject to change and may not be representative of current holdings and characteristics. The outlook for this Portfolio may differ from that presented for other ING Funds. Performance for the different classes of shares will vary based on differences in fees associated with each class.
6
PORTFOLIO MANAGERS' REPORT
ING VP SMALLCAP OPPORTUNITIES PORTFOLIO
| Average Annual Total Returns for the Periods Ended December 31, 2008 | |||||||||||||||||||||||
| 1 Year | 5 Year | 10 Year | Since Inception of Class ADV November 20, 2008 | Since Inception of Class S May 3, 2001 | |||||||||||||||||||
| Class ADV | — | — | — | 25.03 | % | — | |||||||||||||||||
| Class I | (34.48 | )% | (0.49 | )% | 2.79 | % | — | — | |||||||||||||||
| Class S | (34.59 | )% | (0.69 | )% | — | — | (5.51 | )% | |||||||||||||||
| Russell 2000® Growth Index(1) | (38.54 | )% | (2.35 | )% | (0.76 | )% | 5.42 | %(3) | (1.70 | )%(4) | |||||||||||||
| Russell 2000® Index(2) | (33.79 | )% | (0.93 | )% | 3.02 | % | 5.80 | %(3) | 1.68 | %(4) | |||||||||||||
Based on a $10,000 initial investment, the graph and table above illustrate the total return of ING VP SmallCap Opportunities Portfolio against the indices indicated. An index is unmanaged and has no cash in its portfolios, imposes no sales charges and incurs no operating expenses. An investor cannot invest directly in an index. The Portfolio's performance is shown without the imposition of any expenses or charges which are, or may be, imposed under your annuity contract or life insurance policy. Total returns would have been lower if such expenses or charges were included.
The performance graph and table do not reflect the deduction of taxes that a shareholder will pay on Portfolio distributions or the redemption of Portfolio shares.
The performance shown may include the effect of fee waivers and/or expense reimbursements by the Investment Adviser and/or other service providers, which have the effect of increasing total return. Had all fees and expenses been considered, the total returns would have been lower.
The performance update illustrates performance for a variable investment option available through a variable annuity contract and/or a variable universal life policy. The performance shown indicates past performance and is not a projection or prediction of future results. Actual investment returns and principal value will fluctuate so that shares and/or units, at redemption, may be worth more or less than their original cost. For variable annuity contracts, please call (800) 992-0180 to get performance through the most recent month end. For variable universal life policies, please log on to www.ing.com/us to get performance through the most recent month end.
This report contains statements that may be "forward-looking" statements. Actual results may differ materially from those projected in the "forward-looking" statements.
The views expressed in this report reflect those of the portfolio manager, only through the end of the period as stated on the cover. The portfolio manager's views are subject to change at any time based on market and other conditions.
Portfolio holdings are subject to change daily.
(1) The Russell 2000® Growth Index is an unmanaged index that measures the performance of securities of smaller U.S. companies with greater-than-average growth orientation.
(2) The Russell 2000® Index is an unmanaged index that measures the performance of securities of small U.S. companies.
(3) Since inception performance for the indices is shown from December 1, 2008.
(4) Since inception performance for the indices is shown from May 1, 2001.
7
ING VP INTERNATIONAL VALUE PORTFOLIO
PORTFOLIO MANAGERS' REPORT
ING VP International Value Portfolio (the "Portfolio") seeks long-term capital appreciation. The Portfolio is managed by Philip A. Schwartz, CFA, Senior Vice President and Director of International Investment Strategy of ING Investment Management Co. — the Sub- Adviser.
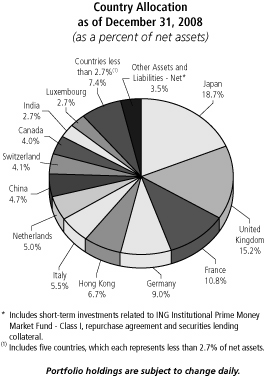
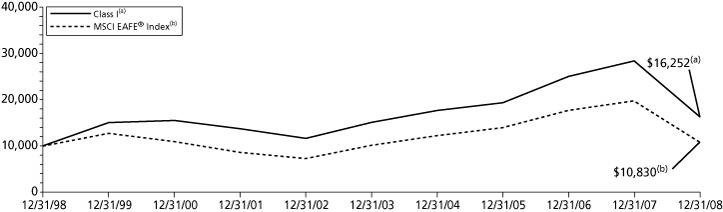
Performance: For the year ended December 31, 2008, the Portfolio's Class I shares provided a total return of (42.76)% compared to the Morgan Stanley Capital International — Europe, Australasia and Far East ("MSCI EAFE®") Index(1), which returned (43.38)% for the same period.
Portfolio Specifics: The year 2008 was underscored by a litany of issues, including an escalating financial crisis, rampant inflation, a possible war between Iran and Israel, a global recession, collapsing of storied companies, unparalleled levels of market volatility, threat of deflation and a credit crunch to boot. Certainly the times have tested the fortitude of investors worldwide, as trillions of dollars have been wiped out. However, one must not forget that chaos breeds opportunity. With massive monetary and fiscal actions taken around the world, we are optimistic about what the future may have in store.
Surprising though it may seem, selection within the financials sector bolstered the Portfolio's 2008 relative performance. Additionally, selection within the industrials sector added value. Regionally, our exposure to non-benchmark North America (Canada specifically) proved effective. The positive performance was offset most by an underweight and selection in consumer staples. Selection within the relatively weak materials sector coupled with selection in consumer discretionary detracted from results. From a regional standpoint our selection within Europe detracted.
Siemens AG, a German industrial corporation, had a sharp rally from its November 20 lows in reaction to President-elect Obama's plans to build out infrastructure. The position was initiated in the fourth quarter of 2008. ArcelorMittal, an Indian steel giant, was initiated in October (after the massive sell-off that commenced in June). The stock saw a bit of appreciation in the fourth quarter amidst a cut in production among steel producers. Nippon Telegraph and Telephone Corp. also contributed to results.
Swiss mining giant Xstrata PLC saw shares fall precipitously during the second half of the year amidst sliding commodity prices. Peugeot S.A., a French automaker was initiated in June; however, the stock followed a downward trend as weakened consumer spending and general malaise impacted the automotive industry.
Current Strategy and Outlook: We believe that we have been capitalizing upon opportunities that the downturn has provided. Despite abating inflationary concerns, risks to the upside remain, as investors gauge the level of systemic risk that is inherent in the global economy. On the upside, however, central banks have responded in a coordinated fashion, potentially mitigating a severe downturn. We will seek further opportunities across a wide array of markets.
Top Ten Holdings*
as of December 31, 2008
(as a percent of net assets)
| Siemens AG | 3.6 | % | |||||
| Tokyo Electron Ltd. | 3.1 | % | |||||
| Nippon Telegraph & Telephone Corp. | 3.0 | % | |||||
| E.ON AG | 3.0 | % | |||||
| Swire Pacific Ltd. | 3.0 | % | |||||
| Huaneng Power International, Inc. | 2.9 | % | |||||
| Total SA | 2.9 | % | |||||
| Canon, Inc. ADR | 2.9 | % | |||||
| ENI S.p.A. | 2.8 | % | |||||
| Terna S.p.A | 2.7 | % | |||||
* Excludes short-term investments related to securities lending collateral.
Portfolio holdings are subject to change daily.
Portfolio holdings and characteristics are subject to change and may not be representative of current holdings and characteristics. The outlook for this Portfolio may differ from that presented for other ING Funds. Performance for the different classes of shares will vary based on differences in fees associated with each class.
8
PORTFOLIO MANAGERS' REPORT
ING VP INTERNATIONAL VALUE PORTFOLIO
| Average Annual Total Returns for the Periods Ended December 31, 2008 | |||||||||||||||||||||||
| 1 Year | 5 Year | 10 Year | Since Inception of Class ADV December 29, 2006 | Since Inception of Class S March 19, 2002 | |||||||||||||||||||
| Class ADV | (43.11 | )% | — | — | (19.88 | )% | — | ||||||||||||||||
| Class I | (42.76 | )% | 1.55 | % | 4.97 | % | — | — | |||||||||||||||
| Class S | (42.31 | )% | 1.41 | % | — | — | 1.78 | % | |||||||||||||||
| MSCI EAFE® Index(1) | (43.38 | )% | 1.66 | % | 0.80 | % | (20.66 | )%(2) | 3.46 | %(3) | |||||||||||||
Based on a $10,000 initial investment, the graph and table above illustrate the total return of ING VP International Value Portfolio against the index indicated. An index is unmanaged and has no cash in its portfolio, imposes no sales charges and incurs no operating expenses. An investor cannot invest directly in an index. The Portfolio's performance is shown without the imposition of any expenses or charges which are, or may be, imposed under your annuity contract or life insurance policy. Total returns would have been lower if such expenses or charges were included.
The performance graph and table do not reflect the deduction of taxes that a shareholder will pay on Portfolio distributions or the redemption of Portfolio shares.
The performance shown may include the effect of fee waivers and/or expense reimbursements by the Investment Adviser and/or other service providers, which have the effect of increasing total return. Had all fees and expenses been considered, the total returns would have been lower.
The performance update illustrates performance for a variable investment option available through a variable annuity contract and/or a variable universal life policy. The performance shown indicates past performance and is not a projection or prediction of future results. Actual investment returns and principal value will fluctuate so that shares and/or units, at redemption, may be worth more or less than their original cost. For variable annuity contracts, please call (800) 992-0180 to get performance through the most recent month end. For variable universal life policies, please log on to www.ing.com/us to get performance through the most recent month end.
This report contains statements that may be "forward-looking" statements. Actual results may differ materially from those projected in the "forward-looking" statements.
The views expressed in this report reflect those of the portfolio managers only through the end of the period as stated on the cover. The portfolio managers' views are subject to change at any time based on market and other conditions.
Portfolio holdings are subject to change daily.
(1) The MSCI EAFE® Index is an unmanaged index that measures the performance of securities listed on exchanges in markets in Europe, Australasia and the Far East. It includes the reinvestment of dividends net of withholding taxes, but does not reflect fees, brokerage commissions or other expenses of investing.
(2) Since inception performance for the index is shown from January 1, 2007.
(3) Since inception performance for the index is shown from April 1, 2002.
Prior to July 1, 2002, the portfolio was sub-advised by a different sub-adviser.
9
SHAREHOLDER EXPENSE EXAMPLES (UNAUDITED)
As a shareholder of a Portfolio, you incur two types of costs: (1) transaction costs, including redemption fees and exchange fees; and (2) ongoing costs, including management fees, distribution and/or service (12b-1) fees, and other Portfolio expenses. These Examples are intended to help you understand your ongoing costs (in dollars) of investing in a Portfolio and to compare these costs with the ongoing costs of investing in other mutual funds.
The Examples are based on an investment of $1,000 invested at the beginning of the period and held for the entire period from July 1, 2008 to December 31, 2008. The Portfolios' expenses are shown without the imposition of any charges which are, or may be, imposed under your annuity contract. Expenses would have been higher if such charges were included.
Actual Expenses
The first section of the table shown, "Actual Portfolio Return," provides information about actual account values and actual expenses. You may use the information in this section, together with the amount you invested, to estimate the expenses that you paid over the period. Simply divide your account value by $1,000 (for example, an $8,600 account value divided by $1,000 = 8.6), then multiply the result by the number in the first section under the heading entitled "Expenses Paid During the Period" to estimate the expenses you paid on your account during this period.
Hypothetical Example for Comparison Purposes
The second section of the table shown, "Hypothetical (5% return before expenses)," provides information about hypothetical account values and hypothetical expenses based on the Portfolio's actual expense ratio and an assumed rate of return of 5% per year before expenses, which is not the Portfolio's actual return. The hypothetical account values and expenses may not be used to estimate the actual ending account balance or expenses you paid for the period. You may use this information to compare the ongoing costs of investing in the Portfolio and other mutual funds. To do so, compare this 5% hypothetical example with the 5% hypothetical examples that appear in the shareholder reports of the other mutual funds.
Please note that the expenses shown in the table are meant to highlight your ongoing costs only and do not reflect any transactional costs, such as redemption fees or exchange fees. Therefore, the hypothetical lines of the table are useful in comparing ongoing costs only, and will not help you determine the relative total costs of owning different mutual funds. In addition, if these transactional costs were included, your costs would have been higher.
| Actual Portfolio Return | Hypothetical (5% return before expenses) | ||||||||||||||||||||||||||||||||||
| ING VP MidCap Opportunities Portfolio | Beginning Account Value July 1, 2008 | Ending Account Value December 31, 2008 | Annualized Expense Ratio | Expenses Paid During the Period Ended December 31, 2008* | Beginning Account Value July 1, 2008 | Ending Account Value December 31, 2008 | Annualized Expense Ratio | Expenses Paid During the Period Ended December 31, 2008* | |||||||||||||||||||||||||||
| Class ADV | $ | 1,000.00 | $ | 662.50 | 1.20 | % | $ | 5.01 | $ | 1,000.00 | $ | 1,019.10 | 1.20 | % | $ | 6.09 | |||||||||||||||||||
| Class I | 1,000.00 | 664.60 | 0.70 | 2.93 | 1,000.00 | 1,021.62 | 0.70 | 3.56 | |||||||||||||||||||||||||||
| Class S | 1,000.00 | 664.20 | 0.90 | 3.76 | 1,000.00 | 1,020.61 | 0.90 | 4.57 | |||||||||||||||||||||||||||
| ING VP SmallCap Opportunities Portfolio | |||||||||||||||||||||||||||||||||||
| Class ADV(1) | $ | 1,000.00 | $ | 1,250.30 | 1.40 | % | $ | 1.81 | $ | 1,000.00 | $ | 1,018.10 | 1.40 | % | $ | 7.10 | |||||||||||||||||||
| Class I | 1,000.00 | 690.00 | 0.90 | 3.82 | 1,000.00 | 1,020.61 | 0.90 | 4.57 | |||||||||||||||||||||||||||
| Class S | 1,000.00 | 689.70 | 1.10 | 4.67 | 1,000.00 | 1,019.61 | 1.10 | 5.58 | |||||||||||||||||||||||||||
| ING VP International Value Portfolio | |||||||||||||||||||||||||||||||||||
| Class ADV | $ | 1,000.00 | $ | 646.60 | 1.50 | % | $ | 6.21 | $ | 1,000.00 | $ | 1,017.60 | 1.50 | % | $ | 7.61 | |||||||||||||||||||
| Class I | 1,000.00 | 648.20 | 1.00 | 4.14 | 1,000.00 | 1,020.11 | 1.00 | 5.08 | |||||||||||||||||||||||||||
| Class S | 1,000.00 | 652.70 | 1.20 | 4.99 | 1,000.00 | 1,019.10 | 1.20 | 6.09 | |||||||||||||||||||||||||||
* Expenses are equal to each Portfolio's respective annualized expense ratios multiplied by the average account value over the period, multiplied by 184/366 to reflect the most recent fiscal half-year.
(1) Commencement of operations was November 20, 2008. Expenses paid for the Actual Portfolio Return reflect the 42 day period ended December 31, 2008.
10
REPORT OF INDEPENDENT REGISTERED PUBLIC ACCOUNTING FIRM
The Shareholders and Board of Trustees
ING Variable Products Trust
We have audited the accompanying statements of assets and liabilities, including the portfolios of investments, of ING VP MidCap Opportunities Portfolio, ING VP SmallCap Opportunities Portfolio, and ING VP International Value Portfolio, each a series of ING Variable Products Trust, as of December 31, 2008, and the related statements of operations for the year then ended, the statements of changes in net assets for each of the years in the two-year period then ended, and the financial highlights for each of the years or periods in the five-year period then ended. These financial statements and financial highlights are the responsibility of management. Our responsibility is to express an opinion on these financial statements and financial highlights based on our audits.
We conducted our audits in accordance with the standards of the Public Company Accounting Oversight Board (United States). Those standards require that we plan and perform the audit to obtain reasonable assurance about whether the financial statements and financial highlights are free of material misstatement. An audit includes examining, on a test basis, evidence supporting the amounts and disclosures in the financial statements. Our procedures included confirmation of securities owned as of December 31, 2008, by correspondence with the custodian and brokers, or by other appropriate auditing procedures when replies from brokers were not received. An audit also includes assessing the accounting principles used and significant estimates made by management, as well as evaluating the overall financial statement presentation. We believe that our audits provide a reasonable basis for our opinion.
In our opinion, the financial statements and financial highlights referred to above present fairly, in all material respects, the financial position of the aforementioned portfolios as of December 31, 2008, and the results of their operations, the changes in their net assets, and the financial highlights for the periods specified in the first paragraph above, in conformity with U.S. generally accepted accounting principles.

Boston, Massachusetts
February 24, 2009
11
STATEMENTS OF ASSETS AND LIABILITIES AS OF DECEMBER 31, 2008
| ING VP MidCap Opportunities Portfolio | ING VP SmallCap Opportunities Portfolio | ING VP International Value Portfolio | |||||||||||||
| ASSETS: | |||||||||||||||
| Investments in securities at value+* | $ | 434,437,456 | $ | 107,873,662 | $ | 337,528,581 | |||||||||
| Short-term investments** | 12,116,164 | 11,999,372 | 15,260,091 | ||||||||||||
| Short-term investments in affiliates**** | 8,533,000 | 2,858,000 | 6,893,000 | ||||||||||||
| Short-term investments at amortized cost | 2,461,000 | — | 2,386,000 | ||||||||||||
| Cash | 7 | 379 | 29,063 | ||||||||||||
| Foreign currencies at value*** | 50,482 | — | 1,254,944 | ||||||||||||
| Receivables: | |||||||||||||||
| Investment securities sold | 7,025,212 | 1,163,239 | 4,480,209 | ||||||||||||
| Fund shares sold | 1,317,215 | 161,470 | 306,938 | ||||||||||||
| Dividends and interest | 310,040 | 58,269 | 572,296 | ||||||||||||
| Prepaid expenses | 1,981 | 688 | 2,072 | ||||||||||||
| Reimbursement due from manager | 155,940 | 5,911 | 47,760 | ||||||||||||
| Total assets | 466,408,497 | 124,120,990 | 368,760,954 | ||||||||||||
| LIABILITIES: | |||||||||||||||
| Payable for investment securities purchased | 8,183,632 | 1,139,075 | 2,667,684 | ||||||||||||
| Payable for fund shares redeemed | 65,728 | 52,578 | 503,249 | ||||||||||||
| Payable upon receipt of securities loaned | 12,494,193 | 12,133,632 | 15,329,004 | ||||||||||||
| Payable to affiliates | 346,830 | 83,640 | 269,976 | ||||||||||||
| Payable for directors fees | 5,412 | 6,590 | 5,904 | ||||||||||||
| Other accrued expenses and liabilities | 63,100 | 62,751 | 180,826 | ||||||||||||
| Total liabilities | 21,158,895 | 13,478,266 | 18,956,643 | ||||||||||||
| NET ASSETS | $ | 445,249,602 | $ | 110,642,724 | $ | 349,804,311 | |||||||||
| NET ASSETS WERE COMPRISED OF: | |||||||||||||||
| Paid-in capital | $ | 1,503,561,856 | $ | 163,109,709 | $ | 599,908,672 | |||||||||
| Undistributed net investment income | 140,380 | 4,255 | 357,245 | ||||||||||||
| Accumulated net realized loss on investments and foreign currency related transactions | (972,977,101 | ) | (19,363,145 | ) | (175,921,459 | ) | |||||||||
| Net unrealized depreciation on investments and foreign currency related transactions | (85,475,533 | ) | (33,108,095 | ) | (74,540,147 | ) | |||||||||
| NET ASSETS | $ | 445,249,602 | $ | 110,642,724 | $ | 349,804,311 | |||||||||
| + Including securities loaned at value | $ | 12,142,621 | $ | 12,088,921 | $ | 14,727,224 | |||||||||
| * Cost of investments in securities | $ | 519,535,175 | $ | 140,847,497 | $ | 411,986,324 | |||||||||
| ** Cost of short-term investments | $ | 12,494,193 | $ | 12,133,632 | $ | 15,329,004 | |||||||||
| *** Cost of foreign currencies | $ | 50,267 | $ | — | $ | 1,259,415 | |||||||||
| **** Cost of short-term investments in affiliates | $ | 8,533,000 | $ | 2,858,000 | $ | 6,893,000 | |||||||||
| Class ADV: | |||||||||||||||
| Net Assets | $ | 785 | $ | 3,751 | $ | 452 | |||||||||
| Shares authorized | unlimited | unlimited | unlimited | ||||||||||||
| Par value | $ | 0.01 | $ | 0.01 | $ | 0.01 | |||||||||
| Shares outstanding | 124 | 312 | 67 | ||||||||||||
| Net asset value and redemption price per share | $ | 6.32 | $ | 12.04 | $ | 6.74 | |||||||||
| Class I: | |||||||||||||||
| Net Assets | $ | 195,295,457 | $ | 56,475,894 | $ | 340,021,877 | |||||||||
| Shares authorized | unlimited | unlimited | unlimited | ||||||||||||
| Par value | $ | 0.01 | $ | 0.01 | $ | 0.01 | |||||||||
| Shares outstanding | 30,506,721 | 4,602,618 | 50,205,326 | ||||||||||||
| Net asset value and redemption price per share | $ | 6.40 | $ | 12.27 | $ | 6.77 | |||||||||
| Class S: | |||||||||||||||
| Net Assets | $ | 249,953,360 | $ | 54,163,079 | $ | 9,781,982 | |||||||||
| Shares authorized | unlimited | unlimited | unlimited | ||||||||||||
| Par value | $ | 0.01 | $ | 0.01 | $ | 0.01 | |||||||||
| Shares outstanding | 39,761,459 | 4,495,328 | 1,411,595 | ||||||||||||
| Net asset value and redemption price per share | $ | 6.29 | $ | 12.05 | $ | 6.93 | |||||||||
See Accompanying Notes to Financial Statements
12
STATEMENTS OF OPERATIONS FOR THE YEAR ENDED DECEMBER 31, 2008
| ING VP MidCap Opportunities Portfolio | ING VP SmallCap Opportunities Portfolio | ING VP International Value Portfolio | |||||||||||||
| INVESTMENT INCOME: | |||||||||||||||
| Dividends, net of foreign taxes withheld*(1) | $ | 3,411,441 | $ | 1,025,846 | $ | 15,343,596 | |||||||||
| Interest | 28,769 | 13,002 | 960,934 | ||||||||||||
| Securities lending income, net | 229,176 | 293,331 | 716,509 | ||||||||||||
| Total investment income | 3,669,386 | 1,332,179 | 17,021,039 | ||||||||||||
| EXPENSES: | |||||||||||||||
| Investment management fees | 3,144,773 | 1,166,075 | 4,026,991 | ||||||||||||
| Distribution and service fees: | |||||||||||||||
| Class ADV | 8 | 2 | 4 | ||||||||||||
| Class S | 593,826 | 202,898 | 31,862 | ||||||||||||
| Transfer agent fees | 1,216 | 758 | 1,122 | ||||||||||||
| Administrative service fees | 433,403 | 155,475 | 473,758 | ||||||||||||
| Shareholder reporting expense | 99,355 | 43,225 | 143,227 | ||||||||||||
| Registration fees | — | — | 398 | ||||||||||||
| Professional fees | 50,036 | 31,541 | 102,290 | ||||||||||||
| Custody and accounting expense | 48,910 | 30,076 | 216,722 | ||||||||||||
| Directors fees | 16,603 | 7,110 | 15,084 | ||||||||||||
| Miscellaneous expense | 11,812 | 8,408 | 20,842 | ||||||||||||
| Interest expense | 333 | 389 | 3,342 | ||||||||||||
| Total expenses | 4,400,275 | 1,645,957 | 5,035,642 | ||||||||||||
| Net waived and reimbursed fees | (905,412 | ) | (79,444 | ) | (261,553 | ) | |||||||||
| Net expenses | 3,494,863 | 1,566,513 | 4,774,089 | ||||||||||||
| Net investment income (loss) | 174,523 | (234,334 | ) | 12,246,950 | |||||||||||
| REALIZED AND UNREALIZED GAIN (LOSS) ON INVESTMENTS AND FOREIGN CURRENCY RELATED TRANSACTIONS: | |||||||||||||||
| Net realized gain (loss) on: | |||||||||||||||
| Investments | (123,758,980 | ) | (18,380,769 | ) | (173,209,791 | ) | |||||||||
| Foreign currency related transactions | — | — | 1,700,435 | ||||||||||||
| Net realized loss on investments and foreign currency related transactions | (123,758,980 | ) | (18,380,769 | ) | (171,509,356 | ) | |||||||||
| Net change in unrealized appreciation or depreciation on: | |||||||||||||||
| Investments | (109,710,909 | ) | (44,168,656 | ) | (97,594,787 | ) | |||||||||
| Foreign currency related transactions | 305 | — | (10,544 | ) | |||||||||||
| Net change in unrealized appreciation or depreciation on investments and foreign currency related transactions | (109,710,604 | ) | (44,168,656 | ) | (97,605,331 | ) | |||||||||
| Net realized and unrealized loss on investments and foreign currency related transactions | (233,469,584 | ) | (62,549,425 | ) | (269,114,687 | ) | |||||||||
| Decrease in net assets resulting from operations | $ | (233,295,061 | ) | $ | (62,783,759 | ) | $ | (256,867,737 | ) | ||||||
| * Foreign taxes withheld | $ | 7,204 | $ | 2,172 | $ | 1,807,174 | |||||||||
| (1) Dividends from affiliates | $ | 286,817 | $ | 81,838 | $ | 532,775 | |||||||||
See Accompanying Notes to Financial Statements
13
STATEMENTS OF CHANGES IN NET ASSETS
| ING VP MidCap Opportunities Portfolio | ING VP SmallCap Opportunities Portfolio | ||||||||||||||||||
| Year Ended December 31, 2008 | Year Ended December 31, 2007 | Year Ended December 31, 2008 | Year Ended December 31, 2007 | ||||||||||||||||
| FROM OPERATIONS: | |||||||||||||||||||
| Net investment income (loss) | $ | 174,523 | $ | (481,868 | ) | $ | (234,334 | ) | $ | (110,075 | ) | ||||||||
| Net realized gain (loss) on investments and foreign currency related transactions | (123,758,980 | ) | 23,754,020 | (18,380,769 | ) | 29,418,968 | |||||||||||||
| Net change in unrealized appreciation or depreciation on investments and foreign currency related transactions | (109,710,604 | ) | 540,832 | (44,168,656 | ) | (9,571,655 | ) | ||||||||||||
| Increase (decrease) in net assets resulting from operations | (233,295,061 | ) | 23,812,984 | (62,783,759 | ) | 19,737,238 | |||||||||||||
| FROM DISTRIBUTIONS TO SHAREHOLDERS: | |||||||||||||||||||
| Net realized gains: | |||||||||||||||||||
| Class I | — | — | (12,294,247 | ) | — | ||||||||||||||
| Class S | — | — | (13,213,982 | ) | — | ||||||||||||||
| Total distributions | — | — | (25,508,229 | ) | — | ||||||||||||||
| FROM CAPITAL SHARE TRANSACTIONS: | |||||||||||||||||||
| Net proceeds from sale of shares | 243,250,863 | 22,816,062 | 22,773,411 | 15,326,085 | |||||||||||||||
| Proceeds from shares issued in merger (Note 12) | 376,785,676 | — | — | — | |||||||||||||||
| Payments by affiliates (Note 16) | 15,465 | — | 110,798 | — | |||||||||||||||
| Reinvestment of distributions | — | — | 25,508,229 | — | |||||||||||||||
| 620,052,004 | 22,816,062 | 48,392,438 | 15,326,085 | ||||||||||||||||
| Cost of shares redeemed | (66,458,733 | ) | (26,642,565 | ) | (38,364,302 | ) | (49,892,455 | ) | |||||||||||
| Net increase (decrease) in net assets resulting from capital share transactions | 553,593,271 | (3,826,503 | ) | 10,028,136 | (34,566,370 | ) | |||||||||||||
| Net increase (decrease) in net assets | 320,298,210 | 19,986,481 | (78,263,852 | ) | (14,829,132 | ) | |||||||||||||
| NET ASSETS: | |||||||||||||||||||
| Beginning of year | 124,951,392 | 104,964,911 | 188,906,576 | 203,735,708 | |||||||||||||||
| End of year | $ | 445,249,602 | $ | 124,951,392 | $ | 110,642,724 | $ | 188,906,576 | |||||||||||
| Undistributed net investment income at end of year | $ | 140,380 | $ | — | $ | 4,255 | $ | 10,722 | |||||||||||
See Accompanying Notes to Financial Statements
14
STATEMENTS OF CHANGES IN NET ASSETS
| ING VP International Value Portfolio | |||||||||||
| Year Ended December 31, 2008 | Year Ended December 31, 2007 | ||||||||||
| FROM OPERATIONS: | |||||||||||
| Net investment income | $ | 12,246,950 | $ | 9,089,975 | |||||||
| Net realized gain (loss) on investments and foreign currency related transactions | (171,509,356 | ) | 76,290,163 | ||||||||
| Net change in unrealized appreciation or depreciation on investments and foreign currency related transactions | (97,605,331 | ) | (22,053,258 | ) | |||||||
| Increase (decrease) in net assets resulting from operations | (256,867,737 | ) | 63,326,880 | ||||||||
| FROM DISTRIBUTIONS TO SHAREHOLDERS: | |||||||||||
| Net investment income: | |||||||||||
| Class ADV | (17 | ) | (13 | ) | |||||||
| Class I | (13,548,576 | ) | (8,825,087 | ) | |||||||
| Class S | (331,802 | ) | (162,420 | ) | |||||||
| Net realized gains: | |||||||||||
| Class ADV | (120 | ) | (178 | ) | |||||||
| Class I | (76,788,879 | ) | (83,156,172 | ) | |||||||
| Class S | (2,020,745 | ) | (1,777,328 | ) | |||||||
| Total distributions | (92,690,139 | ) | (93,921,198 | ) | |||||||
| FROM CAPITAL SHARE TRANSACTIONS: | |||||||||||
| Net proceeds from sale of shares | 154,981,343 | 67,884,934 | |||||||||
| Payments by affiliates (Note 16) | 729,720 | — | |||||||||
| Reinvestment of distributions | 92,690,003 | 93,921,002 | |||||||||
| 248,401,066 | 161,805,936 | ||||||||||
| Cost of shares redeemed | (78,590,732 | ) | (69,048,165 | ) | |||||||
| Net increase in net assets resulting from capital share transactions | 169,810,334 | 92,757,771 | |||||||||
| Net increase (decrease) in net assets | (179,747,542 | ) | 62,163,453 | ||||||||
| NET ASSETS: | |||||||||||
| Beginning of year | 529,551,853 | 467,388,400 | |||||||||
| End of year | $ | 349,804,311 | $ | 529,551,853 | |||||||
| Undistributed net investment income at end of year | $ | 357,245 | $ | 152,688 | |||||||
See Accompanying Notes to Financial Statements
15
FINANCIAL HIGHLIGHTS
Selected data for a share of beneficial interest outstanding throughout each year or period.
| Income (loss) from investment operations | Less distributions | ||||||||||||||||||||||||||||||||||||||||||
| Net asset value, beginning of year or period | Net investment income (loss) | Net realized and unrealized gain (loss) | Total from investment operations | From net investment income | From net realized gains | Total distributions | Payments by affiliates (note 16) | Net asset value, end of year or period | Total Return(1) | ||||||||||||||||||||||||||||||||||
| Year or period ended | ($) | ($) | ($) | ($) | ($) | ($) | ($) | ($) | ($) | (%) | |||||||||||||||||||||||||||||||||
| ING VP MidCap Opportunities Portfolio | |||||||||||||||||||||||||||||||||||||||||||
| Class ADV | |||||||||||||||||||||||||||||||||||||||||||
| 12-31-08 | 10.20 | (0.03 | )• | (3.85 | ) | (3.88 | ) | — | — | — | 0.00 | * | 6.32 | (38.04 | )(a) | ||||||||||||||||||||||||||||
| 12-31-07 | 8.16 | (0.07 | ) | 2.11 | 2.04 | — | — | — | — | 10.20 | 25.00 | ||||||||||||||||||||||||||||||||
| 12-29-06(4)-12-31-06 | 8.16 | *† | (0.00 | )* | — | (0.00 | )* | — | — | — | — | 8.16 | (b) | — | |||||||||||||||||||||||||||||
| Class I | |||||||||||||||||||||||||||||||||||||||||||
| 12-31-08 | 10.26 | 0.01 | (3.87 | ) | (3.86 | ) | — | — | — | 0.00 | * | 6.40 | (37.62 | )(a) | |||||||||||||||||||||||||||||
| 12-31-07 | 8.16 | (0.03 | ) | 2.13 | 2.10 | — | — | — | — | 10.26 | 25.74 | ||||||||||||||||||||||||||||||||
| 12-31-06 | 7.57 | (0.03 | ) | 0.62 | 0.59 | — | — | — | — | 8.16 | 7.79 | ||||||||||||||||||||||||||||||||
| 12-31-05 | 6.86 | (0.02 | ) | 0.73 | 0.71 | — | — | — | ��� | 7.57 | 10.35 | ||||||||||||||||||||||||||||||||
| 12-31-04 | 6.15 | (0.02 | ) | 0.73 | 0.71 | — | — | — | — | 6.86 | 11.54 | ||||||||||||||||||||||||||||||||
| Class S | |||||||||||||||||||||||||||||||||||||||||||
| 12-31-08 | 10.10 | (0.00 | )* | (3.81 | ) | (3.81 | ) | — | — | — | 0.00 | * | 6.29 | (37.72 | )(a) | ||||||||||||||||||||||||||||
| 12-31-07 | 8.05 | (0.06 | ) | 2.11 | 2.05 | — | — | — | — | 10.10 | 25.47 | ||||||||||||||||||||||||||||||||
| 12-31-06 | 7.48 | (0.05 | ) | 0.62 | 0.57 | — | — | — | — | 8.05 | 7.62 | ||||||||||||||||||||||||||||||||
| 12-31-05 | 6.79 | (0.04 | ) | 0.73 | 0.69 | — | — | — | — | 7.48 | 10.16 | ||||||||||||||||||||||||||||||||
| 12-31-04 | 6.11 | (0.03 | ) | 0.71 | 0.68 | — | — | — | — | 6.79 | 11.13 | ||||||||||||||||||||||||||||||||
| ING VP SmallCap Opportunities Portfolio | |||||||||||||||||||||||||||||||||||||||||||
| Class ADV | |||||||||||||||||||||||||||||||||||||||||||
| 11-20-08(4)-12-31-08 | 9.63 | (0.01 | ) | 2.41 | 2.40 | — | — | — | 0.01 | 12.04 | 25.03 | (c) | |||||||||||||||||||||||||||||||
| Class I | |||||||||||||||||||||||||||||||||||||||||||
| 12-31-08 | 21.98 | (0.01 | ) | (6.61 | ) | (6.62 | ) | — | 3.10 | 3.10 | 0.01 | 12.27 | (34.48 | )(c) | |||||||||||||||||||||||||||||
| 12-31-07 | 19.97 | 0.01 | 2.00 | 2.01 | — | — | — | — | 21.98 | 10.07 | |||||||||||||||||||||||||||||||||
| 12-31-06 | 17.74 | (0.07 | ) | 2.30 | 2.23 | — | — | — | — | 19.97 | 12.57 | ||||||||||||||||||||||||||||||||
| 12-31-05 | 16.26 | (0.08 | ) | 1.56 | 1.48 | — | — | — | — | 17.74 | 9.10 | ||||||||||||||||||||||||||||||||
| 12-31-04 | 14.76 | (0.09 | ) | 1.59 | 1.50 | — | — | — | — | 16.26 | 10.16 | ||||||||||||||||||||||||||||||||
| Class S | |||||||||||||||||||||||||||||||||||||||||||
| 12-31-08 | 21.68 | (0.05 | ) | (6.49 | ) | (6.54 | ) | — | 3.10 | 3.10 | 0.01 | 12.05 | (34.59 | )(c) | |||||||||||||||||||||||||||||
| 12-31-07 | 19.74 | (0.03 | ) | 1.97 | 1.94 | — | — | — | — | 21.68 | 9.83 | ||||||||||||||||||||||||||||||||
| 12-31-06 | 17.57 | (0.11 | ) | 2.28 | 2.17 | — | — | — | — | 19.74 | 12.35 | ||||||||||||||||||||||||||||||||
| 12-31-05 | 16.14 | (0.12 | ) | 1.55 | 1.43 | — | — | — | — | 17.57 | 8.86 | ||||||||||||||||||||||||||||||||
| 12-31-04 | 14.68 | (0.11 | ) | 1.57 | 1.46 | — | — | — | — | 16.14 | 9.95 | ||||||||||||||||||||||||||||||||
| Ratios to average net assets | Supplemental data | ||||||||||||||||||||||||||
| Expenses before reductions/additions(2)(3) | Expenses net of fee waivers and/or recoupments, if any(2)(3) | Expenses net of all reductions/additions(2)(3) | Net investment income (loss)(2)(3) | Net assets, end of year or period | Portfolio turnover rate | ||||||||||||||||||||||
| Year or period ended | (%) | (%) | (%) | (%) | ($000's) | (%) | |||||||||||||||||||||
| ING VP MidCap Opportunities Portfolio | |||||||||||||||||||||||||||
| Class ADV | |||||||||||||||||||||||||||
| 12-31-08 | 1.38 | 1.20 | †† | 1.20 | †† | (0.40 | )†† | 1 | 191 | ||||||||||||||||||
| 12-31-07 | 1.39 | 1.40 | † | 1.40 | † | (0.79 | )† | 1 | 186 | ||||||||||||||||||
| 12-29-06(4)-12-31-06 | 1.45 | 1.40 | 1.40 | (1.40 | ) | 1 | 139 | ||||||||||||||||||||
| Class I | |||||||||||||||||||||||||||
| 12-31-08 | 0.88 | 0.70 | †† | 0.70 | †† | 0.11 | †† | 195,295 | 191 | ||||||||||||||||||
| 12-31-07 | 0.89 | 0.90 | † | 0.90 | † | (0.39 | )† | 91,459 | 186 | ||||||||||||||||||
| 12-31-06 | 0.95 | 0.90 | 0.90 | (0.32 | ) | 71,154 | 139 | ||||||||||||||||||||
| 12-31-05 | 0.97 | 0.90 | 0.90 | (0.31 | ) | 78,760 | 90 | ||||||||||||||||||||
| 12-31-04 | 0.96 | 0.94 | 0.94 | (0.47 | ) | 83,969 | 73 | ||||||||||||||||||||
| Class S | |||||||||||||||||||||||||||
| 12-31-08 | 1.13 | 0.90 | †† | 0.90 | †† | (0.02 | )†† | 249,953 | 191 | ||||||||||||||||||
| 12-31-07 | 1.14 | 1.10 | † | 1.10 | † | (0.59 | )† | 33,491 | 186 | ||||||||||||||||||
| 12-31-06 | 1.20 | 1.10 | 1.10 | (0.53 | ) | 33,810 | 139 | ||||||||||||||||||||
| 12-31-05 | 1.22 | 1.10 | 1.10 | (0.51 | ) | 41,989 | 90 | ||||||||||||||||||||
| 12-31-04 | 1.21 | 1.14 | 1.14 | (0.68 | ) | 42,808 | 73 | ||||||||||||||||||||
| ING VP SmallCap Opportunities Portfolio | |||||||||||||||||||||||||||
| Class ADV | |||||||||||||||||||||||||||
| 11-20-08(4)-12-31-08 | 1.43 | 1.40 | †† | 1.40 | †† | (0.93 | )†† | 4 | 148 | ||||||||||||||||||
| Class I | |||||||||||||||||||||||||||
| 12-31-08 | 0.93 | 0.90 | †† | 0.90 | †† | (0.04 | )†† | 56,476 | 148 | ||||||||||||||||||
| 12-31-07 | 0.90 | 0.90 | †† | 0.90 | †† | 0.07 | †† | 83,695 | 97 | ||||||||||||||||||
| 12-31-06 | 0.93 | 0.90 | 0.90 | (0.35 | ) | 81,210 | 84 | ||||||||||||||||||||
| 12-31-05 | 0.96 | 0.90 | 0.90 | (0.52 | ) | 81,155 | 83 | ||||||||||||||||||||
| 12-31-04 | 0.94 | 0.90 | 0.90 | (0.58 | ) | 86,218 | 67 | ||||||||||||||||||||
| Class S | |||||||||||||||||||||||||||
| 12-31-08 | 1.18 | 1.10 | †† | 1.10 | †† | (0.26 | )†† | 54,163 | 148 | ||||||||||||||||||
| 12-31-07 | 1.15 | 1.10 | †† | 1.10 | †† | (0.14 | )†† | 105,212 | 97 | ||||||||||||||||||
| 12-31-06 | 1.18 | 1.10 | 1.10 | (0.55 | ) | 122,526 | 84 | ||||||||||||||||||||
| 12-31-05 | 1.21 | 1.10 | 1.10 | (0.72 | ) | 118,854 | 83 | ||||||||||||||||||||
| 12-31-04 | 1.19 | 1.10 | 1.10 | (0.78 | ) | 109,246 | 67 | ||||||||||||||||||||
See Accompanying Notes to Financial Statements
16
FINANCIAL HIGHLIGHTS (CONTINUED)
Selected data for a share of beneficial interest outstanding throughout each year or period.
| Income (loss) from investment operations | Less distributions | ||||||||||||||||||||||||||||||||||||||||||
| Net asset value, beginning of year or period | Net investment income (loss) | Net realized and unrealized gain (loss) | Total from investment operations | From net investment income | From net realized gains | Total distributions | Payments by affiliates (note 16) | Net asset value, end of year or period | Total Return(1) | ||||||||||||||||||||||||||||||||||
| Year or period ended | ($) | ($) | ($) | ($) | ($) | ($) | ($) | ($) | ($) | (%) | |||||||||||||||||||||||||||||||||
| ING VP International Value Portfolio | |||||||||||||||||||||||||||||||||||||||||||
| Class ADV | |||||||||||||||||||||||||||||||||||||||||||
| 12-31-08 | 14.21 | 0.22 | (5.67 | ) | (5.45 | ) | 0.25 | 1.78 | 2.03 | 0.01 | 6.74 | (43.11 | )(d) | ||||||||||||||||||||||||||||||
| 12-31-07 | 15.26 | 0.19 | 1.60 | 1.79 | 0.19 | 2.65 | 2.84 | — | 14.21 | 12.63 | |||||||||||||||||||||||||||||||||
| 12-29-06(4)-12-31-06 | 15.26 | † | (0.00 | )• | — | (0.00 | )• | — | — | — | — | 15.26 | (b) | — | |||||||||||||||||||||||||||||
| Class I | |||||||||||||||||||||||||||||||||||||||||||
| 12-31-08 | 14.24 | 0.27 | (5.67 | ) | (5.40 | ) | 0.30 | 1.78 | 2.08 | 0.01 | 6.77 | (42.76 | )(d) | ||||||||||||||||||||||||||||||
| 12-31-07 | 15.26 | 0.28 | 1.62 | 1.90 | 0.27 | 2.65 | 2.92 | — | 14.24 | 13.44 | |||||||||||||||||||||||||||||||||
| 12-31-06 | 12.73 | 0.34 | 3.36 | 3.70 | 0.35 | 0.82 | 1.17 | — | 15.26 | 29.44 | |||||||||||||||||||||||||||||||||
| 12-31-05 | 12.76 | 0.18 | • | 0.89 | 1.07 | 0.30 | 0.80 | 1.10 | — | 12.73 | 9.43 | ||||||||||||||||||||||||||||||||
| 12-31-04 | 11.01 | 0.16 | 1.74 | 1.90 | 0.15 | — | 0.15 | — | 12.76 | 17.41 | |||||||||||||||||||||||||||||||||
| Class S | |||||||||||||||||||||||||||||||||||||||||||
| 12-31-08 | 14.39 | 0.25 | (5.66 | ) | (5.41 | ) | 0.28 | 1.78 | 2.06 | 0.01 | 6.93 | (42.31 | )(d) | ||||||||||||||||||||||||||||||
| 12-31-07 | 15.41 | 0.23 | 1.64 | 1.87 | 0.24 | 2.65 | 2.89 | — | 14.39 | 13.06 | |||||||||||||||||||||||||||||||||
| 12-31-06 | 12.88 | 0.28 | 3.39 | 3.67 | 0.32 | 0.82 | 1.14 | — | 15.41 | 28.81 | |||||||||||||||||||||||||||||||||
| 12-31-05 | 12.92 | 0.13 | • | 0.92 | 1.05 | 0.29 | 0.80 | 1.09 | — | 12.88 | 9.04 | ||||||||||||||||||||||||||||||||
| 12-31-04 | 11.16 | 0.13 | 1.76 | 1.89 | 0.13 | — | 0.13 | — | 12.92 | 17.03 | |||||||||||||||||||||||||||||||||
| Ratios to average net assets | Supplemental data | ||||||||||||||||||||||||||
| Expenses before reductions/additions(2)(3) | Expenses net of fee waivers and/or recoupments, if any(2)(3) | Expenses net of all reductions/additions(2)(3) | Net investment income (loss)(2)(3) | Net assets, end of year or period | Portfolio turnover rate | ||||||||||||||||||||||
| Year or period ended | (%) | (%) | (%) | (%) | ($000's) | (%) | |||||||||||||||||||||
| ING VP International Value Portfolio | |||||||||||||||||||||||||||
| Class ADV | |||||||||||||||||||||||||||
| 12-31-08 | 1.56 | 1.50 | †† | 1.50 | †† | 2.06 | †† | 0 | ** | 207 | |||||||||||||||||
| 12-31-07 | 1.69 | 1.50 | †† | 1.50 | †† | 1.25 | †† | 1 | 202 | ||||||||||||||||||
| 12-29-06(4)-12-31-06 | 1.69 | 1.50 | †† | 1.50 | †† | (1.50 | )†† | 1 | 146 | ||||||||||||||||||
| Class I | |||||||||||||||||||||||||||
| 12-31-08 | 1.06 | 1.00 | †† | 1.00 | †† | 2.59 | †† | 340,022 | 207 | ||||||||||||||||||
| 12-31-07 | 1.19 | 1.00 | †† | 1.00 | †† | 1.77 | †† | 515,883 | 202 | ||||||||||||||||||
| 12-31-06 | 1.19 | 1.00 | †† | 1.00 | †† | 2.40 | †† | 460,381 | 146 | ||||||||||||||||||
| 12-31-05 | 1.22 | 1.00 | 1.00 | 1.50 | 348,326 | 125 | |||||||||||||||||||||
| 12-31-04 | 1.22 | 1.00 | 1.00 | 1.48 | 262,694 | 98 | |||||||||||||||||||||
| Class S | |||||||||||||||||||||||||||
| 12-31-08 | 1.31 | 1.20 | †† | 1.20 | †† | 2.35 | †† | 9,782 | 207 | ||||||||||||||||||
| 12-31-07 | 1.44 | 1.20 | †† | 1.20 | †† | 1.44 | †† | 13,668 | 202 | ||||||||||||||||||
| 12-31-06 | 1.44 | 1.20 | †† | 1.20 | †† | 2.00 | †† | 7,007 | 146 | ||||||||||||||||||
| 12-31-05 | 1.47 | 1.20 | 1.20 | 1.05 | 2,847 | 125 | |||||||||||||||||||||
| 12-31-04 | 1.47 | 1.20 | 1.20 | 1.14 | 1,225 | 98 | |||||||||||||||||||||
(1) Total return is calculated assuming reinvestment of all dividends and capital gain distributions at net asset value and does not reflect the effect of insurance contract charges. Total return for periods less than one year is not annualized.
(2) Annualized for periods less than one year.
(3) Expense ratios reflect operating expenses of a Portfolio. Expenses before reductions do not reflect amounts reimbursed by the Investment Adviser and/or Distributor or reductions from brokerage commis sion recapture arrangements or other expense offset arrangements and do not represent the amount paid by a Portfolio during periods when reimbursements or reductions occur. Expenses net of fee waivers reflect expenses after reimbursement by the Investment Adviser or Distributor but prior to reductions from brokerage commission recapture arrangements or other expense offset arrangements. Expenses net of all reductions represent the net expenses paid by a Portfolio. Net investment income (loss) is net of all such additions or reductions.
(4) Commencement of operations.
• Calculated using average number of shares outstanding throughout the period.
* Amount is more than $(0.005), or less than $0.005
** Amount is less than $500.
† Impact of waiving the advisory fee for the ING Institutional Prime Money Market Fund holding has more than 0.005% impact on the expense ratio and net investment income or loss ratio.
†† Impact of waiving the advisory fee for the ING I nstitutional Prime Money Market Fund holding has less than 0.005% impact on the expense ratio and net investment income or loss ratio.
(a) In 2008, there was no impact on total return due to payment by affiliate.
(b) For ING VP MidCap Opportunities Portfolio amount was previously reported as $8.20 and has been corrected to reflect the actual NAV. For ING VP International Portfolio amount was previously reported as $15.38 and has been corrected to reflect the actual NAV.
(c) Excluding a paym ent by affiliate in 2008, VP Small Cap Opportunities total return would have been 24.72%, (34.52)% and (34.64)% for Classes ADV, I and S, respectively.
(d) Excluding a payment by affiliate in 2008, VP International Value total return would have been (43.18)%, (42.86)% and (42.43)% on Classes ADV, I and S, respectively.
See Accompanying Notes to Financial Statements
17
NOTES TO FINANCIAL STATEMENTS AS OF DECEMBER 31, 2008
NOTE 1 — ORGANIZATION
Organization. ING Variable Products Trust (the "Trust") is a business trust organized under the laws of the Commonwealth of Massachusetts on December 17, 1993 and registered under the Investment Company Act of 1940, as amended ("1940 Act"), as a diversified, open-end management investment company. There are three active investment series which comprise the Trust. The names of the Portfolios are: ING VP MidCap Opportunities Portfolio ("MidCap Opportunities"), ING VP SmallCap Opportunities Portfolio ("SmallCap Opportunities") and ING VP International Value Portfolio ("International Value"); each, a "Portfolio" and collectively, the "Portfolios."
Each Portfolio's investment objective is to seek long-term capital appreciation.
Each Portfolio offers Adviser Class ("ADV Class") shares, Class I shares and Class S shares. The classes differ principally in the applicable distribution and shareholder service fees. Shareholders of each class also bear certain expenses that pertain to that particular class. All shareholders bear the common expenses of the Portfolios and earn income and realized gains/losses from a Portfolio pro rata based on the average daily net assets of each class, without distinction between share classes. Dividends are determined separately for each class based on income and expenses allocable to each class. Common expenses of the Portfolios (including custodial asset-based fees, legal and audit fees, printing and mailing expenses, transfer agency out-of-pocket expenses, and fees and expenses of the independent trustees) are allocated to each Portfolio in proportion to its average net assets. Expenses directly attributable to a particular portfolio ( including advisory, administration, custodial transaction-based, registration, other professional, distribution and/or service fees, certain taxes, and offering costs) are charged directly to that Portfolio. Differences in per share dividend rates generally result from the differences in separate class expenses, including distribution and shareholder service fees, if applicable.
Shares of the Portfolios may be offered to separate accounts of insurance companies as investment options under variable annuity contracts and variable life insurance policies ("Variable Contracts"). Shares may also be offered to qualified pension and retirement plans outside the Variable Contract and to certain investment advisers and their affiliates. Class I shares may be made available to other investment companies, including series of the Trust under fund-of-funds arrangements.
Participating insurance companies and other designated organizations are authorized to receive purchase orders on each Portfolio's behalf.
ING Investments, LLC ("ING Investments" or the "Investment Adviser"), an Arizona limited liability company, serves as the Investment Adviser to the Portfolios. ING Investments has engaged ING Investment Management Co. ("ING IM"), a Connecticut corporation, to serve as the sub-adviser to each Portfolio. ING Investments and ING IM are indirect, wholly-owned subsidiaries of ING Groep N.V. ("ING Groep"). ING Groep is a global financial institution of Dutch origin offering banking, investments, life insurance and retirement services to over 75 million private, corporate and institutional clients in more than 50 countries. With a diverse workforce of about 125,000 people, ING Groep comprises a broad spectrum of prominent companies that increasingly serve their clients under the ING brand.
On October 19, 2008, ING Groep announced that it reached an agreement with the Dutch government to strengthen its capital position, creating a strong buffer to navigate the current market and economic environment. ING Groep will issue non-voting core Tier-1 securities for a total consideration of EUR 10 billion to the Dutch State. The transaction boosts ING Bank's core Tier-1 ratio, strengthens the insurance balance sheet and reduces ING Groep's Debt/Equity ratio.
NOTE 2 — SIGNIFICANT ACCOUNTING POLICIES
The following significant accounting policies are consistently followed by the Portfolios in the preparation of their financial statements, and such policies are in conformity with U.S. generally accepted accounting principles for investment companies.
A. Security Valuation. Investments in equity securities traded on a national securities exchange are valued at the last reported sale price. Securities reported by NASDAQ are valued at the NASDAQ official closing prices. Securities traded on an exchange or NASDAQ for which there has been no sale and securities traded in the over-the-counter market are valued at the mean between the last reported bid and ask prices. All investments quoted in foreign currencies will be valued daily in U.S. dollars on the basis of the foreign currency exchange rates prevailing at that time. Debt securities are valued at prices obtained from independent services or from one or more dealers making markets in the securities and may be
18
NOTES TO FINANCIAL STATEMENTS AS OF DECEMBER 31, 2008 (CONTINUED)
NOTE 2 — SIGNIFICANT ACCOUNTING POLICIES (continued)
adjusted based on the Portfolios' valuation procedures. U.S. government obligations are valued by using market quotations or independent pricing services that uses prices provided by market-makers or estimates of market values obtained from yield data relating to instruments or securities with similar characteristics.
Securities and assets for which market quotations are not readily available (which may include certain restricted securities which are subject to limitations as to their sale) are valued at their fair values, as defined by the 1940 Act, and as determined in good faith by or under the supervision of the Portfolios' Board of Trustees ("Board"), in accordance with methods that are specifically authorized by the Board. Securities traded on exchanges, including foreign exchanges, which close earlier than the time that a Portfolio calculates its net asset value ("NAV") may also be valued at their fair values as defined by the Act, and as determined in good faith by or under the supervision of the Board, in accordance with methods that are specifically authorized by the Board. The valuation techniques applied in any specific instance are likely to vary from case to case. With respect to a restricted security, for example, consideration is generally given to the cost of the investment, the market value of any unrestricted securities of the same class at the time of valuation, the potential expiration of restrictions on the security, the existence of any registration rights, the costs to the Portfolios related to registration of the security, as well as factors relevant to the issuer itself. Consideration may also be given to the price and extent of any public trading in similar securities of the issuer or comparable companies' securities. The value of a foreign security traded on an exchange outside the United States is generally based on its price on the principal foreign exchange where it trades as of the time a Portfolio determines its NAV or if the foreign exchange closes prior to the time a Portfolio determines its NAV, the most recent closing price of the foreign security on its principal exchange. Trading in certain non-U.S. securities may not take place on all days on which the New York Stock Exchange ("NYSE") is open. Further, trading takes pl ace in various foreign markets on days on which the NYSE is not open. Consequently, the calculation of a Portfolio's NAV may not take place contemporaneously with the determination of the prices of securities held by a Portfolio in foreign securities markets. Further, the value of a Portfolio's assets may be significantly affected by foreign trading on days when a shareholder cannot purchase or redeem shares of the Portfolio. In calculating a Portfolio's NAV, foreign securities denominated in foreign currency are converted to U.S. dollar equivalents. If an event occurs after the time at which the market for foreign securities held by a Portfolio closes but before the time that a Portfolio's NAV is calculated, such event may cause the closing price on the foreign exchange to not represent a readily available reliable market value quotation for such securities at the time a Portfolio determines its NAV. In such a case, a Portfolio will use the fair value of such securities as determined under a Portfolio's valuation procedures. Events after the close of trading on a foreign market that could require a Portfolio to fair value some or all of its foreign securities include, among others, securities trading in the U.S. and other markets, corporate announcements, natural and other disasters, and political and other events. Among other elements of analysis in the determination of a security's fair value, the Board has authorized the use of one or more independent research services to assist with such determinations. An independent research service may use statistical analyses and quantitative models to help determine fair value as of the time a Portfolio calculates its NAV. There can be no assurance that such models accurately reflect the behavior of the applicable markets or the effect of the behavior of such markets on the fair value of securities, or that such markets will continue to behave in a fashion that is consistent with such models. Unli ke the closing price of a security on an exchange, fair value determinations employ elements of judgment. Consequently, the fair value assigned to a security may not represent the actual value that a Portfolio could obtain if it were to sell the security at the time of the close of the NYSE. Pursuant to procedures adopted by the Board, a Portfolio is not obligated to use the fair valuations suggested by any research service, and valuation recommendations provided by such research services may be overridden if other events have occurred or if other fair valuations are determined in good faith to be more accurate. Unless an event is such that it causes a Portfolio to determine that the closing prices for one or more securities do not represent readily available reliable market value quotations at the time a Portfolio determines its NAV, events that occur between the time of the close of the foreign market on which they are traded and the close of regular trading on the NYSE will not be reflected in a Portfolio 's NAV.
19
NOTES TO FINANCIAL STATEMENTS AS OF DECEMBER 31, 2008 (CONTINUED)
NOTE 2 — SIGNIFICANT ACCOUNTING POLICIES (continued)
Investments in securities maturing in 60 days or less from date of acquisition are valued at amortized cost which approximates market value.
Effective for fiscal years beginning after November 15, 2007, Financial Accounting Standards Board ("FASB") Statement of Financial Accounting Standards No. 157, "Fair Value Measurements", establishes a hierarchy for measuring fair value of assets and liabilities. As required by the standard, each investment asset or liability of the Portfolios is assigned a level at measurement date based on the significance and source of the inputs to its valuation. Quoted prices in active markets for identical securities are classified as "Level 1", inputs other than quoted prices for an asset that are observable are classified as "Level 2" and unobservable inputs, including the sub-adviser's judgment about the assumptions that a market participant would use in pricing an asset or liability are classified as "Level 3". The inputs used for valuing securities are not necessarily an indication of the risks associated with investing in those securities. A tabl e summarizing the Portfolios' investments under these levels of classification is included following the Portfolios of Investments.
B. Security Transactions and Revenue Recognition. Security transactions are accounted for on the trade date. Realized gains and losses are reported on the basis of identified cost of securities sold. Interest income is recorded on an accrual basis. Dividend income is recorded on the ex-dividend date, or for certain foreign securities, when the information becomes available to the Portfolios. Premium amortization and discount accretion are determined by the effective yield method and included in interest income.
C. Foreign Currency Translation. The books and records of the Portfolios are maintained in U.S. dollars. Any foreign currency amounts are translated into U.S. dollars on the following basis:
(1) Market value of investment securities, other assets and liabilities — at the exchange rates prevailing at the end of the day.
(2) Purchases and sales of investment securities, income and expenses — at the rates of exchange prevailing on the respective dates of such transactions.
Although the net assets and the market values are presented at the foreign exchange rates at the end of the day, the Portfolios do not isolate the portion of the results of operations resulting from changes in foreign exchange rates on investments from the fluctuations arising from changes in market prices of securities held. Such fluctuations are included with the net realized and unrealized gains or losses from investments. For securities which are subject to foreign withholding tax upon disposition, liabilities are recorded on the Statements of Assets and Liabilities for the estimated tax withholding based on the securities' current market value. Upon disposition, realized gains or losses on such securities are recorded net of foreign withholding tax.
Reported net realized foreign exchange gains or losses arise from sales of foreign currencies, currency gains or losses realized between the trade and settlement dates on securities transactions, the difference between the amounts of dividends, interest, and foreign withholding taxes recorded on the Portfolios' books, and the U.S. dollar equivalent of the amounts actually received or paid. Net unrealized foreign exchange gains and losses arise from changes in the value of assets and liabilities other than investments in securities at fiscal year end, resulting from changes in the exchange rate. Foreign security and currency transactions may involve certain considerations and risks not typically associated with investing in U.S. companies and the U.S. government securities. These risks include, but are not limited to, revaluation of currencies and future adverse political and economic developments which could cause securities and their market s to be less liquid and prices more volatile than those of comparable U.S. companies and U.S. government securities. The foregoing risks are even greater with respect to securities of issuers in emerging markets.
D. Foreign Currency Transactions and Futures Contracts. Each Portfolio may enter into forward foreign currency exchange transactions to convert to and from different foreign currencies and to and from the U.S. dollar in connection with the planned purchases or sales of securities. When entering into a forward foreign contract, a Portfolio agrees to receive or deliver a fixed quantity of foreign currency for an agreed-upon price on an agreed future date. The Portfolios either enter into these transactions on a spot basis at the spot rate prevailing in the foreign currency exchange market or use forward foreign currency contracts to purchase or sell foreign currencies. When the
20
NOTES TO FINANCIAL STATEMENTS AS OF DECEMBER 31, 2008 (CONTINUED)
NOTE 2 — SIGNIFICANT ACCOUNTING POLICIES (continued)
contract is fulfilled or closed, gains or losses are realized. Until then, the gain or loss is included in unrealized appreciation or depreciation. Risks may arise upon entering into forward contracts from the potential inability of counterparties to meet the terms of their forward contracts and from unanticipated movements in the value of foreign currencies relative to the U.S. dollar.
Each Portfolio may enter into futures contracts involving foreign currency, interest rates, securities and securities indices. A futures contract obligates the seller of the contract to deliver and the purchaser of the contract to take delivery of the type of foreign currency, financial instrument or security called for in the contract at a specified future time for a specified price. Upon entering into such a contract, a Portfolio is required to deposit and maintain as collateral such initial margin as required by the exchange on which the contract is traded. Pursuant to the contract, a Portfolio agrees to receive from or pay to the broker an amount equal to the daily fluctuations in the value of the contract. Such receipts or payments are known as variation margins and are recorded as unrealized gains or losses by a Portfolio. When the contract is closed, a Portfolio records a realized gain or loss equal to the difference between the value of the contract at the time it was opened and the value at the time it was closed.
E. Distributions to Shareholders. The Portfolios record distributions to their shareholders on the ex-dividend date. Dividends from net investment income are declared and paid quarterly by each Portfolio. Each Portfolio distributes capital gains, if any, annually. The Portfolios may make distributions on a more frequent basis to comply with the distribution requirements of the Internal Revenue Code. The characters of income and gains to be distributed are determined in accordance with income tax regulations, which may differ from U.S. generally accepted accounting principals for investment companies.
F. Federal Income Taxes. It is the policy of the Portfolios to comply with the requirements of subchapter M of the Internal Revenue Code that are applicable to regulated investment companies and to distribute substantially all of their net investment income and any net realized capital gains to their shareholders. Therefore, no federal income tax provision is required. Management has considered the sustainability of the Portfolios' tax positions taken on federal income tax returns for all open tax years in making this determination. No capital gain distributions shall be made until any capital loss carryforwards have been fully utilized or expired.
G. Use of Estimates. The preparation of financial statements in conformity with U.S. generally accepted accounting principles requires management to make estimates and assumptions that affect the reported amounts of assets and liabilities and disclosure of contingent assets and liabilities at the date of the financial statements and the reported amounts of increases and decreases in net assets from operations during the reporting period. Actual results could differ from those estimates.
H. Repurchase Agreements. Each Portfolio may invest in repurchase agreements only with government securities dealers recognized by the Board of Governors of the Federal Reserve System. Under such agreements, the seller of the security agrees to repurchase it at a mutually agreed upon time and price. The resale price is in excess of the purchase price and reflects an agreed upon interest rate for the period of time the agreement is outstanding. The period of the repurchase agreements is usually short, from overnight to one week, while the underlying securities generally have longer maturities. Each Portfolio will receive as collateral securities acceptable to it whose market value is equal to at least 100% of the carrying amount of the repurchase agreement, plus accrued interest, bei ng invested by a Portfolio. The underlying collateral is valued daily on a mark-to-market basis to assure that the value, including accrued interest is at least equal to the repurchase price. There would be potential loss to a Portfolio in the event a Portfolio is delayed or prevented from exercising its right to dispose of the collateral, and it might incur disposition costs in liquidating the collateral.
I. Securities Lending. Each Portfolio has the option to temporarily loan up to 30% of its total assets to brokers, dealers or other financial institutions in exchange for a negotiated lender's fee. The borrower is required to fully collateralize the loans with cash or U.S. government securities. Generally, in the event of counterparty default, a Portfolio has the right to use collateral to offset losses incurred. There would be potential loss to a Portfolio in the event a Portfolio is delayed or prevented from exercising its right to dispose of the collateral. Each Portfolio bears the risk of loss
21
NOTES TO FINANCIAL STATEMENTS AS OF DECEMBER 31, 2008 (CONTINUED)
NOTE 2 — SIGNIFICANT ACCOUNTING POLICIES (continued)
with respect to the investment of collateral. Engaging in securities lending could have a leveraging effect, which may intensify the credit, market and other risks associated with investing in a Portfolio.
J. Illiquid and Restricted Securities. Each Portfolio may not invest more than 15% of its net assets in illiquid securities. Illiquid securities are not readily marketable. Disposing of illiquid investments may involve time-consuming negotiation and legal expenses, and it may be difficult or impossible for a Portfolio to sell them promptly at an acceptable price. Restricted securities are those sold under Rule 144A of the Securities Act of 1933 ("1933 Act") or are securities offered pursuant to Section 4(2) of the 1933 Act, and are subject to legal or contractual restrictions on resale and may not be publicly sold without registration under the 1933 Act. Certain restricted securities may be considered liquid pursuant to guidelines approved by the Board or may be deemed to be illiqui d because they may not be readily marketable. Illiquid and restricted securities are valued using market quotations when readily available. In the absence of market quotations, the securities are valued based upon their fair value, as that term is used in the 1940 Act, determined under procedures approved by the Board.
K. When-Issued and Delayed-Delivery Transactions. Each Portfolio may purchase or sell securities on a when-issued or forward commitment basis. The price of the underlying securities and date when the securities will be delivered and paid for are fixed at the time the transaction is negotiated. The market value of these securities is identified in each Portfolio's Portfolio of Investments. Losses may arise due to changes in the market value of the securities or from the inability of counterparties to meet the terms of the contract. In connection with such purchases, the Portfolios are required to segregate liquid assets sufficient to c over the purchase price.
L. Swap Agreements. Certain Portfolios may enter into swap agreements. A swap is an agreement between two parties pursuant to which each party agrees to make one or more payments to the other at specified future intervals based on the return of an asset (such as a stock, bond or currency) or non-asset reference (such as an interest rate or index). The swap agreement will specify the "notional" amount of the asset or non-asset reference to which the contract relates. Subsequent changes in market value, if any, are calculated based upon changes in the performance of the asset or non-asset reference multiplied by the notional value of the contract. A Portfolio may enter into credit default, interest rate, total ret urn and currency swaps to manage its exposure to credit, currency and interest rate risk. All outstanding swap agreements are reported following each Portfolio's Portfolio of Investments.
Swaps are marked to market daily using quotations primarily from third party pricing services, counterparties or brokers. The value of the swap contract is recorded on each Portfolio's Statements of Assets or Liabilities. During the term of the swap, changes in the value of the swap, if any, are recorded as unrealized gains or losses on the Statements of Operations. Upfront payments paid or received by a Portfolio when entering into the agreements are reported on the Statements of Assets and Liabilities and as a component of the changes in unrealized gains or losses on the Statements of Operations. These upfront payments represent the amounts paid or received when initially entering into the swap agreement to compensate for differences between the stated terms of the swap agreement and the prevailing market conditions. The upfront payments are included as a component in the realized gains or losses on each Portfolio's Statement of Operations upon termination or maturity of the swap. A Portfolio also records net periodic payments paid or received on the swap contract as a realized gain or loss on the Statements of Operations.
Entering into swap agreements involves the risk that the maximum potential loss of an investment exceeds the current value of the investment as reported on each Portfolio's Statements of Assets and Liabilities. Other risks involve the possibility that the counterparty to the agreements may default on its obligation to perform, that there will be no liquid market for these investments and that unfavorable changes in the market will have a negative impact on the value of the index or securities underlying the respective swap agreement.
Credit Default Swap Contracts A credit default swap is a bilateral agreement between counterparties in which the buyer of the protection agrees to make a stream of periodic payments to the seller of protection in exchange for the right to receive a specified return in the
22
NOTES TO FINANCIAL STATEMENTS AS OF DECEMBER 31, 2008 (CONTINUED)
NOTE 2 — SIGNIFICANT ACCOUNTING POLICIES (continued)
event of a default or other credit event for a referenced entity, obligation or index. As a seller of protection on credit default swaps, a Portfolio will generally receive from the buyer a fixed payment stream based on the notional amount of the swap contract. This fixed payment stream will continue until the swap contract expires or a defined credit event occurs.
A Portfolio is subject to credit risk in the normal course of pursuing its investment objectives. As a seller of protection in a credit default swap, a Portfolio may execute these contracts to manage its exposure to the market or certain sectors of the market. Certain Portfolios may also enter into credit default swaps to speculate on changes in an issuer's credit quality, to take advantage of perceived spread advantages, or to offset an existing short equivalent (i.e. buying protection on an equivalent reference entity).
Certain Portfolios may sell credit default swaps which expose these Portfolios to the risk of loss from credit risk — related events specified in the contract. Although contract specific, credit events are generally defined as bankruptcy, failure to pay, restructuring, obligation acceleration, obligation default or repudiation/moratorium. If a Portfolio is a seller of protection, and a credit event occurs, as defined under the terms of that particular swap agreement, a Portfolio will generally either (i) pay to the buyer an amount equal to the notional amount of the swap and take delivery of the referenced obligation, other deliverable obligations, or underlying securities comprising a referenced index or (ii) pay a net settlement amount in the form of cash or securities equal to the notional amount of the swap less the recovery value of the referenced obligation or underlying securities comprising a referenced index. If a Portfolio is a buyer of protection and a credit event occurs, as defined under the terms of that particular swap agreement, a Portfolio will either (i) receive from the seller of protection an amount equal to the notional amount of the swap and deliver the referenced obligation, other deliverable obligations or underlying securities comprising the referenced index or (ii) receive a net settlement amount in the form of cash or securities equal to the notional amount of the swap less the recovery value of the referenced obligation or underlying securities comprising the referenced index. Recovery values are assumed by market makers considering either industry standard recovery rates or entity specific factors and considerations until a credit event occurs. If a credit event has occurred, the recovery value is determined by a facilitated auction whereby a minimum number of allowable broker bids, together with a specified valuation method, are used to ca lculate the settlement value.
Implied credit spreads, represented in absolute terms, utilized in determining the market value of credit default swap agreements on corporate issues or sovereign issues are disclosed in each Portfolio's Portfolio of Investment and serve as an indicator of the current status of the payment/performance risk and represent the likelihood or risk of default for the credit derivative. The implied credit spread of a particular referenced entity reflects the cost of buying/selling protection and may include upfront payments required to be made to enter into the agreement. For credit default swaps on asset-backed securities or credit indices, the quoted market prices and resulting market values serve as the indicator of the current status of the payment/performance risk. Wider credit spreads and increasing market values, in absolute terms when compared to the notional amount of the swap, represent a deterioration of the referenced entity's credit so undness and a greater likelihood or risk of default or other credit event occurring as defined under the terms of the agreement.
The maximum amount of future payments (undiscounted) that a Portfolio as seller of protection could be required to make under a credit default swap agreement would be an amount equal to the notional amount of the agreement. Notional amounts of all credit default swap agreements outstanding as of December 31, 2008, for which a Portfolio is seller of protection are disclosed in each Portfolio's Portfolio of Investments. These potential amounts would be partially offset by any recovery values of the respective referenced obligations, upfront payments received upon entering into the agreements, or net amounts received from the settlement of buy protection credit default swap agreements entered into by a Portfolio for the same referenced entity or entities
Interest Rate Swap Contracts An interest rate swap involves the agreement between counterparties to exchange periodic payments based on interest rates. One payment will be based on a floating rate of a specified interest rate while the other
23
NOTES TO FINANCIAL STATEMENTS AS OF DECEMBER 31, 2008 (CONTINUED)
NOTE 2 — SIGNIFICANT ACCOUNTING POLICIES (continued)
will be a fixed rate. Risks involve the future fluctuations of interest rates in which a Portfolio may make payments that are greater than what a Portfolio received from the counterparty. Other risks include credit, liquidity and market risk.
Total Return Swap Contracts A total return swap involves the agreement between counterparties to exchange periodic payments based on an asset (such as a basket of securities) or non-asset (such as an index) reference. The periodic payments or cash flows, are usually based on the non-asset reference versus the total return or the asset-based reference. The asset-based reference generally includes unrealized appreciation or depreciation and to the extent that the total return falls short of or exceeds the non-asset reference, a Portfolio will make or receive a payment to the counterparty. Risks of total return swaps include credit, liquidity and market risks.
Currency Swaps A currency swap involves the agreement between counterparties to exchange two different currencies at contract inception at the prevailing spot rate, and to reverse the exchange at a later agreed upon termination date. The currency exchange at termination may take place at the original exchange rate, an agreed upon exchange rate or the prevailing spot rate on the date of termination. The contract may also include periodic interest payments based on a specified interest rate. Risks related to currency swaps include, but are not limited to, credit, liquidity, market, and exchange rate fluctuations.
Structured Products Certain Portfolios invest in structured products which are specially-designed derivative investments whose principal payments or interest payments are linked to the performance of underlying foreign currencies, interest rate spreads, stock market indices, prices of individual securities, commodities or other financial instruments or the occurrence of other specific events. The terms and conditions of these products may be 'structured' by the purchaser and the borrower issuing the note. The market value of these products will increase or decrease based on the performance of the underlying asset or reference. A Portfolio records the changes in the market value of these structured products as an unrealized gain or loss in the accompanying Portfolio's Statements of Operations. A Portfolio records a realized gain or loss when a structured product is sold or matures.
Risks associated with structured products include credit risk (if the counterparty fails to meet its obligation) and risk associated with the underlying asset or reference. Since a Portfolio enters into the transaction with the borrower at par value, a Portfolio could receive more or less than it originally invested when a note matures. The prices of the notes may also be very volatile and may have limited liquidity in the market which can make it difficult for a Portfolio to value or sell at an advantageous price.
M. Indemnifications. In the normal course of business, the Trust may enter into contracts that provide certain indemnifications. The Trust's maximum exposure under these arrangements is dependent on future claims that may be made against the Portfolios and, therefore, cannot be estimated; however, based on experience, the risk of loss from such claims is considered remote.
NOTE 3 — INVESTMENT TRANSACTIONS
For the year ended December 31, 2008, the cost of purchases and the proceeds from the sales of securities, excluding short-term securities and U.S. government securities, were as follows:
| Purchases | Sales | ||||||||||
| MidCap Opportunities | $ | 1,011,531,030 | $ | 817,449,444 | |||||||
| SmallCap Opportunities | 227,922,661 | 242,674,067 | |||||||||
| International Value | 1,041,190,583 | 949,762,731 | |||||||||
NOTE 4 — INVESTMENT MANAGEMENT AND ADMINISTRATIVE FEES
The Portfolios entered into an investment management agreement ("Investment Management Agreement") with the Investment Adviser. The Investment Management Agreement compensates the Investment Adviser with a fee, computed daily and payable monthly, based on the average daily net assets of each Portfolio. The Investment Adviser receives an investment advisory fee calculated at an annual rate of 0.75% on the first $250 million, 0.70% on the next $400 million, 0.65% on the next $450 million, and 0.60% in excess of $1.1 billion for MidCap Opportunities(1). For SmallCap Opportunities, the Investment Adviser receives an investment advisory fee of 0.75% on the first $250 million, 0.70% on the next $250 million, 0.65% on the next $250 million, 0.60% on the next $250 million, and 0.55% in excess of $ 1 billion of average daily net assets. The Investment Adviser receives an investment advisory fee of 0.85% of average daily net assets from International Value.
(1) Prior to April 28, 2008, the investment management fee for the Portfolio was 0.75%.
24
NOTES TO FINANCIAL STATEMENTS AS OF DECEMBER 31, 2008 (CONTINUED)
NOTE 4 — INVESTMENT MANAGEMENT AND ADMINISTRATIVE FEES (continued)
The Investment Adviser entered into a sub-advisory agreement with ING IM. Subject to such policies as the Board or the Investment Adviser may determine, ING IM manages the Portfolios' assets in accordance with the Portfolios' investment objectives, policies, and limitations.
ING Portfolios are permitted to invest end-of-day cash balances into ING Institutional Prime Money Market Fund. Investment management fees paid by the Portfolios will be reduced by an amount equal to the management fees paid indirectly to ING Institutional Prime Money Market Fund with respect to assets invested by the Portfolios. For the year ended December 31, 2008, the Investment Adviser for MidCap Opportunities waived $8,566, SmallCap Opportunities waived $2,373 and International Value waived $14,608. These fees are not subject to recoupment.
ING Funds Services, LLC (the "Administrator"), an indirect, wholly-owned subsidiary of ING Groep, acts as administrator and provides certain administrative and shareholder services necessary for each Portfolio's operations and is responsible for the supervision of other service providers. For its services, the Administrator is entitled to receive from each Portfolio a fee at an annual rate of 0.10% of each Portfolio's average daily net assets.
In placing equity security transactions, the Investment Adviser or Sub-Adviser is required to use its best efforts to choose a broker capable of providing brokerage services necessary to obtain the best execution for each transaction. Subject to this requirement, the Investment Adviser or Sub-Adviser may allocate equity security transactions through certain designated broker-dealers. Some of these broker-dealers participate in commission recapture programs that have been established for the benefit of the Portfolios. Under these programs, the participating broker-dealers will return to a Portfolio a portion of the brokerage commissions (in the form of a credit to a Portfolio) paid to the broker-dealers to pay certain expenses of a Portfolio. These commission recapture payments benefit the Portfolios and not the Investment Adviser or Sub-Adviser. Any amount credited to a Portfolio is reflected as brokerage commission recapture in the Stateme nts of Operations.
NOTE 5 — SHAREHOLDER SERVICE AND DISTRIBUTION FEES
ADV Class shares of the respective Portfolios are subject to a Shareholder Service and Distribution Plan (the "Plan"). Under the Plan, the Distributor is paid an annual shareholder service fee at the rate of 0.25% and an annual distribution fee at the rate of 0.25% of the average daily net assets attributable to its ADV Class shares.
Class S shares of each Portfolio are subject to a Shareholder Services Plan (the "Plan"). Under the Plan, each Portfolio pays the Administrator a fee calculated at an annual rate of 0.25% of average daily net assets attributable to its Class S shares. The Administrator is entitled to use the proceeds from the Plan to pay for services including, but not limited to, providing information about the Portfolios and delivering Portfolio documents.
During the year ended December 31, 2008, the Administrator voluntarily waived 0.05% of average daily net assets of Class S related to the shareholder service fee for SmallCap Opportunities and International Value. The Administration also voluntary waived 0.05% of average daily net assets of Class S related to the shareholder service fee for Mid Cap Opportunities until April 28, 2008.
NOTE 6 — OTHER TRANSACTIONS WITH AFFILIATED AND RELATED PARTIES
At December 31, 2008, the Portfolios had the following amounts recorded in payable to affiliates on the accompanying Statements of Assets and Liabilities (see Notes 4 and 5):
| Portfolio | Accrued Investment Management Fees | Accrued Administrative Fees | Accrued Shareholder Service and Distribution Fees | Total | |||||||||||||||
| MidCap Opportunities | $ | 260,741 | $ | 35,769 | $ | 50,320 | $ | 346,830 | |||||||||||
| SmallCap Opportunities | 66,137 | 8,836 | 8,667 | 83,640 | |||||||||||||||
| International Value | 240,101 | 28,332 | 1,543 | 269,976 | |||||||||||||||
At December 31, 2008, the following ING Portfolios or indirect, wholly-owned subsidiaries of ING Groep owned more than 5% of the following Portfolios:
ING Life Insurance and Annuity Company — SmallCap Opportunities (18.81%) and International Value (64.58%)
ING LifeStyle Growth Portfolio — MidCap Opportunities (6.76%)
25
NOTES TO FINANCIAL STATEMENTS AS OF DECEMBER 31, 2008 (CONTINUED)
NOTE 6 — OTHER TRANSACTIONS WITH AFFILIATED AND RELATED PARTIES (continued)
ING LifeStyle Moderate Growth Portfolio — MidCap Opportunities (5.69%)
ING Solution 2025 Portfolio — International Value (7.35%)
ING Solution 2035 Portfolio — International Value (8.18%)
ING Solution 2045 Portfolio — International Value (5.60%)
ING USA Annuity and Life Insurance — MidCap Opportunities (55.17%) and SmallCap Opportunities (47.05%)
Reliastar Life Insurance Company — MidCap Opportunities (6.74%); SmallCap Opportunities (23.33%); and International Value (7.65%)
Control is defined by the 1940 Act as the beneficial ownership, either directly or through one or more controlled companies, of more than 25% of the voting securities of a company. The 1940 Act defines affiliates as companies that are under common control. Therefore, because the Portfolios have a common owner that owns over 25% of the outstanding securities of the Portfolios, they may be deemed to be affiliates of each other. Investment activities of these shareholders could have a material impact on the Portfolios.
The Trust has adopted a Retirement Policy ("Policy") covering all independent trustees of the Portfolio who will have served as an independent trustee for at least five years at the time of retirement. Benefits under this Policy are based on an annual rate as defined in the Policy agreement.
NOTE 7 — EXPENSE LIMITATIONS
ING Investments has entered into a written expense limitation agreement ("Expense Limitation Agreement") with each Portfolio whereby the Investment Adviser has agreed to limit the expenses excluding interest, taxes, brokerage commissions and extraordinary expenses (and acquired fund fees and expenses) to the levels listed below:
| Class ADV | Class I | Class S | |||||||||||||
| MidCap Opportunities(1) | 1.40 | % | 0.90 | % | 1.10 | % | |||||||||
| SmallCap Opportunities | 1.40 | % | 0.90 | % | 1.10 | % | |||||||||
| International Value | 1.50 | % | 1.00 | % | 1.20 | % | |||||||||
(1) Effective April 28, 2008, pursuant to a side agreement, ING Investments has lowered the expense limits for MidCap Opportunities through May 1, 2010. The expense limits for MidCap Opportunities are 1.14%, 0.64% and 0.89% for Class ADV, Class I and Class S, respectively.
The Investment Adviser may at a later date recoup from a Portfolio management fees waived and other expenses assumed by the Investment Adviser during the previous 36 months, but only if, after such recoupment, the particular Portfolio's expense ratio does not exceed the percentage described above. Waived and reimbursed fees and any recoupment by the Investment Adviser of such waived and reimbursed fees are reflected on the accompanying Statements of Operations for each Portfolio.
As of December 31, 2008, the amounts of waived and reimbursed fees that are subject to possible recoupment by the Investment Adviser, and the related expiration dates are as follows:
| December 31, | |||||||||||||||||||
| 2009 | 2010 | 2011 | Total | ||||||||||||||||
| MidCap Opportunities | $ | 59,788 | $ | — | $ | 892,023 | $ | 951,811 | |||||||||||
| SmallCap Opportunities | 64,234 | — | 36,492 | $ | 100,726 | ||||||||||||||
| International Value | 807,225 | 990,921 | 240,573 | $ | 2,038,719 | ||||||||||||||
These amounts do not include shareholding servicing fees voluntarily waived by the administrator.
The Expense Limitation Agreement is contractual and shall renew automatically for one-year terms unless ING Investments provides written notice of the termination of the Expense Limitation Agreement within 90 days of the end of the then current term.
NOTE 8 — LINE OF CREDIT
All the Portfolios included in this report, in addition to certain other funds managed by the Investment Adviser have entered into an unsecured committed revolving line of credit agreement (the "Credit Agreement") with The Bank of New York Mellon ("BNY") for an aggregate amount of $125,000,000. The proceeds may be used to: (1) temporarily finance the purchase and sale of securities; (2) finance the redemption of shares of an investor in the Portfolios; and (3) enable the Portfolios to meet other emergency expenses as defined in the Credit Agreement. The Portfolios to which the line of credit is available pay a commitment fee equal to 0.07% per annum on the daily unused portion of the committed line amount payable quarterly in arrears.
The following Portfolios utilized the line of credit during the year ended December 31, 2008:
| Days Utilized | Approximate Average Daily Balance | Approximate Weighted Average Interest Rate | |||||||||||||
| MidCap Opportunities | 2 | $ | 2,345,000 | 2.60 | % | ||||||||||
| SmallCap Opportunities | 5 | 1,598,000 | 1.78 | % | |||||||||||
| International Value | 26 | 5,113,462 | 0.92 | % | |||||||||||
26
NOTES TO FINANCIAL STATEMENTS AS OF DECEMBER 31, 2008 (CONTINUED)
NOTE 9 — CAPITAL SHARES
Transactions in capital shares and dollars were as follows:
| Shares sold | Proceeds from shares issued in merger | Payments by affiliate (Note 16) | Reinvestment of distributions | Shares redeemed | Net increase (decrease) in shares outstanding | ||||||||||||||||||||||
| Year or period ended | # | # | # | # | # | # | |||||||||||||||||||||
| ING VP MidCap Opportunities Portfolio | |||||||||||||||||||||||||||
| Class A | |||||||||||||||||||||||||||
| 12-31-08 | 1 | — | — | — | (2 | ) | (1 | ) | |||||||||||||||||||
| 12-31-07 | 3 | — | — | — | — | 3 | |||||||||||||||||||||
| Class I | |||||||||||||||||||||||||||
| 12-31-08 | 24,207,656 | 459,083 | — | — | (3,077,798 | ) | 21,588,941 | ||||||||||||||||||||
| 12-31-07 | 2,173,505 | — | — | — | (1,975,928 | ) | 197,577 | ||||||||||||||||||||
| Class S | |||||||||||||||||||||||||||
| 12-31-08 | 2,761,944 | 38,484,139 | — | — | (4,801,501 | ) | 36,444,582 | ||||||||||||||||||||
| 12-31-07 | 63,677 | — | — | — | (947,138 | ) | (883,461 | ) | |||||||||||||||||||
| ING VP SmallCap Opportunities Portfolio | |||||||||||||||||||||||||||
| Class A | |||||||||||||||||||||||||||
| 11-20-08(1) - 12-31-08 | 312 | — | — | — | — | 312 | |||||||||||||||||||||
| Class I | |||||||||||||||||||||||||||
| 12-31-08 | 1,244,644 | — | — | 688,368 | (1,138,915 | ) | 794,097 | ||||||||||||||||||||
| 12-31-07 | 513,390 | — | — | — | (771,918 | ) | (258,528 | ) | |||||||||||||||||||
| Class S | |||||||||||||||||||||||||||
| 12-31-08 | 47,828 | — | — | 752,933 | (1,158,827 | ) | (358,066 | ) | |||||||||||||||||||
| 12-31-07 | 196,275 | — | — | — | (1,550,701 | ) | (1,354,426 | ) | |||||||||||||||||||
| ING VP International Value Portfolio | |||||||||||||||||||||||||||
| Class A | |||||||||||||||||||||||||||
| 12-31-08 | 1 | — | — | — | (2 | ) | (1 | ) | |||||||||||||||||||
| 12-31-07 | 3 | — | — | — | — | 3 | |||||||||||||||||||||
| Class I | |||||||||||||||||||||||||||
| 12-31-08 | 12,806,241 | — | — | 8,743,929 | (7,568,643 | ) | 13,981,527 | ||||||||||||||||||||
| 12-31-07 | 3,981,504 | — | — | 6,716,241 | (4,642,822 | ) | 6,054,923 | ||||||||||||||||||||
| Class S | |||||||||||||||||||||||||||
| 12-31-08 | 444,210 | — | — | 224,254 | (206,357 | ) | 462,107 | ||||||||||||||||||||
| 12-31-07 | 433,135 | — | — | 140,145 | (78,369 | ) | 494,911 | ||||||||||||||||||||
| Shares sold | Proceeds from shares issued in merger | Payments by affiliate (Note 16) | Reinvestment of distributions | Shares redeemed | Net increase (decrease) in shares outstanding | ||||||||||||||||||||||
| Year or period ended | ($) | ($) | ($) | ($) | ($) | ($) | |||||||||||||||||||||
| ING VP MidCap Opportunities Portfolio | |||||||||||||||||||||||||||
| Class A | |||||||||||||||||||||||||||
| 12-31-08 | 10 | — | — | — | (20 | ) | (10 | ) | |||||||||||||||||||
| 12-31-07 | 30 | — | — | — | — | 30 | |||||||||||||||||||||
| Class I | |||||||||||||||||||||||||||
| 12-31-08 | 218,886,739 | 4,514,923 | 6,783 | — | (26,775,878 | ) | 196,632,567 | ||||||||||||||||||||
| 12-31-07 | 22,217,863 | — | — | — | (18,105,271 | ) | 4,112,592 | ||||||||||||||||||||
| Class S | |||||||||||||||||||||||||||
| 12-31-08 | 24,364,114 | 372,270,753 | 8,682 | — | (39,682,835 | ) | 356,960,714 | ||||||||||||||||||||
| 12-31-07 | 598,169 | — | — | — | (8,537,294 | ) | (7,939,125 | ) | |||||||||||||||||||
| ING VP SmallCap Opportunities Portfolio | |||||||||||||||||||||||||||
| Class A | |||||||||||||||||||||||||||
| 11-20-08(1) - 12-31-08 | 3,000 | — | 4 | — | — | 3,004 | |||||||||||||||||||||
| Class I | |||||||||||||||||||||||||||
| 12-31-08 | 21,999,700 | — | 56,555 | 12,294,251 | (17,989,268 | ) | 16,361,238 | ||||||||||||||||||||
| 12-31-07 | 11,261,976 | — | — | — | (16,697,365 | ) | (5,435,389 | ) | |||||||||||||||||||
| Class S | |||||||||||||||||||||||||||
| 12-31-08 | 770,711 | — | 54,239 | 13,213,978 | (20,375,034 | ) | (6,336,106 | ) | |||||||||||||||||||
| 12-31-07 | 4,064,109 | — | — | — | (33,195,090 | ) | (29,130,981 | ) | |||||||||||||||||||
| ING VP International Value Portfolio | |||||||||||||||||||||||||||
| Class A | |||||||||||||||||||||||||||
| 12-31-08 | 8 | — | 1 | — | (16 | ) | (7 | ) | |||||||||||||||||||
| 12-31-07 | 42 | — | — | — | — | 42 | |||||||||||||||||||||
| Class I | |||||||||||||||||||||||||||
| 12-31-08 | 149,983,171 | — | 709,313 | 90,337,453 | (76,449,214 | ) | 164,580,723 | ||||||||||||||||||||
| 12-31-07 | 61,258,156 | — | — | 91,981,257 | (67,889,334 | ) | 85,350,079 | ||||||||||||||||||||
| Class S | |||||||||||||||||||||||||||
| 12-31-08 | 4,998,164 | — | 20,406 | 2,352,550 | (2,141,502 | ) | 5,229,618 | ||||||||||||||||||||
| 12-31-07 | 6,626,736 | — | — | 1,939,745 | (1,158,831 | ) | 7,407,650 | ||||||||||||||||||||
(1) Commencement of operations.
27
NOTES TO FINANCIAL STATEMENTS AS OF DECEMBER 31, 2008 (CONTINUED)
NOTE 10 — SECURITIES LENDING
Under an agreement with The Bank of New York Mellon ("BNY"), the Portfolios can lend their securities to approved brokers, dealers and other financial institutions. Loans are collateralized by cash and U.S. government securities. The collateral is equal to at least 105% of the market value of non-U.S. securities loaned and 102% of the market value of U.S. securities loaned when the transaction is entered into and is adjusted daily for changes in the market values of the securities on loan. The cash collateral received is invested in approved investments as defined in the Securities Lending Agreement with BNY (the "Agreement"). The Portfolios bear the risk of loss with respect to the investment of collateral. Currently, the cash collateral is invested in the Bank of New York Mellon Corp. Institutional Cash Reserves Fund ("BICR Fund"). BNY serves as investment manager, custodian and operational trustee of the BICR Fund. As of December 31, 2008 , the BICR Fund held certain defaulted securities that had market values significantly below amortized cost. The investment in the BICR Fund is included in the Portfolio of Investments under Securities Lending Collateral and the unrealized loss on such investment is included in Net Unrealized Depreciation on the Statements of Assets and Liabilities. The Portfolios agreed, in principle, to the terms of capital support extended by The Bank of New York Mellon Corporation ("BNYC"), an affiliated company of BNY, for the certain defaulted securities held by the BICR Fund. BNYC will support the value of these securities up to a certain amount and subject, in part, to the Portfolios' continued lending of securities. The recorded value of each Portfolio's investment in the BICR Fund includes the value of the underlying securities held by the BICR Fund and the estimated value of the support to be provided by BNYC.
Generally, in the event of counterparty default, the Portfolios have the right to use the collateral to offset losses incurred. The Agreement contains certain guarantees by BNY in the event of counterparty default and/or a borrower's failure to return a loaned security; however, there would be a potential loss to the Portfolios in the event the Portfolios are delayed or prevented from exercising their right to dispose of the collateral. Engaging in securities lending could have a leveraging effect, which may intensify the credit, market and other risks associated with investing in a Portfolio. At December 31, 2008, the following Portfolios had securities on loan with the following market values:
| Value of Securities Loaned | Cash Collateral Received* | ||||||||||
| MidCap Opportunities | $ | 12,142,621 | $ | 12,494,193 | |||||||
| SmallCap Opportunities | 12,088,921 | 12,133,632 | |||||||||
| International Value | 14,727,224 | 15,329,004 | |||||||||
* Cash collateral received was invested in the BICR Fund, the fair value of which is presented in the respective Portfolio's Portfolio of Investments.
NOTE 11 — CONCENTRATION OF INVESTMENT RISKS
Foreign Securities (MidCap Opportunities and International Value). Investments in foreign securities may entail risks not present in domestic investments. Since securities in which the Portfolios may invest are denominated in foreign currencies, changes in the relationship of these foreign currencies to the U.S. dollar can significantly affect the value of the investments and earnings of the Portfolios. Foreign investments may also subject the Portfolios to foreign government exchange restrictions, expropriation, taxation or other political, social or economic developments, as well as changes vis-a-vis the U.S. dollar from movements in currency, and changes in security value and interest rate, all of which could affect the market and/or credit risk of the Portfolios' investments.
Emerging Markets Investments (International Value). Because of less developed markets and economies and, in some countries, less mature governments and governmental institutions, the risks of investing in foreign securities can be intensified in the case of investments in issuers domiciled or doing substantial business in emerging market countries.
Derivatives (MidCap Opportunities and International Value). Generally, derivatives can be characterized as financial instruments whose performance is derived, at least in part, from the performance of an underlying asset or assets. Some derivatives are sophisticated instruments that typically involve a small investment of cash relative to the magnitude of risks assumed. These may include swap agreements, options, forwards and futures. Derivative securities are subject to market risk which could be significant for those that have a leveraging effect. Derivatives are also subject to credit risks related to the counterparty's ability to perform and any deterioration in the counterparty's creditworthiness could adversely affect the instrument. In addition, derivatives and their underlying securities may experience periods of illiquidity which could cause a Portfolio t o hold a security it might otherwise sell or could force the sale of a security at inopportune times or for prices that do not reflect current market value. A risk of using derivatives is that a Portfolio's adviser or sub-adviser might imperfectly judge the market's direction.
28
NOTES TO FINANCIAL STATEMENTS AS OF DECEMBER 31, 2008 (CONTINUED)
NOTE 12 — REORGANIZATIONS
On April 28, 2008, MidCap Opportunities, as listed below ("Acquiring Portfolio"), acquired the assets and certain liabilities of ING Mid Cap Growth Portfolio, also listed below ("Acquired Portfolio"), in a tax-free reorganization in exchange for shares of the Acquiring Portfolio, pursuant to a plan of reorganization approved by the Acquired Portfolio's shareholders. The number and value of shares issued by the Acquiring Portfolio are presented in Note 9 — Capital Shares. Net assets and unrealized appreciation as of the reorganization date were as follows:
| Acquiring Portfolio | Acquired Portfolio | Total Net Assets of Acquired Portfolio (000's) | Total Net Assets of Acquiring Portfolio (000's) | Acquired Capital Loss Carryforward (000's) | Acquired Portfolio Unrealized Appreciation (000's) | Conversion Ratio | |||||||||||||||||||||
| MidCap Opportunities | ING Mid Cap Growth Portfolio | $ | 376,786 | $ | 266,503 | $ | (824,611 | ) | $ | 13,448 | 1.1786 | ||||||||||||||||
The net assets of MidCap Opportunities after the acquisition were approximately $643,289,206.
NOTE 13 — FEDERAL INCOME TAXES
The amount of distributions from net investment income and net realized capital gains are determined in accordance with federal income tax regulations, which may differ from U.S. generally accepted accounting principles for investment companies. These book/tax differences may be either temporary or permanent. Permanent differences are reclassified within the capital accounts based on their federal tax-basis treatment; temporary differences are not reclassified. Key differences include the treatment of short-term capital gains, foreign currency transactions, and wash sale deferrals. Distributions in excess of net investment income and/or net realized capital gains for tax purposes are reported as return of capital.
The following permanent tax differences have been reclassified as of December 31, 2008:
| Paid-in Capital | Undistributed Net Investment Income | Accumulated Net Realized Gains/ (Losses) | |||||||||||||
| MidCap Opportunities | $ | — | $ | (34,143 | ) | $ | 34,143 | ||||||||
| SmallCap Opportunities | (345,674 | ) | 227,867 | 117,807 | |||||||||||
| International Value | — | 1,838,002 | (1,838,002 | ) | |||||||||||
Dividends paid by the Portfolios from net investment income and distributions of net realized short-term capital gains are, for federal income tax purposes, taxable as ordinary income to shareholders.
The tax composition of dividends and distributions to shareholders was as follows:
| Year Ended December 31, 2008 | Year Ended December 31, 2007 | ||||||||||||||||||
| Ordinary Income | Long-Term Capital Gains | Ordinary Income | Long-Term Capital Gains | ||||||||||||||||
| SmallCap Opportunities | $ | 4,164,761 | $ | 21,343,468 | $ | — | $ | — | |||||||||||
| International Value | 65,488,459 | 27,201,680 | 54,990,595 | 38,930,603 | |||||||||||||||
The tax-basis components of distributable earnings and the expiration dates of the capital loss carryforwards which may be used to offset future realized capital gains for federal income tax purposes as of December 31, 2008 were:
| Undistributed Ordinary Income | Unrealized Appreciation/ (Depreciation) | Post-October Capital Loss Deferred | Post-October Currency Loss Deferred | Capital Loss Carryforwards | Expiration Dates | ||||||||||||||||||||||
| MidCap Opportunities | $ | 140,380 | $ | (94,644,799 | ) | $ | — | $ | — | $ | (793,584,070 | ) | 2009 | ||||||||||||||
| (1,322,139 | ) | 2010 | |||||||||||||||||||||||||
| (54,086,947 | ) | 2015 | |||||||||||||||||||||||||
| (114,814,679 | ) | 2016 | |||||||||||||||||||||||||
| $ | (963,807,835 | )* | |||||||||||||||||||||||||
| SmallCap Opportunities | — | (38,463,339 | ) | (9,699,177 | ) | — | (4,304,469 | ) | 2016 | ||||||||||||||||||
| International Value | 746,726 | (100,527,505 | ) | (55,629,244 | ) | (390,028 | ) | (94,304,310 | ) | 2016 | |||||||||||||||||
* Utilization of these capital losses is subject to annual limitations under Section 382 of the Internal Revenue Code.
The Portfolios' major tax jurisdictions are federal, Arizona, and Massachusetts. The earliest tax year that remains subject to examination by these jurisdictions is 2004.
29
NOTES TO FINANCIAL STATEMENTS AS OF DECEMBER 31, 2008 (CONTINUED)
NOTE 14 — OTHER ACCOUNTING PRONOUNCEMENT
On March 19, 2008, the FASB issued Statement of Financial Accounting Standards No. 161 ("SFAS No. 161"), "Disclosure about Derivative Instruments and Hedging Activities." This new accounting statement requires enhanced disclosures about an entity's derivative and hedging activities. Entities are required to provide enhanced disclosures about (a) how and why an entity invests in derivatives, (b) how derivatives are accounted for under SFAS No. 133, and (c) how derivatives affect an entity's financial position, financial performance, and cash flows. SFAS No. 161 also requires enhanced disclosures regarding credit-risk-related contingent features of derivative instruments. SFAS No. 161 is effective for financial statements issued for fiscal years and interim periods beginning after November 15, 2008. As of December 31, 2008, management of the Portfolios is currently assessing the impact of the expanded financial statement disclosures that will result from adopting SFAS No. 161.
NOTE 15 — SUBSEQUENT EVENTS
Effective May 1, 2009, the name of each Portfolio will be renamed from "ING VP MidCap Opportunities Portfolio," "ING VP SmallCap Opportunities Portfolio" and "ING VP International Value Portfolio" to "ING MidCap Opportunities Portfolio," "ING SmallCap Opportunities Portfolio" and "ING International Value Portfolio", respectively.
NOTE 16 — INFORMATION REGARDING TRADING OF ING'S U.S. MUTUAL FUNDS
As discussed in earlier supplements that were previously filed with the SEC, ING Investments, the adviser to the ING Funds, has reported to the Boards of Directors/Trustees (the "Boards") of the ING Funds that, like many U.S. financial services companies, ING Investments and certain of its U.S. affiliates have received informal and formal requests for information since September 2003 from various governmental and self-regulatory agencies in connection with investigations related to mutual funds and variable insurance products. ING Investments has advised the Boards that it and its affiliates have cooperated fully with each request.
In addition to responding to regulatory and governmental requests, ING Investments reported that management of U.S. affiliates of ING Groep N.V., including ING Investments (collectively, "ING"), on their own initiative, have conducted, through independent special counsel and a national accounting firm, an extensive internal review of trading in ING insurance, retirement, and mutual fund products. ING's internal review related to mutual fund trading has been completed. ING has reported that, of the millions of customer relationships that ING maintains, the internal review identified several isolated arrangements allowing third parties to engage in frequent trading of mutual funds within ING's variable insurance and mutual fund products, and identified other circumstances where frequent trading occurred, despite measures taken by ING intended to combat market timing. ING further reported that each of these arrangements has been terminated and fully disclosed to regulators. The results of the internal review were also reported to the independent members of the Boards.
ING Investments has advised the Boards that most of the identified arrangements were initiated prior to ING's acquisition of the businesses in question in the U.S. ING Investments further reported that the companies in question did not receive special benefits in return for any of these arrangements, which have all been terminated.
Based on the internal review, ING Investments has advised the Boards that the identified arrangements do not represent a systemic problem in any of the companies that were involved.
Despite the extensive internal review conducted through independent special counsel and a national accounting firm, there can be no assurance that the instances of inappropriate trading reported to the Boards are the only instances of such trading respecting the ING Funds.
ING Investments reported to the Boards that ING is committed to conducting its business with the highest standards of ethical conduct with zero tolerance for noncompliance. Accordingly, ING Investments advised the Boards that ING management was disappointed that its voluntary internal review identified these situations. Viewed in the context of the breadth and magnitude of its U.S. business as a whole, ING management does not believe that ING's acquired companies had systemic ethical or compliance issues in these areas. Nonetheless, ING Investments reported that given ING's refusal to tolerate any lapses, it has taken the steps noted below, and will continue to seek opportunities to further strengthen the internal controls of its affiliates.
• ING has agreed with the ING Funds to indemnify and hold harmless the ING Funds from all damages resulting from wrongful conduct by ING or its employees or from ING's internal investigation, any investigations conducted by any governmental or self-regulatory agencies, litigation or other formal proceedings, including any proceedings by the SEC. ING Investments reported to the Boards that the
30
NOTES TO FINANCIAL STATEMENTS AS OF DECEMBER 31, 2008 (CONTINUED)
NOTE 16 — INFORMATION REGARDING TRADING OF ING'S U.S. MUTUAL FUNDS (continued)
indemnification commitments made by ING Funds related to mutual fund trading have been settled and restitution amounts prepared by an independent consultant have been paid to the affected ING Funds. The net aggregate settlement amounts received by the Portfolios on December 17, 2008 were as follows:
| MidCap Opportunities | $ | 15,465 | |||||
| SmallCap Opportunities | $ | 110,798 | |||||
| International Value | $ | 729,720 | |||||
• ING updated its Code of Conduct for employees reinforcing its employees' obligation to conduct personal trading activity consistent with the law, disclosed limits, and other requirements.
Other Regulatory Matters
The New York Attorney General and other federal and state regulators are also conducting broad inquiries and investigations involving the insurance industry. These initiatives currently focus on, among other things, compensation and other sales incentives; potential conflicts of interest; potential anti-competitive activity; reinsurance; marketing practices (including suitability); specific product types (including group annuities and indexed annuities); fund selection for investment products and brokerage sales; and disclosure. It is likely that the scope of these industry investigations will further broaden before they conclude. ING has received formal and informal requests in connection with such investigations, and is cooperating fully with each request. In connection with one such investigation, affiliates of ING Investments were named in a petition for relief and c ease and desist order filed by the New Hampshire Bureau of Securities Regulation concerning their administration of the New Hampshire state employees deferred compensation plan.
Other federal and state regulators could initiate similar actions in this or other areas of ING's businesses. These regulatory initiatives may result in new legislation and regulation that could significantly affect the financial services industry, including businesses in which ING is engaged. In light of these and other developments, ING continuously reviews whether modifications to its business practices are appropriate. At this time, in light of the current regulatory factors, ING U.S. is actively engaged in reviewing whether any modifications in our practices are appropriate for the future.
There can be no assurance that these matters, or the adverse publicity associated with them, will not result in increased fund redemptions, reduced sale of fund shares, or other adverse consequences to ING Funds.
31
PORTFOLIO OF INVESTMENTS
ING VP MIDCAP OPPORTUNITIES PORTFOLIO AS OF DECEMBER 31, 2008
| Shares | Value | ||||||||||||||
| COMMON STOCK: 93.9% | |||||||||||||||
| Aerospace/Defense: 2.1% | |||||||||||||||
| 55,650 | L-3 Communications Holdings, Inc. | $ | 4,105,857 | ||||||||||||
| 276,030 | @,L | Orbital Sciences Corp. | 5,390,866 | ||||||||||||
| 9,496,723 | |||||||||||||||
| Airlines: 1.0% | |||||||||||||||
| 402,250 | @ | Delta Airlines, Inc. | 4,609,785 | ||||||||||||
| 4,609,785 | |||||||||||||||
| Apparel: 1.7% | |||||||||||||||
| 368,270 | @ | Coach, Inc. | 7,648,968 | ||||||||||||
| 7,648,968 | |||||||||||||||
| Auto Parts & Equipment: 0.5% | |||||||||||||||
| 107,150 | @@ | Autoliv, Inc. | 2,299,439 | ||||||||||||
| 2,299,439 | |||||||||||||||
| Banks: 1.1% | |||||||||||||||
| 90,570 | Northern Trust Corp. | 4,722,320 | |||||||||||||
| 4,722,320 | |||||||||||||||
| Beverages: 0.5% | |||||||||||||||
| 46,830 | Molson Coors Brewing Co. | 2,290,924 | |||||||||||||
| 2,290,924 | |||||||||||||||
| Biotechnology: 2.7% | |||||||||||||||
| 93,635 | @ | Gilead Sciences, Inc. | 4,788,494 | ||||||||||||
| 74,795 | @ | Myriad Genetics, Inc. | 4,955,917 | ||||||||||||
| 61,610 | @ | OSI Pharmaceuticals, Inc. | 2,405,871 | ||||||||||||
| 12,150,282 | |||||||||||||||
| Chemicals: 2.0% | |||||||||||||||
| 251,610 | Ecolab, Inc. | 8,844,092 | |||||||||||||
| 8,844,092 | |||||||||||||||
| Commercial Services: 4.3% | |||||||||||||||
| 95,980 | @ | Apollo Group, Inc. - Class A | 7,353,988 | ||||||||||||
| 316,890 | @ | Quanta Services, Inc. | 6,274,422 | ||||||||||||
| 116,030 | Watson Wyatt Worldwide, Inc. | 5,548,555 | |||||||||||||
| 19,176,965 | |||||||||||||||
| Computers: 2.7% | |||||||||||||||
| 374,627 | @,@@,L | Logitech International SA | 5,836,689 | ||||||||||||
| 430,720 | @ | NetApp, Inc. | 6,017,158 | ||||||||||||
| 11,853,847 | |||||||||||||||
| Cosmetics/Personal Care: 1.1% | |||||||||||||||
| 65,762 | @,L | Chattem, Inc. | 4,703,956 | ||||||||||||
| 4,703,956 | |||||||||||||||
| Distribution/Wholesale: 0.5% | |||||||||||||||
| 197,991 | @ | LKQ Corp. | 2,308,575 | ||||||||||||
| 2,308,575 | |||||||||||||||
| Diversified Financial Services: 4.6% | |||||||||||||||
| 710,890 | Invesco Ltd. | 10,265,248 | |||||||||||||
| 183,440 | @@ | Lazard Ltd. | 5,455,506 | ||||||||||||
| 183,880 | @ | Nasdaq Stock Market, Inc. | 4,543,675 | ||||||||||||
| 20,264,429 | |||||||||||||||
| Shares | Value | ||||||||||||||
| Electric: 1.0% | |||||||||||||||
| 115,470 | NSTAR | $ | 4,213,500 | ||||||||||||
| 4,213,500 | |||||||||||||||
| Electronics: 1.5% | |||||||||||||||
| 161,240 | @,L | Dolby Laboratories, Inc. | 5,282,222 | ||||||||||||
| 44,080 | @ | Flir Systems, Inc. | 1,352,374 | ||||||||||||
| 6,634,596 | |||||||||||||||
| Engineering & Construction: 1.0% | |||||||||||||||
| 102,550 | Fluor Corp. | 4,601,419 | |||||||||||||
| 4,601,419 | |||||||||||||||
| Environmental Control: 1.6% | |||||||||||||||
| 219,550 | Waste Management, Inc. | 7,275,887 | |||||||||||||
| 7,275,887 | |||||||||||||||
| Food: 1.3% | |||||||||||||||
| 98,020 | @ | Ralcorp Holdings, Inc. | 5,724,368 | ||||||||||||
| 5,724,368 | |||||||||||||||
| Healthcare-Products: 7.1% | |||||||||||||||
| 80,130 | @@ | Covidien Ltd. | 2,903,911 | ||||||||||||
| 10,015 | CR Bard, Inc. | 843,864 | |||||||||||||
| 107,180 | @ | Gen-Probe, Inc. | 4,591,591 | ||||||||||||
| 136,320 | @ | Immucor, Inc. | 3,623,386 | ||||||||||||
| 179,879 | @ | Masimo Corp. | 5,365,791 | ||||||||||||
| 426,667 | @ | St. Jude Medical, Inc. | 14,062,944 | ||||||||||||
| 31,391,487 | |||||||||||||||
| Healthcare-Services: 0.5% | |||||||||||||||
| 84,520 | @ | Lincare Holdings, Inc. | 2,276,124 | ||||||||||||
| 2,276,124 | |||||||||||||||
| Insurance: 3.8% | |||||||||||||||
| 121,940 | @@ | ACE Ltd. | 6,453,065 | ||||||||||||
| 127,600 | AON Corp. | 5,828,768 | |||||||||||||
| 87,820 | @ | ProAssurance Corp. | 4,635,140 | ||||||||||||
| 16,916,973 | |||||||||||||||
| Internet: 2.6% | |||||||||||||||
| 166,080 | @ | F5 Networks, Inc. | 3,796,589 | ||||||||||||
| 226,400 | @ | McAfee, Inc. | 7,826,648 | ||||||||||||
| 11,623,237 | |||||||||||||||
| Machinery-Diversified: 2.0% | |||||||||||||||
| 94,192 | Roper Industries, Inc. | 4,088,875 | |||||||||||||
| 123,260 | Wabtec Corp. | 4,899,585 | |||||||||||||
| 8,988,460 | |||||||||||||||
| Media: 1.2% | |||||||||||||||
| 297,253 | @ | Liberty Media Corp. - Entertainment | 5,195,982 | ||||||||||||
| 5,195,982 | |||||||||||||||
| Miscellaneous Manufacturing: 3.3% | |||||||||||||||
| 54,672 | Dover Corp. | 1,799,802 | |||||||||||||
| 134,490 | Honeywell International, Inc. | 4,415,307 | |||||||||||||
| 184,950 | ITT Corp. | 8,505,851 | |||||||||||||
| 14,720,960 | |||||||||||||||
See Accompanying Notes to Financial Statements
32
PORTFOLIO OF INVESTMENTS
ING VP MIDCAP OPPORTUNITIES PORTFOLIO AS OF DECEMBER 31, 2008 (CONTINUED)
| Shares | Value | ||||||||||||||
| Oil & Gas: 9.2% | |||||||||||||||
| 146,660 | Cimarex Energy Co. | $ | 3,927,555 | ||||||||||||
| 91,590 | Hess Corp. | 4,912,888 | |||||||||||||
| 116,680 | Holly Corp. | 2,127,076 | |||||||||||||
| 184,616 | Murphy Oil Corp. | 8,187,720 | |||||||||||||
| 383,340 | Patterson-UTI Energy, Inc. | 4,412,243 | |||||||||||||
| 209,290 | @ | Southwestern Energy Co. | 6,063,131 | ||||||||||||
| 125,290 | @ | Transocean, Ltd. | 5,919,953 | ||||||||||||
| 150,785 | XTO Energy, Inc. | 5,318,187 | |||||||||||||
| 40,868,753 | |||||||||||||||
| Oil & Gas Services: 0.7% | |||||||||||||||
| 139,340 | Smith International, Inc. | 3,189,493 | |||||||||||||
| 3,189,493 | |||||||||||||||
| Packaging & Containers: 2.8% | |||||||||||||||
| 152,000 | @ | Owens-Illinois, Inc. | 4,154,160 | ||||||||||||
| 210,730 | @ | Pactiv Corp. | 5,242,962 | ||||||||||||
| 65,220 | Silgan Holdings, Inc. | 3,118,168 | |||||||||||||
| 12,515,290 | |||||||||||||||
| Pharmaceuticals: 3.2% | |||||||||||||||
| 132,100 | @ | Express Scripts, Inc. | 7,262,858 | ||||||||||||
| 214,792 | Perrigo Co. | 6,939,930 | |||||||||||||
| 14,202,788 | |||||||||||||||
| Retail: 7.3% | |||||||||||||||
| 193,350 | Advance Auto Parts, Inc. | 6,506,228 | |||||||||||||
| 23,102 | Burger King Holdings, Inc. | 551,676 | |||||||||||||
| 184,330 | Darden Restaurants, Inc. | 5,194,419 | |||||||||||||
| 390,410 | Gap, Inc. | 5,227,590 | |||||||||||||
| 271,180 | Ross Stores, Inc. | 8,062,181 | |||||||||||||
| 341,230 | TJX Cos., Inc. | 7,019,101 | |||||||||||||
| 32,561,195 | |||||||||||||||
| Semiconductors: 6.7% | |||||||||||||||
| 302,610 | Altera Corp. | 5,056,613 | |||||||||||||
| 360,150 | Analog Devices, Inc. | 6,850,053 | |||||||||||||
| 319,960 | @ | Broadcom Corp. | 5,429,721 | ||||||||||||
| 149,410 | Linear Technology Corp. | 3,304,949 | |||||||||||||
| 460,190 | National Semiconductor Corp. | 4,634,113 | |||||||||||||
| 487,580 | @ | ON Semiconductor Corp. | 1,657,772 | ||||||||||||
| 282,902 | @,@@ | Verigy Ltd. | 2,721,517 | ||||||||||||
| 29,654,738 | |||||||||||||||
| Software: 9.5% | |||||||||||||||
| 571,460 | @ | Activision Blizzard, Inc. | 4,937,414 | ||||||||||||
| 161,730 | @ | Ansys, Inc. | 4,510,650 | ||||||||||||
| 312,800 | @ | BMC Software, Inc. | 8,417,448 | ||||||||||||
| 93,710 | Dun & Bradstreet Corp. | 7,234,412 | |||||||||||||
| 237,460 | @ | Fiserv, Inc. | 8,636,420 | ||||||||||||
| 367,680 | @ | Intuit, Inc. | 8,747,107 | ||||||||||||
| 42,483,451 | |||||||||||||||
| Telecommunications: 1.4% | |||||||||||||||
| 104,150 | Embarq Corp. | 3,745,234 | |||||||||||||
| 141,890 | @ | Juniper Networks, Inc. | 2,484,494 | ||||||||||||
| 6,229,728 | |||||||||||||||
| Transportation: 1.4% | |||||||||||||||
| 113,400 | CH Robinson Worldwide, Inc. | 6,240,402 | |||||||||||||
| 6,240,402 | |||||||||||||||
| Total Common Stock (Cost $497,986,701) | 417,879,136 | ||||||||||||||
| Shares | Value | ||||||||||||||
| EXCHANGE-TRADED FUNDS: 3.7% | |||||||||||||||
| Exchange-Traded Funds: 3.7% | |||||||||||||||
| 528,682 | iShares Russell Midcap Growth Index Fund | $ | 16,558,320 | ||||||||||||
| Total Exchange-Traded Funds (Cost $21,548,474) | 16,558,320 | ||||||||||||||
| Total Long-Term Investments (Cost $519,535,175) | 434,437,456 | ||||||||||||||
| SHORT-TERM INVESTMENTS: 5.2% | |||||||||||||||
| Affiliated Mutual Fund: 1.9% | |||||||||||||||
| 8,533,000 | ING Institutional Prime Money Market Fund - Class I | 8,533,000 | |||||||||||||
| Total Mutual Fund (Cost $8,533,000) | 8,533,000 | ||||||||||||||
| Principal Amount | Value | ||||||||||
| REPURCHASE AGREEMENT: 0.6% | |||||||||||
| $ | 2,461,000 | Morgan Stanley Repurchase Agreement dated 12/31/08, 0.030%, due 01/02/09, $2,461,004 to be received upon repurchase (Collateralized by $2,510,000 Farm Credit Banks Consolidated Systemwide Bonds, 4.830%, Market Value plus accrued interest $2,536,708, due 04/14/15) | $ | 2,461,000 | |||||||
| Total Repurchase Agreement (Cost $2,461,000) | 2,461,000 | ||||||||||
| Securities Lending Collateralcc: 2.7% | |||||||||||
| 12,494,193 | Bank of New York Mellon Corp. Institutional Cash Reserves | 12,116,164 | |||||||||
| Total Securities Lending Collateral (Cost $12,494,193) | 12,116,164 | ||||||||||
| Total Short-Term Investments (Cost $23,488,193) | 23,110,164 | ||||||||||
| Total Investments in Securities (Cost $543,023,368)* | 102.8 | % | $ | 457,547,620 | |||||||
| Other Assets and Liabilities - Net | (2.8 | ) | (12,298,018 | ) | |||||||
| Net Assets | 100.0 | % | $ | 445,249,602 | |||||||
@ Non-income producing security
@@ Foreign Issuer
cc Securities purchased with cash collateral for securities loaned.
L Loaned security, a portion or all of the security is on loan at December 31, 2008.
* Cost for federal income tax purposes is $552,192,634.
Net unrealized depreciation consists of:
| Gross Unrealized Appreciation | $ | 12,388,790 | |||||
| Gross Unrealized Depreciation | (107,033,804 | ) | |||||
| Net Unrealized Depreciation | $ | (94,645,014 | ) | ||||
See Accompanying Notes to Financial Statements
33
PORTFOLIO OF INVESTMENTS
ING VP MIDCAP OPPORTUNITIES PORTFOLIO AS OF DECEMBER 31, 2008 (CONTINUED)
The following table summarizes the inputs used as of December 31, 2008 in determining the Portfolio's investments at fair value for purposes of SFAS 157:
| Investments in Securities | Other Financial Instruments* | ||||||||||
| Level 1 — Quoted Prices | $ | 442,970,456 | $ | — | |||||||
| Level 2 — Other Significant Observable Inputs | 14,577,164 | — | |||||||||
| Level 3 — Significant Unobservable Inputs | — | — | |||||||||
| Total | $ | 457,547,620 | $ | — | |||||||
"Fair value" for purposes of SFAS 157 is different from "fair value" as used in the 1940 Act. The former generally implies market value, and can include market quotations as a source of value, and the latter refers to determinations of actual value in absence of available market quotations.
* Other financial instruments may include forward foreign currency contracts, futures, swaps, and written options. Forward foreign currency contracts and futures are reported at their unrealized gain/loss at year end. Swaps and written options are reported at their market value at year end.
See Accompanying Notes to Financial Statements
34
PORTFOLIO OF INVESTMENTS
ING VP SMALLCAP OPPORTUNITIES PORTFOLIO AS OF DECEMBER 31, 2008
| Shares | Value | ||||||||||||||
| COMMON STOCK: 93.3% | |||||||||||||||
| Advertising: 0.6% | |||||||||||||||
| 61,954 | @ | inVentiv Health, Inc. | $ | 714,949 | |||||||||||
| 714,949 | |||||||||||||||
| Aerospace/Defense: 2.9% | |||||||||||||||
| 32,500 | Curtiss-Wright Corp. | 1,085,175 | |||||||||||||
| 27,988 | @ | Moog, Inc. | 1,023,521 | ||||||||||||
| 24,700 | @ | Teledyne Technologies, Inc. | 1,100,385 | ||||||||||||
| 3,209,081 | |||||||||||||||
| Apparel: 1.2% | |||||||||||||||
| 13,000 | @ | Deckers Outdoor Corp. | 1,038,310 | ||||||||||||
| 20,046 | @,@@,L | Gildan Activewear, Inc. | 235,741 | ||||||||||||
| 1,274,051 | |||||||||||||||
| Auto Parts & Equipment: 0.8% | |||||||||||||||
| 41,900 | @@ | Autoliv, Inc. | 899,174 | ||||||||||||
| 899,174 | |||||||||||||||
| Banks: 2.3% | |||||||||||||||
| 27,800 | Bank Mutual Corp. | 320,812 | |||||||||||||
| 18,267 | First Midwest Bancorp., Inc. | 364,792 | |||||||||||||
| 19,400 | PrivateBancorp, Inc. | 629,724 | |||||||||||||
| 24,530 | @ | Signature Bank | 703,766 | ||||||||||||
| 10,700 | Westamerica Bancorp. | 547,305 | |||||||||||||
| 2,566,399 | |||||||||||||||
| Biotechnology: 4.7% | |||||||||||||||
| 25,200 | @ | Alexion Pharmaceuticals, Inc. | 911,988 | ||||||||||||
| 15,500 | @,L | AMAG Pharmaceuticals, Inc. | 555,675 | ||||||||||||
| 16,530 | @ | Bio-Rad Laboratories, Inc. | 1,244,874 | ||||||||||||
| 58,789 | @ | Human Genome Sciences, Inc. | 124,633 | ||||||||||||
| 35,600 | @ | Medicines Co. | 524,388 | ||||||||||||
| 9,200 | @ | Myriad Genetics, Inc. | 609,592 | ||||||||||||
| 16,216 | @ | Nanosphere, Inc. | 77,188 | ||||||||||||
| 116,299 | @ | RTI Biologics, Inc. | 320,985 | ||||||||||||
| 11,400 | @,L | United Therapeutics Corp. | 713,070 | ||||||||||||
| 87,800 | @ | Vical, Inc. | 123,798 | ||||||||||||
| 5,206,191 | |||||||||||||||
| Building Materials: 1.1% | |||||||||||||||
| 24,900 | Simpson Manufacturing Co., Inc. | 691,224 | |||||||||||||
| 16,400 | L | Texas Industries, Inc. | 565,800 | ||||||||||||
| 1,257,024 | |||||||||||||||
| Chemicals: 1.6% | |||||||||||||||
| 39,600 | Albemarle Corp. | 883,080 | |||||||||||||
| 13,100 | Minerals Technologies, Inc. | 535,790 | |||||||||||||
| 73,700 | @ | Solutia, Inc. | 331,650 | ||||||||||||
| 1,750,520 | |||||||||||||||
| Commercial Services: 4.4% | |||||||||||||||
| 40,884 | Arbitron, Inc. | 542,940 | |||||||||||||
| 20,600 | @,L | Bankrate, Inc. | 782,800 | ||||||||||||
| 14,000 | @ | Capella Education Co. | 822,640 | ||||||||||||
| 83,343 | Diamond Management & Technology Consultants, Inc. | 350,874 | |||||||||||||
| 10,300 | @ | FTI Consulting, Inc. | 460,204 | ||||||||||||
| 38,300 | @ | Geo Group, Inc. | 690,549 | ||||||||||||
| 26,005 | Watson Wyatt Worldwide, Inc. | 1,243,559 | |||||||||||||
| 4,893,566 | |||||||||||||||
| Shares | Value | ||||||||||||||
| Computers: 5.5% | |||||||||||||||
| 24,800 | @ | CACI International, Inc. | $ | 1,118,232 | |||||||||||
| 32,100 | @,L | Data Domain, Inc. | 603,480 | ||||||||||||
| 120,438 | @ | Mentor Graphics Corp. | 622,664 | ||||||||||||
| 66,300 | @ | Micros Systems, Inc. | 1,082,016 | ||||||||||||
| 84,900 | @,@@ | Ness Technologies, Inc. | 363,372 | ||||||||||||
| 72,000 | @ | Riverbed Technolgoy, Inc. | 820,080 | ||||||||||||
| 18,600 | @ | Stratasys, Inc. | 199,950 | ||||||||||||
| 54,900 | @ | SYKES Enterprises, Inc. | 1,049,688 | ||||||||||||
| 83,707 | @,@@ | Xyratex Ltd. | 246,936 | ||||||||||||
| 6,106,418 | |||||||||||||||
| Cosmetics/Personal Care: 1.2% | |||||||||||||||
| 18,000 | @,L | Chattem, Inc. | 1,287,540 | ||||||||||||
| 1,287,540 | |||||||||||||||
| Distribution/Wholesale: 2.3% | |||||||||||||||
| 71,600 | @ | LKQ Corp. | 834,856 | ||||||||||||
| 25,500 | Owens & Minor, Inc. | 960,075 | |||||||||||||
| 40,800 | L | Pool Corp. | 733,176 | ||||||||||||
| 2,528,107 | |||||||||||||||
| Diversified Financial Services: 1.8% | |||||||||||||||
| 19,384 | @ | Duff & Phelps Corp. | 370,622 | ||||||||||||
| 9,800 | Greenhill & Co., Inc. | 683,746 | |||||||||||||
| 31,400 | @ | Interactive Brokers Group, Inc. | 561,746 | ||||||||||||
| 25,300 | Waddell & Reed Financial, Inc. | 391,138 | |||||||||||||
| 2,007,252 | |||||||||||||||
| Electric: 1.2% | |||||||||||||||
| 35,700 | Black Hills Corp. | 962,472 | |||||||||||||
| 8,900 | ITC Holdings Corp. | 388,752 | |||||||||||||
| 1,351,224 | |||||||||||||||
| Electrical Components & Equipment: 0.7% | |||||||||||||||
| 14,000 | @,L | Energy Conversion Devices, Inc. | 352,940 | ||||||||||||
| 15,962 | @ | Greatbatch, Inc. | 422,355 | ||||||||||||
| 775,295 | |||||||||||||||
| Electronics: 3.6% | |||||||||||||||
| 13,600 | @ | Dionex Corp. | 609,960 | ||||||||||||
| 9,800 | @,L | Faro Technologies, Inc. | 165,228 | ||||||||||||
| 13,693 | @ | Flir Systems, Inc. | 420,101 | ||||||||||||
| 52,700 | @ | Plexus Corp. | 893,265 | ||||||||||||
| 29,900 | @ | Thomas & Betts Corp. | 718,198 | ||||||||||||
| 35,586 | @ | Varian, Inc. | 1,192,487 | ||||||||||||
| 3,999,239 | |||||||||||||||
| Engineering & Construction: 0.6% | |||||||||||||||
| 30,800 | @ | EMCOR Group, Inc. | 690,844 | ||||||||||||
| 690,844 | |||||||||||||||
| Environmental Control: 1.9% | |||||||||||||||
| 8,796 | @ | Clean Harbors, Inc. | 558,018 | ||||||||||||
| 47,144 | @ | Waste Connections, Inc. | 1,488,336 | ||||||||||||
| 2,046,354 | |||||||||||||||
| Food: 1.5% | |||||||||||||||
| 20,500 | Corn Products International, Inc. | 591,425 | |||||||||||||
| 29,200 | Flowers Foods, Inc. | 711,312 | |||||||||||||
| 60,371 | @ | Smart Balance, Inc. | 410,523 | ||||||||||||
| 1,713,260 | |||||||||||||||
See Accompanying Notes to Financial Statements
35
PORTFOLIO OF INVESTMENTS
ING VP SMALLCAP OPPORTUNITIES PORTFOLIO AS OF DECEMBER 31, 2008 (CONTINUED)
| Shares | Value | ||||||||||||||
| Gas: 0.4% | |||||||||||||||
| 16,100 | Southwest Gas Corp. | $ | 406,042 | ||||||||||||
| 406,042 | |||||||||||||||
| Hand/Machine Tools: 0.5% | |||||||||||||||
| 21,300 | L | Franklin Electric Co., Inc. | 598,743 | ||||||||||||
| 598,743 | |||||||||||||||
| Healthcare-Products: 5.7% | |||||||||||||||
| 20,500 | @ | Gen-Probe, Inc. | 878,220 | ||||||||||||
| 17,688 | @ | Haemonetics Corp. | 999,372 | ||||||||||||
| 38,500 | @ | Immucor, Inc. | 1,023,330 | ||||||||||||
| 12,200 | @ | Masimo Corp. | 363,926 | ||||||||||||
| 37,474 | Meridian Bioscience, Inc. | 954,463 | |||||||||||||
| 43,698 | @ | Micrus Endovascular Corp. | 507,334 | ||||||||||||
| 7,200 | @,L | NuVasive, Inc. | 249,480 | ||||||||||||
| 37,315 | @,@@ | Orthofix International NV | 572,039 | ||||||||||||
| 28,300 | @,L | SonoSite, Inc. | 539,964 | ||||||||||||
| 97,330 | @ | Spectranetics Corp. | 254,031 | ||||||||||||
| 6,342,159 | |||||||||||||||
| Healthcare-Services: 2.9% | |||||||||||||||
| 18,419 | @,L | Amedisys, Inc. | 761,441 | ||||||||||||
| 43,200 | @ | Nighthawk Radiology Holdings, Inc. | 209,952 | ||||||||||||
| 37,400 | @ | Psychiatric Solutions, Inc. | 1,041,590 | ||||||||||||
| 25,179 | Universal Health Services, Inc. | 945,975 | |||||||||||||
| 29,605 | @,L | Virtual Radiologic Corp. | 251,050 | ||||||||||||
| 3,210,008 | |||||||||||||||
| Insurance: 1.5% | |||||||||||||||
| 19,028 | @,@@ | Argo Group International Holdings Ltd. | 645,430 | ||||||||||||
| 17,775 | @@ | Aspen Insurance Holdings Ltd. | 431,044 | ||||||||||||
| 15,600 | @@ | Platinum Underwriters Holdings Ltd. | 562,848 | ||||||||||||
| 1,639,322 | |||||||||||||||
| Internet: 1.3% | |||||||||||||||
| 10,800 | @ | F5 Networks, Inc. | 246,888 | ||||||||||||
| 98,500 | @ | Interwoven, Inc. | 1,241,100 | ||||||||||||
| 1,487,988 | |||||||||||||||
| Iron/Steel: 0.4% | |||||||||||||||
| 69,200 | @@,L | Gerdau AmeriSteel Corp. | 419,352 | ||||||||||||
| 419,352 | |||||||||||||||
| Leisure Time: 1.1% | |||||||||||||||
| 46,400 | @ | WMS Industries, Inc. | 1,248,160 | ||||||||||||
| 1,248,160 | |||||||||||||||
| Machinery-Diversified: 2.1% | |||||||||||||||
| 43,500 | Cognex Corp. | 643,800 | |||||||||||||
| 18,500 | Nordson Corp. | 597,365 | |||||||||||||
| 26,004 | Wabtec Corp. | 1,033,659 | |||||||||||||
| 2,274,824 | |||||||||||||||
| Metal Fabricate/Hardware: 0.5% | |||||||||||||||
| 14,900 | Kaydon Corp. | 511,815 | |||||||||||||
| 511,815 | |||||||||||||||
| Shares | Value | ||||||||||||||
| Miscellaneous Manufacturing: 3.8% | |||||||||||||||
| 40,200 | Actuant Corp. | $ | 764,604 | ||||||||||||
| 20,900 | Acuity Brands, Inc. | 729,619 | |||||||||||||
| 15,800 | Aptargroup, Inc. | 556,792 | |||||||||||||
| 51,786 | Barnes Group, Inc. | 750,897 | |||||||||||||
| 37,575 | @ | EnPro Industries, Inc. | 809,366 | ||||||||||||
| 79,900 | @ | Hexcel Corp. | 590,461 | ||||||||||||
| 4,201,739 | |||||||||||||||
| Oil & Gas: 4.2% | |||||||||||||||
| 29,100 | @ | Bill Barrett Corp. | 614,883 | ||||||||||||
| 51,800 | @ | Carrizo Oil & Gas, Inc. | 833,980 | ||||||||||||
| 75,600 | @ | EXCO Resources, Inc. | 684,936 | ||||||||||||
| 42,100 | Holly Corp. | 767,483 | |||||||||||||
| 68,100 | @ | McMoRan Exploration Co. | 667,380 | ||||||||||||
| 19,300 | Penn Virginia Corp. | 501,414 | |||||||||||||
| 89,700 | @ | Petroquest Energy, Inc. | 606,372 | ||||||||||||
| 4,676,448 | |||||||||||||||
| Oil & Gas Services: 2.1% | |||||||||||||||
| 15,000 | Core Laboratories NV | 897,900 | |||||||||||||
| 30,200 | @ | Dril-Quip, Inc. | 619,402 | ||||||||||||
| 119,800 | @ | Key Energy Services, Inc. | 528,318 | ||||||||||||
| 28,100 | @,@@ | Willbros Group, Inc | 238,007 | ||||||||||||
| 2,283,627 | |||||||||||||||
| Packaging & Containers: 0.8% | |||||||||||||||
| 36,100 | Bemis Co. | 854,848 | |||||||||||||
| 854,848 | |||||||||||||||
| Pharmaceuticals: 4.6% | |||||||||||||||
| 154,812 | @,L | Akorn, Inc. | 356,068 | ||||||||||||
| 21,900 | @ | BioMarin Pharmaceuticals, Inc. | 389,820 | ||||||||||||
| 34,600 | @ | Isis Pharmaceuticals, Inc. | 490,628 | ||||||||||||
| 54,348 | @ | KV Pharmaceutical Co. | 156,522 | ||||||||||||
| 70,400 | @,L | Mylan Laboratories | 696,256 | ||||||||||||
| 33,200 | Omnicare, Inc. | 921,632 | |||||||||||||
| 33,800 | @ | Onyx Pharmaceuticals, Inc. | 1,154,608 | ||||||||||||
| 28,900 | Perrigo Co. | 933,759 | |||||||||||||
| 5,099,293 | |||||||||||||||
| Retail: 4.5% | |||||||||||||||
| 57,500 | @ | Aeropostale, Inc. | 925,750 | ||||||||||||
| 17,541 | Cash America International, Inc. | 479,746 | |||||||||||||
| 41,745 | @ | Gymboree Corp. | 1,089,127 | ||||||||||||
| 55,700 | @,L | Jo-Ann Stores, Inc. | 862,793 | ||||||||||||
| 33,991 | @ | Lumber Liquidators, Inc. | 358,945 | ||||||||||||
| 8,916 | @ | Panera Bread Co. | 465,772 | ||||||||||||
| 37,900 | @,L | PF Chang's China Bistro, Inc. | 793,626 | ||||||||||||
| 4,975,759 | |||||||||||||||
| Semiconductors: 4.9% | |||||||||||||||
| 144,500 | @ | Entegris, Inc. | 316,455 | ||||||||||||
| 49,562 | @,L | Formfactor, Inc. | 723,605 | ||||||||||||
| 112,200 | @ | Integrated Device Technology, Inc. | 629,442 | ||||||||||||
| 77,700 | Micrel, Inc. | 567,987 | |||||||||||||
| 45,400 | @ | MKS Instruments, Inc. | 671,466 | ||||||||||||
| 35,000 | @ | Monolithic Power Systems, Inc. | 441,350 | ||||||||||||
| 92,000 | @ | ON Semiconductor Corp. | 312,800 | ||||||||||||
| 83,800 | @ | Semtech Corp. | 944,426 | ||||||||||||
| 82,224 | @,@@ | Verigy Ltd. | 790,995 | ||||||||||||
| 5,398,526 | |||||||||||||||
See Accompanying Notes to Financial Statements
36
PORTFOLIO OF INVESTMENTS
ING VP SMALLCAP OPPORTUNITIES PORTFOLIO AS OF DECEMBER 31, 2008 (CONTINUED)
| Shares | Value | ||||||||||||||
| Software: 6.3% | |||||||||||||||
| 36,428 | @ | Ansys, Inc. | $ | 1,015,977 | |||||||||||
| 75,840 | Blackbaud, Inc. | 1,023,840 | |||||||||||||
| 73,659 | @ | Double-Take Software, Inc. | 660,721 | ||||||||||||
| 74,200 | @ | Informatica Corp. | 1,018,766 | ||||||||||||
| 105,500 | @ | Parametric Technology Corp. | 1,334,575 | ||||||||||||
| 60,400 | @ | Solera Holdings, Inc. | 1,455,640 | ||||||||||||
| 18,700 | @ | SPSS, Inc. | 504,152 | ||||||||||||
| 7,013,671 | |||||||||||||||
| Telecommunications: 2.6% | |||||||||||||||
| 93,600 | Alaska Communications Systems Group, Inc. | 877,968 | |||||||||||||
| 77,700 | @ | Polycom, Inc. | 1,049,727 | ||||||||||||
| 34,500 | @ | SBA Communications Corp. | 563,040 | ||||||||||||
| 32,500 | @ | Starent Networks Corp. | 387,725 | ||||||||||||
| 2,878,460 | |||||||||||||||
| Toys/Games/Hobbies: 0.9% | |||||||||||||||
| 31,706 | @ | Marvel Entertainment, Inc. | 974,960 | ||||||||||||
| 974,960 | |||||||||||||||
| Transportation: 2.3% | |||||||||||||||
| 29,300 | @ | Genesee & Wyoming, Inc. | 893,650 | ||||||||||||
| 24,733 | @ | HUB Group, Inc. | 656,166 | ||||||||||||
| 58,500 | L | Knight Transportation, Inc. | 943,020 | ||||||||||||
| 2,492,836 | |||||||||||||||
| Total Common Stock (Cost $135,994,372) | 103,265,068 | ||||||||||||||
| REAL ESTATE INVESTMENT TRUSTS: 2.2% | |||||||||||||||
| Apartments: 0.7% | |||||||||||||||
| 17,900 | Home Properties, Inc. | 726,740 | |||||||||||||
| 726,740 | |||||||||||||||
| Diversified: 1.1% | |||||||||||||||
| 17,200 | Digital Realty Trust, Inc. | 565,020 | |||||||||||||
| 23,800 | Washington Real Estate Investment Trust | 673,540 | |||||||||||||
| 1,238,560 | |||||||||||||||
| Shopping Centers: 0.4% | |||||||||||||||
| 12,500 | L | Tanger Factory Outlet Centers, Inc. | 470,250 | ||||||||||||
| 470,250 | |||||||||||||||
| Total Real Estate Investment Trusts (Cost $2,739,957) | 2,435,550 | ||||||||||||||
| EXCHANGE-TRADED FUNDS: 2.0% | |||||||||||||||
| Exchange-Traded Funds: 2.0% | |||||||||||||||
| 42,726 | L | iShares Russell 2000 Growth Index Fund | 2,173,044 | ||||||||||||
| Total Exchange-Traded Funds (Cost $2,113,168) | 2,173,044 | ||||||||||||||
| Total Long-Term Investments (Cost $140,847,497) | 107,873,662 | ||||||||||||||
| Shares | Value | ||||||||||||||
| SHORT-TERM INVESTMENTS: 13.4% | |||||||||||||||
| Affiliated Mutual Fund: 2.6% | |||||||||||||||
| 2,858,000 | ING Institutional Prime Money Market Fund - Class I | $ | 2,858,000 | ||||||||||||
| Total Mutual Fund (Cost $2,858,000) | 2,858,000 | ||||||||||||||
| Principal Amount | Value | ||||||||||
| Securities Lending Collateralcc: 10.8% | |||||||||||
| $ | 12,133,632 | Bank of New York Mellon Corp. Institutional Cash Reserves | $ | 11,999,372 | |||||||
| Total Securities Lending Collateral (Cost $12,133,632) | 11,999,372 | ||||||||||
| Total Short-Term Investments (Cost $14,991,632) | 14,857,372 | ||||||||||
| Total Investments in Securities (Cost $155,839,129)* | 110.9 | % | $ | 122,731,034 | |||||||
| Other Assets and Liabilities - Net | (10.9 | ) | (12,088,310 | ) | |||||||
| Net Assets | 100.0 | % | $ | 110,642,724 | |||||||
@ Non-income producing security
@@ Foreign Issuer
cc Securities purchased with cash collateral for securities loaned.
L Loaned security, a portion or all of the security is on loan at December 31, 2008.
* Cost for federal income tax purposes is $161,194,373.
Net unrealized depreciation consists of:
| Gross Unrealized Appreciation | $ | 3,242,032 | |||||
| Gross Unrealized Depreciation | (41,705,371 | ) | |||||
| Net Unrealized Depreciation | $ | (38,463,339 | ) | ||||
The following table summarizes the inputs used as of December 31, 2008 in determining the Portfolio's investments at fair value for purposes of SFAS 157:
| Investments in Securities | Other Financial Instruments* | ||||||||||
| Level 1 — Quoted Prices | $ | 110,731,662 | $ | — | |||||||
| Level 2 — Other Significant Observable Inputs | 11,999,372 | — | |||||||||
| Level 3 — Significant Unobservable Inputs | — | — | |||||||||
| Total | $ | 122,731,034 | $ | — | |||||||
"Fair value" for purposes of SFAS 157 is different from "fair value" as used in the 1940 Act. The former generally implies market value, and can include market quotations as a source of value, and the latter refers to determinations of actual value in absence of available market quotations.
* Other financial instruments may include forward foreign currency contracts, futures, swaps, and written options. Forward foreign currency contracts and futures are reported at their unrealized gain/loss at year end. Swaps and written options are reported at their market value at year end.
See Accompanying Notes to Financial Statements
37
PORTFOLIO OF INVESTMENTS
ING VP INTERNATIONAL VALUE PORTFOLIO AS OF DECEMBER 31, 2008
| Shares | Value | ||||||||||||||
| COMMON STOCK: 95.1% | |||||||||||||||
| Brazil: 0.5% | |||||||||||||||
| 71,800 | Petroleo Brasileiro SA ADR | $ | 1,758,382 | ||||||||||||
| 1,758,382 | |||||||||||||||
| Canada: 4.0% | |||||||||||||||
| 1,380,000 | Bombardier, Inc. - Class B | 4,974,484 | |||||||||||||
| 88,612 | EnCana Corp. | 4,088,570 | |||||||||||||
| 153,600 | GoldCorp, Inc. | 4,843,008 | |||||||||||||
| 13,906,062 | |||||||||||||||
| China: 4.7% | |||||||||||||||
| 14,110,000 | L | Huaneng Power International, Inc. | 10,281,615 | ||||||||||||
| 70,900 | PetroChina Co., Ltd. ADR | 6,308,682 | |||||||||||||
| 16,590,297 | |||||||||||||||
| France: 9.4% | |||||||||||||||
| 393,501 | Air France-KLM | 5,074,694 | |||||||||||||
| 279,115 | L | AXA SA ADR | 6,271,714 | ||||||||||||
| 113,509 | Carrefour SA | 4,387,621 | |||||||||||||
| 110,376 | Sanofi-Aventis | 7,059,994 | |||||||||||||
| 182,680 | Total SA | 10,043,587 | |||||||||||||
| 32,837,610 | |||||||||||||||
| Germany: 9.0% | |||||||||||||||
| 565,500 | Deutsche Telekom AG | 8,534,052 | |||||||||||||
| 270,445 | E.ON AG | 10,462,778 | |||||||||||||
| 166,800 | Siemens AG | 12,583,482 | |||||||||||||
| 31,580,312 | |||||||||||||||
| Hong Kong: 6.7% | |||||||||||||||
| 1,499,000 | Henderson Land Development Co., Ltd. | 5,606,521 | |||||||||||||
| 2,978,000 | L | Hongkong Land Holdings Ltd. | 7,427,305 | ||||||||||||
| 1,490,500 | Swire Pacific Ltd. | 10,325,020 | |||||||||||||
| 23,358,846 | |||||||||||||||
| India: 2.7% | |||||||||||||||
| 395,614 | L | ICICI Bank Ltd. ADR | 7,615,570 | ||||||||||||
| 163,000 | Maruti Udyog Ltd. | 1,750,989 | |||||||||||||
| 9,366,559 | |||||||||||||||
| Italy: 5.5% | |||||||||||||||
| 405,575 | ENI S.p.A. | 9,759,609 | |||||||||||||
| 2,909,200 | Terna S.p.A | 9,600,303 | |||||||||||||
| 19,359,912 | |||||||||||||||
| Japan: 18.7% | |||||||||||||||
| 432,900 | Bridgestone Corp. | 6,493,331 | |||||||||||||
| 318,000 | Canon, Inc. ADR | 9,985,201 | |||||||||||||
| 733,000 | Daiwa Securities Group, Inc. | 4,400,432 | |||||||||||||
| 377 | X | East Japan Railway Co. | 2,980,068 | ||||||||||||
| 1,068,400 | Mitsubishi UFJ Financial Group, Inc. | 6,715,053 | |||||||||||||
| 781,000 | Nippon Express Co., Ltd. | 3,292,005 | |||||||||||||
| 1,966 | X | Nippon Telegraph & Telephone Corp. | 10,555,891 | ||||||||||||
| 426,100 | Sumitomo Corp. | 3,779,201 | |||||||||||||
| 311,700 | Tokyo Electron Ltd. | 10,972,964 | |||||||||||||
| 191,800 | Toyota Motor Corp. | 6,340,587 | |||||||||||||
| 65,514,733 | |||||||||||||||
| Shares | Value | ||||||||||||||
| Luxembourg: 2.7% | |||||||||||||||
| 386,300 | L | ArcelorMittal | $ | 9,499,117 | |||||||||||
| 9,499,117 | |||||||||||||||
| Netherlands: 5.0% | |||||||||||||||
| 568,100 | Royal KPN NV | 8,259,282 | |||||||||||||
| 381,298 | Unilever NV | 9,241,884 | |||||||||||||
| 17,501,166 | |||||||||||||||
| Russia: 0.8% | |||||||||||||||
| 192,800 | @ | OAO Gazprom ADR | 2,777,727 | ||||||||||||
| 2,777,727 | |||||||||||||||
| Singapore: 2.4% | |||||||||||||||
| 920,000 | United Overseas Bank Ltd. | 8,314,069 | |||||||||||||
| 8,314,069 | |||||||||||||||
| Sweden: 1.6% | |||||||||||||||
| 763,800 | Nordea Bank AB | 5,444,127 | |||||||||||||
| 5,444,127 | |||||||||||||||
| Switzerland: 4.1% | |||||||||||||||
| 71,536 | Julius Baer Holding AG - Reg | 2,772,544 | |||||||||||||
| 461,100 | Xstrata PLC | 4,314,687 | |||||||||||||
| 34,000 | Zurich Financial Services AG | 7,428,353 | |||||||||||||
| 14,515,584 | |||||||||||||||
| Turkey: 2.1% | |||||||||||||||
| 1,139,857 | @ | KOC Holding A/S | 1,936,275 | ||||||||||||
| 3,065,900 | @ | Turkiye Garanti Bankasi A/S | 5,277,237 | ||||||||||||
| 7,213,512 | |||||||||||||||
| United Kingdom: 15.2% | |||||||||||||||
| 171,971 | AstraZeneca PLC | 7,035,409 | |||||||||||||
| 201,000 | BP PLC ADR | 9,394,740 | |||||||||||||
| 851,738 | Cadbury PLC | 7,414,883 | |||||||||||||
| 138,800 | Diageo PLC ADR | 7,875,512 | |||||||||||||
| 502,300 | GlaxoSmithKline PLC | 9,341,651 | |||||||||||||
| 367,100 | HSBC Holdings PLC | 3,592,879 | |||||||||||||
| 76,300 | Rio Tinto PLC | 1,695,889 | |||||||||||||
| 1,154,000 | WPP PLC | 6,747,828 | |||||||||||||
| 53,098,791 | |||||||||||||||
| Total Common Stock (Cost $404,097,252) | 332,636,806 | ||||||||||||||
| REAL ESTATE INVESTMENT TRUSTS: 1.4% | |||||||||||||||
| France: 1.4% | |||||||||||||||
| 32,744 | Unibail | 4,891,775 | |||||||||||||
| Total Real Estate Investment Trusts (Cost $7,889,072) | 4,891,775 | ||||||||||||||
| Total Long-Term Investments (Cost $411,986,324) | 337,528,581 | ||||||||||||||
| SHORT-TERM INVESTMENTS: 7.0% | |||||||||||||||
| Affiliated Mutual Fund: 2.0% | |||||||||||||||
| 6,893,000 | ING Institutional Prime Money Market Fund - Class I | 6,893,000 | |||||||||||||
| Total Mutual Fund (Cost $6,893,000) | 6,893,000 | ||||||||||||||
See Accompanying Notes to Financial Statements
38
PORTFOLIO OF INVESTMENTS
ING VP INTERNATIONAL VALUE PORTFOLIO AS OF DECEMBER 31, 2008 (CONTINUED)
| Principal Amount | Value | ||||||||||
| REPURCHASE AGREEMENT: 0.7% | |||||||||||
| $ | 2,386,000 | Morgan Stanley Repurchase Agreement dated 12/31/08, 0.030%, due 01/02/09, $2,386,004 to be received upon repurchase (Collateralized by $2,410,000 Farm Credit Banks Consolidated Systemwide Bonds, 4.830%, Market Value plus accrued interest $2,435,644, due 04/14/15) | $ | 2,386,000 | |||||||
| Total Repurchase Agreement (Cost $2,386,000) | 2,386,000 | ||||||||||
| Securities Lending Collateralcc: 4.3% | |||||||||||
| 15,329,004 | Bank of New York Mellon Corp. Institutional Cash Reserves | 15,260,091 | |||||||||
| Total Securities Lending Collateral (Cost $15,329,004) | 15,260,091 | ||||||||||
| Total Short-Term Investments (Cost $24,608,004) | 24,539,091 | ||||||||||
| Total Investments in Securities (Cost $436,594,328)* | 103.5 | % | $ | 362,067,672 | |||||||
| Other Assets and Liabilities - Net | (3.5 | ) | (12,263,361 | ) | |||||||
| Net Assets | 100.0 | % | $ | 349,804,311 | |||||||
@ Non-income producing security
ADR American Depositary Receipt
cc Securities purchased with cash collateral for securities loaned.
L Loaned security, a portion or all of the security is on loan at December 31, 2008.
X Fair value determined by ING Funds Valuation Committee appointed by the Funds' Board of Directors/Trustees.
* Cost for federal income tax purposes is $462,582,233.
Net unrealized depreciation consists of:
| Gross Unrealized Appreciation | $ | 7,727,871 | |||||
| Gross Unrealized Depreciation | (108,242,432 | ) | |||||
| Net Unrealized Depreciation | $ | (100,514,561 | ) | ||||
The following table summarizes the inputs used as of December 31, 2008 in determining the Portfolio's investments at fair value for purposes of SFAS 157:
| Investments in Securities | Other Financial Instruments* | ||||||||||
| Level 1 — Quoted Prices | $ | 92,583,310 | $ | — | |||||||
| Level 2 — Other Significant Observable Inputs | 269,484,362 | — | |||||||||
| Level 3 — Significant Unobservable Inputs | — | — | |||||||||
| Total | $ | 362,067,672 | $ | — | |||||||
"Fair value" for purposes of SFAS 157 is different from "fair value" as used in the 1940 Act. The former generally implies market value, and can include market quotations as a source of value, and the latter refers to determinations of actual value in absence of available market quotations.
* Other financial instruments may include forward foreign currency contracts, futures, swaps, and written options. Forward foreign currency contracts and futures are reported at their unrealized gain/loss at year end. Swaps and written options are reported at their market value at year end.
| Industry | Percentage of Net Assets | ||||||
| Airlines | 1.4 | % | |||||
| Auto Manufacturers | 2.3 | ||||||
| Auto Parts & Equipment | 1.9 | ||||||
| Banks | 11.4 | ||||||
| Beverages | 2.3 | ||||||
| Distribution/Wholesale | 1.1 | ||||||
| Diversified | 1.4 | ||||||
| Diversified Financial Services | 1.3 | ||||||
| Electric | 8.7 | ||||||
| Food | 6.0 | ||||||
| Holding Companies - Diversified | 3.5 | ||||||
| Insurance | 3.9 | ||||||
| Iron/Steel | 2.7 | ||||||
| Media | 1.9 | ||||||
| Mining | 3.1 | ||||||
| Miscellaneous Manufacturing | 5.0 | ||||||
| Office/Business Equipment | 2.9 | ||||||
| Oil & Gas | 12.6 | ||||||
| Pharmaceuticals | 6.7 | ||||||
| Real Estate | 3.7 | ||||||
| Semiconductors | 3.1 | ||||||
| Telecommunications | 7.8 | ||||||
| Transportation | 1.8 | ||||||
| Short-Term Investments | 7.0 | ||||||
| Other Assets and Liabilities - Net | (3.5 | ) | |||||
| Net Assets | 100.0 | % | |||||
See Accompanying Notes to Financial Statements
39
TAX INFORMATION (UNAUDITED)
Dividends paid during the year ended December 31, 2008 were as follows:
| Fund Name | Type | Per Share Amount | |||||||||
| ING VP SmallCap Opportunities Portfolio | |||||||||||
| All Classes | STCG | $ | 0.5065 | ||||||||
| All Classes | LTCG | $ | 2.5957 | ||||||||
| ING VP International Value Portfolio | |||||||||||
| Class ADV | NII | $ | 0.2497 | ||||||||
| Class I | NII | $ | 0.3040 | ||||||||
| Class S | NII | $ | 0.2775 | ||||||||
| All Classes | STCG | $ | 1.1650 | ||||||||
| All Classes | LTCG | $ | 0.6142 | ||||||||
NII — Net investment income
STCG — Short-term capital gain
LTCG — Long-term capital gain
Of the ordinary distributions made during the year ended December 31, 2008, the following percentage qualifies for the dividends received deduction (DRD) available to corporate shareholders:
| ING VP SmallCap Opportunities Portfolio | 29.84 | % | |||||
Pursuant to Section 853 of the Internal Revenue Code, the Portfolio designates the following amounts as foreign taxes paid for the year ended December 31, 2008. Foreign taxes paid for purposes of Section 853 may be less than actual foreign taxes paid for financial statement purposes.
| Creditable Foreign Taxes Paid | Per Share Amount | Portion of Ordinary Income Distribution Derived from Foreign Sourced Income* | |||||||||||||
| ING VP International Value Portfolio | $ | 1,731,315 | $ | 0.0335 | 87.66 | % | |||||||||
* None of the Portfolio's income was derived from ineligible foreign sources as defined under Section 901(j) of the Internal Revenue Code.
Foreign taxes paid or withheld should be included in taxable income with an offsetting deduction from gross income or as a credit for taxes paid to foreign governments. Shareholders are strongly advised to consult their own tax advisors regarding the appropriate treatment of foreign taxes paid.
Above figures may differ from those cited elsewhere in this report due to differences in the calculation of income and gains under U.S. generally accepted accounting principles (book) purposes and Internal Revenue Service (tax) purposes.
Shareholders are strongly advised to consult their own tax advisers with respect to the tax consequences of their investments in the Portfolios. In January, shareholders, excluding corporate shareholders, receive an IRS 1099-DIV regarding the federal tax status of the dividends and distributions they received in the calendar year.
40
TRUSTEE AND OFFICER INFORMATION (UNAUDITED)
The business and affairs of the Trust are managed under the direction of the Trust's Board. A Trustee who is not an interested person of the Trust, as defined in the 1940 Act, is an independent trustee ("Independent Trustee"). The Trustees and Officers of the Trust are listed below. The Statement of Additional Information includes additional information about trustees of the Trust and is available, without charge, upon request at (800) 992-0180.
| Name, Address, and Age | Position(s) held with Trust | Term of Office and Length of Time Served(1) | Principal Occupation(s) - during the Past 5 Years | Number of Portfolios in Fund Complex Overseen by Trustee(2) | Other Directorships/ Trusteeships held by Director/ Trustee | ||||||||||||||||||
| Independent Trustees: | |||||||||||||||||||||||
| Colleen D. Baldwin 7337 E. Doubletree Ranch Rd. Scottsdale, Arizona 85258 Age: 48 | Trustee | November 2007 - Present | President, National Charity League/Canaan Parish Board (June 2008 - Present) and Consultant (January 2005 - Present). Formerly, Chief Operating Officer, Ivy Asset Management Group (April 2002 - October 2004) | 161 | None. | ||||||||||||||||||
| John V. Boyer(4) 7337 E. Doubletree Ranch Rd. Scottsdale, Arizona 85258 Age: 55 | Trustee | January 2005 - Present | President, Bechtler Arts Foundation (March 2008 - Present). Formerly, Consultant (July 2007 - February 2008); President and Chief Executive Officer, Franklin and Eleanor Roosevelt Institute (March 2006 - July 2007); and Executive Director, The Mark Twain House & Museum (September 1989 - November 2005). | 161 | None. | ||||||||||||||||||
| Patricia W. Chadwick 7337 E. Doubletree Ranch Rd. Scottsdale, Arizona 85258 Age: 60 | Trustee | January 2006 - Present | Consultant and President of self-owned company, Ravengate Partners LLC (January 2000 - Present). | 161 | Wisconsin Energy Corporation (June 2006 - Present). | ||||||||||||||||||
| Peter S. Drotch 7337 E. Doubletree Ranch Rd. Scottsdale, Arizona 85258 Age: 66 | Trustee | November 2007 - Present | Retired partner, PricewaterhouseCoopers, LLP. | 161 | First Marblehead Corporation (September 2003 - Present). | ||||||||||||||||||
| J. Michael Earley 7337 E. Doubletree Ranch Rd. Scottsdale, Arizona 85258 Age: 63 | Trustee | February 2002 - Present | Retired. Formerly, President and Chief Executive Officer, Bankers Trust Company, N.A., Des Moines (June 1992 - December 2008). | 161 | Bankers Trust Company, N.A. (June 1992 - Present) and Midamerica Financial Corporation (December 2002 - Present). | ||||||||||||||||||
| Patrick W. Kenny 7337 E. Doubletree Ranch Rd. Scottsdale, Arizona 85258 Age: 65 | Trustee | January 2005 - Present | President and Chief Executive Officer, International Insurance Society (June 2001 - Present). | 161 | Assured Guaranty Ltd. (April 2004 - Present) and Odyssey Re Holdings Corporation (November 2006 - Present). | ||||||||||||||||||
| Sheryl K. Pressler 7337 E. Doubletree Ranch Rd. Scottsdale, Arizona 85258 Age: 58 | Trustee | January 2006 - Present | Consultant (May 2001 - Present). | 161 | Global Alternative Asset Management, Inc. (October 2007 - Present) and Stillwater Mining Company (May 2002 - Present). | ||||||||||||||||||
41
TRUSTEE AND OFFICER INFORMATION (UNAUDITED) (CONTINUED)
| Name, Address, and Age | Position(s) held with Trust | Term of Office and Length of Time Served(1) | Principal Occupation(s) - during the Past 5 Years | Number of Portfolios in Fund Complex Overseen by Trustee(2) | Other Directorships/ Trusteeships held by Director/ Trustee | ||||||||||||||||||
| Roger B. Vincent 7337 E. Doubletree Ranch Rd. Scottsdale, Arizona 85258 Age: 63 | Trustee | February 2002 - Present | President, Springwell Corporation (March 1989 - Present). | 161 | UGI Corporation (February 2006 - Present) and UGI Utilities, Inc. (February 2006 - Present). | ||||||||||||||||||
| Trustees who are "Interested Persons": | |||||||||||||||||||||||
| Robert W. Crispin(5) 7337 E. Doubletree Ranch Rd. Scottsdale, Arizona 85258 Age: 62 | Trustee | November 2007- Present | Retired. Chairman and Chief Investment Officer, ING Investment Management Co. (June 2001 - December 2007). | 161 | ING Canada Inc. (December 2004 - Present) and ING Bank, fsb (June 2001- Present). | ||||||||||||||||||
| Shaun P. Mathews(3)(5) 7337 E. Doubletree Ranch Rd. Scottsdale, Arizona 85258 Age: 53 | Trustee | November 2007- Present | President and Chief Executive Officer, ING Investments, LLC(5) (November 2006 - Present). Formerly, President, ING Mutual Funds and Investment Products (November 2004 - November 2006); Chief Marketing Officer, ING USFS (April 2002 - October 2004); and Head of Rollover/Payout (October 2001- December 2003). | 200 | ING Services Holding Company, Inc. (May 2000 - Present); Southland Life Insurance Company (June 2002 - Present); and ING Capital Corporation, LLC, ING Funds Distributor, LLC(6), ING Funds Services, LLC(7), ING Investments, LLC(5) and ING Pilgrim Funding, Inc. (December 2006 - Present). | ||||||||||||||||||
(1) Trustees serve until their successors are duly elected and qualified. The tenure of each Trustee is subject to the Board's retirement policy, which states that each Independent Trustee shall retire from service as a Trustee at the conclusion of the first regularly scheduled meeting of the Board that is held after (a) the Trustee reaches the age of 70, if that Trustee qualifies for a retirement benefit as discussed in the board's retirement policy; or (b) the Trustee reaches the age of 72 or has served as a Trustee for 15 years, whichever comes first, if that Trustee does not qualify for the retirement benefit. A unanimous vote of the Board may extend the retirement date of a Trustee for up to one year. An extension may be permitted if the retirement would trigger a requirement to hold a meeting of shareholders of the Fund under applicable law, whether for purposes of appointing a successor to the Trustee or if oth erwise necessary under applicable law, in which case the extension would apply until such time as the shareholder meeting can be held or is no longer needed.
(2) For the purposes of this table (except for Mr. Mathews),"Fund Complex" means the following investment companies: ING Asia Pacific High Dividend Equity Income Fund, ING Equity Trust; ING Funds Trust; ING Global Equity Dividend and Premium Opportunity Fund; ING Global Advantage and Premium Opportunity Fund; ING International High Dividend Equity Income Fund; ING Investors Trust; ING Mayflower Trust; ING Mutual Funds; ING Prime Rate Trust; ING Risk Managed Natural Resources Fund; ING Senior Income Fund; ING Separate Portfolios Trust; ING Variable Insurance Trust; ING Variable Products Trust; and ING Partners, Inc.
(3) For Mr. Mathews, the Fund Complex also includes the following investment companies: ING Series Fund, Inc.; ING Strategic Allocation Portfolios, Inc.; ING Variable Funds; ING Variable Portfolios, Inc.; ING VP Balanced Portfolio, Inc.; ING VP Intermediate Bond Portfolio; and ING VP Money Market Portfolio.
(4) Mr. Boyer held a seat on the Board of Directors of The Mark Twian House & Museum from September 1989 to November 2005. ING Groep N.V. makes non-material, charitable contributions to The Mark Twain House & Museum.
(5) Messrs. Mathews and Crispin are deemed to be "interested persons" of the Fund as defined in the 1940 Act because of their relationship with ING Groep, N.V., the parent corporation of the Manager, ING Investment Manager.
(6) ING Investments, LLC was previously named ING Pilgrim Investments, LLC. ING Pilgrim Investments, LLC is the successor in interest to ING Pilgrim Investments, Inc., which was previously known as Pilgrim Investments, Inc. and before that was known as Pilgrim America Investments, Inc.
(7) ING Funds Distributor, LLC is the successor in interest to ING Funds Distributor, Inc., which was previously known as ING Pilgrim Securities, Inc., and before that was known as Pilgrim Securities, Inc., and before that was known as Pilgrim America Securities, Inc.
(8) ING Funds Services, LLC was previously named ING Pilgrim Group, LLC. ING Pilgrim Group, LLC is the successor in interest to ING Pilgrim Group, Inc., which was previously known as Pilgrim Group, Inc. and before that was known as Pilgrim America Group, Inc.
42
TRUSTEE AND OFFICER INFORMATION (UNAUDITED) (CONTINUED)
| Name, Address and Age | Position(s) Held with the Trust | Term of Office and Length of Time Served(1) | Principal Occupation(s) - during the Past 5 Years | ||||||||||||
| Shaun P. Mathews(5) 7337 East Doubletree Ranch Rd. Scottsdale, Arizona 85258 Age: 53 | President and Chief Executive Officer | November 2006 - Present | President and Chief Executive Officer, ING Investments, LLC (November 2006 - Present). Formerly, President, ING Mutual Funds and Investment Products (November 2004 - November 2006); Chief Marketing Officer, ING USFS (April 2002 - October 2004); and Head of Rollover/Payout (October 2001- December 2003). | ||||||||||||
| Michael J. Roland 7337 East Doubletree Ranch Rd. Scottsdale, Arizona 85258 Age: 50 | Executive Vice President | February 2002 - Present | Head of Mutual Fund Platform (February 2007 - Present) and Executive Vice President, ING Investments, LLC(2) and ING Funds Services, LLC(3) (December 2001 - Present). Formerly, Executive Vice President, Head of Product Management (January 2005 - January 2007); Chief Compliance Officer, ING Investments, LLC(2) and Directed Services LLC(6) (October 2004 -December 2005); and Chief Financial Officer and Treasurer, ING Investments, LLC(2) (December 2001 - March 2005). | ||||||||||||
| Stanley D. Vyner 230 Park Avenue New York, New York 10169 Age: 58 | Executive Vice President | November 1999 - Present | Executive Vice President, ING Investments, LLC(2) (July 2000 - Present) and Chief Investment Risk Officer, ING Investments, LLC(2) (January 2003 - Present). | ||||||||||||
| Joseph M. O'Donnell 7337 East Doubletree Ranch Rd. Scottsdale, Arizona 85258 Age: 54 | Executive Vice President and Chief Compliance Officer | March 2006 - Present November 2004 - Present | Chief Compliance Officer of the ING Funds (November 2004 - Present) and Executive Vice President of the ING Funds (March 2006 - Present). Formerly, Chief Compliance Officer of ING Investments, LLC(2) (March 2006 - July 2008); Investment Advisor Chief Compliance Officer, Directed Services LLC(6) (March 2006 - July 2008) ING Life Insurance and Annuity Company (March 2006 - December 2006); and Vice President, Chief Legal Counsel, Chief Compliance Officer and Secretary of Atlas Securities, Inc., Atlas Advisers, Inc. and Atlas Funds (October 2001 - October 2004). | ||||||||||||
| Todd Modic 7337 East Doubletree Ranch Rd. Scottsdale, Arizona 85258 Age: 41 | Senior Vice President, Chief/Principal Financial Officer and Assistant Secretary | March 2005 - Present | Senior Vice President, ING Funds Services, LLC(3) (March 2005 - Present). Formerly, Vice President, ING Funds Services, LLC(3) (September 2002 - March 2005). | ||||||||||||
| Kimberly A. Anderson 7337 East Doubletree Ranch Rd. Scottsdale, Arizona 85258 Age: 44 | Senior Vice President | November 2003 - Present | Senior Vice President, ING Investments, LLC(2) (October 2003 - Present). | ||||||||||||
| Robert Terris 7337 East Doubletree Ranch Rd. Scottsdale, Arizona 85258 Age: 38 | Senior Vice President | May 2006 - Present | Senior Vice President, Head of Division Operations, ING Funds Services, LLC(3) (May 2006 - Present). Formerly, Vice President of Administration, ING Funds Services, LLC(3) (October 2001 - March 2006). | ||||||||||||
| Ernest J. C'DeBaca 7337 East Doubletree Ranch Rd. Scottsdale, Arizona 85258 Age: 39 | Senior Vice President | May 2006 - Present | Chief Compliance Officer, ING Investments, LLC(2) (July 2008 - Present); Investment Advisor Chief Compliance Officer, Directed Services LLC(6) (July 2008 - Present); Head of Retail Compliance, ING Funds Distributor, LLC(4) and ING Funds Services, LLC(3), (July 2008 - Present); and Senior Vice President, ING Investments, LLC(2) (December 2006 - Present), ING Funds Services, LLC(3) (April 2006 - Present), ING Funds Distributor, LLC(4) (July 2008 - Present), and Directed Services LLC(6) (July 2008 - Present). Formerly, Counsel, ING Americas, U.S. Legal Services (January 2004 - March 2006) and Attorney-Adviser, U.S. Securities and Exchange Commission (May 2001 - December 2003). | ||||||||||||
43
TRUSTEE AND OFFICER INFORMATION (UNAUDITED) (CONTINUED)
| Name, Address and Age | Position(s) Held with the Trust | Term of Office and Length of Time Served(1) | Principal Occupation(s) - during the Past 5 Years | ||||||||||||
| Robyn L. Ichilov 7337 East Doubletree Ranch Rd. Scottsdale, Arizona 85258 Age: 41 | Vice President and Treasurer | November 1999 - Present | Vice President and Treasurer, ING Funds Services, LLC(3) (November 1995 - Present) and ING Investments, LLC(2) (August 1997 - Present). | ||||||||||||
| Lauren D. Bensinger 7337 East Doubletree Ranch Rd. Scottsdale, Arizona 85258 Age: 54 | Vice President | February 2003 - Present | Vice President and Chief Compliance Officer, ING Funds Distributor, LLC(4) (August 1995 - Present); Vice President, ING Investments, LLC(2) and ING Funds Services, LLC(3) (February 1996 - Present); and Director of Compliance, ING Investments, LLC(2) (October 2004 - Present). Formerly, Chief Compliance Officer, ING Investments, LLC(2) (October 2001 - October 2004). | ||||||||||||
| William Evans 10 State House Square Hartford, Connecticut 06103 Age: 36 | Vice President | September 2007 - Present | Vice President, Head of Mutual Fund Advisory Group (April 2007 - Present). Formerly, Vice President, U.S. Mutual Funds and Investment Products (May 2005 - April 2007) and Senior Fund Analyst, U.S. Mutual Funds and Investment Products (May 2002 - May 2005). | ||||||||||||
| Maria M. Anderson 7337 East Doubletree Ranch Rd. Scottsdale, Arizona 85258 Age: 50 | Vice President | September 2004 - Present | Vice President, ING Funds Services, LLC(3) (September 2004 - Present). Formerly, Assistant Vice President, ING Funds Services, LLC(3) (October 2001 - September 2004). | ||||||||||||
| Denise Lewis 7337 East Doubletree Ranch Rd. Scottsdale, Arizona 85258 Age: 45 | Vice President | January 2007 - Present | Vice President, ING Funds Services, LLC (December 2006 - Present). Formerly, Senior Vice President, UMB Investment Services Group, LLC (November 2003 - December 2006). | ||||||||||||
| Kimberly K. Springer 7337 East Doubletree Ranch Rd. Scottsdale, Arizona 85258 Age: 51 | Vice President | March 2006 - Present | Vice President, ING Funds Services, LLC(3) (March 2006 - Present). Formerly, Assistant Vice President, ING Funds Services, LLC(3) (August 2004 - March 2006) and Manager, Registration Statements, ING Funds Services, LLC(3) (May 2003 - August 2004). | ||||||||||||
| Susan P. Kinens 7337 East Doubletree Ranch Rd. Scottsdale, Arizona 85258 Age: 32 | Assistant Vice President | February 2003 - Present | Assistant Vice President, ING Funds Services, LLC(3) (December 2002 - Present). | ||||||||||||
| Craig Wheeler 7337 East Doubletree Ranch Rd. Scottsdale, Arizona 85258 Age: 39 | Assistant Vice President | May 2008 - Present | Assistant Vice President - Director of Tax, ING Funds Services (March 2008 - Present). Formerly, Tax Manager, ING Funds Services (March 2005 - March 2008); Tax Senior , ING Funds Services (January 2004 - March 2005); and Tax Senior, KPMG LLP (August 2002 - December 2003). | ||||||||||||
| Huey P. Falgout, Jr. 7337 East Doubletree Ranch Rd. Scottsdale, Arizona 85258 Age: 45 | Secretary | August 2003 - Present | Chief Counsel, ING Americas, U.S. Legal Services (September 2003 - Present). | ||||||||||||
| Theresa K. Kelety 7337 East Doubletree Ranch Rd. Scottsdale, Arizona 85258 Age: 45 | Assistant Secretary | August 2003 - Present | Senior Counsel, ING Americas, U.S. Legal Services (April 2008 - Present). Formerly, Counsel, ING Americas, U.S. Legal Services (April 2003 - April 2008). | ||||||||||||
44
TRUSTEE AND OFFICER INFORMATION (UNAUDITED) (CONTINUED)
| Name, Address and Age | Position(s) Held with the Trust | Term of Office and Length of Time Served(1) | Principal Occupation(s) - during the Past 5 Years | ||||||||||||
| Kathleen Nichols 7337 East Doubletree Ranch Rd. Scottsdale, Arizona 85258 Age: 33 | Assistant Secretary | May 2008 - Present | Counsel, ING Americas, U.S. Legal Services (February 2008 - Present). Formerly, Associate, Ropes & Gray LLP (September 2005 - February 2008) | ||||||||||||
(1) The officers hold office until the next annual meeting of the Trustees and until their successors shall have been elected and qualified.
(2) ING Investments, LLC was previously named ING Pilgrim Investments, LLC. ING Pilgrim Investments, LLC is the successor in interest to ING Pilgrim Investments, Inc., which was previously known as Pilgrim Investments, Inc. and before that was known as Pilgrim America Investments, Inc.
(3) ING Funds Services, LLC was previously named ING Pilgrim Group, LLC. ING Pilgrim Group, LLC is the successor in interest to ING Pilgrim Group, Inc., which was previously known as Pilgrim Group, Inc. and before that was known as Pilgrim America Group, Inc.
(4) ING Funds Distributor, LLC is the successor in interest to ING Funds Distributor, Inc., which was previously known as ING Pilgrim Securities, Inc., and before that was known as Pilgrim Securities, Inc., and before that was known as Pilgrim America Securities, Inc.
(5) Mr. Mathews commenced services as CEO and President of the ING Funds on November 11, 2006.
(6) Directed Services, LLC is the successor in interest to Directed Services, Inc.
45
ADVISORY CONTRACT APPROVAL DISCUSSION (UNAUDITED)
BOARD CONSIDERATION AND RE-APPROVAL OF INVESTMENT ADVISORY AND SUB-ADVISORY CONTRACTS
Section 15(c) of the Investment Company Act of 1940, as amended (the "1940 Act") provides that, after an initial period, the Portfolios' existing investment advisory and sub-advisory contracts will remain in effect only if the Board of Trustees (the "Board") of ING Variable Products Trust (the "Trust"), including a majority of Board members who have no direct or indirect interest in the advisory and sub-advisory contracts, and who are not "interested persons" of the Portfolios, as such term is defined under the 1940 Act (the "Independent Trustees"), annually review and approve them. Thus, at a meeting held on November 14, 2008, the Board, including a majority of the Independent Trustees, considered whether to renew the investment advisory contracts (the "Advisory Contracts") between ING Investments, LLC (the "Adviser") and the sub-advisory contracts ("Sub-Advisory Contracts") with ING Investment Management Co., the sub-adviser to each Portfo lio ("ING IM").
The Independent Trustees also held separate meetings on October 24 and November 12, 2008 to consider the renewal of the Advisory and Sub-Advisory Contracts. As a result, subsequent references herein to factors considered and determinations made by the Independent Trustees include, as applicable, factors considered and determinations made on those earlier dates by the Independent Trustees.
At its November 14, 2008 meeting, the Board voted to renew the Advisory and Sub-Advisory Contracts for the Portfolios. In reaching these decisions, the Board took into account information furnished to it throughout the year at regular meetings of the Board and the Board's committees, as well as information prepared specifically in connection with the annual renewal process. Determinations by the Independent Trustees also took into account various factors that they believed, in light of the legal advice furnished to them by K&L Gates LLP ("K&L Gates"), their independent legal counsel, and their own business judgment, to be relevant. Further, while the Advisory and Sub-Advisory Contracts for all the Portfolios were considered at the same Board meeting, the Trustees considered each Portfolio's advisory and sub-advisory relationships separately.
Provided below is an overview of the Board's contract approval process in general, as well as a discussion of certain specific factors that the Board considered at its renewal meeting. While the Board gave its attention to the information furnished, at its request, that was most relevant to its considerations, discussed below are a number of the primary factors relevant to the Board's consideration as to whether to renew the Advisory and Sub-Advisory Contracts for the one-year period ending November 30, 2009. Each Board member may have accorded different weight to the various factors in reaching his or her conclusions with respect to each Portfolio's advisory and sub-advisory arrangements.
Overview of the Contract Renewal and Approval Process
Several years ago, the Independent Trustees instituted a revised process by which they seek and consider relevant information when they decide whether to approve new or existing advisory and sub-advisory arrangements for the investment companies in the ING Funds complex under their jurisdiction, including the Portfolios' existing Advisory and Sub-Advisory Contracts. Among other actions, the Independent Trustees: retained the services of independent consultants with experience in the mutual fund industry to assist the Independent Trustees in working with the personnel employed by the Adviser or its affiliates who administer the Portfolios ("Management") to identify the types of information presented to the Board to inform its deliberations with respect to advisory and sub-advisory relationships and to help evaluate that information; established a specific format in which certain requested information is provided to the Board; and determined t he process for reviewing such information in connection with advisory and sub-advisory contract renewals and approvals. The end result was an enhanced process which is currently employed by the Independent Trustees to review and analyze information in connection with their annual renewal of the ING Funds' advisory and sub-advisory contracts, as well as their review and approval of new advisory relationships.
Since the current renewal and approval process was first implemented, the Board's membership has changed substantially through periodic retirements of some Trustees and the appointment and election of new Trustees. In addition, throughout this period the Independent Trustees have reviewed and refined the renewal and approval process at least annually. The Board also established a Contracts Committee and two Investment Review Committees ("IRCs"). Among other matters, the Contracts Committee provides oversight with respect to the contracts renewal process, and each Portfolio is assigned to an IRC, which provides oversight regarding, among other matters, investment performance.
46
ADVISORY CONTRACT APPROVAL DISCUSSION (UNAUDITED) (CONTINUED)
The type and format of the information provided to the Board or to legal counsel for the Independent Trustees in connection with the contract approval and renewal process has been codified in the Portfolios' 15(c) Methodology Guide. This Guide was developed under the direction of the Independent Trustees and sets out a blueprint pursuant to which the Independent Trustees request certain information that they deem important to facilitate an informed review in connection with initial and annual approvals of advisory and sub-advisory contracts.
Management provides certain of the information requested by the 15(c) Methodology Guide in Fund Analysis and Comparison Tables ("FACT sheets") prior to the Independent Trustees' review of advisory and sub-advisory arrangements (including the Portfolios' Advisory and Sub-Advisory Contracts). The Independent Trustees previously retained an independent firm to verify and test the accuracy of certain FACT sheet data for a representative sample of funds in the ING Funds complex. In addition, in 2007 and 2008, the Contracts Committee employed the services of an independent consultant to assist in its review and analysis of, among other matters, the 15(c) Methodology Guide, the content and format of the FACT sheets, and proposed Selected Peer Groups of investment companies ("SPGs") to be used by the Portfolios for certain comparison purposes during the renewal process.
As part of an ongoing process, the Contracts Committee recommends or considers recommendations from Management for refinements to the 15(c) Methodology Guide and other aspects of the review process, and the Board's IRCs review benchmarks used to assess the performance of the funds in the ING Funds complex. The Investment Review Committees may apply a heightened level of scrutiny in cases where performance has lagged an ING Fund's relevant benchmark and/or SPG.
The Board employed its process for reviewing contracts when considering the renewals of the Portfolios' Advisory and Sub-Advisory Contracts that would be effective through November 30, 2009. Set forth below is a discussion of many of the Board's primary considerations and conclusions resulting from this process.
Nature, Extent and Quality of Service
In determining whether to approve the Advisory and Sub-Advisory Contracts for the Portfolios for the year ending November 30, 2009, the Independent Trustees received and evaluated such information as they deemed necessary regarding the nature, extent and quality of services provided to the Portfolios by the Adviser and ING IM. This included information regarding the Adviser and ING IM provided throughout the year at regular meetings of the Board and its committees, as well as information furnished in connection with the contract renewal meetings.
The materials requested by and provided to the Board and/or to K&L Gates prior to the November 14, 2008 Board meeting included, among other information, the following items for each Portfolio: (1) FACT sheets that provided information regarding the performance and expenses of the Portfolio and other similarly managed funds in its SPG, as well as information regarding the Portfolio's investment portfolio, objective and strategies; (2) reports providing risk and attribution analyses of the Portfolio; (3) the 15(c) Methodology Guide, which describes how the FACT sheets were prepared, including the manner in which each Portfolio's benchmark and SPG were selected and how profitability was determined; (4) responses from the Adviser and ING IM to a series of questions posed by K&L Gates on be half of the Trustees; (5) copies of the forms of Advisory Contract and Sub-Advisory Contract; (6) copies of the Forms ADV for the Adviser and ING IM; (7) financial statements for the Adviser and ING IM; (8) a draft of a narrative summary addressing key factors the Board customarily considers in evaluating the renewals of the ING Funds' (including the Portfolios') advisory contracts and sub-advisory contracts, including a written analysis for the Portfolio of how performance, fees and expenses compare to its SPG and/or designated benchmark; (9) independent analyses of Portfolio performance by the Trust's Chief Investment Risk Officer; (10) information regarding net asset flows into and out of the Portfolio; and (11) other information relevant to the Board's evaluations.
For each Portfolio, Class I shares were used for purposes of certain comparisons between the Portfolios and their SPGs. Class I shares generally were selected so that a Portfolio's share class with the longest performance history was compared to the analogous class of shares for each fund in its SPG. The mutual funds included in the Portfolios' SPGs were selected based upon criteria designed to mirror the Portfolio share class being compared to the SPG.
In arriving at its conclusions with respect to the Advisory Contracts, the Board was mindful of the "manager-of-managers" platform of the ING Funds that has been developed by Management. The Board also considered the techniques that the Adviser has
47
ADVISORY CONTRACT APPROVAL DISCUSSION (UNAUDITED) (CONTINUED)
developed, at the Board's direction, to screen and perform due diligence on sub-advisers that are recommended to the Board to manage the investment portfolios of the funds in the ING Funds complex. The Board noted the resources that the Adviser has committed to the Board and the IRCs to assist the Board and the IRCs with their assessment of the investment performance of the Portfolios on an ongoing basis throughout the year. This includes the appointment of a Chief Investment Risk Officer and his staff, who report directly to the Board and who have developed attribution analyses and other metrics used by the Board's Investment Review Committees to analyze the key factors underlying investment performance for the funds in the ING Funds complex.
The Board also noted the techniques used by the Adviser to monitor the performance of ING IM and the proactive approach that the Adviser, working in cooperation with the IRCs, has taken to advocate or recommend, when it believed appropriate, changes designed to assist in improving the Portfolios' performance.
In considering the Portfolios' Advisory Contracts, the Board also considered the extent of benefits provided to the Portfolios' shareholders, beyond advisory services, from being part of the ING family of funds. This includes, in most cases, the right to exchange or transfer investments, without a sales charge, between the same class of shares of such funds or among ING Funds available on a product platform, and the wide range of ING Funds available for exchange or transfer. The Board also took into account the Adviser's efforts in recent years to reduce the expenses of the ING Funds through renegotiated arrangements with the ING Funds' service providers.
Further, the Board received periodic reports showing that the investment policies and restrictions for each Portfolio were consistently complied with and other periodic reports covering matters such as compliance by Adviser and ING IM personnel with codes of ethics. The Board considered reports from the Trust's Chief Compliance Officer ("CCO") evaluating whether the regulatory compliance systems and procedures of the Adviser and ING IM are reasonably designed to assure compliance with the federal securities laws, including those related to, among others, late trading and market timing, best execution, fair value pricing, proxy voting and trade allocation practices. The Board also took into account the CCO's annual and periodic reports and recommendations with respect to service provider compliance programs. In this regard, the Board also considered the policies and procedures developed by the CCO in consultation with the Board's Compliance C ommittee that guide the CCO's compliance oversight function.
The Board reviewed the level of staffing, quality and experience of each Portfolio's portfolio management team. The Board took into account the respective resources and reputations of the Adviser and ING IM, and evaluated the ability of the Adviser and ING IM to attract and retain qualified investment advisory personnel. The Board also considered the adequacy of the resources committed to the Portfolios (and other relevant funds in the ING Funds complex) by the Adviser and ING IM, and whether those resources are commensurate with the needs of the Portfolios and are sufficient to sustain appropriate levels of performance and compliance needs.
Based on their deliberations and the materials presented to them, the Board concluded that the advisory and related services provided by the Adviser and ING IM are appropriate in light of the Portfolios' operations, the competitive landscape of the investment company business, and investor needs, and that the nature and quality of the overall services provided by the Adviser and ING IM were appropriate.
Portfolio Performance
In assessing advisory and sub-advisory relationships, the Board placed emphasis on the net investment returns of each Portfolio. While the Board considered the performance reports and discussions with portfolio managers at Board and committee meetings during the year, particular attention in assessing performance was given to the FACT sheets furnished in connection with the renewal process. The FACT sheet prepared for each Portfolio included its investment performance compared to the Portfolio's Morningstar category median, Lipper category median, SPG and primary benchmark. The FACT sheet performance data was as of June 30, 2008. In addition, the Board also considered at its November 14, 2008 meeting certain additional data regarding performance and Portfolio asset levels as of October 31, 2008. The Board's findings specific to each Portfolio's performance are discussed below.
Economies of Scale
When evaluating the reasonableness of advisory fee rates, the Board also considered whether economies of scale will be realized by the Adviser as a Portfolio grows larger and the extent to which any such economies are reflected in contractual fee rates. In this regard, the Board noted any breakpoints in advisory fee schedules that resulted in a lower
48
ADVISORY CONTRACT APPROVAL DISCUSSION (UNAUDITED) (CONTINUED)
advisory fee rate because a Portfolio achieved sufficient asset levels to receive a breakpoint discount. In the case of sub-advisory fees, the Board considered that breakpoints would inure to the benefit of the Adviser, except to the extent that there are corresponding advisory fee breakpoints or waivers. For a Portfolio that did not have advisory fee breakpoints, but did benefit from waivers or reimbursements of advisory or other fees, the Board also considered the extent to which economies of scale could be realized through waivers, reimbursements or expense reductions.
In evaluating economies of scale, the Independent Trustees also considered prior periodic management reports and industry information on this topic, and the Independent Trustees who were Board members at that time also considered a November 2006 evaluation and analysis presented to them by an independent consultant regarding fee breakpoint arrangements and economies of scale.
The Board also considered that many of the Portfolios had experienced material declines in assets, especially during October 2008, due to general market declines precipitated by the credit crises and other generally adverse market developments. As a result of these asset declines, the Board considered that there were fewer opportunities to realize economies of scale.
Information Regarding Services to Other Clients
The Board requested and considered information regarding the nature of services and fee rates offered by the Adviser and ING IM to other clients, including other registered investment companies and institutional accounts. When fee rates offered to other clients differed materially from those charged to the Portfolios, the Board considered any underlying rationale provided by the Adviser or ING IM for these differences. The Board also noted that the fee rates charged to the Portfolios and other institutional clients of the Adviser or ING IM (including other investment companies) may differ materially due to, among other reasons: differences in services; different regulatory requirements associated with registered investment companies, such as the Portfolios, as compared to non-registered investment company clients; market differences in fee rates that existed when a Portfolio first was organized; differences in the original sponsors of Portfo lios that now are managed by the Adviser; investment capacity constraints that existed when certain contracts were first agreed upon or that might exist at present; and different pricing structures that are necessary to be competitive in different marketing channels.
Fee Rates and Profitability
The Board reviewed and considered each contractual investment advisory fee rate, combined with the administrative fee rate, payable by each Portfolio to the Adviser. The Board also considered the contractual sub-advisory fee rate payable by the Adviser to ING IM for sub-advisory services for each Portfolio. In addition, the Board considered fee waivers and expense limitations applicable to the fees payable by the Portfolios.
The Board considered the fee structure of each Portfolio as it relates to the services provided under the contracts and the potential fall-out benefits to the Adviser and ING IM and their respective affiliates from their association with the Portfolios. For each Portfolio, the Board determined that the fees payable to the Adviser and ING IM are reasonable for the services that each performs, which were considered in light of the nature and quality of the services that each has performed and is expected to perform.
For each Portfolio, the Board considered information on revenues, costs and profits realized by the Adviser, which was prepared by Management in accordance with the allocation methodology (including related assumptions) specified in the 15(c) Methodology Guide. In analyzing the profitability of the Adviser in connection with its services to a Portfolio, the Board took into account the sub-advisory fee rate payable by the Adviser to ING IM. The Board also considered information that it requested and was provided by Management with respect to the profitability of service providers affiliated with the Adviser, as well as information provided by ING IM with respect to its profitability. Further, the Board considered that the decline in asset levels of many Portfolios caused by recent adverse econo mic conditions was likely to cause a similar decline in any profits realized by the Adviser and ING IM.
The Board determined that it had requested and received sufficient information to gain a reasonable understanding regarding the Adviser's and ING IM's profitability. The Board also recognized that profitability analysis is not an exact science and there is no uniform methodology for determining profitability for this purpose. In this context, the Board realized that Management's calculations regarding its costs incurred in establishing the infrastructure necessary for the Portfolios' operations may not be fully reflected in the expenses allocated to each Portfolio in determining profitability, and that the information presented may not portray all of the costs borne by Management or capture
49
ADVISORY CONTRACT APPROVAL DISCUSSION (UNAUDITED) (CONTINUED)
Management's entrepreneurial risk associated with offering and managing a mutual fund complex in the current regulatory and market environment.
Based on the information on revenues, costs, and profitability considered by the Board, and after considering the factors described in this section, the Board concluded that the profits, if any, realized by the Adviser and ING IM were not excessive. In making its determinations, the Board based its conclusions on the reasonableness of the advisory and sub-advisory fees of the Adviser and ING IM primarily on the factors described for each Portfolio below.
Portfolio-by-Portfolio Analysis
The following paragraphs outline certain of the specific factors that the Board considered, and the conclusions reached, at its November 14, 2008 meeting in relation to renewing each Portfolio's current Advisory and Sub-Advisory Contracts for the year ending November 30, 2009. These specific factors are in addition to those considerations discussed above. In each case, the Portfolio's performance was compared to its Morningstar category median and its primary benchmark, a broad-based securities market index that appears in the Portfolio's prospectus. With respect to Morningstar quintile rankings, the first quintile represents the highest (best) performance and the fifth quintile represents the lowest performance. Each Portfolio's management fee and expense ratio were compared to the fees and expense ratios of the funds in its SPG.
ING VP MidCap Opportunities Portfolio
In considering whether to approve the renewal of the Advisory and Sub-Advisory Contracts for ING VP MidCap Opportunities Portfolio, the Board considered that, based on performance data for the periods ended June 30, 2008: (1) the Portfolio outperformed its Morningstar category median for all periods presented with the exception of the most recent calendar quarter, during which it underperformed; (2) the Portfolio outperformed its primary benchmark for all periods presented with the exception of the most recent calendar quarter, during which it underperformed; and (3) the Portfolio is ranked in the first (highest) quintile of its Morningstar category for the one-year and three-year periods, the second quintile for the year-to-date and five-year periods, and the fourth quintile for the most recent calendar quarter.
In considering the fees payable under the Advisory and Sub-Advisory Contracts for the Portfolio, the Board took into account the factors described above and also considered: (1) the economies of scale benefits to the Portfolio and its shareholders from breakpoint discounts applicable to the Portfolio's advisory fees, which result in lower fees at higher asset levels; and (2) the pricing structure (including the expense ratio to be borne by shareholders) of the Portfolio, as compared to its SPG, including that: (a) the management fee (inclusive of a 0.10% administration fee) for the Portfolio is above the median and the average management fees of the funds in its SPG; and (b) the expense ratio for the Portfolio is below the median and the average expense ratios of the funds in its SPG.
In analyzing this fee data, the Board took into account: (1) in January 2008, at the Board's direction, Management lowered the Portfolio's expense limits; and (2) in April 2008, Management added breakpoints to the Portfolio's advisory and sub-advisory fees.
After its deliberation, the Board reached the following conclusions: (1) the Portfolio's management fee rate is reasonable in the context of all factors considered by the Board; and (2) the Portfolio's expense ratio is reasonable in the context of all factors considered by the Board; (3) the Portfolio's performance is reasonable in the context of all factors considered by the Board; and (4) the sub-advisory fee rate payable by the Adviser to ING IM is reasonable in the context of all factors considered by the Board. Based on these conclusions and other factors, the Board voted to renew the Advisory and Sub-Advisory Contracts for the Portfolio for the year ending November 30, 2009. During this renewal process, different Board members may have given different weight to different individual factors and related conclusions.
ING VP SmallCap Opportunities Portfolio
In considering whether to approve the renewal of the Advisory and Sub-Advisory Contracts for ING VP SmallCap Opportunities Portfolio, the Board considered that, based on performance data for the periods ended June 30, 2008: (1) the Portfolio outperformed its Morningstar category median for all periods presented; (2) the Portfolio outperformed its primary benchmark for all periods presented; and (3) the Portfolio is ranked in the first (highest) quintile of its Morningstar category for the year-to-date, one-year, three-year, and ten-year periods, and the second quintile for the most recent calendar quarter and five-year periods.
In considering the fees payable under the Advisory and Sub-Advisory Contracts for the Portfolio, the
50
ADVISORY CONTRACT APPROVAL DISCUSSION (UNAUDITED) (CONTINUED)
Board took into account the factors described above and also considered: (1) the fairness of the compensation under an Advisory Contract with a breakpoint fee schedule where the asset level necessary to achieve a breakpoint discount had not been reached by the Portfolio; (2) the pricing structure (including the expense ratio to be borne by shareholders) of the Portfolio, as compared to its SPG, including that: (a) the management fee (inclusive of 0.10% administration fee) for the Portfolio is below the median and the average management fees of the funds in its SPG; and (b) the expense ratio for the Portfolio is below the median and the average expense ratios of the funds in its SPG.
After its deliberation, the Board reached the following conclusions: (1) the Portfolio's management fee rate is reasonable in the context of all factors considered by the Board; (2) the Portfolio's expense ratio is reasonable in the context of all factors considered by the Board; (3) the Portfolio's performance is reasonable in the context of all factors considered by the Board; and (4) the sub-advisory fee rate payable by the Adviser to ING IM is reasonable in the context of all factors considered by the Board. Based on these conclusions and other factors, the Board voted to renew the Advisory and Sub-Advisory Contracts for the Portfolio for the year ending November 30, 2009. During this renewal process, different Board members may have given different weight to different individual factors and related conclusions.
ING VP International Value Portfolio
In considering whether to approve the renewal of the Advisory and Sub-Advisory Contracts for ING VP International Value Portfolio, the Board considered that, based on performance data for the periods ended June 30, 2008: (1) the Portfolio outperformed its Morningstar category median for all periods presented, with the exception of the five-year period, during which it underperformed; (2) the Portfolio outperformed its primary benchmark for all periods presented, with the exception of the year-to-date and five-year periods, during which it underperformed; and (3) the Portfolio is ranked in the first (highest) quintile of its Morningstar category for the one-year, three-year, and ten-year periods, the second quintile for the most recent calendar quarter and year-to-date periods, and the fourth quintile for the five-year period.
In analyzing this performance data, the Board took into account that, since a change of portfolio managers in December 2006, the Portfolio's performance has improved.
In considering the fees payable under the Advisory and Sub-Advisory Contracts for the Portfolio, the Board took into account the factors described above and also considered: (1) the fairness of the compensation under an Advisory Contract with level fees that does not include breakpoints; and (2) the pricing structure (including the expense ratio to be borne by shareholders) of the Portfolio, as compared to its SPG, including that: (a) the management fee (inclusive of a 0.10% administration fee) for the Portfolio is above the median and the average management fees of the funds in its SPG; and (b) the expense ratio for the Portfolio is above the median and the average expense ratios of the funds in its SPG.
In analyzing this fee data the Board noted that, in January 2008, at the Board's direction Management lowered the Portfolio's Advisory Fee rate.
After its deliberation, the Board reached the following conclusions: (1) the Portfolio's management fee rate is reasonable in the context of all factors considered by the Board; (2) the Portfolio's expense ratio is reasonable in the context of all factors considered by the Board; (3) the Portfolio's performance is reasonable in the context of all factors considered by the Board; and (4) the sub-advisory fee rate payable by the Adviser to ING IM is reasonable in the context of all factors considered by the Board. Based on these conclusions and other factors, the Board voted to renew the Advisory and Sub-Advisory Contracts for the Portfolio for the year ending November 30, 2009. During this renewal process, different Board members may have given different weight to different individual factors and related conclusions.
51
Investment Adviser
ING Investments, LLC
7337 East Doubletree Ranch Road
Scottsdale, Arizona 85258
Administrator
ING Funds Services, LLC
7337 East Doubletree Ranch Road
Scottsdale, Arizona 85258
Transfer Agent
DST Systems, Inc.
P.O. Box 419368
Kansas City, Missouri 64141
Independent Registered Public Accounting Firm
KPMG LLP
99 High Street
Boston, Massachusetts 02110
Custodian
The Bank of New York Mellon
One Wall Street
New York, New York 10286
Legal Counsel
Dechert LLP
1775 I Street, N.W.
Washington, D.C. 20006
Before investing, carefully consider the investment objectives, risks, charges and expenses of the variable universal life insurance policy or variable annuity contract and the underlying variable investment options. This and other information is contained in the prospectus for the variable universal life policy or variable annuity contract and the underlying variable investment options. Obtain these prospectuses from your agent/registered representative and read them carefully before investing.
VPAR-UVPTADVIS (1208-022409)

Item 2. Code of Ethics.
As of the end of the period covered by this report, Registrant had adopted a code of ethics, as defined in Item 2 of Form N-CSR, that applies to the Registrant’s principal executive officer and principal financial officer. There were no amendments to the Code during the period covered by the report. The Registrant did not grant any waivers, including implicit waivers, from any provisions of the Code during the period covered by this report. The code of ethics is filed herewith pursuant to Item 10(a)(1), Exhibit 99.CODE ETH.
Item 3. Audit Committee Financial Expert.
The Board of Trustees has determined that J. Michael Earley and Peter Drotch are audit committee financial experts, as defined in Item 3 of Form N-CSR. Mr. Earley and Mr. Drotch are “independent” for purposes of Item 3 of Form N-CSR.
Item 4. Principal Accountant Fees and Services.
(a) | Audit Fees: The aggregate fees billed for each of the last two fiscal years for professional services rendered by KPMG LLP (“KPMG”), the principal accountant for the audit of the registrant’s annual financial statements, for services that are normally provided by the accountant in connection with statutory and regulatory filings or engagements for those fiscal years were $51,000 for year ended December 31, 2008 and $102,000 for year ended December 31, 2007. |
|
|
(b) | Audit-Related Fees: The aggregate fees billed in each of the last two fiscal years for assurance and related services by KPMG that are reasonably related to the performance of the audit of the registrant’s financial statements and are not reported under paragraph (a) of this Item were $12,900 for year ended December 31, 2008 and $12,450 for year ended December 31, 2007. |
|
|
(c) | Tax Fees: The aggregate fees billed in each of the last two fiscal years for professional services rendered by KPMG for tax compliance, tax advice, and tax planning were $25,913 in the year ended December 31, 2008 and $25,607 in the year ended December 31, 2007. Such services included review of excise distribution calculations (if applicable), preparation of the Funds’ federal, state and excise tax returns, tax services related to mergers and routine consulting. |
|
|
(d) | All Other Fees: The aggregate fees billed in each of the last two fiscal years for products and services provided by KPMG, other than the services reported in paragraphs (a) through (c) of this Item were $10,000 in the year ended December 31, 2008 and $0 in the year ended December 31, 2007. |
|
|
| (e)(1) Audit Committee Pre-Approval Policies and Procedures |
2
AUDIT AND NON-AUDIT SERVICES
PRE-APPROVAL POLICY
I. Statement of Principles
Under the Sarbanes-Oxley Act of 2002 (the “Act”), the Audit Committee of the Board of Directors or Trustees (the “Committee”) of the ING Funds (each a “Fund,” collectively, the “Funds”) set out on Exhibit A to this Audit and Non-Audit Services Pre-Approval Policy (“Policy”) is responsible for the oversight of the work of the Funds’ independent auditors. As part of its responsibilities, the Committee must pre-approve the audit and non-audit services performed by the auditors in order to assure that the provision of these services does not impair the auditors’ independence from the Funds. The Committee has adopted, and the Board has ratified, this Policy, which sets out the procedures and conditions under which the services of the independent auditors may be pre-approved.
Under Securities and Exchange Commission (“SEC”) rules promulgated in accordance with the Act, the Funds may establish two different approaches to pre-approving audit and non-audit services. The Committee may approve services without consideration of specific case-by-case services (“general pre-approval”) or it may pre-approve specific services (“specific pre-approval”). The Committee believes that the combination of these approaches contemplated in this Policy results in an effective and efficient method for pre-approving audit and non-audit services to be performed by the Funds’ independent auditors. Under this Policy, services that are not of a type that may receive general pre-approval require specific pre-approval by the Committee. Any proposed services that exceed pre-approved cost levels or budgeted amounts will also require the Committee’s specific pre-approval.
For both types of approval, the Committee considers whether the subject services are consistent with the SEC’s rules on auditor independence and that such services are compatible with maintaining the auditors independence. The Committee also considers whether a particular audit firm is in the best position to provide effective and efficient services to the Funds. Reasons that the auditors are in the best position include the auditors’ familiarity with the Funds’ business, personnel, culture, accounting systems, risk profile, and other factors, and whether the services will enhance the Funds’ ability to manage and control risk or improve audit quality. Such factors will be considered as a whole, with no one factor being determinative.
The appendices attached to this Policy describe the audit, audit-related, tax-related, and other services that have the Committee’s general pre-approval. For any service that has been approved through general pre-approval, the general pre-approval will remain in place for a period 12 months from the date of pre-approval, unless the Committee determines that a different period is appropriate. The Committee will annually review and pre-approve the services that may be provided by the independent auditors without specific pre-approval. The Committee will revise the list of services subject to general pre-approval as appropriate. This Policy does not serve as a delegation to Fund management of the Committee’s duty to pre-approve services performed by the Funds’ independent auditors.
3
II. Audit Services
The annual audit services engagement terms and fees are subject to the Committee’s specific pre-approval. Audit services are those services that are normally provided by auditors in connection with statutory and regulatory filings or engagements or those that generally only independent auditors can reasonably provide. They include the Funds’ annual financial statement audit and procedures that the independent auditors must perform in order to form an opinion on the Funds’ financial statements (e.g., information systems and procedural reviews and testing). The Committee will monitor the audit services engagement and approve any changes in terms, conditions or fees deemed by the Committee to be necessary or appropriate.
The Committee may grant general pre-approval to other audit services, such as statutory audits and services associated with SEC registration statements, periodic reports and other documents filed with the SEC or issued in connection with securities offerings.
The Committee has pre-approved the audit services listed on Appendix A. The Committee must specifically approve all audit services not listed on Appendix A.
III. Audit-related Services
Audit-related services are assurance and related services that are reasonably related to the performance of the audit or the review of the Funds’ financial statements or are traditionally performed by the independent auditors. The Committee believes that the provision of audit-related services will not impair the independent auditors’ independence, and therefore may grant pre-approval to audit-related services. Audit-related services include accounting consultations related to accounting, financial reporting or disclosure matters not classified as “audit services;” assistance with understanding and implementing new accounting and financial reporting guidance from rulemaking authorities; agreed-upon or expanded audit procedures relating to accounting and/or billing records required to respond to or comply with financial, accounting or regulatory reporting matters; and assistance with internal control reporting requirements under Form N-SAR or Form N-CSR.
The Committee has pre-approved the audit-related services listed on Appendix B. The Committee must specifically approve all audit-related services not listed on Appendix B.
IV. Tax Services
The Committee believes the independent auditors can provide tax services to the Funds, including tax compliance, tax planning, and tax advice, without compromising the auditors’ independence. Therefore, the Committee may grant general pre-approval with respect to tax services historically provided by the Funds’ independent auditors that do not, in the Committee’s view, impair auditor independence and that are consistent with the SEC’s rules on auditor independence.
The Committee will not grant pre-approval if the independent auditors initially recommends a transaction the sole business purpose of which is tax avoidance and the tax treatment of which may not be supported in the Internal Revenue Code and related regulations. The Committee may consult
4
outside counsel to determine that tax planning and reporting positions are consistent with this Policy.
The Committee has pre-approved the tax-related services listed on Appendix C. The Committee must specifically approve all tax-related services not listed on Appendix C.
V. Other Services
The Committee believes it may grant approval of non-audit services that are permissible services for independent auditors to a Fund. The Committee has determined to grant general pre-approval to other services that it believes are routine and recurring, do not impair auditor independence, and are consistent with SEC rules on auditor independence.
The Committee has pre-approved the non-audit services listed on Appendix D. The Committee must specifically approve all non-audit services not listed on Appendix D.
A list of the SEC’s prohibited non-audit services is attached to this Policy as Appendix E. The SEC’s rules and relevant guidance should be consulted to determine the precise definitions of these impermissible services and the applicability of exceptions to certain of the SEC’s prohibitions.
VI. Pre-approval of Fee levels and Budgeted Amounts
The Committee will annually establish pre-approval fee levels or budgeted amounts for audit, audit-related, tax and non-audit services to be provided to the Funds by the independent auditors. Any proposed services exceeding these levels or amounts require the Committee’s specific pre-approval. The Committee considers fees for audit and non-audit services when deciding whether to pre-approve services. The Committee may determine, for a pre-approval period of 12 months, the appropriate ratio between the total amount of fees for the Fund’s audit, audit-related, and tax services (including fees for services provided to Fund affiliates that are subject to pre-approval), and the total amount of fees for certain permissible non-audit services for the Fund classified as other services (including any such services provided to Fund affiliates that are subject to pre-approval).
VII. Procedures
Requests or applications for services to be provided by the independent auditors will be submitted to management. If management determines that the services do not fall within those services generally pre-approved by the Committee and set out in the appendices to these procedures, management will submit the services to the Committee or its delagee. Any such submission will include a detailed description of the services to be rendered. Notwithstanding this paragraph, the Committee will, on a quarterly basis, receive from the independent auditors a list of services provided for the previous calendar quarter on a cumulative basis by the auditors during the Pre-Approval Period.
5
VIII. Delegation
The Committee may delegate pre-approval authority to one or more of the Committee’s members. Any member or members to whom such pre-approval authority is delegated must report any pre-approval decisions, including any pre-approved services, to the Committee at its next scheduled meeting. The Committee will identify any member to whom pre-approval authority is delegated in writing. The member will retain such authority for a period of 12 months from the date of pre-approval unless the Committee determines that a different period is appropriate. The period of delegated authority may be terminated by the Committee or at the option of the member.
IX. Additional Requirements
The Committee will take any measures the Committee deems necessary or appropriate to oversee the work of the independent auditors and to assure the auditors’ independence from the Funds. This may include reviewing a formal written statement from the independent auditors delineating all relationships between the auditors and the Funds, consistent with Independence Standards Board No. 1, and discussing with the auditors their methods and procedures for ensuring independence.
Last Approved: November 29, 2007
6
Appendix A
Pre-Approved Audit Services for the Pre-Approval Period January 1, 2008 through December 31, 2008
Service
|
| The Fund(s) |
| Fee Range |
|
|
|
|
|
Statutory audits or financial audits (including tax services associated with audit services) |
| x |
| As presented to Audit Committee(1) |
|
|
|
|
|
Services associated with SEC registration statements, periodic reports and other documents filed with the SEC or other documents issued in connection with securities offerings (e.g., consents), and assistance in responding to SEC comment letters. |
| x |
| Not to exceed $9,750 per filing |
|
|
|
|
|
Consultations by Fund management with respect to accounting or disclosure treatment of transactions or events and/or the actual or potential effect of final or proposed rules, standards or interpretations by the SEC, Financial Accounting Standards Board, or other regulatory or standard setting bodies. |
| x |
| Not to exceed $8,000 during the Pre-Approval Period |
|
|
|
|
|
Seed capital audit and related review and issuance of consent on the N-2 registration statement |
| x |
| Not to exceed $12,600 per audit |
(1) | For new Funds launched during the Pre-Approval Period, the fee ranges pre-approved will be the same as those for existing Funds, pro-rated in accordance with inception dates as provided in the auditors’ Proposal or any Engagement Letter covering the period at issue. Fees in the Engagement Letter will be controlling. |
7
Appendix B
Pre-Approved Audit-Related Services for the Pre-Approval Period January 1, 2008 through December 31, 2008
Service
|
| The Fund(s) |
| Fund Affiliates |
| Fee Range |
|
|
|
|
|
|
|
Services related to Fund mergers (Excludes tax services - See Appendix C for tax services associated with Fund mergers) |
| x |
| x |
| Not to exceed $10,000 per merger |
|
|
|
|
|
|
|
Consultations by Fund management with respect to accounting or disclosure treatment of transactions or events and/or the actual or potential effect of final or proposed rules, standards or interpretations by the SEC, Financial Accounting Standards Board, or other regulatory or standard setting bodies. [Note: Under SEC rules some consultations may be “audit” services and others may be “audit-related” services.] |
| x |
|
|
| Not to exceed $5,000 per occurrence during the Pre-Approval Period |
|
|
|
|
|
|
|
Review of the Funds’ semi-annual financial statements |
| x |
|
|
| Not to exceed $2,200 per set of financial statements per fund |
|
|
|
|
|
|
|
Reports to regulatory or government agencies related to the annual engagement |
| x |
|
|
| Up to $5,000 per occurrence during the Pre-Approval Period |
|
|
|
|
|
|
|
Regulatory compliance assistance |
| x |
| x |
| Not to exceed $5,000 per quarter |
|
|
|
|
|
|
|
Training courses |
|
|
| x |
| Not to exceed $2,000 per course |
|
|
|
|
|
|
|
For Prime Rate Trust, agreed upon procedures for quarterly reports to rating agencies |
| x |
|
|
| Not to exceed $9,450 per quarter |
|
|
|
|
|
|
|
For Prime Rate Trust and Senior Income Fund, agreed upon procedures for the Revolving Credit and Security Agreement with Citigroup |
| x |
|
|
| Not to exceed $21,000 per fund per year |
8
Appendix C
Pre-Approved Tax Services for the Pre-Approval Period January 1, 2008 through December 31, 2008
Service
|
| The Fund(s) |
| Fund |
| Fee Range |
|
|
|
|
|
|
|
Preparation of federal and state income tax returns and federal excise tax returns for the Funds including assistance and review with excise tax distributions |
| x |
|
|
| As presented to Audit Committee(2) |
|
|
|
|
|
|
|
Review of IRC Sections 851(b) and 817(h) diversification testing on a real-time basis |
| x |
|
|
| As presented to Audit Committee(2) |
|
|
|
|
|
|
|
Assistance and advice regarding year-end reporting for 1099’s |
| x |
|
|
| As presented to Audit Committee(2) |
|
|
|
|
|
|
|
Tax assistance and advice regarding statutory, regulatory or administrative developments |
| x |
| x |
| Not to exceed $5,000 for the Funds or for the Funds’ investment adviser during the Pre-Approval Period |
(2) | For new Funds launched during the Pre-Approval Period, the fee ranges pre-approved will be the same as those for existing Funds, pro-rated in accordance with inception dates as provided in the auditors’ Proposal or any Engagement Letter covering the period at issue. Fees in the Engagement Letter will be controlling. |
9
Service
|
| The Fund(s) |
| Fund |
| Fee Range |
|
|
|
|
|
|
|
Tax training courses |
|
|
| x |
| Not to exceed $2,000 per course during the Pre-Approval Period |
|
|
|
|
|
|
|
Tax services associated with Fund mergers |
| x |
| x |
| Not to exceed $4,000 per fund per merger during the Pre-Approval Period |
|
|
|
|
|
|
|
Other tax-related assistance and consultation, including, without limitation, assistance in evaluating derivative financial instruments and international tax issues, qualification and distribution issues, and similar routine tax consultations. |
| x |
|
|
| Not to exceed $120,000 during the Pre-Approval Period |
10
Appendix D
Pre-Approved Other Services for the Pre-Approval Period January 1, 2008 through December 31, 2008
Service
|
| The Fund(s) |
| Fund Affiliates |
| Fee Range |
|
|
|
|
|
|
|
Agreed-upon procedures for Class B share 12b-1 programs |
|
|
| x |
| Not to exceed $50,000 during the Pre-Approval Period |
|
|
|
|
|
|
|
Security counts performed pursuant to Rule 17f-2 of the 1940 Act (i.e., counts for Funds holding securities with affiliated sub-custodians)
Cost to be borne 50% by the Funds and 50% by ING Investments, LLC. |
| x |
| x |
| Not to exceed $5,000 per Fund during the Pre-Approval Period |
|
|
|
|
|
|
|
Agreed upon procedures for 15 (c) FACT Books |
| x |
|
|
| Not to exceed $35,000 during the Pre-Approval Period |
11
Appendix E
Prohibited Non-Audit Services
Dated: January 1, 2008
· Bookkeeping or other services related to the accounting records or financial statements of the Funds
· Financial information systems design and implementation
· Appraisal or valuation services, fairness opinions, or contribution-in-kind reports
· Actuarial services
· Internal audit outsourcing services
· Management functions
· Human resources
· Broker-dealer, investment adviser, or investment banking services
· Legal services
· Expert services unrelated to the audit
· Any other service that the Public Company Accounting Oversight Board determines, by regulation, is impermissible
12
EXHIBIT A
ING EQUITY TRUST
ING FUNDS TRUST
ING ASIA PACIFIC HIGH DIVIDEND EQUITY INCOME FUND
ING GLOBAL ADVANTAGE AND PREMIUM OPPORTUNITY FUND
ING GLOBAL EQUITY DIVIDEND AND PREMIUM OPPORTUNITY FUND
ING INTERNATIONAL HIGH DIVIDEND EQUITY INCOME FUND
ING RISK MANAGED NATURAL RESOURCES FUND
ING INVESTMENT FUNDS, INC.
ING INVESTORS TRUST
ING MAYFLOWER TRUST
ING MUTUAL FUNDS
ING PARTNERS, INC.
ING PRIME RATE TRUST
ING SENIOR INCOME FUND
ING SEPARATE PORTFOLIOS TRUST
ING VARIABLE INSURANCE TRUST
ING VARIABLE PRODUCTS TRUST
13
(e)(2) | Percentage of services referred to in 4(b) — (4)(d) that were approved by the audit committee |
|
|
| 100% of the services were approved by the audit committee. |
|
|
(f) | Percentage of hours expended attributable to work performed by other than full time employees of KPMG if greater than 50%. |
|
|
| Not applicable. |
|
|
(g) | Non-Audit Fees: The non-audit fees billed by the registrant’s accountant for services rendered to the registrant, and rendered to the registrant’s investment adviser, and any entity controlling, controlled by, or under common control with the adviser that provides ongoing services to the registrant for each of the last two fiscal years of the registrant were $1,826,535 for year ended December 31, 2008 and $240,707 for year ended December 31, 2007. |
|
|
(h) | Principal Accountants Independence: The Registrant’s Audit committee has considered whether the provision of non-audit services that were rendered to the registrant’s investment adviser and any entity controlling, controlled by, or under common control with the investment adviser that provides ongoing services to the registrant that were not pre-approved pursuant to Rule 2-01(c)(7)(ii) of Regulation S-X is compatible with maintaining KPMG’s independence. |
14
Item 5. Audit Committee of Listed Registrants.
Not applicable.
Item 6. Schedule of Investments
Schedule is included as part of the report to shareholders filed under Item 1 of this Form.
Item 7. Disclosure of Proxy Voting Policies and Procedures for Closed-End Management Investment Companies.
Not applicable.
Item 8. Portfolio Managers of Closed-End Management Investment Companies.
Not applicable.
Item 9. Purchases of Equity Securities by Closed-End Management Investment Company and Affiliated Purchasers
Not applicable.
Item 10. Submission of Matters to a Vote of Security Holders.
The Board has a Nominating Committee for the purpose of considering and presenting to the Board candidates it proposes for nomination to fill Independent Trustee vacancies on the Board. The Committee currently consists of all Independent Trustees of the Board (6 individuals). The Nominating Committee operates pursuant to a Charter approved by the Board. The primary purpose of the Nominating Committee is to consider and present to the Board the candidates it proposes for nomination to fill vacancies on the Board. In evaluating candidates, the Nominating Committee may consider a variety of factors, but it has not at this time set any specific minimum qualifications that must be met. Specific qualifications of candidates for Board membership will be based on the needs of the Board at the time of nomination.
The Nominating Committee is willing to consider nominations received from shareholders and shall assess shareholder nominees in the same manner as it reviews its own nominees. A shareholder nominee for director should be submitted in writing to the Fund’s Secretary. Any such shareholder nomination should include at a minimum the following information as to each individual proposed for nomination as trustee: such individual’s written consent to be named in the proxy statement as a nominee (if nominated) and to serve as a trustee (if elected), and all information relating to such individual that is required to be disclosed in the solicitation of proxies for election of trustees, or is otherwise required, in each case under applicable federal securities laws, rules and regulations.
The Secretary shall submit all nominations received in a timely manner to the Nominating Committee. To be timely, any such submission must be delivered to the Fund’s Secretary not earlier than the 90th day prior to such meeting and not later than the close of business on the later of the 60th day prior to such meeting or the 10th day following the day on which public announcement of the date of the meeting is first made, by either disclosure in a press release or in a document publicly filed by the Fund with the Securities and Exchange Commission.
Item 11. Controls and Procedures.
(a) | Based on our evaluation conducted within 90 days of the filing date, hereof, the design and operation of the registrant’s disclosure controls and procedures are effective to ensure that material information relating to the registrant is made known to the certifying officers by others within the appropriate entities, particularly during the period in which Forms N-CSR are being prepared, and the registrant’s disclosure controls and procedures allow timely preparation and review of the information for the registrant’s Form N-CSR and the officer certifications of such Form N-CSR. |
|
|
(b) | There were no significant changes in the registrant’s internal controls that occurred during the second fiscal quarter of the period covered by this report that has materially affected, or is reasonably likely to materially affect, the registrant’s internal control over financial reporting. |
Item 12. Exhibits.
(a)(1) | Code of Ethics pursuant to Item 2 of Form N-CSR is filed and attached hereto as EX-99.CODE ETH. |
|
|
(a)(2) | A separate certification for each principal executive officer and principal financial officer of the |
15
registrant as required by Rule 30a-2 under the Act (17 CFR 270.30a-2) is attached hereto as EX-99.CERT. | |
|
|
(b) | The officer certifications required by Section 906 of the Sarbanes-Oxley Act of 2002 are attached hereto as EX-99.906CERT. |
|
|
(3) | Not applicable. |
16
SIGNATURES
Pursuant to the requirements of the Securities Exchange Act of 1934 and the Investment Company Act of 1940, the registrant has duly caused this report to be signed on its behalf by the undersigned, thereunto duly authorized.
(Registrant): | ING Variable Products Trust |
| |
| |||
By | /s/ Shaun P. Mathews |
| |
|
| ||
| Shaun P. Mathews | ||
| President and Chief Executive Officer | ||
|
| ||
Date: | March 6, 2009 |
| |
Pursuant to the requirements of the Securities Exchange Act of 1934 and the Investment Company Act of 1940, this report has been signed below by the following persons on behalf of the registrant and in the capacities and on the dates indicated.
By | /s/ Shaun P. Mathews |
| ||
|
| |||
| Shaun P. Mathews | |||
| President and Chief Executive Officer | |||
|
| |||
Date: | March 6, 2009 |
| ||
|
|
| ||
|
| |||
By | /s/ Todd Modic |
|
| |
|
|
| ||
| Todd Modic Senior Vice President and |
| ||
|
|
| ||
Date: | March 6, 2009 |
|
| |
17