|
| OMB APPROVAL | ||
|
| OMB Number: | 3235-0570 | |
|
| Expires: | January 31, 2014 | |
| UNITED STATES | Estimated average burden hours per response. . . . . . . . . . . . . . . . .20.6 | ||
| SECURITIES AND EXCHANGE COMMISSION |
| ||
| Washington, D.C. 20549 |
| ||
FORM N-CSR
CERTIFIED SHAREHOLDER REPORT OF REGISTERED
MANAGEMENT INVESTMENT COMPANIES
Investment Company Act file number | 811-8220 | ||||||||
| |||||||||
ING Variable Products Trust | |||||||||
(Exact name of registrant as specified in charter) | |||||||||
| |||||||||
7337 E. Doubletree Ranch Rd., Scottsdale, AZ |
| 85258 | |||||||
(Address of principal executive offices) |
| (Zip code) | |||||||
| |||||||||
CT Corporation System, 101 Federal Street, Boston, MA 02110 | |||||||||
(Name and address of agent for service) | |||||||||
| |||||||||
Registrant’s telephone number, including area code: | 1-800-992-0180 |
| |||||||
| |||||||||
Date of fiscal year end: | December 31 |
| |||||||
| |||||||||
Date of reporting period: | January 1, 2011 to December 31, 2011 |
| |||||||
ITEM 1. REPORTS TO STOCKHOLDERS.
The following is a copy of the report transmitted to stockholders pursuant to Rule 30e-1 under the Act (17 CFR 270.30e-1):

Annual Report
December 31, 2011
Classes ADV, I, S and S2
ING Variable Products Trust
n ING International Value Portfolio
n ING MidCap Opportunities Portfolio
n ING SmallCap Opportunities Portfolio
This report is submitted for general information to shareholders of the ING Funds. It is not authorized for distribution to prospective shareholders unless accompanied or preceded by a prospectus which includes details regarding the funds' investment objectives, risks, charges, expenses and other information. This information should be read carefully.
MUTUAL FUNDS

TABLE OF CONTENTS
| President's Letter | 1 | ||||||
| Market Perspective | 2 | ||||||
| Portfolio Managers' Reports | 4 | ||||||
| Shareholder Expense Examples | 10 | ||||||
| Report of Independent Registered Public Accounting Firm | 11 | ||||||
| Statements of Assets and Liabilities | 12 | ||||||
| Statements of Operations | 14 | ||||||
| Statements of Changes in Net Assets | 15 | ||||||
| Financial Highlights | 17 | ||||||
| Notes to Financial Statements | 19 | ||||||
| Summary Portfolios of Investments | 30 | ||||||
| Tax Information | 39 | ||||||
| Trustee and Officer Information | 40 | ||||||
| Advisory Contract Approval Discussion | 44 | ||||||
PROXY VOTING INFORMATION
A description of the policies and procedures that the Portfolios use to determine how to vote proxies related to portfolio securities is available: (1) without charge, upon request, by calling Shareholder Services toll-free at (800) 992-0180; (2) on the ING Funds' website at www.inginvestment.com; and (3) on the U.S. Securities and Exchange Commission's ("SEC's") website at www.sec.gov. Information regarding how the Portfolios voted proxies related to portfolio securities during the most recent 12-month period ended June 30 is available without charge on the ING Funds' website at www.inginvestment.com and on the SEC's website at www.sec.gov.
QUARTERLY PORTFOLIO HOLDINGS
The Portfolios file their complete schedule of portfolio holdings with the SEC for the first and third quarters of each fiscal year on Form N-Q. This report contains a summary portfolio of investments for the Portfolios. The Portfolios' Forms N-Q are available on the SEC's website at www.sec.gov. The Portfolios' Forms N-Q may be reviewed and copied at the SEC's Public Reference Room in Washington, DC, and information on the operation of the Public Reference Room may be obtained by calling (800) SEC-0330. The Portfolios' Forms N-Q, as well as a complete portfolio of investments, are available without charge upon request from the Portfolios by calling Shareholder Services toll-free at (800) 992-0180.
PRESIDENT'S LETTER

Euro zone — continued uncertainty
Dear Shareholder,
Recent months have seen headlines and financial markets continue to focus on the ongoing euro zone debt crisis. Acknowledging that the status quo was untenable, in early December, Europe opted to move closer together rather than be torn apart. All 17 nations that use the euro and nine other European Union members agreed to a new fiscal compact that would invite closer scrutiny of individual country budgets. Ratings agencies were mostly unimpressed by these machinations; ultimately, Standard & Poor's downgraded nine countries in the region, including formerly AAA-rated France.
With the stability of Italy and Spain now in question, the need for an effective policy response has become even more acute. The new governments in both countries will have but a short grace period in which to demonstrate their resolve; both have been forced to pay yields at euro-era highs for newly issued bonds.
Across the Atlantic, the chasm between the two major political parties in the United States is as wide as ever, most recently evidenced by the failure of the Congressional "supercommittee" on deficit reduction. Notwithstanding the ongoing paralysis in Washington, the U.S. economy is showing new signs of momentum.
We expect the global economy to deliver positive, if uninspiring, growth into 2012 despite the euro zone's debt problems. We believe interest rates should remain low in major advanced countries. Markets — and risk assets in general — are likely to remain vulnerable to uncertainty until there is confidence that Europe has adequately addressed its issues.
In times of uncertainty investors historically have turned to sovereign credits, especially U.S. Treasury securities. This spotlights the critical role that governments play in defining the parameters of the financial markets and serving as foundations for generating value within economies. The current trend toward fiscal austerity downplays this important function and may prolong the global economic doldrums.
How should you respond to uncertainty in your own investment program? Don't try to time the markets. Keep your portfolio well diversified, and pay careful attention to the risks you are assuming. Talk to your financial advisor before you make any changes that might detour your portfolio from your long-term goals.
We appreciate your continued confidence in ING Funds, and we look forward to serving your investment needs in the future.
Sincerely,

Shaun Mathews
President and Chief Executive Officer
ING Funds
January 3, 2012
The views expressed in the President's Letter reflect those of the President as of the date of the letter. Any such views are subject to change at any time based upon market or other conditions and ING Funds disclaim any responsibility to update such views. These views may not be relied on as investment advice and because investment decisions for an ING Fund are based on numerous factors, may not be relied on as an indication of investment intent on behalf of any ING Fund. Reference to specific company securities should not be construed as recommendations or investment advice. Consider the fund's investment objectives, risks, and charges and expenses carefully before investing. The prospectus contains this information and other information about the fund.
International investing poses special risks including currency fluctuation, economic and political risks not found in investments that are solely domestic.
1
MARKET PERSPECTIVE: YEAR ENDED DECEMBER 31, 2011
In our semi-annual report we described how investor sentiment was generally positive through April. Many of the developed world's economies including the U.S., seemed to be returning to health, boosted by heavy, ongoing doses of stimulative and monetary medicine. This was despite natural disasters in Japan, the violent uncertainties of the "Arab Spring" in North Africa and the Middle East, not to mention a European sovereign debt crisis.
But the mood darkened in early May 2011. Global equities in the form of the MSCI World IndexSM measured in local currencies, including net reinvested dividends, slid from May through September, losing over 17%, before a remarkable October rally clawed back about half of this. For the whole fiscal year the Index lost 5.49%. (The MSCI World IndexSM returned (5.54)% for the year ended December 31, 2011, measured in U.S. dollars.)
A confluence of factors caused the deterioration in outlook after April. That month the latest unemployment rate was reported at 8.8%, the lowest in 24 months. New private sector jobs, well above 200,000, were added in each of January, February and March. But in May the unemployment rate rebounded to 9.1%. By September the employment report showed zero new jobs created in August. But more upbeat releases in later months revised this up, and by year end the three-month average of jobs created was back to 143,000 from just 35,000 in September.
In the housing market, home prices (based on the S&P/Case-Shiller 20-City Composite Home Price Index) fell every month in the year. Sales were depressed, despite improved affordability and record low mortgage interest rates, by tight credit with many homeowners in negative equity on their properties.
Gross Domestic Product ("GDP") growth had been reported at 3.1% (quarter-over-quarter, annualized) for the fourth quarter of 2010. On July 29, this was scaled down to 2.3%, among other revisions that showed the recession had been deeper and started earlier than previously thought. Worse, growth in the first quarter of 2011 was a barely perceptible 0.4%. When the second quarter's figure was finalized at just 1.3%, the common assessment was that the economy was operating at "stall-speed". There was relief in October when the first estimate of third quarter GDP growth was a much-improved 2.5%, although this was subsequently revised down to 1.8%.
Political deadlock weighed on sentiment throughout. A stopgap agreement to raise the debt ceiling did not stop Standard & Poors from downgrading the country's credit rating. A bipartisan "Debt Super Committee" appointed to negotiate a more lasting set of budget control measures, admitted defeat on November 21.
Other keenly watched figures like retail sales and wages & salaries were stagnant in the months up to October, improved in that month and were mixed thereafter. Purchasing managers' indices indicated expansion but not by much. Taken together, the data were inconclusive as the year ended but the consensus was that the once-feared return to recession now looked unlikely.
The euro zone's sovereign debt crisis continued to move markets. By early August it seemed to be veering out of control. When attention turned from Greece to the much bigger bond markets of Spain and especially Italy, the European Central Bank ("ECB") stepped in, uneasily, to buy their bonds — and some time. The threat to the euro zone banking system, where vast quantities of Italian and Spanish bonds are held, was clear.
Finally, a baby step towards closer fiscal union among euro zone countries was agreed in December, including restrictions on budget deficits with near automatic disciplinary procedures for violators. Bilateral loans of up to €200 billion would be made to the International Monetary Fund, presumably to fund rescue packages for individual nations. But it provided no lender of last resort with unlimited firepower, nor measures to promote growth and liberalize markets. Investors were under no illusions as the year ended that the crisis had been solved.
In U.S. fixed income markets, the Barclays Capital U.S. Aggregate Bond Index of investment grade bonds rose 7.84% in the fiscal year, while the Barclays Capital High Yield Bond — 2% Issuer Constrained Composite Index gained 4.96%. Most notable within the Barclays Capital U.S. Aggregate Bond Index was the remarkable 29.93% return on long-dated Treasuries, reflecting both the overall decline in risk appetite and quantitative easing.
U.S. equities, represented by the S&P 500® Index, including dividends, returned 2.11% for 2011, almost identical to the dividend yield. Sector returns ranged from (17.06)% for financials to 19.91% for utilities. The operating earnings per share of S&P 500® companies made new records in the second and third quarters of 2011, but estimates for future quarters were coming down as December ended.
In currency markets, the euro zone's problems finally took their toll, as the dollar gained 2.34% on the euro in 2011, which dropped sharply after October. The pound was barely changed despite late weakness: the dollar gained 0.10%. But the dollar fell back against the yen by 5.35% despite Bank of Japan intervention as that currency repeatedly breached post-war high levels.
In international markets, the MSCI Japan® Index slumped 18.73% in 2011. The economy contracted for three straight quarters before finally recovering, as it struggled to recover from the earthquake and tsunami of March as well as a strong yen. The MSCI Europe ex UK® Index sank 12.87%, weighed down by the recessionary threat of the sovereign debt crisis. Euro zone growth shrunk to 0.2% in the second and third quarters and unemployment stood at 10.3%, a euro-era high. The MSCI UK® Index slipped just 1.83%. Weak euro zone demand and fiscal austerity at home depressed stocks, within which, however, the well-represented energy, staples and telecoms sectors managed positive average returns.
Parentheses denote a negative number.
All indices are unmanaged and investors cannot invest directly in an index. Past performance does not guarantee future results. The performance quoted represents past performance. Investment return and principal value of an investment will fluctuate, and shares, when redeemed, may be worth more or less than their original cost. The Portfolios' performance is subject to change since the period's end and may be lower or higher than the performance data shown. Please call (800) 992-0180 or log on to www.inginvestment.com to obtain performance data current to the most recent month end.
Market Perspective reflects the views of ING's Chief Investment Risk Officer only through the end of the period, and is subject to change based on market and other conditions.
2
BENCHMARK DESCRIPTIONS
| Index | Description | ||||||
| MSCI World IndexSM | An unmanaged index that measures the performance of over 1,400 securities listed on exchanges in the U.S., Europe, Canada, Australia, New Zealand and the Far East. | ||||||
| S&P/Case-Shiller 20-City Composite Home Price Index | A composite index of the home price index for the top 20 Metropolitan Statistical Areas in the United States. The index is published monthly by Standard & Poor's. | ||||||
| Barclays Capital U.S. Aggregate Bond Index | An unmanaged index of publicly issued investment grade U.S. Government, mortgage-backed, asset-backed and corporate debt securities. | ||||||
| Barclays Capital High Yield Bond — 2% Issuer Constrained Composite Index | An unmanaged index that includes all fixed income securities having a maximum quality rating of Ba1, a minimum amount outstanding of $150 million, and at least one year to maturity. | ||||||
| S&P 500® Index | An unmanaged index that measures the performance of securities of approximately 500 large-capitalization companies whose securities are traded on major U.S. stock markets. | ||||||
| MSCI Japan® Index | A free float-adjusted market capitalization index that is designed to measure developed market equity performance in Japan. | ||||||
| MSCI Europe ex UK® Index | A free float-adjusted market capitalization index that is designed to measure developed market equity performance in Europe, excluding the UK. | ||||||
| MSCI UK® Index | A free float-adjusted market capitalization index that is designed to measure developed market equity performance in the UK. | ||||||
| MSCI Europe, Australasia and Far East® Index | An unmanaged index that measures the performance of securities listed on exchanges in markets in Europe, Australasia and the Far East. It includes the reinvestment of dividends net of withholding taxes, but does not reflect fees, brokerage commissions or other expenses of investing. | ||||||
| Russell Midcap® Growth Index | An unmanaged index that measures the performance of those companies included in the Russell Midcap® Index with relatively higher price-to-book ratios and higher forecasted growth values. | ||||||
| Russell Midcap® Index | An unmanaged index that measures the performance of the 800 smallest companies in the Russell 1000® Index, which represents approximately 26% of the total market capitalization of the Russell 1000® Index. | ||||||
| Russell 2000® Growth Index | An unmanaged index that measures the performance of securities of smaller U.S. companies with greater than average growth orientation. | ||||||
| Russell 2000® Index | An unmanaged index that measures the performance of securities of small U.S. companies. | ||||||
3
ING INTERNATIONAL VALUE PORTFOLIO
PORTFOLIO MANAGERS' REPORT
ING International Value Portfolio (the "Portfolio") seeks long-term capital appreciation. The Portfolio is managed by Martin Jansen, Senior Portfolio Manager, Joseph Vultaggio, Assistant Portfolio Manager and David Rabinowitz, of ING Investment Management Co. LLC — the Sub- Adviser.*
Performance: For the year ended December 31, 2011, the Portfolio's Class I shares provided a total return of (14.96)% compared to the MSCI Europe, Australasia and Far East ("MSCI EAFE®") Index, which returned (12.14)% for the same period.
Portfolio Specifics: The Portfolio underperformed its benchmark due to weak security selection, which was primarily centered in the consumer staples, materials, industrials and consumer discretionary sectors. However, some of the losses were mitigated by positive sector allocation, most notably stemming from our overweight to the energy sector. From a regional perspective, weak selection was most evident in Europe, particularly in France and the UK. In contrast, strong selection in Japan bolstered results.
Inpex Corp. ("Inpex"), Royal Dutch Shell PLC ("Royal Dutch Shell"), and Power Asset Holdings Ltd. ("Power Assets") were among the leading performers in the portfolio during the period. Inpex, a Japanese oil and gas production company, is well positioned, in our view, to benefit from the need in Japan to diversify away from nuclear energy. Power Assets, a Hong Kong utility, outperformed as the defensive nature of its businesses assisted at a time of weak markets and global growth concerns. Integrated oil company Royal Dutch Shell outperformed, particularly toward the latter stages of 2011, after it reported strong third quarter results.
Air France-KLM, Accor S.A. ("Accor"), and Carlsberg SA ("Carlsberg") were among the lagging performers during the year. Air France-KLM underperformed during the third quarter after announcing operating results that were significantly worse than expectations. Carlsberg, a Danish brewer, came under pressure after Russia, an important source of profit, decided to clamp down on alcoholic beverage trading hours. Accor, a French hotel operator, underperformed due to concerns regarding the cyclicality of its business amid a troubled European growth outlook.
During the reporting period, we reduced our emerging market and Japan exposure, favoring European stocks. We also increased the number of holdings in the Portfolio to help improve its risk/reward ratio.
Current Strategy and Outlook: The fourth quarter represented a continuation of the trends set forth during the year as headline risks increased volatility in international markets, as the European sovereign debt crisis fueled pessimism and contributed to the tempering of equity returns, particularly toward the latter part of the year. Yet, we believe relatively robust corporate earnings combined with strong balance sheets and renewed policy responses aimed at recapitalizing the European banks should help to fortify current, weak investor sentiment. Additionally, indications are that China should have a soft landing after a period of substantial monetary tightening. Against this backdrop, we believe that international equity markets should stabilize and strengthen as we head into 2012. We continue to favor European stocks, while underweighting developed Europe.
Country Allocation
as of December 31, 2011
(as a percentage of net assets)
| United Kingdom | 21.0 | % | |||||
| Japan | 18.3 | % | |||||
| Germany | 12.8 | % | |||||
| France | 9.6 | % | |||||
| Netherlands | 9.4 | % | |||||
| Switzerland | 4.3 | % | |||||
| Italy | 4.2 | % | |||||
| Australia | 3.0 | % | |||||
| Singapore | 2.8 | % | |||||
| United States | 1.3 | % | |||||
| Countries between 0.5% - 1.9%^ | 12.6 | % | |||||
| Assets in Excess of Other Liabilities* | 0.7 | % | |||||
| Net Assets | 100.0 | % | |||||
* Includes short-term investments.
^ Includes 12 countries, which each represents 0.5%-1.9% of net assets.
Portfolio holdings are subject to change daily.
Top Ten Holdings
as of December 31, 2011
(as a percentage of net assets)
| Royal Dutch Shell PLC — Class A | 4.1 | % | |||||
| Vodafone Group PLC | 3.4 | % | |||||
| Novartis AG | 3.0 | % | |||||
| Sanofi-Aventis | 2.4 | % | |||||
| GlaxoSmithKline PLC | 2.3 | % | |||||
| Unilever NV | 2.2 | % | |||||
| Siemens AG | 2.2 | % | |||||
| Hitachi Ltd. | 1.9 | % | |||||
| ENI S.p.A. | 1.8 | % | |||||
| BHP Billiton PLC | 1.7 | % | |||||
Portfolio holdings are subject to change daily.
* Effective April 14, 2011, John Pairaktaridis was removed as portfolio manager to the Portfolio and David Rabinowitz was added as portfolio manager to the Portfolio.
Portfolio holdings and characteristics are subject to change and may not be representative of current holdings and characteristics. The outlook for this Portfolio may differ from that presented for other ING Funds. Performance for the different classes of shares will vary based on differences in fees associated with each class.
4
PORTFOLIO MANAGERS' REPORT
ING INTERNATIONAL VALUE PORTFOLIO
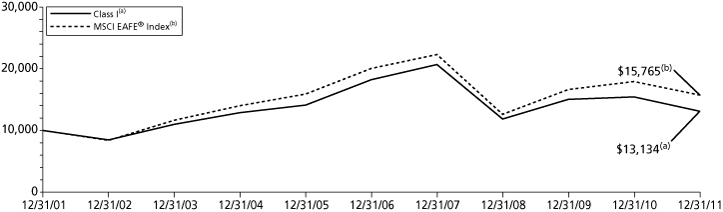
| Average Annual Returns for the Periods Ended December 31, 2011 | |||||||||||||||||||||||||||
| 1 Year | 5 Year | 10 Year | Since Inception of Class ADV December 29, 2006 | Since Inception of Class S March 19, 2002 | Since Inception of Class S2 February 27, 2009 | ||||||||||||||||||||||
| Class ADV | (15.40 | )% | (6.84 | )% | — | (6.83 | )% | — | — | ||||||||||||||||||
| Class I | (14.96 | )% | (6.36 | )% | 2.77 | % | — | — | — | ||||||||||||||||||
| Class S | (14.99 | )% | (6.46 | )% | — | — | 2.20 | % | — | ||||||||||||||||||
| Class S2 | (15.27 | )% | — | — | — | — | 11.53 | % | |||||||||||||||||||
| MSCI EAFE® Index | (12.14 | )% | (4.72 | )% | 4.67 | % | (4.72 | )%(1) | 4.73 | %(2) | 16.50 | %(3) | |||||||||||||||
Based on a $10,000 initial investment, the graph and table above illustrate the total return of ING International Value Portfolio against the index indicated. An index is unmanaged and has no cash in its portfolio, imposes no sales charges and incurs no operating expenses. An investor cannot invest directly in an index. The Portfolio's performance is shown without the imposition of any expenses or charges which are, or may be, imposed under your annuity contract or life insurance policy. Total returns would have been lower if such expenses or charges were included.
The performance graph and table do not reflect the deduction of taxes that a shareholder will pay on Portfolio distributions or the redemption of Portfolio shares.
The performance shown may include the effect of fee waivers and/or expense reimbursements by the Investment Adviser and/or other service providers, which have the effect of increasing total return. Had all fees and expenses been considered, the total returns would have been lower.
The performance update illustrates performance for a variable investment option available through a variable annuity contract and/or a variable universal life policy. The performance shown indicates past performance and is not a projection or prediction of future results. Actual investment returns and principal value will fluctuate so that shares and/or units, at redemption, may be worth more or less than their original cost. Please log on to www.inginvestment.com or call (800) 992-0180 to get performance through the most recent month end.
This report contains statements that may be "forward-looking" statements. Actual results may differ materially from those projected in the "forward-looking" statements.
The views expressed in this report reflect those of the portfolio managers only through the end of the period as stated on the cover. The portfolio managers' views are subject to change at any time based on market and other conditions.
Portfolio holdings are subject to change daily.
(1) Since inception performance for the index is shown from January 1, 2007.
(2) Since inception performance for the index is shown from April 1, 2002.
(3) Since inception performance for the index is shown from March 1, 2009.
Prior to July 1, 2002, the portfolio was sub-advised by a different sub-adviser.
5
ING MIDCAP OPPORTUNITIES PORTFOLIO
PORTFOLIO MANAGERS' REPORT
ING MidCap Opportunities Portfolio (the "Portfolio") seeks long-term capital appreciation. The Portfolio is managed by Jeff Bianchi and James Hasso, Portfolio Managers of ING Investment Management Co. LLC — the Sub-Adviser.
Performance: For the year ended December 31, 2011, the Portfolio's Class I shares provided a total return of (0.51)% compared to the Russell Midcap® Growth Index and the Russell Midcap® Index, which returned (1.65)% and (1.55)%, respectively, for the same period.
Portfolio Specifics: The Portfolio's outperformance was driven by broad-based strong stock selection, particularly in the consumer staples, industrials and consumer discretionary sectors. On the contrary, weak selection in the energy sector, primarily centered on an ill-timed holding of an individual coal company, tempered our gains.
Ross Stores Inc. ("Ross Stores"), Range Resources Corp. ("Range Resources") and Valeant Pharmaceuticals International Inc. ("Valeant Pharmaceuticals") were some of the top performing stocks in the Portfolio during the year. Discount retailer Ross Stores benefited from increasing value-seeking consumer behavior, as well as continued process and operational improvements. Together, these factors helped to fuel strong earnings and gave way to expanding earnings multiples. Range Resources is the lowest cost producer of natural gas. Rampant takeover speculation, coupled with value-producing capital redeployment (selling low returning assets and reinvesting in higher return on invested capital areas) helped to bolster its return. Valeant Pharmaceuticals outperformed after its acquisition of Biovale and the realization of significant earnings accretion.
WMS Industries Inc. ("WMS Industries"), Arch Coal Inc. ("Arch Coal") and Alpha Natural Resources Inc. ("Alpha Natural Resources") were among the Portfolio's laggards during the year. WMS Industries underperformed after weakening demand for their once wildly popular Wizard of Oz game, coupled with increased competition and slowing pro gambling legislation, put downward pressure on its stock. Arch Coal, a leading U.S.-based coal producer, underperformed after a dilutive rights offering, which was used to fund the company's acquisition of ICO Group, another coal producer. In addition, declining coal prices negatively affected its stock's performance. Similarly, Alpha Natural Resources underperformed due to lower coal prices.
Current Strategy and Outlook: Looking forward to the first quarter of 2012, we suspect the current macro forces will continue to dominate markets. We believe elevated levels of volatility will remain as investors seek increased clarity on European issues, while the Presidential election in the U.S. will increasingly play a role as the year progresses. We continue to remain razor-focused on fundamental stock selection. As always, we will seek companies that we believe exhibit strong relative business momentum and market recognition at appropriate prices.
Sector Diversification
as of December 31, 2011
(as a percentage of net assets)
| Consumer Discretionary | 19.9 | % | |||||
| Information Technology | 19.0 | % | |||||
| Industrials | 16.2 | % | |||||
| Health Care | 12.8 | % | |||||
| Energy | 9.0 | % | |||||
| Financials | 8.5 | % | |||||
| Consumer Staples | 6.3 | % | |||||
| Materials | 6.2 | % | |||||
| Telecommunications | 1.8 | % | |||||
| Assets in Excess of Other Liabilities* | 0.3 | % | |||||
| Net Assets | 100.0 | % | |||||
* Includes short-term investments.
Portfolio holdings are subject to change daily.
Top Ten Holdings
as of December 31, 2011
(as a percentage of net assets)
| Harley-Davidson, Inc. | 2.2 | % | |||||
| Bed Bath & Beyond, Inc. | 2.2 | % | |||||
| Range Resources Corp. | 2.0 | % | |||||
| Cameron International Corp. | 2.0 | % | |||||
| Western Union Co. | 1.9 | % | |||||
| Intuit, Inc. | 1.8 | % | |||||
| SBA Communications Corp. | 1.8 | % | |||||
| Coca-Cola Enterprises, Inc. | 1.8 | % | |||||
| Analog Devices, Inc. | 1.8 | % | |||||
| Roper Industries, Inc. | 1.8 | % | |||||
Portfolio holdings are subject to change daily.
Portfolio holdings and characteristics are subject to change and may not be representative of current holdings and characteristics. The outlook for this Portfolio may differ from that presented for other ING Funds. Performance for the different classes of shares will vary based on differences in fees associated with each class.
6
PORTFOLIO MANAGERS' REPORT
ING MIDCAP OPPORTUNITIES PORTFOLIO
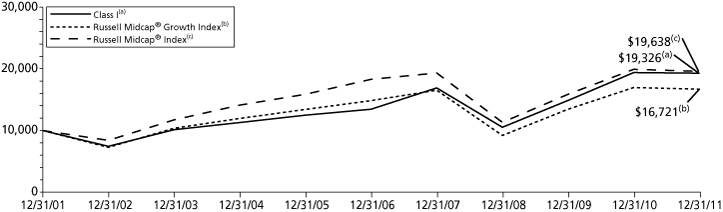
| Average Annual Returns for the Periods Ended December 31, 2011 | |||||||||||||||||||||||||||
| 1 Year | 5 Year | 10 Year | Since Inception of Class ADV December 29, 2006 | Since Inception of Class S May 7, 2001 | Since Inception of Class S2 February 27, 2009 | ||||||||||||||||||||||
| Class ADV | (1.05 | )% | 6.91 | % | — | 6.90 | % | — | — | ||||||||||||||||||
| Class I | (0.51 | )% | 7.54 | % | 6.81 | % | — | — | — | ||||||||||||||||||
| Class S | (0.79 | )% | 7.28 | % | 6.59 | % | — | 4.58 | % | — | |||||||||||||||||
| Class S2 | (0.96 | )% | — | — | — | — | 28.97 | % | |||||||||||||||||||
| Russell Midcap® Growth Index | (1.65 | )% | 2.44 | % | 5.29 | % | 2.44 | %(1) | 5.29 | %(2) | 29.08 | %(3) | |||||||||||||||
| Russell Midcap® Index | (1.55 | )% | 1.41 | % | 6.99 | % | 1.41 | %(1) | 6.99 | %(2) | 29.52 | %(3) | |||||||||||||||
Based on a $10,000 initial investment, the graph and table above illustrate the total return of ING MidCap Opportunities Portfolio against the indices indicated. An index is unmanaged and has no cash in its portfolios, imposes no sales charges and incurs no operating expenses. An investor cannot invest directly in an index. The Portfolio's performance is shown without the imposition of any expenses or charges which are, or may be, imposed under your annuity contract or life insurance policy. Total returns would have been lower if such expenses or charges were included.
The performance graph and table do not reflect the deduction of taxes that a shareholder will pay on Portfolio distributions or the redemption of Portfolio shares.
The performance shown may include the effect of fee waivers and/or expense reimbursements by the Investment Adviser and/or other service providers, which have the effect of increasing total return. Had all fees and expenses been considered, the total returns would have been lower.
Total returns reflect that the Investment Adviser may have waived or recouped fees and expenses otherwise payable by the Portfolio.
The performance update illustrates performance for a variable investment option available through a variable annuity contract and/or a variable universal life policy. The performance shown indicates past performance and is not a projection or prediction of future results. Actual investment returns and principal value will fluctuate so that shares and/or units, at redemption, may be worth more or less than their original cost. Please log on to www.inginvestment.com or call (800) 992-0180 to get performance through the most recent month end.
This report contains statements that may be "forward-looking" statements. Actual results may differ materially from those projected in the "forward-looking" statements.
The views expressed in this report reflect those of the portfolio managers, only through the end of the period as stated on the cover. The portfolio managers' views are subject to change at any time based on market and other conditions.
Portfolio holdings are subject to change daily.
(1) Since inception performance for the indices is shown from January 1, 2007.
(2) Since inception performance for the indices is shown from May 1, 2001.
(3) Since inception performance for the indices is shown from March 1, 2009.
7
ING SMALLCAP OPPORTUNITIES PORTFOLIO
PORTFOLIO MANAGERS' REPORT
ING SmallCap Opportunities Portfolio (the "Portfolio") seeks long-term capital appreciation. The Portfolio is managed by Steve Salopek and James Hasso, Portfolio Managers of ING Investment Management Co. LLC — the Sub-Adviser.
Performance: For the year ended December 31, 2011, the Portfolio's Class I shares provided a total return of 0.85%, compared to the Russell 2000® Growth Index and the Russell 2000® Index, which returned (2.91)% and (4.18)%, respectively, for the same period.
Portfolio Specifics: The Russell 2000® Growth Index declined in 2011 despite a strong fourth quarter and lagged large-cap growth, as the Russell 1000® Growth Index returned 2.64%. Despite signs of an early "January effect" in December 2011, when the smallest of the small-caps outperformed, larger small-caps and higher quality names held up best for the year as a whole. Volatility and correlations were high during the reporting period, resulting from a number of macro headwinds. These included natural disasters, concerns regarding America's economic recovery, the European debt overhang and the ensuing political turmoil.
At the sector level for the Russell 2000® Growth Index, consumer staples led for the year, returning 13.4%, while materials and telecommunication services had the weakest results, as the sectors were down 16.1% and 9.5%, respectively.
Stock selection within information technology, industrials, materials and consumer discretionary, coupled with our overweight in industrials and underweight in materials, benefitted the Portfolio during the period. Notable outperformance within technology was due to strong stock selection within software and semiconductors and semiconductor equipment, as well as our overweight in software and underweight in semiconductors and semiconductor equipment. Stock selection within electronic equipment instruments and components, computers and peripherals and Internet software and services also added value. Within industrials, stock selection within aerospace and defense, commercial services and supplies and electrical equipment added to performance. Materials benefited from stock selection within metals and mining and paper and forest products, as well as our underweight in metals and mining, and our slight overweight in paper and forest products.
Stock selection within consumer staples and energy, coupled with our underweight in consumer staples, detracted most from performance. Within consumer staples, returns were held back by stock selection within food products, while stock selection within energy equipment and services detracted value within energy.
Sally Beauty Holdings, Inc. ("Sally Beauty Holdings") and SuccessFactors, Inc. ("SuccessFactors") contributed significantly to performance over the period. Sally Beauty Holdings engages in the distribution and retail of professional beauty supplies and has performed due to solid fundamentals and strong earnings. SuccessFactors provides cloud-based business execution software solutions that enable organizations to bridge the gap between business strategy and results worldwide. During the reporting period, SAP announced that it will acquire SuccessFactors for $3.4 billion, a 52% premium. The acquisition will provide SAP with a cloud-based human resources application set and will bring cloud software expertise to the company, which largely sells on-premise applications.
OfficeMax, Inc. ("OfficeMax") and Talbots, Inc. ("Talbots") were two of the largest detractors from performance over the period. OfficeMax sells office products to retail and business customers. The stock underperformed this year as earnings and investor sentiment came under pressure from a slow macro recovery, poor communications from the company and a competitive environment. We continue to hold this stock, which we think is attractively valued, and we believe that, as the economy improves, OfficeMax will gain traction in its turnaround.
Talbots operates as a specialty retailer and direct marketer of women's apparel, accessories and shoes. We believed that it was gaining traction in its turnaround by improving merchandise, closing unproductive stores and working on improving profitability. It became clear, in our opinion, they were not able to maintain the improvements that they had worked on, and we therefore exited the position.
Current Strategy and Outlook: We are cautious about the global macroeconomic landscape and continue to assess the potential impact that it may have on the performance of companies and valuations. The Portfolio's positioning has not changed significantly. We aim to be nimble and continue to focus on, in our opinion, quality companies, such as those that have strong managements, strong balance sheets and good cash flow generation capabilities. Even among cyclical holdings, our primary focus is on management quality, cash flows and the strength of the balance sheet. Going forward, we believe that we are well positioned as we think that investors will continue to focus on companies' fundamentals due to the increased economic uncertainty.
Sector Diversification
as of December 31, 2011
(as a percentage of net assets)
| Information Technology | 21.5 | % | |||||
| Health Care | 18.7 | % | |||||
| Industrials | 18.1 | % | |||||
| Consumer Discretionary | 15.9 | % | |||||
| Financials | 10.7 | % | |||||
| Energy | 8.4 | % | |||||
| Materials | 3.1 | % | |||||
| Consumer Staples | 1.3 | % | |||||
| Telecommunications | 0.9 | % | |||||
| Assets in Excess of Other Liabilities* | 1.4 | % | |||||
| Net Assets | 100.0 | % | |||||
* Includes short-term investments.
Portfolio holdings are subject to change daily.
Top Ten Holdings
as of December 31, 2011*
(as a percentage of net assets)
| iShares Russell 2000 Growth Index Fund | 2.0 | % | |||||
| Acuity Brands, Inc. | 1.4 | % | |||||
| Tanger Factory Outlet Centers, Inc. | 1.4 | % | |||||
| Woodward Governor Co. | 1.3 | % | |||||
| Life Time Fitness, Inc. | 1.3 | % | |||||
| Genesee & Wyoming, Inc. | 1.3 | % | |||||
| Clean Harbors, Inc. | 1.2 | % | |||||
| Aspen Technology, Inc. | 1.2 | % | |||||
| Parametric Technology Corp. | 1.1 | % | |||||
| Dril-Quip, Inc. | 1.1 | % | |||||
* Excludes short-term investments.
Portfolio holdings are subject to change daily.
Portfolio holdings and characteristics are subject to change and may not be representative of current holdings and characteristics. The outlook for this Portfolio may differ from that presented for other ING Funds. Performance for the different classes of shares will vary based on differences in fees associated with each class.
8
PORTFOLIO MANAGERS' REPORT
ING SMALLCAP OPPORTUNITIES PORTFOLIO

| Average Annual Returns for the Periods Ended December 31, 2011 | |||||||||||||||||||||||||||
| 1 Year | 5 Year | 10 Year | Since Inception of Class ADV November 20, 2008 | Since Inception of Class S May 3, 2001 | Since Inception of Class S2 February 27, 2009 | ||||||||||||||||||||||
| Class ADV | 0.29 | % | — | — | 27.93 | % | — | — | |||||||||||||||||||
| Class I | 0.85 | % | 4.75 | % | 2.92 | % | — | — | — | ||||||||||||||||||
| Class S | 0.53 | % | 4.50 | % | 2.69 | % | — | 1.10 | % | — | |||||||||||||||||
| Class S2 | 0.39 | % | — | — | — | — | 29.93 | % | |||||||||||||||||||
| Russell 2000® Growth Index | (2.91 | )% | 2.09 | % | 4.48 | % | 20.49 | %(1) | 4.48 | %(2) | 28.50 | %(3) | |||||||||||||||
| Russell 2000® Index | (4.18 | )% | 0.15 | % | 5.62 | % | 17.30 | %(1) | 5.62 | %(2) | 27.26 | %(3) | |||||||||||||||
Based on a $10,000 initial investment, the graph and table above illustrate the total return of ING SmallCap Opportunities Portfolio against the indices indicated. An index is unmanaged and has no cash in its portfolios, imposes no sales charges and incurs no operating expenses. An investor cannot invest directly in an index. The Portfolio's performance is shown without the imposition of any expenses or charges which are, or may be, imposed under your annuity contract or life insurance policy. Total returns would have been lower if such expenses or charges were included.
The performance graph and table do not reflect the deduction of taxes that a shareholder will pay on Portfolio distributions or the redemption of Portfolio shares.
The performance shown may include the effect of fee waivers and/or expense reimbursements by the Investment Adviser and/or other service providers, which have the effect of increasing total return. Had all fees and expenses been considered, the total returns would have been lower.
The performance update illustrates performance for a variable investment option available through a variable annuity contract and/or a variable universal life policy. The performance shown indicates past performance and is not a projection or prediction of future results. Actual investment returns and principal value will fluctuate so that shares and/or units, at redemption, may be worth more or less than their original cost. Please log on to www.inginvestment.com or call (800) 992-0180 to get performance through the most recent month end.
This report contains statements that may be "forward-looking" statements. Actual results may differ materially from those projected in the "forward-looking" statements.
The views expressed in this report reflect those of the portfolio manager, only through the end of the period as stated on the cover. The portfolio manager's views are subject to change at any time based on market and other conditions.
Portfolio holdings are subject to change daily.
(1) Since inception performance for the indices is shown from December 1, 2008.
(2) Since inception performance for the indices is shown from May 1, 2001.
(3) Since inception performance for the indices is shown from March 1, 2009.
9
SHAREHOLDER EXPENSE EXAMPLES (UNAUDITED)
As a shareholder of a Portfolio, you incur two types of costs: (1) transaction costs, including redemption fees and exchange fees; and (2) ongoing costs, including management fees, distribution and/or service (12b-1) fees, and other Portfolio expenses. These Examples are intended to help you understand your ongoing costs (in dollars) of investing in a Portfolio and to compare these costs with the ongoing costs of investing in other mutual funds.
The Examples are based on an investment of $1,000 invested at the beginning of the period and held for the entire period from July 1, 2011 to December 31, 2011. The Portfolios' expenses are shown without the imposition of any charges which are, or may be, imposed under your variable annuity contract, variable life insurance policy, qualified pension, or retirement plan. Expenses would have been higher if such charges were included.
Actual Expenses
The left section of the table shown below, "Actual Portfolio Return," provides information about actual account values and actual expenses. You may use the information in this section, together with the amount you invested, to estimate the expenses that you paid over the period. Simply divide your account value by $1,000 (for example, an $8,600 account value divided by $1,000 = 8.6), then multiply the result by the number in the first section under the heading entitled "Expenses Paid During the Period" to estimate the expenses you paid on your account during this period.
Hypothetical Example for Comparison Purposes
The right section of the table shown below, "Hypothetical (5% return before expenses)," provides information about hypothetical account values and hypothetical expenses based on a Portfolio's actual expense ratio and an assumed rate of return of 5% per year before expenses, which is not a Portfolio's actual return. The hypothetical account values and expenses may not be used to estimate the actual ending account balance or expenses you paid for the period. You may use this information to compare the ongoing costs of investing in a Portfolio and other mutual funds. To do so, compare this 5% hypothetical example with the 5% hypothetical examples that appear in the shareholder reports of the other mutual funds.
Please note that the expenses shown in the table are meant to highlight your ongoing costs only and do not reflect any transactional costs, such as redemption fees or exchange fees. Therefore, the hypothetical lines of the table are useful in comparing ongoing costs only, and will not help you determine the relative total costs of owning different mutual funds. In addition, if these transactional costs were included, your costs would have been higher.
| Actual Portfolio Return | Hypothetical (5% return before expenses) | ||||||||||||||||||||||||||||||||||
| ING International Value Portfolio | Beginning Account Value July 01, 2011 | Ending Account Value December 31, 2011 | Annualized Expense Ratio | Expenses Paid During the Period Ended December 31, 2011* | Beginning Account Value July 01, 2011 | Ending Account Value December 31, 2011 | Annualized Expense Ratio | Expenses Paid During the Period Ended December 31, 2011* | |||||||||||||||||||||||||||
| Class ADV | $ | 1,000.00 | $ | 805.00 | 1.52 | % | $ | 6.92 | $ | 1,000.00 | $ | 1,017.54 | 1.52 | % | $ | 7.73 | |||||||||||||||||||
| Class I | 1,000.00 | 807.60 | 1.02 | 4.65 | 1,000.00 | 1,020.06 | 1.02 | 5.19 | |||||||||||||||||||||||||||
| Class S | 1,000.00 | 809.30 | 1.22 | 5.56 | 1,000.00 | 1,019.06 | 1.22 | 6.21 | |||||||||||||||||||||||||||
| Class S2 | 1,000.00 | 806.10 | 1.42 | 6.46 | 1,000.00 | 1,018.05 | 1.42 | 7.22 | |||||||||||||||||||||||||||
| ING MidCap Opportunities Portfolio | |||||||||||||||||||||||||||||||||||
| Class ADV | $ | 1,000.00 | $ | 900.00 | 1.34 | % | $ | 6.42 | $ | 1,000.00 | $ | 1,018.45 | 1.34 | % | $ | 6.82 | |||||||||||||||||||
| Class I | 1,000.00 | 902.20 | 0.84 | 4.03 | 1,000.00 | 1,020.97 | 0.84 | 4.28 | |||||||||||||||||||||||||||
| Class S | 1,000.00 | 901.00 | 1.09 | 5.22 | 1,000.00 | 1,019.71 | 1.09 | 5.55 | |||||||||||||||||||||||||||
| Class S2 | 1,000.00 | 900.30 | 1.24 | 5.94 | 1,000.00 | 1,018.95 | 1.24 | 6.31 | |||||||||||||||||||||||||||
| ING SmallCap Opportunities Portfolio | |||||||||||||||||||||||||||||||||||
| Class ADV | $ | 1,000.00 | $ | 926.70 | 1.40 | % | $ | 6.80 | $ | 1,000.00 | $ | 1,018.15 | 1.40 | % | $ | 7.12 | |||||||||||||||||||
| Class I | 1,000.00 | 929.40 | 0.90 | 4.38 | 1,000.00 | 1,020.67 | 0.90 | 4.58 | |||||||||||||||||||||||||||
| Class S | 1,000.00 | 928.10 | 1.15 | 5.59 | 1,000.00 | 1,019.41 | 1.15 | 5.85 | |||||||||||||||||||||||||||
| Class S2 | 1,000.00 | 927.30 | 1.30 | 6.32 | 1,000.00 | 1,018.65 | 1.30 | 6.61 | |||||||||||||||||||||||||||
* Expenses are equal to each Portfolios' respective annualized expense ratios multiplied by the average account value over the period, multiplied by 184/365 to reflect the most recent fiscal half-year.
10
REPORT OF INDEPENDENT REGISTERED PUBLIC ACCOUNTING FIRM
The Shareholders and Board of Trustees
ING Variable Products Trust
We have audited the accompanying statements of assets and liabilities, including the summary portfolios of investments, of ING International Value Portfolio, ING MidCap Opportunities Portfolio, and ING SmallCap Opportunities Portfolio, each a series of ING Variable Products Trust, as of December 31, 2011, and the related statements of operations for the year then ended, the statements of changes in net assets for each of the years in the two-year period then ended, and the financial highlights for each of the years or periods in the five-year period then ended. These financial statements and financial highlights are the responsibility of management. Our responsibility is to express an opinion on these financial statements and financial highlights based on our audits.
We conducted our audits in accordance with the standards of the Public Company Accounting Oversight Board (United States). Those standards require that we plan and perform the audit to obtain reasonable assurance about whether the financial statements and financial highlights are free of material misstatement. An audit includes examining, on a test basis, evidence supporting the amounts and disclosures in the financial statements. Our procedures included confirmation of securities owned as of December 31, 2011, by correspondence with the custodian, and brokers, or by other appropriate auditing procedures when replies from brokers were not received. An audit also includes assessing the accounting principles used and significant estimates made by management, as well as evaluating the overall financial statement presentation. We believe that our audits provide a reasonable basis for our opinion.
In our opinion, the financial statements and financial highlights referred to above present fairly, in all material respects, the financial position of the aforementioned portfolios as of December 31, 2011 and the results of their operations, the changes in their net assets, and the financial highlights for the periods specified in the first paragraph above, in conformity with U.S. generally accepted accounting principles.

Boston, Massachusetts
February 21, 2012
11
STATEMENTS OF ASSETS AND LIABILITIES AS OF DECEMBER 31, 2011
| ING International Value Portfolio | ING MidCap Opportunities Portfolio | ING SmallCap Opportunities Portfolio | |||||||||||||
| ASSETS: | |||||||||||||||
| Investments in securities at value+* | $ | 143,981,840 | $ | 890,323,080 | $ | 185,211,650 | |||||||||
| Short-term investments at value*** | 2,564,715 | 15,333,100 | 7,833,650 | ||||||||||||
| Cash | 48,568 | 123,009 | 69 | ||||||||||||
| Foreign currencies at value***** | 67,932 | — | — | ||||||||||||
| Receivables: | |||||||||||||||
| Investments securities sold | — | 1,824,345 | 953,980 | ||||||||||||
| Fund shares sold | 8,502 | 1,831,306 | 140,462 | ||||||||||||
| Dividends | 317,239 | 549,446 | 54,205 | ||||||||||||
| Foreign tax reclaim | 86,534 | — | — | ||||||||||||
| Reimbursement due from manager | 18,395 | — | — | ||||||||||||
| Total assets | 147,093,725 | 909,984,286 | 194,194,016 | ||||||||||||
| LIABILITIES: | |||||||||||||||
| Payable for investment securities purchased | — | 109,654 | 267,097 | ||||||||||||
| Payable for fund shares redeemed | 85,297 | 15,857,701 | 764,072 | ||||||||||||
| Payable upon receipt of securities loaned | 1,627,715 | — | 5,138,650 | ||||||||||||
| Payable to affiliates | 115,003 | 726,090 | 151,437 | ||||||||||||
| Payable for trustee fees | 725 | 4,536 | 942 | ||||||||||||
| Other accrued expenses and liabilities | 277,995 | 67,235 | 27,024 | ||||||||||||
| Total liabilities | 2,106,735 | 16,765,216 | 6,349,222 | ||||||||||||
| NET ASSETS | $ | 144,986,990 | $ | 893,219,070 | $ | 187,844,794 | |||||||||
| NET ASSETS WERE COMPRISED OF: | |||||||||||||||
| Paid-in capital | $ | 349,222,189 | $ | 816,951,448 | $ | 161,122,649 | |||||||||
| Undistributed (distributions in excess of) net investment income | (4,728 | ) | 719,633 | (2,339 | ) | ||||||||||
| Accumulated net realized gain (loss) | (191,402,722 | ) | 23,951,725 | 17,358,677 | |||||||||||
| Net unrealized appreciation (depreciation) | (12,827,749 | ) | 51,596,264 | 9,365,807 | |||||||||||
| NET ASSETS | $ | 144,986,990 | $ | 893,219,070 | $ | 187,844,794 | |||||||||
| + Including securities loaned at value | $ | 1,547,524 | $ | — | $ | 4,991,871 | |||||||||
| * Cost of investments in securities | $ | 156,806,619 | $ | 838,726,816 | $ | 175,845,843 | |||||||||
| *** Cost of short-term investments | $ | 2,564,715 | $ | 15,333,100 | $ | 7,833,650 | |||||||||
| ***** Cost of foreign currencies | $ | 68,505 | $ | — | $ | — | |||||||||
See Accompanying Notes to Financial Statements
12
STATEMENTS OF ASSETS AND LIABILITIES AS OF DECEMBER 31, 2011 (CONTINUED)
| ING International Value Portfolio | ING MidCap Opportunities Portfolio | ING SmallCap Opportunities Portfolio | |||||||||||||
| Class ADV | |||||||||||||||
| Net assets | $ | 1,144,915 | $ | 40,496,927 | $ | 4,819,042 | |||||||||
| Shares authorized | unlimited | unlimited | unlimited | ||||||||||||
| Par value | $ | 0.01 | $ | 0.01 | $ | 0.01 | |||||||||
| Shares outstanding | 163,814 | 3,572,609 | 232,443 | ||||||||||||
| Net asset value and redemption price per share | $ | 6.99 | $ | 11.34 | $ | 20.73 | |||||||||
| Class I | |||||||||||||||
| Net assets | $ | 135,682,370 | $ | 435,027,122 | $ | 117,965,311 | |||||||||
| Shares authorized | unlimited | unlimited | unlimited | ||||||||||||
| Par value | $ | 0.01 | $ | 0.01 | $ | 0.01 | |||||||||
| Shares outstanding | 19,267,658 | 37,420,458 | 5,497,896 | ||||||||||||
| Net asset value and redemption price per share | $ | 7.04 | $ | 11.63 | $ | 21.46 | |||||||||
| Class S | |||||||||||||||
| Net assets | $ | 8,155,834 | $ | 414,381,113 | $ | 63,588,022 | |||||||||
| Shares authorized | unlimited | unlimited | unlimited | ||||||||||||
| Par value | $ | 0.01 | $ | 0.01 | $ | 0.01 | |||||||||
| Shares outstanding | 1,135,998 | 36,449,127 | 3,040,367 | ||||||||||||
| Net asset value and redemption price per share | $ | 7.18 | $ | 11.37 | $ | 20.91 | |||||||||
| Class S2 | |||||||||||||||
| Net assets | $ | 3,871 | $ | 3,313,908 | $ | 1,472,419 | |||||||||
| Shares authorized | unlimited | unlimited | unlimited | ||||||||||||
| Par value | $ | 0.01 | $ | 0.01 | $ | 0.01 | |||||||||
| Shares outstanding | 553 | 291,154 | 70,808 | ||||||||||||
| Net asset value and redemption price per share | $ | 7.01 | $ | 11.38 | $ | 20.79 | |||||||||
See Accompanying Notes to Financial Statements
13
STATEMENTS OF OPERATIONS FOR THE YEAR ENDED DECEMBER 31, 2011
| ING International Value Portfolio | ING MidCap Opportunities Portfolio | ING SmallCap Opportunities Portfolio | |||||||||||||
| INVESTMENT INCOME: | |||||||||||||||
| Dividends, net of foreign taxes withheld* | $ | 6,882,650 | $ | 9,705,787 | $ | 1,293,527 | |||||||||
| Securities lending income, net | 346,959 | 76,306 | 59,648 | ||||||||||||
| Total investment income | 7,229,609 | 9,782,093 | 1,353,175 | ||||||||||||
| EXPENSES: | |||||||||||||||
| Investment management fees | 1,634,229 | 6,416,592 | 1,434,025 | ||||||||||||
| Distribution and service fees: | |||||||||||||||
| Class ADV | 683 | 137,106 | 18,984 | ||||||||||||
| Class S | 24,835 | 1,183,844 | 169,659 | ||||||||||||
| Class S2 | 22 | 11,059 | 4,892 | ||||||||||||
| Transfer agent fees | 277 | 1,032 | 250 | ||||||||||||
| Administrative service fees | 202,980 | 917,929 | 191,202 | ||||||||||||
| Shareholder reporting expense | 62,840 | 131,100 | 15,410 | ||||||||||||
| Professional fees | 73,128 | 86,635 | 27,032 | ||||||||||||
| Custody and accounting expense | 154,055 | 76,650 | 30,660 | ||||||||||||
| Trustee fees | 6,859 | 22,819 | 5,442 | ||||||||||||
| Miscellaneous expense | 35,023 | 26,249 | 5,666 | ||||||||||||
| Interest expense | 2,710 | 401 | 59 | ||||||||||||
| Total expenses | 2,197,641 | 9,011,416 | 1,903,281 | ||||||||||||
| Net recouped/waived and reimbursed fees | (119,019 | ) | 20,688 | (978 | ) | ||||||||||
| Net expenses | 2,078,622 | 9,032,104 | 1,902,303 | ||||||||||||
| Net investment income (loss) | 5,150,987 | 749,989 | (549,128 | ) | |||||||||||
| REALIZED AND UNREALIZED GAIN (LOSS) : | |||||||||||||||
| Net realized gain (loss) on: | |||||||||||||||
| Investments | (8,554,788 | ) | 107,215,387 | 26,968,415 | |||||||||||
| Foreign currency related transactions | (106,060 | ) | — | — | |||||||||||
| Net realized gain (loss) | (8,660,848 | ) | 107,215,387 | 26,968,415 | |||||||||||
| Net change in unrealized appreciation (depreciation) on: | |||||||||||||||
| Investments | (24,462,330 | ) | (125,180,937 | ) | (25,574,840 | ) | |||||||||
| Foreign currency related transactions | 26,736 | — | — | ||||||||||||
| Net change in unrealized appreciation (depreciation) | (24,435,594 | ) | (125,180,937 | ) | (25,574,840 | ) | |||||||||
| Net realized and unrealized gain (loss) | (33,096,442 | ) | (17,965,550 | ) | 1,393,575 | ||||||||||
| Increase (decrease) in net assets resulting from operations | $ | (27,945,455 | ) | $ | (17,215,561 | ) | $ | 844,447 | |||||||
| * Foreign taxes withheld | $ | 701,424 | $ | — | $ | 1,262 | |||||||||
See Accompanying Notes to Financial Statements
14
STATEMENTS OF CHANGES IN NET ASSETS
| ING International Value Portfolio | ING MidCap Opportunities Portfolio | ||||||||||||||||||
| Year Ended December 31, 2011 | Year Ended December 31, 2010 | Year Ended December 31, 2011 | Year Ended December 31, 2010 | ||||||||||||||||
| FROM OPERATIONS: | |||||||||||||||||||
| Net investment income | $ | 5,150,987 | $ | 6,415,692 | $ | 749,989 | $ | 3,111,894 | |||||||||||
| Net realized gain (loss) | (8,660,848 | ) | 23,074,630 | 107,215,387 | 102,954,077 | ||||||||||||||
| Net change in unrealized appreciation (depreciation) | (24,435,594 | ) | (31,261,328 | ) | (125,180,937 | ) | 76,358,046 | ||||||||||||
| Increase (decrease) in net assets resulting from operations | (27,945,455 | ) | (1,771,006 | ) | (17,215,561 | ) | 182,424,017 | ||||||||||||
| FROM DISTRIBUTIONS TO SHAREHOLDERS: | |||||||||||||||||||
| Net investment income: | |||||||||||||||||||
| Class ADV | (6,162 | ) | (365 | ) | — | (34,995 | ) | ||||||||||||
| Class I | (4,629,604 | ) | (6,681,877 | ) | — | (2,157,098 | ) | ||||||||||||
| Class S | (216,050 | ) | (197,642 | ) | — | (1,931,267 | ) | ||||||||||||
| Class S2 | (93 | ) | (73 | ) | — | (1,857 | ) | ||||||||||||
| Return of capital: | |||||||||||||||||||
| Class ADV | (202 | ) | — | — | — | ||||||||||||||
| Class I | (140,121 | ) | — | — | — | ||||||||||||||
| Class S | (7,139 | ) | — | — | — | ||||||||||||||
| Class S2 | (3 | ) | — | — | — | ||||||||||||||
| Total distributions | (4,999,374 | ) | (6,879,957 | ) | — | (4,125,217 | ) | ||||||||||||
| FROM CAPITAL SHARE TRANSACTIONS: | |||||||||||||||||||
| Net proceeds from sale of shares | 4,373,279 | 24,400,483 | 329,723,536 | 185,904,598 | |||||||||||||||
| Proceeds from shares issued in merger (Note 10) | — | — | — | 8,935,072 | |||||||||||||||
| Reinvestment of distributions | 4,999,277 | 6,879,884 | — | 4,125,207 | |||||||||||||||
| 9,372,556 | 31,280,367 | 329,723,536 | 198,964,877 | ||||||||||||||||
| Cost of shares redeemed | (73,380,297 | ) | (192,480,609 | ) | (236,047,779 | ) | (133,268,484 | ) | |||||||||||
| Net increase (decrease) in net assets resulting from capital share transactions | (64,007,741 | ) | (161,200,242 | ) | 93,675,757 | 65,696,393 | |||||||||||||
| Net increase (decrease) in net assets | (96,952,570 | ) | (169,851,205 | ) | 76,460,196 | 243,995,193 | |||||||||||||
| NET ASSETS: | |||||||||||||||||||
| Beginning of year or period | 241,939,560 | 411,790,765 | 816,758,874 | 572,763,681 | |||||||||||||||
| End of year or period | $ | 144,986,990 | $ | 241,939,560 | $ | 893,219,070 | $ | 816,758,874 | |||||||||||
| Undistributed (distributions in excess of) net investment income at end of year or period | $ | (4,728 | ) | $ | (138,911 | ) | $ | 719,633 | $ | — | |||||||||
See Accompanying Notes to Financial Statements
15
STATEMENTS OF CHANGES IN NET ASSETS
| ING SmallCap Opportunities Portfolio | |||||||||||
| Year Ended December 31, 2011 | Year Ended December 31, 2010 | ||||||||||
| FROM OPERATIONS: | |||||||||||
| Net investment (loss) | $ | (549,128 | ) | $ | (378,742 | ) | |||||
| Net realized gain | 26,968,415 | 25,492,851 | |||||||||
| Net change in unrealized appreciation (depreciation) | (25,574,840 | ) | 18,933,142 | ||||||||
| Increase in net assets resulting from operations | 844,447 | 44,047,251 | |||||||||
| FROM CAPITAL SHARE TRANSACTIONS: | |||||||||||
| Net proceeds from sale of shares | 53,542,558 | 28,792,551 | |||||||||
| 53,542,558 | 28,792,551 | ||||||||||
| Cost of shares redeemed | (54,935,659 | ) | (26,083,346 | ) | |||||||
| Net increase (decrease) in net assets resulting from capital share transactions | (1,393,101 | ) | 2,709,205 | ||||||||
| Net increase (decrease) in net assets | (548,654 | ) | 46,756,456 | ||||||||
| NET ASSETS: | |||||||||||
| Beginning of year or period | 188,393,448 | 141,636,992 | |||||||||
| End of year or period | $ | 187,844,794 | $ | 188,393,448 | |||||||
| Accumulated net investment loss at end of year or period | $ | (2,339 | ) | $ | — | ||||||
See Accompanying Notes to Financial Statements
16
FINANCIAL HIGHLIGHTS
Selected data for a share of beneficial interest outstanding throughout each year or period.
| Income (loss) from investment operations | Less distributions | ||||||||||||||||||||||||||||||
| Net asset value, beginning of year or period | Net investment income (loss) | Net realized and unrealized gain (loss) | Total from investment operations | From net investment income | From net realized gains | From return of capital | |||||||||||||||||||||||||
| Year or period ended | ($) | ($) | ($) | ($) | ($) | ($) | ($) | ||||||||||||||||||||||||
| ING International Value Portfolio | |||||||||||||||||||||||||||||||
| Class ADV | |||||||||||||||||||||||||||||||
| 12/31/11 | 8.44 | (0.01 | )• | (1.26 | ) | (1.27 | ) | 0.17 | — | 0.01 | |||||||||||||||||||||
| 12/31/10 | 8.41 | 0.11 | 0.05 | 0.16 | 0.13 | — | — | ||||||||||||||||||||||||
| 12/31/09 | 6.74 | 0.09 | 1.70 | 1.79 | 0.12 | — | — | ||||||||||||||||||||||||
| 12/31/08 | 14.21 | 0.22 | (5.67 | ) | (5.45 | ) | 0.25 | 1.78 | — | ||||||||||||||||||||||
| 12/31/07 | 15.26 | 0.19 | 1.60 | 1.79 | 0.19 | 2.65 | — | ||||||||||||||||||||||||
| Class I | |||||||||||||||||||||||||||||||
| 12/31/11 | 8.49 | 0.21 | (1.45 | ) | (1.24 | ) | 0.20 | — | 0.01 | ||||||||||||||||||||||
| 12/31/10 | 8.46 | 0.16 | • | 0.04 | 0.20 | 0.17 | — | — | |||||||||||||||||||||||
| 12/31/09 | 6.77 | 0.13 | 1.68 | 1.81 | 0.12 | — | — | ||||||||||||||||||||||||
| 12/31/08 | 14.24 | 0.27 | (5.67 | ) | (5.40 | ) | 0.30 | 1.78 | — | ||||||||||||||||||||||
| 12/31/07 | 15.26 | 0.28 | 1.62 | 1.90 | 0.27 | 2.65 | — | ||||||||||||||||||||||||
| Class S | |||||||||||||||||||||||||||||||
| 12/31/11 | 8.64 | 0.19 | (1.46 | ) | (1.27 | ) | 0.18 | — | 0.01 | ||||||||||||||||||||||
| 12/31/10 | 8.60 | 0.13 | 0.06 | 0.19 | 0.15 | — | — | ||||||||||||||||||||||||
| 12/31/09 | 6.93 | 0.11 | 1.68 | 1.79 | 0.12 | — | — | ||||||||||||||||||||||||
| 12/31/08 | 14.39 | 0.25 | (5.66 | ) | (5.41 | ) | 0.28 | 1.78 | — | ||||||||||||||||||||||
| 12/31/07 | 15.41 | 0.23 | 1.64 | 1.87 | 0.24 | 2.65 | — | ||||||||||||||||||||||||
| Class S2 | |||||||||||||||||||||||||||||||
| 12/31/11 | 8.45 | 0.17 | (1.43 | ) | (1.26 | ) | 0.17 | — | 0.01 | ||||||||||||||||||||||
| 12/31/10 | 8.42 | 0.12 | 0.04 | 0.16 | 0.13 | — | — | ||||||||||||||||||||||||
| 02-27-09(5)-12-31-09 | 5.43 | 0.09 | 3.01 | 3.10 | 0.11 | — | — | ||||||||||||||||||||||||
| ING MidCap Opportunities Portfolio | |||||||||||||||||||||||||||||||
| Class ADV | |||||||||||||||||||||||||||||||
| 12/31/11 | 11.46 | (0.02 | ) | (0.10 | ) | (0.12 | ) | — | — | — | |||||||||||||||||||||
| 12/31/10 | 8.88 | 0.08 | • | 2.54 | 2.62 | 0.04 | — | — | |||||||||||||||||||||||
| 12/31/09 | 6.32 | 0.03 | • | 2.54 | 2.57 | 0.01 | — | — | |||||||||||||||||||||||
| 12/31/08 | 10.20 | (0.03 | )• | (3.85 | ) | (3.88 | ) | — | — | — | |||||||||||||||||||||
| 12/31/07 | 8.16 | (0.07 | ) | 2.11 | 2.04 | — | — | — | |||||||||||||||||||||||
| Class I | |||||||||||||||||||||||||||||||
| 12/31/11 | 11.69 | 0.03 | (0.09 | ) | (0.06 | ) | — | — | — | ||||||||||||||||||||||
| 12/31/10 | 9.03 | 0.06 | 2.67 | 2.73 | 0.07 | — | — | ||||||||||||||||||||||||
| 12/31/09 | 6.40 | 0.04 | 2.61 | 2.65 | 0.02 | — | — | ||||||||||||||||||||||||
| 12/31/08 | 10.26 | 0.01 | (3.87 | ) | (3.86 | ) | — | — | — | ||||||||||||||||||||||
| 12/31/07 | 8.16 | (0.03 | ) | 2.13 | 2.10 | — | — | — | |||||||||||||||||||||||
| Class S | |||||||||||||||||||||||||||||||
| 12/31/11 | 11.46 | (0.00 | )* | (0.09 | ) | (0.09 | ) | — | — | — | |||||||||||||||||||||
| 12/31/10 | 8.86 | 0.03 | • | 2.62 | 2.65 | 0.05 | — | — | |||||||||||||||||||||||
| 12/31/09 | 6.29 | 0.02 | 2.56 | 2.58 | 0.01 | — | — | ||||||||||||||||||||||||
| 12/31/08 | 10.10 | (0.00 | )*• | (3.81 | ) | (3.81 | ) | — | — | — | |||||||||||||||||||||
| 12/31/07 | 8.05 | (0.06 | ) | 2.11 | 2.05 | — | — | — | |||||||||||||||||||||||
| Class S2 | |||||||||||||||||||||||||||||||
| 12/31/11 | 11.49 | (0.01 | ) | (0.10 | ) | (0.11 | ) | — | — | — | |||||||||||||||||||||
| 12/31/10 | 8.89 | 0.08 | • | 2.56 | 2.64 | 0.04 | — | — | |||||||||||||||||||||||
| 02-27-09(5)-12-31-09 | 5.55 | 0.01 | 3.34 | 3.35 | 0.01 | — | — | ||||||||||||||||||||||||
| ING SmallCap Opportunities Portfolio | |||||||||||||||||||||||||||||||
| Class ADV | |||||||||||||||||||||||||||||||
| 12/31/11 | 20.67 | (0.14 | )• | 0.20 | 0.06 | — | — | — | |||||||||||||||||||||||
| 12/31/10 | 15.69 | (0.10 | )• | 5.08 | 4.98 | — | — | — | |||||||||||||||||||||||
| 12/31/09 | 12.04 | (0.08 | ) | 3.73 | 3.65 | — | — | — | |||||||||||||||||||||||
| 11-20-08(5)-12-31-08 | 9.63 | (0.01 | )• | 2.41 | 2.40 | — | — | — | |||||||||||||||||||||||
| Ratios to average net assets | Supplemental data | ||||||||||||||||||||||||||||||||||||||||||
| Total distributions | Payment by affiliate | Net asset value, end of year or period | Total Return(1) | Expenses before reductions/additions(2)(3)(4) | Expenses net of fee waivers and/or recoupments if any(2)(3)(4) | Expenses net of all reductions/additions(2)(3)(4) | Net investment income (loss)(2)(4) | Net assets, end of year or period | Portfolio turnover rate | ||||||||||||||||||||||||||||||||||
| Year or period ended | ($) | ($) | ($) | (%) | (%) | (%) | (%) | (%) | ($000's) | (%) | |||||||||||||||||||||||||||||||||
| ING International Value Portfolio | |||||||||||||||||||||||||||||||||||||||||||
| Class ADV | |||||||||||||||||||||||||||||||||||||||||||
| 12/31/11 | 0.18 | — | 6.99 | (15.40 | ) | 1.57 | 1.52 | 1.52 | (0.09 | ) | 1,145 | 69 | |||||||||||||||||||||||||||||||
| 12/31/10 | 0.13 | — | 8.44 | 2.02 | 1.56 | 1.50 | † | 1.50 | † | 1.28 | † | 31 | 155 | ||||||||||||||||||||||||||||||
| 12/31/09 | 0.12 | — | 8.41 | 26.88 | 1.55 | 1.51 | † | 1.51 | † | 1.10 | † | 21 | 214 | ||||||||||||||||||||||||||||||
| 12/31/08 | 2.03 | 0.01 | 6.74 | (43.11 | )(a) | 1.56 | 1.50 | † | 1.50 | † | 2.06 | † | 0 | 207 | |||||||||||||||||||||||||||||
| 12/31/07 | 2.84 | — | 14.21 | 12.63 | 1.69 | 1.50 | † | 1.50 | † | 1.25 | † | 1 | 202 | ||||||||||||||||||||||||||||||
| Class I | |||||||||||||||||||||||||||||||||||||||||||
| 12/31/11 | 0.21 | — | 7.04 | (14.96 | ) | 1.07 | 1.02 | 1.02 | 2.56 | 135,682 | 69 | ||||||||||||||||||||||||||||||||
| 12/31/10 | 0.17 | — | 8.49 | 2.50 | 1.06 | 1.00 | † | 1.00 | † | 1.96 | † | 230,836 | 155 | ||||||||||||||||||||||||||||||
| 12/31/09 | 0.12 | — | 8.46 | 27.18 | 1.05 | 1.01 | † | 1.01 | † | 1.70 | † | 399,689 | 214 | ||||||||||||||||||||||||||||||
| 12/31/08 | 2.08 | 0.01 | 6.77 | (42.76 | )(a) | 1.06 | 1.00 | † | 1.00 | † | 2.59 | † | 340,022 | 207 | |||||||||||||||||||||||||||||
| 12/31/07 | 2.92 | — | 14.24 | 13.44 | 1.19 | 1.00 | † | 1.00 | † | 1.77 | † | 515,883 | 202 | ||||||||||||||||||||||||||||||
| Class S | |||||||||||||||||||||||||||||||||||||||||||
| 12/31/11 | 0.19 | — | 7.18 | (14.99 | ) | 1.32 | 1.22 | 1.22 | 2.27 | 8,156 | 69 | ||||||||||||||||||||||||||||||||
| 12/31/10 | 0.15 | — | 8.64 | 2.36 | 1.31 | 1.20 | † | 1.20 | † | 1.61 | † | 11,068 | 155 | ||||||||||||||||||||||||||||||
| 12/31/09 | 0.12 | — | 8.60 | 26.13 | 1.30 | 1.21 | † | 1.21 | † | 1.44 | † | 12,076 | 214 | ||||||||||||||||||||||||||||||
| 12/31/08 | 2.06 | 0.01 | 6.93 | (42.31 | )(a) | 1.31 | 1.20 | † | 1.20 | † | 2.35 | † | 9,782 | 207 | |||||||||||||||||||||||||||||
| 12/31/07 | 2.89 | — | 14.39 | 13.06 | 1.44 | 1.20 | † | 1.20 | † | 1.44 | † | 13,668 | 202 | ||||||||||||||||||||||||||||||
| Class S2 | |||||||||||||||||||||||||||||||||||||||||||
| 12/31/11 | 0.18 | — | 7.01 | (15.27 | ) | 1.57 | 1.42 | 1.42 | 2.12 | 4 | 69 | ||||||||||||||||||||||||||||||||
| 12/31/10 | 0.13 | — | 8.45 | 2.09 | 1.56 | 1.40 | † | 1.40 | † | 1.47 | † | 5 | 155 | ||||||||||||||||||||||||||||||
| 02-27-09(5)-12-31-09 | 0.11 | — | 8.42 | 57.63 | 1.55 | 1.41 | † | 1.41 | † | 1.39 | † | 5 | 214 | ||||||||||||||||||||||||||||||
| ING MidCap Opportunities Portfolio | |||||||||||||||||||||||||||||||||||||||||||
| Class ADV | |||||||||||||||||||||||||||||||||||||||||||
| 12/31/11 | — | — | 11.34 | (1.05 | ) | 1.34 | 1.34 | 1.34 | (0.23 | ) | 40,497 | 90 | |||||||||||||||||||||||||||||||
| 12/31/10 | 0.04 | — | 11.46 | 29.57 | 1.36 | 1.29 | 1.29 | 0.75 | 15,119 | 96 | |||||||||||||||||||||||||||||||||
| 12/31/09 | 0.01 | — | 8.88 | 40.65 | 1.40 | 1.14 | † | 1.14 | † | 0.36 | † | 957 | 169 | ||||||||||||||||||||||||||||||
| 12/31/08 | — | 0.00 | * | 6.32 | (38.04 | )(b) | 1.38 | 1.20 | † | 1.20 | † | (0.40 | )† | 1 | 191 | ||||||||||||||||||||||||||||
| 12/31/07 | — | — | 10.20 | 25.00 | 1.39 | 1.40 | 1.40 | (0.79 | ) | 1 | 186 | ||||||||||||||||||||||||||||||||
| Class I | |||||||||||||||||||||||||||||||||||||||||||
| 12/31/11 | — | — | 11.63 | (0.51 | ) | 0.84 | 0.84 | 0.84 | 0.24 | 435,027 | 90 | ||||||||||||||||||||||||||||||||
| 12/31/10 | 0.07 | — | 11.69 | 30.36 | 0.86 | 0.79 | 0.79 | 0.62 | 350,626 | 96 | |||||||||||||||||||||||||||||||||
| 12/31/09 | 0.02 | — | 9.03 | 41.44 | 0.90 | 0.64 | † | 0.64 | † | 0.46 | † | 238,426 | 169 | ||||||||||||||||||||||||||||||
| 12/31/08 | — | 0.00 | * | 6.40 | (37.62 | )(b) | 0.88 | 0.70 | † | 0.70 | † | 0.11 | † | 195,295 | 191 | ||||||||||||||||||||||||||||
| 12/31/07 | — | — | 10.26 | 25.74 | 0.89 | 0.90 | 0.90 | (0.39 | ) | 91,459 | 186 | ||||||||||||||||||||||||||||||||
| Class S | |||||||||||||||||||||||||||||||||||||||||||
| 12/31/11 | — | — | 11.37 | (0.79 | ) | 1.09 | 1.09 | 1.09 | (0.04 | ) | 414,381 | 90 | |||||||||||||||||||||||||||||||
| 12/31/10 | 0.05 | — | 11.46 | 29.96 | 1.11 | 1.04 | 1.04 | 0.35 | 450,115 | 96 | |||||||||||||||||||||||||||||||||
| 12/31/09 | 0.01 | — | 8.86 | 41.04 | 1.15 | 0.89 | † | 0.89 | † | 0.25 | † | 333,376 | 169 | ||||||||||||||||||||||||||||||
| 12/31/08 | — | 0.00 | * | 6.29 | (37.72 | )(b) | 1.13 | 0.90 | † | 0.90 | † | (0.02 | )† | 249,953 | 191 | ||||||||||||||||||||||||||||
| 12/31/07 | — | — | 10.10 | 25.47 | 1.14 | 1.10 | 1.10 | (0.59 | ) | 33,491 | 186 | ||||||||||||||||||||||||||||||||
| Class S2 | |||||||||||||||||||||||||||||||||||||||||||
| 12/31/11 | — | — | 11.38 | (0.96 | ) | 1.34 | 1.24 | 1.24 | (0.13 | ) | 3,314 | 90 | |||||||||||||||||||||||||||||||
| 12/31/10 | 0.04 | — | 11.49 | 29.67 | 1.36 | 1.19 | 1.19 | 0.71 | 900 | 96 | |||||||||||||||||||||||||||||||||
| 02-27-09(5)-12-31-09 | 0.01 | — | 8.89 | 60.41 | 1.40 | 1.04 | † | 1.04 | † | 0.14 | † | 5 | 169 | ||||||||||||||||||||||||||||||
| ING SmallCap Opportunities Portfolio | |||||||||||||||||||||||||||||||||||||||||||
| Class ADV | |||||||||||||||||||||||||||||||||||||||||||
| 12/31/11 | — | — | 20.73 | 0.29 | 1.40 | 1.40 | 1.40 | (0.67 | ) | 4,819 | 72 | ||||||||||||||||||||||||||||||||
| 12/31/10 | — | — | 20.67 | 31.74 | 1.40 | 1.40 | 1.40 | (0.57 | ) | 2,120 | 97 | ||||||||||||||||||||||||||||||||
| 12/31/09 | — | — | 15.69 | 30.32 | 1.46 | 1.43 | 1.43 | (0.61 | ) | 88 | 139 | ||||||||||||||||||||||||||||||||
| 11-20-08(5)-12-31-08 | — | 0.01 | 12.04 | 25.03 | (c) | 1.43 | 1.40 | † | 1.40 | † | (0.93 | )† | 4 | 148 | |||||||||||||||||||||||||||||
See Accompanying Notes to Financial Statements
17
FINANCIAL HIGHLIGHTS (CONTINUED)
Selected data for a share of beneficial interest outstanding throughout each year or period.
| Income (loss) from investment operations | Less distributions | ||||||||||||||||||||||||||||||
| Net asset value, beginning of year or period | Net investment income (loss) | Net realized and unrealized gain (loss) | Total from investment operations | From net investment income | From net realized gains | From return of capital | |||||||||||||||||||||||||
| Year or period ended | ($) | ($) | ($) | ($) | ($) | ($) | ($) | ||||||||||||||||||||||||
| ING SmallCap Opportunities Portfolio (continued) | |||||||||||||||||||||||||||||||
| Class I | |||||||||||||||||||||||||||||||
| 12/31/11 | 21.28 | (0.04 | ) | 0.22 | 0.18 | — | — | — | |||||||||||||||||||||||
| 12/31/10 | 16.08 | (0.02 | ) | 5.22 | 5.20 | — | — | — | |||||||||||||||||||||||
| 12/31/09 | 12.27 | (0.02 | ) | 3.83 | 3.81 | — | — | — | |||||||||||||||||||||||
| 12/31/08 | 21.98 | (0.01 | ) | (6.61 | ) | (6.62 | ) | — | 3.10 | — | |||||||||||||||||||||
| 12/31/07 | 19.97 | 0.01 | 2.00 | 2.01 | — | — | — | ||||||||||||||||||||||||
| Class S | |||||||||||||||||||||||||||||||
| 12/31/11 | 20.80 | (0.10 | ) | 0.21 | 0.11 | — | — | — | |||||||||||||||||||||||
| 12/31/10 | 15.75 | (0.07 | ) | 5.12 | 5.05 | — | — | — | |||||||||||||||||||||||
| 12/31/09 | 12.05 | (0.05 | ) | 3.75 | 3.70 | — | — | — | |||||||||||||||||||||||
| 12/31/08 | 21.68 | (0.05 | ) | (6.49 | ) | (6.54 | ) | — | 3.10 | — | |||||||||||||||||||||
| 12/31/07 | 19.74 | (0.03 | ) | 1.97 | 1.94 | — | — | — | |||||||||||||||||||||||
| Class S2 | |||||||||||||||||||||||||||||||
| 12/31/11 | 20.71 | (0.11 | )• | 0.19 | 0.08 | — | — | — | |||||||||||||||||||||||
| 12/31/10 | 15.71 | (0.09 | )• | 5.09 | 5.00 | — | — | — | |||||||||||||||||||||||
| 02-27-09(5)-12-31-09 | 9.88 | (0.06 | ) | 5.89 | 5.83 | — | — | — | |||||||||||||||||||||||
| Ratios to average net assets | Supplemental data | ||||||||||||||||||||||||||||||||||||||||||
| Total distributions | Payment by affiliate | Net asset value, end of year or period | Total Return(1) | Expenses before reductions/additions(2)(3)(4) | Expenses net of fee waivers and/or recoupments if any(2)(3)(4) | Expenses net of all reductions/additions(2)(3)(4) | Net investment income (loss)(2)(4) | Net assets, end of year or period | Portfolio turnover rate | ||||||||||||||||||||||||||||||||||
| Year or period ended | ($) | ($) | ($) | (%) | (%) | (%) | (%) | (%) | ($000's) | (%) | |||||||||||||||||||||||||||||||||
| ING SmallCap Opportunities Portfolio (continued) | |||||||||||||||||||||||||||||||||||||||||||
| Class I | |||||||||||||||||||||||||||||||||||||||||||
| 12/31/11 | — | — | 21.46 | 0.85 | 0.90 | 0.90 | 0.90 | (0.17 | ) | 117,965 | 72 | ||||||||||||||||||||||||||||||||
| 12/31/10 | — | — | 21.28 | 32.34 | 0.90 | 0.90 | 0.90 | (0.14 | ) | 113,938 | 97 | ||||||||||||||||||||||||||||||||
| 12/31/09 | — | — | 16.08 | 31.05 | 0.96 | 0.93 | 0.93 | (0.12 | ) | 79,291 | 139 | ||||||||||||||||||||||||||||||||
| 12/31/08 | 3.10 | 0.01 | 12.27 | (34.48 | )(c) | 0.93 | 0.90 | † | 0.90 | † | (0.04 | )† | 56,476 | 148 | |||||||||||||||||||||||||||||
| 12/31/07 | — | — | 21.98 | 10.07 | 0.90 | 0.90 | † | 0.90 | † | 0.07 | † | 83,695 | 97 | ||||||||||||||||||||||||||||||
| Class S | |||||||||||||||||||||||||||||||||||||||||||
| 12/31/11 | — | — | 20.91 | 0.53 | 1.15 | 1.15 | 1.15 | (0.47 | ) | 63,588 | 72 | ||||||||||||||||||||||||||||||||
| 12/31/10 | — | — | 20.80 | 32.06 | 1.15 | 1.15 | 1.15 | (0.39 | ) | 71,992 | 97 | ||||||||||||||||||||||||||||||||
| 12/31/09 | — | — | 15.75 | 30.71 | 1.21 | 1.17 | 1.17 | (0.36 | ) | 62,253 | 139 | ||||||||||||||||||||||||||||||||
| 12/31/08 | 3.10 | 0.01 | 12.05 | (34.59 | )(c) | 1.18 | 1.10 | † | 1.10 | † | (0.26 | )† | 54,163 | 148 | |||||||||||||||||||||||||||||
| 12/31/07 | — | — | 21.68 | 9.83 | 1.15 | 1.10 | † | 1.10 | † | (0.14 | )† | 105,212 | 97 | ||||||||||||||||||||||||||||||
| Class S2 | |||||||||||||||||||||||||||||||||||||||||||
| 12/31/11 | — | — | 20.79 | 0.39 | 1.40 | 1.30 | 1.30 | (0.56 | ) | 1,472 | 72 | ||||||||||||||||||||||||||||||||
| 12/31/10 | — | — | 20.71 | 31.83 | 1.40 | 1.30 | 1.30 | (0.50 | ) | 344 | 97 | ||||||||||||||||||||||||||||||||
| 02-27-09(5)-12-31-09 | — | — | 15.71 | 59.01 | 1.46 | 1.33 | 1.33 | (0.54 | ) | 5 | 139 | ||||||||||||||||||||||||||||||||
(1) Total return is calculated assuming reinvestment of all dividends, capital gain distributions and return of capital distributions, if any, at net asset value and does not reflect the effect of insurance contract charges. Total return for periods less than one year is not annualized.
(2) Annualized for periods less than one year.
(3) Expense ratios do not include fees and expenses charged under the variable annuity contract or variable life insurance policy.
(4) Expense ratios reflect operating expenses of a Portfolio. Expenses before reductions/additions do not reflect amounts reimbursed by an Investment Adviser and/or Distributor or reductions from brokerage service arrangements or other expense offset arrangements and do not represent the amount paid by a Portfolio during periods when reimbursements or reductions occur. Expenses net of fee waivers reflect expenses after reimbursement by an Investment Adviser and/or Distributor but prior to reductions from brokerage service arrangements or other expense offset arrangements. Expenses net of all reductions/additions represent the net expenses paid by a Portfolio. Net investment income (loss) is net of all such additions or reductions.
(5) Commencement of operations.
(a) Excluding a $729,720 payment by affiliate in 2008, International Value total return would have been (43.18)%, (42.86)% and (42.43)% on Classes ADV, I and S, respectively.
(b) There was no impact on total return due to payment by affiliate in 2008.
(c) Excluding a $110,798 payment by affiliate in 2008, Small Cap Opportunities total return would have been 24.72%, (34.52)% and (34.64)% for Classes ADV, I and S, respectively.
• Calculated using average number of shares outstanding throughout the period.
* Amount is less than $0.005 or 0.005% or more than $(0.005) or (0.005)%.
† Impact of waiving the advisory fee for the ING Institutional Prime Money Market Fund holding has less than 0.005% impact on the expense ratio and net investment income or loss ratio.
See Accompanying Notes to Financial Statements
18
NOTES TO FINANCIAL STATEMENTS AS OF DECEMBER 31, 2011
NOTE 1 — ORGANIZATION
Organization. ING Variable Products Trust (the "Trust") is a business trust organized under the laws of the Commonwealth of Massachusetts on December 17, 1993 and registered under the Investment Company Act of 1940, as amended ("1940 Act"), as a diversified, open-end management investment company. There are three active separate investment series which comprise the Trust: ING International Value Portfolio ("International Value"), ING MidCap Opportunities Portfolio ("MidCap Opportunities") and ING SmallCap Opportunities Portfolio ("SmallCap Opportunities"); each, a "Portfolio" and collectively, the "Portfolios."
Each Portfolio offers Adviser Class ("Class ADV") shares, Class I shares, Class S shares and Service 2 Class ("Class S2") shares. Each class has equal rights as to class and voting privileges. The classes differ principally in the applicable distribution and shareholder service fees. Shareholders of each class also bear certain expenses that pertain to that particular class. All shareholders bear the common expenses of the Portfolios and earn income and realized gains/losses from the Portfolios pro rata based on the average daily net assets of each class, without distinction between share classes. Expenses that are specific to a portfolio or a class are charged directly to that portfolio or class. Other operating expenses shared by several portfolios are generally allocated among those portfolios based on average net assets. Distributions are determined separately for each class based on income and expenses allocable to each class. Realized gain distributions are allocated to each class pro rata based on the shares outstanding of each class on the date of distribution. Differences in per share dividend rates generally result from differences in separate class expenses, including distribution and shareholder service fees, if applicable.
ING Investments, LLC serves as the investment adviser ("ING Investments" or the "Investment Adviser") to the Portfolios. ING Investment Management Co. LLC serves as the sub-adviser ("ING IM" or the "Sub-Adviser") to the Portfolios. ING Funds Services, LLC serves as the administrator ("IFS" or the "Administrator") for the Portfolios. ING Investments Distributor, LLC ("IID" or the "Distributor") serves as the principal underwriter to the Portfolios.
The Investment Adviser, the Sub-Adviser, IFS and IID are indirect, wholly-owned subsidiaries of ING Groep N.V. ("ING Groep"). ING Groep is a global financial institution of Dutch origin offering banking, investments, life insurance and retirement services.
ING Groep has adopted a formal restructuring plan that was approved by the European Commission in November 2009 under which the ING life insurance businesses, including the retirement services and investment management businesses, which include the Investment Adviser and its affiliates, would be separated from ING Groep by the end of 2013. To achieve this goal, ING Groep announced in November 2010 that it plans to pursue two separate initial public offerings: one a U.S. focused offering that would include U.S. based insurance, retirement services, and investment management operations; the other a European based offering for European and Asian based insurance and investment management operations. ING Groep recently announced that it will explore options other than an initial public offering for its Asian insurance and investment management businesses. There can be no assurance that the restructuring plan will be carried out through two offerings or at all.
The restructuring plan and the uncertainty about its implementation, whether implemented through the planned public offerings or through other means, in whole or in part, may be disruptive to the businesses of ING entities, including the ING entities that service the Portfolios, and may cause, among other things, interruption or reduction of business and services, diversion of management's attention from day-to-day operations, and loss of key employees or customers. A failure to complete the offerings or other means of implementation on favorable terms could have a material adverse impact on the operations of the businesses subject to the restructuring plan. The restructuring plan may result in the Investment Adviser's loss of access to services and resources of ING Groep, which could adversely affect their businesses and profitability. In addition, the divestment of ING businesses, including the Investment Adviser, may potentially be deemed a "change of control" of each entity. A change of control would result in the termination of the Portfolios' advisory and sub-advisory agreements, which would trigger the necessity for new agreements that would require approval of the board, and may trigger the need for shareholder approval. Currently, the Investment Adviser does not anticipate that the restructuring will have a material adverse impact on the Portfolios or their operations and administration.
NOTE 2 — SIGNIFICANT ACCOUNTING POLICIES
The following significant accounting policies are consistently followed by the Portfolios in the preparation of their financial statements, and such
19
NOTES TO FINANCIAL STATEMENTS AS OF DECEMBER 31, 2011 (CONTINUED)
NOTE 2 — SIGNIFICANT ACCOUNTING POLICIES (continued)
policies are in conformity with U.S. generally accepted accounting principles ("GAAP") for investment companies.
A. Security Valuation. All investments in securities are recorded at their estimated fair value, as described below. Investments in equity securities traded on a national securities exchange are valued at the last reported sale price. Securities reported by NASDAQ are valued at the NASDAQ official closing prices. Securities traded on an exchange or NASDAQ for which there has been no sale and securities traded in the over-the-counter market are valued at the mean between the last reported bid and ask prices. All investments quoted in foreign currencies will be valued daily in U.S. dollars on the basis of the foreign currency exchange rates prevailing at that time. Debt securities are valued at prices obtained from independent services or from one or more dealers making markets in the securities and may be adjusted based on the Portfolios' valuation procedures. U.S. government obligations are valued by using market quotations or independent pricing services that uses prices provided by market-makers or estimates of market values obtained from yield data relating to instruments or securities with similar characteristics. Investments in open-end mutual funds are valued at net asset value. Investments in securities of sufficient credit quality maturing in 60 days or less are valued at amortized cost which approximates fair value.
Securities and assets for which market quotations are not readily available (which may include certain restricted securities which are subject to limitations as to their sale) are valued at their fair values, as defined by the 1940 Act, and as determined in good faith by or under the supervision of the Portfolios' Board of Trustees ("Board"), in accordance with methods that are specifically authorized by the Board. Securities traded on exchanges, including foreign exchanges, which close earlier than the time that a Portfolio calculates its net asset value ("NAV") may also be valued at their fair values as defined by the 1940 Act, and as determined in good faith by or under the supervision of the Board, in accordance with methods that are specifically authorized by the Board. All such valuations are made in accordance with valuation procedures of the Portfolios (the "Valuation Procedures") which have been approved by the Board. The valuation techniques applied in any specific instance are set forth in the Valuation Procedures and may vary from case to case. With respect to a restricted security, for example, consideration is generally given to the cost of the investment, the market value of any unrestricted securities of the same class at the time of valuation, the potential expiration of restrictions on the security, the existence of any registration rights, the costs to the Portfolios related to registration of the security, as well as factors relevant to the issuer itself. Consideration may also be given to the price and extent of any public trading in similar securities of the issuer or comparable companies' securities. The value of a foreign security traded on an exchange outside the United States is generally based on its price on the principal foreign exchange where it trades as of the time a Portfolio determines its NAV or if the foreign exchange closes prior to the time a Portfolio determines its NAV, the most recent closing price of the foreign security on its principal exchange. Trading in certain non-U.S. securities may not take place on all days on which the New York Stock Exchange ("NYSE") is open. Further, trading takes place in various foreign markets on days on which the NYSE is not open. Consequently, the calculation of a Portfolio's NAV may not take place contemporaneously with the determination of the prices of securities held by a Portfolio in foreign securities markets. Further, the value of a Portfolio's assets may be significantly affected by foreign trading on days when a shareholder cannot purchase or redeem shares of a Portfolio. In calculating a Portfolio's NAV, foreign securities denominated in foreign currency are converted to U.S. dollar equivalents. If an event occurs after the time at which the market for foreign securities held by a Portfolio closes but before the time that a Portfolio's NAV is calculated, such event may cause the closing price on the foreign exchange to not represent a readily available reliable market value quotation for such securities at the time a Portfolio determines its NAV. In such a case, a Portfolio will use the fair value of such securities as determined under a Portfolio's valuation procedures. Events after the close of trading on a foreign market that could require a Portfolio to fair value some or all of its foreign securities include, among others, securities trading in the U.S. and other markets, corporate announcements, natural and other disasters, and political and other events. Among other elements of analysis in the determination of a security's fair
20
NOTES TO FINANCIAL STATEMENTS AS OF DECEMBER 31, 2011 (CONTINUED)
NOTE 2 — SIGNIFICANT ACCOUNTING POLICIES (continued)
value, the Board has authorized the use of one or more independent research services to assist with such determinations. An independent research service may use statistical analyses and quantitative models to help determine fair value as of the time a Portfolio calculates its NAV. There can be no assurance that such models accurately reflect the behavior of the applicable markets or the effect of the behavior of such markets on the fair value of securities, or that such markets will continue to behave in a fashion that is consistent with such models. Unlike the closing price of a security on an exchange, fair value determinations employ elements of judgment. Consequently, the fair value assigned to a security may not represent the actual value that a Portfolio could obtain if it were to sell the security at the time of the close of the NYSE. Pursuant to procedures adopted by the Board, a Portfolio is not obligated to use the fair valuations suggested by any research service, and valuation recommendations provided by such research services may be overridden if other events have occurred or if other fair valuations are determined in good faith to be more accurate. Unless an event is such that it causes a Portfolio to determine that the closing prices for one or more securities do not represent readily available reliable market value quotations at the time a Portfolio determines its NAV, events that occur between the time of the close of the foreign market on which they are traded and the close of regular trading on the NYSE will not be reflected in a Portfolio's NAV.
Fair value is defined as the price that the Portfolios would receive to sell an asset or pay to transfer a liability in an orderly transaction between market participants at the measurement date. Each investment asset or liability of the Portfolios is assigned a level at measurement date based on the significance and source of the inputs to its valuation. Quoted prices in active markets for identical securities are classified as "Level 1," inputs other than quoted prices for an asset or liability that are observable are classified as "Level 2" and unobservable inputs, including the sub-adviser's judgment about the assumptions that a market participant would use in pricing an asset or liability are classified as "Level 3." The inputs used for valuing securities are not necessarily an indication of the risks associated with investing in those securities. Short-term securities of sufficient credit quality which are valued at amortized cost, which approximates fair value, are generally considered to be Level 2 securities under applicable accounting rules. A table summarizing the Portfolios' investments under these levels of classification is included following the Summary Portfolios of Investments.
For the year ended December 31, 2011, there have been no significant changes to the fair valuation methodologies.
B. Security Transactions and Revenue Recognition. Security transactions are accounted for on the trade date. Realized gains and losses are reported on the basis of identified cost of securities sold. Interest income is recorded on an accrual basis. Dividend income is recorded on the ex-dividend date, or for certain foreign securities, when the information becomes available to the Portfolios. Premium amortization and discount accretion are determined by the effective yield method and included in interest income.
C. Foreign Currency Translation. The books and records of the Portfolios are maintained in U.S. dollars. Any foreign currency amounts are translated into U.S. dollars on the following basis:
(1) Market value of investment securities, other assets and liabilities — at the exchange rates prevailing at the end of the day.
(2) Purchases and sales of investment securities, income and expenses — at the rates of exchange prevailing on the respective dates of such transactions.
Although the net assets and the market values are presented at the foreign exchange rates at the end of the day, the Portfolios do not isolate the portion of the results of operations resulting from changes in foreign exchange rates on investments from the fluctuations arising from changes in market prices of securities held. Such fluctuations are included with the net realized and unrealized gains or losses from investments. For securities which are subject to foreign withholding tax upon disposition, liabilities are recorded on the Statements of Assets and Liabilities for the estimated tax withholding based on the securities' current market value. Upon disposition, realized gains or losses on such securities are recorded net of foreign withholding tax.
Reported net realized foreign exchange gains or losses arise from sales of foreign currencies, currency gains or losses realized between the
21
NOTES TO FINANCIAL STATEMENTS AS OF DECEMBER 31, 2011 (CONTINUED)
NOTE 2 — SIGNIFICANT ACCOUNTING POLICIES (continued)
trade and settlement dates on securities transactions, the difference between the amounts of dividends, interest, and foreign withholding taxes recorded on the Portfolios' books, and the U.S. dollar equivalent of the amounts actually received or paid. Net unrealized foreign exchange gains and losses arise from changes in the value of assets and liabilities other than investments in securities at fiscal year end, resulting from changes in the exchange rate. Foreign security and currency transactions may involve certain considerations and risks not typically associated with investing in U.S. companies and U.S. government securities. These risks include, but are not limited to, revaluation of currencies and future adverse political and economic developments which could cause securities and their markets to be less liquid and prices more volatile than those of comparable U.S. companies and U.S. government securities. The foregoing risks are even greater with respect to securities of issuers in emerging markets.
D. Distributions to Shareholders. The Portfolios record distributions to their shareholders on the ex-dividend date. Dividends from net investment income are declared and paid quarterly by each Portfolio. Each Portfolio distributes capital gains, if any, annually. The Portfolios may make distributions on a more frequent basis to comply with the distribution requirements of the Internal Revenue Code. The characters of income and gains to be distributed are determined in accordance with income tax regulations, which may differ from U.S. generally accepted accounting principles for investment companies.
E. Federal Income Taxes. It is the policy of each Portfolio to comply with the requirements of subchapter M of the Internal Revenue Code that are applicable to regulated investment companies and to distribute substantially all of its net investment income and any net realized capital gains to its shareholders. Therefore, a federal income tax or excise tax provision is not required. Management has considered the sustainability of the Portfolios' tax positions taken on federal income tax returns for all open tax years in making this determination. No capital gain distributions shall be made until the capital loss carryforwards have been fully utilized or expire.
F. Use of Estimates. The preparation of financial statements in conformity with U.S. generally accepted accounting principles requires management to make estimates and assumptions that affect the reported amounts of assets and liabilities and disclosure of contingent assets and liabilities at the date of the financial statements and the reported amounts of increases and decreases in net assets from operations during the reporting period. Actual results could differ from those estimates.
G. Foreign Currency Transactions and Futures Contracts. Each Portfolio may enter into forward foreign currency exchange transactions to convert to and from different foreign currencies and to and from the U.S. dollar in connection with the planned purchases or sales of securities. When entering into a forward foreign contract, a Portfolio agrees to receive or deliver a fixed quantity of foreign currency for an agreed-upon price on an agreed future date. The Portfolios either enter into these transactions on a spot basis at the spot rate prevailing in the foreign currency exchange market or use forward foreign currency contracts to purchase or sell foreign currencies. When the contract is fulfilled or closed, gains or losses are realized. Until then, the gain or loss is included in unrealized appreciation or depreciation. Risks may arise upon entering into forward contracts from the potential inability of counterparties to meet the terms of their forward contracts and from unanticipated movements in the value of foreign currencies relative to the U.S. dollar.
Each Portfolio may enter into futures contracts involving foreign currency, interest rates, securities and securities indices. A futures contract obligates the seller of the contract to deliver and the purchaser of the contract to take delivery of the type of foreign currency, financial instrument or security called for in the contract at a specified future time for a specified price. Upon entering into such a contract, a Portfolio is required to deposit and maintain as collateral such initial margin as required by the exchange on which the contract is traded. Pursuant to the contract, a Portfolio agrees to receive from or pay to the broker an amount equal to the daily fluctuations in the value of the contract. Such receipts or payments are known as variation margins and are recorded as unrealized gains or losses by a Portfolio. When the contract is closed, a Portfolio records a realized gain or loss equal to the difference between the value of the contract at the time it was opened and the value at the time
22
NOTES TO FINANCIAL STATEMENTS AS OF DECEMBER 31, 2011 (CONTINUED)
NOTE 2 — SIGNIFICANT ACCOUNTING POLICIES (continued)
it was closed. The Portfolios did not enter into any futures contracts during the year ended December 31, 2011.
H. Repurchase Agreements. Each Portfolio may invest in repurchase agreements only with government securities dealers recognized by the Board of Governors of the Federal Reserve System. Under such agreements, the seller of the security agrees to repurchase it at a mutually agreed upon time and price. The resale price is in excess of the purchase price and reflects an agreed upon interest rate for the period of time the agreement is outstanding. The period of the repurchase agreements is usually short, from overnight to one week, while the underlying securities generally have longer maturities. Each Portfolio will receive as collateral securities acceptable to it whose market value is equal to at least 100% of the carrying amount of the repurchase agreement, plus accrued interest, being invested by a Portfolio. The underlying collateral is valued daily on a mark-to-market basis to assure that the value, including accrued interest is at least equal to the repurchase price. There would be potential loss to a Portfolio in the event a Portfolio is delayed or prevented from exercising its right to dispose of the collateral, and it might incur disposition costs in liquidating the collateral.
I. Securities Lending. SmallCap Opportunities and MidCap Opportunities may temporarily loan up to 33% (and International Value 331/3%) of its total assets to brokers, dealers or other financial institutions in exchange for a negotiated lender's fee. The borrower is required to fully collateralize the loans with cash or U.S. government securities. Generally, in the event of counterparty default, a Portfolio has the right to use collateral to offset losses incurred. There would be potential loss to a Portfolio in the event a Portfolio is delayed or prevented from exercising its right to dispose of the collateral. Each Portfolio bears the risk of loss with respect to the investment of collateral with the following exception: Effective October 1, 2011, BNY provides each Portfolio indemnification from loss with respect to the investment of collateral provided that the cash collateral is invested solely in overnight repurchase agreements. Engaging in securities lending could have a leveraging effect, which may intensify the credit, market and other risks associated with investing in a Portfolio.
J. Illiquid and Restricted Securities. Each Portfolio may not invest more than 15% of its net assets in illiquid securities. Illiquid securities are not readily marketable. Disposing of illiquid investments may involve time-consuming negotiation and legal expenses, and it may be difficult or impossible for a Portfolio to sell them promptly at an acceptable price. Restricted securities are those sold under Rule 144A of the Securities Act of 1933 ("1933 Act") or are securities offered pursuant to Section 4(2) of the 1933 Act, and are subject to legal or contractual restrictions on resale and may not be publicly sold without registration under the 1933 Act. Certain restricted securities may be considered liquid pursuant to guidelines approved by the Board or may be deemed to be illiquid because they may not be readily marketable. Illiquid and restricted securities are valued using market quotations when readily available. In the absence of market quotations, the securities are valued based upon their fair value, as that term is used in the 1940 Act, determined under procedures approved by the Board.
K. Indemnifications. In the normal course of business, the Trust may enter into contracts that provide certain indemnifications. The Trust's maximum exposure under these arrangements is dependent on future claims that may be made against the Portfolios and, therefore, cannot be estimated; however, based on experience, management considers the risk of loss from such claims remote.
NOTE 3 — INVESTMENT TRANSACTIONS
For the year ended December 31, 2011, the cost of purchases and the proceeds from the sales of securities, excluding short-term securities, were as follows:
| Purchases | Sales | ||||||||||
| International Value | $ | 140,872,188 | $ | 201,994,859 | |||||||
| MidCap Opportunities | 910,740,978 | 814,920,700 | |||||||||
| SmallCap Opportunities | 136,129,110 | 136,386,655 | |||||||||
NOTE 4 — INVESTMENT MANAGEMENT AND ADMINISTRATIVE FEES
The Portfolios entered into an investment management agreement ("Investment Management Agreement") with the Investment Adviser. The Investment Management Agreement compensates the Investment Adviser with a fee, computed daily and payable monthly, based on the average daily net assets of each Portfolio. Effective February 1, 2011, the Investment Adviser receives an investment advisory fee calculated at an annual rate of 0.80% on the first
23
NOTES TO FINANCIAL STATEMENTS AS OF DECEMBER 31, 2011 (CONTINUED)
NOTE 4 — INVESTMENT MANAGEMENT AND ADMINISTRATIVE FEES (continued)
$250 million, 0.75% on the next $500 million, and 0.70% in excess of $750 million of the average daily net assets for International Value. Prior to February 1, 2011, the Investment Adviser received an investment advisory fee calculated at an annual rate of 0.85% of the average daily net assets for International Value. The Investment Adviser receives an investment advisory fee calculated at an annual rate of 0.75% on the first $250 million, 0.70% on the next $400 million, 0.65% on the next $450 million, and 0.60% in excess of $1.1 billion of the average daily net assets for MidCap Opportunities. The Investment Adviser receives an investment advisory fee calculated at an annual rate of 0.75% on the first $250 million, 0.70% on the next $250 million, 0.65% on the next $250 million, 0.60% on the next $250 million, and 0.55% in excess of $1 billion of the average daily net assets for SmallCap Opportunities.
The Investment Adviser entered into a sub-advisory agreement with ING IM. Subject to such policies as the Board or the Investment Adviser may determine, ING IM manages the Portfolios' assets in accordance with the Portfolios' investment objectives, policies, and limitations.
IFS acts as administrator and provides certain administrative and shareholder services necessary for each Portfolio's operations and is responsible for the supervision of other service providers. For its services, the Administrator is entitled to receive from each Portfolio a fee at an annual rate of 0.10% of each Portfolio's average daily net assets.
In placing equity security transactions, the Investment Adviser or Sub-Adviser is required to use its best efforts to choose a broker capable of providing brokerage services necessary to obtain the best execution for each transaction. Subject to this requirement, the Investment Adviser or Sub-Adviser may allocate equity security transactions through certain designated broker-dealers. Some of these broker-dealers participate in commission recapture programs that have been established for the benefit of the Portfolios. Under these programs, the participating broker-dealers will return to a Portfolio a portion of the brokerage commissions (in the form of a credit to a Portfolio) paid to the broker-dealers to pay certain expenses of a Portfolio. These commission recapture payments benefit the Portfolios and not the Investment Adviser or Sub-Adviser. Any amount credited to a Portfolio is reflected as brokerage commission recapture in the Statement of Operations.
NOTE 5 — SHAREHOLDER SERVICE AND DISTRIBUTION FEES
Class ADV and Class S2 shares of the Portfolios are subject to a Shareholder Service and Distribution Plan pursuant to Rule 12b-1 under the 1940 Act (the "Plan"). Under the Plan, IID is paid an annual shareholder service fee at the rate of 0.25% and an annual distribution fee at the rate of 0.25% of the average daily net assets attributable to its Class ADV and Class S2 shares. The Distributor contractually agreed to waive a portion of its fee equal to 0.10% of the average daily net assets attributable to Class S2 of each Portfolio, so that the actual fee paid by Class S2 of a Portfolio is an annual rate of 0.15%. The expense waiver will continue through at least May 1, 2012.
Class S shares of the Portfolios are subject to a Shareholder Services Plan (the "Shareholder Services Plan"). Under the Shareholder Services Plan, each Portfolio pays the Distributor a fee calculated at an annual rate of 0.25% of average daily net assets attributable to its Class S shares. The Distributor is entitled to use the proceeds from the Shareholder Services Plan to pay for services including, but not limited to, providing information about the Portfolios and delivering Portfolio documents.
The Distributor has agreed to voluntarily waive 0.05% of average daily net assets of Class S related to the shareholder service fee for International Value through May 1, 2012.
NOTE 6 — OTHER TRANSACTIONS WITH AFFILIATED AND RELATED PARTIES
At December 31, 2011, the Portfolios had the following amounts recorded in payable to affiliates on the accompanying Statements of Assets and Liabilities (see Notes 4 and 5):
| Portfolio | Accrued Investment Management Fees | Accrued Administrative Fees | Accrued Shareholder Service and Distribution Fees | Total | |||||||||||||||
| International Value | $ | 100,525 | $ | 12,566 | $ | 1,912 | $ | 115,003 | |||||||||||
| MidCap Opportunities | 540,412 | 76,881 | 108,797 | 726,090 | |||||||||||||||
| SmallCap Opportunities | 119,450 | 15,927 | 16,060 | 151,437 | |||||||||||||||
24
NOTES TO FINANCIAL STATEMENTS AS OF DECEMBER 31, 2011 (CONTINUED)
NOTE 6 — OTHER TRANSACTIONS WITH AFFILIATED AND RELATED PARTIES (continued)
At December 31, 2011, the following ING Portfolios or indirect, wholly-owned subsidiaries of ING Groep owned more than 5% of the following Portfolios:
| Subsidiary | Portfolios | Percentage | |||||||||
| ING Life Insurance and Annuity Company | International Value | 83.54 | % | ||||||||
| MidCap Opportunities | 15.24 | % | |||||||||
| SmallCap Opportunities | 34.45 | % | |||||||||
| ING National Trust | MidCap Opportunities | 5.12 | % | ||||||||
| SmallCap Opportunities | 11.80 | % | |||||||||
| ING Solution 2025 Portfolio | MidCap Opportunities | 5.21 | % | ||||||||
| ING USA Annuity and Life Insurance Company | MidCap Opportunities | 43.67 | % | ||||||||
| SmallCap Opportunities | 31.75 | % | |||||||||
| Reliastar Life Insurance Company | International Value | 11.24 | % | ||||||||
| SmallCap Opportunities | 17.75 | % | |||||||||
Control is defined by the 1940 Act as the beneficial ownership, either directly or through one or more controlled companies, of more than 25% of the voting securities of a company. The 1940 Act defines affiliates as companies that are under common control. Therefore, because the Portfolios have a common owner that owns over 25% of the outstanding securities of the Portfolios, they may be deemed to be affiliates of each other. Investment activities of these shareholders could have a material impact on the Portfolios.
The Trust has adopted a Deferred Compensation Plan (the "Plan"), which allows eligible non-affiliated trustees as described in the Plan to defer the receipt of all or a portion of the trustees fees payable. Amounts deferred are treated as though invested in various "notional" funds advised by ING Investments until distribution in accordance with the Plan.
NOTE 7 — EXPENSE LIMITATION AGREEMENT
ING Investments has entered into a written expense limitation agreement ("Expense Limitation Agreement") with each Portfolio whereby the Investment Adviser has agreed to limit the expenses excluding interest, taxes, brokerage commissions and extraordinary expenses (and acquired fund fees and expenses) to the levels listed below:
| Portfolio | Class ADV | Class I | Class S | Class S2 | |||||||||||||||
| International Value | 1.50 | % | 1.00 | % | 1.20 | % | 1.40 | % | |||||||||||
| MidCap Opportunities(1) | 1.40 | % | 0.90 | % | 1.10 | % | 1.30 | % | |||||||||||
| SmallCap Opportunities | 1.42 | % | 0.92 | % | 1.17 | % | 1.32 | % | |||||||||||
(1) Pursuant to a side agreement, ING Investments has further lowered the expense limits for MidCap Opportunities through at least May 2, 2012. The expense limits for MidCap Opportunities are 1.35%, 0.85%, 1.10%, and 1.25% for Class ADV, Class I, Class S and Class S2, respectively.
The Investment Adviser may at a later date recoup from a Portfolio management fees waived and other expenses assumed by the Investment Adviser during the previous 36 months, but only if, after such recoupment, the particular Portfolio's expense ratio does not exceed the percentage described above. Waived and reimbursed fees and any recoupment by the Investment Adviser of such waived and reimbursed fees are reflected on the accompanying Statements of Operations for each Portfolio.
As of December 31, 2011, the amounts of waived and reimbursed fees that are subject to possible recoupment by the Investment Adviser, and the related expiration dates are as follows:
| December 31, | |||||||||||||||||||
| 2012 | 2013 | 2014 | Total | ||||||||||||||||
| International Value | $ | 154,057 | $ | 166,986 | $ | 114,048 | $ | 435,091 | |||||||||||
| MidCap Opportunities | 1,290,053 | 456,511 | — | 1,746,564 | |||||||||||||||
| SmallCap Opportunities | 48,522 | — | — | 48,522 | |||||||||||||||
These amounts do not include shareholding servicing fees voluntarily waived by the Distributor.
The Expense Limitation Agreement is contractual and shall renew automatically for one-year terms unless ING Investments provides written notice of the termination of the Expense Limitation Agreement within 90 days of the end of the then current term.
NOTE 8 — LINE OF CREDIT
Each of the Portfolios included in this report, in addition to certain other funds managed by the Investment Adviser have entered into an unsecured committed revolving line of credit agreement (the "Credit Agreement") with The Bank of New York Mellon for an aggregate amount of $125,000,000. The proceeds may be used to: (1) temporarily finance the purchase or sale of securities; and (2) finance the redemption of shares of an investor in the funds. Effective May 27, 2011, the funds to which the line of credit is available pay a commitment fee equal to 0.08% per annum on the daily unused portion of the committed line amount payable quarterly in arrears. Prior to May 27, 2011, the funds to which the line of credit is available paid a commitment fee equal to 0.15% per annum on the daily unused portion of the committed line amount payable quarterly in arrears.
Generally, borrowings under the Credit Agreement accrue interest at the federal funds rate plus a specified margin. Repayments generally must be made within 60 days after the date of a revolving credit advance.
25
NOTES TO FINANCIAL STATEMENTS AS OF DECEMBER 31, 2011 (CONTINUED)
NOTE 8 — LINE OF CREDIT (continued)
The following Portfolios utilized the line of credit during the period ended December 31, 2011:
| Portfolio | Days Utilized | Approximate Average Daily Balance For Days Utilized | Approximate Weighted Average Interest Rate For Days Utilized | ||||||||||||
| International Value | 59 | $ | 1,330,339 | 1.26 | % | ||||||||||
| MidCap Opportunities | 8 | 1,326,875 | 1.38 | ||||||||||||
| SmallCap Opportunities | 3 | 571,667 | 1.25 | ||||||||||||
NOTE 9 — CAPITAL SHARES
Transactions in capital shares and dollars were as follows:
Shares sold | Shares issued in merger | Reinvestment of distributions | Shares redeemed | Net increase (decrease) in shares outstanding | Shares sold | Proceeds from shares issued in merger | Reinvestment of distributions | Shares redeemed | Net increase (decrease) | ||||||||||||||||||||||||||||||||||
| Year or period ended | # | # | # | # | # | ($) | ($) | ($) | ($) | ($) | |||||||||||||||||||||||||||||||||
| International Value | |||||||||||||||||||||||||||||||||||||||||||
| Class ADV | |||||||||||||||||||||||||||||||||||||||||||
| 12/31/11 | 172,355 | — | 909 | (13,100 | ) | 160,164 | 1,189,691 | — | 6,364 | (91,115 | ) | 1,104,940 | |||||||||||||||||||||||||||||||
| 12/31/10 | 1,210 | — | 48 | (71 | ) | 1,187 | 9,714 | — | 365 | (588 | ) | 9,491 | |||||||||||||||||||||||||||||||
| Class I | |||||||||||||||||||||||||||||||||||||||||||
| 12/31/11 | 265,232 | — | 577,484 | (8,763,651 | ) | (7,920,935 | ) | 2,267,084 | — | 4,769,724 | (70,879,215 | ) | (63,842,407 | ) | |||||||||||||||||||||||||||||
| 12/31/10 | 2,877,249 | — | 857,281 | (23,802,680 | ) | (20,068,150 | ) | 23,499,837 | — | 6,681,877 | (190,383,880 | ) | (160,202,166 | ) | |||||||||||||||||||||||||||||
| Class S | |||||||||||||||||||||||||||||||||||||||||||
| 12/31/11 | 119,083 | — | 26,684 | (291,227 | ) | (145,460 | ) | 916,504 | — | 223,189 | (2,409,967 | ) | (1,270,274 | ) | |||||||||||||||||||||||||||||
| 12/31/10 | 107,200 | — | 24,920 | (254,107 | ) | (121,987 | ) | 890,932 | — | 197,642 | (2,096,141 | ) | (1,007,567 | ) | |||||||||||||||||||||||||||||
| Class S2 | |||||||||||||||||||||||||||||||||||||||||||
| 12/31/11 | — | — | — | — | — | — | — | — | — | — | |||||||||||||||||||||||||||||||||
| 12/31/10 | — | — | — | — | — | — | — | — | — | — | |||||||||||||||||||||||||||||||||
| MidCap Opportunities | |||||||||||||||||||||||||||||||||||||||||||
| Class ADV | |||||||||||||||||||||||||||||||||||||||||||
| 12/31/11 | 2,696,115 | — | — | (443,229 | ) | 2,252,886 | 31,468,035 | — | — | (5,070,573 | ) | 26,397,462 | |||||||||||||||||||||||||||||||
| 12/31/10 | 1,034,041 | 208,069 | 3,221 | (33,441 | ) | 1,211,890 | 10,546,105 | 1,923,799 | 34,995 | (336,034 | ) | 12,168,865 | |||||||||||||||||||||||||||||||
| Class I | |||||||||||||||||||||||||||||||||||||||||||
| 12/31/11 | 14,841,264 | — | — | (7,414,500 | ) | 7,426,764 | 182,175,215 | — | — | (89,401,686 | ) | 92,773,529 | |||||||||||||||||||||||||||||||
| 12/31/10 | 10,488,694 | 249,213 | 202,264 | (7,335,991 | ) | 3,604,180 | 104,460,059 | 2,351,788 | 2,157,098 | (74,534,374 | ) | 34,434,571 | |||||||||||||||||||||||||||||||
| Class S | |||||||||||||||||||||||||||||||||||||||||||
| 12/31/11 | 9,540,260 | — | — | (12,365,666 | ) | (2,825,406 | ) | 112,747,662 | — | — | (140,813,080 | ) | (28,065,418 | ) | |||||||||||||||||||||||||||||
| 12/31/10 | 7,104,338 | 503,495 | 184,331 | (6,146,850 | ) | 1,645,314 | 70,059,884 | 4,654,742 | 1,931,267 | (58,352,491 | ) | 18,293,402 | |||||||||||||||||||||||||||||||
| Class S2 | |||||||||||||||||||||||||||||||||||||||||||
| 12/31/11 | 279,661 | — | — | (66,807 | ) | 212,854 | 3,332,624 | — | — | (762,440 | ) | 2,570,184 | |||||||||||||||||||||||||||||||
| 12/31/10 | 78,905 | 2,803 | 167 | (4,116 | ) | 77,759 | 838,550 | 4,743 | 1,847 | (45,585 | ) | 799,555 | |||||||||||||||||||||||||||||||
| SmallCap Opportunities | |||||||||||||||||||||||||||||||||||||||||||
| Class ADV | |||||||||||||||||||||||||||||||||||||||||||
| 12/31/11 | 216,528 | — | — | (86,661 | ) | 129,867 | 4,539,946 | — | — | (1,801,342 | ) | 2,738,604 | |||||||||||||||||||||||||||||||
| 12/31/10 | 108,850 | — | — | (11,911 | ) | 96,939 | 2,018,092 | — | — | (232,866 | ) | 1,785,226 | |||||||||||||||||||||||||||||||
| Class I | |||||||||||||||||||||||||||||||||||||||||||
| 12/31/11 | 2,071,993 | — | — | (1,927,340 | ) | 144,653 | 45,472,333 | — | — | (41,994,897 | ) | 3,477,436 | |||||||||||||||||||||||||||||||
| 12/31/10 | 1,377,297 | — | — | (955,886 | ) | 421,411 | 25,504,565 | — | — | (16,351,448 | ) | 9,153,117 | |||||||||||||||||||||||||||||||
| Class S | |||||||||||||||||||||||||||||||||||||||||||
| 12/31/11 | 104,380 | — | — | (525,451 | ) | (421,071 | ) | 2,181,461 | — | — | (10,942,390 | ) | (8,760,929 | ) | |||||||||||||||||||||||||||||
| 12/31/10 | 53,414 | — | — | (544,598 | ) | (491,184 | ) | 954,106 | — | — | (9,487,146 | ) | (8,533,040 | ) | |||||||||||||||||||||||||||||
| Class S2 | |||||||||||||||||||||||||||||||||||||||||||
| 12/31/11 | 63,506 | — | — | (9,287 | ) | 54,219 | 1,348,818 | — | — | (197,030 | ) | 1,151,788 | |||||||||||||||||||||||||||||||
| 12/31/10 | 16,878 | — | — | (593 | ) | 16,285 | 315,788 | — | — | (11,886 | ) | 303,902 | |||||||||||||||||||||||||||||||
26
NOTES TO FINANCIAL STATEMENTS AS OF DECEMBER 31, 2011 (CONTINUED)
NOTE 10 — REORGANIZATIONS
On August 20, 2010, MidCap Opportunities ("Acquiring Portfolio") acquired all of the net assets of ING Baron Asset Portfolio ("Acquired Portfolio"), an open-end investment company in a tax-free reorganization in exchange for shares of the Acquiring Portfolio, pursuant to a plan of reorganization approved by the Acquired Portfolio's shareholders on August 10, 2010. The purposes of the transaction were to combine comparable investment objectives, policies, restrictions, management, and portfolio holdings of the Acquiring and Acquired Funds. For financial reporting purposes, assets received and shares issued by the Acquiring Portfolio were recorded at fair value; however, the cost basis of the investments received from the Acquired Portfolio was carried forward to align ongoing reporting of the Acquiring Portfolio's realized and unrealized gains and losses with amounts distributable to shareholders for tax purposes.
Assuming the acquisition had been completed on January 1, 2010, the beginning of the annual reporting period of the Acquiring Portfolio, the Acquiring Portfolio's pro forma results of operations for the period ended December 31, 2010, are as follows:
| Net Investment Income | $ | 3,076,969 | |||||
| Net realized and unrealized gain on investments | $ | 179,315,546 | |||||
| Net increase in assets resulting from operations | $ | 182,392,515 | |||||
Because the combined investment Portfolios have been managed as a single integrated Portfolio since the acquisition was completed, it is not practicable to separate the amounts of revenue and earnings of the Acquired Portfolio that have been included in the Acquiring Portfolio's statement of operations since August 20, 2010. Net assets and unrealized appreciation as of the reorganization date were as follows:
| Acquiring Portfolio | Acquired Portfolio | Total Net Assets of Acquired Portfolio (000s) | Total Net Assets of Acquiring Portfolio (000s) | Acquired Capital Loss Carryforwards (000s) | Acquired Portfolio Unrealized Appreciation (000s) | Conversion Ratio | |||||||||||||||||||||
| MidCap Opportunities | ING Baron Asset Portfolio | $ | 8,935 | $ | 623,864 | $ | 1,823 | $ | 53 | 1.0087 | |||||||||||||||||
The net assets of MidCap Opportunities after the acquisition were $632,799,125.
NOTE 11 — SECURITIES LENDING
Under an agreement with The Bank of New York Mellon ("BNY"), the Portfolios can lend their securities to approved brokers, dealers and other financial institutions. Loans are collateralized by cash and U.S. government securities. The collateral is equal to at least 105% of the market value of non-U.S. securities loaned and 102% of the market value of U.S. securities loaned. The market value of the loaned securities is determined at the close of business of the Portfolios at their last sale price or official closing price on the principal exchange or system on which they are traded and any additional collateral is delivered to the Portfolios on the next business day. The cash collateral received is invested in approved investments as defined in the Securities Lending Agreement with BNY (the "Agreement"). The Portfolios bear the risk of loss with respect to the investment of collateral with the following exception: Effective October 1, 2011, BNY provides the Portfolios indemnification from loss with respect to the investment of collateral provided that the cash collateral is invested solely in overnight repurchase agreements
Currently, the cash collateral is invested in overnight repurchase agreements that are collateralized at 102% with securities issued or fully guaranteed by the United States Treasury; United States government or any agency, instrumentality or authority of the United States government. The securities purchased with cash collateral received are reflected in the Summary Portfolio of Investments under Securities Lending Collateral.
Prior to October 1, 2011, the cash collateral was invested in the BNY Mellon Overnight Government Fund (formerly, The BNY Institutional Cash Reserves Fund — Series A) and the BNY Institutional Cash Reserves Fund — Series B ("BICR — Series B"), each a series within the BNY Institutional Cash Reserves Trust (collectively, the "BICR Fund"). BNY serves as investment manager, custodian and operational trustee of the BICR Fund. From the beginning of the period covered by this report through October 16, 2011, BICR-Series B held certain defaulted securities issued by Lehman Brothers Holdings, Inc. (the "Lehman Securities"). The Lehman Securities had market values significantly below amortized cost. On May 22, 2009, the Portfolios agreed to the terms of a capital support agreement (the "Capital Support Agreement") extended by The Bank of New York Mellon Corporation ("BNYC"), an affiliated company of BNY, for the Lehman Securities held by BICR- Series B. Under the terms of the Capital Support Agreement, BNYC
27
NOTES TO FINANCIAL STATEMENTS AS OF DECEMBER 31, 2011 (CONTINUED)
NOTE 11 — SECURITIES LENDING (continued)
agreed to support the value of the Lehman Securities up to 80% of the par value (the remaining 20% of the par value represents an realized loss to the Portfolios) and subject, in part, to the Portfolios' continued participation in the BNY securities lending program through September 15, 2011. As of September 15, 2011, the Portfolios had complied with the requirements under the Capital Support Agreement and therefore the Portfolios could exercise their right to sell the Lehman Securities to BNYC at a price equal to 80% of par value. The sale of the Lehman Securities was completed on October 17, 2011.
Generally, in the event of counterparty default, the Portfolios have the right to use the collateral to offset losses incurred. The Agreement contains certain guarantees by BNY in the event of counterparty default and/or a borrower's failure to return a loaned security; however, there would be a potential loss to the Portfolios in the event the Portfolios are delayed or prevented from exercising their right to dispose of the collateral. Engaging in securities lending could have a leveraging effect, which may intensify the credit, market and other risks associated with investing in a Portfolio. At December 31, 2011, the following Portfolios had securities on loan with the following market values:
| Portfolio | Value of Securities Loaned | Cash Collateral Received | |||||||||
| International Value | $ | 1,547,524 | $ | 1,627,715 | |||||||
| SmallCap Opportunities | 4,991,871 | 5,138,650 | |||||||||
NOTE 12 — CONCENTRATION OF INVESTMENT RISKS
All mutual funds involve risk — some more than others — and there is always the chance that you could lose money or not earn as much as you hope. A Portfolio's risk profile is largely a factor of the principal securities in which it invests and investment techniques that it uses. For more information regarding the types of securities and investment techniques that may be used by a Portfolio and their corresponding risks, see each Portfolio's most recent Prospectus and/or the Statement of Additional Information.
Foreign Securities (MidCap Opportunities and International Value). Investments in foreign securities may entail risks not present in domestic investments.
Since securities in which the Portfolios may invest are denominated in foreign currencies, changes in the relationship of these foreign currencies to the U.S. dollar can significantly affect the value of the investments and earnings of the Portfolios. Foreign investments may also subject the Portfolios to foreign government exchange restrictions, expropriation, taxation or other political, social or economic developments, as well as changes vis-a-vis the U.S. dollar from movements in currency, and changes in security value and interest rate, all of which could affect the market and/or credit risk of the Portfolios' investments.
Emerging Markets Investments (International Value). Because of less developed markets and economies and, in some countries, less mature governments and governmental institutions, the risks of investing in foreign securities can be intensified in the case of investments in issuers domiciled or doing substantial business in emerging market countries.
NOTE 13 — FEDERAL INCOME TAXES
The amount of distributions from net investment income and net realized capital gains are determined in accordance with federal income tax regulations, which may differ from U.S. generally accepted accounting principles for investment companies. These book/tax differences may be either temporary or permanent. Permanent differences are reclassified within the capital accounts based on their federal tax-basis treatment; temporary differences are not reclassified. Key differences include the treatment of short-term capital gains, foreign currency transactions, income from passive foreign investment companies (PFICs), and wash sale deferrals. Distributions in excess of net investment income and/or net realized capital gains for tax purposes are reported as return of capital.
The following permanent tax differences have been reclassified as of December 31, 2011:
| Paid-in Capital | Undistributed Net Investment Income | Accumulated Net Realized Gains/ (Losses) | |||||||||||||
| International Value | $ | — | $ | (164,895 | ) | $ | 164,895 | ||||||||
| MidCap Opportunities | (34,634 | ) | (30,356 | ) | 64,990 | ||||||||||
| SmallCap Opportunities | — | 546,789 | (546,789 | ) | |||||||||||
Dividends paid by the Portfolios from net investment income and distributions of net realized short-term capital gains are, for federal income tax purposes, taxable as ordinary income to shareholders.
The tax composition of dividends and distributions to shareholders was as follows:
| Year Ended December 31, 2011 | Year Ended December 31, 2010 | ||||||||||||||
| Ordinary Income | Return of Capital | Ordinary Income | |||||||||||||
| International Value | $ | 4,851,909 | $ | 147,465 | $ | 6,879,957 | |||||||||
| MidCap Opportunities | — | — | 4,125,217 | ||||||||||||
28
NOTES TO FINANCIAL STATEMENTS AS OF DECEMBER 31, 2011 (CONTINUED)
NOTE 13 — FEDERAL INCOME TAXES (continued)
The tax-basis components of distributable earnings and the expiration dates of the capital loss carryforwards which may be used to offset future realized capital gains for federal income tax purposes as of December 31, 2011 were:
| Undistributed Ordinary Income | Undistributed Long-term Capital Gains | Unrealized Appreciation/ (Depreciation) | Short-term Capital Loss Carryforwards | Expiration | |||||||||||||||||||
| International Value | $ | — | $ | — | $ | (14,739,706 | ) | $ | (76,969,718 | ) | 2016 | ||||||||||||
| (104,716,147 | ) | 2017 | |||||||||||||||||||||
| (7,804,900 | ) | N/A | |||||||||||||||||||||
| $ | (189,490,765 | ) | |||||||||||||||||||||
| MidCap Opportunities | 727,997 | 26,893,336 | 48,654,653 | $ | (420,180 | ) | 2015 | ||||||||||||||||
| (820,634 | ) | 2016 | |||||||||||||||||||||
| (95,470 | ) | 2017 | |||||||||||||||||||||
| $ | (1,336,284 | )* | |||||||||||||||||||||
| SmallCap Opportunities | 3,545,682 | 16,783,106 | 6,395,696 | — | — | ||||||||||||||||||
* Utilization of these capital losses is subject to annual limitations under Section 382 of the Internal Revenue Code.
The Portfolios' major tax jurisdictions are federal, Arizona, and Massachusetts. The earliest tax year that remains subject to examination by these jurisdictions is 2007.
As of December 31, 2011, no provisions for income tax would be required in the Portfolios' financial statements as a result of tax positions taken on federal and state income tax returns for open tax years. The Portfolios' federal and state income and federal excise tax returns for tax years for which the applicable statutes of limitations have not expired are subject to examination by the Internal Revenue Service and state department of revenue.
The Regulated Investment Company Modernization Act of 2010 (the "Act") was enacted on December 22, 2010. The Act makes changes to several tax rules impacting the Portfolios. In general, the provisions of the Act are effective for the Portfolios' tax year ended December 31, 2011. Although the Act provides several benefits, including the unlimited carryforward of future capital losses, there may be a greater likelihood that all or a portion of the Portfolios' pre-enactment capital loss carryforwards may expire without being utilized due to the fact that post-enactment capital losses are required to be utilized before pre-enactment capital loss carryforwards.
NOTE 14 — OTHER ACCOUNTING PRONOUNCEMENTS
In May 2011, the Financial Accounting Standards Board ("FASB") issued Accounting Standards Update ("ASU") No. 2011-04 "Amendments to Achieve Common Fair Value Measurement and Disclosure Requirements". ASU No. 2011-04 amends FASB ASC Topic 820, Fair Value Measurements and Disclosures, to establish common requirements for measuring fair value and for disclosing information about fair value measurements in accordance with GAAP and the International Financial Reporting Standards ("IFRSs"). The ASU is effective prospectively for interim and annual periods beginning after December 15, 2011. As of December 31, 2011, management of the Portfolios is currently assessing the potential impact to financial statement disclosure that may result from adopting this ASU.
NOTE 15 — SUBSEQUENT EVENTS
The Portfolios have evaluated events occurring after the Statements of Assets and Liabilities date (subsequent events) to determine whether any subsequent events necessitated adjustment to or disclosure in the financial statements. No such subsequent events were identified.
29
SUMMARY PORTFOLIO OF INVESTMENTS
ING INTERNATIONAL VALUE PORTFOLIO AS OF DECEMBER 31, 2011
| Shares | Value | Percentage of Net Assets | |||||||||||||||||
| COMMON STOCK: 98.3% | |||||||||||||||||||
| Australia: 3.0% | |||||||||||||||||||
| 90,474 | National Australia Bank Ltd. | $ | 2,155,226 | 1.5 | |||||||||||||||
| 118,524 | Other Securities | 2,192,332 | 1.5 | ||||||||||||||||
| 4,347,558 | 3.0 | ||||||||||||||||||
| Brazil: 1.1% | |||||||||||||||||||
| 119,800 | Banco do Brasil S.A. | 1,522,187 | 1.1 | ||||||||||||||||
| Canada: 1.9% | |||||||||||||||||||
| 49,500 | Other Securities (a) | 2,748,564 | 1.9 | ||||||||||||||||
| China: 1.0% | |||||||||||||||||||
| 2,125,000 | Other Securities | 1,476,048 | 1.0 | ||||||||||||||||
| Finland: 1.3% | |||||||||||||||||||
| 74,802 | Sampo OYJ | 1,850,303 | 1.3 | ||||||||||||||||
| France: 9.6% | |||||||||||||||||||
| 72,999 | Accor S.A. | 1,839,680 | 1.3 | ||||||||||||||||
| 41,064 | BNP Paribas | 1,599,005 | 1.1 | ||||||||||||||||
| 32,001 | Cie Generale des Etablissements Michelin | 1,885,534 | 1.3 | ||||||||||||||||
| 48,123 | Sanofi-Aventis | 3,517,672 | 2.4 | ||||||||||||||||
| 34,324 | Total S.A. | 1,751,477 | 1.2 | ||||||||||||||||
| 89,435 | Other Securities | 3,342,078 | 2.3 | ||||||||||||||||
| 13,935,446 | 9.6 | ||||||||||||||||||
| Germany: 11.8% | |||||||||||||||||||
| 22,753 | BASF AG | 1,584,024 | 1.1 | ||||||||||||||||
| 50,477 | Deutsche Bank AG | 1,913,119 | 1.3 | ||||||||||||||||
| 153,666 | Deutsche Telekom AG | 1,762,681 | 1.2 | ||||||||||||||||
| 74,311 | E.ON AG | 1,601,409 | 1.1 | ||||||||||||||||
| 38,925 | Hannover Rueckversicheru - Reg | 1,928,756 | 1.3 | ||||||||||||||||
| 36,892 | SAP AG | 1,951,274 | 1.4 | ||||||||||||||||
| 32,970 | Siemens AG | 3,154,426 | 2.2 | ||||||||||||||||
| 71,585 | Other Securities | 3,138,062 | 2.2 | ||||||||||||||||
| 17,033,751 | 11.8 | ||||||||||||||||||
| Hong Kong: 1.4% | |||||||||||||||||||
| 393,800 | Other Securities | 2,071,388 | 1.4 | ||||||||||||||||
| Israel: 1.3% | |||||||||||||||||||
| 47,600 | Teva Pharmaceutical Industries Ltd. ADR | 1,921,136 | 1.3 | ||||||||||||||||
| Italy: 4.2% | |||||||||||||||||||
| 126,811 | ENI S.p.A. | 2,614,537 | 1.8 | ||||||||||||||||
| 979,656 | Other Securities | 3,467,805 | 2.4 | ||||||||||||||||
| 6,082,342 | 4.2 | ||||||||||||||||||
| Shares | Value | Percentage of Net Assets | |||||||||||||||||
| Japan: 18.3% | |||||||||||||||||||
| 518,112 | L | Hitachi Ltd. | $ | 2,695,203 | 1.9 | ||||||||||||||
| 319 | Inpex Holdings, Inc. | 2,008,497 | 1.4 | ||||||||||||||||
| 63,000 | JGC Corp. | 1,512,547 | 1.0 | ||||||||||||||||
| 87,100 | Komatsu Ltd. | 2,030,990 | 1.4 | ||||||||||||||||
| 274,400 | Nissan Motor Co., Ltd. | 2,457,278 | 1.7 | ||||||||||||||||
| 1,352 | NTT DoCoMo, Inc. | 2,482,299 | 1.7 | ||||||||||||||||
| 100,700 | Omron Corp. | 2,021,350 | 1.4 | ||||||||||||||||
| 81,900 | Seven & I Holdings Co., Ltd. | 2,282,530 | 1.6 | ||||||||||||||||
| 86,600 | Sumitomo Mitsui Financial Group, Inc. | 2,401,659 | 1.7 | ||||||||||||||||
| 48,000 | Takeda Pharmaceutical Co., Ltd. | 2,108,423 | 1.4 | ||||||||||||||||
| 107,000 | Tokio Marine Holdings, Inc. | 2,369,391 | 1.6 | ||||||||||||||||
| 43,300 | Tokyo Electron Ltd. | 2,193,908 | 1.5 | ||||||||||||||||
| 26,564,075 | 18.3 | ||||||||||||||||||
| Luxembourg: 0.5% | |||||||||||||||||||
| 39,095 | Other Securities | 710,372 | 0.5 | ||||||||||||||||
| Netherlands: 9.4% | |||||||||||||||||||
| 73,734 | European Aeronautic Defence and Space Co. NV | 2,296,001 | 1.6 | ||||||||||||||||
| 163,590 | Royal Dutch Shell PLC - Class A | 6,001,955 | 4.1 | ||||||||||||||||
| 100,215 | Koninklijke Philips Electronics NV | 2,102,676 | 1.5 | ||||||||||||||||
| 93,981 | Unilever NV | 3,231,393 | 2.2 | ||||||||||||||||
| 13,632,025 | 9.4 | ||||||||||||||||||
| Norway: 0.6% | |||||||||||||||||||
| 34,861 | Other Securities | 892,800 | 0.6 | ||||||||||||||||
| Portugal: 1.1% | |||||||||||||||||||
| 532,750 | Energias de Portugal S.A. | 1,645,327 | 1.1 | ||||||||||||||||
| Singapore: 2.8% | |||||||||||||||||||
| 897,100 | Other Securities | 4,083,485 | 2.8 | ||||||||||||||||
| Spain: 1.0% | |||||||||||||||||||
| 79,286 | Other Securities | 1,365,949 | 1.0 | ||||||||||||||||
| Sweden: 1.4% | |||||||||||||||||||
| 158,546 | Swedbank AB | 2,045,973 | 1.4 | ||||||||||||||||
| Switzerland: 4.3% | |||||||||||||||||||
| 33,351 | Nestle S.A. | 1,915,132 | 1.3 | ||||||||||||||||
| 75,763 | Novartis AG | 4,325,543 | 3.0 | ||||||||||||||||
| 6,240,675 | 4.3 | ||||||||||||||||||
See Accompanying Notes to Financial Statements
30
SUMMARY PORTFOLIO OF INVESTMENTS
ING INTERNATIONAL VALUE PORTFOLIO AS OF DECEMBER 31, 2011 (CONTINUED)
| Shares | Value | Percentage of Net Assets | |||||||||||||||||
| United Kingdom: 21.0% | |||||||||||||||||||
| 85,178 | BHP Billiton PLC | $ | 2,490,217 | 1.7 | |||||||||||||||
| 39,800 | BP PLC ADR | 1,701,052 | 1.2 | ||||||||||||||||
| 45,300 | Ensco International PLC ADR | 2,125,476 | 1.5 | ||||||||||||||||
| 144,607 | GlaxoSmithKline PLC | 3,294,979 | 2.3 | ||||||||||||||||
| 284,052 | HSBC Holdings PLC | 2,168,450 | 1.5 | ||||||||||||||||
| 53,918 | Imperial Tobacco Group PLC | 2,040,270 | 1.4 | ||||||||||||||||
| 949,363 | Legal & General Group PLC | 1,517,142 | 1.0 | ||||||||||||||||
| 166,836 | Prudential PLC | 1,650,691 | 1.1 | ||||||||||||||||
| 36,838 | Rio Tinto PLC | 1,799,395 | 1.2 | ||||||||||||||||
| 83,917 | Standard Chartered PLC | 1,835,462 | 1.3 | ||||||||||||||||
| 346,510 | Tesco PLC | 2,168,041 | 1.5 | ||||||||||||||||
| 1,786,906 | Vodafone Group PLC | 4,982,047 | 3.4 | ||||||||||||||||
| 215,631 | Other Securities | 2,712,007 | 1.9 | ||||||||||||||||
| 30,485,229 | 21.0 | ||||||||||||||||||
| United States: 1.3% | |||||||||||||||||||
| 71,200 | Coca-Cola Enterprises, Inc. | 1,835,536 | 1.3 | ||||||||||||||||
| Total Common Stock (Cost $155,224,483) | 142,490,169 | 98.3 | |||||||||||||||||
| PREFERRED STOCK: 1.0% | |||||||||||||||||||
| Germany: 1.0% | |||||||||||||||||||
| 9,977 | Other Securities | 1,491,671 | 1.0 | ||||||||||||||||
| Total Preferred Stock (Cost $1,582,136) | 1,491,671 | 1.0 | |||||||||||||||||
| Total Long-Term Investments (Cost $156,806,619) | 143,981,840 | 99.3 | |||||||||||||||||
| Principal Amount† | Value | Percentage of Net Assets | |||||||||||||||||
| SHORT-TERM INVESTMENTS: 1.8% | |||||||||||||||||||
| Securities Lending Collateralcc(1): 1.1% | |||||||||||||||||||
| 627,715 | Cantor Fitzgerald, Repurchase Agreement dated 12/30/11, 0.12%, due 01/03/12 (Repurchase Amount $627,723, collateralized by various U.S. Government Agency Obligations, 1.437%- 6.014%, Market Value plus accrued interest $640,269, due 06/01/17-09/01/44) | 627,715 | 0.4 | ||||||||||||||||
| Principal Amount† | Value | Percentage of Net Assets | |||||||||||||||||
| 1,000,000 | Citigroup, Inc., Repurchase Agreement dated 12/30/11, 0.08%, due 01/03/12 (Repurchase Amount $1,000,009, collateralized by various U.S. Government and U.S. Government Agency Obligations, 0.000%-5.500%, Market Value plus accrued interest $1,020,000, due 01/19/12-12/20/41) | $ | 1,000,000 | 0.7 | |||||||||||||||
| 1,627,715 | 1.1 | ||||||||||||||||||
| Shares | Value | Percentage of Net Assets | |||||||||||||||||
| Mutual Funds: 0.7% | |||||||||||||||||||
| 937,000 | BlackRock Liquidity Funds, TempFund, Institutional Class (Cost $937,000) | 937,000 | 0.7 | ||||||||||||||||
| Total Short-Term Investments (Cost $2,564,715) | 2,564,715 | 1.8 | |||||||||||||||||
| Total Investments in Securities (Cost $159,371,334) | $ | 146,546,555 | 101.1 | ||||||||||||||||
| Liabilities in Excess of Other Assets | (1,559,565 | ) | (1.1 | ) | |||||||||||||||
| Net Assets | $ | 144,986,990 | 100.0 | ||||||||||||||||
"Other Securities" represents issues not identified as the top 50 holdings in terms of market value and issues or issuers not exceeding 1% of net assets individually or in aggregate respectively as of December 31, 2011.
The following footnotes apply to either the individual securities noted or one or more of the securities aggregated and listed as a single line item.
† Unless otherwise indicated, principal amount is shown in USD.
ADR American Depositary Receipt
cc Securities purchased with cash collateral for securities loaned.
L Loaned security, a portion or all of the security is on loan at December 31, 2011.
(1) Collateral received from brokers for securities lending was invested into these short-term investments.
(a) This grouping contains loaned securities.
Cost for federal income tax purposes is $161,283,291.
Net unrealized depreciation consists of:
| Gross Unrealized Appreciation | $ | 5,335,009 | |||||
| Gross Unrealized Depreciation | (20,071,745 | ) | |||||
| Net Unrealized depreciation | $ | (14,736,736 | ) | ||||
See Accompanying Notes to Financial Statements
31
SUMMARY PORTFOLIO OF INVESTMENTS
ING INTERNATIONAL VALUE PORTFOLIO AS OF DECEMBER 31, 2011 (CONTINUED)
| Sector Diversification | Percentage of Net Assets | ||||||
| Consumer Discretionary | 6.2 | % | |||||
| Consumer Staples | 10.1 | ||||||
| Energy | 12.4 | ||||||
| Financials | 24.0 | ||||||
| Health Care | 10.4 | ||||||
| Industrials | 9.5 | ||||||
| Information Technology | 7.0 | ||||||
| Sector Diversification | Percentage of Net Assets | ||||||
| Materials | 7.4 | % | |||||
| Telecommunications | 8.2 | ||||||
| Utilities | 4.1 | ||||||
| Short-Term Investments | 1.8 | ||||||
| Liabilities in Excess of Other Assets | (1.1 | ) | |||||
| Net Assets | 100.0 | % | |||||
Fair Value Measurements^
The following is a summary of the fair valuations according to the inputs used as of December 31, 2011 in valuing the assets and liabilities:
| Quoted Prices in Active Markets for Identical Investments (Level 1) | Significant Other Observable Inputs# (Level 2) | Significant Unobservable Inputs (Level 3) | Fair Value at 12/31/2011 | ||||||||||||||||
| Asset Table | |||||||||||||||||||
| Investments, at value | |||||||||||||||||||
| Common Stock | |||||||||||||||||||
| Australia | $ | — | $ | 4,347,558 | $ | — | $ | 4,347,558 | |||||||||||
| Brazil | 1,522,187 | — | — | 1,522,187 | |||||||||||||||
| Canada | 2,748,564 | — | — | 2,748,564 | |||||||||||||||
| China | — | 1,476,048 | — | 1,476,048 | |||||||||||||||
| Finland | — | 1,850,303 | — | 1,850,303 | |||||||||||||||
| France | — | 13,935,446 | — | 13,935,446 | |||||||||||||||
| Germany | — | 17,033,751 | — | 17,033,751 | |||||||||||||||
| Hong Kong | — | 2,071,388 | — | 2,071,388 | |||||||||||||||
| Israel | 1,921,136 | — | — | 1,921,136 | |||||||||||||||
| Italy | — | 6,082,342 | — | 6,082,342 | |||||||||||||||
| Japan | — | 26,564,075 | — | 26,564,075 | |||||||||||||||
| Luxembourg | — | 710,372 | — | 710,372 | |||||||||||||||
| Netherlands | — | 13,632,025 | — | 13,632,025 | |||||||||||||||
| Norway | — | 892,800 | — | 892,800 | |||||||||||||||
| Portugal | — | 1,645,327 | — | 1,645,327 | |||||||||||||||
| Singapore | — | 4,083,485 | — | 4,083,485 | |||||||||||||||
| Spain | — | 1,365,949 | — | 1,365,949 | |||||||||||||||
| Sweden | — | 2,045,973 | — | 2,045,973 | |||||||||||||||
| Switzerland | — | 6,240,675 | — | 6,240,675 | |||||||||||||||
| United Kingdom | 3,826,528 | 26,658,701 | — | 30,485,229 | |||||||||||||||
| United States | 1,835,536 | — | — | 1,835,536 | |||||||||||||||
| Total Common Stock | 11,853,951 | 130,636,218 | — | 142,490,169 | |||||||||||||||
| Preferred Stock | — | 1,491,671 | — | 1,491,671 | |||||||||||||||
| Short-Term Investments | 937,000 | 1,627,715 | — | 2,564,715 | |||||||||||||||
| Total Investments, at value | $ | 12,790,951 | $ | 133,755,604 | $ | — | $ | 146,546,555 | |||||||||||
^ See Note 2, "Significant Accounting Policies" in the Notes to Financial Statements for additional information.
# The earlier close of the foreign markets gives rise to the possibility that significant events, including broad market moves, may have occurred in the interim and may materially affect the value of those securities. To account for this, the Portfolio may frequently value many of its foreign equity securities using fair value prices based on third party vendor modeling tools to the extent available. Accordingly, a significant portion of the Portfolio's investments are categorized as Level 2 investments.
There were no significant transfers between Level 1 and 2 during the year ending December 31, 2011.
ING International Value Portfolio
See Accompanying Notes to Financial Statements
32
SUMMARY PORTFOLIO OF INVESTMENTS
ING INTERNATIONAL VALUE PORTFOLIO AS OF DECEMBER 31, 2011 (CONTINUED)
The following is a reconciliation of the fair valuations using significant unobservable inputs (Level 3) for the Portfolio's assets and liabilities during the period ended December 31, 2011:
| Beginning Balance 12/31/10 | Purchases | Sales | Accrued Discounts/ (Premiums) | Total Realized Gain/(Loss) | Total Unrealized Appreciation/ (Depreciation) | Transfers Into Level 3 | Transfers Out of Level 3 | Ending Balance 12/31/11 | |||||||||||||||||||||||||||||||
| Asset Table | |||||||||||||||||||||||||||||||||||||||
| Investments, at value | |||||||||||||||||||||||||||||||||||||||
| Short-Term Investments | $ | 275,654 | $ | — | $ | (275,654 | ) | $ | — | $ | (68,913 | ) | $ | 68,913 | $ | — | $ | — | $ | — | |||||||||||||||||||
| Total Investments, at value | $ | 275,654 | $ | — | $ | (275,654 | ) | $ | — | $ | (68,913 | ) | $ | 68,913 | $ | — | $ | — | $ | — | |||||||||||||||||||
As of December 31, 2011, total change in unrealized gain (loss) on Level 3 securities still held at period end and included in the change in net assets was $0.
See Accompanying Notes to Financial Statements
33
SUMMARY PORTFOLIO OF INVESTMENTS
ING MIDCAP OPPORTUNITIES PORTFOLIO AS OF DECEMBER 31, 2011
| Shares | Value | Percentage of Net Assets | |||||||||||||||||
| COMMON STOCK: 99.7% | |||||||||||||||||||
| Consumer Discretionary: 19.9% | |||||||||||||||||||
| 329,460 | @ | Bed Bath & Beyond, Inc. | $ | 19,098,796 | 2.2 | ||||||||||||||
| 506,000 | Brinker International, Inc. | 13,540,560 | 1.5 | ||||||||||||||||
| 170,606 | Coach, Inc. | 10,413,790 | 1.2 | ||||||||||||||||
| 484,380 | Foot Locker, Inc. | 11,547,619 | 1.3 | ||||||||||||||||
| 498,270 | Harley-Davidson, Inc. | 19,367,755 | 2.2 | ||||||||||||||||
| 795,160 | International Game Technology | 13,676,752 | 1.5 | ||||||||||||||||
| 128,439 | @ | Liberty Media Corp. | 10,024,664 | 1.1 | |||||||||||||||
| 450,390 | Macy's, Inc. | 14,493,550 | 1.6 | ||||||||||||||||
| 365,050 | @ | Michael Kors Holdings Ltd. | 9,947,613 | 1.1 | |||||||||||||||
| 323,640 | Ross Stores, Inc. | 15,382,609 | 1.7 | ||||||||||||||||
| 317,150 | Scripps Networks Interactive - Class A | 13,453,503 | 1.5 | ||||||||||||||||
| 408,604 | Wyndham Worldwide Corp. | 15,457,489 | 1.7 | ||||||||||||||||
| 427,753 | Other Securities | 11,063,091 | 1.3 | ||||||||||||||||
| 177,467,791 | 19.9 | ||||||||||||||||||
| Consumer Staples: 6.3% | |||||||||||||||||||
| 628,930 | Coca-Cola Enterprises, Inc. | 16,213,815 | 1.8 | ||||||||||||||||
| 216,180 | Hershey Co. | 13,355,600 | 1.5 | ||||||||||||||||
| 113,030 | @ | Ralcorp Holdings, Inc. | 9,664,065 | 1.1 | |||||||||||||||
| 429,848 | Other Securities | 17,463,211 | 1.9 | ||||||||||||||||
| 56,696,691 | 6.3 | ||||||||||||||||||
| Energy: 9.0% | |||||||||||||||||||
| 365,930 | @ | Cameron International Corp. | 18,000,097 | 2.0 | |||||||||||||||
| 1,071,275 | @ | Precision Drilling Corp. | 10,991,281 | 1.2 | |||||||||||||||
| 292,480 | Range Resources Corp. | 18,116,211 | 2.0 | ||||||||||||||||
| 247,640 | @ | Unit Corp. | 11,490,496 | 1.3 | |||||||||||||||
| 1,017,334 | Other Securities | 22,000,740 | 2.5 | ||||||||||||||||
| 80,598,825 | 9.0 | ||||||||||||||||||
| Financials: 8.5% | |||||||||||||||||||
| 212,750 | Ameriprise Financial, Inc. | 10,560,910 | 1.2 | ||||||||||||||||
| 366,510 | Lazard Ltd. | 9,569,576 | 1.1 | ||||||||||||||||
| 238,890 | T. Rowe Price Group, Inc. | 13,604,785 | 1.5 | ||||||||||||||||
| 381,540 | UDR, Inc. | 9,576,654 | 1.1 | ||||||||||||||||
| 1,101,695 | Other Securities | 32,176,072 | 3.6 | ||||||||||||||||
| 75,487,997 | 8.5 | ||||||||||||||||||
| Health Care: 12.8% | |||||||||||||||||||
| 359,520 | @ | Agilent Technologies, Inc. | 12,558,034 | 1.4 | |||||||||||||||
| 246,720 | Cardinal Health, Inc. | 10,019,299 | 1.1 | ||||||||||||||||
| 162,870 | Cooper Cos., Inc. | 11,485,592 | 1.3 | ||||||||||||||||
| 130,987 | Perrigo Co. | 12,745,035 | 1.4 | ||||||||||||||||
| 139,070 | @ | Waters Corp. | 10,298,133 | 1.2 | |||||||||||||||
| 226,046 | @ | Watson Pharmaceuticals, Inc. | 13,639,616 | 1.5 | |||||||||||||||
| Shares | Value | Percentage of Net Assets | |||||||||||||||||
| 1,280,646 | Other Securities | $ | 43,200,722 | 4.9 | |||||||||||||||
| 113,946,431 | 12.8 | ||||||||||||||||||
| Industrials: 16.2% | |||||||||||||||||||
| 195,380 | Acuity Brands, Inc. | 10,355,140 | 1.2 | ||||||||||||||||
| 480,530 | @ | Corrections Corp. of America | 9,788,396 | 1.1 | |||||||||||||||
| 251,260 | Dover Corp. | 14,585,643 | 1.6 | ||||||||||||||||
| 153,077 | Gardner Denver, Inc. | 11,796,114 | 1.3 | ||||||||||||||||
| 272,590 | Pall Corp. | 15,578,518 | 1.7 | ||||||||||||||||
| 181,112 | Roper Industries, Inc. | 15,733,199 | 1.8 | ||||||||||||||||
| 125,270 | @ | TransDigm Group, Inc. | 11,985,834 | 1.3 | |||||||||||||||
| 281,330 | Waste Connections, Inc. | 9,323,276 | 1.1 | ||||||||||||||||
| 1,026,557 | Other Securities | 45,770,179 | 5.1 | ||||||||||||||||
| 144,916,299 | 16.2 | ||||||||||||||||||
| Information Technology: 19.0% | |||||||||||||||||||
| 360,980 | @ | Adobe Systems, Inc. | 10,204,905 | 1.1 | |||||||||||||||
| 440,560 | Analog Devices, Inc. | 15,763,237 | 1.8 | ||||||||||||||||
| 243,782 | @ | Citrix Systems, Inc. | 14,802,443 | 1.7 | |||||||||||||||
| 312,630 | Intuit, Inc. | 16,441,212 | 1.8 | ||||||||||||||||
| 505,260 | Jabil Circuit, Inc. | 9,933,412 | 1.1 | ||||||||||||||||
| 312,770 | @ | Lam Research Corp. | 11,578,745 | 1.3 | |||||||||||||||
| 296,640 | @ | Micros Systems, Inc. | 13,817,491 | 1.5 | |||||||||||||||
| 264,324 | @ | NetApp, Inc. | 9,587,031 | 1.1 | |||||||||||||||
| 612,140 | @ | QLogic Corp. | 9,182,100 | 1.1 | |||||||||||||||
| 481,860 | @ | Riverbed Technolgoy, Inc. | 11,323,710 | 1.3 | |||||||||||||||
| 949,930 | Western Union Co. | 17,345,722 | 1.9 | ||||||||||||||||
| 395,930 | Xilinx, Inc. | 12,693,516 | 1.4 | ||||||||||||||||
| 838,350 | Other Securities | 17,168,727 | 1.9 | ||||||||||||||||
| 169,842,251 | 19.0 | ||||||||||||||||||
| Materials: 6.2% | |||||||||||||||||||
| 88,500 | CF Industries Holdings, Inc. | 12,830,730 | 1.4 | ||||||||||||||||
| 207,440 | Cliffs Natural Resources, Inc. | 12,933,884 | 1.5 | ||||||||||||||||
| 196,880 | Sigma-Aldrich Corp. | 12,297,125 | 1.4 | ||||||||||||||||
| 524,310 | Other Securities | 16,911,090 | 1.9 | ||||||||||||||||
| 54,972,829 | 6.2 | ||||||||||||||||||
| Telecommunications: 1.8% | |||||||||||||||||||
| 381,610 | @ | SBA Communications Corp. | 16,393,966 | 1.8 | |||||||||||||||
| Total Common Stock (Cost $838,726,816) | 890,323,080 | 99.7 | |||||||||||||||||
See Accompanying Notes to Financial Statements
34
SUMMARY PORTFOLIO OF INVESTMENTS
ING MIDCAP OPPORTUNITIES PORTFOLIO AS OF DECEMBER 31, 2011 (CONTINUED)
| Shares | Value | Percentage of Net Assets | |||||||||||||||||
| SHORT-TERM INVESTMENTS: 1.7% | |||||||||||||||||||
| Mutual Funds: 1.7% | |||||||||||||||||||
| 15,333,100 | BlackRock Liquidity Funds, TempFund, Institutional Class (Cost $15,333,100) | $ | 15,333,100 | 1.7 | |||||||||||||||
| Total Short-Term Investments (Cost $15,333,100) | 15,333,100 | 1.7 | |||||||||||||||||
| Total Investments in Securities (Cost $854,059,916) | 905,656,180 | 101.4 | |||||||||||||||||
| Liabilities in Excess of Other Assets | (12,437,110 | ) | (1.4 | ) | |||||||||||||||
| Net Assets | $ | 893,219,070 | 100.0 | ||||||||||||||||
"Other Securities" represents issues not identified as the top 50 holdings in terms of market value and issues or issuers not exceeding 1% of net assets individually or in aggregate respectively as of December 31, 2011.
The following footnotes apply to either the individual securities noted or one or more of the securities aggregated and listed as a single line item.
@ Non-income producing security
Cost for federal income tax purposes is $857,001,527.
Net unrealized appreciation consists of:
| Gross Unrealized Appreciation | $ | 91,750,689 | |||||
| Gross Unrealized Depreciation | (43,096,036 | ) | |||||
| Net Unrealized appreciation | $ | 48,654,653 | |||||
Fair Value Measurements^
The following is a summary of the fair valuations according to the inputs used as of December 31, 2011 in valuing the assets and liabilities:
| Quoted Prices in Active Markets for Identical Investments (Level 1) | Significant Other Observable Inputs (Level 2) | Significant Unobservable Inputs (Level 3) | Fair Value at 12/31/2011 | ||||||||||||||||
| Asset Table | |||||||||||||||||||
| Investments, at value | |||||||||||||||||||
| Common Stock* | $ | 890,323,080 | $ | — | $ | — | $ | 890,323,080 | |||||||||||
| Short-Term Investments | 15,333,100 | — | — | 15,333,100 | |||||||||||||||
| Total Investments, at value | $ | 905,656,180 | �� | $ | — | $ | — | $ | 905,656,180 | ||||||||||
^ See Note 2, "Significant Accounting Policies" in the Notes to Financial Statements for additional information.
* For further breakdown of Common Stock by Industry type, please refer to the Portfolio of Investments.
There were no significant transfers between Level 1 and 2 during the year ending December 31, 2011.
The following is a reconciliation of the fair valuations using significant unobservable inputs (Level 3) for the Portfolio's assets and liabilities during the period ended December 31, 2011:
| Beginning Balance 12/31/10 | Purchases | Sales | Accrued Discounts/ (Premiums) | Total Realized Gain/(Loss) | Total Unrealized Appreciation/ (Depreciation) | Transfers Into Level 3 | Transfers Out of Level 3 | Ending Balance 12/31/11 | |||||||||||||||||||||||||||||||
| Asset Table | |||||||||||||||||||||||||||||||||||||||
| Investments, at value | |||||||||||||||||||||||||||||||||||||||
| Short-Term Investments | $ | 1,052,596 | $ | — | $ | (1,052,596 | ) | $ | — | $ | (263,149 | ) | $ | 263,149 | $ | — | $ | — | $ | — | |||||||||||||||||||
| Total Investments, at value | $ | 1,052,596 | $ | — | $ | (1,052,596 | ) | $ | — | $ | (263,149 | ) | $ | 263,149 | $ | — | $ | — | $ | — | |||||||||||||||||||
As of December 31, 2011, total change in unrealized gain (loss) on Level 3 securities still held at period end and included in the change in net assets was $0.
See Accompanying Notes to Financial Statements
35
SUMMARY PORTFOLIO OF INVESTMENTS
ING SMALLCAP OPPORTUNITIES PORTFOLIO AS OF DECEMBER 31, 2011
| Shares | Value | Percentage of Net Assets | |||||||||||||||||
| COMMON STOCK: 96.6% | |||||||||||||||||||
| Consumer Discretionary: 15.9% | |||||||||||||||||||
| 42,849 | Arbitron, Inc. | $ | 1,474,434 | 0.8 | |||||||||||||||
| 89,966 | Cinemark Holdings, Inc. | 1,663,471 | 0.9 | ||||||||||||||||
| 115,509 | Cooper Tire & Rubber Co. | 1,618,281 | 0.8 | ||||||||||||||||
| 75,900 | Finish Line | 1,463,732 | 0.8 | ||||||||||||||||
| 40,499 | @ | Hibbett Sporting Goods, Inc. | 1,829,745 | 1.0 | |||||||||||||||
| 52,251 | @ | Life Time Fitness, Inc. | 2,442,734 | 1.3 | |||||||||||||||
| 41,300 | Monro Muffler, Inc. | 1,602,027 | 0.8 | ||||||||||||||||
| 81,700 | @ | Sally Beauty Holdings, Inc. | 1,726,321 | 0.9 | |||||||||||||||
| 43,694 | Wyndham Worldwide Corp. | 1,652,944 | 0.9 | ||||||||||||||||
| 1,035,007 | Other Securities (a) | 14,429,582 | 7.7 | ||||||||||||||||
| 29,903,271 | 15.9 | ||||||||||||||||||
| Consumer Staples: 1.3% | |||||||||||||||||||
| 29,200 | Casey's General Stores, Inc. | 1,504,092 | 0.8 | ||||||||||||||||
| 38,750 | Other Securities | 945,457 | 0.5 | ||||||||||||||||
| 2,449,549 | 1.3 | ||||||||||||||||||
| Energy: 8.4% | |||||||||||||||||||
| 48,600 | @ | Bill Barrett Corp. | 1,655,802 | 0.9 | |||||||||||||||
| 68,500 | @ | Carrizo Oil & Gas, Inc. | 1,804,975 | 0.9 | |||||||||||||||
| 30,900 | @ | Dril-Quip, Inc. | 2,033,838 | 1.1 | |||||||||||||||
| 37,500 | @ | Rosetta Resources, Inc. | 1,631,250 | 0.9 | |||||||||||||||
| 55,400 | @ | Swift Energy Co. | 1,646,488 | 0.9 | |||||||||||||||
| 320,200 | Other Securities (a) | 7,030,844 | 3.7 | ||||||||||||||||
| 15,803,197 | 8.4 | ||||||||||||||||||
| Financials: 8.7% | |||||||||||||||||||
| 15,500 | @ | Affiliated Managers Group, Inc. | 1,487,225 | 0.8 | |||||||||||||||
| 83,350 | @ | DFC Global Corp. | 1,505,301 | 0.8 | |||||||||||||||
| 329,379 | Hersha Hospitality Trust | 1,607,370 | 0.9 | ||||||||||||||||
| 29,062 | @ | Portfolio Recovery Associates, Inc. | 1,962,266 | 1.0 | |||||||||||||||
| 32,076 | @ | Signature Bank | 1,924,239 | 1.0 | |||||||||||||||
| 33,500 | @ | SVB Financial Group | 1,597,615 | 0.9 | |||||||||||||||
| 88,700 | Tanger Factory Outlet Centers, Inc. | 2,600,684 | 1.4 | ||||||||||||||||
| 103,365 | Other Securities | 3,584,839 | 1.9 | ||||||||||||||||
| 16,269,539 | 8.7 | ||||||||||||||||||
| Health Care: 18.7% | |||||||||||||||||||
| 47,954 | @ | Centene Corp. | 1,898,499 | 1.0 | |||||||||||||||
| 37,500 | Chemed Corp. | 1,920,375 | 1.0 | ||||||||||||||||
| 26,688 | @ | Haemonetics Corp. | 1,633,839 | 0.9 | |||||||||||||||
| 86,231 | @ | Healthsouth Corp. | 1,523,702 | 0.8 | |||||||||||||||
| 35,200 | @ | Onyx Pharmaceuticals, Inc. | 1,547,040 | 0.8 | |||||||||||||||
| 46,200 | @ | Thoratec Corp. | 1,550,472 | 0.9 | |||||||||||||||
| 1,438,679 | Other Securities (a) | 24,987,845 | 13.3 | ||||||||||||||||
| 35,061,772 | 18.7 | ||||||||||||||||||
| Shares | Value | Percentage of Net Assets | |||||||||||||||||
| Industrials: 18.1% | |||||||||||||||||||
| 75,535 | Actuant Corp. | $ | 1,713,889 | 0.9 | |||||||||||||||
| 49,700 | Acuity Brands, Inc. | 2,634,100 | 1.4 | ||||||||||||||||
| 35,892 | @ | Clean Harbors, Inc. | 2,287,397 | 1.2 | |||||||||||||||
| 39,900 | @ | Genesee & Wyoming, Inc. | 2,417,142 | 1.3 | |||||||||||||||
| 107,900 | Knight Transportation, Inc. | 1,687,556 | 0.9 | ||||||||||||||||
| 47,528 | Simpson Manufacturing Co., Inc. | 1,599,793 | 0.9 | ||||||||||||||||
| 31,300 | @ | Teledyne Technologies, Inc. | 1,716,805 | 0.9 | |||||||||||||||
| 30,900 | Toro Co. | 1,874,394 | 1.0 | ||||||||||||||||
| 47,163 | Waste Connections, Inc. | 1,562,982 | 0.9 | ||||||||||||||||
| 26,600 | Watsco, Inc. | 1,746,556 | 0.9 | ||||||||||||||||
| 60,190 | Woodward Governor Co. | 2,463,577 | 1.3 | ||||||||||||||||
| 492,545 | Other Securities | 12,258,746 | 6.5 | ||||||||||||||||
| 33,962,937 | 18.1 | ||||||||||||||||||
| Information Technology: 21.5% | |||||||||||||||||||
| 65,800 | Adtran, Inc. | 1,984,528 | 1.0 | ||||||||||||||||
| 28,438 | @ | Ansys, Inc. | 1,628,929 | 0.9 | |||||||||||||||
| 103,200 | @ | Aruba Networks, Inc. | 1,911,264 | 1.0 | |||||||||||||||
| 130,600 | @ | Aspen Technology, Inc. | 2,265,910 | 1.2 | |||||||||||||||
| 39,238 | @ | Concur Technologies, Inc. | 1,992,898 | 1.1 | |||||||||||||||
| 32,589 | @ | Micros Systems, Inc. | 1,517,996 | 0.8 | |||||||||||||||
| 115,600 | @ | Parametric Technology Corp. | 2,110,856 | 1.1 | |||||||||||||||
| 72,800 | @ | Semtech Corp. | 1,806,896 | 1.0 | |||||||||||||||
| 42,300 | @ | SuccessFactors, Inc. | 1,686,501 | 0.9 | |||||||||||||||
| 1,311,825 | Other Securities (a) | 23,515,977 | 12.5 | ||||||||||||||||
| 40,421,755 | 21.5 | ||||||||||||||||||
| Materials: 3.1% | |||||||||||||||||||
| 258,044 | Other Securities | 5,880,608 | 3.1 | ||||||||||||||||
| Telecommunications: 0.9% | |||||||||||||||||||
| 34,300 | @ | SBA Communications Corp. | 1,473,528 | 0.8 | |||||||||||||||
| 78,628 | Other Securities | 236,670 | 0.1 | ||||||||||||||||
| 1,710,198 | 0.9 | ||||||||||||||||||
| Total Common Stock (Cost $172,062,072) | 181,462,826 | 96.6 | |||||||||||||||||
| EXCHANGE-TRADED FUNDS: 2.0% | |||||||||||||||||||
| 44,507 | iShares Russell 2000 Growth Index Fund | 3,748,824 | 2.0 | ||||||||||||||||
| Total Exchange-Traded Funds (Cost $3,783,771) | 3,748,824 | 2.0 | |||||||||||||||||
| Total Long-Term Investments (Cost $175,845,843) | 185,211,650 | 98.6 | |||||||||||||||||
See Accompanying Notes to Financial Statements
36
SUMMARY PORTFOLIO OF INVESTMENTS
ING SMALLCAP OPPORTUNITIES PORTFOLIO AS OF DECEMBER 31, 2011 (CONTINUED)
| Principal Amount† | Value | Percentage of Net Assets | |||||||||||||||||
| SHORT-TERM INVESTMENTS: 4.2% | |||||||||||||||||||
| Securities Lending Collateralcc(1): 2.8% | |||||||||||||||||||
| 1,220,429 | BNP Paribas Bank, Repurchase Agreement dated 12/30/11, 0.06%, due 01/03/12 (Repurchase Amount $1,220,437, collateralized by various U.S. Government Agency Obligations, 5.000%-6.000%, Market Value plus accrued interest $1,244,838, due 05/15/24-04/15/41) | $ | 1,220,429 | 0.7 | |||||||||||||||
| 1,220,429 | Cantor Fitzgerald, Repurchase Agreement dated 12/30/11, 0.12%, due 01/03/12 (Repurchase Amount $1,220,445, collateralized by various U.S. Government Agency Obligations, 1.437%-6.014%, Market Value plus accrued interest $1,244,838, due 06/01/17-09/01/44) | 1,220,429 | 0.7 | ||||||||||||||||
| 1,220,429 | Citigroup, Inc., Repurchase Agreement dated 12/30/11, 0.08%, due 01/03/12 (Repurchase Amount $1,220,440, collateralized by various U.S. Government and U.S. Government Agency Obligations, 0.000%-5.500%, Market Value plus accrued interest $1,244,838, due 01/19/12-12/20/41) | 1,220,429 | 0.7 | ||||||||||||||||
| 256,934 | Deutsche Bank AG, Repurchase Agreement dated 12/30/11, 0.10%, due 01/03/12 (Repurchase Amount $256,937, collateralized by various U.S. Government and U.S. Government Agency Obligations, 0.000%-6.500%, Market Value plus accrued interest $262,073, due 06/28/12-11/01/41) | 256,934 | 0.1 | ||||||||||||||||
| Principal Amount† | Value | Percentage of Net Assets | |||||||||||||||||
| 1,220,429 | Merrill Lynch & Co., Inc., Repurchase Agreement dated 12/30/11, 0.02%, due 01/03/12 (Repurchase Amount $1,220,432, collateralized by various U.S. Government Securities, 1.875%-4.000%, Market Value plus accrued interest $1,244,839, due 02/15/15-06/30/15) | $ | 1,220,429 | 0.6 | |||||||||||||||
| 5,138,650 | 2.8 | ||||||||||||||||||
| Shares | Value | Percentage of Net Assets | |||||||||||||||||
| Mutual Funds: 1.4% | |||||||||||||||||||
| 2,695,000 | BlackRock Liquidity Funds, TempFund, Institutional Class (Cost $2,695,000) | 2,695,000 | 1.4 | ||||||||||||||||
| Total Short-Term Investments (Cost $7,833,650) | 7,833,650 | 4.2 | |||||||||||||||||
| Total Investments in Securities (Cost $183,679,493) | $ | 193,045,300 | 102.8 | ||||||||||||||||
| Liabilities in Excess of Other Assets | (5,200,506 | ) | (2.8 | ) | |||||||||||||||
| Net Assets | $ | 187,844,794 | 100.0 | ||||||||||||||||
"Other Securities" represents issues not identified as the top 50 holdings in terms of market value and issues or issuers not exceeding 1% of net assets individually or in aggregate respectively as of December 31, 2011.
The following footnotes apply to either the individual securities noted or one or more of the securities aggregated and listed as a single line item.
† Unless otherwise indicated, principal amount is shown in USD.
@ Non-income producing security
cc Securities purchased with cash collateral for securities loaned.
(1) Collateral received from brokers for securities lending was invested into these short-term investments.
(a) This grouping contains loaned securities.
Cost for federal income tax purposes is $186,649,604.
Net unrealized appreciation consists of:
| Gross Unrealized Appreciation | $ | 21,886,644 | |||||
| Gross Unrealized Depreciation | (15,490,948 | ) | |||||
| Net Unrealized appreciation | $ | 6,395,696 | |||||
See Accompanying Notes to Financial Statements
37
SUMMARY PORTFOLIO OF INVESTMENTS
ING SMALLCAP OPPORTUNITIES PORTFOLIO AS OF DECEMBER 31, 2011 (CONTINUED)
Fair Value Measurements^
The following is a summary of the fair valuations according to the inputs used as of December 31, 2011 in valuing the assets and liabilities:
| Quoted Prices in Active Markets for Identical Investments (Level 1) | Significant Other Observable Inputs (Level 2) | Significant Unobservable Inputs (Level 3) | Fair Value at 12/31/2011 | ||||||||||||||||
| Asset Table | |||||||||||||||||||
| Investments, at value | |||||||||||||||||||
| Common Stock* | $ | 181,462,826 | $ | — | $ | — | $ | 181,462,826 | |||||||||||
| Exchange-Traded Funds | 3,748,824 | — | — | 3,748,824 | |||||||||||||||
| Short-Term Investments | 2,695,000 | 5,138,650 | — | 7,833,650 | |||||||||||||||
| Total Investments, at value | $ | 187,906,650 | $ | 5,138,650 | $ | — | $ | 193,045,300 | |||||||||||
^ See Note 2, "Significant Accounting Policies" in the Notes to Financial Statements for additional information.
* For further breakdown of Common Stock by Industry type, please refer to the Portfolio of Investments.
There were no significant transfers between Level 1 and 2 during the year ending December 31, 2011.
The following is a reconciliation of the fair valuations using significant unobservable inputs (Level 3) for the Portfolio's assets and liabilities during the period ended December 31, 2011:
| Beginning Balance 12/31/10 | Purchases | Sales | Accrued Discounts/ (Premiums) | Total Realized Gain/(Loss) | Total Unrealized Appreciation/ (Depreciation) | Transfers Into Level 3 | Transfers Out of Level 3 | Ending Balance 12/31/11 | |||||||||||||||||||||||||||||||
| Asset Table | |||||||||||||||||||||||||||||||||||||||
| Investments, at value | |||||||||||||||||||||||||||||||||||||||
| Short-Term Investments | $ | 373,839 | $ | — | $ | (373,839 | ) | $ | — | $ | (93,459 | ) | $ | 93,459 | $ | — | $ | — | $ | — | |||||||||||||||||||
| Total Investments, at value | $ | 373,839 | $ | — | $ | (373,839 | ) | $ | — | $ | (93,459 | ) | $ | 93,459 | $ | — | $ | — | $ | — | |||||||||||||||||||
As of December 31, 2011, total change in unrealized gain (loss) on Level 3 securities still held at period end and included in the change in net assets was $0.
See Accompanying Notes to Financial Statements
38
TAX INFORMATION (UNAUDITED)
Dividends and distributions paid during the year ended December 31, 2011 were as follows:
| Portfolio Name | Type | Per Share Amount | |||||||||
| ING International Value Portfolio | |||||||||||
| Class ADV | NII | $ | 0.1680 | ||||||||
| Class I | NII | $ | 0.2011 | ||||||||
| Class S | NII | $ | 0.1842 | ||||||||
| Class S2 | NII | $ | 0.1682 | ||||||||
| All Classes | ROC | $ | 0.0061 | ||||||||
NII — Net investment income
ROC — Return of capital
Of the ordinary distributions made during the year ended December 31, 2011, the following percentage qualifies for the dividends received deduction (DRD) available to corporate shareholders:
| ING International Value Portfolio | 0.37 | % | |||||
Pursuant to Section 853 of the Internal Revenue Code, the Portfolio below designates the following amounts as foreign taxes paid for the year ended December 31, 2011. Foreign taxes paid for purposes of Section 853 may be less than actual foreign taxes paid for financial statement purposes.
| Creditable Foreign Taxes Paid | Per Share Amount | Portion of Ordinary Income Distribution Derived from Foreign Sourced Income* | |||||||||||||
| ING International Value Portfolio | $ | 642,215 | $ | 0.0312 | 98.74 | % | |||||||||
* None of the Portfolio's income was derived from ineligible foreign sources as defined under Section 901(j) of the Internal Revenue Code.
Foreign taxes paid or withheld should be included in taxable income with an offsetting deduction from gross income or as a credit for taxes paid to foreign governments. Shareholders are strongly advised to consult their own tax advisors regarding the appropriate treatment of foreign taxes paid.
Above figures may differ from those cited elsewhere in this report due to differences in the calculation of income and gains under U.S. generally accepted accounting principles (book) purposes and Internal Revenue Service (tax) purposes.
Shareholders are strongly advised to consult their own tax advisers with respect to the tax consequences of their investments in the Portfolios. In January, shareholders, excluding corporate shareholders, receive an IRS 1099-DIV regarding the federal tax status of the dividends and distributions they received in the calendar year.
39
TRUSTEE AND OFFICER INFORMATION (UNAUDITED)
The business and affairs of the Trust are managed under the direction of the Trust's Board. A Trustee who is not an interested person of the Trust, as defined in the 1940 Act, is an independent trustee ("Independent Trustee"). The Trustees and Officers of the Trust are listed below. The Statement of Additional Information includes additional information about trustees of the Trust and is available, without charge, upon request at (800) 992-0180.
| Name, Address and Age | Position(s) Held with the Trust | Term of Office and Length of Time Served(1) | Principal Occupation(s) - During the Past 5 Years | Number of Portfolios in Fund Complex Overseen by Trustee(2) | Other Board Positions Held by Trustee | ||||||||||||||||||
| Independent Trustees: | |||||||||||||||||||||||
| Colleen D. Baldwin 7337 East Doubletree Ranch Rd. Suite 100 Scottsdale, Arizona 85258 Age: 51 | Trustee | November 2007 - Present | President, Glantuam Partners, LLC, a business consulting firm (January 2009 - Present) and Consultant (January 2005 - Present). | 140 | None. | ||||||||||||||||||
| John V. Boyer 7337 East Doubletree Ranch Rd. Suite 100 Scottsdale, Arizona 85258 Age: 58 | Trustee | January 2005 - Present | President and Chief Executive Officer, Bechtler Arts Foundation, an arts and education foundation (January 2008 - Present). Formerly, Consultant (July 2007 - February 2008) and President and Chief Executive Officer, Franklin and Eleanor Roosevelt Institute, a public policy foundation (March 2006 - July 2007). | 140 | None. | ||||||||||||||||||
| Patricia W. Chadwick 7337 East Doubletree Ranch Rd. Suite 100 Scottsdale, Arizona 85258 Age: 63 | Trustee | January 2006 - Present | Consultant and President, Ravengate Partners LLC, a consulting firm that provides advice regarding financial markets and the global economy (January 2000 - Present). | 140 | Wisconsin Energy Corporation (June 2006 - Present) and The Royce Fund, 35 Funds (December 2009 - Present). | ||||||||||||||||||
| Peter S. Drotch 7337 East Doubletree Ranch Rd. Suite 100 Scottsdale, Arizona 85258 Age: 70 | Trustee | November 2007 - Present | Retired. | 140 | First Marblehead Corporation (September 2003 - Present). | ||||||||||||||||||
| J. Michael Earley 7337 East Doubletree Ranch Rd. Suite 100 Scottsdale, Arizona 85258 Age: 66 | Trustee | February 2002 - Present | Retired. Formerly, Banking President and Chief Executive Officer, Bankers Trust Company, N.A., Des Moines (June 1992 - December 2008). | 140 | None. | ||||||||||||||||||
| Patrick W. Kenny 7337 East Doubletree Ranch Rd. Suite 100 Scottsdale, Arizona 85258 Age: 69 | Trustee | January 2005 - Present | Retired. Formerly, President and Chief Executive Officer, International Insurance Society (June 2001 - June 2009). | 140 | Assured Guaranty Ltd. (April 2004 - Present). | ||||||||||||||||||
| Sheryl K. Pressler 7337 East Doubletree Ranch Rd. Suite 100 Scottsdale, Arizona 85258 Age: 61 | Trustee | January 2006 - Present | Consultant (May 2001 - Present). | 140 | Stillwater Mining Company (May 2002 - Present). | ||||||||||||||||||
40
TRUSTEE AND OFFICER INFORMATION (UNAUDITED) (CONTINUED)
| Name, Address and Age | Position(s) Held with the Trust | Term of Office and Length of Time Served(1) | Principal Occupation(s) - During the Past 5 Years | Number of Funds in Fund Complex Overseen by Trustee(2) | Other Board Positions Held by Trustee | ||||||||||||||||||
| Roger B. Vincent 7337 East Doubletree Ranch Rd. Suite 100 Scottsdale, Arizona 85258 Age: 66 | Chairperson/ Trustee | February 2002 - Present | President, Springwell Corporation, a corporate finance firm (March 1989 - Present). | 140 | UGI Corporation (February 2006 - Present) and UGI Utilities, Inc. (February 2006 - Present). | ||||||||||||||||||
| Trustees who are "Interested Persons": | |||||||||||||||||||||||
| Robert W. Crispin(3) 7337 E. Doubletree Ranch Rd. Suite 100 Scottsdale, Arizona 85258 Age: 65 | Trustee | November 2007 - Present | Retired. Formerly, Chairman and Chief Executive Officer, ING Investment Management Co. (July 2001 - December 2007). | 140 | Intact Financial Corporation (December 2004 - Present) and PFM Group (November 2010 - Present). | ||||||||||||||||||
| Shaun P. Mathews(3) 7337 E. Doubletree Ranch Rd. Suite 100 Scottsdale, Arizona 85258 Age: 56 | Trustee | November 2007 - Present | President and Chief Executive Officer, ING Investments, LLC (November 2006 - Present). | 177 | ING Capital Corporation, LLC (December 2005 - Present). | ||||||||||||||||||
(1) Trustees serve until their successors are duly elected and qualified. The tenure of each Trustee is subject to the Board's retirement policy which states that each duly elected or appointed Trustee who is not an "interested person" of the Trust, as defined in the 1940 Act, as amended ("Independent Trustees"), shall retire from service as a Trustee at the conclusion of the first regularly scheduled quarterly meeting of the Board that is held after the Trustee reaches the age of 72. A unanimous vote of the Board may extend the retirement date of a Trustee for up to one year. An extension may be permitted if the retirement would trigger a requirement to hold a meeting of shareholders of the Trust under applicable law, whether for purposes of appointing a successor to the Trustee or if otherwise necessary under applicable law, in which case the extension would apply until such time as the shareholder meeting can be held or is no longer needed.
(2) Except for Mr. Mathews and for the purposes of this table "ING Fund Complex" means the following investment companies: ING Asia Pacific High Dividend Equity Income Fund; ING Emerging Markets High Dividend Equity Fund; ING Emerging Markets Local Bond Fund; ING Equity Trust; ING Funds Trust; ING Global Equity Dividend and Premium Opportunity Fund; ING Global Advantage and Premium Opportunity Fund; ING Infrastructure, Industrials and Materials Fund; ING International High Dividend Equity Income Fund; ING Investors Trust; ING Mayflower Trust; ING Mutual Funds; ING Partners, Inc.; ING Prime Rate Trust; ING Risk Managed Natural Resources Fund; ING Senior Income Fund; ING Separate Portfolios Trust; ING Variable Insurance Trust; and ING Variable Products Trust. For Mr. Mathews, the ING Fund Complex also includes the following investment companies: ING Balanced Portfolio, Inc.; ING Intermediate Bond Portfolio; ING Money Market Portfolio; ING Series Fund, Inc.; ING Strategic Allocation Portfolios, Inc.; ING Variable Funds; and ING Variable Portfolios, Inc. Therefore, for the purposes of this table with reference to Mr. Mathews, "Fund Complex" includes these investment companies. The number of funds in the ING Fund Complex is as of January 31, 2012.
(3) Messrs. Crispin and Matthews are deemed "Interested Persons" of the Trust because of their current or prior affiliation with ING Groep, N.V., the parent corporation of the Investment Adviser(s) and the Distributor.
41
TRUSTEE AND OFFICER INFORMATION (UNAUDITED) (CONTINUED)
| Name, Address and Age | Position(s) Held with Trust | Term of Office and Length of Time Served(1) | Principal Occupation(s) - During the Past 5 Years | ||||||||||||
| Shaun P. Mathews 7337 East Doubletree Ranch Rd. Suite 100 Scottsdale, Arizona 85258 Age: 56 | President and Chief Executive Officer | November 2006 - Present | President and Chief Executive Officer, ING Investments, LLC (November 2006 - Present). | ||||||||||||
| Michael J. Roland 7337 East Doubletree Ranch Rd. Suite 100 Scottsdale, Arizona 85258 Age: 53 | Executive Vice President | February 2002 - Present | Chief Compliance Officer, Directed Services LLC and ING Investments, LLC (March 2011 - Present) and Executive Vice President and Chief Operating Officer, ING Investments, LLC and ING Funds Services, LLC (January 2007 - Present). Formerly, Chief Compliance Officer, ING Funds (March 2011 - February 2012). | ||||||||||||
| Stanley D. Vyner 230 Park Avenue New York, New York 10169 Age: 61 | Executive Vice President Chief Investment Risk Officer | November 1999 - Present September 2009 - Present | Executive Vice President, ING Investments, LLC (July 2000 - Present) and Chief Investment Risk Officer, ING Investments, LLC (January 2003 - Present). | ||||||||||||
| Kevin M. Gleason 7337 East Doubletree Ranch Rd. Suite 100 Scottsdale, Arizona 85258 Age: 45 | Chief Compliance Officer | February 2012 - Present | Chief Compliance Officer, ING Funds (February 2012 - Present). Formerly, Assistant General Counsel and Assistant Secretary, The Northwestern Mutual Life Insurance Company, (June 2004 - January 2012). | ||||||||||||
| Kimberly A. Anderson 7337 East Doubletree Ranch Rd. Suite 100 Scottsdale, Arizona 85258 Age: 47 | Senior Vice President | November 2003 - Present | Senior Vice President, ING Investments, LLC (October 2003 - Present). | ||||||||||||
| Todd Modic 7337 East Doubletree Ranch Rd. Suite 100 Scottsdale, Arizona 85258 Age: 44 | Senior Vice President, Chief/Principal Financial Officer and Assistant Secretary | March 2005 - Present | Senior Vice President, ING Funds Services, LLC (March 2005 - Present). | ||||||||||||
| Robert Terris 7337 East Doubletree Ranch Rd. Suite 100 Scottsdale, Arizona 85258 Age: 41 | Senior Vice President | May 2006 - Present | Senior Vice President, Head of Division Operations, ING Funds Services, LLC (May 2006 - Present). | ||||||||||||
| Gregory K. Wilson 7337 East Doubletree Ranch Rd. Suite 100 Scottsdale, Arizona 85258 Age: 52 | Senior Vice President | September 2011 - Present | Vice President - Fund Compliance, ING Funds Services, LLC (October 2009 - Present). Formerly, Finance Director, ING Funds Services, LLC (September 2006 - October 2009). | ||||||||||||
| Robyn L. Ichilov 7337 East Doubletree Ranch Rd. Suite 100 Scottsdale, Arizona 85258 Age: 44 | Vice President and Treasurer | November 1999 - Present | Vice President and Treasurer, ING Funds Services, LLC (November 1995 - Present) and ING Investments, LLC (August 1997 - Present). | ||||||||||||
| Maria M. Anderson 7337 East Doubletree Ranch Rd. Suite 100 Scottsdale, Arizona 85258 Age: 53 | Vice President | September 2004 - Present | Vice President, ING Funds Services, LLC (September 2004 - Present). | ||||||||||||
| Lauren D. Bensinger 7337 East Doubletree Ranch Rd. Suite 100 Scottsdale, Arizona 85258 Age: 58 | Vice President | February 2003 - Present | Vice President, ING Investments, LLC and ING Funds Services, LLC (February 1996 - Present); Director of Compliance, ING Investments, LLC (October 2004 - Present); and Vice President and Money Laundering Reporting Officer, ING Investments Distributor, LLC ( April 2010 - Present). Formerly, Chief Compliance Officer, ING Investments Distributor, LLC (August 1995 - April 2010) | ||||||||||||
42
TRUSTEE AND OFFICER INFORMATION (UNAUDITED) (CONTINUED)
| Name, Address and Age | Position(s) Held with Trust | Term of Office and Length of Time Served(1) | Principal Occupation(s) - During the Past 5 Years | ||||||||||||
| William Evans One Orange Way Windsor, Connecticut 06095 Age: 39 | Vice President | September 2007 - Present | Senior Vice President (March 2010 - Present) and Head of Manager Research and Selection Group, ING Investment Management (April 2007 - Present). Formerly, Vice President, U.S. Mutual Funds and Investment Products (May 2005 - April 2007). | ||||||||||||
| Denise Lewis 7337 East Doubletree Ranch Rd. Suite 100 Scottsdale, Arizona 85258 Age: 48 | Vice President | January 2007 - Present | Vice President, ING Funds Services, LLC (December 2006 - Present). | ||||||||||||
| Kimberly K. Springer 7337 East Doubletree Ranch Rd. Suite 100 Scottsdale, Arizona 85258 Age: 54 | Vice President | March 2006 - Present | Vice President, ING Investment Management - ING Funds (March 2010 - Present); Vice President, ING Funds Services, LLC (March 2006 - Present) and Managing Paralegal, Registration Statements (June 2003 - Present). | ||||||||||||
| Craig Wheeler 7337 East Doubletree Ranch Rd. Suite 100 Scottsdale, Arizona 85258 Age: 42 | Assistant Vice President | May 2008 - Present | Assistant Vice President - Director of Tax, ING Funds Services, LLC (March 2008 - Present). Formerly, Tax Manager, ING Funds Services, LLC (March 2005 - March 2008). | ||||||||||||
| Huey P. Falgout, Jr. 7337 East Doubletree Ranch Rd. Suite 100 Scottsdale, Arizona 85258 Age: 48 | Secretary | August 2003 - Present | Senior Vice President and Chief Counsel, ING Investment Management - ING Funds (March 2010 - Present). Formerly, Chief Counsel, ING Americas, U.S. Legal Services (October 2003 - March 2010). | ||||||||||||
| Paul Caldarelli 7337 East Doubletree Ranch Rd. Suite 100 Scottsdale, Arizona 85258 Age: 60 | Assistant Secretary | June 2010 - Present | Vice President and Senior Counsel, ING Investment Management - ING Funds (March 2010 - Present). Formerly, Senior Counsel, ING Americas, U.S. Legal Services (April 2008 - March 2010) and Counsel, ING Americas, U.S. Legal Services (May 2005 - April 2008). | ||||||||||||
| Theresa K. Kelety 7337 East Doubletree Ranch Rd. Suite 100 Scottsdale, Arizona 85258 Age: 49 | Assistant Secretary | August 2003 - Present | Vice President and Senior Counsel, ING Investment Management - ING Funds (March 2010 - Present). Formerly, Senior Counsel, ING Americas, U.S. Legal Services (April 2008 - March 2010) and Counsel, ING Americas, U.S. Legal Services (April 2003 - April 2008). | ||||||||||||
| Kathleen Nichols 7337 East Doubletree Ranch Rd. Suite 100 Scottsdale, Arizona 85258 Age: 36 | Assistant Secretary | May 2008 - Present | Vice President and Counsel, ING Investment Management - ING Funds (March 2010 - Present). Formerly, Counsel, ING Americas, U.S. Legal Services (February 2008 - March 2010) and Associate, Ropes & Gray LLP (September 2005 - February 2008) | ||||||||||||
(1) The Officers hold office until the next annual meeting of the Board of Trustees and until their successors shall have been elected and qualified.
43
ADVISORY CONTRACT APPROVAL DISCUSSION (UNAUDITED)
BOARD CONSIDERATION AND RE-APPROVAL OF INVESTMENT ADVISORY AND SUB-ADVISORY CONTRACTS
Section 15(c) of the Investment Company Act of 1940, as amended (the "1940 Act") provides that, after an initial period, the Portfolios' existing investment advisory and sub-advisory contracts will remain in effect only if the Board of Trustees (the "Board") of ING Investors Trust (the "Trust"), including a majority of Board members who have no direct or indirect interest in the advisory and sub-advisory contracts, and who are not "interested persons" of the Portfolios, as such term is defined under the 1940 Act (the "Independent Trustees"), annually review and approve them. Thus, at a meeting held on November 17, 2011, the Board, including a majority of the Independent Trustees, considered whether to renew the investment advisory contracts (the "Advisory Contracts") between ING Investments, LLC (the "Adviser") and the Portfolios and the sub-advisory contracts ("Sub-Advisory Contracts") with ING Investment Management Co., the sub-adviser to each Portfolio (the "Sub-Adviser").
The Independent Trustees also held separate meetings on October 12 and November 15, 2011 to consider the renewal of the Advisory Contracts and Sub-Advisory Contracts. As a result, subsequent references herein to factors considered and determinations made by the Independent Trustees include, as applicable, factors considered and determinations made on those earlier dates by the Independent Trustees.
At its November 17, 2011 meeting, the Board voted to renew the Advisory and Sub-Advisory Contracts for the Portfolios. In reaching these decisions, the Board took into account information furnished to it throughout the year at regular meetings of the Board and the Board's committees, as well as information prepared specifically in connection with the annual renewal process. Determinations by the Independent Trustees also took into account various factors that they believed, in light of the legal advice furnished to them by K&L Gates LLP ("K&L Gates"), their independent legal counsel, and their own business judgment, to be relevant. Further, while the Board considered at the same meeting the advisory contracts and sub-advisory contracts that were subject to renewal for the funds under its jurisdiction, the Trustees considered each Portfolio's advisory and sub-advisory relationships separately.
Provided below is an overview of the Board's contract approval process in general, as well as a discussion of certain specific factors that the Board considered at its renewal meeting. While the Board gave its attention to the information furnished at the request of the Independent Trustees that was most relevant to its considerations, discussed below are a number of the primary factors relevant to the Board's consideration as to whether to renew the Advisory and Sub-Advisory Contracts for the one-year period ending November 30, 2012. Each Board member may have accorded different weight to the various factors in reaching his or her conclusions with respect to each Portfolio's advisory and sub-advisory arrangements.
Overview of the Contract Renewal and Approval Process
The Board follows a structured process pursuant to which it seeks and considers relevant information when it decides whether to approve new or existing advisory and sub-advisory arrangements for the investment companies in the ING Fund complex under its jurisdiction, including the Portfolios' existing Advisory and Sub-Advisory Contracts. Among other actions, the Independent Trustees of the Board: retain the services of independent consultants with experience in the mutual fund industry to assist the Independent Trustees in working with the personnel employed by the Adviser or its affiliates who administer the Portfolios ("Management") to identify the types of information presented to the Board to inform its deliberations with respect to advisory and sub-advisory relationships and to help evaluate that information; evaluate industry best practices in regards to the consideration of investment advisory and sub-advisory contracts; established a specific format in which certain requested information is provided to the Board; and determine the process for reviewing such information in connection with advisory and sub-advisory contract renewals and approvals. The result is a process (the "Contract Review Process") employed by the Board and its Independent Trustees to review and analyze information in connection with the annual renewal of the ING Funds' advisory and sub-advisory contracts, as well as the review and approval of new advisory and sub-advisory relationships.
Since the Contract Review Process was first implemented, the Board's membership has changed substantially through periodic retirements of some Trustees and the appointment and election of new Trustees. In addition, the Independent Trustees have reviewed and refined the renewal and approval process at least annually in order to request additional information from Management and address certain unique characteristics related to the introduction of new Portfolios.
44
ADVISORY CONTRACT APPROVAL DISCUSSION (UNAUDITED) (CONTINUED)
The Board has established two Investment Review Committees (each, an "IRC"), which meet independently and, at times, jointly, and a Contracts Committee. Among other matters, the Contracts Committee provides oversight with respect to the contracts renewal and approval process, and each Portfolio is assigned to an IRC which provides oversight regarding, among other matters, the investment performance of the Adviser and Sub-Adviser, as well as the oversight by the Adviser of the performance of the Sub-Adviser. The IRCs may apply a heightened level of scrutiny in cases where performance has lagged a Portfolio's relevant benchmark and/or selected peer group of investment companies ("Selected Peer Groups").
The type and format of the information provided to the Board or to legal counsel for the Independent Trustees in connection with the contract approval and renewal process has been codified in the ING Funds' 15(c) Methodology Guide. This Guide was developed under the direction of the Independent Trustees and sets out a blueprint pursuant to which the Independent Trustees request certain information that they deem important to facilitate an informed review in connection with initial and annual approvals of advisory and sub-advisory contracts.
Management provides certain of the information requested by the 15(c) Methodology Guide in Fund Analysis and Comparison Tables ("FACT sheets") prior to the Independent Trustees' review of advisory and sub-advisory arrangements (including the Portfolios' Advisory and Sub-Advisory Contracts). The Independent Trustees previously retained an independent firm to verify and test the accuracy of certain FACT sheet data for a representative sample of funds in the ING Fund complex. In addition, the Contracts Committee routinely employs the services of an independent consultant to assist in its review and analysis of, among other matters, the 15(c) Methodology Guide, the content and format of the FACT sheets, and Selected Peer Groups to be used by the Portfolios for certain comparison purposes during the renewal process. As part of an ongoing process, the Contracts Committee recommends or considers recommendations from Management for refinements to the 15(c) Methodology Guide and other aspects of the review process, and the Board's IRCs review benchmarks used to assess the performance of funds in the ING Fund complex.
The Board employed its process for reviewing contracts when considering the renewals of the Portfolios' Advisory and Sub-Advisory Contracts that would be effective through November 30, 2012. Set forth below is a discussion of many of the Board's primary considerations and conclusions resulting from this process.
Nature, Extent and Quality of Service
In determining whether to approve the Advisory and Sub-Advisory Contracts for the Portfolios for the year ended November 30, 2012, the Independent Trustees received and evaluated such information as they deemed necessary regarding the nature, extent and quality of services provided to the Portfolios by the Adviser and Sub-Adviser. This included information regarding the Adviser and Sub-Adviser provided throughout the year at regular meetings of the Board and its committees, as well as information furnished in connection with the contract renewal meetings.
The materials requested by the Independent Trustees and provided to the Board, K&L Gates and/or independent consultants that assist the Independent Trustees prior to the November 17, 2011 Board meeting included, among other information, the following items for each Portfolio: (1) FACT sheets that provided information regarding the performance and expenses of the Portfolio and other similarly managed funds in its Selected Peer Group, as well as information regarding the Portfolio's investment portfolio, objective and strategies; (2) reports providing risk and attribution analyses of the Portfolio; (3) the 15(c) Methodology Guide, which describes how the FACT sheets were prepared, including the manner in which each Portfolio's benchmark and Selected Peer Group were selected and how profitability was determined; (4) responses from the Adviser and Sub-Adviser to a series of questions posed by K&L Gates on behalf of the Independent Trustees; (5) copies of the forms of Advisory and Sub-Advisory Contracts; (6) copies of the Forms ADV for the Adviser and Sub-Adviser; (7) financial statements for the Adviser and Sub-Adviser; (8) a draft of a narrative summary addressing key factors the Board customarily considers in evaluating the renewals of the ING Funds' (including the Portfolio's) advisory contracts and sub-advisory contracts, including a written analysis for the Portfolio of how performance, fees and expenses compare to its Selected Peer Group and/or designated benchmark(s); (9) independent analyses of Portfolio performance by the Trust's Chief Investment Risk Officer; (10) for open-end Portfolios, information regarding net asset flows into and out of the Portfolio; and (11) other information relevant to the Board's evaluations.
45
ADVISORY CONTRACT APPROVAL DISCUSSION (UNAUDITED) (CONTINUED)
The Board also noted that ING Groep, N.V. the ultimate parent company of the Adviser, has announced plans for the separation of its U.S.-based insurance, retirement services and investment management operations, which include the Adviser, into an independent, standalone company by the end of 2013. The Board further noted that this separation may result in the Adviser's loss of access to the services and resources of its current ultimate parent company, which could adversely affect its businesses and profitability. The Board recognized that, if the separation plans are deemed to be a change of control, the investment advisory and subadvisory agreements for the Portfolios would terminate and trigger the necessity for new agreements, which would require the approval of the Board and, potentially, the shareholders of a Portfolio. The Board also recognized that there can be no assurance that the separation plan will be carried out. The Board considered the potential effects of the separation on the Portfolios and the Adviser, including its ability prior to, during and after the separation to perform the same level of service to the Portfolios as the Adviser currently provides. In this regard, the Board noted that the Adviser did not currently anticipate that the separation would have a material adverse impact on the Portfolios or their operations and administration.
For each Portfolio, Class I shares were used for purposes of certain comparisons between the Portfolio and its Selected Peer Group. Class I shares generally were selected so that a Portfolio's share class with the longest performance history was compared to the analogous class of shares for each fund in its Selected Peer Group. The mutual funds included in the Portfolios' Selected Peer Groups were selected based upon criteria designed to mirror the Portfolio share class being compared to the Selected Peer Groups.
In arriving at its conclusions with respect to the Advisory Contracts, the Board was mindful of the "manager-of-managers" platform of the ING Funds that has been developed by the Adviser. The Board recognized that the Adviser is responsible for monitoring the investment program and performance of the Sub-Adviser under this manager-of-managers arrangement. The Board also considered the techniques and resources that the Adviser has developed to provide ongoing oversight of the nature and quality of the services the Sub-Adviser provide to the applicable Portfolios and the Sub-Adviser's compliance with applicable laws and regulations. The Board noted that to assist in the selection and monitoring of Sub-Adviser, the Adviser has developed an oversight process formulated by its Manager Research & Selection Group ("MRSG"), which analyzes both qualitative (such as in-person meetings and telephonic meetings with the Sub-Adviser and research on sub-advisers) and quantitative information (such as performance data, portfolio data and attribution analysis) about the Sub-Adviser and the Portfolios that it manages. The Board recognized that the MRSG also typically provides in-person reports to the IRCs at their meetings prior to any Sub-Adviser presentations. In addition, the Board noted that the MRSG prepares periodic due diligence reports regarding the Sub-Adviser based on on-site visits and information and analysis which team members use to attempt to gain and maintain an in-depth understanding of the Sub-Adviser's investment process and to try to identify issues that may be relevant to the Sub-Adviser's services to a Portfolio and/or its performance. The Board also noted that the MRSG provides written reports on these due diligence analyses to the pertinent IRC. The Board noted the resources that the Adviser and Management has committed to its services as a manager-of-managers, including resources for reporting to the Board and the IRCs to assist them with their assessment of the investment performance of the Portfolios on an on-going basis throughout the year. This includes the appointment of a Chief Investment Risk Officer and his staff, who report directly to the Board and who have developed attribution analyses and other metrics used by the IRCs to analyze the key factors underlying investment performance for the funds in the ING Fund complex.
The Board also considered the techniques that the Adviser has developed to screen and perform due diligence on new sub-advisers if and when the Adviser recommends to the Board a new sub-adviser to manage a Portfolio in the ING Fund complex. The Board noted that, for new non-ING-affiliated sub-advisers, the MSRG is responsible for: identifying qualified candidates; analyzing their investment process, personnel and resources; conducting due diligence on the candidates; and selecting the firm to propose as a new sub-adviser, as well as preparing written materials and reports to the Committees and the Board as part of the process of approving any new sub-adviser for a Portfolio.
The Board also considered that in the course of monitoring performance of the Sub-Adviser, the MRSG has developed, based on guidance from the IRCs, a methodology for comparing performance of each Portfolio to a Selected Peer Group. The Board also recognized that the MRSG provides the IRCs with
46
ADVISORY CONTRACT APPROVAL DISCUSSION (UNAUDITED) (CONTINUED)
regular updates on the Portfolios and alerts the IRCs to potential issues as they arise. The Board noted that another service provided by the MSRG is the preparation of the Fund Dispersion Report. This report seeks to monitor any dispersion between Portfolios managed by non-ING-affiliated Sub-Advisers and their similarly managed retail counterparts and again assists the Board in carrying out its general oversight duties. The Board also noted that the Adviser regularly monitors performance, personnel, compliance and myriad other issues that may arise on a day-to-day basis with regards to the Sub-Adviser and noted that, if issues are identified either through formal or informal processes, they are brought before the IRCs and the Board for consideration and action and the Adviser consistently makes its resources available to the Board and the Committees to assist with addressing any issues that arise.
The Board noted that the Portfolios also benefit from the services of the Adviser's Investment Risk Management Department (the "IRMD"), under the leadership of the Chief Investment Risk Officer, the costs of which are shared by the Portfolios and the Adviser. The Board noted that the IRMD regularly presents written materials and reports to the IRCs that focus on the investment risks of the Portfolios. The Board also noted that the IRMD provides the IRCs with analyses that are developed to assist the IRCs in identifying trends in Portfolio performance and other areas over consecutive periods. The Board noted that the services provided by the IRMD are meant to provide an additional perspective for the benefit of the Committees, which may vary from the perspective of the MRSG.
The Board also noted the techniques used by the Adviser to monitor the performance of the Sub-Adviser and the proactive approach that the Adviser, working in cooperation with the IRCs, has taken to advocate or recommend, when it believed appropriate, changes designed to assist in improving the Portfolios' performance.
In considering the Portfolios' Advisory Contracts, the Board also considered the extent of benefits provided to the Portfolios' shareholders, beyond advisory services, from being part of the ING family of funds. This includes, in most cases, the right to exchange or transfer investments, without a sales charge, between the same class of shares of such funds or among ING Funds available on a product platform, and the wide range of ING Funds available for exchange or transfer. The Board also took into account the Adviser's ongoing efforts to reduce the expenses of the ING Funds through renegotiated arrangements with the ING Funds' service providers. In addition, the Board considered the efforts of the Adviser and the expenses that it incurred in recent years to help make the ING Fund complex more balanced and efficient by the launch of new investment products and the combinations of similar funds.
Further, the Board received periodic reports showing that the investment policies and restrictions for each Portfolio were consistently complied with and other periodic reports covering matters such as compliance by Adviser and Sub-Adviser personnel with codes of ethics. The Board considered reports from the Trust's Chief Compliance Officer ("CCO") evaluating whether the regulatory compliance systems and procedures of the Adviser and each Sub-Adviser are reasonably designed to assure compliance with the federal securities laws, including those related to, among others, late trading and market timing, best execution, fair value pricing, proxy voting and trade allocation practices. The Board also took into account the CCO's annual and periodic reports and recommendations with respect to service provider compliance programs. In this regard, the Board also considered the policies and procedures developed by the CCO in consultation with the Board's Compliance Committee that guide the CCO's compliance oversight function.
The Board reviewed the level of staffing, quality and experience of each Portfolio's portfolio management team. The Board took into account the respective resources and reputations of the Adviser and Sub-Adviser, and evaluated the ability of the Adviser and the Sub-Adviser to attract and retain qualified investment advisory personnel. The Board also considered the adequacy of the resources committed to the Portfolios (and other relevant funds in the ING Fund complex) by the Adviser and Sub-Adviser, and whether those resources are commensurate with the needs of the Portfolios and are sufficient to sustain appropriate levels of performance and compliance needs. In this regard, the Board considered the financial stability of the Adviser and the Sub-Adviser.
Based on their deliberations and the materials presented to them, the Board concluded that the advisory and related services provided by the Adviser and each Sub-Adviser are appropriate in light of the Portfolios' operations, the competitive landscape of the investment company business, and investor needs, and that the nature and quality of the overall services provided by the Adviser and the Sub-Adviser were appropriate.
47
ADVISORY CONTRACT APPROVAL DISCUSSION (UNAUDITED) (CONTINUED)
Portfolio Performance
In assessing advisory and sub-advisory relationships, the Board placed emphasis on the investment returns of each Portfolio. While the Board considered the performance reports and discussions with portfolio managers at Board and committee meetings during the year, particular attention in assessing performance was given to the FACT sheets furnished in connection with the renewal process. The FACT sheet prepared for each Portfolio included its investment performance compared to the Portfolio's Morningstar category median and/or Lipper category median, Selected Peer Group and primary benchmark. The FACT sheet performance data was as of June 30, 2011. In addition, the Board also considered at its November 17, 2011 meeting certain additional data regarding performance and Portfolio asset levels as of October 31, 2011. The Board's findings specific to each Portfolio's performance are discussed under "Portfolio-by-Portfolio Analysis" below.
Economies of Scale
When evaluating the reasonableness of advisory fee rates, the Board also considered whether economies of scale likely will be realized by the Adviser and Sub-Adviser as a Portfolio grows larger and the extent to which any such economies are reflected in contractual fee rates. In this regard, the Board noted any breakpoints in advisory fee schedules that will result in a lower advisory fee rate when a Portfolio achieves sufficient asset levels to receive a breakpoint discount. In the case of sub-advisory fees, the Board considered that breakpoints would inure to the benefit of the Adviser, except to the extent that there are corresponding advisory fee breakpoints or waivers. In evaluating fee breakpoint arrangements and economies of scale, the Independent Trustees also considered prior periodic management reports, industry information on this topic and the Portfolios' investment performance.
Information Regarding Services to Other Clients
The Board requested and considered information regarding the nature of services and fee rates offered by the Adviser and Sub-Adviser to other clients, including other registered investment companies and relevant institutional accounts. When fee rates offered to other clients differed materially from those charged to a Portfolio, the Board considered any underlying rationale provided by the Adviser or the Sub-Adviser for these differences. The Board also noted that the fee rates charged to the Portfolios and other institutional clients of the Adviser or Sub-Adviser (including other investment companies) may differ materially due to, among other reasons: differences in services; different regulatory requirements associated with registered investment companies, such as the Portfolios, as compared to non-registered investment company clients; market differences in fee rates that existed when a Portfolio first was organized; differences in the original sponsors of Portfolios that now are managed by the Adviser; investment capacity constraints that existed when certain contracts were first agreed upon or that might exist at present; and different pricing structures that are necessary to be competitive in different marketing channels.
Fee Rates and Profitability
The Board reviewed and considered each contractual investment advisory fee rate, combined with the administrative fee rate, payable by each Portfolio to the Adviser. The Board also considered the contractual sub-advisory fee rate payable by the Adviser to each Sub-Adviser for sub-advisory services for each Portfolio, including the portion of the contractual advisory fees that are paid to each Sub-Adviser, as compared to the portion retained by the Adviser. In addition, the Board considered fee waivers and expense limitations applicable to the fees payable by the Portfolios.
The Board considered: (1) the fee structure of each Portfolio as it relates to the services provided under the contracts; and (2) the potential fall-out benefits to the Adviser and the Sub-Adviser and their respective affiliates from their association with the Portfolios. For each Portfolio, the Board separately determined that the fees payable to the Adviser and the fees payable to the Sub-Adviser are reasonable for the services that each performs, which were considered in light of the nature and quality of the services that each has performed and is expected to perform.
For each Portfolio, the Board considered information on revenues, costs and profits realized by the Adviser and the Sub-Adviser, which was prepared by Management in accordance with the allocation methodology (including related assumptions) specified in the 15(c) Methodology Guide. In analyzing the profitability of the Adviser in connection with its services to a Portfolio, the Board took into account the sub-advisory fee rate payable by the Adviser to each Sub-Adviser. In addition, the Board considered information that it requested and was provided by Management with respect to the profitability of service providers affiliated with the Adviser.
48
ADVISORY CONTRACT APPROVAL DISCUSSION (UNAUDITED) (CONTINUED)
Although the 15(c) Methodology Guide establishes certain standards for profit calculation, the Board recognized that profitability analysis on a client-by-client basis is not an exact science and there is no uniform methodology within the asset management industry for determining profitability for this purpose. In this context, the Board realized that Management's calculations regarding its costs incurred in establishing the infrastructure necessary for the Portfolios' operations may not be fully reflected in the expenses allocated to each Portfolio in determining profitability, and that the information presented may not portray all of the costs borne by the Adviser and Management or capture their entrepreneurial risk associated with offering and managing a mutual fund complex in the current regulatory and market environment. In addition, the Board recognized that the use of different methodologies for purposes of calculating profit data can give rise to dramatically different profit and loss results.
In making its determinations, the Board based its conclusions as to the reasonableness of the advisory and sub-advisory fees of the Adviser and Sub-Adviser primarily on the factors described for each Portfolio below. At the request of the Board, the Adviser has from time to time agreed to implement remedial actions regarding certain Portfolios. These remedial actions have included, among others: reductions in fee rates; changes in Sub-Adviser or portfolio managers; and strategy modifications.
Portfolio-by-Portfolio Analysis
The following paragraphs outline certain of the specific factors that the Board considered, and the conclusions reached, at its November 17, 2011 meeting in relation to renewing each Portfolio's current Advisory and Sub-Advisory Contracts. These specific factors are in addition to those considerations discussed above. In each case, the Portfolio's performance was compared to its Morningstar category median and average, as well as its primary benchmark, a broad-based securities market index that appears in the Portfolio's prospectus. With respect to Morningstar quintile rankings, the first quintile represents the highest (best) performance and the fifth quintile represents the lowest performance. Each Portfolio's management fee and expense ratio were compared to the fees and expense ratios of the funds in its Selected Peer Group.
ING MidCap Opportunities Portfolio
In considering whether to approve the renewal of the Advisory and Sub-Advisory Contracts for ING MidCap Opportunities Portfolio, the Board considered that, based on performance data for the periods ended June 30, 2011: (1) the Portfolio outperformed its Morningstar category median for all periods presented; (2) the Portfolio outperformed its primary benchmark for all periods presented; and (3) the Portfolio is ranked in the first (highest) quintile of its Morningstar category for the most recent calendar quarter, one-year, three-year, and five-year periods, and the second quintile for the year-to-date and ten-year periods.
In considering the fees payable under the Advisory and Sub-Advisory Contracts for the Portfolio, the Board took into account the factors described above and also considered: (1) the economies of scale benefits to the Portfolio and its shareholders from breakpoint discounts applicable to the Portfolio's advisory fee rate, which result in lower fees at higher asset levels; and (2) the pricing structure (including the expense ratio to be borne by shareholders) of the Portfolio, as compared to its Selected Peer Group, including that: (a) the management fee (inclusive of a 0.10% administration fee) for the Portfolio is above the median and the average management fees of the funds in its Selected Peer Group; and (b) the expense ratio for the Portfolio is above the median and the average expense ratios of the funds in its Selected Peer Group.
In analyzing the fee data, the Board took into account Management's representations regarding the competitiveness of the Portfolio's management fee and expense ratio.
After its deliberation, the Board reached the following conclusions: (1) the Portfolio's management fee rate is reasonable in the context of all factors considered by the Board; (2) the Portfolio's expense ratio is reasonable in the context of all factors considered by the Board; (3) the Portfolio's performance is reasonable in the context of all factors considered by the Board; and (4) the sub-advisory fee rate payable by the Adviser to the Sub-Adviser is reasonable in the context of all factors considered by the Board. Based on these conclusions and other factors, the Board voted to renew the Advisory and Sub-Advisory Contracts for the Portfolio for the year ending November 30, 2012. During this renewal process, different Board members may have given different weight to different individual factors and related conclusions.
49
ADVISORY CONTRACT APPROVAL DISCUSSION (UNAUDITED) (CONTINUED)
ING SmallCap Opportunities Portfolio
In considering whether to approve the renewal of the Advisory and Sub-Advisory Contracts for ING SmallCap Opportunities Portfolio, the Board considered that, based on performance data for the periods ended June 30, 2011: (1) the Portfolio outperformed its Morningstar category median for all periods presented, with the exceptions of the year-to-date and ten-year periods, during which it underperformed; (2) the Portfolio outperformed its primary benchmark for the most recent calendar quarter, three-year, and five-year periods, but underperformed for the year-to-date, one-year, and ten-year periods; and (3) the Portfolio is ranked in the first (highest) quintile of its Morningstar category for the most recent calendar quarter and five-year periods, the second quintile for the three-year period, the third quintile for the one-year period, the fourth quintile for the year-to-date period, and the fifth (lowest) quintile for the ten-year period.
In considering the fees payable under the Advisory and Sub-Advisory Contracts for the Portfolio, the Board took into account the factors described above and also considered: (1) the fairness of the compensation under an Advisory Contract with a breakpoint fee schedule where the asset level necessary to achieve a breakpoint discount had not been reached by the Portfolio; and (2) the pricing structure (including the expense ratio to be borne by shareholders) of the Portfolio, as compared to its Selected Peer Group, including that: (a) the management fee (inclusive of a 0.10% administration fee) for the Portfolio is above the median and below the average management fees of the funds in its Selected Peer Group; and (b) the expense ratio for the Portfolio is below the median and the average expense ratios of the funds in its Selected Peer Group.
After its deliberation, the Board reached the following conclusions: (1) the Portfolio's management fee rate is reasonable in the context of all factors considered by the Board; (2) the Portfolio's expense ratio is reasonable in the context of all factors considered by the Board; (3) the Portfolio's performance is reasonable in the context of all factors considered by the Board; and (4) the sub-advisory fee rate payable by the Adviser to the Sub-Adviser is reasonable in the context of all factors considered by the Board. Based on these conclusions and other factors, the Board voted to renew the Advisory and Sub-Advisory Contracts for the Portfolio for the year ending November 30, 2012. During this renewal process, different Board members may have given different weight to different individual factors and related conclusions.
ING International Value Portfolio
In considering whether to approve the renewal of the Advisory and Sub-Advisory Contracts for ING International Value Portfolio, the Board considered that, based on performance data for the periods ended June 30, 2011: (1) the Portfolio underperformed its Morningstar category median for all periods presented; (2) the Portfolio underperformed its primary benchmark for all periods presented, with the exception of the year-to-date period, during which it outperformed; and (3) the Portfolio is ranked in the third quintile of its Morningstar category for the most recent calendar quarter, year-to-date, and five-year periods, the fourth quintile for the three-year period, and the fifth (lowest) quintile for the one-year and ten-year periods.
In analyzing this performance data, the Board took into account: (1) Management's analysis of the negative effect that stock selection and sector allocation had on the Portfolio's performance; (2) that, in April and December 2010, the Portfolio's management team was modified; and (3) that Management would continue to monitor, and the Board or its IRC would periodically review, the Portfolio's performance.
In considering the fees payable under the Advisory and Sub-Advisory Contracts for the Portfolio, the Board took into account the factors described above and also considered: (1) the fairness of the compensation under an Advisory Contract with a breakpoint fee schedule where the asset level necessary to achieve a breakpoint discount had not been reached by the Portfolio; and (2) the pricing structure (including the expense ratio to be borne by shareholders) of the Portfolio, as compared to its Selected Peer Group, including that: (a) the management fee (inclusive of a 0.10% administration fee) for the Portfolio is above the median and the average management fees of the funds in its Selected Peer Group; and (b) the expense ratio for the Portfolio is above the median and the average expense ratios of the funds in its Selected Peer Group.
In analyzing this fee data, the Board took into account Management's representations with respect to the competitiveness of the Portfolio's expense ratio.
After its deliberation, the Board reached the following conclusions: (1) the Portfolio's management fee rate is reasonable in the context of all factors considered by the Board; (2) the Portfolio's expense
50
ADVISORY CONTRACT APPROVAL DISCUSSION (UNAUDITED) (CONTINUED)
ratio is reasonable in the context of all factors considered by the Board; (3) that, in April and December 2010, the Portfolio's management team was modified and it is reasonable to permit the current management team time to establish a longer performance record for the purpose of evaluating investment performance; and (4) the sub-advisory fee rate payable by the Adviser to the Sub-Adviser is reasonable in the context of all factors considered by the Board. Based on these conclusions and other factors, the Board voted to renew the Advisory and Sub-Advisory Contracts for the Portfolio for the year ending November 30, 2012. During this renewal process, different Board members may have given different weight to different individual factors and related conclusions.
51
Investment Adviser
ING Investments, LLC
7337 East Doubletree Ranch Road, Suite 100
Scottsdale, Arizona 85258
Administrator
ING Funds Services, LLC
7337 East Doubletree Ranch Road, Suite 100
Scottsdale, Arizona 85258
Distributor
ING Investments Distributor, LLC
7337 East Doubletree Ranch Road, Suite 100
Scottsdale, Arizona 85258
Transfer Agent
BNY Mellon Investment Servicing (U.S.) Inc.
301 Bellevue Parkway
Wilmington, Delaware 19809
Independent Registered Public Accounting Firm
KPMG LLP
Two Financial Center
60 South Street
Boston, Massachusetts 02111
Custodian
The Bank of New York Mellon
One Wall Street
New York, New York 10286
Legal Counsel
Dechert LLP
1775 I Street, N.W.
Washington, D.C. 20006
Before investing, carefully consider the investment objectives, risks, charges and expenses of the variable universal life insurance policy or variable annuity contract and the underlying variable investment options. This and other information is contained in the prospectus for the variable universal life policy or variable annuity contract and the underlying variable investment options. Obtain these prospectuses from your agent/registered representative and read them carefully before investing.
VPAR-UVPTADVISS2 (1211-021712)

Item 2. Code of Ethics.
As of the end of the period covered by this report, Registrant had adopted a code of ethics, as defined in Item 2 of Form N-CSR, that applies to the Registrant’s principal executive officer and principal financial officer. There were no amendments to the Code during the period covered by the report. The Registrant did not grant any waivers, including implicit waivers, from any provisions of the Code during the period covered by this report. The code of ethics is filed herewith pursuant to Item 10(a)(1), Exhibit 99.CODE ETH.
Item 3. Audit Committee Financial Expert.
The Board of Trustees has determined that J. Michael Earley and Peter Drotch are audit committee financial experts, as defined in Item 3 of Form N-CSR. Mr. Earley and Mr. Drotch are “independent” for purposes of Item 3 of Form N-CSR.
Item 4. Principal Accountant Fees and Services.
(a) Audit Fees: The aggregate fees billed for each of the last two fiscal years for professional services rendered by KPMG LLP (“KPMG”), the principal accountant for the audit of the registrant’s annual financial statements, for services that are normally provided by the accountant in connection with statutory and regulatory filings or engagements for those fiscal years were $56,700 for year ended December 31, 2011 and $56,700 for year ended December 31, 2010.
(b) Audit-Related Fees: The aggregate fees billed in each of the last two fiscal years for assurance and related services by KPMG that are reasonably related to the performance of the audit of the registrant’s financial statements and are not reported under paragraph (a) of this Item were $7,200 for year ended December 31, 2011 and $6,450 for year ended December 31, 2010.
(c) Tax Fees: The aggregate fees billed in each of the last two fiscal years for professional services rendered by KPMG for tax compliance, tax advice, and tax planning were $15,005 in the year ended December 31, 2011 and $26,157 in the year ended December 31, 2010. Such services included review of excise distribution calculations (if applicable), preparation of the Funds’ federal, state and excise tax returns, tax services related to mergers and routine consulting.
(d) All Other Fees: The aggregate fees billed in each of the last two fiscal years for products and services provided by KPMG, other than the services reported in paragraphs (a) through (c) of this Item. None
(e)(1) Audit Committee Pre-Approval Policies and Procedures
AUDIT AND NON-AUDIT SERVICES
PRE-APPROVAL POLICY
I. Statement of Principles
Under the Sarbanes-Oxley Act of 2002 (the “Act”), the Audit Committee of the Board of Directors or Trustees (the “Committee”) of the ING Funds (each a “Fund,” collectively, the “Funds”) set out on Exhibit A to this Audit and Non-Audit Services Pre-Approval Policy (“Policy”) is responsible for the oversight of the work of the Funds’ independent auditors. As part of its responsibilities, the Committee must pre-approve the audit and non-audit services performed by the auditors in order to assure that the provision of these services does not impair the auditors’ independence from the Funds. The Committee has adopted, and the Board has ratified, this Policy, which sets out the procedures and conditions under which the services of the independent auditors may be pre-approved.
Under Securities and Exchange Commission (“SEC”) rules promulgated in accordance with the Act, the Funds may establish two different approaches to pre-approving audit and non-audit services. The Committee may approve services without consideration of specific case-by-case services (“general pre-approval”) or it may pre-approve specific services (“specific pre-approval”). The Committee believes that the combination of these approaches contemplated in this Policy results in an effective and efficient method for pre-approving audit and non-audit services to be performed by the Funds’ independent auditors. Under this Policy, services that are not of a type that may receive general pre-approval require specific pre-approval by the Committee. Any proposed services that exceed pre-approved cost levels or budgeted amounts will also require the Committee’s specific pre-approval.
For both types of approval, the Committee considers whether the subject services are consistent with the SEC’s rules on auditor independence and that such services are compatible with maintaining the auditors independence. The Committee also considers whether a particular audit firm is in the best position to provide effective and efficient services to the Funds. Reasons that the auditors are in the best position include the auditors’ familiarity with the Funds’ business, personnel, culture, accounting systems, risk profile, and other factors, and whether the services will enhance the Funds’ ability to manage and control risk or improve audit quality. Such factors will be considered as a whole, with no one factor being determinative.
The appendices attached to this Policy describe the audit, audit-related, tax-related, and other services that have the Committee’s general pre-approval. For any service that has been approved through general pre-approval, the general pre-approval will remain in place for a period 12 months from the date of pre-approval, unless the Committee determines that a different period is appropriate. The Committee will annually review and pre-approve the services that may be provided by the independent auditors without specific pre-approval. The Committee will revise the list of services subject to general pre-approval as appropriate. This Policy does not serve as a delegation to Fund management of the Committee’s duty to pre-approve services performed by the Funds’ independent auditors.
II. Audit Services
The annual audit services engagement terms and fees are subject to the Committee’s specific pre-approval. Audit services are those services that are normally provided by auditors in connection with statutory and regulatory filings or engagements or those that generally only independent auditors can reasonably provide. They include the Funds’ annual financial statement audit and procedures that the independent auditors must perform in order to form an opinion on the Funds’ financial statements (e.g., information systems and procedural reviews and testing). The Committee will monitor the audit services engagement and approve any changes in terms, conditions or fees deemed by the Committee to be necessary or appropriate.
The Committee may grant general pre-approval to other audit services, such as statutory audits and services associated with SEC registration statements, periodic reports and other documents filed with the SEC or issued in connection with securities offerings.
The Committee has pre-approved the audit services listed on Appendix A. The Committee must specifically approve all audit services not listed on Appendix A.
III. Audit-related Services
Audit-related services are assurance and related services that are reasonably related to the performance of the audit or the review of the Funds’ financial statements or are traditionally performed by the independent auditors. The Committee believes that the provision of audit-related services will not impair the independent auditors’ independence, and therefore may grant pre-approval to audit-related services. Audit-related services include accounting consultations related to accounting, financial reporting or disclosure matters not classified as “audit services;” assistance with understanding and implementing new accounting and financial reporting guidance from rulemaking authorities; agreed-upon or expanded audit procedures relating to accounting and/or billing records required to respond to or comply with financial, accounting or regulatory reporting matters; and assistance with internal control reporting requirements under Form N-SAR or Form N-CSR.
The Committee has pre-approved the audit-related services listed on Appendix B. The Committee must specifically approve all audit-related services not listed on Appendix B.
IV. Tax Services
The Committee believes the independent auditors can provide tax services to the Funds, including tax compliance, tax planning, and tax advice, without compromising the auditors’ independence. Therefore, the Committee may grant general pre-approval with respect to tax services historically provided by the Funds’ independent auditors that do not, in the Committee’s view, impair auditor independence and that are consistent with the SEC’s rules on auditor independence.
The Committee will not grant pre-approval if the independent auditors initially recommends a transaction the sole business purpose of which is tax avoidance and the tax treatment of which may not be supported in the Internal Revenue Code and related regulations. The Committee may consult
outside counsel to determine that tax planning and reporting positions are consistent with this Policy.
The Committee has pre-approved the tax-related services listed on Appendix C. The Committee must specifically approve all tax-related services not listed on Appendix C.
V. Other Services
The Committee believes it may grant approval of non-audit services that are permissible services for independent auditors to a Fund. The Committee has determined to grant general pre-approval to other services that it believes are routine and recurring, do not impair auditor independence, and are consistent with SEC rules on auditor independence.
The Committee has pre-approved the non-audit services listed on Appendix D. The Committee must specifically approve all non-audit services not listed on Appendix D.
A list of the SEC’s prohibited non-audit services is attached to this Policy as Appendix E. The SEC’s rules and relevant guidance should be consulted to determine the precise definitions of these impermissible services and the applicability of exceptions to certain of the SEC’s prohibitions.
VI. Pre-approval of Fee levels and Budgeted Amounts
The Committee will annually establish pre-approval fee levels or budgeted amounts for audit, audit-related, tax and non-audit services to be provided to the Funds by the independent auditors. Any proposed services exceeding these levels or amounts require the Committee’s specific pre-approval. The Committee considers fees for audit and non-audit services when deciding whether to pre-approve services. The Committee may determine, for a pre-approval period of 12 months, the appropriate ratio between the total amount of fees for the Fund’s audit, audit-related, and tax services (including fees for services provided to Fund affiliates that are subject to pre-approval), and the total amount of fees for certain permissible non-audit services for the Fund classified as other services (including any such services provided to Fund affiliates that are subject to pre-approval).
VII. Procedures
Requests or applications for services to be provided by the independent auditors will be submitted to management. If management determines that the services do not fall within those services generally pre-approved by the Committee and set out in the appendices to these procedures, management will submit the services to the Committee or its delagee. Any such submission will include a detailed description of the services to be rendered. Notwithstanding this paragraph, the Committee will, on a quarterly basis, receive from the independent auditors a list of services provided for the previous calendar quarter on a cumulative basis by the auditors during the Pre-Approval Period.
VIII. Delegation
The Committee may delegate pre-approval authority to one or more of the Committee’s members. Any member or members to whom such pre-approval authority is delegated must report any pre-approval decisions, including any pre-approved services, to the Committee at its next scheduled meeting. The Committee will identify any member to whom pre-approval authority is delegated in writing. The member will retain such authority for a period of 12 months from the date of pre-approval unless the Committee determines that a different period is appropriate. The period of delegated authority may be terminated by the Committee or at the option of the member.
IX. Additional Requirements
The Committee will take any measures the Committee deems necessary or appropriate to oversee the work of the independent auditors and to assure the auditors’ independence from the Funds. This may include reviewing a formal written statement from the independent auditors delineating all relationships between the auditors and the Funds, consistent with Independence Standards Board No. 1, and discussing with the auditors their methods and procedures for ensuring independence.
Effective April 23, 2008, the KPMG LLP (“KPMG”) audit team for the ING Funds accepted the global responsibility for monitoring the auditor independence for KPMG relative to the ING Funds. Using a proprietary system called Sentinel, the audit team is able to identify and manage potential conflicts of interest across the member firms of the KPMG International Network and prevent the provision of prohibited services to the ING entities that would impair KPMG independence with the respect to the ING Funds. In addition to receiving pre-approval from the ING Funds Audit Committee for services provided to the ING Funds and for services for ING entities in the Investment Company Complex, the audit team has developed a process for periodic notification via email to the ING Funds’ Audit Committee Chairpersons regarding requests to provide services to ING Groep NV and its affiliates from KPMG offices worldwide. Additionally, KPMG provides a quarterly summary of the fees for services that have commenced for ING Groep NV and Affiliates at each Audit Committee Meeting.
Last Approved: September 29, 2010
Appendix A
Pre-Approved Audit Services for the Pre-Approval Period September 29, 2010 through December 31, 2011
Service
|
| The Fund(s) |
| Fee Range |
Statutory audits or financial audits (including tax services associated with audit services) |
| Ö |
| As presented to Audit Committee(1) |
Services associated with SEC registration statements, periodic reports and other documents filed with the SEC or other documents issued in connection with securities offerings (e.g., consents), and assistance in responding to SEC comment letters. |
| Ö |
| Not to exceed $9,750 per filing |
Consultations by Fund management with respect to accounting or disclosure treatment of transactions or events and/or the actual or potential effect of final or proposed rules, standards or interpretations by the SEC, Financial Accounting Standards Board, or other regulatory or standard setting bodies. |
| Ö |
| Not to exceed $8,000 during the Pre-Approval Period |
Seed capital audit and related review and issuance of consent on the N-2 registration statement |
| Ö |
| Not to exceed $13,000 per audit |
(1) For new Funds launched during the Pre-Approval Period, the fee ranges pre-approved will be the same as those for existing Funds, pro-rated in accordance with inception dates as provided in the auditors’ Proposal or any Engagement Letter covering the period at issue. Fees in the Engagement Letter will be controlling.
Appendix B
Pre-Approved Audit-Related Services for the Pre-Approval Period September 29, 2010 through December 31, 2011
Service
|
| The Fund(s) |
| Fund Affiliates |
| Fee Range |
Services related to Fund mergers (Excludes tax services - See Appendix C for tax services associated with Fund mergers) |
| Ö |
| Ö |
| Not to exceed $10,000 per merger |
Consultations by Fund management with respect to accounting or disclosure treatment of transactions or events and/or the actual or potential effect of final or proposed rules, standards or interpretations by the SEC, Financial Accounting Standards Board, or other regulatory or standard setting bodies. [Note: Under SEC rules some consultations may be “audit” services and others may be “audit-related” services.] |
| Ö |
|
|
| Not to exceed $5,000 per occurrence during the Pre-Approval Period |
Review of the Funds’ semi-annual and quarterly financial statements |
| Ö |
|
|
| Not to exceed $2,400 per set of financial statements per fund |
Reports to regulatory or government agencies related to the annual engagement |
| Ö |
|
|
| Up to $5,000 per occurrence during the Pre-Approval Period |
Regulatory compliance assistance |
| Ö |
| Ö |
| Not to exceed $5,000 per quarter |
Training courses |
|
|
| Ö |
| Not to exceed $2,000 per course |
For Prime Rate Trust, agreed upon procedures for quarterly reports to rating agencies |
| Ö |
|
|
| Not to exceed $9,450 per quarter |
Appendix C
Pre-Approved Tax Services for the Pre-Approval Period September 29, 2010 through December 31, 2011
Service
|
| The Fund(s) |
| Fund |
| Fee Range |
Preparation of federal and state income tax returns and federal excise tax returns for the Funds including assistance and review with excise tax distributions |
| Ö |
|
|
| As presented to Audit Committee(2) |
Review of IRC Sections 851(b) and 817(h) diversification testing on a real-time basis |
| Ö |
|
|
| As presented to Audit Committee(2) |
Assistance and advice regarding year-end reporting for 1099’s |
| Ö |
|
|
| As presented to Audit Committee(2) |
Tax assistance and advice regarding statutory, regulatory or administrative developments |
| Ö |
| Ö |
| Not to exceed $5,000 for the Funds or for the Funds’ investment adviser during the Pre-Approval Period |
(2) For new Funds launched during the Pre-Approval Period, the fee ranges pre-approved will be the same as those for existing Funds, pro-rated in accordance with inception dates as provided in the auditors’ Proposal or any Engagement Letter covering the period at issue. Fees in the Engagement Letter will be controlling.
Service
|
| The Fund(s) |
| Fund |
| Fee Range |
Tax training courses |
|
|
| Ö |
| Not to exceed $2,000 per course during the Pre-Approval Period |
Tax services associated with Fund mergers |
| Ö |
| Ö |
| Not to exceed $4,000 per fund per merger during the Pre-Approval Period |
Other tax-related assistance and consultation, including, without limitation, assistance in evaluating derivative financial instruments and international tax issues, qualification and distribution issues, and similar routine tax consultations. |
| Ö |
|
|
| Not to exceed $120,000 during the Pre-Approval Period |
Appendix D
Pre-Approved Other Services for the Pre-Approval Period September 29 , 2010 through December 31, 2011
Service
|
| The Fund(s) |
| Fund Affiliates |
| Fee Range |
Agreed-upon procedures for Class B share 12b-1 programs |
|
|
| Ö |
| Not to exceed $60,000 during the Pre-Approval Period |
Security counts performed pursuant to Rule 17f-2 of the 1940 Act (i.e., counts for Funds holding securities with affiliated sub-custodians) Cost to be borne 50% by the Funds and 50% by ING Investments, LLC. |
| Ö |
| Ö |
| Not to exceed $5,000 per Fund during the Pre-Approval Period |
Agreed upon procedures for 15 (c) FACT Books |
| Ö |
|
|
| Not to exceed $35,000 during the Pre-Approval Period |
Appendix E
Prohibited Non-Audit Services
Dated: September 29. 2010 to December 31, 2011
· Bookkeeping or other services related to the accounting records or financial statements of the Funds
· Financial information systems design and implementation
· Appraisal or valuation services, fairness opinions, or contribution-in-kind reports
· Actuarial services
· Internal audit outsourcing services
· Management functions
· Human resources
· Broker-dealer, investment adviser, or investment banking services
· Legal services
· Expert services unrelated to the audit
· Any other service that the Public Company Accounting Oversight Board determines, by regulation, is impermissible
EXHIBIT A
ING EQUITY TRUST
ING FUNDS TRUST
ING ASIA PACIFIC HIGH DIVIDEND EQUITY INCOME FUND
ING GLOBAL ADVANTAGE AND PREMIUM OPPORTUNITY FUND
ING GLOBAL EQUITY DIVIDEND AND PREMIUM OPPORTUNITY FUND
ING INTERNATIONAL HIGH DIVIDEND EQUITY INCOME FUND
ING INFRASTRUCTURE, INDUSTRIALS, AND MATERIALS FUND
ING RISK MANAGED NATURAL RESOURCES FUNDING INVESTORS TRUST
ING EMERGING MARKETS HIGH DIVIDEND EQUITY FUND
ING INVESTORS TRUST
ING MAYFLOWER TRUST
ING MUTUAL FUNDS
ING PARTNERS, INC.
ING PRIME RATE TRUST
ING SENIOR INCOME FUND
ING SEPARATE PORTFOLIOS TRUST
ING VARIABLE INSURANCE TRUST
ING VARIABLE PRODUCTS TRUST
(e)(2) Percentage of services referred to in 4(b) — (4)(d) that were approved by the audit committee
100% of the services were approved by the audit committee.
(f) Percentage of hours expended attributable to work performed by other than full time employees of KPMG if greater than 50%.
Not applicable.
(g) Non-Audit Fees: The non-audit fees billed by the registrant’s accountant for services rendered to the registrant, and rendered to the registrant’s investment adviser, and any entity controlling, controlled by, or under common control with the adviser that provides ongoing services to the registrant for each of the last two fiscal years of the registrant were $1,122,245 for year ended December 31, 2011 and $1,220,728 for year ended December 31, 2010.
(h) Principal Accountants Independence: The Registrant’s Audit committee has considered whether the provision of non-audit services that were rendered to the registrant’s investment adviser and any entity controlling, controlled by, or under common control with the investment adviser that provides ongoing services to the registrant that were not pre-approved pursuant to Rule 2-01(c)(7)(ii) of Regulation S-X is compatible with maintaining KPMG’s independence.
Item 5. Audit Committee of Listed Registrants.
Not applicable.
Item 6. Schedule of Investments
Summary schedule is included as part of the report to shareholders filed under Item 1 of this Form, if applicable.
Report of Independent Registered Public Accounting Firm
The Shareholders and Board of Trustees
ING Variable Products Trust
We have audited, in accordance with the standards of the Public Company Accounting Oversight Board (United States), the statements of assets and liabilities, including the summary portfolios of investments, of ING International Value Portfolio, ING MidCap Opportunities Portfolio, and ING SmallCap Opportunities Portfolio, each a series of ING Variable Products Trust, as of December 31, 2011, and the related statements of operations for the year then ended, the statements of changes in net assets for each of the years in the two-year period then ended, and the financial highlights for each of the years or periods in the five-year period then ended and have issued our unqualified report theron dated February 22, 2012 (which report and financial statements are included in Item 1 of this Certified Shareholder Report on Form N-CSR). In connection with our audits of the aforementioned financial statements and financial highlights, we also audited the related portfolios of investments included in Item 6 of this Form N-CSR. The portfolios of investments are the responsibility of management. Our responsibility is to express an opinion on the portfolios of investments based on our audits.
In our opinion, the portfolios of investments, when considered in relation to the basic financial statements taken as a whole, present fairly, in all material respects, the information set forth therein.
![]()
Boston, Massachusetts
February 22, 2012
| PORTFOLIO OF INVESTMENTS |
ING International Value Portfolio | AS OF DECEMBER 31, 2011 |
Shares |
|
|
|
|
| Value |
| Percentage |
| |
COMMON STOCK: 98.3% |
|
|
|
|
| |||||
|
|
|
| Australia: 3.0% |
|
|
|
|
| |
49,668 |
|
|
| Iluka Resources Ltd. |
| $ | 786,692 |
| 0.5 |
|
90,474 |
|
|
| National Australia Bank Ltd. |
| 2,155,226 |
| 1.5 |
| |
68,856 |
|
|
| Westpac Banking Corp. |
| 1,405,640 |
| 1.0 |
| |
|
|
|
|
|
| 4,347,558 |
| 3.0 |
| |
|
|
|
| Brazil: 1.1% |
|
|
|
|
| |
119,800 |
|
|
| Banco do Brasil S.A. |
| 1,522,187 |
| 1.1 |
| |
|
|
|
|
|
|
|
|
|
| |
|
|
|
| Canada: 1.9% |
|
|
|
|
| |
29,600 |
|
|
| Barrick Gold Corp. |
| 1,339,400 |
| 0.9 |
| |
19,900 |
| L |
| National Bank Of Canada |
| 1,409,164 |
| 1.0 |
| |
|
|
|
|
|
| 2,748,564 |
| 1.9 |
| |
|
|
|
| China: 1.0% |
|
|
|
|
| |
2,125,000 |
|
|
| China Construction Bank |
| 1,476,048 |
| 1.0 |
| |
|
|
|
|
|
|
|
|
|
| |
|
|
|
| Finland: 1.3% |
|
|
|
|
| |
74,802 |
|
|
| Sampo OYJ |
| 1,850,303 |
| 1.3 |
| |
|
|
|
|
|
|
|
|
|
| |
|
|
|
| France: 9.6% |
|
|
|
|
| |
72,999 |
|
|
| Accor S.A. |
| 1,839,680 |
| 1.3 |
| |
42,589 |
|
|
| Alstom |
| 1,286,605 |
| 0.9 |
| |
41,064 |
|
|
| BNP Paribas |
| 1,599,005 |
| 1.1 |
| |
37,286 |
|
|
| Capgemini S.A. |
| 1,159,226 |
| 0.8 |
| |
32,001 |
|
|
| Cie Generale des Etablissements Michelin |
| 1,885,534 |
| 1.3 |
| |
48,123 |
|
|
| Sanofi-Aventis |
| 3,517,672 |
| 2.4 |
| |
9,560 |
|
|
| Technip S.A. |
| 896,247 |
| 0.6 |
| |
34,324 |
|
|
| Total S.A. |
| 1,751,477 |
| 1.2 |
| |
|
|
|
|
|
| 13,935,446 |
| 9.6 |
| |
|
|
|
| Germany: 11.8% |
|
|
|
|
| |
22,753 |
|
|
| BASF AG |
| 1,584,024 |
| 1.1 |
| |
50,477 |
|
|
| Deutsche Bank AG |
| 1,913,119 |
| 1.3 |
| |
25,615 |
| @ |
| Deutsche Boerse AG |
| 1,340,630 |
| 0.9 |
| |
153,666 |
|
|
| Deutsche Telekom AG |
| 1,762,681 |
| 1.2 |
| |
74,311 |
|
|
| E.ON AG |
| 1,601,409 |
| 1.1 |
| |
38,925 |
|
|
| Hannover Rueckversicheru - Reg |
| 1,928,756 |
| 1.3 |
| |
14,033 |
|
|
| K+S AG |
| 632,911 |
| 0.5 |
| |
31,937 |
|
|
| Metro AG |
| 1,164,521 |
| 0.8 |
| |
36,892 |
|
|
| SAP AG |
| 1,951,274 |
| 1.4 |
| |
32,970 |
|
|
| Siemens AG |
| 3,154,426 |
| 2.2 |
| |
|
|
|
|
|
| 17,033,751 |
| 11.8 |
| |
|
|
|
| Hong Kong: 1.4% |
|
|
|
|
| |
196,300 |
|
|
| AIA Group Ltd. |
| 611,067 |
| 0.4 |
| |
197,500 |
|
|
| HongKong Electric Holdings |
| 1,460,321 |
| 1.0 |
| |
|
|
|
|
|
| 2,071,388 |
| 1.4 |
| |
|
|
|
| Israel: 1.3% |
|
|
|
|
| |
47,600 |
|
|
| Teva Pharmaceutical Industries Ltd. ADR |
| 1,921,136 |
| 1.3 |
| |
|
|
|
|
|
|
|
|
|
| |
|
|
|
| Italy: 4.2% |
|
|
|
|
| |
313,903 |
|
|
| Enel S.p.A. |
| 1,273,419 |
| 0.9 |
| |
126,811 |
|
|
| ENI S.p.A. |
| 2,614,537 |
| 1.8 |
| |
158,387 |
| @ |
| Fiat Industrial SpA |
| 1,349,362 |
| 0.9 |
| |
507,366 |
|
|
| Intesa Sanpaolo S.p.A. |
| 845,024 |
| 0.6 |
| |
|
|
|
|
|
| 6,082,342 |
| 4.2 |
| |
|
|
|
| Japan: 18.3% |
|
|
|
|
| |
518,112 |
| L |
| Hitachi Ltd. |
| 2,695,203 |
| 1.9 |
| |
319 |
|
|
| Inpex Holdings, Inc. |
| 2,008,497 |
| 1.4 |
| |
63,000 |
|
|
| JGC Corp. |
| 1,512,547 |
| 1.0 |
| |
87,100 |
|
|
| Komatsu Ltd. |
| 2,030,990 |
| 1.4 |
| |
274,400 |
|
|
| Nissan Motor Co., Ltd. |
| 2,457,278 |
| 1.7 |
| |
1,352 |
|
|
| NTT DoCoMo, Inc. |
| 2,482,299 |
| 1.7 |
| |
100,700 |
|
|
| Omron Corp. |
| 2,021,350 |
| 1.4 |
| |
81,900 |
|
|
| Seven & I Holdings Co., Ltd. |
| 2,282,530 |
| 1.6 |
| |
86,600 |
|
|
| Sumitomo Mitsui Financial Group, Inc. |
| 2,401,659 |
| 1.7 |
| |
48,000 |
|
|
| Takeda Pharmaceutical Co., Ltd. |
| 2,108,423 |
| 1.4 |
| |
107,000 |
|
|
| Tokio Marine Holdings, Inc. |
| 2,369,391 |
| 1.6 |
| |
43,300 |
|
|
| Tokyo Electron Ltd. |
| 2,193,908 |
| 1.5 |
| |
|
|
|
|
|
| 26,564,075 |
| 18.3 |
| |
|
|
|
| Luxembourg: 0.5% |
|
|
|
|
| |
39,095 |
|
|
| ArcelorMittal |
| 710,372 |
| 0.5 |
| |
|
|
|
|
|
|
|
|
|
| |
|
|
|
| Netherlands: 9.4% |
|
|
|
|
| |
73,734 |
|
|
| European Aeronautic Defence and Space Co. NV |
| 2,296,001 |
| 1.6 |
| |
163,590 |
|
|
| Royal Dutch Shell PLC - Class A |
| 6,001,955 |
| 4.1 |
| |
100,215 |
|
|
| Koninklijke Philips Electronics NV |
| 2,102,676 |
| 1.5 |
| |
93,981 |
|
|
| Unilever NV |
| 3,231,393 |
| 2.2 |
| |
|
|
|
|
|
| 13,632,025 |
| 9.4 |
| |
|
|
|
| Norway: 0.6% |
|
|
|
|
| |
34,861 |
|
|
| Statoil ASA |
| 892,800 |
| 0.6 |
| |
|
|
|
|
|
|
|
|
|
| |
|
|
|
| Portugal: 1.1% |
|
|
|
|
| |
532,750 |
|
|
| Energias de Portugal S.A. |
| 1,645,327 |
| 1.1 |
| |
|
|
|
|
|
|
|
|
|
| |
|
|
|
| Singapore: 2.8% |
|
|
|
|
| |
240,000 |
|
|
| Oversea-Chinese Banking Corp. |
| 1,447,404 |
| 1.0 |
| |
543,000 |
|
|
| Singapore Telecommunications Ltd. |
| 1,293,290 |
| 0.9 |
| |
114,100 |
|
|
| United Overseas Bank Ltd. |
| 1,342,791 |
| 0.9 |
| |
|
|
|
|
|
| 4,083,485 |
| 2.8 |
| |
|
|
|
| Spain: 1.0% |
|
|
|
|
| |
79,286 |
|
|
| Telefonica S.A. |
| 1,365,949 |
| 1.0 |
| |
|
|
|
|
|
|
|
|
|
| |
|
|
|
| Sweden: 1.4% |
|
|
|
|
| |
158,546 |
|
|
| Swedbank AB |
| 2,045,973 |
| 1.4 |
| |
|
|
|
|
|
|
|
|
|
| |
|
|
|
| Switzerland: 4.3% |
|
|
|
|
| |
33,351 |
|
|
| Nestle S.A. |
| 1,915,132 |
| 1.3 |
| |
75,763 |
|
|
| Novartis AG |
| 4,325,543 |
| 3.0 |
| |
|
|
|
|
|
| 6,240,675 |
| 4.3 |
| |
See Accompanying Notes to Financial Statements
Shares |
|
|
|
|
| Value |
| Percentage |
|
| ||
COMMON STOCK: (continued) |
|
|
|
|
|
| ||||||
|
|
|
| United Kingdom: 21.0% |
|
|
|
|
|
| ||
85,178 |
|
|
| BHP Billiton PLC |
| $ | 2,490,217 |
| 1.7 |
|
| |
39,800 |
|
|
| BP PLC ADR |
| 1,701,052 |
| 1.2 |
|
| ||
45,300 |
|
|
| Ensco International PLC ADR |
| 2,125,476 |
| 1.4 |
|
| ||
144,607 |
|
|
| GlaxoSmithKline PLC |
| 3,294,979 |
| 2.3 |
|
| ||
284,052 |
|
|
| HSBC Holdings PLC |
| 2,168,450 |
| 1.5 |
|
| ||
53,918 |
|
|
| Imperial Tobacco Group PLC |
| 2,040,270 |
| 1.4 |
|
| ||
949,363 |
|
|
| Legal & General Group PLC |
| 1,517,142 |
| 1.1 |
|
| ||
166,836 |
|
|
| Prudential PLC |
| 1,650,691 |
| 1.1 |
|
| ||
36,838 |
|
|
| Rio Tinto PLC |
| 1,799,395 |
| 1.2 |
|
| ||
83,917 |
|
|
| Standard Chartered PLC |
| 1,835,462 |
| 1.3 |
|
| ||
346,510 |
|
|
| Tesco PLC |
| 2,168,041 |
| 1.5 |
|
| ||
1,786,906 |
|
|
| Vodafone Group PLC |
| 4,982,047 |
| 3.4 |
|
| ||
120,515 |
|
|
| WPP PLC |
| 1,263,862 |
| 0.9 |
|
| ||
95,116 |
|
|
| Xstrata PLC |
| 1,448,145 |
| 1.0 |
|
| ||
|
|
|
|
|
| 30,485,229 |
| 21.0 |
|
| ||
|
|
|
| United States: 1.3% |
|
|
|
|
|
| ||
71,200 |
|
|
| Coca-Cola Enterprises, Inc. |
| 1,835,536 |
| 1.3 |
|
| ||
|
|
|
|
|
|
|
|
|
|
| ||
|
|
|
| Total Common Stock |
| 142,490,169 |
| 98.3 |
|
| ||
|
|
|
|
|
|
|
|
|
|
| ||
PREFERRED STOCK: 1.0% |
|
|
|
|
|
| ||||||
|
|
|
| Germany: 1.0% |
|
|
|
|
|
| ||
9,977 |
|
|
| Volkswagen AG |
| 1,491,671 |
| 1.0 |
|
| ||
|
|
|
|
|
|
|
|
|
|
| ||
|
|
|
| Total Preferred Stock |
| 1,491,671 |
| 1.0 |
|
| ||
|
|
|
|
|
|
|
|
|
|
|
| |
|
|
|
| Total Long-Term Investments |
| 143,981,840 |
| 99.3 |
|
| ||
|
|
|
|
|
|
|
|
|
|
| ||
Principal |
|
|
|
|
|
|
|
|
|
| ||
SHORT-TERM INVESTMENTS: 1.8% |
|
|
|
|
|
| ||||||
|
|
|
| Securities Lending Collateral(cc)(1): 1.1% |
|
|
|
|
|
| ||
627,715 |
|
|
| Cantor Fitzgerald, Repurchase Agreement dated 12/30/11, 0.12%, due 01/03/12 (Repurchase Amount $627,723, collateralized by various U.S. Government Agency Obligations, 1.437%-6.014%, Market Value plus accrued interest $640,269, due 06/01/17-09/01/44) |
| 627,715 |
| 0.4 |
|
| ||
1,000,000 |
|
|
| Citigroup, Inc., Repurchase Agreement dated 12/30/11, 0.08%, due 01/03/12 (Repurchase Amount $1,000,009, collateralized by various U.S. Government and U.S. Government Agency Obligations, 0.000%-5.500%, Market Value plus accrued interest $1,020,000, due 01/19/12-12/20/41) |
|
| 1,000,000 |
| 0.7 |
|
| |
|
|
|
|
|
| 1,627,715 |
| 1.1 |
|
| ||
|
|
|
|
|
|
|
|
|
|
| ||
Shares |
|
|
|
|
|
|
|
|
|
| ||
|
|
|
| Mutual Funds: 0.7% |
|
|
|
|
|
| ||
937,000 |
|
|
| BlackRock Liquidity Funds, TempFund, Institutional Class |
| 937,000 |
| 0.7 |
|
| ||
|
|
|
|
|
|
|
|
|
|
| ||
|
|
|
| Total Short-Term Investments |
| 2,564,715 |
| 1.8 |
|
| ||
|
|
|
|
|
|
|
|
|
|
| ||
|
|
|
| Total Investments in Securities |
| $ | 146,546,555 |
| 101.1 |
|
| |
|
|
|
| Liabilities in Excess of Other Assets |
| (1,559,565 | ) | (1.1 | ) |
| ||
|
|
|
| Net Assets |
| $ | 144,986,990 |
| 100.0 |
|
| |
† | Unless otherwise indicated, principal amount is shown in USD. |
@ | Non-income producing security |
|
|
ADR | American Depositary Receipt |
(cc) | Securities purchased with cash collateral for securities loaned. |
L | Loaned security, a portion or all of the security is on loan at December 31, 2011. |
(1) | Collateral received from brokers for securities lending was invested into these short-term investments. |
|
|
| Cost for federal income tax purposes is $161,283,291. |
|
|
| Net unrealized depreciation consists of: |
|
|
| Gross Unrealized Appreciation |
| $ | 5,335,009 |
|
|
|
| Gross Unrealized Depreciation |
| (20,071,745 | ) |
|
| |
| Net Unrealized Depreciation |
| $ | (14,736,736 | ) |
|
|
Sector Diversification |
| Percentage |
|
Consumer Discretionary |
| 6.2 | % |
Consumer Staples |
| 10.1 |
|
Energy |
| 12.3 |
|
Financials |
| 24.1 |
|
Health Care |
| 10.4 |
|
Industrials |
| 9.5 |
|
Information Technology |
| 7.0 |
|
Materials |
| 7.4 |
|
Telecommunications |
| 8.2 |
|
Utilities |
| 4.1 |
|
Short-Term Investments |
| 1.8 |
|
Liabilities in Excess of Other Assets |
| (1.1 | ) |
Net Assets |
| 100.0 | % |
See Accompanying Notes to Financial Statements

| PORTFOLIO OF INVESTMENTS |
ING MidCap Opportunities Portfolio | AS OF DECEMBER 31, 2011 |
Shares |
|
|
|
|
| Value |
| Percentage |
| |
COMMON STOCK: 99.7% |
|
|
|
|
| |||||
|
|
|
| Consumer Discretionary: 19.9% |
|
|
|
|
| |
329,460 |
| @ |
| Bed Bath & Beyond, Inc. |
| $ | 19,098,796 |
| 2.2 |
|
506,000 |
|
|
| Brinker International, Inc. |
| 13,540,560 |
| 1.5 |
| |
170,606 |
|
|
| Coach, Inc. |
| 10,413,790 |
| 1.2 |
| |
484,380 |
|
|
| Foot Locker, Inc. |
| 11,547,619 |
| 1.3 |
| |
498,270 |
|
|
| Harley-Davidson, Inc. |
| 19,367,755 |
| 2.2 |
| |
795,160 |
|
|
| International Game Technology |
| 13,676,752 |
| 1.5 |
| |
128,439 |
| @ |
| Liberty Media Corp. |
| 10,024,664 |
| 1.1 |
| |
450,390 |
|
|
| Macy’s, Inc. |
| 14,493,550 |
| 1.6 |
| |
365,050 |
| @ |
| Michael Kors Holdings Ltd. |
| 9,947,613 |
| 1.1 |
| |
289,473 |
|
|
| Regal Entertainment Group |
| 3,456,308 |
| 0.4 |
| |
323,640 |
|
|
| Ross Stores, Inc. |
| 15,382,609 |
| 1.7 |
| |
317,150 |
|
|
| Scripps Networks Interactive - Class A |
| 13,453,503 |
| 1.5 |
| |
138,280 |
|
|
| Weight Watchers International, Inc. |
| 7,606,783 |
| 0.9 |
| |
408,604 |
|
|
| Wyndham Worldwide Corp. |
| 15,457,489 |
| 1.7 |
| |
|
|
|
|
|
| 177,467,791 |
| 19.9 |
| |
|
|
|
| Consumer Staples: 6.3% |
|
|
|
|
| |
628,930 |
|
|
| Coca-Cola Enterprises, Inc. |
| 16,213,815 |
| 1.8 |
| |
255,990 |
|
|
| ConAgra Foods, Inc. |
| 6,758,136 |
| 0.8 |
| |
77,720 |
|
|
| Herbalife Ltd. |
| 4,015,792 |
| 0.4 |
| |
216,180 |
|
|
| Hershey Co. |
| 13,355,601 |
| 1.5 |
| |
113,030 |
| @ |
| Ralcorp Holdings, Inc. |
| 9,664,065 |
| 1.1 |
| |
96,138 |
|
|
| Whole Foods Market, Inc. |
| 6,689,282 |
| 0.7 |
| |
|
|
|
|
|
| 56,696,691 |
| 6.3 |
| |
|
|
|
| Energy: 9.0% |
|
|
|
|
| |
365,930 |
| @ |
| Cameron International Corp. |
| 18,000,097 |
| 2.0 |
| |
372,540 |
| @ |
| Key Energy Services, Inc. |
| 5,763,194 |
| 0.7 |
| |
477,040 |
| @ |
| McMoRan Exploration Co. |
| 6,940,932 |
| 0.8 |
| |
163,830 |
|
|
| Murphy Oil Corp. |
| 9,131,884 |
| 1.0 |
| |
1,071,275 |
| @ |
| Precision Drilling Corp. |
| 10,991,281 |
| 1.2 |
| |
292,480 |
|
|
| Range Resources Corp. |
| 18,116,211 |
| 2.0 |
| |
247,640 |
| @ |
| Unit Corp. |
| 11,490,496 |
| 1.3 |
| |
3,924 |
|
|
| World Fuel Services Corp. |
| 164,730 |
| 0.0 |
| |
|
|
|
|
|
| 80,598,825 |
| 9.0 |
| |
|
|
|
| Financials: 8.5% |
|
|
|
|
| |
212,750 |
|
|
| Ameriprise Financial, Inc. |
| 10,560,910 |
| 1.2 |
| |
119,925 |
|
|
| Digital Realty Trust, Inc. |
| 7,995,400 |
| 0.9 |
| |
584,930 |
|
|
| Fifth Third Bancorp. |
| 7,440,310 |
| 0.8 |
| |
141,440 |
|
|
| Jones Lang LaSalle, Inc. |
| 8,664,614 |
| 1.0 |
| |
366,510 |
|
|
| Lazard Ltd. |
| 9,569,576 |
| 1.1 |
| |
255,400 |
|
|
| Marsh & McLennan Cos., Inc. |
| 8,075,748 |
| 0.9 |
| |
238,890 |
|
|
| T. Rowe Price Group, Inc. |
| 13,604,785 |
| 1.5 |
| |
381,540 |
|
|
| UDR, Inc. |
| 9,576,654 |
| 1.1 |
| |
|
|
|
|
|
| 75,487,997 |
| 8.5 |
| |
|
|
|
| Health Care: 12.8% |
|
|
|
|
| |
359,520 |
| @ |
| Agilent Technologies, Inc. |
| 12,558,034 |
| 1.4 |
| |
93,180 |
| @ |
| Alexion Pharmaceuticals, Inc. |
| 6,662,370 |
| 0.8 |
| |
246,720 |
|
|
| Cardinal Health, Inc. |
| 10,019,299 |
| 1.1 |
| |
162,870 |
|
|
| Cooper Cos., Inc. |
| 11,485,592 |
| 1.3 |
| |
293,286 |
| @ |
| HCA Holdings, Inc. |
| 6,461,091 |
| 0.7 |
| |
367,620 |
| @ |
| Impax Laboratories, Inc. |
| 7,414,895 |
| 0.8 |
| |
94,240 |
| @ |
| Laboratory Corp. of America Holdings |
| 8,101,813 |
| 0.9 |
| |
255,260 |
|
|
| Medicis Pharmaceutical Corp. |
| 8,487,395 |
| 1.0 |
| |
130,987 |
|
|
| Perrigo Co. |
| 12,745,035 |
| 1.4 |
| |
177,060 |
|
|
| St. Jude Medical, Inc. |
| 6,073,158 |
| 0.7 |
| |
139,070 |
| @ |
| Waters Corp. |
| 10,298,133 |
| 1.2 |
| |
226,046 |
| @ |
| Watson Pharmaceuticals, Inc. |
| 13,639,616 |
| 1.5 |
| |
|
|
|
|
|
| 113,946,431 |
| 12.8 |
| |
|
|
|
| Industrials: 16.2% |
|
|
|
|
| |
195,380 |
|
|
| Acuity Brands, Inc. |
| 10,355,140 |
| 1.2 |
| |
184,272 |
|
|
| Ametek, Inc. |
| 7,757,851 |
| 0.9 |
| |
121,840 |
| @ |
| BE Aerospace, Inc. |
| 4,716,426 |
| 0.5 |
| |
480,530 |
| @ |
| Corrections Corp. of America |
| 9,788,396 |
| 1.1 |
| |
251,260 |
|
|
| Dover Corp. |
| 14,585,643 |
| 1.6 |
| |
211,250 |
|
|
| Equifax, Inc. |
| 8,183,825 |
| 0.9 |
| |
167,950 |
|
|
| Fluor Corp. |
| 8,439,487 |
| 1.0 |
| |
153,077 |
|
|
| Gardner Denver, Inc. |
| 11,796,114 |
| 1.3 |
| |
51,790 |
|
|
| Joy Global, Inc. |
| 3,882,696 |
| 0.4 |
| |
200,575 |
|
|
| Nordson Corp. |
| 8,259,679 |
| 0.9 |
| |
272,590 |
|
|
| Pall Corp. |
| 15,578,519 |
| 1.8 |
| |
88,880 |
|
|
| Regal-Beloit Corp. |
| 4,530,214 |
| 0.5 |
| |
181,112 |
|
|
| Roper Industries, Inc. |
| 15,733,199 |
| 1.8 |
| |
125,270 |
| @ |
| TransDigm Group, Inc. |
| 11,985,834 |
| 1.3 |
| |
281,330 |
|
|
| Waste Connections, Inc. |
| 9,323,276 |
| 1.0 |
| |
|
|
|
|
|
| 144,916,299 |
| 16.2 |
| |
|
|
|
| Information Technology: 19.0% |
|
|
|
|
| |
360,980 |
| @ |
| Adobe Systems, Inc. |
| 10,204,905 |
| 1.1 |
| |
440,560 |
|
|
| Analog Devices, Inc. |
| 15,763,237 |
| 1.8 |
| |
292,790 |
| @ |
| Ariba, Inc. |
| 8,221,543 |
| 0.9 |
| |
243,782 |
| @ |
| Citrix Systems, Inc. |
| 14,802,443 |
| 1.7 |
| |
312,630 |
|
|
| Intuit, Inc. |
| 16,441,212 |
| 1.8 |
| |
505,260 |
|
|
| Jabil Circuit, Inc. |
| 9,933,412 |
| 1.1 |
| |
312,770 |
| @ |
| Lam Research Corp. |
| 11,578,745 |
| 1.3 |
| |
296,640 |
| @ |
| Micros Systems, Inc. |
| 13,817,491 |
| 1.6 |
| |
264,324 |
| @ |
| NetApp, Inc. |
| 9,587,031 |
| 1.1 |
| |
612,140 |
| @ |
| QLogic Corp. |
| 9,182,100 |
| 1.0 |
| |
481,860 |
| @ |
| Riverbed Technolgoy, Inc. |
| 11,323,710 |
| 1.3 |
| |
See Accompanying Notes to Financial Statements
Shares |
|
|
|
|
| Value |
| Percentage |
| |
COMMON STOCK: (continued) |
|
|
|
|
| |||||
|
|
|
| Information Technology: (continued) |
|
|
|
|
| |
545,560 |
|
|
| Seagate Technology |
| $ | 8,947,184 |
| 1.0 |
|
949,930 |
|
|
| Western Union Co. |
| 17,345,722 |
| 1.9 |
| |
395,930 |
|
|
| Xilinx, Inc. |
| 12,693,516 |
| 1.4 |
| |
|
|
|
|
|
| 169,842,251 |
| 19.0 |
| |
|
|
|
| Materials: 6.2% |
|
|
|
|
| |
163,010 |
|
|
| Allegheny Technologies, Inc. |
| 7,791,878 |
| 0.9 |
| |
88,500 |
|
|
| CF Industries Holdings, Inc. |
| 12,830,730 |
| 1.4 |
| |
207,440 |
|
|
| Cliffs Natural Resources, Inc. |
| 12,933,884 |
| 1.5 |
| |
361,300 |
|
|
| Packaging Corp. of America |
| 9,119,212 |
| 1.0 |
| |
196,880 |
|
|
| Sigma-Aldrich Corp. |
| 12,297,125 |
| 1.4 |
| |
|
|
|
|
|
| 54,972,829 |
| 6.2 |
| |
|
|
|
| Telecommunications: 1.8% |
|
|
|
|
| |
381,610 |
| @ |
| SBA Communications Corp. |
| 16,393,966 |
| 1.8 |
| |
|
|
|
|
|
|
|
|
|
| |
|
|
|
| Total Common Stock |
| 890,323,080 |
| 99.7 |
| |
|
|
|
|
|
|
|
|
|
| |
SHORT-TERM INVESTMENTS: 1.7% |
|
|
|
|
| |||||
|
|
|
| Mutual Funds: 1.7% |
|
|
|
|
| |
15,333,100 |
|
|
| BlackRock Liquidity Funds, TempFund, Institutional Class |
| 15,333,100 |
| 1.7 |
| |
|
|
|
|
|
|
|
|
|
| |
|
|
|
| Total Short-Term Investments |
| 15,333,100 |
| 1.7 |
| |
|
|
|
|
|
|
|
|
|
| |
|
|
|
| Total Investments in Securities |
| $ | 905,656,180 |
| 101.4 |
|
|
|
|
| Liabilities in Excess of Other Assets |
| (12,437,110 | ) | (1.4 | ) | |
|
|
|
| Net Assets |
| $ | 893,219,070 |
| 100.0 |
|
@ | Non-income producing security | |||||||
|
| |||||||
| Cost for federal income tax purposes is $857,001,527. | |||||||
|
| |||||||
| Net unrealized appreciation consists of: | |||||||
|
|
|
|
|
|
| ||
| Gross Unrealized Appreciation |
| $ | 91,750,689 |
|
|
| |
| Gross Unrealized Depreciation |
| (43,096,036 | ) |
|
| ||
| Net Unrealized Appreciation |
| $ | 48,654,653 |
|
|
| |
See Accompanying Notes to Financial Statements
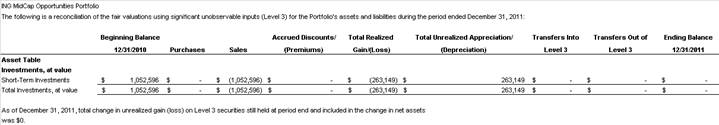
| PORTFOLIO OF INVESTMENTS |
ING SmallCap Opportunities Portfolio | AS OF DECEMBER 31, 2011 |
Shares |
|
|
|
|
| Value |
| Percentage |
| |
COMMON STOCK: 96.6% |
|
|
|
|
| |||||
|
|
|
| Consumer Discretionary: 15.9% |
|
|
|
|
| |
42,849 |
|
|
| Arbitron, Inc. |
| $ | 1,474,434 |
| 0.8 |
|
36,716 |
| @ |
| Arctic Cat, Inc. |
| 827,946 |
| 0.4 |
| |
27,300 |
| @ |
| Bally Technologies, Inc. |
| 1,079,988 |
| 0.6 |
| |
16,600 |
| @ |
| Childrens Place Retail Stores, Inc. |
| 881,792 |
| 0.5 |
| |
89,966 |
|
|
| Cinemark Holdings, Inc. |
| 1,663,471 |
| 0.9 |
| |
72,749 |
| @ |
| Collective Brands, Inc. |
| 1,045,403 |
| 0.5 |
| |
115,509 |
|
|
| Cooper Tire & Rubber Co. |
| 1,618,281 |
| 0.9 |
| |
55,400 |
| @ |
| Dana Holding Corp. |
| 673,110 |
| 0.3 |
| |
75,900 |
|
|
| Finish Line |
| 1,463,731 |
| 0.8 |
| |
36,500 |
|
|
| Gildan Activewear, Inc. |
| 685,835 |
| 0.4 |
| |
40,499 |
| @ |
| Hibbett Sporting Goods, Inc. |
| 1,829,745 |
| 1.0 |
| |
53,600 |
| @,L |
| Imax Corp. |
| 982,488 |
| 0.5 |
| |
50,200 |
| @ |
| Jack in the Box, Inc. |
| 1,049,180 |
| 0.5 |
| |
52,251 |
| @ |
| Life Time Fitness, Inc. |
| 2,442,734 |
| 1.3 |
| |
28,628 |
| @ |
| LKQ Corp. |
| 861,130 |
| 0.4 |
| |
28,307 |
| @,L |
| Lumber Liquidators |
| 499,902 |
| 0.3 |
| |
41,300 |
|
|
| Monro Muffler, Inc. |
| 1,602,027 |
| 0.8 |
| |
170,972 |
| @ |
| OfficeMax, Inc. |
| 776,213 |
| 0.4 |
| |
35,200 |
| L |
| PF Chang’s China Bistro, Inc. |
| 1,088,032 |
| 0.6 |
| |
42,018 |
|
|
| Pool Corp. |
| 1,264,742 |
| 0.7 |
| |
81,700 |
| @ |
| Sally Beauty Holdings, Inc. |
| 1,726,321 |
| 0.9 |
| |
251,400 |
| @ |
| Smith & Wesson Holding Corp. |
| 1,096,104 |
| 0.6 |
| |
28,384 |
| @ |
| Steiner Leisure Ltd. |
| 1,288,350 |
| 0.7 |
| |
101,033 |
| @ |
| Wet Seal, Inc. |
| 329,368 |
| 0.2 |
| |
43,694 |
|
|
| Wyndham Worldwide Corp. |
| 1,652,944 |
| 0.9 |
| |
|
|
|
|
|
| 29,903,271 |
| 15.9 |
| |
|
|
|
| Consumer Staples: 1.3% |
|
|
|
|
| |
29,200 |
|
|
| Casey’s General Stores, Inc. |
| 1,504,092 |
| 0.8 |
| |
15,800 |
|
|
| Diamond Foods, Inc. |
| 509,866 |
| 0.3 |
| |
22,950 |
|
|
| Flowers Foods, Inc. |
| 435,591 |
| 0.2 |
| |
|
|
|
|
|
| 2,449,549 |
| 1.3 |
| |
|
|
|
| Energy: 8.4% |
|
|
|
|
| |
48,600 |
| @ |
| Bill Barrett Corp. |
| 1,655,802 |
| 0.9 |
| |
49,800 |
| @,L |
| C&J Energy Services, Inc. |
| 1,042,314 |
| 0.5 |
| |
68,500 |
| @ |
| Carrizo Oil & Gas, Inc. |
| 1,804,975 |
| 1.0 |
| |
30,900 |
| @ |
| Dril-Quip, Inc. |
| 2,033,838 |
| 1.1 |
| |
26,700 |
|
|
| HollyFrontier Corp. |
| 624,780 |
| 0.3 |
| |
91,800 |
| @ |
| Key Energy Services, Inc. |
| 1,420,146 |
| 0.7 |
| |
93,200 |
| @ |
| McMoRan Exploration Co. |
| 1,356,060 |
| 0.7 |
| |
37,500 |
| @ |
| Rosetta Resources, Inc. |
| 1,631,250 |
| 0.9 |
| |
55,400 |
| @ |
| Swift Energy Co. |
| 1,646,488 |
| 0.9 |
| |
27,900 |
| @ |
| Unit Corp. |
| 1,294,560 |
| 0.7 |
| |
30,800 |
|
|
| World Fuel Services Corp. |
| 1,292,984 |
| 0.7 |
| |
|
|
|
|
|
| 15,803,197 |
| 8.4 |
| |
|
|
|
| Financials: 8.7% |
|
|
|
|
| |
15,500 |
| @ |
| Affiliated Managers Group, Inc. |
| 1,487,225 |
| 0.8 |
| |
83,350 |
| @ |
| DFC Global Corp. |
| 1,505,301 |
| 0.8 |
| |
9,250 |
|
|
| Digital Realty Trust, Inc. |
| 616,697 |
| 0.3 |
| |
55,462 |
| @ |
| Ezcorp, Inc. |
| 1,462,533 |
| 0.8 |
| |
18,500 |
| @ |
| Financial Engines, Inc. |
| 413,105 |
| 0.2 |
| |
329,379 |
|
|
| Hersha Hospitality Trust |
| 1,607,370 |
| 0.9 |
| |
17,500 |
|
|
| Home Properties, Inc. |
| 1,007,475 |
| 0.5 |
| |
29,062 |
| @ |
| Portfolio Recovery Associates, Inc. |
| 1,962,266 |
| 1.0 |
| |
32,076 |
| @ |
| Signature Bank |
| 1,924,239 |
| 1.0 |
| |
2,653 |
| @ |
| Stifel Financial Corp. |
| 85,029 |
| 0.1 |
| |
33,500 |
| @ |
| SVB Financial Group |
| 1,597,615 |
| 0.9 |
| |
88,700 |
|
|
| Tanger Factory Outlet Centers, Inc. |
| 2,600,684 |
| 1.4 |
| |
|
|
|
|
|
| 16,269,539 |
| 8.7 |
| |
|
|
|
| Health Care: 18.7% |
|
|
|
|
| |
26,400 |
| @ |
| Acorda Therapeutics, Inc. |
| 629,376 |
| 0.3 |
| |
60,669 |
| @ |
| Anthera Pharmaceuticals, Inc. |
| 372,508 |
| 0.2 |
| |
39,800 |
| @ |
| Auxilium Pharmaceuticals, Inc. |
| 793,214 |
| 0.4 |
| |
10,600 |
| @ |
| BioMarin Pharmaceuticals, Inc. |
| 364,428 |
| 0.2 |
| |
9,685 |
| @ |
| Bio-Rad Laboratories, Inc. |
| 930,147 |
| 0.5 |
| |
47,954 |
| @ |
| Centene Corp. |
| 1,898,499 |
| 1.0 |
| |
37,500 |
|
|
| Chemed Corp. |
| 1,920,375 |
| 1.0 |
| |
27,000 |
| @ |
| Cubist Pharmaceuticals, Inc. |
| 1,069,740 |
| 0.6 |
| |
26,688 |
| @ |
| Haemonetics Corp. |
| 1,633,839 |
| 0.9 |
| |
86,231 |
| @ |
| Healthsouth Corp. |
| 1,523,702 |
| 0.8 |
| |
59,900 |
| @ |
| Impax Laboratories, Inc. |
| 1,208,183 |
| 0.6 |
| |
55,900 |
| @,L |
| Incyte Corp., Ltd. |
| 839,059 |
| 0.4 |
| |
49,500 |
| @ |
| InterMune, Inc. |
| 623,700 |
| 0.3 |
| |
16,870 |
| @ |
| IPC The Hospitalist Co., Inc. |
| 771,296 |
| 0.4 |
| |
23,400 |
| @ |
| Luminex Corp. |
| 496,782 |
| 0.3 |
| |
34,200 |
| @ |
| MedAssets, Inc. |
| 316,350 |
| 0.2 |
| |
38,100 |
| @ |
| Medicines Co. |
| 710,184 |
| 0.4 |
| |
19,505 |
| @ |
| Mednax, Inc. |
| 1,404,555 |
| 0.8 |
| |
36,091 |
|
|
| Meridian Bioscience, Inc. |
| 679,954 |
| 0.4 |
| |
65,300 |
| @ |
| Merit Medical Systems, Inc. |
| 873,714 |
| 0.5 |
| |
29,700 |
| @ |
| Momenta Pharmaceuticals, Inc. |
| 516,483 |
| 0.3 |
| |
104,720 |
| @,L |
| Nektar Therapeutics |
| 585,908 |
| 0.3 |
| |
30,818 |
| @ |
| Neogen Corp. |
| 944,264 |
| 0.5 |
| |
36,900 |
| @ |
| Omnicell, Inc. |
| 609,588 |
| 0.3 |
| |
31,724 |
| @,L |
| OncoGenex Pharmaceutical, Inc. |
| 372,440 |
| 0.2 |
| |
35,200 |
| @ |
| Onyx Pharmaceuticals, Inc. |
| 1,547,040 |
| 0.8 |
| |
89,700 |
| @ |
| Optimer Pharmaceuticals, Inc. |
| 1,097,928 |
| 0.6 |
| |
52,050 |
|
|
| Owens & Minor, Inc. |
| 1,446,470 |
| 0.8 |
| |
See Accompanying Notes to Financial Statements
Shares |
|
|
|
|
| Value |
| Percentage |
| |
COMMON STOCK: (continued) |
|
|
|
|
| |||||
|
|
|
| Health Care: (continued) |
|
|
|
|
| |
50,600 |
| @ |
| PSS World Medical, Inc. |
| $ | 1,224,014 |
| 0.7 |
|
23,900 |
| @ |
| Salix Pharmaceuticals Ltd. |
| 1,143,615 |
| 0.6 |
| |
83,595 |
| @,L |
| Savient Pharmaceuticals, Inc. |
| 186,417 |
| 0.1 |
| |
14,300 |
| @,L |
| Seattle Genetics, Inc. |
| 239,025 |
| 0.1 |
| |
15,166 |
| @ |
| SonoSite, Inc. |
| 816,841 |
| 0.4 |
| |
30,373 |
|
|
| Steris Corp. |
| 905,723 |
| 0.5 |
| |
46,200 |
| @ |
| Thoratec Corp. |
| 1,550,472 |
| 0.8 |
| |
35,118 |
|
|
| Universal Health Services, Inc. |
| 1,364,685 |
| 0.7 |
| |
45,273 |
| @ |
| Vanda Pharmaceuticals, Inc. |
| 215,499 |
| 0.1 |
| |
118,822 |
| @ |
| Vical, Inc. |
| 524,005 |
| 0.3 |
| |
73,000 |
| @,L |
| Vivus, Inc. |
| 711,750 |
| 0.4 |
| |
|
|
|
|
|
| 35,061,772 |
| 18.7 |
| |
|
|
|
| Industrials: 18.1% |
|
|
|
|
| |
75,535 |
|
|
| Actuant Corp. |
| 1,713,889 |
| 0.9 |
| |
49,700 |
|
|
| Acuity Brands, Inc. |
| 2,634,100 |
| 1.4 |
| |
5,144 |
| @ |
| Advisory Board Co. |
| 381,736 |
| 0.2 |
| |
25,471 |
| @ |
| Allegiant Travel Co. |
| 1,358,623 |
| 0.7 |
| |
35,892 |
| @ |
| Clean Harbors, Inc. |
| 2,287,397 |
| 1.2 |
| |
41,300 |
| @ |
| EnPro Industries, Inc. |
| 1,362,074 |
| 0.7 |
| |
39,900 |
| @ |
| Genesee & Wyoming, Inc. |
| 2,417,142 |
| 1.3 |
| |
60,200 |
| @ |
| Geo Group, Inc. |
| 1,008,350 |
| 0.5 |
| |
46,445 |
|
|
| Gorman-Rupp Co. |
| 1,260,982 |
| 0.7 |
| |
53,651 |
|
|
| Healthcare Services Group |
| 949,086 |
| 0.5 |
| |
46,600 |
| @ |
| Hexcel Corp. |
| 1,128,186 |
| 0.6 |
| |
36,900 |
| @ |
| HUB Group, Inc. |
| 1,196,667 |
| 0.7 |
| |
107,900 |
|
|
| Knight Transportation, Inc. |
| 1,687,556 |
| 0.9 |
| |
27,700 |
|
|
| Regal-Beloit Corp. |
| 1,411,869 |
| 0.8 |
| |
47,528 |
|
|
| Simpson Manufacturing Co., Inc. |
| 1,599,793 |
| 0.9 |
| |
73,704 |
| @ |
| SYKES Enterprises, Inc. |
| 1,154,205 |
| 0.6 |
| |
31,300 |
| @ |
| Teledyne Technologies, Inc. |
| 1,716,805 |
| 0.9 |
| |
30,900 |
|
|
| Toro Co. |
| 1,874,394 |
| 1.0 |
| |
75,430 |
| @ |
| TrueBlue, Inc. |
| 1,046,968 |
| 0.6 |
| |
47,163 |
|
|
| Waste Connections, Inc. |
| 1,562,982 |
| 0.8 |
| |
26,600 |
|
|
| Watsco, Inc. |
| 1,746,556 |
| 0.9 |
| |
60,190 |
|
|
| Woodward Governor Co. |
| 2,463,577 |
| 1.3 |
| |
|
|
|
|
|
| 33,962,937 |
| 18.1 |
| |
|
|
|
| Information Technology: 21.5% |
|
|
|
|
| |
65,800 |
|
|
| Adtran, Inc. |
| 1,984,528 |
| 1.1 |
| |
87,489 |
| @ |
| Advanced Energy Industries, Inc. |
| 938,757 |
| 0.5 |
| |
28,438 |
| @ |
| Ansys, Inc. |
| 1,628,929 |
| 0.9 |
| |
49,700 |
| @ |
| Ariba, Inc. |
| 1,395,576 |
| 0.7 |
| |
103,200 |
| @ |
| Aruba Networks, Inc. |
| 1,911,264 |
| 1.0 |
| |
130,600 |
| @ |
| Aspen Technology, Inc. |
| 2,265,910 |
| 1.2 |
| |
10,091 |
| @ |
| Bankrate, Inc. |
| 216,957 |
| 0.1 |
| |
50,915 |
|
|
| Blackbaud, Inc. |
| 1,410,345 |
| 0.7 |
| |
18,700 |
|
|
| Cognex Corp. |
| 669,273 |
| 0.4 |
| |
39,238 |
| @ |
| Concur Technologies, Inc. |
| 1,992,898 |
| 1.1 |
| |
129,262 |
| @ |
| Formfactor, Inc. |
| 654,066 |
| 0.3 |
| |
65,700 |
| @ |
| Fortinet, Inc. |
| 1,432,917 |
| 0.8 |
| |
34,800 |
| @ |
| Informatica Corp. |
| 1,285,164 |
| 0.7 |
| |
232,400 |
| @ |
| Integrated Device Technology, Inc. |
| 1,268,904 |
| 0.7 |
| |
24,900 |
| @ |
| LogMeIn, Inc. |
| 959,895 |
| 0.5 |
| |
44,757 |
| @,L |
| Meru Networks, Inc. |
| 184,846 |
| 0.1 |
| |
32,589 |
| @ |
| Micros Systems, Inc. |
| 1,517,996 |
| 0.8 |
| |
49,200 |
|
|
| MKS Instruments, Inc. |
| 1,368,744 |
| 0.7 |
| |
66,800 |
| @ |
| Monolithic Power Systems, Inc. |
| 1,006,676 |
| 0.5 |
| |
28,700 |
| @ |
| Multi-Fineline Electronix, Inc. |
| 589,785 |
| 0.3 |
| |
51,113 |
|
|
| National Instruments Corp. |
| 1,326,382 |
| 0.7 |
| |
5,500 |
| @ |
| Netlogic Microsystems, Inc. |
| 272,635 |
| 0.1 |
| |
52,100 |
| @ |
| Netscout Systems, Inc. |
| 916,960 |
| 0.5 |
| |
115,600 |
| @ |
| Parametric Technology Corp. |
| 2,110,856 |
| 1.1 |
| |
51,571 |
| @ |
| Plexus Corp. |
| 1,412,014 |
| 0.8 |
| |
50,700 |
| @ |
| Polycom, Inc. |
| 826,410 |
| 0.4 |
| |
11,800 |
| @ |
| QLIK Technologies, Inc. |
| 285,560 |
| 0.2 |
| |
30,000 |
| @ |
| Quest Software, Inc. |
| 558,000 |
| 0.3 |
| |
53,400 |
| @ |
| Riverbed Technolgoy, Inc. |
| 1,254,900 |
| 0.7 |
| |
72,800 |
| @ |
| Semtech Corp. |
| 1,806,896 |
| 1.0 |
| |
40,600 |
| @ |
| SolarWinds, Inc. |
| 1,134,770 |
| 0.6 |
| |
42,300 |
| @ |
| SuccessFactors, Inc. |
| 1,686,501 |
| 0.9 |
| |
6,785 |
| @ |
| Synaptics, Inc. |
| 204,568 |
| 0.1 |
| |
36,442 |
| @ |
| Taleo Corp. |
| 1,409,941 |
| 0.7 |
| |
28,400 |
| @ |
| Websense, Inc. |
| 531,932 |
| 0.3 |
| |
|
|
|
|
|
| 40,421,755 |
| 21.5 |
| |
|
|
|
| Materials: 3.1% |
|
|
|
|
| |
37,000 |
|
|
| Buckeye Technologies, Inc. |
| 1,237,280 |
| 0.7 |
| |
72,500 |
|
|
| Commercial Metals Co. |
| 1,002,675 |
| 0.5 |
| |
49,700 |
|
|
| HB Fuller Co. |
| 1,148,567 |
| 0.6 |
| |
21,744 |
|
|
| Minerals Technologies, Inc. |
| 1,229,188 |
| 0.6 |
| |
77,100 |
|
|
| Worthington Industries |
| 1,262,898 |
| 0.7 |
| |
|
|
|
|
|
| 5,880,608 |
| 3.1 |
| |
|
|
|
| Telecommunications: 0.9% |
|
|
|
|
| |
78,628 |
|
|
| Alaska Communications Systems Group, Inc. |
| 236,670 |
| 0.1 |
| |
34,300 |
| @ |
| SBA Communications Corp. |
| 1,473,528 |
| 0.8 |
| |
|
|
|
|
|
| 1,710,198 |
| 0.9 |
| |
|
|
|
|
|
|
|
|
|
| |
|
|
|
| Total Common Stock |
| 181,462,826 |
| 96.6 |
| |
See Accompanying Notes to Financial Statements
Shares |
|
|
|
|
| Value |
| Percentage |
| |
EXCHANGE-TRADED FUNDS: 2.0% |
|
|
|
|
| |||||
44,507 |
|
|
| iShares Russell 2000 Growth Index Fund |
| $ | 3,748,824 |
| 2.0 |
|
|
|
|
|
|
|
|
|
|
| |
|
|
|
| Total Exchange-Traded Funds |
| 3,748,824 |
| 2.0 |
| |
|
|
|
|
|
|
|
|
|
| |
|
|
|
| Total Long-Term Investments |
| 185,211,650 |
| 98.6 |
| |
|
|
|
|
|
|
|
| |||
Principal |
|
|
|
|
|
|
|
|
| |
SHORT-TERM INVESTMENTS: 4.2% |
|
|
|
|
| |||||
|
|
|
| Securities Lending Collateral(cc)(1): 2.8% |
|
|
|
|
| |
1,220,429 |
|
|
| BNP Paribas Bank, Repurchase Agreement dated 12/30/11, 0.06%, due 01/03/12 (Repurchase Amount $1,220,437, collateralized by various U.S. Government Agency Obligations, 5.000%-6.000%, Market Value plus accrued interest $1,244,838, due 05/15/24-04/15/41) |
| 1,220,429 |
| 0.7 |
| |
1,220,429 |
|
|
| Cantor Fitzgerald, Repurchase Agreement dated 12/30/11, 0.12%, due 01/03/12 (Repurchase Amount $1,220,445, collateralized by various U.S. Government Agency Obligations, 1.437%-6.014%, Market Value plus accrued interest $1,244,838, due 06/01/17-09/01/44) |
| 1,220,429 |
| 0.7 |
| |
1,220,429 |
|
|
| Citigroup, Inc., Repurchase Agreement dated 12/30/11, 0.08%, due 01/03/12 (Repurchase Amount $1,220,440, collateralized by various U.S. Government and U.S. Government Agency Obligations, 0.000%-5.500%, Market Value plus accrued interest $1,244,838, due 01/19/12-12/20/41) |
| 1,220,429 |
| 0.7 |
| |
256,934 |
|
|
| Deutsche Bank AG, Repurchase Agreement dated 12/30/11, 0.10%, due 01/03/12 (Repurchase Amount $256,937, collateralized by various U.S. Government and U.S. Government Agency Obligations, 0.000%-6.500%, Market Value plus accrued interest $262,073, due 06/28/12-11/01/41) |
| 256,934 |
| 0.1 |
| |
1,220,429 |
|
|
| Merrill Lynch & Co., Inc., Repurchase Agreement dated 12/30/11, 0.02%, due 01/03/12 (Repurchase Amount $1,220,432, collateralized by various U.S. Government Securities, 1.875%-4.000%, Market Value plus accrued interest $1,244,839, due 02/15/15-06/30/15) |
| 1,220,429 |
| 0.6 |
| |
|
|
|
|
|
| 5,138,650 |
| 2.8 |
| |
|
|
|
|
|
|
|
|
|
| |
Shares |
|
|
|
|
|
|
|
|
| |
|
|
|
| Mutual Funds: 1.4% |
|
|
|
|
| |
2,695,000 |
|
|
| BlackRock Liquidity Funds, TempFund, Institutional Class |
| 2,695,000 |
| 1.4 |
| |
|
|
|
|
|
|
|
|
|
| |
|
|
|
| Total Short-Term Investments |
| 7,833,650 |
| 4.2 |
| |
|
|
|
|
|
|
|
|
|
| |
|
|
|
| Total Investments in Securities |
| $ | 193,045,300 |
| 102.8 |
|
|
|
|
| Liabilities in Excess of Other Assets |
| (5,200,506 | ) | (2.8 | ) | |
|
|
|
| Net Assets |
| $ | 187,844,794 |
| 100.0 |
|
† | Unless otherwise indicated, principal amount is shown in USD. |
@ | Non-income producing security |
|
|
(cc) | Securities purchased with cash collateral for securities loaned. |
L | Loaned security, a portion or all of the security is on loan at December 31, 2011. |
(1) | Collateral received from brokers for securities lending was invested into these short-term investments. |
See Accompanying Notes to Financial Statements
| Cost for federal income tax purposes is $186,649,604. | |||||||
|
| |||||||
| Net unrealized appreciation consists of: | |||||||
|
| |||||||
|
| Gross Unrealized Appreciation |
| $ | 21,886,644 |
|
|
|
|
| Gross Unrealized Depreciation |
| (15,490,948 | ) |
|
| |
|
| Net Unrealized Appreciation |
| $ | 6,395,696 |
|
|
|
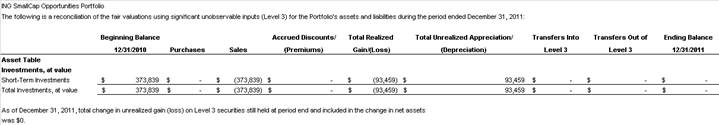
See Accompanying Notes to Financial Statements
Item 7. Disclosure of Proxy Voting Policies and Procedures for Closed-End Management Investment Companies.
Not applicable.
Item 8. Portfolio Managers of Closed-End Management Investment Companies.
Not applicable.
Item 9. Purchases of Equity Securities by Closed-End Management Investment Company and Affiliated Purchasers
Not applicable.
Item 10. Submission of Matters to a Vote of Security Holders.
The Board has a Nominating Committee for the purpose of considering and presenting to the Board candidates it proposes for nomination to fill Independent Trustee vacancies on the Board. The Committee currently consists of all Independent Trustees of the Board (6 individuals). The Nominating Committee operates pursuant to a Charter approved by the Board. The primary purpose of the Nominating Committee is to consider and present to the Board the candidates it proposes for nomination to fill vacancies on the Board. In evaluating candidates, the Nominating Committee may consider a variety of factors, but it has not at this time set any specific minimum qualifications that must be met. Specific qualifications of candidates for Board membership will be based on the needs of the Board at the time of nomination.
The Nominating Committee is willing to consider nominations received from shareholders and shall assess shareholder nominees in the same manner as it reviews its own nominees. A shareholder nominee for director should be submitted in writing to the Fund’s Secretary. Any such shareholder nomination should include at a minimum the following information as to each individual proposed for nomination as trustee: such individual’s written consent to be named in the proxy statement as a nominee (if nominated) and to serve as a trustee (if elected), and all information relating to such individual that is required to be disclosed in the solicitation of proxies for election of trustees, or is otherwise required, in each case under applicable federal securities laws, rules and regulations.
The Secretary shall submit all nominations received in a timely manner to the Nominating Committee. To be timely, any such submission must be delivered to the Fund’s Secretary not earlier than the 90th day prior to such meeting and not later than the close of business on the later of the 60th day prior to such meeting or the 10th day following the day on which public announcement of the date of the meeting is first made, by either disclosure in a press release or in a document publicly filed by the Fund with the Securities and Exchange Commission.
Item 11. Controls and Procedures.
(a) Based on our evaluation conducted within 90 days of the filing date, hereof, the design and operation of the registrant’s disclosure controls and procedures are effective to ensure that material information relating to the registrant is made known to the certifying officers by others within the appropriate entities, particularly during the period in which Forms N-CSR are being prepared, and the registrant’s disclosure controls and procedures allow timely preparation and review of the information for the registrant’s Form N-CSR and the officer certifications of such Form N-CSR.
(b) There were no significant changes in the registrant’s internal controls that occurred during the second fiscal quarter of the period covered by this report that has materially affected, or is reasonably likely to materially affect, the registrant’s internal control over financial reporting.
Item 12. Exhibits.
(a)(1) | Code of Ethics pursuant to Item 2 of Form N-CSR is filed and attached hereto as EX-99.CODE ETH. |
|
|
(a)(2) | A separate certification for each principal executive officer and principal financial officer of the |
registrant as required by Rule 30a-2 under the Act (17 CFR 270.30a-2) is attached hereto as EX-99.CERT. | |
|
|
(b) | The officer certifications required by Section 906 of the Sarbanes-Oxley Act of 2002 are attached hereto as EX-99.906CERT. |
|
|
(3) | Not applicable. |
SIGNATURES
Pursuant to the requirements of the Securities Exchange Act of 1934 and the Investment Company Act of 1940, the registrant has duly caused this report to be signed on its behalf by the undersigned, thereunto duly authorized.
(Registrant): | ING Variable Products Trust |
| |
| |||
By | /s/ Shaun P. Mathews |
| |
|
| ||
| Shaun P. Mathews | ||
| President and Chief Executive Officer | ||
|
| ||
Date: | March 2, 2012 |
| |
Pursuant to the requirements of the Securities Exchange Act of 1934 and the Investment Company Act of 1940, this report has been signed below by the following persons on behalf of the registrant and in the capacities and on the dates indicated.
By | /s/ Shaun P. Mathews |
| |
|
| ||
| Shaun P. Mathews | ||
| President and Chief Executive Officer | ||
|
| ||
Date: | March 2, 2012 |
| |
|
|
| |
|
| ||
By | /s/ Todd Modic |
|
|
|
|
| |
| Todd Modic Senior Vice President and |
| |
|
|
| |
Date: | March 2, 2012 |
|
|