|
| OMB APPROVAL | ||
|
| OMB Number: | 3235-0570 | |
|
| Expires: | January 31, 2014 | |
| UNITED STATES | Estimated average burden hours per response. . . . . . . . . . . . . . . . .20.6 | ||
| SECURITIES AND EXCHANGE COMMISSION |
| ||
| Washington, D.C. 20549 |
| ||
FORM N-CSR
CERTIFIED SHAREHOLDER REPORT OF REGISTERED
MANAGEMENT INVESTMENT COMPANIES
Investment Company Act file number | 811-8220 | ||||||||
| |||||||||
ING Variable Products Trust | |||||||||
(Exact name of registrant as specified in charter) | |||||||||
| |||||||||
7337 E. Doubletree Ranch Rd., Scottsdale, AZ |
| 85258 | |||||||
(Address of principal executive offices) |
| (Zip code) | |||||||
| |||||||||
CT Corporation System, 101 Federal Street, Boston, MA 02110 | |||||||||
(Name and address of agent for service) | |||||||||
| |||||||||
Registrant’s telephone number, including area code: | 1-800-992-0180 |
| |||||||
| |||||||||
Date of fiscal year end: | December 31 |
| |||||||
| |||||||||
Date of reporting period: | January 1, 2012 to December 31, 2012 |
| |||||||
ITEM 1. REPORTS TO STOCKHOLDERS.
The following is a copy of the report transmitted to stockholders pursuant to Rule 30e-1 under the Act (17 CFR 270.30e-1):

| n | ING International Value Portfolio | |
| n | ING MidCap Opportunities Portfolio | |
| n | ING SmallCap Opportunities Portfolio |
This report is submitted for general information to shareholders of the ING Funds. It is not authorized for distribution to prospective shareholders unless accompanied or preceded by a prospectus which includes details regarding the funds’ investment objectives, risks, charges, expenses and other information. This information should be read carefully. |
| MUTUAL FUNDS |
President’s Letter | 1 | |||||
Market Perspective | 2 | |||||
Portfolio Managers’ Report | 4 | |||||
Shareholder Expense Examples | 10 | |||||
Report of Independent Registered Public Accounting Firm | 11 | |||||
Statements of Assets and Liabilities | 12 | |||||
Statements of Operations | 14 | |||||
Statements of Changes in Net Assets | 15 | |||||
Financial Highlights | 17 | |||||
Notes to Financial Statements | 19 | |||||
Summary Portfolios of Investments | 30 | |||||
Tax Information | 39 | |||||
Trustee and Officer Information | 40 | |||||
Advisory Contract Approval Discussion | 44 |

Looking Forward

President and Chief Executive Officer
ING Funds
January 4, 2013
| Index | Description | |||||
|---|---|---|---|---|---|---|
Barclays Capital High Yield Bond — 2% Issuer Constrained Composite Index | An unmanaged index that includes all fixed-income securities having a maximum quality rating of Ba1, a minimum amount outstanding of $150 million, and at least one year to maturity. | |||||
Barclays Capital U.S. Aggregate Bond Index | An unmanaged index of publicly issued investment grade U.S. Government, mortgage-backed, asset-backed and corporate debt securities. | |||||
Barclays Capital U.S. Corporate Investment Grade Bond Index | An unmanaged index consisting of publicly issued, fixed rate, nonconvertible, investment grade debt securities. | |||||
Barclays Capital U.S. Treasury Index | An unmanaged index that includes public obligations of the U.S. Treasury. Treasury bills, certain special issues, such as state and local government series bonds (SLGs), as well as U.S. Treasury TIPS and STRIPS, are excluded. | |||||
MSCI EAFE® Index | An unmanaged index that measures the performance of securities listed on exchanges in markets in Europe, Australasia and the Far East. It includes the reinvestment of dividends net of withholding taxes, but does not reflect fees, brokerage commissions or other expenses of investing. | |||||
MSCI Europe ex UK® Index | A free float-adjusted market capitalization index that is designed to measure developed market equity performance in Europe, excluding the UK. | |||||
MSCI Japan® Index | A free float-adjusted market capitalization index that is designed to measure developed market equity performance in Japan. | |||||
MSCI UK® Index | A free float-adjusted market capitalization index that is designed to measure developed market equity performance in the UK. | |||||
MSCI World IndexSM | An unmanaged index that measures the performance of over 1,400 securities listed on exchanges in the U.S., Europe, Canada, Australia, New Zealand and the Far East. | |||||
Russell 2000® Growth Index | An unmanaged index that measures the performance of securities of smaller U.S. companies with greater than average growth orientation. | |||||
Russell 2000® Index | An unmanaged index that measures the performance of securities of small U.S. companies. | |||||
Russell Midcap® Growth Index | An unmanaged index that measures the performance of those companies included in the Russell Midcap® Index with relatively higher price-to-book ratios and higher forecasted growth values. | |||||
Russell Midcap® Index | An unmanaged index that measures the performance of the 800 smallest companies in the Russell 1000® Index, which represents approximately 26% of the total market capitalization of the Russell 1000® Index. | |||||
S&P 500® Index | An unmanaged index that measures the performance of securities of approximately 500 large-capitalization companies whose securities are traded on major U.S. stock markets. | |||||
S&P/Case-Shiller 20-City Composite Home Price Index | A composite index of the home price index for the top 20 Metropolitan Statistical Areas in the United States. The index is published monthly by Standard & Poor’s | |||||
| ING INTERNATIONAL VALUE PORTFOLIO | PORTFOLIO MANAGERS’ REPORT |
| Geographic Diversification as of December 31, 2012 (as a percentage of net assets) | |||||||
United Kingdom | 21.6 | % | |||||
Japan | 20.2 | % | |||||
France | 11.2 | % | |||||
Germany | 9.4 | % | |||||
Netherlands | 7.9 | % | |||||
Switzerland | 5.8 | % | |||||
Italy | 4.8 | % | |||||
Hong Kong | 4.0 | % | |||||
Singapore | 3.1 | % | |||||
United States | 1.8 | % | |||||
Countries between 0.6%–1.4%ˆ | 9.3 | % | |||||
Assets in Excess of Other Liabilities* | 0.9 | % | |||||
Net Assets | 100.0 | % | |||||
| * Includes short-term investments. | |||||||
| ^ Includes 10 countries, which each represents 0.6%–1.4% of net assets. | |||||||
| Portfolio holdings are subject to change daily. | |||||||
| Top Ten Holdings as of December 31, 2012 (as a percentage of net assets) | |||||||
Royal Dutch Shell PLC — Class A | 3.3 | % | |||||
Roche Holding AG — Genusschein | 2.8 | % | |||||
BHP Billiton PLC | 2.5 | % | |||||
Vodafone Group PLC | 2.5 | % | |||||
Siemens AG | 2.4 | % | |||||
Rio Tinto PLC | 2.4 | % | |||||
HSBC Holdings PLC | 2.2 | % | |||||
Sumitomo Mitsui Financial Group, Inc. | 2.0 | % | |||||
Barclays PLC | 1.9 | % | |||||
Sanofi-Aventis SA | 1.8 | % | |||||
| Portfolio holdings are subject to change daily. | |||||||
| PORTFOLIO MANAGERS’ REPORT | ING INTERNATIONAL VALUE PORTFOLIO |

| Average Annual Returns for the Periods Ended December 31, 2012 | ||||||||||||||||||||||||
|---|---|---|---|---|---|---|---|---|---|---|---|---|---|---|---|---|---|---|---|---|---|---|---|---|
| 1 Year | 5 Year | 10 Year | Since Inception of Class ADV December 29, 2006 | Since Inception of Class S2 February 27, 2009 | ||||||||||||||||||||
Class ADV | 18.64 | % | (5.87 | )% | — | (3.01 | )% | — | ||||||||||||||||
Class I | 19.23 | % | (5.43 | )% | 6.37 | % | — | — | ||||||||||||||||
Class S | 18.90 | % | (5.52 | )% | 6.15 | % | — | — | ||||||||||||||||
Class S2 | 18.67 | % | — | — | — | 13.36 | % | |||||||||||||||||
MSCI EAFE® Index | 17.32 | % | (3.69 | )% | 8.21 | % | (1.36 | )%(1) | 16.71% | (2) | ||||||||||||||
(1) | Since inception performance for the index is shown from January 1, 2007. |
(2) | Since inception performance for the index is shown from March 1, 2009. |
| ING MIDCAP OPPORTUNITIES PORTFOLIO | PORTFOLIO MANAGERS’ REPORT |
| Sector Diversification as of December 31, 2012 (as a percentage of net assets) | |||||||
Consumer Discretionary | 25.6 | % | |||||
Industrials | 16.6 | % | |||||
Information Technology | 15.8 | % | |||||
Health Care | 14.0 | % | |||||
Financials | 8.0 | % | |||||
Energy | 6.3 | % | |||||
Consumer Staples | 6.1 | % | |||||
Materials | 4.6 | % | |||||
Telecommunication Services | 1.7 | % | |||||
Assets in Excess of Other Liabilities* | 1.3 | % | |||||
Net Assets | 100.0 | % | |||||
| * Includes short-term investments. | |||||||
| Portfolio holdings are subject to change daily. | |||||||
| Top Ten Holdings as of December 31, 2012 (as a percentage of net assets) | |||||||
Intuit, Inc. | 2.2 | % | |||||
Delphi Automotive PLC | 2.2 | % | |||||
Discovery Communications, Inc. — Class A | 2.1 | % | |||||
Roper Industries, Inc. | 2.0 | % | |||||
NetApp, Inc. | 2.0 | % | |||||
Coca-Cola Enterprises, Inc. | 2.0 | % | |||||
Cameron International Corp. | 2.0 | % | |||||
Autodesk, Inc. | 1.9 | % | |||||
Whole Foods Market, Inc. | 1.9 | % | |||||
Eastman Chemical Co. | 1.9 | % | |||||
| Portfolio holdings are subject to change daily. | |||||||
| * | Effective April 30, 2012, Mike Pytosh and Kristin Manning were added as portfolio managers to the Portfolio and effective October 1, 2012, James Hasso was removed as a portfolio manager to the Portfolio. |
| PORTFOLIO MANAGERS’ REPORT | ING MIDCAP OPPORTUNITIES PORTFOLIO |
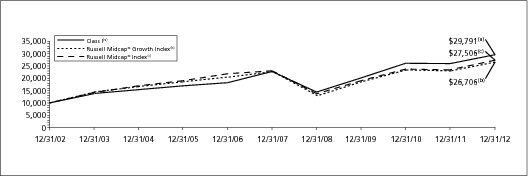
| Average Annual Returns for the Periods Ended December 31, 2012 | ||||||||||||||||||||||||
|---|---|---|---|---|---|---|---|---|---|---|---|---|---|---|---|---|---|---|---|---|---|---|---|---|
| 1 Year | 5 Year | 10 Year | Since Inception of Class ADV December 29, 2006 | Since Inception of Class S2 February 27, 2009 | ||||||||||||||||||||
Class ADV | 13.61 | % | 4.89 | % | — | 7.99 | % | — | ||||||||||||||||
Class I | 14.20 | % | 5.50 | % | 11.53 | % | — | — | ||||||||||||||||
Class S | 13.92 | % | 5.23 | % | 11.29 | % | — | — | ||||||||||||||||
Class S2 | 13.79 | % | — | — | — | 24.87 | % | |||||||||||||||||
Russell Midcap® Growth Index | 15.81 | % | 3.23 | % | 10.32 | % | 4.55% | (1) | 25.44% | (2) | ||||||||||||||
Russell Midcap® Index | 17.28 | % | 3.57 | % | 10.65 | % | 3.90% | (1) | 26.17% | (2) | ||||||||||||||
(1) | Since inception performance for the indices is shown from January 1, 2007. |
(2) | Since inception performance for the indices is shown from March 1, 2009. |
| ING SMALLCAP OPPORTUNITIES PORTFOLIO | PORTFOLIO MANAGERS’ REPORT |
| Sector Diversification as of December 31, 2012 (as a percentage of net assets) | |||||||
Information Technology | 21.5 | % | |||||
Consumer Discretionary | 18.1 | % | |||||
Health Care | 18.1 | % | |||||
Industrials | 16.6 | % | |||||
Financials | 9.5 | % | |||||
Energy | 6.0 | % | |||||
Materials | 4.1 | % | |||||
Exchange-Traded Funds | 2.1 | % | |||||
Consumer Staples | 2.0 | % | |||||
Assets in Excess of Other Liabilities* | 2.0 | % | |||||
Net Assets | 100.0 | % | |||||
| * Includes short-term investments. | |||||||
| Portfolio holdings are subject to change daily. | |||||||
| Top Ten Holdings as of December 31, 2012* (as a percentage of net assets) | |||||||
iShares Russell 2000 Growth Index Fund | 2.1 | % | |||||
Aspen Technology, Inc. | 1.3 | % | |||||
Acuity Brands, Inc. | 1.2 | % | |||||
Parametric Technology Corp. | 1.1 | % | |||||
Aruba Networks, Inc. | 1.1 | % | |||||
Portfolio Recovery Associates, Inc. | 1.1 | % | |||||
Life Time Fitness, Inc. | 1.0 | % | |||||
Cooper Tire & Rubber Co. | 1.0 | % | |||||
Healthsouth Corp. | 1.0 | % | |||||
Semtech Corp. | 1.0 | % | |||||
| * Excludes short-term investments. | |||||||
| Portfolio holdings are subject to change daily. | |||||||
| * | Effective April 30, 2012, Joseph Basset was added as a portfolio manager to the Portfolio. |
| PORTFOLIO MANAGERS’ REPORT | ING SMALLCAP OPPORTUNITIES PORTFOLIO |
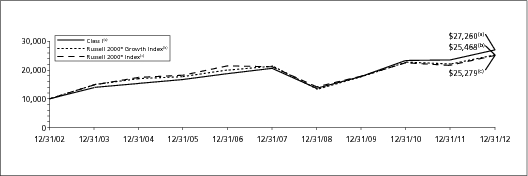
| Average Annual Returns for the Periods Ended December 31, 2012 | ||||||||||||||||||||||||
|---|---|---|---|---|---|---|---|---|---|---|---|---|---|---|---|---|---|---|---|---|---|---|---|---|
| 1 Year | 5 Year | 10 Year | Since Inception of Class ADV November 20, 2008 | Since Inception of Class S2 February 27, 2009 | ||||||||||||||||||||
Class ADV | 14.63 | % | — | — | 24.57 | % | — | |||||||||||||||||
Class I | 15.18 | % | 5.71 | % | 10.55 | % | — | — | ||||||||||||||||
Class S | 14.95 | % | 5.46 | % | 10.30 | % | — | — | ||||||||||||||||
Class S2 | 14.79 | % | — | — | — | 25.84 | % | |||||||||||||||||
Russell 2000® Growth Index | 14.59 | % | 3.49 | % | 9.80 | % | 19.01% | (1) | 24.68% | (2) | ||||||||||||||
Russell 2000® Index | 16.35 | % | 3.56 | % | 9.72 | % | 17.06% | (1) | 24.29% | (2) | ||||||||||||||
(1) | Since inception performance for the indices is shown from December 1, 2008. |
(2) | Since inception performance for the indices is shown from March 1, 2009. |
| Actual Portfolio Return | Hypothetical (5% return before expenses) | ||||||||||||||||||||||||||||||||||
|---|---|---|---|---|---|---|---|---|---|---|---|---|---|---|---|---|---|---|---|---|---|---|---|---|---|---|---|---|---|---|---|---|---|---|---|
| Beginning Account Value July 1, 2012 | Ending Account Value December 31, 2012 | Annualized Expense Ratio | Expenses Paid During the Period Ended December 31, 2012* | Beginning Account Value July 1, 2012 | Ending Account Value December 31, 2012 | Annualized Expense Ratio | Expenses Paid During the Period Ended December 31, 2012* | ||||||||||||||||||||||||||||
ING International Value Portfolio | |||||||||||||||||||||||||||||||||||
Class ADV | $ | 1,000.00 | $ | 1,142.70 | 1.50 | % | $ | 8.08 | $ | 1,000.00 | $ | 1,017.60 | 1.50 | % | $ | 7.61 | |||||||||||||||||||
Class I | 1,000.00 | 1,145.60 | 1.00 | 5.39 | 1,000.00 | 1,020.11 | 1.00 | 5.08 | |||||||||||||||||||||||||||
Class S | 1,000.00 | 1,143.90 | 1.20 | 6.47 | 1,000.00 | 1,019.10 | 1.20 | 6.09 | |||||||||||||||||||||||||||
Class S2 | 1,000.00 | 1,142.80 | 1.40 | 7.54 | 1,000.00 | 1,018.10 | 1.40 | 7.10 | |||||||||||||||||||||||||||
ING MidCap Opportunities Portfolio | |||||||||||||||||||||||||||||||||||
Class ADV | $ | 1,000.00 | $ | 1,049.60 | 1.34 | % | $ | 6.90 | $ | 1,000.00 | $ | 1,018.40 | 1.34 | % | $ | 6.80 | |||||||||||||||||||
Class I | 1,000.00 | 1,052.20 | 0.84 | 4.33 | 1,000.00 | 1,020.91 | 0.84 | 4.27 | |||||||||||||||||||||||||||
Class S | 1,000.00 | 1,050.70 | 1.09 | 5.62 | 1,000.00 | 1,019.66 | 1.09 | 5.53 | |||||||||||||||||||||||||||
Class S2 | 1,000.00 | 1,049.90 | 1.24 | 6.39 | 1,000.00 | 1,018.90 | 1.24 | 6.29 | |||||||||||||||||||||||||||
ING SmallCap Opportunities Portfolio | |||||||||||||||||||||||||||||||||||
Class ADV | $ | 1,000.00 | $ | 1,051.90 | 1.41 | % | $ | 7.27 | $ | 1,000.00 | $ | 1,018.05 | 1.41 | % | $ | 7.15 | |||||||||||||||||||
Class I | 1,000.00 | 1,055.00 | 0.91 | 4.70 | 1,000.00 | 1,020.56 | 0.91 | 4.62 | |||||||||||||||||||||||||||
Class S | 1,000.00 | 1,053.70 | 1.16 | 5.99 | 1,000.00 | 1,019.30 | 1.16 | 5.89 | |||||||||||||||||||||||||||
Class S2 | 1,000.00 | 1,052.70 | 1.31 | 6.76 | 1,000.00 | 1,018.55 | 1.31 | 6.65 | |||||||||||||||||||||||||||
| * | Expenses are equal to each Portfolio’s respective annualized expense ratios multiplied by the average account value over the period, multiplied by 184/366 to reflect the most recent fiscal half-year. |
ING Variable Products Trust

February 15, 2013
| ING International Value Portfolio | ING MidCap Opportunities Portfolio | ING SmallCap Opportunities Portfolio | ||||||||||||||||
|---|---|---|---|---|---|---|---|---|---|---|---|---|---|---|---|---|---|---|
ASSETS: | ||||||||||||||||||
Investments in securities at fair value+* | $ | 132,343,456 | $ | 1,124,459,113 | $ | 217,926,645 | ||||||||||||
Short-term investments at fair value** | 1,592,618 | 25,701,154 | 11,281,853 | |||||||||||||||
Total Investments at fair value | $ | 133,936,074 | $ | 1,150,160,267 | $ | 229,208,498 | ||||||||||||
Cash | 385 | 280 | 14,659 | |||||||||||||||
Foreign currencies at value*** | 73,003 | — | — | |||||||||||||||
Receivables: | ||||||||||||||||||
Investment securities sold | 2,624,052 | — | 1,091,472 | |||||||||||||||
Fund shares sold | 44,307 | 1,059,482 | 103,758 | |||||||||||||||
Dividends | 160,898 | 484,152 | 65,817 | |||||||||||||||
Foreign tax reclaims | 121,490 | — | — | |||||||||||||||
Prepaid expenses | 1,132 | 9,737 | 1,825 | |||||||||||||||
Total assets | 136,961,341 | 1,151,713,918 | 230,486,029 | |||||||||||||||
LIABILITIES: | ||||||||||||||||||
Payable for investment securities purchased | 2,164,990 | — | 1,238,888 | |||||||||||||||
Payable for fund shares redeemed | 79,063 | 1,429,778 | 111,968 | |||||||||||||||
Payable upon receipt of securities loaned | 984,618 | 10,761,154 | 6,485,853 | |||||||||||||||
Payable for investment management fees | 151,442 | 665,101 | 137,786 | |||||||||||||||
Payable for administrative fees | 11,179 | 96,321 | 18,371 | |||||||||||||||
Payable for distribution and shareholder service fees | 1,759 | 126,858 | 20,737 | |||||||||||||||
Payable for trustee fees | 682 | 5,406 | 1,036 | |||||||||||||||
Other accrued expenses and liabilities | 89,109 | 186,629 | 48,605 | |||||||||||||||
Total liabilities | 3,482,842 | 13,271,247 | 8,063,244 | |||||||||||||||
NET ASSETS | $ | 133,478,499 | $ | 1,138,442,671 | $ | 222,422,785 | ||||||||||||
NET ASSETS WERE COMPRISED OF: | ||||||||||||||||||
Paid-in capital | $ | 317,530,610 | $ | 969,396,331 | $ | 187,571,534 | ||||||||||||
Undistributed (distributions in excess of) net investment income | 612,282 | (11,133 | ) | (3,017 | ) | |||||||||||||
Accumulated net realized gain (loss) | (195,422,202 | ) | 34,269,306 | 14,448,733 | ||||||||||||||
Net unrealized appreciation | 10,757,809 | 134,788,167 | 20,405,535 | |||||||||||||||
NET ASSETS | $ | 133,478,499 | $ | 1,138,442,671 | $ | 222,422,785 | ||||||||||||
____________________ | ||||||||||||||||||
+ Including securities loaned at value | $ | 937,117 | $ | 10,503,678 | $ | 6,324,534 | ||||||||||||
* Cost of investments in securities | $ | 121,585,457 | $ | 989,670,946 | $ | 197,521,110 | ||||||||||||
** Cost of short-term investments | $ | 1,592,618 | $ | 25,701,154 | $ | 11,281,853 | ||||||||||||
*** Cost of foreign currencies | $ | 73,046 | $ | — | $ | — | ||||||||||||
| ING International Value Portfolio | ING MidCap Opportunities Portfolio | ING SmallCap Opportunities Portfolio | ||||||||||||||||
|---|---|---|---|---|---|---|---|---|---|---|---|---|---|---|---|---|---|---|
Class ADV | ||||||||||||||||||
Net assets | $ | 1,122,670 | $ | 81,463,056 | $ | 14,235,945 | ||||||||||||
Shares authorized | unlimited | unlimited | unlimited | |||||||||||||||
Par value | $ | 0.01 | $ | 0.01 | $ | 0.01 | ||||||||||||
Shares outstanding | 138,331 | 6,512,407 | 666,143 | |||||||||||||||
Net asset value and redemption price per share | $ | 8.12 | $ | 12.51 | $ | 21.37 | ||||||||||||
Class I | ||||||||||||||||||
Net assets | $ | 124,728,119 | $ | 614,151,445 | $ | 136,299,785 | ||||||||||||
Shares authorized | unlimited | unlimited | unlimited | |||||||||||||||
Par value | $ | 0.01 | $ | 0.01 | $ | 0.01 | ||||||||||||
Shares outstanding | 15,249,358 | 47,696,491 | 6,107,149 | |||||||||||||||
Net asset value and redemption price per share | $ | 8.18 | $ | 12.88 | $ | 22.32 | ||||||||||||
Class S | ||||||||||||||||||
Net assets | $ | 7,623,216 | $ | 435,585,589 | $ | 68,682,262 | ||||||||||||
Shares authorized | �� | unlimited | unlimited | unlimited | ||||||||||||||
Par value | $ | 0.01 | $ | 0.01 | $ | 0.01 | ||||||||||||
Shares outstanding | 913,650 | 34,653,482 | 3,174,380 | |||||||||||||||
Net asset value and redemption price per share | $ | 8.34 | $ | 12.57 | $ | 21.64 | ||||||||||||
Class S2 | ||||||||||||||||||
Net assets | $ | 4,494 | $ | 7,242,581 | $ | 3,204,793 | ||||||||||||
Shares authorized | unlimited | unlimited | unlimited | |||||||||||||||
Par value | $ | 0.01 | $ | 0.01 | $ | 0.01 | ||||||||||||
Shares outstanding | 552 | 575,782 | 149,301 | |||||||||||||||
Net asset value and redemption price per share | $ | 8.14 | $ | 12.58 | $ | 21.47 | ||||||||||||
| ING International Value Portfolio | ING MidCap Opportunities Portfolio | ING SmallCap Opportunities Portfolio | ||||||||||||||||
|---|---|---|---|---|---|---|---|---|---|---|---|---|---|---|---|---|---|---|
INVESTMENT INCOME: | ||||||||||||||||||
Dividends, net of foreign taxes withheld* | $ | 4,616,935 | $ | 14,977,113 | $ | 1,913,842 | ||||||||||||
Securities lending income, net | 189,530 | 81,936 | 59,120 | |||||||||||||||
Total investment income | 4,806,465 | 15,059,049 | 1,972,962 | |||||||||||||||
EXPENSES: | ||||||||||||||||||
Investment management fees | 1,090,681 | 7,469,155 | 1,553,980 | |||||||||||||||
Distribution and shareholder service fees: | ||||||||||||||||||
Class ADV | 5,573 | 314,783 | 43,180 | |||||||||||||||
Class S | 20,020 | 1,125,670 | 165,005 | |||||||||||||||
Class S2 | 22 | 27,062 | 10,849 | |||||||||||||||
Transfer agent fees | 129 | 2,915 | 1,277 | |||||||||||||||
Administrative service fees | 136,333 | 1,081,135 | 207,194 | |||||||||||||||
Shareholder reporting expense | 24,623 | 108,694 | 25,480 | |||||||||||||||
Professional fees | 10,226 | 166,384 | 40,029 | |||||||||||||||
Custody and accounting expense | 26,207 | 147,523 | 40,175 | |||||||||||||||
Trustee fees | 4,090 | 32,435 | 6,216 | |||||||||||||||
Miscellaneous expense | 9,702 | 75,594 | 20,523 | |||||||||||||||
Interest expense | 1,552 | 1,087 | 35 | |||||||||||||||
Total expenses | 1,329,158 | 10,552,437 | 2,113,943 | |||||||||||||||
Net recouped/waived and reimbursed fees | 58,001 | (5,412 | ) | (2,170 | ) | |||||||||||||
Net expenses | 1,387,159 | 10,547,025 | 2,111,773 | |||||||||||||||
Net investment income (loss) | 3,419,306 | 4,512,024 | (138,811 | ) | ||||||||||||||
REALIZED AND UNREALIZED GAIN (LOSS): | ||||||||||||||||||
Net realized gain (loss) on: | ||||||||||||||||||
Investments | (3,323,496 | ) | 38,292,709 | 17,557,510 | ||||||||||||||
Foreign currency related transactions | (19,301 | ) | — | — | ||||||||||||||
Net realized gain (loss) | (3,342,797 | ) | 38,292,709 | 17,557,510 | ||||||||||||||
Net change in unrealized appreciation (depreciation) on: | ||||||||||||||||||
Investments | 23,582,777 | 83,191,903 | 11,039,728 | |||||||||||||||
Foreign currency related transactions | 2,781 | — | — | |||||||||||||||
Net change in unrealized appreciation (depreciation) | 23,585,558 | 83,191,903 | 11,039,728 | |||||||||||||||
Net realized and unrealized gain | 20,242,761 | 121,484,612 | 28,597,238 | |||||||||||||||
Increase in net assets resulting from operations | $ | 23,662,067 | $ | 125,996,636 | $ | 28,458,427 | ||||||||||||
____________________ | ||||||||||||||||||
* Foreign taxes withheld | $ | 397,486 | $ | — | $ | 1,492 | ||||||||||||
| ING International Value Portfolio | ING MidCap Opportunities Portfolio | ||||||||||||||||||
|---|---|---|---|---|---|---|---|---|---|---|---|---|---|---|---|---|---|---|---|
| Year Ended December 31, 2012 | Year Ended December 31, 2011 | Year Ended December 31, 2012 | Year Ended December 31, 2011 | ||||||||||||||||
FROM OPERATIONS: | |||||||||||||||||||
Net investment income | $ | 3,419,306 | $ | 5,150,987 | $ | 4,512,024 | $ | 749,989 | |||||||||||
Net realized gain (loss) | (3,342,797 | ) | (8,660,848 | ) | 38,292,709 | 107,215,387 | |||||||||||||
Net change in unrealized appreciation (depreciation) | 23,585,558 | (24,435,594 | ) | 83,191,903 | (125,180,937 | ) | |||||||||||||
Increase (decrease) in net assets resulting from operations | 23,662,067 | (27,945,455 | ) | 125,996,636 | (17,215,561 | ) | |||||||||||||
FROM DISTRIBUTIONS TO SHAREHOLDERS: | |||||||||||||||||||
Net investment income: | |||||||||||||||||||
Class ADV | (23,251 | ) | (6,162 | ) | (211,627 | ) | — | ||||||||||||
Class I | (3,266,996 | ) | (4,629,604 | ) | (3,079,188 | ) | — | ||||||||||||
Class S | (188,642 | ) | (216,050 | ) | (1,767,703 | ) | — | ||||||||||||
Class S2 | (90 | ) | (93 | ) | (17,753 | ) | — | ||||||||||||
Net realized gains: | |||||||||||||||||||
Class ADV | — | — | (1,672,340 | ) | — | ||||||||||||||
Class I | — | — | (14,851,704 | ) | — | ||||||||||||||
Class S | — | — | (11,557,737 | ) | — | ||||||||||||||
Class S2 | — | — | (148,840 | ) | — | ||||||||||||||
Return of capital: | |||||||||||||||||||
Class ADV | — | (202 | ) | — | — | ||||||||||||||
Class I | — | (140,121 | ) | — | — | ||||||||||||||
Class S | — | (7,139 | ) | — | — | ||||||||||||||
Class S2 | — | (3 | ) | — | — | ||||||||||||||
Total distributions | (3,478,979 | ) | (4,999,374 | ) | (33,306,892 | ) | — | ||||||||||||
FROM CAPITAL SHARE TRANSACTIONS: | |||||||||||||||||||
Net proceeds from sale of shares | 2,093,271 | 4,373,279 | 329,680,490 | 329,723,536 | |||||||||||||||
Reinvestment of distributions | 3,478,889 | �� | 4,999,277 | 33,306,892 | — | ||||||||||||||
| 5,572,160 | 9,372,556 | 362,987,382 | 329,723,536 | ||||||||||||||||
Cost of shares redeemed | (37,263,739 | ) | (73,380,297 | ) | (210,453,525 | ) | (236,047,779 | ) | |||||||||||
Net increase (decrease) in net assets resulting from capital share transactions | (31,691,579 | ) | (64,007,741 | ) | 152,533,857 | 93,675,757 | |||||||||||||
Net increase (decrease) in net assets | (11,508,491 | ) | (96,952,570 | ) | 245,223,601 | 76,460,196 | |||||||||||||
NET ASSETS: | |||||||||||||||||||
Beginning of year or period | 144,986,990 | 241,939,560 | 893,219,070 | 816,758,874 | |||||||||||||||
End of year or period | $ | 133,478,499 | $ | 144,986,990 | $ | 1,138,442,671 | $ | 893,219,070 | |||||||||||
Undistributed (distributions in excess of) net investment income at end of year or period | $ | 612,282 | $ | (4,728 | ) | $ | (11,133 | ) | $ | 719,633 | |||||||||
| ING SmallCap Opportunities Portfolio | |||||||||||
|---|---|---|---|---|---|---|---|---|---|---|---|
| Year Ended December 31, 2012 | Year Ended December 31, 2011 | ||||||||||
FROM OPERATIONS: | |||||||||||
Net investment (loss) | $ | (138,811 | ) | $ | (549,128 | ) | |||||
Net realized gain | 17,557,510 | 26,968,415 | |||||||||
Net change in unrealized appreciation (depreciation) | 11,039,728 | (25,574,840 | ) | ||||||||
Increase in net assets resulting from operations | 28,458,427 | 844,447 | |||||||||
FROM DISTRIBUTIONS TO SHAREHOLDERS: | |||||||||||
Net realized gains: | |||||||||||
Class ADV | (821,671 | ) | — | ||||||||
Class I | (12,759,239 | ) | — | ||||||||
Class S | (6,522,015 | ) | — | ||||||||
Class S2 | (226,396 | ) | — | ||||||||
Total distributions | (20,329,321 | ) | — | ||||||||
FROM CAPITAL SHARE TRANSACTIONS: | |||||||||||
Net proceeds from sale of shares | 38,981,797 | 53,542,558 | |||||||||
Reinvestment of distributions | 20,329,321 | — | |||||||||
| 59,311,118 | 53,542,558 | ||||||||||
Cost of shares redeemed | (32,862,233 | ) | (54,935,659 | ) | |||||||
Net increase (decrease) in net assets resulting from capital share transactions | 26,448,885 | (1,393,101 | ) | ||||||||
Net increase (decrease) in net assets | 34,577,991 | (548,654 | ) | ||||||||
NET ASSETS: | |||||||||||
Beginning of year or period | 187,844,794 | 188,393,448 | |||||||||
End of year or period | $ | 222,422,785 | $ | 187,844,794 | |||||||
Accumulated net investment loss at end of year or period | $ | (3,017 | ) | $ | (2,339 | ) | |||||
| Income (loss) from investment operations | | Less distributions | | Ratios to average net assets | Supplemental data | |||||||||||||||||||||||||||||||||||||||||||||||||||||||||||||||||||||
|---|---|---|---|---|---|---|---|---|---|---|---|---|---|---|---|---|---|---|---|---|---|---|---|---|---|---|---|---|---|---|---|---|---|---|---|---|---|---|---|---|---|---|---|---|---|---|---|---|---|---|---|---|---|---|---|---|---|---|---|---|---|---|---|---|---|---|---|---|---|---|---|---|---|---|
| Net asset value, beginning of year or period | | Net investment income (loss) | | Net realized and unrealized gain (loss) | | Total from investment operations | | From net investment income | | From net realized gains | | From return of capital | | Total distributions | | Payment by affiliate | | Net asset value, end of year or period | | Total Return (1) | | Expenses before reductions/ additions (2)(3)(4) | | Expenses net of fee waivers and/or recoupments, if any (2)(3)(4) | | Expenses net of all reductions/ additions (2)(3)(4) | | Net investment income (loss) (2)(4) | | Net assets, end of year or period | | Portfolio turnover rate | ||||||||||||||||||||||||||||||||||||||||||
| Year or period ended | | ($) | | ($) | | ($) | | ($) | | ($) | | ($) | | ($) | | ($) | | ($) | | ($) | | (%) | | (%) | | (%) | | (%) | | (%) | | ($000’s) | | (%) | ||||||||||||||||||||||||||||||||||||||||
ING International Value Portfolio | ||||||||||||||||||||||||||||||||||||||||||||||||||||||||||||||||||||||||||
Class ADV | ||||||||||||||||||||||||||||||||||||||||||||||||||||||||||||||||||||||||||
12-31-12 | 6.99 | 0.15 | 1.14 | 1.29 | 0.16 | — | — | 0.16 | — | 8.12 | 18.64 | 1.46 | 1.50 | 1.50 | 1.99 | 1,123 | 56 | |||||||||||||||||||||||||||||||||||||||||||||||||||||||||
12-31-11 | 8.44 | (0.01 | )• | (1.26 | ) | (1.27 | ) | 0.17 | — | 0.01 | 0.18 | — | 6.99 | (15.40 | ) | 1.57 | 1.52 | 1.52 | (0.09 | ) | 1,145 | 69 | ||||||||||||||||||||||||||||||||||||||||||||||||||||
12-31-10 | 8.41 | 0.11 | 0.05 | 0.16 | 0.13 | — | — | 0.13 | — | 8.44 | 2.02 | 1.56 | 1.50 | † | 1.50 | † | 1.28 | † | 31 | 155 | ||||||||||||||||||||||||||||||||||||||||||||||||||||||
12-31-09 | 6.74 | 0.09 | 1.70 | 1.79 | 0.12 | — | — | 0.12 | — | 8.41 | 26.88 | 1.55 | 1.51 | † | 1.51 | † | 1.10 | † | 21 | 214 | ||||||||||||||||||||||||||||||||||||||||||||||||||||||
12-31-08 | 14.21 | 0.22 | (5.67 | ) | (5.45 | ) | 0.25 | 1.78 | — | 2.03 | 0.01 | 6.74 | (43.11 | )(a) | 1.56 | 1.50 | † | 1.50 | † | 2.06 | † | 0 | 207 | |||||||||||||||||||||||||||||||||||||||||||||||||||
Class I | ||||||||||||||||||||||||||||||||||||||||||||||||||||||||||||||||||||||||||
12-31-12 | 7.04 | 0.19 | 1.14 | 1.33 | 0.19 | — | — | 0.19 | — | 8.18 | 19.23 | 0.96 | 1.00 | 1.00 | 2.52 | 124,728 | 56 | |||||||||||||||||||||||||||||||||||||||||||||||||||||||||
12-31-11 | 8.49 | 0.21 | (1.45 | ) | (1.24 | ) | 0.20 | — | 0.01 | 0.21 | — | 7.04 | (14.96 | ) | 1.07 | 1.02 | 1.02 | 2.56 | 135,682 | 69 | ||||||||||||||||||||||||||||||||||||||||||||||||||||||
12-31-10 | 8.46 | 0.16 | • | 0.04 | 0.20 | 0.17 | — | — | 0.17 | — | 8.49 | 2.50 | 1.06 | 1.00 | † | 1.00 | † | 1.96 | † | 230,836 | 155 | |||||||||||||||||||||||||||||||||||||||||||||||||||||
12-31-09 | 6.77 | 0.13 | 1.68 | 1.81 | 0.12 | — | — | 0.12 | — | 8.46 | 27.18 | 1.05 | 1.01 | † | 1.01 | † | 1.70 | † | 399,689 | 214 | ||||||||||||||||||||||||||||||||||||||||||||||||||||||
12-31-08 | 14.24 | 0.27 | (5.67 | ) | (5.40 | ) | 0.30 | 1.78 | — | 2.08 | 0.01 | 6.77 | (42.76 | )(a) | 1.06 | 1.00 | † | 1.00 | † | 2.59 | † | 340,022 | 207 | |||||||||||||||||||||||||||||||||||||||||||||||||||
Class S | ||||||||||||||||||||||||||||||||||||||||||||||||||||||||||||||||||||||||||
12-31-12 | 7.18 | 0.18 | 1.16 | 1.34 | 0.18 | — | — | 0.18 | — | 8.34 | 18.90 | 1.21 | 1.20 | 1.20 | 2.33 | 7,623 | 56 | |||||||||||||||||||||||||||||||||||||||||||||||||||||||||
12-31-11 | 8.64 | 0.19 | (1.46 | ) | (1.27 | ) | 0.18 | — | 0.01 | 0.19 | — | 7.18 | (14.99 | ) | 1.32 | 1.22 | 1.22 | 2.27 | 8,156 | 69 | ||||||||||||||||||||||||||||||||||||||||||||||||||||||
12-31-10 | 8.60 | 0.13 | 0.06 | 0.19 | 0.15 | — | — | 0.15 | — | 8.64 | 2.36 | 1.31 | 1.20 | † | 1.20 | † | 1.61 | † | 11,068 | 155 | ||||||||||||||||||||||||||||||||||||||||||||||||||||||
12-31-09 | 6.93 | 0.11 | 1.68 | 1.79 | 0.12 | — | — | 0.12 | — | 8.60 | 26.13 | 1.30 | 1.21 | † | 1.21 | † | 1.44 | † | 12,076 | 214 | ||||||||||||||||||||||||||||||||||||||||||||||||||||||
12-31-08 | 14.39 | 0.25 | (5.66 | ) | (5.41 | ) | 0.28 | 1.78 | — | 2.06 | 0.01 | 6.93 | (42.31 | )(a) | 1.31 | 1.20 | † | 1.20 | † | 2.35 | † | 9,782 | 207 | |||||||||||||||||||||||||||||||||||||||||||||||||||
Class S2 | ||||||||||||||||||||||||||||||||||||||||||||||||||||||||||||||||||||||||||
12-31-12 | 7.01 | 0.15 | 1.14 | 1.29 | 0.16 | — | — | 0.16 | — | 8.14 | 18.67 | 1.46 | 1.40 | 1.40 | 2.05 | 4 | 56 | |||||||||||||||||||||||||||||||||||||||||||||||||||||||||
12-31-11 | 8.45 | 0.17 | (1.43 | ) | (1.26 | ) | 0.17 | — | 0.01 | 0.18 | — | 7.01 | (15.27 | ) | 1.57 | 1.42 | 1.42 | 2.12 | 4 | 69 | ||||||||||||||||||||||||||||||||||||||||||||||||||||||
12-31-10 | 8.42 | 0.12 | 0.04 | 0.16 | 0.13 | — | — | 0.13 | — | 8.45 | 2.09 | 1.56 | 1.40 | † | 1.40 | † | 1.47 | † | 5 | 155 | ||||||||||||||||||||||||||||||||||||||||||||||||||||||
02-27-09(5)–12-31-09 | 5.43 | 0.09 | 3.01 | 3.10 | 0.11 | — | — | 0.11 | — | 8.42 | 57.63 | 1.55 | 1.41 | † | 1.41 | † | 1.39 | † | 5 | 214 | ||||||||||||||||||||||||||||||||||||||||||||||||||||||
ING MidCap Opportunities Portfolio | ||||||||||||||||||||||||||||||||||||||||||||||||||||||||||||||||||||||||||
Class ADV | ||||||||||||||||||||||||||||||||||||||||||||||||||||||||||||||||||||||||||
12-31-12 | 11.34 | 0.01 | 1.52 | 1.53 | 0.04 | 0.32 | — | 0.36 | — | 12.51 | 13.61 | 1.34 | 1.34 | 1.34 | 0.09 | 81,463 | 89 | |||||||||||||||||||||||||||||||||||||||||||||||||||||||||
12-31-11 | 11.46 | (0.02 | ) | (0.10 | ) | (0.12 | ) | — | — | — | — | — | 11.34 | (1.05 | ) | 1.34 | 1.34 | 1.34 | (0.23 | ) | 40,497 | 90 | ||||||||||||||||||||||||||||||||||||||||||||||||||||
12-31-10 | 8.88 | 0.08 | • | 2.54 | 2.62 | 0.04 | — | — | 0.04 | — | 11.46 | 29.57 | 1.36 | 1.29 | 1.29 | 0.75 | 15,119 | 96 | ||||||||||||||||||||||||||||||||||||||||||||||||||||||||
12-31-09 | 6.32 | 0.03 | • | 2.54 | 2.57 | 0.01 | — | — | 0.01 | — | 8.88 | 40.65 | 1.40 | 1.14 | † | 1.14 | † | 0.36 | † | 957 | 169 | |||||||||||||||||||||||||||||||||||||||||||||||||||||
12-31-08 | 10.20 | (0.03 | )• | (3.85 | ) | (3.88 | ) | — | — | — | — | 0.00 | * | 6.32 | (38.04 | )(b) | 1.38 | 1.20 | † | 1.20 | † | (0.40 | )† | 1 | 191 | |||||||||||||||||||||||||||||||||||||||||||||||||
Class I | ||||||||||||||||||||||||||||||||||||||||||||||||||||||||||||||||||||||||||
12-31-12 | 11.63 | 0.07 | 1.57 | 1.64 | 0.07 | 0.32 | — | 0.39 | — | 12.88 | 14.20 | 0.84 | 0.84 | 0.84 | 0.56 | 614,151 | 89 | |||||||||||||||||||||||||||||||||||||||||||||||||||||||||
12-31-11 | 11.69 | 0.03 | (0.09 | ) | (0.06 | ) | — | — | — | — | — | 11.63 | (0.51 | ) | 0.84 | 0.84 | 0.84 | 0.24 | 435,027 | 90 | ||||||||||||||||||||||||||||||||||||||||||||||||||||||
12-31-10 | 9.03 | 0.06 | 2.67 | 2.73 | 0.07 | — | — | 0.07 | — | 11.69 | 30.36 | 0.86 | 0.79 | 0.79 | 0.62 | 350,626 | 96 | |||||||||||||||||||||||||||||||||||||||||||||||||||||||||
12-31-09 | 6.40 | 0.04 | 2.61 | 2.65 | 0.02 | — | — | 0.02 | — | 9.03 | 41.44 | 0.90 | 0.64 | † | 0.64 | † | 0.46 | † | 238,426 | 169 | ||||||||||||||||||||||||||||||||||||||||||||||||||||||
12-31-08 | 10.26 | 0.01 | (3.87 | ) | (3.86 | ) | — | — | — | — | 0.00 | * | 6.40 | (37.62 | )(b) | 0.88 | 0.70 | † | 0.70 | † | 0.11 | † | 195,295 | 191 | ||||||||||||||||||||||||||||||||||||||||||||||||||
Class S | ||||||||||||||||||||||||||||||||||||||||||||||||||||||||||||||||||||||||||
12-31-12 | 11.37 | 0.04 | 1.53 | 1.57 | 0.05 | 0.32 | — | 0.37 | — | 12.57 | 13.92 | 1.09 | 1.09 | 1.09 | 0.29 | 435,586 | 89 | |||||||||||||||||||||||||||||||||||||||||||||||||||||||||
12-31-11 | 11.46 | (0.00 | )* | (0.09 | ) | (0.09 | ) | — | — | — | — | — | 11.37 | (0.79 | ) | 1.09 | 1.09 | 1.09 | (0.04 | ) | 414,381 | 90 | ||||||||||||||||||||||||||||||||||||||||||||||||||||
12-31-10 | 8.86 | 0.03 | • | 2.62 | 2.65 | 0.05 | — | — | 0.05 | — | 11.46 | 29.96 | 1.11 | 1.04 | 1.04 | 0.35 | 450,115 | 96 | ||||||||||||||||||||||||||||||||||||||||||||||||||||||||
12-31-09 | 6.29 | 0.02 | 2.56 | 2.58 | 0.01 | — | — | 0.01 | — | 8.86 | 41.04 | 1.15 | 0.89 | † | 0.89 | † | 0.25 | † | 333,376 | 169 | ||||||||||||||||||||||||||||||||||||||||||||||||||||||
12-31-08 | 10.10 | (0.00 | )*• | (3.81 | ) | (3.81 | ) | — | — | — | — | 0.00 | * | 6.29 | (37.72 | )(b) | 1.13 | 0.90 | † | 0.90 | † | (0.02 | )† | 249,953 | 191 | |||||||||||||||||||||||||||||||||||||||||||||||||
Class S2 | ||||||||||||||||||||||||||||||||||||||||||||||||||||||||||||||||||||||||||
12-31-12 | 11.38 | 0.02 | 1.54 | 1.56 | 0.04 | 0.32 | — | 0.36 | — | 12.58 | 13.79 | 1.34 | 1.24 | 1.24 | 0.18 | 7,243 | 89 | |||||||||||||||||||||||||||||||||||||||||||||||||||||||||
12-31-11 | 11.49 | (0.01 | ) | (0.10 | ) | (0.11 | ) | — | — | — | — | — | 11.38 | (0.96 | ) | 1.34 | 1.24 | 1.24 | (0.13 | ) | 3,314 | 90 | ||||||||||||||||||||||||||||||||||||||||||||||||||||
12-31-10 | 8.89 | 0.08 | • | 2.56 | 2.64 | 0.04 | — | — | 0.04 | — | 11.49 | 29.67 | 1.36 | 1.19 | 1.19 | 0.71 | 900 | 96 | ||||||||||||||||||||||||||||||||||||||||||||||||||||||||
02-27-09(5)–12-31-09 | 5.55 | 0.01 | 3.34 | 3.35 | 0.01 | — | — | 0.01 | — | 8.89 | 60.41 | 1.40 | 1.04 | † | 1.04 | † | 0.14 | † | 5 | 169 | ||||||||||||||||||||||||||||||||||||||||||||||||||||||
| Income (loss) from investment operations | | Less distributions | | Ratios to average net assets | Supplemental data | |||||||||||||||||||||||||||||||||||||||||||||||||||||||||||||||
|---|---|---|---|---|---|---|---|---|---|---|---|---|---|---|---|---|---|---|---|---|---|---|---|---|---|---|---|---|---|---|---|---|---|---|---|---|---|---|---|---|---|---|---|---|---|---|---|---|---|---|---|---|---|---|---|---|---|---|---|---|---|---|---|---|---|---|---|---|
| Net asset value, beginning of year or period | | Net investment income (loss) | | Net realized and unrealized gain (loss) | | Total from investment operations | | From net investment income | | From net realized gains | | From return of capital | | Total distributions | | Payment by affiliate | | Net asset value, end of year or period | | Total Return (1) | | Expenses before reductions/ additions (2)(3)(4) | | Expenses net of fee waivers and/or recoupments, if any (2)(3)(4) | | Expenses net of all reductions/ additions (2)(3)(4) | | Net investment income (loss) (2)(4) | | Net assets, end of year or period | | Portfolio turnover rate | ||||||||||||||||||||||||||||||||||||
| Year or period ended | ($) | | ($) | | ($) | | ($) | | ($) | | ($) | | ($) | | ($) | | ($) | | ($) | | (%) | | (%) | | (%) | | (%) | | (%) | | ($000’s) | | (%) | |||||||||||||||||||||||||||||||||||
ING SmallCap Opportunities Portfolio | ||||||||||||||||||||||||||||||||||||||||||||||||||||||||||||||||||||
Class ADV | ||||||||||||||||||||||||||||||||||||||||||||||||||||||||||||||||||||
12-31-12 | 20.73 | (0.07 | )• | 3.00 | 2.93 | — | 2.29 | — | 2.29 | — | 21.37 | 14.63 | 1.41 | 1.41 | 1.41 | (0.34 | ) | 14,236 | 57 | |||||||||||||||||||||||||||||||||||||||||||||||||
12-31-11 | 20.67 | (0.14 | )• | 0.20 | 0.06 | — | — | — | — | — | 20.73 | 0.29 | 1.40 | 1.40 | 1.40 | (0.67 | ) | 4,819 | 72 | |||||||||||||||||||||||||||||||||||||||||||||||||
12-31-10 | 15.69 | (0.10 | )• | 5.08 | 4.98 | — | — | — | — | — | 20.67 | 31.74 | 1.40 | 1.40 | 1.40 | (0.57 | ) | 2,120 | 97 | |||||||||||||||||||||||||||||||||||||||||||||||||
12-31-09 | 12.04 | (0.08 | ) | 3.73 | 3.65 | — | — | — | — | — | 15.69 | 30.32 | 1.46 | 1.43 | 1.43 | (0.61 | ) | 88 | 139 | |||||||||||||||||||||||||||||||||||||||||||||||||
11-20-08(5)–12-31-08 | 9.63 | (0.01 | )• | 2.41 | 2.40 | — | — | — | — | 0.01 | 12.04 | 25.03 | (c) | 1.43 | 1.40 | † | 1.40 | † | (0.93 | )† | 4 | 148 | ||||||||||||||||||||||||||||||||||||||||||||||
Class I | ||||||||||||||||||||||||||||||||||||||||||||||||||||||||||||||||||||
12-31-12 | 21.46 | 0.01 | 3.14 | 3.15 | — | 2.29 | — | 2.29 | — | 22.32 | 15.18 | 0.91 | 0.91 | 0.91 | 0.03 | 136,300 | 57 | |||||||||||||||||||||||||||||||||||||||||||||||||||
12-31-11 | 21.28 | (0.04 | ) | 0.22 | 0.18 | — | — | — | — | — | 21.46 | 0.85 | 0.90 | 0.90 | 0.90 | (0.17 | ) | 117,965 | 72 | |||||||||||||||||||||||||||||||||||||||||||||||||
12-31-10 | 16.08 | (0.02 | ) | 5.22 | 5.20 | — | — | — | — | — | 21.28 | 32.34 | 0.90 | 0.90 | 0.90 | (0.14 | ) | 113,938 | 97 | |||||||||||||||||||||||||||||||||||||||||||||||||
12-31-09 | 12.27 | (0.02 | ) | 3.83 | 3.81 | — | — | — | — | — | 16.08 | 31.05 | 0.96 | 0.93 | 0.93 | (0.12 | ) | 79,291 | 139 | |||||||||||||||||||||||||||||||||||||||||||||||||
12-31-08 | 21.98 | (0.01 | ) | (6.61 | ) | (6.62 | ) | — | 3.10 | — | 3.10 | 0.01 | 12.27 | (34.48 | )(c) | 0.93 | 0.90 | † | 0.90 | † | (0.04 | )† | 56,476 | 148 | ||||||||||||||||||||||||||||||||||||||||||||
Class S | ||||||||||||||||||||||||||||||||||||||||||||||||||||||||||||||||||||
12-31-12 | 20.91 | (0.05 | ) | 3.07 | 3.02 | — | 2.29 | — | 2.29 | — | 21.64 | 14.95 | 1.16 | 1.16 | 1.16 | (0.22 | ) | 68,682 | 57 | |||||||||||||||||||||||||||||||||||||||||||||||||
12-31-11 | 20.80 | (0.10 | ) | 0.21 | �� | 0.11 | — | — | — | — | — | 20.91 | 0.53 | 1.15 | 1.15 | 1.15 | (0.47 | ) | 63,588 | 72 | ||||||||||||||||||||||||||||||||||||||||||||||||
12-31-10 | 15.75 | (0.07 | ) | 5.12 | 5.05 | — | — | — | — | — | 20.80 | 32.06 | 1.15 | 1.15 | 1.15 | (0.39 | ) | 71,992 | 97 | |||||||||||||||||||||||||||||||||||||||||||||||||
12-31-09 | 12.05 | (0.05 | ) | 3.75 | 3.70 | — | — | — | — | — | 15.75 | 30.71 | 1.21 | 1.17 | 1.17 | (0.36 | ) | 62,253 | 139 | |||||||||||||||||||||||||||||||||||||||||||||||||
12-31-08 | 21.68 | (0.05 | ) | (6.49 | ) | (6.54 | ) | — | 3.10 | — | 3.10 | 0.01 | 12.05 | (34.59 | )(c) | 1.18 | 1.10 | † | 1.10 | † | (0.26 | )† | 54,163 | 148 | ||||||||||||||||||||||||||||||||||||||||||||
Class S2 | ||||||||||||||||||||||||||||||||||||||||||||||||||||||||||||||||||||
12-31-12 | 20.79 | (0.06 | )• | 3.03 | 2.97 | — | 2.29 | — | 2.29 | — | 21.47 | 14.79 | 1.41 | 1.31 | 1.31 | (0.27 | ) | 3,205 | 57 | |||||||||||||||||||||||||||||||||||||||||||||||||
12-31-11 | 20.71 | (0.11 | )• | 0.19 | 0.08 | — | — | — | — | — | 20.79 | 0.39 | 1.40 | 1.30 | 1.30 | (0.56 | ) | 1,472 | 72 | |||||||||||||||||||||||||||||||||||||||||||||||||
12-31-10 | 15.71 | (0.09 | )• | 5.09 | 5.00 | — | — | — | — | — | 20.71 | 31.83 | 1.40 | 1.30 | 1.30 | (0.50 | ) | 344 | 97 | |||||||||||||||||||||||||||||||||||||||||||||||||
02-27-09(5)–12-31-09 | 9.88 | (0.06 | ) | 5.89 | 5.83 | — | — | — | — | — | 15.71 | 59.01 | 1.46 | 1.33 | 1.33 | (0.54 | ) | 5 | 139 | |||||||||||||||||||||||||||||||||||||||||||||||||
(1) | Total return is calculated assuming reinvestment of all dividends, capital gain distributions and return of capital distributions, if any, at net asset value and does not reflect the effect of insurance contract charges. Total return for periods less than one year is not annualized. | |
(2) | Annualized for periods less than one year. | |
(3) | Expense ratios do not include fees and expenses charged under the variable annuity contract or variable life insurance policy. | |
(4) | Expense ratios reflect operating expenses of a Portfolio. Expenses before reductions/additions do not reflect amounts reimbursed by an Investment Adviser and/or Distributor or reductions from brokerage service arrangements or other expense offset arrangements and do not represent the amount paid by a Portfolio during periods when reimbursements or reductions occur. Expenses net of fee waivers reflect expenses after reimbursement by an Investment Adviser and/or Distributor but prior to reductions from brokerage service arrangements or other expense offset arrangements. Expenses net of all reductions/additions represent the net expenses paid by a Portfolio. Net investment income (loss) is net of all such additions or reductions. | |
(5) | Commencement of operations. | |
(a) | Excluding a $729,720 payment by affiliate in 2008, International Value total return would have been (43.18)%, (42.86)% and (42.43)% on Classes ADV, I and S, respectively. | |
(b) | There was no impact on total return due to payment by affiliate in 2008. | |
(c) | Excluding a $110,798 payment by affiliate in 2008, SmallCap Opportunities total return would have been 24.72%, (34.52)% and (34.64)% for Classes ADV, I and S, respectively. | |
• | Calculated using average number of shares outstanding throughout the period. | |
| * | Amount is less than $0.005 or 0.005% or more than $(0.005) or (0.005)%. | |
| † | Impact of waiving the advisory fee for the ING Institutional Prime Money Market Fund holding has less than 0.005% impact on the expense ratio and net investment income or loss ratio. |
valuation, the potential expiration of restrictions on the security, the existence of any registration rights, the costs to the Portfolios related to registration of the security, as well as factors relevant to the issuer itself. Consideration may also be given to the price and extent of any public trading in similar securities of the issuer or comparable companies’ securities. The value of a foreign security traded on an exchange outside the United States is generally based on its price on the principal foreign exchange where it trades as of the time a Portfolio determines its NAV or if the foreign exchange closes prior to the time a Portfolio determines its NAV, the most recent closing price of the foreign security on its principal exchange. Trading in certain non-U.S. securities may not take place on all days on which the New York Stock Exchange (“NYSE”) is open. Further, trading takes place in various foreign markets on days on which the NYSE is not open. Consequently, the calculation of a Portfolio’s NAV may not take place contemporaneously with the determination of the prices of securities held by a Portfolio in foreign securities markets. Further, the value of a Portfolio’s assets may be significantly affected by foreign trading on days when a shareholder cannot purchase or redeem shares of a Portfolio. In calculating a Portfolio’s NAV, foreign securities denominated in foreign currency are converted to U.S. dollar equivalents. If an event occurs after the time at which the market for foreign securities held by a Portfolio closes but before the time that a Portfolio’s NAV is calculated, such event may cause the closing price on the foreign exchange to not represent a readily available reliable market value quotation for such securities at the time a Portfolio determines its NAV. In such a case, a Portfolio will use the fair value of such securities as determined under a Portfolio’s valuation procedures. Events after the close of trading on a foreign market that could require a Portfolio to fair value some or all of its foreign securities include, among others, securities trading in the U.S. and other markets, corporate announcements, natural and other disasters, and political and other events. Among other elements of analysis in the determination of a security’s fair value, the Board has authorized the use of one or more independent research services to assist with such determinations. An independent research service may use statistical analyses and quantitative models to help determine fair value as of the time a Portfolio calculates its NAV. There can be no assurance that such models accurately reflect the behavior of the applicable markets or the effect of the behavior of such markets on the fair value of securities, or that such markets will continue to behave in a fashion that is consistent with such models. Unlike the closing price of a security on an exchange, fair value determinations employ elements of judgment. Consequently, the fair value assigned to a security may not represent the actual value that a Portfolio could obtain if it were to sell the security at the time of the close of the NYSE. Pursuant to procedures adopted by the Board, a Portfolio is not obligated to use the fair valuations suggested by any research service, and valuation recommendations provided by such research services may be overridden if other events have occurred or if other fair valuations are determined in good faith to be more accurate. Unless an event is such that it causes a Portfolio to determine that the closing prices for one or more securities do not represent readily available reliable market value quotations at the time a Portfolio determines its NAV, events that occur between the time of the close of the foreign market on which they are traded and the close of regular trading on the NYSE will not be reflected in a Portfolio’s NAV.
when determining the fair value of the security. In the event that a security or asset cannot be valued pursuant to one of the valuation methods established by the Board, the fair value of the security or asset will be determined in good faith by the Pricing Committee. When a Portfolio uses these fair valuation methods that use significant unobservable inputs to determine its NAV, securities will be priced by a method that the Pricing Committee believes accurately reflects fair value and are categorized as Level 3 of the fair value hierarchy. The methodologies used for valuing securities are not necessarily an indication of the risks of investing in those securities valued in good faith at fair value nor can it be assured a Portfolio can obtain the fair value assigned to a security if they were to sell the security.
| 1. | Market value of investment securities, other assets and liabilities — at the exchange rates prevailing at the end of the day. |
| 2. | Purchases and sales of investment securities, income and expenses — at the rates of exchange prevailing on the respective dates of such transactions. |
brokers, dealers or other financial institutions in exchange for a negotiated lender’s fee. The borrower is required to fully collateralize the loans with cash or U.S. government securities. Generally, in the event of counterparty default, a Portfolio has the right to use collateral to offset losses incurred. There would be potential loss to a Portfolio in the event a Portfolio is delayed or prevented from exercising its right to dispose of the collateral. Each Portfolio bears the risk of loss with respect to the investment of collateral with the following exception: The Bank of New York Mellon (“BNY”) provides each Portfolio indemnification from loss with respect to the investment of collateral provided that the cash collateral is invested solely in overnight repurchase agreements. Engaging in securities lending could have a leveraging effect, which may intensify the credit, market and other risks associated with investing in a Portfolio.
| Purchases | Sales | |||||||||
|---|---|---|---|---|---|---|---|---|---|---|
International Value | $ | 76,268,448 | $ | 108,104,180 | ||||||
MidCap Opportunities | 1,050,801,009 | 937,737,497 | ||||||||
SmallCap Opportunities | 120,344,229 | 116,109,529 | ||||||||
| Affiliated Investment Company/Subsidiary | Portfolios | Percentage | ||||||||
|---|---|---|---|---|---|---|---|---|---|---|
ING Life Insurance and Annuity Company | International Value | 81.86 | % | |||||||
MidCap Opportunities | 20.58 | |||||||||
SmallCap Opportunities | 37.65 | |||||||||
ING National Trust | MidCap Opportunities | 8.64 | ||||||||
SmallCap Opportunities | 16.74 | |||||||||
ING Solution 2025 Portfolio | MidCap Opportunities | 6.52 | ||||||||
ING Solution 2035 Portfolio | MidCap Opportunities | 5.61 | ||||||||
ING USA Annuity and Life Insurance Company | International Value | 5.12 | ||||||||
MidCap Opportunities | 33.16 | |||||||||
SmallCap Opportunities | 26.69 | |||||||||
ReliaStar Life Insurance Company | International Value | 12.52 | ||||||||
SmallCap Opportunities | 15.48 | |||||||||
| Portfolio | Class ADV | Class I | Class S | Class S2 | ||||||||||||||
|---|---|---|---|---|---|---|---|---|---|---|---|---|---|---|---|---|---|---|
International Value | 1.50 | % | 1.00 | % | 1.20 | % | 1.40% | |||||||||||
MidCap Opportunities(1) | 1.40 | % | 0.90 | % | 1.10 | % | 1.30% | |||||||||||
SmallCap Opportunities | 1.42 | % | 0.92 | % | 1.17 | % | 1.32% | |||||||||||
(1) | Pursuant to a side agreement, ING Investments has further lowered the expense limits for MidCap Opportunities. The expense limits for MidCap Opportunities are 1.35%, 0.85%, 1.10%, and 1.25% for Class ADV, Class I, Class S and Class S2, respectively. |
| December 31, | |||||||||||||||||||
|---|---|---|---|---|---|---|---|---|---|---|---|---|---|---|---|---|---|---|---|
| 2013 | 2014 | 2015 | Total | ||||||||||||||||
International Value | $ | 104,977 | $ | 114,048 | $ | — | $ | 219,025 | |||||||||||
MidCap Opportunities | 456,511 | — | — | 456,511 | |||||||||||||||
| Portfolio | Days Utilized | Approximate Average Daily Balance For Days Utilized | Approximate Weighted Average Interest Rate For Days Utilized | |||||||||||
|---|---|---|---|---|---|---|---|---|---|---|---|---|---|---|
International Value | 24 | $ | 734,792 | 1.17 | % | |||||||||
MidCap Opportunities | 7 | 4,527,857 | 1.19 | |||||||||||
| Shares sold | Shares issued in merger | Reinvestment of distributions | Shares redeemed | Net increase (decrease) in shares outstanding | Shares sold | Proceeds from shares issued in merger | Reinvestment of distributions | Shares redeemed | Net increase (decrease) | |||||||||||||||||||||||||||||||||||
|---|---|---|---|---|---|---|---|---|---|---|---|---|---|---|---|---|---|---|---|---|---|---|---|---|---|---|---|---|---|---|---|---|---|---|---|---|---|---|---|---|---|---|---|---|
| Year or period ended | # | # | # | # | # | ($) | ($) | ($) | ($) | ($) | ||||||||||||||||||||||||||||||||||
International Value | ||||||||||||||||||||||||||||||||||||||||||||
Class ADV | ||||||||||||||||||||||||||||||||||||||||||||
12-31-12 | 21,917 | — | 3,140 | (50,540 | ) | (25,483 | ) | 163,899 | — | 23,251 | (379,216 | ) | (192,066 | ) | ||||||||||||||||||||||||||||||
12-31-11 | 172,355 | — | 909 | (13,100 | ) | 160,164 | 1,189,691 | — | 6,364 | (91,115 | ) | 1,104,940 | ||||||||||||||||||||||||||||||||
Class I | ||||||||||||||||||||||||||||||||||||||||||||
12-31-12 | 191,682 | — | 434,722 | (4,644,704 | ) | (4,018,300 | ) | 1,584,454 | — | 3,266,996 | (34,633,292 | ) | (29,781,842 | ) | ||||||||||||||||||||||||||||||
12-31-11 | 265,232 | — | 577,484 | (8,763,651 | ) | (7,920,935 | ) | 2,267,084 | — | 4,769,724 | (70,879,215 | ) | (63,842,407 | ) | ||||||||||||||||||||||||||||||
| Shares sold | Shares issued in merger | Reinvestment of distributions | Shares redeemed | Net increase (decrease) in shares outstanding | Shares sold | Proceeds from shares issued in merger | Reinvestment of distributions | Shares redeemed | Net increase (decrease) | ||||||||||||||||||||||||||||||||||||
|---|---|---|---|---|---|---|---|---|---|---|---|---|---|---|---|---|---|---|---|---|---|---|---|---|---|---|---|---|---|---|---|---|---|---|---|---|---|---|---|---|---|---|---|---|---|
| Year or period ended | # | # | # | # | # | ($) | ($) | ($) | ($) | ($) | |||||||||||||||||||||||||||||||||||
International Value (continued) | |||||||||||||||||||||||||||||||||||||||||||||
Class S | |||||||||||||||||||||||||||||||||||||||||||||
12-31-12 | 45,298 | — | 24,675 | (292,320 | ) | (222,347 | ) | 344,918 | — | 188,642 | (2,251,231 | ) | (1,717,671 | ) | |||||||||||||||||||||||||||||||
12-31-11 | 119,083 | — | 26,684 | (291,227 | ) | (145,460 | ) | 916,504 | — | 223,189 | (2,409,967 | ) | (1,270,274 | ) | |||||||||||||||||||||||||||||||
Class S2 | |||||||||||||||||||||||||||||||||||||||||||||
12-31-12 | — | — | — | — | — | — | — | — | — | — | |||||||||||||||||||||||||||||||||||
12-31-11 | — | — | — | — | — | — | — | — | — | — | |||||||||||||||||||||||||||||||||||
MidCap Opportunities | |||||||||||||||||||||||||||||||||||||||||||||
Class ADV | |||||||||||||||||||||||||||||||||||||||||||||
12-31-12 | 3,262,730 | — | 156,062 | (478,994 | ) | 2,939,798 | 40,501,115 | — | 1,883,967 | (5,869,659 | ) | 36,515,423 | |||||||||||||||||||||||||||||||||
12-31-11 | 2,696,115 | — | — | (443,229 | ) | 2,252,886 | 31,468,035 | — | — | (5,070,573 | ) | 26,397,462 | |||||||||||||||||||||||||||||||||
Class I | |||||||||||||||||||||||||||||||||||||||||||||
12-31-12 | 17,744,681 | — | 1,445,316 | (8,913,964 | ) | 10,276,033 | 229,130,303 | — | 17,930,893 | (113,212,077 | ) | 133,849,119 | |||||||||||||||||||||||||||||||||
12-31-11 | 14,841,264 | — | — | (7,414,500 | ) | 7,426,764 | 182,175,215 | — | — | (89,401,686 | ) | 92,773,529 | |||||||||||||||||||||||||||||||||
Class S | |||||||||||||||||||||||||||||||||||||||||||||
12-31-12 | 4,459,935 | — | 1,099,327 | (7,354,907 | ) | (1,795,645 | ) | 55,627,523 | — | 13,325,440 | (90,292,802 | ) | (21,339,839 | ) | |||||||||||||||||||||||||||||||
12-31-11 | 9,540,260 | — | — | (12,365,666 | ) | (2,825,406 | ) | 112,747,662 | — | — | (140,813,080 | ) | (28,065,418 | ) | |||||||||||||||||||||||||||||||
Class S2 | |||||||||||||||||||||||||||||||||||||||||||||
12-31-12 | 357,431 | — | 13,756 | (86,559 | ) | 284,628 | 4,421,549 | — | 166,592 | (1,078,987 | ) | 3,509,154 | |||||||||||||||||||||||||||||||||
12-31-11 | 279,661 | — | — | (66,807 | ) | 212,854 | 3,332,624 | — | — | (762,440 | ) | 2,570,184 | |||||||||||||||||||||||||||||||||
SmallCap Opportunities | |||||||||||||||||||||||||||||||||||||||||||||
12-31-12 | 432,701 | — | 40,219 | (39,220 | ) | 433,700 | 9,230,774 | — | 821,671 | (831,937 | ) | 9,220,508 | |||||||||||||||||||||||||||||||||
12-31-11 | 216,528 | — | — | (86,661 | ) | 129,867 | 4,539,946 | — | — | (1,801,342 | ) | 2,738,604 | |||||||||||||||||||||||||||||||||
Class I | |||||||||||||||||||||||||||||||||||||||||||||
12-31-12 | 958,527 | — | 599,307 | (948,582 | ) | 609,252 | 21,692,600 | — | 12,759,240 | (21,299,008 | ) | 13,152,832 | |||||||||||||||||||||||||||||||||
12-31-11 | 2,071,993 | — | — | (1,927,340 | ) | 144,653 | 45,472,333 | — | — | (41,994,897 | ) | 3,477,436 | |||||||||||||||||||||||||||||||||
Class S | |||||||||||||||||||||||||||||||||||||||||||||
12-31-12 | 297,152 | — | 315,683 | (478,822 | ) | 134,013 | 6,321,495 | — | 6,522,014 | (10,423,979 | ) | 2,419,530 | |||||||||||||||||||||||||||||||||
12-31-11 | 104,380 | — | — | (525,451 | ) | (421,071 | ) | 2,181,461 | — | — | (10,942,390 | ) | (8,760,929 | ) | |||||||||||||||||||||||||||||||
Class S2 | |||||||||||||||||||||||||||||||||||||||||||||
12-31-12 | 81,518 | — | 11,038 | (14,063 | ) | 78,493 | 1,736,928 | — | 226,396 | (307,309 | ) | 1,656,015 | |||||||||||||||||||||||||||||||||
12-31-11 | 63,506 | — | — | (9,287 | ) | 54,219 | 1,348,818 | — | — | (197,030 | ) | 1,151,788 | |||||||||||||||||||||||||||||||||
| Portfolio | Value of Securities Loaned | Cash Collateral Received | ||||||||
|---|---|---|---|---|---|---|---|---|---|---|
International Value | $ | 937,117 | $ | 984,618 | ||||||
MidCap Opportunities | 10,503,678 | 10,761,154 | ||||||||
SmallCap Opportunities | 6,324,534 | 6,485,853 | ||||||||
| Paid-in Capital | Undistributed Net Investment Income | Accumulated Net Realized Gains/(Losses) | ||||||||||||
|---|---|---|---|---|---|---|---|---|---|---|---|---|---|---|
International Value | $ | — | $ | 676,683 | $ | (676,683 | ) | |||||||
MidCap Opportunities | (88,974 | ) | (166,519 | ) | 255,493 | |||||||||
SmallCap Opportunities | — | 138,133 | (138,133 | ) | ||||||||||
| Year Ended December 31, 2012 | Year Ended December 31, 2011 | ||||||||||||||||||||||
|---|---|---|---|---|---|---|---|---|---|---|---|---|---|---|---|---|---|---|---|---|---|---|---|
| Ordinary Income | Long-term Capital Gains | Ordinary Income | Return of Capital | ||||||||||||||||||||
International Value | $ | 3,478,979 | $ | — | $ | 4,851,909 | $ | 147,465 | |||||||||||||||
MidCap Opportunities | 4,876,122 | 28,430,770 | — | — | |||||||||||||||||||
SmallCap Opportunities | 3,546,008 | 16,783,313 | — | — | |||||||||||||||||||
| Capital Loss Carryforwards | |||||||||||||||||||||||||||
|---|---|---|---|---|---|---|---|---|---|---|---|---|---|---|---|---|---|---|---|---|---|---|---|---|---|---|---|
| Undistributed Ordinary Income | Undistributed Long-term Capital Gains | Unrealized Appreciation/ (Depreciation) | Amount | Character | Expiration | ||||||||||||||||||||||
International Value | $ | 590,204 | $ | — | $ | 9,698,492 | $ | (76,969,718 | ) | Short-term | 2016 | ||||||||||||||||
| (104,716,147 | ) | Short-term | 2017 | ||||||||||||||||||||||||
| (8,802,519 | ) | Short-term | None | ||||||||||||||||||||||||
| (3,846,488 | ) | Long-term | None | ||||||||||||||||||||||||
| $ | (194,334,872 | ) | |||||||||||||||||||||||||
MidCap Opportunities | — | 37,865,152 | 132,170,308 | (61,883 | ) | Short-term | 2015 | ||||||||||||||||||||
| (820,634 | ) | Short-term | 2016 | ||||||||||||||||||||||||
| (95,470 | ) | Short-term | 2017 | ||||||||||||||||||||||||
| $ | (977,987 | )* | |||||||||||||||||||||||||
SmallCap Opportunities | 4,939,752 | 11,929,506 | 17,985,010 | — | — | — | |||||||||||||||||||||
| * | Utilization of these capital losses is subject to annual limitations under Section 382 of the Internal Revenue Code. |
Completion of the Restructuring Plan is expected to result in the Investment Adviser’s loss of access to the resources of ING Groep, which could adversely affect its business. Currently, the Investment Adviser does not anticipate that the Restructuring Plan will have an adverse impact on its operations or the operations of the Portfolios.
| ING INTERNATIONAL VALUE PORTFOLIO | SUMMARY PORTFOLIO OF INVESTMENTS AS OF DECEMBER 31, 2012 |
| Shares | | | | Value | | Percentage of Net Assets | |||||||||||||
|---|---|---|---|---|---|---|---|---|---|---|---|---|---|---|---|---|---|---|---|
COMMON STOCK: 99.1% | |||||||||||||||||||
Australia: 1.2% | |||||||||||||||||||
63,454 | Australia & New Zealand Banking Group Ltd. | $ | 1,671,163 | 1.2 | |||||||||||||||
Belgium: 1.4% | |||||||||||||||||||
54,585 | KBC Groep NV | 1,902,420 | 1.4 | ||||||||||||||||
Canada: 0.6% | |||||||||||||||||||
23,500 | Other Securities | 822,735 | 0.6 | ||||||||||||||||
China: 0.9% | |||||||||||||||||||
400,000 | Other Securities | 1,216,172 | 0.9 | ||||||||||||||||
Denmark: 1.2% | |||||||||||||||||||
92,552 | @ | Danske Bank A/S | 1,571,919 | 1.2 | |||||||||||||||
France: 11.2% | |||||||||||||||||||
123,367 | AXA S.A. | 2,215,163 | 1.7 | ||||||||||||||||
38,467 | BNP Paribas | 2,189,940 | 1.7 | ||||||||||||||||
7,800 | PPR | 1,464,932 | 1.1 | ||||||||||||||||
29,437 | Renault S.A. | 1,598,674 | 1.2 | ||||||||||||||||
25,843 | Sanofi-Aventis SA | 2,450,702 | 1.8 | ||||||||||||||||
46,957 | @ | Societe Generale | 1,785,430 | 1.3 | |||||||||||||||
30,853 | Total S.A. | 1,605,380 | 1.2 | ||||||||||||||||
13,262 | Other Securities | 1,605,649 | 1.2 | ||||||||||||||||
| 14,915,870 | 11.2 | ||||||||||||||||||
Germany: 9.4% | |||||||||||||||||||
15,280 | BASF AG | 1,444,883 | 1.1 | ||||||||||||||||
21,450 | Bayer AG | 2,045,522 | 1.5 | ||||||||||||||||
17,143 | Bayerische Motoren Werke AG | 1,668,212 | 1.3 | ||||||||||||||||
92,843 | Deutsche Post AG | 2,044,925 | 1.5 | ||||||||||||||||
29,756 | Siemens AG | 3,253,854 | 2.4 | ||||||||||||||||
144,704 | Other Securities | 2,115,401 | 1.6 | ||||||||||||||||
| 12,572,797 | 9.4 | ||||||||||||||||||
Hong Kong: 4.0% | |||||||||||||||||||
151,500 | Power Assets Holdings Ltd. | 1,299,804 | 1.0 | ||||||||||||||||
214,000 | Wharf Holdings Ltd. | 1,705,521 | 1.3 | ||||||||||||||||
785,700 | Other Securities | 2,281,300 | 1.7 | ||||||||||||||||
| 5,286,625 | 4.0 | ||||||||||||||||||
Italy: 4.8% | |||||||||||||||||||
348,450 | Enel S.p.A. | 1,449,379 | 1.1 | ||||||||||||||||
86,161 | ENI S.p.A. | 2,110,742 | 1.6 | ||||||||||||||||
135,149 | Fiat Industrial SpA | 1,480,643 | 1.1 | ||||||||||||||||
1,498,335 | Telecom Italia S.p.A. | 1,359,096 | 1.0 | ||||||||||||||||
| 6,399,860 | 4.8 | ||||||||||||||||||
Japan: 20.2% | |||||||||||||||||||
389,112 | Hitachi Ltd. | 2,289,733 | 1.7 | ||||||||||||||||
38,000 | Honda Motor Co., Ltd. | 1,407,316 | 1.1 | ||||||||||||||||
70,800 | Hoya Corp. | 1,395,039 | 1.0 | ||||||||||||||||
67,800 | Japan Tobacco, Inc. | $ | 1,915,308 | 1.4 | |||||||||||||||
46,000 | JGC Corp. | 1,433,428 | 1.1 | ||||||||||||||||
53,200 | Komatsu Ltd. | 1,365,133 | 1.0 | ||||||||||||||||
55,000 | Mitsubishi Estate Co., Ltd. | 1,316,739 | 1.0 | ||||||||||||||||
87,500 | Omron Corp. | 2,100,293 | 1.6 | ||||||||||||||||
14,220 | ORIX Corp. | 1,606,270 | 1.2 | ||||||||||||||||
75,000 | Sumitomo Mitsui Financial Group, Inc. | 2,725,636 | 2.0 | ||||||||||||||||
74,300 | Tokio Marine Holdings, Inc. | 2,069,944 | 1.6 | ||||||||||||||||
33,100 | Tokyo Electron Ltd. | 1,526,614 | 1.1 | ||||||||||||||||
515,750 | Other Securities(a) | 5,832,538 | 4.4 | ||||||||||||||||
| 26,983,991 | 20.2 | ||||||||||||||||||
Netherlands: 7.9% | |||||||||||||||||||
32,839 | European Aeronautic Defence and Space Co. NV | 1,294,561 | 1.0 | ||||||||||||||||
74,771 | Koninklijke Philips Electronics NV | 1,979,962 | 1.5 | ||||||||||||||||
128,392 | Royal Dutch Shell PLC — Class A | 4,456,533 | 3.3 | ||||||||||||||||
49,642 | Unilever NV | 1,899,492 | 1.4 | ||||||||||||||||
15,298 | Other Securities | 932,352 | 0.7 | ||||||||||||||||
| 10,562,900 | 7.9 | ||||||||||||||||||
New Zealand: 0.9% | |||||||||||||||||||
648,468 | Other Securities | 1,227,426 | 0.9 | ||||||||||||||||
Norway: 1.2% | |||||||||||||||||||
61,236 | Statoil ASA | 1,543,430 | 1.2 | ||||||||||||||||
Singapore: 3.1% | |||||||||||||||||||
517,000 | Singapore Telecommunications Ltd. | 1,406,772 | 1.1 | ||||||||||||||||
89,100 | United Overseas Bank Ltd. | 1,461,600 | 1.1 | ||||||||||||||||
154,000 | Other Securities | 1,240,930 | 0.9 | ||||||||||||||||
| �� | 4,109,302 | 3.1 | |||||||||||||||||
Spain: 0.9% | |||||||||||||||||||
69,684 | Other Securities | 1,256,224 | 0.9 | ||||||||||||||||
Sweden: 1.0% | |||||||||||||||||||
130,151 | Telefonaktiebolaget LM Ericsson | 1,314,688 | 1.0 | ||||||||||||||||
Switzerland: 5.8% | |||||||||||||||||||
29,515 | Nestle S.A. | 1,925,661 | 1.4 | ||||||||||||||||
33,147 | Novartis AG | 2,094,005 | 1.6 | ||||||||||||||||
18,626 | Roche Holding AG —Genusschein | 3,765,827 | 2.8 | ||||||||||||||||
| 7,785,493 | 5.8 | ||||||||||||||||||
| ING INTERNATIONAL VALUE PORTFOLIO | SUMMARY PORTFOLIO OF INVESTMENTS AS OF DECEMBER 31, 2012 (CONTINUED) |
| Shares | | | | Value | | Percentage of Net Assets | |||||||||||||
|---|---|---|---|---|---|---|---|---|---|---|---|---|---|---|---|---|---|---|---|
COMMON STOCK: (continued) | |||||||||||||||||||
United Kingdom: 21.6% | |||||||||||||||||||
576,579 | Barclays PLC | $ | 2,504,660 | 1.9 | |||||||||||||||
96,076 | BHP Billiton PLC | 3,388,952 | 2.5 | ||||||||||||||||
99,869 | GlaxoSmithKline PLC | 2,174,389 | 1.6 | ||||||||||||||||
276,751 | HSBC Holdings PLC | 2,932,682 | 2.2 | ||||||||||||||||
657,481 | Legal & General Group PLC | 1,576,561 | 1.2 | ||||||||||||||||
2,686,551 | @ | Lloyds TSB Group PLC | 2,140,909 | 1.6 | |||||||||||||||
54,951 | Rio Tinto PLC | 3,205,069 | 2.4 | ||||||||||||||||
354,444 | Tesco PLC | 1,952,492 | 1.5 | ||||||||||||||||
1,346,232 | Vodafone Group PLC | 3,388,840 | 2.5 | ||||||||||||||||
270,687 | Other Securities | 5,529,010 | 4.2 | ||||||||||||||||
| 28,793,564 | 21.6 | ||||||||||||||||||
United States: 1.8% | |||||||||||||||||||
45,600 | Coca-Cola Enterprises, Inc. | 1,446,888 | 1.1 | ||||||||||||||||
30,700 | Other Securities | 959,989 | 0.7 | ||||||||||||||||
| 2,406,877 | 1.8 | ||||||||||||||||||
Total Common Stock | |||||||||||||||||||
(Cost $121,585,457) | 132,343,456 | 99.1 | |||||||||||||||||
| Principal Amount† | | | | Value | | Percentage of Net Assets | |||||||||||||
|---|---|---|---|---|---|---|---|---|---|---|---|---|---|---|---|---|---|---|---|
SHORT-TERM INVESTMENTS: 1.2% | |||||||||||||||||||
Securities Lending Collateralcc(1): 0.7% | |||||||||||||||||||
974,058 | BNP Paribas Bank, Repurchase Agreement dated 12/31/12, 0.20%, due 01/02/13 (Repurchase Amount $974,069, collateralized by various U.S. Government Agency Obligations, 3.000%–3.500%, Market Value plus accrued interest $993,539, due 09/15/42–11/15/42) | $ | 974,058 | 0.7 | |||||||||||||||
10,560 | Merrill Lynch & Co., Inc., Repurchase Agreement dated 12/31/12, 0.14%, due 01/02/13 (Repurchase Amount $10,560, collateralized by various U.S. Government Agency Obligations, 0.500%–6.000%, Market Value plus accrued interest $10,771, due 08/09/13–04/18/36) | 10,560 | 0.0 | ||||||||||||||||
| 984,618 | 0.7 | ||||||||||||||||||
| Shares | | | | Value | | Percentage of Net Assets | |||||||||||||
|---|---|---|---|---|---|---|---|---|---|---|---|---|---|---|---|---|---|---|---|
SHORT-TERM INVESTMENTS: (continued) | |||||||||||||||||||
Mutual Funds: 0.5% | |||||||||||||||||||
608,000 | BlackRock Liquidity Funds, TempFund, Institutional Class | ||||||||||||||||||
(Cost $608,000) | $ | 608,000 | 0.5 | ||||||||||||||||
Total Short-Term Investments | |||||||||||||||||||
(Cost $1,592,618) | 1,592,618 | 1.2 | |||||||||||||||||
Total Investments in Securities (Cost $123,178,075) | $ | 133,936,074 | 100.3 | ||||||||||||||||
Liabilities in Excess of Other Assets | (457,575 | ) | (0.3 | ) | |||||||||||||||
Net Assets | $ | 133,478,499 | 100.0 | ||||||||||||||||
| † | Unless otherwise indicated, principal amount is shown in USD. | |
| @ | Non-income producing security | |
| cc | Securities purchased with cash collateral for securities loaned. | |
| (1) | Collateral received from brokers for securities lending was invested into these short-term investments. | |
| (a) | This grouping contains securities on loan. | |
| Cost for federal income tax purposes is $124,265,405. |
Net unrealized appreciation consists of: | ||||||
Gross Unrealized Appreciation | $ | 13,489,760 | ||||
Gross Unrealized Depreciation | (3,819,091 | ) | ||||
Net Unrealized Appreciation | $ | 9,670,669 |
| Sector Diversification | Percentage of Net Assets | |||||
|---|---|---|---|---|---|---|
Financials | 26.9 | % | ||||
Energy | 11.0 | |||||
Industrials | 9.6 | |||||
Health Care | 9.3 | |||||
Materials | 8.5 | |||||
Consumer Staples | 8.5 | |||||
Consumer Discretionary | 8.1 | |||||
Information Technology | 7.1 | |||||
Telecommunication Services | 6.2 | |||||
Utilities | 3.9 | |||||
Short-Term Investments | 1.2 | |||||
Liabilities in Excess of Other Assets | (0.3 | ) | ||||
Net Assets | 100.0 | % | ||||
| ING INTERNATIONAL VALUE PORTFOLIO | SUMMARY PORTFOLIO OF INVESTMENTS AS OF DECEMBER 31, 2012 (CONTINUED) |
| Quoted Prices in Active Markets for Identical Investments (Level 1) | Significant Other Observable Inputs # (Level 2) | Significant Unobservable Inputs (Level 3) | Fair Value at 12/31/2012 | |||||||||||||||
|---|---|---|---|---|---|---|---|---|---|---|---|---|---|---|---|---|---|---|
Asset Table | ||||||||||||||||||
Investments, at fair value | ||||||||||||||||||
Common Stock | ||||||||||||||||||
Australia | $ | — | $ | 1,671,163 | $ | — | $ | 1,671,163 | ||||||||||
Belgium | — | 1,902,420 | — | 1,902,420 | ||||||||||||||
Canada | 822,735 | — | — | 822,735 | ||||||||||||||
China | — | 1,216,172 | — | 1,216,172 | ||||||||||||||
Denmark | — | 1,571,919 | — | 1,571,919 | ||||||||||||||
France | — | 14,915,870 | — | 14,915,870 | ||||||||||||||
Germany | — | 12,572,797 | — | 12,572,797 | ||||||||||||||
Hong Kong | — | 5,286,625 | — | 5,286,625 | ||||||||||||||
Italy | — | 6,399,860 | — | 6,399,860 | ||||||||||||||
Japan | 371,185 | 26,612,806 | — | 26,983,991 | ||||||||||||||
Netherlands | — | 10,562,900 | — | 10,562,900 | ||||||||||||||
New Zealand | — | 1,227,426 | — | 1,227,426 | ||||||||||||||
Norway | — | 1,543,430 | — | 1,543,430 | ||||||||||||||
Singapore | — | 4,109,302 | — | 4,109,302 | ||||||||||||||
Spain | — | 1,256,224 | — | 1,256,224 | ||||||||||||||
Sweden | — | 1,314,688 | — | 1,314,688 | ||||||||||||||
Switzerland | — | 7,785,493 | — | 7,785,493 | ||||||||||||||
United Kingdom | 2,377,776 | 26,415,788 | — | 28,793,564 | ||||||||||||||
United States | 2,406,877 | — | — | 2,406,877 | ||||||||||||||
Total Common Stock | 5,978,573 | 126,364,883 | — | 132,343,456 | ||||||||||||||
Short-Term Investments | 608,000 | 984,618 | — | 1,592,618 | ||||||||||||||
Total Investments, at fair value | $ | 6,586,573 | $ | 127,349,501 | $ | — | $ | 133,936,074 | ||||||||||
| ˆ | See Note 2, “Significant Accounting Policies” in the Notes to Financial Statements for additional information. |
| # | The earlier close of the foreign markets gives rise to the possibility that significant events, including broad market moves, may have occurred in the interim and may materially affect the value of those securities. To account for this, the Portfolio may frequently value many of its foreign equity securities using fair value prices based on third party vendor modeling tools to the extent available. Accordingly, a portion of the Portfolio’s investments are categorized as Level 2 investments. |
| ING MIDCAP OPPORTUNITIES PORTFOLIO | SUMMARY PORTFOLIO OF INVESTMENTS AS OF DECEMBER 31, 2012 |
| Shares | | | | Value | | Percentage of Net Assets | |||||||||||||
|---|---|---|---|---|---|---|---|---|---|---|---|---|---|---|---|---|---|---|---|
COMMON STOCK: 98.7% | |||||||||||||||||||
Consumer Discretionary: 25.6% | |||||||||||||||||||
473,651 | Brinker International, Inc. | $ | 14,678,445 | 1.3 | |||||||||||||||
640,380 | @ | Delphi Automotive PLC | 24,494,535 | 2.2 | |||||||||||||||
383,640 | @ | Discovery Communications, Inc.—Class A | 24,353,467 | 2.1 | |||||||||||||||
515,350 | Foot Locker, Inc. | 16,553,042 | 1.5 | ||||||||||||||||
621,730 | Gap, Inc. | 19,298,499 | 1.7 | ||||||||||||||||
336,360 | Harley-Davidson, Inc. | 16,427,822 | 1.4 | ||||||||||||||||
102,109 | @ | Liberty Media Corp.—Liberty Capital | 11,845,665 | 1.1 | |||||||||||||||
669,810 | @, L | Lions Gate Entertainment Corp. | 10,984,884 | 1.0 | |||||||||||||||
462,134 | Macy’s, Inc. | 18,032,469 | 1.6 | ||||||||||||||||
319,140 | @ | Michael Kors Holdings Ltd. | 16,285,714 | 1.4 | |||||||||||||||
787,680 | Newell Rubbermaid, Inc. | 17,541,634 | 1.5 | ||||||||||||||||
231,160 | @ | Penn National Gaming, Inc. | 11,352,268 | 1.0 | |||||||||||||||
265,680 | Petsmart, Inc. | 18,156,571 | 1.6 | ||||||||||||||||
193,440 | Scripps Networks Interactive — Class A | 11,204,045 | 1.0 | ||||||||||||||||
187,770 | Six Flags Entertainment Corp. | 11,491,524 | 1.0 | ||||||||||||||||
150,340 | @ | Ulta Salon Cosmetics & Fragrance, Inc. | 14,772,408 | 1.3 | |||||||||||||||
296,014 | Wyndham Worldwide Corp. | 15,750,905 | 1.4 | ||||||||||||||||
363,090 | Other Securities | 17,806,085 | 1.5 | ||||||||||||||||
| 291,029,982 | 25.6 | ||||||||||||||||||
Consumer Staples: 6.1% | |||||||||||||||||||
713,260 | Coca-Cola Enterprises, Inc. | 22,631,740 | 2.0 | ||||||||||||||||
167,290 | JM Smucker Co. | 14,427,090 | 1.3 | ||||||||||||||||
237,340 | Whole Foods Market, Inc. | 21,676,262 | 1.9 | ||||||||||||||||
175,278 | Other Securities | 10,707,733 | 0.9 | ||||||||||||||||
| 69,442,825 | 6.1 | ||||||||||||||||||
Energy: 6.3% | |||||||||||||||||||
395,470 | @ | Cameron International Corp. | 22,328,236 | 2.0 | |||||||||||||||
898,940 | @ | Denbury Resources, Inc. | 14,562,828 | 1.3 | |||||||||||||||
398,040 | @ | Oasis Petroleum, Inc. | 12,657,672 | 1.1 | |||||||||||||||
296,460 | Range Resources Corp. | 18,626,582 | 1.6 | ||||||||||||||||
121,850 | Other Securities | 4,071,009 | 0.3 | ||||||||||||||||
| 72,246,327 | 6.3 | ||||||||||||||||||
Financials: 8.0% | |||||||||||||||||||
101,890 | @ | Affiliated Managers Group, Inc. | 13,260,984 | 1.1 | |||||||||||||||
182,650 | Ameriprise Financial, Inc. | 11,439,370 | 1.0 | ||||||||||||||||
802,430 | Fifth Third Bancorp. | 12,188,912 | 1.1 | ||||||||||||||||
498,442 | Nasdaq Stock Market, Inc. | 12,466,034 | 1.1 | ||||||||||||||||
243,780 | T. Rowe Price Group, Inc. | $ | 15,877,391 | 1.4 | |||||||||||||||
334,290 | Tanger Factory Outlet Centers, Inc. | 11,432,718 | 1.0 | ||||||||||||||||
541,530 | Other Securities | 14,776,020 | 1.3 | ||||||||||||||||
| 91,441,429 | 8.0 | ||||||||||||||||||
Health Care: 14.0% | |||||||||||||||||||
332,180 | Agilent Technologies, Inc. | 13,599,449 | 1.2 | ||||||||||||||||
197,430 | @ | Alexion Pharmaceuticals, Inc. | 18,520,908 | 1.6 | |||||||||||||||
163,340 | Cooper Cos., Inc. | 15,105,683 | 1.3 | ||||||||||||||||
420,680 | @ | HCA Holdings, Inc. | 12,691,916 | 1.1 | |||||||||||||||
139,390 | @ | Henry Schein, Inc. | 11,215,320 | 1.0 | |||||||||||||||
149,290 | @ | Laboratory Corp. of America Holdings | 12,931,500 | 1.1 | |||||||||||||||
405,650 | Resmed, Inc. | 16,862,870 | 1.5 | ||||||||||||||||
244,626 | @ | Watson Pharmaceuticals, Inc. | 21,037,836 | 1.9 | |||||||||||||||
733,027 | Other Securities | 37,814,212 | 3.3 | ||||||||||||||||
| 159,779,694 | 14.0 | ||||||||||||||||||
Industrials: 16.6% | |||||||||||||||||||
247,770 | Acuity Brands, Inc. | 16,781,462 | 1.5 | ||||||||||||||||
520,623 | Ametek, Inc. | 19,559,806 | 1.7 | ||||||||||||||||
340,610 | Equifax, Inc. | 18,433,813 | 1.6 | ||||||||||||||||
109,750 | Flowserve Corp. | 16,111,300 | 1.4 | ||||||||||||||||
243,421 | Nordson Corp. | 15,364,734 | 1.4 | ||||||||||||||||
272,320 | Pall Corp. | 16,410,003 | 1.5 | ||||||||||||||||
195,901 | Regal-Beloit Corp. | 13,805,143 | 1.2 | ||||||||||||||||
205,322 | Roper Industries, Inc. | 22,889,297 | 2.0 | ||||||||||||||||
519,180 | Waste Connections, Inc. | 17,543,092 | 1.5 | ||||||||||||||||
177,393 | @ | Wesco International, Inc. | 11,961,610 | 1.1 | |||||||||||||||
310,385 | Other Securities | 19,965,758 | 1.7 | ||||||||||||||||
| 188,826,018 | 16.6 | ||||||||||||||||||
Information Technology: 15.8% | |||||||||||||||||||
377,720 | Analog Devices, Inc. | 15,886,903 | 1.4 | ||||||||||||||||
615,200 | @ | Autodesk, Inc. | 21,747,320 | 1.9 | |||||||||||||||
399,640 | Broadcom Corp. | 13,272,044 | 1.2 | ||||||||||||||||
192,090 | @ | F5 Networks, Inc. | 18,661,543 | 1.7 | |||||||||||||||
627,220 | Flir Systems, Inc. | 13,993,278 | 1.2 | ||||||||||||||||
417,665 | Intuit, Inc. | 24,851,068 | 2.2 | ||||||||||||||||
816,570 | @ | Juniper Networks, Inc. | 16,061,932 | 1.4 | |||||||||||||||
680,434 | @ | NetApp, Inc. | 22,828,561 | 2.0 | |||||||||||||||
519,610 | Xilinx, Inc. | 18,653,999 | 1.6 | ||||||||||||||||
248,900 | Other Securities | 13,846,463 | 1.2 | ||||||||||||||||
| 179,803,111 | 15.8 | ||||||||||||||||||
Materials: 4.6% | |||||||||||||||||||
313,670 | Eastman Chemical Co. | 21,345,244 | 1.9 | ||||||||||||||||
524,460 | Packaging Corp. of America | 20,175,976 | 1.7 | ||||||||||||||||
819,937 | Steel Dynamics, Inc. | 11,257,735 | 1.0 | ||||||||||||||||
| 52,778,955 | 4.6 | ||||||||||||||||||
| ING MIDCAP OPPORTUNITIES PORTFOLIO | SUMMARY PORTFOLIO OF INVESTMENTS AS OF DECEMBER 31, 2012 (CONTINUED) |
| Shares | | | | Value | | Percentage of Net Assets | |||||||||||||
|---|---|---|---|---|---|---|---|---|---|---|---|---|---|---|---|---|---|---|---|
COMMON STOCK: (continued) | |||||||||||||||||||
Telecommunication Services: 1.7% | |||||||||||||||||||
269,090 | @ | SBA Communications Corp. | $ | 19,110,772 | 1.7 | ||||||||||||||
Total Common Stock | |||||||||||||||||||
(Cost $989,670,946) | 1,124,459,113 | 98.7 | |||||||||||||||||
| Principal Amount† | | | | Value | | Percentage of Net Assets | |||||||||||||
|---|---|---|---|---|---|---|---|---|---|---|---|---|---|---|---|---|---|---|---|
SHORT-TERM INVESTMENTS: 2.3% | |||||||||||||||||||
Securities Lending Collateralcc(1): 1.0% | |||||||||||||||||||
2,555,815 | Barclays Bank PLC, Repurchase Agreement dated 12/31/12, 0.30%, due 01/02/13 (Repurchase Amount $2,555,857, collateralized by various U.S. Government Agency Obligations, 3.500%–5.500%, Market Value plus accrued interest $2,606,931, due 08/01/27–01/01/43) | 2,555,815 | 0.3 | ||||||||||||||||
2,555,815 | Citigroup, Inc., Repurchase Agreement dated 12/31/12, 0.20%, due 01/02/13 (Repurchase Amount $2,555,843, collateralized by various U.S. Government Agency Obligations, 0.000%–6.500%, Market Value plus accrued interest $2,606,932, due 10/01/16–12/20/42) | 2,555,815 | 0.2 | ||||||||||||||||
2,555,815 | Daiwa Capital Markets, Repurchase Agreement dated 12/31/12, 0.30%, due 01/02/13 (Repurchase Amount $2,555,857, collateralized by various U.S. Government and U.S. Government Agency Obligations, 0.000%–6.500%, Market Value plus accrued interest $2,606,931, due 06/14/13–12/01/42) | 2,555,815 | 0.2 | ||||||||||||||||
537,894 | JPMorgan Chase & Co., Repurchase Agreement dated 12/31/12, 0.18%, due 01/02/13 (Repurchase Amount $537,899, collateralized by various U.S. Government Securities, 0.750%–1.625%, Market Value plus accrued interest $548,653, due 10/31/17–08/15/22) | 537,894 | 0.1 | ||||||||||||||||
2,555,815 | Merrill Lynch & Co., Inc., Repurchase Agreement dated 12/31/12, 0.15%–0.19%, due 01/02/13 (Repurchase Amount $2,555,841, collateralized by various U.S. Government Agency Obligations, 0.500%–6.000%, Market Value plus accrued interest $2,606,932, due 08/09/13–06/20/42) | $ | 2,555,815 | 0.2 | |||||||||||||||
| 10,761,154 | 1.0 | ||||||||||||||||||
| Shares | | | | Value | | Percentage of Net Assets | ||||||||||||
|---|---|---|---|---|---|---|---|---|---|---|---|---|---|---|---|---|---|---|
Mutual Funds: 1.3% | ||||||||||||||||||
14,940,000 | BlackRock Liquidity Funds, TempFund, Institutional Class | |||||||||||||||||
(Cost $14,940,000) | 14,940,000 | 1.3 | ||||||||||||||||
Total Short-Term Investments | ||||||||||||||||||
(Cost $25,701,154) | 25,701,154 | 2.3 | ||||||||||||||||
Total Investments in Securities (Cost $1,015,372,100) | $ | 1,150,160,267 | 101.0 | |||||||||||||||
Liabilities in Excess of Other Assets | (11,717,596 | ) | (1.0 | ) | ||||||||||||||
Net Assets | $ | 1,138,442,671 | 100.0 | |||||||||||||||
| † | Unless otherwise indicated, principal amount is shown in USD. | |
| @ | Non-income producing security | |
| cc | Securities purchased with cash collateral for securities loaned. | |
| L | Loaned security, a portion or all of the security is on loan at December 31, 2012. | |
| (1) | Collateral received from brokers for securities lending was invested into these short-term investments. | |
| Cost for federal income tax purposes is $1,017,989,959. |
Net unrealized appreciation consists of: | ||||||
Gross Unrealized Appreciation | $ | 148,411,223 | ||||
Gross Unrealized Depreciation | (16,240,915 | ) | ||||
Net Unrealized Appreciation | $ | 132,170,308 |
| ING MIDCAP OPPORTUNITIES PORTFOLIO | SUMMARY PORTFOLIO OF INVESTMENTS AS OF DECEMBER 31, 2012 (CONTINUED) |
| Quoted Prices in Active Markets for Identical Investments (Level 1) | Significant Other Observable Inputs (Level 2) | Significant Unobservable Inputs (Level 3) | Fair Value at 12/31/2012 | |||||||||||||||
|---|---|---|---|---|---|---|---|---|---|---|---|---|---|---|---|---|---|---|
Asset Table | ||||||||||||||||||
Investments, at fair value | ||||||||||||||||||
Common Stock* | $ | 1,124,459,113 | $ | — | $ | — | $ | 1,124,459,113 | ||||||||||
Short-Term Investments | 14,940,000 | 10,761,154 | — | 25,701,154 | ||||||||||||||
Total Investments, at fair value | $ | 1,139,399,113 | $ | 10,761,154 | $ | — | $ | 1,150,160,267 | ||||||||||
| ˆ | See Note 2, “Significant Accounting Policies” in the Notes to Financial Statements for additional information. | |
| * | For further breakdown of Common Stock by Industry type, please refer to the Portfolio of Investments. |
| ING SMALLCAP OPPORTUNITIES PORTFOLIO | SUMMARY PORTFOLIO OF INVESTMENTS AS OF DECEMBER 31, 2012 |
| Shares | | | | Value | | Percentage of Net Assets | |||||||||||||
|---|---|---|---|---|---|---|---|---|---|---|---|---|---|---|---|---|---|---|---|
COMMON STOCK: 95.9% | |||||||||||||||||||
Consumer Discretionary: 18.1% | |||||||||||||||||||
55,361 | @ | Arctic Cat, Inc. | $ | 1,848,504 | 0.8 | ||||||||||||||
89,809 | Cooper Tire & Rubber Co. | 2,277,556 | 1.0 | ||||||||||||||||
117,000 | @ | Express, Inc. | 1,765,530 | 0.8 | |||||||||||||||
98,500 | Finish Line | 1,864,605 | 0.8 | ||||||||||||||||
36,299 | @ | Hibbett Sporting Goods, Inc. | 1,912,957 | 0.9 | |||||||||||||||
65,600 | @ | Jack in the Box, Inc. | 1,876,160 | 0.9 | |||||||||||||||
47,151 | @ | Life Time Fitness, Inc. | 2,320,301 | 1.0 | |||||||||||||||
60,300 | Monro Muffler, Inc. | 2,108,691 | 1.0 | ||||||||||||||||
44,118 | Pool Corp. | 1,867,074 | 0.8 | ||||||||||||||||
73,800 | @ | Sally Beauty Holdings, Inc. | 1,739,466 | 0.8 | |||||||||||||||
33,394 | Vail Resorts, Inc. | 1,806,282 | 0.8 | ||||||||||||||||
885,792 | Other Securities(a) | 18,939,194 | 8.5 | ||||||||||||||||
| 40,326,320 | 18.1 | ||||||||||||||||||
Consumer Staples: 2.0% | |||||||||||||||||||
36,100 | Casey’s General Stores, Inc. | 1,916,910 | 0.8 | ||||||||||||||||
82,950 | Other Securities | 2,593,317 | 1.2 | ||||||||||||||||
| 4,510,227 | 2.0 | ||||||||||||||||||
Energy: 6.0% | |||||||||||||||||||
84,000 | @ | Carrizo Oil & Gas, Inc. | 1,757,280 | 0.8 | |||||||||||||||
28,200 | @ | Dril-Quip, Inc. | 2,060,010 | 0.9 | |||||||||||||||
38,300 | @ | Rosetta Resources, Inc. | 1,737,288 | 0.8 | |||||||||||||||
435,941 | Other Securities(a) | 7,756,294 | 3.5 | ||||||||||||||||
| 13,310,872 | 6.0 | ||||||||||||||||||
Financials: 9.5% | |||||||||||||||||||
14,900 | @ | Affiliated Managers Group, Inc. | 1,939,235 | 0.9 | |||||||||||||||
69,633 | @ | Financial Engines, Inc. | 1,932,316 | 0.9 | |||||||||||||||
30,300 | Home Properties, Inc. | 1,857,693 | 0.8 | ||||||||||||||||
21,862 | @ | Portfolio Recovery Associates, Inc. | 2,336,173 | 1.1 | |||||||||||||||
26,376 | @ | Signature Bank | 1,881,664 | 0.8 | |||||||||||||||
59,359 | @ | Stifel Financial Corp. | 1,897,707 | 0.9 | |||||||||||||||
33,100 | @ | SVB Financial Group | 1,852,607 | 0.8 | |||||||||||||||
60,500 | Tanger Factory Outlet Centers, Inc. | 2,069,100 | 0.9 | ||||||||||||||||
397,029 | Other Securities | 5,280,453 | 2.4 | ||||||||||||||||
| 21,046,948 | 9.5 | ||||||||||||||||||
Health Care: 18.1% | |||||||||||||||||||
31,500 | Chemed Corp. | 2,160,585 | 1.0 | ||||||||||||||||
46,684 | @ | Haemonetics Corp. | 1,906,575 | 0.9 | |||||||||||||||
106,431 | @ | Healthsouth Corp. | 2,246,758 | 1.0 | |||||||||||||||
1,486,788 | Other Securities(a) | 33,852,707 | 15.2 | ||||||||||||||||
| 40,166,625 | 18.1 | ||||||||||||||||||
Industrials: 16.6% | |||||||||||||||||||
78,535 | Actuant Corp. | $ | 2,191,912 | 1.0 | |||||||||||||||
40,700 | Acuity Brands, Inc. | 2,756,611 | 1.2 | ||||||||||||||||
49,400 | @ | EnPro Industries, Inc. | 2,020,460 | 0.9 | |||||||||||||||
25,900 | @ | Genesee & Wyoming, Inc. | 1,970,472 | 0.9 | |||||||||||||||
59,250 | @ | HUB Group, Inc. | 1,990,800 | 0.9 | |||||||||||||||
144,000 | Knight Transportation, Inc. | 2,106,720 | 0.9 | ||||||||||||||||
56,700 | Simpson Manufacturing Co., Inc. | 1,859,193 | 0.8 | ||||||||||||||||
29,100 | @ | Teledyne Technologies, Inc. | 1,893,537 | 0.9 | |||||||||||||||
43,300 | Toro Co. | 1,861,034 | 0.8 | ||||||||||||||||
62,663 | Waste Connections, Inc. | 2,117,383 | 1.0 | ||||||||||||||||
52,290 | Woodward Governor Co. | 1,993,817 | 0.9 | ||||||||||||||||
407,733 | Other Securities | 14,226,173 | 6.4 | ||||||||||||||||
| 36,988,112 | 16.6 | ||||||||||||||||||
Information Technology: 21.5% | |||||||||||||||||||
26,507 | @ | Ansys, Inc. | 1,784,981 | 0.8 | |||||||||||||||
116,900 | @ | Aruba Networks, Inc. | 2,425,675 | 1.1 | |||||||||||||||
101,600 | @ | Aspen Technology, Inc. | 2,808,224 | 1.3 | |||||||||||||||
86,745 | Blackbaud, Inc. | 1,980,388 | 0.9 | ||||||||||||||||
84,833 | @ | Cardtronics, Inc. | 2,013,936 | 0.9 | |||||||||||||||
247,371 | @ | Integrated Device Technology, Inc. | 1,805,808 | 0.8 | |||||||||||||||
47,989 | @ | Micros Systems, Inc. | 2,036,653 | 0.9 | |||||||||||||||
111,600 | @ | Parametric Technology Corp. | 2,512,116 | 1.1 | |||||||||||||||
77,100 | @ | Semtech Corp. | 2,232,045 | 1.0 | |||||||||||||||
63,750 | @ | Synaptics, Inc. | 1,910,588 | 0.8 | |||||||||||||||
1,503,781 | Other Securities(a) | 26,409,567 | 11.9 | ||||||||||||||||
| 47,919,981 | 21.5 | ||||||||||||||||||
Materials: 4.1% | |||||||||||||||||||
57,700 | HB Fuller Co. | 2,009,114 | 0.9 | ||||||||||||||||
76,500 | Worthington Industries | 1,988,235 | 0.9 | ||||||||||||||||
333,920 | Other Securities | 5,065,602 | 2.3 | ||||||||||||||||
| 9,062,951 | 4.1 | ||||||||||||||||||
Total Common Stock | |||||||||||||||||||
(Cost $193,166,625) | 213,332,036 | 95.9 | |||||||||||||||||
EXCHANGE-TRADED FUNDS: 2.1% | |||||||||||||||||||
48,207 | iShares Russell 2000 Growth Index Fund | 4,594,609 | 2.1 | ||||||||||||||||
Total Exchange-Traded Funds | |||||||||||||||||||
(Cost $4,354,485) | 4,594,609 | 2.1 | |||||||||||||||||
Total Long-Term Investments | |||||||||||||||||||
(Cost $197,521,110) | 217,926,645 | 98.0 | |||||||||||||||||
| ING SMALLCAP OPPORTUNITIES PORTFOLIO | SUMMARY PORTFOLIO OF INVESTMENTS AS OF DECEMBER 31, 2012 (CONTINUED) |
| Principal Amount† | | | | Value | | Percentage of Net Assets | |||||||||||||
|---|---|---|---|---|---|---|---|---|---|---|---|---|---|---|---|---|---|---|---|
SHORT-TERM INVESTMENTS: 5.1% | |||||||||||||||||||
Securities Lending Collateralcc(1): 2.9% | |||||||||||||||||||
1,540,414 | Barclays Bank PLC, Repurchase Agreement dated 12/31/12, 0.30%, due 01/02/13 (Repurchase Amount $1,540,439, collateralized by various U.S. Government Agency Obligations, 3.500%–5.500%, Market Value plus accrued interest $1,571,222, due 08/01/27–01/01/43) | $ | 1,540,414 | 0.7 | |||||||||||||||
1,540,414 | Citigroup, Inc., Repurchase Agreement dated 12/31/12, 0.20%, due 01/02/13 (Repurchase Amount $1,540,431, collateralized by various U.S. Government Agency Obligations, 0.000%–6.500%, Market Value plus accrued interest $1,571,222, due 10/01/16–12/20/42) | 1,540,414 | 0.7 | ||||||||||||||||
324,197 | JPMorgan Chase & Co., Repurchase Agreement dated 12/31/12, 0.18%, due 01/02/13 (Repurchase Amount $324,200, collateralized by various U.S. Government Securities, 0.750%–1.625%, Market Value plus accrued interest $330,682, due 10/31/17–08/15/22) | 324,197 | 0.1 | ||||||||||||||||
1,540,414 | Merrill Lynch & Co., Inc., Repurchase Agreement dated 12/31/12, 0.15%–0.19%, due 01/02/13 (Repurchase Amount $1,540,430, collateralized by various U.S. Government Agency Obligations, 0.500%–6.000%, Market Value plus accrued interest $1,571,223, due 08/09/13–06/20/42) | 1,540,414 | 0.7 | ||||||||||||||||
1,540,414 | Nomura Securities, Repurchase Agreement dated 12/31/12, 0.35%, due 01/02/13 (Repurchase Amount $1,540,444, collateralized by various U.S. Government Agency Obligations, 0.000%–6.101%, Market Value plus accrued interest $1,571,222, due 03/10/14–12/20/42) | $ | 1,540,414 | 0.7 | |||||||||||||||
| 6,485,853 | 2.9 | ||||||||||||||||||
| Shares | | | | Value | | Percentage of Net Assets | |||||||||||||
|---|---|---|---|---|---|---|---|---|---|---|---|---|---|---|---|---|---|---|---|
Mutual Funds: 2.2% | |||||||||||||||||||
4,796,000 | BlackRock Liquidity Funds, TempFund, Institutional Class | ||||||||||||||||||
(Cost $4,796,000) | 4,796,000 | 2.2 | |||||||||||||||||
Total Short-Term Investments | |||||||||||||||||||
(Cost $11,281,853) | 11,281,853 | 5.1 | |||||||||||||||||
Total Investments in Securities (Cost $208,802,963) | $ | 229,208,498 | 103.1 | ||||||||||||||||
Liabilities in Excess of Other Assets | (6,785,713 | ) | (3.1 | ) | |||||||||||||||
Net Assets | $ | 222,422,785 | 100.0 | ||||||||||||||||
| † | Unless otherwise indicated, principal amount is shown in USD. | |
| @ | Non-income producing security | |
| cc | Securities purchased with cash collateral for securities loaned. | |
| (1) | Collateral received from brokers for securities lending was invested into these short-term investments. | |
| (a) | This grouping contains securities on loan. | |
| Cost for federal income tax purposes is $211,223,488. |
Net unrealized appreciation consists of: | ||||||
Gross Unrealized Appreciation | $ | 30,083,755 | ||||
Gross Unrealized Depreciation | (12,098,745 | ) | ||||
Net Unrealized Appreciation | $ | 17,985,010 |
| ING SMALLCAP OPPORTUNITIES PORTFOLIO | SUMMARY PORTFOLIO OF INVESTMENTS AS OF DECEMBER 31, 2012 (CONTINUED) |
| Quoted Prices in Active Markets for Identical Investments (Level 1) | Significant Other Observable Inputs (Level 2) | Significant Unobservable Inputs (Level 3) | Fair Value at 12/31/2012 | |||||||||||||||
|---|---|---|---|---|---|---|---|---|---|---|---|---|---|---|---|---|---|---|
Asset Table | ||||||||||||||||||
Investments, at fair value | ||||||||||||||||||
Common Stock* | $ | 213,332,036 | $ | — | $ | — | $ | 213,332,036 | ||||||||||
Exchange-Traded Funds | 4,594,609 | — | — | 4,594,609 | ||||||||||||||
Short-Term Investments | 4,796,000 | 6,485,853 | — | 11,281,853 | ||||||||||||||
Total Investments, at fair value | $ | 222,722,645 | $ | 6,485,853 | $ | — | $ | 229,208,498 | ||||||||||
| ˆ | See Note 2, “Significant Accounting Policies” in the Notes to Financial Statements for additional information. | |
| * | For further breakdown of Common Stock by Industry type, please refer to the Portfolio of Investments. |
| Portfolio Name | Type | Per Share Amount | ||||||||
|---|---|---|---|---|---|---|---|---|---|---|
ING International Value Portfolio | ||||||||||
Class ADV | NII | $ | 0.1569 | |||||||
Class I | NII | $ | 0.1948 | |||||||
Class S | NII | $ | 0.1791 | |||||||
Class S2 | NII | $ | 0.1620 | |||||||
ING MidCap Opportunities Portfolio | ||||||||||
Class ADV | NII | $ | 0.0391 | |||||||
Class I | NII | $ | 0.0649 | |||||||
Class S | NII | $ | 0.0473 | |||||||
Class S2 | NII | $ | 0.0347 | |||||||
All Classes | LTCG | $ | 0.3202 | |||||||
ING SmallCap Opportunities Portfolio | ||||||||||
All Classes | STCG | $ | 0.3989 | |||||||
All Classes | LTCG | $ | 1.8880 | |||||||
ING International Value Portfolio | 0.81 | % | ||||
ING MidCap Opportunities Portfolio | 100.00 | % | ||||
ING SmallCap Opportunities Portfolio | 31.37 | % |
| Creditable Foreign Taxes Paid | Per Share Amount | Portion of Ordinary Income Distribution Derived from Foreign Sourced Income* | ||||||||||||
|---|---|---|---|---|---|---|---|---|---|---|---|---|---|---|
ING International Value Portfolio | $301,324 | $0.0185 | 85.06% | |||||||||||
| * | None of the Portfolio’s income was derived from ineligible foreign sources as defined under Section 901(j) of the Internal Revenue Code. |
| Name, Address and Age | Position(s) Held with the Trust | Term of Office and Length of Time Served(1) | Principal Occupation(s) — During the Past 5 Years | Number of Portfolios in Fund Complex Overseen by Trustee(2) | Other Board Positions Held by Trustee | |||||||||||||||||
|---|---|---|---|---|---|---|---|---|---|---|---|---|---|---|---|---|---|---|---|---|---|---|
Independent Trustees: | ||||||||||||||||||||||
Colleen D. Baldwin 7337 East Doubletree Ranch Rd. Suite 100 Scottsdale, Arizona 85258 Age: 52 | Trustee | November 2007–Present | President, Glantuam Partners, LLC, a business consulting firm (January 2009–Present). | 147 | None. | |||||||||||||||||
John V. Boyer 7337 East Doubletree Ranch Rd. Suite 100 Scottsdale, Arizona 85258 Age: 59 | Trustee | January 2005–Present | President and Chief Executive Officer, Bechtler Arts Foundation, an arts and education foundation (January 2008–Present). | 147 | None. | |||||||||||||||||
Patricia W. Chadwick 7337 East Doubletree Ranch Rd. Suite 100 Scottsdale, Arizona 85258 Age: 64 | Trustee | January 2006–Present | Consultant and President, Ravengate Partners LLC, a consulting firm that provides advice regarding financial markets and the global economy (January 2000–Present). | 147 | Wisconsin Energy Corporation (June 2006–Present) and The Royce Fund, (35 funds) (December 2009–Present). | |||||||||||||||||
Peter S. Drotch 7337 East Doubletree Ranch Rd. Suite 100 Scottsdale, Arizona 85258 Age: 71 | Trustee | November 2007–Present | Retired. | 147 | First Marblehead Corporation (September 2003–Present). | |||||||||||||||||
J. Michael Earley 7337 East Doubletree Ranch Rd. Suite 100 Scottsdale, Arizona 85258 Age: 67 | Trustee | February 2002–Present | Retired. Formerly, Banking President and Chief Executive Officer, Bankers Trust Company, N.A., Des Moines (June 1992– December 2008). | 147 | None. | |||||||||||||||||
Patrick W. Kenny 7337 East Doubletree Ranch Rd. Suite 100 Scottsdale, Arizona 85258 Age: 70 | Trustee | January 2005–Present | Retired. Formerly, President and Chief Executive Officer, International Insurance Society (June 2001–June 2009). | 147 | Assured Guaranty Ltd. (April 2004–Present). | |||||||||||||||||
Sheryl K. Pressler 7337 East Doubletree Ranch Rd. Suite 100 Scottsdale, Arizona 85258 Age: 62 | Trustee | January 2006–Present | Consultant (May 2001– Present). | 147 | Stillwater Mining Company (May 2002–Present). | |||||||||||||||||
Roger B. Vincent 7337 East Doubletree Ranch Rd. Suite 100 Scottsdale, Arizona 85258 Age: 67 | Chairperson/ Trustee | February 2002–Present | Retired. Formerly, President, Springwell Corporation, a corporate finance firm (March 1989–August 2011). | 147 | UGI Corporation (February 2006–Present) and UGI Utilities, Inc. (February 2006–Present). | |||||||||||||||||
| Name, Address and Age | Position(s) Held with the Trust | Term of Office and Length of Time Served(1) | Principal Occupation(s) — During the Past 5 Years | Number of Portfolios in Fund Complex Overseen by Trustee(2) | Other Board Positions Held by Trustee | ||||||||||||||||||
|---|---|---|---|---|---|---|---|---|---|---|---|---|---|---|---|---|---|---|---|---|---|---|---|
Trustees who are “Interested Persons”: | |||||||||||||||||||||||
Robert W. Crispin(3) 7337 East Doubletree Ranch Rd. Suite 100 Scottsdale, Arizona 85258 Age: 66 | Trustee | November 2007–Present | Retired. | 147 | Intact Financial Corporation (December 2004–Present) and PFM Group (November 2010–Present). | ||||||||||||||||||
Shaun P. Mathews(3) 7337 East Doubletree Ranch Rd. Suite 100 Scottsdale, Arizona 85258 Age: 57 | Trustee | November 2007–Present | President and Chief Executive Officer, ING Investments, LLC (November 2006–Present). | 182 | ING Capital Corporation, LLC (December 2005–Present). | ||||||||||||||||||
(1) | Subject to the Board’s retirement policy, Trustees serve until their successors are duly elected and qualified. The Board’s retirement policy states that each duly elected or appointed Trustee who is not an “interested person” of the Trust, as defined in the 1940 Act, as amended (“Independent Trustees”), shall retire from service as a Trustee at the close of business on December 31 of the calendar year in which the Trustee reaches the age of 73. A majority vote of the Board may extend the retirement date of a Trustee if such retirement would trigger a requirement to hold a meeting of shareholders of the Trust under applicable law, whether for purposes of appointing a successor to the Trustee or if otherwise necessary under applicable law, in which case the extension would apply until such time as the shareholder meeting can be held or is no longer needed. |
(2) | Except for Mr. Mathews and for the purposes of this table “Fund Complex” means the following investment companies: ING Asia Pacific High Dividend Equity Income Fund; ING Emerging Markets High Dividend Equity Fund; ING Emerging Markets Local Bond Fund; ING Equity Trust; ING Funds Trust; ING Global Equity Dividend and Premium Opportunity Fund; ING Global Advantage and Premium Opportunity Fund; ING Global Strategic Income Fund; ING Infrastructure, Industrials and Materials Fund; ING International High Dividend Equity Income Fund; ING Investors Trust; ING Mayflower Trust; ING Mutual Funds; ING Partners, Inc.; ING Prime Rate Trust; ING Risk Managed Natural Resources Fund; ING Senior Income Fund; ING Separate Portfolios Trust; ING Short Duration High Income Fund; ING Variable Insurance Trust; and ING Variable Products Trust. For Mr. Mathews, the ING Fund Complex also includes the following investment companies: ING Balanced Portfolio, Inc.; ING Intermediate Bond Portfolio; ING Money Market Portfolio; ING Series Fund, Inc.; ING Strategic Allocation Portfolios, Inc.; ING Variable Funds; and ING Variable Portfolios, Inc. Therefore, for the purposes of this table with reference to Mr. Mathews, “Fund Complex” includes these investment companies. The number of funds in the ING Fund Complex is as of January 31, 2013. |
(3) | Messrs. Crispin and Matthews are deemed “Interested Persons” of the Trust because of their current or prior affiliation with ING Groep, N.V., the parent corporation of the Investment Adviser(s) and the Distributor. |
| Name, Address and Age | Position(s) Held With the Trust | Term of Office and Length of Time Served(1) | Principal Occupation(s) — During the Past 5 Years | |||||||||||
|---|---|---|---|---|---|---|---|---|---|---|---|---|---|---|
Shaun P. Mathews 7337 East Doubletree Ranch Rd. Suite 100 Scottsdale, Arizona 85258 Age: 57 | President and Chief Executive Officer | November 2006–Present | President and Chief Executive Officer, ING Investments, LLC (November 2006–Present). | |||||||||||
Michael J. Roland 7337 East Doubletree Ranch Rd. Suite 100 Scottsdale, Arizona 85258 Age: 54 | Executive Vice President | February 2002–Present | Managing Director and Chief Operating Officer, ING Investments, LLC and ING Funds Services, LLC (April 2012–Present) and Chief Compliance Officer, Directed Services LLC and ING Investments, LLC (March 2011–Present). Formerly, Executive Vice President and Chief Operating Officer, ING Investments, LLC and ING Funds Services, LLC (January 2007–April 2012) and Chief Compliance Officer, ING Funds (March 2011–February 2012). | |||||||||||
Stanley D. Vyner 230 Park Avenue New York, New York 10169 Age: 62 | Executive Vice President Chief Investment Risk Officer | November 1999–Present September 2009–Present | Executive Vice President, ING Investments, LLC (July 2000–Present) and Chief Investment Risk Officer, ING Investments, LLC (January 2003–Present). | |||||||||||
Kevin M. Gleason 7337 East Doubletree Ranch Rd. Suite 100 Scottsdale, Arizona 85258 Age: 46 | Chief Compliance Officer | February 2012–Present | Senior Vice President, ING Investments, LLC (February 2012–Present). Formerly, Assistant General Counsel and Assistant Secretary, The Northwestern Mutual Life Insurance Company (June 2004–January 2012). | |||||||||||
Kimberly A. Anderson 7337 East Doubletree Ranch Rd. Suite 100 Scottsdale, Arizona 85258 Age: 48 | Senior Vice President | November 2003–Present | Senior Vice President, ING Investments, LLC (October 2003–Present). | |||||||||||
Todd Modic 7337 East Doubletree Ranch Rd. Suite 100 Scottsdale, Arizona 85258 Age: 45 | Senior Vice President, Chief/Principal Financial Officer and Assistant Secretary | March 2005–Present | Senior Vice President, ING Funds Services, LLC (March 2005–Present). | |||||||||||
Robert Terris 7337 East Doubletree Ranch Rd. Suite 100 Scottsdale, Arizona 85258 Age: 42 | Senior Vice President | May 2006–Present | Senior Vice President, Head of Division Operations, ING Funds Services, LLC (January 2006–Present). | |||||||||||
Julius A. Drelick, III 7337 East Doubletree Ranch Rd. Suite 100 Scottsdale, Arizona 85258 Age: 46 | Senior Vice President | July 2012–Present | Senior Vice President — Fund Compliance, ING Funds Services, LLC (June 2012–resent). Formerly, Vice President — Platform Product Management & Project Management, ING Investments, LLC (April 2007–June 2012). | |||||||||||
Robyn L. Ichilov 7337 East Doubletree Ranch Rd. Suite 100 Scottsdale, Arizona 85258 Age: 45 | Vice President | November 1999–Present | Vice President and Treasurer, ING Funds Services, LLC (November 1995–Present) and ING Investments, LLC (August 1997–Present). Formerly, Treasurer, ING Funds (November 1999–February 2012). | |||||||||||
Maria M. Anderson 7337 East Doubletree Ranch Rd. Suite 100 Scottsdale, Arizona 85258 Age: 54 | Vice President | September 2004–Present | Vice President, ING Funds Services, LLC (September 2004–Present). | |||||||||||
Lauren D. Bensinger 7337 East Doubletree Ranch Rd. Suite 100 Scottsdale, Arizona 85258 Age: 59 | Vice President | February 2003–Present | Vice President, ING Investments, LLC and ING Funds Services, LLC (February 1996–Present); Director of Compliance, ING Investments, LLC (October 2004–Present); and Vice President and Money Laundering Reporting Officer, ING Investments Distributor, LLC (April 2010–Present). Formerly, Chief Compliance Officer, ING Investments Distributor, LLC (August 1995–April 2010). | |||||||||||
Jason Kadavy 7337 East Doubletree Ranch Rd. Suite 100 Scottsdale, Arizona 85258 Age: 36 | Vice President | September 2012–Present | Vice President, ING Funds Services, LLC (July 2007–Present). | |||||||||||
| Name, Address and Age | Position(s) Held With the Trust | Term of Office and Length of Time Served(1) | Principal Occupation(s) — During the Past 5 Years | |||||||||||
|---|---|---|---|---|---|---|---|---|---|---|---|---|---|---|
Fred Bedoya 7337 East Doubletree Ranch Rd. Suite 100 Scottsdale, Arizona 85258 Age: 40 | Vice President and Treasurer | September 2012–Present | Vice President, ING Funds Services, LLC (March 2012–Present). Formerly, Assistant Vice President — Director, ING Funds Services, LLC (March 2003–March 2012). | |||||||||||
Kimberly K. Springer 7337 East Doubletree Ranch Rd. Suite 100 Scottsdale, Arizona 85258 Age: 55 | Vice President | March 2006–Present | Vice President — Platform Product Management & Project Management, ING Investments, LLC (July 2012–Present); Vice President, ING Investment Management — ING Funds (March 2010–Present) and Vice President, ING Funds Services, LLC (March 2006–Present). Formerly Managing Paralegal, Registration Statements (June 2003–July 2012). | |||||||||||
Craig Wheeler 7337 East Doubletree Ranch Rd. Suite 100 Scottsdale, Arizona 85258 Age: 43 | Assistant Vice President | May 2008–Present | Assistant Vice President — Director of Tax, ING Funds Services, LLC (March 2008–Present). Formerly, Tax Manager, ING Funds Services, LLC (March 2005–March 2008). | |||||||||||
Theresa K. Kelety 7337 East Doubletree Ranch Rd. Suite 100 Scottsdale, Arizona 85258 Age: 50 | Assistant Secretary | August 2003–Present | Vice President and Senior Counsel, ING Investment Management — ING Funds (March 2010–Present). Formerly, Senior Counsel, ING Americas, U.S. Legal Services (April 2008–March 2010) and Counsel, ING Americas, U.S. Legal Services (April 2003–April 2008). | |||||||||||
Huey P. Falgout, Jr. 7337 East Doubletree Ranch Rd. Suite 100 Scottsdale, Arizona 85258 Age: 49 | Secretary | August 2003–Present | Senior Vice President and Chief Counsel, ING Investment Management — ING Funds (March 2010–Present). Formerly, Chief Counsel, ING Americas, U.S. Legal Services (October 2003–March 2010). | |||||||||||
Paul A. Caldarelli 7337 East Doubletree Ranch Rd. Suite 100 Scottsdale, Arizona 85258 Age: 61 | Assistant Secretary | June 2010–Present | Vice President and Senior Counsel, ING Investment Management — ING Funds (March 2010–Present). Formerly, Senior Counsel, ING Americas, U.S. Legal Services (April 2008–March 2010) and Counsel, ING Americas, U.S. Legal Services (May 2005–April 2008). | |||||||||||
| (1) | The Officers hold office until the next annual meeting of the Board of Trustees and until their successors shall have been elected and qualified. |
independently and, at times, jointly, and a Contracts Committee. Among other matters, the Contracts Committee provides oversight with respect to the Contract Review Process, and each Portfolio is assigned to an IRC which provides oversight regarding, among other matters, the investment performance of the Adviser and Sub-Adviser, as well as the oversight by the Adviser of the performance of the Sub-Adviser. The IRCs may apply a heightened level of scrutiny in cases where performance has lagged a Portfolio’s relevant benchmark and/or selected peer group of investment companies (“Selected Peer Groups”).
that this separation may result in the Adviser and Sub-Adviser’s loss of access to the services and resources of their current ultimate parent company, which could adversely affect its businesses and profitability. The Board recognized that, if the separation plans are deemed to be a change of control, the investment advisory and sub-advisory agreements for the Portfolios would terminate and trigger the necessity for new agreements, which would require the approval of the Board and, potentially, the shareholders of a Portfolio. The Board also recognized that there can be no assurance that the separation plan will be carried out. The Board considered the potential effects of the separation on the Portfolios and the Adviser and Sub-Adviser, including its ability prior to, during and after the separation to perform the same level of service to the Portfolios as the Adviser and Sub-Adviser currently provides. In this regard, the Board noted that the Adviser and Sub-Adviser did not currently anticipate that the separation would have a material adverse impact on the Portfolios or their operations and administration.
available to the Board and the IRCs to assist with addressing any issues that arise.
remedial actions regarding certain ING Funds. These remedial actions have included, among others: reductions in fee rates; changes in sub-advisers or portfolio managers; and strategy modifications.
7337 East Doubletree Ranch Road, Suite 100
Scottsdale, Arizona 85258
7337 East Doubletree Ranch Road, Suite 100
Scottsdale, Arizona 85258
7337 East Doubletree Ranch Road, Suite 100
Scottsdale, Arizona 85258
301 Bellevue Parkway
Wilmington, Delaware 19809
Two Financial Center
60 South Street
Boston, Massachusetts 02111
One Wall Street
New York, New York 10286
1900 K Street, N.W.
Washington, D.C. 20006
| VPAR-UVPTADVISS2 (1212-021513) |
Item 2. Code of Ethics.
As of the end of the period covered by this report, Registrant had adopted a code of ethics, as defined in Item 2 of Form N-CSR, that applies to the Registrant’s principal executive officer and principal financial officer. There were no amendments to the Code during the period covered by the report. The Registrant did not grant any waivers, including implicit waivers, from any provisions of the Code during the period covered by this report. The code of ethics is filed herewith pursuant to Item 10(a)(1), Exhibit 99.CODE ETH.
Item 3. Audit Committee Financial Expert.
The Board of Trustees has determined that J. Michael Earley, Peter Drotch and Colleen Baldwin are audit committee financial experts, as defined in Item 3 of Form N-CSR. Mr. Earley, Mr. Drotch and Ms. Baldwin are “independent” for purposes of Item 3 of Form N-CSR.
Item 4. Principal Accountant Fees and Services.
(a) Audit Fees: The aggregate fees billed for each of the last two fiscal years for professional services rendered by KPMG LLP (“KPMG”), the principal accountant for the audit of the registrant’s annual financial statements, for services that are normally provided by the accountant in connection with statutory and regulatory filings or engagements for those fiscal years were $56,700 for year ended December 31, 2012 and $56,700 for year ended December 31, 2011.
(b) Audit-Related Fees: The aggregate fees billed in each of the last two fiscal years for assurance and related services by KPMG that are reasonably related to the performance of the audit of the registrant’s financial statements and are not reported under paragraph (a) of this Item were $7,200 for year ended December 31, 2012 and $7,200 for year ended December 31, 2011.
(c) Tax Fees: The aggregate fees billed in each of the last two fiscal years for professional services rendered by KPMG for tax compliance, tax advice, and tax planning were $13,350 in the year ended December 31, 2012 and $15,005 in the year ended December 31, 2011. Such services included review of excise distribution calculations (if applicable), preparation of the Funds’ federal, state and excise tax returns, tax services related to mergers and routine consulting.
(d) All Other Fees: The aggregate fees billed in each of the last two fiscal years for products and services provided by KPMG, other than the services reported in paragraphs (a) through (c) of this Item. None
(e)(1) Audit Committee Pre-Approval Policies and Procedures
AUDIT AND NON-AUDIT SERVICES
PRE-APPROVAL POLICY
| I. | Statement of Principles |
Under the Sarbanes-Oxley Act of 2002 (the “Act”), the Audit Committee of the Board of Directors or Trustees (the “Committee”) of the ING Funds (each a “Fund,” collectively, the “Funds”) set out on Exhibit A to this Audit and Non-Audit Services Pre-Approval Policy (“Policy”) is responsible for the oversight of the work of the Funds’ independent auditors. As part of its responsibilities, the Committee must pre-approve the audit and non-audit services performed by the auditors in order to assure that the provision of these services does not impair the auditors’ independence from the Funds. The Committee has adopted, and the Board has ratified, this Policy, which sets out the procedures and conditions under which the services of the independent auditors may be pre-approved.
Under Securities and Exchange Commission (“SEC”) rules promulgated in accordance with the Act, the Funds may establish two different approaches to pre-approving audit and non-audit services. The Committee may approve services without consideration of specific case-by-case services (“general pre-approval”) or it may pre-approve specific services (“specific pre-approval”). The Committee believes that the combination of these approaches contemplated in this Policy results in an effective and efficient method for pre-approving audit and non-audit services to be performed by the Funds’ independent auditors. Under this Policy, services that are not of a type that may receive general pre-approval require specific pre-approval by the Committee. Any proposed services that exceed pre-approved cost levels or budgeted amounts will also require the Committee’s specific pre-approval.
For both types of approval, the Committee considers whether the subject services are consistent with the SEC’s rules on auditor independence and that such services are compatible with maintaining the auditors independence. The Committee also considers whether a particular audit firm is in the best position to provide effective and efficient services to the Funds. Reasons that the auditors are in the best position include the auditors’ familiarity with the Funds’ business, personnel, culture, accounting systems, risk profile, and other factors, and whether the services will enhance the Funds’ ability to manage and control risk or improve audit quality. Such factors will be considered as a whole, with no one factor being determinative.
The appendices attached to this Policy describe the audit, audit-related, tax-related, and other services that have the Committee’s general pre-approval. For any service that has been approved through general pre-approval, the general pre-approval will remain in place for a period 12 months from the date of pre-approval, unless the Committee determines that a different period is appropriate. The Committee will annually review and pre-approve the services that may be provided by the independent auditors without specific pre-approval. The Committee will revise the list of services subject to general pre-approval as appropriate. This Policy does not serve as a delegation to Fund management of the Committee’s duty to pre-approve services performed by the Funds’ independent auditors.
| II. | Audit Services |
The annual audit services engagement terms and fees are subject to the Committee’s specific pre-approval. Audit services are those services that are normally provided by auditors in connection with statutory and regulatory filings or engagements or those that generally only independent auditors can reasonably provide. They include the Funds’ annual financial statement audit and procedures that the independent auditors must perform in order to form an opinion on the Funds’ financial statements (e.g., information systems and procedural reviews and testing). The Committee will monitor the audit services engagement and approve any changes in terms, conditions or fees deemed by the Committee to be necessary or appropriate.
The Committee may grant general pre-approval to other audit services, such as statutory audits and services associated with SEC registration statements, periodic reports and other documents filed with the SEC or issued in connection with securities offerings.
The Committee has pre-approved the audit services listed on Appendix A. The Committee must specifically approve all audit services not listed on Appendix A.
| III. | Audit-related Services |
Audit-related services are assurance and related services that are reasonably related to the performance of the audit or the review of the Funds’ financial statements or are traditionally performed by the independent auditors. The Committee believes that the provision of audit-related services will not impair the independent auditors’ independence, and therefore may grant pre-approval to audit-related services. Audit-related services include accounting consultations related to accounting, financial reporting or disclosure matters not classified as “audit services;” assistance with understanding and implementing new accounting and financial reporting guidance from rulemaking authorities; agreed-upon or expanded audit procedures relating to accounting and/or billing records required to respond to or comply with financial, accounting or regulatory reporting matters; and assistance with internal control reporting requirements under Form N-SAR or Form N-CSR.
The Committee has pre-approved the audit-related services listed on Appendix B. The Committee must specifically approve all audit-related services not listed on Appendix B.
| IV. | Tax Services |
The Committee believes the independent auditors can provide tax services to the Funds, including tax compliance, tax planning, and tax advice, without compromising the auditors’ independence. Therefore, the Committee may grant general pre-approval with respect to tax services historically provided by the Funds’ independent auditors that do not, in the Committee’s view, impair auditor independence and that are consistent with the SEC’s rules on auditor independence.
The Committee will not grant pre-approval if the independent auditors initially recommends a transaction the sole business purpose of which is tax avoidance and the tax treatment of which may not be supported in the Internal Revenue Code and related regulations. The Committee may consult
2
outside counsel to determine that tax planning and reporting positions are consistent with this Policy.
The Committee has pre-approved the tax-related services listed on Appendix C. The Committee must specifically approve all tax-related services not listed on Appendix C.
| V. | Other Services |
The Committee believes it may grant approval of non-audit services that are permissible services for independent auditors to a Fund. The Committee has determined to grant general pre-approval to other services that it believes are routine and recurring, do not impair auditor independence, and are consistent with SEC rules on auditor independence.
The Committee has pre-approved the non-audit services listed on Appendix D. The Committee must specifically approve all non-audit services not listed on Appendix D.
A list of the SEC’s prohibited non-audit services is attached to this Policy as Appendix E. The SEC’s rules and relevant guidance should be consulted to determine the precise definitions of these impermissible services and the applicability of exceptions to certain of the SEC’s prohibitions.
| VI. | Pre-approval of Fee levels and Budgeted Amounts |
The Committee will annually establish pre-approval fee levels or budgeted amounts for audit, audit-related, tax and non-audit services to be provided to the Funds by the independent auditors. Any proposed services exceeding these levels or amounts require the Committee’s specific pre-approval. The Committee considers fees for audit and non-audit services when deciding whether to pre-approve services. The Committee may determine, for a pre-approval period of 12 months, the appropriate ratio between the total amount of fees for the Fund’s audit, audit-related, and tax services (including fees for services provided to Fund affiliates that are subject to pre-approval), and the total amount of fees for certain permissible non-audit services for the Fund classified as other services (including any such services provided to Fund affiliates that are subject to pre-approval).
| VII. | Procedures |
Requests or applications for services to be provided by the independent auditors will be submitted to management. If management determines that the services do not fall within those services generally pre-approved by the Committee and set out in the appendices to these procedures, management will submit the services to the Committee or its delagee. Any such submission will include a detailed description of the services to be rendered. Notwithstanding this paragraph, the Committee will, on a quarterly basis, receive from the independent auditors a list of services provided for the previous calendar quarter on a cumulative basis by the auditors during the Pre-Approval Period.
3
| VIII. | Delegation |
The Committee may delegate pre-approval authority to one or more of the Committee’s members. Any member or members to whom such pre-approval authority is delegated must report any pre-approval decisions, including any pre-approved services, to the Committee at its next scheduled meeting. The Committee will identify any member to whom pre-approval authority is delegated in writing. The member will retain such authority for a period of 12 months from the date of pre-approval unless the Committee determines that a different period is appropriate. The period of delegated authority may be terminated by the Committee or at the option of the member.
| IX. | Additional Requirements |
The Committee will take any measures the Committee deems necessary or appropriate to oversee the work of the independent auditors and to assure the auditors’ independence from the Funds. This may include reviewing a formal written statement from the independent auditors delineating all relationships between the auditors and the Funds, consistent with Independence Standards Board No. 1, and discussing with the auditors their methods and procedures for ensuring independence.
Effective April 23, 2008, the KPMG LLP (“KPMG”) audit team for the ING Funds accepted the global responsibility for monitoring the auditor independence for KPMG relative to the ING Funds. Using a proprietary system called Sentinel, the audit team is able to identify and manage potential conflicts of interest across the member firms of the KPMG International Network and prevent the provision of prohibited services to the ING entities that would impair KPMG independence with the respect to the ING Funds. In addition to receiving pre-approval from the ING Funds Audit Committee for services provided to the ING Funds and for services for ING entities in the Investment Company Complex, the audit team has developed a process for periodic notification via email to the ING Funds’ Audit Committee Chairpersons regarding requests to provide services to ING Groep NV and its affiliates from KPMG offices worldwide. Additionally, KPMG provides a quarterly summary of the fees for services that have commenced for ING Groep NV and Affiliates at each Audit Committee Meeting.
Last Approved: November 17, 2011
4
Appendix A
Pre-Approved Audit Services for the Pre-Approval Period January 1, 2012 through December 31, 2012
| Service | ||
| The Fund(s) | Fee Range | |
| Statutory audits or financial audits (including tax services associated with audit services) | √ | As presented to Audit Committee1 |
| Services associated with SEC registration statements, periodic reports and other documents filed with the SEC or other documents issued in connection with securities offerings (e.g., consents), and assistance in responding to SEC comment letters. | √ | Not to exceed $9,750 per filing |
| Consultations by Fund management with respect to accounting or disclosure treatment of transactions or events and/or the actual or potential effect of final or proposed rules, standards or interpretations by the SEC, Financial Accounting Standards Board, or other regulatory or standard setting bodies. | √ | Not to exceed $8,000 during the Pre-Approval Period |
| Seed capital audit and related review and issuance of consent on the N-2 registration statement | √ | Not to exceed $13,000 per audit |
____________________
| 1 | For new Funds launched during the Pre-Approval Period, the fee ranges pre-approved will be the same as those for existing Funds, pro-rated in accordance with inception dates as provided in the auditors’ Proposal or any Engagement Letter covering the period at issue. Fees in the Engagement Letter will be controlling. |
5
Appendix B
Pre-Approved Audit-Related Services for the Pre-Approval Period January 1, 2012 through December 31, 2012
| Service | |||
| The Fund(s) | Fund Affiliates | Fee Range | |
| Services related to Fund mergers (Excludes tax services - See Appendix C for tax services associated with Fund mergers) | √ | √ | Not to exceed $10,000 per merger |
| Consultations by Fund management with respect to accounting or disclosure treatment of transactions or events and/or the actual or potential effect of final or proposed rules, standards or interpretations by the SEC, Financial Accounting Standards Board, or other regulatory or standard setting bodies. [Note: Under SEC rules some consultations may be “audit” services and others may be “audit-related” services.] | √ | Not to exceed $5,000 per occurrence during the Pre-Approval Period | |
| Review of the Funds’ semi-annual and quarterly financial statements | √ | Not to exceed $2,400 per set of financial statements per fund | |
| Reports to regulatory or government agencies related to the annual engagement | √ | Up to $5,000 per occurrence during the Pre-Approval Period | |
| Regulatory compliance assistance | √ | √ | Not to exceed $5,000 per quarter |
| Training courses | √ | Not to exceed $2,000 per course | |
| For Prime Rate Trust, agreed upon procedures for quarterly reports to rating agencies | √ | Not to exceed $9,450 per quarter | |
6
Appendix C
Pre-Approved Tax Services for the Pre-Approval Period January 1, 2012 through December 31, 2012
| Service | |||
| The Fund(s) | Fund Affiliates | Fee Range | |
| Preparation of federal and state income tax returns and federal excise tax returns for the Funds including assistance and review with excise tax distributions | √ | As presented to Audit Committee2 | |
| Review of IRC Sections 851(b) and 817(h) diversification testing on a real-time basis | √ | As presented to Audit Committee2 | |
| Assistance and advice regarding year-end reporting for 1099’s | √ | As presented to Audit Committee2 | |
| Tax assistance and advice regarding statutory, regulatory or administrative developments | √ | √ | Not to exceed $5,000 for the Funds or for the Funds’ investment adviser during the Pre-Approval Period |
____________________
| 2 | For new Funds launched during the Pre-Approval Period, the fee ranges pre-approved will be the same as those for existing Funds, pro-rated in accordance with inception dates as provided in the auditors’ Proposal or any Engagement Letter covering the period at issue. Fees in the Engagement Letter will be controlling. |
7
Appendix C, continued
| Service | |||
| The Fund(s) | Fund Affiliates | Fee Range | |
| Tax training courses | √ | Not to exceed $2,000 per course during the Pre-Approval Period | |
| Tax services associated with Fund mergers | √ | √ | Not to exceed $4,000 per fund per merger during the Pre-Approval Period |
| Other tax-related assistance and consultation, including, without limitation, assistance in evaluating derivative financial instruments and international tax issues, qualification and distribution issues, and similar routine tax consultations. | √ | Not to exceed $120,000 during the Pre-Approval Period | |
8
Appendix D
Pre-Approved Other Services for the Pre-Approval Period January 1, 2012 through December 31, 2012
| Service | |||
| The Fund(s) | Fund Affiliates | Fee Range | |
| Agreed-upon procedures for Class B share 12b-1 programs | √ | Not to exceed $60,000 during the Pre-Approval Period | |
Security counts performed pursuant to Rule 17f-2 of the 1940 Act (i.e., counts for Funds holding securities with affiliated sub-custodians) Cost to be borne 50% by the Funds and 50% by ING Investments, LLC. | √
| √
| Not to exceed $5,000 per Fund during the Pre-Approval Period |
| Agreed upon procedures for 15 (c) FACT Books | √ | Not to exceed $35,000 during the Pre-Approval Period | |
9
Appendix E
Prohibited Non-Audit Services
Dated: January 1, 2012 to December 31, 2012
· Bookkeeping or other services related to the accounting records or financial statements of the Funds
· Financial information systems design and implementation
· Appraisal or valuation services, fairness opinions, or contribution-in-kind reports
· Actuarial services
· Internal audit outsourcing services
· Management functions
· Human resources
· Broker-dealer, investment adviser, or investment banking services
· Legal services
· Expert services unrelated to the audit
· Any other service that the Public Company Accounting Oversight Board determines, by regulation, is impermissible
10
EXHIBIT A
ING EQUITY TRUST
ING FUNDS TRUST
ING ASIA PACIFIC HIGH DIVIDEND EQUITY INCOME FUND
ING GLOBAL ADVANTAGE AND PREMIUM OPPORTUNITY FUND
ING GLOBAL EQUITY DIVIDEND AND PREMIUM OPPORTUNITY FUND
ING INTERNATIONAL HIGH DIVIDEND EQUITY INCOME FUND
ING INFRASTRUCTURE, INDUSTRIALS, AND MATERIALS FUND
ING RISK MANAGED NATURAL RESOURCES FUNDING INVESTORS TRUST
ING MAYFLOWER TRUST
ING MUTUAL FUNDS
ING PARTNERS, INC.
ING PRIME RATE TRUST
ING SENIOR INCOME FUND
ING SEPARATE PORTFOLIOS TRUST
ING VARIABLE INSURANCE TRUST
ING VARIABLE PRODUCTS TRUST
ING EMERGING MARKETS LOCAL BOND FUND
ING EMERING MARKETS HIGH DIVIDEND EQUITY FUND
| (e)(2) | Percentage of services referred to in 4(b) — (4)(d) that were approved by the audit committee |
100% of the services were approved by the audit committee.
| (f) | Percentage of hours expended attributable to work performed by other than full time employees of KPMG if greater than 50%. |
Not applicable.
| (g) | Non-Audit Fees: The non-audit fees billed by the registrant’s accountant for services rendered to the registrant, and rendered to the registrant’s investment adviser, and any entity controlling, controlled by, or under common control with the adviser that provides ongoing services to the registrant for each of the last two fiscal years of the registrant were $2,085,015 for year ended December 31, 2012 and $1,122,245 for year ended December 31, 2011. |
| (h) | Principal Accountants Independence: The Registrant’s Audit committee has considered whether the provision of non-audit services that were rendered to the registrant’s investment adviser and any entity controlling, controlled by, or under common control with the investment adviser that provides ongoing services to the registrant that were not pre-approved pursuant to Rule 2-01(c)(7)(ii) of Regulation S-X is compatible with maintaining KPMG’s independence. |
Item 5. Audit Committee of Listed Registrants.
Not applicable.
Item 6. Schedule of Investments
Summary schedule is included as part of the report to shareholders filed under Item 1 of this Form, if applicable.
Report of Independent Registered Public Accounting Firm
The Shareholders and Board of Trustees
ING Variable Products Trust
We have audited, in accordance with the standards of the Public Company Accounting Oversight Board (United States), the statements of assets and liabilities, including the summary portfolios of investments, of ING International Value Portfolio, ING MidCap Opportunities Portfolio, and ING SmallCap Opportunities Portfolio, each a series of ING Variable Products Trust, as of December 31, 2012, and the related statements of operations for the year then ended, the statements of changes in net assets for each of the years in the two-year period then ended, and the financial highlights for each of the years or periods in the five-year period then ended and have issued our unqualified report thereon dated February 15, 2013 (which report and financial statements are included in Item 1 of this Certified Shareholder Report on Form N-CSR). In connection with our audits of the aforementioned financial statements and financial highlights, we also audited the related portfolios of investments included in Item 6 of this Form N-CSR. The portfolios of investments are the responsibility of management. Our responsibility is to express an opinion on the portfolios of investments based on our audits.
In our opinion, the portfolios of investments, when considered in relation to the basic financial statements taken as a whole, present fairly, in all material respects, the information set forth therein.

Boston, Massachusetts
February 25, 2013
| ING International Value Portfolio | PORTFOLIO OF INVESTMENTS |
| as of December 31, 2012 |
| Shares | Value | Percentage of Net Assets | ||||
| COMMON STOCK: 99.1% | ||||||
| Australia: 1.2% | ||||||
| 63,454 | Australia & New Zealand Banking Group Ltd. | 1,671,163 | 1.2 | |||
| Belgium: 1.4% | ||||||
| 54,585 | KBC Groep NV | 1,902,420 | 1.4 | |||
| Canada: 0.6% | ||||||
| 23,500 | Barrick Gold Corp. | 822,735 | 0.6 | |||
| China: 0.9% | ||||||
| 400,000 | China Overseas Land & Investment Ltd. | 1,216,172 | 0.9 | |||
| Denmark: 1.2% | ||||||
| 92,552 | @ | Danske Bank A/S | 1,571,919 | 1.2 | ||
| France: 11.2% | ||||||
| 6,735 | Air Liquide | 850,889 | 0.6 | |||
| 123,367 | AXA S.A. | 2,215,163 | 1.7 | |||
| 38,467 | BNP Paribas | 2,189,940 | 1.7 | |||
| 7,800 | PPR | 1,464,932 | 1.1 | |||
| 29,437 | Renault S.A. | 1,598,674 | 1.2 | |||
| 25,843 | Sanofi-Aventis SA | 2,450,702 | 1.8 | |||
| 46,957 | @ | Societe Generale | 1,785,430 | 1.3 | ||
| 6,527 | Technip S.A. | 754,760 | 0.6 | |||
| 30,853 | Total S.A. | 1,605,380 | 1.2 | |||
| 14,915,870 | 11.2 | |||||
| Germany: 9.4% | ||||||
| 15,280 | BASF AG | 1,444,883 | 1.1 | |||
| 21,450 | Bayer AG | 2,045,522 | 1.5 | |||
| 17,143 | Bayerische Motoren Werke AG | 1,668,212 | 1.3 | |||
| 92,843 | Deutsche Post AG | 2,044,925 | 1.5 | |||
| 81,198 | Deutsche Telekom AG | 924,274 | 0.7 | |||
| 63,506 | E.ON AG | 1,191,127 | 0.9 | |||
| 29,756 | Siemens AG | 3,253,854 | 2.4 | |||
| 12,572,797 | 9.4 | |||||
| Hong Kong: 4.0% | ||||||
| 266,100 | AIA Group Ltd. | 1,055,442 | 0.8 | |||
| 270,600 | Esprit Holdings Ltd. | 383,690 | 0.3 | |||
| 151,500 | Power Assets Holdings Ltd. | 1,299,804 | 1.0 | |||
| 214,000 | Wharf Holdings Ltd. | 1,705,521 | 1.3 | |||
| 249,000 | Yue Yuen Industrial Holdings | 842,168 | 0.6 | |||
| 5,286,625 | 4.0 | |||||
| Italy: 4.8% | ||||||
| 348,450 | Enel S.p.A. | 1,449,379 | 1.1 | |||
| 86,161 | ENI S.p.A. | 2,110,742 | 1.6 | |||
| 135,149 | Fiat Industrial SpA | 1,480,643 | 1.1 | |||
| 1,498,335 | Telecom Italia S.p.A. | 1,359,096 | 1.0 | |||
| 6,399,860 | 4.8 | |||||
| Japan: 20.2% | ||||||
| 24,400 | L | Canon, Inc. | 945,738 | 0.7 | ||
| 210,000 | Dynam Japan Holdings Co. Ltd. | 371,185 | 0.3 | |||
| 389,112 | Hitachi Ltd. | 2,289,733 | 1.7 | |||
| 38,000 | Honda Motor Co., Ltd. | 1,407,316 | 1.1 | |||
| 70,800 | Hoya Corp. | 1,395,039 | 1.1 | |||
| 150 | Inpex Holdings, Inc. | 802,254 | 0.6 | |||
| 67,800 | Japan Tobacco, Inc. | 1,915,308 | 1.4 | |||
| 46,000 | JGC Corp. | 1,433,428 | 1.1 | |||
| 53,200 | Komatsu Ltd. | 1,365,133 | 1.0 | |||
| 55,000 | Mitsubishi Estate Co., Ltd. | 1,316,739 | 1.0 | |||
| 75,500 | Nissan Motor Co., Ltd. | 716,410 | 0.5 | |||
| 145,000 | Nomura Holdings, Inc. | 858,297 | 0.6 | |||
| 87,500 | Omron Corp. | 2,100,293 | 1.6 | |||
| 14,220 | ORIX Corp. | 1,606,270 | 1.2 | |||
| 37,600 | Seven & I Holdings Co., Ltd. | 1,059,973 | 0.8 | |||
| 75,000 | Sumitomo Mitsui Financial Group, Inc. | 2,725,636 | 2.0 | |||
| 74,300 | Tokio Marine Holdings, Inc. | 2,069,944 | 1.6 | |||
| 33,100 | Tokyo Electron Ltd. | 1,526,614 | 1.1 | |||
| 23,100 | Toyota Motor Corp. | 1,078,681 | 0.8 | |||
| 26,983,991 | 20.2 | |||||
| Netherlands: 7.9% | ||||||
| 32,839 | European Aeronautic Defence and Space Co. NV | 1,294,561 | 1.0 | |||
| 15,298 | Koninklijke DSM NV | 932,352 | 0.7 | |||
| 74,771 | Koninklijke Philips Electronics NV | 1,979,962 | 1.5 | |||
| 128,392 | Royal Dutch Shell PLC - Class A | 4,456,533 | 3.3 | |||
| 49,642 | Unilever NV | 1,899,492 | 1.4 | |||
| 10,562,900 | 7.9 | |||||
| New Zealand: 0.9% | ||||||
| 648,468 | Telecom Corp. of New Zealand Ltd. | 1,227,426 | 0.9 | |||
| Norway: 1.2% | ||||||
| 61,236 | Statoil ASA | 1,543,430 | 1.2 | |||
| Singapore: 3.1% | ||||||
| 154,000 | Oversea-Chinese Banking Corp. | 1,240,930 | 0.9 | |||
| 517,000 | Singapore Telecommunications Ltd. | 1,406,772 | 1.1 | |||
| 89,100 | United Overseas Bank Ltd. | 1,461,600 | 1.1 | |||
| 4,109,302 | 3.1 | |||||
| Spain: 0.9% | ||||||
| 69,684 | Gas Natural SDG S.A. | 1,256,224 | 0.9 | |||
| Sweden: 1.0% | ||||||
| 130,151 | Telefonaktiebolaget LM Ericsson | 1,314,688 | 1.0 | |||
| Switzerland: 5.8% | ||||||
| 29,515 | Nestle S.A. | 1,925,661 | 1.4 | |||
| 33,147 | Novartis AG | 2,094,005 | 1.6 | |||
| 18,626 | Roche Holding AG - Genusschein | 3,765,827 | 2.8 | |||
| 7,785,493 | 5.8 | |||||
| United Kingdom: 21.6% | ||||||
| 576,579 | Barclays PLC | 2,504,660 | 1.9 | |||
| 96,076 | BHP Billiton PLC | 3,388,952 | 2.5 | |||
| 29,200 | BP PLC ADR | 1,215,888 | 0.9 | |||
| 19,600 | @ | Ensco PLC | 1,161,888 | 0.9 | ||
| 99,869 | GlaxoSmithKline PLC | 2,174,389 | 1.6 | |||
| 276,751 | HSBC Holdings PLC | 2,932,682 | 2.2 | |||
| 29,827 | Imperial Tobacco Group PLC | 1,156,445 | 0.9 | |||
| 657,481 | Legal & General Group PLC | 1,576,561 | 1.2 | |||
| 2,686,551 | @ | Lloyds TSB Group PLC | 2,140,910 | 1.6 | ||
| 108,809 | Rexam PLC | 778,553 | 0.6 | |||
| 54,951 | Rio Tinto PLC | 3,205,069 | 2.4 | |||
| 354,444 | Tesco PLC | 1,952,492 | 1.5 | |||
| 1,346,232 | Vodafone Group PLC | 3,388,840 | 2.5 | |||
| 83,251 | WPP PLC | 1,216,235 | 0.9 | |||
| 28,793,564 | 21.6 | |||||
| United States: 1.8% | ||||||
| 45,600 | Coca-Cola Enterprises, Inc. | 1,446,888 | 1.1 | |||
| 30,700 | @ | Rowan Companies PLC | 959,989 | 0.7 | ||
| 2,406,877 | 1.8 | |||||
| Total Common Stock | ||||||
| (Cost $121,585,457) | 132,343,456 | 99.1 | ||||
| Principal Amount† | Value | Percentage of Net Assets | ||||
| SHORT-TERM INVESTMENTS: 1.2% | ||||||
| Securities Lending Collateralcc(1): 0.7% | ||||||
| 974,058 | BNP Paribas Bank, Repurchase Agreement dated 12/31/12, 0.20%, due 01/02/13 (Repurchase Amount $974,069, collateralized by various U.S. Government Agency Obligations, 3.000%-3.500%, Market Value plus accrued interest $993,539, due 09/15/42-11/15/42) | 974,058 | 0.7 | |||
| 10,560 | Merrill Lynch & Co., Inc., Repurchase Agreement dated 12/31/12, 0.14%, due 01/02/13 (Repurchase Amount $10,560, collateralized by various U.S. Government Agency Obligations, 0.500%-6.000%, Market Value plus accrued interest $10,771, due 08/09/13-04/18/36) | 10,560 | 0.0 | |||
| 984,618 | 0.7 | |||||
| Shares | Value | Percentage of Net Assets | ||||
| Mutual Funds: 0.5% | ||||||
| 608,000 | BlackRock Liquidity Funds, TempFund, Institutional Class | |||||
| (Cost $608,000) | 608,000 | 0.5 | ||||
| Total Investments in Securities (Cost $123,178,075) | $ | 133,936,074 | 100.3 | |||||||
| Liabilities in Excess of Other Assets | (457,575 | ) | (0.3 | ) | ||||||
| Net Assets | $ | 133,478,499 | 100.0 | |||||||
| † | Unless otherwise indicated, principal amount is shown in USD. |
| @ | Non-income producing security |
| ADR | American Depositary Receipt |
| cc | Securities purchased with cash collateral for securities loaned. |
| L | Loaned security, a portion or all of the security is on loan at December 31, 2012. |
| (1) | Collateral received from brokers for securities lending was invested into these short-term investments. |
| Cost for federal income tax purposes is $124,265,405. | |||||
| Net unrealized appreciation consists of: | |||||
| Gross Unrealized Appreciation | $ | 13,489,760 | |||
| Gross Unrealized Depreciation | (3,819,091 | ) | |||
| Net Unrealized Appreciation | $ | 9,670,669 | |||
| Sector Diversification | Percentage of Net Assets | |||
| Financials | 26.8 | % | ||
| Energy | 11.0 | |||
| Industrials | 9.6 | |||
| Health Care | 9.3 | |||
| Materials | 8.5 | |||
| Consumer Staples | 8.5 | |||
| Consumer Discretionary | 8.1 | |||
| Information Technology | 7.2 | |||
| Telecommunication Services | 6.2 | |||
| Utilities | 3.9 | |||
| Short-Term Investments | 1.2 | |||
| Liabilities in Excess of Other Assets | (0.3 | ) | ||
| Net Assets | 100.0 | % | ||
| Fair Value Measurements^ |
| The following is a summary of the fair valuations according to the inputs used as of December 31, 2012 in valuing the assets and liabilities: |
| Quoted Prices in Active Markets for Identical Investments (Level 1) | Significant Other Observable Inputs # (Level 2) | Significant Unobservable Inputs (Level 3) | Fair Value at December 31, 2012 | |||||||||||||
| Asset Table | ||||||||||||||||
| Investments, at fair value | ||||||||||||||||
| Common Stock | ||||||||||||||||
| Australia | $ | — | $ | 1,671,163 | $ | — | $ | 1,671,163 | ||||||||
| Belgium | — | 1,902,420 | — | 1,902,420 | ||||||||||||
| Canada | 822,735 | — | — | 822,735 | ||||||||||||
| China | — | 1,216,172 | — | 1,216,172 | ||||||||||||
| Denmark | — | 1,571,919 | — | 1,571,919 | ||||||||||||
| France | — | 14,915,870 | — | 14,915,870 | ||||||||||||
| Germany | — | 12,572,797 | — | 12,572,797 | ||||||||||||
| Hong Kong | — | 5,286,625 | — | 5,286,625 | ||||||||||||
| Italy | — | 6,399,860 | — | 6,399,860 | ||||||||||||
| Japan | 371,185 | 26,612,806 | — | 26,983,991 | ||||||||||||
| Netherlands | — | 10,562,900 | — | 10,562,900 | ||||||||||||
| New Zealand | — | 1,227,426 | — | 1,227,426 | ||||||||||||
| Norway | — | 1,543,430 | — | 1,543,430 | ||||||||||||
| Singapore | — | 4,109,302 | — | 4,109,302 | ||||||||||||
| Spain | — | 1,256,224 | — | 1,256,224 | ||||||||||||
| Sweden | — | 1,314,688 | — | 1,314,688 | ||||||||||||
| Switzerland | — | 7,785,493 | — | 7,785,493 | ||||||||||||
| United Kingdom | 2,377,776 | 26,415,788 | — | 28,793,564 | ||||||||||||
| United States | 2,406,877 | — | — | 2,406,877 | ||||||||||||
| Total Common Stock | 5,978,573 | 126,364,883 | — | 132,343,456 | ||||||||||||
| Short-Term Investments | 608,000 | 984,618 | — | 1,592,618 | ||||||||||||
| Total Investments, at fair value | $ | 6,586,573 | $ | 127,349,501 | $ | — | $ | 133,936,074 | ||||||||
| ^ | See Note 2, "Significant Accounting Policies" in the Notes to Financial Statements for additional information. |
| # | The earlier close of the foreign markets gives rise to the possibility that significant events, including broad market moves, may have occurred in the interim and may materially affect the value of those securities. To account for this, the Portfolio may frequently value many of its foreign equity securities using fair value prices based on third party vendor modeling tools to the extent available. Accordingly, a portion of the Portfolio's investments are categorized as Level 2 investments. |
| See Accompanying Notes to Financial Statements |
| ING MidCap Opportunities Portfolio | PORTFOLIO OF INVESTMENTS |
| as of December 31, 2012 |
| Shares | Value | Percentage of Net Assets | ||||
| COMMON STOCK: 98.7% | ||||||
| Consumer Discretionary: 25.6% | ||||||
| 473,651 | Brinker International, Inc. | 14,678,444 | 1.3 | |||
| 640,380 | @ | Delphi Automotive PLC | 24,494,535 | 2.2 | ||
| 383,640 | @ | Discovery Communications, Inc. - Class A | 24,353,467 | 2.1 | ||
| 515,350 | Foot Locker, Inc. | 16,553,042 | 1.5 | |||
| 621,730 | Gap, Inc. | 19,298,499 | 1.7 | |||
| 336,360 | Harley-Davidson, Inc. | 16,427,822 | 1.5 | |||
| 102,109 | @ | Liberty Media Corp. - Liberty Capital | 11,845,665 | 1.0 | ||
| 669,810 | @,L | Lions Gate Entertainment Corp. | 10,984,884 | 1.0 | ||
| 462,134 | Macy's, Inc. | 18,032,469 | 1.6 | |||
| 189,310 | @ | The Madison Square Garden, Inc. | 8,395,899 | 0.7 | ||
| 319,140 | @ | Michael Kors Holdings Ltd. | 16,285,714 | 1.4 | ||
| 787,680 | Newell Rubbermaid, Inc. | 17,541,634 | 1.5 | |||
| 231,160 | @ | Penn National Gaming, Inc. | 11,352,268 | 1.0 | ||
| 265,680 | Petsmart, Inc. | 18,156,571 | 1.6 | |||
| 173,780 | Ross Stores, Inc. | 9,410,187 | 0.8 | |||
| 193,440 | Scripps Networks Interactive - Class A | 11,204,045 | 1.0 | |||
| 187,770 | Six Flags Entertainment Corp. | 11,491,524 | 1.0 | |||
| 150,340 | @ | Ulta Salon Cosmetics & Fragrance, Inc. | 14,772,408 | 1.3 | ||
| 296,014 | Wyndham Worldwide Corp. | 15,750,905 | 1.4 | |||
| 291,029,982 | 25.6 | |||||
| Consumer Staples: 6.1% | ||||||
| 175,278 | Beam, Inc. | 10,707,733 | 0.9 | |||
| 713,260 | Coca-Cola Enterprises, Inc. | 22,631,740 | 2.0 | |||
| 167,290 | JM Smucker Co. | 14,427,090 | 1.3 | |||
| 237,340 | Whole Foods Market, Inc. | 21,676,262 | 1.9 | |||
| 69,442,825 | 6.1 | |||||
| Energy: 6.3% | ||||||
| 395,470 | @ | Cameron International Corp. | 22,328,236 | 2.0 | ||
| 898,940 | @ | Denbury Resources, Inc. | 14,562,828 | 1.3 | ||
| 398,040 | @ | Oasis Petroleum, Inc. | 12,657,672 | 1.1 | ||
| 296,460 | Range Resources Corp. | 18,626,582 | 1.6 | |||
| 121,850 | @ | Southwestern Energy Co. | 4,071,009 | 0.3 | ||
| 72,246,327 | 6.3 | |||||
| Financials: 8.0% | ||||||
| 101,890 | @ | Affiliated Managers Group, Inc. | 13,260,984 | 1.2 | ||
| 182,650 | Ameriprise Financial, Inc. | 11,439,370 | 1.0 | |||
| 802,430 | Fifth Third Bancorp. | 12,188,912 | 1.1 | |||
| 177,590 | Marsh & McLennan Cos., Inc. | 6,121,527 | 0.5 | |||
| 498,442 | Nasdaq Stock Market, Inc. | 12,466,034 | 1.1 | |||
| 243,780 | T. Rowe Price Group, Inc. | 15,877,391 | 1.4 | |||
| 334,290 | Tanger Factory Outlet Centers, Inc. | 11,432,718 | 1.0 | |||
| 363,940 | UDR, Inc. | 8,654,493 | 0.7 | |||
| 91,441,429 | 8.0 | |||||
| Health Care: 14.0% | ||||||
| 332,180 | Agilent Technologies, Inc. | 13,599,449 | 1.2 | |||
| 197,430 | @ | Alexion Pharmaceuticals, Inc. | 18,520,908 | 1.6 | ||
| 163,340 | Cooper Cos., Inc. | 15,105,683 | 1.3 | |||
| 420,680 | @ | HCA Holdings, Inc. | 12,691,916 | 1.1 | ||
| 139,390 | @ | Henry Schein, Inc. | 11,215,319 | 1.0 | ||
| 149,290 | @ | Laboratory Corp. of America Holdings | 12,931,500 | 1.1 | ||
| 256,160 | @ | Myriad Genetics, Inc. | 6,980,360 | 0.6 | ||
| 86,077 | Perrigo Co. | 8,954,590 | 0.8 | |||
| 44,500 | @ | Regeneron Pharmaceuticals, Inc. | 7,612,615 | 0.7 | ||
| 405,650 | Resmed, Inc. | 16,862,871 | 1.5 | |||
| 175,860 | @ | Salix Pharmaceuticals Ltd. | 7,118,813 | 0.6 | ||
| 170,430 | @ | Vertex Pharmaceuticals, Inc. | 7,147,834 | 0.6 | ||
| 244,626 | @ | Watson Pharmaceuticals, Inc. | 21,037,836 | 1.9 | ||
| 159,779,694 | 14.0 | |||||
| Industrials: 16.6% | ||||||
| 247,770 | Acuity Brands, Inc. | 16,781,462 | 1.5 | |||
| 520,623 | Ametek, Inc. | 19,559,806 | 1.7 | |||
| 210,970 | @ | BE Aerospace, Inc. | 10,421,918 | 0.9 | ||
| 340,610 | Equifax, Inc. | 18,433,813 | 1.6 | |||
| 109,750 | Flowserve Corp. | 16,111,300 | 1.4 | |||
| 99,415 | @ | IHS, Inc. | 9,543,840 | 0.8 | ||
| 243,421 | Nordson Corp. | 15,364,734 | 1.4 | |||
| 272,320 | Pall Corp. | 16,410,003 | 1.5 | |||
| 195,901 | Regal-Beloit Corp. | 13,805,143 | 1.2 | |||
| 205,322 | Roper Industries, Inc. | 22,889,297 | 2.0 | |||
| 519,180 | Waste Connections, Inc. | 17,543,092 | 1.5 | |||
| 177,393 | @ | Wesco International, Inc. | 11,961,610 | 1.1 | ||
| 188,826,018 | 16.6 | |||||
| Information Technology: 15.8% | ||||||
| 377,720 | Analog Devices, Inc. | 15,886,903 | 1.4 | |||
| 615,200 | @ | Autodesk, Inc. | 21,747,320 | 1.9 | ||
| 399,640 | Broadcom Corp. | 13,272,044 | 1.2 | |||
| 192,090 | @ | F5 Networks, Inc. | 18,661,543 | 1.7 | ||
| 627,220 | Flir Systems, Inc. | 13,993,278 | 1.2 | |||
| 98,170 | @ | Gartner, Inc. | 4,517,783 | 0.4 | ||
| 417,665 | Intuit, Inc. | 24,851,068 | 2.2 | |||
| 816,570 | @ | Juniper Networks, Inc. | 16,061,932 | 1.4 | ||
| 680,434 | @ | NetApp, Inc. | 22,828,561 | 2.0 | ||
| 150,730 | @ | Teradata Corp. | 9,328,680 | 0.8 | ||
| 519,610 | Xilinx, Inc. | 18,653,999 | 1.6 | |||
| 179,803,111 | 15.8 | |||||
| Materials: 4.6% | ||||||
| 313,670 | Eastman Chemical Co. | 21,345,244 | 1.9 | |||
| 524,460 | Packaging Corp. of America | 20,175,976 | 1.7 | |||
| 819,937 | Steel Dynamics, Inc. | 11,257,735 | 1.0 | |||
| 52,778,955 | 4.6 | |||||
| Telecommunication Services: 1.7% | ||||||
| 269,090 | @ | SBA Communications Corp. | 19,110,772 | 1.7 | ||
| Total Common Stock | ||||||
| (Cost $989,670,946) | 1,124,459,113 | 98.7 | ||||
| Principal Amount† | Value | Percentage of Net Assets | ||||
| SHORT-TERM INVESTMENTS: 2.3% | ||||||
| Securities Lending Collateralcc(1): 1.0% | ||||||
| 2,555,815 | Barclays Bank PLC, Repurchase Agreement dated 12/31/12, 0.30%, due 01/02/13 (Repurchase Amount $2,555,857, collateralized by various U.S. Government Agency Obligations, 3.500%-5.500%, Market Value plus accrued interest $2,606,931, due 08/01/27-01/01/43) | 2,555,815 | 0.3 | |||
| 2,555,815 | Citigroup, Inc., Repurchase Agreement dated 12/31/12, 0.20%, due 01/02/13 (Repurchase Amount $2,555,843, collateralized by various U.S. Government Agency Obligations, 0.000%-6.500%, Market Value plus accrued interest $2,606,932, due 10/01/16-12/20/42) | 2,555,815 | 0.2 | |||
| 2,555,815 | Daiwa Capital Markets, Repurchase Agreement dated 12/31/12, 0.30%, due 01/02/13 (Repurchase Amount $2,555,857, collateralized by various U.S. Government and U.S. Government Agency Obligations, 0.000%-6.500%, Market Value plus accrued interest $2,606,931, due 06/14/13-12/01/42) | 2,555,815 | 0.2 | |||
| 537,894 | JPMorgan Chase & Co., Repurchase Agreement dated 12/31/12, 0.18%, due 01/02/13 (Repurchase Amount $537,899, collateralized by various U.S. Government Securities, 0.750%-1.625%, Market Value plus accrued interest $548,653, due 10/31/17-08/15/22) | 537,894 | 0.1 | |||
| 2,555,815 | Merrill Lynch & Co., Inc., Repurchase Agreements dated 12/31/12, 0.15%-0.19%, due 01/02/13 (Repurchase Amount $2,555,841, collateralized by various U.S. Government Agency Obligations, 0.500%-6.000%, Market Value plus accrued interest $2,606,932, due 08/09/13-06/20/42) | 2,555,815 | 0.2 | |||
| 10,761,154 | 1.0 | |||||
| Shares | Value | Percentage of Net Assets | ||||
| Mutual Funds: 1.3% | ||||||
| 14,940,000 | BlackRock Liquidity Funds, TempFund, Institutional Class | |||||
| (Cost $14,940,000) | 14,940,000 | 1.3 | ||||
| Total Short-Term Investments | ||||||||||
| (Cost $25,701,154) | 25,701,154 | 2.3 | ||||||||
| Total Investments in Securities (Cost $1,015,372,100) | $ | 1,150,160,267 | 101.0 | |||||||
| Liabilities in Excess of Other Assets | (11,717,596 | ) | (1.0 | ) | ||||||
| Net Assets | $ | 1,138,442,671 | 100.0 | |||||||
| † | Unless otherwise indicated, principal amount is shown in USD. |
| @ | Non-income producing security |
| cc | Securities purchased with cash collateral for securities loaned. |
| L | Loaned security, a portion or all of the security is on loan at December 31, 2012. |
| (1) | Collateral received from brokers for securities lending was invested into these short-term investments. |
Cost for federal income tax purposes is $1,017,989,959. | ||
Net unrealized appreciation consists of: | ||
| Gross Unrealized Appreciation | $148,411,223 | |
Gross Unrealized Depreciation | (16,240,915) | |
| Net Unrealized Appreciation | $132,170,308 | |
| Fair Value Measurements^ |
| The following is a summary of the fair valuations according to the inputs used as of December 31, 2012 in valuing the assets and liabilities: |
| Quoted Prices in Active Markets for Identical Investments (Level 1) | Significant Other Observable Inputs (Level 2) | Significant Unobservable Inputs (Level 3) | Fair Value at December 31, 2012 | |||||||||||||
| Asset Table | ||||||||||||||||
| Investments, at fair value | ||||||||||||||||
| Common Stock* | $ | 1,124,459,113 | $ | — | $ | — | $ | 1,124,459,113 | ||||||||
| Short-Term Investments | 14,940,000 | 10,761,154 | — | 25,701,154 | ||||||||||||
| Total Investments, at fair value | $ | 1,139,399,113 | $ | 10,761,154 | $ | — | $ | 1,150,160,267 | ||||||||
| ^ | See Note 2, "Significant Accounting Policies" in the Notes to Financial Statements for additional information. |
| * | For further breakdown of Common Stock by Industry type, please refer to the Portfolio of Investments. |
| See Accompanying Notes to Financial Statements |
ING SmallCap Opportunities Portfolio | PORTFOLIO OF INVESTMENTS |
| as of December 31, 2012 |
| Shares | Value | Percentage of Net Assets | ||||
| COMMON STOCK: 95.9% | ||||||
| Consumer Discretionary: 18.1% | ||||||
| 119,900 | @ | Aeropostale, Inc. | 1,559,899 | 0.7 | ||
| 4,750 | Arbitron, Inc. | 221,730 | 0.1 | |||
| 55,361 | @ | Arctic Cat, Inc. | 1,848,504 | 0.8 | ||
| 37,300 | @ | Bally Technologies, Inc. | 1,667,683 | 0.8 | ||
| 29,600 | Cheesecake Factory | 968,512 | 0.4 | |||
| 36,600 | @ | Childrens Place Retail Stores, Inc. | 1,621,014 | 0.7 | ||
| 60,066 | Cinemark Holdings, Inc. | 1,560,515 | 0.7 | |||
| 89,809 | Cooper Tire & Rubber Co. | 2,277,556 | 1.0 | |||
| 109,300 | Dana Holding Corp. | 1,706,173 | 0.8 | |||
| 117,000 | @ | Express, Inc. | 1,765,530 | 0.8 | ||
| 98,500 | Finish Line | 1,864,605 | 0.8 | |||
| 29,300 | Gildan Activewear, Inc. | 1,071,794 | 0.5 | |||
| 36,299 | @ | Hibbett Sporting Goods, Inc. | 1,912,957 | 0.9 | ||
| 77,032 | @,L | Imax Corp. | 1,731,679 | 0.8 | ||
| 65,600 | @ | Jack in the Box, Inc. | 1,876,160 | 0.9 | ||
| 47,151 | @ | Life Time Fitness, Inc. | 2,320,301 | 1.0 | ||
| 50,956 | @ | LKQ Corp. | 1,075,172 | 0.5 | ||
| 18,107 | @,L | Lumber Liquidators | 956,593 | 0.4 | ||
| 60,300 | Monro Muffler, Inc. | 2,108,691 | 1.0 | |||
| 54,596 | OfficeMax, Inc. | 532,857 | 0.2 | |||
| 44,118 | Pool Corp. | 1,867,074 | 0.8 | |||
| 73,800 | @ | Sally Beauty Holdings, Inc. | 1,739,466 | 0.8 | ||
| 116,700 | @,L | Smith & Wesson Holding Corp. | 984,948 | 0.4 | ||
| 30,858 | @ | Steiner Leisure Ltd. | 1,487,047 | 0.7 | ||
| 33,394 | Vail Resorts, Inc. | 1,806,281 | 0.8 | |||
| 81,233 | @ | Wet Seal, Inc. | 224,203 | 0.1 | ||
| 29,494 | Wyndham Worldwide Corp. | 1,569,376 | 0.7 | |||
| 40,326,320 | 18.1 | |||||
| Consumer Staples: 2.0% | ||||||
| 36,100 | Casey's General Stores, Inc. | 1,916,910 | 0.9 | |||
| 30,500 | @ | Elizabeth Arden, Inc. | 1,372,805 | 0.6 | ||
| 52,450 | Flowers Foods, Inc. | 1,220,512 | 0.5 | |||
| 4,510,227 | 2.0 | |||||
| Energy: 6.0% | ||||||
| 85,741 | @ | Bill Barrett Corp. | 1,525,332 | 0.7 | ||
| 67,000 | @,L | C&J Energy Services, Inc. | 1,436,480 | 0.6 | ||
| 84,000 | @ | Carrizo Oil & Gas, Inc. | 1,757,280 | 0.8 | ||
| 28,200 | @ | Dril-Quip, Inc. | 2,060,010 | 0.9 | ||
| 143,700 | @ | Key Energy Services, Inc. | 998,715 | 0.4 | ||
| 38,300 | @ | Rosetta Resources, Inc. | 1,737,288 | 0.8 | ||
| 81,200 | @ | Swift Energy Co. | 1,249,668 | 0.6 | ||
| 37,600 | @ | Unit Corp. | 1,693,880 | 0.8 | ||
| 20,700 | World Fuel Services Corp. | 852,219 | 0.4 | |||
| 13,310,872 | 6.0 | |||||
| Financials: 9.5% | ||||||
| 14,900 | @ | Affiliated Managers Group, Inc. | 1,939,235 | 0.9 | ||
| 60,600 | Colony Financial, Inc. | 1,181,700 | 0.5 | |||
| 54,200 | Coresite Realty Corp. | 1,499,172 | 0.7 | |||
| 62,250 | @ | DFC Global Corp. | 1,152,248 | 0.5 | ||
| 69,633 | @ | Financial Engines, Inc. | 1,932,316 | 0.9 | ||
| 18,200 | First American Financial Corp. | 438,438 | 0.2 | |||
| 201,779 | Hersha Hospitality Trust | 1,008,895 | 0.5 | |||
| 30,300 | Home Properties, Inc. | 1,857,693 | 0.8 | |||
| 21,862 | @ | Portfolio Recovery Associates, Inc. | 2,336,173 | 1.1 | ||
| 26,376 | @ | Signature Bank | 1,881,664 | 0.8 | ||
| 59,359 | @ | Stifel Financial Corp. | 1,897,707 | 0.9 | ||
| 33,100 | @ | SVB Financial Group | 1,852,607 | 0.8 | ||
| 60,500 | Tanger Factory Outlet Centers, Inc. | 2,069,100 | 0.9 | |||
| 21,046,948 | 9.5 | |||||
| Health Care: 18.1% | ||||||
| 38,500 | @ | Acorda Therapeutics, Inc. | 957,110 | 0.4 | ||
| 57,500 | @ | Align Technology, Inc. | 1,595,625 | 0.7 | ||
| 8,600 | @ | BioMarin Pharmaceuticals, Inc. | 423,550 | 0.2 | ||
| 12,885 | @ | Bio-Rad Laboratories, Inc. | 1,353,569 | 0.6 | ||
| 35,354 | @ | Centene Corp. | 1,449,514 | 0.6 | ||
| 31,500 | Chemed Corp. | 2,160,585 | 1.0 | |||
| 41,200 | @ | Cubist Pharmaceuticals, Inc. | 1,732,872 | 0.8 | ||
| 46,684 | @ | Haemonetics Corp. | 1,906,575 | 0.9 | ||
| 106,431 | @ | Healthsouth Corp. | 2,246,758 | 1.0 | ||
| 54,800 | @ | Impax Laboratories, Inc. | 1,122,852 | 0.5 | ||
| 40,500 | @,L | Incyte Corp., Ltd. | 672,705 | 0.3 | ||
| 86,100 | @,L | InterMune, Inc. | 834,309 | 0.4 | ||
| 28,970 | @ | IPC The Hospitalist Co., Inc. | 1,150,399 | 0.5 | ||
| 51,100 | @ | Luminex Corp. | 856,436 | 0.4 | ||
| 80,100 | @ | Masimo Corp. | 1,682,901 | 0.8 | ||
| 47,700 | @ | Medicines Co. | 1,143,369 | 0.5 | ||
| 21,144 | @ | Mednax, Inc. | 1,681,371 | 0.8 | ||
| 95,200 | @ | Merit Medical Systems, Inc. | 1,323,280 | 0.6 | ||
| 39,000 | @ | Momenta Pharmaceuticals, Inc. | 459,420 | 0.2 | ||
| 28,220 | @ | Nektar Therapeutics | 209,110 | 0.1 | ||
| 26,218 | @ | Neogen Corp. | 1,188,200 | 0.5 | ||
| 45,000 | @ | Omnicell, Inc. | 669,150 | 0.3 | ||
| 36,624 | @,L | OncoGenex Pharmaceutical, Inc. | 480,507 | 0.2 | ||
| 5,632 | @ | Onyx Pharmaceuticals, Inc. | 425,385 | 0.2 | ||
| 82,600 | @ | Optimer Pharmaceuticals, Inc. | 747,530 | 0.3 | ||
| 59,750 | Owens & Minor, Inc. | 1,703,472 | 0.8 | |||
| 42,409 | @ | PSS World Medical, Inc. | 1,224,772 | 0.5 | ||
| 15,000 | @ | Salix Pharmaceuticals Ltd. | 607,200 | 0.3 | ||
| 30,700 | @,L | Seattle Genetics, Inc. | 712,240 | 0.3 | ||
| 37,373 | Steris Corp. | 1,297,964 | 0.6 | |||
| 49,969 | @ | Theravance, Inc. | 1,112,810 | 0.5 | ||
| 23,500 | @ | Thoratec Corp. | 881,720 | 0.4 | ||
| 31,218 | Universal Health Services, Inc. | 1,509,390 | 0.7 | |||
| 141,422 | @ | Vical, Inc. | 411,538 | 0.2 | ||
| 64,400 | @,L | Vivus, Inc. | 864,248 | 0.4 | ||
| 28,100 | @ | WellCare Health Plans, Inc. | 1,368,189 | 0.6 | ||
| 40,166,625 | 18.1 | |||||
| Industrials: 16.6% | ||||||
| 78,535 | Actuant Corp. | 2,191,912 | 1.0 | |||
| 40,700 | Acuity Brands, Inc. | 2,756,611 | 1.2 | |||
| 6,812 | @ | Allegiant Travel Co. | 500,069 | 0.2 | ||
| 27,930 | @ | Clean Harbors, Inc. | 1,536,429 | 0.7 | ||
| 26,800 | Corporate Executive Board Co. | 1,271,928 | 0.6 | |||
| 49,400 | @ | EnPro Industries, Inc. | 2,020,460 | 0.9 | ||
| 25,900 | @ | Genesee & Wyoming, Inc. | 1,970,472 | 0.9 | ||
| 30,614 | Geo Group, Inc. | 863,315 | 0.4 | |||
| 51,445 | Gorman-Rupp Co. | 1,534,604 | 0.7 | |||
| 53,451 | Healthcare Services Group | 1,241,667 | 0.6 | |||
| 59,250 | @ | HUB Group, Inc. | 1,990,800 | 0.9 | ||
| 39,600 | @ | Huron Consulting Group, Inc. | 1,334,124 | 0.6 | ||
| 144,000 | Knight Transportation, Inc. | 2,106,720 | 0.9 | |||
| 22,048 | Regal-Beloit Corp. | 1,553,722 | 0.7 | |||
| 56,700 | Simpson Manufacturing Co., Inc. | 1,859,193 | 0.8 | |||
| 24,303 | @ | SYKES Enterprises, Inc. | 369,892 | 0.2 | ||
| 29,100 | @ | Teledyne Technologies, Inc. | 1,893,537 | 0.8 | ||
| 43,300 | Toro Co. | 1,861,034 | 0.8 | |||
| 71,630 | @ | TrueBlue, Inc. | 1,128,172 | 0.5 | ||
| 62,663 | Waste Connections, Inc. | 2,117,383 | 1.0 | |||
| 19,100 | Watsco, Inc. | 1,430,590 | 0.6 | |||
| 34,000 | Watts Water Technologies, Inc. | 1,461,660 | 0.7 | |||
| 52,290 | Woodward Governor Co. | 1,993,818 | 0.9 | |||
| 36,988,112 | 16.6 | |||||
| Information Technology: 21.5% | ||||||
| 82,189 | @ | Advanced Energy Industries, Inc. | 1,135,030 | 0.5 | ||
| 26,507 | @ | Ansys, Inc. | 1,784,981 | 0.8 | ||
| 116,900 | @ | Aruba Networks, Inc. | 2,425,675 | 1.1 | ||
| 101,600 | @ | Aspen Technology, Inc. | 2,808,224 | 1.3 | ||
| 114,547 | @,L | Bankrate, Inc. | 1,426,110 | 0.6 | ||
| 86,745 | Blackbaud, Inc. | 1,980,388 | 0.9 | |||
| 84,833 | @ | Cardtronics, Inc. | 2,013,935 | 0.9 | ||
| 30,390 | @ | Coherent, Inc. | 1,538,342 | 0.7 | ||
| 5,900 | @ | Commvault Systems, Inc. | 411,289 | 0.2 | ||
| 43,500 | @ | DealerTrack Holdings, Inc. | 1,249,320 | 0.6 | ||
| 58,200 | @ | Exa Corp. | 566,286 | 0.2 | ||
| 45,600 | @ | ExactTarget, Inc. | 912,000 | 0.4 | ||
| 140,562 | @ | Formfactor, Inc. | 640,963 | 0.3 | ||
| 247,371 | @ | Integrated Device Technology, Inc. | 1,805,808 | 0.8 | ||
| 49,900 | j2 Global, Inc. | 1,525,942 | 0.7 | |||
| 40,500 | @ | Liquidity Services, Inc. | 1,654,830 | 0.7 | ||
| 62,900 | @ | LogMeIn, Inc. | 1,409,589 | 0.6 | ||
| 47,989 | @ | Micros Systems, Inc. | 2,036,653 | 0.9 | ||
| 51,700 | MKS Instruments, Inc. | 1,332,826 | 0.6 | |||
| 62,846 | @ | Monolithic Power Systems, Inc. | 1,400,209 | 0.6 | ||
| 65,713 | National Instruments Corp. | 1,696,053 | 0.8 | |||
| 111,600 | @ | Parametric Technology Corp. | 2,512,116 | 1.1 | ||
| 39,700 | Pegasystems, Inc. | 900,396 | 0.4 | |||
| 49,571 | @ | Plexus Corp. | 1,278,932 | 0.6 | ||
| 190,800 | @ | PMC - Sierra, Inc. | 994,068 | 0.4 | ||
| 103,300 | @ | Polycom, Inc. | 1,080,518 | 0.5 | ||
| 73,500 | @ | QLIK Technologies, Inc. | 1,596,420 | 0.7 | ||
| 75,400 | @ | Riverbed Technolgoy, Inc. | 1,486,888 | 0.7 | ||
| 56,463 | @ | SciQuest, Inc. | 895,503 | 0.4 | ||
| 77,100 | @ | Semtech Corp. | 2,232,045 | 1.0 | ||
| 63,750 | @ | Synaptics, Inc. | 1,910,588 | 0.9 | ||
| 60,600 | @ | Synchronoss Technologies, Inc. | 1,278,054 | 0.6 | ||
| 47,919,981 | 21.5 | |||||
| Materials: 4.1% | ||||||
| 43,006 | Buckeye Technologies, Inc. | 1,234,702 | 0.6 | |||
| 88,100 | Commercial Metals Co. | 1,309,166 | 0.6 | |||
| 57,700 | HB Fuller Co. | 2,009,114 | 0.9 | |||
| 163,526 | Hecla Mining Co. | 953,357 | 0.4 | |||
| 39,288 | Minerals Technologies, Inc. | 1,568,377 | 0.7 | |||
| 76,500 | Worthington Industries | 1,988,235 | 0.9 | |||
| 9,062,951 | 4.1 | |||||
| Total Common Stock | ||||||
| (Cost $193,166,625) | 213,332,036 | 95.9 | ||||
| EXCHANGE-TRADED FUNDS: 2.1% | ||||||
| 48,207 | iShares Russell 2000 Growth Index Fund | 4,594,609 | 2.1 | |||
| Total Exchange-Traded Funds | ||||||
| (Cost $4,354,485) | 4,594,609 | 2.1 | ||||
| Total Long-Term Investments | ||||||
| (Cost $197,521,110) | 217,926,645 | 98.0 | ||||
| Principal Amount† | Value | Percentage of Net Assets | ||||
| SHORT-TERM INVESTMENTS: 5.1% | ||||||
| Securities Lending Collateralcc(1): 2.9% | ||||||
| 1,540,414 | Barclays Bank PLC, Repurchase Agreement dated 12/31/12, 0.30%, due 01/02/13 (Repurchase Amount $1,540,439, collateralized by various U.S. Government Agency Obligations, 3.500%-5.500%, Market Value plus accrued interest $1,571,222, due 08/01/27-01/01/43) | 1,540,414 | 0.7 | |||
| 1,540,414 | Citigroup, Inc., Repurchase Agreement dated 12/31/12, 0.20%, due 01/02/13 (Repurchase Amount $1,540,431, collateralized by various U.S. Government Agency Obligations, 0.000%-6.500%, Market Value plus accrued interest $1,571,222, due 10/01/16-12/20/42) | 1,540,414 | 0.7 | |||
| 324,197 | JPMorgan Chase & Co., Repurchase Agreement dated 12/31/12, 0.18%, due 01/02/13 (Repurchase Amount $324,200, collateralized by various U.S. Government Securities, 0.750%-1.625%, Market Value plus accrued interest $330,682, due 10/31/17-08/15/22) | 324,197 | 0.1 | |||
| 1,540,414 | Merrill Lynch & Co., Inc., Repurchase Agreements dated 12/31/12, 0.15%-0.19%, due 01/02/13 (Repurchase Amount $1,540,430, collateralized by various U.S. Government Agency Obligations, 0.500%-6.000%, Market Value plus accrued interest $1,571,223, due 08/09/13-06/20/42) | 1,540,414 | 0.7 | |||
| 1,540,414 | Nomura Securities, Repurchase Agreement dated 12/31/12, 0.35%, due 01/02/13 (Repurchase Amount $1,540,444, collateralized by various U.S. Government Agency Obligations, 0.000%-6.101%, Market Value plus accrued interest $1,571,222, due 03/10/14-12/20/42) | 1,540,414 | 0.7 | |||
| 6,485,853 | 2.9 | |||||
| Shares | Value | Percentage of Net Assets | ||||
| Mutual Funds: 2.2% | ||||||
| 4,796,000 | BlackRock Liquidity Funds, TempFund, Institutional Class | |||||
| (Cost $4,796,000) | 4,796,000 | 2.2 | ||||
| Total Short-Term Investments | ||||||||||
| (Cost $11,281,853) | 11,281,853 | 5.1 | ||||||||
| Total Investments in Securities (Cost $208,802,963) | $ | 229,208,498 | 103.1 | |||||||
| Liabilities in Excess of Other Assets | (6,785,713 | ) | (3.1 | ) | ||||||
| Net Assets | $ | 222,422,785 | 100.0 | |||||||
| † | Unless otherwise indicated, principal amount is shown in USD. |
| @ | Non-income producing security |
| cc | Securities purchased with cash collateral for securities loaned. |
| L | Loaned security, a portion or all of the security is on loan at December 31, 2012. |
| (1) | Collateral received from brokers for securities lending was invested into these short-term investments. |
| Cost for federal income tax purposes is $211,223,488. | |||||
| Net unrealized appreciation consists of: | |||||
| Gross Unrealized Appreciation | $ | 30,083,755 | |||
| Gross Unrealized Depreciation | (12,098,745 | ) | |||
| Net Unrealized Appreciation | $ | 17,985,010 | |||
VPAR-UVPTADVISS2 (1212-021513)
| See Accompanying Notes to Financial Statements |
Item 7. Disclosure of Proxy Voting Policies and Procedures for Closed-End Management Investment Companies.
Not applicable.
Item 8. Portfolio Managers of Closed-End Management Investment Companies.
Not applicable.
Item 9. Purchases of Equity Securities by Closed-End Management Investment Company and Affiliated Purchasers
Not applicable.
Item 10. Submission of Matters to a Vote of Security Holders.
The Board has a Nominating Committee for the purpose of considering and presenting to the Board candidates it proposes for nomination to fill Independent Trustee vacancies on the Board. The Committee currently consists of all Independent Trustees of the Board (6 individuals). The Nominating Committee operates pursuant to a Charter approved by the Board. The primary purpose of the Nominating Committee is to consider and present to the Board the candidates it proposes for nomination to fill vacancies on the Board. In evaluating candidates, the Nominating Committee may consider a variety of factors, but it has not at this time set any specific minimum qualifications that must be met. Specific qualifications of candidates for Board membership will be based on the needs of the Board at the time of nomination.
The Nominating Committee is willing to consider nominations received from shareholders and shall assess shareholder nominees in the same manner as it reviews its own nominees. A shareholder nominee for director should be submitted in writing to the Fund’s Secretary. Any such shareholder nomination should include at a minimum the following information as to each individual proposed for nomination as trustee: such individual’s written consent to be named in the proxy statement as a nominee (if nominated) and to serve as a trustee (if elected), and all information relating to such individual that is required to be disclosed in the solicitation of proxies for election of trustees, or is otherwise required, in each case under applicable federal securities laws, rules and regulations.
The Secretary shall submit all nominations received in a timely manner to the Nominating Committee. To be timely, any such submission must be delivered to the Fund’s Secretary not earlier than the 90th day prior to such meeting and not later than the close of business on the later of the 60th day prior to such meeting or the 10th day following the day on which public announcement of the date of the meeting is first made, by either disclosure in a press release or in a document publicly filed by the Fund with the Securities and Exchange Commission.
Item 11. Controls and Procedures.
| (a) | Based on our evaluation conducted within 90 days of the filing date, hereof, the design and operation of the registrant’s disclosure controls and procedures are effective to ensure that material information relating to the registrant is made known to the certifying officers by others within the appropriate entities, particularly during the period in which Forms N-CSR are being prepared, and the registrant’s disclosure controls and procedures allow timely preparation and review of the information for the registrant’s Form N-CSR and the officer certifications of such Form N-CSR. |
| (b) | There were no significant changes in the registrant’s internal controls that occurred during the second fiscal quarter of the period covered by this report that has materially affected, or is reasonably likely to materially affect, the registrant’s internal control over financial reporting. |
Item 12. Exhibits.
(a)(1) | Code of Ethics pursuant to Item 2 of Form N-CSR is filed and attached hereto as EX-99.CODE ETH. |
|
|
(a)(2) | A separate certification for each principal executive officer and principal financial officer of the |
registrant as required by Rule 30a-2 under the Act (17 CFR 270.30a-2) is attached hereto as EX-99.CERT. | |
|
|
(b) | The officer certifications required by Section 906 of the Sarbanes-Oxley Act of 2002 are attached hereto as EX-99.906CERT. |
|
|
(3) | Not applicable. |
SIGNATURES
Pursuant to the requirements of the Securities Exchange Act of 1934 and the Investment Company Act of 1940, the registrant has duly caused this report to be signed on its behalf by the undersigned, thereunto duly authorized.
(Registrant): | ING Variable Products Trust |
| |
| |||
By | /s/ Shaun P. Mathews |
| |
|
| ||
| Shaun P. Mathews | ||
| President and Chief Executive Officer | ||
|
| ||
Date: | March 6, 2013 |
| |
Pursuant to the requirements of the Securities Exchange Act of 1934 and the Investment Company Act of 1940, this report has been signed below by the following persons on behalf of the registrant and in the capacities and on the dates indicated.
By | /s/ Shaun P. Mathews |
| |
|
| ||
| Shaun P. Mathews | ||
| President and Chief Executive Officer | ||
|
| ||
Date: | March 6, 2013 |
| |
|
|
| |
|
| ||
By | /s/ Todd Modic |
|
|
|
|
| |
| Todd Modic Senior Vice President and |
| |
|
|
| |
Date: | March 6, 2013 |
|
|