| OMB APPROVAL | |
| OMB Number: | 3235-0570 |
| Expires: | January 31, 2017 |
| Estimated average burden hours per response. . . . . . . . . . .20.6 | |
UNITED STATES
SECURITIES AND EXCHANGE COMMISSION
Washington, D.C. 20549
FORM N-CSR
CERTIFIED SHAREHOLDER REPORT OF REGISTERED
MANAGEMENT INVESTMENT COMPANIES
Investment Company Act file number 811-8220
Voya Variable Products Trust
(Exact name of registrant as specified in charter)
7337 E. Doubletree Ranch Rd., Scottsdale, AZ 85258
(Address of principal executive offices) (Zip code)
CT Corporation System, 101 Federal Street, Boston, MA 02110
(Name and address of agent for service)
Registrant’s telephone number, including area code: 1-800-992-0180
Date of fiscal year end: December 31
Date of reporting period: January 1, 2014 to December 31, 2014
ITEM 1. REPORTS TO STOCKHOLDERS.
The following is a copy of the report transmitted to stockholders pursuant to Rule 30e-1 under the Act (17 CFR 270.30e-1):

Annual Report
December 31, 2014
Classes ADV, I, S and S2
Voya Variable Products Trust
| ■ | Voya International Value Portfolio |
| ■ | Voya MidCap Opportunities Portfolio |
| ■ | Voya SmallCap Opportunities Portfolio |
| This report is submitted for general information to shareholders of the Voya mutual funds. It is not authorized for distribution to prospective shareholders unless accompanied or preceded by a prospectus which includes details regarding the funds’ investment objectives, risks, charges, expenses and other information. This information should be read carefully. |
TABLE OF CONTENTS
PROXY VOTING INFORMATION
A description of the policies and procedures that the Portfolios use to determine how to vote proxies related to portfolio securities is available: (1) without charge, upon request, by calling Shareholder Services toll-free at (800) 992-0180; (2) on the Portfolios’ website at www.voyainvestments.com; and (3) on the U.S. Securities and Exchange Commission’s (“SEC’s”) website at www.sec.gov. Information regarding how the Portfolios voted proxies related to portfolio securities during the most recent 12-month period ended June 30 is available without charge on the Portfolios’ website at www.voyainvestments.com and on the SEC’s website at www.sec.gov.
QUARTERLY PORTFOLIO HOLDINGS
The Portfolios file their complete schedule of portfolio holdings with the SEC for the first and third quarters of each fiscal year on Form N-Q. This report contains a summary portfolio of investments for the Portfolios. The Portfolios’ Forms N-Q are available on the SEC’s website at www.sec.gov. The Portfolios’ Forms N-Q may be reviewed and copied at the SEC’s Public Reference Room in Washington, DC, and information on the operation of the Public Reference Room may be obtained by calling (800) SEC-0330. The Portfolios’ Forms N-Q, as well as a complete portfolio of investments, are available without charge upon request from the Portfolios by calling Shareholder Services toll-free at (800) 992-0180.

New Year, Hopeful View
Dear Shareholder,
As 2014 came to a close, U.S. economic growth accelerated, Japan and Europe were struggling and volatility re-emerged in markets around the world. Though periods of volatility may challenge investor resolve over the course of the year, we believe resilience will prevail thanks to continued improvements in global consumer and business spending and ample global liquidity.
Resilience has been a defining characteristic of markets for some time now, as we have seen them shake off such potentially destabilizing events as Europe’s chronic economic malaise, China’s growth slowdown and Japan’s sharp and surprising return to recession. And that’s not to mention the various geopolitical hotspots — Ukraine, the Middle East and elsewhere — that have flared up from time to time. Along the way markets have been fortified by all-time high U.S. corporate earnings; renewed monetary stimulus from central banks in Japan, Europe and China; and plummeting oil prices that have provided a positive supply shock to consumers and businesses. This confluence of events has bolstered markets worldwide and has raised investor confidence that such trends can be sustained into 2015.
Despite our optimism, we — as always — advocate a well-balanced, globally diversified portfolio. We believe such an approach is the best way to potentially benefit from whatever opportunities may arise, while limiting the potential for over-exposure to as-yet-unidentified risks. Also as always, be sure to review your investment strategy and portfolio with your financial advisor to ensure they continue to reflect your goals and needs. Thoroughly discuss any potential portfolio changes with your advisor before taking action.
We appreciate your continued confidence in us, and we look forward to serving your investment needs in the future.
Sincerely,

Shaun Mathews
Executive Vice President
Voya Family of Funds
January 28, 2015
The views expressed in the President’s Letter reflect those of the President as of the date of the letter. Any such views are subject to change at any time based upon market or other conditions and the Voya mutual funds disclaim any responsibility to update such views. These views may not be relied on as investment advice and because investment decisions for a Voya mutual fund are based on numerous factors, may not be relied on as an indication of investment intent on behalf of any Voya mutual fund. Reference to specific company securities should not be construed as recommendations or investment advice.
International investing poses special risks including currency fluctuation, economic and political risks not found in investments that are solely domestic.
| 1 |
Market Perspective: Year Ended December 31, 2014
Global equities, in the form of the MSCI World IndexSM (the “Index”) measured in local currencies, including net reinvested dividends ended 2013 at a record high. Investor sentiment had evidently reconciled itself to the tapering of the U.S. Federal Reserve Board’s (“Fed’s”) $85 billion of monthly Treasury and mortgage-backed securities purchases. The Fed’s December 18 announcement of a reduction in purchases to $75 billion per month with more to come was taken in stride. There was still plenty to worry about however and the Index endured an early slump and wide swings late in 2014 before ending up 9.81% for the year. (The Index returned 4.94% for the one year ended December 31, 2014, measured in U.S. dollars.)
It did not take long for worries about a flagging U.S. economy to resurface. A disappointingly weak employment report on January 10 showed only 74,000 jobs created in December, the lowest in nearly three years. A cold and snowy winter was thought to be depressing hiring and other key statistics like durable goods orders and home sales.
The Index reached its low point on February 3, down almost exactly 5% in 2014. Yet it took only 18 days to erase the loss despite new political turmoil that flared in Eastern Europe as Russia annexed Crimea after the president of Ukraine was deposed.
With the improvement in the season came a pick-up in U.S. economic data. Employment reports were looking better and the unemployment rate fell below 6%. The December bulletin marked the eighth consecutive month in which more than 200,000 jobs were created. National purchasing managers’ activity indices signaled healthy expansion. While the housing market was cooling, the annualized rate of existing home sales exceeded 5 million for five straight months. Consumer confidence touched seven-year high levels. Growth in gross domestic product (“GDP”) was -2.1% (annualized) in the first quarter but bounced back to 5.0% in the third.
Yet concerns remained about the sustainability of the recovery in the U.S. and worldwide. The improving U.S. employment situation was accompanied by labor force participation rates at or near the lowest since 1978. Wage growth was sluggish near 2% annually. The Fed’s monthly Treasury and mortgage-backed securities purchases ended in October.
Outside of the U.S., growth in China was decelerating, which also weighed on global commodity supplying countries. Japan re-entered recession in the third quarter after an April rise in consumption tax. But it was the euro zone that was the most problematic. Growth almost ground to a halt in the second and third quarters. Unemployment seemed stuck at 11.5%, while deflation was perilously close. Markets became increasingly skeptical that the European Central Bank (“ECB”) could attempt U.S., UK and Japan-style quantitative easing with Germany unequivocally opposed. Oil prices had been steadily falling since late June and would halve by year-end. Increased shale oil production notwithstanding, was this also a signal that global economic activity was weaker than anyone had imagined?
Securities prices mirrored investors’ mood swings in the last few months. The Index actually reached a new peak on September 19, but by October 16 fell 8.2%. From there the Index rebounded 12% to December 5, fell 5% to December 16 then rose 4% to end the year 1.3% below its all-time high.
In U.S. fixed income markets, the Barclays Long-Term U.S. Treasury sub-index returned a remarkable 25.07% in 2014; the
Barclays Short-Term U.S. Treasury sub-index just 0.09% as the Treasury yield curve flattened. The Barclays U.S. Aggregate Bond Index (“Barclays Aggregate”) added 5.97%, while the Barclays U.S. Corporate Investment Grade Bond sub-index gained 7.46%. Both outperformed the Barclays High Yield Bond — 2% Issuer Constrained Composite Index (not a part of the Barclays Aggregate), which gained only 2.46%, perhaps reflecting growing disillusionment with the risk/reward profile of high yield bonds after strong returns in recent years.
U.S. equities, represented by the S&P 500® Index including dividends, returned 13.69% in the fiscal year, about 1.5% below its all-time high. The utilities sector was the top performer, returning 28.98%; not surprisingly, the only loser was energy, which dropped 7.78% as oil prices sagged. Record operating earnings per share for S&P 500® companies in the second and third quarters were supported by low interest rates, slow wage growth and historically high share buy-back volumes. Operating margins breached 10% for the first time.
In currencies, the dollar advanced against most other currencies over the year. The dollar surged 13.60% against the euro, on the U.S.’s much better growth and interest rate increase prospects, and 13.74% against the yen, on the likelihood of further monetary easing in Japan and an announced partial re-allocation into non-yen securities for the giant Government Pension Investment Fund (“GPIF”). The dollar gained less, 6.29%, on the pound. The UK had a better growth story than the euro zone, which however is the destination for about 40% of the UK’s exports.
In international markets, the MSCI Japan® Index rose 9.48% in 2014, boosted in the case of Japan’s large exporters by the falling yen and in general by the GPIF’s announcement described above. The MSCI Europe ex UK® Index added 6.63%. The poor economic data referred to above and the lingering conflict in Ukraine dampened markets, which were spasmodically supported by the possibility of quantitative easing. The strong health care sector contributed about one third of the total. Despite superior economic results, the MSCI UK® Index was much weaker, edging up 0.50%. UK stock indices are not particularly representative of the UK economy: the largest 14 names account for half of the index and comprise mostly global banking, energy, pharmaceuticals and materials companies. As a group, they held back returns by about 1.80%.
All indices are unmanaged and investors cannot invest directly in an index. Past performance does not guarantee future results. The performance quoted represents past performance. Investment return and principal value of an investment will fluctuate, and shares, when redeemed, may be worth more or less than their original cost. The Portfolios’ performance is subject to change since the period’s end and may be lower or higher than the performance data shown. Please call (800) 992-0180 or log on to www.voyainvestments.com to obtain performance data current to the most recent month end.
Market Perspective reflects the views of Voya Investment Management’s Chief Investment Risk Officer only through the end of the period, and is subject to change based on market and other conditions.
| 2 |
Benchmark Descriptions
| Index | Description | |||||||
| Barclays High Yield Bond — 2% Issuer Constrained Composite Index | An unmanaged index that includes all fixed-income securities having a maximum quality rating of Ba1, a minimum amount outstanding of $150 million, and at least one year to maturity. | |||||||
| Barclays Long-Term U.S. Treasury Index | The Index includes all publicly issued, U.S. Treasury securities that have a remaining maturity of 10 or more years, are rated investment grade, and have $250 million or more of outstanding face value. | |||||||
| Barclays Short-Term U.S. Treasury Index | A market capitalization-weighted index that is composed of fixed-rate, non-convertible U.S. Treasury securities that have a remaining maturity of between one and 12 months and have $250 million or more of outstanding face value. | |||||||
| Barclays U.S. Aggregate Bond Index | An unmanaged index of publicly issued investment grade U.S. Government, mortgage-backed, asset-backed and corporate debt securities. | |||||||
| Barclays U.S. Corporate Investment Grade Bond Index | An unmanaged index consisting of publicly issued, fixed rate, nonconvertible, investment grade debt securities. | |||||||
| MSCI EAFE® Index | An unmanaged index that measures the performance of securities listed on exchanges in markets in Europe, Australasia and the Far East. It includes the reinvestment of dividends net of withholding taxes, but does not reflect fees, brokerage commissions or other expenses of investing. | |||||||
| MSCI Europe ex UK® Index | A free float-adjusted market capitalization index that is designed to measure developed market equity performance in Europe, excluding the UK. | |||||||
| MSCI Japan® Index | A free float-adjusted market capitalization index that is designed to measure developed market equity performance in Japan. | |||||||
| MSCI UK® Index | A free float-adjusted market capitalization index that is designed to measure developed market equity performance in the UK. | |||||||
| MSCI World IndexSM | An unmanaged index that measures the performance of over 1,400 securities listed on exchanges in the U.S., Europe, Canada, Australia, New Zealand and the Far East. | |||||||
| Russell 2000® Growth Index | An unmanaged index that measures the performance of securities of smaller U.S. companies with greater than average growth orientation. | |||||||
| Russell 2000® Index | An unmanaged index that measures the performance of securities of small U.S. companies. | |||||||
| Russell Midcap® Growth Index | An unmanaged index that measures the performance of those companies included in the Russell Midcap® Index with relatively higher price-to-book ratios and higher forecasted growth values. | |||||||
| Russell Midcap® Index | An unmanaged index that measures the performance of the 800 smallest companies in the Russell 1000T Index, which represents approximately 26% of the total market capitalization of the Russell 1000® Index. | |||||||
| S&P 500® Index | An unmanaged index that measures the performance of securities of approximately 500 large-capitalization companies whose securities are traded on major U.S. stock markets. |
| 3 |
| Voya International Value Portfolio | Portfolio Managers’ Report |
Geographic Diversification | |||||
| Japan | 20.6% | ||||
| France | 14.1% | ||||
| United Kingdom | 14.1% | ||||
| Germany | 11.0% | ||||
| Switzerland | 10.6% | ||||
| Netherlands | 8.7% | ||||
| Italy | 3.2% | ||||
| Australia | 3.2% | ||||
| China | 2.4% | ||||
| Sweden | 2.3% | ||||
| Countries between 0.7%-2.2%^ | 8.4% | ||||
| Assets in Excess of Other Liabilities* | 1.4% | ||||
| Net Assets | 100.0% | ||||
| * | Includes short-term investments. | |
| ^ | Includes 7 countries, which each represents 0.7%-2.2% of net assets. | |
| Portfolio holdings are subject to change daily. |
Voya International Value Portfolio (the “Portfolio”) seeks long-term capital appreciation. The Portfolio is managed by Martin Jansen, Senior Portfolio Manager, Joseph Vultaggio, Portfolio Manager, and David Rabinowitz, Portfolio Manager of Voya Investment Management Co. LLC (“Voya IM”) — the Sub-Adviser.*
Performance: For the year ended December 31, 2014, the Portfolio’s Class I shares provided a total return of -4.94% compared to the MSCI EAFE® Index, which returned -4.90% for the same period.
Portfolio Specifics: The Portfolio outperformed its benchmark before the deduction of fees and operating expenses, but lagged net of those costs. Performance for the period was due to security selection, particularly in the telecommunications services, energy and health care sectors. Security selection in materials, industrials and financials detracted from relative results. From a regional perspective, stock selection in Europe and allocation to emerging markets contributed the most to performance. In contrast, sector allocation in North America and security selection in Asia Pacific ex-Japan detracted from results.
Among the leading individual contributors to performance were Ajinomoto Co., Inc. (“Ajinomoto”), Orange SA (“Orange”) and Statoil ASA (“Statoil”). Japanese food producer Ajinomoto benefited from the acquisition of Windsor Quality Holdings, a U.S. frozen food maker, which may boost sales, along with cost synergies to create a high margin portfolio. The company may also benefit from announced price increases in frozen foods in February 2015. Telecommunications services supplier Orange released third quarter results slightly better than expected. With improvements in the French market and cost cutting measures coming in ahead of schedule, we believe the company’s fundamentals appear more stable. Statoil, an integrated oil company, benefited from management announcing definitive return and growth targets that tied together the benefits of the company’s exploration success with an improving operational outlook.
Top Ten Holdings | |||||
| Royal Dutch Shell PLC - Class A | 3.5% | ||||
| Novartis AG | 3.2% | ||||
| Roche Holding AG - Genusschein | 2.9% | ||||
| Total S.A. | 2.3% | ||||
| Toyota Motor Corp. | 2.2% | ||||
| Nestle S.A. | 2.1% | ||||
| BHP Billiton Ltd. | 1.9% | ||||
| Bayer AG | 1.9% | ||||
| Barclays PLC | 1.7% | ||||
| Hitachi Ltd. | 1.7% | ||||
| Portfolio holdings are subject to change daily. | |||||
Among the leading detractors from performance were Noble Corporation PLC (“Noble Corp.”), BHP Billiton PLC (“BHP Billiton”) and Fortescue Metals Group Ltd. (“Fortescue Metals”), which were all impacted by the severe contraction in commodity prices during the year. Energy service provider Noble Corp. underperformed after investors reacted badly to management comments early in 2014 about the industry experiencing a short pause in its business cycle, even while reporting earnings that were mostly in line with analysts’ expectations. Falling prices hurt iron-ore producer Fortescue Metals, particularly because of its low quality product. International resources company BHP Billiton, the world’s largest mining group, fell sharply in tandem with the overall underperformance of the energy and metals sectors.
Current Strategy and Outlook: In our opinion, international developed stocks have modest upside potential from current levels. While we believe the banking crisis in Europe has been substantially resolved, we also believe that economic recovery is proving more elusive than market participants had hoped. Renewed and substantial quantitative easing measures by the European Central Bank are expected to result in a modest recovery in 2015. On balance, we believe the substantial fall in energy and commodity prices should stimulate global consumption and industrial production as 2015 progresses. We believe that the structural growth issues facing the developed world are expected to improve gradually, albeit with some periodic setbacks. We believe the Portfolio is well diversified across both geographic regions and economic sectors; we continue to favor well-capitalized stocks with what we believe to be unrecognized value.
| * | On September 12, 2014, the Board of Trustees approved a proposal, subject to shareholder approval, to reorganize the Portfolio with and into the Voya Global Value Advantage Portfolio. |
| Portfolio holdings and characteristics are subject to change and may not be representative of current holdings and characteristics. The outlook for this Portfolio may differ from that presented for other Voya mutual funds. Performance for the different classes of shares will vary based on differences in fees associated with each class. |
| 4 |
Voya International Value Portfolio |
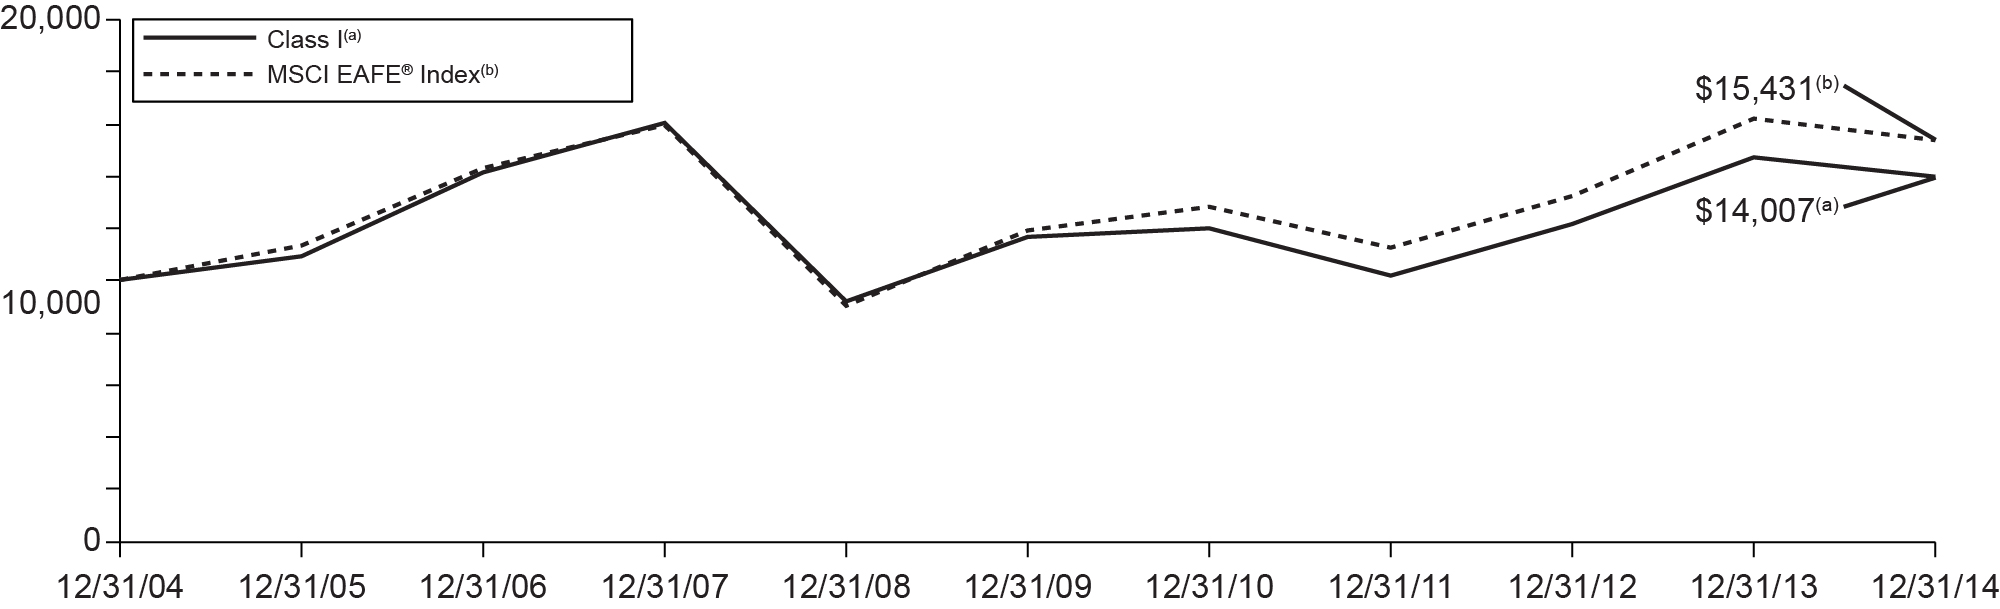
| Average Annual Returns for the Periods Ended December 31, 2014 | ||||||||||||||||||
| 1 Year | 5 Year | 10 Year | Since Inception of Class ADV December 29, 2006 | |||||||||||||||
| Class ADV | -5.44% | 3.14% | — | -0.65% | ||||||||||||||
| Class I | -4.94% | 3.67% | 3.43% | — | ||||||||||||||
| Class S | -5.18% | 3.50% | 3.22% | — | ||||||||||||||
| MSCI EAFE® Index | -4.90% | 5.33% | 4.43% | 0.92% | ||||||||||||||
Based on a $10,000 initial investment, the graph and table above illustrate the total return of Voya International Value Portfolio against the index indicated. The index is unmanaged and has no cash in its portfolio, imposes no sales charges and incurs no operating expenses. An investor cannot invest directly in an index. The Portfolio’s performance is shown without the imposition of any expenses or charges which are, or may be, imposed under your annuity contract or life insurance policy. Total returns would have been lower if such expenses or charges were included.
The performance graph and table do not reflect the deduction of taxes that a shareholder will pay on Portfolio distributions or the redemption of Portfolio shares.
The performance shown may include the effect of fee waivers and/or expense reimbursements by the Investment Adviser and/or other service providers, which have the effect of increasing total return. Had all fees and expenses been considered, the total returns would have been lower.
The performance update illustrates performance for a variable investment option available through a variable contract and/or a variable universal life policy. The performance shown indicates past performance and is not a projection or prediction of future results. Actual investment returns and principal value will fluctuate so that shares and/or units, at redemption, may be worth more or less than their original cost. Please log on to www.voyainvestments.com or call (800) 992-0180 to get performance through the most recent month end.
This report contains statements that may be “forward-looking” statements. Actual results may differ materially from those projected in the “forward-looking” statements.
The views expressed in this report reflect those of the portfolio managers, only through the end of the period as stated on the cover. The portfolio managers’ views are subject to change at any time based on market and other conditions.
Portfolio holdings are subject to change daily.
| 5 |
| Voya MidCap Opportunities Portfolio | Portfolio Managers’ Report |
Sector Diversification | |||||
| Consumer Discretionary | 24.9% | ||||
| Information Technology | 17.5% | ||||
| Industrials | 17.1% | ||||
| Health Care | 12.5% | ||||
| Financials | 9.4% | ||||
| Consumer Staples | 8.8% | ||||
| Energy | 4.9% | ||||
| Materials | 4.3% | ||||
| Assets in Excess of Other Liabilities* | 0.6% | ||||
| Net Assets | 100.0% | ||||
| * Includes short-term investments. | |||||
| Portfolio holdings are subject to change daily. | |||||
Voya MidCap Opportunities Portfolio (the “Portfolio”) seeks long-term capital appreciation. The Portfolio is managed by Jeffrey Bianchi and Michael Pytosh, Portfolio Managers of Voya Investment Management Co. LLC (“Voya IM”) — the Sub-Adviser.
Performance: For the year ended December 31, 2014, the Portfolio’s Class I shares provided a total return of 8.85% compared to the Russell Midcap® Growth Index and the Russell Midcap® Index, which returned 11.90% and 13.22%, respectively, for the same period.
Portfolio Specifics: The Portfolio underperformed its benchmarks during the reporting period, driven primarily by stock selection. In particular, stock selection within the energy and health care sectors detracted the most from performance, while stock selection within the information technology and consumer staples sectors contributed the most to performance.
Best Buy Co., Inc. (“Best Buy”), Informatica Corp. (“Informatica”) and Cabot Oil & Gas Corp. (“Cabot Oil & Gas”) were among the most significant detractors for the reporting period. Our overweight in Best Buy was negative for performance. The stock fell after the company reported disappointing results early in the year, due to the competitive environment in consumer electronics. Stiff competition led to a highly promotional holiday season in 2013 and negatively impacted Best Buy’s revenues and margins. Our overweight in Informatica was a negative for returns. The company reported strong fourth quarter results, but concerns over the company’s competitive position weighed on its share price. The market questioned Informatica’s ability to remain relevant in the era of cloud computing, as a variety of open source software platforms have begun offering alternatives to some of Informatica’s core offerings. Our overweight in Cabot Oil & Gas detracted from performance. The stock fell on concerns of weaker than expected price realization due to an infrastructure bottleneck that limited the company’s ability to transport gas to more attractive markets.
Top Ten Holdings | |||||
| Southwest Airlines Co. | 3.0% | ||||
| Intuit, Inc. | 2.3% | ||||
| VF Corp. | 2.2% | ||||
| Chipotle Mexican Grill, Inc. | 2.0% | ||||
| Jarden Corp. | 2.0% | ||||
| Aon PLC | 1.9% | ||||
| Ametek, Inc. | 1.9% | ||||
| Monster Beverage Corp. | 1.9% | ||||
| Roper Industries, Inc. | 1.9% | ||||
| Mylan Laboratories | 1.8% | ||||
| Portfolio holdings are subject to change daily. | |||||
Southwest Airlines Co. (“Southwest Airlines”), Hillshire Brands Co. (“Hillshire Brands”) and Palo Alto Networks, Inc. (“Palo Alto Networks”) were the largest contributors to performance during the reporting period. Our overweight in the domestic airline Southwest Airlines was beneficial for performance. A strong pricing environment in North America, coupled with solid company cost control, has led to a sizable increase in consensus expectations. An overweight in packaged meat company Hillshire Brands contributed to performance. The stock rose after Pilgrim’s Pride and Tyson Foods entered into a bidding war to acquire the company. In June, Tyson Foods announced a bid to acquire all outstanding shares of Hillshire Brands for $63 per share, up from its previous bid of $50 per share and trumping Pilgrim’s Pride’s offer of $55 per share. An overweight position in Palo Alto Networks was positive for performance. The company reported strong fiscal third quarter results, driven by better than expected billings growth, deferred revenue growth and recurring subscription revenues. In addition, the paid subscriber base for WildFire, one of the company’s key products, continued to experience strong growth. Importantly, the company announced that it reached a settlement with Juniper Networks over a patent infringement case. As part of the settlement, the two companies agreed not to sue each other over patent infringement for eight years.
Current Strategy and Outlook: We believe that the U.S. economy has moved into a phase of self-sustaining, if slow, economic recovery. As we see continued modestly improving economic conditions, consensus expectations are that the U.S. Federal Reserve Board (the “Fed”) may begin to raise the federal funds rate as early as June 2015. The Fed may consider labor market conditions and inflation in its decision to move toward a normalized interest rate environment. We believe the strength of U.S. corporations remains intact, as evidenced by significant amounts of free cash flow and record high incremental margins. U.S. corporations are also actively returning capital to shareholders via dividend increases and share buybacks.
Portfolio holdings and characteristics are subject to change and may not be representative of current holdings and characteristics. The outlook for this Portfolio may differ from that presented for other Voya mutual funds. Performance for the different classes of shares will vary based on differences in fees associated with each class.
| 6 |
Portfolio Managers’ Report | Voya MidCap Opportunities Portfolio |
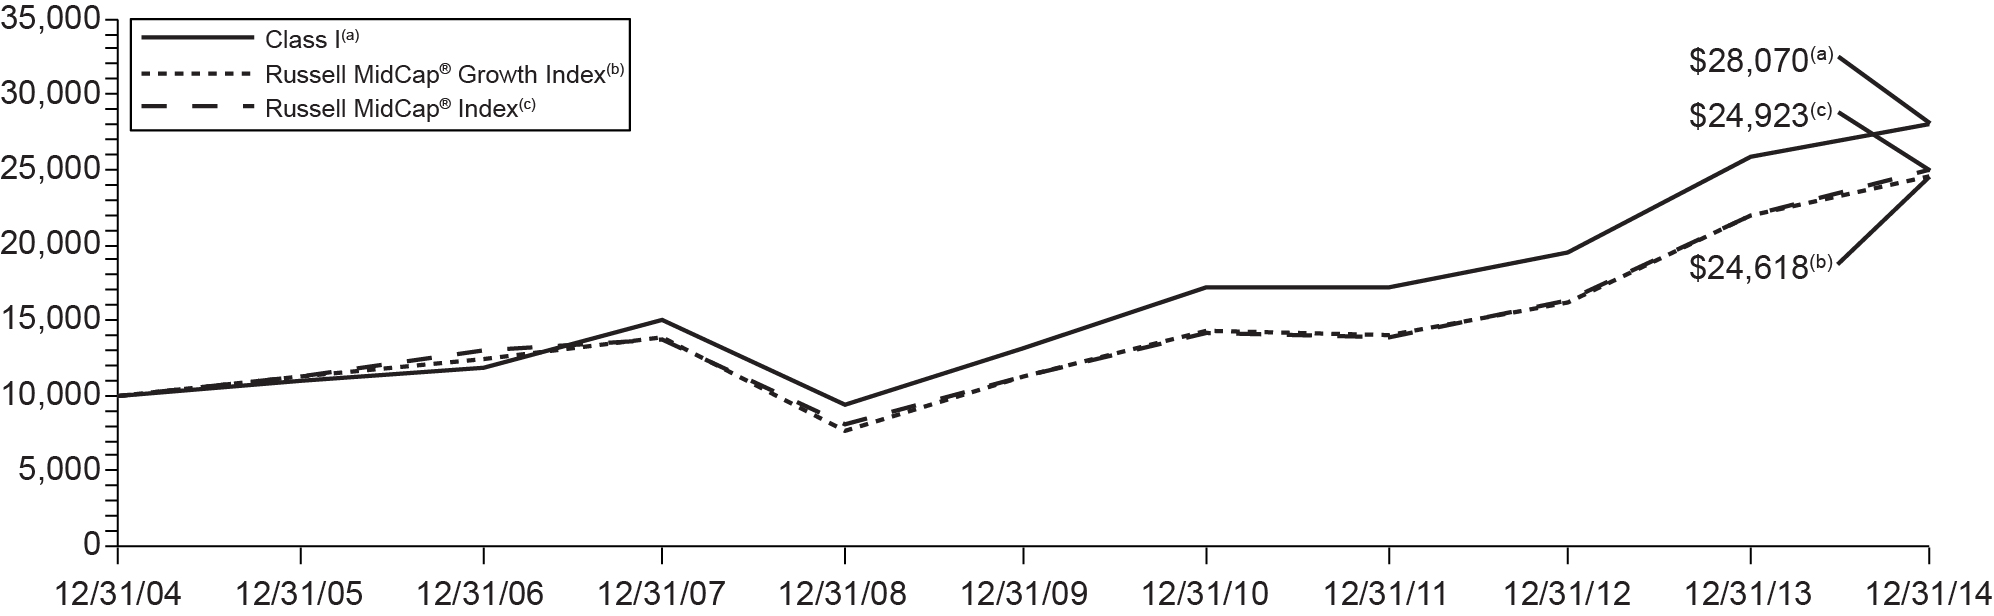
| Average Annual Returns for the Periods Ended December 31, 2014 | ||||||||||||||||||||||
| 1 Year | 5 Year | 10 Year | Since Inception of Class ADV December 29, 2006 | Since Inception of Class S2 February 27, 2009 | ||||||||||||||||||
| Class ADV | 8.29% | 15.68% | — | 10.70% | — | |||||||||||||||||
| Class I | 8.85% | 16.30% | 10.87% | — | — | |||||||||||||||||
| Class S | 8.56% | 15.99% | 10.62% | — | — | |||||||||||||||||
| Class S2 | 8.39% | 15.81% | — | — | 22.96% | |||||||||||||||||
| Russell Midcap® Growth Index | 11.90% | 16.94% | 9.43% | 8.94% | 24.71% | |||||||||||||||||
| Russell Midcap® Index | 13.22% | 17.19% | 9.56% | 8.49% | 25.28% | |||||||||||||||||
Based on a $10,000 initial investment, the graph and table above illustrate the total return of Voya MidCap Opportunities Portfolio against the indices indicated. An index is unmanaged and has no cash in its portfolio, imposes no sales charges and incurs no operating expenses. An investor cannot invest directly in an index. The Portfolio’s performance is shown without the imposition of any expenses or charges which are, or may be, imposed under your annuity contract or life insurance policy. Total returns would have been lower if such expenses or charges were included.
The performance graph and table do not reflect the deduction of taxes that a shareholder will pay on Portfolio distributions or the redemption of Portfolio shares.
The performance shown may include the effect of fee waivers and/or expense reimbursements by the Investment Adviser and/or other service providers, which have the effect of increasing total return. Had all fees and expenses been considered, the total returns would have been lower.
The performance update illustrates performance for a variable investment option available through a variable
contract and/or a variable universal life policy. The performance shown indicates past performance and is not a projection or prediction of future results. Actual investment returns and principal value will fluctuate so that shares and/or units, at redemption, may be worth more or less than their original cost. Please log on to www.voyainvestments.com or call (800) 992-0180 to get performance through the most recent month end.
This report contains statements that may be “forward-looking” statements. Actual results may differ materially from those projected in the “forward-looking” statements.
The views expressed in this report reflect those of the portfolio managers, only through the end of the period as stated on the cover. The portfolio managers’ views are subject to change at any time based on market and other conditions.
Portfolio holdings are subject to change daily.
| 7 |
| Voya SmallCap Opportunities Portfolio | Portfolio Managers’ Report |
| Sector Diversification as of December 31, 2014 (as a percentage of net assets) | |||||
| Information Technology | 23.3% | ||||
| Health Care | 21.4% | ||||
| Consumer Discretionary | 18.2% | ||||
| Industrials | 14.3% | ||||
| Financials | 10.6% | ||||
| Materials | 4.8% | ||||
| Energy | 2.9% | ||||
| Exchange-Traded Funds | 1.7% | ||||
| Consumer Staples | 1.7% | ||||
| Assets in Excess of Other Liabilities* | 1.1% | ||||
| Net Assets | 100.0% | ||||
| * Includes short-term investments. | |||||
| Portfolio holdings are subject to change daily. | |||||
Voya SmallCap Opportunities Portfolio (the “Portfolio”) seeks long-term capital appreciation. The Portfolio is managed by Steve Salopek*, James Hasso and Joseph Basset, CFA, Portfolio Managers of Voya Investment Management Co. LLC (“Voya IM”) — the Sub-Adviser.
Performance: For the year ended December 31, 2014, the Portfolio’s Class I shares provided a total return of 5.62%, compared to the Russell 2000® Growth Index and the Russell 2000® Index, which returned 5.60% and 4.89%, respectively, for the same period.
Portfolio Specifics: Outperformance for the period was due to favorable stock selection. Security selection within the capital goods and software and services sectors contributed the most to relative performance for the period. By contrast, our underweight to the pharmaceuticals and biotechnology sector detracted the most from returns. Our underweight allocation during the first half of 2014 and subsequent overweight allocation during the second half of 2014 to the energy sector helped performance, but this gain was more than offset by the negative impact of security selection in that sector.
The main individual contributors to performance were Knight Transportation, Inc. (“Knight Transportation”) and InterMune, Inc. (“InterMune”).
Our overweight position in Knight Transportation, a provider of truckload transportation services, contributed to performance due to a steady improvement in overall sentiment in the truckload industry. Over the course of 2013, we had built up our position in Knight Transportation, as we thought that the stock became decoupled from what were increasingly strong truckload fundamentals. The Portfolio’s large overweight position paid off as a strong spring freight market in 2014 and tight truckload capacity resulted in higher spot rates in 2014 and, consequently, higher negotiated contractual rate increases. We believe Knight Transportation is a greater beneficiary of a tight truck market because of its decentralized business model and its policy of committing fewer trucks to contracts.
| Top Ten Holdings as of December 31, 2014* (as a percentage of net assets) | |||||
| iShares Russell 2000 Growth Index Fund | 1.7% | ||||
| Qlik Technologies, Inc. | 1.3% | ||||
| Vail Resorts, Inc. | 1.2% | ||||
| WEX, Inc. | 1.2% | ||||
| j2 Global, Inc. | 1.2% | ||||
| Ultimate Software Group, Inc. | 1.2% | ||||
| Team Health Holdings, Inc. | 1.2% | ||||
| Healthsouth Corp. | 1.1% | ||||
| PRA Group, Inc. | 1.1% | ||||
| Cardtronics, Inc. | 1.1% | ||||
| * | Excludes short-term investments. | ||
| Portfolio holdings are subject to change daily. |
Shares of InterMune, a biotechnology company focused on the research, development and commercializing of innovative therapies in pulmonology and orphan fibrotic diseases, outperformed for the period. During the first quarter, the company reported positive Phase 3 data involving a compound to treat a lung disease called idiopathic pulmonary fibrosis. Investors believed InterMune’s strong trial results would set the company up for Food and Drug Administration approval later this year. Furthermore, in August 2014, the company announced a definitive merger agreement under which Roche will acquire InterMune for $74 per share in an all-cash transaction.
Key detractors from performance were Energy XXI Ltd. and Bill Barrett Corp.
Within the energy sector, our overweight positions in Energy XXI Ltd. and Bill Barrett Corp. detracted the most due to the overall weakness in the sector and declining oil prices.
Current Strategy and Outlook: We continue to monitor changes occurring globally, actions at central banks and overall economic data. Our portfolio positioning has not changed significantly. We seek to remain nimble and continue to focus on quality companies, such as those that, in our opinion, have strong managements, solid balance sheets and good cash flow generation capabilities. Going forward, we believe the portfolio is well positioned, as we think that investors will continue to focus on companies’ fundamentals due to ongoing economic uncertainty.
| * | Steve Salopek has decided to retire from Voya Investment Management Co. LLC effective June 30, 2015. |
| Portfolio holdings and characteristics are subject to change and may not be representative of current holdings and characteristics. The outlook for this Portfolio may differ from that presented for other Voya mutual funds. Performance for the different classes of shares will vary based on differences in fees associated with each class. |
| 8 |
Portfolio Managers’ Report | Voya SmallCap Opportunities Portfolio |
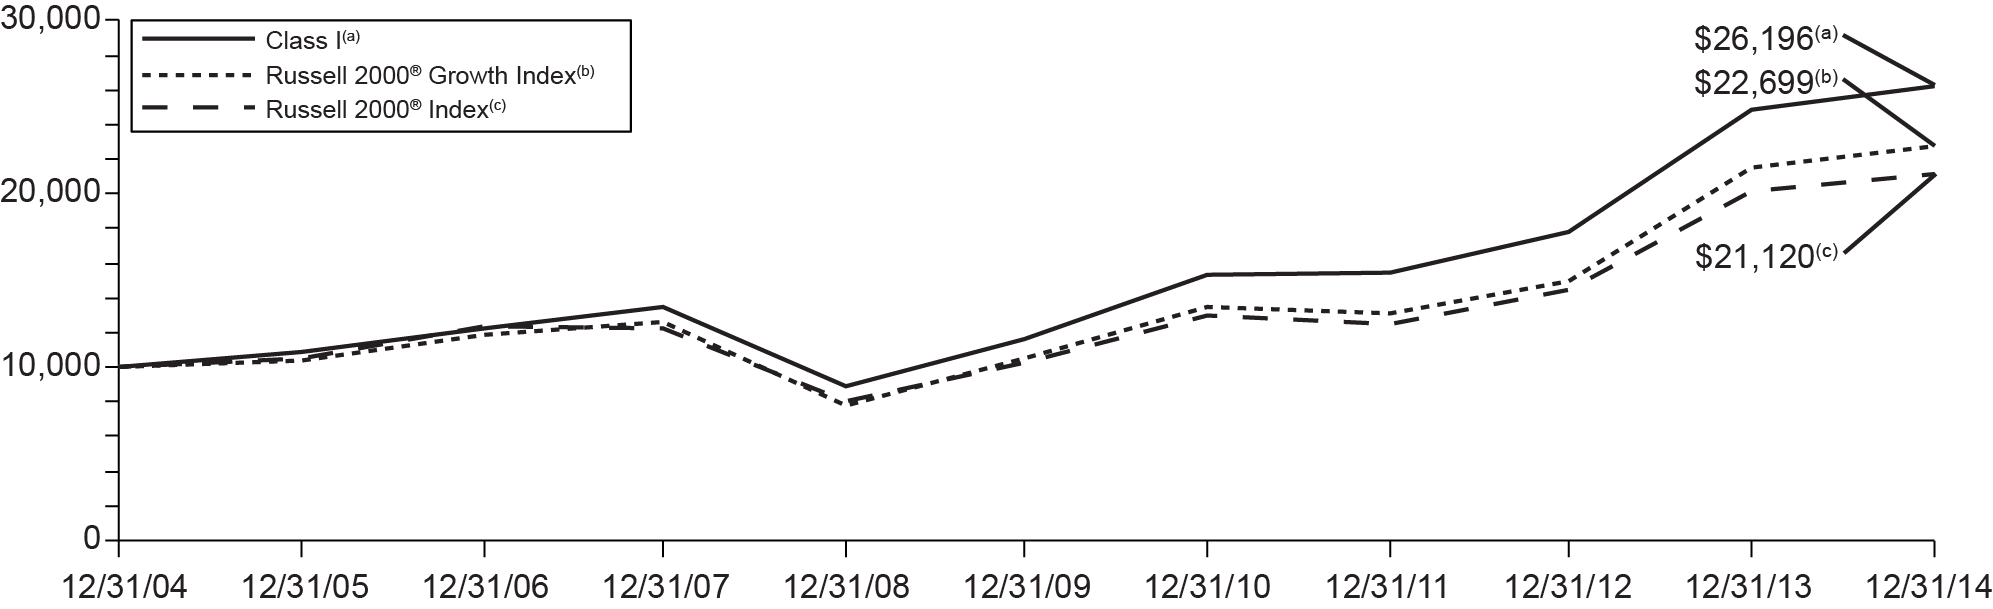
| Average Annual Returns for the Periods Ended December 31, 2014 | ||||||||||||||||||||||
| 1 Year | 5 Year | 10 Year | Since Inception of Class ADV November 20, 2008 | Since Inception of Class S2 February 27, 2009 | ||||||||||||||||||
| Class ADV | 5.07% | 17.10% | — | 23.25% | — | |||||||||||||||||
| Class I | 5.62% | 17.69% | 10.11% | — | — | |||||||||||||||||
| Class S | 5.35% | 17.40% | 9.86% | — | — | |||||||||||||||||
| Class S2 | 5.19% | 17.22% | — | — | 24.06% | |||||||||||||||||
| Russell 2000® Growth Index | 5.60% | 16.80% | 8.54% | 24.19% | 24.13% | |||||||||||||||||
| Russell 2000® Index | 4.89% | 15.55% | 7.77% | 22.20% | 23.06% | |||||||||||||||||
Based on a $10,000 initial investment, the graph and table above illustrate the total return of Voya SmallCap Opportunities Portfolio against the indices indicated. An index is unmanaged and has no cash in its portfolio, imposes no sales charges and incurs no operating expenses. An investor cannot invest directly in an index. The Portfolio’s performance is shown without the imposition of any expenses or charges which are, or may be, imposed under your annuity contract or life insurance policy. Total returns would have been lower if such expenses or charges were included.
The performance graph and table do not reflect the deduction of taxes that a shareholder will pay on Portfolio distributions or the redemption of Portfolio shares.
The performance shown may include the effect of fee waivers and/or expense reimbursements by the Investment Adviser and/or other service providers, which have the effect of increasing total return. Had all fees and expenses been considered, the total returns would have been lower.
The performance update illustrates performance for a variable investment option available through a variable contract and/or a variable universal life policy. The performance shown indicates past performance and is not a projection or prediction of future results. Actual investment returns and principal value will fluctuate so that shares and/or units, at redemption, may be worth more or less than their original cost. Please log on to www.voyainvestments.com or call (800) 992-0180 to get performance through the most recent month end.
This report contains statements that may be “forward-looking” statements. Actual results may differ materially from those projected in the “forward-looking” statements.
The views expressed in this report reflect those of the portfolio managers, only through the end of the period as stated on the cover. The portfolio managers’ views are subject to change at any time based on market and other conditions.
Portfolio holdings are subject to change daily.
| 9 |
SHAREHOLDER EXPENSE EXAMPLES (Unaudited)
As a shareholder of a Portfolio, you incur two types of costs: (1) transaction costs, including redemption fees and exchange fees; and (2) ongoing costs, including management fees, distribution and/or service (12b-1) fees, and other Portfolio expenses. These Examples are intended to help you understand your ongoing costs (in dollars) of investing in a Portfolio and to compare these costs with the ongoing costs of investing in other mutual funds.
The Examples are based on an investment of $1,000 invested at the beginning of the period and held for the entire period from July 1, 2014 to December 31, 2014. The Portfolios’ expenses are shown without the imposition of any charges which are, or may be, imposed under your variable annuity contract, variable life insurance policy, qualified pension, or retirement plan. Expenses would have been higher if such charges were included.
Actual Expenses
The left section of the table shown below, “Actual Portfolio Return,” provides information about actual account values and actual expenses. You may use the information in this section, together with the amount you invested, to estimate the expenses that you paid over the period. Simply divide your account value by $1,000 (for example, an $8,600 account value divided by $1,000 = 8.6), then multiply the result by the number in the first section under the heading entitled “Expenses Paid During the Period” to estimate the expenses you paid on your account during this period.
Hypothetical Example for Comparison Purposes
The right section of the table shown below, “Hypothetical (5% return before expenses),” provides information about hypothetical account values and hypothetical expenses based on a Portfolio’s actual expense ratio and an assumed rate of return of 5% per year before expenses, which is not a Portfolio’s actual return. The hypothetical account values and expenses may not be used to estimate the actual ending account balance or expenses you paid for the period. You may use this information to compare the ongoing costs of investing in a Portfolio and other mutual funds. To do so, compare this 5% hypothetical example with the 5% hypothetical examples that appear in the shareholder reports of the other mutual funds.
Please note that the expenses shown in the table are meant to highlight your ongoing costs only and do not reflect any transactional costs, such as redemption fees or exchange fees. Therefore, the hypothetical lines of the table are useful in comparing ongoing costs only, and will not help you determine the relative total costs of owning different mutual funds. In addition, if these transactional costs were included, your costs would have been higher.
| Actual Portfolio Return | Hypothetical (5% return before expenses) | |||||||||||||||||||||||||||||||
| Beginning Account Value July 1, 2014 | Ending Account Value December 31, 2014 | Annualized Expense Ratio | Expenses Paid During the Period Ended December 31, 2014* | Beginning Account Value July 1, 2014 | Ending Account Value December 31, 2014 | Annualized Expense Ratio | Expenses Paid During the Period Ended December 31, 2014* | |||||||||||||||||||||||||
| Voya International Value Portfolio | ||||||||||||||||||||||||||||||||
| Class ADV | $ | 1,000.00 | $ | 897.90 | 1.45 | % | $ | 6.94 | $ | 1,000.00 | $ | 1,017.90 | 1.45 | % | $ | 7.37 | ||||||||||||||||
| Class I | 1,000.00 | 900.20 | 0.95 | 4.55 | 1,000.00 | 1,020.42 | 0.95 | 4.84 | ||||||||||||||||||||||||
| Class S | 1,000.00 | 899.20 | 1.15 | 5.51 | 1,000.00 | 1,019.41 | 1.15 | 5.85 | ||||||||||||||||||||||||
| Voya MidCap Opportunities Portfolio | ||||||||||||||||||||||||||||||||
| Class ADV | $ | 1,000.00 | $ | 1,062.90 | 1.30 | % | $ | 6.76 | $ | 1,000.00 | $ | 1,018.65 | 1.30 | % | $ | 6.61 | ||||||||||||||||
| Class I | 1,000.00 | 1,065.20 | 0.80 | 4.16 | 1,000.00 | 1,021.17 | 0.80 | 4.08 | ||||||||||||||||||||||||
| Class S | 1,000.00 | 1,063.70 | 1.05 | 5.46 | 1,000.00 | 1,019.91 | 1.05 | 5.35 | ||||||||||||||||||||||||
| Class S2 | 1,000.00 | 1,063.00 | 1.20 | 6.24 | 1,000.00 | 1,019.16 | 1.20 | 6.11 | ||||||||||||||||||||||||
| Voya SmallCap Opportunities Portfolio | ||||||||||||||||||||||||||||||||
| Class ADV | $ | 1,000.00 | $ | 1,028.10 | 1.38 | % | $ | 7.05 | $ | 1,000.00 | $ | 1,018.25 | 1.38 | % | $ | 7.02 | ||||||||||||||||
| Class I | 1,000.00 | 1,030.70 | 0.88 | 4.50 | 1,000.00 | 1,020.77 | 0.88 | 4.48 | ||||||||||||||||||||||||
| Class S | 1,000.00 | 1,029.40 | 1.13 | 5.78 | 1,000.00 | 1,019.51 | 1.13 | 5.75 | ||||||||||||||||||||||||
| Class S2 | 1,000.00 | 1,028.60 | 1.28 | 6.54 | 1,000.00 | 1,018.75 | 1.28 | 6.51 | ||||||||||||||||||||||||
| * | Expenses are equal to each Portfolio’s respective annualized expense ratios multiplied by the average account value over the period, multiplied by 184/365 to reflect the most recent fiscal half-year. |
| 10 |
REPORT OF INDEPENDENT REGISTERED PUBLIC ACCOUNTING FIRM
The Shareholders and Board of Trustees
Voya Variable Products Trust
We have audited the accompanying statements of assets and liabilities, including the summary portfolios of investments, of Voya International Value Portfolio, Voya MidCap Opportunities Portfolio, and Voya SmallCap Opportunities Portfolio, each a series of Voya Variable Products Trust, as of December 31, 2014, and the related statements of operations for the year then ended, the statements of changes in net assets for each of the years in the two-year period then ended, and the financial highlights for each of the years in the five-year period then ended. These financial statements and financial highlights are the responsibility of management. Our responsibility is to express an opinion on these financial statements and financial highlights based on our audits.
We conducted our audits in accordance with the standards of the Public Company Accounting Oversight Board (United States). Those standards require that we plan and perform the audit to obtain reasonable assurance about whether the financial statements and financial highlights are free of material misstatement. An audit includes examining, on a test basis, evidence supporting the amounts and disclosures in the financial statements. Our procedures included confirmation of securities owned as of December 31, 2014, by correspondence with custodian, transfer agent, and brokers, or by other appropriate auditing procedures when replies from brokers were not received. An audit also includes assessing the accounting principles used and significant estimates made by management, as well as evaluating the overall financial statement presentation. We believe that our audits provide a reasonable basis for our opinion.
In our opinion, the financial statements and financial highlights referred to above present fairly, in all material respects, the financial position of the aforementioned funds of Voya Variable Products Trust as of December 31, 2014, the results of their operations for the year then ended, the changes in their net assets for each of the years in the two-year period then ended, and the financial highlights for each of the years in the five-year period then ended, in conformity with U.S. generally accepted accounting principles.

Boston, Massachusetts
February 16, 2015
| 11 |
Statements of Assets and Liabilities as of December 31, 2014
| Voya International Value Portfolio | Voya MidCap Opportunities Portfolio | Voya SmallCap Opportunities Portfolio | ||||||||||
| ASSETS: | ||||||||||||
| Investments in securities at fair value+* | $ | 109,265,944 | $ | 1,486,968,309 | $ | 323,140,539 | ||||||
| Short-term investments at fair value** | 1,552,927 | 23,057,672 | 10,651,655 | |||||||||
| Total investments at fair value | $ | 110,818,871 | $ | 1,510,025,981 | $ | 333,792,194 | ||||||
| Cash | 437 | 889 | 329 | |||||||||
| Foreign currencies at value*** | 65,702 | — | — | |||||||||
| Receivables: | ||||||||||||
| Investment securities sold | 1,123,523 | — | 1,201,481 | |||||||||
| Fund shares sold | 229,064 | 219,604 | 128,948 | |||||||||
| Dividends | 41,315 | 807,179 | 273,804 | |||||||||
| Foreign tax reclaims | 202,468 | 26,288 | — | |||||||||
| Unrealized appreciation on forward foreign currency contracts | 1,359 | — | — | |||||||||
| Prepaid expenses | 939 | 11,384 | 2,446 | |||||||||
| Reimbursement due from manager | 56,161 | — | — | |||||||||
| Other assets | 5,042 | 18,048 | 4,195 | |||||||||
| Total assets | 112,544,881 | 1,511,109,373 | 335,403,397 | |||||||||
| LIABILITIES: | ||||||||||||
| Payable for investment securities purchased | 308 | — | 1,274,916 | |||||||||
| Payable for fund shares redeemed | 40,789 | 5,372,378 | 537,814 | |||||||||
| Payable upon receipt of securities loaned | 1,447,927 | 7,637,672 | 6,707,524 | |||||||||
| Payable for investment management fees | 77,739 | 845,265 | 203,571 | |||||||||
| Payable for administrative fees | 9,717 | 126,721 | 27,564 | |||||||||
| Payable for distribution and shareholder service fees | 1,698 | 194,581 | 38,571 | |||||||||
| Payable for directors fees | 633 | 7,571 | 1,609 | |||||||||
| Payable to directors under the deferred compensation plan (Note 6) | 5,042 | 18,048 | 4,195 | |||||||||
| Payable for proxy and solicitation costs (Note 6) | 82,159 | — | — | |||||||||
| Other accrued expenses and liabilities | 28,240 | 187,321 | 48,896 | |||||||||
| Total liabilities | 1,694,252 | 14,389,557 | 8,844,660 | |||||||||
| NET ASSETS | $ | 110,850,629 | $ | 1,496,719,816 | $ | 326,558,737 | ||||||
| NET ASSETS WERE COMPRISED OF: | ||||||||||||
| Paid-in capital | $ | 282,794,801 | $ | 1,080,691,569 | $ | 230,244,711 | ||||||
| Undistributed (distributions in excess of) net investment income | 220,428 | (18,415 | ) | (4,478 | ) | |||||||
| Accumulated net realized gain (loss) | (174,242,776 | ) | 186,666,648 | 35,175,830 | ||||||||
| Net unrealized appreciation | 2,078,176 | 229,380,014 | 61,142,674 | |||||||||
| NET ASSETS | $ | 110,850,629 | $ | 1,496,719,816 | $ | 326,558,737 | ||||||
| | ||||||||||||
| + Including securities loaned at value | $ | 1,388,982 | $ | 7,475,595 | $ | 6,553,854 | ||||||
| * Cost of investments in securities | $ | 107,169,211 | $ | 1,257,586,468 | $ | 261,997,865 | ||||||
| ** Cost of short-term investments | $ | 1,552,927 | $ | 23,057,672 | $ | 10,651,655 | ||||||
| *** Cost of foreign currencies | $ | 66,198 | $ | — | $ | — | ||||||
See Accompanying Notes to Financial Statements
| 12 |
Statements of Assets and Liabilities as of December 31, 2014 (continued)
| Voya MidCap | Voya SmallCap | |||||||||||
| Voya International | Opportunities | Opportunities | ||||||||||
| Value Portfolio | Portfolio | Portfolio | ||||||||||
| Class ADV | ||||||||||||
| Net assets | $ | 1,264,337 | $ | 143,532,447 | $ | 48,982,093 | ||||||
| Shares authorized | unlimited | unlimited | unlimited | |||||||||
| Par value | $ | 0.010 | $ | 0.010 | $ | 0.010 | ||||||
| Shares outstanding | 143,691 | 9,899,597 | 1,865,186 | |||||||||
| Net asset value and redemption price per share | $ | 8.80 | $ | 14.50 | $ | 26.26 | ||||||
| Class I | ||||||||||||
| Net assets | $ | 102,751,524 | $ | 733,894,218 | $ | 195,608,407 | ||||||
| Shares authorized | unlimited | unlimited | unlimited | |||||||||
| Par value | $ | 0.010 | $ | 0.010 | $ | 0.010 | ||||||
| Shares outstanding | 11,564,202 | 48,376,466 | 6,999,439 | |||||||||
| Net asset value and redemption price per share | $ | 8.89 | $ | 15.17 | $ | 27.95 | ||||||
| Class S | ||||||||||||
| Net assets | $ | 6,834,768 | $ | 605,241,236 | $ | 77,319,179 | ||||||
| Shares authorized | unlimited | unlimited | unlimited | |||||||||
| Par value | $ | 0.010 | $ | 0.010 | $ | 0.010 | ||||||
| Shares outstanding | 753,581 | 41,281,863 | 2,885,531 | |||||||||
| Net asset value and redemption price per share | $ | 9.07 | $ | 14.66 | $ | 26.80 | ||||||
| Class S2 | ||||||||||||
| Net assets | n/a | $ | 14,051,915 | $ | 4,649,058 | |||||||
| Shares authorized | n/a | unlimited | unlimited | |||||||||
| Par value | n/a | $ | 0.010 | $ | 0.010 | |||||||
| Shares outstanding | n/a | 960,513 | 175,725 | |||||||||
| Net asset value and redemption price per share | n/a | $ | 14.63 | $ | 26.46 | |||||||
See Accompanying Notes to Financial Statements
| 13 |
STATEMENTS OF OPERATIONS For the Year ended December 31, 2014
| Voya International Value Portfolio | Voya MidCap Opportunities Portfolio | Voya SmallCap Opportunities Portfolio | ||||||||||
| INVESTMENT INCOME: | ||||||||||||
| Dividends, net of foreign taxes withheld* | $ | 5,172,700 | $ | 19,536,253 | $ | 2,552,913 | ||||||
| Securities lending income, net | 111,257 | 41,802 | 176,151 | |||||||||
| Total investment income | 5,283,957 | 19,578,055 | 2,729,064 | |||||||||
| EXPENSES: | ||||||||||||
| Investment management fees | 1,012,219 | 10,084,888 | 2,378,252 | |||||||||
| Distribution and shareholder service fees: | ||||||||||||
| Class ADV | 6,739 | 699,094 | 222,094 | |||||||||
| Class S | 18,607 | 1,579,804 | 204,596 | |||||||||
| Class S2 | — | 71,171 | 22,072 | |||||||||
| Transfer agent fees | 260 | 4,246 | 485 | |||||||||
| Administrative service fees | 126,526 | 1,514,133 | 321,890 | |||||||||
| Shareholder reporting expense | 17,647 | 187,955 | 33,850 | |||||||||
| Registration fees | — | 3,600 | — | |||||||||
| Professional fees | 17,007 | 135,044 | 33,465 | |||||||||
| Custody and accounting expense | 62,689 | 161,997 | 43,247 | |||||||||
| Directors fees | 3,796 | 45,424 | 9,657 | |||||||||
| Proxy and solicitation costs (Note 6) | 92,000 | — | — | |||||||||
| Miscellaneous expense | 6,962 | 42,232 | 12,021 | |||||||||
| Interest expense | 734 | 112 | — | |||||||||
| Total expenses | 1,365,186 | 14,529,700 | 3,281,629 | |||||||||
| Net waived and reimbursed fees | (140,276 | ) | (14,234 | ) | (4,415 | ) | ||||||
| Net expenses | 1,224,910 | 14,515,466 | 3,277,214 | |||||||||
| Net investment income (loss) | 4,059,047 | 5,062,589 | (548,150 | ) | ||||||||
| REALIZED AND UNREALIZED GAIN (LOSS): | ||||||||||||
| Net realized gain (loss) on: | ||||||||||||
| Investments | 9,881,098 | 192,717,522 | 37,876,510 | |||||||||
| Foreign currency related transactions | (62,118 | ) | 3,012 | — | ||||||||
| Net realized gain | 9,818,980 | 192,720,534 | 37,876,510 | |||||||||
| Net change in unrealized appreciation (depreciation) on: | ||||||||||||
| Investments | (19,635,698 | ) | (78,266,986 | ) | (20,492,687 | ) | ||||||
| Foreign currency related transactions | (26,501 | ) | (3,010 | ) | — | |||||||
| Net change in unrealized appreciation (depreciation) | (19,662,199 | ) | (78,269,996 | ) | (20,492,687 | ) | ||||||
| Net realized and unrealized gain (loss) | (9,843,219 | ) | 114,450,538 | 17,383,823 | ||||||||
| Increase (decrease) in net assets resulting from operations | $ | (5,784,172 | ) | $ | 119,513,127 | $ | 16,835,673 | |||||
| | ||||||||||||
| * Foreign taxes withheld | $ | 392,942 | $ | 25,290 | $ | 524 | ||||||
See Accompanying Notes to Financial Statements
| 14 |
STATEMENTS OF CHANGES IN NET ASSETS
| Voya International Value Portfolio | Voya MidCap Opportunities Portfolio | |||||||||||||||
| Year Ended December 31, 2014 | Year Ended December 31, 2013 | Year Ended December 31, 2014 | Year Ended December 31, 2013 | |||||||||||||
| FROM OPERATIONS: | ||||||||||||||||
| Net investment income | $ | 4,059,047 | $ | 2,860,612 | $ | 5,062,589 | $ | 162,017 | ||||||||
| Net realized gain | 9,818,980 | 11,593,490 | 192,720,534 | 224,720,220 | ||||||||||||
| Net change in unrealized appreciation (depreciation) | (19,662,199 | ) | 10,982,566 | (78,269,996 | ) | 172,203,045 | ||||||||||
| Increase (decrease) in net assets resulting from operations | (5,784,172 | ) | 25,436,668 | 119,513,127 | 397,085,282 | |||||||||||
| FROM DISTRIBUTIONS TO SHAREHOLDERS: | ||||||||||||||||
| Net investment income: | ||||||||||||||||
| Class ADV | (38,981 | ) | (24,731 | ) | (372,599 | ) | — | |||||||||
| Class I | (3,829,633 | ) | (3,244,667 | ) | (2,906,345 | ) | (240,392 | ) | ||||||||
| Class S | (224,859 | ) | (181,650 | ) | (2,115,878 | ) | — | |||||||||
| Class S2(1) | — | (36 | ) | (41,187 | ) | — | ||||||||||
| Net realized gains: | ||||||||||||||||
| Class ADV | — | — | (21,781,737 | ) | (3,104,778 | ) | ||||||||||
| Class I | — | — | (107,183,194 | ) | (18,427,132 | ) | ||||||||||
| Class S | — | — | (94,686,748 | ) | (16,070,181 | ) | ||||||||||
| Class S2 | — | — | (2,148,091 | ) | (268,315 | ) | ||||||||||
| Total distributions | (4,093,473 | ) | (3,451,084 | ) | (231,235,779 | ) | (38,110,798 | ) | ||||||||
| FROM CAPITAL SHARE TRANSACTIONS: | ||||||||||||||||
| Net proceeds from sale of shares | 3,613,888 | 3,398,016 | 135,276,944 | 151,192,057 | ||||||||||||
| Proceeds from shares issued in merger (Note 11) | — | — | — | 303,156,146 | ||||||||||||
| Reinvestment of distributions | 4,093,473 | 3,451,047 | 231,235,779 | 38,110,798 | ||||||||||||
| 7,707,361 | 6,849,063 | 366,512,723 | 492,459,001 | |||||||||||||
| Cost of shares redeemed | (21,637,594 | ) | (27,654,639 | ) | (401,000,843 | ) | (346,945,568 | ) | ||||||||
| Net increase (decrease) in net assets resulting from capital share transactions | (13,930,233 | ) | (20,805,576 | ) | (34,488,120 | ) | 145,513,433 | |||||||||
| Net increase (decrease) in net assets | (23,807,878 | ) | 1,180,008 | (146,210,772 | ) | 504,487,917 | ||||||||||
| NET ASSETS: | ||||||||||||||||
| Beginning of year or period | 134,658,507 | 133,478,499 | 1,642,930,588 | 1,138,442,671 | ||||||||||||
| End of year or period | $ | 110,850,629 | $ | 134,658,507 | $ | 1,496,719,816 | $ | 1,642,930,588 | ||||||||
| Undistributed (distributions in excess of) net investment income at end of year or period | $ | 220,428 | $ | 95,861 | $ | (18,415 | ) | $ | (15,669 | ) | ||||||
| (1) | Class S2 of Voya International Value Portfolio liquidated on April 30, 2013. |
See Accompanying Notes to Financial Statements
| 15 |
STATEMENTS OF CHANGES IN NET ASSETS
| Voya SmallCap Opportunities Portfolio | ||||||||
| Year Ended December 31, 2014 | Year Ended December 31, 2013 | |||||||
| FROM OPERATIONS: | ||||||||
| Net investment (loss) | $ | (548,150 | ) | $ | (802,356 | ) | ||
| Net realized gain | 37,876,510 | 29,411,052 | ||||||
| Net change in unrealized appreciation (depreciation) | (20,492,687 | ) | 61,229,826 | |||||
| Increase in net assets resulting from operations | 16,835,673 | 89,838,522 | ||||||
| FROM DISTRIBUTIONS TO SHAREHOLDERS: | ||||||||
| Net realized gains: | ||||||||
| Class ADV | (4,289,810 | ) | (1,712,645 | ) | ||||
| Class I | (16,435,008 | ) | (9,938,817 | ) | ||||
| Class S | (7,206,064 | ) | (4,998,362 | ) | ||||
| Class S2 | (404,768 | ) | (225,946 | ) | ||||
| Total distributions | (28,335,650 | ) | (16,875,770 | ) | ||||
| FROM CAPITAL SHARE TRANSACTIONS: | ||||||||
| Net proceeds from sale of shares | 34,764,289 | 60,766,106 | ||||||
| Reinvestment of distributions | 28,335,650 | 16,875,770 | ||||||
| 63,099,939 | 77,641,876 | |||||||
| Cost of shares redeemed | (57,691,615 | ) | (40,377,023 | ) | ||||
| Net increase in net assets resulting from capital share transactions | 5,408,324 | 37,264,853 | ||||||
| Net increase (decrease) in net assets | (6,091,653 | ) | 110,227,605 | |||||
| NET ASSETS: | ||||||||
| Beginning of year or period | 332,650,390 | 222,422,785 | ||||||
| End of year or period | $ | 326,558,737 | $ | 332,650,390 | ||||
| Distributions in excess of net investment income at end of year or period | $ | (4,478 | ) | $ | (3,889 | ) | ||
See Accompanying Notes to Financial Statements
| 16 |
Selected data for a share of beneficial interest outstanding throughout each year or period.
| Income (loss) from investment operations | Less Distributions | Ratios to average net assets | Supplemental Data | |||||||||||||||||||||||||||||||||||||||||||||||||||||||||||||||||
| Net asset value, beginning of year or period | Net investment income (loss) | Net realized and unrealized gain (loss) | Total from investment operations | From net investment income | From net realized gains | From return of capital | Total distributions | Payment by affiliate | Net asset value, end of year or period | Total Return(1) | Expenses before reductions/ additions(2)(3)(4) | Expenses net of fee waivers and/or recoupments if any | Expense net of all reductions/ additions(2)(3)(4) | Net investment income (loss)(2)(3) | Net assets, end of year or period | Portfolio turnover rate | ||||||||||||||||||||||||||||||||||||||||||||||||||||
| Year or | ||||||||||||||||||||||||||||||||||||||||||||||||||||||||||||||||||||
| period ended | ($) | ($) | ($) | ($) | ($) | ($) | ($) | ($) | ($) | ($) | (%) | (%) | (%) | (%) | (%) | ($000’s) | (%) | |||||||||||||||||||||||||||||||||||||||||||||||||||
| Voya International Value Portfolio | ||||||||||||||||||||||||||||||||||||||||||||||||||||||||||||||||||||
| Class ADV | ||||||||||||||||||||||||||||||||||||||||||||||||||||||||||||||||||||
| 12-31-14 | 9.57 | 0.25 | (0.75 | ) | (0.50 | ) | 0.27 | — | — | 0.27 | — | 8.80 | (5.44 | ) | 1.56 | 1.45 | 1.45 | 2.66 | 1,264 | 55 | ||||||||||||||||||||||||||||||||||||||||||||||||
| 12-31-13 | 8.12 | 0.14 | 1.50 | 1.64 | 0.19 | — | — | 0.19 | — | 9.57 | 20.54 | 1.46 | 1.50 | 1.50 | 1.61 | 1,315 | 62 | |||||||||||||||||||||||||||||||||||||||||||||||||||
| 12-31-12 | 6.99 | 0.15 | 1.14 | 1.29 | 0.16 | — | — | 0.16 | — | 8.12 | 18.64 | 1.46 | 1.50 | 1.50 | 1.99 | 1,123 | 56 | |||||||||||||||||||||||||||||||||||||||||||||||||||
| 12-31-11 | 8.44 | (0.01 | )* | (1.26 | ) | (1.27 | ) | 0.17 | — | 0.01 | 0.18 | — | 6.99 | (15.40 | ) | 1.57 | 1.52 | 1.52 | (0.09 | ) | 1,145 | 69 | ||||||||||||||||||||||||||||||||||||||||||||||
| 12-31-10 | 8.41 | 0.11 | 0.05 | 0.16 | 0.13 | — | — | 0.13 | — | 8.44 | 2.02 | 1.56 | 1.50 | † | 1.50 | † | 1.28 | † | 31 | 155 | ||||||||||||||||||||||||||||||||||||||||||||||||
| Class I | ||||||||||||||||||||||||||||||||||||||||||||||||||||||||||||||||||||
| 12-31-14 | 9.65 | 0.31 | (0.76 | ) | (0.45 | ) | 0.31 | — | — | 0.31 | — | 8.89 | (4.94 | ) | 1.06 | 0.95 | 0.95 | 3.23 | 102,752 | 55 | ||||||||||||||||||||||||||||||||||||||||||||||||
| 12-31-13 | 8.18 | 0.19 | 1.51 | 1.70 | 0.23 | — | — | 0.23 | — | 9.65 | 21.21 | 0.96 | 1.00 | 1.00 | 2.18 | 125,423 | 62 | |||||||||||||||||||||||||||||||||||||||||||||||||||
| 12-31-12 | 7.04 | 0.19 | 1.14 | 1.33 | 0.19 | — | — | 0.19 | — | 8.18 | 19.23 | 0.96 | 1.00 | 1.00 | 2.52 | 124,728 | 56 | |||||||||||||||||||||||||||||||||||||||||||||||||||
| 12-31-11 | 8.49 | 0.21 | (1.45 | ) | (1.24 | ) | 0.20 | — | 0.01 | 0.21 | — | 7.04 | (14.96 | ) | 1.07 | 1.02 | 1.02 | 2.56 | 135,682 | 69 | ||||||||||||||||||||||||||||||||||||||||||||||||
| 12-31-10 | 8.46 | 0.16• | 0.04 | 0.20 | 0.17 | — | — | 0.17 | — | 8.49 | 2.50 | 1.06 | 1.00 | † | 1.00 | † | 1.96 | † | 230,836 | 155 | ||||||||||||||||||||||||||||||||||||||||||||||||
| Class S | ||||||||||||||||||||||||||||||||||||||||||||||||||||||||||||||||||||
| 12-31-14 | 9.85 | 0.30 | (0.79 | ) | (0.49 | ) | 0.29 | — | — | 0.29 | — | 9.07 | (5.18 | ) | 1.31 | 1.15 | 1.15 | 3.02 | 6,835 | 55 | ||||||||||||||||||||||||||||||||||||||||||||||||
| 12-31-13 | 8.34 | 0.18 | 1.54 | 1.72 | 0.21 | — | — | 0.21 | — | 9.85 | 21.05 | 1.21 | 1.20 | 1.20 | 1.95 | 7,920 | 62 | |||||||||||||||||||||||||||||||||||||||||||||||||||
| 12-31-12 | 7.18 | 0.18 | 1.16 | 1.34 | 0.18 | — | — | 0.18 | — | 8.34 | 18.90 | 1.21 | 1.20 | 1.20 | 2.33 | 7,623 | 56 | |||||||||||||||||||||||||||||||||||||||||||||||||||
| 12-31-11 | 8.64 | 0.19 | (1.46 | ) | (1.27 | ) | 0.18 | — | 0.01 | 0.19 | — | 7.18 | (14.99 | ) | 1.32 | 1.22 | 1.22 | 2.27 | 8,156 | 69 | ||||||||||||||||||||||||||||||||||||||||||||||||
| 12-31-10 | 8.60 | 0.13 | 0.06 | 0.19 | 0.15 | — | — | 0.15 | — | 8.64 | 2.36 | 1.31 | 1.20 | † | 1.20 | † | 1.61 | † | 11,068 | 155 | ||||||||||||||||||||||||||||||||||||||||||||||||
| Voya MidCap Opportunities Portfolio | ||||||||||||||||||||||||||||||||||||||||||||||||||||||||||||||||||||
| Class ADV | ||||||||||||||||||||||||||||||||||||||||||||||||||||||||||||||||||||
| 12-31-14 | 16.02 | (0.00 | )*• | 1.11 | 1.11 | 0.04 | 2.59 | — | 2.63 | — | 14.50 | 8.29 | 1.30 | 1.30 | 1.30 | (0.03 | ) | 143,532 | 98 | |||||||||||||||||||||||||||||||||||||||||||||||||
| 12-31-13 | 12.51 | (0.05 | ) | 3.92 | 3.87 | — | 0.36 | — | 0.36 | — | 16.02 | 31.34 | 1.30 | 1.30 | 1.30 | (0.34 | ) | 143,300 | 81 | |||||||||||||||||||||||||||||||||||||||||||||||||
| 12-31-12 | 11.34 | 0.01 | 1.52 | 1.53 | 0.04 | 0.32 | — | 0.36 | — | 12.51 | 13.61 | 1.34 | 1.34 | 1.34 | 0.09 | 81,463 | 89 | |||||||||||||||||||||||||||||||||||||||||||||||||||
| 12-31-11 | 11.46 | (0.02 | ) | (0.10 | ) | (0.12 | ) | — | — | — | — | — | 11.34 | (1.05 | ) | 1.34 | 1.34 | 1.34 | (0.23 | ) | 40,497 | 90 | ||||||||||||||||||||||||||||||||||||||||||||||
| 12-31-10 | 8.88 | 0.08• | 2.54 | 2.62 | 0.04 | — | — | 0.04 | — | 11.46 | 29.57 | 1.36 | 1.29 | † | 1.29 | † | 0.75 | † | 15,119 | 96 | ||||||||||||||||||||||||||||||||||||||||||||||||
| Class I | ||||||||||||||||||||||||||||||||||||||||||||||||||||||||||||||||||||
| 12-31-14 | 16.58 | 0.08 | 1.16 | 1.24 | 0.06 | 2.59 | — | 2.65 | — | 15.17 | 8.85 | 0.80 | 0.80 | 0.80 | 0.49 | 733,894 | 98 | |||||||||||||||||||||||||||||||||||||||||||||||||||
| 12-31-13 | 12.88 | 0.02 | 4.05 | 4.07 | 0.01 | 0.36 | — | 0.37 | — | 16.58 | 31.97 | 0.80 | 0.80 | 0.80 | 0.16 | 796,010 | 81 | |||||||||||||||||||||||||||||||||||||||||||||||||||
| 12-31-12 | 11.63 | 0.07 | 1.57 | 1.64 | 0.07 | 0.32 | — | 0.39 | — | 12.88 | 14.20 | 0.84 | 0.84 | 0.84 | 0.56 | 614,151 | 89 | |||||||||||||||||||||||||||||||||||||||||||||||||||
| 12-31-11 | 11.69 | 0.03 | (0.09 | ) | (0.06 | ) | — | — | — | — | — | 11.63 | (0.51 | ) | 0.84 | 0.84 | 0.84 | 0.24 | 435,027 | 90 | ||||||||||||||||||||||||||||||||||||||||||||||||
| 12-31-10 | 9.03 | 0.06 | 2.67 | 2.73 | 0.07 | — | — | 0.07 | — | 11.69 | 30.36 | 0.86 | 0.79 | † | 0.79 | † | 0.62 | † | 350,626 | 96 | ||||||||||||||||||||||||||||||||||||||||||||||||
| Class S | ||||||||||||||||||||||||||||||||||||||||||||||||||||||||||||||||||||
| 12-31-14 | 16.14 | 0.04 | 1.12 | 1.16 | 0.05 | 2.59 | — | 2.64 | — | 14.66 | 8.56 | 1.05 | 1.05 | 1.05 | 0.24 | 605,241 | 98 | |||||||||||||||||||||||||||||||||||||||||||||||||||
| 12-31-13 | 12.57 | (0.01 | ) | 3.94 | 3.93 | — | 0.36 | — | 0.36 | — | 16.14 | 31.68 | 1.05 | 1.05 | 1.05 | (0.09 | ) | 689,091 | 81 | |||||||||||||||||||||||||||||||||||||||||||||||||
| 12-31-12 | 11.37 | 0.04 | 1.53 | 1.57 | 0.05 | 0.32 | — | 0.37 | — | 12.57 | 13.92 | 1.09 | 1.09 | 1.09 | 0.29 | 435,586 | 89 | |||||||||||||||||||||||||||||||||||||||||||||||||||
| 12-31-11 | 11.46 | (0.00 | )* | (0.09 | ) | (0.09 | ) | — | — | — | — | — | 11.37 | (0.79 | ) | 1.09 | 1.09 | 1.09 | (0.04 | ) | 414,381 | 90 | ||||||||||||||||||||||||||||||||||||||||||||||
| 12-31-10 | 8.86 | 0.03• | 2.62 | 2.65 | 0.05 | — | — | 0.05 | — | 11.46 | 29.96 | 1.11 | 1.04 | † | 1.04 | † | 0.35 | † | 450,115 | 96 | ||||||||||||||||||||||||||||||||||||||||||||||||
| Class S2 | ||||||||||||||||||||||||||||||||||||||||||||||||||||||||||||||||||||
| 12-31-14 | 16.13 | 0.01 | 1.13 | 1.14 | 0.05 | 2.59 | — | 2.64 | — | 14.63 | 8.39 | 1.30 | 1.20 | 1.20 | 0.06 | 14,052 | 98 | |||||||||||||||||||||||||||||||||||||||||||||||||||
| 12-31-13 | 12.58 | (0.03 | ) | 3.94 | 3.91 | — | 0.36 | — | 0.36 | — | 16.13 | 31.49 | 1.30 | 1.20 | 1.20 | (0.24 | ) | 14,530 | 81 | |||||||||||||||||||||||||||||||||||||||||||||||||
| 12-31-12 | 11.38 | 0.02 | 1.54 | 1.56 | 0.04 | 0.32 | — | 0.36 | — | 12.58 | 13.79 | 1.34 | 1.24 | 1.24 | 0.18 | 7,243 | 89 | |||||||||||||||||||||||||||||||||||||||||||||||||||
| 12-31-11 | 11.49 | (0.01 | ) | (0.10 | ) | (0.11 | ) | — | — | — | — | — | 11.38 | (0.96 | ) | 1.34 | 1.24 | 1.24 | (0.13 | ) | 3,314 | 90 | ||||||||||||||||||||||||||||||||||||||||||||||
| 12-31-10 | 8.89 | 0.08• | 2.56 | 2.64 | 0.04 | — | — | 0.04 | — | 11.49 | 29.67 | 1.36 | 1.19 | † | 1.19 | † | 0.71 | † | 900 | 96 | ||||||||||||||||||||||||||||||||||||||||||||||||
See Accompanying Notes to Financial Statements
| 17 |
Financial Highlights (continued)
| Income (loss) from investment operations | Less Distributions | Ratios to average net assets | Supplemental Data | |||||||||||||||||||||||||||||||||||||||||||||||||||||||||||||||||
| Net asset value, beginning of year or period | Net investment income (loss) | Net realized and unrealized gain (loss) | Total from investment operations | From net investment income | From net realized gains | From return of capital | Total distributions | Payment by affiliate | Net asset value, end of year or period | Total Return(1) | Expenses before reductions/ additions(2)(3)(4) | Expenses net of fee waivers and/or recoupments if any(2)(3)(4) | Expense net of all reductions/ additions(2)(3)(4) | Net investment income (loss)(2)(3) | Net assets, end of year or period | Portfolio turnover rate | ||||||||||||||||||||||||||||||||||||||||||||||||||||
| Year or period ended | ($) | ($) | ($) | ($) | ($) | ($) | ($) | ($) | ($) | ($) | (%) | (%) | (%) | (%) | (%) | ($000’s) | (%) | |||||||||||||||||||||||||||||||||||||||||||||||||||
| Voya SmallCap Opportunities Portfolio | ||||||||||||||||||||||||||||||||||||||||||||||||||||||||||||||||||||
| Class ADV | ||||||||||||||||||||||||||||||||||||||||||||||||||||||||||||||||||||
| 12-31-14 | 27.68 | (0.14 | )• | 1.29 | 1.15 | — | 2.57 | — | 2.57 | — | 26.26 | 5.07 | 1.38 | 1.38 | 1.38 | (0.53) | 48,982 | 33 | ||||||||||||||||||||||||||||||||||||||||||||||||||
| 12-31-13 | 21.37 | (0.16 | )• | 8.07 | 7.91 | — | 1.60 | — | 1.60 | — | 27.68 | 38.39 | 1.38 | 1.38 | 1.38 | (0.63) | 42,105 | 40 | ||||||||||||||||||||||||||||||||||||||||||||||||||
| 12-31-12 | 20.73 | (0.07 | )• | 3.00 | 2.93 | — | 2.29 | — | 2.29 | — | 21.37 | 14.63 | 1.41 | 1.41 | 1.41 | (0.34) | 14,236 | 57 | ||||||||||||||||||||||||||||||||||||||||||||||||||
| 12-31-11 | 20.67 | (0.14 | )• | 0.20 | 0.06 | — | — | — | — | — | 20.73 | 0.29 | 1.40 | 1.40 | 1.40 | (0.67) | 4,819 | 72 | ||||||||||||||||||||||||||||||||||||||||||||||||||
| 12-31-10 | 15.69 | (0.10 | )• | 5.08 | 4.98 | — | — | — | — | — | 20.67 | 31.74 | 1.40 | 1.40 | † | 1.40 | † | (0.57) | † | 2,120 | 97 | |||||||||||||||||||||||||||||||||||||||||||||||
| Class I | ||||||||||||||||||||||||||||||||||||||||||||||||||||||||||||||||||||
| 12-31-14 | 29.14 | (0.01 | ) | 1.39 | 1.38 | — | 2.57 | — | 2.57 | — | 27.95 | 5.62 | 0.88 | 0.88 | 0.88 | (0.03) | 195,608 | 33 | ||||||||||||||||||||||||||||||||||||||||||||||||||
| 12-31-13 | 22.32 | (0.04 | ) | 8.46 | 8.42 | — | 1.60 | — | 1.60 | — | 29.14 | 39.06 | 0.88 | 0.88 | 0.88 | (0.16) | 196,665 | 40 | ||||||||||||||||||||||||||||||||||||||||||||||||||
| 12-31-12 | 21.46 | 0.01 | 3.14 | 3.15 | — | 2.29 | — | 2.29 | — | 22.32 | 15.18 | 0.91 | 0.91 | 0.91 | 0.03 | 136,300 | 57 | |||||||||||||||||||||||||||||||||||||||||||||||||||
| 12-31-11 | 21.28 | (0.04 | ) | 0.22 | 0.18 | — | — | — | — | — | 21.46 | 0.85 | 0.90 | 0.90 | 0.90 | (0.17) | 117,965 | 72 | ||||||||||||||||||||||||||||||||||||||||||||||||||
| 12-31-10 | 16.08 | (0.02 | ) | 5.22 | 5.20 | — | — | — | — | — | 21.28 | 32.34 | 0.90 | 0.90 | † | 0.90 | † | (0.14) | † | 113,938 | 97 | |||||||||||||||||||||||||||||||||||||||||||||||
| Class S | ||||||||||||||||||||||||||||||||||||||||||||||||||||||||||||||||||||
| 12-31-14 | 28.12 | (0.08 | ) | 1.33 | 1.25 | — | 2.57 | — | 2.57 | — | 26.80 | 5.35 | 1.13 | 1.13 | 1.13 | (0.29) | 77,319 | 33 | ||||||||||||||||||||||||||||||||||||||||||||||||||
| 12-31-13 | 21.64 | (0.11 | )• | 8.19 | 8.08 | — | 1.60 | — | 1.60 | — | 28.12 | 38.71 | 1.13 | 1.13 | 1.13 | (0.42) | 89,527 | 40 | ||||||||||||||||||||||||||||||||||||||||||||||||||
| 12-31-12 | 20.91 | (0.05 | ) | 3.07 | 3.02 | — | 2.29 | — | 2.29 | — | 21.64 | 14.95 | 1.16 | 1.16 | 1.16 | (0.22) | 68,682 | 57 | ||||||||||||||||||||||||||||||||||||||||||||||||||
| 12-31-11 | 20.80 | (0.10 | ) | 0.21 | 0.11 | — | — | — | — | — | 20.91 | 0.53 | 1.15 | 1.15 | 1.15 | (0.47) | 63,588 | 72 | ||||||||||||||||||||||||||||||||||||||||||||||||||
| 12-31-10 | 15.75 | (0.07 | ) | 5.12 | 5.05 | — | — | — | — | — | 20.80 | 32.06 | 1.15 | 1.15 | † | 1.15 | † | (0.39) | † | 71,992 | 97 | |||||||||||||||||||||||||||||||||||||||||||||||
| Class S2 | ||||||||||||||||||||||||||||||||||||||||||||||||||||||||||||||||||||
| 12-31-14 | 27.84 | (0.11 | ) | 1.30 | 1.19 | — | 2.57 | — | 2.57 | — | 26.46 | 5.19 | 1.38 | 1.28 | 1.28 | (0.43) | 4,649 | 33 | ||||||||||||||||||||||||||||||||||||||||||||||||||
| 12-31-13 | 21.47 | (0.13 | ) | 8.10 | 7.97 | — | 1.60 | — | 1.60 | — | 27.84 | 38.50 | 1.38 | 1.28 | 1.28 | (0.57) | 4,354 | 40 | ||||||||||||||||||||||||||||||||||||||||||||||||||
| 12-31-12 | 20.79 | (0.06 | )• | 3.03 | 2.97 | — | 2.29 | — | 2.29 | — | 21.47 | 14.79 | 1.41 | 1.31 | 1.31 | (0.27) | 3,205 | 57 | ||||||||||||||||||||||||||||||||||||||||||||||||||
| 12-31-11 | 20.71 | (0.11 | )• | 0.19 | 0.08 | — | — | — | — | — | 20.79 | 0.39 | 1.40 | 1.30 | 1.30 | (0.56) | 1,472 | 72 | ||||||||||||||||||||||||||||||||||||||||||||||||||
| 12-31-10 | 15.71 | (0.09 | )• | 5.09 | 5.00 | — | — | — | — | — | 20.71 | 31.83 | 1.40 | 1.30 | † | 1.30 | † | (0.50) | † | 344 | 97 | |||||||||||||||||||||||||||||||||||||||||||||||
| (1) | Total return is calculated assuming reinvestment of all dividends, capital gain distributions and return of capital distributions, if any, at net asset value and does not reflect the effect of insurance contract charges. Total return for periods less than one year is not annualized. |
| (2) | Annualized for periods less than one year. |
| (3) | Ratios reflect operating expenses of a Portfolio. Expenses before reductions/additions do not reflect amounts reimbursed by an Investment Adviser and/or Distributor or reductions from brokerage service arrangements or other expense offset arrangements and do not represent the amount paid by a Portfolio during periods when reimbursements or reductions occur. Expenses net of fee waivers reflect expenses after reimbursement by an Investment Adviser and/or Distributor but prior to reductions from brokerage service arrangements or other expense offset arrangements. Expenses net of all reductions/additions represent the net expenses paid by a Portfolio. Net investment income (loss) is net of all such additions or reductions. |
| (4) | Ratios do not include fees and expenses charged under the variable annuity contract or variable life insurance policy. |
| • | Calculated using average number of shares outstanding throughout the period. |
| * | Amount is less than $0.005 or 0.005% or more than $(0.005) or (0.005)%. |
| † | Impact of waiving the advisory fee for the ING Institutional Prime Money Market Fund holding has less than 0.005% impact on the expense ratio and net investment income or loss ratio. |
See Accompanying Notes to Financial Statements
| 18 |
NOTES TO FINANCIAL STATEMENTS as of December 31, 2014
NOTE 1 — ORGANIZATION
Voya Variable Products Trust (the “Trust”) is a business trust organized under the laws of the Commonwealth of Massachusetts on December 17, 1993 and registered under the Investment Company Act of 1940, as amended (“1940 Act”), as a diversified, open-end management investment company. There are three active separate investment series (each a “Portfolio” and collectively the “Portfolios”) that comprise the Trust: Voya International Value Portfolio (“International Value”), Voya MidCap Opportunities Portfolio (“MidCap Opportunities”) and Voya SmallCap Opportunities Portfolio (“SmallCap Opportunities”), each a diversified series of the Trust. The investment objective of the Portfolios is described in the Portfolios’ Prospectus.
Each Portfolio offers at least three of the following classes of shares: Adviser Class (“Class ADV”), Class I, Class S, and Service 2 Class (“Class S2”). Each class has equal rights as to voting privileges. The classes differ principally in the applicable distribution and shareholder service fees. Generally, shareholders of each class also bear certain expenses that pertain to that particular class. All shareholders bear the common expenses of a portfolio and earn income and realized gains/losses from a portfolio pro rata based on the daily ending net assets of each class, without distinction between share classes. Expenses that are specific to a portfolio or a class are charged directly to that portfolio or class. Other operating expenses shared by several portfolios are generally allocated among those portfolios based on average net assets. Distributions are determined separately for each class based on income and expenses allocated to each class. Realized gain distributions are allocated to each class pro rata based on the shares outstanding of each class on the date of distribution. Differences in per share dividend rates generally result from differences in separate class expenses, including distribution and shareholder service fees, if applicable.
Voya Investments, LLC (“Voya Investments” or the “Investment Adviser”), an Arizona limited liability company, serves as the Investment Adviser to the Portfolios. Voya Investment Management Co. LLC (“Voya IM” or the “Sub-Adviser”), a Delaware limited liability company, serves as the Sub-Adviser to the Portfolios. Voya Funds Services, LLC (“VFS” or the “Administrator”), a Delaware limited liability company, serves as the Administrator to the Portfolios. Voya Investments Distributor, LLC (“VID” or the “Distributor”), a Delaware limited liability company, serves as the principal underwriter to the Portfolios.
NOTE 2 — SIGNIFICANT ACCOUNTING POLICIES
The following significant accounting policies are consistently followed by the Portfolios in the preparation of
their financial statements. Each Portfolio is considered an investment company under U.S. generally accepted accounting principals (“GAAP”) and follows the accounting and reporting guidance applicable to investment companies.
A. Security Valuation. U.S. GAAP defines fair value as the price the Portfolio(s) would receive to sell an asset or pay to transfer a liability in an orderly transaction between market participants at the measurement date. Investments in equity securities traded on a national securities exchange are valued at the official closing price when available or, for certain markets, the last reported sale price on each valuation day. Securities traded on an exchange for which there has been no sale and securities traded in the over-the-counter-market are valued at the mean between the last reported bid and ask prices on each valuation day. All investments quoted in foreign currencies are valued daily in U.S. dollars on the basis of the foreign currency exchange rates prevailing at that time. Debt securities with more than 60 days to maturity are fair valued using an independent pricing service which takes into consideration such factors as benchmark yields, cash flow assumptions and issuer spreads as well as broker quotes and reported trades for the security as well as securities similar in type, quality, coupon and maturity. Securities for which valuations are not available from an independent pricing service may be valued by brokers which use prices provided by market makers or estimates of fair market value obtained from yield data relating to investments or securities with similar characteristics. U.S. government obligations are valued by using market quotations or independent pricing services that use prices provided by market-makers or estimates of market values obtained from yield data relating to instruments or securities with similar characteristics. Investments in open-end mutual funds are valued at net asset value (“NAV”). Investments in securities of sufficient credit quality, maturing in 60 days or less, are valued at amortized cost which approximates fair value. The amortized cost method involves valuing a security at its cost and amortizing any discount or premium over the period until maturity.
Securities and assets for which market quotations are not readily available (which may include certain restricted securities which are subject to limitations as to their sale) are valued at their fair values, as defined by the 1940 Act, and as determined in good faith by or under the supervision of the Portfolios’ Board of Trustees (“Board”), in accordance with methods that are specifically authorized by the Board. Securities traded on exchanges, including foreign exchanges, which close earlier than the time that a Portfolio calculates its NAV may also be valued at their fair values as defined by the 1940 Act, and as determined in
| 19 |
NOTES TO FINANCIAL STATEMENTS as of December 31, 2014 (continued)
NOTE 2 — SIGNIFICANT ACCOUNTING POLICIES (continued)
good faith by or under the supervision of the Board, in accordance with methods that are specifically authorized by the Board. All such fair valuations are made in accordance with valuation procedures of the Portfolios (the “Valuation Procedures”) which have been approved by the Board. The valuation techniques applied in any specific instance are set forth in the Valuation Procedures and may vary from case to case. With respect to a restricted security, for example, consideration is generally given to the cost of the investment, the market value of any unrestricted securities of the same class at the time of valuation, the potential expiration of restrictions on the security, the existence of any registration rights, the costs to the Portfolios related to registration of the security, as well as factors relevant to the issuer itself. Consideration may also be given to the price and extent of any public trading in similar securities of the issuer or comparable companies’ securities. The value of a foreign security traded on an exchange outside the United States is generally based on its price on the principal foreign exchange where it trades as of the time a Portfolio determines its NAV or if the foreign exchange closes prior to the time a Portfolio determines its NAV, the most recent closing price of the foreign security on its principal exchange. Trading in certain non-U.S. securities may not take place on all days on which the New York Stock Exchange (“NYSE”) is open. Further, trading takes place in various foreign markets on days on which the NYSE is not open. Consequently, the calculation of a Portfolio’s NAV may not take place contemporaneously with the determination of the prices of securities held by a Portfolio in foreign securities markets. Further, the value of a Portfolio’s assets may be significantly affected by foreign trading on days when a shareholder cannot purchase or redeem shares of a Portfolio. In calculating a Portfolio’s NAV, foreign securities denominated in foreign currency are converted to U.S. dollar equivalents. If an event occurs after the time at which the market for foreign securities held by a Portfolio closes but before the time that a Portfolio’s NAV is calculated, such event may cause the closing price on the foreign exchange to not represent a readily available reliable market value quotation for such securities at the time a Portfolio determines its NAV. In such a case, a Portfolio will use the fair value of such securities as determined under a Portfolio’s Valuation Procedures. Events after the close of trading on a foreign market that could require a Portfolio to fair value some or all of its foreign securities include, among others, securities trading in the U.S. and other markets, corporate announcements, natural and other disasters, and political and other events. Among other elements of analysis in the determination of a security’s fair value, the Board has authorized the use of
one or more independent research services to assist with such determinations. An independent research service may use statistical analyses and quantitative models to help determine fair value as of the time a Portfolio calculates its NAV. There can be no assurance that such models accurately reflect the behavior of the applicable markets or the effect of the behavior of such markets on the fair value of securities, or that such markets will continue to behave in a fashion that is consistent with such models. Unlike the closing price of a security on an exchange, fair value determinations employ elements of judgment. Consequently, the fair value assigned to a security may not represent the actual value that a Portfolio could obtain if it were to sell the security at the time of the close of the NYSE. Pursuant to procedures adopted by the Board, a Portfolio is not obligated to use the fair valuations suggested by any research service, and valuation recommendations provided by such research services may be overridden if other events have occurred or if other fair valuations are determined in good faith to be more accurate. Unless an event is such that it causes a Portfolio to determine that the closing prices for one or more securities do not represent readily available reliable market value quotations at the time a Portfolio determines its NAV, events that occur between the time of the close of the foreign market on which they are traded and the close of regular trading on the NYSE will not be reflected in a Portfolio’s NAV.
Each investment asset or liability of the Portfolios is assigned a level at measurement date based on the significance and source of the inputs to its valuation. Quoted prices in active markets for identical securities are classified as “Level 1,” inputs other than quoted prices for an asset or liability that are observable are classified as “Level 2” and unobservable inputs, including the Sub-Adviser’s judgment about the assumptions that a market participant would use in pricing an asset or liability are classified as “Level 3.” The inputs used for valuing securities are not necessarily an indication of the risks associated with investing in those securities. Short-term securities of sufficient credit quality which are valued at amortized cost, which approximates fair value, are generally considered to be Level 2 securities under applicable accounting rules. A table summarizing the Portfolios’ investments under these levels of classification is included following the Summary Portfolio of Investments.
The Board has adopted methods for valuing securities and other assets in circumstances where market quotes are not readily available, and has delegated the responsibility for applying the valuation methods to the “Pricing Committee” as established by the Portfolios’ Administrator. The Pricing Committee considers all facts it deems relevant that are
| 20 |
NOTES TO FINANCIAL STATEMENTS as of December 31, 2014 (continued)
NOTE 2 — SIGNIFICANT ACCOUNTING POLICIES (continued)
reasonably available, through either public information or information available to the Investment Adviser or Sub-Adviser, when determining the fair value of the security. In the event that a security or asset cannot be valued pursuant to one of the valuation methods established by the Board, the fair value of the security or asset will be determined in good faith by the Pricing Committee. When a Portfolio uses these fair valuation methods that use significant unobservable inputs to determine its NAV, securities will be priced by a method that the Pricing Committee believes accurately reflects fair value and are categorized as Level 3 of the fair value hierarchy. The methodologies used for valuing securities are not necessarily an indication of the risks of investing in those securities valued in good faith at fair value nor can it be assured a Portfolio can obtain the fair value assigned to a security if it were to sell the security.
To assess the continuing appropriateness of security valuations, the Pricing Committee may compare prior day prices, prices on comparable securities, and traded prices to the prior or current day prices and the Pricing Committee challenges those prices exceeding certain tolerance levels with the independent pricing service or broker source. For those securities valued in good faith at fair value, the Pricing Committee reviews and affirms the reasonableness of the valuation on a regular basis after considering all relevant information that is reasonably available.
For fair valuations using significant unobservable inputs, U.S. GAAP requires a reconciliation of the beginning to ending balances for reported fair values that presents changes attributable to total realized and unrealized gains or losses, purchases and sales, and transfers in or out of the Level 3 category during the period. The end of period timing recognition is used for the transfers between Levels of a Portfolio’s assets and liabilities. A reconciliation of Level 3 investments is presented only when a Portfolio had a significant amount of Level 3 investments.
For the year ended December 31, 2014, there have been no significant changes to the fair valuation methodologies.
B. Security Transactions and Revenue Recognition. Security transactions are accounted for on the trade date. Realized gains and losses are reported on the basis of identified cost of securities sold. Interest income is recorded on an accrual basis. Dividend income is recorded on the ex-dividend date, or for certain foreign securities, when the information becomes available to the Portfolios. Premium amortization and discount accretion are determined by the effective yield method and included in interest income.
C. Foreign Currency Translation. The books and records of the Portfolios are maintained in U.S. dollars. Any foreign currency amounts are translated into U.S. dollars on the following basis:
| (1) | Market value of investment securities, other assets and liabilities — at the exchange rates prevailing at the end of the day. |
| (2) | Purchases and sales of investment securities, income and expenses — at the rates of exchange prevailing on the respective dates of such transactions. |
Although the net assets and the market values are presented at the foreign exchange rates at the end of the day, the Portfolios do not isolate the portion of the results of operations resulting from changes in foreign exchange rates on investments from the fluctuations arising from changes in market prices of securities held. Such fluctuations are included with the net realized and unrealized gains or losses from investments. For securities which are subject to foreign withholding tax upon disposition, liabilities are recorded on the Statements of Assets and Liabilities for the estimated tax withholding based on the securities’ current market value. Upon disposition, realized gains or losses on such securities are recorded net of foreign withholding tax.
Reported net realized foreign exchange gains or losses arise from sales of foreign currencies, currency gains or losses realized between the trade and settlement dates on securities transactions, the difference between the amounts of dividends, interest, and foreign withholding tax reclaims recorded on the Portfolios’ books, and the U.S. dollar equivalent of the amounts actually received or paid. Net unrealized foreign exchange gains and losses arise from changes in the value of assets and liabilities other than investments in securities at fiscal year end, resulting from changes in the exchange rate. Foreign security and currency transactions may involve certain considerations and risks not typically associated with investing in U.S. companies and U.S. government securities. These risks include, but are not limited to, revaluation of currencies and future adverse political and economic developments which could cause securities and their markets to be less liquid and prices more volatile than those of comparable U.S. companies and U.S. government securities. The foregoing risks are even greater with respect to securities of issuers in emerging markets.
D. Distributions to Shareholders. The Portfolios record distributions to their shareholders on the ex-dividend date. Dividends from net investment income are declared and paid quarterly by each Portfolio. Each Portfolio distributes capital gains, if any, annually. The Portfolios may make distributions on a more frequent basis to comply with the
| 21 |
NOTES TO FINANCIAL STATEMENTS as of December 31, 2014 (continued)
NOTE 2 — SIGNIFICANT ACCOUNTING POLICIES (continued)
distribution requirements of the Internal Revenue Code. The characteristics of income and gains to be distributed are determined in accordance with income tax regulations, which may differ from U.S. GAAP for investment companies.
E. Federal Income Taxes. It is the policy of each Portfolio to comply with the requirements of subchapter M of the Internal Revenue Code that are applicable to regulated investment companies and to distribute substantially all of its net investment income and any net realized capital gains to its shareholders. Therefore, a federal income tax or excise tax provision is not required. Management has considered the sustainability of the Portfolios’ tax positions taken on federal income tax returns for all open tax years in making this determination. No capital gain distributions shall be made until the capital loss carryforwards have been fully utilized or expire.
F. Use of Estimates. The preparation of financial statements in conformity with U.S. GAAP requires management to make estimates and assumptions that affect the reported amounts of assets and liabilities and disclosure of contingent assets and liabilities at the date of the financial statements and the reported amounts of increases and decreases in net assets from operations during the reporting period. Actual results could differ from those estimates.
G. Risk Exposures and the Use of Derivative Instruments. Certain Portfolios’ investment strategies permit the Portfolios to enter into various types of derivatives contracts, including, but not limited to, forward foreign currency contracts, In doing so, a Portfolio will employ strategies in differing combinations to permit it to increase or decrease the level of risk, or change the level or types of exposure to market risk factors. This may allow a Portfolio to pursue its objectives more quickly and efficiently than if it were to make direct purchases or sales of securities capable of affecting a similar response to market factors.
Market Risk Factors. In pursuit of its investment objectives, a Portfolio may seek to use derivatives to increase or decrease its exposure to the following market risk factors:
Equity Risk. Equity risk relates to the change in value of equity securities as they relate to increases or decreases in the general market.
Foreign Exchange Rate Risk. Foreign exchange rate risk relates to the change in the U.S. dollar value of a security held that is denominated in a foreign currency. The U.S. dollar value of a foreign currency denominated security will
decrease as the U.S. dollar appreciates against the currency, while the U.S. dollar value will increase as the U.S. dollar depreciates against the currency.
Risks of Investing in Derivatives. A Portfolio’s use of derivatives can result in losses due to unanticipated changes in the market risk factors and the overall market. In instances where a Portfolio is using derivatives to decrease, or hedge, exposures to market risk factors for securities held by a Portfolio, there are also risks that those derivatives may not perform as expected resulting in losses for the combined or hedged positions.
The use of these strategies involves certain special risks, including a possible imperfect correlation, or even no correlation, between price movements of derivative instruments and price movements of related investments. While some strategies involving derivative instruments can reduce the risk of loss, they can also reduce the opportunity for gain or even result in losses by offsetting favorable price movements in related investments or otherwise, due to the possible inability of a Portfolio to purchase or sell a portfolio security at a time that otherwise would be favorable or the possible need to sell a portfolio security at a disadvantageous time because a Portfolio is required to maintain asset coverage or offsetting positions in connection with transactions in derivative instruments. Additional associated risks from investing in derivatives also exist and potentially could have significant effects on the valuation of the derivative and a Portfolio. Associated risks are not the risks that a Portfolio is attempting to increase or decrease exposure to, per their investment objectives, but are the additional risks from investing in derivatives. Examples of these associated risks are liquidity risk, which is the risk that a Portfolio will not be able to sell the derivative in the open market in a timely manner, and counterparty credit risk, which is the risk that the counterparty will not fulfill its obligation to a Portfolio. Associated risks can be different for each type of derivative and are discussed by each derivative type in the following notes.
Counterparty Credit Risk and Credit Related Contingent Features. Certain derivative positions are subject to counterparty credit risk, which is the risk that the counterparty will not fulfill its obligation to a Portfolio. Each Portfolio’s derivative counterparties are financial institutions who are subject to market conditions that may weaken their financial position. A Portfolio intends to enter into financial transactions with counterparties that it believes to be creditworthy at the time of the transaction. To reduce this risk, a Portfolio has entered into master netting arrangements, established within each Portfolio’s International Swap and Derivatives Association, Inc. Master Agreements (“Master Agreements”). These
| 22 |
NOTES TO FINANCIAL STATEMENTS as of December 31, 2014 (continued)
NOTE 2 — SIGNIFICANT ACCOUNTING POLICIES (continued)
agreements are with select counterparties and they govern transactions, including certain over-the-counter (“OTC”) derivative and forward foreign currency contracts, entered into by a Portfolio and the counterparty. The Master Agreements maintain provisions for general obligations, representations, agreements, collateral, and events of default or termination. The occurrence of a specified event of termination may give a counterparty the right to terminate all of its contracts and affect settlement of all outstanding transactions under the applicable Master Agreement.
A Portfolio may also enter into collateral agreements with certain counterparties to further mitigate counterparty credit risk on OTC derivative and forward foreign currency contracts. Subject to established minimum levels, collateral is generally determined based on the net aggregate unrealized gain or loss on contracts with a certain counterparty. Collateral pledged to or from a Portfolio is held in a segregated account by a third-party agent and can be in the form of cash or debt securities issued by the U.S. government or related agencies.
As of December 31, 2014, the maximum amount of loss that International Value would incur if the counterparties to its derivative transactions failed to perform would be $1,359 which represents the gross payments to be received by the Portfolio on open forward foreign currency contracts were they to be unwound as of December 31, 2014. There was no collateral posted by either counterparty at December 31, 2014 to reduce the potential risk of loss.
Each Portfolio has credit-related contingent features that if triggered would allow its derivative counterparties to close out and demand payment or additional collateral to cover their exposure from a Portfolio. Credit-related contingent features are established between each Portfolio and their derivatives counterparties to reduce the risk that a Portfolio will not fulfill its payment obligations to its counterparties. These triggering features include, but are not limited to, a percentage decrease in a Portfolio’s net assets and or a percentage decrease in a Portfolio’s NAV, which could cause a Portfolio to accelerate payment of any net liability owed to the counterparty. The contingent features are established within each Portfolio’s Master Agreements. There were no OTC instruments in a liability position at December 31, 2014.
H. Forward Foreign Currency Contracts. Each Portfolio may enter into forward foreign currency contracts primarily to hedge against foreign currency exchange rate risks on its non-U.S. dollar denominated investment securities. When entering into a forward currency contract, each
Portfolio agrees to receive or deliver a fixed quantity of foreign currency for an agreed-upon price on an agreed future date. These contracts are valued daily and the Portfolio’s net equity therein, representing unrealized gain or loss on the contracts as measured by the difference between the forward foreign exchange rates at the dates of entry into the contracts and the forward rates at the reporting date, is included in the Statements of Assets and Liabilities. Realized and unrealized gains and losses are included in the Statements of Operations. These instruments involve market and/or credit risk in excess of the amount recognized in the Statements of Assets and Liabilities. Risks arise from the possible inability of counterparties to meet the terms of their contracts and from movement in currency and securities values and interest rates.
During the year ended December 31, 2014, International Value entered into forward foreign currency contracts with the obligation to sell specified foreign currencies in the future at a currently negotiated forward rate in order to increase or decrease exposure to foreign exchange rate risk. During the year ended December 31, 2014, International Value had an average contract amount on forward foreign currency contracts to sell of $783,847. Please refer to the table following the Summary Portfolio of Investments for open forward foreign currency contracts at December 31, 2014.
I. Repurchase Agreements. Each Portfolio may invest in repurchase agreements only with government securities dealers recognized by the Board of Governors of the Federal Reserve System. Under such agreements, the seller of the security agrees to repurchase it at a mutually agreed upon time and price. The resale price is in excess of the purchase price and reflects an agreed upon interest rate for the period of time the agreement is outstanding. The period of the repurchase agreements is usually short, from overnight to one week, while the underlying securities generally have longer maturities. Each Portfolio will receive as collateral securities acceptable to it whose market value is equal to at least 100% of the carrying amount of the repurchase agreements, plus accrued interest, being invested by a Portfolio. The underlying collateral is valued daily on a mark-to-market basis to assure that the value, including accrued interest, is at least equal to the repurchase price. If the seller defaults, a Portfolio might incur a loss or delay in the realization of proceeds if the value of the security collateralizing the repurchase agreement declines, and may incur disposition costs in liquidating the collateral.
J. Securities Lending. Each Portfolio may temporarily loan up to 33% (except International Value, which can loan up to 33⅓%) of its total assets to brokers, dealers or other
| 23 |
NOTES TO FINANCIAL STATEMENTS as of December 31, 2014 (continued)
NOTE 2 — SIGNIFICANT ACCOUNTING POLICIES (continued)
financial institutions in exchange for a negotiated lender’s fee. The borrower is required to fully collateralize the loans with cash or U.S. government securities. Generally, in the event of counterparty default, a Portfolio has the right to use collateral to offset losses incurred. There would be potential loss to a Portfolio in the event a Portfolio is delayed or prevented from exercising its right to dispose of the collateral. Each Portfolio bears the risk of loss with respect to the investment of collateral with the following exception: The Bank of New York Mellon (“BNY”) provides each Portfolio indemnification from loss with respect to the investment of collateral provided that the cash collateral is invested solely in overnight repurchase agreements. Engaging in securities lending could have a leveraging effect, which may intensify the credit, market and other risks associated with investing in a Portfolio.
K. Illiquid and Restricted Securities. Each Portfolio may not invest more than 15% of its net assets in illiquid securities. Illiquid securities are not readily marketable. Disposing of illiquid investments may involve time-consuming negotiation and legal expenses, and it may be difficult or impossible for a Portfolio to sell them promptly at an acceptable price. Restricted securities are those sold under Rule 144A of the Securities Act of 1933 (“1933 Act”) or are securities offered pursuant to Section 4(a)(2) of the 1933 Act, and are subject to legal or contractual restrictions on resale and may not be publicly sold without registration under the 1933 Act. Certain restricted securities may be considered liquid pursuant to guidelines approved by the Board or may be deemed to be illiquid because they may not be readily marketable. Illiquid and restricted securities are fair valued using market quotations when readily available. In the absence of market quotations, the securities are valued based upon their fair value, as that term is used in the 1940 Act, determined in good faith under procedures approved by the Board.
L. Indemnifications. In the normal course of business, the Trust may enter into contracts that provide certain indemnifications. The Trust’s maximum exposure under these arrangements is dependent on future claims that may be made against the Portfolios and, therefore, cannot be estimated; however, based on experience, management considers the risk of loss from such claims remote.
NOTE 3 — INVESTMENT TRANSACTIONS
For the year ended December 31, 2014, the cost of purchases and the proceeds from the sales of securities, excluding short-term securities, were as follows:
| Purchases | Sales | |||||||
| International Value | $ | 68,390,003 | $ | 83,314,505 | ||||
| MidCap Opportunities | 1,476,586,318 | 1,727,773,609 | ||||||
| SmallCap Opportunities | 103,506,792 | 121,746,541 | ||||||
NOTE 4 — INVESTMENT MANAGEMENT AND ADMINISTRATIVE FEES
The Portfolios have entered into an investment management agreement (“Investment Management Agreement”) with the Investment Adviser. The Investment Management Agreement compensates the Investment Adviser with a fee, computed daily and payable monthly, based on the average daily net assets of each Portfolio, at the following annual rates:
| International Value | 0.80% on the first $250 million; 0.75% on the next $500 million; and 0.70% in excess of $750 million | |||
| MidCap Opportunities | 0.75% on the first $250 million; 0.70% on the next $400 million; 0.65% on the next $450 million; and 0.60% in excess of $1.1 billion | |||
| SmallCap Opportunities | 0.75% on the first $250 million; 0.70% on the next $250 million, 0.65% on the next $250 million; 0.60% on the next $250 million; and 0.55% in excess of $1 billion |
The Investment Adviser has entered into a sub-advisory agreement with Voya IM with respect to each Portfolio. Subject to such policies as the Board or the Investment Adviser may determine, Voya IM manages the Portfolios’ assets in accordance with the Portfolios’ investment objectives, policies, and limitations.
The Administrator provides certain administrative and shareholder services necessary for each Portfolio’s operations and is responsible for the supervision of other service providers. For its services, the Administrator is entitled to receive from each Portfolio a fee at an annual rate of 0.10% of each Portfolio’s average daily net assets.
In placing equity security transactions, the Sub-Adviser is required to use its best efforts to choose a broker capable of providing brokerage services necessary to obtain the best execution for each transaction. Subject to this requirement, the Sub-Adviser may allocate equity security transactions through certain designated broker-dealers. Some of these broker-dealers participate in commission recapture programs that have been established for the benefit of the Portfolios. Under these programs, the participating broker-dealers will return to a Portfolio a portion of the brokerage commissions (in the form of a credit to a Portfolio) paid to the broker-dealers to pay certain expenses of a Portfolio. These commission
| 24 |
NOTES TO FINANCIAL STATEMENTS as of December 31, 2014 (continued)
NOTE 4 — INVESTMENT MANAGEMENT AND ADMINISTRATIVE FEES (continued)
recapture payments benefit the Portfolios and not the Sub-Adviser. Any amount credited to a Portfolio is reflected as brokerage commission recapture in the accompanying Statement of Operations.
NOTE 5 — SHAREHOLDER SERVICE AND DISTRIBUTION FEES
Class ADV and Class S2 shares of the respective Portfolios are subject to a Shareholder Service and Distribution Plan pursuant to Rule 12b-1 under the 1940 Act (the “Plan”). Under the Plan, the Distributor is paid an annual shareholder service fee at the rate of 0.25% and an annual distribution fee at the rate of 0.25% of the average daily net assets attributable to its Class ADV and Class S2 shares. The Distributor contractually agreed to waive a portion of its fee equal to 0.10% of the average daily net assets attributable to Class S2 of the Portfolios, so that the actual fee paid by Class S2 of a Portfolio is an annual rate of 0.15%. Termination or modification of this obligation requires approval by the Board.
Class S shares of the Portfolios are subject to a Shareholder Services Plan (the “Shareholder Services Plan”). Under the Shareholder Services Plan, each Portfolio pays the Distributor a fee calculated at an annual rate of 0.25% of average daily net assets attributable to its Class S shares. The Distributor is entitled to use the proceeds from the Shareholder Services Plan to pay for services including, but not limited to, providing information about the Portfolios and delivering Portfolio documents.
The Distributor has agreed to waive 0.05% of average daily net assets of Class S related to the shareholder service fee for International Value. Termination or modification of this obligation requires approval by the Board.
NOTE 6 — OTHER TRANSACTIONS WITH AFFILIATES AND RELATED PARTIES
For the year ended December 31, 2014, International Value incurred $92,000 of proxy and solicitation costs associated with obtaining shareholder approval relating to the proposed merger with and into Voya Global Value Advantage Portfolio, which is not included in this report. The Investment Adviser reimbursed the Portfolio for these costs.
At December 31, 2014, the following direct or indirect, wholly-owned subsidiaries of Voya Financial, Inc. owned more than 5% of the following Portfolios:
| Subsidiary | Portfolio | Percentage | ||||
| ReliaStar Life Insurance Company | International Value | 13.15% | ||||
| SmallCap Opportunities | 12.21 | |||||
| Voya Institutional Trust Company | MidCap Opportunities | 10.19 | ||||
| SmallCap Opportunities | 27.97 | |||||
| Voya Insurance and Annuity Company | International Value | 5.19 | ||||
| MidCap Opportunities | 34.95 | |||||
| SmallCap Opportunities | 17.66 | |||||
| Voya Retirement Insurance and Annuity Company | International Value | 81.22 | ||||
| MidCap Opportunities | 30.38 | |||||
| SmallCap Opportunities | 39.17 | |||||
Control is defined by the 1940 Act as the beneficial ownership, either directly or through one or more controlled companies, of more than 25% of the voting securities of a company. The 1940 Act defines affiliates as companies that are under common control. Therefore, if certain Portfolios have a common owner that owns over 25% of the outstanding securities of the Portfolios, they may be deemed to be affiliates of each other. Investment activities of these shareholders could have a material impact on the Portfolios.
The Portfolios have adopted a Deferred Compensation Plan (the “Plan”), which allows eligible non-affiliated trustees, as described in the Plan, to defer the receipt of all or a portion of the trustees’ fees that they are entitled to receive from the Portfolios. For purposes of determining the amount owed to the trustee under the Plan, the amounts deferred are invested in shares of the funds selected by the trustee (the “Notional Funds”). The Portfolios purchase shares of the Notional Funds, which are all advised by Voya Investments, in amounts equal to the trustees’ deferred fees, resulting in a Portfolio asset equal to the deferred compensation liability. Such assets are included as a component of “Other assets” on the accompanying Statement of Assets and Liabilities. Deferral of trustees’ fees under the Plan will not affect net assets of the Portfolio, and will not materially affect the Portfolios’ assets, liabilities or net investment income per share. Amounts will be deferred until distributed in accordance with the Plan.
| 25 |
NOTES TO FINANCIAL STATEMENTS as of December 31, 2014 (continued)
NOTE 7 — EXPENSE LIMITATION AGREEMENT
The Investment Adviser has entered into a written expense limitation agreement (“Expense Limitation Agreement”) with each Portfolio whereby the Investment Adviser has agreed to limit the expenses excluding interest, taxes, brokerage commissions, extraordinary expenses, and acquired fund fees and expenses to the levels listed below:
| Portfolio | Class ADV | Class I | Class S | Class S2 | ||||||||||||
| International Value(1) | 1.50% | 1.00% | 1.20% | N/A | ||||||||||||
| MidCap Opportunities(2) | 1.40% | 0.90% | 1.10% | 1.30% | ||||||||||||
| SmallCap Opportunities | 1.42% | 0.92% | 1.17% | 1.32% | ||||||||||||
| (1) | Effective January 1, 2014, pursuant to a side letter agreement, the Investment Adviser has further lowered the expense limits for International Value to 1.45%, 0.95%, and 1.15% for Class ADV, Class I, and Class S, respectively. The side letter agreement will continue through May 1, 2015. Termination or modification of this obligation requires approval by the Board. Any fees waived pursuant to the side letter agreement shall not be eligible for recoupment. |
| (2) | Pursuant to a side letter agreement, the Investment Adviser has further lowered the expense limits for MidCap Opportunities to 1.35%, 0.85%, 1.10%, and 1.25% for Class ADV, Class I, Class S and Class S2, respectively. The side letter agreement will continue through May 1, 2015. Termination or modification of this obligation requires approval by the Board |
The Investment Adviser may at a later date recoup from a Portfolio for management fees waived and other expenses assumed by the Investment Adviser during the previous 36 months, but only if, after such recoupment, a Portfolio’s expense ratio does not exceed the percentage described above. Waived and reimbursed fees and any recoupment by the Investment Adviser of such waived and reimbursed fees are reflected on the accompanying Statements of Operations. Amounts payable by the Investment Adviser are reflected on the accompanying Statements of Assets and Liabilities.
As of December 31, 2014, the Portfolios did not have any amount of waived or reimbursed fees that would be subject to possible recoupment by the Investment Adviser.
These amounts do not include shareholding servicing fees voluntarily waived by the Distributor.
The Expense Limitation Agreement is contractual through May 1, 2015 and shall renew automatically for one-year terms. Termination or modification of this obligation requires approval by the Board.
NOTE 8 — LINE OF CREDIT
The Portfolios, in addition to certain other funds managed by the Investment Adviser, have entered into an unsecured committed revolving line of credit agreement (the “Credit Agreement”) with BNY for an aggregate amount of $200,000,000. The proceeds may be used only to: (1) temporarily finance the purchase or sale of securities; and (2) finance the redemption of shares of an investor in the funds. The funds to which the line of credit is available pay a commitment fee equal to 0.07% per annum on the daily unused portion of the committed line amount payable quarterly in arrears. Prior to May 23, 2014, the funds to which the Credit Agreement is available paid a commitment fee equal to 0.08% per annum on the daily unused portion of the committed line amount payable quarterly in arrears.
Borrowings under the Credit Agreement accrue interest at the federal funds rate plus a specified margin. Repayments generally must be made within 60 days after the date of a revolving credit advance.
The following Portfolios utilized the line of credit during the period ended December 31, 2014:
| Portfolio | Days Utilized | Approximate Average Daily Balance For Days Utilized | Approximate Weighted Average Interest Rate For Days Utilized | |||||||||
| International Value | 20 | $ | 444,350 | 1.09% | ||||||||
| MidCap Opportunities | 1 | 1,975,000 | 1.13 | |||||||||
| 26 |
NOTES TO FINANCIAL STATEMENTS as of December 31, 2014 (continued)
NOTE 9 — CAPITAL SHARES
Transactions in capital shares and dollars were as follows:
| Shares sold | Shares issued in merger | Reinvestment of distributions | Shares redeemed | Net increase (decrease) in shares outstanding | Shares sold | Proceeds from shares issued in merger | Reinvestment of distributions | Shares redeemed | Net increase (decrease) | |||||||||||||||||||||||||||||||
| Year or period ended | # | # | # | # | # | ($) | ($) | ($) | ($) | ($) | ||||||||||||||||||||||||||||||
| International Value | ||||||||||||||||||||||||||||||||||||||||
| Class ADV | ||||||||||||||||||||||||||||||||||||||||
| 12/31/2014 | 16,953 | — | 4,006 | (14,640 | ) | 6,319 | 159,549 | — | 38,982 | (138,882 | ) | 59,649 | ||||||||||||||||||||||||||||
| 12/31/2013 | 16,035 | — | 3,005 | (19,999 | ) | (959 | ) | 139,704 | — | 24,731 | (170,222 | ) | (5,787 | ) | ||||||||||||||||||||||||||
| Class I | ||||||||||||||||||||||||||||||||||||||||
| 12/31/2014 | 303,563 | — | 391,016 | (2,125,135 | ) | (1,430,556 | ) | 2,919,844 | — | 3,829,632 | (20,233,597 | ) | (13,484,121 | ) | ||||||||||||||||||||||||||
| 12/31/2013 | 349,096 | — | 387,712 | (2,991,408 | ) | (2,254,600 | ) | 3,117,626 | — | 3,244,666 | (26,160,759 | ) | (19,798,467 | ) | ||||||||||||||||||||||||||
| Class S | ||||||||||||||||||||||||||||||||||||||||
| 12/31/2014 | 56,390 | — | 22,475 | (129,276 | ) | (50,411 | ) | 534,495 | — | 224,859 | (1,265,115 | ) | (505,761 | ) | ||||||||||||||||||||||||||
| 12/31/2013 | 15,511 | — | 21,328 | (146,497 | ) | (109,658 | ) | 140,686 | — | 181,650 | (1,318,884 | ) | (996,548 | ) | ||||||||||||||||||||||||||
| Class S2(1) | ||||||||||||||||||||||||||||||||||||||||
| 12/31/2013 | — | — | — | (552 | ) | (552 | ) | — | — | — | (4,774 | ) | (4,774 | ) | ||||||||||||||||||||||||||
| MidCap Opportunities | ||||||||||||||||||||||||||||||||||||||||
| Class ADV | ||||||||||||||||||||||||||||||||||||||||
| 12/31/2014 | 587,498 | — | 1,652,278 | (1,285,676 | ) | 954,100 | 9,047,099 | — | 22,154,336 | (19,942,710 | ) | 11,258,725 | ||||||||||||||||||||||||||||
| 12/31/2013 | 2,042,352 | 1,118,918 | 223,187 | (951,367 | ) | 2,433,090 | 28,755,203 | 15,307,383 | 3,104,778 | (13,992,671 | ) | 33,174,693 | ||||||||||||||||||||||||||||
| Class I | ||||||||||||||||||||||||||||||||||||||||
| 12/31/2014 | 7,070,791 | — | 7,847,260 | (14,551,084 | ) | 366,967 | 113,909,576 | — | 110,089,539 | (234,136,573 | ) | (10,137,458 | ) | |||||||||||||||||||||||||||
| 12/31/2013 | 6,292,943 | 6,446,546 | 1,297,736 | (13,724,218 | ) | 313,007 | 92,314,013 | 90,885,188 | 18,667,524 | (200,124,880 | ) | 1,741,845 | ||||||||||||||||||||||||||||
| Class S | ||||||||||||||||||||||||||||||||||||||||
| 12/31/2014 | 620,496 | — | 7,139,010 | (9,172,773 | ) | (1,413,267 | ) | 9,560,086 | — | 96,802,626 | (142,592,458 | ) | (36,229,746 | ) | ||||||||||||||||||||||||||
| 12/31/2013 | 1,793,643 | 14,215,244 | 1,147,782 | (9,115,021 | ) | 8,041,648 | 25,214,661 | 195,532,971 | 16,070,181 | (130,827,647 | ) | 105,990,166 | ||||||||||||||||||||||||||||
| Class S2 | ||||||||||||||||||||||||||||||||||||||||
| 12/31/2014 | 173,722 | — | 161,775 | (275,909 | ) | 59,588 | 2,760,183 | — | 2,189,278 | (4,329,102 | ) | 620,359 | ||||||||||||||||||||||||||||
| 12/31/2013 | 340,396 | 103,967 | 19,163 | (138,384 | ) | 325,142 | 4,908,180 | 1,430,604 | 268,315 | (2,000,370 | ) | 4,606,729 | ||||||||||||||||||||||||||||
| SmallCap Opportunities | ||||||||||||||||||||||||||||||||||||||||
| Class ADV | ||||||||||||||||||||||||||||||||||||||||
| 12/31/2014 | 357,817 | — | 179,565 | (193,522 | ) | 343,860 | 9,652,003 | — | 4,289,810 | (5,171,465 | ) | 8,770,348 | ||||||||||||||||||||||||||||
| 12/31/2013 | 895,070 | — | 73,065 | (112,951 | ) | 855,184 | 22,200,746 | — | 1,712,645 | (2,866,905 | ) | 21,046,486 | ||||||||||||||||||||||||||||
| Class I | ||||||||||||||||||||||||||||||||||||||||
| 12/31/2014 | 703,975 | — | 647,302 | (1,101,900 | ) | 249,377 | 19,841,775 | — | 16,435,008 | (31,233,528 | ) | 5,043,255 | ||||||||||||||||||||||||||||
| 12/31/2013 | 1,032,830 | — | 403,853 | (793,770 | ) | 642,913 | 26,843,417 | — | 9,938,817 | (20,518,480 | ) | 16,263,754 | ||||||||||||||||||||||||||||
| Class S | ||||||||||||||||||||||||||||||||||||||||
| 12/31/2014 | 152,709 | — | 295,816 | (747,221 | ) | (298,696 | ) | 4,204,925 | — | 7,206,064 | (20,285,499 | ) | (8,874,510 | ) | ||||||||||||||||||||||||||
| 12/31/2013 | 432,457 | — | 210,192 | (632,802 | ) | 9,847 | 10,734,452 | — | 4,998,362 | (15,961,632 | ) | (228,818 | ) | |||||||||||||||||||||||||||
| Class S2 | ||||||||||||||||||||||||||||||||||||||||
| 12/31/2014 | 39,300 | — | 16,823 | (36,814 | ) | 19,309 | 1,065,586 | — | 404,768 | (1,001,123 | ) | 469,231 | ||||||||||||||||||||||||||||
| 12/31/2013 | 39,689 | — | 9,590 | (42,163 | ) | 7,116 | 987,491 | — | 225,946 | (1,030,006 | ) | 183,431 |
| (1) | Class S2 liquidated on April 30, 2013. |
NOTE 10 — SECURITIES LENDING
Under a Master Securities Lending Agreement (the “Agreement”) with BNY, the Portfolios can lend their securities to approved brokers, dealers and other financial institutions. Loans are collateralized by cash and U.S. government securities. The collateral must be equal to at least 105% of the market value of non-U.S. securities loaned and 102% of the market value of U.S. securities loaned. The market value of the loaned securities is determined at the close of business of the Portfolios at their last sale price or official closing price on the principal
exchange or system on which they are traded and any additional collateral is delivered to the Portfolios on the next business day. The cash collateral received is invested in approved investments as defined in the Agreement with BNY. The Portfolios bear the risk of loss with respect to the investment of collateral with the following exception: BNY provides the Portfolios indemnification from loss with respect to the investment of collateral provided that the cash collateral is invested solely in overnight repurchase agreements.
| 27 |
NOTES TO FINANCIAL STATEMENTS as of December 31, 2014 (continued)
NOTE 10 — SECURITIES LENDING (continued)
The cash collateral is invested in overnight repurchase agreements that are collateralized at 102% with securities issued or fully guaranteed by the United States Treasury; United States government or any agency, instrumentality or authority of the United States government. The securities purchased with cash collateral received are reflected in the Summary Portfolios of Investments under Securities Lending Collateral.
Generally, in the event of counterparty default, the Portfolios have the right to use the collateral to offset losses incurred. The Agreement contains certain guarantees by BNY in the event of counterparty default and/or a borrower’s failure to return a loaned security; however, there would be a potential loss to the Portfolios in the event the Portfolios are delayed or prevented from exercising its right to dispose of the collateral. Engaging in securities lending could have a leveraging effect, which may intensify the credit, market and other risks associated with investing in the Portfolios. The following is a summary of the Portfolio’s securities lending agreements by counterparty which are subject to offset under the Agreement as of December 31, 2014:
International Value
| Counterparty | Securities Loaned at Value | Cash Collateral Received(1) | Net Amount | |||||||||
| ABN AMRO Bank N.V. | $ | 697,629 | $ | (697,629 | ) | $ | — | |||||
| Barclays Capital Inc. | 1,112 | (1,112 | ) | — | ||||||||
| Citigroup Global Markets | 509,196 | (509,196 | ) | — | ||||||||
| Credit Suisse Securities (USA) LLC | 172,872 | (172,872 | ) | — | ||||||||
| Morgan Stanley & Co. LLC | 8,173 | (8,173 | ) | — | ||||||||
| Total | $ | 1,388,982 | $ | (1,388,982 | ) | $ | — | |||||
| (1) | Collateral with a fair value of $1,447,927 has been received in connection with the above securities lending transactions. |
Excess collateral received from the individual counterparty is not shown for financial reporting purposes.
MidCap Opportunities
| Counterparty | Securities Loaned at Value | Cash Collateral Received(1) | Net Amount | |||||||||
| Goldman Sachs & Company | $ | 3,736,309 | $ | (3,736,309 | ) | $ | — | |||||
| RBC Capital Markets, LLC | 2,999,350 | (2,999,350 | ) | — | ||||||||
| SG Americas Securities, LLC | 574,002 | (574,002 | ) | — | ||||||||
| Scotia Capital (USA) INC | 165,934 | (165,934 | ) | — | ||||||||
| Total | $ | 7,475,595 | $ | (7,475,595 | ) | $ | — | |||||
| (1) | Collateral with a fair value of $7,637,672 has been received in connection with the above securities lending transactions. |
Excess collateral received from the individual counterparty is not shown for financial reporting purposes.
SmallCap Opportunities
| Counterparty | Securities Loaned at Value | Cash Collateral Received(1) | Net Amount | |||||||||
| Barclays Capital Inc. | $ | 292,405 | $ | (292,405 | ) | $ | — | |||||
| Deutsche Bank Securities | 2,899,691 | (2,899,691 | ) | — | ||||||||
| Goldman Sachs & Company | 1,079,980 | (1,079,980 | ) | — | ||||||||
| JPMorgan Clearing Corp. | 513,282 | (513,282 | ) | — | ||||||||
| Janney Montgomery Scott LLC | 73,459 | (73,459 | ) | — | ||||||||
| Morgan Stanley & Co. LLC | 664,888 | (664,888 | ) | — | ||||||||
| UBS Securities, LLC | 1,030,148 | (1,030,148 | ) | — | ||||||||
| Total | $ | 6,553,854 | $ | (6,553,854 | ) | $ | — | |||||
| (1) | Collateral with a fair value of $6,707,524 has been received in connection with the above securities lending transactions. |
Excess collateral received from the individual counterparty is not shown for financial reporting purposes.
NOTE 11 — REORGANIZATIONS
On March 22, 2013, MidCap Opportunities (“Acquiring Portfolio”) acquired all of the net assets of ING Blackrock Science and Technology Opportunities Portfolio (“Acquired Portfolio”), an open-end investment company in a tax-free reorganization in exchange for shares of the Acquiring Portfolio, pursuant to a plan of reorganization approved by the Acquired Portfolio’s shareholders on March 12, 2013. The purposes of the transaction were to combine two portfolios with comparable investment objectives, policies, restrictions and management. For financial reporting purposes, assets received and shares issued by the Acquiring Portfolio were recorded at fair value; however, the cost basis of the investments received from the Acquired Portfolio was carried forward to align ongoing reporting of the Acquiring Portfolio’s realized and unrealized gains and losses with amounts distributable to shareholders for tax purposes.
Assuming the acquisition had been completed on January 1, 2013, the beginning of the annual reporting period of the Acquiring Portfolio, the Acquiring Portfolio’s pro forma results of operations for the period ended December 31, 2013, are as follows:
| Net investment income | $ | (192,772 | ) | |
| Net realized and unrealized loss on investments | $ | 411,278,505 | ||
| Net increase in net assets resulting from operations | $ | 411,085,733 |
| 28 |
NOTES TO FINANCIAL STATEMENTS as of December 31, 2014 (continued)
NOTE 11 — REORGANIZATIONS (continued)
Because the combined investment Portfolios have been managed as a single integrated Portfolio since the acquisition was completed, it is not practicable to separate the amounts of revenue and earnings of the Acquired Portfolio that have been included in the Acquiring Portfolio’s statement of operations since March 22, 2013. Net assets and unrealized appreciation as of the reorganization date were as follows:
| Acquiring Portfolio | Acquired Portfolio | Total Net Assets of Acquired Portfolio (000s) | Total Net Assets of Acquiring Portfolio (000s) | Acquired Capital Loss Carryforwards | Acquired Unrealized Appreciation (000s) | Portfolio Conversion Ratio | ||||||||||||||||
| MidCap Opportunities | ING Blackrock Science and Technology Opportunities Portfolio | $ | 303,156 | $ | 1,245,557 | $ | — | $ | 658 | 0.3462 | ||||||||||||
The net assets of MidCap Opportunities after the acquisition were $1,548,713.
NOTE 12 — CONCENTRATION OF INVESTMENT RISKS
All mutual funds involve risk — some more than others — and there is always the chance that you could lose money or not earn as much as you hope. A Portfolio’s risk profile is largely a factor of the principal securities in which it invests and investment techniques that it uses. For more information regarding the types of securities and investment techniques that may be used by a Portfolio and their corresponding risks, see each Portfolio’s most recent Prospectus and/or the Statement of Additional Information.
Foreign Investments and/or Developing and Emerging Markets (International Value and MidCap Opportunities). There are certain risks in owning foreign (non-U.S.) securities, including those resulting from: fluctuations in currency exchange rates; devaluation of currencies; political or economic developments and the possible imposition of currency exchange blockages or other foreign governmental laws or restrictions; reduced availability of public information concerning issuers; accounting, auditing and financial reporting standards or other regulatory practices and requirements that are not uniform when compared to those applicable to domestic companies; settlement and clearance procedures in some countries that may not be reliable and can result in delays in settlement; higher transaction and custody expenses than for domestic securities; and limitations on foreign ownership of equity securities. Also, securities of many foreign companies may be less liquid and the prices more volatile than those of domestic companies. Foreign investment risks may be greater in developing and emerging markets than in developed markets.
NOTE 13 — FEDERAL INCOME TAXES
The amount of distributions from net investment income and net realized capital gains are determined in accordance with federal income tax regulations, which may differ from U.S. GAAP for investment companies. These book/tax differences may be either temporary or permanent. Permanent differences are reclassified within the capital accounts based on their federal tax-basis treatment; temporary differences are not reclassified. Key differences include the treatment of short-term capital gains, foreign currency transactions, income from passive foreign investment companies (PFICs), and wash sale deferrals. Distributions in excess of net investment income and/or net realized capital gains for tax purposes are reported as return of capital.
The following permanent tax differences have been reclassified as of December 31, 2014:
| Undistributed Net Investment Income | Accumulated Net Realized Gains/(Losses) | |||||||
| International Value | $ | 158,993 | $ | (158,993 | ) | |||
| MidCap Opportunities | 370,674 | (370,674 | ) | |||||
| SmallCap Opportunities | 547,561 | (547,561 | ) | |||||
Dividends paid by the Portfolios from net investment income and distributions of net realized short-term capital gains are, for federal income tax purposes, taxable as ordinary income to shareholders.
The tax composition of dividends and distributions to shareholders was as follows:
| Year Ended December 31, 2014 | Year Ended December 31, 2013 | |||||||||||||||
| Ordinary Income | Long-term Capital Gains | Ordinary Income | Long-term Capital Gains | |||||||||||||
| International Value | $ | 4,093,473 | $ | — | $ | 3,451,084 | $ | — | ||||||||
| MidCap Opportunities | 74,099,194 | 157,136,585 | 240,392 | 37,870,406 | ||||||||||||
| SmallCap Opportunities | 9,026,369 | 19,309,281 | 4,941,867 | 11,933,903 | ||||||||||||
| 29 |
NOTES TO FINANCIAL STATEMENTS as of December 31, 2014 (continued)
NOTE 13 — FEDERAL INCOME TAXES (continued)
The tax-basis components of distributable earnings and the capital loss carryforwards which may be used to offset future realized capital gains for federal income tax purposes as of December 31, 2014 are detailed below. The Regulated Investment Company Modernization Act of 2010 (the “Act”) provides an unlimited carryforward period for newly generated capital losses. Under the Act, there may be a greater likelihood that all or a portion of the Portfolios’ pre-enactment capital loss carryforwards may expire without being utilized due to the fact that post-enactment capital losses are required to be utilized before pre-enactment capital loss carryforwards.
| Undistributed Ordinary Income | Undistributed Long-term Capital Gains | Unrealized Appreciation/ (Depreciation) | Short-term Capital Loss Carryforwards | Expiration | ||||||||||||||||
| International Value | $ | 230,371 | $ | — | $ | 1,943,654 | $ | (69,395,525 | ) | 2016 | ||||||||||
| (104,716,147 | ) | 2017 | ||||||||||||||||||
| $ | (174,111,672 | ) | ||||||||||||||||||
| MidCap Opportunities | 36,954,753 | 152,228,499 | 227,124,805 | (165,925 | ) | 2016 | ||||||||||||||
| (95,470 | ) | 2017 | ||||||||||||||||||
| $ | (261,395 | ) | ||||||||||||||||||
| SmallCap Opportunities | 3,955,829 | 32,010,418 | 60,352,257 | — | — | |||||||||||||||
| * | Utilization of these capital losses is subject to annual limitations under Section 382 of the Internal Revenue Code. |
The Portfolios’ major tax jurisdictions are U.S. federal, Arizona, and Massachusetts. The earliest tax year that remains subject to examination by these jurisdictions is 2010.
As of December 31, 2014, no provision for income tax is required in the Portfolios’ financial statements as a result of tax positions taken on federal and state income tax returns for open tax years. The Portfolios’ federal and state income and federal excise tax returns for tax years for which the applicable statutes of limitations have not expired are subject to examination by the Internal Revenue Service and state department of revenue.
NOTE 14 — RESTRUCTURING PLAN
In October 2009, ING Groep N.V. (“ING Groep”) submitted a restructuring plan (the “Restructuring Plan”) to the European Commission in order to receive approval for state aid granted to ING Groep by the Kingdom of the Netherlands in November 2008 and March 2009. To receive approval for this state aid, ING Groep was required to divest its insurance and investment management businesses, including Voya Financial, Inc. (formerly, ING U.S., Inc.), before the end of 2013. In November 2012, the Restructuring Plan was amended to permit ING Groep additional time to complete the divestment. Pursuant to the amended Restructuring Plan, ING Groep was required to divest at least 25% of Voya Financial, Inc. by the end of 2013 and more than 50% by the end of 2014, and is required to divest its remaining interest by the end of 2016 (such divestment, the “Separation Plan”).
In May 2013, Voya Financial, Inc. conducted an initial public offering of its common stock (the “IPO”). In October 2013, March 2014, and September 2014, ING Groep divested additional shares in several secondary offerings of common stock of Voya Financial, Inc. and concurrent share repurchases by Voya Financial, Inc.
These transactions reduced ING Groep’s ownership interest in Voya Financial, Inc. to 32%. Voya Financial, Inc. did not receive any proceeds from these offerings.
In November 2014, through an additional secondary offering and the concurrent repurchase of shares by Voya Financial, Inc., ING Groep further reduced its interest in Voya Financial, Inc. below 25% to approximately 19% (the “November 2014 Offering”). The November 2014 Offering was deemed by the Investment Adviser to be a change of control (the “Change of Control”), which resulted in the automatic termination of the existing investment advisory and sub-advisory agreements under which the Investment Adviser and Sub-Adviser provide services to the Portfolios. In anticipation of this termination, and in order to ensure that the existing investment advisory and sub-advisory services could continue uninterrupted, in 2013 the Board approved new advisory and sub-advisory agreements for the Portfolios, as applicable, in connection with the IPO. In addition, in 2013, shareholders of each Portfolio approved new investment advisory and affiliated sub-advisory agreements prompted by the IPO, as well as any future advisory and affiliated sub-advisory agreements prompted by the Separation Plan that are approved by the Board and that have terms not materially different from the current
| 30 |
NOTES TO FINANCIAL STATEMENTS as of December 31, 2014 (continued)
NOTE 14 — RESTRUCTURING PLAN (continued)
agreements. This meant that shareholders would not have another opportunity to vote on a new agreement with the Investment Adviser or the current affiliated sub-adviser even upon a change of control prompted by the Separation Plan, as long as no single person or group of persons acting together gains “control” (as defined in the 1940 Act) of Voya Financial, Inc.
On November 18, 2014, in response to the Change of Control, the Board, at an in-person meeting, approved new investment advisory and affiliated sub-advisory agreements. At that meeting, the Investment Adviser represented that the agreements approved by the Board were not materially different from the agreements approved by shareholders in 2013 and no single person or group of persons acting together was expected to gain “control” (as defined in the 1940 Act) of Voya Financial, Inc. As a result, shareholders of the Portfolios will not be asked to vote again on these new agreements with the Investment Adviser and affiliated sub-adviser.
NOTE 15 — SUBSEQUENT EVENTS
On September 12, 2014, the Board approved a proposal to reorganize International Value (the “Disappearing
Portfolio”) with and into Voya Global Value Advantage Portfolio, which is not included in this report (the “Reorganization”). The proposed Reorganization is subject to approval by the shareholders of the Disappearing Portfolio at a shareholder meeting scheduled to be held on or about February 17, 2015. The Disappearing Portfolio will notify its shareholders if shareholder approval of its proposed Reorganization is not obtained. If shareholder approval is obtained, it is expected that the Reorganization will take place on or about March 6, 2015.
Subsequent to the period end, the Board approved amendments to the Portfolios’ Valuation Procedures which changed the valuation methodology for investments in securities of sufficient credit quality, maturing in 60 days or less from amortized cost to a price provided by an independent pricing service.
The Portfolios have evaluated events occurring after the Statements of Assets and Liabilities date (“subsequent events”), to determine whether any subsequent events necessitated adjustment to or disclosure in the financial statements. Other than the above, no such subsequent events were identified.
| 31 |
| Voya International Value Portfolio | SUMMARY PORTFOLIO OF INVESTMENTS as of December 31, 2014 |
| Shares | Value | Percentage of Net Assets | ||||||||||||
| COMMON STOCK: 97.9% | ||||||||||||||
| Australia: 3.2% | ||||||||||||||
| 87,696 | BHP Billiton Ltd. | $ | 2,073,365 | 1.9 | ||||||||||
| 30,597 | Macquarie Group Ltd. | 1,442,858 | 1.3 | |||||||||||
| 3,516,223 | 3.2 | |||||||||||||
| China: 2.4% | ||||||||||||||
| 109,000 | China Mobile Ltd. | 1,276,689 | 1.2 | |||||||||||
| 1,068,000 | China Railway Construction Corp. Ltd. | 1,356,041 | 1.2 | |||||||||||
| 2,632,730 | 2.4 | |||||||||||||
| Denmark: 2.2% | ||||||||||||||
| 590 | AP Moller - Maersk A/S -Class B | 1,173,482 | 1.1 | |||||||||||
| 46,840 | @ | Danske Bank A/S | 1,266,360 | 1.1 | ||||||||||
| 2,439,842 | 2.2 | |||||||||||||
| Finland: 0.8% | ||||||||||||||
| 42,318 | Other Securities | 918,792 | 0.8 | |||||||||||
| France: 14.1% | ||||||||||||||
| 33,720 | @ | Alstom | 1,087,561 | 1.0 | ||||||||||
| 17,237 | L | Arkema | 1,140,003 | 1.0 | ||||||||||
| 14,898 | Casino Guichard Perrachon S.A. | 1,370,090 | 1.2 | |||||||||||
| 106,419 | Credit Agricole SA | 1,373,716 | 1.2 | |||||||||||
| 79,008 | Orange SA | 1,343,670 | 1.2 | |||||||||||
| 220,333 | Natixis | 1,453,897 | 1.3 | |||||||||||
| 7,813 | Kering | 1,501,432 | 1.4 | |||||||||||
| 23,041 | Renault S.A. | 1,678,225 | 1.5 | |||||||||||
| 69,836 | Suez Environnement S.A. | 1,216,771 | 1.1 | |||||||||||
| 50,220 | Total S.A. | 2,572,879 | 2.3 | |||||||||||
| 10,341 | Other Securities | 942,797 | 0.9 | |||||||||||
| 15,681,041 | 14.1 | |||||||||||||
| Germany: 11.0% | ||||||||||||||
| 8,328 | Allianz AG | 1,379,339 | 1.2 | |||||||||||
| 17,399 | BASF AG | 1,459,448 | 1.3 | |||||||||||
| 15,197 | Bayer AG | 2,071,485 | 1.9 | |||||||||||
| 10,557 | Bayerische Motoren Werke AG | 1,139,296 | 1.0 | |||||||||||
| 13,314 | Hannover Rueckversicheru - Reg | 1,201,077 | 1.1 | |||||||||||
| 6,031 | Muenchener Rueckversicherungs AG | 1,201,001 | 1.1 | |||||||||||
| 16,389 | Siemens AG | 1,838,914 | 1.7 | |||||||||||
| 34,785 | Other Securities | 1,868,199 | 1.7 | |||||||||||
| 12,158,759 | 11.0 | |||||||||||||
| Hong Kong: 0.7% | ||||||||||||||
| 111,000 | Other Securities | 796,879 | 0.7 | |||||||||||
| Italy: 3.2% | ||||||||||||||
| 241,284 | Enel S.p.A. | 1,075,530 | 1.0 | |||||||||||
| 455,430 | Intesa Sanpaolo S.p.A. | 1,321,162 | 1.2 | |||||||||||
| 185,174 | UniCredit SpA | 1,186,156 | 1.0 | |||||||||||
| 3,582,848 | 3.2 | |||||||||||||
| Shares | Value | Percentage of Net Assets | ||||||||||||
| COMMON STOCK: (continued) | ||||||||||||||
| Japan: 20.6% | ||||||||||||||
| 47,500 | Asahi Group Holdings, Ltd. | $ | 1,469,523 | 1.3 | ||||||||||
| 255,112 | Hitachi Ltd. | 1,882,922 | 1.7 | |||||||||||
| 66,300 | Japan Tobacco, Inc. | 1,824,761 | 1.6 | |||||||||||
| 67,800 | LIXIL Group Corp. | 1,426,902 | 1.3 | |||||||||||
| 81,100 | JSR Corp. | 1,392,024 | 1.3 | |||||||||||
| 52,100 | Komatsu Ltd. | 1,151,823 | 1.0 | |||||||||||
| 80,600 | Mitsubishi Corp. | 1,474,990 | 1.3 | |||||||||||
| 50,000 | Mitsui Fudosan Co., Ltd. | 1,340,778 | 1.2 | |||||||||||
| 733,100 | Mizuho Financial Group, Inc. | 1,228,898 | 1.1 | |||||||||||
| 80,300 | NTT DoCoMo, Inc. | 1,169,413 | 1.1 | |||||||||||
| 24,400 | Omron Corp. | 1,091,546 | 1.0 | |||||||||||
| 113,900 | Panasonic Corp. | 1,341,564 | 1.2 | |||||||||||
| 55,300 | Shionogi & Co., Ltd. | 1,428,723 | 1.3 | |||||||||||
| 40,000 | Toyota Motor Corp. | 2,492,696 | 2.2 | |||||||||||
| 205,800 | Other Securities | 2,176,127 | 2.0 | |||||||||||
| 22,892,690 | 20.6 | |||||||||||||
| Netherlands: 8.7% | ||||||||||||||
| 24,219 | Koninklijke DSM NV | 1,477,193 | 1.3 | |||||||||||
| 51,325 | Koninklijke Philips NV | 1,487,711 | 1.4 | |||||||||||
| 52,771 | Reed Elsevier NV | 1,260,207 | 1.1 | |||||||||||
| 115,064 | Royal Dutch Shell PLC - Class A | 3,840,026 | 3.5 | |||||||||||
| 79,691 | Other Securities(a) | 1,527,743 | 1.4 | |||||||||||
| 9,592,880 | 8.7 | |||||||||||||
| New Zealand: 1.0% | ||||||||||||||
| 441,059 | Spark New Zealand Ltd. | 1,069,198 | 1.0 | |||||||||||
| Norway: 1.4% | ||||||||||||||
| 75,508 | Telenor ASA | 1,527,422 | 1.4 | |||||||||||
| Singapore: 1.6% | ||||||||||||||
| 95,000 | United Overseas Bank Ltd. | 1,753,135 | 1.6 | |||||||||||
| Sweden: 2.3% | ||||||||||||||
| 124,573 | Telefonaktiebolaget LM Ericsson | 1,508,343 | 1.4 | |||||||||||
| 90,221 | Other Securities | 1,044,379 | 0.9 | |||||||||||
| 2,552,722 | 2.3 | |||||||||||||
| Switzerland: 10.6% | ||||||||||||||
| 13,007 | Cie Financiere Richemont SA | 1,153,183 | 1.0 | |||||||||||
| 32,126 | Nestle S.A. | 2,342,018 | 2.1 | |||||||||||
| 38,322 | Novartis AG | 3,554,115 | 3.2 | |||||||||||
| 11,691 | Roche Holding AG - Genusschein | 3,167,585 | 2.9 | |||||||||||
| 6,723 | Swiss Life Holding | 1,588,993 | 1.4 | |||||||||||
| 11,805,894 | 10.6 | |||||||||||||
| United Kingdom: 14.1% | ||||||||||||||
| 76,822 | Admiral Group PLC | 1,576,014 | 1.4 | |||||||||||
| 16,272 | AstraZeneca PLC | 1,149,306 | 1.0 | |||||||||||
| 517,224 | Barclays PLC | 1,944,421 | 1.7 | |||||||||||
See Accompanying Notes to Financial Statements
| 32 |
| Voya International Value Portfolio | SUMMARY PORTFOLIO OF INVESTMENTS as of December 31, 2014 (continued) |
| Shares | Value | Percentage of Net Assets | ||||||||||||
| COMMON STOCK: (continued) | ||||||||||||||
| United Kingdom (continued) | ||||||||||||||
| 64,958 | Diageo PLC | $ | 1,860,860 | 1.7 | ||||||||||
| 117,014 | HSBC Holdings PLC | 1,105,756 | 1.0 | |||||||||||
| 210,475 | Kingfisher PLC | 1,112,602 | 1.0 | |||||||||||
| 397,851 | Legal & General Group PLC | 1,536,165 | 1.4 | |||||||||||
| 51,211 | Prudential PLC | 1,183,974 | 1.1 | |||||||||||
| 29,055 | SABMiller PLC | 1,514,674 | 1.4 | |||||||||||
| 174,878 | Other Securities | 2,639,737 | 2.4 | |||||||||||
| 15,623,509 | 14.1 | |||||||||||||
| Total Common Stock (Cost $106,261,651) | 108,544,564 | 97.9 | ||||||||||||
| PREFERRED STOCK: 0.7% | ||||||||||||||
| Brazil: 0.7% | ||||||||||||||
| 145,934 | Other Securities | 721,380 | 0.7 | |||||||||||
| Total Preferred Stock (Cost $907,560) | 721,380 | 0.7 | ||||||||||||
| Total Long-Term Investments (Cost $107,169,211) | 109,265,944 | 98.6 | ||||||||||||
| Principal Amount† | Value | Percentage of Net Assets | ||||||||||||
| SHORT-TERM INVESTMENTS: 1.4% | ||||||||||||||
| Securities Lending Collateralcc: 1.3% | ||||||||||||||
| 1,000,000 | Cantor Fitzgerald, Repurchase Agreement dated 12/31/14, 0.09%, due 01/02/15 (Repurchase Amount $1,000,005, collateralized by various U.S. Government/U.S. Government Agency Obligations, 0.000%-10.500%, Market Value plus accrued interest $1,020,000, due 01/01/15-09/01/49) | 1,000,000 | 0.9 | |||||||||||
| 447,927 | Royal Bank of Scotland PLC, Repurchase Agreement dated 12/31/14, 0.09%, due 01/02/15 (Repurchase Amount $447,929, collateralized by various U.S. Government and U.S. Government Agency Obligations, 0.375%-7.250%, Market Value plus accrued interest $456,886, due 11/15/15-07/15/56) | 447,927 | 0.4 | |||||||||||
| 1,447,927 | 1.3 | |||||||||||||
| Shares | Value | Percentage of Net Assets | ||||||||||||
| SHORT-TERM INVESTMENTS: (continued) | ||||||||||||||
| Mutual Funds: 0.1% | ||||||||||||||
| 105,000 | BlackRock Liquidity Funds, TempFund, Institutional Class, 0.030%†† (Cost $105,000) | $ | 105,000 | 0.1 | ||||||||||
| Total Short-Term Investments (Cost $1,552,927) | 1,552,927 | 1.4 | ||||||||||||
| Total Investments in Securities (Cost $108,722,138) | $ | 110,818,871 | 100.0 | |||||||||||
| Assets in Excess of Other Liabilities | 31,758 | — | ||||||||||||
| Net Assets | $ | 110,850,629 | 100.0 | |||||||||||
“Other Securities” represents issues not identified as the top 50 holdings in terms of market value and issues or issuers not exceeding 1% of net assets individually or in aggregate respectively as of December 31, 2014.
The following footnotes apply to either the individual securities noted or one or more of the securities aggregated and listed as a single line item.
| † | Unless otherwise indicated, principal amount is shown in USD. |
| †† | Rate shown is the 7-day yield as of December 31, 2014. |
| @ | Non-income producing security. |
| cc | Represents securities purchased with cash collateral received for securities on loan. |
| L | Loaned security, a portion or all of the security is on loan at December 31, 2014. |
| (a) | This grouping contains securities on loan. |
Cost for federal income tax purposes is $108,853,242.
Net unrealized appreciation consists of:
| Gross Unrealized Appreciation | $ | 10,329,982 | ||
| Gross Unrealized Depreciation | (8,364,353 | ) | ||
| Net Unrealized Appreciation | $ | 1,965,629 |
| Sector Diversification | Percentage of Net Assets | |||
| Financials | 25.4 | % | ||
| Industrials | 12.5 | |||
| Consumer Discretionary | 12.0 | |||
| Health Care | 11.9 | |||
| Consumer Staples | 9.3 | |||
| Materials | 7.4 | |||
| Energy | 6.5 | |||
| Telecommunication Services | 5.9 | |||
| Information Technology | 4.1 | |||
| Utilities | 3.6 | |||
| Short-Term Investments | 1.4 | |||
| Assets in Excess of Other Liabilities | — | |||
| Net Assets | 100.0 | % | ||
See Accompanying Notes to Financial Statements
| 33 |
| Voya International Value Portfolio | SUMMARY PORTFOLIO OF INVESTMENTS as of December 31, 2014 (continued) |
Fair Value Measurements^
The following is a summary of the fair valuations according to the inputs used as of December 31, 2014 in valuing the assets and liabilities:(1)
| Quoted Prices in Active Markets for Identical Investments (Level 1) | Significant Other Observable Inputs# (Level 2) | Significant Unobservable Inputs (Level 3) | Fair Value at December 31, 2014 | |||||||||||||
| Asset Table | ||||||||||||||||
| Investments, at fair value | ||||||||||||||||
| Common Stock | ||||||||||||||||
| Australia | $ | — | $ | 3,516,223 | $ | — | $ | 3,516,223 | ||||||||
| China | — | 2,632,730 | — | 2,632,730 | ||||||||||||
| Denmark | — | 2,439,842 | — | 2,439,842 | ||||||||||||
| Finland | — | 918,792 | — | 918,792 | ||||||||||||
| France | — | 15,681,041 | — | 15,681,041 | ||||||||||||
| Germany | — | 12,158,759 | — | 12,158,759 | ||||||||||||
| Hong Kong | — | 796,879 | — | 796,879 | ||||||||||||
| Italy | — | 3,582,848 | — | 3,582,848 | ||||||||||||
| Japan | — | 22,892,690 | — | 22,892,690 | ||||||||||||
| Netherlands | 692,684 | 8,900,196 | — | 9,592,880 | ||||||||||||
| New Zealand | — | 1,069,198 | — | 1,069,198 | ||||||||||||
| Norway | — | 1,527,422 | — | 1,527,422 | ||||||||||||
| Singapore | — | 1,753,135 | — | 1,753,135 | ||||||||||||
| Sweden | — | 2,552,722 | — | 2,552,722 | ||||||||||||
| Switzerland | — | 11,805,894 | — | 11,805,894 | ||||||||||||
| United Kingdom | 778,790 | 14,844,719 | — | 15,623,509 | ||||||||||||
| Total Common Stock | 1,471,474 | 107,073,090 | — | 108,544,564 | ||||||||||||
| Preferred Stock | 721,380 | — | — | 721,380 | ||||||||||||
| Short-Term Investments | 105,000 | 1,447,927 | — | 1,552,927 | ||||||||||||
| Total Investments, at fair value | $ | 2,297,854 | $ | 108,521,017 | $ | — | $ | 110,818,871 | ||||||||
| Other Financial Instruments+ | ||||||||||||||||
| Forward Foreign Currency Contracts | — | 1,359 | — | 1,359 | ||||||||||||
| Total Assets | $ | 2,297,854 | $ | 108,522,376 | $ | — | $ | 110,820,230 | ||||||||
| (1) | For the year ended December 31, 2014, as a result of the fair value pricing procedures for international equities utilized by the Portfolio, certain securities have transferred in and out of Level 1 and Level 2 measurements during the year. The Portfolio’s policy is to recognize transfers between levels at the end of the reporting period. At December 31, 2014, securities valued at $2,721,072 were transferred from Level 1 to Level 2 within the fair value hierarchy. |
| ^ | See Note 2, “Significant Accounting Policies” in the Notes to Financial Statements for additional information. |
| + | Other Financial Instruments are derivatives not reflected in the Portfolio of Investments and may include open forward foreign currency contracts, futures, centrally cleared swaps, OTC swaps and written options. Forward foreign currency contracts, futures and centrally cleared swaps are valued at the unrealized gain (loss) on the instrument. OTC swaps and written options are valued at the fair value of the instrument. |
| # | The earlier close of the foreign markets gives rise to the possibility that significant events, including broad market moves, may have occurred in the interim and may materially affect the value of those securities. To account for this, the Portfolio may frequently value many of its foreign equity securities using fair value prices based on third party vendor modeling tools to the extent available. Accordingly, a portion of the Portfolio’s investments are categorized as Level 2 investments. |
At December 31, 2014, the following forward foreign currency contracts were outstanding for Voya International Value Portfolio:
| Counterparty | Currency | Contract Amount | Buy/Sell | Settlement Date | In Exchange For | Fair Value | Unrealized Appreciation (Depreciation) | ||||||||||||
| The Bank of New York | Japanese Yen | 48,872,683 | Sell | 01/07/15 | $ | 409,397 | $ | 408,038 | $ | 1,359 | |||||||||
| $ | 1,359 | ||||||||||||||||||
See Accompanying Notes to Financial Statements
| 34 |
| Voya International Value Portfolio | SUMMARY PORTFOLIO OF INVESTMENTS as of December 31, 2014 (continued) |
A summary of derivative instruments by primary risk exposure is outlined in the following tables.
The fair value of derivative instruments as of December 31, 2014 was as follows:
| Derivatives not accounted for as hedging instruments | Location on Statement of Assets and Liabilities | Fair Value | ||||
| Asset Derivatives | ||||||
| Foreign exchange contracts | Unrealized appreciation on forward foreign currency contracts | $ | 1,359 | |||
| Total Asset Derivatives | $ | 1,359 | ||||
The effect of derivative instruments on the Portfolio’s Statement of Operations for the year ended December 31, 2014 was as follows:
Amount of Realized Gain or (Loss) on Derivatives Recognized in Income
| Derivatives not accounted for as hedging instruments | Foreign currency related transactions* | |||
| Foreign exchange contracts | $ | 54,512 | ||
| Total | $ | 54,512 | ||
Change in Unrealized Appreciation or (Depreciation) on Derivatives Recognized in Income
| Derivatives not accounted for as hedging instruments | Foreign currency related transactions* | |||
| Foreign exchange contracts | $ | (1,620 | ) | |
| Total | $ | (1,620 | ) | |
| * | Amounts recognized for forward foreign currency contracts are included in net realized gain (loss) on foreign currency related transactions and net change in unrealized appreciation or depreciation on foreign currency related transactions. |
The following is a summary by counterparty of the fair value of OTC derivative instruments subject to Master Netting Agreements and collateral pledged (received), if any, at December 31, 2014:
| The Bank of New York | ||||
| Assets: | ||||
| Forward foreign currency contracts | $ | 1,359 | ||
| Total Assets | $ | 1,359 | ||
| Net OTC derivative instruments by counterparty, at fair value | $ | 1,359 | ||
| Total collateral pledged by the Portfolio/(Received from counterparty) | $ | — | ||
| Net Exposure(1) | $ | 1,359 | ||
| (1) | Positive net exposure represents amounts due from each respective counterparty. Negative exposure represents amounts due from the Portfolio. Please refer to Note 2 for additional details regarding counterparty credit risk and credit related contingent features. |
See Accompanying Notes to Financial Statements
| 35 |
| Voya MidCap Opportunities Portfolio | SUMMARY PORTFOLIO OF INVESTMENTS as of December 31, 2014 |
| Shares | Value | Percentage of Net Assets | ||||||||||||
| COMMON STOCK: 99.4% | ||||||||||||||
| Consumer Discretionary: 24.9% | ||||||||||||||
| 465,491 | Brinker International, Inc. | $ | 27,319,667 | 1.8 | ||||||||||
| 44,157 | Chipotle Mexican Grill, Inc. | 30,225,908 | 2.0 | |||||||||||
| 284,265 | @ | Dish Network Corp. - Class A | 20,720,076 | 1.4 | ||||||||||
| 714,936 | Hilton Worldwide Holdings, Inc. | 18,652,680 | 1.3 | |||||||||||
| 631,255 | @ | Jarden Corp. | 30,224,489 | 2.0 | ||||||||||
| 253,267 | @,L | Lululemon Athletica, Inc. | 14,129,766 | 1.0 | ||||||||||
| 410,439 | Macy’s, Inc. | 26,986,364 | 1.8 | |||||||||||
| 298,948 | Marriott International, Inc. | 23,326,913 | 1.6 | |||||||||||
| 246,057 | Michael Kors Holdings Ltd. | 18,478,881 | 1.2 | |||||||||||
| 276,734 | Ross Stores, Inc. | 26,084,947 | 1.8 | |||||||||||
| 613,843 | @ | Starz | 18,231,137 | 1.2 | ||||||||||
| 196,493 | Tractor Supply Co. | 15,487,578 | 1.0 | |||||||||||
| 188,674 | @ | Ulta Salon Cosmetics & Fragrance, Inc. | 24,120,084 | 1.6 | ||||||||||
| 445,833 | VF Corp. | 33,392,892 | 2.2 | |||||||||||
| 920,676 | Other Securities | 44,941,720 | 3.0 | |||||||||||
| 372,323,102 | 24.9 | |||||||||||||
| Consumer Staples: 8.8% | ||||||||||||||
| 359,632 | Hain Celestial Group, Inc. | 20,962,950 | 1.4 | |||||||||||
| 225,832 | Mead Johnson Nutrition Co. | 22,705,149 | 1.5 | |||||||||||
| 212,325 | Molson Coors Brewing Co. | 15,822,459 | 1.0 | |||||||||||
| 261,432 | @ | Monster Beverage Corp. | 28,326,157 | 1.9 | ||||||||||
| 509,247 | L | Sprouts Farmers Market, Inc. | 17,304,213 | 1.2 | ||||||||||
| 171,675 | TreeHouse Foods, Inc. | 14,683,363 | 1.0 | |||||||||||
| 114,437 | Other Securities | 11,893,437 | 0.8 | |||||||||||
| 131,697,728 | 8.8 | |||||||||||||
| Energy: 4.9% | ||||||||||||||
| 579,653 | Cabot Oil & Gas Corp. | 17,163,525 | 1.1 | |||||||||||
| 307,368 | @ | Cameron International Corp. | 15,353,032 | 1.0 | ||||||||||
| 202,098 | Concho Resources, Inc. | 20,159,276 | 1.4 | |||||||||||
| 371,217 | Other Securities | 20,260,244 | 1.4 | |||||||||||
| 72,936,077 | 4.9 | |||||||||||||
| Financials: 9.4% | ||||||||||||||
| 79,227 | @ | Affiliated Managers Group, Inc. | 16,815,138 | 1.1 | ||||||||||
| 191,749 | Ameriprise Financial, Inc. | 25,358,805 | 1.7 | |||||||||||
| 305,437 | Aon PLC | 28,964,591 | 1.9 | |||||||||||
| 317,713 | Arthur J. Gallagher & Co. | 14,957,928 | 1.0 | |||||||||||
| 252,789 | Extra Space Storage, Inc. | 14,823,547 | 1.0 | |||||||||||
| 260,650 | Lincoln National Corp. | 15,031,686 | 1.0 | |||||||||||
| 144,760 | @ | SVB Financial Group | 16,802,293 | 1.1 | ||||||||||
| 204,501 | Other Securities | 8,188,220 | 0.6 | |||||||||||
| 140,942,208 | 9.4 | |||||||||||||
| Health Care: 12.5% | ||||||||||||||
| 225,622 | Cardinal Health, Inc. | 18,214,464 | 1.2 | |||||||||||
| 97,179 | @ | Illumina, Inc. | 17,937,300 | 1.2 | ||||||||||
| Shares | Value | Percentage of Net Assets | ||||||||||||
| COMMON STOCK: (continued) | ||||||||||||||
| Health Care (continued) | ||||||||||||||
| 166,543 | @ | Medivation, Inc. | $ | 16,589,348 | 1.1 | |||||||||
| 75,480 | Mettler Toledo International, Inc. | 22,829,681 | 1.5 | |||||||||||
| 486,101 | @ | Mylan Laboratories | 27,401,513 | 1.8 | ||||||||||
| 249,401 | St. Jude Medical, Inc. | 16,218,547 | 1.1 | |||||||||||
| 148,971 | Universal Health Services, Inc. | 16,574,513 | 1.1 | |||||||||||
| 415,305 | Zoetis, Inc. | 17,870,574 | 1.2 | |||||||||||
| 380,570 | Other Securities | 33,574,748 | 2.3 | |||||||||||
| 187,210,688 | 12.5 | |||||||||||||
| Industrials: 17.1% | ||||||||||||||
| 546,287 | Ametek, Inc. | 28,751,085 | 1.9 | |||||||||||
| 272,637 | Equifax, Inc. | 22,048,154 | 1.5 | |||||||||||
| 331,680 | Ingersoll-Rand PLC - Class A | 21,025,195 | 1.4 | |||||||||||
| 362,257 | Nielsen Holdings NV | 16,203,756 | 1.1 | |||||||||||
| 321,149 | Oshkosh Truck Corp. | 15,623,899 | 1.1 | |||||||||||
| 592,887 | @ | Quanta Services, Inc. | 16,832,062 | 1.1 | ||||||||||
| 179,548 | Roper Industries, Inc. | 28,072,330 | 1.9 | |||||||||||
| 1,070,282 | Southwest Airlines Co. | 45,294,334 | 3.0 | |||||||||||
| 350,150 | Textron, Inc. | 14,744,816 | 1.0 | |||||||||||
| 465,826 | Waste Connections, Inc. | 20,491,686 | 1.4 | |||||||||||
| 480,922 | Other Securities | 26,263,804 | 1.7 | |||||||||||
| 255,351,121 | 17.1 | |||||||||||||
| Information Technology: 17.5% | ||||||||||||||
| 395,387 | Broadridge Financial Solutions, Inc. ADR | 18,258,972 | 1.2 | |||||||||||
| 247,173 | Cavium, Inc. | 15,280,235 | 1.0 | |||||||||||
| 202,765 | @ | Check Point Software Technologies | 15,931,246 | 1.1 | ||||||||||
| 493,348 | @ | Electronic Arts, Inc. | 23,194,756 | 1.6 | ||||||||||
| 140,425 | @ | F5 Networks, Inc. | 18,320,548 | 1.2 | ||||||||||
| 218,679 | @ | Gartner, Inc. | 18,414,959 | 1.2 | ||||||||||
| 368,522 | Intuit, Inc. | 33,974,043 | 2.3 | |||||||||||
| 455,054 | Microchip Technology, Inc. | 20,527,486 | 1.4 | |||||||||||
| 386,682 | @ | Red Hat, Inc. | 26,735,193 | 1.8 | ||||||||||
| 386,628 | SolarWinds, Inc. | 19,265,673 | 1.3 | |||||||||||
| 587,902 | Xilinx, Inc. | 25,450,278 | 1.7 | |||||||||||
| 591,761 | Other Securities | 25,963,716 | 1.7 | |||||||||||
| 261,317,105 | 17.5 | |||||||||||||
| Materials: 4.3% | ||||||||||||||
| 372,876 | @ | Crown Holdings, Inc. | 18,979,388 | 1.2 | ||||||||||
| 250,195 | Eastman Chemical Co. | 18,979,793 | 1.3 | |||||||||||
| 348,893 | Packaging Corp. of America | 27,231,099 | 1.8 | |||||||||||
| 65,190,280 | 4.3 | |||||||||||||
| Total Common Stock (Cost $1,257,586,468) | 1,486,968,309 | 99.4 | ||||||||||||
See Accompanying Notes to Financial Statements
| 36 |
| Voya MidCap Opportunities Portfolio | SUMMARY PORTFOLIO OF INVESTMENTS as of December 31, 2014 (continued) |
| Principal Amount† | Value | Percentage of Net Assets | ||||||||||||
| SHORT-TERM INVESTMENTS: 1.5% | ||||||||||||||
| Securities Lending Collateralcc: 0.5% | ||||||||||||||
| 1,813,953 | Cantor Fitzgerald, Repurchase Agreement dated 12/31/14, 0.09%, due 01/02/15 (Repurchase Amount $1,813,962, collateralized by various U.S. Government/U.S. Government Agency Obligations, 0.000%-10.500%, Market Value plus accrued interest $1,850,232, due 01/01/15-09/01/49) | $ | 1,813,953 | 0.1 | ||||||||||
| 381,860 | Daiwa Capital Markets, Repurchase Agreement dated 12/31/14, 0.12%, due 01/02/15 (Repurchase Amount $381,863, collateralized by various U.S. Government and U.S. Government Agency Obligations, 0.000%-6.500%, Market Value plus accrued interest $389,497, due 06/01/17-03/01/48) | 381,860 | 0.1 | |||||||||||
| 1,813,953 | Nomura Securities, Repurchase Agreement dated 12/31/14, 0.08%, due 01/02/15 (Repurchase Amount $1,813,961, collateralized by various U.S. Government/U.S. Government Agency Obligations, 0.000%-8.875%, Market Value plus accrued interest $1,850,232, due 01/07/15-10/20/64) | 1,813,953 | 0.1 | |||||||||||
| 1,813,953 | Royal Bank of Scotland PLC, Repurchase Agreement dated 12/31/14, 0.09%, due 01/02/15 (Repurchase Amount $1,813,962, collateralized by various U.S. Government/U.S. Government Agency Obligations, 0.375%-7.250%, Market Value plus accrued interest $1,850,232, due 11/15/15-07/15/56) | 1,813,953 | 0.1 | |||||||||||
| Principal Amount† | Value | Percentage of Net Assets | ||||||||||||
| SHORT-TERM INVESTMENTS: (continued) | ||||||||||||||
| Securities Lending Collateralcc (continued) | ||||||||||||||
| 1,813,953 | State of Wisconsin Investment Board, Repurchase Agreement dated 12/31/14, 0.15%, due 01/02/15 (Repurchase Amount $1,813,968, collateralized by various U.S. Government Securities, 0.125%-2.500%, Market Value plus accrued interest $1,850,414, due 04/15/16-02/15/42) | $ 1,813,953 | 0.1 | |||||||||||
| 7,637,672 | 0.5 | |||||||||||||
| Shares | Value | Percentage of Net Assets | ||||||||||||
| Mutual Funds: 1.0% | ||||||||||||||
| 15,420,000 | BlackRock Liquidity Funds, TempFund, Institutional Class, 0.030%†† (Cost $15,420,000) | 15,420,000 | 1.0 | |||||||||||
| Total Short-Term Investments (Cost $23,057,672) | 23,057,672 | 1.5 | ||||||||||||
| Total Investments in Securities (Cost $1,280,644,140) | $ | 1,510,025,981 | 100.9 | |||||||||||
| Liabilities in Excess of Other Assets | (13,306,165 | ) | (0.9 | ) | ||||||||||
| Net Assets | $ | 1,496,719,816 | 100.0 | |||||||||||
“Other Securities” represents issues not identified as the top 50 holdings in terms of market value and issues or issuers not exceeding 1% of net assets individually or in aggregate respectively as of December 31, 2014.
The following footnotes apply to either the individual securities noted or one or more of the securities aggregated and listed as a single line item.
| † | Unless otherwise indicated, principal amount is shown in USD. |
| †† | Rate shown is the 7-day yield as of December 31, 2014. |
| @ | Non-income producing security. |
| ADR | American Depositary Receipt |
| cc | Represents securities purchased with cash collateral received for securities on loan. |
| L | Loaned security, a portion or all of the security is on loan at December 31, 2014. |
| Cost for federal income tax purposes is $1,282,899,349. | ||||
| Net unrealized appreciation consists of: | ||||
| Gross Unrealized Appreciation | $ | 259,533,538 | ||
| Gross Unrealized Depreciation | (32,406,906 | ) | ||
| Net Unrealized Appreciation | $ | 227,126,632 |
See Accompanying Notes to Financial Statements
| 37 |
| Voya MidCap Opportunities Portfolio | SUMMARY PORTFOLIO OF INVESTMENTS as of December 31, 2014 (continued) |
Fair Value Measurements^
The following is a summary of the fair valuations according to the inputs used as of December 31, 2014 in valuing the assets and liabilities:
| Quoted Prices in Active Markets for Identical Investments (Level 1) | Significant Other Observable Inputs (Level 2) | Significant Unobservable Inputs (Level 3) | Fair Value at December 31, 2014 | |||||||||||||
| Asset Table | ||||||||||||||||
| Investments, at fair value | ||||||||||||||||
| Common Stock* | $ | 1,486,968,309 | $ | — | $ | — | $ | 1,486,968,309 | ||||||||
| Short-Term Investments | 15,420,000 | 7,637,672 | — | 23,057,672 | ||||||||||||
| Total Investments, at fair value | $ | 1,502,388,309 | $ | 7,637,672 | $ | — | $ | 1,510,025,981 | ||||||||
| ^ | See Note 2, “Significant Accounting Policies” in the Notes to Financial Statements for additional information. |
| * | For further breakdown of Common Stock by sector, please refer to the Summary Portfolio of Investments. |
See Accompanying Notes to Financial Statements
| 38 |
| Voya SmallCap Opportunities Portfolio | SUMMARY PORTFOLIO OF INVESTMENTS as of December 31, 2014 |
| Shares | Value | Percentage of Net Assets | ||||||||||||
| COMMON STOCK: 97.2% | ||||||||||||||
| Consumer Discretionary: 18.2% | ||||||||||||||
| 67,800 | Cheesecake Factory | $ | 3,411,018 | 1.0 | ||||||||||
| 134,800 | Dana Holding Corp. | 2,930,552 | 0.9 | |||||||||||
| 59,899 | @ | Hibbett Sporting Goods, Inc. | 2,900,909 | 0.9 | ||||||||||
| 82,732 | @ | Imax Corp. | 2,556,419 | 0.8 | ||||||||||
| 35,000 | Jack in the Box, Inc. | 2,798,600 | 0.9 | |||||||||||
| 144,600 | La Quinta Holdings, Inc. | 3,189,876 | 1.0 | |||||||||||
| 94,956 | @ | LKQ Corp. | 2,670,163 | 0.8 | ||||||||||
| 59,004 | Monro Muffler, Inc. | 3,410,431 | 1.0 | |||||||||||
| 45,718 | Pool Corp. | 2,900,350 | 0.9 | |||||||||||
| 44,394 | Vail Resorts, Inc. | 4,045,625 | 1.2 | |||||||||||
| 1,063,041 | Other Securities(a) | 28,671,676 | 8.8 | |||||||||||
| 59,485,619 | 18.2 | |||||||||||||
| Consumer Staples: 1.7% | ||||||||||||||
| 36,200 | Casey’s General Stores, Inc. | 3,269,584 | 1.0 | |||||||||||
| 114,125 | Other Securities | 2,190,059 | 0.7 | |||||||||||
| 5,459,643 | 1.7 | |||||||||||||
| Energy: 2.9% | ||||||||||||||
| 709,133 | Other Securities | 9,424,857 | 2.9 | |||||||||||
| Financials: 10.6% | ||||||||||||||
| 54,452 | Evercore Partners, Inc. | 2,851,651 | 0.9 | |||||||||||
| 38,484 | MarketAxess Holdings, Inc. | 2,759,688 | 0.8 | |||||||||||
| 301,800 | @ | MGIC Investment Corp. | 2,812,776 | 0.9 | ||||||||||
| 62,186 | @ | PRA Group, Inc. | 3,602,435 | 1.1 | ||||||||||
| 20,376 | Signature Bank | 2,566,561 | 0.8 | |||||||||||
| 26,458 | @ | SVB Financial Group | 3,070,980 | 0.9 | ||||||||||
| 63,814 | The Geo Group, Inc. | 2,575,533 | 0.8 | |||||||||||
| 393,638 | Other Securities | 14,401,189 | 4.4 | |||||||||||
| 34,640,813 | 10.6 | |||||||||||||
| Health Care: 21.4% | ||||||||||||||
| 60,900 | @ | Air Methods Corp. | 2,681,427 | 0.8 | ||||||||||
| 96,687 | Healthsouth Corp. | 3,718,582 | 1.1 | |||||||||||
| 50,400 | Isis Pharmaceuticals, Inc. | 3,111,696 | 1.0 | |||||||||||
| 50,873 | Steris Corp. | 3,299,114 | 1.0 | |||||||||||
| 67,700 | Team Health Holdings, Inc. | 3,894,781 | 1.2 | |||||||||||
| 1,753,355 | Other Securities(a) | 53,333,635 | 16.3 | |||||||||||
| 70,039,235 | 21.4 | |||||||||||||
| Industrials: 14.3% | ||||||||||||||
| 52,500 | Clarcor, Inc. | 3,498,600 | 1.1 | |||||||||||
| 47,600 | EnPro Industries, Inc. | 2,987,376 | 0.9 | |||||||||||
| 106,806 | Healthcare Services Group | 3,303,510 | 1.0 | |||||||||||
| 81,500 | KAR Auction Services, Inc. | 2,823,975 | 0.9 | |||||||||||
| 102,000 | Knight Transportation, Inc. | 3,433,320 | 1.1 | |||||||||||
| Shares | Value | Percentage of Net Assets | ||||||||||||
| COMMON STOCK: (continued) | ||||||||||||||
| Industrials (continued) | ||||||||||||||
| 79,400 | Simpson Manufacturing Co., Inc. | $ | 2,747,240 | 0.8 | ||||||||||
| 48,600 | Toro Co. | 3,101,166 | 1.0 | |||||||||||
| 43,700 | Watts Water Technologies, Inc. | 2,772,328 | 0.8 | |||||||||||
| 489,436 | Other Securities | 21,964,702 | 6.7 | |||||||||||
| 46,632,217 | 14.3 | |||||||||||||
| Information Technology: 23.3% | ||||||||||||||
| 132,400 | Adtran, Inc. | 2,886,320 | 0.9 | |||||||||||
| 80,676 | @ | Aspen Technology, Inc. | 2,825,274 | 0.9 | ||||||||||
| 88,500 | BroadSoft, Inc. | 2,568,270 | 0.8 | |||||||||||
| 91,238 | Cardtronics, Inc. | 3,519,962 | 1.1 | |||||||||||
| 60,500 | Commvault Systems, Inc. | 3,127,245 | 1.0 | |||||||||||
| 74,600 | DealerTrack Holdings, Inc. | 3,305,526 | 1.0 | |||||||||||
| 65,316 | Guidewire Software, Inc. | 3,306,949 | 1.0 | |||||||||||
| 61,058 | Imperva, Inc. | 3,018,097 | 0.9 | |||||||||||
| 65,000 | j2 Global, Inc. | 4,030,000 | 1.2 | |||||||||||
| 26,900 | Littelfuse, Inc. | 2,600,423 | 0.8 | |||||||||||
| 64,639 | @ | Plexus Corp. | 2,663,773 | 0.8 | ||||||||||
| 133,600 | Qlik Technologies, Inc. | 4,126,904 | 1.3 | |||||||||||
| 99,200 | @ | Semtech Corp. | 2,734,944 | 0.8 | ||||||||||
| 27,300 | Ultimate Software Group, Inc. | 4,008,049 | 1.2 | |||||||||||
| 40,873 | WEX, Inc. | 4,043,157 | 1.2 | |||||||||||
| 1,185,818 | Other Securities | 27,389,709 | 8.4 | |||||||||||
| 76,154,602 | 23.3 | |||||||||||||
| Materials: 4.8% | ||||||||||||||
| 84,800 | Boise Cascade Co. | 3,150,320 | 1.0 | |||||||||||
| 65,900 | HB Fuller Co. | 2,934,527 | 0.9 | |||||||||||
| 39,700 | Minerals Technologies, Inc. | 2,757,165 | 0.8 | |||||||||||
| 609,400 | Other Securities(a) | 6,893,486 | 2.1 | |||||||||||
| 15,735,498 | 4.8 | |||||||||||||
| Total Common Stock | ||||||||||||||
| (Cost $258,194,689) | 317,572,484 | 97.2 | ||||||||||||
| EXCHANGE-TRADED FUNDS: 1.7% | ||||||||||||||
| 39,107 | iShares Russell 2000 Growth Index Fund | 5,568,055 | 1.7 | |||||||||||
| Total Exchange-TradedFunds (Cost $3,803,176) | 5,568,055 | 1.7 | ||||||||||||
| Total Long-Term Investments (Cost $261,997,865) | 323,140,539 | 98.9 | ||||||||||||
See Accompanying Notes to Financial Statements
| 39 |
| Voya SmallCap Opportunities Portfolio | SUMMARY PORTFOLIO OF INVESTMENTS as of December 31, 2014 (continued) |
| Principal Amount† | Value | Percentage of Net Assets | ||||||||||||
| SHORT-TERM INVESTMENTS: 3.3% | ||||||||||||||
| Securities Lending Collateralcc: 2.1% | ||||||||||||||
| 1,593,041 | Cantor Fitzgerald, Repurchase Agreement dated 12/31/14, 0.09%, due 01/02/15 (Repurchase Amount $1,593,049, collateralized by various U.S. Government/U.S. Government Agency Obligations, 0.000%-10.500%, Market Value plus accrued interest $1,624,902, due 01/01/15-09/01/49) | $ | 1,593,041 | 0.5 | ||||||||||
| 335,360 | Daiwa Capital Markets, Repurchase Agreement dated 12/31/14, 0.12%, due 01/02/15 (Repurchase Amount $335,362, collateralized by various U.S. Government and U.S. Government Agency Obligations, 0.000%-6.500%, Market Value plus accrued interest $342,067, due 06/01/17-03/01/48) | 335,360 | 0.1 | |||||||||||
| 1,593,041 | Nomura Securities, Repurchase Agreement dated 12/31/14, 0.08%, due 01/02/15 (Repurchase Amount $1,593,048, collateralized by various U.S. Government/U.S. Government Agency Obligations, 0.000%-8.875%, Market Value plus accrued interest $1,624,902, due 01/07/15-10/20/64) | 1,593,041 | 0.5 | |||||||||||
| 1,593,041 | Royal Bank of Scotland PLC, Repurchase Agreement dated 12/31/14, 0.09%, due 01/02/15 (Repurchase Amount $1,593,049, collateralized by various U.S. Government/U.S. Government Agency Obligations, 0.375%-7.250%, Market Value plus accrued interest $1,624,902, due 11/15/15-07/15/56) | 1,593,041 | 0.5 | |||||||||||
| 1,593,041 | State of Wisconsin Investment Board, Repurchase Agreement dated 12/31/14, 0.15%, due 01/02/15 (Repurchase Amount $1,593,054, collateralized by various U.S. Government Securities, 0.125%-2.500%, Market Value plus accrued interest $1,625,062, due 04/15/16-02/15/42) | 1,593,041 | 0.5 | |||||||||||
| 6,707,524 | 2.1 | |||||||||||||
| Shares | Value | Percentage of Net Assets | ||||||||||||
| SHORT-TERM INVESTMENTS: (continued) | ||||||||||||||
| Mutual Funds: 1.2% | ||||||||||||||
| 3,944,131 | BlackRock Liquidity Funds, TempFund, Institutional Class, 0.030%†† (Cost $3,944,131) | $ | 3,944,131 | 1.2 | ||||||||||
| Total Short-Term Investments (Cost $10,651,655) | 10,651,655 | 3.3 | ||||||||||||
| Total Investments in Securities (Cost $272,649,520) | $ | 333,792,194 | 102.2 | |||||||||||
| Liabilities in Excess of Other Assets | (7,233,457 | ) | (2.2 | ) | ||||||||||
| Net Assets | $ | 326,558,737 | 100.0 | |||||||||||
“Other Securities” represents issues not identified as the top 50 holdings in terms of market value and issues or issuers not exceeding 1% of net assets individually or in aggregate respectively as of December 31, 2014.
The following footnotes apply to either the individual securities noted or one or more of the securities aggregated and listed as a single line item.
| † | Unless otherwise indicated, principal amount is shown in USD. |
| †† | Rate shown is the 7-day yield as of December 31, 2014. |
| @ | Non-income producing security. |
| cc | Represents securities purchased with cash collateral received for securities on loan. |
| (a) | This grouping contains securities on loan. |
Cost for federal income tax purposes is $273,439,937.
Net unrealized appreciation consists of:
| Gross Unrealized Appreciation | $ | 71,976,013 | ||
| Gross Unrealized Depreciation | (11,623,756 | ) | ||
| Net Unrealized Appreciation | $ | 60,352,257 |
See Accompanying Notes to Financial Statements
| 40 |
| Voya SmallCap Opportunities Portfolio | SUMMARY PORTFOLIO OF INVESTMENTS as of December 31, 2014 (continued) |
Fair Value Measurements^
The following is a summary of the fair valuations according to the inputs used as of December 31, 2014 in valuing the assets and liabilities:
| Quoted Prices in Active Markets for Identical Investments (Level 1) | Significant Other Observable Inputs (Level 2) | Significant Unobservable Inputs (Level 3) | Fair Value at December 31, 2014 | |||||||||||||
| Asset Table | ||||||||||||||||
| Investments, at fair value | ||||||||||||||||
| Common Stock* | $ | 317,572,484 | $ | — | $ | — | $ | 317,572,484 | ||||||||
| Exchange-Traded Funds | 5,568,055 | — | — | 5,568,055 | ||||||||||||
| Short-Term Investments | 3,944,131 | 6,707,524 | — | 10,651,655 | ||||||||||||
| Total Investments, at fair value | $ | 327,084,670 | $ | 6,707,524 | $ | — | $ | 333,792,194 | ||||||||
| ^ | See Note 2, “Significant Accounting Policies” in the Notes to Financial Statements for additional information. |
| * | For further breakdown of Common Stock by sector, please refer to the Summary Portfolio of Investments. |
See Accompanying Notes to Financial Statements
| 41 |
Dividends and distributions paid during the year ended December 31, 2014 were as follows:
| Portfolio Name | Type | Per Share Amount | |||||||
| Voya International Value Portfolio | |||||||||
| Class ADV | NII | $ | 0.2734 | ||||||
| Class I | NII | $ | 0.3095 | ||||||
| Class S | NII | $ | 0.2945 | ||||||
| Voya MidCap Opportunities Portfolio | |||||||||
| Class ADV | NII | $ | 0.0421 | ||||||
| Class I | NII | $ | 0.0644 | ||||||
| Class S | NII | $ | 0.0518 | ||||||
| Portfolio Name | Type | Per Share Amount | |||||||
| Voya MidCap Opportunities Portfolio (continued) | |||||||||
| Class S2 | NII | $ | 0.0462 | ||||||
| All Classes | STCG | $ | 0.7861 | ||||||
| All Classes | LTCG | $ | 1.7990 | ||||||
| Voya SmallCap Opportunities Portfolio | |||||||||
| All Classes | STCG | $ | 0.8182 | ||||||
| All Classes | LTCG | $ | 1.7503 | ||||||
NII - Net investment income
STCG - Short-term capital gain
LTCG - Long-term capital gain
Of the ordinary distributions made during the year ended December 31, 2014, the following percentages qualify for the dividends received deduction (DRD) available to corporate shareholders:
| Voya International Value Portfolio | 0.01 | % | ||
| Voya MidCap Opportunities Portfolio | 19.18 | % | ||
| Voya SmallCap Opportunities Portfolio | 16.38 | % |
Pursuant to Section 853 of the Internal Revenue Code, the Portfolio below designates the following amounts as foreign taxes paid for the year ended December 31, 2014. Foreign taxes paid for purposes of Section 853 may be less than actual foreign taxes paid for financial statement purposes.
| Creditable Foreign Taxes Paid | Per Share Amount | Portion of Ordinary Income Distribution Derived from Foreign Sourced Income* | |||||||||
| Voya International Value Portfolio | $ | 136,418 | $ | 0.0110 | 95.26% | ||||||
| * | None of the Portfolio’s income was derived from ineligible foreign sources as defined under Section 901(j) of the Internal Revenue Code. |
Foreign taxes paid or withheld should be included in taxable income with an offsetting deduction from gross income or as a credit for taxes paid to foreign governments. Shareholders are strongly advised to consult their own tax advisors regarding the appropriate treatment of foreign taxes paid.
Above figures may differ from those cited elsewhere in this report due to differences in the calculation of income and gains under U.S. generally accepted accounting principles (book) purposes and Internal Revenue Service (tax) purposes.
Shareholders are strongly advised to consult their own tax advisers with respect to the tax consequences of their investments in the Portfolios. In January, shareholders, excluding corporate shareholders, receive an IRS 1099-DIV regarding the federal tax status of the dividends and distributions they received in the calendar year.
| 42 |
TRUSTEE AND OFFICER INFORMATION (Unaudited)
The business and affairs of the Trust are managed under the direction of the Trust’s Board. A Trustee, who is not an interested person of the Trust, as defined in the 1940 Act, is an independent trustee (“Independent Trustee”). The Trustees and Officers of the Trust are listed below. The Statement of Additional Information includes additional information about trustees of the Trust and is available, without charge, upon request at (800) 992-0180.
| Name, Address and Age | Position(s) Held with the Trust | Term of Office and Length of Time Served(1) | Principal Occupation(s) - During the Past 5 Years | Number of Portfolios in Fund Complex Overseen by Trustee(2) | Other Board Positions Held by Trustee | ||||||
| Independent Trustees*: | |||||||||||
| Colleen D. Baldwin 7337 East Doubletree Ranch Rd. Suite 100 Scottsdale, Arizona 85258 Age: 54 | Trustee | November 2007 - Present | President, Glantuam Partners, LLC, a business consulting firm (January 2009 - Present). | 158 | DSM/Dentaquest, Boston, MA (February 2014 - Present). | ||||||
| John V. Boyer 7337 East Doubletree Ranch Rd. Suite 100 Scottsdale, Arizona 85258 Age: 61 | Chairperson/ Trustee | January 2005 - Present | President and Chief Executive Officer, Bechtler Arts Foundation, an arts and education foundation (January 2008 - Present). | 158 | None. | ||||||
| Patricia W. Chadwick 7337 East Doubletree Ranch Rd. Suite 100 Scottsdale, Arizona 85258 Age: 66 | Trustee | January 2006 - Present | Consultant and President, Ravengate Partners LLC, a consulting firm that provides advice regarding financial markets and the global economy (January 2000 - Present). | 158 | Wisconsin Energy Corporation (June 2006 - Present) and The Royce Funds (35 funds) (December 2009 - Present). | ||||||
| Albert E. DePrince, Jr. 7337 E. Doubletree Ranch Rd. Suite 100 Scottsdale, Arizona 85258 Age: 73 | Trustee | May 2013 - Present | Retired. Formerly, Professor of Economics and Finance, Middle Tennessee State University (August 1991 - July 2014); Dr. DePrince continued to hold a position with the university under a post-retirement contract through the end of 2014. | 158 | None. | ||||||
| Peter S. Drotch 7337 East Doubletree Ranch Rd. Suite 100 Scottsdale, Arizona 85258 Age: 73 | Trustee | November 2007 - Present | Retired. | 158 | First Marblehead Corporation (September 2003 - Present). | ||||||
| Russell H. Jones 7337 E. Doubletree Ranch Rd. Suite 100 Scottsdale, Arizona 85258 Age: 70 | Trustee | May 2013 - Present | Retired. | 158 | None. | ||||||
| Patrick W. Kenny 7337 East Doubletree Ranch Rd. Suite 100 Scottsdale, Arizona 85258 Age: 72 | Trustee | January 2005 - Present | Retired. | 158 | Assured Guaranty Ltd. (April 2004 - Present). |
| 43 |
TRUSTEE AND OFFICER INFORMATION (Unaudited) (continued)
| Name, Address and Age | Position(s) Held with the Trust | Term of Office and Length of Time Served(1) | Principal Occupation(s) - During the Past 5 Years | Number of Portfolios in Fund Complex Overseen by Trustee(2) | Other Board Positions Held by Trustee | ||||||
| Joseph E. Obermeyer 7337 E. Doubletree Ranch Rd. Suite 100 Scottsdale, Arizona 85258 Age: 57 | Trustee | May 2013 - Present | President, Obermeyer & Associates, Inc., a provider of financial and economic consulting services (November 1999 - Present). | 158 | None. | ||||||
| Sheryl K. Pressler 7337 East Doubletree Ranch Rd. Suite 100 Scottsdale, Arizona 85258 Age: 64 | Trustee | January 2006 - Present | Consultant (May 2001 - Present). | 158 | None. | ||||||
| Roger B. Vincent 7337 East Doubletree Ranch Rd. Suite 100 Scottsdale, Arizona 85258 Age: 69 | Trustee | February 2002 - Present | Retired. Formerly, President, Springwell Corporation, a corporate finance firm (March 1989 - August 2011). | 158 | UGI Corporation (February 2006 - Present) and UGI Utilities, Inc. (February 2006 - Present). | ||||||
| Trustee who is an “Interested Person”: | |||||||||||
| Shaun P. Mathews(3) 7337 East Doubletree Ranch Rd. Suite 100 Scottsdale, Arizona 85258 Age: 59 | Trustee | November 2007 - Present | President and Chief Executive Officer, Voya Investments, LLC (November 2006 - Present). | 158 | Voya Capital Corporation, LLC and Voya Investments Distributor, LLC (December 2005 - Present); Voya Funds Services, LLC, Voya Investments, LLC and Voya Investment Management, LLC (March 2006 - Present); and Voya Investment Trust Co. (April 2009 - Present). | ||||||
_______________________
| (1) | Trustees serve until their successors are duly elected and qualified. The tenure of each Trustee who is not an “interested person” as defined in the 1940 Act, of the Portfolio (as defined below, “Independent Trustee”) is subject to the Board’s retirement policy which states that each duly elected or appointed Independent Trustee shall retire from and cease to be a member of the Board of Trustees at the close of business on December 31 of the calendar year in which the Independent Trustee attains the age of 75. A majority vote of the Board’s other Independent Trustees may extend the retirement date of an Independent Trustee if the retirement would trigger a requirement to hold a meeting of shareholders of the Trust under applicable law, whether for purposes of appointing a successor to the Independent Trustee or otherwise comply under applicable law, in which case the extension would apply until such time as the shareholder meeting can be held or is no longer required (as determined by a vote of a majority of the other Independent Trustees). |
| (2) | For the purposes of this table, “Fund Complex” means the Voya family of funds including the following investment companies: Voya Asia Pacific High Dividend Equity Income Fund; Voya Balanced Portfolio, Inc.; Voya Emerging Markets High Dividend Equity Fund; Voya Equity Trust; Voya Funds Trust; Voya Global Advantage and Premium Opportunity Fund; Voya Global Equity Dividend and Premium Opportunity Fund; Voya Infrastructure, Industrials and Materials Fund; Voya Intermediate Bond Portfolio; Voya International High Dividend Equity Income Fund; Voya Investors Trust; Voya Money Market Portfolio; Voya Mutual Funds; Voya Natural Resources Equity Income Fund; Voya Partners, Inc.; Voya Prime Rate Trust; Voya Senior Income Fund; Voya Separate Portfolios Trust; Voya Series Fund, Inc.; Voya Strategic Allocation Portfolios, Inc.; Voya Variable Funds; Voya Variable Insurance Trust; Voya Variable Portfolios, Inc.; and Voya Variable Products Trust. The number of funds in the Voya family of funds is as of January 31, 2015. |
| (3) | Mr. Mathews is deemed to be an “Interested Person” of the Trust as defined in the 1940 Act, because of his current affiliation with any of the Voya funds, Voya Financial, Inc. or any of Voya Financial, Inc.’s affiliates. |
| * | Effective on December 31, 2014, J. Michael Earley retired as a Trustee. |
| 44 |
TRUSTEE AND OFFICER INFORMATION (Unaudited) (continued)
| Name, Address and Age | Position(s) Held With the Trust | Term of Office and Length of Time Served(1) | Principal Occupation(s) - During the Past 5 Years | ||||
| Shaun P. Mathews 7337 East Doubletree Ranch Rd. Suite 100 Scottsdale, Arizona 85258 Age: 59 | President and Chief Executive Officer | November 2006 - Present | President and Chief Executive Officer, Voya Investments, LLC (November 2006 - Present). | ||||
| Michael J. Roland 7337 East Doubletree Ranch Rd. Suite 100 Scottsdale, Arizona 85258 Age: 56 | Executive Vice President | February 2002 - Present | Managing Director and Chief Operating Officer, Voya Investments, LLC and Voya Funds Services, LLC (April 2012 - Present). Formerly, Chief Compliance Officer, Directed Services LLC and Voya Investments, LLC (March 2011 - December 2013); Executive Vice President and Chief Operating Officer, Voya Investments, LLC and Voya Funds Services, LLC (January 2007 - April 2012) and Chief Compliance Officer, Voya Family of Funds (March 2011 - February 2012). | ||||
| Stanley D. Vyner 230 Park Avenue New York, New York 10169 Age: 64 | Executive Vice President Chief Investment Risk Officer | November 1999 - Present September 2009 - Present | Executive Vice President, Voya Investments, LLC (July 2000 - Present) and Chief Investment Risk Officer, Voya Investments, LLC (January 2003 - Present). | ||||
| Kevin M. Gleason 7337 East Doubletree Ranch Rd. Suite 100 Scottsdale, Arizona 85258 Age: 48 | Chief Compliance Officer | February 2012 - Present | Senior Vice President and Chief Compliance Officer, Voya Investments, LLC (February 2012 - Present). Formerly, Assistant General Counsel and Assistant Secretary, The Northwestern Mutual Life Insurance Company (June 2004 - January 2012). | ||||
| Todd Modic 7337 East Doubletree Ranch Rd. Suite 100 Scottsdale, Arizona 85258 Age: 47 | Senior Vice President, Chief/Principal Financial Officer and Assistant Secretary | March 2005 - Present | Senior Vice President, Voya Funds Services, LLC (March 2005 - Present). | ||||
| Kimberly A. Anderson 7337 East Doubletree Ranch Rd. Suite 100 Scottsdale, Arizona 85258 Age: 50 | Senior Vice President | November 2003 - Present | Senior Vice President, Voya Investments, LLC (October 2003 - Present). | ||||
| Julius A. Drelick, III 7337 East Doubletree Ranch Rd. Suite 100 Scottsdale, Arizona 85258 Age: 48 | Senior Vice President | July 2012 - Present | Senior Vice President - Head of Fund Compliance, Voya Funds Services, LLC (June 2012 - Present); Chief Compliance Officer of Directed Services LLC and Voya Investments, LLC (January 2014 - Present). Formerly, Vice President - Platform Product Management & Project Management, Voya Investments, LLC (April 2007 - June 2012). | ||||
| Robert Terris 7337 East Doubletree Ranch Rd. Suite 100 Scottsdale, Arizona 85258 Age: 44 | Senior Vice President | May 2006 - Present | Senior Vice President, Head of Division Operations, Voya Funds Services, LLC (January 2006 - Present). | ||||
| Fred Bedoya 7337 East Doubletree Ranch Rd. Suite 100 Scottsdale, Arizona 85258 Age: 42 | Vice President and Treasurer | September 2012 - Present | Vice President, Voya Funds Services, LLC (March 2012 - Present). Formerly, Assistant Vice President - Director, Voya Funds Services, LLC (March 2003 - March 2012). | ||||
| Maria M. Anderson 7337 East Doubletree Ranch Rd. Suite 100 Scottsdale, Arizona 85258 Age: 56 | Vice President | September 2004 - Present | Vice President, Voya Funds Services, LLC (September 2004 - Present). |
| 45 |
TRUSTEE AND OFFICER INFORMATION (Unaudited) (continued)
| Name, Address and Age | Position(s) Held With the Trust | Term of Office and Length of Time Served(1) | Principal Occupation(s) – During the Past 5 Years | ||||
| Lauren D. Bensinger 7337 East Doubletree Ranch Rd. Suite 100 Scottsdale, Arizona 85258 Age: 61 | Vice President | February 2003 - Present | Vice President, Voya Investments, LLC and Voya Funds Services, LLC (February 1996 - Present); Vice President, Voya Investments, LLC (October 2004 - Present); Vice President and Money Laundering Reporting Officer, Voya Investments Distributor, LLC (April 2010 - Present); Anti-Money Laundering Compliance Officer, Voya Financial, Inc. (January 2013 - Present); and Money Laundering Reporting Officer, Voya Investment Management Trust Co. (October 2012 - Present). Formerly, Chief Compliance Officer, Voya Investments Distributor, LLC (August 1995 - April 2010). | ||||
| Sara M. Donaldson 7337 East Doubletree Ranch Rd. Suite 100 Scottsdale, Arizona 85258 Age: 55 | Vice President | September 2014 - Present | Vice President, Voya Funds Services, LLC (April 2014 - Present). Formerly, Director, Compliance, AXA Rosenberg Global Services, LLC (September 1997 - March 2014). | ||||
| Robyn L. Ichilov 7337 East Doubletree Ranch Rd. Suite 100 Scottsdale, Arizona 85258 Age: 47 | Vice President | November 1999 - Present | Vice President, Voya Funds Services, LLC (November 1995 - Present) and Voya Investments, LLC (August 1997 - Present). Formerly, Treasurer, Voya Family of Funds (November 1999 - February 2012). | ||||
| Jason Kadavy 7337 East Doubletree Ranch Rd. Suite 100 Scottsdale, Arizona 85258 Age: 38 | Vice President | September 2012 - Present | Vice President, Voya Funds Services, LLC (July 2007 - Present). | ||||
| Kimberly K. Springer 7337 East Doubletree Ranch Rd. Suite 100 Scottsdale, Arizona 85258 Age: 57 | Vice President | March 2006 - Present | Vice President - Mutual Fund Product Development, Voya Investments, LLC (July 2012 - Present); Vice President, Voya Investment Management - Voya Family of Funds (March 2010 - Present) and Vice President, Voya Funds Services, LLC (March 2006 - Present). Formerly Managing Paralegal, Registration Statements (June 2003 - July 2012). | ||||
| Craig Wheeler 7337 East Doubletree Ranch Rd. Suite 100 Scottsdale, Arizona 85258 Age: 45 | Vice President | May 2008 - Present | Vice President - Director of Tax, Voya Funds Services, LLC (March 2013 - Present). Formerly, Assistant Vice President - Director of Tax, Voya Funds Services, LLC (March 2008 - March 2013). | ||||
| Huey P. Falgout, Jr. 7337 East Doubletree Ranch Rd. Suite 100 Scottsdale, Arizona 85258 Age: 51 | Secretary | August 2003 - Present | Senior Vice President and Chief Counsel, Voya Investment Management - Mutual Fund Legal Department (March 2010 - Present). Formerly, Chief Counsel, ING Americas, U.S. Legal Services (October 2003 - March 2010). | ||||
| Paul A. Caldarelli 7337 East Doubletree Ranch Rd. Suite 100 Scottsdale, Arizona 85258 Age: 63 | Assistant Secretary | June 2010 - Present | Vice President and Senior Counsel, Voya Investment Management - Mutual Fund Legal Department (March 2010 - Present). Formerly, Senior Counsel, ING Americas, U.S. Legal Services (April 2008 - March 2010). | ||||
| Theresa K. Kelety 7337 East Doubletree Ranch Rd. Suite 100 Scottsdale, Arizona 85258 Age: 52 | Assistant Secretary | August 2003 - Present | Vice President and Senior Counsel, Voya Investment Management - Mutual Fund Legal Department (March 2010 - Present). Formerly, Senior Counsel, ING Americas, U.S. Legal Services (April 2008 - March 2010). |
| (1) | The Officers hold office until the next annual meeting of the Board of Trustees and until their successors shall have been elected and qualified. |
| 46 |
ADVISORY CONTRACT APPROVAL DISCUSSION (Unaudited)
BOARD CONSIDERATION AND APPROVAL OF INVESTMENT ADVISORY AND SUB-ADVISORY CONTRACTS
Section 15(c) of the Investment Company Act of 1940, as amended (the “1940 Act”), provides that, after an initial period, the Board of Trustees (the “Board”) of Voya Variable Products Trust (the “Trust”), including a majority of Board members who have no direct or indirect interest in the advisory and sub-advisory contracts of Voya International Value Portfolio, Voya MidCap Opportunities Portfolio, and Voya SmallCap Opportunities Portfolio (collectively, the “Portfolios”), each a series of the Trust, and who are not “interested persons” of the Portfolios, as such term is defined under the 1940 Act (the “Independent Trustees”), must annually review and approve the Portfolios’ existing investment advisory and sub-advisory contracts. Thus, at a meeting held on September 12, 2014, the Board, including a majority of the Independent Trustees, considered whether to renew and approve the amended and restated investment advisory contract (the “Advisory Contract”) between Voya Investments, LLC (“Adviser”) and the Portfolios, as well as the amended and restated sub-advisory contract (“Sub-Advisory Contract”) with Voya Investment Management Co. LLC, the sub-adviser to each Portfolio (the “Sub-Adviser”).
The Independent Trustees also held separate meetings on August 14 and September 10, 2014, to consider the renewal of the Advisory Contract and Sub-Advisory Contract. As a result, subsequent references herein to factors considered and determinations made by the Board include, as applicable, factors considered and determinations made on those earlier dates by the Independent Trustees.
At its September 12, 2014 meeting, the Board voted to renew the Advisory and Sub-Advisory Contracts for the Portfolios. In reaching these decisions, the Board took into account information furnished to it throughout the year at meetings of the Board and the Board’s committees, as well as information prepared specifically in connection with the annual renewal or approval process. Determinations by the Independent Trustees also took into account various factors that they believed, in light of the legal advice furnished to them by K&L Gates LLP (“K&L Gates”), their independent legal counsel, and their own business judgment, to be relevant. Further, while the Board considered at the same meeting the advisory contracts and sub-advisory contracts that were subject to renewal for the investment companies in the Voya family of funds (“Voya funds”), the Board considered each Voya fund’s advisory and sub-advisory relationships separately.
Provided below is a general overview of the Board’s contract approval process that it followed, as well as a
discussion of certain specific factors that the Board considered at its renewal meetings. While the Board gave its attention to information furnished at the request of the Independent Trustees that was most relevant to its considerations, discussed below are some of the primary factors relevant to the Board’s consideration as to whether to renew the Advisory and Sub-Advisory Contracts for the one-year period ending September 30, 2015. Each Board member may have accorded different weight to the various factors in reaching his or her conclusions with respect to each Portfolio’s advisory and sub-advisory arrangements.
Overview of the Contract Renewal and Approval Process
The Board followed a structured process (the “Contract Review Process”) pursuant to which it requested and considered relevant information when it decided whether to approve and renew the Advisory Contract and Sub-Advisory Contract. Among other actions, the Independent Trustees previously retained an independent consultant with experience in the mutual fund industry to assist them in working with personnel employed by the Adviser or its affiliates who administer the Portfolios (“Management”) to: identify the types of information presented to the Board to inform its deliberations with respect to advisory and sub-advisory relationships and to help evaluate that information; evaluate industry best practices in regard to the consideration of investment advisory and sub-advisory contracts; establish a specific format in which certain requested information was provided to the Board; and determine the process for the Board’s review of such information.
The Board has established (among other committees) three Investment Review Committees (each, an “IRC”) and a Contracts Committee. Among other matters, the Contracts Committee provides oversight with respect to the contracts renewal and approval process, and each Portfolio is assigned to an IRC, which provides oversight regarding, among other matters, the investment performance of the Adviser and Sub-Adviser, as well as the oversight by the Adviser of the performance of the Sub-Adviser. The IRCs may apply a heightened level of scrutiny in cases where performance was below a Voya fund’s relevant benchmark, and/or a selected peer group of investment companies (“Selected Peer Group”), and/or Lipper Inc. (“Lipper”) category median, and/or Morningstar, Inc. (“Morningstar”) category median, as applicable.
The type and format of the information provided to the Board or to legal counsel for the Independent Trustees in connection with the Contract Review Process has been codified in a 15(c) methodology guide for the Voya funds “15(c) Methodology Guide”). This 15(c) Methodology Guide was developed under the direction of the
| 47 |
ADVISORY CONTRACT APPROVAL DISCUSSION (Unaudited) (continued)
Independent Trustees and sets out a blueprint pursuant to which they request certain information that they deem important to facilitate an informed review in connection with initial and annual approvals of advisory and sub-advisory contracts.
Management provided certain of the information requested by the 15(c) Methodology Guide in Fund Analysis and Comparison Tables (“FACT sheets”). The Independent Trustees periodically have retained, including most recently in 2014, an independent firm to test and verify the accuracy of certain FACT sheet data for a representative sample of the Voya funds. In addition, the Contracts Committee has routinely employed an independent consultant to assist in its review and analysis of, among other matters, the 15(c) Methodology Guide, the content and format of the FACT sheets, and Selected Peer Group to be used by each Portfolio for certain comparison purposes during the renewal process.
Set forth below is a discussion of many of the Board’s primary considerations and conclusions in connection with its decision to approve each Portfolio’s Advisory and Sub-Advisory Contracts through September 30, 2015.
Nature, Extent and Quality of Service
The Independent Trustees received and evaluated such information as they deemed necessary regarding the nature, extent and quality of services provided to the Portfolios by the Adviser and Sub-Adviser. This included information regarding the Adviser and Sub-Adviser provided throughout the year at regular meetings of the Board and its committees, as well as information furnished in connection with the contract renewal meetings.
The materials requested by the Independent Trustees and provided to the Board, K&L Gates and/or independent consultants that assisted the Independent Trustees prior to the September 12, 2014 Board meeting included, among other information, the following items for each Portfolio: (1) FACT sheets that provided information regarding the performance and expenses of the Portfolio and other similarly managed funds in its Selected Peer Group, information regarding the Portfolio’s investment portfolio, objective and strategies, and information regarding net asset flows into and out of the Portfolio; (2) reports providing risk and attribution analyses of the Portfolio; (3) the 15(c) Methodology Guide, which describes how the FACT sheets were prepared, including the manner in which each Portfolio’s benchmark and Selected Peer Group were selected and how profitability was determined; (4) responses from the Adviser and Sub-Adviser to the Portfolios to a series of questions posed by K&L Gates on behalf of the Independent Trustees; (5) copies of the forms of Advisory and Sub-Advisory Contracts; (6) copies
of the Forms ADV for the Adviser and Sub-Adviser; (7) financial statements for the Adviser and Sub-Adviser; (8) a draft narrative summary addressing key factors the Board customarily considers in evaluating the advisory and sub-advisory contracts for the Voya funds (including the Portfolio’s Advisory Contract and Sub-Advisory Contract); (9) independent analyses of Portfolio performance by the Trust’s Chief Investment Risk Officer; (10) a report by the Trust’s Chief Compliance Officer (“CCO”); and (11) other information relevant to the Board’s evaluations.
The Board was advised that pursuant to an agreement with the European Commission, ING Groep, N.V. (“ING Groep”) is required to divest its entire interest in Voya Financial, Inc. (formerly known as ING U.S. Inc.), its U.S.-based insurance, retirement services and investment management operations, which include the Adviser and the Sub-Adviser, by the end of 2016 (such divestment, the “Separation Plan”). Voya Financial, Inc. is and was, at the time of the September Board meeting, a minority owned subsidiary of ING Groep and a parent company of the Adviser and the Sub-Adviser. The Board further noted that the Separation Plan may result in the Adviser’s and Sub-Adviser’s loss of access to the services and resources of ING Groep, which could adversely affect their businesses and profitability. The Board was advised that the Separation Plan contemplates one or more public offerings and each may be deemed to be a change of control.
The Board was advised that Voya Financial, Inc. had conducted an initial public offering of Voya Financial, Inc. common stock in May 2013 and ING Groep had divested additional shares through three other public offerings since May 2013, reducing its ownership interest in Voya Financial, Inc. to below 50%. The Board was advised that none of these public offerings was deemed to be a change of control. The Board recognized that if any future public offering is deemed to be a change of control, the investment advisory and sub-advisory agreements for each Voya fund would terminate and trigger a need for new agreements, which would require the approval of the Board and, potentially, shareholders of the Portfolios. The Board also was advised that there could be no assurance that the Separation Plan will be carried out completely. The Board considered the potential effects of the Separation Plan on the Portfolios and the Adviser and the Sub-Adviser, including the Adviser’s and the Sub-Adviser’s ability during and after the separation to perform the same level of service to the Portfolios as the Adviser and the Sub-Adviser then provided. The Board was advised that neither the Adviser nor the Sub-Adviser anticipated that the Separation Plan would have a material adverse impact on the Portfolios or their operations and administration.
| 48 |
ADVISORY CONTRACT APPROVAL DISCUSSION (Unaudited) (continued)
The Board was advised that, in connection with the Separation Plan, Voya Financial, Inc. underwent a rebranding effort (the “Rebranding”) whereby Voya Financial, Inc. and several of its affiliates effected name changes. The Voya funds’ names, as well as the Adviser’s and the Sub-Adviser’s names, were also changed in connection with the Rebranding. The Rebranding resulted in amended and restated forms of advisory and sub-advisory contracts being presented to and approved by the Board at its September 12, 2014 meeting. The Board was advised that the Advisory and Sub-Advisory Contracts have the same terms as the then-current advisory and sub-advisory contracts, except for the effective date and certain immaterial changes made to certain provisions related to the Rebranding.
For each Portfolio, a specific class of shares was used for purposes of certain comparisons between the Portfolio and its Selected Peer Group. The specified class of a Portfolio was chosen based on the 15(c) Methodology Guide and was compared to an analogous class of shares for each fund in its Selected Peer Group. The mutual funds included in each Portfolio’s Selected Peer Group were selected based upon criteria designed to represent the Portfolio share class being compared to the Selected Peer Group.
In arriving at its conclusions with respect to the Advisory Contract, the Board was mindful of the “manager-of-managers” platform of the Voya funds that has been developed by the Adviser. The Board recognized that the Adviser is responsible for monitoring the investment program, performance, and developments and ongoing operations of the Sub-Adviser under this manager-of-managers arrangement. The Board also considered the techniques and resources that the Adviser has developed to provide ongoing oversight of the nature, extent and quality of the services the Sub-Adviser provides to the Portfolios and the Sub-Adviser’s compliance with applicable laws and regulations. The Board was advised that to assist in the selection and monitoring of the Sub-Adviser, the Adviser has developed an oversight process formulated by its Manager Research & Selection Group (“MR&S”), which analyzes both qualitative (such as in-person meetings and telephonic meetings with the Sub-Adviser and research on sub-advisers) and quantitative information (such as performance data, portfolio data and attribution analysis) about the Sub-Adviser and the funds that it manages. The Board recognized that MR&S also typically provides in-person reports to the IRCs at their meetings prior to any presentations from the Voya funds’ sub-advisers, including the Sub-Adviser. In addition, the Board noted that MR&S prepares periodic due diligence reports regarding the Sub-Adviser based on on-site visits and information and
analysis which team members use to attempt to gain and maintain an in-depth understanding of the Sub-Adviser’s investment process and to try to identify issues that may be relevant to the Sub-Adviser’s services to a Portfolio and/or its performance. The Board also noted that MR&S provides written reports on these due diligence analyses to the pertinent IRC. The Board was advised of the resources that Management has committed to its services as a manager-of-managers, including resources for reporting to the Board and the relevant IRC to assist them with their assessment of the investment performance of the Portfolios on an on-going basis throughout the year. This includes the appointment of a Chief Investment Risk Officer and his staff, who report directly to the Board and who have developed attribution analyses and other metrics used by the IRCs to analyze the key factors underlying investment performance for the Voya funds.
The Board also considered the techniques that the Adviser has developed to screen and perform due diligence on new sub-advisers if and when the Adviser recommends to the Board a new sub-adviser to manage a fund in the Voya funds complex. The Board considered that, for new non-Voya-affiliated sub-advisers, MR&S is responsible for: identifying qualified candidates; analyzing their investment processes, personnel and resources; conducting due diligence on the candidates; and selecting a firm to propose as a new sub-adviser, as well as preparing written materials and reports to the committees and the Board as part of the process of considering the approval of any new sub-adviser for a Voya fund.
The Board also considered that in the course of monitoring performance of the Sub-Adviser, MR&S has developed, based on guidance from the IRCs, a methodology for comparing performance of each Portfolio to a Selected Peer Group, to each Portfolio’s Morningstar category median, to its Lipper category median and to its primary benchmark. The Board also recognized that MR&S provides the pertinent IRC with regular updates on the Portfolios and alerts the IRC to potential issues as they arise. The Board also was advised that the Adviser regularly monitors performance, personnel, compliance and other issues that may arise on a day-to-day basis regarding the sub-advisers to the Voya funds, including the Sub-Adviser, and considered that, if issues are identified either through formal or informal processes, they are brought before the IRCs and the Board for consideration and action and the Adviser consistently makes its resources available to the Board and the IRCs to assist with addressing any issues that arise.
The Board considered that the Portfolios also benefit from the services of the Adviser’s Investment Risk Management Department (the “IRMD”), under the leadership of the
| 49 |
ADVISORY CONTRACT APPROVAL DISCUSSION (Unaudited) (continued)
Chief Investment Risk Officer, the costs of which are shared by the Voya funds and the Adviser. The Board considered that the IRMD regularly presents written materials and reports to the IRCs that focus on the investment risks of the Voya funds. The Board also considered that the IRMD provides the IRCs with analyses that are developed to assist the IRCs in identifying trends in the Voya funds’ (including the Portfolios’) performance and other areas over consecutive periods. The Board considered that the services provided by the IRMD are meant to provide an additional perspective for the benefit of the IRCs, which may vary from the perspective of MR&S.
The Board also considered the techniques used by the Adviser to monitor the performance of the Sub-Adviser and the proactive approach that the Adviser, working in cooperation with the relevant IRC, has taken to advocate or recommend, when it believed appropriate, changes designed to assist in improving the Portfolios’ performance.
In considering the Portfolios’ Advisory Contract, the Board also considered the extent of benefits provided to the Portfolios’ shareholders, beyond advisory services, from being part of the Voya funds. This includes, in most cases, the right to exchange or transfer investments, without a sales charge, between the same class of shares of such funds or among Voya funds available on a product platform, and the wide range of Voya funds available for exchange or transfer. The Board also took into account the Adviser’s ongoing efforts to reduce the expenses of the Voya funds through renegotiated arrangements with the Voya funds’ service providers. In addition, the Board considered the efforts of the Adviser and the expenses that it incurred in recent years to help make the Voya funds more balanced and efficient by the launch of new investment products and the combinations of similar funds.
Further, the Board received periodic reports showing that the investment policies and restrictions for each Portfolio were consistently complied with and other periodic reports covering matters such as compliance by Adviser and Sub-Adviser personnel with codes of ethics. The Board considered reports from the Trust’s CCO and/or the Adviser’s CCO evaluating whether the regulatory compliance systems and procedures of the Adviser and the Sub-Adviser are reasonably designed to assure compliance with the federal securities laws, including those related to, among others, late trading and market timing, best execution, fair value pricing, proxy voting and trade allocation practices. The Board also took into account the Trust’s CCO’s annual and periodic reports and recommendations with respect to service provider compliance programs. In this regard, the Board also
considered the policies and procedures developed by the Trust’s CCO in consultation with the Board’s Compliance Committee that guide the Trust’s CCO’s compliance oversight function.
The Board requested and, as applicable, considered information regarding the level of staffing, quality and experience of each Portfolio’s portfolio management team, the respective resources and reputations of the Adviser and Sub-Adviser, and the ability of the Adviser and the Sub-Adviser to attract and retain qualified investment advisory personnel, the adequacy of the resources committed to the Portfolios (and other relevant funds in the Voya funds) by the Adviser and Sub-Adviser, whether those resources are commensurate with the needs of the Portfolios and are sufficient to sustain appropriate levels of performance and compliance needs, and the Board considered the financial stability of the Adviser and Sub-Adviser.
Based on their deliberations and the materials presented to them, the Board concluded that the advisory and related services provided by the Adviser and the Sub-Adviser are appropriate in light of the Portfolios’ operations, the competitive landscape of the investment company business, and investor needs, and that the nature, extent and quality of the overall services provided by the Adviser and the Sub-Adviser were appropriate.
Portfolio Performance
In assessing advisory and sub-advisory relationships, the Board placed emphasis on the investment returns of each Portfolio. The Board considered the performance reports and analyses from MR&S and IRMD and discussions with portfolio managers at Board and committee meetings during the year. The Board also paid particular attention in assessing performance information provided on the FACT sheets furnished in connection with the renewal and approval process. The FACT sheets prepared for each Portfolio included its investment performance compared to the Portfolio’s Morningstar category median, Lipper category median, Selected Peer Group and primary benchmark. The FACT sheet performance data was as of March 31, 2014.
The Board also considered at its September 12, 2014 meeting certain additional data regarding performance and Portfolio asset levels for various additional periods ending after March 31, 2014. The Board’s findings specific to the Portfolio’s performance are discussed under “Portfolio-by-Portfolio Analysis” below.
| 50 |
ADVISORY CONTRACT APPROVAL DISCUSSION (Unaudited) (continued)
Economies of Scale
When evaluating the reasonableness of advisory fee rates, the Board also considered whether economies of scale likely will be realized by the Adviser and Sub-Adviser as a Portfolio grows larger and the extent to which any such economies are reflected in contractual fee rates. In this regard, the Board noted any breakpoints in advisory fee rate schedules that will result in a lower advisory fee rate when a Portfolio achieves sufficient asset levels to receive a breakpoint discount. In the case of sub-advisory fees, the Board considered that breakpoints would inure to the benefit of the Adviser, except to the extent that there are corresponding advisory fee rate breakpoints or waivers. The Board also considered that the Portfolios’ have waiver and/or expense reimbursement arrangements. In this connection, the Board considered the extent to which economies of scale could be realized through such fee waivers, expense reimbursements or other expense reductions. In evaluating fee rate breakpoint arrangements and economies of scale, the Independent Trustees also considered prior periodic management reports, industry information on this topic, fee rates at projected levels of growth versus peers and the Portfolios’ investment performance.
Information Regarding Services to Other Clients
The Board requested and considered information regarding the nature of services and fee rates offered by the Adviser and Sub-Adviser to other clients, including other registered investment companies and relevant institutional accounts. When fee rates offered by a sub-adviser to a Voya fund to its other clients differ materially from those charged to the Voya fund, the Board considers any underlying rationale provided by the Adviser or, in certain circumstances, the sub-adviser for these differences. The Board also noted that the fee rates charged to the Portfolios and other institutional clients of the Adviser or Sub-Adviser (including other investment companies) may differ materially due to, among other reasons: differences in services; different regulatory requirements associated with registered investment companies, such as the Portfolios, as compared to non-registered investment company clients; market differences in fee rates that existed when a Portfolio first was organized; differences in the original sponsors of the Portfolios that now are managed by the Adviser; investment capacity constraints that existed when certain contracts were first agreed upon or that might exist at present; and different pricing structures that are necessary to be competitive in different marketing channels.
Fee Rates and Profitability
The Board reviewed and considered the contractual investment advisory fee rate, combined with the administrative fee rate, payable by each Portfolio to the Adviser and to the Adviser’s affiliated company that serves as the administrator to each Portfolio. The Board also considered the contractual sub-advisory fee rate payable by the Adviser to the Sub-Adviser for sub-advisory services for each Portfolio, including the portion of the contractual advisory fees that are paid to the Sub-Adviser, as compared to the portion retained by the Adviser. In addition, the Board considered fee waivers and expense limitations applicable to the fees payable by the Portfolios, including the Adviser’s agreement to extend each such fee waiver and expense limitation agreement for an additional period of at least one year, and not to terminate such agreement in future years without prior approval of the Board.
The Board requested information regarding and, as applicable, considered: (1) the fee rate structure of each Portfolio as it relates to the services provided under the contracts; and (2) the potential fall-out benefits to the Adviser and the Sub-Adviser and their respective affiliates from their association with the Portfolios. For each Portfolio, the Board separately determined that the fees payable to the Adviser and the fee rate payable to the Sub-Adviser are reasonable for the services that each performs, which were considered in light of the nature, extent and quality of the services that each has performed and is expected to perform.
For each Portfolio, the Board considered information on revenues, costs and profits realized by the Adviser and the Sub-Adviser, which was prepared by Management in accordance with the allocation methodology (including related assumptions) specified in the 15(c) Methodology Guide. In analyzing the profitability of the Adviser in connection with its services to a Portfolio, the Board took into account the sub-advisory fee rate payable by the Adviser to the Sub-Adviser. In addition, the Board considered information that it requested and that was provided by Management with respect to the profitability of service providers affiliated with the Adviser. The Board also considered the profitability of the Adviser and its affiliated companies attributable to managing and operating each Portfolio both with and without the profitability of the distributor of the Portfolios and both before and after giving effect to any expenses incurred by the Adviser or any affiliated company in making revenue sharing or other payments to third parties, including affiliated insurance companies, for distribution and administrative services.
| 51 |
ADVISORY CONTRACT APPROVAL DISCUSSION (Unaudited) (continued)
Although the 15(c) Methodology Guide establishes certain standards for profit calculation, the Board recognized that profitability analysis on a Portfolio-by-Portfolio basis is not an exact science and there is no uniform methodology within the asset management industry for determining profitability for this purpose. In this context, the Board realized that Management’s calculations regarding its costs incurred in establishing the infrastructure necessary for the Portfolios’ operations may not be fully reflected in the expenses allocated to the Portfolios in determining profitability, and that the information presented may not portray all of the costs borne by the Adviser and Management or capture their entrepreneurial risk associated with offering and managing a mutual fund complex in the current regulatory and market environment. In addition, the Board recognized that the use of different reasonable methodologies for purposes of calculating profit data can give rise to dramatically different profit and loss results.
In making its determinations, the Board based its conclusions as to the reasonableness of the advisory and sub-advisory fees of the Adviser and the Sub-Adviser primarily on the factors described for each Portfolio below. At the request of the Board, the Adviser has from time to time agreed to implement remedial actions regarding certain Voya funds. These remedial actions have included, among others: reductions in fee rates or adjustments to expense limitation and waiver arrangements; changes in sub-advisers or portfolio managers; and strategy modifications.
Portfolio-by-Portfolio Analysis
The following paragraphs outline certain of the specific factors that the Board considered, and the conclusions reached, at its September 12, 2014 meeting in relation to approving each Portfolio’s Advisory and Sub-Advisory Contracts. These specific factors are in addition to those considerations discussed above. In each case, the Portfolio’s performance was compared to its Morningstar category median and average, as well as its primary benchmark, a broad-based securities market index that appears in the Portfolio’s prospectus. With respect to Morningstar quintile rankings, the first quintile represents the highest (best) performance and the fifth quintile represents the lowest performance. Each Portfolio’s management fee rate and expense ratio were compared to the fees and expense ratios of the funds in its Selected Peer Group.
Voya International Value Portfolio
In considering whether to approve the renewal of the Advisory and Sub-Advisory Contracts for Voya International Value Portfolio, the Board considered that,
based on performance data for the periods ended March 31, 2014: (1) the Portfolio outperformed its Morningstar category median for all periods presented, with the exception of the five-year and ten-year periods, during which it underperformed; (2) the Portfolio outperformed its primary benchmark for the most recent calendar quarter, year-to-date, and one-year periods, but underperformed for the three-year, five-year, and ten-year periods; and (3) the Portfolio is ranked in the second quintile of its Morningstar Category for the most recent calendar quarter, year-to-date, and one-year periods, the third quintile for the three-year period, and the fourth quintile for the five-year and ten-year periods.
In considering the fees payable under the Advisory and Sub-Advisory Contracts for the Portfolio, the Board took into account the factors described above and also considered: (1) the fairness of the compensation under an Advisory Contract with a breakpoint fee schedule where the asset level necessary to achieve a breakpoint discount had not yet been reached by the Portfolio; and (2) the pricing structure (including the expense ratio to be borne by shareholders) of the Portfolio, as compared to its Selected Peer Group, including that: (a) the management fee (inclusive of a 0.10% administration fee) for the Portfolio is above the median and the average management fees of the funds in its Selected Peer Group; and (b) the expense ratio for the Portfolio is equal to the median and above the average expense ratios of the funds in its Selected Peer Group.
In analyzing this fee data, the Board took into account that: (1) as directed by the Board during the 2013 annual review process, lower maximum operating expense limits for the Portfolio were implemented, effective January 2014; and (2) at its September 2014 meeting, the Board approved the merger of the Portfolio into another Voya fund, and, if approved by shareholders, this merger would be completed in 2015.
After its deliberation, the Board reached the following conclusions: (1) the Portfolio’s management fee rate is reasonable in the context of all factors considered by the Board; (2) the Portfolio’s expense ratio is reasonable in the context of all factors considered by the Board; (3) the Portfolio’s performance is reasonable in the context of all factors considered by the Board; and (4) the sub-advisory fee rate payable by the Adviser to the Sub-Adviser is reasonable in the context of all factors considered by the Board. Based on these conclusions and other factors, the Board voted to renew the Advisory and Sub-Advisory Contracts for the Portfolio for the year ending September 30, 2015. During this renewal process, different Board members may have given different weight to different individual factors and related conclusions.
| 52 |
ADVISORY CONTRACT APPROVAL DISCUSSION (Unaudited) (continued)
Voya MidCap Opportunities Portfolio
In considering whether to approve the renewal of the Advisory and Sub-Advisory Contracts for Voya MidCap Opportunities Portfolio, the Board considered that, based on performance data for the periods ended March 31, 2014: (1) the Portfolio underperformed its Morningstar category median for all periods presented, with the exception of the five-year and ten-year periods, during which it outperformed; (2) the Portfolio underperformed its primary benchmark for all periods presented, with the exception of the ten-year period, during which it outperformed; and (3) the Portfolio is ranked in the first (highest) quintile of its Morningstar category for the ten-year period, the second quintile for the five-year period, the third quintile for the three-year period, and the fifth (lowest) quintile for the most recent calendar quarter, year-to-date, and one-year periods.
In analyzing this performance data, the Board took into account: (1) Management’s analysis regarding the negative effect that stock selection had on the Portfolio’s performance during certain periods; (2) Management’s view that resource enhancements recently implemented by the Sub-Adviser can be expected to improve performance; (3) Management’s representations regarding the competitiveness of the Portfolio’s performance during certain periods; and (4) that Management would continue to monitor, and the Board or its Investment Review Committee would periodically review, the Portfolio’s performance.
In considering the fees payable under the Advisory and Sub-Advisory Contracts for the Portfolio, the Board took into account the factors described above and also considered: (1) the economies of scale benefits to the Portfolio and its shareholders from breakpoint discounts applicable to the Portfolio’s advisory fee rate, which result in lower fees at higher asset levels; and (2) the pricing structure (including the expense ratio to be borne by shareholders) of the Portfolio, as compared to its Selected Peer Group, including that: (a) the management fee (inclusive of a 0.10% administration fee) for the Portfolio is above the median and the average management fees of the funds in its Selected Peer Group; and (b) the expense ratio for the Portfolio is above the median and the average expense ratios of the funds in its Selected Peer Group.
In analyzing this fee data, the Board took into account Management’s representations regarding the competitiveness of the Portfolio’s management fee and expense ratio.
After its deliberation, the Board reached the following conclusions: (1) the Portfolio’s management fee rate is reasonable in the context of all factors considered by the
Board; (2) the Portfolio’s expense ratio is reasonable in the context of all factors considered by the Board; (3) taking into account that Management would continue to monitor, and the Board or its Investment Review Committee would periodically review its performance, the Portfolio’s investment performance is reasonable in the context of all factors considered by the Board; and (4) the sub- advisory fee rate payable by the Adviser to the Sub-Adviser is reasonable in the context of all factors considered by the Board. Based on these conclusions and other factors, the Board voted to renew the Advisory and Sub-Advisory Contracts for the Portfolio for the year ending September 30, 2015. During this renewal process, different Board members may have given different weight to different individual factors and related conclusions.
Voya SmallCap Opportunities Portfolio
In considering whether to approve the renewal of the Advisory and Sub-Advisory Contracts for Voya SmallCap Opportunities Portfolio, the Board considered that, based on performance data for the periods ended March 31, 2014: (1) the Portfolio outperformed its Morningstar category median for all periods presented, with the exception of the one-year period, during which it underperformed; (2) the Portfolio outperformed its primary benchmark for all periods presented, with the exception of the one-year period, during which it underperformed; and (3) the Portfolio is ranked in the first (highest) quintile of its Morningstar category for the three-year and ten-year periods, the second quintile for the five-year period, and the third quintile for the most recent calendar quarter, year-to-date, and one-year periods.
In considering the fees payable under the Advisory and Sub-Advisory Contracts for the Portfolio, the Board took into account the factors described above and also considered: (1) the economies of scale benefits to the Portfolio and its shareholders from breakpoint discounts applicable to the Portfolio’s advisory fee rate, which result in lower fees at higher asset levels; and (2) the pricing structure (including the expense ratio to be borne by shareholders) of the Portfolio, as compared to its Selected Peer Group, including that: (a) the management fee (inclusive of a 0.10% administration fee) for the Portfolio is equal to the median and below the average management fees of the funds in its Selected Peer Group; and (b) the expense ratio for the Portfolio is below the median and the average expense ratios of the funds in its Selected Peer Group.
After its deliberation, the Board reached the following conclusions: (1) the Portfolio’s management fee rate is reasonable in the context of all factors considered by the Board; (2) the Portfolio’s expense ratio is reasonable in the
| 53 |
ADVISORY CONTRACT APPROVAL DISCUSSION (Unaudited) (continued)
context of all factors considered by the Board; (3) the Portfolio’s performance is reasonable in the context of all factors considered by the Board; and (4) the sub-advisory fee rate payable by the Adviser to the Sub-Adviser is reasonable in the context of all factors considered by the Board. Based on these conclusions and other factors, the Board voted to renew the Advisory and Sub-Advisory Contracts for the Portfolio for the year ending September 30, 2015. During this renewal process, different Board members may have given different weight to different individual factors and related conclusions.
APPROVAL OF INVESTMENT ADVISORY AND SUB-ADVISORY CONTRACTS IN CONNECTION WITH A CHANGE OF CONTROL EVENT
Section 15(c) of the 1940 Act, provides that, when the Portfolios enter into a new investment advisory contract with the Adviser, and the Adviser enters into a new sub-advisory contract between the Adviser and the Sub-Adviser, the Board, including a majority of the Independent Trustees, must approve the new arrangements. Discussed below are certain factors that the Board considered at a meeting held on November 18, 2014 in determining whether to approve new advisory and sub-advisory arrangements for the Portfolios in connection with a Change of Control Event, as such term is defined below, pursuant to the Separation Plan.
At the November 18, 2014 meeting, the Board noted that pursuant to an agreement with the European Commission, ING Groep, N.V. (as defined above, “ING Groep”), the former parent company of the Adviser and the Sub-Adviser, is required to divest its entire interest in Voya Financial, Inc. (formerly, ING U.S., Inc.), its U.S.-based insurance, retirement services, and investment management operations, which include the Adviser and the Sub-Adviser, by the end of 2016 (as defined above, the “Separation Plan”). Voya Financial, Inc. previously was a wholly owned, indirect subsidiary of ING Groep and is a parent company of the Adviser and the Sub-Adviser.
Each of the Portfolios is subject to the 1940 Act, which provides that any investment advisory agreement, including any sub-advisory agreement, must terminate automatically upon its “assignment.” As used in the 1940 Act, the term assignment includes any transfer of a controlling block of outstanding voting securities of an adviser or the parent company of an adviser. Such a transfer is referred to herein as a “Change of Control Event.” ING Groep’s base case to achieve the Separation Plan was through an initial public offering of Voya Financial, Inc. (the “IPO”) followed by the divestment of ING Groep’s remaining ownership interest over time through one or more additional public offerings of Voya Financial, Inc. stock, or, possibly, through one or more
privately negotiated sales of the stock. The Board recognized that the Separation Plan contemplated several public offerings and each may have been deemed to be a Change of Control Event, triggering the necessity for new agreements, which would require the approval of the Board. The Board concluded that approval by shareholders of the new agreements that would become effective in the event of one or more Change of Control Events would permit the Portfolios to benefit from the continuation of services by the Adviser, Sub-Adviser, and their affiliates throughout the Separation Plan without the need for multiple shareholder meetings. The Board was informed by the Adviser and its counsel that the Adviser obtained regulatory assurances from the staff of the U.S. Securities and Exchange Commission in March 2013 that they would not object to approval of future agreements by shareholders at a single shareholder meeting. Portfolio shareholders approved the future agreements in May 2013.
The IPO was completed in May 2013. ING Groep divested additional shares in Voya Financial, Inc. through four subsequent public offerings since May 2013, including a secondary common stock offering that closed on November 18, 2014 (the “November Transaction”). (In addition, concurrently with the November Transaction, Voya Financial, Inc. repurchased $175 million of its shares directly from ING Groep.) Upon the completion of the November Transaction and the concurrent direct share repurchase, ING Groep’s ownership in Voya Financial, Inc. was reduced from approximately 32.5% to approximately 19%. This was deemed to be a Change of Control Event that resulted in the termination of the Portfolios’ existing advisory and sub-advisory agreements (the “Prior Agreements”) at the close of business on November 18, 2014.
In light of the foregoing, on November 18, 2014 the Board, at an in-person meeting, approved new investment advisory and affiliated sub-advisory agreements (the “New Agreements”) for the Portfolios to replace the Prior Agreements upon termination. At that meeting, the Adviser represented that the agreements approved by the Board were not materially different from the agreements approved by shareholders of the Portfolios in 2013 and no single person or group of persons acting together was expected to gain “control” (as defined in the 1940 Act) of Voya Financial, Inc. As a result, shareholders of the Portfolios will not be asked to vote again on these new agreements with the Adviser and affiliated sub-advisers, including the Sub-Adviser.
The decision by the Board, including a majority of the Independent Trustees, to approve the New Agreements was based on a determination by the Board that it would be
| 54 |
ADVISORY CONTRACT APPROVAL DISCUSSION (Unaudited) (continued)
in the best interests of the shareholders of the Portfolios for the Adviser and the Sub-Adviser to continue providing investment advisory, sub-advisory, and related services for the Portfolios, without interruption, after the Change of Control Event.
Prior to its approval of the New Agreements, the Board reviewed, among other matters, the quality, extent and nature of the services currently being provided by the Adviser and the Sub-Adviser under the Prior Agreements and to be provided under the New Agreements. A substantial portion of this review was conducted as part of, and in conjunction with, the Board’s annual reviews of the Prior Agreements, which were most recently approved for continuation at the in-person meeting of the Board held on September 12, 2014. During the review process that led to its approval of the Prior Agreements on September 12, 2014, the Board was informed by the Adviser that it was likely the Board would be asked in the very near future to consider approval of the New Agreements. The Board further noted that the Change of Control Event would result in the Adviser’s and the Sub-Adviser’s loss of access to certain services and resources of ING Groep, which could adversely affect their businesses and profitability.
On September 12, 2014, the Board concluded, in light of all factors it considered, including undertakings by the Adviser relating to certain follow-up actions, to renew the Prior Agreements and that the fee rates set forth in the Prior Agreements were fair and reasonable. Among other factors, the Board considered: (1) the nature, extent and quality of services provided and to be provided under the Prior Agreements; (2) the extent to which economies of scale are reflected in fee rate schedules under the Prior Agreements; (3) the existence of any “fall-out” benefits to the Adviser, Sub-Adviser, and their affiliates; (4) a comparison of fee rates, expense ratios, and investment performance to those of similar funds; and (5) the costs incurred and profits realized by the Adviser, the Sub-Adviser, and their affiliates with respect to their services to the Portfolios.
A further description of the process followed by the Board in approving the Prior Agreements on September 12, 2014, including the information reviewed, certain material factors considered and certain related conclusions reached, is set forth above under the section titled “BOARD CONSIDERATION AND APPROVAL OF INVESTMENT ADVISORY AND SUB-ADVISORY CONTRACTS.”
In connection with its approval of the New Agreements, on November 18, 2014 the Board considered its conclusions in connection with its September 12, 2014 approvals of those Prior Agreements that were in effect on that date, including the Board’s assessment of the nature, extent and quality of services being provided and, as applicable,
actions taken in certain instances to improve the relationship between the costs and the quality of services being provided. Also in connection with its November 18, 2014 approvals of the New Agreements, the Board considered a representation from the Adviser that there were no additional developments not already disclosed to the Board since September 12, 2014 that would be a material consideration to the Board in connection with its consideration of the New Agreements.
In addition, in determining whether to approve the New Agreements, the Board took into account the considerations set out below.
| 1) | The Independent Trustees solicited and received ongoing advice regarding the Board’s legal duties when approving the New Agreements from K&L Gates, their independent legal counsel, which law firm has extensive experience regarding such matters. |
| 2) | The Board considered Management’s representations regarding its commitment to maintain appropriate levels of overall staffing, ongoing resources and service quality through the transactions under the Separation Plan and after the Change of Control Event. The Board noted that such services include, but are not limited to, portfolio management services, administrative services, and regulatory compliance services. In this regard, the Board considered representations by the Adviser and its affiliates that their separation from ING Groep, as contemplated by the Separation Plan, will not lead to a reduction in the quality or scope of these and other services provided by those firms to the Portfolios. The Board also considered the importance of the asset management operations to the overall success of Voya Financial, which provides a strong incentive to Voya Financial, Inc. to provide appropriate resource allocations to support those asset management operations. |
| 3) | The Board considered representations by the Adviser and its affiliates that approval of the New Agreements would be necessary for the Portfolios to continue receiving investment management services from the Adviser and the Sub-Adviser following the November 18th Change of Control Event. In addition, the Board considered representations by the Adviser and its affiliates, as well as related supporting documentation, indicating that the New Agreements, including the fees payable thereunder, are substantially similar to and, in any event, are no less favorable to the Portfolios than, the terms of the corresponding Prior Agreements. |
| 4) | The Board considered representations by the Adviser and its affiliates, including senior investment |
| 55 |
ADVISORY CONTRACT APPROVAL DISCUSSION (Unaudited) (continued)
management personnel, as well as related supporting documentation, indicating that: (a) the Adviser and the Sub-Adviser can be expected to provide services of the same nature, extent and quality under the New Agreements as were provided under the Prior Agreements; and (b) the November 18th Change of Control Event is not expected to result in any changes to: (i) the management of the Portfolios, including the continuity of the Portfolios’ portfolio managers and other personnel responsible for the management operations of the Portfolios; or (ii) the investment objective of or the principal investment strategies used to manage any of the Portfolios.
| 5) | The Board considered actions taken by the Adviser subsequent to the September 12, 2014, approvals of the Prior Agreements with respect to certain Voya funds in response to requests made by the Board in connection with those approvals. |
| 6) | The Board considered the potential benefits to be realized by the Adviser and its affiliates as a result of the New Agreements. |
Based on the foregoing and other relevant considerations, at a meeting of the Board held on November 18, 2014, the Board, including a majority of the Independent Trustees, voted to approve the New Agreements. In this connection, the Board concluded that, in light of all factors considered, the terms of the New Agreements, including fee rates, were fair and reasonable, and the New Agreements should be approved so as to enable a continuation without interruption of the services being provided by the current service providers pursuant to the Prior Agreements. The Board noted that no one factor was determinative of its decisions which, instead, were premised upon the totality of factors considered. The Board also noted that different Board members likely placed emphasis on different factors in reaching their individual conclusions to vote in favor of the New Agreements.
| 56 |
[This Page Intentionally Left Blank]
Investment Adviser
Voya Investments, LLC
7337 East Doubletree Ranch Road, Suite 100
Scottsdale, Arizona 85258
Administrator
Voya Funds Services, LLC
7337 East Doubletree Ranch Road, Suite 100
Scottsdale, Arizona 85258
Distributor
Voya Investments Distributor, LLC
7337 East Doubletree Ranch Road, Suite 100
Scottsdale, Arizona 85258
Transfer Agent
BNY Mellon Investment Servicing (U.S.) Inc.
301 Bellevue Parkway
Wilmington, Delaware 19809
Independent Registered Public Accounting Firm
KPMG LLP
Two Financial Center
60 South Street
Boston, Massachusetts 02111
Custodian
The Bank of New York Mellon
One Wall Street
New York, New York 10286
Legal Counsel
Dechert LLP
1900 K Street, N.W.
Washington, D.C. 20006
Before investing, carefully consider the investment objectives, risks, charges and expenses of the variable universal life insurance policy or variable annuity contract and the underlying variable investment options. This and other information is contained in the prospectus for the variable universal life policy or variable annuity contract and the underlying variable investment options. Obtain these prospectuses from your agent/registered representative and read them carefully before investing.
![]()
| RETIREMENT | INVESTMENTS | INSURANCE | |
| voyainvestments.com | |
| VPAR-VPTADVISS2 (1214-021615) |
Item 2. Code of Ethics.
As of the end of the period covered by this report, Registrant had adopted a code of ethics, as defined in Item 2 of Form N-CSR, that applies to the Registrant’s principal executive officer and principal financial officer. There were no amendments to the Code during the period covered by the report. The Registrant did not grant any waivers, including implicit waivers, from any provisions of the Code during the period covered by this report. The code of ethics is filed herewith pursuant to Item 10(a)(1), Exhibit 99.CODE ETH.
Item 3. Audit Committee Financial Expert.
The Board of Trustees has determined that J. Michael Earley*, Colleen D. Baldwin, Peter S. Drotch, Patrick W. Kenny, Joseph E. Obermeyer, and Roger B. Vincent are audit committee financial experts, as defined in Item 3 of Form N-CSR. Mr. Earley*, Ms. Baldwin, Mr. Drotch, Mr. Kenny, Mr. Obermeyer and Mr. Vincent are “independent” for purposes of Item 3 of Form N-CSR.
*Effective On December 31, 2014, J. Michael Earley retired as a Director/Trustee.
Item 4. Principal Accountant Fees and Services.
| (a) | Audit Fees: The aggregate fees billed for each of the last two fiscal years for professional services rendered by KPMG LLP (“KPMG”), the principal accountant for the audit of the registrant’s annual financial statements, for services that are normally provided by the accountant in connection with statutory and regulatory filings or engagements for those fiscal years were $61,500 for year ended December 31, 2014 and $63,500 for year ended December 31, 2013. |
| (b) | Audit-Related Fees: The aggregate fees billed in each of the last two fiscal years for assurance and related services by KPMG that are reasonably related to the performance of the audit of the registrant’s financial statements and are not reported under paragraph (a) of this Item were $7,575 for year ended December 31, 2014 and $7,200 for year ended December 31, 2013. |
| (c) | Tax Fees: The aggregate fees billed in each of the last two fiscal years for professional services rendered by KPMG for tax compliance, tax advice, and tax planning were $14,655 in the year ended December 31, 2014 and $18,618 in the year ended December 31, 2013. Such services included review of excise distribution calculations (if applicable), preparation of the Funds’ federal, state and excise tax returns, tax services related to mergers and routine consulting. |
| (d) | All Other Fees: The aggregate fees billed in each of the last two fiscal years for products and services provided by KPMG, other than the services reported in paragraphs (a) through (c) of this Item were $1,079 in the year ended December 31, 2014 and $9 in the year ended December 31, 2013. |
| (e)(1) | Audit Committee Pre-Approval Policies and Procedures |
| 2 |
AUDIT AND NON-AUDIT SERVICES
PRE-APPROVAL POLICY
| I. | Statement of Principles |
Under the Sarbanes-Oxley Act of 2002 (the “Act”), the Audit Committee of the Board of Directors or Trustees (the “Committee”) of the Voya funds (each a “Fund,” collectively, the “Funds”) set out on Exhibit A to this Audit and Non-Audit Services Pre-Approval Policy (“Policy”) is responsible for the oversight of the work of the Funds’ independent auditors. As part of its responsibilities, the Committee must pre-approve the audit and non-audit services performed by the auditors in order to assure that the provision of these services does not impair the auditors’ independence from the Funds. The Committee has adopted, and the Board has ratified, this Policy, which sets out the procedures and conditions under which the services of the independent auditors may be pre-approved.
Under Securities and Exchange Commission (“SEC”) rules promulgated in accordance with the Act, the Funds may establish two different approaches to pre-approving audit and non-audit services. The Committee may approve services without consideration of specific case-by-case services (“general pre-approval”) or it may pre-approve specific services (“specific pre-approval”). The Committee believes that the combination of these approaches contemplated in this Policy results in an effective and efficient method for pre-approving audit and non-audit services to be performed by the Funds’ independent auditors. Under this Policy, services that are not of a type that may receive general pre-approval require specific pre-approval by the Committee. Any proposed services that exceed pre-approved cost levels or budgeted amounts will also require the Committee’s specific pre-approval.
For both types of approval, the Committee considers whether the subject services are consistent with the SEC’s rules on auditor independence and that such services are compatible with maintaining the auditors independence. The Committee also considers whether a particular audit firm is in the best position to provide effective and efficient services to the Funds. Reasons that the auditors are in the best position include the auditors’ familiarity with the Funds’ business, personnel, culture, accounting systems, risk profile, and other factors, and whether the services will enhance the Funds’ ability to manage and control risk or improve audit quality. Such factors will be considered as a whole, with no one factor being determinative.
The appendices attached to this Policy describe the audit, audit-related, tax-related, and other services that have the Committee’s general pre-approval. For any service that has been approved through general pre-approval, the general pre-approval will remain in place for a period 12 months from the date of pre-approval, unless the Committee determines that a different period is appropriate. The Committee will annually review and pre-approve the services that may be provided by the independent auditors without specific pre-approval. The Committee will revise the list of services subject to general pre-approval as appropriate. This Policy does not serve as a delegation to Fund management of the Committee’s duty to pre-approve services performed by the Funds’ independent auditors.
| 3 |
| II. | Audit Services |
The annual audit services engagement terms and fees are subject to the Committee’s specific pre-approval. Audit services are those services that are normally provided by auditors in connection with statutory and regulatory filings or engagements or those that generally only independent auditors can reasonably provide. They include the Funds’ annual financial statement audit and procedures that the independent auditors must perform in order to form an opinion on the Funds’ financial statements (e.g., information systems and procedural reviews and testing). The Committee will monitor the audit services engagement and approve any changes in terms, conditions or fees deemed by the Committee to be necessary or appropriate.
The Committee may grant general pre-approval to other audit services, such as statutory audits and services associated with SEC registration statements, periodic reports and other documents filed with the SEC or issued in connection with securities offerings.
The Committee has pre-approved the audit services listed on Appendix A. The Committee must specifically approve all audit services not listed on Appendix A.
| III. | Audit-related Services |
Audit-related services are assurance and related services that are reasonably related to the performance of the audit or the review of the Funds’ financial statements or are traditionally performed by the independent auditors. The Committee believes that the provision of audit-related services will not impair the independent auditors’ independence, and therefore may grant pre-approval to audit-related services. Audit-related services include accounting consultations related to accounting, financial reporting or disclosure matters not classified as “audit services;” assistance with understanding and implementing new accounting and financial reporting guidance from rulemaking authorities; agreed-upon or expanded audit procedures relating to accounting and/or billing records required to respond to or comply with financial, accounting or regulatory reporting matters; and assistance with internal control reporting requirements under Form N-SAR or Form N-CSR.
The Committee has pre-approved the audit-related services listed on Appendix B. The Committee must specifically approve all audit-related services not listed on Appendix B.
| IV. | Tax Services |
The Committee believes the independent auditors can provide tax services to the Funds, including tax compliance, tax planning, and tax advice, without compromising the auditors’ independence. Therefore, the Committee may grant general pre-approval with respect to tax services historically provided by the Funds’ independent auditors that do not, in the Committee’s view, impair auditor independence and that are consistent with the SEC’s rules on auditor independence.
The Committee will not grant pre-approval if the independent auditors initially recommends a transaction the sole business purpose of which is tax avoidance and the tax treatment of which may not be supported in the Internal Revenue Code and related regulations. The Committee may consult
| 4 |
outside counsel to determine that tax planning and reporting positions are consistent with this Policy.
The Committee has pre-approved the tax-related services listed on Appendix C. The Committee must specifically approve all tax-related services not listed on Appendix C.
| V. | Other Services |
The Committee believes it may grant approval of non-audit services that are permissible services for independent auditors to a Fund. The Committee has determined to grant general pre-approval to other services that it believes are routine and recurring, do not impair auditor independence, and are consistent with SEC rules on auditor independence.
The Committee has pre-approved the non-audit services listed on Appendix D. The Committee must specifically approve all non-audit services not listed on Appendix D.
A list of the SEC’s prohibited non-audit services is attached to this Policy as Appendix E. The SEC’s rules and relevant guidance should be consulted to determine the precise definitions of these impermissible services and the applicability of exceptions to certain of the SEC’s prohibitions.
| VI. | Pre-approval of Fee levels and Budgeted Amounts |
The Committee will annually establish pre-approval fee levels or budgeted amounts for audit, audit-related, tax and non-audit services to be provided to the Funds by the independent auditors. Any proposed services exceeding these levels or amounts require the Committee’s specific pre-approval. The Committee considers fees for audit and non-audit services when deciding whether to pre-approve services. The Committee may determine, for a pre-approval period of 12 months, the appropriate ratio between the total amount of fees for the Fund’s audit, audit-related, and tax services (including fees for services provided to Fund affiliates that are subject to pre-approval), and the total amount of fees for certain permissible non-audit services for the Fund classified as other services (including any such services provided to Fund affiliates that are subject to pre-approval).
| VII. | Procedures |
Requests or applications for services to be provided by the independent auditors will be submitted to management. If management determines that the services do not fall within those services generally pre-approved by the Committee and set out in the appendices to these procedures, management will submit the services to the Committee or its delagee. Any such submission will include a detailed description of the services to be rendered. Notwithstanding this paragraph, the Committee will, on a quarterly basis, receive from the independent auditors a list of services provided for the previous calendar quarter on a cumulative basis by the auditors during the Pre-Approval Period.
| 5 |
| VIII. | Delegation |
The Committee may delegate pre-approval authority to one or more of the Committee’s members. Any member or members to whom such pre-approval authority is delegated must report any pre-approval decisions, including any pre-approved services, to the Committee at its next scheduled meeting. The Committee will identify any member to whom pre-approval authority is delegated in writing. The member will retain such authority for a period of 12 months from the date of pre-approval unless the Committee determines that a different period is appropriate. The period of delegated authority may be terminated by the Committee or at the option of the member.
| IX. | Additional Requirements |
The Committee will take any measures the Committee deems necessary or appropriate to oversee the work of the independent auditors and to assure the auditors’ independence from the Funds. This may include reviewing a formal written statement from the independent auditors delineating all relationships between the auditors and the Funds, consistent with Independence Standards Board No. 1, and discussing with the auditors their methods and procedures for ensuring independence.
Part of KPMG’s performance of an audit in accordance with standards of the Public Company Accounting Oversight Board (US) includes their responsibility to maintain and monitor auditor independence with respect to the Voya funds. Using a proprietary system called Sentinel, the audit team is able to identify and manage potential conflicts of interest across the member firms of the KPMG International Network and prevent the provision of prohibited services to the Voya entities that would impair KPMG independence with the respect to the Voya funds. In addition to receiving pre-approval from the Voya funds Audit Committee for services provided to the Voya funds and for services for Voya entities in the Investment Company Complex, the audit team has developed a process for periodic notification via email to the Voya funds’ Audit Committee Chairpersons regarding requests to provide services to ING Groep NV and its affiliates from KPMG offices worldwide. Additionally, KPMG provides a quarterly summary of the fees for services that have commenced for ING Groep NV and Affiliates at each Audit Committee Meeting.
| 6 |
Last Approved: May 22, 2014
| 7 |
Appendix A
Pre-Approved Audit Services for the Pre-Approval Period October 1, 2013 through December 31, 2014
| Service | ||
| The Fund(s) | Fee Range
| |
| Statutory audits or financial audits (including tax services associated with audit services) | √ | As presented to Audit Committee1 |
Services associated with SEC registration statements, periodic reports and other documents filed with the SEC or other documents issued in connection with securities offerings (e.g., consents), and assistance in responding to SEC comment letters.
| √ | Not to exceed $9,750 per filing |
Consultations by Fund management with respect to accounting or disclosure treatment of transactions or events and/or the actual or potential effect of final or proposed rules, standards or interpretations by the SEC, Financial Accounting Standards Board, or other regulatory or standard setting bodies.
| √ | Not to exceed $8,000 during the Pre-Approval Period |
Seed capital audit and related review and issuance of consent on the N-2 registration statement
| √ | Not to exceed $13,750 per audit
|
Audit of summary portfolio of investments
| √ | Not to exceed $525 per fund
|
| 1 | For new Funds launched during the Pre-Approval Period, the fee ranges pre-approved will be the same as those for existing Funds, pro-rated in accordance with inception dates as provided in the auditors’ Proposal or any Engagement Letter covering the period at issue. Fees in the Engagement Letter will be controlling. |
| 8 |
Appendix B
Pre-Approved Audit-Related Services for the Pre-Approval Period October 1, 2013 through December 31, 2014
| Service | |||
The Fund(s)
| Fund Affiliates | Fee Range | |
Services related to Fund mergers (Excludes tax services - See Appendix C for tax services associated with Fund mergers)
| √ | √ | Not to exceed $10,000 per merger |
Consultations by Fund management with respect to accounting or disclosure treatment of transactions or events and/or the actual or potential effect of final or proposed rules, standards or interpretations by the SEC, Financial Accounting Standards Board, or other regulatory or standard setting bodies. [Note: Under SEC rules some consultations may be “audit” services and others may be “audit-related” services.]
| √ | Not to exceed $5,000 per occurrence during the Pre-Approval Period | |
| Review of the Funds’ semi-annual and quarterly financial statements | √ | Not to exceed $2,525 per set of financial statements per fund
| |
| Reports to regulatory or government agencies related to the annual engagement | √ | Up to $5,000 per occurrence during the Pre-Approval Period
| |
| Regulatory compliance assistance | √ | √ | Not to exceed $5,000 per quarter |
| Training courses | √ | Not to exceed $5,000 per course | |
For Prime Rate Trust, agreed upon procedures for quarterly reports to rating agencies
| √ | Not to exceed $9,450 per quarter | |
| 9 |
Appendix C
Pre-Approved Tax Services for the Pre-Approval Period October 1, 2013 through December 31, 2014
| Service | |||
| The Fund(s) | Fund Affiliates
| Fee Range | |
Preparation of federal and state income tax returns and federal excise tax returns for the Funds including assistance and review with excise tax distributions
| √ | As presented to Audit Committee2 | |
Review of IRC Sections 851(b) and 817(h) diversification testing on a real-time basis
| √ | As presented to Audit Committee2
| |
Assistance and advice regarding year-end reporting for 1099’s
| √ | As presented to Audit Committee2
| |
| Tax assistance and advice regarding statutory, regulatory or administrative developments | √ | √ | Not to exceed $5,000 for the Funds or for the Funds’ investment adviser during the Pre-Approval Period
|
| 2 | For new Funds launched during the Pre-Approval Period, the fee ranges pre-approved will be the same as those for existing Funds, pro-rated in accordance with inception dates as provided in the auditors’ Proposal or any Engagement Letter covering the period at issue. Fees in the Engagement Letter will be controlling. |
| 10 |
Appendix C, continued
| Service | |||
| The Fund(s) | Fund Affiliates
| Fee Range | |
| Tax training courses | √ | Not to exceed $5,000 per course during the Pre-Approval Period
| |
| Tax services associated with Fund mergers | √ | √ | Not to exceed $4,000 per fund per merger during the Pre-Approval Period
|
Other tax-related assistance and consultation, including, without limitation, assistance in evaluating derivative financial instruments and international tax issues, qualification and distribution issues, and similar routine tax consultations.
| √ | Not to exceed $120,000 during the Pre-Approval Period | |
| 11 |
Appendix D
Pre-Approved Other Services for the Pre-Approval Period October 1, 2013 through December 31, 2014
| Service | |||
| The Fund(s) | Fund Affiliates | Fee Range
| |
Agreed-upon procedures for Class B share 12b-1 programs
| √ | Not to exceed $60,000 during the Pre-Approval Period
| |
Security counts performed pursuant to Rule 17f-2 of the 1940 Act (i.e., counts for Funds holding securities with affiliated sub-custodians) Cost to be borne 50% by the Funds and 50% by Voya Investments, LLC.
| √
| √
| Not to exceed $5,300 per Fund during the Pre-Approval Period |
Agreed upon procedures for 15 (c) FACT Books
| √ | Not to exceed $50,000 during the Pre-Approval Period
| |
| 12 |
Appendix E
Prohibited Non-Audit Services
| Dated: | October 1, 2013 to December 31, 2014 |
| · | Bookkeeping or other services related to the accounting records or financial statements of the Funds |
| · | Financial information systems design and implementation |
| · | Appraisal or valuation services, fairness opinions, or contribution-in-kind reports |
| · | Actuarial services |
| · | Internal audit outsourcing services |
| · | Management functions |
| · | Human resources |
| · | Broker-dealer, investment adviser, or investment banking services |
| · | Legal services |
| · | Expert services unrelated to the audit |
| · | Any other service that the Public Company Accounting Oversight Board determines, by regulation, is impermissible |
| 13 |
EXHIBIT A
VOYA ASIA PACIFIC HIGH DIVIDEND EQUITY INCOME FUND
VOYA BALANCED PORTFOLIO, INC.
VOYA EMERGING MARKETS LOCAL BOND FUND
VOYA EMERGING MARKETS HIGH DIVIDEND EQUITY FUND
VOYA EQUITY TRUST
VOYA FUNDS TRUST
VOYA GLOBAL ADVANTAGE AND PREMIUM OPPORTUNITY FUND
VOYA GLOBAL EQUITY DIVIDEND AND PREMIUM OPPORTUNITY FUND
VOYA GLOBAL STRATEGIC INCOME FUND
VOYA INFRASTRUCTURE, INDUSTRIALS, AND MATERIALS FUND
VOYA INTERMEDIATE BOND PORTFOLIO
VOYA INTERNATIONAL HIGH DIVIDEND EQUITY INCOME FUND
VOYA INVESTORS TRUST
VOYA MONEY MARKET PORTFOLIO
VOYA MUTUAL FUNDS
VOYA PARTNERS, INC.
VOYA PRIME RATE TRUST
VOYA RISK MANAGED NATURAL RESOURCES
VOYA SENIOR INCOME FUND
VOYA SEPARATE PORTFOLIOS TRUST
VOYA SERIES FUND, INC.
VOYA SHORT DURATION HIGH INCOME FUND
VOYA STRATEGIC ALLOCATIONS PORTFOLIOS, INC.
VOYA VARIABLE FUNDS
VOYA VARIABLE INSURANCE TRUST
VOYA VARIABLE PORTFOLIOS INC,
VOYA VARIABLE PRODUCTS TRUST
| 14 |
| (e)(2) | Percentage of services referred to in 4(b) — (4)(d) that were approved by the audit committee |
100% of the services were approved by the audit committee.
| (f) | Percentage of hours expended attributable to work performed by other than full time employees of KPMG if greater than 50%. |
Not applicable.
| (g) | Non-Audit Fees: The following table presents (i) the aggregate non-audit fees (i.e., fees for audit-related, tax, and other services) billed to each Registrant by the independent registered public accounting firm for each Registrant's fiscal years ended December 31, 2014 and December 31, 2013; and (ii) the aggregate non-audit fees billed to the investment adviser, or any of its affiliates that provide ongoing services to the registrant, by the independent registered public accounting firm for the same time periods. |
| Registrant/Investment Adviser | 2014 | 2013 | ||||||
| Voya Variable Products Trust | $ | 23,309 | $ | 25,827 | ||||
| Voya Investments, LLC (1) | $ | 184,250 | $ | 1,135,567 | ||||
(1) Each Registrant's investment adviser and any of its affiliates, which are subsidiaries of Voya Financial, Inc.
| (h) | Principal Accountants Independence: The Registrant’s Audit committee has considered whether the provision of non-audit services that were rendered to the registrant’s investment adviser and any entity controlling, controlled by, or under common control with the investment adviser that provides ongoing services to the registrant that were not pre-approved pursuant to Rule 2-01(c)(7)(ii) of Regulation S-X is compatible with maintaining KPMG’s independence. |
Item 5. Audit Committee of Listed Registrants.
Not applicable.
| 15 |
Item 6. Schedule of Investments
Summary schedule is included as part of the report to shareholders filed under Item 1 of this Form, if applicable.
| 16 |
Report of Independent Registered Public Accounting Firm
The Shareholders and Board of Trustees
Voya Variable Products Trust
We have audited the accompanying statements of assets and liabilities, including the summary portfolios of investments, of Voya International Value Portfolio, Voya MidCap Opportunities Portfolio, and Voya SmallCap Opportunities Portfolio, each a series of Voya Variable Products Trust, as of December 31, 2014, and the related statements of operations for the year then ended, the statements of changes in net assets for each of the years in the two-year period then ended (collectively, the “financial statements”), and the financial highlights for each of the years in the five-year period then ended (the financial statements and financial highlights are included in Item 1 of this Form N-CSR), and the portfolios of investments as of December 31, 2014 (included in Item 6 of this Form N-CSR). These financial statements, financial highlights, and portfolios of investments are the responsibility of management. Our responsibility is to express an opinion on these financial statements, financial highlights, and portfolios of investments based on our audits.
We conducted our audits in accordance with the standards of the Public Company Accounting Oversight Board (United States). Those standards require that we plan and perform the audit to obtain reasonable assurance about whether the financial statements, financial highlights, and portfolios of investments are free of material misstatement. An audit includes examining, on a test basis, evidence supporting the amounts and disclosures in the financial statements and portfolios of investments. Our procedures included confirmation of securities owned as of December 31, 2014, by correspondence with the custodian, transfer agent, and brokers, or by other appropriate auditing procedures when replies from brokers were not received. An audit also includes assessing the accounting principles used and significant estimates made by management, as well as evaluating the overall financial statement presentation. We believe that our audits provide a reasonable basis for our opinion.
In our opinion, the financial statements, financial highlights, and portfolios of investments referred to above present fairly, in all material respects, the financial position of the aforementioned funds of Voya Variable Products Trust as of December 31, 2014, and the results of their operations for the year then ended, the changes in their net assets for each of the years in the two-year period then ended, and the financial highlights for each of the years in the five-year period then ended, in conformity with U.S. generally accepted accounting principles.

Boston, Massachusetts
February 16, 2015
| 17 |
| Voya International Value Portfolio | PORTFOLIO OF INVESTMENTS as of December 31, 2014 |
| Shares | Value | Percentage of Net Assets | ||||||||||||
| COMMON STOCK: 97.9% | ||||||||||||||
| Australia: 3.2% | ||||||||||||||
| 87,696 | BHP Billiton Ltd. | 2,073,365 | 1.9 | |||||||||||
| 30,597 | Macquarie Group Ltd. | 1,442,858 | 1.3 | |||||||||||
| 3,516,223 | 3.2 | |||||||||||||
| China: 2.4% | ||||||||||||||
| 109,000 | China Mobile Ltd. | 1,276,689 | 1.2 | |||||||||||
| 1,068,000 | China Railway Construction Corp. Ltd. | 1,356,041 | 1.2 | |||||||||||
| 2,632,730 | 2.4 | |||||||||||||
| Denmark: 2.2% | ||||||||||||||
| 590 | AP Moller - Maersk A/S - Class B | 1,173,482 | 1.1 | |||||||||||
| 46,840 | @ | Danske Bank A/S | 1,266,360 | 1.1 | ||||||||||
| 2,439,842 | 2.2 | |||||||||||||
| Finland: 0.8% | ||||||||||||||
| 42,318 | Fortum OYJ | 918,792 | 0.8 | |||||||||||
| France: 14.1% | ||||||||||||||
| 33,720 | @ | Alstom | 1,087,561 | 1.0 | ||||||||||
| 17,237 | L | Arkema | 1,140,003 | 1.0 | ||||||||||
| 14,898 | Casino Guichard Perrachon S.A. | 1,370,090 | 1.2 | |||||||||||
| 106,419 | Credit Agricole SA | 1,373,716 | 1.2 | |||||||||||
| 79,008 | Orange SA | 1,343,670 | 1.2 | |||||||||||
| 220,333 | Natixis | 1,453,897 | 1.3 | |||||||||||
| 7,813 | Kering | 1,501,432 | 1.4 | |||||||||||
| 23,041 | Renault S.A. | 1,678,226 | 1.5 | |||||||||||
| 10,341 | Sanofi | 942,796 | 0.9 | |||||||||||
| 69,836 | Suez Environnement S.A. | 1,216,771 | 1.1 | |||||||||||
| 50,220 | Total S.A. | 2,572,879 | 2.3 | |||||||||||
| 15,681,041 | 14.1 | |||||||||||||
| Germany: 11.0% | ||||||||||||||
| 8,328 | Allianz AG | 1,379,339 | 1.2 | |||||||||||
| 17,399 | BASF AG | 1,459,448 | 1.3 | |||||||||||
| 15,197 | Bayer AG | 2,071,485 | 1.9 | |||||||||||
| 10,557 | Bayerische Motoren Werke AG | 1,139,296 | 1.0 | |||||||||||
| 4,141 | Continental AG | 873,433 | 0.8 | |||||||||||
| 30,644 | Deutsche Post AG | 994,765 | 0.9 | |||||||||||
| 13,314 | Hannover Rueckversicheru - Reg | 1,201,077 | 1.1 | |||||||||||
| 6,031 | Muenchener Rueckversicherungs AG | 1,201,002 | 1.1 | |||||||||||
| 16,389 | Siemens AG | 1,838,914 | 1.7 | |||||||||||
| 12,158,759 | 11.0 | |||||||||||||
| Hong Kong: 0.7% | ||||||||||||||
| 111,000 | Wharf Holdings Ltd. | 796,879 | 0.7 | |||||||||||
| Italy: 3.2% | ||||||||||||||
| 241,284 | Enel S.p.A. | 1,075,530 | 1.0 | |||||||||||
| 455,430 | Intesa Sanpaolo S.p.A. | 1,321,162 | 1.2 | |||||||||||
| 185,174 | UniCredit SpA | 1,186,156 | 1.0 | |||||||||||
| 3,582,848 | 3.2 | |||||||||||||
| Japan: 20.6% | ||||||||||||||
| 47,500 | Asahi Group Holdings, Ltd. | 1,469,523 | 1.3 | |||||||||||
| 17,600 | Denso Corp. | 820,298 | 0.7 | |||||||||||
| 255,112 | Hitachi Ltd. | 1,882,922 | 1.7 | |||||||||||
| 66,300 | Japan Tobacco, Inc. | 1,824,761 | 1.6 | |||||||||||
| 67,800 | LIXIL Group Corp. | 1,426,902 | 1.3 | |||||||||||
| 81,100 | JSR Corp. | 1,392,024 | 1.3 | |||||||||||
| 52,100 | Komatsu Ltd. | 1,151,823 | 1.0 | |||||||||||
| 80,600 | Mitsubishi Corp. | 1,474,990 | 1.3 | |||||||||||
| 50,000 | Mitsui Fudosan Co., Ltd. | 1,340,778 | 1.2 | |||||||||||
| 733,100 | Mizuho Financial Group, Inc. | 1,228,898 | 1.1 | |||||||||||
| 146,200 | Nomura Holdings, Inc. | 827,351 | 0.7 | |||||||||||
| 80,300 | NTT DoCoMo, Inc. | 1,169,414 | 1.1 | |||||||||||
| 24,400 | Omron Corp. | 1,091,546 | 1.0 | |||||||||||
| 42,000 | ORIX Corp. | 528,477 | 0.5 | |||||||||||
| 113,900 | Panasonic Corp. | 1,341,564 | 1.2 | |||||||||||
| 55,300 | Shionogi & Co., Ltd. | 1,428,723 | 1.3 | |||||||||||
| 40,000 | Toyota Motor Corp. | 2,492,696 | 2.3 | |||||||||||
| 22,892,690 | 20.6 | |||||||||||||
| Netherlands: 8.7% | ||||||||||||||
| 62,800 | L | ArcelorMittal | 692,684 | 0.6 | ||||||||||
| 16,891 | Airbus Group NV | 835,059 | 0.8 | |||||||||||
| 24,219 | Koninklijke DSM NV | 1,477,193 | 1.3 | |||||||||||
| 51,325 | Koninklijke Philips NV | 1,487,711 | 1.4 | |||||||||||
| 52,771 | Reed Elsevier NV | 1,260,207 | 1.1 | |||||||||||
| 115,064 | Royal Dutch Shell PLC - Class A | 3,840,026 | 3.5 | |||||||||||
| 9,592,880 | 8.7 | |||||||||||||
| New Zealand: 1.0% | ||||||||||||||
| 441,059 | Spark New Zealand Ltd. | 1,069,198 | 1.0 | |||||||||||
| Norway: 1.4% | ||||||||||||||
| 75,508 | Telenor ASA | 1,527,422 | 1.4 | |||||||||||
| Singapore: 1.6% | ||||||||||||||
| 95,000 | United Overseas Bank Ltd. | 1,753,135 | 1.6 | |||||||||||
| Sweden: 2.3% | ||||||||||||||
| 124,573 | Telefonaktiebolaget LM Ericsson | 1,508,343 | 1.4 | |||||||||||
| 90,221 | Nordea Bank AB | 1,044,379 | 0.9 | |||||||||||
| 2,552,722 | 2.3 | |||||||||||||
| Switzerland: 10.6% | ||||||||||||||
| 13,007 | Cie Financiere Richemont SA | 1,153,183 | 1.0 | |||||||||||
| 32,126 | Nestle S.A. | 2,342,018 | 2.1 | |||||||||||
| 38,322 | Novartis AG | 3,554,115 | 3.2 | |||||||||||
| 11,691 | Roche Holding AG - Genusschein | 3,167,585 | 2.9 | |||||||||||
| 6,723 | Swiss Life Holding | 1,588,993 | 1.4 | |||||||||||
| 11,805,894 | 10.6 | |||||||||||||
| United Kingdom: 14.1% | ||||||||||||||
| 76,822 | Admiral Group PLC | 1,576,014 | 1.4 | |||||||||||
| 16,272 | AstraZeneca PLC | 1,149,306 | 1.0 | |||||||||||
| 517,224 | Barclays PLC | 1,944,420 | 1.8 | |||||||||||
| 114,730 | CNH Industrial NV | 928,751 | 0.8 | |||||||||||
| 64,958 | Diageo PLC | 1,860,860 | 1.7 | |||||||||||
| 117,014 | HSBC Holdings PLC | 1,105,756 | 1.0 | |||||||||||
| 18 |
| Voya International Value Portfolio | PORTFOLIO OF INVESTMENTS as of December 31, 2014 (continued) |
| Shares | Value | Percentage of Net Assets | ||||||||||||
| COMMON STOCK: (continued) | ||||||||||||||
| United Kingdom (continued) | ||||||||||||||
| 210,475 | Kingfisher PLC | 1,112,603 | 1.0 | |||||||||||
| 397,851 | Legal & General Group PLC | 1,536,165 | 1.4 | |||||||||||
| 47,000 | Noble Corp. PLC | 778,790 | 0.7 | |||||||||||
| 51,211 | Prudential PLC | 1,183,974 | 1.1 | |||||||||||
| 29,055 | SABMiller PLC | 1,514,674 | 1.4 | |||||||||||
| 13,148 | Shire PLC | 932,196 | 0.8 | |||||||||||
| 15,623,509 | 14.1 | |||||||||||||
| Total Common Stock | ||||||||||||||
| (Cost $106,261,651) | 108,544,564 | 97.9 | ||||||||||||
| PREFERRED STOCK: 0.7% | ||||||||||||||
| Brazil: 0.7% | ||||||||||||||
| 145,934 | Cia Energetica de Minas Gerais | 721,380 | 0.7 | |||||||||||
| Total Preferred Stock | ||||||||||||||
| (Cost $907,560) | 721,380 | 0.7 | ||||||||||||
| Total Long-Term Investments | ||||||||||||||
| (Cost $107,169,211) | 109,265,944 | 98.6 | ||||||||||||
| Principal Amount† | Value | Percentage of Net Assets | ||||||||||||
| SHORT-TERM INVESTMENTS: 1.4% | ||||||||||||||
| Securities Lending Collateralcc: 1.3% | ||||||||||||||
| 1,000,000 | Cantor Fitzgerald, Repurchase Agreement dated 12/31/14, 0.09%, due 01/02/15 (Repurchase Amount $1,000,005, collateralized by various U.S. Government/U.S. Government Agency Obligations, 0.000%-10.500%, Market Value plus accrued interest $1,020,000, due 01/01/15-09/01/49) | 1,000,000 | 0.9 | |||||||||||
| 447,927 | Royal Bank of Scotland PLC, Repurchase Agreement dated 12/31/14, 0.09%, due 01/02/15 (Repurchase Amount $447,929, collateralized by various U.S. Government and U.S. Government Agency Obligations, 0.375%-7.250%, Market Value plus accrued interest $456,886, due 11/15/15-07/15/56) | 447,927 | 0.4 | |||||||||||
| 1,447,927 | 1.3 | |||||||||||||
| Shares | Value | Percentage of Net Assets | ||||||||||||
| Mutual Funds: 0.1% | ||||||||||||||
| 105,000 | BlackRock Liquidity Funds, TempFund, Institutional Class, 0.030%†† | |||||||||||||
| (Cost $105,000) | 105,000 | 0.1 | ||||||||||||
| Total Short-Term Investments | ||||||||||||||
| (Cost $1,552,927) | 1,552,927 | 1.4 | ||||||||||||
| Total Investments in Securities (Cost $108,722,138) | $ | 110,818,871 | 100.0 | |||||||||||
| Assets in Excess of Other Liabilities | 31,758 | – | ||||||||||||
| Net Assets | $ | 110,850,629 | 100.0 | |||||||||||
| † | Unless otherwise indicated, principal amount is shown in USD. |
| †† | Rate shown is the 7-day yield as of December 31, 2014. |
| @ | Non-income producing security. |
| cc | Represents securities purchased with cash collateral received for securities on loan. |
| L | Loaned security, a portion or all of the security is on loan at December 31, 2014. |
Cost for federal income tax purposes is $108,853,242.
Net unrealized appreciation consists of:
| Gross Unrealized Appreciation | $ | 10,329,982 | ||
| Gross Unrealized Depreciation | (8,364,353 | ) | ||
| Net Unrealized Appreciation | $ | 1,965,629 |
| Sector Diversification | Percentage of Net Assets | |||
| Financials | 25.3 | % | ||
| Industrials | 12.5 | |||
| Health Care | 12.0 | |||
| Consumer Discretionary | 12.0 | |||
| Consumer Staples | 9.3 | |||
| Materials | 7.4 | |||
| Energy | 6.5 | |||
| Telecommunication Services | 5.9 | |||
| Information Technology | 4.1 | |||
| Utilities | 3.6 | |||
| Short-Term Investments | 1.4 | |||
| Assets in Excess of Other Liabilities | – | |||
| Net Assets | 100.0 | % | ||
| 19 |
| Voya MidCap Opportunities Portfolio | PORTFOLIO OF INVESTMENTS as of December 31, 2014 |
| Shares | Value | Percentage of Net Assets | ||||||||||||
| COMMON STOCK: 99.4% | ||||||||||||||
| Consumer Discretionary: 24.9% | ||||||||||||||
| 465,491 | Brinker International, Inc. | 27,319,667 | 1.8 | |||||||||||
| 44,157 | Chipotle Mexican Grill, Inc. | 30,225,908 | 2.0 | |||||||||||
| 157,632 | Delphi Automotive PLC | 11,462,999 | 0.8 | |||||||||||
| 284,265 | @ | Dish Network Corp. - Class A | 20,720,076 | 1.4 | ||||||||||
| 342,990 | Five Below, Inc. | 14,004,282 | 0.9 | |||||||||||
| 714,936 | Hilton Worldwide Holdings, Inc. | 18,652,680 | 1.3 | |||||||||||
| 631,255 | @ | Jarden Corp. | 30,224,489 | 2.0 | ||||||||||
| 253,267 | @,L | Lululemon Athletica, Inc. | 14,129,766 | 1.0 | ||||||||||
| 410,439 | Macy's, Inc. | 26,986,364 | 1.8 | |||||||||||
| 298,948 | Marriott International, Inc. | 23,326,913 | 1.6 | |||||||||||
| 246,057 | Michael Kors Holdings Ltd. | 18,478,881 | 1.2 | |||||||||||
| 326,601 | Newell Rubbermaid, Inc. | 12,440,232 | 0.8 | |||||||||||
| 276,734 | Ross Stores, Inc. | 26,084,947 | 1.8 | |||||||||||
| 93,453 | Scripps Networks Interactive - Class A | 7,034,207 | 0.5 | |||||||||||
| 613,843 | @ | Starz | 18,231,137 | 1.2 | ||||||||||
| 196,493 | Tractor Supply Co. | 15,487,578 | 1.0 | |||||||||||
| 188,674 | @ | Ulta Salon Cosmetics & Fragrance, Inc. | 24,120,084 | 1.6 | ||||||||||
| 445,833 | VF Corp. | 33,392,892 | 2.2 | |||||||||||
| 372,323,102 | 24.9 | |||||||||||||
| Consumer Staples: 8.8% | ||||||||||||||
| 359,632 | Hain Celestial Group, Inc. | 20,962,949 | 1.4 | |||||||||||
| 114,437 | Hershey Co. | 11,893,438 | 0.8 | |||||||||||
| 225,832 | Mead Johnson Nutrition Co. | 22,705,149 | 1.5 | |||||||||||
| 212,325 | Molson Coors Brewing Co. | 15,822,459 | 1.1 | |||||||||||
| 261,432 | @ | Monster Beverage Corp. | 28,326,157 | 1.9 | ||||||||||
| 509,247 | L | Sprouts Farmers Market, Inc. | 17,304,213 | 1.1 | ||||||||||
| 171,675 | TreeHouse Foods, Inc. | 14,683,363 | 1.0 | |||||||||||
| 131,697,728 | 8.8 | |||||||||||||
| Energy: 4.9% | ||||||||||||||
| 579,653 | Cabot Oil & Gas Corp. | 17,163,525 | 1.1 | |||||||||||
| 307,368 | @ | Cameron International Corp. | 15,353,032 | 1.0 | ||||||||||
| 202,098 | Concho Resources, Inc. | 20,159,275 | 1.4 | |||||||||||
| 93,860 | EQT Corp. | 7,105,202 | 0.5 | |||||||||||
| 277,357 | Noble Energy, Inc. | 13,155,043 | 0.9 | |||||||||||
| 72,936,077 | 4.9 | |||||||||||||
| Financials: 9.4% | ||||||||||||||
| 79,227 | @ | Affiliated Managers Group, Inc. | 16,815,138 | 1.1 | ||||||||||
| 191,749 | Ameriprise Financial, Inc. | 25,358,805 | 1.7 | |||||||||||
| 305,437 | Aon PLC | 28,964,591 | 1.9 | |||||||||||
| 317,713 | �� | Arthur J. Gallagher & Co. | 14,957,928 | 1.0 | ||||||||||
| 252,789 | Extra Space Storage, Inc. | 14,823,547 | 1.0 | |||||||||||
| 260,650 | Lincoln National Corp. | 15,031,686 | 1.0 | |||||||||||
| 204,501 | SEI Investments Co. | 8,188,220 | 0.6 | |||||||||||
| 144,760 | @ | SVB Financial Group | 16,802,293 | 1.1 | ||||||||||
| 140,942,208 | 9.4 | |||||||||||||
| Health Care: 12.5% | ||||||||||||||
| 225,622 | Cardinal Health, Inc. | 18,214,464 | 1.2 | |||||||||||
| 178,219 | DexCom, Inc. | 9,810,956 | 0.7 | |||||||||||
| 54,577 | @ | Henry Schein, Inc. | 7,430,659 | 0.5 | ||||||||||
| 97,179 | @ | Illumina, Inc. | 17,937,300 | 1.2 | ||||||||||
| 166,543 | @ | Medivation, Inc. | 16,589,348 | 1.1 | ||||||||||
| 75,480 | Mettler Toledo International, Inc. | 22,829,681 | 1.5 | |||||||||||
| 486,101 | @ | Mylan Laboratories | 27,401,513 | 1.8 | ||||||||||
| 40,558 | Pacira Pharmaceuticals, Inc./DE | 3,595,872 | 0.2 | |||||||||||
| 249,401 | St. Jude Medical, Inc. | 16,218,547 | 1.1 | |||||||||||
| 148,971 | Universal Health Services, Inc. | 16,574,513 | 1.1 | |||||||||||
| 107,216 | @ | Vertex Pharmaceuticals, Inc. | 12,737,261 | 0.9 | ||||||||||
| 415,305 | Zoetis, Inc. | 17,870,574 | 1.2 | |||||||||||
| 187,210,688 | 12.5 | |||||||||||||
| Industrials: 17.1% | ||||||||||||||
| 546,287 | Ametek, Inc. | 28,751,085 | 1.9 | |||||||||||
| 272,637 | Equifax, Inc. | 22,048,154 | 1.5 | |||||||||||
| 331,680 | Ingersoll-Rand PLC - Class A | 21,025,195 | 1.4 | |||||||||||
| 362,257 | Nielsen Holdings NV | 16,203,756 | 1.1 | |||||||||||
| 321,149 | Oshkosh Truck Corp. | 15,623,899 | 1.1 | |||||||||||
| 592,887 | @ | Quanta Services, Inc. | 16,832,062 | 1.1 | ||||||||||
| 179,548 | Roper Industries, Inc. | 28,072,330 | 1.9 | |||||||||||
| 1,070,282 | Southwest Airlines Co. | 45,294,334 | 3.0 | |||||||||||
| 350,150 | Textron, Inc. | 14,744,816 | 1.0 | |||||||||||
| 321,090 | Tyco International Plc | 14,083,007 | 0.9 | |||||||||||
| 465,826 | Waste Connections, Inc. | 20,491,686 | 1.4 | |||||||||||
| 159,832 | Wesco International, Inc. | 12,180,797 | 0.8 | |||||||||||
| 255,351,121 | 17.1 | |||||||||||||
| Information Technology: 17.5% | ||||||||||||||
| 395,387 | Broadridge Financial Solutions, Inc. ADR | 18,258,972 | 1.2 | |||||||||||
| 247,173 | Cavium, Inc. | 15,280,235 | 1.0 | |||||||||||
| 202,765 | @ | Check Point Software Technologies | 15,931,246 | 1.1 | ||||||||||
| 493,348 | @ | Electronic Arts, Inc. | 23,194,756 | 1.6 | ||||||||||
| 140,425 | @ | F5 Networks, Inc. | 18,320,548 | 1.2 | ||||||||||
| 478,410 | Freescale Semiconductor Holdings Ltd. | 12,070,284 | 0.8 | |||||||||||
| 218,679 | @ | Gartner, Inc. | 18,414,959 | 1.2 | ||||||||||
| 368,522 | Intuit, Inc. | 33,974,043 | 2.3 | |||||||||||
| 455,054 | Microchip Technology, Inc. | 20,527,486 | 1.4 | |||||||||||
| 113,351 | Palo Alto Networks, Inc. | 13,893,432 | 0.9 | |||||||||||
| 386,682 | @ | Red Hat, Inc. | 26,735,193 | 1.8 | ||||||||||
| 386,628 | SolarWinds, Inc. | 19,265,673 | 1.3 | |||||||||||
| 20 |
| Voya MidCap Opportunities Portfolio | PORTFOLIO OF INVESTMENTS as of December 31, 2014 (continued) |
| Shares | Value | Percentage of Net Assets | ||||||||||||
| COMMON STOCK: (continued) | ||||||||||||||
| Information Technology (continued) | ||||||||||||||
| 587,902 | Xilinx, Inc. | 25,450,278 | 1.7 | |||||||||||
| 261,317,105 | 17.5 | |||||||||||||
| Materials: 4.3% | ||||||||||||||
| 372,876 | @ | Crown Holdings, Inc. | 18,979,388 | 1.2 | ||||||||||
| 250,195 | Eastman Chemical Co. | 18,979,793 | 1.3 | |||||||||||
| 348,893 | Packaging Corp. of America | 27,231,099 | 1.8 | |||||||||||
| 65,190,280 | 4.3 | |||||||||||||
| Total Common Stock | ||||||||||||||
| (Cost $1,257,586,468) | 1,486,968,309 | 99.4 | ||||||||||||
| Principal Amount† | Value | Percentage of Net Assets | ||||||||||||
| SHORT-TERM INVESTMENTS: 1.5% | ||||||||||||||
| Securities Lending Collateralcc: 0.5% | ||||||||||||||
| 1,813,953 | Cantor Fitzgerald, Repurchase Agreement dated 12/31/14, 0.09%, due 01/02/15 (Repurchase Amount $1,813,962, collateralized by various U.S. Government/U.S. Government Agency Obligations, 0.000%-10.500%, Market Value plus accrued interest $1,850,232, due 01/01/15-09/01/49) | 1,813,953 | 0.1 | |||||||||||
| 381,860 | Daiwa Capital Markets, Repurchase Agreement dated 12/31/14, 0.12%, due 01/02/15 (Repurchase Amount $381,863, collateralized by various U.S. Government and U.S. Government Agency Obligations, 0.000%-6.500%, Market Value plus accrued interest $389,497, due 06/01/17-03/01/48) | 381,860 | 0.1 | |||||||||||
| 1,813,953 | Nomura Securities, Repurchase Agreement dated 12/31/14, 0.08%, due 01/02/15 (Repurchase Amount $1,813,961, collateralized by various U.S. Government/U.S. Government Agency Obligations, 0.000%-8.875%, Market Value plus accrued interest $1,850,232, due 01/07/15-10/20/64) | 1,813,953 | 0.1 | |||||||||||
| 1,813,953 | Royal Bank of Scotland PLC, Repurchase Agreement dated 12/31/14, 0.09%, due 01/02/15 (Repurchase Amount $1,813,962, collateralized by various U.S. Government/U.S. Government Agency Obligations, 0.375%-7.250%, Market Value plus accrued interest $1,850,232, due 11/15/15-07/15/56) | 1,813,953 | 0.1 | |||||||||||
| 1,813,953 | State of Wisconsin Investment Board, Repurchase Agreement dated 12/31/14, 0.15%, due 01/02/15 (Repurchase Amount $1,813,968, collateralized by various U.S. Government Securities, 0.125%-2.500%, Market Value plus accrued interest $1,850,414, due 04/15/16-02/15/42) | 1,813,953 | 0.1 | |||||||||||
| 7,637,672 | 0.5 | |||||||||||||
| Shares | Value | Percentage of Net Assets | ||||||||||||
| Mutual Funds: 1.0% | ||||||||||||||
| 15,420,000 | BlackRock Liquidity Funds, TempFund, Institutional Class, 0.030%†† | |||||||||||||
| (Cost $15,420,000) | 15,420,000 | 1.0 | ||||||||||||
| Total Short-Term Investments | ||||||||||||||
| (Cost $23,057,672) | 23,057,672 | 1.5 | ||||||||||||
| Total Investments in Securities (Cost $1,280,644,140) | $ | 1,510,025,981 | 100.9 | |||||||||||
| Liabilities in Excess of Other Assets | (13,306,165 | ) | (0.9 | ) | ||||||||||
| Net Assets | $ | 1,496,719,816 | 100.0 | |||||||||||
| † | Unless otherwise indicated, principal amount is shown in USD. |
| †† | Rate shown is the 7-day yield as of December 31, 2014. |
| @ | Non-income producing security. |
| ADR | American Depositary Receipt |
| cc | Represents securities purchased with cash collateral received for securities on loan. |
| L | Loaned security, a portion or all of the security is on loan at December 31, 2014. |
| 21 |
| Voya MidCap Opportunities Portfolio | PORTFOLIO OF INVESTMENTS as of December 31, 2014 (continued) |
Cost for federal income tax purposes is $1,282,899,349.
Net unrealized appreciation consists of:
| Gross Unrealized Appreciation | $ | 259,533,538 | ||
| Gross Unrealized Depreciation | (32,406,906 | ) | ||
| Net Unrealized Appreciation | $ | 227,126,632 |
| 22 |
| Voya SmallCap Opportunities Portfolio | PORTFOLIO OF INVESTMENTS AS OF DECEMBER 31, 2014 |
| Shares | Value | Percentage of Net Assets | ||||||||||||
| COMMON STOCK: 97.2% | ||||||||||||||
| Consumer Discretionary: 18.2% | ||||||||||||||
| 54,301 | Arctic Cat, Inc. | 1,927,685 | 0.6 | |||||||||||
| 48,637 | Bright Horizons Family Solutions, Inc. | 2,286,425 | 0.7 | |||||||||||
| 12,800 | @ | Buffalo Wild Wings, Inc. | 2,308,864 | 0.7 | ||||||||||
| 18,200 | Burlington Stores, Inc. | 860,132 | 0.3 | |||||||||||
| 192,873 | Callaway Golf Co. | 1,485,122 | 0.4 | |||||||||||
| 67,800 | Cheesecake Factory | 3,411,018 | 1.0 | |||||||||||
| 43,600 | Childrens Place Retail Stores, Inc. | 2,485,200 | 0.8 | |||||||||||
| 69,166 | Cinemark Holdings, Inc. | 2,460,926 | 0.7 | |||||||||||
| 134,800 | Dana Holding Corp. | 2,930,552 | 0.9 | |||||||||||
| 69,285 | @ | Express, Inc. | 1,017,797 | 0.3 | ||||||||||
| 104,600 | Finish Line | 2,542,826 | 0.8 | |||||||||||
| 59,899 | @ | Hibbett Sporting Goods, Inc. | 2,900,909 | 0.9 | ||||||||||
| 82,732 | @ | Imax Corp. | 2,556,419 | 0.8 | ||||||||||
| 35,000 | Jack in the Box, Inc. | 2,798,600 | 0.9 | |||||||||||
| 144,600 | La Quinta Holdings, Inc. | 3,189,876 | 1.0 | |||||||||||
| 39,451 | Life Time Fitness, Inc. | 2,233,716 | 0.7 | |||||||||||
| 94,956 | @ | LKQ Corp. | 2,670,163 | 0.8 | ||||||||||
| 28,802 | L | Lumber Liquidators | 1,909,861 | 0.6 | ||||||||||
| 59,004 | Monro Muffler, Inc. | 3,410,431 | 1.0 | |||||||||||
| 113,000 | Pier 1 Imports, Inc. | 1,740,200 | 0.5 | |||||||||||
| 45,718 | Pool Corp. | 2,900,350 | 0.9 | |||||||||||
| 69,800 | @ | Sally Beauty Holdings, Inc. | 2,145,652 | 0.7 | ||||||||||
| 160,768 | L | Smith & Wesson Holding Corp. | 1,522,473 | 0.5 | ||||||||||
| 37,758 | @ | Steiner Leisure Ltd. | 1,744,797 | 0.5 | ||||||||||
| 44,394 | Vail Resorts, Inc. | 4,045,625 | 1.2 | |||||||||||
| 59,485,619 | 18.2 | |||||||||||||
| Consumer Staples: 1.7% | ||||||||||||||
| 36,200 | Casey's General Stores, Inc. | 3,269,584 | 1.0 | |||||||||||
| 114,125 | Flowers Foods, Inc. | 2,190,059 | 0.7 | |||||||||||
| 5,459,643 | 1.7 | |||||||||||||
| Energy: 2.9% | ||||||||||||||
| 131,700 | Bill Barrett Corp. | 1,500,063 | 0.5 | |||||||||||
| 108,800 | C&J Energy Services, Inc. | 1,437,248 | 0.4 | |||||||||||
| 54,000 | Carrizo Oil & Gas, Inc. | 2,246,400 | 0.7 | |||||||||||
| 4,383 | @ | Dril-Quip, Inc. | 336,307 | 0.1 | ||||||||||
| 72,750 | Energy XXI Bermuda Ltd. | 237,165 | 0.1 | |||||||||||
| 214,700 | @ | Key Energy Services, Inc. | 358,549 | 0.1 | ||||||||||
| 74,500 | Rosetta Resources, Inc. | 1,662,095 | 0.5 | |||||||||||
| 48,300 | @ | Unit Corp. | 1,647,030 | 0.5 | ||||||||||
| 9,424,857 | 2.9 | |||||||||||||
| Financials: 10.6% | ||||||||||||||
| 80,100 | Colony Financial, Inc. | 1,907,982 | 0.6 | |||||||||||
| 60,780 | Coresite Realty Corp. | 2,373,459 | 0.7 | |||||||||||
| 38,800 | eHealth, Inc. | 966,896 | 0.3 | |||||||||||
| 54,452 | Evercore Partners, Inc. | 2,851,651 | 0.9 | |||||||||||
| 64,733 | Financial Engines, Inc. | 2,365,991 | 0.7 | |||||||||||
| 65,400 | First American Financial Corp. | 2,217,060 | 0.7 | |||||||||||
| 38,484 | MarketAxess Holdings, Inc. | 2,759,688 | 0.8 | |||||||||||
| 301,800 | @ | MGIC Investment Corp. | 2,812,776 | 0.9 | ||||||||||
| 62,186 | @ | PRA Group, Inc. | 3,602,435 | 1.1 | ||||||||||
| 30,300 | ProAssurance Corp. | 1,368,045 | 0.4 | |||||||||||
| 20,376 | Signature Bank | 2,566,561 | 0.8 | |||||||||||
| 7,100 | Sovran Self Storage, Inc. | 619,262 | 0.2 | |||||||||||
| 39,700 | Springleaf Holdings, Inc. | 1,435,949 | 0.4 | |||||||||||
| 26,458 | @ | SVB Financial Group | 3,070,980 | 0.9 | ||||||||||
| 63,814 | The Geo Group, Inc. | 2,575,533 | 0.8 | |||||||||||
| 6,725 | Virtus Investment Partners | 1,146,545 | 0.4 | |||||||||||
| 34,640,813 | 10.6 | |||||||||||||
| Health Care: 21.4% | ||||||||||||||
| 40,400 | Acorda Therapeutics, Inc. | 1,651,148 | 0.5 | |||||||||||
| 60,900 | @ | Air Methods Corp. | 2,681,427 | 0.8 | ||||||||||
| 19,700 | @ | Alkermes PLC | 1,153,632 | 0.3 | ||||||||||
| 11,285 | @ | Bio-Rad Laboratories, Inc. | 1,360,520 | 0.4 | ||||||||||
| 79,000 | @ | Celldex Therapeutics, Inc. | 1,441,750 | 0.4 | ||||||||||
| 35,500 | Cempra, Inc. | 834,605 | 0.3 | |||||||||||
| 39,700 | Charles River Laboratories International, Inc. | 2,526,508 | 0.8 | |||||||||||
| 28,700 | L | Clovis Oncology, Inc. | 1,607,200 | 0.5 | ||||||||||
| 10,400 | Cubist Pharmaceuticals, Inc. | 1,046,760 | 0.3 | |||||||||||
| 70,300 | Cynosure, Inc. | 1,927,626 | 0.6 | |||||||||||
| 92,000 | Depomed, Inc. | 1,482,120 | 0.5 | |||||||||||
| 67,300 | Dyax Corp. | 946,238 | 0.3 | |||||||||||
| 50,384 | @ | Haemonetics Corp. | 1,885,369 | 0.6 | ||||||||||
| 123,500 | @,L | Halozyme Therapeutics, Inc. | 1,191,775 | 0.4 | ||||||||||
| 96,687 | Healthsouth Corp. | 3,718,582 | 1.1 | |||||||||||
| 32,905 | Impax Laboratories, Inc. | 1,042,430 | 0.3 | |||||||||||
| 54,570 | IPC The Hospitalist Co., Inc. | 2,504,217 | 0.8 | |||||||||||
| 50,400 | Isis Pharmaceuticals, Inc. | 3,111,696 | 0.9 | |||||||||||
| 63,754 | Luminex Corp. | 1,196,025 | 0.4 | |||||||||||
| 83,500 | @ | Masimo Corp. | 2,199,390 | 0.7 | ||||||||||
| 64,566 | Medicines Co. | 1,786,541 | 0.5 | |||||||||||
| 30,834 | @ | Mednax, Inc. | 2,038,436 | 0.6 | ||||||||||
| 92,900 | @ | Merit Medical Systems, Inc. | 1,609,957 | 0.5 | ||||||||||
| 41,408 | Momenta Pharmaceuticals, Inc. | 498,552 | 0.1 | |||||||||||
| 83,020 | @ | Nektar Therapeutics | 1,286,810 | 0.4 | ||||||||||
| 9,427 | @ | Neogen Corp. | 467,485 | 0.1 | ||||||||||
| 56,600 | NPS Pharmaceuticals, Inc. | 2,024,582 | 0.6 | |||||||||||
| 48,700 | Omnicell, Inc. | 1,612,944 | 0.5 | |||||||||||
| 63,350 | Owens & Minor, Inc. | 2,224,219 | 0.7 | |||||||||||
| 20,200 | Pacira Pharmaceuticals, Inc./DE | 1,790,932 | 0.5 | |||||||||||
| 6,300 | L | Puma Biotechnology, Inc. | 1,192,401 | 0.4 | ||||||||||
| 9,900 | Receptos, Inc. | 1,212,849 | 0.4 | |||||||||||
| 23 |
| Voya SmallCap Opportunities Portfolio | PORTFOLIO OF INVESTMENTS AS OF DECEMBER 31, 2014 (continued) |
| Shares | Value | Percentage of Net Assets | ||||||||||||
| COMMON STOCK: (continued) | ||||||||||||||
| Health Care (continued) | ||||||||||||||
| 8,100 | @ | Salix Pharmaceuticals Ltd. | 931,014 | 0.3 | ||||||||||
| 69,000 | Sangamo Biosciences, Inc. | 1,049,490 | 0.3 | |||||||||||
| 25,861 | Seattle Genetics, Inc. | 830,914 | 0.3 | |||||||||||
| 87,900 | Select Medical Holdings Corp. | 1,265,760 | 0.4 | |||||||||||
| 50,873 | Steris Corp. | 3,299,114 | 1.0 | |||||||||||
| 35,300 | Surgical Care Affiliates, Inc. | 1,187,845 | 0.4 | |||||||||||
| 67,700 | Team Health Holdings, Inc. | 3,894,781 | 1.2 | |||||||||||
| 2,791 | L | Theravance, Inc. | 39,493 | 0.0 | ||||||||||
| 69,600 | @ | Thoratec Corp. | 2,259,216 | 0.7 | ||||||||||
| 24,700 | WellCare Health Plans, Inc. | 2,026,882 | 0.6 | |||||||||||
| 70,039,235 | 21.4 | |||||||||||||
| Industrials: 14.3% | ||||||||||||||
| 93,500 | Actuant Corp. | 2,546,940 | 0.8 | |||||||||||
| 38,800 | @ | Advisory Board Co. | 1,900,424 | 0.6 | ||||||||||
| 42,200 | @ | Beacon Roofing Supply, Inc. | 1,173,160 | 0.4 | ||||||||||
| 52,500 | Clarcor, Inc. | 3,498,600 | 1.1 | |||||||||||
| 34,700 | Corporate Executive Board Co. | 2,516,791 | 0.8 | |||||||||||
| 47,600 | EnPro Industries, Inc. | 2,987,376 | 0.9 | |||||||||||
| 68,000 | Gorman-Rupp Co. | 2,184,160 | 0.7 | |||||||||||
| 106,806 | Healthcare Services Group | 3,303,510 | 1.0 | |||||||||||
| 62,100 | @ | HUB Group, Inc. | 2,364,768 | 0.7 | ||||||||||
| 81,500 | KAR Auction Services, Inc. | 2,823,975 | 0.9 | |||||||||||
| 102,000 | Knight Transportation, Inc. | 3,433,320 | 1.1 | |||||||||||
| 33,536 | Regal-Beloit Corp. | 2,521,907 | 0.8 | |||||||||||
| 79,400 | Simpson Manufacturing Co., Inc. | 2,747,240 | 0.8 | |||||||||||
| 23,400 | Teledyne Technologies, Inc. | 2,404,116 | 0.7 | |||||||||||
| 48,600 | Toro Co. | 3,101,166 | 0.9 | |||||||||||
| 45,000 | Waste Connections, Inc. | 1,979,550 | 0.6 | |||||||||||
| 43,700 | Watts Water Technologies, Inc. | 2,772,328 | 0.8 | |||||||||||
| 48,200 | Woodward Governor Co. | 2,372,886 | 0.7 | |||||||||||
| 46,632,217 | 14.3 | |||||||||||||
| Information Technology: 23.3% | ||||||||||||||
| 132,400 | Adtran, Inc. | 2,886,320 | 0.9 | |||||||||||
| 14,307 | @ | Ansys, Inc. | 1,173,174 | 0.4 | ||||||||||
| 80,676 | @ | Aspen Technology, Inc. | 2,825,274 | 0.9 | ||||||||||
| 76,182 | Bankrate, Inc. | 946,942 | 0.3 | |||||||||||
| 54,145 | Blackbaud, Inc. | 2,342,313 | 0.7 | |||||||||||
| 88,500 | BroadSoft, Inc. | 2,568,270 | 0.8 | |||||||||||
| 91,238 | Cardtronics, Inc. | 3,519,962 | 1.1 | |||||||||||
| 37,690 | @ | Coherent, Inc. | 2,288,537 | 0.7 | ||||||||||
| 60,500 | Commvault Systems, Inc. | 3,127,245 | 1.0 | |||||||||||
| 74,600 | DealerTrack Holdings, Inc. | 3,305,526 | 1.0 | |||||||||||
| 30,763 | Faro Technologies, Inc. | 1,928,225 | 0.6 | |||||||||||
| 36,600 | Flir Systems, Inc. | 1,182,546 | 0.4 | |||||||||||
| 65,316 | Guidewire Software, Inc. | 3,306,949 | 1.0 | |||||||||||
| 61,058 | Imperva, Inc. | 3,018,097 | 0.9 | |||||||||||
| 68,700 | Intersil Corp. | 994,089 | 0.3 | |||||||||||
| 65,000 | j2 Global, Inc. | 4,030,000 | 1.2 | |||||||||||
| 26,900 | Littelfuse, Inc. | 2,600,423 | 0.8 | |||||||||||
| 109,200 | LivePerson, Inc. | 1,539,720 | 0.5 | |||||||||||
| 33,100 | MKS Instruments, Inc. | 1,211,460 | 0.4 | |||||||||||
| 31,800 | Monolithic Power Systems, Inc. | 1,581,732 | 0.5 | |||||||||||
| 70,728 | National Instruments Corp. | 2,198,934 | 0.7 | |||||||||||
| 64,639 | @ | Plexus Corp. | 2,663,773 | 0.8 | ||||||||||
| 255,900 | @ | PMC - Sierra, Inc. | 2,344,044 | 0.7 | ||||||||||
| 151,500 | @ | Polycom, Inc. | 2,045,250 | 0.6 | ||||||||||
| 61,200 | PROS Holdings, Inc. | 1,681,776 | 0.5 | |||||||||||
| 133,600 | Qlik Technologies, Inc. | 4,126,904 | 1.3 | |||||||||||
| 69,500 | SciQuest, Inc. | 1,004,275 | 0.3 | |||||||||||
| 99,200 | @ | Semtech Corp. | 2,734,944 | 0.8 | ||||||||||
| 33,203 | @ | SYKES Enterprises, Inc. | 779,274 | 0.2 | ||||||||||
| 51,300 | Synchronoss Technologies, Inc. | 2,147,418 | 0.6 | |||||||||||
| 27,300 | Ultimate Software Group, Inc. | 4,008,049 | 1.2 | |||||||||||
| 40,873 | WEX, Inc. | 4,043,157 | 1.2 | |||||||||||
| 76,154,602 | 23.3 | |||||||||||||
| Materials: 4.8% | ||||||||||||||
| 84,800 | Boise Cascade Co. | 3,150,320 | 1.0 | |||||||||||
| 134,100 | Commercial Metals Co. | 2,184,489 | 0.7 | |||||||||||
| 36,500 | Greif, Inc. - Class A | 1,723,895 | 0.5 | |||||||||||
| 65,900 | HB Fuller Co. | 2,934,527 | 0.9 | |||||||||||
| 374,300 | L | Hecla Mining Co. | 1,044,297 | 0.3 | ||||||||||
| 39,700 | Minerals Technologies, Inc. | 2,757,165 | 0.8 | |||||||||||
| 64,500 | Worthington Industries | 1,940,805 | 0.6 | |||||||||||
| 15,735,498 | 4.8 | |||||||||||||
| Total Common Stock | ||||||||||||||
| (Cost $258,194,689) | 317,572,484 | 97.2 | ||||||||||||
| EXCHANGE-TRADED FUNDS: 1.7% | ||||||||||||||
| 39,107 | iShares Russell 2000 Growth Index Fund | 5,568,055 | 1.7 | |||||||||||
| Total Exchange-Traded Funds | ||||||||||||||
| (Cost $3,803,176) | 5,568,055 | 1.7 | ||||||||||||
| Total Long-Term Investments | ||||||||||||||
| (Cost $261,997,865) | 323,140,539 | 98.9 | ||||||||||||
| 24 |
| Voya SmallCap Opportunities Portfolio | PORTFOLIO OF INVESTMENTS AS OF DECEMBER 31, 2014 (continued) |
| Principal Amount† | Value | Percentage of Net Assets | ||||||||||||
| SHORT-TERM INVESTMENTS: 3.3% | ||||||||||||||
| Securities Lending Collateralcc: 2.1% | ||||||||||||||
| 1,593,041 | Cantor Fitzgerald, Repurchase Agreement dated 12/31/14, 0.09%, due 01/02/15 (Repurchase Amount $1,593,049, collateralized by various U.S. Government/U.S. Government Agency Obligations, 0.000%-10.500%, Market Value plus accrued interest $1,624,902, due 01/01/15-09/01/49) | 1,593,041 | 0.5 | |||||||||||
| 335,360 | Daiwa Capital Markets, Repurchase Agreement dated 12/31/14, 0.12%, due 01/02/15 (Repurchase Amount $335,362, collateralized by various U.S. Government and U.S. Government Agency Obligations, 0.000%-6.500%, Market Value plus accrued interest $342,067, due 06/01/17-03/01/48) | 335,360 | 0.1 | |||||||||||
| 1,593,041 | Nomura Securities, Repurchase Agreement dated 12/31/14, 0.08%, due 01/02/15 (Repurchase Amount $1,593,048, collateralized by various U.S. Government/U.S. Government Agency Obligations, 0.000%-8.875%, Market Value plus accrued interest $1,624,902, due 01/07/15-10/20/64) | 1,593,041 | 0.5 | |||||||||||
| 1,593,041 | Royal Bank of Scotland PLC, Repurchase Agreement dated 12/31/14, 0.09%, due 01/02/15 (Repurchase Amount $1,593,049, collateralized by various U.S. Government/U.S. Government Agency Obligations, 0.375%-7.250%, Market Value plus accrued interest $1,624,902, due 11/15/15-07/15/56) | 1,593,041 | 0.5 | |||||||||||
| 1,593,041 | State of Wisconsin Investment Board, Repurchase Agreement dated 12/31/14, 0.15%, due 01/02/15 (Repurchase Amount $1,593,054, collateralized by various U.S. Government Securities, 0.125%-2.500%, Market Value plus accrued interest $1,625,062, due 04/15/16-02/15/42) | 1,593,041 | 0.5 | |||||||||||
| 6,707,524 | 2.1 | |||||||||||||
| Shares | Value | Percentage of Net Assets | ||||||||||||
| Mutual Funds: 1.2% | ||||||||||||||
| 3,944,131 | BlackRock Liquidity Funds, TempFund, Institutional Class, 0.030%†† | |||||||||||||
| (Cost $3,944,131) | 3,944,131 | 1.2 | ||||||||||||
| Total Short-Term Investments | ||||||||||||||
| (Cost $10,651,655) | 10,651,655 | 3.3 | ||||||||||||
| Total Investments in Securities | ||||||||||||||
| (Cost $272,649,520) | $ | 333,792,194 | 102.2 | |||||||||||
| Liabilities in Excess of Other Assets | (7,233,457 | ) | (2.2 | ) | ||||||||||
| Net Assets | $ | 326,558,737 | 100.0 | |||||||||||
| † | Unless otherwise indicated, principal amount is shown in USD. |
| †† | Rate shown is the 7-day yield as of December 31, 2014. |
| @ | Non-income producing security. |
| cc | Represents securities purchased with cash collateral received for securities on loan. |
| L | Loaned security, a portion or all of the security is on loan at December 31, 2014. |
Cost for federal income tax purposes is $273,439,937.
Net unrealized appreciation consists of:
| Gross Unrealized Appreciation | $ | 71,976,013 | ||
| Gross Unrealized Depreciation | (11,623,756 | ) | ||
| Net Unrealized Appreciation | $ | 60,352,257 |
| 25 |
Item 7. Disclosure of Proxy Voting Policies and Procedures for Closed-End Management Investment Companies.
Not applicable.
Item 8. Portfolio Managers of Closed-End Management Investment Companies.
Not applicable.
Item 9. Purchases of Equity Securities by Closed-End Management Investment Company and Affiliated Purchasers.
Not applicable.
Item 10. Submission of Matters to a Vote of Security Holders.
The Board has a Nominating Committee for the purpose of considering and presenting to the Board candidates it proposes for nomination to fill Independent Trustee vacancies on the Board. The Committee currently consists of all Independent Trustees of the Board (6 individuals). The Nominating Committee operates pursuant to a Charter approved by the Board. The primary purpose of the Nominating Committee is to consider and present to the Board the candidates it proposes for nomination to fill vacancies on the Board. In evaluating candidates, the Nominating Committee may consider a variety of factors, but it has not at this time set any specific minimum qualifications that must be met. Specific qualifications of candidates for Board membership will be based on the needs of the Board at the time of nomination.
The Nominating Committee is willing to consider nominations received from shareholders and shall assess shareholder nominees in the same manner as it reviews its own nominees. A shareholder nominee for director should be submitted in writing to the Fund’s Secretary. Any such shareholder nomination should include at a minimum the following information as to each individual proposed for nomination as trustee: such individual’s written consent to be named in the proxy statement as a nominee (if nominated) and to serve as a trustee (if elected), and all information relating to such individual that is required to be disclosed in the solicitation of proxies for election of trustees, or is otherwise required, in each case under applicable federal securities laws, rules and regulations.
The Secretary shall submit all nominations received in a timely manner to the Nominating Committee. To be timely, any such submission must be delivered to the Fund’s Secretary not earlier than the 90th day prior to such meeting and not later than the close of business on the later of the 60th day prior to such meeting or the 10th day following the day on which public announcement of the date of the meeting is first made, by either disclosure in a press release or in a document publicly filed by the Fund with the Securities and Exchange Commission.
Item 11. Controls and Procedures.
| (a) | Based on our evaluation conducted within 90 days of the filing date, hereof, the design and operation of the registrant’s disclosure controls and procedures are effective to ensure that material information relating to the registrant is made known to the certifying officers by others within the appropriate entities, particularly during the period in which Forms N-CSR are being prepared, and the registrant’s disclosure controls and procedures allow timely preparation and review of the information for the registrant’s Form N-CSR and the officer certifications of such Form N-CSR. |
| (b) | There were no significant changes in the registrant’s internal controls that occurred during the second fiscal quarter of the period covered by this report that has materially affected, or is reasonably likely to materially affect, the registrant’s internal control over financial reporting. |
Item 12. Exhibits.
| (a)(1) | Code of Ethics pursuant to Item 2 of Form N-CSR is filed and attached hereto as EX-99.CODE ETH. |
| (a)(2) | A separate certification for each principal executive officer and principal financial officer of the |
| 26 |
registrant as required by Rule 30a-2 under the Act (17 CFR 270.30a-2) is attached hereto as EX-99.CERT.
| (b) | The officer certifications required by Section 906 of the Sarbanes-Oxley Act of 2002 are attached hereto as EX-99.906CERT. |
(3) Not applicable.
| 27 |
SIGNATURES
Pursuant to the requirements of the Securities Exchange Act of 1934 and the Investment Company Act of 1940, the registrant has duly caused this report to be signed on its behalf by the undersigned, thereunto duly authorized.
| (Registrant): | Voya Variable Products Trust |
| By | /s/ Shaun P. Mathews | |
| Shaun P. Mathews | ||
| President and Chief Executive Officer | ||
| Date: | March 6, 2015 |
Pursuant to the requirements of the Securities Exchange Act of 1934 and the Investment Company Act of 1940, this report has been signed below by the following persons on behalf of the registrant and in the capacities and on the dates indicated.
| By | /s/ Shaun P. Mathews | |
| Shaun P. Mathews | ||
| President and Chief Executive Officer | ||
| Date: | March 6, 2015 | |
| By | /s/ Todd Modic | |
Todd Modic Senior Vice President and Chief Financial Officer | ||
| Date: | March 6, 2015 |
| 28 |