UNITED STATES
SECURITIES AND EXCHANGE COMMISSION
Washington, DC 20549
FORMN-CSRS
CERTIFIED SHAREHOLDER REPORT OF REGISTERED
MANAGEMENT INVESTMENT COMPANIES
Investment Company Act file number811-08226
Templeton Global Investment Trust
(Exact name of registrant as specified in charter)
|
| 300 S.E. 2nd Street, Fort Lauderdale, FL 33301-1923 |
| (Address of principal executive offices) (Zip code) |
Craig S. Tyle, One Franklin Parkway, San Mateo, CA 94403-1906
(Name and address of agent for service)
Registrant’s telephone number, including area code: (954)527-7500
Date of fiscal year end: 3/31
Date of reporting period: 9/30/19
Item 1. Reports to Stockholders.
Sign up for electronic delivery at franklintempleton.com/edelivery
Internet Delivery of Fund Reports Unless You Request Paper Copies:Effective January 1, 2021, as permitted by the SEC, paper copies of the Fund’s shareholder reports will no longer be sent by mail, unless you specifically request them from the Fund or your financial intermediary. Instead, the reports will be made available on a website, and you will be notified by mail each time a report is posted and provided with a website link to access the report.
If you already elected to receive shareholder reports electronically, you will not be affected by this change and you need not take any action. If you have not signed up for electronic delivery, we would encourage you to join fellow shareholders who have. You may elect to receive shareholder reports and other communications electronically from the Fund by calling (800)632-2301 or by contacting your financial intermediary.
You may elect to continue to receive paper copies of all your future shareholder reports free of charge by contacting your financial intermediary or, if you invest directly with a Fund, calling (800)632-2301 to let the Fund know of your request. Your election to receive reports in paper will apply to all funds held in your account.
SHAREHOLDER LETTER
Dear Shareholder:
During the six months ended September 30, 2019, economies in frontier and emerging markets in general grew faster than those in developed markets, although growth moderated for many countries worldwide. In this environment, frontier market stocks rose modestly, as measured by the MSCI Frontier Markets Index, outperforming emerging market stocks but underperforming developed market stocks. The U.S. Federal Reserve’s interest rate cuts and monetary policy easing by other major central banks supported investor sentiment. In contrast, political uncertainties in the eurozone and other regions, global political tensions and a heightened U.S.-China trade conflict hurt investor confidence. Regionally, gains in European and Middle Eastern frontier markets offset losses in Asia and Africa.
We are committed to our long-term perspective and disciplined investment approach as we conduct a rigorous, fundamental analysis of securities with a regular emphasis on investment risk management.
Historically, patient investors have achieved rewarding results by evaluating their goals, diversifying their assets globally and maintaining a disciplined investment program, all hallmarks of the Templeton investment philosophy developed more than 60 years ago. We continue to recommend investors consult their financial advisors and review their portfolios to design a long-term strategy and portfolio allocation that meet their individual needs, goals and risk tolerance.
Templeton Frontier Markets Fund’s semiannual report includes more detail about prevailing conditions and a
discussion about investment decisions during the period. Please remember all securities markets fluctuate, as do mutual fund share prices.
Templeton Frontier Markets Fund is anticipated to be liquidated prior to March 31, 2020, but may be delayed if unforeseen circumstances arise.
We thank you for investing with Franklin Templeton, welcome your questions and comments, and look forward to serving your investment needs in the years ahead. We thank you for your trust and participation in Templeton Frontier Markets Fund. It has been our privilege to serve you.
Sincerely,

Manraj S. Sekhon, CFA
Chief Investment Officer
Franklin Templeton Emerging Markets Equity
This letter reflects our analysis and opinions as of September 30, 2019, unless otherwise indicated. The information is not a complete analysis of every aspect of any market, country, industry, security or fund. Statements of fact are from sources considered reliable.
CFA® is a trademark owned by CFA Institute.
| | | | |
| | |
| | | | Not FDIC Insured | May Lose Value | No Bank Guarantee |
| | | | |
| | | |
| franklintempleton.com | | Not part of the semiannual report | | 1 |
Contents
|
| Visitfranklintempleton.comfor fund updates, to access your account, or to find helpful financial planning tools. |
| | | | |
| | | |
2 | | Semiannual Report | | franklintempleton.com |
SEMIANNUAL REPORT
Templeton Frontier Markets Fund
This semiannual report for Templeton Frontier Markets Fund covers the period ended September 30, 2019. The Fund is anticipated to be liquidated prior to March 31, 2020 (Liquidation Date), but may be delayed if unforeseen circumstances arise. Effective at the close of market on August 19, 2019, the Fund closed to all new investors. The Fund reserves the right to change this policy at any time. Shareholders of the Fund on the Liquidation Date will have their accounts liquidated and the proceeds will be delivered to them.
Your Fund’s Goal and Main Investments
The Fund seeks long-term capital appreciation. Under normal market conditions, the Fund invests at least 80% of its net assets in securities of companies located in “frontier market countries” as defined in the prospectus. Such companies are organized under the laws of, have principal offices in, or have their principal securities trading markets in, frontier market countries; or derive at least 50% of their total revenue or profit from either goods or services produced or sales made in frontier market countries; or have at least 50% of their assets in, or are linked to currencies of, frontier market countries.
Performance Overview
The Fund’s Class A shares posted a-2.94% cumulative total return for the six months under review. For comparison, the MSCI Frontier Markets Index, which measures stock performance in frontier markets, posted a +3.81% total return for the same period.1 Also for comparison, the Fund’s secondary benchmark, the MSCI Frontier Emerging Markets (FEM) Select Countries Capped Index, a capped version of the MSCI FEM Index that measures stock performance in predominantly frontier market countries (index includes some emerging,non-frontier market countries), posted a +0.16% total return.2 Please note index performance information is provided for reference and we do not attempt to track any index but rather undertake investments on the basis of fundamental research. In addition, the Fund’s return reflects
Geographic Composition
Based on Total Net Assets as of 9/30/19

the effect of fees and expenses for professional management, while an index does not have such costs. You can find the Fund’s long-term performance data in the Performance Summary beginning on page 7.
Performance data represent past performance, which does not guarantee future results. Investment return and principal value will fluctuate, and you may have a gain or loss when you sell your shares. Current performance may differ from figures shown. For most recentmonth-end performance, go tofranklintempleton.comor call(800)342-5236.
Economic and Market Overview
The global economy expanded during the six months under review, though many countries’ growth rates moderated. Frontier and emerging market economies in general grew faster than developed market economies.
The Philippine economy grew at its lowest annual rate in four years in 2019’s second quarter. Private consumption and government spending growth moderated, while fixed investment contracted. The Philippine central bank cut its benchmark interest rate three times during the period and
1. Source: Morningstar.
2. Source: Factset. The MSCI FEM Select Countries Capped Index was developed by MSCI for the Fund’s investment manager and represents a capped version of the MSCI FEM Index. MSCI applies caps on the exposure of the MSCI FEM Index to emerging market and frontier market countries to create the MSCI FEM Select Countries Capped Index so that the index reflects predominantly frontier market countries.
The indexes are unmanaged and include reinvestment of any income or distributions. They do not reflect any fees, expenses or sales charges. One cannot invest directly in an index, and an index is not representative of the Fund’s portfolio.
The dollar value, number of shares or principal amount, and names of all portfolio holdings are listed in the Fund’s Statement of Investments (SOI).
The SOI begins on page 15.
| | | | |
| | | |
| franklintempleton.com | | Semiannual Report | | 3 |
TEMPLETON FRONTIER MARKETS FUND
reduced the reserve requirement ratio for banks in an effort to boost the economy. The central bank cited slowing inflation as another reason for the rate cuts and suggested further cuts were possible. In this environment, Philippine stocks declined slightly for thesix-month period.
The Kuwaiti economy was hurt by the oil production cuts agreed upon by the Organization of the Petroleum Exporting Countries and its allies. However, thenon-oil sector, notably private-sector credit, bolstered the economy in 2019’s second quarter. Kuwait’s central bank left its benchmark interest rate unchanged during the period in an effort to support economic growth while maintaining the strength of the Kuwaiti dinar, which could potentially encourage the use of the dinar for domestic savings. Kuwaiti equities were boosted by MSCI’s upgrade of the country’s status from frontier market to emerging market, which will take effect in 2020. In this environment, Kuwaiti stocks rose for thesix-month period.
The Colombian economy’s annual growth rate moderated slightly in 2019’s second quarter. Accelerated growth in retail and wholesale trade as well as construction was partially offset by moderated growth in public administration as well as finance and insurance. Colombia’s central bank held its benchmark interest rate unchanged during the period, citing slowing inflation. In July, the government proposed reforms aimed at improving capital markets. In this environment, Colombian stocks fell for thesix-month period.
Nigeria’s annual economic growth rate moderated in 2019’s second quarter. Although the oil sector recovered from a contraction in the prior quarter,non-oil sector growth moderated. Nigeria’s central bank left its key benchmark interest rate unchanged during the period in an attempt to strike a balance between the competing pressures of rising inflation and slow economic growth. In this environment, Nigerian stocks fell sharply for thesix-month period.
Frontier market stocks overall rose during the six months under review, outperforming emerging market stocks while slightly underperforming developed market stocks. Periods of optimism about a potential U.S.-China trade deal, the U.S. Federal Reserve’s interest rate cuts and monetary policy easing by other major central banks supported sentiment. Political uncertainties in the eurozone and other regions, global political tensions and heightened U.S.-China trade tensions hurt sentiment. Regionally, Europe and the Middle East outperformed other regions, led by Romania and Bahrain, respectively. Large losses in Bangladesh
Top 10 Countries
9/30/19
| | | | |
| | | % of Total Net Assets | |
| |
Philippines | | | 16.9% | |
| |
Kuwait | | | 15.0% | |
| |
Vietnam | | | 13.4% | |
| |
Egypt | | | 9.9% | |
| |
Colombia | | | 8.2% | |
| |
United Arab Emirates | | | 6.5% | |
| |
Peru | | | 6.1% | |
| |
Bangladesh | | | 4.2% | |
| |
Nigeria | | | 4.0% | |
| |
Saudi Arabia | | | 2.8% | |
contributed to a decline in Asia, while many countries in Latin America and the Caribbean saw significant losses as well.3 In Africa, gains in Morocco helped limit an overall decline. In this environment, frontier market stocks, as measured by the MSCI Frontier Markets Index, posted a +3.81% total return for the six months ended September 30, 2019.1
Investment Strategy
Our investment strategy employs a fundamental research, intrinsic value-oriented, long-term approach. We focus on the market price of a company’s securities relative to our evaluation of the company’s long-term earnings, asset value and cash flow potential. This includes an assessment by the investment manager of the potential impacts of material environmental, social and governance (ESG) factors on the long-term risk and return profile of a company. We also consider a company’s profit and loss outlook, balance sheet strength, cash flow trends and asset value in relation to the current price of the company’s securities. The analysis considers the company’s position in its sector, the economic framework and political environment.
Manager’s Discussion
During the six months under review, key contributors to the Fund’s absolute performance included Egyptian companies Commercial International Bank Egypt, Global Telecom Holding and Egyptian Financial Group-Hermes Holding.
Egypt was one of the best-performing global markets over the reporting period. The country continued to record solid economic growth, which the International Monetary Fund
3. Latin America and the Caribbean are not included in the MSCI Frontier Markets Index.
| | | | |
| | | |
4 | | Semiannual Report | | franklintempleton.com |
TEMPLETON FRONTIER MARKETS FUND
(IMF) expects to accelerate in 2020. The successful completion of the three-year arrangement under the IMF’s Extended Fund Facility—whose goals included reducing debt and containing inflation— further supported investor confidence in the market. Amid a downward inflation trend, the central bank surprised markets with a larger-than-expected interest rate cut in August, which was followed with another cut in September.
Commercial International Bank is among the largest private commercial banks in Egypt. Well-positioned to benefit from the positive economic developments in the country, the bank reported double-digit growth in second-quarter net interest income.
Global Telecom is a major mobile operator in the Middle East and North Africa (MENA) region, in terms of subscribers. Shares gained on the heels of a renewed takeover offer from its major shareholder Veon (not a Fund holding). Egyptian authorities approved the offer after Global Telecom agreed to settle its tax liabilities. Shareholders subsequently accepted the offer, which carried a considerable premium to the company’s historical share price, and approved a voluntary delisting of the company.
Egyptian Financial Group-Hermes is a leading investment bank in the MENA region. A potential beneficiary of Egypt’s economic rebound and the country’s underpenetrated financial market, the investment bank reported strong growth in first- and second-quarter earnings.
Conversely, major detractors from absolute performance included Puregold Price Club, Metropolitan Bank & Trust and Hoa Phat Group.
Shares in major Philippine-retailer Puregold Price Club lost ground over the period. The hypermarket and supermarket operator’s first-half net profit declined partly due to reduced marketing support and promotional spending from suppliers. While gross profit margin at itslower-end segment declined, strong performance at its upscale S&R brand helped for the group’s overall performance.
Offering a complete range of commercial and investment banking services, Metropolitan Bank & Trust (Metrobank) is one of the leading banks in the Philippines. While the bank reported net interest andnon-interest income growth in the first half of 2019, aquarter-on-quarter decline in loan growth in the second quarter weighed on investor sentiment. In our analysis, a government budget delay and tight liquidity conditions caused the deterioration in loan growth.
Top 10 Holdings
9/30/19
| | | | |
Company Sector/Industry, Country | | % of Total Net Assets | |
| |
National Bank of Kuwait SAKP Banks, Kuwait | | | 7.4% | |
| |
Bancolombia SA Banks, Colombia | | | 3.8% | |
| |
BDO Unibank Inc. Banks, Philippines | | | 3.6% | |
| |
Human Soft Holding Co. KSC Diversified Consumer Services, Kuwait | | | 3.5% | |
| |
Brac Bank Ltd. Banks, Bangladesh | | | 3.0% | |
| |
Binh Minh Plastics JSC Building Products, Vietnam | | | 2.9% | |
| |
Metropolitan Bank & Trust Co. Banks, Philippines | | | 2.8% | |
| |
Hoa Phat Group JSC Metals & Mining, Vietnam | | | 2.7% | |
| |
Banco Davivienda SA Banks, Colombia | | | 2.7% | |
| |
InRetail Peru Corp. Food & Staples Retailing, Peru | | | 2.6% | |
Hoa Phat is a prominent industrial manufacturer in Vietnam. It is also a leading steel producer with significant market shares in the domestic construction steel and steel pipes markets. The group’s other businesses include furniture, real estate and agriculture. The company’s first- and second-quarter net profit declined largely due to a sharp increase in iron ore prices amid supply shortages. Revenues, however, increased due to higher sales volume.
In the past six months, we increased the Fund’s holdings in the United Araba Emirates (UAE), Egypt and Nigeria due to the availability of what we considered attractive investment opportunities. In terms of sectors, we increased our holdings in real estate and financials.4 Key purchases included new positions in Juhayna Food Industries, one of the largest dairy producers and distributors in Egypt, and Emirates NBD, a leading bank in the UAE. The addition of Halyk Savings Bank of Kazakhstan initiated exposure to that market. We also added to existing investments in leadingUAE-based global port operator DP World and major Vietnamese conglomerate Masan Group.
4. The real estate sector comprises real estate management and development in the SOI. The financials sector comprises banks, capital markets and insurance in the SOI.
| | | | |
| | | |
| franklintempleton.com | | Semiannual Report | | 5 |
TEMPLETON FRONTIER MARKETS FUND
Meanwhile, we decreased the Fund’s investments in Saudi Arabia, Peru and the Philippines in favor of opportunities we found more compelling and to raise funds for redemptions received. The sale of several holdings in Argentina eliminated the portfolio’s exposure to that market. Reductions were also undertaken in the consumer staples, communication services and energy sectors.5 In terms of key sales, we closed positions in Egypt-based telecommunication company Global Telecom and Saudi bankAl-Rajhi Bank, and reduced holdings in National Bank of Kuwait and InRetail Peru, a multi-format retailer in Peru.
Thank you for your participation in Templeton Frontier Markets Fund. It has been a pleasure serving your investment needs.
Sincerely,
| | |
 | | 
|
| | Ahmed Awny |
| | |
 | |  |
| | David Haglund |
| |
| | Bassel Khatoun Portfolio Management Team |
The foregoing information reflects our analysis, opinions and portfolio holdings as of September 30, 2019, the end of the reporting period. The way we implement our main investment strategies and the resulting portfolio holdings may change depending on factors such as market and economic conditions. These opinions may not be relied upon as investment advice or an offer for a particular security. The information is not a complete analysis of every aspect of any market, country, industry, security or the Fund. Statements of fact are from sources considered reliable, but the investment manager makes no representation or warranty as to their completeness or accuracy. Although historical performance is no guarantee of future results, these insights may help you understand our investment management philosophy.
5. The consumer staples sector comprises beverages, food and staples retailing, and food products in the SOI. The communication services sector comprises diversified telecommunication services in the SOI. The energy sector comprises oil, gas and consumable fuels in the SOI.
See www.franklintempletondatasources.com for additional data provider information.
| | | | |
| | | |
6 | | Semiannual Report | | franklintempleton.com |
TEMPLETON FRONTIER MARKETS FUND
Performance Summary as of September 30, 2019
The performance table does not reflect any taxes that a shareholder would pay on Fund dividends, capital gain distributions, if any, or any realized gains on the sale of Fund shares. Total return reflects reinvestment of the Fund’s dividends and capital gain distributions, if any, and any unrealized gains or losses. Your dividend income will vary depending on dividends or interest paid by securities in the Fund’s portfolio, adjusted for operating expenses of each class. Capital gain distributions are net profits realized from the sale of portfolio securities.
Performance as of 9/30/191
Cumulative total return excludes sales charges. Average annual total return includes maximum sales charges. Sales charges will vary depending on the size of the investment and the class of share purchased. The maximum is 5.50% and the minimum is 0%.Class A:5.50% maximum initial sales charge;Advisor Class:no sales charges. For other share classes, visitfranklintempleton.com.
| | | | | | | | |
| Share Class | | Cumulative
Total Return2 | | | Average Annual
Total Return3 | |
| | |
A4 | | | | | | | | |
6-Month | | | -2.94% | | | | -8.26% | |
| | |
1-Year | | | -4.31% | | | | -9.56% | |
| | |
5-Year | | | -33.07% | | | | -8.76% | |
| | |
10-Year | | | -3.15% | | | | -0.88% | |
| | |
Advisor | | | | | | | | |
| | |
6-Month | | | -2.92% | | | | -2.92% | |
| | |
1-Year | | | -4.09% | | | | -4.09% | |
| | |
5-Year | | | -32.31% | | | | -7.51% | |
| | |
10-Year | | | -0.70% | | | | -0.07% | |
Performance data represent past performance, which does not guarantee future results. Investment return and principal value will fluctuate, and you may have a gain or loss when you sell your shares. Current performance may differ from figures shown. For most recentmonth-end performance, go tofranklintempleton.comor call(800)342-5236.
See page 8 for Performance Summary footnotes.
| | | | |
| | | |
| franklintempleton.com | | Semiannual Report | | 7 |
TEMPLETON FRONTIER MARKETS FUND
PERFORMANCE SUMMARY
Total Annual Operating Expenses5
| | | | | | | | |
| Share Class | | With Fee
Waiver | | | Without Fee
Waiver | |
A | | | 2.01% | | | | 2.33% | |
Advisor | | | 1.76% | | | | 2.08% | |
Each class of shares is available to certain eligible investors and has different annual fees and expenses, as described in the prospectus.
All investments involve risks, including possible loss of principal. Special risks are associated with foreign investing, including currency fluctuations, economic instability and political developments. Investments in emerging markets, of which frontier markets are a subset, involve heightened risks related to the same factors, in addition to those associated with these markets’ smaller size, lesser liquidity and lack of established legal, political, business and social frameworks to support securities markets. Because these frameworks are typically even less developed in frontier markets, as well as various factors including the increased potential for extreme price volatility, illiquidity, trade barriers and exchange controls, the risks associated with emerging markets are magnified in frontier markets. To the extent the Fund focuses on particular countries, regions, industries, sectors or types of investment from time to time, it may be subject to greater risks of adverse developments in such areas of focus than a fund that invests in a wider variety of countries, regions, industries, sectors or investments. The Fund’s ability to invest in smaller company securities that may have limited liquidity involves additional risks, such as relatively small revenues, limited product lines and small market share. The Fund is designed for the aggressive portion of a well-diversified portfolio. The Fund is actively managed but there is no guarantee that the manager’s investment decisions will produce the desired results. The Fund’s prospectus also includes a description of the main investment risks.
1. The Fund has an expense reduction and a fee waiver associated with any investments it makes in a Franklin Templeton money fund and/or other Franklin Templeton fund, contractually guaranteed through 7/31/20. Fund investment results reflect the expense reduction and fee waiver; without these reductions, the results would have been lower.
2. Cumulative total return represents the change in value of an investment over the periods indicated.
3. Average annual total return represents the average annual change in value of an investment over the periods indicated. Return for less than one year, if any, has not been annualized.
4. Prior to 9/10/18, these shares were offered at a higher initial sales charge of 5.75%, thus actual returns (with sales charges) would have differed. Average annual total returns (with sales charges) have been restated to reflect the current maximum initial sales charge of 5.50%.
5. Figures are as stated in the Fund’s current prospectus and may differ from the expense ratios disclosed in the Your Fund’s Expenses and Financial Highlights sections in this report. In periods of market volatility, assets may decline significantly, causing total annual Fund operating expenses to become higher than the figures shown.
| | | | |
| | | |
8 | | Semiannual Report | | franklintempleton.com |
TEMPLETON FRONTIER MARKETS FUND
Your Fund’s Expenses
As a Fund shareholder, you can incur two types of costs: (1) transaction costs, including sales charges (loads) on Fund purchases and redemptions; and (2) ongoing Fund costs, including management fees, distribution and service(12b-1) fees, and other Fund expenses. All mutual funds have ongoing costs, sometimes referred to as operating expenses. The table below shows ongoing costs of investing in the Fund and can help you understand these costs and compare them with those of other mutual funds. The table assumes a $1,000 investment held for the six months indicated.
Actual Fund Expenses
The table below provides information about actual account values and actual expenses in the columns under the heading “Actual.” In these columns the Fund’s actual return, which includes the effect of Fund expenses, is used to calculate the “Ending Account Value” for each class of shares. You can estimate the expenses you paid during the period by following these steps (ofcourse, your account value and expenses will differ from those in this illustration):Divide your account value by $1,000 (ifyour account had an $8,600 value, then $8,600÷ $1,000 = 8.6). Then multiply the result by the number in the row for your class of shares under the headings “Actual” and “Expenses Paid During Period” (ifActual Expenses Paid During Period were $7.50, then 8.6 x $7.50 = $64.50). In this illustration, the actual expenses paid this period are $64.50.
Hypothetical Example for Comparison with Other Funds
Under the heading “Hypothetical” in the table, information is provided about hypothetical account values and hypothetical expenses based on the Fund’s actual expense ratio and an assumed rate of return of 5% per year before expenses, which is not the Fund’s actual return. This information may not be used to estimate the actual ending account balance or expenses you paid for the period, but it can help you compare ongoing costs of investing in the Fund with those of other funds. To do so, compare this 5% hypothetical example for the class of shares you hold with the 5% hypothetical examples that appear in the shareholder reports of other funds.
Please note that expenses shown in the table are meant to highlight ongoing costs and do not reflect any transactional costs. Therefore, information under the heading “Hypothetical” is useful in comparing ongoing costs only, and will not help you compare total costs of owning different funds. In addition, if transactional costs were included, your total costs would have been higher.
| | | | | | | | | | | | | | | | | | | | | | | | |
| | | | | | | Actual
(actual return after expenses) | | | | | Hypothetical
(5% annual return before expenses) | | | | | |
Share Class | | Beginning Account Value 4/1/19 | | | | Ending Account Value 9/30/19 | | Expenses Paid During
Period 4/1/19–9/30/191, 2 | | | | | Ending Account Value 9/30/19 | | | | Expenses Paid During Period 4/1/19–9/30/191, 2 | | | | | Net Annualized Expense Ratio2 |
A | | $1,000 | | | | $970.60 | | | $ 9.66 | | | | | $1,015.20 | | | | | $ 9.87 | | | | | 1.96% |
C | | $1,000 | | | | $966.10 | | | $13.32 | | | | | $1,011.45 | | | | | $13.63 | | | | | 2.71% |
R | | $1,000 | | | | $969.40 | | | $10.88 | | | | | $1,013.95 | | | | | $11.13 | | | | | 2.21% |
R6 | | $1,000 | | | | $973.30 | | | $ 7.60 | | | | | $1,017.30 | | | | | $ 7.77 | | | | | 1.54% |
Advisor | | $1,000 | | | | $970.80 | | | $ 8.43 | | | | | $1,016.45 | | | | | $ 8.62 | | | | | 1.71% |
1. Expenses are equal to the annualized expense ratio for thesix-month period as indicated above—in the far right column—multiplied by the simple average account value over the period indicated, and then multiplied by 183/366 to reflect theone-half year period.
2. Reflects expenses after fee waivers and expense reimbursements. Does not include acquired fund fees and expenses.
| | | | |
| | | |
| franklintempleton.com | | Semiannual Report | | 9 |
TEMPLETON GLOBAL INVESTMENT TRUST
Financial Highlights
Templeton Frontier Markets Fund
| | | | | | | | | | | | | | | | | | | | | | | | |
| | | Six Months Ended September 30, 2019 (unaudited) | | | | | | | | | | | | | | | | |
| | | Year Ended March 31, | |
| | | | 2019 | | | | 2018 | | | | 2017 | | | | 2016 | | | | 2015 | |
| | | | | | |
Class A | | | | | | | | | | | | | | | | | | | | | | | | |
Per share operating performance | | | | | | | | | | | | | | | | | | | | | | | | |
(for a share outstanding throughout the period) | | | | | | | | | | | | | | | | | | | | | | | | |
| | | | | | |
Net asset value, beginning of period | | | $11.21 | | | | $13.41 | | | | $11.81 | | | | $10.19 | | | | $13.47 | | | | $18.10 | |
| | | | | | |
Income from investment operationsa: | | | | | | | | | | | | | | | | | | | | | | | | |
| | | | | | |
Net investment incomeb | | | 0.10 | | | | 0.16 | | | | 0.18 | | | | 0.23 | | | | 0.27 | | | | 0.37 | |
| | | | | | |
Net realized and unrealized gains (losses) | | | (0.43 | ) | | | (2.36 | ) | | | 1.49 | | | | 1.46 | | | | (2.77 | ) | | | (3.89 | ) |
| | | | | | |
Total from investment operations | | | (0.33 | ) | | | (2.20 | ) | | | 1.67 | | | | 1.69 | | | | (2.50 | ) | | | (3.52 | ) |
| | | | | | |
Less distributions from: | | | | | | | | | | | | | | | | | | | | | | | | |
| | | | | | |
Net investment income | | | — | | | | — | | | | (0.07 | ) | | | (0.07 | ) | | | (0.78 | ) | | | (0.55 | ) |
| | | | | | |
Net realized gains | | | — | | | | — | | | | — | | | | — | | | | — | | | | (0.56 | ) |
| | | | | | |
Total distributions | | | — | | | | — | | | | (0.07 | ) | | | (0.07 | ) | | | (0.78 | ) | | | (1.11 | ) |
| | | | | | |
Net asset value, end of period | | | $10.88 | | | | $11.21 | | | | $13.41 | | | | $11.81 | | | | $10.19 | | | | $13.47 | |
| | | | | | |
Total returnc | | | (2.94)% | | | | (16.41)% | | | | 14.08% | | | | 16.62% | | | | (18.75)% | | | | (19.91)% | |
| | | | | | |
Ratios to average net assetsd | | | | | | | | | | | | | | | | | | | | | | | | |
| | | | | | |
Expenses before waiver and payments by affiliates | | | 2.49% | | | | 2.34% | | | | 2.39% | | | | 2.08% | | | | 2.15% | | | | 1.98% | |
| | | | | | |
Expenses net of waiver and payments by affiliates | | | 1.96% | | | | 1.96% | | | | 2.28% | | | | 1.98% | | | | 2.15% | e | | | 1.98% | e |
| | | | | | |
Net investment income | | | 1.89% | | | | 1.44% | | | | 1.37% | | | | 2.07% | | | | 2.24% | | | | 2.09% | |
| | | | | | |
Supplemental data | | | | | | | | | | | | | | | | | | | | | | | | |
| | | | | | |
Net assets, end of period (000’s) | | | $24,134 | | | | $31,248 | | | | $47,288 | | | | $50,737 | | | | $58,720 | | | | $148,693 | |
| | | | | | |
Portfolio turnover rate | | | 40.84% | | | | 48.62% | | | | 30.94% | | | | 29.11% | | | | 19.12% | | | | 19.14% | |
aThe amount shown for a share outstanding throughout the period may not correlate with the Statement of Operations for the period due to the timing of sales and repurchases of the Fund’s shares in relation to income earned and/or fluctuating fair value of the investments of the Fund.
bBased on average daily shares outstanding.
cTotal return does not reflect sales commissions or contingent deferred sales charges, if applicable, and is not annualized for periods less than one year.
dRatios are annualized for periods less than one year.
eBenefit of waiver and payments by affiliates rounds to less than 0.01%.
| | | | |
| | | |
10 | | Semiannual Report | The accompanying notes are an integral part of these financial statements. | | franklintempleton.com |
TEMPLETON GLOBAL INVESTMENT TRUST
FINANCIAL HIGHLIGHTS
Templeton Frontier Markets Fund(continued)
| | | | | | | | | | | | | | | | | | | | | | | | |
| | | Six Months Ended September 30, 2019 (unaudited) | | | | | | | | | | | | | | | | |
| | | Year Ended March 31, | |
| | | | 2019 | | | | 2018 | | | | 2017 | | | | 2016 | | | | 2015 | |
| | | | | | |
Class C | | | | | | | | | | | | | | | | | | | | | | | | |
| | | | | | |
Per share operating performance | | | | | | | | | | | | | | | | | | | | | | | | |
(for a share outstanding throughout the period) | | | | | | | | | | | | | | | | | | | | | | | | |
| | | | | | |
Net asset value, beginning of period | | | $10.91 | | | | $13.14 | | | | $11.63 | | | | $10.05 | | | | $13.27 | | | | $17.82 | |
| | | | | | |
Income from investment operationsa: | | | | | | | | | | | | | | | | | | | | | | | | |
| | | | | | |
Net investment incomeb | | | 0.06 | | | | 0.08 | | | | 0.08 | | | | 0.15 | | | | 0.18 | | | | 0.23 | |
| | | | | | |
Net realized and unrealized gains (losses) | | | (0.43 | ) | | | (2.31 | ) | | | 1.48 | | | | 1.43 | | | | (2.72 | ) | | | (3.81 | ) |
| | | | | | |
Total from investment operations | | | (0.37 | ) | | | (2.23 | ) | | | 1.56 | | | | 1.58 | | | | (2.54 | ) | | | (3.58 | ) |
| | | | | | |
Less distributions from: | | | | | | | | | | | | | | | | | | | | | | | | |
| | | | | | |
Net investment income | | | — | | | | — | | | | (0.05 | ) | | | — | | | | (0.68 | ) | | | (0.41 | ) |
| | | | | | |
Net realized gains | | | — | | | | — | | | | — | | | | — | | | | — | | | | (0.56 | ) |
| | | | | | |
Total distributions | | | — | | | | �� | | | | (0.05 | ) | | | — | | | | (0.68 | ) | | | (0.97 | ) |
| | | | | | |
Net asset value, end of period | | | $10.54 | | | | $10.91 | | | | $13.14 | | | | $11.63 | | | | $10.05 | | | | $13.27 | |
| | | | | | |
Total returnc | | | (3.39)% | | | | (16.97)% | | | | 13.20% | | | | 15.82% | | | | (19.32)% | | | | (20.53)% | |
| | | | | | |
Ratios to average net assetsd | | | | | | | | | | | | | | | | | | | | | | | | |
| | | | | | |
Expenses before waiver and payments by affiliates | | | 3.24% | | | | 3.09% | | | | 3.14% | | | | 2.83% | | | | 2.88% | | | | 2.74% | |
| | | | | | |
Expenses net of waiver and payments by affiliates | | | 2.71% | | | | 2.71% | | | | 3.03% | | | | 2.73% | | | | 2.88% | e | | | 2.74% | e |
| | | | | | |
Net investment income | | | 1.14% | | | | 0.69% | | | | 0.62% | | | | 1.32% | | | | 1.51% | | | | 1.33% | |
| | | | | | |
Supplemental data | | | | | | | | | | | | | | | | | | | | | | | | |
| | | | | | |
Net assets, end of period (000’s) | | | $7,130 | | | | $10,107 | | | | $18,133 | | | | $20,188 | | | | $22,466 | | | | $37,770 | |
| | | | | | |
Portfolio turnover rate | | | 40.84% | | | | 48.62% | | | | 30.94% | | | | 29.11% | | | | 19.12% | | | | 19.14% | |
aThe amount shown for a share outstanding throughout the period may not correlate with the Statement of Operations for the period due to the timing of sales and repurchases of the Fund’s shares in relation to income earned and/or fluctuating fair value of the investments of the Fund.
bBased on average daily shares outstanding.
cTotal return does not reflect sales commissions or contingent deferred sales charges, if applicable, and is not annualized for periods less than one year.
dRatios are annualized for periods less than one year.
eBenefit of waiver and payments by affiliates rounds to less than 0.01%.
| | | | |
| | | |
| franklintempleton.com | | The accompanying notes are an integral part of these financial statements. | Semiannual Report | | 11 |
TEMPLETON GLOBAL INVESTMENT TRUST
FINANCIAL HIGHLIGHTS
Templeton Frontier Markets Fund(continued)
| | | | | | | | | | | | | | | | | | | | | | | | |
| | | Six Months Ended September 30, 2019 (unaudited) | | | | | | | | | | | | | | | | |
| | | Year Ended March 31, | |
| | | | 2019 | | | | 2018 | | | | 2017 | | | | 2016 | | | | 2015 | |
| | | | | | |
Class R | | | | | | | | | | | | | | | | | | | | | | | | |
| | | | | | |
Per share operating performance | | | | | | | | | | | | | | | | | | | | | | | | |
(for a share outstanding throughout the period) | | | | | | | | | | | | | | | | | | | | | | | | |
| | | | | | |
Net asset value, beginning of period | | | $11.10 | | | | $13.31 | | | | $11.73 | | | | $10.13 | | | | $13.40 | | | | $18.03 | |
| | | | | | |
Income from investment operationsa: | | | | | | | | | | | | | | | | | | | | | | | | |
| | | | | | |
Net investment incomeb | | | 0.08 | | | | 0.12 | | | | 0.15 | | | | 0.19 | | | | 0.27 | | | | 0.28 | |
| | | | | | |
Net realized and unrealized gains (losses) | | | (0.42 | ) | | | (2.33 | ) | | | 1.49 | | | | 1.46 | | | | (2.78 | ) | | | (3.84 | ) |
| | | | | | |
Total from investment operations | | | (0.34 | ) | | | (2.21 | ) | | | 1.64 | | | | 1.65 | | | | (2.51 | ) | | | (3.56 | ) |
| | | | | | |
Less distributions from: | | | | | | | | | | | | | | | | | | | | | | | | |
| | | | | | |
Net investment income | | | — | | | | — | | | | (0.06 | ) | | | (0.05 | ) | | | (0.76 | ) | | | (0.51 | ) |
| | | | | | |
Net realized gains | | | — | | | | — | | | | — | | | | — | | | | — | | | | (0.56 | ) |
| | | | | | |
Total distributions | | | — | | | | — | | | | (0.06 | ) | | | (0.05 | ) | | | (0.76 | ) | | | (1.07 | ) |
| | | | | | |
Net asset value, end of period | | | $10.76 | | | | $11.10 | | | | $13.31 | | | | $11.73 | | | | $10.13 | | | | $13.40 | |
| | | | | | |
Total returnc | | | (3.06)% | | | | (16.60)% | | | | 13.69% | | | | 16.41% | | | | (18.89)% | | | | (20.17)% | |
| | | | | | |
Ratios to average net assetsd | | | | | | | | | | | | | | | | | | | | | | | | |
| | | | | | |
Expenses before waiver and payments by affiliates | | | 2.74% | | | | 2.59% | | | | 2.64% | | | | 2.34% | | | | 2.40% | | | | 2.24% | |
| | | | | | |
Expenses net of waiver and payments by affiliates | | | 2.21% | | | | 2.21% | | | | 2.53% | | | | 2.24% | | | | 2.40% | e | | | 2.24% | e |
| | | | | | |
Net investment income | | | 1.64% | | | | 1.19% | | | | 1.12% | | | | 1.81% | | | | 2.00% | | | | 1.83% | |
| | | | | | |
Supplemental data | | | | | | | | | | | | | | | | | | | | | | | | |
| | | | | | |
Net assets, end of period (000’s) | | | $62 | | | | $64 | | | | $74 | | | | $129 | | | | $118 | | | | $302 | |
| | | | | | |
Portfolio turnover rate | | | 40.84% | | | | 48.62% | | | | 30.94% | | | | 29.11% | | | | 19.12% | | | | 19.14% | |
aThe amount shown for a share outstanding throughout the period may not correlate with the Statement of Operations for the period due to the timing of sales and repurchases of the Fund’s shares in relation to income earned and/or fluctuating fair value of the investments of the Fund.
bBased on average daily shares outstanding.
cTotal return is not annualized for periods less than one year.
dRatios are annualized for periods less than one year.
eBenefit of waiver and payments by affiliates rounds to less than 0.01%.
| | | | |
| | | |
12 | | Semiannual Report | The accompanying notes are an integral part of these financial statements. | | franklintempleton.com |
TEMPLETON GLOBAL INVESTMENT TRUST
FINANCIAL HIGHLIGHTS
Templeton Frontier Markets Fund(continued)
| | | | | | | | | | | | | | | | | | | | | | | | |
| | | Six Months Ended September 30, 2019 (unaudited) | | | | | | | | | | | | | | | | |
| | | Year Ended March 31, | |
| | | | 2019 | | | | 2018 | | | | 2017 | | | | 2016 | | | | 2015 | |
| | | | | | |
Class R6 | | | | | | | | | | | | | | | | | | | | | | | | |
| | | | | | |
Per share operating performance | | | | | | | | | | | | | | | | | | | | | | | | |
(for a share outstanding throughout the period) | | | | | | | | | | | | | | | | | | | | | | | | |
| | | | | | |
Net asset value, beginning of period | | | $11.25 | | | | $13.49 | | | | $11.81 | | | | $10.21 | | | | $13.51 | | | | $18.18 | |
| | | | | | |
Income from investment operationsa: | | | | | | | | | | | | | | | | | | | | | | | | |
| | | | | | |
Net investment incomeb | | | 0.18 | | | | 0.20 | | | | 0.25 | | | | 0.23 | | | | 0.30 | | | | 0.40 | |
| | | | | | |
Net realized and unrealized gains (losses) | | | (0.48 | ) | | | (2.39 | ) | | | 1.51 | | | | 1.50 | | | | (2.75 | ) | | | (3.88 | ) |
| | | | | | |
Total from investment operations | | | (0.30 | ) | | | (2.19 | ) | | | 1.76 | | | | 1.73 | | | | (2.45 | ) | | | (3.48 | ) |
| | | | | | |
Less distributions from: | | | | | | | | | | | | | | | | | | | | | | | | |
| | | | | | |
Net investment income | | | — | | | | (0.05 | ) | | | (0.08 | ) | | | (0.13 | ) | | | (0.85 | ) | | | (0.63 | ) |
| | | | | | |
Net realized gains | | | — | | | | — | | | | — | | | | — | | | | — | | | | (0.56 | ) |
| | | | | | |
Total distributions | | | — | | | | (0.05 | ) | | | (0.08 | ) | | | (0.13 | ) | | | (0.85 | ) | | | (1.19 | ) |
| | | | | | |
Net asset value, end of period | | | $10.95 | | | | $11.25 | | | | $13.49 | | | | $11.81 | | | | $10.21 | | | | $13.51 | |
| | | | | | |
Total returnc | | | (2.67)% | | | | (16.04)% | | | | 14.64% | | | | 17.13% | | | | (18.29)% | | | | (19.63)% | |
| | | | | | |
Ratios to average net assetsd | | | | | | | | | | | | | | | | | | | | | | | | |
| | | | | | |
Expenses before waiver and payments by affiliates | | | 2.08% | | | | 2.03% | | | | 1.88% | | | | 1.71% | | | | 1.65% | | | | 1.60% | |
| | | | | | |
Expenses net of waiver and payments by affiliates | | | 1.54% | | | | 1.64% | | | | 1.75% | | | | 1.61% | | | | 1.65% | e | | | 1.60% | e |
| | | | | | |
Net investment income | | | 2.31% | | | | 1.76% | | | | 1.90% | | | | 2.44% | | | | 2.74% | | | | 2.47% | |
| | | | | | |
Supplemental data | | | | | | | | | | | | | | | | | | | | | | | | |
| | | | | | |
Net assets, end of period (000’s) | | | $12 | | | | $4,766 | | | | $5,898 | | | | $4,898 | | | | $62,640 | | | | $139,104 | |
| | | | | | |
Portfolio turnover rate | | | 40.84% | | | | 48.62% | | | | 30.94% | | | | 29.11% | | | | 19.12% | | | | 19.14% | |
aThe amount shown for a share outstanding throughout the period may not correlate with the Statement of Operations for the period due to the timing of sales and repurchases of the Fund’s shares in relation to income earned and/or fluctuating fair value of the investments of the Fund.
bBased on average daily shares outstanding.
cTotal return is not annualized for periods less than one year.
dRatios are annualized for periods less than one year.
eBenefit of waiver and payments by affiliates rounds to less than 0.01%.
| | | | |
| | | |
| franklintempleton.com | | The accompanying notes are an integral part of these financial statements. | Semiannual Report | | 13 |
TEMPLETON GLOBAL INVESTMENT TRUST
FINANCIAL HIGHLIGHTS
Templeton Frontier Markets Fund(continued)
| | | | | | | | | | | | | | | | | | | | | | | | |
| | | Six Months Ended September 30, 2019 (unaudited) | | | | | | | | | | | | | | | | |
| | | Year Ended March 31, | |
| | | | 2019 | | | | 2018 | | | | 2017 | | | | 2016 | | | | 2015 | |
| | | | | | |
Advisor Class | | | | | | | | | | | | | | | | | | | | | | | | |
| | | | | | |
Per share operating performance | | | | | | | | | | | | | | | | | | | | | | | | |
(for a share outstanding throughout the period) | | | | | | | | | | | | | | | | | | | | | | | | |
| | | | | | |
Net asset value, beginning of period | | | $11.29 | | | | $13.50 | | | | $11.86 | | | | $10.22 | | | | $13.51 | | | | $18.18 | |
| | | | | | |
Income from investment operationsa: | | | | | | | | | | | | | | | | | | | | | | | | |
| | | | | | |
Net investment incomeb | | | 0.12 | | | | 0.20 | | | | 0.20 | | | | 0.27 | | | | 0.34 | | | | 0.41 | |
| | | | | | |
Net realized and unrealized gains (losses) | | | (0.45 | ) | | | (2.39 | ) | | | 1.52 | | | | 1.45 | | | | (2.82 | ) | | | (3.92 | ) |
| | | | | | |
Total from investment operations | | | (0.33 | ) | | | (2.19 | ) | | | 1.72 | | | | 1.72 | | | | (2.48 | ) | | | (3.51 | ) |
| | | | | | |
Less distributions from: | | | | | | | | | | | | | | | | | | | | | | | | |
| | | | | | |
Net investment income | | | — | | | | (0.02 | ) | | | (0.08 | ) | | | (0.08 | ) | | | (0.81 | ) | | | (0.60 | ) |
| | | | | | |
Net realized gains | | | — | | | | — | | | | — | | | | — | | | | — | | | | (0.56 | ) |
| | | | | | |
Total distributions | | | — | | | | (0.02 | ) | | | (0.08 | ) | | | (0.08 | ) | | | (0.81 | ) | | | (1.16 | ) |
| | | | | | |
Net asset value, end of period | | | $10.96 | | | | $11.29 | | | | $13.50 | | | | $11.86 | | | | $10.22 | | | | $13.51 | |
| | | | | | |
Total returnc | | | (2.92)% | | | | (16.08)% | | | | 14.37% | | | | 16.85% | | | | (18.53)% | | | | (19.78)% | |
| | | | | | |
Ratios to average net assetsd | | | | | | | | | | | | | | | | | | | | | | | | |
| | | | | | |
Expenses before waiver and payments by affiliates | | | 2.24% | | | | 2.09% | | | | 2.14% | | | | 1.84% | | | | 1.90% | | | | 1.74% | |
| | | | | | |
Expenses net of waiver and payments by affiliates | | | 1.71% | | | | 1.71% | | | | 2.03% | | | | 1.74% | | | | 1.90% | e | | | 1.74% | e |
| | | | | | |
Net investment income | | | 2.14% | | | | 1.69% | | | | 1.62% | | | | 2.31% | | | | 2.49% | | | | 2.33% | |
| | | | | | |
Supplemental data | | | | | | | | | | | | | | | | | | | | | | | | |
| | | | | | |
Net assets, end of period (000’s) | | | $12,299 | | | | $18,009 | | | | $30,352 | | | | $54,164 | | | | $79,380 | | | | $523,037 | |
| | | | | | |
Portfolio turnover rate | | | 40.84% | | | | 48.62% | | | | 30.94% | | | | 29.11% | | | | 19.12% | | | | 19.14% | |
aThe amount shown for a share outstanding throughout the period may not correlate with the Statement of Operations for the period due to the timing of sales and repurchases of the Fund’s shares in relation to income earned and/or fluctuating fair value of the investments of the Fund.
bBased on average daily shares outstanding.
cTotal return is not annualized for periods less than one year.
dRatios are annualized for periods less than one year.
eBenefit of waiver and payments by affiliates rounds to less than 0.01%.
| | | | |
| | | |
14 | | Semiannual Report | The accompanying notes are an integral part of these financial statements. | | franklintempleton.com |
TEMPLETON GLOBAL INVESTMENT TRUST
Statement of Investments, September 30, 2019 (unaudited)
Templeton Frontier Markets Fund
| | | | | | | | | | |
| | | Industry | | Shares | | | Value | |
| |
| | | |
Common Stocks 91.9% | | | | | | | | | | |
Bahrain 1.3% | | | | | | | | | | |
aAhli United Bank BSC | | Banks | | | 639,687 | | | $ | 563,471 | |
| | | | | | | | | | |
| | | |
Bangladesh 4.2% | | | | | | | | | | |
Beximco Pharmaceuticals Ltd. | | Pharmaceuticals | | | 541,600 | | | | 541,632 | |
aBrac Bank Ltd. | | Banks | | | 1,793,836 | | | | 1,301,404 | |
| | | |
| | | | | | | | | 1,843,036 | |
| | | |
Colombia 1.6% | | | | | | | | | | |
Grupo Nutresa SA | | Food Products | | | 96,461 | | | | 702,391 | |
| | | |
Egypt 9.9% | | | | | | | | | | |
aCleopatra Hospital | | Health Care Providers & Services | | | 1,877,855 | | | | 697,932 | |
Commercial International Bank Egypt SAE | | Banks | | | 226,642 | | | | 1,086,051 | |
Egypt Kuwait Holding Co. SAE | | Chemicals | | | 428,256 | | | | 604,091 | |
Egyptian Financial Group-Hermes Holding Co. | | Capital Markets | | | 795,128 | | | | 943,475 | |
Juhayna Food Industries | | Food Products | | | 1,836,719 | | | | 1,010,136 | |
| | | |
| | | | | | | | | 4,341,685 | |
| | | |
Kazakhstan 1.5% | | | | | | | | | | |
a,bHalyk Savings Bank of Kazakhstan JSC, GDR, Reg S | | Banks | | | 54,605 | | | | 663,451 | |
| | | |
Kenya 1.9% | | | | | | | | | | |
East African Breweries Ltd. | | Beverages | | | 1,777 | | | | 3,285 | |
KCB Group Ltd. | | Banks | | | 2,059,599 | | | | 833,954 | |
| | | |
| | | | | | | | | 837,239 | |
| | | |
Kuwait 15.0% | | | | | | | | | | |
Agility Public Warehousing Co. KSC | | Air Freight & Logistics | | | 100,863 | | | | 238,358 | |
Gulf Bank KSCP | | Banks | | | 1,175,292 | | | | 1,073,890 | |
Human Soft Holding Co. KSC | | Diversified Consumer Services | | | 147,259 | | | | 1,512,521 | |
Mezzan Holding Co. | | Food Products | | | 262,964 | | | | 499,567 | |
National Bank of Kuwait SAKP | | Banks | | | 1,037,493 | | | | 3,229,272 | |
| | | |
| | | | | | | | | 6,553,608 | |
| | | |
Nigeria 4.0% | | | | | | | | | | |
Guaranty Trust Bank PLC | | Banks | | | 7,296,088 | | | | 587,032 | |
UAC of Nigeria PLC | | Food Products | | | 15,680,314 | | | | 324,045 | |
Zenith Bank PLC | | Banks | | | 16,600,551 | | | | 855,369 | |
| | | |
| | | | | | | | | 1,766,446 | |
| | | |
Pakistan 1.4% | | | | | | | | | | |
MCB Bank Ltd. | | Banks | | | 122,400 | | | | 133,527 | |
United Bank Ltd. | | Banks | | | 530,900 | | | | 469,089 | |
| | | |
| | | | | | | | | 602,616 | |
| | | |
Peru 6.1% | | | | | | | | | | |
Alicorp SA | | Food Products | | | 246,373 | | | | 679,902 | |
bInRetail Peru Corp., Reg S | | Food & Staples Retailing | | | 31,705 | | | | 1,154,062 | |
Intercorp Financial Services Inc. | | Banks | | | 19,852 | | | | 813,932 | |
| | | |
| | | | | | | | | 2,647,896 | |
| | | | |
| | | |
| franklintempleton.com | | Semiannual Report | | 15 |
TEMPLETON GLOBAL INVESTMENT TRUST
STATEMENT OF INVESTMENTS (UNAUDITED)
Templeton Frontier Markets Fund(continued)
| | | | | | | | | | |
| | | Industry | | Shares | | | Value | |
| |
| | | |
Common Stocks(continued) | | | | | | | | | | |
Philippines 16.9% | | | | | | | | | | |
Ayala Corp. | | Industrial Conglomerates | | | 54,960 | | | $ | 938,096 | |
BDO Unibank Inc. | | Banks | | | 560,860 | | | | 1,547,723 | |
International Container Terminal Services Inc. | | Transportation Infrastructure | | | 469,300 | | | | 1,090,384 | |
Metropolitan Bank & Trust Co. | | Banks | | | 912,098 | | | | 1,203,927 | |
Puregold Price Club Inc. | | Food & Staples Retailing | | | 1,225,500 | | | | 923,500 | |
Robinsons Retail Holdings Inc. | | Food & Staples Retailing | | | 725,980 | | | | 1,106,762 | |
Wilcon Depot Inc. | | Specialty Retail | | | 1,730,655 | | | | 551,058 | |
| | | |
| | | | | | | | | 7,361,450 | |
| | | |
Romania 1.2% | | | | | | | | | | |
OMV Petrom SA | | Oil, Gas & Consumable Fuels | | | 5,645,813 | | | | 547,967 | |
| | | |
Saudi Arabia 2.8% | | | | | | | | | | |
aArabian Centres Co. Ltd. | | Real Estate Management & Development | | | 94,222 | | | | 762,326 | |
Mouwasat Medical Services Co. | | Health Care Providers & Services | | | 19,105 | | | | 447,169 | |
| | | |
| | | | | | | | | 1,209,495 | |
| | | |
Senegal 1.1% | | | | | | | | | | |
Sonatel | | Diversified Telecommunication Services | | | 18,553 | | | | 464,382 | |
| | | |
South Africa 0.8% | | | | | | | | | | |
Old Mutual Ltd. | | Insurance | | | 277,380 | | | | 354,051 | |
| | | |
Sri Lanka 1.1% | | | | | | | | | | |
Hatton National Bank PLC | | Banks | | | 651,968 | | | | 483,271 | |
| | | |
Ukraine 1.2% | | | | | | | | | | |
bMHP SE, GDR, Reg S | | Food Products | | | 58,377 | | | | 511,383 | |
| | | |
United Arab Emirates 6.5% | | | | | | | | | | |
Aramex PJSC | | Air Freight & Logistics | | | 948,260 | | | | 1,035,221 | |
DP World PLC | | Transportation Infrastructure | | | 78,813 | | | | 1,102,594 | |
Emirates NBD PJSC | | Banks | | | 194,985 | | | | 687,436 | |
| | | |
| | | | | | | | | 2,825,251 | |
| | | |
Vietnam 13.4% | | | | | | | | | | |
Binh Minh Plastics JSC | | Building Products | | | 565,877 | | | | 1,248,778 | |
FPT Corp. | | Electronic Equipment, Instruments & Components | | | 98,948 | | | | 246,080 | |
aHoa Phat Group JSC | | Metals & Mining | | | 1,266,329 | | | | 1,198,048 | |
aMasan Group Corp. | | Food Products | | | 312,920 | | | | 1,058,757 | |
Vietnam Container Shipping JSC | | Marine | | | 71,488 | | | | 84,734 | |
aVietnam Technological and Commercial Joint Stock Bank | | Banks | | | 902,000 | | | | 907,793 | |
Vincom Retail JSC | | Real Estate Management & Development | | | 767,200 | | | | 1,094,536 | |
| | | |
| | | | | | | | | 5,838,726 | |
| | | |
Total Common Stocks (Cost $42,204,631) | | | | | | | | | 40,117,815 | |
| | | | |
| | | |
16 | | Semiannual Report | | franklintempleton.com |
TEMPLETON GLOBAL INVESTMENT TRUST
STATEMENT OF INVESTMENTS (UNAUDITED)
Templeton Frontier Markets Fund(continued)
| | | | | | | | | | |
| | | Industry | | Shares | | | Value | |
| |
| | | |
Preferred Stocks 6.6% | | | | | | | | | | |
Colombia 6.6% | | | | | | | | | | |
cBanco Davivienda SA, 1.976%, pfd | | Banks | | | 97,867 | | | | $ 1,195,215 | |
cBancolombia SA, 2.639%, ADR, pfd | | Banks | | | 33,883 | | | | 1,675,514 | |
| | | |
Total Preferred Stocks (Cost $2,740,307) | | | | | | | | | 2,870,729 | |
| | | |
Total Investments before Short TermInvestments (Cost $44,944,938) | | | | | | | | | 42,988,544 | |
| | | |
Short Term Investments (Cost $1,117,742) 2.6% | | | | | | | | | | |
| | | |
Money Market Funds 2.6% | | | | | | | | | | |
United States 2.6% | | | | | | | | | | |
d,eInstitutional Fiduciary Trust Money Market Portfolio, 1.71% | | | | | 1,117,742 | | | | 1,117,742 | |
| | | |
Total Investments (Cost $46,062,680) 101.1% | | | | | | | | | 44,106,286 | |
Other Assets, less Liabilities (1.1)% | | | | | | | | | (469,922) | |
| | | |
Net Assets 100.0% | | | | | | | | | $43,636,364 | |
See Abbreviations on page 30.
aNon-income producing.
bSecurity was purchased pursuant to Regulation S under the Securities Act of 1933, which exempts from registration securities offered and sold outside of the United States. Such a security cannot be sold in the United States without either an effective registration statement filed pursuant to the Securities Act of 1933, or pursuant to an exemption from registration. These securities have been deemed liquid under guidelines approved by the Trust’s Board of Trustees. At September 30, 2019, the aggregate value of these securities was $2,328,896, representing 5.3% of net assets.
cVariable rate security. The rate shown represents the yield at period end.
dSee Note 3(f) regarding investments in affiliated management investment companies.
eThe rate shown is the annualizedseven-day effective yield at period end.
| | | | |
| | | |
| franklintempleton.com | | The accompanying notes are an integral part of these financial statements. | Semiannual Report | | 17 |
TEMPLETON GLOBAL INVESTMENT TRUST
FINANCIAL STATEMENTS
Statement of Assets and Liabilities
September 30, 2019 (unaudited)
Templeton Frontier Markets Fund
| | | | |
Assets: | | | | |
Investments in securities: | | | | |
Cost - Unaffiliated issuers | | $ | 44,944,938 | |
Cost -Non-controlled affiliates (Note 3f) | | | 1,117,742 | |
| | | | |
| |
Value - Unaffiliated issuers | | $ | 42,988,544 | |
Value -Non-controlled affiliates (Note 3f) | | | 1,117,742 | |
Restricted currency, at value (cost $8,974) (Note 1c) | | | 2,258 | |
Foreign currency, at value (cost $60) | | | 60 | |
Receivables: | | | | |
Investment securities sold | | | 429,346 | |
Capital shares sold | | | 2,915 | |
Dividends | | | 265,749 | |
Other assets | | | 28 | |
| | | | |
| |
Total assets | | | 44,806,642 | |
| | | | |
| |
Liabilities: | | | | |
Payables: | | | | |
Capital shares redeemed | | | 209,321 | |
Management fees | | | 24,780 | |
Distribution fees | | | 24,062 | |
Transfer agent fees | | | 18,371 | |
Trustees’ fees and expenses | | | 476 | |
Professional fees | | | 59,913 | |
Deferred tax | | | 793,586 | |
Accrued expenses and other liabilities | | | 39,769 | |
| | | | |
| |
Total liabilities | | | 1,170,278 | |
| | | | |
| |
Net assets, at value | | $ | 43,636,364 | |
| | | | |
| |
Net assets consist of: | | | | |
Paid-in capital | | $ | 319,382,958 | |
Total distributable earnings (loss) | | | (275,746,594 | ) |
| | | | |
| |
Net assets, at value | | $ | 43,636,364 | |
| | | | |
| | | | |
| | | |
18 | | Semiannual Report | The accompanying notes are an integral part of these financial statements. | | franklintempleton.com |
TEMPLETON GLOBAL INVESTMENT TRUST
FINANCIAL STATEMENTS
Statement of Assets and Liabilities(continued)
September 30, 2019 (unaudited)
Templeton Frontier Markets Fund
| | | | |
Class A: | | | | |
Net assets, at value | | | $24,134,049 | |
| | | | |
Shares outstanding | | | 2,218,456 | |
| | | | |
Net asset value per sharea | | | $10.88 | |
| | | | |
Maximum offering price per share (net asset value per share ÷ 94.50%) | | | $11.51 | |
| | | | |
Class C: | | | | |
Net assets, at value | | | $ 7,130,018 | |
| | | | |
Shares outstanding | | | 676,466 | |
| | | | |
Net asset value and maximum offering price per sharea | | | $10.54 | |
| | | | |
Class R: | | | | |
Net assets, at value | | | $ 61,995 | |
| | | | |
Shares outstanding | | | 5,764 | |
| | | | |
Net asset value and maximum offering price per share | | | $10.76 | |
| | | | |
Class R6: | | | | |
Net assets, at value | | | $ 11,583 | |
| | | | |
Shares outstanding | | | 1,058 | |
| | | | |
Net asset value and maximum offering price per share | | | $10.95 | |
| | | | |
Advisor Class: | | | | |
Net assets, at value | | | $12,298,719 | |
| | | | |
Shares outstanding | | | 1,121,926 | |
| | | | |
Net asset value and maximum offering price per share | | | $10.96 | |
| | | | |
aRedemption price is equal to net asset value less contingent deferred sales charges, if applicable.
| | | | |
| | | |
| franklintempleton.com | | The accompanying notes are an integral part of these financial statements. | Semiannual Report | | 19 |
TEMPLETON GLOBAL INVESTMENT TRUST
FINANCIAL STATEMENTS
Statement of Operations
for the six months ended September 30, 2019 (unaudited)
Templeton Frontier Markets Fund
| | | | |
Investment income: | | | | |
Dividends: (net of foreign taxes)* | | | | |
Unaffiliated issuers | | $ | 1,087,428 | |
Non-controlled affiliates (Note 3f) | | | 12,556 | |
Interest: | | | | |
Unaffiliated issuers | | | 228 | |
| | | | |
| |
Total investment income | | | 1,100,212 | |
| | | | |
| |
Expenses: | | | | |
Management fees (Note 3a) | | | 400,415 | |
Distribution fees: (Note 3c) | | | | |
Class A | | | 36,021 | |
Class C | | | 45,111 | |
Class R | | | 160 | |
Transfer agent fees: (Note 3e) | | | | |
Class A | | | 28,525 | |
Class C | | | 8,938 | |
Class R | | | 64 | |
Class R6 | | | 659 | |
Advisor Class | | | 15,917 | |
Custodian fees (Note 4) | | | 44,138 | |
Reports to shareholders | | | 14,805 | |
Registration and filing fees | | | 42,934 | |
Professional fees | | | 66,705 | |
Trustees’ fees and expenses | | | 3,849 | |
Other | | | 9,165 | |
| | | | |
| |
Total expenses | | | 717,406 | |
Expenses waived/paid by affiliates (Note 3f and 3g) | | | (150,480 | ) |
| | | | |
| |
Net expenses | | | 566,926 | |
| | | | |
| |
Net investment income | | | 533,286 | |
| | | | |
| |
Realized and unrealized gains (losses): | | | | |
Net realized gain (loss) from: | | | | |
Investments:# | | | | |
Unaffiliated issuers | | | 1,416,719 | |
Foreign currency transactions | | | (117,182 | ) |
| | | | |
| |
Net realized gain (loss) | | | 1,299,537 | |
| | | | |
| |
Net change in unrealized appreciation (depreciation) on: | | | | |
Investments: | | | | |
Unaffiliated issuers | | | (3,156,711 | ) |
Translation of other assets and liabilities denominated in foreign currencies | | | 53,143 | |
Change in deferred taxes on unrealized appreciation | | | 90,907 | |
| | | | |
| |
Net change in unrealized appreciation (depreciation) | | | (3,012,661 | ) |
| | | | |
| |
Net realized and unrealized gain (loss) | | | (1,713,124 | ) |
| | | | |
| |
Net increase (decrease) in net assets resulting from operations | | $ | (1,179,838 | ) |
| | | | |
| |
*Foreign taxes withheld on dividends | | $ | 86,753 | |
#Net of foreign taxes | | $ | 9,364 | |
| | | | |
| | | | |
| | | |
20 | | Semiannual Report | The accompanying notes are an integral part of these financial statements. | | franklintempleton.com |
TEMPLETON GLOBAL INVESTMENT TRUST
FINANCIAL STATEMENTS
Statements of Changes in Net Assets
Templeton Frontier Markets Fund
| | | | | | | | |
| | | Six Months Ended September 30, 2019 (unaudited) | | | Year Ended March 31, 2019 | |
| |
| | |
Increase (decrease) in net assets: | | | | | | | | |
Operations: | | | | | | | | |
Net investment income | | | $ 533,286 | | | | $ 1,084,374 | |
Net realized gain (loss) | | | 1,299,537 | | | | 2,646,741 | |
Net change in unrealized appreciation (depreciation) | | | (3,012,661 | ) | | | (20,053,024 | ) |
| | | | |
| | |
Net increase (decrease) in net assets resulting from operations | | | (1,179,838 | ) | | | (16,321,909 | ) |
| | | | |
| | |
Distributions to shareholders: | | | | | | | | |
Class R6 | | | — | | | | (23,660 | ) |
Advisor Class | | | — | | | | (34,005 | ) |
| | | | |
| | |
Total distributions to shareholders | | | — | | | | (57,665 | ) |
| | | | |
| | |
Capital share transactions: (Note 2) | | | | | | | | |
Class A | | | (6,361,854 | ) | | | (8,415,546 | ) |
Class C | | | (2,736,710 | ) | | | (4,980,442 | ) |
Class R | | | 279 | | | | 2,085 | |
Class R6 | | | (4,895,442 | ) | | | (152,896 | ) |
Advisor Class | | | (5,383,308 | ) | | | (7,624,964 | ) |
| | | | |
| | |
Total capital share transactions | | | (19,377,035 | ) | | | (21,171,763 | ) |
| | | | |
| | |
Net increase (decrease) in net assets | | | (20,556,873 | ) | | | (37,551,337 | ) |
| | | | |
Net assets: | | | | | | | | |
Beginning of period | | | 64,193,237 | | | | 101,744,574 | |
| | | | |
| | |
End of period | | | $ 43,636,364 | | | | $ 64,193,237 | |
| | | | |
| | | | |
| | | |
| franklintempleton.com | | The accompanying notes are an integral part of these financial statements. | Semiannual Report | | 21 |
TEMPLETON GLOBAL INVESTMENT TRUST
Notes to Financial Statements (unaudited)
Templeton Frontier Markets Fund
1. Organization and Significant Accounting Policies
Templeton Global Investment Trust (Trust) is registered under the Investment Company Act of 1940 (1940 Act) as anopen-end management investment company, consisting of four separate funds and applies the specialized accounting and reporting guidance in U.S. Generally Accepted Accounting Principles (U.S. GAAP). Templeton Frontier Markets Fund (Fund) is included in this report. The Fund offers five classes of shares: Class A, Class C, Class R, Class R6 and Advisor Class. Class C shares automatically convert to Class A shares after they have been held for 10 years. Each class of shares may differ by its initial sales load, contingent deferred sales charges, voting rights on matters affecting a single class, its exchange privilege and fees due to differing arrangements for distribution and transfer agent fees.
The following summarizes the Fund’s significant accounting policies.
a. Financial Instrument Valuation
The Fund’s investments in financial instruments are carried at fair value daily. Fair value is the price that would be received to sell an asset or paid to transfer a liability in an orderly transaction between market participants on the measurement date. The Fund calculates the net asset value (NAV) per share each business day as of 4 p.m. Eastern time or the regularly scheduled close of the New York Stock Exchange (NYSE), whichever is earlier. Under compliance policies and procedures approved by the Trust’s Board of Trustees (the Board), the Fund’s administrator has responsibility for oversight of valuation, including leading the cross-functional Valuation Committee (VC). The Fund may utilize independent pricing services, quotations from securities and financial instrument dealers, and other market sources to determine fair value.
Equity securities listed on an exchange or on the NASDAQ National Market System are valued at the last quoted sale price or the official closing price of the day, respectively. Foreign equity securities are valued as of the close of trading on the foreign stock exchange on which the security is primarily traded, or as of 4 p.m. Eastern time. The value is then converted into its U.S. dollar equivalent at the foreign exchange rate in effect at 4 p.m. Eastern time on the day that the value of the security is determined.Over-the-counter (OTC) securities are valued within the range of the most recent quoted bid and ask prices. Securities that trade in
multiple markets or on multiple exchanges are valued according to the broadest and most representative market. Certain equity securities are valued based upon fundamental characteristics or relationships to similar securities.
Investments inopen-end mutual funds are valued at the closing NAV.
The Fund has procedures to determine the fair value of financial instruments for which market prices are not reliable or readily available. Under these procedures, the Fund primarily employs a market-based approach which may use related or comparable assets or liabilities, recent transactions, market multiples, book values, and other relevant information for the investment to determine the fair value of the investment. An income-based valuation approach may also be used in which the anticipated future cash flows of the investment are discounted to calculate fair value. Discounts may also be applied due to the nature or duration of any restrictions on the disposition of the investments. Due to the inherent uncertainty of valuations of such investments, the fair values may differ significantly from the values that would have been used had an active market existed.
Trading in securities on foreign securities stock exchanges and OTC markets may be completed before 4 p.m. Eastern time. In addition, trading in certain foreign markets may not take place on every Fund’s business day. Occasionally, events occur between the time at which trading in a foreign security is completed and 4 p.m. Eastern time that might call into question the reliability of the value of a portfolio security held by the Fund. As a result, differences may arise between the value of the Fund’s portfolio securities as determined at the foreign market close and the latest indications of value at 4 p.m. Eastern time. In order to minimize the potential for these differences, the VC monitors price movements following the close of trading in foreign stock markets through a series of country specific market proxies (such as baskets of American Depositary Receipts, futures contracts and exchange traded funds). These price movements are measured against established trigger thresholds for each specific market proxy to assist in determining if an event has occurred that may call into question the reliability of the values of the foreign securities held by the Fund. If such an event occurs, the securities may be valued using fair value procedures, which may include the use of independent pricing services. At September 30, 2019, a market event occurred resulting in a portion of the securities held by the Fund being valued using fair value procedures.
| | | | |
| | | |
22 | | Semiannual Report | | franklintempleton.com |
TEMPLETON GLOBAL INVESTMENT TRUST
NOTES TO FINANCIAL STATEMENTS (UNAUDITED)
Templeton Frontier Markets Fund(continued)
When the last day of the reporting period is anon-business day, certain foreign markets may be open on those days that the Fund’s NAV is not calculated, which could result in differences between the value of the Fund’s portfolio securities on the last business day and the last calendar day of the reporting period. Any significant security valuation changes due to an open foreign market are adjusted and reflected by the Fund for financial reporting purposes.
b. Foreign Currency Translation
Portfolio securities and other assets and liabilities denominated in foreign currencies are translated into U.S. dollars based on the exchange rate of such currencies against U.S. dollars on the date of valuation. The Fund may enter into foreign currency exchange contracts to facilitate transactions denominated in a foreign currency. Purchases and sales of securities, income and expense items denominated in foreign currencies are translated into U.S. dollars at the exchange rate in effect on the transaction date. Portfolio securities and assets and liabilities denominated in foreign currencies contain risks that those currencies will decline in value relative to the U.S. dollar. Occasionally, events may impact the availability or reliability of foreign exchange rates used to convert the U.S. dollar equivalent value. If such an event occurs, the foreign exchange rate will be valued at fair value using procedures established and approved by the Board.
The Fund does not separately report the effect of changes in foreign exchange rates from changes in market prices on securities held. Such changes are included in net realized and unrealized gain or loss from investments in the Statement of Operations.
Realized foreign exchange gains or losses arise from sales of foreign currencies, currency gains or losses realized between the trade and settlement dates on securities transactions and the difference between the recorded amounts of dividends, interest, and foreign withholding taxes and the U.S. dollar equivalent of the amounts actually received or paid. Net unrealized foreign exchange gains and losses arise from changes in foreign exchange rates on foreign denominated assets and liabilities other than investments in securities held at the end of the reporting period.
c. Restricted Currency
At September 30, 2019, the Fund held currencies in certain markets in which the ability to repatriate such currency is limited. As a result of such limitations on repatriation the Fund may incur substantial delays in gaining access to these assets and may be exposed to potential adverse movements in currency value.
d. Income and Deferred Taxes
It is the Fund’s policy to qualify as a regulated investment company under the Internal Revenue Code. The Fund intends to distribute to shareholders substantially all of its taxable income and net realized gains to relieve it from federal income and excise taxes. As a result, no provision for U.S. federal income taxes is required.
The Fund may be subject to foreign taxation related to income received, capital gains on the sale of securities and certain foreign currency transactions in the foreign jurisdictions in which it invests. Foreign taxes, if any, are recorded based on the tax regulations and rates that exist in the foreign markets in which the Fund invests. When a capital gain tax is determined to apply, the Fund records an estimated deferred tax liability in an amount that would be payable if the securities were disposed of on the valuation date.
The Fund may recognize an income tax liability related to its uncertain tax positions under U.S. GAAP when the uncertain tax position has a less than 50% probability that it will be sustained upon examination by the tax authorities based on its technical merits. As of September 30, 2019, the Fund has determined that no tax liability is required in its financial statements related to uncertain tax positions for any open tax years (or expected to be taken in future tax years). Open tax years are those that remain subject to examination and are based on the statute of limitations in each jurisdiction in which the Fund invests.
e. Security Transactions, Investment Income, Expenses and Distributions
Security transactions are accounted for on trade date. Realized gains and losses on security transactions are determined on a specific identification basis. Estimated expenses are accrued daily. Dividend income is recorded on theex-dividend date except for certain dividends from securities where the dividend rate is not available. In such cases, the dividend is recorded as soon as the information is
| | | | |
| | | |
| franklintempleton.com | | Semiannual Report | | 23 |
TEMPLETON GLOBAL INVESTMENT TRUST
NOTES TO FINANCIAL STATEMENTS (UNAUDITED)
Templeton Frontier Markets Fund(continued)
1. Organization and Significant Accounting Policies(continued)
e. Security Transactions, Investment Income, Expenses and Distributions(continued)
received by the Fund. Distributions to shareholders are recorded on theex-dividend date. Distributable earnings are determined according to income tax regulations (tax basis) and may differ from earnings recorded in accordance with U.S. GAAP. These differences may be permanent or temporary. Permanent differences are reclassified among capital accounts to reflect their tax character. These reclassifications have no impact on net assets or the results of operations. Temporary differences are not reclassified, as they may reverse in subsequent periods.
Common expenses incurred by the Trust are allocated among the Funds based on the ratio of net assets of each Fund to the combined net assets of the Trust or based on the ratio of number of shareholders of each Fund to the combined number of shareholders of the Trust. Fund specific expenses are charged directly to the Fund that incurred the expense.
Realized and unrealized gains and losses and net investment income, excluding class specific expenses, are allocated daily to each class of shares based upon the relative proportion of
net assets of each class. Differences in per share distributions by class are generally due to differences in class specific expenses.
f. Accounting Estimates
The preparation of financial statements in accordance with U.S. GAAP requires management to make estimates and assumptions that affect the reported amounts of assets and liabilities at the date of the financial statements and the amounts of income and expenses during the reporting period. Actual results could differ from those estimates.
g. Guarantees and Indemnifications
Under the Trust’s organizational documents, its officers and trustees are indemnified by the Trust against certain liabilities arising out of the performance of their duties to the Trust. Additionally, in the normal course of business, the Trust, on behalf of the Fund, enters into contracts with service providers that contain general indemnification clauses. The Trust’s maximum exposure under these arrangements is unknown as this would involve future claims that may be made against the Trust that have not yet occurred. Currently, the Trust expects the risk of loss to be remote.
2. Shares of Beneficial Interest
At September 30, 2019, there were an unlimited number of shares authorized ($0.01 par value). Transactions in the Fund’s shares were as follows:
| | | | | | | | | | | | | | | | |
| | | Six Months Ended
September 30, 2019 | | | Year Ended March 31, 2019 | |
| | | | |
| | | | Shares | | | | Amount | | | | Shares | | | | Amount | |
Class A Shares: | | | | | | | | | | | | | | | | |
Shares solda | | | 155,705 | | | | $ 1,765,473 | | | | 503,403 | | | $ | 5,633,691 | |
Shares redeemed | | | (723,623 | ) | | | (8,127,327 | ) | | | (1,242,038 | ) | | | (14,049,237 | ) |
| | | | |
| | | | |
Net increase (decrease) | | | (567,918 | ) | | | $(6,361,854 | ) | | | (738,635 | ) | | $ | (8,415,546 | ) |
| | | | |
| | | | |
Class C Shares: | | | | | | | | | | | | | | | | |
Shares sold | | | 11,625 | | | | $ 127,853 | | | | 51,528 | | | $ | 567,411 | |
Shares redeemeda | | | (261,886 | ) | | | (2,864,563 | ) | | | (504,580 | ) | | | (5,547,853 | ) |
| | | | |
| | | | |
Net increase (decrease) | | | (250,261 | ) | | | $(2,736,710 | ) | | | (453,052 | ) | | $ | (4,980,442 | ) |
| | | | |
| | | | |
Class R Shares: | | | | | | | | | | | | | | | | |
Shares sold | | | 25 | | | | $ 284 | | | | 174 | | | $ | 2,089 | |
Shares redeemed | | | (— | )* | | | (5 | ) | | | (— | )* | | | (4 | ) |
| | | | |
| | | | |
Net increase (decrease) | | | 25 | | | | $ 279 | | | | 174 | | | $ | 2,085 | |
| | | | |
| | | | |
| | | |
24 | | Semiannual Report | | franklintempleton.com |
TEMPLETON GLOBAL INVESTMENT TRUST
NOTES TO FINANCIAL STATEMENTS (UNAUDITED)
Templeton Frontier Markets Fund(continued)
| | | | | | | | | | | | | | | | |
| | | Six Months Ended
September 30, 2019 | | | Year Ended March 31, 2019 | |
| | | | |
| | | | Shares | | | | Amount | | | | Shares | | | | Amount | |
| | | | |
Class R6 Shares: | | | | | | | | | | | | | | | | |
Shares sold | | | 33,480 | | | $ | 381,947 | | | | 72,821 | | | $ | 845,750 | |
Shares issued in reinvestment of distributions | | | — | | | | — | | | | 5 | | | | 49 | |
Shares redeemed | | | (455,953 | ) | | | (5,277,389 | ) | | | (86,627 | ) | | | (998,695 | ) |
| | | | |
| | | | |
Net increase (decrease) | | | (422,473 | ) | | $ | (4,895,442 | ) | | | (13,801 | ) | | $ | (152,896 | ) |
| | | | |
| | | | |
Advisor Class Shares: | | | | | | | | | | | | | | | | |
Shares sold | | | 26,783 | | | $ | 304,127 | | | | 412,557 | | | $ | 4,786,590 | |
Shares issued in reinvestment of distributions | | | — | | | | — | | | | 2,862 | | | | 29,875 | |
Shares redeemed | | | (500,509 | ) | | | (5,687,435 | ) | | | (1,068,729 | ) | | | (12,441,429 | ) |
| | | | |
| | | | |
Net increase (decrease) | | | (473,726 | ) | | $ | (5,383,308 | ) | | | (653,310 | ) | | $ | (7,624,964 | ) |
| | | | |
*Rounds to less than 1 share.
aMay include a portion of Class C shares that were automatically converted to Class A.
3. Transactions with Affiliates
Franklin Resources, Inc. is the holding company for various subsidiaries that together are referred to as Franklin Templeton. Certain officers and trustees of the Fund are also officers and/or directors of the following subsidiaries:
| | |
| Subsidiary | | Affiliation |
| Franklin Templeton Investments (ME) Limited (FTIME) | | Investment manager |
| Franklin Templeton Services, LLC (FT Services) | | Administrative manager |
| Franklin Templeton Distributors, Inc. (Distributors) | | Principal underwriter |
| Franklin Templeton Investor Services, LLC (Investor Services) | | Transfer agent |
a. Management Fees
The Fund pays an investment management fee to FTIME based on the average daily net assets of the Fund as follows:
| | |
| Annualized Fee Rate | | Net Assets |
| 1.400% | | Up to and including $500 million |
| 1.300% | | Over $500 million, up to and including $1 billion |
| 1.200% | | In excess of $1 billion |
b. Administrative Fees
Under an agreement with FTIME, FT Services provides administrative services to the Fund. The fee is paid by FTIME based on the Fund’s average daily net assets, and is not an additional expense of the Fund.
c. Distribution Fees
The Board has adopted distribution plans for each share class, with the exception of Class R6 and Advisor Class shares, pursuant to Rule12b-1 under the 1940 Act. Under the Fund’s Class A reimbursement distribution plan, the Fund reimburses Distributors for costs incurred in connection with the servicing, sale and distribution of the Fund’s shares up to the maximum annual plan rate. Under the Class A reimbursement distribution plan, costs exceeding the maximum for the current plan year
| | | | |
| | | |
| franklintempleton.com | | Semiannual Report | | 25 |
TEMPLETON GLOBAL INVESTMENT TRUST
NOTES TO FINANCIAL STATEMENTS (UNAUDITED)
Templeton Frontier Markets Fund(continued)
3. Transactions with Affiliates(continued)
c. Distribution Fees(continued)
cannot be reimbursed in subsequent periods. In addition, under the Fund’s Class C and R compensation distribution plans, the Fund pays Distributors for costs incurred in connection with the servicing, sale and distribution of the Fund’s shares up to the maximum annual plan rate for each class. The plan year, for purposes of monitoring compliance with the maximum annual plan rates, is February 1 through January 31.
The maximum annual plan rates, based on the average daily net assets, for each class, are as follows:
| | | | |
Class A | | | 0.30 | % |
| |
Class C | | | 1.00 | % |
| |
Class R | | | 0.50 | % |
The Board has set the current rate at 0.25% per year for Class A shares until further notice and approval by the Board.
d. Sales Charges/Underwriting Agreements
Front-end sales charges and contingent deferred sales charges (CDSC) do not represent expenses of the Fund. These charges are deducted from the proceeds of sales of Fund shares prior to investment or from redemption proceeds prior to remittance, as applicable. Distributors has advised the Fund of the following commission transactions related to the sales and redemptions of the Fund’s shares for the period:
| | | | |
Sales charges retained net of commissions paid to unaffiliated brokers/dealers | | $ | 692 | |
| |
CDSC retained | | $ | 483 | |
e. Transfer Agent Fees
Each class of shares pays transfer agent fees to Investor Services for its performance of shareholder servicing obligations. The fees are based on an annualized asset based fee of 0.02% plus a transaction based fee. In addition, each class reimburses Investor Services for out of pocket expenses incurred and, except for Class R6, reimburses shareholder servicing fees paid to third parties. These fees are allocated daily based upon their relative proportion of such classes’ aggregate net assets. Class R6 pays Investor Services transfer agent fees specific to that class.
For the period ended September 30, 2019, the Fund paid transfer agent fees of $54,103, of which $19,473 was retained by Investor Services.
| | | | |
| | | |
26 | | Semiannual Report | | franklintempleton.com |
TEMPLETON GLOBAL INVESTMENT TRUST
NOTES TO FINANCIAL STATEMENTS (UNAUDITED)
Templeton Frontier Markets Fund(continued)
f. Investments in Affiliated Management Investment Companies
The Fund invests in one or more affiliated management investment companies for purposes other than exercising a controlling influence over the management or policies. Management fees paid by the Fund are waived on assets invested in the affiliated management investment companies, as noted in the Statement of Operations, in an amount not to exceed the management and administrative fees paid directly or indirectly by each affiliate. During the period ended September 30, 2019, the Fund held investments in affiliated management investment companies as follows:
| | | | | | | | | | | | | | | | | | | | | | | | | | | | | | | | |
| | | Value at
Beginning
of Period | | | Purchases | | | Sales | | | Realized
Gain (Loss) | | | Net Change in Unrealized
Appreciation (Depreciation) | | | Value at End of Period | | | Number of
Shares Held at End of Period | | | Dividend Income | |
Non-Controlled Affiliates | | | | | | | | | | | | | | | | | | | | | | | | | | | | | | | | |
| | | | | | | | |
Institutional Fiduciary Trust Money Market Portfolio, 1.71% | | | $2,357,813 | | | | $11,536,465 | | | | $(12,776,536 | ) | | | $ — | | | | $ — | | | | $1,117,742 | | | | 1,117,742 | | | | $12,556 | |
| | | | | | | | | | | | |
g. Waiver and Expense Reimbursements
FTIME and Investor Services have contractually agreed in advance to waive or limit their respective fees and to assume as their own expense certain expenses otherwise payable by the Fund so that the expenses (excluding distribution fees, acquired fund fees and expenses, and certainnon-routine expenses or costs, including those relating to litigation, indemnification, reorganizations, and liquidations) for Class A, Class C, Class R and Advisor Class of the Fund do not exceed 1.75%, and for Class R6 do not exceed 1.58%, based on the average net assets of each class until July 31, 2020. Total expenses waived or paid are not subject to recapture subsequent to the Fund’s fiscal year end.
Prior to August 1, 2019, expenses (excluding certain fees and expenses as previously disclosed) for Class R6 were limited to 1.53% based on the average net assets of the class.
Additionally, FTIME has contractually agreed in advance to limit the investment management fees to 1.35% of the average daily net assets of the Fund until July 31, 2020. Total expenses waived or paid are not subject to recapture subsequent to the Fund’s fiscal year end.
4. Expense Offset Arrangement
The Fund has entered into an arrangement with its custodian whereby credits realized as a result of uninvested cash balances are used to reduce a portion of the Fund’s custodian expenses. During the period ended September 30, 2019, there were no credits earned.
5. Income Taxes
For tax purposes, capital losses may be carried over to offset future capital gains.
At March 31, 2019, capital loss carryforwards were as follows:
| | | | |
Capital loss carryforwards not subject to expiration: | | | | |
Short term | | $ | 39,761,432 | |
Long term | | | 233,007,424 | |
| | | | |
| |
Total capital loss carryforwards | | $ | 272,768,856 | |
| | | | |
| | | | |
| | | |
| franklintempleton.com | | Semiannual Report | | 27 |
TEMPLETON GLOBAL INVESTMENT TRUST
NOTES TO FINANCIAL STATEMENTS (UNAUDITED)
Templeton Frontier Markets Fund(continued)
5. Income Taxes(continued)
For tax purposes, the Fund may elect to defer any portion of a post-October capital loss or late-year ordinary loss to the first day of the following fiscal year. At March 31, 2019, the Fund deferred late-year ordinary losses of $261,011.
At September 30, 2019, the cost of investments and net unrealized appreciation (depreciation) for income tax purposes were as follows:
| | | | |
Cost of investments | | $ | 47,652,801 | |
| | | | |
| |
Unrealized appreciation | | $ | 6,524,284 | |
Unrealized depreciation | | | (10,070,799 | ) |
| | | | |
| |
Net unrealized appreciation (depreciation) | | $ | (3,546,515 | ) |
| | | | |
Differences between income and/or capital gains as determined on a book basis and a tax basis are primarily due to differing treatments of foreign capital gains tax and wash sales.
6. Investment Transactions
Purchases and sales of investments (excluding short term securities) for the period ended September 30, 2019, aggregated $22,606,385 and $39,017,289, respectively.
7. Concentration of Risk
Investing in foreign securities may include certain risks and considerations not typically associated with investing in U.S. securities, such as fluctuating currency values and changing local, regional and global economic, political and social conditions, which may result in greater market volatility. Such risks may be greater when investing in emerging markets securities, of which frontier markets are asub-set, due to underdeveloped legal, business, political or other frameworks necessary to support securities markets. Frontier markets generally have smaller economies and magnify the risks of investing in developing markets and may include the potential for extreme price volatility, government ownership, protectionist measures and unsettled securities laws. In addition, certain foreign securities may not be as liquid as U.S. securities, or may have restrictions or delays in repatriation into U.S. dollars.
Zimbabwe adopted the U.S. dollar as its official currency in 2009 after a period of severe hyperinflation and economic decline. Since that time, the economy has continued to struggle and despite the government’s issuance of bond notes in August 2017, liquidity conditions have continued to be challenged. In February 2019, Zimbabwe redenominated its currency from the U.S. dollar to the Zimbabwe dollar. The interbank market has not been established as expected and trading in the Zimbabwean dollar has not been formalized. Repatriation continues to be challenging. Currency restrictions and other concerns have led investors to seek alternative stores of value, causing severe inflationary pressures and extreme price volatility. These economic conditions could affect the value of the Fund’s portfolio. At September 30, 2019, the Fund had less than 0.1% of its net assets invested in Zimbabwe.
8. Upcoming Liquidation
On July 17, 2019, the Board approved a proposal to liquidate the Fund. Effective August 19, 2019, the Fund was closed to all new investors. The Fund is anticipated to liquidate prior to the March 31, 2020 fiscal year end.
| | | | |
| | | |
28 | | Semiannual Report | | franklintempleton.com |
TEMPLETON GLOBAL INVESTMENT TRUST
NOTES TO FINANCIAL STATEMENTS (UNAUDITED)
Templeton Frontier Markets Fund(continued)
9. Credit Facility
The Fund, together with other U.S. registered and foreign investment funds (collectively, Borrowers), managed by Franklin Templeton, are borrowers in a joint syndicated senior unsecured credit facility totaling $2 billion (Global Credit Facility) which matures on February 7, 2020. This Global Credit Facility provides a source of funds to the Borrowers for temporary and emergency purposes, including the ability to meet future unanticipated or unusually large redemption requests.
Under the terms of the Global Credit Facility, the Fund shall, in addition to interest charged on any borrowings made by the Fund and other costs incurred by the Fund, pay its share of fees and expenses incurred in connection with the implementation and maintenance of the Global Credit Facility, based upon its relative share of the aggregate net assets of all of the Borrowers, including an annual commitment fee of 0.15% based upon the unused portion of the Global Credit Facility. These fees are reflected in other expenses in the Statement of Operations. During the period ended September 30, 2019, the Fund did not use the Global Credit Facility.
10. Fair Value Measurements
The Fund follows a fair value hierarchy that distinguishes between market data obtained from independent sources (observable inputs) and the Fund’s own market assumptions (unobservable inputs). These inputs are used in determining the value of the Fund’s financial instruments and are summarized in the following fair value hierarchy:
| | • | Level 1 – quoted prices in active markets for identical financial instruments |
| | • | Level 2 – other significant observable inputs (including quoted prices for similar financial instruments, interest rates, prepayment speed, credit risk, etc.) |
| | • | Level 3 – significant unobservable inputs (including the Fund’s own assumptions in determining the fair value of financial instruments) |
The input levels are not necessarily an indication of the risk or liquidity associated with financial instruments at that level.
A summary of inputs used as of September 30, 2019, in valuing the Fund’s assets carried at fair value, is as follows:
| | | | | | | | | | | | | | | | |
| | | Level 1 | | | Level 2 | | | Level 3 | | | Total | |
| | | | |
Assets: | | | | | | | | | | | | | | | | |
Investments in Securities:a | | | | | | | | | | | | | | | | |
Equity Investments:b | | | | | | | | | | | | | | | | |
Egypt | | $ | — | | | $ | 4,341,685 | | | $ | — | | | $ | 4,341,685 | |
South Africa | | | — | | | | 354,051 | | | | — | | | | 354,051 | |
All Other Equity Investments | | | 38,292,808 | | | | — | | | | — | | | | 38,292,808 | |
Short Term Investments | | | 1,117,742 | | | | — | | | | — | | | | 1,117,742 | |
| | | | |
| | | | |
Total Investments in Securities | | $ | 39,410,550 | | | $ | 4,695,736 | | | $ | — | | | $ | 44,106,286 | |
| | | | |
| | | | |
Other Financial Instruments: | | | | | | | | | | | | | | | | |
Restricted currency | | $ | — | | | $ | — | | | $ | 2,258 | | | $ | 2,258 | |
| | | | |
aFor detailed categories, see the accompanying Statement of Investments.
bIncludes common and preferred stocks.
| | | | |
| | | |
| franklintempleton.com | | Semiannual Report | | 29 |
TEMPLETON GLOBAL INVESTMENT TRUST
NOTES TO FINANCIAL STATEMENTS (UNAUDITED)
Templeton Frontier Markets Fund(continued)
10. Fair Value Measurements(continued)
A reconciliation of assets in which Level 3 inputs are used in determining fair value is presented when there are significant Level 3 financial instruments at the beginning and/or end of the period. At September 30, 2019, the reconciliation of assets is as follows:
| | | | | | | | | | | | | | | | | | | | | | | | | | | | | | | | | | | | |
| | | Balance at
Beginning of
Period | | | Purchases | | | Sales | | | Transfer Into(Out of) Level 3 | | | Cost Basis Adjustments | | | Net Realized Gain (Loss) | | | Net Unrealized Appreciation (Depreciation) | | | Balance at End of Period | | | Net Change in Unrealized Appreciation (Depreciation) on Assets Held at Period End | |
Assets: | | | | | | | | | | | | | | | | | | | | | | | | | | | | | | | | | | | | |
Investments in Securities: | | | | | | | | | | | | | | | | | | | | | | | | | | | | | | | | | | | | |
Equity Investments: | | | | | | | | | | | | | | | | | | | | | | | | | | | | | | | | | | | | |
Zimbabwe | | | $985,898 | | | | $ — | | | | $(886,169) | | | | $— | | | | $— | | | | $(579,502) | | | | $479,773 | | | | $ — | | | | $ — | |
| | | | |
| | | | | | | | | |
Other Financial Instruments Restricted currency | | | $ 28,423 | | | | $616,285 | | | | $(593,691 | ) | | | $— | | | | $— | | | | $ (20,000 | ) | | | $(28,759 | ) | | | $2,258 | | | | $(8,028 | ) |
| | | | |
11. Subsequent Events
The Fund has evaluated subsequent events through the issuance of the financial statements and determined that no events have occurred that require disclosure.
Abbreviations
| | | | |
Selected Portfolio | | |
ADR | | American Depositary Receipt | | |
| GDR | | Global Depositary Receipt | | |
| | | | |
| | | |
30 | | Semiannual Report | | franklintempleton.com |
TEMPLETON GLOBAL INVESTMENT TRUST
TEMPLETON FRONTIER MARKETS FUND
Shareholder Information
Proxy Voting Policies and Procedures
The Fund’s investment manager has established Proxy Voting Policies and Procedures (Policies) that the Fund uses to determine how to vote proxies relating to portfolio securities. Shareholders may view the Fund’s complete Policies online at franklintempleton.com. Alternatively, shareholders may request copies of the Policies free of charge by calling the Proxy Group collect at (954)527-7678 or by sending a written request to: Franklin Templeton Companies, LLC, 300 S.E. 2nd Street, Fort Lauderdale, FL 33301, Attention: Proxy Group. Copies of the Fund’s proxy voting records are also made available online at franklintempleton.com and posted on the U.S. Securities and Exchange Commission’s website at sec.gov and reflect the most recent12-month period ended June 30.
Quarterly Statement of Investments
The Trust, on behalf of the Fund, files a complete statement of investments with the U.S. Securities and Exchange Commission for the first and third quarters for each fiscal year as an exhibit to its report on FormN-PORT.
Shareholders may view the filed FormN-PORT by visiting the Commission’s website at sec.gov. The filed form may also be viewed and copied at the Commission’s Public Reference Room in Washington, DC. Information regarding the operations of the Public Reference Room may be obtained by calling(800) SEC-0330.
| | | | |
| | | |
| franklintempleton.com | | Semiannual Report | | 31 |
This page intentionally left blank.
Authorized for distribution only when accompanied or preceded by a summary prospectus and/or prospectus. Investors should carefully consider a fund’s investment goals, risks, charges and expenses before investing. A prospectus contains this and other information; please read it carefully before investing.
To help ensure we provide you with quality service, all calls to and from our service areas are monitored and/or recorded.
| | | | | | |
 | | Semiannual Report and Shareholder Letter Templeton Frontier Markets Fund |
| | Investment Manager | | Distributor | | Shareholder Services |
| | Franklin Templeton | | Franklin Templeton Distributors, Inc. | | (800)632-2301 |
| | Investments (ME) Limited | | (800) DIAL BEN®/342-5236 | | |
| | | | franklintempleton.com | | |
| | |
| © 2019 Franklin Templeton Investments. All rights reserved. | | 096 S 11/19 |

Sign up for electronic delivery at franklintempleton.com/edelivery
Internet Delivery of Fund Reports Unless You Request Paper Copies: Effective January 1, 2021, as permitted by the SEC, paper copies of the Fund’s shareholder reports will no longer be sent by mail, unless you specifically request them from the Fund or your financial intermediary. Instead, the reports will be made available on a website, and you will be notified by mail each time a report is posted and provided with a website link to access the report.
If you already elected to receive shareholder reports electronically, you will not be affected by this change and you need not take any action. If you have not signed up for electronic delivery, we would encourage you to join fellow shareholders who have. You may elect to receive shareholder reports and other communications electronically from the Fund by calling (800)632-2301 or by contacting your financial intermediary.
You may elect to continue to receive paper copies of all your future shareholder reports free of charge by contacting your financial intermediary or, if you invest directly with a Fund, calling (800)632-2301 to let the Fund know of your request. Your election to receive reports in paper will apply to all funds held in your account.
SHAREHOLDER LETTER
Dear Shareholder:
During the six months ended September 30, 2019, economies in emerging markets generally continued growing faster than those in developed markets, although growth in several countries, including India and China, descended to multi-year lows. The U.S.-China trade conflict and soft global demand contributed to the economic slowdown. In this environment, emerging market small cap stocks declined, as measured by the MSCI Emerging Markets Small Cap Index.
Emerging market equities, particularlysmall-cap equities, were hurt by escalating U.S.-China trade tensions, global political uncertainties such as the Hong Kong protests, and concerns about a slowing global economy. Interest-rate reductions by the U.S. Federal Reserve and the adoption of more accommodative monetary policies by emerging market central banks helped limit losses. Emerging market equities in Asia and Latin America declined, while those in the Europe, Middle East and Africa region remained relatively unchanged.
We are committed to our long-term perspective and disciplined investment approach as we conduct a rigorous, fundamental analysis of securities with a regular emphasis on investment risk management.
Historically, patient investors have achieved rewarding results by evaluating their goals, diversifying their assets globally and maintaining a disciplined investment program, all hallmarks of the Templeton investment philosophy developed more than 60 years ago. We continue to recommend investors consult their financial advisors and review their portfolios to design a long-term strategy and
portfolio allocation that meet their individual needs, goals and risk tolerance.
Templeton Emerging Markets Small Cap Fund’s semiannual report includes more detail about prevailing conditions and a discussion about investment decisions during the period. Please remember all securities markets fluctuate, as do mutual fund share prices.
We thank you for investing with Franklin Templeton, welcome your questions and comments, and look forward to serving your investment needs in the years ahead.
Sincerely,

Manraj S. Sekhon, CFA
Chief Investment Officer
Franklin Templeton Emerging Markets Equity
This letter reflects our analysis and opinions as of September 30, 2019, unless otherwise indicated. The information is not a complete analysis of every aspect of any market, country, industry, security or fund. Statements of fact are from sources considered reliable.
CFA® is a trademark owned by CFA Institute.
|
| |
| Not FDIC Insured | May Lose Value | No Bank Guarantee |
| | | | |
| | | |
| franklintempleton.com | | Not part of the semiannual report | | 1 |
Contents
|
| Visitfranklintempleton.comfor fund updates, to access your account, or to find helpful financial planning tools. |
| | | | |
| | | |
2 | | Semiannual Report | | franklintempleton.com |
SEMIANNUAL REPORT
Templeton Emerging Markets Small Cap Fund
This semiannual report for Templeton Emerging Markets Small Cap Fund covers the period ended September 30, 2019.
Your Fund’s Goal and Main Investments
The Fund seeks long-term capital appreciation. Under normal market conditions, the Fund invests at least 80% of its net assets in securities of small cap companies located in emerging market countries, as defined in the Fund’s prospectus.
Performance Overview
The Fund’s Class A shares posted a-7.62% cumulative total return for the six months under review. For comparison, the MSCI Emerging Markets (EM) Small Cap Index, which measures performance of small cap stocks in emerging markets, posted a-5.27% total return for the same period.1 Please note index performance information is provided for reference and we do not attempt to track any index but rather undertake investments on the basis of fundamental research. In addition, the Fund’s return reflects the effect of fees and expenses for professional management, while an index does not have such costs. You can find the Fund’s long-term performance data in the Performance Summary beginning on page 7.
Performance data represent past performance, which does not guarantee future results. Investment return and principal value will fluctuate, and you may have a gain or loss when you sell your shares. Current performance may differ from figures shown. For most recentmonth-end performance, go tofranklintempleton.comor call(800)342-5236.
Economic and Market Overview
Emerging market economies in general continued to grow faster than their developed market counterparts during the six months ended September 30, 2019, though several emerging market countries’ growth rates dipped to multi-year lows. China’s annual growth rate moderated in 2019’s second and third quarters to its lowest level since 1992. Trade tensions with the U.S. and soft global demand weighed heavily on China’s economy, while increased industrial
Geographic Composition
Based on Total Net Assets as of 9/30/19
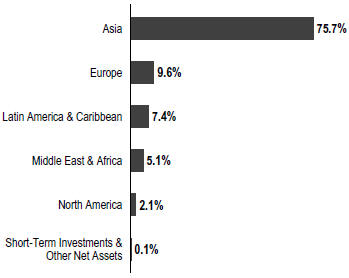
production provided some support. Taiwan’s annual growth rate accelerated in the second quarter as exports recovered. South Korea’s annual growth rate also accelerated in the second quarter, driven by utilities and services. Growth held steady in the third quarter, with faster manufacturing growth counterbalanced by slower services growth and contractions in utilities and construction. India’s annual growth rate hit asix-year low in 2019’s second quarter due to slowdowns in manufacturing, construction and consumer spending. Turning to Europe, Russia’s annual growth rate accelerated in the second quarter as several sectors, including real estate, rebounded from prior contractions. Hungary’s annual growth rate moderated in the second quarter—albeit from a15-year high the prior quarter—as industrial output and construction growth slowed. In Latin America, Brazil’s annual growth rate accelerated in the second quarter, aided by strong exports.
Many emerging market central banks adopted more accommodative monetary policies during the period. The People’s Bank of China (PBOC) implemented an interest-rate reform in August, designating the loan prime rate as the new benchmark for household and business loans, effectively lowering interest rates in August and September. Additionally, the PBOC lowered its cash reserve
1. Source: Morningstar.
The index is unmanaged and includes reinvestment of any income or distributions. It does not reflect any fees, expenses or sales charges. One cannot invest directly in an index, and an index is not representative of the Fund’s portfolio.
The dollar value, number of shares or principal amount, and names of all portfolio holdings are listed in the Fund’s Statement of Investments (SOI). The SOI begins on page 15.
| | | | |
| | | |
| franklintempleton.com | | Semiannual Report | | 3 |
TEMPLETON EMERGING MARKETS SMALL CAP FUND
requirement ratio for some banks in an effort to improve market liquidity. Taiwan’s central bank left its benchmark interest rate unchanged during the period, while South Korea’s central bank unexpectedly lowered its benchmark interest rate once in response to a trade dispute with Japan and rising U.S.-China trade tensions. India’s central bank cut its benchmark rate three times to boost a slowing economy. Russia’s central bank cut its key rate three times in response to slowing inflation growth and weaker-than-expected economic growth, while Hungary’s central bank kept its benchmark rate unchanged. Brazil’s central bank cut its benchmark interest rate twice in response to inflation approaching its target range.
Emerging marketsmall-cap equities overall declined during thesix-month period, lagging their developed and frontier market counterparts. U.S.-China trade tensions, global political uncertainties—including the Hong Kong protests and the impeachment inquiry into U.S. President Donald Trump—and concerns about the global economy weighed on emerging markets. The U.S. Federal Reserve’s interest rate cuts and periods of investor optimism about U.S.-China trade relations supported market sentiment. Regionally, Asian emerging market equities declined due to losses in China, India and South Korea. Taiwanese stocks rose, with electronics parts manufacturers benefiting from the newest iPhone’s strongpre-sales. Latin American emerging market equities fell due to large losses in Argentina and Chile, though Brazilian stocks posted a modest gain. Emerging market stocks in the Europe, Middle East and Africa region ended the period relatively flat, as gains in Russia and Turkey were partially offset by losses in South Africa, Hungary and other countries. In this environment, emerging market small cap stocks, as measured by the MSCI EM Small Cap Index, posted a-5.27% total return for the six months ended September 30, 2019.1
Investment Strategy
Our investment strategy employs a fundamental research, value-oriented, long-term approach. We focus on the market price of a company’s securities relative to our evaluation of the company’s long-term earnings, asset value and cash flow potential. This includes an assessment by the investment manager of the potential impacts of material environmental, social and governance (ESG) factors on the long-term risk and return profile of a company. We also consider a company’s profit and loss outlook, balance sheet strength, cash flow trends and asset value in relation to the current price of the company’s securities. The analysis considers the company’s corporate governance behavior as well as its position in its sector, the economic framework and political environment.
| | |
| | | % of Total
Net Assets |
| |
China | | 20.1% |
| |
India | | 16.7% |
| |
Taiwan | | 15.7% |
| |
South Korea | | 10.3% |
| |
Vietnam | | 6.2% |
| |
Brazil | | 4.1% |
| |
Hungary | | 3.0% |
| |
Turkey | | 2.3% |
| |
Thailand | | 2.2% |
| |
U.S. | | 2.1% |
Manager’s Discussion
During the six months under review, key contributors to the Fund’s absolute performance included Huaxin Cement, TISCO Financial Group and Sunny Optical Technology Group.
Cement stocks in China caught the market’s attention as officials relaxed local government spending limits to support infrastructure investments. One of the top five cement producers in China, Huaxin Cement reported strong net profit growth due to increasing sales volumes and prices. Investor confidence was further driven by expectations that cement prices should benefit from ongoing industry consolidation, supply-side reforms and steady infrastructure demand.
TISCO Financial is a Thailand-based company with key interests in auto lending, commercial banking and the securities business. The group reported an increase in second-quarter net profit, in line with market expectations, as weaker balance sheet growth and revenues were offset by lower-than-expected provisions. TISCO Financial’s high return ratios and dividend yield increased the stock’s attractiveness to investors seeking higher income in the currentlow-interest rate environment.
Sunny Optical Technology designs and manufactures optical and optical-related products. It is the world’s largest supplier of automotive lenses and China’s largest maker of smartphone camera modules and lenses. After a strong start to 2019, shares in the company fell significantly in May, in sync with a general decline in technology companies caused by investor concern about the escalating U.S.-China trade conflict. Shares subsequently rebounded due to resilient monthly shipment data and better-than-expected first-half 2019 revenue and net income.
| | | | |
| | | |
4 | | Semiannual Report | | franklintempleton.com |
TEMPLETON EMERGING MARKETS SMALL CAP FUND
Conversely, major detractors from absolute performance included Health & Happiness H&H International Holdings, Fila Korea andMedy-tox.
H&H International is a leading family nutrition product company in China. The company primarily sells baby nutrition and care products such as infant formula and adult nutrition and care products. Its share price dropped significantly in August following a decline in its adjusted first-half earnings before interest, tax, depreciation and amortization. Investor sentiment was further pressured by worse-than-expected sales performance in July and expectations of continued weakness in certain areas during the second half of 2019, including in its China onshore market, in part due to higher competitive intensity.
Fila Korea is one of the leading sportswear companies in South Korea. It also licenses the FILA brand around the world and owns a stake in U.S. golf product manufacturer Acushnet (not a Fund holding). Shares reached a record-high in May before declining following the publication of quarterly results, which were slightly below expectations. However, the company still reported robust growth in second-quarter operating profit. The company was partly impacted by an inventorybuild-up at the retail level in the first quarter, resulting in lower orders in the second quarter.
Medy-tox is involved in the manufacture and sale of biopharmaceutical products. Its key products include botulinum toxin, hyaluronic acid filler and antitoxin therapeutics. The company reported a decline in second-quarter operating profit, missing market expectations by a wide margin partly due to higher selling, general and administrative expenses. Shares were further pressured by concerns over a potential delay in regulatory approval for its products in China.
In the past six months we increased the Fund’s holdings in Hungary, Vietnam and the United Arab Emirates due to the availability of what we viewed as attractive investment opportunities. In terms of sectors, purchases were made in the materials and health care sectors.2 We added to existing investments in Richter Gedeon, a major Hungarian pharmaceutical company, Hoa Phat Group, one of the largest industrial manufacturing conglomerates and steel
| | | | |
| Top 10 Holdings | | | | |
| 9/30/19 | | | | |
| |
Company Sector/Industry, Country | | % of Total Net Assets | |
| |
Bajaj Holdings & Investment Ltd. Diversified Financial Services, India | | | 5.7% | |
| |
Huaxin Cement Co. Ltd. Construction Materials, China | | | 2.5% | |
| |
Health & Happiness H&H International Holdings Ltd. Food Products, China | | | 2.4% | |
| |
Hoa Phat Group JSC Metals & Mining, Vietnam | | | 2.3% | |
| |
Merida Industry Co. Ltd. Leisure Products, Taiwan | | | 2.3% | |
| |
Primax Electronics Ltd. Technology Hardware, Storage & Peripherals, Taiwan | | | 2.2% | |
| |
IMAX Corp. Entertainment, U.S. | | | 2.1% | |
| |
Baozun Inc. Internet & Direct Marketing Retail, China | | | 2.0% | |
| |
Fila Korea Ltd. Textiles, Apparel & Luxury Goods, South Korea | | | 1.9% | |
| |
Tata Chemicals Ltd. Chemicals, India | | | 1.9% | |
producers in Vietnam, and the aforementioned H&H International.
In contrast, we decreased the Fund’s investments in South Korea, Turkey and Egypt in favor of opportunities we found more compelling in other markets. Reductions were also undertaken in the consumer discretionary, communication services and information technology sectors.3 In terms of key sales, we closed positions in Egypt-based telecommunication company Global Telecom Holding, Turkish warehouse-REIT Reysas Gayrimenkul Yatirim Ortakligi and Turkish dairy products company Pinar Sut Mamulleri Sanayii. We also reduced holdings in the previously mentioned Fila Korea and Sunny Optical Technology.
It is important to recognize the effect of currency movements on the Fund’s performance. In general, if the value of the U.S. dollar goes up compared with a foreign currency, an investment traded in that foreign currency will go down in
2. The materials sector comprises chemicals, construction materials, containers and packaging, metals and mining, and paper and forest products in the SOI. The health care sector comprises biotechnology, health care equipment and supplies, health care providers and services, and pharmaceuticals in the SOI.
3. The consumer discretionary sector comprises auto components; diversified consumer services; hotels, restaurants and leisure; household durables; internet and direct marketing retail; leisure products; specialty retail; and textiles, apparel and luxury goods in the SOI. The communication services sector comprises entertainment and interactive media and services in the SOI. The information technology sector comprises electronic equipment, instruments and components; IT services; semiconductors and semiconductor equipment; and technology hardware, storage and peripherals in the SOI.
See www.franklintempletondatasources.com for additional data provider information.
| | | | |
| | | |
| franklintempleton.com | | Semiannual Report | | 5 |
TEMPLETON EMERGING MARKETS SMALL CAP FUND
value because it will be worth fewer U.S. dollars. This can have a negative effect on Fund performance. Conversely, when the U.S. dollar weakens in relation to a foreign currency, an investment traded in that foreign currency will increase in value, which can contribute to Fund performance. For the six months ended September 30, 2019, the U.S. dollar rose in value relative to most currencies. As a result, the Fund’s performance was negatively affected by the portfolio’s investment predominantly in securities withnon-U.S. currency exposure.
Thank you for your continued participation in Templeton Emerging Markets Small Cap Fund. We look forward to serving your future investment needs.
Sincerely,
| | |
 | |  |
| | |
| | Chetan Sehgal, CFA Portfolio Manager |
The foregoing information reflects our analysis, opinions and portfolio holdings as of September 30, 2019, the end of the reporting period. The way we implement our main investment strategies and the resulting portfolio holdings may change depending on factors such as market and economic conditions. These opinions may not be relied upon as investment advice or an offer for a particular security. The information is not a complete analysis of every aspect of any market, country, industry, security or the Fund. Statements of fact are from sources considered reliable, but the investment manager makes no representation or warranty as to their completeness or accuracy. Although historical performance is no guarantee of future results, these insights may help you understand our investment management philosophy.
| | | | |
| | | |
6 | | Semiannual Report | | franklintempleton.com |
TEMPLETON EMERGING MARKETS SMALL CAP FUND
Performance Summary as of September 30, 2019
The performance table does not reflect any taxes that a shareholder would pay on Fund dividends, capital gain distributions, if any, or any realized gains on the sale of Fund shares. Total return reflects reinvestment of the Fund’s dividends and capital gain distributions, if any, and any unrealized gains or losses. Your dividend income will vary depending on dividends or interest paid by securities in the Fund’s portfolio, adjusted for operating expenses of each class. Capital gain distributions are net profits realized from the sale of portfolio securities.
Performance as of 9/30/191
Cumulative total return excludes sales charges. Average annual total return includes maximum sales charges. Sales charges will vary depending on the size of the investment and the class of share purchased. The maximum is 5.50% and the minimum is 0%.Class A:5.50% maximum initial sales charge;Advisor Class:no sales charges. For other share classes, visitfranklintempleton.com.
| | | | | | | | |
| Share Class | | Cumulative
Total Return2 | | | Average Annual
Total Return3 | |
A4 | | | | | | | | |
| | |
6-Month | | | -7.62% | | | | -12.69% | |
| | |
1-Year | | | -4.11% | | | | -9.35% | |
| | |
5-Year | | | +4.07% | | | | -0.34% | |
| | |
10-Year | | | +59.09% | | | | +4.16% | |
Advisor | | | | | | | | |
| | |
6-Month | | | -7.52% | | | | -7.52% | |
| | |
1-Year | | | -3.88% | | | | -3.88% | |
| | |
5-Year | | | +5.41% | | | | +1.06% | |
| | |
10-Year | | | +63.60% | | | | +5.05% | |
Performance data represent past performance, which does not guarantee future results. Investment return and principal value will fluctuate, and you may have a gain or loss when you sell your shares. Current performance may differ from figures shown. For most recentmonth-end performance, go tofranklintempleton.comor call(800)342-5236.
See page 8 for Performance Summary footnotes.
| | | | |
| | | |
| franklintempleton.com | | Semiannual Report | | 7 |
TEMPLETON EMERGING MARKETS SMALL CAP FUND
PERFORMANCE SUMMARY
Total Annual Operating Expenses5
| | | | | | | | | | | | |
Share Class | | With Fee
Waiver | | | | | | Without Fee
Waiver | |
A | | | 1.86% | | | | | | | | 1.88% | |
Advisor | | | 1.61% | | | | | | | | 1.63% | |
Each class of shares is available to certain eligible investors and has different annual fees and expenses, as described in the prospectus.
All investments involve risks, including possible loss of principal. Special risks are associated with foreign investing, including currency fluctuations, economic instability and political developments. Investments in emerging markets, of which frontier markets are a subset, involve heightened risks related to the same factors, in addition to those associated with these markets’ smaller size, lesser liquidity and lack of established legal, political, business and social frameworks to support securities markets. Because these frameworks are typically even less developed in frontier markets, as well as various factors including the increased potential for extreme price volatility, illiquidity, trade barriers and exchange controls, the risks associated with emerging markets are magnified in frontier markets.Small-cap company stocks have historically had more price volatility than large-company stocks, particularly over the short term. All investments in the Fund should be thought of as long-term investments that could experience significant price volatility in any given year. The Fund is designed for the aggressive portion of a well-diversified portfolio. The Fund is actively managed but there is no guarantee that the manager’s investment decisions will produce the desired results. The Fund’s prospectus also includes a description of the main investment risks.
1. The Fund has a fee waiver associated with any investment it makes in a Franklin Templeton money fund and/or other Franklin Templeton fund, contractually guaranteed through 7/31/20. Fund investment results reflect the fee waiver; without this reduction, the results would have been lower.
2. Cumulative total return represents the change in value of an investment over the periods indicated.
3. Average annual total return represents the average annual change in value of an investment over the periods indicated. Return for less than one year, if any, has not been annualized.
4. Prior to 9/10/18, these shares were offered at a higher initial sales charge of 5.75%, thus actual returns (with sales charges) would have differed. Average annual total returns (with sales charges) have been restated to reflect the current maximum initial sales charge of 5.50%.
5. Figures are as stated in the Fund’s current prospectus and may differ from the expense ratios disclosed in the Your Fund’s Expenses and Financial Highlights sections in this report. In periods of market volatility, assets may decline significantly, causing total annual Fund operating expenses to become higher than the figures shown.
| | | | |
| | | |
8 | | Semiannual Report | | franklintempleton.com |
TEMPLETON EMERGING MARKETS SMALL CAP FUND
Your Fund’s Expenses
As a Fund shareholder, you can incur two types of costs: (1) transaction costs, including sales charges (loads) on Fund purchases and redemptions; and (2) ongoing Fund costs, including management fees, distribution and service(12b-1) fees, and other Fund expenses. All mutual funds have ongoing costs, sometimes referred to as operating expenses. The table below shows ongoing costs of investing in the Fund and can help you understand these costs and compare them with those of other mutual funds. The table assumes a $1,000 investment held for the six months indicated.
Actual Fund Expenses
The table below provides information about actual account values and actual expenses in the columns under the heading “Actual.” In these columns the Fund’s actual return, which includes the effect of Fund expenses, is used to calculate the “Ending Account Value” for each class of shares. You can estimate the expenses you paid during the period by following these steps (ofcourse, your account value and expenses will differ from those in this illustration):Divide your account value by $1,000 (ifyour account had an $8,600 value, then $8,600÷ $1,000 = 8.6). Then multiply the result by the number in the row for your class of shares under the headings “Actual” and “Expenses Paid During Period” (ifActual Expenses Paid During Period were $7.50, then 8.6 x $7.50 = $64.50). In this illustration, the actual expenses paid this period are $64.50.
Hypothetical Example for Comparison with Other Funds
Under the heading “Hypothetical” in the table, information is provided about hypothetical account values and hypothetical expenses based on the Fund’s actual expense ratio and an assumed rate of return of 5% per year before expenses, which is not the Fund’s actual return. This information may not be used to estimate the actual ending account balance or expenses you paid for the period, but it can help you compare ongoing costs of investing in the Fund with those of other funds. To do so, compare this 5% hypothetical example for the class of shares you hold with the 5% hypothetical examples that appear in the shareholder reports of other funds.
Please note that expenses shown in the table are meant to highlight ongoing costs and do not reflect any transactional costs. Therefore, information under the heading “Hypothetical” is useful in comparing ongoing costs only, and will not help you compare total costs of owning different funds. In addition, if transactional costs were included, your total costs would have been higher.
| | | | | | | | | | | | |
| | | | | Actual (actual return after expenses) | | Hypothetical (5% annual return before expenses) | | |
| | | | | | | | |
Share
Class | | Beginning
Account
Value 4/1/19 | | Ending
Account
Value 9/30/19 | | Expenses Paid During
Period 4/1/19–9/30/191, 2 | | Ending
Account
Value 9/30/19 | | Expenses Paid During
Period 4/1/19–9/30/191, 2 | | Net
Annualized
Expense
Ratio2 |
| | | | | | |
A | | $1,000 | | $923.80 | | $ 8.99 | | $1,015.65 | | $ 9.42 | | 1.87% |
C | | $1,000 | | $920.10 | | $12.58 | | $1,011.90 | | $13.18 | | 2.62% |
R | | $1,000 | | $922.20 | | $10.19 | | $1,014.40 | | $10.68 | | 2.12% |
R6 | | $1,000 | | $925.40 | | $ 7.12 | | $1,017.60 | | $ 7.47 | | 1.48% |
Advisor | | $1,000 | | $924.80 | | $ 7.80 | | $1,016.90 | | $ 8.17 | | 1.62% |
1. Expenses are equal to the annualized expense ratio for thesix-month period as indicated above—in the far right column—multiplied by the simple average account value over the period indicated, and then multiplied by 183/366 to reflect theone-half year period.
2. Reflects expenses after fee waivers and expense reimbursements. Does not include acquired fund fees and expenses.
| | | | |
| | | |
| franklintempleton.com | | Semiannual Report | | 9 |
TEMPLETON GLOBAL INVESTMENT TRUST
Financial Highlights
Templeton Emerging Markets Small Cap Fund
| | | | | | | | | | | | | | | | | | | | | | | | |
| | | Six Months Ended | | | | | | | | | | | | | | | | |
| | | September 30, 2019 | | | | | | Year Ended March 31, | | | | |
| | | (unaudited) | | | 2019 | | | 2018 | | | 2017 | | | 2016 | | | 2015 | |
| | | | | | |
Class A | | | | | | | | | | | | | | | | | | | | | | | | |
| | | | | | |
Per share operating performance | | | | | | | | | | | | | | | | | | | | | | | | |
(for a share outstanding throughout the period) | | | | | | | | | | | | | | | | | | | | | | | | |
| | | | | | |
Net asset value, beginning of period | | | $13.78 | | | | $15.25 | | | | $13.02 | | | | $11.41 | | | | $12.25 | | | | $11.64 | |
| | | | | | |
Income from investment operationsa: | | | | | | | | | | | | | | | | | | | | | | | | |
| | | | | | |
Net investment incomeb | | | 0.14 | | | | 0.03 | | | | — | c | | | 0.16 | d | | | 0.04 | | | | — | c |
| | | | | | |
Net realized and unrealized gains (losses) | | | (1.19 | ) | | | (1.15 | ) | | | 2.23 | | | | 1.65 | | | | (0.85 | ) | | | 0.63 | |
| | | | | | |
Total from investment operations | | | (1.05 | ) | | | (1.12 | ) | | | 2.23 | | | | 1.81 | | | | (0.81 | ) | | | 0.63 | |
| | | | | | |
Less distributions from: | | | | | | | | | | | | | | | | | | | | | | | | |
| | | | | | |
Net investment income | | | — | | | | — | | | | — | | | | (0.20 | ) | | | (0.03 | ) | | | (0.02 | ) |
| | | | | | |
Net realized gains | | | — | | | | (0.35 | ) | | | — | | | | — | | | | — | | | | — | |
| | | | | | |
Total distributions | | | — | | | | (0.35 | ) | | | — | | | | (0.20 | ) | | | (0.03 | ) | | | (0.02 | ) |
| | | | | | |
Net asset value, end of period | | | $12.73 | | | | $13.78 | | | | $15.25 | | | | $13.02 | | | | $11.41 | | | | $12.25 | |
| | | | | | |
Total returne | | | (7.62)% | | | | (7.09)% | | | | 17.13% | | | | 16.09% | | | | (6.60)% | | | | 5.40% | |
| | | | | | |
Ratios to average net assetsf | | | | | | | | | | | | | | | | | | | | | | | | |
| | | | | | |
Expenses before waiver and payments by affiliates | | | 1.89% | | | | 1.94% | | | | 1.96% | | | | 1.98% | | | | 2.00% | | | | 2.04% | |
| | | | | | |
Expenses net of waiver and payments by affiliates | | | 1.87% | | | | 1.92% | | | | 1.94% | | | | 1.97% | | | | 1.99% | | | | 2.02% | |
| | | | | | |
Net investment income (loss) | | | 2.11% | | | | 0.19% | | | | (0.01)% | | | | 1.25% | d | | | 0.33% | | | | (0.05)% | |
| | | | | | |
Supplemental data | | | | | | | | | | | | | | | | | | | | | | | | |
| | | | | | |
Net assets, end of period (000’s) | | | $236,864 | | | | $268,761 | | | | $315,469 | | | | $257,388 | | | | $257,977 | | | | $277,148 | |
| | | | | | |
Portfolio turnover rate | | | 3.35% | | | | 12.22% | | | | 7.57% | | | | 21.26% | | | | 18.09% | | | | 19.21% | |
aThe amount shown for a share outstanding throughout the period may not correlate with the Statement of Operations for the period due to the timing of sales and repurchases of the Fund’s shares in relation to income earned and/or fluctuating fair value of the investments of the Fund.
bBased on average daily shares outstanding.
cAmount rounds to less than $0.01 per share.
dNet investment income per share includes approximately $0.09 per share related to income received in the form of special dividends in connection with certain Fund holdings. Excluding this amount, the ratio of net investment income to average net assets would have been 0.48%.
eTotal return does not reflect sales commissions or contingent deferred sales charges, if applicable, and is not annualized for periods less than one year.
fRatios are annualized for periods less than one year.
| | | | |
| | | |
10 | | Semiannual Report | The accompanying notes are an integral part of these financial statements. | | franklintempleton.com |
TEMPLETON GLOBAL INVESTMENT TRUST
FINANCIAL HIGHLIGHTS
Templeton Emerging Markets Small Cap Fund(continued)
| | | | | | | | | | | | | | | | | | | | | | | | |
| | | Six Months Ended | | | | | | | | | | | | | | | | |
| | | September 30, 2019 | | | | | | Year Ended March 31, | | | | |
| | | (unaudited) | | | 2019 | | | 2018 | | | 2017 | | | 2016 | | | 2015 | |
| | | | | | |
Class C | | | | | | | | | | | | | | | | | | | | | | | | |
| | | | | | |
Per share operating performance | | | | | | | | | | | | | | | | | | | | | | | | |
(for a share outstanding throughout the period) | | | | | | | | | | | | | | | | | | | | | | | | |
| | | | | | |
Net asset value, beginning of period | | | $13.02 | | | | $14.54 | | | | $12.51 | | | | $10.96 | | | | $11.82 | | | | $11.30 | |
| | | | | | |
Income from investment operationsa: | | | | | | | | | | | | | | | | | | | | | | | | |
| | | | | | |
Net investment income (loss)b | | | 0.09 | | | | (0.06 | ) | | | (0.10 | ) | | | 0.07 | c | | | (0.04 | ) | | | (0.08 | ) |
| | | | | | |
Net realized and unrealized gains (losses) | | | (1.13 | ) | | | (1.11 | ) | | | 2.13 | | | | 1.59 | | | | (0.82 | ) | | | 0.60 | |
| | | | | | |
Total from investment operations | | | (1.04 | ) | | | (1.17 | ) | | | 2.03 | | | | 1.66 | | | | (0.86 | ) | | | 0.52 | |
| | | | | | |
Less distributions from: | | | | | | | | | | | | | | | | | | | | | | | | |
| | | | | | |
Net investment income | | | — | | | | — | | | | — | | | | (0.11 | ) | | | — | | | | — | |
| | | | | | |
Net realized gains | | | — | | | | (0.35 | ) | | | — | | | | — | | | | — | | | | — | |
| | | | | | |
Total distributions | | | — | | | | (0.35 | ) | | | — | | | | (0.11 | ) | | | — | | | | — | |
| | | | | | |
Net asset value, end of period | | | $11.98 | | | | $13.02 | | | | $14.54 | | | | $12.51 | | | | $10.96 | | | | $11.82 | |
| | | | | | |
Total returnd | | | (7.99)% | | | | (7.85)% | | | | 16.23% | | | | 15.29% | | | | (7.28)% | | | | 4.60% | |
| | | | | | |
Ratios to average net assetse | | | | | | | | | | | | | | | | | | | | | | | | |
| | | | | | |
Expenses before waiver and payments by affiliates | | | 2.64% | | | | 2.69% | | | | 2.71% | | | | 2.72% | | | | 2.73% | | | | 2.74% | |
| | | | | | |
Expenses net of waiver and payments by affiliates | | | 2.62% | | | | 2.67% | | | | 2.69% | | | | 2.71% | | | | 2.72% | | | | 2.72% | |
| | | | | | |
Net investment income (loss) | | | 1.36% | | | | (0.56)% | | | | (0.76)% | | | | 0.51% | c | | | (0.40)% | | | | (0.75)% | |
| | | | | | |
Supplemental data | | | | | | | | | | | | | | | | | | | | | | | | |
| | | | | | |
Net assets, end of period (000’s) | | | $39,398 | | | | $52,300 | | | | $78,836 | | | | $62,889 | | | | $62,148 | | | | $73,687 | |
| | | | | | |
Portfolio turnover rate | | | 3.35% | | | | 12.22% | | | | 7.57% | | | | 21.26% | | | | 18.09% | | | | 19.21% | |
aThe amount shown for a share outstanding throughout the period may not correlate with the Statement of Operations for the period due to the timing of sales and repurchases of the Fund’s shares in relation to income earned and/or fluctuating fair value of the investments of the Fund.
bBased on average daily shares outstanding.
cNet investment income per share includes approximately $0.09 per share related to income received in the form of special dividends in connection with certain Fund holdings. Excluding this amount, the ratio of net investment income to average net assets would have been (0.26)%.
dTotal return does not reflect sales commissions or contingent deferred sales charges, if applicable, and is not annualized for periods less than one year.
eRatios are annualized for periods less than one year.
| | | | |
| | | |
| franklintempleton.com | | The accompanying notes are an integral part of these financial statements. | Semiannual Report | | 11 |
TEMPLETON GLOBAL INVESTMENT TRUST
FINANCIAL HIGHLIGHTS
Templeton Emerging Markets Small Cap Fund(continued)
| | | | | | | | | | | | | | | | | | | | | | | | |
| | | Six Months Ended | | | | | | | | | | | | | | | | |
| | | September 30, 2019 | | | | | | Year Ended March 31, | | | | |
| | | (unaudited) | | | 2019 | | | 2018 | | | 2017 | | | 2016 | | | 2015 | |
| | | | | | |
Class R | | | | | | | | | | | | | | | | | | | | | | | | |
| | | | | | |
Per share operating performance | | | | | | | | | | | | | | | | | | | | | | | | |
(for a share outstanding throughout the period) | | | | | | | | | | | | | | | | | | | | | | | | |
| | | | | | |
Net asset value, beginning of period | | | $13.62 | | | | $15.11 | | | | $12.93 | | | | $11.33 | | | | $12.16 | | | | $11.56 | |
| | | | | | |
Income from investment operationsa: | | | | | | | | | | | | | | | | | | | | | | | | |
| | | | | | |
Net investment income (loss)b | | | 0.12 | | | | (0.05 | ) | | | (0.04 | ) | | | 0.12 | c | | | 0.02 | | | | — | d |
| | | | | | |
Net realized and unrealized gains (losses) | | | (1.18 | ) | | | (1.09 | ) | | | 2.22 | | | | 1.65 | | | | (0.85 | ) | | | 0.60 | |
| | | | | | |
Total from investment operations | | | (1.06 | ) | | | (1.14 | ) | | | 2.18 | | | | 1.77 | | | | (0.83 | ) | | | 0.60 | |
| | | | | | |
Less distributions from: | | | | | | | | | | | | | | | | | | | | | | | | |
| | | | | | |
Net investment income | | | — | | | | — | | | | — | | | | (0.17 | ) | | | (— | )d | | | — | |
| | | | | | |
Net realized gains | | | — | | | | (0.35 | ) | | | — | | | | — | | | | — | | | | — | |
| | | | | | |
Total distributions | | | — | | | | (0.35 | ) | | | — | | | | (0.17 | ) | | | (— | )d | | | — | |
| | | | | | |
Net asset value, end of period | | | $12.56 | | | | $13.62 | | | | $15.11 | | | | $12.93 | | | | $11.33 | | | | $12.16 | |
| | | | | | |
Total returne | | | (7.78)% | | | | (7.29)% | | | | 16.86% | | | | 15.84% | | | | (6.82)% | | | | 5.19% | |
| | | | | | |
Ratios to average net assetsf | | | | | | | | | | | | | | | | | | | | | | | | |
| | | | | | |
Expenses before waiver and payments by affiliates | | | 2.14% | | | | 2.19% | | | | 2.21% | | | | 2.23% | | | | 2.23% | | | | 2.24% | |
| | | | | | |
Expenses net of waiver and payments by affiliates | | | 2.12% | | | | 2.17% | | | | 2.19% | | | | 2.22% | | | | 2.22% | | | | 2.22% | |
| | | | | | |
Net investment income (loss) | | | 1.86% | | | | (0.06)% | | | | (0.26)% | | | | 1.00% | c | | | 0.10% | | | | (0.25)% | |
| | | | | | |
Supplemental data | | | | | | | | | | | | | | | | | | | | | | | | |
| | | | | | |
Net assets, end of period (000’s) | | | $1,827 | | | | $1,728 | | | | $929 | | | | $532 | | | | $477 | | | | $579 | |
| | | | | | |
Portfolio turnover rate | | | 3.35% | | | | 12.22% | | | | 7.57% | | | | 21.26% | | | | 18.09% | | | | 19.21% | |
aThe amount shown for a share outstanding throughout the period may not correlate with the Statement of Operations for the period due to the timing of sales and repurchases of the Fund’s shares in relation to income earned and/or fluctuating fair value of the investments of the Fund.
bBased on average daily shares outstanding.
cNet investment income per share includes approximately $0.09 per share related to income received in the form of special dividends in connection with certain Fund holdings. Excluding this amount, the ratio of net investment income to average net assets would have been 0.23%.
dAmount rounds to less than $0.01 per share.
eTotal return is not annualized for periods less than one year.
fRatios are annualized for periods less than one year.
| | | | |
| | | |
12 | | Semiannual Report | The accompanying notes are an integral part of these financial statements. | | franklintempleton.com |
TEMPLETON GLOBAL INVESTMENT TRUST
FINANCIAL HIGHLIGHTS
Templeton Emerging Markets Small Cap Fund(continued)
| | | | | | | | | | | | |
| | | Six Months Ended | | | | | | | |
| | | September 30, 2019 | | | Year Ended March 31, | |
| | | (unaudited) | | | 2019 | | | 2018a | |
| | | |
Class R6 | | | | | | | | | | | | |
| | | |
Per share operating performance | | | | | | | | | | | | |
| | | |
(for a share outstanding throughout the period) | | | | | | | | | | | | |
| | | |
Net asset value, beginning of period | | | $13.94 | | | | $15.41 | | | | $14.41 | |
| | | |
Income from investment operationsb: | | | | | | | | | | | | |
| | | |
Net investment income (loss)c | | | 0.17 | | | | (0.07 | ) | | | (0.04 | ) |
| | | |
Net realized and unrealized gains (losses) | | | (1.21 | ) | | | (1.01 | ) | | | 1.08 | |
| | | |
Total from investment operations | | | (1.04 | ) | | | (1.08 | ) | | | 1.04 | |
| | | |
Less distributions from: | | | | | | | | | | | | |
| | | |
Net investment income | | | — | | | | (0.04 | ) | | | (0.04 | ) |
| | | |
Net realized gains | | | — | | | | (0.35 | ) | | | — | |
| | | |
Total distributions | | | — | | | | (0.39 | ) | | | (0.04 | ) |
| | | |
Net asset value, end of period | | | $12.90 | | | | $13.94 | | | | $15.41 | |
| | | |
Total returnd | | | (7.46)% | | | | (6.76)% | | | | 7.27% | |
| | | |
Ratios to average net assetse | | | | | | | | | | | | |
| | | |
Expenses before waiver and payments by affiliates | | | 1.50% | | | | 1.57% | | | | 1.59% | |
| | | |
Expenses net of waiver and payments by affiliates | | | 1.48% | | | | 1.55% | | | | 1.54% | |
| | | |
Net investment income | | | 2.50% | | | | 0.56% | f | | | 0.39% | f |
| | | |
Supplemental data | | | | | | | | | | | | |
| | | |
Net assets, end of period (000’s) | | | $124,863 | | | | $198,106 | | | | $23,964 | |
| | | |
Portfolio turnover rate | | | 3.35% | | | | 12.22% | | | | 7.57% | |
aFor the period August 1, 2017 (effective date) to March 31, 2018.
bThe amount shown for a share outstanding throughout the period may not correlate with the Statement of Operations for the period due to the timing of sales and repurchases of the Fund’s shares in relation to income earned and/or fluctuating fair value of the investments of the Fund.
cBased on average daily shares outstanding.
dTotal return is not annualized for periods less than one year.
eRatios are annualized for periods less than one year.
fRatio is calculated based on the Fund level net investment income, as reflected in the Statement of Operations, and adjusted for class specific expenses. The amount may not correlate with the per share amount due to the timing of income earned and/or fluctuating fair value of the investments of the Fund in relation to the timing of sales and repurchases of Fund shares.
| | | | |
| | | |
| franklintempleton.com | | The accompanying notes are an integral part of these financial statements. | Semiannual Report | | 13 |
TEMPLETON GLOBAL INVESTMENT TRUST
FINANCIAL HIGHLIGHTS
Templeton Emerging Markets Small Cap Fund(continued)
| | | | | | | | | | | | | | | | | | | | | | | | |
| | | Six Months Ended | | | | | | | | | | | | | | | | |
| | | September 30, 2019 | | | | | | Year Ended March 31, | | | | |
| | | (unaudited) | | | 2019 | | | 2018 | | | 2017 | | | 2016 | | | 2015 | |
| | | | | | |
Advisor Class | | | | | | | | | | | | | | | | | | | | | | | | |
| | | | | | |
Per share operating performance | | | | | | | | | | | | | | | | | | | | | | | | |
(for a share outstanding throughout the period) | | | | | | | | | | | | | | | | | | | | | | | | |
| | | | | | |
Net asset value, beginning of period | | | $13.96 | | | | $15.42 | | | | $13.15 | | | | $11.52 | | | | $12.37 | | | | $11.76 | |
| | | | | | |
Income from investment operationsa: | | | | | | | | | | | | | | | | | | | | | | | | |
| | | | | | |
Net investment incomeb | | | 0.16 | | | | 0.09 | | | | 0.03 | | | | 0.18 | c | | | 0.07 | | | | 0.02 | |
| | | | | | |
Net realized and unrealized gains (losses) | | | (1.21 | ) | | | (1.19 | ) | | | 2.26 | | | | 1.68 | | | | (0.86 | ) | | | 0.65 | |
| | | | | | |
Total from investment operations | | | (1.05 | ) | | | (1.10 | ) | | | 2.29 | | | | 1.86 | | | | (0.79 | ) | | | 0.67 | |
| | | | | | |
Less distributions from: | | | | | | | | | | | | | | | | | | | | | | | | |
| | | | | | |
Net investment income | | | — | | | | (0.01 | ) | | | (0.02 | ) | | | (0.23 | ) | | | (0.06 | ) | | | (0.06 | ) |
| | | | | | |
Net realized gains | | | — | | | | (0.35 | ) | | | — | | | | — | | | | — | | | | — | |
| | | | | | |
Total distributions | | | — | | | | (0.36 | ) | | | (0.02 | ) | | | (0.23 | ) | | | (0.06 | ) | | | (0.06 | ) |
| | | | | | |
Net asset value, end of period | | | $12.91 | | | | $13.96 | | | | $15.42 | | | | $13.15 | | | | $11.52 | | | | $12.37 | |
| | | | | | |
Total returnd | | | (7.52)% | | | | (6.90)% | | | | 17.48% | | | | 16.42% | | | | (6.35)% | | | | 5.66% | |
| | | | | | |
Ratios to average net assetse | | | | | | | | | | | | | | | | | | | | | | | | |
| | | | | | |
Expenses before waiver and payments by affiliates | | | 1.64% | | | | 1.69% | | | | 1.71% | | | | 1.73% | | | | 1.73% | | | | 1.74% | |
| | | | | | |
Expenses net of waiver and payments by affiliates | | | 1.62% | | | | 1.67% | | | | 1.69% | | | | 1.72% | | | | 1.72% | | | | 1.72% | |
| | | | | | |
Net investment income | | | 2.36% | | | | 0.44% | | | | 0.24% | | | | 1.50% | c | | | 0.60% | | | | 0.25% | |
| | | | | | |
Supplemental data | | | | | | | | | | | | | | | | | | | | | | | | |
| | | | | | |
Net assets, end of period (000’s) | | | $344,675 | | | | $387,850 | | | | $668,474 | | | | $442,583 | | | | $361,128 | | | | $363,848 | |
| | | | | | |
Portfolio turnover rate | | | 3.35% | | | | 12.22% | | | | 7.57% | | | | 21.26% | | | | 18.09% | | | | 19.21% | |
aThe amount shown for a share outstanding throughout the period may not correlate with the Statement of Operations for the period due to the timing of sales and repurchases of the Fund’s shares in relation to income earned and/or fluctuating fair value of the investments of the Fund.
bBased on average daily shares outstanding.
cNet investment income per share includes approximately $0.09 per share related to income received in the form of special dividends in connection with certain Fund holdings. Excluding this amount, the ratio of net investment income to average net assets would have been 0.73%.
dTotal return is not annualized for periods less than one year.
eRatios are annualized for periods less than one year.
| | | | |
| | | |
14 | | Semiannual Report | The accompanying notes are an integral part of these financial statements. | | franklintempleton.com |
TEMPLETON GLOBAL INVESTMENT TRUST
Statement of Investments, September 30, 2019 (unaudited)
Templeton Emerging Markets Small Cap Fund
| | | | | | | | | | |
| | | Industry | | Shares | | | Value | |
| | | |
Common Stocks 99.0% | | | | | | | | | | |
Brazil 3.7% | | | | | | | | | | |
Arezzo Industria e Comercio SA | | Textiles, Apparel & Luxury Goods | | | 236,100 | | | $ | 2,813,102 | |
Duratex SA | | Paper & Forest Products | | | 3,747,000 | | | | 11,404,677 | |
Grendene SA | | Textiles, Apparel & Luxury Goods | | | 3,067,836 | | | | 6,443,995 | |
Ser Educacional SA | | Diversified Consumer Services | | | 902,500 | | | | 4,859,774 | |
Wiz Solucoes e Corretagem de seguros SA | | Insurance | | | 659,685 | | | | 1,769,784 | |
| | | |
| | | | | | | | | 27,291,332 | |
China 20.1% | | | | | | | | | | |
Amvig Holdings Ltd. | | Containers & Packaging | | | 6,108,000 | | | | 1,461,169 | |
a,bBaozun Inc., ADR | | Internet & Direct Marketing Retail | | | 348,708 | | | | 14,889,832 | |
China Everbright Ltd. | | Capital Markets | | | 3,480,000 | | | | 4,071,448 | |
Chinasoft International Ltd. | | IT Services | | | 8,008,000 | | | | 3,535,090 | |
COSCO SHIPPING Ports Ltd. | | Transportation Infrastructure | | | 7,301,506 | | | | 5,831,591 | |
Fanhua Inc., ADR | | Insurance | | | 201,020 | | | | 5,353,163 | |
bHealth & Happiness H&H International Holdings Ltd. | | Food Products | | | 4,268,300 | | | | 17,998,101 | |
Huaxin Cement Co. Ltd., B | | Construction Materials | | | 9,416,474 | | | | 18,503,371 | |
I.T Ltd. | | Specialty Retail | | | 12,576,295 | | | | 3,497,917 | |
JNBY Design Ltd. | | Textiles, Apparel & Luxury Goods | | | 3,229,000 | | | | 4,638,811 | |
Ju Teng International Holdings Ltd. | | Electronic Equipment, Instruments & Components | | | 17,608,000 | | | | 4,133,597 | |
Luk Fook Holdings (International) Ltd. | | Specialty Retail | | | 3,888,000 | | | | 9,762,288 | |
bLuye Pharma Group Ltd. | | Pharmaceuticals | | | 9,551,500 | | | | 6,812,142 | |
aNoah Holdings Ltd., ADR | | Capital Markets | | | 214,154 | | | | 6,253,297 | |
Sunny Optical Technology Group Co. Ltd. | | Electronic Equipment, Instruments & Components | | | 439,800 | | | | 6,464,099 | |
TravelSky Technology Ltd., H | | IT Services | | | 3,627,200 | | | | 7,534,010 | |
Uni-President China Holdings Ltd. | | Food Products | | | 8,091,000 | | | | 8,733,189 | |
Weifu High-Technology Co. Ltd., B | | Auto Components | | | 1,988,000 | | | | 3,150,201 | |
Xinyi Solar Holdings Ltd. | | Semiconductors & Semiconductor Equipment | | | 19,621,816 | | | | 11,766,230 | |
Xtep International Holdings Ltd. | | Textiles, Apparel & Luxury Goods | | | 11,029,100 | | | | 5,966,315 | |
| | | |
| | | | | | | | | 150,355,861 | |
Czech Republic 0.9% | | | | | | | | | | |
Moneta Money Bank AS | | Banks | | | 2,096,954 | | | | 6,464,094 | |
| | | |
Egypt 1.7% | | | | | | | | | | |
Eastern Co SAE | | Tobacco | | | 5,233,095 | | | | 5,323,626 | |
Egyptian International Pharmaceuticals EIPICO | | Pharmaceuticals | | | 669,304 | | | | 2,815,121 | |
Integrated Diagnostics Holdings PLC | | Health Care Providers & Services | | | 1,049,430 | | | | 4,827,378 | |
| | | |
| | | | | | | | | 12,966,125 | |
Georgia 0.6% | | | | | | | | | | |
Georgia Healthcare Group PLC | | Food & Staples Retailing | | | 1,950,607 | | | | 4,796,152 | |
| | | |
Hungary 3.0% | | | | | | | | | | |
Richter Gedeon Nyrt | | Pharmaceuticals | | | 791,640 | | | | 12,806,832 | |
aWizz Air Holdings PLC | | Airlines | | | 211,378 | | | | 9,394,232 | |
| | | |
| | | | | | | | | 22,201,064 | |
| | | | |
| | | |
| franklintempleton.com | | Semiannual Report | | 15 |
TEMPLETON GLOBAL INVESTMENT TRUST
STATEMENT OF INVESTMENTS (UNAUDITED)
Templeton Emerging Markets Small Cap Fund(continued)
| | | | | | | | | | |
| | | Industry | | Shares | | | Value | |
| | | |
Common Stocks(continued) | | | | | | | | | | |
India 16.7% | | | | | | | | | | |
Apollo Tyres Ltd. | | Auto Components | | | 5,470,614 | | | $ | 14,066,629 | |
Bajaj Holdings & Investment Ltd. | | Diversified Financial Services | | | 845,882 | | | | 43,024,496 | |
Dalmia Bharat Ltd. | | Construction Materials | | | 364,920 | | | | 4,249,178 | |
aEquitas Holdings Ltd. | | Consumer Finance | | | 3,113,000 | | | | 4,573,988 | |
Federal Bank Ltd. | | Banks | | | 9,476,047 | | | | 12,125,906 | |
Glenmark Pharmaceuticals Ltd. | | Pharmaceuticals | | | 1,197,798 | | | | 5,511,278 | |
JK Cement Ltd. | | Construction Materials | | | 739,388 | | | | 10,993,222 | |
Redington India Ltd. | | Electronic Equipment, Instruments & Components | | | 5,749,387 | | | | 9,558,575 | |
Tata Chemicals Ltd. | | Chemicals | | | 1,700,500 | | | | 14,176,651 | |
Vardhman Textiles Ltd. | | Textiles, Apparel & Luxury Goods | | | 468,044 | | | | 6,260,242 | |
| | | |
| | | | | | | | | 124,540,165 | |
Indonesia 0.4% | | | | | | | | | | |
Hexindo Adiperkasa Tbk PT | | Trading Companies & Distributors | | | 13,008,000 | | | | 3,161,508 | |
| | | |
Malaysia 0.6% | | | | | | | | | | |
7-Eleven Malaysia Holdings Bhd | | Food & Staples Retailing | | | 13,414,564 | | | | 4,645,598 | |
| | | |
Mexico 1.7% | | | | | | | | | | |
Grupo Herdez SAB de CV | | Food Products | | | 4,480,974 | | | | 9,514,372 | |
Nemak SAB de CV | | Auto Components | | | 6,720,300 | | | | 3,030,905 | |
| | | |
| | | | | | | | | 12,545,277 | |
Nigeria 0.1% | | | | | | | | | | |
UAC of Nigeria PLC | | Food Products | | | 45,432,007 | | | | 938,885 | |
| | | |
Pakistan 0.4% | | | | | | | | | | |
Habib Bank Ltd. | | Banks | | | 2,963,600 | | | | 2,229,081 | |
United Bank Ltd. | | Banks | | | 405,500 | | | | 358,289 | |
| | | |
| | | | | | | | | 2,587,370 | |
Peru 1.1% | | | | | | | | | | |
Intercorp Financial Services Inc. | | Banks | | | 200,780 | | | | 8,231,980 | |
| | | |
Philippines 1.9% | | | | | | | | | | |
DMCI Holdings Inc. | | Industrial Conglomerates | | | 15,192,600 | | | | 2,436,327 | |
International Container Terminal Services Inc. | | Transportation Infrastructure | | | 4,953,880 | | | | 11,509,980 | |
| | | |
| | | | | | | | | 13,946,307 | |
Poland 1.6% | | | | | | | | | | |
Amica SA | | Household Durables | | | 112,408 | | | | 3,161,961 | |
Stock Spirits Group PLC | | Beverages | | | 3,181,741 | | | | 9,114,104 | |
| | | |
| | | | | | | | | 12,276,065 | |
Russia 1.2% | | | | | | | | | | |
aMail.Ru Group Ltd., GDR | | Interactive Media & Services | | | 263,824 | | | | 5,529,751 | |
TMK PAO, GDR | | Energy Equipment & Services | | | 895,595 | | | | 3,027,111 | |
| | | |
| | | | | | | | | 8,556,862 | |
Saudi Arabia 1.3% | | | | | | | | | | |
Mouwasat Medical Services Co. | | Health Care Providers & Services | | | 426,140 | | | | 9,974,166 | |
| | | |
South Africa 0.3% | | | | | | | | | | |
Massmart Holdings Ltd. | | Food & Staples Retailing | | | 801,259 | | | | 2,319,016 | |
| | | | |
| | | |
16 | | Semiannual Report | | franklintempleton.com |
TEMPLETON GLOBAL INVESTMENT TRUST
STATEMENT OF INVESTMENTS (UNAUDITED)
Templeton Emerging Markets Small Cap Fund(continued)
| | | | | | | | | | |
| | | Industry | | Shares | | | Value | |
Common Stocks(continued) | | | | | | | | | | |
South Korea 10.3% | | | | | | | | | | |
Cosmecca Korea Co. Ltd. | | Personal Products | | | 226,111 | | | $ | 2,743,585 | |
Fila Korea Ltd. | | Textiles, Apparel & Luxury Goods | | | 297,663 | | | | 14,372,660 | |
Hankook Technology Group Co. Ltd. | | Diversified Financial Services | | | 656,000 | | | | 7,823,005 | |
Hans Biomed Corp. | | Biotechnology | | | 435,466 | | | | 7,934,863 | |
Interojo Co. Ltd. | | Health Care Equipment & Supplies | | | 114,546 | | | | 2,421,540 | |
Interpark Holdings Corp. | | Internet & Direct Marketing Retail | | | 170,863 | | | | 333,425 | |
I-Sens Inc. | | Health Care Equipment & Supplies | | | 181,746 | | | | 4,168,034 | |
Mando Corp. | | Auto Components | | | 306,807 | | | | 9,262,059 | |
Medy-tox Inc. | | Biotechnology | | | 27,193 | | | | 8,166,086 | |
Sebang Global Battery Co. Ltd. | | Auto Components | | | 238,646 | | | | 7,801,425 | |
Silicon Works Co. Ltd. | | Semiconductors & Semiconductor Equipment | | | 291,623 | | | | 8,292,966 | |
Vieworks Co. Ltd. | | Health Care Equipment & Supplies | | | 151,355 | | | | 3,123,962 | |
Youngone Corp. | | Textiles, Apparel & Luxury Goods | | | 21,387 | | | | 636,725 | |
| | | |
| | | | | | | | | 77,080,335 | |
| | | |
Sri Lanka 1.2% | | | | | | | | | | |
Hatton National Bank PLC | | Banks | | | 3,448,275 | | | | 2,902,515 | |
Hemas Holdings PLC | | Industrial Conglomerates | | | 15,513,186 | | | | 6,388,409 | |
| | | |
| | | | | | | | | 9,290,924 | |
| | | |
Taiwan 15.7% | | | | | | | | | | |
ADLINK Technology Inc. | | Technology Hardware, Storage & Peripherals | | | 4,328,797 | | | | 6,818,211 | |
Eclat Textile Co. Ltd. | | Textiles, Apparel & Luxury Goods | | | 544,400 | | | | 7,294,672 | |
FIT Hon Teng Ltd. | | Electronic Equipment, Instruments & Components | | | 25,437,900 | | | | 10,450,508 | |
Flytech Technology Co. Ltd. | | Electronic Equipment, Instruments & Components | | | 2,181,220 | | | | 5,079,630 | |
Merida Industry Co. Ltd. | | Leisure Products | | | 3,007,100 | | | | 17,095,702 | |
Novatek Microelectronics Corp. Ltd. | | Semiconductors & Semiconductor Equipment | | | 2,464,000 | | | | 14,127,166 | |
Pacific Hospital Supply Co. Ltd. | | Health Care Equipment & Supplies | | | 1,552,000 | | | | 4,314,166 | |
aPChome Online Inc. | | Internet & Direct Marketing Retail | | | 2,081,035 | | | | 8,680,475 | |
aPharmaEssentia Corp. | | Biotechnology | | | 2,369,200 | | | | 8,547,008 | |
Primax Electronics Ltd. | | Technology Hardware, Storage & Peripherals | | | 8,621,100 | | | | 16,411,358 | |
Shin Zu Shing Co. Ltd. | | Machinery | | | 1,793,000 | | | | 6,670,473 | |
St. Shine Optical Co. Ltd. | | Health Care Equipment & Supplies | | | 537,000 | | | | 7,662,533 | |
TTY Biopharm Co. Ltd. | | Pharmaceuticals | | | 1,626,900 | | | | 4,150,309 | |
| | | |
| | | | | | | | | 117,302,211 | |
| | | |
Thailand 2.2% | | | | | | | | | | |
Dynasty Ceramic PCL, fgn | | Building Products | | | 23,444,540 | | | | 1,547,646 | |
Major Cineplex Group PCL, fgn | | Entertainment | | | 5,920,300 | | | | 4,624,025 | |
TISCO Financial Group PCL, fgn | | Banks | | | 3,147,500 | | | | 10,543,097 | |
| | | |
| | | | | | | | | 16,714,768 | |
| | | |
Turkey 2.3% | | | | | | | | | | |
DO & CO Restaurants & Catering AG | | Hotels, Restaurants & Leisure | | | 91,274 | | | | 8,465,924 | |
aMavi Giyim Sanayi Ve Ticaret AS, B | | Textiles, Apparel & Luxury Goods | | | 521,341 | | | | 4,257,088 | |
Soda Sanayii AS | | Chemicals | | | 4,380,215 | | | | 4,581,377 | |
| | | |
| | | | | | | | | 17,304,389 | |
| | | | |
| | | |
| franklintempleton.com | | Semiannual Report | | 17 |
TEMPLETON GLOBAL INVESTMENT TRUST
STATEMENT OF INVESTMENTS (UNAUDITED)
Templeton Emerging Markets Small Cap Fund(continued)
| | | | | | | | | | |
| | | Industry | | Shares | | | Value | |
Common Stocks(continued) | | | | | | | | | | |
| | | |
United Arab Emirates 1.7% | | | | | | | | | | |
Agthia Group PJSC | | Food Products | | | 1,299,581 | | | $ | 1,273,700 | |
Aramex PJSC | | Air Freight & Logistics | | | 10,430,242 | | | | 11,386,758 | |
| | | |
| | | | | | | | | 12,660,458 | |
United States 2.1% | | | | | | | | | | |
aIMAX Corp. | | Entertainment | | | 700,708 | | | | 15,380,541 | |
| | | |
Vietnam 6.2% | | | | | | | | | | |
FPT Corp. | | Electronic Equipment, Instruments & Components | | | 3,056,198 | | | | 7,600,648 | |
aHoa Phat Group JSC | | Metals & Mining | | | 18,364,958 | | | | 17,374,718 | |
aMasan Group Corp. | | Food Products | | | 2,374,060 | | | | 8,032,572 | |
Vietnam Container Shipping JSC | | Marine | | | 1,605,540 | | | | 1,903,036 | |
Vincom Retail JSC | | Real Estate Management & Development | | | 8,204,082 | | | | 11,704,456 | |
| | | |
| | | | | | | | | 46,615,430 | |
| | | |
Total Common Stocks (Cost $699,429,624) | | | | | | | | | 740,146,883 | |
| | | |
Preferred Stocks 0.9% | | | | | | | | | | |
| | | |
Brazil 0.4% | | | | | | | | | | |
cMarcopolo SA, 4.615%, pfd | | Machinery | | | 3,636,826 | | | | 2,843,903 | |
| | | |
Chile 0.5% | | | | | | | | | | |
cEmbotelladora Andina SA, 4.095%, pfd., A | | Beverages | | | 1,250,500 | | | | 3,601,448 | |
| | | |
Total Preferred Stocks (Cost $6,261,008) | | | | | | | | | 6,445,351 | |
| | | |
Total Investments before Short Term
Investments (Cost $705,690,632) | | | | | | | | | 746,592,234 | |
| | | |
Short Term Investments 2.2% | | | | | | | | | | |
| | | |
Money Market Funds (Cost $36,077) 0.0%† | | | | | | | | | | |
| | | |
United States 0.0%† | | | | | | | | | | |
d,eInstitutional Fiduciary Trust Money Market Portfolio, 1.71% | | | | | 36,077 | | | | 36,077 | |
| | | |
fInvestments from Cash Collateral Received for Loaned Securities 2.2% | | | | | | | | | | |
Money Market Funds (Cost $16,502,463) 2.2% | | | | | | | | | | |
United States 2.2% | | | | | | | | | | |
d,eInstitutional Fiduciary Trust Money Market Portfolio, 1.71% | | | | | 16,502,463 | | | | 16,502,463 | |
| | | |
Total Investments (Cost $722,229,172) 102.1% | | | | | | | | | 763,130,774 | |
| | | |
Other Assets, less Liabilities (2.1)% | | | | | | | | | (15,504,342 | ) |
| | | |
Net Assets 100.0% | | | | | | | | $ | 747,626,432 | |
| | | | |
| | | |
18 | | Semiannual Report | | franklintempleton.com |
TEMPLETON GLOBAL INVESTMENT TRUST
STATEMENT OF INVESTMENTS (UNAUDITED)
Templeton Emerging Markets Small Cap Fund(continued)
See Abbreviations on page 32.
†Rounds to less than 0.1% of net assets.
aNon-income producing.
bA portion or all of the security is on loan at September 30, 2019. See Note 1(c).
cVariable rate security. The rate shown represents the yield at period end.
dSee Note 3(f) regarding investments in affiliated management investment companies.
eThe rate shown is the annualizedseven-day effective yield at period end.
fSee Note 1(c) regarding securities on loan.
| | | | |
| | | |
| franklintempleton.com | | The accompanying notes are an integral part of these financial statements. | Semiannual Report | | 19 |
TEMPLETON GLOBAL INVESTMENT TRUST
FINANCIAL STATEMENTS
Statement of Assets and Liabilities
September 30, 2019 (unaudited)
Templeton Emerging Markets Small Cap Fund
| | | | |
Assets: | | | | |
Investments in securities: | | | | |
Cost - Unaffiliated issuers | | | $705,690,632 | |
Cost -Non-controlled affiliates (Note 3f and 8) | | | 16,538,540 | |
| | | | |
Value - Unaffiliated issuers+ | | | $746,592,234 | |
Value -Non-controlled affiliates (Note 3f and 8) | | | 16,538,540 | |
Receivables: | | | | |
Investment securities sold | | | 8,892,931 | |
Capital shares sold | | | 606,042 | |
Dividends | | | 1,479,130 | |
European Union tax reclaims | | | 262,166 | |
Due from custodian | | | 133,500 | |
Other assets | | | 356 | |
| | | | |
| |
Total assets | | | 774,504,899 | |
| | | | |
| |
Liabilities: | | | | |
Payables: | | | | |
Capital shares redeemed | | | 2,785,237 | |
Management fees | | | 890,238 | |
Distribution fees | | | 173,351 | |
Transfer agent fees | | | 213,151 | |
Trustees’ fees and expenses | | | 667 | |
Funds advanced by custodian | | | 5,945,919 | |
Payable upon return of securities loaned | | | 16,635,963 | |
Accrued expenses and other liabilities | | | 233,941 | |
| | | | |
| |
Total liabilities | | | 26,878,467 | |
| | | | |
| |
Net assets, at value | | | $747,626,432 | |
| | | | |
Net assets consist of: | | | | |
Paid-in capital | | | $695,430,344 | |
Total distributable earnings (loss) | | | 52,196,088 | |
| | | | |
| |
Net assets, at value | | | $747,626,432 | |
| | | | |
| |
+Includes securities loaned | | | $ 15,927,377 | |
| | | | |
| | | |
20 | | Semiannual Report | The accompanying notes are an integral part of these financial statements. | | franklintempleton.com |
TEMPLETON GLOBAL INVESTMENT TRUST
FINANCIAL STATEMENTS
Statement of Assets and Liabilities(continued)
September 30, 2019 (unaudited)
Templeton Emerging Markets Small Cap Fund
| | | | |
Class A: | | | | |
Net assets, at value | | | $236,863,860 | |
| | | | |
Shares outstanding | | | 18,610,941 | |
| | | | |
Net asset value per sharea | | | $12.73 | |
| | | | |
Maximum offering price per share (net asset value per share ÷ 94.50%) | | | $13.47 | |
| | | | |
Class C: | | | | |
Net assets, at value | | | $ 39,397,660 | |
| | | | |
Shares outstanding | | | 3,287,993 | |
| | | | |
Net asset value and maximum offering price per sharea | | | $11.98 | |
| | | | |
Class R: | | | | |
Net assets, at value | | | $ 1,826,996 | |
| | | | |
Shares outstanding | | | 145,468 | |
| | | | |
Net asset value and maximum offering price per share | | | $12.56 | |
| | | | |
Class R6: | | | | |
Net assets, at value | | | $124,863,211 | |
| | | | |
Shares outstanding | | | 9,680,964 | |
| | | | |
Net asset value and maximum offering price per share | | | $12.90 | |
| | | | |
Advisor Class: | | | | |
Net assets, at value | | | $344,674,705 | |
| | | | |
Shares outstanding | | | 26,701,792 | |
| | | | |
Net asset value and maximum offering price per share | | | $12.91 | |
| | | | |
aRedemption price is equal to net asset value less contingent deferred sales charges, if applicable.
| | | | |
| | | |
| franklintempleton.com | | The accompanying notes are an integral part of these financial statements. | Semiannual Report | | 21 |
TEMPLETON GLOBAL INVESTMENT TRUST
FINANCIAL STATEMENTS
Statement of Operations
for the six months ended September 30, 2019 (unaudited)
Templeton Emerging Markets Small Cap Fund
| | | | |
Investment income: | | | | |
Dividends: (net of foreign taxes)* | | | | |
Unaffiliated issuers | | $ | 16,487,524 | |
Non-controlled affiliates (Note 3f and 8) | | | 489,366 | |
Income from securities loaned: | | | | |
Unaffiliated issuers (net of fees and rebates) | | | 141,202 | |
Non-controlled affiliates (Note 3f) | | | 136,977 | |
| | | | |
| |
Total investment income | | | 17,255,069 | |
| | | | |
| |
Expenses: | | | | |
Management fees (Note 3a) | | | 5,893,871 | |
Distribution fees: (Note 3c) | | | | |
Class A | | | 320,920 | |
Class C | | | 235,509 | |
Class R | | | 4,597 | |
Transfer agent fees: (Note 3e) | | | | |
Class A | | | 217,145 | |
Class C | | | 39,897 | |
Class R | | | 1,556 | |
Class R6 | | | 27,139 | |
Advisor Class | | | 317,640 | |
Custodian fees (Note 4) | | | 223,908 | |
Reports to shareholders | | | 56,179 | |
Registration and filing fees | | | 63,541 | |
Professional fees | | | 55,386 | |
Trustees’ fees and expenses | | | 47,458 | |
Other | | | 18,875 | |
| | | | |
| |
Total expenses | | | 7,523,621 | |
Expenses waived/paid by affiliates (Note 3f and 3g) | | | (81,892 | ) |
| | | | |
| |
Net expenses | | | 7,441,729 | |
| | | | |
| |
Net investment income | | | 9,813,340 | |
| | | | |
| |
Realized and unrealized gains (losses): | | | | |
Net realized gain (loss) from: | | | | |
Investments:# | | | | |
Unaffiliated issuers | | | 14,041,123 | |
Non-controlled affiliates (Note 3f and 8) | | | (21,003,133 | ) |
Foreign currency transactions | | | (137,653 | ) |
| | | | |
| |
Net realized gain (loss) | | | (7,099,663 | ) |
| | | | |
| |
Net change in unrealized appreciation (depreciation) on: | | | | |
Investments: | | | | |
Unaffiliated issuers | | | (92,372,792 | ) |
Non-controlled affiliates (Note 3f and 8) | | | 21,327,336 | |
Translation of other assets and liabilities denominated in foreign currencies | | | (13,245 | ) |
| | | | |
| |
Net change in unrealized appreciation (depreciation) | | | (71,058,701 | ) |
| | | | |
| |
Net realized and unrealized gain (loss) | | | (78,158,364 | ) |
| | | | |
| |
Net increase (decrease) in net assets resulting from operations | | $ | (68,345,024 | ) |
| | | | |
| |
*Foreign taxes withheld on dividends | | $ | 1,534,329 | |
#Net of foreign taxes | | $ | 125 | |
| | | | |
| | | |
22 | | Semiannual Report | The accompanying notes are an integral part of these financial statements. | | franklintempleton.com |
TEMPLETON GLOBAL INVESTMENT TRUST
FINANCIAL STATEMENTS
Statements of Changes in Net Assets
Templeton Emerging Markets Small Cap Fund
| | | | | | | | |
| | | Six Months Ended
September 30, 2019
(unaudited) | | | Year Ended
March 31, 2019 | |
| |
Increase (decrease) in net assets: | | | | | | | | |
Operations: | | | | | | | | |
Net investment income | | | $ 9,813,340 | | | | $ 3,019,277 | |
Net realized gain (loss) | | | (7,099,663 | ) | | | 30,025,183 | |
Net change in unrealized appreciation (depreciation) | | | (71,058,701 | ) | | | (116,579,817 | ) |
| | | | |
| | |
Net increase (decrease) in net assets resulting from operations | | | (68,345,024 | ) | | | (83,535,357 | ) |
| | | | |
| | |
Distributions to shareholders: | | | | | | | | |
Class A | | | — | | | | (6,717,881 | ) |
Class C | | | — | | | | (1,434,319 | ) |
Class R | | | — | | | | (39,533 | ) |
Class R6 | | | — | | | | (5,744,038 | ) |
Advisor Class | | | — | | | | (9,688,379 | ) |
| | | | |
| | |
Total distributions to shareholders | | | — | | | | (23,624,150 | ) |
| | | | |
| | |
Capital share transactions: (Note 2) | | | | | | | | |
Class A | | | (11,525,161 | ) | | | (16,996,707 | ) |
Class C | | | (8,997,029 | ) | | | (17,761,926 | ) |
Class R | | | 246,281 | | | | 906,129 | |
Class R6 | | | (59,005,611 | ) | | | 160,233,040 | |
Advisor Class | | | (13,490,369 | ) | | | (198,149,225 | ) |
| | | | |
| | |
Total capital share transactions | | | (92,771,889 | ) | | | (71,768,689 | ) |
| | | | |
| | |
Net increase (decrease) in net assets | | | (161,116,913 | ) | | | (178,928,196 | ) |
Net assets: | | | | | | | | |
Beginning of period | | | 908,743,345 | | | | 1,087,671,541 | |
| | | | |
| | |
End of period | | | $ 747,626,432 | | | | $ 908,743,345 | |
| | | | |
| | | | |
| | | |
| franklintempleton.com | | The accompanying notes are an integral part of these financial statements. | Semiannual Report | | 23 |
TEMPLETON GLOBAL INVESTMENT TRUST
Notes to Financial Statements (unaudited)
Templeton Emerging Markets Small Cap Fund
1. Organization and Significant Accounting Policies
Templeton Global Investment Trust (Trust) is registered under the Investment Company Act of 1940 (1940 Act) as anopen-end management investment company, consisting of four separate funds and applies the specialized accounting and reporting guidance in U.S. Generally Accepted Accounting Principles (U.S. GAAP). Templeton Emerging Markets Small Cap Fund (Fund) is included in this report. The Fund offers five classes of shares: Class A, Class C, Class R, Class R6 and Advisor Class. Class C shares automatically convert to Class A shares after they have been held for 10 years. Each class of shares may differ by its initial sales load, contingent deferred sales charges, voting rights on matters affecting a single class, its exchange privilege and fees due to differing arrangements for distribution and transfer agent fees.
The following summarizes the Fund’s significant accounting policies.
a. Financial Instrument Valuation
The Fund’s investments in financial instruments are carried at fair value daily. Fair value is the price that would be received to sell an asset or paid to transfer a liability in an orderly transaction between market participants on the measurement date. The Fund calculates the net asset value (NAV) per share each business day as of 4 p.m. Eastern time or the regularly scheduled close of the New York Stock Exchange (NYSE), whichever is earlier. Under compliance policies and procedures approved by the Trust’s Board of Trustees (the Board), the Fund’s administrator has responsibility for oversight of valuation, including leading the cross-functional Valuation Committee (VC). The Fund may utilize independent pricing services, quotations from securities and financial instrument dealers, and other market sources to determine fair value.
Equity securities listed on an exchange or on the NASDAQ National Market System are valued at the last quoted sale price or the official closing price of the day, respectively. Foreign equity securities are valued as of the close of trading on the foreign stock exchange on which the security is primarily traded, or as of 4 p.m. Eastern time. The value is then converted into its U.S. dollar equivalent at the foreign exchange rate in effect at 4 p.m. Eastern time on the day that the value of the security is determined.Over-the-counter (OTC) securities are valued within the range of the most recent quoted bid and ask prices. Securities that trade in
multiple markets or on multiple exchanges are valued according to the broadest and most representative market. Certain equity securities are valued based upon fundamental characteristics or relationships to similar securities.
Investments inopen-end mutual funds are valued at the closing NAV.
The Fund has procedures to determine the fair value of financial instruments for which market prices are not reliable or readily available. Under these procedures, the Fund primarily employs a market-based approach which may use related or comparable assets or liabilities, recent transactions, market multiples, book values, and other relevant information for the investment to determine the fair value of the investment. An income-based valuation approach may also be used in which the anticipated future cash flows of the investment are discounted to calculate fair value. Discounts may also be applied due to the nature or duration of any restrictions on the disposition of the investments. Due to the inherent uncertainty of valuations of such investments, the fair values may differ significantly from the values that would have been used had an active market existed.
Trading in securities on foreign securities stock exchanges and OTC markets may be completed before 4 p.m. Eastern time. In addition, trading in certain foreign markets may not take place on every Fund’s business day. Occasionally, events occur between the time at which trading in a foreign security is completed and 4 p.m. Eastern time that might call into question the reliability of the value of a portfolio security held by the Fund. As a result, differences may arise between the value of the Fund’s portfolio securities as determined at the foreign market close and the latest indications of value at 4 p.m. Eastern time. In order to minimize the potential for these differences, the VC monitors price movements following the close of trading in foreign stock markets through a series of country specific market proxies (such as baskets of American Depositary Receipts, futures contracts and exchange traded funds). These price movements are measured against established trigger thresholds for each specific market proxy to assist in determining if an event has occurred that may call into question the reliability of the values of the foreign securities held by the Fund. If such an event occurs, the securities may be valued using fair value procedures, which may include the use of independent pricing services. At September 30, 2019, a market event occurred resulting in a portion of the securities held by the Fund being valued using fair value procedures.
| | | | |
| | | |
24 | | Semiannual Report | | franklintempleton.com |
TEMPLETON GLOBAL INVESTMENT TRUST
NOTES TO FINANCIAL STATEMENTS (UNAUDITED)
Templeton Emerging Markets Small Cap Fund(continued)
When the last day of the reporting period is anon-business day, certain foreign markets may be open on those days that the Fund’s NAV is not calculated, which could result in differences between the value of the Fund’s portfolio securities on the last business day and the last calendar day of the reporting period. Any significant security valuation changes due to an open foreign market are adjusted and reflected by the Fund for financial reporting purposes.
b. Foreign Currency Translation
Portfolio securities and other assets and liabilities denominated in foreign currencies are translated into U.S. dollars based on the exchange rate of such currencies against U.S. dollars on the date of valuation. The Fund may enter into foreign currency exchange contracts to facilitate transactions denominated in a foreign currency. Purchases and sales of securities, income and expense items denominated in foreign currencies are translated into U.S. dollars at the exchange rate in effect on the transaction date. Portfolio securities and assets and liabilities denominated in foreign currencies contain risks that those currencies will decline in value relative to the U.S. dollar. Occasionally, events may impact the availability or reliability of foreign exchange rates used to convert the U.S. dollar equivalent value. If such an event occurs, the foreign exchange rate will be valued at fair value using procedures established and approved by the Board.
The Fund does not separately report the effect of changes in foreign exchange rates from changes in market prices on securities held. Such changes are included in net realized and unrealized gain or loss from investments in the Statement of Operations.
Realized foreign exchange gains or losses arise from sales of foreign currencies, currency gains or losses realized between the trade and settlement dates on securities transactions and the difference between the recorded amounts of dividends, interest, and foreign withholding taxes and the U.S. dollar equivalent of the amounts actually received or paid. Net unrealized foreign exchange gains and losses arise from changes in foreign exchange rates on foreign denominated assets and liabilities other than investments in securities held at the end of the reporting period.
c. Securities Lending
The Fund participates in an agency based securities lending program to earn additional income. The Fund receives cash collateral against the loaned securities in an amount equal to at least 102% of the fair value of the loaned securities. Collateral is maintained over the life of the loan in an amount not less than 100% of the fair value of loaned securities, as determined at the close of Fund business each day; any additional collateral required due to changes in security values is delivered to the Fund on the next business day. The collateral is deposited into a joint cash account with other funds and is used to invest in a money market fund managed by Franklin Advisers, Inc., an affiliate of the Fund, and/or uninvested cash as included in due from custodian in the Statement of Assets and Liabilities. The Fund may receive income from the investment of cash collateral, in addition to lending fees and rebates paid by the borrower. Income from securities loaned, net of fees paid to the securities lending agent and/or third-party vendor, is reported separately in the Statement of Operations. The Fund bears the market risk with respect to the collateral investment, securities loaned, and the risk that the agent may default on its obligations to the Fund. If the borrower defaults on its obligation to return the securities loaned, the Fund has the right to repurchase the securities in the open market using the collateral received. The securities lending agent has agreed to indemnify the Fund in the event of default by a third party borrower.
d. Income and Deferred Taxes
It is the Fund’s policy to qualify as a regulated investment company under the Internal Revenue Code. The Fund intends to distribute to shareholders substantially all of its taxable income and net realized gains to relieve it from federal income and excise taxes. As a result, no provision for U.S. federal income taxes is required.
The Fund may be subject to foreign taxation related to income received, capital gains on the sale of securities and certain foreign currency transactions in the foreign jurisdictions in which it invests. Foreign taxes, if any, are recorded based on the tax regulations and rates that exist in the foreign markets in which the Fund invests. When a capital gain tax is determined to apply, the Fund records an estimated deferred tax liability in an amount that would be payable if the securities were disposed of on the valuation date.
| | | | |
| | | |
| franklintempleton.com | | Semiannual Report | | 25 |
TEMPLETON GLOBAL INVESTMENT TRUST
NOTES TO FINANCIAL STATEMENTS (UNAUDITED)
Templeton Emerging Markets Small Cap Fund(continued)
1. Organization and Significant Accounting Policies(continued)
d. Income and Deferred Taxes(continued)
As a result of several court cases, in certain countries across the European Union, the Fund filed additional tax reclaims for previously withheld taxes on dividends earned in those countries (EU reclaims). These additional filings are subject to various administrative proceedings by the local jurisdictions’ tax authorities within the European Union, as well as a number of related judicial proceedings. Income recognized, if any, for EU reclaims is reflected as other income in the Statement of Operations and any related receivable, if any, is reflected as European Union tax reclaims in the Statement of Assets and Liabilities. When uncertainty exists as to the ultimate resolution of these proceedings, the likelihood of receipt of these EU reclaims, and the potential timing of payment, no amounts are reflected in the financial statements. For U.S. income tax purposes, EU reclaims received by the Fund, if any, reduce the amounts of foreign taxes Fund shareholders can use as tax credits in their individual income tax returns.
The Fund may recognize an income tax liability related to its uncertain tax positions under U.S. GAAP when the uncertain tax position has a less than 50% probability that it will be sustained upon examination by the tax authorities based on its technical merits. As of September 30, 2019, the Fund has determined that no tax liability is required in its financial statements related to uncertain tax positions for any open tax years (or expected to be taken in future tax years). Open tax years are those that remain subject to examination and are based on the statute of limitations in each jurisdiction in which the Fund invests.
e. Security Transactions, Investment Income, Expenses and Distributions
Security transactions are accounted for on trade date. Realized gains and losses on security transactions are determined on a specific identification basis. Estimated expenses are accrued daily. Dividend income is recorded on theex-dividend date except for certain dividends from securities where the dividend rate is not available. In such cases, the dividend is recorded as soon as the information is received by the Fund. Distributions to shareholders are
recorded on theex-dividend date. Distributable earnings are determined according to income tax regulations (tax basis) and may differ from earnings recorded in accordance with U.S. GAAP. These differences may be permanent or temporary. Permanent differences are reclassified among capital accounts to reflect their tax character. These reclassifications have no impact on net assets or the results of operations. Temporary differences are not reclassified, as they may reverse in subsequent periods.
Common expenses incurred by the Trust are allocated among the Funds based on the ratio of net assets of each Fund to the combined net assets of the Trust or based on the ratio of number of shareholders of each Fund to the combined number of shareholders of the Trust. Fund specific expenses are charged directly to the Fund that incurred the expense.
Realized and unrealized gains and losses and net investment income, excluding class specific expenses, are allocated daily to each class of shares based upon the relative proportion of net assets of each class. Differences in per share distributions by class are generally due to differences in class specific expenses.
f. Accounting Estimates
The preparation of financial statements in accordance with U.S. GAAP requires management to make estimates and assumptions that affect the reported amounts of assets and liabilities at the date of the financial statements and the amounts of income and expenses during the reporting period. Actual results could differ from those estimates.
g. Guarantees and Indemnifications
Under the Trust’s organizational documents, its officers and trustees are indemnified by the Trust against certain liabilities arising out of the performance of their duties to the Trust. Additionally, in the normal course of business, the Trust, on behalf of the Fund, enters into contracts with service providers that contain general indemnification clauses. The Trust’s maximum exposure under these arrangements is unknown as this would involve future claims that may be made against the Trust that have not yet occurred. Currently, the Trust expects the risk of loss to be remote.
| | | | |
| | | |
26 | | Semiannual Report | | franklintempleton.com |
TEMPLETON GLOBAL INVESTMENT TRUST
NOTES TO FINANCIAL STATEMENTS (UNAUDITED)
Templeton Emerging Markets Small Cap Fund(continued)
2. Shares of Beneficial Interest
At September 30, 2019, there were an unlimited number of shares authorized ($0.01 par value). Transactions in the Fund’s shares were as follows:
| | | | | | | | | | | | | | | | |
| | | Six Months Ended
September 30, 2019 | | | Year Ended March 31, 2019 | |
| | | | |
| | | Shares | | | Amount | | | Shares | | | Amount | |
| | | | |
Class A Shares: | | | | | | | | | | | | | | | | |
| | | | |
Shares solda | | | 1,600,690 | | | $ | 21,322,170 | | | | 4,559,656 | | | $ | 61,671,184 | |
| | | | |
Shares issued in reinvestment of distributions | | | — | | | | — | | | | 491,583 | | | | 6,056,301 | |
| | | | |
Shares redeemed | | | (2,493,143 | ) | | | (32,847,331 | ) | | | (6,236,473 | ) | | | (84,724,192 | ) |
| | | | |
Net increase (decrease) | | | (892,453 | ) | | $ | (11,525,161 | ) | | | (1,185,234 | ) | | $ | (16,996,707 | ) |
| | | | |
Class C Shares: | | | | | | | | | | | | | | | | |
| | | | |
Shares sold | | | 161,495 | | | $ | 2,050,005 | | | | 652,102 | | | $ | 8,498,060 | |
| | | | |
Shares issued in reinvestment of distributions | | | — | | | | — | | | | 118,314 | | | | 1,380,727 | |
| | | | |
Shares redeemeda | | | (889,591 | ) | | | (11,047,034 | ) | | | (2,176,204 | ) | | | (27,640,713 | ) |
| | | | |
Net increase (decrease) | | | (728,096 | ) | | $ | (8,997,029 | ) | | | (1,405,788 | ) | | $ | (17,761,926 | ) |
| | | | |
Class R Shares: | | | | | | | | | | | | | | | | |
| | | | |
Shares sold | | | 47,435 | | | $ | 624,986 | | | | 91,192 | | | $ | 1,249,355 | |
| | | | |
Shares issued in reinvestment of distributions | | | — | | | | — | | | | 3,246 | | | | 39,533 | |
| | | | |
Shares redeemed | | | (28,847 | ) | | | (378,705 | ) | | | (29,077 | ) | | | (382,759 | ) |
| | | | |
Net increase (decrease) | | | 18,588 | | | $ | 246,281 | | | | 65,361 | | | $ | 906,129 | |
| | | | |
Class R6 Shares: | | | | | | | | | | | | | | | | |
| | | | |
Shares sold | | | 1,726,908 | | | $ | 23,018,193 | | | | 15,209,693 | | | $ | 194,031,276 | |
| | | | |
Shares issued in reinvestment of distributions | | | — | | | | — | | | | 52,152 | | | | 649,299 | |
| | | | |
Shares redeemed | | | (6,259,310 | ) | | | (82,023,804 | ) | | | (2,603,401 | ) | | | (34,447,535 | ) |
| | | | |
Net increase (decrease) | | | (4,532,402 | ) | | $ | (59,005,611 | ) | | | 12,658,444 | | | $ | 160,233,040 | |
| | | | |
Advisor Class Shares: | | | | | | | | | | | | | | | | |
| | | | |
Shares sold | | | 3,867,644 | | | $ | 53,175,232 | | | | 12,339,723 | | | $ | 170,703,200 | |
| | | | |
Shares issued in reinvestment of distributions | | | — | | | | — | | | | 699,114 | | | | 8,717,946 | |
| | | | |
Shares redeemed | | | (4,950,971 | ) | | | (66,665,601 | ) | | | (28,602,272 | ) | | | (377,570,371 | ) |
| | | | |
Net increase (decrease) | | | (1,083,327 | ) | | $ | (13,490,369 | ) | | | (15,563,435 | ) | | $ | (198,149,225 | ) |
aMay include a portion of Class C shares that were automatically converted to Class A.
3. Transactions with Affiliates
Franklin Resources, Inc. is the holding company for various subsidiaries that together are referred to as Franklin Templeton. Certain officers and trustees of the Trust are also officers and/or directors of the following subsidiaries:
| | |
| Subsidiary | | Affiliation |
| Templeton Asset Management Ltd. (Asset Management) | | Investment manager |
| Franklin Templeton Services, LLC (FT Services) | | Administrative manager |
| Franklin Templeton Distributors, Inc. (Distributors) | | Principal underwriter |
| Franklin Templeton Investor Services, LLC (Investor Services) | | Transfer agent |
| | | | |
| | | |
| franklintempleton.com | | Semiannual Report | | 27 |
TEMPLETON GLOBAL INVESTMENT TRUST
NOTES TO FINANCIAL STATEMENTS (UNAUDITED)
Templeton Emerging Markets Small Cap Fund(continued)
3. Transactions with Affiliates(continued)
a. Management Fees
The Fund pays an investment management fee to Asset Management based on the average daily net assets of the Fund as follows:
| | |
| Annualized Fee Rate | | Net Assets |
1.400% | | Up to and including $500 million |
1.300% | | Over $500 million, up to and including $1 billion |
1.200% | | In excess of $1 billion |
For the period ended September 30, 2019, the annualized gross effective investment management fee rate was 1.359% of the Fund’s average daily net assets.
b. Administrative Fees
Under an agreement with Asset Management, FT Services provides administrative services to the Fund. The fee is paid by Asset Management based on the Fund’s average daily net assets, and is not an additional expense of the Fund.
c. Distribution Fees
The Board has adopted distribution plans for each share class, with the exception of Class R6 and Advisor Class shares, pursuant to Rule12b-1 under the 1940 Act. Under the Fund’s Class A reimbursement distribution plan, the Fund reimburses Distributors for costs incurred in connection with the servicing, sale and distribution of the Fund’s shares up to the maximum annual plan rate. Under the Class A reimbursement distribution plan, costs exceeding the maximum for the current plan year cannot be reimbursed in subsequent periods. In addition, under the Fund’s Class C and R compensation distribution plans, the Fund pays Distributors for costs incurred in connection with the servicing, sale and distribution of the Fund’s shares up to the maximum annual plan rate for each class. The plan year, for purposes of monitoring compliance with the maximum annual plan rates, is February 1 through January 31.
The maximum annual plan rates, based on the average daily net assets, for each class, are as follows:
| | | | |
Class A | | | 0.35 | % |
Class C | | | 1.00 | % |
Class R | | | 0.50 | % |
The Board has set the current rate at 0.25% per year for Class A shares until further notice and approval by the Board.
d. Sales Charges/Underwriting Agreements
Front-end sales charges and contingent deferred sales charges (CDSC) do not represent expenses of the Fund. These charges are deducted from the proceeds of sales of Fund shares prior to investment or from redemption proceeds prior to remittance, as applicable. Distributors has advised the Fund of the following commission transactions related to the sales and redemptions of the Fund’s shares for the period:
| | | | |
Sales charges retained net of commissions paid to unaffiliated brokers/dealers | | $ | 17,783 | |
CDSC retained | | $ | 1,378 | |
| | | | |
| | | |
28 | | Semiannual Report | | franklintempleton.com |
TEMPLETON GLOBAL INVESTMENT TRUST
NOTES TO FINANCIAL STATEMENTS (UNAUDITED)
Templeton Emerging Markets Small Cap Fund(continued)
e. Transfer Agent Fees
Each class of shares pays transfer agent fees to Investor Services for its performance of shareholder servicing obligations. The fees are based on an annualized asset based fee of 0.02% plus a transaction based fee. In addition, each class reimburses Investor Services for out of pocket expenses incurred and, except for Class R6, reimburses shareholder servicing fees paid to third parties. These fees are allocated daily based upon their relative proportion of such classes’ aggregate net assets. Class R6 pays Investor Services transfer agent fees specific to that class.
For the period ended September 30, 2019, the Fund paid transfer agent fees of $603,377, of which $199,792 was retained by Investor Services.
f. Investments in Affiliated Management Investment Companies
The Fund invests in one or more affiliated management investment companies for purposes other than exercising a controlling influence over the management or policies. Management fees paid by the Fund are waived on assets invested in the affiliated management investment companies, as noted in the Statement of Operations, in an amount not to exceed the management and administrative fees paid directly or indirectly by each affiliate. During the period ended September 30, 2019, the Fund held investments in affiliated management investment companies as follows:
| | | | | | | | | | | | | | | | | | | | | | | | | | | | | | | | |
| | | Value at
Beginning of Period | | | Purchases | | | Sales | | | Realized
Gain (Loss) | | | Net Change in
Unrealized
Appreciation
(Depreciation) | | | Value at End of
Period | | | Number of
Shares
Held at End of Period | | | Investment
Income | |
Non-Controlled Affiliates | | | | | | | | | | | | | | | | | | | | | | | | | | | | | | | | |
| | | | | | | | | | | | | | | | | | | | | | | | | | | | | | | Dividends | |
| | | | | | | | | | | | | | | | | | | | | | | | | | | | | | | | |
Institutional Fiduciary Trust Money Market Portfolio, 1.71% | | $ | 30,542,529 | | | $ | 62,712,148 | | | $ | (93,218,600 | ) | | | $ — | | | | $ — | | | $ | 36,077 | | | | 36,077 | | | | $321,913 | |
| | | | | | | | | | | | | | | | | | | | | | | | | | | | | |
| Income from
securities
loaned |
|
| | | | | | | | | | | | | | | | | | | | | | | | | | | | | | | | |
Institutional Fiduciary Trust Money Market Portfolio, 1.71% | | | 8,321,720 | | | | 50,697,126 | | | | (42,516,383 | ) | | | — | | | | — | | | | 16,502,463 | | | | 16,502,463 | | | | 136,977 | |
| | | | | | | | | | | | |
| | | | | | | | |
Total Affiliated Securities | | $ | 38,864,249 | | | $ | 113,409,274 | | | $ | (135,734,983 | ) | | | $ — | | | | $ — | | | $ | 16,538,540 | | | | | | | | $458,890 | |
| | | | | | | | | | | | |
g. Waiver and Expense Reimbursements
Investor Services has contractually agreed in advance to waive or limit its fees so that the Class R6 transfer agent fees do not exceed 0.03% based on the average net assets of the class until July 31, 2020.
4. Expense Offset Arrangement
The Fund has entered into an arrangement with its custodian whereby credits realized as a result of uninvested cash balances are used to reduce a portion of the Fund’s custodian expenses. During the period ended September 30, 2019, there were no credits earned.
5. Income Taxes
For tax purposes, the Fund may elect to defer any portion of a post-October capital loss or late-year ordinary loss to the first day of the following fiscal year. At March 31, 2019, the Fund deferred late-year ordinary losses of $1,147,730.
| | | | |
| | | |
| franklintempleton.com | | Semiannual Report | | 29 |
TEMPLETON GLOBAL INVESTMENT TRUST
NOTES TO FINANCIAL STATEMENTS (UNAUDITED)
Templeton Emerging Markets Small Cap Fund(continued)
5. Income Taxes(continued)
At September 30, 2019, the cost of investments and net unrealized appreciation (depreciation) for income tax purposes were as follows:
| | | | |
Cost of investments | | $ | 725,298,055 | |
| | | | |
| |
Unrealized appreciation | | $ | 151,742,727 | |
Unrealized depreciation | | | (113,910,008 | ) |
| | | | |
| |
Net unrealized appreciation (depreciation) | | $ | 37,832,719 | |
| | | | |
Differences between income and/or capital gains as determined on a book basis and a tax basis are primarily due to differing treatments of foreign capital gains tax and corporate actions.
6. Investment Transactions
Purchases and sales of investments (excluding short term securities) for the period ended September 30, 2019, aggregated $27,846,971 and $82,172,631, respectively.
At September 30, 2019, in connection with securities lending transactions, the Fund loaned equity investments and received $16,635,963 of cash collateral. The gross amount of recognized liability for such transactions is included in payable upon return of securities loaned in the Statement of Assets and Liabilities. The agreements can be terminated at any time.
7. Concentration of Risk
Investing in foreign securities may include certain risks and considerations not typically associated with investing in U.S. securities, such as fluctuating currency values and changing local, regional and global economic, political and social conditions, which may result in greater market volatility. Current political and financial uncertainty surrounding the European Union may increase market volatility and the economic risk of investing in securities in Europe. In addition, certain foreign securities may not be as liquid as U.S. securities.
8. Holdings of 5% Voting Securities of Portfolio Companies
The 1940 Act defines “affiliated companies” to include investments in portfolio companies in which a fund owns 5% or more of the outstanding voting securities. During the period ended September 30, 2019, investments in “affiliated companies” were as follows:
| | | | | | | | | | | | | | | | | | | | | | | | | | | | | | | | |
| Name of Issuer | | Value at
Beginning
of Period | | | Purchases | | | Sales | | | Realized Gain (Loss) | | | Net Change in
Unrealized
Appreciation
(Depreciation) | | | Value at
End of
Period | | | Number of
Shares Held
at End of Period | | | Dividend
Income | |
| | | | | | | | |
Non-Controlled Affiliates | | | | | | | | | | | | | | | | | | | | | | | | | | | | | | | | |
Pinar Sut Mamulleri Sanayii AS | | | $3,542,439 | | | | $ — | | | | $(3,548,448) | | | | $(15,234,342) | | | | $15,240,351 | | | | $ — | a | | | — | a | | | $167,453 | |
Reysas Gayrimenkul Yatirim Ortakligi AS | | | 3,843,668 | | | | — | | | | (4,161,862) | | | | (5,768,791) | | | | 6,086,985 | | | | — | a | | | — | a | | | — | |
| | | | | | | | | | | | |
| | | | | | | | |
Total Affiliated Securities(Value is 0.0% of Net Assets) | | | $7,386,107 | | | | $ — | | | | $(7,710,310) | | | | $(21,003,133) | | | | $21,327,336 | | | | $ — | | | | | | | | $167,453 | |
| | | | | | | | | | | | |
aAs of September 30, 2019, no longer held by the fund.
| | | | |
| | | |
30 | | Semiannual Report | | franklintempleton.com |
TEMPLETON GLOBAL INVESTMENT TRUST
NOTES TO FINANCIAL STATEMENTS (UNAUDITED)
Templeton Emerging Markets Small Cap Fund(continued)
9. Credit Facility
The Fund, together with other U.S. registered and foreign investment funds (collectively, Borrowers), managed by Franklin Templeton, are borrowers in a joint syndicated senior unsecured credit facility totaling $2 billion (Global Credit Facility) which matures on February 7, 2020. This Global Credit Facility provides a source of funds to the Borrowers for temporary and emergency purposes, including the ability to meet future unanticipated or unusually large redemption requests.
Under the terms of the Global Credit Facility, the Fund shall, in addition to interest charged on any borrowings made by the Fund and other costs incurred by the Fund, pay its share of fees and expenses incurred in connection with the implementation and maintenance of the Global Credit Facility, based upon its relative share of the aggregate net assets of all of the Borrowers, including an annual commitment fee of 0.15% based upon the unused portion of the Global Credit Facility. These fees are reflected in other expenses in the Statement of Operations. During the period ended September 30, 2019, the Fund did not use the Global Credit Facility.
10. Fair Value Measurements
The Fund follows a fair value hierarchy that distinguishes between market data obtained from independent sources (observable inputs) and the Fund’s own market assumptions (unobservable inputs). These inputs are used in determining the value of the Fund’s financial instruments and are summarized in the following fair value hierarchy:
| | • | | Level 1 – quoted prices in active markets for identical financial instruments |
| | • | | Level 2 – other significant observable inputs (including quoted prices for similar financial instruments, interest rates, prepayment speed, credit risk, etc.) |
| | • | | Level 3 – significant unobservable inputs (including the Fund’s own assumptions in determining the fair value of financial instruments) |
The input levels are not necessarily an indication of the risk or liquidity associated with financial instruments at that level.
A summary of inputs used as of September 30, 2019, in valuing the Fund’s assets carried at fair value, is as follows:
| | | | | | | | | | | | | | | | |
| | | Level 1 | | | Level 2 | | | Level 3 | | | Total | |
| | | | |
Assets: | | | | | | | | | | | | | | | | |
| | | | |
Investments in Securities:a | | | | | | | | | | | | | | | | |
| | | | |
Equity Investments:b | | | | | | | | | | | | | | | | |
| | | | |
Egypt | | $ | 4,827,378 | | | $ | 8,138,747 | | | $ | — | | | $ | 12,966,125 | |
| | | | |
All Other Equity Investments | | | 733,626,109 | | | | — | | | | — | | | | 733,626,109 | |
| | | | |
Short Term Investments | | | 16,538,540 | | | | — | | | | — | | | | 16,538,540 | |
| | | | |
| | | | |
Total Investments in Securities | | $ | 754,992,027 | | | $ | 8,138,747 | | | $ | — | | | $ | 763,130,774 | |
| | | | |
aFor detailed categories, see the accompanying Statement of Investments.
bIncludes common and preferred stocks.
11. Subsequent Events
The Fund has evaluated subsequent events through the issuance of the financial statements and determined that no events have occurred that require disclosure.
| | | | |
| | | |
| franklintempleton.com | | Semiannual Report | | 31 |
TEMPLETON GLOBAL INVESTMENT TRUST
NOTES TO FINANCIAL STATEMENTS (UNAUDITED)
Templeton Emerging Markets Small Cap Fund(continued)
| | |
Abbreviations |
| Selected Portfolio |
| ADR | | American Depositary Receipt |
| GDR | | Global Depositary Receipt |
| | | | |
| | | |
32 | | Semiannual Report | | franklintempleton.com |
TEMPLETON GLOBAL INVESTMENT TRUST
TEMPLETON EMERGING MARKETS SMALL CAP FUND
Shareholder Information
Proxy Voting Policies and Procedures
The Fund’s investment manager has established Proxy Voting Policies and Procedures (Policies) that the Fund uses to determine how to vote proxies relating to portfolio securities. Shareholders may view the Fund’s complete Policies online at franklintempleton.com. Alternatively, shareholders may request copies of the Policies free of charge by calling the Proxy Group collect at (954)527-7678 or by sending a written request to: Franklin Templeton Companies, LLC, 300 S.E. 2nd Street, Fort Lauderdale, FL 33301, Attention: Proxy Group. Copies of the Fund’s proxy voting records are also made available online at franklintempleton.com and posted on the U.S. Securities and Exchange Commission’s website at sec.gov and reflect the most recent12-month period ended June 30.
Quarterly Statement of Investments
The Trust, on behalf of the Fund, files a complete statement of investments with the U.S. Securities and Exchange Commission for the first and third quarters for each fiscal year as an exhibit to its report on FormN-PORT. Shareholders may view the filed FormN-PORT by visiting the Commission’s website at sec.gov. The filed form may also be viewed and copied at the Commission’s Public Reference Room in Washington, DC. Information regarding the operations of the Public Reference Room may be obtained by calling(800) SEC-0330.
| | | | |
| | | |
| franklintempleton.com | | Semiannual Report | | 33 |
This page intentionally left blank.
This page intentionally left blank.
This page intentionally left blank.
Authorized for distribution only when accompanied or preceded by a summary prospectus and/or prospectus. Investors should carefully consider a fund’s investment goals, risks, charges and expenses before investing. A prospectus contains this and other information; please read it carefully before investing.
To help ensure we provide you with quality service, all calls to and from our service areas are monitored and/or recorded.
| | | | | | |
| | Semiannual Report and Shareholder Letter Templeton Emerging Markets Small Cap Fund |
| | Investment Manager | | Distributor | | Shareholder Services |
| | Templeton Asset | | Franklin Templeton Distributors, Inc. | | (800)632-2301 |
| | Management Ltd. | | (800) DIAL BEN®/342-5236 | | |
| | | | franklintempleton.com | | |
| | |
| © 2019 Franklin Templeton Investments. All rights reserved. | | 426 S 11/19 |
Item 2. Code of Ethics.
| (a) | The Registrant has adopted a code of ethics that applies to its principal executive officers and principal financial and accounting officer. |
| (f) | Pursuant to Item 13(a)(1), the Registrant is attaching as an exhibit a copy of its code of ethics that applies to its principal executive officers and principal financial and accounting officer. |
Item 3. Audit Committee Financial Expert.
| (a)(1) | The Registrant has an audit committee financial expert serving on its audit committee. |
| (2) | The audit committee financial expert is David W. Niemiec and he is “independent” as defined under the relevant Securities and Exchange Commission Rules and Releases. |
Item 4. Principal Accountant Fees and Services. N/A
Item 5. Audit Committee of Listed Registrants. N/A
Item 6. Schedule of Investments. N/A
Item 7. Disclosure of Proxy Voting Policies and Procedures forClosed-End Management Investment Companies. N/A
Item 8. Portfolio Managers ofClosed-End Management Investment Companies. N/A
Item 9. Purchases of Equity Securities byClosed-End Management Investment Company and Affiliated Purchasers. N/A
Item 10. Submission of Matters to a Vote of Security Holders.
There have been no changes to the procedures by which shareholders may recommend nominees to the Registrant’s Board of Trustees that would require disclosure herein.
Item 11. Controls and Procedures.
(a)Evaluation of Disclosure Controls and Procedures. The Registrant maintains disclosure controls and procedures that are designed to provide reasonable assurance that information required to be disclosed in the Registrant’s filings under the Securities Exchange Act of 1934, as amended, and the Investment Company Act of 1940 is recorded, processed, summarized and reported within the
periods specified in the rules and forms of the Securities and Exchange Commission. Such information is accumulated and communicated to the Registrant’s management, including its principal executive officer and principal financial officer, as appropriate, to allow timely decisions regarding required disclosure. The Registrant’s management, including the principal executive officer and the principal financial officer, recognizes that any set of controls and procedures, no matter how well designed and operated, can provide only reasonable assurance of achieving the desired control objectives.
Within 90 days prior to the filing date of this Shareholder Report onForm N-CSR, the Registrant had carried out an evaluation, under the supervision and with the participation of the Registrant’s management, including the Registrant’s principal executive officer and the Registrant’s principal financial officer, of the effectiveness of the design and operation of the Registrant’s disclosure controls and procedures. Based on such evaluation, the Registrant’s principal executive officer and principal financial officer concluded that the Registrant’s disclosure controls and procedures are effective.
(b)Changes in Internal Controls. There have been no changes in the Registrant’s internal control over financial reporting that occurred during the period covered by this report that has materially affected, or is reasonably likely to materially affect the internal control over financial reporting.
Item 12. Disclosure of Securities Lending Activities forClosed-End Management Investment Company. N/A
Item 13. Exhibits.
(a)(1)Code of Ethics
(a)(2) Certifications pursuant to Section 302 of the Sarbanes-Oxley Act of 2002 of Matthew T. Hinkle, Chief Executive Officer – Finance and Administration, and Robert G. Kubilis, Chief Financial Officer and Chief Accounting Officer
(b)Certifications pursuant to Section 906 of the Sarbanes-Oxley Act of 2002 of Matthew T. Hinkle, Chief Executive Officer – Finance and Administration, and Robert G. Kubilis, Chief Financial Officer and Chief Accounting Officer
SIGNATURES
Pursuant to the requirements of the Securities Exchange Act of 1934 and the Investment Company Act of 1940, the registrant has duly caused this report to be signed on its behalf by the undersigned, thereunto duly authorized.
TEMPLETON GLOBAL INVESTMENT TRUST
| | |
| By | | /S/ MATTHEW T. HINKLE |
| | Matthew T. Hinkle |
| | Chief Executive Officer – Finance and Administration |
| Date November 29, 2019 |
Pursuant to the requirements of the Securities Exchange Act of 1934 and the Investment Company Act of 1940, this report has been signed below by the following persons on behalf of the registrant and in the capacities and on the dates indicated.
| | |
| By | | /S/ MATTHEW T. HINKLE |
| | Matthew T. Hinkle |
| | Chief Executive Officer – Finance and Administration |
| Date November 29, 2019 |
| |
| By | | /S/ ROBERT G. KUBILIS |
| | Robert G. Kubilis |
| | Chief Financial Officer and Chief Accounting Officer |
| Date November 29, 2019 |