UNITED STATES
SECURITIES AND EXCHANGE COMMISSION
Washington, DC 20549
FORM N-CSRS
CERTIFIED SHAREHOLDER REPORT OF REGISTERED
MANAGEMENT INVESTMENT COMPANIES
Investment Company Act file number 811-08226
Templeton Global Investment Trust
(Exact name of registrant as specified in charter)
300 S.E. 2nd Street,
Fort Lauderdale, FL 33301-1923
(Address of principal executive offices) (Zip code)
Craig S. Tyle, One Franklin Parkway, San Mateo, CA 94403-1906
(Name and address of agent for service)
Registrant’s telephone number, including area code: (954) 527-7500
Date of fiscal year end: 12/31
Date of reporting period: 6/30/20
| Item 1. | Reports to Stockholders. |
Sign up for electronic delivery at franklintempleton.com/edelivery
Internet Delivery of Fund Reports Unless You Request Paper Copies: Effective January 1, 2021, as permitted by the SEC, paper copies of the Fund’s shareholder reports will no longer be sent by mail, unless you specifically request them from the Fund or your financial intermediary. Instead, the reports will be made available on a website, and you will be notified by mail each time a report is posted and provided with a website link to access the report.
If you already elected to receive shareholder reports electronically, you will not be affected by this change and you need not take any action. If you have not signed up for electronic delivery, we would encourage you to join fellow shareholders who have. You may elect to receive shareholder reports and other communications electronically from the Fund by calling (800) 632-2301 or by contacting your financial intermediary.
You may elect to continue to receive paper copies of all your future shareholder reports free of charge by contacting your financial intermediary or, if you invest directly with a Fund, calling (800) 632-2301 to let the Fund know of your request. Your election to receive reports in paper will apply to all funds held in your account.
SHAREHOLDER LETTER
Dear Shareholder:
During the six months ended June 30, 2020, global economic growth was impacted by the novel coronavirus (COVID-19) pandemic. Many nations’ efforts to slow the infection rate in March and April severely curtailed global economic activity. Major central banks acted swiftly to maintain financial stability and ease monetary policy. The U.S. Federal Reserve (Fed) issued two emergency rate cuts and revived programs from the Great Recession designed to add liquidity to credit markets. The European Central Bank launched its Pandemic Emergency Purchase Programme, which included many private and public sector securities. In this environment, global developed and emerging market stocks, as measured by the MSCI All Country World Index, posted a -5.99% total return.1 Global government and corporate bonds, as measured by the Bloomberg Barclays Multiverse Index, posted a +2.53% total return.1
We are committed to our long-term perspective and disciplined investment approach as we conduct a rigorous, fundamental analysis of securities with a regular emphasis on investment risk management.
Historically, patient investors have achieved rewarding results by evaluating their goals, diversifying their assets globally and maintaining a disciplined investment program, all hallmarks of the Templeton investment philosophy. We continue to recommend investors consult their financial
advisors and review their portfolios to design a long-term strategy and portfolio allocation that meet their individual needs, goals and risk tolerance.
Templeton Global Balanced Fund’s semiannual report includes more detail about prevailing conditions and a discussion about investment decisions during the period. Please remember all securities markets fluctuate, as do mutual fund share prices.
We thank you for investing with Franklin Templeton, welcome your questions and comments, and look forward to serving your investment needs in the years ahead.
Sincerely,
Alan Bartlett
Chief Investment Officer
Templeton Equity Group
This letter reflects our analysis and opinions as of June 30, 2020, unless otherwise indicated. The information is not a complete analysis of every aspect of any market, country, industry, security or fund. Statements of fact are from sources considered reliable.
1. Source: Morningstar.
See www.franklintempletondatasources.com for additional data provider information.
| | |
| |
| | | Not FDIC Insured | May Lose Value | No Bank Guarantee |
| | | | |
| | | |
| franklintempleton.com | | Not part of the semiannual report | | 1 |
Contents
|
| Visit franklintempleton.com for fund updates, to access your account, or to find helpful financial planning tools. |
| | | | |
| | | |
2 | | Semiannual Report | | franklintempleton.com |
SEMIANNUAL REPORT
Templeton Global Balanced Fund
This semiannual report for Templeton Global Balanced Fund covers the period ended June 30, 2020.
Your Fund’s Goal and Main Investments
The Fund seeks both income and capital appreciation. Under normal market conditions, the Fund invests in a diversified portfolio of debt and equity securities worldwide. The Fund normally invests at least 25% of its assets in fixed income securities and at least 25% of its assets in equity securities. The Fund’s equity component generally consists of primarily of common stocks of companies from a variety of industries located anywhere in the world, including developing markets, that offer or could offer the opportunity to realize capital appreciation and/or attractive dividend yields. The Fund’s fixed income component primarily consists of developed and developing country government and agency bonds and investment-grade and below investment-grade corporate debt securities that offer the opportunity to realize income.
Performance Overview
The Fund’s Class A shares posted a -12.21% cumulative total return for the six months under review. In comparison, the MSCI All Country World Index (ACWI) posted a -5.99% total return and the Bloomberg Barclays Multiverse Index posted a +2.53% total return.1 For the same period, the Custom 50% MSCI ACWI + 50% Bloomberg Barclays Multiverse Index (Blended Benchmark), posted a -1.44% cumulative total return.1 You can find the Fund’s long-term performance data in the Performance Summary beginning on page 10.
Performance data represent past performance, which does not guarantee future results. Investment return and principal value will fluctuate, and you may have a gain or loss when you sell your shares. Current performance may differ from figures shown. For most recent month-end performance, go to franklintempleton.com or call (800) 342-5236.
Asset Allocation*
Based on Total Net Assets as of 6/30/20
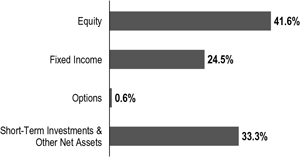
*Figures represent the net Fund exposure and include certain derivatives held in the portfolio (or their underlying reference assets) or unsettled trades and may not total 100% or may be negative due to rounding, use of any derivatives or other factors.
Economic and Market Overview
Global developed and emerging market equities, as measured by the MSCI ACWI (USD), posted a -5.99% total return during the six months under review.1 Stocks fell sharply in early 2020 as countries around the world implemented lockdown measures in an effort to slow the spread of the novel coronavirus (COVID-19). Global supply chain disruptions, business and personal restrictions, and subdued consumer spending drove many investors to sell equity holdings in favor of perceived safe investments such as government bonds and cash. While global equities, notably in the U.S., rebounded in April and May amid optimism about easing lockdown restrictions, concerns about a second wave of infections hindered equities in June, as investors weighed the possibility of renewed restrictions.
In the U.S., government mandates to mitigate the COVID-19 pandemic severely impacted the economy beginning in March 2020. As a result, the unemployment rate surged to 14.7% in April, as many businesses, particularly those involved in hospitality, retail and travel, announced mass layoffs.2 According to the National Bureau of Economic Research, the longest U.S. economic expansion in history
1. Source: Morningstar. The Fund’s Blended Benchmark was calculated internally and rebalanced monthly.
The indexes are unmanaged and include reinvestment of any income or distributions. They do not reflect any fees, expenses or sales charges. One cannot invest directly in an index, and an index is not representative of the Fund’s portfolio.
2. U.S. Bureau of Labor Statistics
See www.franklintempletondatasources.com for additional data provider information.
The dollar value, number of shares or principal amount, and names of all portfolio holdings are listed in the Fund’s Consolidated Statement of Investments (SOI). The Consolidated SOI begins on page 20.
| | | | |
| | | |
| franklintempleton.com | | Semiannual Report | | 3 |
TEMPLETON GLOBAL BALANCED FUND
ended in February 2020 as the country slipped into a severe recession. Nonetheless, near period-end, there were signs that a recovery was underway, as jobless claims fell considerably from their peak in early April, retail sales rose sharply in May, and the unemployment rate fell to 11.1% in June.2 Along with optimism about improved treatments and potential vaccines for COVID-19, the positive economic signals contributed to a significant equity rebound in April and May. However, an increase in COVID-19 infections in many states throughout June pressured U.S. stocks.
In the eurozone, some analysts forecasted a significant contraction in 2020, particularly in southern European countries, as the magnitude of the economic disruption caused by the pandemic became apparent. European developed market equities, as measured by the MSCI Europe Index (USD), posted a -12.43% total return for the period.1 To stimulate growth, the European Central Bank implemented a broad bond-buying program, and many countries passed fiscal stimulus measures.
Asian developed and emerging market equities, as measured by the MSCI All Country Asia Index (USD), posted a -5.51% total return during the six-month period.1 The onset of the pandemic brought dramatically slower economic activity in Asia, as businesses halted operations and manufacturing and export activity declined sharply in the region’s major economies. Asian markets generally advanced toward period-end, bolstered by fiscal stimulus measures and economies reopening throughout the region.
Emerging market stocks, as measured by the MSCI
Emerging Markets Index (USD), posted a -9.67% total return due primarily to the COVID-19 pandemic.1 A sharp decrease in prices for oil and other natural resources also hurt emerging market economies reliant on these exports. In the last quarter of the reporting period, however, investor optimism led to a stock rally, particularly in emerging market countries that had successfully lowered infection rates.
The novel coronavirus (COVID-19) pandemic profoundly impacted economies and global financial markets during the six-month period. Lockdown orders from governments trying to “flatten the curve” (i.e., stem the rate of infection) brought entire countries, regions and continents to an economic standstill in March and April. The speed and pervasiveness of the economic shocks were unprecedented. There is no historical comparison for the magnitude of aggregate demand that was destroyed, nor the magnitude of job losses in such a compressed timescale.
Risk aversion rapidly escalated to crisis levels and deepened throughout March, driving correlations to 1.0 across multiple
asset classes as investors shed risk and moved into perceived safe havens. Credit markets experienced substantial price volatility, with the lower-rated credit tiers bearing the brunt of the selloffs. Sovereign bond yields declined in higher-rated countries but rose in more vulnerable ones as volatility escalated. The yield on the 10-year U.S. Treasury (UST) note quickly dropped from 2.00% at the start of the period to a low of 0.54% on March 9. It finished the six-month period at 0.66%, 134 basis points (bps) lower that where it began. The yield on the 10-year German Bund dropped 27 bps further into negative territory during the period, finishing at -0.46%.
The U.S. Federal Reserve (Fed) responded quickly to the deepening crisis with two emergency rate cuts in March, the second of which dropped the federal funds target rate 100 bps to the zero bound that was used during the 2008 global financial crisis (GFC). The Fed also cut reserve requirements and encouraged financial institutions to borrow directly from the discount window. Growing liquidity strains throughout financial markets prompted the Fed to re-start liquidity programs that had been created during the GFC, such as the Commercial Paper Funding Facility and the Primary Dealer Credit Facility.
On March 23, the Fed took its financial market interventions beyond the scope of the GFC programs by creating corporate lending programs, and announcing its intentions to support lending to small- and medium-sized businesses through the newly created Main Street Business Lending Program. The Fed also pledged to buy unlimited government bonds, abandoning the previous quantitative easing targets it had announced a week earlier on March 15.
The heightened demand for U.S. dollars (USD) around the world also led the Fed to expand its liquidity swaps program with foreign central banks beyond the five banks in its standing facility including the European Central Bank (ECB), Bank of Japan (BOJ), Bank of England, Bank of Canada and Swiss National Bank. The swap program was expanded on March 19 to include the Reserve Bank of Australia, Reserve Bank of New Zealand, Danmarks Nationalbank, Norges Bank, Sveriges Riksbank, Bank of Korea, Monetary Authority of Singapore, Banco de Mexico and Banco Central do Brasil. The program enables a foreign central bank to borrow USD directly from the Fed to lend to its own local institutions, facilitating the flow of the world’s reserve currency. The USD notably strengthened from mid-March to mid-May before broadly weakening over the final six weeks of the period.
On the U.S. fiscal side, Congress passed the Coronavirus Aid, Relief, and Economic Security Act on March 26, a
| | | | |
| | | |
4 | | Semiannual Report | | franklintempleton.com |
TEMPLETON GLOBAL BALANCED FUND
USD$2.2 trillion fiscal relief program designed to provide loans to businesses, income support and unemployment benefits to individuals, and funding for hospitals and public health services. It was the largest economic relief bill in U.S. history and was designed as a stopgap for social distancing policies.
On March 18, ECB President Christine Lagarde unveiled the €750 billion Pandemic Emergency Purchase Programme (PEPP) in an unscheduled mid-week announcement. Lagarde commented that, “there are no limits to our commitment to the euro. We are determined to use the full potential of our tools, within our mandate.” PEPP appeared geared to support the more vulnerable states, as the program has unprecedented flexibility to buy a wide range of eligible securities, including Greek and Italian sovereign debt, as well as corporate commercial paper.
In the second quarter of 2020, global financial markets began to rebound from the extreme lows in March, as central banks and governments deployed massive monetary and fiscal measures to respond to the crisis. Regional economies began to incrementally reopen and improving economic data appeared to bolster optimism that the worst of the economic shocks had passed. Credit spreads tightened in many sectors during the second quarter, returning to levels last seen in early March and late February.
However, sharp resurgences in COVID-19 cases in several regions, including the U.S., Latin America and China amongst others, prompted governments to return to shutdown policies in June. Though several economic measures improved in May and June, the stronger figures reflected a rebound from the extreme low points in March and April, and were not trends that could be extrapolated into the upcoming months, in our assessment.
Unprecedented interventions from the Fed and central banks around the world widened the disconnect between financial markets and real economies during the period. In our opinion, central bank efforts to bolster liquidity in financial markets have been effective, but they do not replace lost revenues or cure insolvencies; they only deepen the debt burdens. We expected corporate bankruptcies to be the next challenge policymakers will have to face, as business insolvencies appeared likely to worsen with each passing month of stifled economic activity. We saw risks for an upcoming second leg down in financial markets.
Rallies in risk assets during the final months of the period appeared to underappreciate the ongoing economic damage and the risks for successive waves of infections that could further suppress economic activity going forward, in our view.
Massive unemployment, deepening economic hardship and growing insolvencies will not be fully remedied by partial reopenings or government interventions alone. The longer that economic activity remains suppressed and the longer that workers go without incomes, the more entrenched the economic damage will become.
On the policy front, the Fed maintained its monetary stance at its April and June meetings, and reaffirmed its commitment to using its “full range of tools to support the U.S. economy.” The updated dot plot survey in June indicated that Fed officials expected rates to remain unchanged through 2022. The Fed also updated its projections for U.S. GDP (gross domestic product) growth to -6.5% for 2020 and +5.0% for 2021. It also projected unemployment to be 9.3% at the end of 2020. Fed Chair Jay Powell commented at the end of June during testimony to the House financial services committee that, “the path forward for the economy is extraordinarily uncertain and will depend in large part on our success in containing the virus.” He also continued to emphasize the importance of fiscal support for workers. Powell also indicated that yield curve control was not in imminent consideration and likely not an appropriate tool for U.S. financial markets. In previous comments, he had also ruled out the potential for negative policy rates.
In Europe, the European Commission proposed a €750 billion financing program in May that would deliver up to €500 billion in grants and €250 billion in loans to member states in need of financial support. The program was still in policy discussions at the end of June. On the monetary side, the ECB increased the size of the PEPP by €600 billion to €1.35 trillion at its June 4 policy meeting. Italian bonds rallied on the news, as did the euro, which appreciated 1.2% against the USD in the month of June. The ECB also updated its growth forecast for the eurozone in 2020 to -8.7%, which would be the largest contraction in the post-war era. In May, Lagarde acknowledged that a recovery to previous GDP levels would take at least two to three years.
In Japan, monetary policy responses to the crisis focused more on ensuring businesses had ample access to capital through various loan programs than on lowering the cost of capital. At its April 27 meeting, the BOJ quadrupled the size of its corporate debt purchases. It also announced that it would remove quantitative easing caps. On the price stability front, deflation returned during the period, despite years of persistent efforts from the BOJ to drive inflation higher. Core inflation dropped to -0.2% year-over-year in April and May. The BOJ offered no indications on whether the return of deflation would alter monetary policy in the months ahead,
| | | | |
| | | |
| franklintempleton.com | | Semiannual Report | | 5 |
TEMPLETON GLOBAL BALANCED FUND
Geographic Composition*
Based on Total Net Assets as of 6/30/20
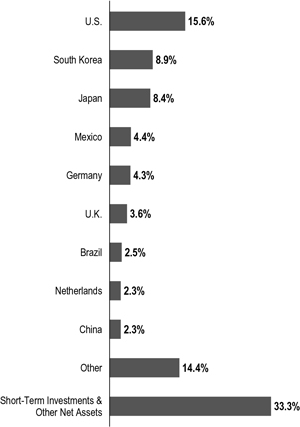
*Figures represent the net Fund exposure and include certain derivatives held in the portfolio (or their underlying reference assets) and may not total 100% or may be negative due to rounding, use of any derivatives or other factors.
but it remained a concern that officials continued to monitor. The BOJ kept overnight interest rates at -0.1% and the yield target on the 10-year Japanese government bond at 0.0% throughout the period.
Nearly every country in the world declared some form of fiscal response to the crisis, with most countries pursuing programs that went beyond the measures they deployed during the GFC. Debt-to-GDP ratios rose significantly in just about every country. On the monetary front, many central banks aggressively cut policy rates during the peaks in financial market volatility in March, but paused on making additional cuts in April, similar to the approaches taken by the Fed and the ECB. Several central banks returned to rate cuts in May and June, with many indicating they intended to respond with additional accommodation as needed. During the period, Brazil cut its policy rate by 225 bps to 2.25%, Mexico by 225 bps to 5.00%, Colombia by 175 bps to 2.50%, India by 115 bps to 4.00%, Indonesia by 75 bps to 4.25%, South Korea by 75 bps to 0.50%, Australia by 50 bps to
0.25%, Norway by 150 bps to 0.00%, Canada by 150 bps to 0.25% and the United Kingdom by 65 bps to 0.10%.
Investment Strategy
We search for undervalued or out-of-favor debt and equity securities and for equity securities that offer or may offer current income. When choosing equity securities for the Fund, we use a fundamental research, value-oriented, long-term approach, focusing on the market price of a security relative to our evaluation of the company’s long-term earnings, asset value and cash flow potential, as reflected by various metrics. Because this is a global fund, we analyze global economic trends to identify global macro trends (for example, regions with strong economic growth), and evaluate market inefficiencies to identify investment opportunities stemming from market mispricings.
When choosing fixed income investments for the Fund, we perform an independent analysis of the securities being considered for the Fund’s portfolio, rather than relying principally on their ratings assigned by rating agencies, as well as an assessment of the potential impacts of material environmental, social and governance (ESG) factors on the long-term risk and return profile of a country. In our analysis of corporate debt securities, we consider a variety of factors, including a company’s experience and managerial strength; responsiveness to changes in interest rates and business conditions; debt maturity schedules and borrowing requirements; a company’s changing financial condition and market recognition of the change; and a security’s relative value based on such factors as anticipated cash flow, interest or dividend coverage, asset coverage and earnings prospects. With respect to sovereign debt securities, we consider market, political and economic conditions, and evaluate interest and currency exchange rate changes and credit risks. We regularly enter into currency-related transactions involving certain derivative instruments, including currency and cross currency forwards, but we may also use other derivative instruments, to provide a hedge against risks associated with other securities held in the Fund or to implement a currency investment strategy. The use of these derivative transactions may allow the Fund to obtain net long or net short exposures to selected currencies, interest rates, countries, durations or credit risks, and may be used for hedging or investment purposes.
Manager’s Discussion
Despite unprecedented support measures from global central banks and policymakers, macroeconomic conditions remain far from normal. We have never experienced such a precarious market situation and believe global stock market
| | | | |
| | | |
6 | | Semiannual Report | | franklintempleton.com |
TEMPLETON GLOBAL BALANCED FUND
valuations are severely disconnected from underlying challenges. In response, we have tried to diversify away from risks created by policy interventions and de-correlate our portfolio from an increasingly volatile market.
Equity
Global equities, as measured by the MSCI ACWI Index, declined during the six months under review, weighed down by coronavirus concerns and economic uncertainty. However, markets rebounded strongly in the last few months of the period on promises of unlimited policy stimulus and optimism about economic re-openings. It was a challenging six months for value investors such as Templeton, with value stocks significantly underperforming growth stocks.
In this environment, the equity portion underperformed its benchmark index for the period, primarily due to stock selection and an underweighting in the information technology (IT) sector and stock selection in the communication services sector. An underweighting in the energy sector also detracted from relative performance.
In IT, Japanese electronic components manufacturer Kyocera detracted from relative results. The company’s shares declined on continued concerns about demand prospects in end markets for the firm’s automotive and industrial components. Kyocera has remained sensitive to global GDP trends due to the diversity of its customer base, though segments such as electronic devices and ceramics stand to benefit from secular growth trends like the adoption of 5G and increasing content demand, which may offset cyclicality elsewhere. Ultimately, we believe the key to unlocking the company’s value is the more efficient use of its balance sheet, which is overcapitalized in cash and investments. Since the retirement of the company’s founder two years ago, a more shareholder-friendly management team has taken over and explicitly targeted higher returns on equity. We believe this bodes well for the prospects of better long-term returns and is not adequately reflected in Kyocera’s share price.
In communications services, Luxembourg-based satellite operator SES detracted from relative performance. The company reported weaker-than-expected fourth-quarter results and lowered 2020 fiscal year revenue and earnings guidance due to lower-than-expected revenue growth in the video business and slowing growth in its networks business. Management also cut the dividend by half, citing the need to protect its investment-grade debt rating. We exited the position during the period to invest in what we viewed to be more compellingly valued opportunities.
Top Five Equity Holdings
6/30/20
| | |
Company Sector/Industry, Country | | % of Total
Net Assets |
| |
Bayer AG Pharmaceuticals, Germany | | 1.8% |
| |
Samsung Electronics Co. Ltd. Technology Hardware, Storage & Peripherals, South Korea | | 1.6% |
| |
Dollar Tree Inc. Multiline Retail, U.S. | | 1.5% |
| |
AIA Group Ltd. Insurance, Hong Kong | | 1.4% |
| |
Berkshire Hathaway Inc. Diversified Financial Services, U.S. | | 1.4% |
In energy, Husky Energy and Royal Dutch Shell were significant relative detractors, and both positions were sold during the period. The confluence of a pandemic-related demand shock with a supply shock stemming from the Saudi-Russian price war was unexpected, and we used associated volatility to reduce exposure to energy stocks, having found higher quality and more stable cyclical exposure in other sectors.
In contrast, stock selection and underweightings in consumer staples and utilities contributed to relative performance, along with an overweight in materials.
The consumer staples sector has traded at a premium despite low margins, fierce competition and poor pricing power, making value opportunities highly specific and idiosyncratic. Traditionally defensive consumer staples stocks such as U.S. grocer Kroger was a key relative contributor, benefiting from consumer stockpiling ahead of an extended period of stay-at-home social distancing measures.
German power utility E.ON led relative contributors in the utilities sector. E.ON’s transition from a diversified and geographically dispersed operation into a focused European utility is nearing completion, and the company should benefit over time from a stable regulatory environment and lower interest costs once debt is refinanced. In our analysis, synergies from the firm’s acquisition of power distribution company Innogy (not a Fund holding) are yet to be realised and should create economies of scale and support profitability over our long-term investment horizon. Overall, the firm offers a relatively high dividend yield supported by regulated earnings, while also having the potential to become a higher-growth utility once the benefits of the Innogy integration materialize.
| | | | |
| | | |
| franklintempleton.com | | Semiannual Report | | 7 |
TEMPLETON GLOBAL BALANCED FUND
In materials, U.S.-based copper miner Freeport-McMoRan contributed to relative returns. The firm rallied strongly after copper prices recovered to pre-crisis levels and investors reacted positively to an announced austerity plan, which includes capital expenditure reductions, executive pay cuts and a suspension of the dividend.
Regionally, stock selection and an overweight in Asia detracted significantly from relative performance. No regions contributed to relative performance during the period, but stock selection in Germany, the Netherlands and France did help results.
It is important to recognize the effect of currency movements on the Fund’s performance. In general, if the value of the U.S. dollar goes up compared with a foreign currency, an investment traded in that foreign currency will go down in value because it will be worth fewer U.S. dollars. This can have a negative effect on Fund performance. Conversely, when the U.S. dollar weakens in relation to a foreign currency, an investment traded in that foreign currency will increase in value, which can contribute to Fund performance. For the six months ended June 30, 2020, the U.S. dollar rose in value relative to most currencies. As a result, the Fund’s performance was negatively affected by the portfolio’s investment primarily in securities with non-U.S. currency exposure.
Top Five Fixed Income Holdings*
6/30/20
| | |
Issue/Issuer | | % of Total
Net Assets |
| |
Korea Treasury Bond | | 7.3% |
| |
Government of Mexico | | 4.0% |
| |
U.S. Treasury Note | | 3.9% |
| |
Nota do Tesouro Nacional | | 2.2% |
| |
Government of Ghana | | 1.8% |
*Does not include cash and cash equivalents.
Fixed Income
The fixed income sleeve of the strategy was structured around four key pillars during the reporting period: (1) maintaining high liquidity through elevated cash balances and risk-adjusted position weights; (2) holding long exposures to perceived safe-haven assets such as the Japanese yen, Swiss franc, Norwegian krone and Swedish krona; (3) targeting appropriate risk-adjusted returns in a select subset of emerging markets; and (4) underweighting overvalued developed fixed income markets, notably longer-term USTs. The strategy continued to emphasize select duration exposures in countries that have attractive
risk-adjusted yields, resilient economic fundamentals and prudent fiscal and monetary policies. Several emerging markets continued to offer significantly higher yields than those available in the developed markets. The strategy entered the reporting period in a de-risked state as the investment team saw elevated global financial market risks that it believed were significantly underappreciated by markets. While the team was not explicitly anticipating the COVID-19 crisis or the collapse in oil prices in the first quarter of 2020, it was concerned that overvalued risk assets were vulnerable to a geopolitical, economic or financial market shock. The team adjusted the risk-sizing of various positions and hedged (using currency forwards) a substantial amount of local-currency emerging market beta risk through proxy hedges (net-negative Australian dollar) and direct hedges (Indian rupee, South Korean won, Mexican peso and Brazilian real). The team also continued to broadly avoid credit sectors, which it believed were overvalued leading up to the crisis and increasingly vulnerable to insolvencies as the economic crisis progressed. The strategy also maintained negative duration exposure to longer-term USTs before the COVID-19 crisis erupted in March 2020, as the team believed that inflation pressures, rising deficit spending and surging levels of debt issuance were significantly underpriced in the longer-term range of the U.S. Treasury yield curve. The team unwound its net-negative positioning in longer-term USTs into curve steepening in March. The strategy continued to hold safe-haven assets that it had previously added in the third quarter of 2019, notably the Japanese yen, Swiss franc, Swedish krona and Norwegian krone. These positions were intended to hedge against global financial market risks associated with rising geopolitical tensions as well as price distortions from ongoing loose monetary policies across the developed world. The strategy also continued to hold a net-negative position in the euro to hedge against broad-based USD strength and unresolved structural risks across Europe, and a net-negative position in the Australian dollar to hedge against broad emerging market risks. During the period, the team used forward currency exchange contracts and currency options to actively manage currencies, and used interest-rate swaps to tactically manage duration exposures.
During the period, the Fund’s negative absolute performance was primarily due to currency positions. Interest-rate strategies contributed to absolute results, while overall credit exposures had a largely neutral effect. Among currencies, positions in Latin America (the Brazilian real and Argentine peso) and Asia ex-Japan (Indonesian rupiah) detracted from absolute performance. The Fund maintained a defensive approach regarding interest rates in developed markets,
| | | | |
| | | |
8 | | Semiannual Report | | franklintempleton.com |
TEMPLETON GLOBAL BALANCED FUND
while holding duration exposures in select emerging markets. Select duration exposures in Latin America (Mexico and Argentina) Africa (Ghana) and Asia (India) contributed to absolute results, while negative duration exposure to USTs during the first quarter detracted.
On a relative basis, the Fund underperformed its fixed income benchmark due to currency positions, followed by interest-rate strategies. Overall credit exposures had a largely neutral effect on relative results. Among currencies, overweighted positions in Latin America (the Brazilian real and Argentine peso) and Asia ex-Japan (Indonesian rupiah) detracted from relative performance, as did overweighted positions in northern European currencies (the Norwegian krone). Underweighted duration exposure in the U.S. detracted from relative performance, as did select underweighted duration exposures in Europe. However, select overweighted duration exposures in Latin America (Mexico and Argentina), Africa (Ghana) and Asia ex-Japan (India) contributed to relative results.
Thank you for your continued participation in Templeton Global Balanced Fund. We look forward to serving your future investment needs.
Michael Hasenstab, Ph.D.
Co-Lead Portfolio Manager
Warren Pustam, CFA
Co-Lead Portfolio Manager
Herbert J. Arnett, Jr.
Portfolio Manager
The foregoing information reflects our analysis, opinions and portfolio holdings as of June 30, 2020, the end of the reporting period. The way we implement our main investment strategies and the resulting portfolio holdings may change depending on factors such as market and economic conditions. These opinions may not be relied upon as investment advice or an offer for a particular security. The information is not a complete analysis of every aspect of any market, country, industry, security or the Fund. Statements of fact are from sources considered reliable, but the investment manager makes no representation or warranty as to their completeness or accuracy. Although historical performance is no guarantee of future results, these insights may help you understand our investment management philosophy.
CFA® is a trademark owned by CFA Institute.
| | | | |
| | | |
| franklintempleton.com | | Semiannual Report | | 9 |
TEMPLETON GLOBAL BALANCED FUND
Performance Summary as of June 30, 20201
The performance table does not reflect any taxes that a shareholder would pay on Fund dividends, capital gain distributions, if any, or any realized gains on the sale of Fund shares. Total return reflects reinvestment of the Fund’s dividends and capital gain distributions, if any, and any unrealized gains or losses. Your dividend income will vary depending on dividends or interest paid by securities in the Fund’s portfolio, adjusted for operating expenses of each class. Capital gain distributions are net profits realized from the sale of portfolio securities.
Performance as of 6/30/201
Cumulative total return excludes sales charges. Average annual total return includes maximum sales charges. Sales charges will vary depending on the size of the investment and the class of share purchased. The maximum is 5.50% and the minimum is 0%. Class A: 5.50% maximum initial sales charge; Advisor Class: no sales charges. For other share classes, visit franklintempleton.com.
| | | | | | | | |
| Share Class | |
| Cumulative
Total Return |
2 | |
| Average Annual
Total Return |
3 |
| |
| | |
A4 | | | | | | | | |
6-Month | | | -12.21% | | | | -17.17% | |
| |
| | |
1-Year | | | -10.69% | | | | -15.73% | |
| |
| | |
5-Year | | | -5.28% | | | | -2.19% | |
| |
| | |
10-Year | | | +50.26% | | | | +3.58% | |
| |
| | |
Advisor | | | | | | | | |
6-Month | | | -12.36% | | | | -12.36% | |
| |
| | |
1-Year | | | -10.42% | | | | -10.42% | |
| |
| | |
5-Year | | | -4.33% | | | | -0.88% | |
| |
| | |
10-Year | | | +54.35% | | | | +4.44% | |
| |
Performance data represent past performance, which does not guarantee future results. Investment return and principal value will fluctuate, and you may have a gain or loss when you sell your shares. Current performance may differ from figures shown. For most recent month-end performance, go to franklintempleton.com or call (800) 342-5236.
See page 11 for Performance Summary footnotes.
| | | | |
| | | |
10 | | Semiannual Report | | franklintempleton.com |
TEMPLETON GLOBAL BALANCED FUND
PERFORMANCE SUMMARY
Distributions (1/1/20–6/30/20)
| | |
| Share Class | | Net Investment
Income |
| |
A | | $0.0309 |
| |
A1 | | $0.0309 |
| |
C | | $0.0211 |
| |
C1 | | $0.0252 |
| |
R | | $0.0287 |
| |
R6 | | $0.0356 |
| |
Advisor | | $0.0341 |
Total Annual Operating Expenses5
| | | | | | |
| Share Class | | With Fee
Waiver | | | Without Fee
Waiver |
| | |
A | | | 1.22% | | | 1.25% |
| | |
Advisor | | | 0.97% | | | 1.00% |
Each class of shares is available to certain eligible investors and has different annual fees and expenses, as described in the prospectus.
All investments involve risks, including possible loss of principal. Special risks are associated with foreign investing, including currency fluctuations, economic instability and political developments; investments in emerging markets involve heightened risks related to the same factors. Stock prices fluctuate, sometimes rapidly and dramatically, due to factors affecting individual companies, particular industries or sectors, or general market conditions. Bond prices generally move in the opposite direction of interest rates. Thus, as the prices of bonds in the Fund adjust to a rise in interest rates, the Fund’s share price may decline. The risks associated with higher yielding, lower rated debt securities include higher risk of default and loss of principal. The markets for a particular security or instrument or type of security or instrument are or may become relatively illiquid. Reduced liquidity will have an adverse impact on the security’s value and on the Fund’s ability to sell such securities or instruments when necessary to meet the Fund’s liquidity needs or in response to a specific market event. The Fund’s investment in derivative securities, such as swaps, financial futures and option contracts, and use of foreign currency techniques involve special risks as such may not achieve the anticipated benefits and/or may result in losses to the Fund. Unexpected events and their aftermaths, such as the spread of deadly diseases; natural, environmental or man-made disasters; financial, political or social disruptions; terrorism and war; and other tragedies or catastrophes, can cause investor fear and panic, which can adversely affect the economies of many companies, sectors, nations, regions and the market in general, in ways that cannot necessarily be foreseen. The Fund’s prospectus also includes a description of the main investment risks.
1. The Fund has a fee waiver associated with any investment it makes in a Franklin Templeton money fund and/or other Franklin Templeton fund, contractually guaranteed through 4/30/21. Fund investment results reflect the fee waiver; without this waiver, the results would have been lower.
2. Cumulative total return represents the change in value of an investment over the periods indicated.
3. Average annual total return represents the average annual change in value of an investment over the periods indicated. Return for less than one year, if any, has not been annualized.
4. Prior to 9/10/18, these shares were offered at a higher initial sales charge of 5.75%; thus actual returns would have differed. Total returns with sales charges have been restated to reflect the current maximum initial sales charge of 5.50%. Effective 9/27/11, Class A shares closed to new investors, were renamed Class A1 Shares, and a new Class A with different expense structure became available. Class A performance shown has been calculated as follows: (a) for periods prior to 9/27/11 a restated figure is used based on Class A1 performance and including the Rule 12b-1 rate differential between Class A and A1, and (b) for periods after 9/27/11, actual Class A performance is used, reflecting all charges and fees applicable to that class.
5. Figures are as stated in the Fund’s current prospectus and may differ from the expense ratios disclosed in the Your Fund’s Expenses and Financial Highlights sections in this report. In periods of market volatility, assets may decline significantly, causing total annual Fund operating expenses to become higher than the figures shown.
See www.franklintempletondatasources.com for additional data provider information.
| | | | |
| | | |
| franklintempleton.com | | Semiannual Report | | 11 |
TEMPLETON GLOBAL BALANCED FUND
Your Fund’s Expenses
As a Fund shareholder, you can incur two types of costs: (1) transaction costs, including sales charges (loads) on Fund purchases and redemptions; and (2) ongoing Fund costs, including management fees, distribution and service (12b-1) fees, and other Fund expenses. All mutual funds have ongoing costs, sometimes referred to as operating expenses. The table below shows ongoing costs of investing in the Fund and can help you understand these costs and compare them with those of other mutual funds. The table assumes a $1,000 investment held for the six months indicated.
Actual Fund Expenses
The table below provides information about actual account values and actual expenses in the columns under the heading “Actual.” In these columns the Fund’s actual return, which includes the effect of Fund expenses, is used to calculate the “Ending Account Value” for each class of shares. You can estimate the expenses you paid during the period by following these steps (of course, your account value and expenses will differ from those in this illustration): Divide your account value by $1,000 (if your account had an $8,600 value, then $8,600 ÷ $1,000 = 8.6). Then multiply the result by the number in the row for your class of shares under the headings “Actual” and “Expenses Paid During Period” (if Actual Expenses Paid During Period were $7.50, then 8.6 x $7.50 = $64.50). In this illustration, the actual expenses paid this period are $64.50.
Hypothetical Example for Comparison with Other Funds
Under the heading “Hypothetical” in the table, information is provided about hypothetical account values and hypothetical expenses based on the Fund’s actual expense ratio and an assumed rate of return of 5% per year before expenses, which is not the Fund’s actual return. This information may not be used to estimate the actual ending account balance or expenses you paid for the period, but it can help you compare ongoing costs of investing in the Fund with those of other funds. To do so, compare this 5% hypothetical example for the class of shares you hold with the 5% hypothetical examples that appear in the shareholder reports of other funds.
Please note that expenses shown in the table are meant to highlight ongoing costs and do not reflect any transactional costs. Therefore, information under the heading “Hypothetical” is useful in comparing ongoing costs only, and will not help you compare total costs of owning different funds. In addition, if transactional costs were included, your total costs would have been higher.
| | | | | | | | | | | | | | | | | | |
| | | | | | | Actual (actual return after expenses) | | | | Hypothetical (5% annual return before expenses) | | | | |
Share
Class | | Beginning
Account
Value 1/1/20 | | | | Ending
Account
Value 6/30/20 | | Expenses Paid During Period
1/1/20–6/30/201, 2 | | | | Ending
Account
Value 6/30/20 | | Expenses Paid During
Period
1/1/20–6/30/201, 2 | | | | Net
Annualized
Expense
Ratio2 |
| A | | $1,000 | | | | $877.90 | | $5.74 | | | | $1,018.75 | | $6.17 | | | | 1.23% |
| A1 | | $1,000 | | | | $874.80 | | $5.73 | | | | $1,018.75 | | $6.17 | | | | 1.23% |
| C | | $1,000 | | | | $870.20 | | $9.21 | | | | $1,015.02 | | $9.92 | | | | 1.98% |
| C1 | | $1,000 | | | | $872.60 | | $7.59 | | | | $1,016.76 | | $8.17 | | | | 1.63% |
| R | | $1,000 | | | | $877.50 | | $6.68 | | | | $1,017.75 | | $7.17 | | | | 1.43% |
| R6 | | $1,000 | | | | $876.50 | | $4.06 | | | | $1,020.54 | | $4.37 | | | | 0.87% |
| Advisor | | $1,000 | | | | $876.40 | | $4.57 | | | | $1,019.99 | | $4.92 | | | | 0.98% |
1. Expenses are equal to the annualized expense ratio for the six-month period as indicated above—in the far right column—multiplied by the simple average account value over the period indicated, and then multiplied by 182/366 to reflect the one-half year period.
2. Reflects expenses after fee waivers and expense reimbursements. Does not include acquired fund fees and expenses.
| | | | |
| | | |
12 | | Semiannual Report | | franklintempleton.com |
TEMPLETON GLOBAL INVESTMENT TRUST
Consolidated Financial Highlights
Templeton Global Balanced Fund
| | | | | | | | | | | | | | | | | | | | | | | | |
| | | Six Months Ended June 30, 2020 (unaudited) | | | | | | | | | | | | | | | Year Ended March 31, 2016 | |
| | | Year Ended December 31, | |
| | | 2019 | | | 2018 | | | 2017 | | | 2016a | |
| | | | | | |
Class A | | | | | | | | | | | | | | | | | | | | | | | | |
| | | | | | |
Per share operating performance (for a share outstanding throughout the period) | | | | | | | | | | | | | | | | | | | | | | | | |
| | | | | | |
Net asset value, beginning of period | | | $ 2.84 | | | | $ 2.77 | | | | $ 3.17 | | | | $ 2.91 | | | | $ 2.72 | | | | $ 3.13 | |
| | | | | | |
Income from investment operationsb: | | | | | | | | | | | | | | | | | | | | | | | | |
| | | | | | |
Net investment incomec | | | 0.03 | | | | 0.11 | | | | 0.10 | | | | 0.09 | | | | 0.07 | | | | 0.08 | |
| | | | | | |
Net realized and unrealized gains (losses) | | | (0.38 | ) | | | 0.08 | | | | (0.38 | ) | | | 0.25 | | | | 0.15 | | | | (0.32 | ) |
| | | | | | |
Total from investment operations | | | (0.35 | ) | | | 0.19 | | | | (0.28 | ) | | | 0.34 | | | | 0.22 | | | | (0.24 | ) |
| | | | | | |
Less distributions from: | | | | | | | | | | | | | | | | | | | | | | | | |
| | | | | | |
Net investment income | | | (0.03 | ) | | | (0.12 | ) | | | (0.12 | ) | | | (0.08 | ) | | | (0.03 | ) | | | (0.09 | ) |
| | | | | | |
Net realized gains | | | — | | | | — | | | | — | | | | — | | | | — | | | | (0.08 | ) |
| | | | | | |
Total distributions | | | (0.03 | ) | | | (0.12 | ) | | | (0.12 | ) | | | (0.08 | ) | | | (0.03 | ) | | | (0.17 | ) |
| | | | | | |
Net asset value, end of period | | | $ 2.46 | | | | $ 2.84 | | | | $ 2.77 | | | | $ 3.17 | | | | $ 2.91 | | | | $ 2.72 | |
| | | | | | |
Total returnd | | | (12.21)% | | | | 6.96% | | | | (9.44)% | | | | 12.18% | | | | 7.97% | | | | (7.74)% | |
| | | | | | |
Ratios to average net assetse | | | | | | | | | | | | | | | | | | | | | | | | |
| | | | | | |
Expenses before waiver and payments by affiliates and expense reduction | | | 1.29% | | | | 1.22% | | | | 1.19% | | | | 1.17% | | | | 1.16% | | | | 1.11% | |
| | | | | | |
Expenses net of waiver and payments by affiliates and expense reduction | | | 1.23% | | | | 1.19% | f | | | 1.16%f | | | | 1.14%f | | | | 1.15%f | | | | 1.10%f | |
| | | | | | |
Net investment income | | | 2.28% | | | | 3.81% | | | | 3.17% | | | | 2.82% | | | | 3.28% | | | | 2.55% | |
| | | | | | |
Supplemental data | | | | | | | | | | | | | | | | | | | | | | | | |
| | | | | | |
Net assets, end of period (000’s) | | | $346,525 | | | | $465,915 | | | | $557,604 | | | | $745,957 | | | | $780,810 | | | | $987,949 | |
| | | | | | |
Portfolio turnover rate | | | 44.23% | | | | 26.62% | | | | 45.92% | | | | 34.25% | | | | 16.66% | | | | 44.25% | |
aFor the period April 1, 2016 to December 31, 2016.
bThe amount shown for a share outstanding throughout the period may not correlate with the Consolidated Statement of Operations for the period due to the timing of sales and repurchases of the Fund’s shares in relation to income earned and/or fluctuating fair value of the investments of the Fund.
cBased on average daily shares outstanding.
dTotal return does not reflect sales commissions or contingent deferred sales charges, if applicable, and is not annualized for periods less than one year.
eRatios are annualized for periods less than one year, except for non-recurring expenses, if any.
fBenefit of expense reduction rounds to less than 0.01%.
| | | | |
| | | |
| franklintempleton.com | | The accompanying notes are an integral part of these consolidated financial statements. | Semiannual Report | | 13 |
TEMPLETON GLOBAL INVESTMENT TRUST
CONSOLIDATED FINANCIAL HIGHLIGHTS
Templeton Global Balanced Fund (continued)
| | | | | | | | | | | | | | | | | | | | | | | | |
| | | Six Months Ended June 30, 2020 (unaudited) | | | | | | | | | | | | | | | Year Ended March 31, 2016 | |
| | | Year Ended December 31, | |
| | | 2019 | | | 2018 | | | 2017 | | | 2016a | |
| | | | | | |
Class A1 | | | | | | | | | | | | | | | | | | | | | | | | |
| | | | | | |
Per share operating performance (for a share outstanding throughout the period) | | | | | | | | | | | | | | | | | | | | | | | | |
| | | | | | |
Net asset value, beginning of period | | | $ 2.84 | | | | $ 2.77 | | | | $ 3.18 | | | | $ 2.91 | | | | $ 2.72 | | | | $ 3.13 | |
| | | | | | |
Income from investment operationsb: | | | | | | | | | | | | | | | | | | | | | | | | |
| | | | | | |
Net investment incomec | | | 0.03 | | | | 0.11 | | | | 0.10 | | | | 0.09 | | | | 0.07 | | | | 0.08 | |
| | | | | | |
Net realized and unrealized gains (losses) | | | (0.38 | ) | | | 0.08 | | | | (0.39 | ) | | | 0.26 | | | | 0.15 | | | | (0.32 | ) |
| | | | | | |
Total from investment operations | | | (0.35 | ) | | | 0.19 | | | | (0.29 | ) | | | 0.35 | | | | 0.22 | | | | (0.24 | ) |
| | | | | | |
Less distributions from: | | | | | | | | | | | | | | | | | | | | | | | | |
| | | | | | |
Net investment income | | | (0.03 | ) | | | (0.12 | ) | | | (0.12 | ) | | | (0.08 | ) | | | (0.03 | ) | | | (0.09 | ) |
| | | | | | |
Net realized gains | | | — | | | | — | | | | — | | | | — | | | | — | | | | (0.08 | ) |
| | | | | | |
Total distributions | | | (0.03 | ) | | | (0.12 | ) | | | (0.12 | ) | | | (0.08 | ) | | | (0.03 | ) | | | (0.17 | ) |
| | | | | | |
Net asset value, end of period | | | $ 2.46 | | | | $ 2.84 | | | | $ 2.77 | | | | $ 3.18 | | | | $ 2.91 | | | | $ 2.72 | |
| | | | | | |
Total returnd | | | (12.52)% | | | | 7.33% | | | | (9.45)% | | | | 12.18% | | | | 7.97% | | | | (7.76)% | |
| | | | | | |
Ratios to average net assetse | | | | | | | | | | | | | | | | | | | | | | | | |
| | | | | | |
Expenses before waiver and payments by affiliates and expense reduction | | | 1.29% | | | | 1.22% | | | | 1.19% | | | | 1.17% | | | | 1.16% | | | | 1.11% | |
| | | | | | |
Expenses net of waiver and payments by affiliates and expense reduction | | | 1.23% | | | | 1.19%f | | | | 1.16%f | | | | 1.14%f | | | | 1.15%f | | | | 1.10%f | |
| | | | | | |
Net investment income | | | 2.28% | | | | 3.81% | | | | 3.17% | | | | 2.82% | | | | 3.28% | | | | 2.55% | |
| | | | | | |
Supplemental data | | | | | | | | | | | | | | | | | | | | | | | | |
| | | | | | |
Net assets, end of period (000’s) | | | $192,516 | | | | $252,990 | | | | $285,358 | | | | $293,488 | | | | $319,161 | | | | $370,212 | |
| | | | | | |
Portfolio turnover rate | | | 44.23% | | | | 26.62% | | | | 45.92% | | | | 34.25% | | | | 16.66% | | | | 44.25% | |
aFor the period April 1, 2016 to December 31, 2016.
bThe amount shown for a share outstanding throughout the period may not correlate with the Consolidated Statement of Operations for the period due to the timing of sales and repurchases of the Fund’s shares in relation to income earned and/or fluctuating fair value of the investments of the Fund.
cBased on average daily shares outstanding.
dTotal return does not reflect sales commissions or contingent deferred sales charges, if applicable, and is not annualized for periods less than one year.
eRatios are annualized for periods less than one year, except for non-recurring expenses, if any.
fBenefit of expense reduction rounds to less than 0.01%.
| | | | |
| | | |
14 | | Semiannual Report | The accompanying notes are an integral part of these consolidated financial statements. | | franklintempleton.com |
TEMPLETON GLOBAL INVESTMENT TRUST
CONSOLIDATED FINANCIAL HIGHLIGHTS
Templeton Global Balanced Fund (continued)
| | | | | | | | | | | | | | | | | | | | | | | | |
| | | Six Months Ended June 30, 2020 (unaudited) | | | | | | | | | | | | | | | Year Ended March 31, 2016 | |
| | | Year Ended December 31, | |
| | | 2019 | | | 2018 | | | 2017 | | | 2016a | |
| | | | | | |
Class C | | | | | | | | | | | | | | | | | | | | | | | | |
| | | | | | |
Per share operating performance (for a share outstanding throughout the period) | | | | | | | | | | | | | | | | | | | | | | | | |
| | | | | | |
Net asset value, beginning of period | | | $ 2.82 | | | | $ 2.75 | | | | $ 3.16 | | | | $ 2.90 | | | | $ 2.70 | | | | $ 3.12 | |
| | | | | | |
Income from investment operationsb: | | | | | | | | | | | | | | | | | | | | | | | | |
| | | | | | |
Net investment incomec | | | 0.02 | | | | 0.09 | | | | 0.08 | | | | 0.06 | | | | 0.05 | | | | 0.05 | |
| | | | | | |
Net realized and unrealized gains (losses) | | | (0.38 | ) | | | 0.08 | | | | (0.40 | ) | | | 0.26 | | | | 0.16 | | | | (0.31 | ) |
| | | | | | |
Total from investment operations | | | (0.36 | ) | | | 0.17 | | | | (0.32 | ) | | | 0.32 | | | | 0.21 | | | | (0.26 | ) |
| | | | | | |
Less distributions from: | | | | | | | | | | | | | | | | | | | | | | | | |
| | | | | | |
Net investment income | | | (0.02 | ) | | | (0.10 | ) | | | (0.09 | ) | | | (0.06 | ) | | | (0.01 | ) | | | (0.08 | ) |
| | | | | | |
Net realized gains | | | — | | | | — | | | | — | | | | — | | | | — | | | | (0.08 | ) |
| | | | | | |
Total distributions | | | (0.02 | ) | | | (0.10 | ) | | | (0.09 | ) | | | (0.06 | ) | | | (0.01 | ) | | | (0.16 | ) |
| | | | | | |
Net asset value, end of period | | | $ 2.44 | | | | $ 2.82 | | | | $ 2.75 | | | | $ 3.16 | | | | $ 2.90 | | | | $ 2.70 | |
| | | | | | |
Total returnd | | | (12.98)% | | | | 6.55% | | | | (10.23)% | | | | 11.03% | | | | 7.74% | | | | (8.68)% | |
| | | | | | |
Ratios to average net assetse | | | | | | | | | | | | | | | | | | | | | | | | |
| | | | | | |
Expenses before waiver and payments by affiliates and expense reduction | | | 2.04% | | | | 1.97% | | | | 1.94% | | | | 1.92% | | | | 1.89% | | | | 1.86% | |
| | | | | | |
Expenses net of waiver and payments by affiliates and expense reduction | | | 1.98% | | | | 1.94%f | | | | 1.91%f | | | | 1.89%f | | | | 1.88%f | | | | 1.85%f | |
| | | | | | |
Net investment income | | | 1.53% | | | | 3.06% | | | | 2.42% | | | | 2.07% | | | | 2.55% | | | | 1.80% | |
| | | | | | |
Supplemental data | | | | | | | | | | | | | | | | | | | | | | | | |
| | | | | | |
Net assets, end of period (000’s) | | | $97,136 | | | | $139,231 | | | | $203,587 | | | | $317,374 | | | | $340,265 | | | | $464,899 | |
| | | | | | |
Portfolio turnover rate | | | 44.23% | | | | 26.62% | | | | 45.92% | | | | 34.25% | | | | 16.66% | | | | 44.25% | |
aFor the period April 1, 2016 to December 31, 2016.
bThe amount shown for a share outstanding throughout the period may not correlate with the Consolidated Statement of Operations for the period due to the timing of sales and repurchases of the Fund’s shares in relation to income earned and/or fluctuating fair value of the investments of the Fund.
cBased on average daily shares outstanding.
dTotal return does not reflect sales commissions or contingent deferred sales charges, if applicable, and is not annualized for periods less than one year.
eRatios are annualized for periods less than one year, except for non-recurring expenses, if any.
fBenefit of expense reduction rounds to less than 0.01%.
| | | | |
| | | |
| franklintempleton.com | | The accompanying notes are an integral part of these consolidated financial statements. | Semiannual Report | | 15 |
TEMPLETON GLOBAL INVESTMENT TRUST
CONSOLIDATED FINANCIAL HIGHLIGHTS
Templeton Global Balanced Fund (continued)
| | | | | | | | | | | | | | | | | | | | | | | | |
| | | Six Months Ended June 30, 2020 (unaudited) | | | | | | | | | | | | | | | Year Ended March 31, 2016 | |
| | | Year Ended December 31, | |
| | | 2019 | | | 2018 | | | 2017 | | | 2016a | |
| | | | | | |
Class C1 | | | | | | | | | | | | | | | | | | | | | | | | |
| | | | | | |
Per share operating performance (for a share outstanding throughout the period) | | | | | | | | | | | | | | | | | | | | | | | | |
| | | | | | |
Net asset value, beginning of period | | | $ 2.84 | | | | $ 2.77 | | | | $ 3.17 | | | | $ 2.91 | | | | $ 2.72 | | | | $ 3.13 | |
| | | | | | |
Income from investment operationsb: | | | | | | | | | | | | | | | | | | | | | | | | |
| | | | | | |
Net investment incomec | | | 0.02 | | | | 0.10 | | | | 0.09 | | | | 0.08 | | | | 0.06 | | | | 0.06 | |
| | | | | | |
Net realized and unrealized gains (losses) | | | (0.37 | ) | | | 0.08 | | | | (0.39 | ) | | | 0.25 | | | | 0.15 | | | | (0.31 | ) |
| | | | | | |
Total from investment operations | | | (0.35 | ) | | | 0.18 | | | | (0.30 | ) | | | 0.33 | | | | 0.21 | | | | (0.25 | ) |
| | | | | | |
Less distributions from: | | | | | | | | | | | | | | | | | | | | | | | | |
| | | | | | |
Net investment income | | | (0.03 | ) | | | (0.11 | ) | | | (0.10 | ) | | | (0.07 | ) | | | (0.02 | ) | | | (0.08 | ) |
| | | | | | |
Net realized gains | | | — | | | | — | | | | — | | | | — | | | | — | | | | (0.08 | ) |
| | | | | | |
Total distributions | | | (0.03 | ) | | | (0.11 | ) | | | (0.10 | ) | | | (0.07 | ) | | | (0.02 | ) | | | (0.16 | ) |
| | | | | | |
Net asset value, end of period | | | $ 2.46 | | | | $ 2.84 | | | | $ 2.77 | | | | $ 3.17 | | | | $ 2.91 | | | | $ 2.72 | |
| | | | | | |
Total returnd | | | (12.74)% | | | | 6.82% | | | | (9.88)% | | | | 11.71% | | | | 7.62% | | | | (8.07)% | |
| | | | | | |
Ratios to average net assetse | | | | | | | | | | | | | | | | | | | | | | | | |
| | | | | | |
Expenses before waiver and payments by affiliates and expense reduction | | | 1.69% | | | | 1.62% | | | | 1.59% | | | | 1.57% | | | | 1.56% | | | | 1.51% | |
| | | | | | |
Expenses net of waiver and payments by affiliates and expense reduction | | | 1.63% | | | | 1.59%f | | | | 1.56%f | | | | 1.54%f | | | | 1.55%f | | | | 1.50%f | |
| | | | | | |
Net investment income | | | 1.88% | | | | 3.41% | | | | 2.77% | | | | 2.42% | | | | 2.88% | | | | 2.15% | |
| | | | | | |
Supplemental data | | | | | | | | | | | | | | | | | | | | | | | | |
| | | | | | |
Net assets, end of period (000’s) | | | $16,207 | | | | $27,765 | | | | $62,418 | | | | $173,079 | | | | $202,929 | | | | $233,840 | |
| | | | | | |
Portfolio turnover rate | | | 44.23% | | | | 26.62% | | | | 45.92% | | | | 34.25% | | | | 16.66% | | | | 44.25% | |
aFor the period April 1, 2016 to December 31, 2016.
bThe amount shown for a share outstanding throughout the period may not correlate with the Consolidated Statement of Operations for the period due to the timing of sales and repurchases of the Fund’s shares in relation to income earned and/or fluctuating fair value of the investments of the Fund.
cBased on average daily shares outstanding.
dTotal return does not reflect sales commissions or contingent deferred sales charges, if applicable, and is not annualized for periods less than one year.
eRatios are annualized for periods less than one year, except for non-recurring expenses, if any.
fBenefit of expense reduction rounds to less than 0.01%.
| | | | |
| | | |
16 | | Semiannual Report | The accompanying notes are an integral part of these consolidated financial statements. | | franklintempleton.com |
TEMPLETON GLOBAL INVESTMENT TRUST
CONSOLIDATED FINANCIAL HIGHLIGHTS
Templeton Global Balanced Fund (continued)
| | | | | | | | | | | | | | | | | | | | | | | | |
| | | Six Months Ended June 30, 2020 (unaudited) | | | | | | | | | | | | | | | Year Ended March 31, 2016 | |
| | | Year Ended December 31, | |
| | | 2019 | | | 2018 | | | 2017 | | | 2016a | |
| | | | | | |
Class R | | | | | | | | | | | | | | | | | | | | | | | | |
| | | | | | |
Per share operating performance (for a share outstanding throughout the period) | | | | | | | | | | | | | | | | | | | | | | | | |
| | | | | | |
Net asset value, beginning of period | | | $ 2.85 | | | | $ 2.78 | | | | $ 3.18 | | | | $ 2.92 | | | | $ 2.72 | | | | $ 3.14 | |
| | | | | | |
Income from investment operationsb: | | | | | | | | | | | | | | | | | | | | | | | | |
| | | | | | |
Net investment incomec | | | 0.03 | | | | 0.10 | | | | 0.09 | | | | 0.08 | | | | 0.06 | | | | 0.07 | |
| | | | | | |
Net realized and unrealized gains (losses) | | | (0.38 | ) | | | 0.08 | | | | (0.38 | ) | | | 0.25 | | | | 0.16 | | | | (0.32 | ) |
| | | | | | |
Total from investment operations | | | (0.35 | ) | | | 0.18 | | | | (0.29 | ) | | | 0.33 | | | | 0.22 | | | | (0.25 | ) |
| | | | | | |
Less distributions from: | | | | | | | | | | | | | | | | | | | | | | | | |
| | | | | | |
Net investment income | | | (0.03 | ) | | | (0.11 | ) | | | (0.11 | ) | | | (0.07 | ) | | | (0.02 | ) | | | (0.09 | ) |
| | | | | | |
Net realized gains | | | — | | | | — | | | | — | | | | — | | | | — | | | | (0.08 | ) |
| | | | | | |
Total distributions | | | (0.03 | ) | | | (0.11 | ) | | | (0.11 | ) | | | (0.07 | ) | | | (0.02 | ) | | | (0.17 | ) |
| | | | | | |
Net asset value, end of period | | | $ 2.47 | | | | $ 2.85 | | | | $ 2.78 | | | | $ 3.18 | | | | $ 2.92 | | | | $ 2.72 | |
| | | | | | |
Total returnd | | | (12.25)% | | | | 6.66% | | | | (9.67)% | | | | 11.84% | | | | 8.11% | | | | (8.24)% | |
| | | | | | |
Ratios to average net assetse | | | | | | | | | | | | | | | | | | | | | | | | |
| | | | | | |
Expenses before waiver and payments by affiliates and expense reduction | | | 1.49% | | | | 1.47% | | | | 1.44% | | | | 1.42% | | | | 1.41% | | | | 1.36% | |
| | | | | | |
Expenses net of waiver and payments by affiliates and expense reduction | | | 1.43% | | | | 1.44%f | | | | 1.41%f | | | | 1.39%f | | | | 1.40%f | | | | 1.35%f | |
| | | | | | |
Net investment income | | | 2.08% | | | | 3.56% | | | | 2.92% | | | | 2.57% | | | | 3.03% | | | | 2.30% | |
| | | | | | |
Supplemental data | | | | | | | | | | | | | | | | | | | | | | | | |
| | | | | | |
Net assets, end of period (000’s) | | | $1,832 | | | | $2,348 | | | | $2,778 | | | | $4,944 | | | | $5,487 | | | | $6,498 | |
| | | | | | |
Portfolio turnover rate | | | 44.23% | | | | 26.62% | | | | 45.92% | | | | 34.25% | | | | 16.66% | | | | 44.25% | |
aFor the period April 1, 2016 to December 31, 2016.
bThe amount shown for a share outstanding throughout the period may not correlate with the Consolidated Statement of Operations for the period due to the timing of sales and repurchases of the Fund’s shares in relation to income earned and/or fluctuating fair value of the investments of the Fund.
cBased on average daily shares outstanding.
dTotal return is not annualized for periods less than one year.
eRatios are annualized for periods less than one year, except for non-recurring expenses, if any.
fBenefit of expense reduction rounds to less than 0.01%.
| | | | |
| | | |
| franklintempleton.com | | The accompanying notes are an integral part of these consolidated financial statements. | Semiannual Report | | 17 |
TEMPLETON GLOBAL INVESTMENT TRUST
CONSOLIDATED FINANCIAL HIGHLIGHTS
Templeton Global Balanced Fund (continued)
| | | | | | | | | | | | | | | | | | | | | | | | |
| | | Six Months Ended June 30, 2020 (unaudited) | | | | | | | | | | | | | | | Year Ended March 31, 2016 | |
| | | Year Ended December 31, | |
| | | 2019 | | | 2018 | | | 2017 | | | 2016a | |
| | | | | | |
Class R6 | | | | | | | | | | | | | | | | | | | | | | | | |
| | | | | | |
Per share operating performance (for a share outstanding throughout the period) | | | | | | | | | | | | | | | | | | | | | | | | |
| | | | | | |
Net asset value, beginning of period | | | $ 2.85 | | | | $ 2.78 | | | | $ 3.18 | | | | $ 2.92 | | | | $ 2.73 | | | | $ 3.14 | |
| | | | | | |
Income from investment operationsb: | | | | | | | | | | | | | | | | | | | | | | | | |
| | | | | | |
Net investment incomec | | | 0.03 | | | | 0.12 | | | | 0.11 | | | | 0.09 | | | | 0.08 | | | | 0.08 | |
| | | | | | |
Net realized and unrealized gains (losses) | | | (0.38 | ) | | | 0.08 | | | | (0.38 | ) | | | 0.26 | | | | 0.15 | | | | (0.31 | ) |
| | | | | | |
Total from investment operations | | | (0.35 | ) | | | 0.20 | | | | (0.27 | ) | | | 0.35 | | | | 0.23 | | | | (0.23 | ) |
| | | | | | |
Less distributions from: | | | | | | | | | | | | | | | | | | | | | | | | |
| | | | | | |
Net investment income | | | (0.04 | ) | | | (0.13 | ) | | | (0.13 | ) | | | (0.09 | ) | | | (0.04 | ) | | | (0.10 | ) |
| | | | | | |
Net realized gains | | | — | | | | — | | | | — | | | | — | | | | — | | | | (0.08 | ) |
| | | | | | |
Total distributions | | | (0.04 | ) | | | (0.13 | ) | | | (0.13 | ) | | | (0.09 | ) | | | (0.04 | ) | | | (0.18 | ) |
| | | | | | |
Net asset value, end of period | | | $ 2.46 | | | | $ 2.85 | | | | $ 2.78 | | | | $ 3.18 | | | | $ 2.92 | | | | $ 2.73 | |
| | | | | | |
Total returnd | | | (12.35)% | | | | 7.32% | | | | (9.09)% | | | | 12.56% | | | | 8.35% | | | | (7.44)% | |
| | | | | | |
Ratios to average net assetse | | | | | | | | | | | | | | | | | | | | | | | | |
| | | | | | |
Expenses before waiver and payments by affiliates and expense reduction | | | 0.99% | | | | 0.92% | | | | 0.89% | | | | 0.84% | | | | 0.81% | | | | 0.81% | |
| | | | | | |
Expenses net of waiver and payments by affiliates and expense reduction | | | 0.87% | | | | 0.84%f | | | | 0.82%f | | | | 0.77%f | | | | 0.79%f | | | | 0.75%f | |
| | | | | | |
Net investment income | | | 2.64% | | | | 4.16% | | | | 3.51% | | | | 3.19% | | | | 3.64% | | | | 2.90% | |
| | | | | | |
Supplemental data | | | | | | | | | | | | | | | | | | | | | | | | |
| | | | | | |
Net assets, end of period (000’s) | | | $4,509 | | | | $6,080 | | | | $7,933 | | | | $11,254 | | | | $752 | | | | $1,089 | |
| | | | | | |
Portfolio turnover rate | | | 44.23% | | | | 26.62% | | | | 45.92% | | | | 34.25% | | | | 16.66% | | | | 44.25% | |
aFor the period April 1, 2016 to December 31, 2016.
bThe amount shown for a share outstanding throughout the period may not correlate with the Consolidated Statement of Operations for the period due to the timing of sales and repurchases of the Fund’s shares in relation to income earned and/or fluctuating fair value of the investments of the Fund.
cBased on average daily shares outstanding.
dTotal return is not annualized for periods less than one year.
eRatios are annualized for periods less than one year, except for non-recurring expenses, if any.
fBenefit of expense reduction rounds to less than 0.01%.
| | | | |
| | | |
18 | | Semiannual Report | The accompanying notes are an integral part of these consolidated financial statements. | | franklintempleton.com |
TEMPLETON GLOBAL INVESTMENT TRUST
CONSOLIDATED FINANCIAL HIGHLIGHTS
Templeton Global Balanced Fund (continued)
| | | | | | | | | | | | | | | | | | | | | | | | |
| | | Six Months Ended June 30, 2020 (unaudited) | | | | | | | | | | | | | | | Year Ended March 31, 2016 | |
| | | Year Ended December 31, | |
| | | 2019 | | | 2018 | | | 2017 | | | 2016a | |
| | | | | | |
Advisor Class | | | | | | | | | | | | | | | | | | | | | | | | |
| | | | | | |
Per share operating performance (for a share outstanding throughout the period) | | | | | | | | | | | | | | | | | | | | | | | | |
| | | | | | |
Net asset value, beginning of period | | | $ 2.85 | | | | $ 2.78 | | | | $ 3.19 | | | | $ 2.92 | | | | $ 2.73 | | | | $ 3.14 | |
| | | | | | |
Income from investment operationsb: | | | | | | | | | | | | | | | | | | | | | | | | |
| | | | | | |
Net investment incomec | | | 0.03 | | | | 0.12 | | | | 0.11 | | | | 0.10 | | | | 0.08 | | | | 0.08 | |
| | | | | | |
Net realized and unrealized gains (losses) | | | (0.38 | ) | | | 0.08 | | | | (0.39 | ) | | | 0.26 | | | | 0.14 | | | | (0.31 | ) |
| | | | | | |
Total from investment operations | | | (0.35 | ) | | | 0.20 | | | | (0.28 | ) | | | 0.36 | | | | 0.22 | | | | (0.23 | ) |
| | | | | | |
Less distributions from: | | | | | | | | | | | | | | | | | | | | | | | | |
| | | | | | |
Net investment income | | | (0.03 | ) | | | (0.13 | ) | | | (0.13 | ) | | | (0.09 | ) | | | (0.03 | ) | | | (0.10 | ) |
| | | | | | |
Net realized gains | | | — | | | | — | | | | — | | | | — | | | | — | | | | (0.08 | ) |
| | | | | | |
Total distributions | | | (0.03 | ) | | | (0.13 | ) | | | (0.13 | ) | | | (0.09 | ) | | | (0.03 | ) | | | (0.18 | ) |
| | | | | | |
Net asset value, end of period | | | $ 2.47 | | | | $ 2.85 | | | | $ 2.78 | | | | $ 3.19 | | | | $ 2.92 | | | | $ 2.73 | |
| | | | | | |
Total returnd | | | (12.36)% | | | | 7.57% | | | | (9.19)% | | | | 12.42% | | | | 8.22% | | | | (7.52)% | |
| | | | | | |
Ratios to average net assetse | | | | | | | | | | | | | | | | | | | | | | | | |
| | | | | | |
Expenses before waiver and payments by affiliates and expense reduction | | | 1.04% | | | | 0.97% | | | | 0.94% | | | | 0.92% | | | | 0.91% | | | | 0.86% | |
| | | | | | |
Expenses net of waiver and payments by affiliates and expense reduction | | | 0.98% | | | | 0.94%f | | | | 0.91%f | | | | 0.89%f | | | | 0.90%f | | | | 0.85%f | |
| | | | | | |
Net investment income | | | 2.53% | | | | 4.06% | | | | 3.42% | | | | 3.07% | | | | 3.53% | | | | 2.80% | |
| | | | | | |
Supplemental data | | | | | | | | | | | | | | | | | | | | | | | | |
| | | | | | |
Net assets, end of period (000’s) | | | $81,569 | | | | $141,277 | | | | $207,346 | | | | $246,044 | | | | $212,161 | | | | $299,226 | |
| | | | | | |
Portfolio turnover rate | | | 44.23% | | | | 26.62% | | | | 45.92% | | | | 34.25% | | | | 16.66% | | | | 44.25% | |
aFor the period April 1, 2016 to December 31, 2016.
bThe amount shown for a share outstanding throughout the period may not correlate with the Consolidated Statement of Operations for the period due to the timing of sales and repurchases of the Fund’s shares in relation to income earned and/or fluctuating fair value of the investments of the Fund.
cBased on average daily shares outstanding.
dTotal return is not annualized for periods less than one year.
eRatios are annualized for periods less than one year, except for non-recurring expenses, if any.
fBenefit of expense reduction rounds to less than 0.01%.
| | | | |
| | | |
| franklintempleton.com | | The accompanying notes are an integral part of these consolidated financial statements. | Semiannual Report | | 19 |
TEMPLETON GLOBAL INVESTMENT TRUST
Consolidated Statement of Investments, June 30, 2020 (unaudited)
Templeton Global Balanced Fund
| | | | | | | | | | | | |
| | | Industry | | | Shares | | | Value | |
| |
| | | |
Common Stocks 41.6% | | | | | | | | | | | | |
China 2.3% | | | | | | | | | | | | |
a Alibaba Group Holding Ltd. | | | Internet & Direct Marketing Retail | | | | 159,600 | | | $ | 4,306,584 | |
a Baidu Inc., ADR | | | Interactive Media & Services | | | | 65,300 | | | | 7,828,817 | |
b Xiabuxiabu Catering Management China Holdings Co. Ltd. | | | Hotels, Restaurants & Leisure | | | | 4,711,000 | | | | 4,673,048 | |
| | | | | | | | | | | | |
| | | |
| | | | | | | | | | | 16,808,449 | |
| | | | | | | | | | | | |
Denmark 0.9% | | | | | | | | | | | | |
AP Moeller-Maersk A/S, B | | | Marine | | | | 5,511 | | | | 6,458,294 | |
| | | | | | | | | | | | |
| | | |
France 1.2% | | | | | | | | | | | | |
a ArcelorMittal SA | | | Metals & Mining | | | | 493,831 | | | | 5,230,125 | |
a Dassault Aviation SA | | | Aerospace & Defense | | | | 4,354 | | | | 3,994,428 | |
| | | | | | | | | | | | |
| | | |
| | | | | | | | | | | 9,224,553 | |
| | | | | | | | | | | | |
Germany 4.3% | | | | | | | | | | | | |
Bayer AG | | | Pharmaceuticals | | | | 183,073 | | | | 13,568,805 | |
Bayerische Motoren Werke AG | | | Automobiles | | | | 76,462 | | | | 4,880,949 | |
E.ON SE | | | Multi-Utilities | | | | 831,401 | | | | 9,383,752 | |
Siemens AG | | | Industrial Conglomerates | | | | 35,741 | | | | 4,214,816 | |
| | | | | | | | | | | | |
| | | |
| | | | | | | | | | | 32,048,322 | |
| | | | | | | | | | | | |
Hong Kong 1.6% | | | | | | | | | | | | |
AIA Group Ltd. | | | Insurance | | | | 1,119,600 | | | | 10,476,702 | |
Value Partners Group Ltd. | | | Capital Markets | | | | 2,550,000 | | | | 1,299,912 | |
| | | | | | | | | | | | |
| | | |
| | | | | | | | | | | 11,776,614 | |
| | | | | | | | | | | | |
India 1.0% | | | | | | | | | | | | |
Housing Development Finance Corp. Ltd. | | | Thrifts & Mortgage Finance | | | | 314,236 | | | | 7,302,663 | |
| | | | | | | | | | | | |
| | | |
Ireland 0.9% | | | | | | | | | | | | |
a Ryanair Holdings PLC, ADR | | | Airlines | | | | 96,000 | | | | 6,368,640 | |
| | | | | | | | | | | | |
| | | |
Japan 8.2% | | | | | | | | | | | | |
Hosokawa Micron Corp. | | | Machinery | | | | 31,700 | | | | 1,678,977 | |
Isuzu Motors Ltd. | | | Automobiles | | | | 432,400 | | | | 3,929,364 | |
Japan Airlines Co. Ltd. | | | Airlines | | | | 153,000 | | | | 2,760,965 | |
Kirin Holdings Co. Ltd. | | | Beverages | | | | 170,200 | | | | 3,587,773 | |
Komatsu Ltd. | | | Machinery | | | | 102,100 | | | | 2,091,061 | |
Kyocera Corp. | |
| Electronic Equipment, Instruments
& Components |
| | | 98,300 | | | | 5,365,662 | |
Nippon Television Holdings Inc. | | | Media | | | | 434,600 | | | | 4,707,142 | |
Seria Co. Ltd. | | | Multiline Retail | | | | 225,800 | | | | 8,053,547 | |
Sony Corp. | | | Household Durables | | | | 32,300 | | | | 2,229,673 | |
Sumitomo Metal Mining Co. Ltd. | | | Metals & Mining | | | | 207,890 | | | | 5,856,217 | |
Takeda Pharmaceutical Co. Ltd. | | | Pharmaceuticals | | | | 285,200 | | | | 10,246,647 | |
Tokyo Broadcasting System Holdings Inc. | | | Media | | | | 306,000 | | | | 4,894,883 | |
Toyota Industries Corp. | | | Auto Components | | | | 106,400 | | | | 5,655,440 | |
| | | | | | | | | | | | |
| | | |
| | | | | | | | | | | 61,057,351 | |
| | | | | | | | | | | | |
| | | | |
| | | |
20 | | Semiannual Report | | franklintempleton.com |
TEMPLETON GLOBAL INVESTMENT TRUST
CONSOLIDATED STATEMENT OF INVESTMENTS (UNAUDITED)
Templeton Global Balanced Fund (continued)
| | | | | | | | | | | | |
| | | Industry | | | Shares | | | Value | |
| |
| | | |
Common Stocks (continued) | | | | | | | | | | | | |
Netherlands 2.3% | | | | | | | | | | | | |
Flow Traders | | | Capital Markets | | | | 120,703 | | | $ | 4,318,322 | |
NN Group NV | | | Insurance | | | | 134,809 | | | | 4,530,226 | |
NXP Semiconductors NV | | | Semiconductors & Semiconductor Equipment | | | | 71,400 | | | | 8,142,456 | |
| | | | | | | | | | | | |
| | | |
| | | | | | | | | | | 16,991,004 | |
| | | | | | | | | | | | |
South Africa 0.0% | | | | | | | | | | | | |
a,c,d K2016470219 South Africa Ltd., A | | | Specialty Retail | | | | 32,900,733 | | | | — | |
a,c,d K2016470219 South Africa Ltd., B | | | Specialty Retail | | | | 4,646,498 | | | | — | |
| | | | | | | | | | | | |
| | | |
| | | | | | | | | | | — | |
| | | | | | | | | | | | |
South Korea 1.6% | | | | | | | | | | | | |
Samsung Electronics Co. Ltd. | | | Technology Hardware, Storage & Peripherals | | | | 263,156 | | | | 11,680,464 | |
| | | | | | | | | | | | |
| | | |
Spain 0.9% | | | | | | | | | | | | |
Amadeus IT Group SA | | | IT Services | | | | 127,162 | | | | 6,675,681 | |
| | | | | | | | | | | | |
| | | |
Taiwan 1.2% | | | | | | | | | | | | |
Taiwan Semiconductor Manufacturing Co. Ltd. | | | Semiconductors & Semiconductor Equipment | | | | 827,000 | | | | 8,857,624 | |
| | | | | | | | | | | | |
| | | |
United Kingdom 3.5% | | | | | | | | | | | | |
Imperial Brands PLC | | | Tobacco | | | | 380,721 | | | | 7,247,355 | |
a LivaNova PLC | | | Health Care Equipment & Supplies | | | | 102,100 | | | | 4,914,073 | |
a Persimmon PLC | | | Household Durables | | | | 134,011 | | | | 3,792,566 | |
Prudential PLC | | | Insurance | | | | 318,907 | | | | 4,805,115 | |
Travis Perkins PLC | | | Trading Companies & Distributors | | | | 393,218 | | | | 5,482,018 | |
| | | | | | | | | | | | |
| | | |
| | | | | | | | | | | 26,241,127 | |
| | | | | | | | | | | | |
United States 11.7% | | | | | | | | | | | | |
a Berkshire Hathaway Inc., B | | | Diversified Financial Services | | | | 57,800 | | | | 10,317,878 | |
a Booking Holdings Inc. | | | Internet & Direct Marketing Retail | | | | 4,240 | | | | 6,751,522 | |
Comcast Corp., A | | | Media | | | | 258,324 | | | | 10,069,469 | |
a Dollar Tree Inc. | | | Multiline Retail | | | | 121,600 | | | | 11,269,888 | |
a F5 Networks Inc. | | | Communications Equipment | | | | 40,000 | | | | 5,579,200 | |
Freeport-McMoRan Inc. | | | Metals & Mining | | | | 497,000 | | | | 5,750,290 | |
The Kroger Co. | | | Food & Staples Retailing | | | | 214,600 | | | | 7,264,210 | |
a Laboratory Corp. of America Holdings | | | Health Care Providers & Services | | | | 33,200 | | | | 5,514,852 | |
Medtronic PLC | | | Health Care Equipment & Supplies | | | | 42,200 | | | | 3,869,740 | |
Oracle Corp. | | | Software | | | | 80,010 | | | | 4,422,153 | |
a,c,e Turtle Bay Resort | | | Hotels, Restaurants & Leisure | | | | 1,587,888 | | | | 34,934 | |
United Parcel Service Inc., B | | | Air Freight & Logistics | | | | 66,900 | | | | 7,437,942 | |
UnitedHealth Group Inc. | | | Health Care Providers & Services | | | | 12,680 | | | | 3,739,966 | |
Visa Inc., A | | | IT Services | | | | 22,200 | | | | 4,288,374 | |
| | | | | | | | | | | | |
| | | |
| | | | | | | | | | | 86,310,418 | |
| | | | | | | | | | | | |
| | | |
Total Common Stocks
(Cost $297,943,141) | | | | | | | | | | | 307,801,204 | |
| | | | | | | | | | | | |
| | | | |
| | | |
| franklintempleton.com | | Semiannual Report | | 21 |
TEMPLETON GLOBAL INVESTMENT TRUST
CONSOLIDATED STATEMENT OF INVESTMENTS (UNAUDITED)
Templeton Global Balanced Fund (continued)
| | | | | | | | | | | | | | | | |
| | | Industry | | | Principal
Amount* | | | | | | Value | |
| |
| | | | |
Corporate Bonds 0.0%† | | | | | | | | | | | | | | | | |
South Africa 0.0%† | | | | | | | | | | | | | | | | |
c,f,g K2016470219 South Africa Ltd., | | | | | | | | | | | | | | | | |
senior secured note, 144A, PIK, 3.00%, 12/31/22 | | | Specialty Retail | | | | 2,686,371 | | | | | | | $ | - | |
senior secured note, 144A, PIK, 8.00%, 12/31/22 | | | Specialty Retail | | | | 2,504,000 | | | | EUR | | | | 3,516 | |
c,f,g K2016470260 South Africa Ltd., senior secured note, 144A, PIK, 25.00%, 12/31/22 | | | Specialty Retail | | | | 1,112,784 | | | | | | | | 5,564 | |
| | | | | | | | | | | | | | | | |
| | | | |
Total Corporate Bonds
(Cost $4,103,720) | | | | | | | | | | | | | | | 9,080 | |
| | | | | | | | | | | | | | | | |
| | | | |
Foreign Government and Agency Securities 20.6% | | | | | | | | | | | | | | | | |
Argentina 1.6% | | | | | | | | | | | | | | | | |
h,i Argentina Treasury Bond BONCER, | | | | | | | | | | | | | | | | |
Index Linked, 1.20%, 3/18/22 | | | | | | | 427,091,263 | | | | ARS | | | | 4,040,334 | |
Index Linked, 1.40%, 3/25/23 | | | | | | | 238,304,727 | | | | ARS | | | | 2,016,526 | |
Index Linked, 1.50%, 3/25/24 | | | | | | | 238,304,736 | | | | ARS | | | | 1,882,809 | |
h Argentine Bonos del Tesoro, | | | | | | | | | | | | | | | | |
18.20%, 10/03/21 | | | | | | | 193,279,000 | | | | ARS | | | | 1,404,362 | |
16.00%, 10/17/23 | | | | | | | 298,989,000 | | | | ARS | | | | 1,500,250 | |
senior note, 15.50%, 10/17/26 | | | | | | | 243,952,000 | | | | ARS | | | | 877,205 | |
h,j Government of Argentina, FRN, 26.415%, (ARS Badlar + 2.00%), 4/03/22 | | | | | | | 37,519,000 | | | | ARS | | | | 339,231 | |
| | | | | | | | | | | | | | | | |
| | | | |
| | | | | | | | | | | | | | | 12,060,717 | |
| | | | | | | | | | | | | | | | |
Brazil 2.5% | | | | | | | | | | | | | | | | |
Letra Tesouro Nacional, | | | | | | | | | | | | | | | | |
Strip, 4/01/21 | | | | | | | 5,020 | k | | | BRL | | | | 908,656 | |
Strip, 7/01/21 | | | | | | | 9,890 | k | | | BRL | | | | 1,777,177 | |
Nota do Tesouro Nacional, 10.00%, 1/01/21 | | | | | | | 84,037 | k | | | BRL | | | | 16,045,946 | |
| | | | | | | | | | | | | | | | |
| | | | |
| | | | | | | | | | | | | | | 18,731,779 | |
| | | | | | | | | | | | | | | | |
Colombia 1.0% | | | | | | | | | | | | | | | | |
Government of Colombia, | | | | | | | | | | | | | | | | |
senior bond, 7.75%, 4/14/21 | | | | | | | 689,000,000 | | | | COP | | | | 188,321 | |
senior bond, 4.375%, 3/21/23 | | | | | | | 52,000,000 | | | | COP | | | | 13,915 | |
senior bond, 9.85%, 6/28/27 | | | | | | | 83,000,000 | | | | COP | | | | 27,916 | |
Titulos de Tesoreria, | | | | | | | | | | | | | | | | |
senior bond, B, 11.00%, 7/24/20 | | | | | | | 677,000,000 | | | | COP | | | | 181,015 | |
senior bond, B, 7.00%, 5/04/22 | | | | | | | 844,000,000 | | | | COP | | | | 240,185 | |
senior bond, B, 10.00%, 7/24/24 | | | | | | | 1,738,000,000 | | | | COP | | | | 569,740 | |
senior bond, B, 7.50%, 8/26/26 | | | | | | | 19,829,000,000 | | | | COP | | | | 6,013,650 | |
| | | | | | | | | | | | | | | | |
| | | | |
| | | | | | | | | | | | | | | 7,234,742 | |
| | | | | | | | | | | | | | | | |
El Salvador 0.0%† | | | | | | | | | | | | | | | | |
f Government of El Salvador, 144A, 7.65%, 6/15/35 | | | | | | | 100,000 | | | | | | | | 87,250 | |
| | | | | | | | | | | | | | | | |
| | | | | | |
| | | |
22 | | Semiannual Report | | franklintempleton.com |
TEMPLETON GLOBAL INVESTMENT TRUST
CONSOLIDATED STATEMENT OF INVESTMENTS (UNAUDITED)
Templeton Global Balanced Fund (continued)
| | | | | | | | | | | | |
| | | Principal
Amount* | | | | | | Value | |
| |
| | | |
Foreign Government and Agency Securities (continued) | | | | | | | | | | | | |
Ghana 1.8% | | | | | | | | | | | | |
Government of Ghana, | | | | | | | | | | | | |
24.75%, 3/01/21 | | | 110,000 | | | | GHS | | | $ | 19,949 | |
24.50%, 6/21/21 | | | 600,000 | | | | GHS | | | | 110,148 | |
24.75%, 7/19/21 | | | 6,550,000 | | | | GHS | | | | 1,205,973 | |
18.75%, 1/24/22 | | | 7,110,000 | | | | GHS | | | | 1,246,300 | |
19.75%, 3/25/24 | | | 7,250,000 | | | | GHS | | | | 1,277,854 | |
19.00%, 11/02/26 | | | 25,220,000 | | | | GHS | | | | 4,042,157 | |
senior bond, 19.75%, 3/15/32 | | | 18,930,000 | | | | GHS | | | | 3,058,743 | |
senior note, 24.00%, 11/23/20 | | | 7,760,000 | | | | GHS | | | | 1,384,379 | |
senior note, 16.50%, 3/22/21 | | | 50,000 | | | | GHS | | | | 8,633 | |
senior note, 18.25%, 7/25/22 | | | 7,580,000 | | | | GHS | | | | 1,316,489 | |
| | | | | | | | | | | | |
| | | |
| | | | | | | | | | | 13,670,625 | |
| | | | | | | | | | | | |
India 0.2% | | | | | | | | | | | | |
Government of India, senior note, 7.16%, 5/20/23 | | | 83,000,000 | | | | INR | | | | 1,175,958 | |
| | | | | | | | | | | | |
| | | |
Indonesia 1.8% | | | | | | | | | | | | |
Government of Indonesia, | | | | | | | | | | | | |
senior bond, FR35, 12.90%, 6/15/22 | | | 10,168,000,000 | | | | IDR | | | | 808,661 | |
senior bond, FR39, 11.75%, 8/15/23 | | | 1,616,000,000 | | | | IDR | | | | 131,139 | |
senior bond, FR43, 10.25%, 7/15/22 | | | 154,000,000 | | | | IDR | | | | 11,751 | |
senior bond, FR46, 9.50%, 7/15/23 | | | 73,000,000,000 | | | | IDR | | | | 5,594,705 | |
senior bond, FR63, 5.625%, 5/15/23 | | | 2,150,000,000 | | | | IDR | | | | 149,135 | |
senior bond, FR70, 8.375%, 3/15/24 | | | 84,648,000,000 | | | | IDR | | | | 6,327,074 | |
| | | | | | | | | | | | |
| | | |
| | | | | | | | | | | 13,022,465 | |
| | | | | | | | | | | | |
Mexico 4.0% | | | | | | | | | | | | |
Government of Mexico, | | | | | | | | | | | | |
senior bond, M, 6.50%, 6/10/21 | | | 2,228,700 | l | | | MXN | | | | 9,857,358 | |
senior bond, M, 6.50%, 6/09/22 | | | 1,962,300 | l | | | MXN | | | | 8,833,162 | |
senior bond, M, 8.00%, 12/07/23 | | | 327,300 | l | | | MXN | | | | 1,570,633 | |
senior bond, M 20, 10.00%, 12/05/24 | | | 85,300 | l | | | MXN | | | | 447,037 | |
senior note, M, 7.25%, 12/09/21 | | | 2,012,900 | l | | | MXN | | | | 9,073,049 | |
| | | | | | | | | | | | |
| | | |
| | | | | | | | | | | 29,781,239 | |
| | | | | | | | | | | | |
South Korea 7.3% | | | | | | | | | | | | |
Korea Monetary Stabilization Bond, senior note, 1.18%, 8/02/21 | | | 208,000,000 | | | | KRW | | | | 174,316 | |
Korea Treasury Bond, | | | | | | | | | | | | |
senior bond, 4.25%, 6/10/21 | | | 3,380,800,000 | | | | KRW | | | | 2,915,572 | |
senior note, 1.375%, 9/10/21 | | | 8,462,200,000 | | | | KRW | | | | 7,117,245 | |
senior note, 2.00%, 12/10/21 | | | 380,000,000 | | | | KRW | | | | 322,690 | |
senior note, 2.25%, 9/10/23 | | | 876,000,000 | | | | KRW | | | | 760,674 | |
senior note, 1.875%, 3/10/24 | | | 2,205,000,000 | | | | KRW | | | | 1,897,466 | |
senior note, 1.375%, 9/10/24 | | | 4,655,400,000 | | | | KRW | | | | 3,932,809 | |
senior note, 3.00%, 9/10/24 | | | 745,000,000 | | | | KRW | | | | 670,717 | |
senior note, 1.875%, 6/10/29 | | | 13,100,000,000 | | | | KRW | | | | 11,401,141 | |
| | | | |
| | | |
| franklintempleton.com | | Semiannual Report | | 23 |
TEMPLETON GLOBAL INVESTMENT TRUST
CONSOLIDATED STATEMENT OF INVESTMENTS (UNAUDITED)
Templeton Global Balanced Fund (continued)
| | | | | | | | | | | | | | |
| | | | | | Principal
Amount* | | | | | Value | |
| |
| | | |
Foreign Government and Agency Securities (continued) | | | | | | | | | | | |
South Korea (continued) | | | | | | | | | | | | | | |
Korea Treasury Bond, (continued) | | | | | | | | | | | | | | |
senior note, 1.375%, 12/10/29 | | | | | | | 29,872,200,000 | | | KRW | | $ | 24,911,852 | |
| | | | | | | | | | | | | | |
| | | | |
| | | | | | | | | | | | | 54,104,482 | |
| | | | | | | | | | | | | | |
m Supranational 0.4% | | | | | | | | | | | | | | |
Inter-American Development Bank, senior bond, 7.50%, 12/05/24 | | | | | | | 60,000,000 | | | MXN | | | 2,814,649 | |
| | | | | | | | | | | | | | |
| | | |
Total Foreign Government and Agency Securities
(Cost $204,842,979) | | | | | | | | | | 152,683,906 | |
| | | | | | | | | | | | | | |
| | | |
U.S. Government and Agency Securities 3.9% | | | | | | | | | | | |
United States 3.9% | | | | | | | | | | | | | | |
U.S. Treasury Note, | | | | | | | | | | | | | | |
1.375%, 1/31/25 | | | | | | | 15,300,000 | | | | | | 16,077,252 | |
2.625%, 12/31/25 | | | | | | | 4,900,000 | | | | | | 5,507,906 | |
1.625%, 2/15/26 | | | | | | | 2,650,000 | | | | | | 2,835,655 | |
2.125%, 5/31/26 | | | | | | | 1,210,000 | | | | | | 1,332,796 | |
1.625%, 10/31/26 | | | | | | | 2,650,000 | | | | | | 2,847,301 | |
| | | | | | | | | | | | | | |
| | | | |
| | | | | | | | | | | | | 28,600,910 | |
| | | | | | | | | | | | | | |
| | | |
Total U.S. Government and Agency Securities
(Cost $27,402,501) | | | | | | | | | | 28,600,910 | |
| | | | | | | | | | | | | | |
| | | | |
| | | Number of
Contracts | | | Notional
Amount# | | | | | | |
| | | | |
Options Purchased 0.6% | | | | | | | | | | | | | | |
Calls - Over-the-Counter | | | | | | | | | | | | | | |
Currency Options 0.4% | | | | | | | | | | | | | | |
AUD/JPY, Counterparty CITI, September Strike Price 79.45 JPY, Expires 9/11/20 | | | 1 | | | | 2,520,000 | | | AUD | | | 4,935 | |
AUD/JPY, Counterparty CITI, October Strike Price 77.95 JPY, Expires 10/22/20 | | | 1 | | | | 5,042,000 | | | AUD | | | 32,198 | |
AUD/JPY, Counterparty CITI, October Strike Price 79.00 JPY, Expires 10/29/20 | | | 1 | | | | 2,079,000 | | | AUD | | | 9,654 | |
AUD/JPY, Counterparty CITI, November Strike Price 84.33 JPY, Expires 11/12/20 | | | 1 | | | | 1,133,000 | | | AUD | | | 978 | |
AUD/JPY, Counterparty CITI, December Strike Price 82.15 JPY, Expires 12/21/20 | | | 1 | | | | 4,531,000 | | | AUD | | | 11,033 | |
AUD/JPY, Counterparty CITI, January Strike Price 79.00 JPY, Expires 1/22/21 | | | 1 | | | | 3,405,000 | | | AUD | | | 27,094 | |
AUD/JPY, Counterparty CITI, April Strike Price 72.90 JPY, Expires 4/29/21 | | | 1 | | | | 1,915,000 | | | AUD | | | 71,858 | |
AUD/JPY, Counterparty CITI, April Strike Price 81.00 JPY, Expires 4/29/21 | | | 1 | | | | 2,458,000 | | | AUD | | | 16,046 | |
| | | | | | |
| | | |
24 | | Semiannual Report | | franklintempleton.com |
TEMPLETON GLOBAL INVESTMENT TRUST
CONSOLIDATED STATEMENT OF INVESTMENTS (UNAUDITED)
Templeton Global Balanced Fund (continued)
| | | | | | | | | | | | | | | | |
| | | Number of
Contracts | | | Notional
Amount# | | | | | | Value | |
| |
| | | |
Options Purchased (continued) | | | | | | | | | | | | | |
Calls - Over-the-Counter (continued) | | | | | | | | | | | | | |
Currency Options (continued) | | | | | | | | | | | | | | | | |
AUD/JPY, Counterparty CITI, June Strike Price 81.00 JPY, Expires 6/21/21 | | | 1 | | | | 3,782,000 | | | | AUD | | | $ | 30,323 | |
AUD/USD, Counterparty HSBK, January Strike Price $0.71, Expires 1/22/21 | | | 1 | | | | 1,009,000 | | | | AUD | | | | 15,449 | |
AUD/USD, Counterparty HSBK, February Strike Price $0.75, Expires 2/08/21 | | | 1 | | | | 2,017,000 | | | | AUD | | | | 10,027 | |
AUD/USD, Counterparty HSBK, February Strike Price $0.74, Expires 2/10/21 | | | 1 | | | | 2,420,000 | | | | AUD | | | | 14,200 | |
AUD/USD, Counterparty MSCO, October Strike Price $0.75, Expires 10/28/20 | | | 1 | | | | 1,008,500 | | | | AUD | | | | 1,638 | |
AUD/USD, Counterparty MSCO, May Strike Price $0.77, Expires 5/12/21 | | | 1 | | | | 2,719,000 | | | | AUD | | | | 12,107 | |
USD/MXN, Counterparty CITI, July Strike Price 21.03 MXN, Expires 7/30/20 | | | 1 | | | | 1,413,000 | | | | | | | | 126,931 | |
USD/MXN, Counterparty CITI, September Strike Price 21.94 MXN, Expires 9/03/20 | | | 1 | | | | 354,000 | | | | | | | | 21,802 | |
USD/MXN, Counterparty CITI, September Strike Price 23.21 MXN, Expires 9/03/20 | | | 1 | | | | 804,000 | | | | | | | | 23,611 | |
USD/MXN, Counterparty CITI, September Strike Price 23.34 MXN, Expires 9/03/20 | | | 1 | | | | 473,000 | | | | | | | | 12,457 | |
USD/MXN, Counterparty CITI, September Strike Price 31.04 MXN, Expires 9/03/20 | | | 1 | | | | 1,381,000 | | | | | | | | 896 | |
USD/MXN, Counterparty CITI, November Strike Price 26.72 MXN, Expires 11/09/20 | | | 1 | | | | 4,391,000 | | | | | | | | 46,285 | |
USD/MXN, Counterparty CITI, December Strike Price 23.97 MXN, Expires 12/07/20 | | | 1 | | | | 3,302,000 | | | | | | | | 114,626 | |
USD/MXN, Counterparty CITI, February Strike Price 25.49 MXN, Expires 2/11/21 | | | 1 | | | | 2,569,000 | | | | | | | | 70,694 | |
USD/MXN, Counterparty CITI, March Strike Price 24.62 MXN, Expires 3/24/21 | | | 1 | | | | 2,568,000 | | | | | | | | 103,981 | |
USD/MXN, Counterparty CITI, April Strike Price 23.75 MXN, Expires 4/09/21 | | | 1 | | | | 1,360,000 | | | | | | | | 75,279 | |
USD/MXN, Counterparty CITI, April Strike Price 25.48 MXN, Expires 4/09/21 | | | 1 | | | | 2,600,000 | | | | | | | | 87,118 | |
USD/MXN, Counterparty CITI, April Strike Price 27.45 MXN, Expires 4/28/21 | | | 1 | | | | 8,109,000 | | | | | | | | 178,260 | |
USD/MXN, Counterparty CITI, June Strike Price 26.09 MXN, Expires 6/18/21 | | | 1 | | | | 2,761,000 | | | | | | | | 96,304 | |
USD/MXN, Counterparty CITI, June Strike Price 24.81 MXN, Expires 6/30/21 | | | 1 | | | | 4,142,000 | | | | | | | | 215,144 | |
USD/MXN, Counterparty CITI, December Strike Price 29.73 MXN, Expires 12/07/21 | | | 1 | | | | 3,963,000 | | | | | | | | 110,659 | |
USD/MXN, Counterparty GSCO, July Strike Price 20.00 MXN, Expires 7/31/20 | | | 1 | | | | 1,351,000 | | | | | | | | 180,749 | |
USD/MXN, Counterparty GSCO, July Strike Price 24.18 MXN, Expires 7/31/20 | | | 1 | | | | 1,351,000 | | | | | | | | 11,157 | |
USD/MXN, Counterparty GSCO, March Strike Price 20.62 MXN, Expires 3/03/21 | | | 1 | | | | 884,000 | | | | | | | | 119,343 | |
USD/MXN, Counterparty GSCO, June Strike Price 22.83 MXN, Expires 6/09/21 | | | 1 | | | | 844,000 | | | | | | | | 68,245 | |
| | | | |
| | | |
| franklintempleton.com | | Semiannual Report | | 25 |
TEMPLETON GLOBAL INVESTMENT TRUST
CONSOLIDATED STATEMENT OF INVESTMENTS (UNAUDITED)
Templeton Global Balanced Fund (continued)
| | | | | | | | | | | | | | | | |
| | | Number of
Contracts | | | Notional
Amount# | | | | | | Value | |
| |
| | | | |
Options Purchased (continued) | | | | | | | | | | | | | | | | |
Calls - Over-the-Counter (continued) | | | | | | | | | | | | | | | | |
Currency Options (continued) | | | | | | | | | | | | | | | | |
USD/MXN, Counterparty JPHQ, July Strike Price 20.90 MXN, Expires 7/27/20 | | | 1 | | | | 1,580,000 | | | | | | | $ | 149,291 | |
USD/MXN, Counterparty JPHQ, August Strike Price 22.50 MXN, Expires 8/31/20 | | | 1 | | | | 1,568,000 | | | | | | | | 68,638 | |
USD/MXN, Counterparty JPHQ, September Strike Price 23.25 MXN, Expires 9/22/20 | | | 1 | | | | 2,125,000 | | | | | | | | 67,828 | |
USD/MXN, Counterparty JPHQ, December Strike Price 23.25 MXN, Expires 12/23/20 | | | 1 | | | | 2,391,000 | | | | | | | | 117,585 | |
USD/MXN, Counterparty MSCO, September Strike Price 22.82 MXN, Expires 9/02/20 | | | 1 | | | | 2,733,000 | | | | | | | | 98,904 | |
USD/MXN, Counterparty MSCO, September Strike Price 25.02 MXN, Expires 9/02/20 | | | 1 | | | | 909,000 | | | | | | | | 8,223 | |
USD/MXN, Counterparty MSCO, January Strike Price 24.50 MXN, Expires 1/14/21 | | | 1 | | | | 1,052,000 | | | | | | | | 35,766 | |
USD/MXN, Counterparty MSCO, January Strike Price 26.53 MXN, Expires 1/14/21 | | | 1 | | | | 9,441,000 | | | | | | | | 169,456 | |
USD/MXN, Counterparty MSCO, March Strike Price 28.75 MXN, Expires 3/30/21 | | | 1 | | | | 5,716,000 | | | | | | | | 82,436 | |
| | | | | | | | | | | | | | | | |
| | | | | | | | | | | | | | | 2,719,208 | |
| | | | | | | | | | | | | | | | |
Puts - Exchange-Traded | | | | | | | | | | | | | | | | |
iShares MSCI EAFE ETF, Counterparty DMN, Strike Price $45, Expires 8/21/20 | | | 7,682 | | | | 768,200 | | | | | | | | 76,820 | |
iShares MSCI EAFE ETF, Counterparty DMN, Strike Price $51, Expires 8/21/20 | | | 3,567 | | | | 356,700 | | | | | | | | 137,329 | |
iShares MSCI Japan ETF, Counterparty DMN, Strike Price $41, Expires 9/18/20 | | | 6,242 | | | | 624,200 | | | | | | | | 174,776 | |
iShares MSCI Japan ETF, Counterparty DMN, Strike Price $46, Expires 9/18/20 | | | 3,073 | | | | 307,300 | | | | | | | | 162,869 | |
iShares MSCI United Kingdom ETF, Counterparty DMN, Strike Price $20, Expires 7/17/20 | | | 4,848 | | | | 484,800 | | | | | | | | - | |
iShares MSCI United Kingdom ETF, Counterparty DMN, Strike Price $22, Expires 7/17/20 | | | 2,907 | | | | 290,700 | | | | | | | | - | |
SPDR S&P 500 ETF Trust, Counterparty DMN, Strike Price $230, Expires 8/21/20 | | | 1,178 | | | | 117,800 | | | | | | | | 95,418 | |
SPDR S&P 500 ETF Trust, Counterparty DMN, Strike Price $262, Expires 8/21/20 | | | 571 | | | | 57,100 | | | | | | | | 130,759 | |
| | | | | | | | | | | | | | | | |
| | | | | | | | | | | | | | | 777,971 | |
| | | | | | | | | | | | | | | | |
Puts - Over-the-Counter | | | | | | | | | | | | | | | | |
Currency Options 0.1% | | | | | | | | | | | | | | | | |
AUD/USD, Counterparty HSBK, March Strike Price $0.64, Expires 3/22/21 | | | 1 | | | | 2,672,000 | | | | AUD | | | | 28,837 | |
AUD/JPY, Counterparty CITI, October Strike Price 67.10 JPY, Expires 10/29/20 | | | 1 | | | | 5,545,000 | | | | AUD | | | | 28,382 | |
AUD/JPY, Counterparty CITI, November Strike Price 66.78 JPY, Expires 11/12/20 | | | 1 | | | | 566,000 | | | | AUD | | | | 3,128 | |
AUD/JPY, Counterparty CITI, November Strike Price 69.18 JPY, Expires 11/12/20 | | | 1 | | | | 340,000 | | | | AUD | | | | 2,837 | |
| | | | | | |
| | | |
26 | | Semiannual Report | | franklintempleton.com |
TEMPLETON GLOBAL INVESTMENT TRUST
CONSOLIDATED STATEMENT OF INVESTMENTS (UNAUDITED)
Templeton Global Balanced Fund (continued)
| | | | | | | | | | | | | | | | |
| | | Number of
Contracts | | | Notional
Amount# | | | | | | Value | |
| |
| | | | |
Options Purchased (continued) | | | | | | | | | | | | | | | | |
Puts - Over-the-Counter (continued) | | | | | | | | | | | | | | | | |
Currency Options (continued) | | | | | | | | | | | | | | | | |
AUD/JPY, Counterparty CITI, December Strike | | | | | | | | | | | | | | | | |
Price 65.85 JPY, Expires 12/21/20 | | | 1 | | | | 2,267,000 | | | | AUD | | | $ | 14,503 | |
AUD/JPY, Counterparty CITI, March Strike Price 68.50 JPY, Expires 3/24/21 | | | 1 | | | | 2,270,000 | | | | AUD | | | | 30,975 | |
AUD/JPY, Counterparty CITI, April Strike Price 71.00 JPY, Expires 4/29/21 | | | 1 | | | | 6,553,000 | | | | AUD | | | | 137,135 | |
AUD/JPY, Counterparty CITI, June Strike Price 58.95 JPY, Expires 6/21/21 | | | 1 | | | | 5,042,000 | | | | AUD | | | | 33,329 | |
AUD/JPY, Counterparty CITI, June Strike Price 71.44 JPY, Expires 6/21/21 | | | 1 | | | | 5,042,000 | | | | AUD | | | | 125,167 | |
AUD/JPY, Counterparty CITI, June Strike Price 69.20 JPY, Expires 6/24/21 | | | 1 | | | | 4,034,000 | | | | AUD | | | | 78,505 | |
AUD/USD, Counterparty HSBK, October Strike Price $0.63, Expires 10/27/20 | | | 1 | | | | 2,017,000 | | | | AUD | | | | 6,768 | |
AUD/USD, Counterparty HSBK, January Strike Price $0.61, Expires 1/22/21 | | | 1 | | | | 3,128,000 | | | | AUD | | | | 15,797 | |
AUD/USD, Counterparty HSBK, February Strike Price $0.65, Expires 2/08/21 | | | 1 | | | | 4,035,000 | | | | AUD | | | | 48,466 | |
AUD/USD, Counterparty HSBK, February Strike Price $0.65, Expires 2/10/21 | | | 1 | | | | 4,840,000 | | | | AUD | | | | 51,623 | |
AUD/USD, Counterparty MSCO, October Strike Price $0.67, Expires 10/28/20 | | | 1 | | | | 2,017,000 | | | | AUD | | | | 20,051 | |
AUD/USD, Counterparty MSCO, November Strike Price $0.65, Expires 11/19/20 | | | 1 | | | | 4,280,000 | | | | AUD | | | | 30,004 | |
AUD/USD, Counterparty MSCO, December Strike Price $0.65, Expires 12/18/20 | | | 1 | | | | 3,656,000 | | | | AUD | | | | 34,331 | |
USD/MXN, Counterparty CITI, September Strike Price 19.11 MXN, Expires 9/03/20 | | | 1 | | | | 2,761,000 | | | | | | | | 480 | |
USD/MXN, Counterparty CITI, September Strike Price 21.33 MXN, Expires 9/03/20 | | | 1 | | | | 4,143,000 | | | | | | | | 14,525 | |
USD/MXN, Counterparty CITI, September Strike Price 20.85 MXN, Expires 9/17/20 | | | 1 | | | | 5,497,000 | | | | | | | | 12,473 | |
USD/MXN, Counterparty CITI, November Strike Price 22.45 MXN, Expires 11/09/20 | | | 1 | | | | 2,196,000 | | | | | | | | 44,256 | |
USD/MXN, Counterparty CITI, February Strike Price 20.88 MXN, Expires 2/11/21 | | | 1 | | | | 1,285,000 | | | | | | | | 9,386 | |
USD/MXN, Counterparty CITI, April Strike Price 21.20 MXN, Expires 4/09/21 | | | 1 | | | | 2,837,000 | | | | | | | | 31,519 | |
USD/MXN, Counterparty GSCO, July Strike Price 20.83 MXN, Expires 7/31/20 | | | 1 | | | | 2,702,000 | | | | | | | | 1,756 | |
USD/MXN, Counterparty GSCO, July Strike Price 22.03 MXN, Expires 7/31/20 | | | 1 | | | | 1,212,000 | | | | | | | | 6,323 | |
USD/MXN, Counterparty GSCO, August Strike Price 22.45 MXN, Expires 8/31/20 | | | 1 | | | | 946,000 | | | | | | | | 13,146 | |
USD/MXN, Counterparty GSCO, August Strike Price 20.30 MXN, Expires 8/31/20 | | | 1 | | | | 1,012,000 | | | | | | | | 778 | |
USD/MXN, Counterparty GSCO, September Strike Price 23.73 MXN, Expires 9/30/20 | | | 1 | | | | 2,702,000 | | | | | | | | 117,294 | |
USD/MXN, Counterparty GSCO, March Strike Price 18.65 MXN, Expires 3/03/21 | | | 1 | | | | 884,000 | | | | | | | | 965 | |
| | | | |
| | | |
| franklintempleton.com | | Semiannual Report | | 27 |
TEMPLETON GLOBAL INVESTMENT TRUST
CONSOLIDATED STATEMENT OF INVESTMENTS (UNAUDITED)
Templeton Global Balanced Fund (continued)
| | | | | | | | | | | | | | | | |
| |
| Number of
Contracts |
| |
| Notional
Amount# |
| | | | | | | Value | |
| |
| | | | |
Options Purchased (continued) | | | | | | | | | | | | | | | | |
Puts - Over-the-Counter (continued) | | | | | | | | | | | | | | | | |
Currency Options (continued) | | | | | | | | | | | | | | | | |
USD/MXN, Counterparty GSCO, June Strike Price 22.83 MXN, Expires 6/09/21 | | | 1 | | | | 844,000 | | | | | | | $ | 29,485 | |
USD/MXN, Counterparty MSCO, September Strike Price 20.11 MXN, Expires 9/02/20 | | | 1 | | | | 2,733,000 | | | | | | | | 1,744 | |
USD/MXN, Counterparty MSCO, September Strike Price 20.64 MXN, Expires 9/10/20 | | | 1 | | | | 1,657,000 | | | | | | | | 2,606 | |
USD/MXN, Counterparty MSCO, September Strike Price 20.13 MXN, Expires 9/22/20 | | | 1 | | | | 3,160,000 | | | | | | | | 3,024 | |
USD/MXN, Counterparty MSCO, September Strike Price 22.46 MXN, Expires 9/22/20 | | | 1 | | | | 965,000 | | | | | | | | 15,666 | |
USD/MXN, Counterparty MSCO, September Strike Price 20.91 MXN, Expires 9/24/20 | | | 1 | | | | 2,074,000 | | | | | | | | 5,484 | |
USD/MXN, Counterparty MSCO, September Strike Price 20.90 MXN, Expires 9/25/20 | | | 1 | | | | 752,000 | | | | | | | | 2,010 | |
USD/MXN, Counterparty MSCO, January Strike Price 20.95 MXN, Expires 1/14/21 | | | 1 | | | | 1,879,000 | | | | | | | | 13,277 | |
| | | | | | | | | | | | | | | | |
| | | | | | | | | | | | | | | 1,016,035 | |
| | | | | | | | | | | | | | | | |
| | | | |
Total Options Purchased
(Cost $8,289,516) | | | | | | | | | | | | | | | 4,513,214 | |
| | | | | | | | | | | | | | | | |
| | | | |
Total Investments before Short Term Investments
(Cost $542,581,857) | | | | | | | | | | | | | | | 493,608,314 | |
| | | | | | | | | | | | | | | | |
| | | | |
| | | | | | Principal
Amount* | | | | | | | |
| | | | |
Short Term Investments 32.8% | | | | | | | | | | | | | | | | |
| | | | |
Foreign Government and Agency Securities 5.4% | | | | | | | | | | | | | | | | |
Argentina 0.2% | | | | | | | | | | | | | | | | |
h,i Argentina Treasury Bond BONCER, Index Linked, 1.10%, 4/17/21 | | | | | | | 65,646,000 | | | | ARS | | | | 639,008 | |
h,i Letras de la Nacion Argentina con Ajuste por CER, Index Linked, 0.00%, 12/04/20 | | | | | | | 88,386,300 | | | | ARS | | | | 870,054 | |
| | | | | | | | | | | | | | | | |
| | | | | | | | | | | | | | | 1,509,062 | |
| | | | | | | | | | | | | | | | |
| | | | |
Brazil 1.0% | | | | | | | | | | | | | | | | |
Letra Tesouro Nacional, Strip, 7/01/20 - 10/01/20 | | | | | | | 38,134 | k | | | BRL | | | | 7,006,884 | |
| | | | | | | | | | | | | | | | |
| | | | |
Japan 3.8% | | | | | | | | | | | | | | | | |
n Japan Treasury Discount Bill, | | | | | | | | | | | | | | | | |
7/06/20 - 10/12/20 | | | | | | | 2,160,650,000 | | | | JPY | | | | 20,013,973 | |
11/10/20 | | | | | | | 882,500,000 | | | | JPY | | | | 8,178,852 | �� |
| | | | | | | | | | | | | | | | |
| | | | | | | | | | | | | | | 28,192,825 | |
| | | | | | | | | | | | | | | | |
| | | | | | |
| | | |
28 | | Semiannual Report | | franklintempleton.com |
TEMPLETON GLOBAL INVESTMENT TRUST
CONSOLIDATED STATEMENT OF INVESTMENTS (UNAUDITED)
Templeton Global Balanced Fund (continued)
| | | | | | | | | | | | | | |
| | | |
| Principal
Amount* |
| | | | | | | Value | |
| |
Foreign Government and Agency Securities (continued) | | | | | | | | | | | | | | |
Mexico 0.4% | | | | | | | | | | | | | | |
| | | | |
n Mexico Treasury Bill, 7/16/20 - 2/25/21 | | | | | 7,388,840 | o | | | MXN | | | $ | 3,184,483 | |
| | | | | | | | | | | | | | |
| | | | |
Total Foreign Government and Agency Securities (Cost $40,570,357) | | | | | | | | | | | | | 39,893,254 | |
| | | | | | | | | | | | | | |
| | | | |
Total Investments before Money Market Funds and Repurchase Agreement
(Cost $583,152,214) | | | | | | | | | | | | | 533,501,568 | |
| | | | | | | | | | | | | | |
| | | | |
| | | | | Shares | | | | | | | |
| | | | |
Money Market Funds (Cost $185,438,552) 25.0% | | | | | | | | | | | | | | |
| | | | |
United States 25.0% | | | | | | | | | | | | | | |
| | | | |
p,q Institutional Fiduciary Trust Money Market Portfolio, 0.0% | | | | | 185,438,552 | | | | | | | | 185,438,552 | |
| | | | | | | | | | | | | | |
| | | | |
| | | | | Principal
Amount* | | | | | | | |
| | | | |
Repurchase Agreements (Cost $16,552,509) 2.2% | | | | | | | | | | | | | | |
r Joint Repurchase Agreement, 0.065%, 7/01/20 | | | | | | | | | | | | | | |
(Maturity Value $16,552,539) | | | | | | | | | | | | | | |
BNP Paribas Securities Corp. | | | | | | | | | | | | | | |
(Maturity Value $11,483,986) | | | | | | | | | | | | | | |
Deutsche Bank Securities Inc. | | | | | | | | | | | | | | |
(Maturity Value $3,154,583) | | | | | | | | | | | | | | |
HSBC Securities (USA) Inc. | | | | | | | | | | | | | | |
(Maturity Value $1,913,970) | | | | | | | | | | | | | | |
Collateralized by U.S. Government Agency | | | | | | | | | | | | | | |
Securities, 4.00%, 3/20/44; U.S. | | | | | | | | | | | | | | |
Government Strips, 8/15/39; and U.S. | | | | | | | | | | | | | | |
Treasury Notes, 1.75% - 2.25%, 4/15/22 -7/31/24 (valued at $16,902,144) | | | | | 16,552,509 | | | | | | | | 16,552,509 | |
| | | | | | | | | | | | | | |
| | | | |
| | | | | Shares | | | | | | | |
| | | | |
s Investments from Cash Collateral Received for Loaned Securities 0.2% | | | | | | | | | | | | | | |
| | | | |
Money Market Funds (Cost $1,169,000) 0.2% | | | | | | | | | | | | | | |
| | | | |
United States 0.2% | | | | | | | | | | | | | | |
p Institutional Fiduciary Trust Money Market Portfolio, 0.0% | | | | | 1,169,000 | | | | | | | | 1,169,000 | |
| | | | | | | | | | | | | | |
| | | | |
| | | |
| franklintempleton.com | | Semiannual Report | | 29 |
TEMPLETON GLOBAL INVESTMENT TRUST
CONSOLIDATED STATEMENT OF INVESTMENTS (UNAUDITED)
Templeton Global Balanced Fund (continued)
| | | | | | | | | | | | | | | | |
| | | | | |
| Principal
Amount* |
| | | | | | | Value | |
| |
| | | | |
Short Term Investments (continued) | | | | | | | | | | | | | | | | |
Investments from Cash Collateral Received for Loaned Securities (continued) | | | | | | | | | | | | | | | | |
Repurchase Agreements (Cost $292,503) 0.0%† | | | | | | | | | | | | | | | | |
United States 0.0%† | | | | | | | | | | | | | | | | |
| | | | |
r Joint Repurchase Agreement, 0.07%, 7/01/20 (Maturity Value $292,504)
BNP Paribas Securities Corp. Collateralized by U.S. Treasury Bonds,
7.875%, 2/15/21; U.S. Treasury Notes, 0.125%-2.875%, 12/31/20 - 1/31/24; and U.S. Treasury Strips, 8/15/20 - 11/15/22 (valued at $298,353) | | | | | | | 292,503 | | | | | | | $ | 292,503 | |
| | | | | | | | | | | | | | | | |
| | | | |
Total Investments from Cash Collateral Received for Loaned Securities (Cost $1,461,503) | | | | | | | | | | | | | | | 1,461,503 | |
| | | | | | | | | | | | | | | | |
| | | | |
Total Investments
(Cost $786,604,778) 99.5% | | | | | | | | | | | | | | | 736,954,132 | |
| | | | |
Options Written (0.5)% | | | | | | | | | | | | | | | (3,384,815 | ) |
| | | | |
Other Assets, less Liabilities 1.0% | | | | | | | | | | | | | | | 6,722,516 | |
| | | | | | | | | | | | | | | | |
| | | | |
Net Assets 100.0% | | | | | | | | | | | | | | $ | 740,291,833 | |
| | | | | | | | | | | | | | | | |
| | | | |
| | | Number of
Contracts | | | Notional
Amount# | | | | | | | |
| | | | |
t Options Written (0.5)% | | | | | | | | | | | | | | | | |
Calls - Over-the-Counter | | | | | | | | | | | | | | | | |
Currency Options (0.3)% | | | | | | | | | | | | | | | | |
AUD/JPY, Counterparty CITI, September Strike Price 75.80 JPY, Expires 9/11/20 | | | 1 | | | | 2,520,000 | | | | AUD | | | | (24,820 | ) |
AUD/JPY, Counterparty CITI, October Strike Price 71.60 JPY, Expires 10/29/20 | | | 1 | | | | 4,158,000 | | | | AUD | | | | (157,001 | ) |
AUD/JPY, Counterparty CITI, December Strike Price 75.70 JPY, Expires 12/21/20 | | | 1 | | | | 4,531,000 | | | | AUD | | | | (79,129 | ) |
AUD/JPY, Counterparty CITI, January Strike Price 76.00 JPY, Expires 1/22/21 | | | 1 | | | | 3,405,000 | | | | AUD | | | | (60,421 | ) |
AUD/JPY, Counterparty CITI, January Strike Price 76.95 JPY, Expires 1/22/21 | | | 1 | | | | 4,034,000 | | | | AUD | | | | (56,457 | ) |
AUD/JPY, Counterparty CITI, April Strike Price 71.75 JPY, Expires 4/29/21 | | | 1 | | | | 4,915,000 | | | | AUD | | | | (219,746 | ) |
AUD/JPY, Counterparty CITI, June Strike Price 78.00 JPY, Expires 6/21/21 | | | 1 | | | | 3,782,000 | | | | AUD | | | | (59,438 | ) |
AUD/USD, Counterparty HSBK, October Strike Price $0.67, Expires 10/27/20 | | | 1 | | | | 3,025,000 | | | | AUD | | | | (97,049 | ) |
AUD/USD, Counterparty HSBK, November Strike Price $0.71, Expires 11/05/20 | | | 1 | | | | 1,511,000 | | | | AUD | | | | (12,581 | ) |
AUD/USD, Counterparty HSBK, January Strike Price $0.67, Expires 1/22/21 | | | 1 | | | | 3,128,000 | | | | AUD | | | | (105,091 | ) |
AUD/USD, Counterparty HSBK, February Strike Price $0.69, Expires 2/08/21 | | | 1 | | | | 2,017,000 | | | | AUD | | | | (46,262 | ) |
| | | | |
| | | |
30 | | Semiannual Report | | franklintempleton.com |
TEMPLETON GLOBAL INVESTMENT TRUST
CONSOLIDATED STATEMENT OF INVESTMENTS (UNAUDITED)
Templeton Global Balanced Fund (continued)
| | | | | | | | | | | | | | | | |
| | | Number of
Contracts | | | Notional
Amount# | | | | | | Value | |
| |
| | | | |
t Options Written (continued) | | | | | | | | | | | | | | | | |
Calls - Over-the-Counter (continued) | | | | | | | | | | | | | | | | |
Currency Options (continued) | | | | | | | | | | | | | | | | |
AUD/USD, Counterparty HSBK, February Strike Price $0.69, Expires 2/10/21 | | | 1 | | | | 2,420,000 | | | | AUD | | | $ | (63,384 | ) |
AUD/USD, Counterparty HSBK, May Strike Price $0.78, Expires 5/05/21 | | | 1 | | | | 2,518,000 | | | | AUD | | | | (8,783 | ) |
AUD/USD, Counterparty MSCO, August Strike Price $0.69, Expires 8/12/20 | | | 1 | | | | 1,873,000 | | | | AUD | | | | (15,495 | ) |
AUD/USD, Counterparty MSCO, August Strike Price $0.70, Expires 8/12/20 | | | 1 | | | | 1,306,000 | | | | AUD | | | | (10,502 | ) |
AUD/USD, Counterparty MSCO, October Strike Price $0.72, Expires 10/28/20 | | | 1 | | | | 1,008,500 | | | | AUD | | | | (5,815 | ) |
AUD/USD, Counterparty MSCO, May Strike Price $0.74, Expires 5/12/21 | | | 1 | | | | 5,438,000 | | | | AUD | | | | (49,781 | ) |
USD/MXN, Counterparty CITI, November Strike Price 31.74 MXN, Expires 11/09/20 | | | 1 | | | | 2,196,000 | | | | | | | | (5,936 | ) |
USD/MXN, Counterparty CITI, December Strike Price 23.46 MXN, Expires 12/07/20 | | | 1 | | | | 1,101,000 | | | | | | | | (46,959 | ) |
USD/MXN, Counterparty CITI, December Strike Price 25.43 MXN, Expires 12/07/20 | | | 1 | | | | 1,101,000 | | | | | | | | (21,914 | ) |
USD/MXN, Counterparty CITI, February Strike Price 29.11 MXN, Expires 2/11/21 | | | 1 | | | | 1,927,000 | | | | | | | | (20,833 | ) |
USD/MXN, Counterparty CITI, March Strike Price 25.87 MXN, Expires 3/24/21 | | | 1 | | | | 2,072,000 | | | | | | | | (58,606 | ) |
USD/MXN, Counterparty CITI, March Strike Price 31.07 MXN, Expires 3/24/21 | | | 1 | | | | 1,027,000 | | | | | | | | (8,933 | ) |
USD/MXN, Counterparty CITI, April Strike Price 27.24 MXN, Expires 4/09/21 | | | 1 | | | | 2,600,000 | | | | | | | | (55,656 | ) |
USD/MXN, Counterparty CITI, June Strike Price 28.24 MXN, Expires 6/18/21 | | | 1 | | | | 2,761,000 | | | | | | | | (60,482 | ) |
USD/MXN, Counterparty CITI, June Strike Price 28.40 MXN, Expires 6/30/21 | | | 1 | | | | 2,761,000 | | | | | | | | (63,475 | ) |
USD/MXN, Counterparty CITI, December Strike Price 27.93 MXN, Expires 12/07/21 | | | 1 | | | | 1,321,000 | | | | | | | | (49,526 | ) |
USD/MXN, Counterparty GSCO, July Strike Price 22.03 MXN, Expires 7/31/20 | | | 1 | | | | 1,212,000 | | | | | | | | (61,959 | ) |
USD/MXN, Counterparty GSCO, July Strike Price 22.94 MXN, Expires 7/31/20 | | | 1 | | | | 1,351,000 | | | | | | | | (33,774 | ) |
USD/MXN, Counterparty GSCO, July Strike Price 23.32 MXN, Expires 7/31/20 | | | 1 | | | | 1,351,000 | | | | | | | | (24,273 | ) |
USD/MXN, Counterparty GSCO, August Strike Price 22.45 MXN, Expires 8/31/20 | | | 1 | | | | 946,000 | | | | | | | | (42,651 | ) |
USD/MXN, Counterparty GSCO, August Strike Price 24.62 MXN, Expires 8/31/20 | | | 1 | | | | 1,012,000 | | | | | | | | (11,210 | ) |
USD/MXN, Counterparty GSCO, June Strike Price 30.36 MXN, Expires 6/09/21 | | | 1 | | | | 844,000 | | | | | | | | (12,100 | ) |
USD/MXN, Counterparty JPHQ, July Strike Price 22.30 MXN, Expires 7/27/20 | | | 1 | | | | 1,580,000 | | | | | | | | (63,932 | ) |
USD/MXN, Counterparty JPHQ, September Strike Price 24.90 MXN, Expires 9/22/20 | | | 1 | | | | 1,063,000 | | | | | | | | (13,564 | ) |
USD/MXN, Counterparty MSCO, September Strike Price 23.31 MXN, Expires 9/02/20 | | | 1 | | | | 2,733,000 | | | | | | | | (72,304 | ) |
| | | | |
| | | |
| franklintempleton.com | | Semiannual Report | | 31 |
TEMPLETON GLOBAL INVESTMENT TRUST
CONSOLIDATED STATEMENT OF INVESTMENTS (UNAUDITED)
Templeton Global Balanced Fund (continued)
| | | | | | | | | | | | | | | | |
| | | Number of
Contracts | | | Notional
Amount# | | | | | | Value | |
| |
| | | | |
t Options Written (continued) | | | | | | | | | | | | | | | | |
Calls - Over-the-Counter (continued) | | | | | | | | | | | | | | | | |
Currency Options (continued) | | | | | | | | | | | | | | | | |
USD/MXN, Counterparty MSCO, September Strike Price 22.46 MXN, Expires 9/10/20 | | | 1 | | | | 552,000 | | | | | | | $ | (26,147) | |
USD/MXN, Counterparty MSCO, September Strike Price 22.46 MXN, Expires 9/22/20 | | | 1 | | | | 965,000 | | | | | | | | (47,841 | ) |
USD/MXN, Counterparty MSCO, September Strike Price 25.31 MXN, Expires 9/28/20 | | | 1 | | | | 1,879,000 | | | | | | | | (21,017 | ) |
USD/MXN, Counterparty MSCO, January Strike Price 25.45 MXN, Expires 1/14/21 | | | 1 | | | | 751,000 | | | | | | | | (18,663 | ) |
USD/MXN, Counterparty MSCO, January Strike Price 27.60 MXN, Expires 1/14/21 | | | 1 | | | | 526,000 | | | | | | | | (7,027 | ) |
USD/MXN, Counterparty MSCO, January Strike Price 29.21 MXN, Expires 1/14/21 | | | 1 | | | | 1,504,000 | | | | | | | | (13,540 | ) |
USD/MXN, Counterparty MSCO, March Strike Price 34.23 MXN, Expires 3/30/21 | | | 1 | | | | 3,810,000 | | | | | | | | (20,646 | ) |
| | | | | | | | | | | | | | | | |
| | | | | | | | | | | | | | | (1,954,723 | ) |
| | | | | | | | | | | | | | | | |
Puts - Over-the-Counter | | | | | | | | | | | | | | | | |
Currency Options (0.2)% | | | | | | | | | | | | | | | | |
AUD/JPY, Counterparty CITI, October Strike Price 62.80 JPY, Expires 10/29/20 | | | 1 | | | | 2,772,000 | | | | AUD | | | | (6,807 | ) |
AUD/JPY, Counterparty CITI, April Strike Price 66.00 JPY, Expires 4/29/21 | | | 1 | | | | 3,277,000 | | | | AUD | | | | (38,012 | ) |
AUD/JPY, Counterparty CITI, April Strike Price 72.90 JPY, Expires 4/29/21 | | | 1 | | | | 1,915,000 | | | | AUD | | | | (50,680 | ) |
AUD/JPY, Counterparty CITI, June Strike Price 64.86 JPY, Expires 6/21/21 | | | 1 | | | | 7,563,000 | | | | AUD | | | | (91,381 | ) |
AUD/USD, Counterparty HSBK, January Strike Price $0.52, Expires 1/22/21 | | | 1 | | | | 1,513,000 | | | | AUD | | | | (1,468 | ) |
AUD/USD, Counterparty HSBK, January Strike Price $0.63, Expires 1/27/21 | | | 1 | | | | 1,334,000 | | | | AUD | | | | (8,715 | ) |
AUD/USD, Counterparty HSBK, March Strike Price $0.59, Expires 3/22/21 | | | 1 | | | | 1,084,000 | | | | AUD | | | | (4,297 | ) |
AUD/USD, Counterparty MSCO, August Strike Price $0.63, Expires 8/12/20 | | | 1 | | | | 1,338,000 | | | | AUD | | | | (1,035 | ) |
AUD/USD, Counterparty MSCO, August Strike Price $0.64, Expires 8/12/20 | | | 1 | | | | 1,070,000 | | | | AUD | | | | (1,215 | ) |
AUD/USD, Counterparty MSCO, August Strike Price $0.68, Expires 8/12/20 | | | 1 | | | | 1,311,000 | | | | AUD | | | | (7,846 | ) |
USD/MXN, Counterparty CITI, July Strike Price 23.10 MXN, Expires 7/30/20 | | | 1 | | | | 1,013,000 | | | | | | | | (21,357 | ) |
USD/MXN, Counterparty CITI, September Strike Price 22.93 MXN, Expires 9/03/20 | | | 1 | | | | 2,762,000 | | | | | | | | (63,714 | ) |
USD/MXN, Counterparty CITI, September Strike Price 23.21 MXN, Expires 9/03/20 | | | 1 | | | | 804,000 | | | | | | | | (23,611 | ) |
USD/MXN, Counterparty CITI, September Strike Price 23.34 MXN, Expires 9/03/20 | | | 1 | | | | 473,000 | | | | | | | | (15,561 | ) |
USD/MXN, Counterparty CITI, September Strike Price 20.06 MXN, Expires 9/17/20 | | | 1 | | | | 2,748,000 | | | | | | | | (2,226 | ) |
USD/MXN, Counterparty CITI, September Strike Price 22.40 MXN, Expires 9/17/20 | | | 1 | | | | 2,748,000 | | | | | | | | (40,352 | ) |
| | | | |
| | | |
32 | | Semiannual Report | | franklintempleton.com |
TEMPLETON GLOBAL INVESTMENT TRUST
CONSOLIDATED STATEMENT OF INVESTMENTS (UNAUDITED)
Templeton Global Balanced Fund (continued)
| | | | | | | | | | | | | | |
| | | Number of
Contracts | | | Notional
Amount# | | | | | Value | |
| |
| | | | |
t Options Written (continued) | | | | | | | | | | | | | | |
Puts - Over-the-Counter (continued) | | | | | | | | | | | | | | |
Currency Options (continued) | | | | | | | | | | | | | | |
USD/MXN, Counterparty CITI, November Strike Price 23.88 MXN, Expires 11/09/20 | | | 1 | | | | 4,391,000 | | | | | $ | (234,853 | ) |
USD/MXN, Counterparty CITI, February Strike Price 22.92 MXN, Expires 2/11/21 | | | 1 | | | | 1,927,000 | | | | | | (64,953 | ) |
USD/MXN, Counterparty CITI, April Strike Price 22.71 MXN, Expires 4/09/21 | | | 1 | | | | 2,837,000 | | | | | | (88,869 | ) |
USD/MXN, Counterparty CITI, April Strike Price 23.02 MXN, Expires 4/28/21 | | | 1 | | | | 4,055,000 | | | | | | (153,948 | ) |
USD/MXN, Counterparty CITI, June Strike Price 20.24 MXN, Expires 6/30/21 | | | 1 | | | | 1,381,000 | | | | | | (8,635 | ) |
USD/MXN, Counterparty GSCO, August Strike Price 21.54 MXN, Expires 8/31/20 | | | 1 | | | | 1,012,000 | | | | | | (4,480 | ) |
USD/MXN, Counterparty GSCO, September Strike Price 22.40 MXN, Expires 9/30/20 | | | 1 | | | | 5,404,000 | | | | | | (77,710 | ) |
USD/MXN, Counterparty GSCO, March Strike Price 19.80 MXN, Expires 3/03/21 | | | 1 | | | | 884,000 | | | | | | (2,675 | ) |
USD/MXN, Counterparty GSCO, June Strike Price 19.61 MXN, Expires 6/09/21 | | | 1 | | | | 844,000 | | | | | | (3,271 | ) |
USD/MXN, Counterparty JPHQ, August Strike Price 22.50 MXN, Expires 8/31/20 | | | 1 | | | | 1,568,000 | | | | | | (22,979 | ) |
USD/MXN, Counterparty JPHQ, December Strike Price 23.25 MXN, Expires 12/23/20 | | | 1 | | | | 2,391,000 | | | | | | (93,459 | ) |
USD/MXN, Counterparty MSCO, September Strike Price 21.23 MXN, Expires 9/02/20 | | | 1 | | | | 2,108,000 | | | | | | (6,373 | ) |
USD/MXN, Counterparty MSCO, September Strike Price 21.50 MXN, Expires 9/10/20 | | | 1 | | | | 1,657,000 | | | | | | (8,018 | ) |
USD/MXN, Counterparty MSCO, September Strike Price 21.68 MXN, Expires 9/22/20 | | | 1 | | | | 3,160,000 | | | | | | (21,545 | ) |
USD/MXN, Counterparty MSCO, September Strike Price 22.13 MXN, Expires 9/24/20 | | | 1 | | | | 2,074,000 | | | | | | (24,000 | ) |
USD/MXN, Counterparty MSCO, September Strike Price 21.90 MXN, Expires 9/25/20 | | | 1 | | | | 752,000 | | | | | | (6,743 | ) |
USD/MXN, Counterparty MSCO, September Strike Price 22.02 MXN, Expires 9/28/20 | | | 1 | | | | 1,253,000 | | | | | | (13,282 | ) |
USD/MXN, Counterparty MSCO, January Strike Price 22.37 MXN, Expires 1/14/21 | | | 1 | | | | 1,127,000 | | | | | | (25,518 | ) |
USD/MXN, Counterparty MSCO, January Strike Price 23.10 MXN, Expires 1/14/21 | | | 1 | | | | 3,258,000 | | | | | | (119,914 | ) |
USD/MXN, Counterparty MSCO, March Strike Price 23.03 MXN, Expires 3/30/21 | | | 1 | | | | 1,905,000 | | | | | | (70,590 | ) |
| | | | | | | | | | | | | | |
| | | | | | | | | | | | | (1,430,092 | ) |
| | | | | | | | | | | | | | |
| | | | |
Total Options Written (Premiums received $2,753,135) | | | | | | | | | | | | $ | (3,384,815 | ) |
| | | | | | | | | | | | | | |
| | | | |
| | | |
| franklintempleton.com | | Semiannual Report | | 33 |
TEMPLETON GLOBAL INVESTMENT TRUST
CONSOLIDATED STATEMENT OF INVESTMENTS (UNAUDITED)
Templeton Global Balanced Fund (continued)
†Rounds to less than 0.1% of net assets.
*The principal/notional amount is stated in U.S. dollars unless otherwise indicated.
#Notional amount is the number of units specified in the contract, and can include currency units, bushels, shares, pounds, barrels or other units. Currency units are stated in U.S. dollars unless otherwise indicated.
aNon-income producing.
bA portion or all of the security is on loan at June 30, 2020. See Note 1(g).
cFair valued using significant unobservable inputs. See Note 13 regarding fair value measurements.
dSee Note 10 regarding restricted securities.
eThe security is owned by FT Holdings Corporation IV, a wholly-owned subsidiary of the Fund. See Note 1(h).
fSecurity was purchased pursuant to Rule 144A under the Securities Act of 1933 and may be sold in transactions exempt from registration only to qualified institutional buyers or in a public offering registered under the Securities Act of 1933. At June 30, 2020, the aggregate value of these securities was $96,330, representing less than 0.1% of net assets.
gIncome may be received in additional securities and/or cash.
hSecurities denominated in Argentine Peso have been designated as Level 3 investments. See Note 13 regarding fair value measurements.
iRedemption price at maturity is adjusted for inflation. See Note 1(j).
jThe coupon rate shown represents the rate at period end.
kPrincipal amount is stated in 1,000 Brazilian Real Units.
lPrincipal amount is stated in 100 Mexican Peso Units.
mA supranational organization is an entity formed by two or more central governments through international treaties.
nThe security was issued on a discount basis with no stated coupon rate.
oPrincipal amount is stated in 10 Mexican Peso Units.
pSee Note 3(f) regarding investments in affiliated management investment companies.
qThe rate shown is the annualized seven-day effective yield at period end.
rSee Note 1(c) regarding joint repurchase agreement.
sSee Note 1(g) regarding securities on loan.
tSee Note 1(d) regarding written options.
At June 30, 2020, the Fund had the following forward exchange contracts outstanding. See Note 1(d).
Forward Exchange Contracts
| | | | | | | | | | | | | | | | | | | | | | | | | | | | | | |
| Currency | | Counterpartya | | | Type | | | Quantity | | | Contract
Amount* | | | | | Settlement
Date | | | Unrealized
Appreciation | | | Unrealized
Depreciation | |
| | | | | | |
OTC Forward Exchange Contracts | | | | | | | | | | | | | | | | | | | | | | | |
Brazilian Real | | | CITI | | | | Buy | | | | 13,611,173 | | | | 2,510,823 | | | | | | 7/02/20 | | | $ | — | | | $ | (7,524 | ) |
Brazilian Real | | | CITI | | | | Sell | | | | 6,071,000 | | | | 1,170,697 | | | | | | 7/02/20 | | | | 54,149 | | | | — | |
Brazilian Real | | | CITI | | | | Sell | | | | 7,540,173 | | | | 1,301,976 | | | | | | 7/02/20 | | | | — | | | | (84,775 | ) |
Brazilian Real | | | JPHQ | | | | Buy | | | | 13,830,400 | | | | 2,548,913 | | | | | | 7/02/20 | | | | — | | | | (5,294 | ) |
Brazilian Real | | | JPHQ | | | | Sell | | | | 13,830,400 | | | | 2,726,395 | | | | | | 7/02/20 | | | | 182,777 | | | | — | |
Brazilian Real | | | JPHQ | | | | Sell | | | | 13,830,400 | | | | 2,547,926 | | | | | | 7/09/20 | | | | 5,115 | | | | — | |
Australian Dollar | | | DBAB | | | | Buy | | | | 5,540,000 | | | | 3,654,760 | | | | | | 7/14/20 | | | | 168,419 | | | | — | |
Australian Dollar | | | DBAB | | | | Sell | | | | 12,490,000 | | | | 7,750,045 | | | | | | 7/14/20 | | | | — | | | | (869,360 | ) |
Swedish Krona | | | JPHQ | | | | Buy | | | | 21,150,000 | | | | 1,937,069 | | | EUR | | | 7/14/20 | | | | 93,035 | | | | — | |
Swiss Franc | | | JPHQ | | | | Buy | | | | 4,630,000 | | | | 4,392,227 | | | EUR | | | 7/14/20 | | | | — | | | | (46,995 | ) |
Brazilian Real | | | CITI | | | | Sell | | | | 13,611,173 | | | | 2,509,481 | | | | | | 7/15/20 | | | | 7,657 | | | | — | |
Euro | | | JPHQ | | | | Buy | | | | 1,300,000 | | | | 1,462,071 | | | | | | 7/15/20 | | | | — | | | | (1,112 | ) |
Euro | | | JPHQ | | | | Buy | | | | 9,055,813 | | | | 10,165,150 | | | | | | 7/15/20 | | | | 11,905 | | | | — | |
Euro | | | JPHQ | | | | Sell | | | | 10,355,813 | | | | 11,791,957 | | | | | | 7/15/20 | | | | 153,943 | | | | — | |
Swedish Krona | | | DBAB | | | | Buy | | | | 49,884,350 | | | | 4,654,709 | | | EUR | | | 7/15/20 | | | | 122,790 | | | | — | |
Norwegian Krone | | | JPHQ | | | | Buy | | | | 13,536,100 | | | | 1,248,615 | | | EUR | | | 7/16/20 | | | | 3,508 | | | | — | |
Norwegian Krone | | | DBAB | | | | Buy | | | | 10,071,000 | | | | 877,762 | | | EUR | | | 7/17/20 | | | | 60,154 | | | | — | |
South Korean Won | | | HSBK | | | | Sell | | | | 5,354,972,927 | | | | 4,660,754 | | | | | | 7/17/20 | | | | 196,115 | | | | — | |
Euro | | | UBSW | | | | Buy | | | | 3,114,000 | | | | 3,510,007 | | | | | | 7/23/20 | | | | — | | | | (9,760 | ) |
| | | | |
| | | |
34 | | Semiannual Report | | franklintempleton.com |
TEMPLETON GLOBAL INVESTMENT TRUST
CONSOLIDATED STATEMENT OF INVESTMENTS (UNAUDITED)
Templeton Global Balanced Fund (continued)
Forward Exchange Contracts (continued)
| | | | | | | | | | | | | | | | | | | | | | | | | | | | | | | | |
| Currency | | Counterpartya | | Type | | | Quantity | | | Contract
Amount* | | | | | | Settlement
Date | | | Unrealized
Appreciation | | | Unrealized
Depreciation | |
| | | | | |
OTC Forward Exchange Contracts (continued) | | | | | | | | | | | | | | | | | | | | | |
Euro | | | UBSW | | | | Sell | | | | 3,506,930 | | | | 3,981,944 | | | | | | | | 7/23/20 | | | $ | 40,029 | | | $ | — | |
South Korean Won | | | HSBK | | | | Sell | | | | 5,885,027,073 | | | | 4,778,553 | | | | | | | | 7/28/20 | | | | — | | | | (128,597 | ) |
South Korean Won | | | HSBK | | | | Sell | | | | 4,594,897,268 | | | | 3,747,266 | | | | | | | | 7/29/20 | | | | — | | | | (84,168 | ) |
Brazilian Real | | | CITI | | | | Sell | | | | 7,552,151 | | | | 1,301,976 | | | | | | | | 8/04/20 | | | | — | | | | (84,917 | ) |
Brazilian Real | | | HSBK | | | | Sell | | | | 9,528,984 | | | | 1,669,642 | | | | | | | | 8/04/20 | | | | — | | | | (80,280 | ) |
Brazilian Real | | | JPHQ | | | | Sell | | | | 32,382,000 | | | | 6,475,104 | | | | | | | | 8/04/20 | | | | 528,406 | | | | — | |
Swiss Franc | | | UBSW | | | | Buy | | | | 910,087 | | | | 865,041 | | | | EUR | | | | 8/10/20 | | | | — | | | | (10,961 | ) |
Swiss Franc | | | UBSW | | | | Buy | | | | 3,640,350 | | | | 3,360,606 | | | | EUR | | | | 8/10/20 | | | | 68,107 | | | | — | |
Swiss Franc | | | GSCO | | | | Buy | | | | 3,572,651 | | | | 3,304,145 | | | | EUR | | | | 8/12/20 | | | | 60,115 | | | | — | |
Swedish Krona | | | DBAB | | | | Buy | | | | 49,884,300 | | | | 4,701,581 | | | | EUR | | | | 8/13/20 | | | | 68,480 | | | | — | |
Swiss Franc | | | GSCO | | | | Buy | | | | 1,786,326 | | | | 1,699,886 | | | | EUR | | | | 8/13/20 | | | | — | | | | (23,697 | ) |
Euro | | | DBAB | | | | Buy | | | | 2,570,000 | | | | 2,910,204 | | | | | | | | 8/14/20 | | | | — | | | | (20,002 | ) |
Euro | | | DBAB | | | | Buy | | | | 3,340,000 | | | | 3,753,639 | | | | | | | | 8/14/20 | | | | 2,498 | | | | — | |
Euro | | | DBAB | | | | Sell | | | | 10,412,000 | | | | 11,338,668 | | | | | | | | 8/14/20 | | | | — | | | | (370,586 | ) |
Norwegian Krone | | | DBAB | | | | Buy | | | | 27,581,500 | | | | 2,491,104 | | | | EUR | | | | 8/19/20 | | | | 65,023 | | | | — | |
Australian Dollar | | | JPHQ | | | | Sell | | | | 34,173,781 | | | | 2,433,249,414 | | | | JPY | | | | 8/21/20 | | | | — | | | | (1,038,326 | ) |
Australian Dollar | | | CITI | | | | Sell | | | | 5,221,330 | | | | 370,602,955 | | | | JPY | | | | 8/24/20 | | | | — | | | | (169,359 | ) |
Euro | | | HSBK | | | | Sell | | | | 5,607,052 | | | | 662,301,201 | | | | JPY | | | | 8/24/20 | | | | — | | | | (168,825 | ) |
Euro | | | HSBK | | | | Sell | | | | 2,803,526 | | | | 339,888,207 | | | | JPY | | | | 8/25/20 | | | | — | | | | (3,462 | ) |
Australian Dollar | | | CITI | | | | Sell | | | | 5,235,270 | | | | 371,175,407 | | | | JPY | | | | 8/26/20 | | | | — | | | | (173,606 | ) |
Euro | | | DBAB | | | | Buy | | | | 2,804,187 | | | | 3,151,107 | | | | | | | | 8/26/20 | | | | 3,274 | | | | — | |
Euro | | | DBAB | | | | Sell | | | | 6,231,599 | | | | 6,841,050 | | | | | | | | 8/26/20 | | | | — | | | | (168,767 | ) |
Indian Rupee | | | HSBK | | | | Sell | | | | 85,800,000 | | | | 1,118,907 | | | | | | | | 8/26/20 | | | | — | | | | (9,914 | ) |
Japanese Yen | | | CITI | | | | Buy | | | | 99,123,200 | | | | 896,110 | | | | | | | | 8/26/20 | | | | 22,582 | | | | — | |
Japanese Yen | | | JPHQ | | | | Buy | | | | 209,581,500 | | | | 1,949,024 | | | | | | | | 8/26/20 | | | | — | | | | (6,584 | ) |
Japanese Yen | | | JPHQ | | | | Sell | | | | 118,000,000 | | | | 1,101,435 | | | | | | | | 8/26/20 | | | | 7,789 | | | | — | |
Norwegian Krone | | | DBAB | | | | Buy | | | | 16,393,500 | | | | 1,755,531 | | | | | | | | 8/26/20 | | | | — | | | | (51,565 | ) |
Norwegian Krone | | | DBAB | | | | Buy | | | | 16,393,500 | | | | 1,497,746 | | | | EUR | | | | 8/26/20 | | | | 19,178 | | | | — | |
Japanese Yen | | | JPHQ | | | | Buy | | | | 209,585,600 | | | | 1,913,543 | | | | | | | | 8/27/20 | | | | 28,959 | | | | — | |
Japanese Yen | | | CITI | | | | Buy | | | | 255,150,000 | | | | 2,468,806 | | | | | | | | 8/31/20 | | | | — | | | | (103,860 | ) |
Brazilian Real | | | CITI | | | | Sell | | | | 12,180,861 | | | | 2,277,563 | | | | | | | | 9/02/20 | | | | 43,369 | | | | — | |
Brazilian Real | | | CITI | | | | Sell | | | | 12,540,000 | | | | 2,236,888 | | | | | | | | 9/02/20 | | | | — | | | | (63,179 | ) |
Brazilian Real | | | HSBK | | | | Sell | | | | 11,840,206 | | | | 2,034,613 | | | | | | | | 9/02/20 | | | | — | | | | (137,098 | ) |
Euro | | | JPHQ | | | | Sell | | | | 11,745,813 | | | | 13,144,563 | | | | | | | | 9/04/20 | | | | — | | | | (70,796 | ) |
Euro | | | UBSW | | | | Sell | | | | 943,744 | | | | 1,062,288 | | | | | | | | 9/08/20 | | | | 371 | | | | — | |
South Korean Won | | | GSCO | | | | Sell | | | | 5,211,000,000 | | | | 4,341,053 | | | | | | | | 9/09/20 | | | | — | | | | (4,557 | ) |
Australian Dollar | | | CITI | | | | Sell | | | | 17,534,250 | | | | 1,341,808,481 | | | | JPY | | | | 9/10/20 | | | | 335,622 | | | | — | |
Japanese Yen | | | MSCS | | | | Buy | | | | 1,010,000,000 | | | | 9,479,785 | | | | | | | | 9/15/20 | | | | — | | | | (115,842 | ) |
Swedish Krona | | | DBAB | | | | Buy | | | | 24,942,150 | | | | 2,377,798 | | | | EUR | | | | 9/15/20 | | | | 2,969 | | | | — | |
Norwegian Krone | | | JPHQ | | | | Buy | | | | 13,536,100 | | | | 1,247,108 | | | | EUR | | | | 9/16/20 | | | | 3,542 | | | | — | |
Swedish Krona | | | DBAB | | | | Buy | | | | 24,942,200 | | | | 2,374,148 | | | | EUR | | | | 9/16/20 | | | | 7,054 | | | | — | |
Norwegian Krone | | | DBAB | | | | Buy | | | | 22,113,500 | | | | 2,049,159 | | | | EUR | | | | 9/18/20 | | | | — | | | | (7,583 | ) |
Norwegian Krone | | | JPHQ | | | | Buy | | | | 12,113,700 | | | | 1,342,635 | | | | | | | | 9/21/20 | | | | — | | | | (83,399 | ) |
Norwegian Krone | | | JPHQ | | | | Buy | | | | 13,824,100 | | | | 1,287,727 | | | | EUR | | | | 9/21/20 | | | | — | | | | (12,377 | ) |
Norwegian Krone | | | DBAB | | | | Buy | | | | 13,389,000 | | | | 1,249,650 | | | | EUR | | | | 9/22/20 | | | | — | | | | (14,776 | ) |
Japanese Yen | | | BNDP | | | | Buy | | | | 317,077,140 | | | | 2,970,403 | | | | | | | | 9/24/20 | | | | — | | | | (30,254 | ) |
| | | | |
| | | |
| franklintempleton.com | | Semiannual Report | | 35 |
TEMPLETON GLOBAL INVESTMENT TRUST
CONSOLIDATED STATEMENT OF INVESTMENTS (UNAUDITED)
Templeton Global Balanced Fund (continued)
Forward Exchange Contracts (continued)
| | | | | | | | | | | | | | | | | | | | | | | | | | | | | | | | |
| Currency | | Counterpartya | | Type | | | Quantity | | | Contract
Amount* | | | | | | Settlement
Date | | | Unrealized
Appreciation | | | Unrealized
Depreciation | |
| | | | | |
OTC Forward Exchange Contracts (continued) | | | | | | | | | | | | | | | | | | | | | |
Japanese Yen | | | HSBK | | | | Buy | | | | 740,597,560 | | | | 6,842,496 | | | | | | | | 9/24/20 | | | $ | 24,815 | | | $ | — | |
Norwegian Krone | | | DBAB | | | | Buy | | | | 13,389,000 | | | | 1,483,875 | | | | | | | | 9/24/20 | | | | — | | | | (92,054 | ) |
Euro | | | HSBK | | | | Sell | | | | 2,803,598 | | | | 337,940,133 | | | | JPY | | | | 9/25/20 | | | | — | | | | (22,249 | ) |
Norwegian Krone | | | DBAB | | | | Buy | | | | 6,689,000 | | | | 614,391 | | | | EUR | | | | 9/29/20 | | | | 3,686 | | | | — | |
Norwegian Krone | | | JPHQ | | | | Buy | | | | 120,073,113 | | | | 11,001,356 | | | | EUR | | | | 9/30/20 | | | | 96,811 | | | | — | |
Brazilian Real | | | JPHQ | | | | Sell | | | | 7,341,200 | | | | 1,407,574 | | | | | | | | 10/02/20 | | | | 62,466 | | | | — | |
South Korean Won | | | HSBK | | | | Sell | | | | 9,458,966,732 | | | | 7,743,096 | | | | | | | | 10/07/20 | | | | — | | | | (149,952 | ) |
Mexican Peso | | | CITI | | | | Sell | | | | 11,739,000 | | | | 460,010 | | | | | | | | 10/08/20 | | | | — | | | | (44,194 | ) |
Mexican Peso | | | CITI | | | | Sell | | | | 12,045,000 | | | | 584,516 | | | | | | | | 10/08/20 | | | | 67,168 | | | | — | |
Mexican Peso | | | CITI | | | | Sell | | | | 9,047,000 | | | | 438,398 | | | | | | | | 10/09/20 | | | | 49,864 | | | | — | |
Euro | | | HSBK | | | | Sell | | | | 3,767,000 | | | | 4,233,128 | | | | | | | | 10/13/20 | | | | — | | | | (9,296 | ) |
Mexican Peso | | | CITI | | | | Sell | | | | 30,162,000 | | | | 1,458,637 | | | | | | | | 10/13/20 | | | | 163,913 | | | | — | |
South Korean Won | | | DBAB | | | | Sell | | | | 33,248,000,000 | | | | 27,430,080 | | | | | | | | 10/13/20 | | | | — | | | | (315,893 | ) |
Euro | | | DBAB | | | | Sell | | | | 975,303 | | | | 1,100,161 | | | | | | | | 10/15/20 | | | | 1,707 | | | | — | |
Mexican Peso | | | CITI | | | | Sell | | | | 44,398,000 | | | | 2,154,845 | | | | | | | | 10/15/20 | | | | 249,485 | | | | — | |
Mexican Peso | | | CITI | | | | Sell | | | | 40,653,000 | | | | 1,991,262 | | | | | | | | 10/16/20 | | | | 246,827 | | | | — | |
Brazilian Real | | | CITI | | | | Sell | | | | 19,549,300 | | | | 3,564,593 | | | | | | | | 11/04/20 | | | | — | | | | (13,547 | ) |
Swiss Franc | | | UBSW | | | | Buy | | | | 910,087 | | | | 865,756 | | | | EUR | | | | 11/09/20 | | | | — | | | | (11,064 | ) |
Swiss Franc | | | UBSW | | | | Buy | | | | 1,820,175 | | | | 1,660,501 | | | | EUR | | | | 11/09/20 | | | | 57,906 | | | | — | |
Swiss Franc | | | GSCO | | | | Buy | | | | 1,786,326 | | | | 1,630,157 | | | | EUR | | | | 11/12/20 | | | | 56,283 | | | | — | |
Norwegian Krone | | | DBAB | | | | Buy | | | | 13,252,000 | | | | 1,449,573 | | | | | | | | 11/16/20 | | | | — | | | | (71,727 | ) |
Euro | | | BOFA | | | | Sell | | | | 3,610,760 | | | | 3,930,204 | | | | | | | | 11/20/20 | | | | — | | | | (140,529 | ) |
Euro | | | JPHQ | | | | Sell | | | | 1,372,953 | | | | 1,507,852 | | | | | | | | 11/23/20 | | | | — | | | | (40,129 | ) |
Australian Dollar | | | JPHQ | | | | Sell | | | | 4,881,968 | | | | 357,762,355 | | | | JPY | | | | 11/24/20 | | | | — | | | | (47,657 | ) |
Euro | | | HSBK | | | | Sell | | | | 2,803,525 | | | | 331,144,012 | | | | JPY | | | | 11/24/20 | | | | — | | | | (86,016 | ) |
Japanese Yen | | | HSBK | | | | Buy | | | | 308,598,830 | | | | 2,839,779 | | | | | | | | 12/08/20 | | | | 26,827 | | | | — | |
Japanese Yen | | | MSCS | | | | Buy | | | | 7,481,000,000 | | | | 70,712,895 | | | | | | | | 12/18/20 | | | | — | | | | (1,204,418 | ) |
Mexican Peso | | | CITI | | | | Sell | | | | 24,789,254 | | | | 1,091,033 | | | | | | | | 12/18/20 | | | | 35,230 | | | | — | |
Mexican Peso | | | CITI | | | | Sell | | | | 11,414,746 | | | | 498,482 | | | | | | | | 12/21/20 | | | | 12,487 | | | | — | |
Japanese Yen | | | BNDP | | | | Buy | | | | 317,077,140 | | | | 2,975,085 | | | | | | | | 12/24/20 | | | | — | | | | (28,591 | ) |
Mexican Peso | | | CITI | | | | Sell | | | | 40,252,000 | | | | 1,787,405 | | | | | | | | 3/11/21 | | | | 89,546 | | | | — | |
| | | | | | | | | | | | | | | | | | | | | | | | | | | | |
Total Forward Exchange Contracts | | | | | | | | | | | | | | | | | | | $ | 3,611,955 | | | $ | (6,539,473 | ) |
| | | | | | | | | | | | | | | | | | | | | | | | | | | | |
Net unrealized appreciation (depreciation) | | | | | | | | | | | | | | | | | | | | | | | $ | (2,927,518 | ) |
| | | | | | | | | | | | | | | | | | | | | | | | | | | | | | | | |
*In U.S. dollars unless otherwise indicated.
aMay be comprised of multiple contracts with the same counterparty, currency and settlement date.
See Note 11 regarding other derivative information.
See Abbreviations on page 60.
| | | | |
| | | |
36 | | Semiannual Report | The accompanying notes are an integral part of these consolidated financial statements. | | franklintempleton.com |
TEMPLETON GLOBAL INVESTMENT TRUST
CONSOLIDATED FINANCIAL STATEMENTS
Consolidated Statement of Assets and Liabilities
June 30, 2020 (unaudited)
Templeton Global Balanced Fund
| | | | |
Assets: | | | | |
Investments in securities: | | | | |
Cost - Unaffiliated issuers | | $ | 583,152,214 | |
Cost - Non-controlled affiliates (Note 3f) | | | 186,607,552 | |
Cost - Unaffiliated repurchase agreements | | | 16,845,012 | |
| | | | |
Value - Unaffiliated issuers+ | | $ | 533,501,568 | |
Value - Non-controlled affiliates (Note 3f) | | | 186,607,552 | |
Value - Unaffiliated repurchase agreements | | | 16,845,012 | |
Cash | | | 5,156,473 | |
Restricted cash for OTC derivative contracts (Note 1e) | | | 1,740,000 | |
Restricted currency, at value (cost $19,895) (Note 1f) | | | 21,456 | |
Foreign currency, at value (cost $969,968) | | | 968,745 | |
Receivables: | | | | |
Investment securities sold | | | 808,299 | |
Capital shares sold | | | 94,850 | |
Dividends and interest | | | 3,938,351 | |
European Union tax reclaims | | | 88,583 | |
Deposits with brokers for: | | | | |
OTC derivative contracts | | | 3,280,000 | |
Unrealized appreciation on OTC forward exchange contracts | | | 3,611,955 | |
FT Subsidiary deferred tax benefit (Note 1h) | | | 143,814 | |
Other assets | | | 775 | |
| | | | |
Total assets | | | 756,807,433 | |
| | | | |
Liabilities: | | | | |
Payables: | | | | |
Investment securities purchased | | | 681,744 | |
Capital shares redeemed | | | 1,453,134 | |
Management fees | | | 454,291 | |
Distribution fees | | | 205,290 | |
Transfer agent fees | | | 209,259 | |
Trustees’ fees and expenses | | | 5,889 | |
Deposits from brokers for: | | | | |
OTC derivative contracts | | | 1,740,000 | |
Options written, at value (premiums received $2,753,135) | | | 3,384,815 | |
Payable upon return of securities loaned | | | 1,461,503 | |
Unrealized depreciation on OTC forward exchange contracts | | | 6,539,473 | |
Deferred tax | | | 121,837 | |
Accrued expenses and other liabilities | | | 258,365 | |
| | | | |
Total liabilities | | | 16,515,600 | |
| | | | |
Net assets, at value | | $ | 740,291,833 | |
| | | | |
Net assets consist of: | | | | |
Paid-in capital | | $ | 997,717,489 | |
Total distributable earnings (losses) | | | (257,425,656 | ) |
| | | | |
Net assets, at value | | $ | 740,291,833 | |
| | | | |
| | | | |
+Includes securities loaned | | $ | 1,380,810 | |
| | | | | | |
| | | | |
| | franklintempleton.com | | The accompanying notes are an integral part of these consolidated financial statements. | Semiannual Report | | 37 |
TEMPLETON GLOBAL INVESTMENT TRUST
CONSOLIDATED FINANCIAL STATEMENTS
Consolidated Statement of Assets and Liabilities (continued)
June 30, 2020 (unaudited)
Templeton Global Balanced Fund
| | | | |
Class A: | | | | |
Net assets, at value | | | $346,524,518 | |
| | | | |
Shares outstanding | | | 141,135,265 | |
| | | | |
Net asset value per sharea | | | $2.46 | |
| | | | |
Maximum offering price per share (net asset value per share ÷ 94.50%) | | | $2.60 | |
| | | | |
Class A1: | | | | |
Net assets, at value | | | $192,515,579 | |
| | | | |
Shares outstanding | | | 78,291,681 | |
| | | | |
Net asset value per sharea | | | $2.46 | |
| | | | |
Maximum offering price per share (net asset value per share ÷ 96.25%) | | | $2.56 | |
| | | | |
Class C: | | | | |
Net assets, at value | | | $ 97,135,587 | |
| | | | |
Shares outstanding | | | 39,755,661 | |
| | | | |
Net asset value and maximum offering price per sharea | | | $2.44 | |
| | | | |
Class C1: | | | | |
Net assets, at value | | | $ 16,207,017 | |
| | | | |
Shares outstanding | | | 6,584,830 | |
| | | | |
Net asset value and maximum offering price per sharea | | | $2.46 | |
| | | | |
Class R: | | | | |
Net assets, at value | | | $ 1,831,562 | |
| | | | |
Shares outstanding | | | 742,635 | |
| | | | |
Net asset value and maximum offering price per share | | | $2.47 | |
| | | | |
Class R6: | | | | |
Net assets, at value | | | $ 4,508,512 | |
| | | | |
Shares outstanding | | | 1,831,893 | |
| | | | |
Net asset value and maximum offering price per share | | | $2.46 | |
| | | | |
Advisor Class: | | | | |
Net assets, at value | | | $ 81,569,058 | |
| | | | |
Shares outstanding | | | 33,066,452 | |
| | | | |
Net asset value and maximum offering price per share | | | $2.47 | |
| | | | |
aRedemption price is equal to net asset value less contingent deferred sales charges, if applicable.
| | | | |
| | | |
38 | | Semiannual Report | The accompanying notes are an integral part of these consolidated financial statements. | | franklintempleton.com |
TEMPLETON GLOBAL INVESTMENT TRUST
CONSOLIDATED FINANCIAL STATEMENTS
Consolidated Statement of Operations
for the six months ended June 30, 2020 (unaudited)
Templeton Global Balanced Fund
| | | | |
Investment income: | | | | |
Dividends:(net of foreign taxes)* | | | | |
Unaffiliated issuers | | $ | 5,203,576 | |
Non-controlled affiliates (Note 3f) | | | 260,412 | |
Interest:(net of foreign taxes)~ | | | | |
Unaffiliated issuers: | | | | |
Inflation principal adjustments | | | 704,461 | |
Paid in cash | | | 8,549,689 | |
Income from securities loaned: | | | | |
Unaffiliated entities (net of fees and rebates) | | | 2,682 | |
Non-controlled affiliates (Note 3f) | | | 74 | |
| | | | |
| |
Total investment income | | | 14,720,894 | |
| | | | |
Expenses: | | | | |
Management fees (Note 3a) | | | 3,294,502 | |
Distribution fees: (Note 3c) | | | | |
Class A | | | 482,309 | |
Class A1 | | | 264,051 | |
Class C | | | 558,141 | |
Class C1 | | | 66,117 | |
Class R | | | 3,730 | |
Transfer agent fees: (Note 3e) | | | | |
Class A | | | 266,965 | |
Class A1 | | | 146,324 | |
Class C | | | 77,254 | |
Class C1 | | | 14,061 | |
Class R | | | 1,330 | |
Class R6 | | | 2,342 | |
Advisor Class | | | 72,713 | |
Custodian fees (Note 4) | | | 141,847 | |
Reports to shareholders | | | 63,437 | |
Registration and filing fees | | | 76,224 | |
Professional fees | | | 76,333 | |
Trustees’ fees and expenses | | | 71,985 | |
Other | | | 37,751 | |
| | | | |
| |
Total expenses | | | 5,717,416 | |
Expense reductions (Note 4) | | | (38,577 | ) |
Expenses waived/paid by affiliates (Note 3f and 3g) | | | (215,934 | ) |
| | | | |
Net expenses | | | 5,462,905 | |
| | | | |
Net investment income | | | 9,257,989 | |
| | | | |
Realized and unrealized gains (losses): | | | | |
Net realized gain (loss) from: | | | | |
Investments:# | | | | |
Unaffiliated issuers | | | (112,880,099 | ) |
Written options | | | (2,268,623 | ) |
Foreign currency transactions | | | (1,421,467 | ) |
Forward exchange contracts | | | 4,390,953 | |
Swap contracts | | | (16,517,124 | ) |
| | | | |
Net realized gain (loss) | | | (128,696,360 | ) |
| | | | |
Net change in unrealized appreciation (depreciation) on: | | | | |
Investments: | | | | |
Unaffiliated issuers | | | (13,077,266 | ) |
| | | | |
| | | |
| franklintempleton.com | | The accompanying notes are an integral part of these consolidated financial statements. | Semiannual Report | | 39 |
TEMPLETON GLOBAL INVESTMENT TRUST
CONSOLIDATED FINANCIAL STATEMENTS
Consolidated Statement of Operations (continued)
for the six months ended June 30, 2020 (unaudited)
Templeton Global Balanced Fund
| | | | |
Translation of other assets and liabilities denominated in foreign currencies | | | (137,223 | ) |
Forward exchange contracts | | | 2,648,553 | |
Written options | | | (1,220,076 | ) |
Swap contracts | | | 5,160,817 | |
Change in deferred taxes on unrealized appreciation | | | 172,774 | |
| | | | |
| |
Net change in unrealized appreciation (depreciation) | | | (6,452,421 | ) |
| | | | |
| |
Net realized and unrealized gain (loss) | | | (135,148,781 | ) |
| | | | |
| |
Net increase (decrease) in net assets resulting from operations | | | $(125,890,792 | ) |
| | | | |
| | | | |
*Foreign taxes withheld on dividends | | $ | 580,463 | |
~Foreign taxes withheld on interest | | $ | 161,647 | |
#Net of foreign taxes | | $ | 208,406 | |
| | | | |
| | | |
40 | | Semiannual Report | The accompanying notes are an integral part of these consolidated financial statements. | | franklintempleton.com |
TEMPLETON GLOBAL INVESTMENT TRUST
CONSOLIDATED FINANCIAL STATEMENTS
Consolidated Statements of Changes in Net Assets
Templeton Global Balanced Fund
| | | | | | | | |
| | | Six Months Ended
June 30, 2020
(unaudited) | | | Year Ended
December 31, 2019 | |
Increase (decrease) in net assets: | | | | | | | | |
Operations: | | | | | | | | |
Net investment income | | $ | 9,257,989 | | | $ | 45,282,342 | |
Net realized gain (loss) | | | (128,696,360 | ) | | | (53,854,942 | ) |
Net change in unrealized appreciation (depreciation) | | | (6,452,421 | ) | | | 89,352,368 | |
| | | | |
Net increase (decrease) in net assets resulting from operations | | | (125,890,792 | ) | | | 80,779,768 | |
| | | | |
Distributions to shareholders: | | | | | | | | |
Class A | | | (4,637,272 | ) | | | (21,685,405 | ) |
Class A1 | | | (2,547,207 | ) | | | (11,542,983 | ) |
Class C | | | (920,540 | ) | | | (5,974,221 | ) |
Class C1 | | | (193,325 | ) | | | (1,648,499 | ) |
Class R | | | (21,195 | ) | | | (102,554 | ) |
Class R6 | | | (71,113 | ) | | | (310,749 | ) |
Advisor Class | | | (1,384,841 | ) | | | (7,809,150 | ) |
| | | | |
Total distributions to shareholders | | | (9,775,493 | ) | | | (49,073,561 | ) |
| | | | |
Capital share transactions: (Note 2) | | | | | | | | |
Class A | | | (58,174,420 | ) | | | (105,366,578 | ) |
Class A1 | | | (27,493,547 | ) | | | (39,225,200 | ) |
Class C | | | (24,242,433 | ) | | | (69,062,384 | ) |
Class C1 | | | (8,228,302 | ) | | | (36,115,316 | ) |
Class R | | | (232,158 | ) | | | (494,695 | ) |
Class R6 | | | (742,577 | ) | | | (2,056,106 | ) |
Advisor Class | | | (40,534,117 | ) | | | (70,805,226 | ) |
| | | | |
Total capital share transactions | | | (159,647,554 | ) | | | (323,125,505 | ) |
| | | | |
Net increase (decrease) in net assets | | | (295,313,839 | ) | | | (291,419,298 | ) |
Net assets: | | | | | | | | |
Beginning of period | | | 1,035,605,672 | | | | 1,327,024,970 | |
| | | | |
End of period | | $ | 740,291,833 | | | $ | 1,035,605,672 | |
| | | | |
| | | | |
| | | |
| franklintempleton.com | | The accompanying notes are an integral part of these consolidated financial statements. | Semiannual Report | | 41 |
TEMPLETON GLOBAL INVESTMENT TRUST
Notes to Consolidated Financial Statements (unaudited)
Templeton Global Balanced Fund
1. Organization and Significant Accounting Policies
Templeton Global Investment Trust (Trust) is registered under the Investment Company Act of 1940 (1940 Act) as an open-end management investment company, consisting of three separate funds and applies the specialized accounting and reporting guidance in U.S. Generally Accepted Accounting Principles (U.S. GAAP). Templeton Global Balanced Fund (Fund) is included in this report. The Fund offers seven classes of shares: Class A, Class A1, Class C, Class C1, Class R, Class R6, and Advisor Class. Class C and Class C1 shares automatically convert to Class A shares after they have been held for 10 years. Each class of shares may differ by its initial sales load, contingent deferred sales charges, voting rights on matters affecting a single class, its exchange privilege and fees due to differing arrangements for distribution and transfer agent fees.
The following summarizes the Fund’s significant accounting policies.
a. Financial Instrument Valuation
The Fund’s investments in financial instruments are carried at fair value daily. Fair value is the price that would be received to sell an asset or paid to transfer a liability in an orderly transaction between market participants on the measurement date. The Fund calculates the net asset value (NAV) per share each business day as of 4 p.m. Eastern time or the regularly scheduled close of the New York Stock Exchange (NYSE), whichever is earlier. Under compliance policies and procedures approved by the Trust’s Board of Trustees (the Board), the Fund’s administrator has responsibility for oversight of valuation, including leading the cross-functional Valuation Committee (VC). The Fund may utilize independent pricing services, quotations from securities and financial instrument dealers, and other market sources to determine fair value.
Equity securities and derivative financial instruments listed on an exchange or on the NASDAQ National Market System are valued at the last quoted sale price or the official closing price of the day, respectively. Foreign equity securities are valued as of the close of trading on the foreign stock exchange on which the security is primarily traded, or as of 4 p.m. Eastern time. The value is then converted into its U.S. dollar equivalent at the foreign exchange rate in effect at 4 p.m. Eastern time on the day that the value of the security is determined. Over-the-counter (OTC) securities are valued within the range of the most recent quoted bid and ask
prices. Securities that trade in multiple markets or on multiple exchanges are valued according to the broadest and most representative market. Certain equity securities are valued based upon fundamental characteristics or relationships to similar securities.
Debt securities generally trade in the OTC market rather than on a securities exchange. The Fund’s pricing services use multiple valuation techniques to determine fair value. In instances where sufficient market activity exists, the pricing services may utilize a market-based approach through which quotes from market makers are used to determine fair value. In instances where sufficient market activity may not exist or is limited, the pricing services also utilize proprietary valuation models which may consider market characteristics such as benchmark yield curves, credit spreads, estimated default rates, anticipated market interest rate volatility, coupon rates, anticipated timing of principal repayments, underlying collateral, and other unique security features in order to estimate the relevant cash flows, which are then discounted to calculate the fair value. Securities denominated in a foreign currency are converted into their U.S. dollar equivalent at the foreign exchange rate in effect at 4 p.m. Eastern time on the date that the values of the foreign debt securities are determined.
Investments in open-end mutual funds are valued at the closing NAV. Investments in repurchase agreements are valued at cost, which approximates fair value.
Certain derivative financial instruments are centrally cleared or trade in the OTC market. The Fund’s pricing services use various techniques including industry standard option pricing models and proprietary discounted cash flow models to determine the fair value of those instruments. The Fund’s net benefit or obligation under the derivative contract, as measured by the fair value of the contract, is included in net assets.
The Fund has procedures to determine the fair value of financial instruments for which market prices are not reliable or readily available. Under these procedures, the Fund primarily employs a market-based approach which may use related or comparable assets or liabilities, recent transactions, market multiples, book values, and other relevant information for the investment to determine the fair value of the investment. An income-based valuation approach may also be used in which the anticipated future cash flows of the investment are discounted to calculate fair value. Discounts
| | | | |
| | | |
42 | | Semiannual Report | | franklintempleton.com |
TEMPLETON GLOBAL INVESTMENT TRUST
NOTES TO CONSOLIDATED FINANCIAL STATEMENTS (UNAUDITED)
Templeton Global Balanced Fund (continued)
may also be applied due to the nature or duration of any restrictions on the disposition of the investments. Due to the inherent uncertainty of valuations of such investments, the fair values may differ significantly from the values that would have been used had an active market existed.
Trading in securities on foreign securities stock exchanges and OTC markets may be completed before 4 p.m. Eastern time. In addition, trading in certain foreign markets may not take place on every Fund’s business day. Events can occur between the time at which trading in a foreign security is completed and 4 p.m. Eastern time that might call into question the reliability of the value of a portfolio security held by the Fund. As a result, differences may arise between the value of the Fund’s portfolio securities as determined at the foreign market close and the latest indications of value at 4 p.m. Eastern time. In order to minimize the potential for these differences, an independent pricing service may be used to adjust the value of the Fund’s portfolio securities to the latest indications of fair value at 4 p.m Eastern time. At June 30, 2020, certain securities may have been fair valued using these procedures, in which case the securities were categorized as Level 2 inputs within the fair value hierarchy. See the Fair Value Measurements note for more information.
When the last day of the reporting period is a non-business day, certain foreign markets may be open on those days that the Fund’s NAV is not calculated, which could result in differences between the value of the Fund’s portfolio securities on the last business day and the last calendar day of the reporting period. Any significant security valuation changes due to an open foreign market are adjusted and reflected by the Fund for financial reporting purposes.
b. Foreign Currency Translation
Portfolio securities and other assets and liabilities denominated in foreign currencies are translated into U.S. dollars based on the exchange rate of such currencies against U.S. dollars on the date of valuation. The Fund may enter into foreign currency exchange contracts to facilitate transactions denominated in a foreign currency. Purchases and sales of securities, income and expense items denominated in foreign currencies are translated into U.S. dollars at the exchange rate in effect on the transaction date. Portfolio securities and assets and liabilities denominated in foreign currencies contain risks that those currencies will decline in value relative to the U.S. dollar. Occasionally, events may impact the availability or reliability of foreign
exchange rates used to convert the U.S. dollar equivalent value. If such an event occurs, the foreign exchange rate will be valued at fair value using procedures established and approved by the Board.
The Fund does not separately report the effect of changes in foreign exchange rates from changes in market prices on securities held. Such changes are included in net realized and unrealized gain or loss from investments in the Consolidated Statement of Operations.
Realized foreign exchange gains or losses arise from sales of foreign currencies, currency gains or losses realized between the trade and settlement dates on securities transactions and the difference between the recorded amounts of dividends, interest, and foreign withholding taxes and the U.S. dollar equivalent of the amounts actually received or paid. Net unrealized foreign exchange gains and losses arise from changes in foreign exchange rates on foreign denominated assets and liabilities other than investments in securities held at the end of the reporting period.
c. Joint Repurchase Agreement
The Fund enters into a joint repurchase agreement whereby its uninvested cash balance is deposited into a joint cash account with other funds managed by the investment manager or an affiliate of the investment manager and is used to invest in one or more repurchase agreements. The value and face amount of the joint repurchase agreement are allocated to the funds based on their pro-rata interest. A repurchase agreement is accounted for as a loan by the Fund to the seller, collateralized by securities which are delivered to the Fund’s custodian. The fair value, including accrued interest, of the initial collateralization is required to be at least 102% of the dollar amount invested by the funds, with the value of the underlying securities marked to market daily to maintain coverage of at least 100%. Repurchase agreements are subject to the terms of Master Repurchase Agreements (MRAs) with approved counterparties (sellers). The MRAs contain various provisions, including but not limited to events of default and maintenance of collateral for repurchase agreements. In the event of default by either the seller or the Fund, certain MRAs may permit the non-defaulting party to net and close-out all transactions, if any, traded under such agreements. The Fund may sell securities it holds as collateral and apply the proceeds towards the repurchase price and any other amounts owed by the seller to the Fund in the event of default by the seller. This could involve costs or
| | | | | | |
| | | | |
| | franklintempleton.com | | Semiannual Report | | 43 |
TEMPLETON GLOBAL INVESTMENT TRUST
NOTES TO CONSOLIDATED FINANCIAL STATEMENTS (UNAUDITED)
Templeton Global Balanced Fund (continued)
1. Organization and Significant Accounting Policies (continued)
c. Joint Repurchase Agreement (continued)
delays in addition to a loss on the securities if their value falls below the repurchase price owed by the seller. The joint repurchase agreement held by the Fund at period end, as indicated in the Consolidated Statement of Investments, had been entered into on June 30, 2020.
d. Derivative Financial Instruments
The Fund invested in derivative financial instruments in order to manage risk or gain exposure to various other investments or markets. Derivatives are financial contracts based on an underlying or notional amount, require no initial investment or an initial net investment that is smaller than would normally be required to have a similar response to changes in market factors, and require or permit net settlement. Derivatives contain various risks including the potential inability of the counterparty to fulfill their obligations under the terms of the contract, the potential for an illiquid secondary market, and/or the potential for market movements which expose the Fund to gains or losses in excess of the amounts shown in the Consolidated Statement of Assets and Liabilities. Realized gain and loss and unrealized appreciation and depreciation on these contracts for the period are included in the Consolidated Statement of Operations.
Derivative counterparty credit risk is managed through a formal evaluation of the creditworthiness of all potential counterparties. The Fund attempts to reduce its exposure to counterparty credit risk on OTC derivatives, whenever possible, by entering into International Swaps and Derivatives Association (ISDA) master agreements with certain counterparties. These agreements contain various provisions, including but not limited to collateral requirements, events of default, or early termination. Termination events applicable to the counterparty include certain deteriorations in the credit quality of the counterparty. Termination events applicable to the Fund include failure of the Fund to maintain certain net asset levels and/or limit the decline in net assets over various periods of time. In the event of default or early termination, the ISDA master agreement gives the non-defaulting party the right to net and close-out all transactions traded, whether or not arising under the ISDA agreement, to one net amount payable by one counterparty to the other. However, absent an event of default or early termination, OTC derivative assets and liabilities are presented gross and not offset in the
Consolidated Statement of Assets and Liabilities. Early termination by the counterparty may result in an immediate payment by the Fund of any net liability owed to that counterparty under the ISDA agreement.
Collateral requirements differ by type of derivative. Collateral or initial margin requirements are set by the broker or exchange clearing house for exchange traded and centrally cleared derivatives. Initial margin deposited is held at the exchange and can be in the form of cash and/or securities. For OTC derivatives traded under an ISDA master agreement, posting of collateral is required by either the Fund or the applicable counterparty if the total net exposure of all OTC derivatives with the applicable counterparty exceeds the minimum transfer amount, which typically ranges from $100,000 to $250,000, and can vary depending on the counterparty and the type of the agreement. Generally, collateral is determined at the close of Fund business each day and any additional collateral required due to changes in derivative values may be delivered by the Fund or the counterparty the next business day, or within a few business days. Collateral pledged and/or received by the Fund for OTC derivatives, if any, is held in segregated accounts with the Fund’s custodian/counterparty broker and can be in the form of cash and/or securities. Unrestricted cash may be invested according to the Fund’s investment objectives. To the extent that the amounts due to the Fund from its counterparties are not subject to collateralization or are not fully collateralized, the Fund bears the risk of loss from counterparty non-performance.
The Fund entered into OTC forward exchange contracts primarily to manage and/or gain exposure to certain foreign currencies. A forward exchange contract is an agreement between the Fund and a counterparty to buy or sell a foreign currency at a specific exchange rate on a future date.
The Fund entered into interest rate swap contracts primarily to manage interest rate risk. An interest rate swap is an agreement between the Fund and a counterparty to exchange cash flows based on the difference between two interest rates, applied to a notional amount. These agreements may be privately negotiated in the over-the-counter market (OTC interest rate swaps) or may be executed on a registered exchange (centrally cleared interest rate swaps). For centrally cleared interest rate swaps, required initial margins are pledged by the Fund, and the daily change in fair value is accounted for as a variation margin payable or receivable in the Consolidated Statement of Assets and
| | | | |
| | | |
44 | | Semiannual Report | | franklintempleton.com |
TEMPLETON GLOBAL INVESTMENT TRUST
NOTES TO CONSOLIDATED FINANCIAL STATEMENTS (UNAUDITED)
Templeton Global Balanced Fund (continued)
Liabilities. Over the term of the contract, contractually required payments to be paid and to be received are accrued daily and recorded as unrealized depreciation and appreciation until the payments are made, at which time they are realized. The Fund did not hold any interest rate swap contracts at period end.
The Fund purchased or wrote OTC option contracts primarily to manage and/or gain exposure to foreign exchange rate risk. An option is a contract entitling the holder to purchase or sell a specific amount of shares or units of an asset or notional amount of a swap (swaption), at a specified price. When an option is purchased or written, an amount equal to the premium paid or received is recorded as an asset or liability, respectively. Upon exercise of an option, the acquisition cost or sales proceeds of the underlying investment is adjusted by any premium received or paid. Upon expiration of an option, any premium received or paid is recorded as a realized gain or loss. Upon closing an option other than through expiration or exercise, the difference between the premium received or paid and the cost to close the position is recorded as a realized gain or loss.
The Fund invests in value recovery instruments (VRI) primarily to gain exposure to economic growth. Periodic payments from VRI are dependent on established benchmarks for underlying variables. VRI has a notional amount, which is used to calculate amounts of payments to holders. Payments are recorded upon receipt as realized gains in the Consolidated Statement of Operations. The risks of investing in VRI include growth risk, liquidity, and the potential loss of investment. The Fund did not hold any VRI at period end.
See Note 10 regarding other derivative information.
e. Restricted Cash
At June 30, 2020, the Fund held restricted cash in connection with investments in certain derivative securities. Restricted cash is held in a segregated account with the counterparty broker and is reflected in the Consolidated Statement of Assets and Liabilities.
f. Restricted Currency
At June 30, 2020, the Fund held currencies in certain markets in which the ability to repatriate such currency is limited. As a result of such limitations on repatriation, the Fund may incur substantial delays in gaining access to these assets and may be exposed to potential adverse movements in currency value.
g. Securities Lending
The Fund participates in an agency based securities lending program to earn additional income. The Fund receives cash collateral against the loaned securities in an amount equal to at least 102% of the fair value of the loaned securities. Collateral is maintained over the life of the loan in an amount not less than 100% of the fair value of loaned securities, as determined at the close of Fund business each day; any additional collateral required due to changes in security values is delivered to the Fund on the next business day. The collateral is deposited into a joint cash account with other funds and is used to invest in a money market fund managed by Franklin Advisers, Inc., an affiliate of the Fund, and/or a joint repurchase agreement. The Fund may receive income from the investment of cash collateral, in addition to lending fees and rebates paid by the borrower. Income from securities loaned, net of fees paid to the securities lending agent and/or third-party vendor, is reported separately in the Consolidated Statement of Operations. The Fund bears the market risk with respect to the collateral investment, securities loaned, and the risk that the agent may default on its obligations to the Fund. If the borrower defaults on its obligation to return the securities loaned, the Fund has the right to repurchase the securities in the open market using the collateral received. The securities lending agent has agreed to indemnify the Fund in the event of default by a third party borrower.
h. Investments in FT Holdings Corporation IV (FT Subsidiary)
The Fund invests in certain financial instruments through its investment in FT Subsidiary. FT Subsidiary is a Delaware Corporation, is a wholly-owned subsidiary of the Fund, and is able to invest in certain financial instruments consistent with the investment objective of the Fund. At June 30, 2020, FT Subsidiary’s investment, Turtle Bay Resort, as well as any other assets and liabilities of FT Subsidiary are reflected in the Fund’s Consolidated Statement of Investments and Consolidated Statement of Assets and Liabilities.
| | | | | | |
| | | | |
| | franklintempleton.com | | Semiannual Report | | 45 |
TEMPLETON GLOBAL INVESTMENT TRUST
NOTES TO CONSOLIDATED FINANCIAL STATEMENTS (UNAUDITED)
Templeton Global Balanced Fund (continued)
1. Organization and Significant Accounting Policies (continued)
h. Investments in FT Holdings Corporation IV (FT Subsidiary) (continued)
At June 30, 2020, FT Subsidiary, which is a tax paying entity, recognized an unrealized loss on its Turtle Bay investment. An estimated deferred tax asset based on such unrealized loss is reflected as FT Subsidiary deferred tax benefit in the Consolidated Statement of Assets and Liabilities. The estimated benefit was calculated using a federal rate of 21%. When the Turtle Bay investment liquidates, the FT Subsidiary will recognize a capital loss. This loss may be carried back to offset prior year capital gains, subject to carryback limitation rules. If there are no limitations, the carryback will result in a tax refund which will relieve the deferred tax asset.
The financial statements have been consolidated and include the accounts of the Fund and FT Subsidiary. All intercompany transactions and balances have been eliminated. At June 30, 2020, the net assets of FT Subsidiary were $5,323,027, representing 0.7% of the Fund’s consolidated net assets. The Fund’s investment in FT Subsidiary is limited to 25% of consolidated assets.
i. Income and Deferred Taxes
It is the Fund’s policy to qualify as a regulated investment company under the Internal Revenue Code. The Fund intends to distribute to shareholders substantially all of its taxable income and net realized gains to relieve it from federal income and excise taxes. As a result, no provision for U.S. federal income taxes is required.
The Fund may be subject to foreign taxation related to income received, capital gains on the sale of securities and certain foreign currency transactions in the foreign jurisdictions in which it invests. Foreign taxes, if any, are recorded based on the tax regulations and rates that exist in the foreign markets in which the Fund invests. When a capital gain tax is determined to apply, the Fund records an estimated deferred tax liability in an amount that would be payable if the securities were disposed of on the valuation date.
As a result of several court cases, in certain countries across the European Union, the Fund filed additional tax reclaims for previously withheld taxes on dividends earned in those countries (EU reclaims). These additional filings are subject to various administrative proceedings by the local
jurisdictions’ tax authorities within the European Union, as well as a number of related judicial proceedings. Income recognized, if any, for EU reclaims is reflected as other income in the Consolidated Statement of Operations and any related receivable, if any, is reflected as European Union tax reclaims in the Consolidated Statement of Assets and Liabilities. When uncertainty exists as to the ultimate resolution of these proceedings, the likelihood of receipt of these EU reclaims, and the potential timing of payment, no amounts are reflected in the consolidated financial statements. For U.S. income tax purposes, EU reclaims received by the Fund, if any, reduce the amounts of foreign taxes Fund shareholders can use as tax credits in their individual income tax returns.
The Fund may recognize an income tax liability related to its uncertain tax positions under U.S. GAAP when the uncertain tax position has a less than 50% probability that it will be sustained upon examination by the tax authorities based on its technical merits. As of June 30, 2020, the Fund has determined that no tax liability is required in its consolidated financial statements related to uncertain tax positions for any open tax years (or expected to be taken in future tax years). Open tax years are those that remain subject to examination and are based on the statute of limitations in each jurisdiction in which the Fund invests.
j. Security Transactions, Investment Income, Expenses and Distributions
Security transactions are accounted for on trade date. Realized gains and losses on security transactions are determined on a specific identification basis. Interest income and estimated expenses are accrued daily. Amortization of premium and accretion of discount on debt securities are included in interest income. Dividend income is recorded on the ex-dividend date except for certain dividends from securities where the dividend rate is not available. In such cases, the dividend is recorded as soon as the information is received by the Fund. Distributions to shareholders are recorded on the ex-dividend date. Distributable earnings are determined according to income tax regulations (tax basis) and may differ from earnings recorded in accordance with U.S. GAAP. These differences may be permanent or temporary. Permanent differences are reclassified among capital accounts to reflect their tax character. These reclassifications have no impact on net assets or the results of operations. Temporary differences are not reclassified, as they may reverse in subsequent periods.
| | | | |
| | | |
46 | | Semiannual Report | | franklintempleton.com |
TEMPLETON GLOBAL INVESTMENT TRUST
NOTES TO CONSOLIDATED FINANCIAL STATEMENTS (UNAUDITED)
Templeton Global Balanced Fund (continued)
Common expenses incurred by the Trust are allocated among the Funds based on the ratio of net assets of each Fund to the combined net assets of the Trust or based on the ratio of number of shareholders of each Fund to the combined number of shareholders of the Trust. Fund specific expenses are charged directly to the Fund that incurred the expense.
Realized and unrealized gains and losses and net investment income, excluding class specific expenses, are allocated daily to each class of shares based upon the relative proportion of net assets of each class. Differences in per share distributions by class are generally due to differences in class specific expenses.
Inflation-indexed bonds are adjusted for inflation through periodic increases or decreases in the security’s interest accruals, face amount, or principal redemption value, by amounts corresponding to the rate of inflation as measured by an index. Any increase or decrease in the face amount or principal redemption value will be included as inflation principal adjustments in the Consolidated Statement of Operations.
k. Accounting Estimates
The preparation of financial statements in accordance with U.S. GAAP requires management to make estimates and assumptions that affect the reported amounts of the consolidated assets and liabilities at the date of the financial statements and the amounts of income and expenses during the reporting period. Actual results could differ from those estimates.
l. Guarantees and Indemnifications
Under the Trust’s organizational documents, its officers and trustees are indemnified by the Trust against certain liabilities arising out of the performance of their duties to the Trust. Additionally, in the normal course of business, the Trust, on behalf of the Fund, enters into contracts with service providers that contain general indemnification clauses. The Trust’s maximum exposure under these arrangements is unknown as this would involve future claims that may be made against the Trust that have not yet occurred. Currently, the Trust expects the risk of loss to be remote.
2. Shares of Beneficial Interest
At June 30, 2020, there were an unlimited number of shares authorized ($0.01 par value). Transactions in the Fund’s shares were as follows:
| | | | | | | | | | | | | | | | |
| | | Six Months Ended June 30, 2020 | | | Year Ended December 31, 2019 | |
| | | Shares | | | Amount | | | Shares | | | Amount | |
| | | | |
Class A Shares: | | | | | | | | | | | | | | | | |
Shares solda | | | 5,084,725 | | | $ | 12,994,624 | | | | 15,457,226 | | | $ | 43,595,980 | |
Shares issued in reinvestment of distributions | | | 1,945,564 | | | | 4,465,760 | | | | 7,443,835 | | | | 20,890,310 | |
Shares redeemed | | | (30,059,853 | ) | | | (75,634,804 | ) | | | (60,106,395 | ) | | | (169,852,868 | ) |
| | | | |
Net increase (decrease) | | | (23,029,564 | ) | | $ | (58,174,420 | ) | | | (37,205,334 | ) | | $ | (105,366,578 | ) |
| | | | |
Class A1 Shares: | | | | | | | | | | | | | | | | |
Shares sold | | | 2,606,653 | | | $ | 6,682,533 | | | | 9,105,301 | | | $ | 25,895,514 | |
Shares issued in reinvestment of distributions | | | 1,067,794 | | | | 2,454,509 | | | | 3,954,661 | | | | 11,127,734 | |
Shares redeemed | | | (14,387,915 | ) | | | (36,630,589 | ) | | | (26,966,275 | ) | | | (76,248,448 | ) |
| | | | |
Net increase (decrease) | | | (10,713,468 | ) | | $ | (27,493,547 | ) | | | (13,906,313 | ) | | $ | (39,225,200 | ) |
| | | | |
Class C Shares: | | | | | | | | | | | | | | | | |
Shares sold | | | 1,051,962 | | | $ | 2,733,661 | | | | 3,745,169 | | | $ | 10,592,333 | |
Shares issued in reinvestment of distributions | | | 384,437 | | | | 873,404 | | | | 2,035,382 | | | | 5,686,049 | |
Shares redeemed | | | (10,993,271 | ) | | | (27,849,498 | ) | | | (30,382,070 | ) | | | (85,340,766 | ) |
| | | | |
Net increase (decrease) | | | (9,556,872 | ) | | $ | (24,242,433 | ) | | | (24,601,519 | ) | | $ | (69,062,384 | ) |
| | | | | | |
| | | | |
| | franklintempleton.com | | Semiannual Report | | 47 |
TEMPLETON GLOBAL INVESTMENT TRUST
NOTES TO CONSOLIDATED FINANCIAL STATEMENTS (UNAUDITED)
Templeton Global Balanced Fund (continued)
2. Shares of Beneficial Interest (continued)
| | | | | | | | | | | | | | | | |
| | | Six Months Ended June 30, 2020 | | | Year Ended December 31, 2019 | |
| | | Shares | | | Amount | | | Shares | | | Amount | |
| | | | |
Class C1 Shares: | | | | | | | | | | | | | | | | |
Shares sold | | | 241,332 | | | $ | 592,883 | | | | 311,079 | | | $ | 881,750 | |
Shares issued in reinvestment of distributions | | | 80,271 | | | | 184,532 | | | | 560,212 | | | | 1,577,535 | |
Shares redeemeda | | | (3,501,524 | ) | | | (9,005,717 | ) | | | (13,620,596 | ) | | | (38,574,601 | ) |
| | | | |
Net increase (decrease) | | | (3,179,921 | ) | | $ | (8,228,302 | ) | | | (12,749,305 | ) | | $ | (36,115,316 | ) |
| | | | |
Class R Shares: | | | | | | | | | | | | | | | | |
Shares sold | | | 67,266 | | | $ | 174,573 | | | | 94,956 | | | $ | 268,890 | |
Shares issued in reinvestment of distributions | | | 6,067 | | | | 13,991 | | | | 23,796 | | | | 67,155 | |
Shares redeemed | | | (154,492 | ) | | | (420,722 | ) | | | (294,355 | ) | | | (830,740 | ) |
| | | | |
Net increase (decrease) | | | (81,159 | ) | | $ | (232,158 | ) | | | (175,603 | ) | | $ | (494,695 | ) |
| | | | |
Class R6 Shares: | | | | | | | | | | | | | | | | |
Shares sold | | | 294,462 | | | $ | 767,573 | | | | 448,072 | | | $ | 1,272,111 | |
Shares issued in reinvestment of distributions | | | 30,794 | | | | 71,078 | | | | 110,227 | | | | 310,365 | |
Shares redeemed | | | (630,332 | ) | | | (1,581,228 | ) | | | (1,279,143 | ) | | | (3,638,582 | ) |
| | | | |
Net increase (decrease) | | | (305,076 | ) | | $ | (742,577 | ) | | | (720,844 | ) | | $ | (2,056,106 | ) |
| | | | |
Advisor Class Shares: | | | | | | | | | | | | | | | | |
Shares sold | | | 1,980,557 | | | $ | 5,094,826 | | | | 8,325,950 | | | $ | 23,723,126 | |
Shares issued in reinvestment of distributions | | | 532,873 | | | | 1,226,938 | | | | 2,440,632 | | | | 6,892,913 | |
Shares redeemed | | | (18,985,205 | ) | | | (46,855,881 | ) | | | (35,767,251 | ) | | | (101,421,265 | ) |
| | | | |
Net increase (decrease) | | | (16,471,775 | ) | | $ | (40,534,117 | ) | | | (25,000,669 | ) | | $ | (70,805,226 | ) |
aMay include a portion of Class C1 shares that were automatically converted to Class A.
3. Transactions with Affiliates
Franklin Resources, Inc. is the holding company for various subsidiaries that together are referred to as Franklin Templeton. Certain officers and trustees of the Fund are also officers and/or directors of the following subsidiaries:
| | | | |
| Subsidiary | | Affiliation | | |
Templeton Global Advisors Limited (Global Advisors) | | Investment manager | | |
Franklin Advisers, Inc. (Advisers) | | Investment manager | | |
Franklin Templeton Services, LLC (FT Services) | | Administrative manager | | |
Franklin Templeton Distributors, Inc. (Distributors) | | Principal underwriter | | |
Franklin Templeton Investor Services, LLC (Investor Services) | | Transfer agent | | |
| | | | |
| | | |
48 | | Semiannual Report | | franklintempleton.com |
TEMPLETON GLOBAL INVESTMENT TRUST
NOTES TO CONSOLIDATED FINANCIAL STATEMENTS (UNAUDITED)
Templeton Global Balanced Fund (continued)
a. Management Fees
The Fund pays an investment management fee to Global Advisors based on the average daily net assets of the Fund as follows:
| | | | |
| Annualized Fee Rate | | Net Assets | | |
0.825% | | Up to and including $500 million | | |
0.725% | | Over $500 million, up to and including $1 billion | | |
0.675% | | Over $1 billion, up to and including $1.5 billion | | |
0.625% | | Over $1.5 billion, up to and including $6.5 billion | | |
0.600% | | Over $6.5 billion, up to and including $11.5 billion | | |
0.578% | | Over $11.5 billion, up to and including $16.5 billion | | |
0.565% | | Over $16.5 billion, up to and including $19.0 billion | | |
0.555% | | Over $19.0 billion, up to and including $21.5 billion | | |
0.545% | | In excess of $21.5 billion | | |
For the period ended June 30, 2020, the annualized gross effective investment management fee rate was 0.785% of the Fund’s average daily net assets.
Under a subadvisory agreement, Advisers, an affiliate of Global Advisors, provides subadvisory services to the Fund. The subadvisory fee is paid by Global Advisors based on the Fund’s average daily net assets, and is not an additional expense of the Fund.
b. Administrative Fees
Under an agreement with Global Advisors, FT Services provides administrative services to the Fund. The fee is paid by Global Advisors based on the Fund’s average daily net assets, and is not an additional expense of the Fund.
c. Distribution Fees
The Board has adopted distribution plans for each share class, with the exception of Class R6 and Advisor Class shares, pursuant to Rule 12b-1 under the 1940 Act. Under the Fund’s Class A and A1 reimbursement distribution plans, the Fund reimburses Distributors for costs incurred in connection with the servicing, sale and distribution of the Fund’s shares up to the maximum annual plan rate. Under the Class A and A1 reimbursement distribution plan, costs exceeding the maximum for the current plan year cannot be reimbursed in subsequent periods. In addition, under the Fund’s Class C, C1 and R compensation distribution plans, the Fund pays Distributors for costs incurred in connection with the servicing, sale and distribution of the Fund’s shares up to the maximum annual plan rate for each class. The plan year, for purposes of monitoring compliance with the maximum annual plan rates, is February 1 through January 31.
The maximum annual plan rates, based on the average daily net assets, for each class, are as follows:
| | | | |
Class A | | | 0.25 | % |
Class A1 | | | 0.25 | % |
Class C | | | 1.00 | % |
Class C1 | | | 0.65 | % |
Class R | | | 0.50 | % |
| | | | | | |
| | | | |
| | franklintempleton.com | | Semiannual Report | | 49 |
TEMPLETON GLOBAL INVESTMENT TRUST
NOTES TO CONSOLIDATED FINANCIAL STATEMENTS (UNAUDITED)
Templeton Global Balanced Fund (continued)
3. Transactions with Affiliates (continued)
d. Sales Charges/Underwriting Agreements
Front-end sales charges and contingent deferred sales charges (CDSC) do not represent expenses of the Fund. These charges are deducted from the proceeds of sales of Fund shares prior to investment or from redemption proceeds prior to remittance, as applicable. Distributors has advised the Fund of the following commission transactions related to the sales and redemptions of the Fund’s shares for the period:
| | | | |
Sales charges retained net of commissions paid to unaffiliated brokers/dealers | | $ | 9,244 | |
CDSC retained | | $ | 3,765 | |
e. Transfer Agent Fees
Each class of shares pays transfer agent fees to Investor Services for its performance of shareholder servicing obligations. The fees are based on an annualized asset based fee of 0.02% plus a transaction based fee. In addition, each class reimburses Investor Services for out of pocket expenses incurred and, except for Class R6, reimburses shareholder servicing fees paid to third parties. These fees are allocated daily based upon their relative proportion of such classes’ aggregate net assets. Class R6 pays Investor Services transfer agent fees specific to that class.
For the period ended June 30, 2020, the Fund paid transfer agent fees of $580,989, of which $248,915 was retained by Investor Services.
f. Investments in Affiliated Management Investment Companies
The Fund invests in one or more affiliated management investment companies for purposes other than exercising a controlling influence over the management or policies. Management fees paid by the Fund are waived on assets invested in the affiliated management investment companies, as noted in the Consolidated Statement of Operations, in an amount not to exceed the management and administrative fees paid directly or indirectly by each affiliate. During the period ended June 30, 2020, the Fund held investments in affiliated management investment companies as follows:
| | | | | | | | | | | | | | | | | | | | | | | | | | | | | | | | |
| | | Value at
Beginning
of Period | | | Purchases | | | Sales | | | Realized
Gain (Loss) | | | Net Change in
Unrealized
Appreciation
(Depreciation) | | | Value at
End of
Period | | | Number of
Shares
Held at End
of Period | | | Investment
Income | |
| |
Non-Controlled Affiliates | | | | | | | | | | | | | | | | | | | | | | | | | | | | | | | | |
| | | | | | | | | | | | | | | | | | | | | | | | | | | | | | | Dividends | |
| | | | | | | | | | | | | | | | | | | | | | | | | | | | | | | | |
Institutional Fiduciary Trust Money Market Portfolio, 0.0% | | | $131,795,067 | | | | $262,075,893 | | | | $(208,432,408) | | | | $ — | | | | $ — | | | | $185,438,552 | | | | 185,438,552 | | | | $260,412 | |
| | | | | | | | | | | | | | | | | | | | | | | | | | | | | |
| Income from
securities
loaned |
|
| | | | | | | | | | | | | | | | | | | | | | | | | | | | | | | | |
Institutional Fiduciary Trust Money Market Portfolio, 0.0% | | | — | | | | 3,501,000 | | | | (2,332,000 | ) | | | — | | | | — | | | | 1,169,000 | | | | 1,169,000 | | | | 74 | |
| | | | | | | | | | | | |
Total Affiliated Securities | | | $131,795,067 | | | | $265,576,893 | | | | $(210,764,408) | | | | $ — | | | | $ — | | | | $186,607,552 | | | | | | | | $260,486 | |
| | | | | | | | | | | | |
g. Waiver and Expense Reimbursements
Investor Services has voluntarily agreed in advance to waive or limit its fees so that the Class R6 transfer agent fees do not exceed 0.03% based on the average net assets of the class until April 30, 2021.
| | | | |
| | | |
50 | | Semiannual Report | | franklintempleton.com |
TEMPLETON GLOBAL INVESTMENT TRUST
NOTES TO CONSOLIDATED FINANCIAL STATEMENTS (UNAUDITED)
Templeton Global Balanced Fund (continued)
4. Expense Offset Arrangement
The Fund has entered into an arrangement with its custodian whereby credits realized as a result of uninvested cash balances are used to reduce a portion of the Fund’s custodian expenses. During the period ended June 30, 2019, the custodian fees were reduced as noted in the Consolidated Statement of Operations.
5. Income Taxes
For tax purposes, capital losses may be carried over to offset future capital gains.
At December 31, 2019, the capital loss carryforwards were as follows:
| | | | |
Capital loss carryforwards not subject to expiration: | | | | |
Short term | | $ | 19,920,202 | |
Long term | | | 72,942,004 | |
| | | | |
Total capital loss carryforwards | | $ | 92,862,206 | |
| | | | |
At June 30, 2020, the cost of investments and net unrealized appreciation (depreciation) for income tax purposes were as follows:
| | | | |
Cost of investments | | $ | 788,794,442 | |
| | | | |
Unrealized appreciation | | $ | 48,983,481 | |
Unrealized depreciation | | | (108,093,918 | ) |
| | | | |
Net unrealized appreciation (depreciation) | | $ | (59,110,437 | ) |
| | | | |
Differences between income and/or capital gains as determined on a book basis and a tax basis are primarily due to differing treatments of foreign currency transactions, bond discounts and premiums, tax straddles, and corporate actions.
6. Investment Transactions
Purchases and sales of investments (excluding short term securities) for the period ended June 30, 2020, aggregated $281,190,571 and $477,559,460, respectively.
At June 30, 2020, in connection with securities lending transactions, the Fund loaned equity investments and received $1,461,503 of cash collateral. The gross amount of recognized liability for such transactions is included in payable upon return of securities loaned in the Consolidated Statement of Assets and Liabilities. The agreements can be terminated at any time.
7. Credit Risk
At June 30, 2020, the Fund had 7.2% of its portfolio invested in high yield, senior secured floating rate loans, or other securities rated below investment grade and unrated securities, if any. These securities may be more sensitive to economic conditions causing greater price volatility and are potentially subject to a greater risk of loss due to default than higher rated securities.
| | | | | | |
| | | | |
| | franklintempleton.com | | Semiannual Report | | 51 |
TEMPLETON GLOBAL INVESTMENT TRUST
NOTES TO CONSOLIDATED FINANCIAL STATEMENTS (UNAUDITED)
Templeton Global Balanced Fund (continued)
8. Concentration of Risk
Investments in issuers domiciled or with significant operations in developing or emerging market countries may be subject to higher risks than investments in developed countries. These risks include fluctuating currency values, underdeveloped legal or business systems, and changing local and regional economic, political and social conditions, which may result in greater market volatility. In addition, certain foreign securities may not be as liquid as U.S. securities. Currencies of developing or emerging market countries may be subject to significantly greater risks than currencies of developed countries, including the potential inability to repatriate those currencies into U.S. dollars.
At June 30, 2020, the Fund had 1.9% of its net assets denominated in Argentine Pesos, which has restricted currency repatriation since September 2019, and had restructured certain issues of its debt. Political and economic conditions in Argentina could continue to affect the value of the Fund’s holdings.
9. Novel Coronavirus Pandemic
The global outbreak of the novel coronavirus disease, known as COVID-19, has caused adverse effects on many companies, sectors, nations, regions and the markets in general, and may continue for an unpredictable duration. The effects of this pandemic may materially impact the value and performance of the Fund, its ability to buy and sell fund investments at appropriate valuations and its ability to achieve its investment objectives.
10. Restricted Securities
The Fund invests in securities that are restricted under the Securities Act of 1933 (1933 Act). Restricted securities are often purchased in private placement transactions, and cannot be sold without prior registration unless the sale is pursuant to an exemption under the 1933 Act. Disposal of these securities may require greater effort and expense, and prompt sale at an acceptable price may be difficult. The Fund may have registration rights for restricted securities. The issuer generally incurs all registration costs.
At June 30, 2020, investments in restricted securities, excluding securities exempt from registration under the 1933 Act, were as follows:
| | | | | | | | | | | | | | | | |
| Shares | | | Issuer | | Acquisition Date | | | Cost | | | Value | |
| | | | |
| | 32,900,733 | | | K2016470219 South Africa Ltd., A | | | 2/08/13 - 2/01/17 | | | $ | 81,025 | | | $ | — | |
| | 4,646,498 | | | K2016470219 South Africa Ltd., B | | | 2/01/17 | | | | 3,450 | | | | — | |
| | | | Total Restricted Securities(Value is 0.0% of Net Assets) | | | | | | $ | 84,475 | | | $ | — | |
| | | | |
| | | |
52 | | Semiannual Report | | franklintempleton.com |
TEMPLETON GLOBAL INVESTMENT TRUST
NOTES TO CONSOLIDATED FINANCIAL STATEMENTS (UNAUDITED)
Templeton Global Balanced Fund (continued)
11. Other Derivative Information
At June 30, 2020, investments in derivative contracts are reflected in the Consolidated Statement of Assets and Liabilities as follows:
| | | | | | | | | | | | |
| | | Asset Derivatives | | | Liability Derivatives | |
Derivative Contracts
Not Accounted for as
Hedging Instruments | | Consolidated Statement of
Assets and Liabilities Location | | Fair Value | | | Consolidated Statement of
Assets and Liabilities
Location | | Fair Value | |
| |
| | | | |
Foreign exchange contracts | | Investments in securities, at value | | $
| 3,735,243
| a
| | Options written, at value | | $ | 3,384,815 | |
| | | | |
| | Unrealized appreciation on OTC forward exchange contracts | | | 3,611,955 | | | Unrealized depreciation on OTC forward exchange contracts | | | 6,539,473 | |
Equity contracts | | Investments in securities, at value | | | 777,971 | a | | Options written, at value | | | — | |
| | | | | | | | | | | | |
Totals | | | | $ | 8,125,169 | | | | | $ | 9,924,288 | |
| | | | | | | | | | | | |
aPurchased option contracts are included in investments in securities, at value in the Consolidated Statement of Assets and Liabilities.
For the period ended June 30, 2020, the effect of derivative contracts in the Consolidated Statement of Operations was as follows:
| | | | | | | | | | | | |
Derivative Contracts Not Accounted for as Hedging Instruments | | Consolidated Statement of
Operations Location | | Net Realized Gain (Loss) for the Period | | | Consolidated Statement of
Operations Location | | Net Change in
Unrealized
Appreciation
(Depreciation)
for the Period | |
| |
| | Net realized gain (loss) from: | | | | | | Net change in unrealized appreciation (depreciation) on: | | | | |
Interest rate contracts | | Swap contracts | | $ | (16,517,124 | ) | | Swap contracts | | | $5,160,817 | |
Foreign exchange contracts | | Investments | | | 8,123,910 | a | | Investments | | | 1,487,690 a | |
| | Written options | | | (2,268,623 | ) | | Written options | | | (1,220,076) | |
| | Forward exchange contracts | | | 4,390,953 | | | Forward exchange contracts | | | 2,648,553 | |
Equity contracts | | Investments | | | — | | | Investments | | | (3,050,492)a | |
| | | | | | | | | | | | |
Totals | | | | $ | (6,270,884 | ) | | | | | $5,026,492 | |
| | | | | | | | | | | | |
aPurchased option contracts are included in net realized gain (loss) from investments and net change in unrealized appreciation (depreciation) on investments in the Consolidated Statement of Operations.
For the period ended June 30, 2020, the average month end notional amount of options and swap contracts, and the average month end contract value for forward exchange contracts, were as follows:
| | | | |
Options | | $ | 428,744,760 | |
Swap contracts | | $ | 14,204,286 | |
Forward exchange contracts | | $ | 502,287,449 | |
See Note 1(d) regarding derivative financial instruments.
| | | | | | |
| | | | |
| | franklintempleton.com | | Semiannual Report | | 53 |
TEMPLETON GLOBAL INVESTMENT TRUST
NOTES TO CONSOLIDATED FINANCIAL STATEMENTS (UNAUDITED)
Templeton Global Balanced Fund (continued)
11. Other Derivative Information (continued)
At June 30, 2020, OTC derivative assets and liabilities are as follows:
| | | | | | | | | | |
| | | Gross Amounts of Assets and Liabilities Presented
in the Consolidated Statement of Assets and Liabilities |
| | | | | |
| | | Assetsa | | Liabilitiesa |
Derivatives | | | | | | | | | | |
Forward exchange contracts | | | | $3,611,955 | | | | | $6,539,473 | |
Options purchased | | | | 3,735,243 | | | | | — | |
Options written | | | | — | | | | | 3,384,815 | |
| | | | | |
Total | | | | $7,347,198 | | | | | $9,924,288 | |
| | | | | |
aAbsent an event of default or early termination, OTC derivative assets and liabilities are presented gross and not offset in the Consolidated Statement of Assets and Liabilities.
At June 30, 2020, OTC derivative assets, which may be offset against OTC derivative liabilities and collateral received from the counterparty, are as follows:
| | | | | | | | | | | | | | | | | | | | | | | | | |
| | | | | Amounts Not Offset in the Consolidated Statement of Assets and Liabilities | | |
| | | Gross Amounts of
Assets Presented in
the Statement of
Assets and Liabilities | | Financial
Instruments
Available for
Offset | | Financial
Instruments
Collateral
Receiveda,b | | Cash
Collateral
Receivedb | | Net Amount
(Not less
than zero) |
Counterparty | | | | | | | | | | | | | | | | | | | | | | | | | |
BNDP | | | $ | — | | | | $ | — | | | | $ | — | | | | $ | — | | | | $ | — | |
BOFA | | | | — | | | | | — | | | | | — | | | | | — | | | | | — | |
CITI | | | | 3,432,665 | | | | | (2,699,252 | ) | | | | — | | | | | (733,413 | ) | | | | — | |
DBAB | | | | 525,232 | | | | | (525,232 | ) | | | | — | | | | | — | | | | | — | |
GSCO | | | | 665,639 | | | | | (302,357 | ) | | | | — | | | | | (363,282 | ) | | | | — | |
HSBK | | | | 438,924 | | | | | (438,924 | ) | | | | — | | | | | — | | | | | — | |
JPHQ | | | | 1,581,598 | | | | | (1,546,603 | ) | | | | (34,995 | ) | | | | — | | | | | — | |
MSCO | | | | 536,727 | | | | | (536,727 | ) | | | | — | | | | | — | | | | | — | |
UBSW | | | | 166,413 | | | | | (31,785 | ) | | | | — | | | | | — | | | | | 134,628 | |
| | | | | |
Total | | | | $7,347,198 | | | | | $(6,080,880 | ) | | | $ | (34,995 | ) | | | | $(1,096,695 | ) | | | | $134,628 | |
| | | | |
| | | |
54 | | Semiannual Report | | franklintempleton.com |
TEMPLETON GLOBAL INVESTMENT TRUST
NOTES TO CONSOLIDATED FINANCIAL STATEMENTS (UNAUDITED)
Templeton Global Balanced Fund (continued)
At June 30, 2020, OTC derivative liabilities, which may be offset against OTC derivative assets and collateral pledged to the counterparty, are as follows:
| | | | | | | | | | | | | | | | | | | | |
| | | | | | Amounts Not Offset in the | | | | |
| | | | | | Consolidated Statement of Assets and Liabilities | | | | |
| | | | | |
| | | Gross Amounts of
Liabilities Presented in
the Statement of
Assets and Liabilities | | | Financial
Instruments
Available for
Offset | | | Financial
Instruments
Collateral
Pledged | | | Cash
Collateral
Pledgedb | | | Net Amount
(Not less
than zero) | |
Counterparty | | | | | | | | | | | | | | | | | | | | |
BNDP | | | $ 58,845 | | | | $ — | | | | $ — | | | | $ (10,000) | | | | $ 48,845 | |
BOFA | | | 140,529 | | | | — | | | | — | | | | (110,000) | | | | 30,529 | |
CITI | | | 2,699,252 | | | | (2,699,252 | ) | | | — | | | | — | | | | — | |
DBAB | | | 1,982,313 | | | | (525,232 | ) | | | — | | | | (1,457,081) | | | | — | |
GSCO | | | 302,357 | | | | (302,357 | ) | | | — | | | | — | | | | — | |
HSBK | | | 1,227,487 | | | | (438,924 | ) | | | — | | | | (480,000) | | | | 308,563 | |
JPHQ | | | 1,546,603 | | | | (1,546,603 | ) | | | — | | | | — | | | | — | |
MSCO | | | 1,935,117 | | | | (536,727 | ) | | | — | | | | (1,100,000) | | | | 298,390 | |
UBSW | | | 31,785 | | | | (31,785 | ) | | | — | | | | — | | | | — | |
Total | | | $9,924,288 | | | | $(6,080,880 | ) | | | $ — | | | | $(3,157,081) | | | | $686,327 | |
aAt June 30, 2020, the Fund received U.S. Treasury Bonds and Notes as collateral for derivatives.
bIn some instances, the collateral amounts disclosed in the table above were adjusted due to the requirement to limit collateral amounts to avoid the effect of overcollateral-ization. Actual collateral received and/or pledged may be more than the amounts disclosed herein.
See Note 1(d) regarding derivative financial instruments.
See Abbreviations on page 60.
12. Credit Facility
The Fund, together with other U.S. registered and foreign investment funds (collectively, Borrowers), managed by Franklin Templeton, are borrowers in a joint syndicated senior unsecured credit facility totaling $2 billion (Global Credit Facility) which matures on February 5, 2021. This Global Credit Facility provides a source of funds to the Borrowers for temporary and emergency purposes, including the ability to meet future unanticipated or unusually large redemption requests.
Under the terms of the Global Credit Facility, the Fund shall, in addition to interest charged on any borrowings made by the Fund and other costs incurred by the Fund, pay its share of fees and expenses incurred in connection with the implementation and maintenance of the Global Credit Facility, based upon its relative share of the aggregate net assets of all of the Borrowers, including an annual commitment fee of 0.15% based upon the unused portion of the Global Credit Facility. These fees are reflected in other expenses in the Statement of Operations. During the period ended June 30, 2020, the Fund did not use the Global Credit Facility.
| | | | | | |
| | | | |
| | franklintempleton.com | | Semiannual Report | | 55 |
TEMPLETON GLOBAL INVESTMENT TRUST
NOTES TO CONSOLIDATED FINANCIAL STATEMENTS (UNAUDITED)
Templeton Global Balanced Fund (continued)
13. Fair Value Measurements
The Fund follows a fair value hierarchy that distinguishes between market data obtained from independent sources (observable inputs) and the Fund’s own market assumptions (unobservable inputs). These inputs are used in determining the value of the Fund’s financial instruments and are summarized in the following fair value hierarchy:
| | • | | Level 1 – quoted prices in active markets for identical financial instruments |
| | • | | Level 2 – other significant observable inputs (including quoted prices for similar financial instruments, interest rates, prepayment speed, credit risk, etc.) |
| | • | | Level 3 – significant unobservable inputs (including the Fund’s own assumptions in determining the fair value of financial instruments) |
The input levels are not necessarily an indication of the risk or liquidity associated with financial instruments at that level.
| | | | |
| | | |
56 | | Semiannual Report | | franklintempleton.com |
TEMPLETON GLOBAL INVESTMENT TRUST
NOTES TO CONSOLIDATED FINANCIAL STATEMENTS (UNAUDITED)
Templeton Global Balanced Fund (continued)
A summary of inputs used as of June 30, 2020, in valuing the Fund’s assets and liabilities carried at fair value, is as follows:
| | | | | | | | | | | | | | | | |
| | | Level 1 | | | Level 2 | | | Level 3 | | | Total | |
| | | | |
Assets: | | | | | | | | | | | | | | | | |
| | | | |
Investments in Securities:a | | | | | | | | | | | | | | | | |
| | | | |
Equity Investments: | | | | | | | | | | | | | | | | |
| | | | |
China | | $ | 7,828,817 | | | $ | 8,979,632 | | | $ | — | | | $ | 16,808,449 | |
| | | | |
Denmark | | | — | | | | 6,458,294 | | | | — | | | | 6,458,294 | |
| | | | |
France | | | — | | | | 9,224,553 | | | | — | | | | 9,224,553 | |
| | | | |
Germany | | | — | | | | 32,048,322 | | | | — | | | | 32,048,322 | |
| | | | |
Hong Kong | | | — | | | | 11,776,614 | | | | — | | | | 11,776,614 | |
| | | | |
India | | | — | | | | 7,302,663 | | | | — | | | | 7,302,663 | |
| | | | |
Japan | | | — | | | | 61,057,351 | | | | — | | | | 61,057,351 | |
| | | | |
Netherlands | | | 8,142,456 | | | | 8,848,548 | | | | — | | | | 16,991,004 | |
| | | | |
South Africa | | | — | | | | — | | | | — | b | | | — | |
| | | | |
South Korea | | | — | | | | 11,680,464 | | | | — | | | | 11,680,464 | |
| | | | |
Spain | | | — | | | | 6,675,681 | | | | — | | | | 6,675,681 | |
| | | | |
Taiwan | | | — | | | | 8,857,624 | | | | — | | | | 8,857,624 | |
| | | | |
United Kingdom | | | 4,914,073 | | | | 21,327,054 | | | | — | | | | 26,241,127 | |
| | | | |
United States | | | 86,275,484 | | | | — | | | | 34,934 | | | | 86,310,418 | |
| | | | |
All Other Equity Investments | | | 6,368,640 | | | | — | | | | — | | | | 6,368,640 | |
| | | | |
Corporate Bonds: | | | | | | | | | | | | | | | | |
| | | | |
South Africa | | | — | | | | — | | | | 9,080 | b | | | 9,080 | |
| | | | |
Foreign Government and Agency Securities: | | | | | | | | | | | | | | | | |
| | | | |
Argentina | | | — | | | | — | | | | 12,060,717 | | | | 12,060,717 | |
| | | | |
All Other Foreign Government and Agency Securities | | | — | | | | 140,623,189 | | | | — | | | | 140,623,189 | |
| | | | |
U.S. Government and Agency Securities | | | — | | | | 28,600,910 | | | | — | | | | 28,600,910 | |
| | | | |
Options Purchased | | | 777,971 | | | | 3,735,243 | | | | — | | | | 4,513,214 | |
| | | | |
Short Term Investments: | | | | | | | | | | | | | | | | |
| | | | |
Argentina | | | — | | | | — | | | | 1,509,062 | | | | 1,509,062 | |
| | | | |
United States | | | 185,731,055 | | | | 17,721,509 | | | | — | | | | 203,452,564 | |
| | | | |
All Other Short Term Investments | | | — | | | | 38,384,192 | | | | — | | | | 38,384,192 | |
| | | | |
| | | | |
Total Investments in Securities | | $ | 300,038,496 | | | $ | 423,301,843 | | | $ | 13,613,793 | | | $ | 736,954,132 | |
| | | | |
| | | | |
Other Financial Instruments: | | | | | | | | | | | | | | | | |
| | | | |
Forward Exchange Contracts | | $ | — | | | $ | 3,611,955 | | | $ | — | | | $ | 3,611,955 | |
| | | | |
Restricted Currency (ARS) | | | — | | | | — | | | | 21,456 | | | | 21,456 | |
| | | | |
| | | | |
Total Other Financial Instruments | | $ | — | | | $ | 3,611,955 | | | $ | 21,456 | | | $ | 3,633,411 | |
| | | | |
| | | | |
Receivables: | | | | | | | | | | | | | | | | |
| | | | |
Interest (ARS) | | $ | — | | | $ | — | | | $ | 309,153 | | | $ | 309,153 | |
| | | | |
| | | | | | |
| | | | |
| | franklintempleton.com | | Semiannual Report | | 57 |
TEMPLETON GLOBAL INVESTMENT TRUST
NOTES TO CONSOLIDATED FINANCIAL STATEMENTS (UNAUDITED)
Templeton Global Balanced Fund (continued)
13. Fair Value Measurements (continued)
| | | | | | | | | | | | | | | | |
| | | Level 1 | | | Level 2 | | | Level 3 | | | Total | |
| | | | |
Liabilities: | | | | | | | | | | | | | | | | |
| | | | |
Other Financial Instruments: | | | | | | | | | | | | | | | | |
| | | | |
Options Written | | $ | — | | | $ | 3,384,815 | | | $ | — | | | $ | 3,384,815 | |
| | | | |
Forward Exchange Contracts | | | — | | | | 6,539,473 | | | | — | | | | 6,539,473 | |
| | | | |
| | | | |
Total Other Financial Instruments | | $ | — | | | $ | 9,924,288 | | | $ | — | | | $ | 9,924,288 | |
| | | | |
| | | | |
Payables: | | | | | | | | | | | | | | | | |
| | | | |
Deferred Tax (ARS) | | $ | — | | | $ | — | | | $ | 711 | | | $ | 711 | |
| | | | |
aFor detailed categories, see the accompanying Statement of Investments.
bIncludes securities determined to have no value at June 30, 2020.
A reconciliation in which Level 3 inputs are used in determining fair value is presented when there are significant Level 3 assets and/or liabilities at the beginning and/or end of the year. At June 30, 2020, the reconciliation is as follows:
| | | | | | | | | | | | | | | | | | | | | | | | | | | | | | | | | | | | | | | | |
| | | Balance at Beginning of
Period | | | Purchases | | | Sales | | | Transfer
Into
Level 3a | | | Transfer
Out of
Level 3 | | | Cost Basis
Adjustmentsb
| | | Net Realized Gain (Loss) | | | Net
Unrealized
Appreciation
(Depreciation) | | | Balance at End of Period | | | Net Change in
Unrealized
Appreciation
(Depreciation)
on Assets
Held at Period End | |
Assets: | | | | | | | | | | | | | | | | | | | | | | | | | | | | | | | | | | | | | | | | |
Investments in Securities: | | | | | | | | | | | | | | | | | | | | | | | | | | | | | | | | | | | | | | | | |
Common Stocks | | | | | | | | | | | | | | | | | | | | | | | | | | | | | | | | | | | | | | | | |
South Africa | | | $ 26,811 | | | | $ — | | | $ | — | | | | $ — | | | | $— | | | | $ — | | | $ | — | | | | $ (26,811 | ) | | | $ — | c | | | $ (26,811) | |
United States | | | 34,934 | | | | — | | | | — | | | | — | | | | — | | | | — | | | | — | | | | — | | | | 34,934 | | | | — | |
Corporate Bonds | | | | | | | | | | | | | | | | | | | | | | | | | | | | | | | | | | | | | | | | |
South Africa | | | 8,254 | | | | — | | | | — | | | | 6,506 | | | | — | | | | 194,184 | | | | — | | | | (199,864 | ) | | | 9,080 | c | | | (199,864 | ) |
Foreign Government and Agency Securities Argentina | | | 9,148,100 | | | | 5,392,079 | | | | (2,739,406 | ) | | | — | | | | — | | | | 1,232,332 | | | | (4,677,895 | ) | | | 3,705,507 | | | | 12,060,717 | | | | 1,919,727 | |
Short Term Investment Argentina | | | 702,477 | | | | 1,644,883 | | | | (458,037 | ) | | | — | | | | — | | | | 168,038 | | | | (179,464 | ) | | | (368,835 | ) | | | 1,509,062 | | | | (166,777 | ) |
| | | | |
Total Investment in Securities | | $ | 9,920,576 | | | $ | 7,036,962 | | | $ | (3,197,443 | ) | | | $6,506 | | | | $— | | | $ | 1,594,554 | | | $ | (4,857,359 | ) | | | $3,109,997 | | | $ | 13,613,793 | | | $ | 1,526,275 | |
| | | | |
Other Financial Instruments: | | | | | | | | | | | | | | | | | | | | | | | | | | | | | | | | | | | | | | | | |
Restricted Currency(ARS) | | | $2,466,942 | | | | $2,250,918 | | | $ | (4,276,127) | | | | $ — | | | | $— | | | | $ — | | | $ | (482,940) | | | | $ 62,663 | | | | $ 21,456 | | | | $ 1,560 | |
| | | | |
Receivables: | | | | | | | | | | | | | | | | | | | | | | | | | | | | | | | | | | | | | | | | |
Interest Receivable(ARS) | | | $ 419,240 | | | | $ 751,751 | | | $ | (734,686) | | | | $ — | | | | $— | | | | $ — | | | $ | (169,724) | | | | $ 42,572 | | | | $ 309,153 | | | | $ 18,820 | |
| | | | |
Liabilities: | | | | | | | | | | | | | | | | | | | | | | | | | | | | | | | | | | | | | | | | |
| | | | |
| | | |
58 | | Semiannual Report | | franklintempleton.com |
TEMPLETON GLOBAL INVESTMENT TRUST
NOTES TO CONSOLIDATED FINANCIAL STATEMENTS (UNAUDITED)
Templeton Global Balanced Fund (continued)
| | | | | | | | | | | | | | | | | | | | | | | | | | | | | | | | | | | | | | | | |
| | | Balance at
Beginning of
Period | | | Purchases | | | Sales | | | Transfer
Into
Level 3a | | | Transfer
Out of
Level 3 | | | Cost Basis
Adjustmentsb
| | | Net
Realized
Gain
(Loss) | | | Net
Unrealized
Appreciation
(Depreciation) | | | Balance at End
of Period | | | Net Change in
Unrealized
Appreciation
(Depreciation)
on Assets
Held at Period End | |
Payables: | | | | | | | | | | | | | | | | | | | | | | | | | | | | | | | | | | | | | | | | |
Deferred Tax (ARS) | | | $ 1,002 | | | $ | — | | | $ | — | | | $ | — | | | | $— | | | | $ — | | | $ | — | | | $ | (291 | ) | | $ | 711 | | | | $ (291) | |
| | | | |
aTransferred into Level 3 as a result of the unavailability of a quoted market price in an active market for identical securities or as a result of the unreliability of the foreign exchange rate and other significant observable valuation inputs.
bMay include accretion, amortization, partnership adjustments, and/or other cost basis adjustments.
cIncludes securities determined to have no value.
Significant unobservable valuation inputs for material Level 3 assets and/or liabilities and impact to fair value as a result of changes in unobservable valuation inputs as of June 30, 2020, are as follows:
| | | | | | | | | | | | | | | | | | |
| Description | | Fair Value at
End of Period | | | Valuation
Technique | | | Unobservable
Inputs | | Amount | | | Impact to Fair
Value if Input
Increasesa | |
| | | | | |
Assets: | | | | | | | | | | | | | | | | | | |
Investments in Securities: | | | | | | | | | | | | | | | | | | |
| | | | | |
Foreign Government and Agency Securities Argentina | | | $12,060,717 | | |
| Market
comparables |
| | Implied foreign exchange rate | | | 105.9 ARS/USD | | | | Decreaseb | |
| |
| | | | | |
Short Term Investments Argentina | | | 1,509,062 | | |
| Market
comparables |
| | Implied foreign exchange rate | | | 105.9 ARS/USD | | | | Decreasec | |
| |
| | | | | |
All otherd | | | 374,623 | e | | | | | | | | | | | | | | |
| |
| | | | | |
Liabilities: | | | | | | | | | | | | | | | | | | |
| | | | | |
All otherd | | | 711 | | | | | | | | | | | | | | | |
| |
aRepresents the directional change in the fair value that would result from a significant and reasonable increase in the corresponding input. A significant and reasonable decrease in the input would have the opposite effect. Significant impacts, if any, to fair value and/or net assets have been indicated.
bRepresents a significant impact to fair value and net assets.
cRepresents a significant impact to fair value but not net assets.
dIncludes fair value of immaterial investments developed using various valuation techniques and unobservable inputs. May also include investments with values derived using private transaction prices or non-public third party pricing information which is unobservable.
eIncludes securities determined to have no value at June 30, 2020.
14. New Accounting Pronouncements
In March 2020, the Financial Accounting Standards Board issued Accounting Standards Update (ASU) No. 2020-04, Reference Rate Reform (Topic 848) – Facilitation of the Effects of Reference Rate Reform on Financial Reporting. The amendments in the ASU provides optional temporary financial reporting relief from the effect of certain types of contract modifications due to the planned discontinuation of the LIBOR and other interbank-offered based reference rates as of the end of 2021. The ASU is effective for certain reference rate-related contract modifications that occur during the period March 12, 2020 through December 31, 2022. Management is currently evaluating the impact, if any, of applying this ASU.
15. Subsequent Events
The Fund has evaluated subsequent events through the issuance of the financial statements and determined that no events have occurred that require disclosure.
| | | | | | |
| | | | |
| | franklintempleton.com | | Semiannual Report | | 59 |
TEMPLETON GLOBAL INVESTMENT TRUST
NOTES TO CONSOLIDATED FINANCIAL STATEMENTS (UNAUDITED)
Templeton Global Balanced Fund (continued)
Abbreviations
| | | | | | | | | | |
| Counterparty | | Currency | | Selected Portfolio |
| | | | | |
| BNDP | | BNP Paribas SA | | ARS | | Argentine Peso | | ADR | | American Depositary Receipt |
| | | | | |
| BOFA | | Bank of America | | AUD | | Australian Dollar | | ARPP7DRR | | Argentina Central Bank 7 Day |
| | | | | |
| CITI | | Citigroup, Inc. | | BRL | | Brazilian Real | | Badlar | | Argentina Deposit Rates Badlar Banks ARS |
| | | | | |
| DBAB | | Deutsche Bank | | COP | | Colombian Peso | | FRN | | Floating Rate Note |
| | | | | |
| DMN | | Decision Model and Notation | | EUR | | Euro | | IDR | | International Depositary Receipt |
| | | | | |
| GSCO | | The Goldman Sachs | | GHS | | Ghanaian Cedi | | LIBOR | | London InterBank Offered Rate |
| | | | | |
| HSBK | | HSBC Bank PLC | | IDR | | Indonesian Rupiah | | PIK | | Payment-In-Kind |
| | | | | |
| JPHQ | | JP Morgan Chase | | INR | | Indian Rupee | | VRI | | Value Recovery Instrument |
| | | | | |
| MSCO | | Morgan Stanley | | JPY | | Japanese yen | | | | |
| | | | | |
| SCNY | | Standard Chartered | | KRW | | South Korean Won | | | | |
| | | | | |
| UBSW | | UBS AG | | MXN | | Mexican Peso | | | | |
| | | | | |
| | | | USD | | United States Dollar | | | | |
| | | | |
| | | |
60 | | Semiannual Report | | franklintempleton.com |
TEMPLETON GLOBAL INVESTMENT TRUST
Tax Information (unaudited)
Templeton Global Balanced Fund
At December 31, 2019, more than 50% of Fund’s total assets were invested in securities of foreign issuers. In most instances, foreign taxes were withheld from income paid to the Fund on these investments. As shown in the table below, the Fund hereby reports to shareholders the foreign source income and foreign taxes paid, pursuant to Section 853 of the Internal Revenue Code. This written statement will allow shareholders of record on March 13, 2020, to treat their proportionate share of foreign taxes paid by the Fund as having been paid directly by them. The shareholder shall consider these amounts as foreign taxes paid in the tax year in which they receive the Fund distribution.
The following table provides a detailed analysis of foreign tax paid, foreign source income, and foreign source qualified dividends as reported by the Fund to the shareholders of record.
| | | | | | | | | | | | |
| Class | | Foreign Tax Paid
Per Share | | | Foreign Source
Income Per Share | | | Foreign Source Qualified
Dividends Per Share | |
Class A | | | $0.0118 | | | | $0.1407 | | | | $0.0506 | |
Class A1 | | | $0.0118 | | | | $0.1410 | | | | $0.0507 | |
Class C | | | $0.0118 | | | | $0.1163 | | | | $0.0418 | |
Class C1 | | | $0.0118 | | | | $0.1152 | | | | $0.0414 | |
Class R | | | $0.0118 | | | | $0.1332 | | | | $0.0480 | |
Class R6 | | | $0.0118 | | | | $0.1496 | | | | $0.0538 | |
Advisor Class | | | $0.0118 | | | | $0.1464 | | | | $0.0527 | |
Foreign Tax Paid Per Share is the amount per share available to you, as a tax credit (assuming you held your shares in the Fund for a minimum of 16 days during the 31-day period beginning 15 days before the ex-dividend date of the Fund’s distribution to which the foreign taxes relate), or, as a tax deduction.
Foreign Source Income Per Share is the amount per share of income dividends attributable to foreign securities held by the Fund, plus any foreign taxes withheld on these dividends. The amounts reported include foreign source qualified dividends that have not been adjusted for the rate differential applicable to such dividend income.1
Foreign Source Qualified Dividends Per Share is the amount per share of foreign source qualified dividends, plus any foreign taxes withheld on these dividends. These amounts represent the portion of the Foreign Source Income Per Share that were derived from qualified foreign securities held by the Fund.1
At the beginning of each calendar year, shareholders will receive Form 1099-DIV which will include their share of taxes paid and foreign source income distributed during the prior calendar year. The Foreign Source Income reported on Form 1099-DIV has not been adjusted for the rate differential on foreign source qualified dividend income. Shareholders are advised to check with their tax advisors for information on the treatment of these amounts on their individual income tax returns.
1. Qualified dividends are taxed at reduced long term capital gains tax rates. In determining the amount of foreign tax credit that may be applied against the U.S. tax liability of individuals receiving foreign source qualified dividends, adjustments may be required to the foreign tax credit limitation calculation to reflect the rate differential applicable to such dividend income. The rules however permit certain individuals to elect not to apply the rate differential adjustments for capital gains and/or dividends for any taxable year. Please consult your tax advisor and the instructions to Form 1116 for more information.
| | | | | | |
| | | | |
| | franklintempleton.com | | Semiannual Report | | 61 |
TEMPLETON GLOBAL INVESTMENT TRUST
TEMPLETON GLOBAL BALANCED FUND
Shareholder Information
Board Approval of Investment Management Agreements
TEMPLETON GLOBAL INVESTMENT TRUST
Templeton Global Balanced Fund
(Fund)
At an in-person meeting held on February 25, 2020 (Meeting), the Board of Trustees (Board) of the Templeton Global Investment Trust (Trust), including a majority of the trustees who are not “interested persons” as defined in the Investment Company Act of 1940 (Independent Trustees), reviewed and approved the continuance of the investment management agreement between Templeton Global Advisors Limited (TGAL) and the Trust, on behalf of the Fund and the investment sub-advisory agreement between TGAL and Franklin Advisers, Inc. (Sub-Adviser), an affiliate of TGAL, on behalf of the Fund (each a Management Agreement) for an additional one-year period. The Independent Trustees received advice from and met separately with Independent Trustee counsel in considering whether to approve the continuation of each Management Agreement. TGAL and the Sub-Adviser are each referred to herein as a Manager.
In considering the continuation of each Management Agreement, the Board reviewed and considered information provided by each Manager at the Meeting and throughout the year at meetings of the Board and its committees. The Board also reviewed and considered information provided in response to a detailed set of requests for information submitted to each Manager by Independent Trustee counsel on behalf of the Independent Trustees in connection with the annual contract renewal process. In addition, prior to the Meeting, the Independent Trustees held a telephonic contract renewal meeting at which the Independent Trustees conferred amongst themselves and Independent Trustee counsel about contract renewal matters and, in some cases, requested additional information from each Manager relating to the contract. The Board reviewed and considered all of the factors it deemed relevant in approving the continuance of each Management Agreement, including, but not limited to: (i) the nature, extent and quality of the services provided by each Manager; (ii) the investment performance of the Fund; (iii) the costs of the services provided and profits realized by each Manager and its affiliates from the relationship with the Fund; (iv) the extent to which economies of scale are realized as the Fund grows; and (v) whether fee levels reflect these economies of scale for the benefit of Fund investors.
In approving the continuance of each Management Agreement, the Board, including a majority of the Independent Trustees, determined that the terms of the Management Agreement are fair and reasonable and that the continuance of such Management Agreement is in the interests of the Fund and its shareholders. While attention was given to all information furnished, the following discusses some primary factors relevant to the Board’s determination.
Nature, Extent and Quality of Services
The Board reviewed and considered information regarding the nature, extent and quality of investment management services provided by each Manager and its affiliates to the Fund and its shareholders. This information included, among other things, the qualifications, background and experience of the senior management and investment personnel of each Manager; as well as information on succession planning where appropriate; the structure of investment personnel compensation; oversight of third-party service providers; investment performance reports and related financial information for the Fund; reports on expenses and shareholder services, legal and compliance matters; risk controls; pricing and other services provided by each Manager and its affiliates; and management fees charged by each Manager and its affiliates to US funds and other accounts, including management’s explanation of differences among accounts where relevant. The Board also reviewed and considered an annual report on payments made by Franklin Templeton (FT) or the Fund to financial intermediaries, as well as a memorandum relating to third-party servicing arrangements which included discussion of the changing distribution landscape for the Fund. The Board noted management’s continuing efforts and expenditures in establishing effective business continuity plans and developing strategies to address areas of heightened concern in the mutual fund industry, such as cybersecurity and liquidity risk management.
The Board also reviewed and considered the benefits provided to Fund shareholders of investing in a fund that is part of the FT family of funds. The Board noted the financial position of Franklin Resources, Inc. (FRI), the Managers’ parent, and its commitment to the mutual fund business as evidenced by its continued introduction of new funds, reassessment of the fund offerings in response to the market environment and project initiatives and capital investments relating to the services provided to the Fund by the FT organization. The Board specifically noted FT’s commitment to enhancing services and controlling costs, as
| | | | |
| | | |
62 | | Semiannual Report | | franklintempleton.com |
TEMPLETON GLOBAL INVESTMENT TRUST
TEMPLETON GLOBAL BALANCED FUND
SHAREHOLDER INFORMATION
reflected in its plan to outsource certain administrative functions, and growth opportunities, as evidenced by its upcoming acquisition of the Legg Mason companies. The Board acknowledged the change in leadership at FRI and the opportunity to hear from Jennifer Johnson, President and Chief Executive Officer of FRI, about goals she has for the company that will benefit the Fund.
Following consideration of such information, the Board was satisfied with the nature, extent and quality of services provided by each Manager and its affiliates to the Fund and its shareholders.
Fund Performance
The Board reviewed and considered the performance results of the Fund over various time periods ended December 31, 2019. The Board considered the performance returns for the Fund in comparison to the performance returns of mutual funds deemed comparable to the Fund included in a universe (Performance Universe) selected by Broadridge Financial Solutions, Inc. (Broadridge), an independent provider of investment company data. The Board received a description of the methodology used by Broadridge to select the mutual funds included in a Performance Universe. The Board also considered the performance returns for the Fund in comparison to the performance returns of a customized peer group (Performance Customized Peer Group) selected by the Manager. The Board also reviewed and considered Fund performance reports provided and discussions that occurred with portfolio managers at Board meetings throughout the year. A summary of the Fund’s performance results is below.
The Performance Universe for the Fund included the Fund and all retail and institutional mixed-asset target allocation moderate funds. The Performance Customized Peer Group included funds that hold at least 40% non-US stocks/bonds in at least 3 different countries and at least 25% of assets in fixed income securities and at least 25% of its assets in equity securities. The Board noted that the Fund’s annualized income return for the one-, three-, five- and 10-year periods was above the medians and in the first quintile (best) of its Performance Universe and Performance Customized Peer Group. The Board also noted that the Fund’s annualized total return for the one-, three-, five- and 10-year periods was below the medians and in the fifth quintile (worst) of its Performance Universe and Performance Customized Peer Group. The Board discussed this performance with management and management explained that the Performance Universe was overly broad in that it not
only included global allocation funds like the Fund, but also funds with little to no exposure outside of the US that benefited from the outperformance of US equity investments versus international equity investments. Management further explained that the equity sleeve of the Fund had a significant US underweight relative to its Performance Universe and Performance Customized Peer Group, and that the Fund had no exposure to US bonds (compared to 33.3% median exposure for the peer group). Management also explained that the Performance Universe included a mix of value, blend and growth funds, whereas the Fund followed a value-oriented investment approach (which has recently been out of favor). Management further noted the Fund’s significantly higher cash balance (20.2%) versus the peer median (5.7%). The Board noted a number of changes implemented by management to address the Fund’s below median annualized total return, in particular, changes to the Fund’s portfolio management team, macroeconomic analysis and portfolio construction. The Board concluded that the Fund’s Management Agreement should be continued for an additional one-year period, and these changes continued to be monitored. In doing so, the Board noted that, while below the median, the Fund’s one-year annualized total return was 7.33%.
Comparative Fees and Expenses
The Board reviewed and considered information regarding the Fund’s actual total expense ratio and its various components, including, as applicable, management fees; transfer agent expenses; underlying fund expenses; Rule 12b-1 and non-Rule 12b-1 service fees; and other non-management fees. The Board also noted the quarterly and annual reports it receives on all marketing support payments made by FT to financial intermediaries. The Board considered the actual total expense ratio and, separately, the contractual management fee rate, without the effect of fee waivers, if any (Management Rate) of the Fund in comparison to the median expense ratio and median Management Rate, respectively, of other mutual funds deemed comparable to and with a similar expense structure to the Fund selected by Broadridge (Expense Group). Broadridge fee and expense data is based upon information taken from each fund’s most recent annual report, which reflects historical asset levels that may be quite different from those currently existing, particularly in a period of market volatility. While recognizing such inherent limitation and the fact that expense ratios and Management Rates generally increase as assets decline and decrease as assets grow, the Board believed the independent analysis conducted by Broadridge to be an appropriate measure of
| | | | |
| | | |
| franklintempleton.com | | Semiannual Report | | 63 |
TEMPLETON GLOBAL INVESTMENT TRUST
TEMPLETON GLOBAL BALANCED FUND
SHAREHOLDER INFORMATION
comparative fees and expenses. The Broadridge Management Rate includes administrative charges, and the actual total expense ratio, for comparative consistency, was shown for Class A1 shares for the Fund and for Class A shares for other funds in the Expense Group. The Board received a description of the methodology used by Broadridge to select the mutual funds included in an Expense Group.
The Expense Group for the Fund included the Fund and 13 other mixed-asset target allocation moderate funds. The Board noted that the Management Rate and the actual total expense ratio for the Fund were above the medians of its Expense Group. The Board took into account the complexity and costs of managing a global portfolio of both equity and debt securities. The Board concluded that the Management Rate charged to the Fund is reasonable. In doing so, the Board noted that the Sub-Adviser is paid out of the management fee TGAL receives from the Fund.
Profitability
The Board reviewed and considered information regarding the profits realized by each Manager and its affiliates in connection with the operation of the Fund. In this respect, the Board considered the Fund profitability analysis that addresses the overall profitability of FT’s US fund business, as well as its profits in providing investment management and other services to each of the individual funds during the 12-month period ended September 30, 2019, being the most recent fiscal year-end for FRI. The Board noted that although management continually makes refinements to its methodologies used in calculating profitability in response to organizational and product-related changes, the overall methodology has remained consistent with that used in the Fund’s profitability report presentations from prior years. Additionally, PricewaterhouseCoopers LLP, auditor to FRI and certain FT funds, was engaged to review and assess the allocation methodologies to be used solely by the Fund’s Board with respect to the profitability analysis.
The Board noted management’s belief that costs incurred in establishing the infrastructure necessary for the type of mutual fund operations conducted by each Manager and its affiliates may not be fully reflected in the expenses allocated to the Fund in determining its profitability, as well as the fact that the level of profits, to a certain extent, reflected operational cost savings and efficiencies initiated by management. As part of this evaluation, the Board considered the initiative currently underway to outsource certain operations, which effort would require considerable
upfront expenditures by the Managers but, over the long run is expected to result in greater efficiencies. The Board also noted management’s expenditures in improving shareholder services provided to the Fund, as well as the need to implement systems and meet additional regulatory and compliance requirements resulting from recent US Securities and Exchange Commission and other regulatory requirements, notably in the area of cybersecurity protections.
The Board also considered the extent to which each Manager and its affiliates might derive ancillary benefits from fund operations, including revenues generated from transfer agent services, potential benefits resulting from personnel and systems enhancements necessitated by fund growth, as well as increased leverage with service providers and counterparties. Based upon its consideration of all these factors, the Board concluded that the level of profits realized by each Manager and its affiliates from providing services to the Fund was not excessive in view of the nature, extent and quality of services provided to the Fund.
Economies of Scale
The Board reviewed and considered the extent to which each Manager may realize economies of scale, if any, as the Fund grows larger and whether the Fund’s management fee structure reflects any economies of scale for the benefit of shareholders. With respect to possible economies of scale, the Board noted the existence of management fee breakpoints, which operate generally to share any economies of scale with the Fund’s shareholders by reducing the Fund’s effective management fees as the Fund grows in size. The Board considered each Manager’s view that any analyses of potential economies of scale in managing a particular fund are inherently limited in light of the joint and common costs and investments each Manager incurs across the FT family of funds as a whole. The Board noted that the Fund had experienced a decrease in assets and would not be expected to demonstrate additional economies of scale in the near term, but concluded that to the extent economies of scale may be realized by a Manager and its affiliates, the Fund’s management fee structure provided a sharing of benefits with the Fund and its shareholders as the Fund grows.
Conclusion
Based on its review, consideration and evaluation of all factors it believed relevant, including the above-described factors and conclusions, the Board unanimously approved
| | | | |
| | | |
64 | | Semiannual Report | | franklintempleton.com |
TEMPLETON GLOBAL INVESTMENT TRUST
TEMPLETON GLOBAL BALANCED FUND
SHAREHOLDER INFORMATION
the continuation of each Management Agreement for an additional one-year period.
Liquidity Risk Management Program
The Funds have adopted and implemented a written Liquidity Risk Management Program (the “LRMP”) as required by Rule 22e-4 under the Investment Company Act of 1940. The program is designed to assess and manage each Fund’s liquidity risk, taking into consideration the Fund’s investment strategy and the liquidity of its portfolio investments during normal and reasonably foreseeable stressed conditions; its short and long-term cash flow projections; and its cash holdings and access to other funding sources including the Funds’ interfund lending facility and line of credit. The Funds’ Board of Trustees approved the appointment of the Director of Liquidity Risk within the Investment Risk Management Group (the “IRMG”) as the Administrator of the LRMP. The IRMG maintains the Investment Liquidity Committee (the “ILC”) to provide oversight and administration of policies and procedures governing liquidity risk management for FT products and portfolios. The ILC includes representatives from Franklin Templeton’s Risk, Trading, Global Compliance, Investment Compliance, Investment Operations, Valuation Committee and Product Management groups.
The LRMP Administrator Annual Report was presented to the Fund(s) Board of Trustees at their meetings in May 2020. The report covered the adequacy and effectiveness of the program during the period December 1, 2018 to December 31, 2019 (the “covered period”). The report concluded that (i.) the LRMP, as adopted and implemented, remains reasonably designed to assess and manage each Fund’s liquidity risk; (ii.) the LRMP, including the Highly Liquid Investment Minimum (“HLIM”) where applicable, was implemented and operated effectively to achieve the goal of assessing and managing each Fund’s liquidity risk; and (iii.) each fund was able to meet requests for redemption without significant dilution of remaining investors’ interests in the Fund. In addition, the LRMP Administrator presented the Fund Board of Trustees an update on liquidity during the first quarter of 2020 in relation to the COVID-19 pandemic.
During the reporting period, the Fund maintained a high level of liquid assets that are defined under the Liquidity Rule as “Highly Liquid Investments.” As a result, the Fund was designated a “Primarily Highly Liquid Fund” as defined under the Liquidity Rule and has not adopted a “Highly Liquid Investment Minimum.” A Highly Liquid Investment is defined
as cash and any investment reasonably expected to be convertible to cash in current market conditions in three business days or less without the conversion to cash significantly changing the market value of the investment.
There can be no assurance that the program will achieve its objectives in the future. Please refer to your Fund’s prospectus for more information regarding the Fund’s exposure to liquidity risk and other principal risks to which an investment in the Fund may be subject.
Proxy Voting Policies and Procedures
The Fund’s investment manager has established Proxy Voting Policies and Procedures (Policies) that the Fund uses to determine how to vote proxies relating to portfolio securities. Shareholders may view the Fund’s complete Policies online at franklintempleton.com. Alternatively, shareholders may request copies of the Policies free of charge by calling the Proxy Group collect at (954) 527-7678 or by sending a written request to: Franklin Templeton Companies, LLC, 300 S.E. 2nd Street, Fort Lauderdale, FL 33301, Attention: Proxy Group. Copies of the Fund’s proxy voting records are also made available online at franklintempleton.com and posted on the U.S. Securities and Exchange Commission’s website at sec.gov and reflect the most recent 12-month period ended June 30.
Quarterly Consolidated Statement of Investments
The Trust, on behalf of the Fund, files a complete consolidated statement of investments with the U.S. Securities and Exchange Commission for the first and third quarters for each fiscal year as an exhibit to its report on Form N-PORT. Shareholders may view the filed Form N-PORT by visiting the Commission’s website at sec.gov. The filed form may also be viewed and copied at the Commission’s Public Reference Room in Washington, DC. Information regarding the operations of the Public Reference Room may be obtained by calling (800) SEC-0330.
Householding of Reports and Prospectuses
You will receive the Fund’s financial reports every six months as well as an annual updated summary prospectus (prospectus available upon request). To reduce Fund expenses, we try to identify related shareholders in a household and send only one copy of the financial reports
| | | | | | |
| | | | |
| | franklintempleton.com | | Semiannual Report | | 65 |
TEMPLETON GLOBAL INVESTMENT TRUST
TEMPLETON GLOBAL BALANCED FUND
SHAREHOLDER INFORMATION
and summary prospectus. This process, called “householding,” will continue indefinitely unless you instruct us otherwise. If you prefer not to have these documents householded, please call us at (800) 632-2301. At any time you may view current prospectuses/summary prospectuses and financial reports on our website. If you choose, you may receive these documents through electronic delivery.
| | | | |
| | | |
66 | | Semiannual Report | | franklintempleton.com |
This page intentionally left blank.
This page intentionally left blank.
Authorized for distribution only when accompanied or preceded by a summary prospectus and/or prospectus. Investors should carefully consider a fund’s investment goals, risks, charges and expenses before investing. A prospectus contains this and other information; please read it carefully before investing.
To help ensure we provide you with quality service, all calls to and from our service areas are monitored and/or recorded.
| | | | | | | | |
 | | Semiannual Report and Shareholder Letter Templeton Global Balanced Fund | | | | |
| | | | |
| | Investment Manager | | Distributor | | | | Shareholder Services |
| | Templeton Global Advisors | | Franklin Templeton Distributors, Inc. | | | | (800) 632-2301 |
| | Limited | | (800) DIAL BEN® / 342-5236 | | |
| | | | franklintempleton.com | | | | |
| | |
© 2020 Franklin Templeton Investments. All rights reserved. | | 325 S 08/20 |
| (a) | The Registrant has adopted a code of ethics that applies to its principal executive officers and principal financial and accounting officer. |
| (f) | Pursuant to Item 13(a)(1), the Registrant is attaching as an exhibit a copy of its code of ethics that applies to its principal executive officers and principal financial and accounting officer. |
| Item 3. | Audit Committee Financial Expert. |
| (a) | (1) The Registrant has an audit committee financial expert serving on its audit committee. |
| | (2) | The audit committee financial experts are Ann Torre Bates and David W. Niemiec and they are “independent” as defined under the relevant Securities and Exchange Commission Rules and Releases. |
| Item 4. | Principal Accountant Fees and Services. N/A |
| Item 5. | Audit Committee of Listed Registrants. N/A |
| Item 6. | Schedule of Investments. N/A |
| Item 7. | Disclosure of Proxy Voting Policies and Procedures for Closed-End Management Investment Companies. N/A |
| Item 8. | Portfolio Managers of Closed-End Management Investment Companies. N/A |
| Item 9. | Purchases of Equity Securities by Closed-End Management Investment Company and Affiliated Purchasers. N/A |
| Item 10. | Submission of Matters to a Vote of Security Holders. |
There have been no changes to the procedures by which shareholders may recommend nominees to the Registrant’s Board of Trustees that would require disclosure herein.
| Item 11. | Controls and Procedures. |
(a) Evaluation of Disclosure Controls and Procedures. The Registrant maintains disclosure controls and procedures that are designed to provide reasonable assurance that information required to be disclosed in the Registrant’s filings under the Securities Exchange Act of 1934, as amended, and the Investment Company Act of 1940 is recorded, processed, summarized and reported within the periods specified in the rules and forms of the Securities and Exchange Commission. Such information is accumulated and communicated to the Registrant’s management, including its principal executive officer and principal financial officer, as appropriate, to allow timely decisions regarding required disclosure. The Registrant’s management, including the principal executive officer and the principal financial officer, recognizes that any set of controls and procedures, no matter how well designed and operated, can provide only reasonable assurance of achieving the desired control objectives.
Within 90 days prior to the filing date of this Shareholder Report on Form N-CSR, the Registrant had carried out an evaluation, under the supervision and with the participation of the Registrant’s management, including the Registrant’s principal executive officer and the Registrant’s principal financial officer, of the effectiveness of the design and operation of the Registrant’s disclosure controls and procedures. Based on such evaluation, the Registrant’s principal executive officer and principal financial officer concluded that the Registrant’s disclosure controls and procedures are effective.
(b) Changes in Internal Controls. There have been no changes in the Registrant’s internal control over financial reporting that occurred during the
period covered by this report that has materially affected, or is reasonably likely to materially affect the internal control over financial reporting.
| Item 12. | Disclosure of Securities Lending Activities for Closed-End Management Investment Company. N/A |
(a)(1) Code of Ethics
(a)(2) Certifications pursuant to Section 302 of the Sarbanes-Oxley Act of 2002 of Matthew T. Hinkle, Chief Executive Officer – Finance and Administration, and Robert G. Kubilis, Chief Financial Officer and Chief Accounting Officer
(b) Certifications pursuant to Section 906 of the Sarbanes-Oxley Act of 2002 of Matthew T. Hinkle, Chief Executive Officer – Finance and Administration, and Robert G. Kubilis, Chief Financial Officer and Chief Accounting Officer
SIGNATURES
Pursuant to the requirements of the Securities Exchange Act of 1934 and the Investment Company Act of 1940, the registrant has duly caused this report to be signed on its behalf by the undersigned, thereunto duly authorized.
TEMPLETON GLOBAL INVESTMENT TRUST
| | |
| By | | S\MATTHEW T. HINKLE |
| | Matthew T. Hinkle |
| | Chief Executive Officer – Finance and Administration |
Date August 25, 2020
Pursuant to the requirements of the Securities Exchange Act of 1934 and the Investment Company Act of 1940, this report has been signed below by the following persons on behalf of the registrant and in the capacities and on the dates indicated.
| | |
| By | | S\MATTHEW T. HINKLE |
| | Matthew T. Hinkle |
| | Chief Executive Officer – Finance and Administration |
Date August 25, 2020
| | |
| By | | S\ROBERT G. KUBILIS |
| | Robert G. Kubilis |
| | Chief Financial Officer and Chief Accounting Officer |
Date August 25, 2020