UNITED STATES
SECURITIES AND EXCHANGE COMMISSION
Washington, D.C. 20549
FORM N-CSR
CERTIFIED SHAREHOLDER REPORT OF REGISTERED
MANAGEMENT INVESTMENT COMPANIES
Investment Company Act file number: 811-08228
(Exact name of registrant as specified in charter)
1055 Maitland Center Commons, Maitland, FL 32751
(Address of principal executive offices) (Zip code)
Citi Fund Services Ohio, Inc., 4400 Easton Commons, Suite 200, Columbus, OH 43219-8000
(Name and address of agent for service)
Registrant’s telephone number, including area code: (800) 846-7526
Date of fiscal year end: December 31
Date of reporting period: December 31, 2024
Item 1. Reports to Stockholders.
(a)
Timothy Plan US Small Cap Core ETF
Ticker: TPSC Exchange: NYSE
Annual Shareholder Report — December 31, 2024
The annual shareholder report contains important information about Timothy Plan US Small Cap Core ETF (the "Fund") for the period of January 1, 2024 to December 31, 2024, as well as certain changes to the Fund. You can find additional information about the Fund at etf.timothyplan.com. You may also request more information by calling 800.846.7526 or visiting timothyplan.com/contact-us.
What were the Fund's costs for the last year
(based on a hypothetical $10,000 investment)
| FUND NAME | COSTS OF A $10,000 INVESTMENT | COSTS PAID AS A PERCENTAGE OF A $10,000 INVESTMENT |
|---|
| Timothy Plan US Small Cap Core ETF | $55 | 0.52% |
|---|
How did the Fund perform last year? What affected the Fund’s performance?
The Timothy Plan Small Cap Core ETF (TPSC) seeks a rules-based approach that combines Biblically Responsible Investing (BRI) criteria with volatility weighting in an effort to outperform traditional indexing strategies. The rules-based volatility weighting methodology weights stocks based on volatility, so each stock in the portfolio has an equal contribution to overall risk.
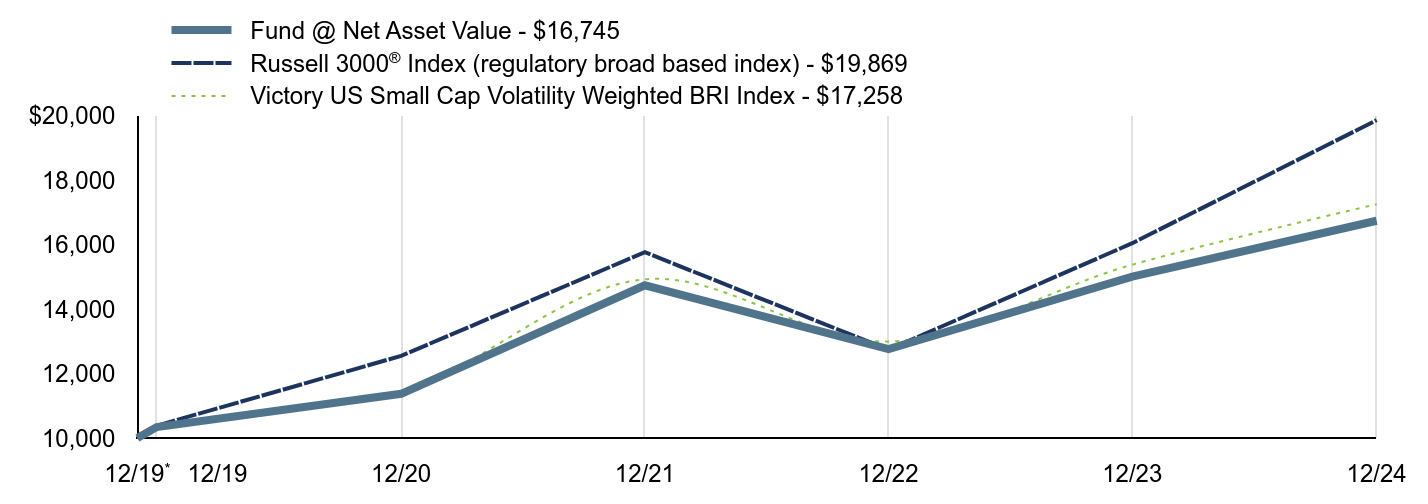
In 2024, TPSC returned 11.57% NAV, underperforming the Russell 3000 Index, which returned 23.81%.
An underweight in Healthcare combined with positive stock selection contributed to relative performance. An underweight to Information Technology along with stock selection within the sector was a detractor to relative performance.
The top three largest contributors to performance were FTAI Aviation, Sprouts Farmers Market, and Brinker International. The largest stock detractors during the quarter were Adient PLC, Par Pacific Holdings, and Jack in the Box.
Growth of a $10,000 Investment
The graph reflects investment growth of a hypothetical investment of $10,000 in the Fund. The graph and table total returns do not reflect the deduction of taxes that a shareholder would pay on Fund distributions, or redemption of shares.
| Fund @ Net Asset Value - $16,745 | Russell 3000® Index (regulatory broad based index) - $19,869 | Victory US Small Cap Volatility Weighted BRI Index - $17,258 |
|---|
12/19Footnote Reference* | $10,000 | $10,000 | $10,000 |
|---|
| 12/19 | $10,339 | $10,381 | $10,344 |
|---|
| 12/20 | $11,372 | $12,550 | $11,444 |
|---|
| 12/21 | $14,740 | $15,770 | $14,928 |
|---|
| 12/22 | $12,757 | $12,741 | $12,996 |
|---|
| 12/23 | $15,008 | $16,049 | $15,382 |
|---|
| 12/24 | $16,745 | $19,869 | $17,258 |
|---|
| Footnote | Description |
Footnote* | Inception date for the Timothy Plan US Small Cap Core ETF is 12/2/2019. |
AVERAGE ANNUAL TOTAL RETURN
| 1 Year | 5 Year | Since Inception |
|---|
| Fund @ Net Asset Value | 11.57%Footnote Reference | 10.12%Footnote Reference | 10.68%Footnote Reference |
|---|
Russell 3000® IndexFootnote Reference1 | 23.81% | 13.86% | 14.47% |
|---|
Victory US Small Cap Volatility Weighted BRI IndexFootnote Reference2 | 12.20% | 10.78% | 11.34% |
|---|
| Footnote | Description |
Footnote | High double-digit returns are attributable, in part, to unusually favorable market conditions and may not be repeated or consistently achieved in the future. |
Footnote1 | The unmanaged Russell 3000® Index is a market-capitalization-weighted index that measures the performance of the 3,000 largest U.S. stocks by market capitalization and covers 98% of the investable U.S. equity universe. |
Footnote2 | Victory US Small Cap Volatility Weighted BRI Index is an unmanaged, volatility weighted index created by the Fund's Sub-Advisor. A volatility weighted index assigns percentage values to each security in the index based on the volatility of that security in the market. The Index eliminates companies that do not satisfy the proprietary Biblically Responsible Investing ("BRI") filtering criteria. |
The performance data quoted represents past performance and current returns may be lower or higher. The investment return and principal value will fluctuate so that an investor’s shares, when redeemed, may be worth more or less than the original cost.
| Net Assets | $169,765,980 |
|---|
| Number of Portfolio Holdings | 461 |
|---|
| Net Investment Advisory Fees | $706,972 |
|---|
| Portfolio Turnover Rate | 44% |
|---|
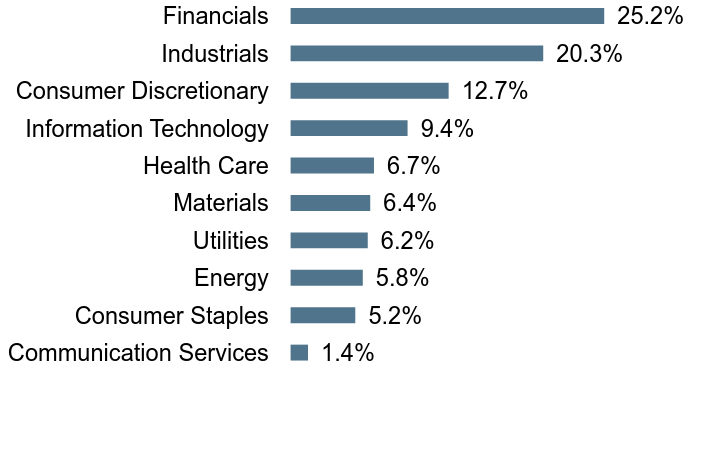
Graphical Presentation of Holdings
(as of 12/31/2024)
Top SectorsFootnote Reference* (% of Net Assets)Footnote Reference
| Value | Value |
|---|
| Communication Services | 1.4% |
| Consumer Staples | 5.2% |
| Energy | 5.8% |
| Utilities | 6.2% |
| Materials | 6.4% |
| Health Care | 6.7% |
| Information Technology | 9.4% |
| Consumer Discretionary | 12.7% |
| Industrials | 20.3% |
| Financials | 25.2% |
Top 10 HoldingsFootnote Reference* (% of Net Assets)Footnote Reference
| DT Midstream, Inc. | 0.5% |
| IDACORP, Inc. | 0.4% |
| Grand Canyon Education, Inc. | 0.4% |
| Spire, Inc. | 0.4% |
| TXNM Energy, Inc. | 0.4% |
| Federated Hermes, Inc. | 0.4% |
| Madison Square Garden Sports Corp. | 0.4% |
| New Jersey Resources Corp. | 0.4% |
| MDU Resources Group, Inc. | 0.4% |
| The Hanover Insurance Group, Inc. | 0.4% |
* Does not include futures contracts, money market instruments, and short-term investments.
Utilize the Full Financials link below to refer to the Schedule of Portfolio Investments for a complete list of securities.
There were no material fund changes during the year ended December 31, 2024.
Additional information about the Fund is available on etf.timothyplan.com including:
Full Financial Statements
Prospectus
Fund Holdings
Proxy Voting
Contact us at 800.846.7526 or visit timothyplan.com/contact-us.
Timothy Plan US Large/Mid Cap Core ETF
Ticker: TPLC Exchange: NYSE
Annual Shareholder Report — December 31, 2024
The annual shareholder report contains important information about Timothy Plan US Large/Mid Cap Core ETF (the "Fund") for the period of January 1, 2024 to December 31, 2024, as well as certain changes to the Fund. You can find additional information about the Fund at etf.timothyplan.com. You may also request more information by calling 800.846.7526 or visiting timothyplan.com/contact-us.
What were the Fund's costs for the last year
(based on a hypothetical $10,000 investment)
| FUND NAME | COSTS OF A $10,000 INVESTMENT | COSTS PAID AS A PERCENTAGE OF A $10,000 INVESTMENT |
|---|
| Timothy Plan US Large/Mid Cap Core ETF | $55 | 0.52% |
|---|
How did the Fund perform last year? What affected the Fund’s performance?
The Timothy Plan US Large/Mid Cap Core ETF (TPLC) seeks a rules-based approach that combines Biblically Responsible Investing (BRI) criteria with volatility weighting in an effort to outperform traditional indexing strategies. The rules-based volatility weighting methodology weights stocks based on volatility, so each stock in the portfolio has an equal contribution to overall risk.
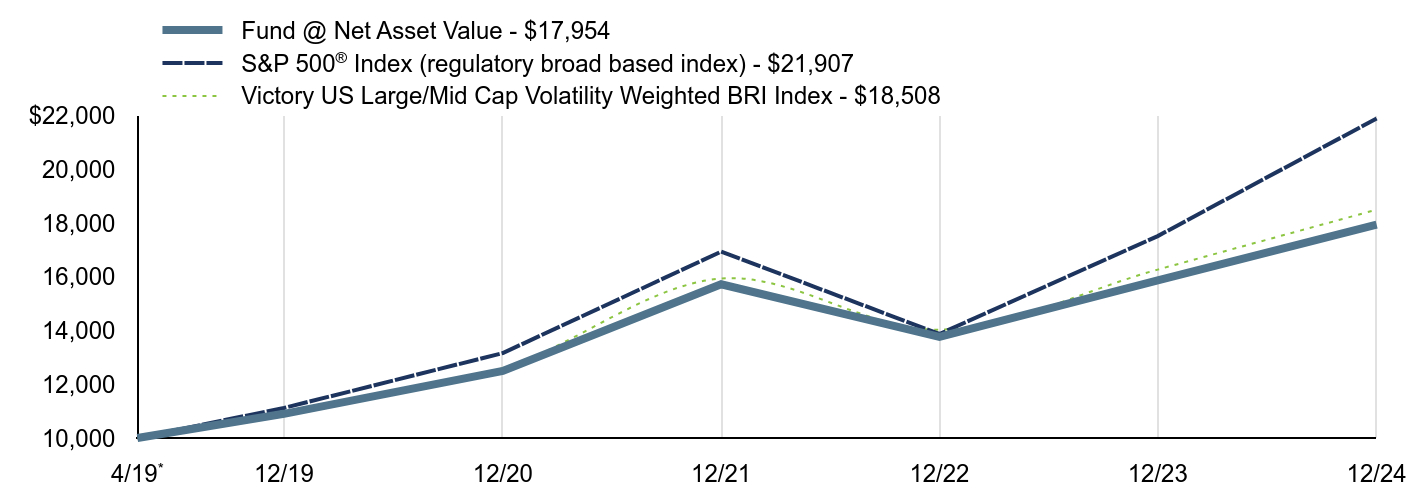
In 2024, TPLC returned 13.12% NAV, underperforming the S&P 500® Index (the “Index”), which returned 25.02%.
An underweight in Real Estate contributed to relative performance, with stock selection in the Energy sector also contributing. An underweight and stock selection in Information Technology was a detractor to relative performance.
The top three largest contributors to performance were Vistra, AppLovin Corp., and Howmet Aerospace. The largest stock detractors to performance during the year were Celanese Corporation, Five Below Inc., and Dollar Tree, Inc.
Growth of a $10,000 Investment
The graph reflects investment growth of a hypothetical investment of $10,000 in the Fund. The graph and table total returns do not reflect the deduction of taxes that a shareholder would pay on Fund distributions, or redemption of shares.
| Fund @ Net Asset Value - $17,954 | S&P 500® Index (regulatory broad based index) - $21,907 | Victory US Large/Mid Cap Volatility Weighted BRI Index - $18,508 |
|---|
4/19Footnote Reference* | $10,000 | $10,000 | $10,000 |
|---|
| 12/19 | $10,901 | $11,119 | $10,939 |
|---|
| 12/20 | $12,500 | $13,165 | $12,605 |
|---|
| 12/21 | $15,728 | $16,944 | $15,942 |
|---|
| 12/22 | $13,765 | $13,876 | $14,038 |
|---|
| 12/23 | $15,871 | $17,523 | $16,275 |
|---|
| 12/24 | $17,954 | $21,907 | $18,508 |
|---|
| Footnote | Description |
Footnote* | Inception date for the Timothy Plan US Large/Mid Cap Core ETF is 4/30/2019. |
AVERAGE ANNUAL TOTAL RETURN
| 1 Year | 5 Year | Since Inception |
|---|
| Fund @ Net Asset Value | 13.12%Footnote Reference | 10.49%Footnote Reference | 10.87%Footnote Reference |
|---|
S&P 500® IndexFootnote Reference1 | 25.02% | 14.53% | 14.83% |
|---|
Victory US Large/Mid Cap Volatility Weighted BRI IndexFootnote Reference2 | 13.72% | 11.09% | 11.47% |
|---|
| Footnote | Description |
Footnote | High double-digit returns are attributable, in part, to unusually favorable market conditions and may not be repeated or consistently achieved in the future. |
Footnote1 | The unmanaged S&P 500® Index is a market-capitalization-weighted index that measures the performance of the common stocks of 500 leading U.S. companies. |
Footnote2 | The universe for the Victory US Large/Mid Cap Volatility Weighted BRI Index begins with the largest U.S. companies by market capitalization with positive earnings in each of the four most recent quarters. The Index eliminates companies that do not satisfy the proprietary Biblically Responsible Investing ("BRI") filtering criteria. |
The performance data quoted represents past performance and current returns may be lower or higher. The investment return and principal value will fluctuate so that an investor’s shares, when redeemed, may be worth more or less than the original cost.
| Net Assets | $267,798,092 |
|---|
| Number of Portfolio Holdings | 287 |
|---|
| Net Investment Advisory Fees | $1,252,267 |
|---|
| Portfolio Turnover Rate | 25% |
|---|
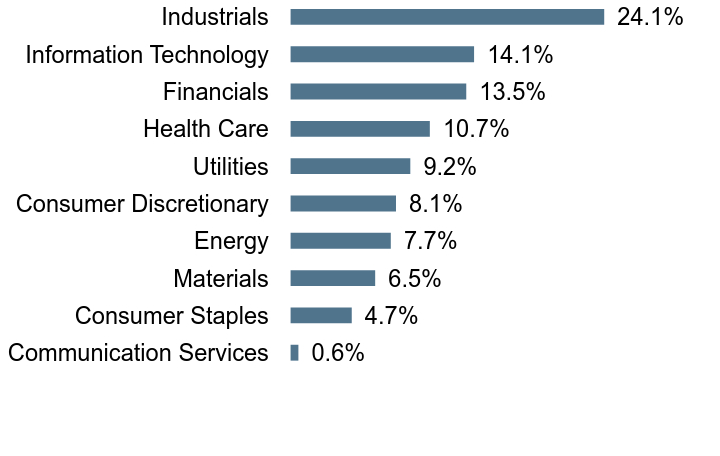
Graphical Presentation of Holdings
(as of 12/31/2024)
Top SectorsFootnote Reference* (% of Net Assets)Footnote Reference
| Value | Value |
|---|
| Communication Services | 0.6% |
| Consumer Staples | 4.7% |
| Materials | 6.5% |
| Energy | 7.7% |
| Consumer Discretionary | 8.1% |
| Utilities | 9.2% |
| Health Care | 10.7% |
| Financials | 13.5% |
| Information Technology | 14.1% |
| Industrials | 24.1% |
Top 10 HoldingsFootnote Reference* (% of Net Assets)Footnote Reference
| NiSource, Inc. | 0.7% |
| Republic Services, Inc. | 0.6% |
| Atmos Energy Corp. | 0.6% |
| Entergy Corp. | 0.6% |
| Kinder Morgan, Inc. | 0.6% |
| VeriSign, Inc. | 0.6% |
| Intercontinental Exchange, Inc. | 0.6% |
| Cheniere Energy, Inc. | 0.6% |
| Evergy, Inc. | 0.6% |
| Illinois Tool Works, Inc. | 0.6% |
* Does not include futures contracts, money market instruments, and short-term investments.
Utilize the Full Financials link below to refer to the Schedule of Portfolio Investments for a complete list of securities.
There were no material fund changes during the year ended December 31, 2024.
Additional information about the Fund is available on etf.timothyplan.com including:
Full Financial Statements
Prospectus
Fund Holdings
Proxy Voting
Contact us at 800.846.7526 or visit timothyplan.com/contact-us.
Timothy Plan High Dividend Stock ETF
Ticker: TPHD Exchange: NYSE
Annual Shareholder Report — December 31, 2024
The annual shareholder report contains important information about Timothy Plan High Dividend Stock ETF (the "Fund") for the period of January 1, 2024 to December 31, 2024, as well as certain changes to the Fund. You can find additional information about the Fund at etf.timothyplan.com. You may also request more information by calling 800.846.7526 or visiting timothyplan.com/contact-us.
What were the Fund's costs for the last year
(based on a hypothetical $10,000 investment)
| FUND NAME | COSTS OF A $10,000 INVESTMENT | COSTS PAID AS A PERCENTAGE OF A $10,000 INVESTMENT |
|---|
| Timothy Plan High Dividend Stock ETF | $55 | 0.52% |
|---|
How did the Fund perform last year? What affected the Fund’s performance?
The Timothy Plan High Dividend Stock ETF (TPHD) seeks a rules-based approach that combines Biblically Responsible Investing (BRI) criteria with volatility weighting in an effort to outperform traditional indexing strategies. The rules-based volatility weighting methodology weights stocks based on volatility, so each stock in the portfolio has an equal contribution to overall risk.
In 2024, TPHD returned 11.99% NAV, underperforming the S&P 500® Index, which returned 25.02%.
An underweight in Healthcare contributed to relative performance. An overweight to Energy was a detractor to relative performance. Stock selection in the Information Technology sector contributed to relative performance.
The top three largest contributors to performance were Vistra Corp., Targa Resources Corp., and Kinder Morgan Inc. The largest stock detractors during the year were Celanese Corporation, Huntington Ingalls Industries, and Franklin Resources Inc.
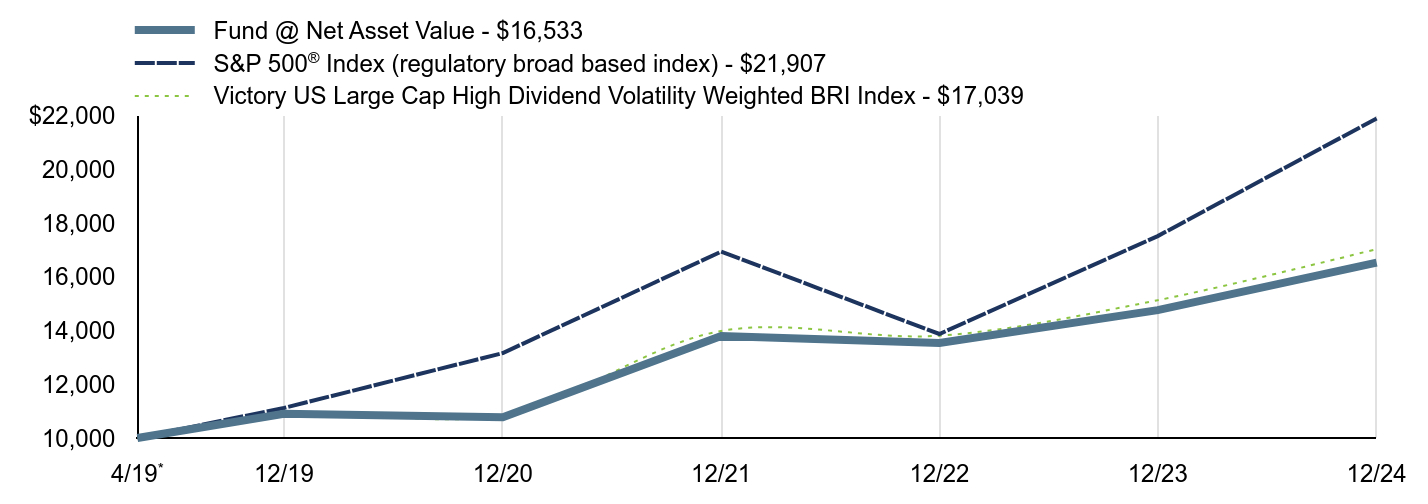
Growth of a $10,000 Investment
The graph reflects investment growth of a hypothetical investment of $10,000 in the Fund. The graph and table total returns do not reflect the deduction of taxes that a shareholder would pay on Fund distributions, or redemption of shares.
| Fund @ Net Asset Value - $16,533 | S&P 500® Index (regulatory broad based index) - $21,907 | Victory US Large Cap High Dividend Volatility Weighted BRI Index - $17,039 |
|---|
4/19Footnote Reference* | $10,000 | $10,000 | $10,000 |
|---|
| 12/19 | $10,900 | $11,119 | $10,937 |
|---|
| 12/20 | $10,773 | $13,165 | $10,859 |
|---|
| 12/21 | $13,799 | $16,944 | $13,987 |
|---|
| 12/22 | $13,540 | $13,876 | $13,813 |
|---|
| 12/23 | $14,763 | $17,523 | $15,134 |
|---|
| 12/24 | $16,533 | $21,907 | $17,039 |
|---|
| Footnote | Description |
Footnote* | Inception date for the Timothy Plan High Dividend Stock ETF is 4/30/2019. |
AVERAGE ANNUAL TOTAL RETURN
| 1 Year | 5 Year | Since Inception |
|---|
| Fund @ Net Asset Value | 11.99%Footnote Reference | 8.69% | 9.27% |
|---|
S&P 500® IndexFootnote Reference1 | 25.02% | 14.53% | 14.83% |
|---|
Victory US Large Cap High Dividend Volatility Weighted BRI IndexFootnote Reference2 | 12.59% | 9.27% | 9.85% |
|---|
| Footnote | Description |
Footnote | High double-digit returns are attributable, in part, to unusually favorable market conditions and may not be repeated or consistently achieved in the future. |
Footnote1 | The unmanaged S&P 500® Index is a market-capitalization-weighted index that measures the performance of the common stocks of 500 leading U.S. companies. |
Footnote2 | The Victory US Large Cap High Dividend Volatility Weighted BRI Index is comprised of the 100 highest dividend yielding stocks from the Victory US Large/Mid Cap Volatility Weighted BRI Index with positive earnings in each of the four most recent quarters. The universe of the Index begins with the largest US companies by market capitalization with positive earnings in each of the four most recent quarters. The Index eliminates companies that do not satisfy the proprietary Biblically Responsible Investing ("BRI") filtering criteria. |
The performance data quoted represents past performance and current returns may be lower or higher. The investment return and principal value will fluctuate so that an investor’s shares, when redeemed, may be worth more or less than the original cost.
| Net Assets | $238,131,671 |
|---|
| Number of Portfolio Holdings | 101 |
|---|
| Net Investment Advisory Fees | $1,219,635 |
|---|
| Portfolio Turnover Rate | 34% |
|---|
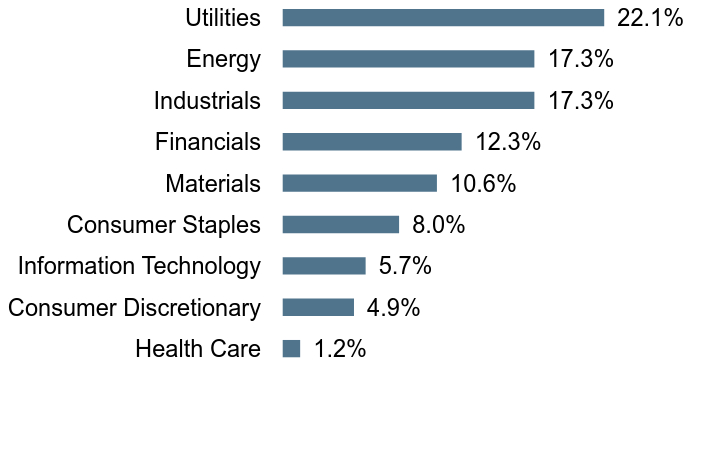
Graphical Presentation of Holdings
(as of 12/31/2024)
Top SectorsFootnote Reference* (% of Net Assets)Footnote Reference
| Value | Value |
|---|
| Health Care | 1.2% |
| Consumer Discretionary | 4.9% |
| Information Technology | 5.7% |
| Consumer Staples | 8.0% |
| Materials | 10.6% |
| Financials | 12.3% |
| Industrials | 17.3% |
| Energy | 17.3% |
| Utilities | 22.1% |
Top 10 HoldingsFootnote Reference* (% of Net Assets)Footnote Reference
| NiSource, Inc. | 1.6% |
| Atmos Energy Corp. | 1.6% |
| Entergy Corp. | 1.5% |
| Kinder Morgan, Inc. | 1.5% |
| Evergy, Inc. | 1.4% |
| Illinois Tool Works, Inc. | 1.4% |
| Ameren Corp. | 1.4% |
| Alliant Energy Corp. | 1.4% |
| The Williams Cos., Inc. | 1.4% |
| CMS Energy Corp. | 1.4% |
* Does not include futures contracts, money market instruments, and short-term investments.
Utilize the Full Financials link below to refer to the Schedule of Portfolio Investments for a complete list of securities.
There were no material fund changes during the year ended December 31, 2024.
Additional information about the Fund is available on etf.timothyplan.com including:
Full Financial Statements
Prospectus
Fund Holdings
Proxy Voting
Contact us at 800.846.7526 or visit timothyplan.com/contact-us.
Timothy Plan International ETF
Ticker: TPIF Exchange: NYSE
Annual Shareholder Report — December 31, 2024
The annual shareholder report contains important information about Timothy Plan International ETF (the "Fund") for the period of January 1, 2024 to December 31, 2024, as well as certain changes to the Fund. You can find additional information about the Fund at etf.timothyplan.com. You may also request more information by calling 800.846.7526 or visiting timothyplan.com/contact-us.
What were the Fund's costs for the last year
(based on a hypothetical $10,000 investment)
| FUND NAME | COSTS OF A $10,000 INVESTMENT | COSTS PAID AS A PERCENTAGE OF A $10,000 INVESTMENT |
|---|
| Timothy Plan International ETF | $63 | 0.62% |
|---|
How did the Fund perform last year? What affected the Fund’s performance?
The Timothy Plan International ETF (TPIF) seeks a rules-based approach that combines Biblically Responsible Investing (BRI) criteria with volatility weighting in an effort to outperform traditional indexing strategies. The rules-based volatility weighting methodology weights stocks based on volatility, so each stock in the portfolio has an equal contribution to overall risk.
In 2024, TPIF returned 2.77% NAV, underperforming the MSCI EAFE Index (the “Index”), which returned 3.82%.
An overweight in the Healthcare sector was a contributor to relative performance. An overweight in the Materials sector was a detractor to relative performance.
At the country level, stock selection in Japan was a detractor to relative performance. An overweight to Canada contributed to relative performance.
The top three largest contributors to performance were Mitsubishi Heavy Industries, Rheinmetall, and Hitachi. The largest stock detractors during the year were Oriental Land Co., Edenred SA, and Neste Corporation.
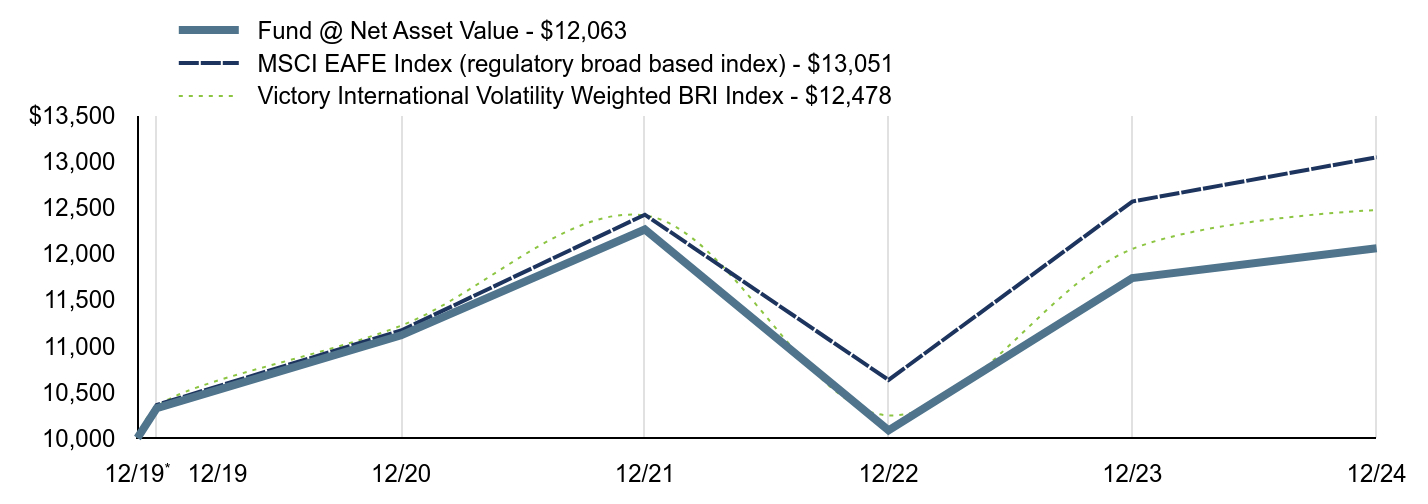
Growth of a $10,000 Investment
The graph reflects investment growth of a hypothetical investment of $10,000 in the Fund. The graph and table total returns do not reflect the deduction of taxes that a shareholder would pay on Fund distributions, or redemption of shares.
| Fund @ Net Asset Value - $12,063 | MSCI EAFE Index (regulatory broad based index) - $13,051 | Victory International Volatility Weighted BRI Index - $12,478 |
|---|
12/19Footnote Reference* | $10,000 | $10,000 | $10,000 |
|---|
| 12/19 | $10,325 | $10,360 | $10,339 |
|---|
| 12/20 | $11,116 | $11,169 | $11,221 |
|---|
| 12/21 | $12,266 | $12,427 | $12,419 |
|---|
| 12/22 | $10,083 | $10,631 | $10,245 |
|---|
| 12/23 | $11,738 | $12,570 | $12,054 |
|---|
| 12/24 | $12,063 | $13,051 | $12,478 |
|---|
| Footnote | Description |
Footnote* | Inception date for the Timothy Plan International ETF is 12/2/2019. |
AVERAGE ANNUAL TOTAL RETURN
| 1 Year | 5 Year | Since Inception |
|---|
| Fund @ Net Asset Value | 2.77% | 3.16% | 3.76% |
|---|
MSCI EAFE IndexFootnote Reference1 | 3.82% | 4.73% | 5.38% |
|---|
Victory International Volatility Weighted BRI IndexFootnote Reference2 | 3.52% | 3.83% | 4.46% |
|---|
| Footnote | Description |
Footnote1 | The MSCI EAFE Index is an equity index that captures large-cap and mid-cap representation across Developed markets countries around the world. The index reflects the reinvestment of dividends paid on the stocks constituting the index, net of withholding taxes. |
Footnote2 | The universe for the Victory International Volatility Weighted BRI Index begins with the largest developed international companies by market capitalization with positive earnings in each of the four most recent quarters. The Index eliminates companies that do not satisfy the proprietary Biblically Responsible Investing ("BRI") filtering criteria. |
The performance data quoted represents past performance and current returns may be lower or higher. The investment return and principal value will fluctuate so that an investor’s shares, when redeemed, may be worth more or less than the original cost.
| Net Assets | $112,124,993 |
|---|
| Number of Portfolio Holdings | 362 |
|---|
| Net Investment Advisory Fees | $668,453 |
|---|
| Portfolio Turnover Rate | 35% |
|---|
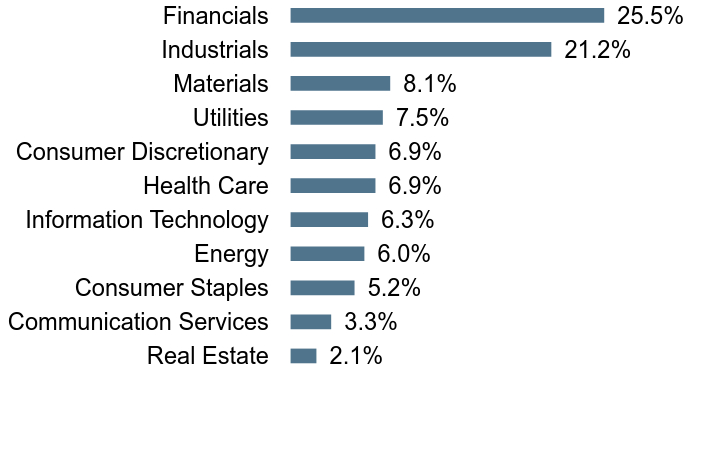
Graphical Presentation of Holdings
(as of 12/31/2024)
Top SectorsFootnote Reference* (% of Net Assets)Footnote Reference
| Value | Value |
|---|
| Real Estate | 2.1% |
| Communication Services | 3.3% |
| Consumer Staples | 5.2% |
| Energy | 6.0% |
| Information Technology | 6.3% |
| Health Care | 6.9% |
| Consumer Discretionary | 6.9% |
| Utilities | 7.5% |
| Materials | 8.1% |
| Industrials | 21.2% |
| Financials | 25.5% |
Top 10 HoldingsFootnote Reference* (% of Net Assets)Footnote Reference
| Hydro One Ltd. | 0.6% |
| London Stock Exchange Group PLC | 0.6% |
| United Overseas Bank Ltd. | 0.6% |
| Fortis, Inc. | 0.5% |
| Waste Connections, Inc. | 0.5% |
| Metro, Inc. | 0.5% |
| Oversea-Chinese Banking Corp. Ltd. | 0.5% |
| Pembina Pipeline Corp. | 0.5% |
| DBS Group Holdings Ltd. | 0.5% |
| Wolters Kluwer NV | 0.5% |
* Does not include futures contracts, money market instruments, and short-term investments.
Utilize the Full Financials link below to refer to the Schedule of Portfolio Investments for a complete list of securities.
There were no material fund changes during the year ended December 31, 2024.
Additional information about the Fund is available on etf.timothyplan.com including:
Full Financial Statements
Prospectus
Fund Holdings
Proxy Voting
Contact us at 800.846.7526 or visit timothyplan.com/contact-us.
Timothy Plan US Large/Mid Cap Core Enhanced ETF
Ticker: TPLE Exchange: NYSE
Annual Shareholder Report — December 31, 2024
The annual shareholder report contains important information about Timothy Plan US Large/Mid Cap Core Enhanced ETF (the "Fund") for the period of January 1, 2024 to December 31, 2024, as well as certain changes to the Fund. You can find additional information about the Fund at etf.timothyplan.com. You may also request more information by calling 800.846.7526 or visiting timothyplan.com/contact-us.
What were the Fund's costs for the last year
(based on a hypothetical $10,000 investment)
| FUND NAME | COSTS OF A $10,000 INVESTMENT | COSTS PAID AS A PERCENTAGE OF A $10,000 INVESTMENT |
|---|
| Timothy Plan US Large/Mid Cap Core Enhanced ETF | $55 | 0.52% |
|---|
How did the Fund perform last year? What affected the Fund’s performance?
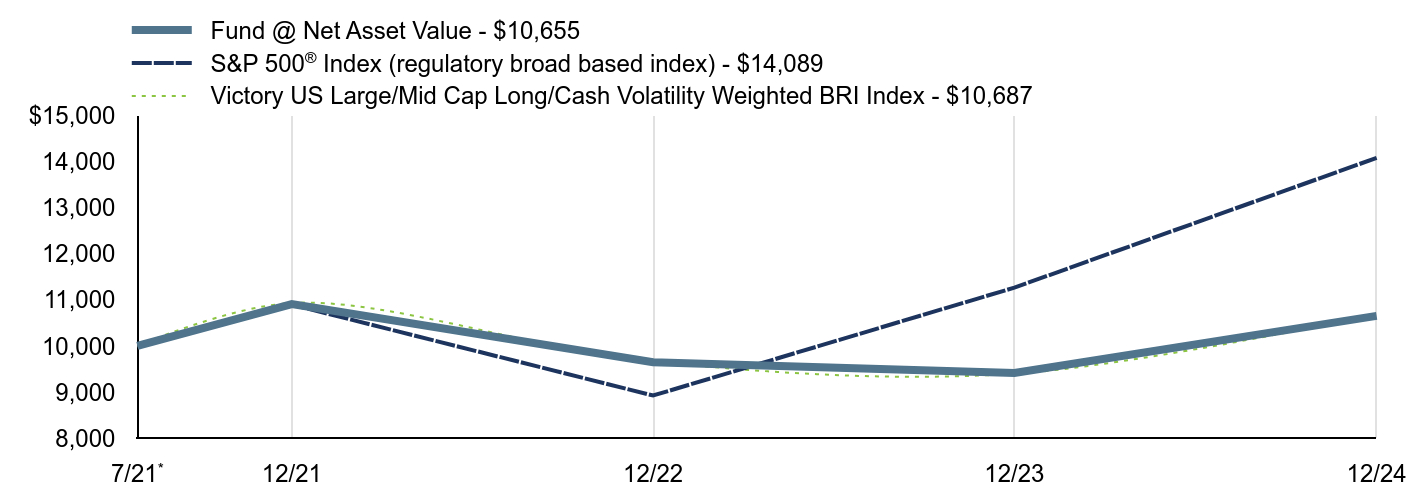
The Timothy Plan US Large/Mid Cap Core Enhanced ETF (TPLE) seeks a rules-based approach that combines Biblically Responsible Investing (BRI) criteria with volatility weighting in an effort to outperform traditional indexing strategies. The rules-based volatility weighting methodology weights stocks based on volatility, so each stock in the portfolio has an equal contribution to overall risk. In addition, the fund seeks to manage risk during times of significant market decline by employing a rules-based mathematical formula to reduce exposure in the equity markets by moving to cash equivalents.
In 2024, TPLE returned 13.18% NAV, underperforming the S&P 500® Index (the “Index”), which returned 25.02%.
As a result of tactical allocation, the portfolio was invested in 100% equities for the year.
An underweight in Real Estate contributed to relative performance, with stock selection in the Energy sector also contributing. An underweight and stock selection in Information Technology was a detractor to relative performance.
The top three largest contributors to performance were Vistra, AppLovin Corp., and Howmet Aerospace. The largest stock detractors to performance during the year were Celanese Corporation, Five Below Inc., and Dollar Tree, Inc.
Growth of a $10,000 Investment
The graph reflects investment growth of a hypothetical investment of $10,000 in the Fund. The graph and table total returns do not reflect the deduction of taxes that a shareholder would pay on Fund distributions, or redemption of shares.
| Fund @ Net Asset Value - $10,655 | S&P 500® Index (regulatory broad based index) - $14,089 | Victory US Large/Mid Cap Long/Cash Volatility Weighted BRI Index - $10,687 |
|---|
7/21Footnote Reference* | $10,000 | $10,000 | $10,000 |
|---|
| 12/21 | $10,909 | $10,897 | $10,935 |
|---|
| 12/22 | $9,646 | $8,923 | $9,660 |
|---|
| 12/23 | $9,414 | $11,269 | $9,397 |
|---|
| 12/24 | $10,655 | $14,089 | $10,687 |
|---|
| Footnote | Description |
Footnote* | Inception date for the Timothy Plan US Large/Mid Cap Core Enhanced ETF is 7/28/2021. |
AVERAGE ANNUAL TOTAL RETURN
| 1 Year | Since Inception |
|---|
| Fund @ Net Asset Value | 13.18%Footnote Reference | 1.87% |
|---|
S&P 500® IndexFootnote Reference1 | 25.02% | 10.52% |
|---|
Victory US Large/Mid Cap Long/Cash Volatility Weighted BRI IndexFootnote Reference2 | 13.72% | 1.96% |
|---|
| Footnote | Description |
Footnote | High double-digit returns are attributable, in part, to unusually favorable market conditions and may not be repeated or consistently achieved in the future. |
Footnote1 | The unmanaged S&P 500® Index is a market-capitalization-weighted index that measures the performance of the common stocks of 500 leading U.S. companies. |
Footnote2 | The universe for the Victory US Large/Mid Cap Long/Cash Volatility Weighted BRI Index begins with the largest U.S. companies by market capitalization with positive earnings in each of the four most recent quarters. The Index eliminates companies that do not satisfy the proprietary Biblically Responsible Investing ("BRI") filtering criteria. |
The performance data quoted represents past performance and current returns may be lower or higher. The investment return and principal value will fluctuate so that an investor’s shares, when redeemed, may be worth more or less than the original cost.
| Net Assets | $70,383,119 |
|---|
| Number of Portfolio Holdings | 288 |
|---|
| Net Investment Advisory Fees | $362,057 |
|---|
| Portfolio Turnover Rate | 29% |
|---|
Graphical Presentation of Holdings
(as of 12/31/2024)
Top SectorsFootnote Reference* (% of Net Assets)Footnote Reference
| Value | Value |
|---|
| Communication Services | 0.6% |
| Consumer Staples | 4.7% |
| Materials | 6.5% |
| Energy | 7.7% |
| Consumer Discretionary | 8.1% |
| Utilities | 9.2% |
| Health Care | 10.7% |
| Financials | 13.4% |
| Information Technology | 14.1% |
| Industrials | 24.1% |
Top 10 HoldingsFootnote Reference* (% of Net Assets)Footnote Reference
| NiSource, Inc. | 0.7% |
| Republic Services, Inc. | 0.6% |
| Atmos Energy Corp. | 0.6% |
| Entergy Corp. | 0.6% |
| Kinder Morgan, Inc. | 0.6% |
| VeriSign, Inc. | 0.6% |
| Intercontinental Exchange, Inc. | 0.6% |
| Cheniere Energy, Inc. | 0.6% |
| Evergy, Inc. | 0.6% |
| Illinois Tool Works, Inc. | 0.6% |
* Does not include futures contracts, money market instruments, and short-term investments.
Utilize the Full Financials link below to refer to the Schedule of Portfolio Investments for a complete list of securities.
There were no material fund changes during the year ended December 31, 2024.
Additional information about the Fund is available on etf.timothyplan.com including:
Full Financial Statements
Prospectus
Fund Holdings
Proxy Voting
Contact us at 800.846.7526 or visit timothyplan.com/contact-us.
Timothy Plan High Dividend Stock Enhanced ETF
Ticker: TPHE Exchange: NYSE
Annual Shareholder Report — December 31, 2024
The annual shareholder report contains important information about Timothy Plan High Dividend Stock Enhanced ETF (the "Fund") for the period of January 1, 2024 to December 31, 2024, as well as certain changes to the Fund. You can find additional information about the Fund at etf.timothyplan.com. You may also request more information by calling 800.846.7526 or visiting timothyplan.com/contact-us.
What were the Fund's costs for the last year
(based on a hypothetical $10,000 investment)
| FUND NAME | COSTS OF A $10,000 INVESTMENT | COSTS PAID AS A PERCENTAGE OF A $10,000 INVESTMENT |
|---|
| Timothy Plan High Dividend Stock Enhanced ETF | $55 | 0.52% |
|---|
How did the Fund perform last year? What affected the Fund’s performance?
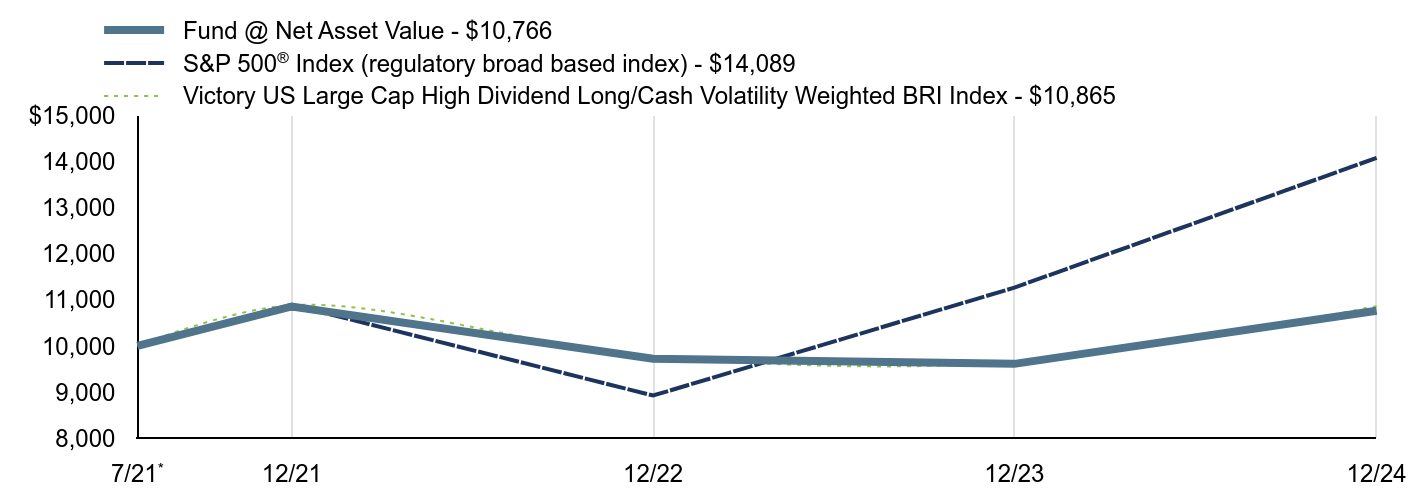
The Timothy Plan High Dividend Stock Enhanced ETF (TPHE) seeks a rules-based approach that combines Biblically Responsible Investing (BRI) criteria with volatility weighting in an effort to outperform traditional indexing strategies. The rules-based volatility weighting methodology weights stocks based on volatility, so each stock in the portfolio has an equal contribution to overall risk. In addition, the fund seeks to manage risk during times of significant market decline by employing a rules-based mathematical formula to reduce exposure in the equity markets by moving to cash equivalents.
In 2024, TPHE returned 12.01% NAV, underperforming the S&P® 500 Index, which returned 25.02%.
As a result of tactical allocation, the portfolio was invested in 100% equities for the year.
An underweight in Healthcare contributed to relative performance. An overweight to Energy was a detractor to relative performance. Stock selection in the Information Technology sector contributed to relative performance.
The top three largest contributors to performance were Vistra Corp., Targa Resources Corp., and Kinder Morgan Inc. The largest stock detractors during the year were Celanese Corporation, Huntington Ingalls Industries, and Franklin Resources Inc.
Growth of a $10,000 Investment
The graph reflects investment growth of a hypothetical investment of $10,000 in the Fund. The graph and table total returns do not reflect the deduction of taxes that a shareholder would pay on Fund distributions, or redemption of shares.
| Fund @ Net Asset Value - $10,766 | S&P 500® Index (regulatory broad based index) - $14,089 | Victory US Large Cap High Dividend Long/Cash Volatility Weighted BRI Index - $10,865 |
|---|
7/21Footnote Reference* | $10,000 | $10,000 | $10,000 |
|---|
| 12/21 | $10,859 | $10,897 | $10,887 |
|---|
| 12/22 | $9,725 | $8,923 | $9,773 |
|---|
| 12/23 | $9,612 | $11,269 | $9,650 |
|---|
| 12/24 | $10,766 | $14,089 | $10,865 |
|---|
| Footnote | Description |
Footnote* | Inception date for the Timothy Plan High Dividend Stock Enhanced ETF is 7/28/2021. |
AVERAGE ANNUAL TOTAL RETURN
| 1 Year | Since Inception |
|---|
| Fund @ Net Asset Value | 12.01%Footnote Reference | 2.18% |
|---|
S&P 500® IndexFootnote Reference1 | 25.02% | 10.52% |
|---|
Victory US Large Cap High Dividend Long/Cash Volatility Weighted BRI IndexFootnote Reference2 | 12.59% | 2.45% |
|---|
| Footnote | Description |
Footnote | High double-digit returns are attributable, in part, to unusually favorable market conditions and may not be repeated or consistently achieved in the future. |
Footnote1 | The unmanaged S&P 500® Index is a market-capitalization-weighted index that measures the performance of the common stocks of 500 leading U.S. companies. |
Footnote2 | The Victory Large Cap High Dividend Volatility Long/Cash Weighted BRI Index is comprised of the 100 highest dividend yielding stocks from the Victory US Large/Mid Cap Volatility Weighted BRI Index with positive earnings in each of the four most recent quarters. The universe for the Index begins with the largest US companies by market capitalization with positive earnings in each of the four most recent quarters. The Index eliminates companies that do not satisfy the proprietary Biblically Responsible Investing ("BRI") filtering criteria. |
The performance data quoted represents past performance and current returns may be lower or higher. The investment return and principal value will fluctuate so that an investor’s shares, when redeemed, may be worth more or less than the original cost.
| Net Assets | $64,550,447 |
|---|
| Number of Portfolio Holdings | 102 |
|---|
| Net Investment Advisory Fees | $350,498 |
|---|
| Portfolio Turnover Rate | 39% |
|---|
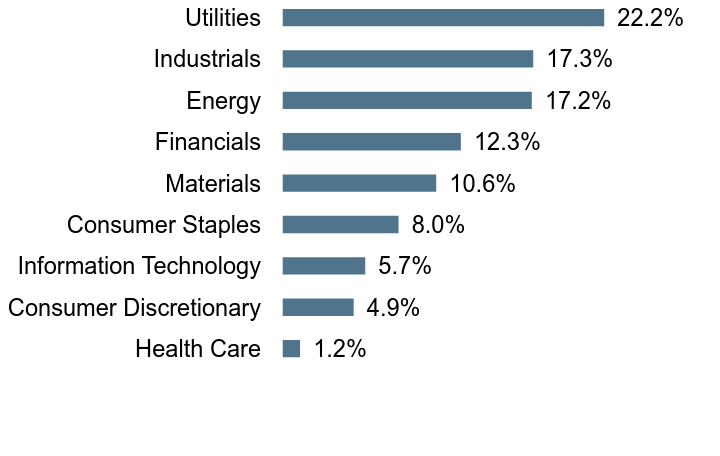
Graphical Presentation of Holdings
(as of 12/31/2024)
Top SectorsFootnote Reference* (% of Net Assets)Footnote Reference
| Value | Value |
|---|
| Health Care | 1.2% |
| Consumer Discretionary | 4.9% |
| Information Technology | 5.7% |
| Consumer Staples | 8.0% |
| Materials | 10.6% |
| Financials | 12.3% |
| Energy | 17.2% |
| Industrials | 17.3% |
| Utilities | 22.2% |
Top 10 HoldingsFootnote Reference* (% of Net Assets)Footnote Reference
| NiSource, Inc. | 1.6% |
| Atmos Energy Corp. | 1.6% |
| Entergy Corp. | 1.5% |
| Kinder Morgan, Inc. | 1.5% |
| Evergy, Inc. | 1.4% |
| Illinois Tool Works, Inc. | 1.4% |
| Ameren Corp. | 1.4% |
| Alliant Energy Corp. | 1.4% |
| The Williams Cos., Inc. | 1.4% |
| CMS Energy Corp. | 1.4% |
* Does not include futures contracts, money market instruments, and short-term investments.
Utilize the Full Financials link below to refer to the Schedule of Portfolio Investments for a complete list of securities.
There were no material fund changes during the year ended December 31, 2024.
Additional information about the Fund is available on etf.timothyplan.com including:
Full Financial Statements
Prospectus
Fund Holdings
Proxy Voting
Contact us at 800.846.7526 or visit timothyplan.com/contact-us.
Timothy Plan Market Neutral ETF
Ticker: TPMN Exchange: NYSE
Annual Shareholder Report — December 31, 2024
The annual shareholder report contains important information about Timothy Plan Market Neutral ETF (the "Fund") for the period of January 1, 2024 to December 31, 2024, as well as certain changes to the Fund. You can find additional information about the Fund at etf.timothyplan.com. You may also request more information by calling 800.846.7526 or visiting timothyplan.com/contact-us.
What were the Fund's costs for the last year
(based on a hypothetical $10,000 investment)
| FUND NAME | COSTS OF A $10,000 INVESTMENT | COSTS PAID AS A PERCENTAGE OF A $10,000 INVESTMENT |
|---|
| Timothy Plan Market Neutral ETF | $65 | 0.65% |
|---|
How did the Fund perform last year? What affected the Fund’s performance?
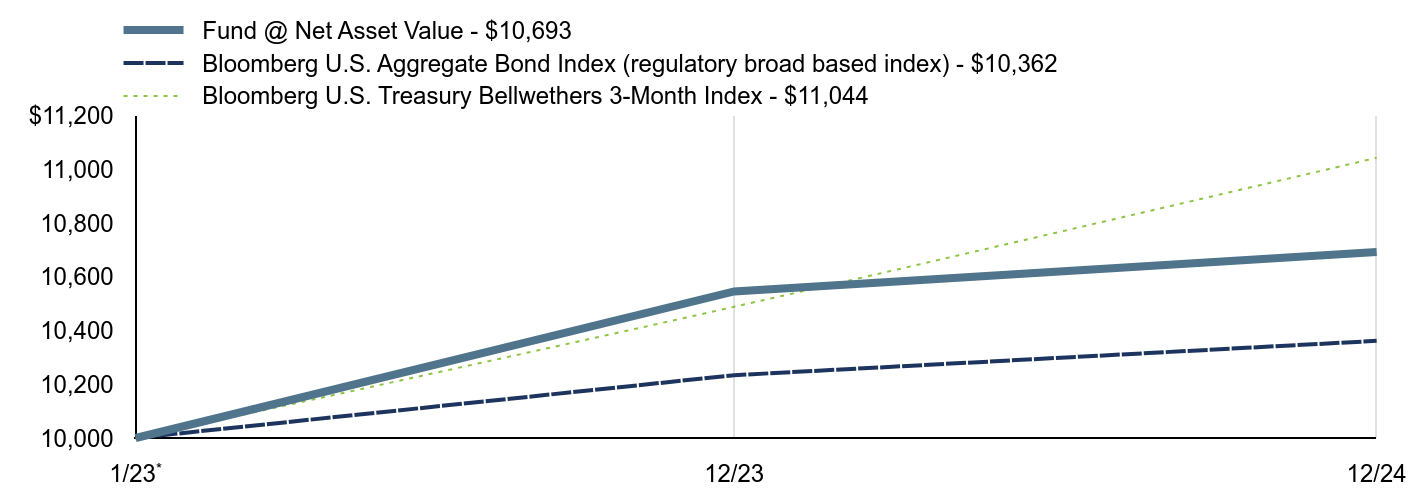
The Timothy Plan Market Neutral ETF (TPMN) pursues its investment objective by implementing a proprietary, "market neutral" investment strategy designed to seek income from its investments while maintaining a low correlation to the foreign and domestic equity and bond markets. The fund is actively managed, meaning that the Sub-Advisor may make changes to the Fund's portfolio at any time. The Fund uses a multi-strategy approach. First, it seeks income from long positions in foreign and domestic dividend producing equity securities of any market capitalization size that satisfy the Biblically Responsible Investing ("BRI") filtering criteria. Second, the Fund seeks to offset market risk by selling short high-correlating equity index futures contracts, such as the S&P 500® Index, Russell 2000® or MSCI EAFE + Emerging Markets Indexes, or exchange-traded funds ("ETFs") that track such indexes.
In 2024, TPMN returned 1.39% NAV, outperforming the Bloomberg U.S. Aggregate Bond Index (the “Index”), which returned 1.25%.
The Fund’s total return was driven by a positive contribution from the Global High Dividend Long/Short Portfolio which was enough to offset the negative contribution of Overlay Strategy. Cash has been a positive contributor. In the Global High Dividend Long/Short Portfolio, all sleeves were positive contributors. In the Overlay Strategy, gains from the Nasdaq 100 Index long futures were not enough to offset the negative return of the S&P 500 Index short position, resulting in a negative total contribution.
Growth of a $10,000 Investment
The graph reflects investment growth of a hypothetical investment of $10,000 in the Fund. The graph and table total returns do not reflect the deduction of taxes that a shareholder would pay on Fund distributions, or redemption of shares.
| Fund @ Net Asset Value - $10,693 | Bloomberg U.S. Aggregate Bond Index (regulatory broad based index) - $10,362 | Bloomberg U.S. Treasury Bellwethers 3-Month Index - $11,044 |
|---|
1/23Footnote Reference* | $10,000 | $10,000 | $10,000 |
|---|
| 12/23 | $10,546 | $10,234 | $10,489 |
|---|
| 12/24 | $10,693 | $10,362 | $11,044 |
|---|
| Footnote | Description |
Footnote* | Inception date for the Timothy Plan Market Neutral ETF is 1/24/2023. |
AVERAGE ANNUAL TOTAL RETURN
| 1 Year | Since Inception |
|---|
| Fund @ Net Asset Value | 1.39% | 3.52% |
|---|
Bloomberg U.S. Aggregate Bond IndexFootnote Reference1 | 1.25% | 1.86% |
|---|
Bloomberg U.S. Treasury Bellwethers 3-Month IndexFootnote Reference2 | 5.29% | 5.27% |
|---|
| Footnote | Description |
Footnote1 | The unmanaged Bloomberg U.S. Aggregate Bond Index measures the investment grade, USD-denominated, fixed rate taxable bond market. The index includes Treasurys, government-related and corporate securities, and asset backed securities. |
Footnote2 | The unmanaged Bloomberg U.S. Treasury Bellwethers 3-Month Index represents the total return received by investors of 3-month U.S. Treasury securities. |
The performance data quoted represents past performance and current returns may be lower or higher. The investment return and principal value will fluctuate so that an investor’s shares, when redeemed, may be worth more or less than the original cost.
| Net Assets | $41,703,293 |
|---|
| Number of Portfolio Holdings | 300 |
|---|
| Net Investment Advisory Fees | $257,351 |
|---|
| Portfolio Turnover Rate | 35% |
|---|
Graphical Presentation of Holdings
(as of 12/31/2024)
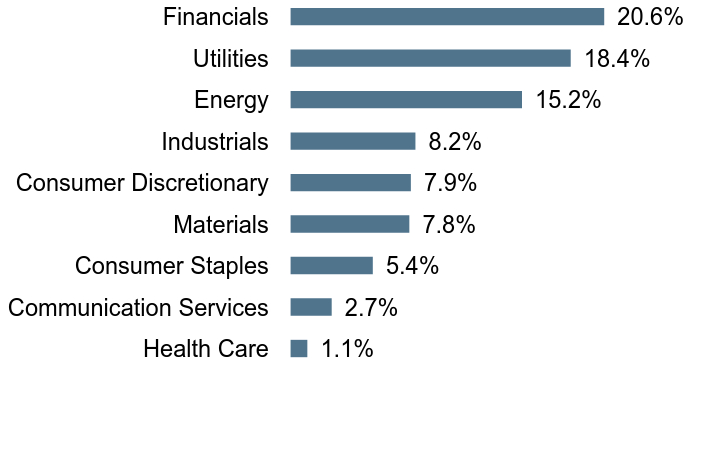
Top SectorsFootnote Reference* (% of Net Assets)Footnote Reference
| Value | Value |
|---|
| Health Care | 1.1% |
| Communication Services | 2.7% |
| Consumer Staples | 5.4% |
| Materials | 7.8% |
| Consumer Discretionary | 7.9% |
| Industrials | 8.2% |
| Energy | 15.2% |
| Utilities | 18.4% |
| Financials | 20.6% |
Top 10 HoldingsFootnote Reference* (% of Net Assets)Footnote Reference
| TXNM Energy, Inc. | 0.8% |
| DT Midstream, Inc. | 0.7% |
| ACS Actividades de Construccion y Servicios SA | 0.7% |
| Keyera Corp. | 0.7% |
| Pembina Pipeline Corp. | 0.6% |
| Spire, Inc. | 0.6% |
| Intesa Sanpaolo SpA | 0.6% |
| NiSource, Inc. | 0.6% |
| ANZ Group Holdings Ltd. | 0.6% |
| Mediobanca Banca di Credito Finanziario SpA | 0.6% |
* Does not include futures contracts, money market instruments, and short-term investments.
Utilize the Full Financials link below to refer to the Schedule of Portfolio Investments for a complete list of securities.
There were no material fund changes during the year ended December 31, 2024.
Additional information about the Fund is available on etf.timothyplan.com including:
Full Financial Statements
Prospectus
Fund Holdings
Proxy Voting
Contact us at 800.846.7526 or visit timothyplan.com/contact-us.
(b) Not applicable.
Item 2. Code of Ethics.
As of the end of the period covered by this report, the Registrant has adopted a code of ethics that applies to the Registrant’s principal executive officer, principal financial officer, principal accounting officer or controller, or persons performing similar functions, regardless of whether these individuals are employed by the Registrant or a third party (the “Code of Ethics”). During the period covered by this report, there were no amendments, nor did the Registrant grant any waivers, including any implicit waivers, from any provision of the Code of Ethics. The Code of Ethics is attached hereto as Exhibit 19(a)(1) of this Form.
Item 3. Audit Committee Financial Expert.
The Registrant’s Board of Trustees has determined that the Registrant has at least one “audit committee financial expert” (as defined in Item 3 of Form N-CSR) serving on its audit committee. Dale Bissonette is an “audit committee financial expert” and is “independent” (as each term is defined in Item 3 of Form N-CSR).
Item 4. Principal Accountant Fees and Services.
(a) Audit Fees. Fees for audit services provided to the Registrant were $92,250 and $92,250 for the fiscal years ended December 31, 2024 and 2023, respectively.
(b) Audit-Related Fees. The aggregate fees billed in each of the last two fiscal years for audit-related services by the principal accountant that are reasonably related to the performance of the audit of the Registrant’s financial statements and are not reported under paragraph (a) of this item were $0 and $0 for the fiscal years ended December 31, 2024 and 2023, respectively. The fees, paid by the Registrant, were payment for the principal accountant performing work relating to assurance and related services.
(c) Tax Fees. Fees for tax services, which consisted of income and excise tax compliance services, were $21,000 and $21,000 for the fiscal years ended December 31, 2024, and 2023, respectively.
(d) All Other Fees. Fees for other services totaled $0 and $0 for the fiscal years ended December 31, 2024, and 2023, respectively.
(e) (1) The Registrant’s Audit Committee has adopted Pre-Approval Policies and Procedures. The Audit Committee must pre-approve all audit services and non-audit services that the principal accountant provides to the Registrant. The Audit Committee must also pre-approve any engagement of the principal accountant to provide non-audit services to the Registrant’s investment adviser, or any affiliate of the adviser that provides ongoing services to the Registrant, if such non-audit services directly impact the Registrant’s operations and financial reporting.
(2) 100% of services described in items (b) were pre-approved by the Audit Committee pursuant to Rule 2 01(c)(7)(i)(c) of Regulation S-X for the fiscal years ended December 31, 2024, and 2023
(f) Not applicable
(g) The aggregate fees billed by the principal accountant for non-audit services to the Registrant, the Registrant’s investment adviser and any entity controlling, controlled by, or under common control with the adviser that provides ongoing services to the Registrant were $21,000 and $21,000 for the years ended December 31, 2024 and 2023, respectively.
(h) The Registrant’s Audit Committee has considered whether the provision of non-audit services that were rendered to the Registrant’s investment adviser, and any entity controlling, controlled by, or under common control with the adviser that provides ongoing services to the Registrant that were not pre-approved pursuant to paragraph (c)(7)(ii) of Rule 2-01 of Regulation S-X is compatible with maintaining the principal auditor’s independence.
(i) Not applicable.
(j) Not applicable.
Item 5. Audit Committee of Listed Registrants.
The Registrant is a listed issuer as defined in Rule 10A-3 under the Exchange Act and has a separately-designated standing audit committee established in accordance with Section
3(a)(58)(A) of the Exchange Act. The Registrant’s audit committee members are Mr. Dale Bissonette, Mr. John Mulder, Mr. Scott Preissler and Mr. Richard Copeland.
Item 6. Investments.
(a) The Schedule of Investments as of the close of the reporting period are included as part of the report to shareholders filed under Item 7 of the Form N-CSR.
(b) Not applicable.
Item 7. Financial Statements and Other Information.
(a)
ANNUAL
Full
Financials
December
31,
2024
Listed
and
traded
on:
The
New
York
Stock
Exchange
Ticker
Symbol
TIMOTHY
PLAN
US
SMALL
CAP
CORE
ETF
TPSC
TIMOTHY
PLAN
US
LARGE/MID
CAP
CORE
ETF
TPLC
TIMOTHY
PLAN
HIGH
DIVIDEND
STOCK
ETF
TPHD
TIMOTHY
PLAN
INTERNATIONAL
ETF
TPIF
TIMOTHY
PLAN
US
LARGE/MID
CAP
CORE
ENHANCED
ETF
TPLE
TIMOTHY
PLAN
HIGH
DIVIDEND
STOCK
ENHANCED
ETF
TPHE
TIMOTHY
PLAN
MARKET
NEUTRAL
ETF
TPMN
•
NOT
FDIC
INSURED
•NO
BANK
GUARANTEE
•
MAY
LOSE
VALUE
•
INVESTMENTS
INVOLVE
RISK
•
PRINCIPAL
LOSS
IS
POSSIBLE
Schedule
of
Portfolio
Investments
3
Statements
of
Assets
and
Liabilities
33
Statements
of
Operations
37
Statements
of
Changes
in
Net
Assets
41
Financial
Highlights
45
Notes
to
Financial
Statements
52
Report
of
Independent
Registered
Public
Accounting
Firm
63
Other
Information
(Unaudited)
65
Schedule
of
Portfolio
Investments
December
31,
2024
Timothy
Plan
US
Small
Cap
Core
ETF
See
notes
to
financial
statements.
SECURITY
DESCRIPTION
SHARES
VALUE
($)
Common
Stocks
(99.7%)
Communication
Services
(
1
.4
%
):
Cable
One,
Inc.
782
283,178
Cogent
Communications
Holdings,
Inc.
4,175
321,767
Integral
Ad
Science
Holding
Corp.(a)
17,188
179,443
Iridium
Communications,
Inc.
10,252
297,513
Madison
Square
Garden
Entertainment
Corp.(a)
11,095
394,982
Madison
Square
Garden
Sports
Corp.(a)
2,863
646,122
United
States
Cellular
Corp.(a)
3,571
223,973
2,346,978
Consumer
Discretionary
(
12
.7
%
):
Academy
Sports
&
Outdoors,
Inc.
6,006
345,525
Acushnet
Holdings
Corp.
6,614
470,123
Adient
PLC(a)
14,065
242,340
Adtalem
Global
Education,
Inc.(a)
3,855
350,227
Arhaus,
Inc.
19,515
183,441
Asbury
Automotive
Group,
Inc.(a)
1,506
366,003
Atmus
Filtration
Technologies,
Inc.
9,206
360,691
Boot
Barn
Holdings,
Inc.(a)
1,760
267,203
Brinker
International,
Inc.(a)
3,418
452,167
Brunswick
Corp.
4,296
277,865
Carter's,
Inc.
7,198
390,060
Carvana
Co.(a)
716
145,606
Cava
Group,
Inc.(a)
1,594
179,803
Cavco
Industries,
Inc.(a)
787
351,183
Century
Communities,
Inc.
3,145
230,717
Champion
Homes,
Inc.(a)
2,948
259,719
Chewy,
Inc.,
Class
A(a)
6,304
211,121
Columbia
Sportswear
Co.
6,492
544,874
Dillard's,
Inc.,
Class
A
807
348,414
Dorman
Products,
Inc.(a)
3,232
418,706
Dream
Finders
Homes,
Inc.,
Class
A(a)
6,093
141,784
Dutch
Bros,
Inc.,
Class
A(a)
7,626
399,450
Fox
Factory
Holding
Corp.(a)
4,854
146,931
Frontdoor,
Inc.(a)
7,618
416,476
Garrett
Motion,
Inc.(a)
40,424
365,029
Graham
Holdings
Co.,
Class
B
541
471,709
Grand
Canyon
Education,
Inc.(a)
4,416
723,341
Green
Brick
Partners,
Inc.(a)
4,188
236,580
Group
1
Automotive,
Inc.
1,043
439,604
Harley-Davidson,
Inc.
8,818
265,686
Hilton
Grand
Vacations,
Inc.(a)
9,800
381,710
Installed
Building
Products,
Inc.
1,066
186,816
KB
Home
4,099
269,386
Kontoor
Brands,
Inc.
4,628
395,277
Laureate
Education,
Inc.(a)
27,424
501,585
La-Z-Boy,
Inc.
7,836
341,415
LCI
Industries
2,579
266,643
LGI
Homes,
Inc.(a)
2,246
200,792
Life
Time
Group
Holdings,
Inc.(a)
11,500
254,380
SECURITY
DESCRIPTION
SHARES
VALUE
($)
Consumer
Discretionary
(12.7%):
(continued)
Lucky
Strike
Entertainment
Corp.
19,249
192,682
M/I
Homes,
Inc.(a)
1,769
235,189
Mister
Car
Wash,
Inc.(a)
45,462
331,418
Modine
Manufacturing
Co.(a)
1,400
162,302
Ollie's
Bargain
Outlet
Holdings,
Inc.(a)
3,286
360,573
OneSpaWorld
Holdings
Ltd.
22,098
439,750
Patrick
Industries,
Inc.
4,088
339,631
Phinia,
Inc.
7,213
347,450
Polaris,
Inc.
4,366
251,569
RH(a)
534
210,177
Sonic
Automotive,
Inc.,
Class
A
5,748
364,136
Steven
Madden
Ltd.
9,706
412,699
Strategic
Education,
Inc.
3,475
324,634
Stride,
Inc.(a)
5,721
594,584
The
Buckle,
Inc.
8,639
438,948
The
Cheesecake
Factory,
Inc.
8,785
416,760
The
Wendy's
Co.
25,988
423,604
Topgolf
Callaway
Brands
Corp.(a)
25,208
198,135
Tri
Pointe
Homes,
Inc.(a)
8,515
308,754
United
Parks
&
Resorts,
Inc.(a)
6,685
375,630
Upbound
Group,
Inc.
12,452
363,225
Valvoline,
Inc.(a)
10,963
396,641
Visteon
Corp.(a)
4,226
374,931
Winnebago
Industries,
Inc.
6,110
291,936
Worthington
Enterprises,
Inc.
8,493
340,654
YETI
Holdings,
Inc.(a)
6,031
232,254
21,528,648
Consumer
Staples
(
5
.2
%
):
Cal-Maine
Foods,
Inc.
5,592
575,529
Central
Garden
&
Pet
Co.,
Class
A(a)
13,305
439,730
Edgewell
Personal
Care
Co.
14,581
489,922
Energizer
Holdings,
Inc.
14,923
520,663
Flowers
Foods,
Inc.
27,715
572,592
Freshpet,
Inc.(a)
2,249
333,099
Grocery
Outlet
Holding
Corp.(a)
17,507
273,284
Interparfums,
Inc.
2,795
367,570
J
&
J
Snack
Foods
Corp.
2,389
370,606
Lancaster
Colony
Corp.
2,404
416,229
National
Beverage
Corp.
8,208
350,235
PriceSmart,
Inc.
5,482
505,276
Seaboard
Corp.
162
393,605
Spectrum
Brands
Holdings,
Inc.
4,324
365,335
Sprouts
Farmers
Market,
Inc.(a)
2,940
373,586
The
Andersons,
Inc.
7,661
310,424
The
Chefs'
Warehouse,
Inc.(a)
8,678
427,999
The
Simply
Good
Foods
Co.(a)
13,496
526,074
Utz
Brands,
Inc.
22,325
349,609
WD-40
Co.
1,796
435,853
Weis
Markets,
Inc.
7,216
488,668
8,885,888
Energy
(
5
.8
%
):
Archrock,
Inc.
16,291
405,483
Schedule
of
Portfolio
Investments
-
continued
December
31,
2024
Timothy
Plan
US
Small
Cap
Core
ETF
See
notes
to
financial
statements.
SECURITY
DESCRIPTION
SHARES
VALUE
($)
Energy
(5.8%):
(continued)
Atlas
Energy
Solutions,
Inc.
15,225
337,690
Cactus,
Inc.,
Class
A
5,031
293,609
California
Resources
Corp.
5,414
280,932
CNX
Resources
Corp.(a)
11,757
431,129
CONSOL
Energy,
Inc.
2,595
276,835
Crescent
Energy
Co.,
Class
A
22,165
323,831
CVR
Energy,
Inc.
12,982
243,283
Dorian
LPG
Ltd.
8,638
210,508
DT
Midstream,
Inc.
7,985
793,949
Excelerate
Energy,
Inc.,
Class
A
12,473
377,308
Gulfport
Energy
Corp.(a)
2,801
515,944
Helmerich
&
Payne,
Inc.
8,633
276,429
International
Seaways,
Inc.
7,797
280,224
Kinetik
Holdings,
Inc.
9,143
518,499
Kodiak
Gas
Services,
Inc.
10,512
429,205
Kosmos
Energy
Ltd.(a)
57,232
195,733
Liberty
Energy,
Inc.
14,812
294,611
Magnolia
Oil
&
Gas
Corp.,
Class
A
16,062
375,530
Northern
Oil
&
Gas,
Inc.
9,304
345,737
Oceaneering
International,
Inc.(a)
10,688
278,743
Patterson-UTI
Energy,
Inc.
34,422
284,326
Peabody
Energy
Corp.
12,650
264,891
SM
Energy
Co.
6,749
261,591
Talos
Energy,
Inc.(a)
25,920
251,683
Tidewater,
Inc.(a)
3,527
192,962
Valaris
Ltd.(a)
5,717
252,920
Viper
Energy,
Inc.
7,485
367,289
World
Kinect
Corp.
14,119
388,414
9,749,288
Financials
(
25
.2
%
):
Affiliated
Managers
Group,
Inc.
2,822
521,844
Ameris
Bancorp
6,501
406,768
Artisan
Partners
Asset
Management,
Inc.,
Class
A
9,842
423,698
Assured
Guaranty
Ltd.
5,529
497,665
Atlantic
Union
Bankshares
Corp.
10,358
392,361
Axis
Capital
Holdings
Ltd.
6,813
603,768
Axos
Financial,
Inc.(a)
4,964
346,735
BancFirst
Corp.
3,753
439,777
Bank
of
Hawaii
Corp.
6,042
430,432
Bank
OZK
7,361
327,785
BankUnited,
Inc.
8,775
334,942
Banner
Corp.
6,231
416,044
BGC
Group,
Inc.,
Class
A
35,826
324,584
BOK
Financial
Corp.
4,283
455,925
Bread
Financial
Holdings,
Inc.
5,014
306,155
Cadence
Bank
11,379
392,007
Cathay
General
Bancorp
8,989
427,966
City
Holding
Co.
4,228
500,933
CNO
Financial
Group,
Inc.
13,223
492,028
Cohen
&
Steers,
Inc.
3,977
367,236
Columbia
Banking
System,
Inc.
9,994
269,938
Community
Financial
System,
Inc.
6,331
390,496
SECURITY
DESCRIPTION
SHARES
VALUE
($)
Financials
(25.2%):
(continued)
CVB
Financial
Corp.
19,370
414,712
Donnelley
Financial
Solutions,
Inc.(a)
6,485
406,804
Enova
International,
Inc.(a)
4,226
405,189
Enterprise
Financial
Services
Corp.
7,213
406,813
Euronet
Worldwide,
Inc.(a)
4,703
483,656
EVERTEC,
Inc.
11,580
399,857
FB
Financial
Corp.
7,719
397,606
Federal
Agricultural
Mortgage
Corp.,
Class
C
2,000
393,900
Federated
Hermes,
Inc.
15,744
647,236
First
Bancorp
7,780
342,087
First
Bancorp
Puerto
Rico
22,219
413,051
First
Commonwealth
Financial
Corp.
24,129
408,263
First
Financial
Bancorp
16,743
450,052
First
Financial
Bankshares,
Inc.
9,973
359,527
First
Hawaiian,
Inc.
19,656
510,073
First
Interstate
BancSystem,
Inc.,
Class
A
11,532
374,444
First
Merchants
Corp.
10,636
424,270
FirstCash
Holdings,
Inc.
3,807
394,405
FNB
Corp.
32,136
474,970
Fulton
Financial
Corp.
21,554
415,561
Genworth
Financial,
Inc.(a)
69,430
485,316
Glacier
Bancorp,
Inc.
6,893
346,166
Goosehead
Insurance,
Inc.,
Class
A(a)
2,257
241,996
Hamilton
Lane,
Inc.,
Class
A
2,235
330,892
Hancock
Whitney
Corp.
7,285
398,635
Hilltop
Holdings,
Inc.
14,116
404,141
Home
Bancshares,
Inc.
17,106
484,100
Independent
Bank
Corp.
5,769
370,312
International
Bancshares
Corp.
6,864
433,530
Jackson
Financial,
Inc.,
Class
A
3,096
269,600
Kemper
Corp.
6,869
456,376
Lakeland
Financial
Corp.
5,540
380,930
Lazard,
Inc.
6,944
357,477
Live
Oak
Bancshares,
Inc.
5,884
232,712
Merchants
Bancorp
6,419
234,101
Mercury
General
Corp.
5,801
385,650
MGIC
Investment
Corp.
19,824
470,027
Moelis
&
Co.,
Class
A
5,276
389,791
Mr.
Cooper
Group,
Inc.(a)
4,580
439,726
Navient
Corp.
25,978
345,248
NBT
Bancorp,
Inc.
8,373
399,894
NMI
Holdings,
Inc.(a)
12,981
477,182
Northwest
Bancshares,
Inc.
34,600
456,374
OFG
Bancorp
10,684
452,147
Palomar
Holdings,
Inc.(a)
3,168
334,509
Park
National
Corp.
2,193
375,946
Pathward
Financial,
Inc.
6,298
463,407
Payoneer
Global,
Inc.(a)
30,000
301,200
PennyMac
Financial
Services,
Inc.
3,728
380,778
Piper
Sandler
Cos.
1,409
422,630
PJT
Partners,
Inc.,
Class
A
3,046
480,689
Schedule
of
Portfolio
Investments
-
continued
December
31,
2024
Timothy
Plan
US
Small
Cap
Core
ETF
See
notes
to
financial
statements.
SECURITY
DESCRIPTION
SHARES
VALUE
($)
Financials
(25.2%):
(continued)
PROG
Holdings,
Inc.
5,564
235,135
Provident
Financial
Services,
Inc.
17,652
333,093
Radian
Group,
Inc.
13,698
434,501
Renasant
Corp.
11,977
428,178
Rocket
Cos.,
Inc.,
Class
A(a)
13,504
152,055
Ryan
Specialty
Holdings,
Inc.
5,854
375,593
S&T
BanCorp,
Inc.
9,214
352,159
Seacoast
Banking
Corp.
of
Florida
14,006
385,585
ServisFirst
Bancshares,
Inc.
3,672
311,165
Shift4
Payments,
Inc.,
Class
A(a)
2,635
273,460
Simmons
First
National
Corp.,
Class
A
16,519
366,391
SiriusPoint
Ltd.(a)
33,107
542,624
SLM
Corp.
19,423
535,686
StepStone
Group,
Inc.,
Class
A
5,527
319,903
Stewart
Information
Services
Corp.
6,375
430,249
Stock
Yards
Bancorp,
Inc.
5,158
369,364
StoneX
Group,
Inc.(a)
5,067
496,414
Synovus
Financial
Corp.
8,186
419,369
Texas
Capital
Bancshares,
Inc.(a)
5,014
392,095
The
Bancorp,
Inc.(a)
5,279
277,834
The
Hanover
Insurance
Group,
Inc.
3,984
616,165
The
Western
Union
Co.
43,270
458,662
Towne
Bank
13,207
449,830
Triumph
Financial,
Inc.(a)
3,895
353,978
UMB
Financial
Corp.
3,708
418,485
United
Bankshares,
Inc.
11,159
419,020
United
Community
Banks,
Inc.
14,035
453,471
Valley
National
Bancorp
28,365
256,987
Virtu
Financial,
Inc.,
Class
A
9,558
341,029
WaFd,
Inc.
10,512
338,907
Walker
&
Dunlop,
Inc.
3,495
339,749
WesBanco,
Inc.
13,079
425,591
White
Mountains
Insurance
Group
Ltd.
276
536,837
WSFS
Financial
Corp.
7,379
392,046
42,824,655
Health
Care
(
6
.7
%
):
ACADIA
Pharmaceuticals,
Inc.(a)
16,820
308,647
Addus
HomeCare
Corp.(a)
3,269
409,769
ADMA
Biologics,
Inc.(a)
10,908
187,072
Alkermes
PLC(a)
11,385
327,433
Astrana
Health,
Inc.(a)
4,978
156,956
Catalyst
Pharmaceuticals,
Inc.(a)
14,735
307,520
CONMED
Corp.
4,424
302,779
Corcept
Therapeutics,
Inc.(a)
5,619
283,142
CorVel
Corp.(a)
3,745
416,669
Doximity,
Inc.,
Class
A(a)
4,593
245,220
Haemonetics
Corp.(a)
5,290
413,043
Halozyme
Therapeutics,
Inc.(a)
6,896
329,698
Harmony
Biosciences
Holdings,
Inc.(a)
8,693
299,126
Integer
Holdings
Corp.(a)
3,179
421,281
Krystal
Biotech,
Inc.(a)
1,040
162,926
SECURITY
DESCRIPTION
SHARES
VALUE
($)
Health
Care
(6.7%):
(continued)
Lantheus
Holdings,
Inc.(a)
1,667
149,130
LeMaitre
Vascular,
Inc.
3,766
346,999
Ligand
Pharmaceuticals,
Inc.(a)
2,540
272,161
MannKind
Corp.(a)
38,357
246,636
Merit
Medical
Systems,
Inc.(a)
5,920
572,582
National
HealthCare
Corp.
3,538
380,547
Option
Care
Health,
Inc.(a)
14,822
343,870
Patterson
Cos.,
Inc.
17,232
531,780
Premier,
Inc.,
Class
A
26,002
551,242
Prestige
Consumer
Healthcare,
Inc.(a)
7,064
551,628
Privia
Health
Group,
Inc.(a)
15,798
308,851
Progyny,
Inc.(a)
11,973
206,534
Protagonist
Therapeutics,
Inc.(a)
5,122
197,709
RadNet,
Inc.(a)
4,093
285,855
Select
Medical
Holdings
Corp.
19,461
366,840
Sotera
Health
Co.(a)
18,740
256,363
Supernus
Pharmaceuticals,
Inc.(a)
9,477
342,688
TG
Therapeutics,
Inc.(a)
8,089
243,479
TransMedics
Group,
Inc.(a)
1,426
88,911
UFP
Technologies,
Inc.(a)
758
185,339
Vericel
Corp.(a)
7,047
386,951
11,387,376
Industrials
(
20
.3
%
):
AAR
Corp.(a)
5,993
367,251
ABM
Industries,
Inc.
8,802
450,486
AeroVironment,
Inc.(a)
1,010
155,429
Air
Lease
Corp.
8,385
404,241
Alamo
Group,
Inc.
2,382
442,838
Albany
International
Corp.
5,765
461,027
Allison
Transmission
Holdings,
Inc.
4,157
449,205
ArcBest
Corp.
2,410
224,901
Arcosa,
Inc.
3,590
347,297
Armstrong
World
Industries,
Inc.
3,390
479,109
ASGN,
Inc.(a)
4,123
343,611
AZZ,
Inc.
4,163
341,033
Blue
Bird
Corp.(a)
4,978
192,300
Boise
Cascade
Co.
2,011
239,027
Brady
Corp.,
Class
A
7,124
526,107
Casella
Waste
Systems,
Inc.(a)
5,344
565,449
CBIZ,
Inc.(a)
5,160
422,243
Chart
Industries,
Inc.(a)
1,794
342,367
Cimpress
PLC(a)
3,072
220,324
Construction
Partners,
Inc.,
Class
A(a)
3,881
343,313
CSW
Industrials,
Inc.
939
331,279
Dycom
Industries,
Inc.(a)
1,913
332,977
Enerpac
Tool
Group
Corp.
12,646
519,624
EnerSys
4,173
385,710
Enpro,
Inc.
2,067
356,454
Esab
Corp.
4,061
487,076
ESCO
Technologies,
Inc.
3,510
467,567
ExlService
Holdings,
Inc.(a)
11,581
513,965
Exponent,
Inc.
2,938
261,776
Schedule
of
Portfolio
Investments
-
continued
December
31,
2024
Timothy
Plan
US
Small
Cap
Core
ETF
See
notes
to
financial
statements.
SECURITY
DESCRIPTION
SHARES
VALUE
($)
Industrials
(20.3%):
(continued)
Federal
Signal
Corp.
4,416
407,994
First
Advantage
Corp.(a)
25,320
474,244
Flowserve
Corp.
8,808
506,636
Franklin
Electric
Co.,
Inc.
4,725
460,451
GATX
Corp.
3,669
568,548
Gibraltar
Industries,
Inc.(a)
4,869
286,784
GMS,
Inc.(a)
4,273
362,479
Granite
Construction,
Inc.
6,032
529,067
Griffon
Corp.
3,904
278,238
H&E
Equipment
Services,
Inc.
5,276
258,313
Hayward
Holdings,
Inc.(a)
20,548
314,179
Herc
Holdings,
Inc.
1,769
334,925
Hillman
Solutions
Corp.(a)
35,657
347,299
HNI
Corp.
8,210
413,538
Huron
Consulting
Group,
Inc.(a)
4,002
497,289
ICF
International,
Inc.
2,662
317,337
IES
Holdings,
Inc.(a)
871
175,036
Insperity,
Inc.
4,201
325,619
JBT
Marel
Corp.
3,772
479,421
Kadant,
Inc.
1,048
361,549
Kennametal,
Inc.
18,267
438,773
Kirby
Corp.(a)
3,331
352,420
Korn
Ferry
5,749
387,770
Kratos
Defense
&
Security
Solutions,
Inc.(a)
11,902
313,975
Leonardo
DRS,
Inc.(a)
13,361
431,694
ManpowerGroup,
Inc.
6,379
368,196
MasTec,
Inc.(a)
2,183
297,194
Masterbrand,
Inc.(a)
17,134
250,328
Matson,
Inc.
2,910
392,384
Maximus,
Inc.
6,689
499,334
MDU
Resources
Group,
Inc.
34,506
621,798
MillerKnoll,
Inc.
11,014
248,806
Moog,
Inc.,
Class
A
1,929
379,704
MSC
Industrial
Direct
Co.,
Inc.
5,333
398,322
Mueller
Industries,
Inc.
5,413
429,576
Mueller
Water
Products,
Inc.,
Class
A
17,569
395,302
MYR
Group,
Inc.(a)
2,090
310,929
OPENLANE,
Inc.(a)
30,158
598,335
Powell
Industries,
Inc.
465
103,067
Primoris
Services
Corp.
5,050
385,820
Resideo
Technologies,
Inc.(a)
13,594
313,342
REV
Group,
Inc.
8,099
258,115
Rush
Enterprises,
Inc.,
Class
A
7,174
393,063
Ryder
System,
Inc.
2,679
420,228
Schneider
National,
Inc.,
Class
B
16,847
493,280
SkyWest,
Inc.(a)
3,717
372,183
SPX
Technologies,
Inc.(a)
2,094
304,719
Standex
International
Corp.
2,310
431,947
Sterling
Infrastructure,
Inc.(a)
1,363
229,597
Tecnoglass,
Inc.
3,233
256,442
Tennant
Co.
4,783
389,958
Terex
Corp.
5,282
244,134
SECURITY
DESCRIPTION
SHARES
VALUE
($)
Industrials
(20.3%):
(continued)
The
Brink's
Co.
4,258
395,015
Trinity
Industries,
Inc.
9,287
325,974
UniFirst
Corp.
2,196
375,714
Valmont
Industries,
Inc.
1,227
376,284
Verra
Mobility
Corp.(a)
15,360
371,405
Vestis
Corp.
11,585
176,555
Vicor
Corp.(a)
5,272
254,743
VSE
Corp.
3,656
347,686
Watts
Water
Technologies,
Inc.,
Class
A
2,313
470,233
Werner
Enterprises,
Inc.
12,906
463,584
Zurn
Elkay
Water
Solutions
Corp.
11,922
444,691
34,385,551
Information
Technology
(
9
.4
%
):
ACI
Worldwide,
Inc.(a)
8,277
429,659
Advanced
Energy
Industries,
Inc.
2,986
345,271
Agilysys,
Inc.(a)
2,638
347,451
Alarm.com
Holdings,
Inc.(a)
7,926
481,901
Allegro
MicroSystems,
Inc.(a)
10,734
234,645
Altair
Engineering,
Inc.,
Class
A(a)
3,883
423,674
Appfolio,
Inc.,
Class
A(a)
1,069
263,744
Axcelis
Technologies,
Inc.(a)
2,210
154,413
Badger
Meter,
Inc.
1,661
352,331
Belden,
Inc.
2,823
317,898
Blackbaud,
Inc.(a)
4,952
366,052
BlackLine,
Inc.(a)
5,406
328,469
Calix,
Inc.(a)
6,671
232,618
Cirrus
Logic,
Inc.(a)
2,400
238,992
Clear
Secure,
Inc.,
Class
A
7,209
192,048
Commvault
Systems,
Inc.(a)
1,853
279,636
Crane
NXT
Co.
7,424
432,225
Diebold
Nixdorf,
Inc.(a)
5,758
247,824
DigitalOcean
Holdings,
Inc.(a)
5,299
180,537
Diodes,
Inc.(a)
4,120
254,080
Dolby
Laboratories,
Inc.,
Class
A
7,645
597,075
DXC
Technology
Co.(a)
14,441
288,531
ePlus,
Inc.(a)
3,254
240,406
FormFactor,
Inc.(a)
4,454
195,976
Harmonic,
Inc.(a)
17,986
237,955
Impinj,
Inc.(a)
846
122,890
InterDigital,
Inc.
2,750
532,730
IPG
Photonics
Corp.(a)
4,312
313,569
Itron,
Inc.(a)
2,571
279,159
LiveRamp
Holdings,
Inc.(a)
11,783
357,850
MARA
Holdings,
Inc.(a)
7,024
117,792
N-able,
Inc.(a)
37,970
354,640
Napco
Security
Technologies
Inc.
5,647
200,807
OSI
Systems,
Inc.(a)
2,715
454,572
PC
Connection,
Inc.
5,600
387,912
Pegasystems,
Inc.
2,917
271,864
Plexus
Corp.(a)
2,755
431,102
Power
Integrations,
Inc.
4,682
288,879
Progress
Software
Corp.
6,275
408,816
Schedule
of
Portfolio
Investments
-
continued
December
31,
2024
Timothy
Plan
US
Small
Cap
Core
ETF
See
notes
to
financial
statements.
Percentages
indicated
are
based
on
net
assets
as
of
December
31,
2024
.
SECURITY
DESCRIPTION
SHARES
VALUE
($)
Information
Technology
(9.4%):
(continued)
Riot
Platforms,
Inc.(a)
15,796
161,277
Rogers
Corp.(a)
3,509
356,550
SolarWinds
Corp.
26,340
375,345
Sprinklr,
Inc.,
Class
A(a)
43,105
364,237
Synaptics,
Inc.(a)
3,746
285,895
Teradata
Corp.(a)
8,527
265,616
TTM
Technologies,
Inc.(a)
15,961
395,035
Veeco
Instruments,
Inc.(a)
7,707
206,548
Verint
Systems,
Inc.(a)
10,576
290,311
Vertex,
Inc.,
Class
A(a)
5,661
302,014
Vishay
Intertechnology,
Inc.
20,724
351,065
Vontier
Corp.
12,419
452,921
15,992,807
Materials
(
6
.4
%
):
Alpha
Metallurgical
Resources,
Inc.(a)
893
178,707
Ashland,
Inc.
4,678
334,290
ATI,
Inc.(a)
4,791
263,697
Avient
Corp.
8,054
329,086
Balchem
Corp.
2,903
473,174
Cabot
Corp.
3,082
281,417
Carpenter
Technology
Corp.
1,701
288,677
Element
Solutions,
Inc.
15,360
390,605
Greif,
Inc.,
Class
A
7,685
469,707
H.B.
Fuller
Co.
6,731
454,208
Hawkins,
Inc.
2,312
283,613
Innospec,
Inc.
3,857
424,501
Knife
River
Corp.(a)
4,026
409,203
Louisiana-Pacific
Corp.
3,094
320,384
Materion
Corp.
2,867
283,489
Minerals
Technologies,
Inc.
5,990
456,498
NewMarket
Corp.
908
479,742
Pactiv
Evergreen,
Inc.
22,209
387,991
Quaker
Chemical
Corp.
2,806
394,973
Sealed
Air
Corp.
11,062
374,227
Sensient
Technologies
Corp.
6,150
438,249
Silgan
Holdings,
Inc.
10,541
548,659
Sonoco
Products
Co.
11,022
538,425
Stepan
Co.
5,660
366,202
Summit
Materials,
Inc.,
Class
A(a)
9,328
471,997
Sylvamo
Corp.
3,150
248,913
The
Chemours
Co.
8,987
151,880
United
States
Lime
&
Minerals,
Inc.
3,026
401,671
Warrior
Met
Coal,
Inc.
3,764
204,159
Worthington
Steel,
Inc.
6,836
217,522
10,865,866
Real
Estate
(
0
.4
%
):
Newmark
Group,
Inc.,
Class
A
22,381
286,701
The
St.
Joe
Co.
7,010
314,959
601,660
Utilities
(
6
.2
%
):
American
States
Water
Co.
6,647
516,605
Avista
Corp.
14,652
536,703
Black
Hills
Corp.
9,923
580,694
SECURITY
DESCRIPTION
SHARES
VALUE
($)
Utilities
(6.2%):
(continued)
California
Water
Service
Group
9,952
451,124
Chesapeake
Utilities
Corp.
4,803
582,844
Clearway
Energy,
Inc.,
Class
C
13,898
361,348
IDACORP,
Inc.
6,650
726,712
MGE
Energy,
Inc.
4,206
395,196
National
Fuel
Gas
Co.
9,694
588,232
New
Jersey
Resources
Corp.
13,709
639,525
Northwestern
Energy
Group,
Inc.
11,371
607,894
ONE
Gas,
Inc.
7,704
533,502
Ormat
Technologies,
Inc.
5,651
382,686
Otter
Tail
Corp.
5,330
393,567
Portland
General
Electric
Co.
13,693
597,289
SJW
Group
8,848
435,498
Southwest
Gas
Holdings,
Inc.
6,491
458,978
Spire,
Inc.
10,029
680,267
TXNM
Energy,
Inc.
13,824
679,726
UGI
Corp.
15,271
431,100
10,579,490
Total
Common
Stocks
(Cost
$150,953,924)
169,148,207
Total
Investments
(Cost
$150,953,924)
—
99.7%(b)
169,148,207
Other
assets
in
excess
of
liabilities
—
0.3%
617,773
NET
ASSETS
-
100.00%
$
169,765,980
(a)
Non-income
producing
security.
(b)
See
Federal
Tax
Information
listed
in
the
Notes
to
Financial
Statements.
Schedule
of
Portfolio
Investments
-
continued
December
31,
2024
Timothy
Plan
US
Small
Cap
Core
ETF
See
notes
to
financial
statements.
Futures
Contracts
Long
Futures
Index
Futures
Expiration
Date
Number
of
Contracts
Notional
Amount
Value
Value
and
Unrealized
Appreciation/
(Depreciation)
E-Mini
Russell
2000
Index
3/21/25
5
$
587,859
$
562,450
$
(
25,409
)
$
(
25,409
)
Schedule
of
Portfolio
Investments
December
31,
2024
Timothy
Plan
US
Large/Mid
Cap
Core
ETF
See
notes
to
financial
statements.
SECURITY
DESCRIPTION
SHARES
VALUE
($)
Common
Stocks
(99.5%)
Communication
Services
(
0
.6
%
):
Live
Nation
Entertainment,
Inc.(a)
8,001
1,036,129
The
Trade
Desk,
Inc.,
Class
A(a)
4,741
557,210
1,593,339
Consumer
Discretionary
(
8
.1
%
):
Aptiv
PLC(a)
9,626
582,181
Burlington
Stores,
Inc.(a)
2,699
769,377
CarMax,
Inc.(a)
10,208
834,606
Carvana
Co.(a)
1,529
310,937
Cava
Group,
Inc.(a)
3,401
383,633
Chewy,
Inc.,
Class
A(a)
13,442
450,173
Chipotle
Mexican
Grill,
Inc.(a)
14,287
861,506
Coupang,
Inc.(a)
25,706
565,018
Deckers
Outdoor
Corp.(a)
3,920
796,113
Domino's
Pizza,
Inc.
1,986
833,643
DR
Horton,
Inc.
4,003
559,699
Floor
&
Decor
Holdings,
Inc.,
Class
A(a)
5,945
592,717
Garmin
Ltd.
5,616
1,158,356
Genuine
Parts
Co.
7,623
890,061
Lennar
Corp.,
Class
A
4,509
614,892
NVR,
Inc.(a)
109
891,500
O'Reilly
Automotive,
Inc.(a)
1,075
1,274,735
Penske
Automotive
Group,
Inc.
6,492
989,641
Pool
Corp.
2,272
774,616
PulteGroup,
Inc.
5,829
634,778
Ross
Stores,
Inc.
8,424
1,274,298
Service
Corp.
International
16,277
1,299,230
Tesla,
Inc.(a)
1,968
794,757
Texas
Roadhouse,
Inc.
5,643
1,018,167
Toll
Brothers,
Inc.
4,624
582,393
TopBuild
Corp.(a)
1,612
501,880
Tractor
Supply
Co.
17,398
923,138
Wingstop,
Inc.
1,692
480,866
21,642,911
Consumer
Staples
(
4
.7
%
):
Bunge
Global
SA
10,444
812,126
Casey's
General
Stores,
Inc.
2,079
823,762
Coca-Cola
Consolidated,
Inc.
553
696,775
Costco
Wholesale
Corp.
1,440
1,319,429
Dollar
General
Corp.
6,166
467,506
Hormel
Foods
Corp.
27,577
865,091
Kenvue,
Inc.
41,844
893,369
Kimberly
Clark
Corp.
9,258
1,213,168
McCormick
&
Co.,
Inc.
13,406
1,022,073
Sysco
Corp.
16,498
1,261,437
The
Campbell's
Co.
25,157
1,053,575
The
J.M.
Smucker
Co.
9,448
1,040,414
U.S.
Foods
Holding
Corp.(a)
16,630
1,121,860
12,590,585
Energy
(
7
.7
%
):
Baker
Hughes
Co.
25,338
1,039,365
Cheniere
Energy,
Inc.
7,224
1,552,221
SECURITY
DESCRIPTION
SHARES
VALUE
($)
Energy
(7.7%):
(continued)
ConocoPhillips
11,051
1,095,928
Coterra
Energy,
Inc.
45,025
1,149,938
Devon
Energy
Corp.
23,651
774,097
Diamondback
Energy,
Inc.
4,673
765,578
EOG
Resources,
Inc.
8,689
1,065,098
EQT
Corp.
21,003
968,448
Halliburton
Co.
30,452
827,990
Kinder
Morgan,
Inc.
60,180
1,648,932
Occidental
Petroleum
Corp.
21,778
1,076,051
ONEOK,
Inc.
13,373
1,342,649
Ovintiv,
Inc.
20,409
826,564
Permian
Resources
Corp.
58,915
847,198
Phillips
66
Co.
7,256
826,676
Schlumberger
NV
21,840
837,346
Targa
Resources
Corp.
6,981
1,246,108
Texas
Pacific
Land
Corp.
553
611,596
The
Williams
Cos.,
Inc.
27,220
1,473,146
Valero
Energy
Corp.
6,083
745,715
20,720,644
Financials
(
13
.5
%
):
Aflac,
Inc.
10,875
1,124,910
American
Financial
Group,
Inc.
10,365
1,419,279
Arch
Capital
Group
Ltd.
11,779
1,087,791
Arthur
J.
Gallagher
&
Co.
5,202
1,476,588
Block,
Inc.(a)
7,607
646,519
Blue
Owl
Capital,
Inc.
37,991
883,671
Brown
&
Brown,
Inc.
14,284
1,457,254
Cboe
Global
Markets,
Inc.
5,800
1,133,320
Cincinnati
Financial
Corp.
8,846
1,271,170
Coinbase
Global,
Inc.,
Class
A(a)
1,827
453,644
Corebridge
Financial,
Inc.
27,787
831,665
East
West
BanCorp,
Inc.
10,322
988,435
Equitable
Holdings,
Inc.
24,649
1,162,693
Everest
Group
Ltd.
2,817
1,021,050
Fidelity
National
Information
Services,
Inc.
13,393
1,081,753
First
Citizens
BancShares,
Inc.,
Class
A
412
870,564
Interactive
Brokers
Group,
Inc.
6,972
1,231,743
Intercontinental
Exchange,
Inc.
10,487
1,562,668
Jack
Henry
&
Associates,
Inc.
7,323
1,283,722
Jefferies
Financial
Group,
Inc.
16,009
1,255,106
Kinsale
Capital
Group,
Inc.
1,214
564,668
LPL
Financial
Holdings,
Inc.
3,189
1,041,240
Markel
Group,
Inc.(a)
800
1,380,984
Morningstar,
Inc.
3,478
1,171,251
MSCI,
Inc.
1,406
843,614
Nasdaq,
Inc.
18,280
1,413,227
Principal
Financial
Group,
Inc.
14,401
1,114,781
Reinsurance
Group
of
America,
Inc.
5,288
1,129,675
RenaissanceRe
Holdings
Ltd.
4,263
1,060,677
Robinhood
Markets,
Inc.,
Class
A(a)
17,221
641,655
Rocket
Cos.,
Inc.,
Class
A(a)
28,781
324,074
Ryan
Specialty
Holdings,
Inc.
12,482
800,845
Schedule
of
Portfolio
Investments
-
continued
December
31,
2024
Timothy
Plan
US
Large/Mid
Cap
Core
ETF
See
notes
to
financial
statements.
SECURITY
DESCRIPTION
SHARES
VALUE
($)
Financials
(13.5%):
(continued)
Tradeweb
Markets,
Inc.,
Class
A
9,412
1,232,219
W.R.
Berkley
Corp.
19,391
1,134,761
36,097,216
Health
Care
(
10
.7
%
):
Agilent
Technologies,
Inc.
6,705
900,750
Align
Technology,
Inc.(a)
3,036
633,036
Avantor,
Inc.(a)
30,693
646,701
BioMarin
Pharmaceutical,
Inc.(a)
10,571
694,832
Cardinal
Health,
Inc.
10,707
1,266,317
Cencora,
Inc.
6,325
1,421,101
Danaher
Corp.
4,060
931,973
DaVita,
Inc.(a)
5,519
825,366
Dexcom,
Inc.(a)
5,925
460,787
Edwards
Lifesciences
Corp.(a)
7,939
587,724
GE
HealthCare
Technologies,
Inc.
8,851
691,971
HCA
Healthcare,
Inc.
2,768
830,815
Humana,
Inc.
2,760
700,240
IDEXX
Laboratories,
Inc.(a)
1,965
812,410
Incyte
Corp.(a)
14,779
1,020,786
Insulet
Corp.(a)
2,736
714,287
Intuitive
Surgical,
Inc.(a)
2,160
1,127,434
IQVIA
Holdings,
Inc.(a)
3,651
717,458
Mettler-Toledo
International,
Inc.(a)
519
635,090
Neurocrine
Biosciences,
Inc.(a)
6,204
846,846
Regeneron
Pharmaceuticals,
Inc.(a)
1,318
938,851
ResMed,
Inc.
2,568
587,276
Revvity,
Inc.
7,525
839,865
Sarepta
Therapeutics,
Inc.(a)
4,035
490,616
Solventum
Corp.(a)
10,088
666,413
STERIS
PLC
5,167
1,062,129
Stryker
Corp.
3,759
1,353,428
Teleflex,
Inc.
4,113
732,032
Tenet
Healthcare
Corp.(a)
4,814
607,671
United
Therapeutics
Corp.(a)
2,527
891,627
Universal
Health
Services,
Inc.,
Class
B
4,442
796,984
Veeva
Systems,
Inc.,
Class
A(a)
4,166
875,901
Waters
Corp.(a)
2,465
914,466
West
Pharmaceutical
Services,
Inc.
2,286
748,802
Zoetis,
Inc.
4,970
809,762
28,781,747
Industrials
(
24
.1
%
):
A.O.
Smith
Corp.
12,555
856,377
Advanced
Drainage
Systems,
Inc.
4,485
518,466
AECOM
10,610
1,133,360
Allegion
PLC
8,014
1,047,269
AMETEK,
Inc.
6,907
1,245,056
Axon
Enterprise,
Inc.(a)
1,583
940,809
Builders
FirstSource,
Inc.(a)
2,841
406,064
Carlisle
Cos.,
Inc.
1,998
736,942
Carrier
Global
Corp.
10,546
719,870
Caterpillar,
Inc.
2,406
872,801
CH
Robinson
Worldwide,
Inc.
6,577
679,536
SECURITY
DESCRIPTION
SHARES
VALUE
($)
Industrials
(24.1%):
(continued)
Cintas
Corp.
6,658
1,216,417
Clean
Harbors,
Inc.(a)
3,987
917,568
Comfort
Systems
USA,
Inc.
1,292
547,885
Copart,
Inc.(a)
22,072
1,266,712
CSX
Corp.
39,410
1,271,761
Curtiss-Wright
Corp.
3,407
1,209,042
Deere
&
Co.
2,700
1,143,990
Dover
Corp.
6,379
1,196,700
EMCOR
Group,
Inc.
1,672
758,921
Equifax,
Inc.
3,056
778,822
Expeditors
International
of
Washington,
Inc.
9,737
1,078,567
Fastenal
Co.
14,845
1,067,504
Fortive
Corp.
14,026
1,051,950
GE
Vernova,
Inc.
1,872
615,757
General
Dynamics
Corp.
5,167
1,361,453
Graco,
Inc.
15,087
1,271,683
HEICO
Corp.
4,652
1,105,966
Howmet
Aerospace,
Inc.
6,952
760,340
Hubbell,
Inc.
1,796
752,326
Huntington
Ingalls
Industries,
Inc.
4,135
781,391
IDEX
Corp.
6,083
1,273,111
Illinois
Tool
Works,
Inc.
6,091
1,544,434
Ingersoll
Rand,
Inc.
9,162
828,794
ITT,
Inc.
6,157
879,712
J.B.
Hunt
Transport
Services,
Inc.
5,368
916,103
Leidos
Holdings,
Inc.
8,177
1,177,979
Lennox
International,
Inc.
1,456
887,141
Masco
Corp.
11,837
859,011
Norfolk
Southern
Corp.
3,723
873,788
Old
Dominion
Freight
Line,
Inc.
3,835
676,494
Otis
Worldwide
Corp.
12,642
1,170,776
PACCAR,
Inc.
9,316
969,050
Parker-Hannifin
Corp.
1,446
919,699
Paychex,
Inc.
10,348
1,450,997
Quanta
Services,
Inc.
2,358
745,246
Republic
Services,
Inc.
8,479
1,705,805
Rockwell
Automation,
Inc.
2,664
761,345
Rollins,
Inc.
23,850
1,105,447
Snap-on,
Inc.
3,724
1,264,223
SS&C
Technologies
Holdings,
Inc.
18,406
1,394,807
Tetra
Tech,
Inc.
20,195
804,569
Textron,
Inc.
12,248
936,849
Trane
Technologies
PLC
2,586
955,139
TransDigm
Group,
Inc.
814
1,031,566
U-Haul
Holding
Co.
13,898
890,167
Union
Pacific
Corp.
5,929
1,352,049
United
Rentals,
Inc.
822
579,050
Verisk
Analytics,
Inc.
4,809
1,324,543
Vertiv
Holdings
Co.,
Class
A
3,872
439,898
Waste
Management,
Inc.
6,372
1,285,806
Watsco,
Inc.
1,804
854,898
Schedule
of
Portfolio
Investments
-
continued
December
31,
2024
Timothy
Plan
US
Large/Mid
Cap
Core
ETF
See
notes
to
financial
statements.
SECURITY
DESCRIPTION
SHARES
VALUE
($)
Industrials
(24.1%):
(continued)
Westinghouse
Air
Brake
Technologies
Corp.
6,224
1,180,008
WW
Grainger,
Inc.
1,092
1,151,023
Xylem,
Inc.
8,635
1,001,833
64,502,665
Information
Technology
(
14
.1
%
):
Akamai
Technologies,
Inc.(a)
8,614
823,929
Amphenol
Corp.,
Class
A
14,157
983,204
Analog
Devices,
Inc.
3,203
680,509
AppLovin
Corp.,
Class
A(a)
2,678
867,217
Arista
Networks,
Inc.(a)
5,690
628,916
Bentley
Systems,
Inc.,
Class
B
16,310
761,677
Broadcom,
Inc.
2,778
644,052
Cadence
Design
Systems,
Inc.(a)
2,713
815,148
CDW
Corp.
4,507
784,398
Cognizant
Technology
Solutions
Corp.,
Class
A
16,564
1,273,772
Corpay,
Inc.(a)
2,810
950,960
Crowdstrike
Holdings,
Inc.,
Class
A(a)
1,585
542,324
Datadog,
Inc.,
Class
A(a)
5,296
756,745
DocuSign,
Inc.(a)
11,126
1,000,673
Dynatrace,
Inc.(a)
14,712
799,597
Enphase
Energy,
Inc.(a)
4,080
280,214
Entegris,
Inc.
5,484
543,245
EPAM
Systems,
Inc.(a)
2,836
663,114
F5,
Inc.(a)
4,298
1,080,818
Fair
Isaac
Corp.(a)
393
782,436
First
Solar,
Inc.(a)
2,184
384,908
Fortinet,
Inc.(a)
7,450
703,876
Gartner,
Inc.(a)
2,052
994,132
Jabil,
Inc.
4,885
702,952
Keysight
Technologies,
Inc.(a)
4,882
784,196
KLA
Corp.
707
445,495
Manhattan
Associates,
Inc.(a)
2,628
710,191
Microchip
Technology,
Inc.
8,419
482,830
Monolithic
Power
Systems,
Inc.
512
302,950
NetApp,
Inc.
6,052
702,516
NVIDIA
Corp.
3,239
434,965
NXP
Semiconductors
NV
2,874
597,361
ON
Semiconductor
Corp.(a)
7,201
454,023
Palantir
Technologies,
Inc.,
Class
A(a)
9,178
694,132
Palo
Alto
Networks,
Inc.(a)
2,851
518,768
PTC,
Inc.(a)
6,574
1,208,761
Pure
Storage,
Inc.,
Class
A(a)
9,084
558,030
Roper
Technologies,
Inc.
2,512
1,305,863
Seagate
Technology
Holdings
PLC
7,230
624,021
ServiceNow,
Inc.(a)
744
788,729
Skyworks
Solutions,
Inc.
6,720
595,930
Super
Micro
Computer,
Inc.(a)
4,827
147,127
Synopsys,
Inc.(a)
1,329
645,043
TE
Connectivity
PLC
8,132
1,162,632
Teledyne
Technologies,
Inc.(a)
2,387
1,107,878
Teradyne,
Inc.
4,084
514,257
SECURITY
DESCRIPTION
SHARES
VALUE
($)
Information
Technology
(14.1%):
(continued)
Trimble,
Inc.(a)
15,942
1,126,462
Tyler
Technologies,
Inc.(a)
1,759
1,014,310
VeriSign,
Inc.(a)
7,630
1,579,105
Zebra
Technologies
Corp.(a)
2,059
795,227
37,749,618
Materials
(
6
.5
%
):
Avery
Dennison
Corp.
6,326
1,183,784
Celanese
Corp.
6,572
454,848
CF
Industries
Holdings,
Inc.
10,289
877,857
Eastman
Chemical
Co.
9,903
904,342
Freeport-McMoRan,
Inc.
13,410
510,653
International
Paper
Co.
17,016
915,801
Linde
PLC
3,617
1,514,329
LyondellBasell
Industries
NV,
Class
A
13,866
1,029,828
Martin
Marietta
Materials,
Inc.
1,965
1,014,923
Nucor
Corp.
5,996
699,793
Packaging
Corp.
of
America
6,097
1,372,618
PPG
Industries,
Inc.
10,494
1,253,508
Reliance,
Inc.
3,169
853,285
RPM
International,
Inc.
8,788
1,081,451
Steel
Dynamics,
Inc.
6,787
774,193
The
Sherwin-Williams
Co.
3,207
1,090,156
Vulcan
Materials
Co.
4,301
1,106,346
Westlake
Corp.
6,238
715,187
17,352,902
Real
Estate
(
0
.3
%
):
CoStar
Group,
Inc.(a)
11,458
820,278
820,278
Utilities
(
9
.2
%
):
Alliant
Energy
Corp.
25,256
1,493,640
Ameren
Corp.
17,064
1,521,085
American
Electric
Power
Co.,
Inc.
13,963
1,287,807
American
Water
Works
Co.,
Inc.
8,975
1,117,298
Atmos
Energy
Corp.
12,034
1,675,975
CenterPoint
Energy,
Inc.
41,633
1,321,015
CMS
Energy
Corp.
21,998
1,466,167
Consolidated
Edison,
Inc.
14,884
1,328,099
Constellation
Energy
Corp.
1,708
382,097
DTE
Energy
Co.
10,724
1,294,923
Entergy
Corp.
21,796
1,652,573
Evergy,
Inc.
25,194
1,550,691
NextEra
Energy,
Inc.
11,808
846,516
NiSource,
Inc.
47,823
1,757,973
NRG
Energy,
Inc.
7,884
711,294
Public
Service
Enterprise
Group,
Inc.
16,969
1,433,711
The
AES
Corp.
39,173
504,156
The
Southern
Co.
16,892
1,390,549
Vistra
Corp.
3,487
480,753
Schedule
of
Portfolio
Investments
-
continued
December
31,
2024
Timothy
Plan
US
Large/Mid
Cap
Core
ETF
See
notes
to
financial
statements.
Percentages
indicated
are
based
on
net
assets
as
of
December
31,
2024
.
SECURITY
DESCRIPTION
SHARES
VALUE
($)
Utilities
(9.2%):
(continued)
WEC
Energy
Group,
Inc.
15,391
1,447,370
24,663,692
Total
Common
Stocks
(Cost
$232,489,844)
266,515,597
Total
Investments
(Cost
$232,489,844)
—
99.5%(b)
266,515,597
Other
assets
in
excess
of
liabilities
—
0.5%
1,282,495
NET
ASSETS
-
100.00%
$
267,798,092
(a)
Non-income
producing
security.
(b)
See
Federal
Tax
Information
listed
in
the
Notes
to
Financial
Statements.
Futures
Contracts
Long
Futures
Index
Futures
Expiration
Date
Number
of
Contracts
Notional
Amount
Value
Value
and
Unrealized
Appreciation/
(Depreciation)
S&P
500
Index
E-mini
3/21/25
4
$
1,226,115
$
1,187,150
$
(
38,965
)
$
(
38,965
)
Schedule
of
Portfolio
Investments
December
31,
2024
Timothy
Plan
High
Dividend
Stock
ETF
See
notes
to
financial
statements.
SECURITY
DESCRIPTION
SHARES
VALUE
($)
Common
Stocks
(99.4%)
Consumer
Discretionary
(
4
.9
%
):
Garmin
Ltd.
12,440
2,565,874
Genuine
Parts
Co.
16,886
1,971,609
Penske
Automotive
Group,
Inc.
14,382
2,192,392
Service
Corp.
International
36,058
2,878,150
Tractor
Supply
Co.
38,540
2,044,933
11,652,958
Consumer
Staples
(
8
.0
%
):
Bunge
Global
SA
23,136
1,799,055
Dollar
General
Corp.
13,661
1,035,777
Hormel
Foods
Corp.
61,085
1,916,236
Kenvue,
Inc.
92,702
1,979,188
Kimberly
Clark
Corp.
20,507
2,687,237
McCormick
&
Co.,
Inc.
29,698
2,264,176
Sysco
Corp.
36,544
2,794,154
The
Campbell's
Co.
55,726
2,333,805
The
J.M.
Smucker
Co.
20,930
2,304,812
19,114,440
Energy
(
17
.3
%
):
Baker
Hughes
Co.
56,125
2,302,247
ConocoPhillips
24,482
2,427,880
Coterra
Energy,
Inc.
99,737
2,547,283
Devon
Energy
Corp.
52,391
1,714,757
Diamondback
Energy,
Inc.
10,352
1,695,968
EOG
Resources,
Inc.
19,246
2,359,175
EQT
Corp.
46,524
2,145,222
Halliburton
Co.
67,454
1,834,074
Kinder
Morgan,
Inc.
133,307
3,652,612
Occidental
Petroleum
Corp.
48,243
2,383,687
ONEOK,
Inc.
29,623
2,974,149
Ovintiv,
Inc.
45,210
1,831,005
Permian
Resources
Corp.
130,508
1,876,705
Phillips
66
Co.
16,073
1,831,197
Schlumberger
NV
48,378
1,854,813
Targa
Resources
Corp.
15,463
2,760,145
The
Williams
Cos.,
Inc.
60,293
3,263,057
Valero
Energy
Corp.
13,473
1,651,655
41,105,631
Financials
(
12
.3
%
):
Aflac,
Inc.
24,090
2,491,870
American
Financial
Group,
Inc.
22,944
3,141,722
Blue
Owl
Capital,
Inc.
84,170
1,957,794
Cincinnati
Financial
Corp.
19,593
2,815,514
Corebridge
Financial,
Inc.
61,552
1,842,251
East
West
BanCorp,
Inc.
22,867
2,189,744
Equitable
Holdings,
Inc.
54,602
2,575,576
Everest
Group
Ltd.
6,238
2,261,026
Fidelity
National
Information
Services,
Inc.
29,669
2,396,365
Jefferies
Financial
Group,
Inc.
35,467
2,780,613
Principal
Financial
Group,
Inc.
31,896
2,469,069
Reinsurance
Group
of
America,
Inc.
11,715
2,502,676
29,424,220
SECURITY
DESCRIPTION
SHARES
VALUE
($)
Health
Care
(
1
.2
%
):
Cardinal
Health,
Inc.
23,714
2,804,655
2,804,655
Industrials
(
17
.3
%
):
A.O.
Smith
Corp.
27,812
1,897,057
CH
Robinson
Worldwide,
Inc.
14,570
1,505,372
CSX
Corp.
87,299
2,817,139
Deere
&
Co.
5,980
2,533,726
Fastenal
Co.
32,882
2,364,545
General
Dynamics
Corp.
11,446
3,015,907
Huntington
Ingalls
Industries,
Inc.
9,159
1,730,776
Illinois
Tool
Works,
Inc.
13,491
3,420,778
Masco
Corp.
26,219
1,902,713
Norfolk
Southern
Corp.
8,245
1,935,101
Otis
Worldwide
Corp.
28,005
2,593,543
Paychex,
Inc.
22,921
3,213,983
Rockwell
Automation,
Inc.
5,903
1,687,018
Snap-on,
Inc.
8,247
2,799,692
Union
Pacific
Corp.
13,136
2,995,533
Waste
Management,
Inc.
14,114
2,848,064
Watsco,
Inc.
3,998
1,894,612
41,155,559
Information
Technology
(
5
.7
%
):
Analog
Devices,
Inc.
7,093
1,506,979
Cognizant
Technology
Solutions
Corp.,
Class
A
36,686
2,821,153
Microchip
Technology,
Inc.
18,651
1,069,635
NetApp,
Inc.
13,407
1,556,285
NXP
Semiconductors
NV
6,366
1,323,173
Seagate
Technology
Holdings
PLC
16,016
1,382,341
Skyworks
Solutions,
Inc.
14,883
1,319,824
TE
Connectivity
PLC
18,015
2,575,604
13,554,994
Materials
(
10
.6
%
):
Avery
Dennison
Corp.
14,011
2,621,878
Celanese
Corp.
14,555
1,007,352
CF
Industries
Holdings,
Inc.
22,791
1,944,528
Eastman
Chemical
Co.
21,939
2,003,469
International
Paper
Co.
37,692
2,028,583
LyondellBasell
Industries
NV,
Class
A
30,715
2,281,203
Nucor
Corp.
13,281
1,550,026
Packaging
Corp.
of
America
13,504
3,040,156
PPG
Industries,
Inc.
23,245
2,776,615
Reliance,
Inc.
7,021
1,890,474
RPM
International,
Inc.
19,467
2,395,609
Steel
Dynamics,
Inc.
15,036
1,715,157
25,255,050
Utilities
(
22
.1
%
):
Alliant
Energy
Corp.
55,944
3,308,528
Ameren
Corp.
37,796
3,369,136
American
Electric
Power
Co.,
Inc.
30,929
2,852,582
American
Water
Works
Co.,
Inc.
19,880
2,474,861
Atmos
Energy
Corp.
26,661
3,713,078
CenterPoint
Energy,
Inc.
92,221
2,926,172
Schedule
of
Portfolio
Investments
-
continued
December
31,
2024
Timothy
Plan
High
Dividend
Stock
ETF
See
notes
to
financial
statements.
Percentages
indicated
are
based
on
net
assets
as
of
December
31,
2024
.
SECURITY
DESCRIPTION
SHARES
VALUE
($)
Utilities
(22.1%):
(continued)
CMS
Energy
Corp.
48,727
3,247,655
Consolidated
Edison,
Inc.
32,970
2,941,913
DTE
Energy
Co.
23,755
2,868,416
Entergy
Corp.
48,282
3,660,741
Evergy,
Inc.
55,806
3,434,859
NextEra
Energy,
Inc.
26,158
1,875,267
NiSource,
Inc.
105,932
3,894,060
NRG
Energy,
Inc.
17,467
1,575,873
Public
Service
Enterprise
Group,
Inc.
37,586
3,175,641
The
AES
Corp.
86,774
1,116,781
The
Southern
Co.
37,418
3,080,250
WEC
Energy
Group,
Inc.
34,092
3,206,012
52,721,825
Total
Common
Stocks
(Cost
$225,985,430)
236,789,332
Total
Investments
(Cost
$225,985,430)
—
99.4%(a)
236,789,332
Other
assets
in
excess
of
liabilities
—
0.6%
1,342,339
NET
ASSETS
-
100.00%
$
238,131,671
(a)
See
Federal
Tax
Information
listed
in
the
Notes
to
Financial
Statements.
Futures
Contracts
Long
Futures
Index
Futures
Expiration
Date
Number
of
Contracts
Notional
Amount
Value
Value
and
Unrealized
Appreciation/
(Depreciation)
S&P
500
Index
E-mini
3/21/25
4
$
1,220,077
$
1,187,150
$
(
32,927
)
$
(
32,927
)
Schedule
of
Portfolio
Investments
December
31,
2024
Timothy
Plan
International
ETF
See
notes
to
financial
statements.
SECURITY
DESCRIPTION
SHARES
VALUE
($)
Common
Stocks
(99.0%)
Australia
(
7.7%
):
Communication
Services
(
0.7%
):
REA
Group
Ltd.
1,988
287,012
Telstra
Group
Ltd.
190,903
473,705
760,717
Consumer
Discretionary
(
0.3%
):
Wesfarmers
Ltd.
8,213
363,530
363,530
Consumer
Staples
(
0.7%
):
Coles
Group
Ltd.
(a)
39,222
458,472
Woolworths
Group
Ltd.
19,498
367,873
826,345
Energy
(
0.5%
):
Santos
Ltd.
77,157
318,935
Woodside
Energy
Group
Ltd.
18,761
285,589
604,524
Financials
(
2.0%
):
ANZ
Group
Holdings
Ltd.
(a)
21,347
377,000
Commonwealth
Bank
of
Australia
4,371
414,507
Insurance
Australia
Group
Ltd.
75,461
395,042
National
Australia
Bank
Ltd.
16,386
376,182
Suncorp
Group
Ltd.
30,201
355,266
Westpac
Banking
Corp.
18,097
361,933
2,279,930
Health
Care
(
0.9%
):
Cochlear
Ltd.
1,597
286,466
CSL
Ltd.
2,335
406,855
Pro
Medicus
Ltd.
1,684
260,640
953,961
Industrials
(
1.1%
):
Brambles
Ltd.
26,086
310,573
Computershare
Ltd.
21,168
444,703
Reece
Ltd.
14,251
197,358
SGH
Ltd.
(a)
10,116
288,639
1,241,273
Information
Technology
(
0.2%
):
WiseTech
Global
Ltd.
(a)
2,249
168,477
168,477
Materials
(
1.0%
):
BHP
Group
Ltd.
12,881
315,244
Fortescue
Ltd.
18,760
211,859
Northern
Star
Resources
Ltd.
(a)
27,492
262,666
Rio
Tinto
Ltd.
4,497
326,861
1,116,630
Utilities
(
0.3%
):
Origin
Energy
Ltd.
53,829
363,073
363,073
8,678,460
Austria
(
0.9%
):
Energy
(
0.3%
):
OMV
AG
9,009
348,406
348,406
SECURITY
DESCRIPTION
SHARES
VALUE
($)
Austria
(0.9%):
(continued)
Financials
(
0.4%
):
Erste
Group
Bank
AG
7,043
435,186
435,186
Utilities
(
0.2%
):
Verbund
AG
3,937
285,429
285,429
1,069,021
Belgium
(
1.5%
):
Consumer
Discretionary
(
0.4%
):
D'ieteren
Group
2,441
406,273
406,273
Financials
(
0.8%
):
Groupe
Bruxelles
Lambert
NV
7,395
505,877
KBC
Group
NV
4,981
384,539
890,416
Health
Care
(
0.3%
):
UCB
SA
1,840
366,274
366,274
1,662,963
Canada
(
12.3%
):
Consumer
Discretionary
(
0.6%
):
Dollarama,
Inc.
3,373
329,204
Magna
International,
Inc.
7,350
307,234
636,438
Consumer
Staples
(
1.0%
):
George
Weston
Ltd.
3,306
514,174
Metro,
Inc.
9,669
606,457
1,120,631
Energy
(
2.6%
):
ARC
Resources
Ltd.
17,463
316,747
Cameco
Corp.
3,756
193,144
Canadian
Natural
Resources
Ltd.
8,887
274,407
Cenovus
Energy,
Inc.
16,994
257,635
Imperial
Oil
Ltd.
4,539
279,768
Pembina
Pipeline
Corp.
15,276
564,467
Suncor
Energy,
Inc.
8,609
307,332
TC
Energy
Corp.
7,695
358,650
Tourmaline
Oil
Corp.
6,829
316,054
2,868,204
Financials
(
2.4%
):
Brookfield
Corp.
6,441
370,247
Fairfax
Financial
Holdings
Ltd.
264
367,355
Great-West
Lifeco,
Inc.
15,797
523,929
Intact
Financial
Corp.
2,656
483,653
National
Bank
of
Canada
5,651
515,207
Power
Corp.
of
Canada
14,499
452,331
2,712,722
Schedule
of
Portfolio
Investments
-
continued
December
31,
2024
Timothy
Plan
International
ETF
See
notes
to
financial
statements.
SECURITY
DESCRIPTION
SHARES
VALUE
($)
Canada
(12.3%):
(continued)
Industrials
(
1.9%
):
Canadian
National
Railway
Co.
4,214
427,967
Canadian
Pacific
Kansas
City
Ltd.
5,162
373,799
TFI
International,
Inc.
2,586
349,478
Waste
Connections,
Inc.
3,536
606,678
WSP
Global,
Inc.
2,408
423,800
2,181,722
Information
Technology
(
0.5%
):
Constellation
Software,
Inc.
114
352,550
Shopify,
Inc.,
Class
A
(a)
2,012
214,162
566,712
Materials
(
1.5%
):
Agnico
Eagle
Mines
Ltd.
3,887
304,134
Barrick
Gold
Corp.
13,335
206,803
Ivanhoe
Mines
Ltd.
(a)
13,431
159,419
Kinross
Gold
Corp.
23,095
214,512
Nutrien
Ltd.
6,694
299,560
Teck
Resources
Ltd.,
Class
B
4,715
191,185
Wheaton
Precious
Metals
Corp.
4,824
271,558
1,647,171
Utilities
(
1.8%
):
Brookfield
Renewable
Corp.
(a)
8,833
244,470
Emera,
Inc.
14,039
524,814
Fortis,
Inc.
14,719
611,679
Hydro
One
Ltd.
20,836
641,766
2,022,729
13,756,329
Chile
(
0.2%
):
Materials
(
0.2%
):
Antofagasta
PLC
9,125
181,607
181,607
Denmark
(
2.1%
):
Consumer
Discretionary
(
0.3%
):
Pandora
A/S
2,056
376,176
376,176
Financials
(
0.7%
):
Danske
Bank
A/S
12,379
350,315
Tryg
A/S
21,103
444,159
794,474
Health
Care
(
0.5%
):
Coloplast
A/S,
Class
B
2,629
287,148
Genmab
A/S
(a)
1,353
280,539
567,687
Industrials
(
0.3%
):
DSV
A/S
1,344
285,489
285,489
Materials
(
0.3%
):
Novonesis
(Novozymes),
Class
B
5,400
305,856
305,856
2,329,682
SECURITY
DESCRIPTION
SHARES
VALUE
($)
Finland
(
1.3%
):
Energy
(
0.1%
):
Neste
Oyj
10,761
135,135
135,135
Financials
(
0.4%
):
Sampo
Oyj,
Class
A
Shares
11,004
448,808
448,808
Industrials
(
0.2%
):
Wartsila
OYJ
Abp
14,052
249,013
249,013
Materials
(
0.3%
):
UPM-Kymmene
Oyj
10,457
287,654
287,654
Utilities
(
0.3%
):
Fortum
Oyj
23,133
323,804
323,804
1,444,414
France
(
6.3%
):
Communication
Services
(
0.3%
):
Bollore
SE
59,866
368,299
368,299
Consumer
Discretionary
(
0.7%
):
Cie
Generale
des
Etablissements
Michelin
SCA
12,226
402,667
Hermes
International
SCA
132
317,446
720,113
Consumer
Staples
(
0.3%
):
Carrefour
SA
21,703
308,620
308,620
Energy
(
0.3%
):
TotalEnergies
SE
6,388
353,099
353,099
Financials
(
0.9%
):
Amundi
SA
5,009
333,058
Credit
Agricole
SA
24,776
341,028
Societe
Generale
SA
12,093
340,172
1,014,258
Health
Care
(
0.4%
):
BioMerieux
2,872
307,864
Sartorius
Stedim
Biotech
874
170,812
478,676
Industrials
(
2.1%
):
Aeroports
de
Paris
SA
2,552
295,235
Bouygues
SA
11,580
342,292
Bureau
Veritas
SA
11,580
351,887
Legrand
SA
3,390
330,177
Safran
SA
1,804
396,288
Thales
SA
2,013
289,067
Vinci
SA
3,405
351,739
2,356,685
Information
Technology
(
0.3%
):
Dassault
Systemes
SE
8,977
311,466
311,466
Schedule
of
Portfolio
Investments
-
continued
December
31,
2024
Timothy
Plan
International
ETF
See
notes
to
financial
statements.
SECURITY
DESCRIPTION
SHARES
VALUE
($)
France
(6.3%):
(continued)
Materials
(
0.3%
):
Air
Liquide
SA
2,175
353,486
353,486
Utilities
(
0.7%
):
Engie
SA
26,501
420,215
Veolia
Environnement
SA
12,547
352,293
772,508
7,037,210
Germany
(
5.4%
):
Consumer
Discretionary
(
0.2%
):
Continental
AG
3,811
255,848
255,848
Financials
(
1.7%
):
Commerzbank
AG
13,077
212,977
Deutsche
Boerse
AG
2,205
507,899
Hannover
Rueck
SE
1,438
359,526
Muenchener
Rueckversicherungs-
Gesellschaft
AG
in
Muenchen,
Class
R
787
397,033
Talanx
AG
4,549
387,042
1,864,477
Health
Care
(
0.3%
):
Fresenius
Medical
Care
AG
6,585
301,175
301,175
Industrials
(
1.5%
):
Brenntag
SE
4,874
292,179
Deutsche
Post
AG
9,101
320,292
Knorr-Bremse
AG
4,009
292,102
Rational
AG
316
269,680
Rheinmetall
AG
490
311,905
Siemens
Energy
AG
(a)
4,974
259,536
1,745,694
Information
Technology
(
0.4%
):
Infineon
Technologies
AG
6,497
211,289
Nemetschek
SE
2,622
254,181
465,470
Materials
(
0.7%
):
Heidelberg
Materials
AG
3,181
393,042
Symrise
AG
3,376
358,918
751,960
Utilities
(
0.6%
):
E.ON
SE
29,834
347,460
RWE
AG
9,681
289,068
636,528
6,021,152
Hong
Kong
(
3.0%
):
Financials
(
0.5%
):
AIA
Group
Ltd.
30,586
221,723
Hang
Seng
Bank
Ltd.
25,079
308,547
530,270
SECURITY
DESCRIPTION
SHARES
VALUE
($)
Hong
Kong
(3.0%):
(continued)
Industrials
(
0.5%
):
CK
Hutchison
Holdings
Ltd.
65,744
351,305
Techtronic
Industries
Co.
Ltd.
15,404
203,300
554,605
Real
Estate
(
0.9%
):
Henderson
Land
Development
Co.
Ltd.
89,061
270,632
Sun
Hung
Kai
Properties
Ltd.
33,667
323,604
Swire
Pacific
Ltd.,
Class
A
43,071
390,703
984,939
Utilities
(
1.1%
):
CLP
Holdings
Ltd.
50,968
428,540
Hong
Kong
&
China
Gas
Co.
Ltd.
472,082
377,476
Power
Assets
Holdings
Ltd.
65,035
453,865
1,259,881
3,329,695
Ireland
(
1.3%
):
Consumer
Staples
(
0.3%
):
Kerry
Group
PLC,
Class
A
4,368
421,857
421,857
Financials
(
0.5%
):
AIB
Group
PLC
55,674
307,336
Bank
of
Ireland
Group
PLC
24,950
227,554
534,890
Industrials
(
0.5%
):
Kingspan
Group
PLC
3,774
275,370
Ryanair
Holdings
PLC,
ADR
6,086
265,289
540,659
1,497,406
Israel
(
0.9%
):
Financials
(
0.7%
):
Bank
Hapoalim
BM
32,485
393,850
Bank
Leumi
Le-Israel
BM
30,395
362,901
756,751
Information
Technology
(
0.2%
):
Nice
Ltd.
(a)
1,359
232,514
232,514
989,265
Italy
(
4.6%
):
Communication
Services
(
0.4%
):
Infrastrutture
Wireless
Italiane
SpA
39,168
398,158
398,158
Consumer
Discretionary
(
0.2%
):
Moncler
SpA
4,817
254,338
254,338
Energy
(
0.4%
):
Eni
SpA
28,585
387,536
387,536
Schedule
of
Portfolio
Investments
-
continued
December
31,
2024
Timothy
Plan
International
ETF
See
notes
to
financial
statements.
SECURITY
DESCRIPTION
SHARES
VALUE
($)
Italy
(4.6%):
(continued)
Financials
(
1.7%
):
Generali
17,114
483,360
Intesa
Sanpaolo
SpA
84,881
339,601
Mediobanca
Banca
di
Credito
Finanziario
SpA
24,336
354,758
Poste
Italiane
SpA
31,363
442,414
UniCredit
SpA
6,617
264,021
1,884,154
Health
Care
(
0.3%
):
Recordati
Industria
Chimica
e
Farmaceutica
SpA
6,749
353,691
353,691
Industrials
(
0.5%
):
Leonardo
SpA
11,388
305,833
Prysmian
SpA
4,396
280,734
586,567
Utilities
(
1.1%
):
Enel
SpA
60,343
430,356
Snam
SpA
90,636
401,490
Terna
-
Rete
Elettrica
Nazionale
53,786
424,481
1,256,327
5,120,771
Japan
(
16.5%
):
Communication
Services
(
0.1%
):
Nexon
Co.
Ltd.
9,100
137,457
137,457
Consumer
Discretionary
(
2.1%
):
Asics
Corp.
8,800
173,953
Denso
Corp.
16,400
230,838
Fast
Retailing
Co.
Ltd.
800
273,667
Nitori
Holdings
Co.
Ltd.
1,700
201,357
Oriental
Land
Co.
Ltd.
12,100
263,181
Pan
Pacific
International
Holdings
Corp.
9,900
271,585
Sekisui
House
Ltd.
10,200
245,194
Shimano,
Inc.
1,800
244,721
Sumitomo
Electric
Industries
Ltd.
14,500
262,987
Suzuki
Motor
Corp.
19,900
226,409
2,393,892
Consumer
Staples
(
1.2%
):
Aeon
Co.
Ltd.
16,100
378,119
Ajinomoto
Co.,
Inc.
8,000
328,075
Kao
Corp.
7,900
320,760
Unicharm
Corp.
32,700
270,716
1,297,670
Energy
(
0.4%
):
ENEOS
Holdings,
Inc.
40,500
212,707
Inpex
Corp.
16,900
211,666
424,373
SECURITY
DESCRIPTION
SHARES
VALUE
($)
Japan
(16.5%):
(continued)
Financials
(
2.4%
):
Dai-ichi
Life
Holdings,
Inc.
8,800
236,878
Daiwa
Securities
Group,
Inc.
28,300
188,511
Japan
Exchange
Group,
Inc.
20,800
234,005
Japan
Post
Bank
Co.
Ltd.
27,700
263,126
Japan
Post
Holdings
Co.
Ltd.
26,500
251,054
MS&AD
Insurance
Group
Holdings,
Inc.
7,900
173,184
ORIX
Corp.
10,300
223,113
Resona
Holdings,
Inc.
28,600
208,051
Sompo
Holdings,
Inc.
9,600
251,334
Sumitomo
Mitsui
Financial
Group,
Inc.
11,200
267,951
Sumitomo
Mitsui
Trust
Group,
Inc.
10,300
241,706
Tokio
Marine
Holdings,
Inc.
5,100
185,679
2,724,592
Health
Care
(
1.8%
):
Chugai
Pharmaceutical
Co.
Ltd.
5,200
231,328
Daiichi
Sankyo
Co.
Ltd.
6,800
188,099
Eisai
Co.
Ltd.
7,200
198,111
Hoya
Corp.
1,600
201,513
Kyowa
Kirin
Co.
Ltd.
13,200
199,305
Olympus
Corp.
14,700
221,486
Shionogi
&
Co.
Ltd.
21,500
303,238
Sysmex
Corp.
14,600
270,647
Terumo
Corp.
11,900
231,601
2,045,328
Industrials
(
4.0%
):
Central
Japan
Railway
Co.
16,600
312,839
Daikin
Industries
Ltd.
1,800
213,488
East
Japan
Railway
Co.
17,300
307,338
FANUC
Corp.
9,500
252,098
Hitachi
Ltd.
7,100
177,669
ITOCHU
Corp.
5,000
248,904
Komatsu
Ltd.
8,800
243,310
Kubota
Corp.
19,700
230,270
Marubeni
Corp.
14,400
218,979
Mitsubishi
Corp.
12,600
208,545
Mitsubishi
Electric
Corp.
12,200
208,361
Mitsubishi
Heavy
Industries
Ltd.
11,000
155,425
Mitsui
OSK
Lines
Ltd.
7,100
248,565
NIDEC
Corp.
12,900
234,091
Nippon
Yusen
KK
6,900
231,257
Secom
Co.
Ltd.
9,500
324,194
SMC
Corp.
600
237,132
Toyota
Industries
Corp.
2,600
212,604
Toyota
Tsusho
Corp.
11,800
212,105
4,477,174
Schedule
of
Portfolio
Investments
-
continued
December
31,
2024
Timothy
Plan
International
ETF
See
notes
to
financial
statements.
SECURITY
DESCRIPTION
SHARES
VALUE
($)
Japan
(16.5%):
(continued)
Information
Technology
(
2.5%
):
Advantest
Corp.
2,900
169,543
Canon,
Inc.
7,900
259,149
Disco
Corp.
600
162,957
FUJIFILM
Holdings
Corp.
9,900
208,219
Fujitsu
Ltd.
10,900
193,953
Keyence
Corp.
500
205,396
Kyocera
Corp.
28,400
284,397
Lasertec
Corp.
800
77,213
Murata
Manufacturing
Co.
Ltd.
12,500
203,354
NEC
Corp.
2,200
191,852
Nomura
Research
Institute
Ltd.
8,100
239,865
Obic
Co.
Ltd.
9,900
295,307
TDK
Corp.
15,200
200,229
Tokyo
Electron
Ltd.
900
138,349
2,829,783
Materials
(
1.0%
):
Nippon
Paint
Holdings
Co.
Ltd.
37,500
243,954
Nippon
Sanso
Holdings
Corp.
5,700
160,280
Nippon
Steel
Corp.
15,900
321,577
Nitto
Denko
Corp.
11,900
202,708
Shin-Etsu
Chemical
Co.
Ltd.
5,400
181,773
1,110,292
Real
Estate
(
0.9%
):
Daiwa
House
Industry
Co.
Ltd.
11,000
339,656
Mitsubishi
Estate
Co.
Ltd.
15,000
209,798
Mitsui
Fudosan
Co.
Ltd.
22,800
184,046
Sumitomo
Realty
&
Development
Co.
Ltd.
6,500
204,093
937,593
Utilities
(
0.1%
):
The
Kansai
Electric
Power
Co.,
Inc.
12,600
140,432
140,432
18,518,586
Luxembourg
(
0.5%
):
Energy
(
0.3%
):
Tenaris
SA
20,015
374,583
374,583
Health
Care
(
0.2%
):
Eurofins
Scientific
SE
3,866
197,438
197,438
572,021
Netherlands
(
3.0%
):
Consumer
Discretionary
(
0.2%
):
Prosus
NV
(a)
7,120
282,800
282,800
Financials
(
1.5%
):
ABN
AMRO
Bank
NV
19,625
302,649
Adyen
NV
(a)
123
183,061
Euronext
NV
4,137
464,032
ING
Groep
NV
20,233
317,054
NN
Group
NV
9,008
392,496
1,659,292
SECURITY
DESCRIPTION
SHARES
VALUE
($)
Netherlands
(3.0%):
(continued)
Industrials
(
0.8%
):
Ferrovial
SE
9,859
414,565
Wolters
Kluwer
NV
3,186
529,279
943,844
Information
Technology
(
0.2%
):
ASM
International
NV
328
189,830
189,830
Materials
(
0.3%
):
Akzo
Nobel
NV
5,271
316,414
316,414
3,392,180
New
Zealand
(
0.5%
):
Health
Care
(
0.2%
):
Fisher
&
Paykel
Healthcare
Corp.
Ltd.
13,078
280,878
280,878
Information
Technology
(
0.3%
):
Xero
Ltd.
(a)
2,703
281,936
281,936
562,814
Norway
(
1.6%
):
Communication
Services
(
0.4%
):
Telenor
ASA
36,494
407,043
407,043
Energy
(
0.5%
):
Aker
BP
ASA
13,167
256,572
Equinor
ASA
12,561
293,010
549,582
Financials
(
0.3%
):
DNB
Bank
ASA
17,670
352,393
352,393
Industrials
(
0.2%
):
Kongsberg
Gruppen
ASA
2,523
283,847
283,847
Materials
(
0.2%
):
Norsk
Hydro
ASA
35,172
193,336
193,336
1,786,201
Portugal
(
0.7%
):
Consumer
Staples
(
0.3%
):
Jeronimo
Martins
SGPS
SA
13,767
263,069
263,069
Energy
(
0.2%
):
Galp
Energia
SGPS
SA
14,160
233,915
233,915
Utilities
(
0.2%
):
EDP
SA
81,053
259,479
259,479
756,463
Russian
Federation
(
0.0%
):
Materials
(
0.0%
):
Evraz
PLC
(a)(b)(c)
38,723
—
—
Schedule
of
Portfolio
Investments
-
continued
December
31,
2024
Timothy
Plan
International
ETF
See
notes
to
financial
statements.
SECURITY
DESCRIPTION
SHARES
VALUE
($)
Singapore
(
3.3%
):
Communication
Services
(
0.4%
):
Singapore
Telecommunications
Ltd.
187,600
423,210
423,210
Consumer
Staples
(
0.3%
):
Wilmar
International
Ltd.
163,000
370,102
370,102
Financials
(
1.6%
):
DBS
Group
Holdings
Ltd.
16,940
542,457
Oversea-Chinese
Banking
Corp.
Ltd.
48,300
590,440
United
Overseas
Bank
Ltd.
23,900
635,968
1,768,865
Industrials
(
0.7%
):
Singapore
Airlines
Ltd.
79,600
375,466
Singapore
Technologies
Engineering
Ltd.
142,000
484,670
860,136
Real
Estate
(
0.3%
):
CapitaLand
Investment
Ltd.
156,300
299,938
299,938
3,722,251
South
Korea
(
2.6%
):
Communication
Services
(
0.2%
):
NAVER
Corp.
(a)
2,011
271,768
271,768
Consumer
Discretionary
(
0.5%
):
Hyundai
Mobis
Co.
Ltd.
1,509
242,477
Kia
Corp.
2,723
186,307
LG
Electronics,
Inc.
3,190
180,979
609,763
Financials
(
0.9%
):
Hana
Financial
Group,
Inc.
4,364
168,416
KB
Financial
Group,
Inc.
2,745
154,614
Meritz
Financial
Group,
Inc.
(a)
3,155
222,938
Samsung
Fire
&
Marine
Insurance
Co.
Ltd.
699
170,262
Samsung
Life
Insurance
Co.
Ltd.
2,523
162,509
Shinhan
Financial
Group
Co.
Ltd.
4,763
154,203
1,032,942
Health
Care
(
0.2%
):
Celltrion,
Inc.
1,842
234,624
234,624
Industrials
(
0.3%
):
Hanwha
Aerospace
Co.
Ltd.
521
115,577
Samsung
C&T
Corp.
2,091
163,098
278,675
Information
Technology
(
0.2%
):
Samsung
SDI
Co.
Ltd.
649
109,137
SK
Hynix,
Inc.
1,200
141,785
250,922
Materials
(
0.3%
):
LG
Chem
Ltd.
(a)
839
142,513
POSCO
Holdings,
Inc.
904
155,703
298,216
2,976,910
SECURITY
DESCRIPTION
SHARES
VALUE
($)
Spain
(
3.0%
):
Consumer
Discretionary
(
0.6%
):
Amadeus
IT
Group
SA
5,122
361,792
Industria
de
Diseno
Textil
SA
6,403
329,192
690,984
Energy
(
0.4%
):
Repsol
SA
33,037
399,990
399,990
Financials
(
0.5%
):
Banco
de
Sabadell
SA
135,388
263,195
CaixaBank
SA
54,042
293,066
556,261
Industrials
(
0.7%
):
ACS
Actividades
de
Construccion
y
Servicios
SA
(a)
8,101
406,422
Aena
SME
SA
1,964
401,534
807,956
Utilities
(
0.8%
):
Endesa
SA
18,796
404,330
Iberdrola
SA
33,707
464,308
868,638
3,323,829
Sweden
(
5.2%
):
Consumer
Staples
(
0.4%
):
Essity
AB,
Class
B
15,508
414,700
414,700
Financials
(
2.0%
):
EQT
AB
7,404
204,954
Industrivarden
AB,
Class
C
11,728
370,255
Investor
AB,
Class
B
14,718
389,582
L
E
Lundbergforetagen
AB,
Class
B
7,896
357,744
Skandinaviska
Enskilda
Banken
AB,
Class
A
22,582
309,285
Svenska
Handelsbanken
AB,
Class
A
28,671
296,099
Swedbank
AB,
Class
A
15,670
309,350
2,237,269
Health
Care
(
0.2%
):
Swedish
Orphan
Biovitrum
AB
(a)
9,531
273,573
273,573
Industrials
(
2.3%
):
Alfa
Laval
AB
8,136
340,364
Assa
Abloy
AB,
Class
B
12,627
373,172
Atlas
Copco
AB,
Class
A
17,421
266,012
Epiroc
AB,
Class
A
15,339
267,096
Indutrade
AB
9,330
233,716
Lifco
AB,
Class
B
10,132
293,756
Saab
AB,
Class
B
10,644
224,953
Sandvik
AB
16,494
295,785
Volvo
AB,
Class
B
12,269
298,018
2,592,872
Information
Technology
(
0.3%
):
Hexagon
AB,
Class
B
33,820
322,972
322,972
5,841,386
Schedule
of
Portfolio
Investments
-
continued
December
31,
2024
Timothy
Plan
International
ETF
See
notes
to
financial
statements.
SECURITY
DESCRIPTION
SHARES
VALUE
($)
Switzerland
(
7.6%
):
Communication
Services
(
0.4%
):
Swisscom
AG,
Registered
883
491,042
491,042
Consumer
Discretionary
(
0.5%
):
Cie
Financiere
Richemont
SA,
Registered
2,064
313,741
The
Swatch
Group
AG
1,349
245,354
559,095
Consumer
Staples
(
0.3%
):
Chocoladefabriken
Lindt
&
Spruengli
AG
33
366,303
366,303
Financials
(
1.4%
):
Julius
Baer
Group
Ltd.
5,015
324,272
Partners
Group
Holding
AG
231
313,195
Swiss
Life
Holding
AG
594
458,071
Swiss
Re
AG
2,880
416,508
1,512,046
Health
Care
(
1.3%
):
Alcon
AG
4,387
371,870
Lonza
Group
AG,
Registered
441
260,458
Sandoz
Group
AG
7,302
299,179
Sonova
Holding
AG
984
321,384
Straumann
Holding
AG,
Class
R
1,637
206,159
1,459,050
Industrials
(
1.9%
):
ABB
Ltd.,
Registered
6,926
374,624
Geberit
AG,
Registered
713
404,442
Kuehne
+
Nagel
International
AG,
Class
R
1,273
291,589
Schindler
Holding
AG
1,891
521,942
SGS
SA,
Registered
(a)
3,176
318,160
VAT
Group
AG
532
201,025
2,111,782
Information
Technology
(
0.5%
):
Logitech
International
SA,
Class
R
3,758
310,847
STMicroelectronics
NV
8,396
211,089
521,936
Materials
(
1.3%
):
EMS-Chemie
Holding
AG
547
368,707
Givaudan
SA,
Registered
85
371,594
Holcim
AG
4,341
418,022
Sika
AG,
Registered
1,435
341,350
1,499,673
8,520,927
United
Kingdom
(
6.4%
):
Communication
Services
(
0.4%
):
Informa
PLC
47,885
478,544
478,544
Consumer
Discretionary
(
0.3%
):
Next
PLC
2,865
340,611
340,611
Consumer
Staples
(
0.4%
):
Haleon
PLC
96,084
453,895
453,895
SECURITY
DESCRIPTION
SHARES
VALUE
($)
United
Kingdom
(6.4%):
(continued)
Financials
(
2.2%
):
3i
Group
PLC
8,161
364,068
Admiral
Group
PLC
11,292
373,710
Legal
&
General
Group
PLC
135,800
390,618
Lloyds
Banking
Group
PLC
464,591
318,563
London
Stock
Exchange
Group
PLC
4,534
640,450
Wise
PLC,
Class
A
(a)
29,155
389,020
2,476,429
Health
Care
(
0.3%
):
Smith
&
Nephew
PLC
26,920
334,061
334,061
Industrials
(
1.4%
):
Ashtead
Group
PLC
3,743
232,617
Bunzl
PLC
9,816
404,971
International
Consolidated
Airlines
Group
SA
109,975
415,584
Rentokil
Initial
PLC
41,201
206,699
Rolls-Royce
Holdings
PLC
(a)
38,189
271,799
1,531,670
Information
Technology
(
0.7%
):
Halma
PLC
10,034
337,728
The
Sage
Group
PLC
28,116
448,006
785,734
Materials
(
0.4%
):
Anglogold
Ashanti
PLC
7,411
171,046
Rio
Tinto
PLC
5,528
326,805
497,851
Utilities
(
0.3%
):
SSE
PLC
(a)
16,886
339,026
339,026
7,237,821
United
States
(
0.6%
):
Industrials
(
0.3%
):
RB
Global,
Inc.
4,069
367,294
367,294
Materials
(
0.3%
):
CRH
PLC
3,577
331,951
331,951
699,245
Total
Common
Stocks
(Cost
$102,257,918)
111,028,609
SECURITY
DESCRIPTION
SHARES
VALUE
($)
Warrant
(0.0%)
Canada
(
0.0%
):
Information
Technology
(
0.0%
):
Constellation
Software,
Inc.
(a)(c)
141
—
—
Total
Warrant
(Cost
$–)
—
Schedule
of
Portfolio
Investments
-
continued
December
31,
2024
Timothy
Plan
International
ETF
See
notes
to
financial
statements.
Percentages
indicated
are
based
on
net
assets
as
of
December
31,
2024.
VALUE
($)
Total
Investments
(Cost
$
102,257,918
)—
99.0%
(d)
111,028,609
Other
assets
in
excess
of
liabilities
—
1.0%
1,096,384
NET
ASSETS
-
100.00%
$
112,124,993
(a)
Non-income
producing
security.
(b)
The
following
table
details
the
earliest
acquisition
date
and
cost
of
the
Fund's
restricted
securities
due
to
trading
restrictions
at
December
31,
2024.
(c)
Security
was
fair
valued
based
upon
procedures
approved
by
the
Board
of
Trustees
and
represents
0.00%
of
the
Fund's
net
asset
as
of
December
31,
2024.
This
security
is
classified
as
Level
3
within
the
fair
value
hierarchy.
(d)
See
Federal
Tax
Information
listed
in
the
Notes
to
Financial
Statements.
Futures
Contracts
Long
Futures
Index
Futures
Expiration
Date
Number
of
Contracts
Notional
Amount
Value
Value
and
Unrealized
Appreciation/
(Depreciation)
Mini
MSCI
EAFE
Index
3/21/25
7
$
806,134
$
793,625
$
(12,509)
$
(12,509)
Schedule
of
Portfolio
Investments
December
31,
2024
Timothy
Plan
US
Large/Mid
Cap
Core
Enhanced
ETF
See
notes
to
financial
statements.
SECURITY
DESCRIPTION
SHARES
VALUE
($)
Common
Stocks
(99.4%)
Communication
Services
(
0
.6
%
):
Live
Nation
Entertainment,
Inc.(a)
2,102
272,209
The
Trade
Desk,
Inc.,
Class
A(a)
1,245
146,325
418,534
Consumer
Discretionary
(
8
.1
%
):
Aptiv
PLC(a)
2,528
152,893
Burlington
Stores,
Inc.(a)
708
201,822
CarMax,
Inc.(a)
2,681
219,199
Carvana
Co.(a)
402
81,751
Cava
Group,
Inc.(a)
894
100,843
Chewy,
Inc.,
Class
A(a)
3,531
118,253
Chipotle
Mexican
Grill,
Inc.(a)
3,753
226,306
Coupang,
Inc.(a)
6,751
148,387
Deckers
Outdoor
Corp.(a)
1,029
208,980
Domino's
Pizza,
Inc.
522
219,115
DR
Horton,
Inc.
1,052
147,091
Floor
&
Decor
Holdings,
Inc.,
Class
A(a)
1,562
155,731
Garmin
Ltd.
1,475
304,234
Genuine
Parts
Co.
2,003
233,870
Lennar
Corp.,
Class
A
1,184
161,462
NVR,
Inc.(a)
28
229,009
O'Reilly
Automotive,
Inc.(a)
282
334,396
Penske
Automotive
Group,
Inc.
1,705
259,910
Pool
Corp.
597
203,541
PulteGroup,
Inc.
1,531
166,726
Ross
Stores,
Inc.
2,213
334,761
Service
Corp.
International
4,275
341,230
Tesla,
Inc.(a)
517
208,785
Texas
Roadhouse,
Inc.
1,482
267,397
Toll
Brothers,
Inc.
1,215
153,029
TopBuild
Corp.(a)
423
131,697
Tractor
Supply
Co.
4,570
242,484
Wingstop,
Inc.
444
126,185
5,679,087
Consumer
Staples
(
4
.7
%
):
Bunge
Global
SA
2,743
213,296
Casey's
General
Stores,
Inc.
546
216,342
Coca-Cola
Consolidated,
Inc.
145
182,699
Costco
Wholesale
Corp.
378
346,350
Dollar
General
Corp.
1,620
122,828
Hormel
Foods
Corp.
7,243
227,213
Kenvue,
Inc.
10,992
234,679
Kimberly
Clark
Corp.
2,432
318,689
McCormick
&
Co.,
Inc.
3,521
268,441
Sysco
Corp.
4,333
331,301
The
Campbell's
Co.
6,608
276,743
The
J.M.
Smucker
Co.
2,482
273,318
U.S.
Foods
Holding
Corp.(a)
4,368
294,665
3,306,564
Energy
(
7
.7
%
):
Baker
Hughes
Co.
6,655
272,988
Cheniere
Energy,
Inc.
1,897
407,608
SECURITY
DESCRIPTION
SHARES
VALUE
($)
Energy
(7.7%):
(continued)
ConocoPhillips
2,903
287,890
Coterra
Energy,
Inc.
11,826
302,036
Devon
Energy
Corp.
6,212
203,319
Diamondback
Energy,
Inc.
1,228
201,183
EOG
Resources,
Inc.
2,282
279,728
EQT
Corp.
5,517
254,389
Halliburton
Co.
7,999
217,493
Kinder
Morgan,
Inc.
15,807
433,112
Occidental
Petroleum
Corp.
5,720
282,625
ONEOK,
Inc.
3,512
352,605
Ovintiv,
Inc.
5,361
217,120
Permian
Resources
Corp.
15,475
222,530
Phillips
66
Co.
1,905
217,037
Schlumberger
NV
5,737
219,957
Targa
Resources
Corp.
1,834
327,369
Texas
Pacific
Land
Corp.
145
160,364
The
Williams
Cos.,
Inc.
7,149
386,904
Valero
Energy
Corp.
1,598
195,899
5,442,156
Financials
(
13
.4
%
):
Aflac,
Inc.
2,856
295,425
American
Financial
Group,
Inc.
2,634
360,674
Arch
Capital
Group
Ltd.
3,094
285,731
Arthur
J.
Gallagher
&
Co.
1,366
387,739
Block,
Inc.(a)
1,998
169,810
Blue
Owl
Capital,
Inc.
9,980
232,135
Brown
&
Brown,
Inc.
3,752
382,779
Cboe
Global
Markets,
Inc.
1,523
297,594
Cincinnati
Financial
Corp.
2,323
333,815
Coinbase
Global,
Inc.,
Class
A(a)
479
118,936
Corebridge
Financial,
Inc.
7,298
218,429
East
West
BanCorp,
Inc.
2,712
259,701
Equitable
Holdings,
Inc.
6,474
305,379
Everest
Group
Ltd.
740
268,220
Fidelity
National
Information
Services,
Inc.
3,518
284,149
First
Citizens
BancShares,
Inc.,
Class
A
108
228,206
Interactive
Brokers
Group,
Inc.
1,831
323,483
Intercontinental
Exchange,
Inc.
2,754
410,374
Jack
Henry
&
Associates,
Inc.
1,923
337,102
Jefferies
Financial
Group,
Inc.
4,206
329,750
Kinsale
Capital
Group,
Inc.
318
147,911
LPL
Financial
Holdings,
Inc.
837
273,289
Markel
Group,
Inc.(a)
210
362,508
Morningstar,
Inc.
913
307,462
MSCI,
Inc.
369
221,404
Nasdaq,
Inc.
4,802
371,243
Principal
Financial
Group,
Inc.
3,782
292,765
Reinsurance
Group
of
America,
Inc.
1,389
296,732
RenaissanceRe
Holdings
Ltd.
1,120
278,667
Robinhood
Markets,
Inc.,
Class
A(a)
4,524
168,564
Rocket
Cos.,
Inc.,
Class
A(a)
7,561
85,137
Ryan
Specialty
Holdings,
Inc.
3,278
210,316
Schedule
of
Portfolio
Investments
-
continued
December
31,
2024
Timothy
Plan
US
Large/Mid
Cap
Core
Enhanced
ETF
See
notes
to
financial
statements.
SECURITY
DESCRIPTION
SHARES
VALUE
($)
Financials
(13.4%):
(continued)
Tradeweb
Markets,
Inc.,
Class
A
2,472
323,634
W.R.
Berkley
Corp.
5,093
298,042
9,467,105
Health
Care
(
10
.7
%
):
Agilent
Technologies,
Inc.
1,761
236,573
Align
Technology,
Inc.(a)
797
166,182
Avantor,
Inc.(a)
8,061
169,845
BioMarin
Pharmaceutical,
Inc.(a)
2,777
182,532
Cardinal
Health,
Inc.
2,812
332,575
Cencora,
Inc.
1,661
373,193
Danaher
Corp.
1,067
244,930
DaVita,
Inc.(a)
1,450
216,848
Dexcom,
Inc.(a)
1,557
121,088
Edwards
Lifesciences
Corp.(a)
2,085
154,353
GE
HealthCare
Technologies,
Inc.
2,325
181,769
HCA
Healthcare,
Inc.
727
218,209
Humana,
Inc.
725
183,940
IDEXX
Laboratories,
Inc.(a)
516
213,335
Incyte
Corp.(a)
3,881
268,061
Insulet
Corp.(a)
719
187,709
Intuitive
Surgical,
Inc.(a)
568
296,473
IQVIA
Holdings,
Inc.(a)
959
188,453
Mettler-Toledo
International,
Inc.(a)
137
167,644
Neurocrine
Biosciences,
Inc.(a)
1,629
222,359
Regeneron
Pharmaceuticals,
Inc.(a)
346
246,466
ResMed,
Inc.
675
154,366
Revvity,
Inc.
1,976
220,541
Sarepta
Therapeutics,
Inc.(a)
1,060
128,885
Solventum
Corp.(a)
2,650
175,059
STERIS
PLC
1,357
278,945
Stryker
Corp.
987
355,369
Teleflex,
Inc.
1,080
192,218
Tenet
Healthcare
Corp.(a)
1,264
159,555
United
Therapeutics
Corp.(a)
664
234,286
Universal
Health
Services,
Inc.,
Class
B
1,167
209,383
Veeva
Systems,
Inc.,
Class
A(a)
1,094
230,014
Waters
Corp.(a)
647
240,024
West
Pharmaceutical
Services,
Inc.
600
196,536
Zoetis,
Inc.
1,305
212,624
7,560,342
Industrials
(
24
.1
%
):
A.O.
Smith
Corp.
3,298
224,957
Advanced
Drainage
Systems,
Inc.
1,178
136,177
AECOM
2,786
297,601
Allegion
PLC
2,105
275,081
AMETEK,
Inc.
1,814
326,992
Axon
Enterprise,
Inc.(a)
415
246,643
Builders
FirstSource,
Inc.(a)
745
106,483
Carlisle
Cos.,
Inc.
524
193,272
Carrier
Global
Corp.
2,771
189,148
Caterpillar,
Inc.
632
229,264
CH
Robinson
Worldwide,
Inc.
1,728
178,537
SECURITY
DESCRIPTION
SHARES
VALUE
($)
Industrials
(24.1%):
(continued)
Cintas
Corp.
1,749
319,542
Clean
Harbors,
Inc.(a)
1,047
240,957
Comfort
Systems
USA,
Inc.
340
144,180
Copart,
Inc.(a)
5,797
332,690
CSX
Corp.
10,351
334,027
Curtiss-Wright
Corp.
896
317,963
Deere
&
Co.
709
300,403
Dover
Corp.
1,676
314,418
EMCOR
Group,
Inc.
439
199,262
Equifax,
Inc.
803
204,645
Expeditors
International
of
Washington,
Inc.
2,557
283,239
Fastenal
Co.
3,899
280,377
Fortive
Corp.
3,684
276,300
GE
Vernova,
Inc.
492
161,834
General
Dynamics
Corp.
1,357
357,556
Graco,
Inc.
3,963
334,041
HEICO
Corp.
1,222
290,518
Howmet
Aerospace,
Inc.
1,826
199,710
Hubbell,
Inc.
471
197,297
Huntington
Ingalls
Industries,
Inc.
1,086
205,221
IDEX
Corp.
1,598
334,445
Illinois
Tool
Works,
Inc.
1,600
405,696
Ingersoll
Rand,
Inc.
2,406
217,647
ITT,
Inc.
1,618
231,180
J.B.
Hunt
Transport
Services,
Inc.
1,409
240,460
Leidos
Holdings,
Inc.
2,148
309,441
Lennox
International,
Inc.
382
232,753
Masco
Corp.
3,108
225,548
Norfolk
Southern
Corp.
977
229,302
Old
Dominion
Freight
Line,
Inc.
1,007
177,635
Otis
Worldwide
Corp.
3,321
307,558
PACCAR,
Inc.
2,447
254,537
Parker-Hannifin
Corp.
380
241,691
Paychex,
Inc.
2,718
381,118
Quanta
Services,
Inc.
619
195,635
Republic
Services,
Inc.
2,227
448,028
Rockwell
Automation,
Inc.
700
200,053
Rollins,
Inc.
6,264
290,336
Snap-on,
Inc.
978
332,011
SS&C
Technologies
Holdings,
Inc.
4,834
366,321
Tetra
Tech,
Inc.
5,305
211,351
Textron,
Inc.
3,217
246,068
Trane
Technologies
PLC
679
250,789
TransDigm
Group,
Inc.
213
269,931
U-Haul
Holding
Co.
3,651
233,847
Union
Pacific
Corp.
1,558
355,286
United
Rentals,
Inc.
215
151,455
Verisk
Analytics,
Inc.
1,263
347,868
Vertiv
Holdings
Co.,
Class
A
1,017
115,541
Waste
Management,
Inc.
1,674
337,796
Watsco,
Inc.
474
224,624
Schedule
of
Portfolio
Investments
-
continued
December
31,
2024
Timothy
Plan
US
Large/Mid
Cap
Core
Enhanced
ETF
See
notes
to
financial
statements.
SECURITY
DESCRIPTION
SHARES
VALUE
($)
Industrials
(24.1%):
(continued)
Westinghouse
Air
Brake
Technologies
Corp.
1,634
309,790
WW
Grainger,
Inc.
287
302,512
Xylem,
Inc.
2,268
263,133
16,939,721
Information
Technology
(
14
.1
%
):
Akamai
Technologies,
Inc.(a)
2,263
216,456
Amphenol
Corp.,
Class
A
3,718
258,215
Analog
Devices,
Inc.
841
178,679
AppLovin
Corp.,
Class
A(a)
703
227,652
Arista
Networks,
Inc.(a)
1,492
164,911
Bentley
Systems,
Inc.,
Class
B
4,284
200,063
Broadcom,
Inc.
730
169,243
Cadence
Design
Systems,
Inc.(a)
712
213,928
CDW
Corp.
1,183
205,889
Cognizant
Technology
Solutions
Corp.,
Class
A
4,350
334,515
Corpay,
Inc.(a)
739
250,092
Crowdstrike
Holdings,
Inc.,
Class
A(a)
416
142,339
Datadog,
Inc.,
Class
A(a)
1,391
198,760
DocuSign,
Inc.(a)
2,922
262,805
Dynatrace,
Inc.(a)
3,864
210,008
Enphase
Energy,
Inc.(a)
1,072
73,625
Entegris,
Inc.
1,441
142,745
EPAM
Systems,
Inc.(a)
744
173,962
F5,
Inc.(a)
1,129
283,910
Fair
Isaac
Corp.(a)
103
205,066
First
Solar,
Inc.(a)
574
101,162
Fortinet,
Inc.(a)
1,956
184,803
Gartner,
Inc.(a)
539
261,129
Jabil,
Inc.
1,283
184,624
Keysight
Technologies,
Inc.(a)
1,282
205,928
KLA
Corp.
186
117,202
Manhattan
Associates,
Inc.(a)
690
186,466
Microchip
Technology,
Inc.
2,212
126,858
Monolithic
Power
Systems,
Inc.
135
79,879
NetApp,
Inc.
1,590
184,567
NVIDIA
Corp.
851
114,281
NXP
Semiconductors
NV
755
156,927
ON
Semiconductor
Corp.(a)
1,892
119,291
Palantir
Technologies,
Inc.,
Class
A(a)
2,411
182,344
Palo
Alto
Networks,
Inc.(a)
748
136,106
PTC,
Inc.(a)
1,727
317,543
Pure
Storage,
Inc.,
Class
A(a)
2,386
146,572
Roper
Technologies,
Inc.
660
343,101
Seagate
Technology
Holdings
PLC
1,899
163,903
ServiceNow,
Inc.(a)
195
206,723
Skyworks
Solutions,
Inc.
1,765
156,520
Super
Micro
Computer,
Inc.(a)
1,268
38,649
Synopsys,
Inc.(a)
349
169,391
TE
Connectivity
PLC
2,136
305,384
Teledyne
Technologies,
Inc.(a)
627
291,009
Teradyne,
Inc.
1,072
134,986
SECURITY
DESCRIPTION
SHARES
VALUE
($)
Information
Technology
(14.1%):
(continued)
Trimble,
Inc.(a)
4,187
295,853
Tyler
Technologies,
Inc.(a)
462
266,408
VeriSign,
Inc.(a)
2,005
414,955
Zebra
Technologies
Corp.(a)
541
208,945
9,914,372
Materials
(
6
.5
%
):
Avery
Dennison
Corp.
1,662
311,010
Celanese
Corp.
1,726
119,456
CF
Industries
Holdings,
Inc.
2,703
230,620
Eastman
Chemical
Co.
2,602
237,615
Freeport-McMoRan,
Inc.
3,522
134,118
International
Paper
Co.
4,469
240,522
Linde
PLC
950
397,736
LyondellBasell
Industries
NV,
Class
A
3,642
270,491
Martin
Marietta
Materials,
Inc.
516
266,514
Nucor
Corp.
1,574
183,702
Packaging
Corp.
of
America
1,601
360,433
PPG
Industries,
Inc.
2,756
329,204
Reliance,
Inc.
833
224,294
RPM
International,
Inc.
2,308
284,022
Steel
Dynamics,
Inc.
1,783
203,387
The
Sherwin-Williams
Co.
842
286,221
Vulcan
Materials
Co.
1,130
290,670
Westlake
Corp.
1,638
187,797
4,557,812
Real
Estate
(
0
.3
%
):
CoStar
Group,
Inc.(a)
3,009
215,414
215,414
Utilities
(
9
.2
%
):
Alliant
Energy
Corp.
6,633
392,276
Ameren
Corp.
4,482
399,525
American
Electric
Power
Co.,
Inc.
3,667
338,207
American
Water
Works
Co.,
Inc.
2,357
293,423
Atmos
Energy
Corp.
3,161
440,232
CenterPoint
Energy,
Inc.
10,935
346,968
CMS
Energy
Corp.
5,778
385,104
Consolidated
Edison,
Inc.
3,909
348,800
Constellation
Energy
Corp.
449
100,446
DTE
Energy
Co.
2,817
340,153
Entergy
Corp.
5,726
434,145
Evergy,
Inc.
6,617
407,276
NextEra
Energy,
Inc.
3,102
222,382
NiSource,
Inc.
12,561
461,742
NRG
Energy,
Inc.
2,071
186,846
Public
Service
Enterprise
Group,
Inc.
4,457
376,572
The
AES
Corp.
10,289
132,419
The
Southern
Co.
4,436
365,172
Vistra
Corp.
916
126,289
Schedule
of
Portfolio
Investments
-
continued
December
31,
2024
Timothy
Plan
US
Large/Mid
Cap
Core
Enhanced
ETF
See
notes
to
financial
statements.
Percentages
indicated
are
based
on
net
assets
as
of
December
31,
2024.
SECURITY
DESCRIPTION
SHARES
VALUE
($)
Utilities
(9.2%):
(continued)
WEC
Energy
Group,
Inc.
4,042
380,110
6,478,087
Total
Common
Stocks
(Cost
$63,276,160)
69,979,194
Investment
Companies
(0.5%)
Federated
Hermes
Treasury
Obligations
Fund,
Institutional
Shares,
4.33%(b)
338,346
338,346
Total
Investment
Companies
(Cost
$338,346)
338,346
Total
Investments
(Cost
$63,614,506)
—
99.9%(c)
70,317,540
Other
assets
in
excess
of
liabilities
—
0.1%
65,579
NET
ASSETS
-
100.00%
$
70,383,119
(a)
Non-income
producing
security.
(b)
Rate
disclosed
is
the
7-Day
effective
yield
on
December
31,
2024.
(c)
See
Federal
Tax
Information
listed
in
the
Notes
to
Financial
Statements.
Futures
Contracts
Long
Futures
Index
Futures
Expiration
Date
Number
of
Contracts
Notional
Amount
Value
Value
and
Unrealized
Appreciation/
(Depreciation)
S&P
500
Index
E-mini
3/21/25
1
$
306,424
$
296,787
$
(
9,637
)
$
(
9,637
)
Schedule
of
Portfolio
Investments
December
31,
2024
Timothy
Plan
High
Dividend
Stock
Enhanced
ETF
See
notes
to
financial
statements.
SECURITY
DESCRIPTION
SHARES
VALUE
($)
Common
Stocks
(99.4%)
Consumer
Discretionary
(
4
.9
%
):
Garmin
Ltd.
3,367
694,477
Genuine
Parts
Co.
4,570
533,593
Penske
Automotive
Group,
Inc.
3,892
593,297
Service
Corp.
International
9,759
778,963
Tractor
Supply
Co.
10,430
553,416
3,153,746
Consumer
Staples
(
8
.0
%
):
Bunge
Global
SA
6,262
486,933
Dollar
General
Corp.
3,697
280,307
Hormel
Foods
Corp.
16,533
518,640
Kenvue,
Inc.
25,090
535,671
Kimberly
Clark
Corp.
5,550
727,272
McCormick
&
Co.,
Inc.
8,037
612,741
Sysco
Corp.
9,891
756,266
The
Campbell's
Co.
15,083
631,676
The
J.M.
Smucker
Co.
5,665
623,830
5,173,336
Energy
(
17
.2
%
):
Baker
Hughes
Co.
15,191
623,135
ConocoPhillips
6,627
657,200
Coterra
Energy,
Inc.
26,994
689,427
Devon
Energy
Corp.
14,180
464,111
Diamondback
Energy,
Inc.
2,802
459,052
EOG
Resources,
Inc.
5,209
638,519
EQT
Corp.
12,592
580,617
Halliburton
Co.
18,257
496,408
Kinder
Morgan,
Inc.
36,313
994,976
Occidental
Petroleum
Corp.
13,057
645,146
ONEOK,
Inc.
8,018
805,007
Ovintiv,
Inc.
12,237
495,598
Permian
Resources
Corp.
35,322
507,930
Phillips
66
Co.
4,350
495,596
Schlumberger
NV
13,094
502,024
Targa
Resources
Corp.
4,186
747,201
The
Williams
Cos.,
Inc.
16,424
888,867
Valero
Energy
Corp.
3,647
447,086
11,137,900
Financials
(
12
.3
%
):
Aflac,
Inc.
6,520
674,429
American
Financial
Group,
Inc.
6,211
850,472
Blue
Owl
Capital,
Inc.
22,779
529,839
Cincinnati
Financial
Corp.
5,303
762,041
Corebridge
Financial,
Inc.
16,660
498,634
East
West
BanCorp,
Inc.
6,189
592,659
Equitable
Holdings,
Inc.
14,778
697,078
Everest
Group
Ltd.
1,689
612,195
Fidelity
National
Information
Services,
Inc.
8,031
648,664
Jefferies
Financial
Group,
Inc.
9,598
752,483
Principal
Financial
Group,
Inc.
8,634
668,358
Reinsurance
Group
of
America,
Inc.
3,171
677,421
7,964,273
SECURITY
DESCRIPTION
SHARES
VALUE
($)
Health
Care
(
1
.2
%
):
Cardinal
Health,
Inc.
6,419
759,175
759,175
Industrials
(
17
.3
%
):
A.O.
Smith
Corp.
7,527
513,417
CH
Robinson
Worldwide,
Inc.
3,943
407,391
CSX
Corp.
23,781
767,413
Deere
&
Co.
1,619
685,970
Fastenal
Co.
8,900
639,999
General
Dynamics
Corp.
3,118
821,562
Huntington
Ingalls
Industries,
Inc.
2,479
468,457
Illinois
Tool
Works,
Inc.
3,675
931,833
Masco
Corp.
7,097
515,029
Norfolk
Southern
Corp.
2,231
523,616
Otis
Worldwide
Corp.
7,579
701,891
Paychex,
Inc.
6,244
875,534
Rockwell
Automation,
Inc.
1,597
456,407
Snap-on,
Inc.
2,232
757,719
Union
Pacific
Corp.
3,556
810,910
Waste
Management,
Inc.
3,821
771,039
Watsco,
Inc.
1,082
512,749
11,160,936
Information
Technology
(
5
.7
%
):
Analog
Devices,
Inc.
1,920
407,923
Cognizant
Technology
Solutions
Corp.,
Class
A
9,929
763,540
Microchip
Technology,
Inc.
5,048
289,503
NetApp,
Inc.
3,629
421,254
NXP
Semiconductors
NV
1,723
358,125
Seagate
Technology
Holdings
PLC
4,335
374,154
Skyworks
Solutions,
Inc.
4,029
357,292
TE
Connectivity
PLC
4,875
696,979
3,668,770
Materials
(
10
.6
%
):
Avery
Dennison
Corp.
3,792
709,597
Celanese
Corp.
3,939
272,618
CF
Industries
Holdings,
Inc.
6,168
526,254
Eastman
Chemical
Co.
5,938
542,258
International
Paper
Co.
10,202
549,072
LyondellBasell
Industries
NV,
Class
A
8,313
617,407
Nucor
Corp.
3,595
419,572
Packaging
Corp.
of
America
3,655
822,850
PPG
Industries,
Inc.
6,291
751,460
Reliance,
Inc.
1,900
511,594
RPM
International,
Inc.
5,269
648,403
Steel
Dynamics,
Inc.
4,070
464,265
6,835,350
Utilities
(
22
.2
%
):
Alliant
Energy
Corp.
15,239
901,234
Ameren
Corp.
10,295
917,696
American
Electric
Power
Co.,
Inc.
8,371
772,057
American
Water
Works
Co.,
Inc.
5,381
669,881
Atmos
Energy
Corp.
7,261
1,011,239
CenterPoint
Energy,
Inc.
24,960
791,981
Schedule
of
Portfolio
Investments
-
continued
December
31,
2024
Timothy
Plan
High
Dividend
Stock
Enhanced
ETF
See
notes
to
financial
statements.
Percentages
indicated
are
based
on
net
assets
as
of
December
31,
2024
.
SECURITY
DESCRIPTION
SHARES
VALUE
($)
Utilities
(22.2%):
(continued)
CMS
Energy
Corp.
13,273
884,645
Consolidated
Edison,
Inc.
8,923
796,199
DTE
Energy
Co.
6,429
776,302
Entergy
Corp.
13,152
997,185
Evergy,
Inc.
15,202
935,683
NextEra
Energy,
Inc.
7,080
507,565
NiSource,
Inc.
28,856
1,060,747
NRG
Energy,
Inc.
4,727
426,470
Public
Service
Enterprise
Group,
Inc.
10,238
865,009
The
AES
Corp.
23,485
302,252
The
Southern
Co.
10,193
839,088
SECURITY
DESCRIPTION
SHARES
VALUE
($)
Utilities
(22.2%):
(continued)
WEC
Energy
Group,
Inc.
9,287
873,350
14,328,583
Total
Common
Stocks
(Cost
$60,828,307)
64,182,069
Investment
Companies
(0.4%)
Federated
Hermes
Treasury
Obligations
Fund,
Institutional
Shares,
4.33%(a)
244,270
244,270
Total
Investment
Companies
(Cost
$244,270)
244,270
Total
Investments
(Cost
$61,072,577)
—
99.8%(b)
64,426,339
Other
assets
in
excess
of
liabilities
—
0.2%
124,108
NET
ASSETS
-
100.00%
$
64,550,447
(a)
Rate
disclosed
is
the
7-Day
effective
yield
on
December
31,
2024.
(b)
See
Federal
Tax
Information
listed
in
the
Notes
to
Financial
Statements.
Futures
Contracts
Long
Futures
Index
Futures
Expiration
Date
Number
of
Contracts
Notional
Amount
Value
Value
and
Unrealized
Appreciation/
(Depreciation)
S&P
500
Index
E-mini
3/21/25
1
$
306,424
$
296,787
$
(
9,637
)
$
(
9,637
)
Schedule
of
Portfolio
Investments
December
31,
2024
Timothy
Plan
Market
Neutral
ETF
See
notes
to
financial
statements.
SECURITY
DESCRIPTION
SHARES
VALUE
($)
Common
Stocks
(87.3%)
Communication
Services
(
2
.7
%
):
Cable
One,
Inc.
281
101,756
Gray
Television,
Inc.
26,593
83,768
Infrastrutture
Wireless
Italiane
SpA
5,928
60,261
John
Wiley
&
Sons,
Inc.,
Class
A
2,102
91,878
LG
Uplus
Corp.
5,049
35,437
Playtika
Holding
Corp.
8,103
56,235
SK
Telecom
Co.
Ltd.
1,433
53,745
Spark
New
Zealand
Ltd.
58,106
95,871
Tele2
AB,
Class
B
Shares
20,816
205,658
Telenor
ASA
21,512
239,938
Telstra
Group
Ltd.
33,792
83,851
1,108,398
Consumer
Discretionary
(
7
.9
%
):
Barratt
Redrow
PLC
27,612
152,108
Bath
&
Body
Works,
Inc.
2,227
86,341
Bloomin'
Brands,
Inc.
6,653
81,233
Canadian
Tire
Corp
Ltd.,
Class
A(a)
413
43,452
Carter's,
Inc.
1,947
105,508
Dillard's,
Inc.,
Class
A
162
69,942
Dine
Brands
Global,
Inc.
4,103
123,500
Ethan
Allen
Interiors,
Inc.
4,289
120,564
Garmin
Ltd.
428
88,279
H&R
Block,
Inc.
2,139
113,025
Haverty
Furniture
Cos.,
Inc.
4,089
91,021
Jack
in
the
Box,
Inc.
2,019
84,071
LCI
Industries
1,094
113,109
Lear
Corp.
959
90,817
LKQ
Corp.
2,121
77,947
Magna
International,
Inc.
2,649
110,730
Mazda
Motor
Corp.
7,200
49,585
Monro,
Inc.
3,868
95,926
Movado
Group,
Inc.
5,948
117,057
Newell
Brands,
Inc.
6,079
60,547
Oxford
Industries,
Inc.
1,028
80,986
Papa
John's
International,
Inc.
2,620
107,603
Persimmon
PLC
3,420
51,284
Polaris,
Inc.
1,391
80,149
Porsche
Automobil
Holding
SE,
Preference
5,661
213,124
Smith
&
Wesson
Brands,
Inc.
7,187
72,625
Stellantis
NV
8,119
105,867
Strategic
Education,
Inc.
1,103
103,042
Taylor
Wimpey
PLC
99,234
151,663
The
Buckle,
Inc.
2,405
122,198
The
Wendy's
Co.
6,890
112,307
Upbound
Group,
Inc.
4,477
130,594
Vail
Resorts,
Inc.
456
85,477
3,291,681
Consumer
Staples
(
5
.4
%
):
B&G
Foods,
Inc.
15,706
108,214
Bunge
Global
SA
1,204
93,623
Cal-Maine
Foods,
Inc.
1,537
158,188
SECURITY
DESCRIPTION
SHARES
VALUE
($)
Consumer
Staples
(5.4%):
(continued)
Dollar
General
Corp.
918
69,603
Energizer
Holdings,
Inc.
5,769
201,280
Flowers
Foods,
Inc.
7,703
159,144
Fresh
Del
Monte
Produce,
Inc.
3,669
121,847
Hormel
Foods
Corp.
2,402
75,351
Ingredion,
Inc.
1,001
137,697
J
Sainsbury
PLC
39,282
134,528
Kenvue,
Inc.
3,607
77,009
Kesko
Oyj,
Class
B
4,356
82,019
Nu
Skin
Enterprises,
Inc.,
Class
A
14,458
99,616
Reynolds
Consumer
Products,
Inc.
7,041
190,037
Salmar
ASA
1,240
58,908
SpartanNash
Co.
7,335
134,377
The
Campbell's
Co.
3,052
127,818
The
J.M.
Smucker
Co.
1,289
141,945
WK
Kellogg
Co.
5,143
92,523
2,263,727
Energy
(
15
.2
%
):
Aker
BP
ASA
7,062
137,610
Ampol
Ltd.
7,799
136,046
Antero
Midstream
Corp.
13,699
206,718
APA
Corp.
4,140
95,593
Ardmore
Shipping
Corp.
6,362
77,298
Atlas
Energy
Solutions,
Inc.
1,816
40,279
Berry
Corp.
35,731
147,569
Chord
Energy
Corp.
913
106,748
Civitas
Resources,
Inc.
3,326
152,564
Coterra
Energy,
Inc.
5,161
131,812
Crescent
Energy
Co.,
Class
A
10,763
157,247
Devon
Energy
Corp.
2,286
74,821
DHT
Holdings,
Inc.
13,476
125,192
DT
Midstream,
Inc.
3,063
304,554
Eni
SpA
9,865
133,743
Equinor
ASA
5,008
116,821
FLEX
LNG
Ltd.
6,488
148,835
FutureFuel
Corp.
14,623
77,356
Golar
LNG
Ltd.
1,190
50,361
Granite
Ridge
Resources,
Inc.
11,404
73,670
HD
Hyundai
Co.
Ltd.
1,918
103,211
HF
Sinclair
Corp.
2,352
82,438
Keyera
Corp.
9,774
298,939
Kinder
Morgan,
Inc.
7,947
217,748
Kinetik
Holdings,
Inc.
3,924
222,530
Noble
Corp.
PLC
4,305
135,177
Nordic
American
Tankers
Ltd.
64,753
161,882
Northern
Oil
&
Gas,
Inc.
3,509
130,394
OMV
AG
3,232
124,991
ONEOK,
Inc.
1,799
180,620
Ovintiv,
Inc.
1,640
66,420
Patterson-UTI
Energy,
Inc.
16,575
136,909
Pembina
Pipeline
Corp.
7,202
266,123
Phillips
66
Co.
880
100,258
Repsol
SA
10,446
126,473
Schedule
of
Portfolio
Investments
-
continued
December
31,
2024
Timothy
Plan
Market
Neutral
ETF
See
notes
to
financial
statements.
SECURITY
DESCRIPTION
SHARES
VALUE
($)
Energy
(15.2%):
(continued)
Riley
Exploration
Permian,
Inc.
3,489
111,369
Santos
Ltd.
17,934
74,132
SFL
Corp.
Ltd.
17,560
179,463
Sitio
Royalties
Corp.,
Class
A
7,787
149,355
Suncor
Energy,
Inc.
1,063
37,948
TC
Energy
Corp.
4,479
208,758
Tenaris
SA
4,908
91,854
The
Williams
Cos.,
Inc.
3,176
171,885
TotalEnergies
SE
1,121
61,964
VAALCO
Energy,
Inc.
14,428
63,050
Valero
Energy
Corp.
853
104,569
Vitesse
Energy,
Inc.
6,081
152,025
Woodside
Energy
Group
Ltd.
5,170
78,700
6,334,022
Financials
(
20
.6
%
):
ABN
AMRO
Bank
NV
7,683
118,484
Ageas
SA
3,647
177,151
A-Mark
Precious
Metals,
Inc.
3,018
82,693
ANZ
Group
Holdings
Ltd.(a)
13,854
244,669
Artisan
Partners
Asset
Management,
Inc.,
Class
A
4,839
208,319
Axis
Capital
Holdings
Ltd.
900
79,758
Banco
Latinoamericano
de
Comercio
Exterior
SA,
Class
E
3,177
113,006
Bank
of
Hawaii
Corp.
1,163
82,852
Bank
OZK
2,671
118,940
BankUnited,
Inc.
3,021
115,312
Blue
Owl
Capital,
Inc.
7,176
166,914
Columbia
Banking
System,
Inc.
3,328
89,889
Credit
Agricole
SA
5,461
75,168
Dime
Community
Bancshares,
Inc.
2,414
74,194
First
American
Financial
Corp.
608
37,964
First
Bancorp
Puerto
Rico
4,542
84,436
First
Busey
Corp.
2,774
65,383
First
Financial
Bancorp
4,882
131,228
First
Hawaiian,
Inc.
4,069
105,591
First
Interstate
BancSystem,
Inc.,
Class
A
4,723
153,356
FNB
Corp.
14,389
212,669
Generali
7,365
208,014
Glacier
Bancorp,
Inc.
2,710
136,096
Great-West
Lifeco,
Inc.
2,414
80,064
HA
Sustainable
Infrastructure
Capital,
Inc.
2,256
60,529
Hana
Financial
Group,
Inc.
1,747
67,421
Hanmi
Financial
Corp.
5,122
120,982
Hope
Bancorp,
Inc.
13,778
169,332
Industrial
Bank
of
Korea
6,667
64,912
Intesa
Sanpaolo
SpA
63,829
255,374
Invesco
Ltd.
7,330
128,128
Janus
Henderson
Group
PLC
5,408
230,002
Jefferies
Financial
Group,
Inc.
3,090
242,256
KBC
Group
NV
1,768
136,492
SECURITY
DESCRIPTION
SHARES
VALUE
($)
Financials
(20.6%):
(continued)
Lazard,
Inc.
2,751
141,621
Legal
&
General
Group
PLC
20,203
58,112
Mediobanca
Banca
di
Credito
Finanziario
SpA
16,680
243,152
MGIC
Investment
Corp.
1,748
41,445
NH
Investment
&
Securities
Co.
Ltd.
2,416
22,899
NN
Group
NV
3,812
166,096
Northwest
Bancshares,
Inc.
15,353
202,506
OceanFirst
Financial
Corp.
4,451
80,563
Old
Republic
International
Corp.
6,159
222,894
OneMain
Holdings,
Inc.
3,300
172,029
Pacific
Premier
Bancorp,
Inc.
5,150
128,338
Patria
Investments
Ltd.,
Class
A
9,883
114,939
Popular,
Inc.
1,460
137,328
Poste
Italiane
SpA
12,853
181,308
Power
Corp.
of
Canada
7,061
220,285
Principal
Financial
Group,
Inc.
903
69,901
Prosperity
Bancshares,
Inc.
1,775
133,746
Safety
Insurance
Group,
Inc.
1,660
136,784
Schroders
PLC
8,882
35,977
Shinhan
Financial
Group
Co.
Ltd.
933
30,206
Societe
Generale
SA
1,530
43,038
Southside
Bancshares,
Inc.
3,788
120,307
Svenska
Handelsbanken
AB,
Class
A
5,748
59,362
Swedbank
AB,
Class
A
2,113
41,714
Swiss
Re
AG
1,351
195,383
Synovus
Financial
Corp.
2,903
148,721
TFS
Financial
Corp.
5,708
71,693
The
Bank
of
NT
Butterfield
&
Son
Ltd.
5,618
205,338
The
Western
Union
Co.
13,049
138,319
UWM
Holdings
Corp.
6,197
36,376
Valley
National
Bancorp
9,326
84,494
Virtus
Investment
Partners,
Inc.
426
93,967
WesBanco,
Inc.
3,206
104,323
Westpac
Banking
Corp.
7,215
144,297
Woori
Financial
Group,
Inc.
7,926
82,771
XP,
Inc.,
Class
A
3,012
35,692
8,583,502
Health
Care
(
1
.1
%
):
Baxter
International,
Inc.
3,084
89,929
Embecta
Corp.
4,847
100,091
Ono
Pharmaceutical
Co.
Ltd.
13,200
137,135
Premier,
Inc.,
Class
A
5,866
124,359
451,514
Industrials
(
8
.2
%
):
ACCO
Brands
Corp.
11,711
61,483
ACS
Actividades
de
Construccion
y
Servicios
SA(a)
6,596
302,252
Adecco
Group
AG
3,736
92,082
AGCO
Corp.
1,269
118,626
Bouygues
SA
6,237
184,359
CNH
Industrial
NV
7,317
82,902
Costamare,
Inc.
7,438
95,578
Schedule
of
Portfolio
Investments
-
continued
December
31,
2024
Timothy
Plan
Market
Neutral
ETF
See
notes
to
financial
statements.
SECURITY
DESCRIPTION
SHARES
VALUE
($)
Industrials
(8.2%):
(continued)
Deluxe
Corp.
7,508
169,606
Deutsche
Post
AG
2,457
86,469
Doosan
Bobcat,
Inc.
1,211
34,475
Douglas
Dynamics,
Inc.
3,602
85,115
Eiffage
SA
533
46,768
Ennis,
Inc.
3,775
79,615
Genco
Shipping
&
Trading
Ltd.
8,247
114,963
Golden
Ocean
Group
Ltd.
11,396
102,108
GS
Holdings
Corp.(a)
2,792
74,552
HNI
Corp.
2,555
128,695
Insteel
Industries,
Inc.
2,830
76,438
Komatsu
Ltd.
1,400
38,708
Kuehne
+
Nagel
International
AG,
Class
R
452
103,534
ManpowerGroup,
Inc.
1,462
84,387
Matthews
International
Corp.,
Class
A
5,014
138,788
MSC
Industrial
Direct
Co.,
Inc.
1,134
84,698
National
Presto
Industries,
Inc.
1,480
145,662
Paychex,
Inc.
377
52,863
Randstad
NV
1,785
75,262
Resources
Connection,
Inc.
16,239
138,519
Robert
Half,
Inc.
1,722
121,332
Ryder
System,
Inc.
532
83,450
Teleperformance
SE
402
34,607
Transurban
Group(a)
7,733
64,074
Trinity
Industries,
Inc.
4,553
159,810
Vinci
SA
360
37,188
Volvo
AB,
Class
B
2,247
54,580
Watsco,
Inc.
162
76,770
3,430,318
Materials
(
7
.8
%
):
Amcor
PLC
11,566
108,836
Anglo
American
PLC
1,401
41,456
Ardagh
Metal
Packaging
SA
36,292
109,239
Arkema
SA
1,566
119,291
BHP
Group
Ltd.
4,065
99,485
Boliden
AB
3,761
105,607
CRH
PLC
1,100
101,772
Eastman
Chemical
Co.
2,129
194,420
Evonik
Industries
AG
11,075
191,900
FMC
Corp.
1,168
56,776
Fortescue
Ltd.
7,992
90,255
Huntsman
Corp.
6,093
109,857
International
Paper
Co.
1,559
83,905
JFE
Holdings,
Inc.
13,100
148,169
Kaiser
Aluminum
Corp.
1,482
104,140
LyondellBasell
Industries
NV,
Class
A
1,932
143,490
Mitsui
Chemicals,
Inc.
3,300
72,783
Newmont
Corp.
1,192
44,366
Nippon
Steel
Corp.
5,600
113,260
Norsk
Hydro
ASA
12,315
67,694
Nutrien
Ltd.
1,915
85,697
SECURITY
DESCRIPTION
SHARES
VALUE
($)
Materials
(7.8%):
(continued)
Packaging
Corp.
of
America
943
212,298
Ramaco
Resources,
Inc.,
Class
A
5,557
57,015
Rio
Tinto
PLC
1,560
92,224
Ryerson
Holding
Corp.
5,259
97,344
Sonoco
Products
Co.
3,017
147,380
Southern
Copper
Corp.
527
48,026
SunCoke
Energy,
Inc.
13,584
145,349
The
Mosaic
Co.
3,721
91,462
The
Scotts
Miracle-Gro
Co.
1,345
89,227
UPM-Kymmene
Oyj
3,370
92,703
3,265,426
Utilities
(
18
.4
%
):
Alliant
Energy
Corp.
3,051
180,436
American
Electric
Power
Co.,
Inc.
1,333
122,943
APA
Group(a)
11,827
51,010
Avista
Corp.
5,711
209,194
Black
Hills
Corp.
3,577
209,326
Brookfield
Infrastructure
Corp.(a)
2,796
111,868
Canadian
Utilities
Ltd.,
Class
A
1,936
46,942
Clearway
Energy,
Inc.,
Class
C
2,709
70,434
CMS
Energy
Corp.
3,168
211,147
Consolidated
Edison,
Inc.
2,373
211,743
DTE
Energy
Co.
1,993
240,655
EDP
SA
36,980
118,386
Emera,
Inc.
6,161
230,314
Endesa
SA
9,828
211,415
Enel
SpA
33,892
241,712
Engie
SA
14,995
237,769
Entergy
Corp.
2,160
163,771
Evergy,
Inc.
2,675
164,646
Eversource
Energy
2,338
134,271
Fortum
Oyj
9,688
135,608
IDACORP,
Inc.
1,464
159,986
National
Fuel
Gas
Co.
2,460
149,273
New
Jersey
Resources
Corp.
3,149
146,901
NextEra
Energy,
Inc.
1,508
108,109
NiSource,
Inc.
6,674
245,336
Northwest
Natural
Holding
Co.
3,884
153,651
Northwestern
Energy
Group,
Inc.
4,394
234,903
OGE
Energy
Corp.
3,251
134,104
ONE
Gas,
Inc.
2,830
195,977
Origin
Energy
Ltd.
12,527
84,494
Pinnacle
West
Capital
Corp.
2,417
204,889
Portland
General
Electric
Co.
5,290
230,750
Public
Service
Enterprise
Group,
Inc.
2,497
210,972
Redeia
Corp.
SA
14,123
241,349
RWE
AG
1,963
58,614
Snam
SpA
27,690
122,658
Southwest
Gas
Holdings,
Inc.
2,472
174,795
Spire,
Inc.
3,810
258,432
SSE
PLC(a)
7,278
146,123
The
Southern
Co.
2,550
209,916
TXNM
Energy,
Inc.
6,445
345,566
Schedule
of
Portfolio
Investments
-
continued
December
31,
2024
Timothy
Plan
Market
Neutral
ETF
See
notes
to
financial
statements.
Percentages
indicated
are
based
on
net
assets
as
of
December
31,
2024
.
SECURITY
DESCRIPTION
SHARES
VALUE
($)
Utilities
(18.4%):
(continued)
UGI
Corp.
4,650
131,269
United
Utilities
Group
PLC
6,140
80,813
Veolia
Environnement
SA
5,718
160,549
WEC
Energy
Group,
Inc.
1,752
164,758
7,657,777
Total
Common
Stocks
(Cost
$34,170,350)
36,386,365
Total
Investments
(Cost
$34,170,350)
—
87.3%(b)
36,386,365
Other
assets
in
excess
of
liabilities
—
12.7%
5,316,928
NET
ASSETS
-
100.00%
$
41,703,293
(a)
Non-income
producing
security.
(b)
See
Federal
Tax
Information
listed
in
the
Notes
to
Financial
Statements.
Futures
Contracts
Short
Futures
Index
Futures
Expiration
Date
Number
of
Contracts
Notional
Amount
Value
Value
and
Unrealized
Appreciation/
(Depreciation)
E-Mini
Russell
2000
Index
3/21/25
88
$
(
10,460,047
)
$
(
9,899,120
)
$
560,927
Mini
MSCI
EAFE
Index
3/21/25
87
(
10,168,270
)
(
9,863,625
)
304,645
S&P
500
Index
E-mini
3/21/25
176
(
53,880,208
)
(
52,234,600
)
1,645,608
$
2,511,180
Long
Futures
Index
Futures
Expiration
Date
Number
of
Contracts
Notional
Amount
Value
Value
and
Unrealized
Appreciation/
(Depreciation)
NASDAQ
100
E
Mini
Future
Index
3/21/25
84
$
37,061,342
$
35,660,520
$
(
1,400,822
)
$
(
1,400,822
)
Total
Net
Futures
Contracts
$
1,110,358
Statements
of
Assets
and
Liabilities
December
31,
2024
Timothy
Plan
See
notes
to
financial
statements.
Timothy
Plan
US
Small
Cap
Core
ETF
Timothy
Plan
US
Large/Mid
Cap
Core
ETF
ASSETS:
Investments,
at
value
(Cost
$150,953,924
and
$232,489,844)
$
169,148,207
$
266,515,597
Cash
368,478
918,826
Deposits
with
broker
for
futures
contracts
152,270
341,598
Interest
and
dividends
receivable
172,784
145,109
Variation
margin
receivable
on
open
futures
contracts
376
—
Reclaims
receivable
—
1,386
Total
Assets
169,842,115
267,922,516
LIABILITIES:
Variation
margin
payable
on
open
futures
contracts
—
4,600
Accrued
expenses
and
other
payables:
—
—
Investment
advisory
fees
76,135
119,824
Total
Liabilities
76,135
124,424
Net
Assets
169,765,980
267,798,092
NET
ASSETS
CONSIST
OF:
Capital
$
171,732,714
$
261,641,470
Total
distributable
earnings/(loss)
(
1,966,734
)
6,156,622
Net
Assets
$
169,765,980
$
267,798,092
Shares
Outstanding
(unlimited
shares
authorized,
no
par
value):
4,350,000
6,250,000
Net
asset
value
per
share:
$
39.03
$
42.85
Statements
of
Assets
and
Liabilities
-
continued
December
31,
2024
Timothy
Plan
See
notes
to
financial
statements.
Timothy
Plan
High
Dividend
Stock
ETF
Timothy
Plan
International
ETF
ASSETS:
Investments,
at
value
(Cost
$225,985,430
and
$102,257,918)
$
236,789,332
$
111,028,609
Foreign
currency,
at
value
(Cost
$—
and
$30,016)
—
29,709
Cash
820,635
628,973
Deposits
with
broker
for
futures
contracts
404,920
80,661
Interest
and
dividends
receivable
226,242
62,590
Reclaims
receivable
3,050
354,432
Total
Assets
238,244,179
112,184,974
LIABILITIES:
Variation
margin
payable
on
open
futures
contracts
4,600
879
Accrued
expenses
and
other
payables:
—
—
Investment
advisory
fees
107,908
59,102
Total
Liabilities
112,508
59,981
Net
Assets
238,131,671
112,124,993
NET
ASSETS
CONSIST
OF:
Capital
$
254,620,920
$
113,960,442
Total
distributable
earnings/(loss)
(
16,489,249
)
(
1,835,449
)
Net
Assets
$
238,131,671
$
112,124,993
Shares
Outstanding
(unlimited
shares
authorized,
no
par
value):
6,550,000
4,250,000
Net
asset
value
per
share:
$
36.36
$
26.38
Statements
of
Assets
and
Liabilities
-
continued
December
31,
2024
Timothy
Plan
See
notes
to
financial
statements.
Timothy
Plan
US
Large/Mid
Cap
Core
Enhanced
ETF
Timothy
Plan
High
Dividend
Stock
Enhanced
ETF
ASSETS:
Investments,
at
value
(Cost
$63,614,506
and
$61,072,577)
$
70,317,540
$
64,426,339
Deposits
with
broker
for
futures
contracts
58,600
91,303
Interest
and
dividends
receivable
39,881
62,338
Reclaims
receivable
373
852
Total
Assets
70,416,394
64,580,832
LIABILITIES:
Variation
margin
payable
on
open
futures
contracts
1,150
1,150
Accrued
expenses
and
other
payables:
—
—
Investment
advisory
fees
32,125
29,235
Total
Liabilities
33,275
30,385
Net
Assets
70,383,119
64,550,447
NET
ASSETS
CONSIST
OF:
Capital
$
78,461,038
$
74,896,682
Total
distributable
earnings/(loss)
(
8,077,919
)
(
10,346,235
)
Net
Assets
$
70,383,119
$
64,550,447
Shares
Outstanding
(unlimited
shares
authorized,
no
par
value):
2,750,000
2,600,000
Net
asset
value
per
share:
$
25.59
$
24.83
Statements
of
Assets
and
Liabilities
-
continued
December
31,
2024
Timothy
Plan
See
notes
to
financial
statements.
Timothy
Plan
Market
Neutral
ETF
ASSETS:
Investments,
at
value
(Cost
$34,170,350)
$
36,386,365
Foreign
currency,
at
value
(Cost
$6,647)
6,647
Cash
2,501,676
Deposits
with
broker
for
futures
contracts
3,255,505
Interest
and
dividends
receivable
54,112
Variation
margin
receivable
on
open
futures
contracts
212,405
Reclaims
receivable
53,907
Total
Assets
42,470,617
LIABILITIES:
Payable
for
investments
purchased
416,726
Variation
margin
payable
on
open
futures
contracts
328,020
Accrued
expenses
and
other
payables:
—
Investment
advisory
fees
22,578
Total
Liabilities
767,324
Net
Assets
41,703,293
NET
ASSETS
CONSIST
OF:
Capital
$
45,884,713
Total
distributable
earnings/(loss)
(
4,181,420
)
Net
Assets
$
41,703,293
Shares
Outstanding
(unlimited
shares
authorized,
no
par
value):
1,770,000
Net
asset
value
per
share:
$
23.56
Statements
of
Operations
For
the
Year
Ended
December
31,
2024
Timothy
Plan
See
notes
to
financial
statements.
Timothy
Plan
US
Small
Cap
Core
ETF
Timothy
Plan
US
Large/Mid
Cap
Core
ETF
Investment
Income:
Dividend
income
$
2,093,354
$
3,398,828
Interest
income
5,744
13,396
Foreign
tax
withholding
(
3,145
)
(
1,113
)
Total
Income
2,095,953
3,411,111
Expenses:
Investment
advisory
fees
706,972
1,252,267
Total
Expenses
706,972
1,252,267
Net
Investment
Income
(Loss)
1,388,981
2,158,844
Realized/Unrealized
Gains
(Losses)
from
Investments:
Net
realized
gains
(losses)
from
investments
(
7,247,287
)
(
7,798,604
)
Net
realized
gains
(losses)
from
in-kind
transactions
15,468,001
31,917,550
Net
realized
gains
(losses)
from
futures
contracts
99,994
168,354
Net
change
in
unrealized
appreciation/depreciation
on
investments
5,520,963
2,239,157
Net
change
in
unrealized
appreciation/depreciation
on
futures
contracts
(
47,199
)
(
63,416
)
Net
realized/unrealized
gains
on
investments
13,794,472
26,463,041
Change
in
net
assets
resulting
from
operations
$
15,183,453
$
28,621,885
Statements
of
Operations
-
continued
For
the
Year
Ended
December
31,
2024
Timothy
Plan
See
notes
to
financial
statements.
Timothy
Plan
High
Dividend
Stock
ETF
Timothy
Plan
International
ETF
Investment
Income:
Dividend
income
$
6,260,993
$
3,763,264
Interest
income
15,311
4,674
Foreign
tax
withholding
(
3,325
)
(
576,639
)
Total
Income
6,272,979
3,191,299
Expenses:
Investment
advisory
fees
1,219,635
668,453
Total
Expenses
1,219,635
668,453
Net
Investment
Income
(Loss)
5,053,344
2,522,846
Realized/Unrealized
Gains
(Losses)
from
Investments:
Net
realized
gains
(losses)
from
investments
and
foreign
currency
transactions
(
7,575,111
)
1,298,483
Net
realized
gains
(losses)
from
in-kind
transactions
33,080,075
—
Net
realized
gains
(losses)
from
futures
contracts
204,919
(
11,800
)
Net
change
in
unrealized
appreciation/depreciation
on
investments
and
foreign
currency
translations
(
5,033,820
)
(
955,069
)
Net
change
in
unrealized
appreciation/depreciation
on
futures
contracts
(
56,628
)
(
25,958
)
Net
realized/unrealized
gains
on
investments
20,619,435
305,656
Change
in
net
assets
resulting
from
operations
$
25,672,779
$
2,828,502
Statements
of
Operations
-
continued
For
the
Year
Ended
December
31,
2024
Timothy
Plan
See
notes
to
financial
statements.
Timothy
Plan
US
Large/Mid
Cap
Core
Enhanced
ETF
Timothy
Plan
High
Dividend
Stock
Enhanced
ETF
Investment
Income:
Dividend
income
$
990,201
$
1,815,914
Interest
income
2,642
3,210
Foreign
tax
withholding
(
356
)
(
593
)
Total
Income
992,487
1,818,531
Expenses:
Investment
advisory
fees
362,057
350,498
Total
Expenses
362,057
350,498
Net
Investment
Income
(Loss)
630,430
1,468,033
Realized/Unrealized
Gains
(Losses)
from
Investments:
Net
realized
gains
(losses)
from
investments
(
284,921
)
1,004,544
Net
realized
gains
(losses)
from
in-kind
transactions
6,015,369
5,318,966
Net
realized
gains
(losses)
from
futures
contracts
52,568
45,927
Net
change
in
unrealized
appreciation/depreciation
on
investments
1,663,014
(
270,038
)
Net
change
in
unrealized
appreciation/depreciation
on
futures
contracts
(
11,345
)
(
11,779
)
Net
realized/unrealized
gains
on
investments
7,434,685
6,087,620
Change
in
net
assets
resulting
from
operations
$
8,065,115
$
7,555,653
Statements
of
Operations
-
continued
For
the
Year
Ended
December
31,
2024
Timothy
Plan
See
notes
to
financial
statements.
Timothy
Plan
Market
Neutral
ETF
Investment
Income:
Dividend
income
$
1,775,411
Interest
income
178,333
Foreign
tax
withholding
(
136,543
)
Total
Income
1,817,201
Expenses:
Investment
advisory
fees
257,351
Total
Expenses
257,351
Net
Investment
Income
(Loss)
1,559,850
Realized/Unrealized
Gains
(Losses)
from
Investments:
Net
realized
gains
(losses)
from
investments
and
foreign
currency
transactions
653,916
Net
realized
gains
(losses)
from
in-kind
transactions
235,569
Net
realized
gains
(losses)
from
futures
contracts
(
4,525,522
)
Net
change
in
unrealized
appreciation/depreciation
on
investments
and
foreign
currency
translations
406,205
Net
change
in
unrealized
appreciation/depreciation
on
futures
contracts
2,397,115
Net
realized/unrealized
losses
on
investments
(
832,717
)
Change
in
net
assets
resulting
from
operations
$
727,133
Statements
of
Changes
in
Net
Assets
Timothy
Plan
See
notes
to
financial
statements.
Timothy
Plan
US
Small
Cap
Core
ETF
Timothy
Plan
US
Large/Mid
Cap
Core
ETF
For
the
Year
Ended
December
31,
2024
For
the
Year
Ended
December
31,
2023
For
the
Year
Ended
December
31,
2024
For
the
Year
Ended
December
31,
2023
From
Investment
Activities:
Operations:
Net
investment
income
(loss)
$
1,388,981
$
941,090
$
2,158,844
$
2,121,169
Net
realized
gains
(losses)
8,320,708
(
1,176,390
)
24,287,300
2,796,523
Net
change
in
unrealized
appreciation/depreciation
5,473,764
12,553,275
2,175,741
23,954,965
Change
in
net
assets
resulting
from
operations
15,183,453
12,317,975
28,621,885
28,872,657
Distributions
to
Shareholders:
Distributions
(
1,405,308
)
(
1,014,568
)
(
2,166,878
)
(
2,035,463
)
Change
in
net
assets
resulting
from
distributions
to
shareholders
(
1,405,308
)
(
1,014,568
)
(
2,166,878
)
(
2,035,463
)
Change
in
net
assets
resulting
from
capital
transactions
53,511,526
19,751,180
4,392,539
31,053,472
Change
in
net
assets
67,289,671
31,054,587
30,847,546
57,890,666
Net
Assets:
Beginning
of
period
102,476,309
71,421,722
236,950,546
179,059,880
End
of
period
$
169,765,980
$
102,476,309
$
267,798,092
$
236,950,546
Capital
Transactions:
Proceeds
from
shares
issued
$
105,385,140
$
52,216,218
$
104,545,272
$
75,986,933
Cost
of
shares
redeemed
(
51,873,614
)
(
32,465,038
)
(
100,152,733
)
(
44,933,461
)
Change
in
net
assets
resulting
from
capital
transactions
$
53,511,526
$
19,751,180
$
4,392,539
$
31,053,472
Share
Transactions:
Issued
2,850,000
1,600,000
2,500,000
2,150,000
Redeemed
(
1,400,000
)
(
1,050,000
)
(
2,450,000
)
(
1,300,000
)
Change
in
Shares
1,450,000
550,000
50,000
850,000
Statements
of
Changes
in
Net
Assets
-
continued
Timothy
Plan
See
notes
to
financial
statements.
Timothy
Plan
High
Dividend
Stock
ETF
Timothy
Plan
International
ETF
For
the
Year
Ended
December
31,
2024
For
the
Year
Ended
December
31,
2023
For
the
Year
Ended
December
31,
2024
For
the
Year
Ended
December
31,
2023
From
Investment
Activities:
Operations:
Net
investment
income
(loss)
$
5,053,344
$
4,642,065
$
2,522,846
$
2,257,286
Net
realized
gains
(losses)
25,709,883
857,330
1,286,683
(
2,510,198
)
Net
change
in
unrealized
appreciation/depreciation
(
5,090,448
)
12,686,240
(
981,027
)
13,166,040
Change
in
net
assets
resulting
from
operations
25,672,779
18,185,635
2,828,502
12,913,128
Distributions
to
Shareholders:
Distributions
(
4,895,565
)
(
4,513,975
)
(
3,111,526
)
(
2,243,745
)
Change
in
net
assets
resulting
from
distributions
to
shareholders
(
4,895,565
)
(
4,513,975
)
(
3,111,526
)
(
2,243,745
)
Change
in
net
assets
resulting
from
capital
transactions
(
11,443,891
)
36,140,658
14,606,623
10,256,927
Change
in
net
assets
9,333,323
49,812,318
14,323,599
20,926,310
Net
Assets:
Beginning
of
period
228,798,348
178,986,030
97,801,394
76,875,084
End
of
period
$
238,131,671
$
228,798,348
$
112,124,993
$
97,801,394
Capital
Transactions:
Proceeds
from
shares
issued
$
138,750,959
$
92,478,496
$
14,606,623
$
16,109,565
Cost
of
shares
redeemed
(
150,194,850
)
(
56,337,838
)
—
(
5,852,638
)
Change
in
net
assets
resulting
from
capital
transactions
$
(
11,443,891
)
$
36,140,658
$
14,606,623
$
10,256,927
Share
Transactions:
Issued
3,850,000
3,000,000
550,000
650,000
Redeemed
(
4,200,000
)
(
1,850,000
)
—
(
250,000
)
Change
in
Shares
(
350,000
)
1,150,000
550,000
400,000
Statements
of
Changes
in
Net
Assets
-
continued
Timothy
Plan
See
notes
to
financial
statements.
Timothy
Plan
US
Large/Mid
Cap
Core
Enhanced
ETF
Timothy
Plan
High
Dividend
Stock
Enhanced
ETF
For
the
Year
Ended
December
31,
2024
For
the
Year
Ended
December
31,
2023
For
the
Year
Ended
December
31,
2024
For
the
Year
Ended
December
31,
2023
From
Investment
Activities:
Operations:
Net
investment
income
(loss)
$
630,430
$
1,027,288
$
1,468,033
$
1,826,942
Net
realized
gains
(losses)
5,783,016
(
7,677,050
)
6,369,437
(
6,820,555
)
Net
change
in
unrealized
appreciation/depreciation
1,651,669
5,067,239
(
281,817
)
3,940,819
Change
in
net
assets
resulting
from
operations
8,065,115
(
1,582,523
)
7,555,653
(
1,052,794
)
Distributions
to
Shareholders:
Distributions
(
633,632
)
(
957,342
)
(
1,413,960
)
(
1,717,979
)
Change
in
net
assets
resulting
from
distributions
to
shareholders
(
633,632
)
(
957,342
)
(
1,413,960
)
(
1,717,979
)
Change
in
net
assets
resulting
from
capital
transactions
4,774,464
(
9,342,524
)
(
8,355,308
)
1,480,043
Change
in
net
assets
12,205,947
(
11,882,389
)
(
2,213,615
)
(
1,290,730
)
Net
Assets:
Beginning
of
period
58,177,172
70,059,561
66,764,062
68,054,792
End
of
period
$
70,383,119
$
58,177,172
$
64,550,447
$
66,764,062
Capital
Transactions:
Proceeds
from
shares
issued
$
24,141,386
$
3,153,818
$
17,354,716
$
16,781,494
Cost
of
shares
redeemed
(
19,366,922
)
(
12,496,342
)
(
25,710,024
)
(
15,301,451
)
Change
in
net
assets
resulting
from
capital
transactions
$
4,774,464
$
(
9,342,524
)
$
(
8,355,308
)
$
1,480,043
Share
Transactions:
Issued
950,000
150,000
700,000
750,000
Redeemed
(
750,000
)
(
550,000
)
(
1,050,000
)
(
700,000
)
Change
in
Shares
200,000
(
400,000
)
(
350,000
)
50,000
Statements
of
Changes
in
Net
Assets
-
continued
Timothy
Plan
See
notes
to
financial
statements.
Timothy
Plan
Market
Neutral
ETF
For
the
Year
Ended
December
31,
2024
For
the
Period
January
25,
2023
(a)
through
December
31,
2023
From
Investment
Activities:
Operations:
Net
investment
income
(loss)
$
1,559,850
$
1,871,463
Net
realized
gains
(losses)
(
3,636,037
)
(
346,591
)
Net
change
in
unrealized
appreciation/depreciation
2,803,320
520,739
Change
in
net
assets
resulting
from
operations
727,133
2,045,611
Distributions
to
Shareholders:
Distributions
(
1,688,176
)
(
3,362,437
)
Change
in
net
assets
resulting
from
distributions
to
shareholders
(
1,688,176
)
(
3,362,437
)
Change
in
net
assets
resulting
from
capital
transactions
8,257,471
35,723,691
Change
in
net
assets
7,296,428
34,406,865
Net
Assets:
Beginning
of
period
34,406,865
—
End
of
period
$
41,703,293
$
34,406,865
Capital
Transactions:
Proceeds
from
shares
issued
$
9,680,975
$
76,207,397
Cost
of
shares
redeemed
(
1,423,504
)
(
40,483,706
)
Change
in
net
assets
resulting
from
capital
transactions
$
8,257,471
$
35,723,691
Share
Transactions:
Issued
410,000
3,050,000
Redeemed
(
60,000
)
(
1,630,000
)
Change
in
Shares
350,000
1,420,000
(a)
Commencement
of
operations.
Financial
Highlights
For
a
Share
Outstanding
Throughout
Each
Period
Timothy
Plan
See
notes
to
financial
statements.
Timothy
Plan
US
Small
Cap
Core
ETF
For
the
Year
Ended
December
31,
2024
For
the
Year
Ended
December
31,
2023
For
the
Year
Ended
December
31,
2022
For
the
Year
Ended
December
31,
2021
For
the
Year
Ended
December
31,
2020
Net
Asset
Value,
Beginning
of
Period
$
35.34
$
30.39
$
35.49
$
27.71
$
25.55
Investment
Activities:
Net
Investment
Income
(Loss)
(a)
0.38
0.36
0.34
0.40
0.32
Net
Realized
and
Unrealized
Gains
(Losses)
on
Investments
3.69
4.97
(
5.11
)
7.78
2.15
Total
from
Investment
Activities
4.07
5.33
(
4.77
)
8.18
2.47
Distributions
to
Shareholders:
Net
Investment
Income
(
0.38
)
(
0.38
)
(
0.33
)
(
0.40
)
(
0.31
)
Total
Distributions
(
0.38
)
(
0.38
)
(
0.33
)
(
0.40
)
(
0.31
)
Net
Asset
Value,
End
of
Period
$
39.03
$
35.34
$
30.39
$
35.49
$
27.71
Total
Return
(b)
11
.57
%
17
.64
%
(
13
.45
%
)
29
.62
%
9
.99
%
Ratios/Supplemental
Data:
Ratio
of
Expenses
to
Average
Net
Assets
0
.52
%
0
.52
%
0
.52
%
0
.52
%
0
.52
%
Ratio
of
Net
Investment
Income
(Loss)
to
Average
Net
Assets
1
.02
%
1
.13
%
1
.09
%
1
.20
%
1
.45
%
Net
Assets,
End
of
Period
(000's)
$
169,766
$
102,476
$
71,422
$
56,792
$
31,869
Portfolio
Turnover
(c)
44
%
60
%
59
%
57
%
78
%
Table
Line
(a)
Per
share
net
investment
income
(loss)
has
been
calculated
using
the
average
daily
shares
method.
(b)
Assumes
reinvestment
of
all
net
investment
income
and
realized
capital
gain
distributions,
if
any,
during
the
period.
Includes
adjustments
in
accordance
with
U.S.
Generally
Accepted
Accounting
Principles
and
could
differ
from
the
reported
return.
(c)
Excludes
impact
of
in-kind
transactions.
Financial
Highlights
-
continued
For
a
Share
Outstanding
Throughout
Each
Period
Timothy
Plan
See
notes
to
financial
statements.
Timothy
Plan
US
Large/Mid
Cap
Core
ETF
For
the
Year
Ended
December
31,
2024
For
the
Year
Ended
December
31,
2023
For
the
Year
Ended
December
31,
2022
For
the
Year
Ended
December
31,
2021
For
the
Year
Ended
December
31,
2020
Net
Asset
Value,
Beginning
of
Period
$
38.22
$
33.47
$
38.65
$
30.93
$
27.23
Investment
Activities:
Net
Investment
Income
(Loss)
(a)
0.37
0.36
0.35
0.24
0.23
Net
Realized
and
Unrealized
Gains
(Losses)
on
Investments
4.64
4.73
(
5.17
)
7.72
3.72
Total
from
Investment
Activities
5.01
5.09
(
4.82
)
7.96
3.95
Distributions
to
Shareholders:
Net
Investment
Income
(
0.38
)
(
0.34
)
(
0.36
)
(
0.24
)
(
0.25
)
Total
Distributions
(
0.38
)
(
0.34
)
(
0.36
)
(
0.24
)
(
0.25
)
Net
Asset
Value,
End
of
Period
$
42.85
$
38.22
$
33.47
$
38.65
$
30.93
Total
Return
(b)
13
.12
%
15
.30
%
(
12
.48
%
)
25
.82
%
14
.67
%
Ratios/Supplemental
Data:
Ratio
of
Expenses
to
Average
Net
Assets
0
.52
%
0
.52
%
0
.52
%
0
.52
%
0
.52
%
Ratio
of
Net
Investment
Income
(Loss)
to
Average
Net
Assets
0
.90
%
1
.03
%
1
.02
%
0
.69
%
0
.88
%
Net
Assets,
End
of
Period
(000's)
$
267,798
$
236,951
$
179,060
$
168,140
$
163,904
Portfolio
Turnover
(c)
25
%
30
%
26
%
27
%
45
%
Table
Line
(a)
Per
share
net
investment
income
(loss)
has
been
calculated
using
the
average
daily
shares
method.
(b)
Assumes
reinvestment
of
all
net
investment
income
and
realized
capital
gain
distributions,
if
any,
during
the
period.
Includes
adjustments
in
accordance
with
U.S.
Generally
Accepted
Accounting
Principles
and
could
differ
from
the
reported
return.
(c)
Excludes
impact
of
in-kind
transactions.
Financial
Highlights
-
continued
For
a
Share
Outstanding
Throughout
Each
Period
Timothy
Plan
See
notes
to
financial
statements.
Timothy
Plan
High
Dividend
Stock
ETF
For
the
Year
Ended
December
31,
2024
For
the
Year
Ended
December
31,
2023
For
the
Year
Ended
December
31,
2022
For
the
Year
Ended
December
31,
2021
For
the
Year
Ended
December
31,
2020
Net
Asset
Value,
Beginning
of
Period
$
33.16
$
31.13
$
32.49
$
25.88
$
26.89
Investment
Activities:
Net
Investment
Income
(Loss)
(a)
0.77
0.75
0.73
0.61
0.57
Net
Realized
and
Unrealized
Gains
(Losses)
on
Investments
3.19
2.01
(
1.35
)
6.60
(
0.96
)
Total
from
Investment
Activities
3.96
2.76
(
0.62
)
7.21
(
0.39
)
Distributions
to
Shareholders:
Net
Investment
Income
(
0.76
)
(
0.73
)
(
0.74
)
(
0.60
)
(
0.62
)
Total
Distributions
(
0.76
)
(
0.73
)
(
0.74
)
(
0.60
)
(
0.62
)
Net
Asset
Value,
End
of
Period
$
36.36
$
33.16
$
31.13
$
32.49
$
25.88
Total
Return
(b)
11
.99
%
9
.03
%
(
1
.88
%
)
28
.10
%
(
1
.17
%
)
Ratios/Supplemental
Data:
Ratio
of
Expenses
to
Average
Net
Assets
0
.52
%
0
.52
%
0
.52
%
0
.52
%
0
.52
%
Ratio
of
Net
Investment
Income
(Loss)
to
Average
Net
Assets
2
.15
%
2
.39
%
2
.32
%
2
.07
%
2
.45
%
Net
Assets,
End
of
Period
(000's)
$
238,132
$
228,798
$
178,986
$
131,582
$
122,911
Portfolio
Turnover
(c)
34
%
41
%
42
%
43
%
68
%
Table
Line
(a)
Per
share
net
investment
income
(loss)
has
been
calculated
using
the
average
daily
shares
method.
(b)
Assumes
reinvestment
of
all
net
investment
income
and
realized
capital
gain
distributions,
if
any,
during
the
period.
Includes
adjustments
in
accordance
with
U.S.
Generally
Accepted
Accounting
Principles
and
could
differ
from
the
reported
return.
(c)
Excludes
impact
of
in-kind
transactions.
Financial
Highlights
-
continued
For
a
Share
Outstanding
Throughout
Each
Period
Timothy
Plan
See
notes
to
financial
statements.
Timothy
Plan
International
ETF
For
the
Year
Ended
December
31,
2024
For
the
Year
Ended
December
31,
2023
For
the
Year
Ended
December
31,
2022
For
the
Year
Ended
December
31,
2021
For
the
Year
Ended
December
31,
2020
Net
Asset
Value,
Beginning
of
Period
$
26.43
$
23.30
$
29.06
$
26.98
$
25.58
Investment
Activities:
Net
Investment
Income
(Loss)
(a)
0.63
0.64
0.66
0.56
0.47
Net
Realized
and
Unrealized
Gains
(Losses)
on
Investments
0.11
3.12
(
5.82
)
2.21
1.40
Total
from
Investment
Activities
0.74
3.76
(
5.16
)
2.77
1.87
Distributions
to
Shareholders:
Net
Investment
Income
(
0.79
)
(
0.63
)
(
0.60
)
(
0.69
)
(
0.47
)
Total
Distributions
(
0.79
)
(
0.63
)
(
0.60
)
(
0.69
)
(
0.47
)
Net
Asset
Value,
End
of
Period
$
26.38
$
26.43
$
23.30
$
29.06
$
26.98
Total
Return
(b)
2
.77
%
16
.41
%
(
17
.80
%
)
10
.34
%
7
.66
%
Ratios/Supplemental
Data:
Ratio
of
Expenses
to
Average
Net
Assets
0
.62
%
0
.62
%
0
.62
%
0
.62
%
0
.62
%
Ratio
of
Net
Investment
Income
(Loss)
to
Average
Net
Assets
2
.34
%
2
.60
%
2
.72
%
1
.94
%
1
.98
%
Net
Assets,
End
of
Period
(000's)
$
112,125
$
97,801
$
76,875
$
82,827
$
71,500
Portfolio
Turnover
(c)
35
%
34
%
39
%
42
%
63
%
Table
Line
(a)
Per
share
net
investment
income
(loss)
has
been
calculated
using
the
average
daily
shares
method.
(b)
Assumes
reinvestment
of
all
net
investment
income
and
realized
capital
gain
distributions,
if
any,
during
the
period.
Includes
adjustments
in
accordance
with
U.S.
Generally
Accepted
Accounting
Principles
and
could
differ
from
the
reported
return.
(c)
Excludes
impact
of
in-kind
transactions.
Financial
Highlights
-
continued
For
a
Share
Outstanding
Throughout
Each
Period
Timothy
Plan
See
notes
to
financial
statements.
Timothy
Plan
US
Large/Mid
Cap
Core
Enhanced
ETF
For
the
Year
Ended
December
31,
2024
For
the
Year
Ended
December
31,
2023
For
the
Year
Ended
December
31,
2022
For
the
period
July
29,
2021
(a)
to
December
31,
2021
Net
Asset
Value,
Beginning
of
Period
$
22.81
$
23.75
$
27.19
$
25.00
Investment
Activities:
Net
Investment
Income
(Loss)
(b)
0.23
0.38
0.25
0.11
Net
Realized
and
Unrealized
Gains
(Losses)
on
Investments
2.77
(
0.96
)
(
3.40
)
2.16
Total
from
Investment
Activities
3.00
(
0.58
)
(
3.15
)
2.27
Distributions
to
Shareholders:
Net
Investment
Income
(
0.22
)
(
0.36
)
(
0.28
)
(
0.08
)
Return
of
Capital
—
—
(
0.01
)
—
Total
Distributions
(
0.22
)
(
0.36
)
(
0.29
)
(
0.08
)
Net
Asset
Value,
End
of
Period
$
25.59
$
22.81
$
23.75
$
27.19
Total
Return
(c)(d)
13
.18
%
(
2
.40
%
)
(
11
.58
%
)
9
.09
%
Ratios/Supplemental
Data:
Ratio
of
Expenses
to
Average
Net
Assets
(e)
0
.52
%
0
.52
%
(f)
0
.52
%
0
.51
%
Ratio
of
Net
Investment
Income
(Loss)
to
Average
Net
Assets
(e)
0
.91
%
1
.69
%
1
.05
%
1
.00
%
Net
Assets,
End
of
Period
(000's)
$
70,383
$
58,177
$
70,060
$
69,327
Portfolio
Turnover
(c)(g)
29
%
(h)
302
%
(i)
155
%
(i)
13
%
Table
Line
(a)
Commencement
of
operations.
(b)
Per
share
net
investment
income
(loss)
has
been
calculated
using
the
average
daily
shares
method.
(c)
Not
annualized
for
periods
less
than
one
year.
(d)
Assumes
reinvestment
of
all
net
investment
income
and
realized
capital
gain
distributions,
if
any,
during
the
period.
Includes
adjustments
in
accordance
with
U.S.
Generally
Accepted
Accounting
Principles
and
could
differ
from
the
reported
return.
(e)
Annualized
for
periods
less
than
one
year.
(f)
Does
not
include
acquired
fund
fees
and
expenses,
if
any.
(g)
Excludes
impact
of
in-kind
transactions.
(h)
Portfolio
turnover
decreased
significantly
due
to
changes
in
the
volume
and
timing
of
purchases
and
sales
of
portfolio
holdings
during
the
year.
(i)
Portfolio
turnover
increased
significantly
due
to
changes
in
the
volume
and
timing
of
purchases
and
sales
of
portfolio
holdings
during
the
year.
Financial
Highlights
-
continued
For
a
Share
Outstanding
Throughout
Each
Period
Timothy
Plan
See
notes
to
financial
statements.
Timothy
Plan
High
Dividend
Stock
Enhanced
ETF
For
the
Year
Ended
December
31,
2024
For
the
Year
Ended
December
31,
2023
For
the
Year
Ended
December
31,
2022
For
the
period
July
29,
2021
(a)
to
December
31,
2021
Net
Asset
Value,
Beginning
of
Period
$
22.63
$
23.47
$
26.90
$
25.00
Investment
Activities:
Net
Investment
Income
(Loss)
(b)
0.53
0.60
0.60
0.28
Net
Realized
and
Unrealized
Gains
(Losses)
on
Investments
2.18
(
0.88
)
(
3.37
)
1.86
Total
from
Investment
Activities
2.71
(
0.28
)
(
2.77
)
2.14
Distributions
to
Shareholders:
Net
Investment
Income
(
0.51
)
(
0.56
)
(
0.66
)
(
0.24
)
Total
Distributions
(
0.51
)
(
0.56
)
(
0.66
)
(
0.24
)
Net
Asset
Value,
End
of
Period
$
24.83
$
22.63
$
23.47
$
26.90
Total
Return
(c)(d)
12
.01
%
(
1
.17
%
)
(
10
.44
%
)
8
.59
%
Ratios/Supplemental
Data:
Ratio
of
Expenses
to
Average
Net
Assets
(e)
0
.52
%
0
.52
%
(f)
0
.52
%
0
.51
%
Ratio
of
Net
Investment
Income
(Loss)
to
Average
Net
Assets
(e)
2
.18
%
2
.60
%
2
.39
%
2
.50
%
Net
Assets,
End
of
Period
(000's)
$
64,550
$
66,764
$
68,055
$
47,081
Portfolio
Turnover
(c)(g)
39
%
(h)
209
%
191
%
(i)
16
%
Table
Line
(a)
Commencement
of
operations.
(b)
Per
share
net
investment
income
(loss)
has
been
calculated
using
the
average
daily
shares
method.
(c)
Not
annualized
for
periods
less
than
one
year.
(d)
Assumes
reinvestment
of
all
net
investment
income
and
realized
capital
gain
distributions,
if
any,
during
the
period.
Includes
adjustments
in
accordance
with
U.S.
Generally
Accepted
Accounting
Principles
and
could
differ
from
the
reported
return.
(e)
Annualized
for
periods
less
than
one
year.
(f)
Does
not
include
acquired
fund
fees
and
expenses,
if
any.
(g)
Excludes
impact
of
in-kind
transactions.
(h)
Portfolio
turnover
decreased
significantly
due
to
changes
in
the
volume
and
timing
of
purchases
and
sales
of
portfolio
holdings
during
the
year.
(i)
Portfolio
turnover
increased
significantly
due
to
changes
in
the
volume
and
timing
of
purchases
and
sales
of
portfolio
holdings
during
the
year.
Financial
Highlights
-
continued
For
a
Share
Outstanding
Throughout
Each
Period
Timothy
Plan
See
notes
to
financial
statements.
Timothy
Plan
Market
Neutral
ETF
For
the
Year
Ended
December
31,
2024
For
the
period
January
25,
2023
(a)
to
December
31,
2023
Net
Asset
Value,
Beginning
of
Period
$
24.23
$
25.00
Investment
Activities:
Net
Investment
Income
(Loss)
(b)
0.93
1.01
Net
Realized
and
Unrealized
Gains
(Losses)
on
Investments
(
0.62
)
0.31
Total
from
Investment
Activities
0.31
1.32
Distributions
to
Shareholders:
Net
Investment
Income
(
0.98
)
(
1.06
)
Net
Realized
Gains
From
Investments
—
(
1.03
)
Total
Distributions
(
0.98
)
(
2.09
)
Net
Asset
Value,
End
of
Period
$
23.56
$
24.23
Total
Return
(c)(d)
1
.39
%
5
.46
%
Ratios/Supplemental
Data:
Ratio
of
Expenses
to
Average
Net
Assets
(e)
0
.65
%
0
.65
%
Ratio
of
Net
Investment
Income
(Loss)
to
Average
Net
Assets
(e)
3
.94
%
4
.37
%
Net
Assets,
End
of
Period
(000's)
$
41,703
$
34,407
Portfolio
Turnover
(c)(f)
35
%
(g)
112
%
Table
Line
(a)
Commencement
of
operations.
(b)
Per
share
net
investment
income
(loss)
has
been
calculated
using
the
average
daily
shares
method.
(c)
Not
annualized
for
periods
less
than
one
year.
(d)
Assumes
reinvestment
of
all
net
investment
income
and
realized
capital
gain
distributions,
if
any,
during
the
period.
Includes
adjustments
in
accordance
with
U.S.
Generally
Accepted
Accounting
Principles
and
could
differ
from
the
reported
return.
(e)
Annualized
for
periods
less
than
one
year.
(f)
Excludes
impact
of
in-kind
transactions.
(g)
Portfolio
turnover
decreased
significantly
due
to
changes
in
the
volume
and
timing
of
purchases
and
sales
of
portfolio
holdings
during
the
year.
Notes
to
Financial
Statements
December
31,
2024
Timothy
Plan
1.
ORGANIZATION:
The
Timothy
Plan
(the
“Trust”)
was
organized
pursuant
to
a
trust
agreement
dated
December
16,
1993
as
a
Delaware
business
trust.
The
Trust
is
registered
under
the
Investment
Company
Act
of
1940,
as
amended
(the
“1940
Act”),
as
an
open-end
investment
company
and
thus
is
determined
to
be
an
investment
company
for
accounting
purposes.
The
Trust
follows
the
investment
company
accounting
and
reporting
guidance
under
Financial
Accounting
Standards
Board
(“FASB”)
Accounting
Standards
Codification
(“ASC”)
Topic
946
“Financial
Services—
Investment
Companies.”
The
Trust
is
comprised
of
multiple
series
funds,
seven
of
which
are
exchange-traded
funds
(“ETFs”),
and
are
authorized
to
issue
an
unlimited
number
of
shares,
which
are
units
of
beneficial
interest
with
no
par
value.
Each
ETF
is
classified
as
diversified
under
the
1940
Act.
The
accompanying
financial
statements
are
those
of
the
Timothy
Plan
US
Small
Cap
Core
ETF
(“US
Small
Cap
Core
ETF”),
Timothy
Plan
US
Large/Mid
Cap
Core
ETF
(“US
Large/Mid
Cap
Core
ETF”),
Timothy
Plan
High
Dividend
Stock
ETF
(“High
Dividend
Stock
ETF”),
Timothy
Plan
International
ETF
(“International
ETF”),
Timothy
Plan
US
Large/Mid
Cap
Core
Enhanced
ETF
(“US
Large/Mid
Cap
Core
Enhanced
ETF”),
Timothy
Plan
High
Dividend
Stock
Enhanced
ETF
(“High
Dividend
Stock
Enhanced
ETF”)
and
Timothy
Plan
Market
Neutral
ETF
(“Market
Neutral
ETF”)
(individually,
a
“Fund”
and
collectively,
the
“Funds”).
The
Funds,
except
for
the
Market
Neutral
ETF,
seek
to
provide
investment
results
that
track
the
performance
of
an
underlying
index,
before
fees
and
expenses.
The
underlying
indices
for
the
US
Small
Cap
Core
ETF,
US
Large/Mid
Cap
Core
ETF,
High
Dividend
Stock
ETF,
International
ETF,
US
Large/Mid
Cap
Core
Enhanced
ETF,
and
High
Dividend
Stock
Enhanced
ETF
are
the
Victory
US
Small
Cap
Volatility
Weighted
BRI
Index,
Victory
US
Large/Mid
Cap
Volatility
Weighted
BRI
Index,
Victory
US
Large
Cap
High
Dividend
Volatility
Weighted
BRI
Index,
Victory
International
Volatility
Weighted
BRI
Index,
Victory
US
Large/Mid
Cap
Long/Cash
Volatility
Wtd
BRI
Index,
and
Victory
US
Large
Cap
High
Div
Long/Cash
Vol
Wtd
BRI
Index
(individually,
an
“Index”
and
collectively,
the
“Indices”),
respectively.
The
Market
Neutral
ETF
seeks
to
provide
high
current
income
and
low
correlation
to
stocks
and
bonds.
Under
the
Trust’s
organizational
documents,
its
officers
and
Board
of
Trustees
(the
“Board”)
are
indemnified
against
certain
liabilities
arising
out
of
the
performance
of
their
duties
to
the
Funds.
In
addition,
in
the
normal
course
of
business,
the
Funds
enter
into
contracts
with
their
vendors
and
others
that
provide
for
general
indemnifications.
The
Funds’
maximum
exposure
under
these
arrangements
is
unknown,
as
this
would
involve
future
claims
that
may
be
made
against
the
Funds.
However,
based
on
experience,
the
Funds
expect
that
risk
of
loss
to
be
remote.
2.
SIGNIFICANT
ACCOUNTING
POLICIES:
The
following
is
a
summary
of
significant
accounting
policies
followed
by
the
Trust
in
the
preparation
of
its
financial
statements.
The
policies
are
in
conformity
with
accounting
principles
generally
accepted
in
the
United
States
of
America
(“GAAP”).
The
preparation
of
financial
statements
in
accordance
with
GAAP
requires
management
to
make
estimates
and
assumptions
that
affect
the
reported
amounts
of
assets
and
liabilities
and
disclosure
of
contingent
assets
and
liabilities
at
the
date
of
the
financial
statements
and
the
reported
amounts
of
income
and
expenses
for
the
period.
Actual
results
could
differ
from
those
estimates.
The
Funds
follow
the
specialized
accounting
and
reporting
requirements
under
GAAP
that
are
applicable
to
investment
companies.
Shares
of
the
Funds
are
listed
and
traded
on
the
New
York
Stock
Exchange
(“NYSE”
or
the
“Exchange”).
The
Funds’
shares
are
offered
at
net
asset
value
(“NAV”)
only
in
aggregations
of
50,000
Shares
(each
a
“Creation
Unit”).
The
Funds
will
issue
and
redeem
Creation
Units
principally
in
exchange
for
a
basket
of
securities
included
in
the
respective
Fund’s
Index
(the
“Deposit
Securities”),
together
with
the
deposit
of
a
specified
cash
payment
(the
“Cash
Component”),
plus
transaction
fees
(“Transaction
Fees”)
as
further
described
below.
Shares
trade
on
the
Exchange
at
market
prices
that
may
be
below,
at,
or
above
NAV.
Shares
of
a
Fund
may
only
be
purchased
or
redeemed
by
certain
financial
institutions
(“Authorized
Participants”).
An
Authorized
Participant
is
either
(
i
)
a
broker-dealer
or
other
participant
in
the
clearing
process
through
the
Continuous
Net
Settlement
System
(“Clearing
Process”)
of
the
National
Securities
Clearing
Corporation
(“NSCC”)
or
(ii)
a
DTC
participant
and,
in
each
case,
must
have
executed
a
Participant
Agreement
with
the
Distributor.
Most
retail
investors
do
not
qualify
as
Authorized
Participants
nor
have
the
resources
to
buy
and
sell
whole
Creation
Units.
Therefore,
they
are
unable
to
purchase
or
redeem
the
shares
directly
from
a
Fund.
The
Funds
reserve
the
right
to
offer
creations
and
redemptions
of
Shares
for
cash.
In
addition,
Shares
may
be
issued
in
advance
of
receipt
of
Deposit
Securities
subject
to
various
conditions,
including
a
requirement
to
maintain
on
deposit
with
the
Trust
cash
equal
to
up
to
105%
of
the
market
value
of
the
missing
Deposit
Securities.
In
each
instance
of
such
cash
creations
or
redemptions,
transaction
fees
may
be
imposed
and
may
be
higher
than
the
transaction
fees
associated
with
in-kind
creations
or
redemptions.
Transaction
Fees
include
a
fixed
fee
(“Fixed
Fee”)
payable
to
the
Custodian
(“Citibank
N.A.”),
which
is
imposed
on
each
creation
and
redemption
transaction
regardless
of
the
number
of
Creation
Units
involved
in
the
transaction.
Transaction
Fees
may
also
include
an
additional
variable
charge
(“Variable
Charge”)
for
purchases
and
redemptions
of
Creation
Units
for
cash
or
involving
cash-in-lieu,
to
compensate
each
Fund
and
Notes
to
Financial
Statements
-
continued
December
31,
2024
Timothy
Plan
its
ongoing
shareholders
for
brokerage
and
market
impact
expenses
relating
to
Creation
Unit
transactions.
Under
certain
circumstances,
the
Transaction
Fees
may
be
waived
or
adjusted.
In
such
cases,
the
Authorized
Participant
will
reimburse
each
Fund
for,
among
other
things,
any
difference
between
the
market
value
at
which
the
securities
and/or
financial
instruments
were
purchased
by
each
Fund
and
the
cash-in-lieu
amount,
applicable
registration
fees,
brokerage
commissions
and
certain
taxes
and
other
costs
and
expenses
related
to
the
execution
of
trades
resulting
from
such
transaction
(up
to
the
maximum
amount
shown
below).
In
addition,
purchasers
of
Creation
Units
are
responsible
for
the
costs
of
transferring
the
Deposit
Securities
to
the
account
of
each
Fund.
Variable
fees
received
by
each
Fund
are
displayed
in
the
Capital
Share
Transaction
section
of
the
Statements
of
Changes
in
Net
Assets
as
an
increase
to
Paid-In-Capital.
Investors
who
use
the
services
of
a
broker,
or
other
such
intermediary
may
be
charged
a
fee
for
such
services.
The
Transaction
Fees
for
each
Fund
are
listed
below:
*
As
a
percentage
of
the
amount
invested.
Investment
Valuation:
The
Funds
record
investments
at
fair
value.
Fair
value
is
defined
as
the
price
that
would
be
received
to
sell
an
asset
or
paid
to
transfer
a
liability
in
an
orderly
transaction
between
market
participants
at
the
measurement
date.
The
valuation
techniques
described
below
maximize
the
use
of
observable
inputs
and
minimize
the
use
of
unobservable
inputs
in
determining
fair
value.
The
inputs
used
for
valuing
the
Funds’
investments
are
summarized
in
the
three
broad
levels
listed
below:
Level
1
—
quoted
prices
in
active
markets
for
identical
securities
Level
2
—
other
significant
observable
inputs
(including
quoted
prices
for
similar
securities
or
interest
rates
applicable
to
those
securities,
etc.)
Level
3
—
significant
unobservable
inputs
(including
the
Funds’
own
assumptions
in
determining
the
fair
value
of
investments)
Changes
in
valuation
techniques
may
result
in
transfers
in
or
out
of
an
assigned
level
within
the
disclosure
hierarchy.
The
inputs
or
methodologies
used
for
valuation
techniques
are
not
necessarily
an
indication
of
the
risk
associated
with
entering
into
those
investments.
Portfolio
securities
listed
or
traded
on
securities
exchanges
including,
common
stocks,
warrants
and
American
Depositary
Receipts
(“ADRs”),
are
valued
at
the
closing
price
on
the
exchange
or
system
where
the
security
is
principally
traded,
if
available,
or
at
the
Nasdaq
Official
Closing
Price.
If
there
have
been
no
sales
for
that
day
on
the
exchange
or
system,
then
a
security
is
valued
at
the
last
available
bid
quotation
on
the
exchange
or
system
where
the
security
is
principally
traded.
In
each
of
these
situations,
valuations
are
typically
categorized
as
Level
1
in
the
fair
value
hierarchy.
Futures
contracts
are
valued
at
the
settlement
price
established
each
day
by
the
board
of
trade
or
an
exchange
on
which
they
are
traded.
These
valuations
are
typically
categorized
as
Level
1
in
the
fair
value
hierarchy.
Investments
in
open-end
investment
companies
are
valued
at
net
asset
value.
These
valuations
are
typically
categorized
as
Level
1
in
the
fair
value
hierarchy.
Investments
for
which
there
are
no
such
quotations,
or
for
which
quotations
do
not
appear
reliable,
are
valued
at
fair
value
in
accordance
with
procedures
established
by
valuation
designee
and
under
the
general
supervision
and
oversight
of
the
Trust’s
Board.
These
valuations
Fee
for
In-Kind
and
Cash
Purchases
and
Redemptions
Maximum
Additional
Variable
Charge
for
Cash
Purchases
and
Redemptions*
US
Small
Cap
Core
ETF
$250
2.00%
US
Large/Mid
Cap
Core
ETF
$500
2.00%
High
Dividend
Stock
ETF
$250
2.00%
International
ETF
$4,500
2.00%
US
Large/Mid
Cap
Core
Enhanced
ETF
$500
2.00%
High
Dividend
Stock
Enhanced
ETF
$250
2.00%
Market
Neutral
ETF
$250
2.00%
Notes
to
Financial
Statements
-
continued
December
31,
2024
Timothy
Plan
are
typically
categorized
as
Level
2
or
Level
3
in
the
fair
value
hierarchy,
based
on
the
observability
of
inputs
used
to
determine
the
fair
value.
A
summary
of
the
valuations
as
of
December
31,
2024
,
based
upon
the
three
levels
defined
above,
is
included
in
the
table
below
while
the
breakdown,
by
category,
of
investments
is
disclosed
in
the
Schedules
of
Portfolio
Investments:
US
Small
Cap
Core
ETF
Investment
Securities:
Level
1
-
Quoted
Prices
Level
2
-
Other
Significant
Observable
Inputs
Level
3
-
Other
Significant
Unobservable
Inputs
Total
Common
Stocks
$
169,148,207
$
–
$
–
$
169,148,207
Total
Investment
Securities
169,148,207
–
–
169,148,207
Other
Financial
Instruments*
Liabilities:
Futures
Contracts
(25,409)
–
–
(25,409)
Total
$
(25,409)
$
–
$
–
$
(25,409)
US
Large/Mid
Cap
Core
ETF
Investment
Securities:
Level
1
-
Quoted
Prices
Level
2
-
Other
Significant
Observable
Inputs
Level
3
-
Other
Significant
Unobservable
Inputs
Total
Common
Stocks
$
266,515,597
$
–
$
–
$
266,515,597
Total
Investment
Securities
266,515,597
–
–
266,515,597
Other
Financial
Instruments*
Liabilities:
Futures
Contracts
(38,965)
–
–
(38,965)
Total
$
(38,965)
$
–
$
–
$
(38,965)
High
Dividend
Stock
ETF
Investment
Securities:
Level
1
-
Quoted
Prices
Level
2
-
Other
Significant
Observable
Inputs
Level
3
-
Other
Significant
Unobservable
Inputs
Total
Common
Stocks
$
236,789,332
$
–
$
–
$
236,789,332
Total
Investment
Securities
236,789,332
–
–
236,789,332
Other
Financial
Instruments*
Liabilities:
Futures
Contracts
(32,927)
–
–
(32,927)
Total
$
(32,927)
$
–
$
–
$
(32,927)
International
ETF
Investment
Securities:
Level
1
-
Quoted
Prices
Level
2
-
Other
Significant
Observable
Inputs
Level
3
-
Other
Significant
Unobservable
Inputs
Total
Common
Stocks
$
111,028,609
$
–
$
–(a)
$
111,028,609
Warrants
$
–
$
–
$
–(a)
$
–
Total
Investment
Securities
111,028,609
–
–
111,028,609
Other
Financial
Instruments*
Liabilities:
Notes
to
Financial
Statements
-
continued
December
31,
2024
Timothy
Plan
As
of
December
31,
2024
,
there
were
no
transfers
into/out
of
Level
3.
Management
has
determined
that
the
amount
of
Level
3
securities
compared
to
total
net
assets
is
not
material;
therefore,
no
additional
disclosures
are
necessary
for
the
period
ended
December
31,
2024
.
Futures
Contracts
(12,509)
–
–
(12,509)
Total
$
(12,509)
$
–
$
–
$
(12,509)
US
Large/Mid
Cap
Core
Enhanced
ETF
Investment
Securities:
Level
1
-
Quoted
Prices
Level
2
-
Other
Significant
Observable
Inputs
Level
3
-
Other
Significant
Unobservable
Inputs
Total
Common
Stocks
$
69,979,194
$
–
$
–
$
69,979,194
Investment
Companies
$
338,346
$
–
$
–
$
338,346
Total
Investment
Securities
70,317,540
–
–
70,317,540
Other
Financial
Instruments*
Liabilities:
Futures
Contracts
(9,637)
–
–
(9,637)
Total
$
(9,637)
$
–
$
–
$
(9,637)
High
Dividend
Stock
Enhanced
ETF
Investment
Securities:
Level
1
-
Quoted
Prices
Level
2
-
Other
Significant
Observable
Inputs
Level
3
-
Other
Significant
Unobservable
Inputs
Total
Common
Stocks
$
64,182,069
$
–
$
–
$
64,182,069
Investment
Companies
$
244,270
$
–
$
–
$
244,270
Total
Investment
Securities
64,426,339
–
–
64,426,339
Other
Financial
Instruments*
Liabilities:
Futures
Contracts
(9,637)
–
–
(9,637)
Total
$
(9,637)
$
–
$
–
$
(9,637)
Market
Neutral
ETF
Investment
Securities:
Level
1
-
Quoted
Prices
Level
2
-
Other
Significant
Observable
Inputs
Level
3
-
Other
Significant
Unobservable
Inputs
Total
Common
Stocks
$
36,386,365
$
–
$
–
$
36,386,365
Total
Investment
Securities
36,386,365
–
–
36,386,365
Other
Financial
Instruments*
Assets:
Futures
Contracts
2,511,180
–
–
2,511,180
Liabilities:
Futures
Contracts
(1,400,822)
–
–
(1,400,822)
Total
$
1,110,358
$
–
$
–
$
1,110,358
*
Futures
Contracts
are
valued
at
the
unrealized
appreciation
(depreciation)
on
the
investment.
(a)
Zero
market
value.
Notes
to
Financial
Statements
-
continued
December
31,
2024
Timothy
Plan
Real
Estate
Investment
Trusts
(“REITs”):
The
Funds
may
invest
in
REITs
which
report
information
on
the
source
of
their
distributions
annually.
REITs
are
pooled
investment
vehicles
that
invest
primarily
in
income-producing
real
estate
or
real
estate
related
loans
or
interests
(such
as
mortgages).
Certain
distributions
received
from
REITs
during
the
year
are
recorded
as
realized
gains
or
return
of
capital
as
estimated
by
the
Funds
or
when
such
information
becomes
known.
Investment
Companies:
The
Funds
may
invest
in
portfolios
of
open-end
investment
companies.
These
investment
companies
value
securities
in
their
portfolios
for
which
market
quotations
are
readily
available
at
their
market
values
(generally
the
last
reported
sale
price)
and
all
other
securities
and
assets
at
their
fair
value
by
the
methods
established
by
the
board
of
directors
of
the
underlying
funds.
Investment
Transactions
and
Related
Income:
Changes
in
holdings
of
investments
are
accounted
for
no
later
than
one
business
day
following
the
trade
date.
For
financial
reporting
purposes,
however,
investment
transactions
are
accounted
for
on
trade
date
on
the
last
business
day
of
the
reporting
period.
Interest
income
is
recognized
on
an
accrual
basis
and
includes,
where
applicable,
the
amortization
of
premiums
or
accretion
of
discounts.
Dividend
income
is
recorded
on
the
ex-dividend
date.
Non-cash
dividends
included
in
income,
if
any,
are
recorded
at
the
fair
value
of
the
securities
received.
Gains
or
losses
realized
on
sales
of
securities
are
determined
by
comparing
the
identified
cost
of
the
security
lot
sold
with
the
net
sales
proceeds.
Withholding
taxes
on
interest,
dividends
and
gains
as
a
result
of
certain
investments
in
ADRs
by
the
Funds
have
been
provided
for
in
accordance
with
each
investment’s
applicable
country’s
tax
rules
and
rates.
Futures
Contracts:
During
the
period
ended
December
31,
2024
,
the
Funds
used
futures
contracts
to
provide
market
exposure
on
the
Funds’
cash
balances.
Futures
contracts
are
valued
based
upon
their
quoted
daily
settlement
prices.
Upon
entering
into
a
futures
contract,
and
to
maintain
the
Fund’s
open
positions
in
futures
contracts,
the
Fund
would
be
required
to
deposit
with
its
custodian
or
futures
broker
in
a
segregated
account
in
the
name
of
the
futures
broker
an
amount
of
cash,
U.S.
government
securities,
suitable
money
market
instruments,
or
other
liquid
securities,
known
as
“initial
margin.”
The
margin
required
for
a
particular
futures
contract
is
set
by
the
exchange
on
which
the
contract
is
traded,
and
may
be
significantly
modified
from
time
to
time
by
the
exchange
during
the
term
of
the
contract.
Futures
contracts
are
customarily
purchased
and
sold
on
margins
that
may
range
upward
from
less
than
5%
of
the
value
of
the
contract
being
traded.
Deposits
for
futures
for
the
Funds
are
reported
as
Deposit
with
broker
for
futures
contracts
on
the
Statements
of
Assets
and
Liabilities.
If
the
price
of
an
open
futures
contract
changes
(by
increase
in
underlying
instrument
or
index
in
the
case
of
a
sale
or
by
decrease
in
the
case
of
a
purchase)
so
that
the
loss
on
the
futures
contract
reaches
a
point
at
which
the
margin
on
deposit
does
not
satisfy
margin
requirements,
the
broker
will
require
an
increase
in
the
margin.
However,
if
the
value
of
a
position
increases
because
of
favorable
price
changes
in
the
futures
contract
so
that
the
margin
deposit
exceeds
the
required
margin,
the
broker
will
pay
the
excess
to
a
Fund.
These
subsequent
payments,
called
“Variation
Margin,”
to
and
from
the
futures
broker,
are
made
on
a
daily
basis
as
the
price
of
the
underlying
assets
fluctuate
making
the
long
and
short
positions
in
the
futures
contract
more
or
less
valuable,
a
process
known
as
“marking
to
the
market.”
The
Funds
recorded
a
payable
or
receivable
on
variation
margin.
The
Funds
expect
to
earn
interest
income
on
its
margin
deposits.
Gains
or
losses
are
recognized
but
not
considered
realized
until
the
contracts
expire
or
are
closed.
Futures
contracts
involve,
to
varying
degrees,
elements
of
market
risk
(generally
equity
price
risk
related
to
stock
futures,
interest
rate
risk
related
to
bond
futures,
and
foreign
currency
risk
related
to
currency
futures)
and
exposure
to
loss
in
excess
of
the
variation
margin
disclosed
in
the
Statements
of
Assets
and
Liabilities.
The
primary
risks
associated
with
the
use
of
futures
contracts
are
the
imperfect
correlation
between
the
change
in
fair
value
of
the
underlying
securities
and
the
prices
of
futures
contracts,
the
possibility
of
an
illiquid
market,
and
the
inability
of
the
counterparty
to
meet
the
terms
of
the
contract.
Realized
and
unrealized
gains
and
losses
are
reported
as
“Net
realized
gains/(losses)
from
futures
transactions”
and
“Net
change
in
unrealized
appreciation/depreciation
on
futures
contracts”,
respectively,
on
the
Statements
of
Operations.
Average
Notional
Value
The
table
below
summarizes
the
monthly
average
notional
value
of
futures
contracts
for
the
period
ended
December
31,
2024
.
Average
Notional
Value
Fund
Long
Short
US
Small
Cap
Core
ETF
$
546,465
$
—
US
Large/Mid
Cap
Core
ETF
939,489
—
High
Dividend
Stock
ETF
1,097,145
—
International
ETF
607,316
—
US
Large/Mid
Cap
Core
Enhanced
ETF
274,691
—
High
Dividend
Stock
Enhanced
ETF
274,691
—
Market
Neutral
ETF
33,602,453
69,949,382
Notes
to
Financial
Statements
-
continued
December
31,
2024
Timothy
Plan
Summary
of
Derivative
Instruments
The
following
is
a
summary
of
the
fair
values
of
derivative
instruments
on
Statements
of
Assets
and
Liabilities,
categorized
by
risk
exposure,
as
of
December
31,
2024
:
*
Includes
cumulative
unrealized
appreciation
(depreciation)
of
futures
contracts
as
reported
on
the
Schedules
of
Portfolio
Investments.
Only
current
day’s
variation
margin
for
futures
contracts
is
reported
within
the
Statements
of
Assets
and
Liabilities.
The
following
is
a
summary
of
the
effect
of
derivative
instruments
on
the
Statements
of
Operations,
categorized
by
risk
exposure,
for
the
period
ended
December
31,
2024
:
Foreign
Currency
Translations:
The
accounting
records
of
the
Funds
are
maintained
in
U.S.
dollars.
Investment
securities
and
other
assets
and
liabilities
of
a
Fund
denominated
in
a
foreign
currency
are
translated
into
U.S.
dollars
at
current
exchange
rates.
Purchases
and
sales
of
securities,
income
receipts
and
expense
payments
are
translated
into
U.S.
dollars
at
the
exchange
rates
on
the
date
of
the
transactions.
The
Funds
do
not
isolate
the
portion
of
the
results
of
operations
resulting
from
changes
in
foreign
exchange
rates
on
investments
from
fluctuations
arising
from
changes
in
market
prices
of
securities
held.
Such
fluctuations
are
disclosed
as
net
change
in
unrealized
appreciation/depreciation
on
investments
and
foreign
currency
translations
on
the
Statements
of
Operations.
Any
realized
gains
or
losses
from
these
fluctuations
are
disclosed
as
net
realized
gains
or
losses
from
investment
transactions
and
foreign
currency
transactions
on
the
Statements
of
Operations.
Foreign
Taxes:
The
Funds
may
be
subject
to
foreign
taxes
related
to
foreign
income
received
(a
portion
of
which
may
be
reclaimable),
capital
gains
on
the
sale
of
securities,
and
certain
foreign
currency
transactions.
All
foreign
taxes
are
recorded
in
accordance
with
the
applicable
regulations
and
rates
that
exist
in
the
foreign
jurisdictions
in
which
the
Funds
invest.
Dividends
to
Shareholders:
Dividends
from
net
investment
income,
if
any,
are
declared
and
paid
monthly
by
the
Funds.
Distributable
net
realized
gains,
if
any,
are
declared
and
distributed
at
least
annually
by
each
Fund.
The
amounts
of
dividends
from
net
investment
income
and
distributions
from
net
realized
gains
are
determined
in
accordance
with
federal
Assets
Liabilities
Fund
Variation
Margin
Receivable
on
Open
Futures
Contracts*
Variation
Margin
Payable
on
Open
Futures
Contracts*
Equity
Risk
Exposure
–
–
US
Small
Cap
Core
ETF
$
–
$
(25,409)
US
Large/Mid
Cap
Core
ETF
–
(38,965)
High
Dividend
Stock
ETF
–
(32,927)
International
ETF
–
(12,509)
US
Large/Mid
Cap
Core
Enhanced
ETF
–
(9,637)
High
Dividend
Stock
Enhanced
ETF
–
(9,637)
Market
Neutral
ETF
2,511,180
(1,400,822)
Fund
Net
realized
gains
(losses)
from
futures
transactions
Net
Change
in
unrealized
appreciation
(depreciation)
on
futures
transactions
Equity
Risk
Exposure:
–
–
US
Small
Cap
Core
ETF
$
99,994
$
(47,199)
US
Large/Mid
Cap
Core
ETF
168,354
(63,416)
High
Dividend
Stock
ETF
204,919
(56,628)
International
ETF
(11,800
)
(25,958)
US
Large/Mid
Cap
Core
Enhanced
ETF
52,568
(11,345)
High
Dividend
Stock
Enhanced
ETF
45,927
(11,779)
Market
Neutral
ETF
(4,525,522)
2,397,115
Notes
to
Financial
Statements
-
continued
December
31,
2024
Timothy
Plan
income
tax
regulations,
which
may
differ
from
GAAP.
To
the
extent
these
“book/tax”
differences
are
permanent
in
nature
(i.e.,
that
they
result
from
other
than
timing
of
recognition
“temporary
difference”),
such
amounts
are
reclassified
within
the
components
of
net
assets
based
on
their
federal
tax-basis
treatment;
temporary
differences
(e.g.,
wash
sales)
do
not
require
reclassification.
To
the
extent
dividends
and
distributions
exceed
net
investment
income
and
net
realized
gains
for
tax
purposes,
they
are
reported
as
distributions
of
capital.
Net
investment
losses
incurred
by
a
Fund
may
be
reclassified
as
an
offset
to
capital
on
the
accompanying
Statements
of
Assets
and
Liabilities.
Federal
Income
Taxes:
It
is
the
policy
of
each
Fund
to
continue
to
qualify
as
a
regulated
investment
company
by
complying
with
the
provisions
available
to
certain
investment
companies,
as
defined
in
applicable
sections
of
the
Internal
Revenue
Code,
and
to
make
distributions
of
net
investment
income
and
net
realized
gains
sufficient
to
relieve
it
from
all,
or
substantially
all,
federal
income
taxes.
Accordingly,
no
provision
for
federal
income
taxes
is
required
in
the
financial
statements.
The
Funds
identifies
its
major
tax
jurisdiction
as
U.S.
Federal.
As
of
and
during
the
period
ended
December
31,
2024
,
the
Funds
did
not
have
a
liability
for
any
unrecognized
tax
benefits.
The
Funds
recognize
interest
and
penalties,
if
any,
related
to
unrecognized
tax
benefits
as
income
tax
expense
on
the
Statements
of
Operations.
During
the
period,
the
Funds
did
not
incur
any
interest
or
penalties.
For
the
current
open
tax
year,
management
of
the
Funds
has
concluded
that
there
are
no
significant
uncertain
tax
positions
that
would
require
recognition
in
the
financial
statements.
Further,
management
of
the
Funds
is
not
aware
of
any
tax
positions
for
which
it
is
reasonably
possible
that
the
total
amounts
of
any
unrecognized
tax
benefits
will
significantly
change
over
the
next
fiscal
year.
3.
PURCHASES
AND
SALES
OF
SECURITIES:
Purchases
and
sales
of
securities
(excluding
securities
maturing
less
than
one
year
from
acquisition)
and
in-kind
transactions
associated
with
purchases
and
sales for
the
period
ended
December
31,
2024,
were
as
follows:
For
the
period
ended
December
31,
2024
,
there
were
no
purchases
or
sales
of
U.S.
Government
Securities.
4.
FEES
AND
TRANSACTIONS
WITH
AFFILIATES
AND
OTHER
PARTIES:
Timothy
Partners,
Ltd
(“TPL”
or
the
“Advisor”),
a
Florida
limited
partnership,
serves
as
the
Funds’
investment
advisor
pursuant
to
an
Investment
Advisory
Agreement.
Subject
always
to
the
supervision
and
approval
of
the
Board,
the
Advisor
is
responsible
for
the
overall
management
of
the
Funds.
The
Advisor
has
arranged
for
distribution,
custody,
fund
administration,
transfer
agency
and
all
other
services
necessary
for
the
Funds
to
operate.
The
Advisor
receives
a
fee
for
its
services,
(the
“Management
Fee”).
From
the
Management
Fee,
the
Advisor
is
obligated
to
pay
or
arrange
for
the
payment
of
substantially
all
expenses
of
the
Funds,
including
the
cost
of
transfer
agency,
custody,
fund
administration
and
accounting,
legal,
audit,
independent
trustees
and
other
services,
except
for
interest
expenses,
distribution
fees
or
expenses,
brokerage
expenses,
acquired
fund
fees
and
expenses,
taxes
and
extraordinary
expenses
such
as
litigation
and
other
expenses
not
incurred
in
the
ordinary
course
of
the
Fund’s
business.
The
Advisor’s
Management
Fee
is
designed
to
cause
substantially
all
of
the
Funds’
expenses
to
be
paid
and
to
compensate
the
Advisor
for
providing
services
for
the
Funds.
US
Small
Cap
Core
ETF,
US
Large/Mid
Cap
Core
ETF,
High
Dividend
Stock
ETF,
High
Dividend
Stock
Enhanced
ETF,
and
US
Large/Mid
Cap
Core
Enhanced
ETF
pay
a
Management
Fee
equivalent
to
0.52%,
International
ETF
pays
a
Management
Fee
equivalent
to
0.62%,
and
Market
Neutral
ETF
pays
a
Management
Fee
equivalent
to
0.65%
of
the
Fund’s
average
daily
net
assets,
computed
daily
and
paid
monthly.
Victory
Capital
Management,
Inc.,
a
New
York
corporation,
serves
as
the
Funds’
sub-advisor
pursuant
to
a
written
sub-advisory
agreement
with
the
Advisor
and
receives
fees
from
the
Advisor
for
these
services.
Citibank,
N.A.
serves
as
the
Funds’
Custodian
and
Transfer
Agent
pursuant
to
a
Global
Custodial
and
Agency
Services
Agreement
with
the
Trust.
Citi
Fund
Services
Ohio,
Inc.
(“Citi”),
an
affiliate
of
Citibank,
N.A.,
acts
as
the
Funds’
administrator
and
fund
accountant
pursuant
to
a
Services
Agreement
with
the
Trust.
Excluding
in-kind
transactions
Associated
with
in-kind
transactions
Fund
Purchases
Sales
Purchases
Sales
US
Small
Cap
Core
ETF
$
60,485,205
$
60,153,676
$
104,720,834
$
51,639,466
US
Large/Mid
Cap
Core
ETF
61,352,978
61,600,432
104,244,001
99,742,886
High
Dividend
Stock
ETF
80,111,967
79,909,442
138,042,955
149,434,941
International
ETF
37,311,983
37,328,382
13,603,769
—
US
Large/Mid
Cap
Core
Enhanced
ETF
20,224,219
20,185,709
24,122,623
19,345,055
High
Dividend
Stock
Enhanced
ETF
26,001,955
25,715,505
17,238,152
25,618,208
Market
Neutral
ETF
12,397,080
15,198,755
8,261,794
1,210,090
Notes
to
Financial
Statements
-
continued
December
31,
2024
Timothy
Plan
Foreside
Fund
Services,
LLC
(“Foreside”)
serves
as
the
Funds’
distributor.
Drake
Compliance
LLC
provides
compliance
services
to
the
Trust.
Certain
officers
and/or
interested
trustees
of
the
Funds
are
also
officers
and/or
employees
of
the
Advisor.
5.
INVESTMENT
RISKS:
The
risks
below
are
presented
in
an
order
intended
to
facilitate
readability.
Their
order
does
not
imply
that
the
realization
of
one
risk
is
more
likely
to
occur
more
frequently
than
another
risk,
nor
does
it
imply
that
the
realization
of
one
risk
is
likely
to
have
a
greater
adverse
impact
than
another
risk.
Each
Fund
may
be
subject
to
other
risks
in
addition
to
these
identified
risks.
ETF
Risk
The
NAV
of
a
Fund
can
fluctuate
up
or
down,
and
you
could
lose
money
investing
in
a
Fund
if
the
prices
of
the
securities
owned
by
the
Fund
decline.
In
addition,
a
Fund
may
be
subject
to
the
following
risks:
(1)
the
market
price
of
a
Fund’s
shares
may
trade
above
or
below
its
NAV;
(2)
an
active
trading
market
for
a
Fund’s
shares
may
not
develop
or
be
maintained;
or
(3)
trading
of
a
Fund’s
shares
may
be
halted
if
the
listing
exchange’s
officials
deem
such
action
appropriate,
the
shares
are
delisted
from
the
exchange,
or
the
activation
of
market-wide
“circuit
breakers”
(which
are
tied
to
large
decreases
in
stock
prices)
halts
stock
trading
generally.
Excluded
Security
Risk
Because
the
Index
omits
Excluded
Securities,
the
Funds
may
be
riskier
than
other
funds
that
invest
in
a
broader
array
of
securities.
Biblically
Responsible
Investing
(“BRI”)
may
not
be
successful.
Because
the
Index
is
reconstituted
only
at
prescribed
times
during
the
year,
the
Funds
may
temporarily
hold
securities
that
do
not
comply
with
the
BRI
screening
criteria
if
the
application
of
the
criteria
or
the
nature
of
a
company’s
business
changes
in
between
these
dates.
Equity
Securities
Risk
The
value
of
the
equity
securities
in
which
the
Funds
invest
may
decline
in
response
to
developments
affecting
individual
companies
and/or
general
economic
conditions
in
the
United
States
or
abroad.
A
company’s
earnings
or
dividends
may
not
increase
as
expected
(or
may
decline)
because
of
poor
management,
competitive
pressures,
reliance
on
particular
suppliers
or
geographical
regions,
labor
problems
or
shortages,
corporate
restructurings,
fraudulent
disclosures,
man-made
or
natural
disasters,
military
confrontations
or
wars,
terrorism,
public
health
crises,
or
other
events,
conditions
and
factors.
Price
changes
may
be
temporary
or
last
for
extended
periods.
Foreign
Securities
Risk
Foreign
securities
(including
depositary
receipts)
are
subject
to
political,
regulatory,
and
economic
risks
not
present
in
domestic
investments.
Foreign
securities
could
be
affected
by
factors
not
present
in
the
U.S.
including
expropriation,
confiscation
of
property,
and
difficulties
in
enforcing
contracts.
Compared
to
U.S.
companies,
there
generally
is
less
publicly
available
information
about
foreign
companies
and
there
may
be
less
governmental
regulation
and
supervision
of
foreign
companies.
Foreign
securities
generally
experience
more
volatility
than
their
domestic
counterparts.
Depositary
receipts
may
have
additional
risks,
including
creditworthiness
of
the
depositary
bank
and
the
risk
of
an
illiquid
market.
In
addition,
to
the
extent
investments
are
made
in
a
limited
number
of
countries,
events
in
those
countries
will
have
a
more
significant
impact
on
the
Funds.
Fluctuations
in
the
exchange
rates
between
the
U.S.
dollar
and
foreign
currencies,
currency
exchange
control
regulations,
and
restrictions
or
prohibitions
on
the
repatriation
of
foreign
currencies
may
negatively
affect
an
investment.
Market
Risk
The
prices
of
the
securities,
particularly
the
common
stocks,
in
which
the
Funds
invest,
may
decline
for
a
number
of
reasons.
The
price
declines
of
common
stocks,
in
particular,
may
be
steep,
sudden,
and/or
prolonged.
Adverse
market
conditions,
sometimes
in
response
to
general
economic
or
industry
news,
may
cause
the
prices
of
a
Fund’s
holdings
to
fall
as
part
of
a
broad
market
decline.
In
addition,
certain
unanticipated
events,
such
as
natural
disasters,
terrorist
attacks,
and
other
geopolitical
events,
can
have
a
dramatic
adverse
effect
on
securities
held
by
a
Fund.
6.
FEDERAL
INCOME
TAX
INFORMATION:
As
of
December
31,
2024,
on
the
Statements
of
Assets
and
Liabilities,
as
a
result
of
permanent
book-to-tax
differences
primarily
attributable
to
the
accounting
for
applicable
in-kind
redemptions
and
designation
of
dividends
paid
were
reclassified
between
the
individual
components
of
total
distributable
earnings
(loss)
as
follows:
Notes
to
Financial
Statements
-
continued
December
31,
2024
Timothy
Plan
The
tax
characteristics
of
distributions
paid
to
shareholders
during
the
year/period
ended
December
31,
2024
were
as
follows:
The
tax
characteristics
of
distributions
paid
to
shareholders
during
the
year/period
ended
December
31,
2023
were
as
follows:
As
of
December
31,
2024,
the
components
of
accumulated
earnings/(deficit)
on
a
tax
basis
were
as
follows:
Fund
Total
Accumulated
Earnings/(Loss)
Capital
US
Small
Cap
Core
ETF
$
(15,423,273)
$
15,423,273
US
Large/Mid
Cap
Core
ETF
(31,979,636)
31,979,636
High
Dividend
Stock
ETF
(33,270,062)
33,270,062
US
Large/Mid
Cap
Core
Enhanced
ETF
(5,572,923)
5,572,923
High
Dividend
Stock
Enhanced
ETF
(4,718,422)
4,718,422
Market
Neutral
ETF
(121,065)
121,065
Year
Ended
December
31,
2024
Distributions
Paid
From:
Fund
Ordinary
Income
Total
Taxable
Distributions
Total
Distributions
Paid
*
US
Small
Cap
Core
ETF
$
1,405,308
$
1,405,308
$
1,405,308
US
Large/Mid
Cap
Core
ETF
2,166,878
2,166,878
2,166,878
High
Dividend
Stock
ETF
4,895,565
4,895,565
4,895,565
International
ETF
3,111,526
3,111,526
3,111,526
US
Large/Mid
Cap
Core
Enhanced
ETF
633,632
633,632
633,632
High
Dividend
Stock
Enhanced
ETF
1,413,960
1,413,960
1,413,960
Market
Neutral
ETF
1,688,176
1,688,176
1,688,176
*
Total
distributions
paid
may
differ
from
the
Statement
of
Changes
in
Net
Assets
because
distributions
are
recognized
when
actually
paid
for
tax
purposes.
Year
Ended
December
31,
2023
Distributions
Paid
From:
Fund
Ordinary
Income
Net
Long-Term
Gains
Total
Taxable
Distributions
Total
Distributions
Paid
*
US
Small
Cap
Core
ETF
$
1,014,568
$
—
$
1,014,568
$
1,014,568
US
Large/Mid
Cap
Core
ETF
2,035,463
—
2,035,463
2,035,463
High
Dividend
Stock
ETF
4,513,975
—
4,513,975
4,513,975
International
ETF
2,243,745
—
2,243,745
2,243,745
US
Large/Mid
Cap
Core
Enhanced
ETF
957,342
—
957,342
957,342
High
Dividend
Stock
Enhanced
ETF
1,717,979
—
1,717,979
1,717,979
Market
Neutral
ETF
2,475,678
886,759
3,362,437
3,362,437
*
Total
distributions
paid
may
differ
from
the
Statement
of
Changes
in
Net
Assets
because
distributions
are
recognized
when
actually
paid
for
tax
purposes.
Notes
to
Financial
Statements
-
continued
December
31,
2024
Timothy
Plan
At
December
31,
2024
,
the
Funds
had
net
capital
loss
carry
forwards
(“CLCFs”)
for
federal
income
tax
purposes
which
are
available
to
reduce
the
future
capital
gain
distributions
to
shareholders.
CLCFs
not
subject
to
expiration:
During
the
tax
year
ended
December
31,
2024,
International
ETF
Fund
utilized
capital
loss
carryforwards
in
the
amount
of
$1,068,183.
As
of
December
31,
2024
,
the
cost
basis
for
federal
income
tax
purposes,
gross
unrealized
appreciation,
gross
unrealized
depreciation
and
net
unrealized
appreciation
(depreciation)
for
investments
were
as
follows:
7.
New
Accounting
Pronouncement:
In
this
reporting
period,
the
Funds
adopted
FASB
Accounting
Standards
Update
2023-07,
Segment
Reporting
(Topic
280):
Improvements
to
Reportable
Segment
Disclosures.
Adoption
of
the
new
standard
impacted
financial
statement
disclosures
only
and
did
not
affect
each
fund’s
financial
position
or
the
results
of
its
operations.
Fund
Undistributed
Ordinary
Income
Accumulated
Earnings
Other
Earnings
(Loss)
Accumulated
Capital
and
Other
Losses
Qualified
Late-
Year
Losses
*
Unrealized
Appreciation
(Depreciation)
**
Total
Accumulated
Earnings/
(Deficit)
US
Small
Cap
Core
ETF
$
11,894
$
11,894
$
—
$
(20,137,995)
$
—
$
18,159,367
$
(1,966,734)
US
Large/Mid
Cap
Core
ETF
85,225
85,225
—
(27,955,160)
—
34,026,557
6,156,622
High
Dividend
Stock
ETF
303,106
303,106
—
(27,605,040)
—
10,812,685
(16,489,249)
International
ETF
223,980
223,980
(13,709)
(9,787,280)
—
7,741,560
(1,835,449)
US
Large/Mid
Cap
Core
Enhanced
ETF
69,919
69,919
—
(12,487,686)
—
4,339,848
(8,077,919)
High
Dividend
Stock
Enhanced
ETF
169,464
169,464
—
(11,807,388)
—
1,291,689
(10,346,235)
Market
Neutral
ETF
—
—
(2,314)
(6,159,219)
(494)
1,980,607
(4,181,420)
*
Qualified
late-year
losses
are
comprised
of
post-October
capital
losses
incurred
after
October
31
and
certain
late-year
ordinary
losses.
Late-year
ordinary
losses
represent
ordinary
losses
incurred
after
December
31
and
specified
losses
incurred
after
October
31.
These
losses
are
deemed
to
arise
on
the
first
day
of
the
Fund’s
next
taxable
year.
**
The
difference
between
book-basis
and
tax-basis
unrealized
appreciation
(depreciation)
is
attributable
primarily
to
tax
deferral
of
losses
on
wash
sales,
futures
mark
to
market,
return
of
capital
from
underlying
investments
and
passive
foreign
investment
company
mark
to
market.
Fund
Short-Term
Amount
Long-Term
Amount
Total
US
Small
Cap
Core
ETF
$
(12,849,415)
$
(7,288,580)
$
(20,137,995)
US
Large/Mid
Cap
Core
ETF
(13,673,827)
(14,281,333)
(27,955,160)
High
Dividend
Stock
ETF
(15,152,605)
(12,452,435)
(27,605,040)
International
ETF
(4,111,567)
(5,675,713)
(9,787,280)
US
Large/Mid
Cap
Core
Enhanced
ETF
(9,724,185)
(2,763,501)
(12,487,686)
High
Dividend
Stock
Enhanced
ETF
(11,217,103)
(590,285)
(11,807,388)
Market
Neutral
ETF
(2,435,242)
(3,723,977)
(6,159,219)
Fund
Cost
of
Investments
for
Federal
Tax
Purposes
Gross
Unrealized
Appreciation
Gross
Unrealized
Depreciation
Net
Unrealized
Appreciation
(Depreciation)
US
Small
Cap
Core
ETF
$
150,988,840
$
24,003,355
$
(5,843,988)
$
18,159,367
US
Large/Mid
Cap
Core
ETF
232,489,040
42,868,914
(8,842,357)
34,026,557
High
Dividend
Stock
ETF
225,976,647
22,400,740
(11,588,055)
10,812,685
International
ETF
103,287,049
15,005,571
(7,264,011)
7,741,560
US
Large/Mid
Cap
Core
Enhanced
ETF
65,977,692
9,354,103
(5,014,255)
4,339,848
High
Dividend
Stock
Enhanced
ETF
63,134,650
6,622,283
(5,330,594)
1,291,689
Market
Neutral
ETF
34,404,664
3,861,770
(1,881,163)
1,980,607
Notes
to
Financial
Statements
-
continued
December
31,
2024
Timothy
Plan
The
management
committee
of
the
Funds’
adviser
acts
as
each
fund’s
Chief
Operating
Decision
Maker
(“CODM”).
Each
Fund
represents
a
single
operating
segment,
as
the
CODM
monitors
the
operating
results
of
each
Fund
as
a
whole
and
the
Fund’s
long-term
strategic
asset
allocation
is
pre-determined
in
accordance
with
the
terms
of
its
prospectus,
based
on
a
defined
investment
strategy.
The
financial
information
in
the
form
of
the
funds’
portfolio
composition,
total
returns,
expense
ratios,
and
changes
in
net
assets,
which
are
used
by
the
CODM
to
assess
the
segment’s
performance
versus
each
Fund’s
comparative
benchmarks
and
to
make
resource
allocation
decisions
for
the
Fund’s
single
segment,
is
consistent
with
that
presented
within
each
Fund’s
financial
statements.
Segment
assets
are
reflected
on
the
accompanying
statements
of
Assets
and
Liabilities
as
“total
assets”
and
significant
segment
expenses
are
listed
on
the
accompanying
Statements
of
Operations.
8.
SUBSEQUENT
EVENTS:
Management
has
evaluated
subsequent
events
through
the
date
these
financial
statements
were
issued.
Distributions
Subsequent
to
December
31,
2024,
the
Funds
paid
a
distribution
from
ordinary
income
for
the
following
amounts:
Fund
1/9/2025
2/7/2025
US
Small
Cap
Core
ETF
$
—
$
160,685
US
Large/Mid
Cap
Core
ETF
15,885
248,395
High
Dividend
Stock
ETF
38,933
617,065
International
ETF
5,206
245,284
US
Large/Mid
Cap
Core
Enhanced
ETF
4,408
116,641
High
Dividend
Stock
Enhanced
ETF
10,709
258,440
Market
Neutral
ETF
20,482
55,246
Report
of
Independent
Registered
Public
Accounting
Firm
Timothy
Plan
See
notes
to
financial
statements.
To
the
Shareholders
and
Board
of
Trustees
of
The
Timothy
Plan
Opinion
on
the
Financial
Statements
We
have
audited
the
accompanying
statements
of
assets
and
liabilities,
including
the
schedules
of
portfolio
investments,
of
The
Timothy
Plan
comprising
the
funds
listed
below
(the
“Funds”)
as
of
December
31,
2024,
the
related
statements
of
operations,
the
statements
of
changes
in
net
assets,
and
the
financial
highlights
for
each
of
the
periods
indicated
below
(collectively
referred
to
as
the
“financial
statements”).
In
our
opinion,
the
financial
statements
present
fairly,
in
all
material
respects,
the
financial
position
of
each
of
the
Funds
as
of
December
31,
2024,
the
results
of
their
operations,
the
changes
in
net
assets,
and
the
financial
highlights
for
each
of
the
periods
indicated
below
in
conformity
with
accounting
principles
generally
accepted
in
the
United
States
of
America.
Basis
for
Opinion
These
financial
statements
are
the
responsibility
of
the
Funds’
management.
Our
responsibility
is
to
express
an
opinion
on
the
Funds’
financial
statements
based
on
our
audits.
We
are
a
public
accounting
firm
registered
with
the
Public
Company
Accounting
Oversight
Board
(United
States)
(“PCAOB”)
and
are
required
to
be
independent
with
respect
to
the
Funds
in
accordance
with
the
U.S.
federal
securities
laws
and
the
applicable
rules
and
regulations
of
the
Securities
and
Exchange
Commission
and
the
PCAOB.
We
conducted
our
audits
in
accordance
with
the
standards
of
the
PCAOB.
Those
standards
require
that
we
plan
and
perform
the
audit
to
obtain
reasonable
assurance
about
whether
the
financial
statements
are
free
of
material
misstatement
whether
due
to
error
or
fraud.
Our
audits
included
performing
procedures
to
assess
the
risks
of
material
misstatement
of
the
financial
statements,
whether
due
to
error
or
fraud,
and
performing
procedures
that
respond
to
those
risks.
Such
procedures
included
examining,
on
a
test
basis,
evidence
regarding
the
amounts
and
disclosures
in
the
financial
statements.
Our
procedures
included
confirmation
of
securities
owned
as
of
December
31,
2024,
by
correspondence
with
the
custodian
and
brokers;
when
replies
were
not
received
from
brokers,
we
performed
other
auditing
procedures.
Our
audits
also
included
evaluating
the
accounting
principles
used
and
significant
estimates
made
by
management,
as
well
as
evaluating
the
overall
presentation
of
the
financial
statements.
We
believe
that
our
audits
provide
a
reasonable
basis
for
our
opinion.
Fund
Name
Statements
of
Operations
Statements
of
Changes
in
Net
Assets
Financial
Highlights
Timothy
Plan
US
Small
Cap
Core
ETF
Timothy
Plan
US
Large/Mid
Cap
Core
ETF
Timothy
Plan
High
Dividend
Stock
ETF
Timothy
Plan
International
ETF
For
the
year
ended
December
31,
2024
For
the
years
ended
December
31,
2024
and
2023
For
the
years
ended
December
31,
2024,
2023,
2022,
2021
and
2020
Timothy
Plan
US
Large/Mid
Cap
Core
Enhanced
ETF
Timothy
Plan
High
Dividend
Stock
Enhanced
ETF
For
the
year
ended
December
31,
2024
For
the
years
ended
December
31,
2024
and
2023
For
the
years
ended
December
31,
2024,
2023
and
2022,
and
for
the
period
July
29,
2021
(commencement
of
operations)
through
December
31,
2021
Timothy
Plan
Market
Neutral
ETF
For
the
year
ended
December
31,
2024
For
the
year
ended
December
31,
2024
and
for
the
period
January
25,
2023
(commencement
of
operations)
through
December
31,
2023
Report
of
Independent
Registered
Public
Accounting
Firm
-
continued
Timothy
Plan
See
notes
to
financial
statements.
We
have
served
as
the
Funds’
auditor
of
one
or
more
investment
companies
advised
by
Timothy
Partners,
Ltd.,
since
2005.
COHEN
&
COMPANY,
LTD.
Cleveland,
Ohio
February
26,
2025
Other
Information
(Unaudited)
December
31,
2024
Timothy
Plan
Additional
Federal
Income
Tax
Information:
For
the
fiscal
year
ended
December
31,
2024
,
the
Funds
hereby
designate
the
maximum
amount
allowable
of
their
net
taxable
income
as
qualified
dividends
taxed
at
individual
net
capital
gain
rates.
Shareholders
will
be
notified
via
IRS
Form
1099
of
the
amounts
for
use
in
preparing
their
income
tax
return.
Dividends
qualified
for
corporate
dividends
received
deductions
of:
The
following
Fund
intends
to
elect
to
pass
through
to
shareholders
the
income
tax
credit
for
taxes
paid
to
foreign
countries.
Foreign
source
income
and
foreign
tax
expense
per
outstanding
share
on
December
31,
2024
,
were
as
follows:
Premium/Discount
Information
The
Funds’
website
at
https://timothyplan.com
shows
the
previous
day’s
closing
NAV
and
closing
market
price
for
each
Fund’s
ETF
Shares.
The
website
also
discloses,
in
the
Premium/Discount
section
of
each
Fund’s
page,
how
frequently
each
Fund’s
ETF
Shares
traded
at
a
premium
or
discount
to
NAV
(based
on
closing
NAVs
and
market
prices)
and
the
magnitudes
of
such
premiums
and
discounts.
Amount
US
Small
Cap
Core
ETF
100%
US
Large/Mid
Cap
Core
ETF
100%
High
Dividend
Stock
ETF
100%
US
Large/Mid
Cap
Core
Enhanced
ETF
97%
High
Dividend
Stock
Enhanced
ETF
99%
Market
Neutral
ETF
57%
Foreign
Source
Income
Foreign
Tax
Expense
International
ETF
$
0.88
$
0.12
Visit
our
website
at
etf.timothyplan.com
Call
Timothy
Plan
at
800.846.7526
Timothy
Plan
1055
Maitland
Center
Commons
Maitland,
Florida
32751
PAST
PERFORMANCE
DOES
NOT
GUARANTEE
FUTURE
RESULTS,
AND
YOU
MAY
LOSE
MONEY.
You
should
consider
the
Fund’s
investment
objectives,
risks,
charges,
and
expenses.
This
and
other
important
information
can
be
found
in
the
Fund’s
prospectus.
To
obtain
a
copy,
visit
timothyplan.com
or
call
800.846.7526.
Read
the
prospectus
carefully
before
investing
or
sending
money.
ETFs
distributed
by
Foreside
Fund
Services,
LLC,
member
FINRA
and
SIPC.
Timothy
Partners,
Ltd.
is
not
affiliated
with
Foreside
Fund
Services,
LLC.
(b) The Financial Highlights are included as a part of the Financial Statements filed under Item 7(a) of this Form.
Item 8. Changes in and Disagreements with Accountants for Open-End Management Investment Companies.
Not applicable.
Item 9. Proxy Disclosures for Open-End Management Investment Companies.
Proxy disclosures, if any, are included as part of the Financial Statements filed under Item 7(a) of this Form.
Item 10. Remuneration Paid to Directors, Officers, and Others of Open-End Management Investment Companies.
Not applicable.
Item 11. Statement Regarding Basis for Approval of Investment Advisory Contract.
Approval of Investment Advisory Contract is a part of the Financial Statements filed under Item 7(a) of this Form.
Item 12. Disclosure of Proxy Voting Policies and Procedures for Closed-End Management Investment Companies.
Not applicable.
Item 13. Portfolio Managers of Closed-End Management Investment Companies.
Not applicable.
Item 14. Purchases of Equity Securities by Closed-End Management Investment Company and Affiliated Purchasers.
Not applicable.
Item 15. Submission of Matters to a Vote of Security Holders.
Not applicable.
Item 16. Controls and Procedures.
(a) The Registrant’s principal executive officer and principal financial officer have concluded, based on their evaluation of the Registrant’s disclosure controls and procedures as conducted within 90 days of the filing date of this report, that those disclosure controls and procedures provide reasonable assurance that material information required to be disclosed by the Registrant on this report is recorded, processed, summarized and reported within the time periods specified in the Securities and Exchange Commission's rules and forms.
(b) There were no changes in the Registrant’s internal control over financial reporting (as defined in Rule 30a-3(d) under the Act (17CFR 270.30a-3(d)) that occurred during the period covered by this report that have materially affected or are reasonably likely to materially affect, the Registrant’s internal control over financial reporting.
Item 17. Disclosure of Securities Lending Activities for Closed-End Management Investment Companies.
Not applicable.
Item 18. Recovery of Erroneously Awarded Compensation.
Not applicable.
Item 19. Exhibits.
(a)(1) The Code of Ethics is attached hereto
(a)(2) Not applicable.
SIGNATURES
Pursuant to the requirements of the Securities Exchange Act of 1934 and the Investment Company Act of 1940, the registrant has duly caused this report to be signed on its behalf by the undersigned, thereunto duly authorized.
(Registrant) Timothy Plan
By (Signature and Title) /s/ Arthur D. Ally
Arthur D. Ally, Principal Executive Officer and Principal Financial Officer
Date March 7, 2025________________________
Pursuant to the requirements of the Securities Exchange Act of 1934 and the Investment Company Act of 1940, this report has been signed below by the following persons on behalf of the registrant and in the capacities and on the dates indicated.
By (Signature and Title) /s/ Arthur D. Ally
Arthur D. Ally, Principal Executive Officer and Principal Financial Officer
Date March 7, 2025________________________