united states
securities and exchange commission
washington, d.c. 20549
form n-csr
certified shareholder report of registered management
investment companies
| Investment Company Act file number | 811-08228 | |
The Timothy Plan
(Exact name of registrant as specified in charter)
1055 Maitland Center Commons, Maitland, FL 32751
(Address of principal executive offices) (Zip code)
The Timothy Plan
1055 Maitland Center Commons, Maitland, FL 32751
(Name and address of agent for service)
Registrant's telephone number, including area code: (407) 644-1986
Date of fiscal year end: 9/30
Date of reporting period: 9/30/2024
Item 1. Reports to Stockholders.
(a)
0000916490tp:MSCIACWIexUSANetUSD2907BroadBasedIndexMember2022-09-300000916490tp:C000012345Membertp:InvestmentTypeExchangeMinusTradedFundsCTIMember2024-09-30
Timothy Plan Conservative Growth Fund
Annual Shareholder Report - September 30, 2024
This annual shareholder report contains important information about Timothy Plan Conservative Growth Fund for the period of October 1, 2023 to November 30, 2024. You can find additional information about the Fund at timothyplan.com. You can also request this information by contacting us at (800) 846-7526. This report describes changes to the Fund that occurred during the reporting period.
What were the Fund’s costs for the last year?
(based on a hypothetical $10,000 investment)
| Class Name | Costs of a $10,000 investment | Costs paid as a percentage of a $10,000 investment |
|---|
| Class A | $97 | 0.90% |
How did the Fund perform during the reporting period?
For the twelve months ended September 30, 2024, the Timothy Plan Conservative Growth Fund - Class A returned 14.71%, underperforming the Dow Jones Moderate Portfolio Index, which returned 20.62%. The Fund’s more defensive allocation, focusing on income-generating assets and stability, provided solid returns but lagged the broader equity-driven index.
Key Performance Drivers:
• Fixed Income & High Yield Bond: The Fund’s significant allocation to Fixed Income (30%) and High Yield Bond (7%) added stability and consistent returns, though these sectors underperformed the more growth-focused portions of the market.
• Equity Allocation: Exposure to US Small Cap Core ETF (7%) and US Large/Mid Cap Core Enhanced ETF (12%) provided gains, particularly in growth sectors like Technology and Industrials, though the defensive nature of the allocation limited upside.
• Dividend and Income Focus: The High Dividend Stock Enhanced ETF (6%) contributed steady income but underperformed high-growth stocks during the period. The focus on dividend-paying stocks helped cushion against market volatility.
• International Exposure: The Fund’s allocations to International Fund (12%) and International ETF (9%) contributed positively, with strong performance from holdings in Europe and Japan, though global volatility tempered some gains.
• Market Neutral ETF: The Market Neutral ETF (15%) provided income and reduced overall risk, ensuring the Fund maintained a defensive posture amid fluctuating market conditions.
Reasons for Underperformance:
• The Fund’s conservative allocation, with a heavier emphasis on fixed income and defensive equity positions, resulted in underperformance compared to the broader equity-driven Dow Jones Moderate Portfolio Index. The lower exposure to high-growth sectors, such as Technology, and the allocation to fixed income, while providing stability, limited the upside potential in the strong equity market environment.
The Fund will continue to balance growth and income opportunities, adjusting allocations with the goal of preserving capital while seeking long-term growth in line with its conservative investment strategy.
How has the Fund performed over the last ten years?
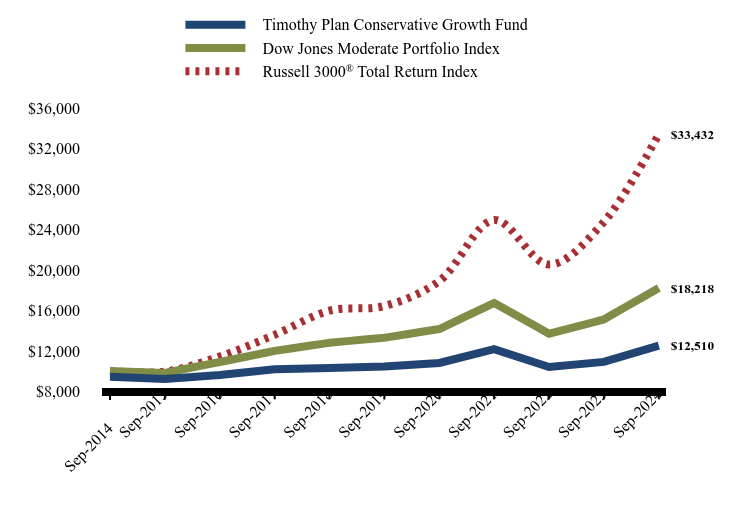
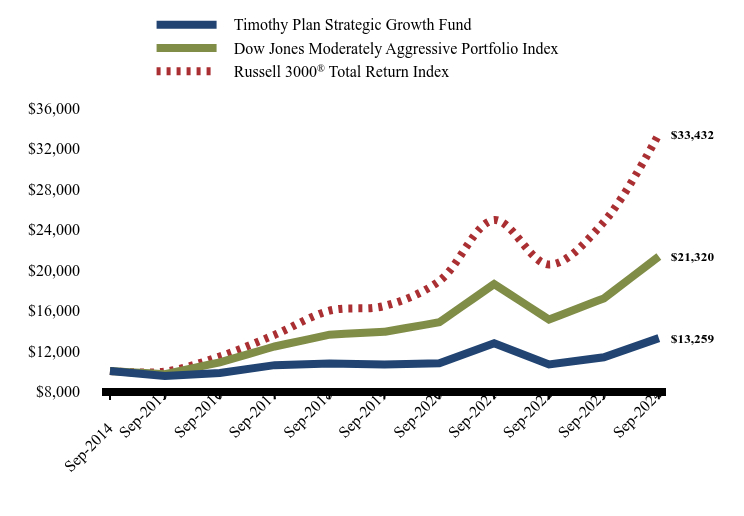
Total Return Based on $10,000 Investment
| Timothy Plan Conservative Growth Fund | Dow Jones Moderate Portfolio Index | Russell 3000® Total Return Index |
|---|
| Sep-2014 | $9,451 | $10,000 | $10,000 |
| Sep-2015 | $9,218 | $9,817 | $9,951 |
| Sep-2016 | $9,607 | $10,895 | $11,440 |
| Sep-2017 | $10,190 | $11,994 | $13,579 |
| Sep-2018 | $10,298 | $12,800 | $15,967 |
| Sep-2019 | $10,464 | $13,294 | $16,433 |
| Sep-2020 | $10,806 | $14,155 | $18,898 |
| Sep-2021 | $12,170 | $16,729 | $24,921 |
| Sep-2022 | $10,408 | $13,700 | $20,528 |
| Sep-2023 | $10,906 | $15,103 | $24,729 |
| Sep-2024 | $12,510 | $18,218 | $33,432 |
Average Annual Total Returns
| 1 Year | 5 Years | 10 Years |
|---|
| Timothy Plan Conservative Growth Fund | | | |
| Without Load | 14.71% | 3.64% | 2.84% |
| With Load* | 8.35% | 2.47% | 2.26% |
| Dow Jones Moderate Portfolio Index | 20.62% | 6.50% | 6.18% |
Russell 3000® Total Return Index | 35.19% | 15.26% | 12.83% |
The Fund's past performance is not a good predictor of how the Fund will perform in the future. The graph and table do not reflect the deduction of taxes that a shareholder would pay on fund distributions or redemption of fund shares.
| Net Assets | $38,518,717 |
| Number of Portfolio Holdings | 9 |
| Advisory Fee #ERROR:A result could not be returned because the conditional could not be evaluated to a True/False value ((history)) | $56,692 |
| Portfolio Turnover | 4% |
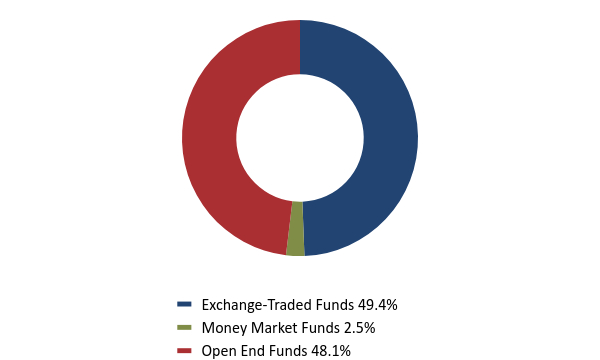
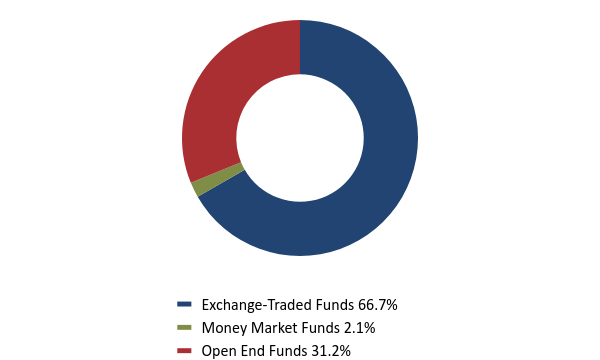
Asset Weighting (% of total investments)
| Value | Value |
|---|
| Exchange-Traded Funds | 49.4% |
| Money Market Funds | 2.5% |
| Open End Funds | 48.1% |
What did the Fund invest in?
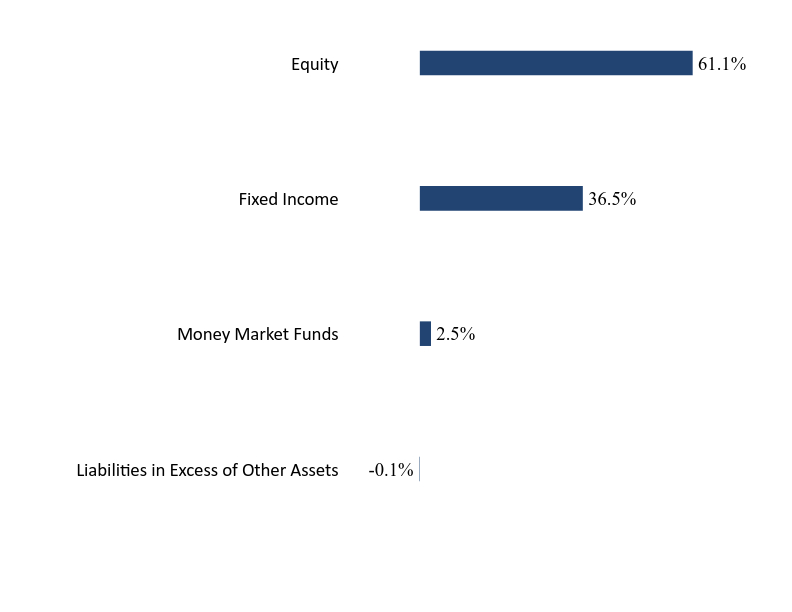
Sector Weighting (% of net assets)
| Value | Value |
|---|
| Liabilities in Excess of Other Assets | -0.1% |
| Money Market Funds | 2.5% |
| Fixed Income | 36.5% |
| Equity | 61.1% |
Top 10 Holdings (% of net assets)
| Holding Name | % of Net Assets |
| Timothy Plan Fixed Income Fund, Class A | 30.0% |
| Timothy Plan Market Neutral ETF | 15.0% |
| Timothy Plan US Large/Mid Cap Core Enhanced ETF | 12.2% |
| Timothy Plan International Fund, Class A | 11.6% |
| Timothy Plan International ETF | 9.1% |
| Timothy Plan US Small Cap Core ETF | 7.1% |
| Timothy Plan High Yield Bond Fund, Class A | 6.5% |
| Timothy Plan High Dividend Stock Enhanced ETF | 6.1% |
| Fidelity Government Portfolio, Institutional Class | 2.5% |
No material changes occurred during the year ended September 30, 2024.
Timothy Plan Conservative Growth Fund - Class A (TCGAX )
Annual Shareholder Report - September 30, 2024
Where can I find additional information about the Fund?
Additional information is available on the Fund's website ( timothyplan.com ), including its:
Prospectus
Financial information
Holdings
Proxy voting information
Timothy Plan Conservative Growth Fund
Annual Shareholder Report - September 30, 2024
This annual shareholder report contains important information about Timothy Plan Conservative Growth Fund for the period of October 1, 2023 to November 30, 2024. You can find additional information about the Fund at timothyplan.com. You can also request this information by contacting us at (800) 846-7526. This report describes changes to the Fund that occurred during the reporting period.
What were the Fund’s costs for the last year?
(based on a hypothetical $10,000 investment)
| Class Name | Costs of a $10,000 investment | Costs paid as a percentage of a $10,000 investment |
|---|
| Class C | $150 | 1.40% |
How did the Fund perform during the reporting period?
For the twelve months ended September 30, 2024, the Timothy Plan Conservative Growth Fund - Class C returned 14.14%, underperforming the Dow Jones Moderate Portfolio Index, which returned 20.62%. The Fund’s more defensive allocation, focusing on income-generating assets and stability, provided solid returns but lagged the broader equity-driven index.
Key Performance Drivers:
• Fixed Income & High Yield Bond: The Fund’s significant allocation to Fixed Income (30%) and High Yield Bond (7%) added stability and consistent returns, though these sectors underperformed the more growth-focused portions of the market.
• Equity Allocation: Exposure to US Small Cap Core ETF (7%) and US Large/Mid Cap Core Enhanced ETF (12%) provided gains, particularly in growth sectors like Technology and Industrials, though the defensive nature of the allocation limited upside.
• Dividend and Income Focus: The High Dividend Stock Enhanced ETF (6%) contributed steady income but underperformed high-growth stocks during the period. The focus on dividend-paying stocks helped cushion against market volatility.
• International Exposure: The Fund’s allocations to International Fund (12%) and International ETF (9%) contributed positively, with strong performance from holdings in Europe and Japan, though global volatility tempered some gains.
• Market Neutral ETF: The Market Neutral ETF (15%) provided income and reduced overall risk, ensuring the Fund maintained a defensive posture amid fluctuating market conditions.
Reasons for Underperformance:
• The Fund’s conservative allocation, with a heavier emphasis on fixed income and defensive equity positions, resulted in underperformance compared to the broader equity-driven Dow Jones Moderate Portfolio Index. The lower exposure to high-growth sectors, such as Technology, and the allocation to fixed income, while providing stability, limited the upside potential in the strong equity market environment.
The Fund will continue to balance growth and income opportunities, adjusting allocations with the goal of preserving capital while seeking long-term growth in line with its conservative investment strategy.
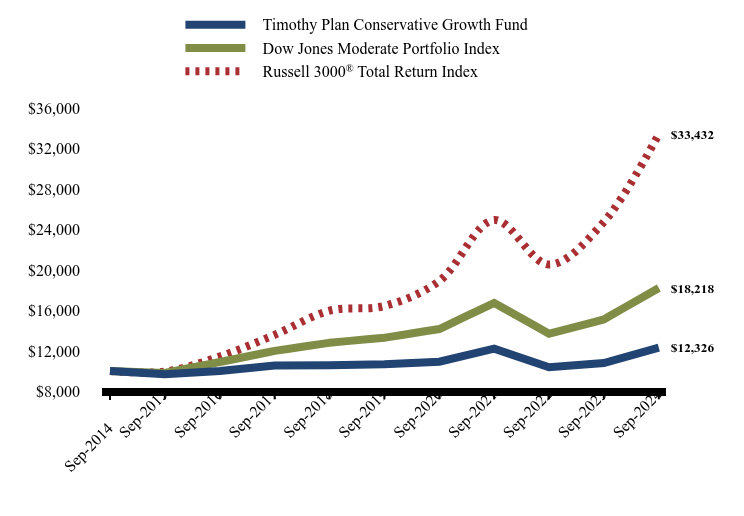
How has the Fund performed over the last ten years?
Total Return Based on $10,000 Investment
| Timothy Plan Conservative Growth Fund | Dow Jones Moderate Portfolio Index | Russell 3000® Total Return Index |
|---|
| Sep-2014 | $10,000 | $10,000 | $10,000 |
| Sep-2015 | $9,681 | $9,817 | $9,951 |
| Sep-2016 | $10,010 | $10,895 | $11,440 |
| Sep-2017 | $10,549 | $11,994 | $13,579 |
| Sep-2018 | $10,574 | $12,800 | $15,967 |
| Sep-2019 | $10,674 | $13,294 | $16,433 |
| Sep-2020 | $10,926 | $14,155 | $18,898 |
| Sep-2021 | $12,220 | $16,729 | $24,921 |
| Sep-2022 | $10,374 | $13,700 | $20,528 |
| Sep-2023 | $10,799 | $15,103 | $24,729 |
| Sep-2024 | $12,326 | $18,218 | $33,432 |
Average Annual Total Returns
| 1 Year | 5 Years | 10 Years |
|---|
| Timothy Plan Conservative Growth Fund | 14.14% | 2.92% | 2.11% |
| Dow Jones Moderate Portfolio Index | 20.62% | 6.50% | 6.18% |
Russell 3000® Total Return Index | 35.19% | 15.26% | 12.83% |
The Fund's past performance is not a good predictor of how the Fund will perform in the future. The graph and table do not reflect the deduction of taxes that a shareholder would pay on fund distributions or redemption of fund shares.
| Net Assets | $38,518,717 |
| Number of Portfolio Holdings | 9 |
| Advisory Fee #ERROR:A result could not be returned because the conditional could not be evaluated to a True/False value ((history)) | $56,692 |
| Portfolio Turnover | 4% |
Asset Weighting (% of total investments)
| Value | Value |
|---|
| Exchange-Traded Funds | 49.4% |
| Money Market Funds | 2.5% |
| Open End Funds | 48.1% |
What did the Fund invest in?
Sector Weighting (% of net assets)
| Value | Value |
|---|
| Liabilities in Excess of Other Assets | -0.1% |
| Money Market Funds | 2.5% |
| Fixed Income | 36.5% |
| Equity | 61.1% |
Top 10 Holdings (% of net assets)
| Holding Name | % of Net Assets |
| Timothy Plan Fixed Income Fund, Class A | 30.0% |
| Timothy Plan Market Neutral ETF | 15.0% |
| Timothy Plan US Large/Mid Cap Core Enhanced ETF | 12.2% |
| Timothy Plan International Fund, Class A | 11.6% |
| Timothy Plan International ETF | 9.1% |
| Timothy Plan US Small Cap Core ETF | 7.1% |
| Timothy Plan High Yield Bond Fund, Class A | 6.5% |
| Timothy Plan High Dividend Stock Enhanced ETF | 6.1% |
| Fidelity Government Portfolio, Institutional Class | 2.5% |
No material changes occurred during the year ended September 30, 2024.
Timothy Plan Conservative Growth Fund - Class C (TCVCX )
Annual Shareholder Report - September 30, 2024
Where can I find additional information about the Fund?
Additional information is available on the Fund's website ( timothyplan.com ), including its:
Prospectus
Financial information
Holdings
Proxy voting information
Timothy Plan Conservative Growth Fund
Annual Shareholder Report - September 30, 2024
This annual shareholder report contains important information about Timothy Plan Conservative Growth Fund for the period of October 1, 2023 to November 30, 2024. You can find additional information about the Fund at timothyplan.com. You can also request this information by contacting us at (800) 846-7526. This report describes changes to the Fund that occurred during the reporting period.
What were the Fund’s costs for the last year?
(based on a hypothetical $10,000 investment)
| Class Name | Costs of a $10,000 investment | Costs paid as a percentage of a $10,000 investment |
|---|
| Class I | $70 | 0.65% |
How did the Fund perform during the reporting period?
For the twelve months ended September 30, 2024, the Timothy Plan Conservative Growth Fund - Class I returned 14.49%, underperforming the Dow Jones Moderate Portfolio Index, which returned 20.62%. The Fund’s more defensive allocation, focusing on income-generating assets and stability, provided solid returns but lagged the broader equity-driven index.
Key Performance Drivers:
• Fixed Income & High Yield Bond: The Fund’s significant allocation to Fixed Income (30%) and High Yield Bond (7%) added stability and consistent returns, though these sectors underperformed the more growth-focused portions of the market.
• Equity Allocation: Exposure to US Small Cap Core ETF (7%) and US Large/Mid Cap Core Enhanced ETF (12%) provided gains, particularly in growth sectors like Technology and Industrials, though the defensive nature of the allocation limited upside.
• Dividend and Income Focus: The High Dividend Stock Enhanced ETF (6%) contributed steady income but underperformed high-growth stocks during the period. The focus on dividend-paying stocks helped cushion against market volatility.
• International Exposure: The Fund’s allocations to International Fund (12%) and International ETF (9%) contributed positively, with strong performance from holdings in Europe and Japan, though global volatility tempered some gains.
• Market Neutral ETF: The Market Neutral ETF (15%) provided income and reduced overall risk, ensuring the Fund maintained a defensive posture amid fluctuating market conditions.
Reasons for Underperformance:
• The Fund’s conservative allocation, with a heavier emphasis on fixed income and defensive equity positions, resulted in underperformance compared to the broader equity-driven Dow Jones Moderate Portfolio Index. The lower exposure to high-growth sectors, such as Technology, and the allocation to fixed income, while providing stability, limited the upside potential in the strong equity market environment.
The Fund will continue to balance growth and income opportunities, adjusting allocations with the goal of preserving capital while seeking long-term growth in line with its conservative investment strategy.
How has the Fund performed over the last ten years?
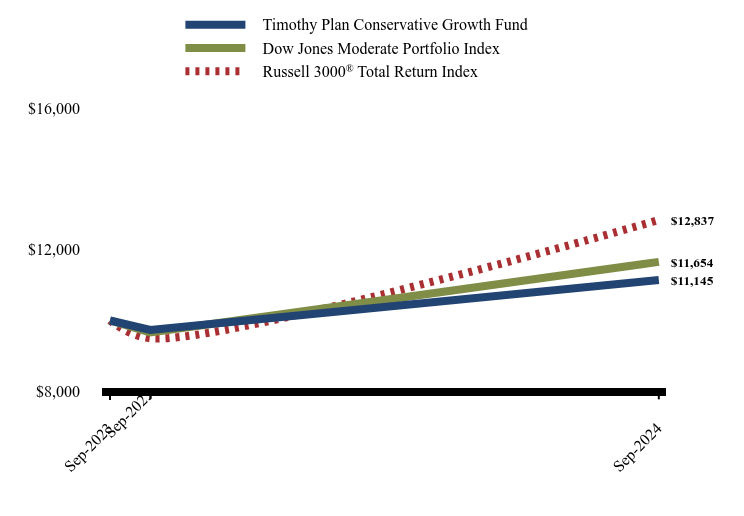
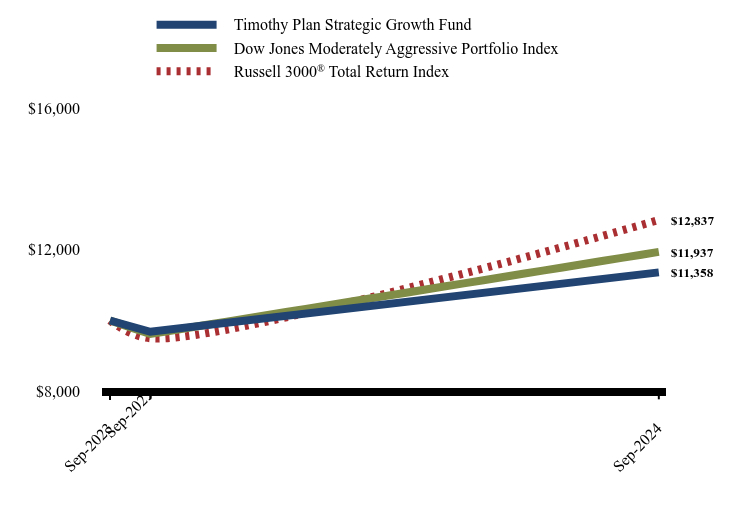
Total Return Based on $10,000 Investment
| Timothy Plan Conservative Growth Fund | Dow Jones Moderate Portfolio Index | Russell 3000® Total Return Index |
|---|
| Sep-2023 | $10,000 | $10,000 | $10,000 |
| Sep-2023 | $9,735 | $9,662 | $9,496 |
| Sep-2024 | $11,145 | $11,654 | $12,837 |
Average Annual Total Returns
| 1 Year | Since Inception (September 1, 2023) |
|---|
| Timothy Plan Conservative Growth Fund | 14.49% | 10.57% |
| Dow Jones Moderate Portfolio Index | 20.62% | 15.24% |
Russell 3000® Total Return Index | 35.19% | 26.04% |
The Fund's past performance is not a good predictor of how the Fund will perform in the future. The graph and table do not reflect the deduction of taxes that a shareholder would pay on fund distributions or redemption of fund shares.
| Net Assets | $38,518,717 |
| Number of Portfolio Holdings | 9 |
| Advisory Fee #ERROR:A result could not be returned because the conditional could not be evaluated to a True/False value ((history)) | $56,692 |
| Portfolio Turnover | 4% |
Asset Weighting (% of total investments)
| Value | Value |
|---|
| Exchange-Traded Funds | 49.4% |
| Money Market Funds | 2.5% |
| Open End Funds | 48.1% |
What did the Fund invest in?
Sector Weighting (% of net assets)
| Value | Value |
|---|
| Liabilities in Excess of Other Assets | -0.1% |
| Money Market Funds | 2.5% |
| Fixed Income | 36.5% |
| Equity | 61.1% |
Top 10 Holdings (% of net assets)
| Holding Name | % of Net Assets |
| Timothy Plan Fixed Income Fund, Class A | 30.0% |
| Timothy Plan Market Neutral ETF | 15.0% |
| Timothy Plan US Large/Mid Cap Core Enhanced ETF | 12.2% |
| Timothy Plan International Fund, Class A | 11.6% |
| Timothy Plan International ETF | 9.1% |
| Timothy Plan US Small Cap Core ETF | 7.1% |
| Timothy Plan High Yield Bond Fund, Class A | 6.5% |
| Timothy Plan High Dividend Stock Enhanced ETF | 6.1% |
| Fidelity Government Portfolio, Institutional Class | 2.5% |
No material changes occurred during the year ended September 30, 2024.
Timothy Plan Conservative Growth Fund - Class I (TIICX)
Annual Shareholder Report - September 30, 2024
Where can I find additional information about the Fund?
Additional information is available on the Fund's website ( timothyplan.com ), including its:
Prospectus
Financial information
Holdings
Proxy voting information
Timothy Plan Defensive Strategies Fund
Annual Shareholder Report - September 30, 2024
This annual shareholder report contains important information about Timothy Plan Defensive Strategies Fund for the period of October 1, 2023 to November 30, 2024. You can find additional information about the Fund at timothyplan.com. You can also request this information by contacting us at (800) 846-7526. This report describes changes to the Fund that occurred during the reporting period.
What were the Fund’s costs for the last year?
(based on a hypothetical $10,000 investment)
| Class Name | Costs of a $10,000 investment | Costs paid as a percentage of a $10,000 investment |
|---|
| Class A | $128 | 1.19% |
How did the Fund perform during the reporting period?
For the twelve months ended September 30, 2024, the Timothy Plan Defensive Strategies Fund - Class A delivered a 15.92% return, outperforming its blended benchmark’s 14.01% return. This fund includes the allocation of inflation-sensitive investment sleeves. Each sleeve played a crucial role in navigating inflationary pressures and market volatility.
Key Performance Drivers:
• Multi-Asset Sleeve (Timothy Partners, Ltd.): The Multi-Asset Sleeve provided strong returns, with physical gold appreciating by over 42%, offering stability. The Timothy Plan Market Neutral ETF also contributed steady income while reducing overall portfolio risk, with its Overlay Strategy—a combination of long Nasdaq 100 futures and short S&P 500 futures—helping manage risk effectively.
• TIPS Sleeve (Barrow Hanley): The TIPS sleeve returned 7.92% gross of fees, benefiting from the Federal Reserve’s September rate cut and helping protect against inflation. The portfolio’s focus on shorter maturities proved advantageous in a fluctuating interest rate environment.
• Real Estate Sleeve (Chilton Capital Management): The Real Estate Sleeve returned 33.5%, just under the MSCI US REIT Index’s 34.4%. REIT prices surged in the third quarter following Fed rate cuts and optimism over declining inflation. Underweight positions in lodging and strong stock selection in healthcare contributed to performance, while underweight positions in regional malls detracted.
• Commodity Sleeve (CoreCommodity): The Commodity sleeve posted a 3.7% return, outperforming the Bloomberg Commodity Index’s 1.0%. Gains in agriculture, forestry, and industrial metals, especially copper, were key contributors, while energy holdings, although negative, performed better than the benchmark.
We believe the Timothy Plan Defensive Strategies Fund is well-positioned to manage future market volatility and inflationary pressures. With its diversified allocation across gold, TIPS, real estate, and commodities, the Fund remains flexible and resilient in various economic conditions.
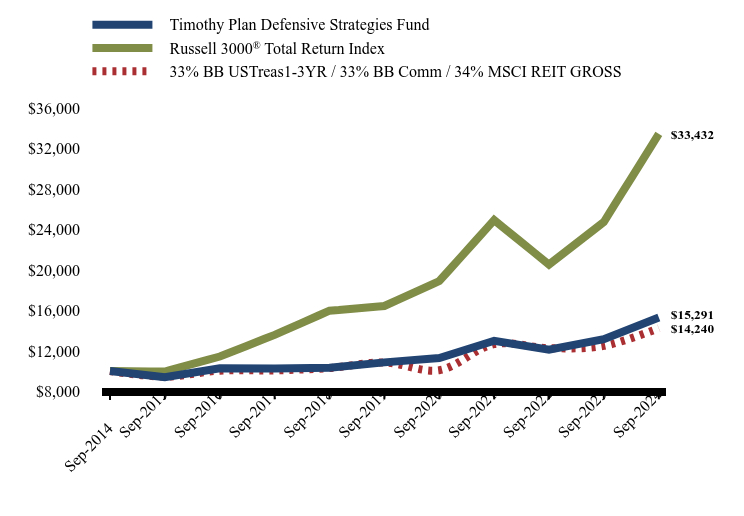
How has the Fund performed over the last ten years?
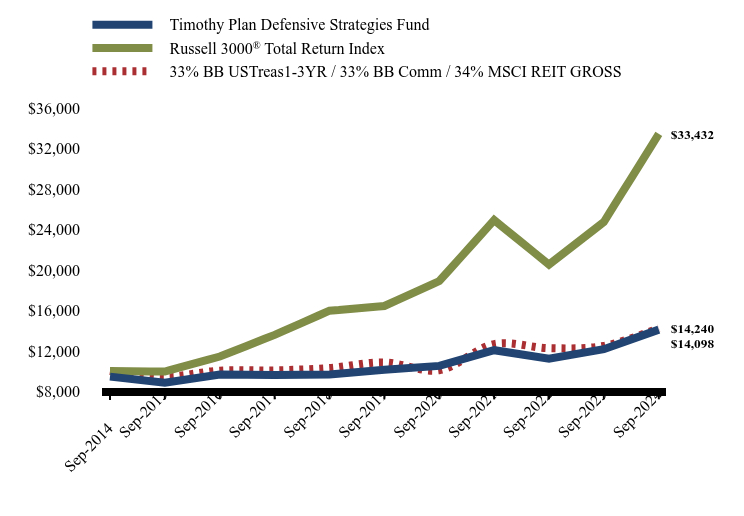
Total Return Based on $10,000 Investment
| Timothy Plan Defensive Strategies Fund | Russell 3000® Total Return Index | 33% BB USTreas1-3YR / 33% BB Comm / 34% MSCI REIT GROSS |
|---|
| Sep-2014 | $9,452 | $10,000 | $10,000 |
| Sep-2015 | $8,856 | $9,951 | $9,455 |
| Sep-2016 | $9,654 | $11,440 | $10,044 |
| Sep-2017 | $9,610 | $13,579 | $10,071 |
| Sep-2018 | $9,656 | $15,967 | $10,308 |
| Sep-2019 | $10,132 | $16,433 | $10,857 |
| Sep-2020 | $10,511 | $18,898 | $10,088 |
| Sep-2021 | $12,064 | $24,921 | $12,669 |
| Sep-2022 | $11,229 | $20,528 | $12,269 |
| Sep-2023 | $12,162 | $24,729 | $12,489 |
| Sep-2024 | $14,098 | $33,432 | $14,240 |
Average Annual Total Returns
| 1 Year | 5 Years | 10 Years |
|---|
| Timothy Plan Defensive Strategies Fund | | | |
| Without Load | 15.92% | 6.83% | 4.08% |
| With Load | 9.51% | 5.63% | 3.49% |
Russell 3000® Total Return Index | 35.19% | 15.26% | 12.83% |
| 33% BB USTreas1-3YR / 33% BB Comm / 34% MSCI REIT GROSS | 14.01% | 5.57% | 3.60% |
The Fund's past performance is not a good predictor of how the Fund will perform in the future. The graph and table do not reflect the deduction of taxes that a shareholder would pay on fund distributions or redemption of fund shares.
| Net Assets | $79,330,603 |
| Number of Portfolio Holdings | 198 |
| Advisory Fee #ERROR:A result could not be returned because the conditional could not be evaluated to a True/False value ((history)) | $330,329 |
| Portfolio Turnover | 19% |
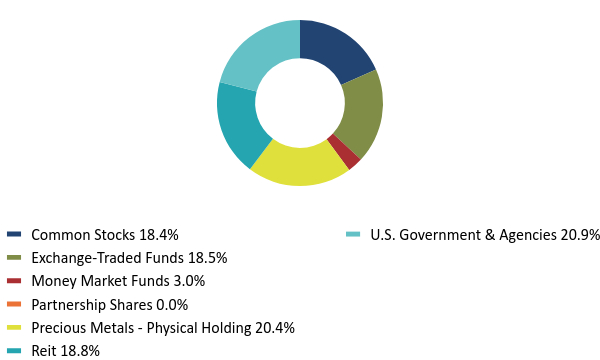
Asset Weighting (% of total investments)
| Value | Value |
|---|
| Common Stocks | 18.4% |
| Exchange-Traded Funds | 18.5% |
| Money Market Funds | 3.0% |
| Partnership Shares | 0.0% |
| Precious Metals - Physical Holding | 20.4% |
| Reit | 18.8% |
| U.S. Government & Agencies | 20.9% |
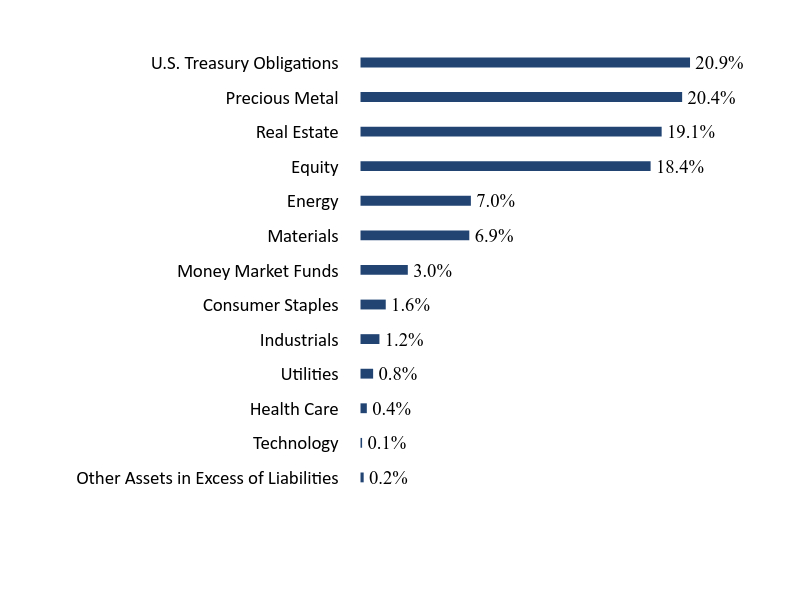
What did the Fund invest in?
Sector Weighting (% of net assets)
| Value | Value |
|---|
| Other Assets in Excess of Liabilities | 0.2% |
| Technology | 0.1% |
| Health Care | 0.4% |
| Utilities | 0.8% |
| Industrials | 1.2% |
| Consumer Staples | 1.6% |
| Money Market Funds | 3.0% |
| Materials | 6.9% |
| Energy | 7.0% |
| Equity | 18.4% |
| Real Estate | 19.1% |
| Precious Metal | 20.4% |
| U.S. Treasury Obligations | 20.9% |
Top 10 Holdings (% of net assets)
| Holding Name | % of Net Assets |
| GOLD BARS - XAU BGN CURNCY | 20.4% |
| Timothy Plan Market Neutral ETF | 18.4% |
| United States Treasury Inflation Indexed Bonds | 3.4% |
| Fidelity Government Portfolio, Institutional Class | 3.0% |
| United States Treasury Inflation Indexed Bonds | 2.9% |
| United States Treasury Inflation Indexed Bonds | 2.9% |
| United States Treasury Inflation Indexed Bonds | 2.5% |
| United States Treasury Inflation Indexed Bonds | 2.2% |
| United States Treasury Inflation Indexed Bonds | 2.0% |
| United States Treasury Inflation Indexed Bonds | 1.9% |
No material changes occurred during the year ended September 30, 2024.
Timothy Plan Defensive Strategies Fund
Annual Shareholder Report - September 30, 2024
Where can I find additional information about the Fund?
Additional information is available on the Fund's website ( timothyplan.com ), including its:
Prospectus
Financial information
Holdings
Proxy voting information
Timothy Plan Defensive Strategies Fund
Annual Shareholder Report - September 30, 2024
This annual shareholder report contains important information about Timothy Plan Defensive Strategies Fund for the period of October 1, 2023 to November 30, 2024. You can find additional information about the Fund at timothyplan.com. You can also request this information by contacting us at (800) 846-7526. This report describes changes to the Fund that occurred during the reporting period.
What were the Fund’s costs for the last year?
(based on a hypothetical $10,000 investment)
| Class Name | Costs of a $10,000 investment | Costs paid as a percentage of a $10,000 investment |
|---|
| Class C | $209 | 1.94% |
How did the Fund perform during the reporting period?
For the twelve months ended September 30, 2024, the Timothy Plan Defensive Strategies Fund - Class C delivered a 15.13% return, outperforming its blended benchmark’s 14.01% return. This fund includes the allocation of inflation-sensitive investment sleeves. Each sleeve played a crucial role in navigating inflationary pressures and market volatility.
Key Performance Drivers:
• Multi-Asset Sleeve (Timothy Partners, Ltd.): The Multi-Asset Sleeve provided strong returns, with physical gold appreciating by over 42%, offering stability. The Timothy Plan Market Neutral ETF also contributed steady income while reducing overall portfolio risk, with its Overlay Strategy—a combination of long Nasdaq 100 futures and short S&P 500 futures—helping manage risk effectively.
• TIPS Sleeve (Barrow Hanley): The TIPS sleeve returned 7.92% gross of fees, benefiting from the Federal Reserve’s September rate cut and helping protect against inflation. The portfolio’s focus on shorter maturities proved advantageous in a fluctuating interest rate environment.
• Real Estate Sleeve (Chilton Capital Management): The Real Estate Sleeve returned 33.5%, just under the MSCI US REIT Index’s 34.4%. REIT prices surged in the third quarter following Fed rate cuts and optimism over declining inflation. Underweight positions in lodging and strong stock selection in healthcare contributed to performance, while underweight positions in regional malls detracted.
• Commodity Sleeve (CoreCommodity): The Commodity sleeve posted a 3.7% return, outperforming the Bloomberg Commodity Index’s 1.0%. Gains in agriculture, forestry, and industrial metals, especially copper, were key contributors, while energy holdings, although negative, performed better than the benchmark.
We believe the Timothy Plan Defensive Strategies Fund is well-positioned to manage future market volatility and inflationary pressures. With its diversified allocation across gold, TIPS, real estate, and commodities, the Fund remains flexible and resilient in various economic conditions.
How has the Fund performed over the last ten years?
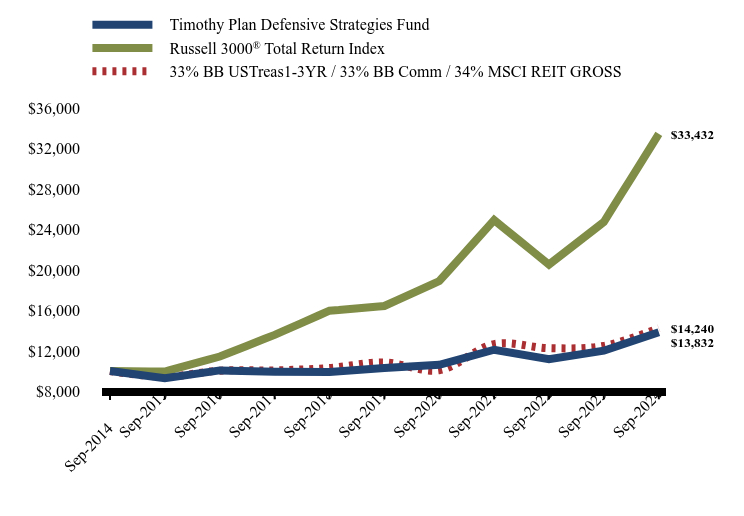
Total Return Based on $10,000 Investment
| Timothy Plan Defensive Strategies Fund | Russell 3000® Total Return Index | 33% BB USTreas1-3YR / 33% BB Comm / 34% MSCI REIT GROSS |
|---|
| Sep-2014 | $10,000 | $10,000 | $10,000 |
| Sep-2015 | $9,294 | $9,951 | $9,455 |
| Sep-2016 | $10,067 | $11,440 | $10,044 |
| Sep-2017 | $9,930 | $13,579 | $10,071 |
| Sep-2018 | $9,912 | $15,967 | $10,308 |
| Sep-2019 | $10,314 | $16,433 | $10,857 |
| Sep-2020 | $10,624 | $18,898 | $10,088 |
| Sep-2021 | $12,107 | $24,921 | $12,669 |
| Sep-2022 | $11,176 | $20,528 | $12,269 |
| Sep-2023 | $12,014 | $24,729 | $12,489 |
| Sep-2024 | $13,832 | $33,432 | $14,240 |
Average Annual Total Returns
| 1 Year | 5 Years | 10 Years |
|---|
| Timothy Plan Defensive Strategies Fund | 15.13% | 6.05% | 3.30% |
| 33% BB USTreas1-3YR / 33% BB Comm / 34% MSCI REIT GROSS | 14.01% | 5.57% | 3.60% |
Russell 3000® Total Return Index | 35.19% | 15.26% | 12.83% |
The Fund's past performance is not a good predictor of how the Fund will perform in the future. The graph and table do not reflect the deduction of taxes that a shareholder would pay on fund distributions or redemption of fund shares.
| Net Assets | $79,330,603 |
| Number of Portfolio Holdings | 198 |
| Advisory Fee #ERROR:A result could not be returned because the conditional could not be evaluated to a True/False value ((history)) | $330,329 |
| Portfolio Turnover | 19% |
Asset Weighting (% of total investments)
| Value | Value |
|---|
| Common Stocks | 18.4% |
| Exchange-Traded Funds | 18.5% |
| Money Market Funds | 3.0% |
| Partnership Shares | 0.0% |
| Precious Metals - Physical Holding | 20.4% |
| Reit | 18.8% |
| U.S. Government & Agencies | 20.9% |
What did the Fund invest in?
Sector Weighting (% of net assets)
| Value | Value |
|---|
| Other Assets in Excess of Liabilities | 0.2% |
| Technology | 0.1% |
| Health Care | 0.4% |
| Utilities | 0.8% |
| Industrials | 1.2% |
| Consumer Staples | 1.6% |
| Money Market Funds | 3.0% |
| Materials | 6.9% |
| Energy | 7.0% |
| Equity | 18.4% |
| Real Estate | 19.1% |
| Precious Metal | 20.4% |
| U.S. Treasury Obligations | 20.9% |
Top 10 Holdings (% of net assets)
| Holding Name | % of Net Assets |
| GOLD BARS - XAU BGN CURNCY | 20.4% |
| Timothy Plan Market Neutral ETF | 18.4% |
| United States Treasury Inflation Indexed Bonds | 3.4% |
| Fidelity Government Portfolio, Institutional Class | 3.0% |
| United States Treasury Inflation Indexed Bonds | 2.9% |
| United States Treasury Inflation Indexed Bonds | 2.9% |
| United States Treasury Inflation Indexed Bonds | 2.5% |
| United States Treasury Inflation Indexed Bonds | 2.2% |
| United States Treasury Inflation Indexed Bonds | 2.0% |
| United States Treasury Inflation Indexed Bonds | 1.9% |
No material changes occurred during the year ended September 30, 2024.
Timothy Plan Defensive Strategies Fund
Annual Shareholder Report - September 30, 2024
Where can I find additional information about the Fund?
Additional information is available on the Fund's website ( timothyplan.com ), including its:
Prospectus
Financial information
Holdings
Proxy voting information
Timothy Plan Defensive Strategies Fund
Annual Shareholder Report - September 30, 2024
This annual shareholder report contains important information about Timothy Plan Defensive Strategies Fund for the period of October 1, 2023 to November 30, 2024. You can find additional information about the Fund at timothyplan.com. You can also request this information by contacting us at (800) 846-7526. This report describes changes to the Fund that occurred during the reporting period.
What were the Fund’s costs for the last year?
(based on a hypothetical $10,000 investment)
| Class Name | Costs of a $10,000 investment | Costs paid as a percentage of a $10,000 investment |
|---|
| Class I | $102 | 0.94% |
How did the Fund perform during the reporting period?
For the twelve months ended September 30, 2024, the Timothy Plan Defensive Strategies Fund - Class I delivered a 16.20% return, outperforming its blended benchmark’s 14.01% return. This fund includes the allocation of inflation-sensitive investment sleeves. Each sleeve played a crucial role in navigating inflationary pressures and market volatility.
Key Performance Drivers:
• Multi-Asset Sleeve (Timothy Partners, Ltd.): The Multi-Asset Sleeve provided strong returns, with physical gold appreciating by over 42%, offering stability. The Timothy Plan Market Neutral ETF also contributed steady income while reducing overall portfolio risk, with its Overlay Strategy—a combination of long Nasdaq 100 futures and short S&P 500 futures—helping manage risk effectively.
• TIPS Sleeve (Barrow Hanley): The TIPS sleeve returned 7.92% gross of fees, benefiting from the Federal Reserve’s September rate cut and helping protect against inflation. The portfolio’s focus on shorter maturities proved advantageous in a fluctuating interest rate environment.
• Real Estate Sleeve (Chilton Capital Management): The Real Estate Sleeve returned 33.5%, just under the MSCI US REIT Index’s 34.4%. REIT prices surged in the third quarter following Fed rate cuts and optimism over declining inflation. Underweight positions in lodging and strong stock selection in healthcare contributed to performance, while underweight positions in regional malls detracted.
• Commodity Sleeve (CoreCommodity): The Commodity sleeve posted a 3.7% return, outperforming the Bloomberg Commodity Index’s 1.0%. Gains in agriculture, forestry, and industrial metals, especially copper, were key contributors, while energy holdings, although negative, performed better than the benchmark.
We believe the Timothy Plan Defensive Strategies Fund is well-positioned to manage future market volatility and inflationary pressures. With its diversified allocation across gold, TIPS, real estate, and commodities, the Fund remains flexible and resilient in various economic conditions.
How has the Fund performed over the last ten years?
Total Return Based on $10,000 Investment
| Timothy Plan Defensive Strategies Fund | Russell 3000® Total Return Index | 33% BB USTreas1-3YR / 33% BB Comm / 34% MSCI REIT GROSS |
|---|
| Sep-2014 | $10,000 | $10,000 | $10,000 |
| Sep-2015 | $9,391 | $9,951 | $9,455 |
| Sep-2016 | $10,275 | $11,440 | $10,044 |
| Sep-2017 | $10,246 | $13,579 | $10,071 |
| Sep-2018 | $10,325 | $15,967 | $10,308 |
| Sep-2019 | $10,859 | $16,433 | $10,857 |
| Sep-2020 | $11,289 | $18,898 | $10,088 |
| Sep-2021 | $12,996 | $24,921 | $12,669 |
| Sep-2022 | $12,113 | $20,528 | $12,269 |
| Sep-2023 | $13,160 | $24,729 | $12,489 |
| Sep-2024 | $15,291 | $33,432 | $14,240 |
Average Annual Total Returns
| 1 Year | 5 Years | 10 Years |
|---|
| Timothy Plan Defensive Strategies Fund | 16.20% | 7.08% | 4.34% |
| 33% BB USTreas1-3YR / 33% BB Comm / 34% MSCI REIT GROSS | 14.01% | 5.57% | 3.60% |
Russell 3000® Total Return Index | 35.19% | 15.26% | 12.83% |
The Fund's past performance is not a good predictor of how the Fund will perform in the future. The graph and table do not reflect the deduction of taxes that a shareholder would pay on fund distributions or redemption of fund shares.
| Net Assets | $79,330,603 |
| Number of Portfolio Holdings | 198 |
| Advisory Fee #ERROR:A result could not be returned because the conditional could not be evaluated to a True/False value ((history)) | $330,329 |
| Portfolio Turnover | 19% |
Asset Weighting (% of total investments)
| Value | Value |
|---|
| Common Stocks | 18.4% |
| Exchange-Traded Funds | 18.5% |
| Money Market Funds | 3.0% |
| Partnership Shares | 0.0% |
| Precious Metals - Physical Holding | 20.4% |
| Reit | 18.8% |
| U.S. Government & Agencies | 20.9% |
What did the Fund invest in?
Sector Weighting (% of net assets)
| Value | Value |
|---|
| Other Assets in Excess of Liabilities | 0.2% |
| Technology | 0.1% |
| Health Care | 0.4% |
| Utilities | 0.8% |
| Industrials | 1.2% |
| Consumer Staples | 1.6% |
| Money Market Funds | 3.0% |
| Materials | 6.9% |
| Energy | 7.0% |
| Equity | 18.4% |
| Real Estate | 19.1% |
| Precious Metal | 20.4% |
| U.S. Treasury Obligations | 20.9% |
Top 10 Holdings (% of net assets)
| Holding Name | % of Net Assets |
| GOLD BARS - XAU BGN CURNCY | 20.4% |
| Timothy Plan Market Neutral ETF | 18.4% |
| United States Treasury Inflation Indexed Bonds | 3.4% |
| Fidelity Government Portfolio, Institutional Class | 3.0% |
| United States Treasury Inflation Indexed Bonds | 2.9% |
| United States Treasury Inflation Indexed Bonds | 2.9% |
| United States Treasury Inflation Indexed Bonds | 2.5% |
| United States Treasury Inflation Indexed Bonds | 2.2% |
| United States Treasury Inflation Indexed Bonds | 2.0% |
| United States Treasury Inflation Indexed Bonds | 1.9% |
No material changes occurred during the year ended September 30, 2024.
Timothy Plan Defensive Strategies Fund
Annual Shareholder Report - September 30, 2024
Where can I find additional information about the Fund?
Additional information is available on the Fund's website ( timothyplan.com ), including its:
Prospectus
Financial information
Holdings
Proxy voting information
Timothy Plan Fixed Income Fund
Annual Shareholder Report - September 30, 2024
This annual shareholder report contains important information about Timothy Plan Fixed Income Fund for the period of October 1, 2023 to November 30, 2024. You can find additional information about the Fund at timothyplan.com. You can also request this information by contacting us at (800) 846-7526. This report describes changes to the Fund that occurred during the reporting period.
What were the Fund’s costs for the last year?
(based on a hypothetical $10,000 investment)
| Class Name | Costs of a $10,000 investment | Costs paid as a percentage of a $10,000 investment |
|---|
| Class A | $113 | 1.07% |
How did the Fund perform during the reporting period?
For the twelve months ended September 30, 2024, the Timothy Plan Fixed Income Fund - Class A returned 10.37%, trailing the Bloomberg Aggregate Index, which returned 11.57%. U.S. Treasury yields were volatile as the Federal Reserve maintained high rates throughout the year before cutting rates by 50 basis points in September.
Key Performance Drivers:
• Sector Allocation: The Fund's overweight to mortgage-backed securities (MBS) contributed to performance, with MBS returning 12.25%, though underperforming investment-grade credit, which returned 13.81%. Mortgage issuance slowed due to higher mortgage rates, dampening refinancing and home purchase activity.
• Top Contributors: Tightening investment-grade credit spreads from 112 to 84 basis points supported the Fund’s credit positions. Strong inflows into the IG credit market helped offset the impact of higher rates, and the portfolio’s overweight to mortgages benefited from declining U.S. Treasury yields.
• Largest Detractors: The underweight to Financials detracted from performance, as the sector returned 14.00%, outpacing the Bloomberg Aggregate Index. Additionally, the volatility of U.S. Treasury yields and the inversion of the yield curve presented challenges throughout the year.
Looking ahead, the portfolio is defensively positioned, and we believe that will allow the Fund to take advantage of future opportunities as market conditions evolve, particularly in the event of further rate cuts or a market sell-off.
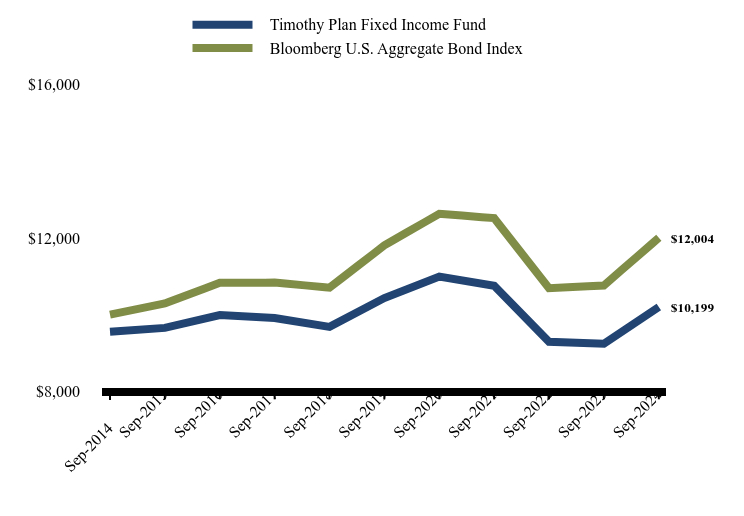
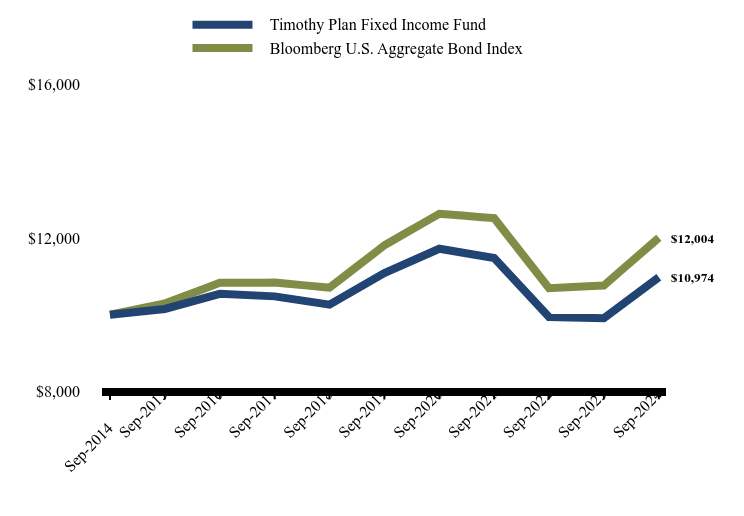
How has the Fund performed over the last ten years?
Total Return Based on $10,000 Investment
| Timothy Plan Fixed Income Fund | Bloomberg U.S. Aggregate Bond Index |
|---|
| Sep-2014 | $9,551 | $10,000 |
| Sep-2015 | $9,655 | $10,294 |
| Sep-2016 | $9,990 | $10,829 |
| Sep-2017 | $9,910 | $10,836 |
| Sep-2018 | $9,681 | $10,705 |
| Sep-2019 | $10,433 | $11,807 |
| Sep-2020 | $10,995 | $12,632 |
| Sep-2021 | $10,753 | $12,518 |
| Sep-2022 | $9,291 | $10,691 |
| Sep-2023 | $9,241 | $10,760 |
| Sep-2024 | $10,199 | $12,004 |
Average Annual Total Returns
| 1 Year | 5 Years | 10 Years |
|---|
| Timothy Plan Fixed Income Fund | | | |
| Without Load | 10.37% | -0.45% | 0.66% |
| With Load* | 5.39% | -1.37% | 0.20% |
| Bloomberg U.S. Aggregate Bond Index | 11.57% | 0.33% | 1.84% |
The Fund's past performance is not a good predictor of how the Fund will perform in the future. The graph and table do not reflect the deduction of taxes that a shareholder would pay on fund distributions or redemption of fund shares.
| Net Assets | $115,024,650 |
| Number of Portfolio Holdings | 105 |
| Advisory Fee #ERROR:A result could not be returned because the conditional could not be evaluated to a True/False value ((history)) | $446,879 |
| Portfolio Turnover | 50% |
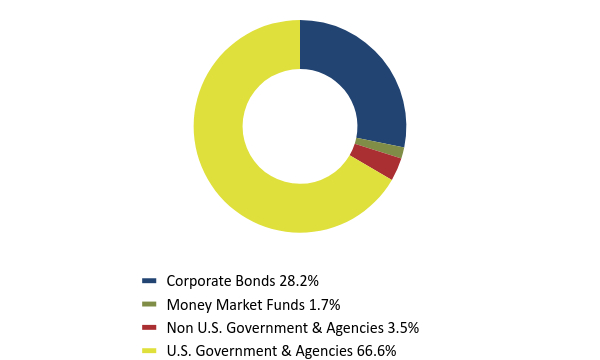
Asset Weighting (% of total investments)
| Value | Value |
|---|
| Corporate Bonds | 28.2% |
| Money Market Funds | 1.7% |
| Non U.S. Government & Agencies | 3.5% |
| U.S. Government & Agencies | 66.6% |
What did the Fund invest in?
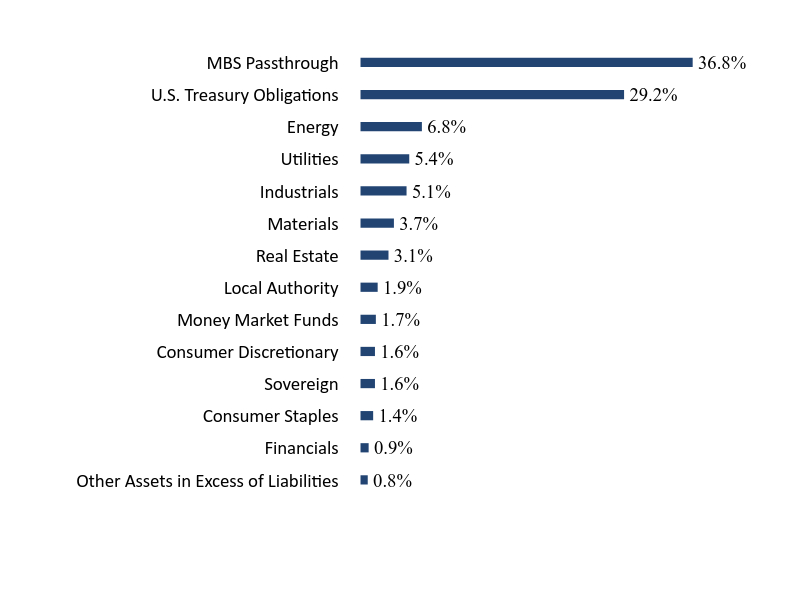
Sector Weighting (% of net assets)
| Value | Value |
|---|
| Other Assets in Excess of Liabilities | 0.8% |
| Financials | 0.9% |
| Consumer Staples | 1.4% |
| Sovereign | 1.6% |
| Consumer Discretionary | 1.6% |
| Money Market Funds | 1.7% |
| Local Authority | 1.9% |
| Real Estate | 3.1% |
| Materials | 3.7% |
| Industrials | 5.1% |
| Utilities | 5.4% |
| Energy | 6.8% |
| U.S. Treasury Obligations | 29.2% |
| MBS Passthrough | 36.8% |
Top 10 Holdings (% of net assets)
| Holding Name | % of Net Assets |
| United States Treasury Note, 4.375%, 05/15/34 | 8.4% |
| United States Treasury Note, 4.625%, 05/15/54 | 7.9% |
| United States Treasury Note, 4.625%, 04/30/29 | 4.4% |
| United States Treasury Note, 4.500%, 02/15/44 | 3.1% |
| United States Treasury Note, 4.875%, 04/30/26 | 2.9% |
| Phillips 66 Company, 3.605%, 02/15/25 | 1.9% |
| Province of Ontario Canada, 2.500%, 04/27/26 | 1.9% |
| CSX Corporation, 3.250%, 06/01/27 | 1.9% |
| NiSource, Inc., 3.490%, 05/15/27 | 1.9% |
| American Electric Power Company, Inc., 3.200%, 11/13/27 | 1.9% |
No material changes occurred during the year ended September 30, 2024.
Timothy Plan Fixed Income Fund
Annual Shareholder Report - September 30, 2024
Where can I find additional information about the Fund?
Additional information is available on the Fund's website ( timothyplan.com ), including its:
Prospectus
Financial information
Holdings
Proxy voting information
Timothy Plan Fixed Income Fund
Annual Shareholder Report - September 30, 2024
This annual shareholder report contains important information about Timothy Plan Fixed Income Fund for the period of October 1, 2023 to November 30, 2024. You can find additional information about the Fund at timothyplan.com. You can also request this information by contacting us at (800) 846-7526. This report describes changes to the Fund that occurred during the reporting period.
What were the Fund’s costs for the last year?
(based on a hypothetical $10,000 investment)
| Class Name | Costs of a $10,000 investment | Costs paid as a percentage of a $10,000 investment |
|---|
| Class C | $191 | 1.82% |
How did the Fund perform during the reporting period?
For the twelve months ended September 30, 2024, the Timothy Plan Fixed Income Fund - Class C returned 9.51%, trailing the Bloomberg Aggregate Index, which returned 11.57%. U.S. Treasury yields were volatile as the Federal Reserve maintained high rates throughout the year before cutting rates by 50 basis points in September.
Key Performance Drivers:
• Sector Allocation: The Fund's overweight to mortgage-backed securities (MBS) contributed to performance, with MBS returning 12.25%, though underperforming investment-grade credit, which returned 13.81%. Mortgage issuance slowed due to higher mortgage rates, dampening refinancing and home purchase activity.
• Top Contributors: Tightening investment-grade credit spreads from 112 to 84 basis points supported the Fund’s credit positions. Strong inflows into the IG credit market helped offset the impact of higher rates, and the portfolio’s overweight to mortgages benefited from declining U.S. Treasury yields.
• Largest Detractors: The underweight to Financials detracted from performance, as the sector returned 14.00%, outpacing the Bloomberg Aggregate Index. Additionally, the volatility of U.S. Treasury yields and the inversion of the yield curve presented challenges throughout the year.
Looking ahead, the portfolio is defensively positioned, and we believe that will allow the Fund to take advantage of future opportunities as market conditions evolve, particularly in the event of further rate cuts or a market sell-off.
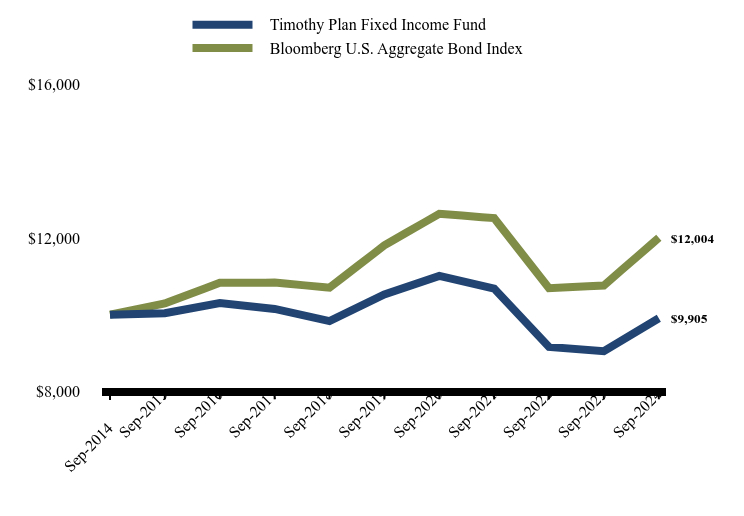
How has the Fund performed over the last ten years?
Total Return Based on $10,000 Investment
| Timothy Plan Fixed Income Fund | Bloomberg U.S. Aggregate Bond Index |
|---|
| Sep-2014 | $10,000 | $10,000 |
| Sep-2015 | $10,036 | $10,294 |
| Sep-2016 | $10,304 | $10,829 |
| Sep-2017 | $10,150 | $10,836 |
| Sep-2018 | $9,831 | $10,705 |
| Sep-2019 | $10,525 | $11,807 |
| Sep-2020 | $11,009 | $12,632 |
| Sep-2021 | $10,680 | $12,518 |
| Sep-2022 | $9,159 | $10,691 |
| Sep-2023 | $9,045 | $10,760 |
| Sep-2024 | $9,905 | $12,004 |
Average Annual Total Returns
| 1 Year | 5 Years | 10 Years |
|---|
| Timothy Plan Fixed Income Fund | 9.51% | -1.21% | -0.10% |
| Bloomberg U.S. Aggregate Bond Index | 11.57% | 0.33% | 1.84% |
The Fund's past performance is not a good predictor of how the Fund will perform in the future. The graph and table do not reflect the deduction of taxes that a shareholder would pay on fund distributions or redemption of fund shares.
| Net Assets | $115,024,650 |
| Number of Portfolio Holdings | 105 |
| Advisory Fee #ERROR:A result could not be returned because the conditional could not be evaluated to a True/False value ((history)) | $446,879 |
| Portfolio Turnover | 50% |
Asset Weighting (% of total investments)
| Value | Value |
|---|
| Corporate Bonds | 28.2% |
| Money Market Funds | 1.7% |
| Non U.S. Government & Agencies | 3.5% |
| U.S. Government & Agencies | 66.6% |
What did the Fund invest in?
Sector Weighting (% of net assets)
| Value | Value |
|---|
| Other Assets in Excess of Liabilities | 0.8% |
| Financials | 0.9% |
| Consumer Staples | 1.4% |
| Sovereign | 1.6% |
| Consumer Discretionary | 1.6% |
| Money Market Funds | 1.7% |
| Local Authority | 1.9% |
| Real Estate | 3.1% |
| Materials | 3.7% |
| Industrials | 5.1% |
| Utilities | 5.4% |
| Energy | 6.8% |
| U.S. Treasury Obligations | 29.2% |
| MBS Passthrough | 36.8% |
Top 10 Holdings (% of net assets)
| Holding Name | % of Net Assets |
| United States Treasury Note, 4.375%, 05/15/34 | 8.4% |
| United States Treasury Note, 4.625%, 05/15/54 | 7.9% |
| United States Treasury Note, 4.625%, 04/30/29 | 4.4% |
| United States Treasury Note, 4.500%, 02/15/44 | 3.1% |
| United States Treasury Note, 4.875%, 04/30/26 | 2.9% |
| Phillips 66 Company, 3.605%, 02/15/25 | 1.9% |
| Province of Ontario Canada, 2.500%, 04/27/26 | 1.9% |
| CSX Corporation, 3.250%, 06/01/27 | 1.9% |
| NiSource, Inc., 3.490%, 05/15/27 | 1.9% |
| American Electric Power Company, Inc., 3.200%, 11/13/27 | 1.9% |
No material changes occurred during the year ended September 30, 2024.
Timothy Plan Fixed Income Fund
Annual Shareholder Report - September 30, 2024
Where can I find additional information about the Fund?
Additional information is available on the Fund's website ( timothyplan.com ), including its:
Prospectus
Financial information
Holdings
Proxy voting information
Timothy Plan Fixed Income Fund
Annual Shareholder Report - September 30, 2024
This annual shareholder report contains important information about Timothy Plan Fixed Income Fund for the period of October 1, 2023 to November 30, 2024. You can find additional information about the Fund at timothyplan.com. You can also request this information by contacting us at (800) 846-7526. This report describes changes to the Fund that occurred during the reporting period.
What were the Fund’s costs for the last year?
(based on a hypothetical $10,000 investment)
| Class Name | Costs of a $10,000 investment | Costs paid as a percentage of a $10,000 investment |
|---|
| Class I | $86 | 0.82% |
How did the Fund perform during the reporting period?
For the twelve months ended September 30, 2024, the Timothy Plan Fixed Income Fund - Class I returned 10.76%, trailing the Bloomberg Aggregate Index, which returned 11.57%. U.S. Treasury yields were volatile as the Federal Reserve maintained high rates throughout the year before cutting rates by 50 basis points in September.
Key Performance Drivers:
• Sector Allocation: The Fund's overweight to mortgage-backed securities (MBS) contributed to performance, with MBS returning 12.25%, though underperforming investment-grade credit, which returned 13.81%. Mortgage issuance slowed due to higher mortgage rates, dampening refinancing and home purchase activity.
• Top Contributors: Tightening investment-grade credit spreads from 112 to 84 basis points supported the Fund’s credit positions. Strong inflows into the IG credit market helped offset the impact of higher rates, and the portfolio’s overweight to mortgages benefited from declining U.S. Treasury yields.
• Largest Detractors: The underweight to Financials detracted from performance, as the sector returned 14.00%, outpacing the Bloomberg Aggregate Index. Additionally, the volatility of U.S. Treasury yields and the inversion of the yield curve presented challenges throughout the year.
Looking ahead, the portfolio is defensively positioned, and we believe that will allow the Fund to take advantage of future opportunities as market conditions evolve, particularly in the event of further rate cuts or a market sell-off.
How has the Fund performed over the last ten years?
Total Return Based on $10,000 Investment
| Timothy Plan Fixed Income Fund | Bloomberg U.S. Aggregate Bond Index |
|---|
| Sep-2014 | $10,000 | $10,000 |
| Sep-2015 | $10,148 | $10,294 |
| Sep-2016 | $10,544 | $10,829 |
| Sep-2017 | $10,477 | $10,836 |
| Sep-2018 | $10,261 | $10,705 |
| Sep-2019 | $11,087 | $11,807 |
| Sep-2020 | $11,719 | $12,632 |
| Sep-2021 | $11,477 | $12,518 |
| Sep-2022 | $9,938 | $10,691 |
| Sep-2023 | $9,908 | $10,760 |
| Sep-2024 | $10,974 | $12,004 |
Average Annual Total Returns
| 1 Year | 5 Years | 10 Years |
|---|
| Timothy Plan Fixed Income Fund | 10.76% | -0.21% | 0.93% |
| Bloomberg U.S. Aggregate Bond Index | 11.57% | 0.33% | 1.84% |
The Fund's past performance is not a good predictor of how the Fund will perform in the future. The graph and table do not reflect the deduction of taxes that a shareholder would pay on fund distributions or redemption of fund shares.
| Net Assets | $115,024,650 |
| Number of Portfolio Holdings | 105 |
| Advisory Fee #ERROR:A result could not be returned because the conditional could not be evaluated to a True/False value ((history)) | $446,879 |
| Portfolio Turnover | 50% |
Asset Weighting (% of total investments)
| Value | Value |
|---|
| Corporate Bonds | 28.2% |
| Money Market Funds | 1.7% |
| Non U.S. Government & Agencies | 3.5% |
| U.S. Government & Agencies | 66.6% |
What did the Fund invest in?
Sector Weighting (% of net assets)
| Value | Value |
|---|
| Other Assets in Excess of Liabilities | 0.8% |
| Financials | 0.9% |
| Consumer Staples | 1.4% |
| Sovereign | 1.6% |
| Consumer Discretionary | 1.6% |
| Money Market Funds | 1.7% |
| Local Authority | 1.9% |
| Real Estate | 3.1% |
| Materials | 3.7% |
| Industrials | 5.1% |
| Utilities | 5.4% |
| Energy | 6.8% |
| U.S. Treasury Obligations | 29.2% |
| MBS Passthrough | 36.8% |
Top 10 Holdings (% of net assets)
| Holding Name | % of Net Assets |
| United States Treasury Note, 4.375%, 05/15/34 | 8.4% |
| United States Treasury Note, 4.625%, 05/15/54 | 7.9% |
| United States Treasury Note, 4.625%, 04/30/29 | 4.4% |
| United States Treasury Note, 4.500%, 02/15/44 | 3.1% |
| United States Treasury Note, 4.875%, 04/30/26 | 2.9% |
| Phillips 66 Company, 3.605%, 02/15/25 | 1.9% |
| Province of Ontario Canada, 2.500%, 04/27/26 | 1.9% |
| CSX Corporation, 3.250%, 06/01/27 | 1.9% |
| NiSource, Inc., 3.490%, 05/15/27 | 1.9% |
| American Electric Power Company, Inc., 3.200%, 11/13/27 | 1.9% |
No material changes occurred during the year ended September 30, 2024.
Timothy Plan Fixed Income Fund
Annual Shareholder Report - September 30, 2024
Where can I find additional information about the Fund?
Additional information is available on the Fund's website ( timothyplan.com ), including its:
Prospectus
Financial information
Holdings
Proxy voting information
Timothy Plan Growth & Income Fund
Annual Shareholder Report - September 30, 2024
This annual shareholder report contains important information about Timothy Plan Growth & Income Fund for the period of October 1, 2023 to November 30, 2024. You can find additional information about the Fund at timothyplan.com. You can also request this information by contacting us at (800) 846-7526. This report describes changes to the Fund that occurred during the reporting period.
What were the Fund’s costs for the last year?
(based on a hypothetical $10,000 investment)
| Class Name | Costs of a $10,000 investment | Costs paid as a percentage of a $10,000 investment |
|---|
| Class A | $170 | 1.59% |
How did the Fund perform during the reporting period?
For the twelve months ending September 30, 2024, the Fund delivered strong returns across its equity and fixed income allocations. The fixed income portion, managed by Barrow Hanley, returned 11.28% gross of fees (11.06% net), slightly underperforming the Bloomberg Aggregate Index’s 11.57% return. The equity portion, managed by Timothy Partners, Ltd., which includes Timothy Plan High Dividend Stock ETF (TPHD) and Timothy Plan High Dividend Stock Enhanced ETF (TPHE), also contributed positively.
Key Performance Drivers:
• Equity Allocation (Timothy Partners, Ltd.): About 5% of the Fund is in TPHD and 36% in TPHE, both benefiting from stable, dividend-paying stocks that provide diversification and income.
• Fixed Income Allocation (Barrow Hanley): Volatile U.S. Treasury yields and rate cut expectations shaped the fixed income strategy. Overweighting mortgage-backed securities (MBS) added value, while an underweight to Financials detracted.
• Top Contributors: Dividend-paying stocks in the equity portion provided stability. In fixed income, MBS performed well due to tightening credit spreads and falling Treasury yields.
• Largest Detractors: The underweight to Financials in the fixed income portion and U.S. Treasury yield volatility posed challenges.
We believe the Fund is defensively positioned to take advantage of market opportunities from rate cuts and improving conditions, combining stable equities with actively managed fixed income.
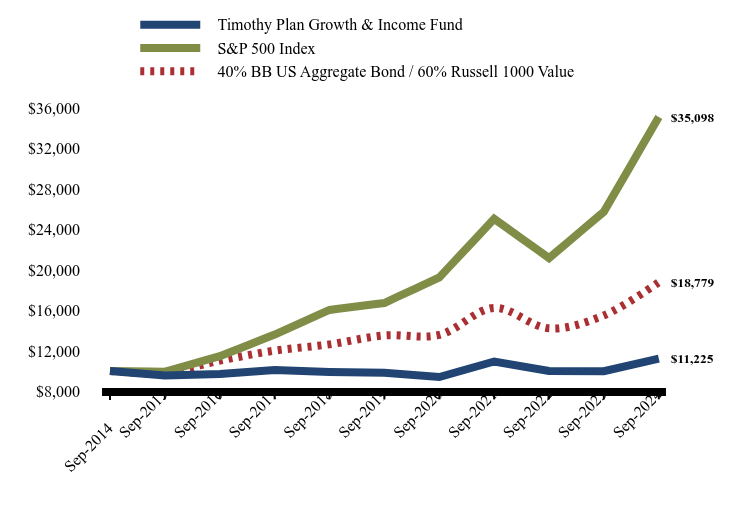
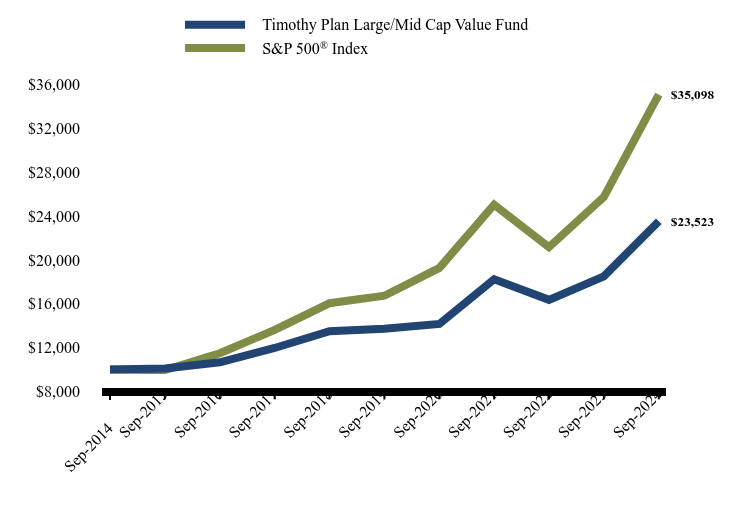
How has the Fund performed over the last ten years?
Total Return Based on $10,000 Investment
| Timothy Plan Growth & Income Fund | S&P 500 Index | 40% BB US Aggregate Bond / 60% Russell 1000 Value |
|---|
| Sep-2014 | $9,448 | $10,000 | $10,000 |
| Sep-2015 | $9,094 | $9,939 | $9,861 |
| Sep-2016 | $9,309 | $11,472 | $11,031 |
| Sep-2017 | $9,765 | $13,607 | $12,022 |
| Sep-2018 | $9,646 | $16,044 | $12,640 |
| Sep-2019 | $9,637 | $16,727 | $13,521 |
| Sep-2020 | $9,301 | $19,260 | $13,571 |
| Sep-2021 | $10,898 | $25,040 | $16,245 |
| Sep-2022 | $10,030 | $21,165 | $14,223 |
| Sep-2023 | $10,080 | $25,741 | $15,504 |
| Sep-2024 | $11,423 | $35,098 | $18,779 |
Average Annual Total Returns
| 1 Year | 5 Years | 10 Years |
|---|
| Timothy Plan Growth & Income Fund | | | |
| Without Load | 13.32% | 3.46% | 1.92% |
| With Load | 7.06% | 2.29% | 1.34% |
| S&P 500 Index | 36.35% | 15.98% | 13.38% |
| 40% BB US Aggregate Bond / 60% Russell 1000 Value | 21.13% | 6.79% | 6.50% |
The Fund's past performance is not a good predictor of how the Fund will perform in the future. The graph and table do not reflect the deduction of taxes that a shareholder would pay on fund distributions or redemption of fund shares.
| Net Assets | $19,068,361 |
| Number of Portfolio Holdings | 89 |
| Advisory Fee #ERROR:A result could not be returned because the conditional could not be evaluated to a True/False value ((history)) | $69,131 |
| Portfolio Turnover | 53% |
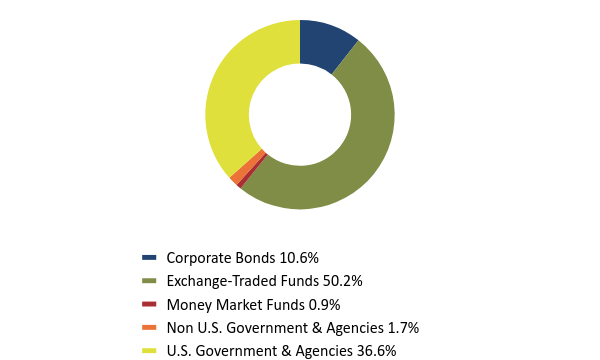
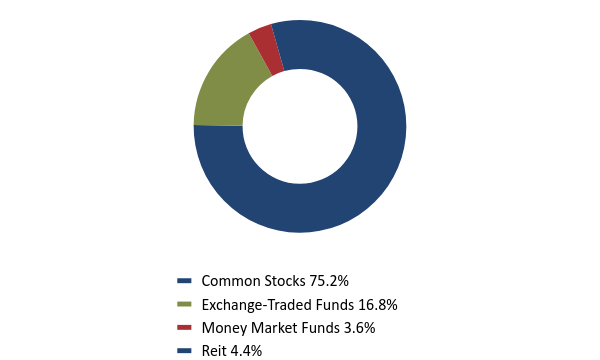
Asset Weighting (% of total investments)
| Value | Value |
|---|
| Corporate Bonds | 10.6% |
| Exchange-Traded Funds | 50.2% |
| Money Market Funds | 0.9% |
| Non U.S. Government & Agencies | 1.7% |
| U.S. Government & Agencies | 36.6% |
What did the Fund invest in?
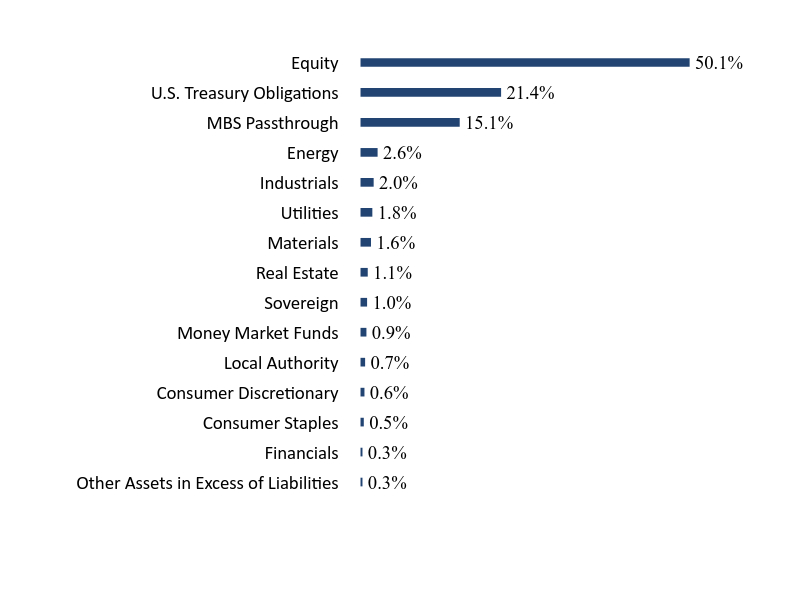
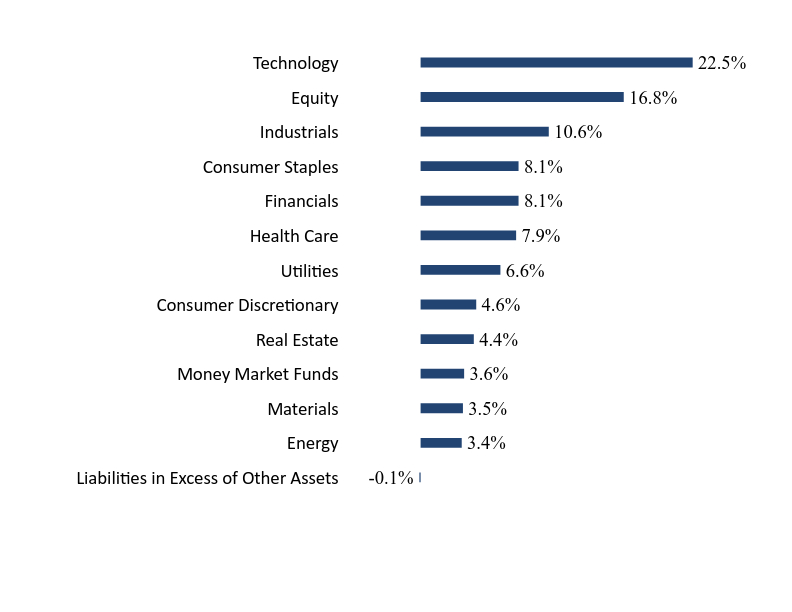
Sector Weighting (% of net assets)
| Value | Value |
|---|
| Other Assets in Excess of Liabilities | 0.3% |
| Financials | 0.3% |
| Consumer Staples | 0.5% |
| Consumer Discretionary | 0.6% |
| Local Authority | 0.7% |
| Money Market Funds | 0.9% |
| Sovereign | 1.0% |
| Real Estate | 1.1% |
| Materials | 1.6% |
| Utilities | 1.8% |
| Industrials | 2.0% |
| Energy | 2.6% |
| MBS Passthrough | 15.1% |
| U.S. Treasury Obligations | 21.4% |
| Equity | 50.1% |
Top 10 Holdings (% of net assets)
| Holding Name | % of Net Assets |
| Timothy Plan High Dividend Stock Enhanced ETF | 50.1% |
| United States Treasury Note | 5.9% |
| United States Treasury Note | 4.1% |
| United States Treasury Note | 3.6% |
| United States Treasury Note | 2.7% |
| United States Treasury Note | 1.9% |
| United States Treasury Note | 1.8% |
| United States Treasury Note | 1.4% |
| Israel Government International Bond | 1.0% |
| Fidelity Government Portfolio, Institutional Class | 0.9% |
No material changes occurred during the year ended September 30, 2024.
Timothy Plan Growth & Income Fund
Annual Shareholder Report - September 30, 2024
Where can I find additional information about the Fund?
Additional information is available on the Fund's website ( timothyplan.com ), including its:
Prospectus
Financial information
Holdings
Proxy voting information
Timothy Plan Growth & Income Fund
Annual Shareholder Report - September 30, 2024
This annual shareholder report contains important information about Timothy Plan Growth & Income Fund for the period of October 1, 2023 to November 30, 2024. You can find additional information about the Fund at timothyplan.com. You can also request this information by contacting us at (800) 846-7526. This report describes changes to the Fund that occurred during the reporting period.
What were the Fund’s costs for the last year?
(based on a hypothetical $10,000 investment)
| Class Name | Costs of a $10,000 investment | Costs paid as a percentage of a $10,000 investment |
|---|
| Class C | $249 | 2.34% |
How did the Fund perform during the reporting period?
For the twelve months ending September 30, 2024, the Fund delivered strong returns across its equity and fixed income allocations. The fixed income portion, managed by Barrow Hanley, returned 11.28% gross of fees (11.06% net), slightly underperforming the Bloomberg Aggregate Index’s 11.57% return. The equity portion, managed by Timothy Partners, Ltd., which includes Timothy Plan High Dividend Stock ETF (TPHD) and Timothy Plan High Dividend Stock Enhanced ETF (TPHE), also contributed positively.
Key Performance Drivers:
• Equity Allocation (Timothy Partners, Ltd.): About 5% of the Fund is in TPHD and 36% in TPHE, both benefiting from stable, dividend-paying stocks that provide diversification and income.
• Fixed Income Allocation (Barrow Hanley): Volatile U.S. Treasury yields and rate cut expectations shaped the fixed income strategy. Overweighting mortgage-backed securities (MBS) added value, while an underweight to Financials detracted.
• Top Contributors: Dividend-paying stocks in the equity portion provided stability. In fixed income, MBS performed well due to tightening credit spreads and falling Treasury yields.
• Largest Detractors: The underweight to Financials in the fixed income portion and U.S. Treasury yield volatility posed challenges.
We believe the Fund is defensively positioned to take advantage of market opportunities from rate cuts and improving conditions, combining stable equities with actively managed fixed income.
How has the Fund performed over the last ten years?
Total Return Based on $10,000 Investment
| Timothy Plan Growth & Income Fund | S&P 500 Index | 40% BB US Aggregate Bond / 60% Russell 1000 Value |
|---|
| Sep-2014 | $10,000 | $10,000 | $10,000 |
| Sep-2015 | $9,558 | $9,939 | $9,861 |
| Sep-2016 | $9,706 | $11,472 | $11,031 |
| Sep-2017 | $10,110 | $13,607 | $12,022 |
| Sep-2018 | $9,911 | $16,044 | $12,640 |
| Sep-2019 | $9,830 | $16,727 | $13,521 |
| Sep-2020 | $9,417 | $19,260 | $13,571 |
| Sep-2021 | $10,948 | $25,040 | $16,245 |
| Sep-2022 | $10,004 | $21,165 | $14,223 |
| Sep-2023 | $9,981 | $25,741 | $15,504 |
| Sep-2024 | $11,225 | $35,098 | $18,779 |
Average Annual Total Returns
| 1 Year | 5 Years | 10 Years |
|---|
| Timothy Plan Growth & Income Fund | 12.47% | 2.69% | 1.16% |
| 40% BB US Aggregate Bond / 60% Russell 1000 Value | 21.13% | 6.79% | 6.50% |
| S&P 500 Index | 36.35% | 15.98% | 13.38% |
The Fund's past performance is not a good predictor of how the Fund will perform in the future. The graph and table do not reflect the deduction of taxes that a shareholder would pay on fund distributions or redemption of fund shares.
| Net Assets | $19,068,361 |
| Number of Portfolio Holdings | 89 |
| Advisory Fee #ERROR:A result could not be returned because the conditional could not be evaluated to a True/False value ((history)) | $69,131 |
| Portfolio Turnover | 53% |
Asset Weighting (% of total investments)
| Value | Value |
|---|
| Corporate Bonds | 10.6% |
| Exchange-Traded Funds | 50.2% |
| Money Market Funds | 0.9% |
| Non U.S. Government & Agencies | 1.7% |
| U.S. Government & Agencies | 36.6% |
What did the Fund invest in?
Sector Weighting (% of net assets)
| Value | Value |
|---|
| Other Assets in Excess of Liabilities | 0.3% |
| Financials | 0.3% |
| Consumer Staples | 0.5% |
| Consumer Discretionary | 0.6% |
| Local Authority | 0.7% |
| Money Market Funds | 0.9% |
| Sovereign | 1.0% |
| Real Estate | 1.1% |
| Materials | 1.6% |
| Utilities | 1.8% |
| Industrials | 2.0% |
| Energy | 2.6% |
| MBS Passthrough | 15.1% |
| U.S. Treasury Obligations | 21.4% |
| Equity | 50.1% |
Top 10 Holdings (% of net assets)
| Holding Name | % of Net Assets |
| Timothy Plan High Dividend Stock Enhanced ETF | 50.1% |
| United States Treasury Note | 5.9% |
| United States Treasury Note | 4.1% |
| United States Treasury Note | 3.6% |
| United States Treasury Note | 2.7% |
| United States Treasury Note | 1.9% |
| United States Treasury Note | 1.8% |
| United States Treasury Note | 1.4% |
| Israel Government International Bond | 1.0% |
| Fidelity Government Portfolio, Institutional Class | 0.9% |
No material changes occurred during the year ended September 30, 2024.
Timothy Plan Growth & Income Fund
Annual Shareholder Report - September 30, 2024
Where can I find additional information about the Fund?
Additional information is available on the Fund's website ( timothyplan.com ), including its:
Prospectus
Financial information
Holdings
Proxy voting information
Timothy Plan Growth & Income Fund
Annual Shareholder Report - September 30, 2024
This annual shareholder report contains important information about Timothy Plan Growth & Income Fund for the period of October 1, 2023 to November 30, 2024. You can find additional information about the Fund at timothyplan.com. You can also request this information by contacting us at (800) 846-7526. This report describes changes to the Fund that occurred during the reporting period.
What were the Fund’s costs for the last year?
(based on a hypothetical $10,000 investment)
| Class Name | Costs of a $10,000 investment | Costs paid as a percentage of a $10,000 investment |
|---|
| Class I | $143 | 1.34% |
How did the Fund perform during the reporting period?
For the twelve months ending September 30, 2024, the Fund delivered strong returns across its equity and fixed income allocations. The fixed income portion, managed by Barrow Hanley, returned 11.28% gross of fees (11.06% net), slightly underperforming the Bloomberg Aggregate Index’s 11.57% return. The equity portion, managed by Timothy Partners, Ltd., which includes Timothy Plan High Dividend Stock ETF (TPHD) and Timothy Plan High Dividend Stock Enhanced ETF (TPHE), also contributed positively.
Key Performance Drivers:
• Equity Allocation (Timothy Partners, Ltd.): About 5% of the Fund is in TPHD and 36% in TPHE, both benefiting from stable, dividend-paying stocks that provide diversification and income.
• Fixed Income Allocation (Barrow Hanley): Volatile U.S. Treasury yields and rate cut expectations shaped the fixed income strategy. Overweighting mortgage-backed securities (MBS) added value, while an underweight to Financials detracted.
• Top Contributors: Dividend-paying stocks in the equity portion provided stability. In fixed income, MBS performed well due to tightening credit spreads and falling Treasury yields.
• Largest Detractors: The underweight to Financials in the fixed income portion and U.S. Treasury yield volatility posed challenges.
We believe the Fund is defensively positioned to take advantage of market opportunities from rate cuts and improving conditions, combining stable equities with actively managed fixed income.
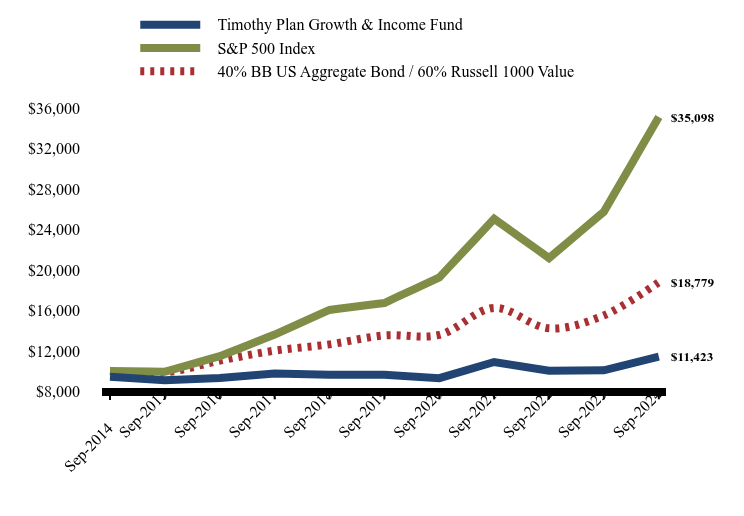
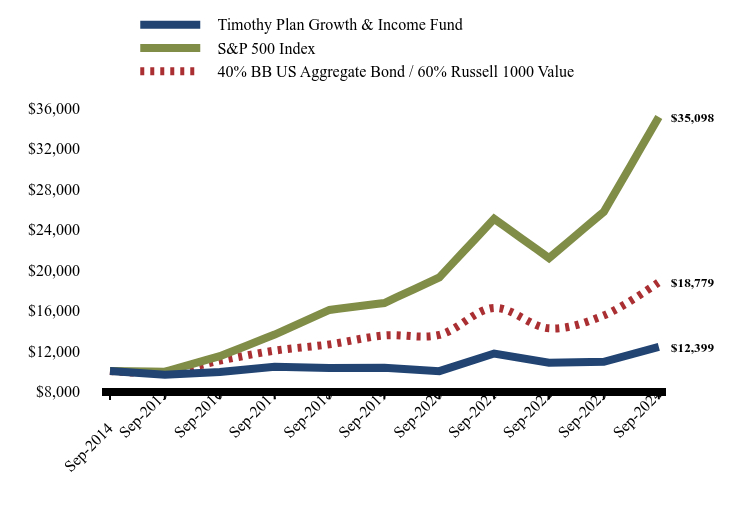
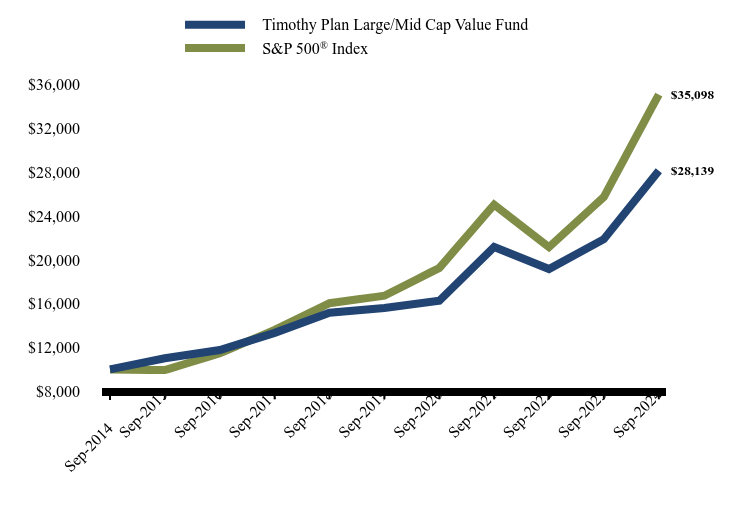
How has the Fund performed over the last ten years?
Total Return Based on $10,000 Investment
| Timothy Plan Growth & Income Fund | S&P 500 Index | 40% BB US Aggregate Bond / 60% Russell 1000 Value |
|---|
| Sep-2014 | $10,000 | $10,000 | $10,000 |
| Sep-2015 | $9,650 | $9,939 | $9,861 |
| Sep-2016 | $9,902 | $11,472 | $11,031 |
| Sep-2017 | $10,416 | $13,607 | $12,022 |
| Sep-2018 | $10,312 | $16,044 | $12,640 |
| Sep-2019 | $10,323 | $16,727 | $13,521 |
| Sep-2020 | $9,993 | $19,260 | $13,571 |
| Sep-2021 | $11,736 | $25,040 | $16,245 |
| Sep-2022 | $10,835 | $21,165 | $14,223 |
| Sep-2023 | $10,916 | $25,741 | $15,504 |
| Sep-2024 | $12,399 | $35,098 | $18,779 |
Average Annual Total Returns
| 1 Year | 5 Years | 10 Years |
|---|
| Timothy Plan Growth & Income Fund | 13.59% | 3.73% | 2.17% |
| 40% BB US Aggregate Bond / 60% Russell 1000 Value | 21.13% | 6.79% | 6.50% |
| S&P 500 Index | 36.35% | 15.98% | 13.38% |
The Fund's past performance is not a good predictor of how the Fund will perform in the future. The graph and table do not reflect the deduction of taxes that a shareholder would pay on fund distributions or redemption of fund shares.
| Net Assets | $19,068,361 |
| Number of Portfolio Holdings | 89 |
| Advisory Fee #ERROR:A result could not be returned because the conditional could not be evaluated to a True/False value ((history)) | $69,131 |
| Portfolio Turnover | 53% |
Asset Weighting (% of total investments)
| Value | Value |
|---|
| Corporate Bonds | 10.6% |
| Exchange-Traded Funds | 50.2% |
| Money Market Funds | 0.9% |
| Non U.S. Government & Agencies | 1.7% |
| U.S. Government & Agencies | 36.6% |
What did the Fund invest in?
Sector Weighting (% of net assets)
| Value | Value |
|---|
| Other Assets in Excess of Liabilities | 0.3% |
| Financials | 0.3% |
| Consumer Staples | 0.5% |
| Consumer Discretionary | 0.6% |
| Local Authority | 0.7% |
| Money Market Funds | 0.9% |
| Sovereign | 1.0% |
| Real Estate | 1.1% |
| Materials | 1.6% |
| Utilities | 1.8% |
| Industrials | 2.0% |
| Energy | 2.6% |
| MBS Passthrough | 15.1% |
| U.S. Treasury Obligations | 21.4% |
| Equity | 50.1% |
Top 10 Holdings (% of net assets)
| Holding Name | % of Net Assets |
| Timothy Plan High Dividend Stock Enhanced ETF | 50.1% |
| United States Treasury Note | 5.9% |
| United States Treasury Note | 4.1% |
| United States Treasury Note | 3.6% |
| United States Treasury Note | 2.7% |
| United States Treasury Note | 1.9% |
| United States Treasury Note | 1.8% |
| United States Treasury Note | 1.4% |
| Israel Government International Bond | 1.0% |
| Fidelity Government Portfolio, Institutional Class | 0.9% |
No material changes occurred during the year ended September 30, 2024.
Timothy Plan Growth & Income Fund
Annual Shareholder Report - September 30, 2024
Where can I find additional information about the Fund?
Additional information is available on the Fund's website ( timothyplan.com ), including its:
Prospectus
Financial information
Holdings
Proxy voting information
Timothy Plan High Yield Bond Fund
Annual Shareholder Report - September 30, 2024
This annual shareholder report contains important information about Timothy Plan High Yield Bond Fund for the period of October 1, 2023 to November 30, 2024. You can find additional information about the Fund at timothyplan.com. You can also request this information by contacting us at (800) 846-7526. This report describes changes to the Fund that occurred during the reporting period.
What were the Fund’s costs for the last year?
(based on a hypothetical $10,000 investment)
| Class Name | Costs of a $10,000 investment | Costs paid as a percentage of a $10,000 investment |
|---|
| Class A | $123 | 1.14% |
How did the Fund perform during the reporting period?
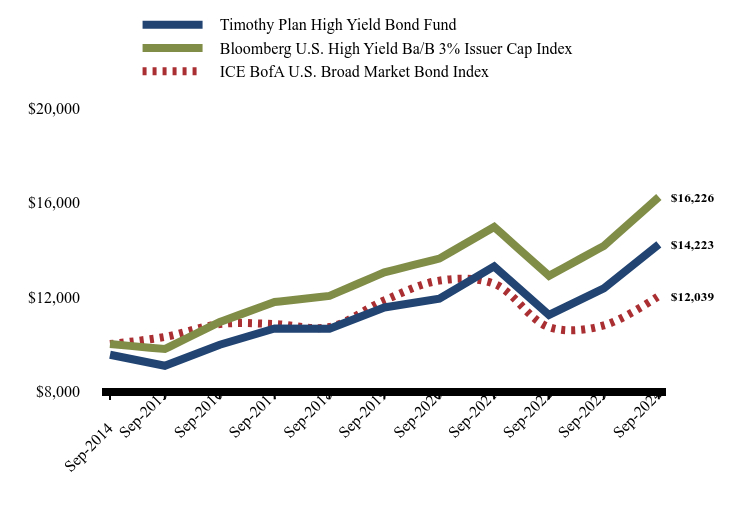
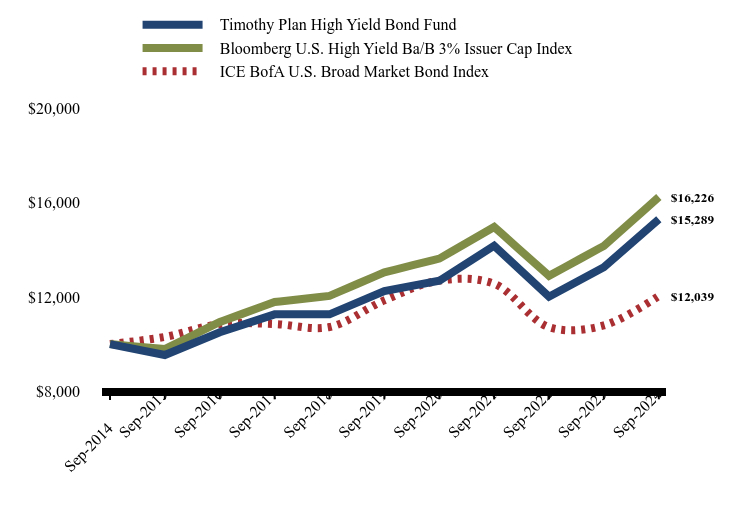
For the twelve months ended September 30, 2024, the Timothy Plan High Yield Fund - Class A returned 15.07%, outperforming its benchmark, the Bloomberg U.S. HY Ba/B 3% Issuer Cap Index, which returned 14.62%. Lower yields and tighter spreads narrowed high-yield bond spreads during the year.
Key Performance Drivers:
• Sector Allocation: An overweight to Financials benefited the Fund, as the sector produced the highest nominal and excess returns within the Index. An underweight to Energy also contributed positively, as the sector underperformed relative to the overall Index.
• Top Contributors: The overweight allocation to Financials was a key contributor, along with the continued strength of the high yield market, which saw improvements in credit quality and leverage.
• Largest Detractors: An underweight to Utilities detracted from performance as the sector outperformed the Index. Additionally, an underweight to Consumer Cyclicals negatively impacted relative returns, as the category’s performance exceeded that of the broader market.
Looking ahead, the portfolio remains focused on individual credit selection to avoid downgrades, emphasizing sectors and opportunities that should offer strong risk-adjusted returns.
How has the Fund performed over the last ten years?
How did the Fund perform during the reporting period?
| Timothy Plan High Yield Bond Fund | Bloomberg U.S. High Yield Ba/B 3% Issuer Cap Index | ICE BofA U.S. Broad Market Bond Index |
|---|
| Sep-2014 | $9,547 | $10,000 | $10,000 |
| Sep-2015 | $9,082 | $9,791 | $10,305 |
| Sep-2016 | $9,972 | $10,937 | $10,847 |
| Sep-2017 | $10,664 | $11,783 | $10,850 |
| Sep-2018 | $10,647 | $12,040 | $10,722 |
| Sep-2019 | $11,551 | $13,040 | $11,853 |
| Sep-2020 | $11,927 | $13,621 | $12,689 |
| Sep-2021 | $13,290 | $14,962 | $12,552 |
| Sep-2022 | $11,237 | $12,893 | $10,719 |
| Sep-2023 | $12,360 | $14,156 | $10,790 |
| Sep-2024 | $14,223 | $16,226 | $12,039 |
Average Annual Total Returns
| 1 Year | 5 Years | 10 Years |
|---|
| Timothy Plan High Yield Bond Fund | | | |
| Without Load | 15.07% | 4.25% | 4.07% |
| With Load* | 9.92% | 3.30% | 3.59% |
| Bloomberg U.S. High Yield Ba/B 3% Issuer Cap Index | 14.63% | 4.47% | 4.96% |
| ICE BofA U.S. Broad Market Bond Index | 11.58% | 0.31% | 1.87% |
The Fund's past performance is not a good predictor of how the Fund will perform in the future. The graph and table do not reflect the deduction of taxes that a shareholder would pay on fund distributions or redemption of fund shares.
| Net Assets | $182,833,032 |
| Number of Portfolio Holdings | 144 |
| Advisory Fee #ERROR:A result could not be returned because the conditional could not be evaluated to a True/False value ((history)) | $882,416 |
| Portfolio Turnover | 33% |
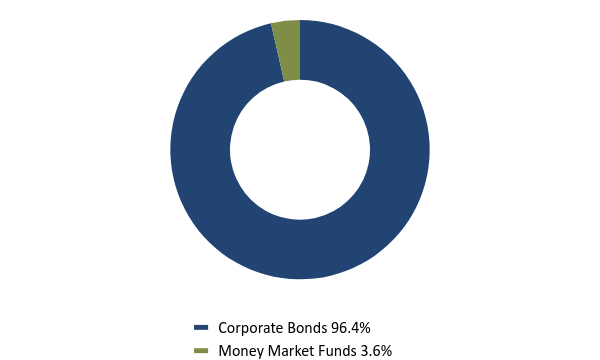
Asset Weighting (% of total investments)
| Value | Value |
|---|
| Corporate Bonds | 96.4% |
| Money Market Funds | 3.6% |
What did the Fund invest in?
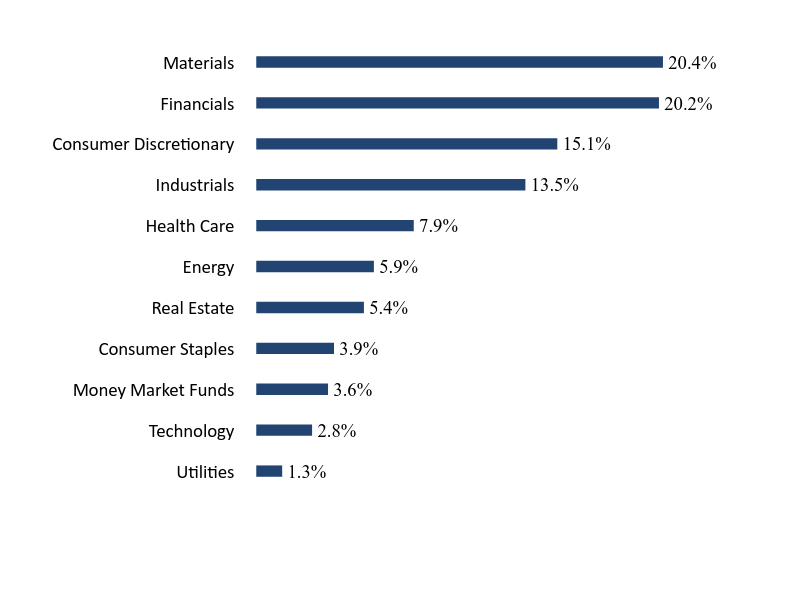
Sector Weighting (% of net assets)
| Value | Value |
|---|
| Utilities | 1.3% |
| Technology | 2.8% |
| Money Market Funds | 3.6% |
| Consumer Staples | 3.9% |
| Real Estate | 5.4% |
| Energy | 5.9% |
| Health Care | 7.9% |
| Industrials | 13.5% |
| Consumer Discretionary | 15.1% |
| Financials | 20.2% |
| Materials | 20.4% |
Top 10 Holdings (% of net assets)
| Holding Name | % of Net Assets |
| Fidelity Government Portfolio, Institutional Class | 3.6% |
| Burford Capital Global Finance, LLC | 2.2% |
| Mauser Packaging Solutions Holding Company | 1.9% |
| Howard Hughes Corporation (The) | 1.8% |
| Enviri Corporation | 1.7% |
| Ken Garff Automotive, LLC | 1.7% |
| Interface, Inc. | 1.6% |
| Chemours Company (The) | 1.5% |
| TMS International Corporation | 1.5% |
| Mativ Holdings, Inc. | 1.4% |
No material changes occurred during the year ended September 30, 2024.
Timothy Plan High Yield Bond Fund
Annual Shareholder Report - September 30, 2024
Where can I find additional information about the Fund?
Additional information is available on the Fund's website ( timothyplan.com ), including its:
Prospectus
Financial information
Holdings
Proxy voting information
Timothy Plan High Yield Bond Fund
Annual Shareholder Report - September 30, 2024
This annual shareholder report contains important information about Timothy Plan High Yield Bond Fund for the period of October 1, 2023 to November 30, 2024. You can find additional information about the Fund at timothyplan.com. You can also request this information by contacting us at (800) 846-7526. This report describes changes to the Fund that occurred during the reporting period.
What were the Fund’s costs for the last year?
(based on a hypothetical $10,000 investment)
| Class Name | Costs of a $10,000 investment | Costs paid as a percentage of a $10,000 investment |
|---|
| Class C | $202 | 1.89% |
How did the Fund perform during the reporting period?
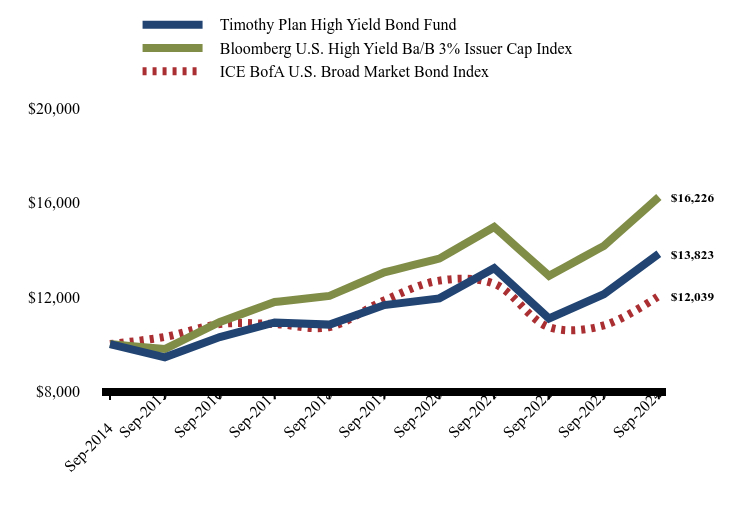
For the twelve months ended September 30, 2024, the Timothy Plan High Yield Fund - Class C returned 14.14%, outperforming its benchmark, the Bloomberg U.S. HY Ba/B 3% Issuer Cap Index, which returned 14.62%. Lower yields and tighter spreads narrowed high-yield bond spreads during the year.
Key Performance Drivers:
• Sector Allocation: An overweight to Financials benefited the Fund, as the sector produced the highest nominal and excess returns within the Index. An underweight to Energy also contributed positively, as the sector underperformed relative to the overall Index.
• Top Contributors: The overweight allocation to Financials was a key contributor, along with the continued strength of the high yield market, which saw improvements in credit quality and leverage.
• Largest Detractors: An underweight to Utilities detracted from performance as the sector outperformed the Index. Additionally, an underweight to Consumer Cyclicals negatively impacted relative returns, as the category’s performance exceeded that of the broader market.
Looking ahead, the portfolio remains focused on individual credit selection to avoid downgrades, emphasizing sectors and opportunities that should offer strong risk-adjusted returns.
How has the Fund performed over the last ten years?
How did the Fund perform during the reporting period?
| Timothy Plan High Yield Bond Fund | Bloomberg U.S. High Yield Ba/B 3% Issuer Cap Index | ICE BofA U.S. Broad Market Bond Index |
|---|
| Sep-2014 | $10,000 | $10,000 | $10,000 |
| Sep-2015 | $9,442 | $9,791 | $10,305 |
| Sep-2016 | $10,296 | $10,937 | $10,847 |
| Sep-2017 | $10,918 | $11,783 | $10,850 |
| Sep-2018 | $10,825 | $12,040 | $10,722 |
| Sep-2019 | $11,652 | $13,040 | $11,853 |
| Sep-2020 | $11,937 | $13,621 | $12,689 |
| Sep-2021 | $13,216 | $14,962 | $12,552 |
| Sep-2022 | $11,083 | $12,893 | $10,719 |
| Sep-2023 | $12,111 | $14,156 | $10,790 |
| Sep-2024 | $13,823 | $16,226 | $12,039 |
Average Annual Total Returns
| 1 Year | 5 Years | 10 Years |
|---|
| Timothy Plan High Yield Bond Fund | 14.14% | 3.48% | 3.29% |
| Bloomberg U.S. High Yield Ba/B 3% Issuer Cap Index | 14.63% | 4.47% | 4.96% |
| ICE BofA U.S. Broad Market Bond Index | 11.58% | 0.31% | 1.87% |
The Fund's past performance is not a good predictor of how the Fund will perform in the future. The graph and table do not reflect the deduction of taxes that a shareholder would pay on fund distributions or redemption of fund shares.
| Net Assets | $182,833,032 |
| Number of Portfolio Holdings | 144 |
| Advisory Fee #ERROR:A result could not be returned because the conditional could not be evaluated to a True/False value ((history)) | $882,416 |
| Portfolio Turnover | 33% |
Asset Weighting (% of total investments)
| Value | Value |
|---|
| Corporate Bonds | 96.4% |
| Money Market Funds | 3.6% |
What did the Fund invest in?
Sector Weighting (% of net assets)
| Value | Value |
|---|
| Utilities | 1.3% |
| Technology | 2.8% |
| Money Market Funds | 3.6% |
| Consumer Staples | 3.9% |
| Real Estate | 5.4% |
| Energy | 5.9% |
| Health Care | 7.9% |
| Industrials | 13.5% |
| Consumer Discretionary | 15.1% |
| Financials | 20.2% |
| Materials | 20.4% |
Top 10 Holdings (% of net assets)
| Holding Name | % of Net Assets |
| Fidelity Government Portfolio, Institutional Class | 3.6% |
| Burford Capital Global Finance, LLC | 2.2% |
| Mauser Packaging Solutions Holding Company | 1.9% |
| Howard Hughes Corporation (The) | 1.8% |
| Enviri Corporation | 1.7% |
| Ken Garff Automotive, LLC | 1.7% |
| Interface, Inc. | 1.6% |
| Chemours Company (The) | 1.5% |
| TMS International Corporation | 1.5% |
| Mativ Holdings, Inc. | 1.4% |
No material changes occurred during the year ended September 30, 2024.
Timothy Plan High Yield Bond Fund
Annual Shareholder Report - September 30, 2024
Where can I find additional information about the Fund?
Additional information is available on the Fund's website ( timothyplan.com ), including its:
Prospectus
Financial information
Holdings
Proxy voting information
Timothy Plan High Yield Bond Fund
Annual Shareholder Report - September 30, 2024
This annual shareholder report contains important information about Timothy Plan High Yield Bond Fund for the period of October 1, 2023 to November 30, 2024. You can find additional information about the Fund at timothyplan.com. You can also request this information by contacting us at (800) 846-7526. This report describes changes to the Fund that occurred during the reporting period.
What were the Fund’s costs for the last year?
(based on a hypothetical $10,000 investment)
| Class Name | Costs of a $10,000 investment | Costs paid as a percentage of a $10,000 investment |
|---|
| Class I | $96 | 0.89% |
How did the Fund perform during the reporting period?
For the twelve months ended September 30, 2024, the Timothy Plan High Yield Fund - Class I returned 15.34%, outperforming its benchmark, the Bloomberg U.S. HY Ba/B 3% Issuer Cap Index, which returned 14.62%. Lower yields and tighter spreads narrowed high-yield bond spreads during the year.
Key Performance Drivers:
• Sector Allocation: An overweight to Financials benefited the Fund, as the sector produced the highest nominal and excess returns within the Index. An underweight to Energy also contributed positively, as the sector underperformed relative to the overall Index.
• Top Contributors: The overweight allocation to Financials was a key contributor, along with the continued strength of the high yield market, which saw improvements in credit quality and leverage.
• Largest Detractors: An underweight to Utilities detracted from performance as the sector outperformed the Index. Additionally, an underweight to Consumer Cyclicals negatively impacted relative returns, as the category’s performance exceeded that of the broader market.
Looking ahead, the portfolio remains focused on individual credit selection to avoid downgrades, emphasizing sectors and opportunities that should offer strong risk-adjusted returns.
How has the Fund performed over the last ten years?
How did the Fund perform during the reporting period?
| Timothy Plan High Yield Bond Fund | Bloomberg U.S. High Yield Ba/B 3% Issuer Cap Index | ICE BofA U.S. Broad Market Bond Index |
|---|
| Sep-2014 | $10,000 | $10,000 | $10,000 |
| Sep-2015 | $9,538 | $9,791 | $10,305 |
| Sep-2016 | $10,503 | $10,937 | $10,847 |
| Sep-2017 | $11,260 | $11,783 | $10,850 |
| Sep-2018 | $11,261 | $12,040 | $10,722 |
| Sep-2019 | $12,249 | $13,040 | $11,853 |
| Sep-2020 | $12,681 | $13,621 | $12,689 |
| Sep-2021 | $14,166 | $14,962 | $12,552 |
| Sep-2022 | $12,007 | $12,893 | $10,719 |
| Sep-2023 | $13,256 | $14,156 | $10,790 |
| Sep-2024 | $15,289 | $16,226 | $12,039 |
Average Annual Total Returns
| 1 Year | 5 Years | 10 Years |
|---|
| Timothy Plan High Yield Bond Fund | 15.34% | 4.53% | 4.34% |
| Bloomberg U.S. High Yield Ba/B 3% Issuer Cap Index | 14.63% | 4.47% | 4.96% |
| ICE BofA U.S. Broad Market Bond Index | 11.58% | 0.31% | 1.87% |
The Fund's past performance is not a good predictor of how the Fund will perform in the future. The graph and table do not reflect the deduction of taxes that a shareholder would pay on fund distributions or redemption of fund shares.
| Net Assets | $182,833,032 |
| Number of Portfolio Holdings | 144 |
| Advisory Fee #ERROR:A result could not be returned because the conditional could not be evaluated to a True/False value ((history)) | $882,416 |
| Portfolio Turnover | 33% |
Asset Weighting (% of total investments)
| Value | Value |
|---|
| Corporate Bonds | 96.4% |
| Money Market Funds | 3.6% |
What did the Fund invest in?
Sector Weighting (% of net assets)
| Value | Value |
|---|
| Utilities | 1.3% |
| Technology | 2.8% |
| Money Market Funds | 3.6% |
| Consumer Staples | 3.9% |
| Real Estate | 5.4% |
| Energy | 5.9% |
| Health Care | 7.9% |
| Industrials | 13.5% |
| Consumer Discretionary | 15.1% |
| Financials | 20.2% |
| Materials | 20.4% |
Top 10 Holdings (% of net assets)
| Holding Name | % of Net Assets |
| Fidelity Government Portfolio, Institutional Class | 3.6% |
| Burford Capital Global Finance, LLC | 2.2% |
| Mauser Packaging Solutions Holding Company | 1.9% |
| Howard Hughes Corporation (The) | 1.8% |
| Enviri Corporation | 1.7% |
| Ken Garff Automotive, LLC | 1.7% |
| Interface, Inc. | 1.6% |
| Chemours Company (The) | 1.5% |
| TMS International Corporation | 1.5% |
| Mativ Holdings, Inc. | 1.4% |
No material changes occurred during the year ended September 30, 2024.
Timothy Plan High Yield Bond Fund
Annual Shareholder Report - September 30, 2024
Where can I find additional information about the Fund?
Additional information is available on the Fund's website ( timothyplan.com ), including its:
Prospectus
Financial information
Holdings
Proxy voting information
Timothy Plan International Fund
Annual Shareholder Report - September 30, 2024
This annual shareholder report contains important information about Timothy Plan International Fund for the period of October 1, 2023 to November 30, 2024. You can find additional information about the Fund at timothyplan.com. You can also request this information by contacting us at (800) 846-7526. This report describes changes to the Fund that occurred during the reporting period.
What were the Fund’s costs for the last year?
(based on a hypothetical $10,000 investment)
| Class Name | Costs of a $10,000 investment | Costs paid as a percentage of a $10,000 investment |
|---|
| Class A | $180 | 1.59% |
How did the Fund perform during the reporting period?
For the twelve months ended September 30, 2024, the Timothy Plan International Fund outperformed the MSCI ACWI ex. US index. The Fund benefitted from falling inflation, lower bond yields, and European central banks pivoting into an easing cycle. Japan’s equity market resurgence also contributed to the Fund’s strong performance.
Key Performance Drivers:
• Stock Selection: Positive stock selection in seven out of ten sectors drove the Fund’s outperformance, with Materials, Industrials, Health Care, and Utilities leading the way. Negative stock selection in the energy sector decreased slightly.
• Top Contributors: Strong contributors included CRH Ltd (Materials - Ireland/USA), Techtronic Industries (Industrials - Hong Kong), ABB Ltd (Industrials - Switzerland), and Tokio Marine Holdings (Financials - Japan).
• Largest Detractors: The main detractors were Equinor ASA (Energy - Norway), Magna International (Consumer Discretionary - Canada), and NICE Ltd (Technology - Israel).
Major central banks are expected to continue their rate-cutting paths, which should support equity markets and many of the Fund’s holdings. Japan’s corporate governance reforms should also benefit the Fund’s Japanese holdings, though volatility may persist due to geopolitical risks and economic uncertainties.
How has the Fund performed over the last ten years?
Total Return Based on $10,000 Investment
| Timothy Plan International Fund | MSCI ACWI ex USA Index |
|---|
| Sep-2014 | $9,447 | $10,000 |
| Sep-2015 | $9,001 | $8,784 |
| Sep-2016 | $9,167 | $9,597 |
| Sep-2017 | $10,717 | $11,479 |
| Sep-2018 | $10,804 | $11,681 |
| Sep-2019 | $10,205 | $11,537 |
| Sep-2020 | $11,225 | $11,884 |
| Sep-2021 | $14,529 | $14,726 |
| Sep-2022 | $10,412 | $11,020 |
| Sep-2023 | $12,422 | $13,267 |
| Sep-2024 | $15,744 | $16,630 |
Average Annual Total Returns
| 1 Year | 5 Years | 10 Years |
|---|
| Timothy Plan International Fund | | | |
| Without Load | 26.74% | 9.06% | 5.24% |
| With Load* | 19.80% | 7.83% | 4.64% |
| MSCI ACWI ex USA Index | 25.35% | 7.59% | 5.22% |
The Fund's past performance is not a good predictor of how the Fund will perform in the future. The graph and table do not reflect the deduction of taxes that a shareholder would pay on fund distributions or redemption of fund shares.
| Net Assets | $182,644,980 |
| Number of Portfolio Holdings | 51 |
| Advisory Fee #ERROR:A result could not be returned because the conditional could not be evaluated to a True/False value ((history)) | $1,559,578 |
| Portfolio Turnover | 18% |
Asset Weighting (% of total investments)
| Value | Value |
|---|
| Common Stocks | 95.1% |
| Money Market Funds | 4.9% |
What did the Fund invest in?
Sector Weighting (% of net assets)
| Value | Value |
|---|
| Other Assets in Excess of Liabilities | 0.1% |
| Communications | 2.3% |
| Consumer Discretionary | 2.8% |
| Utilities | 3.2% |
| Consumer Staples | 4.1% |
| Money Market Funds | 4.9% |
| Energy | 5.1% |
| Materials | 6.2% |
| Health Care | 11.0% |
| Technology | 14.0% |
| Industrials | 21.1% |
| Financials | 25.2% |
Top 10 Holdings (% of net assets)
| Holding Name | % of Net Assets |
| Fidelity Government Portfolio, Institutional Class | 4.9% |
| Alcon, Inc. | 3.4% |
| London Stock Exchange Group plc | 3.0% |
| CRH plc | 2.9% |
| Canadian Pacific Kansas City Ltd. | 2.9% |
| Techtronic Industries Company Ltd. | 2.8% |
| ASM International N.V. | 2.7% |
| Taiwan Semiconductor Manufacturing Company Ltd. | 2.7% |
| Hoya Corporation | 2.7% |
| Safran S.A. | 2.6% |
Effective February 1, 2024, Timothy Plan voluntarily reduced the advisory fee to 0.90% from 0.95% for the Fund.
Timothy Plan International Fund
Annual Shareholder Report - September 30, 2024
Where can I find additional information about the Fund?
Additional information is available on the Fund's website ( timothyplan.com ), including its:
Prospectus
Financial information
Holdings
Proxy voting information
Timothy Plan International Fund
Annual Shareholder Report - September 30, 2024
This annual shareholder report contains important information about Timothy Plan International Fund for the period of October 1, 2023 to November 30, 2024. You can find additional information about the Fund at timothyplan.com. You can also request this information by contacting us at (800) 846-7526. This report describes changes to the Fund that occurred during the reporting period.
What were the Fund’s costs for the last year?
(based on a hypothetical $10,000 investment)
| Class Name | Costs of a $10,000 investment | Costs paid as a percentage of a $10,000 investment |
|---|
| Class C | $264 | 2.34% |
How did the Fund perform during the reporting period?
For the twelve months ended September 30, 2024, the Timothy Plan International Fund outperformed the MSCI ACWI ex. US index. The Fund benefitted from falling inflation, lower bond yields, and European central banks pivoting into an easing cycle. Japan’s equity market resurgence also contributed to the Fund’s strong performance.
Key Performance Drivers:
• Stock Selection: Positive stock selection in seven out of ten sectors drove the Fund’s outperformance, with Materials, Industrials, Health Care, and Utilities leading the way. Negative stock selection in the energy sector decreased slightly.
• Top Contributors: Strong contributors included CRH Ltd (Materials - Ireland/USA), Techtronic Industries (Industrials - Hong Kong), ABB Ltd (Industrials - Switzerland), and Tokio Marine Holdings (Financials - Japan).
• Largest Detractors: The main detractors were Equinor ASA (Energy - Norway), Magna International (Consumer Discretionary - Canada), and NICE Ltd (Technology - Israel).
Major central banks are expected to continue their rate-cutting paths, which should support equity markets and many of the Fund’s holdings. Japan’s corporate governance reforms should also benefit the Fund’s Japanese holdings, though volatility may persist due to geopolitical risks and economic uncertainties.
How has the Fund performed over the last ten years?
Total Return Based on $10,000 Investment
| Timothy Plan International Fund | MSCI ACWI ex USA Index |
|---|
| Sep-2014 | $10,000 | $10,000 |
| Sep-2015 | $9,469 | $8,784 |
| Sep-2016 | $9,573 | $9,597 |
| Sep-2017 | $11,098 | $11,479 |
| Sep-2018 | $11,111 | $11,681 |
| Sep-2019 | $10,409 | $11,537 |
| Sep-2020 | $11,379 | $11,884 |
| Sep-2021 | $14,608 | $14,726 |
| Sep-2022 | $10,385 | $11,020 |
| Sep-2023 | $12,302 | $13,267 |
| Sep-2024 | $15,477 | $16,630 |
Average Annual Total Returns
| 1 Year | 5 Years | 10 Years |
|---|
| Timothy Plan International Fund | 25.81% | 8.26% | 4.46% |
| MSCI ACWI ex USA Index | 25.35% | 7.59% | 5.22% |
The Fund's past performance is not a good predictor of how the Fund will perform in the future. The graph and table do not reflect the deduction of taxes that a shareholder would pay on fund distributions or redemption of fund shares.
| Net Assets | $182,644,980 |
| Number of Portfolio Holdings | 51 |
| Advisory Fee #ERROR:A result could not be returned because the conditional could not be evaluated to a True/False value ((history)) | $1,559,578 |
| Portfolio Turnover | 18% |
Asset Weighting (% of total investments)
| Value | Value |
|---|
| Common Stocks | 95.1% |
| Money Market Funds | 4.9% |
What did the Fund invest in?
Sector Weighting (% of net assets)
| Value | Value |
|---|
| Other Assets in Excess of Liabilities | 0.1% |
| Communications | 2.3% |
| Consumer Discretionary | 2.8% |
| Utilities | 3.2% |
| Consumer Staples | 4.1% |
| Money Market Funds | 4.9% |
| Energy | 5.1% |
| Materials | 6.2% |
| Health Care | 11.0% |
| Technology | 14.0% |
| Industrials | 21.1% |
| Financials | 25.2% |
Top 10 Holdings (% of net assets)
| Holding Name | % of Net Assets |
| Fidelity Government Portfolio, Institutional Class | 4.9% |
| Alcon, Inc. | 3.4% |
| London Stock Exchange Group plc | 3.0% |
| CRH plc | 2.9% |
| Canadian Pacific Kansas City Ltd. | 2.9% |
Techtronic Industries Company Ltd. | 2.8% |
| ASM International N.V. | 2.7% |
| Taiwan Semiconductor Manufacturing Company Ltd. | 2.7% |
| Hoya Corporation | 2.7% |
| Safran S.A. | 2.6% |
Effective February 1, 2024, Timothy Plan voluntarily reduced the advisory fee to 0.90% from 0.95% for the Fund.
Timothy Plan International Fund
Annual Shareholder Report - September 30, 2024
Where can I find additional information about the Fund?
Additional information is available on the Fund's website ( timothyplan.com ), including its:
Prospectus
Financial information
Holdings
Proxy voting information
Timothy Plan International Fund
Annual Shareholder Report - September 30, 2024
This annual shareholder report contains important information about Timothy Plan International Fund for the period of October 1, 2023 to November 30, 2024. You can find additional information about the Fund at timothyplan.com. You can also request this information by contacting us at (800) 846-7526. This report describes changes to the Fund that occurred during the reporting period.
What were the Fund’s costs for the last year?
(based on a hypothetical $10,000 investment)
| Class Name | Costs of a $10,000 investment | Costs paid as a percentage of a $10,000 investment |
|---|
| Class I | $152 | 1.34% |
How did the Fund perform during the reporting period?
For the twelve months ended September 30, 2024, the Timothy Plan International Fund outperformed the MSCI ACWI ex. US index. The Fund benefitted from falling inflation, lower bond yields, and European central banks pivoting into an easing cycle. Japan’s equity market resurgence also contributed to the Fund’s strong performance.
Key Performance Drivers:
• Stock Selection: Positive stock selection in seven out of ten sectors drove the Fund’s outperformance, with Materials, Industrials, Health Care, and Utilities leading the way. Negative stock selection in the energy sector decreased slightly.
• Top Contributors: Strong contributors included CRH Ltd (Materials - Ireland/USA), Techtronic Industries (Industrials - Hong Kong), ABB Ltd (Industrials - Switzerland), and Tokio Marine Holdings (Financials - Japan).
• Largest Detractors: The main detractors were Equinor ASA (Energy - Norway), Magna International (Consumer Discretionary - Canada), and NICE Ltd (Technology - Israel).
Major central banks are expected to continue their rate-cutting paths, which should support equity markets and many of the Fund’s holdings. Japan’s corporate governance reforms should also benefit the Fund’s Japanese holdings, though volatility may persist due to geopolitical risks and economic uncertainties.
How has the Fund performed over the last ten years?
Total Return Based on $10,000 Investment
| Timothy Plan International Fund | MSCI ACWI ex USA Index |
|---|
| Sep-2014 | $10,000 | $10,000 |
| Sep-2015 | $9,561 | $8,784 |
| Sep-2016 | $9,759 | $9,597 |
| Sep-2017 | $11,435 | $11,479 |
| Sep-2018 | $11,555 | $11,681 |
| Sep-2019 | $10,939 | $11,537 |
| Sep-2020 | $12,079 | $11,884 |
| Sep-2021 | $15,664 | $14,726 |
| Sep-2022 | $11,247 | $11,020 |
| Sep-2023 | $13,458 | $13,267 |
| Sep-2024 | $17,108 | $16,630 |
Average Annual Total Returns
| 1 Year | 5 Years | 10 Years |
|---|
| Timothy Plan International Fund | 27.13% | 9.36% | 5.52% |
| MSCI ACWI ex USA Index | 25.35% | 7.59% | 5.22% |
The Fund's past performance is not a good predictor of how the Fund will perform in the future. The graph and table do not reflect the deduction of taxes that a shareholder would pay on fund distributions or redemption of fund shares.
| Net Assets | $182,644,980 |
| Number of Portfolio Holdings | 51 |
| Advisory Fee #ERROR:A result could not be returned because the conditional could not be evaluated to a True/False value ((history)) | $1,559,578 |
| Portfolio Turnover | 18% |
Asset Weighting (% of total investments)
| Value | Value |
|---|
| Common Stocks | 95.1% |
| Money Market Funds | 4.9% |
What did the Fund invest in?
Sector Weighting (% of net assets)
| Value | Value |
|---|
| Other Assets in Excess of Liabilities | 0.1% |
| Communications | 2.3% |
| Consumer Discretionary | 2.8% |
| Utilities | 3.2% |
| Consumer Staples | 4.1% |
| Money Market Funds | 4.9% |
| Energy | 5.1% |
| Materials | 6.2% |
| Health Care | 11.0% |
| Technology | 14.0% |
| Industrials | 21.1% |
| Financials | 25.2% |
Top 10 Holdings (% of net assets)
| Holding Name | % of Net Assets |
| Fidelity Government Portfolio, Institutional Class | 4.9% |
| Alcon, Inc. | 3.4% |
| London Stock Exchange Group plc | 3.0% |
| CRH plc | 2.9% |
| Canadian Pacific Kansas City Ltd. | 2.9% |
| Techtronic Industries Company Ltd. | 2.8% |
| ASM International N.V. | 2.7% |
| Taiwan Semiconductor Manufacturing Company Ltd. | 2.7% |
| Hoya Corporation | 2.7% |
| Safran S.A. | 2.6% |
Effective February 1, 2024, Timothy Plan voluntarily reduced the advisory fee to 0.90% from 0.95% for the Fund.
Timothy Plan International Fund
Annual Shareholder Report - September 30, 2024
Where can I find additional information about the Fund?
Additional information is available on the Fund's website ( timothyplan.com ), including its:
Prospectus
Financial information
Holdings
Proxy voting information
Timothy Plan Israel Common Values Fund
Annual Shareholder Report - September 30, 2024
This annual shareholder report contains important information about Timothy Plan Israel Common Values Fund for the period of October 1, 2023 to November 30, 2024. You can find additional information about the Fund at timothyplan.com. You can also request this information by contacting us at (800) 846-7526. This report describes changes to the Fund that occurred during the reporting period.
What were the Fund’s costs for the last year?
(based on a hypothetical $10,000 investment)
| Class Name | Costs of a $10,000 investment | Costs paid as a percentage of a $10,000 investment |
|---|
| Class A | $189 | 1.77% |
How did the Fund perform during the reporting period?
For the twelve months ended September 30, 2024, the Fund rose mostly in line with the benchmark TA-125 index, achieving double-digit gains despite significant volatility following the attacks on Israel. The Fund’s NAV initially fell by more than 16% but recovered to pre-war levels within two months, reflecting resilience in both equities and the shekel currency.
Key Performance Drivers:
• Sector Allocation: Positive sector allocation came from an underweight to Communication Services, an underperforming sector, and an overweight to the outperforming Technology sector. The health care sector was detracted, driven by the strong performance of Teva Pharmaceutical, a company screened out of the fund.
• Top Contributors: CyberArk Software Ltd (Technology), Tel-Aviv Stock Exchange, Inc (Financials), and defense manufacturer Leonardo DRS, Inc (Industrials) were the Fund’s strongest performers.
• Largest Detractors: Not owning Teva Pharmaceutical (Health Care) was the largest headwind to performance, along with holdings in Mobileye Global, Inc (Consumer Discretionary) and Maytronics Limited (Consumer Discretionary).
The Fund remains focused on Israel’s innovative companies, with an optimistic long-term outlook despite uncertainties from the ongoing war and its economic effects. The Fund continues to seek attractive investment opportunities that align with its values.
How has the Fund performed over the last ten years?
Total Return Based on $10,000 Investment
| Timothy Plan Israel Common Values Fund | Israel TA-125 Index |
|---|
| Sep-2014 | $9,447 | $10,000 |
| Sep-2015 | $8,519 | $9,346 |
| Sep-2016 | $9,555 | $9,483 |
| Sep-2017 | $11,620 | $10,321 |
| Sep-2018 | $12,433 | $11,607 |
| Sep-2019 | $14,189 | $12,379 |
| Sep-2020 | $13,288 | $11,075 |
| Sep-2021 | $19,832 | $16,244 |
| Sep-2022 | $17,351 | $14,942 |
| Sep-2023 | $15,529 | $13,776 |
| Sep-2024 | $17,664 | $16,028 |
Average Annual Total Returns
| 1 Year | 5 Years | 10 Years |
|---|
| Timothy Plan Israel Common Values Fund | | | |
| Without Load | 13.75% | 4.48% | 6.46% |
| With Load* | 7.47% | 3.30% | 5.85% |
| Israel TA-125 Index | 16.35% | 5.30% | 4.83% |
The Fund's past performance is not a good predictor of how the Fund will perform in the future. The graph and table do not reflect the deduction of taxes that a shareholder would pay on fund distributions or redemption of fund shares.
| Net Assets | $99,977,879 |
| Number of Portfolio Holdings | 57 |
| Advisory Fee #ERROR:A result could not be returned because the conditional could not be evaluated to a True/False value ((history)) | $979,623 |
| Portfolio Turnover | 9% |
Asset Weighting (% of total investments)
| Value | Value |
|---|
| Common Stocks | 93.5% |
| Money Market Funds | 2.3% |
| Partnership Shares | 2.7% |
| Reit | 1.5% |
What did the Fund invest in?
Sector Weighting (% of net assets)
| Value | Value |
|---|
| Liabilities in Excess of Other Assets | -0.1% |
| Materials | 1.1% |
| Utilities | 1.7% |
| Money Market Funds | 2.3% |
| Health Care | 2.7% |
| Consumer Staples | 2.9% |
| Consumer Discretionary | 5.0% |
| Industrials | 8.2% |
| Energy | 9.0% |
| Real Estate | 13.1% |
| Financials | 25.0% |
| Technology | 29.1% |
Top 10 Holdings (% of net assets)
| Holding Name | % of Net Assets |
| Nova Ltd. | 5.0% |
| Bank Leumi Le-Israel BM | 4.7% |
| Bank Hapoalim BM | 4.1% |
| CyberArk Software Ltd. | 4.1% |
| Mizrahi Tefahot Bank Ltd. | 3.7% |
| Nice Ltd. | 3.7% |
| Elbit Systems Ltd. | 3.6% |
| Tel Aviv Stock Exchange Ltd. | 3.5% |
| Azrieli Group Ltd. | 3.1% |
| Israel Discount Bank Ltd., Class A | 2.9% |
No material changes occurred during the year ended September 30, 2024.
Timothy Plan Israel Common Values Fund
Annual Shareholder Report - September 30, 2024
Where can I find additional information about the Fund?
Additional information is available on the Fund's website ( timothyplan.com ), including its:
Prospectus
Financial information
Holdings
Proxy voting information
Timothy Plan Israel Common Values Fund
Annual Shareholder Report - September 30, 2024
This annual shareholder report contains important information about Timothy Plan Israel Common Values Fund for the period of October 1, 2023 to November 30, 2024. You can find additional information about the Fund at timothyplan.com. You can also request this information by contacting us at (800) 846-7526. This report describes changes to the Fund that occurred during the reporting period.
What were the Fund’s costs for the last year?
(based on a hypothetical $10,000 investment)
| Class Name | Costs of a $10,000 investment | Costs paid as a percentage of a $10,000 investment |
|---|
| Class C | $268 | 2.52% |
How did the Fund perform during the reporting period?
For the twelve months ended September 30, 2024, the Fund rose mostly in line with the benchmark TA-125 index, achieving double-digit gains despite significant volatility following the attacks on Israel. The Fund’s NAV initially fell by more than 16% but recovered to pre-war levels within two months, reflecting resilience in both equities and the shekel currency.
Key Performance Drivers:
• Sector Allocation: Positive sector allocation came from an underweight to Communication Services, an underperforming sector, and an overweight to the outperforming Technology sector. The health care sector was detracted, driven by the strong performance of Teva Pharmaceutical, a company screened out of the fund.
• Top Contributors: CyberArk Software Ltd (Technology), Tel-Aviv Stock Exchange, Inc (Financials), and defense manufacturer Leonardo DRS, Inc (Industrials) were the Fund’s strongest performers.
• Largest Detractors: Not owning Teva Pharmaceutical (Health Care) was the largest headwind to performance, along with holdings in Mobileye Global, Inc (Consumer Discretionary) and Maytronics Limited (Consumer Discretionary).
The Fund remains focused on Israel’s innovative companies, with an optimistic long-term outlook despite uncertainties from the ongoing war and its economic effects. The Fund continues to seek attractive investment opportunities that align with its values.
How has the Fund performed over the last ten years?
Total Return Based on $10,000 Investment
| Timothy Plan Israel Common Values Fund | Israel TA-125 Index |
|---|
| Sep-2014 | $10,000 | $10,000 |
| Sep-2015 | $8,946 | $9,346 |
| Sep-2016 | $9,967 | $9,483 |
| Sep-2017 | $12,020 | $10,321 |
| Sep-2018 | $12,765 | $11,607 |
| Sep-2019 | $14,458 | $12,379 |
| Sep-2020 | $13,446 | $11,075 |
| Sep-2021 | $19,908 | $16,244 |
| Sep-2022 | $17,284 | $14,942 |
| Sep-2023 | $15,360 | $13,776 |
| Sep-2024 | $17,335 | $16,028 |
Average Annual Total Returns
| 1 Year | 5 Years | 10 Years |
|---|
| Timothy Plan Israel Common Values Fund | 12.85% | 3.70% | 5.66% |
| Israel TA-125 Index | 16.35% | 5.30% | 4.83% |
The Fund's past performance is not a good predictor of how the Fund will perform in the future. The graph and table do not reflect the deduction of taxes that a shareholder would pay on fund distributions or redemption of fund shares.
| Net Assets | $99,977,879 |
| Number of Portfolio Holdings | 57 |
| Advisory Fee #ERROR:A result could not be returned because the conditional could not be evaluated to a True/False value ((history)) | $979,623 |
| Portfolio Turnover | 9% |
Asset Weighting (% of total investments)
| Value | Value |
|---|
| Common Stocks | 93.5% |
| Money Market Funds | 2.3% |
| Partnership Shares | 2.7% |
| Reit | 1.5% |
What did the Fund invest in?
Sector Weighting (% of net assets)
| Value | Value |
|---|
| Liabilities in Excess of Other Assets | -0.1% |
| Materials | 1.1% |
| Utilities | 1.7% |
| Money Market Funds | 2.3% |
| Health Care | 2.7% |
| Consumer Staples | 2.9% |
| Consumer Discretionary | 5.0% |
| Industrials | 8.2% |
| Energy | 9.0% |
| Real Estate | 13.1% |
| Financials | 25.0% |
| Technology | 29.1% |
Top 10 Holdings (% of net assets)
| Holding Name | % of Net Assets |
| Nova Ltd. | 5.0% |
| Bank Leumi Le-Israel BM | 4.7% |
| Bank Hapoalim BM | 4.1% |
| CyberArk Software Ltd. | 4.1% |
| Mizrahi Tefahot Bank Ltd. | 3.7% |
| Nice Ltd. | 3.7% |
| Elbit Systems Ltd. | 3.6% |
| Tel Aviv Stock Exchange Ltd. | 3.5% |
| Azrieli Group Ltd. | 3.1% |
| Israel Discount Bank Ltd., Class A | 2.9% |
No material changes occurred during the year ended September 30, 2024.
Timothy Plan Israel Common Values Fund
Annual Shareholder Report - September 30, 2024
Where can I find additional information about the Fund?
Additional information is available on the Fund's website ( timothyplan.com ), including its:
Prospectus
Financial information
Holdings
Proxy voting information
Timothy Plan Israel Common Values Fund
Annual Shareholder Report - September 30, 2024
This annual shareholder report contains important information about Timothy Plan Israel Common Values Fund for the period of October 1, 2023 to November 30, 2024. You can find additional information about the Fund at timothyplan.com. You can also request this information by contacting us at (800) 846-7526. This report describes changes to the Fund that occurred during the reporting period.
What were the Fund’s costs for the last year?
(based on a hypothetical $10,000 investment)
| Class Name | Costs of a $10,000 investment | Costs paid as a percentage of a $10,000 investment |
|---|
| Class I | $163 | 1.52% |
How did the Fund perform during the reporting period?
For the twelve months ended September 30, 2024, the Fund rose mostly in line with the benchmark TA-125 index, achieving double-digit gains despite significant volatility following the attacks on Israel. The Fund’s NAV initially fell by more than 16% but recovered to pre-war levels within two months, reflecting resilience in both equities and the shekel currency.
Key Performance Drivers:
• Sector Allocation: Positive sector allocation came from an underweight to Communication Services, an underperforming sector, and an overweight to the outperforming Technology sector. The health care sector was detracted, driven by the strong performance of Teva Pharmaceutical, a company screened out of the fund.
• Top Contributors: CyberArk Software Ltd (Technology), Tel-Aviv Stock Exchange, Inc (Financials), and defense manufacturer Leonardo DRS, Inc (Industrials) were the Fund’s strongest performers.
• Largest Detractors: Not owning Teva Pharmaceutical (Health Care) was the largest headwind to performance, along with holdings in Mobileye Global, Inc (Consumer Discretionary) and Maytronics Limited (Consumer Discretionary).
The Fund remains focused on Israel’s innovative companies, with an optimistic long-term outlook despite uncertainties from the ongoing war and its economic effects. The Fund continues to seek attractive investment opportunities that align with its values.
How has the Fund performed over the last ten years?
Total Return Based on $10,000 Investment
| Timothy Plan Israel Common Values Fund | Israel TA-125 Index |
|---|
| Sep-2014 | $10,000 | $10,000 |
| Sep-2015 | $9,040 | $9,346 |
| Sep-2016 | $10,171 | $9,483 |
| Sep-2017 | $12,395 | $10,321 |
| Sep-2018 | $13,290 | $11,607 |
| Sep-2019 | $15,209 | $12,379 |
| Sep-2020 | $14,285 | $11,075 |
| Sep-2021 | $21,367 | $16,244 |
| Sep-2022 | $18,738 | $14,942 |
| Sep-2023 | $16,820 | $13,776 |
| Sep-2024 | $19,175 | $16,028 |
Average Annual Total Returns
| 1 Year | 5 Years | 10 Years |
|---|
| Timothy Plan Israel Common Values Fund | 14.00% | 4.74% | 6.73% |
| Israel TA-125 Index | 16.35% | 5.30% | 4.83% |
The Fund's past performance is not a good predictor of how the Fund will perform in the future. The graph and table do not reflect the deduction of taxes that a shareholder would pay on fund distributions or redemption of fund shares.
| Net Assets | $99,977,879 |
| Number of Portfolio Holdings | 57 |
| Advisory Fee #ERROR:A result could not be returned because the conditional could not be evaluated to a True/False value ((history)) | $979,623 |
| Portfolio Turnover | 9% |
Asset Weighting (% of total investments)
| Value | Value |
|---|
| Common Stocks | 93.5% |
| Money Market Funds | 2.3% |
| Partnership Shares | 2.7% |
| Reit | 1.5% |
What did the Fund invest in?
Sector Weighting (% of net assets)
| Value | Value |
|---|
| Liabilities in Excess of Other Assets | -0.1% |
| Materials | 1.1% |
| Utilities | 1.7% |
| Money Market Funds | 2.3% |
| Health Care | 2.7% |
| Consumer Staples | 2.9% |
| Consumer Discretionary | 5.0% |
| Industrials | 8.2% |
| Energy | 9.0% |
| Real Estate | 13.1% |
| Financials | 25.0% |
| Technology | 29.1% |
Top 10 Holdings (% of net assets)
| Holding Name | % of Net Assets |
| Nova Ltd. | 5.0% |
| Bank Leumi Le-Israel BM | 4.7% |
| Bank Hapoalim BM | 4.1% |
| CyberArk Software Ltd. | 4.1% |
| Mizrahi Tefahot Bank Ltd. | 3.7% |
| Nice Ltd. | 3.7% |
| Elbit Systems Ltd. | 3.6% |
| Tel Aviv Stock Exchange Ltd. | 3.5% |
| Azrieli Group Ltd. | 3.1% |
| Israel Discount Bank Ltd., Class A | 2.9% |
No material changes occurred during the year ended September 30, 2024.
Timothy Plan Israel Common Values Fund
Annual Shareholder Report - September 30, 2024
Where can I find additional information about the Fund?
Additional information is available on the Fund's website ( timothyplan.com ), including its:
Prospectus
Financial information
Holdings
Proxy voting information
Timothy Plan Large/Mid Cap Growth Fund
Annual Shareholder Report - September 30, 2024
This annual shareholder report contains important information about Timothy Plan Large/Mid Cap Growth Fund for the period of October 1, 2023 to November 30, 2024. You can find additional information about the Fund at timothyplan.com. You can also request this information by contacting us at (800) 846-7526. This report describes changes to the Fund that occurred during the reporting period.
What were the Fund’s costs for the last year?
(based on a hypothetical $10,000 investment)
| Class Name | Costs of a $10,000 investment | Costs paid as a percentage of a $10,000 investment |
|---|
| Class A | $150 | 1.27% |
How did the Fund perform during the reporting period?
For the twelve months ended September 30, 2024, the Timothy Plan Large/Mid Growth Fund - Class A achieved a 36.13% return, underperforming its benchmark, the Russell 1000 Growth Index, which returned 42%. Despite this, the Fund delivered strong absolute performance in a favorable market environment, as stocks rebounded after an initial decline in Q3 2023.
Key Performance Drivers:
• Sector Allocation: The Consumer Discretionary sector contributed significantly, adding 147 basis points, with an underweight position in Tesla contributing 117 basis points.
• Top Contributors: Broadcom Inc., the leader in networking semiconductors, gained 110% and added 126 basis points to relative performance. The portfolio’s exclusion of five of the "Magnificent 7" technology stocks, due to screening restrictions, acted as a headwind, as these stocks accounted for 60% of the Russell 1000 Growth Index’s rise.
• Largest Detractors: The Communication Services sector detracted 229 basis points from performance, mainly due to not owning Meta Platforms, which rose 91%. Cable One, Inc., a rural broadband provider, was the largest individual detractor, falling 28% and being removed from the portfolio.
Looking forward, we believe the Fund remains well-positioned to capitalize on growth opportunities, with a focus on sectors like Consumer Discretionary and Technology, while remaining mindful of valuation risks in the broader market.
How has the Fund performed over the last ten years?
Total Return Based on $10,000 Investment
| Timothy Plan Large/Mid Cap Growth Fund | Russell 1000® Growth Index | Russell 1000® Total Return Index |
|---|
| Sep-2014 | $9,454 | $10,000 | $10,000 |
| Sep-2015 | $9,421 | $10,317 | $9,939 |
| Sep-2016 | $10,047 | $11,737 | $11,423 |
| Sep-2017 | $11,708 | $14,312 | $13,540 |
| Sep-2018 | $13,053 | $18,076 | $15,946 |
| Sep-2019 | $12,861 | $18,746 | $16,563 |
| Sep-2020 | $15,038 | $25,782 | $19,215 |
| Sep-2021 | $19,748 | $32,825 | $25,165 |
| Sep-2022 | $16,047 | $25,410 | $20,833 |
| Sep-2023 | $19,070 | $32,453 | $25,248 |
| Sep-2024 | $25,960 | $46,145 | $34,257 |
Average Annual Total Returns
| 1 Year | 5 Years | 10 Years |
|---|
| Timothy Plan Large/Mid Cap Growth Fund | | | |
| Without Load | 36.13% | 15.08% | 10.63% |
| With Load* | 28.61% | 13.78% | 10.01% |
Russell 1000® Growth Index | 42.19% | 19.74% | 16.52% |
Russell 1000® Total Return Index | 35.68% | 15.64% | 13.10% |
The Fund's past performance is not a good predictor of how the Fund will perform in the future. The graph and table do not reflect the deduction of taxes that a shareholder would pay on fund distributions or redemption of fund shares.
| Net Assets | $216,606,938 |
| Number of Portfolio Holdings | 53 |
| Advisory Fee #ERROR:A result could not be returned because the conditional could not be evaluated to a True/False value ((history)) | $1,295,172 |
| Portfolio Turnover | 53% |
Asset Weighting (% of total investments)
| Value | Value |
|---|
| Common Stocks | 80.9% |
| Exchange-Traded Funds | 11.8% |
| Money Market Funds | 4.4% |
| Reit | 2.9% |
What did the Fund invest in?
Sector Weighting (% of net assets)
| Value | Value |
|---|
| Liabilities in Excess of Other Assets | -0.1% |
| Real Estate | 3.0% |
| Consumer Staples | 4.0% |
| Financials | 4.2% |
| Money Market Funds | 4.4% |
| Materials | 5.5% |
| Consumer Discretionary | 7.4% |
| Industrials | 10.8% |
| Health Care | 11.6% |
| Equity | 11.8% |
| Technology | 37.4% |
Top 10 Holdings (% of net assets)
| Holding Name | % of Net Assets |
| Timothy Plan US Large/Mid Cap Core Enhanced ETF | 9.6% |
| NVIDIA Corporation | 9.6% |
| Fidelity Government Portfolio, Institutional Class | 4.4% |
| Costco Wholesale Corporation | 4.0% |
| Broadcom, Inc. | 3.2% |
| ServiceNow, Inc. | 3.2% |
| Tesla, Inc. | 2.7% |
| Arthur J Gallagher & Company | 2.7% |
| Linde plc | 2.6% |
| Stryker Corporation | 2.4% |
No material changes occurred during the year ended September 30, 2024.
Timothy Plan Large/Mid Cap Growth Fund
Annual Shareholder Report - September 30, 2024
Where can I find additional information about the Fund?
Additional information is available on the Fund's website ( timothyplan.com ), including its:
Prospectus
Financial information
Holdings
Proxy voting information
Timothy Plan Large/Mid Cap Growth Fund
Annual Shareholder Report - September 30, 2024
This annual shareholder report contains important information about Timothy Plan Large/Mid Cap Growth Fund for the period of October 1, 2023 to November 30, 2024. You can find additional information about the Fund at timothyplan.com. You can also request this information by contacting us at (800) 846-7526. This report describes changes to the Fund that occurred during the reporting period.
What were the Fund’s costs for the last year?
(based on a hypothetical $10,000 investment)
| Class Name | Costs of a $10,000 investment | Costs paid as a percentage of a $10,000 investment |
|---|
| Class C | $237 | 2.02% |
How did the Fund perform during the reporting period?
For the twelve months ended September 30, 2024, the Timothy Plan Large/Mid Growth Fund - Class C achieved a 35.14% return, underperforming its benchmark, the Russell 1000 Growth Index, which returned 42%. Despite this, the Fund delivered strong absolute performance in a favorable market environment, as stocks rebounded after an initial decline in Q3 2023.
Key Performance Drivers:
• Sector Allocation: The Consumer Discretionary sector contributed significantly, adding 147 basis points, with an underweight position in Tesla contributing 117 basis points.
• Top Contributors: Broadcom Inc., the leader in networking semiconductors, gained 110% and added 126 basis points to relative performance. The portfolio’s exclusion of five of the "Magnificent 7" technology stocks, due to screening restrictions, acted as a headwind, as these stocks accounted for 60% of the Russell 1000 Growth Index’s rise.
• Largest Detractors: The Communication Services sector detracted 229 basis points from performance, mainly due to not owning Meta Platforms, which rose 91%. Cable One, Inc., a rural broadband provider, was the largest individual detractor, falling 28% and being removed from the portfolio.
Looking forward, we believe the Fund remains well-positioned to capitalize on growth opportunities, with a focus on sectors like Consumer Discretionary and Technology, while remaining mindful of valuation risks in the broader market.
How has the Fund performed over the last ten years?
Total Return Based on $10,000 Investment
| Timothy Plan Large/Mid Cap Growth Fund | Russell 1000® Growth Index | Russell 1000® Total Return Index |
|---|
| Sep-2014 | $10,000 | $10,000 | $10,000 |
| Sep-2015 | $9,886 | $10,317 | $9,939 |
| Sep-2016 | $10,483 | $11,737 | $11,423 |
| Sep-2017 | $12,116 | $14,312 | $13,540 |
| Sep-2018 | $13,404 | $18,076 | $15,946 |
| Sep-2019 | $13,103 | $18,746 | $16,563 |
| Sep-2020 | $15,212 | $25,782 | $19,215 |
| Sep-2021 | $19,825 | $32,825 | $25,165 |
| Sep-2022 | $16,006 | $25,410 | $20,833 |
| Sep-2023 | $18,853 | $32,453 | $25,248 |
| Sep-2024 | $25,479 | $46,145 | $34,257 |
Average Annual Total Returns
| 1 Year | 5 Years | 10 Years |
|---|
| Timothy Plan Large/Mid Cap Growth Fund | 35.14% | 14.22% | 9.80% |
Russell 1000® Growth Index | 42.19% | 19.74% | 16.52% |
Russell 1000® Total Return Index | 35.68% | 15.64% | 13.10% |
The Fund's past performance is not a good predictor of how the Fund will perform in the future. The graph and table do not reflect the deduction of taxes that a shareholder would pay on fund distributions or redemption of fund shares.
| Net Assets | $216,606,938 |
| Number of Portfolio Holdings | 53 |
| Advisory Fee #ERROR:A result could not be returned because the conditional could not be evaluated to a True/False value ((history)) | $1,295,172 |
| Portfolio Turnover | 53% |
Asset Weighting (% of total investments)
| Value | Value |
|---|
| Common Stocks | 80.9% |
| Exchange-Traded Funds | 11.8% |
| Money Market Funds | 4.4% |
| Reit | 2.9% |
What did the Fund invest in?
Sector Weighting (% of net assets)
| Value | Value |
|---|
| Liabilities in Excess of Other Assets | -0.1% |
| Real Estate | 3.0% |
| Consumer Staples | 4.0% |
| Financials | 4.2% |
| Money Market Funds | 4.4% |
| Materials | 5.5% |
| Consumer Discretionary | 7.4% |
| Industrials | 10.8% |
| Health Care | 11.6% |
| Equity | 11.8% |
| Technology | 37.4% |
Top 10 Holdings (% of net assets)
| Holding Name | % of Net Assets |
| Timothy Plan US Large/Mid Cap Core Enhanced ETF | 9.6% |
| NVIDIA Corporation | 9.6% |
| Fidelity Government Portfolio, Institutional Class | 4.4% |
| Costco Wholesale Corporation | 4.0% |
| Broadcom, Inc. | 3.2% |
| ServiceNow, Inc. | 3.2% |
| Tesla, Inc. | 2.7% |
| Arthur J Gallagher & Company | 2.7% |
| Linde plc | 2.6% |
| Stryker Corporation | 2.4% |
No material changes occurred during the year ended September 30, 2024.
Timothy Plan Large/Mid Cap Growth Fund
Annual Shareholder Report - September 30, 2024
Where can I find additional information about the Fund?
Additional information is available on the Fund's website ( timothyplan.com ), including its:
Prospectus
Financial information
Holdings
Proxy voting information
Timothy Plan Large/Mid Cap Growth Fund
Annual Shareholder Report - September 30, 2024
This annual shareholder report contains important information about Timothy Plan Large/Mid Cap Growth Fund for the period of October 1, 2023 to November 30, 2024. You can find additional information about the Fund at timothyplan.com. You can also request this information by contacting us at (800) 846-7526. This report describes changes to the Fund that occurred during the reporting period.
What were the Fund’s costs for the last year?
(based on a hypothetical $10,000 investment)
| Class Name | Costs of a $10,000 investment | Costs paid as a percentage of a $10,000 investment |
|---|
| Class I | $121 | 1.02% |
How did the Fund perform during the reporting period?
For the twelve months ended September 30, 2024, the Timothy Plan Large/Mid Growth Fund - Class I achieved a 36.49% return, underperforming its benchmark, the Russell 1000 Growth Index, which returned 42%. Despite this, the Fund delivered strong absolute performance in a favorable market environment, as stocks rebounded after an initial decline in Q3 2023.
Key Performance Drivers:
• Sector Allocation: The Consumer Discretionary sector contributed significantly, adding 147 basis points, with an underweight position in Tesla contributing 117 basis points.
• Top Contributors: Broadcom Inc., the leader in networking semiconductors, gained 110% and added 126 basis points to relative performance. The portfolio’s exclusion of five of the "Magnificent 7" technology stocks, due to screening restrictions, acted as a headwind, as these stocks accounted for 60% of the Russell 1000 Growth Index’s rise.
• Largest Detractors: The Communication Services sector detracted 229 basis points from performance, mainly due to not owning Meta Platforms, which rose 91%. Cable One, Inc., a rural broadband provider, was the largest individual detractor, falling 28% and being removed from the portfolio.
Looking forward, we believe the Fund remains well-positioned to capitalize on growth opportunities, with a focus on sectors like Consumer Discretionary and Technology, while remaining mindful of valuation risks in the broader market.
How has the Fund performed over the last ten years?
Total Return Based on $10,000 Investment
| Timothy Plan Large/Mid Cap Growth Fund | Russell 1000® Growth Index | Russell 1000® Total Return Index |
|---|
| Sep-2014 | $10,000 | $10,000 | $10,000 |
| Sep-2015 | $9,990 | $10,317 | $9,939 |
| Sep-2016 | $10,691 | $11,737 | $11,423 |
| Sep-2017 | $12,482 | $14,312 | $13,540 |
| Sep-2018 | $13,941 | $18,076 | $15,946 |
| Sep-2019 | $13,768 | $18,746 | $16,563 |
| Sep-2020 | $16,151 | $25,782 | $19,215 |
| Sep-2021 | $21,261 | $32,825 | $25,165 |
| Sep-2022 | $17,329 | $25,410 | $20,833 |
| Sep-2023 | $20,623 | $32,453 | $25,248 |
| Sep-2024 | $28,149 | $46,145 | $34,257 |
Average Annual Total Returns
| 1 Year | 5 Years | 10 Years |
|---|
| Timothy Plan Large/Mid Cap Growth Fund | 36.49% | 15.38% | 10.90% |
Russell 1000® Growth Index | 42.19% | 19.74% | 16.52% |
Russell 1000® Total Return Index | 35.68% | 15.64% | 13.10% |
The Fund's past performance is not a good predictor of how the Fund will perform in the future. The graph and table do not reflect the deduction of taxes that a shareholder would pay on fund distributions or redemption of fund shares.
| Net Assets | $216,606,938 |
| Number of Portfolio Holdings | 53 |
| Advisory Fee #ERROR:A result could not be returned because the conditional could not be evaluated to a True/False value ((history)) | $1,295,172 |
| Portfolio Turnover | 53% |
Asset Weighting (% of total investments)
| Value | Value |
|---|
| Common Stocks | 80.9% |
| Exchange-Traded Funds | 11.8% |
| Money Market Funds | 4.4% |
| Reit | 2.9% |
What did the Fund invest in?
Sector Weighting (% of net assets)
| Value | Value |
|---|
| Liabilities in Excess of Other Assets | -0.1% |
| Real Estate | 3.0% |
| Consumer Staples | 4.0% |
| Financials | 4.2% |
| Money Market Funds | 4.4% |
| Materials | 5.5% |
| Consumer Discretionary | 7.4% |
| Industrials | 10.8% |
| Health Care | 11.6% |
| Equity | 11.8% |
| Technology | 37.4% |
Top 10 Holdings (% of net assets)
| Holding Name | % of Net Assets |
| Timothy Plan US Large/Mid Cap Core Enhanced ETF | 9.6% |
| NVIDIA Corporation | 9.6% |
| Fidelity Government Portfolio, Institutional Class | 4.4% |
| Costco Wholesale Corporation | 4.0% |
| Broadcom, Inc. | 3.2% |
| ServiceNow, Inc. | 3.2% |
| Tesla, Inc. | 2.7% |
| Arthur J Gallagher & Company | 2.7% |
| Linde plc | 2.6% |
| Stryker Corporation | 2.4% |
No material changes occurred during the year ended September 30, 2024.
Timothy Plan Large/Mid Cap Growth Fund
Annual Shareholder Report - September 30, 2024
Where can I find additional information about the Fund?
Additional information is available on the Fund's website ( timothyplan.com ), including its:
Prospectus
Financial information
Holdings
Proxy voting information
Timothy Plan Large/Mid Cap Value Fund
Annual Shareholder Report - September 30, 2024
This annual shareholder report contains important information about Timothy Plan Large/Mid Cap Value Fund for the period of October 1, 2023 to November 30, 2024. You can find additional information about the Fund at timothyplan.com. You can also request this information by contacting us at (800) 846-7526. This report describes changes to the Fund that occurred during the reporting period.
What were the Fund’s costs for the last year?
(based on a hypothetical $10,000 investment)
| Class Name | Costs of a $10,000 investment | Costs paid as a percentage of a $10,000 investment |
|---|
| Class A | $136 | 1.19% |
How did the Fund perform during the reporting period?
For the twelve months ended September 30, 2024, the Timothy Plan Large/Mid Cap Value Fund - Class A gained 28.18%, trailing the S&P 500® Index, which gained 36.35%. Relative performance was impacted by an underweight position in Information Technology and an overweight in Consumer Staples. The Fund benefited from stock selection in Industrials and Health Care, which helped offset some of the underperformance.
Key Performance Drivers:
• Sector Allocation: The Fund’s underweight to Information Technology and overweight to Consumer Staples detracted from relative performance. Strong stock selection in Industrials and Health Care helped offset some of these headwinds.
• "Magnificent 7" Impact: The underweight to five of the "Magnificent 7" large-cap growth stocks significantly affected performance. Although NVIDIA Corp. (NVDA) was held and performed well, the lack of exposure to other tech giants accounted for over a third of the underperformance.
• Top Contributors: NVIDIA Corp. (NVDA), driven by enthusiasm for AI, gained over 150%, making it the Fund’s best performer. Broadcom Inc. (AVGO) and Monolithic Power Systems Inc. (MPWR) also contributed positively with strong gains in the semiconductor and power management sectors.
• Largest Detractors: Lattice Semiconductor Corp. (LSCC) was sold after its CEO’s departure. ConocoPhillips (COP) underperformed as oil prices declined in the spring, and Dollar General Corp. (DG) struggled with supply chain issues and was sold.
Looking forward, Westwood remains cautious about risks to the economic environment and continues to favor sectors like Industrials and Real Estate for consistent cash flow and shareholder returns. The Fund remains underweight in high-valuation sectors like Information Technology and Communication Services.
How has the Fund performed over the last ten years?
Total Return Based on $10,000 Investment
| Timothy Plan Large/Mid Cap Value Fund | S&P 500® Index |
|---|
| Sep-2014 | $9,451 | $10,000 |
| Sep-2015 | $9,601 | $9,939 |
| Sep-2016 | $10,216 | $11,472 |
| Sep-2017 | $11,554 | $13,607 |
| Sep-2018 | $13,124 | $16,044 |
| Sep-2019 | $13,457 | $16,727 |
| Sep-2020 | $13,986 | $19,260 |
| Sep-2021 | $18,167 | $25,040 |
| Sep-2022 | $16,405 | $21,165 |
| Sep-2023 | $18,693 | $25,741 |
| Sep-2024 | $23,961 | $35,098 |
Average Annual Total Returns
| 1 Year | 5 Years | 10 Years |
|---|
| Timothy Plan Large/Mid Cap Value Fund | | | |
| Without Load | 28.18% | 12.23% | 9.75% |
| With Load* | 21.13% | 10.97% | 9.13% |
S&P 500® Index | 36.35% | 15.98% | 13.38% |
The Fund's past performance is not a good predictor of how the Fund will perform in the future. The graph and table do not reflect the deduction of taxes that a shareholder would pay on fund distributions or redemption of fund shares.
| Net Assets | $354,857,874 |
| Number of Portfolio Holdings | 44 |
| Advisory Fee #ERROR:A result could not be returned because the conditional could not be evaluated to a True/False value ((history)) | $2,036,126 |
| Portfolio Turnover | 34% |
Asset Weighting (% of total investments)
| Value | Value |
|---|
| Common Stocks | 75.2% |
| Exchange-Traded Funds | 16.8% |
| Money Market Funds | 3.6% |
| Reit | 4.4% |
What did the Fund invest in?
Sector Weighting (% of net assets)
| Value | Value |
|---|
| Liabilities in Excess of Other Assets | -0.1% |
| Energy | 3.4% |
| Materials | 3.5% |
| Money Market Funds | 3.6% |
| Real Estate | 4.4% |
| Consumer Discretionary | 4.6% |
| Utilities | 6.6% |
| Health Care | 7.9% |
| Financials | 8.1% |
| Consumer Staples | 8.1% |
| Industrials | 10.6% |
| Equity | 16.8% |
| Technology | 22.5% |
Top 10 Holdings (% of net assets)
| Holding Name | % of Net Assets |
| Timothy Plan US Large/Mid Cap Core Enhanced ETF | 7.1% |
| Timothy Plan High Dividend Stock Enhanced ETF | 6.3% |
| Fidelity Government Portfolio, Institutional Class | 3.6% |
| Monolithic Power Systems, Inc. | 2.7% |
| O'Reilly Automotive, Inc. | 2.6% |
| CACI International, Inc., Class A | 2.5% |
| WEC Energy Group, Inc. | 2.4% |
| Arthur J Gallagher & Company | 2.4% |
| McCormick & Company, Inc. | 2.4% |
| Hubbell, Inc. | 2.3% |
No material changes occurred during the year ended September 30, 2024.
Timothy Plan Large/Mid Cap Value Fund
Annual Shareholder Report - September 30, 2024
Where can I find additional information about the Fund?
Additional information is available on the Fund's website ( timothyplan.com ), including its:
Prospectus
Financial information
Holdings
Proxy voting information
Timothy Plan Large/Mid Cap Value Fund
Annual Shareholder Report - September 30, 2024
This annual shareholder report contains important information about Timothy Plan Large/Mid Cap Value Fund for the period of October 1, 2023 to November 30, 2024. You can find additional information about the Fund at timothyplan.com. You can also request this information by contacting us at (800) 846-7526. This report describes changes to the Fund that occurred during the reporting period.
What were the Fund’s costs for the last year?
(based on a hypothetical $10,000 investment)
| Class Name | Costs of a $10,000 investment | Costs paid as a percentage of a $10,000 investment |
|---|
| Class C | $220 | 1.94% |
How did the Fund perform during the reporting period?
For the twelve months ended September 30, 2024, the Timothy Plan Large/Mid Cap Value Fund - Class C gained 27.23%, trailing the S&P 500® Index, which gained 36.35%. Relative performance was impacted by an underweight position in Information Technology and an overweight in Consumer Staples. The Fund benefited from stock selection in Industrials and Health Care, which helped offset some of the underperformance.
Key Performance Drivers:
• Sector Allocation: The Fund’s underweight to Information Technology and overweight to Consumer Staples detracted from relative performance. Strong stock selection in Industrials and Health Care helped offset some of these headwinds.
• "Magnificent 7" Impact: The underweight to five of the "Magnificent 7" large-cap growth stocks significantly affected performance. Although NVIDIA Corp. (NVDA) was held and performed well, the lack of exposure to other tech giants accounted for over a third of the underperformance.
• Top Contributors: NVIDIA Corp. (NVDA), driven by enthusiasm for AI, gained over 150%, making it the Fund’s best performer. Broadcom Inc. (AVGO) and Monolithic Power Systems Inc. (MPWR) also contributed positively with strong gains in the semiconductor and power management sectors.
• Largest Detractors: Lattice Semiconductor Corp. (LSCC) was sold after its CEO’s departure. ConocoPhillips (COP) underperformed as oil prices declined in the spring, and Dollar General Corp. (DG) struggled with supply chain issues and was sold.
Looking forward, Westwood remains cautious about risks to the economic environment and continues to favor sectors like Industrials and Real Estate for consistent cash flow and shareholder returns. The Fund remains underweight in high-valuation sectors like Information Technology and Communication Services.
How has the Fund performed over the last ten years?
Total Return Based on $10,000 Investment
| Timothy Plan Large/Mid Cap Value Fund | S&P 500® Index |
|---|
| Sep-2014 | $10,000 | $10,000 |
| Sep-2015 | $10,082 | $9,939 |
| Sep-2016 | $10,651 | $11,472 |
| Sep-2017 | $11,958 | $13,607 |
| Sep-2018 | $13,482 | $16,044 |
| Sep-2019 | $13,717 | $16,727 |
| Sep-2020 | $14,148 | $19,260 |
| Sep-2021 | $18,238 | $25,040 |
| Sep-2022 | $16,352 | $21,165 |
| Sep-2023 | $18,488 | $25,741 |
| Sep-2024 | $23,523 | $35,098 |
Average Annual Total Returns
| 1 Year | 5 Years | 10 Years |
|---|
| Timothy Plan Large/Mid Cap Value Fund | 27.23% | 11.39% | 8.93% |
S&P 500® Index | 36.35% | 15.98% | 13.38% |
The Fund's past performance is not a good predictor of how the Fund will perform in the future. The graph and table do not reflect the deduction of taxes that a shareholder would pay on fund distributions or redemption of fund shares.
| Net Assets | $354,857,874 |
| Number of Portfolio Holdings | 44 |
| Advisory Fee #ERROR:A result could not be returned because the conditional could not be evaluated to a True/False value ((history)) | $2,036,126 |
| Portfolio Turnover | 34% |
Asset Weighting (% of total investments)
| Value | Value |
|---|
| Common Stocks | 75.2% |
| Exchange-Traded Funds | 16.8% |
| Money Market Funds | 3.6% |
| Reit | 4.4% |
What did the Fund invest in?
Sector Weighting (% of net assets)
| Value | Value |
|---|
| Liabilities in Excess of Other Assets | -0.1% |
| Energy | 3.4% |
| Materials | 3.5% |
| Money Market Funds | 3.6% |
| Real Estate | 4.4% |
| Consumer Discretionary | 4.6% |
| Utilities | 6.6% |
| Health Care | 7.9% |
| Financials | 8.1% |
| Consumer Staples | 8.1% |
| Industrials | 10.6% |
| Equity | 16.8% |
| Technology | 22.5% |
Top 10 Holdings (% of net assets)
| Holding Name | % of Net Assets |
| Timothy Plan US Large/Mid Cap Core Enhanced ETF | 7.1% |
| Timothy Plan High Dividend Stock Enhanced ETF | 6.3% |
| Fidelity Government Portfolio, Institutional Class | 3.6% |
| Monolithic Power Systems, Inc. | 2.7% |
| O'Reilly Automotive, Inc. | 2.6% |
| CACI International, Inc., Class A | 2.5% |
| WEC Energy Group, Inc. | 2.4% |
| Arthur J Gallagher & Company | 2.4% |
| McCormick & Company, Inc. | 2.4% |
| Hubbell, Inc. | 2.3% |
No material changes occurred during the year ended September 30, 2024.
Timothy Plan Large/Mid Cap Value Fund
Annual Shareholder Report - September 30, 2024
Where can I find additional information about the Fund?
Additional information is available on the Fund's website ( timothyplan.com ), including its:
Prospectus
Financial information
Holdings
Proxy voting information
Timothy Plan Large/Mid Cap Value Fund
Annual Shareholder Report - September 30, 2024
This annual shareholder report contains important information about Timothy Plan Large/Mid Cap Value Fund for the period of October 1, 2023 to November 30, 2024. You can find additional information about the Fund at timothyplan.com. You can also request this information by contacting us at (800) 846-7526. This report describes changes to the Fund that occurred during the reporting period.
What were the Fund’s costs for the last year?
(based on a hypothetical $10,000 investment)
| Class Name | Costs of a $10,000 investment | Costs paid as a percentage of a $10,000 investment |
|---|
| Class I | $107 | 0.94% |
How did the Fund perform during the reporting period?
For the twelve months ended September 30, 2024, the Timothy Plan Large/Mid Cap Value Fund - Class I gained 28.53%, trailing the S&P 500® Index, which gained 36.35%. Relative performance was impacted by an underweight position in Information Technology and an overweight in Consumer Staples. The Fund benefited from stock selection in Industrials and Health Care, which helped offset some of the underperformance.
Key Performance Drivers:
• Sector Allocation: The Fund’s underweight to Information Technology and overweight to Consumer Staples detracted from relative performance. Strong stock selection in Industrials and Health Care helped offset some of these headwinds.
• "Magnificent 7" Impact: The underweight to five of the "Magnificent 7" large-cap growth stocks significantly affected performance. Although NVIDIA Corp. (NVDA) was held and performed well, the lack of exposure to other tech giants accounted for over a third of the underperformance.
• Top Contributors: NVIDIA Corp. (NVDA), driven by enthusiasm for AI, gained over 150%, making it the Fund’s best performer. Broadcom Inc. (AVGO) and Monolithic Power Systems Inc. (MPWR) also contributed positively with strong gains in the semiconductor and power management sectors.
• Largest Detractors: Lattice Semiconductor Corp. (LSCC) was sold after its CEO’s departure. ConocoPhillips (COP) underperformed as oil prices declined in the spring, and Dollar General Corp. (DG) struggled with supply chain issues and was sold.
Looking forward, Westwood remains cautious about risks to the economic environment and continues to favor sectors like Industrials and Real Estate for consistent cash flow and shareholder returns. The Fund remains underweight in high-valuation sectors like Information Technology and Communication Services.
How has the Fund performed over the last ten years?
Total Return Based on $10,000 Investment
| Timothy Plan Large/Mid Cap Value Fund | S&P 500® Index |
|---|
| Sep-2014 | $10,000 | $10,000 |
| Sep-2015 | $11,023 | $9,939 |
| Sep-2016 | $11,766 | $11,472 |
| Sep-2017 | $13,338 | $13,607 |
| Sep-2018 | $15,182 | $16,044 |
| Sep-2019 | $15,604 | $16,727 |
| Sep-2020 | $16,265 | $19,260 |
| Sep-2021 | $21,177 | $25,040 |
| Sep-2022 | $19,170 | $21,165 |
| Sep-2023 | $21,893 | $25,741 |
| Sep-2024 | $28,139 | $35,098 |
Average Annual Total Returns
| 1 Year | 5 Years | 10 Years |
|---|
| Timothy Plan Large/Mid Cap Value Fund | 28.53% | 12.52% | 10.90% |
S&P 500® Index | 36.35% | 15.98% | 13.38% |
The Fund's past performance is not a good predictor of how the Fund will perform in the future. The graph and table do not reflect the deduction of taxes that a shareholder would pay on fund distributions or redemption of fund shares.
| Net Assets | $354,857,874 |
| Number of Portfolio Holdings | 44 |
| Advisory Fee #ERROR:A result could not be returned because the conditional could not be evaluated to a True/False value ((history)) | $2,036,126 |
| Portfolio Turnover | 34% |
Asset Weighting (% of total investments)
| Value | Value |
|---|
| Common Stocks | 75.2% |
| Exchange-Traded Funds | 16.8% |
| Money Market Funds | 3.6% |
| Reit | 4.4% |
What did the Fund invest in?
Sector Weighting (% of net assets)
| Value | Value |
|---|
| Liabilities in Excess of Other Assets | -0.1% |
| Energy | 3.4% |
| Materials | 3.5% |
| Money Market Funds | 3.6% |
| Real Estate | 4.4% |
| Consumer Discretionary | 4.6% |
| Utilities | 6.6% |
| Health Care | 7.9% |
| Financials | 8.1% |
| Consumer Staples | 8.1% |
| Industrials | 10.6% |
| Equity | 16.8% |
| Technology | 22.5% |
Top 10 Holdings (% of net assets)
| Holding Name | % of Net Assets |
| Timothy Plan US Large/Mid Cap Core Enhanced ETF | 7.1% |
| Timothy Plan High Dividend Stock Enhanced ETF | 6.3% |
| Fidelity Government Portfolio, Institutional Class | 3.6% |
| Monolithic Power Systems, Inc. | 2.7% |
| O'Reilly Automotive, Inc. | 2.6% |
| CACI International, Inc., Class A | 2.5% |
| WEC Energy Group, Inc. | 2.4% |
| Arthur J Gallagher & Company | 2.4% |
| McCormick & Company, Inc. | 2.4% |
| Hubbell, Inc. | 2.3% |
No material changes occurred during the year ended September 30, 2024.
Timothy Plan Large/Mid Cap Value Fund
Annual Shareholder Report - September 30, 2024
Where can I find additional information about the Fund?
Additional information is available on the Fund's website ( timothyplan.com ), including its:
Prospectus
Financial information
Holdings
Proxy voting information
Timothy Plan Small Cap Value Fund
Annual Shareholder Report - September 30, 2024
This annual shareholder report contains important information about Timothy Plan Small Cap Value Fund for the period of October 1, 2023 to November 30, 2024. You can find additional information about the Fund at timothyplan.com. You can also request this information by contacting us at (800) 846-7526. This report describes changes to the Fund that occurred during the reporting period.
What were the Fund’s costs for the last year?
(based on a hypothetical $10,000 investment)
| Class Name | Costs of a $10,000 investment | Costs paid as a percentage of a $10,000 investment |
|---|
| Class A | $149 | 1.33% |
How did the Fund perform during the reporting period?
For the twelve months ended September 30, 2024, the Timothy Plan Small Cap Value Fund - Class A gained 24.15%, slightly trailing the Russell 2000® Index, which gained 26.76%. Small-cap and value stocks rebounded in the third quarter of 2024 after lagging earlier in the year.
Key Performance Drivers:
• Sector Allocation: The Fund's underweight positions in the Information Technology and Health Care sectors detracted from relative performance. In contrast, stock selection and overweight positions in Financials and Industrials benefited the Fund.
• Top Contributors: Baldwin Insurance Group Inc. (BWIN), an insurance broker, was the best performer, showing strong organic growth and increasing profit margins. Blue Bird Corp. (BLBD), a leader in alternative fuel school buses, and Boot Barn Holdings Inc. (BOOT), a western wear retailer, both contributed positively due to solid business growth.
• Largest Detractors: Vital Energy Inc. (VTLE), an oil and gas producer, declined after an earnings miss in May but remains a long-term hold. LegalZoom.com Inc. (LZ) fell due to slowing business formation, and the Fund exited the position after leadership changes. CONMED Corp. (CNMD) dropped after disappointing earnings in January.
After strong returns over the past year, the Fund is positioned defensively, favoring Financials, Industrials, and Real Estate sectors, while underweighting high-growth sectors such as Information Technology and Health Care due to concerns over stretched valuations.
How has the Fund performed over the last ten years?
Total Return Based on $10,000 Investment
| Timothy Plan Small Cap Value Fund | Russell 2000® Total Return Index | Russell 3000® Total Return Index |
|---|
| Sep-2014 | $9,451 | $10,000 | $10,000 |
| Sep-2015 | $9,635 | $10,125 | $9,951 |
| Sep-2016 | $10,663 | $11,691 | $11,440 |
| Sep-2017 | $12,961 | $14,115 | $13,579 |
| Sep-2018 | $14,272 | $16,266 | $15,967 |
| Sep-2019 | $13,733 | $14,820 | $16,433 |
| Sep-2020 | $11,758 | $14,878 | $18,898 |
| Sep-2021 | $17,758 | $21,972 | $24,921 |
| Sep-2022 | $14,591 | $16,809 | $20,528 |
| Sep-2023 | $16,845 | $18,310 | $24,729 |
| Sep-2024 | $20,914 | $23,210 | $33,432 |
Average Annual Total Returns
| 1 Year | 5 Years | 10 Years |
|---|
| Timothy Plan Small Cap Value Fund | | | |
| Without Load | 24.15% | 8.78% | 8.27% |
| With Load* | 17.31% | 7.55% | 7.66% |
Russell 2000® Total Return Index | 26.76% | 9.39% | 8.78% |
Russell 3000® Total Return Index | 35.19% | 15.26% | 12.83% |
The Fund's past performance is not a good predictor of how the Fund will perform in the future. The graph and table do not reflect the deduction of taxes that a shareholder would pay on fund distributions or redemption of fund shares.
| Net Assets | $195,874,164 |
| Number of Portfolio Holdings | 62 |
| Advisory Fee #ERROR:A result could not be returned because the conditional could not be evaluated to a True/False value ((history)) | $1,298,344 |
| Portfolio Turnover | 50% |
Asset Weighting (% of total investments)
| Value | Value |
|---|
| Common Stocks | 77.7% |
| Exchange-Traded Funds | 11.5% |
| Money Market Funds | 1.1% |
| Reit | 9.7% |
What did the Fund invest in?
Sector Weighting (% of net assets)
| Value | Value |
|---|
| Communications | 0.9% |
| Money Market Funds | 1.1% |
| Consumer Staples | 2.6% |
| Utilities | 3.5% |
| Technology | 5.4% |
| Health Care | 6.8% |
| Energy | 7.2% |
| Materials | 8.8% |
| Consumer Discretionary | 8.8% |
| Real Estate | 9.7% |
| Equity | 11.5% |
| Industrials | 13.1% |
| Financials | 20.6% |
Top 10 Holdings (% of net assets)
| Holding Name | % of Net Assets |
| Timothy Plan US Small Cap Core ETF | 11.5% |
| GMS, Inc. | 1.9% |
| Century Communities, Inc. | 1.9% |
| Moog, Inc., Class A | 1.9% |
| Boise Cascade Company | 1.9% |
| Stepan Company | 1.9% |
| PotlatchDeltic Corporation | 1.9% |
| Piper Sandler Cos | 1.9% |
| Merit Medical Systems, Inc. | 1.8% |
| First Bancorp | 1.8% |
No material changes occurred during the year ended September 30, 2024.
Timothy Plan Small Cap Value Fund
Annual Shareholder Report - September 30, 2024
Where can I find additional information about the Fund?
Additional information is available on the Fund's website ( timothyplan.com ), including its:
Prospectus
Financial information
Holdings
Proxy voting information
Timothy Plan Small Cap Value Fund
Annual Shareholder Report - September 30, 2024
This annual shareholder report contains important information about Timothy Plan Small Cap Value Fund for the period of October 1, 2023 to November 30, 2024. You can find additional information about the Fund at timothyplan.com. You can also request this information by contacting us at (800) 846-7526. This report describes changes to the Fund that occurred during the reporting period.
What were the Fund’s costs for the last year?
(based on a hypothetical $10,000 investment)
| Class Name | Costs of a $10,000 investment | Costs paid as a percentage of a $10,000 investment |
|---|
| Class C | $232 | 2.08% |
How did the Fund perform during the reporting period?
For the twelve months ended September 30, 2024, the Timothy Plan Small Cap Value Fund - Class C gained 23.28%, slightly trailing the Russell 2000® Index, which gained 26.76%. Small-cap and value stocks rebounded in the third quarter of 2024 after lagging earlier in the year.
Key Performance Drivers:
• Sector Allocation: The Fund's underweight positions in the Information Technology and Health Care sectors detracted from relative performance. In contrast, stock selection and overweight positions in Financials and Industrials benefited the Fund.
• Top Contributors: Baldwin Insurance Group Inc. (BWIN), an insurance broker, was the best performer, showing strong organic growth and increasing profit margins. Blue Bird Corp. (BLBD), a leader in alternative fuel school buses, and Boot Barn Holdings Inc. (BOOT), a western wear retailer, both contributed positively due to solid business growth.
• Largest Detractors: Vital Energy Inc. (VTLE), an oil and gas producer, declined after an earnings miss in May but remains a long-term hold. LegalZoom.com Inc. (LZ) fell due to slowing business formation, and the Fund exited the position after leadership changes. CONMED Corp. (CNMD) dropped after disappointing earnings in January.
After strong returns over the past year, the Fund is positioned defensively, favoring Financials, Industrials, and Real Estate sectors, while underweighting high-growth sectors such as Information Technology and Health Care due to concerns over stretched valuations.
How has the Fund performed over the last ten years?
Total Return Based on $10,000 Investment
| Timothy Plan Small Cap Value Fund | Russell 2000® Total Return Index | Russell 3000® Total Return Index |
|---|
| Sep-2014 | $10,000 | $10,000 | $10,000 |
| Sep-2015 | $10,120 | $10,125 | $9,951 |
| Sep-2016 | $11,113 | $11,691 | $11,440 |
| Sep-2017 | $13,413 | $14,115 | $13,579 |
| Sep-2018 | $14,653 | $16,266 | $15,967 |
| Sep-2019 | $13,995 | $14,820 | $16,433 |
| Sep-2020 | $11,894 | $14,878 | $18,898 |
| Sep-2021 | $17,823 | $21,972 | $24,921 |
| Sep-2022 | $14,536 | $16,809 | $20,528 |
| Sep-2023 | $16,660 | $18,310 | $24,729 |
| Sep-2024 | $20,538 | $23,210 | $33,432 |
Average Annual Total Returns
| 1 Year | 5 Years | 10 Years |
|---|
| Timothy Plan Small Cap Value Fund | 23.28% | 7.97% | 7.46% |
Russell 2000® Total Return Index | -% | -% | -% |
Russell 3000® Total Return Index | -% | -% | -% |
The Fund's past performance is not a good predictor of how the Fund will perform in the future. The graph and table do not reflect the deduction of taxes that a shareholder would pay on fund distributions or redemption of fund shares.
| Net Assets | $195,874,164 |
| Number of Portfolio Holdings | 62 |
| Advisory Fee #ERROR:A result could not be returned because the conditional could not be evaluated to a True/False value ((history)) | $1,298,344 |
| Portfolio Turnover | 50% |
Asset Weighting (% of total investments)
| Value | Value |
|---|
| Common Stocks | 77.7% |
| Exchange-Traded Funds | 11.5% |
| Money Market Funds | 1.1% |
| Reit | 9.7% |
What did the Fund invest in?
Sector Weighting (% of net assets)
| Value | Value |
|---|
| Communications | 0.9% |
| Money Market Funds | 1.1% |
| Consumer Staples | 2.6% |
| Utilities | 3.5% |
| Technology | 5.4% |
| Health Care | 6.8% |
| Energy | 7.2% |
| Materials | 8.8% |
| Consumer Discretionary | 8.8% |
| Real Estate | 9.7% |
| Equity | 11.5% |
| Industrials | 13.1% |
| Financials | 20.6% |
Top 10 Holdings (% of net assets)
| Holding Name | % of Net Assets |
| Timothy Plan US Small Cap Core ETF | 11.5% |
| GMS, Inc. | 1.9% |
| Century Communities, Inc. | 1.9% |
| Moog, Inc., Class A | 1.9% |
| Boise Cascade Company | 1.9% |
| Stepan Company | 1.9% |
| PotlatchDeltic Corporation | 1.9% |
| Piper Sandler Cos | 1.9% |
| Merit Medical Systems, Inc. | 1.8% |
| First Bancorp | 1.8% |
No material changes occurred during the year ended September 30, 2024.
Timothy Plan Small Cap Value Fund
Annual Shareholder Report - September 30, 2024
Where can I find additional information about the Fund?
Additional information is available on the Fund's website ( timothyplan.com ), including its:
Prospectus
Financial information
Holdings
Proxy voting information
Timothy Plan Small Cap Value Fund
Annual Shareholder Report - September 30, 2024
This annual shareholder report contains important information about Timothy Plan Small Cap Value Fund for the period of October 1, 2023 to November 30, 2024. You can find additional information about the Fund at timothyplan.com. You can also request this information by contacting us at (800) 846-7526. This report describes changes to the Fund that occurred during the reporting period.
What were the Fund’s costs for the last year?
(based on a hypothetical $10,000 investment)
| Class Name | Costs of a $10,000 investment | Costs paid as a percentage of a $10,000 investment |
|---|
| Class I | $121 | 1.08% |
How did the Fund perform during the reporting period?
For the twelve months ended September 30, 2024, the Timothy Plan Small Cap Value Fund - Class I gained 24.45%, slightly trailing the Russell 2000® Index, which gained 26.76%. Small-cap and value stocks rebounded in the third quarter of 2024 after lagging earlier in the year.
Key Performance Drivers:
• Sector Allocation: The Fund's underweight positions in the Information Technology and Health Care sectors detracted from relative performance. In contrast, stock selection and overweight positions in Financials and Industrials benefited the Fund.
• Top Contributors: Baldwin Insurance Group Inc. (BWIN), an insurance broker, was the best performer, showing strong organic growth and increasing profit margins. Blue Bird Corp. (BLBD), a leader in alternative fuel school buses, and Boot Barn Holdings Inc. (BOOT), a western wear retailer, both contributed positively due to solid business growth.
• Largest Detractors: Vital Energy Inc. (VTLE), an oil and gas producer, declined after an earnings miss in May but remains a long-term hold. LegalZoom.com Inc. (LZ) fell due to slowing business formation, and the Fund exited the position after leadership changes. CONMED Corp. (CNMD) dropped after disappointing earnings in January.
After strong returns over the past year, the Fund is positioned defensively, favoring Financials, Industrials, and Real Estate sectors, while underweighting high-growth sectors such as Information Technology and Health Care due to concerns over stretched valuations.
How has the Fund performed over the last ten years?
Total Return Based on $10,000 Investment
| Timothy Plan Small Cap Value Fund | Russell 2000® Total Return Index | Russell 3000® Total Return Index |
|---|
| Sep-2014 | $10,000 | $10,000 | $10,000 |
| Sep-2015 | $10,223 | $10,125 | $9,951 |
| Sep-2016 | $11,340 | $11,691 | $11,440 |
| Sep-2017 | $13,822 | $14,115 | $13,579 |
| Sep-2018 | $15,254 | $16,266 | $15,967 |
| Sep-2019 | $14,720 | $14,820 | $16,433 |
| Sep-2020 | $12,638 | $14,878 | $18,898 |
| Sep-2021 | $19,125 | $21,972 | $24,921 |
| Sep-2022 | $15,749 | $16,809 | $20,528 |
| Sep-2023 | $18,234 | $18,310 | $24,729 |
| Sep-2024 | $22,691 | $23,210 | $33,432 |
Average Annual Total Returns
| 1 Year | 5 Years | 10 Years |
|---|
| Timothy Plan Small Cap Value Fund | 24.45% | 9.04% | 8.54% |
Russell 2000® Total Return Index | 26.76% | 9.39% | 8.78% |
Russell 3000® Total Return Index | 35.19% | 15.26% | 12.83% |
The Fund's past performance is not a good predictor of how the Fund will perform in the future. The graph and table do not reflect the deduction of taxes that a shareholder would pay on fund distributions or redemption of fund shares.
| Net Assets | $195,874,164 |
| Number of Portfolio Holdings | 62 |
| Advisory Fee #ERROR:A result could not be returned because the conditional could not be evaluated to a True/False value ((history)) | $1,298,344 |
| Portfolio Turnover | 50% |
Asset Weighting (% of total investments)
| Value | Value |
|---|
| Common Stocks | 77.7% |
| Exchange-Traded Funds | 11.5% |
| Money Market Funds | 1.1% |
| Reit | 9.7% |
What did the Fund invest in?
Sector Weighting (% of net assets)
| Value | Value |
|---|
| Communications | 0.9% |
| Money Market Funds | 1.1% |
| Consumer Staples | 2.6% |
| Utilities | 3.5% |
| Technology | 5.4% |
| Health Care | 6.8% |
| Energy | 7.2% |
| Materials | 8.8% |
| Consumer Discretionary | 8.8% |
| Real Estate | 9.7% |
| Equity | 11.5% |
| Industrials | 13.1% |
| Financials | 20.6% |
Top 10 Holdings (% of net assets)
| Holding Name | % of Net Assets |
| Timothy Plan US Small Cap Core ETF | 11.5% |
| GMS, Inc. | 1.9% |
| Century Communities, Inc. | 1.9% |
| Moog, Inc., Class A | 1.9% |
| Boise Cascade Company | 1.9% |
| Stepan Company | 1.9% |
| PotlatchDeltic Corporation | 1.9% |
| Piper Sandler Cos | 1.9% |
| Merit Medical Systems, Inc. | 1.8% |
| First Bancorp | 1.8% |
No material changes occurred during the year ended September 30, 2024.
Timothy Plan Small Cap Value Fund
Annual Shareholder Report - September 30, 2024
Where can I find additional information about the Fund?
Additional information is available on the Fund's website ( timothyplan.com ), including its:
Prospectus
Financial information
Holdings
Proxy voting information
Timothy Plan Small/Mid Cap Growth Fund
Annual Shareholder Report - September 30, 2024
This annual shareholder report contains important information about Timothy Plan Small/Mid Cap Growth Fund for the period of October 1, 2023 to November 30, 2024. You can find additional information about the Fund at timothyplan.com. You can also request this information by contacting us at (800) 846-7526. This report describes changes to the Fund that occurred during the reporting period.
What were the Fund’s costs for the last year?
(based on a hypothetical $10,000 investment)
| Class Name | Costs of a $10,000 investment | Costs paid as a percentage of a $10,000 investment |
|---|
| Class A | $180 | 1.48% |
How did the Fund perform during the reporting period?
For the twelve months ended September 30, 2024, the Timothy Plan Small/Mid Cap Growth Fund - Class A achieved a 42.75% return, outperforming the benchmark Russell Midcap Growth Index, which gained 29.3%. The favorable environment for stocks was driven by improving inflationary indicators and anticipation of Federal Reserve interest rate cuts.
Key Performance Drivers:
• Top Performing Sectors: Industrials and Technology were the best-performing sectors within the Fund, contributing significantly to its absolute and relative outperformance.
• Top Contributors: Telecom hardware company Super Micro Computer and retailer Burlington Stores were the top contributors, delivering strong gains for the Fund.
• Largest Detractors: The Healthcare and Energy sectors were the weakest performers. The largest individual detractors were software company CrowdStrike Holdings and semiconductor company On Semiconductor.
The Fund remains positioned to capture growth opportunities as market conditions improve. With inflationary pressures easing and interest rates expected to decline, sectors such as Industrials and Technology appear poised to continue driving performance. We believe the Fund’s disciplined approach to stock selection will help navigate potential volatility and potentially deliver long-term growth.
How has the Fund performed over the last ten years?
Total Return Based on $10,000 Investment
| Timothy Plan Small/Mid Cap Growth Fund | Russell 3000® Total Return Index | Russell Midcap® Growth Index |
|---|
| Sep-2014 | $9,454 | $10,000 | $10,000 |
| Sep-2015 | $9,232 | $9,951 | $10,145 |
| Sep-2016 | $9,137 | $11,440 | $11,285 |
| Sep-2017 | $10,866 | $13,579 | $13,296 |
| Sep-2018 | $12,420 | $15,967 | $16,102 |
| Sep-2019 | $11,336 | $16,433 | $16,940 |
| Sep-2020 | $14,289 | $18,898 | $20,875 |
| Sep-2021 | $19,131 | $24,921 | $27,232 |
| Sep-2022 | $14,030 | $20,528 | $19,199 |
| Sep-2023 | $16,499 | $24,729 | $22,552 |
| Sep-2024 | $23,552 | $33,432 | $29,168 |
Average Annual Total Returns
| 1 Year | 5 Years | 10 Years |
|---|
| Timothy Plan Small/Mid Cap Growth Fund | | | |
| Without Load | 42.75% | 15.75% | 9.56% |
| With Load* | 34.90% | 14.44% | 8.94% |
Russell 3000® Total Return Index | 35.19% | 15.26% | 12.83% |
Russell Midcap® Growth Index | 29.33% | 11.48% | 11.30% |
The Fund's past performance is not a good predictor of how the Fund will perform in the future. The graph and table do not reflect the deduction of taxes that a shareholder would pay on fund distributions or redemption of fund shares.
| Net Assets | $72,026,174 |
| Number of Portfolio Holdings | 40 |
| Advisory Fee #ERROR:A result could not be returned because the conditional could not be evaluated to a True/False value ((history)) | $472,346 |
| Portfolio Turnover | 95% |
Asset Weighting (% of total investments)
| Value | Value |
|---|
| Common Stocks | 90.8% |
| Money Market Funds | 7.0% |
| Reit | 2.2% |
What did the Fund invest in?
Sector Weighting (% of net assets)
| Value | Value |
|---|
| Liabilities in Excess of Other Assets | -2.6% |
| Financials | 0.9% |
| Real Estate | 2.2% |
| Energy | 5.5% |
| Money Market Funds | 7.2% |
| Health Care | 15.3% |
| Consumer Discretionary | 18.8% |
| Technology | 25.1% |
| Industrials | 27.6% |
Top 10 Holdings (% of net assets)
| Holding Name | % of Net Assets |
| Fidelity Government Portfolio, Institutional Class | 7.2% |
| Comfort Systems USA, Inc. | 4.7% |
| Toll Brothers, Inc. | 4.5% |
| Clean Harbors, Inc. | 3.9% |
| Monolithic Power Systems, Inc. | 3.9% |
| Parker-Hannifin Corporation | 3.7% |
| Burlington Stores, Inc. | 3.6% |
| Marvell Technology, Inc. | 3.6% |
| Deckers Outdoor Corporation | 3.6% |
| Tenet Healthcare Corporation | 3.5% |
No material changes occurred during the year ended September 30, 2024.
Timothy Plan Small/Mid Cap Growth Fund
Annual Shareholder Report - September 30, 2024
Where can I find additional information about the Fund?
Additional information is available on the Fund's website ( timothyplan.com ), including its:
Prospectus
Financial information
Holdings
Proxy voting information
Timothy Plan Small/Mid Cap Growth Fund
Annual Shareholder Report - September 30, 2024
This annual shareholder report contains important information about Timothy Plan Small/Mid Cap Growth Fund for the period of October 1, 2023 to November 30, 2024. You can find additional information about the Fund at timothyplan.com. You can also request this information by contacting us at (800) 846-7526. This report describes changes to the Fund that occurred during the reporting period.
What were the Fund’s costs for the last year?
(based on a hypothetical $10,000 investment)
| Class Name | Costs of a $10,000 investment | Costs paid as a percentage of a $10,000 investment |
|---|
| Class C | $270 | 2.23% |
How did the Fund perform during the reporting period?
For the twelve months ended September 30, 2024, the Timothy Plan Small/Mid Cap Growth Fund - Class C achieved a 41.68% return, outperforming the benchmark Russell Midcap Growth Index, which gained 29.3%. The favorable environment for stocks was driven by improving inflationary indicators and anticipation of Federal Reserve interest rate cuts.
Key Performance Drivers:
• Top Performing Sectors: Industrials and Technology were the best-performing sectors within the Fund, contributing significantly to its absolute and relative outperformance.
• Top Contributors: Telecom hardware company Super Micro Computer and retailer Burlington Stores were the top contributors, delivering strong gains for the Fund.
• Largest Detractors: The Healthcare and Energy sectors were the weakest performers. The largest individual detractors were software company CrowdStrike Holdings and semiconductor company On Semiconductor.
The Fund remains positioned to capture growth opportunities as market conditions improve. With inflationary pressures easing and interest rates expected to decline, sectors such as Industrials and Technology appear poised to continue driving performance. We believe the Fund’s disciplined approach to stock selection will help navigate potential volatility and potentially deliver long-term growth.
How has the Fund performed over the last ten years?
Total Return Based on $10,000 Investment
| Timothy Plan Small/Mid Cap Growth Fund | Russell 3000® Total Return Index | Russell Midcap® Growth Index |
|---|
| Sep-2014 | $10,000 | $10,000 | $10,000 |
| Sep-2015 | $9,690 | $9,951 | $10,145 |
| Sep-2016 | $9,523 | $11,440 | $11,285 |
| Sep-2017 | $11,224 | $13,579 | $13,296 |
| Sep-2018 | $12,758 | $15,967 | $16,102 |
| Sep-2019 | $11,553 | $16,433 | $16,940 |
| Sep-2020 | $14,451 | $18,898 | $20,875 |
| Sep-2021 | $19,201 | $24,921 | $27,232 |
| Sep-2022 | $13,972 | $20,528 | $19,199 |
| Sep-2023 | $16,322 | $24,729 | $22,552 |
| Sep-2024 | $23,125 | $33,432 | $29,168 |
Average Annual Total Returns
| 1 Year | 5 Years | 10 Years |
|---|
| Timothy Plan Small/Mid Cap Growth Fund | 41.68% | 14.89% | 8.74% |
Russell 3000® Total Return Index | 35.19% | 15.26% | 12.83% |
Russell Midcap® Growth Index | 29.33% | 11.48% | 11.30% |
The Fund's past performance is not a good predictor of how the Fund will perform in the future. The graph and table do not reflect the deduction of taxes that a shareholder would pay on fund distributions or redemption of fund shares.
| Net Assets | $72,026,174 |
| Number of Portfolio Holdings | 40 |
| Advisory Fee #ERROR:A result could not be returned because the conditional could not be evaluated to a True/False value ((history)) | $472,346 |
| Portfolio Turnover | 95% |
Asset Weighting (% of total investments)
| Value | Value |
|---|
| Common Stocks | 90.8% |
| Money Market Funds | 7.0% |
| Reit | 2.2% |
What did the Fund invest in?
Sector Weighting (% of net assets)
| Value | Value |
|---|
| Liabilities in Excess of Other Assets | -2.6% |
| Financials | 0.9% |
| Real Estate | 2.2% |
| Energy | 5.5% |
| Money Market Funds | 7.2% |
| Health Care | 15.3% |
| Consumer Discretionary | 18.8% |
| Technology | 25.1% |
| Industrials | 27.6% |
Top 10 Holdings (% of net assets)
| Holding Name | % of Net Assets |
| Fidelity Government Portfolio, Institutional Class | 7.2% |
| Comfort Systems USA, Inc. | 4.7% |
| Toll Brothers, Inc. | 4.5% |
| Clean Harbors, Inc. | 3.9% |
| Monolithic Power Systems, Inc. | 3.9% |
| Parker-Hannifin Corporation | 3.7% |
| Burlington Stores, Inc. | 3.6% |
| Marvell Technology, Inc. | 3.6% |
| Deckers Outdoor Corporation | 3.6% |
| Tenet Healthcare Corporation | 3.5% |
No material changes occurred during the year ended September 30, 2024.
Timothy Plan Small/Mid Cap Growth Fund
Annual Shareholder Report - September 30, 2024
Where can I find additional information about the Fund?
Additional information is available on the Fund's website ( timothyplan.com ), including its:
Prospectus
Financial information
Holdings
Proxy voting information
Timothy Plan Small/Mid Cap Growth Fund
Annual Shareholder Report - September 30, 2024
This annual shareholder report contains important information about Timothy Plan Small/Mid Cap Growth Fund for the period of October 1, 2023 to November 30, 2024. You can find additional information about the Fund at timothyplan.com. You can also request this information by contacting us at (800) 846-7526. This report describes changes to the Fund that occurred during the reporting period.
What were the Fund’s costs for the last year?
(based on a hypothetical $10,000 investment)
| Class Name | Costs of a $10,000 investment | Costs paid as a percentage of a $10,000 investment |
|---|
| Class I | $150 | 1.23% |
How did the Fund perform during the reporting period?
For the twelve months ended September 30, 2024, the Timothy Plan Small/Mid Cap Growth Fund - Class I achieved a 43.24% return, outperforming the benchmark Russell Midcap Growth Index, which gained 29.3%. The favorable environment for stocks was driven by improving inflationary indicators and anticipation of Federal Reserve interest rate cuts.
Key Performance Drivers:
• Top Performing Sectors: Industrials and Technology were the best-performing sectors within the Fund, contributing significantly to its absolute and relative outperformance.
• Top Contributors: Telecom hardware company Super Micro Computer and retailer Burlington Stores were the top contributors, delivering strong gains for the Fund.
• Largest Detractors: The Healthcare and Energy sectors were the weakest performers. The largest individual detractors were software company CrowdStrike Holdings and semiconductor company On Semiconductor.
The Fund remains positioned to capture growth opportunities as market conditions improve. With inflationary pressures easing and interest rates expected to decline, sectors such as Industrials and Technology appear poised to continue driving performance. We believe the Fund’s disciplined approach to stock selection will help navigate potential volatility and potentially deliver long-term growth.
How has the Fund performed over the last ten years?
Total Return Based on $10,000 Investment
| Timothy Plan Small/Mid Cap Growth Fund | Russell 3000® Total Return Index | Russell Midcap® Growth Index |
|---|
| Sep-2014 | $10,000 | $10,000 | $10,000 |
| Sep-2015 | $9,790 | $9,951 | $10,145 |
| Sep-2016 | $9,716 | $11,440 | $11,285 |
| Sep-2017 | $11,577 | $13,579 | $13,296 |
| Sep-2018 | $13,270 | $15,967 | $16,102 |
| Sep-2019 | $12,145 | $16,433 | $16,940 |
| Sep-2020 | $15,340 | $18,898 | $20,875 |
| Sep-2021 | $20,584 | $24,921 | $27,232 |
| Sep-2022 | $15,134 | $20,528 | $19,199 |
| Sep-2023 | $17,825 | $24,729 | $22,552 |
| Sep-2024 | $25,533 | $33,432 | $29,168 |
Average Annual Total Returns
| 1 Year | 5 Years | 10 Years |
|---|
| Timothy Plan Small/Mid Cap Growth Fund | 43.24% | 16.02% | 9.83% |
Russell 3000® Total Return Index | 35.19% | 15.26% | 12.83% |
Russell Midcap® Growth Index | 29.33% | 11.48% | 11.30% |
The Fund's past performance is not a good predictor of how the Fund will perform in the future. The graph and table do not reflect the deduction of taxes that a shareholder would pay on fund distributions or redemption of fund shares.
| Net Assets | $72,026,174 |
| Number of Portfolio Holdings | 40 |
| Advisory Fee #ERROR:A result could not be returned because the conditional could not be evaluated to a True/False value ((history)) | $472,346 |
| Portfolio Turnover | 95% |
Asset Weighting (% of total investments)
| Value | Value |
|---|
| Common Stocks | 90.8% |
| Money Market Funds | 7.0% |
| Reit | 2.2% |
What did the Fund invest in?
Sector Weighting (% of net assets)
| Value | Value |
|---|
| Liabilities in Excess of Other Assets | -2.6% |
| Financials | 0.9% |
| Real Estate | 2.2% |
| Energy | 5.5% |
| Money Market Funds | 7.2% |
| Health Care | 15.3% |
| Consumer Discretionary | 18.8% |
| Technology | 25.1% |
| Industrials | 27.6% |
Top 10 Holdings (% of net assets)
| Holding Name | % of Net Assets |
| Fidelity Government Portfolio, Institutional Class | 7.2% |
| Comfort Systems USA, Inc. | 4.7% |
| Toll Brothers, Inc. | 4.5% |
| Clean Harbors, Inc. | 3.9% |
| Monolithic Power Systems, Inc. | 3.9% |
| Parker-Hannifin Corporation | 3.7% |
| Burlington Stores, Inc. | 3.6% |
| Marvell Technology, Inc. | 3.6% |
| Deckers Outdoor Corporation | 3.6% |
| Tenet Healthcare Corporation | 3.5% |
No material changes occurred during the year ended September 30, 2024.
Timothy Plan Small/Mid Cap Growth Fund
Annual Shareholder Report - September 30, 2024
Where can I find additional information about the Fund?
Additional information is available on the Fund's website ( timothyplan.com ), including its:
Prospectus
Financial information
Holdings
Proxy voting information
Timothy Plan Strategic Growth Fund
Annual Shareholder Report - September 30, 2024
This annual shareholder report contains important information about Timothy Plan Strategic Growth Fund for the period of October 1, 2023 to November 30, 2024. You can find additional information about the Fund at timothyplan.com. You can also request this information by contacting us at (800) 846-7526. This report describes changes to the Fund that occurred during the reporting period.
What were the Fund’s costs for the last year?
(based on a hypothetical $10,000 investment)
| Class Name | Costs of a $10,000 investment | Costs paid as a percentage of a $10,000 investment |
|---|
| Class A | $97 | 0.89% |
How did the Fund perform during the reporting period?
For the twelve months ended September 30, 2024, the Timothy Plan Strategic Growth Fund - Class A returned 17.23%, underperforming the Dow Jones Mod Aggressive Portfolio Index, which returned 24.10%. The Fund's performance reflects its allocation across various Timothy Plan mutual funds and ETFs, with asset allocation varying within allowable ranges over the past year in response to changing market conditions.
Key Performance Drivers:
• Equity Allocation: Exposure to the US Small Cap Core ETF and US Large/Mid Cap Core Enhanced ETF drove much of the positive performance, particularly as the Technology and Industrial sectors saw strong gains.
• Sector Performance: The High Dividend Stock Enhanced ETF and International ETF provided stable returns, but the defensive nature of dividend stocks and limited exposure to high-growth tech stocks compared to the index were performance headwinds.
• Fixed Income & High Yield Bond: Allocations to Fixed Income and High-Yield Bonds added stability, though they trailed equities. Bond yields fluctuated throughout the year, and tightening credit spreads supported high-yield bonds.
• Market-neutral ETF: The Market-Neutral ETF reduced overall portfolio volatility, delivering steady income during periods of market fluctuation.
• International Allocation: International holdings in Europe and Japan, particularly through the International Fund and International ETF, benefited from lower borrowing costs and market recoveries in those regions.
Reasons for Underperformance:
• The Fund’s limited exposure to high-growth technology stocks and allocation to fixed-income and more defensive sectors contributed to its underperformance relative to the benchmark. While this strategy provided stability, it resulted in a more conservative outcome than the index, which was heavily driven by growth stocks.
The Fund remains committed to adjusting allocations based on market conditions to balance growth opportunities with capital preservation in light of ongoing uncertainties.
How has the Fund performed over the last ten years?
Total Return Based on $10,000 Investment
| Timothy Plan Strategic Growth Fund | Dow Jones Moderately Aggressive Portfolio Index | Russell 3000® Total Return Index |
|---|
| Sep-2014 | $9,448 | $10,000 | $10,000 |
| Sep-2015 | $9,055 | $9,690 | $9,951 |
| Sep-2016 | $9,420 | $10,869 | $11,440 |
| Sep-2017 | $10,229 | $12,431 | $13,579 |
| Sep-2018 | $10,466 | $13,598 | $15,967 |
| Sep-2019 | $10,439 | $13,879 | $16,433 |
| Sep-2020 | $10,651 | $14,820 | $18,898 |
| Sep-2021 | $12,690 | $18,600 | $24,921 |
| Sep-2022 | $10,683 | $15,088 | $20,528 |
| Sep-2023 | $11,471 | $17,180 | $24,729 |
| Sep-2024 | $13,447 | $21,320 | $33,432 |
Average Annual Total Returns
| 1 Year | 5 Years | 10 Years |
|---|
| Timothy Plan Strategic Growth Fund | | | |
| Without Load | 17.23% | 5.19% | 3.59% |
| With Load* | 10.80% | 4.01% | 3.01% |
| Dow Jones Moderately Aggressive Portfolio Index | 24.10% | 8.96% | 7.86% |
Russell 3000® Total Return Index | 35.19% | 15.26% | 12.83% |
The Fund's past performance is not a good predictor of how the Fund will perform in the future. The graph and table do not reflect the deduction of taxes that a shareholder would pay on fund distributions or redemption of fund shares.
| Net Assets | $33,757,663 |
| Number of Portfolio Holdings | 9 |
| Advisory Fee #ERROR:A result could not be returned because the conditional could not be evaluated to a True/False value ((history)) | $49,623 |
| Portfolio Turnover | 3% |
Asset Weighting (% of total investments)
| Value | Value |
|---|
| Exchange-Traded Funds | 66.7% |
| Money Market Funds | 2.1% |
| Open End Funds | 31.2% |
What did the Fund invest in?
Sector Weighting (% of net assets)
| Value | Value |
|---|
| Liabilities in Excess of Other Assets | -0.1% |
| Money Market Funds | 2.1% |
| Fixed Income | 18.0% |
| Equity | 80.0% |
Top 10 Holdings (% of net assets)
| Holding Name | % of Net Assets |
| Timothy Plan International ETF | 16.2% |
| Timothy Plan US Large/Mid Cap Core Enhanced ETF | 15.4% |
| Timothy Plan Market Neutral ETF | 15.0% |
| Timothy Plan International Fund, Class A | 13.2% |
| Timothy Plan US Small Cap Core ETF | 12.1% |
| Timothy Plan Fixed Income Fund, Class A | 12.0% |
| Timothy Plan High Dividend Stock Enhanced ETF | 8.1% |
| Timothy Plan High Yield Bond Fund, Class A | 6.0% |
| Fidelity Government Portfolio, Institutional Class | 2.1% |
No material changes occurred during the year ended September 30, 2024.
Timothy Plan Strategic Growth Fund
Annual Shareholder Report - September 30, 2024
Where can I find additional information about the Fund?
Additional information is available on the Fund's website ( timothyplan.com ), including its:
Prospectus
Financial information
Holdings
Proxy voting information
Timothy Plan Strategic Growth Fund
Annual Shareholder Report - September 30, 2024
This annual shareholder report contains important information about Timothy Plan Strategic Growth Fund for the period of October 1, 2023 to November 30, 2024. You can find additional information about the Fund at timothyplan.com. You can also request this information by contacting us at (800) 846-7526. This report describes changes to the Fund that occurred during the reporting period.
What were the Fund’s costs for the last year?
(based on a hypothetical $10,000 investment)
| Class Name | Costs of a $10,000 investment | Costs paid as a percentage of a $10,000 investment |
|---|
| Class C | $151 | 1.39% |
How did the Fund perform during the reporting period?
For the twelve months ended September 30, 2024, the Timothy Plan Strategic Growth Fund - Class C returned 16.61%, underperforming the Dow Jones Mod Aggressive Portfolio Index, which returned 24.10%. The Fund's performance reflects its allocation across various Timothy Plan mutual funds and ETFs, with asset allocation varying within allowable ranges over the past year in response to changing market conditions.
Key Performance Drivers:
• Equity Allocation: Exposure to the US Small Cap Core ETF and US Large/Mid Cap Core Enhanced ETF drove much of the positive performance, particularly as the Technology and Industrial sectors saw strong gains.
• Sector Performance: The High Dividend Stock Enhanced ETF and International ETF provided stable returns, but the defensive nature of dividend stocks and limited exposure to high-growth tech stocks compared to the index were performance headwinds.
• Fixed Income & High Yield Bond: Allocations to Fixed Income and High-Yield Bonds added stability, though they trailed equities. Bond yields fluctuated throughout the year, and tightening credit spreads supported high-yield bonds.
• Market-neutral ETF: The Market-Neutral ETF reduced overall portfolio volatility, delivering steady income during periods of market fluctuation.
• International Allocation: International holdings in Europe and Japan, particularly through the International Fund and International ETF, benefited from lower borrowing costs and market recoveries in those regions.
Reasons for Underperformance:
• The Fund’s limited exposure to high-growth technology stocks and allocation to fixed-income and more defensive sectors contributed to its underperformance relative to the benchmark. While this strategy provided stability, it resulted in a more conservative outcome than the index, which was heavily driven by growth stocks.
The Fund remains committed to adjusting allocations based on market conditions to balance growth opportunities with capital preservation in light of ongoing uncertainties.
How has the Fund performed over the last ten years?
Total Return Based on $10,000 Investment
| Timothy Plan Strategic Growth Fund | Dow Jones Moderately Aggressive Portfolio Index | Russell 3000® Total Return Index |
|---|
| Sep-2014 | $10,000 | $10,000 | $10,000 |
| Sep-2015 | $9,511 | $9,690 | $9,951 |
| Sep-2016 | $9,820 | $10,869 | $11,440 |
| Sep-2017 | $10,586 | $12,431 | $13,579 |
| Sep-2018 | $10,747 | $13,598 | $15,967 |
| Sep-2019 | $10,641 | $13,879 | $16,433 |
| Sep-2020 | $10,782 | $14,820 | $18,898 |
| Sep-2021 | $12,744 | $18,600 | $24,921 |
| Sep-2022 | $10,651 | $15,088 | $20,528 |
| Sep-2023 | $11,370 | $17,180 | $24,729 |
| Sep-2024 | $13,259 | $21,320 | $33,432 |
Average Annual Total Returns
| 1 Year | 5 Years | 10 Years |
|---|
| Timothy Plan Strategic Growth Fund | 16.61% | 4.50% | 2.86% |
| Dow Jones Moderately Aggressive Portfolio Index | 24.10% | 8.96% | 7.86% |
Russell 3000® Total Return Index | 35.19% | 15.26% | 12.83% |
The Fund's past performance is not a good predictor of how the Fund will perform in the future. The graph and table do not reflect the deduction of taxes that a shareholder would pay on fund distributions or redemption of fund shares.
| Net Assets | $33,757,663 |
| Number of Portfolio Holdings | 9 |
| Advisory Fee #ERROR:A result could not be returned because the conditional could not be evaluated to a True/False value ((history)) | $49,623 |
| Portfolio Turnover | 3% |
Asset Weighting (% of total investments)
| Value | Value |
|---|
| Exchange-Traded Funds | 66.7% |
| Money Market Funds | 2.1% |
| Open End Funds | 31.2% |
What did the Fund invest in?
Sector Weighting (% of net assets)
| Value | Value |
|---|
| Liabilities in Excess of Other Assets | -0.1% |
| Money Market Funds | 2.1% |
| Fixed Income | 18.0% |
| Equity | 80.0% |
Top 10 Holdings (% of net assets)
| Holding Name | % of Net Assets |
| Timothy Plan International ETF | 16.2% |
| Timothy Plan US Large/Mid Cap Core Enhanced ETF | 15.4% |
| Timothy Plan Market Neutral ETF | 15.0% |
| Timothy Plan International Fund, Class A | 13.2% |
| Timothy Plan US Small Cap Core ETF | 12.1% |
| Timothy Plan Fixed Income Fund, Class A | 12.0% |
| Timothy Plan High Dividend Stock Enhanced ETF | 8.1% |
| Timothy Plan High Yield Bond Fund, Class A | 6.0% |
| Fidelity Government Portfolio, Institutional Class | 2.1% |
No material changes occurred during the year ended September 30, 2024.
Timothy Plan Strategic Growth Fund
Annual Shareholder Report - September 30, 2024
Where can I find additional information about the Fund?
Additional information is available on the Fund's website ( timothyplan.com ), including its:
Prospectus
Financial information
Holdings
Proxy voting information
Timothy Plan Strategic Growth Fund
Annual Shareholder Report - September 30, 2024
This annual shareholder report contains important information about Timothy Plan Strategic Growth Fund for the period of October 1, 2023 to November 30, 2024. You can find additional information about the Fund at timothyplan.com. You can also request this information by contacting us at (800) 846-7526. This report describes changes to the Fund that occurred during the reporting period.
What were the Fund’s costs for the last year?
(based on a hypothetical $10,000 investment)
| Class Name | Costs of a $10,000 investment | Costs paid as a percentage of a $10,000 investment |
|---|
| Class I | $70 | 0.64% |
How did the Fund perform during the reporting period?
For the twelve months ended September 30, 2024, the Timothy Plan Strategic Growth Fund - Class I returned 17.33%, underperforming the Dow Jones Mod Aggressive Portfolio Index, which returned 24.10%. The Fund's performance reflects its allocation across various Timothy Plan mutual funds and ETFs, with asset allocation varying within allowable ranges over the past year in response to changing market conditions.
Key Performance Drivers:
• Equity Allocation: Exposure to the US Small Cap Core ETF and US Large/Mid Cap Core Enhanced ETF drove much of the positive performance, particularly as the Technology and Industrial sectors saw strong gains.
• Sector Performance: The High Dividend Stock Enhanced ETF and International ETF provided stable returns, but the defensive nature of dividend stocks and limited exposure to high-growth tech stocks compared to the index were performance headwinds.
• Fixed Income & High Yield Bond: Allocations to Fixed Income and High-Yield Bonds added stability, though they trailed equities. Bond yields fluctuated throughout the year, and tightening credit spreads supported high-yield bonds.
• Market-neutral ETF: The Market-Neutral ETF reduced overall portfolio volatility, delivering steady income during periods of market fluctuation.
• International Allocation: International holdings in Europe and Japan, particularly through the International Fund and International ETF, benefited from lower borrowing costs and market recoveries in those regions.
Reasons for Underperformance:
• The Fund’s limited exposure to high-growth technology stocks and allocation to fixed-income and more defensive sectors contributed to its underperformance relative to the benchmark. While this strategy provided stability, it resulted in a more conservative outcome than the index, which was heavily driven by growth stocks.
The Fund remains committed to adjusting allocations based on market conditions to balance growth opportunities with capital preservation in light of ongoing uncertainties.
How has the Fund performed over the last ten years?
Total Return Based on $10,000 Investment
| Timothy Plan Strategic Growth Fund | Dow Jones Moderately Aggressive Portfolio Index | Russell 3000® Total Return Index |
|---|
| Sep-2023 | $10,000 | $10,000 | $10,000 |
| Sep-2023 | $9,681 | $9,619 | $9,496 |
| Sep-2024 | $11,358 | $11,937 | $12,837 |
Average Annual Total Returns
| 1 Year | Since Inception (September 1, 2023) |
|---|
| Timothy Plan Strategic Growth Fund | 17.33% | -% |
| Dow Jones Moderately Aggressive Portfolio Index | 24.10% | 17.82% |
Russell 3000® Total Return Index | 35.19% | 26.04% |
The Fund's past performance is not a good predictor of how the Fund will perform in the future. The graph and table do not reflect the deduction of taxes that a shareholder would pay on fund distributions or redemption of fund shares.
| Net Assets | $33,757,663 |
| Number of Portfolio Holdings | 9 |
| Advisory Fee #ERROR:A result could not be returned because the conditional could not be evaluated to a True/False value ((history)) | $49,623 |
| Portfolio Turnover | 3% |
Asset Weighting (% of total investments)
| Value | Value |
|---|
| Exchange-Traded Funds | 66.7% |
| Money Market Funds | 2.1% |
| Open End Funds | 31.2% |
What did the Fund invest in?
Sector Weighting (% of net assets)
| Value | Value |
|---|
| Liabilities in Excess of Other Assets | -0.1% |
| Money Market Funds | 2.1% |
| Fixed Income | 18.0% |
| Equity | 80.0% |
Top 10 Holdings (% of net assets)
| Holding Name | % of Net Assets |
| Timothy Plan International ETF | 16.2% |
| Timothy Plan US Large/Mid Cap Core Enhanced ETF | 15.4% |
| Timothy Plan Market Neutral ETF | 15.0% |
| Timothy Plan International Fund, Class A | 13.2% |
| Timothy Plan US Small Cap Core ETF | 12.1% |
| Timothy Plan Fixed Income Fund, Class A | 12.0% |
| Timothy Plan High Dividend Stock Enhanced ETF | 8.1% |
| Timothy Plan High Yield Bond Fund, Class A | 6.0% |
| Fidelity Government Portfolio, Institutional Class | 2.1% |
No material changes occurred during the year ended September 30, 2024.
Timothy Plan Strategic Growth Fund
Annual Shareholder Report - September 30, 2024
Where can I find additional information about the Fund?
Additional information is available on the Fund's website ( timothyplan.com ), including its:
Prospectus
Financial information
Holdings
Proxy voting information
Item 2. Code of Ethics.
| (a) | The registrant has, as of the end of the period covered by this report, adopted a code of ethics that applies to the registrant's principal executive officer, principal financial officer, and principal accounting officer or controller, or persons performing similar functions, regardless of whether these individuals are employed by the registrant or a third party. |
| | |
(b) | N/A |
| | |
| (c) | During the period covered by this report, there were no amendments to any provision of the code of ethics. |
| | |
(d) | During the period covered by this report, there were no waivers or implicit waivers of a provision of the code of ethics. |
| | |
| (e) | N/A |
| | |
| (f) | See Item 19(a)(1) |
Item 3. Audit Committee Financial Expert.
(a)(1) The registrant has an Audit committee currently composed of three independent trustees, Mr. Alan Ross, Mr. John Mulder and Mr. Richard Copeland. The registrant’s board of trustees has determined that Mr. Alan Ross is qualified to serve as an Audit Committee Financial expert, and has designated him as such.
(a)(2) Not applicable.
(a)(3) Not applicable.
Item 4. Principal Accountant Fees and Services.
| (a) | Audit Fees. The aggregate fees billed for each of the last two fiscal years for professional services rendered by the registrant's principal accountant for the audit of the registrant's annual financial statements or services that are normally provided by the accountant in connection with statutory and regulatory filings or engagements for those fiscal years are as follows: |
| | |
| | The Timothy Plan | |
| | FY 2024 | $ 190,100 | |
| | FY 2023 | $ 190,100 |
| | |
| (b) | Audit-Related Fees. There were no fees billed in each of the last two fiscal years for assurances and related services by the principal accountant that are reasonably related to the performance of the audit of the registrant’s financial statements and are not reported under paragraph (a) of this Item. |
| | |
| (c) | Tax Fees. There were no fees billed in each of the last two fiscal years for professional services rendered by the principal accountant for tax compliance. |
| | |
| (d) | All Other Fees. The aggregate fees billed in each of the last two fiscal years for products and services provided by the registrant’s principal accountant, other than the services reported in paragraphs (a) through (c) of this item were $0 and $0 for the fiscal years ended September 30, 2024 and 2023 respectively. |
| | |
| (e)(1) | The audit committee does not have pre-approval policies and procedures. Instead, the audit committee or audit committee chairman approves on a case-by-case basis each audit or non-audit service before the principal accountant is engaged by the registrant. |
| | |
| (e)(2) | There were no services described in each of paragraphs (b) through (d) of this Item that were approved by the audit committee pursuant to paragraph (c)(7)(i)(C) of Rule 2-01 of Regulation S-X. |
| | |
| (f) | Not applicable. |
| | |
| (g) | All non-audit fees billed by the registrant's principal accountant for services rendered to the registrant for the fiscal years ended September 30, 2024 and 2023 respectively are disclosed in (b)-(d) above. There were no audit or non-audit services performed by the registrant's principal accountant for the registrant's adviser. |
| | |
| (h) | Not applicable. |
| | |
| (i) | Not applicable. |
| | |
| (j) | Not applicable. |
| | | | | | |
Item 5. Audit Committee of Listed Registrants.
Not applicable
Item 6. Investments.
The Registrant’s schedule of investments in unaffiliated issuers is included in the Financial Statements under Item 7 of this form.
Item 7. Financial Statements and Financial Highlights for Open-End Management Investment Companies.
(a)

FINANCIAL STATEMENTS
September 30, 2024
TIMOTHY PLAN FAMILY OF FUNDS
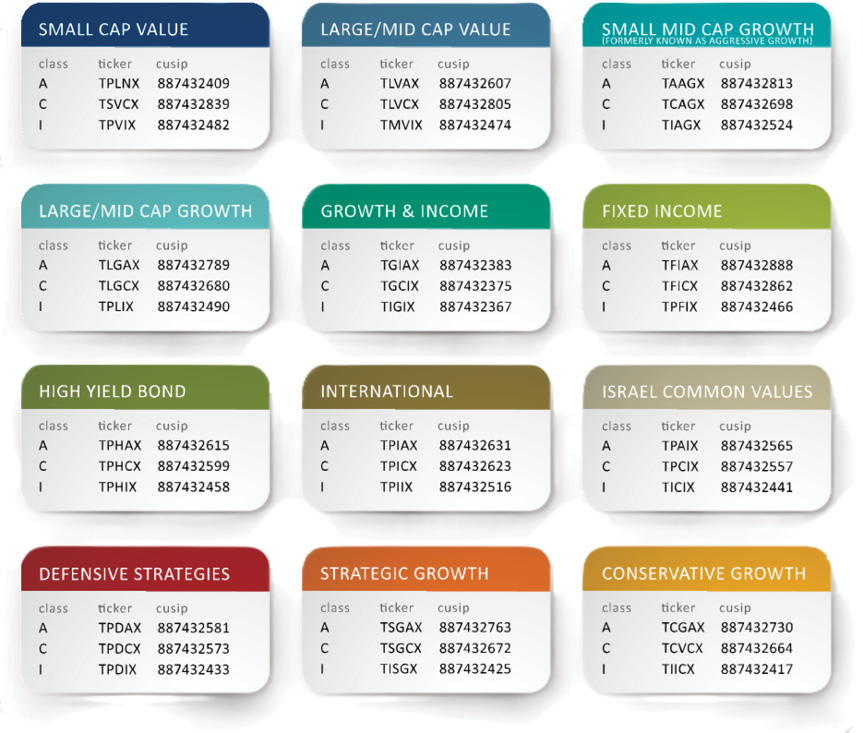
Table of Contents
| | |
Section 1 | Schedule of Investments | 2 |
Section 2 | Statements of Assets and Liabilities | 47 |
Section 3 | Statements of Operations | 54 |
Section 4 | Statements of Changes in Net Assets | 58 |
Section 5 | Financial Highlights | 64 |
Section 6 | Notes to Financial Statements | 100 |
Section 7 | Opinion Letter | 124 |
Section 8 | Privacy Notice | 125 |
Section 9 | Disclosures | 127 |
FINANCIAL STATEMENTS | 1
Section 1 | Schedule of Investments
SEPTEMBER 30, 2024
Small/Mid Cap Growth Fund
| | Shares | | | | Fair Value | |
| COMMON STOCKS — 95.4% | |
| | | | | AEROSPACE & DEFENSE — 2.0% | | | | |
| | | 999 | | TransDigm Group, Inc. | | $ | 1,425,703 | |
| | | | | | | | | |
| | | | | APPAREL & TEXTILE PRODUCTS — 3.6% | | | | |
| | | 16,116 | | Deckers Outdoor Corporation(a) | | | 2,569,696 | |
| | | | | | | | | |
| | | | | BIOTECH & PHARMA — 0.8% | | | | |
| | | 13,759 | | Ionis Pharmaceuticals, Inc.(a) | | | 551,186 | |
| | | | | | | | | |
| | | | | COMMERCIAL SUPPORT SERVICES — 3.9% | | | | |
| | | 11,751 | | Clean Harbors, Inc.(a) | | | 2,840,334 | |
| | | | | | | | | |
| | | | | DATA CENTER REIT — 2.2% | | | | |
| | | 9,963 | | Digital Realty Trust, Inc. | | | 1,612,312 | |
| | | | | | | | | |
| | | | | ELECTRICAL EQUIPMENT — 7.5% | | | | |
| | | 34,452 | | Amphenol Corporation, Class A | | | 2,244,892 | |
| | | 5,731 | | Trane Technologies PLC | | | 2,227,812 | |
| | | 9,247 | | Vertiv Holdings Company | | | 919,984 | |
| | | | | | | | 5,392,688 | |
| | | | | ENGINEERING & CONSTRUCTION — 7.6% | | | | |
| | | 8,655 | | Comfort Systems USA, Inc. | | | 3,378,480 | |
| | | 6,800 | | Quanta Services, Inc. | | | 2,027,420 | |
| | | | | | | | 5,405,900 | |
| | | | | HEALTH CARE FACILITIES & SERVICES — 6.6% | | | | |
| | | 19,897 | | Cardinal Health, Inc. | | | 2,199,016 | |
| | | 15,288 | | Tenet Healthcare Corporation(a) | | | 2,540,866 | |
| | | | | | | | 4,739,882 | |
| | | | | HOME CONSTRUCTION — 5.6% | | | | |
| | | 3,862 | | Lennar Corporation, Class A | | | 724,048 | |
| | | 21,203 | | Toll Brothers, Inc. | | | 3,275,651 | |
| | | | | | | | 3,999,699 | |
| | | | | INDUSTRIAL SUPPORT SERVICES — 3.0% | | | | |
| | | 2,655 | | United Rentals, Inc. | | | 2,149,833 | |
| | | | | | | | | |
| | | | | INSURANCE — 0.9% | | | | |
| | | 10,853 | | Kemper Corporation | | | 664,746 | |
| | | | | | | | | |
| | | | | LEISURE FACILITIES & SERVICES — 3.1% | | | | |
| | | 5,146 | | Domino’s Pizza, Inc. | | | 2,213,500 | |
SCHEDULE OF INVESTMENTS
The accompanying notes are an integral part of these financial statements.
FINANCIAL STATEMENTS | 2
Small/Mid Cap Growth Fund
| | Shares | | | | Fair Value | |
| | | | | MACHINERY — 3.6% | | | | |
| | | 4,156 | | Parker-Hannifin Corporation | | $ | 2,625,844 | |
| | | | | | | | | |
| | | | | MEDICAL EQUIPMENT & DEVICES — 7.9% | | | | |
| | | 25,810 | | Avantor, Inc.(a) | | | 667,705 | |
| | | 11,356 | | DexCom, Inc.(a) | | | 761,306 | |
| | | 13,073 | | Lantheus Holdings, Inc.(a) | | | 1,434,762 | |
| | | 15,930 | | Natera, Inc.(a) | | | 2,022,314 | |
| | | 2,895 | | West Pharmaceutical Services, Inc. | | | 868,963 | |
| | | | | | | | 5,755,050 | |
| | | | | OIL & GAS PRODUCERS — 4.3% | | | | |
| | | 11,039 | | Cheniere Energy, Inc. | | | 1,985,254 | |
| | | 6,698 | | Diamondback Energy, Inc. | | | 1,154,735 | |
| | | | | | | | 3,139,989 | |
| | | | | RENEWABLE ENERGY — 1.2% | | | | |
| | | 3,363 | | First Solar, Inc.(a) | | | 838,867 | |
| | | | | | | | | |
| | | | | RETAIL - DISCRETIONARY — 6.5% | | | | |
| | | 9,776 | | Burlington Stores, Inc.(a) | | | 2,575,781 | |
| | | 14,539 | | Ross Stores, Inc. | | | 2,188,265 | |
| | | | | | | | 4,764,046 | |
| | | | | SEMICONDUCTORS — 7.5% | | | | |
| | | 35,677 | | Marvell Technology, Inc. | | | 2,573,025 | |
| | | 3,031 | | Monolithic Power Systems, Inc. | | | 2,802,160 | |
| | | | | | | | 5,375,185 | |
| | | | | SOFTWARE — 9.8% | | | | |
| | | 5,582 | | Crowdstrike Holdings, Inc., Class A(a) | | | 1,565,583 | |
| | | 1,711 | | HubSpot, Inc.(a) | | | 909,568 | |
| | | 7,895 | | Manhattan Associates, Inc.(a) | | | 2,221,494 | |
| | | 5,536 | | MongoDB, Inc.(a) | | | 1,496,658 | |
| | | 5,208 | | Zscaler, Inc.(a) | | | 890,256 | |
| | | | | | | | 7,083,559 | |
| | | | | TECHNOLOGY HARDWARE — 5.7% | | | | |
| | | 3,931 | | Arista Networks, Inc.(a) | | | 1,508,796 | |
| | | 14,376 | | Pure Storage, Inc., Class A(a) | | | 722,250 | |
| | | 16,994 | | Seagate Technology Holdings PLC | | | 1,861,353 | |
| | | | | | | | 4,092,399 | |
| | | | | TECHNOLOGY SERVICES — 2.1% | | | | |
| | | 2,619 | | MSCI, Inc. | | | 1,526,694 | |
| | | | | | | | | |
| | | | | TOTAL COMMON STOCKS (Cost $53,612,028) | | | 68,767,112 | |
| | | | | | | | | |
SCHEDULE OF INVESTMENTS
The accompanying notes are an integral part of these financial statements.
FINANCIAL STATEMENTS | 3
Small/Mid Cap Growth Fund
| | Shares | | | | Fair Value | |
| SHORT-TERM INVESTMENTS — 7.2% | |
| | | | | MONEY MARKET FUNDS — 7.2% | | | | |
| | | 5,151,213 | | Fidelity Government Portfolio, Institutional Class, 4.84% (Cost $5,151,213)(b) | | $ | 5,151,213 | |
| | | | | | | | | |
| | | | | TOTAL INVESTMENTS — 102.6% (Cost $58,763,241) | | $ | 73,918,325 | |
| | | | | LIABILITIES IN EXCESS OF OTHER ASSETS — (2.6)% | | | (1,892,151 | ) |
| | | | | NET ASSETS — 100.0% | | $ | 72,026,174 | |
MSCI | Morgan Stanley Capital International |
PLC | Public Limited Company |
REIT | Real Estate Investment Trust |
| | |
(a) | Non-income producing security. |
(b) | Rate disclosed is the seven day effective yield as of September 30, 2024. |
SCHEDULE OF INVESTMENTS
The accompanying notes are an integral part of these financial statements.
FINANCIAL STATEMENTS | 4
International Fund
| | Shares | | | | Fair Value | |
| COMMON STOCKS — 95.0% | |
| | | | | AEROSPACE & DEFENSE — 4.2% | | | | |
| | | 82,000 | | Safran S.A. - ADR | | $ | 4,828,324 | |
| | | 92,000 | | Thales S.A. - ADR | | | 2,912,720 | |
| | | | | | | | 7,741,044 | |
| | | | | APPAREL & TEXTILE PRODUCTS — 1.8% | | | | |
| | | 207,000 | | Cie Financiere Richemont S.A. - ADR | | | 3,272,670 | |
| | | | | | | | | |
| | | | | AUTOMOTIVE — 1.0% | | | | |
| | | 43,800 | | Magna International, Inc. | | | 1,797,552 | |
| | | | | | | | | |
| | | | | BANKING — 12.3% | | | | |
| | | 40,522 | | DBS Group Holdings Ltd. - ADR | | | 4,780,381 | |
| | | 34,500 | | HDFC Bank Ltd. - ADR | | | 2,158,320 | |
| | | 112,100 | | ICICI Bank Ltd. - ADR | | | 3,346,185 | |
| | | 272,000 | | Itau Unibanco Holding S.A. - ADR | | | 1,808,800 | |
| | | 78,700 | | KBC Group N.V. - ADR | | | 3,125,964 | |
| | | 334,000 | | Sumitomo Mitsui Financial Group, Inc. - ADR | | | 4,218,420 | |
| | | 131,000 | | UniCredit SpA - ADR | | | 2,872,830 | |
| | | | | | | | 22,310,900 | |
| | | | | BIOTECH & PHARMA — 1.5% | | | | |
| | | 5,200 | | Argenx S.E. - ADR(a) | | | 2,818,816 | |
| | | | | | | | | |
| | | | | CHEMICALS — 2.3% | | | | |
| | | 109,362 | | Air Liquide S.A. - ADR | | | 4,226,841 | |
| | | | | | | | | |
| | | | | CONSTRUCTION MATERIALS — 2.9% | | | | |
| | | 58,000 | | CRH plc | | | 5,378,920 | |
| | | | | | | | | |
| | | | | DIVERSIFIED INDUSTRIALS — 1.7% | | | | |
| | | 60,000 | | Hitachi Ltd. - ADR | | | 3,180,000 | |
| | | | | | | | | |
| | | | | ELECTRIC UTILITIES — 3.2% | | | | |
| | | 438,000 | | Enel - Societa per Azioni - ADR | | | 3,486,480 | |
| | | 39,200 | | Iberdrola SA - ADR | | | 2,430,008 | |
| | | | | | | | 5,916,488 | |
| | | | | ELECTRICAL EQUIPMENT — 2.6% | | | | |
| | | 81,000 | | ABB Ltd. - ADR | | | 4,691,520 | |
| | | | | | | | | |
| | | | | ENGINEERING & CONSTRUCTION — 2.9% | | | | |
| | | 63,000 | | Cellnex Telecom S.A. - ADR | | | 1,270,710 | |
| | | 139,000 | | Vinci S.A. - ADR | | | 4,068,530 | |
| | | | | | | | 5,339,240 | |
SCHEDULE OF INVESTMENTS
The accompanying notes are an integral part of these financial statements.
FINANCIAL STATEMENTS | 5
International Fund
| | Shares | | | | Fair Value | |
| | | | | FOOD — 0.5% | | | | |
| | | 53,000 | | Mowi ASA - ADR | | $ | 949,760 | |
| | | | | | | | | |
| | | | | HEALTH CARE FACILITIES & SERVICES — 2.3% | | | | |
| | | 14,400 | | ICON plc(a) | | | 4,137,264 | |
| | | | | | | | | |
| | | | | HOUSEHOLD PRODUCTS — 1.3% | | | | |
| | | 340,000 | | Unicharm Corporation - ADR | | | 2,437,800 | |
| | | | | | | | | |
| | | | | INDUSTRIAL SUPPORT SERVICES — 1.6% | | | | |
| | | 9,500 | | Ashtead Group plc - ADR | | | 2,934,455 | |
| | | | | | | | | |
| | | | | INSTITUTIONAL FINANCIAL SERVICES — 5.0% | | | | |
| | | 157,500 | | Deutsche Boerse A.G. - ADR | | | 3,690,225 | |
| | | 158,000 | | London Stock Exchange Group plc - ADR | | | 5,490,500 | |
| | | | | | | | 9,180,725 | |
| | | | | INSURANCE — 5.5% | | | | |
| | | 60,000 | | AIA Group Ltd. - ADR | | | 2,111,400 | |
| | | 62,400 | | Muenchener Rueckversicherungs-Gesellschaft A.G. in - ADR | | | 3,438,240 | |
| | | 120,000 | | Tokio Marine Holdings, Inc. - ADR | | | 4,398,000 | |
| | | | | | | | 9,947,640 | |
| | | | | INTERNET MEDIA & SERVICES — 2.3% | | | | |
| | | 485,181 | | Prosus N.V. - ADR | | | 4,221,075 | |
| | | | | | | | | |
| | | | | MACHINERY — 5.2% | | | | |
| | | 244,000 | | Atlas Copco A.B. - ADR | | | 4,167,520 | |
| | | 68,150 | | Techtronic Industries Company Ltd. - ADR | | | 5,131,695 | |
| | | | | | | | 9,299,215 | |
| | | | | MEDICAL EQUIPMENT & DEVICES — 7.3% | | | | |
| | | 62,500 | | Alcon, Inc. | | | 6,254,375 | |
| | | 35,000 | | Hoya Corporation - ADR | | | 4,844,000 | |
| | | 66,400 | | Smith & Nephew plc - ADR | | | 2,067,696 | |
| | | | | | | | 13,166,071 | |
| | | | | METALS & MINING — 1.0% | | | | |
| | | 26,300 | | Rio Tinto plc - ADR | | | 1,871,771 | |
| | | | | | | | | |
| | | | | OIL & GAS PRODUCERS — 5.1% | | | | |
| | | 142,600 | | Canadian Natural Resources Ltd. | | | 4,735,746 | |
| | | 135,000 | | Equinor ASA - ADR | | | 3,419,550 | |
| | | 81,500 | | Petroleo Brasileiro S.A. - ADR | | | 1,174,415 | |
| | | | | | | | 9,329,711 | |
| | | | | SEMICONDUCTORS — 7.0% | | | | |
| | | 7,400 | | ASM International N.V. - ADR | | | 4,849,960 | |
| | | 5,700 | | NXP Semiconductors N.V. | | | 1,368,057 | |
SCHEDULE OF INVESTMENTS
The accompanying notes are an integral part of these financial statements.
FINANCIAL STATEMENTS | 6
International Fund
| | Shares | | | | Fair Value | |
| | | | | SEMICONDUCTORS — 7.0% (Continued) | | | | |
| | | 27,900 | | Taiwan Semiconductor Manufacturing Company Ltd. - ADR | | $ | 4,845,393 | |
| | | 19,200 | | Tokyo Electron Ltd. - ADR | | | 1,705,536 | |
| | | | | | | | 12,768,946 | |
| | | | | SOFTWARE — 1.7% | | | | |
| | | 17,400 | | Nice Ltd. - ADR(a) | | | 3,021,858 | |
| | | | | | | | | |
| | | | | SPECIALTY FINANCE — 2.5% | | | | |
| | | 39,500 | | ORIX Corporation - ADR | | | 4,583,975 | |
| | | | | | | | | |
| | | | | TECHNOLOGY HARDWARE — 2.4% | | | | |
| | | 347,028 | | FUJIFILM Holdings Corporation - ADR | | | 4,462,780 | |
| | | | | | | | | |
| | | | | TECHNOLOGY SERVICES — 2.8% | | | | |
| | | 50,000 | | Amadeus IT Group S.A. - ADR | | | 3,613,000 | |
| | | 71,000 | | Infosys Ltd. - ADR | | | 1,581,170 | |
| | | | | | | | 5,194,170 | |
| | | | | TRANSPORTATION & LOGISTICS — 2.9% | | | | |
| | | 61,800 | | Canadian Pacific Kansas City Ltd. | | | 5,286,372 | |
| | | | | | | | | |
| | | | | WHOLESALE - CONSUMER STAPLES — 2.2% | | | | |
| | | 37,100 | | ITOCHU Corporation - ADR | | | 3,993,815 | |
| | | | | | | | | |
| | | | | TOTAL COMMON STOCKS (Cost $118,453,958) | | | 173,461,394 | |
| | | | | | | | | |
| SHORT-TERM INVESTMENTS — 4.9% | |
| | | | | MONEY MARKET FUNDS — 4.9% | | | | |
| | | 9,027,878 | | Fidelity Government Portfolio, Institutional Class, 4.84% (Cost $9,027,878)(b) | | | 9,027,878 | |
| | | | | | | | | |
| | | | | TOTAL INVESTMENTS — 99.9% (Cost $127,481,836) | | $ | 182,489,272 | |
| | | | | OTHER ASSETS IN EXCESS OF LIABILITIES — 0.1% | | | 155,708 | |
| | | | | NET ASSETS — 100.0% | | $ | 182,644,980 | |
ADR | American Depositary Receipt |
LTD | Limited Company |
NV | Naamioze Vennootschap |
PLC | Public Limited Company |
S/A | Société Anonyme |
| | |
(a) | Non-income producing security. |
(b) | Rate disclosed is the seven day effective yield as of September 30, 2024. |
SCHEDULE OF INVESTMENTS
The accompanying notes are an integral part of these financial statements.
FINANCIAL STATEMENTS | 7
International Fund
| | | | | DIVERSIFICATION OF ASSETS | | | | | |
| | % OF NET
ASSETS | | COUNTRY | | % OF NET
ASSETS | | COUNTRY |
| | | 18.5 | % | Japan | | | 2.7 | % | Taiwan Province Of China |
| | | 8.8 | % | France | | | 2.6 | % | Singapore |
| | | 7.8 | % | Switzerland | | | 2.4 | % | Norway |
| | | 7.3 | % | Netherlands | | | 2.3 | % | Sweden |
| | | 6.8 | % | United Kingdom | | | 1.7 | % | Belgium |
| | | 6.5 | % | Canada | | | 1.7 | % | Israel |
| | | 5.2 | % | Ireland | | | 1.6 | % | Brazil |
| | | 4.0 | % | Spain | | | 95.0 | % | Total |
| | | 4.0 | % | Hong Kong | | | 4.9 | % | Money Market Funds |
| | | 3.9 | % | Germany | | | 0.1 | % | Other Assets In Excess Of Liabilities |
| | | 3.9 | % | India | | | 100.0 | % | Grand Total |
| | | 3.5 | % | Italy | | | | | |
SCHEDULE OF INVESTMENTS
The accompanying notes are an integral part of these financial statements.
FINANCIAL STATEMENTS | 8
Large/Mid Cap Growth Fund
| | Shares | | | | Fair Value | |
| COMMON STOCKS — 83.9% | |
| | | | | AEROSPACE & DEFENSE — 2.2% | | | | |
| | | 3,295 | | TransDigm Group, Inc. | | $ | 4,702,393 | |
| | | | | | | | | |
| | | | | AUTOMOTIVE — 2.7% | | | | |
| | | 22,594 | | Tesla, Inc.(a) | | | 5,911,268 | |
| | | | | | | | | |
| | | | | BIOTECH & PHARMA — 3.3% | | | | |
| | | 3,193 | | Regeneron Pharmaceuticals, Inc.(a) | | | 3,356,609 | |
| | | 19,582 | | Zoetis, Inc. | | | 3,825,931 | |
| | | | | | | | 7,182,540 | |
| | | | | CHEMICALS — 4.1% | | | | |
| | | 11,762 | | Linde plc | | | 5,608,828 | |
| | | 8,605 | | Sherwin-Williams Company (The) | | | 3,284,270 | |
| | | | | | | | 8,893,098 | |
| | | | | COMMERCIAL SUPPORT SERVICES — 3.5% | | | | |
| | | 16,108 | | Cintas Corporation | | | 3,316,315 | |
| | | 21,235 | | Waste Management, Inc. | | | 4,408,386 | |
| | | | | | | | 7,724,701 | |
| | | | | CONSTRUCTION MATERIALS — 1.0% | | | | |
| | | 4,168 | | Martin Marietta Materials, Inc. | | | 2,243,426 | |
| | | | | | | | | |
| | | | | ELECTRICAL EQUIPMENT — 2.0% | | | | |
| | | 65,116 | | Amphenol Corporation, Class A | | | 4,242,959 | |
| | | | | | | | | |
| | | | | FORESTRY, PAPER & WOOD PRODUCTS — 0.4% | | | | |
| | | 13,111 | | Trex Company, Inc.(a) | | | 872,930 | |
| | | | | | | | | |
| | | | | HEALTH CARE FACILITIES & SERVICES — 1.5% | | | | |
| | | 8,034 | | HCA Healthcare, Inc. | | | 3,265,259 | |
| | | | | | | | | |
| | | | | INDUSTRIAL REIT — 1.3% | | | | |
| | | 21,866 | | Prologis, Inc. | | | 2,761,238 | |
| | | | | | | | | |
| | | | | INFRASTRUCTURE REIT — 1.6% | | | | |
| | | 8,728 | | American Tower Corporation | | | 2,029,784 | |
| | | 13,435 | | Crown Castle, Inc. | | | 1,593,794 | |
| | | | | | | | 3,623,578 | |
| | | | | INFRASTRUCTURE SOFTWARE — 0.7% | | | | |
| | | 14,033 | | Datadog, Inc., Class A(a) | | | 1,614,637 | |
| | | | | | | | | |
| | | | | INSTITUTIONAL FINANCIAL SERVICES — 1.5% | | | | |
| | | 20,674 | | Intercontinental Exchange, Inc. | | | 3,321,071 | |
SCHEDULE OF INVESTMENTS
The accompanying notes are an integral part of these financial statements.
FINANCIAL STATEMENTS | 9
Large/Mid Cap Growth Fund
| | Shares | | | | Fair Value | |
| | | | | INSURANCE — 2.7% | | | | |
| | | 20,537 | | Arthur J Gallagher & Company | | $ | 5,778,496 | |
| | | | | | | | | |
| | | | | LEISURE FACILITIES & SERVICES — 2.3% | | | | |
| | | 59,088 | | Chipotle Mexican Grill, Inc.(a) | | | 3,404,651 | |
| | | 3,681 | | Wingstop, Inc. | | | 1,531,590 | |
| | | | | | | | 4,936,241 | |
| | | | | MACHINERY — 1.3% | | | | |
| | | 6,946 | | Caterpillar, Inc. | | | 2,716,720 | |
| | | | | | | | | |
| | | | | MEDICAL EQUIPMENT & DEVICES — 6.8% | | | | |
| | | 17,047 | | Danaher Corporation | | | 4,739,407 | |
| | | 9,677 | | Intuitive Surgical, Inc.(a) | | | 4,754,020 | |
| | | 14,128 | | Stryker Corporation | | | 5,103,882 | |
| | | | | | | | 14,597,309 | |
| | | | | RETAIL - CONSUMER STAPLES — 4.0% | | | | |
| | | 9,666 | | Costco Wholesale Corporation | | | 8,569,102 | |
| | | | | | | | | |
| | | | | RETAIL - DISCRETIONARY — 2.4% | | | | |
| | | 5,197 | | Burlington Stores, Inc.(a) | | | 1,369,306 | |
| | | 3,337 | | O’Reilly Automotive, Inc.(a) | | | 3,842,889 | |
| | | | | | | | 5,212,195 | |
| | | | | SEMICONDUCTORS — 18.4% | | | | |
| | | 17,926 | | Analog Devices, Inc. | | | 4,126,027 | |
| | | 40,699 | | Broadcom, Inc. | | | 7,020,578 | |
| | | 4,958 | | KLA Corporation | | | 3,839,525 | |
| | | 170,763 | | NVIDIA Corporation | | | 20,737,459 | |
| | | 7,643 | | NXP Semiconductors N.V. | | | 1,834,396 | |
| | | 13,051 | | Taiwan Semiconductor Manufacturing Company Ltd. - ADR | | | 2,266,567 | |
| | | | | | | | 39,824,552 | |
| | | | | SOFTWARE — 14.7% | | | | |
| | | 15,523 | | Cadence Design Systems, Inc.(a) | | | 4,207,199 | |
| | | 3,787 | | Crowdstrike Holdings, Inc., Class A(a) | | | 1,062,140 | |
| | | 27,791 | | DocuSign, Inc.(a) | | | 1,725,543 | |
| | | 8,209 | | Guidewire Software, Inc.(a) | | | 1,501,754 | |
| | | 3,090 | | HubSpot, Inc.(a) | | | 1,642,644 | |
| | | 5,050 | | Manhattan Associates, Inc.(a) | | | 1,420,969 | |
| | | 1,782 | | MongoDB, Inc.(a) | | | 481,764 | |
| | | 11,240 | | Palo Alto Networks, Inc.(a) | | | 3,841,832 | |
| | | 7,688 | | ServiceNow, Inc.(a) | | | 6,876,071 | |
| | | 22,795 | | Shopify, Inc., Class A(a) | | | 1,826,791 | |
| | | 7,988 | | Synopsys, Inc.(a) | | | 4,045,043 | |
| | | 4,979 | | Tyler Technologies, Inc.(a) | | | 2,906,342 | |
| | | | | | | | 31,538,092 | |
SCHEDULE OF INVESTMENTS
The accompanying notes are an integral part of these financial statements.
FINANCIAL STATEMENTS | 10
Large/Mid Cap Growth Fund
| | Shares | | | | Fair Value | |
| | | | | TECHNOLOGY HARDWARE — 2.7% | | | | |
| | | 12,459 | | Arista Networks, Inc.(a) | | $ | 4,782,013 | |
| | | 18,074 | | Ciena Corporation(a) | | | 1,113,178 | |
| | | | | | | | 5,895,191 | |
| | | | | TECHNOLOGY SERVICES — 1.0% | | | | |
| | | 10,016 | | CDW Corporation | | | 2,266,621 | |
| | | | | | | | | |
| | | | | TRANSPORTATION & LOGISTICS — 1.8% | | | | |
| | | 37,975 | | Canadian Pacific Kansas City Ltd. | | | 3,248,381 | |
| | | 3,764 | | Old Dominion Freight Line, Inc. | | | 747,681 | |
| | | | | | | | 3,996,062 | |
| | | | | TOTAL COMMON STOCKS (Cost $128,669,896) | | | 181,689,679 | |
| | | | | | | | | |
| EXCHANGE-TRADED FUNDS — 11.8% | |
| | | | | EQUITY — 11.8% | | | | |
| | | 791,000 | | Timothy Plan US Large/Mid Cap Core Enhanced ETF(b) | | | 20,746,268 | |
| | | 109,000 | | Timothy Plan US Large/Mid Cap Core ETF(b) | | | 4,795,292 | |
| | | | | | | | 25,541,560 | |
| | | | | TOTAL EXCHANGE-TRADED FUNDS (Cost $23,130,928) | | | 25,541,560 | |
| | | | | | | | | |
| SHORT-TERM INVESTMENTS — 4.4% | |
| | | | | MONEY MARKET FUNDS — 4.4% | | | | |
| | | 9,544,833 | | Fidelity Government Portfolio, Institutional Class, 4.84% (Cost $9,544,833)(c) | | | 9,544,833 | |
| | | | | | | | | |
| | | | | TOTAL INVESTMENTS — 100.1% (Cost $161,345,657) | | $ | 216,776,072 | |
| | | | | LIABILITIES IN EXCESS OF OTHER ASSETS — (0.1)% | | | (169,134 | ) |
| | | | | NET ASSETS — 100.0% | | $ | 216,606,938 | |
ADR | American Depositary Receipt |
ETF | Exchange-Traded Fund |
LTD | Limited Company |
NV | Naamioze Vennootschap |
PLC | Public Limited Company |
REIT | Real Estate Investment Trust |
| | |
(a) | Non-income producing security. |
(b) | Investment in affiliate. |
(c) | Rate disclosed is the seven day effective yield as of September 30, 2024. |
SCHEDULE OF INVESTMENTS
The accompanying notes are an integral part of these financial statements.
FINANCIAL STATEMENTS | 11
Small Cap Value Fund
| | Shares | | | | Fair Value | |
| COMMON STOCKS — 87.4% | |
| | | | | AEROSPACE & DEFENSE — 6.4% | | | | |
| | | 51,869 | | AAR Corporation(a) | | $ | 3,390,158 | |
| | | 50,003 | | Barnes Group, Inc. | | | 2,020,621 | |
| | | 75,529 | | Kratos Defense & Security Solutions, Inc.(a) | | | 1,759,826 | |
| | | 41,040 | | Mercury Systems, Inc.(a) | | | 1,518,480 | |
| | | 18,374 | | Moog, Inc., Class A | | | 3,711,915 | |
| | | | | | | | 12,401,000 | |
| | | | | BANKING — 13.9% | | | | |
| | | 92,132 | | Atlantic Union Bankshares Corporation | | | 3,470,612 | |
| | | 47,338 | | Bank of NT Butterfield & Son Ltd. (The) | | | 1,745,825 | |
| | | 33,942 | | Banner Corporation | | | 2,021,586 | |
| | | 29,039 | | City Holding Company | | | 3,408,888 | |
| | | 85,717 | | First Bancorp | | | 3,564,970 | |
| | | 58,371 | | National Bank Holdings Corporation, Class A | | | 2,457,419 | |
| | | 94,644 | | Provident Financial Services, Inc. | | | 1,756,593 | |
| | | 100,042 | | Renasant Corporation | | | 3,251,365 | |
| | | 128,132 | | Seacoast Banking Corporation of Florida | | | 3,414,718 | |
| | | 77,296 | | Veritex Holdings, Inc. | | | 2,034,431 | |
| | | | | | | | 27,126,407 | |
| | | | | BIOTECH & PHARMA — 1.8% | | | | |
| | | 48,117 | | Prestige Consumer Healthcare, Inc.(a) | | | 3,469,236 | |
| | | | | | | | | |
| | | | | CHEMICALS — 5.1% | | | | |
| | | 40,015 | | Avient Corporation | | | 2,013,555 | |
| | | 20,870 | | Hawkins, Inc. | | | 2,660,299 | |
| | | 15,513 | | Innospec, Inc. | | | 1,754,365 | |
| | | 46,961 | | Stepan Company | | | 3,627,737 | |
| | | | | | | | 10,055,956 | |
| | | | | ELECTRIC UTILITIES — 3.5% | | | | |
| | | 87,741 | | Avista Corporation | | | 3,399,964 | |
| | | 60,900 | | Northwestern Energy Group, Inc. | | | 3,484,698 | |
| | | | | | | | 6,884,662 | |
| | | | | FOOD — 1.8% | | | | |
| | | 20,626 | | J & J Snack Foods Corporation | | | 3,550,147 | |
| | | | | | | | | |
| | | | | FORESTRY, PAPER & WOOD PRODUCTS — 1.9% | | | | |
| | | 26,159 | | Boise Cascade Company | | | 3,687,896 | |
| | | | | | | | | |
| | | | | HOME CONSTRUCTION — 1.9% | | | | |
| | | 36,260 | | Century Communities, Inc. | | | 3,734,055 | |
| | | | | | | | | |
SCHEDULE OF INVESTMENTS
The accompanying notes are an integral part of these financial statements.
FINANCIAL STATEMENTS | 12
Small Cap Value Fund
| | Shares | | | | Fair Value | |
| | | | | HOUSEHOLD PRODUCTS — 0.8% | | | | |
| | | 48,757 | | Central Garden & Pet Company, Class A(a) | | $ | 1,530,970 | |
| | | | | | | | | |
| | | | | INDUSTRIAL INTERMEDIATE PROD — 1.4% | | | | |
| | | 34,358 | | AZZ, Inc. | | | 2,838,314 | |
| | | | | | | | | |
| | | | | INSTITUTIONAL FINANCIAL SERVICES — 4.0% | | | | |
| | | 25,937 | | Moelis & Company, Class A | | | 1,776,944 | |
| | | 124,401 | | Perella Weinberg Partners LP | | | 2,402,183 | |
| | | 12,673 | | Piper Sandler Cos | | | 3,596,724 | |
| | | | | | | | 7,775,851 | |
| | | | | INSURANCE — 2.7% | | | | |
| | | 37,645 | | AMERISAFE, Inc. | | | 1,819,383 | |
| | | 71,292 | | BRP Group, Inc.(a) | | | 3,550,341 | |
| | | | | | | | 5,369,724 | |
| | | | | LEISURE FACILITIES & SERVICES — 1.5% | | | | |
| | | 54,217 | | Papa John’s International, Inc. | | | 2,920,670 | |
| | | | | | | | | |
| | | | | MACHINERY — 1.8% | | | | |
| | | 19,445 | | Alamo Group, Inc. | | | 3,502,628 | |
| | | | | | | | | |
| | | | | MEDICAL EQUIPMENT & DEVICES — 5.0% | | | | |
| | | 111,763 | | Avanos Medical, Inc.(a) | | | 2,685,665 | |
| | | 49,007 | | CONMED Corporation | | | 3,524,583 | |
| | | 36,374 | | Merit Medical Systems, Inc.(a) | | | 3,594,842 | |
| | | | | | | | 9,805,090 | |
| | | | | METALS & MINING — 1.8% | | | | |
| | | 214,781 | | Constellium S.E.(a) | | | 3,492,339 | |
| | | | | | | | | |
| | | | | OFFICE REIT — 1.8% | | | | |
| | | 114,103 | | COPT Defense Properties | | | 3,460,744 | |
| | | | | | | | | |
| | | | | OIL & GAS PRODUCERS — 6.3% | | | | |
| | | 105,273 | | Laredo Petroleum, Inc.(a) | | | 2,831,844 | |
| | | 90,946 | | Northern Oil and Gas, Inc. | | | 3,220,398 | |
| | | 153,896 | | Sitio Royalties Corporation, Class A | | | 3,207,193 | |
| | | 77,566 | | SM Energy Company | | | 3,100,313 | |
| | | | | | | | 12,359,748 | |
| | | | | OIL & GAS SERVICES & EQUIPMENT — 0.9% | | | | |
| | | 58,310 | | Thermon Group Holdings, Inc.(a) | | | 1,739,970 | |
| | | | | | | | | |
SCHEDULE OF INVESTMENTS
The accompanying notes are an integral part of these financial statements.
FINANCIAL STATEMENTS | 13
Small Cap Value Fund
| | Shares | | | | Fair Value | |
| | | | | REAL ESTATE INVESTMENT TRUSTS — 6.1% | | | | |
| | | 141,483 | | Plymouth Industrial REIT, Inc. | | $ | 3,197,516 | |
| | | 79,876 | | PotlatchDeltic Corporation | | | 3,598,414 | |
| | | 261,884 | | Summit Hotel Properties, Inc. | | | 1,796,524 | |
| | | 158,971 | | Urban Edge Properties | | | 3,400,390 | |
| | | | | | | | 11,992,844 | |
| | | | | RETAIL - DISCRETIONARY — 5.4% | | | | |
| | | 60,998 | | Academy Sports & Outdoors, Inc. | | | 3,559,843 | |
| | | 10,550 | | Boot Barn Holdings, Inc.(a) | | | 1,764,804 | |
| | | 41,247 | | GMS, Inc.(a) | | | 3,735,741 | |
| | | 27,115 | | Sonic Automotive, Inc., Class A | | | 1,585,685 | |
| | | | | | | | 10,646,073 | |
| | | | | RETAIL REIT — 1.8% | | | | |
| | | 121,213 | | Four Corners Property Trust, Inc. | | | 3,552,753 | |
| | | | | | | | | |
| | | | | SEMICONDUCTORS — 1.9% | | | | |
| | | 44,185 | | Rambus, Inc.(a) | | | 1,865,491 | |
| | | 58,643 | | Veeco Instruments, Inc.(a) | | | 1,942,842 | |
| | | | | | | | 3,808,333 | |
| | | | | SOFTWARE — 1.8% | | | | |
| | | 123,272 | | Verra Mobility Corporation(a) | | | 3,428,194 | |
| | | | | | | | | |
| | | | | TECHNOLOGY HARDWARE — 1.7% | | | | |
| | | 373,135 | | Viavi Solutions, Inc.(a) | | | 3,365,678 | |
| | | | | | | | | |
| | | | | TELECOMMUNICATIONS — 0.9% | | | | |
| | | 23,862 | | Cogent Communications Holdings, Inc. | | | 1,811,603 | |
| | | | | | | | | |
| | | | | TRANSPORTATION & LOGISTICS — 1.8% | | | | |
| | | 32,710 | | ArcBest Corporation | | | 3,547,400 | |
| | | | | | | | | |
| | | | | TRANSPORTATION EQUIPMENT — 1.7% | | | | |
| | | 70,836 | | Blue Bird Corporation(a) | | | 3,397,295 | |
| | | | | | | | | |
| | | | | TOTAL COMMON STOCKS (Cost $153,390,172) | | | 171,255,580 | |
| | | | | | | | | |
| EXCHANGE-TRADED FUNDS — 11.5% | |
| | | | | EQUITY — 11.5% | | | | |
| | | 580,000 | | Timothy Plan US Small Cap Core ETF(b) | | | 22,571,396 | |
| | | | | | | | | |
| | | | | TOTAL EXCHANGE-TRADED FUNDS (Cost $14,834,080) | | | 22,571,396 | |
SCHEDULE OF INVESTMENTS
The accompanying notes are an integral part of these financial statements.
FINANCIAL STATEMENTS | 14
Small Cap Value Fund
| | Shares | | | | Fair Value | |
| SHORT-TERM INVESTMENTS — 1.1% | |
| | | | | MONEY MARKET FUNDS — 1.1% | | | | |
| | | 2,063,892 | | Fidelity Government Portfolio, Institutional Class, 4.84% (Cost $2,063,892)(c) | | $ | 2,063,892 | |
| | | | | | | | | |
| | | | | TOTAL INVESTMENTS — 100.0% (Cost $170,288,144) | | $ | 195,890,868 | |
| | | | | LIABILITIES IN EXCESS OF OTHER ASSETS — 0.0%(d) | | | (16,704 | ) |
| | | | | NET ASSETS — 100.0% | | $ | 195,874,164 | |
ETF | Exchange-Traded Fund |
LP | Limited Partnership |
LTD | Limited Company |
REIT | Real Estate Investment Trust |
| | |
(a) | Non-income producing security. |
(b) | Investment in affiliate. |
(c) | Rate disclosed is the seven day effective yield as of September 30, 2024. |
(d) | Percentage rounds to less than 0.1%. |
SCHEDULE OF INVESTMENTS
The accompanying notes are an integral part of these financial statements.
FINANCIAL STATEMENTS | 15
Large/Mid Cap Value Fund
| | Shares | | | | Fair Value | |
| COMMON STOCKS — 79.7% | |
| | | | | AEROSPACE & DEFENSE — 2.0% | | | | |
| | | 23,452 | | General Dynamics Corporation | | $ | 7,087,194 | |
| | | | | | | | | |
| | | | | BANKING — 3.6% | | | | |
| | | 179,501 | | Atlantic Union Bankshares Corporation | | | 6,761,804 | |
| | | 52,269 | | Cullen/Frost Bankers, Inc. | | | 5,846,810 | |
| | | | | | | | 12,608,614 | |
| | | | | CHEMICALS — 2.0% | | | | |
| | | 18,966 | | Sherwin-Williams Company (The) | | | 7,238,754 | |
| | | | | | | | | |
| | | | | COMMERCIAL SUPPORT SERVICES — 1.9% | | | | |
| | | 37,479 | | Waste Connections, Inc. | | | 6,701,995 | |
| | | | | | | | | |
| | | | | CONTAINERS & PACKAGING — 1.5% | | | | |
| | | 55,114 | | Crown Holdings, Inc. | | | 5,284,330 | |
| | | | | | | | | |
| | | | | ELECTRIC UTILITIES — 6.6% | | | | |
| | | 100,838 | | CMS Energy Corporation | | | 7,122,188 | |
| | | 94,157 | | NextEra Energy, Inc. | | | 7,959,091 | |
| | | 88,274 | | WEC Energy Group, Inc. | | | 8,490,193 | |
| | | | | | | | 23,571,472 | |
| | | | | ELECTRICAL EQUIPMENT — 4.5% | | | | |
| | | 19,100 | | Hubbell, Inc. | | | 8,181,484 | |
| | | 29,706 | | Littelfuse, Inc. | | | 7,879,517 | |
| | | | | | | | 16,061,001 | |
| | | | | FOOD — 6.1% | | | | |
| | | 56,816 | | J M Smucker Company (The) | | | 6,880,418 | |
| | | 36,524 | | Lancaster Colony Corporation | | | 6,449,043 | |
| | | 102,319 | | McCormick & Company, Inc. | | | 8,420,853 | |
| | | | | | | | 21,750,314 | |
| | | | | HEALTH CARE FACILITIES & SERVICES — 2.0% | | | | |
| | | 17,544 | | HCA Healthcare, Inc. | | | 7,130,408 | |
| | | | | | | | | |
| | | | | INSTITUTIONAL FINANCIAL SERVICES — 2.1% | | | | |
| | | 47,052 | | Intercontinental Exchange, Inc. | | | 7,558,433 | |
| | | | | | | | | |
| | | | | INSURANCE — 2.4% | | | | |
| | | 30,074 | | Arthur J Gallagher & Company | | | 8,461,921 | |
| | | | | | | | | |
| | | | | LEISURE FACILITIES & SERVICES — 2.0% | | | | |
| | | 16,537 | | Domino’s Pizza, Inc. | | | 7,113,225 | |
| | | | | | | | | |
SCHEDULE OF INVESTMENTS
The accompanying notes are an integral part of these financial statements.
FINANCIAL STATEMENTS | 16
Large/Mid Cap Value Fund
| | Shares | | | | Fair Value | |
| | | | | MEDICAL EQUIPMENT & DEVICES — 5.9% | | | | |
| | | 28,024 | | Danaher Corporation | | $ | 7,791,232 | |
| | | 57,927 | | Revvity, Inc. | | | 7,400,174 | |
| | | 23,046 | | STERIS plc | | | 5,589,577 | |
| | | | | | | | 20,780,983 | |
| | | | | OIL & GAS PRODUCERS — 3.4% | | | | |
| | | 57,825 | | ConocoPhillips | | | 6,087,816 | |
| | | 48,266 | | EOG Resources, Inc. | | | 5,933,339 | |
| | | | | | | | 12,021,155 | |
| | | | | REAL ESTATE INVESTMENT TRUSTS — 2.2% | | | | |
| | | 63,296 | | Prologis, Inc. | | | 7,993,019 | |
| | | | | | | | | |
| | | | | RETAIL - CONSUMER STAPLES — 2.0% | | | | |
| | | 7,840 | | Costco Wholesale Corporation | | | 6,950,317 | |
| | | | | | | | | |
| | | | | RETAIL - DISCRETIONARY — 2.6% | | | | |
| | | 8,006 | | O’Reilly Automotive, Inc.(a) | | | 9,219,710 | |
| | | | | | | | | |
| | | | | SEMICONDUCTORS — 10.6% | | | | |
| | | 41,030 | | Broadcom, Inc. | | | 7,077,675 | |
| | | 96,066 | | Marvell Technology, Inc. | | | 6,928,280 | |
| | | 88,646 | | Microchip Technology, Inc. | | | 7,117,387 | |
| | | 10,218 | | Monolithic Power Systems, Inc. | | | 9,446,541 | |
| | | 57,440 | | NVIDIA Corporation | | | 6,975,514 | |
| | | | | | | | 37,545,397 | |
| | | | | SOFTWARE — 7.4% | | | | |
| | | 24,878 | | Cadence Design Systems, Inc.(a) | | | 6,742,684 | |
| | | 11,229 | | Synopsys, Inc.(a) | | | 5,686,253 | |
| | | 11,980 | | Tyler Technologies, Inc.(a) | | | 6,992,966 | |
| | | 252,214 | | Verra Mobility Corporation(a) | | | 7,014,072 | |
| | | | | | | | 26,435,975 | |
| | | | | TECHNOLOGY SERVICES — 4.5% | | | | |
| | | 80,159 | | Amdocs Ltd. | | | 7,012,309 | |
| | | 17,562 | | CACI International, Inc., Class A(a) | | | 8,861,083 | |
| | | | | | | | 15,873,392 | |
| | | | | TIMBER REIT — 2.2% | | | | |
| | | 225,834 | | Weyerhaeuser Company | | | 7,646,739 | |
| | | | | | | | | |
| | | | | TRANSPORTATION & LOGISTICS — 2.2% | | | | |
| | | 31,118 | | Union Pacific Corporation | | | 7,669,965 | |
| | | | | | | | | |
| | | | | TOTAL COMMON STOCKS (Cost $195,045,560) | | | 282,704,313 | |
| | | | | | | | | |
SCHEDULE OF INVESTMENTS
The accompanying notes are an integral part of these financial statements.
FINANCIAL STATEMENTS | 17
Large/Mid Cap Value Fund
| | Shares | | | | Fair Value | |
| EXCHANGE-TRADED FUNDS — 16.8% | |
| | | | | EQUITY — 16.8% | | | | |
| | | 868,000 | | Timothy Plan High Dividend Stock Enhanced ETF(b) | | $ | 22,286,768 | |
| | | 182,500 | | Timothy Plan High Dividend Stock ETF(b) | | | 6,880,250 | |
| | | 969,000 | | Timothy Plan US Large/Mid Cap Core Enhanced ETF(b) | | | 25,414,835 | |
| | | 118,000 | | Timothy Plan US Large/Mid Cap Core ETF(b) | | | 5,191,233 | |
| | | | | | | | 59,773,086 | |
| | | | | TOTAL EXCHANGE-TRADED FUNDS (Cost $54,059,654) | | | 59,773,086 | |
| | | | | | | | | |
| SHORT-TERM INVESTMENTS — 3.6% | |
| | | | | MONEY MARKET FUNDS — 3.6% | | | | |
| | | 12,668,778 | | Fidelity Government Portfolio, Institutional Class, 4.84% (Cost $12,668,778)(c) | | | 12,668,778 | |
| | | | | | | | | |
| | | | | TOTAL INVESTMENTS — 100.1% (Cost $261,773,992) | | $ | 355,146,177 | |
| | | | | LIABILITIES IN EXCESS OF OTHER ASSETS — (0.1)% | | | (288,303 | ) |
| | | | | NET ASSETS — 100.0% | | $ | 354,857,874 | |
ETF | Exchange-Traded Fund |
LTD | Limited Company |
PLC | Public Limited Company |
REIT | Real Estate Investment Trust |
| | |
(a) | Non-income producing security. |
(b) | Investment in affiliate. |
(c) | Rate disclosed is the seven day effective yield as of September 30, 2024. |
SCHEDULE OF INVESTMENTS
The accompanying notes are an integral part of these financial statements.
FINANCIAL STATEMENTS | 18
Fixed Income Fund
| | Principal
Amount ($) | | | | Coupon
Rate (%) | | | Maturity | | | Fair Value | |
| CORPORATE BONDS — 28.0% | | | |
| | | | | CHEMICALS — 2.0% | | | | | | | | | | | | |
| | | 1,570,000 | | Nutrien Ltd. | | | 4.0000 | | | | 12/15/26 | | | $ | 1,559,356 | |
| | | 805,000 | | Nutrien Ltd. | | | 2.9500 | | | | 05/13/30 | | | | 749,259 | |
| | | | | | | | | | | | | | | | 2,308,615 | |
| | | | | COMMERCIAL SUPPORT SERVICES — 0.8% | | | | | | | | | | | | |
| | | 450,000 | | Republic Services, Inc. | | | 5.0000 | | | | 04/01/34 | | | | 463,318 | |
| | | 450,000 | | Waste Management, Inc. | | | 4.6250 | | | | 02/15/33 | | | | 457,797 | |
| | | | | | | | | | | | | | | | 921,115 | |
| | | | | ELECTRIC UTILITIES — 3.5% | | | | | | | | | | | | |
| | | 2,205,000 | | American Electric Power Company, Inc. | | | 3.2000 | | | | 11/13/27 | | | | 2,135,087 | |
| | | 1,000,000 | | Electricite de France S.A.(a) | | | 5.7000 | | | | 05/23/28 | | | | 1,040,966 | |
| | | 405,000 | | National Rural Utilities Cooperative Finance | | | 5.0500 | | | | 09/15/28 | | | | 418,310 | |
| | | 442,000 | | WEC Energy Group, Inc. | | | 3.5500 | | | | 06/15/25 | | | | 438,204 | |
| | | | | | | | | | | | | | | | 4,032,567 | |
| | | | | GAS & WATER UTILITIES — 1.9% | | | | | | | | | | | | |
| | | 2,185,000 | | NiSource, Inc. | | | 3.4900 | | | | 05/15/27 | | | | 2,146,484 | |
| | | | | | | | | | | | | | | | | |
| | | | | INSTITUTIONAL FINANCIAL SERVICES — 0.9% | | | | | | | | | | | | |
| | | 1,000,000 | | Cboe Global Markets, Inc. | | | 3.6500 | | | | 01/12/27 | | | | 989,146 | |
| | | | | | | | | | | | | | | | | |
| | | | | MACHINERY — 1.5% | | | | | | | | | | | | |
| | | 900,000 | | Caterpillar Financial Services Corporation | | | 4.3500 | | | | 05/15/26 | | | | 905,569 | |
| | | 900,000 | | John Deere Capital Corporation | | | 3.9000 | | | | 06/07/32 | | | | 877,274 | |
| | | | | | | | | | | | | | | | 1,782,843 | |
| | | | | METALS & MINING — 1.7% | | | | | | | | | | | | |
| | | 1,430,000 | | BHP Billiton Finance USA Ltd. | | | 5.2500 | | | | 09/08/33 | | | | 1,497,718 | |
| | | 450,000 | | Rio Tinto Finance USA plc | | | 5.0000 | | | | 03/09/33 | | | | 470,437 | |
| | | | | | | | | | | | | | | | 1,968,155 | |
| | | | | OIL & GAS PRODUCERS — 6.8% | | | | | | | | | | | | |
| | | 1,815,000 | | Columbia Pipelines Holding Company, LLC(a) | | | 6.0420 | | | | 08/15/28 | | | | 1,897,828 | |
| | | 1,125,000 | | Energy Transfer, L.P. | | | 5.7500 | | | | 02/15/33 | | | | 1,178,838 | |
| | | 1,980,000 | | Energy Transfer, L.P. | | | 6.2500 | | | | 04/15/49 | | | | 2,080,894 | |
| | | 450,000 | | Enterprise Products Operating, LLC | | | 5.3500 | | | | 01/31/33 | | | | 472,063 | |
| | | 2,240,000 | | Phillips 66 Company | | | 3.6050 | | | | 02/15/25 | | | | 2,227,723 | |
| | | | | | | | | | | | | | | | 7,857,346 | |
| | | | | REAL ESTATE INVESTMENT TRUSTS — 3.1% | | | | | | | | | | | | |
| | | 1,520,000 | | Digital Realty Trust, L.P. | | | 3.7000 | | | | 08/15/27 | | | | 1,498,378 | |
| | | 2,200,000 | | Healthpeak Properties, Inc. | | | 3.5000 | | | | 07/15/29 | | | | 2,110,342 | |
| | | | | | | | | | | | | | | | 3,608,720 | |
| | | | | RETAIL - CONSUMER STAPLES — 1.4% | | | | | | | | | | | | |
| | | 1,575,000 | | Dollar General Corporation | | | 4.1250 | | | | 05/01/28 | | | | 1,553,983 | |
SCHEDULE OF INVESTMENTS
The accompanying notes are an integral part of these financial statements.
FINANCIAL STATEMENTS | 19
Fixed Income Fund
| | Principal
Amount ($) | | | | Coupon
Rate (%) | | | Maturity | | | Fair Value | |
| | | | | RETAIL - DISCRETIONARY — 1.6% | | | | | | | | | | | | |
| | | 1,795,000 | | Tractor Supply Company | | | 5.2500 | | | | 05/15/33 | | | $ | 1,867,620 | |
| | | | | | | | | | | | | | | | | |
| | | | | TRANSPORTATION & LOGISTICS — 2.8% | | | | | | | | | | | | |
| | | 1,000,000 | | Canadian Pacific Railway Company | | | 2.9000 | | | | 02/01/25 | | | | 992,830 | |
| | | 2,190,000 | | CSX Corporation | | | 3.2500 | | | | 06/01/27 | | | | 2,149,981 | |
| | | | | | | | | | | | | | | | 3,142,811 | |
| | | | | | | | | | | | | | | | | |
| | | | | TOTAL CORPORATE BONDS (Cost $32,263,183) | | | | | | | | | | | 32,179,405 | |
| NON U.S. GOVERNMENT & AGENCIES — 3.5% | | | |
| | | | | LOCAL AUTHORITY — 1.9% | | | | | | | | | | | | |
| | | 2,235,000 | | Province of Ontario Canada | | | 2.5000 | | | | 04/27/26 | | | | 2,187,407 | |
| | | | | | | | | | | | | | | | | |
| | | | | SOVEREIGN — 1.6% | | | | | | | | | | | | |
| | | 1,800,000 | | Israel Government International Bond | | | 5.5000 | | | | 03/12/34 | | | | 1,813,644 | |
| | | | | | | | | | | | | | | | | |
| | | | | TOTAL NON U.S. GOVERNMENT & AGENCIES (Cost $4,008,000) | | | | | | | | | | | 4,001,051 | |
| | | | | | | | | | | | | | | | | |
| U.S. GOVERNMENT & AGENCIES — 66.0% | | | |
| | | | | AGENCY FIXED RATE — 36.7% | | | | | | | | | | | | |
| | | 1,097,947 | | Fannie Mae Pool FM5537 | | | 2.0000 | | | | 01/01/36 | | | | 1,012,273 | |
| | | 820,412 | | Fannie Mae Pool MA4316 | | | 2.5000 | | | | 04/01/36 | | | | 771,594 | |
| | | 628,985 | | Fannie Mae Pool MA4366 | | | 2.5000 | | | | 06/01/41 | | | | 567,592 | |
| | | 368,450 | | Fannie Mae Pool MA4475 | | | 2.5000 | | | | 10/01/41 | | | | 333,036 | |
| | | 1,058,687 | | Fannie Mae Pool MA4617 | | | 3.0000 | | | | 04/01/42 | | | | 987,303 | |
| | | 861,994 | | Fannie Mae Pool FM4053 | | | 2.5000 | | | | 08/01/50 | | | | 756,340 | |
| | | 1,172,351 | | Fannie Mae Pool CA8897 | | | 3.0000 | | | | 02/01/51 | | | | 1,068,225 | |
| | | 740,114 | | Fannie Mae Pool MA4258 | | | 3.5000 | | | | 02/01/51 | | | | 695,667 | |
| | | 407,038 | | Fannie Mae Pool FM6550 | | | 2.0000 | | | | 03/01/51 | | | | 342,897 | |
| | | 723,990 | | Fannie Mae Pool CB0855 | | | 3.0000 | | | | 06/01/51 | | | | 656,863 | |
| | | 1,391,561 | | Fannie Mae Pool FS3744 | | | 2.0000 | | | | 07/01/51 | | | | 1,158,193 | |
| | | 439,852 | | Fannie Mae Pool FS1807 | | | 3.5000 | | | | 07/01/51 | | | | 415,045 | |
| | | 1,423,317 | | Fannie Mae Pool CB1384 | | | 2.5000 | | | | 08/01/51 | | | | 1,242,075 | |
| | | 1,272,257 | | Fannie Mae Pool FS6141 | | | 2.0000 | | | | 01/01/52 | | | | 1,063,558 | |
| | | 316,897 | | Fannie Mae Pool BU1322 | | | 2.5000 | | | | 02/01/52 | | | | 275,724 | |
| | | 877,874 | | Fannie Mae Pool CB3486 | | | 3.5000 | | | | 05/01/52 | | | | 818,569 | |
| | | 464,676 | | Fannie Mae Pool FS1704 | | | 4.0000 | | | | 05/01/52 | | | | 450,497 | |
| | | 781,923 | | Fannie Mae Pool BV9960 | | | 4.0000 | | | | 06/01/52 | | | | 754,027 | |
| | | 839,324 | | Fannie Mae Pool FS3159 | | | 4.5000 | | | | 10/01/52 | | | | 830,781 | |
| | | 1,286,524 | | Fannie Mae Pool FS4075 | | | 5.0000 | | | | 04/01/53 | | | | 1,298,438 | |
SCHEDULE OF INVESTMENTS
The accompanying notes are an integral part of these financial statements.
FINANCIAL STATEMENTS | 20
Fixed Income Fund
| | Principal
Amount ($) | | | | Coupon
Rate (%) | | | Maturity | | | Fair Value | |
| | | | | AGENCY FIXED RATE — 36.7% (Continued) | | | | | | | | |
| | | 1,195,581 | | Fannie Mae Pool FS5044 | | | 4.5000 | | | | 06/01/53 | | | $ | 1,190,457 | |
| | | 304,925 | | Fannie Mae Pool FS4621 | | | 5.0000 | | | | 06/01/53 | | | | 309,266 | |
| | | 933,127 | | Fannie Mae Pool FS8291 | | | 5.5000 | | | | 07/01/53 | | | | 951,921 | |
| | | 1,147,245 | | Fannie Mae Pool FS6787 | | | 6.0000 | | | | 01/01/54 | | | | 1,183,278 | |
| | | 1,097,270 | | Fannie Mae Pool CB7980 | | | 5.5000 | | | | 02/01/54 | | | | 1,118,136 | |
| | | 290,899 | | Fannie Mae Pool FS8138 | | | 6.5000 | | | | 06/01/54 | | | | 303,508 | |
| | | 50,392 | | Ginnie Mae I Pool 723248 | | | 5.0000 | | | | 10/15/39 | | | | 51,891 | |
| | | 211,709 | | Ginnie Mae I Pool 783060 | | | 4.0000 | | | | 08/15/40 | | | | 208,106 | |
| | | 116,877 | | Ginnie Mae I Pool 783403 | | | 3.5000 | | | | 09/15/41 | | | | 112,573 | |
| | | 91,966 | | Ginnie Mae II Pool 4520 | | | 5.0000 | | | | 08/20/39 | | | | 94,541 | |
| | | 121,195 | | Ginnie Mae II Pool 4947 | | | 5.0000 | | | | 02/20/41 | | | | 123,674 | |
| | | 222,325 | | Ginnie Mae II Pool MA3376 | | | 3.5000 | | | | 01/20/46 | | | | 211,896 | |
| | | 141,833 | | Ginnie Mae II Pool MA3596 | | | 3.0000 | | | | 04/20/46 | | | | 131,377 | |
| | | 377,702 | | Ginnie Mae II Pool MA3663 | | | 3.5000 | | | | 05/20/46 | | | | 359,750 | |
| | | 136,156 | | Ginnie Mae II Pool MA3736 | | | 3.5000 | | | | 06/20/46 | | | | 129,583 | |
| | | 233,892 | | Ginnie Mae II Pool MA4004 | | | 3.5000 | | | | 10/20/46 | | | | 222,461 | |
| | | 157,301 | | Ginnie Mae II Pool MA4509 | | | 3.0000 | | | | 06/20/47 | | | | 145,042 | |
| | | 188,413 | | Ginnie Mae II Pool MA4652 | | | 3.5000 | | | | 08/20/47 | | | | 179,068 | |
| | | 231,498 | | Ginnie Mae II Pool MA4719 | | | 3.5000 | | | | 09/20/47 | | | | 219,458 | |
| | | 236,692 | | Ginnie Mae II Pool MA4778 | | | 3.5000 | | | | 10/20/47 | | | | 224,457 | |
| | | 188,420 | | Ginnie Mae II Pool MA4901 | | | 4.0000 | | | | 12/20/47 | | | | 184,442 | |
| | | 162,103 | | Ginnie Mae II Pool MA4963 | | | 4.0000 | | | | 01/20/48 | | | | 158,539 | |
| | | 154,513 | | Ginnie Mae II Pool MA6092 | | | 4.5000 | | | | 08/20/49 | | | | 153,696 | |
| | | 166,314 | | Ginnie Mae II Pool MA6156 | | | 4.5000 | | | | 09/20/49 | | | | 165,577 | |
| | | 595,477 | | Ginnie Mae II Pool BN2662 | | | 3.0000 | | | | 10/20/49 | | | | 544,177 | |
| | | 150,916 | | Ginnie Mae II Pool MA6221 | | | 4.5000 | | | | 10/20/49 | | | | 150,596 | |
| | | 154,812 | | Ginnie Mae II Pool MA6477 | | | 4.5000 | | | | 02/20/50 | | | | 154,773 | |
| | | 239,656 | | Ginnie Mae II Pool MA6478 | | | 5.0000 | | | | 02/20/50 | | | | 243,884 | |
| | | 245,290 | | Ginnie Mae II Pool MA6544 | | | 4.5000 | | | | 03/20/50 | | | | 245,165 | |
| | | 174,685 | | Ginnie Mae II Pool MA6545 | | | 5.0000 | | | | 03/20/50 | | | | 177,784 | |
| | | 1,003,520 | | Ginnie Mae II Pool MA6598 | | | 2.5000 | | | | 04/20/50 | | | | 887,761 | |
| | | 250,272 | | Ginnie Mae II Pool MA6600 | | | 3.5000 | | | | 04/20/50 | | | | 236,809 | |
| | | 211,434 | | Ginnie Mae II Pool MA6601 | | | 4.0000 | | | | 04/20/50 | | | | 206,516 | |
| | | 191,461 | | Ginnie Mae II Pool MA6603 | | | 5.0000 | | | | 04/20/50 | | | | 194,809 | |
| | | 900,566 | | Ginnie Mae II Pool MA7255 | | | 2.5000 | | | | 03/20/51 | | | | 794,954 | |
| | | 665,371 | | Ginnie Mae II Pool MA7418 | | | 2.5000 | | | | 06/20/51 | | | | 586,171 | |
| | | 1,109,250 | | Ginnie Mae II Pool MA7419 | | | 3.0000 | | | | 06/20/51 | | | | 1,013,691 | |
| | | 1,005,537 | | Ginnie Mae II Pool MA7472 | | | 2.5000 | | | | 07/20/51 | | | | 886,637 | |
| | | 1,183,371 | | Ginnie Mae II Pool CE1974 | | | 3.0000 | | | | 08/20/51 | | | | 1,092,935 | |
| | | 1,034,881 | | Ginnie Mae II Pool CE1990 | | | 2.5000 | | | | 09/20/51 | | | | 911,301 | |
| | | 1,184,071 | | Ginnie Mae II Pool MA7705 | | | 2.5000 | | | | 11/20/51 | | | | 1,043,485 | |
| | | 1,269,929 | | Ginnie Mae II Pool MA7768 | | | 3.0000 | | | | 12/20/51 | | | | 1,159,347 | |
| | | 966,621 | | Ginnie Mae II Pool MA7829 | | | 3.5000 | | | | 01/20/52 | | | | 908,834 | |
SCHEDULE OF INVESTMENTS
The accompanying notes are an integral part of these financial statements.
FINANCIAL STATEMENTS | 21
Fixed Income Fund
| | Principal
Amount ($) | | | | Coupon
Rate (%) | | | Maturity | | | Fair Value | |
| | | | | AGENCY FIXED RATE — 36.7% (Continued) | | | | | | | | | | | | |
| | | 940,368 | | Ginnie Mae II Pool MA7939 | | | 4.0000 | | | | 03/20/52 | | | $ | 909,191 | |
| | | 1,053,820 | | Ginnie Mae II Pool MA7987 | | | 2.5000 | | | | 04/20/52 | | | | 928,673 | |
| | | 1,012,140 | | Ginnie Mae II Pool MA8268 | | | 4.5000 | | | | 09/20/52 | | | | 1,000,754 | |
| | | 1,044,904 | | Ginnie Mae II Pool MA8800 | | | 5.0000 | | | | 04/20/53 | | | | 1,048,727 | |
| | | 1,251,751 | | Ginnie Mae II Pool MA8874 | | | 3.0000 | | | | 05/20/53 | | | | 1,146,732 | |
| | | 1,251,581 | | Ginnie Mae II Pool MA8943 | | | 3.0000 | | | | 06/20/53 | | | | 1,142,377 | |
| | | 980,600 | | Ginnie Mae II Pool MA9017 | | | 5.5000 | | | | 07/20/53 | | | | 991,089 | |
| | | | | | | | | | | | | | | | 42,238,566 | |
| | | | | U.S. TREASURY BILLS — 29.3% | | | | | | | | | | | | |
| | | 1,570,000 | | United States Treasury Note Series BL-2024 | | | 4.5000 | | | | 11/30/24 | | | | 1,569,452 | |
| | | 3,295,000 | | United States Treasury Note | | | 4.8750 | | | | 04/30/26 | | | | 3,352,019 | |
| | | 4,885,000 | | United States Treasury Note | | | 4.6250 | | | | 04/30/29 | | | | 5,099,005 | |
| | | 1,220,000 | | United States Treasury Note | | | 4.6250 | | | | 04/30/31 | | | | 1,288,077 | |
| | | 9,215,000 | | United States Treasury Note | | | 4.3750 | | | | 05/15/34 | | | | 9,641,913 | |
| | | 3,430,000 | | United States Treasury Note | | | 4.5000 | | | | 02/15/44 | | | | 3,575,775 | |
| | | 8,435,000 | | United States Treasury Note | | | 4.6250 | | | | 05/15/54 | | | | 9,138,136 | |
| | | | | | | | | | | | | | | | 33,664,377 | |
| | | | | TOTAL U.S. GOVERNMENT & AGENCIES (Cost $76,977,745) | | | | | | | | | | | 75,902,943 | |
| | Shares | | | | | |
| SHORT-TERM INVESTMENTS — 1.7% | |
| | | | | MONEY MARKET FUNDS — 1.7% | | | | |
| | | 1,990,884 | | Fidelity Government Portfolio, Institutional Class, 4.84% (Cost $1,990,884)(b) | | | 1,990,884 | |
| | | | | | | | | |
| | | | | TOTAL INVESTMENTS — 99.2% (Cost $115,239,812) | | $ | 114,074,283 | |
| | | | | OTHER ASSETS IN EXCESS OF LIABILITIES— 0.8% | | | 950,367 | |
| | | | | NET ASSETS — 100.0% | | $ | 115,024,650 | |
LLC | Limited Liability Company |
LP | Limited Partnership |
LTD | Limited Company |
PLC | Public Limited Company |
S/A | Société Anonyme |
| | |
(a) | Security exempt from registration under Rule 144A or Section 4(2) of the Securities Act of 1933. The security may be resold in transactions exempt from registration, normally to qualified institutional buyers. As of September 30, 2024 the total market value of 144A securities is 2,938,794 or 2.6% of net assets. |
(b) | Rate disclosed is the seven day effective yield as of September 30, 2024. |
SCHEDULE OF INVESTMENTS
The accompanying notes are an integral part of these financial statements.
FINANCIAL STATEMENTS | 22
High Yield Bond Fund
| | Principal
Amount ($) | | | | Spread | | | Coupon
Rate (%) | | | Maturity | | | Fair Value | |
| CORPORATE BONDS — 96.4% | | | | |
| | | | | AEROSPACE & DEFENSE — 1.3% | | | | | | | | | | | | | | | | |
| | | 1,000,000 | | TransDigm, Inc.(a) | | | | | | | 6.3750 | | | | 03/01/29 | | | $ | 1,034,429 | |
| | | 1,250,000 | | TransDigm, Inc.(a) | | | | | | | 6.8750 | | | | 12/15/30 | | | | 1,309,978 | |
| | | | | | | | | | | | | | | | | | | | 2,344,407 | |
| | | | | ASSET MANAGEMENT — 0.9% | | | | | | | | | | | | | | | | |
| | | 1,600,000 | | AG TTMT Escrow Issuer, LLC(a) | | | | | | | 8.6250 | | | | 09/30/27 | | | | 1,641,707 | |
| | | | | | | | | | | | | | | | | | | | | |
| | | | | AUTOMOTIVE — 1.8% | | | | | | | | | | | | | | | | |
| | | 2,250,000 | | Adient Global Holdings Ltd.(a) | | | | | | | 8.2500 | | | | 04/15/31 | | | | 2,387,644 | |
| | | 1,000,000 | | Goodyear Tire & Rubber Company (The) | | | | | | | 5.6250 | | | | 04/30/33 | | | | 883,200 | |
| | | | | | | | | | | | | | | | | | | | 3,270,844 | |
| | | | | BIOTECH & PHARMA — 0.2% | | | | | | | | | | | | | | | | |
| | | 439,000 | | Bausch Health Americas, Inc.(a) | | | | | | | 8.5000 | | | | 01/31/27 | | | | 361,431 | |
| | | | | | | | | | | | | | | | | | | | | |
| | | | | CHEMICALS — 7.0% | | | | | | | | | | | | | | | | |
| | | 2,000,000 | | Avient Corporation(a) | | | | | | | 7.1250 | | | | 08/01/30 | | | | 2,091,106 | |
| | | 645,000 | | Avient Corporation(a) | | | | | | | 6.2500 | | | | 11/01/31 | | | | 661,812 | |
| | | 2,500,000 | | Axalta Coating Systems, LLC(a) | | | | | | | 3.3750 | | | | 02/15/29 | | | | 2,343,190 | |
| | | 3,000,000 | | Chemours Company (The)(a) | | | | | | | 4.6250 | | | | 11/15/29 | | | | 2,689,752 | |
| | | 1,360,000 | | INEOS Finance plc(a) | | | | | | | 7.5000 | | | | 04/15/29 | | | | 1,423,500 | |
| | | 2,570,000 | | Mativ Holdings, Inc.(a) | | | | | | | 8.0000 | | | | 10/01/29 | | | | 2,625,989 | |
| | | 1,000,000 | | WR Grace Holdings, LLC(a) | | | | | | | 7.3750 | | | | 03/01/31 | | | | 1,048,849 | |
| | | | | | | | | | | | | | | | | | | | 12,884,198 | |
| | | | | COMMERCIAL SUPPORT SERVICES — 8.6% | | | | | | | | | | | | | | | | |
| | | 2,310,000 | | Allied Universal Holdco, LLC(a) | | | | | | | 7.8750 | | | | 02/15/31 | | | | 2,362,111 | |
| | | 955,000 | | Allied Universal Holdco, LLC / Allied Universal Finance Corporation(a) | | | | | | | 9.7500 | | | | 07/15/27 | | | | 958,483 | |
| | | 125,000 | | Allied Universal Holdco, LLC / Allied Universal Finance Corporation(a) | | | | | | | 4.6250 | | | | 06/01/28 | | | | 117,759 | |
| | | 1,625,000 | | Clean Harbors, Inc.(a) | | | | | | | 6.3750 | | | | 02/01/31 | | | | 1,666,208 | |
| | | 1,625,000 | | Covanta Holding Corporation(a) | | | | | | | 4.8750 | | | | 12/01/29 | | | | 1,531,088 | |
| | | 2,250,000 | | Covanta Holding Corporation | | | | | | | 5.0000 | | | | 09/01/30 | | | | 2,115,185 | |
| | | 3,255,000 | | Enviri Corporation(a) | | | | | | | 5.7500 | | | | 07/31/27 | | | | 3,197,977 | |
| | | 500,000 | | GFL Environmental, Inc.(a) | | | | | | | 6.7500 | | | | 01/15/31 | | | | 525,331 | |
| | | 1,000,000 | | VT Topco, Inc.(a) | | | | | | | 8.5000 | | | | 08/15/30 | | | | 1,068,537 | |
| | | 1,200,000 | | Waste Pro USA, Inc.(a) | | | | | | | 5.5000 | | | | 02/15/26 | | | | 1,197,706 | |
| | | 1,000,000 | | Williams Scotsman, Inc.(a) | | | | | | | 6.6250 | | | | 06/15/29 | | | | 1,030,496 | |
| | | | | | | | | | | | | | | | | | | | 15,770,881 | |
| | | | | CONSTRUCTION MATERIALS — 0.5% | | | | | | | | | | | | | | | | |
| | | 500,000 | | Cemex S.A.B. de C.V.(a) | | | | | | | 5.2000 | | | | 09/17/30 | | | | 501,768 | |
| | | 500,000 | | Cemex S.A.B. de C.V.(a) | | | | | | | 3.8750 | | | | 07/11/31 | | | | 460,584 | |
| | | | | | | | | | | | | | | | | | | | 962,352 | |
SCHEDULE OF INVESTMENTS
The accompanying notes are an integral part of these financial statements.
FINANCIAL STATEMENTS | 23
High Yield Bond Fund
| | Principal
Amount ($) | | | | Spread | | | Coupon
Rate (%) | | | Maturity | | | Fair Value | |
| | | | | CONSUMER SERVICES — 2.2% | | | | | | | | | | | | | | | | |
| | | 2,592,000 | | PROG Holdings, Inc.(a) | | | | | | | 6.0000 | | | | 11/15/29 | | | $ | 2,559,467 | |
| | | 1,500,000 | | Upbound Group, Inc.(a) | | | | | | | 6.3750 | | | | 02/15/29 | | | | 1,453,491 | |
| | | | | | | | | | | | | | | | | | | | 4,012,958 | |
| | | | | CONTAINERS & PACKAGING — 8.6% | | | | | | | | | | | | | | | | |
| | | 875,000 | | Ardagh Metal Packaging Finance USA, LLC / Ardagh(a) | | | | | | | 6.0000 | | | | 06/15/27 | | | | 882,204 | |
| | | 2,500,000 | | Ardagh Metal Packaging Finance USA, LLC / Ardagh(a) | | | | | | | 4.0000 | | | | 09/01/29 | | | | 2,226,307 | |
| | | 1,000,000 | | Canpack S.A. / Canpack US, LLC(a) | | | | | | | 3.8750 | | | | 11/15/29 | | | | 937,404 | |
| | | 1,000,000 | | Graham Packaging Company, Inc.(a) | | | | | | | 7.1250 | | | | 08/15/28 | | | | 992,975 | |
| | | 1,250,000 | | Graphic Packaging International, LLC(a) | | | | | | | 3.7500 | | | | 02/01/30 | | | | 1,171,744 | |
| | | 1,250,000 | | LABL, Inc.(a) | | | | | | | 5.8750 | | | | 11/01/28 | | | | 1,174,376 | |
| | | 625,000 | | LABL, Inc.(a) | | | | | | | 9.5000 | | | | 11/01/28 | | | | 646,668 | |
| | | 1,000,000 | | LABL, Inc.(a) | | | | | | | 8.2500 | | | | 11/01/29 | | | | 903,326 | |
| | | 3,300,000 | | Mauser Packaging Solutions Holding Company(a) | | | | | | | 7.8750 | | | | 04/15/27 | | | | 3,409,664 | |
| | | 1,500,000 | | Pactiv Evergreen Group Issuer, LLC / Pactiv Evergreen Group Issuer, Inc.(a) | | | | | | | 4.3750 | | | | 10/15/28 | | | | 1,438,278 | |
| | | 1,750,000 | | TriMas Corporation(a) | | | | | | | 4.1250 | | | | 04/15/29 | | | | 1,677,959 | |
| | | | | | | | | | | | | | | | | | | | 15,460,905 | |
| | | | | ELECTRIC UTILITIES — 1.3% | | | | | | | | | | | | | | | | |
| | | 160,000 | | Alpha Generation, LLC(a) | | | | | | | 6.7500 | | | | 10/15/32 | | | | 162,506 | |
| | | 2,000,000 | | Vistra Corporation(a),(b) | H15T5Y + 5.740% | | | 7.0000 | | | | 06/15/70 | | | | 2,043,024 | |
| | | 250,000 | | Vistra Operations Company, LLC(a) | | | | | | | 4.3750 | | | | 05/01/29 | | | | 242,206 | |
| | | | | | | | | | | | | | | | | | | | 2,447,736 | |
| | | | | ELECTRICAL EQUIPMENT — 2.5% | | | | | | | | | | | | | | | | |
| | | 500,000 | | BWX Technologies, Inc.(a) | | | | | | | 4.1250 | | | | 06/30/28 | | | | 482,694 | |
| | | 500,000 | | BWX Technologies, Inc.(a) | | | | | | | 4.1250 | | | | 04/15/29 | | | | 480,919 | |
| | | 700,000 | | Gates Corporation (The)(a) | | | | | | | 6.8750 | | | | 07/01/29 | | | | 725,957 | |
| | | 1,360,000 | | WESCO Distribution, Inc.(a) | | | | | | | 6.3750 | | | | 03/15/29 | | | | 1,407,019 | |
| | | 1,360,000 | | WESCO Distribution, Inc.(a) | | | | | | | 6.6250 | | | | 03/15/32 | | | | 1,418,250 | |
| | | | | | | | | | | | | | | | | | | | 4,514,839 | |
| | | | | FOOD — 0.9% | | | | | | | | | | | | | | | | |
| | | 1,600,000 | | Darling Ingredients, Inc.(a) | | | | | | | 6.0000 | | | | 06/15/30 | | | | 1,616,382 | |
| | | | | | | | | | | | | | | | | | | | | |
| | | | | FORESTRY, PAPER & WOOD PRODUCTS — 1.4% | | | | | | | | | | | | | | | | |
| | | 2,500,000 | | Schweitzer-Mauduit International, Inc.(a) | | | | | | | 6.8750 | | | | 10/01/26 | | | | 2,500,048 | |
| | | | | | | | | | | | | | | | | | | | | |
| | | | | HEALTH CARE FACILITIES & SERVICES — 4.7% | | | | | | | | | | | | | | | | |
| | | 1,000,000 | | Catalent Pharma Solutions, Inc.(a) | | | | | | | 3.1250 | | | | 02/15/29 | | | | 986,108 | |
| | | 335,000 | | Concentra Escrow Issuer Corporation(a) | | | | | | | 6.8750 | | | | 07/15/32 | | | | 352,493 | |
| | | 320,000 | | HAH Group Holding Company, LLC(a) | | | | | | | 9.7500 | | | | 10/01/31 | | | | 325,029 | |
| | | 750,000 | | HealthEquity, Inc.(a) | | | | | | | 4.5000 | | | | 10/01/29 | | | | 725,947 | |
| | | 500,000 | | Heartland Dental, LLC / Heartland Dental Finance Corporation(a) | | | | | | | 10.5000 | | | | 04/30/28 | | | | 535,655 | |
| | | 250,000 | | LifePoint Health, Inc.(a) | | | | | | | 5.3750 | | | | 01/15/29 | | | | 236,494 | |
SCHEDULE OF INVESTMENTS
The accompanying notes are an integral part of these financial statements.
FINANCIAL STATEMENTS | 24
High Yield Bond Fund
| | Principal
Amount ($) | | | | Spread | | | Coupon
Rate (%) | | | Maturity | | | Fair Value | |
| | | | | HEALTH CARE FACILITIES & SERVICES — 4.7% (Continued) | | | | | | | | | | | | | | | | |
| | | 2,000,000 | | LifePoint Health, Inc.(a) | | | | | | | 9.8750 | | | | 08/15/30 | | | $ | 2,203,353 | |
| | | 625,000 | | LifePoint Health, Inc.(a) | | | | | | | 11.0000 | | | | 10/15/30 | | | | 705,943 | |
| | | 1,250,000 | | Pediatrix Medical Group, Inc.(a) | | | | | | | 5.3750 | | | | 02/15/30 | | | | 1,211,803 | |
| | | 500,000 | | Star Parent, Inc.(a) | | | | | | | 9.0000 | | | | 10/01/30 | | | | 537,415 | |
| | | 750,000 | | Tenet Healthcare Corporation | | | | | | | 6.1250 | | | | 10/01/28 | | | | 755,696 | |
| | | | | | | | | | | | | | | | | | | | 8,575,936 | |
| | | | | HOME CONSTRUCTION — 4.0% | | | | | | | | | | | | | | | | |
| | | 500,000 | | Ashton Woods USA, LLC / Ashton Woods Finance Company(a) | | | | | | | 6.6250 | | | | 01/15/28 | | | | 504,845 | |
| | | 1,250,000 | | Ashton Woods USA, LLC / Ashton Woods Finance Company (a) | | | | | | | 4.6250 | | | | 08/01/29 | | | | 1,200,943 | |
| | | 500,000 | | Ashton Woods USA, LLC / Ashton Woods Finance Company (a) | | | | | | | 4.6250 | | | | 04/01/30 | | | | 479,110 | |
| | | 3,042,000 | | Interface, Inc.(a) | | | | | | | 5.5000 | | | | 12/01/28 | | | | 2,984,122 | |
| | | 680,000 | | STL Holding Company, LLC(a) | | | | | | | 8.7500 | | | | 02/15/29 | | | | 724,031 | |
| | | 1,523,000 | | Weekley Homes, LLC / Weekley Finance Corporation(a) | | | | | | | 4.8750 | | | | 09/15/28 | | | | 1,484,505 | |
| | | | | | | | | | | | | | | | | | | | 7,377,556 | |
| | | | | HOUSEHOLD PRODUCTS — 0.6% | | | | | | | | | | | | | | | | |
| | | 1,000,000 | | Energizer Holdings, Inc.(a) | | | | | | | 6.5000 | | | | 12/31/27 | | | | 1,021,260 | |
| | | | | | | | | | | | | | | | | | | | | |
| | | | | INDUSTRIAL SUPPORT SERVICES — 0.3% | | | | | | | | | | | | | | | | |
| | | 500,000 | | BCPE Empire Holdings, Inc.(a) | | | | | | | 7.6250 | | | | 05/01/27 | | | | 502,123 | |
| | | | | | | | | | | | | | | | | | | | | |
| | | | | INSTITUTIONAL FINANCIAL SERVICES — 0.7% | | | | | | | | | | | | | | | | |
| | | 1,250,000 | | Aretec Group, Inc.(a) | | | | | | | 10.0000 | | | | 08/15/30 | | | | 1,331,832 | |
| | | | | | | | | | | | | | | | | | | | | |
| | | | | INSURANCE — 3.1% | | | | | | | | | | | | | | | | |
| | | 1,000,000 | | Acrisure, LLC / Acrisure Finance, Inc.(a) | | | | | | | 8.2500 | | | | 02/01/29 | | | | 1,032,647 | |
| | | 1,000,000 | | Acrisure, LLC / Acrisure Finance, Inc.(a) | | | | | | | 7.5000 | | | | 11/06/30 | | | | 1,029,984 | |
| | | 1,325,000 | | Baldwin Insurance Group Holdings, LLC(a) | | | | | | | 7.1250 | | | | 05/15/31 | | | | 1,395,414 | |
| | | 1,250,000 | | HUB International Ltd.(a) | | | | | | | 7.2500 | | | | 06/15/30 | | | | 1,303,915 | |
| | | 500,000 | | HUB International Ltd.(a) | | | | | | | 7.3750 | | | | 01/31/32 | | | | 516,654 | |
| | | 320,000 | | Ryan Specialty, LLC(a) | | | | | | | 5.8750 | | | | 08/01/32 | | | | 326,285 | |
| | | | | | | | | | | | | | | | | | | | 5,604,899 | |
| | | | | LEISURE FACILITIES & SERVICES — 1.5% | | | | | | | | | | | | | | | | |
| | | 1,000,000 | | Brinker International, Inc.(a) | | | | | | | 8.2500 | | | | 07/15/30 | | | | 1,075,322 | |
| | | 1,500,000 | | Raising Cane’s Restaurants, LLC(a) | | | | | | | 9.3750 | | | | 05/01/29 | | | | 1,626,251 | |
| | | | | | | | | | | | | | | | | | | | 2,701,573 | |
| | | | | MACHINERY — 0.8% | | | | | | | | | | | | | | | | |
| | | 1,000,000 | | Esab Corporation(a) | | | | | | | 6.2500 | | | | 04/15/29 | | | | 1,028,392 | |
| | | 500,000 | | SPX FLOW, Inc.(a) | | | | | | | 8.7500 | | | | 04/01/30 | | | | 525,101 | |
| | | | | | | | | | | | | | | | | | | | 1,553,493 | |
SCHEDULE OF INVESTMENTS
The accompanying notes are an integral part of these financial statements.
FINANCIAL STATEMENTS | 25
High Yield Bond Fund
| | Principal
Amount ($) | | | | Spread | | | Coupon
Rate (%) | | | Maturity | | | Fair Value | |
| | | | | MEDICAL EQUIPMENT & DEVICES — 3.0% | | | | | | | | | | | | | | | | |
| | | 750,000 | | Bausch & Lomb Escrow Corporation(a) | | | | | | | 8.3750 | | | | 10/01/28 | | | $ | 794,063 | |
| | | 1,000,000 | | Medline Borrower, L.P.(a) | | | | | | | 3.8750 | | | | 04/01/29 | | | | 947,547 | |
| | | 1,500,000 | | Medline Borrower, L.P.(a) | | | | | | | 5.2500 | | | | 10/01/29 | | | | 1,470,912 | |
| | | 2,250,000 | | Sotera Health Holdings, LLC(a) | | | | | | | 7.3750 | | | | 06/01/31 | | | | 2,339,418 | |
| | | | | | | | | | | | | | | | | | | | 5,551,940 | |
| | | | | METALS & MINING — 1.0% | | | | | | | | | | | | | | | | |
| | | 2,000,000 | | Kaiser Aluminum Corporation(a) | | | | | | | 4.5000 | | | | 06/01/31 | | | | 1,829,650 | |
| | | | | | | | | | | | | | | | | | | | | |
| | | | | OIL & GAS PRODUCERS — 5.9% | | | | | | | | | | | | | | | | |
| | | 1,322,000 | | CQP Holdco, L.P. / BIP-V Chinook Holdco, LLC(a) | | | | | | | 5.5000 | | | | 06/15/31 | | | | 1,297,097 | |
| | | 1,000,000 | | CQP Holdco, L.P. / BIP-V Chinook Holdco, LLC(a) | | | | | | | 7.5000 | | | | 12/15/33 | | | | 1,085,805 | |
| | | 500,000 | | Energy Transfer, L.P. | | | | | | | 5.7500 | | | | 04/01/25 | | | | 499,678 | |
| | | 500,000 | | Genesis Energy, L.P. / Genesis Energy Finance Corporation | | | | | | | 7.7500 | | | | 02/01/28 | | | | 506,623 | |
| | | 100,000 | | Genesis Energy, L.P. / Genesis Energy Finance Corporation | | | | | | | 8.2500 | | | | 01/15/29 | | | | 103,658 | |
| | | 750,000 | | Genesis Energy, L.P. / Genesis Energy Finance Corporation | | | | | | | 8.8750 | | | | 04/15/30 | | | | 789,107 | |
| | | 1,500,000 | | Global Partners, L.P. / GLP Finance Corporation | | | | | | | 7.0000 | | | | 08/01/27 | | | | 1,512,381 | |
| | | 500,000 | | Global Partners, L.P. / GLP Finance Corporation(a) | | | | | | | 8.2500 | | | | 01/15/32 | | | | 518,866 | |
| | | 1,250,000 | | ITT Holdings, LLC(a) | | | | | | | 6.5000 | | | | 08/01/29 | | | | 1,185,948 | |
| | | 2,000,000 | | NuStar Logistics, L.P. B | | | | | | | 5.6250 | | | | 04/28/27 | | | | 2,010,509 | |
| | | 1,250,000 | | Permian Resources Operating, LLC(a) | | | | | | | 5.8750 | | | | 07/01/29 | | | | 1,249,685 | |
| | | 100,000 | | Permian Resources Operating, LLC(a) | | | | | | | 7.0000 | | | | 01/15/32 | | | | 104,115 | |
| | | | | | | | | | | | | | | | | | | | 10,863,472 | |
| | | | | REAL ESTATE INVESTMENT TRUSTS — 1.9% | | | | | | | | | | | | | | | | |
| | | 1,320,000 | | Diversified Healthcare Trust | | | | | | | 9.7500 | | | | 06/15/25 | | | | 1,321,320 | |
| | | 750,000 | | Service Properties Trust | | | | | | | 5.5000 | | | | 12/15/27 | | | | 714,757 | |
| | | 1,375,000 | | Service Properties Trust(a) | | | | | | | 8.6250 | | | | 11/15/31 | | | | 1,496,513 | |
| | | | | | | | | | | | | | | | | | | | 3,532,590 | |
| | | | | REAL ESTATE OWNERS & DEVELOPERS — 2.7% | | | | | | | | | | | | | | | | |
| | | 1,500,000 | | Greystar Real Estate Partners, LLC(a) | | | | | | | 7.7500 | | | | 09/01/30 | | | | 1,594,311 | |
| | | 3,499,000 | | Howard Hughes Corporation (The)(a) | | | | | | | 4.3750 | | | | 02/01/31 | | | | 3,210,594 | |
| | | | | | | | | | | | | | | | | | | | 4,804,905 | |
| | | | | REAL ESTATE SERVICES — 0.8% | | | | | | | | | | | | | | | | |
| | | 1,345,000 | | Newmark Group, Inc.(a) | | | | | | | 7.5000 | | | | 01/12/29 | | | | 1,454,584 | |
| | | | | | | | | | | | | | | | | | | | | |
| | | | | RETAIL - CONSUMER STAPLES — 0.6% | | | | | | | | | | | | | | | | |
| | | 1,250,000 | | Ingles Markets, Inc.(a) | | | | | | | 4.0000 | | | | 06/15/31 | | | | 1,144,483 | |
| | | | | | | | | | | | | | | | | | | | | |
| | | | | RETAIL - DISCRETIONARY — 5.6% | | | | | | | | | | | | | | | | |
| | | 1,550,000 | | Beacon Roofing Supply, Inc.(a) | | | | | | | 4.1250 | | | | 05/15/29 | | | | 1,461,943 | |
| | | 500,000 | | Builders FirstSource, Inc.(a) | | | | | | | 6.3750 | | | | 03/01/34 | | | | 519,810 | |
| | | 1,118,000 | | Champions Financing, Inc.(a) | | | | | | | 8.7500 | | | | 02/15/29 | | | | 1,141,635 | |
| | | 65,000 | | Cougar JV Subsidiary, LLC(a) | | | | | | | 8.0000 | | | | 05/15/32 | | | | 68,784 | |
SCHEDULE OF INVESTMENTS
The accompanying notes are an integral part of these financial statements.
FINANCIAL STATEMENTS | 26
High Yield Bond Fund
| | Principal
Amount ($) | | | | Spread | | | Coupon
Rate (%) | | | Maturity | | | Fair Value | |
| | | | | RETAIL - DISCRETIONARY — 5.6% (Continued) | | | | | | | | | | | | | | | | |
| | | 3,162,000 | | Ken Garff Automotive, LLC(a) | | | | | | | 4.8750 | | | | 09/15/28 | | | $ | 3,065,428 | |
| | | 1,500,000 | | Lithia Motors, Inc.(a) | | | | | | | 3.8750 | | | | 06/01/29 | | | | 1,401,077 | |
| | | 750,000 | | Lithia Motors, Inc.(a) | | | | | | | 4.3750 | | | | 01/15/31 | | | | 698,551 | |
| | | 500,000 | | Sally Holdings, LLC / Sally Capital, Inc. | | | | | | | 6.7500 | | | | 03/01/32 | | | | 514,027 | |
| | | 1,550,000 | | Sonic Automotive, Inc.(a) | | | | | | | 4.8750 | | | | 11/15/31 | | | | 1,432,127 | |
| | | | | | | | | | | | | | | | | | | | 10,303,382 | |
| | | | | SEMICONDUCTORS — 0.4% | | | | | | | | | | | | | | | | |
| | | 750,000 | | Entegris Escrow Corporation(a) | | | | | | | 4.7500 | | | | 04/15/29 | | | | 739,880 | |
| | | | | | | | | | | | | | | | | | | | | |
| | | | | SOFTWARE — 0.6% | | | | | | | | | | | | | | | | |
| | | 1,000,000 | | UKG, Inc.(a) | | | | | | | 6.8750 | | | | 02/01/31 | | | | 1,033,891 | |
| | | | | | | | | | | | | | | | | | | | | |
| | | | | SPECIALTY FINANCE — 15.5% | | | | | | | | | | | | | | | | |
| | | 1,000,000 | | AerCap Ireland Capital DAC / Aercap Global Aviation Trust(b) | | | H15T5Y + 2.720% | | | | 6.9500 | | | | 03/10/55 | | | | 1,036,249 | |
| | | 2,500,000 | | Air Lease Corporation(b) | | | H15T5Y + 4.076% | | | | 4.6500 | | | | 06/15/70 | | | | 2,443,129 | |
| | | 290,000 | | Bread Financial Holdings, Inc.(a) | | | | | | | 7.0000 | | | | 01/15/26 | | | | 289,070 | |
| | | 1,250,000 | | Bread Financial Holdings, Inc.(a) | | | | | | | 9.7500 | | | | 03/15/29 | | | | 1,322,983 | |
| | | 1,000,000 | | Burford Capital Global Finance, LLC(a) | | | | | | | 6.2500 | | | | 04/15/28 | | | | 998,931 | |
| | | 3,710,000 | | Burford Capital Global Finance, LLC(a) | | | | | | | 9.2500 | | | | 07/01/31 | | | | 3,996,772 | |
| | | 1,000,000 | | Freedom Mortgage Corporation(a) | | | | | | | 6.6250 | | | | 01/15/27 | | | | 1,003,110 | |
| | | 1,000,000 | | Freedom Mortgage Corporation(a) | | | | | | | 12.0000 | | | | 10/01/28 | | | | 1,093,277 | |
| | | 2,000,000 | | Freedom Mortgage Holdings, LLC(a) | | | | | | | 9.1250 | | | | 05/15/31 | | | | 2,058,748 | |
| | | 2,955,000 | | ILFC E-Capital Trust I(a),(b) | | | TSFR3M + 1.812% | | | | 6.5650 | | | | 12/21/65 | | | | 2,344,722 | |
| | | 1,500,000 | | ILFC E-Capital Trust II(a),(b) | | | TSFR3M + 2.062% | | | | 6.8150 | | | | 12/21/65 | | | | 1,200,524 | |
| | | 1,250,000 | | Ladder Capital Finance Holdings LLLP / Ladder(a) | | | | | | | 4.2500 | | | | 02/01/27 | | | | 1,222,479 | |
| | | 750,000 | | Ladder Capital Finance Holdings LLLP / Ladder(a) | | | | | | | 7.0000 | | | | 07/15/31 | | | | 795,926 | |
| | | 500,000 | | Nationstar Mortgage Holdings, Inc.(a) | | | | | | | 6.0000 | | | | 01/15/27 | | | | 500,575 | |
| | | 1,250,000 | | Nationstar Mortgage Holdings, Inc.(a) | | | | | | | 5.5000 | | | | 08/15/28 | | | | 1,238,349 | |
| | | 1,340,000 | | Nationstar Mortgage Holdings, Inc.(a) | | | | | | | 6.5000 | | | | 08/01/29 | | | | 1,363,600 | |
| | | 1,500,000 | | OneMain Finance Corporation | | | | | | | 9.0000 | | | | 01/15/29 | | | | 1,590,803 | |
| | | 1,500,000 | | Rithm Capital Corporation(a) | | | | | | | 6.2500 | | | | 10/15/25 | | | | 1,500,537 | |
| | | 2,000,000 | | Rithm Capital Corporation(a) | | | | | | | 8.0000 | | | | 04/01/29 | | | | 2,021,300 | |
| | | 320,000 | | Starwood Property Trust, Inc.(a) | | | | | | | 6.0000 | | | | 04/15/30 | | | | 320,447 | |
| | | | | | | | | | | | | | | | | | | | 28,341,531 | |
| | | | | STEEL — 2.0% | | | | | | | | | | | | | | | | |
| | | 1,000,000 | | Commercial Metals Company | | | | | | | 4.3750 | | | | 03/15/32 | | | | 951,459 | |
| | | 2,804,000 | | TMS International Corporation(a) | | | | | | | 6.2500 | | | | 04/15/29 | | | | 2,672,854 | |
| | | | | | | | | | | | | | | | | | | | 3,624,313 | |
| | | | | TECHNOLOGY HARDWARE — 1.4% | | | | | | | | | | | | | | | | |
| | | 550,000 | | Ciena Corporation(a) | | | | | | | 4.0000 | | | | 01/31/30 | | | | 520,635 | |
| | | 1,000,000 | | TTM Technologies, Inc.(a) | | | | | | | 4.0000 | | | | 03/01/29 | | | | 948,419 | |
| | | 1,000,000 | | Zebra Technologies Corporation(a) | | | | | | | 6.5000 | | | | 06/01/32 | | | | 1,045,266 | |
| | | | | | | | | | | | | | | | | | | | 2,514,320 | |
SCHEDULE OF INVESTMENTS
The accompanying notes are an integral part of these financial statements.
FINANCIAL STATEMENTS | 27
High Yield Bond Fund
| | Principal
Amount ($) | | | | Spread | | | Coupon
Rate (%) | | | Maturity | | | Fair Value | |
| | | | | TECHNOLOGY SERVICES — 0.4% | | | | | | | | | | | | | | | | |
| | | 250,000 | | GTCR W-2 Merger Sub, LLC(a) | | | | | | | 7.5000 | | | | 01/15/31 | | | $ | 268,486 | |
| | | 500,000 | | Insight Enterprises, Inc.(a) | | | | | | | 6.6250 | | | | 05/15/32 | | | | 522,320 | |
| | | | | | | | | | | | | | | | | | | | 790,806 | |
| | | | | WHOLESALE - CONSUMER STAPLES — 1.7% | | | | | | | | | | | | | | | | |
| | | 1,280,000 | | KeHE Distributors, LLC / KeHE Finance Corp /(a) | | | | | | | 9.0000 | | | | 02/15/29 | | | | 1,332,447 | |
| | | 2,000,000 | | United Natural Foods, Inc.(a) | | | | | | | 6.7500 | | | | 10/15/28 | | | | 1,912,067 | |
| | | | | | | | | | | | | | | | | | | | 3,244,514 | |
| | | | | TOTAL CORPORATE BONDS (Cost $170,723,297) | | | | | | | | | | | | | | | 176,231,621 | |
| | Shares | | | | | | |
| SHORT-TERM INVESTMENTS — 3.6% | |
| | | | | MONEY MARKET FUNDS — 3.6% | | | | |
| | | 6,576,489 | | Fidelity Government Portfolio, Institutional Class, 4.84% (Cost $6,576,489)(c) | | | 6,576,489 | |
| | | | | | | | | |
| | | | | TOTAL INVESTMENTS — 100.0% (Cost $177,299,786) | | $ | 182,808,110 | |
| | | | | OTHER ASSETS IN EXCESS OF LIABILITIES — 0.0%(d) | | | 24,922 | |
| | | | | NET ASSETS — 100.0% | | $ | 182,833,032 | |
LLC | Limited Liability Company |
LP | Limited Partnership |
LTD | Limited Company |
PLC | Public Limited Company |
| | |
H15T5Y | US Treasury Yield Curve Rate T Note Constant Maturity 5 Year |
TSFR3M | Term SOFR Secured Overnight Financing Rate 3 Month |
| | |
(a) | Security exempt from registration under Rule 144A or Section 4(2) of the Securities Act of 1933. The security may be resold in transactions exempt from registration, normally to qualified institutional buyers. As of September 30, 2024 the total market value of 144A securities is 158,483,840 or 86.7% of net assets. |
(b) | Variable rate security; the rate shown represents the rate on September 30, 2024. |
(c) | Rate disclosed is the seven day effective yield as of September 30, 2024. |
(d) | Percentage rounds to less than 0.1%. |
SCHEDULE OF INVESTMENTS
The accompanying notes are an integral part of these financial statements.
FINANCIAL STATEMENTS | 28
Israel Common Values Fund
| | Shares | | | | Fair Value | |
| COMMON STOCKS — 97.8% | |
| | | | | AEROSPACE & DEFENSE — 6.3% | | | | |
| | | 18,101 | | Elbit Systems Ltd. | | $ | 3,622,010 | |
| | | 94,000 | | Leonardo DRS, Inc.(a) | | | 2,652,680 | |
| | | | | | | | 6,274,690 | |
| | | | | APPAREL & TEXTILE PRODUCTS — 2.6% | | | | |
| | | 23,816 | | Delta Galil Ltd. | | | 1,076,361 | |
| | | 20,000 | | Fox Wizel Ltd. | | | 1,510,072 | |
| | | | | | | | 2,586,433 | |
| | | | | BANKING — 17.4% | | | | |
| | | 86,000 | | Bank Hapoalim BM - ADR | | | 4,140,900 | |
| | | 478,000 | | Bank Leumi Le-Israel BM | | | 4,671,921 | |
| | | 45,300 | | First International Bank Of Israel Ltd. | | | 1,872,363 | |
| | | 527,000 | | Israel Discount Bank Ltd., Class A | | | 2,947,174 | |
| | | 95,000 | | Mizrahi Tefahot Bank Ltd. | | | 3,707,454 | |
| | | | | | | | 17,339,812 | |
| | | | | BIOTECH & PHARMA — 0.6% | | | | |
| | | 33,000 | | Enlight Renewable Energy Ltd.(a) | | | 553,555 | |
| | | | | | | | | |
| | | | | CHEMICALS — 1.1% | | | | |
| | | 247,902 | | ICL Group Ltd. | | | 1,053,584 | |
| | | | | | | | | |
| | | | | ELECTRIC UTILITIES — 1.7% | | | | |
| | | 22,700 | | Ormat Technologies, Inc. | | | 1,746,566 | |
| | | | | | | | | |
| | | | | ELECTRICAL EQUIPMENT — 1.9% | | | | |
| | | 24,300 | | Camtek Ltd. | | | 1,940,355 | |
| | | | | | | | | |
| | | | | HEALTH CARE FACILITIES & SERVICES — 1.7% | | | | |
| | | 12,769 | | Danel Adir Yeoshua Ltd. | | | 1,167,887 | |
| | | 1,575,013 | | Novolog Ltd. | | | 634,939 | |
| | | | | | | | 1,802,826 | |
| | | | | INSTITUTIONAL FINANCIAL SERVICES — 3.4% | | | | |
| | | 365,194 | | Tel Aviv Stock Exchange Ltd. | | | 3,447,906 | |
| | | | | | | | | |
| | | | | INSURANCE — 4.2% | | | | |
| | | 97,000 | | Harel Insurance Investments & Financial Services | | | 941,563 | |
| | | 773,628 | | Migdal Insurance & Financial Holdings Ltd. | | | 1,054,523 | |
| | | 199,400 | | Phoenix Holdings Ltd. (The) | | | 2,246,278 | |
| | | | | | | | 4,242,364 | |
| | | | | LEISURE FACILITIES & SERVICES — 1.5% | | | | |
| | | 12,800 | | Fattal Holdings 1998 Ltd.(a) | | | 1,463,573 | |
| | | | | | | | | |
SCHEDULE OF INVESTMENTS
The accompanying notes are an integral part of these financial statements.
FINANCIAL STATEMENTS | 29
Israel Common Values Fund
| | Shares | | | | Fair Value | |
| | | | | MEDICAL EQUIPMENT & DEVICES — 0.4% | | | | |
| | | 23,000 | | Inmode Ltd.(a) | | $ | 389,850 | |
| | | | | | | | | |
| | | | | OIL & GAS PRODUCERS — 7.9% | | | | |
| | | 350,000 | | Delek Drilling, L.P. | | | 962,235 | |
| | | 104,968 | | Energean plc | | | 1,265,876 | |
| | | 102,000 | | Energean plc | | | 1,246,445 | |
| | | 5,600 | | Israel Corp Ltd. (The) | | | 1,218,142 | |
| | | 1,100,000 | | Isramco Negev 2, L.P. | | | 477,671 | |
| | | 2,350,000 | | Oil Refineries Ltd. | | | 605,732 | |
| | | 8,000 | | Paz Oil Company Ltd. | | | 840,919 | |
| | | 1,600,000 | | Ratio Energies Finance, L.P. | | | 1,300,324 | |
| | | | | | | | 7,917,344 | |
| | | | | REAL ESTATE INVESTMENT TRUSTS — 2.8% | | | | |
| | | 12,000 | | Big Shopping Centers Ltd.(a) | | | 1,335,408 | |
| | | 369,000 | | Reit 1 Ltd. | | | 1,497,457 | |
| | | | | | | | 2,832,865 | |
| | | | | REAL ESTATE OWNERS & DEVELOPERS — 10.3% | | | | |
| | | 237,000 | | Amot Investments Ltd. | | | 1,022,807 | |
| | | 44,000 | | Azrieli Group Ltd. | | | 3,061,341 | |
| | | 40,000 | | Elco Ltd. | | | 1,188,746 | |
| | | 160,000 | | Gav-Yam Lands Corp Ltd. | | | 1,323,928 | |
| | | 24,380 | | Melisron Ltd. | | | 1,844,663 | |
| | | 703,430 | | Mivne Real Estate KD Ltd. | | | 1,799,942 | |
| | | | | | | | 10,241,427 | |
| | | | | RENEWABLE ENERGY — 1.1% | | | | |
| | | 296,360 | | Energix-Renewable Energies Ltd. | | | 1,071,515 | |
| | | | | | | | | |
| | | | | RETAIL - CONSUMER STAPLES — 2.9% | | | | |
| | | 18,700 | | Rami Levy Chain Stores Hashikma Marketing 2006 Ltd. | | | 1,043,264 | |
| | | 210,000 | | Shufersal Ltd. | | | 1,864,388 | |
| | | | | | | | 2,907,652 | |
| | | | | SEMICONDUCTORS — 7.9% | | | | |
| | | 24,000 | | Nova Ltd.(a) | | | 5,000,160 | |
| | | 66,223 | | Tower Semiconductor Ltd.(a) | | | 2,931,030 | |
| | | | | | | | 7,931,190 | |
| | | | | SOFTWARE — 18.9% | | | | |
| | | 14,100 | | CyberArk Software Ltd.(a) | | | 4,111,700 | |
| | | 29,935 | | Hilan Ltd. | | | 1,570,498 | |
| | | 39,800 | | Mobileye Global, Inc., Class A(a) | | | 545,260 | |
| | | 6,500 | | Monday.com Ltd.(a) | | | 1,805,505 | |
| | | 21,100 | | Nice Ltd. - ADR(a) | | | 3,664,437 | |
| | | 34,000 | | Oddity Tech Ltd.(a) | | | 1,372,920 | |
| | | 41,000 | | One Software Technologies Ltd. | | | 553,038 | |
SCHEDULE OF INVESTMENTS
The accompanying notes are an integral part of these financial statements.
FINANCIAL STATEMENTS | 30
Israel Common Values Fund
| | Shares | | | | Fair Value | |
| | | | | SOFTWARE — 18.9% (Continued) | | | | |
| | | 55,300 | | Sapiens International Corp N.V. | | $ | 2,061,031 | |
| | | 46,200 | | Varonis Systems, Inc.(a) | | | 2,610,299 | |
| | | 21,500 | | Verint Systems, Inc.(a) | | | 544,595 | |
| | | | | | | | 18,839,283 | |
| | | | | TECHNOLOGY HARDWARE — 0.4% | | | | |
| | | 36,000 | | AudioCodes Ltd. | | | 350,280 | |
| | | | | | | | | |
| | | | | TECHNOLOGY SERVICES — 1.9% | | | | |
| | | 72,783 | | Magic Software Enterprises Ltd. | | | 860,295 | |
| | | 56,210 | | Matrix IT Ltd. | | | 1,074,206 | |
| | | | | | | | 1,934,501 | |
| | | | | WHOLESALE - DISCRETIONARY — 0.9% | | | | |
| | | 17,300 | | Tadiran Group Ltd. | | | 927,573 | |
| | | | | | | | | |
| | | | | TOTAL COMMON STOCKS (Cost $54,144,405) | | | 97,795,144 | |
| | | | | | | | | |
| SHORT-TERM INVESTMENTS — 2.3% | |
| | | | | MONEY MARKET FUNDS — 2.3% | | | | |
| | | 2,278,333 | | Fidelity Government Portfolio, Institutional Class, 4.84% (Cost $2,278,333)(b) | | | 2,278,333 | |
| | | | | | | | | |
| | | | | TOTAL INVESTMENTS — 100.1% (Cost $56,422,738) | | $ | 100,073,477 | |
| | | | | LIABILITIES IN EXCESS OF OTHER ASSETS — (0.1)% | | | (95,598 | ) |
| | | | | NET ASSETS — 100.0% | | $ | 99,977,879 | |
ADR | American Depositary Receipt |
LP | Limited Partnership |
LTD | Limited Company |
NV | Naamioze Vennootschap |
PLC | Public Limited Company |
REIT | Real Estate Investment Trust |
| | |
(a) | Non-income producing security. |
(b) | Rate disclosed is the seven day effective yield as of September 30, 2024. |
SCHEDULE OF INVESTMENTS
The accompanying notes are an integral part of these financial statements.
FINANCIAL STATEMENTS | 31
Israel Common Values Fund
| | % OF NET
ASSETS | | COUNTRY | | | | | |
| | | 85.2 | % | Israel | | | | | |
| | | 8.1 | % | United States | | | | | |
| | | 2.5 | % | United Kingdom | | | | | |
| | | 2.1 | % | Cayman Islands | | | | | |
| | | 97.8 | % | Total | | | | | |
| | | 2.3 | % | Money Market Funds | | | | | |
| | | -0.1 | % | Liabilities In Excess Of Other Assets | | | | | |
| | | 100.0 | % | Grand Total | | | | | |
SCHEDULE OF INVESTMENTS
The accompanying notes are an integral part of these financial statements.
FINANCIAL STATEMENTS | 32
Defensive Strategies Fund
| | Shares | | | | Fair Value | |
| COMMON STOCKS — 37.1% | |
| | | | | CHEMICALS — 1.5% | | | | |
| | | 940 | | Albemarle Corporation | | $ | 89,027 | |
| | | 2,049 | | CF Industries Holdings, Inc. | | | 175,804 | |
| | | 1,853 | | FMC Corporation | | | 122,187 | |
| | | 6,014 | | ICL Group Ltd. | | | 25,560 | |
| | | 7,069 | | K+S A.G. | | | 90,596 | |
| | | 5,479 | | Mosaic Company (The) | | | 146,728 | |
| | | 4,976 | | Nutrien Ltd. | | | 239,146 | |
| | | 3,601 | | OCI N.V. | | | 102,565 | |
| | | 3,097 | | Sociedad Quimica y Minera de Chile S.A. - ADR | | | 129,083 | |
| | | 1,773 | | Yara International ASA | | | 56,138 | |
| | | | | | | | 1,176,834 | |
| | | | | DATA CENTER REIT — 0.9% | | | | |
| | | 4,000 | | Digital Realty Trust, Inc. | | | 647,321 | |
| | | | | | | | | |
| | | | | ELECTRIC UTILITIES — 0.0%(a) | | | | |
| | | 290 | | Neoen S.A. | | | 12,593 | |
| | | | | | | | | |
| | | | | ENGINEERING & CONSTRUCTION — 0.0%(a) | | | | |
| | | 799 | | Technip Energies N.V. | | | 19,234 | |
| | | | | | | | | |
| | | | | FOOD — 1.3% | | | | |
| | | 2,563 | | Adecoagro S.A. | | | 28,372 | |
| | | 4,499 | | BRF S.A. - ADR(b) | | | 19,661 | |
| | | 853 | | Cal-Maine Foods, Inc. | | | 63,839 | |
| | | 4,632 | | Darling Ingredients, Inc.(b) | | | 172,124 | |
| | | 1,353 | | Dole plc | | | 22,040 | |
| | | 564 | | Fresh Del Monte Produce, Inc. | | | 16,661 | |
| | | 2,408 | | Hormel Foods Corporation | | | 76,334 | |
| | | 1,385 | | Ingredion, Inc. | | | 190,340 | |
| | | 1,300 | | MEIJI Holdings Company Ltd. | | | 32,472 | |
| | | 2,600 | | Morinaga Milk Industry Company Ltd. | | | 63,551 | |
| | | 5,082 | | Mowi ASA | | | 91,388 | |
| | | 1,400 | | NH Foods Ltd. | | | 51,948 | |
| | | 4,300 | | Nisshin Seifun Group, Inc. | | | 54,406 | |
| | | 4,700 | | Nissui Corporation | | | 30,003 | |
| | | 2,546 | | Pilgrim’s Pride Corporation(b) | | | 117,243 | |
| | | 841 | | Salmar ASA | | | 44,115 | |
| | | | | | | | 1,074,497 | |
SCHEDULE OF INVESTMENTS
The accompanying notes are an integral part of these financial statements.
FINANCIAL STATEMENTS | 33
Defensive Strategies Fund
| | Shares | | | | Fair Value | |
| | | | | FORESTRY, PAPER & WOOD PRODUCTS — 0.2% | | | | |
| | | 2,400 | | Canfor Corporation(b) | | $ | 30,224 | |
| | | 1,900 | | Sumitomo Forestry Company Ltd. | | | 93,794 | |
| | | | | | | | 124,018 | |
| | | | | GAS & WATER UTILITIES — 0.8% | | | | |
| | | 403 | | American States Water Company | | | 33,566 | |
| | | 559 | | American Water Works Company, Inc. | | | 81,748 | |
| | | 910 | | California Water Service Group | | | 49,340 | |
| | | 4,258 | | Cia de Saneamento Basico do Estado de Sao Paulo - ADR | | | 70,427 | |
| | | 1,577 | | Essential Utilities, Inc. | | | 60,825 | |
| | | 1,154 | | Severn Trent plc | | | 40,763 | |
| | | 264 | | SJW Group | | | 15,341 | |
| | | 4,078 | | United Utilities Group plc | | | 57,003 | |
| | | 5,852 | | Veolia Environnement S.A. | | | 192,352 | |
| | | | | | | | 601,365 | |
| | | | | HEALTH CARE FACILITIES & SERVICES — 0.4% | | | | |
| | | 48,754 | | Brookdale Senior Living, Inc.(b) | | | 331,040 | |
| | | | | | | | | |
| | | | | HEALTH CARE REIT — 1.0% | | | | |
| | | 13,000 | | American Healthcare REIT, Inc. | | | 339,300 | |
| | | 25,235 | | Healthcare Realty Trust, Inc. | | | 458,015 | |
| | | | | | | | 797,315 | |
| | | | | INDUSTRIAL REIT — 0.5% | | | | |
| | | 8,100 | | Rexford Industrial Realty, Inc. | | | 407,511 | |
| | | | | | | | | |
| | | | | MACHINERY — 1.2% | | | | |
| | | 748 | | AGCO Corporation | | | 73,199 | |
| | | 7,354 | | CNH Industrial N.V. | | | 81,629 | |
| | | 1,248 | | Deere & Company | | | 520,828 | |
| | | 11,900 | | Kubota Corporation | | | 168,161 | |
| | | 1,700 | | Kurita Water Industries Ltd. | | | 72,932 | |
| | | 400 | | Organo Corporation | | | 19,482 | |
| | | 840 | | Weir Group plc (The) | | | 24,326 | |
| | | | | | | | 960,557 | |
| | | | | METALS & MINING — 5.0% | | | | |
| | | 413 | | Agnico Eagle Mines Ltd. | | | 33,271 | |
| | | 2,734 | | Agnico Eagle Mines Ltd. | | | 220,267 | |
| | | 959 | | Alamos Gold, Inc., Class A | | | 19,122 | |
| | | 471 | | Alcoa Corporation | | | 18,171 | |
| | | 2,139 | | Anglo American PLC | | | 69,465 | |
| | | 637 | | Anglogold Ashanti plc | | | 16,963 | |
| | | 1,391 | | Antofagasta plc | | | 37,437 | |
| | | 513 | | Aurubis A.G. | | | 37,614 | |
| | | 44,540 | | B2Gold Corporation | | | 137,183 | |
SCHEDULE OF INVESTMENTS
The accompanying notes are an integral part of these financial statements.
FINANCIAL STATEMENTS | 34
Defensive Strategies Fund
| | Shares | | | | Fair Value | |
| | | | | METALS & MINING — 5.0% (Continued) | | | | |
| | | 10,928 | | Barrick Gold Corporation | | $ | 217,358 | |
| | | 7,327 | | BHP Group Ltd. - ADR | | | 455,080 | |
| | | 2,734 | | Cameco Corporation | | | 130,576 | |
| | | 4,500 | | Capstone Copper Corporation(b) | | | 35,206 | |
| | | 8,700 | | Centerra Gold, Inc. | | | 62,469 | |
| | | 3,247 | | Cia de Minas Buenaventura S.A.A - ADR | | | 44,938 | |
| | | 964 | | Cleveland-Cliffs, Inc.(b) | | | 12,310 | |
| | | 400 | | Dowa Holdings Company Ltd. | | | 14,625 | |
| | | 10,920 | | Eldorado Gold Corporation(b) | | | 189,680 | |
| | | 2,100 | | Endeavour Mining plc | | | 49,910 | |
| | | 190 | | Eramet S.A. | | | 14,978 | |
| | | 600 | | First Quantum Minerals Ltd.(b) | | | 8,182 | |
| | | 951 | | Franco-Nevada Corporation | | | 118,162 | |
| | | 5,003 | | Freeport-McMoRan, Inc. | | | 249,751 | |
| | | 14,103 | | Gold Fields Ltd. - ADR | | | 216,481 | |
| | | 5,000 | | Hudbay Minerals, Inc. | | | 45,995 | |
| | | 2,500 | | Ivanhoe Mines Ltd.(b) | | | 37,196 | |
| | | 6,715 | | Kinross Gold Corporation | | | 62,852 | |
| | | 800 | | Labrador Iron Ore Royalty Corporation | | | 19,025 | |
| | | 13,200 | | Lundin Mining Corporation | | | 138,314 | |
| | | 2,500 | | Mitsubishi Materials Corporation | | | 44,790 | |
| | | 2,026 | | MP Materials Corporation(b) | | | 35,759 | |
| | | 2,661 | | Norsk Hydro ASA | | | 17,264 | |
| | | 1,459 | | Osisko Gold Royalties Ltd. | | | 27,006 | |
| | | 5,864 | | Pan American Silver Corporation | | | 122,382 | |
| | | 4,990 | | Rio Tinto plc - ADR | | | 355,138 | |
| | | 307 | | Royal Gold, Inc. | | | 43,072 | |
| | | 6,049 | | Sandstorm Gold Ltd. | | | 36,294 | |
| | | 516 | | Southern Copper Corporation | | | 59,686 | |
| | | 7,739 | | SSR Mining, Inc. | | | 43,958 | |
| | | 1,400 | | Sumitomo Metal Mining Company Ltd. | | | 41,798 | |
| | | 1,143 | | Teck Resources Ltd., Class B | | | 59,706 | |
| | | 1,355 | | Teck Resources Ltd., Class B | | | 70,785 | |
| | | 12,534 | | Vale S.A. - ADR | | | 146,397 | |
| | | 2,310 | | Wheaton Precious Metals Corporation | | | 141,095 | |
| | | | | | | | 3,957,711 | |
| | | | | OFFICE REIT — 0.5% | | | | |
| | | 12,335 | | Highwoods Properties, Inc. | | | 413,346 | |
| | | | | | | | | |
| | | | | OIL & GAS PRODUCERS — 5.6% | | | | |
| | | 7,597 | | Aker BP ASA | | | 162,857 | |
| | | 5,447 | | APA Corporation | | | 133,234 | |
| | | 6,300 | | ARC Resources Ltd. | | | 106,498 | |
SCHEDULE OF INVESTMENTS
The accompanying notes are an integral part of these financial statements.
FINANCIAL STATEMENTS | 35
Defensive Strategies Fund
| | Shares | | | | Fair Value | |
| | | | | OIL & GAS PRODUCERS — 5.6% (Continued) | | | | |
| | | 14,900 | | Baytex Energy Corporation | | $ | 44,513 | |
| | | 1,128 | | Black Stone Minerals, L.P. | | | 17,033 | |
| | | 6,274 | | Canadian Natural Resources Ltd. | | | 208,360 | |
| | | 14,000 | | Cenovus Energy, Inc. | | | 234,178 | |
| | | 468 | | Chord Energy Corporation | | | 60,948 | |
| | | 735 | | Civitas Resources, Inc. | | | 37,242 | |
| | | 2,443 | | CNX Resources Corporation(b) | | | 79,569 | |
| | | 2,914 | | ConocoPhillips | | | 306,787 | |
| | | 4,962 | | Coterra Energy, Inc. | | | 118,840 | |
| | | 5,594 | | Devon Energy Corporation | | | 218,837 | |
| | | 1,525 | | Eni SpA - ADR | | | 46,223 | |
| | | 1,772 | | EOG Resources, Inc. | | | 217,832 | |
| | | 1,232 | | EQT Corporation | | | 45,140 | |
| | | 6,311 | | Equinor ASA - ADR | | | 159,858 | |
| | | 170 | | Hess Corporation | | | 23,086 | |
| | | 900 | | Imperial Oil Ltd. | | | 63,325 | |
| | | 11,800 | | Inpex Corporation | | | 159,112 | |
| | | 1,313 | | Kosmos Energy Ltd.(b) | | | 5,291 | |
| | | 1,920 | | Magnolia Oil & Gas Corporation, Class A | | | 46,886 | |
| | | 4,038 | | Marathon Oil Corporation | | | 107,532 | |
| | | 2,143 | | Matador Resources Company | | | 105,907 | |
| | | 6,400 | | MEG Energy Corporation | | | 120,256 | |
| | | 5,974 | | Murphy Oil Corporation | | | 201,563 | |
| | | 3,067 | | Occidental Petroleum Corporation | | | 158,073 | |
| | | 255 | | Ovintiv, Inc. | | | 9,769 | |
| | | 12,064 | | Petroleo Brasileiro S.A. - ADR | | | 173,842 | |
| | | 1,300 | | Peyto Exploration & Development Corporation | | | 14,804 | |
| | | 2,000 | | PrairieSky Royalty Ltd. | | | 40,656 | |
| | | 546 | | Range Resources Corporation | | | 16,795 | |
| | | 4,459 | | SM Energy Company | | | 178,226 | |
| | | 3,472 | | Southwestern Energy Company(b) | | | 24,686 | |
| | | 6,000 | | Suncor Energy, Inc. | | | 221,489 | |
| | | 3,390 | | TotalEnergies S.E. | | | 220,817 | |
| | | 2,700 | | Tourmaline Oil Corporation | | | 125,405 | |
| | | 6,248 | | Var Energi ASA | | | 19,362 | |
| | | 5,200 | | Veren, Inc. | | | 32,031 | |
| | | 3,900 | | Vermilion Energy, Inc. | | | 38,068 | |
| | | 2,239 | | Viper Energy, Inc. | | | 101,001 | |
| | | 400 | | Whitecap Resources, Inc. | | | 2,987 | |
| | | 2,942 | | Woodside Energy Group Ltd. - ADR | | | 50,720 | |
| | | | | | | | 4,459,638 | |
SCHEDULE OF INVESTMENTS
The accompanying notes are an integral part of these financial statements.
FINANCIAL STATEMENTS | 36
Defensive Strategies Fund
| | Shares | | | | Fair Value | |
| | | | | OIL & GAS SERVICES & EQUIPMENT — 1.2% | | | | |
| | | 2,584 | | Archrock, Inc. | | $ | 52,300 | |
| | | 3,881 | | Baker Hughes Company | | | 140,298 | |
| | | 2,140 | | ChampionX Corporation | | | 64,521 | |
| | | 3,524 | | Halliburton Company | | | 102,372 | |
| | | 2,624 | | Helmerich & Payne, Inc. | | | 79,822 | |
| | | 6,476 | | Liberty Oilfield Services, Inc., Class A | | | 123,627 | |
| | | 969 | | Noble Corp plc | | | 35,020 | |
| | | 2,196 | | NOV, Inc. | | | 35,070 | |
| | | 863 | | Oceaneering International, Inc.(b) | | | 21,463 | |
| | | 8,724 | | Patterson-UTI Energy, Inc. | | | 66,739 | |
| | | 4,301 | | Schlumberger N.V. | | | 180,427 | |
| | | 1,900 | | Secure Energy Services, Inc. | | | 17,183 | |
| | | 3,929 | | TGS NOPEC Geophysical Company ASA | | | 36,956 | |
| | | 4,187 | | Transocean Ltd.(b) | | | 17,795 | |
| | | | | | | | 973,593 | |
| | | | | REAL ESTATE INVESTMENT TRUSTS — 13.9% | | | | |
| | | 16,000 | | American Homes 4 Rent, Class A | | | 614,240 | |
| | | 3,100 | | American Tower Corporation, A | | | 720,936 | |
| | | 16,700 | | Americold Realty Trust, Inc. | | | 472,109 | |
| | | 3,500 | | AvalonBay Communities, Inc. | | | 788,375 | |
| | | 7,000 | | Camden Property Trust | | | 864,710 | |
| | | 7,900 | | Crown Castle, Inc. | | | 937,177 | |
| | | 1,515 | | Equinix, Inc. | | | 1,344,759 | |
| | | 11,260 | | InvenTrust Properties Corporation | | | 319,446 | |
| | | 378 | | PotlatchDeltic Corporation | | | 17,029 | |
| | | 7,000 | | Prologis, Inc. | | | 883,960 | |
| | | 2,200 | | Public Storage | | | 800,514 | |
| | | 1,623 | | Rayonier, Inc. | | | 52,228 | |
| | | 2,630 | | SBA Communications Corporation, A | | | 633,041 | |
| | | 12,000 | | Sila Realty Trust, Inc. | | | 303,480 | |
| | | 4,600 | | Sun Communities, Inc. | | | 621,690 | |
| | | 14,000 | | Ventas, Inc. | | | 897,820 | |
| | | 5,400 | | Welltower, Inc. | | | 691,362 | |
| | | 1,049 | | Weyerhaeuser Company | | | 35,519 | |
| | | | | | | | 10,998,395 | |
| | | | | RENEWABLE ENERGY — 0.1% | | | | |
| | | 266 | | Enphase Energy, Inc.(b) | | | 30,063 | |
| | | 223 | | First Solar, Inc.(b) | | | 55,625 | |
| | | | | | | | 85,688 | |
| | | | | RESIDENTIAL REIT — 0.4% | | | | |
| | | 10,000 | | Invitation Homes, Inc. | | | 352,600 | |
| | | | | | | | | |
SCHEDULE OF INVESTMENTS
The accompanying notes are an integral part of these financial statements.
FINANCIAL STATEMENTS | 37
Defensive Strategies Fund
| | Shares | | | | Fair Value | |
| | | | | RETAIL REIT — 1.2% | | | | |
| | | 15,000 | | Brixmor Property Group, Inc. | | $ | 417,900 | |
| | | 12,170 | | NNN REIT, Inc. | | | 590,123 | |
| | | | | | | | 1,008,023 | |
| | | | | SELF-STORAGE REIT — 0.7% | | | | |
| | | 3,000 | | Extra Space Storage, Inc. | | | 540,570 | |
| | | | | | | | | |
| | | | | SEMICONDUCTORS — 0.1% | | | | |
| | | 7,600 | | SUMCO Corporation | | | 81,539 | |
| | | | | | | | | |
| | | | | STEEL — 0.3% | | | | |
| | | 2,219 | | ArcelorMittal S.A. - ADR | | | 58,271 | |
| | | 311 | | ATI, Inc.(b) | | | 20,809 | |
| | | 3,200 | | JFE Holdings, Inc. | | | 42,715 | |
| | | 1,078 | | POSCO Holdings, Inc. - ADR | | | 75,450 | |
| | | 59 | | Steel Dynamics, Inc. | | | 7,439 | |
| | | 1,095 | | Ternium S.A. - ADR | | | 40,416 | |
| | | | | | | | 245,100 | |
| | | | | WHOLESALE - CONSUMER STAPLES — 0.3% | | | | |
| | | 2,104 | | Bunge Global S.A. | | | 203,331 | |
| | | | | | | | | |
| | | | | TOTAL COMMON STOCKS (Cost $26,581,119) | | | 29,471,819 | |
| | | | | | | | | |
| EXCHANGE-TRADED FUNDS — 18.4% | |
| | | | | EQUITY — 18.4% | | | | |
| | | 611,600 | | Timothy Plan Market Neutral ETF(c) | | | 14,631,918 | |
| | | | | | | | | |
| | | | | TOTAL EXCHANGE-TRADED FUNDS (Cost $15,212,535) | | | 14,631,918 | |
| | | | | | | | | |
| PRECIOUS METALS - PHYSICAL HOLDING — 20.4% | |
| | | | | PRECIOUS METAL — 20.4% | | | | |
| | | 6,143 | | GOLD BARS - XAU BGN CURNCY(b) | | | 16,175,060 | |
| | | | | | | | | |
| | | | | TOTAL PRECIOUS METALS - PHYSICAL HOLDING (Cost $7,240,876) | | | 16,175,060 | |
SCHEDULE OF INVESTMENTS
The accompanying notes are an integral part of these financial statements.
FINANCIAL STATEMENTS | 38
Defensive Strategies Fund
| | Principal
Amount ($) | | | | Coupon
Rate (%) | | | Maturity | | | Fair Value | |
| U.S. GOVERNMENT & AGENCIES — 20.9% | | | |
| | | | | U.S. TREASURY INFLATION PROTECTED — 20.9% | | | | | | | | | | | | |
| | | 1,768,727 | | United States Treasury Inflation Indexed Bonds | | | 2.3750 | | | | 01/15/25 | | | $ | 1,757,085 | |
| | | 2,035,739 | | United States Treasury Inflation Indexed Bonds | | | 2.0000 | | | | 01/15/26 | | | | 2,301,791 | |
| | | 2,261,507 | | United States Treasury Inflation Indexed Bonds | | | 2.3750 | | | | 01/15/27 | | | | 2,298,483 | |
| | | 2,072,070 | | United States Treasury Inflation Indexed Bonds | | | 0.5000 | | | | 01/15/28 | | | | 2,005,978 | |
| | | 983,384 | | United States Treasury Inflation Indexed Bonds | | | 1.7500 | | | | 01/15/28 | | | | 991,025 | |
| | | 1,532,137 | | United States Treasury Inflation Indexed Bonds | | | 0.8750 | | | | 01/15/29 | | | | 1,495,281 | |
| | | 1,552,868 | | United States Treasury Inflation Indexed Bonds | | | 2.5000 | | | | 01/15/29 | | | | 1,619,050 | |
| | | 2,968,308 | | United States Treasury Inflation Indexed Bonds | | | 0.1250 | | | | 01/15/31 | | | | 2,726,063 | |
| | | 337,521 | | United States Treasury Inflation Indexed Bonds | | | 2.1250 | | | | 02/15/41 | | | | 352,822 | |
| | | 1,624,881 | | United States Treasury Inflation Indexed Bonds | | | 0.1250 | | | | 02/15/51 | | | | 1,023,923 | |
| | | | | | | | | | | | | | | | 16,571,501 | |
| | | | | TOTAL U.S. GOVERNMENT & AGENCIES (Cost $17,910,040) | | | | | | | | | | | 16,571,501 | |
| | Shares | | | | | | |
| SHORT-TERM INVESTMENTS — 3.0% | |
| | | | | MONEY MARKET FUNDS — 3.0% | | | | |
| | | 2,340,431 | | Fidelity Government Portfolio, Institutional Class, 4.84% (Cost $2,340,431)(d) | | | 2,340,431 | |
| | | | | | | | | |
| | | | | TOTAL INVESTMENTS — 99.8% (Cost $69,285,001) | | $ | 79,190,729 | |
| | | | | OTHER ASSETS IN EXCESS OF LIABILITIES — 0.2% | | | 139,874 | |
| | | | | NET ASSETS — 100.0% | | $ | 79,330,603 | |
ADR | American Depositary Receipt |
ETF | Exchange-Traded Fund |
LP | Limited Partnership |
LTD | Limited Company |
NV | Naamioze Vennootschap |
PLC | Public Limited Company |
REIT | Real Estate Investment Trust |
S/A | Société Anonyme |
| | |
(a) | Percentage rounds to less than 0.1%. |
(b) | Non-income producing security. |
(c) | Investment is affiliate. |
(d) | Rate disclosed is the seven day effective yield as of September 30, 2024. |
SCHEDULE OF INVESTMENTS
The accompanying notes are an integral part of these financial statements.
FINANCIAL STATEMENTS | 39
Defensive Strategies Fund
| | | | | DIVERSIFICATION OF ASSETS | | | | | |
| | % OF NET
ASSETS | | COUNTRY | | % OF NET
ASSETS | | COUNTRY |
| | | 86.1 | % | United States | | | 0.2 | % | Germany |
| | | 4.4 | % | Canada | | | 0.2 | % | Luxembourg |
| | | 1.2 | % | Japan | | | 0.1 | % | South Korea |
| | | 0.9 | % | United Kingdom | | | 0.1 | % | Italy |
| | | 0.7 | % | Norway | | | 0.1 | % | Peru |
| | | 0.6 | % | Australia | | | 0.0 | %(a) | Israel |
| | | 0.5 | % | France | | | 0.0 | %(a) | Ireland |
| | | 0.5 | % | Brazil | | | 0.0 | %(a) | Cayman Islands |
| | | 0.3 | % | Switzerland | | | 96.8 | % | Total |
| | | 0.3 | % | South Africa | | | 3.0 | % | Money Market Funds |
| | | 0.2 | % | Netherlands | | | 0.2 | % | Other Assets In Excess Of Liabilities |
| | | 0.2 | % | Curaçao | | | 100.0 | % | Grand Total |
| | | 0.2 | % | Chile | | | | | |
(a) | Percentage rounds to less than 0.1%. |
SCHEDULE OF INVESTMENTS
The accompanying notes are an integral part of these financial statements.
FINANCIAL STATEMENTS | 40
Strategic Growth Fund
| | Shares | | | | Fair Value | |
| EXCHANGE-TRADED FUNDS — 66.8% | |
| | | | | EQUITY — 66.8% | | | | |
| | | 106,706 | | Timothy Plan High Dividend Stock Enhanced ETF(a) | | $ | 2,739,783 | |
| | | 189,056 | | Timothy Plan International ETF(a) | | | 5,458,879 | |
| | | 211,800 | | Timothy Plan Market Neutral ETF(a) | | | 5,067,103 | |
| | | 197,339 | | Timothy Plan US Large/Mid Cap Core Enhanced ETF(a) | | | 5,175,788 | |
| | | 105,123 | | Timothy Plan US Small Cap Core ETF(a) | | | 4,090,988 | |
| | | | | | | | 22,532,541 | |
| | | | | TOTAL EXCHANGE-TRADED FUNDS (Cost $20,503,059) | | | 22,532,541 | |
| | | | | | | | | |
| OPEN END FUNDS — 31.2% | |
| | | | | EQUITY — 13.2% | | | | |
| | | 326,604 | | Timothy Plan International Fund, Class A(a) | | | 4,458,141 | |
| | | | | | | | | |
| | | | | FIXED INCOME — 18.0% | | | | |
| | | 434,630 | | Timothy Plan Fixed Income Fund, Class A(a) | | | 4,050,753 | |
| | | 224,885 | | Timothy Plan High Yield Bond Fund, Class A(a) | | | 2,035,213 | |
| | | | | | | | 6,085,966 | |
| | | | | TOTAL OPEN END FUNDS (Cost $10,373,672) | | | 10,544,107 | |
| | | | | | | | | |
| SHORT-TERM INVESTMENTS — 2.1% | |
| | | | | MONEY MARKET FUNDS — 2.1% | | | | |
| | | 720,121 | | Fidelity Government Portfolio, Institutional Class, 4.84% (Cost $720,121)(b) | | | 720,121 | |
| | | | | | | | | |
| | | | | TOTAL INVESTMENTS — 100.1% (Cost $31,596,852) | | $ | 33,796,769 | |
| | | | | LIABILITIES IN EXCESS OF OTHER ASSETS — (0.1)% | | | (39,106 | ) |
| | | | | NET ASSETS — 100.0% | | $ | 33,757,663 | |
ETF | Exchange-Traded Fund |
| | |
(a) | Investment is affiliate. |
(b) | Rate disclosed is the seven day effective yield as of September 30, 2024. |
SCHEDULE OF INVESTMENTS
The accompanying notes are an integral part of these financial statements.
FINANCIAL STATEMENTS | 41
Conservative Growth Fund
| | Shares | | | | Fair Value | |
| EXCHANGE-TRADED FUNDS — 49.4% | |
| | | | | EQUITY — 49.4% | | | | |
| | | 91,260 | | Timothy Plan High Dividend Stock Enhanced ETF(a) | | $ | 2,343,192 | |
| | | 121,144 | | Timothy Plan International ETF(a) | | | 3,497,960 | |
| | | 241,300 | | Timothy Plan Market Neutral ETF(a) | | | 5,772,861 | |
| | | 179,986 | | Timothy Plan US Large/Mid Cap Core Enhanced ETF(a) | | | 4,720,655 | |
| | | 69,905 | | Timothy Plan US Small Cap Core ETF(a) | | | 2,720,437 | |
| | | | | | | | 19,055,105 | |
| | | | | TOTAL EXCHANGE-TRADED FUNDS (Cost $17,723,327) | | | 19,055,105 | |
| | | | | | | | | |
| OPEN END FUNDS — 48.2% | |
| | | | | EQUITY — 11.7% | | | | |
| | | 329,251 | | Timothy Plan International Fund, Class A(a) | | | 4,494,276 | |
| | | | | | | | | |
| | | | | FIXED INCOME — 36.5% | | | | |
| | | 1,238,263 | | Timothy Plan Fixed Income Fund, Class A(a) | | | 11,540,609 | |
| | | 277,635 | | Timothy Plan High Yield Bond Fund, Class A(a) | | | 2,512,599 | |
| | | | | | | | 14,053,208 | |
| | | | | TOTAL OPEN END FUNDS (Cost $19,298,286) | | | 18,547,484 | |
| | | | | | | | | |
| SHORT-TERM INVESTMENTS — 2.5% | |
| | | | | MONEY MARKET FUNDS — 2.5% | | | | |
| | | 960,121 | | Fidelity Government Portfolio, Institutional Class, 4.84% (Cost $960,121)(b) | | | 960,121 | |
| | | | | | | | | |
| | | | | TOTAL INVESTMENTS — 100.1% (Cost $37,981,734) | | $ | 38,562,710 | |
| | | | | LIABILITIES IN EXCESS OF OTHER ASSETS — (0.1)% | | | (43,993 | ) |
| | | | | NET ASSETS — 100.0% | | $ | 38,518,717 | |
ETF | Exchange-Traded Fund |
| | |
(a) | Investment in affiliate. |
(b) | Rate disclosed is the seven day effective yield as of September 30, 2024. |
SCHEDULE OF INVESTMENTS
The accompanying notes are an integral part of these financial statements.
FINANCIAL STATEMENTS | 42
Growth & Income Fund
| | Shares | | | | Fair Value | |
| EXCHANGE-TRADED FUNDS — 50.1% | |
| | | | | EQUITY — 50.1% | | | | |
| | | 372,000 | | Timothy Plan High Dividend Stock Enhanced ETF(a) | | $ | 9,551,472 | |
| | | | | TOTAL EXCHANGE-TRADED FUNDS (Cost $9,409,143) | | | 9,551,472 | |
| | Principal
Amount ($) | | | | Coupon
Rate (%) | | | Maturity | | | Fair Value | |
| CORPORATE BONDS — 10.5% | | | |
| | | | | CHEMICALS — 0.7% | | | | | | | | | | | | |
| | | 85,000 | | Nutrien Ltd. | | | 4.0000 | | | | 12/15/26 | | | | 84,362 | |
| | | 60,000 | | Nutrien Ltd. | | | 2.9500 | | | | 05/13/30 | | | | 55,794 | |
| | | | | | | | | | | | | | | | 140,156 | |
| | | | | COMMERCIAL SUPPORT SERVICES — 0.5% | | | | | | | | | | | | |
| | | 35,000 | | Republic Services, Inc. | | | 5.0000 | | | | 04/01/34 | | | | 36,013 | |
| | | 50,000 | | Waste Management, Inc. | | | 4.6250 | | | | 02/15/33 | | | | 50,834 | |
| | | | | | | | | | | | | | | | 86,847 | |
| | | | | ELECTRIC UTILITIES — 1.1% | | | | | | | | | | | | |
| | | 135,000 | | American Electric Power Company, Inc. | | | 3.2000 | | | | 11/13/27 | | | | 130,654 | |
| | | 70,000 | | National Rural Utilities Cooperative Finance Corporation | | | 5.0500 | | | | 09/15/28 | | | | 72,260 | |
| | | 22,000 | | WEC Energy Group, Inc. | | | 3.5500 | | | | 06/15/25 | | | | 21,807 | |
| | | | | | | | | | | | | | | | 224,721 | |
| | | | | GAS & WATER UTILITIES — 0.7% | | | | | | | | | | | | |
| | | 130,000 | | NiSource, Inc. | | | 3.4900 | | | | 05/15/27 | | | | 127,692 | |
| | | | | | | | | | | | | | | | | |
| | | | | INSTITUTIONAL FINANCIAL SERVICES — 0.3% | | | | | | | | | | | | |
| | | 55,000 | | Cboe Global Markets, Inc. | | | 3.6500 | | | | 01/12/27 | | | | 54,392 | |
| | | | | | | | | | | | | | | | | |
| | | | | MACHINERY — 0.6% | | | | | | | | | | | | |
| | | 55,000 | | Caterpillar Financial Services Corporation | | | 4.3500 | | | | 05/15/26 | | | | 55,317 | |
| | | 55,000 | | John Deere Capital Corporation | | | 3.9000 | | | | 06/07/32 | | | | 53,576 | |
| | | | | | | | | | | | | | | | 108,893 | |
| | | | | METALS & MINING — 0.9% | | | | | | | | | | | | |
| | | 85,000 | | BHP Billiton Finance USA Ltd. | | | 5.2500 | | | | 09/08/33 | | | | 88,988 | |
| | | 70,000 | | Rio Tinto Finance USA plc | | | 5.0000 | | | | 03/09/33 | | | | 73,127 | |
| | | | | | | | | | | | | | | | 162,115 | |
| | | | | OIL & GAS PRODUCERS — 2.6% | | | | | | | | | | | | |
| | | 115,000 | | Columbia Pipelines Holding Company, LLC(b) | | | 6.0420 | | | | 08/15/28 | | | | 120,195 | |
| | | 70,000 | | Energy Transfer, L.P. | | | 5.7500 | | | | 02/15/33 | | | | 73,294 | |
| | | 120,000 | | Energy Transfer, L.P. | | | 6.2500 | | | | 04/15/49 | | | | 126,034 | |
| | | 70,000 | | Enterprise Products Operating, LLC | | | 5.3500 | | | | 01/31/33 | | | | 73,407 | |
| | | 115,000 | | Phillips 66 Company | | | 3.6050 | | | | 02/15/25 | | | | 114,357 | |
| | | | | | | | | | | | | | | | 507,287 | |
SCHEDULE OF INVESTMENTS
The accompanying notes are an integral part of these financial statements.
FINANCIAL STATEMENTS | 43
Growth & Income Fund
| | Principal
Amount ($) | | | | Coupon
Rate (%) | | | Maturity | | | Fair Value | |
| | | | | REAL ESTATE INVESTMENT TRUSTS — 1.1% | | | | | | | | | | | | |
| | | 95,000 | | Digital Realty Trust, L.P. | | | 3.7000 | | | | 08/15/27 | | | $ | 93,632 | |
| | | 120,000 | | Healthpeak Properties, Inc. | | | 3.5000 | | | | 07/15/29 | | | | 115,046 | |
| | | | | | | | | | | | | | | | 208,678 | |
| | | | | RETAIL - CONSUMER STAPLES — 0.5% | | | | | | | | | | | | |
| | | 95,000 | | Dollar General Corporation | | | 4.1250 | | | | 05/01/28 | | | | 93,687 | |
| | | | | | | | | | | | | | | | | |
| | | | | RETAIL - DISCRETIONARY — 0.6% | | | | | | | | | | | | |
| | | 110,000 | | Tractor Supply Company | | | 5.2500 | | | | 05/15/33 | | | | 114,376 | |
| | | | | | | | | | | | | | | | | |
| | | | | TRANSPORTATION & LOGISTICS — 0.9% | | | | | | | | | | | | |
| | | 55,000 | | Canadian Pacific Railway Company | | | 2.9000 | | | | 02/01/25 | | | | 54,599 | |
| | | 130,000 | | CSX Corporation | | | 3.2500 | | | | 06/01/27 | | | | 127,587 | |
| | | | | | | | | | | | | | | | 182,186 | |
| | | | | TOTAL CORPORATE BONDS (Cost $1,974,104) | | | | | | | | | | | 2,011,030 | |
| | | | | | | | | | | | | | | | | |
| NON U.S. GOVERNMENT & AGENCIES — 1.7% | | | |
| | | | | LOCAL AUTHORITY — 0.7% | | | | | | | | | | | | |
| | | 135,000 | | Province of Ontario, Canada | | | 2.5000 | | | | 04/27/26 | | | | 132,066 | |
| | | | | | | | | | | | | | | | | |
| | | | | SOVEREIGN — 1.0% | | | | | | | | | | | | |
| | | 200,000 | | Israel Government International Bond | | | 5.5000 | | | | 03/12/34 | | | | 200,516 | |
| | | | | | | | | | | | | | | | | |
| | | | | TOTAL NON U.S. GOVERNMENT & AGENCIES (Cost $324,957) | | | | | | | | | | | 332,582 | |
| | | | | | | | | | | | | | | | | |
| U.S. GOVERNMENT & AGENCIES — 36.5% | | | |
| | | | | AGENCY FIXED RATE — 15.0% | | | | | | | | | | | | |
| | | 97,595 | | Fannie Mae Pool FM5537 | | | 2.0000 | | | | 01/01/36 | | | | 89,927 | |
| | | 63,682 | | Fannie Mae Pool MA4316 | | | 2.5000 | | | | 04/01/36 | | | | 59,863 | |
| | | 18,992 | | Fannie Mae Pool MA4475 | | | 2.5000 | | | | 10/01/41 | | | | 17,158 | |
| | | 56,356 | | Fannie Mae Pool MA4617 | | | 3.0000 | | | | 04/01/42 | | | | 52,530 | |
| | | 42,946 | | Fannie Mae Pool FM4053 | | | 2.5000 | | | | 08/01/50 | | | | 37,662 | |
| | | 47,851 | | Fannie Mae Pool CA8897 | | | 3.0000 | | | | 02/01/51 | | | | 43,579 | |
| | | 6,880 | | Fannie Mae Pool MA4258 | | | 3.5000 | | | | 02/01/51 | | | | 6,465 | |
| | | 18,844 | | Fannie Mae Pool FM6550 | | | 2.0000 | | | | 03/01/51 | | | | 15,865 | |
| | | 35,553 | | Fannie Mae Pool CB0855 | | | 3.0000 | | | | 06/01/51 | | | | 32,240 | |
| | | 58,735 | | Fannie Mae Pool FS3744 | | | 2.0000 | | | | 07/01/51 | | | | 48,853 | |
| | | 93,986 | | Fannie Mae Pool FS1807 | | | 3.5000 | | | | 07/01/51 | | | | 88,648 | |
| | | 136,318 | | Fannie Mae Pool CB1384 | | | 2.5000 | | | | 08/01/51 | | | | 118,894 | |
| | | 30,387 | | Fannie Mae Pool BU1322 | | | 2.5000 | | | | 02/01/52 | | | | 26,425 | |
| | | 95,139 | | Fannie Mae Pool CB3486 | | | 3.5000 | | | | 05/01/52 | | | | 88,675 | |
SCHEDULE OF INVESTMENTS
The accompanying notes are an integral part of these financial statements.
FINANCIAL STATEMENTS | 44
Growth & Income Fund
| | Principal
Amount ($) | | | | Coupon
Rate (%) | | | Maturity | | | Fair Value | |
| | | | | AGENCY FIXED RATE — 15.0% (Continued) | | | | | | | | | | | | |
| | | 64,651 | | Fannie Mae Pool FS1704 | | | 4.0000 | | | | 05/01/52 | | | $ | 62,653 | |
| | | 89,290 | | Fannie Mae Pool FS3159 | | | 4.5000 | | | | 10/01/52 | | | | 88,346 | |
| | | 83,712 | | Fannie Mae Pool FS4075 | | | 5.0000 | | | | 04/01/53 | | | | 84,455 | |
| | | 94,388 | | Fannie Mae Pool FS5044 | | | 4.5000 | | | | 06/01/53 | | | | 93,947 | |
| | | 92,341 | | Fannie Mae Pool FS8291 | | | 5.5000 | | | | 07/01/53 | | | | 94,164 | |
| | | 95,415 | | Fannie Mae Pool CB7980 | | | 5.5000 | | | | 02/01/54 | | | | 97,192 | |
| | | 29,583 | | Fannie Mae Pool FS8138 | | | 6.5000 | | | | 06/01/54 | | | | 30,854 | |
| | | 43,638 | | Ginnie Mae I Pool 723248 | | | 5.0000 | | | | 10/15/39 | | | | 44,920 | |
| | | 44,654 | | Ginnie Mae I Pool 783403 | | | 3.5000 | | | | 09/15/41 | | | | 42,992 | |
| | | 39,550 | | Ginnie Mae II Pool MA3376 | | | 3.5000 | | | | 01/20/46 | | | | 37,680 | |
| | | 29,496 | | Ginnie Mae II Pool MA3596 | | | 3.0000 | | | | 04/20/46 | | | | 27,308 | |
| | | 25,180 | | Ginnie Mae II Pool MA3663 | | | 3.5000 | | | | 05/20/46 | | | | 23,974 | |
| | | 32,781 | | Ginnie Mae II Pool MA3736 | | | 3.5000 | | | | 06/20/46 | | | | 31,185 | |
| | | 11,150 | | Ginnie Mae II Pool MA4509 | | | 3.0000 | | | | 06/20/47 | | | | 10,275 | |
| | | 31,278 | | Ginnie Mae II Pool MA4652 | | | 3.5000 | | | | 08/20/47 | | | | 29,715 | |
| | | 29,463 | | Ginnie Mae II Pool MA4719 | | | 3.5000 | | | | 09/20/47 | | | | 27,920 | |
| | | 56,115 | | Ginnie Mae II Pool MA4778 | | | 3.5000 | | | | 10/20/47 | | | | 53,193 | |
| | | 21,221 | | Ginnie Mae II Pool MA6092 | | | 4.5000 | | | | 08/20/49 | | | | 21,100 | |
| | | 16,365 | | Ginnie Mae II Pool MA6156 | | | 4.5000 | | | | 09/20/49 | | | | 16,286 | |
| | | 41,683 | | Ginnie Mae II Pool BN2662 | | | 3.0000 | | | | 10/20/49 | | | | 38,073 | |
| | | 17,439 | | Ginnie Mae II Pool MA6221 | | | 4.5000 | | | | 10/20/49 | | | | 17,395 | |
| | | 15,488 | | Ginnie Mae II Pool MA6478 | | | 5.0000 | | | | 02/20/50 | | | | 15,755 | |
| | | 18,990 | | Ginnie Mae II Pool MA6544 | | | 4.5000 | | | | 03/20/50 | | | | 18,973 | |
| | | 12,313 | | Ginnie Mae II Pool MA6545 | | | 5.0000 | | | | 03/20/50 | | | | 12,526 | |
| | | 19,439 | | Ginnie Mae II Pool MA6600 | | | 3.5000 | | | | 04/20/50 | | | | 18,385 | |
| | | 17,619 | | Ginnie Mae II Pool MA6601 | | | 4.0000 | | | | 04/20/50 | | | | 17,203 | |
| | | 22,861 | | Ginnie Mae II Pool MA6603 | | | 5.0000 | | | | 04/20/50 | | | | 23,252 | |
| | | 43,326 | | Ginnie Mae II Pool MA7255 | | | 2.5000 | | | | 03/20/51 | | | | 38,225 | |
| | | 35,205 | | Ginnie Mae II Pool MA7418 | | | 2.5000 | | | | 06/20/51 | | | | 30,998 | |
| | | 103,113 | | Ginnie Mae II Pool MA7419 | | | 3.0000 | | | | 06/20/51 | | | | 94,182 | |
| | | 109,695 | | Ginnie Mae II Pool MA7472 | | | 2.5000 | | | | 07/20/51 | | | | 96,673 | |
| | | 100,286 | | Ginnie Mae II Pool CE1974 | | | 3.0000 | | | | 08/20/51 | | | | 92,575 | |
| | | 71,227 | | Ginnie Mae II Pool CE1990 | | | 2.5000 | | | | 09/20/51 | | | | 62,688 | |
| | | 124,656 | | Ginnie Mae II Pool MA7768 | | | 3.0000 | | | | 12/20/51 | | | | 113,741 | |
| | | 52,578 | | Ginnie Mae II Pool MA7829 | | | 3.5000 | | | | 01/20/52 | | | | 49,414 | |
| | | 68,611 | | Ginnie Mae II Pool MA7939 | | | 4.0000 | | | | 03/20/52 | | | | 66,309 | |
| | | 109,990 | | Ginnie Mae II Pool MA8800 | | | 5.0000 | | | | 04/20/53 | | | | 110,348 | |
| | | 118,587 | | Ginnie Mae II Pool MA8874 | | | 3.0000 | | | | 05/20/53 | | | | 108,583 | |
| | | 100,301 | | Ginnie Mae II Pool MA8943 | | | 3.0000 | | | | 06/20/53 | | | | 91,502 | |
| | | 97,135 | | Ginnie Mae II Pool MA9017 | | | 5.5000 | | | | 07/20/53 | | | | 98,136 | |
| | | | | | | | | | | | | | | | 2,859,879 | |
| | | | | | | | | | | | | | | | | |
SCHEDULE OF INVESTMENTS
The accompanying notes are an integral part of these financial statements.
FINANCIAL STATEMENTS | 45
Growth & Income Fund
| | Principal
Amount ($) | | | | Coupon
Rate (%) | | | Maturity | | | Fair Value | |
| | | | | U.S. TREASURY BILLS — 21.5% | | | | | | | | | | | | |
| | | 260,000 | | United States Treasury Note Series BL-2024 | | | 4.5000 | | | | 11/30/24 | | | $ | 259,898 | |
| | | 505,000 | | United States Treasury Note | | | 4.8750 | | | | 04/30/26 | | | | 513,660 | |
| | | 335,000 | | United States Treasury Note | | | 4.6250 | | | | 04/30/29 | | | | 349,604 | |
| | | 750,000 | | United States Treasury Note | | | 4.6250 | | | | 04/30/31 | | | | 791,689 | |
| | | 1,080,000 | | United States Treasury Note | | | 4.3750 | | | | 05/15/34 | | | | 1,129,781 | |
| | | 350,000 | | United States Treasury Note | | | 4.5000 | | | | 02/15/44 | | | | 364,766 | |
| | | 630,000 | | United States Treasury Note | | | 4.6250 | | | | 05/15/54 | | | | 682,369 | |
| | | | | | | | | | | | | | | | 4,091,767 | |
| | | | | TOTAL U.S. GOVERNMENT & AGENCIES (Cost $6,922,266) | | | | | | | | | | | 6,951,646 | |
| | Shares | | | | | | |
| SHORT-TERM INVESTMENTS — 0.9% | |
| | | | | MONEY MARKET FUNDS — 0.9% | | | | |
| | | 166,202 | | Fidelity Government Portfolio, Institutional Class, 4.84% (Cost $166,202)(c) | | | 166,202 | |
| | | | | | | | | |
| | | | | TOTAL INVESTMENTS — 99.7% (Cost $18,796,672) | | $ | 19,012,932 | |
| | | | | OTHER ASSETS IN EXCESS OF LIABILITIES — 0.3% | | | 55,429 | |
| | | | | NET ASSETS — 100.0% | | $ | 19,068,361 | |
ETF | Exchange-Traded Fund |
LLC | Limited Liability Company |
LP | Limited Partnership |
LTD | Limited Company |
PLC | Public Limited Company |
| | |
(a) | Investment in affiliate. |
(b) | Security exempt from registration under Rule 144A or Section 4(2) of the Securities Act of 1933. The security may be resold in transactions exempt from registration, normally to qualified institutional buyers. As of September 30, 2024 the total market value of 144A securities is 120,195 or 0.6% of net assets. |
(c) | Rate disclosed is the seven day effective yield as of September 30, 2024. |
SCHEDULE OF INVESTMENTS
The accompanying notes are an integral part of these financial statements.
FINANCIAL STATEMENTS | 46
Section 2 | Statements of Assets and Liabilities
SEPTEMBER 30, 2024
| | SMALL/MID CAP
GROWTH
FUND | | | INTERNATIONAL
FUND | | | LARGE/MID CAP
GROWTH
FUND | |
ASSETS: | | | | | | | | | | | | |
Investments, at cost | | $ | 58,763,241 | | | $ | 127,481,836 | | | $ | 138,214,729 | |
Investments in affiliates, at cost | | | — | | | | — | | | | 23,130,928 | |
Investments, at value | | $ | 73,918,325 | | | $ | 182,489,272 | | | $ | 191,234,512 | |
Investments in affiliates, at value | | | — | | | | — | | | | 25,541,560 | |
Cash | | | — | | | | — | | | | — | |
Dividends and interest receivable | | | 38,694 | | | | 243,909 | | | | 89,257 | |
Receivable for fund shares sold | | | 129,535 | | | | 46,073 | | | | 66,637 | |
Receivable for securities sold | | | — | | | | — | | | | — | |
Receivable for foreign tax reclaims | | | — | | | | 449,660 | | | | — | |
Prepaid expenses and other assets | | | 42,536 | | | | 19,333 | | | | 76,125 | |
Total Assets | | | 74,129,090 | | | | 183,248,247 | | | | 217,008,091 | |
| | | | | | | | | | | | |
LIABILITIES: | | | | | | | | | | | | |
Payable for securities purchased | | | 1,976,196 | | | | 221,500 | | | | — | |
Payable for fund shares redeemed | | | 42,387 | | | | 135,828 | | | | 221,767 | |
Payable to service providers | | | — | | | | 38,863 | | | | — | |
Accrued advisory fees | | | 42,894 | | | | 131,700 | | | | 123,174 | |
Accrued 12b-1 fees | | | 11,312 | | | | 12,986 | | | | 34,330 | |
Accrued expenses and other liabilities | | | 30,127 | | | | 62,390 | | | | 21,882 | |
Total Liabilities | | | 2,102,916 | | | | 603,267 | | | | 401,153 | |
| | | | | | | | | | | | | |
Net Assets | | $ | 72,026,174 | | | $ | 182,644,980 | | | $ | 216,606,938 | |
| | | | | | | | | | | | |
NET ASSETS CONSIST OF: | | | | | | | | | | | | |
Paid in capital ($0 par value, unlimited shares authorized) | | $ | 51,541,136 | | | $ | 129,043,769 | | | $ | 146,577,925 | |
Accumulated earnings (deficit) | | | 20,485,038 | | | | 53,601,211 | | | | 70,029,013 | |
Net Assets | | $ | 72,026,174 | | | $ | 182,644,980 | | | $ | 216,606,938 | |
| | | | | | | | | | | | |
Class A | | | | | | | | | | | | |
Net Assets | | $ | 45,753,763 | | | $ | 58,745,020 | | | $ | 132,331,846 | |
Shares of beneficial interest outstanding ($0 par value, unlimited shares authorized) | | | 3,438,865 | | | | 4,303,634 | | | | 9,893,783 | |
Net Asset Value, offering price and redemption price per share | | $ | 13.30 | | | $ | 13.65 | | | $ | 13.38 | |
Offering Price Per Share (NAV / 0.945) *(NAV / 0.955) | | $ | 14.07 | | | $ | 14.44 | | | $ | 14.15 | |
| | | | | | | | | | | | | |
Class C | | | | | | | | | | | | |
Net Assets | | $ | 3,003,908 | | | $ | 1,697,318 | | | $ | 10,312,250 | |
Shares of beneficial interest outstanding ($0 par value, unlimited shares authorized) | | | 309,677 | | | | 129,970 | | | | 1,093,674 | |
Net Asset Value, offering price and redemption price per share | | $ | 9.70 | | | $ | 13.06 | | | $ | 9.43 | |
Minimum Redemption Price Per Share (NAV * 0.99) | | $ | 9.60 | | | $ | 12.93 | | | $ | 9.34 | |
| | | | | | | | | | | | | |
Class I | | | | | | | | | | | | |
Net Assets | | $ | 23,268,503 | | | $ | 122,202,642 | | | $ | 73,962,842 | |
Shares of beneficial interest outstanding ($0 par value, unlimited shares authorized) | | | 1,687,398 | | | | 8,915,509 | | | | 5,325,965 | |
Net Asset Value, offering price and redemption price per share | | $ | 13.79 | | | $ | 13.71 | | | $ | 13.89 | |
STATEMENTS OF ASSETS LIABILITIES
The accompanying notes are an integral part of these financial statements.
FINANCIAL STATEMENTS | 47
| | SMALL CAP
VALUE
FUND | | | LARGE/MID CAP
VALUE
FUND | | | FIXED
INCOME
FUND | |
ASSETS: | | | | | | | | | | | | |
Investments, at cost | | $ | 155,454,064 | | | $ | 207,714,338 | | | $ | 115,239,812 | |
Investments in affiliates, at cost | | | 14,834,080 | | | | 54,059,654 | | | | — | |
Investments, at value | | $ | 173,319,472 | | | $ | 295,373,091 | | | $ | 114,074,283 | |
Investments in affiliates, at value | | | 22,571,396 | | | | 59,773,086 | | | | — | |
Cash | | | — | | | | — | | | | — | |
Dividends and interest receivable | | | 225,876 | | | | 118,175 | | | | 1,069,996 | |
Receivable for fund shares sold | | | 38,194 | | | | 76,355 | | | | 12,553 | |
Receivable for securities sold | | | — | | | | — | | | | — | |
Receivable for foreign tax reclaims | | | — | | | | — | | | | — | |
Prepaid expenses and other assets | | | 25,380 | | | | 56,016 | | | | 14,067 | |
Total Assets | | | 196,180,318 | | | | 355,396,723 | | | | 115,170,899 | |
| | | | | | | | | | | | |
LIABILITIES: | | | | | | | | | | | | |
Payable for securities purchased | | | — | | | | — | | | | — | |
Payable for fund shares redeemed | | | 103,031 | | | | 267,063 | | | | 37,806 | |
Payable to service providers | | | 27,552 | | | | 9,481 | | | | 14,249 | |
Accrued advisory fees | | | 114,243 | | | | 179,947 | | | | 39,811 | |
Accrued 12b-1 fees | | | 26,378 | | | | 50,049 | | | | 19,646 | |
Accrued expenses and other liabilities | | | 34,950 | | | | 32,309 | | | | 34,737 | |
Total Liabilities | | | 306,154 | | | | 538,849 | | | | 146,249 | |
| | | | | | | | | | | | | |
Net Assets | | $ | 195,874,164 | | | $ | 354,857,874 | | | $ | 115,024,650 | |
| | | | | | | | | | | | |
NET ASSETS CONSIST OF: | | | | | | | | | | | | |
Paid in capital ($0 par value, unlimited shares authorized) | | $ | 162,212,482 | | | $ | 229,554,733 | | | $ | 128,204,773 | |
Accumulated earnings (deficit) | | | 33,661,682 | | | | 125,303,141 | | | | (13,180,123 | ) |
Net Assets | | $ | 195,874,164 | | | $ | 354,857,874 | | | $ | 115,024,650 | |
| | | | | | | | | | | | |
STATEMENTS OF ASSETS LIABILITIES
The accompanying notes are an integral part of these financial statements.
FINANCIAL STATEMENTS | 48
| | SMALL CAP
VALUE
FUND | | | LARGE/MID CAP
VALUE
FUND | | | FIXED
INCOME
FUND | |
Class A | | | | | | | | | | | | |
Net Assets | | $ | 111,014,895 | | | $ | 199,553,769 | | | $ | 75,162,464 | |
Shares of beneficial interest outstanding ($0 par value, unlimited shares authorized) | | | 5,380,433 | | | | 7,681,563 | | | | 8,065,711 | |
Net Asset Value, offering price and redemption price per share | | $ | 20.63 | | | $ | 25.98 | | | $ | 9.32 | |
Offering Price Per Share (NAV / 0.945) *(NAV / 0.955) | | $ | 21.83 | | | $ | 27.49 | | | $ | 9.76 | * |
| | | | | | | | | | | | | |
Class C | | | | | | | | | | | | |
Net Assets | | $ | 5,265,865 | | | $ | 13,661,764 | | | $ | 5,860,012 | |
Shares of beneficial interest outstanding ($0 par value, unlimited shares authorized) | | | 433,573 | | | | 743,221 | | | | 656,945 | |
Net Asset Value, offering price and redemption price per share | | $ | 12.15 | | | $ | 18.38 | | | $ | 8.92 | |
Minimum Redemption Price Per Share (NAV * 0.99) | | $ | 12.03 | | | $ | 18.20 | | | $ | 8.83 | |
| | | | | | | | | | | | | |
Class I | | | | | | | | | | | | |
Net Assets | | $ | 79,593,404 | | | $ | 141,642,341 | | | $ | 34,002,174 | |
Shares of beneficial interest outstanding ($0 par value, unlimited shares authorized) | | | 3,780,302 | | | | 5,372,681 | | | | 3,685,343 | |
Net Asset Value, offering price and redemption price per share | | $ | 21.05 | | | $ | 26.36 | | | $ | 9.23 | |
(a) | The NAV shown above differs from the traded NAV on March 28, 2024 due to financial statement rounding and/or financial statement adjustments. |
STATEMENTS OF ASSETS LIABILITIES
The accompanying notes are an integral part of these financial statements.
FINANCIAL STATEMENTS | 49
| | HIGH YIELD
BOND
FUND | | | ISRAEL
COMMON
VALUES FUND | | | DEFENSIVE
STRATEGIES
FUND | |
ASSETS: | | | | | | | | | | | | |
Investments, at cost | | $ | 177,299,786 | | | $ | 56,422,738 | | | $ | 46,831,590 | |
Investments in affiliates, at cost | | | — | | | | — | | | | 15,212,535 | |
Investments, at value | | $ | 182,808,110 | | | $ | 100,073,477 | | | $ | 48,383,751 | |
Investments in affiliates, at value | | | — | | | | — | | | | 14,631,918 | |
Gold Investments, at fair value (Cost $7,240,876) | | | — | | | | — | | | | 16,175,060 | |
Cash | | | — | | | | — | | | | 983 | |
Foreign Cash (Cost $124,904, $11,014) | | | — | | | | — | | | | 128,007 | |
Dividends and interest receivable | | | 2,980,827 | | | | 117,678 | | | | 133,806 | |
Receivable for fund shares sold | | | 88,161 | | | | 33,465 | | | | 4,018 | |
Receivable for securities sold | | | — | | | | — | | | | 19,878 | |
Prepaid expenses and other assets | | | 40,663 | | | | 19,726 | | | | | |
Receivable for foreign tax reclaims | | | 185,917,761 | | | | 100,244,346 | | | | 79,477,421 | |
| | | | | | | | | | | | |
LIABILITIES: | | | | | | | | | | | | |
Payable for securities purchased | | | 2,916,537 | | | | — | | | | — | |
Payable for fund shares redeemed | | | 36,815 | | | | 72,028 | | | | 34,388 | |
Payable to service providers | | | — | | | | 27,019 | | | | 15,268 | |
Accrued advisory fees | | | 75,133 | | | | 79,356 | | | | 28,859 | |
Accrued 12b-1 fees | | | 14,973 | | | | 14,706 | | | | 8,656 | |
Accrued expenses and other liabilities | | | 41,271 | | | | 73,358 | | | | 59,647 | |
Total Liabilities | | | 3,084,729 | | | | 266,467 | | | | 146,818 | |
| | | | | | | | | | | | | |
Net Assets | | $ | 182,833,032 | | | $ | 99,977,879 | | | $ | 79,330,603 | |
| | | | | | | | | | | | |
NET ASSETS CONSIST OF: | | | | | | | | | | | | |
Paid in capital ($0 par value, unlimited shares authorized) | | $ | 189,947,998 | | | $ | 63,736,351 | | | $ | 68,150,832 | |
Accumulated earnings (deficit) | | | (7,114,966 | ) | | | 36,241,528 | | | | 11,179,771 | |
Net Assets | | $ | 182,833,032 | | | $ | 99,977,879 | | | $ | 79,330,603 | |
| | | | | | | | | | | | | |
STATEMENTS OF ASSETS LIABILITIES
The accompanying notes are an integral part of these financial statements.
FINANCIAL STATEMENTS | 50
| | HIGH YIELD
BOND
FUND | | | ISRAEL
COMMON
VALUES FUND | | | DEFENSIVE
STRATEGIES
FUND | |
Class A | | | | | | | | | | | | |
Net Assets | | $ | 64,380,673 | | | $ | 51,467,034 | | | $ | 43,177,632 | |
Shares of beneficial interest outstanding ($0 par value, unlimited shares authorized) | | | 7,114,134 | | | | 2,339,540 | | | | 2,938,897 | |
Net Asset Value, offering price and redemption price per share | | $ | 9.05 | | | $ | 22.00 | | | $ | 14.69 | |
Offering Price Per Share (NAV / 0.945) *(NAV / 0.955) | | $ | 9.48 | | | $ | 23.28 | | | $ | 15.54 | |
| | | | | | | | | | | | | |
Class C | | | | | | | | | | | | |
Net Assets | | $ | 2,469,157 | | | $ | 5,747,106 | | | $ | 3,259,290 | |
Shares of beneficial interest outstanding ($0 par value, unlimited shares authorized) | | | 267,472 | | | | 283,427 | | | | 236,580 | |
Net Asset Value, offering price and redemption price per share | | $ | 9.23 | | | $ | 20.28 | | | $ | 13.78 | |
Minimum Redemption Price Per Share (NAV * 0.99) | | $ | 9.14 | | | $ | 20.08 | | | $ | 13.64 | |
| | | | | | | | | | | | | |
Class I | | | | | | | | | | | | |
Net Assets | | $ | 115,983,202 | | | $ | 42,763,739 | | | $ | 32,893,681 | |
Shares of beneficial interest outstanding ($0 par value, unlimited shares authorized) | | | 12,807,516 | | | | 1,911,743 | | | | 2,234,117 | |
Net Asset Value, offering price and redemption price per share | | $ | 9.06 | | | $ | 22.37 | | | $ | 14.72 | |
STATEMENTS OF ASSETS LIABILITIES
The accompanying notes are an integral part of these financial statements.
FINANCIAL STATEMENTS | 51
| | STRATEGIC
GROWTH
FUND | | | CONSERVATIVE
GROWTH
FUND | | | GROWTH &
INCOME
FUND | |
ASSETS: | | | | | | | | | | | | |
Investments, at cost | | $ | 720,121 | | | $ | 960,121 | | | $ | 9,387,529 | |
Investments in affiliates, at cost | | | 30,876,731 | | | | 37,021,613 | | | | 9,409,143 | |
Investments, at value | | $ | 720,121 | | | $ | 960,121 | | | $ | 9,461,460 | |
Investments in affiliates, at value | | | 33,076,648 | | | | 37,602,589 | | | | 9,551,472 | |
Gold Investments, at fair value (Cost $7,240,876) | | | — | | | | — | | | | — | |
Cash | | | — | | | | — | | | | — | |
Foreign Cash (Cost $124,904, $11,014) | | | — | | | | — | | | | — | |
Dividends and interest receivable | | | 3,464 | | | | 4,303 | | | | 100,099 | |
Receivable for fund shares sold | | | 3,866 | | | | 971 | | | | 1,596 | |
Receivable for securities sold | | | — | | | | — | | | | — | |
Prepaid expenses and other assets | | | 12,902 | | | | 21,929 | | | | 16,282 | |
Receivable for foreign tax reclaims | | | 33,817,001 | | | | 38,589,913 | | | | 19,130,909 | |
| | | | | | | | | | | | |
LIABILITIES: | | | | | | | | | | | | |
Payable for securities purchased | | | — | | | | — | | | | — | |
Payable for fund shares redeemed | | | 512 | | | | 376 | | | | 12,271 | |
Payable to service providers | | | 11,318 | | | | 16,866 | | | | — | |
Accrued advisory fees | | | 4,106 | | | | 4,539 | | | | 5,441 | |
Accrued 12b-1 fees | | | 7,119 | | | | 8,640 | | | | 3,826 | |
Accrued expenses and other liabilities | | | 36,283 | | | | 40,775 | | | | 41,010 | |
Total Liabilities | | | 59,338 | | | | 71,196 | | | | 62,548 | |
| | | | | | | | | | | | | |
Net Assets | | $ | 33,757,663 | | | $ | 38,518,717 | | | $ | 19,068,361 | |
| | | | | | | | | | | | |
NET ASSETS CONSIST OF: | | | | | | | | | | | | |
Paid in capital ($0 par value, unlimited shares authorized) | | $ | 30,547,412 | | | $ | 36,979,639 | | | $ | 19,013,922 | |
Accumulated earnings (deficit) | | | 3,210,251 | | | | 1,539,078 | | | | 54,439 | |
Net Assets | | $ | 33,757,663 | | | $ | 38,518,717 | | | $ | 19,068,361 | |
| | | | | | | | | | | | | |
STATEMENTS OF ASSETS LIABILITIES
The accompanying notes are an integral part of these financial statements.
FINANCIAL STATEMENTS | 52
| | STRATEGIC
GROWTH
FUND | | | CONSERVATIVE
GROWTH
FUND | | | GROWTH &
INCOME
FUND | |
Class A | | | | | | | | | | | | |
Net Assets | | $ | 31,768,604 | | | $ | 35,489,897 | | | $ | 14,226,331 | |
Shares of beneficial interest outstanding ($0 par value, unlimited shares authorized) | | | 3,133,192 | | | | 3,298,794 | | | | 1,295,463 | |
Net Asset Value, offering price and redemption price per share | | $ | 10.14 | | | $ | 10.76 | | | $ | 10.98 | |
Offering Price Per Share (NAV / 0.945) *(NAV / 0.955) | | $ | 10.73 | | | $ | 11.39 | | | $ | 11.62 | |
| | | | | | | | | | | | | |
Class C | | | | | | | | | | | | |
Net Assets | | $ | 1,971,170 | | | $ | 2,897,515 | | | $ | 1,138,772 | |
Shares of beneficial interest outstanding ($0 par value, unlimited shares authorized) | | | 228,508 | | | | 311,260 | | | | 108,280 | |
Net Asset Value, offering price and redemption price per share | | $ | 8.63 | | | $ | 9.31 | | | $ | 10.52 | |
Minimum Redemption Price Per Share (NAV * 0.99) | | $ | 8.54 | | | $ | 9.22 | | | $ | 10.41 | |
| | | | | | | | | | | | | |
Class I | | | | | | | | | | | | |
Net Assets | | $ | 17,889 | | | $ | 131,305 | | | $ | 3,703,258 | |
Shares of beneficial interest outstanding ($0 par value, unlimited shares authorized) | | | 1,762 | | | | 12,223 | | | | 334,487 | |
Net Asset Value, offering price and redemption price per share | | $ | 10.15 | | | $ | 10.74 | | | $ | 11.07 | |
STATEMENTS OF ASSETS LIABILITIES
The accompanying notes are an integral part of these financial statements.
FINANCIAL STATEMENTS | 53
Section 3 | Statements of Operations
FOR THE YEAR ENDED SEPTEMBER 30, 2024
| | SMALL/MID CAP
GROWTH
FUND | | | INTERNATIONAL
FUND | | | LARGE/MID CAP
GROWTH
FUND | |
Investment Income: | | | | | | | | | | | | |
Interest income | | $ | 181,561 | | | $ | 287,450 | | | $ | 475,518 | |
Dividend Income | | | 431,270 | | | | 4,074,467 | | | | 1,447,835 | |
Dividend income from affiliated investments | | | — | | | | — | | | | 244,214 | |
Foreign tax withheld | | | (30 | ) | | | (698,623 | ) | | | (8,650 | ) |
Total Investment Income | | | 612,801 | | | | 3,663,294 | | | | 2,158,917 | |
| | | | | | | | | | | | |
Operating Expenses: | | | | | | | | | | | | |
Investment advisory fees | | | 535,325 | | | | 1,701,701 | | | | 1,559,963 | |
12b-1 Fees: | | | | | | | | | | | | |
Class A | | | 97,997 | | | | 141,268 | | | | 289,874 | |
Class C | | | 26,377 | | | | 17,088 | | | | 97,915 | |
Administration fees | | | 124,458 | | | | 337,110 | | | | 299,370 | |
Registration fees | | | 46,920 | | | | 62,598 | | | | 55,200 | |
Non 12b-1 shareholder service fees | | | 37,098 | | | | 181,200 | | | | 105,036 | |
Printing expenses | | | 34,299 | | | | 34,357 | | | | 22,971 | |
Audit fees | | | 18,408 | | | | 16,572 | | | | 17,466 | |
Custody fees | | | 16,860 | | | | 38,370 | | | | 28,500 | |
Trustees’ fees | | | 5,508 | | | | 11,256 | | | | 10,236 | |
Legal fees | | | 4,158 | | | | 7,680 | | | | 7,164 | |
Compliance officer fees | | | 2,112 | | | | 15,366 | | | | 13,590 | |
Insurance expenses | | | 732 | | | | 5,172 | | | | 2,568 | |
Miscellaneous expenses | | | 10,212 | | | | 5,586 | | | | 11,400 | |
Total Operating Expenses | | | 960,464 | | | | 2,575,324 | | | | 2,521,253 | |
Less: Expenses waived by Advisor for Affiliated Holdings | | | — | | | | — | | | | (183,843 | ) |
Less: Expenses waived by Advisor | | | (62,979 | ) | | | (142,123 | ) | | | (80,948 | ) |
Net Operating Expenses | | | 897,485 | | | | 2,433,201 | | | | 2,256,462 | |
| | | | | | | | | | | | |
Net Investment Income (Loss) | | | (284,684 | ) | | | 1,230,093 | | | | (97,545 | ) |
| | | | | | | | | | | | |
Realized and Unrealized Gain (Loss) on Investments: | | | | | | | | | | | | |
Net realized gain (loss) on | | | | | | | | | | | | |
investments | | | 7,994,387 | | | | (257,817 | ) | | | 15,357,465 | |
foreign currency transactions | | | — | | | | (311 | ) | | | (204 | ) |
and affiliated investments | | | — | | | | — | | | | 1,569,717 | |
Capital gain dividends from REITS | | | 27,395 | | | | — | | | | 35,373 | |
Net change in unrealized appreciation (depreciation) on investments | | | 11,837,127 | | | | 39,630,361 | | | | 35,054,483 | |
affiliated investments | | | — | | | | — | | | | 3,046,942 | |
and foreign currency translations | | | — | | | | 437 | | | | 19 | |
Net Realized and Unrealized Gain (Loss) on Investments | | | 19,858,909 | | | | 39,372,670 | | | | 55,063,795 | |
| | | | | | | | | | | | |
Net Increase (Decrease) in Net Assets Resulting From Operations | | $ | 19,574,225 | | | $ | 40,602,763 | | | $ | 54,966,250 | |
STATEMENTS OF OPERATIONS
The accompanying notes are an integral part of these financial statements.
FINANCIAL STATEMENTS | 54
| | SMALL CAP
VALUE
FUND | | | LARGE/MID CAP
VALUE
FUND | | | FIXED
INCOME
FUND | |
Investment Income: | | | | | | | | | | | | |
Interest income | | $ | 136,729 | | | $ | 836,955 | | | $ | 4,388,990 | |
Dividend Income | | | 3,032,324 | | | | 3,903,530 | | | | — | |
Dividend income from affiliated investments | | | 238,132 | | | | 916,818 | | | | — | |
Foreign tax withheld | | | (3,673 | ) | | | (6,818 | ) | | | — | |
Total Investment Income | | | 3,403,512 | | | | 5,650,485 | | | | 4,388,990 | |
| | | | | | | | | | | | |
Operating Expenses: | | | | | | | | | | | | |
Investment advisory fees | | | 1,541,489 | | | | 2,712,714 | | | | 670,319 | |
12b-1 Fees: | | | | | | | | | | | | |
Class A | | | 262,002 | | | | 457,016 | | | | 184,409 | |
Class C | | | 57,285 | | | | 138,286 | | | | 64,602 | |
Administration fees | | | 355,116 | | | | 571,980 | | | | 229,410 | |
Registration fees | | | 61,560 | | | | 64,710 | | | | 55,350 | |
Non 12b-1 shareholder service fees | | | 109,230 | | | | 200,520 | | | | 92,904 | |
Printing expenses | | | 38,192 | | | | 29,172 | | | | 19,554 | |
Audit fees | | | 18,324 | | | | 17,970 | | | | 16,674 | |
Custody fees | | | 36,336 | | | | 54,696 | | | | 21,996 | |
Trustees’ fees | | | 11,484 | | | | 18,426 | | | | 7,536 | |
Legal fees | | | 7,140 | | | | 13,044 | | | | 4,740 | |
Compliance officer fees | | | 17,970 | | | | 26,172 | | | | 9,756 | |
Insurance expenses | | | 3,612 | | | | 7,032 | | | | 3,660 | |
Miscellaneous expenses | | | 11,352 | | | | 7,230 | | | | 3,120 | |
Total Operating Expenses | | | 2,531,092 | | | | 4,318,968 | | | | 1,384,030 | |
Less: Expenses waived by Advisor for Affiliated Holdings | | | (161,998 | ) | | | (405,105 | ) | | | — | |
Less: Expenses waived by Advisor | | | (81,147 | ) | | | (271,483 | ) | | | (223,440 | ) |
Net Operating Expenses | | | 2,287,947 | | | | 3,642,380 | | | | 1,160,590 | |
| | | | | | | | | | | | |
Net Investment Income (Loss) | | | 1,115,565 | | | | 2,008,105 | | | | 3,228,400 | |
| | | | | | | | | | | | |
Realized and Unrealized Gain (Loss) on Investments: | | | | | | | | | | | | |
Net realized gain (loss) on | | | | | | | | | | | | |
investments | | | 10,692,130 | | | | 29,156,537 | | | | (3,523,451 | ) |
foreign currency transactions | | | 4 | | | | — | | | | — | |
and affiliated investments | | | — | | | | 5,038,880 | | | | — | |
Capital gain dividends from REITS | | | 230,951 | | | | 11,394 | | | | | |
Net change in unrealized appreciation (depreciation) on investments | | | 22,655,129 | | | | 38,200,467 | | | | 11,218,868 | |
affiliated investments | | | 4,603,460 | | | | 5,432,155 | | | | — | |
and foreign currency translations | | | — | | | | — | | | | — | |
Net Realized and Unrealized Gain (Loss) on Investments | | | 38,181,674 | | | | 77,839,433 | | | | 7,695,417 | |
| | | | | | | | | | | | |
Net Increase (Decrease) in Net Assets Resulting From Operations | | $ | 39,297,239 | | | $ | 79,847,538 | | | $ | 10,923,817 | |
STATEMENTS OF OPERATIONS
The accompanying notes are an integral part of these financial statements.
FINANCIAL STATEMENTS | 55
| | HIGH YIELD
BOND
FUND | | | ISRAEL
COMMON
VALUES FUND | | | DEFENSIVE
STRATEGIES
FUND | |
Investment Income: | | | | | | | | | | | | |
Interest income | | $ | 12,394,456 | | | $ | 118,350 | | | $ | 580,311 | |
Dividend Income | | | — | | | | 3,162,685 | | | | 815,460 | |
Dividend income from affiliated investments | | | — | | | | — | | | | 889,483 | |
Foreign tax withheld | | | — | | | | (771,618 | ) | | | (37,938 | ) |
Total Investment Income | | | 12,394,456 | | | | 2,509,417 | | | | 2,247,316 | |
| | | | | | | | | | | | |
Operating Expenses: | | | | | | | | | | | | |
Investment advisory fees | | | 1,058,899 | | | | 979,623 | | | | 447,666 | |
12b-1 fees: | | | | | | | | | | | | |
Class A | | | 155,504 | | | | 122,555 | | | | 103,837 | |
Class C | | | 24,013 | | | | 62,580 | | | | 33,296 | |
Administration fees | | | 341,397 | | | | 211,275 | | | | 167,715 | |
Non 12b-1 shareholder service fees | | | 150,990 | | | | 88,485 | | | | 46,968 | |
Registration fees | | | 71,010 | | | | 49,470 | | | | 44,847 | |
Printing expenses | | | 44,748 | | | | 20,736 | | | | 19,914 | |
Custody fees | | | 25,230 | | | | 92,277 | | | | 52,665 | |
Audit fees | | | 16,872 | | | | 16,785 | | | | 18,600 | |
Trustees’ fees | | | 15,015 | | | | 11,400 | | | | 6,495 | |
Compliance officer fees | | | 12,807 | | | | 4,539 | | | | 3,225 | |
Legal fees | | | 8,400 | | | | 9,000 | | | | 3,942 | |
Insurance expenses | | | 3,594 | | | | 2,361 | | | | 2,001 | |
Miscellaneous expenses | | | 1,998 | | | | 5,223 | | | | 5,652 | |
Total Operating Expenses | | | 1,930,477 | | | | 1,676,309 | | | | 956,823 | |
Less: Expenses waived by Advisor for Affiliated Holdings | | | — | | | | — | | | | (80,032 | ) |
Less: Expenses waived by Advisor | | | (176,483 | ) | | | — | | | | (37,305 | ) |
Net Operating Expenses | | | 1,753,994 | | | | 1,676,309 | | | | 839,486 | |
| | | | | | | | | | | | | |
Net Investment Income (Loss) | | | 10,640,462 | | | | 833,108 | | | | 1,407,830 | |
| | | | | | | | | | | | |
Realized and Unrealized Gain (Loss) on Investments: | | | | | | | | | | | | |
Net realized gain (loss) on | | | | | | | | | | | | |
investments | | | (4,306,843 | ) | | | (1,331,910 | ) | | | 253,250 | |
foreign currency transactions | | | — | | | | (25,359 | ) | | | (10,174 | ) |
and affiliated investments | | | — | | | | — | | | | — | |
Capital gain distributions from affiliated funds | | | | | | | | | | | 375,501 | |
Capital gain dividends from REITS | | | — | | | | — | | | | 77,654 | |
Net change in unrealized appreciation (depreciation) on investments | | | 18,123,363 | | | | 13,541,137 | | | | 4,887,512 | |
affiliated investments | | | — | | | | — | | | | (738,728 | ) |
alternative investments | | | — | | | | — | | | | 4,813,988 | |
and foreign currency translations | | | — | | | | (3 | ) | | | 7,769 | |
Net Realized and Unrealized Gain (Loss) on Investments | | | 13,816,520 | | | | 12,183,865 | | | | 9,666,772 | |
| | | | | | | | | | | | |
Net Increase (Decrease) in Net Assets Resulting From Operations | | $ | 24,456,982 | | | $ | 13,016,973 | | | $ | 11,074,602 | |
STATEMENTS OF OPERATIONS
The accompanying notes are an integral part of these financial statements.
FINANCIAL STATEMENTS | 56
| | STRATEGIC
GROWTH
FUND | | | CONSERVATIVE
GROWTH
FUND | | | GROWTH &
INCOME
FUND | |
Investment Income: | | | | | | | | | | | | |
Interest income | | $ | 32,222 | | | $ | 37,322 | | | $ | 428,865 | |
Dividend Income | | | — | | | | — | | | | — | |
Dividend income from affiliated investments | | | 910,172 | | | | 1,102,639 | | | | 194,082 | |
Foreign tax withheld | | | — | | | | — | | | | — | |
Total Investment Income | | | 942,394 | | | | 1,139,961 | | | | 622,947 | |
| | | | | | | | | | | | |
Operating Expenses: | | | | | | | | | | | | |
Investment advisory fees | | | 49,623 | | | | 56,692 | | | | 141,492 | |
12b-1 fees: | | | | | | | | | | | | |
Class A | | | 77,144 | | | | 87,014 | | | | 33,754 | |
Class C | | | 16,645 | | | | 22,928 | | | | 13,022 | |
Administration fees | | | 85,035 | | | | 94,077 | | | | 75,420 | |
Non 12b-1 shareholder service fees | | | 11,004 | | | | 4,974 | | | | 13,512 | |
Registration fees | | | 16,830 | | | | 32,595 | | | | 31,185 | |
Printing expenses | | | 13,695 | | | | 17,097 | | | | 7,656 | |
Custody fees | | | 5,334 | | | | 10,289 | | | | 10,650 | |
Audit fees | | | 18,579 | | | | 18,585 | | | | 18,483 | |
Trustees’ fees | | | 2,580 | | | | 1,134 | | | | 1,503 | |
Compliance officer fees | | | 2,655 | | | | 4,236 | | | | 6,903 | |
Legal fees | | | 3,780 | | | | 4,470 | | | | 3,213 | |
Insurance expenses | | | 366 | | | | 366 | | | | 516 | |
Miscellaneous expenses | | | 1,851 | | | | 2,655 | | | | 3,648 | |
Total Operating Expenses | | | 305,121 | | | | 357,112 | | | | 360,957 | |
Less: Expenses waived by Advisor for Affiliated Holdings | | | — | | | | — | | | | (57,547 | ) |
Less: Expenses waived by Advisor | | | — | | | | — | | | | (14,814 | ) |
Net Operating Expenses | | | 305,121 | | | | 357,112 | | | | 288,596 | |
| | | | | | | | | | | | | |
Net Investment Income (Loss) | | | 637,273 | | | | 782,849 | | | | 334,351 | |
| | | | | | | | | | | | |
Realized and Unrealized Gain (Loss) on Investments: | | | | | | | | | | | | |
Net realized gain (loss) on | | | | | | | | | | | | |
investments | | | — | | | | — | | | | (301,621 | ) |
foreign currency transactions | | | — | | | | — | | | | — | |
and affiliated investments | | | 370,188 | | | | 216,684 | | | | 325,463 | |
Capital gain distribution from affiliated funds | | | 124,146 | | | | 147,113 | | | | | |
Net change in unrealized appreciation (depreciation) on investments | | | — | | | | — | | | | 914,629 | |
affiliated investments | | | 4,111,426 | | | | 4,036,348 | | | | 1,005,875 | |
alternative investments | | | — | | | | — | | | | — | |
and foreign currency translations | | | — | | | | — | | | | — | |
Net Realized and Unrealized Gain (Loss) on Investments | | | 4,605,760 | | | | 4,400,145 | | | | 1,944,346 | |
| | | | | | | | | | | | |
Net Increase (Decrease) in Net Assets Resulting From Operations | | $ | 5,243,033 | | | $ | 5,182,994 | | | $ | 2,278,697 | |
STATEMENTS OF OPERATIONS
The accompanying notes are an integral part of these financial statements.
FINANCIAL STATEMENTS | 57
Section 4 | Statements of Changes in Net Assets
| | Small/Mid Cap Growth Fund | | | International Fund | |
| | Year Ended
September 30,
2024 | | | Year Ended
September 30,
2023 | | | Year Ended
September 30,
2024 | | | Year Ended
September 30,
2023 | |
Operations: | | | | | | | | | | | | | | | | |
Net investment income (loss) | | $ | (284,684 | ) | | $ | (116,118 | ) | | $ | 1,230,093 | | | $ | 1,436,566 | |
Net realized gain (loss) from investments and foreign currency transactions | | | 7,994,387 | | | | 2,576,672 | | | | (258,128 | ) | | | 1,463,898 | |
Capital gain dividends from REITs | | | 27,395 | | | | — | | | | — | | | | — | |
Net change in unrealized appreciation (depreciation) on investments, affiliated investments and foreign currency translations | | | 11,837,127 | | | | 3,442,018 | | | | 39,630,798 | | | | 19,302,713 | |
Net increase (decrease) in net assets resulting from operations | | | 19,574,225 | | | | 5,902,572 | | | | 40,602,763 | | | | 22,203,177 | |
| | | | | | | | | | | | | | | | | |
Distributions to Shareholders: | | | | | | | | | | | | | | | | |
Total distributions paid | | | | | | | | | | | | | | | | |
Class A | | | (1,126,332 | ) | | | (886,181 | ) | | | (594,610 | ) | | | (242,141 | ) |
Class C | | | (96,042 | ) | | | (91,155 | ) | | | (3,064 | ) | | | — | |
Class I | | | (626,048 | ) | | | (146,597 | ) | | | (1,373,863 | ) | | | (572,599 | ) |
Total dividends and distributions to shareholders | | | (1,848,422 | ) | | | (1,123,933 | ) | | | (1,971,537 | ) | | | (814,740 | ) |
| | | | | | | | | | | | | | | | | |
Share Transactions of Beneficial Interest: | | | | | | | | | | | | | | | | |
Net proceeds from shares sold | | | | | | | | | | | | | | | | |
Class A | | | 6,898,652 | | | | 4,490,305 | | | | 4,816,314 | | | | 14,838,545 | |
Class C | | | 674,611 | | | | 462,776 | | | | 282,903 | | | | 478,792 | |
Class I | | | 64,434,899 | | | | 20,983,945 | | | | 41,113,777 | | | | 51,222,061 | |
Reinvestment of dividends and distributions | | | | | | | | | | | | | | | | |
Class A | | | 1,088,816 | | | | 854,542 | | | | 533,705 | | | | 203,371 | |
Class C | | | 95,775 | | | | 90,051 | | | | 3,038 | | | | — | |
Class I | | | 600,916 | | | | 135,571 | | | | 1,085,333 | | | | 405,754 | |
Cost of shares redeemed | | | | | | | | | | | | | | | | |
Class A | | | (6,781,266 | ) | | | (5,273,576 | ) | | | (17,274,527 | ) | | | (11,132,405 | ) |
Class C | | | (1,028,052 | ) | | | (497,386 | ) | | | (821,750 | ) | | | (402,666 | ) |
Class I | | | (54,058,453 | ) | | | (18,368,393 | ) | | | (48,184,909 | ) | | | (31,128,361 | ) |
Net increase (decrease) in net assets from share transactions of beneficial interest | | | 11,925,898 | | | | 2,877,835 | | | | (18,446,116 | ) | | | 24,485,091 | |
| | | | | | | | | | | | | | | | | |
Total Increase (Decrease) in Net Assets | | | 29,651,701 | | | | 7,656,474 | | | | 20,185,110 | | | | 45,873,528 | |
| | | | | | | | | | | | | | | | | |
Net Assets: | | | | | | | | | | | | | | | | |
Beginning of year | | | 42,374,473 | | | | 34,717,999 | | | | 162,459,870 | | | | 116,586,342 | |
End of year | | $ | 72,026,174 | | | $ | 42,374,473 | | | $ | 182,644,980 | | | $ | 162,459,870 | |
| | | | | | | | | | | | | | | | | |
Share Activity: | | | | | | | | | | | | | | | | |
Shares Sold | | | | | | | | | | | | | | | | |
Class A | | | 587,191 | | | | 474,340 | | | | 395,030 | | | | 1,334,490 | |
Class C | | | 77,073 | | | | 65,331 | | | | 24,076 | | | | 46,285 | |
Class I | | | 5,379,082 | | | | 1,996,454 | | | | 3,337,117 | | | | 4,641,314 | |
Shares Reinvested | | | | | | | | | | | | | | | | |
Class A | | | 106,642 | | | | 94,113 | | | | 46,330 | | | | 18,972 | |
Class C | | | 12,787 | | | | 13,261 | | | | 274 | | | | — | |
Class I | | | 56,905 | | | | 14,484 | | | | 93,968 | | | | 37,780 | |
Shares Redeemed | | | | | | | | | | | | | | | | |
Class A | | | (590,220 | ) | | | (556,670 | ) | | | (1,452,813 | ) | | | (1,010,574 | ) |
Class C | | | (125,328 | ) | | | (71,344 | ) | | | (71,406 | ) | | | (39,228 | ) |
Class I | | | (4,537,151 | ) | | | (1,751,336 | ) | | | (3,926,664 | ) | | | (2,835,781 | ) |
Net increase (decrease) in shares of beneficial interest outstanding | | | 966,981 | | | | 278,633 | | | | (1,554,088 | ) | | | 2,193,258 | |
STATEMENTS OF CHANGES IN NET ASSETS
The accompanying notes are an integral part of these financial statements.
FINANCIAL STATEMENTS | 58
| | Large/Mid Cap Growth Fund | | | Small Cap Value Fund | |
| | Year Ended
September 30,
2024 | | | Year Ended
September 30,
2023 | | | Year Ended
September 30,
2024 | | | Year Ended
September 30,
2023 | |
Operations: | | | | | | | | | | | | | | | | |
Net investment income (loss) | | $ | (97,545 | ) | | $ | 94,000 | | | $ | 1,115,565 | | | $ | 1,538,443 | |
Net realized gain (loss) from investments and foreign currency transactions | | | 16,926,978 | | | | 11,756,034 | | | | 10,692,134 | | | | 4,566,242 | |
Capital gain dividends from REITs | | | 35,373 | | | | — | | | | 230,951 | | | | 185,673 | |
Net change in unrealized appreciation (depreciation) on investments, affiliated investments and foreign currency translations | | | 38,101,444 | | | | 9,400,500 | | | | 27,258,589 | | | | 14,224,369 | |
Net increase (decrease) in net assets resulting from operations | | | 54,966,250 | | | | 21,250,534 | | | | 39,297,239 | | | | 20,514,727 | |
| | | | | | | | | | | | | | | | | |
Distributions to Shareholders: | | | | | | | | | | | | | | | | |
Total distributions paid | | | | | | | | | | | | | | | | |
Class A | | | (6,001,965 | ) | | | (8,357,597 | ) | | | (4,172,819 | ) | | | (6,249,977 | ) |
Class C | | | (726,774 | ) | | | (1,163,353 | ) | | | (338,255 | ) | | | (616,255 | ) |
Class I | | | (2,852,544 | ) | | | (2,198,299 | ) | | | (2,830,140 | ) | | | (3,302,915 | ) |
Total dividends and distributions to shareholders | | | (9,581,283 | ) | | | (11,719,249 | ) | | | (7,341,214 | ) | | | (10,169,147 | ) |
| | | | | | | | | | | | | | | | | |
Share Transactions of Beneficial Interest: | | | | | | | | | | | | | | | | |
Net proceeds from shares sold | | | | | | | | | | | | | | | | |
Class A | | | 20,939,680 | | | | 12,086,420 | | | | 8,260,717 | | | | 7,002,628 | |
Class C | | | 1,521,435 | | | | 1,454,167 | | | | 740,974 | | | | 1,199,547 | |
Class I | | | 38,577,219 | | | | 28,650,628 | | | | 28,458,185 | | | | 38,632,157 | |
Reinvestment of dividends and distributions | | | | | | | | | | | | | | | | |
Class A | | | 5,826,879 | | | | 8,050,811 | | | | 4,069,229 | | | | 6,022,122 | |
Class C | | | 712,715 | | | | 1,134,944 | | | | 330,170 | | | | 600,778 | |
Class I | | | 2,617,058 | | | | 2,010,936 | | | | 2,697,660 | | | | 3,083,981 | |
Cost of shares redeemed | | | | | | | | | | | | | | | | |
Class A | | | (17,293,754 | ) | | | (15,511,902 | ) | | | (16,523,668 | ) | | | (11,829,855 | ) |
Class C | | | (3,905,905 | ) | | | (1,702,208 | ) | | | (3,193,778 | ) | | | (1,248,875 | ) |
Class I | | | (26,810,225 | ) | | | (9,838,117 | ) | | | (31,464,693 | ) | | | (23,468,305 | ) |
Net increase (decrease) in net assets from share transactions of beneficial interest | | | 22,185,102 | | | | 26,335,679 | | | | (6,625,204 | ) | | | 19,994,178 | |
| | | | | | | | | | | | | | | | | |
Total Increase (Decrease) in Net Assets | | | 67,570,069 | | | | 35,866,964 | | | | 25,330,821 | | | | 30,339,758 | |
| | | | | | | | | | | | | | | | | |
Net Assets: | | | | | | | | | | | | | | | | |
Beginning of year | | | 149,036,869 | | | | 113,169,905 | | | | 170,543,343 | | | | 140,203,585 | |
End of year | | $ | 216,606,938 | | | $ | 149,036,869 | | | $ | 195,874,164 | | | $ | 170,543,343 | |
| | | | | | | | | | | | | | | | | |
Share Activity: | | | | | | | | | | | | | | | | |
Shares Sold | | | | | | | | | | | | | | | | |
Class A | | | 1,760,356 | | | | 1,171,671 | | | | 437,992 | | | | 397,289 | |
Class C | | | 178,914 | | | | 190,058 | | | | 66,947 | | | | 109,728 | |
Class I | | | 3,098,822 | | | | 2,695,519 | | | | 1,498,733 | | | | 2,113,130 | |
Shares Reinvested | | | | | | | | | | | | | | | | |
Class A | | | 543,555 | | | | 812,395 | | | | 227,968 | | | | 343,925 | |
Class C | | | 93,778 | | | | 156,544 | | | | 31,236 | | | | 56,358 | |
Class I | | | 235,559 | | | | 196,572 | | | | 148,468 | | | | 173,063 | |
Shares Redeemed | | | | | | | | | | | | | | | | |
Class A | | | (1,436,887 | ) | | | (1,515,394 | ) | | | (878,265 | ) | | | (670,732 | ) |
Class C | | | (472,074 | ) | | | (227,260 | ) | | | (285,035 | ) | | | (116,914 | ) |
Class I | | | (2,191,203 | ) | | | (919,747 | ) | | | (1,671,044 | ) | | | (1,322,793 | ) |
Net increase (decrease) in shares of beneficial interest outstanding | | | 1,810,820 | | | | 2,560,358 | | | | (423,000 | ) | | | 1,083,054 | |
STATEMENTS OF CHANGES IN NET ASSETS
The accompanying notes are an integral part of these financial statements.
FINANCIAL STATEMENTS | 59
| | Large/Mid Cap Value Fund | | | Fixed Income Fund | |
| | Year Ended
September 30,
2024 | | | Year Ended
September 30,
2023 | | | Year Ended
September 30,
2024 | | | Year Ended
September 30,
2023 | |
Operations: | | | | | | | | | | | | | | | | |
Net investment income (loss) | | $ | 2,008,105 | | | $ | 1,705,615 | | | $ | 3,228,400 | | | $ | 2,221,452 | |
Net realized gain (loss) from investments and foreign currency transactions | | | 34,195,417 | | | | 997,909 | | | | (3,523,451 | ) | | | (5,811,763 | ) |
Capital gain dividends from REITs | | | 11,394 | | | | 3,088 | | | | — | | | | — | |
Net change in unrealized appreciation (depreciation) on investments, affiliated investments and foreign currency translations | | | 43,632,622 | | | | 30,984,862 | | | | 11,218,868 | | | | 3,152,513 | |
Net increase (decrease) in net assets resulting from operations | | | 79,847,538 | | | | 33,691,474 | | | | 10,923,817 | | | | (437,798 | ) |
| | | | | | | | | | | | | | | | | |
Distributions to Shareholders: | | | | | | | | | | | | | | | | |
Total distributions paid | | | | | | | | | | | | | | | | |
Class A | | | (1,533,935 | ) | | | (8,491,776 | ) | | | (2,053,790 | ) | | | (1,537,644 | ) |
Class C | | | (74,122 | ) | | | (1,067,512 | ) | | | (131,860 | ) | | | (132,190 | ) |
Class I | | | (1,280,169 | ) | | | (4,721,274 | ) | | | (994,719 | ) | | | (606,661 | ) |
Total dividends and distributions to shareholders | | | (2,888,226 | ) | | | (14,280,562 | ) | | | (3,180,369 | ) | | | (2,276,495 | ) |
| | | | | | | | | | | | | | | | | |
Share Transactions of Beneficial Interest: | | | | | | | | | | | | | | | | |
Net proceeds from shares sold | | | | | | | | | | | | | | | | |
Class A | | | 21,410,460 | | | | 17,644,025 | | | | 15,332,680 | | | | 10,264,261 | |
Class C | | | 2,236,488 | | | | 2,912,101 | | | | 585,740 | | | | 930,481 | |
Class I | | | 47,999,136 | | | | 59,642,729 | | | | 16,173,028 | | | | 16,118,195 | |
Reinvestment of dividends and distributions | | | | | | | | | | | | | | | | |
Class A | | | 1,478,791 | | | | 8,119,208 | | | | 1,833,239 | | | | 1,344,833 | |
Class C | | | 72,383 | | | | 1,041,605 | | | | 105,049 | | | | 99,296 | |
Class I | | | 1,181,987 | | | | 4,208,753 | | | | 827,734 | | | | 492,335 | |
Cost of shares redeemed | | | | | | | | | | | | | | | | |
Class A | | | (29,812,138 | ) | | | (22,922,491 | ) | | | (15,739,938 | ) | | | (22,610,116 | ) |
Class C | | | (6,994,515 | ) | | | (3,233,973 | ) | | | (2,957,491 | ) | | | (2,037,419 | ) |
Class I | | | (44,841,279 | ) | | | (43,223,850 | ) | | | (11,819,275 | ) | | | (10,335,104 | ) |
Net increase (decrease) in net assets from share transactions of beneficial interest | | | (7,268,687 | ) | | | 24,188,107 | | | | 4,340,766 | | | | (5,733,238 | ) |
| | | | | | | | | | | | | | | | | |
Total Increase (Decrease) in Net Assets | | | 69,690,625 | | | | 43,599,019 | | | | 12,084,214 | | | | (8,447,531 | ) |
| | | | | | | | | | | | | | | | | |
Net Assets: | | | | | | | | | | | | | | | | |
Beginning of year | | | 285,167,249 | | | | 241,568,230 | | | | 102,940,436 | | | | 111,387,967 | |
End of year | | $ | 354,857,874 | | | $ | 285,167,249 | | | $ | 115,024,650 | | | $ | 102,940,436 | |
| | | | | | | | | | | | | | | | | |
Share Activity: | | | | | | | | | | | | | | | | |
Shares Sold | | | | | | | | | | | | | | | | |
Class A | | | 922,042 | | | | 858,342 | | | | 1,703,628 | | | | 1,133,685 | |
Class C | | | 137,591 | | | | 195,481 | | | | 68,198 | | | | 106,527 | |
Class I | | | 2,054,807 | | | | 2,849,297 | | | | 1,813,310 | | | | 1,794,335 | |
Shares Reinvested | | | | | | | | | | | | | | | | |
Class A | | | 69,135 | | | | 399,567 | | | | 201,491 | | | | 150,383 | |
Class C | | | 4,753 | | | | 71,687 | | | | 12,059 | | | | 11,577 | |
Class I | | | 54,570 | | | | 204,606 | | | | 91,906 | | | | 55,645 | |
Shares Redeemed | | | | | | | | | | | | | | | | |
Class A | | | (1,275,210 | ) | | | (1,115,087 | ) | | | (1,748,813 | ) | | | (2,482,221 | ) |
Class C | | | (439,030 | ) | | | (221,160 | ) | | | (340,496 | ) | | | (236,081 | ) |
Class I | | | (1,904,213 | ) | | | (2,056,109 | ) | | | (1,323,075 | ) | | | (1,159,014 | ) |
Net increase (decrease) in shares of beneficial interest outstanding | | | (375,555 | ) | | | 1,186,624 | | | | 478,208 | | | | (625,164 | ) |
STATEMENTS OF CHANGES IN NET ASSETS
The accompanying notes are an integral part of these financial statements.
FINANCIAL STATEMENTS | 60
| | High Yield Bond Fund | | | Israel Common Values Fund | |
| | Year Ended
September 30,
2024 | | | Year Ended
September 30,
2023 | | | Year Ended
September 30,
2024 | | | Year Ended
September 30,
2023 | |
Operations: | | | | | | | | | | | | | | | | |
Net investment income (loss) | | $ | 10,640,462 | | | $ | 7,923,181 | | | $ | 833,108 | | | $ | 568,254 | |
Net realized gain (loss) from investments and foreign currency transactions | | | (4,306,843 | ) | | | (8,483,138 | ) | | | (1,357,269 | ) | | | (1,931,234 | ) |
Capital gain dividends from REITs | | | — | | | | — | | | | — | | | | — | |
Net change in unrealized appreciation (depreciation) on investments and foreign currency translations | | | 18,123,363 | | | | 14,300,995 | | | | 13,541,134 | | | | (9,779,417 | ) |
Net increase (decrease) in net assets resulting from operations | | | 24,456,982 | | | | 13,741,038 | | | | 13,016,973 | | | | (11,142,397 | ) |
| | | | | | | | | | | | | | | | | |
Distributions to Shareholders: | | | | | | | | | | | | | | | | |
Total distributions paid | | | | | | | | | | | | | | | | |
Class A | | | (3,512,305 | ) | | | (3,373,954 | ) | | | — | | | | — | |
Class C | | | (112,492 | ) | | | (113,340 | ) | | | — | | | | — | |
Class I | | | (6,869,832 | ) | | | (4,349,798 | ) | | | (39,507 | ) | | | — | |
Total dividends and distributions to shareholders | | | (10,494,629 | ) | | | (7,837,092 | ) | | | (39,507 | ) | | | — | |
| | | | | | | | | | | | | | | | | |
Share Transactions of Beneficial Interest: | | | | | | | | | | | | | | | | |
Net proceeds from shares sold | | | | | | | | | | | | | | | | |
Class A | | | 14,807,399 | | | | 18,004,465 | | | | 10,189,271 | | | | 11,962,354 | |
Class C | | | 542,162 | | | | 766,453 | | | | 649,800 | | | | 781,957 | |
Class I | | | 124,189,467 | | | | 102,250,908 | | | | 12,689,327 | | | | 19,014,293 | |
Reinvestment of dividends and distributions | | | | | | | | | | | | | | | | |
Class A | | | 3,118,565 | | | | 2,974,022 | | | | — | | | | — | |
Class C | | | 110,040 | | | | 110,085 | | | | — | | | | — | |
Class I | | | 5,680,419 | | | | 3,135,159 | | | | 34,442 | | | | — | |
Cost of shares redeemed | | | | | | | | | | | | | | | | |
Class A | | | (15,652,928 | ) | | | (35,077,468 | ) | | | (12,147,547 | ) | | | (13,029,177 | ) |
Class C | | | (950,350 | ) | | | (754,350 | ) | | | (3,760,290 | ) | | | (1,854,766 | ) |
Class I | | | (95,496,352 | ) | | | (101,986,575 | ) | | | (16,175,892 | ) | | | (11,063,965 | ) |
Net increase (decrease) in net assets from share transactions of beneficial interest | | | 36,348,422 | | | | (10,577,301 | ) | | | (8,520,889 | ) | | | 5,810,696 | |
| | | | | | | | | | | | | | | | | |
Total Increase (Decrease) in Net Assets | | | 50,310,775 | | | | (4,673,355 | ) | | | 4,456,577 | | | | (5,331,701 | ) |
| | | | | | | | | | | | | | | | | |
Net Assets: | | | | | | | | | | | | | | | | |
Beginning of year | | | 132,522,257 | | | | 137,195,612 | | | | 95,521,302 | | | | 100,853,003 | |
End of year | | $ | 182,833,032 | | | $ | 132,522,257 | | | $ | 99,977,879 | | | $ | 95,521,302 | |
| | | | | | | | | | | | | | | | | |
Share Activity: | | | | | | | | | | | | | | | | |
Shares Sold | | | | | | | | | | | | | | | | |
Class A | | | 1,712,026 | | | | 2,145,704 | | | | 511,613 | | | | 572,009 | |
Class C | | | 60,637 | | | | 89,026 | | | | 34,976 | | | | 40,465 | |
Class I | | | 14,300,186 | | | | 12,107,178 | | | | 628,405 | | | | 911,164 | |
Shares Reinvested | | | | | | | | | | | | | | | | |
Class A | | | 354,236 | | | | 356,016 | | | | — | | | | — | |
Class C | | | 12,246 | | | | 12,935 | | | | — | | | | — | |
Class I | | | 645,045 | | | | 374,875 | | | | 1,740 | | | | — | |
Shares Redeemed | | | | | | | | | | | | | | | | |
Class A | | | (1,782,840 | ) | | | (4,162,681 | ) | | | (602,039 | ) | | | (632,138 | ) |
Class C | | | (107,132 | ) | | | (87,930 | ) | | | (202,322 | ) | | | (97,170 | ) |
Class I | | | (10,916,692 | ) | | | (12,108,200 | ) | | | (776,417 | ) | | | (534,702 | ) |
Net increase (decrease) in shares of beneficial interest outstanding | | | 4,277,712 | | | | (1,273,077 | ) | | | (404,044 | ) | | | 259,628 | |
STATEMENTS OF CHANGES IN NET ASSETS
The accompanying notes are an integral part of these financial statements.
FINANCIAL STATEMENTS | 61
| | Defensive Strategies Fund | | | Strategic Growth Fund | |
| | Year Ended
September 30,
2024 | | | Year Ended
September 30,
2023 | | | Year Ended
September 30,
2024 | | | Year Ended
September 30,
2023 | |
Operations: | | | | | | | | | | | | | | | | |
Net investment income (loss) | | $ | 1,407,830 | | | $ | 943,781 | | | $ | 637,273 | | | $ | 440,678 | |
Net realized gain (loss) from investments and foreign currency transactions | | | 243,076 | | | | 725,601 | | | | 370,188 | | | | 207,612 | |
Capital gain dividends from affiliated funds | | | 375,501 | | | | — | | | | 124,146 | | | | — | |
Capital gain dividends from REITs | | | 77,654 | | | | 65,638 | | | | — | | | | | |
Net change in unrealized appreciation (depreciation) on investments and foreign currency translations | | | 8,970,541 | | | | 4,837,886 | | | | 4,111,426 | | | | 1,785,933 | |
Net increase (decrease) in net assets resulting from operations | | | 11,074,602 | | | | 6,572,906 | | | | 5,243,033 | | | | 2,434,223 | |
| | | | | | | | | | | | | | | | | |
Distributions to Shareholders: | | | | | | | | | | | | | | | | |
Total distributions paid | | | | | | | | | | | | | | | | |
Class A | | | (998,781 | ) | | | (2,087,703 | ) | | | (498,218 | ) | | | (2,160,890 | ) |
Class C | | | (48,377 | ) | | | (187,628 | ) | | | (23,165 | ) | | | (197,275 | ) |
Class I | | | (704,021 | ) | | | (1,231,772 | ) | | | 0 | (a) | | | — | |
Total dividends and distributions to shareholders | | | (1,751,179 | ) | | | (3,507,103 | ) | | | (521,383 | ) | | | (2,358,165 | ) |
| | | | | | | | | | | | | | | | | |
Share Transactions of Beneficial Interest: | | | | | | | | | | | | | | | | |
Net proceeds from shares sold | | | | | | | | | | | | | | | | |
Class A | | | 6,419,448 | | | | 7,149,362 | | | | 2,655,271 | | | | 2,119,961 | |
Class C | | | 286,819 | | | | 416,209 | | | | 186,455 | | | | 261,558 | |
Class I | | | 11,183,629 | | | | 12,672,145 | | | | 17,000 | | | | 18 | |
Reinvestment of dividends and distributions | | | | | | | | | | | | | | | | |
Class A | | | 869,149 | | | | 1,819,449 | | | | 482,302 | | | | 2,096,847 | |
Class C | | | 45,507 | | | | 176,672 | | | | 22,701 | | | | 196,816 | |
Class I | | | 649,838 | | | | 1,168,983 | | | | 0 | (a) | | | — | |
Cost of shares redeemed | | | | | | | | | | | | | | | | |
Class A | | | (9,073,954 | ) | | | (16,427,011 | ) | | | (5,701,485 | ) | | | (4,331,805 | ) |
Class C | | | (1,615,017 | ) | | | (1,534,029 | ) | | | (1,258,361 | ) | | | (411,607 | ) |
Class I | | | (9,274,279 | ) | | | (13,453,254 | ) | | | — | | | | — | |
Net increase (decrease) in net assets from share transactions of beneficial interest | | | (508,860 | ) | | | (8,011,474 | ) | | | (3,596,117 | ) | | | (68,212 | ) |
| | | | | | | | | | | | | | | | | |
Total Increase (Decrease) in Net Assets | | | 8,814,563 | | | | (4,945,671 | ) | | | 1,125,533 | | | | 7,846 | |
| | | | | | | | | | | | | | | | | |
Net Assets: | | | | | | | | | | | | | | | | |
Beginning of year | | | 70,516,040 | | | | 75,461,711 | | | | 32,632,130 | | | | 32,624,284 | |
End of year | | $ | 79,330,603 | | | $ | 70,516,040 | | | $ | 33,757,663 | | | $ | 32,632,130 | |
| | | | | | | | | | | | | | | | | |
Share Activity: | | | | | | | | | | | | | | | | |
Shares Sold | | | | | | | | | | | | | | | | |
Class A | | | 479,122 | | | | 548,607 | | | | 288,442 | | | | 234,939 | |
Class C | | | 22,514 | | | | 33,759 | | | | 23,777 | | | | 33,800 | |
Class I | | | 831,142 | | | | 968,235 | | | | 1,760 | | | | 2 | |
Shares Reinvested | | | | | | | | | | | | | | | | |
Class A | | | 66,652 | | | | 141,702 | | | | 53,649 | | | | 232,983 | |
Class C | | | 3,699 | | | | 14,612 | | | | 2,956 | | | | 25,594 | |
Class I | | | 49,834 | | | | 91,042 | | | | 0 | (b) | | | — | |
Shares Redeemed | | | | | | | | | | | | | | | | |
Class A | | | (674,972 | ) | | | (1,242,611 | ) | | | (612,136 | ) | | | (477,887 | ) |
Class C | | | (128,377 | ) | | | (124,531 | ) | | | (159,863 | ) | | | (53,181 | ) |
Class I | | | (689,721 | ) | | | (1,030,897 | ) | | | — | | | | — | |
Net increase (decrease) in shares of beneficial interest outstanding | | | (40,107 | ) | | | (600,082 | ) | | | (401,415 | ) | | | (3,750 | ) |
(a) Less than $1.
(b) Less than 1 share
STATEMENTS OF CHANGES IN NET ASSETS
The accompanying notes are an integral part of these financial statements.
FINANCIAL STATEMENTS | 62
| | Conservative Growth Fund | | | Growth & Income Fund | |
| | Year Ended
September 30,
2024 | | | Year Ended
September 30,
2023 | | | Year Ended
September 30,
2024 | | | Year Ended
September 30,
2023 | |
Operations: | | | | | | | | | | | | | | | | |
Net investment income (loss) | | $ | 782,849 | | | $ | 567,271 | | | $ | 334,351 | | | $ | 291,172 | |
Net realized gain (loss) from investments, affiliated investments and foreign currency transactions | | | 216,684 | | | | 110,867 | | | | 23,842 | | | | 271,675 | |
Capital gain dividends from affiliated funds | | | 147,113 | | | | 63,565 | | | | — | | | | — | |
Capital gain dividends from REITs | | | — | | | | — | | | | — | | | | — | |
Net change in unrealized appreciation (depreciation) on investments, affiliated investments and foreign currency translations | | | 4,036,348 | | | | 1,270,530 | | | | 1,920,504 | | | | (439,059 | ) |
Net increase (decrease) in net assets resulting from operations | | | 5,182,994 | | | | 2,012,233 | | | | 2,278,697 | | | | 123,788 | |
| | | | | | | | | | | | | | | | | |
Distributions to Shareholders: | | | | | | | | | | | | | | | | |
Total distributions paid | | | | | | | | | | | | | | | | |
Class A | | | (592,194 | ) | | | (1,949,664 | ) | | | (319,139 | ) | | | (1,005,818 | ) |
Class C | | | (35,028 | ) | | | (216,573 | ) | | | (21,089 | ) | | | (138,050 | ) |
Class I | | | 0 | | | | — | | | | (84,722 | ) | | | (289,249 | ) |
Total dividends and distributions to shareholders | | | (627,222 | ) | | | (2,166,237 | ) | | | (424,950 | ) | | | (1,433,117 | ) |
| | | | | | | | | | | | | | | | | |
Share Transactions of Beneficial Interest: | | | | | | | | | | | | | | | | |
Net proceeds from shares sold | | | | | | | | | | | | | | | | |
Class A | | | 2,723,395 | | | | 1,813,711 | | | | 2,337,063 | | | | 1,777,993 | |
Class C | | | 242,896 | | | | 555,686 | | | | 136,292 | | | | 432,927 | |
Class I | | | 124,054 | | | | 18 | | | | 1,166,692 | | | | 2,501,037 | |
Reinvestment of dividends and distributions | | | | | | | | | | | | | | | | |
Class A | | | 569,811 | | | | 1,878,918 | | | | 302,558 | | | | 947,767 | |
Class C | | | 33,144 | | | | 207,916 | | | | 21,038 | | | | 136,611 | |
Class I | | | 0 | | | | — | | | | 80,781 | | | | 276,568 | |
Cost of shares redeemed | | | | | | | | | | | | | | | | |
Class A | | | (7,220,915 | ) | | | (5,380,917 | ) | | | (2,520,821 | ) | | | (2,236,709 | ) |
Class C | | | (1,266,967 | ) | | | (1,095,974 | ) | | | (814,601 | ) | | | (691,367 | ) |
Class I | | | — | | | | — | | | | (1,288,559 | ) | | | (2,268,045 | ) |
Net increase (decrease) in net assets from share transactions of beneficial interest | | | (4,794,582 | ) | | | (2,020,642 | ) | | | (579,557 | ) | | | 876,782 | |
| | | | | | | | | | | | | | | | | |
Total Increase (Decrease) in Net Assets | | | (238,810 | ) | | | (2,174,646 | ) | | | 1,274,190 | | | | (432,547 | ) |
| | | | | | | | | | | | | | | | | |
Net Assets: | | | | | | | | | | | | | | | | |
Beginning of year | | | 38,757,527 | | | | 40,932,173 | | | | 17,794,171 | | | | 18,226,718 | |
End of year | | $ | 38,518,717 | | | $ | 38,757,527 | | | $ | 19,068,361 | | | $ | 17,794,171 | |
| | | | | | | | | | | | | | | | | |
Share Activity: | | | | | | | | | | | | | | | | |
Shares Sold | | | | | | | | | | | | | | | | |
Class A | | | 273,121 | | | | 185,211 | | | | 152,264 | | | | 170,280 | |
Class C | | | 28,153 | | | | 65,417 | | | | 8,980 | | | | 42,270 | |
Class I | | | 12,221 | | | | 2 | | | | 44,735 | | | | 234,320 | |
Shares Reinvested | | | | | | | | | | | | | | | | |
Class A | | | 58,562 | | | | 191,920 | | | | 18,161 | | | | 89,873 | |
Class C | | | 3,922 | | | | 24,432 | | | | 1,510 | | | | 13,480 | |
Class I | | | 0 | | | | — | | | | 4,615 | | | | 26,024 | |
Shares Redeemed | | | | | | | | | | | | | | | | |
Class A | | | (725,537 | ) | | | (549,980 | ) | | | (133,623 | ) | | | (210,706 | ) |
Class C | | | (147,174 | ) | | | (129,415 | ) | | | (56,790 | ) | | | (68,334 | ) |
Class I | | | — | | | | — | | | | (90,031 | ) | | | (213,605 | ) |
Net increase (decrease) in shares of beneficial interest outstanding | | | (496,732 | ) | | | (212,413 | ) | | | (50,179 | ) | | | 83,602 | |
(a) Less than $1.
(b) Less than 1 share
STATEMENTS OF CHANGES IN NET ASSETS
The accompanying notes are an integral part of these financial statements.
FINANCIAL STATEMENTS | 63
Section 5 | Financial Highlights
Small/Mid Cap Growth Fund (Class A Shares)
SELECTED DATA BASED ON A SHARE OUTSTANDING THROUGHOUT EACH YEAR
| | | FOR THE
YEAR ENDED
SEPTEMBER
30 | | | FOR THE
YEAR ENDED
SEPTEMBER
30 | | | FOR THE
YEAR ENDED
SEPTEMBER
30 | | | FOR THE
YEAR ENDED
SEPTEMBER
30 | | | FOR THE
YEAR ENDED
SEPTEMBER
30 | |
| | | 2024 | | | 2023 | | | 2022 | | | 2021 | | | 2020 | |
| | | | | | | | | | | | | | | | | | | | | |
Net asset value, beginning of year | | $ | 9.62 | | | $ | 8.42 | | | $ | 12.53 | | | $ | 9.92 | | | $ | 7.87 | |
| | | | | | | | | | | | | | | | | | | | |
INCOME (LOSS) FROM INVESTMENT OPERATIONS: | | | | | | | | | | | | | | | | | | | | |
Net investment loss (A) | | | (0.06 | ) | | | (0.03 | ) | | | (0.09 | ) | | | (0.14 | ) | | | (0.09 | ) |
Net realized and unrealized gain (loss) on investments | | | 4.07 | | | | 1.50 | | | | (2.95 | ) | | | 3.39 | | | | 2.14 | |
Total from investment operations | | | 4.01 | | | | 1.47 | | | | (3.04 | ) | | | 3.25 | | | | 2.05 | |
| | | | | | | | | | | | | | | | | | | | | |
LESS DISTRIBUTIONS: | | | | | | | | | | | | | | | | | | | | |
From net realized gains on investments | | | (0.33 | ) | | | (0.27 | ) | | | (1.07 | ) | | | (0.64 | ) | | | — | |
Return of Capital | | | — | | | | — | | | | — | | | | — | | | | — | |
Total distributions | | | (0.33 | ) | | | (0.27 | ) | | | (1.07 | ) | | | (0.64 | ) | | | — | |
| | | | | | | | | | | | | | | | | | | | | |
Net asset value, end of year | | $ | 13.30 | | | $ | 9.62 | | | $ | 8.42 | | | $ | 12.53 | | | $ | 9.92 | |
| | | | | | | | | | | | | | | | | | | | | |
Total return (B)(C) | | | 42.75 | % | | | 17.59 | % | | | (26.66 | )% | | | 33.89 | % | | | 26.05 | % |
| | | | | | | | | | | | | | | | | | | | | |
RATIOS/SUPPLEMENTAL DATA: | | | | | | | | | | | | | | | | | | | | |
Net assets, end of year (in 000’s) | | $ | 45,754 | | | $ | 32,076 | | | $ | 27,983 | | | $ | 37,917 | | | $ | 30,316 | |
Ratios to average net assets | | | | | | | | | | | | | | | | | | | | |
Expenses, before waiver and reimbursement | | | 1.58 | % | | | 1.58 | % | | | 1.62 | % | | | 1.60 | % | | | 1.71 | % |
Expenses, net waiver and reimbursement (D) | | | 1.48 | % | | | 1.48 | %(E) | | | 1.52 | % | | | 1.50 | % | | | 1.61 | % |
Net investment loss, before waiver and reimbursement | | | (0.61 | )% | | | (0.38 | )% | | | (1.00 | )% | | | (1.30 | )% | | | (1.19 | )% |
Net investment loss, net waiver and reimbursement (D) | | | (0.51 | )% | | | (0.28 | )%(E) | | | (0.90 | )% | | | (1.20 | )% | | | (1.09 | )% |
Portfolio turnover rate | | | 95 | % | | | 67 | % | | | 46 | % | | | 48 | % | | | 96 | % |
(A) | Per share amounts calculated using average shares method, which more appropriately presents the per share data for the period. |
(B) | Total return calculation does not reflect sales load. Total return represents aggregate total return based on Net Asset Value. |
(C) | Total return in the above table represents the rate that the investor would have earned or lost on an investment in the Fund assuming reinvestment of dividends. Total return would have been higher or lower if certain expenses had not been reimbursed, waived or recouped. |
(D) | This expense decrease from the contractual waiver is reflected in both the net expense and the net investment income ratios shown. |
(E) | For the period October 1, 2022 through January 28, 2023 the voluntary waiver was 0.03%. |
FINANCIAL HIGHLIGHTS
The accompanying notes are an integral part of these financial statements.
FINANCIAL STATEMENTS | 64
Small/Mid Cap Growth Fund (Class C Shares)
SELECTED DATA BASED ON A SHARE OUTSTANDING THROUGHOUT EACH YEAR
| | | FOR THE
YEAR ENDED
SEPTEMBER
30 | | | FOR THE
YEAR ENDED
SEPTEMBER
30 | | | FOR THE
YEAR ENDED
SEPTEMBER
30 | | | FOR THE
YEAR ENDED
SEPTEMBER
30 | | | FOR THE
YEAR ENDED
SEPTEMBER
30 | |
| | | 2024 | | | 2023 | | | 2022 | | | 2021 | | | 2020 | |
| | | | | | | | | | | | | | | | | | | | | |
Net asset value, beginning of year | | $ | 7.14 | | | $ | 6.36 | | | $ | 9.79 | | | $ | 7.93 | | | $ | 6.34 | |
| | | | | | | | | | | | | | | | | | | | | |
INCOME (LOSS) FROM INVESTMENT OPERATIONS: | | | | | | | | | | | | | | | | | | | | |
Net investment loss (A) | | | (0.11 | ) | | | (0.07 | ) | | | (0.13 | ) | | | (0.18 | ) | | | (0.12 | ) |
Net realized and unrealized gain (loss) on investments | | | 3.00 | | | | 1.12 | | | | (2.23 | ) | | | 2.68 | | | | 1.71 | |
Total from investment operations | | | 2.89 | | | | 1.05 | | | | (2.36 | ) | | | 2.50 | | | | 1.59 | |
| | | | | | | | | | | | | | | | | | | | |
LESS DISTRIBUTIONS: | | | | | | | | | | | | | | | | | | | | |
From net realized gains on investments | | | (0.33 | ) | | | (0.27 | ) | | | (1.07 | ) | | | (0.64 | ) | | | — | |
Return of Capital | | | — | | | | — | | | | — | | | | — | | | | — | |
Total distributions | | | (0.33 | ) | | | (0.27 | ) | | | (1.07 | ) | | | (0.64 | ) | | | — | |
| | | | | | | | | | | | | | | | | | | | |
Net asset value, end of year | | $ | 9.70 | | | $ | 7.14 | | | $ | 6.36 | | | $ | 9.79 | | | $ | 7.93 | |
| | | | | | | | | | | | | | | | | | | | | |
Total return (B)(C) | | | 41.88 | % | | | 16.66 | % | | | (27.23 | )% | | | 32.87 | % | | | 25.08 | % |
| | | | | | | | | | | | | | | | | | | | |
RATIOS/SUPPLEMENTAL DATA: | | | | | | | | | | | | | | | | | | | | |
Net assets, end of year (in 000’s) | | $ | 3,004 | | | $ | 2,466 | | | $ | 2,150 | | | $ | 2,877 | | | $ | 2,230 | |
Ratios to average net assets | | | | | | | | | | | | | | | | | | | | |
Expenses, before waiver and reimbursement | | | 2.33 | % | | | 2.33 | % | | | 2.37 | % | | | 2.35 | % | | | 2.46 | % |
Expenses, net waiver and reimbursement (D) | | | 2.23 | % | | | 2.23 | %(E) | | | 2.27 | % | | | 2.25 | % | | | 2.36 | % |
Net investment loss, before waiver and reimbursement | | | (1.36 | )% | | | (1.13 | )% | | | (1.75 | )% | | | (2.05 | )% | | | (1.92 | )% |
Net investment loss, net waiver and reimbursement (D) | | | (1.26 | )% | | | (1.03 | )%(E) | | | (1.65 | )% | | | (1.95 | )% | | | (1.82 | )% |
Portfolio turnover rate | | | 95 | % | | | 67 | % | | | 46 | % | | | 56 | % | | | 96 | % |
(A) | Per share amounts calculated using average shares method, which more appropriately presents the per share data for the period. |
(B) | Total return calculation does not reflect sales load. Total return represents aggregate total return based on Net Asset Value. |
(C) | Total return in the above table represents the rate that the investor would have earned or lost on an investment in the Fund assuming reinvestment of dividends. Total return would have been higher or lower if certain expenses had not been reimbursed, waived or recouped. |
(D) | This expense decrease from the contractual waiver is reflected in both the net expense and the net investment income ratios shown. |
(E) | For the period October 1, 2022 through January 28, 2023 the voluntary waiver was 0.03%. |
FINANCIAL HIGHLIGHTS
The accompanying notes are an integral part of these financial statements.
FINANCIAL STATEMENTS | 65
Small/Mid Cap Growth Fund (Class I Shares)
SELECTED DATA BASED ON A SHARE OUTSTANDING THROUGHOUT EACH YEAR
| | | FOR THE
YEAR ENDED
SEPTEMBER
30 | | | FOR THE
YEAR ENDED
SEPTEMBER
30 | | | FOR THE
YEAR ENDED
SEPTEMBER
30 | | | FOR THE
YEAR ENDED
SEPTEMBER
30 | | | FOR THE
YEAR ENDED
SEPTEMBER
30 | |
| | | 2024 | | | 2023 | | | 2022 | | | 2021 | | | 2020 | |
| | | | | | | | | | | | | | | | | | | | | |
Net asset value, beginning of year | | $ | 9.93 | | | $ | 8.67 | | | $ | 12.84 | | | $ | 10.13 | | | $ | 8.02 | |
| | | | | | | | | | | | | | | | | | | | |
INCOME (LOSS) FROM INVESTMENT OPERATIONS: | | | | | | | | | | | | | | | | | | | | |
Net investment loss (A) | | | (0.03 | ) | | | (0.00 | )* | | | (0.09 | ) | | | (0.12 | ) | | | (0.08 | ) |
Net realized and unrealized gain (loss) on investments | | | 4.22 | | | | 1.53 | | | | (3.01 | ) | | | 3.47 | | | | 2.19 | |
Total from investment operations | | | 4.19 | | | | 1.53 | | | | (3.10 | ) | | | 3.35 | | | | 2.11 | |
| | | | | | | | | | | | | | | | | | | | | |
LESS DISTRIBUTIONS: | | | | | | | | | | | | | | | | | | | | |
From net realized gains on investments | | | (0.33 | ) | | | (0.27 | ) | | | (1.07 | ) | | | (0.64 | ) | | | — | |
Return of Capital | | | — | | | | — | | | | — | | | | — | | | | — | |
Total distributions | | | (0.33 | ) | | | (0.27 | ) | | | (1.07 | ) | | | (0.64 | ) | | | — | |
| | | | | | | | | | | | | | | | | | | | | |
Net asset value, end of year | | $ | 13.79 | | | $ | 9.93 | | | $ | 8.67 | | | $ | 12.84 | | | $ | 10.13 | |
| | | | | | | | | | | | | | | | | | | | | |
Total return (B)(C) | | | 43.24 | % | | | 17.78 | % | | | (26.48 | )% | | | 34.19 | % | | | 26.31 | % |
| | | | | | | | | | | | | | | | | | | | | |
RATIOS/SUPPLEMENTAL DATA: | | | | | | | | | | | | | | | | | | | | |
Net assets, end of year (in 000’s) | | $ | 23,269 | | | $ | 7,833 | | | $ | 4,586 | | | $ | 12,104 | | | $ | 3,759 | |
Ratios to average net assets | | | | | | | | | | | | | | | | | | | | |
Expenses, before waiver and reimbursement | | | 1.33 | % | | | 1.33 | % | | | 1.44 | % | | | 1.35 | % | | | 1.46 | % |
Expenses, net waiver and reimbursement (C) | | | 1.23 | % | | | 1.23 | %(D) | | | 1.34 | % | | | 1.25 | % | | | 1.36 | % |
Net investment income (loss), before waiver and reimbursement | | | (0.34 | )% | | | (0.13 | )% | | | (0.85 | )% | | | (1.05 | )% | | | (1.02 | )% |
Net investment income (loss), net waiver and reimbursement (C) | | | (0.24 | )% | | | (0.03 | )%(D) | | | (0.75 | )% | | | (0.95 | )% | | | (0.92 | )% |
Portfolio turnover rate | | | 95 | % | | | 67 | % | | | 46 | % | | | 56 | % | | | 96 | % |
(A) | Per share amounts calculated using average shares method, which more appropriately presents the per share data for the period. |
(B) | Total return in the above table represents the rate that the investor would have earned or lost on an investment in the Fund assuming reinvestment of dividends. Total return would have been higher or lower if certain expenses had not been reimbursed, waived or recouped. |
(C) | This expense decrease from the contractual waiver is reflected in both the net expense and the net investment income ratios shown. |
(D) | For the period October 1, 2022 through January 28, 2023 the voluntary waiver was 0.03%. |
FINANCIAL HIGHLIGHTS
The accompanying notes are an integral part of these financial statements.
FINANCIAL STATEMENTS | 66
International Fund (Class A Shares)
SELECTED DATA BASED ON A SHARE OUTSTANDING THROUGHOUT EACH YEAR
| | | FOR THE
YEAR ENDED
SEPTEMBER
30 | | | FOR THE
YEAR ENDED
SEPTEMBER
30 | | | FOR THE
YEAR ENDED
SEPTEMBER
30 | | | FOR THE
YEAR ENDED
SEPTEMBER
30 | | | FOR THE
YEAR ENDED
SEPTEMBER
30 | |
| | | 2024 | | | 2023 | | | 2022 | | | 2021 | | | 2020 | |
| | | | | | | | | | | | | | | | | | | | | |
Net asset value, beginning of year | | $ | 10.88 | | | $ | 9.16 | | | $ | 12.84 | | | $ | 9.92 | | | $ | 9.09 | |
| | | | | | | | | | | | | | | | | | | | |
INCOME (LOSS) FROM INVESTMENT OPERATIONS: | | | | | | | | | | | | | | | | | | | | |
Net investment income (loss) (A) | | | 0.07 | | | | 0.09 | | | | 0.10 | | | | 0.02 | | | | (0.03 | ) |
Net realized and unrealized gain (loss) on investments | | | 2.82 | | | | 1.68 | | | | (3.72 | ) | | | 2.90 | | | | 0.94 | |
Total from investment operations | | | 2.89 | | | | 1.77 | | | | (3.62 | ) | | | 2.92 | | | | 0.91 | |
| | | | | | | | | | | | | | | | | | | | | |
LESS DISTRIBUTIONS: | | | | | | | | | | | | | | | | | | | | |
From net investment income | | | (0.12 | ) | | | (0.05 | ) | | | (0.06 | ) | | | — | | | | (0.08 | ) |
Return of Capital | | | — | | | | — | | | | — | | | | — | | | | 0.00 | * |
Total distributions | | | (0.12 | ) | | | (0.05 | ) | | | (0.06 | ) | | | — | | | | (0.08 | ) |
| | | | | | | | | | | | | | | | | | | | | |
Net asset value, end of year | | $ | 13.65 | | | $ | 10.88 | | | $ | 9.16 | | | $ | 12.84 | | | $ | 9.92 | |
| | | | | | | | | | | | | | | | | | | | | |
Total return (B)(C) | | | 26.74 | % | | | 19.31 | % | | | (28.33 | )% | | | 29.44 | % | | | 10.00 | % |
| | | | | | | | | | | | | | | | | | | | | |
RATIOS/SUPPLEMENTAL DATA: | | | | | | | | | | | | | | | | | | | | |
Net assets, end of year (in 000’s) | | $ | 58,745 | | | $ | 57,824 | | | $ | 45,524 | | | $ | 61,220 | | | $ | 48,608 | |
Ratios to average net assets | | | | | | | | | | | | | | | | | | | | |
Expenses, before waiver and reimbursement | | | 1.67 | % | | | 1.64 | % | | | 1.72 | % | | | 1.63 | % | | | 1.76 | % |
Expenses, net waiver and reimbursement (D) | | | 1.59 | %(E) | | | 1.59 | %(F) | | | 1.67 | % | | | 1.58 | % | | | 1.71 | % |
Net investment income (loss) before waiver and reimbursement | | | 0.49 | % | | | 0.76 | % | | | 0.79 | % | | | 0.13 | % | | | (0.38 | )% |
Net investment income (loss), net waiver and reimbursement (D) | | | 0.57 | %(E) | | | 0.81 | %(F) | | | 0.84 | % | | | 0.18 | % | | | (0.33 | )% |
Portfolio turnover rate | | | 18 | % | | | 20 | % | | | 7 | % | | | 17 | % | | | 25 | % |
* | Amount is less than $0.005 per share. |
(A) | Per share amounts calculated using average shares method, which more appropriately presents the per share data for the period. |
(B) | Total return calculation does not reflect sales load. Total return represents aggregate total return based on Net Asset Value. |
(C) | Total return in the above table represents the rate that the investor would have earned or lost on an investment in the Fund assuming reinvestment of dividends. Total return would have been higher or lower if certain expenses had not been reimbursed, waived or recouped. |
(D) | This expense decrease from the contractual waiver is reflected in both the net expense and the net investment income ratios shown. |
(E) | For the period February 1, 2024 through September 30, 2024 the voluntary waiver was 0.05%. |
(F) | For the period October 1, 2022 through January 28, 2023 the voluntary waiver was 0.02%. |
FINANCIAL HIGHLIGHTS
The accompanying notes are an integral part of these financial statements.
FINANCIAL STATEMENTS | 67
International Fund (Class C Shares)
SELECTED DATA BASED ON A SHARE OUTSTANDING THROUGHOUT EACH YEAR
| | | FOR THE
YEAR ENDED
SEPTEMBER
30 | | | FOR THE
YEAR ENDED
SEPTEMBER
30 | | | FOR THE
YEAR ENDED
SEPTEMBER
30 | | | FOR THE
YEAR ENDED
SEPTEMBER
30 | | | FOR THE
YEAR ENDED
SEPTEMBER
30 | |
| | | 2024 | | | 2023 | | | 2022 | | | 2021 | | | 2020 | |
| | | | | | | | | | | | | | | | | | | | | |
Net asset value, beginning of year | | $ | 10.40 | | | $ | 8.78 | | | $ | 12.35 | | | $ | 9.62 | | | $ | 8.80 | |
| | | | | | | | | | | | | | | | | | | | |
INCOME (LOSS) FROM INVESTMENT OPERATIONS: | | | | | | | | | | | | | | | | | | | | |
Net investment income (loss) (A) | | | (0.02 | ) | | | 0.01 | | | | 0.00 | * | | | (0.07 | ) | | | (0.10 | ) |
Net realized and unrealized gain (loss) on investments | | | 2.70 | | | | 1.61 | | | | (3.57 | ) | | | 2.80 | | | | 0.92 | |
Total from investment operations | | | 2.68 | | | | 1.62 | | | | (3.57 | ) | | | 2.73 | | | | 0.82 | |
| | | | | | | | | | | | | | | | | | | | | |
LESS DISTRIBUTIONS: | | | | | | | | | | | | | | | | | | | | |
From net investment income | | | (0.02 | ) | | | — | | | | — | | | | — | | | | — | |
Total distributions | | | (0.02 | ) | | | — | | | | — | | | | — | | | | — | |
| | | | | | | | | | | | | | | | | | | | | |
Net asset value, end of year | | $ | 13.06 | | | $ | 10.40 | | | $ | 8.78 | | | $ | 12.35 | | | $ | 9.62 | |
| | | | | | | | | | | | | | | | | | | | | |
Total return (B)(C) | | | 25.81 | % | | | 18.45 | % | | | (28.91 | )% | | | 28.38 | % | | | 9.32 | % |
| | | | | | | | | | | | | | | | | | | | | |
RATIOS/SUPPLEMENTAL DATA: | | | | | | | | | | | | | | | | | | | | |
Net assets, end of year (in 000’s) | | $ | 1,697 | | | $ | 1,841 | | | $ | 1,492 | | | $ | 2,337 | | | $ | 2,122 | |
Ratios to average net assets | | | | | | | | | | | | | | | | | | | | |
Expenses, before waiver and reimbursement | | | 2.42 | % | | | 2.39 | % | | | 2.47 | % | | | 2.38 | % | | | 2.51 | % |
Expenses, net waiver and reimbursement (D) | | | 2.34 | %(E) | | | 2.34 | %(F) | | | 2.42 | % | | | 2.33 | % | | | 2.46 | % |
Net investment income (loss) before waiver and reimbursement | | | (0.25 | )% | | | 0.02 | % | | | 0.00 | % | | | (0.65 | )% | | | (1.17 | )% |
Net investment income (loss), net waiver and reimbursement (D) | | | (0.17 | )%(E) | | | 0.07 | %(F) | | | 0.05 | % | | | (0.60 | )% | | | (1.12 | )% |
Portfolio turnover rate | | | 18 | % | | | 20 | % | | | 7 | % | | | 17 | % | | | 25 | % |
* | Amount is less than $0.005 per share. |
(A) | Per share amounts calculated using average shares method, which more appropriately presents the per share data for the period. |
(B) | Total return calculation does not reflect redemption fee. |
(C) | Total return in the above table represents the rate that the investor would have earned or lost on an investment in the Fund assuming reinvestment of dividends. Total return would have been higher or lower if certain expenses had not been reimbursed, waived or recouped. |
(D) | This expense decrease from the contractual waiver is reflected in both the net expense and the net investment income ratios shown. |
(E) | For the period February 1, 2024 through September 30, 2024 the voluntary waiver was 0.05%. |
(F) | For the period October 1, 2022 through January 28, 2023 the voluntary waiver was 0.02%. |
FINANCIAL HIGHLIGHTS
The accompanying notes are an integral part of these financial statements.
FINANCIAL STATEMENTS | 68
International Fund (Class I Shares)
SELECTED DATA BASED ON A SHARE OUTSTANDING THROUGHOUT EACH YEAR
| | | FOR THE
YEAR ENDED
SEPTEMBER
30 | | | FOR THE
YEAR ENDED
SEPTEMBER
30 | | | FOR THE
YEAR ENDED
SEPTEMBER
30 | | | FOR THE
YEAR ENDED
SEPTEMBER
30 | | | FOR THE
YEAR ENDED
SEPTEMBER
30 | |
| | | 2024 | | | 2023 | | | 2022 | | | 2021 | | | 2020 | |
| | | | | | | | | | | | | | | | | | | | | |
Net asset value, beginning of year | | $ | 10.92 | | | $ | 9.19 | | | $ | 12.89 | | | $ | 9.94 | | | $ | 9.10 | |
| | | | | | | | | | | | | | | | | | | | |
INCOME (LOSS) FROM INVESTMENT OPERATIONS: | | | | | | | | | | | | | | | | | | | | |
Net investment income (loss) (A) | | | 0.10 | | | | 0.12 | | | | 0.13 | | | | 0.06 | | | | (0.01 | ) |
Net realized and unrealized gain (loss) on investments | | | 2.84 | | | | 1.69 | | | | (3.74 | ) | | | 2.89 | | | | 0.96 | |
Total from investment operations | | | 2.94 | | | | 1.81 | | | | (3.61 | ) | | | 2.95 | | | | 0.95 | |
| | | | | | | | | | | | | | | | | | | | |
LESS DISTRIBUTIONS: | | | | | | | | | | | | | | | | | | | | |
From net investment income | | | (0.15 | ) | | | (0.08 | ) | | | (0.09 | ) | | | — | | | | (0.11 | ) |
Return of Capital | | | — | | | | — | | | | — | | | | — | | | | 0.00 | * |
Total distributions | | | (0.15 | ) | | | (0.08 | ) | | | (0.09 | ) | | | — | | | | (0.11 | ) |
| | | | | | | | | | | | | | | | | | | | |
Net asset value, end of year | | $ | 13.71 | | | $ | 10.92 | | | $ | 9.19 | | | $ | 12.89 | | | $ | 9.94 | |
| | | | | | | | | | | | | | | | | | | | |
Total return (B) | | | 27.13 | % | | | 19.66 | % | | | (28.20 | )% | | | 29.68 | % | | | 10.42 | % |
| | | | | | | | | | | | | | | | | | | | |
RATIOS/SUPPLEMENTAL DATA: | | | | | | | | | | | | | | | | | | | | |
Net assets, end of year (in 000’s) | | $ | 122,203 | | | $ | 102,795 | | | $ | 69,570 | | | $ | 72,957 | | | $ | 37,226 | |
Ratios to average net assets | | | | | | | | | | | | | | | | | | | | |
Expenses, before waiver and reimbursement | | | 1.42 | % | | | 1.39 | % | | | 1.47 | % | | | 1.38 | % | | | 1.51 | % |
Expenses, net waiver and reimbursement (C) | | | 1.34 | %(D) | | | 1.34 | %(E) | | | 1.42 | % | | | 1.33 | % | | | 1.46 | % |
Net investment income (loss), before waiver and reimbursement | | | 0.73 | % | | | 1.03 | % | | | 1.13 | % | | | 0.45 | % | | | (0.16 | )% |
Net investment income (loss), net waiver and reimbursement (C) | | | 0.81 | %(D) | | | 1.08 | %(E) | | | 1.18 | % | | | 0.50 | % | | | (0.11 | )% |
Portfolio turnover rate | | | 18 | % | | | 20 | % | | | 7 | % | | | 17 | % | | | 25 | % |
* | Amount is less than $0.005 per share. |
(A) | Per share amounts calculated using average shares method, which more appropriately presents the per share data for the period. |
(B) | Total return in the above table represents the rate that the investor would have earned or lost on an investment in the Fund assuming reinvestment of dividends. Total return would have been higher or lower if certain expenses had not been reimbursed, waived or recouped. |
(C) | This expense decrease from the contractual waiver is reflected in both the net expense and the net investment income ratios shown. |
(D) | For the period February 1, 2024 through September 30, 2024 the voluntary waiver was 0.05%. |
(E) | For the period October 1, 2022 through January 28, 2023 the voluntary waiver was 0.02%. |
FINANCIAL HIGHLIGHTS
The accompanying notes are an integral part of these financial statements.
FINANCIAL STATEMENTS | 69
Large/Mid Cap Growth Fund (Class A Shares)
SELECTED DATA BASED ON A SHARE OUTSTANDING THROUGHOUT EACH YEAR
| | | FOR THE
YEAR ENDED
SEPTEMBER
30 | | | FOR THE
YEAR ENDED
SEPTEMBER
30 | | | FOR THE
YEAR ENDED
SEPTEMBER
30 | | | FOR THE
YEAR ENDED
SEPTEMBER
30 | | | FOR THE
YEAR ENDED
SEPTEMBER
30 | |
| | | 2024 | | | 2023 | | | 2022 | | | 2021 | | | 2020 | |
| | | | | | | | | | | | | | | | | | | | | |
Net asset value, beginning of year | | $ | 10.43 | | | $ | 9.65 | | | $ | 12.61 | | | $ | 9.77 | | | $ | 8.70 | |
| | | | | | | | | | | | | | | | | | | | |
INCOME (LOSS) FROM INVESTMENT OPERATIONS: | | | | | | | | | | | | | | | | | | | | |
Net investment income (loss) (A) | | | (0.01 | ) | | | 0.01 | | | | (0.04 | ) | | | (0.07 | ) | | | (0.04 | ) |
Net realized and unrealized gain (loss) on investments | | | 3.62 | | | | 1.76 | | | | (2.12 | ) | | | 3.10 | | | | 1.48 | |
Total from investment operations | | | 3.61 | | | | 1.77 | | | | (2.16 | ) | | | 3.03 | | | | 1.44 | |
| | | | | | | | | | | | | | | | | | | | | |
LESS DISTRIBUTIONS: | | | | | | | | | | | | | | | | | | | | |
From net realized gains on investments | | | (0.66 | ) | | | (0.99 | ) | | | (0.80 | ) | | | (0.19 | ) | | | (0.37 | ) |
Total distributions | | | (0.66 | ) | | | (0.99 | ) | | | (0.80 | ) | | | (0.19 | ) | | | (0.37 | ) |
| | | | | | | | | | | | | | | | | | | | | |
Net asset value, end of year | | $ | 13.38 | | | $ | 10.43 | | | $ | 9.65 | | | $ | 12.61 | | | $ | 9.77 | |
| | | | | | | | | | | | | | | | | | | | | |
Total return (B)(C) | | | 36.13 | % | | | 18.83 | % | | | (18.74 | )% | | | 31.32 | % | | | 16.93 | % |
| | | | | | | | | | | | | | | | | | | | | |
RATIOS/SUPPLEMENTAL DATA: | | | | | | | | | | | | | | | | | | | | |
Net assets, end of year (in 000’s) | | $ | 132,332 | | | $ | 94,109 | | | $ | 82,627 | | | $ | 96,378 | | | $ | 70,891 | |
Ratios to average net assets | | | | | | | | | | | | | | | | | | | | |
Expenses, before waiver and reimbursement | | | 1.41 | % | | | 1.48 | % | | | 1.50 | % | | | 1.50 | % | | | 1.54 | % |
Expenses, net waiver and reimbursement (D,E) | | | 1.27 | % | | | 1.29 | %(F) | | | 1.30 | % | | | 1.39 | % | | | 1.49 | % |
Net investment income (loss) before waiver and reimbursement | | | (0.21 | )% | | | (0.11 | )% | | | (0.55 | )% | | | (0.71 | )% | | | (0.48 | )% |
Net investment income (loss), net waiver and reimbursement (D,E) | | | (0.08 | )% | | | 0.07 | %(F) | | | (0.35 | )% | | | (0.60 | )% | | | (0.43 | )% |
Portfolio turnover rate | | | 53 | % | | | 39 | % | | | 35 | % | | | 22 | % | | | 23 | % |
(A) | Per share amounts calculated using average shares method, which more appropriately presents the per share data for the period. |
(B) | Total return calculation does not reflect sales load. |
(C) | Total return in the above table represents the rate that the investor would have earned or lost on an investment in the Fund assuming reinvestment of dividends. Total return would have been higher or lower if certain expenses had not been reimbursed, waived or recouped. |
(D) | This expense decrease from the contractual waiver is reflected in both the net expense and the net investment income ratios shown. |
(E) | These ratios exclude the impact of expenses of the underlying security holdings as represented in the Schedule of Investments. |
(F) | For the period October 1, 2022 through January 28, 2023 the voluntary waiver was 0.06%. |
FINANCIAL HIGHLIGHTS
The accompanying notes are an integral part of these financial statements.
FINANCIAL STATEMENTS | 70
Large/Mid Cap Growth Fund (Class C Shares)
SELECTED DATA BASED ON A SHARE OUTSTANDING THROUGHOUT EACH YEAR
| | | FOR THE
YEAR ENDED
SEPTEMBER
30 | | | FOR THE
YEAR ENDED
SEPTEMBER
30 | | | FOR THE
YEAR ENDED
SEPTEMBER
30 | | | FOR THE
YEAR ENDED
SEPTEMBER
30 | | | FOR THE
YEAR ENDED
SEPTEMBER
30 | |
| | | 2024 | | | 2023 | | | 2022 | | | 2021 | | | 2020 | |
| | | | | | | | | | | | | | | | | | | | | |
Net asset value, beginning of year | | $ | 7.58 | | | $ | 7.31 | | | $ | 9.79 | | | $ | 7.68 | | | $ | 6.96 | |
| | | | | | | | | | | | | | | | | | | | |
INCOME (LOSS) FROM INVESTMENT OPERATIONS: | | | | | | | | | | | | | | | | | | | | |
Net investment loss (A) | | | (0.07 | ) | | | (0.05 | ) | | | (0.10 | ) | | | (0.12 | ) | | | (0.08 | ) |
Net realized and unrealized gain (loss) on investments | | | 2.58 | | | | 1.31 | | | | (1.58 | ) | | | 2.42 | | | | 1.17 | |
Total from investment operations | | | 2.51 | | | | 1.26 | | | | (1.68 | ) | | | 2.30 | | | | 1.09 | |
| | | | | | | | | | | | | | | | | | | | | |
LESS DISTRIBUTIONS: | | | | | | | | | | | | | | | | | | | | |
From net realized gains on investments | | | (0.66 | ) | | | (0.99 | ) | | | (0.80 | ) | | | (0.19 | ) | | | (0.37 | ) |
Total distributions | | | (0.66 | ) | | | (0.99 | ) | | | (0.80 | ) | | | (0.19 | ) | | | (0.37 | ) |
| | | | | | | | | | | | | | | | | | | | | |
Net asset value, end of year | | $ | 9.43 | | | $ | 7.58 | | | $ | 7.31 | | | $ | 9.79 | | | $ | 7.68 | |
| | | | | | | | | | | | | | | | | | | | | |
Total return (B)(C) | | | 35.14 | % | | | 17.79 | % | | | (19.27 | )% | | | 30.32 | % | | | 16.09 | % |
| | | | | | | | | | | | | | | | | | | | | |
RATIOS/SUPPLEMENTAL DATA: | | | | | | | | | | | | | | | | | | | | |
Net assets, end of year (in 000’s) | | $ | 10,312 | | | $ | 9,802 | | | $ | 8,577 | | | $ | 10,845 | | | $ | 8,192 | |
Ratios to average net assets | | | | | | | | | | | | | | | | | | | | |
Expenses, before waiver and reimbursement | | | 2.16 | % | | | 2.21 | % | | | 2.25 | % | | | 2.25 | % | | | 2.29 | % |
Expenses, net waiver and reimbursement (D,E) | | | 2.02 | % | | | 2.04 | %(F) | | | 2.05 | % | | | 2.14 | % | | | 2.24 | % |
Net investment loss before waiver and reimbursement | | | (0.96 | )% | | | (0.85 | )% | | | (1.30 | )% | | | (1.46 | )% | | | (1.23 | )% |
Net investment loss, net waiver and reimbursement (D,E) | | | (0.82 | )% | | | (0.68 | )%(F) | | | (1.10 | )% | | | (1.35 | )% | | | (1.18 | )% |
Portfolio turnover rate | | | 53 | % | | | 39 | % | | | 35 | % | | | 22 | % | | | 23 | % |
(A) | Per share amounts calculated using average shares method, which more appropriately presents the per share data for the period. |
(B) | Total return calculation does not reflect redemption fee. |
(C) | Total return in the above table represents the rate that the investor would have earned or lost on an investment in the Fund assuming reinvestment of dividends. Total return would have been higher or lower if certain expenses had not been reimbursed, waived or recouped. |
(D) | This expense decrease from the contractual waiver is reflected in both the net expense and the net investment income ratios shown. |
(E) | These ratios exclude the impact of expenses of the underlying security holdings as represented in the Schedule of Investments. |
(F) | For the period October 1, 2022 through January 28, 2023 the voluntary waiver was 0.06%. |
FINANCIAL HIGHLIGHTS
The accompanying notes are an integral part of these financial statements.
FINANCIAL STATEMENTS | 71
Large/Mid Cap Growth Fund (Class I Shares)
SELECTED DATA BASED ON A SHARE OUTSTANDING THROUGHOUT EACH YEAR
| | | FOR THE
YEAR ENDED
SEPTEMBER
30 | | | FOR THE
YEAR ENDED
SEPTEMBER
30 | | | FOR THE
YEAR ENDED
SEPTEMBER
30 | | | FOR THE
YEAR ENDED
SEPTEMBER
30 | | | FOR THE
YEAR ENDED
SEPTEMBER
30 | |
| | | 2024 | | | 2023 | | | 2022 | | | 2021 | | | 2020 | |
| | | | | | | | | | | | | | | | | | | | | |
Net asset value, beginning of year | | $ | 10.79 | | | $ | 9.94 | | | $ | 12.93 | | | $ | 9.99 | | | $ | 8.86 | |
| | | | | | | | | | | | | | | | | | | | |
INCOME (LOSS) FROM INVESTMENT OPERATIONS: | | | | | | | | | | | | | | | | | | | | |
Net investment income (loss) (A) | | | 0.02 | | | | 0.03 | | | | (0.01 | ) | | | (0.04 | ) | | | (0.02 | ) |
Net realized and unrealized gain (loss) on investments | | | 3.75 | | | | 1.81 | | | | (2.18 | ) | | | 3.17 | | | | 1.52 | |
Total from investment operations | | | 3.77 | | | | 1.84 | | | | (2.19 | ) | | | 3.13 | | | | 1.50 | |
| | | | | | | | | | | | | | | | | | | | | |
LESS DISTRIBUTIONS: | | | | | | | | | | | | | | | | | | | | |
From net realized gains on investments | | | (0.01 | ) | | | — | | | | — | | | | — | | | | — | |
Total distributions | | | (0.66 | ) | | | (0.99 | ) | | | (0.80 | ) | | | (0.19 | ) | | | (0.37 | ) |
| | | | (0.67 | ) | | | (0.99 | ) | | | (0.80 | ) | | | (0.19 | ) | | | (0.37 | ) |
Net asset value, end of year | | | | | | | | | | | | | | | | | | | | |
| | | $ | 13.89 | | | $ | 10.79 | | | $ | 9.94 | | | $ | 12.93 | | | $ | 9.99 | |
Total return (B)(C) | | | | | | | | | | | | | | | | | | | | |
| | | | 36.49 | % | | | 19.01 | % | | | (18.50 | )% | | | 31.64 | % | | | 17.30 | % |
RATIOS/SUPPLEMENTAL DATA: | | | | | | | | | | | | | | | | | | | | |
Net assets, end of year (in 000’s) | | | | | | | | | | | | | | | | | | | | |
Ratios to average net assets | | $ | 73,963 | | | $ | 45,126 | | | $ | 21,966 | | | $ | 27,220 | | | $ | 19,378 | |
Ratios to average net assets | | | | | | | | | | | | | | | | | | | | |
Expenses, before waiver and reimbursement | | | 1.16 | % | | | 1.21 | % | | | 1.25 | % | | | 1.25 | % | | | 1.29 | % |
Expenses, net waiver and reimbursement (C,D) | | | 1.02 | % | | | 1.04 | %(E) | | | 1.05 | % | | | 1.14 | % | | | 1.24 | % |
Net investment income (loss), before waiver and reimbursement | | | 0.03 | % | | | 0.13 | % | | | (0.30 | )% | | | (0.45 | )% | | | (0.22 | )% |
Net investment income (loss), net waiver and reimbursement (C,D) | | | 0.17 | % | | | 0.31 | %(E) | | | (0.10 | )% | | | (0.34 | )% | | | (0.17 | )% |
Portfolio turnover rate | | | 53 | % | | | 39 | % | | | 35 | % | | | 22 | % | | | 23 | % |
(A) | Per share amounts calculated using average shares method, which more appropriately presents the per share data for the period. |
(B) | Total return in the above table represents the rate that the investor would have earned or lost on an investment in the Fund assuming reinvestment of dividends. Total return would have been higher or lower if certain expenses had not been reimbursed, waived or recouped. |
(C) | This expense decrease from the contractual waiver is reflected in both the net expense and the net investment income ratios shown. |
(D) | These ratios exclude the impact of expenses of the underlying security holdings as represented in the Schedule of Investments. |
(E) | For the period October 1, 2022 through January 28, 2023 the voluntary waiver was 0.06%. |
FINANCIAL HIGHLIGHTS
The accompanying notes are an integral part of these financial statements.
FINANCIAL STATEMENTS | 72
Small Cap Value Fund (Class A Shares)
SELECTED DATA BASED ON A SHARE OUTSTANDING THROUGHOUT EACH YEAR
| | | FOR THE
YEAR ENDED
SEPTEMBER
30 | | | FOR THE
YEAR ENDED
SEPTEMBER
30 | | | FOR THE
YEAR ENDED
SEPTEMBER
30 | | | FOR THE
YEAR ENDED
SEPTEMBER
30 | | | FOR THE
YEAR ENDED
SEPTEMBER
30 | |
| | | 2024 | | | 2023 | | | 2022 | | | 2021 | | | 2020 | |
| | | | | | | | | | | | | | | | | | | | | |
Net asset value, beginning of year | | $ | 17.32 | | | $ | 15.98 | | | $ | 21.35 | | | $ | 14.16 | | | $ | 17.15 | |
| | | | | | | | | | | | | | | | | | | | |
INCOME (LOSS) FROM INVESTMENT OPERATIONS: | | | | | | | | | | | | | | | | | | | | |
Net investment income (A) | | | 0.10 | | | | 0.16 | | | | 0.09 | | | | 0.12 | | | | 0.04 | |
Net realized and unrealized gain (loss) on investments | | | 3.97 | | | | 2.32 | | | | (3.50 | ) | | | 7.10 | | | | (2.39 | ) |
Total from investment operations | | | 4.07 | | | | 2.48 | | | | (3.41 | ) | | | 7.22 | | | | (2.35 | ) |
| | | | | | | | | | | | | | | | | | | | | |
LESS DISTRIBUTIONS: | | | | | | | | | | | | | | | | | | | | |
From net investment income | | | (0.15 | ) | | | (0.07 | ) | | | (0.08 | ) | | | (0.03 | ) | | | (0.04 | ) |
From net realized gains on investments | | | (0.61 | ) | | | (1.07 | ) | | | (1.88 | ) | | | — | | | | (0.60 | ) |
Total distributions | | | (0.76 | ) | | | (1.14 | ) | | | (1.96 | ) | | | (0.03 | ) | | | (0.64 | ) |
| | | | | | | | | | | | | | | | | | | | | |
Net asset value, end of year | | $ | 20.63 | | | $ | 17.32 | | | $ | 15.98 | | | $ | 21.35 | | | $ | 14.16 | |
| | | | | | | | | | | | | | | | | | | | | |
Total return (B)(C) | | | 24.15 | % | | | 15.45 | % | | | (17.84 | )% | | | 51.03 | % | | | (14.38 | )% |
| | | | | | | | | | | | | | | | | | | | | |
RATIOS/SUPPLEMENTAL DATA: | | | | | | | | | | | | | | | | | | | | |
Net assets, end of year (in 000’s) | | $ | 111,015 | | | $ | 96,865 | | | $ | 88,234 | | | $ | 105,800 | | | $ | 74,130 | |
Ratios to average net assets | | | | | | | | | | | | | | | | | | | | |
Expenses, before waiver and reimbursement | | | 1.46 | % | | | 1.47 | % | | | 1.50 | % | | | 1.46 | % | | | 1.57 | % |
Expenses, net waiver and reimbursement (D,E) | | | 1.33 | % | | | 1.32 | %(G) | | | 1.34 | % | | | 1.34 | % | | | 1.47 | % |
Net investment income, before waiver and reimbursement | | | 0.40 | % | | | 0.74 | % | | | 0.30 | % | | | 0.50 | % | | | 0.19 | % |
Net investment income, net waiver and reimbursement (D,E,F) | | | 0.53 | % | | | 0.89 | %(G) | | | 0.46 | % | | | 0.62 | % | | | 0.29 | % |
Portfolio turnover rate | | | 50 | % | | | 55 | % | | | 49 | % | | | 61 | % | | | 73 | % |
(A) | Per share amounts calculated using average shares method, which more appropriately presents the per share data for the period. |
(B) | Total return calculation does not reflect sales load. |
(C) | Total return in the above table represents the rate that the investor would have earned or lost on an investment in the Fund assuming reinvestment of dividends. Total return would have been higher or lower if certain expenses had not been reimbursed, waived or recouped. |
(D) | This expense decrease from the contractual waiver is reflected in both the net expense and the net investment income ratios shown. |
(E) | These ratios exclude the impact of expenses of the underlying security holdings as represented in the Schedule of Investments. |
(F) | Recognition of net investment income (loss) by the Fund is affected by the timing of the declaration of dividends by the underlying investment companies in which the Fund invests. |
(G) | For the period October 1, 2022 through January 28, 2023 the voluntary waiver was 0.05%. |
FINANCIAL HIGHLIGHTS
The accompanying notes are an integral part of these financial statements.
FINANCIAL STATEMENTS | 73
Small Cap Value Fund (Class C Shares)
SELECTED DATA BASED ON A SHARE OUTSTANDING THROUGHOUT EACH YEAR
| | | FOR THE
YEAR ENDED
SEPTEMBER
30 | | | FOR THE
YEAR ENDED
SEPTEMBER
30 | | | FOR THE
YEAR ENDED
SEPTEMBER
30 | | | FOR THE
YEAR ENDED
SEPTEMBER
30 | | | FOR THE
YEAR ENDED
SEPTEMBER
30 | |
| | | 2024 | | | 2023 | | | 2022 | | | 2021 | | | 2020 | |
| | | | | | | | | | | | | | | | | | | | | |
Net asset value, beginning of year | | $ | 10.48 | | | $ | 10.06 | | | $ | 14.16 | | | $ | 9.45 | | | $ | 11.69 | |
| | | | | | | | | | | | | | | | | | | | |
INCOME (LOSS) FROM INVESTMENT OPERATIONS: | | | | | | | | | | | | | | | | | | | | |
Net investment income (loss) (A) | | | (0.02 | ) | | | 0.01 | | | | (0.04 | ) | | | (0.02 | ) | | | (0.05 | ) |
Net realized and unrealized gain (loss) on investments | | | 2.36 | | | | 1.48 | | | | (2.18 | ) | | | 4.73 | | | | (1.59 | ) |
Total from investment operations | | | 2.34 | | | | 1.49 | | | | (2.22 | ) | | | 4.71 | | | | (1.64 | ) |
| | | | | | | | | | | | | | | | | | | | | |
LESS DISTRIBUTIONS: | | | | | | | | | | | | | | | | | | | | |
From net investment income | | | (0.06 | ) | | | — | | | | — | | | | — | | | | — | |
From net realized gains on investments | | | (0.61 | ) | | | (1.07 | ) | | | (1.88 | ) | | | — | | | | (0.60 | ) |
Total distributions | | | (0.67 | ) | | | (1.07 | ) | | | (1.88 | ) | | | — | | | | (0.60 | ) |
| | | | | | | | | | | | | | | | | | | | | |
Net asset value, end of year | | $ | 12.15 | | | $ | 10.48 | | | $ | 10.06 | | | $ | 14.16 | | | $ | 9.45 | |
| | | | | | | | | | | | | | | | | | | | | |
Total return (B)(C) | | | 23.28 | % | | | 14.61 | % | | | (18.44 | )% | | | 49.84 | % | | | (15.01 | )% |
| | | | | | | | | | | | | | | | | | | | | |
RATIOS/SUPPLEMENTAL DATA: | | | | | | | | | | | | | | | | | | | | |
Net assets, end of year (in 000’s) | | $ | 5,266 | | | $ | 6,502 | | | $ | 5,747 | | | $ | 7,293 | | | $ | 5,663 | |
Ratios to average net assets | | | | | | | | | | | | | | | | | | | | |
Expenses, before waiver and reimbursement | | | 2.21 | % | | | 2.22 | % | | | 2.25 | % | | | 2.21 | % | | | 2.32 | % |
Expenses, net waiver and reimbursement (D,E) | | | 2.08 | % | | | 2.07 | %(G) | | | 2.09 | % | | | 2.09 | % | | | 2.22 | % |
Net investment income, before waiver and reimbursement | | | (0.30 | )% | | | 0.00 | %* | | | (0.46 | )% | | | (0.26 | )% | | | (0.55 | )% |
Net investment income, net waiver and reimbursement (D,E,F) | | | (0.17 | )% | | | 0.15 | %(G) | | | (0.30 | )% | | | (0.14 | )% | | | (0.45 | )% |
Portfolio turnover rate | | | 50 | % | | | 55 | % | | | 49 | % | | | 61 | % | | | 73 | % |
* | Amount is less than 0.005% per share. |
(A) | Per share amounts calculated using average shares method, which more appropriately presents the per share data for the period. |
(B) | Total return calculation does not reflect redemption fee. |
(C) | Total return in the above table represents the rate that the investor would have earned or lost on an investment in the Fund assuming reinvestment of dividends. Total return would have been higher or lower if certain expenses had not been reimbursed, waived or recouped. |
(D) | This expense decrease from the contractual waiver is reflected in both the net expense and the net investment income ratios shown. |
(E) | These ratios exclude the impact of expenses of the underlying security holdings as represented in the Schedule of Investments. |
(F) | Recognition of net investment income (loss) by the Fund is affected by the timing of the declaration of dividends by the underlying investment companies in which the Fund invests. |
(G) | For the period October 1, 2022 through January 28, 2023 the voluntary waiver was 0.05%. |
FINANCIAL HIGHLIGHTS
The accompanying notes are an integral part of these financial statements.
FINANCIAL STATEMENTS | 74
Small Cap Value Fund (Class I Shares)
SELECTED DATA BASED ON A SHARE OUTSTANDING THROUGHOUT EACH YEAR
| | | FOR THE
YEAR ENDED
SEPTEMBER
30 | | | FOR THE
YEAR ENDED
SEPTEMBER
30 | | | FOR THE
YEAR ENDED
SEPTEMBER
30 | | | FOR THE
YEAR ENDED
SEPTEMBER
30 | | | FOR THE
YEAR ENDED
SEPTEMBER
30 | |
| | | 2024 | | | 2023 | | | 2022 | | | 2021 | | | 2020 | |
| | | | | | | | | | | | | | | | | | | | | |
Net asset value, beginning of year | | $ | 17.66 | | | $ | 16.27 | | | $ | 21.71 | | | $ | 14.42 | | | $ | 17.45 | |
| | | | | | | | | | | | | | | | | | | | |
INCOME (LOSS) FROM INVESTMENT OPERATIONS: | | | | | | | | | | | | | | | | | | | | |
Net investment income (A) | | | 0.15 | | | | 0.20 | | | | 0.14 | | | | 0.17 | | | | 0.08 | |
Net realized and unrealized gain (loss) on investments | | | 4.04 | | | | 2.38 | | | | (3.57 | ) | | | 7.21 | | | | (2.42 | ) |
Total from investment operations | | | 4.19 | | | | 2.58 | | | | (3.43 | ) | | | 7.38 | | | | (2.34 | ) |
| | | | | | | | | | | | | | | | | | | | | |
LESS DISTRIBUTIONS: | | | | | | | | | | | | | | | | | | | | |
From net investment income | | | (0.19 | ) | | | (0.12 | ) | | | (0.13 | ) | | | (0.09 | ) | | | (0.09 | ) |
From net realized gains on investments | | | (0.61 | ) | | | (1.07 | ) | | | (1.88 | ) | | | — | | | | (0.60 | ) |
Total distributions | | | (0.80 | ) | | | (1.19 | ) | | | (2.01 | ) | | | (0.09 | ) | | | (0.69 | ) |
| | | | | | | | | | | | | | | | | | | | | |
Net asset value, end of year | | $ | 21.05 | | | $ | 17.66 | | | $ | 16.27 | | | $ | 21.71 | | | $ | 14.42 | |
| | | | | | | | | | | | | | | | | | | | | |
Total return (B)(C) | | | 24.45 | % | | | 15.78 | % | | | (17.65 | )% | | | 51.33 | % | | | (14.14 | )% |
| | | | | | | | | | | | | | | | | | | | | |
RATIOS/SUPPLEMENTAL DATA: | | | | | | | | | | | | | | | | | | | | |
Net assets, end of year (in 000’s) | | $ | 79,593 | | | $ | 67,177 | | | $ | 46,222 | | | $ | 56,299 | | | $ | 35,473 | |
Ratios to average net assets | | | | | | | | | | | | | | | | | | | | |
Expenses, before waiver and reimbursement | | | 1.21 | % | | | 1.22 | % | | | 1.25 | % | | | 1.21 | % | | | 1.32 | % |
Expenses, net waiver and reimbursement (C,D) | | | 1.08 | % | | | 1.07 | %(F) | | | 1.09 | % | | | 1.09 | % | | | 1.22 | % |
Net investment income, before waiver and reimbursement | | | 0.66 | % | | | 1.00 | % | | | 0.55 | % | | | 0.75 | % | | | 0.44 | % |
Net investment income, net waiver and reimbursement (C,D,E) | | | 0.79 | % | | | 1.15 | %(F) | | | 0.72 | % | | | 0.87 | % | | | 0.54 | % |
Portfolio turnover rate | | | 50 | % | | | 55 | % | | | 49 | % | | | 61 | % | | | 73 | % |
(A) | Per share amounts calculated using average shares method, which more appropriately presents the per share data for the period. |
(B) | Total return in the above table represents the rate that the investor would have earned or lost on an investment in the Fund assuming reinvestment of dividends. Total return would have been higher or lower if certain expenses had not been reimbursed, waived or recouped. |
(C) | This expense decrease from the contractual waiver is reflected in both the net expense and the net investment income ratios shown. |
(D) | These ratios exclude the impact of expenses of the underlying security holdings as represented in the Schedule of Investments. |
(E) | Recognition of net investment income (loss) by the Fund is affected by the timing of the declaration of dividends by the underlying investment companies in which the Fund invests. |
(F) | For the period October 1, 2022 through January 28, 2023 the voluntary waiver was 0.05%. |
FINANCIAL HIGHLIGHTS
The accompanying notes are an integral part of these financial statements.
FINANCIAL STATEMENTS | 75
Large/Mid Cap Value Fund (Class A Shares)
SELECTED DATA BASED ON A SHARE OUTSTANDING THROUGHOUT EACH YEAR
| | | FOR THE
YEAR ENDED
SEPTEMBER
30 | | | FOR THE
YEAR ENDED
SEPTEMBER
30 | | | FOR THE
YEAR ENDED
SEPTEMBER
30 | | | FOR THE
YEAR ENDED
SEPTEMBER
30 | | | FOR THE
YEAR ENDED
SEPTEMBER
30 | |
| | | 2024 | | | 2023 | | | 2022 | | | 2021 | | | 2020 | |
| | | | | | | | | | | | | | | | | | | | | |
Net asset value, beginning of year | | $ | 20.45 | | | $ | 18.91 | | | $ | 21.88 | | | $ | 17.43 | | | $ | 18.86 | |
| | | | | | | | | | | | | | | | | | | | |
INCOME (LOSS) FROM INVESTMENT OPERATIONS: | | | | | | | | | | | | | | | | | | | | |
Net investment income (loss) (A) | | | 0.13 | | | | 0.12 | | | | 0.07 | | | | (0.01 | ) | | | 0.03 | |
Net realized and unrealized gain (loss) on investments (B) | | | 5.59 | | | | 2.51 | | | | (2.01 | ) | | | 5.12 | | | | 0.72 | |
Total from investment operations | | | 5.72 | | | | 2.63 | | | | (1.94 | ) | | | 5.11 | | | | 0.75 | |
| | | | | | | | | | | | | | | | | | | | | |
LESS DISTRIBUTIONS: | | | | | | | | | | | | | | | | | | | | |
From net investment income | | | (0.10 | ) | | | (0.04 | ) | | | (0.00 | )* | | | (0.03 | ) | | | (0.08 | ) |
From net realized gains on investments | | | (0.09 | ) | | | (1.05 | ) | | | (1.03 | ) | | | (0.63 | ) | | | (2.10 | ) |
Total distributions | | | (0.19 | ) | | | (1.09 | ) | | | (1.03 | ) | | | (0.66 | ) | | | (2.18 | ) |
| | | | | | | | | | | | | | | | | | | | | |
Net asset value, end of year | | $ | 25.98 | | | $ | 20.45 | | | $ | 18.91 | | | $ | 21.88 | | | $ | 17.43 | |
| | | | | | | | | | | | | | | | | | | | | |
Total return (C)(D) | | | 28.18 | % | | | 13.95 | % | | | (9.70 | )% | | | 29.89 | % | | | 3.93 | % |
| | | | | | | | | | | | | | | | | | | | | |
RATIOS/SUPPLEMENTAL DATA: | | | | | | | | | | | | | | | | | | | | |
Net assets, end of year (in 000’s) | | $ | 199,554 | | | $ | 162,861 | | | $ | 147,928 | | | $ | 160,560 | | | $ | 130,296 | |
Ratios to average net assets | | | | | | | | | | | | | | | | | | | | |
Expenses, before waiver and reimbursement | | | 1.39 | % | | | 1.45 | % | | | 1.46 | % | | | 1.45 | % | | | 1.51 | % |
Expenses, net waiver and reimbursement (E,F) | | | 1.19 | %(H) | | | 1.24 | %(I) | | | 1.21 | % | | | 1.30 | % | | | 1.41 | % |
Net investment income (loss), before waiver and reimbursement | | | 0.34 | % | | | 0.36 | % | | | 0.08 | % | | | (0.17 | )% | | | 0.06 | % |
Net investment income (loss), net waiver and reimbursement (E,F,G) | | | 0.55 | %(H) | | | 0.56 | %(I) | | | 0.33 | % | | | (0.02 | )% | | | 0.16 | % |
Portfolio turnover rate | | | 34 | % | | | 17 | % | | | 34 | % | | | 33 | % | | | 26 | % |
* | Amount is less than $0.005 per share. |
(A) | Per share amounts calculated using average shares method, which more appropriately presents the per share data for the period. |
(B) | Realized and unrealized gains and losses per share in this caption are balancing amounts necessary to reconcile the change in net asset value per share for the period, and may not agree to the aggregate gains and losses in the Statement of Operations due to the fluctuations in share transactions. |
(C) | Total return calculation does not reflect sales load. |
(D) | Total return in the above table represents the rate that the investor would have earned or lost on an investment in the Fund assuming reinvestment of dividends. Total return would have been higher or lower if certain expenses had not been reimbursed, waived or recouped. |
(E) | This expense decrease from the contractual waiver is reflected in both the net expense and the net investment income ratios shown. |
(F) | These ratios exclude the impact of expenses of the underlying security holdings as represented in the Schedule of Investments. |
(G) | Recognition of net investment income (loss) by the Fund is affected by the timing of the declaration of dividends by the underlying investment companies in which the Fund invests. |
(H) | For the year ended September 30, 2024, the voluntary waiver was 0.05%. |
(I) | For the year ended September 30, 2023, the voluntary waiver was 0.07%. |
FINANCIAL HIGHLIGHTS
The accompanying notes are an integral part of these financial statements.
FINANCIAL STATEMENTS | 76
Large/Mid Cap Value Fund (Class C Shares)
SELECTED DATA BASED ON A SHARE OUTSTANDING THROUGHOUT EACH YEAR
| | | FOR THE
YEAR ENDED
SEPTEMBER
30 | | | FOR THE
YEAR ENDED
SEPTEMBER
30 | | | FOR THE
YEAR ENDED
SEPTEMBER
30 | | | FOR THE
YEAR ENDED
SEPTEMBER
30 | | | FOR THE
YEAR ENDED
SEPTEMBER
30 | |
| | | 2024 | | | 2023 | | | 2022 | | | 2021 | | | 2020 | |
| | | | | | | | | | | | | | | | | | | | | |
Net asset value, beginning of year | | $ | 14.53 | | | $ | 13.78 | | | $ | 16.31 | | | $ | 13.21 | | | $ | 14.82 | |
| | | | | | | | | | | | | | | | | | | | |
INCOME (LOSS) FROM INVESTMENT OPERATIONS: | | | | | | | | | | | | | | | | | | | | |
Net investment loss (A) | | | (0.03 | ) | | | (0.03 | ) | | | (0.07 | ) | | | (0.12 | ) | | | (0.08 | ) |
Net realized and unrealized gain (loss) on investments (B) | | | 3.97 | | | | 1.83 | | | | (1.43 | ) | | | 3.85 | | | | 0.57 | |
Total from investment operations | | | 3.94 | | | | 1.80 | | | | (1.50 | ) | | | 3.73 | | | | 0.49 | |
| | | | | | | | | | | | | | | | | | | | | |
LESS DISTRIBUTIONS: | | | | | | | | | | | | | | | | | | | | |
From net realized gains on investments | | | (0.09 | ) | | | (1.05 | ) | | | (1.03 | ) | | | (0.63 | ) | | | (2.10 | ) |
Total distributions | | | (0.09 | ) | | | (1.05 | ) | | | (1.03 | ) | | | (0.63 | ) | | | (2.10 | ) |
| | | | | | | | | | | | | | | | | | | | | |
Net asset value, end of year | | $ | 18.38 | | | $ | 14.53 | | | $ | 13.78 | | | $ | 16.31 | | | $ | 13.21 | |
| | | | | | | | | | | | | | | | | | | | | |
Total return (C)(D) | | | 27.23 | % | | | 13.06 | % | | | (10.34 | )% | | | 28.91 | % | | | 3.14 | % |
| | | | | | | | | | | | | | | | | | | | | |
RATIOS/SUPPLEMENTAL DATA: | | | | | | | | | | | | | | | | | | | | |
Net assets, end of year (in 000’s) | | $ | 13,662 | | | $ | 15,111 | | | $ | 13,695 | | | $ | 15,162 | | | $ | 14,102 | |
Ratios to average net assets | | | | | | | | | | | | | | | | | | | | |
Expenses, before waiver and reimbursement | | | 2.14 | % | | | 2.20 | % | | | 2.21 | % | | | 2.20 | % | | | 2.26 | % |
Expenses, net waiver and reimbursement (E,F) | | | 1.94 | %(H) | | | 1.99 | %(I) | | | 1.96 | % | | | 2.05 | % | | | 2.16 | % |
Net investment loss, before waiver and reimbursement | | | (0.41 | )% | | | (0.40 | )% | | | (0.67 | )% | | | (0.92 | )% | | | (0.69 | )% |
Net investment loss, net waiver and reimbursement (E,F,G) | | | (0.21 | )%(H) | | | (0.19 | )%(I) | | | (0.42 | )% | | | (0.77 | )% | | | (0.59 | )% |
Portfolio turnover rate | | | 34 | % | | | 17 | % | | | 34 | % | | | 33 | % | | | 26 | % |
(A) | Per share amounts calculated using average shares method, which more appropriately presents the per share data for the period. |
(B) | Realized and unrealized gains per share in this caption are balancing amounts necessary to reconcile the change in net asset value per share for the period, and may not reconcile with aggregate gains and losses in the Statement of Operations due to the timing of share transactions for the period. |
(C) | Total return calculation does not reflect redemption fee. |
(D) | Total return in the above table represents the rate that the investor would have earned or lost on an investment in the Fund assuming reinvestment of dividends. Total return would have been higher or lower if certain expenses had not been reimbursed, waived or recouped. |
(E) | This expense decrease from the contractual waiver is reflected in both the net expense and the net investment income ratios shown. |
(F) | These ratios exclude the impact of expenses of the underlying security holdings as represented in the Schedule of Investments. |
(G) | Recognition of net investment income (loss) by the Fund is affected by the timing of the declaration of dividends by the underlying investment companies in which the Fund invests. |
(H) | For the year ended September 30, 2024, the voluntary waiver was 0.05%. |
(I) | For the year ended September 30, 2023, the voluntary waiver was 0.07%. |
FINANCIAL HIGHLIGHTS
The accompanying notes are an integral part of these financial statements.
FINANCIAL STATEMENTS | 77
Large/Mid Cap Value Fund (Class I Shares)
SELECTED DATA BASED ON A SHARE OUTSTANDING THROUGHOUT EACH YEAR
| | | FOR THE
YEAR ENDED
SEPTEMBER
30 | | | FOR THE
YEAR ENDED
SEPTEMBER
30 | | | FOR THE
YEAR ENDED
SEPTEMBER
30 | | | FOR THE
YEAR ENDED
SEPTEMBER
30 | | | FOR THE
YEAR ENDED
SEPTEMBER
30 | |
| | | 2024 | | | 2023 | | | 2022 | | | 2021 | | | 2020 | |
| | | | | | | | | | | | | | | | | | | | | |
Net asset value, beginning of year | | $ | 20.74 | | | $ | 19.17 | | | $ | 22.14 | | | $ | 17.63 | | | $ | 19.05 | |
| | | | | | | | | | | | | | | | | | | | |
INCOME (LOSS) FROM INVESTMENT OPERATIONS: | | | | | | | | | | | | | | | | | | | | |
Net investment income (A) | | | 0.19 | | | | 0.17 | | | | 0.13 | | | | 0.04 | | | | 0.07 | |
Net realized and unrealized gain (loss) on investments | | | 5.67 | | | | 2.54 | | | | (2.04 | ) | | | 5.18 | | | | 0.74 | |
Total from investment operations | | | 5.86 | | | | 2.71 | | | | (1.91 | ) | | | 5.22 | | | | 0.81 | |
| | | | | | | | | | | | | | | | | | | | | |
LESS DISTRIBUTIONS: | | | | | | | | | | | | | | | | | | | | |
From net investment income | | | (0.15 | ) | | | (0.09 | ) | | | (0.03 | ) | | | (0.08 | ) | | | (0.13 | ) |
From net realized gains on investments | | | (0.09 | ) | | | (1.05 | ) | | | (1.03 | ) | | | (0.63 | ) | | | (2.10 | ) |
Total distributions | | | (0.24 | ) | | | (1.14 | ) | | | (1.06 | ) | | | (0.71 | ) | | | (2.23 | ) |
| | | | | | | | | | | | | | | | | | | | | |
Net asset value, end of year | | $ | 26.36 | | | $ | 20.74 | | | $ | 19.17 | | | $ | 22.14 | | | $ | 17.63 | |
| | | | | | | | | | | | | | | | | | | | | |
Total return (B) | | | 28.53 | % | | | 14.21 | % | | | (9.48 | )% | | | 30.20 | % | | | 4.24 | % |
| | | | | | | | | | | | | | | | | | | | | |
RATIOS/SUPPLEMENTAL DATA: | | | | | | | | | | | | | | | | | | | | |
Net assets, end of year (in 000’s) | | $ | 141,642 | | | $ | 107,195 | | | $ | 79,945 | | | $ | 77,776 | | | $ | 47,340 | |
Ratios to average net assets | | | | | | | | | | | | | | | | | | | | |
Expenses, before waiver and reimbursement | | | 1.14 | % | | | 1.20 | % | | | 1.21 | % | | | 1.20 | % | | | 1.26 | % |
Expenses, net waiver and reimbursement (C,D) | | | 0.94 | %(F) | | | 0.99 | %(G) | | | 0.96 | % | | | 1.05 | % | | | 1.16 | % |
Net investment income, before waiver and reimbursement | | | 0.59 | % | | | 0.61 | % | | | 0.34 | % | | | 0.08 | % | | | 0.31 | % |
Net investment income, net waiver and reimbursement (C,D,E) | | | 0.8 | %(F) | | | 0.81 | %(G) | | | 0.59 | % | | | 0.23 | % | | | 0.41 | % |
Portfolio turnover rate | | | 34 | % | | | 17 | % | | | 34 | % | | | 33 | % | | | 26 | % |
(A) | Per share amounts calculated using average shares method, which more appropriately presents the per share data for the period. |
(B) | Total return in the above table represents the rate that the investor would have earned or lost on an investment in the Fund assuming reinvestment of dividends. Total return would have been higher or lower if certain expenses had not been reimbursed, waived or recouped. |
(C) | This expense decrease from the contractual waiver is reflected in both the net expense and the net investment income ratios shown. |
(D) | These ratios exclude the impact of expenses of the underlying security holdings as represented in the Schedule of Investments. |
(E) | Recognition of net investment income (loss) by the Fund is affected by the timing of the declaration of dividends by the underlying investment companies in which the Fund invests. |
(F) | For the year ended September 30, 2024, the voluntary waiver was 0.05%. |
(G) | For the year ended September 30, 2023, the voluntary waiver was 0.07%. |
FINANCIAL HIGHLIGHTS
The accompanying notes are an integral part of these financial statements.
FINANCIAL STATEMENTS | 78
Fixed Income Fund (Class A Shares)
SELECTED DATA BASED ON A SHARE OUTSTANDING THROUGHOUT EACH YEAR
| | | FOR THE
YEAR ENDED
SEPTEMBER
30 | | | FOR THE
YEAR ENDED
SEPTEMBER
30 | | | FOR THE
YEAR ENDED
SEPTEMBER
30 | | | FOR THE
YEAR ENDED
SEPTEMBER
30 | | | FOR THE
YEAR ENDED
SEPTEMBER
30 | |
| | | 2024 | | | 2023 | | | 2022 | | | 2021 | | | 2020 | |
| | | | | | | | | | | | | | | | | | | | | |
Net asset value, beginning of year | | $ | 8.68 | | | $ | 8.92 | | | $ | 10.44 | | | $ | 10.80 | | | $ | 10.39 | |
| | | | | | | | | | | | | | | | | | | | |
INCOME (LOSS) FROM INVESTMENT OPERATIONS: | | | | | | | | | | | | | | | | | | | | |
Net investment income (A) | | | 0.26 | | | | 0.19 | | | | 0.08 | | | | 0.03 | | | | 0.12 | |
Net realized and unrealized gain (loss) on investments | | | 0.63 | | | | (0.23 | ) | | | (1.49 | ) | | | (0.27 | ) | | | 0.44 | |
Total from investment operations | | | 0.89 | | | | (0.04 | ) | | | (1.41 | ) | | | (0.24 | ) | | | 0.56 | |
| | | | | | | | | | | | | | | | | | | | | |
LESS DISTRIBUTIONS: | | | | | | | | | | | | | | | | | | | | |
From net investment income | | | (0.25 | ) | | | (0.20 | ) | | | (0.11 | ) | | | (0.12 | ) | | | (0.15 | ) |
Total distributions | | | (0.25 | ) | | | (0.20 | ) | | | (0.11 | ) | | | (0.12 | ) | | | (0.15 | ) |
| | | | | | | | | | | | | | | | | | | | | |
Net asset value, end of year | | $ | 9.32 | | | $ | 8.68 | | | $ | 8.92 | | | $ | 10.44 | | | $ | 10.80 | |
| | | | | | | | | | | | | | | | | | | | | |
Total return (C) | | | 10.37 | % | | | (0.55 | )% | | | (13.60 | )% | | | (2.20 | )% | | | 5.39 | % |
| | | | | | | | | | | | | | | | | | | | | |
RATIOS/SUPPLEMENTAL DATA: | | | | | | | | | | | | | | | | | | | | |
Net assets, end of year (in 000’s) | | $ | 75,162 | | | $ | 68,641 | | | $ | 81,219 | | | $ | 96,586 | | | $ | 91,403 | |
Ratios to average net assets | | | | | | | | | | | | | | | | | | | | |
Expenses, before waiver and reimbursement | | | 1.27 | % | | | 1.29 | % | | | 1.22 | % | | | 1.34 | % | | | 1.30 | % |
Expenses, net waiver and reimbursement (D) | | | 1.07 | % | | | 1.07 | %(E) | | | 1.02 | % | | | 1.14 | % | | | 1.10 | % |
Net investment income, before waiver and reimbursement | | | 2.67 | % | | | 1.87 | % | | | 0.64 | % | | | 0.11 | % | | | 0.90 | % |
Net investment income, net waiver and reimbursement (D) | | | 2.86 | % | | | 2.09 | %(E) | | | 0.84 | % | | | 0.31 | % | | | 1.10 | % |
Portfolio turnover rate | | | 50 | % | | | 68 | % | | | 68 | % | | | 45 | % | | | 32 | % |
(A) | Per share amounts calculated using average shares method, which more appropriately presents the per share data for the period. |
(B) | Total return calculation does not reflect sales load. |
(C) | Total return in the above table represents the rate that the investor would have earned or lost on an investment in the Fund assuming reinvestment of dividends. Total return would have been higher or lower if certain expenses had not been reimbursed, waived or recouped. |
(D) | This expense decrease from the contractual waiver is reflected in both the net expense and the net investment income ratios shown. |
(E) | For the period October 1, 2022 through January 28, 2023 the voluntary waiver was 0.07%. |
FINANCIAL HIGHLIGHTS
The accompanying notes are an integral part of these financial statements.
FINANCIAL STATEMENTS | 79
Fixed Income Fund (Class C Shares)
SELECTED DATA BASED ON A SHARE OUTSTANDING THROUGHOUT EACH YEAR
| | | FOR THE
YEAR ENDED
SEPTEMBER
30 | | | FOR THE
YEAR ENDED
SEPTEMBER
30 | | | FOR THE
YEAR ENDED
SEPTEMBER
30 | | | FOR THE
YEAR ENDED
SEPTEMBER
30 | | | FOR THE
YEAR ENDED
SEPTEMBER
30 | |
| | | 2024 | | | 2023 | | | 2022 | | | 2021 | | | 2020 | |
| | | | | | | | | | | | | | | | | | | | | |
Net asset value, beginning of year | | $ | 8.32 | | | $ | 8.56 | | | $ | 10.04 | | | $ | 10.38 | | | $ | 9.99 | |
| | | | | | | | | | | | | | | | | | | | |
INCOME (LOSS) FROM INVESTMENT OPERATIONS: | | | | | | | | | | | | | | | | | | | | |
Net investment income (loss) (A) | | | 0.18 | | | | 0.12 | | | | 0.01 | | | | (0.04 | ) | | | 0.04 | |
Net realized and unrealized gain (loss) on investments | | | 0.61 | | | | (0.22 | ) | | | (1.44 | ) | | | (0.27 | ) | | | 0.42 | |
Total from investment operations | | | 0.79 | | | | (0.10 | ) | | | (1.43 | ) | | | (0.31 | ) | | | 0.46 | |
| | | | | | | | | | | | | | | | | | | | | |
LESS DISTRIBUTIONS: | | | | | | | | | | | | | | | | | | | | |
From net investment income | | | (0.19 | ) | | | (0.14 | ) | | | (0.05 | ) | | | (0.03 | ) | | | (0.07 | ) |
Total distributions | | | (0.19 | ) | | | (0.14 | ) | | | (0.05 | ) | | | (0.03 | ) | | | (0.07 | ) |
| | | | | | | | | | | | | | | | | | | | | |
Net asset value, end of year | | $ | 8.92 | | | $ | 8.32 | | | $ | 8.56 | | | $ | 10.04 | | | $ | 10.38 | |
| | | | | | | | | | | | | | | | | | | | | |
Total return (B)(C) | | | 9.51 | % | | | (1.24 | )% | | | (14.24 | )% | | | (2.99 | )% | | | 4.59 | % |
| | | | | | | | | | | | | | | | | | | | | |
RATIOS/SUPPLEMENTAL DATA: | | | | | | | | | | | | | | | | | | | | |
Net assets, end of year (in 000’s) | | $ | 5,860 | | | $ | 7,628 | | | $ | 8,861 | | | $ | 11,369 | | | $ | 9,320 | |
Ratios to average net assets | | | | | | | | | | | | | | | | | | | | |
Expenses, before waiver and reimbursement | | | 2.02 | % | | | 2.04 | % | | | 1.97 | % | | | 2.09 | % | | | 2.05 | % |
Expenses, net waiver and reimbursement (D) | | | 1.82 | % | | | 1.82 | %(E) | | | 1.77 | % | | | 1.89 | % | | | 1.85 | % |
Net investment income (loss), before waiver and reimbursement | | | 1.92 | % | | | 1.12 | % | | | (0.11 | )% | | | (0.64 | )% | | | 0.15 | % |
Net investment income (loss), net waiver and reimbursement (D) | | | 2.10 | % | | | 1.35 | %(E) | | | 0.09 | % | | | (0.44 | )% | | | 0.35 | % |
Portfolio turnover rate | | | 50 | % | | | 68 | % | | | 68 | % | | | 45 | % | | | 32 | % |
(A) | Per share amounts calculated using average shares method, which more appropriately presents the per share data for the period. |
(B) | Total return calculation does not reflect redemption fee. |
(C) | Total return in the above table represents the rate that the investor would have earned or lost on an investment in the Fund assuming reinvestment of dividends. Total return would have been higher or lower if certain expenses had not been reimbursed, waived or recouped. |
(D) | This expense decrease from the contractual waiver is reflected in both the net expense and the net investment income ratios shown. |
(E) | For the period October 1, 2022 through January 28, 2023 the voluntary waiver was 0.07%. |
FINANCIAL HIGHLIGHTS
The accompanying notes are an integral part of these financial statements.
FINANCIAL STATEMENTS | 80
Fixed Income Fund (Class I Shares)
SELECTED DATA BASED ON A SHARE OUTSTANDING THROUGHOUT EACH YEAR
| | | FOR THE
YEAR ENDED
SEPTEMBER
30 | | | FOR THE
YEAR ENDED
SEPTEMBER
30 | | | FOR THE
YEAR ENDED
SEPTEMBER
30 | | | FOR THE
YEAR ENDED
SEPTEMBER
30 | | | FOR THE
YEAR ENDED
SEPTEMBER
30 | |
| | | 2024 | | | 2023 | | | 2022 | | | 2021 | | | 2020 | |
| | | | | | | | | | | | | | | | | | | | | |
Net asset value, beginning of year | | $ | 8.59 | | | $ | 8.83 | | | $ | 10.34 | | | $ | 10.73 | | | $ | 10.32 | |
| | | | | | | | | | | | | | | | | | | | |
INCOME (LOSS) FROM INVESTMENT OPERATIONS: | | | | | | | | | | | | | | | | | | | | |
Net investment income (A) | | | 0.28 | | | | 0.22 | | | | 0.11 | | | | 0.06 | | | | 0.14 | |
Net realized and unrealized gain (loss) on investments | | | 0.63 | | | | (0.24 | ) | | | (1.49 | ) | | | (0.28 | ) | | | 0.44 | |
Total from investment operations | | | 0.91 | | | | (0.02 | ) | | | (1.38 | ) | | | (0.22 | ) | | | 0.58 | |
| | | | | | | | | | | | | | | | | | | | | |
LESS DISTRIBUTIONS: | | | | | | | | | | | | | | | | | | | | |
From net investment income | | | (0.27 | ) | | | (0.22 | ) | | | (0.13 | ) | | | (0.17 | ) | | | (0.17 | ) |
Total distributions | | | (0.27 | ) | | | (0.22 | ) | | | (0.13 | ) | | | (0.17 | ) | | | (0.17 | ) |
| | | | | | | | | | | | | | | | | | | | | |
Net asset value, end of year | | $ | 9.23 | | | $ | 8.59 | | | $ | 8.83 | | | $ | 10.34 | | | $ | 10.73 | |
| | | | | | | | | | | | | | | | | | | | | |
Total return (B) | | | 10.76 | % | | | (0.30 | )% | | | (13.41 | )% | | | (2.07 | )% | | | 5.70 | % |
| | | | | | | | | | | | | | | | | | | | | |
RATIOS/SUPPLEMENTAL DATA: | | | | | | | | | | | | | | | | | | | | |
Net assets, end of year (in 000’s) | | $ | 34,002 | | | $ | 26,672 | | | $ | 21,308 | | | $ | 18,389 | | | $ | 13,215 | |
Ratios to average net assets | | | | | | | | | | | | | | | | | | | | |
Expenses, before waiver and reimbursement | | | 1.02 | % | | | 1.04 | % | | | 0.97 | % | | | 1.09 | % | | | 1.05 | % |
Expenses, net waiver and reimbursement (C) | | | 0.82 | % | | | 0.82 | %(D) | | | 0.77 | % | | | 0.89 | % | | | 0.85 | % |
Net investment income, before waiver and reimbursement | | | 2.92 | % | | | 2.18 | % | | | 0.90 | % | | | 0.36 | % | | | 1.12 | % |
Net investment income, net waiver and reimbursement (C) | | | 3.11 | % | | | 2.41 | %(D) | | | 1.10 | % | | | 0.56 | % | | | 1.32 | % |
Portfolio turnover rate | | | 50 | % | | | 68 | % | | | 68 | % | | | 45 | % | | | 32 | % |
(A) | Per share amounts calculated using average shares method, which more appropriately presents the per share data for the period. |
(B) | Total return in the above table represents the rate that the investor would have earned or lost on an investment in the Fund assuming reinvestment of dividends. Total return would have been higher or lower if certain expenses had not been reimbursed, waived or recouped. |
(C) | This expense decrease from the contractual waiver is reflected in both the net expense and the net investment income ratios shown. |
(D) | For the period October 1, 2022 through January 28, 2023 the voluntary waiver was 0.07%. |
FINANCIAL HIGHLIGHTS
The accompanying notes are an integral part of these financial statements.
FINANCIAL STATEMENTS | 81
High Yield Bond Fund (Class A Shares)
SELECTED DATA BASED ON A SHARE OUTSTANDING THROUGHOUT EACH YEAR
| | | FOR THE
YEAR ENDED
SEPTEMBER
30 | | | FOR THE
YEAR ENDED
SEPTEMBER
30 | | | FOR THE
YEAR ENDED
SEPTEMBER
30 | | | FOR THE
YEAR ENDED
SEPTEMBER
30 | | | FOR THE
YEAR ENDED
SEPTEMBER
30 | |
| | | 2024 | | | 2023 | | | 2022 | | | 2021 | | | 2020 | |
| | | | | | | | | | | | | | | | | | | | | |
Net asset value, beginning of year | | $ | 8.32 | | | $ | 7.98 | | | $ | 9.91 | | | $ | 9.26 | | | $ | 9.39 | |
| | | | | | | | | | | | | | | | | | | | |
INCOME (LOSS) FROM INVESTMENT OPERATIONS: | | | | | | | | | | | | | | | | | | | | |
Net investment income (A) | | | 0.52 | | | | 0.44 | | | | 0.41 | | | | 0.41 | | | | 0.43 | |
Net realized and unrealized gain (loss) on investments | | | 0.71 | | | | 0.35 | | | | (1.90 | ) | | | 0.64 | | | | (0.15 | ) |
Total from investment operations | | | 1.23 | | | | 0.79 | | | | (1.49 | ) | | | 1.05 | | | | 0.28 | |
| | | | | | | | | | | | | | | | | | | | | |
LESS DISTRIBUTIONS: | | | | | | | | | | | | | | | | | | | | |
From net investment income | | | (0.50 | ) | | | (0.45 | ) | | | (0.41 | ) | | | (0.40 | ) | | | (0.41 | ) |
From net realized gains on investments | | | — | | | | — | | | | (0.03 | ) | | | — | | | | — | |
Total distributions | | | (0.50 | ) | | | (0.45 | ) | | | (0.44 | ) | | | (0.40 | ) | | | (0.41 | ) |
| | | | | | | | | | | | | | | | | | | | | |
Net asset value, end of year | | $ | 9.05 | | | $ | 8.32 | | | $ | 7.98 | | | $ | 9.91 | | | $ | 9.26 | |
| | | | | | | | | | | | | | | | | | | | | |
Total return (B)(C) | | | 15.07 | % | | | 10.00 | % | | | (15.45 | )% | | | 11.42 | % | | | 3.26 | % |
| | | | | | | | | | | | | | | | | | | | | |
RATIOS/SUPPLEMENTAL DATA: | | | | | | | | | | | | | | | | | | | | |
Net assets, end of year (in 000’s) | | $ | 64,381 | | | $ | 56,855 | | | $ | 67,766 | | | $ | 64,216 | | | $ | 45,940 | |
Ratios to average net assets | | | | | | | | | | | | | | | | | | | | |
Expenses, before waiver and reimbursement | | | 1.24 | % | | | 1.32 | % | | | 1.26 | % | | | 1.38 | % | | | 1.34 | % |
Expenses, net waiver and reimbursement (D) | | | 1.14 | % | | | 1.19 | %(E) | | | 1.18 | % | | | 1.33 | % | | | 1.29 | % |
Net investment income, before waiver and reimbursement | | | 5.78 | % | | | 5.06 | % | | | 4.36 | % | | | 4.15 | % | | | 4.61 | % |
Net investment income, net waiver and reimbursement (D) | | | 5.88 | % | | | 5.18 | %(E) | | | 4.44 | % | | | 4.20 | % | | | 4.66 | % |
Portfolio turnover rate | | | 33 | % | | | 72 | % | | | 24 | % | | | 57 | % | | | 91 | % |
(A) | Per share amounts calculated using average shares method, which more appropriately presents the per share data for the period. |
(B) | Total return calculation does not reflect sales load. |
(C) | Total return in the above table represents the rate that the investor would have earned or lost on an investment in the Fund assuming reinvestment of dividends. Total return would have been higher or lower if certain expenses had not been reimbursed, waived or recouped. |
(D) | This expense decrease from the contractual waiver is reflected in both the net expense and the net investment income ratios shown. |
(E) | For the period October 1, 2022 through January 28, 2023 the voluntary waiver was 0.03%. |
FINANCIAL HIGHLIGHTS
The accompanying notes are an integral part of these financial statements.
FINANCIAL STATEMENTS | 82
High Yield Bond Fund (Class C Shares)
SELECTED DATA BASED ON A SHARE OUTSTANDING THROUGHOUT EACH YEAR
| | | FOR THE
YEAR ENDED
SEPTEMBER
30 | | | FOR THE
YEAR ENDED
SEPTEMBER
30 | | | FOR THE
YEAR ENDED
SEPTEMBER
30 | | | FOR THE
YEAR ENDED
SEPTEMBER
30 | | | FOR THE
YEAR ENDED
SEPTEMBER
30 | |
| | | 2024 | | | 2023 | | | 2022 | | | 2021 | | | 2020 | |
| | | | | | | | | | | | | | | | | | | | | |
Net asset value, beginning of year | | $ | 8.48 | | | $ | 8.12 | | | $ | 10.08 | | | $ | 9.40 | | | $ | 9.52 | |
| | | | | | | | | | | | | | | | | | | | |
INCOME (LOSS) FROM INVESTMENT OPERATIONS: | | | | | | | | | | | | | | | | | | | | |
Net investment income (A) | | | 0.46 | | | | 0.38 | | | | 0.34 | | | | 0.34 | | | | 0.36 | |
Net realized and unrealized gain (loss) on investments | | | 0.72 | | | | 0.37 | | | | (1.93 | ) | | | 0.66 | | | | (0.14 | ) |
Total from investment operations | | | 1.18 | | | | 0.75 | | | | (1.59 | ) | | | 1.00 | | | | 0.22 | |
| | | | | | | | | | | | | | | | | | | | | |
LESS DISTRIBUTIONS: | | | | | | | | | | | | | | | | | | | | |
From net investment income | | | (0.43 | ) | | | (0.39 | ) | | | (0.34 | ) | | | (0.32 | ) | | | (0.34 | ) |
From net realized gains on investments | | | — | | | | — | | | | (0.03 | ) | | | — | | | | — | |
Total distributions | | | (0.43 | ) | | | (0.39 | ) | | | (0.37 | ) | | | (0.32 | ) | | | (0.34 | ) |
| | | | | | | | | | | | | | | | | | | | | |
Net asset value, end of year | | $ | 9.23 | | | $ | 8.48 | | | $ | 8.12 | | | $ | 10.08 | | | $ | 9.40 | |
| | | | | | | | | | | | | | | | | | | | | |
Total return (B)(C) | | | 14.14 | % | | | 9.27 | % | | | (16.14 | )% | | | 10.71 | % | | | 2.45 | % |
| | | | | | | | | | | | | | | | | | | | | |
RATIOS/SUPPLEMENTAL DATA: | | | | | | | | | | | | | | | | | | | | |
Net assets, end of year (in 000’s) | | $ | 2,469 | | | $ | 2,559 | | | $ | 2,337 | | | $ | 3,138 | | | $ | 2,427 | |
Ratios to average net assets | | | | | | | | | | | | | | | | | | | | |
Expenses, before waiver and reimbursement | | | 1.99 | % | | | 2.07 | % | | | 2.01 | % | | | 2.13 | % | | | 2.09 | % |
Expenses, net waiver and reimbursement (D) | | | 1.89 | % | | | 1.94 | %(E) | | | 1.93 | % | | | 2.08 | % | | | 2.04 | % |
Net investment income, before waiver and reimbursement | | | 5.02 | % | | | 4.32 | % | | | 3.60 | % | | | 3.40 | % | | | 3.84 | % |
Net investment income, net waiver and reimbursement (D) | | | 5.12 | % | | | 4.44 | %(E) | | | 3.68 | % | | | 3.45 | % | | | 3.89 | % |
Portfolio turnover rate | | | 33 | % | | | 72 | % | | | 24 | % | | | 57 | % | | | 91 | % |
(A) | Per share amounts calculated using average shares method, which more appropriately presents the per share data for the period. |
(B) | Total return calculation does not reflect redemption fee. |
(C) | Total return in the above table represents the rate that the investor would have earned or lost on an investment in the Fund assuming reinvestment of dividends. Total return would have been higher or lower if certain expenses had not been reimbursed, waived or recouped. |
(D) | This expense decrease from the contractual waiver is reflected in both the net expense and the net investment income ratios shown. |
(E) | For the period October 1, 2022 through January 28, 2023 the voluntary waiver was 0.03%. |
FINANCIAL HIGHLIGHTS
The accompanying notes are an integral part of these financial statements.
FINANCIAL STATEMENTS | 83
High Yield Bond Fund (Class I Shares)
SELECTED DATA BASED ON A SHARE OUTSTANDING THROUGHOUT EACH YEAR
| | | FOR THE
YEAR ENDED
SEPTEMBER
30 | | | FOR THE
YEAR ENDED
SEPTEMBER
30 | | | FOR THE
YEAR ENDED
SEPTEMBER
30 | | | FOR THE
YEAR ENDED
SEPTEMBER
30 | | | FOR THE
YEAR ENDED
SEPTEMBER
30 | |
| | | 2024 | | | 2023 | | | 2022 | | | 2021 | | | 2020 | |
| | | | | | | | | | | | | | | | | | | | | |
Net asset value, beginning of year | | $ | 8.33 | | | $ | 7.98 | | | $ | 9.91 | | | $ | 9.26 | | | $ | 9.39 | |
| | | | | | | | | | | | | | | | | | | | |
INCOME (LOSS) FROM INVESTMENT OPERATIONS: | | | | | | | | | | | | | | | | | | | | |
Net investment income (A) | | | 0.54 | | | | 0.46 | | | | 0.43 | | | | 0.44 | | | | 0.45 | |
Net realized and unrealized gain (loss) on investments | | | 0.71 | | | | 0.36 | | | | (1.90 | ) | | | 0.63 | | | | (0.14 | ) |
Total from investment operations | | | 1.25 | | | | 0.82 | | | | (1.47 | ) | | | 1.07 | | | | 0.31 | |
| | | | | | | | | | | | | | | | | | | | | |
LESS DISTRIBUTIONS: | | | | | | | | | | | | | | | | | | | | |
From net investment income | | | (0.52 | ) | | | (0.47 | ) | | | (0.43 | ) | | | (0.42 | ) | | | (0.44 | ) |
From net realized gains on investments | | | — | | | | — | | | | (0.03 | ) | | | — | | | | — | |
Total distributions | | | (0.52 | ) | | | (0.47 | ) | | | (0.46 | ) | | | (0.42 | ) | | | (0.44 | ) |
| | | | | | | | | | | | | | | | | | | | | |
Net asset value, end of year | | $ | 9.06 | | | $ | 8.33 | | | $ | 7.98 | | | $ | 9.91 | | | $ | 9.26 | |
| | | | | | | | | | | | | | | | | | | | | |
Total return (B) | | | 15.34 | % | | | 10.40 | % | | | (15.24 | )% | | | 11.71 | % | | | 3.53 | % |
| | | | | | | | | | | | | | | | | | | | | |
RATIOS/SUPPLEMENTAL DATA: | | | | | | | | | | | | | | | | | | | | |
Net assets, end of year (in 000’s) | | $ | 115,983 | | | $ | 73,109 | | | $ | 67,093 | | | $ | 69,150 | | | $ | 30,924 | |
Ratios to average net assets | | | | | | | | | | | | | | | | | | | | |
Expenses, before waiver and reimbursement | | | 0.99 | % | | | 1.07 | % | | | 1.01 | % | | | 1.13 | % | | | 1.09 | % |
Expenses, net waiver and reimbursement (C) | | | 0.89 | % | | | 0.94 | %(D) | | | 0.93 | % | | | 1.08 | % | | | 1.04 | % |
Net investment income, before waiver and reimbursement | | | 6.02 | % | | | 5.31 | % | | | 4.59 | % | | | 4.40 | % | | | 4.86 | % |
Net investment income, net waiver and reimbursement (C) | | | 6.12 | % | | | 5.45 | %(D) | | | 4.68 | % | | | 4.45 | % | | | 4.91 | % |
Portfolio turnover rate | | | 33 | % | | | 72 | % | | | 24 | % | | | 57 | % | | | 91 | % |
(A) | Per share amounts calculated using average shares method, which more appropriately presents the per share data for the period. |
(B) | Total return in the above table represents the rate that the investor would have earned or lost on an investment in the Fund assuming reinvestment of dividends. Total return would have been higher or lower if certain expenses had not been reimbursed, waived or recouped. |
(C) | This expense decrease from the contractual waiver is reflected in both the net expense and the net investment income ratios shown. |
(D) | For the period October 1, 2022 through January 28, 2023 the voluntary waiver was 0.03%. |
FINANCIAL HIGHLIGHTS
The accompanying notes are an integral part of these financial statements.
FINANCIAL STATEMENTS | 84
Israel Common Values Fund (Class A Shares)
SELECTED DATA BASED ON A SHARE OUTSTANDING THROUGHOUT EACH YEAR
| | | FOR THE
YEAR ENDED
SEPTEMBER
30 | | | FOR THE
YEAR ENDED
SEPTEMBER
30 | | | FOR THE
YEAR ENDED
SEPTEMBER
30 | | | FOR THE
YEAR ENDED
SEPTEMBER
30 | | | FOR THE
YEAR ENDED
SEPTEMBER
30 | |
| | | 2024 | | | 2023 | | | 2022 | | | 2021 | | | 2020 | |
| | | | | | | | | | | | | | | | | | | | | |
Net asset value, beginning of year | | $ | 19.34 | | | $ | 21.61 | | | $ | 24.70 | | | $ | 16.55 | | | $ | 17.84 | |
| | | | | | | | | | | | | | | | | | | | |
INCOME (LOSS) FROM INVESTMENT OPERATIONS: | | | | | | | | | | | | | | | | | | | | |
Net investment income (loss) (A) | | | 0.16 | | | | 0.11 | | | | 0.05 | | | | (0.10 | ) | | | (0.10 | ) |
Net realized and unrealized gain (loss) on investments | | | 2.50 | | | | (2.38 | ) | | | (3.14 | ) | | | 8.25 | | | | (1.01 | ) |
Total from investment operations | | | 2.66 | | | | (2.27 | ) | | | (3.09 | ) | | | 8.15 | | | | (1.11 | ) |
| | | | | | | | | | | | | | | | | | | | | |
LESS DISTRIBUTIONS: | | | | | | | | | | | | | | | | | | | | |
From net investment income | | | — | | | | — | | | | — | | | | — | | | | (0.18 | ) |
From net realized gains on investments | | | — | | | | — | | | | — | | | | — | | | | — | |
Return of Capital | | | — | | | | — | | | | — | | | | — | | | | 0.00 | * |
Total distributions | | | — | | | | — | | | | — | | | | — | | | | (0.18 | ) |
| | | | | | | | | | | | | | | | | | | | | |
Net asset value, end of year | | $ | 22.00 | | | $ | 19.34 | | | $ | 21.61 | | | $ | 24.70 | | | $ | 16.55 | |
| | | | | | | | | | | | | | | | | | | | | |
Total return (B)(C) | | | 13.75 | % | | | (10.50 | )% | | | (12.51 | )% | | | 49.24 | % | | | (6.35 | )% |
| | | | | | | | | | | | | | | | | | | | | |
RATIOS/SUPPLEMENTAL DATA: | | | | | | | | | | | | | | | | | | | | |
Net assets, end of year (in 000’s) | | $ | 51,467 | | | $ | 47,004 | | | $ | 53,800 | | | $ | 57,667 | | | $ | 36,800 | |
Ratio of expenses to average net assets | | | 1.77 | % | | | 1.82 | % | | | 1.72 | % | | | 1.72 | % | | | 1.84 | % |
Ratio of net investment income (loss) to average net assets | | | 0.79 | % | | | 0.53 | % | | | 0.20 | % | | | (0.48 | )% | | | (0.62 | )% |
Portfolio turnover rate | | | 9 | % | | | 7 | % | | | 8 | % | | | 12 | % | | | 16 | % |
* | Amount is less than $0.005 per share. |
(A) | Per share amounts calculated using average shares method, which more appropriately presents the per share data for the period. |
(B) | Total return calculation does not reflect sales load. |
(C) | Total return in the above table represents the rate that the investor would have earned or lost on an investment in the Fund assuming reinvestment of dividends. |
FINANCIAL HIGHLIGHTS
The accompanying notes are an integral part of these financial statements.
FINANCIAL STATEMENTS | 85
Israel Common Values Fund (Class C Shares)
SELECTED DATA BASED ON A SHARE OUTSTANDING THROUGHOUT EACH YEAR
| | | FOR THE
YEAR ENDED
SEPTEMBER
30 | | | FOR THE
YEAR ENDED
SEPTEMBER
30 | | | FOR THE
YEAR ENDED
SEPTEMBER
30 | | | FOR THE
YEAR ENDED
SEPTEMBER
30 | | | FOR THE
YEAR ENDED
SEPTEMBER
30 | |
| | | 2024 | | | 2023 | | | 2022 | | | 2021 | | | 2020 | |
| | | | | | | | | | | | | | | | | | | | | |
Net asset value, beginning of year | | $ | 17.97 | | | $ | 20.22 | | | $ | 23.29 | | | $ | 15.73 | | | $ | 16.97 | |
| | | | | | | | | | | | | | | | | | | | |
INCOME (LOSS) FROM INVESTMENT OPERATIONS: | | | | | | | | | | | | | | | | | | | | |
Net investment loss (A) | | | (0.01 | ) | | | (0.05 | ) | | | (0.13 | ) | | | (0.26 | ) | | | (0.22 | ) |
Net realized and unrealized gain (loss) on investments | | | 2.32 | | | | (2.20 | ) | | | (2.94 | ) | | | 7.82 | | | | (0.96 | ) |
Total from investment operations | | | 2.31 | | | | (2.25 | ) | | | (3.07 | ) | | | 7.56 | | | | (1.18 | ) |
| | | | | | | | | | | | | | | | | | | | | |
LESS DISTRIBUTIONS: | | | | | | | | | | | | | | | | | | | | |
From net investment income | | | — | | | | — | | | | — | | | | — | | | | (0.06 | ) |
From net realized gains on investments | | | — | | | | — | | | | — | | | | — | | | | — | |
Return of Capital | | | — | | | | — | | | | — | | | | — | | | | 0.00 | * |
Total distributions | | | — | | | | — | | | | — | | | | — | | | | (0.06 | ) |
| | | | | | | | | | | | | | | | | | | | | |
Net asset value, end of year | | $ | 20.28 | | | $ | 17.97 | | | $ | 20.22 | | | $ | 23.29 | | | $ | 15.73 | |
| | | | | | | | | | | | | | | | | | | | | |
Total return (B)(C) | | | 12.85 | % | | | (11.13 | )% | | | (13.18 | )% | | | 48.06 | % | | | (7.00 | )% |
| | | | | | | | | | | | | | | | | | | | | |
RATIOS/SUPPLEMENTAL DATA: | | | | | | | | | | | | | | | | | | | | |
Net assets, end of year (in 000’s) | | $ | 5,747 | | | $ | 8,101 | | | $ | 10,263 | | | $ | 12,293 | | | $ | 9,076 | |
Ratio of expenses to average net assets | | | 2.52 | % | | | 2.57 | % | | | 2.47 | % | | | 2.47 | % | | | 2.59 | % |
Ratio of net investment loss to average net assets | | | (0.06 | )% | | | (0.25 | )% | | | (0.54 | )% | | | (1.27 | )% | | | (1.37 | )% |
Portfolio turnover rate | | | 9 | % | | | 7 | % | | | 8 | % | | | 12 | % | | | 16 | % |
* | Amount is less than $0.005 per share. |
(A) | Per share amounts calculated using average shares method, which more appropriately presents the per share data for the period. |
(B) | Total return calculation does not reflect redemption fee. |
(C) | Total return in the above table represents the rate that the investor would have earned or lost on an investment in the Fund assuming reinvestment of dividends. |
FINANCIAL HIGHLIGHTS
The accompanying notes are an integral part of these financial statements.
FINANCIAL STATEMENTS | 86
Israel Common Values Fund (Class I Shares)
SELECTED DATA BASED ON A SHARE OUTSTANDING THROUGHOUT EACH YEAR
| | | FOR THE
YEAR ENDED
SEPTEMBER
30 | | | FOR THE
YEAR ENDED
SEPTEMBER
30 | | | FOR THE
YEAR ENDED
SEPTEMBER
30 | | | FOR THE
YEAR ENDED
SEPTEMBER
30 | | | FOR THE
YEAR ENDED
SEPTEMBER
30 | |
| | | 2024 | | | 2023 | | | 2022 | | | 2021 | | | 2020 | |
| | | | | | | | | | | | | | | | | | | | | |
Net asset value, beginning of year | | $ | 19.64 | | | $ | 21.88 | | | $ | 24.95 | | | $ | 16.68 | | | $ | 17.97 | |
| | | | | | | | | | | | | | | | | | | | |
INCOME (LOSS) FROM INVESTMENT OPERATIONS: | | | | | | | | | | | | | | | | | | | | |
Net investment income (loss) (A) | | | 0.22 | | | | 0.17 | | | | 0.12 | | | | (0.05 | ) | | | (0.06 | ) |
Net realized and unrealized gain (loss) on investments | | | 2.53 | | | | (2.41 | ) | | | (3.19 | ) | | | 8.32 | | | | (1.01 | ) |
Total from investment operations | | | 2.75 | | | | (2.24 | ) | | | (3.07 | ) | | | 8.27 | | | | (1.07 | ) |
| | | | | | | | | | | | | | | | | | | | | |
LESS DISTRIBUTIONS: | | | | | | | | | | | | | | | | | | | | |
From net investment income | | | (0.02 | ) | | | — | | | | — | | | | — | | | | (0.22 | ) |
From net realized gains on investments | | | — | | | | — | | | | — | | | | — | | | | — | |
Return of Capital | | | — | | | | — | | | | — | | | | — | | | | 0.00 | * |
Total distributions | | | (0.02 | ) | | | — | | | | — | | | | — | | | | (0.22 | ) |
| | | | | | | | | | | | | | | | | | | | | |
Net asset value, end of year | | $ | 22.37 | | | $ | 19.64 | | | $ | 21.88 | | | $ | 24.95 | | | $ | 16.68 | |
| | | | | | | | | | | | | | | | | | | | | |
Total return (B) | | | 14.00 | % | | | (10.24 | )% | | | (12.30 | )% | | | 49.58 | % | | | (6.08 | )% |
| | | | | | | | | | | | | | | | | | | | | |
RATIOS/SUPPLEMENTAL DATA: | | | | | | | | | | | | | | | | | | | | |
Net assets, end of year (in 000’s) | | $ | 42,764 | | | $ | 40,417 | | | $ | 36,790 | | | $ | 45,063 | | | $ | 23,928 | |
Ratio of expenses to average net assets | | | 1.52 | % | | | 1.56 | % | | | 1.47 | % | | | 1.47 | % | | | 1.59 | % |
Ratio of net investment income (loss) to average net assets | | | 1.06 | % | | | 0.82 | % | | | 0.48 | % | | | (0.22 | )% | | | (0.37 | )% |
Portfolio turnover rate | | | 9 | % | | | 7 | % | | | 8 | % | | | 12 | % | | | 16 | % |
* | Amount is less than $0.005 per share. |
(A) | Per share amounts calculated using average shares method, which more appropriately presents the per share data for the period. |
(B) | Total return in the above table represents the rate that the investor would have earned or lost on an investment in the Fund assuming reinvestment of dividends. |
FINANCIAL HIGHLIGHTS
The accompanying notes are an integral part of these financial statements.
FINANCIAL STATEMENTS | 87
Defensive Strategies Fund (Class A Shares)
SELECTED DATA BASED ON A SHARE OUTSTANDING THROUGHOUT EACH YEAR
| | | FOR THE
YEAR ENDED
SEPTEMBER
30 | | | FOR THE
YEAR ENDED
SEPTEMBER
30 | | | FOR THE
YEAR ENDED
SEPTEMBER
30 | | | FOR THE
YEAR ENDED
SEPTEMBER
30 | | | FOR THE
YEAR ENDED
SEPTEMBER
30 | |
| | | 2024 | | | 2023 | | | 2022 | | | 2021 | | | 2020 | |
| | | | | | | | | | | | | | | | | | | | | |
Net asset value, beginning of year | | $ | 12.98 | | | $ | 12.52 | | | $ | 13.52 | | | $ | 11.78 | | | $ | 11.69 | |
| | | | | | | | | | | | | | | | | | | | |
INCOME (LOSS) FROM INVESTMENT OPERATIONS: | | | | | | | | | | | | | | | | | | | | |
Net investment income (loss) (A) | | | 0.25 | | | | 0.15 | | | | 0.28 | | | | 0.10 | | | | (0.01 | ) |
Net realized and unrealized gain (loss) on investments | | | 1.78 | | | | 0.88 | | | | (1.21 | ) | | | 1.64 | | | | 0.44 | |
Total from investment operations | | | 2.03 | | | | 1.03 | | | | (0.93 | ) | | | 1.74 | | | | 0.43 | |
| | | | | | | | | | | | | | | | | | | | | |
LESS DISTRIBUTIONS: | | | | | | | | | | | | | | | | | | | | |
From net investment income | | | (0.22 | ) | | | (0.25 | ) | | | (0.07 | ) | | | — | | | | (0.06 | ) |
From net realized gains on investments | | | (0.10 | ) | | | (0.32 | ) | | | — | | | | — | | | | (0.28 | ) |
Return of capital | | | — | | | | — | | | | — | | | | — | | | | 0.00 | * |
Total distributions | | | (0.32 | ) | | | (0.57 | ) | | | (0.07 | ) | | | — | | | | (0.34 | ) |
| | | | | | | | | | | | | | | | | | | | | |
Net asset value, end of year | | $ | 14.69 | | | $ | 12.98 | | | $ | 12.52 | | | $ | 13.52 | | | $ | 11.78 | |
| | | | | | | | | | | | | | | | | | | | | |
Total return (B)(C) | | | 15.92 | % | | | 8.30 | % | | | (6.92 | )% | | | 14.77 | % | | | 3.75 | % |
| | | | | | | | | | | | | | | | | | | | | |
RATIOS/SUPPLEMENTAL DATA: | | | | | | | | | | | | | | | | | | | | |
Net assets, end of year (in 000’s) | | $ | 43,178 | | | $ | 39,823 | | | $ | 45,313 | | | $ | 40,342 | | | $ | 29,577 | |
Ratios to average net assets | | | | | | | | | | | | | | | | | | | | |
Expenses, before waiver and reimbursement | | | 1.35 | % | | | 1.36 | % | | | 1.42 | % | | | 1.48 | % | | | 1.54 | % |
Expenses, net waiver and reimbursement (D) | | | 1.19 | % | | | 1.27 | %(E) | | | 1.37 | % | | | 1.43 | % | | | 1.49 | % |
Net investment income (loss), before waiver and reimbursement | | | 1.68 | % | | | 1.09 | % | | | 1.95 | % | | | 0.74 | % | | | (0.13 | )% |
Net investment income (loss), net waiver and reimbursement (D) | | | 1.84 | % | | | 1.18 | %(E) | | | 2.00 | % | | | 0.79 | % | | | (0.08 | )% |
Portfolio turnover rate | | | 19 | % | | | 46 | % | | | 35 | % | | | 34 | % | | | 49 | % |
* | Amount is less than $0.005 per share. |
(A) | Per share amounts calculated using average shares method, which more appropriately presents the per share data for the period. |
(B) | Total return calculation does not reflect sales load. Total return represents aggregate total return based on Net Asset Value. |
(C) | Total return in the above table represents the rate that the investor would have earned or lost on an investment in the Fund assuming reinvestment of dividends. Total return would have been higher or lower if certain expenses had not been reimbursed, waived or recouped. |
(D) | This expense decrease from the contractual waiver is reflected in both the net expense and the net investment income ratios shown. |
(E) | For the period October 1, 2022 through January 28, 2023 the voluntary waiver was 0.02%. |
FINANCIAL HIGHLIGHTS
The accompanying notes are an integral part of these financial statements.
FINANCIAL STATEMENTS | 88
Defensive Strategies Fund (Class C Shares)
SELECTED DATA BASED ON A SHARE OUTSTANDING THROUGHOUT EACH YEAR
| | | FOR THE
YEAR ENDED
SEPTEMBER
30 | | | FOR THE
YEAR ENDED
SEPTEMBER
30 | | | FOR THE
YEAR ENDED
SEPTEMBER
30 | | | FOR THE
YEAR ENDED
SEPTEMBER
30 | | | FOR THE
YEAR ENDED
SEPTEMBER
30 | |
| | | 2024 | | | 2023 | | | 2022 | | | 2021 | | | 2020 | |
| | | | | | | | | | | | | | | | | | | | | |
Net asset value, beginning of year | | $ | 12.15 | | | $ | 11.76 | | | $ | 12.74 | | | $ | 11.18 | | | $ | 11.13 | |
| | | | | | | | | | | | | | | | | | | | |
INCOME (LOSS) FROM INVESTMENT OPERATIONS: | | | | | | | | | | | | | | | | | | | | |
Net investment income (loss) (A) | | | 0.13 | | | | 0.05 | | | | 0.18 | | | | 0.01 | | | | (0.09 | ) |
Net realized and unrealized gain (loss) on investments | | | 1.69 | | | | 0.83 | | | | (1.16 | ) | | | 1.55 | | | | 0.42 | |
Total from investment operations | | | 1.82 | | | | 0.88 | | | | (0.98 | ) | | | 1.56 | | | | 0.33 | |
| | | | | | | | | | | | | | | | | | | | | |
LESS DISTRIBUTIONS: | | | | | | | | | | | | | | | | | | | | |
From net investment income | | | (0.09 | ) | | | (0.17 | ) | | | — | | | | — | | | | — | |
From net realized gains on investments | | | (0.10 | ) | | | (0.32 | ) | | | — | | | | — | | | | (0.28 | ) |
From return of capital | | | — | | | | — | | | | — | | | | — | | | | 0.00 | * |
Total distributions | | | (0.19 | ) | | | (0.49 | ) | | | — | | | | — | | | | (0.28 | ) |
| | | | | | | | | | | | | | | | | | | | | |
Net asset value, end of year | | $ | 13.78 | | | $ | 12.15 | | | $ | 11.76 | | | $ | 12.74 | | | $ | 11.18 | |
| | | | | | | | | | | | | | | | | | | | | |
Total return (B)(C) | | | 15.13 | % | | | 7.50 | % | | | (7.69 | )% | | | 13.95 | % | | | 3.01 | % |
| | | | | | | | | | | | | | | | | | | | | |
RATIOS/SUPPLEMENTAL DATA: | | | | | | | | | | | | | | | | | | | | |
Net assets, end of year (in 000’s) | | $ | 3,259 | | | $ | 4,117 | | | $ | 4,880 | | | $ | 3,388 | | | $ | 2,464 | |
Ratios to average net assets | | | | | | | | | | | | | | | | | | | | |
Expenses, before waiver and reimbursement | | | 2.10 | % | | | 2.11 | % | | | 2.17 | % | | | 2.23 | % | | | 2.29 | % |
Expenses, net waiver and reimbursement (D) | | | 1.94 | % | | | 2.02 | %(E) | | | 2.12 | % | | | 2.18 | % | | | 2.24 | % |
Net investment income (loss), before waiver and reimbursement | | | 0.88 | % | | | 0.30 | % | | | 1.32 | % | | | (0.01 | )% | | | (0.89 | )% |
Net investment income (loss), net waiver and reimbursement (D) | | | 1.04 | % | | | 0.39 | %(E) | | | 1.37 | % | | | 0.04 | % | | | (0.84 | )% |
Portfolio turnover rate | | | 19 | % | | | 46 | % | | | 35 | % | | | 34 | % | | | 49 | % |
* | Amount is less than $0.005 per share. |
(A) | Per share amounts calculated using average shares method, which more appropriately presents the per share data for the period. |
(B) | Total return calculation does not reflect redemption fee. Total return represents aggregate total return based on Net Asset Value. |
(C) | Total return in the above table represents the rate that the investor would have earned or lost on an investment in the Fund assuming reinvestment of dividends. Total return would have been higher or lower if certain expenses had not been reimbursed, waived or recouped. |
(D) | This expense decrease from the contractual waiver is reflected in both the net expense and the net investment income ratios shown. |
(E) | For the period October 1, 2022 through January 28, 2023 the voluntary waiver was 0.02%. |
FINANCIAL HIGHLIGHTS
The accompanying notes are an integral part of these financial statements.
FINANCIAL STATEMENTS | 89
Defensive Strategies Fund (Class I Shares)
SELECTED DATA BASED ON A SHARE OUTSTANDING THROUGHOUT EACH YEAR
| | | FOR THE
YEAR ENDED
SEPTEMBER
30 | | | FOR THE
YEAR ENDED
SEPTEMBER
30 | | | FOR THE
YEAR ENDED
SEPTEMBER
30 | | | FOR THE
YEAR ENDED
SEPTEMBER
30 | | | FOR THE
YEAR ENDED
SEPTEMBER
30 | |
| | | 2024 | | | 2023 | | | 2022 | | | 2021 | | | 2020 | |
| | | | | | | | | | | | | | | | | | | | | |
Net asset value, beginning of year | | $ | 13.01 | | | $ | 12.54 | | | $ | 13.55 | | | $ | 11.77 | | | $ | 11.69 | |
| | | | | | | | | | | | | | | | | | | | |
INCOME (LOSS) FROM INVESTMENT OPERATIONS: | | | | | | | | | | | | | | | | | | | | |
Net investment income (A) | | | 0.28 | | | | 0.19 | | | | 0.35 | | | | 0.17 | | | | 0.02 | |
Net realized and unrealized gain (loss) on investments | | | 1.78 | | | | 0.89 | | | | (1.26 | ) | | | 1.61 | | | | 0.43 | |
Total from investment operations | | | 2.06 | | | | 1.08 | | | | (0.91 | ) | | | 1.78 | | | | 0.45 | |
| | | | | | | | | | | | | | | | | | | | | |
LESS DISTRIBUTIONS: | | | | | | | | | | | | | | | | | | | | |
From net investment income | | | (0.25 | ) | | | (0.29 | ) | | | (0.10 | ) | | | — | | | | (0.09 | ) |
From net realized gains on investments | | | (0.10 | ) | | | (0.32 | ) | | | — | | | | — | | | | (0.28 | ) |
From return of capital | | | — | | | | — | | | | — | | | | — | | | | 0.00 | * |
Total distributions | | | (0.35 | ) | | | (0.61 | ) | | | (0.10 | ) | | | — | | | | (0.37 | ) |
| | | | | | | | | | | | | | | | | | | | | |
Net asset value, end of year | | $ | 14.72 | | | $ | 13.01 | | | $ | 12.54 | | | $ | 13.55 | | | $ | 11.77 | |
| | | | | | | | | | | | | | | | | | | | | |
Total return (B)(C) | | | 16.20 | % | | | 8.64 | % | | | (6.80 | )% | | | 15.12 | % | | | 3.96 | % |
| | | | | | | | | | | | | | | | | | | | | |
RATIOS/SUPPLEMENTAL DATA: | | | | | | | | | | | | | | | | | | | | |
Net assets, end of year (in 000’s) | | $ | 32,894 | | | $ | 26,576 | | | $ | 25,269 | | | $ | 14,750 | | | $ | 5,212 | |
Ratios to average net assets | | | | | | | | | | | | | | | | | | | | |
Expenses, before waiver and reimbursement | | | 1.10 | % | | | 1.11 | % | | | 1.17 | % | | | 1.23 | % | | | 1.29 | % |
Expenses, net waiver and reimbursement (D) | | | 0.94 | % | | | 1.03 | %(E) | | | 1.12 | % | | | 1.18 | % | | | 1.24 | % |
Net investment income, before waiver and reimbursement | | | 1.88 | % | | | 1.36 | % | | | 2.39 | % | | | 1.21 | % | | | 0.16 | % |
Net investment income, net waiver and reimbursement (D) | | | 2.05 | % | | | 1.44 | %(E) | | | 2.44 | % | | | 1.26 | % | | | 0.21 | % |
Portfolio turnover rate | | | 19 | % | | | 46 | % | | | 35 | % | | | 34 | % | | | 49 | % |
* | Amount is less than $0.005 per share. |
(A) | Per share amounts calculated using average shares method, which more appropriately presents the per share data for the period. |
(B) | Total return represents aggregate total return based on Net Asset Value. |
(C) | Total return in the above table represents the rate that the investor would have earned or lost on an investment in the Fund assuming reinvestment of dividends. Total return would have been higher or lower if certain expenses had not been reimbursed, waived or recouped. |
(D) | This expense decrease from the contractual waiver is reflected in both the net expense and the net investment income ratios shown. |
(E) | For the period October 1, 2022 through January 28, 2023 the voluntary waiver was 0.02%. |
FINANCIAL HIGHLIGHTS
The accompanying notes are an integral part of these financial statements.
FINANCIAL STATEMENTS | 90
Strategic Growth Fund (Class A Shares)
SELECTED DATA BASED ON A SHARE OUTSTANDING THROUGHOUT EACH YEAR
| | | FOR THE
YEAR ENDED
SEPTEMBER
30 | | | FOR THE
YEAR ENDED
SEPTEMBER
30 | | | FOR THE
YEAR ENDED
SEPTEMBER
30 | | | FOR THE
YEAR ENDED
SEPTEMBER
30 | | | FOR THE
YEAR ENDED
SEPTEMBER
30 | |
| | | 2024 | | | 2023 | | | 2022 | | | 2021 | | | 2020 | |
| | | | | | | | | | | | | | | | | | | | | |
Net asset value, beginning of year | | $ | 8.79 | | | $ | 8.77 | | | $ | 10.92 | | | $ | 9.48 | | | $ | 9.64 | |
| | | | | | | | | | | | | | | | | | | | |
INCOME (LOSS) FROM INVESTMENT OPERATIONS: | | | | | | | | | | | | | | | | | | | | |
Net investment income (A) | | | 0.18 | | | | 0.12 | | | | 0.06 | | | | 0.03 | | | | 0.04 | |
Net realized and unrealized gain (loss) on investments | | | 1.32 | | | | 0.54 | | | | (1.70 | ) | | | 1.75 | | | | 0.16 | |
Total from investment operations | | | 1.50 | | | | 0.66 | | | | (1.64 | ) | | | 1.78 | | | | 0.20 | |
| | | | | | | | | | | | | | | | | | | | | |
LESS DISTRIBUTIONS: | | | | | | | | | | | | | | | | | | | | |
From net investment income | | | (0.13 | ) | | | (0.06 | ) | | | (0.02 | ) | | | (0.01 | ) | | | — | |
From net realized gains on investments | | | (0.02 | ) | | | (0.58 | ) | | | (0.49 | ) | | | (0.33 | ) | | | (0.36 | ) |
Total distributions | | | (0.15 | ) | | | (0.64 | ) | | | (0.51 | ) | | | (0.34 | ) | | | (0.36 | ) |
| | | | | | | | | | | | | | | | | | | | | |
Net asset value, end of year | | $ | 10.14 | | | $ | 8.79 | | | $ | 8.77 | | | $ | 10.92 | | | $ | 9.48 | |
| | | | | | | | | | | | | | | | | | | | | |
Total return (B)(C) | | | 17.23 | % | | | 7.37 | % | | | (15.82 | )% | | | 19.15 | % | | | 2.03 | % |
| | | | | | | | | | | | | | | | | | | | | |
RATIOS/SUPPLEMENTAL DATA: | | | | | | | | | | | | | | | | | | | | |
Net assets, end of year (in 000’s) | | $ | 31,769 | | | $ | 29,928 | | | $ | 29,944 | | | $ | 37,731 | | | $ | 32,260 | |
Ratios to average net assets | | | | | | | | | | | | | | | | | | | | |
Expenses, before waiver and reimbursement (D) | | | 0.89 | % | | | 1.28 | % | | | 1.09 | % | | | 1.10 | % | | | 1.15 | % |
Expenses, net waiver and reimbursement (D) | | | 0.89 | % | | | 1.03 | %(F) | | | N/A | | | | N/A | | | | N/A | |
Net investment income, before waiver and reimbursement (D,E) | | | 1.96 | % | | | 1.08 | % | | | 0.56 | % | | | 0.27 | % | | | 0.42 | % |
Net investment income, net waiver and reimbursement (D,E) | | | 1.96 | % | | | 1.33 | %(F) | | | N/A | | | | N/A | | | | N/A | |
Portfolio turnover rate | | | 3 | % | | | 26 | % | | | 28 | % | | | 22 | % | | | 47 | % |
(A) | Per share amounts calculated using average shares method, which more appropriately presents the per share data for the period. |
(B) | Total return calculation does not reflect sales load. |
(C) | Total return in the above table represents the rate that the investor would have earned or lost on an investment in the Fund assuming reinvestment of dividends. Total return would have been higher or lower if certain expenses had not been reimbursed, waived or recouped. |
(D) | These ratios exclude the impact of expenses of the underlying security holdings as represented in the Schedule of Investments. |
(E) | Recognition of net investment income (loss) by the Fund is affected by the timing of the declaration of dividends by the underlying investment companies in which the Fund invests. |
(F) | For the period April 1, 2023 through September 30, 2023 the voluntary waiver was 0.25%. |
FINANCIAL HIGHLIGHTS
The accompanying notes are an integral part of these financial statements.
FINANCIAL STATEMENTS | 91
Strategic Growth Fund (Class C Shares)
SELECTED DATA BASED ON A SHARE OUTSTANDING THROUGHOUT EACH YEAR
| | | FOR THE
YEAR ENDED
SEPTEMBER
30 | | | FOR THE
YEAR ENDED
SEPTEMBER
30 | | | FOR THE
YEAR ENDED
SEPTEMBER
30 | | | FOR THE
YEAR ENDED
SEPTEMBER
30 | | | FOR THE
YEAR ENDED
SEPTEMBER
30 | |
| | | 2024 | | | 2023 | | | 2022 | | | 2021 | | | 2020 | |
| | | | | | | | | | | | | | | | | | | | | |
Net asset value, beginning of year | | $ | 7.48 | | | $ | 7.54 | | | $ | 9.50 | | | $ | 8.34 | | | $ | 8.58 | |
| | | | | | | | | | | | | | | | | | | | |
INCOME (LOSS) FROM INVESTMENT OPERATIONS: | | | | | | | | | | | | | | | | | | | | |
Net investment income (loss) (A) | | | 0.11 | | | | 0.05 | | | | (0.02 | ) | | | (0.05 | ) | | | (0.03 | ) |
Net realized and unrealized gain (loss) on investments | | | 1.12 | | | | 0.47 | | | | (1.45 | ) | | | 1.54 | | | | 0.15 | |
Total from investment operations | | | 1.23 | | | | 0.52 | | | | (1.47 | ) | | | 1.49 | | | | 0.12 | |
| | | | | | | | | | | | | | | | | | | | | |
LESS DISTRIBUTIONS: | | | | | | | | | | | | | | | | | | | | |
From net investment income | | | (0.06 | ) | | | — | | | | — | | | | — | | | | — | |
From net realized gains on investments | | | (0.02 | ) | | | (0.58 | ) | | | (0.49 | ) | | | (0.33 | ) | | | (0.36 | ) |
Total distributions | | | (0.08 | ) | | | (0.58 | ) | | | (0.49 | ) | | | (0.33 | ) | | | (0.36 | ) |
| | | | | | | | | | | | | | | | | | | | | |
Net asset value, end of year | | $ | 8.63 | | | $ | 7.48 | | | $ | 7.54 | | | $ | 9.50 | | | $ | 8.34 | |
| | | | | | | | | | | | | | | | | | | | | |
Total return (B)(C) | | | 16.61 | % | | | 6.75 | % | | | (16.42 | )% | | | 18.19 | % | | | 1.33 | % |
| | | | | | | | | | | | | | | | | | | | | |
RATIOS/SUPPLEMENTAL DATA: | | | | | | | | | | | | | | | | | | | | |
Net assets, end of year (in 000’s) | | $ | 1,971 | | | $ | 2,704 | | | $ | 2,680 | | | $ | 2,967 | | | $ | 2,743 | |
Ratios to average net assets | | | | | | | | | | | | | | | | | | | | |
Expenses, before waiver and reimbursement (D) | | | 1.39 | % | | | 1.91 | % | | | 1.84 | % | | | 1.85 | % | | | 1.90 | % |
Expenses, net waiver and reimbursement (D) | | | 1.39 | % | | | 1.66 | %(F) | | | N/A | | | | N/A | | | | N/A | |
Net investment income, before waiver and reimbursement (D,E) | | | 1.39 | % | | | 0.45 | % | | | (0.20 | )% | | | (0.48 | )% | | | (0.32 | )% |
Net investment income, net waiver and reimbursement (D,E) | | | 1.39 | % | | | 0.70 | %(F) | | | N/A | | | | N/A | | | | N/A | |
Portfolio turnover rate | | | 3 | % | | | 26 | % | | | 28 | % | | | 22 | % | | | 47 | % |
(A) | Per share amounts calculated using average shares method, which more appropriately presents the per share data for the period. |
(B) | Total return calculation does not reflect redemption fee. |
(C) | Total return in the above table represents the rate that the investor would have earned or lost on an investment in the Fund assuming reinvestment of dividends. Total return would have been higher or lower if certain expenses had not been reimbursed, waived or recouped. |
(D) | These ratios exclude the impact of expenses of the underlying security holdings as represented in the Schedule of Investments. |
(E) | Recognition of net investment income (loss) by the Fund is affected by the timing of the declaration of dividends by the underlying investment companies in which the Fund invests. |
(F) | For the period April 1, 2023 through September 30, 2023 the voluntary waiver was 0.25%. |
FINANCIAL HIGHLIGHTS
The accompanying notes are an integral part of these financial statements.
FINANCIAL STATEMENTS | 92
Strategic Growth Fund (Class I Shares)
SELECTED DATA BASED ON A SHARE OUTSTANDING THROUGHOUT EACH PERIOD
| | | FOR THE
YEAR ENDED
SEPTEMBER 30 | | | FOR THE
PERIOD ENDED
SEPTEMBER 30 | |
| | | 2024 | | | 2023* | |
| | | | | | | | | |
Net asset value, beginning of period | | $ | 8.79 | | | $ | 9.08 | |
| | | | | | | | | |
INCOME (LOSS) FROM INVESTMENT OPERATIONS: | | | | | | | | |
Net investment income (A) | | | 0.23 | | | | 0.03 | |
Net realized and unrealized gain (loss) on investments (B) | | | 1.28 | | | | (0.32 | ) |
Total from investment operations | | | 1.51 | | | | (0.29 | ) |
| | | | | | | | | |
LESS DISTRIBUTIONS: | | | | | | | | |
From net investment income | | | (0.13 | ) | | | — | |
From net realized gains on investments | | | (0.02 | ) | | | — | |
Total distributions | | | (0.15 | ) | | | — | |
| | | | | | | | | |
Net asset value, end of period | | $ | 10.15 | | | $ | 8.79 | |
| | | | | | | | | |
Total return (C)(D) | | | 17.33 | % | | | (3.19 | )%(E) |
| | | | | | | | | |
RATIOS/SUPPLEMENTAL DATA: | | | | | | | | |
Net assets, end of period | | $ | 17,889 | | | $ | 18 | |
Ratios to average net assets | | | | | | | | |
Expenses, before waiver and reimbursement (F) | | | 0.64 | % | | | 1.03 | %(G) |
Expenses, net waiver and reimbursement (F) | | | 0.64 | % | | | 0.78%(G,H) | |
Net investment income, before waiver and reimbursement (F,I) | | | 2.33 | % | | | 3.37 | %(G) |
Net investment income, net waiver and reimbursement (F,I) | | | 2.33 | % | | | 3.62%(G,H) | |
Portfolio turnover rate | | | 3 | % | | | 26 | %(E) |
* | The Strategic Growth Fund Class I shares inception date is September 1, 2023. |
(A) | Per share amounts calculated using average shares method, which more appropriately presents the per share data for the period. |
(B) | Realized and unrealized gain (loss) per share in this caption are balancing amounts necessary to reconcile the change in net asset value per share for the period, and may not reconcile with aggregate gains and losses in the Statement of Operations due to the timing of share transactions for the period. |
(C) | Total return calculation does not reflect redemption fee. |
(D) | Total return in the above table represents the rate that the investor would have earned or lost on an investment in the Fund assuming reinvestment of dividends. Total return would have been higher or lower if certain expenses had not been reimbursed, waived or recouped. |
(E) | For periods of less than one full year, total return and turnover are not annualized. |
(F) | These ratios exclude the impact of expenses of the underlying security holdings as represented in the Schedule of Investments. |
(H) | For the period September 1, 2023 through September 30, 2023 the voluntary waiver was 0.02%. |
(I) | Recognition of net investment income (loss) by the Fund is affected by the timing of the declaration of dividends by the underlying investment companies in which the Fund invests. |
FINANCIAL HIGHLIGHTS
The accompanying notes are an integral part of these financial statements.
FINANCIAL STATEMENTS | 93
Conservative Growth Fund (Class A Shares)
SELECTED DATA BASED ON A SHARE OUTSTANDING THROUGHOUT EACH YEAR
| | | FOR THE
YEAR ENDED
SEPTEMBER
30 | | | FOR THE
YEAR ENDED
SEPTEMBER
30 | | | FOR THE
YEAR ENDED
SEPTEMBER
30 | | | FOR THE
YEAR ENDED
SEPTEMBER
30 | | | FOR THE
YEAR ENDED
SEPTEMBER
30 | |
| | | 2024 | | | 2023 | | | 2022 | | | 2021 | | | 2020 | |
| | | | | | | | | | | | | | | | | | | | | |
Net asset value, beginning of year | | $ | 9.54 | | | $ | 9.58 | | | $ | 11.66 | | | $ | 10.62 | | | $ | 10.66 | |
| | | | | | | | | | | | | | | | | | | | |
INCOME (LOSS) FROM INVESTMENT OPERATIONS: | | | | | | | | | | | | | | | | | | | | |
Net investment income (A) | | | 0.21 | | | | 0.14 | | | | 0.05 | | | | 0.02 | | | | 0.05 | |
Net realized and unrealized gain (loss) on investments | | | 1.18 | | | | 0.33 | | | | (1.66 | ) | | | 1.31 | | | | 0.30 | |
Total from investment operations | | | 1.39 | | | | 0.47 | | | | (1.61 | ) | | | 1.33 | | | | 0.35 | |
| | | | | | | | | | | | | | | | | | | | | |
LESS DISTRIBUTIONS: | | | | | | | | | | | | | | | | | | | | |
From net investment income | | | (0.15 | ) | | | (0.04 | ) | | | (0.02 | ) | | | (0.04 | ) | | | — | |
From net realized gains on investments | | | (0.02 | ) | | | (0.47 | ) | | | (0.45 | ) | | | (0.25 | ) | | | (0.39 | ) |
Total distributions | | | (0.17 | ) | | | (0.51 | ) | | | (0.47 | ) | | | (0.29 | ) | | | (0.39 | ) |
| | | | | | | | | | | | | | | | | | | | | |
Net asset value, end of year | | $ | 10.76 | | | $ | 9.54 | | | $ | 9.58 | | | $ | 11.66 | | | $ | 10.62 | |
| | | | | | | | | | | | | | | | | | | | | |
Total return (B)(C) | | | 14.71 | % | | | 4.79 | % | | | (14.48 | )% | | | 12.63 | % | | | 3.27 | % |
| | | | | | | | | | | | | | | | | | | | | |
RATIOS/SUPPLEMENTAL DATA: | | | | | | | | | | | | | | | | | | | | |
Net assets, end of year (in 000’s) | | $ | 35,490 | | | $ | 35,238 | | | $ | 37,037 | | | $ | 46,151 | | | $ | 41,546 | |
Ratios to average net assets | | | | | | | | | | | | | | | | | | | | |
Expenses, before waiver and reimbursement (D) | | | 0.90 | % | | | 1.24 | % | | | 1.04 | % | | | 1.10 | % | | | 1.12 | % |
Expenses, net waiver and reimbursement (D) | | | 0.90 | % | | | 0.99 | %(F) | | | N/A | | | | N/A | | | | N/A | |
Net investment income, before waiver and reimbursement (D,E) | | | 2.11 | % | | | 1.17 | % | | | 0.43 | % | | | 0.20 | % | | | 0.43 | % |
Net investment income, net waiver and reimbursement (D,E) | | | 2.11 | % | | | 1.42 | %(F) | | | N/A | | | | N/A | | | | N/A | |
Portfolio turnover rate | | | 4 | % | | | 27 | % | | | 21 | % | | | 21 | % | | | 37 | % |
(A) | Per share amounts calculated using average shares method, which more appropriately presents the per share data for the period. |
(B) | Total return calculation does not reflect sales load. |
(C) | Total return in the above table represents the rate that the investor would have earned or lost on an investment in the Fund assuming reinvestment of dividends. Total return would have been higher or lower if certain expenses had not been reimbursed, waived or recouped. |
(D) | These ratios exclude the impact of expenses of the underlying security holdings as represented in the Schedule of Investments. |
(E) | Recognition of net investment income (loss) by the Fund is affected by the timing of the declaration of dividends by the underlying investment companies in which the Fund invests. |
(F) | For the period April 1, 2023 through September 30, 2023 the voluntary waiver was 0.25%. |
FINANCIAL HIGHLIGHTS
The accompanying notes are an integral part of these financial statements.
FINANCIAL STATEMENTS | 94
Conservative Growth Fund (Class C Shares)
SELECTED DATA BASED ON A SHARE OUTSTANDING THROUGHOUT EACH YEAR
| | | FOR THE
YEAR ENDED
SEPTEMBER
30 | | | FOR THE
YEAR ENDED
SEPTEMBER
30 | | | FOR THE
YEAR ENDED
SEPTEMBER
30 | | | FOR THE
YEAR ENDED
SEPTEMBER
30 | | | FOR THE
YEAR ENDED
SEPTEMBER
30 | |
| | | 2024 | | | 2023 | | | 2022 | | | 2021 | | | 2020 | |
| | | | | | | | | | | | | | | | | | | | | |
Net asset value, beginning of year | | $ | 8.25 | | | $ | 8.36 | | | $ | 10.29 | | | $ | 9.43 | | | $ | 9.59 | |
| | | | | | | | | | | | | | | | | | | | |
INCOME (LOSS) FROM INVESTMENT OPERATIONS: | | | | | | | | | | | | | | | | | | | | |
Net investment income (loss) (A) | | | 0.14 | | | | 0.06 | | | | (0.03 | ) | | | (0.06 | ) | | | (0.03 | ) |
Net realized and unrealized gain (loss) on investments | | | 1.02 | | | | 0.30 | | | | (1.45 | ) | | | 1.17 | | | | 0.26 | |
Total from investment operations | | | 1.16 | | | | 0.36 | | | | (1.48 | ) | | | 1.11 | | | | 0.23 | |
| | | | | | | | | | | | | | | | | | | | | |
LESS DISTRIBUTIONS: | | | | | | | | | | | | | | | | | | | | |
From net investment income | | | (0.08 | ) | | | — | | | | — | | | | — | | | | — | |
From net realized gains on investments | | | (0.02 | ) | | | (0.47 | ) | | | (0.45 | ) | | | (0.25 | ) | | | (0.39 | ) |
Total distributions | | | (0.10 | ) | | | (0.47 | ) | | | (0.45 | ) | | | (0.25 | ) | | | (0.39 | ) |
| | | | | | | | | | | | | | | | | | | | | |
Net asset value, end of year | | $ | 9.31 | | | $ | 8.25 | | | $ | 8.36 | | | $ | 10.29 | | | $ | 9.43 | |
| | | | | | | | | | | | | | | | | | | | | |
Total return (B)(C) | | | 14.14 | % | | | 4.10 | % | | | (15.10 | )% | | | 11.84 | % | | | 2.36 | % |
| | | | | | | | | | | | | | | | | | | | | |
RATIOS/SUPPLEMENTAL DATA: | | | | | | | | | | | | | | | | | | | | |
Net assets, end of year (in 000’s) | | $ | 2,898 | | | $ | 3,519 | | | $ | 3,895 | | | $ | 5,496 | | | $ | 4,712 | |
Ratios to average net assets | | | | | | | | | | | | | | | | | | | | |
Expenses, before waiver and reimbursement (D) | | | 1.40 | % | | | 1.87 | % | | | 1.79 | % | | | 1.85 | % | | | 1.87 | % |
Expenses, net waiver and reimbursement (D) | | | 1.40 | % | | | 1.63 | %(F) | | | N/A | | | | N/A | | | | N/A | |
Net investment income, before waiver and reimbursement (D,E) | | | 1.57 | % | | | 0.53 | % | | | (0.32 | )% | | | (0.56 | )% | | | (0.31 | )% |
Net investment income, net waiver and reimbursement (D,E) | | | 1.57 | % | | | 0.77 | %(F) | | | N/A | | | | N/A | | | | N/A | |
Portfolio turnover rate | | | 4 | % | | | 27 | % | | | 21 | % | | | 21 | % | | | 37 | % |
(A) | Per share amounts calculated using average shares method, which more appropriately presents the per share data for the period. |
(B) | Total return calculation does not reflect redemption fees. Total return represents aggregate total return based on Net Asset Value. |
(C) | Total return in the above table represents the rate that the investor would have earned or lost on an investment in the Fund assuming reinvestment of dividends. Total return would have been higher or lower if certain expenses had not been reimbursed, waived or recouped. |
(D) | These ratios exclude the impact of expenses of the underlying security holdings as represented in the Schedule of Investments. |
(E) | Recognition of net investment income (loss) by the Fund is affected by the timing of the declaration of dividends by the underlying investment companies in which the Fund invests. |
(F) | For the period April 1, 2023 through September 30, 2023 the voluntary waiver was 0.25%. |
FINANCIAL HIGHLIGHTS
The accompanying notes are an integral part of these financial statements.
FINANCIAL STATEMENTS | 95
Conservative Growth Fund (Class I Shares)
SELECTED DATA BASED ON A SHARE OUTSTANDING THROUGHOUT EACH PERIOD
| | | FOR THE
YEAR ENDED
SEPTEMBER 30 | | | FOR THE
PERIOD ENDED
SEPTEMBER 30 | |
| | | 2024 | | | 2023* | |
| | | | | | | | | |
Net asset value, beginning of period | | $ | 9.54 | | | $ | 9.80 | |
| | | | | | | | | |
INCOME (LOSS) FROM INVESTMENT OPERATIONS: | | | | | | | | |
Net investment income (A) | | | 0.28 | | | | 0.05 | |
Net realized and unrealized gain (loss) on investments (B) | | | 1.09 | | | | (0.31 | ) |
Total from investment operations | | | 1.37 | | | | (0.26 | ) |
| | | | | | | | | |
LESS DISTRIBUTIONS: | | | | | | | | |
From net investment income | | | (0.15 | ) | | | — | |
From net realized gains on investments | | | (0.02 | ) | | | — | |
Total distributions | | | (0.17 | ) | | | — | |
| | | | | | | | | |
Net asset value, end of period | | $ | 10.74 | | | $ | 9.54 | |
| | | | | | | | | |
Total return (C)(D) | | | 14.49 | % | | | (2.65 | )%(E) |
| | | | | | | | | |
RATIOS/SUPPLEMENTAL DATA: | | | | | | | | |
Net assets, end of period | | $ | 131,305 | | | $ | 18 | |
Ratios to average net assets | | | | | | | | |
Expenses, before waiver and reimbursement (F) | | | 0.65 | % | | | 0.99 | %(G) |
Expenses, net waiver and reimbursement (F) | | | 0.65 | % | | | 0.74%(G,H) | |
Net investment income, before waiver and reimbursement (F,I) | | | 2.69 | % | | | 5.50 | %(G) |
Net investment income, net waiver and reimbursement (F,I) | | | 2.69 | % | | | 5.75%(G,H) | |
Portfolio turnover rate | | | 4 | % | | | 27 | %(E) |
* | The Conservative Growth Fund Class I shares inception date is September 1, 2023. |
(A) | Per share amounts calculated using average shares method, which more appropriately presents the per share data for the period. |
(B) | Realized and unrealized gain (loss) per share in this caption are balancing amounts necessary to reconcile the change in net asset value per share for the period, and may not reconcile with aggregate gains and losses in the Statement of Operations due to the timing of share transactions for the period. |
(C) | Total return calculation does not reflect redemption fee. |
(D) | Total return in the above table represents the rate that the investor would have earned or lost on an investment in the Fund assuming reinvestment of dividends. Total return would have been higher or lower if certain expenses had not been reimbursed, waived or recouped. |
(E) | For periods of less than one full year, total return and turnover are not annualized. |
(F) | These ratios exclude the impact of expenses of the underlying security holdings as represented in the Schedule of Investments. |
(H) | For the period September 1, 2023 through September 30, 2023 the voluntary waiver was 0.02%. |
(I) | Recognition of net investment income (loss) by the Fund is affected by the timing of the declaration of dividends by the underlying investment companies in which the Fund invests. |
FINANCIAL HIGHLIGHTS
The accompanying notes are an integral part of these financial statements.
FINANCIAL STATEMENTS | 96
Growth & Income Fund (Class A Shares)
SELECTED DATA BASED ON A SHARE OUTSTANDING THROUGHOUT EACH YEAR
| | | FOR THE
YEAR ENDED
SEPTEMBER
30 | | | FOR THE
YEAR ENDED
SEPTEMBER
30 | | | FOR THE
YEAR ENDED
SEPTEMBER
30 | | | FOR THE
YEAR ENDED
SEPTEMBER
30 | | | FOR THE
YEAR ENDED
SEPTEMBER
30 | |
| | | 2024 | | | 2023 | | | 2022 | | | 2021 | | | 2020 | |
| | | | | | | | | | | | | | | | | | | | | |
Net asset value, beginning of year | | $ | 9.92 | | | $ | 10.66 | | | $ | 11.75 | | | $ | 10.11 | | | $ | 10.60 | |
| | | | | | | | | | | | | | | | | | | | |
INCOME (LOSS) FROM INVESTMENT OPERATIONS: | | | | | | | | | | | | | | | | | | | | |
Net investment income (A) | | | 0.09 | | | | 0.17 | | | | 0.11 | | | | 0.06 | | | | 0.09 | |
Net realized and unrealized gain (loss) on investments | | | 1.12 | | | | (0.08 | ) | | | (1.03 | ) | | | 1.68 | | | | (0.47 | ) |
Total from investment operations | | | 1.31 | | | | 0.09 | | | | (0.92 | ) | | | 1.74 | | | | (0.38 | ) |
| | | | | | | | | | | | | | | | | | | | | |
LESS DISTRIBUTIONS: | | | | | | | | | | | | | | | | | | | | |
From net investment income | | | (0.19 | ) | | | (0.17 | ) | | | (0.12 | ) | | | (0.10 | ) | | | (0.11 | ) |
From net realized gains on investments | | | (0.06 | ) | | | (0.66 | ) | | | (0.05 | ) | | | — | | | | — | |
Return of Capital | | | — | | | | — | | | | — | | | | — | | | | 0.00 | * |
Total distributions | | | (0.25 | ) | | | (0.83 | ) | | | (0.17 | ) | | | (0.10 | ) | | | (0.11 | ) |
| | | | | | | | | | | | | | | | | | | | | |
Net asset value, end of year | | $ | 10.98 | | | $ | 9.92 | | | $ | 10.66 | | | $ | 11.75 | | | $ | 10.11 | |
| | | | | | | | | | | | | | | | | | | | | |
Total return (B)(C) | | | 13.32 | % | | | 0.50 | % | | | (7.97 | )% | | | 17.18 | % | | | (3.48 | )% |
| | | | | | | | | | | | | | | | | | | | | |
RATIOS/SUPPLEMENTAL DATA: | | | | | | | | | | | | | | | | | | | | |
Net assets, end of year (in 000’s) | | $ | 14,226 | | | $ | 12,726 | | | $ | 13,150 | | | $ | 14,191 | | | $ | 13,295 | |
Ratios to average net assets | | | | | | | | | | | | | | | | | | | | |
Expenses, before waiver and reimbursement | | | 1.98 | % | | | 1.98 | % | | | 1.85 | % | | | 1.90 | % | | | 1.85 | % |
Expenses, net waiver and reimbursement (D) | | | 1.59 | % | | | 1.58 | %(F) | | | 1.27 | % | | | 1.52 | % | | | 1.50 | % |
Net investment income, before waiver and reimbursement | | | 1.46 | % | | | 1.23 | % | | | 0.36 | % | | | 0.18 | % | | | 0.55 | % |
Net investment income, net waiver and reimbursement (D,E) | | | 1.86 | % | | | 1.63 | %(F) | | | 0.94 | % | | | 0.56 | % | | | 0.90 | % |
Portfolio turnover rate | | | 53 | % | | | 96 | % | | | 60 | % | | | 43 | % | | | 39 | % |
* | Amount is less than $0.005 per share |
(A) | Per share amounts calculated using average shares method, which more appropriately presents the per share data for the period. |
(B) | Total return calculation does not reflect sales load. |
(C) | Total return in the above table represents the rate that the investor would have earned or lost on an investment in the Fund assuming reinvestment of dividends. Total return would have been higher or lower if certain expenses had not been reimbursed, waived or recouped. |
(D) | This expense decrease from the contractual waiver is reflected in both the net expense and the net investment income ratios shown. |
(E) | Recognition of net investment income (loss) by the Fund is affected by the timing of the declaration of dividends by the underlying investment companies in which the Fund invests. |
(F) | For the period October 1, 2022 through January 28, 2023 the voluntary waiver was 0.15%. |
FINANCIAL HIGHLIGHTS
The accompanying notes are an integral part of these financial statements.
FINANCIAL STATEMENTS | 97
Growth & Income Fund (Class C Shares)
SELECTED DATA BASED ON A SHARE OUTSTANDING THROUGHOUT EACH YEAR
| | | FOR THE
YEAR ENDED
SEPTEMBER
30 | | | FOR THE
YEAR ENDED
SEPTEMBER
30 | | | FOR THE
YEAR ENDED
SEPTEMBER
30 | | | FOR THE
YEAR ENDED
SEPTEMBER
30 | | | FOR THE
YEAR ENDED
SEPTEMBER
30 | |
| | | 2024 | | | 2023 | | | 2022 | | | 2021 | | | 2020 | |
| | | | | | | | | | | | | | | | | | | | | |
Net asset value, beginning of year | | $ | 9.51 | | | $ | 10.25 | | | $ | 11.31 | | | $ | 9.74 | | | $ | 10.21 | |
| | | | | | | | | | | | | | | | | | | | |
INCOME (LOSS) FROM INVESTMENT OPERATIONS: | | | | | | | | | | | | | | | | | | | | |
Net investment income (loss) (A) | | | 0.11 | | | | 0.09 | | | | 0.02 | | | | (0.02 | ) | | | 0.02 | |
Net realized and unrealized gain (loss) on investments | | | 1.07 | | | | (0.07 | ) | | | (0.98 | ) | | | 1.60 | | | | (0.45 | ) |
Total from investment operations | | | 1.18 | | | | 0.02 | | | | (0.96 | ) | | | 1.58 | | | | (0.43 | ) |
| | | | | | | | | | | | | | | | | | | | | |
LESS DISTRIBUTIONS: | | | | | | | | | | | | | | | | | | | | |
From net investment income | | | (0.11 | ) | | | (0.10 | ) | | | (0.05 | ) | | | (0.01 | ) | | | (0.04 | ) |
From net realized gains on investments | | | (0.06 | ) | | | (0.66 | ) | | | (0.05 | ) | | | — | | | | — | |
Return of Capital | | | — | | | | — | | | | — | | | | — | | | | 0.00 | * |
Total distributions | | | (0.17 | ) | | | (0.76 | ) | | | (0.10 | ) | | | (0.01 | ) | | | (0.04 | ) |
| | | | | | | | | | | | | | | | | | | | | |
Net asset value, end of year | | $ | 10.52 | | | $ | 9.51 | | | $ | 10.25 | | | $ | 11.31 | | | $ | 9.74 | |
| | | | | | | | | | | | | | | | | | | | | |
Total return (B)(C) | | | 12.47 | % | | | (0.23 | )% | | | (8.62 | )% | | | 16.25 | % | | | (4.20 | )% |
| | | | | | | | | | | | | | | | | | | | | |
RATIOS/SUPPLEMENTAL DATA: | | | | | | | | | | | | | | | | | | | | |
Net assets, end of year (in 000’s) | | $ | 1,139 | | | $ | 1,664 | | | $ | 1,923 | | | $ | 1,938 | | | $ | 1,719 | |
Ratios to average net assets | | | | | | | | | | | | | | | | | | | | |
Expenses, before waiver and reimbursement | | | 2.73 | % | | | 2.73 | % | | | 2.60 | % | | | 2.65 | % | | | 2.60 | % |
Expenses, net waiver and reimbursement (D) | | | 2.34 | % | | | 2.33 | %(F) | | | 2.02 | % | | | 2.27 | % | | | 2.25 | % |
Net investment loss, before waiver and reimbursement | | | 0.73 | % | | | 0.47 | % | | | (0.41 | )% | | | (0.57 | )% | | | (0.19 | )% |
Net investment income (loss), net waiver and reimbursement (D,E) | | | 1.13 | % | | | 0.88 | %(F) | | | 0.17 | % | | | (0.19 | )% | | | 0.16 | % |
Portfolio turnover rate | | | 53 | % | | | 96 | % | | | 60 | % | | | 43 | % | | | 39 | % |
* | Amount is less than $0.005 per share |
(A) | Per share amounts calculated using average shares method, which more appropriately presents the per share data for the period. |
(B) | Total return calculation does not reflect redemption fee. |
(C) | Total return in the above table represents the rate that the investor would have earned or lost on an investment in the Fund assuming reinvestment of dividends. Total return would have been higher or lower if certain expenses had not been reimbursed, waived or recouped. |
(D) | This expense decrease from the contractual waiver is reflected in both the net expense and the net investment income ratios shown. |
(E) | Recognition of net investment income (loss) by the Fund is affected by the timing of the declaration of dividends by the underlying investment companies in which the Fund invests. |
(F) | For the period October 1, 2022 through January 28, 2023 the voluntary waiver was 0.15%. |
FINANCIAL HIGHLIGHTS
The accompanying notes are an integral part of these financial statements.
FINANCIAL STATEMENTS | 98
Growth & Income Fund (Class I Shares)
SELECTED DATA BASED ON A SHARE OUTSTANDING THROUGHOUT EACH YEAR
| | | FOR THE
YEAR ENDED
SEPTEMBER
30 | | | FOR THE
YEAR ENDED
SEPTEMBER
30 | | | FOR THE
YEAR ENDED
SEPTEMBER
30 | | | FOR THE
YEAR ENDED
SEPTEMBER
30 | | | FOR THE
YEAR ENDED
SEPTEMBER
30 | |
| | | 2024 | | | 2023 | | | 2022 | | | 2021 | | | 2020 | |
| | | | | | | | | | | | | | | | | | | | | |
Net asset value, beginning of year | | $ | 10.00 | | | $ | 10.74 | | | $ | 11.83 | | | $ | 10.18 | | | $ | 10.67 | |
| | | | | | | | | | | | | | | | | | | | |
INCOME (LOSS) FROM INVESTMENT OPERATIONS: | | | | | | | | | | | | | | | | | | | | |
Net investment income (A) | | | 0.22 | | | | 0.20 | | | | 0.15 | | | | 0.09 | | | | 0.12 | |
Net realized and unrealized gain (loss) on investments | | | 1.13 | | | | (0.08 | ) | | | (1.04 | ) | | | 1.69 | | | | (0.47 | ) |
Total from investment operations | | | 1.35 | | | | 0.12 | | | | (0.89 | ) | | | 1.78 | | | | (0.35 | ) |
| | | | | | | | | | | | | | | | | | | | | |
LESS DISTRIBUTIONS: | | | | | | | | | | | | | | | | | | | | |
From net investment income | | | (0.22 | ) | | | (0.20 | ) | | | (0.15 | ) | | | (0.13 | ) | | | (0.14 | ) |
From net realized gains on investments | | | (0.06 | ) | | | (0.66 | ) | | | (0.05 | ) | | | — | | | | — | |
Return of Capital | | | — | | | | — | | | | — | | | | — | | | | 0.00 | * |
Total distributions | | | (0.28 | ) | | | (0.86 | ) | | | (0.20 | ) | | | (0.13 | ) | | | (0.14 | ) |
| | | | | | | | | | | | | | | | | | | | | |
Net asset value, end of year | | $ | 11.07 | | | $ | 10.00 | | | $ | 10.74 | | | $ | 11.83 | | | $ | 10.18 | |
| | | | | | | | | | | | | | | | | | | | | |
Total return (B)(C) | | | 13.59 | % | | | 0.75 | % | | | (7.67 | )% | | | 17.44 | % | | | (3.20 | )% |
| | | | | | | | | | | | | | | | | | | | | |
RATIOS/SUPPLEMENTAL DATA: | | | | | | | | | | | | | | | | | | | | |
Net assets, end of year (in 000’s) | | $ | 3,703 | | | $ | 3,404 | | | $ | 3,154 | | | $ | 2,070 | | | $ | 2,102 | |
Ratios to average net assets | | | | | | | | | | | | | | | | | | | | |
Expenses, before waiver and reimbursement | | | 1.73 | % | | | 1.73 | % | | | 1.69 | % | | | 1.65 | % | | | 1.60 | % |
Expenses, net waiver and reimbursement (D) | | | 1.34 | % | | | 1.32 | %(F) | | | 1.02 | % | | | 1.27 | % | | | 1.25 | % |
Net investment income, before waiver and reimbursement | | | 1.70 | % | | | 1.50 | % | | | 0.52 | % | | | 0.43 | % | | | 0.86 | % |
Net investment income, net waiver and reimbursement (D,E) | | | 2.10 | % | | | 1.91 | %(F) | | | 1.19 | % | | | 0.81 | % | | | 1.21 | % |
Portfolio turnover rate | | | 53 | % | | | 96 | % | | | 60 | % | | | 43 | % | | | 39 | % |
* | Amount is less than $0.005 per share |
(A) | Per share amounts calculated using average shares method, which more appropriately presents the per share data for the period. |
(B) | Total return represents aggregate total return based on Net Asset Value. |
(C) | Total return in the above table represents the rate that the investor would have earned or lost on an investment in the Fund assuming reinvestment of dividends. Total return would have been higher or lower if certain expenses had not been reimbursed, waived or recouped. |
(D) | This expense decrease from the contractual waiver is reflected in both the net expense and the net investment income ratios shown. |
(E) | Recognition of net investment income (loss) by the Fund is affected by the timing of the declaration of dividends by the underlying investment companies in which the Fund invests. |
(F) | For the period October 1, 2022 through January 28, 2023 the voluntary waiver was 0.15%. |
FINANCIAL HIGHLIGHTS
The accompanying notes are an integral part of these financial statements.
FINANCIAL STATEMENTS | 99
Section 6 | Notes to Financial Statements
SEPTEMBER 30, 2024
Timothy Plan Family of Funds
NOTE 1 | | Significant Accounting Policies |
The Timothy Plan (the “Trust”) is organized as a series of a Delaware business trust pursuant to a trust agreement dated December 16, 1993. The Trust is registered under the Investment Company Act of 1940, as amended, as an open-end management investment company. As of September 30, 2024, the Trust consisted of nineteen series. These financial statements include the following twelve series: Timothy Plan Small/Mid Cap Growth Fund (formerly the Timothy Plan Aggressive Growth Fund), Timothy Plan International Fund, Timothy Plan Large/Mid Cap Growth Fund, Timothy Plan Small Cap Value Fund, Timothy Plan Large/Mid Cap Value Fund, Timothy Plan Fixed Income Fund, Timothy Plan High Yield Bond Fund, Timothy Plan Israel Common Values Fund, Timothy Plan Defensive Strategies Fund, Timothy Plan Strategic Growth Fund, Timothy Plan Conservative Growth Fund and Timothy Plan Growth & Income Fund (the “Funds”). The Funds are diversified funds except for the Timothy Plan Defensive Strategy Fund which is a non-diversified fund. The Timothy Plan Small/Mid Cap Growth Fund changed its name effective February 2, 2024.
The Timothy Plan Small/Mid Cap Growth Fund’s investment objective is long-term growth of capital. The Fund seeks to achieve its investment strategy by normally investing at least 80% of the Fund’s total assets in small and mid-cap stocks. The Adviser considers small and mid-cap companies to be companies that, at the time of investment, have market capitalizations within the range of market capitalization of the companies appearing in the Russell MidCap Growth® Index.
The Timothy Plan International Fund’s investment objective is long-term growth of capital. The Fund seeks to achieve its investment objectives by normally investing at least 80% of the Fund’s total assets in the securities of foreign companies (companies domiciled in countries other than the United States), without regard to market capitalizations. Although the Fund maintains a diversified investment portfolio, the political or economic developments within a particular country or region may have an adverse effect on the ability of domiciled issuers to meet their obligations. Additionally, political or economic developments may have an effect on the liquidity and volatility of portfolio securities and currency holdings.
The Timothy Plan Large/Mid Cap Growth Fund’s investment objective is long-term growth of capital. Current income is not a significant investment consideration and any such income realized will be considered incidental to the Fund’s investment objective. The Fund seeks to achieve its investment objective by normally investing at least 80% of the Fund’s total assets in U.S. common stocks with market capitalizations in excess of $2 billion.
The Timothy Plan Small Cap Value Fund’s primary objective is long-term capital growth, with a secondary objective of current income. The Fund seeks to achieve its investment objective by primarily investing at least 80% of the Fund’s total assets in U.S. stocks with market capitalizations that fall within the range of companies included in the Russell 2000 Index.
The Timothy Plan Large/Mid Cap Value Fund’s investment objective is long-term capital growth, with a secondary objective of current income. The Fund seeks to achieve its investment objective by primarily investing in U.S. common stocks. The Fund will invest at least 80% of its assets in the common stock of companies whose total market capitalization generally exceeds $2 billion.
The Timothy Plan Fixed Income Fund seeks to generate a high level of current income consistent with prudent investment risk. To achieve its investment objective, the Fund normally invests in a diversified portfolio of debt securities. These include corporate bonds, U.S. Government and agency securities, convertible securities and preferred securities.
NOTES TO FINANCIAL STATEMENTS
FINANCIAL STATEMENTS | 100
The Timothy Plan High Yield Bond Fund’s investment objective is to generate a high level of current income. To achieve its investment objective, the Fund normally invests in a diversified portfolio of high yield fixed income securities. These include corporate bonds, U.S. Government and agency securities, convertible securities and preferred securities. The Fund will generally purchase securities that are not investment-grade, meaning securities with a rating of “BBB” or lower as rated by Standard and Poor’s or a comparable rating by another nationally recognized rating agency. Investments in these higher yielding securities are generally accompanied by a greater degree of credit risk than higher rated securities. Additionally, lower rated securities may be more susceptible to adverse economic and competitive industry conditions than investment-grade securities.
The Timothy Plan Israel Common Values Fund seeks to provide long-term growth of capital. This Fund seeks to achieve its investment objectives by normally investing at least 80% of the Fund’s total assets in the common stock of companies domiciled and/or headquartered in Israel through the purchase of American Depositary Receipts (ADRs) and direct investments in such companies on foreign stock exchanges, without regard to market capitalizations.
The Timothy Plan Defensive Strategies Fund’s investment objective is the protection of principal through aggressive, proactive reactions to prevailing economic conditions. To achieve its investment objective, the Fund normally invests in Real Estate Investment Trusts (“REITs”), commodities based Exchange-Traded Funds (“ETFs”), Treasury Inflation Protected Securities (“TIPS”), and currently holds gold bullion.
The Timothy Plan Strategic Growth Fund seeks to generate medium to high levels of long-term capital growth. The Fund seeks to achieve its investment objective by normally investing at least 75% of its net assets in the following Funds which are other series of the Trust:
Timothy Plan Traditional Funds | % of Fund’s Net Assets
Invested in Timothy
Plan Traditional Funds |
Defensive Strategies Fund | 5 - 30% |
International Fund | 0 - 45% |
Fixed Income Fund | 0 - 40% |
Large/Mid Cap Growth Fund | 0 - 20% |
Large/Mid Cap Value Fund | 0 - 20% |
Israel Common Values Fund | 0 - 10% |
Small Cap Value Fund | 0 - 10% |
Small/Mid Cap Growth Fund | 0 - 10% |
High Yield Bond Fund | 0 - 7.5% |
Timothy Plan Exchange Traded Funds | % of Fund’s Net Assets
Invested in Timothy
Plan Exchange Traded
Funds |
International ETF | 0 - 45% |
US Large/Mid Cap Core Enhanced ETF | 0 - 40% |
US Large/Mid Cap Core ETF | 0 - 40% |
High Dividend Stock Enhanced ETF | 0 - 20% |
High Dividend Stock ETF | 0 - 20% |
US Small Cap Core ETF | 0 - 16.5% |
Market Neutral ETF | 0 - 10% |
NOTES TO FINANCIAL STATEMENTS
FINANCIAL STATEMENTS | 101
The Timothy Plan Conservative Growth Fund seeks to generate moderate levels of long-term capital growth with a secondary objective of current income. The Fund seeks to achieve its investment objective by normally investing at least 75% of its net assets in the following Funds which are other series of the Trust:
Timothy Plan Traditional Funds | % of Fund’s Net Assets
Invested in Timothy
Plan Traditional Funds |
Fixed Income | 20 - 60% |
International | 0 - 30% |
High Yield Bond | 0 - 9% |
Timothy Plan Exchange Traded Funds | % of Fund’s Net Assets
Invested in Timothy
Plan Exchange Traded
Funds |
International ETF | 0 - 30% |
US Large/Mid Cap Core Enhanced ETF | 0 - 30% |
US Large/Mid Cap Core ETF | 0 - 30% |
Market Neutral ETF | 0 - 20% |
High Dividend Stock Enhanced ETF | 0 - 15% |
High Dividend Stock ETF | 0 - 15% |
US Small Cap Core ETF | 0 - 12% |
The Timothy Plan Growth & Income Fund’s investment objective is to provide total return through a combination of growth and income and preservation of capital in declining markets. To achieve its goals, the Fund primarily invests in equity securities of foreign and domestic companies that the advisor believes are undervalued, and in fixed income securities. The Fund will normally hold both equity securities and fixed income securities, with at least 25% of its assets in equity securities and at least 25% of its assets in fixed income securities.
The following is a summary of significant accounting policies consistently followed by the Funds in the preparation of their financial statements. The policies are in conformity with accounting principles generally accepted in the United States of America (“GAAP”) for investment companies. The Funds are an investment company and accordingly follow the investment company accounting and reporting guidance of the Financial Accounting Standards Board (FASB) Accounting Standards Codification Topic 946 “Financial Services – Investment Companies”.
| | A. | SECURITY VALUATION AND FAIR VALUE MEASUREMENTS |
All investments in securities are recorded at their estimated fair value as described in Note 2.
| | B. | INVESTMENT INCOME AND SECURITIES TRANSACTIONS |
Security transactions are accounted for on the date the securities are purchased or sold (trade date). The costing method for the Timothy Plan Funds is specific identification. Dividend income is recognized on the ex-dividend date. Interest income and expenses are recognized on an accrual basis. The Timothy Plan Small/Mid Cap Growth Fund, Large/Mid Cap Value Fund, Israel Common Values Fund, Small Cap Value Fund and Defensive Strategies Fund have made certain investments in REITs. Dividend income from REITs is recognized on the ex-dividend date. It is common for distributions from REITs to exceed taxable earnings and profits, resulting in the excess portion of such dividends being designated as a return of capital. The calendar year-end amounts of ordinary income, capital gains, and return of capital included in distributions received from the Funds’ investments in REITS are
NOTES TO FINANCIAL STATEMENTS
FINANCIAL STATEMENTS | 102
reported to the Funds after the end of the calendar year; accordingly, the Funds estimate these amounts for accounting purposes until the characterization of REIT distributions is reported to the Funds after the end of the calendar year. Estimates are based on the most recent REIT distribution information available. Withholding taxes on foreign dividends have been provided for in accordance with the Funds’ understanding of the applicable country’s tax rules and rates. Discounts and premiums on securities purchased are amortized over the lives of the respective securities using the effective yield method. The ability of issuers of debt securities held by the Funds to meet their obligations may be affected by economic and political developments in a specific country or region.
The Funds may be subject to foreign taxes related to foreign income received (a portion of which may be reclaimable), capital gains on the sale of securities and certain foreign currency transactions. All foreign taxes are recorded in accordance with the applicable regulations and rates that exist in the foreign jurisdictions in which the Funds invest.
Investment securities denominated in foreign currencies are translated into U.S. dollar amounts at the date of valuation. Purchases and sales of investment securities and income and expense items denominated in foreign currencies are translated into U.S. dollar amounts on the respective dates of such transactions. The Funds do not isolate that portion of the results of operations resulting from changes in foreign exchange rates on investments from the fluctuations arising from changes in market prices of securities held. Such fluctuations are included in the net realized and unrealized gain or loss from investments. Reported net realized foreign exchange gains or losses arise from sales of foreign currencies, currency gains or losses realized between the trade and settlement dates on securities transactions, and the difference between the amounts of dividends, interest and foreign withholding taxes recorded on the Funds’ books and the U.S. dollar equivalent of the amounts actually received or paid. Net unrealized foreign exchange gains and losses arise from changes in the fair values of assets and liabilities, other than investments in securities at fiscal period end, resulting from changes in exchange rates.
There is a risk that some or all of the Trust’s gold bars held by the custodian or any sub-custodian on behalf of the Trust could be lost, damaged or stolen. Access to the Trust’s gold bars could be restricted by natural events (such as an earthquake) or human actions (such as a terrorist attack). Any of these events may adversely affect the operations of the Trust and, consequently, an investment in the fund shares.
Several factors may affect the price of gold, including but not limited to:
| | ● | Global or regional political, economic or financial events and situations; |
| | ● | Investors’ expectations with respect to the rate of inflation; |
| | ● | Currency exchange rates; |
| | ● | Investment and trading activities of hedge funds and commodity funds. |
| | F. | NET ASSET VALUE PER SHARE |
The Net Asset Value (“NAV”) per share of the capital stock of the Funds is determined daily as of the close of trading on the New York Stock Exchange by dividing the value of its net assets by the number of Fund shares outstanding. The NAV is calculated separately for each class of each Fund in the Trust. The net asset value of the classes may differ because of different fees and expenses charged to each class.
NOTES TO FINANCIAL STATEMENTS
FINANCIAL STATEMENTS | 103
Expenses incurred by the Trust that do not relate to a specific Fund of the Trust are allocated to the individual Funds based on each Fund’s relative net assets or another appropriate basis as determined by the Board of Trustees (the “Board”).
There are three classes of shares currently offered by all Funds in the Trust: Class A shares are offered with a front-end sales charge and ongoing service/distribution fees; Class C shares are offered with a contingent deferred sales charge (“CDSC”) that ends after the first year and ongoing service and distribution fees; Class I shares, which commenced operations on August 1, 2013 except for Strategic Growth and Conservative Growth which commenced operations on September 1, 2023, are offered without any sales charges or ongoing service distribution fees.
Class specific expenses are borne by each specific class. Income, expenses, and realized and unrealized gains/losses are allocated to the respective classes on the basis of relative daily net assets.
In the preparation of financial statements in conformity with GAAP, management makes estimates and assumptions that affect the reported amounts of assets and liabilities and disclosure of contingent assets and liabilities at the date of the financial statements, as well as the reported amounts of revenues and expenses during the year ended. Actual results could differ from those estimates.
It is the policy of each Fund to continue to comply with all requirements under subchapter M of the Internal Revenue Code applicable to regulated investment companies and to distribute substantially all of its taxable income to its shareholders. Each Fund also intends to distribute sufficient net investment income and net capital gains, if any, so that it will not be subject to excise tax on undistributed income or gains. Therefore, no federal income tax or excise provision is required.
Management has analyzed the Funds’ tax positions and has concluded that no liability for unrecognized tax benefits should be recorded related to uncertain tax positions taken on returns filed for open tax years ended September 30, 2021 to September 30, 2023, or expected to be taken in the Funds’ September 30, 2024 year-end tax returns.
The Funds recognize interest and penalties, if any, related to unrecognized tax benefits as income tax expense in the Statements of Operations. During the year, the Funds did not incur any interest or penalties.
The Trust indemnifies its officers and trustees for certain liabilities that may arise from the performance of their duties to the Trust. Additionally, in the normal course of business, the Funds enter into contracts that contain a variety of representations and warranties and which provide general indemnities. The Funds’ maximum exposure under these arrangements is unknown, as this would involve future claims that may be made against the Funds that have not yet occurred. However, based on experience, the Funds expect the risk of loss due to these warranties and indemnities to be remote.
NOTES TO FINANCIAL STATEMENTS
FINANCIAL STATEMENTS | 104
| | L. | DISTRIBUTIONS TO SHAREHOLDERS |
Distributions to shareholders, which are determined in accordance with income tax regulations, are recorded on the ex-dividend date. The treatment for financial reporting purposes of distributions made to shareholders during the period from net investment income or net realized capital gains may differ from their ultimate treatment for federal income tax purposes. These differences are caused primarily by differences in the timing of the recognition of certain components of income, expense or realized capital gain for federal income tax purposes. Where such differences are permanent in nature, they are reclassified in the components of net assets based on their ultimate characterization for federal income tax purposes. Any such reclassifications will have no effect on net assets, results of operations, or Net Asset Values (NAVs) per share of the Funds.
During the fiscal year ended September 30, 2024, certain of the Funds utilized tax equalization which is the use of earnings and profits distributions to shareholders on redemption of shares as part of the dividends paid deduction for income tax purposes. Permanent book and tax differences, primarily attributable to the book/tax treatment of adjustments for prior year tax returns, and use of tax equalization credits, resulted in reclassifications for the Funds for the fiscal year ended September 30, 2024, as follows:
FUND | | PAID IN CAPITAL | | | ACCUMULATED
EARNINGS (LOSSES) | |
Small/Mid Cap Growth Fund | | $ | 2,323,549 | | | $ | (2,323,549 | ) |
International Fund | | | — | | | | — | |
Large/Mid Cap Growth Fund | | | 2,047,866 | | | | (2,047,866 | ) |
Small Cap Value Fund | | | 1,346,774 | | | | (1,346,774 | ) |
Large/Mid Cap Value Fund | | | 3,322,357 | | | | (3,322,357 | ) |
Fixed Income Fund | | | — | | | | — | |
High Yield Bond Fund | | | — | | | | — | |
Israel Common Values Fund | | | — | | | | — | |
Defensive Strategies Fund | | | 203,578 | | | | (203,578 | ) |
Strategic Growth Fund | | | 103,013 | | | | (103,013 | ) |
Conservative Growth Fund | | | 106,795 | | | | (106,795 | ) |
Growth & Income Fund | | | — | | | | — | |
Effective May 22, 2015, the Timothy Plan Family of Funds entered into a precious metals storage agreement with Brink’s Global Services U.S.A., Inc. to maintain the custody of the gold held in the Timothy Plan Defensive Strategies Fund.
Note 2 | | Security Valuation and Fair Value Measurements |
The Funds’ securities are valued at fair value. Fair value is defined as the price that a Fund would receive upon selling an investment in a timely transaction to an independent buyer in the principal or most advantageous market of the investment. GAAP established a three-tier hierarchy to maximize the use of observable market data and minimize the use of unobservable inputs and to establish classification of fair value measurements for disclosure purposes.
Inputs refer broadly to the assumptions that market participants would use in pricing the asset or liability, including assumptions about risk (the risk inherent in a particular valuation technique used to measure fair value including such a pricing model and/or the risk inherent in the inputs to the valuation technique). Inputs may be observable
NOTES TO FINANCIAL STATEMENTS
FINANCIAL STATEMENTS | 105
or unobservable. Observable inputs are inputs that reflect the assumptions market participants would use in pricing the asset or liability developed based on market data obtained from sources independent of the reporting entity. Unobservable inputs are inputs that reflect the reporting entity’s own assumptions about the assumptions market participants would use in pricing the asset or liability developed based on the best information available in the circumstances.
The Funds may hold securities, such as private investments, interests in commodity pools, other non-traded securities or temporarily illiquid securities, for which market quotations are not readily available or are determined to be unreliable. These securities will be valued using the “fair value” procedures approved by the Board. The Board has delegated execution of these procedures to the Adviser as its valuation designee (the “Valuation Designee”). The Board may also enlist third party consultants such a valuation specialist at a public accounting firm, valuation consultant or financial officer of a security issuer on an as-needed basis to assist the Valuation Designee in determining a security-specific fair value. The Board is responsible for reviewing and approving fair value methodologies utilized by the Valuation Designee, which approval shall be based upon whether the Valuation Designee followed the valuation procedures established by the Board.
FAIR VALUATION PROCESS
The applicable investments are valued by the Valuation Designee pursuant to valuation procedures established by the Board. For example, fair value determinations are required for the following securities: (i) securities for which market quotations are insufficient or not readily available on a particular business day (including securities for which there is a short and temporary lapse in the provision of a price by the regular pricing source); (ii) securities for which, in the judgment of the Valuation Designee, the prices or values available do not represent the fair value of the instrument; factors which may cause the Valuation Designee to make such a judgment include, but are not limited to, the following: only a bid price or an asked price is available; the spread between bid and asked prices is substantial; the frequency of sales; the thinness of the market; the size of reported trades; and actions of the securities markets, such as the suspension or limitation of trading; (iii) securities determined to be illiquid; and (iv) securities with respect to which an event that will affect the value thereof has occurred (a “significant event”) since the closing prices were established on the principal exchange on which they are traded, but prior to a Fund’s calculation of its net asset value. Specifically, interests in commodity pools or managed futures pools are valued on a daily basis by reference to the closing market prices of each futures contract or other asset held by a pool, as adjusted for pool expenses. Restricted or illiquid securities, such as private investments or non-traded securities are valued based upon the current bid for the security from two or more independent dealers or other parties reasonably familiar with the facts and circumstances of the security (who should take into consideration all relevant factors as may be appropriate under the circumstances). If a current bid from such independent dealers or other independent parties is unavailable, the Valuation Designee shall determine, the fair value of such security using the following factors: (i) the type of security; (ii) the cost at date of purchase; (iii) the size and nature of the Fund’s holdings; (iv) the discount from market value of unrestricted securities of the same class at the time of purchase and subsequent thereto; (v) information as to any transactions or offers with respect to the security; (vi) the nature and duration of restrictions on disposition of the security and the existence of any registration rights; (vii) how the yield of the security compares to similar securities of companies of similar or equal creditworthiness; (viii) the level of recent trades of similar or comparable securities; (ix) the liquidity characteristics of the security; (x) current market conditions; and (xi) the market value of any securities into which the security is convertible or exchangeable.
VALUATION OF FUND OF FUNDS
A Fund may invest in portfolios of open-end or closed-end investment companies (the “Underlying Funds”). The Underlying Funds value securities in their portfolios for which market quotations are readily available at their market values (generally the last reported sale price) and all other securities and assets at their fair value based upon methods established by the Board of Trustees of the Underlying Funds.
NOTES TO FINANCIAL STATEMENTS
FINANCIAL STATEMENTS | 106
Open-ended funds are valued at their respective net asset values as reported by such investment companies. The shares of many closed-end investment companies, after their initial public offering, frequently trade at a price per share, which is different than the net asset value per share. The difference represents a market premium or market discount of such shares. There can be no assurances that the market discount or market premium on shares of any closed-end investment company purchased by the Fund will not change.
EXCHANGE TRADED FUNDS
The Funds may invest in exchange traded funds (“ETFs”). ETFs are a type of index fund bought and sold on a securities exchange. An ETF trades like common stock and may be actively traded or represent a fixed portfolio of securities designed to track the performance and dividend yield of a particular domestic or foreign market index. The risks of owning an ETF generally reflect the risks of owning the underlying securities they are designed to track, although the lack of liquidity on an ETF could result in it being more volatile. Each ETF is subject to specific risks, depending on the nature of the ETF. Additionally, ETFs have fees and expenses that reduce their value.
OPTIONS TRANSACTIONS
The Funds are subject to equity price risk in the normal course of pursuing their investment objectives and may purchase or sell options to help hedge against this risk.
Each Fund may write call options only if it (i) owns an offsetting position in the underlying security or (ii) has an absolute or immediate right to acquire that security without additional cash consideration or exchange of other securities held in its portfolio.
When the Funds write a call option, an amount equal to the premium received is included in the statement of assets and liabilities as a liability. The amount of the liability is subsequently marked-to-market to reflect the current market value of the option. If an option expires on its stipulated expiration date or if the Funds enter into a closing purchase transaction, a gain or loss is realized. If a written call option is exercised, a gain or loss is realized for the sale of the underlying security and the proceeds from the sale are increased by the premium originally received. As writer of an option, the Funds have no control over whether the option will be exercised and, as a result, retain the market risk of an unfavorable change in the price of the security underlying the written option.
The Funds may purchase put and call options. Call options are purchased to hedge against an increase in the value of securities held in a Funds’ portfolio. If such an increase occurs, the call options will permit the Fund to purchase the securities underlying such options at the exercise price, not at the current market price. Put options are purchased to hedge against a decline in the value of securities held in a Fund’s portfolio. If such a decline occurs, the put options will permit the Fund to sell the securities underlying such options at the exercise price, or to close out the options at a profit. The premium paid for a put or call option plus any transaction costs will reduce the benefit, if any, realized by the Fund upon exercise of the option, and, unless the price of the underlying security rises or declines sufficiently, the option may expire worthless to the Fund. In addition, in the event that the price of the security in connection with which an option was purchased moves in a direction favorable to a Fund, the benefits realized by the Fund as a result of such favorable movement will be reduced by the amount of the premium paid for the option and related transaction costs. Written and purchased options are non-income producing securities. With purchased options, there is minimal counterparty credit risk to the Funds since these options are exchange traded and the exchange’s clearinghouse, as counterparty to all exchange traded options, guarantees against a possible default.
There were no options held at September 30, 2024, and there were no options transactions for the year ended September 30, 2024.
The Trust utilizes various methods to measure the fair value of all of its investments on a recurring basis. GAAP establishes a hierarchy that prioritizes inputs to valuation methods. The three levels of input are:
| | ● | Level 1 – Unadjusted quoted prices in active markets for identical assets and liabilities that the Fund has the ability to access. |
NOTES TO FINANCIAL STATEMENTS
FINANCIAL STATEMENTS | 107
| | ● | Level 2 – Observable inputs other than quoted prices included in Level 1 that are observable for the asset or liability, either directly or indirectly. These inputs may include quoted prices for the identical instrument in an inactive market, prices for similar instruments, interest rates, prepayment speeds, credit risk, yield curves, default rates and similar data. |
| | ● | Level 3 – Unobservable inputs for the asset or liability, to the extent relevant observable inputs are not available, representing the Fund’s own assumptions about the assumptions a market participant would use in valuing the asset or liability, and would be based on the best information available. |
The inputs used to measure fair value may fall into different levels of the fair value hierarchy. In such cases, for disclosure purposes, the level in the fair value hierarchy within which the fair value measurement falls in its entirety is determined based on the lowest level input that is significant to the fair value measurement in its entirety.
Each Fund generally determines the total value of each class of its shares by using market prices for the securities comprising its portfolio. Equity securities, including common stock, preferred stock, ADRs, REITs, LPs, LLCs, PLCs, GDRs and NVDRs are generally valued by using market quotations, but may be valued on the basis of prices furnished by a pricing service when the advisor or sub-advisor believes such prices more accurately reflect the fair value of such securities. Securities including ETFs, that are traded on any stock exchange are generally valued by the pricing service at the last quoted sale price. Lacking a last sale price, an exchange traded security is generally valued by the pricing service at its last bid price. Securities traded in the NASDAQ over-the-counter market are generally valued by the pricing service at the NASDAQ Official Closing Price. When using the market quotations or close prices provided by the pricing service and when the market is considered active, the security will be classified as a Level 1 security. Equity securities traded on inactive markets or valued by reference to similar instruments are categorized as a Level 2. When market quotations are not readily available, when the advisor or sub-advisor determines that the market quotation or the price provided by the pricing service does not accurately reflect the current fair value, or when restricted or illiquid securities are being valued, such securities are valued as determined in good faith by the advisor or sub-advisor, in conformity with guidelines adopted by and subject to review by the Board. These securities will generally be categorized as Level 3 securities. Foreign investments are not fair valued using fair value triggers.
Investments in alternative investments, such as gold bars, are valued at the spot rate at 4:00 p.m. Eastern time each business day and are categorized as Level 1 in the hierarchy.
Investments in mutual funds, including money market mutual funds, are generally priced at the ending NAV provided by the service agent of the funds. These securities will be categorized as Level 1 securities.
Fixed income securities such as corporate bonds, convertible bonds, government mortgage-backed securities, government notes and bonds, non U.S. government bonds, U.S. government agency securities and treasury inflation protected securities, when valued using market quotations in an active market, will be categorized as Level 1 securities. However, they may be valued on the basis of prices furnished by a pricing service when the advisor or sub-advisor believes such prices more accurately reflect the fair value of such securities. A pricing service utilizes electronic data processing techniques based on yield spreads relating to securities with similar characteristics to determine prices for normal institutional-size trading units of debt securities without regard to sale or bid prices. These securities will generally be categorized as Level 2 securities. If the advisor or sub-advisor decides that a price provided by the pricing service does not accurately reflect the fair value of the securities, when prices are not readily available from a pricing service, or when restricted or illiquid securities are being valued, securities are valued at fair value as determined in good faith by the advisor or sub-advisor, in conformity with guidelines adopted by and subject to review of the Board. These securities will be categorized as Level 3 securities.
Short-term investments in fixed income securities (those with maturities of less than 60 days when acquired, or which subsequently are within 60 days of maturity) may be valued by using the amortized cost method of valuation, which the Board has determined will represent fair value. These securities will be classified as Level 2 securities.
NOTES TO FINANCIAL STATEMENTS
FINANCIAL STATEMENTS | 108
The Board has delegated to the advisor responsibility for determining the value of Fund portfolio securities under certain circumstances. Under such circumstances, the advisor will use its best efforts to arrive at the fair value of a security held by the Fund under all reasonably ascertainable facts and circumstances. The advisor must prepare a report for the Board not less than quarterly containing a complete listing of any securities for which fair value pricing was employed and detailing the specific reasons for such fair value pricing. The Board has adopted written policies and procedures to guide the advisor and sub-advisors with respect to the circumstances under which, and the methods to be used, in fair valuing securities.
The following is a summary of the inputs used to value each Fund’s investments as of September 30, 2024:
Small/Mid Cap Growth Fund
ASSETS | | LEVEL 1 | | | LEVEL 2 | | | LEVEL 3 | | | TOTAL | |
Common Stocks | | $ | 68,767,112 | | | $ | — | | | $ | — | | | $ | 68,767,112 | |
Money Market Fund | | | 5,151,213 | | | | — | | | | — | | | | 5,151,213 | |
Total | | $ | 73,918,325 | | | $ | — | | | $ | — | | | $ | 73,918,325 | |
International Fund
ASSETS | | LEVEL 1 | | | LEVEL 2 | | | LEVEL 3 | | | TOTAL | |
Common Stocks | | $ | 173,461,394 | | | $ | — | | | | | | | $ | 173,461,394 | |
Money Market Fund | | | 9,027,878 | | | | — | | | | — | | | | 9,027,878 | |
Total | | $ | 182,489,272 | | | $ | — | | | $ | — | | | $ | 182,489,272 | |
Large/Mid Cap Growth Fund
ASSETS | | LEVEL 1 | | | LEVEL 2 | | | LEVEL 3 | | | TOTAL | |
Common Stocks | | $ | 181,689,679 | | | $ | — | | | $ | — | | | $ | 181,689,679 | |
Exchange - Traded Funds | | | 25,541,560 | | | | — | | | | — | | | | 25,541,560 | |
Money Market Fund | | | 9,544,833 | | | | — | | | | — | | | | 9,544,833 | |
Total | | $ | 216,776,072 | | | $ | — | | | $ | — | | | $ | 216,776,072 | |
Small Cap Value Fund
ASSETS | | LEVEL 1 | | | LEVEL 2 | | | LEVEL 3 | | | TOTAL | |
Common Stocks | | $ | 171,255,580 | | | $ | — | | | $ | — | | | $ | 171,255,580 | |
Exchange - Traded Fund | | | 22,571,396 | | | | — | | | | — | | | | 22,571,396 | |
Money Market Fund | | | 2,063,892 | | | | — | | | | — | | | | 2,063,892 | |
Total | | $ | 195,890,868 | | | $ | — | | | $ | — | | | $ | 195,890,868 | |
Large/Mid Cap Value Fund
ASSETS | | LEVEL 1 | | | LEVEL 2 | | | LEVEL 3 | | | TOTAL | |
Common Stocks | | $ | 282,704,313 | | | $ | — | | | $ | — | | | $ | 282,704,313 | |
Exchange - Traded Funds | | | 59,773,086 | | | | — | | | | — | | | | 59,773,086 | |
Money Market Fund | | | 12,668,778 | | | | — | | | | — | | | | 12,668,778 | |
Total | | $ | 355,146,177 | | | $ | — | | | $ | — | | | $ | 355,146,177 | |
NOTES TO FINANCIAL STATEMENTS
FINANCIAL STATEMENTS | 109
Fixed Income Fund
ASSETS | | LEVEL 1 | | | LEVEL 2 | | | LEVEL 3 | | | TOTAL | |
Corporate Bonds | | $ | — | | | $ | 32,179,405 | | | $ | — | | | $ | 32,179,405 | |
Non U.S. Government & Agencies | | | — | | | | 4,001,051 | | | | — | | | | 4,001,051 | |
U.S. Government & Agencies | | | — | | | | 75,902,943 | | | | — | | | | 75,902,943 | |
Money Market Fund | | | 1,990,884 | | | | — | | | | — | | | | 1,990,884 | |
Total | | $ | 1,990,884 | | | $ | 112,083,399 | | | $ | — | | | $ | 114,074,283 | |
High Yield Bond Fund
ASSETS | | LEVEL 1 | | | LEVEL 2 | | | LEVEL 3 | | | TOTAL | |
Corporate Bonds | | $ | — | | | $ | 176,231,621 | | | $ | — | | | $ | 176,231,621 | |
Money Market Fund | | | 6,576,489 | | | | — | | | | — | | | | 6,576,489 | |
Total | | $ | 6,576,489 | | | $ | 176,231,621 | | | $ | — | | | $ | 182,808,110 | |
Israel Common Values Fund
ASSETS | | LEVEL 1 | | | LEVEL 2 | | | LEVEL 3 | | | TOTAL | |
Common Stocks | | $ | 93,654,244 | | | $ | 4,140,900 | | | $ | — | | | $ | 97,795,144 | |
Money Market Fund | | | 2,278,333 | | | | — | | | | — | | | | 2,278,333 | |
Total | | $ | 95,932,577 | | | $ | 4,140,900 | | | $ | — | | | $ | 100,073,477 | |
Defensive Strategies Fund
ASSETS | | LEVEL 1 | | | LEVEL 2 | | | LEVEL 3 | | | TOTAL | |
Common Stocks | | $ | 29,471,819 | | | $ | — | | | $ | — | | | $ | 29,471,819 | |
Exchange - Traded Funds | | | 14,631,918 | | | | — | | | | — | | | | 14,631,918 | |
Precious Metals - Physical Holding | | | 16,175,060 | | | | — | | | | — | | | | 16,175,060 | |
U.S. Government & Agencies | | | — | | | | 16,571,501 | | | | — | | | | 16,571,501 | |
Money Market Fund | | | 2,340,431 | | | | — | | | | — | | | | 2,340,431 | |
Total | | $ | 62,619,228 | | | $ | 16,571,501 | | | $ | — | | | $ | 79,190,729 | |
Strategic Growth Fund
ASSETS | | LEVEL 1 | | | LEVEL 2 | | | LEVEL 3 | | | TOTAL | |
Exchange - Traded Funds | | $ | 22,532,541 | | | $ | — | | | $ | — | | | $ | 22,532,541 | |
Open End Funds | | | 10,544,107 | | | | — | | | | — | | | | 10,544,107 | |
Money Market Fund | | | 720,121 | | | | — | | | | — | | | | 720,121 | |
Total | | $ | 33,796,769 | | | $ | — | | | $ | — | | | $ | 33,796,769 | |
NOTES TO FINANCIAL STATEMENTS
FINANCIAL STATEMENTS | 110
Conservative Growth Fund
ASSETS | | LEVEL 1 | | | LEVEL 2 | | | LEVEL 3 | | | TOTAL | |
Exchange - Traded Funds | | $ | 19,055,105 | | | $ | — | | | $ | — | | | $ | 19,055,105 | |
Open End Funds | | | 18,547,484 | | | | — | | | | — | | | | 18,547,484 | |
Money Market Fund | | | 960,121 | | | | — | | | | — | | | | 960,121 | |
Total | | $ | 38,562,710 | | | $ | — | | | $ | — | | | $ | 38,562,710 | |
Growth & Income Fund
ASSETS | | LEVEL 1 | | | LEVEL 2 | | | LEVEL 3 | | | TOTAL | |
Exchange - Traded Fund | | $ | 9,551,472 | | | $ | — | | | $ | — | | | $ | 9,551,472 | |
Corporate Bonds | | | — | | | | 2,011,030 | | | | — | | | | 2,011,030 | |
Non U.S. Government & Agencies | | | — | | | | 332,582 | | | | — | | | | 332,582 | |
U.S. Government & Agencies | | | — | | | | 6,951,646 | | | | — | | | | 6,951,646 | |
Money Market Fund | | | 166,202 | | | | — | | | | — | | | | 166,202 | |
Total | | $ | 9,717,674 | | | $ | 9,295,258 | | | $ | — | | | $ | 19,012,932 | |
Refer to the Schedules of Investments for industry classifications.
For the year ended September 30, 2024, there were no changes into/out of Level 3. Additional disclosures surrounding Level 3 investments were not significant to the financial statements.
The following is a reconciliation of assets in which level 3 inputs were used in determining value:
International Fund
| | | Common Stocks | | | Total | |
Beginning balance September 30, 2023 | | $ | 43,600 | | | $ | 43,600 | |
Total realized gain (loss) | | | (1,507,588 | ) | | | (1,507,588 | ) |
Change in unrealized appreciation (depreciation) | | | 1,943,588 | | | | 1,943,588 | |
Cost of Purchases | | | — | | | | — | |
Proceeds from sales | | | (479,600 | ) | | | (479,600 | ) |
Net transfers in/out of level 3 | | | — | | | | — | |
Ending balance September 30, 2024 | | $ | — | | | $ | — | |
NOTES TO FINANCIAL STATEMENTS
FINANCIAL STATEMENTS | 111
Note 3 | | Purchases and Sales of Securities |
The following is a summary of the cost of purchases and proceeds from the sale of securities, other than short-term investments, for the year ended September 30, 2024:
| | | PURCHASES | | | SALES | |
Fund | | U.S. Gov’t
Obligations | | | Other | | | U.S. Gov’t
Obligations | | | Other | |
Small/Mid Cap Growth | | $ | — | | | $ | 64,182,722 | | | $ | — | | | $ | 56,863,357 | |
International | | | — | | | | 30,297,490 | | | | — | | | | 45,802,394 | |
Large/Mid Cap Growth * | | | — | | | | 107,422,045 | | | | — | | | | 92,575,259 | |
Small Cap Value * | | | — | | | | 89,736,357 | | | | — | | | | 101,731,035 | |
Large/Mid Cap Value * | | | — | | | | 104,988,161 | | | | — | | | | 107,520,814 | |
Fixed Income | | | 42,430,299 | | | | 16,011,033 | | | | 43,781,478 | | | | 11,733,312 | |
High Yield Bond | | | — | | | | 84,416,926 | | | | — | | | | 51,438,867 | |
Israel Common Values | | | — | | | | 8,517,195 | | | | — | | | | 15,179,689 | |
Defensive Strategies * | | | — | | | | 13,695,537 | | | | — | | | | 15,476,525 | |
Strategic Growth * | | | — | | | | 1,053,262 | | | | — | | | | 4,835,359 | |
Conservative Growth * | | | — | | | | 1,564,305 | | | | — | | | | 6,706,543 | |
Growth & Income * | | | 6,017,864 | | | | 3,598,589 | | | | 5,922,085 | | | | 4,483,936 | |
| | * | The security transactions are inclusive of purchases and sales of affiliated funds. |
Note 4 | | Investment Advisory Agreement and Transactions with Service Providers |
Timothy Partners, Ltd., (“TPL”) is the investment advisor for the Funds pursuant to an investment advisory agreement (the “Agreement”) that was renewed by the Board on February 29, 2024. TPL supervises the investment of the assets of each Fund in accordance with the objectives, policies and restrictions of the Trust. Under the terms of the Agreement, as amended, TPL is paid an annual fee equal to 0.85% on the Small Cap Value Fund, 0.85% on the Large/Mid Cap Value Fund, 0.85% on the Small/Mid Cap Growth Fund, 0.85% on the Large/Mid Cap Growth Fund, 1.00% on the International Fund, 0.60% on the Fixed Income Fund, 0.60% on the High Yield Bond Fund, 1.00% on the Israel Common Values Fund, 0.60% on the Defensive Strategies Fund, 0.85% on the Growth & Income Fund and 0.15% on both the Strategic Growth Fund and the Conservative Growth Fund. TPL has contractually agreed, through January 28, 2025, to reduce the fee it receives from the International Fund to 0.95%; from the Large/Mid Cap Growth Fund, the Small Cap Value Fund and the Large/Mid Cap Value Fund to 0.80%; from the Small/Mid Cap Growth Fund to 0.75%; from the Defensive Strategies Fund to 0.55%; from the High Yield Bond Fund to 0.50%; from the Growth & Income Fund to 0.70%; and from the Fixed Income Fund to 0.40%. Effective August 12, 2023, TPL voluntarily reduced the fee to 0.75% for the Large/Mid Cap Value Fund. Effective February 1, 2024, TPL voluntarily reduced the fee to 0.90% for the International Fund. An officer and trustee of the Funds is also an officer and owner of the advisor.
Timothy Partners, Ltd (“TPL”) has contractually agreed to waive the management fee with respect to any portion of the Fund’s assets, except Strategic Growth Fund and Conservative Growth Fund, estimated to be attributable to investments in other equity and fixed income mutual funds and exchange-traded funds managed by TPL or its affiliates that have a contractual management fee, through January 28, 2025. The contractual agreements may be terminated upon 90 days’ notice by a majority of the non-interested trustees of the Trust or by a vote of a majority of the outstanding voting securities of the Fund. The waived advisory fees are not recoupable.
NOTES TO FINANCIAL STATEMENTS
FINANCIAL STATEMENTS | 112
For the year ended September 30, 2024, TPL waived advisory fees for the Funds as follows:
FUND | | Year Ended
September 30, 2024 | |
Small/Mid Cap Growth Fund | | $ | 62,979 | |
International Fund | | | 142,123 | |
Large/Mid Cap Growth Fund | | | 80,948 | |
Small Cap Value Fund | | | 81,147 | |
Large/Mid Cap Value Fund | | | 271,483 | |
Fixed Income Fund | | | 223,440 | |
High Yield Bond Fund | | | 176,483 | |
Defensive Strategies Fund | | | 37,305 | |
Strategic Growth | | | 165,407 | |
Conservative Growth | | | 189,647 | |
Growth & Income Fund | | | 14,814 | |
The Small Cap Value Fund, the Large/Mid Cap Growth Fund, the Large/Mid Cap Value Fund, the Fixed Income Fund, the Defensive Strategies Fund and the Growth & Income Fund invested a portion of assets in the Timothy Plan High Dividend Stock Enhanced ETF, the Timothy Plan High Dividend Stock ETF, the Timothy Plan US Large/Mid Cap Core Enhanced ETF, the Timothy Plan US Large/Mid Cap Core ETF, the Timothy Plan US Small Cap Core ETF and the Timothy Plan Market Neutral ETF. For the year ended September 30, 2024, the Funds’ waived fees as follows pursuant to that arrangement.
FUND | | Year Ended
September 30, 2024 | |
Large/Mid Cap Growth Fund | | $ | 183,843 | |
Small Cap Value Fund | | | 161,998 | |
Large/Mid Cap Value Fund | | | 405,105 | |
Defensive Strategies Fund | | | 80,032 | |
Growth & Income Fund | | | 57,547 | |
TPL, with the prior approval of the Board and shareholders of the applicable Fund, has engaged the services of other investment advisory firms (“Investment Managers”) to provide portfolio management services to the Funds. TPL pays the Investment Managers as follows:
Barrow Hanley
As compensation for its services with respect to the Fixed-Income Fund and High Yield Bond Fund, Barrow Hanley receives from TPL an annual fee at a rate equal to 0.375% of 1% of the first $20,000,000 in the average net assets of each Fund. As compensation for its services with respect to the Defensive Strategies Fund, Barrow Hanley receives from TPL an annual fee at a rate equal to 0.15% of the average net assets in the Debt Instrument Allocation of the Fund. As compensation for its services with respect to the Growth and Income Fund , Barrow Hanley receives from TPL an annual fee at a rate equal to 0.375 of 1% of the first $20,000,00 of the average net assets in the fixed income allocation of the Fund.
Chartwell
As compensation for its services, Chartwell receives from TPL an annual fee at a rate equal to 0.42% of the first $10 million in assets of each Fund; 0.40% of the next $5 million in assets; 0.35% of the next $10 million in assets; and 0.25% of assets over $25 million.
NOTES TO FINANCIAL STATEMENTS
FINANCIAL STATEMENTS | 113
Chilton
For its services rendered to the DS Fund, Adviser will pay to Investment Manager a fee at an annual rate equal to 0.42% of the Defensive Strategies Fund’s average daily assets allocated to the REIT sleeve of the Defensive Strategies Fund’s investment portfolio (“Allocated Assets”) up to $10 million, 0.39% for the next $10 million in Allocated Assets, 0.35% for the next $30 million in Allocated Assets, and 0.30% of Allocated Assets over $50 million.
CoreCommodity
As compensation for its services to the Fund, CORE receives from TPL an annual fee at a rate equal to 0.40% of the Fund’s average daily assets up to $25 million, and 0.35% of average daily net assets over $25 million.
Eagle
As compensation for its services, Eagle receives from TPL an annual fee at a rate equal to 0.60% of the first $100 million in assets of the Fund; and 0.50% of assets over $100 million.
Westwood
As compensation for its services, Westwood receives from TPL an annual fee at a rate equal to 0.42% of the first $10 million in assets of each Fund; 0.40% of the next $5 million in assets; 0.35% of the next $10 million in assets; and 0.25% of assets over $25 million.
Ultimus Fund Services, LLC (“UFS”) provides administrative, fund accounting, and transfer agency services to the Funds pursuant to agreements with the Trust, for which it receives from each Fund: (i) basis points in decreasing amounts as assets reach certain breakpoints; and (ii) any related out-of-pocket expenses. Fees are billed monthly as follows:
Fund Accounting and Fund Administration Fees:
Fund Complex Base annual fee:
| | ● | 25 basis points (0.25%) on the first $200 million of net assets |
| | ● | 15 basis points (0.15%) on the next $200 million of net assets; |
| | ● | 8 basis points (0.08%) on the next $600 million of net assets; and |
| | ● | 6 basis points (0.06%) on net assets greater than $1 billion. |
Transfer agency fees for the Funds are combined with the Fund Accounting and Fund Administration fees under the Trust’s agreement with UFS. Therefore, there is no separate base annual fee per Fund or share class.
The Timothy Plan Small/Mid Cap Growth, Timothy Plan International, Timothy Plan Large/Mid Cap Growth, Timothy Plan Small Cap Value, Timothy Plan Large/Mid Cap Value, Timothy Plan Fixed Income, Timothy Plan High Yield Bond, Timothy Plan Defensive Strategies, Timothy Plan Israel Common Values and Timothy Plan Growth & Income Funds have adopted shareholder services plans (the “Plans”) pursuant to Rule 12b-1 under the Investment Company Act of 1940, as amended. The Plans provide that the Funds will pay TPL or others for expenses that relate to the promotion or distribution of shares. Under the Class A Plan, the Funds will pay TPL a fee at an annual rate of 0.25%, payable monthly, of the average daily net assets attributable to such class of shares. Under the Class C Plan, the Funds will pay TPL a fee at an annual rate of 1.00%, payable monthly, of which, 0.25% may be a service fee and 0.75% may be payable to outside broker/dealers, of the average daily net assets attributable to such class of shares. Class I shares are not subject to the shareholder services plan.
The Timothy Plan Conservative Growth and Timothy Plan Strategic Growth Funds have adopted shareholder services plans (the “Plans”) pursuant to Rule 12b-1 under the Investment Company Act of 1940, as amended. The Plans provide that the Funds will pay TPL or others for expenses that relate to the promotion or distribution of shares. Class A shares of the Funds pay a service fee at an annual rate of 0.25%, payable monthly of the average daily net assets attributable to such class of shares. Under the Class C Plan, the Funds will pay TPL a fee at an annual rate of 0.75%, payable monthly to outside broker/dealers, of the average daily net assets attributable to such class of shares.
NOTES TO FINANCIAL STATEMENTS
FINANCIAL STATEMENTS | 114
For the year ended September 30, 2024, the Funds paid TPL under the terms of the Plans as follows:
FUND | | 12B-1 FEES | |
| | Year Ended
September 30, 2024 | |
Small/Mid Cap Growth | | $ | 124,374 | |
International | | | 158,356 | |
Large/Mid Cap Growth | | | 387,789 | |
Small Cap Value | | | 319,287 | |
Large/Mid Cap Value | | | 595,302 | |
Fixed Income | | | 249,011 | |
High Yield Bond | | | 179,517 | |
Israel Common Values | | | 185,135 | |
Defensive Strategies | | | 137,133 | |
Strategic Growth | | | 93,789 | |
Conservative Growth | | | 109,942 | |
Growth & Income | | | 46,776 | |
TPL also serves as the principal underwriter of the Funds’ shares. An officer and trustees of the Funds are also officers of the principal underwriter. For the year ended September 30, 2024, TPL received sales charges deducted from the proceeds of sales of Class A capital shares and CDSC fees deducted from the redemption of Class C capital shares as follows:
FUND | | SALES CHARGES
(CLASS A) | | | CDSC FEES
(CLASS C) | |
Small/Mid Cap Growth | | $ | 14,994 | | | $ | 290 | |
International | | | 10,385 | | | | 139 | |
Large/Mid Cap Growth | | | 43,178 | | | | 799 | |
Small Cap Value | | | 17,306 | | | | 1,060 | |
Large/Mid Cap Value | | | 42,206 | | | | 1,156 | |
Fixed Income | | | 53,037 | | | | 1,587 | |
High Yield Bond | | | 10,902 | | | | 91 | |
Israel Common Values | | | 12,675 | | | | 985 | |
Defensive Strategies | | | 11,961 | | | | 30 | |
Strategic Growth | | | 6,494 | | | | 137 | |
Conservative Growth | | | 7,298 | | | | 456 | |
Growth & Income | | | 5,303 | | | | 67 | |
Note 5 | | Control Ownership |
The beneficial ownership, either directly or indirectly, of more than 25% of the voting securities of a Fund creates the presumption of control of the Fund under Section 2(a) 9 of the Investment Company Act of 1940. At September 30, 2024, there were no shareholders with ownership, either directly or indirectly, of more than 25% of the voting securities of a Fund.
NOTES TO FINANCIAL STATEMENTS
FINANCIAL STATEMENTS | 115
Certain Timothy Plan Funds own shares of other Timothy Plan Funds. U.S. Bank, N.A., custodian of the Timothy Plan Funds, holds these shares in omnibus accounts, some of which are controlled by National Financial Services, Inc. The following shows the percentage of each Timothy Plan Fund that is held by U.S. Bank, N.A., as custodian of the Timothy Plan Funds. These accounts can be considered affiliated to the Timothy Plan.
FUND - CLASS A | % OF FUND OWNED
BY OTHER TIMOTHY
PLAN FUNDS |
International | 15.24% |
Fixed Income | 20.74% |
High Yield Bond | 7.06% |
Note 6 | | Underlying Investment in Other Investment Companies |
The Conservative Growth Fund currently seeks to achieve its investment objectives by investing a portion of its assets in the Timothy Plan Fixed Income Fund (the “Security”). The Fund may redeem its investments from the Security at any time if the advisor determines that it is in the best interest of the Fund and its shareholders to do so.
The performance of the Fund will be directly affected by the performance of the Security. The annual report of the Security, along with the report of the independent registered public accounting firm is included in the Security’s N-CSRs available at www.sec.gov. As of September, 2024, 29.7% of the Conservative Growth Fund’s net assets were invested in the Timothy Plan Fixed Income Fund.
The Growth & Income Fund currently seeks to achieve its investment objectives by investing a portion of its assets in the Timothy Plan High Dividend Stock Enhanced ETF (the “ETF”). The Fund may redeem its investments from the ETF at any time if the advisor determines that it is in the best interest of the Fund and its shareholders to do so.
The performance of the Fund will be directly affected by the performance of the ETF. The annual report of the ETF, along with the report of the independent registered public accounting firm is included in the Security’s N-CSRs available at www.sec.gov. As of September 30, 2024, 50.1% of the Growth & Income Fund’s net assets were invested in the Timothy Plan High Dividend Stock Enhanced ETF.
Note 7 | | Investments in Affiliated Companies |
The Funds’ transactions with affiliates represent holdings for which the respective Fund and the underlying investee fund have the same investment advisor or where the investee fund’s investment advisor is under common control with the Fund’s investment advisor.
NOTES TO FINANCIAL STATEMENTS
FINANCIAL STATEMENTS | 116
The Timothy Plan Large/Mid Cap Growth Fund, Small Cap Value Fund, Large/Mid Cap Value Fund, Defensive Strategies Fund, Strategic Growth Fund, Conservative Growth Fund and Growth & Income Fund had the following transactions during the year ended September 30, 2024, with affiliates:
LARGE/MID
CAP GROWTH | | YEAR ENDED SEPTEMBER 30, 2024 | |
Fund | | Fair Value
September 30,
2023 | | | Purchases | | | Sales | | | Dividends
Credited to
Income | | | Amount of
Gain (Loss)
Realized on
Sale of Shares | | | Net Change
in Unrealized
Appreciation
(Depreciation) | | | Fair Value
September 30,
2024 | | | Shares
September 30,
2024 | |
Timothy Plan US Large/Mid Cap Core Enhanced ETF | | $ | 13,724,506 | | | $ | 4,074,382 | | | $ | — | | | $ | 190,308 | | | $ | — | | | $ | 2,947,380 | | | $ | 20,746,268 | | | | 791,000 | |
Timothy Plan US Large/Mid Cap Core ETF | | | 7,204,230 | | | | — | | | | 4,078,217 | | | | 53,906 | | | | 1,569,717 | | | | 99,562 | | | | 4,795,292 | | | | 109,000 | |
Total | | $ | 20,928,736 | | | | | | | | | | | $ | 244,214 | | | $ | 1,569,717 | | | $ | 3,046,942 | | | $ | 25,541,560 | | | | 900,000 | |
SMALL CAP
VALUE | | YEAR ENDED SEPTEMBER 30, 2024 | |
Fund | | Fair Value
September 30,
2023 | | | Purchases | | | Sales | | | Dividends
Credited to
Income | | | Amount of
Gain (Loss)
Realized on
Sale of Shares | | | Net Change
in Unrealized
Appreciation
(Depreciation) | | | Fair Value
September 30,
2024 | | | Shares
September 30,
2024 | |
Timothy Plan US Small Cap Core ETF | | $ | 17,967,936 | | | $ | — | | | $ | — | | | $ | 238,132 | | | $ | — | | | $ | 4,603,460 | | | $ | 22,571,396 | | | | 580,000 | |
LARGE/MID
CAP VALUE | | YEAR ENDED SEPTEMBER 30, 2024 | |
Fund | | Fair Value
September 30,
2023 | | | Purchases | | | Sales | | | Dividends
Credited to
Income | | | Amount of
Gain (Loss)
Realized on
Sale of Shares | | | Net Change
in Unrealized
Appreciation
(Depreciation) | | | Fair Value
September 30,
2024 | | | Shares
September 30,
2024 | |
Timothy Plan High Dividend Stock Enhanced ETF | | $ | 12,610,985 | | | $ | 6,955,363 | | | $ | — | | | | 429,836 | | | $ | — | | | $ | 2,720,420 | | | $ | 22,286,768 | | | | 868,000 | |
Timothy Plan High Dividend Stock ETF | | | 11,709,511 | | | | — | | | | 6,896,445 | | | | 196,850 | | | | 1,899,445 | | | | 167,739 | | | | 6,880,250 | | | | 182,500 | |
Timothy Plan US Large/Mid Cap Core Enhanced ETF | | | 13,944,449 | | | | 8,173,163 | | | | — | | | | 220,179 | | | | — | | | | 3,297,223 | | | | 25,414,835 | | | | 969,000 | |
Timothy Plan US Large/Mid Cap Core ETF | | | 10,961,460 | | | | — | | | | 8,156,435 | | | | 69,953 | | | | 3,139,435 | | | | (753,227 | ) | | | 5,191,233 | | | | 118,000 | |
Total | | $ | 49,226,405 | | | | | | | | | | | $ | 916,818 | | | $ | 5,038,880 | | | $ | 5,432,155 | | | $ | 59,773,086 | | | | 2,137,500 | |
NOTES TO FINANCIAL STATEMENTS
FINANCIAL STATEMENTS | 117
DEFENSIVE
STRATEGIES | | YEAR ENDED SEPTEMBER 30, 2024 | |
Fund | | Fair Value
September 30,
2023 | | | Purchases | | | Sales | | | Dividends
Credited to
Income | | | Amount of
Gain (Loss)
Realized on
Sale of Shares | | | Net Change
in Unrealized
Appreciation
(Depreciation) | | | Fair Value
September 30,
2024 | | | Shares
September 30,
2024 | |
Timothy Plan Market Neutral ETF | | $ | 14,810,883 | | | $ | 559,763 | | | $ | 375,501 | | | $ | 889,483 | | | $ | 375,501 | | | $ | (738,728 | ) | | $ | 14,631,918 | | | | 611,600 | |
STRATEGIC
GROWTH | | YEAR ENDED SEPTEMBER 30, 2024 | |
Fund | | Fair Value
September 30,
2023 | | | Purchases | | | Sales | | | Dividends
Credited to
Income | | | Amount of
Gain (Loss)
Realized
on Sale of
Shares* | | | Net Change
in Unrealized
Appreciation
(Depreciation) | | | Fair Value
September 30,
2024 | | | Shares
September 30,
2024 | |
International | | $ | 4,183,074 | | | $ | 96,465 | | | $ | 812,931 | | | $ | 44,512 | | | $ | 206,655 | | | $ | 784,878 | | | $ | 4,458,141 | | | | 326,604 | |
Fixed Income | | | 4,030,737 | | | | 138,420 | | | | 403,141 | | | | 110,697 | | | | (66,698 | ) | | | 351,435 | | | | 4,050,753 | | | | 434,630 | |
High Yield Bond | | | 2,037,294 | | | | 145,025 | | | | 316,346 | | | | 112,654 | | | | (19,606 | ) | | | 188,846 | | | | 2,035,213 | | | | 224,885 | |
Timothy Plan High Dividend Stock Enhanced ETF | | | 2,632,373 | | | | 31,665 | | | | 345,148 | | | | 63,751 | | | | (21,455 | ) | | | 442,348 | | | | 2,739,783 | | | | 106,706 | |
Timothy Plan International ETF | | | 5,174,284 | | | | — | | | | 728,135 | | | | 173,491 | | | | 67,121 | | | | 945,609 | | | | 5,458,879 | | | | 189,056 | |
Timothy Plan Market Neutral ETF | | | 5,329,502 | | | | 668,041 | | | | 805,777 | | | | 300,939 | | | | 109,804 | | | | (234,467 | ) | | | 5,067,103 | | | | 211,800 | |
Timothy Plan US Large/Mid Cap Core Enhanced ETF | | | 4,918,806 | | | | 31,959 | | | | 683,890 | | | | 56,205 | | | | (21,340 | ) | | | 930,253 | | | | 5,175,788 | | | | 197,339 | |
Timothy Plan US Small Cap Core ETF | | | 3,888,602 | | | | — | | | | 739,991 | | | | 47,923 | | | | 239,853 | | | | 702,524 | | | | 4,090,988 | | | | 105,123 | |
Total | | $ | 32,194,672 | | | | | | | | | | | $ | 910,172 | | | $ | 494,334 | | | $ | 4,111,426 | | | $ | 33,076,648 | | | | 1,796,143 | |
| | * | Includes capital gain distributions from affiliated funds |
NOTES TO FINANCIAL STATEMENTS
FINANCIAL STATEMENTS | 118
CONSERVATIVE
GROWTH | | YEAR ENDED SEPTEMBER 30, 2024 | |
Fund | | Fair Value
September 30,
2023 | | | Purchases | | | Sales | | | Dividends
Credited to
Income | | | Amount of
Gain (Loss)
Realized
on Sale of
Shares* | | | Net Change
in Unrealized
Appreciation
(Depreciation) | | | Fair Value
September 30,
2024 | | | Shares
September 30,
2024 | |
International | | $ | 4,377,866 | | | $ | 166,108 | | | $ | 1,059,938 | | | $ | 45,510 | | | $ | 247,122 | | | $ | 763,118 | | | $ | 4,494,276 | | | | 329,251 | |
Fixed Income | | | 11,901,279 | | | | 520,580 | | | | 1,709,575 | | | | 316,960 | | | | (200,090 | ) | | | 1,028,415 | | | | 11,540,609 | | | | 1,238,263 | |
High Yield Bond | | | 2,606,804 | | | | 495,340 | | | | 799,969 | | | | 140,729 | | | | (46,944 | ) | | | 257,368 | | | | 2,512,599 | | | | 277,635 | |
Timothy Plan High Dividend Stock Enhanced ETF | | | 2,327,640 | | | | — | | | | 344,747 | | | | 54,665 | | | | (24,028 | ) | | | 384,327 | | | | 2,343,192 | | | | 91,260 | |
Timothy Plan International ETF | | | 3,428,908 | | | | — | | | | 589,996 | | | | 111,459 | | | | 49,840 | | | | 609,208 | | | | 3,497,960 | | | | 121,144 | |
Timothy Plan Market Neutral ETF | | | 6,278,143 | | | | 501,845 | | | | 869,087 | | | | 349,529 | | | | 133,058 | | | | (271,098 | ) | | | 5,772,861 | | | | 241,300 | |
Timothy Plan US Large/Mid Cap Core Enhanced ETF | | | 4,633,912 | | | | — | | | | 743,001 | | | | 51,705 | | | | (37,043 | ) | | | 866,787 | | | | 4,720,655 | | | | 179,986 | |
Timothy Plan US Small Cap Core ETF | | | 2,670,562 | | | | — | | | | 590,230 | | | | 32,082 | | | | 241,882 | | | | 398,223 | | | | 2,720,437 | | | | 69,905 | |
Total | | $ | 38,225,114 | | | | | | | | | | | $ | 1,102,639 | | | $ | 363,797 | | | $ | 4,036,348 | | | $ | 37,602,589 | | | | 2,548,744 | |
| | * | Includes capital gain distributions from affiliated funds |
GROWTH &
INCOME | | YEAR ENDED SEPTEMBER 30, 2024 | |
Fund | | Fair Value
September 30,
2023 | | | Purchases | | | Sales | | | Dividends
Credited to
Income | | | Amount of
Gain (Loss)
Realized on
Sale of Shares | | | Net Change
in Unrealized
Appreciation
(Depreciation) | | | Fair Value
September 30,
2024 | | | Shares
September 30,
2024 | |
Timothy Plan High Dividend Stock Enhanced ETF | | $ | 6,492,567 | | | $ | 1,833,968 | | | $ | — | | | $ | 186,962 | | | $ | — | | | $ | 1,224,937 | | | $ | 9,551,472 | | | | 372,000 | |
Timothy Plan High Dividend Stock ETF | | | 841,860 | | | | — | | | | 948,261 | | | | 7,120 | | | | 325,463 | | | | (219,062 | ) | | | — | | | | — | |
Total | | $ | 7,334,427 | | | | | | | | | | | $ | 194,082 | | | $ | 325,463 | | | $ | 1,005,875 | | | $ | 9,551,472 | | | | 372,000 | |
NOTES TO FINANCIAL STATEMENTS
FINANCIAL STATEMENTS | 119
Note 8 | | Aggregate Unrealized Appreciation and Depreciation |
The identified cost of investments in securities owned by each Fund for federal income tax purposes, and their respective gross unrealized appreciation and depreciation at September 30, 2024, were as follows:
FUND | | TAX COST | | | GROSS
UNREALIZED
APPRECIATION | | | GROSS
UNREALIZED
DEPRECIATION | | | NET UNREALIZED
APPRECIATION/
(DEPRECIATION) | |
Small/Mid Cap Growth | | $ | 58,794,378 | | | $ | 16,363,159 | | | $ | (1,239,212 | ) | | $ | 15,123,947 | |
International | | | 128,923,051 | | | | 55,709,750 | | | | (2,143,529 | ) | | | 53,566,221 | |
Large/Mid Cap Growth | | | 161,370,803 | | | | 56,937,797 | | | | (1,532,528 | ) | | | 55,405,269 | |
Small Cap Value | | | 173,562,329 | | | | 33,770,302 | | | | (11,441,763 | ) | | | 22,328,539 | |
Large/Mid Cap Value | | | 261,532,258 | | | | 94,118,491 | | | | (504,572 | ) | | | 93,613,919 | |
Fixed Income | | | 115,239,812 | | | | 2,448,119 | | | | (3,613,648 | ) | | | (1,165,529 | ) |
High Yield Bond | | | 177,308,440 | | | | 6,356,320 | | | | (856,650 | ) | | | 5,499,670 | |
Israel Common Values | | | 58,113,364 | | | | 45,362,153 | | | | (3,402,040 | ) | | | 41,960,113 | |
Defensive Strategies | | | 69,673,998 | | | | 13,204,429 | | | | (3,687,698 | ) | | | 9,516,731 | |
Strategic Growth | | | 31,637,521 | | | | 2,917,701 | | | | (758,453 | ) | | | 2,159,248 | |
Conservative Growth | | | 38,129,709 | | | | 2,176,200 | | | | (1,743,199 | ) | | | 433,001 | |
Growth & Income | | | 18,796,672 | | | | 362,957 | | | | (146,697 | ) | | | 216,260 | |
Note 9 | | Distributions to Shareholders and Tax Components of Capital |
The tax character of distributions paid during the fiscal year ended September 30, 2024, and the fiscal year ended September 30, 2023, were as follows:
FOR THE FISCAL YEAR ENDED
SEPTEMBER 30, 2024 | | ORDINARY
INCOME | | | LONG-TERM
CAPITAL GAINS | | | TOTAL | |
Small/Mid Cap Growth | | $ | — | | | $ | 1,848,422 | | | $ | 1,848,422 | |
International Fund | | | 1,971,537 | | | | — | | | | 1,971,537 | |
Large/Mid Cap Growth Fund | | | 58,780 | | | | 9,522,503 | | | | 9,581,283 | |
Small Cap Value | | | 3,142,570 | | | | 4,198,644 | | | | 7,341,214 | |
Large/Mid Cap Value Fund | | | 1,638,034 | | | | 1,250,192 | | | | 2,888,226 | |
Fixed Income Fund | | | 3,180,369 | | | | — | | | | 3,180,369 | |
High Yield Bond Fund | | | 10,494,629 | | | | — | | | | 10,494,629 | |
Israel Common Values Fund | | | 39,507 | | | | — | | | | 39,507 | |
Defensive Strategies Fund | | | 1,590,608 | | | | 160,571 | | | | 1,751,179 | |
Strategic Growth Fund | | | 446,733 | | | | 74,650 | | | | 521,383 | |
Conservative Growth Fund | | | 568,460 | | | | 58,762 | | | | 627,222 | |
Growth & Income Fund | | | 331,177 | | | | 93,773 | | | | 424,950 | |
NOTES TO FINANCIAL STATEMENTS
FINANCIAL STATEMENTS | 120
FOR THE FISCAL YEAR ENDED
SEPTEMBER 30, 2023 | | ORDINARY
INCOME | | | LONG-TERM
CAPITAL GAINS | | | TOTAL | |
Small/Mid Cap Growth | | $ | — | | | $ | 1,123,933 | | | $ | 1,123,933 | |
International Fund | | | 814,740 | | | | — | | | | 814,740 | |
Large/Mid Cap Growth Fund | | | — | | | | 11,719,249 | | | | 11,719,249 | |
Small Cap Value | | | 736,882 | | | | 9,432,265 | | | | 10,169,147 | |
Large/Mid Cap Value Fund | | | 705,131 | | | | 13,575,431 | | | | 14,280,562 | |
Fixed Income Fund | | | 2,276,495 | | | | — | | | | 2,276,495 | |
High Yield Bond Fund | | | 7,837,092 | | | | — | | | | 7,837,092 | |
Israel Common Values Fund | | | — | | | | — | | | | — | |
Defensive Strategies Fund | | | 1,823,639 | | | | 1,683,464 | | | | 3,507,103 | |
Strategic Growth Fund | | | 191,945 | | | | 2,166,220 | | | | 2,358,165 | |
Conservative Growth Fund | | | 184,255 | | | | 1,981,982 | | | | 2,166,237 | |
Growth & Income Fund | | | 291,798 | | | | 1,141,319 | | | | 1,433,117 | |
As of September 30, 2024, the components of distributable earnings on a tax basis were as follows:
| | | Undistributed
Ordinary
Income | | | Undistributed
Long-Term
Capital Gains | | | Post October
Loss and Late
Year Loss | | | Capital Loss
Carry
Forwards | | | Other
Book/Tax
Differences | | | Unrealized
Appreciation/
(Depreciation) | | | Total
Accumulated
Earnings/
(Deficits) | |
Small/Mid Cap Growth | | $ | 3,974,776 | | | $ | 1,645,608 | | | $ | (259,293 | ) | | $ | — | | | $ | — | | | $ | 15,123,947 | | | $ | 20,485,038 | |
International Fund | | | 2,060,517 | | | | — | | | | (137,677 | ) | | | (1,888,081 | ) | | | — | | | | 53,566,452 | | | | 53,601,211 | |
Large/Mid Cap Growth Fund | | | 1,381,345 | | | | 13,559,219 | | | | (316,818 | ) | | | — | | | | — | | | | 55,405,267 | | | | 70,029,013 | |
Small Cap Value | | | 6,617,705 | | | | 4,715,438 | | | | — | | | | — | | | | — | | | | 22,328,539 | | | | 33,661,682 | |
Large/Mid Cap Value Fund | | | 4,606,542 | | | | 27,082,680 | | | | — | | | | — | | | | — | | | | 93,613,919 | | | | 125,303,141 | |
Fixed Income Fund | | | 226,531 | | | | — | | | | (4,013,528 | ) | | | (8,227,597 | ) | | | — | | | | (1,165,529 | ) | | | (13,180,123 | ) |
High Yield Bond Fund | | | 216,093 | | | | — | | | | (4,370,772 | ) | | | (8,459,957 | ) | | | — | | | | 5,499,670 | | | | (7,114,966 | ) |
Israel Common Values Fund | | | 1,155,686 | | | | — | | | | (1,605,387 | ) | | | (5,268,921 | ) | | | — | | | | 41,960,150 | | | | 36,241,528 | |
Defensive Strategies Fund | | | 1,586,402 | | | | 69,366 | | | | — | | | | — | | | | — | | | | 9,524,003 | | | | 11,179,771 | |
Strategic Growth Fund | | | 638,285 | | | | 412,718 | | | | — | | | | — | | | | — | | | | 2,159,248 | | | | 3,210,251 | |
Conservative Growth Fund | | | 784,179 | | | | 321,898 | | | | — | | | | — | | | | — | | | | 433,001 | | | | 1,539,078 | |
Growth & Income Fund | | | 18,364 | | | | — | | | | (132,164 | ) | | | (48,021 | ) | | | — | | | | 216,260 | | | | 54,439 | |
The difference between book basis and tax basis unrealized appreciation (depreciation), undistributed net investment income (loss) and accumulated net realized gain (loss) from investments are primarily attributable to the tax deferral of losses on wash sales, mark-to-market on passive foreign investment companies, adjustments for C-Corporation
NOTES TO FINANCIAL STATEMENTS
FINANCIAL STATEMENTS | 121
return of capital distributions, and perpetual bonds. The unrealized appreciation (depreciation) in the table above includes unrealized foreign currency gains (losses) of $231, $7,272, $(2), $37 for the International, Defensive Strategies, Large-Mid Cap Growth, and Israel Common Values Funds, respectively.
Note 10 | | Capital Loss Carryforwards, Post October and Other Losses |
Late year losses incurred after December 31 within the fiscal year are deemed to arise on the first business day of the following fiscal year for tax purposes. The following Funds incurred and elected to defer such late year losses as follows:
FUND | | LATE YEAR LOSSES | |
Small/Mid Cap Growth | | $ | 259,293 | |
Large/Mid Cap Growth Fund | | | 316,818 | |
Capital losses incurred after October 31 within the fiscal year are deemed to arise on the first business day of the following fiscal year for tax purposes. The following Funds incurred and elected to defer such capital losses as follows:
FUND | | POST OCTOBER
LOSSES | |
International Fund | | $ | 137,677 | |
Fixed Income Fund | | | 4,013,528 | |
High Yield Bond Fund | | | 4,370,772 | |
Israel Common Values Fund | | | 1,605,387 | |
Growth & Income | | | 132,164 | |
At September 30, 2024, the Funds had capital loss carry forwards for federal income tax purposes available to offset future capital gains as follows:
| | Capital Loss Carry Forward | |
FUND | | SHORT-TERM | | | LONG-TERM | | | TOTAL | |
International Fund | | $ | 1,760,179 | | | $ | 127,902 | | | $ | 1,888,081 | |
Fixed Income Fund | | | 2,678,366 | | | | 5,549,231 | | | | 8,227,597 | |
High Yield Bond Fund | | | 756,758 | | | | 7,703,199 | | | | 8,459,957 | |
Israel Common Values Fund | | | 4,120,703 | | | | 1,148,218 | | | | 5,268,921 | |
Growth & Income Fund | | | 28,161 | | | | 19,860 | | | | 48,021 | |
To the extent these loss carryforwards are used to offset future capital gains, it is probable that the amount, which is offset will not be distributed to shareholders.
Note 11 | | Subsequent Events |
Subsequent events after the date of the Statements of Assets and Liabilities have been evaluated through the date the financial statements were issued. Management has determined that no events or transactions occurred requiring adjustment or disclosure in the financial statements.
NOTES TO FINANCIAL STATEMENTS
FINANCIAL STATEMENTS | 122
Note 12 | | Foreign Tax Credit (UNAUDITED) |
The following funds intend to elect to pass through to shareholders the income tax credit for taxes paid to foreign countries. Foreign source income and foreign tax expense per outstanding share as of fiscal years ended September 30, 2024 and September 30, 2023, were as follows:
FOR FISCAL YEAR ENDED
SEPTEMBER 30, 2024 | FOREIGN
TAXES PAID | FOREIGN SOURCE
INCOME |
International Fund | 0.04 | 0.11 |
Israel Common Values Fund | 0.17 | 0.21 |
Strategic Growth Fund | 0.01 | 0.04 |
Conservative Growth Fund | 0.01 | 0.02 |
FOR FISCAL YEAR ENDED
SEPTEMBER 30, 2023 | FOREIGN
TAXES PAID | FOREIGN SOURCE
INCOME |
International Fund | 0.04 | 0.07 |
Israel Common Values Fund | 0.16 | 0.07 |
Strategic Growth Fund | 0.01 | 0.06 |
Conservative Growth Fund | 0.01 | 0.04 |
NOTES TO FINANCIAL STATEMENTS
FINANCIAL STATEMENTS | 123
REPORT OF INDEPENDENT REGISTERED PUBLIC ACCOUNTING FIRM
To the Shareholders and Board of Trustees of
The Timothy Plan
Opinion on the Financial Statements
We have audited the accompanying statements of assets and liabilities, including the schedules of investments, of Timothy Plan Small/Mid Cap Growth Fund (formerly the Timothy Plan Aggressive Growth Fund), Timothy Plan International Fund, Timothy Plan Large/Mid Cap Growth Fund, Timothy Plan Small Cap Value Fund, Timothy Plan Large/Mid Cap Value Fund, Timothy Plan Fixed Income Fund, Timothy Plan High Yield Bond Fund, Timothy Plan Israel Common Values Fund, Timothy Plan Defensive Strategies Fund, Timothy Plan Strategic Growth Fund, Timothy Plan Conservative Growth Fund, and Timothy Plan Growth & Income Fund (the “Funds”), twelve of the portfolios constituting The Timothy Plan, as of September 30, 2024, the related statements of operations for the year then ended, the statements of changes in net assets for each of the two years in the period then ended, the financial highlights for each of the five years in the period then ended, and the related notes (collectively referred to as the “financial statements”). In our opinion, the financial statements present fairly, in all material respects, the financial position of each of the Funds as of September 30, 2024, the results of their operations for the year then ended, the changes in net assets for each of the two years in the period then ended, and the financial highlights for each of the five years in the period then ended, in conformity with accounting principles generally accepted in the United States of America.
Basis for Opinion
These financial statements are the responsibility of the Funds’ management. Our responsibility is to express an opinion on the Funds’ financial statements based on our audits. We are a public accounting firm registered with the Public Company Accounting Oversight Board (United States) (“PCAOB”) and are required to be independent with respect to the Funds in accordance with the U.S. federal securities laws and the applicable rules and regulations of the Securities and Exchange Commission and the PCAOB.
We conducted our audits in accordance with the standards of the PCAOB. Those standards require that we plan and perform the audit to obtain reasonable assurance about whether the financial statements are free of material misstatement whether due to error or fraud.
Our audits included performing procedures to assess the risks of material misstatement of the financial statements, whether due to error or fraud, and performing procedures that respond to those risks. Such procedures included examining, on a test basis, evidence regarding the amounts and disclosures in the financial statements. Our procedures included confirmation of securities owned as of September 30, 2024, including observation of precious metals, by correspondence with the custodian and brokers; when replies were not received from brokers, we performed other auditing procedures. Our audits also included evaluating the accounting principles used and significant estimates made by management, as well as evaluating the overall presentation of the financial statements. We believe that our audits provide a reasonable basis for our opinion.
We have served as the auditor of one or more investment companies advised by Timothy Partners, Ltd., since 2005.

COHEN & COMPANY, LTD.
Cleveland, Ohio
November 26, 2024
REPORT OF INDEPENDENT REGISTERED PUBLIC ACCOUNTING FIRM
ANNUAL REPORT | 124
Section 8 | Privacy Notice
FACTS | WHAT DOES THE TIMOTHY PLAN DO WITH YOUR PERSONAL INFORMATION? |
| | | | |
WHY? | Financial companies choose how they share your personal information. Federal law gives consumers the right to limit some, but not all information sharing. Federal law also requires us to tell you how we collect, share, and protect your personal information. Please read this Notice carefully to understand what we do. |
| | | | |
WHAT? | The types of information we collect and share depend on the product or service you have with us. This information can include: ● Social Security Number ● Assets ● Retirement Assets ● Transaction History ● Checking Account History ● Purchase History ● Account Balances ● Account Transactions ● Wire Transfer Instructions When you are no longer our customer, we continue to share your information as described in this Notice. |
| | | | |
HOW? | All financial companies need to share your personal information to run their everyday business. In the section below, we list the reasons financial companies can share their customers’ personal information; the reasons The Timothy Plan chooses to share; and whether you can limit this sharing. |
| | | | |
Reasons we can share your personal information. | Does The Timothy Plan share? | Can you limit this sharing? |
For our everyday business purposes-
Such as to process your transactions, maintain your account(s), respond to court orders and legal investigations, or report to credit bureaus. | Yes | No |
For our marketing purposes-
to offer our products and services to you. | No | We don’t share |
For joint marketing with other financial companies | No | We don’t share |
For our affiliates’ everyday business purposes-
information about your transactions and experiences. | Yes | No |
For our affiliates’ everyday business purposes-
information about your creditworthiness | No | We don’t share |
For non-affiliates to market to you | No | We don’t share |
| | | |
Questions? | Call 800-662-0201 |
PRIVACY NOTICE
FINANCIAL STATEMENTS | 125
Page 2 | | |
| |
WHO WE ARE |
Who is providing this Notice? | Timothy Plan Family of Mutual Funds
Timothy Partners, Ltd. |
WHAT WE DO |
How does The Timothy Plan protect your personal information? | To protect your personal information from unauthorized access and use, we use security measures that comply with federal law. These measures include computer safeguards and secured files and buildings. Our service providers are held accountable for adhering to strict policies and procedures to prevent any misuse of your nonpublic personal information. |
How does The Timothy Plan collect your personal information? | We collect your personal information, for example, when you ● Open an account ● Provide account information ● Give us your contact information ● Make deposits or withdrawals from your account ● Make a wire transfer ● Tell us where to send the money ● Tell us who receives the money ● Show your government-issued ID ● Show your driver’s license We also collect your personal information from other companies. |
Why can’t I limit all sharing? | Federal law gives you the right to limit only: ● Sharing for affiliates’ everyday business purposes- information about your creditworthiness. ● Affiliates from using your information to market to you. ● Sharing for non-affiliates to market to you State laws and individual companies may give you additional rights to limit sharing. |
| | |
DEFINITIONS |
Affiliates | Companies related by common ownership or control. They can be financial and non-financial companies. Timothy Partners, Ltd. is an affiliate of The Timothy Plan |
Non-affiliates | Companies not related by common ownership or control. They can be financial and non-financial companies. ● The Timothy Plan does not share with non-affiliates so they can market to you. |
Joint marketing | A formal agreement between non-affiliated financial companies that together market financial products to you. ● The Timothy Plan does not jointly market. |
PRIVACY NOTICE
FINANCIAL STATEMENTS | 126
Section 9 | Disclosures
Customer Identification Program
The Board of Trustees of the Trust has approved procedures designed to prevent and detect attempts to launder money as required under the USA PATRIOT Act. The day-to-day responsibility for monitoring and reporting any such activities has been delegated to the transfer agent, subject to the oversight and supervision of the Board.
Disclosures
HOW TO OBTAIN PROXY VOTING INFORMATION
Information regarding how the Funds voted proxies relating to Fund securities during the period ended June 30 of well as a description of the policies and procedures that the Funds use to determine how to vote proxies is available without charge, upon request, by calling 1-800-732-0330 or by referring to the Security and Exchange Commission’s (“SEC”) website at http://www.sec.gov
HOW TO OBTAIN 1ST AND 3RD FISCAL QUARTER PORTFOLIO HOLDINGS
The Trust files a complete listing of the Fund’s portfolio holdings with the SEC as of the end of the first and third quarters of each fiscal year on Form N-Q or as an exhibit to its reports on Form N-Q’s successor form, Form N-PORT. The filings are available free of charge, upon request, by calling the Trust toll-free at 1-800-662-0201. Furthermore, you may obtain a copy of these filings on the SEC’s website at www.sec.gov.
DISCLOSURES
FINANCIAL STATEMENTS | 127
Intentionally Left Blank
Intentionally Left Blank
INVESTMENT ADVISOR
Timothy Partners, Ltd.
1055 Maitland Center Commons
Maitland, FL 32751
DISTRIBUTOR
Timothy Partners, Ltd.
1055 Maitland Center Commons
Maitland, FL 32751
TRANSFER AGENT
Ultimus Fund Solutions, LLC
4221 N. 203rd St, Suite 100
Elkhorn, NE 68022-3474
INDEPENDENT REGISTERED PUBLIC ACCOUNTING FIRM
Cohen & Company, Ltd.
1350 Euclid Ave., Suite 800
Cleveland, OH 44115
LEGAL COUNSEL
David Mahaffey
Sullivan & Worcester LLP

For additional information or a prospectus, please call:
1-800-846-7526 Visit the Timothy Plan website on the internet at:
timothyplan.com This report is submitted for the general information for shareholders of the Funds. It is not authorized for distribution to prospective investors in the Funds unless preceded or accompanied by an effective Prospectus which includes details regarding the Funds’ objectives, policies, expenses and other information. Distributed by Timothy Partners, Ltd. | HEADQUARTERS
The Timothy Plan
1055 Maitland Center Commons
Maitland, Florida 32751 (800) 846-7526 www.timothyplan.com
invest@timothyplan.com SHAREHOLDER SERVICES
Ultimus Fund Solutions, LLC
4221 N. 203rd St, Suite 100
Elkhorn, NE 68022-3474 |
Item 8. Changes in and Disagreements with Accountants for Open-End Management Investment Companies.
Not applicable
Item 9. Proxy Disclosures for Open-End Management Investment Companies.
Not applicable
Item 10. Remuneration Paid to Directors, Officers, and Others of Open-End Management Investment Companies.
Included under Item 7
Item 11. Statement Regarding Basis for Approval of Investment Advisory Contract.
Included under Item 7
Item 12. Disclosure of Proxy Voting Policies and Procedures for Closed-End Management Investment Companies.
Not applicable
Item 13. Portfolio Managers of Closed-End Management Investment Companies.
Not applicable
Item 14. Purchases of Equity Securities by Closed-End Management Investment Company and Affiliated Purchasers.
Not applicable
Item 15. Submission of Matters to a Vote of Security Holders.
None
Item 16. Controls and Procedures
(a) The registrant’s Principal Executive Officer and Principal Financial Officer have concluded that the registrant’s disclosure controls and procedures (as defined in Rule 30a-3(c) under the Act) are effective in design and operation and are sufficient to form the basis of the certifications required by Rule 30a-(2) under the Act, based on their evaluation of these disclosure controls and procedures as of a date within 90 days of this report on Form N-CSR.
(b) There were no changes in the registrant’s internal control over financial reporting (as defined in Rule 30a-3(d) under the Act) during the period covered by this report that have materially affected, or are reasonably likely to materially affect, the registrant’s internal control over financial reporting.
Item 17. Disclosure of Securities Lending Activities for Closed-End Management Investment Companies.
Not applicable
Item 18. Recovery of Erroneously Awarded Compensation.
Item 19. Exhibits.
SIGNATURES
Pursuant to the requirements of the Securities Exchange Act of 1934 and the Investment Company Act of 1940, the registrant has duly caused this report to be signed on its behalf by the undersigned, thereunto duly authorized.
The Timothy Plan
| By | /s/ Arthur D. Ally | |
| Arthur D. Ally | |
| President/Principle Executive Officer & Treasurer/Principle Financial Officer |
| Date: 12/10/2024 | |
Pursuant to the requirements of the Securities Exchange Act of 1934 and the Investment Company Act of 1940, this report has been signed below by the following persons on behalf of the registrant and in the capacities and on the dates indicated.
| By | /s/ Arthur D. Ally | |
| Arthur D. Ally | |
| President/Principle Executive Officer & Treasurer/Principle Financial Officer |
| Date: 12/10/2024 | |