UNITED STATES
SECURITIES AND EXCHANGE COMMISSION
WASHINGTON, D.C. 20549
FORMN-CSR
CERTIFIED SHAREHOLDER REPORT OF REGISTERED MANAGEMENT
INVESTMENT COMPANIES
Investment Company Act file number 811-08228
The Timothy Plan
(Exact name of registrant as specified in charter)
1055 Maitland Center Commons, Maitland, FL 32751
(Address of principal executive offices) (Zip code)
Art Ally, The Timothy Plan
1055 Maitland Center Commons, Maitland, FL 32751
(Name and address of agent for service)
Registrant’s telephone number, including area code: 800-846-7526
Date of fiscal year end: 9/30
Date of reporting period:9/30/19
FormN-CSR is to be used by management investment companies to file reports with the Commission not later than 10 days after the transmission to stockholders of any report that is required to be transmitted to stockholders under Rule30e-1 under the Investment Company Act of 1940 (17 CFR270.30e-1). The Commission may use the information provided on FormN-CSR in its regulatory, disclosure review, inspection and policymaking roles.
A registrant is required to disclose the information specified by FormN-CSR, and the Commission will make this information public. A registrant is not required to respond to the collection of information contained in FormN-CSR unless the Form displays a currently valid Office of Management and Budget (“OMB”) control number. Please direct comments concerning the accuracy of the information collection burden estimate and any suggestions for reducing the burden to Secretary, Securities and Exchange Commission, 450 Fifth Street, NW, Washington, DC 20549-0609. The OMB has reviewed this collection of information under the clearance requirements of 44 U.S.C. § 3507.
Item 1. Reports to Stockholders.
The Registrant’s audited annual financial reports transmitted to shareholders pursuant to Rule30e-1 under the Investment Company Act of 1940 are as follows:
Beginning on January 1, 2021, as permitted by regulations adopted by the Securities and Exchange Commission, paper copies of the Funds’ shareholder reports like this one will no longer be sent by mail, unless you specifically request paper copies of the reports. Instead, the reports will be made available on the Funds’ website, www.timothyplan.com, and you will be notified by mail each time a report is posted and provided with a website link to access the report.
If you already elected to receive shareholder reports electronically, you will not be affected by this change and you need not take any action. You may elect to receive shareholder reports and other communications from the Funds electronically or to continue receiving paper copies of shareholder reports, which are available free of charge, by contacting your financial intermediary (such as a broker-dealer or bank) or, if you are a direct investor, by following the instructions included with paper Funds documents that have been mailed to you.
1
September 30, 2019
Dear Shareholder,
As you review the details on the following pages, you will see that we started out this fiscal year where most of our funds endured a very large downturn (in the markets) in the 4th quarter, 2018. Pundits searched for valid reasons causing the decline, but as the markets have since demonstrated, there really was little except what we believe were fear and hype behind the decline. Consequently, I am pleased to report that we more than recovered the losses during the first nine months of 2019. Hence, ourone-year performance over the past fiscal year(10-1-18 thru9-30-19) varies among our funds from slightly down to fairly strongly up. Among our better performers were our fixed-income oriented funds along with our international funds and our Defensive Strategies Fund. All of that simply underscores the wisdom of asset allocation since different market segments perform differently over differing periods.
The positive returns we experienced thus far in 2019 are, we believe, in large part the result of our country’s leadership and the positivepro-business agenda President Trump is pursuing. These changes have given us a positive long-term view of our economy and, therefore the equity markets. Even though we experienced periodic short-term volatility, we fully expect the market trend to continue upward. Nevertheless, Timothy Partners, Ltd, (the “Advisor”) continued (and will continue) to take a conservative approach to the markets as we believe our shareholders prefer a preservation of principal course to that of chasing returns. I do need to reiterate, however, that, in the capital markets in general and our funds in particular, returns can never be guaranteed.
For more complete information about the individual funds, please read each of thesub-advisors’ annual review letters in the pages that follow. They more fully detail the various factors that impacted this fiscal year’s performance along with their economic outlook for the coming year.
Although we cannot guarantee any actual outcome, I remain confident that all of oursub-advisors are, in our opinion, among the best in the industry and they each continue to honor our overall policy to manage their respective funds both in accordance with our screening restrictions and with a continued conservative bias.
Finally, I would once again like to thank you for your moral convictions that led you to becoming part of the Timothy Plan Family.
Yours in Christ,
Arthur D. Ally
President
2
| | |
| |
Timothy Plan Aggressive Growth Fund Letter from the Manager – September 30, 2019 | | 
|
| | | |
This time last year we wrote about an accelerating economy in the trailing12-month period, as GDP grew over 3% due to the positive effects of the corporatetax-rate cut and increased government defense spending. A year later, the growth rate of the U.S. economy is losing speed, leading many to question whether we can even stay at a “muddle-through” growth rate of1.0- 1.75%, or fall victim to a recession. The biggest issue currently is that, due largely to the trade war, confidence is plummeting and corporate America remains wary of investing in the face of escalating trade tensions. The manufacturing sector is already in a recession, as evidenced by September’s ISM (Institute for Supply Management) reading of 47.8, the lowest level since June of 2009. Any reading below 50 indicates contraction. On the other hand, the consumer – at 70%+ of our economy – is a more important gauge, and we can be much more optimistic on that front. The unemployment rate recently fell to a fresh50-year low of 3.5%, and we are currently in the midst of an amazing 108 consecutive months of job growth, the longest streak in history. Wages are growing at a reasonable clip of about 3%, as inflation continues to be very tame. The consumer balance sheet has also benefited fromde-leveraging since the financial crisis, and aggregate household net worth has now surpassed $100 trillion, though it can be argued that the benefits of the rising stock market and higher home prices, are enjoyed primarily by the upper-income cohort.
The Fund returned-3.84 percent in the September 2019 quarter, 16.63 percent year to date, and - 7.31 percent over the last 12 months. This compares to the Russell Midcap Growth Index that returned-0.68 percent in the past quarter, 25.23 percent year to date, and 5.2 percent over the last 12 months.
The underperformance over the past 12 months was driven by weak stock selection in the consumer discretionary and the industrial sectors. Our largest stock underperformer in the consumer discretionary sector was Farfetch [FTCH], which suffered after missing its sales projections and having significant senior management turnover. Within the industrial sector, our investment in Insperity [NSP] proved to be disappointing. Insperity is a Professional Employer Organization [PEO] that provides outsourced human resources services to its clients. While the company missed earnings expectations modestly, investors are more concerned that the current economic slowdown will adversely affect Insperity in the future.
The largest outperformers over the past 12 months were primarily investments in the healthcare sector, specifically medical device companies. Insulet [PODD] had significant gains after they reported strong sales and earnings growth as their insulin pump systems are becoming more widely adopted both the in the US and Europe. While historically only type 1 diabetics have used these pump systems, now with greater insurance coverage and technology advances, type 2 diabetics are beginning to adopt these systems as well. Another top performer was Edwards Lifesciences [EW]. Edwards also exceeded investors’ expectations driven by strong growth of their cardiovascular devices, specifically their transcatheter aortic valve replacements [TAVR]. We are optimistic that sales growth should further accelerate going forward after recent clinical data showed that a wider group oflow-risk patients would also benefit from the use of TAVR.
We are monitoring the macro economic data as investors are concerned that the current slowdown in the manufacturing segment extends into the services / consumer-driven segment of the economy. That data had led to investors overweighting sectors that had minimal industrial exposure [healthcare and technology], and underweighting sectors that had exposure to the global economic slowdown. However, over the past month, we are seeing some signals from the markets that perhaps valuations in the industrial segments have become overly compressed, with several sectors trading at10-year-low valuations. While it is difficult to justify investing in many of these sectors based on current fundamentals, we are closely watching both the economic and corporate earnings data to see if the recent rotation into more cyclical segments of the economy is justified. It is in everyone’s interest to see some resolution in the ongoing litany of new global tariffs. Perhaps pressure ahead of the 2020 elections will lead to a partial resolution or ceasefire on this front.
3
We continue to find compelling investment opportunities, particularly in the Real Estate and medical device industries. Given the dramatically lower interest rates seen globally, REITs as an asset class should continue to be in favor to investors due their attractive dividend yield. We remain focused on generating alpha and producing the strongest investment results over the long run. We thank you for your continuing support and investment.
Chartwell Investment Partners, LLC
4
The Timothy Plan International Fund
Letter from The Manager - September 30, 2019
While calendar year 2019 has brought good absolute and relative performance for the Timothy International Fund versus the MSCI EAFE index, the last twelve months proved more challenging due to the market plunge in the 4th quarter of 2018. Sector allocation was tough due to underweights to more defensive sectors such as Utilities, Real Estate, and Consumer Staples which held up much better in the stock selloff in late 2018. The Fund’s overweight to Technology and underweight to the Materials sector helped but were not enough to offset the sharp declines in stocks in late 2018. Stock selection was a bit more balanced for the portfolio with very good selection in the Financials, Technology, and Industrials sectors but offset by negative selection in Health Care, Energy, and Consumer Discretionary. In Health Care, strong performance from British medical device company Smith & Nephew was offset by poor performance from German dialysis provider Fresenius Medical Care. In Industrials, French toll road operator Vinci and Hong-Kong based tools manufacturer Techtronic performed well. From a country standpoint the Fund benefited from its underweight to Japan and good stock selection there but was hurt from its underweight to defensive Switzerland and detrimental stock selection in France where auto parts company Valeo fell on concerns over weakness in the global auto cycle and Europe-specific auto manufacturing disruptions.
The international markets were sent on a tailspin in the 4th quarter of 2018 on uncertainty over Federal Reserve monetary policy, theUS-China trade war, unending Brexit risks, Italian politics, and concerns of slowing global economic growth. This calendar year has been a bit of a roller coaster for the markets overall with increased volatility but thus far has experienced a nice rebound in equity prices. Global central banks have stepped in to offer “whatever it takes” with the Federal Reserve, the European Central Bank, and the Bank of Japan all focused on maintaining or increasing monetary stimulus. Bond yields plummeted during the year which saw the German yield curve all the way to 30 years plunge into negative territory, an unprecedented occurrence. TheUS-China trade war remains a concern as markets await some kind of truce there. Concerns still abound for economic growth as we enter into 2020 but the European and Japanese economics could provide positive momentum as they slowly rebound out of their recent slump in spite of a new consumption tax in Japan that will lead to short term pressures late in 2019.
Relative and absolute valuations remain attractive for international equities while any sign of dollar weakness or Europe and/or Japan closing the economic growth gap with the U.S. could see some renewed optimism for international equity outperformance. We remain committed to a consistent investment approach dedicated to finding long-term investments for shareholders and thank you for your continued investment in the Fund.
Eagle Global Advisors, LLC
5
| | |
Timothy Plan Large/Mid Cap Growth Fund Letter from the Manager – September 30, 2019 | | |
This time last year we wrote about an accelerating economy in the trailing12-month period, as GDP grew over 3% (though it was later revised down to +2.5%), due in part to the positive effects of the corporatetax-rate cut. A year later, the growth rate of the U.S. economy is losing speed (and Europe has already precipitously slowed), leading many to question whether we can even stay at a “muddle-through” growth rate of1.0-1.75% or fall victim to a recession. The biggest issue currently is that, due largely to the trade war, confidence is plummeting and corporate America remains wary of investing in the face of escalating trade tensions. The manufacturing sector is already in a mini-recession, as evidenced by September’s ISM (Institute for Supply Management) reading of 47.8 (below 50 indicates contraction), the lowest level since June of 2009. On the other hand, the consumer – at 70%+ of our economy – is a more important gauge, and we can be much more sanguine on that front. The unemployment rate recently fell to a fresh50-year low of 3.5%, and we are currently in the midst of an amazing 108 consecutive months of job growth, the longest streak in history. Wages are growing at a reasonable clip of about 3%, as inflation continues to be very tame. The consumer balance sheet has also benefited fromde-leveraging since the financial crisis, and aggregate household net worth has now surpassed $100 trillion, though it can be argued that the benefits of this (booming stock market and rising home prices) are enjoyed primarily by the upper-income cohort.
Unlike recent years, for this12-month period, there was not a meaningful spread in performance between growth and value stocks, however, size was impactful to the Fund’s relative performance. Due to the restrictions, we can’t own many of thelarge-cap growth stocks in the benchmark, hence, the Fund’s weighted market cap is significantly smaller than that of the R1G. By way of illustration of the size effect, the Russell top 200 market cap stocks were up 4.1% in the period, the Russell 2000 (small stocks) fell 8.9%, and the Russell Microcap (smallest) index was down 16%.
The Fund underperformed the Russell 1000 Growth Index, rising 0.2%, vs. +3.7% for the benchmark. Sector allocation was a net negative, primarily from our underweight of Real Estate (best-performing sector) and our overweight of Energy (worst-performing sector). Combined, these effects cost the fund 150 basis points. Stock selection was a negative within Industrials, as Fortive fell 18%, and Caterpillar dropped 15%; cyclical stocks did not fare well in the past year due to concerns over tariffs and a slowing economy. In the same vein, trucker J.B. Hunt was down 15%. In Financials, two bank positions – SVB Financial and East West Bancorp (down 34% and 21% respectively) – had negative impacts on the fund; the falling interest-rate environment was generally not good for banks during the period (they were down 26% in the benchmark). Other detractors across various sectors included ConocoPhillips (- 25%), NVIDIA(-38%), and Sarepta Therapeutics(-53%). Sarepta had soared 71% in the prior12-month period, on the heels of an exceptional commercial launch of the drug Ingrezza, after presenting promising gene-therapy data for the treatment of Duchenne Muscular Dystrophy (DMD). However, in August they received a surprising decision from the FDA in which the agency denied approval of Sarepta’s drug Golodirsen in DMD. Given the prior approval of a similar drug Sarepta has on the market, Exondys 51, there were expectations of an approval. NVDA was also coming off a big prior year – when it was up 58%; more recently, however, its growth in both gaming and chips for the data-center end market have slowed. Turning to positive impacts, stock selection in Consumer Staples was buoyed by spice-company McCormick, which rose 20%, and Costco, up 24%. Both of these companies are well-positioned relative to consumer trends and preferences. In Technology, although not being able to own Microsoft (+23%) was a headwind, we had good results from several of our positions: tech reseller CDW was up 40%, as it continues toout-grow its industry; cyber-security company Rapid7 +23%; software company ServiceNow +30% (outperforming Microsoft); and NXP Semiconductors +29%. In Healthcare, animal-health company Zoetis rose 37% as it continues to produce consistentmid-teens earnings growth (and has had 5 consecutive quarters of positive earnings surprises).
6
For the portfolio, there has been no change to our time-tested,bottom-up fundamental approach to managing large andmid-cap growth investments. As an overview, the Fund remains well diversified by issuers and sectors, as all areas of the economy are impacted by broad macroeconomic trends. We have recently taken some weight out of the economically-sensitive areas of our holdings, as the tariffs (and global economic slowdown) make these stocks vulnerable. We also cut back on stocks that could be negatively impacted by lower interest rates, as that trend seems to be in place for the foreseeable future. Healthcare is an area of interest for purchase candidates, as the political rhetoric around “Medicare for All” and drug pricing has created some opportunities. We thank you for your continuing support and investment.
Chartwell Investment Partners, LLC
7
September 30, 2019
Dear Timothy PlanLarge/Mid-Cap Growth Fund Shareholder:
On May 1, 2019, Timothy Plan added two new Exchange Traded Funds to our diversified product line: Timothy PlanLarge-Cap Core (TPLC) and Timothy Plan High Dividend Stock (TPHD). These are both smart beta index funds traded on the New York Stock Exchange. Since TPLC fits nicely into the investment objective of ourLarge/Mid-Cap Growth Fund, we incorporated this particular ETF into the holdings of this fund so that:
| | • | | Approximately 20% of the fund is now invested in TPLC |
| | • | | And the remainder of the fund continues to be actively managed by our long-timesub-advisor, Chartwell Investment Partners. |
In addition to greatly increasing the diversification of the holdings in this fund, we believe this addition should have the positive effect of lowering our expense ratio over both the near and longer term.
ETFs are passively managed investment vehicles, with Timothy ETFs being reflections of biblically responsible investment (BRI) indices that were developed specifically to accommodate the BRI space. As stated above, the ETFs were not incorporated into the portfolio until May, following the 2018sell-off, and although the market was choppy, the ETF was a positive contributor, although the Fund overall had a slightly negative return of-1.54% for the fiscal year. We suggest you look to Chartwell’sSub-Advisor’s letter for the Fund for more information and future market outlook.
As you know, no one can guarantee future performance. However, the one thing that I can assure you of is every one of oursub-advisors is doing their very best and our team here at Timothy is working very hard to provide you an investment in which you can feel comfortable.
Sincerely,
Arthur D. Ally
President
8
LETTER FROM THE MANAGER
September 30, 2019
TIMOTHY PLAN SMALL CAP VALUE FUND
We are pleased to provide you with our report for the Timothy Plan Small Cap Value Fund for the twelve months ending September 30, 2019 and would like to thank you for entrusting your assets with us.
Looking back, equity markets began the last twelve months with a harshsell-off over fears of slowing global growth, continued pressures from the trade dispute between the U.S. and China, and a potential policy error by the Federal Reserve in over-tightening monetary policy. None of these fears were new to investors, but they culminated into a broad market decline across all of the sectors and market capitalizations. As fears abated, markets rallied with larger caps regaining their losses and then some while smaller cap stocks remain in negative territory. Economic data has moderated over the last year, with the most recent Gross Domestic Product (GDP) figure showing just 2 percent growth and other indicators, like the Institute of Supply Management’s (ISM) Manufacturing Purchasing Managers Index (PMI) have fallen into contraction territory. The Federal Reserve has entirely reversed course, with expectations for rate hikes to continue as the calendar year turned have morphed into several rate cuts with the potential for more in the future. This added support has certainly been well-received by investors, though expectations remain for challenging growth conditions more broadly. Little progress has been made on the trade negotiations underway with China, sapping business confidence and adding to the uncertainty. While corporate profits have been resilient, investments in capital expenditures have failed to materialize as fast as hoped due to these concerns and companies continue to return record levels of cash to shareholders in the form of dividends and buybacks. While the U.S. muddles through, the rest of the world has seen challenging economic conditions, though, some signs may be emerging for a potential rebound in the coming quarters. There remains a high degree of concern globally regarding future growth and disruptions from these macroeconomic factors in the future.
For the twelve months ending September 30, 2019, the Timothy Plan Small Cap Value Fund produced a net return of - 2.57%, while the Russell 2000 Index produced a return of-8.86%. Positive stock selection was seen broadly across most sectors as higher-quality businesses were strongly preferred by the market. This was particularly true within Health Care and Consumer Staples, the top relative contributors. Energy performed poorly, both in a relative and absolute sense, as an overweight weighed heavily on relative performance. An underweight to Information Technology, despite positive selection, also detracted from relative performance.
Installed Building Products recovered strongly in the spring after investors’ concerns regarding their ability to pass through increased costs for the insulation they install were assuaged with further tailwinds from the strong U.S. housing market. UniFirst saw the market reward their reacceleration in earnings growth as strong demand for their uniform rental services continued to rise from employment growth in their serviced industries. Lattice Semiconductor rallied as their strong product pipeline and improving gross margins continued to exceed investor expectations as their chips are well suited for edge and internet of things (IoT) applications. Novanta remained a solid execution story as management’s efforts to reshape their portfolio towards higher-growth areas like medical over the last several years delivered strong sales and earnings growth once again. CONMED saw strength in the organic growth in their core areas of orthopedics and general surgery. Their recent acquisition performed above expectations and new sports medicine products look promising to bolster growth in the future.
Falling crude oil prices over concerns of oversupply and lower demand growth weighed heavily on a number of names including Callon Petroleum, Penn Virginia, and SRC Energy. Penn Virginia also struggled after walking away from a potential merger with another exploration and production company as some deal-related investors rotated out of the shares. Interface continued to execute as topline growth led to strong earnings growth, however, a challenging environment in terms of future commercial remodel activity in the U.S. and Europe weighed on shares. Children’s Place remains positioned to capitalize on the bankruptcy of a large competitor, Gymboree, however, the near-term environment remains highly promotional hurting their sales and margins.
The Small Cap Value team is focused on seekingwell-run companies with growth prospects that are underappreciated by the marketplace. We look for companies with above average growth and strong balance sheets that generate positive cash flows. As economic growth continues to remain positive, we feel our companies are well positioned to achieve higher earnings and have the potential to provide superior relative returns.
We thank you for your continued confidence in the Westwood process and investment teams and we look forward to serving your investment needs through the years ahead.
Westwood Management Corporation
9
LETTER FROM THE MANAGER
September 30, 2019
TIMOTHY PLAN LARGE/MID CAP VALUE FUND
We are pleased to provide you with our report for the Timothy Plan Large/Mid Cap Value Fund for the twelve months ending September 30, 2019 and would like to thank you for entrusting your assets with us.
Looking back, equity markets began the last twelve months with a harshsell-off over fears of slowing global growth, continued pressures from the trade dispute between the U.S. and China, and a potential policy error by the Federal Reserve in over-tightening monetary policy. None of these fears were new to investors, but they culminated into a broad market decline across all of the sectors and market capitalizations. As fears abated, markets rallied with larger caps regaining their losses and then some while smaller cap stocks remain in negative territory. Economic data has moderated over the last year, with the most recent Gross Domestic Product (GDP) figure showing just 2 percent growth and other indicators, like the Institute of Supply Management’s (ISM) Manufacturing Purchasing Managers Index (PMI) have fallen into contraction territory. The Federal Reserve has entirely reversed course, with expectations for rate hikes to continue as the calendar year turned have morphed into several rate cuts with the potential for more in the future. This added support has certainly been well-received by investors, though expectations remain for challenging growth conditions more broadly. Little progress has been made on the trade negotiations underway with China, sapping business confidence and adding to the uncertainty. While corporate profits have been resilient, investments in capital expenditures have failed to materialize as fast as hoped due to these concerns and companies continue to return record levels of cash to shareholders in the form of dividends and buybacks. While the U.S. muddles through, the rest of the world has seen challenging economic conditions, though, some signs may be emerging for a potential rebound in the coming quarters. There remains a high degree of concern globally regarding future growth and disruptions from these macroeconomic factors in the future.
For the twelve months ending September 30, 2019, the Timothy Plan Large/Mid Cap Value Fund produced a net return of 3.85%, while the S&P 500 Index produced a return of 4.25%. While absolute returns have remained positive despite compressing from their recent highs, relative performance faced some headwinds. Notable positives included better stock selection within Health Care and Communication Services while our exposure and selection within Energy, the worst performing sector, weighed heavily on relative performance as did less favorable selection in Financials.
Several areas saw strong stock selection, particularly in Health Care, as high-quality medical device companies were less impacted by the political headlines suggesting the possibility of‘Medicare-for-All’. STERIS and DENTSPLY SIRONA saw strong performance on the back of continued execution of their respective growth and cost initiatives. DENTSPLY, in particular, saw a strong rebound despite the persistent headwinds in the dental market. Within Communication Services, Cable One remains the lone contributor. Their strategy to shift towards high-speed data customers and away from video subscribers has continued to deliver strong growth in margins and free cash flow. Management continues to target the longer-term increase in broadband penetration, along with the completion of a facility upgrade, to further grow their free cash flow. KLA Corp. remains committed to their long-term operating model as their recent investor day highlighted the potential for their semiconductor process control segment to outgrow an already healthy 6 percent growing end market. This should further enhance their superior free cash flow and margin profile founded on product leadership and services offering. CMS Energy rallied as investors looked for stable, steady income as interest rates declined and their consistent execution fit the profile. Their upcoming long-term capital plan provides significant visibility into the company’s ability to consistently deliver above-average returns and earnings growth.
The Fund’s exposure to Energy was the most notable headwind, as the sector experienced significant declines during the period. Falling commodity prices, as expectations for global crude oil demand growth moderated, pressured a number of stocks within the oil patch including EOG Resources and Diamondback Energy. While many companies’ execution remained strong, the 25 percent plus decline in crude prices proved challenging to overcome, however, both continue to focus on generating improved returns over absolute growth and are well-positioned in the lower crude price environment. Similarly, Financials saw less favorable selection and faced broad macroeconomic pressures. The decline in interest rates weighed heavily on banks given their net interest margin or spread between their cost of deposits and what they earn on loans. TCF Financial closed their acquisition of Chemical Financial and continues to work through the integration with potentially meaningful cost savings coming in the next several quarters. Western Alliance posted strong fundamentals, given the backdrop, and management reiterated their ability to adjust their operations to respond to the current environment. PerkinElmer declined as growth slowed within their industrial segment, particularly in China. Management noted that they faced some headwinds as customers switched to domestic manufacturers in China, even as demand moderated in the food safety testing arena.
The Westwood team remains focused on seeking high-quality companies trading at a discount to intrinsic value. In the face of growing concerns over global growth, particularly here in the U.S., the market has seen a distinct pivot towards higher-quality franchises with strong balance sheets and cash generation. Concurrently, the fall in interest rates as investors seek
10
out stability and income along with the Federal Reserve’s pivot towards cutting rates has helped hold equities near their recent highs. The Fed began the year expecting to hike rates while reducing their balance sheet; now, the Fed expects to grow its balance sheet modestly while lowering rates. Fiscal policies, particularly the tax cuts, have seen some of their positive effects offset by the ongoing trade dispute with China. These uncertainties have weighed heavily on business confidence, with some spillover beginning to manifest in the consumer arena and limited the incentive for companies to invest in capital expenditures. Returns amongst those businesses better positioned to weather volatility and those who can’t have widened as of late. In total, the overall impact to the investing landscape should provide additional opportunities to active managers as dispersion of returns increases and correlations between stocks decrease. We continue to leverage our intensive research-driven process to identify securities with company-specific opportunities and visible earnings growth. As has always been our practice, we look to invest in companies with conservative balance sheets, robust free cash flow generation, and high returns as we believe those characteristics among others help provide attractive risk-adjusted returns for the portfolio. Given the above-average market returns over the past few years, we are mindful of the potential for downside risk and are focusing on opportunities which we feel have measurable and limited potential for loss should volatility rise.
We thank you for your continued confidence in the Westwood process and investment teams and we look forward to serving your investment needs through the years ahead.
Westwood Management Corporation
11
September 30, 2019
Dear Timothy PlanLarge/Mid-Cap Value Fund Shareholder:
On May 1, 2019, Timothy Plan added two new Exchange Traded Funds to our diversified product line: Timothy PlanLarge-Cap Core (TPLC) and Timothy Plan High Dividend Stock (TPHD). These are both smart beta index funds traded on the New York Stock Exchange. Since both of these fit nicely into the investment objective of ourLarge/Mid-Cap Value Fund, we incorporated them into the holdings of this fund so that:
| | • | | 10% of the fund is invested in TPLC |
| | • | | 10% of the fund is invested in TPHD |
| | • | | And 80% of the fund continues to be actively managed by our long-timesub-advisor, Westwood Capital Management. |
In addition to greatly increasing the diversification of the holdings in this fund, we believe this addition should have the positive effect of lowering our expense ratio over both the near and longer term.
ETFs are passively managed investment vehicles, with Timothy ETFs being reflections of biblically responsible investment (BRI) indices that were developed specifically to accommodate the BRI space. As stated above, the ETFs were not incorporated into the portfolio until May, following the 2018sell-off, and although the market was choppy, the ETFs were both minor contributors to the Fund’s positive return of 2.54% for the fiscal year. We suggest you look to Westwood’sSub-Advisor’s letter for the Fund for more information and future market outlook.
As you know, no one can guarantee future performance. However, the one thing that I can assure you of is every one of oursub-advisors is doing their very best and our team here at Timothy is working very hard to provide you an investment in which you can feel comfortable.
Sincerely,
Arthur D. Ally
President
12
Letter from the Manager
September 30, 2019
Timothy Plan Fixed Income Fund
The fiscal year ended September 30, 2019 saw a decline in yields as the Federal Reserve (Fed) began cutting rates due to U.S.-China Trade issues and signs of slowing economic growth. The Timothy Plan Fixed Income Fund invests in the broad U.S. investment grade bond market benchmarked to the Bloomberg Barclays Aggregate index which began the last 12 months with a 3.45% yield and ended at 2.11%.
The U.S. Treasury (UST)10-year fell after starting the fiscal period at 3.06%, peaking at 3.24% in November, and ending at 1.67%. By comparison, the2-year rate declined slightly less starting at 2.82% and ending the last 12 months at 1.63% or 1.19% lower. The2- and10-year UST yield curve inverted during the12-month period with the narrowest differential reaching-4 basis points; 1.42% versus 1.46%, respectively. The inversion reversed and maintained a difference of +5 basis points by the end of September 30, 2019. The2- and10-year inversion is the mostoft-cited harbinger of an economic slowdown since it has preceded the last eleven U.S. recessions. Undoubtedly, U.S. economic growth has slowed as GDP fell to a 2.3% year-over-year rate from 3.2%12-months prior. Consequently, the Fed reversed its hawkish stance in 2019 and by fiscal year end had cut interest rates twice.
Investment Grade (IG) Credit spreads started the last 12 months at 143 basis points and narrowed to 109 by the end of September 2019. The narrowing was a result of supply/demand dynamics that included a year-over-year decline in gross supply through the first half of 2019. In addition, foreign buying of IG Credit remerged due to anemic yields in Europe and developed Asia. The Mortgage Backed Securities (MBS) sector struggled during the period as lower UST yields sparked a wave of mortgage refinancing.
The Timothy Fixed Income Fund A shares returned 7.76% over the12-months ended September 30, 2019 which was below the Bloomberg Barclays Aggregate index at 10.30%. The overweight to Utilities added value as the sector performed better than all other major sectors and the overall index. Underweight to the Financial sector and security selection in Technology also added to results. Detracting from results was our security selection in Industrials as holdings lagged their counterparts in the sector. The portfolio’s MBS holdings generated returns below their counterparts in the index which also hurt performance. The portfolio is positioned with less interest rate risk than the market, an over-weight in corporate bonds and GNMA MBS for yield. We remain focused on generating income consistent with a prudent level of risk.
BARROW, HANLEY, MEWHINNEY & STRAUSS
13
Letter from the Manager
September 30, 2019
Timothy Plan High Yield Bond Fund
The fiscal year ended September 30, 2019 saw a decline in High Yield rates as investor’s continued to search for yield and income. The Timothy Plan High Yield Bond Fund invests primarily in BB and B rated High Yield (HY) bonds with a benchmark of the Bloomberg Barclays BA/B HY* index which began the last 12 months yielding 5.68% and ended at 4.77%. Over the period, the HY market posted a return of 8.31% and trailed investment grade credit bonds. Performance of the index was led by higher quality Ba rated credits.
The primary influence on performance has been favorable technicals, particularly low yields in overseas markets and low default rates. Low yields overseas make the U.S. more attractive, on a relative basis, and has resulted in the demand for higher yielding securities. During the first nine months of 2019, U.S. HY mutual funds received net inflows of $15.5B and Exchange Traded Funds also had positive flows. On a trailing1-year basis, the HY default rate remained near historic lows at 1.62%.
The Timothy Plan High Yield Bond Fund A shares generated a total return of 8.50% over the 12 months ended September 30, 2019 while the Bloomberg Barclays Ba/B HY* index returned 8.31%. Security selection in Energy, Capital Goods and Basic Industries benefited performance. Overweight to Utilities also helped performance as the sector generated the highest nominal return of any other major sector in the index. Detracting from performance was our security selection in Electric issuers as our holdings lagged their counterparts in the index. The portfolio remains focused on generating a higher level of carry income consistent with a reasonable level of risk.
BARROW, HANLEY, MEWHINNEY & STRAUSS
*Bloomberg Barclays US High Yield Ba/B 3% Issuer Cap Index
14
Letter from the Manager
September 30, 2019
Timothy Plan Defensive Strategies Fund – TIPS
Over the past 12 months, ended September 30, 2019, economic momentum slowed as GDP growth fell and inflation remained subdued. The Timothy Defensive Strategies Fund has an allocation of U.S. Treasury Inflation Protected Securities (TIPS) designed to help protect assets from higher rates of inflation.
Investors’ future inflation expectations reached a high in late 2018 but subsequently fell during the12- month period. We measure investors’ inflation expectations as the difference between the U.S. Treasury 10 year and the U.S. TIPS 10 year. This “breakeven rate” of inflation is what would be required to make these two securities have the same yield. The “breakeven rate” of inflation rose to a high of 2.17% in October 2018 and eventually declined to a low of 1.51% by the end of September 2019. TIPS securities generated a return of 7.13%, as reported by Bloomberg Barclays, for the 12 months ended September 30th.
The TIPS allocation we manage held 5 to 10% in investment grade corporate bonds for their higher nominal yield. Inflation has remained relatively subdued but going forward the potential of higher inflation exists as central banks have reengaged in monetary stimulus and the unemployment rate remains low which could potentially trigger higher wages. The primary goal of the TIPS allocation continues to be protection from rising inflation rates.
BARROW, HANLEY, MEWHINNEY & STRAUSS
15
| | |
 | | 2005 Market St. |
| | Philadelphia, PA 19103-7094 |
The Timothy Plan Defensive Strategies Fund
Real Estate Sleeve (the “Portfolio”)
Annual Manager Letter: 12 months ended September 30, 2019
During the last twelve months stock and bond volatility significantly increased. This was highlighted in December, when the Federal Reserve appeared to make a policy mistake raising rates while credit spreads widened and inflation expectations fell. The Federal Reserve, which had been on a steady path of continual interest rate increases, suddenly reversed course and has now cut the Federal Funds rate three times in the last nine months. Global growth continues to slow, and many central banks, including the U.S. are searching for a way to increase growth and inflation expectations. The US continues to be the strongest market globally, despite its slowing economy. Europe continues to struggle from the continual delay in Brexit, as well poor demographics. The Emerging markets have had a difficult year due to slowing growth and protests in Hong Kong.
REITs outperformed significantly rallying over 19% during this period. During times of uncertainty, REITs can perform quite well as investors search for safety, which many REITs offer matching long-term income with long term debt. During much of the last year, the yield curve flattened and then inverted. Often this can signal a slowdown in the economy. While growth has slowed, we have yet to see evidence of a recession, but it certainly bears watching given the length of the recovery. September proved to be a very interesting month as value outperformed growth significantly for the first time in a few years. What was interesting is this occurred during a period when the yield curve began to steepen, which could be signaling a potential return to global growth in 2020. Should this occur, we would expect the more discounted real estate names to perform quite well. While certainly not as discounted as they were a year ago, we still believe the REITs can perform well in the low growth, low yield world.
For the twelve months ended September 30, 2019, the Timothy Plan Defensive Fund Real Estate Sleeve generated a gross return of 19.79% versus the FTSE NAREIT Equity REITs Index return of 18.48%. Strong allocation drove performance while stock selection was a negative. Stock selection was primarily attributable to one security, Brookdale Senior Living. Data Centers, Towers, Apartments, and Manufactured Homes lead the returns. All have strong consistent growth. Data Centers and Towers benefit from the increased use of data connectivity and the deployment of 5G. Apartments and Manufactured Homes both benefit from the desire for lower cost housing and flexibility. During times of uncertainty investors were willing to pay a higher multiple for stocks that offer consistent growth, which greatly benefited these sectors which saw significant multiple expansion over the last twelve months. In addition, our underweight to Lodging was a significant contributor. Lodging continues to suffer from supply and price transparency. In our view, there is too much supply being delivered in many markets across the country making a difficult environment even more challenging, as such we remain underweight. The biggest detractors were in Office and Healthcare. In Office, our exposure to some NYC office companies hurt performance. While the stocks remain discounted the NYC office market has become more difficult over the last year as the city has changed zoning restrictions in certain areas, leading to increased supply risk. As such, despite the discounted valuations we have further
16
reduced our exposure due to limited catalysts to unlock the embedded value. In the Healthcare sector, Brookdale Senior Living, lagged the index. Brookdale, a senior living operator experienced a softer 2019 than we had expected due to some supply and the stock lagged. The industry now appears to have bottomed as supply has started to significantly fall. Demand has also increased, and we are hopeful the combination of lower supply and strong demand will significantly improve the company’s valuation.
Real estate stocks continue to deliver on their merits of higher than average yield and good dividend growth. Importantly, some sectors should see trough fundamentals in 2019 which will set up for a stronger 2020 and 2021. We believe retail, while still a challenging market should see less bankruptcies and thus FFO growth should improve as the year progresses. Senior housing appears to finally be bottoming and could set up for very strong growth the next few years. The sectors that have been the most challenged, with the exception of malls, appear to be turning operationally. As these stocks are discounted there may be some interesting investment opportunities.
17
Important Information:
Investing involves risk, including possible loss of principal.
The FTSE NAREIT Equity REITs Index measures the performance of all publicly traded equity real estate investment trusts (REITs) traded on U.S. exchanges, excluding timber and infrastructure REITs.
All third-party trademarks are the property of their respective owners.
Index performance returns do not reflect any management fees, transaction costs or expenses. Indices are unmanaged and one cannot invest directly in an index.
The views expressed represent the investment team’s assessment of the account and market environment as of September 30, 2019 and should not be considered a recommendation to buy, hold, or sell any security, and should not be relied on as research or investment advice. Holdings are as of September 30, 2019 and subject to change.
Past performance is no guarantee of future results.
Unless otherwise noted, the source of statistical information used in this document was FactSet.
Because this Strategy expects to hold a concentrated fund of a limited number of securities, the fund’s risk is increased because each investment has a greater effect on the Strategy’s overall performance.
REIT investments are subject to many of the risks associated with direct real estate ownership, including changes in economic conditions, credit risk, and interest rate fluctuations.
International investments entail risks not ordinarily associated with U.S. investments including fluctuation in currency values, differences in accounting principles, or economic or political instability in other nations.
Additional information regarding the firm’s policies and procedures for calculating and reporting performance results is available upon request. A complete list and description of composites managed is available upon request. The above information is not intended and should not be construed as a presentation of information regarding any mutual fund.
Macquarie Investment Management (MIM) is the marketing name for the following registered investment advisers: Macquarie Investment Management Business Trust, Macquarie Funds Management Hong Kong Limited, Macquarie Investment Management Austria Kapitalanlage AG, Macquarie Investment Management Global Limited, Macquarie Investment Management Europe Limited, Macquarie Capital Investment Management LLC and Macquarie Investment Management Europe S.A.
Other than Macquarie Bank Limited (MBL), none of the entities noted are authorised deposit-taking institutions for the purposes of the Banking Act 1959 (Commonwealth of Australia). The obligations of these entities do not represent deposits or other liabilities of MBL. MBL does not guarantee or otherwise provide assurance in respect of the obligations of these entities, unless noted otherwise.
© 2019 Macquarie Group Limited
18

Annual Letter from the Manager
We are pleased to provide you with our annual report for the Timothy Plan Defensive Strategies Fund Commodity Sleeve (the Portfolio) for the twelve months ending September 30, 2019. The CoreCommodity sleeve of the Timothy Defensive Fund fell (17.73%) on a gross basis. Commodities broadly fell over these twelve months with the Bloomberg Commodity Total Return Index falling (6.57%). The Portfolio had positive contributions to performance from precious metals, although energy, industrial metals, and agriculture detracted from performance.
Metals & Mining
Industrial metal commodity futures were modestly down for the period with the Bloomberg Industrial Metals Subindex Total Return falling (2.1%). The best performing base metal was Nickel, rising more than 37% over the period, as Indonesia implemented an export ban on nickel ore earlier than expected. Aluminum was the worst performing base metal, falling(-17%) for the year. The Portfolio’s industrial metal holdings performed worse than the commodity futures, falling (12%) for the period. The Portfolio’s largest industrial metal holdings as of September 30th were Rio Tinto (RIO US), Teck Resources (TECK/B CN), and BHP Group (BHP US).
Precious metal futures finished a strong year up, with the Bloomberg Precious Metals Subindex Total Return rising 20.5%. Timothy’s precious metal miners outperformed, rallying 36% over the same time period. The Portfolio’s largest precious metal holdings as of September 30th were Newmont Goldcorp (NEM US), Iamgold (IAG US), and Franco-Nevada Corp (FNV US).
Energy
Energy was the worst performing sector for the prior year, with the Bloomberg Energy Subindex Total Return falling (21.6%). The Portfolio’s energy holdings were also the worst performing sector, falling (37%) for the period. Crude oil prices fell approximately (26%) in both Brent and WTI futures. The Portfolio’s largest energy holdings as of September 30th were Suncor Energy (SU CN), ConocoPhillips (COP US), and EOG Resources (EOG US).
Agriculture
Over the past year agricultural commodities, as proxied by the Bloomberg Commodity Agriculture and Livestock Subindex Total Return, fell nearly (5.0%). Over the same period the Portfolio’s agricultural holdings were roughly flat, rising almost 1%, providing additional relative outperformance. Of primary agricultural futures, Kansas City wheat fell the most in the preceding twelve months, declining (18.8%). Over the same period, corn prices, rose nearly 9%. The Portfolio’s largest agriculture holdings as of September 30th were Deere & Company (DE US), American Water Works Co (AWK US), and Kubota Corp (6326 JP).
Market Outlook
The Timothy Plan Defensive Strategy Fund Commodity Sleeve currently utilizes a diversified portfolio of natural resource equities that is intended to capture commodity price movements. We believe that many global commodities remain attractively priced relative to their marginal production costs. To the extent commodities rally as prices normalize to historic average premiums above these levels, we expect the Portfolio to perform positively.
|
| CoreCommodity Management, LLC 680 Washington Boulevard Stamford, CT 06901 Tel: 203.708.6500 www.CoreCommodityllc.com |
19
September 30, 2019
Dear Shareholder,
The Defensive Strategies Fund was designed and is managed to do what its name implies, hedge against a possible scenario of hyper-inflation which could result from our Congress’s proven unwillingness to address our core problems of too much spending and too much debt. The Fund was also designed withbuilt-in flexibility that allows it to be adjusted to address a possible risk of extreme deflation, with the ability to convert the inflation sensitive assets to cash and fixed income securities during a deflationary environment, and to be adjusted to a more normal, traditional investment strategy.
The Fund’s portfolio is comprised of four inflation sensitive investment sleeves: commodities (commodity company stocks and ETF’s), real estate (in the form of REITs), precious metals (primarily gold bullion), and TIPs (Treasury Inflation Protected Bonds), with the balance in cash. Timothy Partners, Ltd. (the “Advisor”) is responsible for setting the percentages of the Fund that will be allocated to each investment sleeve. Differentsub-advisors manage the holdings in each sleeve. Even with continued low inflation over the past year, the Fund experienced a respectable 4.92% total return for the fiscal year ended September 30, 2019. For a more complete description of the elements that impacted Fund performance and the outlook for the future, please read the varioussub-advisors’ reports in the pages that follow.
I would like to point out that, since there does not exist an appropriate benchmark index with which to compare our performance, we have created a blended index comprised of roughly 33% each of U.S. Government TIPs, FTSE NAREIT Equity Index and Dow Jones UBS Commodity Index. We believe the blend offers a fairly accurate reflection and comparison of the composition of the Fund. For the fiscal year ended September 30, 2019, the blended index had a total return of 0.22%.
While no one can predict future events, I remain confident that oursub-advisors (i.e. money management firms that manage the various sleeves of this Fund) are, in our opinion, among the best in the industry, and they each continue to honor our overall policy that they manage their respective Fund sleeve both in accordance with our screening restrictions and with a conservative bias. As I stated in last year’s report, although we will do our very best to be successful, we cannot guarantee results in any of these scenarios.
Finally, I would once again like to thank you for your moral convictions that led you to become part of the Timothy Plan Family.
Yours in Christ,
Arthur D. Ally
Fund Advisor
20
September 30, 2019
Dear Timothy Plan Strategic Growth Fund Shareholder:
Asset allocation has normally been, and we believe it continues to be, a very prudent approach to investing. As a review, your Timothy Plan Strategic Growth investment is a compilation of many of Timothy’s underlying funds (including two of our new ETF’s) and, as such, your performance is directly related to the performance of those underlying funds. Although the fourth quarter of 2018 experienced a fairly substantial decline, the underlying funds recovered nicely, allowing the Strategic Growth Fund to post only a slightly negative 0.26%end-of-fiscal year return. Throughout the down-turn, we maintained a constant allocation model that we believe provided for less volatile fluctuations than might otherwise have been expected. In 2019 and into 2020, we have a fairly positive outlook for the economy. As a result, we have adjusted our positions in the underlying funds to the allocations shown below:
| | | | |
• Large-Cap Core ETF | | | 17.00 | % |
• High Dividend Stock ETF | | | 8.50 | % |
• Small-Cap Value Fund | | | 4.00 | % |
• Aggressive Growth Fund | | | 3.00 | % |
• International Fund | | | 19.50 | % |
• High-Yield Bond Fund | | | 5.50 | % |
• Defensive Strategies Fund | | | 8.00 | % |
• Fixed Income Fund | | | 19.50 | % |
• Israel Common Values Fund | | | 5.00 | % |
• Emerging Markets Fund | | | 7.00 | % |
• Cash | | | 3.00 | % |
We understand that the fourth quarter market decline in 2018, followed by a very positive first three quarters of 2019, may be unsettling for some investors. Please understand that our #1 concern was (and continues to be) preservation of principal and, even though we want to participate in the markets’ strong upward trend, we will attempt to adjust the allocation above to changing market conditions.
As you know, no one can guarantee future performance. However, the one thing that I can assure you of is every one of thesub-advisors of the under-lying funds is doing their very best, and our team here at Timothy is working very hard to provide you an investment in which you can feel comfortable. For a commentary on each fund, please see the managers’ comments in this report.
Sincerely,
Arthur D. Ally
President
21
September 30, 2019
Dear Timothy Plan Conservative Growth Fund Shareholder:
Asset allocation has normally been, and we believe it continues to be, a very prudent approach to investing. As a review, your Timothy Plan Conservative Growth investment is a compilation of many of Timothy’s underlying funds (including two of our new ETF’s) and, as such, your performance is directly related to the performance of those underlying funds. Although the fourth quarter of 2018 experienced a fairly substantial decline, the underlying funds recovered nicely, allowing the Conservative Growth Fund to post anend-of-fiscal year return positive 1.6% return. Throughout the down-turn, we maintained a conservative allocation model that we believe provided for less volatile fluctuations than might otherwise have been expected. In 2019 and into 2020, we maintain a fairly positive outlook for the economy. As a result, we have adjusted our positions in the underlying funds to the allocations shown below:
| | | | | | | | |
| | • Large-Cap Core ETF | | | 14.00 % | | | |
| | • High Dividend Stock ETF | | | 6.00 % | | | |
| | • Small-Cap Value Fund | | | 3.00 % | | | |
| | • Aggressive Growth Fund | | | 2.00 % | | | |
| | • International Fund | | | 10.50 % | | | |
| | • High-Yield Bond Fund | | | 5.50 % | | | |
| | • Defensive Strategies Fund | | | 7.00 % | | | |
| | • Fixed Income Fund | | | 39.50 % | | | |
| | • Israel Common Values Fund | | | 3.50 % | | | |
| | • Emerging Markets Fund | | | 4.50 % | | | |
| | • Cash | | | 5.00 % | | | |
Even though the Portfolio has been designed to be conservatively allocated, we understand that the fourth quarter market decline in 2018 followed by a very positive first three quarters of 2019 may be unsettling for some investors. Please understand that our #1 concern was (and continues to be) preservation of principal and, even though we want to participate in the markets’ strong upward trend, we will attempt to adjust our allocation above to changing market conditions.
As you know, no one can guarantee future performance. However, the one thing that I can assure you of is every one of oursub-advisors is doing their very best and our team here at Timothy is working very hard to provide you an investment in which you can feel comfortable. For a commentary on each fund, please see the managers’ comments in this report.
Sincerely,
Arthur D. Ally
President
22
The Timothy Plan Israel Common Values Fund
Letter from The Manager - September 30, 2019
The Timothy Plan Israel Common Values Fund had a really good year over the last twelve months both in absolute terms and relative to Israel’sTA-125 index. Strong stock performance in the Consumer Discretionary, Consumer Staples, Real Estate, and Technology sectors helped absolute performance. Cybersecurity company CyberArk Software (Technology) and Israel’s leading air conditioner systems company Tadiran Holdings (Consumer Discretionary) are a couple of examples of great performers over the last twelve months. Positive sector allocation helped relative performance to the index with underweights to the Health Care, Communications Services, and Materials sectors helping as those three sectors were the worst performing over the last twelve months. An overweight to the Technology sector also aided performance as Tech shares performed well during this period. Stock selection was positive in Health Care and Consumer Discretionary while negative in the Technology sector. The Fund was also helped by the continued appetite for M&A in Israel with foreign companies looking for ways to acquire the entrepreneurial and innovative essence in the country. Among Fund holdings acquired by other companies during the year were Mellanox Technologies (Technology) and Pointer Telocation Ltd (Industrials). The main disappointment for the year was not owning enough of a strong Real Estate sector that benefitted from low interest rates, robust economic growth, and continued immigration into the country leading to strong demand.
The Israeli economy remains on a solid footing with strong consumption on the back of low unemployment levels and strong wage growth. Economists expect the country’s economic growth to remain well underpinned around the 3% level for the foreseeable future. Solid economic growth has led to robust earnings growth supporting equity prices over the last twelve months. The Bank of Israel began to tighten monetary policy in late 2018 but reversed course during 2019 as global central banks shifted to more dovish policies and as inflation disappointed and the shekel appreciated. We believe the Bank of Israel will remain quite accommodative in its monetary policy in the coming year. There remains uncertainty as to who will govern the country going forward but the strong economic prospects and estimates of continued earnings growth help keep investor’s minds on the longer term and not on short term political disruptions.
The Fund continues to invest alongside the innovate spirit of Israeli companies providing ample attractive investment opportunities. A strong domestic economy will continue to support corporate earnings growth over the medium term. We remain committed to a consistent investment approach dedicated to finding long-term investments for shareholders and thank you for your continued investment in the Fund.
Eagle Global Advisors, LLC
23
Letter from the Manager
The Timothy Plan Emerging Markets Equity Fund
September 30, 2019
Brandes Investment Partners is pleased to manage the Emerging Markets Fund on behalf of the Timothy Plan. The Timothy Plan Emerging Markets Fund returned 4.3%, outperforming the MSCI Emerging Markets Index, which declined 2.0% for the fiscal year ended September 30, 2019.
Positive Contributors
Holdings in Brazil led performance as the election of right-wing presidential candidate Jair Bolsonaro bolstered the country’s stock market. Bolsonaro, a departure from the left-wing Workers’ Party that had dominated Brazilian politics since 2002, has vowed to deal with Brazil’s fiscal woes and reduce structural impediments to economic growth. Noteworthy contributors included oil & gas firms Petrobras and Petrobras Distribuidora, and electric utility Companhia Paranaense de Energia (Copel). Higher education services provider Estacio Participacoes saw enrollment increase across multiple segments while enrollment forin-person courses remained stable even as tuition prices for that segment climbed. Another notable contributor among our Brazilian holdings was health care services provider Hapvida Participacoes e Investimentos. The market responded positively to Hapvida’s agreement early in the year to buy a local competitor in a bid to expand in Sao Paulo.
Many of the Fund’s holdings in Russia performed well, led by food retailer X5 Retail Group and Sberbank.
X5’s shares rose on margin improvement, helped by continued food inflation in Russia. Holdings in real estate and communication services drove performance. Mexico-based Fideicomiso PLA Administradora Industrial (known as Terrafina), Fibra Uno and Fibra Macquarie Mexico lifted returns as these income-oriented securities benefited from the U.S. Federal Reserve and Bank of Mexico reducing interest rates.
Indonesian holdings Bank Rakyat and one of our communication services holdings, XL Axiata, added value. For XL Axiata, investors welcomed the company’s encouraging earnings growth and favorable outlook. Finally, select financial holdings also aided performance, namely Banco Latinoamericano of Panama.
Performance Detractors
Holdings in Mexico fell amid concerns about possible anti-business policies of newly inaugurated President Andres Manuel Lopez Obrador (Amlo). Late in 2018, Mexico’s currency and bonds declined after Amlo cancelled a $13 billion airport project, igniting worries of a less investment-friendly environment. A subsequent proposal to cap banking fees intensified market concerns. Notable detractors included cement company Cemex, which continued to face a variety of concerns. These include a sharp drop in Mexico’s construction activity this year, fears of a recession in the United States (its biggest market), and a lack of confidence in management’s capital allocation prowess. We believe these issues have been more than accounted for in Cemex’s current share price. Trading at less than book value and a low multiple of forward earnings, the company represents what we see as an attractive value opportunity
Shares of Taiwanese AsusTek Computer declined due to a poor earnings report, driven mainly by greater price competition in the United States and Europe, concerns over the U.S.-China tariff dispute, and margin compression in the component and handset segments. We believe these issues are temporary and cyclical, and more than accounted for in the share price. With the majority of its market value in cash and equity holdings, AsusTek has a solid asset backing to weather its shorter-term challenges, based on our analysis.
Other detractors included India-based electric utility Reliance Infrastructure andBrazil-based regional jet manufacturer Embraer. Embraer has receivedsign-off for its deal with Boeing from most of the required stakeholders, including the Brazilian government and shareholders. The deal is expected to close by the end of 2019, assuming anti-trust regulators approve it. Earlier in the year, Embraer’s shares declined as the company missed revenue and net income forecasts. Nevertheless, our valuation thesis remains positive. We view the deal favorably as it crystalizes the value of Embraer’s commercial segment ahead of any need for regional jet volume recovery, partially mitigating the risks related to the capital expenditure cycle of airlines (Embraer’s customers). The deal also offsets the competitive threat from Airbus/Bombardier and provides a closer relationship with Boeing, which we believe creates an upside potential for both of the company’s remaining segments.
24
Holdings that are domiciled in Argentina or have economic exposure to the country weighed on returns. In August 2019, left-wing populist candidate Alberto Fernandez decisively won Argentina’s primary presidential election over incumbent President Macri, sparking investor concern and a renewed focus on sovereign default risks. For our holding in oil and gas firm YPF, a government-initiated90-day price freeze for key commodities exacerbated negative sentiment. YPF’s management initially estimated a$100-$150 million per month cash flow impact, but lowered it to the $40-$60 million range more recently. We believe that these challenges have been more than factored in YPF’s share price and that the market seems to ascribe minimal value to YPF’s vast shale acreage. We maintained our measured allocation to the company, recognizing the increased risk profile amid the recent developments. Other detractors related to the turmoil in Argentina included Spain-based payment services company Prosegur Cash, which generates the majority of its revenue in Latin America.
Finally, Hong Kong-based retailers Lifestyle International Holdings and Luk Fook Holdings also hurt returns as ongoing demonstrations in Hong Kong hurt sales and tourist spending.
Select Activity
Over the course of the fiscal year, the Emerging Markets Investment Committee initiated several positions for the Fund. Flex Ltd., is one of the world’s largest electronics manufacturing services (EMS) providers, second only to Hon Hai of Taiwan/China. Headquartered in Singapore, Flex provides manufacturing and supply services globally. We have owned Flex several times, and the company has demonstrated the ability to improve its margins to more normalized (higher) levels when it has incurred operational or execution problems that we deemed fixable or that appeared to be more than accounted for in the share price. We feel that is the situation with Flex today, trading at a low multiple of earnings the market seems to be overemphasizing the addressable issues while underappreciating the longer-term positioning of it’s more meaningful businesses.
Keeping in the technology sector, we initiated a new position inmade-to-order chipmaker Taiwan Semiconductor Manufacturing Company (TSMC). TSMC is the world’s dominant semiconductor foundry, controlling slightly more than half of this secularly growing end market. In our view, the company is one of the most attractively valued and sustainable franchises in the global semiconductor industry, and should continue to generate appealing returns on capital and free cash flow going forward.
In addition, we initiated new positions in companies that we know very well as we have owned them in the past, namely Latin American airline Copa Holdings and Austria-domiciled Erste Group Bank, which operates mainly in emerging European countries.
Examples of positions sold include Russian Lukoil and India-based Reliance Infrastructure. A number of recent developments led to a reconsideration of our investment thesis for Reliance Infrastructure and our eventual divestment. Most notably, during the second half of 2018, Reliance sold its Mumbai utility. The utility had been Reliance’s main earnings contributor and was sold to pay down debt. Prior to the sale, our investment case for Reliance Infrastructure was supported by the valuation of its electricity assets. We also anticipated some upside potential from its significant balance of financial assets. However, the disposal of the Mumbai utility meaningfully reduced Reliance’s earnings power and led to a deterioration in the quality of its net asset value (NAV), which now consists primarily of financial holdings and contingent assets. Our loss of confidence in the company, combined with its poor transparency, triggered our decision to exit the position.
Current Positioning
As of September 30, we held our largest country overweights to Brazil and South Korea, while remaining materially underweight to Taiwan, India and China. On a sector basis, our largest overweights were to real estate, consumer discretionary and communication services. Meanwhile, the financial sector continued to represent a significant underweight position, due to our lower exposure to banks in China, Brazil and India. Additionally, we maintained a lower allocation to information technology than did the benchmark.
The valuation discount between value and growth stocks in emerging markets (MSCI EM Value vs. MSCI EM Growth) remains among the highest levels in over 20 years (based onprice-to-forward earnings). While our portfolio is not tilted toward a certain economic outcome (i.e., strong economic growth or a recession), we believe it
25
is well positioned for a value rebound should this valuation dispersion narrow. More than a third of our holdings traded at less than 10x forward earnings at quarter end, while also having strong balance sheets, compelling growth prospects and strong free cash flow.
Thank you for your continued trust.
BRANDES INVESTMENT PARTNERS, L.P.
26
Letter from the Manager
September 30, 2019
Fixed Income Allocation of The Timothy Plan Growth & Income Fund – Inception Date May 14, 2019
The fiscal year ended September 30, 2019 saw a decline in yields as the Federal Reserve (Fed) began cutting rates due to U.S.-China Trade issues and signs of slowing economic growth. The Fixed Income allocation of the Timothy Plan Growth & Income Fund, with an inception date of May 14, 2019, invests in the broad U.S. investment grade bond market benchmarked to the Bloomberg Barclays Aggregate index. At the end of September 30, 2019, the yield on the Fixed Income allocation was 2.20%.
The U.S. Treasury (UST)10-year fell after starting the fiscal period at 3.06%, peaking at 3.24% in November, and ending at 1.67%. By comparison, the2-year rate declined slightly less starting at 2.82% and ending the last 12 months at 1.63% or 1.19% lower. The2- and10-year UST yield curve inverted during the12-month period with the narrowest differential reaching-4 basis points; 1.42% versus 1.46%, respectively. The inversion reversed and maintained a difference of +5 basis points by the end of September 30, 2019. The2- and10-year inversion is the mostoft-cited harbinger of an economic slowdown since it has preceded the last eleven U.S. recessions. Undoubtedly, U.S. economic growth has slowed as GDP fell to a 2.3% year-over-year rate from 3.2%12-months prior. Consequently, the Fed reversed its hawkish stance in 2019 and by fiscal year end had cut interest rates twice.
Investment Grade (IG) Credit spreads started the last 12 months at 143 basis points and narrowed to 109 by the end of September 2019. The narrowing was a result of supply/demand dynamics that included a year-over-year decline in gross supply through the first half of 2019. In addition, foreign buying of IG Credit remerged due to anemic yields in Europe and developed Asia. The Mortgage Backed Securities (MBS) sector struggled during the period as lower UST yields sparked a wave of mortgage refinancing.
Since inception through September 30, 2019, the overweight to Utilities added value as the sector performed better than all other major sectors and the overall index. In addition, security selection in real estate investment trusts (REITS) within Financials also added to results. Detracting from results was our shorter duration positioning in a declining interest rate environment. The portfolio is positioned with less interest rate risk than the market, an over-weight in corporate bonds and GNMA MBS for yield. We remain focused on generating income consistent with a prudent level of risk.
BARROW, HANLEY, MEWHINNEY & STRAUSS
27
September 30, 2019
Dear Timothy Plan Growth and Income Fund Shareholder:
On May 1, 2019, Timothy Plan added two new Exchange Traded Funds to our diversified product line: Timothy PlanLarge-Cap Core (TPLC) and Timothy Plan High Dividend Stock (TPHD). These are both smart beta index funds traded on the New York Stock Exchange. Since TPHD fits nicely into the investment objective of our Growth and Income Fund, we incorporated this particular ETF into the holdings of the fund so that:
| | • | Approximately 60% of the fund is now invested in TPHD |
| | • | While the remaining fixed income portion of the fund is now actively managed by our long-time fixed incomesub-advisor, Barrow Hanley. |
This represents (since May 1st) a complete revamping of the management of this fund as approved by shareholders through a proxy vote in April of this year. It is our belief that this management change will result in both better performance and a reduction of this fund’s expense ratio.
ETFs are passively managed investment vehicles, with Timothy ETFs being reflections of biblically responsible investment (BRI) indices that were developed specifically to accommodate the BRI space. As stated above, the ETFs were not incorporated into the portfolio until May, following the 2018sell-off, and although the market was choppy, the ETF was a positive contributor to the Fund, although the Fund overall had a slightly negative return of-0.10% for the fiscal year. We suggest you look to Barrow Hanley’sSub-Advisor’s letter for the Fund for more information and future market outlook.
As you know, no one can guarantee future performance. However, the one thing that I can assure you of is every one of oursub-advisors is doing their very best and our team here at Timothy is working very hard to provide you an investment in which you can feel comfortable.
Sincerely,
Arthur D. Ally
President
28
Fund Performance - (Unaudited)
September 30, 2019
Aggressive Growth Fund
| | | | | | | | |
| Fund/Index | | 1 Year Total Return | | 5 Year Average Annual Return | | 10 Year Average Annual Return | |
Timothy Aggressive Growth Fund - Class A (With Sales Charge) | | (13.75)% | | 2.54% | | | 9.36% | |
RussellMid-Cap Growth Index | | 5.20% | | 11.12% | | | 14.08% | |
Timothy Aggressive Growth Fund - Class C * | | (10.27)% | | 2.93% | | | 9.15% | |
RussellMid-Cap Growth Index | | 5.20% | | 11.12% | | | 14.08% | |
Timothy Aggressive Growth Fund - Class I | | (8.48)% | | 3.96% | | | 4.83% (a) | |
RussellMid-Cap Growth Index | | 5.20% | | 11.12% | | | 11.53% (a) | |
| | (a) | For the period August 1, 2013 (commencement of investment in accordance with objective) to September 30, 2019. |
| | * | With Maximum Deferred Sales Charge |
Timothy Plan Aggressive Growth Fund vs. RussellMid-Cap Growth Index
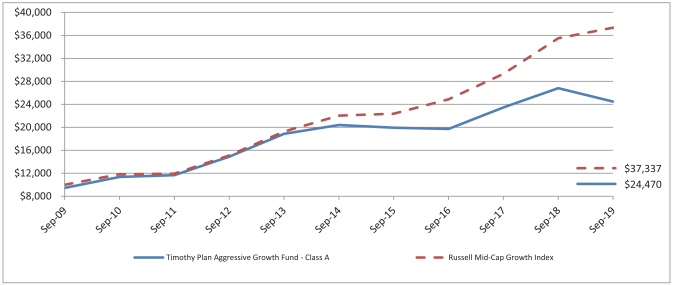
The chart shows the value of a hypothetical initial investment of $10,000 in the Fund’s Class A shares and the RussellMid-Cap Growth Index on September 30, 2009 and held through September 30, 2019. The RussellMid-Cap Growth Index is a widely recognized, unmanaged index of common stock prices. Performance figures include the change in value of the stocks in the index and the reinvestment of dividends. The index return does not reflect expenses, which have been deducted from the Fund’s return. The returns shown do not reflect deduction of taxes that a shareholder would pay on Fund distributions or the redemption of Fund shares. THE FUND’S RETURN REPRESENTS PAST PERFORMANCE AND IS NOT PREDICTIVE OF FUTURE RESULTS.
29
Fund Performance - (Unaudited)
September 30, 2019
International Fund
| | | | | | | | |
| Fund/Index | | 1 Year Total Return | | 5 Year Average Annual Return | | 10 Year Average Annual Return | |
Timothy International Fund - Class A (With Sales Charge) | | (10.77)% | | 0.41% | | | 2.72% | |
MSCI EAFE Index | | (4.27)% | | 0.46% | | | 1.98% | |
Timothy International Fund - Class C * | | (7.25)% | | 0.81% | | | 2.53% | |
MSCI EAFE Index | | (4.27)% | | 0.46% | | | 1.98% | |
Timothy International Fund - Class I | | (5.33)% | | 1.81% | | | 2.62% (a) | |
MSCI EAFE Index | | (4.27)% | | 0.46% | | | 1.33% (a) | |
| | (a) | For the period August 1, 2013 (commencement of investment in accordance with objective) to September 30, 2019. |
| | * | With Maximum Deferred Sales Charge |
Timothy Plan International Fund vs. MSCI EAFE Index
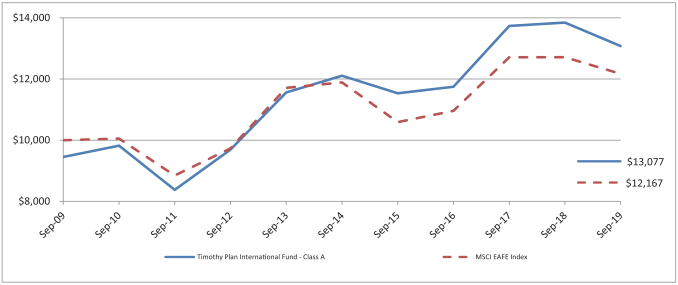
The chart shows the value of a hypothetical initial investment of $10,000 in the Fund’s Class A shares and the MSCI EAFE Index on September 30, 2009 and held through September 30, 2019. The MSCI EAFE Index is a widely recognized unmanaged index of equity prices and is representative of equity market performance of developed countries, excluding the U.S. and Canada. Performance figures include the change in value of the stocks in the index and the reinvestment of dividends. The index return does not reflect expenses, which have been deducted from the Fund’s return. The returns shown do not reflect deduction of taxes that a shareholder would pay on Fund distributions or the redemption of Fund shares. THE FUND’S RETURN REPRESENTS PAST PERFORMANCE AND IS NOT PREDICTIVE OF FUTURE RESULTS.
30
Fund Performance - (Unaudited)
September 30, 2019
Large/Mid Cap Growth Fund
| | | | | | | | |
| Fund/Index | | 1 Year Total Return | | 5 Year Average Annual Return | | 10 Year Average Annual Return | |
Timothy Large/Mid Cap Growth Fund - Class A (With Sales Charge) | | (6.86)% | | 5.16% | | | 9.82% | |
Russell 1000 Growth Index | | 3.71% | | 13.39% | | | 14.94% | |
Timothy Large/Mid Cap Growth Fund - Class C * | | (3.15)% | | 5.55% | | | 9.62% | |
Russell 1000 Growth Index | | 3.71% | | 13.39% | | | 14.94% | |
Timothy Large/Mid Cap Growth Fund - Class I | | (1.24)% | | 6.60% | | | 7.81% (a) | |
Russell 1000 Growth Index | | 3.71% | | 13.39% | | | 14.15% (a) | |
| | (a) | For the period August 1, 2013 (commencement of investment in accordance with objective) to September 30, 2019. |
| | * | With Maximum Deferred Sales Charge |
Timothy Plan Large/Mid Cap Growth Fund vs. Russell 1000 Growth Index
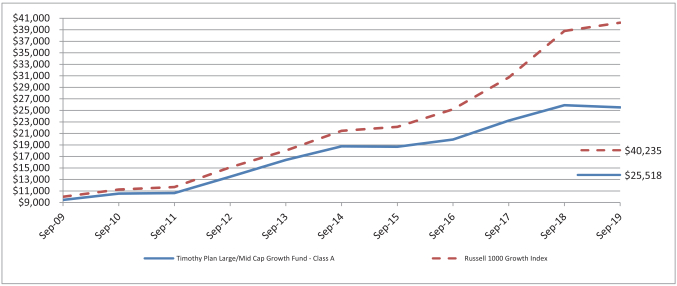
The chart shows the value of a hypothetical initial investment of $10,000 in the Fund’s Class A shares and the Russell 1000 Growth Index on September 30, 2009 and held through September 30, 2019. The Russell 1000 Growth Index is a widely recognized, unmanaged index of common stock prices. Performance figures include the change in value of the stocks in the index and the reinvestment of dividends. The index return does not reflect expenses, which have been deducted from the Fund’s return. The returns shown do not reflect deduction of taxes that a shareholder would pay on Fund distributions or the redemption of Fund shares. THE FUND’S RETURN REPRESENTS PAST PERFORMANCE AND IS NOT PREDICTIVE OF FUTURE RESULTS.
31
Fund Performance - (Unaudited)
September 30, 2019
Small Cap Value Fund
| | | | | | | | |
| Fund/Index | | 1 Year Total Return | | 5 Year Average Annual Return | | 10 Year Average Annual Return | |
Timothy Small Cap Value Fund - Class A (With Sales Charge) | | (9.05)% | | 6.55% | | | 11.33% | |
Russell 2000 Index | | (8.89)% | | 8.19% | | | 11.19% | |
Timothy Small Cap Value Fund - Class C * | | (5.27)% | | 6.95% | | | 11.12% | |
Russell 2000 Index | | (8.89)% | | 8.19% | | | 11.19% | |
Timothy Small Cap Value Fund - Class I | | (3.51)% | | 8.04% | | | 8.29% (a) | |
Russell 2000 Index | | (8.89)% | | 8.19% | | | 7.53% (a) | |
| | (a) | For the period August 1, 2013 (commencement of investment in accordance with objective) to September 30, 2019. |
| | * | With Maximum Deferred Sales Charge |
Timothy Plan Small Cap Value Fund vs. Russell 2000 Index
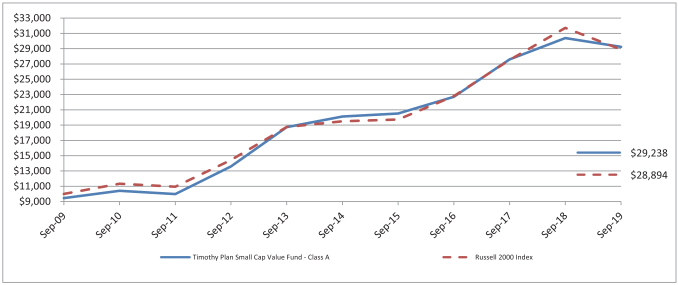
The chart shows the value of a hypothetical initial investment of $10,000 in the Fund’s Class A shares and the Russell 2000 Index on September 30, 2009 and held through September 30, 2019. The Russell 2000 Index is a widely recognized, unmanaged index of common stock prices. Performance figures include the change in value of the stocks in the index and the reinvestment of dividends. The index return does not reflect expenses, which have been deducted from the Fund’s return. The returns shown do not reflect deduction of taxes that a shareholder would pay on Fund distributions or the redemption of Fund shares. THE FUND’S RETURN REPRESENTS PAST PERFORMANCE AND IS NOT PREDICTIVE OF FUTURE RESULTS.
32
Fund Performance - (Unaudited)
September 30, 2019
Large/Mid Cap Value Fund
| | | | | | | | |
| Fund/Index | | 1 Year Total Return | | 5 Year Average Annual Return | | 10 Year Average Annual Return | |
Timothy Large/Mid Cap Value Fund - Class A (With Sales Charge) | | (3.12)% | | 6.12% | | | 10.35% | |
S&P 500 Index | | 4.25% | | 10.84% | | | 13.24% | |
Timothy Large/Mid Cap Value Fund - Class C * | | 0.84% | | 6.53% | | | 10.15% | |
S&P 500 Index | | 4.25% | | 10.84% | | | 13.24% | |
Timothy Large/Mid Cap Value Fund - Class I | | 2.78% | | 9.31% | | | 8.70% (a) | |
S&P 500 Index | | 4.25% | | 10.84% | | | 11.73% (a) | |
| | (a) | For the period August 1, 2013 (commencement of investment in accordance with objective) to September 30, 2019. |
| | * | With Maximum Deferred Sales Charge |
Timothy Plan Large/Mid Cap Value Fund vs. S&P 500 Index
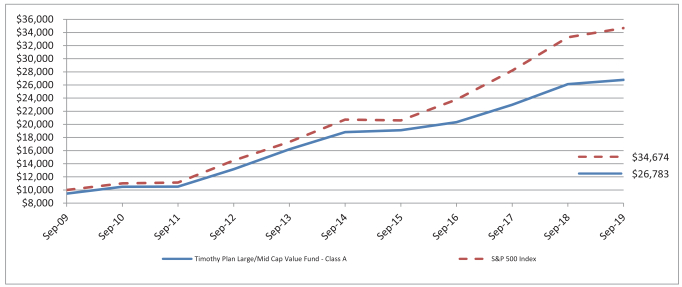
The chart shows the value of a hypothetical initial investment of $10,000 in the Fund’s Class A shares and the S&P 500 Index on September 30, 2009 and held through September 30, 2019. The S&P 500 Index is a widely recognized, unmanaged index of common stock prices. Performance figures include the change in value of the stocks in the index and the reinvestment of dividends. The index return does not reflect expenses, which have been deducted from the Fund’s return. The returns shown do not reflect deduction of taxes that a shareholder would pay on Fund distributions or the redemption of Fund shares. THE FUND’S RETURN REPRESENTS PAST PERFORMANCE AND IS NOT PREDICTIVE OF FUTURE RESULTS.
33
Fund Performance - (Unaudited)
September 30, 2019
Fixed Income Fund
| | | | | | | | |
| Fund/Index | | 1 Year Total Return | | 5 Year Average Annual Return | | 10 Year Average Annual Return | |
Timothy Fixed Income Fund - Class A (With Sales Charge) | | 2.94% | | 0.85% | | | 1.79% | |
Barclays Capital U.S. Aggregate Bond Index | | 10.30% | | 3.38% | | | 3.75% | |
Timothy Fixed Income Fund - Class C * | | 6.06% | | 1.03% | | | 1.62% | |
Barclays Capital U.S. Aggregate Bond Index | | 10.30% | | 3.38% | | | 3.75% | |
Timothy Fixed Income Fund - Class I | | 8.05% | | 2.09% | | | 2.32% (a) | |
Barclays Capital U.S. Aggregate Bond Index | | 10.30% | | 3.38% | | | 3.54% (a) | |
| | (a) | For the period August 1, 2013 (commencement of investment in accordance with objective) to September 30, 2019. |
| | * | With Maximum Deferred Sales Charge |
Timothy Plan Fixed Income Fund vs. Barclays Capital U.S. Aggregate Bond Index
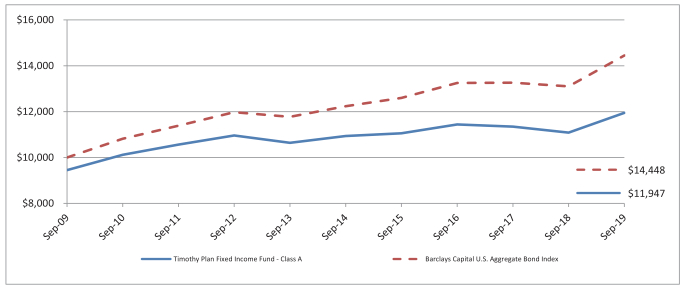
The chart shows the value of a hypothetical initial investment of $10,000 in the Fund’s Class A shares and the Barclays Capital U.S. Aggregate Bond Index on September 30, 2009 and held through September 30, 2019. The Barclays Capital U.S. Aggregate Bond Index is a widely recognized, unmanaged index of bond prices. Performance figures include the change in value of the bonds in the index and the reinvestment of interest. The index return does not reflect expenses, which have been deducted from the Fund’s return. The returns shown do not reflect deduction of taxes that a shareholder would pay on Fund distributions or the redemption of Fund shares. THE FUND’S RETURN REPRESENTS PAST PERFORMANCE AND IS NOT PREDICTIVE OF FUTURE RESULTS.
34
Fund Performance - (Unaudited)
September 30, 2019
High Yield Bond Fund
| | | | | | | | |
| Fund/Index | | 1 Year Total Return | | 5 Year Average Annual Return | | 10 Year Average Annual Return | |
Timothy High Yield Bond Fund - Class A (With Sales Charge) | | 3.56% | | 2.93% | | | 5.42% | |
Barclays Capital U.S. Corporate High Yield Bond Index | | 6.36% | | 5.37% | | | 7.94% | |
Barclays U.S. High Yield Ba/B 3% Index * | | 8.31% | | 5.45% | | | 7.70% | |
Timothy High Yield Bond Fund - Class C ** | | 6.63% | | 3.10% | | | 5.24% | |
Barclays Capital U.S. Corporate High Yield Bond Index | | 6.36% | | 5.37% | | | 7.94% | |
Barclays U.S. High Yield Ba/B 3% Index * | | 8.31% | | 5.45% | | | 7.70% | |
Timothy High Yield Bond Fund - Class I | | 8.78% | | 4.14% | | | 4.36% (a) | |
Barclays Capital U.S. Corporate High Yield Bond Index | | 6.36% | | 5.37% | | | 5.59% (a) | |
Barclays U.S. High Yield Ba/B 3% Index * | | 8.31% | | 5.45% | | | 5.65% (a) | |
| | (a) | For the period August 1, 2013 (commencement of investment in accordance with objective) to September 30, 2019. |
| | * | Change in Fund’s benchmark. As a result, the Fund’s performance is compared to both indices in the table above. The Barclays U.S. High Yield Ba/B 3% Index is more suitable for the Fund’s objective. |
| | ** | With Maximum Deferred Sales Charge |
Timothy Plan High Yield Bond Fund vs. Barclays Capital U.S. Corporate High Yield Bond Index va. Barclays U.S. High Yield Ba/B 3% Index
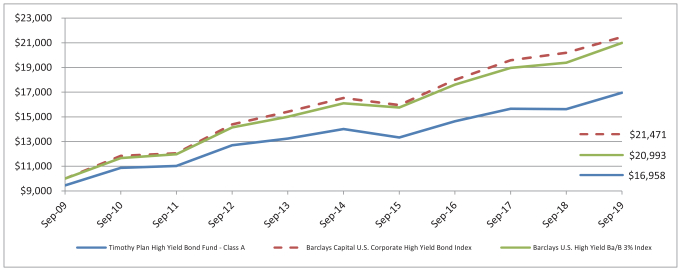
The chart shows the value of a hypothetical initial investment of $10,000 in the Fund’s Class A shares, the Barclays Capital U.S. Corporate High Yield Bond Index and Barclays U.S. High Yield Ba/B 3% Index on September 30, 2009 and held through September 30, 2019. The Barclays Capital U.S. Corporate High Yield Bond Index measures the performance of bonds with Ba or B ratings. The Barclays U.S. High Yield Ba/B 3% Index is an issuer-constrained version of the flagship U.S. Corporate High Yield Index, which measures theUSD-denominated, high yield, fixed-rate corporate bond market. Performance figures include the change in value of the bonds in the index and the reinvestment of interest. The index return does not reflect expenses, which have been deducted from the Fund’s return. The returns shown do not reflect deduction of taxes that a shareholder would pay on Fund distributions or the redemption of Fund shares. THE FUND’S RETURN REPRESENTS PAST PERFORMANCE AND IS NOT PREDICTIVE OF FUTURE RESULTS.
35
Fund Performance - (Unaudited)
September 30, 2019
Israel Common Values Fund
| | | | | | | | |
| Fund/Index | | 1 Year Total Return | | 5 Year Average Annual Return | | Average Annual Return Since Inception | |
Timothy Israel Common Values Fund - Class A (With Sales Charge) | | 7.82% | | 7.25% | | | 7.96% (a) | |
TA - 125 Index | | 6.65% | | 4.36% | | | 6.47% (a) | |
Timothy Israel Common Values Fund - Class C * | | 12.26% | | 7.65% | | | 7.90% (a) | |
TA - 125 Index | | 6.65% | | 4.36% | | | 6.47% (a) | |
Timothy Israel Common Values Fund - Class I | | 14.44% | | 8.75% | | | 8.11% (b) | |
TA - 125 Index | | 6.65% | | 4.36% | | | 5.89% (b) | |
| | (a) | For the period October 12, 2011 (commencement of investment in accordance with objective) to September 30, 2019. |
| | (b) | For the period August 1, 2013 (commencement of investment in accordance with objective) to September 30, 2019. |
| | * | With Maximum Deferred Sales Charge |
Timothy Plan Israel Common Values Fund vs. TA - 125 Index
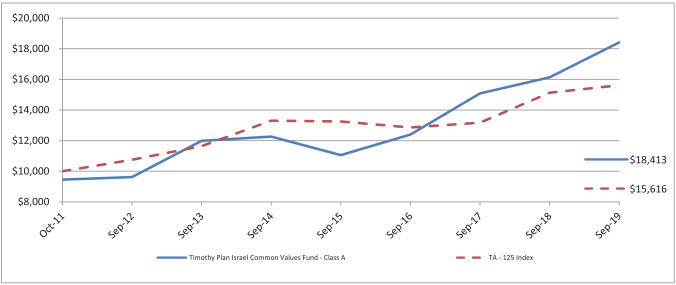
The chart shows the value of a hypothetical initial investment of $10,000 in the Fund’s Class A shares and the TA - 125 Index on October 12, 2011 and held through September 30, 2019. The TA - 125 Index is an unmanaged index of equity prices representing the 125 most highly capitalized companies listed on the Tel Aviv Stock Exchange . Performance figures include the change in value of the stocks in the index and the reinvestment of dividends. The index return does not reflect expenses, which have been deducted from the Fund’s return. The returns shown do not reflect deduction of taxes that a shareholder would pay on Fund distributions or the redemption of Fund shares. THE FUND’S RETURN REPRESENTS PAST PERFORMANCE AND IS NOT PREDICTIVE OF FUTURE RESULTS.
36
Fund Performance - (Unaudited)
September 30, 2019
Defensive Strategies Fund
| | | | | | | | |
| Fund/Index | | 1 Year Total Return | | 5 Year Total Return | | Average Annual Return Since Inception | |
Timothy Defensive Strategies Fund - Class A (With Sales Charge) | | (0.88)% | | 0.26% | | | 2.61% (a) | |
Dow Jones Moderately Conservative U.S. Portfolio Index | | 4.52% | | 7.23% | | | 9.64% (a) | |
Timothy Defensive Strategies Fund Blended Index (c) | | 0.22% | | (2.30)% | | | (0.59)% (a) | |
Timothy Defensive Strategies Fund - Class C * | | 3.06% | | 0.62% | | | 2.46% (a) | |
Dow Jones Moderately Conservative U.S. Portfolio Index | | 4.52% | | 7.23% | | | 9.64% (a) | |
Timothy Defensive Strategies Fund Blended Index (c) | | 0.22% | | (2.30)% | | | (0.59)% (a) | |
Timothy Defensive Strategies Fund - Class I | | 5.17% | | 1.66% | | | 1.90% (b) | |
Dow Jones Moderately Conservative U.S. Portfolio Index | | 4.52% | | 7.23% | | | 7.62% (b) | |
Timothy Defensive Strategies Fund Blended Index (c) | | 0.22% | | (2.30)% | | | (2.16)% (b) | |
| | (a) | For the period November 4, 2009 (commencement of investment in accordance with objective) to September 30, 2019. |
| | (b) | For the period August 1, 2013 (commencement of investment in accordance with objective) to September 30, 2019. |
| | (c) | The Timothy Defensive Strategies Fund Blended Index reflects an unmanaged portfolio of 33% of the Barclays U.S. TIPs Index, 33% of the FTSE NAREIT ALL REITs Index and 34% of the Dow Jones Commodity Total Return Index. The Timothy Defensive Strategies Fund Blended Index is more suitable for the Fund’s objective. |
| | * | With Maximum Deferred Sales Charge |
Timothy Plan Defensive Strategies Fund vs. Dow Jones Moderately Conservative U.S. Portfolio Index vs. The Timothy Defensive Strategies Fund Blended Index (c)
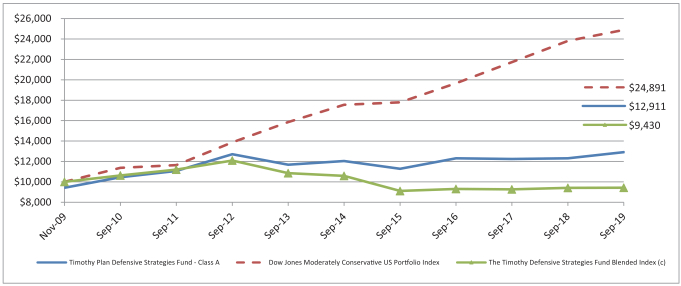
The chart shows the value of a hypothetical initial investment of $10,000 in the Fund’s Class A shares, Dow Jones Moderately Conservative U.S. Portfolio Index and the Timothy Defensive Strategies Fund Blended Index on November 4, 2009 and held through September 30, 2019. The Dow Jones Moderately Conservative U.S. Portfolio Index is a widely recognized unmanaged index of stocks, bonds and cash. Performance figures include the change in value of the asset classes in the index and the reinvestment of dividends. The index return does not reflect expenses, which have been deducted from the Fund’s return. The returns shown do not reflect deduction of taxes that a shareholder would pay on Fund distributions or the redemption of Fund shares. THE FUND’S RETURN REPRESENTS PAST PERFORMANCE AND IS NOT PREDICTIVE OF FUTURE RESULTS.
37
Fund Performance - (Unaudited)
September 30, 2019
Strategic Growth Fund
| | | | | | |
| Fund/Index | | 1 Year Total Return | | 5 Year Average Annual Return | | 10 Year
Average Annual Return |
Timothy Strategic Growth Fund - Class A (With Sales Charge) | | (5.71)% | | 0.86% | | 4.61% |
Dow Jones Moderately Aggressive Portfolio Index | | 2.06% | | 6.77% | | 8.84% |
Timothy Strategic Growth Fund - Class C * | | (1.97)% | | 1.25% | | 4.40% |
Dow Jones Moderately Aggressive Portfolio Index | | 2.06% | | 6.77% | | 8.84% |
| | * | With Maximum Deferred Sales Charge |
Timothy Plan Strategic Growth Fund vs. Dow Jones Moderately Aggressive Portfolio Index
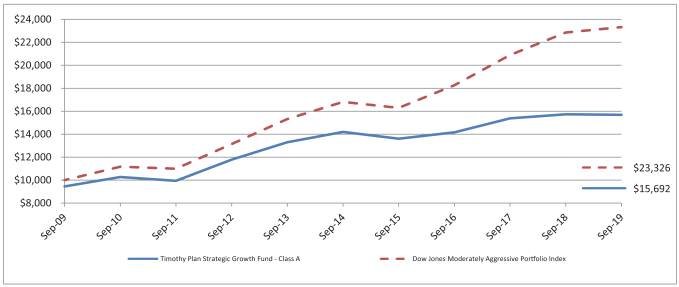
The chart shows the value of a hypothetical initial investment of $10,000 in the Fund’s Class A shares and the Dow Jones Moderately Aggressive Portfolio Index on September 30, 2009 and held through September 30, 2019. The Dow Jones Moderately Aggressive Portfolio Index is a widely recognized index that measures global stocks, bonds and cash which are in turn represented by multiplesub-indexes. Performance figures include the change in value of the investments in the index and the reinvestment of dividends. The index return does not reflect expenses, which have been deducted from the Fund’s return. The returns shown do not reflect deduction of taxes that a shareholder would pay on Fund distributions or the redemption of Fund shares. THE FUND’S RETURN REPRESENTS PAST PERFORMANCE AND IS NOT PREDICTIVE OF FUTURE RESULTS.
38
Fund Performance - (Unaudited)
September 30, 2019
Conservative Growth Fund
| | | | | | |
| Fund/Index | | 1 Year Total Return | | 5 Year Average Annual Return | | 10 Year Average Annual Return |
Timothy Conservative Growth Fund - Class A (With Sales Charge) | | (4.01)% | | 0.91% | | 3.76% |
Dow Jones Moderate Portfolio Index | | 3.85% | | 5.86% | | 7.47% |
Timothy Conservative Growth Fund - Class C * | | (0.04)% | | 1.31% | | 3.57% |
Dow Jones Moderate Portfolio Index | | 3.85% | | 5.86% | | 7.47% |
| | * | With Maximum Deferred Sales Charge |
Timothy Plan Conservative Growth Fund vs. Dow Jones Moderate Portfolio Index
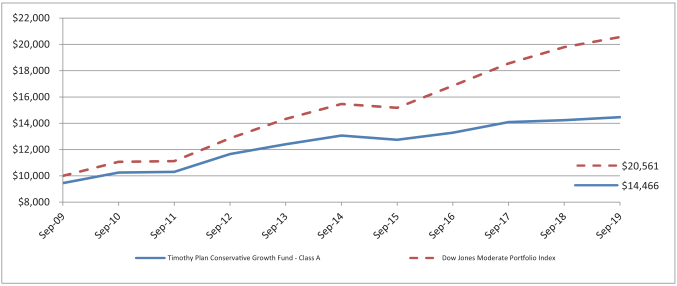
The chart shows the value of a hypothetical initial investment of $10,000 in the Fund’s Class A shares and the Dow Jones Moderate Portfolio Index on September 30, 2009 and held through September 30, 2019. The Dow Jones Moderate Portfolio Index is a widely recognized index that measures global stocks, bonds and cash which are in turn represented by multiplesub-indexes. Performance figures include the change in value of the investments in the index and the reinvestment of dividends. The index return does not reflect expenses, which have been deducted from the Fund’s return. The returns shown do not reflect deduction of taxes that a shareholder would pay on Fund distributions or the redemption of Fund shares. THE FUND’S RETURN REPRESENTS PAST PERFORMANCE AND IS NOT PREDICTIVE OF FUTURE RESULTS.
39
Fund Performance - (Unaudited)
September 30, 2019
Emerging Markets Fund
| | | | | | | | |
| Fund/Index | | 1 Year Total Return | | 5 Year Average Annual Return | | Average Annual Return Since Inception | |
Timothy Emerging Markets Fund - Class A (With Sales Charge) | | (3.68)% | | (2.60)% | | | (1.07)% (a) | |
MSCI Emerging Markets Index | | (4.48)% | | (0.09)% | | | (0.10)% (a) | |
Timothy Emerging Markets Fund - Class C * | | 0.19% | | (2.19)% | | | (0.97)% (a) | |
MSCI Emerging Markets Index | | (4.48)% | | (0.09)% | | | (0.10)% (a) | |
Timothy Emerging Markets Fund - Class I | | 2.20% | | (1.20)% | | | 0.05% (b) | |
MSCI Emerging Markets Index | | (4.48)% | | (0.09)% | | | 0.78% (b) | |
| | (a) | For the period December 3, 2012 (commencement of investment in accordance with objective) to September 30, 2019. |
| | (b) | For the period August 1, 2013 (commencement of investment in accordance with objective) to September 30, 2019. |
| | * | With Maximum Deferred Sales Charge |
Timothy Plan Emerging Markets Fund vs. MSCI Emerging Markets Index
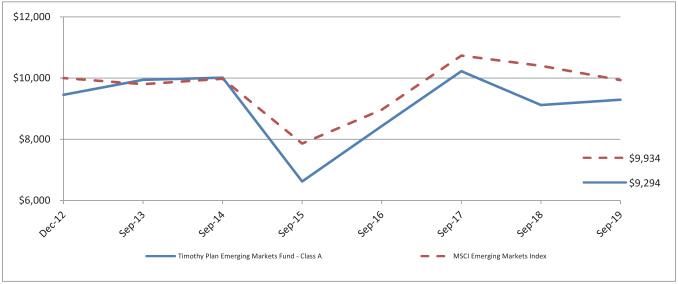
The chart shows the value of a hypothetical initial investment of $10,000 in the Fund’s Class A shares and the MSCI Emerging Markets Index on December 3, 2012 and held through September 30, 2019. The MSCI Emerging Markets Index is a free float-adjusted market capitalization index that is designed to measure equity market performance of emerging markets. The MSCI Emerging Markets Index consists of the following 21 emerging market country indices: Brazil, Chile, China, Colombia, Czech Republic, Egypt, Hungary, India, Indonesia, Korea, Malaysia, Mexico, Morocco, Peru, Philippines, Poland, Russia, South Africa, Taiwan, Thailand, and Turkey. Performance figures include the change in value of the stocks in the index and the reinvestment of dividends. The index return does not reflect expenses, which have been deducted from the Fund’s return. The returns shown do not reflect deduction of taxes that a shareholder would pay on Fund distributions or the redemption of Fund shares. THE FUND’S RETURN REPRESENTS PAST PERFORMANCE AND IS NOT PREDICTIVE OF FUTURE RESULTS.
40
Fund Performance - (Unaudited)
September 30, 2019
Growth & Income Fund
| | | | | | | | |
| Fund/Index | | 1 Year Total Return | | 5 Year Total Return | | Average Annual Return Since Inception | |
Timothy Growth & Income Fund - Class A (With Sales Charge) | | (5.57)% | | (0.74)% | | | 0.91% (a) | |
Timothy Growth & Income Fund Blended Index (b) | | 6.97% | | 6.22% | | | 7.21% (a) | |
Timothy Growth & Income Fund Blended Index (c) | | 6.01% | | 6.71% | | | 7.15% (a) | |
Dow Jones Moderately Aggressive Portfolio Index | | 2.06% | | 6.77% | | | 7.13% (a) | |
Timothy Growth & Income Fund - Class C * | | (1.79)% | | (0.34)% | | | 1.11% (a) | |
Timothy Growth & Income Fund Blended Index (b) | | 6.97% | | 6.22% | | | 7.21% (a) | |
Timothy Growth & Income Fund Blended Index (c) | | 6.01% | | 6.71% | | | 7.15% (a) | |
Dow Jones Moderately Aggressive Portfolio Index | | 2.06% | | 6.77% | | | 7.13% (a) | |
Timothy Growth & Income Fund - Class I | | 0.11% | | 0.64% | | | 2.08% (a) | |
Timothy Growth & Income Fund Blended Index (b) | | 6.97% | | 6.22% | | | 7.21% (a) | |
Timothy Growth & Income Fund Blended Index (c) | | 6.01% | | 6.71% | | | 7.15% (a) | |
Dow Jones Moderately Aggressive Portfolio Index | | 2.06% | | 6.77% | | | 7.13% (a) | |
| | (a) | For the period October 1, 2013 (commencement of investment in accordance with objective) to September 30, 2019. |
| | (b) | The Timothy Growth & Income Fund Blended Index reflects an unmanaged portfolio of 40% of the Barclays U.S. Aggregate Bond Index and 60% of the Russell 1000 Value Index. The advisor believes the new Timothy Growth & Income Fund Blended Index is a more appropriate benchmark for the Fund. |
| | (c) | The Timothy Growth & Income Fund Blended Index reflects an unmanaged portfolio of 50% of the Barclays Intermediate Government/Credit Index and 50% of the Russell 3000 Total Return Index. |
| | * | With Maximum Deferred Sales Charge |
Timothy Growth & Income Fund vs. Timothy Growth & Income Fund Blended Index (b) vs. Timothy Growth & Income Fund Blended Index (c) vs. Dow Jones Moderately Aggressive Portfolio Index
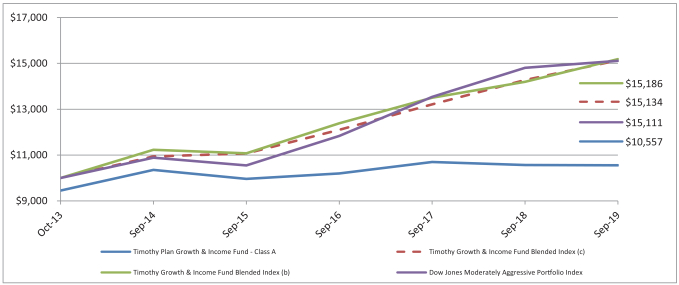
The chart shows the value of a hypothetical initial investment of $10,000 in the Fund’s Class A shares, the Timothy Growth & Income Fund Blended Index (b), the Timothy Growth & Income Fund Blended Index (c) and the Dow Jones Moderately Aggressive Portfolio Index on October 1, 2013 and held through September 30, 2019. The Dow Jones Moderately Aggressive Portfolio Index is a widely recognized index that measures global stocks, bonds and cash which are in turn represented by multiplesub-indexes. Performance figures include the change in value of the stocks in the index and the reinvestment of dividends. The index return does not reflect expenses, which have been deducted from the Fund’s return. The returns shown do not reflect deduction of taxes that a shareholder would pay on Fund distributions or the redemption of Fund shares. THE FUND’S RETURN REPRESENTS PAST PERFORMANCE AND IS NOT PREDICTIVE OF FUTURE RESULTS.
41
Schedule of Investments | Aggressive Growth Fund
As of September 30, 2019
| | | | | | | | |
| | |
| Shares | | | | | Fair Value | |
| | |
| | |
| | | | COMMON STOCK - 90.7 % | | | | |
| | | | AEROSPACE/DEFENSE - 4.4 % | | | | |
| | 4,144 | | | HEICO Corp. | | $ | 517,503 | |
| | 1,155 | | | TransDigm Group, Inc. | | | 601,374 | |
| | | | | | | | |
| | | | | | | 1,118,877 | |
| | | | | | | | |
| | |
| | | | APPAREL - 2.6 % | | | | |
| | 4,449 | | | Deckers Outdoor Corp. * | | | 655,605 | |
| | | | | | | | |
| | |
| | | | BANKS - 3.9 % | | | | |
| | 14,440 | | | CenterState Banks, Inc. | | | 346,343 | |
| | 1,095 | | | SVB Financial Group * | | | 228,800 | |
| | 8,861 | | | Western Alliance Bancorp | | | 408,315 | |
| | | | | | | | |
| | | | | | | 983,458 | |
| | | | | | | | |
| | | | BIOTECHNOLOGY - 2.3 % | | | | |
| | 18,229 | | | Amarin Corp PLC (ADR) * | | | 276,352 | |
| | 2,279 | | | Sage Therapeutics, Inc. * | | | 319,721 | |
| | | | | | | | |
| | | | | | | 596,073 | |
| | | | | | | | |
| | | | CHEMICALS - 1.9 % | | | | |
| | 2,915 | | | Ingevity Corp. * | | | 247,309 | |
| | 1,506 | | | Quaker Chemical Corp. | | | 238,159 | |
| | | | | | | | |
| | | | | | | 485,468 | |
| | | | | | | | |
| | | | COMMERCIAL SERVICES - 5.0 % | | | | |
| | 5,112 | | | ASGN, Inc. * | | | 321,340 | |
| | 1,918 | | | FleetCor Technologies, Inc. * | | | 550,044 | |
| | 4,136 | | | Insperity, Inc. | | | 407,892 | |
| | | | | | | | |
| | | | | | | 1,279,276 | |
| | | | | | | | |
| | |
| | | | COMPUTERS - 7.6 % | | | | |
| | 2,633 | | | EPAM Systems, Inc. * | | | 480,049 | |
| | 8,675 | | | Genpact Ltd. | | | 336,156 | |
| | 13,578 | | | Nutanix, Inc. * | | | 356,422 | |
| | 16,882 | | | Rapid7, Inc. * | | | 766,274 | |
| | | | | | | | |
| | | | | | | 1,938,901 | |
| | | | | | | | |
| | | | ELECTRONICS - 2.7 % | | | | |
| | 7,415 | | | Fortive Corp. | | | 508,372 | |
| | 1,585 | | | Woodward, Inc. | | | 170,911 | |
| | | | | | | | |
| | | | | | | 679,283 | |
| | | | | | | | |
| | | | FOOD - 2.0 % | | | | |
| | 11,315 | | | Performance Food Group Co. * | | | 520,603 | |
| | | | | | | | |
| | |
| | | | HEALTHCARE - PRODUCTS - 12.6 % | | | | |
| | 5,937 | | | DENTSPLY SIRONA, Inc. | | | 316,502 | |
| | 3,141 | | | Edwards Lifesciences Corp. * | | | 690,737 | |
| | 2,852 | | | Haemonetics Corp. * | | | 359,751 | |
| | 1,898 | | | ICU Medical, Inc. * | | | 302,921 | |
| | 3,630 | | | Insulet Corp. * | | | 598,696 | |
| | 2,743 | | | Teleflex, Inc. | | | 931,934 | |
| | | | | | | | |
| | | | | | | 3,200,541 | |
| | | | | | | | |
| | | | HEALTHCARE - SERVICES - 3.3 % | | | | |
| | 4,260 | | | Encompass Health Corp. | | | 269,573 | |
| | 3,921 | | | ICON PLC * | | | 577,720 | |
| | | | | | | | |
| | | | | | | 847,293 | |
| | | | | | | | |
| | | | INTERNET - 6.2 % | | | | |
| | 1,500 | | | Palo Alto Networks, Inc. * | | | 305,745 | |
| | 3,425 | | | Proofpoint, Inc. * | | | 441,996 | |
| | 6,624 | | | RingCentral, Inc. - Class A * | | | 832,372 | |
| | | | | | | | |
| | | | | | | 1,580,113 | |
| | | | | | | | |
The accompanying notes are an integral part of these financial statements.
42
Schedule of Investments | Aggressive Growth Fund
As of September 30, 2019 (Continued)
| | | | | | | | |
| | |
| Shares | | | | | Fair Value | |
| | |
| | |
| | | | MACHINERY - CONSTRUCTION & MINING - 1.7 % | | | | |
| | 5,885 | | | Oshkosh Corp. | | $ | 446,083 | |
| | | | | | | | |
| | |
| | | | OIL & GAS - 0.6 % | | | | |
| | 2,080 | | | Concho Resources, Inc. | | | 141,232 | |
| | | | | | | | |
| | |
| | | | PHARMACEUTICALS - 2.1 % | | | | |
| | 1,022 | | | DexCom, Inc. * | | | 152,523 | |
| | 2,120 | | | PRA Health Sciences, Inc. * | | | 210,368 | |
| | 2,270 | | | Sarepta Therapeutics, Inc. * | | | 170,976 | |
| | | | | | | | |
| | | | | | | 533,867 | |
| | | | | | | | |
| | | | RETAIL - 9.3 % | | | | |
| | 2,274 | | | Burlington Stores, Inc. * | | | 454,391 | |
| | 3,112 | | | Casey’s General Stores, Inc. | | | 501,530 | |
| | 6,746 | | | Ollie’s Bargain Outlet Holdings, Inc. * | | | 395,586 | |
| | 1,085 | | | O’Reilly Automotive, Inc. * | | | 432,383 | |
| | 6,363 | | | Tractor Supply Co. | | | 575,470 | |
| | | | | | | | |
| | | | | | | 2,359,360 | |
| | | | | | | | |
| | | | SEMICONDUCTORS - 9.5 % | | | | |
| | 16,086 | | | Advanced Micro Devices, Inc. * | | | 466,333 | |
| | 1,934 | | | Lam Research Corp. | | | 446,967 | |
| | 4,108 | | | Monolithic Power System, Inc. | | | 639,328 | |
| | 4,782 | | | NXP Semiconductors NV | | | 521,812 | |
| | 3,548 | | | Xilinx, Inc. | | | 340,253 | |
| | | | | | | | |
| | | | | | | 2,414,693 | |
| | | | | | | | |
| | | | SOFTWARE - 11.1 % | | | | |
| | 6,969 | | | Fidelity National Information Services, Inc. | | | 925,204 | |
| | 6,132 | | | InterXion Holding NV * | | | 499,513 | |
| | 7,742 | | | ManTech International Corp. | | | 552,856 | |
| | 1,643 | | | MSCI, Inc. | | | 357,763 | |
| | 1,916 | | | ServiceNow, Inc. * | | | 486,377 | |
| | | | | | | | |
| | | | | | | 2,821,713 | |
| | | | | | | | |
| | | | TELECOMMUNICATIONS - 0.9 % | | | | |
| | 20,256 | | | Vonage Holdings Corp. * | | | 228,893 | |
| | | | | | | | |
| | |
| | | | TEXTILES - 1.0 % | | | | |
| | 1,315 | | | UniFirst Corp. | | | 256,583 | |
| | | | | | | | |
| | |
| | | | TOTAL COMMON STOCK(Cost $19,746,878) | | | 23,087,915 | |
| | | | | | | | |
| | |
| | | | REITs - 1.4 % | | | 365,918 | |
| | | | | | | | |
| | 9,871 | | | Americold Realty Trust (Cost $332,486) | | | | |
| | |
| | | | MONEY MARKET FUND - 8.5 % | | | | |
| | 2,164,844 | | | Fidelity Institutional Money Market Funds - Government Portfolio - Class I, 1.86% (A) (Cost $2,164,844) | | | 2,164,844 | |
| | | | | | | | |
| | |
| | | | TOTAL INVESTMENTS - 100.6 %(Cost $22,244,208) | | $ | 25,618,677 | |
| | | | OTHER ASSETS IN EXCESS OF LIABILITIES - NET - (0.6) % | | | (149,912) | |
| | | | | | | | |
| | | | NET ASSETS - 100.0 % | | $ | 25,468,765 | |
| | | | | | | | |
*Non-income producing securities.
ADR - American Depositary Receipt.
PLC - Public Limited Co.
REITs - Real Estate Investment Trust.
(A) Variable rate security; the rate shown represents the yield at September 30, 2019.
The accompanying notes are an integral part of these financial statements.
43
Schedule of Investments | International Fund
As of September 30, 2019
| | | | | | | | |
| | |
| Shares | | | | | Fair Value | |
| | |
| | |
| | | | COMMON STOCK - 97.0 % | | | | |
| | | | AUTO PARTS & EQUIPMENT - 3.4 % | | | | |
| | 29,100 | | | Magna International, Inc. - Class A | | $ | 1,551,903 | |
| | 90,300 | | | Valeo SA (ADR) | | | 1,470,084 | |
| | | | | | | | |
| | | | | | | 3,021,987 | |
| | | | | | | | |
| | | | BANKS - 9.9 % | | | | |
| | 41,839 | | | DBS Group Holdings Ltd. (ADR) | | | 3,031,236 | |
| | 114,000 | | | DNB ASA (ADR) | | | 2,001,270 | |
| | 90,500 | | | Intesa Sanpaola SpA (ADR) | | | 1,283,743 | |
| | 63,600 | | | KBC Group NV (ADR) | | | 2,064,138 | |
| | 156,000 | | | Mizuho Financial Group, Inc. (ADR) | | | 478,920 | |
| | | | | | | | |
| | | | | | | 8,859,307 | |
| | | | | | | | |
| | | | BUILDING MATERIALS - 1.3 % | | | | |
| | 52,600 | | | Xinyi Glass Holdings Ltd. (ADR) | | | 1,188,760 | |
| | | | | | | | |
| | |
| | | | CHEMICALS - 2.2 % | | | | |
| | 21,600 | | | Arkema SA (ADR) | | | 2,017,440 | |
| | | | | | | | |
| | |
| | | | COMMERCIAL SERVICES - 4.3 % | | | | |
| | 36,700 | | | Amadeus IT Group SA (ADR) | | | 2,632,491 | |
| | 11,000 | | | Ashtead Group PLC (ADR) | | | 1,225,785 | |
| | | | | | | | |
| | | | | | | 3,858,276 | |
| | | | | | | | |
| | | | COSMETICS/PERSONAL CARE - 1.2 % | | | | |
| | 70,000 | | | Kao Corp. (ADR) | | | 1,040,900 | |
| | | | | | | | |
| | |
| | | | DIVERSIFIED FINANCIAL SERVICES - 5.1 % | | | | |
| | 18,900 | | | AerCap Holdings NV * | | | 1,034,775 | |
| | 106,000 | | | Deutsche Boerse AG (ADR) | | | 1,648,300 | |
| | 25,500 | | | ORIX Corp. (ADR) | | | 1,916,325 | |
| | | | | | | | |
| | | | | | | 4,599,400 | |
| | | | | | | | |
| | | | ELECTRIC - 3.0 % | | | | |
| | 251,000 | | | Enel SpA (ADR) | | | 1,872,460 | |
| | 128,900 | | | Power Assets Holdings Ltd. (ADR) | | | 859,763 | |
| | | | | | | | |
| | | | | | | 2,732,223 | |
| | | | | | | | |
| | | | ELECTRONICS - 1.6 % | | | | |
| | 17,000 | | | Hoya Corp. (ADR) | | | 1,395,530 | |
| | | | | | | | |
| | |
| | | | ENGINEERING & CONSTRUCTION - 4.1 % | | | | |
| | 135,000 | | | Vinci SA (ADR) | | | 3,631,500 | |
| | | | | | | | |
| | |
| | | | FOOD - 5.2 % | | | | |
| | 18,000 | | | Kerry Group PLC (ADR) | | | 2,147,760 | |
| | 110,000 | | | Mowi ASA (ADR) | | | 2,543,200 | |
| | | | | | | | |
| | | | | | | 4,690,960 | |
| | | | | | | | |
| | | | HAND/MACHINE TOOLS - 3.2 % | | | | |
| | 82,650 | | | Techtronic Industries Co. (ADR) | | | 2,891,097 | |
| | | | | | | | |
| | |
| | | | HEALTHCARE - PRODUCTS - 4.9 % | | | | |
| | 24,700 | | | Alcon, Inc. * | | | 1,439,763 | |
| | 61,000 | | | Smith & Nephew PLC (ADR) | | | 2,935,930 | |
| | | | | | | | |
| | | | | | | 4,375,693 | |
| | | | | | | | |
| | | | HEALTHCARE - SERVICES - 2.3 % | | | | |
| | 61,000 | | | Fresenius Medical Care AG & Co. (ADR) | | | 2,048,990 | |
| | | | | | | | |
| | |
| | | | HOME BUILDERS - 1.3 % | | | | |
| | 58,000 | | | Sekisui House Ltd. (ADR) | | | 1,144,630 | |
| | | | | | | | |
| | |
| | | | INSURANCE - 7.4 % | | | | |
| | 52,400 | | | Ageas (ADR) | | | 2,910,951 | |
| | 69,000 | | | AIA Group Ltd. (ADR) | | | 2,596,477 | |
| | 44,200 | | | Muenchener Rueckversicherungs AG (ADR) | | | 1,140,095 | |
| | | | | | | | |
| | | | | | | 6,647,523 | |
| | | | | | | | |
The accompanying notes are an integral part of these financial statements.
44
Schedule of Investments | International Fund
As of September 30, 2019 (Continued)
| | | | | | | | |
| | |
| Shares | | | | | Fair Value | |
| | |
| | |
| | | | INTERNET - 4.7 % | | | | |
| | 57,600 | | | Tencent Holdings Ltd. (ADR) | | $ | 2,397,888 | |
| | 50,700 | | | Yandex NV * | | | 1,775,007 | |
| | | | | | | | |
| | | | | | | 4,172,895 | |
| | | | | | | | |
| | | | LEISURE TIME - 1.7 % | | | | |
| | 99,000 | | | Shimano, Inc. (ADR) | | | 1,490,940 | |
| | | | | | | | |
| | |
| | | | MACHINERY - DIVERSIFIED - 3.0 % | | | | |
| | 53,500 | | | Atlas Copco AB (ADR) | | | 1,447,175 | |
| | 59,000 | | | CNH Industrial NV | | | 598,850 | |
| | 32,000 | | | FANUC Corp. (ADR) | | | 602,240 | |
| | | | | | | | |
| | | | | | | 2,648,265 | |
| | | | | | | | |
| | | | METAL FABRICATE/HARDWARE - 0.5 % | | | | |
| | 21,000 | | | Tenaris SA (ADR) | | | 444,780 | |
| | | | | | | | |
| | |
| | | | MINING - 1.6 % | | | | |
| | 28,000 | | | Rio Tinto PLC (ADR) | | | 1,458,520 | |
| | | | | | | | |
| | |
| | | | MISCELLANEOUS MANUFACTURING - 2.0 % | | | | |
| | 41,138 | | | FUJIFILM Holdings Corp. (ADR) | | | 1,807,809 | |
| | | | | | | | |
| | |
| | | | OIL & GAS - 3.9 % | | | | |
| | 62,600 | | | Eni SpA (ADR) | | | 1,908,674 | |
| | 84,000 | | | EQUINOR ASA (ADR) | | | 1,591,800 | |
| | | | | | | | |
| | | | | | | 3,500,474 | |
| | | | | | | | |
| | | | OIL & GAS SERVICES - 1.0 % | | | | |
| | 38,600 | | | Technip SA | | | 931,804 | |
| | | | | | | | |
| | |
| | | | PHARMACEUTICALS - 1.2 % | | | | |
| | 44,500 | | | Ipsen SA (ADR) | | | 1,043,525 | |
| | | | | | | | |
| | |
| | | | RETAIL - 1.7 % | | | | |
| | 93,000 | | | Pan Pacific International Holdings Corp. (ADR) | | | 1,551,240 | |
| | | | | | | | |
| | |
| | | | SEMICONDUCTORS - 3.3 % | | | | |
| | 4,150 | | | ASML Holding NV | | | 1,030,943 | |
| | 10,400 | | | Mellanox Technologies Ltd. * | | | 1,139,736 | |
| | 7,000 | | | NXP Semiconductors NV | | | 763,840 | |
| | | | | | | | |
| | | | | | | 2,934,519 | |
| | | | | | | | |
| | | | SOFTWARE - 2.4 % | | | | |
| | 51,640 | | | Open Text Corp. | | | 2,107,428 | |
| | | | | | | | |
| | |
| | | | TELECOMMUNICATIONS - 6.6 % | | | | |
| | 18,600 | | | Nice Ltd. (ADR) * | | | 2,674,680 | |
| | 55,900 | | | Nippon Telegraph & Telephone Corp. (ADR) | | | 2,677,051 | |
| | 110,000 | | | Nokia OYJ (ADR) | | | 556,600 | |
| | | | | | | | |
| | | | | | | 5,908,331 | |
| | | | | | | | |
| | | | TRANSPORTATION - 3.0 % | | | | |
| | 12,100 | | | Canadian Pacific Railway Ltd. | | | 2,691,766 | |
| | | | | | | | |
| | |
| | | | TOTAL COMMON STOCK(Cost $78,079,829) | | | 86,836,512 | |
| | | | | | | | |
| | |
| | | | MONEY MARKET FUND - 2.3 % | | | | |
| | 2,083,856 | | | Fidelity Institutional Money Market Funds - Government Portfolio - Class I, 1.86% (A) (Cost $2,083,856) | | | 2,083,856 | |
| | | | | | | | |
| | |
| | | | TOTAL INVESTMENTS - 99.3 %(Cost $80,163,685) | | $ | 88,920,368 | |
| | | | OTHER ASSETS IN EXCESS OF LIABILITIES - NET - 0.7 % | | | 660,465 | |
| | | | | | | | |
| | | | NET ASSETS - 100.0 % | | $ | 89,580,833 | |
| | | | | | | | |
The accompanying notes are an integral part of these financial statements.
45
Schedule of Investments | International Fund
As of September 30, 2019 (Continued)
*Non-income producing securities.
ADR - American Depositary Receipt.
PLC - Public Limited Co.
(A) Variable rate security; the rate shown represents the yield at September 30, 2019.
| | | | |
| Diversification of Assets | | | |
| |
| Country | | | % of Net Assets | |
| |
| Japan | | | 15.7% | |
| France | | | 9.1% | |
| Hong Kong | | | 8.4% | |
| United Kingdom | | | 8.0% | |
| Canada | | | 7.1% | |
| Norway | | | 6.8% | |
| Italy | | | 5.7% | |
| Belgium | | | 5.6% | |
| Germany | | | 5.4% | |
| Israel | | | 4.3% | |
| Ireland | | | 3.6% | |
| Singapore | | | 3.4% | |
| Spain | | | 2.9% | |
| China | | | 2.7% | |
| Netherlands | | | 2.0% | |
| Russia | | | 2.0% | |
| Sweden | | | 1.6% | |
| Switzerland | | | 1.6% | |
| Finland | | | 0.6% | |
| Luxembourg | | | 0.5% | |
| | | | |
| Total | | | 97.0% | |
| Money Market Fund | | | 2.3% | |
| Other Assets Less Liabilities - Net | | | 0.7% | |
| | | | |
| Grand Total | | | 100.0% | |
| | | | |
The accompanying notes are an integral part of these financial statements.
46
Schedule of Investments | Large/Mid Cap Growth Fund
As of September 30, 2019
| | | | | | | | |
| | |
| Shares | | | | | Fair Value | |
| | |
| | |
| | | | COMMON STOCK - 74.0% | | | | |
| | | | AEROSPACE/DEFENSE - 1.7% | | | | |
| | 8,009 | | | General Dynamics Corp. | | $ | 1,463,485 | |
| | | | | | | | |
| | |
| | | | BANKS - 0.6% | | | | |
| | 10,530 | | | Western Alliance Bancorp | | | 485,222 | |
| | | | | | | | |
| | |
| | | | BIOTECHNOLOGY - 1.4% | | | | |
| | 2,331 | | | Sage Therapeutics, Inc. * | | | 327,016 | |
| | 5,274 | | | Vertex Pharmaceuticals, Inc. * | | | 893,521 | |
| | | | | | | | |
| | | | | | | 1,220,537 | |
| | | | | | | | |
| | |
| | | | COMMERCIAL SERVICES - 1.3% | | | | |
| | 5,236 | | | Grand Canyon Education, Inc. * | | | 514,175 | |
| | 1,898 | | | MarketAxess Holdings, Inc. | | | 621,595 | |
| | | | | | | | |
| | | | | | | 1,135,770 | |
| | | | | | | | |
| | |
| | | | COMPUTERS - 4.5% | | | | |
| | 3,571 | | | EPAM Systems, Inc. * | | | 651,065 | |
| | 8,783 | | | Nutanix, Inc. * | | | 230,554 | |
| | 39,926 | | | Rapid7, Inc. * | | | 1,812,241 | |
| | 20,413 | | | Western Digital Corp. | | | 1,217,431 | |
| | | | | | | | |
| | | | | | | 3,911,291 | |
| | | | | | | | |
| | |
| | | | DIVERSIFIED FINANCIAL SERVICES - 2.4% | | | | |
| | 22,043 | | | Intercontinental Exchange, Inc. | | | 2,033,908 | |
| | | | | | | | |
| | |
| | | | ELECTRIC - 1.1% | | | | |
| | 29,780 | | | PPL Corp. | | | 937,772 | |
| | | | | | | | |
| | |
| | | | ELECTRICAL COMPONENTS & EQUIPMENT - 1.3% | | | | |
| | 16,519 | | | Emerson Electric Co. | | | 1,104,460 | |
| | | | | | | | |
| | |
| | | | ELECTRONICS - 6.0% | | | | |
| | 15,269 | | | Amphenol Corp. - Class A | | | 1,473,459 | |
| | 10,397 | | | Fortive Corp. | | | 712,818 | |
| | 17,471 | | | Honeywell International, Inc. | | | 2,956,093 | |
| | | | | | | | |
| | | | | | | 5,142,370 | |
| | | | | | | | |
| | |
| | | | FOOD - 1.8% | | | | |
| | 9,751 | | | McCormick & Co., Inc. | | | 1,524,081 | |
| | | | | | | | |
| | |
| | | | HEALTHCARE - PRODUCTS - 4.6% | | | | |
| | 4,034 | | | Edwards Lifesciences Corp. * | | | 887,117 | |
| | 5,797 | | | Insulet Corp. * | | | 956,099 | |
| | 1,462 | | | Intuitive Surgical, Inc. * | | | 789,378 | |
| | 3,878 | | | Teleflex, Inc. | | | 1,317,550 | |
| | | | | | | | |
| | | | | | | 3,950,144 | |
| | | | | | | | |
| | |
| | | | HEALTHCARE - SERVICES - 1.5% | | | | |
| | 14,205 | | | Centene Corp. * | | | 614,508 | |
| | 4,477 | | | IQVIA Holdings, Inc. * | | | 668,774 | |
| | | | | | | | |
| | | | | | | 1,283,282 | |
| | | | | | | | |
| | |
| | | | INSURANCE - 2.1% | | | | |
| | 20,430 | | | Arthur J. Gallagher & Co. | | | 1,829,915 | |
| | | | | �� | | | |
| | |
| | | | INTERNET - 4.7% | | | | |
| | 22,685 | | | CDW Corp. | | | 2,795,699 | |
| | 6,288 | | | Palo Alto Networks, Inc. * | | | 1,281,683 | |
| | | | | | | | |
| | | | | | | 4,077,382 | |
| | | | | | | | |
The accompanying notes are an integral part of these financial statements.
47
Schedule of Investments | Large/Mid Cap Growth Fund
As of September 30, 2019 (Continued)
| | | | | | | | |
| | |
| Shares | | | | | Fair Value | |
| | |
| | |
| | | | MACHINERY - CONSTRUCTION & MINING - 2.0% | | | | |
| | 8,340 | | | Caterpillar, Inc. | | $ | 1,053,426 | |
| | 8,989 | | | Oshkosh Corp. | | | 681,366 | |
| | | | | | | | |
| | | | | | | 1,734,792 | |
| | | | | | | | |
| | |
| | | | MACHINERY - DIVERSIFIED - 1.0% | | | | |
| | 10,964 | | | Xylem, Inc. | | | 872,954 | |
| | | | | | | | |
| | |
| | | | OIL & GAS - 2.5% | | | | |
| | 2,646 | | | Concho Resources, Inc. | | | 179,663 | |
| | 26,759 | | | ConocoPhillips | | | 1,524,728 | |
| | 4,972 | | | Diamondback Energy, Inc. | | | 447,033 | |
| | | | | | | | |
| | | | | | | 2,151,424 | |
| | | | | | | | |
| | |
| | | | PHARMACEUTICALS - 3.8% | | | | |
| | 6,418 | | | Neurocrine Biosciences, Inc. * | | | 578,326 | |
| | 5,833 | | | Sarepta Therapeutics, Inc. * | | | 439,342 | |
| | 18,263 | | | Zoetis, Inc. | | | 2,275,387 | |
| | | | | | | | |
| | | | | | | 3,293,055 | |
| | | | | | | | |
| | |
| | | | RETAIL - 12.3% | | | | |
| | 5,648 | | | Burlington Stores, Inc. * | | | 1,128,583 | |
| | 7,051 | | | Costco Wholesale Corp. | | | 2,031,464 | |
| | 9,885 | | | Dollar General Corp. | | | 1,571,122 | |
| | 15,625 | | | Lowe’s Cos, Inc. | | | 1,718,125 | |
| | 2,381 | | | Lululemon Athletica, Inc. * | | | 458,414 | |
| | 4,178 | | | O’Reilly Automotive, Inc. * | | | 1,664,975 | |
| | 18,886 | | | Restaurant Brands International, Inc. | | | 1,343,550 | |
| | 7,620 | | | Tractor Supply Co. | | | 689,153 | |
| | | | | | | | |
| | | | | | | 10,605,386 | |
| | | | | | | | |
| | |
| | | | SEMICONDUCTORS - 10.7% | | | | |
| | 27,061 | | | Advanced Micro Devices, Inc. * | | | 784,498 | |
| | 5,481 | | | Broadcom Ltd. | | | 1,513,140 | |
| | 19,594 | | | Maxim Integrated Products, Inc. | | | 1,134,689 | |
| | 26,876 | | | Micron Technology, Inc. * | | | 1,151,637 | |
| | 4,948 | | | Monolithic Power Systems, Inc. | | | 770,057 | |
| | 13,413 | | | NVIDIA Corp. | | | 2,334,801 | |
| | 13,876 | | | NXP Semiconductors NV | | | 1,514,149 | |
| | | | | | | | |
| | | | | | | 9,202,971 | |
| | | | | | | | |
| | |
| | | | SOFTWARE - 5.0% | | | | |
| | 8,859 | | | Fidelity National Information Services, Inc. | | | 1,176,121 | |
| | 18,713 | | | InterXion Holding NV * | | | 1,524,361 | |
| | 6,387 | | | ServiceNow, Inc. * | | | 1,621,340 | |
| | | | | | | | |
| | | | | | | 4,321,822 | |
| | | | | | | | |
| | |
| | | | TELECOMMUNICATIONS - 0.8% | | | | |
| | 60,074 | | | Vonage Holdings Corp. * | | | 678,836 | |
| | | | | | | | |
| | |
| | | | TRANSPORTATION - 0.9% | | | | |
| | 11,329 | | | CSX Corp. | | | 784,760 | |
| | | | | | | | |
| | |
| | | | TOTAL COMMON STOCK(Cost $51,149,835) | | | 63,745,619 | |
| | | | | | | | |
| | |
| | | | EXCHANGE TRADED FUND (A) - 21.4 % | | | | |
| | 720,000 | | | Timothy Plan U.S. Large Cap Core ETF (Cost $18,061,200) | | | 18,399,168 | |
| | | | | | | | |
The accompanying notes are an integral part of these financial statements.
48
Schedule of Investments | Large/Mid Cap Growth Fund
As of September 30, 2019 (Continued)
| | | | | | | | |
| | |
| Shares | | | | | Fair Value | |
| | |
| | |
| | | | MONEY MARKET FUND - 4.7 % | | | | |
| | 4,086,671 | | | Fidelity Institutional Money Market Funds - Government Portfolio - Class I, 1.86% (B) (Cost $4,086,671) | | $ | 4,086,671 | |
| | | | | | | | |
| | |
| | | | TOTAL INVESTMENTS - 100.1 %(Cost $73,297,706) | | $ | 86,231,458 | |
| | | | OTHER ASSETS IN EXCESS OF LIABILITIES - NET - (0.1) % | | | (114,990) | |
| | | | | | | | |
| | | | NET ASSETS - 100.0 % | | $ | 86,116,468 | |
| | | | | | | | |
*Non-income producing securities.
ETF - Exchange Traded Fund.
(A) Affiliated Fund.
(B) Variable rate security; the rate shown represents the yield at September 30, 2019.
The accompanying notes are an integral part of these financial statements.
49
Schedule of Investments | Small Cap Value Fund
As of September 30, 2019
| | | | | | | | |
| | |
| Shares | | | | | Fair Value | |
| | |
| | |
| | | | COMMON STOCK - 86.4% | | | | |
| | | | AEROSPACE/DEFENSE - 2.0% | | | | |
| | 49,459 | | | Kaman Corp. | | $ | 2,940,832 | |
| | | | | | | | |
| | |
| | | | APPAREL - 2.0% | | | | |
| | 41,213 | | | Oxford Industries, Inc. | | | 2,954,972 | |
| | | | | | | | |
| | |
| | | | AUTO PARTS & EQUIPMENT - 1.5% | | | | |
| | 49,939 | | | Douglas Dynamics, Inc. | | | 2,225,781 | |
| | | | | | | | |
| | |
| | | | BANKS - 12.0% | | | | |
| | 75,170 | | | Central Pacific Financial Corp. | | | 2,134,828 | |
| | 79,311 | | | Columbia Banking System, Inc. | | | 2,926,576 | |
| | 88,105 | | | Great Western Bancorp, Inc. | | | 2,907,465 | |
| | 121,753 | | | Heritage Commerce Corp. | | | 1,431,207 | |
| | 118,904 | | | Hilltop Holdings, Inc. | | | 2,840,617 | |
| | 88,335 | | | Renasant Corp. | | | 3,092,608 | |
| | 27,083 | | | South State Corp. | | | 2,039,350 | |
| | | | | | | | |
| | | | | | | 17,372,651 | |
| | | | | | | | |
| | |
| | | | BUILDING MATERIALS - 5.2% | | | | |
| | 37,730 | | | Apogee Enterprises, Inc. | | | 1,471,093 | |
| | 110,701 | | | Continental Building Products, Inc. * | | | 3,021,030 | |
| | 75,444 | | | Universal Forest Products, Inc. | | | 3,008,707 | |
| | | | | | | | |
| | | | | | | 7,500,830 | |
| | | | | | | | |
| | |
| | | | CHEMICALS - 2.0% | | | | |
| | 33,043 | | | Innospec, Inc. | | | 2,945,453 | |
| | | | | | | | |
| | |
| | | | COMMERCIAL SERVICES - 0.9% | | | | |
| | 94,500 | | | Repay Holdings Corp. * | | | 1,259,685 | |
| | | | | | | | |
| | |
| | | | DIVERSIFIED FINANCIAL SERVICES - 3.0% | | | | |
| | 65,341 | | | Houlihan Lokey, Inc. | | | 2,946,879 | |
| | 44,210 | | | Moelis & Co. | | | 1,452,298 | |
| | | | | | | | |
| | | | | | | 4,399,177 | |
| | | | | | | | |
| | |
| | | | ELECTRIC - 4.1% | | | | |
| | 62,343 | | | Avista Corp. | | | 3,019,895 | |
| | 38,715 | | | NorthWestern Corp. | | | 2,905,561 | |
| | | | | | | | |
| | | | | | | 5,925,456 | |
| | | | | | | | |
| | |
| | | | ELECTRICAL COMPONENTS & EQUIPMENT - 1.9% | | | | |
| | 33,419 | | | Novanta, Inc. * | | | 2,731,001 | |
| | | | | | | | |
| | |
| | | | ELECTRONICS - 0.1% | | | | |
| | 1,322 | | | OSI Systems, Inc. * | | | 134,262 | |
| | | | | | | | |
| | |
| | | | ENGINEERING & CONSTRUCTION - 1.9% | | | | |
| | 62,955 | | | Comfort Systems USA, Inc. | | | 2,784,500 | |
| | | | | | | | |
| | |
| | | | FOOD - 4.1% | | | | |
| | 212,767 | | | Hostess Brands, Inc. * | | | 2,975,547 | |
| | 15,178 | | | J & J Snack Foods Corp. | | | 2,914,176 | |
| | | | | | | | |
| | | | | | | 5,889,723 | |
| | | | | | | | |
| | |
| | | | GAS - 2.1% | | | | |
| | 90,996 | | | South Jersey Industries, Inc. | | | 2,994,678 | |
| | | | | | | | |
| | |
| | | | HEALTHCARE - PRODUCTS - 1.9% | | | | |
| | 27,894 | | | CONMED Corp. | | | 2,682,008 | |
| | | | | | | | |
| | |
| | | | HOME BUILDERS - 1.9% | | | | |
| | 48,250 | | | Installed Building Products, Inc. * | | | 2,766,655 | |
| | | | | | | | |
| | |
| | | | HOUSEHOLD PRODUCTS/WARES - 1.0% | | | | |
| | 53,159 | | | Central Garden & Pet Co. * | | | 1,473,833 | |
| | | | | | | | |
The accompanying notes are an integral part of these financial statements.
50
Schedule of Investments | Small Cap Value Fund
As of September 30, 2019 (Continued)
| | | | | | | | |
| | |
| Shares | | | | | Fair Value | |
| | |
| | |
| | | | INSURANCE - 6.0 % | | | | |
| | 44,045 | | | Argo Group International Holdings Ltd | | $ | 3,093,721 | |
| | 37,222 | | | Employers Holdings, Inc. | | | 1,622,135 | |
| | 40,403 | | | Mercury General Corp. | | | 2,257,720 | |
| | 17,397 | | | Safety Insurance Group, Inc. | | | 1,762,838 | |
| | | | | | | | |
| | | | | | | 8,736,414 | |
| | | | | | | | |
| | | | MACHINERY - DIVERSIFIED - 3.6 % | | | | |
| | 13,035 | | | Alamo Group, Inc. | | | 1,534,480 | |
| | 21,990 | | | Albany International Corp. - Class A | | | 1,982,618 | |
| | 47,900 | | | Columbus McKinnon Corp. | | | 1,744,997 | |
| | | | | | | | |
| | | | | | | 5,262,095 | |
| | | | | | | | |
| | | | MISCELLANEOUS MANUFACTURER - 2.3 % | | | | |
| | 50,937 | | | Federal Signal Corp. | | | 1,667,677 | |
| | 66,139 | | | Lydall, Inc. * | | | 1,647,523 | |
| | | | | | | | |
| | | | | | | 3,315,200 | |
| | | | | | | | |
| | | | OFFICE FURNISHINGS - 4.1 % | | | | |
| | 196,510 | | | Interface, Inc. | | | 2,837,604 | |
| | 119,055 | | | Knoll, Inc. | | | 3,018,044 | |
| | | | | | | | |
| | | | | | | 5,855,648 | |
| | | | | | | | |
| | | | OIL & GAS - 4.3 % | | | | |
| | 337,363 | | | Callon Petroleum Co. * | | | 1,464,155 | |
| | 311,952 | | | Jagged Peak Energy, Inc. * | | | 2,264,772 | |
| | 40,100 | | | Penn Virginia Corp. * | | | 1,165,707 | |
| | 299,003 | | | SRC Energy, Inc. * | | | 1,393,354 | |
| | | | | | | | |
| | | | | | | 6,287,988 | |
| | | | | | | | |
| | | | RETAIL - 6.0 % | | | | |
| | 72,188 | | | BJ’s Wholesale Club Holdings, Inc. * | | | 1,867,504 | |
| | 157,884 | | | Bloomin’ Brands, Inc. | | | 2,988,744 | |
| | 37,047 | | | Children’s Place, Inc. | | | 2,852,249 | |
| | 18,078 | | | Papa John’s International, Inc. | | | 946,383 | |
| | | | | | | | |
| | | | | | | 8,654,880 | |
| | | | | | | | |
| | | | SAVINGS & LOANS - 4.0 % | | | | |
| | 94,833 | | | Berkshire Hills Bancorp, Inc. | | | 2,777,659 | |
| | 81,888 | | | Washington Federal, Inc. | | | 3,029,037 | |
| | | | | | | | |
| | | | | | | 5,806,696 | |
| | | | | | | | |
| | | | SEMICONDUCTORS - 2.5 % | | | | |
| | 23,801 | | | Brooks Automation, Inc. | | | 881,351 | |
| | 152,471 | | | Lattice Semiconductor Corp. * | | | 2,787,932 | |
| | | | | | | | |
| | | | | | | 3,669,283 | |
| | | | | | | | |
| | | | SOFTWARE - 2.0 % | | | | |
| | 39,124 | | | Omnicell, Inc. * | | | 2,827,491 | |
| | | | | | | | |
| | |
| | | | TELECOMMUNICATIONS - 2.0 % | | | | |
| | 209,406 | | | Viavi Solutions, Inc. * | | | 2,932,731 | |
| | | | | | | | |
| | |
| | | | TEXTILES - 2.0 % | | | | |
| | 15,083 | | | UniFirst Corp. | | | 2,942,995 | |
| | | | | | | | |
| | |
| | | | TOTAL COMMON STOCK(Cost $119,436,893) | | | 125,272,918 | |
| | | | | | | | |
| | |
| | | | REITs - 12.2 % | | | | |
| | 137,363 | | | Columbia Property Trust, Inc. | | | 2,905,227 | |
| | 135,275 | | | Easterly Government Properties, Inc. | | | 2,881,357 | |
| | 45,626 | | | National Storage Affiliates Trust | | | 1,522,540 | |
| | 53,926 | | | PotlatchDeltic Corp. | | | 2,215,550 | |
| | 167,720 | | | Ramco-Gershenson Properties Trust | | | 2,272,606 | |
| | 102,820 | | | STAG Industrial, Inc. | | | 3,031,134 | |
| | 251,672 | | | Summit Hotel Properties, Inc. | | | 2,919,395 | |
| | | | | | | | |
| | | | TOTAL REITs(Cost $17,205,899) | | | 17,747,809 | |
| | | | | | | | |
The accompanying notes are an integral part of these financial statements.
51
Schedule of Investments | Small Cap Value Fund
As of September 30, 2019 (Continued)
| | | | | | | | |
| | |
| Shares | | | | | Fair Value | |
| | |
| | |
| | | | MONEY MARKET FUND - 1.6 % | | | | |
| | 2,250,799 | | | Fidelity Institutional Money Market Funds - Government Portfolio - Class I, 1.86% (A) (Cost $2,250,799) | | $ | 2,250,799 | |
| | | | | | | | |
| | |
| | | | TOTAL INVESTMENTS - 100.2 %(Cost $138,893,591) | | $ | 145,271,526 | |
| | | | OTHER ASSETS IN EXCESS OF LIABILITIES - NET - (0.2) % | | | (239,544) | |
| | | | | | | | |
| | | | NET ASSETS - 100.0 % | | $ | 145,031,982 | |
| | | | | | | | |
*Non-income producing securities.
REITs - Real Estate Investment Trust.
(A) Variable rate security; the rate shown represents the yield at September 30, 2019.
The accompanying notes are an integral part of these financial statements.
52
Schedule of Investments | Large/Mid Cap Value Fund
As of September 30, 2019
| | | | | | | | |
| | |
| Shares | | | | | Fair Value | |
| | |
| | |
| | | | COMMON STOCK - 71.7 % | | | | |
| | | | AEROSPACE/DEFENSE - 2.0 % | | | | |
| | 22,311 | | | General Dynamics Corp. | | $ | 4,076,889 | |
| | | | | | | | |
| | |
| | | | BANKS - 5.8 % | | | | |
| | 45,695 | | | East West Bancorp, Inc. | | | 2,023,832 | |
| | 78,567 | | | First Hawaiian, Inc. | | | 2,097,739 | |
| | 99,995 | | | TCF Financial Corp. | | | 3,806,810 | |
| | 86,640 | | | Western Alliance Bancorp | | | 3,992,371 | |
| | | | | | | | |
| | | | | | | 11,920,752 | |
| | | | | | | | |
| | | | BUILDING MATERIALS - 1.1 % | | | | |
| | 24,889 | | | Eagle Materials, Inc. | | | 2,240,259 | |
| | | | | | | | |
| | |
| | | | CHEMICALS - 2.0 % | | | | |
| | 7,622 | | | Sherwin-Williams Co. | | | 4,191,109 | |
| | | | | | | | |
| | |
| | | | COMMERCIAL SERVICES - 2.0 % | | | | |
| | 29,717 | | | Equifax, Inc. | | | 4,180,290 | |
| | | | | | | | |
| | |
| | | | COMPUTERS - 3.9 % | | | | |
| | 17,201 | | | CACI International, Inc. * | | | 3,977,903 | |
| | 107,282 | | | Genpact Ltd | | | 4,157,178 | |
| | | | | | | | |
| | | | | | | 8,135,081 | |
| | | | | | | | |
| | | | DIVERSIFIED FINANCIAL SERVICES - 2.0 % | | | | |
| | 44,459 | | | Intercontinental Exchange, Inc. | | | 4,102,232 | |
| | | | | | | | |
| | |
| | | | ELECTRIC - 4.0 % | | | | |
| | 65,112 | | | CMS Energy Corp. | | | 4,163,912 | |
| | 31,004 | | | DTE Energy Co. | | | 4,122,292 | |
| | | | | | | | |
| | | | | | | 8,286,204 | |
| | | | | | | | |
| | | | ELECTRIC COMPONENTS & EQUIPMENT - 1.0 % | | | | |
| | 15,034 | | | Hubbell, Inc. | | | 1,975,468 | |
| | | | | | | | |
| | |
| | | | ELECTRONICS - 8.1 % | | | | |
| | 43,580 | | | Amphenol Corp. - Class A | | | 4,205,470 | |
| | 80,650 | | | FLIR Systems, Inc. | | | 4,241,384 | |
| | 24,546 | | | Honeywell International, Inc. | | | 4,153,183 | |
| | 48,575 | | | PerkinElmer, Inc. | | | 4,137,133 | |
| | | | | | | | |
| | | | | | | 16,737,170 | |
| | | | | | | | |
| | | | FOOD - 5.7 % | | | | |
| | 33,419 | | | JM Smucker Co. | | | 3,676,758 | |
| | 54,795 | | | Lamb Weston Holdings, Inc. | | | 3,984,692 | |
| | 26,541 | | | McCormick & Co., Inc. | | | 4,148,358 | |
| | | | | | | | |
| | | | | | | 11,809,808 | |
| | | | | | | | |
| | | | HEALTHCARE - PRODUCTS - 6.9 % | | | | |
| | 78,215 | | | Dentsply Sirona, Inc. | | | 4,169,642 | |
| | 117,560 | | | Patterson Companies, Inc. | | | 2,094,919 | |
| | 27,265 | | | STERIS PLC | | | 3,939,520 | |
| | 29,414 | | | Zimmer Biomet Holdings, Inc. | | | 4,037,660 | |
| | | | | | | | |
| | | | | | | 14,241,741 | |
| | | | | | | | |
| | | | INSURANCE - 6.0 % | | | | |
| | 46,088 | | | Arthur J. Gallagher & Co. | | | 4,128,102 | |
| | 32,050 | | | Assurant, Inc. | | | 4,032,531 | |
| | 15,726 | | | Everest Re Group Ltd. | | | 4,184,531 | |
| | | | | | | | |
| | | | | | | 12,345,164 | |
| | | | | | | | |
| | | | MACHINERY - DIVERSIFIED - 2.1 % | | | | |
| | 33,139 | | | Curtiss-Wright Corp. | | | 4,287,192 | |
| | | | | | | | |
| | |
| | | | MEDIA - 2.1 % | | | | |
| | 3,529 | | | Cable One, Inc. | | | 4,427,836 | |
| | | | | | | | |
| | |
| | | | MISCELLANEOUS MANUFACTURING - 1.1 % | | | | |
| | 27,300 | | | Eaton Corp. PLC | | | 2,269,995 | |
| | | | | | | | |
The accompanying notes are an integral part of these financial statements.
53
Schedule of Investments | Large/Mid Cap Value Fund
As of September 30, 2019 (Continued)
| | | | | | | | |
| | |
| Shares | | | | | Fair Value | |
| | |
| | |
| | | | OIL & GAS - 2.6 % | | | | |
| | 44,205 | | | EOG Resources, Inc. | | $ | 3,280,895 | |
| | 34,725 | | | Marathon Petroleum Corp. | | | 2,109,544 | |
| | | | | | | | |
| | | | | | | 5,390,439 | |
| | | | | | | | |
| | |
| | | | RETAIL - 5.2 % | | | | |
| | 25,973 | | | Advance Auto Parts, Inc. | | | 4,295,934 | |
| | 27,529 | | | Dollar General Corp. | | | 4,375,459 | |
| | 20,357 | | | Genuine Parts Co. | | | 2,027,354 | |
| | | | | | | | |
| | | | | | | 10,698,747 | |
| | | | | | | | |
| | | | SEMICONDUCTORS - 4.1 % | | | | |
| | 170,319 | | | Marvell Technology Group Ltd. | | | 4,252,865 | |
| | 27,150 | | | Monolithic Power Systems, Inc. | | | 4,225,355 | |
| | | | | | | | |
| | | | | | | 8,478,220 | |
| | | | | | | | |
| | |
| | | | SOFTWARE - 2.1 % | | | | |
| | 32,359 | | | Fidelity National Information Services, Inc. | | | 4,295,981 | |
| | | | | | | | |
| | |
| | | | TRANSPORTATION - 1.9 % | | | | |
| | 24,173 | | | Union Pacific Corp. | | | 3,915,543 | |
| | | | | | | | |
| | |
| | | | TOTAL COMMON STOCK(Cost $128,453,574) | | | 148,006,120 | |
| | | | | | | | |
| | |
| | | | EXCHANGE TRADED FUNDS (A) - 22.8 % | | | | |
| | 920,000 | | | Timothy Plan High Dividend Stock ETF | | | 23,493,856 | |
| | 920,000 | | | Timothy Plan U.S. Large Cap Core ETF | | | 23,510,048 | |
| | | | | | | | |
| | | | TOTAL EXCHANGE TRADED FUNDS(Cost $46,064,400) | | | 47,003,904 | |
| | | | | | | | |
| | |
| | | | REITs - 3.8 % | | | | |
| | 28,645 | | | Crown Castle International Corp. | | | 3,981,941 | |
| | 16,042 | | | Public Storage | | | 3,934,621 | |
| | | | | | | | |
| | | | TOTAL REITs(Cost $7,411,280) | | | 7,916,562 | |
| | | | | | | | |
| | |
| | | | MONEY MARKET FUND - 0.2 % | | | | |
| | 401,169 | | | Fidelity Institutional Money Market Funds - Government Portfolio - Class I, 1.86% (B) (Cost $401,169) | | | 401,169 | |
| | | | | | | | |
| | |
| | | | TOTAL INVESTMENTS - 98.5 %(Cost $182,330,423) | | $ | 203,327,755 | |
| | | | OTHER ASSETS IN EXCESS OF LIABILITIES - NET - 1.5 % | | | 3,195,986 | |
| | | | | | | | |
| | | | NET ASSETS - 100.0 % | | $ | 206,523,741 | |
| | | | | | | | |
*Non-income producing securities.
ETF - Exchange Traded Funds.
PLC - Public Limited Co.
REITs - Real Estate Investment Trust.
(A) Affiliated Funds.
(B) Variable rate security; the rate shown represents the yield at September 30, 2019.
The accompanying notes are an integral part of these financial statements.
54
Schedule of Investments | Fixed Income Fund
As of September 30, 2019
| | | | | | | | | | | | | | | | |
| | |
| Par Value | | | | | Coupon Rate (%) | | | Maturity | | | Fair Value | |
| | |
| | | | |
| | | | BONDS & NOTES - 97.3 % | | | | | | | | | | | | |
| | | | CORPORATE BONDS - 29.5 % | | | | | | | | | | | | |
| | $ 1,000,000 | | | ABB Finance USA, Inc. | | | 2.875 | | | | 5/8/2022 | | | $ | 1,022,272 | |
| | 1,000,000 | | | American Electric Power | | | 3.200 | | | | 11/13/2027 | | | | 1,044,681 | |
| | 500,000 | | | Analog Devices, Inc. | | | 3.900 | | | | 12/15/2025 | | | | 538,132 | |
| | 1,000,000 | | | Aptiv Corp. | | | 4.150 | | | | 3/15/2024 | | | | 1,059,231 | |
| | 1,000,000 | | | Buckeye Partners LP | | | 3.950 | | | | 12/1/2026 | | | | 881,266 | |
| | 1,000,000 | | | Canadian Pacific RR Co. | | | 2.900 | | | | 2/1/2025 | | | | 1,027,579 | |
| | 1,000,000 | | | CBOE Holdings, Inc. | | | 3.650 | | | | 1/12/2027 | | | | 1,064,423 | |
| | 1,000,000 | | | Columbia Pipeline Group, Inc. | | | 4.500 | | | | 6/1/2025 | | | | 1,078,568 | |
| | 1,000,000 | | | CSX Corp. | | | 3.250 | | | | 6/1/2027 | | | | 1,050,841 | |
| | 500,000 | | | Digital Realty Trust LP | | | 3.700 | | | | 8/15/2027 | | | | 525,135 | |
| | 500,000 | | | Dollar General Corp. | | | 4.125 | | | | 5/1/2028 | | | | 547,201 | |
| | 865,000 | | | Dominion Energy, Inc. | | | 2.579 | | | | 7/1/2020 | | | | 867,068 | |
| | 750,000 | | | Eaton Corp. | | | 2.750 | | | | 11/2/2022 | | | | 763,425 | |
| | 1,000,000 | | | Enable Midstream Partners LP | | | 3.900 | | | | 5/15/2024 | | | | 1,019,984 | |
| | 855,000 | | | European Investment Bank | | | 2.375 | | | | 6/15/2022 | | | | 872,022 | |
| | 880,000 | | | HCP, Inc. | | | 3.500 | | | | 7/15/2029 | | | | 915,444 | |
| | 889,030 | | | John Sevier Combined Cycle Generation LLC | | | 4.626 | | | | 1/15/2042 | | | | 1,050,985 | |
| | 750,000 | | | Johnson Controls, Inc. | | | 5.000 | | | | 3/30/2020 | | | | 760,086 | |
| | 1,000,000 | | | Kennametal, Inc. | | | 3.875 | | | | 2/15/2022 | | | | 1,026,131 | |
| | 865,000 | | | KFW | | | 2.125 | | | | 6/15/2022 | | | | 876,384 | |
| | 800,000 | | | LYB International Finance BV | | | 4.000 | | | | 7/15/2023 | | | | 846,443 | |
| | 855,000 | | | National Rural Utilities Cooperative Finance Corp. | | | 2.950 | | | | 2/7/2024 | | | | 884,883 | |
| | 1,500,000 | | | NiSource Finance Corp. | | | 3.490 | | | | 5/15/2027 | | | | 1,574,405 | |
| | 1,000,000 | | | Nutrien Ltd. | | | 4.000 | | | | 12/15/2026 | | | | 1,071,857 | |
| | 1,000,000 | | | Phillips 66 Partners LP | | | 3.605 | | | | 2/15/2025 | | | | 1,045,391 | |
| | 870,000 | | | Province of Ontario Canada | | | 2.500 | | | | 4/27/2026 | | | | 903,830 | |
| | 865,000 | | | Province of Quebec Canada | | | 2.375 | | | | 1/31/2022 | | | | 877,244 | |
| | 1,000,000 | | �� | Stanley Black & Decker, Inc. | | | 2.900 | | | | 11/1/2022 | | | | 1,025,107 | |
| | 700,000 | | | Sunoco Logistics Partners LP | | | 4.250 | | | | 4/1/2024 | | | | 737,447 | |
| | 1,200,000 | | | Ventas Realty LP/CAP Corp. | | | 3.250 | | | | 8/15/2022 | | | | 1,231,861 | |
| | 830,000 | | | WEC Energy Group, Inc. | | | 3.550 | | | | 6/15/2025 | | | | 883,235 | |
| | 1,000,000 | | | Zimmer Biomet Holdings, Inc. | | | 3.700 | | | | 3/19/2023 | | | | 1,042,599 | |
| | | | | | | | | | | | | | | | |
| | | | TOTAL CORPORATE BONDS(Cost $29,191,134) | | | | | | | | | | | 30,115,160 | |
| | | | | | | | | | | | | | | | |
| | | | |
| | | | U.S. GOVERNMENT & AGENCY OBLIGATIONS - 67.8 % | | | | | | | | | | | | |
| | | | GOVERNMENT MORTGAGE-BACKED SECURITIES - 23.3 % | | | | | | | | | | | | |
| | 280,049 | | | GNMA Pool G2 4520 | | | 5.000 | | | | 8/20/2039 | | | | 309,979 | |
| | 355,438 | | | GNMA Pool G2 4947 | | | 5.000 | | | | 2/20/2041 | | | | 392,979 | |
| | 1,122,835 | | | GNMA Pool G2 MA3375 | | | 3.000 | | | | 1/20/2046 | | | | 1,159,525 | |
| | 935,493 | | | GNMA Pool G2 MA3376 | | | 3.500 | | | | 1/20/2046 | | | | 978,775 | |
| | 666,412 | | | GNMA Pool G2 MA3596 | | | 3.000 | | | | 4/20/2046 | | | | 687,524 | |
| | 1,676,406 | | | GNMA Pool G2 MA3663 | | | 3.500 | | | | 5/20/2046 | | | | 1,751,103 | |
| | 798,444 | | | GNMA Pool G2 MA3735 | | | 3.000 | | | | 6/20/2046 | | | | 823,273 | |
| | 616,801 | | | GNMA Pool G2 MA3736 | | | 3.500 | | | | 6/20/2046 | | | | 643,790 | |
| | 1,003,134 | | | GNMA Pool G2 MA4004 | | | 3.500 | | | | 10/20/2046 | | | | 1,047,682 | |
| | 1,000,132 | | | GNMA Pool G2 MA4126 | | | 3.000 | | | | 12/20/2046 | | | | 1,031,526 | |
| | 720,372 | | | GNMA Pool G2 MA4509 | | | 3.000 | | | | 6/20/2047 | | | | 742,125 | |
| | 1,006,307 | | | GNMA Pool G2 MA4652 | | | 3.500 | | | | 8/20/2047 | | | | 1,046,702 | |
| | 1,324,611 | | | GNMA Pool G2 MA4719 | | | 3.500 | | | | 9/20/2047 | | | | 1,378,319 | |
| | 1,344,456 | | | GNMA Pool G2 MA4778 | | | 3.500 | | | | 10/20/2047 | | | | 1,397,116 | |
| | 1,116,012 | | | GNMA Pool G2 MA4901 | | | 4.000 | | | | 12/20/2047 | | | | 1,165,142 | |
| | 1,028,985 | | | GNMA Pool G2 MA4963 | | | 4.000 | | | | 1/20/2048 | | | | 1,073,242 | |
| | 1,139,278 | | | GNMA Pool G2 MA5764 | | | 4.500 | | | | 2/20/2049 | | | | 1,192,214 | |
| | 610,102 | | | GNMA Pool G2 MA5819 | | | 5.000 | | | | 3/20/2049 | | | | 645,288 | |
| | 387,675 | | | GNMA Pool G2 MA5933 | | | 5.000 | | | | 5/20/2049 | | | | 411,628 | |
| | 1,168,775 | | | GNMA Pool G2 MA6041 | | | 4.500 | | | | 7/20/2049 | | | | 1,231,180 | |
| | 1,086,461 | | | GNMA Pool G2 MA6092 | | | 4.500 | | | | 8/20/2049 | | | | 1,148,181 | |
| | 1,216,852 | | | GNMA Pool G2 MA6093 | | | 5.000 | | | | 8/20/2049 | | | | 1,290,499 | |
| | 1,270,351 | | | GNMA Pool G2 MA6156 | | | 4.500 | | | | 9/20/2049 | | | | 1,339,168 | |
| | 526,225 | | | GNMA Pool GN 783060 | | | 4.000 | | | | 8/15/2040 | | | | 561,875 | |
| | 235,454 | | | GNMA Pool GN 783403 | | | 3.500 | | | | 9/15/2041 | | | | 247,869 | |
| | | | | | | | | | | | | | | | |
| | | | TOTAL GOVERNMENT MORTGAGE-BACKED SECURITIES(Cost$23,531,346) | | | | | | | | 23,696,704 | |
| | | | | | | | | | | | | | | | |
The accompanying notes are an integral part of these financial statements.
55
Schedule of Investments | Fixed Income Fund
As of September 30, 2019 (Continued)
| | | | | | | | | | | | | | | | |
| Par Value | | | | | Coupon Rate (%) | | | Maturity | | | Fair Value | |
| | | | |
| | | | GOVERNMENT NOTES & BONDS - 44.5 % | | | | | | | | | | | | |
| $ | 5,005,000 | | | United States Treasury Note | | | 3.125 | | | | 5/15/2021 | | | $ | 5,116,440 | |
| | 5,975,000 | | | United States Treasury Note | | | 2.125 | | | | 6/30/2022 | | | | 6,062,641 | |
| | 10,935,000 | | | United States Treasury Note | | | 2.250 | | | | 11/15/2024 | | | | 11,295,513 | |
| | 10,020,000 | | | United States Treasury Note | | | 2.000 | | | | 8/15/2025 | | | | 10,244,667 | |
| | 6,405,000 | | | United States Treasury Note | | | 1.625 | | | | 2/15/2026 | | | | 6,408,628 | |
| | 4,540,000 | | | United States Treasury Note | | | 4.500 | | | | 2/15/2036 | | | | 6,260,057 | |
| | | | | | | | | | | | | | | | |
| | | | TOTAL GOVERNMENT NOTES & BONDS(Cost $44,066,071) | | | | 45,387,946 | |
| | | | | | | | | | | | | | | | |
| | |
| | | | TOTAL U.S. GOVERNMENT & AGENCY OBLIGATIONS(Cost $67,597,417) | | | | 69,084,650 | |
| | | | | | | | | | | | | | | | |
| | |
| | | | TOTAL BONDS AND NOTES(Cost $96,788,551) | | | | 99,199,810 | |
| | | | | | | | | | | | | | | | |
| | | | |
| | Shares | | | | | | | | | | | | | | | |
| | | | MONEY MARKET FUND - 2.7 % | | | | | | | | | | | | |
| | 2,735,949 | | | Fidelity Institutional Money Market Funds - Government Portfolio - Class I, 1.86% (A)
(Cost $2,735,949) | | | | | | | | 2,735,949 | |
| | | | | | | | | | | | | | | | |
| | | | |
| | | | TOTAL INVESTMENTS - 100.0 %(Cost $99,524,500) | | | | | | | | | | $ | 101,935,759 | |
| | | | OTHER ASSETS IN EXCESS OF LIABILITIES - NET - 0.0 % * | | | | 36,712 | |
| | | | | | | | | | | | | | | | |
| | | | NET ASSETS - 100.0 % | | | | | | | | | | $ | 101,972,471 | |
| | | | | | | | | | | | | | | | |
GNMA - Government National Mortgage Association.
LLC - Limited Liability Company.
LP - Limited Partnership.
(A) Variable rate security; the rate shown represents the yield at September 30, 2019.
* Amount is less than 0.05%
The accompanying notes are an integral part of these financial statements.
56
Schedule of Investments | High Yield Bond Fund
As of September 30, 2019
| | | | | | | | | | | | | | | | |
| Par Value | | | | | Coupon Rate (%) | | | Maturity | | | Fair Value | |
| | | | |
| | | | CORPORATE BONDS - 95.1 % | | | | | | | | | | | | |
| | $ 500,000 | | | Adient Global Holdings Ltd. (A) | | | 4.875 | | | | 8/15/2026 | | | $ | 408,750 | |
| | 1,000,000 | | | Adient US LLC (A) | | | 7.000 | | | | 5/15/2026 | | | | 1,047,500 | |
| | 1,000,000 | | | Alliance Resource Operating Partners LP (A) | | | 7.500 | | | | 5/1/2025 | | | | 991,250 | |
| | 1,000,000 | | | Ashtead Capital, Inc. (A) | | | 4.125 | | | | 8/15/2025 | | | | 1,022,500 | |
| | 950,000 | | | B&G Foods, Inc. | | | 5.250 | | | | 4/1/2025 | | | | 973,750 | |
| | 750,000 | | | BBA US Holdings, Inc. (A) | | | 5.375 | | | | 5/1/2026 | | | | 789,375 | |
| | 500,000 | | | Beazer Homes USA, Inc. | | | 5.875 | | | | 10/15/2027 | | | | 486,675 | |
| | 500,000 | | | BWX Technologies, Inc. (A) | | | 5.375 | | | | 7/15/2026 | | | | 528,125 | |
| | 500,000 | | | Cascades, Inc. (A) | | | 5.500 | | | | 7/15/2022 | | | | 508,750 | |
| | 500,000 | | | Cemex Finance LLC (A) | | | 6.000 | | | | 4/1/2024 | | | | 514,500 | |
| | 500,000 | | | Centene Corp. | | | 4.750 | | | | 1/15/2025 | | | | 514,500 | |
| | 560,000 | | | Centennial Resource Production LLC (A) | | | 6.875 | | | | 4/1/2027 | | | | 561,400 | |
| | 250,000 | | | Colfax Corp. (A) | | | 6.375 | | | | 2/15/2026 | | | | 269,297 | |
| | 390,000 | | | Connect US Finco LLC (A) | | | 6.750 | | | | 10/1/2026 | | | | 397,800 | |
| | 250,000 | | | Crestwood Midstream Finance Corp. | | | 5.750 | | | | 4/1/2025 | | | | 258,125 | |
| | 1,000,000 | | | Crestwood Midstream Finance Corp. (A) | | | 5.625 | | | | 5/1/2027 | | | | 1,023,440 | |
| | 1,500,000 | | | DaVita HealthCare Partners, Inc. | | | 5.000 | | | | 5/1/2025 | | | | 1,499,730 | |
| | 500,000 | | | DCP Midstream, LLC, 3 mo. LIBOR + 3.85% (A) (B) | | | 5.850 | | | | 5/21/2043 | | | | 456,650 | |
| | 500,000 | | | Diamond Sports Finance Co. (A) | | | 5.375 | | | | 8/15/2026 | | | | 520,000 | |
| | 1,000,000 | | | Energizer Holdings, Inc. (A) | | | 5.500 | | | | 6/15/2025 | | | | 1,037,830 | |
| | 1,000,000 | | | Freedom Mortgage Corp. (A) | | | 8.250 | | | | 4/15/2025 | | | | 922,500 | |
| | 500,000 | | | Genesis Energy LP | | | 6.750 | | | | 8/1/2022 | | | | 509,175 | |
| | 750,000 | | | Geo Group, Inc. | | | 5.125 | | | | 4/1/2023 | | | | 665,625 | |
| | 500,000 | | | Geo Group, Inc. | | | 6.000 | | | | 4/15/2026 | | | | 406,000 | |
| | 670,000 | | | GFL Environmental, Inc. (A) | | | 8.500 | | | | 5/1/2027 | | | | 744,538 | |
| | 1,000,000 | | | Global Finance Corp. (A) | | | 7.000 | | | | 8/1/2027 | | | | 1,032,500 | |
| | 500,000 | | | Go Daddy Operating Co. LLC (A) | | | 5.250 | | | | 12/1/2027 | | | | 527,500 | |
| | 1,000,000 | | | Goodyear Tire & Rubber Co. | | | 4.875 | | | | 3/15/2027 | | | | 989,850 | |
| | 1,075,000 | | | Greif, Inc. (A) | | | 6.500 | | | | 3/1/2027 | | | | 1,142,725 | |
| | 500,000 | | | Hanesbrands, Inc. (A) | | | 4.875 | | | | 5/15/2026 | | | | 530,750 | |
| | 250,000 | | | Icahn Enterprises Finance Corp. (A) | | | 4.750 | | | | 9/15/2024 | | | | 250,063 | |
| | 1,000,000 | | | Icahn Enterprises Finance Corp. (A) | | | 6.250 | | | | 5/15/2026 | | | | 1,051,250 | |
| | 500,000 | | | Itron, Inc. (A) | | | 5.000 | | | | 1/15/2026 | | | | 516,400 | |
| | 250,000 | | | Jefferies Finance LLC (A) | | | 6.250 | | | | 6/3/2026 | | | | 258,750 | |
| | 500,000 | | | Kaiser Aluminum Corp. | | | 5.875 | | | | 5/15/2024 | | | | 521,805 | |
| | 1,500,000 | | | Koppers, Inc. (A) | | | 6.000 | | | | 2/15/2025 | | | | 1,508,445 | |
| | 500,000 | | | Magnolia Oil Gas (A) | | | 6.000 | | | | 8/1/2026 | | | | 502,500 | |
| | 300,000 | | | MEDNAX, Inc. (A) | | | 6.250 | | | | 1/15/2027 | | | | 298,479 | |
| | 1,000,000 | | | Millicom International Cellular SA (A) | | | 5.125 | | | | 1/15/2028 | | | | 1,046,350 | |
| | 1,000,000 | | | MPT Operating Partnership LP | | | 5.250 | | | | 8/1/2026 | | | | 1,051,500 | |
| | 1,000,000 | | | MTS Systems Corp. (A) | | | 5.750 | | | | 8/15/2027 | | | | 1,042,500 | |
| | 1,500,000 | | | Nationstar Mortgage Holdings, Inc. (A) | | | 9.125 | | | | 7/15/2026 | | | | 1,599,375 | |
| | 1,500,000 | | | Newmark Group, Inc. | | | 6.125 | | | | 11/15/2023 | | | | 1,628,300 | |
| | 1,500,000 | | | NGL Energy Partners LP | | | 6.125 | | | | 3/1/2025 | | | | 1,436,250 | |
| | 340,000 | | | NuStar Logistics LP | | | 6.000 | | | | 6/1/2026 | | | | 368,832 | |
| | 1,000,000 | | | NuStar Logistics LP | | | 5.625 | | | | 4/28/2027 | | | | 1,060,000 | |
| | 1,000,000 | | | Olin Corp. | | | 5.625 | | | | 8/1/2029 | | | | 1,042,800 | |
| | 580,000 | | | Panther BF Aggregator 2 LP (A) | | | 6.250 | | | | 5/15/2026 | | | | 611,900 | |
| | 1,080,000 | | | Panther BF Aggregator 2 LP (A) | | | 8.500 | | | | 5/15/2027 | | | | 1,096,200 | |
| | 1,000,000 | | | PBF Finance Corp. | | | 7.250 | | | | 6/15/2025 | | | | 1,040,000 | |
| | 1,500,000 | | | Plastipak Holdings, Inc. (A) | | | 6.250 | | | | 10/15/2025 | | | | 1,245,000 | |
| | 390,000 | | | Qorvo, Inc. (A) | | | 4.375 | | | | 10/15/2029 | | | | 393,413 | |
| | 500,000 | | | Qualitytech LP (A) | | | 4.750 | | | | 11/15/2025 | | | | 517,500 | |
| | 1,000,000 | | | Reynolds Group Issuer, Inc. (A) | | | 5.125 | | | | 7/15/2023 | | | | 1,026,250 | |
| | 750,000 | | | ScottsMiracle-Gro Co. | | | 5.250 | | | | 12/15/2026 | | | | 790,312 | |
| | 390,000 | | | Select Medical Corp. (A) | | | 6.250 | | | | 8/15/2026 | | | | 408,525 | |
| | 500,000 | | | SemGroup LP | | | 5.625 | | | | 7/15/2022 | | | | 510,005 | |
| | 500,000 | | | SemGroup LP | | | 6.375 | | | | 3/15/2025 | | | | 520,000 | |
| | 250,000 | | | Service Corp. International | | | 5.125 | | | | 6/1/2029 | | | | 268,437 | |
| | 1,000,000 | | | Standard Industries, Inc. (A) | | | 5.000 | | | | 2/15/2027 | | | | 1,037,800 | |
| | 500,000 | | | Steel Dynamics, Inc. | | | 5.250 | | | | 4/15/2023 | | | | 509,375 | |
| | 1,000,000 | | | Suburban Propane Partners LP | | | 5.875 | | | | 3/1/2027 | | | | 1,027,020 | |
The accompanying notes are an integral part of these financial statements.
57
Schedule of Investments | High Yield Bond Fund
As of September 30, 2019 (Continued)
| | | | | | | | | | | | | | | | |
| Par Value | | | | | Coupon Rate (%) | | | Maturity | | | Fair Value | |
| | | |
| | | | CORPORATE BONDS - 95.1 % (Cont.) | | | | | | | | | |
| | $ 500,000 | | | Targa Resources Partners LP | | | 4.250 | | | | 11/15/2023 | | | $ | 505,625 | |
| | 500,000 | | | Targa Resources Partners LP | | | 5.375 | | | | 2/1/2027 | | | | 519,375 | |
| | 500,000 | | | Teleflex, Inc. | | | 4.875 | | | | 6/1/2026 | | | | 523,750 | |
| | 390,000 | | | Tenet Healthcare Corp. (A) | | | 4.625 | | | | 9/1/2024 | | | | 401,673 | |
| | 1,000,000 | | | Tenet Healthcare Corp. (A) | | | 6.250 | | | | 2/1/2027 | | | | 1,042,800 | |
| | 150,000 | | | TransDigm, Inc. (A) | | | 6.250 | | | | 3/15/2026 | | | | 161,437 | |
| | 750,000 | | | TRI Pointe Group, Inc. | | | 5.875 | | | | 6/15/2024 | | | | 800,625 | |
| | 1,000,000 | | | TTM Technologies, Inc. (A) | | | 5.625 | | | | 10/1/2025 | | | | 1,002,500 | |
| | 750,000 | | | United Rentals North America, Inc. | | | 4.875 | | | | 1/15/2028 | | | | 782,812 | |
| | 750,000 | | | Vistra Operations Co. LLC (A) | | | 5.625 | | | | 2/15/2027 | | | | 792,600 | |
| | 1,185,000 | | | Vizient, Inc. (A) | | | 6.250 | | | | 5/15/2027 | | | | 1,273,875 | |
| | 1,000,000 | | | Waste Pro USA, Inc. (A) | | | 5.500 | | | | 2/15/2026 | | | | 1,035,960 | |
| | 325,000 | | | Weekley Finance Corp. | | | 6.000 | | | | 2/1/2023 | | | | 325,682 | |
| | 500,000 | | | Weekley Finance Corp. | | | 6.625 | | | | 8/15/2025 | | | | 503,750 | |
| | 1,000,000 | | | Whiting Petroleum Corp. | | | 6.625 | | | | 1/15/2026 | | | | 680,000 | |
| | | | | | | | | | | | | | | | |
| | | | TOTAL CORPORATE BONDS(Cost $56,700,595) | | | | 57,818,910 | |
| | | | | | | | | | | | | | | | |
| | | | |
| Shares | | | | | | | | | | | | |
| | | | MONEY MARKET FUND - 5.4 % | | | | | |
| | 3,258,394 | | | Fidelity Institutional Money Market Funds - Government Portfolio - Class I, 1.86% (C) (Cost $3,258,394) | | | | | | | | 3,258,394 | |
| | | | | | | | | | | | | | | | |
| | | | |
| | | | TOTAL INVESTMENTS - 100.5 %(Cost $59,958,989) | | | | | | | | | | $ | 61,077,304 | |
| | | | OTHER ASSETS IN EXCESS OF LIABILITIES - NET - (0.5) % | | | | | | | | | | | (276,953) | |
| | | | | | | | | | | | | | | | |
| | | | NET ASSETS - 100.0 % | | | | | | | | | | $ | 60,800,351 | |
| | | | | | | | | | | | | | | | |
LIBOR - London Interbank Offered Rate. The 3 month U.S. LIBOR rate as of September 30, 2019 is 2.09%.
LLC - Limited Liability Company.
LP - Limited Partnership.
(A) 144A Security - Security exempt from registration under Rule 144A of the Securities Act of 1933. The 144A securities had a fair value of $35,099,225 and represent 57.7% of total net assets. The securities may be resold in transactions exempt from registration typically only to qualified institutional buyers. Unless otherwise indicated, these securities are not considered to be illiquid.
(B) Variable rate security; the interest rate shown reflects the effective rate at September 30, 2019.
(C) Variable rate security; the rate shown represents the yield at September 30, 2019.
The accompanying notes are an integral part of these financial statements.
58
Schedule of Investments | Israel Common Values Fund
As of September 30, 2019
| | | | | | | | |
| Shares | | | | | Fair Value | |
| | |
| | | | COMMON STOCK - 93.4 % | | | | |
| | | | AEROSPACE/DEFENSE - 3.9 % | | | | |
| | 19,001 | | | Elbit Systems Ltd. | | $ | 3,130,795 | |
| | | | | | | | |
| | |
| | | | AGRICULTURE - 0.0 % ** | | | | |
| | 900 | | | Mehadrin Ltd. * | | | 36,074 | |
| | | | | | | | |
| | |
| | | | APPAREL - 0.6 % | | | | |
| | 19,500 | | | Delta-Galil Industries Ltd. | | | 486,630 | |
| | | | | | | | |
| | |
| | | | BANKS - 19.0 % | | | | |
| | 94,500 | | | Bank Hapoalim BM (ADR) * | | | 3,751,650 | |
| | 443,000 | | | Bank LeumiLe-Israel BM | | | 3,153,179 | |
| | 66,300 | | | First International Bank Of Israel Ltd. | | | 1,765,749 | |
| | 704,000 | | | Israel Discount Bank Ltd. | | | 3,096,887 | |
| | 105,000 | | | Mizrahi Tefahot Bank Ltd. | | | 2,610,047 | |
| | 280,000 | | | Tel Aviv Stock Exchange Ltd. * | | | 867,599 | |
| | | | | | | | |
| | | | | | | 15,245,111 | |
| | | | | | | | |
| | | | BUILDING MATERIALS - 1.1 % | | | | |
| | 18,000 | | | Caesarstone Ltd. | | | 298,980 | |
| | 150,000 | | | Inrom Construction Industries Ltd. | | | 597,704 | |
| | | | | | | | |
| | | | | | | 896,684 | |
| | | | | | | | |
| | | | CHEMICALS - 3.7 % | | | | |
| | 11,757 | | | International Flavors & Fragrances, Inc. | | | 1,415,239 | |
| | 304,075 | | | Israel Chemicals Ltd. | | | 1,523,416 | |
| | | | | | | | |
| | | | | | | 2,938,655 | |
| | | | | | | | |
| | | | COMPUTERS - 6.5 % | | | | |
| | 14,900 | | | Check Point Software Technologies Ltd. * | | | 1,631,550 | |
| | 20,400 | | | CyberArk Software Ltd. * | | | 2,036,328 | |
| | 56,210 | | | Matrix IT Ltd. | | | 957,695 | |
| | 10,000 | | | Varonis Systems, Inc. * | | | 597,800 | |
| | | | | | | | |
| | | | | | | 5,223,373 | |
| | | | | | | | |
| | | | ELECTRIC - 2.1 % | | | | |
| | 7,000 | | | Kenon Holdings Ltd. | | | 139,484 | |
| | 20,700 | | | Ormat Technologies, Inc. | | | 1,537,830 | |
| | | | | | | | |
| | | | | | | 1,677,314 | |
| | | | | | | | |
| | | | ELECTRONICS - 0.9 % | | | | |
| | 27,896 | | | Ituran Location and Control Ltd. | | | 691,542 | |
| | | | | | | | |
| | |
| | | | ENERGY-ALTERNATE SOURCES - 0.5 % | | | | |
| | 181,360 | | | Energix-Renewable Energies Ltd. * | | | 439,338 | |
| | | | | | | | |
| | |
| | | | FOOD - 6.9 % | | | | |
| | 29,700 | | | Rami Levy Chain Stores Hashikma Marketing 2006 Ltd. | | | 1,681,616 | |
| | 210,000 | | | Shufersal Ltd. | | | 1,530,986 | |
| | 62,500 | | | Strauss Group Ltd. | | | 1,958,182 | |
| | 34,000 | | | Victory Supermarket Chain Ltd. | | | 411,917 | |
| | | | | | | | |
| | | | | | | 5,582,701 | |
| | | | | | | | |
| | | | HEALTHCARE - SERVICES - 1.0 % | | | | |
| | 11,269 | | | Danel Adir Yeoshua Ltd. | | | 767,412 | |
| | | | | | | | |
| | |
| | | | HOLDING COMPANIES - DIVERSIFIED - 1.6 % | | | | |
| | 45,000 | | | Elco Ltd. | | | 1,274,728 | |
| | | | | | | | |
| | |
| | | | HOME BUILDERS - 1.4 % | | | | |
| | 1,800 | | | Bayside Land Corp. | | | 1,151,217 | |
| | | | | | | | |
The accompanying notes are an integral part of these financial statements.
59
Schedule of Investments | Israel Common Values Fund
As of September 30, 2019 (Continued)
| | | | | | | | |
| Shares | | | | | Fair Value | |
| | |
| | | | INSURANCE - 5.9 % | | | | |
| | 59,950 | | | Clal Insurance Enterprises Holdings Ltd. * | | $ | 907,236 | |
| | 184,000 | | | Harel Insurance Investments & Financial Services Ltd. | | | 1,599,240 | |
| | 1,080,000 | | | Migdal Insurance & Financial Holding Ltd. | | | 1,149,353 | |
| | 167,400 | | | Phoenix Holdings Ltd. | | | 1,061,963 | |
| | | | | | | | |
| | | | | | | 4,717,792 | |
| | | | | | | | |
| | |
| | | | LEISURE TIME - 1.2 % | | | | |
| | 116,000 | | | Maytronics Ltd. | | | 988,526 | |
| | | | | | | | |
| | |
| | | | OIL & NATURAL GAS - 6.2 % | | | | |
| | 346,541 | | | Delek Drilling LP | | | 809,574 | |
| | 30,000 | | | Energean Oil & Gas PLC * | | | 346,400 | |
| | 5,000 | | | Israel Corp. Ltd. * | | | 1,124,202 | |
| | 1,995,000 | | | Oil Refineries Ltd. * | | | 1,052,084 | |
| | 8,000 | | | Paz Oil Co. Ltd. | | | 1,169,227 | |
| | 737,500 | | | Ratio Oil Exploration 1992 LP * | | | 484,198 | |
| | | | | | | | |
| | | | | | | 4,985,685 | |
| | | | | | | | |
| | |
| | | | PHARMACEUTICALS - 0.9 % | | | | |
| | 1,575,013 | | | Novolog Ltd. | | | 724,566 | |
| | | | | | | | |
| | |
| | | | REAL ESTATE - 10.5 % | | | | |
| | 105,000 | | | Alony Hetz Properties & Investments Ltd. | | | 1,536,121 | |
| | 176,000 | | | Amot Investments Ltd. | | | 1,302,860 | |
| | 31,000 | | | Azrieli Group Ltd. | | | 2,434,835 | |
| | 91,000 | | | Gazit-Globe Ltd. | | | 917,121 | |
| | 332,522 | | | Jerusalem Economy Ltd. * | | | 1,473,283 | |
| | 12,580 | | | Melisron Ltd. | | | 812,504 | |
| | | | | | | | |
| | | | | | | 8,476,724 | |
| | | | | | | | |
| | |
| | | | RETAIL - 1.6 % | | | | |
| | 32,300 | | | Tadiran Holdings Ltd. | | | 1,258,248 | |
| | | | | | | | |
| | |
| | | | SEMICONDUCTORS - 5.8 % | | | | |
| | 16,700 | | | Mellanox Technologies Ltd. * | | | 1,830,153 | |
| | 48,000 | | | Nova Measuring Instruments Ltd. * | | | 1,524,960 | |
| | 1 | | | Tower Semiconductor Ltd. * | | | 12 | |
| | 69,323 | | | Tower Semiconductor Ltd. * | | | 1,333,775 | |
| | | | | | | | |
| | | | | | | 4,688,900 | |
| | | | | | | | |
| | |
| | | | SOFTWARE - 5.2 % | | | | |
| | 24,935 | | | Hilan Ltd. | | | 1,017,975 | |
| | 78,783 | | | Magic Software Enterprises Ltd. | | | 724,016 | |
| | 43,500 | | | Radware Ltd. * | | | 1,055,310 | |
| | 48,300 | | | Sapiens International Corp. NV | | | 948,612 | |
| | 9,500 | | | Verint Systems, Inc. * | | | 406,410 | |
| | | | | | | | |
| | | | | | | 4,152,323 | |
| | | | | | | | |
| | |
| | | | TELECOMMUNICATIONS - 5.8 % | | | | |
| | 19,300 | | | AudioCodes Ltd. | | | 364,963 | |
| | 25,600 | | | Nice Ltd. (ADR) * | | | 3,681,280 | |
| | 20,455 | | | Pointer Telocation Ltd. * | | | 307,643 | |
| | 8,917 | | | Silicom Ltd. * | | | 281,777 | |
| | | | | | | | |
| | | | | | | 4,635,663 | |
| | | | | | | | |
| | |
| | | | TEXTILES - 1.1 % | | | | |
| | 25,300 | | | Fox Wizel Ltd. | | | 904,039 | |
| | | | | | | | |
| | |
| | | | TOTAL COMMON STOCK (Cost $53,860,442) | | | 75,074,040 | |
| | | | | | | | |
| | |
| | | | REITs - 1.5 % | | | | |
| | 194,000 | | | Reit 1 Ltd. * (Cost $910,932) | | | 1,222,337 | |
| | | | | | | | |
The accompanying notes are an integral part of these financial statements.
60
Schedule of Investments | Israel Common Values Fund
As of September 30, 2019 (Continued)
| | | | | | | | |
| Shares | | | | | Fair Value | |
| | |
| | | | MONEY MARKET FUND - 5.1 % | | | | |
| | 4,120,607 | | | Fidelity Institutional Money Market Funds - Government Portfolio - Class I, 1.86% (A) | | $ | 4,120,607 | |
| | | | | | | | |
| | | | (Cost $4,120,607) | | | | |
| | |
| | | | TOTAL INVESTMENTS - 100.0 %(Cost $58,891,981) | | $ | 80,416,984 | |
| | | | OTHER ASSETS IN EXCESS OF LIABILITIES - NET - 0.0 % ** | | | (11,417) | |
| | | | | | | | |
| | | | NET ASSETS - 100.0 % | | $ | 80,405,567 | |
| | | | | | | | |
*Non-income producing securities.
** Amount is less than 0.05%
ADR - American Depositary Receipt.
LP - Limited Partnership.
PLC - Public Limited Co.
REITs - Real Estate Investment Trust.
(A) Variable rate security; the rate shown represents the yield at September 30, 2019.
| | | | |
| Diversification of Assets | | | |
Country | | | % of Net Assets | |
Israel | | | 89.3% | |
United States | | | 4.9% | |
United Kingdom | | | 0.4% | |
Singapore | | | 0.2% | |
Iceland | | | 0.1% | |
| | | | |
Total | | | 94.9% | |
Money Market Fund | | | 5.1% | |
Other Assets Less Liabilities - Net | | | 0.0% | |
| | | | |
Grand Total | | | 100.0% | |
| | | | |
The accompanying notes are an integral part of these financial statements.
61
Schedule of Investments | Defensive Strategies Fund
As of September 30, 2019
| | | | | | | | |
| | |
| Shares | | | | | Fair Value | |
| | |
| | |
| | | | COMMON STOCK - 19.8 % | | | | |
| | | | AGRICULTURE - 0.6 % | | | | |
| | 1,709 | | | Adecoagro SA * | | $ | 9,963 | |
| | 1,997 | | | Bunge Ltd. | | | 113,070 | |
| | 3,205 | | | Darling Ingredients, Inc. * | | | 61,312 | |
| | 1,142 | | | Nutrien Ltd. | | | 56,963 | |
| | | | | | | | |
| | | | | | | 241,308 | |
| | | | | | | | |
| | | | CHEMICALS - 1.1 % | | | | |
| | 887 | | | CF Industries Holdings, Inc. | | | 43,640 | |
| | 2,013 | | | FMC Corp. | | | 176,500 | |
| | 5,370 | | | K+S AG | | | 74,438 | |
| | 2,260 | | | Mosaic Co. | | | 46,330 | |
| | 1,463 | | | Sasol Ltd. (ADR) | | | 24,886 | |
| | 1,807 | | | Sociedad Quimica Y Minera de Chile, SA (ADR) | | | 50,217 | |
| | 484 | | | Wacker Chemie AG | | | 31,818 | |
| | | | | | | | |
| | | | | | | 447,829 | |
| | | | | | | | |
| | | | COMMERCIAL SERVICES - 0.0 % ** | | | | |
| | 1,043 | | | Harsco Corp. * | | | 19,775 | |
| | | | | | | | |
| | | | | | | | |
| | | | ENVIRONMENTAL CONTROL - 0.4 % | | | | |
| | 3,576 | | | Evoqua Water Technologies Corp. * | | | 60,863 | |
| | 1,300 | | | Kurita Water Industries Ltd. | | | 34,799 | |
| | 1,279 | | | Pentair PLC | | | 48,346 | |
| | | | | | | | |
| | | | | | | 144,008 | |
| | | | | | | | |
| | | | FOOD - 1.1 % | | | | |
| | 5,133 | | | BRF SA (ADR) * | | | 47,018 | |
| | 680 | | | Cal-Maine Foods, Inc. | | | 27,169 | |
| | 269 | | | Fresh Del Monte Produce, Inc. | | | 9,176 | |
| | 500 | | | Ingredion, Inc. | | | 40,870 | |
| | 1,900 | | | Megmilk Snow Brand Co. Ltd. | | | 45,727 | |
| | 12,300 | | | Nippon Suisan Kaisha Ltd. | | | 69,538 | |
| | 2,128 | | | Pilgrim’s Pride Corp. * | | | 68,192 | |
| | 942 | | | Sanderson Farms, Inc. | | | 142,553 | |
| | | | | | | | |
| | | | | | | 450,243 | |
| | | | | | | | |
| | | | FOREST PRODUCTS & PAPER - 0.0 % ** | | | | |
| | 900 | | | Sumitomo Forestry Co. Ltd. | | | 11,958 | |
| | | | | | | | |
| | |
| | | | HEALTHCARE - SERVICES - 1.0 % | | | | |
| | 51,136 | | | Brookdale Senior Living, Inc. * | | | 387,611 | |
| | | | | | | | |
| | |
| | | | IRON/STEEL - 0.9 % | | | | |
| | 1,178 | | | Allegheny Technologies, Inc. * | | | 23,855 | |
| | 3,413 | | | ArcelorMittal (ADR) | | | 48,601 | |
| | 1,259 | | | Gerdau SA (ADR) | | | 3,966 | |
| | 4,300 | | | Hitachi Metals Ltd. | | | 46,392 | |
| | 5,600 | | | Kobe Steel Ltd. | | | 29,846 | |
| | 2,000 | | | Nippon Steel & Sumitomo Metal Corp. | | | 27,860 | |
| | 762 | | | POSCO (ADR) | | | 35,936 | |
| | 588 | | | Salzgitter AG | | | 9,872 | |
| | 733 | | | Severstal PAO (GDR) | | | 10,519 | |
| | 2,055 | | | Steel Dynamics, Inc. | | | 61,239 | |
| | 841 | | | Ternium SA (ADR) | | | 16,139 | |
| | 1,800 | | | Tokyo Steel Manufacturing Co. Ltd. | | | 13,790 | |
| | 4,228 | | | United States Steel Corp. | | | 48,833 | |
| | | | | | | | |
| | | | | | | 376,848 | |
| | | | | | | | |
| | | | MACHINERY - DIVERSIFIED - 1.6 % | | | | |
| | 1,442 | | | AGCO Corp. | | | 109,159 | |
| | 4,046 | | | CNH Industrial NV | | | 41,067 | |
| | 1,861 | | | Deere & Co. | | | 313,913 | |
| | 12,000 | | | Kubota Corp. | | | 181,485 | |
| | | | | | | | |
| | | | | | | 645,624 | |
| | | | | | | | |
| | | | METAL FABRICATE/HARDWARE - 0.2 % | | | | |
| | 500 | | | Maruichi Steel Tube Ltd. | | | 13,199 | |
| | 1,843 | | | Rexnord Corp. * | | | 49,853 | |
| | 942 | | | Tenaris SA (ADR) | | | 19,952 | |
| | | | | | | | |
| | | | | | | 83,004 | |
| | | | | | | | |
The accompanying notes are an integral part of these financial statements.
62
Schedule of Investments | Defensive Strategies Fund
As of September 30, 2019 (Continued)
| | | | | | | | |
| | |
| Shares | | | | | Fair Value | |
| | |
| | |
| | | | MINING - 4.8 % | | | | |
| | 2,967 | | | Alamos Gold, Inc. | | $ | 17,209 | |
| | 3,064 | | | Anglo American PLC | | | 70,652 | |
| | 1,391 | | | Antofagasta PLC | | | 15,410 | |
| | 2,915 | | | BHP Billiton Ltd. (ADR) | | | 143,943 | |
| | 234 | | | BHP Billiton PLC (ADR) | | | 10,025 | |
| | 2,352 | | | Cameco Corp. * | | | 22,344 | |
| | 3,247 | | | Cia De Minas Buenaventura (ADR) | | | 49,289 | |
| | 817 | | | Compass Minerals International, Inc. | | | 46,152 | |
| | 3,000 | | | Detour Gold Corp. * | | | 44,071 | |
| | 145 | | | Eramet | | | 7,182 | |
| | 959 | | | Franco-Nevada Corp. | | | 87,422 | |
| | 24,174 | | | Glencore PLC | | | 72,910 | |
| | 17,287 | | | Gold Fields Ltd. (ADR) | | | 85,052 | |
| | 21,521 | | | Hecla Mining Co. | | | 37,877 | |
| | 31,631 | | | IAMGOLD Corp. * | | | 107,862 | |
| | 1,412 | | | KAZ Minerals PLC | | | 7,539 | |
| | 1,000 | | | Kirkland Lake Gold Ltd. | | | 44,826 | |
| | 1,766 | | | Livent Corp. * | | | 11,815 | |
| | 1,800 | | | Lundin Mining Corp. | | | 8,470 | |
| | 1,500 | | | Mitsubishi Materials Corp. | | | 40,458 | |
| | 5,412 | | | MMC Norilsk Nickel PJSC (ADR) | | | 138,547 | |
| | 5,054 | | | Newmont Goldcorp Corp. | | | 191,648 | |
| | 3,600 | | | Pretium Resources, Inc. * | | | 41,436 | |
| | 5,198 | | | Rio Tinto PLC (ADR) | | | 270,764 | |
| | 117 | | | Royal Gold, Inc. | | | 14,416 | |
| | 1,948 | | | Southern Copper Corp. | | | 66,485 | |
| | 1,700 | | | Sumitomo Metal Mining Co. Ltd. | | | 52,648 | |
| | 9,143 | | | Teck Resources Ltd. | | | 148,332 | |
| | 1,249 | | | Vedanta Ltd. (ADR) | | | 10,841 | |
| | 3,225 | | | Wheaton Precious Metals Corp. | | | 84,624 | |
| | | | | | | | |
| | | | | | | 1,950,249 | |
| | | | | | | | |
| | | | OIL & GAS - 5.8 % | | | | |
| | 4,506 | | | Antero Resources Corp. * | | | 13,608 | |
| | 2,136 | | | Apache Corp. | | | 54,682 | |
| | 21,100 | | | ARC Resources Ltd | | | 100,560 | |
| | 281 | | | Cabot Oil & Gas Corp. | | | 4,937 | |
| | 4,417 | | | Callon Petroleum Co. * | | | 19,170 | |
| | 683 | | | Canadian Natural Resources Ltd. | | | 18,188 | |
| | 6,166 | | | Cenovus Energy, Inc. | | | 57,888 | |
| | 1,323 | | | Centennial Resource Development, Inc. * | | | 5,973 | |
| | 901 | | | Chesapeake Energy Corp. * | | | 1,270 | |
| | 370 | | | Cimarex Energy Co. | | | 17,738 | |
| | 1,167 | | | Concho Resources, Inc. | | | 79,239 | |
| | 2,567 | | | ConocoPhillips | | | 146,268 | |
| | 2,504 | | | Continental Resources, Inc. * | | | 77,098 | |
| | 3,900 | | | Crescent Point Energy Corp. | | | 16,672 | |
| | 2,369 | | | Devon Energy Corp. | | | 56,998 | |
| | 319 | | | Diamondback Energy, Inc. | | | 28,681 | |
| | 1,026 | | | Ecopetrol SA (ADR) | | | 17,473 | |
| | 2,920 | | | Encana Corp. | | | 13,432 | |
| | 17,000 | | | Enerplus Corp. | | | 126,730 | |
| | 1,962 | | | EOG Resources, Inc. | | | 145,620 | |
| | 127 | | | EQT Corp. | | | 1,351 | |
| | 5,349 | | | Equinor ASA (ADR) | | | 101,364 | |
| | 587 | | | Helmerich & Payne, Inc. | | | 23,521 | |
| | 628 | | | Hess Corp. | | | 37,981 | |
| | 3,600 | | | Husky Energy, Inc. | | | 25,341 | |
| | 10,200 | | | Inpex Corp. | | | 93,539 | |
| | 1,199 | | | Lukoil PJSC (ADR) | | | 99,205 | |
| | 7,122 | | | Marathon Oil Corp. | | | 87,387 | |
| | 2,350 | | | Matador Resources Co. * | | | 38,846 | |
| | 151 | | | Murphy Oil Corp. | | | 3,339 | |
| | 21 | | | Noble Energy, Inc. | | | 472 | |
| | 349 | | | Novatek OJSC (GDR) | | | 70,777 | |
The accompanying notes are an integral part of these financial statements.
63
Schedule of Investments | Defensive Strategies Fund
As of September 30, 2019 (Continued)
| | | | | | | | |
| | |
| Shares | | | | | Fair Value | |
| | |
| | |
| | | | OIL & GAS - 5.8 % (Continued) | | | | |
| | 92 | | | Oasis Petroleum, Inc. * | | $ | 318 | |
| | 2,152 | | | Occidental Petroleum Corp. | | | 95,699 | |
| | 800 | | | Parex Resources, Inc. * | | | 12,266 | |
| | 3,768 | | | Parsley Energy, Inc. | | | 63,302 | |
| | 1,939 | | | PDC Energy, Inc. * | | | 53,807 | |
| | 3,018 | | | Petroleo Brasileiro SA (ADR) | | | 43,670 | |
| | 4,200 | | | Peyto Exploration & Development Corp. | | | 10,595 | |
| | 307 | | | Pioneer Natural Resources Co. | | | 38,611 | |
| | 3,059 | | | PrairieSky Royalty Ltd. | | | 42,697 | |
| | 2,659 | | | QEP Resources, Inc. | | | 9,838 | |
| | 3,069 | | | Range Resources Corp. | | | 11,724 | |
| | 4,135 | | | Rosneft Oil Company (GDR) | | | 26,530 | |
| | 9,000 | | | Seven Generations Energy Ltd. * | | | 57,236 | |
| | 1,829 | | | Southwestern Energy Co. * | | | 3,530 | |
| | 13,289 | | | SRC Energy, Inc. * | | | 61,927 | |
| | 4,900 | | | Suncor Energy, Inc. | | | 154,661 | |
| | 4,900 | | | Tourmaline Oil Corp. | | | 48,519 | |
| | 3,648 | | | Valaris PLC | | | 17,547 | |
| | 1,925 | | | WPX Energy, Inc. * | | | 20,386 | |
| | 504 | | | YPF SA (ADR) | | | 4,662 | |
| | | | | | | | |
| | | | | | | 2,362,873 | |
| | | | | | | | |
| | | | OIL & GAS SERVICES - 0.7 % | | | | |
| | 1,569 | | | Baker Hughes, Inc. | | | 36,401 | |
| | 682 | | | Core Laboratories NV | | | 31,795 | |
| | 2,336 | | | Halliburton Co. | | | 44,034 | |
| | 409 | | | National Oilwell Varco, Inc. | | | 8,671 | |
| | 3,327 | | | Oceaneering International, Inc. * | | | 45,081 | |
| | 5,705 | | | Patterson-UTI Energy, Inc. | | | 48,778 | |
| | 1,091 | | | Schlumberger Ltd. | | | 37,279 | |
| | 733 | | | TechnipFMC PLC (France) | | | 17,589 | |
| | 1,311 | | | TechnipFMC PLC | | | 31,648 | |
| | | | | | | | |
| | | | | | | 301,276 | |
| | | | | | | | |
| | | | WATER - 1.6 % | | | | |
| | 459 | | | American States Water Co. | | | 41,246 | |
| | 1,810 | | | American Water Works Co., Inc. | | | 224,856 | |
| | 1,837 | | | Aqua America, Inc. | | | 82,353 | |
| | 437 | | | California Water Service Group | | | 23,130 | |
| | 8,680 | | | Cia de Saneamento Basico do Estado de Sao Paulo (ADR) | | | 103,118 | |
| | 1,505 | | | United Utilities Group PLC | | | 15,315 | |
| | 5,651 | | | Veolia Environnement SA | | | 143,298 | |
| | | | | | | | |
| | | | | | | 633,316 | |
| | | | | | | | |
| | |
| | | | TOTAL COMMON STOCK(Cost $9,837,509) | | | 8,055,922 | |
| | | | | | | | |
| | |
| | | | REITs - 19.3 % | | | | |
| | 356 | | | American Tower Corp. | | | 78,722 | |
| | 2,905 | | | Americold Realty Trust | | | 107,688 | |
| | 5,593 | | | Apartment Investment & Management Co. - Class A | | | 291,619 | |
| | 1,800 | | | AvalonBay Communities, Inc. | | | 387,594 | |
| | 1,503 | | | Boston Properties, Inc. | | | 194,879 | |
| | 2,016 | | | Columbia Property Trust, Inc. | | | 42,639 | |
| | 5,331 | | | CubeSmart | | | 186,052 | |
| | 10,242 | | | Duke Realty Corp. | | | 347,921 | |
| | 2,719 | | | EPR Properties | | | 208,982 | |
| | 903 | | | Equinix, Inc. | | | 520,851 | |
| | 2,379 | | | Equity Lifestyle Properties, Inc. | | | 317,834 | |
| | 3,106 | | | Equity Residential | | | 267,924 | |
| | 741 | | | Essex Property Trust, Inc. | | | 242,048 | |
| | 1,566 | | | Federal Realty Investment Trust | | | 213,195 | |
| | 7,544 | | | HCP, Inc. | | | 268,793 | |
| | 8,675 | | | Hospitality Properties Trust | | | 223,728 | |
| | 4,179 | | | Hudson Pacific Properties, Inc. | | | 139,829 | |
| | 8,806 | | | Invitation Homes, Inc. | | | 260,746 | |
| | 1,984 | | | Kilroy Realty Corp. | | | 154,534 | |
The accompanying notes are an integral part of these financial statements.
64
Schedule of Investments | Defensive Strategies Fund
As of September 30, 2019 (Continued)
| | | | | | | | | | | | | | | | |
| | |
| Shares | | | | | | | | | | | Fair Value | |
| | |
| | | | |
| | | | REITs - 19.3 % (Continued) | | | | | | | | | | | | |
| | 1,540 | | | Mid-America Apartment Communities, Inc. | | | | | | | | | | $ | 200,215 | |
| | 2,221 | | | National Retail Properties, Inc. | | | | | | | | | | | 125,264 | |
| | 998 | | | PotlatchDeltic Corp. | | | | | | | | | | | 41,003 | |
| | 6,674 | | | Prologis, Inc. | | | | | | | | | | | 568,758 | |
| | 1,359 | | | PS Business Parks, Inc. | | | | | | | | | | | 247,270 | |
| | 1,022 | | | Public Storage | | | | | | | | | | | 250,666 | |
| | 3,791 | | | Rayonier, Inc. | | | | | | | | | | | 106,906 | |
| | 2,496 | | | Regency Centers Corp. | | | | | | | | | | | 173,447 | |
| | 1,815 | | | RLJ Lodging Trust | | | | | | | | | | | 30,837 | |
| | 4,494 | | | Sabra Health Care REIT, Inc. | | | | | | | | | | | 103,182 | |
| | 1,850 | | | Simon Property Group, Inc. | | | | | | | | | | | 287,953 | |
| | 3,032 | | | Spirit Realty Capital, Inc. | | | | | | | | | | | 145,112 | |
| | 8,215 | | | Store Capital Corp. | | | | | | | | | | | 307,323 | |
| | 1,032 | | | Sun Communities, Inc. | | | | | | | | | | | 153,200 | |
| | 2,890 | | | UDR, Inc. | | | | | | | | | | | 140,107 | |
| | 1,310 | | | Vornado Realty Trust | | | | | | | | | | | 83,408 | |
| | 4,602 | | | Welltower, Inc. | | | | | | | | | | | 417,171 | |
| | 1,726 | | | Weyerhaeuser Co. | | | | | | | | | | | 47,810 | |
| | | | | | | | | | | | | | | | |
| | | | TOTAL REITS(Cost $7,065,620) | | | | | | | | | | | 7,885,210 | |
| | | | | | | | | | | | | | | | |
| | | | |
| Principal | | | | | Coupon Rate % | | | Maturity | | | | |
| | | | BONDS & NOTES - 29.1 % | | | | | | | | | | | | |
| | | | COPORATE BONDS - 2.3 % | | | | | | | | | | | | |
| | $ 400,000 | | | LYB International Finance BV * | | | 4.000 | | | | 7/15/2023 | | | | 423,221 | |
| | 500,000 | | | Welltower, Inc. | | | 3.750 | | | | 3/15/2023 | | | | 523,784 | |
| | | | | | | | | | | | | | | | |
| | | | TOTAL CORPORATE BONDS(Cost $894,835) | | | | | | | | | | | 947,005 | |
| | | | | | | | | | | | | | | | |
| | |
| | | | TREASURY INFLATION PROTECTED SECURITIES (TIPS) - 26.8 % | | | | | |
| | 930,941 | | | TIPS | | | 0.125 | | | | 4/15/2021 | | | | 921,067 | |
| | 1,160,434 | | | TIPS | | | 0.125 | | | | 4/15/2022 | | | | 1,148,767 | |
| | 1,247,978 | | | TIPS | | | 0.625 | | | | 1/15/2024 | | | | 1,267,653 | |
| | 1,184,131 | | | TIPS | | | 2.375 | | | | 1/15/2025 | | | | 1,318,242 | |
| | 1,079,338 | | | TIPS | | | 2.000 | | | | 1/15/2026 | | | | 1,198,339 | |
| | 1,164,063 | | | TIPS | | | 2.375 | | | | 1/15/2027 | | | | 1,343,814 | |
| | 1,004,205 | | | TIPS | | | 1.750 | | | | 1/15/2028 | | | | 1,128,487 | |
| | 985,842 | | | TIPS | | | 2.500 | | | | 1/15/2029 | | | | 1,190,516 | |
| | 1,042,671 | | | TIPS | | | 2.125 | | | | 2/15/2041 | | | | 1,394,473 | |
| | | | | | | | | | | | | | | | |
| | | | TOTAL TREASURY INFLATION PROTECTED SECURITIES (TIPS)(Cost $10,637,415) | | | | | | | | 10,911,358 | |
| | | | | | | | | | | | | | | | |
| | | | |
| | | | TOTAL BONDS AND NOTES(Cost $11,532,250) | | | | | | | | | | | 11,858,363 | |
| | | | | | | | | | | | | | | | |
| Ounces | | | | | | | | | | | | |
| | | | ALTERNATIVE INVESTMENTS - 22.2 % | | | | | | | | |
| | 6,143 | | | Gold Bars * (Cost $7,240,876) | | | | | | | | | | | 9,046,593 | |
| | | | | | | | | | | | | | | | |
| | | | |
| Shares | | | MONEY MARKET FUND - 9.7 % | | | | | | | | | |
| | 3,939,988 | | | Fidelity Institutional Money Market Funds - Government Portfolio - Class I, 1.86% (A) (Cost $3,939,988) | | | | | | | | 3,939,988 | |
| | | | | | | | | | | | | | | | |
| | | | |
| | | | TOTAL INVESTMENTS - 100.1 %(Cost $39,616,243) | | | | | | | | | | $ | 40,786,076 | |
| | | | OTHER ASSETS IN EXCESS OF LIABILITIES - NET - (0.1) % | | | | | | | | | | | (58,679) | |
| | | | | | | | | | | | | | | | |
| | | | NET ASSETS - 100.0 % | | | | | | | | | | $ | 40,727,397 | |
| | | | | | | | | | | | | | | | |
*Non-income producing securities/investments.
** Less than 0.05%.
ADR - American Depositary Receipt.
GDR - Global Depositary Receipt.
PLC - Public Limited Co.
REITs - Real Estate Investment Trust.
(A) Variable rate security; the rate shown represents the yield at September 30, 2019.
The accompanying notes are an integral part of these financial statements.
65
Schedule of Investments | Strategic Growth Fund
As of September 30, 2019
| | | | | | | | |
| | |
| Shares | | | | | Fair Value | |
| | |
| | |
| | | | EXCHANGE TRADED FUNDS (A) - 25.7 % | | | | |
| | 120,000 | | | Timothy Plan High Dividend Stock ETF | | $ | 3,064,416 | |
| | 237,200 | | | Timothy Plan U.S. Large Cap Core ETF | | | 6,061,504 | |
| | | | | | | | |
| | | | TOTAL EXCHANGE TRADED FUNDS(Cost $8,909,237) | | | 9,125,920 | |
| | | | | | | | |
| | |
| | | | MUTUAL FUNDS - 71.3 % (B) | | | | |
| | 132,387 | | | Timothy Plan Aggressive Growth Fund | | | 1,041,884 | |
| | 241,524 | | | Timothy Plan Defensive Strategies Fund | | | 2,823,419 | |
| | 287,405 | | | Timothy Plan Emerging Markets Fund | | | 2,503,301 | |
| | 665,594 | | | Timothy Plan Fixed Income Fund | | | 6,915,517 | |
| | 208,138 | | | Timothy Plan High Yield Bond Fund | | | 1,954,418 | |
| | 755,987 | | | Timothy Plan International Fund | | | 6,871,920 | |
| | 102,292 | | | Timothy Plan Israel Common Values Fund | | | 1,824,888 | |
| | 83,825 | | | Timothy Plan Small Cap Value Fund | | | 1,437,598 | |
| | | | | | | | |
| | | | TOTAL MUTUAL FUNDS(Cost $24,378,233) | | | 25,372,945 | |
| | | | | | | | |
| | |
| | | | MONEY MARKET FUND - 3.2 % | | | | |
| | 1,153,329 | | | Fidelity Institutional Money Market Funds - Government Portfolio - Class I, 1.86% (C) (Cost $1,153,329) | | | 1,153,329 | |
| | | | | | | | |
| | |
| | | | TOTAL INVESTMENTS - 100.2 %(Cost $34,440,799) | | $ | 35,652,194 | |
| | | | OTHER ASSETS IN EXCESS OF LIABILITIES - NET - (0.2) % | | | (87,132) | |
| | | | | | | | |
| | | | NET ASSETS - 100.0 % | | $ | 35,565,062 | |
| | | | | | | | |
ETF - Exchange Traded Funds.
(A) Affiliated Funds.
(B) Affiliated Funds - Class A.
(C) Variable rate security; the rate shown represents the yield at September 30, 2019.
The accompanying notes are an integral part of these financial statements.
66
Schedule of Investments | Conservative Growth Fund
As of September 30, 2019 (Unaudited)
| | | | | | | | |
| | |
| Shares | | | | | Fair Value |
| | |
| | |
| | | | EXCHANGE TRADED FUNDS (A) - 20.0 % | | | | |
| | 109,400 | | | Timothy Plan High Dividend Stock ETF | | $ | 2,793,726 | |
| | 252,400 | | | Timothy Plan U.S. Large Cap Core ETF | | | 6,449,931 | |
| | | | | | | | |
| | | | TOTAL EXCHANGE FUNDS(Cost $9,024,233) | | | 9,243,657 | |
| | | | | | | | |
| | |
| | | | MUTUAL FUNDS - 74.6 % (B) | | | | |
| | 114,183 | | | Timothy Plan Aggressive Growth Fund | | | 898,620 | |
| | 273,079 | | | Timothy Plan Defensive Strategies Fund | | | 3,192,294 | |
| | 238,747 | | | Timothy Plan Emerging Markets Fund | | | 2,079,491 | |
| | 1,719,656 | | | Timothy Plan Fixed Income Fund | | | 17,867,223 | |
| | 268,953 | | | Timothy Plan High Yield Bond Fund | | | 2,525,476 | |
| | 526,009 | | | Timothy Plan International Fund | | | 4,781,421 | |
| | 92,524 | | | Timothy Plan Israel Common Values Fund | | | 1,650,624 | |
| | 81,302 | | | Timothy Plan Small Cap Value Fund | | | 1,394,328 | |
| | | | | | | | |
| | | | TOTAL MUTUAL FUNDS(Cost $33,341,936) | | | 34,389,477 | |
| | | | | | | | |
| | |
| | | | MONEY MARKET FUND - 5.7 % | | | | |
| | 2,614,768 | | | Fidelity Institutional Money Market Funds - Government Portfolio - Class I, 1.86% (C) (Cost $2,614,768) | | | 2,614,768 | |
| | | | | | | | |
| | |
| | | | TOTAL INVESTMENTS - 100.3 %(Cost $44,980,937) | | $ | 46,247,902 | |
| | | | OTHER ASSETS IN EXCESS OF LIABILITIES - NET - (0.3) % | | | (153,767) | |
| | | | | | | | |
| | | | NET ASSETS - 100.0 % | | $ | 46,094,135 | |
| | | | | | | | |
ETF - Exchange Traded Funds.
(A) Affiliated Funds.
(B) Affiliated Funds - Class A.
(C) Variable rate security; the rate shown represents the yield at September 30, 2019.
The accompanying notes are an integral part of these financial statements.
67
Schedule of Investments | Emerging Markets Fund
As of September 30, 2019
| | | | | | | | |
| | |
| Shares | | | | | Fair Value | |
| | |
| | |
| | | | COMMON STOCK - 77.4 % | | | | |
| | | | AEROSPACE/DEFENSE - 4.2 % | | | | |
| | 47,885 | | | Embraer SA (ADR) | | $ | 826,016 | |
| | | | | | | | |
| | |
| | | | AGRICULTURE - 3.3 % | | | | |
| | 68,523 | | | Adecoagro SA * | | | 399,489 | |
| | 26,435 | | | Astral Foods Ltd. | | | 256,287 | |
| | | | | | | | |
| | | | | | | 655,776 | |
| | | | | | | | |
| | | | AIRLINES - 1.0 % | | | | |
| | 2,040 | | | Copa Holdings SA | | | 201,450 | |
| | | | | | | | |
| | |
| | | | AUTO MANUFACTURERS - 3.3 % | | | | |
| | 16,724 | | | Kia Motors Corp. | | | 637,558 | |
| | | | | | | | |
| | |
| | | | AUTO PARTS & EQUIPMENT - 3.2 % | | | | |
| | 2,268 | | | China Yuchai International Ltd. | | | 29,371 | |
| | 2,852 | | | Hyundai Mobis Co. Ltd. | | | 600,848 | |
| | | | | | | | |
| | | | | | | 630,219 | |
| | | | | | | | |
| | | | BANKS - 19.1 % | | | | |
| | 26,201 | | | Absa Group Ltd. | | | 264,161 | |
| | 190,191 | | | AkBank TAS * | | | 273,506 | |
| | 238,153 | | | Banco del Bajio SA * (A) | | | 393,223 | |
| | 24,600 | | | Bangkok Bank PCL (NVDR) | | | 139,549 | |
| | 996,800 | | | Bank Rakyat Indonesia Persero Tbk PT | | | 289,314 | |
| | 7,980 | | | Erste Group Bank AG | | | 263,952 | |
| | 16,600 | | | Hapvida Participacoes E Investimentos SA | | | 216,636 | |
| | 42,546 | | | Nova Ljubljanska Banka dd (GDR) | | | 503,727 | |
| | 157,038 | | | Sberbank of Russia | | | 551,370 | |
| | 111,100 | | | Siam Commercial Bank Public Company Limited | | | 428,635 | |
| | 16,746 | | | TBC Bank Group PLC | | | 255,062 | |
| | 88,647 | | | Turkiye Garanti Bankasi AS * | | | 160,291 | |
| | | | | | | | |
| | | | | | | 3,739,426 | |
| | | | | | | | |
| | | | BUILDING MATERIALS - 3.8 % | | | | |
| | 187,491 | | | Cemex SAB de CV (ADR) | | | 734,965 | |
| | 85,571 | | | Urbi Desarrollos Urbanos SAB de CV * | | | 6,501 | |
| | | | | | | | |
| | | | | | | 741,466 | |
| | | | | | | | |
| | | | COMMERCIAL SERVICES - 5.9 % | | | | |
| | 73,700 | | | Cielo SA | | | 141,547 | |
| | 23,500 | | | Estacio Participacoes SA | | | 202,650 | |
| | 275,506 | | | Hyve Group PLC | | | 289,599 | |
| | 247,571 | | | Prosegur Cash SA | | | 355,731 | |
| | 2,058 | | | S-1 Corp. | | | 168,783 | |
| | | | | | | | |
| | | | | | | 1,158,310 | |
| | | | | | | | |
| | | | COMPUTERS - 2.0 % | | | | |
| | 59,000 | | | Asustek Computer, Inc. | | | 392,706 | |
| | | | | | | | |
| | |
| | | | ELECTRONICS - 1.4 % | | | | |
| | 27,139 | | | Flex Ltd. * | | | 284,010 | |
| | | | | | | | |
| | |
| | | | ENGINEERING & CONSTRUCTION - 2.1 % | | | | |
| | 1,154,200 | | | Jasmine Broadband Internet Infrastructure Fund | | | 415,112 | |
| | | | | | | | |
| | |
| | | | FOOD - 3.3 % | | | | |
| | 2,215 | | | Binggrae Co. Ltd. | | | 107,958 | |
| | 730,000 | | | First Pacific Co. Ltd. | | | 279,358 | |
| | 7,137 | | | X5 Retail Group NV (GDR) | | | 249,652 | |
| | | | | | | | |
| | | | | | | 636,968 | |
| | | | | | | | |
The accompanying notes are an integral part of these financial statements.
68
Schedule of Investments | Emerging Markets Fund
As of September 30, 2019 (Continued)
| | | | | | | | |
| | |
| Shares | | | | | Fair Value |
| | |
| | |
| | | | INSURANCE - 1.4 % | | | | |
| | 40,673 | | | Korean Reinsurance Company | | $ | 272,366 | |
| | | | | | | | |
| | |
| | | | IRON/STEEL - 2.2 % | | | | |
| | 2,284 | | | POSCO | | | 433,447 | |
| | | | | | | | |
| | |
| | | | MINING - 1.0 % | | | | |
| | 14,950 | | | NAC Kazatomprom JSC (GDR) | | | 197,340 | |
| | | | | | | | |
| | |
| | | | MULTI-NATIONAL - 3.3 % | | | | |
| | 32,563 | | | Banco Latinoamericano de Comercio Exterior SA | | | 649,306 | |
| | | | | | | | |
| | |
| | | | OIL & GAS - 4.2 % | | | | |
| | 265,277 | | | Vivo Energy PLC (A) | | | 408,626 | |
| | 44,904 | | | YPF SA (ADR) | | | 415,362 | |
| | | | | | | | |
| | | | | | | 823,988 | |
| | | | | | | | |
| | | | RETAIL - 2.4 % | | | | |
| | 202,500 | | | Lifestyle International Holdings Ltd. | | | 211,040 | |
| | 101,000 | | | Luk Fook Holdings International Ltd. | | | 253,550 | |
| | | | | | | | |
| | | | | | | 464,590 | |
| | | | | | | | |
| | | | SEMICONDUCTORS - 2.8 % | | | | |
| | 7,239 | | | Samsung Electronics Co., Ltd. | | | 296,847 | |
| | 28,000 | | | Taiwan Semiconductor Manufacturing Co. Ltd. | | | 245,483 | |
| | | | | | | | |
| | | | | | | 542,330 | |
| | | | | | | | |
| | | | SOFTWARE - 2.1 % | | | | |
| | 914,000 | | | Chinasoft International Ltd. | | | 403,403 | |
| | | | | | | | |
| | |
| | | | TELECOMMUNICATIONS - 5.4 % | | | | |
| | 21,306 | | | Empresa Nacional de Telecomunicaciones SA * | | | 187,057 | |
| | 118,438 | | | Mobile TeleSystems PJSC | | | 483,737 | |
| | 1,609,875 | | | XL Axiata TBK PT * | | | 390,135 | |
| | | | | | | | |
| | | | | | | 1,060,929 | |
| | | | | | | | |
| | |
| | | | TOTAL COMMON STOCK(Cost $18,085,006) | | | 15,166,716 | |
| | | | | | | | |
| | |
| | | | PREFERRED STOCK - 7.2 % | | | | |
| | 10,000 | | | Cia Brasileira de Distribuicao | | | 192,130 | |
| | 827,893 | | | Grupo Aval Acciones y Valores SA | | | 310,598 | |
| | 64,900 | | | Petroleo Brasileiro SA | | | 428,626 | |
| | 836,971 | | | Surgutneftegas OJSC | | | 483,431 | |
| | | | | | | | |
| | | | TOTAL PREFERRED STOCK(Cost $1,332,293) | | | 1,414,785 | |
| | | | | | | | |
| | |
| | | | REITs - 9.5 % | | | | |
| | 1,102,377 | | | Emlak Konut Gayrimenkul Yatirim Ortakligi AS | | | 271,373 | |
| | 443,043 | | | Fibra Uno Administracion SA de CV | | | 648,722 | |
| | 226,500 | | | Macquarie Mexico Real Estate Management SA de CV (A) | | | 285,649 | |
| | 420,201 | | | PLA Administradora Industrial S de RL de CV | | | 645,710 | |
| | | | | | | | |
| | | | TOTAL REITs(Cost $2,461,194) | | | 1,851,454 | |
| | | | | | | | |
| | |
| | | | MONEY MARKET FUND - 5.1 % | | | | |
| | 998,023 | | | Fidelity Institutional Money Market Funds - Government Portfolio - Class I, 1.86% (B) (Cost $998,023) | | | 998,023 | |
| | | | | | | | |
| | |
| | | | TOTAL INVESTMENTS - 99.2 %(Cost $22,876,516) | | $ | 19,430,978 | |
| | | | OTHER ASSETS IN EXCESS OF LIABILITIES - NET - 0.8 % | | | 162,054 | |
| | | | | | | | |
| | | | NET ASSETS - 100.0 % | | $ | 19,593,032 | |
| | | | | | | | |
The accompanying notes are an integral part of these financial statements.
69
Schedule of Investments | Emerging Markets Fund
As of September 30, 2019 (Continued)
*Non-income producing securities.
ADR - American Depositary Receipt.
GDR - Global Depositary Receipt.
NVDR -Non-Voting Depositary Receipt.
PLC - Public Limited Co.
REITs - Real Estate Investment Trust.
(A) 144A Security - Security exempt from registration under Rule 144A of the Securities Act of 1933. The 144A securities had a fair value of $1,087,498 and represent 5.6% of total net assets. The securities may be resold in transactions exempt from registration typically only to qualified institutional buyers. Unless otherwise indicated, these securities are not considered to be illiquid.
(B) Variable rate security; the rate shown represents the yield at September 30, 2019.
| | | | |
| Diversification of Assets | | | |
| |
| Country | | % of Net Assets | |
| |
| Mexico | | | 13.9% | |
| South Korea | | | 12.8% | |
| Brazil | | | 10.2% | |
| Russia | | | 9.0% | |
| Thailand | | | 5.0% | |
| Panama | | | 4.3% | |
| Argentina | | | 4.2% | |
| Hong Kong | | | 3.8% | |
| Turkey | | | 3.6% | |
| United Kingdom | | | 3.6% | |
| Indonesia | | | 3.5% | |
| Taiwan | | | 3.3% | |
| South Africa | | | 2.7% | |
| Slovenia | | | 2.6% | |
| China | | | 2.1% | |
| Spain | | | 1.8% | |
| Colombia | | | 1.6% | |
| United States | | | 1.4% | |
| Austria | | | 1.3% | |
| Georgia | | | 1.3% | |
| Kazakhstan | | | 1.0% | |
| Chile | | | 1.0% | |
| Singapore | | | 0.1% | |
| | | | |
| Total | | | 94.1% | |
| Money Market Fund | | | 5.1% | |
| Other Assets in Excess of Liabilities - Net | | | 0.8% | |
| | | | |
| Grand Total | | | 100.0% | |
| | | | |
The accompanying notes are an integral part of these financial statements.
70
Schedule of Investments | Growth & Income Fund
As of September 30, 2019
| | | | | | | | | | | | | | | | |
| | |
| Par Value | | | | | Coupon Rate (%) | | | Maturity | | | Fair Value |
| | |
| | | | |
| | | | BONDS & NOTES - 38.5 % | | | | | | | | | | | | |
| | | | |
| | | | CORPORATE BONDS - 16.5 % | | | | | | | | | | | | |
| | | | |
| | $ 160,000 | | | ABB Finance USA, Inc. | | | 2.875 | | | | 5/8/2022 | | | $ | 163,506 | |
| | | | |
| | 160,000 | | | American Electric Power | | | 3.200 | | | | 11/13/2027 | | | | 167,004 | |
| | | | |
| | 160,000 | | | Aptiv Corp. | | | 4.150 | | | | 3/15/2024 | | | | 169,372 | |
| | | | |
| | 160,000 | | | Canadian Pacific RR Co. | | | 2.900 | | | | 2/1/2025 | | | | 164,308 | |
| | | | |
| | 160,000 | | | CBOE Holdings, Inc. | | | 3.650 | | | | 1/12/2027 | | | | 170,170 | |
| | | | |
| | 160,000 | | | CSX Corp. | | | 3.250 | | | | 6/1/2027 | | | | 167,991 | |
| | | | |
| | 80,000 | | | Digital Realty Trust LP | | | 3.700 | | | | 8/15/2027 | | | | 83,947 | |
| | | | |
| | 80,000 | | | Dollar General Corp. | | | 4.125 | | | | 5/1/2028 | | | | 87,478 | |
| | | | |
| | 120,000 | | | Dominion Energy, Inc. | | | 2.579 | | | | 7/1/2020 | | | | 120,268 | |
| | | | |
| | 120,000 | | | Eaton Corp. | | | 2.750 | | | | 11/2/2022 | | | | 122,105 | |
| | | | |
| | 120,000 | | | European Investment Bank | | | 2.375 | | | | 6/15/2022 | | | | 122,346 | |
| | | | |
| | 120,000 | | | HCP, Inc. | | | 3.500 | | | | 7/15/2029 | | | | 124,682 | |
| | | | |
| | 120,000 | | | KFW | | | 2.125 | | | | 6/15/2022 | | | | 121,536 | |
| | | | |
| | 130,000 | | | LYB International Finance BV | | | 4.000 | | | | 7/15/2023 | | | | 137,460 | |
| | | | |
| | 120,000 | | | National Rural Utilities Cooperative Finance Corp. | | | 2.950 | | | | 2/7/2024 | | | | 124,116 | |
| | | | |
| | 240,000 | | | NiSource Finance Corp. | | | 3.490 | | | | 5/15/2027 | | | | 251,692 | |
| | | | |
| | 160,000 | | | Nutrien Ltd. | | | 4.000 | | | | 12/15/2026 | | | | 171,356 | |
| | | | |
| | 160,000 | | | Phillips 66 Partners LP | | | 3.605 | | | | 2/15/2025 | | | | 167,157 | |
| | | | |
| | 120,000 | | | Province of Ontario Canada | | | 2.500 | | | | 4/27/2026 | | | | 124,564 | |
| | | | |
| | 120,000 | | | Province of Quebec Canada | | | 2.375 | | | | 1/31/2022 | | | | 121,656 | |
| | | | |
| | 110,000 | | | Sunoco Logistics Partners LP | | | 4.250 | | | | 4/1/2024 | | | | 115,813 | |
| | | | |
| | 190,000 | | | Ventas Capital Corp. | | | 3.250 | | | | 8/15/2022 | | | | 194,981 | |
| | | | |
| | 115,000 | | | WEC Energy Group, Inc. | | | 3.550 | | | | 6/15/2025 | | | | 122,285 | |
| | | | | | | | | | | | | | | | |
| | | | TOTAL CORPORATE BONDS(Cost $3,223,843) | | | | | | | | | | | 3,315,793 | |
| | | | | | | | | | | | | | | | |
| | | |
| | | | U.S. GOVERNMENT & AGENCY OBLIGATIONS - 22.0 % | | | | | | | | | |
| | | |
| | | | GOVERNMENT MORTGAGE-BACKED SECURITIES - 11.5 % | | | | | | | | | |
| | | | |
| | 139,627 | | | GNMA Pool G2 MA3375 | | | 3.000 | | | | 1/20/2046 | | | | 144,146 | |
| | | | |
| | 166,419 | | | GNMA Pool G2 MA3376 | | | 3.500 | | | | 1/20/2046 | | | | 174,067 | |
| | | | |
| | 138,590 | | | GNMA Pool G2 MA3596 | | | 3.000 | | | | 4/20/2046 | | | | 142,937 | |
| | | | |
| | 111,760 | | | GNMA Pool G2 MA3663 | | | 3.500 | | | | 5/20/2046 | | | | 116,705 | |
| | | | |
| | 148,500 | | | GNMA Pool G2 MA3736 | | | 3.500 | | | | 6/20/2046 | | | | 154,951 | |
| | | | |
| | 140,813 | | | GNMA Pool G2 MA4126 | | | 3.000 | | | | 12/20/2046 | | | | 145,189 | |
| | | | |
| | 51,060 | | | GNMA Pool G2 MA4509 | | | 3.000 | | | | 6/20/2047 | | | | 52,586 | |
| | | | |
| | 167,055 | | | GNMA Pool G2 MA4652 | | | 3.500 | | | | 8/20/2047 | | | | 173,709 | |
| | | | |
| | 168,587 | | | GNMA Pool G2 MA4719 | | | 3.500 | | | | 9/20/2047 | | | | 175,370 | |
| | | | |
| | 134,624 | | | GNMA Pool G2 MA5764 | | | 4.500 | | | | 2/20/2049 | | | | 140,816 | |
| | | | |
| | 140,420 | | | GNMA Pool G2 MA5819 | | | 5.000 | | | | 3/20/2049 | | | | 148,442 | |
| | | | |
| | 83,424 | | | GNMA Pool G2 MA5933 | | | 5.000 | | | | 5/20/2049 | | | | 88,532 | |
| | | | |
| | 114,117 | | | GNMA Pool G2 MA5986 | | | 4.000 | | | | 6/20/2049 | | | | 118,931 | |
| | | | |
| | 134,285 | | | GNMA Pool G2 MA6041 | | | 4.500 | | | | 7/20/2049 | | | | 141,392 | |
| | | | |
| | 159,480 | | | GNMA Pool G2 MA6092 | | | 4.500 | | | | 8/20/2049 | | | | 168,466 | |
| | | | |
| | 89,768 | | | GNMA Pool G2 MA6093 | | | 5.000 | | | | 8/20/2049 | | | | 95,152 | |
| | | | |
| | 125,000 | | | GNMA Pool G2 MA6156 | | | 4.500 | | | | 9/20/2049 | | | | 131,713 | |
| | | | | | | | | | | | | | | | |
| | | | TOTAL GOVERNMENT MORTGAGE-BACKED SECURITIES(Cost $2,293,924) | | | | 2,313,104 | |
| | | | | | | | | | | | | | | | |
The accompanying notes are an integral part of these financial statements.
71
Schedule of Investments | Growth & Income Fund
As of September 30, 2019 (Continued)
| | | | | | | | | | | | | | | | |
| Par Value | | | | | Coupon Rate (%) | | | Maturity | | | Fair Value | |
| | | |
| | | | GOVERNMENT NOTES, BONDS & AGENCIES - 10.5 % | | | | | | | | | |
| | $ 125,000 | | | United States Treasury Note | | | 3.125 | | | | 5/15/2021 | | | $ | 127,759 | |
| | 185,000 | | | United States Treasury Note | | | 2.125 | | | | 6/30/2022 | | | | 187,681 | |
| | 380,000 | | | United States Treasury Note | | | 2.250 | | | | 11/15/2024 | | | | 392,424 | |
| | 350,000 | | | United States Treasury Note | | | 2.000 | | | | 8/15/2025 | | | | 357,765 | |
| | 555,000 | | | United States Treasury Note | | | 1.625 | | | | 2/15/2026 | | | | 555,217 | |
| | 355,000 | | | United States Treasury Note | | | 4.500 | | | | 2/15/2036 | | | | 489,373 | |
| | | | | | | | | | | | | | | | |
| | | | TOTAL GOVERNMENT NOTES, BONDS & AGENCIES(Cost $2,039,570) | | | | | | | | 2,110,219 | |
| | | | | | | | | | | | | | | | |
| | | |
| | | | TOTAL U.S. GOVERNMENT & AGENCY OBLIGATIONS(Cost $4,333,494) | | | | | | | | 4,423,323 | |
| | | | | | | | | | | | | | | | |
| | | | |
| | | | TOTAL BONDS & NOTES(Cost $7,557,337) | | | | | | | | | | | 7,739,116 | |
| | | | | | | | | | | | | | | | |
| | | | |
| Shares | | | | | | | | | | | | |
| | | | EXCHANGE TRADED FUND (A) - 60.6 % | | | | | | | | | | | | |
| | 476,000 | | | Timothy Plan High Dividend Stock ETF (Cost $11,883,212) | | | | | | | | 12,155,517 | |
| | | | | | | | | | | | | | | | |
| | | | |
| | | | MONEY MARKET FUND - 2.8 % | | | | | | | | | | | | |
| | 562,954 | | | Fidelity Institutional Money Market Funds - Government Portfolio - Class I, 1.86% (B) (Cost $562,954) | | | | | | | | 562,954 | |
| | | | | | | | | | | | | | | | |
| | | | |
| | | | TOTAL INVESTMENTS - 101.9 %(Cost $20,003,503) | | | | | | | | | | $ | 20,457,587 | |
| | | | OTHER ASSETS IN EXCESS OF LIABILITIES - NET - (1.9) % | | | | | | | | (388,418) | |
| | | | | | | | | | | | | | | | |
| | | | NET ASSETS - 100.0 % | | | | | | | | | | $ | 20,069,169 | |
| | | | | | | | | | | | | | | | |
ETF - Exchange Traded Fund.
GNMA - Government National Mortgage Association.
LP - Limited Partnership.
(A) Affiliated Fund.
(B) Variable rate security; the rate shown represents the yield at September 30, 2019.
The accompanying notes are an integral part of these financial statements.
72
Timothy Plan Funds
Statements of Assets and Liabilities
September 30, 2019
| | | | | | | | | | | | | | | | | | | | | | | | |
| |
| | | | | | |
| | | Aggressive Growth Fund | | | International Fund | | | Large/Mid Cap Growth Fund | | | Small Cap Value Fund | | | Large/Mid Cap Value Fund | | | Fixed Income Fund | |
| | | | | | | | | | | | | | | | | | | |
| |
ASSETS: | | | | | | | | | | | | | | | | | | | | | | | | |
Investments, at cost | | $ | 22,244,208 | | | $ | 80,163,685 | | | $ | 55,236,506 | | | $ | 138,893,591 | | | $ | 136,266,023 | | | $ | 99,524,500 | |
Investments in affiliates, at cost | | | - | | | | - | | | | 18,061,200 | | | | - | | | | 46,064,400 | | | | - | |
| | | | | | | | | | | | | | | | | | | | | | | | |
Investments, at value | | $ | 25,618,677 | | | $ | 88,920,368 | | | $ | 67,832,290 | | | $ | 145,271,526 | | | $ | 156,323,851 | | | $ | 101,935,759 | |
Investments in affiliates, at value | | | - | | | | - | | | | 18,399,168 | | | | - | | | | 47,003,904 | | | | - | |
Cash | | | - | | | | 22,066 | | | | - | | | | - | | | | - | | | | - | |
Dividends and interest receivable | | | 13,502 | | | | 207,816 | | | | 52,883 | | | | 128,379 | | | | 92,753 | | | | 582,569 | |
Receivable for fund shares sold | | | 5,047 | | | | 34,222 | | | | 121,576 | | | | 184,781 | | | | 179,157 | | | | 266,857 | |
Receivable for securities sold | | | - | | | | 307,916 | | | | - | | | | 1,355,965 | | | | 3,508,440 | | | | - | |
Receivable for foreign tax reclaims | | | - | | | | 311,405 | | | | - | | | | - | | | | - | | | | - | |
Prepaid expenses and other assets | | | 15,193 | | | | 20,562 | | | | 21,389 | | | | 30,747 | | | | 34,875 | | | | 21,598 | |
| | | | | | | | | | | | | | | | | | | | | | | | |
Total Assets | | | 25,652,419 | | | | 89,824,355 | | | | 86,427,306 | | | | 146,971,398 | | | | 207,142,980 | | | | 102,806,783 | |
| | | | | | | | | | | | | | | | | | | | | | | | |
| | | | | | |
LIABILITIES: | | | | | | | | | | | | | | | | | | | | | | | | |
Payable for securities purchased | | | 121,624 | | | | - | | | | - | | | | 1,626,265 | | | | - | | | | 606,255 | |
Payable for fund shares redeemed | | | 10,720 | | | | 100,859 | | | | 183,060 | | | | 126,555 | | | | 346,502 | | | | 111,476 | |
Payable to service providers | | | 7,791 | | | | 31,676 | | | | 22,995 | | | | 44,219 | | | | 69,943 | | | | 27,727 | |
Accrued advisory fees | | | 16,049 | | | | 71,928 | | | | 57,158 | | | | 89,114 | | | | 128,713 | | | | 34,580 | |
Accrued12b-1 fees | | | 6,449 | | | | 14,343 | | | | 19,666 | | | | 27,364 | | | | 41,946 | | | | 23,565 | |
Accrued expenses and other liabilities | | | 21,021 | | | | 24,716 | | | | 27,959 | | | | 25,899 | | | | 32,135 | | | | 30,709 | |
| | | | | | | | | | | | | | | | | | | | | | | | |
Total Liabilities | | | 183,654 | | | | 243,522 | | | | 310,838 | | | | 1,939,416 | | | | 619,239 | | | | 834,312 | |
| | | | | | | | | | | | | | | | | | | | | | | | |
| | | | | | |
Net Assets | | $ | 25,468,765 | | | $ | 89,580,833 | | | $ | 86,116,468 | | | $ | 145,031,982 | | | $ | 206,523,741 | | | $ | 101,972,471 | |
| | | | | | | | | | | | | | | | | | | | | | | | |
| | | | | | |
NET ASSETS CONSIST OF: | | | | | | | | | | | | | | | | | | | | | | | | |
Paid in capital ($0 par value, unlimited shares authorized) | | $ | 22,915,974 | | | $ | 85,663,526 | | | $ | 69,823,999 | | | $ | 136,606,396 | | | $ | 161,002,154 | | | $ | 100,875,366 | |
Accumulated earnings | | | 2,552,791 | | | | 3,917,307 | | | | 16,292,469 | | | | 8,425,586 | | | | 45,521,587 | | | | 1,097,105 | |
| | | | | | | | | | | | | | | | | | | | | | | | |
Net Assets | | $ | 25,468,765 | | | $ | 89,580,833 | | | $ | 86,116,468 | | | $ | 145,031,982 | | | $ | 206,523,741 | | | $ | 101,972,471 | |
| | | | | | | | | | | | | | | | | | | | | | | | |
| | | | | | |
Class A | | | | | | | | | | | | | | | | | | | | | | | | |
Net Assets | | $ | 21,802,430 | | | $ | 58,397,042 | | | $ | 64,150,358 | | | $ | 99,076,582 | | | $ | 142,420,288 | | | $ | 85,375,283 | |
Shares of beneficial interest outstanding
($0 par value, unlimited shares authorized) | | | 2,771,405 | | | | 6,425,811 | | | | 7,377,569 | | | | 5,776,076 | | | | 7,553,280 | | | | 8,213,199 | |
Net Asset Value, offering price and redemption price per share | | $ | 7.87 | | | $ | 9.09 | | | $ | 8.70 | | | $ | 17.15 | | | $ | 18.86 | | | $ | 10.39 | |
| | | | | | | | | | | | | | | | | | | | | | | | |
Offering Price Per Share (NAV / 0.945) *(NAV / 0.955) | | $ | 8.33 | | | $ | 9.62 | | | $ | 9.21 | | | $ | 18.15 | | | $ | 19.96 | | | $ | 10.88 | * |
| | | | | | | | | | | | | | | | | | | | | | | | |
| | | | | | |
Class C | | | | | | | | | | | | | | | | | | | | | | | | |
Net Assets | | $ | 2,433,002 | | | $ | 2,641,403 | | | $ | 7,950,421 | | | $ | 8,962,577 | | | $ | 16,626,801 | | | $ | 8,501,895 | |
Shares of beneficial interest outstanding
($0 par value, unlimited shares authorized) | | | 383,920 | | | | 300,048 | | | | 1,142,479 | | | | 766,498 | | | | 1,122,012 | | | | 851,068 | |
Net Asset Value, offering price and redemption price per share | | $ | 6.34 | | | $ | 8.80 | | | $ | 6.96 | | | $ | 11.69 | | | $ | 14.82 | | | $ | 9.99 | |
| | | | | | | | | | | | | | | | | | | | | | | | |
Minimum Redemption Price Per Share (NAV * 0.99) | | $ | 6.28 | | | $ | 8.71 | | | $ | 6.89 | | | $ | 11.57 | | | $ | 14.67 | | | $ | 9.89 | |
| | | | | | | | | | | | | | | | | | | | | | | | |
| | | | | | |
Class I | | | | | | | | | | | | | | | | | | | | | | | | |
Net Assets | | $ | 1,233,333 | | | $ | 28,542,388 | | | $ | 14,015,689 | | | $ | 36,992,823 | | | $ | 47,476,652 | | | $ | 8,095,293 | |
Shares of beneficial interest outstanding
($0 par value, unlimited shares authorized) | | | 153,831 | | | | 3,134,892 | | | | 1,581,464 | | | | 2,120,166 | | | | 2,491,903 | | | | 784,168 | |
Net Asset Value, offering price and redemption price per share | | $ | 8.02 | | | $ | 9.10 | | | $ | 8.86 | | | $ | 17.45 | | | $ | 19.05 | | | $ | 10.32 | |
| | | | | | | | | | | | | | | | | | | | | | | | |
The accompanying notes are an integral part of these financial statements.
73
Timothy Plan Funds
Statements of Assets and Liabilities (Continued)
September 30, 2019
| | | | | | | | | | | | | | | | | | | | | | | | | | | | |
| |
| | | | | | | |
| | | High Yield Bond Fund | | | Israel Common Values Fund | | | Defensive Strategies Fund | | | Strategic Growth Fund | | | Conservative Growth Fund | | | Emerging Markets Fund | | | Growth & Income Fund | |
| | | | | | | | | | | | | | | | | | | | | | |
| | | | | | | | | |
ASSETS: | | | | | | | | | | | | | | | | | | | | | | | | | | | | |
Investments, at cost | | $ | 59,958,989 | | | $ | 58,891,981 | | | $ | 32,375,367 | | | $ | 1,153,329 | | | $ | 2,614,768 | | | $ | 22,876,516 | | | $ | 8,120,291 | |
Investments in affiliates, at cost | | | - | | | | - | | | | - | | | | 33,287,470 | | | | 42,366,169 | | | | - | | | | 11,883,212 | |
| | | | | | | | | | | | | | | | | | | | | | | | | | | | |
Investments, at value | | $ | 61,077,304 | | | $ | 80,416,984 | | | $ | 31,739,483 | | | $ | 1,153,329 | | | $ | 2,614,768 | | | $ | 19,430,978 | | | $ | 8,302,070 | |
Investments in affiliates, at value | | | - | | | | - | | | | - | | | | 34,498,865 | | | | 43,633,134 | | | | - | | | | 12,155,517 | |
Gold and Silver Investments, at fair value (Cost $7,240,876) | | | - | | | | - | | | | 9,046,593 | | | | - | | | | - | | | | - | | | | - | |
Foreign Cash | | | | | | | | | | | | | | | | | | | | | | | | | | | | |
Canadian Dollar (CAD)(Cost $337) | | | - | | | | - | | | | 337 | | | | - | | | | - | | | | - | | | | - | |
Columbian Peso (COP)(Cost $164,516) | | | - | | | | - | | | | - | | | | - | | | | - | | | | 164,516 | | | | - | |
Dividends and interest receivable | | | 944,427 | | | | 24,994 | | | | 78,013 | | | | 1,661 | | | | 3,889 | | | | 21,773 | | | | 45,081 | |
Receivable for fund shares sold | | | 147,179 | | | | 117,876 | | | | 147,554 | | | | 3,750 | | | | 2,774 | | | | 48,806 | | | | 25,373 | |
Receivable for securities sold | | | - | | | | 676,899 | | | | 227,354 | | | | - | | | | - | | | | - | | | | - | |
Receivable for foreign tax reclaims | | | - | | | | - | | | | 7,875 | | | | - | | | | - | | | | - | | | | 2,272 | |
Prepaid expenses and other assets | | | 19,452 | | | | 30,797 | | | | 19,920 | | | | 14,965 | | | | 21,760 | | | | 17,338 | | | | 16,559 | |
| | | | | | | | | | | | | | | | | | | | | | | | | | | | |
Total Assets | | | 62,188,362 | | | | 81,267,550 | | | | 41,267,129 | | | | 35,672,570 | | | | 46,276,325 | | | | 19,683,411 | | | | 20,546,872 | |
| | | | | | | | | | | | | | | | | | | | | | | | | | | | |
| | | | | | | |
LIABILITIES: | | | | | | | | | | | | | | | | | | | | | | | | | | | | |
Payable for securities purchased | | | 1,295,625 | | | | 699,576 | | | | 418,210 | | | | - | | | | - | | | | - | | | | 403,837 | |
Payable for fund shares redeemed | | | 15,883 | | | | 43,369 | | | | 42,990 | | | | 54,159 | | | | 116,704 | | | | 23,227 | | | | 25,787 | |
Payable to service providers | | | 14,898 | | | | 6,729 | | | | 17,893 | | | | 11,136 | | | | 15,582 | | | | 8,673 | | | | 12,335 | |
Accrued advisory fees | | | 27,327 | | | | 63,415 | | | | 18,284 | | | | 15,456 | | | | 22,602 | | | | 19,028 | | | | 8,175 | |
Accrued12b-1 fees | | | 10,180 | | | | 17,453 | | | | 6,784 | | | | 1,481 | | | | 3,058 | | | | 4,959 | | | | 4,942 | |
Accrued expenses and other liabilities | | | 24,098 | | | | 31,441 | | | | 35,571 | | | | 25,276 | | | | 24,244 | | | | 34,492 | | | | 22,627 | |
| | | | | | | | | | | | | | | | | | | | | | | | | | | | |
Total Liabilities | | | 1,388,011 | | | | 861,983 | | | | 539,732 | | | | 107,508 | | | | 182,190 | | | | 90,379 | | | | 477,703 | |
| | | | | | | | | | | | | | | | | | | | | | | | | | | | |
| | | | | | | |
Net Assets | | $ | 60,800,351 | | | $ | 80,405,567 | | | $ | 40,727,397 | | | $ | 35,565,062 | | | $ | 46,094,135 | | | $ | 19,593,032 | | | $ | 20,069,169 | |
| | | | | | | | | | | | | | | | | | | | | | | | | | | | |
| | | | | | | |
NET ASSETS CONSIST OF: | | | | | | | | | | | | | | | | | | | | | | | | | | | | |
Paid in capital ($0 par value, unlimited shares authorized) | | $ | 60,940,452 | | | $ | 61,107,448 | | | $ | 38,668,610 | | | $ | 33,198,431 | | | $ | 43,283,158 | | | $ | 22,287,929 | | | $ | 20,036,552 | |
Accumulated earnings/(losses) | | | (140,101) | | | | 19,298,119 | | | | 2,058,787 | | | | 2,366,631 | | | | 2,810,977 | | | | (2,694,897) | | | | 32,617 | |
| | | | | | | | | | | | | | | | | | | | | | | | | | | | |
Net Assets | | $ | 60,800,351 | | | $ | 80,405,567 | | | $ | 40,727,397 | | | $ | 35,565,062 | | | $ | 46,094,135 | | | $ | 19,593,032 | | | $ | 20,069,169 | |
| | | | | | | | | | | | | | | | | | | | | | | | | | | | |
| | | | | | | |
Class A | | | | | | | | | | | | | | | | | | | | | | | | | | | | |
Net Assets | | $ | 39,777,061 | | | $ | 49,122,897 | | | $ | 33,925,842 | | | $ | 32,318,177 | | | $ | 40,590,187 | | | $ | 15,677,224 | | | $ | 14,499,526 | |
Shares of beneficial interest outstanding
($0 par value, unlimited shares authorized) | | | 4,235,825 | | | | 2,754,126 | | | | 2,901,395 | | | | 3,353,177 | | | | 3,805,995 | | | | 1,800,458 | | | | 1,367,903 | |
Net Asset Value, offering price and redemption price per share | | $ | 9.39 | | | $ | 17.84 | | | $ | 11.69 | | | $ | 9.64 | | | $ | 10.66 | | | $ | 8.71 | | | $ | 10.60 | |
| | | | | | | | | | | | | | | | | | | | | | | | | | | | |
Offering Price Per Share (NAV / 0.945) *(NAV / 0.955) | | $ | 9.83 | * | | $ | 18.88 | | | $ | 12.37 | | | $ | 10.20 | | | $ | 11.28 | | | $ | 9.22 | | | $ | 11.22 | |
| | | | | | | | | | | | | | | | | | | | | | | | | | | | |
| | | | | | | |
Class C | | | | | | | | | | | | | | | | | | | | | | | | | | | | |
Net Assets | | $ | 2,660,283 | | | $ | 9,750,010 | | | $ | 3,109,766 | | | $ | 3,246,885 | | | $ | 5,503,948 | | | $ | 1,656,940 | | | $ | 2,388,028 | |
Shares of beneficial interest outstanding
($0 par value, unlimited shares authorized) | | | 279,329 | | | | 574,483 | | | | 279,300 | | | | 378,448 | | | | 574,127 | | | | 195,724 | | | | 233,936 | |
Net Asset Value, offering price and redemption price per share | | $ | 9.52 | | | $ | 16.97 | | | $ | 11.13 | | | $ | 8.58 | | | $ | 9.59 | | | $ | 8.47 | | | $ | 10.21 | |
| | | | | | | | | | | | | | | | | | | | | | | | | | | | |
Minimum Redemption Price Per Share
(NAV * 0.99) | | $ | 9.42 | | | $ | 16.80 | | | $ | 11.02 | | | $ | 8.49 | | | $ | 9.49 | | | $ | 8.39 | | | $ | 10.11 | |
| | | | | | | | | | | | | | | | | | | | | | | | | | | | |
| | | | | | | |
Class I | | | | | | | | | | | | | | | | | | | | | | | | | | | | |
Net Assets | | $ | 18,363,007 | | | $ | 21,532,660 | | | $ | 3,691,789 | | | $ | - | | | $ | - | | | $ | 2,258,868 | | | $ | 3,181,615 | |
Shares of beneficial interest outstanding
($0 par value, unlimited shares authorized) | | | 1,955,025 | | | | 1,198,295 | | | | 315,881 | | | | - | | | | - | | | | 257,644 | | | | 298,071 | |
Net Asset Value, offering price and redemption price per share | | $ | 9.39 | | | $ | 17.97 | | | $ | 11.69 | | | $ | - | | | $ | - | | | $ | 8.77 | | | $ | 10.67 | |
| | | | | | | | | | | | | | | | | | | | | | | | | | | | |
The accompanying notes are an integral part of these financial statements.
74
Timothy Plan Funds
Statements of Operations
For the Year Ended September 30, 2019
| | | | | | | | | | | | | | | | | | | | | | | | |
| |
| | | | | | |
| | | Aggressive
Growth Fund | | | International Fund | | | Large/Mid Cap
Growth Fund | | | Small Cap Value
Fund | | | Large/Mid Cap
Value Fund | | | Fixed Income
Fund | |
| | | | | | | | | | | | | | | | | | | | | | | | |
| |
Investment Income: | | | | | | | | | | | | | | | | | | | | | | | | |
Interest income | | $ | 46,706 | | | $ | 87,712 | | | $ | 94,224 | | | $ | 53,150 | | | $ | 98,948 | | | $ | 2,382,263 | |
Dividend Income | | | 147,639 | | | | 2,665,269 | | | | 890,157 | | | | 2,553,625 | | | | 3,677,348 | | | | 10,509 | |
Dividend income from affiliated investments | | | - | | | | - | | | | 73,074 | | | | - | | | | 303,160 | | | | - | |
Foreign tax withheld | | | (807) | | | | (230,388) | | | | (7,643) | | | | - | | | | - | | | | - | |
| | | | | | | | | | | | | | | | | | | | | | | | |
Total Investment Income | | | 193,538 | | | | 2,522,593 | | | | 1,049,812 | | | | 2,606,775 | | | | 4,079,456 | | | | 2,392,772 | |
| | | | | | | | | | | | | | | | | | | | | | | | |
| | | | | | |
Operating Expenses: | | | | | | | | | | | | | | | | | | | | | | | | |
Investment advisory fees | | | 225,372 | | | | 942,035 | | | | 742,366 | | | | 1,225,222 | | | | 1,798,562 | | | | 520,274 | |
12b-1 Fees: | | | | | | | | | | | | | | | | | | | | | | | | |
Class A | | | 55,132 | | | | 155,817 | | | | 169,922 | | | | 248,962 | | | | 382,404 | | | | 182,643 | |
Class C | | | 32,207 | | | | 34,004 | | | | 91,145 | | | | 110,573 | | | | 204,060 | | | | 90,571 | |
Administration fees | | | 63,579 | | | | 225,445 | | | | 203,513 | | | | 331,644 | | | | 497,065 | | | | 208,492 | |
Registration fees | | | 32,238 | | | | 41,332 | | | | 41,052 | | | | 52,388 | | | | 53,821 | | | | 33,613 | |
Audit fees | | | 13,282 | | | | 13,566 | | | | 13,576 | | | | 13,455 | | | | 13,353 | | | | 13,282 | |
Non12b-1 shareholder service fees | | | 10,305 | | | | 74,963 | | | | 50,160 | | | | 66,684 | | | | 104,361 | | | | 68,151 | |
Printing expenses | | | 9,998 | | | | 38,001 | | | | 40,427 | | | | 63,613 | | | | 88,287 | | | | 31,714 | |
Compliance officer fees | | | 2,479 | | | | 8,125 | | | | 8,043 | | | | 13,282 | | | | 20,216 | | | | 7,876 | |
Trustees’ fees | | | 1,455 | | | | 10,110 | | | | 12,155 | | | | 18,559 | | | | 29,717 | | | | 9,689 | |
Custody fees | | | 1,197 | | | | 12,862 | | | | 14,785 | | | | 29,537 | | | | 29,738 | | | | 11,029 | |
Insurance expenses | | | 436 | | | | 2,189 | | | | 4,817 | | | | 7,651 | | | | 14,900 | | | | 2,339 | |
Miscellaneous expenses | | | 9,647 | | | | 8,112 | | | | 9,531 | | | | 3,018 | | | | 6,214 | | | | 4,988 | |
| | | | | | | | | | | | | | | | | | | | | | | | |
Total Operating Expenses | | | 457,327 | | | | 1,566,561 | | | | 1,401,492 | | | | 2,184,588 | | | | 3,242,698 | | | | 1,184,661 | |
Less: Expenses waived by Advisor | | | (22,439) | | | | (39,588) | | | | (36,904) | | | | (121,813) | | | | (205,161) | | | | (143,845) | |
| | | | | | | | | | | | | | | | | | | | | | | | |
Net Operating Expenses | | | 434,888 | | | | 1,526,973 | | | | 1,364,588 | | | | 2,062,775 | | | | 3,037,537 | | | | 1,040,816 | |
| | | | | | | | | | | | | | | | | | | | | | | | |
Net Investment Income (Loss) | | | (241,350) | | | | 995,620 | | | | (314,776) | | | | 544,000 | | | | 1,041,919 | | | | 1,351,956 | |
| | | | | | | | | | | | | | | | | | | | | | | | |
Realized and Unrealized
Gain (Loss) on Investments: | | | | | | | | | | | | | | | | | | | | | | | | |
Net realized gain (loss) on investments | | | (657,613) | | | | (3,463,698) | | | | 3,640,176 | | | | 2,564,882 | | | | 23,401,368 | | | | (60,200) | |
and foreign currency transactions | | | - | | | | 162 | | | | - | | | | - | | | | - | | | | - | |
Capital gain dividends from REITs | | | - | | | | - | | | | - | | | | 118,100 | | | | 12,891 | | | | - | |
Net change in unrealized appreciation (depreciation) on investments | | | (2,362,602) | | | | (3,661,267) | | | | (6,202,277) | | | | (10,298,517) | | | | (21,589,969) | | | | 5,200,724 | |
affiliated investments | | | - | | | | - | | | | 337,968 | | | | - | | | | 939,504 | | | | - | |
and foreign currency translations | | | - | | | | (46) | | | | - | | | | - | | | | - | | | | - | |
| | | | | | | | | | | | | | | | | | | | | | | | |
Net Realized and Unrealized Gain (Loss) on Investments | | | (3,020,215) | | | | (7,124,849) | | | | (2,224,133) | | | | (7,615,535) | | | | 2,763,794 | | | | 5,140,524 | |
| | | | | | | | | | | | | | | | | | | | | | | | |
Net Increase (Decrease) in Net Assets Resulting From Operations | | $ | (3,261,565) | | | $ | (6,129,229) | | | $ | (2,538,909) | | | $ | (7,071,535) | | | $ | 3,805,713 | | | $ | 6,492,480 | |
| | | | | | | | | | | | | | | | | | | | | | | | |
The accompanying notes are an integral part of these financial statements.
75
Timothy Plan Funds
Statements of Operations (Continued)
For the Year Ended September 30, 2019
| | | | | | | | | | | | | | | | | | | | | | | | | | | | |
| |
| | | | | | | |
| | | High Yield Bond Fund | | | Israel Common
Values Fund | | | Defensive
Strategies Fund | | | Strategic Growth
Fund | | | Conservative
Growth Fund | | | Emerging
Markets Fund | | | Growth & Income
Fund | |
| | | | | | | | | | | | | | | | | | | | | | | | | | | | |
| |
Investment Income: | | | | | | | | | | | | | | | | | | | | | | | | | | | | |
Interest income | | $ | 3,019,229 | | | $ | 85,823 | | | $ | 344,301 | | | $ | 18,831 | | | $ | 43,799 | | | $ | 56,401 | | | $ | 349,348 | |
Dividend Income | | | - | | | | 1,433,213 | | | | 518,583 | | | | - | | | | - | | | | 877,527 | | | | 107,900 | |
Dividend income from affiliated investments | | | - | | | | - | | | | - | | | | 480,505 | | | | 699,094 | | | | - | | | | 130,609 | |
Foreign tax withheld | | | - | | | | (329,510) | | | | (14,909) | | | | - | | | | - | | | | (103,784) | | | | (278) | |
| | | | | | | | | | | | | | | | | | | | | | | | | | | | |
Total Investment Income | | | 3,019,229 | | | | 1,189,526 | | | | 847,975 | | | | 499,336 | | | | 742,893 | | | | 830,144 | | | | 587,579 | |
| | | | | | | | | | | | | | | | | | | | | | | | | | | | |
| | | | | | | |
Operating Expenses: | | | | | | | | | | | | | | | | | | | | | | | | | | | | |
Investment advisory fees | | | 323,951 | | | | 658,596 | | | | 259,191 | | | | 231,801 | | | | 303,242 | | | | 260,754 | | | | 235,040 | |
12b-1 fees: | | | | | | | | | | | | | | | | | | | | | | | | | | | | |
Class A | | | 93,748 | | | | 104,679 | | | | 89,895 | | | | - | | | | - | | | | 44,309 | | | | 57,586 | |
Class C | | | 28,446 | | | | 91,788 | | | | 41,954 | | | | 34,887 | | | | 54,430 | | | | 19,310 | | | | 26,582 | |
Administration fees | | | 137,490 | | | | 144,492 | | | | 108,103 | | | | 85,311 | | | | 111,968 | | | | 59,310 | | | | 74,796 | |
Non12b-1 shareholder service fees | | | 39,462 | | | | 37,426 | | | | 24,920 | | | | 5,752 | | | | 7,594 | | | | 21,988 | | | | 21,831 | |
Registration fees | | | 37,464 | | | | 37,874 | | | | 30,164 | | | | 27,812 | | | | 29,611 | | | | 44,066 | | | | 30,392 | |
Printing expenses | | | 23,063 | | | | 24,915 | | | | 17,361 | | | | 15,528 | | | | 16,006 | | | | 11,132 | | | | 12,275 | |
Audit fees | | | 13,008 | | | | 13,454 | | | | 13,180 | | | | 13,647 | | | | 13,637 | | | | 14,134 | | | | 13,637 | |
Custody fees | | | 5,513 | | | | 60,103 | | | | 46,230 | | | | 6,200 | | | | 6,000 | | | | 43,452 | | | | 4,228 | |
Trustees’ fees | | | 4,365 | | | | 8,093 | | | | 6,318 | | | | 4,078 | | | | 5,432 | | | | 3,123 | | | | 1,430 | |
Compliance officer fees | | | 1,785 | | | | 5,472 | | | | 2,067 | | | | 2,821 | | | | 3,098 | | | | 1,813 | | | | 1,621 | |
Insurance expenses | | | 1,213 | | | | 3,017 | | | | 2,779 | | | | 578 | | | | 2,186 | | | | 294 | | | | 1,999 | |
Miscellaneous expenses | | | 4,971 | | | | 2,732 | | | | 9,291 | | | | 4,815 | | | | 5,762 | | | | 9,620 | | | | 9,038 | |
| | | | | | | | | | | | | | | | | | | | | | | | | | | | |
Total Operating Expenses | | | 714,479 | | | | 1,192,641 | | | | 651,453 | | | | 433,230 | | | | 558,966 | | | | 533,305 | | | | 490,455 | |
Less: Expenses waived by Advisor | | | (23,167) | | | | - | | | | (18,051) | | | | - | | | | - | | | | (9,101) | | | | (11,640) | |
| | | | | | | | | | | | | | | | | | | | | | | | | | | | |
Net Operating Expenses | | | 691,312 | | | | 1,192,641 | | | | 633,402 | | | | 433,230 | | | | 558,966 | | | | 524,204 | | | | 478,815 | |
| | | | | | | | | | | | | | | | | | | | | | | | | | | | |
| | | | | | | |
Net Investment Income (Loss) | | | 2,327,917 | | | | (3,115) | | | | 214,573 | | | | 66,106 | | | | 183,927 | | | | 305,940 | | | | 108,764 | |
| | | | | | | | | | | | | | | | | | | | | | | | | | | | |
| | | | | | | |
Realized and Unrealized
Gain (Loss) on Investments: | | | | | | | | | | | | | | | | | | | | | | | | | | | | |
Net realized gain (loss) on investments | | | (120,540) | | | | 1,322,833 | | | | 698,416 | | | | - | | | | - | | | | 814,069 | | | | (472,359) | |
foreign currency transactions | | | - | | | | 4,920 | | | | (1,433) | | | | - | | | | - | | | | (10,405) | | | | (73) | |
and affiliated investments | | | - | | | | - | | | | - | | | | 537,455 | | | | 697,815 | | | | - | | | | 42,350 | |
Capital gain distributions from affiliated funds | | | - | | | | - | | | | - | | | | 922,334 | | | | 976,773 | | | | - | | | | - | |
Capital gain dividends from REITs | | | - | | | | - | | | | 68,360 | | | | - | | | | - | | | | - | | | | 106 | |
Net change in unrealized appreciation (depreciation) on investments | | | 2,025,674 | | | | 7,770,552 | | | | (1,035,188) | | | | - | | | | - | | | | (819,135) | | | | (320,518) | |
affiliated investments | | | - | | | | - | | | | - | | | | (1,747,061) | | | | (1,356,488) | | | | - | | | | 271,189 | |
alternative investments | | | - | | | | - | | | | 1,825,133 | | | | - | | | | - | | | | - | | | | - | |
and foreign currency translations | | | - | | | | 687 | | | | (254) | | | | - | | | | - | | | | (692) | | | | (31) | |
| | | | | | | | | | | | | | | | | | | | | | | | | | | | |
Net Realized and Unrealized Gain (Loss) on Investments | | | 1,905,134 | | | | 9,098,992 | | | | 1,555,034 | | | | (287,272) | | | | 318,100 | | | | (16,163) | | | | (479,336) | |
| | | | | | | | | | | | | | | | | | | | | | | | | | | | |
| | | | | | | |
Net Increase (Decrease) in Net Assets Resulting From Operations | | $ | 4,233,051 | | | $ | 9,095,877 | | | $ | 1,769,607 | | | $ | (221,166) | | | $ | 502,027 | | | $ | 289,777 | | | $ | (370,572) | |
| | | | | | | | | | | | | | | | | | | | | | | | | | | | |
The accompanying notes are an integral part of these financial statements.
76
Timothy Plan Funds
Statements of Changes in Net Assets
| | | | | | | | | | | | | | | | | | | | | | | | |
| | | Aggressive Growth Fund | | | International Fund | | | Large/Mid Cap Growth Fund | |
| | | | | | |
| | | Year Ended September 30, 2019 | | | Year Ended September 30, 2018 | | | Year Ended September 30, 2019 | | | Year Ended September 30, 2018 | | | Year Ended September 30, 2019 | | | Year Ended September 30, 2018 | |
Operations: | | | | | | | | | | | | | | | | | | | | | | | | |
Net investment income (loss) | | $ | (241,350) | | | $ | (337,247) | | | $ | 995,620 | | | $ | 1,234,439 | | | $ | (314,776) | | | $ | (248,708) | |
Net realized gain (loss) from investments and foreign currency transactions | | | (657,613) | | | | 2,614,277 | | | | (3,463,536) | | | | (305,961) | | | | 3,640,176 | | | | 4,948,472 | |
Net change in unrealized appreciation (depreciation) on investments, affiliated investments and foreign currency translations | | | (2,362,602) | | | | 1,679,056 | | | | (3,661,313) | | | | (809,339) | | | | (5,864,309) | | | | 5,152,488 | |
| | | | | | | | | | | | | | | | | | | | | | | | |
Net increase (decrease) in net assets resulting from operations | | | (3,261,565) | | | | 3,956,086 | | | | (6,129,229) | | | | 119,139 | | | | (2,538,909) | | | | 9,852,252 | |
| | | | | | | | | | | | | | | | | | | | | | | | |
| | | | | | |
Distributions to Shareholders: | | | | | | | | | | | | | | | | | | | | | | | | |
Net investment income | | | | | | | | | | | | | | | | | | | | | | | | |
Class A | | | - | | | | - | | | | - | | | | (1,590,599) | | | | - | | | | - | |
Class C | | | - | | | | - | | | | - | | | | (78,049) | | | | - | | | | - | |
Class I | | | - | | | | - | | | | - | | | | (317,870) | | | | - | | | | - | |
Net realized gains | | | | | | | | | | | | | | | | | | | | | | | | |
Class A | | | - | | | | - | | | | - | | | | - | | | | - | | | | (1,847,919) | |
Class C | | | - | | | | - | | | | - | | | | - | | | | - | | | | (315,112) | |
Class I | | | - | | | | - | | | | - | | | | - | | | | - | | | | (131,374) | |
Return of Capital | | | | | | | | | | | | | | | | | | | | | | | | |
Class A | | | (363) | | | | - | | | | - | | | | - | | | | - | | | | - | |
Class C | | | (40) | | | | - | | | | - | | | | - | | | | - | | | | - | |
Class I | | | (21) | | | | - | | | | - | | | | - | | | | - | | | | - | |
Total distributions paid * | | | | | | | | | | | | | | | | | | | | | | | | |
Class A | | | (1,499,415) | | | | - | | | | (708,387) | | | | - | | | | (3,489,484) | | | | - | |
Class C | | | (288,448) | | | | - | | | | (6,387) | | | | - | | | | (615,960) | | | | - | |
Class I | | | (73,870) | | | | - | | | | (385,842) | | | | - | | | | (360,231) | | | | - | |
| | | | | | | | | | | | | | | | | | | | | | | | |
Total dividends and distributions to shareholders | | | (1,862,157) | | | | - | | | | (1,100,616) | | | | (1,986,518) | | | | (4,465,675) | | | | (2,294,405) | |
| | | | | | | | | | | | | | | | | | | | | | | | |
| | | | | | |
Share Transactions of Beneficial Interest: | | | | | | | | | | | | | | | | | | | | | | | | |
Net proceeds from shares sold | | | | | | | | | | | | | | | | | | | | | | | | |
Class A | | | 7,677,448 | | | | 6,109,332 | | | | 9,719,151 | | | | 26,340,958 | | | | 16,861,703 | | | | 26,743,917 | |
Class C | | | 598,286 | | | | 936,704 | | | | 487,937 | | | | 1,087,173 | | | | 1,375,432 | | | | 2,228,727 | |
Class I | | | 334,672 | | | | 481,847 | | | | 12,092,068 | | | | 23,288,714 | | | | 10,550,381 | | | | 7,874,524 | |
Reinvestment of dividends and distributions | | | | | | | | | | | | | | | | | | | | | | | | |
Class A | | | 1,464,627 | | | | - | | | | 589,421 | | | | 1,371,884 | | | | 3,336,072 | | | | 1,776,200 | |
Class C | | | 275,499 | | | | - | | | | 5,743 | | | | 67,879 | | | | 572,523 | | | | 286,578 | |
Class I | | | 67,868 | | | | - | | | | 245,561 | | | | 195,978 | | | | 328,907 | | | | 114,736 | |
Cost of shares redeemed | | | | | | | | | | | | | | | | | | | | | | | | |
Class A | | | (8,980,506) | | | | (6,037,901) | | | | (17,850,706) | | | | (37,345,703) | | | | (30,537,990) | | | | (23,051,846) | |
Class C | | | (2,135,525) | | | | (660,781) | | | | (2,332,459) | | | | (915,581) | | | | (4,394,174) | | | | (1,800,801) | |
Class I | | | (267,041) | | | | (248,327) | | | | (13,001,207) | | | | (4,224,936) | | | | (6,775,094) | | | | (2,062,243) | |
| | | | | | | | | | | | | | | | | | | | | | | | |
Net increase (decrease) in net assets from share transactions of beneficial interest | | | (964,672) | | | | 580,874 | | | | (10,044,491) | | | | 9,866,366 | | | | (8,682,240) | | | | 12,109,792 | |
| | | | | | | | | | | | | | | | | | | | | | | | |
| | | | | | |
Total Increase (Decrease) in Net Assets | | | (6,088,394) | | | | 4,536,960 | | | | (17,274,336) | | | | 7,998,987 | | | | (15,686,824) | | | | 19,667,639 | |
| | | | | | |
Net Assets: | | | | | | | | | | | | | | | | | | | | | | | | |
Beginning of year | | | 31,557,159 | | | | 27,020,199 | | | | 106,855,169 | | | | 98,856,182 | | | | 101,803,292 | | | | 82,135,653 | |
| | | | | | | | | | | | | | | | | | | | | | | | |
End of year** | | $ | 25,468,765 | | | $ | 31,557,159 | | | $ | 89,580,833 | | | $ | 106,855,169 | | | $ | 86,116,468 | | | $ | 101,803,292 | |
| | | | | | | | | | | | | | | | | | | | | | | | |
| | | | | | |
Share Activity: | | | | | | | | | | | | | | | | | | | | | | | | |
Shares Sold | | | | | | | | | | | | | | | | | | | | | | | | |
Class A | | | 953,759 | | | | 710,533 | | | | 1,092,071 | | | | 2,594,394 | | | | 2,002,309 | | | | 2,994,799 | |
Class C | | | 92,555 | | | | 130,147 | | | | 56,309 | | | | 110,883 | | | | 203,906 | | | | 302,780 | |
Class I | | | 41,644 | | | | 55,163 | | | | 1,354,200 | | | | 2,284,264 | | | | 1,232,870 | | | | 872,751 | |
Shares Reinvested | | | | | | | | | | | | | | | | | | | | | | | | |
Class A | | | 213,192 | | | | - | | | | 72,589 | | | | 138,017 | | | | 454,506 | | | | 203,693 | |
Class C | | | 49,462 | | | | - | | | | 726 | | | | 7,027 | | | | 96,874 | | | | 39,969 | |
Class I | | | 9,709 | | | | - | | | | 30,241 | | | | 19,696 | | | | 44,031 | | | | 12,979 | |
Shares Redeemed | | | | | | | | | | | | | | | | | | | | | | | | |
Class A | | | (1,192,228) | | | | (696,184) | | | | (2,008,393) | | | | (3,689,300) | | | | (3,636,280) | | | | (2,594,895) | |
Class C | | | (328,106) | | | | (92,398) | | | | (264,990) | | | | (93,666) | | | | (646,675) | | | | (248,808) | |
Class I | | | (32,820) | | | | (27,915) | | | | (1,454,079) | | | | (422,471) | | | | (807,955) | | | | (225,749) | |
| | | | | | | | | | | | | | | | | | | | | | | | |
Net increase (decrease) in shares of beneficial interest outstanding | | | (192,833) | | | | 79,346 | | | | (1,121,326) | | | | 948,844 | | | | (1,056,414) | | | | 1,357,519 | |
| | | | | | | | | | | | | | | | | | | | | | | | |
* Distributions from net investment income and net realized capital gains are combined for the year ended September 30, 2019. See “New Accounting Pronouncements” in the Notes to Financial Statements for more information. The dividends and distibutions to shareholders for the year ended September 30, 2018 have not been reclassified to conform to the current year presentation.
** Net Assets - End of Period includes accumulated net investment income (loss) of $(267,521) for the Aggressive Growth Fund, $(548,573) for the International Fund and $(229,905) for the Large/Mid Cap Growth Fund as of September 30, 2018.
The accompanying notes are an integral part of these financial statements.
77
Timothy Plan Funds
Statements of Changes in Net Assets (Continued)
| | | | | | | | | | | | | | | | | | | | | | | | |
| | | Small Cap Value Fund | | | Large/Mid Cap Value Fund | | | Fixed Income Fund | |
| | | | | | |
| | | Year Ended September 30, 2019 | | | Year Ended September 30, 2018 | | | Year Ended September 30, 2019 | | | Year Ended September 30, 2018 | | | Year Ended September 30, 2019 | | | Year Ended September 30, 2018 | |
Operations: | | | | | | | | | | | | | | | | | | | | | | | | |
Net investment income (loss) | | $ | 544,000 | | | $ | (65,711) | | | $ | 1,041,919 | | | $ | 723,877 | | | $ | 1,351,956 | | | $ | 1,248,681 | |
Net realized gain (loss) from investments and foreign currency transactions | | | 2,564,882 | | | | 20,589,359 | | | | 23,401,368 | | | | 19,004,936 | | | | (60,200) | | | | (414,217) | |
Capital gain dividends from REITs | | | 118,100 | | | | 279,942 | | | | 12,891 | | | | 352 | | | | - | | | | - | |
Net change in unrealized appreciation (depreciation) on investments, affiliated investments and foreign currency translations | | | (10,298,517) | | | | (6,327,556) | | | | (20,650,465) | | | | 7,805,963 | | | | 5,200,724 | | | | (2,914,612) | |
| | | | | | | | | | | | | | | | | | | | | | | | |
Net increase (decrease) in net assets resulting from operations | | | (7,071,535) | | | | 14,476,034 | | | | 3,805,713 | | | | 27,535,128 | | | | 6,492,480 | | | | (2,080,148) | |
| | | | | | | | | | | | | | | | | | | | | | | | |
| | | | | | |
Distributions to Shareholders: | | | | | | | | | | | | | | | | | | | | | | | | |
Net investment income | | | | | | | | | | | | | | | | | | | | | | | | |
Class A | | | - | | | | (22,710) | | | | - | | | | (220,445) | | | | - | | | | (1,218,734) | |
Class C | | | - | | | | - | | | | - | | | | - | | | | - | | | | (101,803) | |
Class I | | | - | | | | (52,883) | | | | - | | | | (76,736) | | | | - | | | | (54,148) | |
Net realized gains | | | | | | | | | | | | | | | | | | | | | | | | |
Class A | | | - | | | | (9,388,636) | | | | - | | | | (10,710,030) | | | | - | | | | - | |
Class C | | | - | | | | (1,526,616) | | | | - | | | | (1,896,292) | | | | - | | | | - | |
Class I | | | - | | | | (1,716,592) | | | | - | | | | (1,324,276) | | | | - | | | | - | |
Total distributions paid * | | | | | | | | | | | | | | | | | | | | | | | | |
Class A | | | (12,397,401) | | | | - | | | | (14,065,260) | | | | - | | | | (1,270,649) | | | | - | |
Class C | | | (2,186,667) | | | | - | | | | (2,541,277) | | | | - | | | | (103,735) | | | | - | |
Class I | | | (3,941,007) | | | | - | | | | (3,049,819) | | | | - | | | | (100,824) | | | | - | |
| | | | | | | | | | | | | | | | | | | | | | | | |
Total dividends and distributions to shareholders | | | (18,525,075) | | | | (12,707,437) | | | | (19,656,356) | | | | (14,227,779) | | | | (1,475,208) | | | | (1,374,685) | |
| | | | | | | | | | | | | | | | | | | | | | | | |
| | | | | | |
Share Transactions of Beneficial Interest: | | | | | | | | | | | | | | | | | | | | | | | | |
Net proceeds from shares sold | | | | | | | | | | | | | | | | | | | | | | | | |
Class A | | | 17,337,139 | | | | 29,520,528 | | | | 35,570,961 | | | | 42,017,010 | | | | 33,469,517 | | | | 13,394,512 | |
Class C | | | 1,491,795 | | | | 1,993,048 | | | | 2,507,557 | | | | 3,682,182 | | | | 3,045,521 | | | | 3,335,525 | |
Class I | | | 14,472,068 | | | | 17,485,340 | | | | 22,824,218 | | | | 20,485,063 | | | | 5,617,316 | | | | 1,810,955 | |
Reinvestment of dividends and distributions | | | | | | | | | | | | | | | | | | | | | | | | |
Class A | | | 11,849,967 | | | | 8,933,806 | | | | 13,102,756 | | | | 10,092,852 | | | | 1,128,758 | | | | 1,067,151 | |
Class C | | | 2,115,445 | | | | 1,478,389 | | | | 2,373,937 | | | | 1,738,242 | | | | 85,898 | | | | 87,551 | |
Class I | | | 3,695,999 | | | | 1,609,352 | | | | 2,724,948 | | | | 1,175,132 | | | | 87,826 | | | | 46,244 | |
Cost of shares redeemed | | | | | | | | | | | | | | | | | | | | | | | | |
Class A | | | (27,525,777) | | | | (37,994,067) | | | | (66,666,482) | | | | (57,481,324) | | | | (19,588,969) | | | | (21,251,623) | |
Class C | | | (6,267,871) | | | | (1,771,734) | | | | (11,659,902) | | | | (4,442,696) | | | | (4,788,268) | | | | (3,003,371) | |
Class I | | | (11,268,023) | | | | (3,561,465) | | | | (11,992,169) | | | | (7,228,663) | | | | (1,082,881) | | | | (679,913) | |
| | | | | | | | | | | | | | | | | | | | | | | | |
Net increase (decrease) in net assets from share transactions of beneficial interest | | | 5,900,742 | | | | 17,693,197 | | | | (11,214,176) | | | | 10,037,798 | | | | 17,974,718 | | | | (5,192,969) | |
| | | | | | | | | | | | | | | | | | | | | | | | |
| | | | | | |
Total Increase (Decrease) in Net Assets | | | (19,695,868) | | | | 19,461,794 | | | | (27,064,819) | | | | 23,345,147 | | | | 22,991,990 | | | | (8,647,802) | |
| | | | | | |
Net Assets: | | | | | | | | | | | | | | | | | | | | | | | | |
Beginning of year | | | 164,727,850 | | | | 145,266,056 | | | | 233,588,560 | | | | 210,243,413 | | | | 78,980,481 | | | | 87,628,283 | |
| | | | | | | | | | | | | | | | | | | | | | | | |
End of year** | | $ | 145,031,982 | | | $ | 164,727,850 | | | $ | 206,523,741 | | | $ | 233,588,560 | | | $ | 101,972,471 | | | $ | 78,980,481 | |
| | | | | | | | | | | | | | | | | | | | | | | | |
| | | | | | |
Share Activity: | | | | | | | | | | | | | | | | | | | | | | | | |
| | | | | | |
Shares Sold | | | | | | | | | | | | | | | | | | | | | | | | |
Class A | | | 1,029,152 | | | | 1,453,270 | | | | 1,965,482 | | | | 2,121,546 | | | | 3,307,246 | | | | 1,337,781 | |
Class C | | | 127,840 | | | | 132,775 | | | | 174,277 | | | | 230,041 | | | | 314,165 | | | | 347,652 | |
Class I | | | 848,925 | | | | 849,056 | | | | 1,245,993 | | | | 1,027,556 | | | | 555,144 | | | | 182,832 | |
Shares Reinvested | | | | | | | | | | | | | | | | | | | | | | | | |
Class A | | | 822,914 | | | | 459,560 | | | | 818,924 | | | | 526,767 | | | | 111,290 | | | | 107,477 | |
Class C | | | 214,114 | | | | 103,525 | | | | 187,663 | | | | 111,426 | | | | 8,847 | | | | 9,157 | |
Class I | | | 252,804 | | | | 81,901 | | | | 168,832 | | | | 60,825 | | | | 8,672 | | | | 4,701 | |
Shares Redeemed | | | | | | | | | | | | | | | | | | | | | | | | |
Class A | | | (1,639,322) | | | | (1,858,772) | | | | (3,679,480) | | | | (2,919,770) | | | | (1,947,266) | | | | (2,123,360) | |
Class C | | | (543,038) | | | | (118,838) | | | | (807,950) | | | | (278,184) | | | | (494,340) | | | | (313,092) | |
Class I | | | (660,690) | | | | (173,006) | | | | (651,174) | | | | (362,574) | | | | (109,114) | | | | (68,181) | |
| | | | | | | | | | | | | | | | | | | | | | | | |
Net increase (decrease) in shares of beneficial interest outstanding | | | 452,699 | | | | 929,471 | | | | (577,433) | | | | 517,633 | | | | 1,754,644 | | | | (515,033) | |
| | | | | | | | | | | | | | | | | | | | | | | | |
* Distributions from net investment income and net realized capital gains are combined for the year ended September 30, 2019. See “New Accounting Pronouncements” in the Notes to Financial Statements for more information. The dividends and distibutions to shareholders for the year ended September 30, 2018 have not been reclassified to conform to the current year presentation.
** Net Assets - End of Period includes accumulated net investment income of $0 for the Small Cap Value Fund, $722,928 for the Large/Mid Cap Value Fund and $366,969 for the Fixed Income Growth Fund as of September 30, 2018.
The accompanying notes are an integral part of these financial statements.
78
Timothy Plan Funds
Statements of Changes in Net Assets (Continued)
| | | | | | | | | | | | | | | | | | | | | | | | |
| | | High Yield Bond Fund | | | Israel Common Values Fund | | | Defensive Strategies Fund | |
| | | | | | |
| | | Year Ended September 30, 2019 | | | Year Ended September 30, 2018 | | | Year Ended September 30, 2019 | | | Year Ended September 30, 2018 | | | Year Ended September 30, 2019 | | | Year Ended September 30, 2018 | |
Operations: | | | | | | | | | | | | | | | | | | | | | | | | |
Net investment income (loss) | | $ | 2,327,917 | | | $ | 2,224,935 | | | $ | (3,115) | | | $ | (180,624) | | | $ | 214,573 | | | $ | 453,199 | |
Net realized gain (loss) from investments and foreign currency transactions | | | (120,540) | | | | 218,979 | | | | 1,327,753 | | | | (671,674) | | | | 696,983 | | | | 1,327,973 | |
Capital gain dividends from REITs | | | - | | | | - | | | | - | | | | - | | | | 68,360 | | | | 73,608 | |
Net change in unrealized appreciation (depreciation) on investments investments and foreign currency translations | | | 2,025,674 | | | | (2,642,975) | | | | 7,771,239 | | | | 4,238,260 | | | | 789,691 | | | | (1,465,859) | |
| | | | | | | | | | | | | | | | | | | | | | | | |
Net increase (decrease) in net assets resulting from operations | | | 4,233,051 | | | | (199,061) | | | | 9,095,877 | | | | 3,385,962 | | | | 1,769,607 | | | | 388,921 | |
| | | | | | | | | | | | | | | | | | | | | | | | |
| | | | | | |
Distributions to Shareholders: | | | | | | | | | | | | | | | | | | | | | | | | |
Net investment income | | | | | | | | | | | | | | | | | | | | | | | | |
Class A | | | - | | | | (1,768,397) | | | | - | | | | (359,503) | | | | - | | | | (60,700) | |
Class C | | | - | | | | (102,963) | | | | - | | | | (42,642) | | | | - | | | | - | |
Class I | | | - | | | | (432,389) | | | | - | | | | (5,694) | | | | - | | | | (11,149) | |
Return of Capital | | | | | | | | | | | | | | | | | | | | | | | | |
Class A | | | - | | | | - | | | | - | | | | (129,767) | | | | - | | | | - | |
Class C | | | - | | | | - | | | | - | | | | (29,086) | | | | - | | | | - | |
Class I | | | - | | | | - | | | | - | | | | (31,812) | | | | - | | | | - | |
Total distributions paid * | | | | | | | | | | | | | | | | | | | | | | | | |
Class A | | | (1,557,285) | | | | - | | | | (243,814) | | | | - | | | | (935,146) | | | | - | |
Class C | | | (91,853) | | | | - | | | | (60,850) | | | | - | | | | (93,234) | | | | - | |
Class I | | | (640,911) | | | | - | | | | (66,962) | | | | - | | | | (78,462) | | | | - | |
| | | | | | | | | | | | | | | | | | | | | | | | |
Total dividends and distributions to shareholders | | | (2,290,049) | | | | (2,303,749) | | | | (371,626) | | | | (598,504) | | | | (1,106,842) | | | | (71,849) | |
| | | | | | | | | | | | | | | | | | | | | | | | |
| | | | | | |
Share Transactions of Beneficial Interest: | | | | | | | | | | | | | | | | | | | | | | | | |
Net proceeds from shares sold | | | | | | | | | | | | | | | | | | | | | | | | |
Class A | | | 15,115,879 | | | | 15,559,524 | | | | 19,868,088 | | | | 20,164,685 | | | | 7,505,953 | | | | 7,809,456 | |
Class C | | | 578,549 | | | | 554,200 | | | | 1,278,811 | | | | 2,149,433 | | | | 405,740 | | | | 541,442 | |
Class I | | | 9,071,441 | | | | 8,399,536 | | | | 10,931,321 | | | | 8,130,495 | | | | 1,383,319 | | | | 1,070,040 | |
Reinvestment of dividends and distributions | | | | | | | | | | | | | | | | | | | | | | | | |
Class A | | | 1,312,260 | | | | 1,555,166 | | | | 222,531 | | | | 449,425 | | | | 890,434 | | | | 57,373 | |
Class C | | | 84,398 | | | | 92,585 | | | | 52,260 | | | | 61,406 | | | | 87,912 | | | | - | |
Class I | | | 508,873 | | | | 315,949 | | | | 63,076 | | | | 31,555 | | | | 57,489 | | | | 8,471 | |
Cost of shares redeemed | | | | | | | | | | | | | | | | | | | | | | | | |
Class A | | | (19,860,715) | | | | (26,107,974) | | | | (17,312,111) | | | | (16,303,706) | | | | (15,577,577) | | | | (17,672,282) | |
Class C | | | (1,338,739) | | | | (828,446) | | | | (1,915,130) | | | | (1,345,224) | | | | (2,865,541) | | | | (1,796,160) | |
Class I | | | (3,402,024) | | | | (6,455,778) | | | | (1,949,665) | | | | (735,007) | | | | (898,725) | | | | (683,791) | |
| | | | | | | | | | | | | | | | | | | | | | | | |
Net increase (decrease) in net assets from share transactions of beneficial interest | | | 2,069,922 | | | | (6,915,238) | | | | 11,239,181 | | | | 12,603,062 | | | | (9,010,996) | | | | (10,665,451) | |
| | | | | | | | | | | | | | | | | | | | | | | | |
| | | | | | |
Total Increase (Decrease) in Net Assets | | | 4,012,924 | | | | (9,418,048) | | | | 19,963,432 | | | | 15,390,520 | | | | (8,348,231) | | | | (10,348,379) | |
| | | | | | |
Net Assets: | | | | | | | | | | | | | | | | | | | | | | | | |
Beginning of year | | | 56,787,427 | | | | 66,205,475 | | | | 60,442,135 | | | | 45,051,615 | | | | 49,075,628 | | | | 59,424,007 | |
| | | | | | | | | | | | | | | | | | | | | | | | |
End of year** | | $ | 60,800,351 | | | $ | 56,787,427 | | | $ | 80,405,567 | | | $ | 60,442,135 | | | $ | 40,727,397 | | | $ | 49,075,628 | |
| | | | | | | | | | | | | | | | | | | | | | | | |
| | | | | | |
Share Activity: | | | | | | | | | | | | | | | | | | | | | | | | |
| | | | | | |
Shares Sold | | | | | | | | | | | | | | | | | | | | | | | | |
Class A | | | 1,652,409 | | | | 1,683,808 | | | | 1,223,010 | | | | 1,308,467 | | | | 659,905 | | | | 680,848 | |
Class C | | | 62,759 | | | | 59,502 | | | | 82,872 | | | | 146,910 | | | | 37,624 | | | | 49,408 | |
Class I | | | 992,290 | | | | 916,697 | | | | 676,199 | | | | 537,915 | | | | 121,889 | | | | 93,378 | |
Shares Reinvested | | | | | | | | | | | | | | | | | | | | | | | | |
Class A | | | 143,994 | | | | 170,795 | | | | 15,315 | | | | 29,744 | | | | 83,845 | | | | 5,019 | |
Class C | | | 9,155 | | | | 10,053 | | | | 3,757 | | | | 4,212 | | | | 8,644 | | | | - | |
Class I | | | 55,522 | | | | 34,809 | | | | 4,317 | | | | 2,081 | | | | 5,429 | | | | 742 | |
Shares Redeemed | | | | | | | | | | | | | | | | | | | | | | | | |
Class A | | | (2,215,554) | | | | (2,832,414) | | | | (1,098,199) | | | | (1,068,959) | | | | (1,388,078) | | | | (1,543,665) | |
Class C | | | (144,851) | | | | (89,194) | | | | (123,096) | | | | (91,658) | | | | (265,431) | | | | (164,218) | |
Class I | | | (375,994) | | | | (701,269) | | | | (119,939) | | | | (48,538) | | | | (79,725) | | | | (59,636) | |
| | | | | | | | | | | | | | | | | | | | | | | | |
Net increase (decrease) in shares of beneficial interest outstanding | | | 179,730 | | | | (747,213) | | | | 664,236 | | | | 820,174 | | | | (815,898) | | | | (938,124) | |
| | | | | | | | | | | | | | | | | | | | | | | | |
* Distributions from net investment income and net realized capital gains are combined for the year ended September 30, 2019. See “New Accounting Pronouncements” in the Notes to Financial Statements for more information. The dividends and distibutions to shareholders for the year ended September 30, 2018 have not been reclassified to conform to the current year presentation.
** Net Assets - End of Period includes accumulated net investment income (loss) of $34,306 for the High Yield Bond Fund, $(1,500,349) for the Israel Common Values Fund and $368,580 for the Defensive Strategies Growth Fund as of September 30, 2018.
The accompanying notes are an integral part of these financial statements.
79
Timothy Plan Funds
Statements of Changes in Net Assets (Continued)
| | | | | | | | | | | | | | | | | | | | | | | | |
| | | Strategic Growth Fund | | | Conservative Growth Fund | | | Emerging Markets Fund | |
| | | | | | |
| | | Year Ended September 30, 2019 | | | Year Ended September 30, 2018 | | | Year Ended September 30, 2019 | | | Year Ended September 30, 2018 | | | Year Ended September 30, 2019 | | | Year Ended September 30, 2018 | |
Operations: | | | | | | | | | | | | | | | | | | | | | | | | |
Net investment income (loss) | | $ | 66,106 | | | $ | (46,312) | | | $ | 183,927 | | | $ | 5,369 | | | $ | 305,940 | | | $ | 109,807 | |
Net realized gain from investments, affiliated investments and foreign currency transactions | | | 537,455 | | | | 480,513 | | | | 697,815 | | | | 449,831 | | | | 803,664 | | | | 974,901 | |
Capital gain distributions from affiliated investments | | | 922,334 | | | | 606,054 | | | | 976,773 | | | | 673,012 | | | | - | | | | - | |
Net change in unrealized appreciation (depreciation) on investments, affiliated investments and foreign currency translations | | | (1,747,061) | | | | (165,160) | | | | (1,356,488) | | | | (609,539) | | | | (819,827) | | | | (3,943,422) | |
| | | | | | | | | | | | | | | | | | | | | | | | |
Net increase (decrease) in net assets resulting from operations | | | (221,166) | | | | 875,095 | | | | 502,027 | | | | 518,673 | | | | 289,777 | | | | (2,858,714) | |
| | | | | | | | | | | | | | | | | | | | | | | | |
| | | | | | |
Distributions to Shareholders: | | | | | | | | | | | | | | | | | | | | | | | | |
Net Investment Income | | | | | | | | | | | | | | | | | | | | | | | | |
Class A | | | - | | | | - | | | | - | | | | - | | | | - | | | | (113,234) | |
Class C | | | - | | | | - | | | | - | | | | - | | | | - | | | | (5,091) | |
Class I | | | - | | | | - | | | | - | | | | - | | | | - | | | | (14,243) | |
From net realized gains | | | | | | | | | | | | | | | | | | | | | | | | |
Class A | | | - | | | | - | | | | - | | | | (137,622) | | | | - | | | | - | |
Class C | | | - | | | | - | | | | - | | | | (31,354) | | | | - | | | | - | |
Total distributions paid * | | | | | | | | | | | | | | | | | | | | | | | | |
Class A | | | (100,346) | | | | - | | | | (896,237) | | | | - | | | | (131,029) | | | | - | |
Class C | | | (22,035) | | | | - | | | | (216,818) | | | | - | | | | - | | | | - | |
Class I | | | - | | | | - | | | | - | | | | - | | | | (21,765) | | | | - | |
| | | | | | | | | | | | | | | | | | | | | | | | |
Total dividends and distributions to shareholders | | | (122,381) | | | | - | | | | (1,113,055) | | | | (168,976) | | | | (152,794) | | | | (132,568) | |
| | | | | | | | | | | | | | | | | | | | | | | | |
| | | | | | |
Share Transactions of Beneficial Interest: | | | | | | | | | | | | | | | | | | | | | | | | |
Net proceeds from shares sold | | | | | | | | | | | | | | | | | | | | | | | | |
Class A | | | 6,003,858 | | | | 3,962,826 | | | | 6,203,911 | | | | 4,287,330 | | | | 8,644,315 | | | | 11,859,076 | |
Class C | | | 826,373 | | | | 695,858 | | | | 950,990 | | | | 1,689,015 | | | | 228,313 | | | | 789,603 | |
Class I | | | - | | | | - | | | | - | | | | - | | | | 1,331,590 | | | | 847,810 | |
Reinvestment of dividends and distributions | | | | | | | | | | | | | | | | | | | | | | | | |
Class A | | | 97,936 | | | | - | | | | 860,318 | | | | 131,649 | | | | 120,467 | | | | 105,541 | |
Class C | | | 21,796 | | | | - | | | | 202,216 | | | | 30,014 | | | | - | | | | 4,430 | |
Class I | | | - | | | | - | | | | - | | | | - | | | | 16,344 | | | | 12,412 | |
Cost of shares redeemed | | | | | | | | | | | | | | | | | | | | | | | | |
Class A | | | (5,635,144) | | | | (5,414,758) | | | | (8,100,727) | | | | (7,840,182) | | | | (10,113,231) | | | | (9,432,142) | |
Class C | | | (3,797,182) | | | | (1,461,107) | | | | (4,669,461) | | | | (2,480,370) | | | | (790,043) | | | | (723,848) | |
Class I | | | - | | | | - | | | | - | | | | - | | | | (979,613) | | | | (538,854) | |
| | | | | | | | | | | | | | | | | | | | | | | | |
Net increase (decrease) in net assets from share transactions of beneficial interest | | | (2,482,363) | | | | (2,217,181) | | | | (4,552,753) | | | | (4,182,544) | | | | (1,541,858) | | | | 2,924,028 | |
| | | | | | | | | | | | | | | | | | | | | | | | |
| | | | | | |
Total Decrease in Net Assets | | | (2,825,910) | | | | (1,342,086) | | | | (5,163,781) | | | | (3,832,847) | | | | (1,404,875) | | | | (67,254) | |
| | | | | | |
Net Assets: | | | | | | | | | | | | | | | | | | | | | | | | |
Beginning of year | | | 38,390,972 | | | | 39,733,058 | | | | 51,257,916 | | | | 55,090,763 | | | | 20,997,907 | | | | 21,065,161 | |
| | | | | | | | | | | | | | | | | | | | | | | | |
End of year** | | $ | 35,565,062 | | | $ | 38,390,972 | | | $ | 46,094,135 | | | $ | 51,257,916 | | | $ | 19,593,032 | | | $ | 20,997,907 | |
| | | | | | | | | | | | | | | | | | | | | | | | |
| | | | | | |
Share Activity: | | | | | | | | | | | | | | | | | | | | | | | | |
| | | | | | |
Shares Sold | | | | | | | | | | | | | | | | | | | | | | | | |
Class A | | | 642,410 | | | | 406,432 | | | | 594,953 | | | | 396,929 | | | | 979,758 | | | | 1,212,100 | |
Class C | | | 98,951 | | | | 79,661 | | | | 102,264 | | | | 171,926 | | | | 27,137 | | | | 84,433 | |
Class I | | | - | | | | - | | | | - | | | | - | | | | 151,693 | | | | 90,646 | |
Shares Reinvested | | | | | | | | | | | | | | | | | | | | | | | | |
Class A | | | 11,481 | | | | - | | | | 89,617 | | | | 12,201 | | | | 14,983 | | | | 11,017 | |
Class C | | | 2,857 | | | | - | | | | 23,297 | | | | 3,047 | | | | - | | | | 473 | |
Class I | | | - | | | | - | | | | - | | | | - | | | | 2,023 | | | | 1,289 | |
Shares Redeemed | | | | | | | | | | | | | | | | | | | | | | | | |
Class A | | | (607,077) | | | | (557,644) | | | | (787,889) | | | | (727,089) | | | | (1,160,285) | | | | (992,425) | |
Class C | | | (448,707) | | | | (167,568) | | | | (495,509) | | | | (253,047) | | | | (93,284) | | | | (77,584) | |
Class I | | | - | | | | - | | | | - | | | | - | | | | (110,839) | | | | (57,141) | |
| | | | | | | | | | | | | | | | | | | | | | | | |
Net increase (decrease) in shares of beneficial interest outstanding | | | (300,085) | | | | (239,119) | | | | (473,267) | | | | (396,033) | | | | (188,814) | | | | 272,808 | |
| | | | | | | | | | | | | | | | | | | | | | | | |
* Distributions from net investment income and net realized capital gains are combined for the year ended September 30, 2019. See “New Accounting Pronouncements” in the Notes to Financial Statements for more information. The dividends and distibutions to shareholders for the year ended September 30, 2018 have not been reclassified to conform to the current year presentation.
** Net Assets - End of Period includes accumulated net investment income (loss) of $(262,904) for the Strategic Growth Fund, $(198,280) for the Conservative Growth Fund and $85,297 for the Emerging Markets Fund as of September 30, 2018.
The accompanying notes are an integral part of these financial statements.
80
Timothy Plan Funds
Statements of Changes in Net Assets (Continued)
| | | | | | | | |
| | | Growth & Income Fund | |
| | |
| | | Year Ended
September 30, 2019 | | | Year Ended
September 30, 2018 | |
Operations: | | | | | | | | |
Net investment income | | $ | 108,764 | | | $ | 29,004 | |
Net realized gain (loss) from investments, affiliated investments and foreign currency transactions | | | (430,082) | | | | 586,267 | |
Capital gain dividends from REITs | | | 106 | | | | 1,275 | |
Net change in unrealized appreciation (depreciation) on investments and affiliated investments | | | (49,360) | | | | (1,092,083) | |
| | | | | | | | |
Net decrease in net assets resulting from operations | | | (370,572) | | | | (475,537) | |
| | | | | | | | |
| | |
Distributions to Shareholders: | | | | | | | | |
Net Investment Income | | | | | | | | |
Class A | | | - | | | | (18,351) | |
Class I | | | - | | | | (5,651) | |
From net realized gains | | | | | | | | |
Class A | | | - | | | | (721,257) | |
Class C | | | - | | | | (74,717) | |
Class I | | | - | | | | (65,160) | |
Return of Capital | | | | | | | | |
Class A | | | (5,772) | | | | - | |
Class C | | | (951) | | | | - | |
Class I | | | (1,266) | | | | - | |
Total distributions paid * | | | | | | | | |
Class A | | | (565,583) | | | | - | |
Class C | | | (56,700) | | | | - | |
Class I | | | (70,194) | | | | - | |
| | | | | | | | |
Total dividends and distributions to shareholders | | | (700,466) | | | | (885,136) | |
| | | | | | | | |
| | |
Share Transactions of Beneficial Interest: | | | | | | | | |
Net proceeds from shares sold | | | | | | | | |
Class A | | | 2,652,484 | | | | 3,785,740 | |
Class C | | | 347,351 | | | | 770,706 | |
Class I | | | 1,230,114 | | | | 1,229,539 | |
Reinvestment of dividends and distributions | | | | | | | | |
Class A | | | 544,800 | | | | 710,191 | |
Class C | | | 52,310 | | | | 68,477 | |
Class I | | | 66,587 | | | | 69,743 | |
Cost of shares redeemed | | | | | | | | |
Class A | | | (15,565,523) | | | | (6,094,471) | |
Class C | | | (1,079,663) | | | | (528,346) | |
Class I | | | (1,012,494) | | | | (376,437) | |
| | | | | | | | |
Net decrease in net assets from share transactions of beneficial interest | | | (12,764,034) | | | | (364,858) | |
| | | | | | | | |
| | |
Total Decrease in Net Assets | | | (13,835,072) | | | | (1,725,531) | |
| | |
Net Assets: | | | | | | | | |
Beginning of year | | | 33,904,241 | | | | 35,629,772 | |
| | | | | | | | |
End of year** | | $ | 20,069,169 | | | $ | 33,904,241 | |
| | | | | | | | |
| | |
Share Activity: | | | | | | | | |
Shares Sold | | | | | | | | |
Class A | | | 258,763 | | | | 338,559 | |
Class C | | | 35,230 | | | | 71,395 | |
Class I | | | 118,099 | | | | 108,880 | |
Shares Reinvested | | | | | | | | |
Class A | | | 55,559 | | | | 63,566 | |
Class C | | | 5,581 | | | | 6,305 | |
Class I | | | 6,694 | | | | 6,217 | |
Shares Redeemed | | | | | | | | |
Class A | | | (1,496,576) | | | | (548,737) | |
Class C | | | (109,113) | | | | (48,945) | |
Class I | | | (102,055) | | | | (33,491) | |
| | | | | | | | |
Net decrease in shares of beneficial interest outstanding | | | (1,227,818) | | | | (36,251) | |
| | | | | | | | |
|
| |
* Distributions from net investment income and net realized capital gains are combined for the year ended September 30, 2019. See “New Accounting Pronouncements” in the Notes to Financial Statements for more information. The dividends and distibutions to shareholders for the year ended September 30, 2018 have not been reclassified to conform to the current year presentation.
** Net Assets - End of Period includes accumulated net investment income of $10,026 for the Growth & Income Fund as of September 30, 2018.
The accompanying notes are an integral part of these financial statements.
81
Timothy Aggressive Growth Fund(Class A Shares)
Selected data based on a share outstanding throughout each year
| | | | | | | | | | | | | | | | | | | | |
| | | For the Year
ended
September 30,
2019 | | | For the Year
ended
September 30,
2018 | | | For the Year
ended
September 30,
2017 | | | For the Year
ended
September 30,
2016 | | | For the Year
ended
September 30,
2015 | |
| | | | | |
Net asset value, beginning of year | | $ | 9.27 | | | $ | 8.10 | | | $ | 6.82 | | | $ | 7.98 | | | $ | 9.18 | |
| | | | | | | | | | | | | | | | | | | | |
| | | | | |
INCOME (LOSS) FROM INVESTMENT OPERATIONS: | | | | | | | | | | | | | | | | | | | | |
Net investment loss (A) | | | (0.07) | | | | (0.09) | | | | (0.08) | | | | (0.04) | | | | (0.08) | |
Net realized and unrealized gain (loss) on investments | | | (0.81) | | | | 1.26 | | | | 1.36 | | | | (0.02) | (B) | | | (0.05) | |
| | | | | | | | | | | | | | | | | | | | |
Total from investment operations | | | (0.88) | | | | 1.17 | | | | 1.28 | | | | (0.06) | | | | (0.13) | |
| | | | | | | | | | | | | | | | | | | | |
| | | | | |
LESS DISTRIBUTIONS: | | | | | | | | | | | | | | | | | | | | |
From net realized gains on investments | | | (0.52) | | | | - | | | | - | | | | (1.10) | | | | (1.07) | |
Return of Capital | | | (0.00) | * | | | - | | | | - | | | | - | | | | - | |
| | | | | | | | | | | | | | | | | | | | |
Total distributions | | | (0.52) | | | | - | | | | - | | | | (1.10) | | | | (1.07) | |
| | | | | | | | | | | | | | | | | | | | |
| | | | | |
Net asset value, end of year | | $ | 7.87 | | | $ | 9.27 | | | $ | 8.10 | | | $ | 6.82 | | | $ | 7.98 | |
| | | | | | | | | | | | | | | | | | | | |
| | | | | |
Total return (C)(D) | | | (8.72)% | | | | 14.44% | | | | 18.77% | | | | (1.03)% | | | | (2.35)% | |
| | | | | |
RATIOS/SUPPLEMENTAL DATA: | | | | | | | | | | | | | | | | | | | | |
Net assets, end of year (in 000’s) | | $ | 21,802 | | | $ | 25,926 | | | $ | 22,549 | | | $ | 21,209 | | | $ | 16,306 | |
Ratios to average net assets | | | | | | | | | | | | | | | | | | | | |
Expenses, before waiver and reimbursement | | | 1.64% | | | | 1.73% | | | | 1.69% | | | | 1.69% | | | | 1.77% | |
Expenses, net waiver and reimbursement (E) | | | 1.56% | | | | 1.63% | | | | 1.59% | | | | 1.59% | | | | 1.67% | |
Net investment loss, before waiver and reimbursement | | | (0.91)% | | | | (1.16)% | | | | (1.12)% | | | | (0.73)% | | | | (1.04)% | |
Net investment loss, net waiver and reimbursement (E) | | | (0.82)% | | | | (1.06)% | | | | (1.02)% | | | | (0.63)% | | | | (0.94)% | |
| | | | | |
Portfolio turnover rate | | | 77% | | | | 85% | | | | 151% | | | | 124% | | | | 144% | |
* Amount is less than $0.005 per share.
| (A) | Per share amounts calculated using average shares method, which more appropriately presents the per share data for the period. |
| (B) | Realized and unrealized gains per share in this caption are balancing amounts necessary to reconcile the change in net asset value per share for the period, and may not reconcile with the aggregate gains and losses in the Statements of Operations due to share transactions for the period. |
| (C) | Total return calculation does not reflect sales load. Total return represents aggregate total return based on Net Asset Value. |
| (D) | Total return in the above table represents the rate that the investor would have earned or lost on an investment in the Fund assuming reinvestment of dividends. Total return would have been higher or lower if certain expenses had not been reimbursed, waived or recouped. |
| (E) | This expense decrease from the voluntary waiver is reflected in both the net expense and the net investment income ratios shown. |
The accompanying notes are an integral part of these financial statements.
82
Timothy Aggressive Growth Fund(Class C Shares)
Selected data based on a share outstanding throughout each year
| | | | | | | | | | | | | | | | | | | | |
| | | For the Year
ended
September 30,
2019 | | | For the Year
ended
September 30,
2018 | | | For the Year
ended
September 30,
2017 | | | For the Year
ended
September 30,
2016 | | | For the Year
ended
September 30,
2015 | |
| | | | | |
Net asset value, beginning of year | | $ | 7.64 | | | $ | 6.73 | | | $ | 5.71 | | | $ | 6.90 | | | $ | 8.13 | |
| | | | | | | | | | | | | | | | | | | | |
| | | | | |
INCOME (LOSS) FROM INVESTMENT OPERATIONS: | | | | | | | | | | | | | | | | | | | | |
Net investment loss (A) | | | (0.11) | | | | (0.13) | | | | (0.11) | | | | (0.08) | | | | (0.13) | |
Net realized and unrealized gain (loss) on investments | | | (0.67) | | | | 1.04 | | | | 1.13 | | | | (0.01) | (B) | | | (0.03) | |
| | | | | | | | | | | | | | | | | | | | |
Total from investment operations | | | (0.78) | | | | 0.91 | | | | 1.02 | | | | (0.09) | | | | (0.16) | |
| | | | | | | | | | | | | | | | | | | | |
| | | | | |
LESS DISTRIBUTIONS: | | | | | | | | | | | | | | | | | | | | |
From net realized gains on investments | | | (0.52) | | | | - | | | | - | | | | (1.10) | | | | (1.07) | |
Return of Capital | | | (0.00) | * | | | - | | | | - | | | | - | | | | - | |
| | | | | | | | | | | | | | | | | | | | |
Total distributions | | | (0.52) | | | | - | | | | - | | | | (1.10) | | | | (1.07) | |
| | | | | | | | | | | | | | | | | | | | |
| | | | | |
Net asset value, end of year | | $ | 6.34 | | | $ | 7.64 | | | $ | 6.73 | | | $ | 5.71 | | | $ | 6.90 | |
| | | | | | | | | | | | | | | | | | | | |
| | | | | |
Total return (C)(D) | | | (9.33)% | | | | 13.52% | | | | 17.86% | | | | (1.73)% | | | | (3.10)% | |
| | | | | |
RATIOS/SUPPLEMENTAL DATA: | | | | | | | | | | | | | | | | | | | | |
Net assets, end of year (in 000’s) | | $ | 2,433 | | | $ | 4,358 | | | $ | 3,584 | | | $ | 3,426 | | | $ | 3,442 | |
Ratios to average net assets | | | | | | | | | | | | | | | | | | | | |
Expenses, before waiver and reimbursement | | | 2.39% | | | | 2.48% | | | | 2.44% | | | | 2.44% | | | | 2.52% | |
Expenses, net waiver and reimbursement (E) | | | 2.31% | | | | 2.38% | | | | 2.34% | | | | 2.34% | | | | 2.42% | |
Net investment loss, before waiver and reimbursement | | | (1.73)% | | | | (1.91)% | | | | (1.88)% | | | | (1.47)% | | | | (1.78)% | |
Net investment loss, net waiver and reimbursement (E) | | | (1.64)% | | | | (1.81)% | | | | (1.78)% | | | | (1.37)% | | | | (1.69)% | |
| | | | | |
Portfolio turnover rate | | | 77% | | | | 85% | | | | 151% | | | | 124% | | | | 144% | |
* Amount is less than $0.005 per share.
| (A) | Per share amounts calculated using average shares method, which more appropriately presents the per share data for the period. |
| (B) | Realized and unrealized gains per share in this caption are balancing amounts necessary to reconcile the change in net asset value per share for the period, and may not reconcile with the aggregate gains and losses in the Statements of Operations due to share transactions for the period. |
| (C) | Total return calculation does not reflect redemption fee. Total return represents aggregate total return based on Net Asset Value. |
| (D) | Total return in the above table represents the rate that the investor would have earned or lost on an investment in the Fund assuming reinvestment of dividends. Total return would have been higher or lower if certain expenses had not been reimbursed, waived or recouped. |
| (E) | This expense decrease from the voluntary waiver is reflected in both the net expense and the net investment income ratios shown. |
The accompanying notes are an integral part of these financial statements.
83
Timothy Aggressive Growth Fund(Class I Shares)
Selected data based on a share outstanding throughout each year
| | | | | | | | | | | | | | | | | | | | |
| | | For the Year
ended
September 30,
2019 | | | For the Year
ended
September 30,
2018 | | | For the Year
ended
September 30,
2017 | | | For the Year
ended
September 30,
2016 | | | For the Year
ended
September 30,
2015 | |
| | | | | |
Net asset value, beginning of year | | $ | 9.41 | | | $ | 8.21 | | | $ | 6.89 | | | $ | 8.03 | | | $ | 9.21 | |
| | | | | | | | | | | | | | | | | | | | |
| | | | | |
INCOME (LOSS) FROM INVESTMENT OPERATIONS: | | | | | | | | | | | | | | | | | | | | |
Net investment loss (A) | | | (0.05) | | | | (0.07) | | | | (0.06) | | | | (0.03) | | | | (0.06) | |
Net realized and unrealized gain (loss) on investments | | | (0.82) | | | | 1.27 | | | | 1.38 | | | | (0.01) | (B) | | | (0.05) | |
| | | | | | | | | | | | | | | | | | | | |
Total from investment operations | | | (0.87) | | | | 1.20 | | | | 1.32 | | | | (0.04) | | | | (0.11) | |
| | | | | | | | | | | | | | | | | | | | |
| | | | | |
LESS DISTRIBUTIONS: | | | | | | | | | | | | | | | | | | | | |
From net realized gains on investments | | | (0.52) | | | | - | | | | - | | | | (1.10) | | | | (1.07) | |
Return of Capital | | | (0.00) | * | | | - | | | | - | | | | - | | | | - | |
| | | | | | | | | | | | | | | | | | | | |
Total distributions | | | (0.52) | | | | - | | | | - | | | | (1.10) | | | | (1.07) | |
| | | | | | | | | | | | | | | | | | | | |
| | | | | |
Net asset value, end of year | | $ | 8.02 | | | $ | 9.41 | | | $ | 8.21 | | | $ | 6.89 | | | $ | 8.03 | |
| | | | | | | | | | | | | | | | | | | | |
| | | | | |
Total return (C) | | | (8.48)% | | | | 14.62% | | | | 19.16% | | | | (0.75)% | | | | (2.10)% | |
| | | | | |
RATIOS/SUPPLEMENTAL DATA: | | | | | | | | | | | | | | | | | | | | |
Net assets, end of year (in 000’s) | | $ | 1,233 | | | $ | 1,273 | | | $ | 887 | | | $ | 395 | | | $ | 303 | |
Ratios to average net assets | | | | | | | | | | | | | | | | | | | | |
Expenses, before waiver and reimbursement | | | 1.39% | | | | 1.48% | | | | 1.44% | | | | 1.44% | | | | 1.52% | |
Expenses, net waiver and reimbursement (D) | | | 1.31% | | | | 1.38% | | | | 1.34% | | | | 1.34% | | | | 1.42% | |
Net investment loss, before waiver and reimbursement | | | (0.67)% | | | | (0.91)% | | | | (0.88)% | | | | (0.48)% | | | | (0.74)% | |
Net investment loss, net waiver and reimbursement (D) | | | (0.57)% | | | | (0.81)% | | | | (0.78)% | | | | (0.38)% | | | | (0.69)% | |
| | | | | |
Portfolio turnover rate | | | 77% | | | | 85% | | | | 151% | | | | 124% | | | | 144% | |
* Amount is less than $0.005 per share.
| (A) | Per share amounts calculated using average shares method, which more appropriately presents the per share data for the period. |
| (B) | Realized and unrealized gains per share in this caption are balancing amounts necessary to reconcile the change in net asset value per share for the period, and may not reconcile with the aggregate gains and losses in the Statements of Operations due to share transactions for the period. |
| (C) | Total return in the above table represents the rate that the investor would have earned or lost on an investment in the Fund assuming reinvestment of dividends. Total return would have been higher or lower if certain expenses had not been reimbursed, waived or recouped. |
| (D) | This expense decrease from the voluntary waiver is reflected in both the net expense and the net investment income ratios shown. |
The accompanying notes are an integral part of these financial statements.
84
Timothy International Fund(Class A Shares)
Selected data based on a share outstanding throughout each year
| | | | | | | | | | | | | | | | | | | | |
| | | For the Year
ended
September 30,
2019 | | | For the Year
ended
September 30,
2018 | | | For the Year
ended
September 30,
2017 | | | For the Year
ended
September 30,
2016 | | | For the Year
ended
September 30,
2015 | |
| | | | | |
Net asset value, beginning of year | | $ | 9.74 | | | $ | 9.86 | | | $ | 8.53 | | | $ | 8.47 | | | $ | 8.89 | |
| | | | | | | | | | | | | | | | | | | | |
| | | | | |
INCOME (LOSS) FROM INVESTMENT OPERATIONS: | | | | | | | | | | | | | | | | | | | | |
Net investment income (loss) (A) | | | 0.09 | | | | 0.11 | | | | 0.04 | | | | 0.00 | * | | | 0.08 | |
Net realized and unrealized gain (loss) on investments | | | (0.64) | | | | (0.02) | | | | 1.38 | | | | 0.15 | | | | (0.50) | |
| | | | | | | | | | | | | | | | | | | | |
Total from investment operations | | | (0.55) | | | | 0.09 | | | | 1.42 | | | | 0.15 | | | | (0.42) | |
| | | | | | | | | | | | | | | | | | | | |
| | | | | |
LESS DISTRIBUTIONS: | | | | | | | | | | | | | | | | | | | | |
From net investment income | | | (0.10) | | | | (0.21) | | | | (0.09) | | | | (0.09) | | | | - | |
| | | | | | | | | | | | | | | | | | | | |
Total distributions | | | (0.10) | | | | (0.21) | | | | (0.09) | | | | (0.09) | | | | - | |
| | | | | | | | | | | | | | | | | | | | |
| | | | | |
Net asset value, end of year | | $ | 9.09 | | | $ | 9.74 | | | $ | 9.86 | | | $ | 8.53 | | | $ | 8.47 | |
| | | | | | | | | | | | | | | | | | | | |
| | | | | |
Total return (B)(C) | | | (5.55)% | | | | 0.91% | | | | 16.78% | | | | 1.85% | | | | (4.72)% | (D) |
| | | | | |
RATIOS/SUPPLEMENTAL DATA: | | | | | | | | | | | | | | | | | | | | |
Net assets, end of year (in 000’s) | | $ | 58,397 | | | $ | 70,790 | | | $ | 81,153 | | | $ | 70,013 | | | $ | 53,458 | |
Ratios to average net assets | | | | | | | | | | | | | | | | | | | | |
Expenses, before waiver and reimbursement | | | 1.71% | | | | 1.71% | | | | 1.69% | | | | 1.68% | | | | 1.67% | |
Expenses, net waiver and reimbursement (E) | | | 1.67% | | | | 1.66% | | | | 1.64% | | | | 1.63% | | | | 1.62% | |
Net investment income (loss) before waiver and reimbursement | | | 0.96% | | | | 1.05% | | | | 0.35% | | | | (0.03)% | | | | 0.88% | |
Net investment income (loss), net waiver and reimbursement (E) | | | 1.01% | | | | 1.10% | | | | 0.40% | | | | 0.02% | | | | 0.93% | |
| | | | | |
Portfolio turnover rate | | | 27% | | | | 19% | | | | 42% | | | | 28% | | | | 30% | |
* Amount is less than $0.005 per share.
| (A) | Per share amounts calculated using average shares method, which more appropriately presents the per share data for the period. |
| (B) | Total return calculation does not reflect sales load. Total return represents aggregate total return based on Net Asset Value. |
| (C) | Total return in the above table represents the rate that the investor would have earned or lost on an investment in the Fund assuming reinvestment of dividends. Total return would have been higher or lower if certain expenses had not been reimbursed, waived or recouped. |
| (D) | As a result of a trade error, the Fund experienced a loss totaling $4,927.83 for the year ended September 30, 2015, all of which was reimbursed by the Advisor; there was no effect on total return due to trade error. |
| (E) | This expense decrease from the voluntary waiver is reflected in both the net expense and the net investment income ratios shown. |
The accompanying notes are an integral part of these financial statements.
85
Timothy International Fund(Class C Shares)
Selected data based on a share outstanding throughout each year
| | | | | | | | | | | | | | | | | | | | |
| | | For the Year
ended
September 30,
2019 | | | For the Year
ended
September 30,
2018 | | | For the Year
ended
September 30,
2017 | | | For the Year
ended
September 30,
2016 | | | For the Year
ended
September 30,
2015 | |
| | | | | |
Net asset value, beginning of year | | $ | 9.41 | | | $ | 9.55 | | | $ | 8.25 | | | $ | 8.21 | | | $ | 8.67 | |
| | | | | | | | | | | | | | | | | | | | |
| | | | | |
INCOME (LOSS) FROM INVESTMENT OPERATIONS: | | | | | | | | | | | | | | | | | | | | |
Net investment income (loss) (A) | | | 0.01 | | | | 0.03 | | | | (0.03) | | | | (0.06) | | | | 0.02 | |
Net realized and unrealized gain (loss) on investments | | | (0.61) | | | | (0.01) | | | | 1.34 | | | | 0.15 | | | | (0.48) | |
| | | | | | | | | | | | | | | | | | | | |
Total from investment operations | | | (0.60) | | | | 0.02 | | | | 1.31 | | | | 0.09 | | | | (0.46) | |
| | | | | | | | | | | | | | | | | | | | |
| | | | | |
LESS DISTRIBUTIONS: | | | | | | | | | | | | | | | | | | | | |
From net investment income | | | (0.01) | | | | (0.16) | | | | (0.01) | | | | (0.05) | | | | - | |
| | | | | | | | | | | | | | | | | | | | |
Total distributions | | | (0.01) | | | | (0.16) | | | | (0.01) | | | | (0.05) | | | | - | |
| | | | | | | | | | | | | | | | | | | | |
| | | | | |
Net asset value, end of year | | $ | 8.80 | | | $ | 9.41 | | | $ | 9.55 | | | $ | 8.25 | | | $ | 8.21 | |
| | | | | | | | | | | | | | | | | | | | |
| | | | | |
Total return (B)(C) | | | (6.31)% | | | | 0.12% | | | | 15.93% | | | | 1.09% | | | | (5.31)% | (D) |
| | | | | |
RATIOS/SUPPLEMENTAL DATA: | | | | | | | | | | | | | | | | | | | | |
Net assets, end of year (in 000’s) | | $ | 2,641 | | | $ | 4,779 | | | $ | 4,620 | | | $ | 4,495 | | | $ | 3,498 | |
Ratios to average net assets | | | | | | | | | | | | | | | | | | | | |
Expenses, before waiver and reimbursement | | | 2.46% | | | | 2.46% | | | | 2.44% | | | | 2.43% | | | | 2.41% | |
Expenses, net waiver and reimbursement (E) | | | 2.42% | | | | 2.41% | | | | 2.39% | | | | 2.38% | | | | 2.36% | |
Net investment income (loss) before waiver and reimbursement | | | 0.09% | | | | 0.28% | | | | (0.41)% | | | | (0.74)% | | | | 0.17% | |
Net investment income (loss), net waiver and reimbursement (E) | | | 0.12% | | | | 0.33% | | | | (0.36)% | | | | (0.69)% | | | | 0.18% | |
| | | | | |
Portfolio turnover rate | | | 27% | | | | 19% | | | | 42% | | | | 28% | | | | 30% | |
| (A) | Per share amounts calculated using average shares method, which more appropriately presents the per share data for the period. |
| (B) | Total return calculation does not reflect redemption fee. |
| (C) | Total return in the above table represents the rate that the investor would have earned or lost on an investment in the Fund assuming reinvestment of dividends. Total return would have been higher or lower if certain expenses had not been reimbursed, waived or recouped. |
| (D) | As a result of a trade error, the Fund experienced a loss totaling $4,927.83 for the year ended September 30, 2015, all of which was reimbursed by the Advisor; there was no effect on total return due to trade error. |
| (E) | This expense decrease from the voluntary waiver is reflected in both the net expense and the net investment income ratios shown. |
The accompanying notes are an integral part of these financial statements.
86
Timothy International Fund(Class I Shares)
Selected data based on a share outstanding throughout each year
| | | | | | | | | | | | | | | | | | | | |
| | | For the Year
ended
September 30,
2019 | | | For the Year
ended
September 30,
2018 | | | For the Year
ended
September 30,
2017 | | | For the Year
ended
September 30,
2016 | | | For the Year
ended
September 30,
2015 | |
| | | | | |
Net asset value, beginning of year | | $ | 9.76 | | | $ | 9.89 | | | $ | 8.55 | | | $ | 8.49 | | | $ | 8.88 | |
| | | | | | | | | | | | | | | | | | | | |
| | | | | |
INCOME (LOSS) FROM INVESTMENT OPERATIONS: | | | | | | | | | | | | | | | | | | | | |
Net investment income (A) | | | 0.11 | | | | 0.17 | | | | 0.07 | | | | 0.02 | | | | 0.15 | |
Net realized and unrealized gain (loss) on investments | | | (0.64) | | | | (0.06) | | | | 1.38 | | | | 0.15 | (B) | | | (0.54) | |
| | | | | | | | | | | | | | | | | | | | |
Total from investment operations | | | (0.53) | | | | 0.11 | | | | 1.45 | | | | 0.17 | | | | (0.39) | |
| | | | | | | | | | | | | | | | | | | | |
| | | | | |
LESS DISTRIBUTIONS: | | | | | | | | | | | | | | | | | | | | |
From net investment income | | | (0.13) | | | | (0.24) | | | | (0.11) | | | | (0.11) | | | | - | |
| | | | | | | | | | | | | | | | | | | | |
Total distributions | | | (0.13) | | | | (0.24) | | | | (0.11) | | | | (0.11) | | | | - | |
| | | | | | | | | | | | | | | | | | | | |
| | | | | |
Net asset value, end of year | | $ | 9.10 | | | $ | 9.76 | | | $ | 9.89 | | | $ | 8.55 | | | $ | 8.49 | |
| | | | | | | | | | | | | | | | | | | | |
| | | | | |
Total return (C) | | | (5.33)% | | | | 1.04% | | | | 17.18% | | | | 2.08% | | | | (4.39)% | (D) |
| | | | | |
RATIOS/SUPPLEMENTAL DATA: | | | | | | | | | | | | | | | | | | | | |
Net assets, end of year (in 000’s) | | $ | 28,542 | | | $ | 31,286 | | �� | $ | 13,083 | | | $ | 2,880 | | | $ | 1,581 | |
Ratios to average net assets | | | | | | | | | | | | | | | | | | | | |
Expenses, before waiver and reimbursement | | | 1.46% | | | | 1.45% | | | | 1.43% | | | | 1.45% | | | | 1.42% | |
Expenses, net waiver and reimbursement (E) | | | 1.42% | | | | 1.41% | | | | 1.38% | | | | 1.39% | | | | 1.37% | |
Net investment income, before waiver and reimbursement | | | 1.24% | | | | 1.60% | | | | 0.74% | | | | 0.22% | | | | 1.13% | |
Net investment income, net waiver and reimbursement (E) | | | 1.28% | | | | 1.65% | | | | 0.79% | | | | 0.29% | | | | 1.18% | |
| | | | | |
Portfolio turnover rate | | | 27% | | | | 19% | | | | 42% | | | | 28% | | | | 30% | |
| (A) | Per share amounts calculated using average shares method, which more appropriately presents the per share data for the period. |
| (B) | Realized and unrealized gains per share in this caption are balancing amounts necessary to reconcile the change in net asset value per share for the period, and may not reconcile with the aggregate gains and losses in the Statements of Operations due to share transactions for the period. |
| (C) | Total return in the above table represents the rate that the investor would have earned or lost on an investment in the Fund assuming reinvestment of dividends. Total return would have been higher or lower if certain expenses had not been reimbursed, waived or recouped. |
| (D) | As a result of a trade error, the Fund experienced a loss totaling $4,927.83 for the year ended September 30, 2015, all of which was reimbursed by the Advisor; there was no effect on total return due to trade error. |
| (E) | This expense decrease from the voluntary waiver is reflected in both the net expense and the net investment income ratios shown. |
The accompanying notes are an integral part of these financial statements.
87
Timothy Large/Mid Cap Growth Fund(Class A Shares)
Selected data based on a share outstanding throughout each year
| | | | | | | | | | | | | | | | | | | | |
| | | For the Year
ended
September 30,
2019 | | | For the Year
ended
September 30,
2018 | | | For the Year
ended
September 30,
2017 | | | For the Year
ended
September 30,
2016 | | | For the Year
ended
September 30,
2015 | |
| | | | | |
Net asset value, beginning of year | | $ | 9.34 | | | $ | 8.59 | | | $ | 7.46 | | | $ | 7.75 | | | $ | 8.66 | |
| | | | | | | | | | | | | | | | | | | | |
| | | | | |
INCOME (LOSS) FROM INVESTMENT OPERATIONS: | | | | | | | | | | | | | | | | | | | | |
Net investment loss (A) | | | (0.03) | | | | (0.02) | | | | (0.01) | | | | (0.02) | | | | (0.01) | |
Net realized and unrealized gain (loss) on investments | | | (0.19) | | | | 0.99 | | | | 1.23 | | | | 0.51 | | | | 0.03 | (B) |
| | | | | | | | | | | | | | | | | | | | |
Total from investment operations | | | (0.22) | | | | 0.97 | | | | 1.22 | | | | 0.49 | | | | 0.02 | |
| | | | | | | | | | | | | | | | | | | | |
| | | | | |
LESS DISTRIBUTIONS: | | | | | | | | | | | | | | | | | | | | |
From net realized gains on investments | | | (0.42) | | | | (0.22) | | | | (0.09) | | | | (0.78) | | | | (0.93) | |
| | | | | | | | | | | | | | | | | | | | |
Total distributions | | | (0.42) | | | | (0.22) | | | | (0.09) | | | | (0.78) | | | | (0.93) | |
| | | | | | | | | | | | | | | | | | | | |
| | | | | |
Net asset value, end of year | | $ | 8.70 | | | $ | 9.34 | | | $ | 8.59 | | | $ | 7.46 | | | $ | 7.75 | |
| | | | | | | | | | | | | | | | | | | | |
| | | | | |
Total return (C)(D) | | | (1.48)% | | | | 11.49% | | | | 16.53% | | | | 6.65% | | | | (0.35)% | |
| | | | | |
RATIOS/SUPPLEMENTAL DATA: | | | | | | | | | | | | | | | | | | | | |
Net assets, end of year (in 000’s) | | $ | 64,150 | | | $ | 79,897 | | | $ | 68,291 | | | $ | 53,827 | | | $ | 52,682 | |
Ratios to average net assets | | | | | | | | | | | | | | | | | | | | |
Expenses, before waiver and reimbursement | | | 1.56% | | | | 1.52% | | | | 1.52% | | | | 1.54% | | | | 1.56% | |
Expenses, net waiver and reimbursement (E) | | | 1.52% | | | | 1.47% | | | | 1.47% | | | | 1.49% | | | | 1.51% | |
Net investment loss, before waiver and reimbursement | | | (0.35)% | | | | (0.25)% | | | | (0.19)% | | | | (0.38)% | | | | (0.14)% | |
Net investment loss, net waiver and reimbursement (E) | | | (0.31)% | | | | (0.20)% | | | | (0.14)% | | | | (0.33)% | | | | (0.09)% | |
| | | | | |
Portfolio turnover rate | | | 44% | | | | 57% | | | | 76% | | | | 71% | | | | 73% | |
| (A) | Per share amounts calculated using average shares method, which more appropriately presents the per share data for the period. |
| (B) | Realized and unrealized gains per share in this caption are balancing amounts necessary to reconcile the change in net asset value per share for the period, and may not reconcile with the aggregate gains and losses in the Statements of Operations due to share transactions for the period. |
| (C) | Total return calculation does not reflect sales load. |
| (D) | Total return in the above table represents the rate that the investor would have earned or lost on an investment in the Fund assuming reinvestment of dividends. Total return would have been higher or lower if certain expenses had not been reimbursed, waived or recouped. |
| (E) | This expense decrease from the voluntary waiver is reflected in both the net expense and the net investment income ratios shown. |
The accompanying notes are an integral part of these financial statements.
88
Timothy Large/Mid Cap Growth Fund(Class C Shares)
Selected data based on a share outstanding throughout each year
| | | | | | | | | | | | | | | | | | | | |
| | | For the Year
ended
September 30,
2019 | | | For the Year
ended
September 30,
2018 | | | For the Year
ended
September 30,
2017 | | | For the Year
ended
September 30,
2016 | | | For the Year
ended
September 30,
2015 | |
| | | | | |
Net asset value, beginning of year | | $ | 7.63 | | | $ | 7.11 | | | $ | 6.24 | | | $ | 6.64 | | | $ | 7.60 | |
| | | | | | | | | | | | | | | | | | | | |
| | | | | |
INCOME (LOSS) FROM INVESTMENT OPERATIONS: | | | | | | | | | | | | | | | | | | | | |
Net investment loss (A) | | | (0.07) | | | | (0.07) | | | | (0.06) | | | | (0.07) | | | | (0.06) | |
Net realized and unrealized gain (loss) on investments | | | (0.18) | | | | 0.81 | | | | 1.02 | | | | 0.45 | | | | 0.03 | (B) |
| | | | | | | | | | | | | | | | | | | | |
Total from investment operations | | | (0.25) | | | | 0.74 | | | | 0.96 | | | | 0.38 | | | | (0.03) | |
| | | | | | | | | | | | | | | | | | | | |
| | | | | |
LESS DISTRIBUTIONS: | | | | | | | | | | | | | | | | | | | | |
From net realized gains on investments | | | (0.42) | | | | (0.22) | | | | (0.09) | | | | (0.78) | | | | (0.93) | |
| | | | | | | | | | | | | | | | | | | | |
Total distributions | | | (0.42) | | | | (0.22) | | | | (0.09) | | | | (0.78) | | | | (0.93) | |
| | | | | | | | | | | | | | | | | | | | |
| | | | | |
Net asset value, end of year | | $ | 6.96 | | | $ | 7.63 | | | $ | 7.11 | | | $ | 6.24 | | | $ | 6.64 | |
| | | | | | | | | | | | | | | | | | | | |
| | | | | |
Total return (C)(D) | | | (2.24)% | | | | 10.63% | | | | 15.58% | | | | 6.04% | | | | (1.14)% | |
| | | | | |
RATIOS/SUPPLEMENTAL DATA: | | | | | | | | | | | | | | | | | | | | |
Net assets, end of year (in 000’s) | | $ | 7,950 | | | $ | 11,355 | | | $ | 9,909 | | | $ | 7,636 | | | $ | 6,490 | |
Ratios to average net assets | | | | | | | | | | | | | | | | | | | | |
Expenses, before waiver and reimbursement | | | 2.31% | | | | 2.27% | | | | 2.27% | | | | 2.30% | | | | 2.31% | |
Expenses, net waiver and reimbursement (E) | | | 2.27% | | | | 2.22% | | | | 2.22% | | | | 2.24% | | | | 2.26% | |
Net investment loss, before waiver and reimbursement | | | (1.10)% | | | | (1.00)% | | | | (0.94)% | | | | (1.14)% | | | | (0.88)% | |
Net investment loss, net waiver and reimbursement (E) | | | (1.06)% | | | | (0.95)% | | | | (0.89)% | | | | (1.08)% | | | | (0.84)% | |
| | | | | |
Portfolio turnover rate | | | 44% | | | | 57% | | | | 76% | | | | 71% | | | | 73% | |
| (A) | Per share amounts calculated using average shares method, which more appropriately presents the per share data for the period. |
| (B) | Realized and unrealized gains per share in this caption are balancing amounts necessary to reconcile the change in net asset value per share for the period, and may not reconcile with the aggregate gains and losses in the Statements of Operations due to share transactions for the period. |
| (C) | Total return calculation does not reflect redemption fee. |
| (D) | Total return in the above table represents the rate that the investor would have earned or lost on an investment in the Fund assuming reinvestment of dividends. Total return would have been higher or lower if certain expenses had not been reimbursed, waived or recouped. |
| (E) | This expense decrease from the voluntary waiver is reflected in both the net expense and the net investment income ratios shown. |
The accompanying notes are an integral part of these financial statements.
89
Timothy Large/Mid Cap Growth Fund(Class I Shares)
Selected data based on a share outstanding throughout each year
| | | | | | | | | | | | | | | | | | | | |
| | | For the Year
ended
September 30,
2019 | | | For the Year
ended
September 30,
2018 | | | For the Year
ended
September 30,
2017 | | | For the Year
ended
September 30,
2016 | | | For the Year
ended
September 30,
2015 | |
| | | | | |
Net asset value, beginning of year | | $ | 9.48 | | | $ | 8.70 | | | $ | 7.54 | | | $ | 7.80 | | | $ | 8.69 | |
| | | | | | | | | | | | | | | | | | | | |
| | | | | |
INCOME (LOSS) FROM INVESTMENT OPERATIONS: | | | | | | | | | | | | | | | | | | | | |
Net investment income (loss) (A) | | | (0.01) | | | | 0.00 | * | | | 0.01 | | | | (0.01) | | | | 0.02 | |
Net realized and unrealized gain (loss) on investments | | | (0.19) | | | | 1.00 | | | | 1.24 | | | | 0.53 | | | | 0.02 | (B) |
| | | | | | | | | | | | | | | | | | | | |
Total from investment operations | | | (0.20) | | | | 1.00 | | | | 1.25 | | | | 0.52 | | | | 0.04 | |
| | | | | | | | | | | | | | | | | | | | |
| | | | | |
LESS DISTRIBUTIONS: | | | | | | | | | | | | | | | | | | | | |
From net realized gains on investments | | | (0.42) | | | | (0.22) | | | | (0.09) | | | | (0.78) | | | | (0.93) | |
| | | | | | | | | | | | | | | | | | | | |
Total distributions | | | (0.42) | | | | (0.22) | | | | (0.09) | | | | (0.78) | | | | (0.93) | |
| | | | | | | | | | | | | | | | | | | | |
| | | | | |
Net asset value, end of year | | $ | 8.86 | | | $ | 9.48 | | | $ | 8.70 | | | $ | 7.54 | | | $ | 7.80 | |
| | | | | | | | | | | | | | | | | | | | |
| | | | | |
Total return (C) | | | (1.24)% | | | | 11.69% | | | | 16.75% | | | | 7.01% | | | | (0.10)% | |
| | | | | |
RATIOS/SUPPLEMENTAL DATA: | | | | | | | | | | | | | | | | | | | | |
Net assets, end of year (in 000’s) | | $ | 14,016 | | | $ | 10,551 | | | $ | 3,936 | | | $ | 1,088 | | | $ | 1,202 | |
Ratios to average net assets | | | | | | | | | | | | | | | | | | | | |
Expenses, before waiver and reimbursement | | | 1.31% | | | | 1.27% | | | | 1.26% | | | | 1.29% | | | | 1.31% | |
Expenses, net waiver and reimbursement (D) | | | 1.27% | | | | 1.22% | | | | 1.21% | | | | 1.24% | | | | 1.26% | |
Net investment income (loss), before waiver and reimbursement | | | (0.09)% | | | | (0.03)% | | | | 0.10% | | | | (0.12)% | | | | 0.13% | |
Net investment income (loss), net waiver and reimbursement (D) | | | (0.06)% | | | | 0.02% | | | | 0.15% | | | | (0.08)% | | | | 0.16% | |
| | | | | |
Portfolio turnover rate | | | 44% | | | | 57% | | | | 76% | | | | 71% | | | | 73% | |
* Amount is less than $0.005 per share.
| (A) | Per share amounts calculated using average shares method, which more appropriately presents the per share data for the period. |
| (B) | Realized and unrealized gains per share in this caption are balancing amounts necessary to reconcile the change in net asset value per share for the period, and may not reconcile with the aggregate gains and losses in the Statements of Operations due to share transactions for the period. |
| (C) | Total return in the above table represents the rate that the investor would have earned or lost on an investment in the Fund assuming reinvestment of dividends. Total return would have been higher or lower if certain expenses had not been reimbursed, waived or recouped. |
| (D) | This expense decrease from the voluntary waiver is reflected in both the net expense and the net investment income ratios shown. |
The accompanying notes are an integral part of these financial statements.
90
Timothy Small Cap Value Fund(Class A Shares)
Selected data based on a share outstanding throughout each year
| | | | | | | | | | | | | | | | | | | | |
| | | For the Year
ended
September 30,
2019 | | | For the Year
ended
September 30,
2018 | | | For the Year
ended
September 30,
2017 | | | For the Year
ended
September 30,
2016 | | | For the Year
ended
September 30,
2015 | |
| | | | | |
Net asset value, beginning of year | | $ | 20.67 | | | $ | 20.50 | | | $ | 17.09 | | | $ | 16.93 | | | $ | 19.79 | |
| | | | | | | | | | | | | | | | | | | | |
| | | | | |
INCOME (LOSS) FROM INVESTMENT OPERATIONS: | | | | | | | | | | | | | | | | | | | | |
Net investment income (loss) (A) | | | 0.06 | | | | 0.00 | * | | | 0.03 | | | | (0.01) | | | | (0.07) | |
Net realized and unrealized gain (loss) on investments | | | (1.28) | | | | 1.96 | | | | 3.63 | | | | 1.65 | | | | 0.64 | |
| | | | | | | | | | | | | | | | | | | | |
Total from investment operations | | | (1.22) | | | | 1.96 | | | | 3.66 | | | | 1.64 | | | | 0.57 | |
| | | | | | | | | | | | | | | | | | | | |
| | | | | |
LESS DISTRIBUTIONS: | | | | | | | | | | | | | | | | | | | | |
From net investment income | | | - | | | | (0.00) | * | | | - | | | | - | | | | - | |
From net realized gains on investments | | | (2.30) | | | | (1.79) | | | | (0.25) | | | | (1.48) | | | | (3.43) | |
| | | | | | | | | | | | | | | | | | | | |
Total distributions | | | (2.30) | | | | (1.79) | | | | (0.25) | | | | (1.48) | | | | (3.43) | |
| | | | | | | | | | | | | | | | | | | | |
| | | | | |
Net asset value, end of year | | $ | 17.15 | | | $ | 20.67 | | | $ | 20.50 | | | $ | 17.09 | | | $ | 16.93 | |
| | | | | | | | | | | | | | | | | | | | |
| | | | | |
Total return (B)(C) | | | (3.77)% | | | | 10.11% | | | | 21.55% | | | | 10.67% | | | | 1.90% | |
| | | | | |
RATIOS/SUPPLEMENTAL DATA: | | | | | | | | | | | | | | | | | | | | |
Net assets, end of year (in 000’s) | | $ | 99,077 | | | $ | 114,985 | | | $ | 112,953 | | | $ | 94,871 | | | $ | 71,840 | |
Ratios to average net assets | | | | | | | | | | | | | | | | | | | | |
Expenses, before waiver and reimbursement | | | 1.52% | | | | 1.50% | | | | 1.46% | | | | 1.48% | | | | 1.53% | |
Expenses, net waiver and reimbursement (D) | | | 1.43% | | | | 1.44% | | | | 1.41% | | | | 1.44% | | | | 1.48% | |
Net investment income (loss), before waiver and reimbursement | | | 0.29% | | | | (0.08)% | | | | 0.13% | | | | (0.09)% | | | | (0.45)% | |
Net investment income (loss), net waiver and reimbursement (D) | | | 0.38% | | | | (0.02)% | | | | 0.18% | | | | (0.04)% | | | | (0.40)% | |
| | | | | |
Portfolio turnover rate | | | 63% | | | | 58% | | | | 57% | | | | 73% | | | | 30% | |
* Amount is less than $0.005 per share.
| (A) | Per share amounts calculated using average shares method, which more appropriately presents the per share data for the period. |
| (B) | Total return calculation does not reflect sales load. |
| (C) | Total return in the above table represents the rate that the investor would have earned or lost on an investment in the Fund assuming reinvestment of dividends. Total return would have been higher or lower if certain expenses had not been reimbursed, waived or recouped. |
| (D) | This expense decrease from the voluntary waiver is reflected in both the net expense and the net investment income ratios shown. |
The accompanying notes are an integral part of these financial statements.
91
Timothy Small Cap Value Fund(Class C Shares)
Selected data based on a share outstanding throughout each year
| | | | | | | | | | | | | | | | | | | | |
| | | For the Year
ended
September 30,
2019 | | | For the Year
ended
September 30,
2018 | | | For the Year
ended
September 30,
2017 | | | For the Year
ended
September 30,
2016 | | | For the Year
ended
September 30,
2015 | |
| | | | | |
Net asset value, beginning of year | | $ | 15.09 | | | $ | 15.54 | | | $ | 13.10 | | | $ | 13.42 | | | $ | 16.45 | |
| | | | | | | | | | | | | | | | | | | | |
| | | | | |
INCOME (LOSS) FROM INVESTMENT OPERATIONS: | | | | | | | | | | | | | | | | | | | | |
Net investment loss (A) | | | (0.05) | | | | (0.11) | | | | (0.08) | | | | (0.10) | | | | (0.17) | |
Net realized and unrealized gain (loss) on investments | | | (1.05) | | | | 1.45 | | | | 2.77 | | | | 1.26 | | | | 0.57 | |
| | | | | | | | | | | | | | | | | | | | |
Total from investment operations | | | (1.10) | | | | 1.34 | | | | 2.69 | | | | 1.16 | | | | 0.40 | |
| | | | | | | | | | | | | | | | | | | | |
| | | | | |
LESS DISTRIBUTIONS: | | | | | | | | | | | | | | | | | | | | |
From net realized gains on investments | | | (2.30) | | | | (1.79) | | | | (0.25) | | | | (1.48) | | | | (3.43) | |
| | | | | | | | | | | | | | | | | | | | |
Total distributions | | | (2.30) | | | | (1.79) | | | | (0.25) | | | | (1.48) | | | | (3.43) | |
| | | | | | | | | | | | | | | | | | | | |
| | | | | |
Net asset value, end of year | | $ | 11.69 | | | $ | 15.09 | | | $ | 15.54 | | | $ | 13.10 | | | $ | 13.42 | |
| | | | | | | | | | | | | | | | | | | | |
| | | | | |
Total return (B)(C) | | | (4.49)% | | | | 9.24% | | | | 20.70% | | | | 9.81% | | | | 1.14% | |
| | | | | |
RATIOS/SUPPLEMENTAL DATA: | | | | | | | | | | | | | | | | | | | | |
Net assets, end of year (in 000’s) | | $ | 8,963 | | | $ | 14,603 | | | $ | 13,210 | | | $ | 10,257 | | | $ | 8,981 | |
Ratios to average net assets | | | | | | | | | | | | | | | | | | | | |
Expenses, before waiver and reimbursement | | | 2.27% | | | | 2.25% | | | | 2.21% | | | | 2.23% | | | | 2.28% | |
Expenses, net waiver and reimbursement (D) | | | 2.18% | | | | 2.19% | | | | 2.16% | | | | 2.18% | | | | 2.23% | |
Net investment loss, before waiver and reimbursement | | | (0.50)% | | | | (0.82)% | | | | (0.62)% | | | | (0.84)% | | | | (1.19)% | |
Net investment loss, net waiver and reimbursement (D) | | | (0.42)% | | | | (0.76)% | | | | (0.57)% | | | | (0.78)% | | | | (1.14)% | |
| | | | | |
Portfolio turnover rate | | | 63% | | | | 58% | | | | 57% | | | | 73% | | | | 30% | |
| (A) | Per share amounts calculated using average shares method, which more appropriately presents the per share data for the period. |
| (B) | Total return calculation does not reflect redemption fee. |
| (C) | Total return in the above table represents the rate that the investor would have earned or lost on an investment in the Fund assuming reinvestment of dividends. Total return would have been higher or lower if certain expenses had not been reimbursed, waived or recouped. |
| (D) | This expense decrease from the voluntary waiver is reflected in both the net expense and the net investment income ratios shown. |
The accompanying notes are an integral part of these financial statements.
92
Timothy Small Cap Value Fund(Class I Shares)
Selected data based on a share outstanding throughout each year
| | | | | | | | | | | | | | | | | | | | |
| | | For the Year
ended
September 30,
2019 | | | For the Year
ended
September 30,
2018 | | | For the Year
ended
September 30,
2017 | | | For the Year
ended
September 30,
2016 | | | For the Year
ended
September 30,
2015 | |
| | | | | |
Net asset value, beginning of year | | $ | 20.93 | | | $ | 20.74 | | | $ | 17.24 | | | $ | 17.03 | | | $ | 19.84 | |
| | | | | | | | | | | | | | | | | | | | |
| | | | | |
INCOME (LOSS) FROM INVESTMENT OPERATIONS: | | | | | | | | | | | | | | | | | | | | |
Net investment income (loss) (A) | | | 0.11 | | | | 0.06 | | | | 0.08 | | | | 0.04 | | | | (0.03) | |
Net realized and unrealized gain (loss) on investments | | | (1.29) | | | | 1.97 | | | | 3.67 | | | | 1.65 | | | | 0.65 | |
| | | | | | | | | | | | | | | | | | | | |
Total from investment operations | | | (1.18) | | | | 2.03 | | | | 3.75 | | | | 1.69 | | | | 0.62 | |
| | | | | | | | | | | | | | | | | | | | |
| | | | | |
LESS DISTRIBUTIONS: | | | | | | | | | | | | | | | | | | | | |
From net investment income | | | - | | | | (0.05) | | | | - | | | | - | | | | - | |
From net realized gains on investments | | | (2.30) | | | | (1.79) | | | | (0.25) | | | | (1.48) | | | | (3.43) | |
| | | | | | | | | | | | | | | | | | | | |
Total distributions | | | (2.30) | | | | (1.84) | | | | (0.25) | | | | (1.48) | | | | (3.43) | |
| | | | | | | | | | | | | | | | | | | | |
| | | | | |
Net asset value, end of year | | $ | 17.45 | | | $ | 20.93 | | | $ | 20.74 | | | $ | 17.24 | | | $ | 17.03 | |
| | | | | | | | | | | | | | | | | | | | |
| | | | | |
Total return (B) | | | (3.51)% | | | | 10.37% | | | | 21.89% | | | | 10.92% | | | | 2.18% | |
| | | | | |
RATIOS/SUPPLEMENTAL DATA: | | | | | | | | | | | | | | | | | | | | |
Net assets, end of year (in 000’s) | | $ | 36,993 | | | $ | 35,140 | | | $ | 19,103 | | | $ | 2,324 | | | $ | 870 | |
Ratios to average net assets | | | | | | | | | | | | | | | | | | | | |
Expenses, before waiver and reimbursement | | | 1.27% | | | | 1.25% | | | | 1.21% | | | | 1.26% | | | | 1.28% | |
Expenses, net waiver and reimbursement (C) | | | 1.18% | | | | 1.19% | | | | 1.16% | | | | 1.20% | | | | 1.23% | |
Net investment income (loss), before waiver and reimbursement | | | 0.56% | | | | 0.21% | | | | 0.38% | | | | 0.18% | | | | (0.19)% | |
Net investment income (loss), net waiver and reimbursement (C) | | | 0.64% | | | | 0.27% | | | | 0.43% | | | | 0.23% | | | | (0.14)% | |
| | | | | |
Portfolio turnover rate | | | 63% | | | | 58% | | | | 57% | | | | 73% | | | | 30% | |
| (A) | Per share amounts calculated using average shares method, which more appropriately presents the per share data for the period. |
| (B) | Total return in the above table represents the rate that the investor would have earned or lost on an investment in the Fund assuming reinvestment of dividends. Total return would have been higher or lower if certain expenses had not been reimbursed, waived or recouped. |
| (C) | This expense decrease from the voluntary waiver is reflected in both the net expense and the net investment income ratios shown. |
The accompanying notes are an integral part of these financial statements.
93
Timothy Large/Mid Cap Value Fund(Class A Shares)
Selected data based on a share outstanding throughout each year
| | | | | | | | | | | | | | | | | | | | |
| | | For the Year
ended
September 30,
2019 | | | For the Year
ended
September 30,
2018 | | | For the Year
ended
September 30,
2017 | | | For the Year
ended
September 30,
2016 | | | For the Year
ended
September 30,
2015 | |
| | | | | |
Net asset value, beginning of year | | $ | 20.38 | | | $ | 19.16 | | | $ | 17.15 | | | $ | 18.20 | | | $ | 19.61 | |
| | | | | | | | | | | | | | | | | | | | |
| | | | | |
INCOME (LOSS) FROM INVESTMENT OPERATIONS: | | | | | | | | | | | | | | | | | | | | |
Net investment income (loss) (A) | | | 0.09 | | | | 0.07 | | | | 0.05 | | | | 0.01 | | | | (0.01) | |
Net realized and unrealized gain (loss) on investments (B) | | | 0.12 | | | | 2.45 | | | | 2.18 | | | | 1.04 | | | | 0.38 | |
| | | | | | | | | | | | | | | | | | | | |
Total from investment operations | | | 0.21 | | | | 2.52 | | | | 2.23 | | | | 1.05 | | | | 0.37 | |
| | | | | | | | | | | | | | | | | | | | |
| | | | | |
LESS DISTRIBUTIONS: | | | | | | | | | | | | | | | | | | | | |
From net investment income | | | (0.06) | | | | (0.03) | | | | - | | | | - | | | | - | |
From net realized gains on investments | | | (1.67) | | | | (1.27) | | | | (0.22) | | | | (2.10) | | | | (1.78) | |
| | | | | | | | | | | | | | | | | | | | |
Total distributions | | | (1.73) | | | | (1.30) | | | | (0.22) | | | | (2.10) | | | | (1.78) | |
| | | | | | | | | | | | | | | | | | | | |
| | | | | |
Net asset value, end of year | | $ | 18.86 | | | $ | 20.38 | | | $ | 19.16 | | | $ | 17.15 | | | $ | 18.20 | |
| | | | | | | | | | | | | | | | | | | | |
| | | | | |
Total return (C)(D) | | | 2.54% | | | | 13.58% | | | | 13.10% | | | | 6.40% | | | | 1.59% | |
| | | | | |
RATIOS/SUPPLEMENTAL DATA: | | | | | | | | | | | | | | | | | | | | |
Net assets, end of year (in 000’s) | | $ | 142,420 | | | $ | 172,163 | | | $ | 167,056 | | | $ | 154,260 | | | $ | 135,091 | |
Ratios to average net assets | | | | | | | | | | | | | | | | | | | | |
Expenses, before waiver and reimbursement | | | 1.51% | | | | 1.46% | | | | 1.49% | | | | 1.48% | | | | 1.48% | |
Expenses, net waiver and reimbursement (E) | | | 1.41% | | | | 1.35% | | | | 1.41% | | | | 1.43% | | | | 1.43% | |
Net investment income (loss), before waiver and reimbursement | | | 0.42% | | | | 0.27% | | | | 0.18% | | | | (0.01)% | | | | (0.13)% | |
Net investment income (loss), net waiver and reimbursement (E) | | | 0.52% | | | | 0.38% | | | | 0.26% | | | | 0.04% | | | | (0.08)% | |
Portfolio turnover rate | | | 51% | | | | 24% | | | | 39% | | | | 45% | | | | 11% | |
| (A) | Per share amounts calculated using average shares method, which more appropriately presents the per share data for the period. |
| (B) | Realized and unrealized gains and losses per share in this caption are balancing amounts necessary to reconcile the change in net asset value per share for the period, and may not agree to the aggregate gains and losses in the Statement of Operations due to the fluctuations in share transactions. |
| (C) | Total return calculation does not reflect sales load. |
| (D) | Total return in the above table represents the rate that the investor would have earned or lost on an investment in the Fund assuming reinvestment of dividends. Total return would have been higher or lower if certain expenses had not been reimbursed, waived or recouped. |
| (E) | This expense decrease from the voluntary waiver is reflected in both the net expense and the net investment income ratios shown. |
The accompanying notes are an integral part of these financial statements.
94
Timothy Large/Mid Cap Value Fund(Class C Shares)
Selected data based on a share outstanding throughout each year
| | | | | | | | | | | | | | | | | | | | | | |
| | | For the Year
ended
September 30,
2019 | | | For the Year
ended
September 30,
2018 | | | For the Year
ended
September 30,
2017 | | | For the Year
ended
September 30,
2016 | | | For the Year
ended
September 30,
2015 | | | |
| | | | | | | | | | | | | | | | | | |
Net asset value, beginning of year | | $ | 16.49 | | | $ | 15.82 | | | $ | 14.30 | | | $ | 15.62 | | | $ | 17.19 | |
| | | | | | | | | | | | | | | | | | | | |
INCOME (LOSS) FROM INVESTMENT OPERATIONS: | | | | | | | | | | | | | | | | | | | | |
Net investment loss (A) | | | (0.03) | | | | (0.06) | | | | (0.07) | | | | (0.10) | | | | (0.14) | |
Net realized and unrealized gain (loss) on investments (B) | | | 0.03 | | | | 2.00 | | | | 1.81 | | | | 0.88 | | | | 0.35 | |
| | | | | | | | | | | | | | | | | | | | |
Total from investment operations | | | 0.00 | | | | 1.94 | | | | 1.74 | | | | 0.78 | | | | 0.21 | |
| | | | | | �� | | | | | | | | | | | | | | |
LESS DISTRIBUTIONS: | | | | | | | | | | | | | | | | | | | | |
From net realized gains on investments | | | (1.67) | | | | (1.27) | | | | (0.22) | | | | (2.10) | | | | (1.78) | |
| | | | | | | | | | | | | | | | | | | | |
Total distributions | | | (1.67) | | | | (1.27) | | | | (0.22) | | | | (2.10) | | | | (1.78) | |
| | | | | | | | | | | | | | | | | | | | |
Net asset value, end of year | | $ | 14.82 | | | $ | 16.49 | | | $ | 15.82 | | | $ | 14.30 | | | $ | 15.62 | |
| | | | | | | | | | | | | | | | | | | | |
Total return (C)(D) | | | 1.74% | | | | 12.75% | | | | 12.27% | | | | 5.64% | | | | 0.82% | |
RATIOS/SUPPLEMENTAL DATA: | | | | | | | | | | | | | | | | | | | | |
Net assets, end of year (in 000’s) | | $ | 16,627 | | | $ | 25,852 | | | $ | 23,803 | | | $ | 20,855 | | | $ | 18,458 | |
Ratios to average net assets | | | | | | | | | | | | | | | | | | | | |
Expenses, before waiver and reimbursement | | | 2.26% | | | | 2.21% | | | | 2.24% | | | | 2.23% | | | | 2.23% | |
Expenses, net waiver and reimbursement (E) | | | 2.16% | | | | 2.10% | | | | 2.16% | | | | 2.18% | | | | 2.18% | |
Net investment loss, before waiver and reimbursement | | | (0.32)% | | | | (0.48)% | | | | (0.57)% | | | | (0.76)% | | | | (0.88)% | |
Net investment loss, net waiver and reimbursement (E) | | | (0.22)% | | | | (0.37)% | | | | (0.49)% | | | | (0.70)% | | | | (0.83)% | |
Portfolio turnover rate | | | 51% | | | | 24% | | | | 39% | | | | 45% | | | | 11% | |
| (A) | Per share amounts calculated using average shares method, which more appropriately presents the per share data for the period. |
| (B) | Realized and unrealized gains per share in this caption are balancing amounts necessary to reconcile the change in net asset value per share for the period, and may not reconcile with aggregate gains and losses in the Statement of Operations due to the timing of share transactions for the period. |
| (C) | Total return calculation does not reflect redemption fee. |
| (D) | Total return in the above table represents the rate that the investor would have earned or lost on an investment in the Fund assuming reinvestment of dividends. Total return would have been higher or lower if certain expenses had not been reimbursed, waived or recouped. |
| (E) | This expense decrease from the voluntary waiver is reflected in both the net expense and the net investment income ratios shown. |
The accompanying notes are an integral part of these financial statements.
95
Timothy Large/Mid Cap Value Fund(Class I Shares)
Selected data based on a share outstanding throughout each year
| | | | | | | | | | | | | | | | | | | | | | |
| | | For the Year
ended
September 30,
2019 | | | For the Year
ended
September 30,
2018 | | | For the Year
ended
September 30,
2017 | | | For the Year
ended
September 30,
2016 | | | For the Year
ended
September 30,
2015 | | | |
| | | | | | | | | | | | | | | | | | |
Net asset value, beginning of year | | $ | 20.58 | | | $ | 19.34 | | | $ | 17.27 | | | $ | 18.26 | | | $ | 19.63 | |
| | | | | | | | | | | | | | | | | | | | |
INCOME (LOSS) FROM INVESTMENT OPERATIONS: | | | | | | | | | | | | | | | | | | | | |
Net investment income (A) | | | 0.14 | | | | 0.13 | | | | 0.10 | | | | 0.05 | | | | 0.03 | |
Net realized and unrealized gain (loss) on investments | | | 0.11 | | | | 2.45 | | | | 2.19 | | | | 1.06 | (B) | | | 0.38 | |
| | | | | | | | | | | | | | | | | | | | |
Total from investment operations | | | 0.25 | | | | 2.58 | | | | 2.29 | | | | 1.11 | | | | 0.41 | |
| | | | | | | | | | | | | | | | | | | | |
LESS DISTRIBUTIONS: | | | | | | | | | | | | | | | | | | | | |
From net investment income | | | (0.11) | | | | (0.07) | | | | - | | | | - | | | | - | |
From net realized gains on investments | | | (1.67) | | | | (1.27) | | | | (0.22) | | | | (2.10) | | | | (1.78) | |
| | | | | | | | | | | | | | | | | | | | |
Total distributions | | | (1.78) | | | | (1.34) | | | | (0.22) | | | | (2.10) | | | | (1.78) | |
| | | | | | | | | | | | | | | | | | | | |
Net asset value, end of year | | $ | 19.05 | | | $ | 20.58 | | | $ | 19.34 | | | $ | 17.27 | | | $ | 18.26 | |
| | | | | | | | | | | | | | | | | | | | |
Total return (C) | | | 2.78% | | | | 13.83% | | | | 13.36% | | | | 6.74% | | | | 1.81% | |
RATIOS/SUPPLEMENTAL DATA: | | | | | | | | | | | | | | | | | | | | |
Net assets, end of year (in 000’s) | | $ | 47,477 | | | $ | 35,573 | | | $ | 19,384 | | | $ | 5,382 | | | $ | 3,424 | |
Ratios to average net assets | | | | | | | | | | | | | | | | | | | | |
Expenses, before waiver and reimbursement | | | 1.26% | | | | 1.21% | | | | 1.23% | | | | 1.25% | | | | 1.23% | |
Expenses, net waiver and reimbursement (D) | | | 1.16% | | | | 1.10% | | | | 1.14% | | | | 1.19% | | | | 1.18% | |
Net investment income, before waiver and reimbursement | | | 0.66% | | | | 0.54% | | | | 0.46% | | | | 0.24% | | | | 0.12% | |
Net investment income, net waiver and reimbursement (D) | | | 0.77% | | | | 0.65% | | | | 0.55% | | | | 0.30% | | | | 0.18% | |
Portfolio turnover rate | | | 51% | | | | 24% | | | | 39% | | | | 45% | | | | 11% | |
| (A) | Per share amounts calculated using average shares method, which more appropriately presents the per share data for the period. |
| (B) | Realized and unrealized gains per share in this caption are balancing amounts necessary to reconcile the change in net asset value per share for the period, and may not reconcile with the aggregate gains and losses in the Statements of Operations due to share transactions for the period. |
| (C) | Total return in the above table represents the rate that the investor would have earned or lost on an investment in the Fund assuming reinvestment of dividends. Total return would have been higher or lower if certain expenses had not been reimbursed, waived or recouped. |
| (D) | This expense decrease from the voluntary waiver is reflected in both the net expense and the net investment income ratios shown. |
The accompanying notes are an integral part of these financial statements.
96
Timothy Fixed Income Fund(Class A Shares)
Selected data based on a share outstanding throughout each year
| | | | | | | | | | | | | | | | | | | | | | |
| | | For the Year
ended
September 30,
2019 | | | For the Year
ended
September 30,
2018 | | | For the Year
ended
September 30,
2017 | | | For the Year
ended
September 30,
2016 | | | For the Year
ended
September 30,
2015 | | | |
| | | | | | | | | | | | | | | | | | |
Net asset value, beginning of year | | $ | 9.81 | | | $ | 10.22 | | | $ | 10.47 | | | $ | 10.27 | | | $ | 10.43 | |
| | | | | | | | | | | | | | | | | | | | |
INCOME (LOSS) FROM INVESTMENT OPERATIONS: | | | | | | | | | | | | | | | | | | | | |
Net investment income (A) | | | 0.16 | | | | 0.16 | | | | 0.13 | | | | 0.14 | | | | 0.15 | |
Net realized and unrealized gain (loss) on investments | | | 0.60 | | | | (0.39) | | | | (0.22) | | | | 0.21 | | | | (0.04) | |
| | | | | | | | | | | | | | | | | | | | |
Total from investment operations | | | 0.76 | | | | (0.23) | | | | (0.09) | | | | 0.35 | | | | 0.11 | |
| | | | | | | | | | | | | | | | | | | | |
LESS DISTRIBUTIONS: | | | | | | | | | | | | | | | | | | | | |
From net investment income | | | (0.18) | | | | (0.18) | | | | (0.16) | | | | (0.15) | | | | (0.25) | |
From net realized gains on investments | | | - | | | | - | | | | - | | | | - | | | | (0.02) | |
| | | | | | | | | | | | | | | | | | | | |
Total distributions | | | (0.18) | | | | (0.18) | | | | (0.16) | | | | (0.15) | | | | (0.27) | |
| | | | | | | | | | | | | | | | | | | | |
Net asset value, end of year | | $ | 10.39 | | | $ | 9.81 | | | $ | 10.22 | | | $ | 10.47 | | | $ | 10.27 | |
| | | | | | | | | | | | | | | | | | | | |
Total return (B)(C) | | | 7.76% | | | | (2.31)% | | | | (0.81)% | | | | 3.47% | | | | 1.08% | |
RATIOS/SUPPLEMENTAL DATA: | | | | | | | | | | | | | | | | | | | | |
Net assets, end of year (in 000’s) | | $ | 85,375 | | | $ | 66,119 | | | $ | 75,858 | | | $ | 86,142 | | | $ | 66,107 | |
Ratios to average net assets | | | | | | | | | | | | | | | | | | | | |
Expenses, before waiver and reimbursement | | | 1.30% | | | | 1.30% | | | | 1.30% | | | | 1.24% | | | | 1.28% | |
Expenses, net waiver and reimbursement (D) | | | 1.13% | | | | 1.10% | | | | 1.10% | | | | 1.04% | | | | 1.11% | |
Net investment income, before waiver and reimbursement | | | 1.46% | | | | 1.40% | | | | 1.05% | | | | 1.19% | | | | 1.29% | |
Net investment income, net waiver and reimbursement (D) | | | 1.62% | | | | 1.60% | | | | 1.25% | | | | 1.39% | | | | 1.48% | |
Portfolio turnover rate | | | 53% | | | | 30% | | | | 43% | | | | 40% | | | | 28% | |
| (A) | Per share amounts calculated using average shares method, which more appropriately presents the per share data for the period. |
| (B) | Total return calculation does not reflect sales load. |
| (C) | Total return in the above table represents the rate that the investor would have earned or lost on an investment in the Fund assuming reinvestment of dividends. Total return would have been higher or lower if certain expenses had not been reimbursed, waived or recouped. |
| (D) | This expense decrease from the voluntary waiver is reflected in both the net expense and the net investment income ratios shown. |
The accompanying notes are an integral part of these financial statements.
97
Timothy Fixed Income Fund(Class C Shares)
Selected data based on a share outstanding throughout each year
| | | | | | | | | | | | | | | | | | | | | | |
| | | For the Year
ended
September 30,
2019 | | | For the Year
ended
September 30,
2018 | | | For the Year
ended
September 30,
2017 | | | For the Year
ended
September 30,
2016 | | | For the Year
ended
September 30,
2015 | | | |
| | | | | | | | | | | | | | | | | | |
Net asset value, beginning of year | | $ | 9.44 | | | $ | 9.85 | | | $ | 10.09 | | | $ | 9.89 | | | $ | 10.07 | |
| | | | | | | | | | | | | | | | | | | | |
INCOME (LOSS) FROM INVESTMENT OPERATIONS: | | | | | | | | | | | | | | | | | | | | |
Net investment income (A) | | | 0.09 | | | | 0.08 | | | | 0.05 | | | | 0.07 | | | | 0.08 | |
Net realized and unrealized gain (loss) on investments | | | 0.57 | | | | (0.39) | | | | (0.20) | | | | 0.19 | | | | (0.04) | |
| | | | | | | | | | | | | | | | | | | | |
Total from investment operations | | | 0.66 | | | | (0.31) | | | | (0.15) | | | | 0.26 | | | | 0.04 | |
| | | | | | | | | | | | | | | | | | | | |
LESS DISTRIBUTIONS: | | | | | | | | | | | | | | | | | | | | |
From net investment income | | | (0.11) | | | | (0.10) | | | | (0.09) | | | | (0.06) | | | | (0.20) | |
From net realized gains on investments | | | - | | | | - | | | | - | | | | - | | | | (0.02) | |
| | | | | | | | | | | | | | | | | | | | |
Total distributions | | | (0.11) | | | | (0.10) | | | | (0.09) | | | | (0.06) | | | | (0.22) | |
| | | | | | | | | | | | | | | | | | | | |
Net asset value, end of year | | $ | 9.99 | | | $ | 9.44 | | | $ | 9.85 | | | $ | 10.09 | | | $ | 9.89 | |
| | | | | | | | | | | | | | | | | | | | |
Total return (B)(C) | | | 7.06% | | | | (3.15)% | | | | (1.49)% | | | | 2.66% | | | | 0.36% | |
RATIOS/SUPPLEMENTAL DATA: | | | | | | | | | | | | | | | | | | | | |
Net assets, end of year (in 000’s) | | $ | 8,502 | | | $ | 9,653 | | | $ | 9,637 | | | $ | 9,660 | | | $ | 8,510 | |
Ratios to average net assets | | | | | | | | | | | | | | | | | | | 2.03% | |
Expenses, before waiver and reimbursement | | | 2.05% | | | | 2.05% | | | | 2.06% | | | | 1.99% | | | | | |
Expenses, net waiver and reimbursement (D) | | | 1.88% | | | | 1.85% | | | | 1.86% | | | | 1.79% | | | | 1.86% | |
Net investment income, before waiver and reimbursement | | | 0.72% | | | | 0.65% | | | | 0.30% | | | | 0.46% | | | | 0.56% | |
Net investment income, net waiver and reimbursement (D) | | | 0.89% | | | | 0.85% | | | | 0.50% | | | | 0.65% | | | | 0.73% | |
Portfolio turnover rate | | | 53% | | | | 30% | | | | 43% | | | | 40% | | | | 28% | |
| (A) | Per share amounts calculated using average shares method, which more appropriately presents the per share data for the period. |
| (B) | Total return calculation does not reflect redemption fee. |
| (C) | Total return in the above table represents the rate that the investor would have earned or lost on an investment in the Fund assuming reinvestment of dividends. Total return would have been higher or lower if certain expenses had not been reimbursed, waived or recouped. |
| (D) | This expense decrease from the voluntary waiver is reflected in both the net expense and the net investment income ratios shown. |
The accompanying notes are an integral part of these financial statements.
98
Timothy Fixed Income Fund(Class I Shares)
Selected data based on a share outstanding throughout each year
| | | | | | | | | | | | | | | | | | | | | | |
| | | For the Year
ended
September 30,
2019 | | | For the Year
ended
September 30,
2018 | | | For the Year
ended
September 30,
2017 | | | For the Year
ended
September 30,
2016 | | | For the Year
ended
September 30,
2015 | | | |
| | | | | | | | | | | | | | | | | | |
Net asset value, beginning of year | | $ | 9.74 | | | $ | 10.15 | | | $ | 10.41 | | | $ | 10.20 | | | $ | 10.36 | |
| | | | | | | | | | | | | | | | | | | | |
INCOME (LOSS) FROM INVESTMENT OPERATIONS: | | | | | | | | | | | | | | | | | | | | |
Net investment income (A) | | | 0.19 | | | | 0.18 | | | | 0.16 | | | | 0.17 | | | | 0.18 | |
Net realized and unrealized gain (loss) on investments | | | 0.59 | | | | (0.39) | | | | (0.23) | | | | 0.22 | | | | (0.05) | |
| | | | | | | | | | | | | | | | | | | | |
Total from investment operations | | | 0.78 | | | | (0.21) | | | | (0.07) | | | | 0.39 | | | | 0.13 | |
| | | | | | | | | | | | | | | | | | | | |
LESS DISTRIBUTIONS: | | | | | | | | | | | | | | | | | | | | |
From net investment income | | | (0.20) | | | | (0.20) | | | | (0.19) | | | | (0.18) | | | | (0.27) | |
From net realized gains on investments | | | - | | | | - | | | | - | | | | - | | | | (0.02) | |
| | | | | | | | | | | | | | | | | | | | |
Total distributions | | | (0.20) | | | | (0.20) | | | | (0.19) | | | | (0.18) | | | | (0.29) | |
| | | | | | | | | | | | | | | | | | | | |
Net asset value, end of year | | $ | 10.32 | | | $ | 9.74 | | | $ | 10.15 | | | $ | 10.41 | | | $ | 10.20 | |
| | | | | | | | | | | | | | | | | | | | |
Total return (B) | | | 8.05% | | | | (2.06)% | | | | (0.64)% | | | | 3.91% | | | | 1.28% | |
RATIOS/SUPPLEMENTAL DATA: | | | | | | | | | | | | | | | | | | | | |
Net assets, end of year (in 000’s) | | $ | 8,095 | | | $ | 3,208 | | | $ | 2,134 | | | $ | 564 | | | $ | 483 | |
Ratios to average net assets | | | | | | | | | | | | | | | | | | | | |
Expenses, before waiver and reimbursement | | | 1.05% | | | | 1.05% | | | | 1.08% | | | | 0.96% | | | | 1.03% | |
Expenses, net waiver and reimbursement (C) | | | 0.88% | | | | 0.85% | | | | 0.88% | | | | 0.78% | | | | 0.87% | |
Net investment income, before waiver and reimbursement | | | 1.68% | | | | 1.66% | | | | 1.37% | | | | 1.45% | | | | 1.58% | |
Net investment income, net waiver and reimbursement (C) | | | 1.86% | | | | 1.86% | | | | 1.57% | | | | 1.63% | | | | 1.73% | |
Portfolio turnover rate | | | 53% | | | | 30% | | | | 43% | | | | 40% | | | | 28% | |
| (A) | Per share amounts calculated using average shares method, which more appropriately presents the per share data for the period. |
| (B) | Total return in the above table represents the rate that the investor would have earned or lost on an investment in the Fund assuming reinvestment of dividends. Total return would have been higher or lower if certain expenses had not been reimbursed, waived or recouped. |
| (C) | This expense decrease from the voluntary waiver is reflected in both the net expense and the net investment income ratios shown. |
The accompanying notes are an integral part of these financial statements.
99
Timothy High Yield Bond Fund(Class A Shares)
Selected data based on a share outstanding throughout each year
| | | | | | | | | | | | | | | | | | | | |
| | | For the Year
ended
September 30,
2019 | | | For the Year
ended
September 30,
2018 | | | For the Year
ended
September 30,
2017 | | | For the Year
ended
September 30,
2016 | | | For the Year
ended
September 30,
2015 | |
| | | | | |
Net asset value, beginning of year | | $ | 9.02 | | | $ | 9.40 | | | $ | 9.11 | | | $ | 8.64 | | | $ | 9.49 | |
| | | | | | | | | | | | | | | | | | | | |
| | | | | |
INCOME (LOSS) FROM INVESTMENT OPERATIONS: | | | | | | | | | | | | | | | | | | | | |
Net investment income (A) | | | 0.39 | | | | 0.34 | | | | 0.34 | | | | 0.36 | | | | 0.40 | |
Net realized and unrealized gain (loss) on investments | | | 0.36 | | | | (0.36) | | | | 0.28 | | | | 0.46 | | | | (0.85) | |
| | | | | | | | | | | | | | | | | | | | |
Total from investment operations | | | 0.75 | | | | (0.02) | | | | 0.62 | | | | 0.82 | | | | (0.45) | |
| | | | | | | | | | | | | | | | | | | | |
| | | | | |
LESS DISTRIBUTIONS: | | | | | | | | | | | | | | | | | | | | |
From net investment income | | | (0.38) | | | | (0.36) | | | | (0.33) | | | | (0.35) | | | | (0.40) | |
| | | | | | | | | | | | | | | | | | | | |
Total distributions | | | (0.38) | | | | (0.36) | | | | (0.33) | | | | (0.35) | | | | (0.40) | |
| | | | | | | | | | | | | | | | | | | | |
| | | | | |
Net asset value, end of year | | $ | 9.39 | | | $ | 9.02 | | | $ | 9.40 | | | $ | 9.11 | | | $ | 8.64 | |
| | | | | | | | | | | | | | | | | | | | |
| | | | | |
Total return (B)(C) | | | 8.50% | | | | (0.17)% | | | | 6.94% | | | | 9.80% | | | | (4.88)% | |
| | | | | |
RATIOS/SUPPLEMENTAL DATA: | | | | | | | | | | | | | | | | | | | | |
Net assets, end of year (in 000’s) | | $ | 39,777 | | | $ | 41,991 | | | $ | 52,950 | | | $ | 49,187 | | | $ | 36,279 | |
Ratios to average net assets | | | | | | | | | | | | | | | | | | | | |
Expenses, before waiver and reimbursement | | | 1.35% | | | | 1.44% | | | | 1.32% | | | | 1.29% | | | | 1.30% | |
Expenses, net waiver and reimbursement (D) | | | 1.31% | | | | 1.39% | | | | 1.27% | | | | 1.24% | | | | 1.25% | |
Net investment income, before waiver and reimbursement | | | 4.24% | | | | 3.67% | | | | 3.66% | | | | 4.03% | | | | 4.28% | |
Net investment income, net waiver and reimbursement (D) | | | 4.28% | | | | 3.72% | | | | 3.71% | | | | 4.08% | | | | 4.33% | |
Portfolio turnover rate | | | 75% | | | | 12% | | | | 45% | | | | 27% | | | | 39% | |
| (A) | Per share amounts calculated using average shares method, which more appropriately presents the per share data for the period. |
| (B) | Total return calculation does not reflect sales load. |
| (C) | Total return in the above table represents the rate that the investor would have earned or lost on an investment in the Fund assuming reinvestment of dividends. Total return would have been higher or lower if certain expenses had not been reimbursed, waived or recouped. |
| (D) | This expense decrease from the voluntary waiver is reflected in both the net expense and the net investment income ratios shown. |
The accompanying notes are an integral part of these financial statements.
100
Timothy High Yield Bond Fund(Class C Shares)
Selected data based on a share outstanding throughout each year
| | | | | | | | | | | | | | | | | | | | |
| | | For the Year
ended
September 30,
2019 | | | For the Year
ended
September 30,
2018 | | | For the Year
ended
September 30,
2017 | | | For the Year
ended
September 30,
2016 | | | For the Year
ended
September 30,
2015 | |
| | | | | |
Net asset value, beginning of year | | $ | 9.14 | | | $ | 9.51 | | | $ | 9.22 | | | $ | 8.72 | | | $ | 9.57 | |
| | | | | | | | | | | | | | | | | | | | |
| | | | | |
INCOME (LOSS) FROM INVESTMENT OPERATIONS: | | | | | | | | | | | | | | | | | | | | |
Net investment income (A) | | | 0.32 | | | | 0.28 | | | | 0.28 | | | | 0.30 | | | | 0.33 | |
Net realized and unrealized gain (loss) on investments | | | 0.36 | | | | (0.36) | | | | 0.27 | | | | 0.47 | | | | (0.86) | |
| | | | | | | | | | | | | | | | | | | | |
Total from investment operations | | | 0.68 | | | | (0.08) | | | | 0.55 | | | | 0.77 | | | | (0.53) | |
| | | | | | | | | | | | | | | | | | | | |
| | | | | |
LESS DISTRIBUTIONS: | | | | | | | | | | | | | | | | | | | | |
From net investment income | | | (0.30) | | | | (0.29) | | | | (0.26) | | | | (0.27) | | | | (0.32) | |
| | | | | | | | | | | | | | | | | | | | |
Total distributions | | | (0.30) | | | | (0.29) | | | | (0.26) | | | | (0.27) | | | | (0.32) | |
| | | | | | | | | | | | | | | | | | | | |
| | | | | |
Net asset value, end of year | | $ | 9.52 | | | $ | 9.14 | | | $ | 9.51 | | | $ | 9.22 | | | $ | 8.72 | |
| | | | | | | | | | | | | | | | | | | | |
| | | | | |
Total return (B)(C) | | | 7.63% | | | | (0.85)% | | | | 6.04% | | | | 9.04% | | | | (5.58)% | |
| | | | | |
RATIOS/SUPPLEMENTAL DATA: | | | | | | | | | | | | | | | | | | | | |
Net assets, end of year (in 000’s) | | $ | 2,660 | | | $ | 3,219 | | | $ | 3,539 | | | $ | 3,108 | | | $ | 2,714 | |
Ratios to average net assets | | | | | | | | | | | | | | | | | | | | |
Expenses, before waiver and reimbursement | | | 2.10% | | | | 2.19% | | | | 2.07% | | | | 2.03% | | | | 2.05% | |
Expenses, net waiver and reimbursement (D) | | | 2.06% | | | | 2.14% | | | | 2.02% | | | | 1.98% | | | | 2.00% | |
Net investment income, before waiver and reimbursement | | | 3.46% | | | | 2.92% | | | | 2.91% | | | | 3.30% | | | | 3.53% | |
Net investment income, net waiver and reimbursement (D) | | | 3.50% | | | | 2.97% | | | | 2.96% | | | | 3.35% | | | | 3.57% | |
Portfolio turnover rate | | | 75% | | | | 12% | | | | 45% | | | | 27% | | | | 39% | |
| (A) | Per share amounts calculated using average shares method, which more appropriately presents the per share data for the period. |
| (B) | Total return calculation does not reflect redemption fee. |
| (C) | Total return in the above table represents the rate that the investor would have earned or lost on an investment in the Fund assuming reinvestment of dividends. Total return would have been higher or lower if certain expenses had not been reimbursed, waived or recouped. |
| (D) | This expense decrease from the voluntary waiver is reflected in both the net expense and the net investment income ratios shown. |
The accompanying notes are an integral part of these financial statements.
101
Timothy High Yield Bond Fund(Class I Shares)
Selected data based on a share outstanding throughout each year
| | | | | | | | | | | | | | | | | | | | |
| | | For the Year
ended
September 30,
2019 | | | For the Year
ended
September 30,
2018 | | | For the Year
ended
September 30,
2017 | | | For the Year
ended
September 30,
2016 | | | For the Year
ended
September 30,
2015 | |
| | | | | |
Net asset value, beginning of year | | $ | 9.02 | | | $ | 9.41 | | | $ | 9.12 | | | $ | 8.65 | | | $ | 9.50 | |
| | | | | | | | | | | | | | | | | | | | |
| | | | | |
INCOME (LOSS) FROM INVESTMENT OPERATIONS: | | | | | | | | | | | | | | | | | | | | |
Net investment income (A) | | | 0.42 | | | | 0.36 | | | | 0.37 | | | | 0.39 | | | | 0.43 | |
Net realized and unrealized gain (loss) on investments | | | 0.35 | | | | (0.36) | | | | 0.28 | | | | 0.46 | | | | (0.86) | |
| | | | | | | | | | | | | | | | | | | | |
Total from investment operations | | | 0.77 | | | | 0.00 | | | | 0.65 | | | | 0.85 | | | | (0.43) | |
| | | | | | | | | | | | | | | | | | | | |
| | | | | |
LESS DISTRIBUTIONS: | | | | | | | | | | | | | | | | | | | | |
From net investment income | | | (0.40) | | | | (0.39) | | | | (0.36) | | | | (0.38) | | | | (0.42) | |
| | | | | | | | | | | | | | | | | | | | |
Total distributions | | | (0.40) | | | | (0.39) | | | | (0.36) | | | | (0.38) | | | | (0.42) | |
| | | | | | | | | | | | | | | | | | | | |
| | | | | |
Net asset value, end of year | | $ | 9.39 | | | $ | 9.02 | | | $ | 9.41 | | | $ | 9.12 | | | $ | 8.65 | |
| | | | | | | | | | | | | | | | | | | | |
| | | | | |
Total return (B) | | | 8.78% | | | | 0.00% | | | | 7.21% | | | | 10.12% | | | | (4.62)% | |
| | | | | |
RATIOS/SUPPLEMENTAL DATA: | | | | | | | | | | | | | | | | | | | | |
Net assets, end of year (in 000’s) | | $ | 18,363 | | | $ | 11,578 | | | $ | 9,717 | | | $ | 1,560 | | | $ | 2,758 | |
Ratios to average net assets | | | | | | | | | | | | | | | | | | | | |
Expenses, before waiver and reimbursement | | | 1.10% | | | | 1.19% | | | | 1.06% | | | | 0.96% | | | | 1.06% | |
Expenses, net waiver and reimbursement (C) | | | 1.06% | | | | 1.14% | | | | 1.01% | | | | 0.92% | | | | 1.00% | |
Net investment income, before waiver and reimbursement | | | 4.52% | | | | 3.92% | | | | 3.89% | | | | 4.38% | | | | 4.55% | |
Net investment income, net waiver and reimbursement (C) | | | 4.56% | | | | 3.97% | | | | 3.94% | | | | 4.42% | | | | 4.58% | |
| | | | | |
Portfolio turnover rate | | | 75% | | | | 12% | | | | 45% | | | | 27% | | | | 39% | |
| (A) | Per share amounts calculated using average shares method, which more appropriately presents the per share data for the period. |
| (B) | Total return in the above table represents the rate that the investor would have earned or lost on an investment in the Fund assuming reinvestment of dividends. Total return would have been higher or lower if certain expenses had not been reimbursed, waived or recouped. |
| (C) | This expense decrease from the voluntary waiver is reflected in both the net expense and the net investment income ratios shown. |
The accompanying notes are an integral part of these financial statements.
102
Timothy Israel Common Values Fund(Class A Shares)
Selected data based on a share outstanding throughout each year
| | | | | | | | | | | | | | | | | | | | |
| | | For the Year
ended
September 30,
2019 | | | For the Year
ended
September 30,
2018 | | | For the Year
ended
September 30,
2017 | �� | | For the Year
ended
September 30,
2016 | | | For the Year
ended
September 30,
2015 | |
| | | | | |
Net asset value, beginning of year | | $ | 15.74 | | | $ | 14.91 | | | $ | 12.45 | | | $ | 11.10 | | | $ | 12.31 | |
| | | | | | | | | | | | | | | | | | | | |
| | | | | |
INCOME (LOSS) FROM INVESTMENT OPERATIONS: | | | | | | | | | | | | | | | | | | | | |
Net investment income (loss)(A) | | | 0.00 | * | | | (0.04) | | | | 0.07 | | | | (0.09) | | | | (0.10) | |
Net realized and unrealized gain (loss) on investments | | | 2.20 | | | | 1.07 | | | | 2.58 | | | | 1.44 | | | | (1.11) | |
| | | | | | | | | | | | | | | | | | | | |
Total from investment operations | | | 2.20 | | | | 1.03 | | | | 2.65 | | | | 1.35 | | | | (1.21) | |
| | | | | | | | | | | | | | | | | | | | |
| | | | | |
LESS DISTRIBUTIONS: | | | | | | | | | | | | | | | | | | | | |
From net investment income | | | - | | | | (0.14) | | | | (0.19) | | | | - | | | | - | |
From net realized gains on investments | | | (0.10) | | | | - | | | | - | | | | - | | | | - | |
Return of Capital | | | - | | | | (0.06) | | | | - | | | | - | | | | - | |
| | | | | | | | | | | | | | | | | | | | |
Total distributions | | | (0.10) | | | | (0.20) | | | | (0.19) | | | | - | | | | - | |
| | | | | | | | | | | | | | | | | | | | |
| | | | | |
Net asset value, end of year | | $ | 17.84 | | | $ | 15.74 | | | $ | 14.91 | | | $ | 12.45 | | | $ | 11.10 | |
| | | | | | | | | | | | | | | | | | | | |
| | | | | |
Total return (B)(C) | | | 14.12% | | | | 7.00% | | | | 21.62% | | | | 12.16% | | | | (9.83)% | |
| | | | | |
RATIOS/SUPPLEMENTAL DATA: | | | | | | | | | | | | | | | | | | | | |
Net assets, end of year (in 000’s) | | $ | 49,123 | | | $ | 41,137 | | | $ | 34,958 | | | $ | 16,030 | | | $ | 11,756 | |
Ratio of expenses to average net assets | | | 1.76% | | | | 1.84% | | | | 1.80% | | | | 1.96% | | | | 1.93% | |
Ratio of net investment income (loss) to average net assets | | | 0.02% | | | | (0.27)% | | | | 0.54% | | | | (0.82)% | | | | (0.83)% | |
| | | | | |
Portfolio turnover rate | | | 23% | | | | 9% | | | | 10% | | | | 38% | | | | 24% | |
* Amount is less than $0.005 per share.
| (A) | Per share amounts calculated using average shares method, which more appropriately presents the per share data for the period. |
| (B) | Total return calculation does not reflect sales load. |
| (C) | Total return in the above table represents the rate that the investor would have earned or lost on an investment in the Fund assuming reinvestment of dividends. |
The accompanying notes are an integral part of these financial statements.
103
Timothy Israel Common Values Fund(Class C Shares)
Selected data based on a share outstanding throughout each year
| | | | | | | | | | | | | | | | | | | | |
| | | For the Year
ended
September 30,
2019 | | | For the Year
ended
September 30,
2018 | | | For the Year
ended
September 30,
2017 | | | For the Year
ended
September 30,
2016 | | | For the Year
ended
September 30,
2015 | |
| | | | | |
Net asset value, beginning of year | | $ | 15.09 | | | $ | 14.33 | | | $ | 12.01 | | | $ | 10.78 | | | $ | 12.05 | |
| | | | | | | | | | | | | | | | | | | | |
| | | | | |
INCOME (LOSS) FROM INVESTMENT OPERATIONS: | | | | | | | | | | | | | | | | | | | | |
Net investment loss (A) | | | (0.12) | | | | (0.15) | | | | (0.03) | | | | (0.18) | | | | (0.18) | |
Net realized and unrealized gain (loss) on investments | | | 2.10 | | | | 1.03 | | | | 2.48 | | | | 1.41 | | | | (1.09) | |
| | | | | | | | | | | | | | | | | | | | |
Total from investment operations | | | 1.98 | | | | 0.88 | | | | 2.45 | | | | 1.23 | | | | (1.27) | |
| | | | | | | | | | | | | | | | | | | | |
| | | | | |
LESS DISTRIBUTIONS: | | | | | | | | | | | | | | | | | | | | |
From net investment income | | | - | | | | (0.07) | | | | (0.13) | | | | - | | | | - | |
From net realized gains on investments | | | (0.10) | | | | - | | | | - | | | | - | | | | - | |
Return of Capital | | | - | | | | (0.05) | | | | - | | | | - | | | | - | |
| | | | | | | | | | | | | | | | | | | | |
Total distributions | | | (0.10) | | | | (0.12) | | | | (0.13) | | | | - | | | | - | |
| | | | | | | | | | | | | | | | | | | | |
| | | | | |
Net asset value, end of year | | $ | 16.97 | | | $ | 15.09 | | | $ | 14.33 | | | $ | 12.01 | | | $ | 10.78 | |
| | | | | | | | | | | | | | | | | | | | |
| | | | | |
Total return (B)(C) | | | 13.26% | | | | 6.20% | | | | 20.60% | | | | 11.41% | | | | (10.54)% | |
| | | | | |
RATIOS/SUPPLEMENTAL DATA: | | | | | | | | | | | | | | | | | | | | |
Net assets, end of year (in 000’s) | | $ | 9,750 | | | $ | 9,220 | | | $ | 7,905 | | | $ | 4,144 | | | $ | 2,722 | |
Ratio of expenses to average net assets | | | 2.51% | | | | 2.59% | | | | 2.56% | | | | 2.71% | | | | 2.68% | |
Ratio of net investment loss to average net assets | | | (0.75)% | | | | (1.01)% | | | | (0.21)% | | | | (1.57)% | | | | (1.59)% | |
| | | | | |
Portfolio turnover rate | | | 23% | | | | 9% | | | | 10% | | | | 38% | | | | 24% | |
| (A) | Per share amounts calculated using average shares method, which more appropriately presents the per share data for the period. |
| (B) | Total return calculation does not reflect redemption fee. |
| (C) | Total return in the above table represents the rate that the investor would have earned or lost on an investment in the Fund assuming reinvestment of dividends. |
The accompanying notes are an integral part of these financial statements.
104
Timothy Israel Common Values Fund(Class I Shares)
Selected data based on a share outstanding throughout each year
| | | | | | | | | | | | | | | | | | | | |
| | | For the Year
ended
September 30,
2019 | | | For the Year
ended
September 30,
2018 | | | For the Year
ended
September 30,
2017 | | | For the Year
ended
September 30,
2016 | | | For the Year
ended
September 30,
2015 | |
| | | | | |
Net asset value, beginning of year | | $ | 15.81 | | | $ | 14.97 | | | $ | 12.50 | | | $ | 11.11 | | | $ | 12.29 | |
| | | | | | | | | | | | | | | | | | | | |
| | | | | |
INCOME (LOSS) FROM INVESTMENT OPERATIONS: | | | | | | | | | | | | | | | | | | | | |
Net investment income (loss) (A) | | | 0.06 | | | | 0.01 | | | | 0.12 | | | | (0.08) | | | | (0.03) | |
Net realized and unrealized gain (loss) on investments | | | 2.20 | | | | 1.06 | (B) | | | 2.57 | (B) | | | 1.47 | (B) | | | (1.15) | (B) |
| | | | | | | | | | | | | | | | | | | | |
Total from investment operations | | | 2.26 | | | | 1.07 | | | | 2.69 | | | | 1.39 | | | | (1.18) | |
| | | | | | | | | | | | | | | | | | | | |
| | | | | |
LESS DISTRIBUTIONS: | | | | | | | | | | | | | | | | | | | | |
From net investment income | | | - | | | | (0.04) | | | | (0.22) | | | | - | | | | - | |
From net realized gains on investments | | | (0.10) | | | | - | | | | - | | | | - | | | | - | |
Return of Capital | | | - | | | | (0.19) | | | | - | | | | - | | | | - | |
| | | | | | | | | | | | | | | | | | | | |
Total distributions | | | (0.10) | | | | (0.23) | | | | (0.22) | | | | - | | | | - | |
| | | | | | | | | | | | | | | | | | | | |
| | | | | |
Net asset value, end of year | | $ | 17.97 | | | $ | 15.81 | | | $ | 14.97 | | | $ | 12.50 | | | $ | 11.11 | |
| | | | | | | | | | | | | | | | | | | | |
| | | | | |
Total return (C) | | | 14.44% | | | | 7.22% | | | | 21.87% | | | | 12.51% | | | | (9.60)% | |
| | | | | |
RATIOS/SUPPLEMENTAL DATA: | | | | | | | | | | | | | | | | | | | | |
Net assets, end of year (in 000’s) | | $ | 21,533 | | | $ | 10,084 | | | $ | 2,189 | | | $ | 520 | | | $ | 236 | |
Ratio of expenses to average net assets | | | 1.51% | | | | 1.69% | | | | 1.56% | | | | 1.72% | | | | 1.68% | |
Ratio of net investment income (loss) to average net assets | | | 0.38% | | | | 0.05% | | | | 0.83% | | | | (0.58)% | | | | (0.58)% | |
Portfolio turnover rate | | | 23% | | | | 9% | | | | 10% | | | | 38% | | | | 24% | |
| (A) | Per share amounts calculated using average shares method, which more appropriately presents the per share data for the period. |
| (B) | Realized and unrealized gains per share in this caption are balancing amounts necessary to reconcile the change in net asset value per share for the period, and may not reconcile with aggregate gains and losses in the Statement of Operations due to the timing of share transactions for the period. |
| (C) | Total return in the above table represents the rate that the investor would have earned or lost on an investment in the Fund assuming reinvestment of dividends. |
The accompanying notes are an integral part of these financial statements.
105
Timothy Defensive Strategies Fund(Class A Shares)
Selected data based on a share outstanding throughout each year
| | | | | | | | | | | | | | | | | | | | | | | | |
| | | For the Year
ended
September 30,
2019 | | | For the Year
ended
September 30,
2018 | | | For the Year
ended
September 30,
2017 | | | For the Year
ended
September 30,
2016 | | | For the Year
ended
September 30,
2015 | | | | |
| | | | | | |
Net asset value, beginning of year | | $ | 11.44 | | | $ | 11.37 | | | $ | 11.49 | | | $ | 10.54 | | | $ | 11.38 | | | | | |
| | | | | | | | | | | | | | | | | | | | | | | | |
| | | | | | |
INCOME (LOSS) FROM INVESTMENT OPERATIONS: | | | | | | | | | | | | | | | | | | | | | | | | |
Net investment income (A) | | | 0.06 | | | | 0.10 | | | | 0.00 | * | | | 0.04 | | | | 0.02 | | | | | |
Net realized and unrealized gain (loss) on investments | | | 0.48 | | | | (0.01) | | | | (0.08) | | | | 0.91 | | | | (0.73) | | | | | |
| | | | | | | | | | | | | | | | | | | | | | | | |
Total from investment operations | | | 0.54 | | | | 0.09 | | | | (0.08) | | | | 0.95 | | | | (0.71) | | | | | |
| | | | | | | | | | | | | | | | | | | | | | | | |
| | | | | | |
LESS DISTRIBUTIONS: | | | | | | | | | | | | | | | | | | | | | | | | |
From net investment income | | | (0.11) | | | | (0.02) | | | | (0.04) | | | | - | | | | (0.12) | | | | | |
From net realized gains on investments | | | (0.18) | | | | - | | | | - | | | | - | | | | (0.01) | | | | | |
| | | | | | | | | | | | | | | | | | | | | | | | |
Total distributions | | | (0.29) | | | | (0.02) | | | | (0.04) | | | | - | | | | (0.13) | | | | | |
| | | | | | | | | | | | | | | | | | | | | | | | |
| | | | | | |
Net asset value, end of year | | $ | 11.69 | | | $ | 11.44 | | | $ | 11.37 | | | $ | 11.49 | | | $ | 10.54 | | | | | |
| | | | | | | | | | | | | | | | | | | | | | | | |
| | | | | | |
Total return (B)(C) | | | 4.92% | | | | 0.75% | | | | (0.72)% | | | | 9.01% | | | | (6.30)% | | | | | |
| | | | | | |
RATIOS/SUPPLEMENTAL DATA: | | | | | | | | | | | | | | | | | | | | | | | | |
Net assets, end of year (in 000’s) | | $ | 33,926 | | | $ | 40,573 | | | $ | 50,080 | | | $ | 68,706 | | | $ | 71,569 | | | | | |
Ratios to average net assets | | | 1.45% | | | | 1.41% | | | | 1.44% | | | | 1.35% | | | | 1.26% | | | | | |
Expenses, before waiver and reimbursement | | | | | | | | | | | | | | | | | | | | | | | | |
Expenses, net waiver and reimbursement (D) | | | 1.41% | | | | 1.36% | | | | 1.39% | | | | 1.30% | | | | 1.21% | | | | | |
Net investment income, before waiver and reimbursement | | | 0.52% | | | | 0.86% | | | | (0.05)% | | | | 0.35% | | | | 0.11% | | | | | |
Net investment income, net waiver and reimbursement (D) | | | 0.56% | | | | 0.91% | | | | 0.00% | | | | 0.40% | | | | 0.16% | | | | | |
| | | | | | |
Portfolio turnover rate | | | 34% | | | | 35% | | | | 51% | | | | 58% | | | | 42% | | | | | |
* Amount is less than $0.005 per share.
| (A) | Per share amounts calculated using average shares method, which more appropriately presents the per share data for the period. |
| (B) | Total return calculation does not reflect sales load. Total return represents aggregate total return based on Net Asset Value. |
| (C) | Total return in the above table represents the rate that the investor would have earned or lost on an investment in the Fund assuming reinvestment of dividends. Total return would have been higher or lower if certain expenses had not been reimbursed, waived or recouped. |
| (D) | This expense decrease from the voluntary waiver is reflected in both the net expense and the net investment income ratios shown. |
The accompanying notes are an integral part of these financial statements.
106
Timothy Defensive Strategies Fund(Class C Shares)
Selected data based on a share outstanding throughout each year
| | | | | | | | | | | | | | | | | | | | | | | | |
| | | For the Year
ended
September 30,
2019 | | | For the Year
ended
September 30,
2018 | | | For the Year
ended
September 30,
2017 | | | For the Year
ended
September 30,
2016 | | | For the Year
ended
September 30,
2015 | | | | |
| | | | | | |
Net asset value, beginning of year | | $ | 10.90 | | | $ | 10.90 | | | $ | 11.07 | | | $ | 10.22 | | | $ | 11.04 | | | | | |
| | | | | | | | | | | | | | | | | | | | | | | | |
| | | | | | |
INCOME (LOSS) FROM INVESTMENT OPERATIONS: | | | | | | | | | | | | | | | | | | | | | | | | |
Net investment income (loss) (A) | | | (0.03) | | | | 0.02 | | | | (0.08) | | | | (0.04) | | | | (0.07) | | | | | |
Net realized and unrealized gain (loss) on investments | | | 0.46 | | | | (0.02) | | | | (0.09) | | | | 0.89 | (B) | | | (0.71) | | | | | |
| | | | | | | | | | | | | | | | | | | | | | | | |
Total from investment operations | | | 0.43 | | | | 0.00 | | | | (0.17) | | | | 0.85 | | | | (0.78) | | | | | |
| | | | | | | | | | | | | | | | | | | | | | | | |
| | | | | | |
LESS DISTRIBUTIONS: | | | | | | | | | | | | | | | | | | | | | | | | |
From net investment income | | | (0.02) | | | | - | | | | - | | | | - | | | | (0.03) | | | | | |
From net realized gains on investments | | | (0.18) | | | | - | | | | - | | | | - | | | | (0.01) | | | | | |
| | | | | | | | | | | | | | | | | | | | | | | | |
Total distributions | | | (0.20) | | | | - | | | | - | | | | - | | | | (0.04) | | | | | |
| | | | | | | | | | | | | | | | | | | | | | | | |
| | | | | | |
Net asset value, end of year | | $ | 11.13 | | | $ | 10.90 | | | $ | 10.90 | | | $ | 11.07 | | | $ | 10.22 | | | | | |
| | | | | | | | | | | | | | | | | | | | | | | | |
| | | | | | |
Total return (C)(D) | | | 4.06% | | | | 0.00% | | | | (1.54)% | | | | 8.32% | | | | (7.06)% | | | | | |
| | | | | | |
RATIOS/SUPPLEMENTAL DATA: | | | | | | | | | | | | | | | | | | | | | | | | |
Net assets, end of year (in 000’s) | | $ | 3,110 | | | $ | 5,432 | | | $ | 6,683 | | | $ | 9,630 | | | $ | 14,671 | | | | | |
Ratios to average net assets | | | 2.20% | | | | 2.16% | | | | 2.21% | | | | 2.07% | | | | 2.01% | | | | | |
Expenses, before waiver and reimbursement | | | | | | | | | | | | | | | | | | | | | | | | |
Expenses, net waiver and reimbursement (E) | | | 2.16% | | | | 2.11% | | | | 2.16% | | | | 2.02% | | | | 1.96% | | | | | |
Net investment income (loss), before waiver and reimbursement | | | (0.31)% | | | | 0.09% | | | | (0.79)% | | | | (0.46)% | | | | (0.67)% | | | | | |
Net investment income (loss), net waiver and reimbursement (E) | | | (0.27)% | | | | 0.14% | | | | (0.74)% | | | | (0.41)% | | | | (0.62)% | | | | | |
| | | | | | |
Portfolio turnover rate | | | 34% | | | | 35% | | | | 51% | | | | 58% | | | | 42% | | | | | |
| (A) | Per share amounts calculated using average shares method, which more appropriately presents the per share data for the period. |
| (B) | Realized and unrealized gains per share in this caption are balancing amounts necessary to reconcile the change in net asset value per share for the period, and may not reconcile with the aggregate gains and losses in the Statements of Operations due to share transactions for the period. |
| (C) | Total return calculation does not reflect redemption fee. Total return represents aggregate total return based on Net Asset Value. |
| (D) | Total return in the above table represents the rate that the investor would have earned or lost on an investment in the Fund assuming reinvestment of dividends. Total return would have been higher or lower if certain expenses had not been reimbursed, waived or recouped. |
| (E) | This expense decrease from the voluntary waiver is reflected in both the net expense and the net investment income ratios shown. |
The accompanying notes are an integral part of these financial statements.
107
Timothy Defensive Strategies Fund(Class I Shares)
Selected data based on a share outstanding throughout each year
| | | | | | | | | | | | | | | | | | | | | | | | |
| | | For the Year
ended
September 30,
2019 | | | For the Year
ended
September 30,
2018 | | | For the Year
ended
September 30,
2017 | | | For the Year
ended
September 30,
2016 | | | For the Year
ended
September 30,
2015 | | | | |
| | | | | | |
Net asset value, beginning of year | | $ | 11.45 | | | $ | 11.38 | | | $ | 11.51 | | | $ | 10.52 | | | $ | 11.36 | | | | | |
| | | | | | | | | | | | | | | | | | | | | | | | |
| | | | | | |
INCOME (LOSS) FROM INVESTMENT OPERATIONS: | | | | | | | | | | | | | | | | | | | | | | | | |
Net investment income (A) | | | 0.09 | | | | 0.14 | | | | 0.06 | | | | 0.09 | | | | 0.05 | | | | | |
Net realized and unrealized gain (loss) on investments | | | 0.47 | | | | (0.02) | | | | (0.12) | | | | 0.90 | | | | (0.73) | | | | | |
| | | | | | | | | | | | | | | | | | | | | | | | |
Total from investment operations | | | 0.56 | | | | 0.12 | | | | (0.06) | | | | 0.99 | | | | (0.68) | | | | | |
| | | | | | | | | | | | | | | | | | | | | | | | |
| | | | | | |
LESS DISTRIBUTIONS: | | | | | | | | | | | | | | | | | | | | | | | | |
From net investment income | | | (0.14) | | | | (0.05) | | | | (0.07) | | | | - | | | | (0.15) | | | | | |
From net realized gains on investments | | | (0.18) | | | | - | | | | - | | | | - | | | | (0.01) | | | | | |
| | | | | | | | | | | | | | | | | | | | | | | | |
Total distributions | | | (0.32) | | | | (0.05) | | | | (0.07) | | | | - | | | | (0.16) | | | | | |
| | | | | | | | | | | | | | | | | | | | | | | | |
| | | | | | |
Net asset value, end of year | | $ | 11.69 | | | $ | 11.45 | | | $ | 11.38 | | | $ | 11.51 | | | $ | 10.52 | | | | | |
| | | | | | | | | | | | | | | | | | | | | | | | |
| | | | | | |
Total return (B,C) | | | 5.17% | | | | 1.04% | | | | (0.54)% | | | | 9.41% | | | | (6.09)% | | | | | |
| | | | | | |
RATIOS/SUPPLEMENTAL DATA: | | | | | | | | | | | | | | | | | | | | | | | | |
Net assets, end of year (in 000’s) | | $ | 3,692 | | | $ | 3,071 | | | $ | 2,661 | | | $ | 398 | | | $ | 163 | | | | | |
Ratios to average net assets | | | 1.20% | | | | 1.16% | | | | 1.14% | | | | 1.18% | | | | 1.01% | | | | | |
Expenses, before waiver and reimbursement | | | | | | | | | | | | | | | | | | | | | | | | |
Expenses, net waiver and reimbursement (D) | | | 1.16% | | | | 1.11% | | | | 1.09% | | | | 1.12% | | | | 0.96% | | | | | |
Net investment income, before waiver and reimbursement | | | 0.78% | | | | 1.14% | | | | 0.44% | | | | 0.73% | | | | 0.42% | | | | | |
Net investment income, net waiver and reimbursement (D) | | | 0.82% | | | | 1.19% | | | | 0.49% | | | | 0.79% | | | | 0.47% | | | | | |
| | | | | | |
Portfolio turnover rate | | | 34% | | | | 35% | | | | 51% | | | | 58% | | | | 42% | | | | | |
| (A) | Per share amounts calculated using average shares method, which more appropriately presents the per share data for the period. |
| (B) | Total return represents aggregate total return based on Net Asset Value. |
| (C) | Total return in the above table represents the rate that the investor would have earned or lost on an investment in the Fund assuming reinvestment of dividends. Total return would have been higher or lower if certain expenses had not been reimbursed, waived or recouped. |
| (D) | This expense decrease from the voluntary waiver is reflected in both the net expense and the net investment income ratios shown. |
The accompanying notes are an integral part of these financial statements.
108
Timothy Strategic Growth Fund(Class A Shares)
Selected data based on a share outstanding throughout each year
| | | | | | | | | | | | | | | | | | | | | | | | |
| | | For the Year
ended
September 30,
2019 | | | For the Year
ended
September 30,
2018 | | | For the Year
ended
September 30,
2017 | | | For the Year
ended
September 30,
2016 | | | For the Year
ended
September 30,
2015 | | | | |
| | | | | | |
Net asset value, beginning of year | | $ | 9.70 | | | $ | 9.48 | | | $ | 8.73 | | | $ | 8.42 | | | $ | 8.90 | | | | | |
| | | | | | | | | | | | | | | | | | | | | | | | |
| | | | | | |
INCOME (LOSS) FROM INVESTMENT OPERATIONS: | | | | | | | | | | | | | | | | | | | | | | | | |
Net investment income (loss) (A) | | | 0.01 | | | | 0.00 | * | | | (0.04) | | | | (0.03) | | | | 0.03 | | | | | |
Net realized and unrealized gain (loss) on investments | | | (0.04) | | | | 0.22 | | | | 0.79 | | | | 0.37 | | | | (0.40) | | | | | |
| | | | | | | | | | | | | | | | | | | | | | | | |
Total from investment operations | | | (0.03) | | | | 0.22 | | | | 0.75 | | | | 0.34 | | | | (0.37) | | | | | |
| | | | | | | | | | | | | | | | | | | | | | | | |
| | | | | | |
LESS DISTRIBUTIONS: | | | | | | | | | | | | | | | | | | | | | | | | |
From net investment income | | | - | | | | - | | | | - | | | | (0.03) | | | | (0.11) | | | | | |
From net realized gains on investments | | | (0.03) | | | | - | | | | - | | | | - | | | | - | | | | | |
| | | | | | | | | | | | | | | | | | | | | | | | |
Total distributions | | | (0.03) | | | | - | | | | - | | | | (0.03) | | | | (0.11) | | | | | |
| | | | | | | | | | | | | | | | | | | | | | | | |
| | | | | | |
Net asset value, end of year | | $ | 9.64 | | | $ | 9.70 | | | $ | 9.48 | | | $ | 8.73 | | | $ | 8.42 | | | | | |
| | | | | | | | | | | | | | | | | | | | | | | | |
| | | | | | |
Total return (B)(C) | | | (0.26)% | | | | 2.32% | | | | 8.59% | | | | 4.03% | | | | (4.16)% | | | | | |
| | | | | | |
RATIOS/SUPPLEMENTAL DATA: | | | | | | | | | | | | | | | | | | | | | | | | |
Net assets, end of year (in 000’s) | | $ | 32,318 | | | $ | 32,078 | | | $ | 32,767 | | | $ | 32,800 | | | $ | 33,071 | | | | | |
Ratio of expenses to average net assets (D) | | | 1.12% | | | | 1.10% | | | | 1.07% | | | | 1.05% | | | | 1.08% | | | | | |
Ratio of net investment income (loss), to average net assets (D)(E) | | | 0.16% | | | | 0.00% | | | | (0.45)% | | | | (0.38)% | | | | 0.37% | | | | | |
| | | | | | |
Portfolio turnover rate | | | 50% | | | | 8% | | | | 36% | | | | 37% | | | | 24% | | | | | |
* Amount is less than $0.005 per share.
| (A) | Per share amounts calculated using average shares method, which more appropriately presents the per share data for the period. |
| (B) | Total return calculation does not reflect sales load. |
| (C) | Total return in the above table represents the rate that the investor would have earned or lost on an investment in the Fund assuming reinvestment of dividends. |
| (D) | These ratios exclude the impact of expenses of the underlying security holdings as represented in the Schedule of Investments. |
| (E) | Recognition of net investment income (loss) by the Fund is affected by the timing of the declaration of dividends by the underlying investment companies in which the Fund invests. |
The accompanying notes are an integral part of these financial statements.
109
Timothy Strategic Growth Fund(Class C Shares)
Selected data based on a share outstanding throughout each year
| | | | | | | | | | | | | | | | | | | | | | | | |
| | | For the Year
ended
September 30,
2019 | | | For the Year
ended
September 30,
2018 | | | For the Year
ended
September 30,
2017 | | | For the Year
ended
September 30,
2016 | | | For the Year
ended
September 30,
2015 | | | | |
| | | | | | |
Net asset value, beginning of year | | $ | 8.70 | | | $ | 8.57 | | | $ | 7.95 | | | $ | 7.70 | | | $ | 8.15 | | | | | |
| | | | | | | | | | | | | | | | | | | | | | | | |
| | | | | | |
INCOME (LOSS) FROM INVESTMENT OPERATIONS: | | | | | | | | | | | | | | | | | | | | | | | | |
Net investment income (loss) (A) | | | 0.03 | | | | (0.06) | | | | (0.10) | | | | (0.08) | | | | (0.02) | | | | | |
Net realized and unrealized gain (loss) on investments | | | (0.12) | | | | 0.19 | | | | 0.72 | | | | 0.33 | | | | (0.38) | | | | | |
| | | | | | | | | | | | | | | | | | | | | | | | |
Total from investment operations | | | (0.09) | | | | 0.13 | | | | 0.62 | | | | 0.25 | | | | (0.40) | | | | | |
| | | | | | | | | | | | | | | | | | | | | | | | |
| | | | | | |
LESS DISTRIBUTIONS: | | | | | | | | | | | | | | | | | | | | | | | | |
From net investment income | | | - | | | | - | | | | - | | | | - | | | | (0.05) | | | | | |
From net realized gains on investments | | | (0.03) | | | | - | | | | - | | | | - | | | | - | | | | | |
| | | | | | | | | | | | | | | | | | | | | | | | |
Total distributions | | | (0.03) | | | | - | | | | - | | | | - | | | | (0.05) | | | | | |
| | | | | | | | | | | | | | | | | | | | | | | | |
| | | | | | |
Net asset value, end of year | | $ | 8.58 | | | $ | 8.70 | | | $ | 8.57 | | | $ | 7.95 | | | $ | 7.70 | | | | | |
| | | | | | | | | | | | | | | | | | | | | | | | |
| | | | | | |
Total return (B)(C) | | | (0.99)% | | | | 1.52% | | | | 7.80% | | | | 3.25% | | | | (4.89)% | | | | | |
| | | | | | |
RATIOS/SUPPLEMENTAL DATA: | | | | | | | | | | | | | | | | | | | | | | | | |
Net assets, end of year (in 000’s) | | $ | 3,247 | | | $ | 6,313 | | | $ | 6,966 | | | $ | 7,380 | | | $ | 7,713 | | | | | |
Ratio of expenses to average net assets (D) | | | 1.87% | | | | 1.85% | | | | 1.82% | | | | 1.80% | | | | 1.84% | | | | | |
Ratio of net investment income (loss), to average net assets (D)(E) | | | 0.35% | | | | (0.70)% | | | | (1.18)% | | | | (1.09)% | | | | (0.29)% | | | | | |
Portfolio turnover rate | | | 50% | | | | 8% | | | | 36% | | | | 37% | | | | 24% | | | | | |
| (A) | Per share amounts calculated using average shares method, which more appropriately presents the per share data for the period. |
| (B) | Total return calculation does not reflect redemption fee. |
| (C) | Total return in the above table represents the rate that the investor would have earned or lost on an investment in the Fund assuming reinvestment of dividends. |
| (D) | These ratios exclude the impact of expenses of the underlying security holdings as represented in the Schedule of Investments. |
| (E) | Recognition of net investment income (loss) by the Fund is affected by the timing of the declaration of dividends by the underlying investment companies in which the Fund invests. |
The accompanying notes are an integral part of these financial statements.
110
Timothy Conservative Growth Fund(Class A Shares)
Selected data based on a share outstanding throughout each year
| | | | | | | | | | | | | | | | | | | | | | | | |
| | | For the Year
ended
September 30,
2019 | | | For the Year
ended
September 30,
2018 | | | For the Year
ended
September 30,
2017 | | | For the Year
ended
September 30,
2016 | | | For the Year
ended
September 30,
2015 | | | | |
| | | | | | |
Net asset value, beginning of year | | $ | 10.75 | | | $ | 10.67 | | | $ | 10.06 | | | $ | 10.32 | | | $ | 11.01 | | | | | |
| | | | | | | | | | | | | | | | | | | | | | | | |
| | | | | | |
INCOME (LOSS) FROM INVESTMENT OPERATIONS: | | | | | | | | | | | | | | | | | | | | | | | | |
Net investment income (loss) (A) | | | 0.05 | | | | 0.02 | | | | (0.02) | | | | (0.03) | | | | 0.06 | | | | | |
Net realized and unrealized gain (loss) on investments | | | 0.10 | | | | 0.09 | | | | 0.63 | | | | 0.43 | | | | (0.32) | | | | | |
| | | | | | | | | | | | | | | | | | | | | | | | |
Total from investment operations | | | 0.15 | | | | 0.11 | | | | 0.61 | | | | 0.40 | | | | (0.26) | | | | | |
| | | | | | | | | | | | | | | | | | | | | | | | |
| | | | | | |
LESS DISTRIBUTIONS: | | | | | | | | | | | | | | | | | | | | | | | | |
From net investment income | | | - | | | | - | | | | - | | | | (0.05) | | | | (0.10) | | | | | |
From net realized gains on investments | | | (0.24) | | | | (0.03) | | | | - | | | | (0.61) | | | | (0.33) | | | | | |
| | | | | | | | | | | | | | | | | | | | | | | | |
Total distributions | | | (0.24) | | | | (0.03) | | | | - | | | | (0.66) | | | | (0.43) | | | | | |
| | | | | | | | | | | | | | | | | | | | | | | | |
| | | | | | |
Net asset value, end of year | | $ | 10.66 | | | $ | 10.75 | | | $ | 10.67 | | | $ | 10.06 | | | $ | 10.32 | | | | | |
| | | | | | | | | | | | | | | | | | | | | | | | |
| | | | | | |
Total return (B)(C) | | | 1.61% | | | | 1.06% | | | | 6.06% | | | | 4.22% | | | | (2.47)% | | | | | |
| | | | | | |
RATIOS/SUPPLEMENTAL DATA: | | | | | | | | | | | | | | | | | | | | | | | | |
Net assets, end of year (in 000’s) | | $ | 40,590 | | | $ | 42,040 | | | $ | 45,110 | | | $ | 44,437 | | | $ | 44,706 | | | | | |
Ratio of expenses to average net assets (D) | | | 1.08% | | | | 1.08% | | | | 1.04% | | | | 1.02% | | | | 1.07% | | | | | |
Ratio of net investment income (loss) to average net assets (D)(E) | | | 0.44% | | | | 0.14% | | | | (0.20)% | | | | (0.27)% | | | | 0.53% | | | | | |
Portfolio turnover rate | | | 42% | | | | 7% | | | | 27% | | | | 27% | | | | 25% | | | | | |
| (A) | Per share amounts calculated using average shares method, which more appropriately presents the per share data for the period. |
| (B) | Total return calculation does not reflect sales load. |
| (C) | Total return in the above table represents the rate that the investor would have earned or lost on an investment in the Fund assuming reinvestment of dividends. |
| (D) | These ratios exclude the impact of expenses of the underlying security holdings as represented in the Schedule of Investments. |
| (E) | Recognition of net investment income (loss) by the Fund is affected by the timing of the declaration of dividends by the underlying investment companies in which the Fund invests. |
The accompanying notes are an integral part of these financial statements.
111
Timothy Conservative Growth Fund(Class C Shares)
Selected data based on a share outstanding throughout each year
| | | | | | | | | | | | | | | | | | | | | | | | |
| | | For the Year
ended
September 30,
2019 | | | For the Year
ended
September 30,
2018 | | | For the Year
ended
September 30,
2017 | | | For the Year
ended
September 30,
2016 | | | For the Year
ended
September 30,
2015 | | | | |
| | | | | | |
Net asset value, beginning of year | | $ | 9.76 | | | $ | 9.76 | | | $ | 9.27 | | | $ | 9.58 | | | $ | 10.22 | | | | | |
| | | | | | | | | | | | | | | | | | | | | | | | |
| | | | | | |
INCOME (LOSS) FROM INVESTMENT OPERATIONS: | | | | | | | | | | | | | | | | | | | | | | | | |
Net investment income (loss) (A) | | | 0.01 | | | | (0.06) | | | | (0.09) | | | | (0.09) | | | | (0.01) | | | | | |
Net realized and unrealized gain (loss) on investments | | | 0.06 | | | | 0.09 | (B) | | | 0.58 | (B) | | | 0.39 | (B) | | | (0.30) | (B) | | | | |
| | | | | | | | | | | | | | | | | | | | | | | | |
Total from investment operations | | | 0.07 | | | | 0.03 | | | | 0.49 | | | | 0.30 | | | | (0.31) | | | | | |
| | | | | | | | | | | | | | | | | | | | | | | | |
| | | | | | |
LESS DISTRIBUTIONS: | | | | | | | | | | | | | | | | | | | | | | | | |
From net realized gains on investments | | | (0.24) | | | | (0.03) | | | | - | | | | (0.61) | | | | (0.33) | | | | | |
| | | | | | | | | | | | | | | | | | | | | | | | |
Total distributions | | | (0.24) | | | | (0.03) | | | | - | | | | (0.61) | | | | (0.33) | | | | | |
| | | | | | | | | | | | | | | | | | | | | | | | |
| | | | | | |
Net asset value, end of year | | $ | 9.59 | | | $ | 9.76 | | | $ | 9.76 | | | $ | 9.27 | | | $ | 9.58 | | | | | |
| | | | | | | | | | | | | | | | | | | | | | | | |
| | | | | | |
Total return (C)(D) | | | 0.94% | | | | 0.34% | | | | 5.29% | | | | 3.39% | | | | (3.19)% | | | | | |
| | | | | | |
RATIOS/SUPPLEMENTAL DATA: | | | | | | | | | | | | | | | | | | | | | | | | |
Net assets, end of year (in 000’s) | | $ | 5,504 | | | $ | 9,218 | | | $ | 9,981 | | | $ | 10,697 | | | $ | 11,135 | | | | | |
Ratio of expenses to average net assets (E) | | | 1.83% | | | | 1.83% | | | | 1.79% | | | | 1.77% | | | | 1.82% | | | | | |
Ratio of net investment income (loss), to average net assets (E)(F) | | | 0.14% | | | | (0.63)% | | | | (0.96)% | | | | (1.01)% | | | | (0.14)% | | | | | |
Portfolio turnover rate | | | 42% | | | | 7% | | | | 27% | | | | 27% | | | | 25% | | | | | |
| (A) | Per share amounts calculated using average shares method, which more appropriately presents the per share data for the period. |
| (B) | Realized and unrealized gains per share in this caption are balancing amounts necessary to reconcile the change in net asset value per share for the period, and may not reconcile with aggregate gains and losses in the Statement of Operations due to the timing of share transactions for the period. |
| (C) | Total return calculation does not reflect redemption fees. Total return represents aggregate total return based on Net Asset Value. |
| (D) | Total return in the above table represents the rate that the investor would have earned or lost on an investment in the Fund assuming reinvestment of dividends. |
| (E) | These ratios exclude the impact of expenses of the underlying security holdings as represented in the Schedule of Investments. |
| (F) | Recognition of net investment income (loss) by the Fund is affected by the timing of the declaration of dividends by the underlying investment companies in which the Fund invests. |
The accompanying notes are an integral part of these financial statements.
112
Timothy Emerging Markets Fund(Class A Shares)
Selected data based on a share outstanding throughout each year
| | | | | | | | | | | | | | | | | | | | |
| | | For the Year
ended
September 30,
2019 | | | For the Year
ended
September 30,
2018 | | | For the Year
ended
September 30,
2017 | | | For the Year
ended
September 30,
2016 | | | For the Year
ended
September 30,
2015 | |
| | | | | |
Net asset value, beginning of year | | $ | 8.62 | | | $ | 9.73 | | | $ | 8.06 | | | $ | 6.34 | | | $ | 10.23 | |
| | | | | | | | | | | | | | | | | | | | |
| | | | | |
INCOME (LOSS) FROM INVESTMENT OPERATIONS: | | | | | | | | | | | | | | | | | | | | |
Net investment income (A) | | | 0.13 | | | | 0.05 | | | | 0.06 | | | | 0.03 | | | | 0.04 | |
Net realized and unrealized gain (loss) on investments | | | 0.03 | (B) | | | (1.09) | | | | 1.65 | | | | 1.69 | | | | (3.35) | |
| | | | | | | | | | | | | | | | | | | | |
Total from investment operations | | | 0.16 | | | | (1.04) | | | | 1.71 | | | | 1.72 | | | | (3.31) | |
| | | | | | | | | | | | | | | | | | | | |
| | | | | |
LESS DISTRIBUTIONS: | | | | | | | | | | | | | | | | | | | | |
From net investment income | | | (0.07) | | | | (0.07) | | | | (0.04) | | | | - | | | | (0.04) | |
From net realized gains on investments | | | - | | | | - | | | | - | | | | - | | | | (0.54) | |
| | | | | | | | | | | | | | | | | | | | |
Total distributions | | | (0.07) | | | | (0.07) | | | | (0.04) | | | | - | | | | (0.58) | |
| | | | | | | | | | | | | | | | | | | | |
| | | | | |
Net asset value, end of year | | $ | 8.71 | | | $ | 8.62 | | | $ | 9.73 | | | $ | 8.06 | | | $ | 6.34 | |
| | | | | | | | | | | | | | | | | | | | |
| | | | | |
Total return (C)(D) | | | 1.90% | | | | (10.81)% | | | | 21.29% | | | | 27.13% | | | | (33.78)% | |
| | | | | |
RATIOS/SUPPLEMENTAL DATA: | | | | | | | | | | | | | | | | | | | | |
Net assets, end of year (in 000’s) | | $ | 15,677 | | | $ | 16,941 | | | $ | 16,889 | | | $ | 7,118 | | | $ | 5,981 | |
Ratios to average net assets | | | | | | | | | | | | | | | | | | | | |
Expenses, before waiver and reimbursement | | | 2.41% | | | | 2.60% | | | | 2.27% | | | | 2.58% | | | | 2.50% | |
Expenses, net waiver and reimbursement (E) | | | 2.37% | | | | 2.55% | | | | 2.22% | | | | 2.53% | | | | 2.45% | |
Net investment income (loss), before waiver and reimbursement | | | 1.42% | | | | 0.48% | | | | 0.68% | | | | 0.39% | | | | 0.36% | |
Net investment income (loss), net waiver and reimbursement (E) | | | 1.46% | | | | 0.53% | | | | 0.73% | | | | 0.44% | | | | 0.41% | |
Portfolio turnover rate | | | 41% | | | | 51% | | | | 31% | | | | 24% | | | | 37% | |
| (A) | Per share amounts calculated using average shares method, which more appropriately presents the per share data for the period. |
| (B) | Realized and unrealized gains per share in this caption are balancing amounts necessary to reconcile the change in net asset value per share for the period, and may not reconcile with aggregate gains and losses in the Statement of Operations due to the timing of share transactions for the period. |
| (C) | Total return calculation does not reflect sales load. |
| (D) | Total return in the above table represents the rate that the investor would have earned or lost on an investment in the Fund assuming reinvestment of dividends. Total return would have been higher or lower if certain expenses had not been reimbursed, waived or recouped. |
| (E) | This expense decrease from the voluntary waiver is reflected in both the net expense and the net investment income ratios shown. |
The accompanying notes are an integral part of these financial statements.
113
Timothy Emerging Markets Fund(Class C Shares)
Selected data based on a share outstanding throughout each year
| | | | | | | | | | | | | | | | | | | | | | | | |
| | | For the Year
ended
September 30,
2019 | | | For the Year
ended
September 30,
2018 | | | For the Year
ended
September 30,
2017 | | | For the Year
ended
September 30,
2016 | | | For the Year
ended
September 30,
2015 | | | | |
| | | | | | |
Net asset value, beginning of year | | $ | 8.37 | | | $ | 9.48 | | | $ | 7.88 | | | $ | 6.23 | | | $ | 10.09 | | | | | |
| | | | | | | | | | | | | | | | | | | | | | | | |
| | | | | | |
INCOME (LOSS) FROM INVESTMENT OPERATIONS: | | | | | | | | | | | | | | | | | | | | | | | | |
Net investment income (loss) (A) | | | 0.05 | | | | (0.02) | | | | 0.00 | * | | | (0.02) | | | | (0.02) | | | | | |
Net realized and unrealized gain (loss) on investments | | | 0.05 | (B) | | | (1.07) | | | | 1.60 | | | | 1.67 | (B) | | | (3.30) | | | | | |
| | | | | | | | | | | | | | | | | | | | | | | | |
Total from investment operations | | | 0.10 | | | | (1.09) | | | | 1.60 | | | | 1.65 | | | | (3.32) | | | | | |
| | | | | | | | | | | | | | | | | | | | | | | | |
| | | | | | |
LESS DISTRIBUTIONS: | | | | | | | | | | | | | | | | | | | | | | | | |
From net investment income | | | - | | | | (0.02) | | | | - | | | | - | | | | - | | | | | |
From net realized gains on investments | | | - | | | | - | | | | - | | | | - | | | | (0.54) | | | | | |
| | | | | | | | | | | | | | | | | | | | | | | | |
Total distributions | | | - | | | | (0.02) | | | | - | | | | - | | | | (0.54) | | | | | |
| | | | | | | | | | | | | | | | | | | | | | | | |
| | | | | | |
Net asset value, end of year | | $ | 8.47 | | | $ | 8.37 | | | $ | 9.48 | | | $ | 7.88 | | | $ | 6.23 | | | | | |
| | | | | | | | | | | | | | | | | | | | | | | | |
| | | | | | |
Total return (C)(D) | | | 1.19% | | | | (11.53)% | | | | 20.30% | | | | 26.48% | | | | (34.29)% | | | | | |
| | | | | | |
RATIOS/SUPPLEMENTAL DATA: | | | | | | | | | | | | | | | | | | | | | | | | |
Net assets, end of year (in 000’s) | | $ | 1,657 | | | $ | 2,192 | | | $ | 2,413 | | | $ | 897 | | | $ | 498 | | | | | |
Ratios to average net assets | | | | | | | | | | | | | | | | | | | | | | | | |
Expenses, before waiver and reimbursement | | | 3.16% | | | | 3.35% | | | | 3.02% | | | | 3.36% | | | | 3.26% | | | | | |
Expenses, net waiver and reimbursement (E) | | | 3.12% | | | | 3.30% | | | | 2.97% | | | | 3.28% | | | | 3.21% | | | | | |
Net investment income (loss), before waiver and reimbursement | | | 0.55% | | | | (0.25)% | | | | (0.04)% | | | | (0.29)% | | | | (0.39)% | | | | | |
Net investment income (loss), net waiver and reimbursement (E) | | | 0.59% | | | | (0.20)% | | | | 0.01% | | | | (0.24)% | | | | (0.34)% | | | | | |
Portfolio turnover rate | | | 41% | | | | 51% | | | | 31% | | | | 24% | | | | 37% | | | | | |
* Amount is less than $0.005 per share
| (A) | Per share amounts calculated using average shares method, which more appropriately presents the per share data for the period. |
| (B) | Realized and unrealized gains per share in this caption are balancing amounts necessary to reconcile the change in net asset value per share for the period, and may not reconcile with the aggregate gains and losses in the Statements of Operations due to share transactions for the period. |
| (C) | Total return calculation does not reflect redemption fee. |
| (D) | Total return in the above table represents the rate that the investor would have earned or lost on an investment in the Fund assuming reinvestment of dividends. Total return would have been higher or lower if certain expenses had not been reimbursed, waived or recouped. |
| (E) | This expense decrease from the voluntary waiver is reflected in both the net expense and the net investment income ratios shown. |
The accompanying notes are an integral part of these financial statements.
114
Timothy Emerging Markets Fund (Class I Shares)
Selected data based on a share outstanding throughout each year
| | | | | | | | | | | | | | | | | | | | | | |
| | | For the Year
ended
September 30,
2019 | | | For the Year
ended
September 30,
2018 | | | For the Year
ended
September 30,
2017 | | | For the Year
ended
September 30,
2016 | | | For the Year
ended
September 30,
2015 | | | |
| | | | | | |
Net asset value, beginning of year | | $ | 8.68 | | | $ | 9.79 | | | $ | 8.11 | | | $ | 6.35 | | | $ | 10.25 | | | |
| | | | | | | | | | | | | | | | | | | | | | |
| | | | | | |
INCOME (LOSS) FROM INVESTMENT OPERATIONS: | | | | | | | | | | | | | | | | | | | | | | |
| | | | | | |
Net investment income (A) | | | 0.15 | | | | 0.08 | | | | 0.09 | | | | 0.05 | | | | 0.08 | | | |
| | | | | | |
Net realized and unrealized gain (loss) on investments | | | 0.03 | (B) | | | (1.11) | | | | 1.64 | | | | 1.71 | | | | (3.38) | | | |
| | | | | | | | | | | | | | | | | | | | | | |
Total from investment operations | | | 0.18 | | | | (1.03) | | | | 1.73 | | | | 1.76 | | | | (3.30) | | | |
| | | | | | | | | | | | | | | | | | | | | | |
| | | | | | |
LESS DISTRIBUTIONS: | | | | | | | | | | | | | | | | | | | | | | |
| | | | | | |
From net investment income | | | (0.09) | | | | (0.08) | | | | (0.05) | | | | - | | | | (0.06) | | | |
| | | | | | |
From net realized gains on investments | | | - | | | | - | | | | - | | | | - | | | | (0.54) | | | |
| | | | | | | | | | | | | | | | | | | | | | |
Total distributions | | | (0.09) | | | | (0.08) | | | | (0.05) | | | | - | | | | (0.60) | | | |
| | | | | | | | | | | | | | | | | | | | | | |
| | | | | | |
Net asset value, end of year | | $ | 8.77 | | | $ | 8.68 | | | $ | 9.79 | | | $ | 8.11 | | | $ | 6.35 | | | |
| | | | | | | | | | | | | | | | | | | | | | |
| | | | | | |
Total return (C) | | | 2.20% | | | | (10.58)% | | | | 21.52% | | | | 27.72% | | | | (33.04)% | | | |
| | | | | | |
RATIOS/SUPPLEMENTAL DATA: | | | | | | | | | | | | | | | | | | | | | | |
| | | | | | |
Net assets, end of year (in 000’s) | | $ | 2,259 | | | $ | 1,865 | | | $ | 1,762 | | | $ | 703 | | | $ | 329 | | | |
| | | | | | |
Ratios to average net assets | | | | | | | | | | | | | | | | | | | | | | |
| | | | | | |
Expenses, before waiver and reimbursement | | | 2.16% | | | | 2.35% | | | | 2.02% | | | | 2.42% | | | | 2.26% | | | |
| | | | | | |
Expenses, net waiver and reimbursement (D) | | | 2.12% | | | | 2.30% | | | | 1.97% | | | | 2.38% | | | | 2.21% | | | |
| | | | | | |
Net investment income, before waiver and reimbursement | | | 1.68% | | | | 0.74% | | | | 0.97% | | | | 0.61% | | | | 0.90% | | | |
| | | | | | |
Net investment income, net waiver and reimbursement (D) | | | 1.72% | | | | 0.79% | | | | 1.02% | | | | 0.66% | | | | 0.95% | | | |
| | | | | | |
Portfolio turnover rate | | | 41% | | | | 51% | | | | 31% | | | | 24% | | | | 37% | | | |
| (A) | Per share amounts calculated using average shares method, which more appropriately presents the per share data for the period. |
| (B) | Realized and unrealized gains per share in this caption are balancing amounts necessary to reconcile the change in net asset value per share for the period, and may not reconcile with the aggregate gains and losses in the Statements of Operations due to share transactions for the period. |
| (C) | Total return in the above table represents the rate that the investor would have earned or lost on an investment in the Fund assuming reinvestment of dividends. Total return would have been higher or lower if certain expenses had not been reimbursed, waived or recouped. |
| (D) | This expense decrease from the voluntary waiver is reflected in both the net expense and the net investment income ratios shown. |
The accompanying notes are an integral part of these financial statements.
115
Timothy Growth & Income Fund (Class A Shares)
Selected data based on a share outstanding throughout each year
| | | | | | | | | | | | | | | | | | | | | | |
| | | For the Year
ended
September 30,
2019 | | | For the Year
ended
September 30,
2018 | | | For the Year
ended
September 30,
2017 | | | For the Year
ended
September 30,
2016 | | | For the Year
ended
September 30,
2015 | | | |
| | | | | | |
Net asset value, beginning of year | | $ | 10.87 | | | $ | 11.28 | | | $ | 10.76 | | | $ | 10.53 | | | $ | 10.95 | | | |
| | | | | | | | | | | | | | | | | | | | | | |
| | | | | | |
INCOME (LOSS) FROM INVESTMENT OPERATIONS: | | | | | | | | | | | | | | | | | | | | | | |
| | | | | | |
Net investment income (A) | | | 0.04 | | | | 0.01 | | | | 0.01 | | | | 0.03 | | | | 0.01 | | | |
| | | | | | |
Net realized and unrealized gain (loss) on investments | | | (0.07) | | | | (0.14) | | | | 0.52 | | | | 0.22 | | | | (0.42) | | | |
| | | | | | | | | | | | | | | | | | | | | | |
Total from investment operations | | | (0.03) | | | | (0.13) | | | | 0.53 | | | | 0.25 | | | | (0.41) | | | |
| | | | | | | | | | | | | | | | | | | | | | |
| | | | | | |
LESS DISTRIBUTIONS: | | | | | | | | | | | | | | | | | | | | | | |
| | | | | | |
From net investment income | | | (0.05) | | | | (0.01) | | | | (0.01) | | | | (0.02) | | | | (0.01) | | | |
| | | | | | |
From net realized gains on investments | | | (0.19) | | | | (0.27) | | | | - | | | | - | | | | - | | | |
| | | | | | |
Return of Capital | | | (0.00) | * | | | - | | | | - | | | | - | | | | - | | | |
| | | | | | | | | | | | | | | | | | | | | | |
Total distributions | | | (0.24) | | | | (0.28) | | | | (0.01) | | | | (0.02) | | | | (0.01) | | | |
| | | | | | | | | | | | | | | | | | | | | | |
| | | | | | |
Net asset value, end of year | | $ | 10.60 | | | $ | 10.87 | | | $ | 11.28 | | | $ | 10.76 | | | $ | 10.53 | | | |
| | | | | | | | | | | | | | | | | | | | | | |
| | | | | | |
Total return (B)(C) | | | (0.10)% | | | | (1.22)% | | | | 4.91% | | | | 2.36% | | | | (3.75)% | | | |
| | | | | | |
RATIOS/SUPPLEMENTAL DATA: | | | | | | | | | | | | | | | | | | | | | | |
| | | | | | |
Net assets, end of year (in 000’s) | | $ | 14,500 | | | $ | 27,716 | | | $ | 30,426 | | | $ | 36,486 | | | $ | 26,378 | | | |
| | | | | | |
Ratios to average net assets | | | | | | | | | | | | | | | | | | | | | | |
| | | | | | |
Expenses, before waiver and reimbursement | | | 1.69% | | | | 1.70% | | | | 1.59% | | | | 1.59% | | | | 1.56% | | | |
| | | | | | |
Expenses, net waiver and reimbursement (D) | | | 1.65% | | | | 1.65% | | | | 1.54% | | | | 1.54% | | | | 1.51% | | | |
| | | | | | |
Net investment income (loss), before waiver and reimbursement | | | 0.37% | | | | 0.08% | | | | 0.03% | | | | 0.20% | | | | 0.08% | | | |
| | | | | | |
Net investment income (loss), net waiver and reimbursement (D) | | | 0.42% | | | | 0.13% | | | | 0.08% | | | | 0.25% | | | | 0.13% | | | |
Portfolio turnover rate | | | 167% | | | | 56% | | | | 118% | | | | 45% | | | | 75% | | | |
* Amount is less than $0.005 per share
| (A) | Per share amounts calculated using average shares method, which more appropriately presents the per share data for the period. |
| (B) | Total return calculation does not reflect sales load. |
| (C) | Total return in the above table represents the rate that the investor would have earned or lost on an investment in the Fund assuming reinvestment of dividends. Total return would have been higher or lower if certain expenses had not been reimbursed, waived or recouped. |
| (D) | This expense decrease from the voluntary waiver is reflected in both the net expense and the net investment income ratios shown. |
The accompanying notes are an integral part of these financial statements.
116
Timothy Growth & Income Fund (Class C Shares)
Selected data based on a share outstanding throughout each year
| | | | | | | | | | | | | | | | | | | | | | | | |
| | | For the Year
ended
September 30,
2019 | | | For the Year
ended
September 30,
2018 | | | For the Year
ended
September 30,
2017 | | | For the Year
ended
September 30,
2016 | | | For the Year
ended
September 30,
2015 | | | | |
| | | | | | |
Net asset value, beginning of year | | $ | 10.51 | | | $ | 10.99 | | | $ | 10.55 | | | $ | 10.39 | | | $ | 10.87 | | | | | |
| | | | | | | | | | | | | | | | | | | | | | | | |
| | | | | | |
INCOME (LOSS) FROM INVESTMENT OPERATIONS: | | | | | | | | | | | | | | | | | | | | | | | | |
| | | | | | |
Net investment loss (A) | | | (0.03) | | | | (0.07) | | | | (0.07) | | | | (0.06) | | | | (0.06) | | | | | |
| | | | | | |
Net realized and unrealized gain (loss) on investments | | | (0.07) | | | | (0.14) | | | | 0.51 | | | | 0.22 | (B) | | | (0.42) | | | | | |
| | | | | | | | | | | | | | | | | | | | | | | | |
Total from investment operations | | | (0.10) | | | | (0.21) | | | | 0.44 | | | | 0.16 | | | | (0.48) | | | | | |
| | | | | | | | | | | | | | | | | | | | | | | | |
| | | | | | |
LESS DISTRIBUTIONS: | | | | | | | | | | | | | | | | | | | | | | | | |
| | | | | | |
From net investment income | | | (0.01) | | | | - | | | | - | | | | - | | | | - | | | | | |
| | | | | | |
From net realized gains on investments | | | (0.19) | | | | (0.27) | | | | - | | | | - | | | | - | | | | | |
| | | | | | |
Return of Capital | | | (0.00) | * | | | - | | | | - | | | | - | | | | - | | | | | |
| | | | | | | | | | | | | | | | | | | | | | | | |
Total distributions | | | (0.20) | | | | (0.27) | | | | - | | | | - | | | | - | | | | | |
| | | | | | | | | | | | | | | | | | | | | | | | |
| | | | | | |
Net asset value, end of year | | $ | 10.21 | | | $ | 10.51 | | | $ | 10.99 | | | $ | 10.55 | | | $ | 10.39 | | | | | |
| | | | | | | | | | | | | | | | | | | | | | | | |
| | | | | | |
Total return (C)(D) | | | (0.82)% | | | | (1.97)% | | | | 4.17% | | | | 1.54% | | | | (4.42)% | | | | | |
| | | | | | |
RATIOS/SUPPLEMENTAL DATA: | | | | | | | | | | | | | | | | | | | | | | | | |
| | | | | | |
Net assets, end of year (in 000’s) | | $ | 2,388 | | | $ | 3,176 | | | $ | 3,006 | | | $ | 3,028 | | | $ | 3,330 | | | | | |
| | | | | | |
Ratios to average net assets | | | | | | | | | | | | | | | | | | | | | | | | |
| | | | | | |
Expenses, before waiver and reimbursement | | | 2.44% | | | | 2.45% | | | | 2.34% | | | | 2.32% | | | | 2.30% | | | | | |
| | | | | | |
Expenses, net waiver and reimbursement (E) | | | 2.40% | | | | 2.40% | | | | 2.29% | | | | 2.28% | | | | 2.25% | | | | | |
| | | | | | |
Net investment loss, before waiver and reimbursement | | | (0.34%) | | | | (0.67%) | | | | (0.73%) | | | | (0.61%) | | | | (0.60%) | | | | | |
| | | | | | |
Net investment loss, net waiver and reimbursement (E) | | | (0.29%) | | | | (0.62%) | | | | (0.68%) | | | | (0.56%) | | | | (0.55%) | | | | | |
| | | | | | |
Portfolio turnover rate | | | 167% | | | | 56% | | | | 118% | | | | 45% | | | | 75% | | | | | |
* Amount is less than $0.005 per share
| (A) | Per share amounts calculated using average shares method, which more appropriately presents the per share data for the period. |
| (B) | Realized and unrealized gains per share in this caption are balancing amounts necessary to reconcile the change in net asset value per share for the period, and may not reconcile with the aggregate gains and losses in the Statements of Operations due to share transactions for the period. |
| (C) | Total return calculation does not reflect redemption fee. |
| (D) | Total return in the above table represents the rate that the investor would have earned or lost on an investment in the Fund assuming reinvestment of dividends. Total return would have been higher or lower if certain expenses had not been reimbursed, waived or recouped. |
| (E) | This expense decrease from the voluntary waiver is reflected in both the net expense and the net investment income ratios shown. |
The accompanying notes are an integral part of these financial statements.
117
Timothy Growth & Income Fund(Class I Shares)
Selected data based on a share outstanding throughout each year
| | | | | | | | | | | | | | | | | | | | | | | | |
| | | For the Year
ended
September 30,
2019 | | | For the Year
ended
September 30,
2018 | | | For the Year
ended
September 30,
2017 | | | For the Year
ended
September 30,
2016 | | | For the Year
ended
September 30,
2015 | | | | |
| | | | | | |
Net asset value, beginning of year | | $ | 10.94 | | | $ | 11.34 | | | $ | 10.81 | | | $ | 10.56 | | | $ | 10.96 | | | | | |
| | | | | | | | | | | | | | | | | | | | | | | | |
| | | | | | |
INCOME (LOSS) FROM INVESTMENT OPERATIONS: | | | | | | | | | | | | | | | | | | | | | | | | |
| | | | | | |
Net investment income (A) | | | 0.08 | | | | 0.04 | | | | 0.03 | | | | 0.05 | | | | 0.04 | | | | | |
| | | | | | |
Net realized and unrealized gain (loss) on investments | | | (0.09) | | | | (0.15) | | | | 0.53 | | | | 0.23 | | | | (0.42) | | | | | |
| | | | | | | | | | | | | | | | | | | | | | | | |
Total from investment operations | | | (0.01) | | | | (0.11) | | | | 0.56 | | | | 0.28 | | | | (0.38) | | | | | |
| | | | | | | | | | | | | | | | | | | | | | | | |
| | | | | | |
LESS DISTRIBUTIONS: | | | | | | | | | | | | | | | | | | | | | | | | |
| | | | | | |
From net investment income | | | (0.07) | | | | (0.02) | | | | (0.03) | | | | (0.03) | | | | (0.02) | | | | | |
| | | | | | |
From net realized gains on investments | | | (0.19) | | | | (0.27) | | | | - | | | | - | | | | - | | | | | |
| | | | | | |
Return of Capital | | | (0.00) | * | | | - | | | | - | | | | - | | | | - | | | | | |
| | | | | | | | | | | | | | | | | | | | | | | | |
Total distributions | | | (0.26) | | | | (0.29) | | | | (0.03) | | | | (0.03) | | | | (0.02) | | | | | |
| | | | | | | | | | | | | | | | | | | | | | | | |
| | | | | | |
Net asset value, end of year | | $ | 10.67 | | | $ | 10.94 | | | $ | 11.34 | | | $ | 10.81 | | | $ | 10.56 | | | | | |
| | | | | | | | | | | | | | | | | | | | | | | | |
| | | | | | |
Total return (B,C) | | | 0.11% | | | | (0.96)% | | | | 5.19% | | | | 2.61% | | | | (3.50)% | | | | | |
| | | | | | |
RATIOS/SUPPLEMENTAL DATA: | | | | | | | | | | | | | | | | | | | | | | | | |
| | | | | | |
Net assets, end of year (in 000’s) | | $ | 3,182 | | | $ | 3,012 | | | $ | 2,197 | | | $ | 1,593 | | | $ | 1,573 | | | | | |
| | | | | | |
Ratios to average net assets | | | | | | | | | | | | | | | | | | | | | | | | |
| | | | | | |
Expenses, before waiver and reimbursement | | | 1.44% | | | | 1.45% | | | | 1.34% | | | | 1.32% | | | | 1.31% | | | | | |
| | | | | | |
Expenses, net waiver and reimbursement (D) | | | 1.40% | | | | 1.40% | | | | 1.29% | | | | 1.28% | | | | 1.26% | | | | | |
| | | | | | |
Net investment income, before waiver and reimbursement | | | 0.70% | | | | 0.33% | | | | 0.27% | | | | 0.41% | | | | 0.32% | | | | | |
| | | | | | |
Net investment income, net waiver and reimbursement (D) | | | 0.75% | | | | 0.38% | | | | 0.32% | | | | 0.46% | | | | 0.38% | | | | | |
Portfolio turnover rate | | | 167% | | | | 56% | | | | 118% | | | | 45% | | | | 75% | | | | | |
| * | Amount is less than $0.005 per share |
| (A) | Per share amounts calculated using average shares method, which more appropriately presents the per share data for the period. |
| (B) | Total return represents aggregate total return based on Net Asset Value. |
| (C) | Total return in the above table represents the rate that the investor would have earned or lost on an investment in the Fund assuming reinvestment of dividends. Total return would have been higher or lower if certain expenses had not been reimbursed, waived or recouped. |
| (D) | This expense decrease from the voluntary waiver is reflected in both the net expense and the net investment income ratios shown. |
The accompanying notes are an integral part of these financial statements.
118
Notes to Financial Statements
September 30, 2019
Timothy Plan Family of Funds
Note 1|Significant Accounting Policies
The Timothy Plan (the “Trust”) is organized as a series of a Delaware business trust pursuant to a trust agreement dated December 16, 1993. The Trust is registered under the Investment Company Act of 1940, as amended, as anopen-end management investment company. As of September 30, 2019, the Trust consisted of fifteen series. These financial statements include the following thirteen series: Timothy Plan Aggressive Growth Fund, Timothy Plan International Fund, Timothy Plan Large/Mid Cap Growth Fund, Timothy Plan Small Cap Value Fund, Timothy Plan Large/Mid Cap Value Fund, Timothy Plan Fixed Income Fund, Timothy Plan High Yield Bond Fund, Timothy Plan Israel Common Values Fund, Timothy Plan Defensive Strategies Fund, Timothy Plan Strategic Growth Fund, Timothy Plan Conservative Growth Fund, Timothy Plan Emerging Markets Fund and Timothy Plan Growth & Income Fund (the “Funds”). The Funds are diversified funds except for the Timothy Plan Defensive Strategy Fund which is anon-diversified fund.
The Timothy Plan Aggressive Growth Fund’s investment objective is long-term growth of capital. The Fund seeks to achieve its investment objective by normally investing at least 80% of the Fund’s total assets in U.S. common stocks without regard to market capitalizations and investing in the securities of a limited number of companies which the Fund’s Advisor believes show a high probability for superior growth.
The Timothy Plan International Fund’s investment objective is long-term growth of capital. The Fund seeks to achieve its investment objective by normally investing at least 80% of the Fund’s total assets in the common stock and similar securities of foreign companies through the purchase of American Depositary Receipts (“ADRs”) without regard to market capitalization, investing its assets in the ADRs of companies which the Fund’s Advisor believes show a high probability for superior growth, and allocating investments across countries and regions considering the size of the market in each country and region relative to the size of the international market as a whole. Although the Fund maintains a diversified investment portfolio, the political or economic developments within a particular country or region may have an adverse effect on the ability of domiciled issuers to meet their obligations. Additionally, political or economic developments may have an effect on the liquidity and volatility of portfolio securities and currency holdings.
The Timothy Plan Large/Mid Cap Growth Fund’s investment objective is long-term growth of capital. Current income is not a significant investment consideration and any such income realized will be considered incidental to the Fund’s investment objective. The Fund seeks to achieve its investment objective by normally investing at least 80% of the Fund’s total assets in U.S. common stocks with market capitalizations in excess of $2 billion.
The Timothy Plan Small Cap Value Fund’s primary objective is long-term capital growth, with a secondary objective of current income. The Fund seeks to achieve its investment objective by primarily investing at least 80% of the Fund’s total assets in U.S. stocks with market capitalizations that fall within the range of companies included in the Russell 2000 Index.
The Timothy Plan Large/Mid Cap Value Fund’s investment objective is long-term capital growth, with a secondary objective of current income. The Fund seeks to achieve its investment objective by primarily investing in U.S. common stocks. The Fund will invest at least 80% of its assets in the common stock of companies whose total market capitalization generally exceeds $2 billion.
The Timothy Plan Fixed Income Fund seeks to generate a high level of current income consistent with prudent investment risk. To achieve its investment objective, the Fund normally invests in a diversified portfolio of debt securities. These include corporate bonds, U.S. Government and agency securities, convertible securities and preferred securities.
The Timothy Plan High Yield Bond Fund’s investment objective is to generate a high level of current income. To achieve its investment objective, the Fund normally invests in a diversified portfolio of high yield fixed income securities. These include corporate bonds, U.S. Government and agency securities, convertible securities and preferred securities. The Fund will generally purchase securities that are not investment-grade, meaning securities with a rating of “BBB” or lower as rated by Standard and Poor’s or a comparable rating by another nationally recognized rating agency. Investments in these higher yielding securities are generally accompanied by a greater degree of credit risk than higher rated securities. Additionally, lower rated securities may be more susceptible to adverse economic and competitive industry conditions than investment-grade securities.
The Timothy Plan Israel Common Values Fund seeks to provide long-term growth of capital. This Fund seeks to achieve its investment objectives by normally investing at least 80% of the Fund’s total assets in the common stock of companies domiciled and/or headquartered in Israel through the purchase of American Depositary Receipts (ADRs) and direct investments in such companies on foreign stock exchanges, without regard to market capitalizations.
The Timothy Plan Defensive Strategies Fund’s investment objective is the protection of principal through aggressive, proactive reactions to prevailing economic conditions. To achieve its investment objective, the Fund normally invests in Real Estate Investment Trusts (“REITs”), commodities based Exchange-Traded Funds (“ETFs”), Treasury Inflation Protected Securities (“TIPS”), and currently holds gold and silver bullion.
The Timothy Plan Strategic Growth Fund seeks to generate medium to high levels of long-term capital growth. The Fund seeks to achieve its investment objective by normally investing at least 75% of its net assets in the following Funds which are other series of the Trust: approximately0-10% of its net assets in the Timothy Plan Small Cap Value Fund; approximately0-20% of its net assets in the Timothy Plan Large/Mid Cap Value Fund; approximately0-20% of its net assets in the Timothy Plan Large/Mid Cap Growth Fund; approximately5-15% of its net assets in the Timothy Plan High Yield Bond Fund; approximately0-20% of its net assets in the Timothy Plan International Fund; approximately0-10% of its net assets in the Timothy Plan Aggressive Growth Fund; approximately5-30% of its net assets in the Timothy Plan Defensive Strategies Fund; approximately0-10% of its net assets in the Timothy Plan Israel Common Values Fund; approximately0-10% of its net assets in the Timothy Plan Emerging Markets Fund; approximately0-25% of its net assets in the Timothy Plan Growth & Income Fund; and approximately0-20% of its net assets in the Timothy Fixed Income Fund; approximately0-40% of its net assets in the Timothy Plan U.S. Large Cap Core ETF; approximately0-20% of its net assets in the Timothy
119
Notes to Financial Statements
September 30, 2019 (Continued)
Timothy Plan Family of Funds
Plan High Dividend Stock ETF; approximately0-30% of its net assets in the Timothy Plan International ETF; approximately0-20% of its net assets in the Timothy Plan Small Cap Core ETF.
The Timothy Plan Conservative Growth Fund seeks to generate moderate levels of long-term capital growth with a secondary objective of current income. The Fund seeks to achieve its investment objective by normally investing at least 75% of its net assets in the following Funds which are other series of the Trust: approximately0-10% of its net assets in the Timothy Plan Small Cap Value Fund; approximately0-15% of its net assets in the Timothy Plan Large/Mid Cap Value Fund; approximately0-15% of its net assets in the Timothy Plan Large/Mid Cap Growth Fund; approximately0-5% of its net assets in the Timothy Plan Aggressive Growth Fund; approximately5-15% of its net assets in the Timothy Plan High Yield Bond Fund; approximately0-20% of its net assets in the Timothy Plan International Fund; approximately20%-40% of its net assets in the Timothy Plan Fixed Income Fund; approximately5-30% of its net assets in the Timothy Plan Defensive Strategies Fund; approximately0-10% of its net assets in the Timothy Plan Israel Common Values Fund; approximately0-10% of its net assets in the Timothy Plan Emerging Markets Fund; and approximately0-30% of its net assets in the Timothy Plan Growth & Income Fund; approximately0-30% of its net assets in the Timothy Plan U.S. Large Cap Core ETF; approximately0-25% of its net assets in the Timothy Plan High Dividend Stock ETF; approximately0-25% of its net assets in the Timothy Plan International ETF; approximately0-15% of its net assets in the Timothy Plan Small Cap Core ETF..
The Timothy Plan Emerging Markets Fund commenced operations on December 3, 2012. The Fund’s investment objective is long-term growth of capital. The Fund seeks to achieve its investment objectives by normally investing at least 80% of the Fund’s total assets in equity securities of companies that are either located in emerging markets or that have at least more than 50% of their assets or revenue derived from emerging markets. These companies may have market capitalizations of any size.
The Timothy Plan Growth & Income Fund commenced operations on October 1, 2013. The Fund’s investment objective is to provide total return through a combination of growth and income and preservation of capital in declining markets. To achieve its goals, the Fund primarily invests in equity securities of foreign and domestic companies that the Advisor believes are undervalued, and in fixed income securities. The Fund will normally hold both equity securities and fixed income securities, with at least 25% of its assets in equity securities and at least 25% of its assets in fixed income securities.
The following is a summary of significant accounting policies consistently followed by the Funds in the preparation of their financial statements. The policies are in conformity with accounting principles generally accepted in the United States of America (“GAAP”) for investment companies. The Funds are an investment company and accordingly follows the investment company accounting and reporting guidance of the Financial Accounting Standards Board (FASB) Accounting Standard Codification Topic 946“Financial Services – Investment Companies” including FASB Accounting Standard Update ASU2013-08.
A. SECURITY VALUATION AND FAIR VALUE MEASUREMENTS
All investments in securities are recorded at their estimated fair value as described in Note 2.
B. INVESTMENT INCOME AND SECURITIES TRANSACTIONS
Security transactions are accounted for on the date the securities are purchased or sold (trade date). The costing method for the Timothy Plan Funds is specific identification. Dividend income is recognized on theex-dividend date. Interest income and expenses are recognized on an accrual basis. The Timothy Plan Aggressive Growth Fund, Large/Mid Cap Value Fund, Israel Common Values Fund, Small Cap Value Fund, Defensive Strategies Fund, Emerging Markets Fund and Growth & Income Fund have made certain investments in REITs. Dividend income from REITs is recognized on theex-dividend date. It is common for distributions from REITs to exceed taxable earnings and profits, resulting in the excess portion of such dividends being designated as a return of capital. The calendaryear-end amounts of ordinary income, capital gains, and return of capital included in distributions received from the Funds’ investments in REITS are reported to the Funds after the end of the calendar year; accordingly, the Funds estimate these amounts for accounting purposes until the characterization of REIT distributions is reported to the Funds after the end of the calendar year. Estimates are based on the most recent REIT distribution information available. Withholding taxes on foreign dividends have been provided for in accordance with the Funds’ understanding of the applicable country’s tax rules and rates. Discounts and premiums on securities purchased are amortized over the lives of the respective securities. The ability of issuers of debt securities held by the Funds to meet their obligations may be affected by economic and political developments in a specific country or region.
C. FOREIGN TAXES
The Funds may be subject to foreign taxes related to foreign income received (a portion of which may be reclaimable), capital gains on the sale of securities and certain foreign currency transactions. All foreign taxes are recorded in accordance with the applicable regulations and rates that exist in the foreign jurisdictions in which the Funds invest.
D. FOREIGN CURRENCY
Investment securities denominated in foreign currencies are translated into U.S. dollar amounts at the date of valuation. Purchases and sales of investment securities and income and expense items denominated in foreign currencies are translated into U.S. dollar amounts on the respective dates of such transactions. The Funds do not isolate that portion of the results of operations resulting from changes in foreign exchange rates on investments from the fluctuations arising from changes in market prices of securities held. Such fluctuations are included in the net realized and unrealized gain or loss from investments. Reported net realized foreign exchange gains or losses arise from sales of foreign currencies, currency gains or losses realized between the trade and settlement dates on securities transactions, and the difference between the amounts of dividends, interest and foreign withholding taxes recorded on the Funds’ books and the U.S. dollar equivalent of the amounts actually received or paid. Net unrealized foreign exchange gains and losses arise from changes in the fair values of assets and liabilities, other than investments in securities at fiscal period end, resulting from changes in exchange rates.
120
Notes to Financial Statements
September 30, 2019 (Continued)
Timothy Plan Family of Funds
E. GOLD/SILVER RISK FACTORS
There is a risk that some or all of the Trust’s gold and silver bars held by the custodian or anysub-custodian on behalf of the Trust could be lost, damaged or stolen. Access to the Trust’s gold and silver bars could be restricted by natural events (such as an earthquake) or human actions (such as a terrorist attack). Any of these events may adversely affect the operations of the Trust and, consequently, an investment in the fund shares.
Several factors may affect the price of gold and silver, including but not limited to:
| | • | | Global or regional political, economic or financial events and situations; |
| | • | | Investors’ expectations with respect to the rate of inflation; |
| | • | | Currency exchange rates; |
| | • | | Investment and trading activities of hedge funds and commodity funds. |
F. NET ASSET VALUE PER SHARE
The Net Asset Value (“NAV”) per share of the capital stock of the Funds is determined daily as of the close of trading on the New York Stock Exchange by dividing the value of its net assets by the number of Fund shares outstanding. The NAV is calculated separately for each class of each Fund in the Trust. The net asset value of the classes may differ because of different fees and expenses charged to each class.
G. EXPENSES
Expenses incurred by the Trust that do not relate to a specific Fund of the Trust are allocated to the individual Funds based on each Fund’s relative net assets or another appropriate basis as determined by the Board of Trustees (the “Board”).
H. CLASSES
There are three classes of shares currently offered by all Funds in the Trust, except Strategic Growth Fund and Conservative Growth Fund: Class A shares are offered with afront-end sales charge and ongoing service/distribution fees; Class C shares are offered with a contingent deferred sales charge (“CDSC”) that ends after the first year and ongoing service and distribution fees; Class I shares, which commenced operations on August 1, 2013, are offered without any sales charges or ongoing service distribution fees.
Class specific expenses are borne by each specific class. Income, expenses, and realized and unrealized gains/losses are allocated to the respective classes on the basis of relative daily net assets.
I. USE OF ESTIMATES
In the preparation of financial statements in conformity with GAAP, management makes estimates and assumptions that affect the reported amounts of assets and liabilities and disclosure of contingent assets and liabilities at the date of the financial statements, as well as the reported amounts of revenues and expenses during the year ended. Actual results could differ from those estimates.
J. FEDERAL INCOME TAXES
It is the policy of each Fund to continue to comply with all requirements under subchapter M of the Internal Revenue Code applicable to regulated investment companies and to distribute substantially all of its taxable income to its shareholders. Each Fund also intends to distribute sufficient net investment income and net capital gains, if any, so that it will not be subject to excise tax on undistributed income or gains. Therefore, no federal income tax or excise provision is required.
As of September 30, 2019, the Funds did not have a liability for any unrecognized tax benefits. The Funds recognize interest and penalties, if any, related to unrecognized tax benefits as income tax expense in the Statements of Operations. During the year ended September 30, 2019, the Funds did not incur any interest or penalties. The Funds are not aware of any tax positions for which it is reasonably possible that the total amounts of unrecognized tax benefits will change materially within the next twelve months.
K. INDEMNIFICATION
The Trust indemnifies its officers and trustees for certain liabilities that may arise from the performance of their duties to the Trust. Additionally, in the normal course of business, the Funds enter into contracts that contain a variety of representations and warranties and which provide general indemnities. The Funds’ maximum exposure under these arrangements is unknown, as this would involve future claims that may be made against the Funds that have not yet occurred. However, based on experience, the Funds expect the risk of loss due to these warranties and indemnities to be remote.
L. DISTRIBUTIONS TO SHAREHOLDERS
Distributions to shareholders, which are determined in accordance with income tax regulations, are recorded on theex-dividend date. The treatment for financial reporting purposes of distributions made to shareholders during the period from net investment income or net realized capital gains may differ from their ultimate treatment for federal income tax purposes. These differences are caused primarily by differences in the timing of the recognition of certain components of income, expense or realized capital gain for federal income tax purposes. Where such differences are permanent in nature, they are reclassified in the components of net assets based on their ultimate characterization for federal income tax purposes. Any such reclassifications will have no effect on net assets, results of operations, or Net Asset Values (NAVs) per share of the Funds.
121
Notes to Financial Statements
September 30, 2019 (Continued)
Timothy Plan Family of Funds
Permanent book and tax differences, primarily attributable to the book/tax treatment of net operating losses, the expiration of capital loss carry forwards, adjustments for equalization debits, and the reclassification of Fund distributions resulted in reclassifications for the Funds for the fiscal year ended September 30, 2019 as follows:
| | | | | | | | | | |
| | | Fund | | Paid In Capital | | | Accumulated
Earnings (Losses) | |
| | Aggressive Growth Fund | | $ | (348,559 | ) | | $ | 348,559 | |
| | International Fund | | | (844,129 | ) | | | 844,129 | |
| | Large/Mid Cap Growth Fund | | | (272,390 | ) | | | 272,390 | |
| | Small Cap Value Fund | | | - | | | | - | |
| | Large/Mid Cap Value Fund | | | - | | | | - | |
| | Fixed Income Fund | | | - | | | | - | |
| | High Yield Bond Fund | | | - | | | | - | |
| | Israel Common Values Fund | | | 190,665 | | | | (190,665 | ) |
| | Defensive Strategies Fund | | | 3,503 | | | | (3,503 | ) |
| | Strategic Growth Fund | | | - | | | | - | |
| | Conservative Growth Fund | | | 330 | | | | (330 | ) |
| | Emerging Markets Fund | | | - | | | | - | |
| | Growth & Income Fund | | | - | | | | - | |
M.SUB-CUSTODIAN
Effective May 22, 2015, the Timothy Plan Family of Funds entered into a precious metals storage agreement with Brink’s Global Services U.S.A., Inc. to maintain the custody of the gold and silver held in the Timothy Plan Defensive Strategies Fund.
Note 2|Security Valuation and Fair Value Measurements
Fair value is defined as the price that a Fund would receive upon selling an investment in a timely transaction to an independent buyer in the principal or most advantageous market of the investment. GAAP established a three-tier hierarchy to maximize the use of observable market data and minimize the use of unobservable inputs and to establish classification of fair value measurements for disclosure purposes.
Inputs refer broadly to the assumptions that market participants would use in pricing the asset or liability, including assumptions about risk (the risk inherent in a particular valuation technique used to measure fair value including such a pricing model and/or the risk inherent in the inputs to the valuation technique). Inputs may be observable or unobservable. Observable inputs are inputs that reflect the assumptions market participants would use in pricing the asset or liability developed based on market data obtained from sources independent of the reporting entity. Unobservable inputs are inputs that reflect the reporting entity’s own assumptions about the assumptions market participants would use in pricing the asset or liability developed based on the best information available in the circumstances.
VALUATION OF FUND OF FUNDS
A Fund may invest in portfolios ofopen-end orclosed-end investment companies (the “Underlying Funds”). The Underlying Funds value securities in their portfolios for which market quotations are readily available at their market values (generally the last reported sale price) and all other securities and assets at their fair value based upon methods established by the Board of Trustees of the Underlying Funds.
Open-ended funds are valued at their respective net asset values as reported by such investment companies. The shares of manyclosed-end investment companies, after their initial public offering, frequently trade at a price per share, which is different than the net asset value per share. The difference represents a market premium or market discount of such shares. There can be no assurances that the market discount or market premium on shares of anyclosed-end investment company purchased by the Fund will not change.
EXCHANGE TRADED FUNDS
The Funds may invest in exchange traded funds (“ETFs”). ETFs are a type of index fund bought and sold on a securities exchange. An ETF trades like common stock and may be actively traded or represent a fixed portfolio of securities designed to track the performance and dividend yield of a particular domestic or foreign market index. The risks of owning an ETF generally reflect the risks of owning the underlying securities they are designed to track, although the lack of liquidity on an ETF could result in it being more volatile. Each ETF is subject to specific risks, depending on the nature of the ETF. Additionally, ETFs have fees and expenses that reduce their value.
OPTIONS TRANSACTIONS –The Funds are subject to equity price risk in the normal course of pursuing their investment objectives and maypurchase or sell options to help hedge against this risk.
Each Fund may write call options only if it (i) owns an offsetting position in the underlying security or (ii) has an absolute or immediate right to acquire that security without additional cash consideration or exchange of other securities held in its portfolio.
When the Funds write a call option, an amount equal to the premium received is included in the statement of assets and liabilities as a liability. The amount of the liability is subsequentlymarked-to-market to reflect the current market value of the option. If an option expires on its stipulated expiration date or if the Funds enter into a closing purchase transaction, a gain or loss is realized. If a written call option is exercised, a gain or loss is realized for the sale of the underlying security and the proceeds from the sale are increased by the premium originally received. As writer of an
122
Notes to Financial Statements
September 30, 2019 (Continued)
Timothy Plan Family of Funds
option, the Funds have no control over whether the option will be exercised and, as a result, retain the market risk of an unfavorable change in the price of the security underlying the written option.
The Funds may purchase put and call options. Call options are purchased to hedge against an increase in the value of securities held in a Funds’ portfolio. If such an increase occurs, the call options will permit the Fund to purchase the securities underlying such options at the exercise price, not at the current market price. Put options are purchased to hedge against a decline in the value of securities held in a Fund’s portfolio. If such a decline occurs, the put options will permit the Fund to sell the securities underlying such options at the exercise price, or to close out the options at a profit. The premium paid for a put or call option plus any transaction costs will reduce the benefit, if any, realized by the Fund upon exercise of the option, and, unless the price of the underlying security rises or declines sufficiently, the option may expire worthless to the Fund. In addition, in the event that the price of the security in connection with which an option was purchased moves in a direction favorable to a Fund, the benefits realized by the Fund as a result of such favorable movement will be reduced by the amount of the premium paid for the option and related transaction costs. Written and purchased options arenon-income producing securities. With purchased options, there is minimal counterparty credit risk to the Funds since these options are exchange traded and the exchange’s clearinghouse, as counterparty to all exchange traded options, guarantees against a possible default.
There were no options held at September 30, 2019, and there were no options transactions for the year ended September 30, 2019.
The Trust utilizes various methods to measure the fair value of all of its investments on a recurring basis. GAAP establishes a hierarchy that prioritizes inputs to valuation methods. The three levels of input are:
| | ●Level | 1 – Unadjusted quoted prices in active markets for identical assets and liabilities that the Fund has the ability to access. |
| | ●Level | 2 – Observable inputs other than quoted prices included in Level 1 that are observable for the asset or liability, either directly or indirectly. These inputs may include quoted prices for the identical instrument in an inactive market, prices for similar instruments, interest rates, prepayment speeds, credit risk, yield curves, default rates and similar data. |
| | ●Level | 3 – Unobservable inputs for the asset or liability, to the extent relevant observable inputs are not available, representing the Fund’s own assumptions about the assumptions a market participant would use in valuing the asset or liability, and would be based on the best information available. |
The inputs used to measure fair value may fall into different levels of the fair value hierarchy. In such cases, for disclosure purposes, the level in the fair value hierarchy within which the fair value measurement falls in its entirety is determined based on the lowest level input that is significant to the fair value measurement in its entirety.
Each Fund generally determines the total value of each class of its shares by using market prices for the securities comprising its portfolio. Equity securities, including common stock, ADRs, REITs, LPs, LLCs, PLCs, GDRs and NVDRs are generally valued by using market quotations, but may be valued on the basis of prices furnished by a pricing service when the Advisor orSub- Advisor believes such prices more accurately reflect the fair value of such securities. Securities including ETFs, that are traded on any stock exchange are generally valued by the pricing service at the last quoted sale price. Lacking a last sale price, an exchange traded security is generally valued by the pricing service at its last bid price. Securities traded in the NASDAQover-the-counter market are generally valued by the pricing service at the NASDAQ Official Closing Price. When using the market quotations or close prices provided by the pricing service and when the market is considered active, the security will be classified as a Level 1 security. Equity securities traded on inactive markets or valued by reference to similar instruments are categorized as a Level 2. When market quotations are not readily available, when the Advisor orSub-Advisor determines that the market quotation or the price provided by the pricing service does not accurately reflect the current fair value, or when restricted or illiquid securities are being valued, such securities are valued as determined in good faith by the Advisor orSub-Advisor, in conformity with guidelines adopted by and subject to review by the Board of Trustees (“Board”). These securities will generally be categorized as Level 3 securities. Foreign investments are not fair valued using fair value triggers.
Investments in alternative investments, such as gold and silver bars, are valued at the spot rate at 4:00 p.m. Eastern time each business day and are categorized as Level 1 in the hierarchy.
Investments in mutual funds, including money market mutual funds, are generally priced at the ending NAV provided by the service agent of the funds. These securities will be categorized as Level 1 securities.
Fixed income securities such as corporate bonds, government mortgage-backed securities, U.S. government notes and bonds, U.S. government agency securities and treasury inflation protected securities, when valued using market quotations in an active market, will be categorized as Level 1 securities. However, they may be valued on the basis of prices furnished by a pricing service when the Advisor orSub-Advisor believes such prices more accurately reflect the fair value of such securities. A pricing service utilizes electronic data processing techniques based on yield spreads relating to securities with similar characteristics to determine prices for normalinstitutional-size trading units of debt securities without regard to sale or bid prices. These securities will generally be categorized as Level 2 securities. If the Advisor orSub-Advisor decides that a price provided by the pricing service does not accurately reflect the fair value of the securities, when prices are not readily available from a pricing service, or when restricted or illiquid securities are being valued, securities are valued at fair value as determined in good faith by the Advisor orSub-Advisor, in conformity with guidelines adopted by and subject to review of the Board. These securities will be categorized as Level 3 securities.
Short-term investments in fixed income securities (those with maturities of less than 60 days when acquired, or which subsequently are within 60 days of maturity) may be valued by using the amortized cost method of valuation, which the Board has determined will represent fair value. These securities will be classified as Level 2 securities.
The Board has delegated to the Advisor and/orSub- Advisors responsibility for determining the value of Fund portfolio securities under certain circumstances. Under such circumstances, the Advisor orSub-Advisor will use its best efforts to arrive at the fair value of a security held by the Fund
123
Notes to Financial Statements
September 30, 2019 (Continued)
Timothy Plan Family of Funds
under all reasonably ascertainable facts and circumstances. The Advisor must prepare a report for the Board not less than quarterly containing a complete listing of any securities for which fair value pricing was employed and detailing the specific reasons for such fair value pricing. The Board has adopted written policies and procedures to guide the Advisor andSub-Advisors with respect to the circumstances under which, and the methods to be used, in fair valuing securities.
The following is a summary of the inputs used to value each Fund’s investments as of September 30, 2019:
| | | | | | | | | | | | | | | | |
Aggressive Growth Fund | | | | | | | | | | | | | | | | |
| | | | |
| Assets | | Level 1 | | | Level 2 | | | Level 3 | | | Total | |
Common Stock | | $ | 23,087,915 | | | $ | - | | | $ | - | | | $ | 23,087,915 | |
REITs | | | 365,918 | | | | - | | | | - | | | | 365,918 | |
Money Market Fund | | | 2,164,844 | | | | - | | | | - | | | | 2,164,844 | |
Total | | $ | 25,618,677 | | | $ | - | | | $ | - | | | $ | 25,618,677 | |
| | | | |
International Fund | | | | | | | | | | | | | | | | |
| | | | |
Assets | | | Level 1 | | | | Level 2 | | | | Level 3 | | | | Total | |
Common Stock | | $ | 85,647,752 | | | $ | 1,188,760 | | | $ | - | | | $ | 86,836,512 | |
Money Market Fund | | | 2,083,856 | | | | - | | | | - | | | | 2,083,856 | |
Total | | $ | 87,731,608 | | | $ | 1,188,760 | | | $ | - | | | $ | 88,920,368 | |
| | | | |
Large/Mid Cap Growth Fund | | | | | | | | | | | | | | | | |
| | | | |
Assets | | | Level 1 | | | | Level 2 | | | | Level 3 | | | | Total | |
Common Stock | | $ | 63,745,619 | | | $ | - | | | $ | - | | | $ | 63,745,619 | |
Exchange Traded Fund | | | 18,399,168 | | | | - | | | | - | | | | 18,399,168 | |
Money Market Fund | | | 4,086,671 | | | | - | | | | - | | | | 4,086,671 | |
Total | | $ | 86,231,458 | | | $ | - | | | $ | - | | | $ | 86,231,458 | |
| | | | |
Small Cap Value Fund | | | | | | | | | | | | | | | | |
| | | | |
Assets | | | Level 1 | | | | Level 2 | | | | Level 3 | | | | Total | |
Common Stock | | $ | 125,272,918 | | | $ | - | | | $ | - | | | $ | 125,272,918 | |
REITs | | | 17,747,809 | | | | - | | | | - | | | | 17,747,809 | |
Money Market Fund | | | 2,250,799 | | | | - | | | | - | | | | 2,250,799 | |
Total | | $ | 145,271,526 | | | $ | - | | | $ | - | | | $ | 145,271,526 | |
| | | | |
Large/Mid Cap Value Fund | | | | | | | | | | | | | | | | |
| | | | |
Assets | | | Level 1 | | | | Level 2 | | | | Level 3 | | | | Total | |
Common Stock | | $ | 148,006,120 | | | $ | - | | | $ | - | | | $ | 148,006,120 | |
Exchange Traded Funds | | | 47,003,904 | | | | - | | | | - | | | | 47,003,904 | |
REITs | | | 7,916,562 | | | | - | | | | - | | | | 7,916,562 | |
Money Market Fund | | | 401,169 | | | | - | | | | - | | | | 401,169 | |
Total | | $ | 203,327,755 | | | $ | - | | | $ | - | | | $ | 203,327,755 | |
| | | | |
Fixed Income Fund | | | | | | | | | | | | | | | | |
| | | | |
Assets | | | Level 1 | | | | Level 2 | | | | Level 3 | | | | Total | |
Corporate Bonds | | $ | - | | | $ | 30,115,160 | | | $ | - | | | $ | 30,115,160 | |
Government Mortgage-Backed Securities | | | - | | | | 23,696,704 | | | | - | | | | 23,696,704 | |
Government Notes & Bonds | | | - | | | | 45,387,946 | | | | - | | | | 45,387,946 | |
Money Market Fund | | | 2,735,949 | | | | - | | | | - | | | | 2,735,949 | |
Total | | $ | 2,735,949 | | | $ | 99,199,810 | | | $ | - | | | $ | 101,935,759 | |
| | | | |
High Yield Bond Fund | | | | | | | | | | | | | | | | |
| | | | |
Assets | | | Level 1 | | | | Level 2 | | | | Level 3 | | | | Total | |
Corporate Bonds | | $ | - | | | $ | 57,818,910 | | | $ | - | | | $ | 57,818,910 | |
Money Market Fund | | | 3,258,394 | | | | - | | | | - | | | | 3,258,394 | |
Total | | $ | 3,258,394 | | | $ | 57,818,910 | | | $ | - | | | $ | 61,077,304 | |
124
Notes to Financial Statements
September 30, 2019 (Continued)
Timothy Plan Family of Funds
| | | | | | | | | | | | | | | | |
Israel Common Values Fund | | | | | | | | | | | | | | | | |
| | | | |
| Assets | | Level 1 | | | Level 2 | | | Level 3 | | | Total | |
Common Stock | | $ | 75,074,040 | | | $ | - | | | $ | - | | | $ | 75,074,040 | |
REITs | | | 1,222,337 | | | | - | | | | - | | | | 1,222,337 | |
Money Market Fund | | | 4,120,607 | | | | - | | | | - | | | | 4,120,607 | |
Total | | $ | 80,416,984 | | | $ | - | | | $ | - | | | $ | 80,416,984 | |
| | | | |
Defensive Strategies Fund | | | | | | | | | | | | | | | | |
| | | | |
| Assets | | Level 1 | | | Level 2 | | | Level 3 | | | Total | |
Common Stock | | $ | 8,055,922 | | | $ | - | | | $ | - | | | $ | 8,055,922 | |
REITs | | | 7,885,210 | | | | - | | | | - | | | | 7,885,210 | |
Corporate Bonds | | | - | | | | 947,005 | | | | - | | | | 947,005 | |
Treasury Inflation Protected Securities (TIPS) | | | - | | | | 10,911,358 | | | | - | | | | 10,911,358 | |
Alternative Investments | | | 9,046,593 | | | | - | | | | - | | | | 9,046,593 | |
Money Market Fund | | | 3,939,988 | | | | - | | | | - | | | | 3,939,988 | |
Total | | $ | 28,927,713 | | | $ | 11,858,363 | | | $ | - | | | $ | 40,786,076 | |
| | | | |
Strategic Growth Fund | | | | | | | | | | | | | | | | |
| | | | |
| Assets | | Level 1 | | | Level 2 | | | Level 3 | | | Total | |
Exchange Traded Funds | | $ | 9,125,920 | | | $ | - | | | $ | - | | | $ | 9,125,920 | |
Mutual Funds | | | 25,372,945 | | | | - | | | | - | | | | 25,372,945 | |
Money Market Fund | | | 1,153,329 | | | | - | | | | - | | | | 1,153,329 | |
Total | | $ | 35,652,194 | | | $ | - | | | $ | - | | | $ | 35,652,194 | |
| | | | |
Conservative Growth Fund | | | | | | | | | | | | | | | | |
| | | | |
| Assets | | Level 1 | | | Level 2 | | | Level 3 | | | Total | |
Exchange Traded Funds | | $ | 9,243,657 | | | $ | - | | | $ | - | | | $ | 9,243,657 | |
Mutual Funds | | | 34,389,477 | | | | - | | | | - | | | | 34,389,477 | |
Money Market Fund | | | 2,614,768 | | | | - | | | | - | | | | 2,614,768 | |
Total | | $ | 46,247,902 | | | $ | - | | | $ | - | | | $ | 46,247,902 | |
| | | | |
Emerging Markets Fund | | | | | | | | | | | | | | | | |
| | | | |
| Assets | | Level 1 | | | Level 2 | | | Level 3 | | | Total | |
Common Stock | | $ | 13,771,599 | | | $ | 1,395,117 | | | $ | - | | | $ | 15,166,716 | |
Preferred Stock | | | 931,354 | | | | 483,431 | | | | - | | | | 1,414,785 | |
REITs | | | 1,851,454 | | | | - | | | | - | | | | 1,851,454 | |
Money Market Fund | | | 998,023 | | | | - | | | | - | | | | 998,023 | |
Total | | $ | 17,552,430 | | | $ | 1,878,548 | | | $ | - | | | $ | 19,430,978 | |
| | | | |
Growth & Income Fund | | | | | | | | | | | | | | | | |
| | | | |
| Assets | | Level 1 | | | Level 2 | | | Level 3 | | | Total | |
Corporate Bonds | | $ | - | | | $ | 3,315,793 | | | $ | - | | | $ | 3,315,793 | |
Government Mortgage-Backed Securities | | | - | | | | 2,313,104 | | | | - | | | | 2,313,104 | |
Government Notes, Bonds & Agencies | | | - | | | | 2,110,219 | | | | - | | | | 2,110,219 | |
Exchange Traded Fund | | | 12,155,517 | | | | - | | | | - | | | | 12,155,517 | |
Money Market Fund | | | 562,954 | | | | - | | | | - | | | | 562,954 | |
Total | | $ | 12,718,471 | | | $ | 7,739,116 | | | $ | - | | | $ | 20,457,587 | |
Refer to the Schedules of Investments for industry classifications.
The Funds did not hold any Level 3 securities during the period presented. There were transfers into Level 2 during the current period presented. It is the Trust’s policy to record transfers between Level 1 and Level 2 at the end of the reporting period.
International Fund
| | | | | | | | | | |
| | | Common Stock | | | Total | | | |
Transfer into Level 2 from Level 1 | | $ | 1,188,760 | | | $ | 1,188,760 | | | |
The reason for transfers is while observable inputs were used to value these investments, there were no observable trades for these securities at September 30, 2019.
125
Notes to Financial Statements
September 30, 2019 (Continued)
Timothy Plan Family of Funds
Note 3 | Purchases and Sales of Securities
The following is a summary of the cost of purchases and proceeds from the sale of securities, other than short-term investments, for the year ended September 30, 2019:
| | | | | | | | | | | | | | | | | | |
| | | Purchases | | | Sales | | | |
| Fund | | U.S. Gov’t
Obligations | | | Other | | | U.S. Gov’t
Obligations | | | Other | | | |
Aggressive Growth | | $ | - | | | | $19,009,630 | | | $ | - | | | | $22,795,780 | | | |
International | | | - | | | | 24,154,983 | | | | - | | | | 35,140,635 | | | |
Large/Mid Cap Growth * | | | - | | | | 36,792,613 | | | | - | | | | 49,486,879 | | | |
Small Cap Value | | | - | | | | 89,625,697 | | | | - | | | | 102,557,962 | | | |
Large/Mid Cap Value * | | | - | | | | 104,734,214 | | | | - | | | | 129,111,091 | | | |
Fixed Income | | | 46,932,691 | | | | 15,974,116 | | | | 30,872,427 | | | | 13,885,384 | | | |
High Yield Bond | | | - | | | | 42,081,694 | | | | - | | | | 39,452,096 | | | |
Israel Common Values | | | - | | | | 25,765,892 | | | | - | | | | 14,504,403 | | | |
Defensive Strategies | | | - | | | | 13,965,533 | | | | - | | | | 27,416,541 | | | |
Strategic Growth * | | | - | | | | 17,452,237 | | | | - | | | | 19,231,955 | | | |
Conservative Growth * | | | - | | | | 18,812,543 | | | | - | | | | 23,278,152 | | | |
Emerging Markets | | | - | | | | 7,967,199 | | | | - | | | | 7,858,170 | | | |
Growth & Income * | | | 13,722,904 | | | | 25,203,681 | | | | 26,780,764 | | �� | | 24,875,951 | | | |
* The security transactions are inclusive of purchases and sales of affiliated funds.
Note 4 | Investment Advisory Agreement and Transactions with Service Providers
Timothy Partners, Ltd., (“TPL”) is the investment advisor for the Funds pursuant to an investment advisory agreement (the “Agreement”) that was renewed by the Board on February 21, 2019. TPL supervises the investment of the assets of each Fund in accordance with the objectives, policies and restrictions of the Trust. Under the terms of the Agreement, as amended, TPL receives a fee, accrued daily and paid monthly, at an annual rate of 1.20% of the average daily net assets of the Timothy Plan Emerging Markets Fund; 1.00% of the average daily net assets of the Timothy Plan International Fund and Timothy Plan Israel Common Values Fund; 0.85% of the average daily net assets of the Timothy Plan Aggressive Growth, the Timothy Plan Small Cap Value, the Timothy Plan Large/Mid Cap Growth, the Timothy Plan Growth & Income and the Timothy Plan Large/Mid Cap Value Funds; 0.60% of the average daily net assets of the Timothy Plan Fixed Income, the Timothy Plan High Yield Bond, and the Timothy Plan Defensive Strategies Funds; and 0.65% of the average daily net assets of the Timothy Plan Conservative Growth and the Timothy Plan Strategic Growth Funds. TPL has voluntarily agreed to reduce the fee it receives from the Emerging Markets Fund to 1.15%; from the International Fund to 0.95%; from the Large/Mid Cap Growth Fund and the Growth & Income Fund to 0.80%; from the Small Cap Value Fund and the Aggressive Growth Fund to 0.75%; from the High Yield Bond Fund and the Defensive Strategies Fund to 0.55%; and from the Fixed Income Fund to 0.40%. Effective March 1, 2019, Timothy Plan Large/Mid Cap Value Fund agreed to voluntarily increase the fee from 0.70% to 0.75%. Effective September 6, 2019, Timothy Plan Growth & Income Fund agreed to voluntarily decrease the fee from 0.80% to 0.50%. From January 1, 2019 through February 28, 2019 the Advisor did not waive fees for any of the Funds. Such voluntary fee reductions/reimbursements may be authorized by TPL at any time, but such action shall not obligate TPL to waive any fees in the near future. Such voluntary fee reductions/reimbursements are not subject to future recoupment. An officer and trustees of the Funds is also an officer and owner of the Advisor.
For the year ended September 30, 2019, TPL waived advisory fees for the Funds as follows:
| | | | | | |
| Fund | | Year Ended
September 30, 2019 | | | |
Aggressive Growth Fund | | $ | 22,439 | | | |
International Fund | | | 39,588 | | | |
Large/Mid Cap Growth Fund | | | 36,904 | | | |
Small Cap Value Fund | | | 121,813 | | | |
Large/Mid Cap Value Fund | | | 205,161 | | | |
Fixed Income Fund | | | 143,845 | | | |
High Yield Bond Fund | | | 23,167 | | | |
Defensive Strategies Fund | | | 18,051 | | | |
Emerging Markets Fund | | | 9,101 | | | |
Growth & Income Fund | | | 11,640 | | | |
Gemini Fund Services, LLC (“GFS”) provides administrative, fund accounting, and transfer agency services to the Funds pursuant to agreements with the Trust, for which it receives from each Fund: (i) basis points in decreasing amounts as assets reach certain breakpoints; and (ii) any relatedout-of-pocket expenses. Fees are billed monthly as follows:
126
Notes to Financial Statements
September 30, 2019 (Continued)
Timothy Plan Family of Funds
Fund Accounting and Fund Administration Fees:
Fund Complex Base annual fee:
25 basis points (0.25%) on the first $200 million of net assets
15 basis points (0.15%) on the next $200 million of net assets;
8 basis points (0.08%) on the next $600 million of net assets; and
6 basis points (0.06%) on net assets greater than $1 billion.
Transfer agency fees for the Funds are combined with the Fund Accounting and Fund Administration fees under the Trust’s agreement with GFS. Therefore, there is no separate base annual fee per Fund or share class.
The Timothy Plan Aggressive Growth, Timothy Plan International, Timothy Plan Large/Mid Cap Growth, Timothy Plan Small Cap Value, Timothy Plan Large/Mid Cap Value, Timothy Plan Fixed Income, Timothy Plan High Yield Bond, Timothy Plan Defensive Strategies, Timothy Plan Israel Common Values, Timothy Plan Emerging Markets, and Timothy Plan Growth & Income Funds have adopted shareholder services plans (the “Plans”) pursuant to Rule12b-1 under the Investment Company Act of 1940, as amended. The Plans provide that the Funds will pay TPL or others for expenses that relate to the promotion or distribution of shares. Under the Class A Plan, the Funds will pay TPL a fee at an annual rate of 0.25%, payable monthly, of the average daily net assets attributable to such class of shares. Under the Class C Plan, the Funds will pay TPL a fee at an annual rate of 1.00%, payable monthly, of which, 0.25% may be a service fee and 0.75% may be payable to outside broker/dealers, of the average daily net assets attributable to such class of shares. Class I shares are not subject to the shareholder services plan.
The Timothy Plan Conservative Growth and Timothy Plan Strategic Growth Funds have adopted shareholder services plans (the “Plans”) pursuant to Rule12b-1 under the Investment Company Act of 1940, as amended. The Plans provide that the Funds will pay TPL or others for expenses that relate to the promotion or distribution of shares. Class A shares of the Funds do not impose a service fee. Under the Class C Plan, the Funds will pay TPL a fee at an annual rate of 0.75%, payable monthly to outside broker/dealers, of the average daily net assets attributable to such class of shares.
For the year ended September 30, 2019, the Funds paid TPL under the terms of the Plans as follows:
| | | | | | |
| Fund | | 12b-1 Fees | | | |
| | |
| | | Year Ended
September 30, 2019 | | | |
Aggressive Growth | | $ | 87,339 | | | |
International | | | 189,821 | | | |
Large/Mid Cap Growth | | | 261,067 | | | |
Small Cap Value | | | 359,535 | | | |
Large/Mid Cap Value | | | 586,464 | | | |
Fixed Income | | | 273,214 | | | |
High Yield Bond | | | 122,194 | | | |
Israel Common Values | | | 196,467 | | | |
Defensive Strategies | | | 131,849 | | | |
Strategic Growth | | | 34,887 | | | |
Conservative Growth | | | 54,430 | | | |
Emerging Markets | | | 63,619 | | | |
Growth & Income | | | 84,168 | | | |
TPL also serves as the principal underwriter of the Funds’ shares. An officer and trustees of the Funds are also officers of the principal underwriter. For the year ended September 30, 2019, TPL received sales charges deducted from the proceeds of sales of Class A capital shares and CDSC fees deducted from the redemption of Class C capital shares as follows:
| | | | | | | | | | | | |
| Fund | | Sales Charges
(Class A) | | CDSC Fees
(Class C) | | |
Aggressive Growth | | | | $7,864 | | | | | $1,067 | | | |
International | | | | 9,114 | | | | | 601 | | | |
Large/Mid Cap Growth | | | | 22,608 | | | | | 2,284 | | | |
Small Cap Value | | | | 25,245 | | | | | 1,049 | | | |
Large/Mid Cap Value | | | | 34,743 | | | | | 3,481 | | | |
Fixed Income | | | | 10,437 | | | | | 2,903 | | | |
High Yield Bond | | | | 8,526 | | | | | 481 | | | |
Israel Common Values | | | | 17,849 | | | | | 965 | | | |
Defensive Strategies | | | | 8,249 | | | | | 892 | | | |
Strategic Growth | | | | 10,638 | | | | | 185 | | | |
Conservative Growth | | | | 8,523 | | | | | 1,698 | | | |
Emerging Markets | | | | 4,542 | | | | | 410 | | | |
Growth & Income | | | | 6,277 | | | | | 1,444 | | | |
127
Notes to Financial Statements
September 30, 2019 (Continued)
Timothy Plan Family of Funds
Effective February 1, 2019, NorthStar Financial Services Group, LLC, the parent company of Gemini Fund Services, LLC (“GFS”) and its affiliated companies including Blu Giant, LLC (“Blu Giant”) (collectively, the “Gemini Companies”), sold its interest in the Gemini Companies to a third party private equity firm that contemporaneously acquired Ultimus Fund Solutions, LLC (an independent mutual fund administration firm) and its affiliates (collectively, the “Ultimus Companies”). As a result of these separate transactions, the Gemini Companies and the Ultimus Companies are now indirectly owned through a common parent entity, The Ultimus Group, LLC.
Note 5| Control Ownership
The beneficial ownership, either directly or indirectly, of more than 25% of the voting securities of a Fund creates the presumption of control of the Fund under Section 2(a) 9 of the Investment Company Act of 1940. At September 30, 2019, there were no shareholders with ownership, either directly or indirectly, of more than 25% of the voting securities of a Fund.
Certain Timothy Plan Funds own shares of other Timothy Plan Funds. U.S. Bank, N.A., custodian of the Timothy Plan Funds, holds these shares in omnibus accounts, some of which are controlled by National Financial Services, Inc. The following shows the percentage of each Timothy Plan Fund that is held by U.S. Bank, N.A., as custodian of the Timothy Plan Funds. These accounts can be considered affiliated to the Timothy Plan.
| | | | |
| Fund - Class A | | % of Fund Owned by Other Timothy
Plan Funds | | |
Aggressive Growth | | 12.42% | | |
International | | 28.02% | | |
Small Cap Value | | 3.98% | | |
Fixed Income | | 39.31% | | |
High Yield Bond | | 15.54% | | |
Israel Common Values | | 9.86% | | |
Defensive Strategies | | 24.56% | | |
Emerging Markets | | 40.84% | | |
Note 6 | Underlying Investment in Other Investment Companies
The Conservative Growth Fund currently seeks to achieve its investment objectives by investing a portion of its assets in the Timothy Plan Fixed Income Fund (the “Security”). The Fund may redeem its investments from the Security at any time if the Advisor determines that it is in the best interest of the Fund and its shareholders to do so.
The performance of the Fund will be directly affected by the performance of the Security. The annual report of the Security, along with the report of the independent registered public accounting firm is included in the Security’sN-CSRs available at www.sec.gov. As of September 30, 2019, 38.8% of the Conservative Growth Fund’s net assets were invested in the Timothy Plan Fixed Income Fund.
The Growth & Income Fund currently seeks to achieve its investment objectives by investing a portion of its assets in the Timothy Plan High Dividend Stock ETF (the “ETF”). The Fund may redeem its investments from the ETF at any time if the Advisor determines that it is in the best interest of the Fund and its shareholders to do so.
The performance of the Fund will be directly affected by the performance of the ETF. The annual report of the ETF, along with the report of the independent registered public accounting firm is included in the Security’sN-CSRs available at www.sec.gov. As of September 30, 2019, 60.6% of the Growth & Income Fund’s net assets were invested in the Timothy Plan High Dividend Stock ETF.
Note 7 | Investments in Affiliated Companies
The Funds’ transactions with affiliates represent holdings for which the respective Fund and the underlying investee fund have the same investment advisor or where the investee fund’s investment advisor is under common control with the Fund’s investment advisor.
James Investment Partners is the sponsor to the James Biblically Responsible Investment ETF and, as such, is an affiliate.
The Timothy Plan Large/Mid Cap Growth Fund, Large/Mid Cap Value Fund, Strategic Growth Fund, Conservative Growth Fund and Growth & Income Fund had the following transactions during the year ended September 30, 2019, with affiliates:
| | | | | | | | | | | | | | | | | | | | | | | | | | | | | | | | |
| | | |
| Large/Mid Cap Growth | | Year Ended September 30, 2019 | | | | |
| | | | | | | | |
| Fund | | Balance
September 30,
2018 | | | Purchases | | | Sales | | | Dividends Credited
to Income | | | Amount of Gain
(Loss) Realized on
Sale of Shares | | | Net Change in
Unrealized
Appreciation
(Depreciation) | | | Fair Value
September 30,
2019 | | | | |
Timothy Plan U.S. Large Cap Core ETF | | $ | - | | | $ | 18,061,200 | | | $ | - | | | $ | 73,074 | | | $ | - | | | $ | 337,968 | | | $ | 18,399,168 | | | | | |
128
Notes to Financial Statements
September 30, 2019 (Continued)
Timothy Plan Family of Funds
| | | | | | | | | | | | | | | | | | | | | | | | | | | | | | |
| | | |
| Large/Mid Cap Value | | Year Ended September 30, 2019 | | | |
| Fund | | Balance September 30, 2018 | | | Purchases | | | Sales | | | Dividends Credited to Income | | | Amount of Gain (Loss) Realized on Sale of Shares | | | Net Change in Unrealized Appreciation (Depreciation) | | | Fair Value September 30, 2019 | |
| Timothy Plan High Dividend Stock ETF | | $ | - | | | $ | 22,986,200 | | | $ | - | | | $ | 209,788 | | | $ | - | | | $ | 507,656 | | | $ | 23,493,856 | |
| Timothy Plan U.S. Large Cap Core ETF | | | - | | | | 23,078,200 | | | | - | | | | 93,372 | | | | - | | | | 431,848 | | | | 23,510,048 | |
| Total | | | | | | | | | | | | | | $ | 303,160 | | | $ | - | | | $ | 939,504 | | | $ | 47,003,904 | |
| | | | | | | | | | | | | | | | | | | | | | | | | | | | | | |
| | | |
| Strategic Growth | | Year Ended September 30, 2019 | | | |
| | | | | | | | | | | | | | | | | | Net Change in | | | | |
| | | Balance | | | | | | | | | Dividends | | | Amount of Gain | | | Unrealized | | | Fair Value | |
| | | September 30, | | | | | | | | | Credited to | | | (Loss) Realized on | | | Appreciation | | | September 30, | |
| Fund | | 2018 | | | Purchases | | | Sales | | | Income | | | Sale of Shares* | | | (Depreciation) | | | 2019 | |
| Aggressive Growth | | $ | 2,123,602 | | | $ | 223,481 | | | $ | 942,725 | | | $ | 2,862 | | | $ | 181,742 | | | $ | (423,968 | ) | | $ | 1,041,884 | |
| International | | | 7,533,228 | | | | 443,262 | | | | 621,096 | | | | 77,840 | | | | 9,625 | | | | (493,099 | ) | | | 6,871,920 | |
| Large/Mid Cap Growth | | | 3,869,816 | | | | 356,854 | | | | 3,942,450 | | | | - | | | | 462,713 | | | | (567,253 | ) | | | - | |
| Small Cap Value | | | 2,292,304 | | | | 366,022 | | | | 834,953 | | | | 62,394 | | | | 191,443 | | | | (377,313 | ) | | | 1,437,598 | |
| Large/Mid Cap Value | | | 4,209,704 | | | | 461,636 | | | | 4,313,998 | | | | 30,450 | | | | 426,489 | | | | (454,602 | ) | | | - | |
| Fixed Income | | | 1,950,425 | | | | 5,208,497 | | | | 454,988 | | | | 66,373 | | | | (11,371 | ) | | | 222,954 | | | | 6,915,517 | |
| High Yield Bond | | | 2,527,231 | | | | 104,035 | | | | 744,009 | | | | 85,059 | | | | (64,491 | ) | | | 131,652 | | | | 1,954,418 | |
| Israel Common Values | | | 1,918,799 | | | | 33,401 | | | | 355,042 | | | | - | | | | 87,196 | | | | 152,341 | | | | 1,824,888 | |
| Defensive Strategies | | | 4,673,014 | | | | 200,351 | | | | 2,082,577 | | | | 67,041 | | | | 124,583 | | | | (49,276 | ) | | | 2,823,419 | |
| Emerging Markets | | | 2,736,063 | | | | 170,387 | | | | 433,618 | | | | 20,286 | | | | 55,623 | | | | (25,154 | ) | | | 2,503,301 | |
| Growth & Income | | | 3,654,003 | | | | 122,074 | | | | 3,643,994 | | | | 31,782 | | | | (13,268 | ) | | | (80,026 | ) | | | - | |
| Timothy Plan High Dividend Stock ETF | | | - | | | | 3,435,408 | | | | 425,034 | | | | 17,114 | | | | (2,579 | ) | | | 56,621 | | | | 3,064,416 | |
| Timothy Plan U.S. Large Cap Core ETF | | | - | | | | 6,326,828 | | | | 437,470 | | | | 19,304 | | | | 12,084 | | | | 160,062 | | | | 6,061,504 | |
| Total | | | | | | | | | | | | | | $ | 480,505 | | | $ | 1,459,789 | | | $ | (1,747,061 | ) | | $ | 34,498,865 | |
| *Includes capital gain distributions from affiliated funds | |
| | | | | | | | | | | | | | | | | | | | | | | | | | | | | | |
| | | |
| Conservative Growth | | Year Ended September 30, 2019 | | | |
| | | | | | | | | | | | | | | | | | Net Change in | | | | |
| | | Balance | | | | | | | | | Dividends | | | Amount of Gain | | | Unrealized | | | Fair Value | |
| | | September 30, | | | | | | | | | Credited to | | | (Loss) Realized on | | | Appreciation | | | September 30, | |
| Fund | | 2018 | | | Purchases | | | Sales | | | Income | | | Sale of Shares* | | | (Depreciation) | | | 2019 | |
| Aggressive Growth | | $ | 2,046,709 | | | $ | 262,925 | | | $ | 1,031,227 | | | $ | 2,782 | | | $ | 223,355 | | | $ | (486,029 | ) | | $ | 898,620 | |
| International | | | 5,375,945 | | | | 436,671 | | | | 686,733 | | | | 56,133 | | | | 23,993 | | | | (368,455 | ) | | | 4,781,421 | |
| Large/Mid Cap Growth | | | 3,846,334 | | | | 350,370 | | | | 3,895,433 | | | | - | | | | 537,378 | | | | (658,182 | ) | | | - | |
| Small Cap Value | | | 2,531,545 | | | | 470,177 | | | | 1,164,931 | | | | 69,653 | | | | 252,753 | | | | (472,118 | ) | | | 1,394,328 | |
| Large/Mid Cap Value | | | 4,311,072 | | | | 469,191 | | | | 4,391,149 | | | | 31,515 | | | | 492,476 | | | | (540,903 | ) | | | - | |
| Fixed Income | | | 12,665,871 | | | | 6,016,047 | | | | 1,612,289 | | | | 246,386 | | | | (126,263 | ) | | | 923,857 | | | | 17,867,223 | |
| High Yield Bond | | | 3,349,233 | | | | 116,940 | | | | 1,027,326 | | | | 111,170 | | | | (55,257 | ) | | | 141,886 | | | | 2,525,476 | |
| Israel Common Values | | | 1,780,089 | | | | 15,340 | | | | 350,313 | | | | - | | | | 111,058 | | | | 105,519 | | | | 1,650,624 | |
| Defensive Strategies | | | 5,676,984 | | | | 146,651 | | | | 2,660,006 | | | | 82,291 | | | | 125,331 | | | | (44,275 | ) | | | 3,192,294 | |
| Emerging Markets | | | 2,331,129 | | | | 163,684 | | | | 444,071 | | | | 17,465 | | | | 95,695 | | | | (66,946 | ) | | | 2,079,491 | |
| Growth & Income | | | 4,842,505 | | | | 94,123 | | | | 4,756,298 | | | | 42,171 | | | | (18,116 | ) | | | (110,266 | ) | | | - | |
| Timothy Plan High Dividend Stock ETF | | | - | | | | 3,426,478 | | | | 670,053 | | | | 18,409 | | | | (4,066 | ) | | | 41,367 | | | | 2,793,726 | |
| Timothy Plan U.S. Large Cap Core ETF | | | - | | | | 6,843,945 | | | | 588,322 | | | | 21,119 | | | | 16,251 | | | | 178,057 | | | | 6,449,931 | |
| Total | | | | | | | | | | | | | | $ | 699,094 | | | $ | 1,674,588 | | | $ | (1,356,488 | ) | | $ | 43,633,134 | |
| *Includes capital gain distributions from affiliated funds | |
| | | | | | | | | | | | | | | | | | | | | | | | | | | | | | |
| | |
| | | Growth & Income | | Year Ended September 30, 2019 | |
| | | | | | | | | | | | | | | | | | | Net Change in | | | | |
| | | | Balance | | | | | | | | | | | | Amount of Gain | | | Unrealized | | | Fair Value | |
| | | | September 30, | | | | | | | | | Dividends Credited | | | (Loss) Realized on | | | Appreciation | | | September 30, | |
| | Fund | | 2018 | | | Purchases | | | Sales | | | to Income | | | Sale of Shares | | | (Depreciation) | | | 2019 | |
| | James Biblically Responsible Investment ETF | | $ | 113,310 | | | $ | - | | | $ | 98,149 | | | $ | 937 | | | $ | (14,046 | ) | | $ | (1,115 | ) | | $ | - | |
| | Timothy Plan High Dividend Stock ETF | | | - | | | | 18,404,298 | | | | 6,577,481 | | | | 129,672 | | | | 56,396 | | | | 272,304 | | | | 12,155,517 | |
| | Total | | | | | | | | | | | | | | $ | 130,609 | | | $ | 42,350 | | | $ | 271,189 | | | $ | 12,155,517 | |
129
Notes to Financial Statements
September 30, 2019 (Continued)
Timothy Plan Family of Funds
Note 8|Aggregate Unrealized Appreciation and Depreciation
The identified cost of investments in securities owned by each Fund for federal income tax purposes, and their respective gross unrealized appreciation and depreciation at September 30, 2019, were as follows:
| | | | | | | | | | | | | | | | | | |
| | | | | | |
| Fund | | Tax Cost | | | Gross Unrealized
Appreciation | | | Gross Unrealized
Depreciation | | | Net Unrealized
Appreciation/
(Depreciation) | | | |
Aggressive Growth | | $ | 22,248,301 | | | $ | 4,458,267 | | | $ | (1,087,891 | ) | | $ | 3,370,376 | |
International | | | 80,656,541 | | | | 12,916,958 | | | | (4,653,131 | ) | | | 8,263,827 | |
Large/Mid Cap Growth | | | 73,369,029 | | | | 14,865,840 | | | | (2,003,411 | ) | | | 12,862,429 | |
Small Cap Value | | | 142,373,174 | | | | 14,817,846 | | | | (11,919,494 | ) | | | 2,898,352 | |
Large/Mid Cap Value | | | 182,236,544 | | | | 29,300,917 | | | | (8,209,706 | ) | | | 21,091,211 | |
Fixed Income | | | 99,619,117 | | | | 2,586,134 | | | | (269,492 | ) | | | 2,316,642 | |
High Yield Bond | | | 59,958,989 | | | | 1,803,391 | | | | (685,076 | ) | | | 1,118,315 | |
Israel Common Values | | | 60,984,626 | | | | 22,222,801 | | | | (2,790,443 | ) | | | 19,432,358 | |
Defensive Strategies | | | 39,851,312 | | | | 3,597,348 | | | | (2,662,584 | ) | | | 934,764 | |
Strategic Growth | | | 34,546,111 | | | | 1,314,457 | | | | (208,374 | ) | | | 1,106,083 | |
Conservative Growth | | | 45,122,429 | | | | 1,302,687 | | | | (177,214 | ) | | | 1,125,473 | |
Emerging Markets | | | 22,956,873 | | | | 874,495 | | | | (4,400,390 | ) | | | (3,525,895 | ) |
Growth & Income | | | 20,003,503 | | | | 454,898 | | | | (814 | ) | | | 454,084 | |
Note 9 |Distributions to Shareholders and Tax Components of Capital
The tax character of distributions paid during the fiscal year ended September 30, 2019 and the fiscal year ended September 30, 2018 were as follows:
| | | | | | | | | | | | | | | | | | | | |
| | | | | | | | |
| | | Aggressive Growth | | | International * | | | Large/Mid Cap Growth | | | Small Cap Value | | | | |
| | | | |
Year ended September 30, 2019 | | | | | | | | | | | | | | | | |
Ordinary Income | | $ | 43,474 | | | $ | 1,317,512 | | | $ | - | | | $ | 4,515,051 | |
Long-term Capital Gains | | | 1,818,259 | | | | - | | | | 4,465,675 | | | | 14,010,024 | |
Return of Capital | | | 424 | | | | - | | | | - | | | | - | |
| | | | |
| | $ | 1,862,157 | | | $ | 1,317,512 | | | $ | 4,465,675 | | | $ | 18,525,075 | |
| | | | |
Year ended September 30, 2018 | | | | | | | | | | | | | | | | |
Ordinary Income | | $ | - | | | $ | 2,275,886 | | | $ | - | | | $ | 2,201,065 | |
Long-term Capital Gains | | | - | | | | - | | | | 2,294,405 | | | | 10,506,372 | |
| | | | |
| | $ | - | | | $ | 2,275,886 | | | $ | 2,294,405 | | | $ | 12,707,437 | |
| | | | |
| |
| | | | |
| | | Large/Mid Cap Value | | | Fixed Income | | | High Yield Bond | | | Israel Common Values* | | | Defensive Strategies | |
| | | | |
Year ended September 30, 2019 | | | | | | | | | | | | | | | | | | | | |
Ordinary Income | | $ | 1,656,902 | | | $ | 1,475,208 | | | $ | 2,290,049 | | | $ | 338,491 | | | $ | 655,005 | |
Long-term Capital Gains | | | 17,999,454 | | | | - | | | | - | | | | 362,645 | | | | 451,837 | |
| | | | |
| | $ | 19,656,356 | | | $ | 1,475,208 | | | $ | 2,290,049 | | | $ | 701,136 | | | $ | 1,106,842 | |
| | | | |
Year ended September 30, 2018 | | | | | | | | | | | | | | | | | | | | |
Ordinary Income | | $ | 2,005,692 | | | $ | 1,374,685 | | | $ | 2,303,749 | | | $ | 651,092 | | | $ | 71,849 | |
Long-term Capital Gains | | | 12,222,087 | | | | - | | | | - | | | | - | | | | - | |
Return of Capital | | | - | | | | - | | | | - | | | | 190,665 | | | | - | |
| | | | |
| | $ | 14,227,779 | | | $ | 1,374,685 | | | $ | 2,303,749 | | | $ | 841,757 | | | $ | 71,849 | |
| | | | |
| | |
| | | | | | | | |
| | | Strategic Growth | | | Conservative Growth | | | Emerging Markets* | | | Growth & Income Fund | | | | |
| | | | |
Year ended September 30, 2019 | | | | | | | | | | | | | | | | |
Ordinary Income | | $ | - | | | $ | - | | | $ | 254,757 | | | $ | 328,500 | |
Long-term Capital Gains | | | 122,381 | | | | 1,113,055 | | | | - | | | | 363,977 | |
Return of Capital | | | - | | | | - | | | | - | | | | 7,989 | |
| | | | |
| | $ | 122,381 | | | $ | 1,113,055 | | | $ | 254,757 | | | $ | 700,466 | |
| | | | |
Year ended September 30, 2018 | | | | | | | | | | | | | | | | |
Ordinary Income | | $ | - | | | $ | - | | | $ | 189,144 | | | $ | 24,002 | |
Long-term Capital Gains | | | - | | | | 168,976 | | | | - | | | | 861,134 | |
| | | | |
| | $ | - | | | $ | 168,976 | | | $ | 189,144 | | | $ | 885,136 | |
| | | | |
130
Notes to Financial Statements
September 30, 2019 (Continued)
Timothy Plan Family of Funds
* The difference between ordinary distributions paid from book and ordinary distributions paid from tax relates to allowable foreign tax credits of $101,963, $329,510, and $216,896 for fiscal year ended September 30, 2019 for the Emerging Markets, Israel Common Values, and International Funds, respectively, and $56,576, $243,253, and $289,368 for the fiscal year ended September 30, 2018 for the Emerging Markets, Israel Common Values, and International Funds, which have been passed through to the Funds’ underlying shareholders and are deemed dividends for tax purposes.
As of September 30, 2019, the components of distributable earnings on a tax basis were as follows:
| | | | | | | | | | | | | | | | | | |
| | | | | | |
| | | Aggressive Growth
Fund | | | International
Fund | | | Large/Mid Cap
Growth Fund | | | Small Cap Value
Fund | |
| | | | |
Undistributed Ordinary Income | | $ | - | | | $ | 719,040 | | | $ | - | | | $ | 435,080 | |
Long-Term Capital Gains | | | - | | | | - | | | | 3,702,331 | | | | 5,092,154 | |
Capital Loss Carry Forward | | | (139,560 | ) | | | (883,643 | ) | | | - | | | | - | |
Post October and Other Losses | | | (678,025 | ) | | | (4,181,929 | ) | | | (272,291 | ) | | | - | |
Unrealized Appreciation (Depreciation) | | | 3,370,376 | | | | 8,263,839 | | | | 12,862,429 | | | | 2,898,352 | |
| | | | |
| | $ | 2,552,791 | | | $ | 3,917,307 | | | $ | 16,292,469 | | | $ | 8,425,586 | |
| | | | |
| | | | | | |
| | | | | | |
| | | Large/Mid Cap
Value Fund | | | Fixed Income
Fund | | | High Yield Bond
Fund | | | Israel Common
Values Fund | |
| | | | |
Undistributed Ordinary Income | | $ | 964,884 | | | $ | 393,539 | | | $ | 72,174 | | | $ | 394,455 | |
Long-Term Capital Gains | | | 23,465,492 | | | | - | | | | - | | | | - | |
Capital Loss Carry Forward | | | - | | | | (1,510,987 | ) | | | (1,229,861 | ) | | | - | |
Post October and Other Losses | | | - | | | | (102,089 | ) | | | (100,729 | ) | | | (529,025) | |
Unrealized Appreciation (Depreciation) | | | 21,091,211 | | | | 2,316,642 | | | | 1,118,315 | | | | 19,432,689 | |
| | | | |
| | $ | 45,521,587 | | | $ | 1,097,105 | | | $ | (140,101 | ) | | $ | 19,298,119 | |
| | | | |
| | | | | | |
| | | | | | |
| | | Defensive
Strategies Fund | | | Strategic Growth
Fund | | | Conservative
Growth Fund | | | Emerging Markets
Fund | |
| | | | |
Undistributed Ordinary Income | | $ | 530,950 | | | $ | - | | | $ | 96,081 | | | $ | 802,073 | |
Long-Term Capital Gains | | | 593,316 | | | | 1,336,145 | | | | 1,589,423 | | | | 29,639 | |
Capital Loss Carry Forward | | | - | | | | - | | | | - | | | | - | |
Post October and Other Losses | | | - | | | | (75,597 | ) | | | - | | | | - | |
Unrealized Appreciation (Depreciation) | | | 934,521 | | | | 1,106,083 | | | | 1,125,473 | | | | (3,526,609) | |
| | | | |
| | $ | 2,058,787 | | | $ | 2,366,631 | | | $ | 2,810,977 | | | $ | (2,694,897) | |
| | | | |
| | | | | | |
| | | | | | | | | | | | | | | | | | |
| | | Growth & Income
Fund | |
| | | | |
Undistributed Ordinary Income | | $ | - | |
Long-Term Capital Gains | | | - | |
Capital Loss Carry Forward | | | (308,394) | |
Post October and Other Losses | | | (113,042) | |
Unrealized Appreciation (Depreciation) | | | 454,053 | |
| | | | |
| | $ | 32,617 | |
| | | | |
The difference between book basis and tax basis unrealized appreciation (depreciation), undistributed net investment income (loss) and accumulated net realized gain (loss) from investments are primarily attributable to the tax deferral of losses on wash sales,mark-to-market on open forward currency contracts and passive foreign investment companies, and adjustments forC-Corporation return of capital distributions. The unrealized appreciation (depreciation) in the table above includes unrealized foreign currency gains (losses) of $331, $12, $(243), $(714) and $(31) for the Israel Common Values, International, Defensive Strategies, Emerging Markets, and Growth & Income Funds, respectively.
Note 10 |Capital Loss Carryforwards, Post October and Other Losses
Late year losses incurred after December 31 within the fiscal year are deemed to arise on the first business day of the following fiscal year for tax purposes. The following Funds incurred and elected to defer such late year losses as follows:
| | | | | | |
Fund | | Late Year Losses | | | |
Aggressive Growth Fund | | $ | 165,024 | |
Large/Mid Cap Growth Fund | | | 272,291 | |
Strategic Growth Fund | | | 75,597 | |
Growth & Income Fund | | | 73 | |
Capital losses incurred after October 31 within the fiscal year are deemed to arise on the first business day of the following fiscal year for tax purposes. The following Funds incurred and elected to defer such capital losses as follows:
| | | | | | |
Fund | | Post October Losses | | | |
Aggressive Growth Fund | | $ | 513,001 | |
International Fund | | | 4,181,929 | |
Fixed Income Fund | | | 102,089 | |
High Yield Bond Fund | | | 100,729 | |
Israel Common Values Fund | | | 529,025 | |
Growth & Income Fund | | | 112,969 | |
131
Notes to Financial Statements
September 30, 2019 (Continued)
Timothy Plan Family of Funds
At September 30, 2019, the Funds had capital loss carry forwards for federal income tax purposes available to offset future capital gains, utilized and expired capital loss carryforwards as follows:
| | | | | | | | | | | | | | | | | | | | | | |
| | | Capital Loss Carry Forward | | | |
| Fund | | Expired | | | Non-Expiring Short-Term | | | Non-Expiring Long-Term | | | Non-Expiring Total | | | Utilized | |
Aggressive Growth Fund | | $ | - | | | $ | 139,560 | | | $ | - | | | $ | 139,560 | | | $ | - | |
International Fund | | | 844,129 | | | | 883,643 | | | | - | | | | 883,643 | | | | - | |
Fixed Income Fund | | | - | | | | 832,168 | | | | 678,819 | | | | 1,510,987 | | | | - | |
High Yield Bond Fund | | | - | | | | 190,417 | | | | 1,039,444 | | | | 1,229,861 | | | | - | |
Israel Common Values Fund | | | - | | | | - | | | | - | | | | - | | | | 702,224 | |
Emerging Markets Fund | | | - | | | | - | | | | - | | | | - | | | | 254,672 | |
Growth & Income Fund | | | - | | | | 182,803 | | | | 125,591 | | | | 308,394 | | | | - | |
To the extent these loss carryforwards are used to offset future capital gains, it is probable that the amount, which is offset, will not be distributed to shareholders.
Note 11|NEW ACCOUNTING PRONOUNCEMENTS
In March 2017, the Financial Accounting Standards Board (FASB) issued Accounting Standards Update (ASU)No. 2017-08, Receivables— Nonrefundable Fees and Other Costs (Subtopic310-20): Premium Amortization on Purchased Callable Debt Securities. The amendments in the ASU shorten the amortization period for certain callable debt securities, held at a premium, to be amortized to the earliest call date. The ASU does not require an accounting change for securities held at a discount; which continues to be amortized to maturity. The ASU is effective for fiscal years and interim periods within those fiscal years beginning after December 15, 2018. Management is currently evaluating the impact, if any, of applying this provision.
In August 2018, FASB issued ASUNo. 2018-13, which changed certain fair value measurement disclosure requirements. The ASU, in addition to other modifications and additions, removed the requirement to disclose the amount and reasons for transfers between Level 1 and Level 2 of the fair value hierarchy, and the policy for the timing of transfers between levels. For investment companies, the amendments are effective for financial statements issued for fiscal years beginning after December 15, 2019, and interim periods within those fiscal years. Early adoption is allowed. At this time, management is evaluating the implications of the ASU and any impact on the financial statement disclosures.
In August 2018, the Securities and Exchange Commission adopted amendments to certain disclosure requirements under RegulationS-X to conform to US GAAP, including: (i) an amendment to require presentation of the total, rather than the components, of distributable earnings on the Statement of Assets and Liabilities; and (ii) an amendment to require presentation of the total, rather than the components, of distributions to shareholders, except for tax return of capital distributions, on the Statement of Changes in Net Assets. The amendments also removed the requirement for parenthetical disclosure of undistributed net investment income on the Statement of Changes in Net Assets. These amendments have been adopted with these financial statements.
Note 12 |SUBSEQUENT EVENTS
Subsequent events after the date of the Statement of Assets and Liabilities have been evaluated through the date the financial issues were issued. Management has determined that no events or transactions occurred requiring adjustment or disclosure in the financial statements other than the following.
The Board has determined based on the recommendation of the Timothy Plan Emerging Markets Fund’s Adviser that with respect to the Timothy Plan Emerging Market Fund, that it is in the best interests of the Timothy Plan Emerging Markets Fund and its shareholders that the Timothy Plan Emerging Markets Fund cease operations. The Board has determined to close the Timothy Plan Emerging Markets Fund and redeem all outstanding shares on December 27, 2019.
Note 13 |TAX INFORMATION (Unaudited)
The Strategic Growth and Conservative Growth Funds designate the following for federal income tax purposes for the year ended September 30, 2019:
| | | | | | | | | | |
| | | Strategic Growth Fund | | Foreign Taxes paid | | | Foreign Source Income | |
| | | | | | |
| | Timothy Israel Common Values Fund | | $ | 7,453 | | | $ | 31,506 | |
| | Timothy Emerging Markets Fund | | | 13,017 | | | | 112,028 | |
| | Timothy International Fund | | | 16,619 | | | | 204,224 | |
| | Conservative Growth Fund | | Foreign Taxes paid | | | Foreign Source Income | |
| | | | | | |
| | Timothy Israel Common Values Fund | | $ | 6,742 | | | $ | 28,497 | |
| | Timothy Emerging Markets Fund | | | 10,813 | | | | 93,061 | |
| | Timothy International Fund | | | 11,564 | | | | 142,097 | |
132
Notes to Financial Statements
September 30, 2019 (Continued)
Timothy Plan Family of Funds
Note 14|SHAREHOLDER PROXY VOTE
The Trust held a Special Meeting (the “Special Meeting”) of its shareholders of the Timothy Plan Growth and Income Fund on April 29, 2019 for the purpose of approval by the Fund’s shareholders of a new investmentsub-advisory agreement with Barrow, Hanley, Mewhinney & Strauss, LLC (“BHMS”) to manage the fixed income allocation of the Fund’s portfolio.
| | | | |
| Shares Voted | | Shares Voted Against | | |
| In Favor | | or Abstentions | | |
| 1,565,491 | | 20,305 | | |
Effective May 1, 2019, Barrow, Hanley, Mewhinney & Strauss, LLC (“BHMS”) serves as Investment Manager to the fixed income allocation of the Fund’s investment portfolio.
133

REPORT OF INDEPENDENT REGISTERED PUBLIC ACCOUNTING FIRM
To the Shareholders and Board of Trustees of
The Timothy Plan
Opinion on the Financial Statements
We have audited the accompanying statements of assets and liabilities, including the schedules of investments, of Timothy Plan Aggressive Growth Fund, Timothy Plan International Fund, Timothy Plan Large/Mid Cap Growth Fund, Timothy Plan Small Cap Value Fund, Timothy Plan Large/Mid Cap Value Fund, Timothy Plan Fixed Income Fund, Timothy Plan High Yield Bond Fund, Timothy Plan Israel Common Values Fund, Timothy Plan Defensive Strategies Fund, Timothy Plan Strategic Growth Fund, Timothy Plan Conservative Growth Fund, Timothy Plan Emerging Markets Fund, and Timothy Plan Growth & Income Fund (the “Funds”), thirteen of the portfolios constituting The Timothy Plan, as of September 30, 2019, and the related statements of operations for the year then ended, the statements of changes in net assets for each of the two years in the period then ended, including the related notes, and the financial highlights for each of the five years in the period then ended (collectively referred to as the “financial statements”). In our opinion, the financial statements present fairly, in all material respects, the financial position of each of the Funds as of September 30, 2019, the results of their operations for the year then ended, the changes in their net assets for each of the two years in the period then ended, and the financial highlights for each of the five years in the period then ended, in conformity with accounting principles generally accepted in the United States of America.
Basis for Opinion
These financial statements are the responsibility of the Funds’ management. Our responsibility is to express an opinion on the Funds’ financial statements based on our audits. We are a public accounting firm registered with the Public Company Accounting Oversight Board (United States) (“PCAOB”) and are required to be independent with respect to the Funds in accordance with the U.S. federal securities laws and the applicable rules and regulations of the Securities and Exchange Commission and the PCAOB.
We conducted our audits in accordance with the standards of the PCAOB. Those standards require that we plan and perform the audit to obtain reasonable assurance about whether the financial statements are free of material misstatement, whether due to error or fraud.
Our audits included performing procedures to assess the risks of material misstatement of the financial statements, whether due to error or fraud, and performing procedures that respond to those risks. Such procedures included examining, on a test basis, evidence regarding the amounts and disclosures in the financial statements. Our procedures included confirmation of securities owned as of September 30, 2019, by correspondence with the custodian and brokers or by other appropriate auditing procedures where replies from brokers were not received. Our audits also included evaluating the accounting principles used and significant estimates made by management, as well as evaluating the overall presentation of the financial statements. We believe that our audits provide a reasonable basis for our opinion.
We have served as the auditor of one or more investment companies advised by Timothy Partners, Ltd., since 2005.

COHEN & COMPANY, LTD.
Cleveland, Ohio
November 27, 2019
COHEN & COMPANY, LTD.
134
Expense Examples – (Unaudited)
September 30, 2019
As a shareholder of a Fund, you incur two types of costs: direct costs, such as wire fees and low balance fees; and indirect costs, including management fees, and other Fund operating expenses. This example is intended to help you understand your indirect costs, also referred to as “ongoing costs”, (in dollars) of investing in each Fund, and to compare these costs with the ongoing costs of investing in other mutual funds.
This example is based on an investment of $1,000 invested at the beginning of the period and held for the entiresix-month period of April 1, 2019, through September 30, 2019.
Actual Expenses
The first line of the following tables provides information about actual account values and actual expenses. You may use the information in this line, together with the amount you invested at the beginning of the period, to estimate the expenses that you paid over the period. Simply divide your account value by $1,000 (for example, an $8,600 account value divided by $1,000 = 8.6), then multiply the result by the number in the first line under the heading “Expenses Paid During Period” to estimate the expenses you paid on your account during this period.
Hypothetical Example for Comparison Purposes
The second line of the tables provides information about hypothetical account values and hypothetical expenses based on each Fund’s actual expense ratio and an assumed rate of return of 5% per year before expenses, which is not the Fund’s actual return. The hypothetical account values and expenses may not be used to estimate the actual ending account balance or expenses you paid for the period. You may use this information to compare ongoing costs of investing in each Fund and other funds. To do so, compare this 5% hypothetical example with the 5% hypothetical examples that appear in the shareholder reports of other funds.
Please note that the expenses shown in the tables are meant to highlight your ongoing costs only and do not reflect any direct costs, such as wire fees or low balance fees. Therefore, the second line of the table is useful in comparing ongoing costs only, and will not help you determine the relative total costs of owning different funds. In addition, if these direct costs were included, your costs would be higher.
AGGRESSIVE GROWTH FUND
| | | | | | | | | | |
| | | Beginning Account
Value | | | | Ending Account
Value | | | | Expenses Paid
During Period |
| | | | | |
| | | 4/1/2019 | | | | 9/30/2019 | | | | 4/1/2019 through
9/30/2019 |
Actual - Class A * | | $1,000.00 | | | | $ 998.70 | | | | $ 7.27 |
Hypothetical - Class A ** | | $1,000.00 | | | | $1,017.80 | | | | $ 7.33 |
Actual - Class C * | | $1,000.00 | | | | $ 995.30 | | | | $11.00 |
Hypothetical - Class C ** | | $1,000.00 | | | | $1,014.04 | | | | $11.11 |
Actual - Class I * | | $1,000.00 | | | | $1,000.00 | | | | $ 6.02 |
Hypothetical - Class I ** | | $1,000.00 | | | | $1,019.05 | | | | $ 6.07 |
| * | Expenses are equal to the Fund’s annualized expense ratio of 1.45% for Class A, 2.20% for Class C and 1.20% for Class I, which is net of any expenses paid indirectly, multiplied by the average account value over the period, multiplied by 183 days/365 days (to reflect the partial year period). The Aggressive Growth Fund’s ending account value on the first line of each share class in the table is based on its actual total return of (0.13)% for Class A, (0.47)% for Class C and 0.00% for Class I for the period of April 1, 2019, to September 30, 2019. |
| ** | Assumes a 5% return before expenses. |
135
Expense Examples – (Unaudited)(Continued)
September 30, 2019
INTERNATIONAL FUND
| | | | | | | | | | |
| | | Beginning Account
Value | | | | Ending Account
Value | | | | Expenses Paid
During Period |
| | | | | |
| | | 4/1/2019 | | | | 9/30/2019 | | | | 4/1/2019 through
9/30/2019 |
Actual - Class A * | | $1,000.00 | | | | $1,013.40 | | | | $ 8.23 |
Hypothetical - Class A ** | | $1,000.00 | | | | $1,016.90 | | | | $ 8.24 |
Actual - Class C * | | $1,000.00 | | | | $1,009.20 | | | | $11.99 |
Hypothetical - Class C ** | | $1,000.00 | | | | $1,013.14 | | | | $12.01 |
Actual - Class I * | | $1,000.00 | | | | $1,013.40 | | | | $ 6.97 |
Hypothetical - Class I ** | | $1,000.00 | | | | $1,018.15 | | | | $ 6.98 |
| * | Expenses are equal to the Fund’s annualized expense ratio of 1.63% for Class A, 2.38% for Class C and 1.38% for Class I, which is net of any expenses paid indirectly, multiplied by the average account value over the period, multiplied by 183 days/365 days (to reflect the partial year period). The International Fund’s ending account value on the first line of each share class in the table is based on its actual total return of 1.34% for Class A, 0.92% for Class C, and 1.34% for Class I for the period of April 1, 2019, to September 30, 2019. |
| ** | Assumes a 5% return before expenses. |
LARGE/MID CAP GROWTH FUND
| | | | | | | | | | |
| | | Beginning Account Value | | | | Ending Account Value | | | | Expenses Paid During Period |
| | | | | |
| | | 4/1/2019 | | | | 9/30/2019 | | | | 4/1/2019 through
9/30/2019 |
Actual - Class A * | | $1,000.00 | | | | $1,038.20 | | | | $ 7.51 |
Hypothetical - Class A ** | | $1,000.00 | | | | $1,017.70 | | | | $ 7.44 |
Actual - Class C * | | $1,000.00 | | | | $1,034.20 | | | | $11.32 |
Hypothetical - Class C ** | | $1,000.00 | | | | $1,013.94 | | | | $11.21 |
Actual - Class I * | | $1,000.00 | | | | $1,038.70 | | | | $ 6.24 |
Hypothetical - Class I ** | | $1,000.00 | | | | $1,018.95 | | | | $ 6.17 |
| * | Expenses are equal to the Fund’s annualized expense ratio of 1.47% for Class A, 2.22% for Class C and 1.22% for Class I, which is net of any expenses paid indirectly, multiplied by the average account value over the period, multiplied by 183 days/365 days (to reflect the partial year period). The Large/Mid Cap Growth Fund’s ending account value on the first line of each share class in the table is based on its actual total return of 3.82% for Class A, 3.42% for Class C, and 3.87% for Class I for the period of April 1, 2019, to September 30, 2019. |
| ** | Assumes a 5% return before expenses. |
SMALL CAP VALUE FUND
| | | | | | | | | | |
| | | Beginning Account
Value | | | | Ending Account
Value | | | | Expenses Paid
During Period |
| | | | | |
| | | 4/1/2019 | | | | 9/30/2019 | | | | 4/1/2019 through
9/30/2019 |
Actual - Class A * | | $1,000.00 | | | | $1,054.10 | | | | $ 6.80 |
Hypothetical - Class A ** | | $1,000.00 | | | | $1,018.45 | | | | $ 6.68 |
Actual - Class C * | | $1,000.00 | | | | $1,050.30 | | | | $10.64 |
Hypothetical - Class C ** | | $1,000.00 | | | | $1,014.69 | | | | $10.45 |
Actual - Class I * | | $1,000.00 | | | | $1,055.70 | | | | $ 5.51 |
Hypothetical - Class I ** | | $1,000.00 | | | | $1,019.70 | | | | $ 5.42 |
| * | Expenses are equal to the Fund’s annualized expense ratio of 1.32% for Class A, 2.07% for Class C and 1.07% for Class I, which is net of any expenses paid indirectly, multiplied by the average account value over the period, multiplied by 183 days/365 days (to reflect the partial year period). The Large/Mid Cap Growth Fund’s ending account value on the first line of each share class in the table is based on its actual total return of 5.41% for Class A, 5.03% for Class C, and 5.57% for Class I for the period of April 1, 2019, to September 30, 2019. |
| ** | Assumes a 5% return before expenses. |
136
Expense Examples – (Unaudited)(Continued)
September 30, 2019
LARGE/MID CAP VALUE FUND
| | | | | | | | | | |
| | | Beginning Account
Value | | | | Ending Account
Value | | | | Expenses Paid
During Period |
| | | | | |
| | | 4/1/2019 | | | | 9/30/2019 | | | | 4/1/2019 through
9/30/2019 |
Actual - Class A * | | $1,000.00 | | | | $1,060.70 | | | | $ 7.23 |
Hypothetical - Class A ** | | $1,000.00 | | | | $1,018.05 | | | | $ 7.08 |
Actual - Class C * | | $1,000.00 | | | | $1,056.30 | | | | $11.08 |
Hypothetical - Class C ** | | $1,000.00 | | | | $1,014.29 | | | | $10.86 |
Actual - Class I * | | $1,000.00 | | | | $1,061.30 | | | | $ 5.94 |
Hypothetical - Class I ** | | $1,000.00 | | | | $1,019.30 | | | | $ 5.82 |
| * | Expenses are equal to the Fund’s annualized expense ratio of 1.40% for Class A, 2.15% for Class C, and 1.15% for Class I which is net of any expenses paid indirectly, multiplied by the average account value over the period, multiplied by 183 days/365 days (to reflect the partial year period). The Large/Mid Cap Value Fund’s ending account value on the first line of each share class in the table is based on its actual total return of 6.07% for Class A, 5.63% for Class C, and 6.13% for Class I for the period of April 1, 2019, to September 30, 2019. |
| ** | Assumes a 5% return before expenses. |
FIXED INCOME FUND
| | | | | | | | | | |
| | | Beginning Account
Value | | | | Ending Account
Value | | | | Expenses Paid
During Period |
| | | | | |
| | | 4/1/2019 | | | | 9/30/2019 | | | | 4/1/2019 through
9/30/2019 |
Actual - Class A * | | $1,000.00 | | | | $1,037.20 | | | | $ 5.87 |
Hypothetical - Class A ** | | $1,000.00 | | | | $1,019.30 | | | | $ 5.82 |
Actual - Class C * | | $1,000.00 | | | | $1,034.00 | | | | $ 9.69 |
Hypothetical - Class C ** | | $1,000.00 | | | | $1,015.54 | | | | $ 9.60 |
Actual - Class I * | | $1,000.00 | | | | $1,039.30 | | | | $ 4.60 |
Hypothetical - Class I ** | | $1,000.00 | | | | $1,020.56 | | | | $ 4.56 |
| * | Expenses are equal to the Fund’s annualized expense ratio of 1.15% for Class A, 1.90% for Class C, and 0.90% for Class I which is net of any expenses paid indirectly, multiplied by the average account value over the period, multiplied by 183 days/365 days (to reflect the partial year period). The Fixed Income Fund’s ending account value on the first line of each share class in the table is based on its actual total return of 3.72% for Class A, 3.40% for Class C, and 3.93% for Class I for the period of April 1, 2019, to September 30, 2019. |
| ** | Assumes a 5% return before expenses. |
HIGH YIELD BOND FUND
| | | | | | | | | | |
| | | Beginning Account
Value | | | | Ending Account
Value | | | | Expenses Paid
During Period |
| | | | | |
| | | 4/1/2019 | | | | 9/30/2019 | | | | 4/1/2019 through
9/30/2019 |
Actual - Class A * | | $1,000.00 | | | | $1,053.20 | | | | $ 6.18 |
Hypothetical - Class A ** | | $1,000.00 | | | | $1,019.05 | | | | $ 6.07 |
Actual - Class C * | | $1,000.00 | | | | $1,049.50 | | | | $10.02 |
Hypothetical - Class C ** | | $1,000.00 | | | | $1,015.29 | | | | $ 9.85 |
Actual - Class I * | | $1,000.00 | | | | $1,054.40 | | | | $ 4.89 |
Hypothetical - Class I ** | | $1,000.00 | | | | $1,020.31 | | | | $ 4.81 |
| ** | Expenses are equal to the Fund’s annualized expense ratio of 1.20% for Class A, 1.95% for Class C, and 0.95% for Class I which is net of any expenses paid indirectly, multiplied by the average account value over the period, multiplied by 183 days/365 days (to reflect the partial year period). The High Yield Bond Fund’s ending account value on the first line of each share class in the table is based on its actual total return of 5.32% for Class A, 4.95% for Class C, and 5.44% for Class I for the period of April 1, 2019, to September 30, 2019. |
| ** | Assumes a 5% return before expenses. |
137
Expense Examples – (Unaudited)(Continued)
September 30, 2019
DEFENSIVE STRATEGIES FUND
| | | | | | | | | | |
| | | Beginning Account
Value | | | | Ending Account
Value | | | | Expenses Paid
During Period |
| | | | | |
| | | 4/1/2019 | | | | 9/30/2019 | | | | 4/1/2019 through
9/30/2019 |
Actual - Class A * | | $1,000.00 | | | | $1,033.60 | | | | $ 7.54 |
Hypothetical - Class A ** | | $1,000.00 | | | | $1,017.65 | | | | $ 7.49 |
Actual - Class C * | | $1,000.00 | | | | $1,029.60 | | | | $11.35 |
Hypothetical - Class C ** | | $1,000.00 | | | | $1,013.89 | | | | $11.26 |
Actual - Class I * | | $1,000.00 | | | | $1,035.40 | | | | $ 6.28 |
Hypothetical - Class I ** | | $1,000.00 | | | | $1,018.90 | | | | $ 6.23 |
| * | Expenses are equal to the Fund’s annualized expense ratio of 1.48% for Class A, 2.23% for Class C and 1.23% for Class I, which is net of any expenses paid indirectly, multiplied by the average account value over the period, multiplied by 183 days/365 days (to reflect the partial year period). The Defensive Strategies Fund’s ending account value on the first line of each share class in the table is based on its actual total return of 3.36% for Class A, 2.96% for Class C and 3.54% for Class I for the period of April 1, 2019, to September 30, 2019. |
| ** | Assumes a 5% return before expenses. |
STRATEGIC GROWTH FUND
| | | | | | | | | | |
| | | Beginning Account
Value | | | | Ending Account
Value | | | | Expenses Paid
During Period |
| | | | | |
| | | 4/1/2019 | | | | 9/30/2019 | | | | 4/1/2019 through
9/30/2019 |
Actual - Class A * | | $1,000.00 | | | | $1,033.20 | | | | $ 5.61 |
Hypothetical - Class A ** | | $1,000.00 | | | | $1,019.55 | | | | $ 5.57 |
Actual - Class C * | | $1,000.00 | | | | $1,030.00 | | | | $ 9.41 |
Hypothetical - Class C ** | | $1,000.00 | | | | $1,015.79 | | | | $ 9.35 |
| * | Expenses are equal to the Fund’s annualized expense ratio of 1.10% for Class A and 1.85% for Class C, which is net of any expenses paid indirectly, multiplied by the average account value over the period, multiplied by 183 days/365 days (to reflect the partial year period). The Strategic Growth Fund’s ending account value on the first line of each share class in the table is based on its actual total return of 3.32% for Class A and 3.00% for Class C for thesix-month period of April 1, 2019, to September 30, 2019. |
| ** | Assumes a 5% return before expenses. |
CONSERVATIVE GROWTH FUND
| | | | | | | | | | |
| | | Beginning Account
Value | | | | Ending Account
Value | | | | Expenses Paid
During Period |
| | | | | |
| | | 4/1/2019 | | | | 9/30/2019 | | | | 4/1/2019 through
9/30/2019 |
Actual - Class A * | | $1,000.00 | | | | $1,032.90 | | | | $ 5.50 |
Hypothetical - Class A ** | | $1,000.00 | | | | $1,019.65 | | | | $ 5.47 |
Actual - Class C * | | $1,000.00 | | | | $1,030.10 | | | | $ 9.31 |
Hypothetical - Class C ** | | $1,000.00 | | | | $1,015.89 | | | | $ 9.25 |
| * | Expenses are equal to the Fund’s annualized expense ratio of 1.08% for Class A and 1.83% for Class C, which is net of any expenses paid indirectly, multiplied by the average account value over the period, multiplied by 183 days/365 days (to reflect the partial year period). The Conservative Growth Fund’s ending account value on the first line of each share class in the table is based on its actual total return of 3.29% for Class A and 3.01% for Class C for thesix-month period of April 1, 2019, to September 30, 2019. |
| ** | Assumes a 5% return before expenses. |
138
Expense Examples – (Unaudited)(Continued)
September 30, 2019
ISRAEL COMMON VALUES FUND
| | | | | | | | | | |
| | | Beginning Account
Value | | | | Ending Account
Value | | | | Expenses Paid
During Period |
| | | | | |
| | | 4/1/2019 | | | | 9/30/2019 | | | | 4/1/2019 through
9/30/2019 |
Actual - Class A * | | $1,000.00 | | | | $1,124.10 | | | | $ 9.21 |
Hypothetical - Class A ** | | $1,000.00 | | | | $1,016.39 | | | | $ 8.74 |
Actual - Class C * | | $1,000.00 | | | | $1,119.40 | | | | $13.18 |
Hypothetical - Class C ** | | $1,000.00 | | | | $1,012.63 | | | | $12.51 |
Actual - Class I * | | $1,000.00 | | | | $1,125.20 | | | | $ 7.88 |
Hypothetical - Class I ** | | $1,000.00 | | | | $1,017.65 �� | | | | $ 7.49 |
| * | Expenses are equal to the Fund’s annualized expense ratio of 1.73% for Class A, 2.48% for Class C and 1.48% for Class I, which is net of any expenses paid indirectly, multiplied by the average account value over the period, multiplied by 183 days/365 days (to reflect the partial year period). The Israel Common Values Fund’s ending account value on the first line of each share class in the table is based on its actual total return of 12.41% for Class A, 11.94% for Class C and 12.52% for Class I for the period of April 1, 2019, to September 30, 2019. |
| ** | Assumes a 5% return before expenses. |
EMERGING MARKETS FUND
| | | | | | | | | | |
| | | Beginning Account
Value | | | | Ending Account
Value | | | | Expenses Paid
During Period |
| | | | | |
| | | 4/1/2019 | | | | 9/30/2019 | | | | 4/1/2019 through
9/30/2019 |
Actual - Class A * | | $1,000.00 | | | | $ 995.40 | | | | $10.85 |
Hypothetical - Class A ** | | $1,000.00 | | | | $1,014.19 | | | | $10.96 |
Actual - Class C * | | $1,000.00 | | | | $ 991.80 | | | | $14.58 |
Hypothetical - Class C ** | | $1,000.00 | | | | $1,010.43 | | | | $14.72 |
Actual - Class I * | | $1,000.00 | | | | $ 996.60 | | | | $ 9.61 |
Hypothetical - Class I ** | | $1,000.00 | | | | $1,015.44 | | | | $ 9.70 |
| * | Expenses are equal to the Fund’s annualized expense ratio of 2.17% for Class A, 2.92% for Class C and 1.92% for Class I, which is net of any expenses paid indirectly, multiplied by the average account value over the period, multiplied by 183 days/365 days to reflect the partial year period). The Emerging Markets Fund’s ending account value on the first line of each share class in the table is based on its actual total return of (0.46)% for Class A, (0.82)% for Class C and (0.34)% for Class I for the period of April 1, 2019, to September 30, 2019. |
| ** | Assumes a 5% return before expenses. |
GROWTH & INCOME FUND
| | | | | | | | | | |
| | | Beginning Account
Value | | | | Ending Account
Value | | | | Expenses Paid
During Period |
| | | | | |
| | | 4/1/2019 | | | | 9/30/2019 | | | | 4/1/2019 through
9/30/2019 |
Actual - Class A * | | $1,000.00 | | | | $1,046.10 | | | | $ 8.62 |
Hypothetical - Class A ** | | $1,000.00 | | | | $1,016.65 | | | | $ 8.49 |
Actual - Class C * | | $1,000.00 | | | | $1,041.50 | | | | $12.44 |
Hypothetical - Class C ** | | $1,000.00 | | | | $1,012.89 | | | | $12.26 |
Actual - Class I *** | | $1,000.00 | | | | $1,046.20 | | | | $ 7.34 |
Hypothetical - Class I ** | | $1,000.00 | | | | $1,017.90 | | | | $ 7.23 |
| * | Expenses are equal to the Fund’s annualized expense ratio of 1.68% for Class A, 2.43% for Class C and 1.43% for Class I, which is net of any expenses paid indirectly, multiplied by the average account value over the period, multiplied by 183 days/365 days (to reflect the partial year period). The Growth & Income Fund’s ending account value on the first line of each share class in the table is based on its actual total return of 4.61% for Class A, 4.15% for Class C and 4.62% for Class I for the period of April 1, 2019, to September 30, 2019. |
| ** | Assumes a 5% return before expenses. |
139
Officers and Trustees of the Trust (Unaudited)
The Trustees and principal executive officers of the Trust and their principal occupations for the past five years are listed as follows:
INTERESTED TRUSTEES
| | | | | | |
| Name, Age and Address | | Position(s) Held With Trust | | Term of Office and Length of Time Served | | Number of Portfolios in Fund Complex Overseen by Trustee |
Arthur D. Ally* | | Chairman and President | | Indefinite; Trustee and President since 1994 | | 15 |
1055 Maitland Center Commons | | | | | | |
Maitland, FL | | | | | | Other Directorships |
| | Principal Occupation During Past 5 Years | | Held by Trustee |
Born: 1942 | | President and controlling shareholder of Covenant Funds, Inc. (“CFI”), a holding company. President and general partner of Timothy Partners, Ltd. (“TPL”), the investment Advisor and principal underwriter to each Fund. CFI is also the managing general partner of TPL. | | None |
| | | | | | |
| Name, Age and Address | | Position(s) Held With Trust | | Term of Office and Length of Time Served | | Number of Portfolios in Fund Complex Overseen by Trustee |
Joseph E. Boatwright** | | Trustee, Secretary | | Indefinite; Trustee and Secretary since 1995 | | 15 |
1055 Maitland Center Commons | | | | | | Other Directorships |
Maitland, FL | | Principal Occupation During Past 5 Years | | Held by Trustee |
Born: 1930 | | Retired Minister. Currently serves as a consultant to the Greater Orlando Baptist Association. Served as Senior Pastor to Aloma Baptist Church from 1970-1996. | | None |
| | | | | | |
| Name, Age and Address | | Position(s) Held With Trust | | Term of Office and Length of Time Served | | Number of Portfolios in Fund Complex Overseen by Trustee |
Mathew D. Staver** | | Trustee | | Indefinite; Trustee since 2000 | | 15 |
1055 Maitland Center Commons | | | | | | Other Directorships |
Maitland, FL | | Principal Occupation During Past 5 Years | | Held by Trustee |
Born: 1956 | | Attorney specializing in free speech, appellate practice and religious liberty constitutional law. Founder of Liberty Counsel, a religious civil liberties education and legal defense organization. Host of two radio programs devoted to religious freedom issues. Editor of a monthly newsletter devoted to religious liberty topics. Mr. Staver has argued before the United States Supreme Court and has published numerous legal articles. | | None |
| | | | | | |
| Name, Age and Address | | Position(s) Held With Trust | | Term of Office and Length of Time Served | | Number of Portfolios in Fund Complex Overseen by Trustee |
Charles E. Nelson*** | | Trustee | | Indefinite; Trustee since 2000 | | 15 |
1055 Maitland Center Commons | | | | | | Other Directorships |
Maitland, FL | | Principal Occupation During Past 5 Years | | Held by Trustee |
Born: 1934 | | Certified Public Accountant, semi-retired. Formernon-profit industry accounting officer. Former financial executive with commercial bank. Former partner national accounting firm. | | None |
* Mr. Ally is an “interested” Trustee, as that term is defined in the 1940 Act, because of his positions with and financial interests in CFI and TPL.
** Messrs. Boatwright and Staver are “interested” Trustees, as that term is defined in the 1940 Act, because each has a limited partnership interest in TPL.
***Mr. Nelson is an “interested” Trustee, as that term is defined in the 1940 Act, because he is employed by an affiliate of the Advisor.
140
Officers and Trustees of the Trust (Unaudited)
(Continued)
INDEPENDENT TRUSTEES
| | | | | | |
| Name, Age and Address | | Position(s) Held With Trust | | Term of Office and Length of Time Served | | Number of Portfolios in Fund Complex Overseen by Trustee |
Kenneth Blackwell | | Trustee | | Indefinite; Trustee since 2011 | | 15 |
1055 Maitland Center Commons | | | | | | Other Directorships |
Maitland, FL | | Principal Occupation During Past 5 Years | | Held by Trustee |
Born: 1948 | | Currently serving as an independent consultant or Fellow with the Family Research Council and the American Civil Rights Union, and is a Visiting Professor at Liberty University, Lynchburg, VA. Former Secretary of State for the State of Ohio. | | None |
| | | | | | |
| Name, Age and Address | | Position(s) Held With Trust | | Term of Office and Length of Time Served | | Number of Portfolios in Fund Complex Overseen by Trustee |
Richard W. Copeland | | Trustee | | Indefinite; Trustee since 2005 | | 15 |
1055 Maitland Center Commons | | | | | | Other Directorships |
Maitland, FL | | Principal Occupation During Past 5 Years | | Held by Trustee |
Born: 1947 | | Retired Associate Professor Stetson University. Retired Principal of Copeland & Covert, Attorneys at Law; specializing in tax and estate planning. B.A. from Mississippi College, JD from University of Florida and LLM Taxation from University of Miami. | | None |
| | | | | | |
| Name, Age and Address | | Position(s) Held With Trust | | Term of Office and Length of Time Served | | Number of Portfolios in Fund Complex Overseen by Trustee |
Deborah Honeycutt | | Trustee | | Indefinite; Trustee since 2010 | | 15 |
1055 Maitland Center Commons | | | | | | Other Directorships |
Maitland, FL | | Principal Occupation During Past 5 Years | | Held by Trustee |
Born: 1947 | | Dr. Honeycutt is a licensed physician currently serving as Medical Director of Clayton State University Health Services in Morrow, GA, CEO of Minority Health Services in Atlanta, and as a volunteer at Good Shepherd Clinic. Dr. Honeycutt received her B.A. and M.D. at the University of Illinois. | | None |
| | | | | | |
| Name, Age and Address | | Position(s) Held With Trust | | Term of Office and Length of Time Served | | Number of Portfolios in Fund Complex Overseen by Trustee |
Bill Johnson | | Trustee | | Indefinite; Trustee since 2005 | | 15 |
1055 Maitland Center Commons | | | | | | Other Directorships |
Maitland, FL | | Principal Occupation During Past 5 Years | | Held by Trustee |
Born: 1946 | | President (and Founder) of American Decency Association, Freemont, MI since 1999. Previously served as Michigan State Director for American Family Association (1987-1999). Previously a public school teacher for 18 years. B.S. from Michigan State University and a Masters of Religious Education from Grand Rapids Baptist Seminary. | | None |
141
Officers and Trustees of the Trust (Unaudited)
(Continued)
| | | | | | |
| Name, Age and Address | | Position(s) Held With Trust | | Term of Office and Length of Time Served | | Number of Portfolios in Fund Complex Overseen by Trustee |
John C. Mulder | | Trustee | | Indefinite; Trustee since 2005 | | 15 |
1055 Maitland Center Commons | | | | | | Other Directorships |
Maitland, FL | | Principal Occupation During Past 5 Years | | Held by Trustee |
Born: 1950 | | President of WaterStone (formerly the Christian Community Foundation and National Foundation) since 2001. Prior: 22 years of executive experience for a group of banks and a trust company. B.A. in Economics from Wheaton College and MBA from University of Chicago. | | None |
| | | | | | |
| Name, Age and Address | | Position(s) Held With Trust | | Term of Office and Length of Time Served | | Number of Portfolios in Fund Complex Overseen by Trustee |
Scott Preissler, Ph.D. | | Trustee | | Indefinite; Trustee since 2004 | | 15 |
1055 Maitland Center Commons | �� | | | | | Other Directorships |
Maitland, FL | | Principal Occupation During Past 5 Years | | Held by Trustee |
Born: 1960 | | Former Director of Steward Leadership and Professor in Residence at Shorter University. Former Chairman of Stewardship Studies at Southwestern Baptist Theological Seminary, Ft. Worth, TX. Also serves as Founder and Chairman of the International Center for Biblical Stewardship. | | None |
| | | | | | |
| Name, Age and Address | | Position(s) Held With Trust | | Term of Office and Length of Time Served | | Number of Portfolios in Fund Complex Overseen by Trustee |
Alan M. Ross | | Trustee, Vice | | Indefinite; Trustee since 2004 | | 15 |
| | Chairman | | | | |
1055 Maitland Center Commons | | | | | | Other Directorships |
Maitland, FL | | Principal Occupation During Past 5 Years | | Held by Trustee |
Born: 1951 | | Founder and CEO of Corporate Development Institute which he founded in 2000. Previously he served as President and CEO of Fellowship of Companies for Christ and has authored three books: Beyond World Class, Unconditional Excellence, Breaking Through to Prosperity. | | None |
| | | | | | |
| Name, Age and Address | | Position(s) Held With Trust | | Term of Office and Length of Time Served | | Number of Portfolios in Fund Complex Overseen by Trustee |
Patrice Tsague | | Trustee | | Indefinite; Trustee since 2011 | | 15 |
1055 Maitland Center Commons | | | | | | Other Directorships |
Maitland, FL | | Principal Occupation During Past 5 Years | | Held by Trustee |
Born: 1973 | | President and Chief Servant Officer of the Nehemiah Project International Ministries Inc. since 1999. | | None |
The Fund’s Statement of Additional Information includes additional information about the Trustees and is available free of charge, upon request, by calling toll-free at1-800-846-7526.
142
Privacy Notice
| | |
FACTS | | WHAT DOES THE TIMOTHY PLAN DO WITH YOUR PERSONAL
INFORMATION? |
| | |
| WHY? | | Financial companies choose how they share your personal information. Federal law gives consumers the right to limit some, but not all information sharing. Federal law also requires us to tell you how we collect, share, and protect your personal information. Please read this Notice carefully to understand what we do. |
| | |
WHAT? | | The types of information we collect and share depend on the product or service you have with us. This information can include: |
| | | • Social Security Number |
| | | • Assets |
| | | • Retirement Assets |
| | | • Transaction History |
| | | • Checking Account History |
| | | • Purchase History |
| | | • Account Balances |
| | | • Account Transactions |
| | | • Wire Transfer Instructions |
| | | When you areno longer our customer, we continue to share your information as described in this Notice. |
| | |
| HOW? | | All financial companies need to share your personal information to run their everyday business. In the section below, we list the reasons financial companies can share their customers’ personal information; the reasons The Timothy Plan chooses to share; and whether you can limit this sharing. |
| | | | |
Reasons we can share your personal information. | | Does The Timothy Plan share? | | Can you limit this sharing? |
For our everyday business purposes- Such as to process your transactions, maintain your account(s), respond to court orders and legal investigations, or report to credit bureaus. | | Yes | | No |
For our marketing purposes- to offer our products and services to you. | | No | | We don’t share |
For joint marketing with other financial companies | | No | | We don’t share |
For our affiliates’ everyday business purposes- information about your transactions and experiences. | | Yes | | No |
For our affiliates’ everyday business purposes- information about your creditworthiness | | No | | We don’t share |
Fornon-affiliates to market to you | | No | | We don’t share |
| | | | |
Questions? | | Call800-662-0201 |
143
| | |
Who we are | | |
Who is providing this Notice? | | Timothy Plan Family of Mutual Funds
Timothy Partners, Ltd. |
What we do | | |
How does The Timothy Plan protect your personal information? | | To protect your personal information from unauthorized access and use, we use security measures that comply with federal law. These measures include computer safeguards and secured files and buildings. Our service providers are held accountable for adhering to strict policies and procedures to prevent any misuse of your nonpublic personal information. |
How does The Timothy Plan collect your personal information? | | We collect your personal information, for example, when you |
| | | • Open an account |
| | | • Provide account information |
| | | • Give us your contact information |
| | | • Make deposits or withdrawals from your account |
| | | • Make a wire transfer |
| | | • Tell us where to send the money |
| | | • Tell us who receives the money |
| | | • Show your government-issued ID |
| | | • Show your driver’s license |
| | | We also collect your personal information from other companies. |
Why can’t I limit all sharing? | | Federal law gives you the right to limit only: |
| | | • Sharing for affiliates’ everyday business purposes- |
| | | information about your creditworthiness. |
| | | • Affiliates from using your information to market to you. |
| | | • Sharing fornon-affiliates to market to you |
| | | State laws and individual companies may give you additional rights to limit sharing. |
Definitions
| | |
Affiliates | | Companies related by common ownership or control. They can be financial and non-financial companies. Timothy Partners, Ltd. is an affiliate of The Timothy Plan |
Non-affiliates | | Companies not related by common ownership or control. They can be financial andnon-financial companies. • The Timothy Plan does not share withnon-affiliates so they can market to you. |
Joint marketing | | A formal agreement betweennon-affiliated financial companies that together market financial products to you. • The Timothy Plan does not jointly market. |
Customer Identification Program
The Board of Trustees of the Trust has approved procedures designed to prevent and detect attempts to launder money as required under the USA PATRIOT Act. Theday-to-day responsibility for monitoring and reporting any such activities has been delegated to the transfer agent, subject to the oversight and supervision of the Board.
144
Disclosures
HOW TO OBTAIN PROXY VOTING INFORMATION
Information regarding how the Funds voted proxies relating to Fund securities during the period ended June 30 of well as a description of the policies and procedures that the Funds use to determine how to vote proxies is available without charge, upon request, by calling1-800-732-0330 or by referring to the Security and Exchange Commission’s (“SEC”) website at http://www.sec.gov
HOW TO OBTAIN 1ST AND 3RD FISCAL QUARTER PORTFOLIO HOLDINGS
Each Fund files its complete schedule of portfolio holdings with the SEC for the first and third quarters of each fiscal year on FormN-Q. FormN-Q is available on the SEC’s website at http://www.sec.gov and may be reviewed and copied at the SEC’s Public Reference Room in Washington, DC(1-800-SEC-0330). The information on FormN-Q is available without charge, upon request, by calling1-800-732-0330.
145
BOARD OF TRUSTEES
Arthur D. Ally
Kenneth Blackwell
Joseph E. Boatwright
Rick Copeland
Deborah Honeycutt
Bill Johnson
John C. Mulder
Charles E. Nelson
Scott Preissler
Alan Ross
Mathew D. Staver
Patrice Tsague
OFFICERS
Arthur D. Ally, President
Joseph E. Boatwright, Secretary
INVESTMENT ADVISOR
Timothy Partners, Ltd.
1055 Maitland Center Commons
Maitland, FL 32751
DISTRIBUTOR
Timothy Partners, Ltd.
1055 Maitland Center Commons
Maitland, FL 32751
TRANSFER AGENT
Ultimus Fund Solutions, LLC
17605 Wright St., Suite 2
Omaha, NE 68130
INDEPENDENT REGISTERED PUBLIC ACCOUNTING FIRM
Cohen & Company, Ltd.
1350 Euclid Ave., Suite 800
Cleveland, OH 44115
| | |
LEGAL COUNSEL David Jones & Assoc., P.C. 18630 Crosstimber San Antonio, TX 78258 | |  |
| |
For additional information or a prospectus, please call:1-800-846-7526 Visit the Timothy Plan web site on the internet at: www.timothyplan.com | | HEADQUARTERS The Timothy Plan 1055 Maitland Center Commons Maitland, Florida 32751 (800)846-7526 www.timothyplan.com invest@timothyplan.com |
| |
| This report is submitted for the general information of the shareholders of the Funds. It is not authorized for distribution to prospective investors in the Funds unless preceded or accompanied by an effective Prospectus which includes details regarding the Funds’ objectives, policies, expenses and other information. Distributed by Timothy Partners, Ltd. | | SHAREHOLDER SERVICES Ultimus Fund Solutions, LLC 17605 Wright St., Suite 2 Omaha, NE 68130 (800)662-020 |
Item 2. Code of Ethics.
(a) As of the end of the period covered by this report, the registrant has adopted a code of ethics that applies to the registrant’s principal executive officer, principal financial officer, principal accounting officer or controller, or persons performing similar functions, regardless of whether these individuals are employed by the registrant or a third party.
(b) For purposes of this item, “code of ethics” means written standards that are reasonably designed to deter wrongdoing and to promote:
| | (1) | Honest and ethical conduct, including the ethical handling of actual or apparent conflicts of interest between personal and professional relationships; |
| | (2) | Full, fair, accurate, timely, and understandable disclosure in reports and documents that a registrant files with, or submits to, the Commission and in other public communications made by the registrant; |
| | (3) | Compliance with applicable governmental laws, rules, and regulations; |
| | (4) | The prompt internal reporting of violations of the code to an appropriate person or persons identified in the code; and |
| | (5) | Accountability for adherence to the code. |
(c) Amendments: During the period covered by the report, there have not been any amendments to the provisions of the code of ethics.
(d) Waivers: During the period covered by the report, the registrant has not granted any express or implicit waivers from the provisions of the code of ethics.
(e) Posting: We do not intend to post the Code of Ethics for the Officers or any amendments or waivers on a website.
(f) Availability: The Code of Ethics for the Officers can be obtained, free of charge by calling the toll free number for the appropriate Fund.
Item 3. Audit Committee Financial Expert.
(a) The registrant has an Audit committee currently composed of three independent Trustees, Mr. Alan Ross, Mr. John Mulder and Mr. Richard Copeland. The registrant’s board of trustees has determined that Mr. Alan Ross is qualified to serve as an Audit Committee Financial Expert, and has designated him as such.
Item 4. Principal Accountant Fees and Services.
| | |
The Timothy Plan |
FY 2019 | | $175,500 |
FY 2018 | | $175,500 |
FY 2017 | | $175,500 |
FY 2016 | | $170,900 |
FY 2015 | | $168,900 |
FY 2014 | | $168,400 |
-2-
| | | | |
| The Timothy Plan | | Registrant | | Adviser |
FY 2019 | | $0 | | $0 |
FY 2018 | | $ 0 | | $0 |
FY 2017 | | $ 0 | | $ 0 |
FY 2016 | | $ 0 | | $ 0 |
FY 2014 | | $ 0 | | $ 0 |
FY 2015 | | $ 0 | | $ 0 |
| | |
| The Timothy Plan |
FY 2019 | | $ 0 |
FY 2018 | | $ 0 |
FY 2017 | | $ 0 |
FY 2016 | | $ 0 |
FY 2015 | | $ 0 |
FY 2014 | | $ 0 |
Nature of the preparation of the 1120 RIC
fees:
| | |
(d) | | All Other Fees |
| | Registrant |
| | |
| The Timothy Plan |
FY 2019 | | $ 0 |
FY 2018 | | $ 0 |
FY 2017 | | $ 0 |
FY 2016 | | $ 0 |
FY 2015 | | $ 0 |
FY 2014 | | $ 0 |
| | | | | | |
(e) | | | (1) | | | Audit Committee’sPre-Approval Policies |
The Audit Committee Charter requires the Audit Committee to be responsible for the selection, retention or termination of auditors and, in connection therewith, to (i) evaluate the proposed fees and other compensation, if any, to be paid to the auditors, (ii) evaluate the independence of the auditors,(iii) pre-approve all audit services and, when appropriate, anynon-audit services provided by the independent auditors to the Trust,(iv) pre-approve, when appropriate, anynon-audit services provided by the independent auditors to the Trust’s investment adviser, or any entity controlling, controlled by, or under common control with the investment adviser and that provides ongoing services to the Trust if the engagement relates directly to the operations and financial reporting of the Trust, and (v) receive the auditors’ specific representations as to their independence;
| | (2) | Percentages of Services Approved by the Audit Committee |
-3-
| | |
Audit-Related Fees: | | 0 % |
Tax Fees: | | 0 % |
All Other Fees: | | 0 % |
(f) During audit of registrant’s financial statements for the most recent fiscal year, less than 50 percent of the hours expended on the principal accountant’s engagement were attributed to work performed by persons other than the principal accountant’s full-time, permanent employees.
(g) The aggregatenon-audit fees billed by the registrant’s accountant for services rendered to the registrant, and rendered to the registrant’s investment adviser (not including anysub-adviser whose role is primarily portfolio management and is subcontracted with or overseen by another investment adviser), and any entity controlling, controlled by, or under common control with the adviser that provides ongoing services to the registrant:
| | | | | | | | |
Registrant Adviser | |
FY 2019 | | | $0 | | | | $0 | |
FY 2018 | | | $0 | | | | $0 | |
FY 2017 | | | $0 | | | | $0 | |
FY 2016 | | | $0 | | | | $0 | |
FY 2015 | | | $0 | | | | $0 | |
FY 2014 | | | $0 | | | | $0 | |
(h) Not applicable. The auditor performed no services for the registrant’s investment adviser or any entity controlling, controlled by, or under common control with the investment adviser that provides ongoing services to the registrant.
Item 5. Audit Committee of Listed Companies. Not applicable.
Item 6. Schedule of Investments. Not applicable – schedule filed with Item 1.
Item 7. Disclosure of Proxy Voting Policies and Procedures forClosed-End Funds. Not applicable.
Item 8. Portfolio Managers ofClosed-End Management Investment Companies. Not applicable.
Item 9. Purchases of Equity Securities byClosed-End Management Investment Company and Affiliated Purchasers. Not applicable.
Item 10. Submission of Matters to a Vote of Security Holders
The registrant has not adopted procedures by which shareholders may recommend nominees to the registrant’s board of trustees.
Item 11. Controls and Procedures.
(a) Based on an evaluation of the registrant’s disclosure controls and procedures as of November 19, 2010, the disclosure controls and procedures are reasonably designed to ensure that the information required in filings on FormsN-CSR is recorded, processed, summarized, and reported on a timely basis.
-4-
(b) There were no significant changes in the registrant’s internal control over financial reporting that occurred during the registrant’s second fiscal quarter of the period covered by this report that has materially affected, or is reasonably likely to materially affect, the registrant’s internal control over financial reporting.
Item 12. Disclosure of Securities Lending Activities forClosed-End Management Investment Companies.Not applicable.
Item 13. Exhibits.
| (a)(1) | Code is filed herewith |
| (a)(2) | Certifications by the registrant’s principal executive officer and principal financial officer, pursuant to Section 302 of the Sarbanes- Oxley Act of 2002 and required byRule 30a-2 under the Investment Company Act of 1940 are filed herewith. |
| (b) | Certification pursuant to 18 U.S.C. Section 1350, as adopted pursuant to Section 906 of the Sarbanes-Oxley Act of 2002 is filed herewith. |
-5-
SIGNATURES
Pursuant to the requirements of the Securities Exchange Act of 1934 and the Investment Company Act of 1940, the registrant has duly caused this report to be signed on its behalf by the undersigned, thereunto duly authorized.
(Registrant) The Timothy Plan
| | | | |
By | | /s/ Arthur D. Ally | | |
| | Arthur D. Ally, President/Principle Executive Officer & Treasurer/Principle Financial Officer |
| | |
Date | | 11/27/19 | | |
Pursuant to the requirements of the Securities Exchange Act of 1934 and the Investment Company Act of 1940, this report has been signed below by the following persons on behalf of the registrant and in the capacities and on the dates indicated.
| | | | |
By | | /s/ Arthur D. Ally | | |
| | Arthur D. Ally, President/Principle Executive Officer & Treasurer/Principle Financial Officer |
| | |
Date | | 11/27/19 | | |
-6-