UNITED STATES
SECURITIES AND EXCHANGE COMMISSION
Washington, D.C. 20549
FORMN-CSR
CERTIFIED SHAREHOLDER REPORT OF REGISTERED
MANAGEMENT INVESTMENT COMPANIES
Investment Company Act file number 811-08228
Timothy Plan
(Exact name of registrant as specified in charter)
1055 Maitland Center Commons, Maitland, FL 32751
(Address of principal executive offices) (Zip code)
Citi Fund Services Ohio, Inc., 4400 Easton Commons, Suite 200, Columbus, OH 43219-8000
(Name and address of agent for service)
Registrant’s telephone number, including area code: 800-846-7526
Date of fiscal year end:December 31
Date of reporting period:December 31, 2019
Item 1. Reports to Stockholders.

ANNUAL REPORT
December 31, 2019
| | |
| | Ticker
Symbol |
| |
| TIMOTHY PLAN US SMALL CAP CORE ETF | | TPSC |
| |
| TIMOTHY PLAN US LARGE CAP CORE ETF | | TPLC |
| |
| TIMOTHY PLAN HIGH DIVIDEND STOCK ETF | | TPHD |
| |
| TIMOTHY PLAN INTERNATIONAL ETF | | TPIF |
Listed and traded on: The New York Stock Exchange
Beginning on January 1, 2021, as permitted by regulations adopted by the Securities and Exchange Commission (the “SEC”), paper copies of the Fund’s shareholder reports like this one will no longer be sent by mail, unless you specifically request paper copies of the reports. Instead, the reports will be made available on the Fund’s website www.timothyplan.com, and you will be notified by mail each time a report is posted and provided with a website link to access the report.
If you already elected to receive shareholder reports electronically, you will not be affected by this change and you need not take any action. You may elect to receive shareholder reports and other communications from the Fund electronically or to continue receiving paper copies of shareholder reports, which are available free of charge, by contacting your financial intermediary (such as a broker-dealer or bank) or, if you are a direct investor, by following the instructions included with paper Fund documents that have been mailed to you.
Table of Contents
December 31, 2019
Dear Timothy Plan ETF Shareholder:
Timothy Partners, Ltd. is pleased to have added four (4) Exchange Traded Funds (“ETFs”) to our Timothy Plan Mutual Fund Family (TPLC and TPHD were launched5-1-19 and TPSC and TPIF were added12-3-19).
Although the markets have been rather mixed during this period, we believe our strategy as implemented by oursub-advisor, Victory Capital Management (“VCM”), with our Biblically Responsible screens and VCM’s smart beta index management style have thus far proven to be very competitive in these various markets. Our returns were 9.01% and 9.00% from inception to December 31, 2019 in the US Large Cap Core and High Dividend Stock ETFs, respectively, compared to the Victory US Large Cap Volatility Weighted BRI Index at 9.39% return and the Victory US Large Cap High Yield Dividend Volatility Weighted BRI Index at 9.38%. The other two ETFs, the US Small Cap Core and International ETFs were available for less than a month, and although they were both showing positive results, it is too early to characterize their performance patterns. In all four ETFs the smart beta strategy utilized by oursub-advisor for the past few years will continue to be employed. ETF’s are designed to mimic their indexes, so future performance will align with Index performance.
As you know, no one can predict future events or investment results, nevertheless we believe you will be pleased with our performance over full market cycles. Please review VCM’s report that follows for more detailed information.
Thank you for your convictions that led you to become part of the Timothy Plan Family of Funds.
Sincerely,
Arthur D. Ally, President
1
Timothy Plan US Large Cap Core ETF – TPLC
Letter from the Manager – December 31, 2019
The Timothy Plan US Large Cap Core ETF (“Fund”) seeks to provide investment results that track the performance of the Victory US Large Cap Volatility Weighted BRI Index (“Index”) before fees and expenses.
Since the inception date of May 1, 2019 through December 31, 2019, the Fund returned 9.01% compared to the Index’s return of 9.39%. The primary difference in performance versus the underlying benchmark can be attributed to underlying fund fees.
When comparing performance relative to a broadmarket-cap based Index, such as the S&P 500, Industrials and Consumer Discretionary sectors contributed positively to the Funds relative performance. Information Technology and Health Care detracted from performance relative to the S&P 500. Underweights to the top 10 companies within the S&P 500, which accounted for 24% of its composition, was a key driver in relative underperformance.
VICTORY CAPITAL MANAGEMENT, INC.
2
Timothy Plan High Dividend Stock ETF – TPHD
Letter from the Manager – December 31, 2019
The Timothy Plan High Dividend Stock ETF (“Fund”) seeks to provide investment results that track the performance of the Victory US Large Cap High Dividend Volatility Weighted BRI Index (“Index”) before fees and expenses.
Since the inception date of May 1, 2019 through December 31, 2019, the Fund returned 9.00% compared to the Index’s return of 9.38%. The primary difference in performance versus the underlying benchmark can be attributed to underlying fund fees.
When comparing performance relative to a broadmarket-cap based Index such as the Russell 1000 Value, the Utilities and Financials sectors contributed positively to the Funds relative performance. Materials and Consumer Discretionary sectors detracted from performance relative to the Russell 1000 Value. Positive stock selection within the top quartile of the highest yields stocks was a key factor in outperformance relative to the Russell 1000 Value.
VICTORY CAPITAL MANAGEMENT, INC.
3
Fund Performance - (Unaudited)
December 31, 2019
Timothy Plan US Large Cap Core ETF
| | | | | | |
Average Annual Return Period Ended December 31, 2019 |
| Inception Date | | Timothy Plan US Large Cap Core ETF
4/30/19 | | |
| | | | | | | Victory US Large Cap
Volatility Weighted BRI |
| | | Net Asset Value | | Market Price Value | | Index |
Since Inception | | 9.01% | | 9.04% | | 9.39% |
| | |
Expense Ratios |
Gross | | 0.52% |
Past performance is not indicative of future results. The performance data quoted represents past performance and current returns may be lower or higher. The investment return and principal value will fluctuate so that an investor’s shares, when redeemed, may be worth more or less than the original cost. To obtain performance information current to the most recent month’s end, please visit www.timothyplan.com.
The above expense ratios are from the Fund’s prospectus dated April 29, 2019 (as amended on December 2, 2019). Additional information pertaining to the Fund’s expense ratios as of December 31, 2019 can be found in the financial highlights.
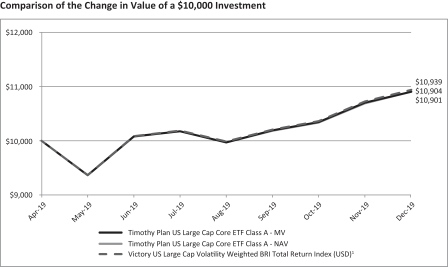
| 1 | The Victory US Large Cap Volatility Weighted BRI Total Return Index is comprised of the 500 largest U.S. companies by market capitalization with positive earnings in each of the four most recent quarters. |
The graph reflects investment growth of a hypothetical $10,000 investment of the Fund.Past performance is no guarantee of future results.
4
Timothy Plan High Dividend Stock ETF
| | | | | | |
Average Annual Return Period Ended December 31, 2019 |
| Inception Date | | Timothy Plan High Dividend Stock ETF
4/30/19 | | |
| | | | | | | Victory US Large Cap High
Dividend Volatility |
| | | Net Asset Value | | Market Price Value | | Weighted BRI Index |
Since Inception | | 9.00% | | 9.01% | | 9.38% |
| | |
Expense Ratios |
Gross | | 0.52% |
Past performance is not indicative of future results. The performance data quoted represents past performance and current returns may be lower or higher. The investment return and principal value will fluctuate so that an investor’s shares, when redeemed, may be worth more or less than the original cost. To obtain performance information current to the most recent month’s end, please visit www.timothyplan.com.
The above expense ratios are from the Fund’s prospectus dated April 29, 2019 (as amended on December 2, 2019). Additional information pertaining to the Fund’s expense ratios as of December 31, 2019 can be found in the financial highlights.
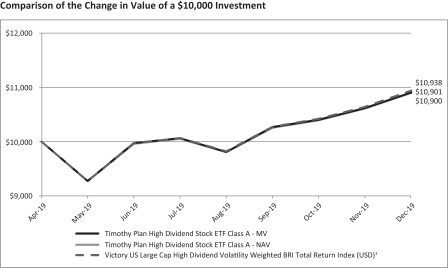
| 1 | The Victory US Large Cap High Dividend Volatility Weighted BRI Total Return Index is comprised of the largest 100 dividend yielding stocks among the largest U.S. companies by market capitalization from the Victory US Large Cap Volatility Weighted BRI Index, with positive earnings in each of the four most recent quarters. |
The graph reflects investment growth of a hypothetical $10,000 investment of the Fund.Past performance is no guarantee of future results.
5
| | |
| | | Schedule of Portfolio Investments |
Timothy Plan US Small Cap Core ETF | | December 31, 2019 |
| | | | | | | | | | | | |
| SECURITY DESCRIPTION | | SHARES | | | | | | VALUE ($) | |
Common Stocks (99.8%) | | | | | | | | | | | | |
| | | |
Communication Services (1.6%): | | | | | | | | | | | | |
Cogent Communications Holdings, Inc. | | | 480 | | | | | | | | 31,589 | |
Fluent, Inc.(a) | | | 3,704 | | | | | | | | 9,260 | |
MSG Networks, Inc.(a) | | | 1,152 | | | | | | | | 20,045 | |
QuinStreet, Inc.(a) | | | 1,040 | | | | | | | | 15,922 | |
Shenandoah Telecommunication Co. | | | 720 | | | | | | | | 29,960 | |
Techtarget, Inc.(a) | | | 688 | | | | | | | | 17,957 | |
Telephone & Data Systems, Inc. | | | 752 | | | | | | | | 19,123 | |
The Meet Group, Inc.(a) | | | 3,064 | | | | | | | | 15,351 | |
| | | |
| | | | | | | | | | | 159,207 | |
| | | |
Consumer Discretionary (13.4%): | | | | | | | | | | | | |
Acushnet Holdings Corp. | | | 1,072 | | | | | | | | 34,840 | |
American Public Education, Inc.(a) | | | 736 | | | | | | | | 20,159 | |
America’sCar-Mart, Inc.(a) | | | 248 | | | | | | | | 27,196 | |
Asbury Automotive Group, Inc.(a) | | | 264 | | | | | | | | 29,513 | |
At Home Group, Inc.(a) | | | 704 | | | | | | | | 3,872 | |
Bloomin’ Brands, Inc. | | | 1,088 | | | | | | | | 24,012 | |
Boot Barn Holdings, Inc.(a) | | | 400 | | | | | | | | 17,812 | |
Brinker International, Inc. | | | 512 | | | | | | | | 21,504 | |
Cavco Industries, Inc.(a) | | | 80 | | | | | | | | 15,630 | |
Century Communities, Inc.(a) | | | 664 | | | | | | | | 18,160 | |
Cheesecake Factory, Inc. | | | 664 | | | | | | | | 25,803 | |
Conn’s, Inc.(a) | | | 520 | | | | | | | | 6,443 | |
Dave & Buster’s | | | 416 | | | | | | | | 16,711 | |
del Taco Restaurants, Inc.(a) | | | 2,344 | | | | | | | | 18,529 | |
Denny’s Corp.(a) | | | 1,520 | | | | | | | | 30,218 | |
Dine Brands Global, Inc. | | | 264 | | | | | | | | 22,049 | |
Dorman Products, Inc.(a) | | | 248 | | | | | | | | 18,779 | |
Fox Factory Holding Corp.(a) | | | 344 | | | | | | | | 23,932 | |
Funko, Inc.(a) | | | 680 | | | | | | | | 11,669 | |
Garrett Motion, Inc.(a) | | | 1,616 | | | | | | | | 16,144 | |
See notes to financial statements.
6
| | |
| | | Schedule of Portfolio Investments — continued |
Timothy Plan US Small Cap Core ETF | | December 31, 2019 |
| | | | | | | | | | | | |
| SECURITY DESCRIPTION | | SHARES | | | | | | VALUE ($) | |
Consumer Discretionary (continued) | | | | | | | | | | | | |
G-III Apparel Group, Ltd.(a) | | | 464 | | | | | | | | 15,544 | |
Group 1 Automotive, Inc. | | | 240 | | | | | | | | 24,000 | |
Haverty Furniture Cos., Inc. | | | 944 | | | | | | | | 19,031 | |
Hilton Grand Vacations(a) | | | 632 | | | | | | | | 21,734 | |
Hooker Furniture Corp. | | | 728 | | | | | | | | 18,702 | |
Installed Building Products(a) | | | 320 | | | | | | | | 22,038 | |
iRobot Corp.(a) | | | 248 | | | | | | | | 12,556 | |
Jack In The Box, Inc. | | | 256 | | | | | | | | 19,976 | |
KB Home | | | 656 | | | | | | | | 22,481 | |
La Z Boy, Inc. | | | 616 | | | | | | | | 19,392 | |
LCI Industries | | | 224 | | | | | | | | 23,997 | |
LGI Homes, Inc.(a) | | | 232 | | | | | | | | 16,391 | |
M/I Homes, Inc.(a) | | | 576 | | | | | | | | 22,666 | |
Malibu Boats, Inc.(a) | | | 512 | | | | | | | | 20,966 | |
MarineMax, Inc.(a) | | | 984 | | | | | | | | 16,423 | |
Mastercraft Boat Holdings, Inc.(a) | | | 880 | | | | | | | | 13,860 | |
MDC Holdings, Inc. | | | 576 | | | | | | | | 21,980 | |
Meritage Corp.(a) | | | 272 | | | | | | | | 16,622 | |
Modine Manufacturing Co.(a) | | | 1,336 | | | | | | | | 10,287 | |
Monro, Inc. | | | 280 | | | | | | | | 21,896 | |
Movado Group, Inc. | | | 568 | | | | | | | | 12,348 | |
Murphy USA, Inc.(a) | | | 328 | | | | | | | | 38,375 | |
Oxford Industries, Inc. | | | 320 | | | | | | | | 24,134 | |
PetMed Express, Inc. | | | 832 | | | | | | | | 19,568 | |
Rent-A-Center, Inc. | | | 760 | | | | | | | | 21,918 | |
RH(a) | | | 80 | | | | | | | | 17,080 | |
Ruth’s Hospitality Group, Inc. | | | 1,624 | | | | | | | | 35,347 | |
Sally Beauty Holdings, Inc.(a) | | | 976 | | | | | | | | 17,812 | |
Shoe Carnival, Inc. | | | 392 | | | | | | | | 14,614 | |
Sonic Automotive, Inc. | | | 472 | | | | | | | | 14,632 | |
Stamps.com, Inc.(a) | | | 80 | | | | | | | | 6,682 | |
Standard Motor Products | | | 528 | | | | | | | | 28,100 | |
See notes to financial statements.
7
| | |
| | | Schedule of Portfolio Investments — continued |
Timothy Plan US Small Cap Core ETF | | December 31, 2019 |
| | | | | | | | | | | | |
| SECURITY DESCRIPTION | | SHARES | | | | | | VALUE ($) | |
Consumer Discretionary (continued) | | | | | | | | | | | | |
Steven Madden, Ltd. | | | 616 | | | | | | | | 26,495 | |
Stitch Fix, Inc.(a) | | | 520 | | | | | | | | 13,343 | |
Stoneridge, Inc.(a) | | | 760 | | | | | | | | 22,283 | |
Sturm Ruger & Co. | | | 456 | | | | | | | | 21,446 | |
Tailored Brands, Inc. | | | 2,008 | | | | | | | | 8,313 | |
Taylor Morrison Home Corp.(a) | | | 944 | | | | | | | | 20,636 | |
The Buckle, Inc. | | | 776 | | | | | | | | 20,983 | |
The Children’s Place, Inc. | | | 192 | | | | | | | | 12,004 | |
The Michaels Cos., Inc.(a) | | | 1,088 | | | | | | | | 8,802 | |
Tilly’s, Inc. | | | 1,360 | | | | | | | | 16,660 | |
Tri Pointe Group, Inc.(a) | | | 1,592 | | | | | | | | 24,804 | |
Tupperware Corp. | | | 776 | | | | | | | | 6,658 | |
Visteon Corp.(a) | | | 144 | | | | | | | | 12,469 | |
William Lyon Homes, Inc.(a) | | | 904 | | | | | | | | 18,062 | |
Wingstop, Inc. | | | 280 | | | | | | | | 24,144 | |
Winnebago Industries, Inc. | | | 464 | | | | | | | | 24,583 | |
Wolverine World Wide, Inc. | | | 720 | | | | | | | | 24,293 | |
Yeti Holdings, Inc.(a) | | | 360 | | | | | | | | 12,521 | |
Zumiez, Inc.(a) | | | 464 | | | | | | | | 16,027 | |
| | | |
| | | | | | | | | | | 1,368,653 | |
| |
Consumer Staples (4.2%): | | | | |
B&G Foods, Inc. | | | 1,152 | | | | | | | | 20,655 | |
Central Garden And Pet Co.(a) | | | 528 | | | | | | | | 15,502 | |
elf Beauty, Inc.(a) | | | 744 | | | | | | | | 12,001 | |
Hostess Brands, Inc.(a) | | | 2,368 | | | | | | | | 34,430 | |
Ingles Markets, Inc. | | | 656 | | | | | | | | 31,167 | |
Inter Parfums, Inc. | | | 384 | | | | | | | | 27,921 | |
John B. Sanfilippo & Son, Inc. | | | 264 | | | | | | | | 24,098 | |
Lifevantage Corp.(a) | | | 992 | | | | | | | | 15,485 | |
Medifast, Inc. | | | 192 | | | | | | | | 21,039 | |
National Beverage Corp.(a) | | | 336 | | | | | | | | 17,143 | |
See notes to financial statements.
8
| | |
| | | Schedule of Portfolio Investments — continued |
Timothy Plan US Small Cap Core ETF | | December 31, 2019 |
| | | | | | | | | | | | |
| SECURITY DESCRIPTION | | SHARES | | | | | | VALUE ($) | |
Consumer Staples (continued) | | | | | | | | | | | | |
PriceSmart, Inc. | | | 256 | | | | | | | | 18,181 | |
Sprouts Farmers Market, Inc.(a) | | | 1,456 | | | | | | | | 28,174 | |
The Chefs’ Warehouse, Inc.(a) | | | 680 | | | | | | | | 25,915 | |
The Simply Good Foods Co.(a) | | | 888 | | | | | | | | 25,344 | |
Tootsie Roll Industries, Inc. | | | 968 | | | | | | | | 33,048 | |
Usana Health Sciences, Inc.(a) | | | 224 | | | | | | | | 17,595 | |
WD-40 Co. | | | 176 | | | | | | | | 34,169 | |
Weis Markets, Inc. | | | 816 | | | | | | | | 33,039 | |
| | | |
| | | | | | | | | | | 434,906 | |
| |
Energy (3.2%): | | | | |
Apergy Corp.(a) | | | 640 | | | | | | | | 21,619 | |
Arch Coal, Inc. | | | 232 | | | | | | | | 16,644 | |
Archrock, Inc. | | | 1,808 | | | | | | | | 18,152 | |
Cactus, Inc. | | | 632 | | | | | | | | 21,691 | |
CONSOL Energy, Inc.(a) | | | 1,240 | | | | | | | | 17,992 | |
Core Laboratories N.V. | | | 352 | | | | | | | | 13,260 | |
Delek US Holdings, Inc. | | | 448 | | | | | | | | 15,021 | |
Falcon Minerals Corp. | | | 2,400 | | | | | | | | 16,944 | |
Gulfport Energy Corp.(a) | | | 3,632 | | | | | | | | 11,041 | |
Liberty Oilfield Services, Inc. | | | 1,432 | | | | | | | | 15,924 | |
Magnolia Oil & Gas Corp.(a) | | | 1,744 | | | | | | | | 21,940 | |
Matrix Service Co.(a) | | | 896 | | | | | | | | 20,500 | |
Murphy Oil Corp. | | | 744 | | | | | | | | 19,939 | |
Newpark Resources, Inc.(a) | | | 1,968 | | | | | | | | 12,339 | |
Peabody Energy Corp. | | | 960 | | | | | | | | 8,755 | |
Propetro Holding Corp.(a) | | | 1,256 | | | | | | | | 14,130 | |
Rex American Resources Corp.(a) | | | 272 | | | | | | | | 22,293 | |
Solaris Oilfield Infrast | | | 1,296 | | | | | | | | 18,144 | |
World Fuel Services Corp. | | | 536 | | | | | | | | 23,274 | |
| | | |
| | | | | | | | | | | 329,602 | |
See notes to financial statements.
9
| | |
| | | Schedule of Portfolio Investments — continued |
Timothy Plan US Small Cap Core ETF | | December 31, 2019 |
| | | | | | | | | | | | |
| SECURITY DESCRIPTION | | SHARES | | | | | | VALUE ($) | |
Financials (24.7%): | | | | | | | | | | | | |
Ameris BanCorp | | | 624 | | | | | | | | 26,545 | |
Amerisafe, Inc. | | | 624 | | | | | | | | 41,202 | |
Artisan Partners Asset Management, Inc., Class A | | | 952 | | | | | | | | 30,769 | |
Atlantic Union Bankshares | | | 664 | | | | | | | | 24,933 | |
Axos Financial, Inc.(a) | | | 712 | | | | | | | | 21,559 | |
Bancfirst Corp. | | | 552 | | | | | | | | 34,467 | |
BancorpSouth Bank | | | 968 | | | | | | | | 30,405 | |
Banner Corp. | | | 480 | | | | | | | | 27,163 | |
Berkshire Hills BanCorp, Inc. | | | 856 | | | | | | | | 28,145 | |
Brookline BanCorp, Inc. | | | 2,216 | | | | | | | | 36,475 | |
Cannae Holdings, Inc.(a) | | | 1,032 | | | | | | | | 38,380 | |
Capitol Federal Financial, Inc. | | | 2,728 | | | | | | | | 37,455 | |
Cathay General BanCorp | | | 808 | | | | | | | | 30,744 | |
Centerstate Banks, Inc. | | | 1,168 | | | | | | | | 29,177 | |
City Holding Co. | | | 408 | | | | | | | | 33,436 | |
Cohen & Steers, Inc. | | | 584 | | | | | | | | 36,651 | |
Columbia Banking System, Inc. | | | 720 | | | | | | | | 29,293 | |
Columbia Financial, Inc.(a) | | | 2,568 | | | | | | | | 43,503 | |
CVB Financial Corp. | | | 1,512 | | | | | | | | 32,629 | |
Employers Holdings, Inc. | | | 784 | | | | | | | | 32,732 | |
Enterprise Financial Services Corp. | | | 640 | | | | | | | | 30,854 | |
FB Financial Corp. | | | 712 | | | | | | | | 28,188 | |
FBL Financial Group, Inc., Class A | | | 520 | | | | | | | | 30,644 | |
First BanCorp. | | | 2,496 | | | | | | | | 26,433 | |
First Busey Corp. | | | 1,216 | | | | | | | | 33,440 | |
First Commonwealth Financial Corp. | | | 2,336 | | | | | | | | 33,895 | |
First Financial BanCorp. | | | 1,096 | | | | | | | | 27,882 | |
First Interstate Bancsys | | | 816 | | | | | | | | 34,207 | |
First Merchants Corp. | | | 672 | | | | | | | | 27,948 | |
First Midwest BanCorp, Inc. | | | 1,416 | | | | | | | | 32,653 | |
First Source | | | 664 | | | | | | | | 34,448 | |
Fulton Financial Corp. | | | 1,976 | | | | | | | | 34,442 | |
See notes to financial statements.
10
| | |
| | | Schedule of Portfolio Investments — continued |
Timothy Plan US Small Cap Core ETF | | December 31, 2019 |
| | | | | | | | | | | | |
| SECURITY DESCRIPTION | | SHARES | | | | | | VALUE ($) | |
Financials (continued) | | | | | | | | | | | | |
Great Western BanCorp, Inc. | | | 752 | | | | | | | | 26,124 | |
Heartland Financial USA, Inc. | | | 568 | | | | | | | | 28,252 | |
Hilltop Holdings, Inc. | | | 1,192 | | | | | | | | 29,717 | |
Home Bancshares, Inc. | | | 1,264 | | | | | | | | 24,850 | |
Hope BanCorp, Inc. | | | 1,712 | | | | | | | | 25,440 | |
Houlihan Lokey, Inc. | | | 688 | | | | | | | | 33,623 | |
Independent Bank Group, Inc. | | | 504 | | | | | | | | 27,942 | |
International Bancshares Corp. | | | 688 | | | | | | | | 29,632 | |
James River Group Holdings Ltd. | | | 1,000 | | | | | | | | 41,210 | |
Kearny Financial Corp. | | | 2,880 | | | | | | | | 39,830 | |
Kinsale Capital Group, Inc. | | | 240 | | | | | | | | 24,398 | |
Lakeland Financial Corp. | | | 712 | | | | | | | | 34,838 | |
Meta Financial Group, Inc. | | | 552 | | | | | | | | 20,154 | |
Moelis & Co. | | | 696 | | | | | | | | 22,216 | |
National General Holdings Corp. | | | 1,320 | | | | | | | | 29,172 | |
Navient Corp. | | | 1,848 | | | | | | | | 25,281 | |
NBT BanCorp, Inc. | | | 920 | | | | | | | | 37,315 | |
Nelnet, Inc. | | | 528 | | | | | | | | 30,750 | |
NMI Holdings, Inc.(a) | | | 784 | | | | | | | | 26,013 | |
Northwest Bancshares, Inc. | | | 2,472 | | | | | | | | 41,110 | |
Oceanfirst Financial Corp. | | | 1,360 | | | | | | | | 34,734 | |
Old National BanCorp | | | 1,824 | | | | | | | | 33,361 | |
Pacific Premier BanCorp, Inc. | | | 744 | | | | | | | | 24,258 | |
Park National Corp. | | | 304 | | | | | | | | 31,124 | |
Pennymac Financial Services | | | 912 | | | | | | | | 31,044 | |
PRA Group, Inc.(a) | | | 752 | | | | | | | | 27,298 | |
Provident Financial Services, Inc. | | | 1,400 | | | | | | | | 34,510 | |
Renasant Corp. | | | 744 | | | | | | | | 26,352 | |
S&T BanCorp, Inc. | | | 832 | | | | | | | | 33,521 | |
Safety Insurance Group, Inc. | | | 352 | | | | | | | | 32,571 | |
Sandy Spring BanCorp | | | 864 | | | | | | | | 32,728 | |
Seacoast Banking Corp.(a) | | | 1,024 | | | | | | | | 31,304 | |
See notes to financial statements.
11
| | |
| | | Schedule of Portfolio Investments — continued |
Timothy Plan US Small Cap Core ETF | | December 31, 2019 |
| | | | | | | | | | | | |
| SECURITY DESCRIPTION | | SHARES | | | | | | VALUE ($) | |
Financials (continued) | | | | | | | | | | | | |
Servisfirst Bancshares, Inc. | | | 776 | | | | | | | | 29,240 | |
Simmons First National Corp., Class A | | | 1,056 | | | | | | | | 28,290 | |
South State Corp. | | | 368 | | | | | | | | 31,924 | |
Southside Bancshares, Inc. | | | 920 | | | | | | | | 34,169 | |
Texas Capital Bancshares, Inc.(a) | | | 376 | | | | | | | | 21,346 | |
Tompkins Financial Corp. | | | 368 | | | | | | | | 33,672 | |
Towne Bank | | | 1,080 | | | | | | | | 30,046 | |
Trico Bancshares | | | 920 | | | | | | | | 37,546 | |
Trustmark Corp. | | | 872 | | | | | | | | 30,093 | |
United Community Banks, Inc. | | | 912 | | | | | | | | 28,163 | |
Veritex Holdings, Inc. | | | 1,088 | | | | | | | | 31,693 | |
Waddell & Reed Financial | | | 1,600 | | | | | | | | 26,752 | |
Walker & Dunlop, Inc. | | | 408 | | | | | | | | 26,389 | |
Washington Federal, Inc. | | | 872 | | | | | | | | 31,959 | |
WesBanco, Inc. | | | 784 | | | | | | | | 29,627 | |
Westamerica BanCorp. | | | 544 | | | | | | | | 36,867 | |
WSFS Financial Corp. | | | 648 | | | | | | | | 28,506 | |
| | | |
| | | | | | | | | | | 2,507,651 | |
| |
Health Care (8.2%): | | | | |
Addus Homecare Corp.(a) | | | 248 | | | | | | | | 24,111 | |
AMN Healthcare Services, Inc.(a) | | | 400 | | | | | | | | 24,924 | |
ANI Pharmaceuticals, Inc.(a) | | | 320 | | | | | | | | 19,734 | |
Anika Therapeutics, Inc.(a) | | | 240 | | | | | | | | 12,444 | |
Atrion Corp. | | | 40 | | | | | | | | 30,060 | |
Biolife Solutions, Inc.(a) | | | 768 | | | | | | | | 12,426 | |
Biospecifics Technologies Corp.(a) | | | 416 | | | | | | | | 23,687 | |
Biotelemetry, Inc.(a) | | | 456 | | | | | | | | 21,113 | |
Computer Programs & Systems | | | 888 | | | | | | | | 23,443 | |
CONMED Corp. | | | 304 | | | | | | | | 33,996 | |
Corcept Therapeutics, Inc.(a) | | | 1,048 | | | | | | | | 12,681 | |
CorVel Corp.(a) | | | 352 | | | | | | | | 30,751 | |
See notes to financial statements.
12
| | |
| | | Schedule of Portfolio Investments — continued |
Timothy Plan US Small Cap Core ETF | | December 31, 2019 |
| | | | | | | | | | | | |
| SECURITY DESCRIPTION | | SHARES | | | | | | VALUE ($) | |
Health Care (continued) | | | | | | | | | | | | |
Eagle Pharmaceuticals, Inc.(a) | | | 280 | | | | | | | | 16,822 | |
Enanta Pharmaceuticals, Inc.(a) | | | 256 | | | | | | | | 15,816 | |
Ensign Group, Inc. | | | 512 | | | | | | | | 23,229 | |
Healthstream, Inc.(a) | | | 1,136 | | | | | | | | 30,899 | |
Innoviva, Inc.(a) | | | 1,784 | | | | | | | | 25,262 | |
Inogen, Inc.(a) | | | 216 | | | | | | | | 14,759 | |
Integer Holdings Corp.(a) | | | 304 | | | | | | | | 24,451 | |
Iradimed Corp.(a) | | | 504 | | | | | | | | 11,784 | |
Lantheus Holdings, Inc.(a) | | | 792 | | | | | | | | 16,244 | |
Lemaitre Vascular, Inc. | | | 552 | | | | | | | | 19,844 | |
Medpace Holdings, Inc.(a) | | | 192 | | | | | | | | 16,140 | |
Meridian Bioscience, Inc. | | | 1,912 | | | | | | | | 18,680 | |
Merit Medical Systems, Inc.(a) | | | 544 | | | | | | | | 16,984 | |
National Healthcare Corp. | | | 440 | | | | | | | | 38,029 | |
Nextgen Healthcare, Inc.(a) | | | 1,072 | | | | | | | | 17,227 | |
Omnicell, Inc.(a) | | | 208 | | | | | | | | 16,998 | |
Patterson Cos., Inc. | | | 1,408 | | | | | | | | 28,836 | |
Phibro Animal Health Corp. | | | 600 | | | | | | | | 14,898 | |
Quidel Corp.(a) | | | 296 | | | | | | | | 22,209 | |
Select Medical Holdings Corp.(a) | | | 1,536 | | | | | | | | 35,850 | |
Simulations Plus, Inc. | | | 480 | | | | | | | | 13,954 | |
Staar Surgical Co.(a) | | | 464 | | | | | | | | 16,319 | |
Supernus Pharmaceuticals, Inc.(a) | | | 632 | | | | | | | | 14,991 | |
Tactile Systems Technology, Inc.(a) | | | 368 | | | | | | | | 24,844 | |
Tivity Health, Inc.(a) | | | 1,048 | | | | | | | | 21,322 | |
U.S. Physical Therapy, Inc. | | | 192 | | | | | | | | 21,955 | |
Utah Medical Products, Inc. | | | 208 | | | | | | | | 22,443 | |
| | | |
| | | | | | | | | | | 830,159 | |
| |
Industrials (23.6%): | | | | |
AAON, Inc. | | | 440 | | | | | | | | 21,740 | |
ABM Industries, Inc. | | | 744 | | | | | | | | 28,056 | |
Aerovironment, Inc.(a) | | | 296 | | | | | | | | 18,275 | |
See notes to financial statements.
13
| | |
| | | Schedule of Portfolio Investments — continued |
Timothy Plan US Small Cap Core ETF | | December 31, 2019 |
| | | | | | | | | | | | |
| SECURITY DESCRIPTION | | SHARES | | | | | | VALUE ($) | |
Industrials (continued) | | | | | | | | | | | | |
Aircastle, Ltd. | | | 1,272 | | | | | | | | 40,717 | |
Alamo Group, Inc. | | | 208 | | | | | | | | 26,114 | |
Albany International Corp. | | | 280 | | | | | | | | 21,258 | |
Allegiant Travel Co. | | | 192 | | | | | | | | 33,416 | |
Ameresco, Inc.(a) | | | 1,456 | | | | | | | | 25,480 | |
American Woodmark Corp.(a) | | | 216 | | | | | | | | 22,574 | |
Applied Industrial Technologies, Inc. | | | 432 | | | | | | | | 28,810 | |
Arcbest Corp. | | | 648 | | | | | | | | 17,885 | |
Astronics Corp.(a) | | | 504 | | | | | | | | 14,087 | |
Atkore International Group, Inc.(a) | | | 736 | | | | | | | | 29,779 | |
AZZ, Inc. | | | 664 | | | | | | | | 30,511 | |
Barnes Group, Inc. | | | 472 | | | | | | | | 29,245 | |
BMC Stock Holdings, Inc.(a) | | | 936 | | | | | | | | 26,854 | |
Brady Corp. | | | 592 | | | | | | | | 33,898 | |
Builders FirstSource, Inc.(a) | | | 888 | | | | | | | | 22,564 | |
Chart Industries, Inc.(a) | | | 304 | | | | | | | | 20,517 | |
Comfort Systems USA, Inc. | | | 440 | | | | | | | | 21,934 | |
Continental Bldg Prods, Inc.(a) | | | 752 | | | | | | | | 27,395 | |
DMC Global, Inc. | | | 248 | | | | | | | | 11,145 | |
DXP Enterprise, Inc.(a) | | | 376 | | | | | | | | 14,969 | |
Echo Global Logistics, Inc.(a) | | | 888 | | | | | | | | 18,382 | |
Encore Wire Corp. | | | 456 | | | | | | | | 26,174 | |
Energy Recovery, Inc.(a) | | | 1,608 | | | | | | | | 15,742 | |
EnerSys | | | 304 | | | | | | | | 22,748 | |
Ennis, Inc. | | | 1,528 | | | | | | | | 33,081 | |
ESCO Technologies, Inc. | | | 384 | | | | | | | | 35,521 | |
Federal Signal Corp. | | | 784 | | | | | | | | 25,284 | |
Forward Air Corp. | | | 440 | | | | | | | | 30,777 | |
Franklin Electric Co. | | | 528 | | | | | | | | 30,265 | |
GATX Corp. | | | 344 | | | | | | | | 28,500 | |
Gibraltar Industries, Inc.(a) | | | 664 | | | | | | | | 33,493 | |
GMS, Inc.(a) | | | 544 | | | | | | | | 14,732 | |
See notes to financial statements.
14
| | |
| | | Schedule of Portfolio Investments — continued |
Timothy Plan US Small Cap Core ETF | | December 31, 2019 |
| | | | | | | | | | | | |
| SECURITY DESCRIPTION | | SHARES | | | | | | VALUE ($) | |
Industrials (continued) | | | | | | | | | | | | |
Gorman-Rupp Co. | | | 736 | | | | | | | | 27,600 | |
H&E Equipment Services, Inc. | | | 664 | | | | | | | | 22,198 | |
Healthcare Services Group | | | 664 | | | | | | | | 16,148 | |
Heartland Express, Inc. | | | 1,320 | | | | | | | | 27,785 | |
Heidrick & Struggles International, Inc. | | | 576 | | | | | | | | 18,720 | |
Helios Technologies, Inc. | | | 352 | | | | | | | | 16,273 | |
Hillenbrand, Inc. | | | 720 | | | | | | | | 23,983 | |
HNI Corp. | | | 656 | | | | | | | | 24,574 | |
Hub Group, Inc., Class A(a) | | | 440 | | | | | | | | 22,568 | |
ICF International, Inc. | | | 384 | | | | | | | | 35,182 | |
Interface, Inc. | | | 1,272 | | | | | | | | 21,102 | |
Jeld-Wen Holding, Inc.(a) | | | 1,032 | | | | | | | | 24,159 | |
Kadant, Inc. | | | 288 | | | | | | | | 30,338 | |
Kaman Corp. | | | 520 | | | | | | | | 34,278 | |
Kennametal, Inc. | | | 664 | | | | | | | | 24,495 | |
Kimball International, Inc. | | | 1,224 | | | | | | | | 25,300 | |
Knoll, Inc. | | | 1,104 | | | | | | | | 27,887 | |
Kratos Defense & Security Solutions, Inc.(a) | | | 896 | | | | | | | | 16,137 | |
Marten Transport Ltd. | | | 920 | | | | | | | | 19,771 | |
Matson, Inc. | | | 624 | | | | | | | | 25,459 | |
Matthews International Corp., Class A | | | 520 | | | | | | | | 19,848 | |
McGrath Rentcorp | | | 392 | | | | | | | | 30,004 | |
Meritor, Inc.(a) | | | 976 | | | | | | | | 25,561 | |
Mesa Air Group, Inc.(a) | | | 1,816 | | | | | | | | 16,235 | |
Moog, Inc. | | | 280 | | | | | | | | 23,892 | |
MRC Global, Inc.(a) | | | 1,488 | | | | | | | | 20,296 | |
Mueller Industries, Inc. | | | 760 | | | | | | | | 24,130 | |
MYR Group, Inc.(a) | | | 576 | | | | | | | | 18,772 | |
National Presto Industries, Inc. | | | 264 | | | | | | | | 23,335 | |
Now, Inc.(a) | | | 1,664 | | | | | | | | 18,703 | |
NV5 Global, Inc.(a) | | | 176 | | | | | | | | 8,879 | |
Patrick Industries, Inc. | | | 352 | | | | | | | | 18,455 | |
See notes to financial statements.
15
| | |
| | | Schedule of Portfolio Investments — continued |
Timothy Plan US Small Cap Core ETF | | December 31, 2019 |
| | | | | | | | | | | | |
| SECURITY DESCRIPTION | | SHARES | | | | | | VALUE ($) | |
Industrials (continued) | | | | | | | | | | | | |
PGT Innovations, Inc.(a) | | | 1,024 | | | | | | | | 15,268 | |
Primoris Services Corp. | | | 1,208 | | | | | | | | 26,866 | |
Proto Labs, Inc.(a) | | | 144 | | | | | | | | 14,623 | |
Raven Industries, Inc. | | | 672 | | | | | | | | 23,157 | |
Regal Beloit Corp. | | | 392 | | | | | | | | 33,558 | |
Resources Connection, Inc. | | | 1,848 | | | | | | | | 30,178 | |
Rush Enterprises, Inc., Class A | | | 656 | | | | | | | | 30,504 | |
Ryder System, Inc. | | | 376 | | | | | | | | 20,421 | |
Saia, Inc.(a) | | | 200 | | | | | | | | 18,624 | |
Simpson Manufacturing Co., Inc. | | | 408 | | | | | | | | 32,734 | |
SkyWest, Inc. | | | 448 | | | | | | | | 28,954 | |
SP Plus Corp.(a) | | | 808 | | | | | | | | 34,284 | |
Spirit Airlines, Inc.(a) | | | 432 | | | | | | | | 17,414 | |
SPX Corp.(a) | | | 592 | | | | | | | | 30,121 | |
Standex International Corp. | | | 224 | | | | | | | | 17,774 | |
Steelcase, Inc., Class A | | | 1,160 | | | | | | | | 23,734 | |
Systemax, Inc. | | | 728 | | | | | | | | 18,316 | |
Tennant Co. | | | 288 | | | | | | | | 22,441 | |
The Greenbrier Cos., Inc. | | | 576 | | | | | | | | 18,680 | |
Thermon Group Holdings, Inc.(a) | | | 1,112 | | | | | | | | 29,802 | |
TriMas Corp.(a) | | | 1,088 | | | | | | | | 34,174 | |
Trinity Industries, Inc. | | | 1,080 | | | | | | | | 23,922 | |
Triton International Ltd. | | | 712 | | | | | | | | 28,622 | |
TrueBlue, Inc.(a) | | | 1,024 | | | | | | | | 24,637 | |
U.S. Ecology, Inc. | | | 392 | | | | | | | | 22,701 | |
Universal Forest Products, Inc. | | | 520 | | | | | | | | 24,804 | |
Universal Logistics Holdings, Inc. | | | 736 | | | | | | | | 13,955 | |
Valmont Industries, Inc. | | | 224 | | | | | | | | 33,551 | |
Vectrus, Inc.(a) | | | 312 | | | | | | | | 15,993 | |
Vicor Corp.(a) | | | 416 | | | | | | | | 19,436 | |
Wabash National Corp. | | | 1,592 | | | | | | | | 23,386 | |
Werner Enterprises, Inc. | | | 736 | | | | | | | | 26,783 | |
See notes to financial statements.
16
| | |
| | | Schedule of Portfolio Investments — continued |
Timothy Plan US Small Cap Core ETF | | December 31, 2019 |
| | | | | | | | | | | | |
| SECURITY DESCRIPTION | | SHARES | | | | | | VALUE ($) | |
Industrials (continued) | | | | | | | | | | | | |
WESCO International, Inc.(a) | | | 520 | | | | | | | | 30,883 | |
| | | |
| | | | | | | | | | | 2,424,289 | |
| |
Information Technology (10.8%): | | | | |
Advanced Energy Industries, Inc.(a) | | | 320 | | | | | | | | 22,784 | |
Anixter International, Inc.(a) | | | 296 | | | | | | | | 27,262 | |
AVX Corp. | | | 1,448 | | | | | | | | 29,641 | |
Axcelis Technologies, Inc.(a) | | | 968 | | | | | | | | 23,324 | |
Badger Meter, Inc. | | | 528 | | | | | | | | 34,282 | |
Belden, Inc. | | | 296 | | | | | | | | 16,280 | |
Benchmark Electronics, Inc. | | | 880 | | | | | | | | 30,236 | |
Brooks Automation, Inc. | | | 400 | | | | | | | | 16,784 | |
Cass Information Systems, Inc. | | | 576 | | | | | | | | 33,258 | |
Comtech Telecommunications Corp. | | | 520 | | | | | | | | 18,455 | |
CSG Systems International, Inc. | | | 472 | | | | | | | | 24,440 | |
CTS Corp. | | | 736 | | | | | | | | 22,087 | |
Digi International, Inc.(a) | | | 1,504 | | | | | | | | 26,651 | |
Diodes, Inc.(a) | | | 408 | | | | | | | | 22,999 | |
Ebix, Inc. | | | 392 | | | | | | | | 13,097 | |
eplus, Inc.(a) | | | 224 | | | | | | | | 18,881 | |
Evertec, Inc. | | | 680 | | | | | | | | 23,147 | |
Exlservice Holdings, Inc.(a) | | | 472 | | | | | | | | 32,785 | |
Fabrinet(a) | | | 312 | | | | | | | | 20,230 | |
FormFactor, Inc.(a) | | | 960 | | | | | | | | 24,931 | |
Greensky, Inc.(a) | | | 1,464 | | | | | | | | 13,030 | |
Ichor Holding Ltd.(a) | | | 664 | | | | | | | | 22,091 | |
II-VI, Inc.(a) | | | 504 | | | | | | | | 16,970 | |
Insight Enterprises, Inc.(a) | | | 408 | | | | | | | | 28,678 | |
Intelligent Systems Corp.(a) | | | 152 | | | | | | | | 6,071 | |
KEMET Corp. | | | 632 | | | | | | | | 17,096 | |
ManTech International Corp. | | | 416 | | | | | | | | 33,230 | |
Mesa Laboratories, Inc. | | | 64 | | | | | | | | 15,962 | |
See notes to financial statements.
17
| | |
| | | Schedule of Portfolio Investments — continued |
Timothy Plan US Small Cap Core ETF | | December 31, 2019 |
| | | | | | | | | | | | |
| SECURITY DESCRIPTION | | SHARES | | | | | | VALUE ($) | |
Information Technology (continued) | | | | | | | | | | | | |
Methode Electronics, Inc. | | | 576 | | | | | | | | 22,666 | |
MTS Systems Corp. | | | 552 | | | | | | | | 26,513 | |
Napco SEC System, Inc.(a) | | | 424 | | | | | | | | 12,461 | |
NIC, Inc. | | | 824 | | | | | | | | 18,416 | |
Onto Innovation, Inc.(a) | | | 472 | | | | | | | | 17,247 | |
OSI Systems, Inc.(a) | | | 232 | | | | | | | | 23,372 | |
Paysign, Inc.(a) | | | 656 | | | | | | | | 6,658 | |
PC Connection, Inc. | | | 408 | | | | | | | | 20,261 | |
Perficient, Inc.(a) | | | 616 | | | | | | | | 28,379 | |
Photronics, Inc.(a) | | | 1,816 | | | | | | | | 28,620 | |
Plexus Corp.(a) | | | 376 | | | | | | | | 28,929 | |
Power Integrations, Inc. | | | 224 | | | | | | | | 22,156 | |
Progress Software Corp. | | | 488 | | | | | | | | 20,276 | |
Rogers Corp.(a) | | | 96 | | | | | | | | 11,974 | |
ScanSource, Inc.(a) | | | 768 | | | | | | | | 28,378 | |
Semtech Corp.(a) | | | 336 | | | | | | | | 17,774 | |
Smart Global Holdings, Inc.(a) | | | 408 | | | | | | | | 15,480 | |
SPS Commerce, Inc.(a) | | | 424 | | | | | | | | 23,498 | |
Sykes Enterprises, Inc.(a) | | | 1,096 | | | | | | | | 40,542 | |
Ttec Holdings, Inc. | | | 496 | | | | | | | | 19,652 | |
Virtusa Corp.(a) | | | 424 | | | | | | | | 19,220 | |
Vishay Intertechnology, Inc. | | | 1,088 | | | | | | | | 23,164 | |
| | | |
| | | | | | | | | | | 1,110,318 | |
| |
Materials (7.7%): | | | | |
Advansix, Inc.(a) | | | 768 | | | | | | | | 15,329 | |
Allegheny Technologies, Inc.(a) | | | 872 | | | | | | | | 18,016 | |
American Vanguard Corp. | | | 1,360 | | | | | | | | 26,479 | |
Balchem Corp. | | | 208 | | | | | | | | 21,139 | |
Cabot Corp. | | | 448 | | | | | | | | 21,289 | |
Carpenter Technology Corp. | | | 368 | | | | | | | | 18,319 | |
Chase Corp. | | | 216 | | | | | | | | 25,592 | |
See notes to financial statements.
18
| | |
| | | Schedule of Portfolio Investments — continued |
Timothy Plan US Small Cap Core ETF | | December 31, 2019 |
| | | | | | | | | | | | |
SECURITY DESCRIPTION | | | SHARES | | | | | | | | VALUE ($) | |
Materials (continued) | | | | | | | | | | | | |
Chemours Co. | | | 840 | | | | | | | | 15,196 | |
Commercial Metals Co. | | | 960 | | | | | | | | 21,379 | |
Domtar Corp. | | | 648 | | | | | | | | 24,780 | |
Ferro Corp.(a) | | | 1,472 | | | | | | | | 21,830 | |
Futurefuel Corp. | | | 1,264 | | | | | | | | 15,661 | |
GCP Applied Technologies(a) | | | 1,016 | | | | | | | | 23,073 | |
Greif, Inc., Class A | | | 456 | | | | | | | | 20,155 | |
H.B. Fuller Co. | | | 496 | | | | | | | | 25,579 | |
Hawkins, Inc. | | | 472 | | | | | | | | 21,622 | |
Innophos Holdings, Inc. | | | 624 | | | | | | | | 19,956 | |
Innospec, Inc. | | | 304 | | | | | | | | 31,445 | |
Intrepid Potash, Inc.(a) | | | 4,536 | | | | | | | | 12,293 | |
Kaiser Aluminum Corp. | | | 256 | | | | | | | | 28,387 | |
Kraton Corp.(a) | | | 608 | | | | | | | | 15,395 | |
Kronos Worldwide, Inc. | | | 1,520 | | | | | | | | 20,368 | |
Louisiana-Pacific Corp. | | | 984 | | | | | | | | 29,195 | |
Minerals Technologies, Inc. | | | 408 | | | | | | | | 23,513 | |
Neenah, Inc. | | | 368 | | | | | | | | 25,918 | |
PolyOne Corp. | | | 648 | | | | | | | | 23,840 | |
PQ Group Holdings, Inc.(a) | | | 1,560 | | | | | | | | 26,801 | |
Quaker Chemical Corp. | | | 144 | | | | | | | | 23,691 | |
Ryerson Holding Corp.(a) | | | 1,608 | | | | | | | | 19,023 | |
Schnitzer Steel Industries, Inc. | | | 864 | | | | | | | | 18,732 | |
Sensient Technologies Corp. | | | 512 | | | | | | | | 33,837 | |
Stepan Co. | | | 304 | | | | | | | | 31,142 | |
SunCoke Energy, Inc. | | | 2,768 | | | | | | | | 17,245 | |
U.S. Steel Corp. | | | 1,088 | | | | | | | | 12,414 | |
Warrior Met Coal, Inc. | | | 856 | | | | | | | | 18,087 | |
Worthington Industries, Inc. | | | 608 | | | | | | | | 25,645 | |
| | | |
| | | | | | | | | | | 792,365 | |
See notes to financial statements.
19
| | |
| | | Schedule of Portfolio Investments — continued |
Timothy Plan US Small Cap Core ETF | | December 31, 2019 |
| | | | | | | | | | | | |
| SECURITY DESCRIPTION | | SHARES | | | | | | VALUE ($) | |
Real Estate (0.2%): | | | | | | | | | | | | |
Marcus & Millichap, Inc.(a) | | | 648 | | | | | | | | 24,138 | |
| | | |
| | | | | | | | | | | 24,138 | |
| |
Utilities (2.2%): | | | | |
Chesapeake Utilities Corp. | | | 392 | | | | | | | | 37,565 | |
MGE Energy, Inc. | | | 416 | | | | | | | | 32,789 | |
Middlesex Water Co. | | | 416 | | | | | | | | 26,445 | |
Otter Tail Corp. | | | 760 | | | | | | | | 38,981 | |
SJW Group | | | 624 | | | | | | | | 44,342 | |
Unitil Corp. | | | 584 | | | | | | | | 36,103 | |
| | | |
| | | | | | | | | | | | 216,225 | |
| | | |
Total Common Stocks (Cost $9,849,296) | | | | | | | | | | | 10,197,513 | |
| | | |
Total Investments (Cost $9,849,296) — 99.8%(b) | | | | | | | | | | | 10,197,513 | |
| | | |
Other assets in excess of liabilities — 0.2% | | | | | | | | | | | 24,294 | |
| | | |
NET ASSETS - 100.00% | | | | | | | | | | | 10,221,807 | |
Percentages indicated are based on net assets as of December 31, 2019.
| (a) | Non-income producing security. |
| (b) | See Federal Tax Information listed in the Notes to Financial Statements. |
See notes to financial statements.
20
| | |
| | | Schedule of Portfolio Investments |
Timothy Plan US Large Cap Core ETF | | December 31, 2019 |
| | | | | | | | | | | | |
| SECURITY DESCRIPTION | | SHARES | | | | | | VALUE ($) | |
Common Stocks (99.7%) | |
| | | |
Communication Services (0.5%): | | | | | | | | | | | | |
Cable One, Inc. | | | 467 | | | | | | | | 695,115 | |
| | | |
| | | | | | | | | | | 695,115 | |
| |
Consumer Discretionary (9.0%): | | | | |
Advance Auto Parts, Inc. | | | 2,392 | | | | | | | | 383,103 | |
Aptiv PLC | | | 3,658 | | | | | | | | 347,400 | |
AutoZone, Inc.(a) | | | 423 | | | | | | | | 503,924 | |
Booking Holdings, Inc.(a) | | | 197 | | | | | | | | 404,585 | |
BorgWarner, Inc. | | | 8,605 | | | | | | | | 373,285 | |
Bright Horizons Family Solutions, Inc.(a) | | | 3,552 | | | | | | | | 533,829 | |
Burlington Stores, Inc.(a) | | | 1,309 | | | | | | | | 298,491 | |
CarMax, Inc.(a) | | | 4,142 | | | | | | | | 363,129 | |
Columbia Sportswear Co. | | | 3,548 | | | | | | | | 355,474 | |
Dollar General Corp. | | | 2,666 | | | | | | | | 415,843 | |
Dr Horton, Inc. | | | 7,433 | | | | | | | | 392,091 | |
Five Below(a) | | | 2,179 | | | | | | | | 278,607 | |
Garmin Ltd. | | | 4,364 | | | | | | | | 425,752 | |
Gentex Corp. | | | 15,057 | | | | | | | | 436,352 | |
Genuine Parts Co. | | | 5,459 | | | | | | | | 579,910 | |
Grand Canyon Education, Inc.(a) | | | 2,496 | | | | | | | | 239,092 | |
Kohl’s Corp. | | | 4,856 | | | | | | | | 247,413 | |
Lear Corp. | | | 2,760 | | | | | | | | 378,672 | |
Lennar Corp. | | | 6,908 | | | | | | | | 385,397 | |
LKQ Corp.(a) | | | 11,789 | | | | | | | | 420,867 | |
Mohawk Industries, Inc.(a) | | | 2,377 | | | | | | | | 324,175 | |
NVR, Inc.(a) | | | 117 | | | | | | | | 445,584 | |
O’Reilly Automotive, Inc.(a) | | | 1,196 | | | | | | | | 524,159 | |
Pool Corp. | | | 2,196 | | | | | | | | 466,386 | |
Pultegroup, Inc. | | | 10,810 | | | | | | | | 419,428 | |
Ross Stores, Inc. | | | 4,154 | | | | | | | | 483,609 | |
Service Corp. International | | | 11,385 | | | | | | | | 524,052 | |
See notes to financial statements.
21
| | |
| | | Schedule of Portfolio Investments — continued |
Timothy Plan US Large Cap Core ETF | | December 31, 2019 |
| | | | | | | | | | | | |
| SECURITY DESCRIPTION | | SHARES | | | | | | VALUE ($) | |
Consumer Discretionary (continued) | | | | | | | | | | | | |
Tapestry, Inc. | | | 8,126 | | | | | | | | 219,158 | |
Tractor Supply Co. | | | 4,329 | | | | | | | | 404,502 | |
Yum China Holdings, Inc. | | | 7,251 | | | | | | | | 348,121 | |
| | | |
| | | | | | | | | | | 11,922,390 | |
| |
Consumer Staples (2.4%): | | | | |
Casey’s General Stores, Inc. | | | 2,959 | | | | | | | | 470,451 | |
Costco Wholesale Corp. | | | 1,974 | | | | | | | | 580,199 | |
Lamb Weston Holding, Inc. | | | 5,650 | | | | | | | | 486,069 | |
McCormick & Co., Inc. | | | 2,855 | | | | | | | | 484,579 | |
Monster Beverage Corp.(a) | | | 6,168 | | | | | | | | 391,976 | |
The JM Smucker Co. | | | 4,244 | | | | | | | | 441,928 | |
US Foods Holding Corp.(a) | | | 11,415 | | | | | | | | 478,174 | |
| | | |
| | | | | | | | | | | 3,333,376 | |
| |
Energy (3.9%): | | | | |
Cabot Oil & Gas Corp. | | | 20,489 | | | | | | | | 356,713 | |
ConocoPhillips | | | 6,349 | | | | | | | | 412,875 | |
Continental Resources, Inc. | | | 6,465 | | | | | | | | 221,750 | |
Diamondback Energy, Inc. | | | 3,277 | | | | | | | | 304,302 | |
EOG Resources, Inc. | | | 4,236 | | | | | | | | 354,807 | |
Halliburton Co. | | | 13,644 | | | | | | | | 333,869 | |
HollyFrontier Corp. | | | 5,865 | | | | | | | | 297,414 | |
Kinder Morgan, Inc. | | | 29,207 | | | | | | | | 618,313 | |
Marathon Oil Corp. | | | 21,075 | | | | | | | | 286,199 | |
Occidental Petroleum Corp. | | | 8,341 | | | | | | | | 343,733 | |
ONEOK, Inc. | | | 7,120 | | | | | | | | 538,770 | |
Phillips 66 | | | 4,370 | | | | | | | | 486,862 | |
Schlumberger Ltd. | | | 9,385 | | | | | | | | 377,277 | |
Valero Energy Corp. | | | 3,737 | | | | | | | | 349,970 | |
| | | |
| | | | | | | | | | | 5,282,854 | |
See notes to financial statements.
22
| | |
| | | Schedule of Portfolio Investments — continued |
Timothy Plan US Large Cap Core ETF | | December 31, 2019 |
| | | | | | | | | | | | |
| SECURITY DESCRIPTION | | SHARES | | | | | | VALUE ($) | |
Financials (11.9%): | | | | | | | | | | | | |
Aflac, Inc. | | | 12,758 | | | | | | | | 674,898 | |
Arch Capital Group Ltd.(a) | | | 14,179 | | | | | | | | 608,137 | |
Arthur J Gallagher & Co. | | | 6,939 | | | | | | | | 660,801 | |
Assurant, Inc. | | | 4,147 | | | | | | | | 543,589 | |
BOK Financial Corp. | | | 5,123 | | | | | | | | 447,750 | |
Brown & Brown, Inc. | | | 16,109 | | | | | | | | 635,983 | |
CBOE Global Markets, Inc. | | | 4,624 | | | | | | | | 554,880 | |
Commerce Bancshares, Inc. | | | 8,817 | | | | | | | | 599,027 | |
Credit Acceptance Corp.(a) | | | 891 | | | | | | | | 394,116 | |
E*TRADE Financial Corp. | | | 9,386 | | | | | | | | 425,843 | |
East West BanCorp, Inc. | | | 7,131 | | | | | | | | 347,280 | |
FactSet Research Systems, Inc. | | | 1,756 | | | | | | | | 471,135 | |
Fidelity National Financial, Inc. | | | 12,179 | | | | | | | | 552,318 | |
First American Financial Corp. | | | 9,119 | | | | | | | | 531,820 | |
Franklin Resources, Inc. | | | 14,760 | | | | | | | | 383,465 | |
Globe Life, Inc. | | | 6,329 | | | | | | | | 666,127 | |
Intercontinental Exchange, Inc. | | | 6,844 | | | | | | | | 633,411 | |
Invesco Ltd. | | | 22,501 | | | | | | | | 404,568 | |
LPL Financial Holdings, Inc. | | | 4,232 | | | | | | | | 390,402 | |
MarketAxess Holdings, Inc. | | | 910 | | | | | | | | 344,990 | |
Morningstar, Inc. | | | 3,461 | | | | | | | | 523,684 | |
MSCI, Inc. | | | 1,682 | | | | | | | | 434,259 | |
New York Community BanCorp, Inc. | | | 32,940 | | | | | | | | 395,939 | |
People’s United Financial, Inc. | | | 28,029 | | | | | | | | 473,690 | |
Reinsurance Group of America, Inc. | | | 3,680 | | | | | | | | 600,061 | |
Santander Consumer USA Holdings, Inc. | | | 16,824 | | | | | | | | 393,177 | |
SEI Investments Co. | | | 7,595 | | | | | | | | 497,321 | |
Signature Bank | | | 3,284 | | | | | | | | 448,627 | |
SVB Financial Group(a) | | | 1,408 | | | | | | | | 353,464 | |
Synovus Financial Corp. | | | 9,728 | | | | | | | | 381,338 | |
TCF Financial Corp. | | | 9,084 | | | | | | | | 425,131 | |
See notes to financial statements.
23
| | |
| | | Schedule of Portfolio Investments — continued |
Timothy Plan US Large Cap Core ETF | | December 31, 2019 |
| | | | | | | | | | | | |
| SECURITY DESCRIPTION | | SHARES | | | | | | VALUE ($) | |
Financials (continued) | | | | | | | | | | | | |
WR Berkley Corp. | | | 9,725 | | | | | | | | 671,998 | |
| | | |
| | | | | | | | | | | 15,869,229 | |
| |
Health Care (11.0%): | | | | |
ABIOMED, Inc.(a) | | | 1,287 | | | | | | | | 219,549 | |
Agilent Technologies, Inc. | | | 5,154 | | | | | | | | 439,688 | |
Align Technology, Inc.(a) | | | 1,016 | | | | | | | | 283,505 | |
Bruker Corp. | | | 7,320 | | | | | | | | 373,100 | |
Centene Corp.(a) | | | 6,616 | | | | | | | | 415,948 | |
Cerner Corp. | | | 6,833 | | | | | | | | 501,474 | |
Charles River Laboratories International, Inc.(a) | | | 2,867 | | | | | | | | 437,963 | |
Chemed Corp. | | | 1,408 | | | | | | | | 618,478 | |
DENTSPLY Sirona, Inc. | | | 6,511 | | | | | | | | 368,457 | |
Edwards Lifesciences Corp.(a) | | | 1,573 | | | | | | | | 366,965 | |
Elanco Animal Health, Inc.(a) | | | 12,544 | | | | | | | | 369,421 | |
Encompass Health Corp. | | | 6,217 | | | | | | | | 430,652 | |
Exelixis, Inc.(a) | | | 16,719 | | | | | | | | 294,589 | |
Henry Schein, Inc.(a) | | | 6,824 | | | | | | | | 455,297 | |
Hill-Rom Holdings, Inc. | | | 4,682 | | | | | | | | 531,547 | |
IDEXX Laboratories, Inc.(a) | | | 1,467 | | | | | | | | 383,078 | |
Illumina, Inc.(a) | | | 988 | | | | | | | | 327,759 | |
Incyte Corp.(a) | | | 4,073 | | | | | | | | 355,654 | |
Insulet Corp.(a) | | | 1,503 | | | | | | | | 257,314 | |
Intuitive Surgical, Inc.(a) | | | 708 | | | | | | | | 418,534 | |
IQVIA Holdings, Inc.(a) | | | 3,083 | | | | | | | | 476,354 | |
Jazz Pharmaceuticals PLC(a) | | | 2,947 | | | | | | | | 439,928 | |
Masimo Corp.(a) | | | 2,564 | | | | | | | | 405,266 | |
Mettler-Toledo International(a) | | | 610 | | | | | | | | 483,901 | |
Molina Healthcare, Inc.(a) | | | 2,293 | | | | | | | | 311,137 | |
PerkinElmer, Inc. | | | 5,262 | | | | | | | | 510,940 | |
PRA Health Sciences, Inc.(a) | | | 3,859 | | | | | | | | 428,928 | |
Regeneron Pharmaceuticals, Inc.(a) | | | 1,119 | | | | | | | | 420,162 | |
See notes to financial statements.
24
| | |
| | | Schedule of Portfolio Investments — continued |
Timothy Plan US Large Cap Core ETF | | December 31, 2019 |
| | | | | | | | | | | | |
| SECURITY DESCRIPTION | | SHARES | | | | | | VALUE ($) | |
Health Care (continued) | | | | | | | | | | | | |
ResMed, Inc. | | | 2,502 | | | | | | | | 387,735 | |
Teleflex, Inc. | | | 1,285 | | | | | | | | 483,725 | |
Varian Medical Systems, Inc.(a) | | | 4,063 | | | | | | | | 576,988 | |
Veeva Systems, Inc.(a) | | | 1,780 | | | | | | | | 250,375 | |
Vertex Pharamaceuticals, Inc.(a) | | | 2,083 | | | | | | | | 456,073 | |
Waters Corp.(a) | | | 1,609 | | | | | | | | 375,943 | |
West Pharmaceutical Services, Inc. | | | 3,046 | | | | | | | | 457,905 | |
Zoetis, Inc. | | | 3,770 | | | | | | | | 498,959 | |
| | | |
| | | | | | | | | | | 14,813,291 | |
| |
Industrials (22.0%): | | | | |
Aecom(a) | | | 12,267 | | | | | | | | 529,076 | |
AGCO Corp. | | | 4,864 | | | | | | | | 375,744 | |
Allegion PLC | | | 5,370 | | | | | | | | 668,780 | |
Allison Transmission Holding, Inc. | | | 9,192 | | | | | | | | 444,157 | |
AMERCO, Inc. | | | 1,264 | | | | | | | | 475,036 | |
Ametek, Inc. | | | 6,038 | | | | | | | | 602,230 | |
AO Smith Corp. | | | 8,203 | | | | | | | | 390,791 | |
Bwx Technologies, Inc. | | | 6,751 | | | | | | | | 419,102 | |
Carlisle Companies, Inc. | | | 3,156 | | | | | | | | 510,767 | |
Caterpillar, Inc. | | | 2,889 | | | | | | | | 426,648 | |
CH Robinson Worldwide, Inc. | | | 5,331 | | | | | | | | 416,884 | |
Cintas Corp. | | | 1,691 | | | | | | | | 455,014 | |
Copart, Inc.(a) | | | 5,760 | | | | | | | | 523,814 | |
Costar Group, Inc.(a) | | | 582 | | | | | | | | 348,211 | |
CSX Corp. | | | 6,311 | | | | | | | | 456,664 | |
Deere & Co. | | | 2,158 | | | | | | | | 373,895 | |
Donaldson Co., Inc. | | | 7,814 | | | | | | | | 450,243 | |
Dover Corp. | | | 4,639 | | | | | | | | 534,691 | |
Eaton Corp. PLC | | | 5,458 | | | | | | | | 516,982 | |
Emerson Electric Co. | | | 6,410 | | | | | | | | 488,827 | |
Expeditors International of Washington, Inc. | | | 6,546 | | | | | | | | 510,719 | |
See notes to financial statements.
25
| | |
| | | Schedule of Portfolio Investments — continued |
Timothy Plan US Large Cap Core ETF | | December 31, 2019 |
| | | | | | | | | | | | |
| SECURITY DESCRIPTION | | SHARES | | | | | | VALUE ($) | |
Industrials (continued) | | | | | | | | | | | | |
Fastenal Co. | | | 11,166 | | | | | | | | 412,584 | |
Flowserve Corp. | | | 7,142 | | | | | | | | 355,457 | |
Fortive Corp. | | | 6,953 | | | | | | | | 531,140 | |
Fortune Brands Home & Security, Inc. | | | 6,664 | | | | | | | | 435,426 | |
Gardner Denver Holdings, Inc.(a) | | | 9,709 | | | | | | | | 356,126 | |
General Dynamics Corp. | | | 2,860 | | | | | | | | 504,361 | |
Graco, Inc. | | | 10,723 | | | | | | | | 557,596 | |
HD Supply Holdings, Inc.(a) | | | 12,194 | | | | | | | | 490,443 | |
HEICO Corp. | | | 3,236 | | | | | | | | 369,389 | |
Hexcel Corp. | | | 6,141 | | | | | | | | 450,197 | |
Honeywell International, Inc. | | | 3,548 | | | | | | | | 627,996 | |
Hubbell, Inc. | | | 3,370 | | | | | | | | 498,153 | |
Huntington Ingalls Industries, Inc. | | | 2,159 | | | | | | | | 541,650 | |
IDEX Corp. | | | 3,282 | | | | | | | | 564,504 | |
Illinois Tool Works, Inc. | | | 2,843 | | | | | | | | 510,688 | |
J.B. Hunt Transport Services, Inc. | | | 3,270 | | | | | | | | 381,871 | |
Kansas City Southern | | | 3,149 | | | | | | | | 482,301 | |
Knight-Swift Transportation Holdings, Inc. | | | 6,622 | | | | | | | | 237,332 | |
L3Harris Technologies, Inc. | | | 1,983 | | | | | | | | 392,376 | |
Lennox International, Inc. | | | 2,007 | | | | | | | | 489,647 | |
Masco Corp. | | | 8,205 | | | | | | | | 393,758 | |
Middleby Corp.(a) | | | 3,359 | | | | | | | | 367,878 | |
Nordson Corp. | | | 3,061 | | | | | | | | 498,453 | |
Norfolk Southern Corp. | | | 2,445 | | | | | | | | 474,648 | |
Old Dominion Freight Line, Inc. | | | 2,249 | | | | | | | | 426,815 | |
PACCAR, Inc. | | | 6,430 | | | | | | | | 508,613 | |
Parker Hannifin Corp. | | | 2,086 | | | | | | | | 429,341 | |
Rollins, Inc. | | | 11,553 | | | | | | | | 383,097 | |
Roper Technologies, Inc. | | | 1,593 | | | | | | | | 564,288 | |
Snap-on, Inc. | | | 2,550 | | | | | | | | 431,970 | |
Spirit Aerosystems Holdings, Inc. | | | 4,185 | | | | | | | | 305,003 | |
Teledyne Technologies, Inc.(a) | | | 1,565 | | | | | | | | 542,335 | |
See notes to financial statements.
26
| | |
| | | Schedule of Portfolio Investments — continued |
Timothy Plan US Large Cap Core ETF | | December 31, 2019 |
| | | | | | | | | | | | |
| SECURITY DESCRIPTION | | SHARES | | | | | | VALUE ($) | |
Industrials (continued) | | | | | | | | | | | | |
Toro Co. | | | 7,321 | | | | | | | | 583,265 | |
TransDigm Group, Inc. | | | 685 | | | | | | | | 383,600 | |
Transunion | | | 5,364 | | | | | | | | 459,212 | |
Union Pacific Corp. | | | 2,861 | | | | | | | | 517,241 | |
United Rentals, Inc.(a) | | | 2,248 | | | | | | | | 374,899 | |
Verisk Analytics, Inc. | | | 4,478 | | | | | | | | 668,744 | |
Waste Management, Inc. | | | 6,142 | | | | | | | | 699,943 | |
Watsco, Inc. | | | 2,841 | | | | | | | | 511,805 | |
Woodward, Inc. | | | 3,382 | | | | | | | | 400,564 | |
XPO Logistics, Inc.(a) | | | 2,991 | | | | | | | | 238,383 | |
Xylem, Inc. | | | 6,315 | | | | | | | | 497,559 | |
| | | |
| | | | | | | | | | | 29,768,926 | |
| | | |
Information Technology (19.5%): | | | | | | | | | | | | |
Advanced Micro Devices, Inc.(a) | | | 5,937 | | | | | | | | 272,271 | |
Akamai Technologies, Inc.(a) | | | 5,048 | | | | | | | | 436,046 | |
Alliance Data Systems Corp. | | | 2,465 | | | | | | | | 276,573 | |
Amphenol Corp. | | | 4,755 | | | | | | | | 514,634 | |
Analog Devices, Inc. | | | 3,085 | | | | | | | | 366,621 | |
ANSYS, Inc.(a) | | | 1,901 | | | | | | | | 489,336 | |
Arista Networks, Inc.(a) | | | 1,099 | | | | | | | | 223,537 | |
Aspen Technology, Inc.(a) | | | 2,491 | | | | | | | | 301,237 | |
Black Knight, Inc.(a) | | | 10,475 | | | | | | | | 675,428 | |
Broadcom, Inc. | | | 1,191 | | | | | | | | 376,380 | |
CACI International, Inc.(a) | | | 1,813 | | | | | | | | 453,232 | |
Cadence Design Systems, Inc.(a) | | | 5,834 | | | | | | | | 404,646 | |
CDW Corp. | | | 3,067 | | | | | | | | 438,090 | |
Ciena Corp.(a) | | | 6,268 | | | | | | | | 267,581 | |
Citrix Systems, Inc. | | | 6,461 | | | | | | | | 716,525 | |
Cognex Corp. | | | 5,956 | | | | | | | | 333,774 | |
Cognizant Technology Solutions Corp. | | | 6,425 | | | | | | | | 398,479 | |
Dolby Laboratories, Inc. | | | 6,423 | | | | | | | | 441,902 | |
See notes to financial statements.
27
| | |
| | | Schedule of Portfolio Investments — continued |
Timothy Plan US Large Cap Core ETF | | December 31, 2019 |
| | | | | | | | | | | | |
| SECURITY DESCRIPTION | | SHARES | | | | | | VALUE ($) | |
Information Technology (continued) | | | | | | | | | | | | |
DXC Technology Co. | | | 7,203 | | | | | | | | 270,761 | |
Entegris, Inc. | | | 7,045 | | | | | | | | 352,884 | |
EPAM Systems, Inc.(a) | | | 1,856 | | | | | | | | 393,769 | |
Euronet Worldwide, Inc.(a) | | | 2,787 | | | | | | | | 439,120 | |
F5 Networks, Inc.(a) | | | 2,797 | | | | | | | | 390,601 | |
Fair Isaac Corp.(a) | | | 1,107 | | | | | | | | 414,771 | |
Fidelity National Information Services, Inc. | | | 3,840 | | | | | | | | 534,106 | |
Fiserv, Inc.(a) | | | 4,028 | | | | | | | | 465,758 | |
Fleetcor Technologies, Inc.(a) | | | 1,407 | | | | | | | | 404,822 | |
FLIR Systems, Inc. | | | 8,195 | | | | | | | | 426,714 | |
Fortinet, Inc.(a) | | | 3,988 | | | | | | | | 425,759 | |
Gartner, Inc.(a) | | | 2,374 | | | | | | | | 365,833 | |
Genpact Ltd. | | | 13,098 | | | | | | | | 552,343 | |
IPG Photonics Corp.(a) | | | 1,789 | | | | | | | | 259,262 | |
Jack Henry & Associates, Inc. | | | 3,944 | | | | | | | | 574,522 | |
Juniper Networks, Inc. | | | 18,116 | | | | | | | | 446,196 | |
KLA Corp. | | | 2,079 | | | | | | | | 370,415 | |
Lam Research Corp. | | | 1,166 | | | | | | | | 340,938 | |
Manhattan Associates, Inc.(a) | | | 3,287 | | | | | | | | 262,138 | |
Maxim Integrated Products, Inc. | | | 6,222 | | | | | | | | 382,715 | |
Microchip Technology, Inc. | | | 3,097 | | | | | | | | 324,318 | |
Micron Technology, Inc.(a) | | | 4,843 | | | | | | | | 260,457 | |
Monolithic Power Systems, Inc. | | | 2,204 | | | | | | | | 392,356 | |
National Instruments Corp. | | | 10,322 | | | | | | | | 437,033 | |
NetApp, Inc. | | | 5,117 | | | | | | | | 318,533 | |
NVIDIA Corp. | | | 1,275 | | | | | | | | 300,008 | |
On Semiconductor Corp.(a) | | | 13,245 | | | | | | | | 322,913 | |
Paychex, Inc. | | | 6,945 | | | | | | | | 590,742 | |
Paycom Software, Inc.(a) | | | 1,270 | | | | | | | | 336,245 | |
Paylocity Holding Corp.(a) | | | 2,484 | | | | | | | | 300,117 | |
Qorvo, Inc.(a) | | | 4,059 | | | | | | | | 471,778 | |
RealPage, Inc.(a) | | | 6,515 | | | | | | | | 350,181 | |
See notes to financial statements.
28
| | |
| | | Schedule of Portfolio Investments — continued |
Timothy Plan US Large Cap Core ETF | | December 31, 2019 |
| | | | | | | | | | | | |
| SECURITY DESCRIPTION | | SHARES | | | | | | VALUE ($) | |
Information Technology (continued) | | | | | | | | | | | | |
Sabre Corp. | | | 18,882 | | | | | | | | 423,712 | |
Seagate Technology PLC | | | 5,573 | | | | | | | | 331,594 | |
Skyworks Solutions, Inc. | | | 3,354 | | | | | | | | 405,432 | |
Ssnc Technologies Holdings, Inc. | | | 5,769 | | | | | | | | 354,217 | |
Synopsys, Inc.(a) | | | 2,885 | | | | | | | | 401,592 | |
TE Connectivity Ltd. | | | 4,778 | | | | | | | | 457,923 | |
Teradyne, Inc. | | | 4,036 | | | | | | | | 275,215 | |
The Trade Desk, Inc.(a) | | | 802 | | | | | | | | 208,344 | |
Trimble, Inc.(a) | | | 10,114 | | | | | | | | 421,653 | |
Tyler Technologies, Inc.(a) | | | 1,672 | | | | | | | | 501,633 | |
Ubiquiti, Inc. | | | 2,209 | | | | | | | | 417,457 | |
Universal Display Corp. | | | 1,257 | | | | | | | | 259,030 | |
VeriSign, Inc.(a) | | | 2,671 | | | | | | | | 514,648 | |
Western Union Co. | | | 23,190 | | | | | | | | 621,028 | |
Wex, Inc.(a) | | | 1,859 | | | | | | | | 389,386 | |
Xilinx, Inc. | | | 2,307 | | | | | | | | 225,555 | |
Zebra Technologies Corp.(a) | | | 1,284 | | | | | | | | 327,985 | |
| | | |
| | | | | | | | | | | 26,400,804 | |
| | | |
Materials (9.0%): | | | | | | | | | | | | |
Albemarle Corp. | | | 4,226 | | | | | | | | 308,667 | |
AptarGroup, Inc. | | | 6,051 | | | | | | | | 699,617 | |
Ball Corp. | | | 6,543 | | | | | | | | 423,136 | |
Celanese Corp. | | | 3,173 | | | | | | | | 390,660 | |
CF Industries Holdings, Inc. | | | 6,505 | | | | | | | | 310,549 | |
Crown Holdings, Inc.(a) | | | 6,913 | | | | | | | | 501,469 | |
Eastman Chemical Co. | | | 4,750 | | | | | | | | 376,485 | |
Ecolab, Inc. | | | 3,001 | | | | | | | | 579,162 | |
FMC Corp. | | | 4,877 | | | | | | | | 486,822 | |
International Flavors & Fragrances, Inc. | | | 2,781 | | | | | | | | 358,805 | |
International Paper Co. | | | 9,407 | | | | | | | | 433,192 | |
LyondellBasell Industries N.V., Class A | | | 3,763 | | | | | | | | 355,528 | |
See notes to financial statements.
29
| | |
| | | Schedule of Portfolio Investments — continued |
Timothy Plan US Large Cap Core ETF | | December 31, 2019 |
| | | | | | | | | | | | |
| SECURITY DESCRIPTION | | SHARES | | | | | | VALUE ($) | |
Materials (continued) | | | | | | | | | | | | |
Martin Marietta Materials, Inc. | | | 1,587 | | | | | | | | 443,789 | |
NewMarket Corp. | | | 1,075 | | | | | | | | 523,009 | |
Nucor Corp. | | | 7,412 | | | | | | | | 417,147 | |
Packaging Corp. of America | | | 3,887 | | | | | | | | 435,305 | |
PPG Industries, Inc. | | | 4,082 | | | | | | | | 544,906 | |
Reliance Steel & Aluminum Co. | | | 4,158 | | | | | | | | 497,963 | |
Royal Gold, Inc. | | | 3,448 | | | | | | | | 421,518 | |
RPM International, Inc. | | | 7,320 | | | | | | | | 561,883 | |
Sealed Air Corp. | | | 9,321 | | | | | | | | 371,255 | |
Sherwin-Williams Co. | | | 807 | | | | | | | | 470,917 | |
Sonoco Products Co. | | | 10,195 | | | | | | | | 629,235 | |
Steel Dynamics, Inc. | | | 9,412 | | | | | | | | 320,384 | |
Vulcan Materials Co. | | | 3,149 | | | | | | | | 453,424 | |
Westlake Chemical Corp. | | | 4,140 | | | | | | | | 290,421 | |
Westrock Co. | | | 8,326 | | | | | | | | 357,269 | |
| | | |
| | | | | | | | | | | 11,962,517 | |
| | | |
Real Estate (0.1%): | | | | | | | | | | | | |
The Howard Hughes Corp.(a) | | | 1,497 | | | | | | | | 189,820 | |
| | | |
| | | | | | | | | | | 189,820 | |
| | | |
Utilities (10.4%): | | | | | | | | | | | | |
AES Corp. | | | 31,475 | | | | | | | | 626,353 | |
Alliant Energy Corp. | | | 13,755 | | | | | | | | 752,674 | |
American Electric Power Co., Inc. | | | 7,994 | | | | | | | | 755,513 | |
American Water Works Co., Inc. | | | 5,735 | | | | | | | | 704,545 | |
Atmos Energy Corp. | | | 6,538 | | | | | | | | 731,341 | |
CenterPoint Energy, Inc. | | | 21,471 | | | | | | | | 585,514 | |
CMS Energy Corp. | | | 11,355 | | | | | | | | 713,548 | |
Consolidated Edison, Inc. | | | 8,329 | | | | | | | | 753,525 | |
DTE Energy Co. | | | 5,956 | | | | | | | | 773,506 | |
Evergy, Inc. | | | 10,777 | | | | | | | | 701,475 | |
Eversource Energy | | | 9,391 | | | | | | | | 798,892 | |
See notes to financial statements.
30
| | |
| | | Schedule of Portfolio Investments — continued |
Timothy Plan US Large Cap Core ETF | | December 31, 2019 |
| | | | | | | | | | | | |
| SECURITY DESCRIPTION | | SHARES | | | | | | VALUE ($) | |
Utilities (continued) | | | | | | | | | | | | |
FirstEnergy Corp. | | | 13,668 | | | | | | | | 664,265 | |
IDACORP, Inc. | | | 6,423 | | | | | | | | 685,976 | |
MDU Resources Group, Inc. | | | 23,147 | | | | | | | | 687,697 | |
NextEra Energy, Inc. | | | 3,070 | | | | | | | | 743,431 | |
OGE Energy Corp. | | | 16,151 | | | | | | | | 718,235 | |
Pinnacle West Capital Corp. | | | 7,400 | | | | | | | | 665,482 | |
PPL Corp. | | | 20,508 | | | | | | | | 735,827 | |
Public Service Enterprise Group, Inc. | | | 11,671 | | | | | | | | 689,173 | |
WEC Energy Group | | | 7,519 | | | | | | | | 693,477 | |
| | | |
| | | | | | | | | | | | 14,180,449 | |
| | | |
Total Common Stocks (Cost $126,672,202) | | | | | | | | | | | 134,418,771 | |
| | | |
Total Investments (Cost $126,672,202) — 99.7%(b) | | | | | | | | | | | 134,418,771 | |
| | | |
Other assets in excess of liabilities — 0.3% | | | | | | | | | | | 376,242 | |
| | | |
NET ASSETS - 100.00% | | | | | | | | | | | 134,795,013 | |
Percentages indicated are based on net assets as of December 31, 2019.
| (a) | Non-income producing security. |
| (b) | See Federal Tax Information listed in the Notes to Financial Statements. |
Futures Contracts
Long Futures
| | | | | | | | | | | | | | | | |
| | | | |
| Index Futures | | Expiration Date | | | Number of
Contracts | | | Notional
Amount | | | Value and
Unrealized
Appreciation/
(Depreciation) | |
S&P 500 IndexE-mini March Future (U.S. Dollar) | | | 3/20/20 | | | | 2 | | | $ | 323,110 | | | $ | 4,554 | |
| | | | | | | | | | | | | | | | |
| | | | | | | | | | | | | | $ | 4,554 | |
| | | | | | | | | | | | | | | | |
See notes to financial statements.
31
| | |
| | | Schedule of Portfolio Investments |
Timothy Plan High Dividend Stock ETF | | December 31, 2019 |
| | | | | | | | | | | | |
| SECURITY DESCRIPTION | | SHARES | | | | VALUE ($) | |
Common Stocks (99.7%) | | | | | | | | | | | | |
| | | |
Consumer Discretionary (4.7%): | | | | | | | | | | | | |
BorgWarner, Inc. | | | 16,855 | | | | | | | | 731,170 | |
Garmin Ltd. | | | 8,556 | | | | | | | | 834,723 | |
Genuine Parts Co. | | | 10,711 | | | | | | | | 1,137,830 | |
Kohl’s Corp. | | | 9,521 | | | | | | | | 485,095 | |
Lear Corp. | | | 5,393 | | | | | | | | 739,920 | |
Tapestry, Inc. | | | 15,934 | | | | | | | | 429,740 | |
| | | |
| | | | | | | | | | | 4,358,478 | |
| |
Consumer Staples (0.9%): | | | | |
The JM Smucker Co. | | | 8,306 | | | | | | | | 864,904 | |
| | | |
| | | | | | | | | | | 864,904 | |
| |
Energy (8.6%): | | | | |
Cabot Oil & Gas Corp. | | | 40,136 | | | | | | | | 698,768 | |
ConocoPhillips | | | 12,454 | | | | | | | | 809,884 | |
Halliburton Co. | | | 26,718 | | | | | | | | 653,789 | |
HollyFrontier Corp. | | | 11,521 | | | | | | | | 584,230 | |
Kinder Morgan, Inc. | | | 57,232 | | | | | | | | 1,211,601 | |
Occidental Petroleum Corp. | | | 16,371 | | | | | | | | 674,649 | |
ONEOK, Inc. | | | 13,940 | | | | | | | | 1,054,840 | |
Phillips 66 | | | 8,582 | | | | | | | | 956,121 | |
Schlumberger Ltd. | | | 18,363 | | | | | | | | 738,193 | |
Valero Energy Corp. | | | 7,293 | | | | | | | | 682,989 | |
| | | |
| | | | | | | | | | | 8,065,064 | |
| |
Financials (14.7%): | | | | |
Aflac, Inc. | | | 24,984 | | | | | | | | 1,321,654 | |
Arthur J Gallagher & Co. | | | 13,602 | | | | | | | | 1,295,318 | |
Assurant, Inc. | | | 8,115 | | | | | | | | 1,063,714 | |
BOK Financial Corp. | | | 10,012 | | | | | | | | 875,049 | |
East West BanCorp, Inc. | | | 13,978 | | | | | | | | 680,729 | |
Fidelity National Financial, Inc. | | | 23,865 | | | | | | | | 1,082,278 | |
See notes to financial statements.
32
| | |
| | | Schedule of Portfolio Investments — continued |
Timothy Plan High Dividend Stock ETF | | December 31, 2019 |
| | | | | | | | | | | | |
| SECURITY DESCRIPTION | | SHARES | | | | VALUE ($) | |
Financials (continued) | | | | | | | | | | | | |
First American Financial Corp. | | | 17,874 | | | | | | | | 1,042,412 | |
Franklin Resources, Inc. | | | 28,925 | | | | | | | | 751,472 | |
Invesco Ltd. | | | 44,113 | | | | | | | | 793,151 | |
New York Community BanCorp, Inc. | | | 64,515 | | | | | | | | 775,470 | |
People’s United Financial, Inc. | | | 54,933 | | | | | | | | 928,367 | |
Santander Consumer USA Holdings, Inc. | | | 32,958 | | | | | | | | 770,228 | |
Signature Bank | | | 6,452 | | | | | | | | 881,408 | |
Synovus Financial Corp. | | | 19,090 | | | | | | | | 748,328 | |
TCF Financial Corp. | | | 17,774 | | | | | | | | 831,823 | |
| | | |
| | | | | | | | | | | 13,841,401 | |
| |
Health Care (0.9%): | | | | |
Encompass Health Corp. | | | 12,163 | | | | | | | | 842,531 | |
| | | |
| | | | | | | | | | | 842,531 | |
| |
Industrials (20.2%): | | | | |
AO Smith Corp. | | | 16,053 | | | | | | | | 764,765 | |
Caterpillar, Inc. | | | 5,677 | | | | | | | | 838,379 | |
CH Robinson Worldwide, Inc. | | | 10,428 | | | | | | | | 815,470 | |
Deere & Co. | | | 4,207 | | | | | | | | 728,905 | |
Dover Corp. | | | 9,079 | | | | | | | | 1,046,446 | |
Eaton Corp. PLC | | | 10,709 | | | | | | | | 1,014,356 | |
Emerson Electric Co. | | | 12,531 | | | | | | | | 955,614 | |
Fastenal Co. | | | 21,854 | | | | | | | | 807,505 | |
General Dynamics Corp. | | | 5,594 | | | | | | | | 986,502 | |
Honeywell International, Inc. | | | 6,933 | | | | | | | | 1,227,141 | |
Hubbell, Inc. | | | 6,604 | | | | | | | | 976,203 | |
Illinois Tool Works, Inc. | | | 5,540 | | | | | | | | 995,150 | |
Norfolk Southern Corp. | | | 4,760 | | | | | | | | 924,059 | |
PACCAR, Inc. | | | 12,595 | | | | | | | | 996,265 | |
Parker Hannifin Corp. | | | 4,089 | | | | | | | | 841,598 | |
Snap-on, Inc. | | | 4,971 | | | | | | | | 842,087 | |
TransDigm Group, Inc. | | | 1,333 | | | | | | | | 746,480 | |
See notes to financial statements.
33
| | |
| | | Schedule of Portfolio Investments — continued |
Timothy Plan High Dividend Stock ETF | | December 31, 2019 |
| | | | | | | | | | | | |
| SECURITY DESCRIPTION | | SHARES | | | | VALUE ($) | |
Industrials (continued) | | | | | | | | | | | | |
Union Pacific Corp. | | | 5,597 | | | | | | | | 1,011,881 | |
Waste Management, Inc. | | | 12,039 | | | | | | | | 1,371,964 | |
Watsco, Inc. | | | 5,534 | | | | | | | | 996,950 | |
| | | |
| | | | | | | | | | | 18,887,720 | |
| |
Information Technology (13.3%): | | | | |
Alliance Data Systems Corp. | | | 4,821 | | | | | | | | 540,916 | |
Analog Devices, Inc. | | | 6,065 | | | | | | | | 720,765 | |
Broadcom, Inc. | | | 2,333 | | | | | | | | 737,275 | |
DXC Technology Co. | | | 14,083 | | | | | | | | 529,380 | |
Juniper Networks, Inc. | | | 35,493 | | | | | | | | 874,193 | |
KLA Corp. | | | 4,070 | | | | | | | | 725,152 | |
Lam Research Corp. | | | 2,258 | | | | | | | | 660,239 | |
Maxim Integrated Products, Inc. | | | 12,175 | | | | | | | | 748,884 | |
National Instruments Corp. | | | 20,250 | | | | | | | | 857,385 | |
NetApp, Inc. | | | 9,995 | | | | | | | | 622,189 | |
Paychex, Inc. | | | 13,626 | | | | | | | | 1,159,028 | |
Sabre Corp. | | | 36,965 | | | | | | | | 829,495 | |
Seagate Technology PLC | | | 10,946 | | | | | | | | 651,287 | |
Skyworks Solutions, Inc. | | | 6,561 | | | | | | | | 793,093 | |
TE Connectivity Ltd. | | | 9,389 | | | | | | | | 899,842 | |
Western Union Co. | | | 45,457 | | | | | | | | 1,217,338 | |
| | | |
| | | | | | | | | | | 12,566,461 | |
| |
Materials (13.0%): | | | | |
Albemarle Corp. | | | 8,248 | | | | | | | | 602,434 | |
Celanese Corp. | | | 6,225 | | | | | | | | 766,422 | |
CF Industries Holdings, Inc. | | | 12,717 | | | | | | | | 607,110 | |
Eastman Chemical Co. | | | 9,307 | | | | | | | | 737,673 | |
FMC Corp. | | | 9,583 | | | | | | | | 956,575 | |
International Flavors & Fragrances, Inc. | | | 5,459 | | | | | | | | 704,320 | |
International Paper Co. | | | 18,430 | | | | | | | | 848,702 | |
LyondellBasell Industries N.V., Class A | | | 7,369 | | | | | | | | 696,223 | |
See notes to financial statements.
34
| | |
| | | Schedule of Portfolio Investments — continued |
Timothy Plan High Dividend Stock ETF | | December 31, 2019 |
| | | | | | | | | | | | |
| SECURITY DESCRIPTION | | SHARES | | | | VALUE ($) | |
Materials (continued) | | | | | | | | | | | | |
Nucor Corp. | | | 14,505 | | | | | | | | 816,341 | |
Packaging Corp. of America | | | 7,642 | | | | | | | | 855,828 | |
Reliance Steel & Aluminum Co. | | | 8,144 | | | | | | | | 975,326 | |
RPM International, Inc. | | | 14,338 | | | | | | | | 1,100,584 | |
Sonoco Products Co. | | | 19,969 | | | | | | | | 1,232,486 | |
Steel Dynamics, Inc. | | | 18,453 | | | | | | | | 628,140 | |
Westrock Co. | | | 16,321 | | | | | | | | 700,334 | |
| | | |
| | | | | | | | | | | 12,228,498 | |
| |
Utilities (23.4%): | | | | |
AES Corp. | | | 61,663 | | | | | | | | 1,227,094 | |
Alliant Energy Corp. | | | 26,944 | | | | | | | | 1,474,376 | |
American Electric Power Co., Inc. | | | 15,632 | | | | | | | | 1,477,380 | |
CenterPoint Energy, Inc. | | | 42,057 | | | | | | | | 1,146,894 | |
CMS Energy Corp. | | | 22,212 | | | | | | | | 1,395,802 | |
Consolidated Edison, Inc. | | | 16,329 | | | | | | | | 1,477,285 | |
DTE Energy Co. | | | 11,687 | | | | | | | | 1,517,791 | |
Evergy, Inc. | | | 21,097 | | | | | | | | 1,373,204 | |
Eversource Energy | | | 18,388 | | | | | | | | 1,564,267 | |
FirstEnergy Corp. | | | 26,789 | | | | | | | | 1,301,945 | |
MDU Resources Group, Inc. | | | 45,335 | | | | | | | | 1,346,903 | |
OGE Energy Corp. | | | 31,656 | | | | | | | | 1,407,742 | |
Pinnacle West Capital Corp. | | | 14,475 | | | | | | | | 1,301,737 | |
PPL Corp. | | | 40,195 | | | | | | | | 1,442,197 | |
Public Service Enterprise Group, Inc. | | | 22,849 | | | | | | | | 1,349,233 | |
WEC Energy Group | | | 14,724 | | | | | | | | 1,357,995 | |
| | | |
| | | | | | | | | | | | 22,161,845 | |
| | | |
Total Common Stocks (Cost $87,668,881) | | | | | | | | | | | 93,816,902 | |
| | | |
Total Investments (Cost $87,668,881) — 99.7%(a) | | | | | | | | | | | 93,816,902 | |
| | | |
Other assets in excess of liabilities — 0.3% | | | | | | | | | | | 315,142 | |
| | | |
NET ASSETS - 100.00% | | | | | | | | | | | 94,132,044 | |
Percentages indicated are based on net assets as of December 31, 2019.
| (a) | See Federal Tax Information listed in the Notes to Financial Statements. |
See notes to financial statements.
35
| | |
| | | Schedule of Portfolio Investments — continued |
Timothy Plan High Dividend Stock ETF | | December 31, 2019 |
Futures Contracts
Long Futures
| | | | | | | | | | | | | | | | |
| Index Futures | | Expiration Date | | | Number of
Contracts | | | Notional
Amount | | | Value and
Unrealized
Appreciation/
(Depreciation) | |
S&P 500 IndexE-mini March Future (U.S. Dollar) | | | 3/20/20 | | | | 1 | | | $ | 161,555 | | | | $ (137) | |
| | | | | | | | | | | | | | | | |
| | | | | | | | | | | | | | | $ (137) | |
| | | | | | | | | | | | | | | | |
See notes to financial statements.
36
| | |
| | | Schedule of Portfolio Investments |
Timothy Plan International ETF | | December 31, 2019 |
| | | | | | | | | | | | |
| SECURITY DESCRIPTION | | SHARES | | | | | | VALUE ($) | |
Common Stocks (99.6%) | |
| | | | |
Australia (6.5%): | | | | |
Communication Services (0.5%): | | | | | | | | | | | | |
Rea Group Ltd. | | | 670 | | | | | | | | 48,699 | |
Telstra Corp. Ltd. | | | 25,817 | | | | | | | | 64,121 | |
| | | | | | | | | | | 112,820 | |
| | | |
Consumer Staples (0.6%): | | | | | | | | | | | | |
Wesfarmers, Ltd. | | | 2,240 | | | | | | | | 65,064 | |
Woolworths Group Ltd. | | | 2,803 | | | | | | | | 71,112 | |
| | | | | | | | | | | 136,176 | |
| | | |
Energy (0.8%): | | | | | | | | | | | | |
Origin Energy Ltd. | | | 9,553 | | | | | | | | 56,635 | |
Santos Ltd. | | | 9,985 | | | | | | | | 57,305 | |
Woodside Petroleum Ltd. | | | 2,746 | | | | | | | | 66,237 | |
| | | | | | | | | | | 180,177 | |
| | | |
Financials (1.5%): | | | | | | | | | | | | |
ASX Ltd. | | | 1,315 | | | | | | | | 72,342 | |
Commonwealth Bank of Australia | | | 1,280 | | | | | | | | 71,754 | |
Insurance Australia Group Ltd. | | | 14,035 | | | | | | | | 75,428 | |
National Australia Bank Ltd. | | | 3,567 | | | | | | | | 61,639 | |
Suncorp Group Ltd. | | | 7,273 | | | | | | | | 66,132 | |
| | | | | | | | | | | 347,295 | |
| | | |
Health Care (1.1%): | | | | | | | | | | | | |
Cochlear Ltd. | | | 350 | | | | | | | | 55,185 | |
CSL Ltd. | | | 361 | | | | | | | | 69,844 | |
Ramsay Health Care Ltd. | | | 1,276 | | | | | | | | 64,932 | |
Sonic Healthcare Ltd. | | | 3,662 | | | | | | | | 73,866 | |
| | | | | | | | | | | 263,827 | |
| | | |
Industrials (0.5%): | | | | | | | | | | | | |
Aurizon Holdings Ltd. | | | 17,518 | | | | | | | | 64,280 | |
Brambles Ltd. | | | 7,946 | | | | | | | | 65,338 | |
| | | | | | | | | | | 129,618 | |
See notes to financial statements.
37
| | |
| | | Schedule of Portfolio Investments — continued |
Timothy Plan International ETF | | December 31, 2019 |
| | | | | | | | | | | | |
| SECURITY DESCRIPTION | | SHARES | | | | | | VALUE ($) | |
| | | | | | | | | | | | | |
Australia (6.5%): (continued) | | | | | | | | | | | | |
| | | |
Information Technology (0.1%): | | | | | | | | | | | | |
Wisetech Global Ltd. | | | 1,191 | | | | | | | | 19,528 | |
| | | | | | | | | | | 19,528 | |
| | | |
Materials (1.1%): | | | | | | | | | | | | |
BHP Group Ltd. | | | 2,485 | | | | | | | | 67,856 | |
BHP Group PLC | | | 2,481 | | | | | | | | 58,383 | |
Fortescue Metals Group Ltd. | | | 4,512 | | | | | | | | 33,840 | |
Newcrest Mining Ltd. | | | 1,815 | | | | | | | | 38,521 | |
Rio Tinto Ltd. | | | 788 | | | | | | | | 55,507 | |
| | | | | | | | | | | 254,107 | |
| | | |
Utilities (0.3%): | | | | | | | | | | | | |
AGL Energy Ltd. | | | 4,300 | | | | | | | | 61,937 | |
| | | | | | | | | | | | 61,937 | |
| | | | | | | | | | | | 1,505,485 | |
| | | |
Austria (0.5%): | | | | | | | | | | | | |
Energy (0.3%): | | | | | | | | | | | | |
OMV AG | | | 1,043 | | | | | | | | 58,585 | |
| | | | | | | | | | | 58,585 | |
| | | |
Financials (0.2%): | | | | | | | | | | | | |
Erste Group Bank AG | | | 1,394 | | | | | | | | 52,472 | |
| | | | | | | | | | | | 52,472 | |
| | | | | | | | | | | | 111,057 | |
| | | |
Belgium (1.0%): | | | | | | | | | | | | |
Financials (0.6%): | | | | | | | | | | | | |
Ageas | | | 1,566 | | | | | | | | 92,529 | |
KBC Group NV | | | 747 | | | | | | | | 56,185 | |
| | | | | | | | | | | 148,714 | |
See notes to financial statements.
38
| | |
| | | Schedule of Portfolio Investments — continued |
Timothy Plan International ETF | | December 31, 2019 |
| | | | | | | | | | | | |
| SECURITY DESCRIPTION | | SHARES | | | | | | VALUE ($) | |
| | | | | | | | | | | | | |
Belgium (1.0%): (continued) | | | | | | | | | | | | |
Materials (0.4%): | | | | | | | | | | | | |
Solvay SA | | | 445 | | | | | | | | 51,559 | |
Umicore | | | 746 | | | | | | | | 36,280 | |
| | | | | | | | | | | | 87,839 | |
| | | | | | | | | | | | 236,553 | |
| | | |
Bermuda (0.5%): | | | | | | | | | | | | |
Industrials (0.2%): | | | | | | | | | | | | |
Jardine Matheson Holdings Ltd. | | | 1,000 | | | | | | | | 55,600 | |
| | | | | | | | | | | 55,600 | |
| | | |
Real Estate (0.3%): | | | | | | | | | | | | |
Hongkong Land Holdings Ltd. | | | 10,000 | | | | | | | | 57,500 | |
| | | | | | | | | | | | 57,500 | |
| | | | | | | | | | | | 113,100 | |
| | | |
Canada (9.6%): | | | | | | | | | | | | |
Consumer Discretionary (0.9%): | | | | | | | | | | | | |
Dollarama, Inc. | | | 1,347 | | | | | | | | 46,300 | |
Gildan Activewear, Inc. | | | 2,093 | | | | | | | | 61,884 | |
Magna International, Inc. | | | 946 | | | | | | | | 51,876 | |
Restaurant Brands International, Inc. | | | 795 | | | | | | | | 50,686 | |
| | | | | | | | | | | 210,746 | |
| | | |
Consumer Staples (1.7%): | | | | | | | | | | | | |
Alimentation Couche-Tard, Inc. | | | 2,208 | | | | | | | | 70,080 | |
Empire Co. Ltd. | | | 2,645 | | | | | | | | 62,051 | |
Loblaw Cos. Ltd. | | | 1,717 | | | | | | | | 88,600 | |
Metro, Inc. | | | 2,606 | | | | | | | | 107,560 | |
Saputo, Inc. | | | 2,341 | | | | | | | | 72,480 | |
| | | | | | | | | | | 400,771 | |
| | | |
Energy (1.4%): | | | | | | | | | | | | |
Imperial Oil Ltd. | | | 2,522 | | | | | | | | 66,721 | |
Inter Pipeline Ltd. | | | 3,790 | | | | | | | | 65,794 | |
See notes to financial statements.
39
| | |
| | | Schedule of Portfolio Investments — continued |
Timothy Plan International ETF | | December 31, 2019 |
| | | | | | | | | | | | |
| SECURITY DESCRIPTION | | SHARES | | | | | | VALUE ($) | |
| | | | | | | | | | | | | |
Canada (9.6%): (continued) | | | | | | | | | | | | |
Energy (1.4%): (continued) | | | | | | | | | | | | |
Pembina Pipelines Corp. | | | 2,502 | | | | | | | | 92,746 | |
TC Energy Corp. | | | 1,795 | | | | | | | | 95,611 | |
| | | | | | | | | | | 320,872 | |
| | | |
Financials (1.7%): | | | | | | | | | | | | |
Great-West Lifeco, Inc. | | | 3,269 | | | | | | | | 83,739 | |
National Bank of Canada | | | 2,327 | | | | | | | | 129,182 | |
Power Corp. | | | 3,226 | | | | | | | | 83,110 | |
Power Financial Corp. | | | 3,571 | | | | | | | | 96,096 | |
| | | | | | | | | | | 392,127 | |
| | | |
Industrials (0.7%): | | | | | | | | | | | | |
Canadian National Railway Co. | | | 924 | | | | | | | | 83,597 | |
Canadian Pacific Railway, Ltd. | | | 322 | | | | | | | | 82,094 | |
| | | | | | | | | | | 165,691 | |
| | | |
Information Technology (1.0%): | | | | | | | | | | | | |
CGI, Inc. (a) | | | 1,241 | | | | | | | | 103,866 | |
Constellation Software, Inc. | | | 48 | | | | | | | | 46,623 | |
Open Text Corp. | | | 1,619 | | | | | | | | 71,349 | |
| | | | | | | | | | | 221,838 | |
| | | |
Materials (0.6%): | | | | | | | | | | | | |
CCL Industries, Inc. | | | 1,376 | | | | | | | | 58,626 | |
Kirkland Lake Gold Ltd. | | | 704 | | | | | | | | 31,036 | |
Teck Resources Ltd., Class B | | | 2,266 | | | | | | | | 39,303 | |
| | | | | | | | | | | 128,965 | |
| | | |
Utilities (1.6%): | | | | | | | | | | | | |
Canadian Utilities Ltd., Class A | | | 3,505 | | | | | | | | 105,738 | |
Emera, Inc. | | | 2,844 | | | | | | | | 122,202 | |
Fortis, Inc. | | | 3,618 | | | | | | | | 150,137 | |
| | | | | | | | | | | | 378,077 | |
| | | | | | | | | | | | 2,219,087 | |
See notes to financial statements.
40
| | |
| | | Schedule of Portfolio Investments — continued |
Timothy Plan International ETF | | December 31, 2019 |
| | | | | | | | | | | | |
| SECURITY DESCRIPTION | | SHARES | | | | | | VALUE ($) | |
| | | | | | | | | | | | | |
Chile (0.2%): | | | | |
Materials (0.2%): | | | | | | | | | | | | |
Antofagasta PLC | | | 3,165 | | | | | | | | 38,430 | |
| | | | | | | | | | | 38,430 | |
| |
Denmark (2.3%): | | | | |
Financials (0.5%): | | | | | | | | | | | | |
Danske Bank A/S | | | 2,766 | | | | | | | | 44,765 | |
Tryg A/S | | | 2,712 | | | | | | | | 80,413 | |
| | | | | | | | | | | 125,178 | |
| | | |
Health Care (0.8%): | | | | | | | | | | | | |
Coloplast A/S | | | 581 | | | | | | | | 72,083 | |
Demant A/S (a) | | | 1,717 | | | | | | | | 54,081 | |
Genmab A/S (a) | | | 244 | | | | | | | | 54,270 | |
| | | | | | | | | | | 180,434 | |
| | | |
Industrials (0.5%): | | | | | | | | | | | | |
DSV Panalpina A S | | | 562 | | | | | | | | 64,781 | |
Vestas Wind Systems A/S | | | 546 | | | | | | | | 55,183 | |
| | | | | | | | | | | 119,964 | |
| | | |
Materials (0.5%): | | | | | | | | | | | | |
Christian Hansen Holding A/S | | | 558 | | | | | | | | 44,349 | |
Novozymes A/S, Class B Shares | | | 1,200 | | | | | | | | 58,731 | |
| | | | | | | | | | | | 103,080 | |
| | | | | | | | | | | | 528,656 | |
| |
Finland (1.8%): | | | | |
Energy (0.2%): | | | | | | | | | | | | |
Neste OYJ | | | 1,447 | | | | | | | | 50,344 | |
| | | | | | | | | | | 50,344 | |
| | | |
Financials (0.6%): | | | | | | | | | | | | |
Nordea Bank ABP | | | 6,319 | | | | | | | | 51,046 | |
Sampo OYJ | | | 1,694 | | | | | | | | 73,929 | |
| | | | | | | | | | | 124,975 | |
See notes to financial statements.
41
| | |
| | | Schedule of Portfolio Investments — continued |
Timothy Plan International ETF | | December 31, 2019 |
| | | | | | | | | | | | |
| SECURITY DESCRIPTION | | SHARES | | | | | | VALUE ($) | |
| | | | | | | | | | | | | |
Finland (1.8%): (continued) | | | | | | | | | | | | |
Industrials (0.3%): | | | | | | | | | | | | |
Kone OYJ | | | 1,141 | | | | | | | | 74,584 | |
| | | | | | | | | | | 74,584 | |
Materials (0.4%): | | | | | | | | | | | | |
Stora ENSO OYJ, Class R Shares | | | 2,853 | | | | | | | | 41,487 | |
UPM-Kymmene OYJ | | | 1,421 | | | | | | | | 49,265 | |
| | | | | | | | | | | 90,752 | |
Utilities (0.3%): | | | | | | | | | | | | |
Fortum OYJ | | | 2,510 | | | | | | | | 61,935 | |
| | | | | | | | | | | | 61,935 | |
| | | | | | | | | | | | 402,590 | |
France (8.6%): | | | | |
Consumer Discretionary (1.1%): | | | | | | | | | | | | |
Compagnie Generale DES Etablissements Michelin | | | 401 | | | | | | | | 49,069 | |
Hermes International SA | | | 100 | | | | | | | | 74,721 | |
PSA Peugeot Citroen | | | 1,837 | | | | | | | | 43,886 | |
Renault SA | | | 688 | | | | | | | | 32,549 | |
SEB SA | | | 295 | | | | | | | | 43,808 | |
| | | | | | | | | | | 244,033 | |
Financials (1.2%): | | | | | | | | | | | | |
Amundi SA | | | 776 | | | | | | | | 60,839 | |
CNP Assurances SA | | | 3,120 | | | | | | | | 62,044 | |
Credit Agricole SA | | | 3,830 | | | | | | | | 55,522 | |
Natixis | | | 9,765 | | | | | | | | 43,350 | |
Societe Generale | | | 1,403 | | | | | | | | 48,806 | |
| | | | | | | | | | | 270,561 | |
Health Care (1.0%): | | | | | | | | | | | | |
bioMerieux | | | 618 | | | | | | | | 55,002 | |
Essilorluxottica | | | 368 | | | | | | | | 56,051 | |
Ipsen SA | | | 381 | | | | | | | | 33,759 | |
Orpea | | | 384 | | | | | | | | 49,229 | |
Sartorius Stedim Biotech | | | 281 | | | | | | | | 46,551 | |
| | | | | | | | | | | 240,592 | |
See notes to financial statements.
42
| | |
| | | Schedule of Portfolio Investments — continued |
Timothy Plan International ETF | | December 31, 2019 |
| | | | | | | | | | | | |
| SECURITY DESCRIPTION | | SHARES | | | | | | VALUE ($) | |
| | | | | | | | | | | | | |
France (8.6%): (continued) | | | | | | | | | | | | |
Industrials (3.6%): | | | | | | | | | | | | |
Aeroports de Paris | | | 324 | | | | | | | | 63,995 | |
Airbus Group SE | | | 420 | | | | | | | | 61,466 | |
Bollore | | | 14,288 | | | | | | | | 62,339 | |
Bureau Veritas SA | | | 2,446 | | | | | | | | 63,812 | |
Edenred | | | 1,232 | | | | | | | | 63,702 | |
Eiffage SA | | | 622 | | | | | | | | 71,159 | |
Groupe Eurotunnel SA | | | 4,021 | | | | | | | | 69,950 | |
Legrand SA | | | 829 | | | | | | | | 67,541 | |
Safran SA | | | 361 | | | | | | | | 55,734 | |
Schneider Electric SA | | | 647 | | | | | | | | 66,400 | |
Teleperformance | | | 219 | | | | | | | | 53,400 | |
Thales SA | | | 546 | | | | | | | | 56,659 | |
Vinci SA | | | 657 | | | | | | | | 72,952 | |
| | | | | | | | | | | 829,109 | |
Information Technology (0.4%): | | | | | | | | | | | | |
ATOS SE | | | 568 | | | | | | | | 47,347 | |
Dassault Systemes SA | | | 300 | | | | | | | | 49,311 | |
| | | | | | | | | | | 96,658 | |
Materials (0.4%): | | | | | | | | | | | | |
Air Liquide SA | | | 585 | | | | | | | | 82,805 | |
| | | | | | | | | | | 82,805 | |
Utilities (0.9%): | | | | | | | | | | | | |
Engie | | | 4,097 | | | | | | | | 66,171 | |
Suez | | | 4,380 | | | | | | | | 66,247 | |
Veolia Environnement | | | 2,820 | | | | | | | | 74,993 | |
| | | | | | | | | | | | 207,411 | |
| | | | | | | | | | | | 1,971,169 | |
Germany (5.4%): | | | | |
Consumer Discretionary (0.6%): | | | | | | | | | | | | |
Bayerische Motoren Werke (BMW) AG | | | 817 | | | | | | | | 67,022 | |
See notes to financial statements.
43
| | |
| | | Schedule of Portfolio Investments — continued |
Timothy Plan International ETF | | December 31, 2019 |
| | | | | | | | | | | | |
| SECURITY DESCRIPTION | | SHARES | | | | | | VALUE ($) | |
| | | | | | | | | | | | | |
Germany (5.4%): (continued) | | | | | | | | | | | | |
Consumer Discretionary (0.6%): (continued) | | | | | | | | | | | | |
Continental AG | | | 321 | | | | | | | | 41,498 | |
Puma SE | | | 545 | | | | | | | | 41,780 | |
| | | | | | | | | | | 150,300 | |
Consumer Staples (0.3%): | | | | | | | | | | | | |
Beiersdorf AG | | | 575 | | | | | | | | 68,781 | |
| | | | | | | | | | | 68,781 | |
Financials (1.5%): | | | | | | | | | | | | |
Deutsche Boerse AG | | | 451 | | | | | | | | 70,894 | |
Hannover Rueck SE | | | 434 | | | | | | | | 83,872 | |
Muenchener Rueckversicherungs-Gesellschaft AG | | | 311 | | | | | | | | 91,739 | |
Talanx AG | | | 1,904 | | | | | | | | 94,348 | |
| | | | | | | | | | | 340,853 | |
Health Care (0.5%): | | | | | | | | | | | | |
Carl Zeiss Meditec AG | | | 361 | | | | | | | | 46,037 | |
Fresenius Medical Care AG | | | 827 | | | | | | | | 61,182 | |
| | | | | | | | | | | 107,219 | |
Industrials (1.5%): | | | | | | | | | | | | |
Brenntag AG | | | 1,085 | | | | | | | | 58,997 | |
Deutsche Post AG | | | 2,075 | | | | | | | | 79,152 | |
Fraport AG Frankfurt Airport | | | 725 | | | | | | | | 61,622 | |
MTU Aero Engines AG | | | 224 | | | | | | | | 63,966 | |
Rational AG | | | 89 | | | | | | | | 71,573 | |
| | | | | | | | | | | 335,310 | |
Information Technology (0.2%): | | | | | | | | | | | | |
Infineon Technologies AG | | | 1,969 | | | | | | | | 44,853 | |
Wirecard AG | | | 108 | | | | | | | | 13,022 | |
| | | | | | | | | | | 57,875 | |
Materials (0.6%): | | | | | | | | | | | | |
Evonik Industries AG | | | 1,846 | | | | | | | | 56,338 | |
Symrise AG | | | 708 | | | | | | | | 74,486 | |
| | | | | | | | | | | 130,824 | |
See notes to financial statements.
44
| | |
| | | Schedule of Portfolio Investments — continued |
Timothy Plan International ETF | | December 31, 2019 |
| | | | | | | | | | | | |
| SECURITY DESCRIPTION | | SHARES | | | | | | VALUE ($) | |
| | | | | | | | | | | | | |
Germany (5.4%): (continued) | | | | | | | | | | | | |
Real Estate (0.2%): | | | | | | | | | | | | |
Deutsche Wohnen SE | | | 1,355 | | | | | | | | 55,350 | |
| | | | | | | | | | | | 55,350 | |
| | | | | | | | | | | | 1,246,512 | |
Hong Kong (5.4%): | | | | |
Consumer Discretionary (0.2%): | | | | |
Techtronic Industries Co. | | | 5,500 | | | | | | | | 44,858 | |
| | | | | | | | | | | 44,858 | |
Consumer Staples (0.3%): | | | | | | | | | | | | |
Sun Art Retail Group Ltd. | | | 34,000 | | | | | | | | 41,236 | |
WH Group Ltd. | | | 32,500 | | | | | | | | 33,577 | |
| | | | | | | | | | | 74,813 | |
Financials (0.5%): | | | | | | | | | | | | |
AIA Group Ltd. | | | 5,400 | | | | | | | | 56,690 | |
Hang Seng Bank | | | 3,100 | | | | | | | | 64,055 | |
| | | | | | | | | | | 120,745 | |
Health Care (0.1%): | | | | | | | | | | | | |
Sino Biopharmaceutical Ltd. | | | 20,000 | | | | | | | | 27,978 | |
| | | | | | | | | | | 27,978 | |
Industrials (0.7%): | | | | | | | | | | | | |
CK Hutchison Holdings Ltd. | | | 8,000 | | | | | | | | 76,285 | |
MTR Corp. Ltd. | | | 11,500 | | | | | | | | 67,966 | |
| | | | | | | | | | | 144,251 | |
Real Estate (2.4%): | | | | | | | | | | | | |
CK Asset Holdings Ltd. | | | 8,000 | | | | | | | | 57,753 | |
Hang Lung Properties Ltd. | | | 24,452 | | | | | | | | 53,663 | |
Henderson Land Development Co. Ltd. | | | 11,000 | | | | | | | | 53,999 | |
New World Development Co. Ltd. | | | 34,000 | | | | | | | | 46,603 | |
Shimao Property Holdings Ltd. | | | 11,500 | | | | | | | | 44,572 | |
Sino Land Co. Ltd. | | | 38,000 | | | | | | | | 55,207 | |
Sun Hung KAI Properties Ltd. | | | 3,834 | | | | | | | | 58,702 | |
See notes to financial statements.
45
| | |
| | | Schedule of Portfolio Investments — continued |
Timothy Plan International ETF | | December 31, 2019 |
| | | | | | | | | | | | |
| SECURITY DESCRIPTION | | SHARES | | | | | | VALUE ($) | |
| | | | | | | | | | | | | |
Hong Kong (5.4%): (continued) | | | | | | | | | | | | |
Real Estate (2.4%): (continued) | | | | | | | | | | | | |
Swire Pacific Ltd., Class A | | | 6,500 | | | | | | | | 60,397 | |
Wharf Real Estate Investment | | | 8,000 | | | | | | | | 48,821 | |
Wheelock & Co. Ltd. | | | 11,000 | | | | | | | | 73,340 | |
| | | | | | | | | | | 553,057 | |
Utilities (1.2%): | | | | | | | | | | | | |
CK Infrastructure Holdings Ltd. | | | 11,500 | | | | | | | | 81,839 | |
Hong Kong & China Gas Co. Ltd. | | | 38,000 | | | | | | | | 74,227 | |
Power Assets Holdings Ltd. | | | 15,500 | | | | | | | | 113,388 | |
| | | | | | | | | | | | 269,454 | |
| | | | | | | | | | | | 1,235,156 | |
| |
Ireland (1.4%): | | | | |
Consumer Staples (0.3%): | | | | | | | | | | | | |
Kerry Group PLC | | | 594 | | | | | | | | 74,019 | |
| | | | | | | | | | | 74,019 | |
| | | |
Industrials (0.8%): | | | | | | | | | | | | |
DCC PLC | | | 695 | | | | | | | | 60,235 | |
Experian PLC | | | 2,128 | | | | | | | | 71,923 | |
Kingspan Group PLC | | | 910 | | | | | | | | 55,575 | |
| | | | | | | | | | | 187,733 | |
| | | |
Materials (0.3%): | | | | | | | | | | | | |
CRH PLC | | | 1,691 | | | | | | | | 67,653 | |
| | | | | | | | | | | | 67,653 | |
| | | | | | | | | | | | 329,405 | |
Israel (1.1%): | | | | |
Financials (0.6%): | | | | | | | | | | | | |
Bank Hapoalim BM | | | 8,724 | | | | | | | | 72,405 | |
Bank Leumi | | | 10,227 | | | | | | | | 74,481 | |
| | | | | | | | | | | 146,886 | |
See notes to financial statements.
46
| | |
| | | Schedule of Portfolio Investments — continued |
Timothy Plan International ETF | | December 31, 2019 |
| | | | | | | | | | | | |
| SECURITY DESCRIPTION | | SHARES | | | | | | VALUE ($) | |
| | | | | | | | | | | | | |
Israel (1.1%): (continued) | | | | | | | | | | | | |
Information Technology (0.3%): | | | | | | | | | | | | |
Nice Ltd. (a) | | | 396 | | | | | | | | 61,442 | |
| | | | | | | | | | | 61,442 | |
| | | |
Real Estate (0.2%): | | | | | | | | | | | | |
Azrieli Group Ltd. | | | 708 | | | | | | | | 51,787 | |
| | | | | | | | | | | | 51,787 | |
| | | | | | | | | | | | 260,115 | |
Italy (2.8%): | | | | |
Consumer Discretionary (0.2%): | | | | | | | | | | | | |
Moncler SpA | | | 1,139 | | | | | | | | 51,190 | |
| | | | | | | | | | | 51,190 | |
| | | |
Consumer Staples (0.3%): | | | | | | | | | | | | |
Davide Campari - Milano SpA | | | 6,141 | | | | | | | | 56,066 | |
| | | | | | | | | | | 56,066 | |
| | | |
Energy (0.6%): | | | | | | | | | | | | |
Eni SpA | | | 4,667 | | | | | | | | 72,477 | |
Snam SpA | | | 13,185 | | | | | | | | 69,298 | |
| | | | | | | | | | | 141,775 | |
| | | |
Financials (0.9%): | | | | | | | | | | | | |
Assicurazioni Generali SpA | | | 4,489 | | | | | | | | 92,617 | |
Intesa Sanpaolo SpA | | | 21,595 | | | | | | | | 56,883 | |
Poste Italiane SpA | | | 4,603 | | | | | | | | 52,247 | |
| | | | | | | | | | | 201,747 | |
| | | |
Industrials (0.2%): | | | | | | | | | | | | |
Atlantia SpA | | | 1,787 | | | | | | | | 41,670 | |
| | | | | | | | | | | 41,670 | |
See notes to financial statements.
47
| | |
| | | Schedule of Portfolio Investments — continued |
Timothy Plan International ETF | | December 31, 2019 |
| | | | | | | | | | | | |
| SECURITY DESCRIPTION | | SHARES | | | | | | VALUE ($) | |
| | | | | | | | | | | | | |
Italy (2.8%): (continued) | | | | | | | | | | | | |
Utilities (0.6%): | | | | | | | | | | | | |
ENEL SpA | | | 9,621 | | | | | | | | 76,314 | |
Terna SpA | | | 10,729 | | | | | | | | 71,648 | |
| | | | | | | | | | | | 147,962 | |
| | | | | | | | | | | | 640,410 | |
| |
Japan (19.5%): | | | | |
Communication Services (1.0%): | | | | | | | | | | | | |
KDDI Corp. | | | 2,500 | | | | | | | | 74,858 | |
Nippon Telegraph & Telephone Corp. | | | 3,000 | | | | | | | | 76,132 | |
NTT DoCoMo, Inc. | | | 3,100 | | | | | | | | 86,688 | |
| | | | | | | | | | | 237,678 | |
| | | |
Consumer Discretionary (3.0%): | | | | | | | | | | | | |
Bridgestone Corp. | | | 1,900 | | | | | | | | 71,180 | |
Denso Corp. | | | 1,400 | | | | | | | | 63,995 | |
Fast Retailing Co. Ltd. | | | 100 | | | | | | | | 59,831 | |
Hikari Tsushin, Inc. | | | 200 | | | | | | | | 50,497 | |
Nitori Co. Ltd. | | | 400 | | | | | | | | 63,421 | |
Oriental Land Co. Ltd. | | | 400 | | | | | | | | 54,786 | |
Pan Pacific International Holdings Corp. | | | 3,400 | | | | | | | | 56,677 | |
Panasonic Corp. | | | 7,200 | | | | | | | | 68,229 | |
Shimano ORD | | | 400 | | | | | | | | 65,427 | |
Sumitomo Electric Industries Ltd. | | | 5,000 | | | | | | | | 76,031 | |
Toyota Industries Corp. | | | 1,100 | | | | | | | | 64,092 | |
| | | | | | | | | | | 694,166 | |
| | | |
Consumer Staples (0.7%): | | | | | | | | | | | | |
KAO Corp. | | | 700 | | | | | | | | 58,151 | |
Unicharm Corp. | | | 1,600 | | | | | | | | 54,492 | |
Yakult Honsha Co. Ltd. | | | 1,000 | | | | | | | | 55,504 | |
| | | | | | | | | | | 168,147 | |
See notes to financial statements.
48
| | |
| | | Schedule of Portfolio Investments — continued |
Timothy Plan International ETF | | December 31, 2019 |
| | | | | | | | | | | | |
| SECURITY DESCRIPTION | | SHARES | | | | | | VALUE ($) | |
| | | | | | | | | | | | | |
Japan (19.5%): (continued) | | | | | | | | | | | | |
Financials (3.0%): | | | | | | | | | | | | |
DAI-Ichi Life Holdings, Inc. | | | 3,500 | | | | | | | | 58,521 | |
Japan Exchange Group, Inc. | | | 3,500 | | | | | | | | 62,178 | |
Japan Post Bank Co. Ltd. | | | 9,100 | | | | | | | | 87,951 | |
Japan Post Holdings Co. Ltd. | | | 9,300 | | | | | | | | 87,829 | |
ORIX Corp. | | | 4,400 | | | | | | | | 73,347 | |
Resona Holding, Inc. | | | 14,800 | | | | | | | | 65,254 | |
Sony Financial Holdings, Inc. | | | 2,900 | | | | | | | | 70,151 | |
Sumitomo Mitsui Financial Group, Inc. | | | 2,400 | | | | | | | | 89,205 | |
Sumitomo Mitsui Trust Holdings, Inc. | | | 2,200 | | | | | | | | 87,826 | |
| | | | | | | | | | | 682,262 | |
| | | |
Health Care (1.7%): | | | | | | | | | | | | |
Chugai Pharmaceutical Co. Ltd. | | | 800 | | | | | | | | 74,227 | |
Hoya Corp. | | | 600 | | | | | | | | 57,714 | |
Kyowa Kirin Co. Ltd. | | | 3,000 | | | | | | | | 71,051 | |
ONO Pharmaceutical Co. Ltd. | | | 3,000 | | | | | | | | 69,091 | |
Shionogi & Co. Ltd. | | | 1,100 | | | | | | | | 68,517 | |
Terumo Corp. | | | 1,600 | | | | | | | | 57,216 | |
| | | | | | | | | | | 397,816 | |
| | | |
Industrials (6.2%): | | | | | | | | | | | | |
ANA Holdings, Inc. | | | 2,700 | | | | | | | | 90,513 | |
Central Japan Railway Co. | | | 200 | | | | | | | | 40,501 | |
Daikin Industries Ltd. | | | 400 | | | | | | | | 56,885 | |
East Japan Railway Co. | | | 800 | | | | | | | | 72,592 | |
Fanuc Corp. | | | 300 | | | | | | | | 56,139 | |
Hankyu Hanshin Holdings, Inc. | | | 1,700 | | | | | | | | 73,233 | |
Japan Airlines Co. Ltd. | | | 2,700 | | | | | | | | 84,425 | |
KEIO Corp. | | | 900 | | | | | | | | 54,759 | |
Kintetsu Group Holdings Co. Ltd. | | | 1,300 | | | | | | | | 70,839 | |
Kubota Corp. | | | 3,500 | | | | | | | | 55,606 | |
See notes to financial statements.
49
| | |
| | | Schedule of Portfolio Investments — continued |
Timothy Plan International ETF | | December 31, 2019 |
| | | | | | | | | | | | |
| SECURITY DESCRIPTION | | SHARES | | | | | | VALUE ($) | |
| | | | | | | | | | | | | |
Japan (19.5%): (continued) | | | | | | | | | | | | |
Industrials (6.2%): (continued) | | | | | | | | | | | | |
Marubeni Corp. | | | 8,000 | | | | | | | | 59,691 | |
Mitsubishi Corp. | | | 2,700 | | | | | | | | 72,073 | |
Mitsubishi Electric Corp. | | | 3,900 | | | | | | | | 53,794 | |
Mitsubishi Heavy Industries Ltd. | | | 1,800 | | | | | | | | 70,383 | |
Nidec Corp. | | | 400 | | | | | | | | 55,247 | |
Odakyu Railway | | | 2,900 | | | | | | | | 68,095 | |
Secom Co. Ltd. | | | 800 | | | | | | | | 71,995 | |
SG Holdings Co. Ltd. | | | 2,200 | | | | | | | | 49,816 | |
Sumitomo Corp. | | | 4,200 | | | | | | | | 62,783 | |
Tokyu Corp. | | | 3,400 | | | | | | | | 63,187 | |
Toyota Tsusho Corp. | | | 1,600 | | | | | | | | 56,848 | |
West Japan Railway Co. | | | 1,000 | | | | | | | | 86,902 | |
| | | | | | | | | | | 1,426,306 | |
| | | |
Information Technology (1.7%): | | | | | | | | | | | | |
Canon, Inc. | | | 2,700 | | | | | | | | 74,223 | |
Fujifilm Holdings Corp. | | | 1,500 | | | | | | | | 72,211 | |
Keyence Corp. | | | 200 | | | | | | | | 70,858 | |
Kyocera Corp. | | | 1,000 | | | | | | | | 68,851 | |
Nomura Research Institute Ltd. | | | 2,300 | | | | | | | | 49,497 | |
NTT Data Corp. | | | 3,800 | | | | | | | | 51,313 | |
| | | | | | | | | | | 386,953 | |
| | | |
Materials (0.9%): | | | | | | | | | | | | |
Mitsubishi Chemical Holdings Corp. | | | 6,900 | | | | | | | | 51,922 | |
Nippon Paint Holdings Co. Ltd. | | | 900 | | | | | | | | 46,723 | |
Shin-Etsu Chemical Co. Ltd. | | | 500 | | | | | | | | 55,504 | |
Taiyo Nippon Sanso Corp. | | | 2,200 | | | | | | | | 49,168 | |
| | | | | | | | | | | 203,317 | |
See notes to financial statements.
50
| | |
| | | Schedule of Portfolio Investments — continued |
Timothy Plan International ETF | | December 31, 2019 |
| | | | | | | | | | | | |
| SECURITY DESCRIPTION | | SHARES | | | | | | VALUE ($) | |
| | | | | | | | | | | | | |
Japan (19.5%): (continued) | | | | | | | | | | | | |
Real Estate (1.3%): | | | | | | | | | | | | |
Daito Trust Construction Co. Ltd. | | | 400 | | | | | | | | 49,632 | |
Daiwa House Industry Co. Ltd. | | | 1,700 | | | | | | | | 53,047 | |
Mitsubishi Estate Co. Ltd. | | | 2,900 | | | | | | | | 55,776 | |
Mitsui Fudosan Co. Ltd. | | | 2,600 | | | | | | | | 63,947 | |
Sumitomo Realty & Development | | | 2,000 | | | | | | | | 70,177 | |
| | | | | | | | | | | | 292,579 | |
| | | | | | | | | | | | 4,489,224 | |
Korea, Republic Of (4.4%): | | | | |
Communication Services (0.6%): | | | | | | | | | | | | |
Naver Corp. | | | 313 | | | | | | | | 50,484 | |
SK Telecom Co. Ltd. | | | 368 | | | | | | | | 75,745 | |
| | | | | | | | | | | 126,229 | |
| | | |
Consumer Discretionary (0.4%): | | | | | | | | | | | | |
Hyundai Mobis | | | 214 | | | | | | | | 47,379 | |
KIA Motors Corp. | | | 1,307 | | | | | | | | 50,073 | |
| | | | | | | | | | | 97,452 | |
| | | |
Consumer Staples (0.2%): | | | | | | | | | | | | |
LG Household & Health Care Ltd. | | | 42 | | | | | | | | 45,803 | |
| | | | | | | | | | | 45,803 | |
| | | |
Energy (0.2%): | | | | | | | | | | | | |
SK Innovation Co. Ltd. | | | 317 | | | | | | | | 41,123 | |
| | | | | | | | | | | 41,123 | |
| | | |
Financials (1.0%): | | | | | | | | | | | | |
Hana Financial Group, Inc. | | | 1,877 | | | | | | | | 59,899 | |
KB Financial Group, Inc. | | | 1,430 | | | | | | | | 58,929 | |
Samsung Fire & Marine Insurance Co. Ltd. | | | 259 | | | | | | | | 54,541 | |
Shinhan Financial Group Co. Ltd. | | | 1,674 | | | | | | | | 62,759 | |
| | | | | | | | | | | 236,128 | |
See notes to financial statements.
51
| | |
| | | Schedule of Portfolio Investments — continued |
Timothy Plan International ETF | | December 31, 2019 |
| | | | | | | | | | | | |
| SECURITY DESCRIPTION | | SHARES | | | | | | VALUE ($) | |
| | | | | | | | | | | | | |
Korea, Republic Of (4.4%): (continued) | | | | | | | | | | | | |
Health Care (0.2%): | | | | | | | | | | | | |
Celltrion, Inc. (a) | | | 230 | | | | | | | | 35,995 | |
| | | | | | | | | | | 35,995 | |
| | | |
Industrials (0.8%): | | | | | | | | | | | | |
LG Corp. | | | 935 | | | | | | | | 59,676 | |
Samsung C&T Corp. | | | 691 | | | | | | | | 64,839 | |
SK Holdings Co. Ltd. | | | 247 | | | | | | | | 55,966 | |
| | | | | | | | | | | 180,481 | |
| | | |
Information Technology (0.8%): | | | | | | | | | | | | |
Samsung Electronics Co. Ltd. | | | 1,188 | | | | | | | | 57,330 | |
Samsung SDI Co. Ltd. | | | 208 | | | | | | | | 42,453 | |
Samsung SDS Co. Ltd. | | | 298 | | | | | | | | 50,126 | |
SK Hynix, Inc. | | | 500 | | | | | | | | 40,690 | |
| | | | | | | | | | | 190,599 | |
| | | |
Materials (0.2%): | | | | | | | | | | | | |
LG Chem Ltd. | | | 180 | | | | | | | | 49,425 | |
| | | | | | | | | | | | 49,425 | |
| | | | | | | | | | | | 1,003,235 | |
Luxembourg (0.7%): | | | | |
Energy (0.2%): | | | | | | | | | | | | |
Tenaris SA | | | 3,844 | | | | | | | | 43,330 | |
| | | | | | | | | | | 43,330 | |
| | | |
Health Care (0.2%): | | | | | | | | | | | | |
Eurofins Scientific | | | 66 | | | | | | | | 36,583 | |
| | | | | | | | | | | 36,583 | |
| | | |
Real Estate (0.3%): | | | | | | | | | | | | |
Aroundtown SA | | | 8,296 | | | | | | | | 74,290 | |
| | | | | | | | | | | | 74,290 | |
| | | | | | | | | | | | 154,203 | |
See notes to financial statements.
52
| | |
| | | Schedule of Portfolio Investments — continued |
Timothy Plan International ETF | | December 31, 2019 |
| | | | | | | | | | | | |
| SECURITY DESCRIPTION | | SHARES | | | | | | VALUE ($) | |
| | | | | | | | | | | | | |
Netherlands (1.9%): | | | | |
Financials (0.3%): | | | | | | | | | | | | |
EXOR NV | | | 767 | | | | | | | | 59,428 | |
| | | | | | | | | | | 59,428 | |
Industrials (0.6%): | | | | | | | | | | | | |
Randstad NV | | | 981 | | | | | | | | 59,900 | |
Wolters Kluwer NV | | | 1,005 | | | | | | | | 73,291 | |
| | | | | | | | | | | 133,191 | |
| | | |
Information Technology (0.4%): | | | | | | | | | | | | |
Adyen NV (a) | | | 57 | | | | | | | | 46,734 | |
ASML Holding N.V. | | | 186 | | | | | | | | 55,013 | |
| | | | | | | | | | | 101,747 | |
| | | |
Materials (0.6%): | | | | | | | | | | | | |
AKZO Nobel N.V | | | 762 | | | | | | | | 77,467 | |
Koninklijke DSM NV | | | 470 | | | | | | | | 61,202 | |
| | | | | | | | | | | | 138,669 | |
| | | | | | | | | | | | 433,035 | |
Norway (1.7%): | | | | |
Consumer Staples (0.6%): | | | | | | | | | | | | |
Mowi ASA | | | 2,202 | | | | | | | | 57,256 | |
Orkla ASA, Class A | | | 7,139 | | | | | | | | 72,364 | |
| | | | | | | | | | | 129,620 | |
| | | |
Energy (0.4%): | | | | | | | | | | | | |
AKER BP ASA | | | 1,147 | | | | | | | | 37,640 | |
Statoil ASA | | | 2,558 | | | | | | | | 51,152 | |
| | | | | | | | | | | 88,792 | |
| | | |
Financials (0.5%): | | | | | | | | | | | | |
DNB ASA | | | 3,176 | | | | | | | | 59,349 | |
Gjensidige Forsikring ASA | | | 3,128 | | | | | | | | 65,669 | |
| | | | | | | | | | | 125,018 | |
See notes to financial statements.
53
| | |
| | | Schedule of Portfolio Investments — continued |
Timothy Plan International ETF | | December 31, 2019 |
| | | | | | | | | | | | |
| SECURITY DESCRIPTION | | SHARES | | | | | | VALUE ($) | |
| | | | | | | | | | | | | |
Norway (1.7%): (continued) | | | | | | | | | | | | |
Materials (0.2%): | | | | | | | | | | | | |
Yara International ASA | | | 1,113 | | | | | | | | 46,314 | |
| | | | | | | | | | | | 46,314 | |
| | | | | | | | | | | | 389,744 | |
Portugal (0.2%): | | | | |
Consumer Staples (0.2%): | | | | | | | | | | | | |
Jeronimo Martins & Filho SA | | | 2,906 | | | | | | | | 47,799 | |
| | | | | | | | | | | 47,799 | |
| |
Russian Federation (0.2%): | | | | |
Materials (0.2%): | | | | | | | | | | | | |
Evraz PLC | | | 6,770 | | | | | | | | 36,223 | |
| | | | | | | | | | | 36,223 | |
| |
Singapore (3.5%): | | | | |
Communication Services (0.4%): | | | | | | | | | | | | |
Singapore Telecommunications Ltd. | | | 35,100 | | | | | | | | 87,972 | |
| | | | | | | | | | | 87,972 | |
| | | |
Consumer Discretionary (0.2%): | | | | | | | | | | | | |
Jardine Cycle & Carriage Ltd. | | | 2,500 | | | | | | | | 55,964 | |
| | | | | | | | | | | 55,964 | |
Consumer Staples (0.3%): | | | | | | | | | | | | |
Wilmar International Ltd. | | | 25,500 | | | | | | | | 78,135 | |
| | | | | | | | | | | 78,135 | |
| | | |
Financials (1.1%): | | | | | | | | | | | | |
DBS Group Holdings Ltd. | | | 4,200 | | | | | | | | 80,839 | |
Oversea-Chinese Banking Corp. Ltd. | | | 11,100 | | | | | | | | 90,643 | |
United Overseas Bank | | | 4,100 | | | | | | | | 80,530 | |
| | | | | | | | | | | 252,012 | |
See notes to financial statements.
54
| | |
| | | Schedule of Portfolio Investments — continued |
Timothy Plan International ETF | | December 31, 2019 |
| | | | | | | | | | | | |
| SECURITY DESCRIPTION | | SHARES | | | | | | VALUE ($) | |
| | | | | | | | | | | | | |
Singapore (3.5%): (continued) | | | | | | | | | | | | |
Industrials (1.1%): | | | | | | | | | | | | |
Keppel Corp. Ltd. | | | 17,000 | | | | | | | | 85,594 | |
Singapore Airlines Ltd. | | | 14,200 | | | | | | | | 95,470 | |
Singapore Tech Engineering Ltd. | | | 25,900 | | | | | | | | 75,893 | |
| | | | | | | | | | | 256,957 | |
| | | |
Real Estate (0.4%): | | | | | | | | | | | | |
Capitaland Ltd. | | | 28,500 | | | | | | | | 79,484 | |
| | | | | | | | | | | | 79,484 | |
| | | | | | | | | | | | 810,524 | |
Spain (3.2%): | | | | |
Consumer Discretionary (0.3%): | | | | | | | | | | | | |
Industria de Diseno Textil SA | | | 1,867 | | | | | | | | 65,857 | |
| | | | | | | | | | | 65,857 | |
| | | |
Energy (0.3%): | | | | | | | | | | | | |
Repsol SA | | | 4,031 | | | | | | | | 62,980 | |
| | | | | | | | | | | 62,980 | |
| | | |
Financials (0.2%): | | | | | | | | | | | | |
Caixabank SA | | | 13,945 | | | | | | | | 43,763 | |
| | | | | | | | | | | 43,763 | |
| | | |
Health Care (0.3%): | | | | | | | | | | | | |
Grifols SA | | | 1,900 | | | | | | | | 66,979 | |
| | | | | | | | | | | 66,979 | |
| | | |
Industrials (0.6%): | | | | | | | | | | | | |
ACS Actividades de Construccion y Servicios SA | | | 1,429 | | | | | | | | 57,139 | |
Aena SME SA | | | 395 | | | | | | | | 75,537 | |
| | | | | | | | | | | 132,676 | |
| | | |
Information Technology (0.2%): | | | | | | | | | | | | |
Amadeus IT Group SA | | | 761 | | | | | | | | 62,138 | |
| | | | | | | | | | | 62,138 | |
See notes to financial statements.
55
| | |
| | | Schedule of Portfolio Investments — continued |
Timothy Plan International ETF | | December 31, 2019 |
| | | | | | | | | | | | |
| SECURITY DESCRIPTION | | SHARES | | | | | | VALUE ($) | |
| | | | | | | | | | | | | |
Spain (3.2%): (continued) | | | | | | | | | | | | |
Utilities (1.3%): | | | | | | | | | | | | |
Endesa SA | | | 3,140 | | | | | | | | 83,784 | |
Iberdrola SA | | | 8,490 | | | | | | | | 87,416 | |
Naturgy Energy Group SA | | | 2,742 | | | | | | | | 68,890 | |
Red Electrica Corp. | | | 3,387 | | | | | | | | 68,095 | |
| | | | | | | | | | | | 308,185 | |
| | | | | | | | | | | | 742,578 | |
Sweden (3.5%): | | | | |
Communication Services (0.3%): | | | | | | | | | | | | |
Telia Co. AB | | | 18,327 | | | | | | | | 78,781 | |
| | | | | | | | | | | 78,781 | |
Consumer Staples (0.5%): | | | | | | | | | | | | |
Essity Aktiebolag, Class B | | | 1,962 | | | | | | | | 63,239 | |
ICA Gruppen AB | | | 1,194 | | | | | | | | 55,751 | |
| | | | | | | | | | | 118,990 | |
| |
Financials (0.7%): | | | | |
Skandinavisk Enskilda Banken AB | | | 5,434 | | | | | | | | 51,117 | |
Svenska Handelsbanken AB | | | 6,164 | | | | | | | | 66,423 | |
Swedbank AB, Class A Shares | | | 2,404 | | | | | | | | 35,803 | |
| | | | | | | | | | | 153,343 | |
| |
Industrials (1.8%): | | | | |
ALFA Laval AB | | | 2,233 | | | | | | | | 56,258 | |
ASSA Abloy AB | | | 2,690 | | | | | | | | 62,916 | |
Atlas Copco AB, Class A Shares | | | 1,590 | | | | | | | | 63,441 | |
Epiroc AB, Class A | | | 4,221 | | | | | | | | 51,549 | |
Sandvik AB | | | 3,007 | | | | | | | | 58,657 | |
Skanska AB | | | 2,591 | | | | | | | | 58,581 | |
Volvo AB | | | 3,372 | | | | | | | | 56,503 | |
| | | | | | | | | | | 407,905 | |
See notes to financial statements.
56
| | |
| | | Schedule of Portfolio Investments — continued |
Timothy Plan International ETF | | December 31, 2019 |
| | | | | | | | | | | | |
| SECURITY DESCRIPTION | | SHARES | | | | | | VALUE ($) | |
| | | | | | | | | | | | | |
Sweden (3.5%): (continued) | | | | | | | | | | | | |
Information Technology (0.2%): | | | | |
Hexagon AB, Class B Shares | | | 874 | | | | | | | | 49,005 | |
| | | | | | | | | | | | 49,005 | |
| | | | | | | | | | | | 808,024 | |
Switzerland (7.6%): | | | | | | | | | | | | |
Communication Services (0.4%): | | | | | | | | | | | | |
Swisscom AG | | | 175 | | | | | | | | 92,709 | |
| | | | | | | | | | | 92,709 | |
| |
Consumer Discretionary (0.5%): | | | | |
CIE Financiere Richemont SA | | | 745 | | | | | | | | 58,562 | |
Swatch Group AG | | | 189 | | | | | | | | 52,739 | |
| | | | | | | | | | | 111,301 | |
| |
Consumer Staples (0.7%): | | | | |
Barry Callebaut AG | | | 35 | | | | | | | | 77,336 | |
Chocoladefabriken Lindt & Spruengli AG | | | 11 | | | | | | | | 85,433 | |
| | | | | | | | | | | 162,769 | |
| |
Financials (1.5%): | | | | |
Baloise Holding AG | | | 481 | | | | | | | | 86,994 | |
Julius Baer Group Ltd. | | | 1,057 | | | | | | | | 54,543 | |
Partners Group Holding AG | | | 105 | | | | | | | | 96,297 | |
Swiss Life Holding AG | | | 202 | | | | | | | | 101,417 | |
| | | | | | | | | | | 339,251 | |
| |
Health Care (0.8%): | | | | |
Sonova Holding AG | | | 274 | | | | | | | | 62,723 | |
Straumann Holding AG | | | 73 | | | | | | | | 71,702 | |
Vifor Pharma AG | | | 307 | | | | | | | | 56,048 | |
| | | | | | | | | | | 190,473 | |
See notes to financial statements.
57
| | |
| | | Schedule of Portfolio Investments — continued |
Timothy Plan International ETF | | December 31, 2019 |
| | | | | | | | | | | | |
| SECURITY DESCRIPTION | | SHARES | | | | | | VALUE ($) | |
| | | | | | | | | | | | | |
Switzerland (7.6%): (continued) | | | | | | | | | | | | |
Industrials (1.8%): | | | | | | | | | | | | |
ABB Ltd. | | | 3,538 | | | | | | | | 85,452 | |
Geberit AG | | | 172 | | | | | | | | 96,559 | |
Kuehne & Nagel International AG | | | 411 | | | | | | | | 69,321 | |
Schindler Holding AG | | | 289 | | | | | | | | 73,534 | |
SGS SA | | | 35 | | | | | | | | 95,892 | |
| | | | | | | | | | | 420,758 | |
| |
Information Technology (0.3%): | | | | |
Stmicroelectronics NV | | | 1,439 | | | | | | | | 38,687 | |
Temenos AG | | | 280 | | | | | | | | 44,333 | |
| | | | | | | | | | | 83,020 | |
| |
Materials (1.6%): | | | | |
EMS-Chemie Holding AG | | | 94 | | | | | | | | 61,834 | |
Givaudan SA | | | 32 | | | | | | | | 100,240 | |
Glencore PLC | | | 14,251 | | | | | | | | 44,420 | |
Lafargeholcim Ltd. | | | 1,336 | | | | | | | | 74,145 | |
Sika AG | | | 419 | | | | | | | | 78,747 | |
| | | | | | | | | | | | 359,386 | |
| | | | | | | | | | | | 1,759,667 | |
United Kingdom (5.8%): | | | | | | | | | | | | |
Communication Services (0.6%): | | | | | | | | | | | | |
BT Group PLC | | | 23,951 | | | | | | | | 61,043 | |
Informa PLC | | | 6,032 | | | | | | | | 68,464 | |
| | | | | | | | | | | 129,507 | |
| |
Consumer Discretionary (0.7%): | | | | |
Barratt Developments PLC | | | 5,816 | | | | | | | | 57,508 | |
Burberry Group PLC | | | 1,612 | | | | | | | | 47,075 | |
Next PLC | | | 605 | | | | | | | | 56,233 | |
| | | | | | | | | | | 160,816 | |
See notes to financial statements.
58
| | |
| | | Schedule of Portfolio Investments — continued |
Timothy Plan International ETF | | December 31, 2019 |
| | | | | | | | | | | | |
| SECURITY DESCRIPTION | | SHARES | | | | | | VALUE ($) | |
| | | | | | | | | | | | | |
United Kingdom (5.8%): (continued) | | | | | | | | | | | | |
Consumer Staples (0.3%): | | | | |
Associated British Foods PLC | | | 2,081 | | | | | | | | 71,603 | |
| | | | | | | | | | | 71,603 | |
| |
Financials (1.3%): | | | | |
3I Group PLC | | | 4,517 | | | | | | | | 65,686 | |
Hargreaves Lansdown PLC | | | 1,693 | | | | | | | | 43,387 | |
Legal & General Group PLC | | | 16,047 | | | | | | | | 64,395 | |
London Stock Exchange Group | | | 507 | | | | | | | | 52,039 | |
Schroders PLC | | | 1,393 | | | | | | | | 61,508 | |
| | | | | | | | | | | 287,015 | |
| |
Health Care (0.3%): | | | | |
Smith & Nephew PLC | | | 3,138 | | | | | | | | 76,158 | |
| | | | | | | | | | | 76,158 | |
| |
Industrials (1.6%): | | | | |
Ashtead Group PLC | | | 1,716 | | | | | | | | 54,862 | |
Bunzl PLC | | | 2,387 | | | | | | | | 65,282 | |
Ferguson PLC | | | 669 | | | | | | | | 60,692 | |
International Consolidated Airlines Group SA | | | 6,038 | | | | | | | | 49,979 | |
Intertek Group PLC | | | 905 | | | | | | | | 70,141 | |
Smiths Group PLC | | | 3,207 | | | | | | | | 71,653 | |
| | | | | | | | | | | 372,609 | |
| | | |
Information Technology (0.3%): | | | | | | | | | | | | |
Halma PLC | | | 2,477 | | | | | | | | 69,416 | |
| | | | | | | | | | | 69,416 | |
| |
Materials (0.7%): | | | | |
Anglo American PLC | | | 1,769 | | | | | | | | 50,910 | |
Mondi PLC | | | 2,366 | | | | | | | | 55,542 | |
Rio Tinto PLC | | | 953 | | | | | | | | 56,835 | |
| | | | | | | | | | | | 163,287 | |
| | | | | | | | | | | | 1,330,411 | |
See notes to financial statements.
59
| | |
| | | Schedule of Portfolio Investments — continued |
Timothy Plan International ETF | | December 31, 2019 |
| | | | | | | | | | | | |
| SECURITY DESCRIPTION | | SHARES | | | | | | VALUE ($) | |
| | | | | | | | | | | | | |
United States (0.3%): | | | | | | | | | | | | |
Industrials (0.3%): | | | | | | | | | | | | |
Waste Connections, Inc. | | | 862 | | | | | | | | 78,306 | |
| | | | | | | | | | | 78,306 | |
| | | |
Total Common Stocks (Cost $22,251,271) | | | | | | | | | | | 22,920,698 | |
| | | | | | | | | | | | | |
Rights (0.0%) | | | | | | | | | | | | |
Spain (0.0%): | | | | | | | | | | | | |
Energy (0.0%): | | | | | | | | | | | | |
Repsol SA Expires 01/08/20 @ $0.00(a) | | | 3,978 | | | | | | | | 1,887 | |
| | | | | | | | | | | 1,887 | |
| | | |
Total Rights (Cost $1,880) | | | | | | | | | | | 1,887 | |
| | | |
Total Investments (Cost $22,253,151) — 99.6%(b) | | | | | | | | | | | 22,922,585 | |
Other assets in excess of liabilities — 0.4% | | | | | | | | | | | 95,689 | |
NET ASSETS - 100.00% | | | | | | | | | | | 23,018,274 | |
Percentages indicated are based on net assets as of December 31, 2019.
| (a) | Non-income producing security. |
| (b) | See Federal Tax Information listed in the Notes to Financial Statements. |
See notes to financial statements.
60
| | |
| | | Statements of Assets and Liabilities |
| |
Timothy Plan | | December 31, 2019 |
| | | | | | | | |
| |
| Timothy Plan US Small
Cap Core ETF |
| |
| Timothy Plan US Large
Cap Core ETF |
|
| | | | |
ASSETS: | | | | | | | | |
Investments, at value (Cost $9,849,296 and $126,672,202) | | $ | 10,197,513 | | | $ | 134,418,771 | |
Cash and cash equivalents | | | 21,152 | | | | 244,998 | |
Deposits with brokers for futures contracts | | | 100 | | | | 46,867 | |
Interest and dividends receivable | | | 7,401 | | | | 121,565 | |
Receivable for capital shares issued | | | — | | | | 10,864,976 | |
Variation margin receivable on open futures contracts | | | — | | | | 770 | |
Total Assets | | | 10,226,166 | | | | 145,697,947 | |
LIABILITIES: | | | | | | | | |
Payable for investments purchased | | | — | | | | 10,849,856 | |
Accrued expenses and other payables: | | | | | | | | |
Investment advisory fees | | | 4,359 | | | | 53,078 | |
Total Liabilities | | | 4,359 | | | | 10,902,934 | |
Net Assets | | $ | 10,221,807 | | | $ | 134,795,013 | |
NET ASSETS CONSIST OF: | | | | | | | | |
Capital | | $ | 9,873,590 | | | $ | 128,027,475 | |
Total distributable earnings/(loss) | | | 348,217 | | | | 6,767,538 | |
Net Assets | | $ | 10,221,807 | | | $ | 134,795,013 | |
| | |
Shares Outstanding (unlimited shares authorized, no par value): | | | 400,000 | | | | 4,950,000 | |
Net asset value: | | | $25.55 | | | | $27.23 | |
See notes to financial statements.
61
| | |
| | | Statements of Assets and Liabilities |
| |
Timothy Plan | | December 31, 2019 |
| | | | | | | | |
| |
| Timothy Plan High
Dividend Stock ETF |
| |
| Timothy Plan
International ETF |
|
ASSETS: | | | | | | | | |
Investments, at value (Cost $87,668,881 and $22,253,151) | | $ | 93,816,902 | | | $ | 22,922,585 | |
Cash and cash equivalents | | | 115,460 | | | | 67,961 | |
Deposits with brokers for futures contracts | | | 24,545 | | | | 100 | |
Interest and dividends receivable | | | 204,021 | | | | 35,062 | |
Receivable for capital shares issued | | | 2,679,276 | | | | — | |
Receivable for investments sold | | | — | | | | 3,842 | |
Variation margin receivable on open futures contracts | | | 385 | | | | — | |
Reclaims receivable | | | — | | | | 175 | |
Total Assets | | | 96,840,589 | | | | 23,029,725 | |
LIABILITIES: | | | | | | | | |
Payable for foreign currency (Cost $2,161) | | | — | | | | 2,154 | |
Payable for investments purchased | | | 2,669,527 | | | | — | |
Accrued expenses and other payables: | | | | | | | | |
Investment advisory fees | | | 39,018 | | | | 9,297 | |
Total Liabilities | | | 2,708,545 | | | | 11,451 | |
Net Assets | | $ | 94,132,044 | | | $ | 23,018,274 | |
NET ASSETS CONSIST OF: | | | | | | | | |
Capital | | $ | 88,737,317 | | | $ | 22,334,992 | |
Total distributable earnings/(loss) | | | 5,394,727 | | | | 683,282 | |
Net Assets | | $ | 94,132,044 | | | $ | 23,018,274 | |
| | |
Shares Outstanding (unlimited shares authorized, no par value): | | | 3,500,000 | | | | 900,000 | |
Net asset value: | | | $26.89 | | | | $25.58 | |
See notes to financial statements.
62
| | |
| | | Statements of Operations |
Timothy Plan | | For the Period Ended December 31, 2019 |
| | | | | | | | |
| |
| Timothy Plan US
Small Cap Core ETF(a) |
| |
| Timothy Plan US
Large Cap Core
ETF(b) |
|
| | | | |
Investment Income: | | | | | | | | |
Dividend income | | | $11,815 | | | | $874,850 | |
Interest income | | | 27 | | | | 549 | |
Foreign tax withholding | | | — | | | | (259) | |
Total Income | | | 11,842 | | | | 875,140 | |
Expenses: | | | | | | | | |
Investment advisory fees | | | 4,359 | | | | 261,554 | |
Total Expenses | | | 4,359 | | | | 261,554 | |
Net Investment Income (Loss) | | | 7,483 | | | | 613,586 | |
Net Realized/Unrealized Gains (Losses) from Investment Transactions: | | | | | | | | |
Net realized gains (losses) from investment transactions | | | — | | | | (1,013,012) | |
Net realized gains (losses) fromin-kind transactions | | | 58,371 | | | | 1,411,775 | |
Net realized gains (losses) from futures transactions | | | — | | | | 7,977 | |
Net change in unrealized appreciation/depreciation on investments | | | 348,217 | | | | 7,746,569 | |
Net change in unrealized appreciation/depreciation on futures transactions | | | — | | | | 4,554 | |
Net realized/unrealized gains on investments | | | 406,588 | | | | 8,157,863 | |
Change in net assets resulting from operations | | $ | 414,071 | | | | $8,771,449 | |
| (a) | For the period from the commencement of operations on December 3, 2019 through December 31, 2019. |
| (b) | For the period from the commencement of operations on May 1, 2019 through December 31, 2019. |
See notes to financial statements.
63
| | |
| | | Statements of Operations |
Timothy Plan | | For the Period Ended December 31, 2019 |
| | | | | | | | |
| |
| Timothy Plan High
Dividend Stock ETF(a) |
| |
| Timothy Plan
International ETF(b) |
|
| | | | |
Investment Income: | | | | | | | | |
Dividend income | | $ | 1,520,214 | | | $ | 46,192 | |
Interest income | | | 618 | | | | 261 | |
Foreign tax withholding | | | (657) | | | | (7,066) | |
Total Income | | | 1,520,175 | | | | 39,387 | |
Expenses: | | | | | | | | |
Investment advisory fees | | | 237,373 | | | | 9,296 | |
Total Expenses | | | 237,373 | | | | 9,296 | |
Net Investment Income (Loss) | | | 1,282,802 | | | | 30,091 | |
Net Realized/Unrealized Gains (Losses) from Investment Transactions and foreign currency translations: | | | | | | | | |
Net realized gains (losses) from investment transactions and foreign currency translations | | | (813,370) | | | | 13,397 | |
Net realized gains (losses) fromin-kind transactions | | | 1,274,259 | | | | — | |
Net realized gains (losses) from futures transactions | | | 15,421 | | | | — | |
Net change in unrealized appreciation/depreciation on investments and foreign currency translations | | | 6,148,021 | | | | 669,652 | |
Net change in unrealized appreciation/depreciation on futures transactions | | | (137) | | | | — | |
Net realized/unrealized gains on investments and foreign currency translations | | | 6,624,194 | | | | 683,049 | |
Change in net assets resulting from operations | | $ | 7,906,996 | | | | $713,140 | |
| (a) | For the period from the commencement of operations on May 1, 2019 through December 31, 2019. |
| (b) | For the period from the commencement of operations on December 3, 2019 through December 31, 2019. |
See notes to financial statements.
64
| | |
| | | |
| |
Timothy Plan | | Statements of Changes in Net Assets |
| | | | | | | | |
| | | Timothy Plan
US Small Cap
Core ETF | | | Timothy Plan
US Large Cap
Core ETF | |
| | | For the Period
December 3,
2019(a)
through
December 31,
2019 | | | For the Period
May 1, 2019(a)
through
December 31,
2019 | |
From Investment Activities: | | | | | | | | |
Operations: | | | | | | | | |
Net investment income (loss) | | | $7,483 | | | | $613,586 | |
Net realized gains (losses) from investment transactions | | | 58,371 | | | | 406,740 | |
Net change in unrealized appreciation/depreciation on investments | | | 348,217 | | | | 7,751,123 | |
Change in net assets resulting from operations | | | 414,071 | | | | 8,771,449 | |
Distributions to Shareholders: | | | | | | | | |
Distributions | | | (7,507 | ) | | | (593,505 | ) |
Change in net assets resulting from distributions to shareholders | | | (7,507 | ) | | | (593,505 | ) |
Change in net assets resulting from capital transactions | | | 9,815,243 | | | | 126,617,069 | |
Change in net assets | | | 10,221,807 | | | | 134,795,013 | |
Net Assets: | | | | | | | | |
Beginning of period | | | — | | | | — | |
End of period | | | $10,221,807 | | | | $134,795,013 | |
Capital Transactions: | | | | | | | | |
Proceeds from shares issued | | | $11,097,743 | | | | $139,366,129 | |
Cost of shares redeemed | | | (1,282,500 | ) | | | (12,749,060 | ) |
Change in net assets resulting from capital transactions | | | $9,815,243 | | | | $126,617,069 | |
| | |
Share Transactions: | | | | | | | | |
Issued | | | 450,000 | | | | 5,450,000 | |
Redeemed | | | (50,000 | ) | | | (500,000 | ) |
Change in Shares | | | 400,000 | | | | 4,950,000 | |
| (a) | Commencement of operations. |
See notes to financial statements.
65
| | |
| | | |
| |
Timothy Plan | | Statements of Changes in Net Assets |
| | | | | | | | |
| | | Timothy Plan
High Dividend
Stock ETF | | | Timothy Plan
International
ETF | |
| | | For the Period
May 1, 2019(a)
through
December 31,
2019 | | | For the Period
December 3,
2019(a)
through
December 31,
2019 | |
From Investment Activities: | | | | | | | | |
Operations: | | | | | | | | |
Net investment income (loss) | | | $1,282,802 | | | | $30,091 | |
Net realized gains (losses) from investment transactions | | | 476,310 | | | | 13,397 | |
Net change in unrealized appreciation/depreciation on investments | | | 6,147,884 | | | | 669,652 | |
Change in net assets resulting from operations | | | 7,906,996 | | | | 713,140 | |
Distributions to Shareholders: | | | | | | | | |
Distributions | | | (1,238,011 | ) | | | (29,857 | ) |
Change in net assets resulting from distributions to shareholders | | | (1,238,011 | ) | | | (29,857 | ) |
Change in net assets resulting from capital transactions | | | 87,463,059 | | | | 22,334,991 | |
Change in net assets | | | 94,132,044 | | | | 23,018,274 | |
Net Assets: | | | | | | | | |
Beginning of period | | | — | | | | — | |
End of period | | $ | 94,132,044 | | | $ | 23,018,274 | |
Capital Transactions: | | | | | | | | |
Proceeds from shares issued | | | $103,751,741 | | | $ | 22,334,991 | |
Cost of shares redeemed | | | (16,288,682 | ) | | | — | |
Change in net assets resulting from capital transactions | | | $87,463,059 | | | $ | 22,334,991 | |
| | |
Share Transactions: | | | | | | | | |
Issued | | | 4,150,000 | | | | 900,000 | |
Redeemed | | | (650,000 | ) | | | — | |
Change in Shares | | | 3,500,000 | | | | 900,000 | |
| (a) | Commencement of operations. |
See notes to financial statements.
66
| | |
| |
| Timothy Plan | | Financial Highlights |
| For a Share Outstanding Throughout Each Period |
| | | | | | | | | | | | | | | | | | | | | | | | |
| | | | | Timothy Plan
US Small Cap
Core ETF | | | | | Timothy Plan
US Large Cap
Core ETF | | | | | Timothy Plan
High
Dividend
Stock ETF | | | | | Timothy Plan
International
ETF | |
| | | | | | | | |
| | | | | For the period
December 3,
2019(a) to
December 31,
2019 | | | | | For the period
May 1, 2019(a)
to
December 31,
2019 | | | | | For the period
May 1, 2019(a)
to
December 31,
2019 | | | | | For the period
December 3,
2019(a) to
December 31,
2019 | |
| | | | | | | | | | | | | | | | | | | | | | | | |
Net Asset Value, Beginning of Period | | | | | $24.73 | | | | | | $25.16 | | | | | | $25.10 | | | | | | $24.80 | |
| |
Investment Activities: | | | | | | | | | | | | | | | | | | | | | | | | |
Net Investment Income (Loss)(b) | | | | | 0.02 | | | | | | 0.21 | | | | | | 0.48 | | | | | | 0.04 | |
Net Realized and Unrealized Gains (Losses) on Investments | | | | | 0.82 | | | | | | 2.04 | | | | | | 1.74 | | | | | | 0.77 | |
| |
Total from Investment Activities | | | | | 0.84 | | | | | | 2.25 | | | | | | 2.22 | | | | | | 0.81 | |
| |
Distributions to Shareholders: | | | | | | | | | | | | | | | | | | | | | | | | |
Net Investment Income | | | | | (0.02 | ) | | | | | (0.18 | ) | | | | | (0.43 | ) | | | | | (0.03 | ) |
| |
Total Distributions | | | | | (0.02 | ) | | | | | (0.18 | ) | | | | | (0.43 | ) | | | | | (0.03 | ) |
| |
Net Asset Value, End of Period | | | | | $25.55 | | | | | | $27.23 | | | | | | $26.89 | | | | | | $25.58 | |
| |
| |
Total Return (excludes sales charge)(c) | | | | | 3.39 | % | | | | | 9.01 | % | | | | | 9.00 | % | | | | | 3.25 | % |
| | | | | | | | |
Ratios/Supplemental Data: | | | | | | | | | | | | | | | | | | | | | | | | |
Ratio of Expenses to Average Net Assets(d) | | | | | 0.52 | % | | | | | 0.52 | % | | | | | 0.52 | % | | | | | 0.62 | % |
Ratio of Net Investment Income (Loss) to Average Net Assets(d) | | | | | 0.89 | % | | | | | 1.22 | % | | | | | 2.81 | % | | | | | 1.99 | % |
Net Assets, End of Period (000’s) | | | | | $10,222 | | | | | | $134,795 | | | | | | $94,132 | | | | | | $23,018 | |
Portfolio Turnover(c) | | | | | — | | | | | | 17 | % | | | | | 23 | % | | | | | 12 | % |
| |
Amounts designated as “—” are 0 or have been rounded to 0.
| (a) | Commencement of operations. |
| (b) | Per share net investment income (loss) has been calculated using the average daily shares method. |
| (c) | Not annualized for periods less than one year. |
| (d) | Annualized for periods less than one year. |
See notes to financial statements.
67
| | |
| | | Notes to Financial Statements |
| |
The Timothy Plan | | December 31, 2019 |
1. ORGANIZATION:
The Timothy Plan (the “Trust”) was organized pursuant to a trust agreement dated December 16, 1993 as a Delaware business trust. The Trust is registered under the Investment Company Act of 1940, as amended (the “1940 Act”), as anopen-end investment company and thus is determined to be an investment company for accounting purposes. The Trust follows the investment company accounting and reporting guidance under Financial Accounting Standards Board (“FASB”) Accounting Standards Codification (“ASC”) Topic 946“Financial Services—Investment Companies.” The Trust is comprised of multiple series funds, four of which are exchange-traded funds (“ETFs”), and are authorized to issue an unlimited number of shares, which are units of beneficial interest with no par value. Each ETF is classified as diversified under the 1940 Act.
The accompanying financial statements are those of the Timothy Plan US Small Cap Core ETF (“US Small Cap Core ETF”), Timothy Plan US Large Cap Core ETF (“US Large Cap Core ETF”), Timothy Plan High Dividend Stock ETF (“High Dividend Stock ETF”), and Timothy Plan International ETF (“International ETF”) (individually, a “Fund” and collectively, the “Funds”). The US Large Cap Core ETF and High Dividend Stock ETF commenced operations on May 1, 2019 and the US Small Cap Core ETF and International ETF commenced operations on December 3, 2019. The Funds seek to provide investment results that track the performance of an underlying index, before fees and expenses. The underlying indices for the US Small Cap Core ETF, US Large Cap Core ETF, High Dividend Stock ETF, and the International ETF are the Victory US Small Cap Volatility Weighted BRI Index, Victory US Large Cap Volatility Weighted BRI Index, Victory US Large Cap High Dividend Volatility Weighted BRI Index, and Victory International 500 Volatility Weighted BRI Index (individually, an “Index” and collectively, the “Indices”), respectively. The remaining series funds are presented in separate annual reports.
Under the Trust’s organizational documents, its officers and Board of Trustees (the “Board”) are indemnified against certain liabilities arising out of the performance of their duties to the Funds. In addition, in the normal course of business, the Funds enter into contracts with their vendors and others that provide for general indemnifications. The Funds’ maximum exposure under these arrangements is unknown, as this would involve future claims that may be made against the Funds. However, based on experience, the Funds expect that risk of loss to be remote.
2. SIGNIFICANT ACCOUNTING POLICIES:
Shares of the Funds are listed and traded on the New York Stock Exchange (“NYSE” or the “Exchange”). The Funds’ shares are offered at net asset value (“NAV”) only in aggregations of 50,000 Shares (each a “Creation Unit”). The Funds will issue and redeem Creation Units principally in exchange for a basket of securities included in the respective Fund’s Index (the “Deposit Securities”), together with the deposit of a specified cash payment (the “Cash Component”), plus transaction fees (“Transaction Fees”) as further described below. Shares trade on the Exchange at market prices that may be below, at, or above NAV.
68
| | |
| | | Notes to Financial Statements |
| |
The Timothy Plan | | December 31, 2019 |
Shares of a Fund may only be purchased or redeemed by certain financial institutions (“Authorized Participants”). An Authorized Participant is either (i) a broker-dealer or other participant in the clearing process through the Continuous Net Settlement System (“Clearing Process”) of the National Securities Clearing Corporation (“NSCC”) or (ii) a DTC participant and, in each case, must have executed a Participant Agreement with the Distributor. Most retail investors do not qualify as Authorized Participants nor have the resources to buy and sell whole Creation Units. Therefore, they are unable to purchase or redeem the shares directly from a Fund.
The Funds reserve the right to offer creations and redemptions of Shares for cash. In addition, Shares may be issued in advance of receipt of Deposit Securities subject to various conditions, including a requirement to maintain on deposit with the Trust cash equal to up to 105% of the market value of the missing Deposit Securities. In each instance of such cash creations or redemptions, transaction fees may be imposed and may be higher than the transaction fees associated within-kind creations or redemptions.
Transaction Fees include a fixed fee (“Fixed Fee”) payable to the Custodian (“Citibank N.A.”), which is imposed on each creation and redemption transaction regardless of the number of Creation Units involved in the transaction. Transaction Fees may also include an additional variable charge (“Variable Charge”) for purchases and redemptions of Creation Units for cash or involvingcash-in-lieu, to compensate each Fund and its ongoing shareholders for brokerage and market impact expenses relating to Creation Unit transactions. Under certain circumstances, the Transaction Fees may be waived or adjusted. In such cases, the Authorized Participant will reimburse each Fund for, among other things, any difference between the market value at which the securities and/or financial instruments were purchased by each Fund and thecash-in-lieu amount, applicable registration fees, brokerage commissions and certain taxes and other costs and expenses related to the execution of trades resulting from such transaction (up to the maximum amount shown below). In addition, purchasers of Creation Units are responsible for the costs of transferring the Deposit Securities to the account of each Fund. Variable fees received by each Fund are displayed in the Capital Share Transaction section of the Statements of Changes in Net Assets as an increase toPaid-In-Capital.
Investors who use the services of a broker, or other such intermediary may be charged a fee for such services.
69
| | |
| | | Notes to Financial Statements |
| |
The Timothy Plan | | December 31, 2019 |
The Transaction Fees for each Fund are listed below:
| | | | |
| | | Fee for In-Kind and
Cash Purchases and
Redemptions | | Maximum
Additional Variable
Charge for Cash
Purchases and
Redemptions* |
US Small Cap Core ETF | | $250 | | 2.00% |
| | |
US Large Cap Core ETF | | $500 | | 2.00% |
| | |
High Dividend Stock ETF | | $250 | | 2.00% |
| | |
International ETF | | $4,500 | | 2.00% |
* As a percentage of the amount invested.
The following is a summary of significant accounting policies followed by the Trust in the preparation of its financial statements. The policies are in conformity with accounting principles generally accepted in the United States of America (“GAAP”). The preparation of financial statements in accordance with GAAP requires management to make estimates and assumptions that affect the reported amounts of assets and liabilities and disclosure of contingent assets and liabilities at the date of the financial statements and the reported amounts of income and expenses for the period. Actual results could differ from those estimates. The Funds follow the specialized accounting and reporting requirements under GAAP that are applicable to investment companies.
Investment Valuation:
The Funds record investments at fair value. Fair value is defined as the price that would be received to sell an asset or paid to transfer a liability in an orderly transaction between market participants at the measurement date.
The valuation techniques described below maximize the use of observable inputs and minimize the use of unobservable inputs in determining fair value. The inputs used for valuing the Funds’ investments are summarized in the three broad levels listed below:
• Level 1 — quoted prices in active markets for identical securities
• Level 2 — other significant observable inputs (including quoted prices for similar securities or interest rates applicable to those securities, etc.)
• Level 3 — significant unobservable inputs (including the Funds’ own assumptions in determining the fair value of investments)
70
| | |
| | | Notes to Financial Statements |
| |
The Timothy Plan | | December 31, 2019 |
Changes in valuation techniques may result in transfers in or out of an assigned level within the disclosure hierarchy. The inputs or methodologies used for valuation techniques are not necessarily an indication of the risk associated with entering into those investments.
Portfolio securities listed or traded on securities exchanges, American Depositary Receipts (“ADRs”) and Rights, are valued at the closing price on the exchange or system where the security is principally traded, if available, or at the NASDAQ Official Closing Price. If there have been no sales for that day on the exchange or system, then a security is valued at the last available bid quotation on the exchange or system where the security is principally traded. In each of these situations, valuations are typically categorized as Level 1 in the fair value hierarchy.
Futures contracts are valued at the settlement price established each day by the board of trade or an exchange on which they are traded. These valuations are typically categorized as Level 1 in the fair value hierarchy.
Investments inopen-end investment companies are valued at net asset value. These valuations are typically categorized as Level 1 in the fair value hierarchy.
Investments for which there are no such quotations, or for which quotations do not appear reliable, are valued at fair value in accordance with procedures established by and under the general supervision and responsibility of the Trust’s Board. These valuations are typically categorized as Level 2 or Level 3 in the fair value hierarchy, based on the observability of inputs used to determine the fair value.
A summary of the valuations as of December 31, 2019, based upon the three levels defined above, is included in the table below while the breakdown, by category, of investments is disclosed in the Schedules of Portfolio Investments:
US Small Cap Core ETF
| | | | | | | | | | | | | | | | |
| | | Level 1 -
Quoted Prices | | | Level 2 - Other
Significant
Observable
Inputs | | | Level 3 - Other
Significant
Unobservable
Inputs | | | Total | |
Investment Securities: | | | | | | | | | | | | | | | | |
Common Stock | | $ | 10,197,513 | | | $ | – | | | $ | – | | | $ | 10,197,513 | |
| | | | | | | | | | | | | | | | |
Total Investment Securities | | | 10,197,513 | | | | – | | | | – | | | | 10,197,513 | |
| | | | | | | | | | | | | | | | |
Total Investments | | $ | 10,197,513 | | | $ | – | | | $ | – | | | $ | 10,197,513 | |
| | | | | | | | | | | | | | | | |
71
| | |
| | | Notes to Financial Statements |
| |
The Timothy Plan | | December 31, 2019 |
US Large Cap Core ETF
| | | | | | | | | | | | | | | | |
| | | Level 1 -
Quoted Prices | | | Level 2 - Other
Significant
Observable
Inputs | | | Level 3 - Other
Significant
Unobservable
Inputs | | | Total | |
Investment Securities: | | | | | | | | | | | | | | | | |
Common Stock | | $ | 134,418,771 | | | $ | – | | | $ | – | | | $ | 134,418,771 | |
| | | | | | | | | | | | | | | | |
Total Investment Securities | | | 134,418,771 | | | | – | | | | – | | | | 134,418,771 | |
| | | | | | | | | | | | | | | | |
Other Financial Instruments* | | | | | | | | | | | | | | | | |
Futures Contracts | | | 4,554 | | | | – | | | | – | | | | 4,554 | |
| | | | | | | | | | | | | | | | |
Total Investments | | $ | 134,423,325 | | | $ | – | | | $ | – | | | $ | 134,423,325 | |
| | | | | | | | | | | | | | | | |
High Dividend Stock ETF
| | | | | | | | | | | | | | | | |
| | | Level 1 -
Quoted Prices | | | Level 2 - Other
Significant
Observable
Inputs | | | Level 3 - Other
Significant
Unobservable
Inputs | | | Total | |
Investment Securities: | | | | | | | | | | | | | | | | |
Common Stock | | $ | 93,816,902 | | | $ | – | | | $ | – | | | $ | 93,816,902 | |
| | | | | | | | | | | | | | | | |
Total Investment Securities | | | 93,816,902 | | | | – | | | | – | | | | 93,816,902 | |
| | | | | | | | | | | | | | | | |
Other Financial Instruments* | | | | | | | | | | | | | | | | |
Futures Contracts | | | (137) | | | | – | | | | – | | | | (137) | |
| | | | | | | | | | | | | | | | |
Total Investments | | $ | 93,816,765 | | | $ | – | | | $ | – | | | $ | 93,816,765 | |
| | | | | | | | | | | | | | | | |
International ETF
| | | | | | | | | | | | | | | | |
| | | Level 1 -
Quoted Prices | | | Level 2 - Other
Significant
Observable
Inputs | | | Level 3 - Other
Significant
Unobservable
Inputs | | | Total | |
Investment Securities: | | | | | | | | | | | | | | | | |
Common Stock | | $ | 22,920,698 | | | $ | – | | | $ | – | | | $ | 22,920,698 | |
Rights | | | 1,887 | | | | – | | | | – | | | | 1,887 | |
| | | | | | | | | | | | | | | | |
Total Investment Securities | | | 22,922,585 | | | | – | | | | – | | | | 22,922,585 | |
| | | | | | | | | | | | | | | | |
Total Investments | | $ | 22,922,585 | | | $ | – | | | $ | – | | | $ | 22,922,585 | |
| | | | | | | | | | | | | | | | |
72
| | |
| | | Notes to Financial Statements |
| |
The Timothy Plan | | December 31, 2019 |
*Other Financial Instruments would include any derivative instruments, such as futures contracts. These investments are generally at the unrealized appreciation/(depreciation) on the instrument.
Real Estate Investment Trusts (“REITs”):
The Funds may invest in REITs which report information on the source of their distributions annually. REITs are pooled investment vehicles that invest primarily in income-producing real estate or real estate related loans or interests (such as mortgages). Certain distributions received from REITs during the year are recorded as realized gains or return of capital as estimated by the Funds or when such information becomes known.
Investment Companies:
The Funds may invest in portfolios ofopen-end investment companies. These investment companies value securities in their portfolios for which market quotations are readily available at their market values (generally the last reported sale price) and all other securities and assets at their fair value by the methods established by the board of directors of the underlying funds.
Investment Transactions and Related Income:
Changes in holdings of investments are accounted for no later than one business day following the trade date. For financial reporting purposes, however, investment transactions are accounted for on trade date on the last business day of the reporting period. Interest income is recognized on an accrual basis and includes, where applicable, the amortization of premiums or accretion of discounts. Dividend income is recorded on theex-dividend date. Gains or losses realized on sales of securities are determined by comparing the identified cost of the security lot sold with the net sales proceeds.
Withholding taxes on interest, dividends and gains as a result of certain investments in ADRs by the Funds have been provided for in accordance with each investment’s applicable country’s tax rules and rates.
Futures Contracts:
During the period ended December 31, 2019, the US Large Cap Core ETF and High Dividend Stock ETF Funds used futures contracts to provide market exposure on the Funds’ cash balances. Futures contracts are valued based upon their quoted daily settlement prices. Upon entering into a futures contract, and to maintain the Fund’s open positions in futures contracts, the Fund would be required to deposit with its custodian or futures broker in a segregated account in the name of the futures broker an amount of cash, U.S. government securities, suitable money market instruments, or other liquid securities, known as “initial margin.” The margin required for a particular futures contract is set by the exchange on
73
| | |
| | | Notes to Financial Statements |
| |
The Timothy Plan | | December 31, 2019 |
which the contract is traded, and may be significantly modified from time to time by the exchange during the term of the contract. Futures contracts are customarily purchased and sold on margins that may range upward from less than 5% of the value of the contract being traded. If the price of an open futures contract changes (by increase in underlying instrument or index in the case of a sale or by decrease in the case of a purchase) so that the loss on the futures contract reaches a point at which the margin on deposit does not satisfy margin requirements, the broker will require an increase in the margin. However, if the value of a position increases because of favorable price changes in the futures contract so that the margin deposit exceeds the required margin, the broker will pay the excess to a Fund. These subsequent payments, called “Variation Margin,” to and from the futures broker, are made on a daily basis as the price of the underlying assets fluctuate making the long and short positions in the futures contract more or less valuable, a process known as “marking to the market.” The Funds recorded a payable or receivable on variation margin. The Funds expect to earn interest income on its margin deposits. Gains or losses are recognized but not considered realized until the contracts expire or are closed. Futures contracts involve, to varying degrees, elements of market risk (generally equity price risk related to stock futures, interest rate risk related to bond futures, and foreign currency risk related to currency futures) and exposure to loss in excess of the variation margin disclosed in the Statements of Assets and Liabilities. The primary risks associated with the use of futures contracts are the imperfect correlation between the change in fair value of the underlying securities and the prices of futures contracts, the possibility of an illiquid market, and the inability of the counterparty to meet the terms of the contract. The monthly average notional amount for these contracts were $102,796 and $163,156 for US Large Cap Core ETF and High Dividend Stock ETF, respectively, for the period ended December 31, 2019. Realized gains and losses are reported as “Net realized gains/(losses) from futures transactions” on the Statements of Operations.
Summary of Derivative Instruments
The following is a summary of the fair values of derivative instruments on the Statements of Assets and Liabilities, categorized by risk exposure, as of December 31, 2019:
| | | | | | | | | | | | | | |
| | | | | Asset Derivatives | | | | | Liability Derivatives | | | |
Fund | | Primary Risk Exposure | | Statements of Asset
and Liabilities
Location | | Total Fair
Value | | | Statements of Asset
and Liabilities
Location | | Total Fair
Value | |
| | Equity Risk | | | | | | | | | | | | |
US Large Cap Core ETF | | Equity Contracts | | Receivable for variation margin on futures contracts* | | $ | 4,554 | | | Payable for variation margin on futures contracts* | | $ | - | |
High Dividend Stock ETF | | | | Receivable for variation margin on futures contracts* | | | - | | | Payable for variation margin on futures contracts* | | | 137 | |
* For futures contracts, the amounts represent the cumulative appreciation/(depreciation) of these futures contracts as reported in the Schedule of Portfolio Investments. Only the current day’s variation margin is reported within the Statements of Assets and Liabilities as Variation Margin on futures contracts.
74
| | |
| | | Notes to Financial Statements |
| |
The Timothy Plan | | December 31, 2019 |
The following is a summary of the effect of derivative instruments on the Statements of Operations, categorized by risk exposure, for the year ended December 31, 2019:
| | | | | | | | | | |
| | | | | Realized Gains (Losses)
on Derivatives
Recognized as a Result
from Operations | | | Change in Unrealized
Appreciation/
(Depreciation) on
Derivatives
Recognized as a
Result from
Operations | |
Fund | | Primary Risk Exposure | | Net realized gains
(losses) from futures
transactions | | | Change in unrealized
appreciation
(depreciation) on
futures transactions | |
| | | Equity Risk | | | | | | |
US Large Cap Core ETF | | Equity Contracts | | $ | 7,977 | | | $ | 4,554 | |
High Dividend Stock ETF | | Equity Contracts | | | 15,421 | | | | (137 | ) |
Foreign Currency Translations:
The accounting records of the Funds are maintained in U.S. dollars. Investment securities and other assets and liabilities of a Fund denominated in a foreign currency are translated into U.S. dollars at current exchange rates. Purchases and sales of securities, income receipts and expense payments are translated into U.S. dollars at the exchange rates on the date of the transactions. The Funds do not isolate the portion of the results of operations resulting from changes in foreign exchange rates on investments from fluctuations arising from changes in market prices of securities held. Such fluctuations are disclosed as net change in unrealized appreciation/depreciation on investments and foreign currency translations on the Statements of Operations. Any realized gains or losses from these fluctuations are disclosed as net realized gains or losses from investment transactions and foreign currency translations on the Statements of Operations.
Foreign Taxes:
The Funds may be subject to foreign taxes related to foreign income received (a portion of which may be reclaimable), capital gains on the sale of securities, and certain foreign currency transactions. All foreign taxes are recorded in accordance with the applicable regulations and rates that exist in the foreign jurisdictions in which the Funds invest.
Dividends to Shareholders:
Dividends from net investment income, if any, are declared and paid monthly for the Funds. Distributable net realized gains, if any, are declared and distributed at least annually from each Fund.
The amounts of dividends from net investment income and distributions from net realized gains are determined in accordance with federal income tax regulations, which may differ from GAAP. To the extent these “book/tax” differences are permanent in nature (i.e., that they result from other than timing of recognition “temporary difference”), such amounts are reclassified within the components of net assets based on their federaltax-basis
75
| | |
| | | Notes to Financial Statements |
| |
The Timothy Plan | | December 31, 2019 |
treatment; temporary differences (e.g., wash sales) do not require reclassification. To the extent dividends and distributions exceed net investment income and net realized gains for tax purposes, they are reported as distributions of capital. Net investment losses incurred by a Fund may be reclassified as an offset to capital on the accompanying Statements of Assets and Liabilities.
Federal Income Taxes:
It is the policy of each Fund to continue to qualify as a regulated investment company by complying with the provisions available to certain investment companies, as defined in applicable sections of the Internal Revenue Code, and to make distributions of net investment income and net realized gains sufficient to relieve it from all, or substantially all, federal income taxes. Accordingly, no provision for federal income taxes is required in the financial statements. The Funds identifies its major tax jurisdiction as U.S. Federal.
As of and during the period ended December 31, 2019, the Funds did not have a liability for any unrecognized tax benefits. The Funds recognize interest and penalties, if any, related to unrecognized tax benefits as income tax expense on the Statements of Operations. During the period, the Funds did not incur any interest or penalties. For the current open tax year, management of the Funds has concluded that there are no significant uncertain tax positions that would require recognition in the financial statements. Further, management of the Funds is not aware of any tax positions for which it is reasonably possible that the total amounts of any unrecognized tax benefits will significantly change over the next fiscal year.
3. PURCHASES AND SALES OF SECURITIES:
Purchases and sales of securities (excluding securities maturing less than one year from acquisition) andin-kind transactions associated with purchases and sales for the period ended December 31, 2019 were as follows:
| | | | | | | | | | | | | | | | |
| | | Excludingin-kind
transactions | | | Associated within-kind
transactions | |
Fund | | Purchases | | | Sales | | | Purchases | | | Sales | |
US Small Cap Core ETF | | $ | 46,329 | | | $ | — | | | $ | 11,024,342 | | | $ | 1,279,746 | |
US Large Cap Core ETF | | | 12,778,214 | | | | 12,519,316 | | | | 138,896,113 | | | | 12,722,270 | |
High Dividend Stock ETF | | | 14,982,317 | | | | 14,468,140 | | | | 103,390,024 | | | | 16,299,022 | |
International ETF | | | 3,605,312 | | | | 1,585,358 | | | | 20,220,710 | | | | — | |
For the period ended December 31, 2019, there were no purchases or sales of U.S. Government Securities.
4. FEES AND TRANSACTIONS WITH AFFILIATES AND OTHER PARTIES:
Timothy Partners, Ltd. (“TPL” or the “Advisor”), a Florida limited partnership, serves as the Funds’ investment advisor pursuant to an Investment Advisory Agreement. Subject at all times to the supervision and approval of the Board, the Advisor is responsible for the
76
| | |
| | | Notes to Financial Statements |
| |
The Timothy Plan | | December 31, 2019 |
overall management of the Funds. The Advisor has arranged for distribution, custody, fund administration, transfer agency and all other services necessary for the Funds to operate. The Advisor receives a fee for its services, (the “Management Fee”). From the Management Fee, the Advisor is obligated to pay or arrange for the payment of substantially all expenses of the Funds, including the cost of transfer agency, custody, fund administration and accounting, legal, audit, independent trustees and other services, except for interest expenses, distribution fees or expenses, brokerage expenses, acquired fund fees and expenses, taxes and extraordinary expenses such as litigation and other expenses not incurred in the ordinary course of the Fund’s business. The Advisor’s Management Fee is designed to cause substantially all of the Funds’ expenses to be paid and to compensate the Advisor for providing services for the Funds. US Large Cap Core ETF, US Small Cap Core ETF and High Dividend Stock ETF pay a Management Fee equivalent to 0.52% and International ETF pays a Management Fee equivalent to 0.62% of the Fund’s average daily net assets, computed daily and paid monthly.
Victory Capital Management, Inc., a New York corporation, serves as the Funds’sub-advisor pursuant to a writtensub-advisory agreement with the Advisor and receives fees from the Advisor for these services.
Citibank, N.A. serves as the Funds’ Custodian and Transfer Agent pursuant to a Global Custodial and Agency Services Agreement with the Trust. Citi Fund Services Ohio, Inc. (“Citi”), an affiliate of Citibank, N.A., acts as the Funds’ administrator and fund accountant pursuant to a Services Agreement with the Trust.
Foreside Fund Services, LLC (“Foreside”) serves as the Funds’ distributor.
Drake Compliance LLC provides compliance services to the Trust.
Certain officers and/or interested trustees of the Funds are also officers and/or employees of the Advisor.
5. INVESTMENT RISKS:
Each Fund may be subject to other risks in addition to these identified risks.
ETF Risk
The NAV of a Fund can fluctuate up or down, and you could lose money investing in a Fund if the prices of the securities owned by the Fund decline. In addition, a Fund may be subject to the following risks: (1) the market price of a Fund’s shares may trade above or below its NAV; (2) an active trading market for a Fund’s shares may not develop or be maintained; or (3) trading of a Fund’s shares may be halted if the listing exchange’s officials deem such action appropriate, the shares are delisted from the exchange, or the activation of market-wide “circuit breakers” (which are tied to large decreases in stock prices) halts stock trading generally.
77
| | |
| | | Notes to Financial Statements |
| |
The Timothy Plan | | December 31, 2019 |
Market Risk
The prices of the securities, particularly the common stocks, in which the Funds invest, may decline for a number of reasons. The price declines of common stocks, in particular, may be steep, sudden, and/or prolonged. Adverse market conditions, sometimes in response to general economic or industry news, may cause the prices of a Fund’s holdings to fall as part of a broad market decline. In addition, certain unanticipated events, such as natural disasters, terrorist attacks, and other geopolitical events, can have a dramatic adverse effect on securities held by a Fund.
Foreign Securities Risk
Foreign securities, foreign currencies, and securities issued by U.S. entities with substantial foreign operations can involve additional risks relating to political, economic, or regulatory conditions in foreign countries. These risks include fluctuations in foreign currencies; imposition of additional taxes; trading, settlement, custodial and other operational risks; and risk arising from the less stringent investor protection and disclosure standards of some foreign markets. All of these factors can make foreign investments more volatile and potentially less liquid than U.S. investments. In addition, foreign markets can perform differently from the U.S. market.
Excluded Security Risk
Because the Index omits Excluded Securities, the Fund may be riskier than other funds that invest in a broader array of securities. Biblically Responsible Investing (“BRI”) may not be successful. Because the Index is reconstituted only at prescribed times during the year, the Fund may temporarily hold securities that do not comply with the BRI screening criteria if the application of the criteria or the nature of a company’s business changes in between these dates.
6. FEDERAL INCOME TAX INFORMATION:
As of December 31, 2019, the cost basis for federal income tax purposes, gross unrealized appreciation, gross unrealized depreciation and net unrealized appreciation (depreciation) for investments were as follows:
| | | | | | | | |
Fund | | Cost of
Investments
for Federal
Tax Purposes | | Gross Unrealized
Appreciation | | Gross Unrealized
Depreciation | | Net Unrealized
Appreciation
(Depreciation) |
US Small Cap Core ETF | | $9,849,296 | | $437,549 | | $ (89,332) | | $ 348,217 |
US Large Cap Core ETF | | 126,666,716 | | 8,689,775 | | (937,720) | | 7,752,055 |
High Dividend Stock ETF | | 87,642,360 | | 6,911,656 | | (737,114) | | 6,174,542 |
International ETF | | 22,268,043 | | 768,054 | | (113,512) | | 654,542 |
78
| | |
| | | Notes to Financial Statements |
| |
The Timothy Plan | | December 31, 2019 |
The tax character of distributions paid to shareholders during the period ended December 31, 2019 were as follows:
| | | | | | | | | | | | |
| | | Period Ended December 31, 2019 | |
| | | Distributions Paid From: | | | | | | | |
Fund | | Ordinary
Income | | | Total Taxable
Distributions | | | Total Distributions
Paid* | |
US Small Cap Core ETF | | $ | 7,507 | | | $ | 7,507 | | | $ | 7,507 | |
US Large Cap Core ETF | | | 593,505 | | | | 593,505 | | | | 593,505 | |
High Dividend ETF | | | 1,238,011 | | | | 1,238,011 | | | | 1,238,011 | |
International ETF | | | 29,857 | | | | 29,857 | | | | 29,857 | |
* Total distributions paid may differ from the Statement of Changes in Net Assets because distributions are recognized when actually paid for tax purposes.
As of December 31, 2019, the components of accumulated earnings/(deficit) on a tax basis were as follows:
| | | | | | | | | | | | | | | | | | | | |
Fund | | Undistributed
Ordinary
Income | | | Accumulated
Earnings | | | Accumulated
Capital and
Other
Losses | | | Unrealized
Appreciation
(Depreciation)* | | | Total
Accumulated
Earnings/
(Deficit) | |
US Small Cap Core ETF | | $ | — | | | $ | — | | | $ | — | | | $ | 348,217 | | | $ | 348,217 | |
US Large Cap Core ETF | | | 7,089 | | | | 7,089 | | | | (991,606 | ) | | | 7,752,055 | | | | 6,767,538 | |
High Dividend ETF | | | 16,139 | | | | 16,139 | | | | (795,954 | ) | | | 6,174,542 | | | | 5,394,727 | |
International ETF | | | 28,523 | | | | 28,523 | | | | — | | | | 654,759 | ** | | | 683,282 | |
* The difference between book-basis andtax-basis unrealized appreciation (depreciation) is attributable primarily to tax deferral of losses on wash sales, futures mark to market, return of capital from underlying investments and passive foreign investment company mark to market.
** The amount includes $217 of unrealized appreciation on foreign currency translation.
At December 31, 2019, the Funds had net capital loss carry forwards (“CLCFs”) for federal income tax purposes which are available to reduce the future capital gain distributions to shareholders.
CLCFs not subject to expiration:
| | | | | | | | |
Fund | | Short-Term Amount | | | Total | |
US Large Cap Core ETF | | $ | 991,606 | | | $ | 991,606 | |
High Dividend ETF | | | 795,954 | | | | 795,954 | |
During the period ended December 31, 2019, the Funds realized the following net capital gains (losses) resulting from in-kind redemptions, in which shareholders exchanged Fund shares for securities held by the Fund rather than for cash. Because such gains (losses) are
79
| | |
| | | Notes to Financial Statements |
| |
The Timothy Plan | | December 31, 2019 |
not taxable to the Fund, and are not distributed to shareholders, they have been reclassified from accumulated net realized gains (losses) to paid-in capital.
| | | | | | | | |
Fund | | Short-Term Amount | | | Total | |
US Small Cap Core ETF | | | $ (58,371 | ) | | | $ (58,371 | ) |
US Large Cap Core ETF | | | (1,410,406 | ) | | | (1,410,406 | ) |
High Dividend ETF | | | (1,274,259 | ) | | | (1,274,259 | ) |
7. RECENT ACCOUNTING PRONOUNCEMENTS:
In August 2018, the FASB issued Accounting Standards UpdateNo. 2018-13, “Disclosure Framework - Changes to Disclosure Requirements for Fair Value Measurement” (“ASU2018-13”). This update makes certain removals from, changes to and additions to existing disclosure requirements for fair value measurement. In addition, the amendments clarify that materiality is an appropriate consideration when evaluating disclosure requirements. ASU2018-13 is effective for financial statements issued for fiscal years beginning after December 15, 2019 and interim periods within those fiscal years. The Funds have adopted ASU2018-13 with the financial statements prepared as of December 31, 2019.
8. SUBSEQUENT EVENTS:
Management has evaluated subsequent events through the date these financial statements were issued.
Distributions
On February 12, the Funds declared and paid, respectively, a distribution from ordinary income for the following amounts:
| | | | |
Fund | | Amount | |
US Small Cap Core ETF | | $ | 9,320 | |
US Large Cap Core ETF | | | 32,432 | |
High Dividend Stock ETF | | | 99,267 | |
80

REPORT OF INDEPENDENT REGISTERED PUBLIC ACCOUNTING FIRM
To the Shareholders and Board of Trustees of
The Timothy Plan
Opinion on the Financial Statements
We have audited the accompanying statements of assets and liabilities, including the schedules of portfolio investments, of Timothy Plan US Small Cap Core ETF, Timothy Plan US Large Cap Core ETF, Timothy Plan High Dividend Stock ETF, and Timothy Plan International ETF (the “Funds”), four of the portfolios constituting The Timothy Plan, as of December 31, 2019, and the related statements of operations, changes in net assets, including the related notes, and the financial highlights for the period May 1, 2019 (commencement of operations) through December 31, 2019, for Timothy Plan US Large Cap Core ETF and Timothy Plan High Dividend Stock ETF, and the related statements of operations, changes in net assets, including the related notes, and the financial highlights for the period December 3, 2019 (commencement of operations) through December 31, 2019, for Timothy Plan US Small Cap Core ETF and Timothy Plan International ETF (collectively referred to as the “financial statements”). In our opinion, the financial statements present fairly, in all material respects, the financial position of each of the Funds as of December 31, 2019, the results of their operations, changes in their net assets and the financial highlights for the periods indicated above, in conformity with accounting principles generally accepted in the United States of America.
Basis for Opinion
These financial statements are the responsibility of the Funds’ management. Our responsibility is to express an opinion on the Funds’ financial statements based on our audit. We are a public accounting firm registered with the Public Company Accounting Oversight Board (United States) (“PCAOB”) and are required to be independent with respect to the Funds in accordance with the U.S. federal securities laws and the applicable rules and regulations of the Securities and Exchange Commission and the PCAOB.
We conducted our audit in accordance with the standards of the PCAOB. Those standards require that we plan and perform the audit to obtain reasonable assurance about whether the financial statements are free of material misstatement whether due to error or fraud.
Our audit included performing procedures to assess the risks of material misstatement of the financial statements, whether due to error or fraud, and performing procedures that respond to those risks. Such procedures included examining, on a test basis, evidence regarding the amounts and disclosures in the financial statements. Our procedures included confirmation of securities owned as of December 31, 2019, by correspondence with the custodian and brokers. Our audit also included evaluating the accounting principles used and significant estimates made by management, as well as evaluating the overall presentation of the financial statements. We believe that our audit provides a reasonable basis for our opinion.
We have served as the auditor of one or more investment companies advised by Timothy Partners, Ltd., since 2005.
COHEN & COMPANY, LTD.
Cleveland, Ohio
February 28, 2020
COHEN & COMPANY, LTD.
800.229.1099 | 866.818.4538 | cohencpa.com
Registered with the Public Company Accounting Oversight Board
81
| | |
| | | Other Information (Unaudited) |
| |
Timothy Plan | | December 31, 2019 |
For the year ended December 31, 2019, the Funds paid qualified dividend income for the purposes of reduced individual federal income tax rates of:
| | | | |
| | | Amount | |
US Large Cap Core ETF | | | 100% | |
High Dividend ETF | | | 100% | |
Dividends qualified for corporate dividends received deductions of:
| | | | |
| | | Amount | |
US Large Cap Core ETF | | | 100% | |
High Dividend ETF | | | 100% | |
The following Funds intend to elect to pass through to shareholders the income tax credit for taxes paid to foreign countries. Foreign source income and foreign tax expense per outstanding share on December 31, 2019, were as follows:
| | | | | | |
| | | Foreign Source Income | | Foreign
Tax
Expense | |
International ETF | | 0.04 | | | 0.01 | |
82
| | |
| | | Other Information (Unaudited) |
| |
Timothy Plan | | December 31, 2019 |
Proxy Voting and FormN-PORT Information
Proxy Voting:
Information regarding the policies and procedures that each Fund uses to determine how to vote proxies relating to portfolio securities is available without charge, upon request, by calling800-539-3863. The information is also included in the Funds’ Statement of Additional Information, which is available on the SEC’s website at www.sec.gov.
Information relating to how the Funds voted proxies relating to portfolio securities held during the period ended June 30 is available on the SEC’s website at www.sec.gov.
Availability of Schedules of Portfolio Investments:
The Trust files a complete list of Schedules of Portfolio Investments with the SEC for the first and third quarters of each fiscal year on FormN- PORT. FormsN- PORT are available on the SEC’s website at www.sec.gov.
Expense Examples:
As a shareholder of the Funds, you may incur two types of costs: (1) transaction costs, including sales charges (loads) on purchases; and (2) ongoing costs, including management fees, and other Fund expenses. These examples are intended to help you understand your ongoing costs (in dollars) of investing in the Funds and to compare these costs with the ongoing costs of investing in other mutual funds.
These examples are based on an investment of $1,000 invested at the beginning of the period and held for the periods presented below.
TheActual Expense figures in the table below provide information about actual account values and actual expenses. You may use the information below, together with the amount you invested, to estimate the expenses that you paid over the period. Simply divide your account value by $1,000 (for example, an $8,600 account value divided by $1,000 = 8.6), then multiply the result by the number in the table under the heading entitled “Actual Expenses Paid During Period” to estimate the expenses you paid on your account during this period.
TheHypothetical Expense figures in the table below provide information about hypothetical account values and hypothetical expenses based on each Fund’s actual expense ratio and an assumed rate of return of 5% per year before expenses, which is not the Fund’s actual return. The hypothetical account values and expenses may not be used to estimate the actual ending account balance or expenses you paid for the period. You may use this information to compare this 5% hypothetical example with the 5% hypothetical examples that appear in shareholder reports of other funds.
83
| | |
| | | Other Information (Unaudited) |
| |
Timothy Plan | | December 31, 2019 |
Please note the expenses shown in the table are meant to highlight your ongoing costs only and do not reflect any transactional costs. Therefore, the table is useful in comparing ongoing costs only, and will not help you determine the relative total costs of owning different funds. In addition, if these transactional costs were included, your costs would have been higher.
| | | | | | | | | | | | | | | | | | | | | | | | |
Fund | | Beginning
Account
Value
7/1/19 | | | Actual
Ending
Account
Value
12/31/19 | | | Hypothetical
Ending
Account
Value
12/31/19 | | | Actual
Expenses
Paid
During
Period
7/1/19 -
12/31/19* | | | Hypothetical
Expenses
Paid During
Period
7/1/19 -
12/31/19* | | | Annualized
Expense
Ratio
During
Period
7/1/19 -
12/31/19 | |
| | | | | | | | | | | | | | | | | | | | | | | | |
US Small Cap Core ETF | | | | | | | | | | | | | | | | | | | | | |
| | | | | | |
ETF Shares | | $ | 1,000 | | | $ | 1,033.90 | | | $ | 1,022.63 | | | $ | 0.42 | ** | | $ | 2.65 | | | | 0.52 | % |
| | | |
US Large Cap Core ETF | | | | | | | | | | | | | |
| | | | | | |
ETF Shares | | $ | 1,000 | | | $ | 1,081.90 | | | $ | 1,022.58 | | | $ | 2.73 | | | $ | 2.65 | | | | 0.52 | % |
| | | |
High Dividend Stock ETF | | | | | | | | | | | | | |
| | | | | | |
ETF Shares | | $ | 1,000 | | | $ | 1,094.30 | | | $ | 1,022.58 | | | $ | 2.74 | | | $ | 2.65 | | | | 0.52 | % |
| | | |
International ETF | | | | | | | | | | | | | |
| | | | | | |
ETF Shares | | $ | 1,000 | | | $ | 1,032.50 | | | $ | 1,022.18 | | | $ | 0.50 | ** | | $ | 3.16 | | | | 0.62 | % |
*Expenses are equal to the average account value over the period, multiplied by the Fund’s annualized expense ratio, multiplied by 184/365 (to reflect the one half year period).
**Expenses are equal to the average account value over the period, multiplied by the Fund’s annualized expense ratio, multiplied by 29/365 (to reflect the number of days from commencement of operations on December 3, 2019 through December 31, 2019).
84
Trustees and Executive Officers of the Trust
The Trustees and Principal Executive Officers of the Trust and their principal occupations for the past five years are listed as follows:
| | | | | | |
| Name, Address & Age | | Position(s) Held with the Trust | | Length of Time Served and Term of
Office | | Number of Portfolios in Fund Complex
Overseen by
Trustee |
| Arthur D Ally* | | Trustee, Chairman, President and Treasurer | | Trustee and President since 1994 Indefinite Term | | 18 |
1055 Maitland Center Commons Maitland, FL | | Principal Occupation During Past 5 Years | | Other Directorships Held by Trustee |
| Born: 1942 | | President and controlling shareholder of Covenant Funds, Inc. (“CFI”), a holding company. President and general partner of Timothy Partners, Ltd., the investment Advisor and principal underwriter to each Fund. CFI is also the managing general partner of TPL. | | None |
| | | | | |
| Name, Address & Age | | Position(s) Held with the Trust | | Length of Time Served and Term of
Office | | Number of Portfolios
in Fund Complex
Overseen by
Trustee |
| Joseph E. Boatwright** | | Trustee, and Secretary | | Trustee and Secretary since 1995 Indefinite Term | | 18 |
1055 Maitland Center Commons Maitland, FL | | Principal Occupation During Past 5 Years | | Other Directorships Held by Trustee |
| Born: 1930 | | Retired Minister. Currently serves as a consultant to the Greater Orlando Baptist Association. Served as Senior Pastor to Aloma Baptist Church from 1970-1996. | | None |
| | | | | |
| Name, Address & Age | | Position(s) Held with the Trust | | Length of Time Served and Term of
Office | | Number of Portfolios
in Fund Complex
Overseen by
Trustee |
| Mathew D. Staver** | | Trustee | | Trustee since 2000 Indefinite Term | | 18 |
1055 Maitland Center Commons Maitland, FL | | Principal Occupation During Past 5 Years | | Other Directorships Held by Trustee |
| Born: 1956 | | Attorney specializing in free speech, appellate practice and religious liberty constitutional law. Founder of Liberty Counsel, a religious civil liberties education and legal defense organization. Host of two radio programs devoted to religious freedom issues. Editor of a monthly newsletter devoted to religious liberty topics. Mr. Staver has argued before the United States Supreme Court and has published numerous legal articles. | | None |
| | | | | |
85
| | | | | | |
| Name, Address & Age | | Position(s) Held with the Trust | | Length of Time Served and Term of
Office | | Number of Portfolios
in Fund Complex
Overseen by
Trustee |
| Charles E. Nelson*** | | Trustee | | Trustee since 2000 Indefinite Term | | 18 |
1055 Maitland Center Commons Maitland, FL | | Principal Occupation During Past 5 Years | | Other Directorships Held by Trustee |
| Born: 1934 | | Certified Public Accountant, semi-retired.Former non-profit industry accounting officer. Former financial executive with commercial bank. Former partner national accounting firm. | | None |
| * | Mr. Ally is an “interested” Trustee, as that term is defined in the 1940 Act, because of his positions with and financial interests in CFI and TPL. |
| ** | Messrs. Boatwright and Staver are “interested” Trustees, as that term is defined in the 1940 Act, because each has a limited partnership interest in TPL. |
| *** | Mr. Nelson is an “interested” Trustee, as that term is defined in the 1940 Act, because he is employed by the Advisor. |
INDEPENDENT TRUSTEES
| | | | | | |
| Name, Address & Age | | Position(s)
Held with the Trust | | Length of Time Served and Term of
Office | | Number of Portfolios
in Fund Complex
Overseen by Trustee |
| Kenneth Blackwell | | Trustee | | Trustee since 2011 Indefinite Term | | 18 |
1055 Maitland Center Commons Maitland, FL | | Principal Occupation During Past 5 Years | | Other Directorships Held by Trustee |
| Born: 1948 | | Currently serving as an independent consultant or Fellow with the Family Research Council and the American Civil Rights Union, and is a Visiting Professor at Liberty University, Lynchburg, VA. Former Secretary of State for the State of Ohio. | | None |
| | | | |
| Name, Address & Age | | Position(s)
Held with the Trust | | Length of Time
Served and Term of
Office | | Number of Portfolios
in Fund Complex
Overseen by Trustee |
| Richard W. Copeland | | Trustee | | Trustee since 2005 Indefinite Term | | 18 |
1055 Maitland Center Commons Maitland, FL | | Principal Occupation During Past 5 Years | | Other Directorships Held by Trustee |
| Born: 1947 | | Retired. Associate Professor Stetson University for past 40 years. Retired Principal of Copeland & Covert, Attorneys at Law; specializing in tax and estate planning. B.A. from Mississippi College, JD from University of Florida and LLM Taxation from University of Miami. | | None |
| | | | |
86
| | | | | | |
| Name, Address & Age | | Position(s)
Held with the Trust | | Length of Time
Served and Term of
Office | | Number of Portfolios
in Fund Complex
Overseen by Trustee |
| Deborah Honeycutt | | Trustee | | Trustee since 2010 Indefinite Term | | 18 |
1055 Maitland Center Commons Maitland, FL | | Principal Occupation During Past 5 Years | | Other Directorships Held by Trustee |
| Born: 1947 | | Dr. Honeycutt is a licensed physician currently serving as Medical Director of Clayton State University Health Services in Morrow, GA, CEO of Minority Health Services in Atlanta, and as a volunteer at Good Shepherd Clinic. Dr. Honeycutt received her B.A. and M.D. at the University of Illinois. | | None |
| | | | |
| Name, Address & Age | | Position(s) Held
with the Trust | | Length of Time
Served and Term of
Office | | Number of Portfolios
in Fund Complex
Overseen by Trustee |
| Bill Johnson | | Trustee | | Trustee since 2005 Indefinite Term | | 18 |
1055 Maitland Center Commons Maitland, FL | | Principal Occupation During Past 5 Years | | Other Directorships Held by Trustee |
| Born: 1946 | | President (and Founder) of American Decency Association, Freemont, MI since 1999. Previously served as Michigan State Director for American Family Association (1987-1999). Previously a public school teacher for 18 years. B.S. from Michigan State University and a Master of Religious Education from Grand Rapids Baptist Seminary. | | None |
| | | | |
| Name, Address & Age | | Position(s) Held
with the Trust | | Length of Time
Served and Term of
Office | | Number of Portfolios
in Fund Complex
Overseen by Trustee |
| John C. Mulder | | Trustee | | Trustee since 2005 Indefinite Term | | 18 |
1055 Maitland Center Commons Maitland, FL | | Principal Occupation During Past 5 Years | | Other Directorships Held by Trustee |
| Born: 1950 | | President of WaterStone (formerly the Christian Community Foundation and National Foundation) since 2001. Prior: 22 years of executive experience for a group of banks and a trust company. B.A. Economics from Wheaton College and MBA from University of Chicago. | | None |
87
| | | | | | |
| Name, Address & Age | | Position(s) Held with the Trust | | Length of Time Served and Term of
Office | | Number of Portfolios
in Fund Complex
Overseen by Trustee |
| Scott Preissler, Ph.D. | | Trustee | | Trustee since 2004 Indefinite Term | | 18 |
1055 Maitland Center Commons Maitland, FL | | Principal Occupation During Past 5 Years | | Other Directorships Held by Trustee |
| Born: 1960 | | Scott Preissler, Ph.D. is the Executive Director of The National Center for Stewardship & Generosity. He is a former professor and past President and CEO of The Christian Stewardship Association (CSA) and Southern Baptist state headquarters in Texas and Georgia. | | None |
| | | | |
| Name, Address & Age | | Position(s) Held with the Trust | | Length of Time Served and Term of
Office | | Number of Portfolios
in Fund Complex
Overseen by Trustee |
| Alan M. Ross | | Trustee | | Trustee since 2004 Indefinite Term | | 18 |
1055 Maitland Center Commons Maitland, FL | | Principal Occupation During Past 5 Years | | Other Directorships Held by Trustee |
| Born: 1951 | | Founder and CEO of Corporate Development Institute which he founded in 2000. Previously he served as President and CEO of Fellowship of Companies for Christ and has authored three books: Beyond World Class, Unconditional Excellence, Breaking Through to Prosperity. | | None |
| | | | |
| Name, Address & Age | | Position(s)
Held with the Trust | | Length of Time Served and Term of
Office | | Number of Portfolios
in Fund Complex
Overseen by Trustee |
| Patrice Tsague | | Trustee | | Trustee since 2011 Indefinite Term | | 18 |
1055 Maitland Center Commons Maitland, FL | | Principal Occupation During Past 5 Years | | Other Directorships Held by Trustee |
| Born: 1973 | | President and Chief Servant Officer of the Nehemiah Project International Ministries Inc. since 1999. | | None |
The Statement of Additional Information includes additional information about the Trustees of the Trust and is available, without charge, on the SEC’s website at www.sec.gov and/or by calling 800-539-3863.
88
EXECUTIVE OFFICERS
| | | | | | |
| Name, Address & Age | | Position(s) Held with the Trust | | Length of Time Served and Term of
Office | | Number of Portfolios
in Fund Complex
Overseen by Trustee |
| Terry Covert | | Executive Officer, Vice President | | Officer since 2019 Indefinite Term | | N/A |
1055 Maitland Center Commons Maitland, FL | | Principal Occupation During Past 5 Years | | Other Directorships Held by Trustee |
| Born: 1947 | | Chief Compliance Officer and General Counsel for Advisor, Timothy Partners, Ltd. | | N/A |
| | | | |
| Name, Address & Age | | Position(s) Held with the Trust | | Length of Time Served and Term of
Office | | Number of Portfolios
in Fund Complex
Overseen by Trustee |
| Cheryl Mumbert | | Executive Officer, Vice President | | Officer since 2019 Indefinite Term | | N/A |
1055 Maitland Center Commons Maitland, FL | | Principal Occupation During Past 5 Years | | Other Directorships Held by Trustee |
| Born: 1970 | | Chief Marketing Officer for Advisor, Timothy Partners, Ltd. | | N/A |
| | | | |
| Name, Address & Age | | Position(s)
Held with the Trust | | Length of Time
Served and Term of
Office | | Number of Portfolios
in Fund Complex
Overseen by Trustee |
| David Jones | | Chief Compliance Officer | | Since 2004 Indefinite Term | | N/A |
1055 Maitland Center Commons Maitland, FL | | Principal Occupation During Past 5 Years | | Other Directorships Held by Trustee |
| Born: 1957 | | Co-founder and Managing Member, Drake Compliance, LLC (compliance consulting); founder and controlling shareholder, David Jones & Associates (law firm), 1998 to 2015. | | N/A |
89
Timothy Plan
1055 Maitland Center Commons
Maitland, Florida 32751
PAST PERFORMANCE DOES NOT GUARANTEE FUTURE RESULTS, AND YOU MAY LOSE MONEY. You should consider the fund’s investment objectives, risks, charges, and expenses. This and other important information can be found in the fund’s prospectus. To obtain a copy, visit timothyplan.com or call 800.846.7526. Read the prospectus carefully before investing or sending money. ETFs distributed by Foreside Fund Services, LLC, member FINRA and SIPC. Timothy Partners, Ltd. is not affiliated with Foreside Fund Services, LLC.

| | |
| Visit our website at | | Call Timothy Plan at |
| |
| etf.timothyplan.com | | 800.846.7526 |
Item 2. Code of Ethics.
(a) The registrant has adopted a code of ethics that applies to the registrant’s principal executive officer, principal financial officer,
principal accounting officer or controller, or persons performing similar functions. This code of ethics is included as an Exhibit.
(b) During the period covered by the report, with respect to the registrant’s code of ethics that applies to its principal executive
officer, principal financial officer, principal accounting officer or controller, or persons performing similar functions, there have been
no amendments to, not any waivers granted from, a provision that relates to any element of the code of ethics definition enumerated in
paragraph (b) of this Item 2.
Item 3. Audit Committee Financial Expert.
| 3(a)(1) | The registrant’s board of directors has determined that the registrant has at least one audit committee financial expert serving on its audit committee. |
| 3(a)(2) | The audit committee financial expert is Mr. Alan Ross who is “independent for purposes of this Item 3 of FormN-CSR. |
Item 4. Principal Accountant Fees and Services.
| | |
| | 2019 |
(a) Audit Fees | | $53,250 |
(b) Audit-Related Fees | | $0 |
(c) Tax Fees* | | $12,000 |
* Related to preparation of federal income, excise tax returns, state tax returns and review of capital gain distribution calculations.
(e)(1) The Audit Committee maypre-approve at any regularly scheduled Audit Committee meeting audit, audit-related, tax and othernon-audit services to be rendered or that may be rendered by the Auditor to the Funds and certainnon-audit services to be rendered by the Auditor to the Advisor which requirepre-approval by the Audit Committee. In connection with suchpre-approvals, the Auditor, or a Fund officer, with the assistance of the Auditor, shall provide the Audit Committee with a report containing information about each type of service to bepre-approved at the meeting.
(e)(2) 2019 – 100%
Item 5. Audit Committee of Listed Registrants.
The Registrant is a listed issuer as defined in Rule10A-3 under the Exchange Act and has a separately-designated standing audit committee established in accordance with Section 3(a)(58)(A) of the Exchange Act. The Registrant’s audit committee members are Mr. Alan Ross, Mr. John Mulder and Mr. Richard Copeland.
Item 6. Investments.
| (a) | The Schedule of Investments as of the close of the reporting period are included as part of the report to shareholders filed under Item 1 of the FormN-CSR. |
Item 7. Disclosure of Proxy Voting Policies and Procedures forClosed-End Management Investment Companies.
Not applicable.
Item 8. Portfolio Managers ofClosed-End Management Investment Companies.
Not applicable.
Item 9. Purchases of Equity Securities byClosed-End Management Investment Company and Affiliated Purchasers.
Not applicable.
Item 10. Submission of Matters to a Vote of Security Holders.
Not applicable.
Item 11. Controls and Procedures.
| (a) | The registrant’s principal executive officer and principal financial officer have concluded, based on their evaluation of the registrant’s disclosure controls and procedures as conducted within 90 days of the filing date of this report, that these disclosure controls and procedures are adequately designed and are operating effectively to ensure that information required to be disclosed by the registrant on FormN-CSR is recorded, processed, summarized and reported within the time periods specified in the Securities and Exchange Commission’s rules and forms. |
| (b) | There were no changes in the registrant’s internal control over financial reporting (as defined in Rule30a-3(d) under the Act (17 CFR270.30a-3(d)) that occurred during the period covered by this report that have materially affected or are reasonably likely to materially affect, the registrant’s internal control over financial reporting. |
Item 12. Disclosure of Securities Lending Activities forClosed-End Management Investment Companies.
Not applicable.
Item 13. Exhibits.
(a)(1) The code of ethics that is the subject of the disclosure required by Item 2 is attached hereto.
(a)(2) Certifications pursuant to Rule30a-2(a) are attached hereto.
(a)(3) Not applicable.
| (b) | Certifications pursuant to Rule30a-2(b) are furnished herewith. |
SIGNATURES
Pursuant to the requirements of the Securities Exchange Act of 1934 and the Investment Company Act of 1940, the registrant has duly caused this report to be signed on its behalf by the undersigned, thereunto duly authorized.
(Registrant) Timothy Plan
| | | | | | |
| By (Signature and Title)/s/ Arthur D. Ally | | | | |
| | Arthur D. Ally, Principal Executive Officer and Principal Financial Officer | | | | |
Date3/3/2020
Pursuant to the requirements of the Securities Exchange Act of 1934 and the Investment Company Act of 1940, this report has been signed below by the following persons on behalf of the registrant and in the capacities and on the dates indicated.
| | | | | | |
| By (Signature and Title)/s/ Arthur D. Ally | | | | |
| | Art Ally, Principal Executive Officer and Principal Financial Officer | | | | |
Date 3/3/2020