 Earnings Conference Call March 5, 2015 Creating sustainable food, feed and fuel ingredients for a growing population Exhibit 99.2 Fourth Quarter & Fiscal Year End 2014 Randall C. Stuewe, Chairman and CEO John O. Muse, EVP Chief Financial Officer |
 Creating sustainable food, feed and fuel ingredients for a growing population Safe Harbor Statement 2 This presentation contains “forward-looking” statements regarding the business operations and prospects of Darling Ingredients Inc. and industry factors affecting it. These statements are identified by words such as “believe,” “anticipate,” “expect,” “estimate,” “intend,” “could,” “may,” “will,” “should,” “planned,” “potential,” “continue,” “momentum,” and other words referring to events that may occur in the future. These statements reflect Darling Ingredient’s current view of future events and are based on its assessment of, and are subject to, a variety of risks and uncertainties beyond its control, each of which could cause actual results to differ materially from those indicated in the forward-looking statements. These factors include, among others, existing and unknown future limitations on the ability of the Company's direct and indirect subsidiaries to upstream their profits to the Company for payments on the Company's indebtedness or other purposes; unanticipated costs or operating problems related to the acquisition and integration of Rothsay and Darling Ingredients International (including transactional costs and integration of the new enterprise resource planning (ERP) system); global demands for bio-fuels and grain and oilseed commodities, which have exhibited volatility, and can impact the cost of feed for cattle, hogs and poultry, thus affecting available rendering feedstock and selling prices for the Company’s products; reductions in raw material volumes available to the Company due to weak margins in the meat production industry as a result of higher feed costs, reduced consumer demand or other factors, reduced volume from food service establishments, reduced demand for animal feed, or otherwise; reduced finished product prices; continued decline in fat and used cooking oil finished product prices; changes to worldwide government policies relating to renewable fuels and greenhouse gas emissions that adversely affect programs like the Renewable Fuel Standards Program (RFS2) and tax credits for biofuels both in the United States and abroad; possible product recall resulting from developments relating to the discovery of unauthorized adulterations to food or food additives; the occurrence of Bird Flu including, but not limited to H1N1 flu, bovine spongiform encephalopathy (or "BSE"), porcine epidemic diarrhea ("PED") or other diseases associated with animal origin in the United States or elsewhere; unanticipated costs and/or reductions in raw material volumes related to the Company’s compliance with the existing or unforeseen new U.S. or foreign regulations (including, without limitation, China) affecting the industries in which the Company operates or its value added products (including new or modified animal feed, Bird Flu, PED or BSE or similar or unanticipated regulations); risks associated with the renewable diesel plant in Norco, Louisiana owned and operated by a joint venture between Darling Ingredients and Valero Energy Corporation, including possible unanticipated operating disruptions; risks relating to possible third party claims of intellectual property infringement; increased contributions to the Company’s pension and benefit plans, including multiemployer and employer-sponsored defined benefit pension plans as required by legislation, regulation or other applicable U.S. or foreign law or resulting from a U.S. mass withdrawal event; bad debt write-offs; loss of or failure to obtain necessary permits and registrations; continued or escalated conflict in the Middle East, North Korea, Ukraine or elsewhere; and/or unfavorable export or import markets. These factors, coupled with volatile prices for natural gas and diesel fuel, climate conditions, currency exchange fluctuations, general performance of the U.S. and global economies, disturbances in world financial, credit, commodities and stock markets, and any decline in consumer confidence and discretionary spending, including the inability of consumers and companies to obtain credit due to lack of liquidity in the financial markets, among others, could negatively impact the Company's results of operations. Among other things, future profitability may be affected by the Company’s ability to grow its business, which faces competition from companies that may have substantially greater resources than the Company. Other risks and uncertainties regarding Darling Ingredients Inc., its business and the industries in which it operates are referenced from time to time in the Company’s filings with the Securities and Exchange Commission. Darling Ingredients Inc. is under no obligation to (and expressly disclaims any such obligation to) update or alter its forward-looking statements whether as a result of new information, future events or otherwise. |
 Fourth Quarter 2014 Highlights 3 Delivering used cooking oil to one of our plants for processing • Food segment earnings steady • Global gelatin business continues to perform nicely • Edible fats supply in Europe strong, due to Russian border closure • Casings business showing signs of life as hog casings margins improve • Feed segment earnings pressured by lower finished product prices • Global fat prices declined in concert with increasing global grain supplies, ample palm oil supplies and lower crude oil prices • Global protein demand remained strong, especially for chicken-derived materials for pet food and aquaculture • Raw material procurement formulas being adjusted to improve margins • Strong input volumes globally • Fuel segment delivers record earnings • Diamond Green Diesel delivers record production and benefits from reinstatement of blenders tax credit • New biogas plant begins to contribute • Rendac earnings adjusting to lower energy prices Creating sustainable food, feed and fuel ingredients for a growing population |
 Creating sustainable food, feed and fuel ingredients for a growing population 2014 Highlights 4 • Adjusted (Non-GAAP) fully diluted EPS of $0.51 for the quarter and $1.20 for the full year • Global revenue nearing $4 billion • Pro-forma adjusted EBITDA (Non-GAAP) $512,595 for full year • Debt reduced by $122.3 million in 2014 • CAPEX of $228.9 million in 2014 • Total debt at $2.125 billion • Weakening Euro/CAD affecting translated earnings Darling Ingredients’ chemist at one of our corporate labs |
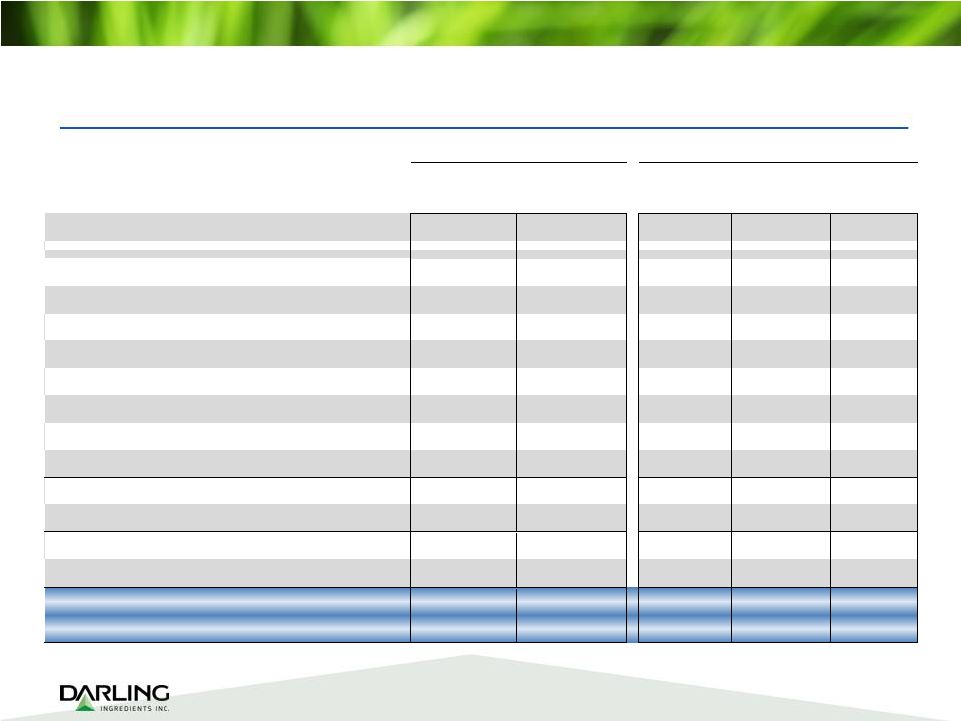 Earnings Summary 5 January 3, December 28, January 3, December 28, $ Change 2015 2013 2015 2013 Favorable (Unfavorable) Revenues 1,000,203 $ 447,939 $ 3,956,443 $ 1,802,268 $ 2,154,175 $ Gross profit 205,905 110,345 833,272 462,449 370,823 Selling, general, and administrative expenses 94,841 45,982 374,580 170,825 (203,755) Depreciation and amortizaton 69,039 31,713 269,517 98,787 (170,730) Acquisition and integration costs 2,363 14,114 24,667 23,271 (1,396) Interest expense 24,633 21,501 135,416 38,108 (97,308) Foreign currency gain/(loss) (1,267) 28,107 (13,548) 28,107 (41,655) Other income/(expense), net 271 (928) 299 (3,547) 3,846 Equity in net income of unconsolidated subsidary 59,547 (1,136) 65,609 7,660 57,949 Income before taxes 73,580 23,078 81,452 163,678 (82,226) Income tax expense 4,792 585 13,141 54,711 41,570 Net income 68,788 22,493 68,311 108,967 (40,656) Net (income)/loss attributable in minority interests 1,155 - (4,096) - (4,096) Net income attributable to Darling 69,943 $ 22,493 $ 64,215 $ 108,967 $ (44,752) $ Earnings per share (fully diluted) 0.42 $ 0.18 $ 0.39 $ 0.91 $ (0.52) $ Three Months Ended Fiscal Year Ended Creating sustainable food, feed and fuel ingredients for a growing population |
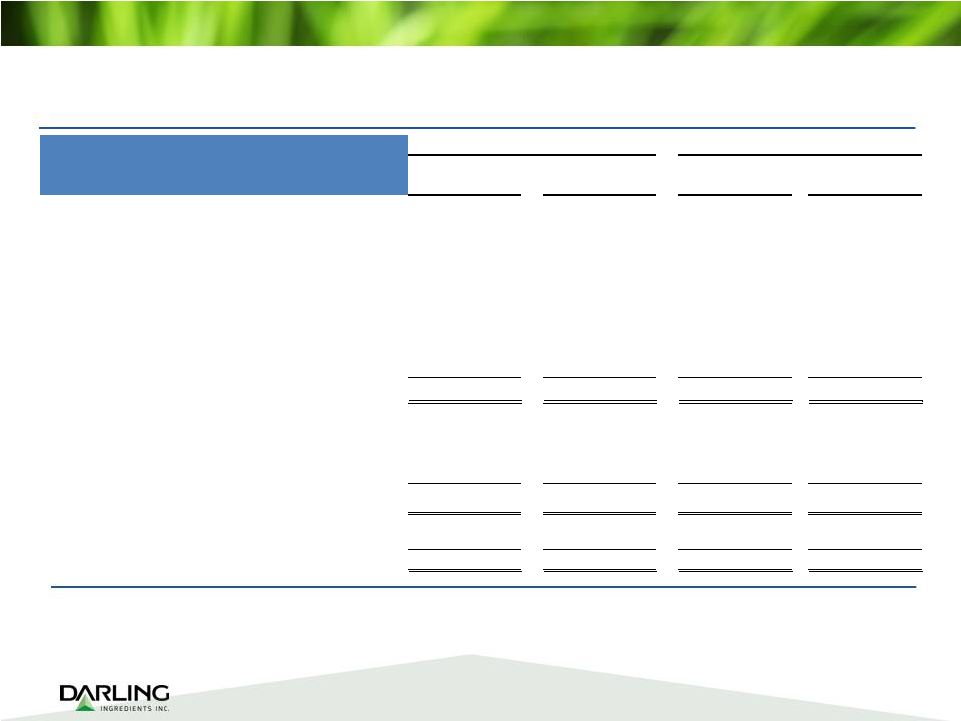
  6 Note: Adjustments to diluted earnings per share of acquisition related items are net of tax. Calculations of all adjustment tax amounts were at the applicable effective tax rate for the period, except for fiscal 2014 and fiscal 2013, which were impacted by biofuel tax incentives and nonrecurring acquistion and integration costs. The effective tax rate used for calculating Non-GAAP Adjusted EPS in the above table for the years ended January 3, 2105, December 28, 2013 and December 29, 2012 was 37.1%, 38.5% and 36.8%, respectively. The applicable effective tax rate for the fourth quarter of fiscal 2014 and 2013 were impacted by biofuel tax incentives and nonrecurring acquisition and integration costs. The efective tax rate used for calculaing Non-GAAP adjusted EPS for three months ended January 3, 2015 and December 28, 2013 was 37.2% and 38.7%, respectively. January 3, December 28, January 3, December 28, December 29, 2015 2013 2015 2013 2012 Reported Earnings Per Share (fully diluted) $ 0.42 $ 0.18 $ 0.39 $ 0.91 $ 1.11 Adjustments: Non-cash inventory step-up associated with VION Acquisition - - 0.19 - - Acquisition and integration costs 0.01 0.08 0.13 0.13 - Amortization of intangibles 0.08 0.05 0.32 0.16 0.15 Bridge financing - 0.06 - 0.07 - Redemption premium on 8.5% Senior Notes and write off deferred loan costs - - 0.12 - - Foreign currency price risk VION Acquisition (0.14) 0.05 (0.14) - Adjusted diluted earnings per share attributable to Darling (Non-GAAP) $ 0.51 $ 0.23 $ 1.20 $ 1.13 $ 1.26 Weighted average shares of common stock outstanding (in millions) 165,224 124,202 165,059 119,924 118,089 Three Months Ended Fiscal Year Ended Creating sustainable food, feed and fuel ingredients for a growing population Adjusted (Non-GAAP) Diluted EPS |
 Adjusted EBITDA 7 _ _ _ _ _ _ _ Adjusted EBITDA and Pro Forma Adjusted EBITDA January 3, December 28, January 3, December 28, (US$ in thousands) 2015 2013 2015 2013 Net income attributable to Darling $ 69,943 $ 22,493 $ 64,215 $ 108,967 Depreciation and amortization 69,039 31,713 269,517 98,787 Interest expense 24,633 21,501 135,416 38,108 Income tax expense 4,792 585 13,141 54,711 Foreign currency (gain)/loss 1,267 (28,107) 13,548 (28,107) Other expense/(income), net (269) 928 (299) 3,547 Equity in net (income)/loss of unconsolidated subsidiaries (59,547) 1,136 (65,609) (7,660) Net income attributable to noncontrolling interests -1,155 4,096 Adjusted EBITDA (Non-GAAP) $ 108,703 $ 50,249 $ 434,025 $ 268,353 Non-cash inventory step-up associated with VION Acquisition _ 49,803 Acquisition and integration-related expenses 2,362 14,114 24,667 23,271 Darling Ingredients International - 13th week (1) 4,100 Pro Forma Adjusted EBITDA (Non-GAAP) $ 111,065 $ 64,363 $ 512,595 $ 291,624 DGD Joint Venture Adjusted EBITDA (Darling's Share) (2) $ 63,757 $ 3,295 $ 81,639 $ 16,490 Three Months Ended Fiscal Year Ended (1) January 7, 2014 closed on VION Ingredients, thus the 13th week would be revenue adjusted for January 1, 2014 through January 7, 2014 (2) Darling's pro forma adjusted EBITDA (Non-GAAP) in the above table does not include the DGD Joint Venture adjusted EBITDA (Darling's share) if we had consolidated the DGD Joint Venture Creating sustainable food, feed and fuel ingredients for a growing population |
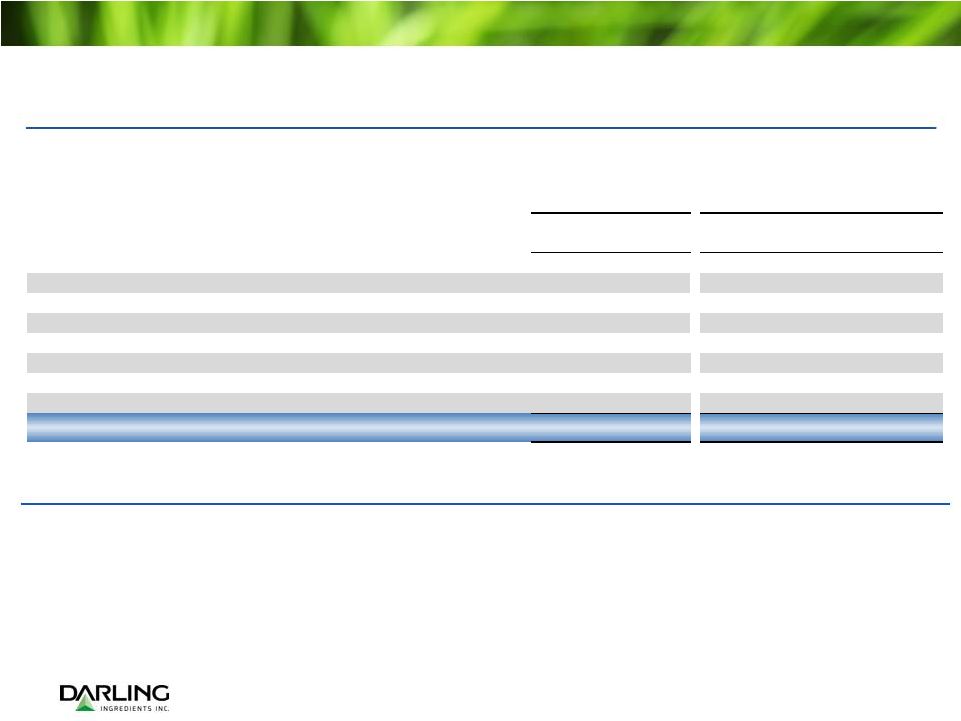
 Balance Sheet Highlights and Debt Summary 8 (US$, in thousands) January 3, 2015 Cash 108,784 $ Accounts receivable 409,779 Total inventories 401,613 Net working capital 569,570 Net property, plant and equipment 1,574,116 Total assets 5,170,713 Total debt 2,152,440 Shareholders' equity 2,051,134 (US$, in thousands) January 3, 2015 Credit Agreement Revolving Credit Facility 101,863 $ Term Loan A 312,161 Term Loan B 1,205,669 5.375% Senior Notes due 2022 500,000 Other Notes and Obligations 32,747 Total Debt: 2,152,440 $ Debt Summary Balance Sheet Highlights Creating sustainable food, feed and fuel ingredients for a growing population |
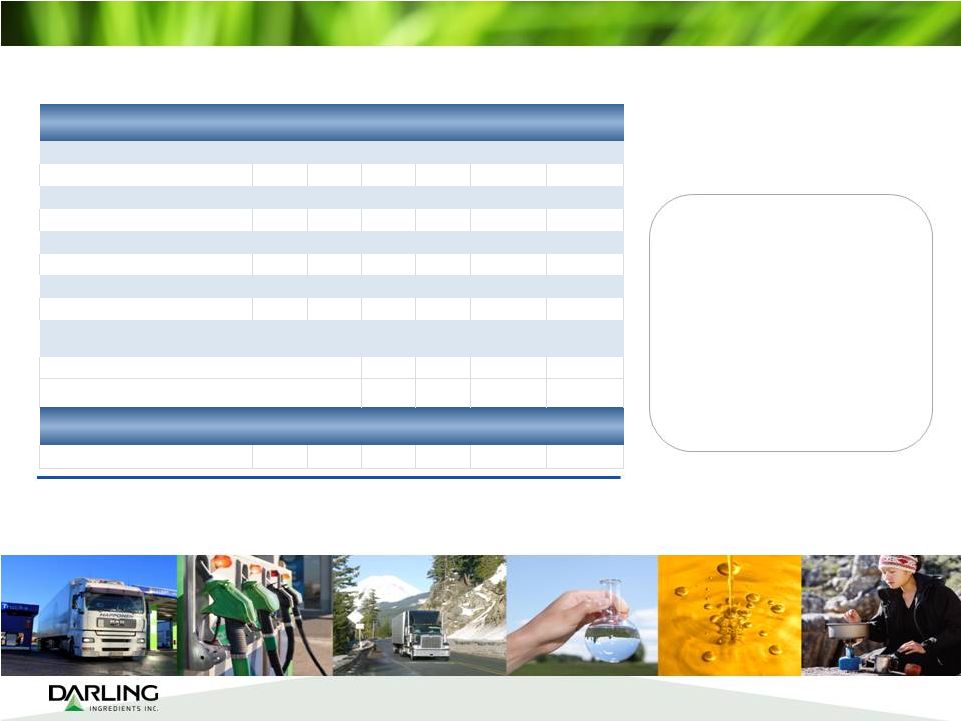
 Creating sustainable food, feed and fuel ingredients for a growing population Operational Highlights Food Segment $ and metric tons (millions) Q1 2014 Q2 2014 Q3 2014 Q4 2014 Total Delta % Q3 to Q4 Revenue 293.5 331.4 301.4 322.0 1,248.3 6.8% Gross Margin 62.3 65.3 64.2 63.4 255.2 -1.3% Gross Margin % 21.2% 19.7% 21.3% 19.7% 20.4% Operating Income/(Loss) (12.1) 11.3 14.0 13.7 26.9 -2.1% Adjusted Operating Income 30.8 14.7 14.0 13.7 73.2 -2.1% EBITDA 5.3 30.9 32.6 31.4 100.2 -3.7% Adjusted EBITDA 38.3 34.3 32.6 31.4 136.6 -3.7% Adjusted EBITDA/Revenue 13.0% 10.4% 10.8% 9.7% 10.9% Raw Material Processed (millions of metric tons) 0.25 0.27 0.26 0.28 1.06 7.7% (3) 9 (A) (1) (1) (2) (1) (2) (1) • Gelatin business performed nicely; China normalizing and South American margins adjusting to supply and currency • European edible fats business volumes remained strong • CTH showed improved margins on hog casings (1) Has impact of inventory step-up in 1 st and 2 nd quarter. (2) Exclusive of non-cash inventory step-up and Darling Ingredients International 13 th week. (3) Raw material process volumes for the first quarter have been adjusted to be consistent with the presentation of the second quarter figures. (A) Quarters 1, 2 and 3 revenues have been adjusted for reclass between sales and cost of sales. |
 Creating sustainable food, feed and fuel ingredients for a growing population Feed Segment Operational Highlights • Lower finished product pricing in 4 th quarter, primarily in fats • Protein prices eased, but demand remained strong • Strong raw material volumes • Raw material procurement formulas being adjusted globally US$ and metric tons (millions) Q1 2014 Q2 2014 Q3 2014 Q4 2014 Total Delta % Q3 to Q4 Revenue $586.1 $622.1 $607.3 $606.0 $2,421.5 0.2% Gross Margin (1) 142.5 165.4 132.5 132.5 572.9 0.0% Gross Margin % (1) 24.3% 26.6% 21.8% 21.9% 23.7% Operating Income (2) 37.5 74.7 46.4 33.6 192.2 -27.6% Adjusted Operating Income (1) 52.4 76.2 46.4 33.6 208.6 -27.6% EBITDA (2) 76.1 114.6 84.2 76.4 351.3 -9.3% Adjusted EBITDA (1) 90.9 116.1 84.2 76.4 367.6 -9.3% Adjusted EBITDA/Revenue 15.5% 18.7% 13.9% 12.6% 15.2% Raw Material Processed (millions of metric tons) 1.67 1.67 1.66 1.85 6.85 11.4% (3) 10 (A) Quarters 1, 2 and 3 revenues have been adjusted for reclass between sales and cost of sales. (A) (1) Has impact of inventory step-up in 1 st and 2 nd quarter. (2) Exclusive of non-cash inventory step-up and Darling Ingredients International 13 th week. (3) Raw material process volumes for the first quarter have been adjusted to be consistent with the presentation of the second quarter figures. |
 Creating sustainable food, feed and fuel ingredients for a growing population • Diamond Green Diesel, as well as our biodiesel operations in Canada and US, received the Tax Credit Benefit for 2014 • DGD running in excess of 11,000 barrels per day of input feedstock • New Ecoson biogas plant in Son, Netherlands is on line Fuel Segment 11 $ and metric tons (millions) Q1 2014 Q2 2014 Q3 2014 Q4 2014 Total Delta % Q3 to Q4 Revenue $66.7 77.7 70.0 72.2 286.6 3.1% Gross Margin 15.3 15.9 17.8 10.0 59.0 -43.8% Gross Margin % 21.1% 20.5% 25.4% 13.9% 20.6% Operating Income (2) 2.3 5.2 2.8 10.9 21.2 289.3% Adjusted Operating Income (1) 3.5 5.2 2.8 10.9 22.4 289.3% EBITDA (2) 9.7 11.1 11.5 16.9 49.2 47.0% Adjusted EBITDA (1) 10.9 11.1 11.5 16.9 50.4 47.0% Adjusted EBITDA/Revenue 16.3% 14.3% 16.4% 23.4% 17.6% Raw Material Processed * (millions of metric tons) 0.23 (3) 0.24 0.26 0.33 1.07 26.9% *Excludes raw material processed at the DGD joint venture. Diamond Green Diesel (50% Joint Venture) US$ (millions) Q1 2014 Q2 2014 Q3 2014 Q4 2014 Total Delta % Q3 to Q4 EBITDA (Darling's share) $9.1 5.9 2.9 63.7 $81.6 2096.6% (1) Has impact of inventory step-up in 1st quarter. (2) Exclusive of non-cash inventory step-up and Darling Ingredients Int'l 13th week. (3) Raw material process volumes for the first quarter have been adjusted to be consistent with the presentation of the second quarter figures. (A) (A) Quarters 1, 2 and 3 revenues have been adjusted for reclass between sales and cost of sales. Operational Highlights |
 Creating sustainable food, feed and fuel ingredients for a growing population Non-U.S. GAAP Measures 12 Adjusted EBITDA is presented here not as an alternative to net income, but rather as a measure of the Company’s operating performance and is not intended to be a presentation in accordance with GAAP. Since EBITDA (generally, net income plus interest expenses, taxes, depreciation and amortization) is not calculated identically by all companies, this presentation may not be comparable to EBITDA or adjusted EBITDA presentations disclosed by other companies. Adjusted EBITDA is calculated in this presentation and represents, for any relevant period, net income/(loss) plus depreciation and amortization, goodwill and long-lived asset impairment, interest expense, (income)/loss from discontinued operations, net of tax, income tax provision, other income/(expense) and equity in net loss of unconsolidated subsidiary. Management believes that Adjusted EBITDA is useful in evaluating the Company’s operating performance compared to that of other companies in its industry because the calculation of Adjusted EBITDA generally eliminates the effects of financing income taxes and certain non-cash and other items that may vary for different companies for reasons unrelated to overall operating performance. As a result, the Company’s management used Adjusted EBITDA as a measure to evaluate performance and for other discretionary purposes. However, Adjusted EBITDA is not a recognized measurement under GAAP, should not be considered as an alternative to net income as a measure of operating results or to cash flow as a measure of liquidity, and is not intended to be a presentation in accordance with GAAP. In addition to the foregoing, management also uses or will use Adjusted EBITDA to measure compliance with certain financial covenants under the Company’s Senior Secured Credit Facilities and 5.375% Notes that were outstanding at January 3, 2015. However, the amounts shown in this presentation for Adjusted EBITDA differ from the amounts calculated under similarly titled definitions in the Company’s Senior Secured Credit Facilities and 5.375% Notes, as those definitions permit further adjustments to reflect certain other non-recurring costs and non-cash charges. In addition, the Company’s management used adjusted diluted earnings per share as a measure of earnings due to the significant merger and acquisition activity of the Company. However, adjusted earnings per share is not a recognized measurement under GAAP and should not be considered as an alternative to diluted earnings per share presented in accordance with GAAP. Adjusted diluted earnings per share is defined as adjusted net income attributable to Darling divided by the weighted average shares of diluted common stock. Adjusted net income attributable to Darling is defined as a reconciliation of net income attributable to Darling, net of tax (i) adjusted for net of tax acquisition and integration costs related to merger and acquisitions, (ii) net of tax amortization of acquisition related intangibles and (iii) net of tax certain non-recurring items that are not part of normal operations. This measure is solely for the purpose of calculating adjusted diluted earnings per share and is not intended to be a substitute of presentation in accordance with GAAP. |
 Creating sustainable food, feed and fuel ingredients for a growing population Pro Forma Operating Performance – 2013 13 Exchange Rates: 2013 USD/EURO 1.3279 USD/CA 0.9706 Feed Segment Q1 Q2 Q3 Q4 Total Revenue 672.0 689.6 662.2 631.9 2,655.7 EBITDA 121.2 118.8 101.3 97.1 438.4 Food Segment Q1 Q2 Q3 Q4 Total Revenue 309.7 303.7 303.4 301.2 1,218.0 EBITDA 42.4 38.3 47.3 5.4 133.3 Fuel Segment Q1 Q2 Q3 Q4 Total Revenue 73.7 78.4 80.1 74.5 306.8 EBITDA 12.9 11.5 16.1 13.0 53.6 Diamond Green Diesel (50% Joint Venture) Q1 Q2 Q3 Q4 Total EBITDA (Darling's Share -1.2 -2.0 16.4 3.3 16.5 US $ (millions) * Excludes corporate expense (1) Impacted by year end audit adjustments prior to VION acquisition. (1) See Cautionary Statement at end of this presentation. |
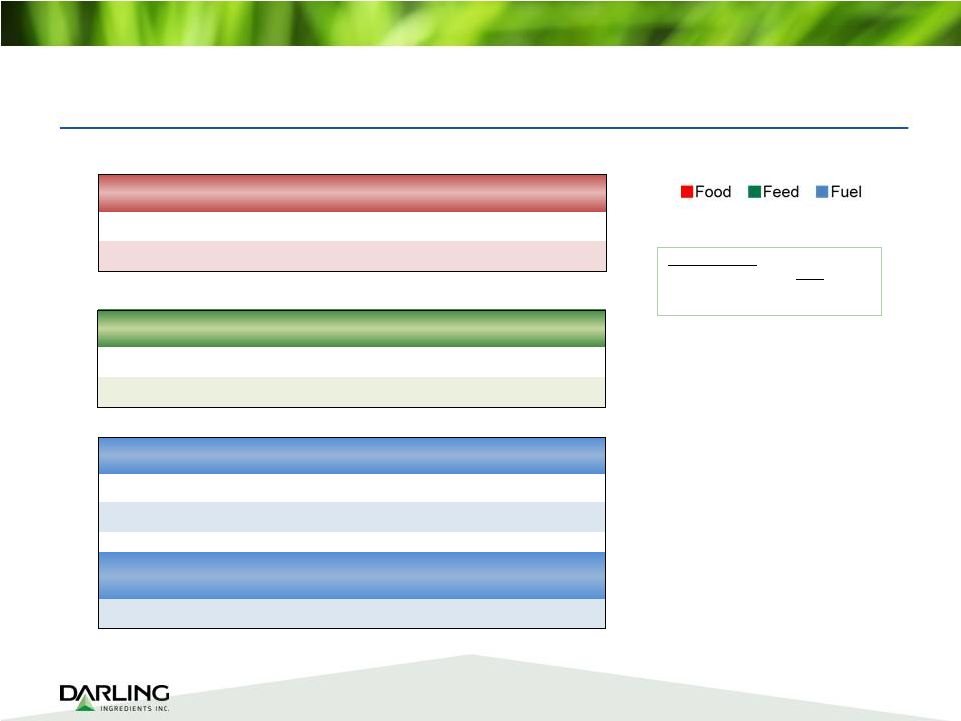
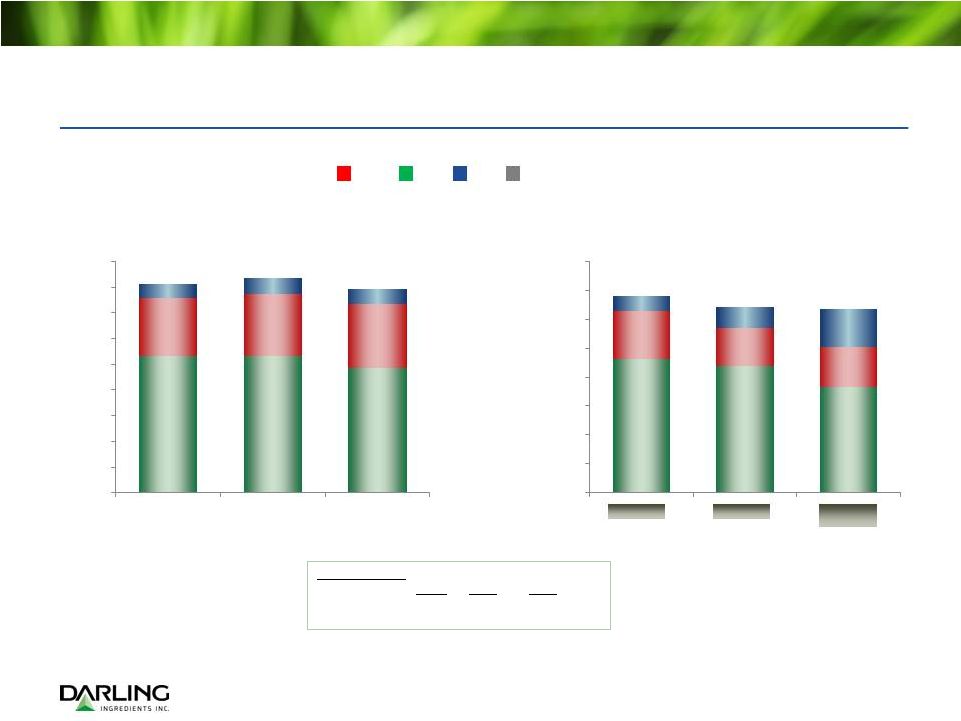 Creating sustainable food, feed and fuel ingredients for a growing population 14 Pro Forma Operating Performance US $ (millions) $4,068 $4,180 $3,956 $594 $653 $610 Exchange Rates: 2012 2013 2014 USD/EURO 1.2845 1.3279 1.32704 USD/CA 1.0005 0.9706 0.90446 See Cautionary Statement at end of this presentation. Net Sales Adjusted EBITDA 2012 2014 2013 $(42) $(32) $(28) Note: 2013 and 2014 include Adjusted EBITDA from Diamond Green Diesel JV. $2,661 $2,655 $2,421 $1,124 $1,218 $1,248 $283 $307 $287 - $500 $1,000 $1,500 $2,000 $2,500 $3,000 $3,500 $4,000 $4,500 2012 2013 2014 $461 $438 $367 $167 $133 $137 $53 $71 $132 $ $100 $200 $300 $400 $500 $600 $700 $800 Creating sustainable food, feed and fuel ingredients for a growing population Food Feed Fuel Corp. Unallocated |
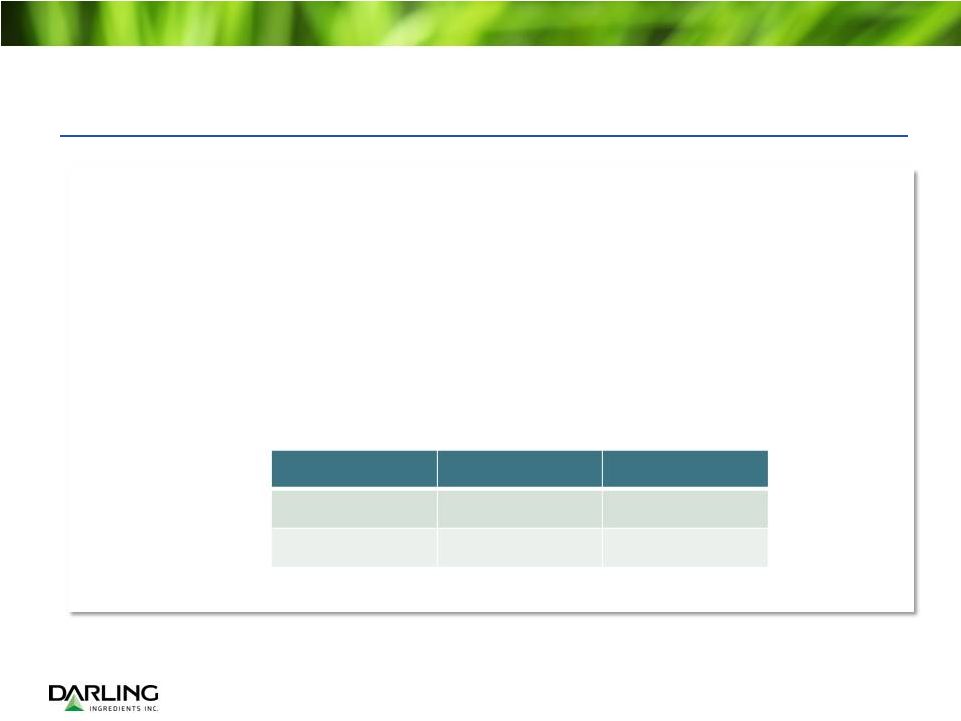
 Creating sustainable food, feed and fuel ingredients for a growing population Feed Segment Reduction Explained- 2013 vs. 2014 15 Feed Segment Lower N.A. domestic fats Lower USA export fat values Lower Bakery Feeds earnings FX translation impact 2013 2014 YG $762/mt $638/mt 16% decline 2013 2014 Corn $6.22/bu $4.23/bu 32% decline 2013 2014 USD/EURO 1.3279 1.32704 USD/CA 0.9706 0.90446 2013 2014 East coast $876/mt $718/mt 18% decline • Lower fat prices drove majority of earnings decline • Lag affect when adjusting raw material costs • USA reduced export premiums to Europe • UCO collection business which is non-formula • Fallen stock collection business • Ambiguous renewable fuel policies in USA and Europe affected fat prices. • Bakery Feeds earnings reduced significantly with declining corn price • FX impact in Canada and significantly weaker Euro in Q4 of 2014. Note: 2013 Pro Forma Rail and truck loading at Jacksonville, MS facility. See Cautionary Statement at end of this presentation. |
 Creating sustainable food, feed and fuel ingredients for a growing population Foreign Currency Impact The U.S. dollar has strengthened against most of the functional currencies used by the Company’s non-domestic operations. Using actual results for fiscal year 2014 and comparing the yearly average rates to the spot rates at the end of January 2015, the impact of the strengthened dollar would result in an annual decrease in net sales and operating income of approximately $290 million and approximately $31 million, respectively if the same amount of non-domestic operations were attained in fiscal 2015. The U.S. dollar continues to strengthen at the timing of this filing. The impact is mainly affected by the drop in the Euro in comparison to the U.S. dollar. Exchange Rate: Avg. 2014 Spot Jan. 2015 USD/Euro 1.32704 1.13355 USD/CA .90446 .78974 Assumptions: 16 |
 Creating sustainable food, feed and fuel ingredients for a growing population Upcoming Conference Appearances 17 o 27 th Annual ROTH Conference o BMO Farm to Market Conference o Avondale Partners Conference March 10, 2015 The Ritz-Carlton – Dana Point, CA Creating sustainable food, feed and fuel ingredients for a growing population May 21, 2015 Grand Hyatt – New York City June 3, 2015 Millennium Broadway Hotel – New York City |
 Creating sustainable food, feed and fuel ingredients for a growing population 18 The unaudited pro forma financial information (“Unaudited Pro Forma Financial Information”) presented in the Financial Section pages of this presentation was prepared by Darling management and is based upon (i) Darling audited financial statements for the fiscal years ended December 29, 2012 and December 28, 2013, respectively, (ii) VION Ingredients audited financial statements for the year ended December 31, 2012 as prepared under Dutch GAAP, but including a US GAAP reconciliation footnote, (iii) VION Ingredients unaudited condensed consolidated and combined interim financial statements for the twelve months ended December 31, 2012 and twelve months ended December 31, 2013, respectively as prepared under Dutch GAAP, but including a US GAAP reconciliation footnote; (iv) the Rothsay audited statement of assets acquired and liabilities assumed and the related statement of net revenues and direct costs and operating expenses for the fiscal year ended December 29, 2012 and (v) Rothsay unaudited statement of assets acquired and liabilities assumed and the related statement of net revenues and direct costs and operating expenses for the fiscal year ended December 28, 2013. Darling is presenting the Unaudited Pro Forma Financial Information for informational purposes only. Darling believes that the Unaudited Pro Forma Financial Information was prepared in good faith and on a reasonable basis based on the best information available at the time of its preparation. The Unaudited Pro Forma Financial Information, however, is not fact. The Unaudited Pro Forma Financial Information was not intended to be used as predictive of future performance. It was not prepared in compliance with the requirements of GAAP, the published guidelines of the SEC regarding pro forma information, or the guidelines established by the American Institute of Certified Public Accountants for preparation and presentation of pro forma financial information. Darling’s independent public auditor has not audited or reviewed the Unaudited Pro Forma Financial Information. The inclusion of the Unaudited Pro Forma Financial Information in this presentation should not be regarded as a representation that Darling or any of its officers, affiliates, advisors, or representatives consider the Unaudited Pro Forma Financial Information to be a reliable prediction of future events or results, or a representation that actual results would have been comparable had the Transactions occurred on the dates indicated, and the information should not be relied upon as such. Darling acquired Rothsay on October 28, 2013 and VION Ingredients on January 7, 2014 (collectively, the “Transactions”). Neither Rothsay nor VION Ingredients had been operated as a stand-alone business prior to the respective acquisitions, but rather as divisions of their respective parent entities. Management does not believe that the Unaudited Pro Forma Financial Information is necessarily indicative of future performance of Darling, and in fact, actual performance may differ significantly (either better or worse) from the performance indicated in the Unaudited Pro Forma Financial Information due to (i) the challenges inherent in integrating the businesses of Darling, Rothsay and VION Ingredients, (ii) changes to Darling’s operations and strategy that may have been implemented or may be implemented in the future as a result of the Transactions or otherwise, and (iii) numerous other potential risks and uncertainties, including, but not limited to, those set forth under “Risk Factors” in Darling’s Form 10-K filings with the SEC. Investors are cautioned not to rely on the Unaudited Pro Forma Financial Information as a measure of future performance. There can be no assurance that the results indicated in Unaudited Pro Forma Financial Information would have been realized had the Transactions taken place on the dates assumed in the Unaudited Pro Forma Financial Information or that actual results for the combined entity will not be materially different. Pro forma information is inherently reliable and should not be used as the basis for an investment decision. Darling does not undertake to revise or update the Unaudited Pro Forma Financial Information, even if some or all of the assumptions utilized in preparing the information proves to be wrong. ASSUMPTIONS The key assumptions that were used to prepare the Unaudited Pro Forma Financial Information includes, but is not limited to the following: 1. The Unaudited Pro Forma Financial Information is not intended to and in fact does not comply with Regulation S-X Article 3; 2. The Unaudited Pro Forma Financial Information assumes that the acquisitions of Darling Ingredients International and Rothsay occurred on January 1, 2012, and have been presented herein on a combined basis. Thus, the presentation effectively combines the historic financial information (unless as otherwise noted below) of the respective businesses and does not eliminate any net sales and the profit related thereto for any transactions between Darling Ingredients Inc. and Darling Ingredients International (formerly known as VION Ingredients), or Darling Ingredients Inc. and Rothsay for periods prior to the respective acquisition dates; 3. For periods prior to January 7, 2014, the Unaudited Pro Forma Financial Information for Darling Ingredients International is based on the company’s underlying Dutch GAAP financial statements, which have been converted to US GAAP taking into account all known and material Dutch – US GAAP adjustments; 4. For periods prior to January 7, 2014, the Unaudited Pro Forma Financial Information for Darling Ingredients International does not reflect the application of purchase accounting in accordance with ASC 805 and hence, the recognition of Darling Ingredients International’s assets and liabilities assumed at their respective fair values. Thus, there is no non-cash inventory step-up adjustment for any financial period presented that excludes the twelve months ended January 3, 2015; 5. For periods prior to October 28, 2013, the Unaudited Pro Forma Financial Information for Rothsay is based on the Rothsay statement of assets acquired and liabilities assumed and the related statement of net revenues and direct costs and operating expenses, which were prepared under US GAAP; 6. For periods prior to October 28, 2013, the Unaudited Pro Forma Financial Information for Rothsay does not reflect the application of purchase accounting in accordance with ASC 805 and hence, the recognition of Rothsay’s assets and liabilities assumed at their respective fair values. Thus, there is no non-cash inventory step-up adjustment for any financial period presented that excludes the three months ended December 28, 2013; 7. No procedures were performed by management to ensure that the Unaudited Pro Forma Financial Information for Darling Ingredients International or Rothsay for the Fourth Quarter 2013 reflects an appropriate cut-off with respect to sales transactions, expense accruals, payroll, or other similar income statement items that could have an impact on the net sales and Pro Forma Adjusted EBITDA presented herein; 8. Prior to the acquisition by Darling Ingredients Inc. neither Darling Ingredients International Inc. nor Rothsay prepared segment financial information in accordance with segments reflected in the Unaudited Pro Forma Financial Information reflected herein; therefore, the allocation of SG&A costs to the respective segments for periods prior to the respective acquisition were based upon the allocation methodology utilized for Q4 2014; 9. The foreign currency translation rate for net sales and Pro Forma Adjusted EBITDA was based on the average rate for each of the respective periods presented. Cautionary Statement Regarding Unaudited Pro Forma Financial Information |