UNITED STATES
SECURITIES AND EXCHANGE COMMISSION
Washington, D.C. 20549
FORM N-CSR
CERTIFIED SHAREHOLDER REPORT OF REGISTERED
MANAGEMENT INVESTMENT COMPANIES
Investment Company Act file number: 811-08282
Loomis Sayles Funds I
(Exact name of Registrant as specified in charter)
| | |
| 399 Boylston Street, Boston, Massachusetts | | 02116 |
| (Address of principal executive offices) | | (Zip code) |
Coleen Downs Dinneen, Esq.
Natixis Distributors, L.P.
399 Boylston Street
Boston, Massachusetts 02116
(Name and address of agent for service)
Registrant’s telephone number, including area code: (617) 449-2810
Date of fiscal year end: September 30
Date of reporting period: September 30, 2008
Item 1. Reports to Stockholders.
The Registrant’s annual report transmitted to shareholders pursuant to Rule 30e-1 under the Investment Company Act of 1940 is as follows:

Loomis Sayles Mid Cap Growth Fund
Loomis Sayles Small Cap Growth Fund
Loomis Sayles Small Cap Value Fund
ANNUAL REPORT
SEPTEMBER 30, 2008
FUND AND MANAGER REVIEW
Loomis Sayles Mid Cap Growth Fund

Phil Fine, CFA
Manager since February 1999
FUND FACTS
Symbol | Institutional: LSAIX;
Retail: LAGRX
Objective | Long-term capital growth from investments in common stocks or similar securities
Strategy | Invests at least 80% of its net assets (plus any borrowings made for investment purposes) in common stocks or other equity securities (which may include securities offered in the secondary markets or in initial public offerings) of companies with market capitalizations that fall within the capitalization range of the Russell Midcap Growth Index, although the Fund may invest in companies of any size
Fund Inception Date | 12/31/96
Total Net Assets | $146.3 million
PORTFOLIO REVIEW
Strong stock selection and an overweight in the materials and processing sector, coupled with strong selection in the energy sector, were primarily responsible for the Fund’s outperformance relative to its Benchmark, the Russell Midcap Growth Index, for the fiscal year ended September 30, 2008.
Early in 2008, we trimmed the Fund’s exposure to late-cyclical (companies sensitive to the economy late in the cycle) energy, materials and industrial holdings in anticipation of an economic downturn. We also increased the Fund’s weightings in healthcare and consumer discretionary. This proved to be the wrong strategy, so in late March and early April we reversed course and added significantly to our energy and materials exposure, which proved successful. Our concerns about the sustainability of the commodities bubble caused us to partially offset that exposure with holdings in technology, financial companies (asset managers) and discount merchandisers. Late in the period, on signs of a global economic slowdown, we significantly reduced our exposure to late cyclicals and increased the Portfolio’s defensive characteristics by adding to consumer staples and healthcare.
For much of the year, rising demand in emerging markets and a weak US dollar drove commodity prices higher. We had some big winners in coal (Alpha Natural Resources), oil services (Cameron International) and exploration and production (Range Resources, Southwestern Energy). In the materials sector, our biggest winners were in metals (Cleveland-Cliffs) and fertilizer (CF Industries). All of these strong performers were sold except Range Resources.
No sector in the Fund or Benchmark generated positive absolute returns for the period. For the most part, the least negative sectors were the most defensive: healthcare and consumer staples. Technology and financial services represented the largest detractors to absolute performance. The technology sector experienced across-the-board weakness stemming from earnings disappointments and/
or lowered guidance, combined with compression in the P/E multiple among high P/E stocks. In financial services, we had minimal exposure to banks, but experienced losses in companies exposed to the capital markets.
OUTLOOK
The equity and credit markets are facing unprecedented challenges. The freezing of liquidity and credit quality and the failure or near-failure of several financial institutions in the United States and Europe created a crisis of confidence not seen in decades. The Federal Reserve Board, US Treasury, Congress and governments worldwide recognize what must be accomplished and are working to restore liquidity and confidence. Furthermore, large equity infusions from private investors are beginning to appear.
With the recent sell-off, the market may have discounted expectations for slower economic growth and lower earnings, and the ingredients for a market bottom seem to be falling into place. We believe negative news on consumer spending, home prices and unemployment is likely to continue, but the market is forward-looking and we think it will begin to discount a brighter future well before there are any concrete signs of improvement.
1
AVERAGE ANNUAL TOTAL RETURNS
Periods Ended September 30, 2008
| | | | | | | | | | |
| 1 Year | | | 5 Years | | | 10 Years | | | Since
Inception | |
| Loomis Sayles Mid Cap Growth: Institutional | |
| -21.12 | % | | 9.88 | % | | 8.64 | % | | 8.36 | % |
| Loomis Sayles Mid Cap Growth: Retail | |
| -21.27 | | | 9.61 | | | 8.35 | | | 8.08 | |
| Russell Midcap Growth Index(c) | |
| -24.65 | | | 6.53 | | | 5.51 | | | 5.86 | |
| Lipper Mid-Cap Growth Funds Index(c) | |
| -24.16 | | | 7.23 | | | 6.01 | | | 5.07 | |
| | | | | | | | |
| Gross expense ratio (before reductions and reimbursements)* |
| Institutional: 1.10% | | Retail: 1.43% | | |
| Net expense ratio (after reductions and reimbursements)* |
| Institutional: 1.00% | | Retail: 1.25% | | |
* As stated in the most recent prospectus
CUMULATIVE PERFORMANCE
Inception to September 30, 2008(a)(b)
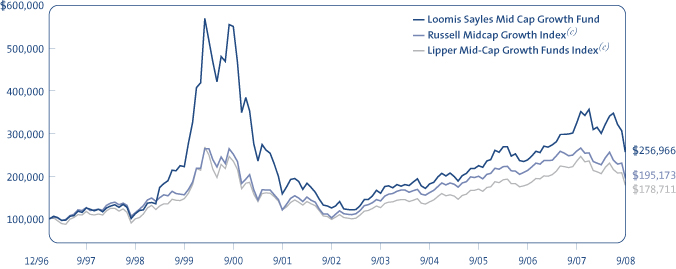
Data quoted reflects past performance and cannot guarantee future results. Average annual total returns assume reinvestment of dividends and capital gain distributions. Investment return and principal value will fluctuate so that shares, when redeemed, may be worth more or less than their original cost. For performance current to the most recent month end, please visit the Loomis Sayles website. Current performance may be higher or lower than quoted.
Returns do not reflect the taxes that a shareholder would pay on fund distributions or the redemption of shares. Periods of less than one year are not annualized. Performance data reflects certain fee reductions and reimbursements, if any, without which performance would be lower.
(a) Cumulative performance is shown for the Institutional Class of Shares. Performance of the Retail Class would be lower due to higher fees. (b) The mountain chart is based on the initial investment minimum of $100,000 for the Institutional Class. (c) See page 7 for a description of the Indices.
WHAT YOU SHOULD KNOW
Small- and mid-cap stocks may be more volatile than larger, more established companies. The secondary market for these stocks may be less liquid, which could adversely impact the Fund’s value. Growth funds involve increased risks, in part, because the value of the underlying securities is based on future expectations that may or may not be met.
The Fund can invest a significant percentage of assets in foreign securities and the value of the fund shares can be adversely affected by changes in currency exchange rates, political, and economic developments. In emerging markets these risks can be significant. The Fund is subject to currency risk, which is the risk that fluctuations in exchange rates between the US dollar and foreign currencies may cause the value of a Fund’s investments to decline. Fund shares should be viewed as a long-term investment.
2
FUND AND MANAGER REVIEW
Loomis Sayles Small Cap Growth Fund

Mark F. Burns, CFA
Manager since January 2005

John Slavik, CFA
Manager since April 2005
FUND FACTS
Symbol | Institutional: LSSIX;
Retail: LCGRX
Objective | Long-term capital growth from investments in common stocks or other equity securities
Strategy | Invests at least 80% of its net assets (plus any borrowings made for investment purposes) in equity securities of companies with market capitalizations that fall within the capitalization range of the Russell 2000 Index. Unlike the Index, the Fund may invest in companies of any size
Fund Inception Date | 12/31/96
Total Net Assets | $124.4 million
PORTFOLIO REVIEW
The Fund slightly underperformed its Benchmark, the Russell 2000 Growth Index, for the fiscal year ended September 30, 2008, primarily due to stock selection in the energy and financial services sectors. The stocks we selected in technology and utilities performed well for the Fund, but not enough to offset poor performance in energy and financial services.
In light of high market volatility, we sought to limit
the Fund’s risk by reducing exposure to the technology, financial services and consumer discretionary sectors. In technology, we trimmed semiconductors, an industry that was experiencing a cyclical slowdown. In financial services, we exited companies exposed to the ongoing credit crisis, and as economic growth prospects dwindled, we reduced the Fund’s consumer discretionary weighting.
On an absolute basis, technology was the largest detractor, followed by consumer discretionary, financial services and energy. Within the financial services sector, Aircastle, an airline leasing company, and National Financial Partners, a financial planning company, experienced earnings shortfalls and both were sold early in the period. The Fund’s position in eHealth declined even though the company’s results met expectations. Investors were hoping for better performance from this internet-based health insurance company. We sold the stock in July. In the energy sector, declining global commodity markets put pricing pressure on many companies, including Mitcham Industries, a seismic equipment leasing company, and Exterran Holdings, which provides oil and gas production and processing facilities worldwide. We sold the stock late in the period.
The only sector that made a positive contribution to absolute performance was consumer staples. Within the sector our selections included bakery company Flowers Foods, which was one of the top-performing stocks during the period, due to strong revenue and earnings growth and its sound expansion strategy. Our position in Petrohawk Energy Corp., an oil and gas exploration and production company, was the Fund’s best-performing stock. Shares spiked after reporting positive natural gas output from a new well and we sold the stock.
OUTLOOK
The equity and credit markets are facing unprecedented challenges. The freezing of liquidity and credit quality and the failure or near-failure of several financial institutions in the United States and Europe created a crisis of confidence not seen in decades. The Federal Reserve Board, US Treasury, Congress and governments worldwide recognize what must be accomplished and are working to restore liquidity and confidence. Furthermore, large equity infusions from private investors are beginning to appear.
3
With the recent sell-off, the market may have discounted expectations for slower economic growth and lower earnings, and the ingredients for a market bottom seem to be falling into place. We believe negative news on consumer spending, home prices and unemployment is likely to continue, but the market is forward-looking and we think it will begin to discount a brighter future well before there are any concrete signs of improvement.
AVERAGE ANNUAL TOTAL RETURNS
Periods ended September 30, 2008
| | | | | | | | | | |
| 1 Year | | | 5 Years | | | 10 Years | | | Since
Inception | |
| Loomis Sayles Small Cap Growth: Institutional | |
| -17.64 | % | | 8.76 | % | | 3.53 | % | | 3.32 | % |
| Loomis Sayles Small Cap Growth: Retail | |
| -17.86 | | | 8.47 | | | 3.27 | | | 3.06 | |
| Russell 2000 Growth Index(c) | |
| -17.07 | | | 6.64 | | | 4.67 | | | 3.27 | |
| Russell 2000 Index(c) | |
| -14.48 | | | 8.15 | | | 7.81 | | | 6.83 | |
| Lipper Small-Cap Growth Funds Index(c) | |
| -23.85 | | | 4.42 | | | 6.32 | | | 4.49 | |
| Gross expense ratio (before reductions and reimbursements)* | |
| Institutional: 1.23% | | | Retail: 1.50% | |
| Net expense ratio (after reductions and reimbursements)* | |
| Institutional: 1.00% | | | Retail: 1.25% | |
* As stated in the most recent prospectus
CUMULATIVE PERFORMANCE
Inception to September 30, 2008(a)(b)
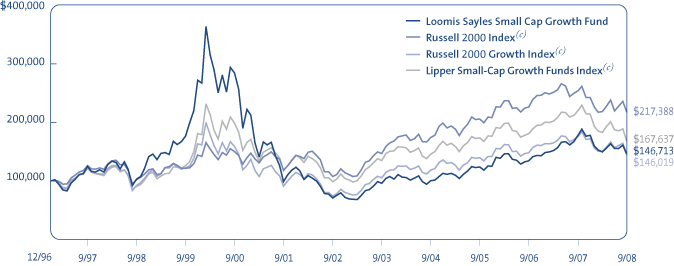
Data quoted reflects past performance and cannot guarantee future results. Average annual total returns assume reinvestment of dividends and capital gains distributions. Investment return and principal value will fluctuate so that shares, when redeemed, may be worth more or less than their original cost. For performance current to the most recent month end, please visit the Loomis Sayles website. Current performance may be higher or lower than quoted.
Returns do not reflect the taxes that a shareholder would pay on fund distributions or the redemption of shares. Periods of less than one year are not annualized. Performance data reflects certain fee reductions and reimbursements, if any, without which performance would be lower.
(a) Cumulative performance is shown for the Institutional Class of Shares. Performance of the Retail Class would be lower due to higher fees. (b) The mountain chart is based on the initial investment minimum of $100,000 for the Institutional Class. (c) See page 7 for a description of the Indices.
WHAT YOU SHOULD KNOW
Small- and mid-cap stocks may be more volatile than larger, more established companies. The secondary market for these stocks may be less liquid, which could adversely impact the Fund’s value. Growth funds involve increased risks, in part, because the value of the underlying securities is based on future expectations that may or may not be met.
The Fund can invest a significant percentage of assets in foreign securities and the value of the fund shares can be adversely affected by changes in currency exchange rates, political, and economic developments. In emerging markets these risks can be significant. The Fund is subject to currency risk, which is the risk that fluctuations in exchange rates between the US dollar and foreign currencies may cause the value of a Fund’s investments to decline. Fund shares should be viewed as a long-term investment.
4
FUND AND MANAGER REVIEW
Loomis Sayles Small Cap Value Fund

Joseph Gatz, CFA
Manager since January 2000

Daniel Thelen, CFA
Manager since April 2000
FUND FACTS
Symbol | Institutional: LSSCX;
Retail: LSCRX; Admin: LSVAX
Objective | Long-term capital growth from investments in common stocks or other equity securities
Strategy | Invests at least 80% of its net assets (plus any borrowings made for investment purposes) in equity securities of companies with market capitalizations that fall within the capitalization range of the Russell 2000 Index. Unlike the Index, the Fund may invest in companies of any size
Fund Inception Date | 5/13/91
Class Inception Date | Institutional: 5/13/91
Retail: 12/31/96
Admin: 1/2/98
Total Net Assets | $1,095.6 million
PORTFOLIO REVIEW
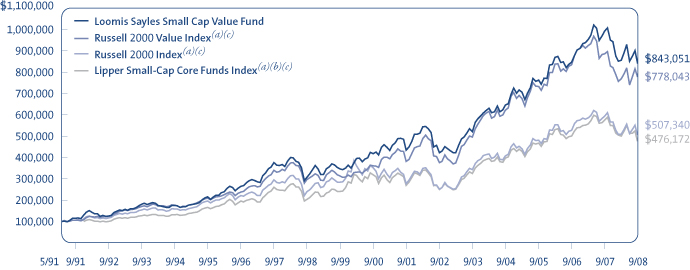
The Fund underperformed its Benchmark, the Russell 2000 Value Index, for the fiscal year ended September 30, 2008, primarily due to stock selection in the energy and financial services sectors.
Our weakest sector during the fiscal year was financial services, which represented the most heavily weighted sector within the Benchmark and which declined over 17% during the period. Weakness in financial services was driven by continued deterioration in credit trends within the banking industry and highly risk-averse behavior on the part of lenders, which resulted in a lack of liquidity throughout the credit markets. In addition, certain financial services holdings disappointed from a fundamental perspective. National Financial Partners, a distributor of financial services products to small- and medium-sized businesses and individuals, reported a shortfall to organic growth and was eliminated from the Portfolio in March 2008. Advanta Corp., a provider of credit cards and related products to small- and medium-sized businesses, sold off sharply on concerns over increasing losses as a result of deteriorating credit trends throughout the US economy. We shared those concerns and exited our position during the fourth quarter of 2007.
Consumer discretionary stocks were also weak during the period, as housing prices fell, employment trends worsened and food and gasoline prices moved higher. While our consumer stocks declined during the period, our strategy of seeking out company-specific catalysts resulted in favorable stock selection, which offset some of the impact of sector weakness. These negative trends were also partially offset by timely additions to “early-cycle” transportation stocks, such as Ryder System, Inc. and Hub Group, Inc. late in 2007, as well as an increase in the Fund’s healthcare weighting. Healthcare proved resilient from overall market weakness. The Fund’s two best- performing healthcare holdings were Perrigo Co., a manufacturer of store-brand, over-the-counter pharmaceuticals; and Atlanta-based Sciele Pharma, a branded pharmaceutical company that was acquired by a Japanese drug manufacturer at a substantial premium. The Fund’s top performers in consumer staples included Ralcorp Holdings, a private label cereal manufacturer; and Spartan Stores, a Midwestern grocery and food distribution chain.
As US and global economic growth prospects deteriorated throughout the period, we adopted a somewhat more defensive posture for the Fund, increasing its weighting in healthcare and reducing positions in producer durables and technology. We also increased the Fund’s weighting in consumer discretionary stocks; this sector has often been early in discounting economic recoveries.
OUTLOOK
In these volatile markets—with fundamental challenges in the banking industry, capital markets and the global economy—the importance of a steady, time-tested investment strategy has never been greater. While in recent months the markets have seemed to act irrationally at times, our team is committed to understanding risks and unearthing opportunities in the current market while balancing capital preservation and long term capital gain
5
prospects. Our approach continues to emphasize bottom-up stock selection to drive performance, as opposed to sector rotation or asset allocation. Our focus remains on what appear to be fundamentally sound, small companies with valuations that we believe do not reflect fair value of the enterprise. In selecting stocks for the Fund, we look for companies with strong market niches, solid cash flow, balance sheet support, attractive valuations and a catalyst for improvement. Although we think economic news is likely to remain difficult for some time, stock prices are a discounting mechanism, and at some point we believe they will begin to anticipate restoration of stability in the capital markets and a resumption of economic growth. In the meantime, we will rely on our strategy to guide us through and we look forward to better markets ahead.
AVERAGE ANNUAL TOTAL RETURNS
Periods ended September 30, 2008
| | | | | | | | |
| 1 Year | | | 5 Years | | | 10 Years | | Since
Inception(a)(b) |
| Loomis Sayles Small Cap Value: Institutional |
| -15.02 | % | | 10.07 | % | | 10.63% | | 13.05% |
| Loomis Sayles Small Cap Value: Retail(a) |
| -15.21 | | | 9.79 | | | 10.35 | | 12.85 |
| Loomis Sayles Small Cap Value: Admin(a) |
| -15.44 | | | 9.51 | | | 10.06 | | 12.50 |
| Russell 2000 Value Index(c) |
| -12.25 | | | 9.45 | | | 10.14 | | 12.50 |
Russell 2000 Index(c)
|
| -14.48 | | | 8.15 | | | 7.81 | | 9.77 |
| Lipper Small-Cap Core Funds Index(b)(c) |
| -17.21 | | | 7.94 | | | 8.85 | | N/A |
| | | | | | | | |
| Gross expense ratio (before reductions and reimbursements)* |
| Institutional: 0.89% | | Retail: 1.24% | | Admin: 1.57% |
| Net expense ratio (after reductions and reimbursements)* |
| Institutional: 0.89% | | Retail: 1.16% | | Admin: 1.41% |
* As stated in the most recent prospectus
CUMULATIVE PERFORMANCE
Inception to September 30, 2008(d)(e)
Data quoted reflects past performance and cannot guarantee future results. Average annual total returns assume reinvestment of dividends and capital gains distributions. Investment return and principal value will fluctuate so that shares, when redeemed, may be worth more or less than their original cost. For performance current to the most recent month end, please visit the Loomis Sayles website. Current performance may be higher or lower than quoted.
Returns do not reflect the taxes that a shareholder would pay on fund distributions or the redemption of shares. Periods of less than one year are not annualized. Performance data reflects certain fee reductions and reimbursements, if any, without which performance would be lower.
(a) Performance shown for periods prior to the inception date of the Retail Class (12/31/96) and Admin Class (1/02/98) represents the performance of the Institutional Class of shares during the periods shown, adjusted to reflect current levels of 12b-1 fees payable by the respective Classes. Since index performance data is not available coincident with the Fund’s inception date, the beginning value of the index is the value as of the month end closest to the Fund’s inception date. (b) The Lipper Small-Cap Core Funds Index performance data is not available prior to January 1, 1992. (c) See page 7 for a description of the Indices. (d) Cumulative performance is shown for the Institutional Class of Shares. Performance of the Retail and Admin Classes would be lower due to higher fees and expenses. (e) The mountain chart is based on the initial investment minimum of $100,000 for the Institutional Class.
WHAT YOU SHOULD KNOW
Value stocks may fall out of favor with investors and underperform the overall equity market during any given period. Small- and mid-cap stocks may be more volatile than larger, more established companies. The secondary market for these stocks may be less liquid, which could adversely impact the Fund’s value. Foreign investments involve special risks, including greater economic, political and currency fluctuation risks, which may be even greater in emerging markets. Foreign countries may have different accounting standards than US standards.
The Fund can invest a significant percentage of assets in foreign securities and the value of the fund shares can be adversely affected by changes in currency exchange rates, political, and economic developments. In emerging markets these risks can be significant. The Fund is subject to currency risk, which is the risk that fluctuations in exchange rates between the US dollar and foreign currencies may cause the value of a Fund’s investments to decline. Fund shares should be viewed as a long-term investment.
6
ADDITIONAL INFORMATION
Index Definitions
Indexes are unmanaged and do not have expenses that affect results, unlike mutual funds. Index returns are adjusted for the reinvestment of capital gain distributions and income dividends. It is not possible to invest directly in an index.
Lipper Mid-Cap Growth Funds Index is an equally weighted index of typically the 30 largest mutual funds within the mid-cap growth funds investment objective.
Lipper Small-Cap Core Funds Index is an equally weighted index of typically the 30 largest mutual funds within the small-cap core funds investment objective.
Lipper Small-Cap Growth Funds Index is an equally weighted index of typically the 30 largest mutual funds within the small-cap growth funds investment objective.
Source: Lipper, Inc.
Russell Midcap Growth Index is a market capitalization weighted index of medium capitalization stocks determined by Russell to be growth stocks as measured by their price-to-book ratios and forecasted growth values. The stocks are also members of the Russell 1000 Growth Index.
Russell 2000 Growth Index is an index comprised of those Russell 2000 companies with higher price-to-book ratios and higher forecasted growth values.
Russell 2000 Index is an index comprised of the 2,000 smallest companies in the Russell 3000 Index (a broad market index), representing approximately 8% of the Russell 3000 total market capitalization.
Russell 2000 Value Index is an index comprised of those Russell 2000 companies with lower price-to-book ratios and lower forecasted growth values.
After-Tax Returns
After-tax returns are calculated using the historical highest individual federal marginal income tax rates and do not reflect the impact of state and local taxes. Actual after-tax returns depend on an investor’s tax situation and may differ from those shown. After-tax returns shown are not relevant to investors who hold their shares through tax-deferred arrangements, such as 401(k) plans, qualified plans, education savings accounts or individual retirement accounts. Under certain circumstances, the addition of the tax benefits from capital losses resulting from redemptions may cause the return after taxes on distributions and sale of fund shares to be greater than the return after taxes on distributions or even the return before taxes.
Proxy Voting Information
A description of the Funds’ proxy voting policies and procedures is available without charge, upon request, (i) by calling Loomis Sayles at 800-633-3330; (ii) on the Funds’ website, www.loomissayles.com, and (iii) on the SEC’s website, www.sec.gov. Information about how the Funds voted proxies relating to portfolio securities during the 12 months ended June 30, 2008 is available on (i) the Funds’ website and (ii) the SEC’s website.
Quarterly Portfolio Schedules
The Funds file a complete schedule of portfolio holdings with the SEC for the first and third quarters of each fiscal year on Form N-Q. The Funds’ Forms N-Q are available on the SEC’s website at www.sec.gov and may be reviewed and copied at the SEC’s Public Reference Room in Washington, DC. Information on the operation of the Public Reference Room may be obtained by calling 800-SEC-0330.
UNDERSTANDING YOUR FUND’S EXPENSES
As a mutual fund shareholder you incur two types of costs: (1) transaction costs, including redemption fees and certain exchange fees; and (2) ongoing costs, including management fees, distribution and/or service fees (12b-1 fees), and other Fund expenses. These costs are described in more detail in the Funds’ prospectus. The examples below are intended to help you understand the ongoing costs of investing in the Funds and help you compare these with the ongoing costs of investing in other mutual funds.
The first line in the table of each Fund shows the actual amount of Fund expenses you would have paid on a $1,000 investment in the Fund from April 1, 2008 through September 30, 2008. It also shows how much a $1,000 investment would be worth at the close of the period, assuming actual fund returns and expenses. To estimate the expenses you paid over the period, simply divide your account value by $1,000 (for example $8,600 account value divided by $1,000 = 8.6) and multiply the result by the number in the Expenses Paid During the Period column as shown below for your class.
The second line in the table of each Fund provides information about hypothetical account values and hypothetical expenses based on the Fund’s actual expense ratios and an assumed rate of return of 5% per year before expenses, which is not the Fund’s actual return. The hypothetical account values and expenses may not be used to estimate the actual ending account balance or expenses you paid on your investment for the period. You may use this information to compare the ongoing costs of investing in the Funds and other funds. To do so, compare this 5% hypothetical example with the 5% hypothetical examples that appear in the shareholder reports of other funds.
7
Please note that the expenses shown reflect ongoing costs only, and do not include any transaction costs. Therefore, the second line in the table is useful in comparing ongoing costs only, and will not help you determine the relative costs of owning different funds. If transaction costs were included, total costs would be higher.
Loomis Sayles Mid Cap Growth Fund
| | | | | | |
| Institutional Class | | Beginning
Account Value
4/1/2008 | | Ending
Account Value
9/30/2008 | | Expenses Paid
During Period*
4/1/2008 – 9/30/2008 |
Actual | | $1,000.00 | | $ 855.00 | | $4.64 |
Hypothetical (5% return before expenses) | | $1,000.00 | | $1,020.00 | | $5.05 |
| | | |
Retail Class | | | | | | |
Actual | | $1,000.00 | | $ 854.40 | | $5.80 |
Hypothetical (5% return before expenses) | | $1,000.00 | | $1,018.75 | | $6.31 |
* Expenses are equal to the Fund’s annualized expense ratio (after fee reduction/reimbursement): 1.00% and 1.25% for the Institutional and Retail Class, respectively, multiplied by the average account value over the period, multiplied by the number of days in the most recent fiscal half-year, divided by 366 (to reflect the half-year period). |
Loomis Sayles Small Cap Growth Fund
| | | | | | |
| Institutional Class | | Beginning
Account Value
4/1/2008 | | Ending
Account Value
9/30/2008 | | Expenses Paid
During Period*
4/1/2008 – 9/30/2008 |
Actual | | $1,000.00 | | $ 977.60 | | $4.94 |
Hypothetical (5% return before expenses) | | $1,000.00 | | $1,020.00 | | $5.05 |
| | | |
Retail Class | | | | | | |
Actual | | $1,000.00 | | $ 976.20 | | $6.18 |
Hypothetical (5% return before expenses) | | $1,000.00 | | $1,018.75 | | $6.31 |
* Expenses are equal to the Fund’s annualized expense ratio (after advisory reduction/reimbursement): 1.00% and 1.25% for Institutional and Retail Class, respectively, multiplied by the average account value over the period, multiplied by the number of days in the most recent fiscal half-year, divided by 366 (to reflect the half-year period). |
Loomis Sayles Small Cap Value Fund
| | | | | | |
Institutional Class | | Beginning
Account Value
4/1/2008 | | Ending
Account Value
9/30/2008 | | Expenses Paid
During Period*
4/1/2008 – 9/30/2008 |
Actual | | $1,000.00 | | $ 985.20 | | $4.52 |
Hypothetical (5% return before expenses) | | $1,000.00 | | $1,020.45 | | $4.60 |
| | | |
Retail Class | | | | | | |
Actual | | $1,000.00 | | $ 984.20 | | $5.70 |
Hypothetical (5% return before expenses) | | $1,000.00 | | $1,019.25 | | $5.81 |
| | | |
Admin Class | | | | | | |
Actual | | $1,000.00 | | $ 983.00 | | $6.94 |
Hypothetical (5% return before expenses) | | $1,000.00 | | $1,018.00 | | $7.06 |
* Expenses are equal to the Fund’s annualized expense ratio (after fee reduction/reimbursement): 0.91%, 1.15% and 1.40% for Institutional, Retail and Admin Class, respectively, multiplied by the average account value over the period, multiplied by the number of days in the most recent fiscal half-year, divided by 366 (to reflect the half-year period). |
8
BOARD APPROVAL OF THE EXISTING ADVISORY AGREEMENTS
The Board of Trustees, including the Independent Trustees, considers matters bearing on each Fund’s advisory agreement (collectively, the “Agreements”) at most of its meetings throughout the year. Each year, usually in the spring, the Contract Review and Governance Committee of the Board meets to review the Agreements to determine whether to recommend that the full Board approve the continuation of the Agreements, typically for an additional one-year period. After the Committee has made its recommendation, the full Board, including the Independent Trustees, determines whether to approve the continuation of the Agreements.
In connection with these meetings, the Trustees receive materials that the Funds’ investment adviser believe to be reasonably necessary for the Trustees to evaluate the Agreements. These materials generally include, among other items, (i) information on the investment performance of the Funds and the performance of peer groups of funds and the Funds’ performance benchmarks, (ii) information on the Funds’ advisory fees, and other expenses, including information comparing the Funds’ expenses to those of peer groups of funds and information about any applicable expense caps and fee “breakpoints,” (iii) sales and redemption data in respect of the Funds, (iv) information about the profitability of the Agreements to the Funds’ adviser (the “Adviser”), and (v) information obtained through the completion of a questionnaire by the Adviser (the Trustees are consulted as to the information requested through that questionnaire). The Board of Trustees, including the Independent Trustees, also consider other matters such as (i) the Adviser’s financial results and financial condition, (ii) each Fund’s investment objective and strategies and the size, education and experience of the Adviser’s respective investment staffs and their use of technology, external research and trading cost measurement tools, (iii) arrangements in respect of the distribution of the Funds’ shares and the related costs, (iv) the procedures employed to determine the value of the Funds’ assets, (v) the allocation of the Funds’ brokerage, if any, including allocations to brokers affiliated with the Adviser and the use of “soft” commission dollars to pay Fund expenses and to pay for research and other similar services, (vi) the resources devoted to, and the record of compliance with, the Funds’ investment policies and restrictions, policies on personal securities transactions and other compliance policies, and (vii) the general economic outlook with particular emphasis on the mutual fund industry. Throughout the process, the Trustees are afforded the opportunity to ask questions of and request additional materials from the Adviser.
In addition to the materials requested by the Trustees in connection with the annual consideration of the continuation of the Agreements, the Trustees receive materials in advance of each regular quarterly meeting of the Board of Trustees that provide detailed information about the Funds’ investment performance and the fees charged to the Funds for advisory and other services. This information generally includes, among other things, an internal performance rating for each Fund based on agreed-upon criteria, graphs showing performance and fee differentials against each Fund’s peer group, performance ratings provided by a third-party, total return information for various periods, and third-party performance rankings for various periods comparing a Fund against its peer group. The portfolio management team for each Fund makes periodic presentations to the Contract Review and Governance Committee and/or the full Board of Trustees, and Funds identified as presenting possible performance concerns may be subject to more frequent board presentations and reviews. In addition, each quarter the Trustees are provided with detailed statistical information about each Fund’s portfolio.
The Board of Trustees most recently approved the continuation of the Agreements at their meeting held in June, 2008. The Agreements were continued for a one-year period for all Funds. In considering whether to approve the continuation of the Agreements, the Board of Trustees, including the Independent Trustees, did not identify any single factor as determinative. Matters considered by the Trustees, including the Independent Trustees, in connection with their approval of the Agreements included the following:
The nature, extent and quality of the services provided to the Funds under the Agreements. The Trustees considered the nature, extent and quality of the services provided by the Adviser and its affiliates to the Funds and the resources dedicated to the Funds by the Adviser and its affiliates, including recent or planned investments by certain of the Adviser in additional personnel or other resources. They also took note of the competitive market for talented personnel, in particular, for personnel who have contributed to the generation of strong investment performance. They considered the need for the Adviser to offer competitive compensation in order to attract and retain capable personnel. They also considered the administrative services provided by Natixis Advisors and its affiliates to the Funds.
For each Fund, the Trustees also considered the benefits to shareholders of investing in a mutual fund that is part of a family of funds that offers shareholders the right to exchange shares of one type of fund for shares of another type of fund, and provides a variety of fund and shareholder services.
After reviewing these and related factors, the Trustees concluded, within the context of their overall conclusions regarding each of the Agreements, that the nature, extent and quality of services provided supported the renewal of the Agreements.
Investment performance of the Funds and the Adviser. As noted above, the Trustees received information about the performance of the Funds over various time periods, including information which compared the performance of the Funds to the performance of peer groups of funds and the Funds’ respective performance benchmarks. In addition, the Trustees also reviewed data prepared by an independent third party which analyzed the performance of the Funds using a variety of performance metrics, including metrics which also measured the performance of the Funds on a risk adjusted basis.
9
With respect to each Fund, the Board concluded that the Fund’s performance or other relevant factors supported the renewal of the Agreement relating to that Fund. In the case of each Fund that had performance that lagged that of a relevant peer group for certain (although not necessarily all) periods, the Board concluded that other factors relevant to performance supported renewal of the Funds’ Agreements. These factors varied from Fund to Fund, including that reductions in the Funds’ expense levels resulting from decreased expenses and/or increased assets were not yet fully reflected in the Funds’ performance results.
The Trustees also considered the Adviser’s performance and reputation generally, the Funds’ performance as a fund family generally (as noted by certain financial publications), and the historical responsiveness of the Adviser to Trustee concerns about performance and the willingness of the Adviser to take steps intended to improve performance.
After reviewing these and related factors, the Trustees concluded, within the context of their overall conclusions regarding each of the Agreements, that the performance of the Funds and the Adviser supported the renewal of the Agreements.
The costs of the services to be provided and profits to be realized by the Adviser and its affiliates from their respective relationships with the Funds. The Trustees considered the fees charged to the Funds for advisory services as well as the total expense levels of the Funds. This information included comparisons (provided both by management and also by an independent third party) of the Funds’ advisory fees and total expense levels to those of their peer groups and information about the advisory fees charged by the Adviser to comparable accounts. In considering the fees charged to comparable accounts, the Trustees considered, among other things, management’s representations about the differences between managing mutual funds as compared to other types of accounts, including the additional resources required to effectively manage mutual fund assets. In evaluating each Funds advisory fees, the Trustees also took into account the demands, complexity and quality of the investment management of such Fund. The Trustees considered that over the past several years, management had made recommendations regarding reductions in advisory fee rates, implementation of advisory fee breakpoints and the institution of advisory fee waivers and expense caps. They noted that all of the Loomis Sayles Funds in this report have expense caps in place, and they considered the amounts waived or reimbursed by the Adviser under these caps.
The Trustees also considered the compensation directly or indirectly received by the Adviser and its affiliates from their relationships with the Funds. The Trustees reviewed information provided by management as to the profitability of the Adviser and its affiliates’ relationships with the Funds, and information about the allocation of expenses used to calculate profitability. They also reviewed information provided by management about the effect of distribution costs and Fund growth on Adviser profitability, including information regarding resources spent on distribution activities and the increase in net sales for the family of funds. When reviewing profitability, the Trustees also considered information about court cases in which adviser profitability was an issue, the performance of the relevant Funds, the expense levels of the Funds, and whether the Adviser had implemented breakpoints and/or expense caps with respect to such Funds.
After reviewing these and related factors, the Trustees concluded, within the context of their overall conclusions regarding each of the Agreements, that the advisory fees charged to each of the Funds were fair and reasonable, and that the costs of these services generally and the related profitability of the Adviser and its affiliates in respect of their relationships with the Funds supported the renewal of the Agreements.
Economies of Scale. The Trustees considered the existence of any economies of scale in the provision of services by the Adviser and whether those economies are shared with the Funds through breakpoints in their investment advisory fees or other means, such as expense waivers. The Trustees noted that each of the Funds was subject to expense caps. In considering these issues, the Trustees also took note of the costs of the services provided (both on an absolute and a relative basis) and the profitability to the Adviser and its affiliates of their relationships with the Funds, as discussed above.
After reviewing these and related factors, the Trustees considered, within the context of their overall conclusions regarding each of the Agreements, that the extent to which economies of scale were shared with the Funds supported the renewal of the Agreements.
The Trustees also considered other factors, which included but were not limited to the following:
| • | | whether each Fund has operated in accordance with its investment objective and the Fund’s record of compliance with its investment restrictions, and the compliance programs of the Funds and the Adviser. They also considered the compliance-related resources the Adviser and its affiliates were providing to the Funds. |
| • | | the nature, quality, cost and extent of administrative and shareholder services performed by the Adviser and its affiliates, both under the Agreements and under separate agreements covering administrative services. |
| • | | so-called “fallout benefits” to the Adviser, such as the engagement of affiliates of the Adviser to provide distribution, administrative and brokerage services to the Funds, and the benefits of research made available to the Adviser by reason of brokerage commissions generated by the Funds’ securities transactions. The Trustees also considered the fact that Natixis Advisors’ parent company benefits from the retention of affiliated Adviser. The Trustees considered the possible conflicts of interest associated with these fallout and other benefits, and the reporting, disclosure and other processes in place to disclose and monitor such possible conflicts of interest. |
Based on their evaluation of all factors that they deemed to be material, including those factors described above, and assisted by the advice of independent counsel, the Trustees, including the Independent Trustees, concluded that each of the existing advisory agreements should be continued through June 30, 2009.
10
PORTFOLIO OF INVESTMENTS – as of September 30, 2008
Loomis Sayles Mid Cap Growth Fund
| | | | | | | |
| | | | | Shares | | Value (†) |
| | | | | | | |
| | | |
| COMMON STOCKS – 93.6% of Net Assets | | | | | | | |
| | | |
| Biotechnology – 4.4% | | | | | | | |
Alexion Pharmaceuticals, Inc.(b)(c) | | | | 45,054 | | $ | 1,770,622 |
Myriad Genetics, Inc.(b)(c) | | | | 41,167 | | | 2,670,915 |
Onyx Pharmaceuticals, Inc.(b)(c) | | | | 54,868 | | | 1,985,124 |
| | | | | | | |
| | | | | | | 6,426,661 |
| | | | | | | |
| Capital Markets – 1.7% | | | | | | | |
T. Rowe Price Group, Inc.(b) | | | | 46,683 | | | 2,507,344 |
| | | | | | | |
| Commercial Banks – 2.0% | | | | | | | |
SVB Financial Group(c) | | | | 51,729 | | | 2,996,144 |
| | | | | | | |
| Commercial Services & Supplies – 5.3% | | | | | | | |
Stericycle, Inc.(c) | | | | 91,839 | | | 5,410,235 |
Waste Connections, Inc.(c) | | | | 67,930 | | | 2,329,999 |
| | | | | | | |
| | | | | | | 7,740,234 |
| | | | | | | |
| Communications Equipment – 1.4% | | | | | | | |
Juniper Networks, Inc.(b)(c) | | | | 98,016 | | | 2,065,197 |
| | | | | | | |
| Diversified Consumer Services – 1.6% | | | | | | | |
New Oriental Education & Technology Group, Inc., Sponsored ADR(c) | | | | 36,348 | | | 2,334,996 |
| | | | | | | |
| Diversified Financial Services – 1.6% | | | | | | | |
Nasdaq OMX Group, Inc. (The)(c) | | | | 74,728 | | | 2,284,435 |
| | | | | | | |
| Electrical Equipment – 1.0% | | | | | | | |
First Solar, Inc.(c) | | | | 7,532 | | | 1,422,870 |
| | | | | | | |
| Electronic Equipment & Instruments – 2.1% | | | | | | | |
Mettler-Toledo International, Inc.(c) | | | | 31,996 | | | 3,135,608 |
| | | | | | | |
| Energy Equipment & Services – 1.5% | | | | | | | |
Core Laboratories N.V.(b) | | | | 21,550 | | | 2,183,446 |
| | | | | | | |
| Food & Staples Retailing – 2.3% | | | | | | | |
BJ’s Wholesale Club, Inc.(b)(c) | | | | 85,505 | | | 3,322,724 |
| | | | | | | |
| Food Products – 1.6% | | | | | | | |
H.J. Heinz Co. | | | | 48,333 | | | 2,415,200 |
| | | | | | | |
| Health Care Equipment & Supplies – 11.9% | | | | | | | |
C.R. Bard, Inc.(b) | | | | 33,288 | | | 3,158,032 |
IDEXX Laboratories, Inc.(b)(c) | | | | 64,257 | | | 3,521,283 |
Intuitive Surgical, Inc.(c) | | | | 10,450 | | | 2,518,241 |
Masimo Corp.(b)(c) | | | | 45,413 | | | 1,689,364 |
NuVasive, Inc.(b)(c) | | | | 62,090 | | | 3,062,900 |
Varian Medical Systems, Inc.(c) | | | | 60,431 | | | 3,452,423 |
| | | | | | | |
| | | | | | | 17,402,243 |
| | | | | | | |
| Hotels, Restaurants & Leisure – 1.0% | | | | | | | |
Yum! Brands, Inc.(b) | | | | 44,822 | | | 1,461,645 |
| | | | | | | |
| Household Products – 1.9% | | | | | | | |
Church & Dwight Co., Inc. | | | | 44,503 | | | 2,763,191 |
| | | | | | | |
| Internet Software & Services – 2.2% | | | | | | | |
Equinix, Inc.(b)(c) | | | | 30,263 | | | 2,102,068 |
Websense, Inc.(c) | | | | 50,877 | | | 1,137,101 |
| | | | | | | |
| | | | | | | 3,239,169 |
| | | | | | | |
11
| | | | | | | |
| | | | | Shares | | Value (†) |
| | | | | | | |
| | | |
| COMMON STOCKS – continued | | | | | | | |
| | | |
| IT Services – 1.5% | | | | | | | |
MasterCard, Inc., Class A(b) | | | | 12,645 | | $ | 2,242,338 |
| | | | | | | |
| Life Sciences Tools & Services – 4.7% | | | | | | | |
Covance, Inc.(c) | | | | 25,555 | | | 2,259,317 |
Illumina, Inc.(c) | | | | 113,026 | | | 4,580,944 |
| | | | | | | |
| | | | | | | 6,840,261 |
| | | | | | | |
| Machinery – 1.9% | | | | | | | |
Wabtec Corp. | | | | 53,511 | | | 2,741,369 |
| | | | | | | |
| Multiline Retail – 3.0% | | | | | | | |
Dollar Tree, Inc.(c) | | | | 122,756 | | | 4,463,408 |
| | | | | | | |
| Oil, Gas & Consumable Fuels – 7.4% | | | | | | | |
Continental Resources, Inc.(b)(c) | | | | 61,970 | | | 2,431,083 |
Petrohawk Energy Corp.(c) | | | | 138,444 | | | 2,994,544 |
Range Resources Corp. | | | | 59,742 | | | 2,561,140 |
Whiting Petroleum Corp.(c) | | | | 39,271 | | | 2,798,451 |
| | | | | | | |
| | | | | | | 10,785,218 |
| | | | | | | |
| Personal Products – 3.5% | | | | | | | |
Alberto-Culver Co. | | | | 94,169 | | | 2,565,164 |
Avon Products, Inc. | | | | 60,962 | | | 2,534,190 |
| | | | | | | |
| | | | | | | 5,099,354 |
| | | | | | | |
| Road & Rail – 4.4% | | | | | | | |
J.B. Hunt Transport Services, Inc. | | | | 67,140 | | | 2,240,462 |
Kansas City Southern(b)(c) | | | | 94,065 | | | 4,172,723 |
| | | | | | | |
| | | | | | | 6,413,185 |
| | | | | | | |
| Software – 7.1% | | | | | | | |
Activision Blizzard, Inc.(c) | | | | 153,845 | | | 2,373,829 |
Ansys, Inc.(c) | | | | 42,013 | | | 1,591,032 |
Concur Technologies, Inc.(b)(c) | | | | 61,943 | | | 2,369,939 |
McAfee, Inc.(b)(c) | | | | 74,693 | | | 2,536,574 |
Solera Holdings, Inc.(c) | | | | 55,348 | | | 1,589,595 |
| | | | | | | |
| | | | | | | 10,460,969 |
| | | | | | | |
| Specialty Retail – 11.7% | | | | | | | |
Advance Auto Parts, Inc. | | | | 62,637 | | | 2,484,184 |
Aeropostale, Inc.(b)(c) | | | | 81,494 | | | 2,616,772 |
Buckle, Inc. (The)(b) | | | | 57,650 | | | 3,201,881 |
Guess?, Inc. | | | | 65,453 | | | 2,277,110 |
Ross Stores, Inc. | | | | 115,995 | | | 4,269,776 |
Urban Outfitters, Inc.(b)(c) | | | | 70,985 | | | 2,262,292 |
| | | | | | | |
| | | | | | | 17,112,015 |
| | | | | | | |
| Thrifts & Mortgage Finance – 1.5% | | | | | | | |
Hudson City Bancorp, Inc. | | | | 120,877 | | | 2,230,181 |
| | | | | | | |
| Trading Companies & Distributors – 1.7% | | | | | | | |
Fastenal Co.(b) | | | | 50,056 | | | 2,472,266 |
| | | | | | | |
| Wireless Telecommunication Services – 1.7% | | | | | | | |
American Tower Corp., Class A(c) | | | | 67,849 | | | 2,440,529 |
| | | | | | | |
| | | |
| TOTAL COMMON STOCKS | | | | | | | |
(Identified Cost $148,324,626) | | | | | | | 137,002,200 |
| | | | | | | |
12
PORTFOLIO OF INVESTMENTS – as of September 30, 2008
Loomis Sayles Mid Cap Growth Fund – continued
| | | | | | | | |
| | | | | Shares/
Principal Amount | | Value (†) |
| | | | | | | | |
| | | |
| SHORT-TERM INVESTMENTS – 21.8% | | | | | | | | |
State Street Navigator Securities Lending Prime Portfolio(d) | | | | | 22,705,247 | | $ | 22,705,247 |
| Tri-Party Repurchase Agreement with Fixed Income Clearing Corporation, dated 9/30/2008 at 1.300% to be repurchased at $9,112,329 on 10/01/2008 collateralized by $9,500,000 Federal Home Loan Bank Discount Notes, Zero Coupon due 7/13/2009 valued at $9,298,125, including accrued interest (Note 2g Notes to Financial Statements) | | | | $ | 9,112,000 | | | 9,112,000 |
| | | | | | | | |
| | | |
| TOTAL SHORT-TERM INVESTMENTS | | | | | | | | |
(Identified Cost $31,817,247) | | | | | | | | 31,817,247 |
| | | | | | | | |
| | | |
| TOTAL INVESTMENTS – 115.4% | | | | | | | | |
(Identified Cost $180,141,873)(a) | | | | | | | | 168,819,447 |
Other assets less liabilities—(15.4)% | | | | | | | | (22,516,104) |
| | | | | | | | |
| | | |
| NET ASSETS – 100.0% | | | | | | | $ | 146,303,343 |
| | | | | | | | |
| | | |
(†) See Note 2a of Notes to Financial Statements. | | | | | | | | |
(a) Federal Tax Information: | | | | | | | | |
At September 30, 2008, the net unrealized depreciation on investments based on a cost of $180,443,243 for federal income tax purposes was as follows: | | | |
Aggregate gross unrealized appreciation for all investments in which there is an excess of value over tax cost | | $ | 1,762,223 |
Aggregate gross unrealized depreciation for all investments in which there is an excess of tax cost over value | | | (13,386,019) |
| | | | | | | | |
Net unrealized depreciation | | | | | | | $ | (11,623,796) |
| | | | | | | | |
| (b) | All or a portion of this security was on loan to brokers at September 30, 2008. |
| (c) | Non-income producing security. |
| (d) | Represents investment of securities lending collateral. |
| ADR | An American Depositary Receipt is a certificate issued by a custodian bank representing the right to receive securities of the foreign issuer described. The values of ADRs are significantly influenced by trading on exchanges not located in the United States. |
NET ASSET SUMMARY AT SEPTEMBER 30, 2008 (Unaudited)
| | | |
Health Care Equipment & Supplies | | 11.9 | % |
Specialty Retail | | 11.7 | |
Oil, Gas & Consumable Fuels | | 7.4 | |
Software | | 7.1 | |
Commercial Services & Supplies | | 5.3 | |
Life Sciences Tools & Services | | 4.7 | |
Biotechnology | | 4.4 | |
Road & Rail | | 4.4 | |
Personal Products | | 3.5 | |
Multiline Retail | | 3.0 | |
Food & Staples Retailing | | 2.3 | |
Internet Software & Services | | 2.2 | |
Electronic Equipment & Instruments | | 2.1 | |
Commercial Banks | | 2.0 | |
Other Investments, less than 2% each | | 21.6 | |
Short-Term Investments | | 21.8 | |
| | | |
Total Investments | | 115.4 | |
Other assets less liabilities | | (15.4 | ) |
| | | |
Net Assets | | 100.0 | % |
| | | |
See accompanying notes to financial statements.
13
PORTFOLIO OF INVESTMENTS – as of September 30, 2008
Loomis Sayles Small Cap Growth Fund
| | | | | | | |
| | | | | Shares | | Value (†) |
| | | | | | | |
| | | |
| COMMON STOCKS – 97.8% of Net Assets | | | | | | | |
| | | |
| Aerospace & Defense – 3.1% | | | | | | | |
Curtiss-Wright Corp.(b) | | | | 29,192 | | $ | 1,326,776 |
Moog, Inc., Class A(b)(c) | | | | 24,085 | | | 1,032,765 |
Orbital Sciences Corp.(c) | | | | 59,926 | | | 1,436,426 |
| | | | | | | |
| | | | | | | 3,795,967 |
| | | | | | | |
| Biotechnology – 2.9% | | | | | | | |
BioMarin Pharmaceutical, Inc.(b)(c) | | | | 32,188 | | | 852,660 |
Isis Pharmaceuticals, Inc.(b)(c) | | | | 51,044 | | | 862,133 |
Rigel Pharmaceuticals, Inc.(b)(c) | | | | 41,462 | | | 968,138 |
United Therapeutics Corp.(b)(c) | | | | 8,992 | | | 945,689 |
| | | | | | | |
| | | | | | | 3,628,620 |
| | | | | | | |
| Capital Markets – 1.1% | | | | | | | |
Stifel Financial Corp.(b)(c) | | | | 27,832 | | | 1,388,817 |
| | | | | | | |
| Commercial Banks – 2.3% | | | | | | | |
PrivateBankcorp, Inc.(b) | | | | 25,892 | | | 1,078,661 |
Signature Bank(c) | | | | 24,523 | | | 855,362 |
Westamerica Bancorporation(b) | | | | 15,272 | | | 878,598 |
| | | | | | | |
| | | | | | | 2,812,621 |
| | | | | | | |
| Commercial Services & Supplies – 9.4% | | | | | | | |
Clean Harbors, Inc.(b)(c) | | | | 23,450 | | | 1,584,047 |
FTI Consulting, Inc.(c) | | | | 22,966 | | | 1,659,064 |
Geo Group, Inc. (The)(b)(c) | | | | 59,324 | | | 1,198,938 |
Hill International, Inc.(c) | | | | 87,150 | | | 1,207,028 |
ICF International, Inc.(b)(c) | | | | 85,065 | | | 1,680,034 |
Innerworkings, Inc.(b)(c) | | | | 100,054 | | | 1,109,599 |
Team, Inc.(b)(c) | | | | 41,082 | | | 1,483,882 |
Waste Connections, Inc.(b)(c) | | | | 52,371 | | | 1,796,325 |
| | | | | | | |
| | | | | | | 11,718,917 |
| | | | | | | |
| Communications Equipment – 2.9% | | | | | | | |
Brocade Communications Systems, Inc.(c) | | | | 124,997 | | | 727,482 |
DG FastChannel, Inc.(b)(c) | | | | 71,034 | | | 1,557,065 |
Foundry Networks, Inc.(c) | | | | 75,722 | | | 1,378,898 |
| | | | | | | |
| | | | | | | 3,663,445 |
| | | | | | | |
| Construction & Engineering – 1.9% | | | | | | | |
MasTec, Inc.(c) | | | | 66,152 | | | 879,160 |
Northwest Pipe Co.(b)(c) | | | | 34,867 | | | 1,520,899 |
| | | | | | | |
| | | | | | | 2,400,059 |
| | | | | | | |
| Diversified Consumer Services – 2.8% | | | | | | | |
American Public Education, Inc.(b)(c) | | | | 25,112 | | | 1,212,407 |
Capella Education Co.(b)(c) | | | | 19,845 | | | 850,557 |
DeVry, Inc. | | | | 28,257 | | | 1,399,852 |
| | | | | | | |
| | | | | | | 3,462,816 |
| | | | | | | |
| Diversified Financial Services – 0.6% | | | | | | | |
Heckmann Corp.(b)(c) | | | | 90,457 | | | 746,270 |
| | | | | | | |
| Diversified Telecommunication Services – 1.3% | | | | | | | |
NTELOS Holdings Corp. | | | | 58,662 | | | 1,577,421 |
| | | | | | | |
| Electric Utilities – 1.1% | | | | | | | |
ITC Holdings Corp. | | | | 27,151 | | | 1,405,607 |
| | | | | | | |
14
PORTFOLIO OF INVESTMENTS – as of September 30, 2008
Loomis Sayles Small Cap Growth Fund – continued
| | | | | | | |
| | | | | Shares | | Value (†) |
| | | | | | | |
| | | |
| COMMON STOCKS – continued | | | | | | | |
| | | |
| Electrical Equipment – 1.6% | | | | | | | |
Energy Conversion Devices, Inc.(c) | | | | 13,093 | | $ | 762,667 |
Woodward Governor Co.(b) | | | | 35,899 | | | 1,266,158 |
| | | | | | | |
| | | | | | | 2,028,825 |
| | | | | | | |
| Electronic Equipment & Instruments – 1.2% | | | | | | | |
IPG Photonics Corp.(b)(c) | | | | 78,253 | | | 1,526,716 |
| | | | | | | |
| Energy Equipment & Services – 3.4% | | | | | | | |
Hornbeck Offshore Services, Inc.(b)(c) | | | | 28,596 | | | 1,104,377 |
IHS, Inc., Class A(b)(c) | | | | 24,896 | | | 1,186,045 |
Mitcham Industries, Inc.(b)(c) | | | | 35,907 | | | 362,302 |
T-3 Energy Services, Inc.(c) | | | | 21,071 | | | 782,156 |
Tesco Corp.(b)(c) | | | | 39,251 | | | 821,916 |
| | | | | | | |
| | | | | | | 4,256,796 |
| | | | | | | |
| Food Products – 2.1% | | | | | | | |
Flowers Foods, Inc.(b) | | | | 47,230 | | | 1,386,673 |
Green Mountain Coffee Roasters, Inc.(b)(c) | | | | 29,861 | | | 1,174,732 |
| | | | | | | |
| | | | | | | 2,561,405 |
| | | | | | | |
| Health Care Equipment & Supplies – 6.7% | | | | | | | |
Insulet Corp.(b)(c) | | | | 60,793 | | | 846,238 |
Masimo Corp.(b)(c) | | | | 34,247 | | | 1,273,988 |
Natus Medical, Inc.(b)(c) | | | | 67,580 | | | 1,531,363 |
NuVasive, Inc.(b)(c) | | | | 22,592 | | | 1,114,463 |
Quidel Corp.(c) | | | | 63,682 | | | 1,045,022 |
RTI Biologics, Inc.(b)(c) | | | | 133,599 | | | 1,249,151 |
SonoSite, Inc.(c) | | | | 39,087 | | | 1,227,332 |
| | | | | | | |
| | | | | | | 8,287,557 |
| | | | | | | |
| Health Care Providers & Services – 7.7% | | | | | | | |
athenahealth, Inc.(c) | | | | 31,690 | | | 1,054,326 |
Bio-Reference Labs, Inc.(c) | | | | 47,342 | | | 1,368,184 |
CardioNet, Inc.(b)(c) | | | | 49,577 | | | 1,237,442 |
Catalyst Health Solutions, Inc.(c) | | | | 46,263 | | | 1,208,390 |
Gentiva Health Services, Inc.(c) | | | | 35,900 | | | 967,146 |
MWI Veterinary Supply, Inc.(b)(c) | | | | 35,180 | | | 1,382,222 |
Psychiatric Solutions, Inc.(b)(c) | | | | 28,788 | | | 1,092,505 |
Sun Healthcare Group, Inc.(c) | | | | 89,538 | | | 1,312,627 |
| | | | | | | |
| | | | | | | 9,622,842 |
| | | | | | | |
| Health Care Technology – 1.4% | | | | | | | |
Phase Forward, Inc.(b)(c) | | | | 81,879 | | | 1,712,090 |
| | | | | | | |
| Hotels, Restaurants & Leisure – 1.7% | | | | | | | |
Buffalo Wild Wings, Inc.(b)(c) | | | | 26,362 | | | 1,060,807 |
Panera Bread Co., Class A(b)(c) | | | | 19,753 | | | 1,005,428 |
| | | | | | | |
| | | | | | | 2,066,235 |
| | | | | | | |
| Insurance – 1.4% | | | | | | | |
AmTrust Financial Services, Inc.(b) | | | | 69,064 | | | 938,580 |
Arch Capital Group Ltd.(c) | | | | 11,714 | | | 855,473 |
| | | | | | | |
| | | | | | | 1,794,053 |
| | | | | | | |
| Internet Software & Services – 6.2% | | | | | | | |
Ariba, Inc.(b)(c) | | | | 141,661 | | | 2,001,670 |
Constant Contact, Inc.(b)(c) | | | | 70,291 | | | 1,199,867 |
SkillSoft PLC, ADR(c) | | | | 142,582 | | | 1,491,408 |
15
| | | | | | | |
| | | | | Shares | | Value (†) |
| | | | | | | |
| | | |
| COMMON STOCKS – continued | | | | | | | |
| | | |
| Internet Software & Services – continued | | | | | | | |
VistaPrint Ltd.(b)(c) | | | | 43,782 | | $ | 1,437,801 |
Vocus, Inc.(b)(c) | | | | 45,814 | | | 1,555,843 |
| | | | | | | |
| | | | | | | 7,686,589 |
| | | | | | | |
| IT Services – 0.8% | | | | | | | |
Syntel, Inc.(b) | | | | 42,244 | | | 1,034,978 |
| | | | | | | |
| Life Sciences Tools & Services – 3.3% | | | | | | | |
Icon PLC, Sponsored ADR(c) | | | | 35,804 | | | 1,369,503 |
Luminex Corp.(b)(c) | | | | 51,643 | | | 1,291,592 |
Parexel International Corp.(c) | | | | 50,329 | | | 1,442,429 |
| | | | | | | |
| | | | | | | 4,103,524 |
| | | | | | | |
| Machinery – 3.6% | | | | | | | |
Energy Recovery, Inc.(b)(c) | | | | 87,240 | | | 836,631 |
ESCO Technologies, Inc.(c) | | | | 15,845 | | | 763,254 |
Freightcar America, Inc.(b) | | | | 34,006 | | | 995,356 |
Kaydon Corp.(b) | | | | 24,666 | | | 1,111,450 |
Valmont Industries, Inc.(b) | | | | 9,128 | | | 754,794 |
| | | | | | | |
| | | | | | | 4,461,485 |
| | | | | | | |
| Media – 2.5% | | | | | | | |
Knology, Inc.(b)(c) | | | | 97,319 | | | 785,364 |
Morningstar, Inc.(b)(c) | | | | 21,559 | | | 1,195,878 |
RHI Entertainment, Inc.(c) | | | | 75,427 | | | 1,123,862 |
| | | | | | | |
| | | | | | | 3,105,104 |
| | | | | | | |
| Oil, Gas & Consumable Fuels – 4.2% | | | | | | | |
Arena Resources, Inc.(b)(c) | | | | 27,359 | | | 1,062,897 |
Comstock Resources, Inc.(c) | | | | 11,633 | | | 582,232 |
Foundation Coal Holdings, Inc. | | | | 22,281 | | | 792,758 |
Goodrich Petroleum Corp.(c) | | | | 21,730 | | | 947,211 |
Petroleum Development Corp.(b)(c) | | | | 19,088 | | | 846,934 |
Rex Energy Corp.(b)(c) | | | | 65,658 | | | 1,034,770 |
| | | | | | | |
| | | | | | | 5,266,802 |
| | | | | | | |
| Pharmaceuticals – 2.6% | | | | | | | |
Alpharma, Inc., Class A(b)(c) | | | | 19,081 | | | 703,898 |
Auxilium Pharmaceuticals, Inc.(c) | | | | 21,897 | | | 709,463 |
Eurand NV(b)(c) | | | | 51,836 | | | 941,342 |
Viropharma, Inc.(b)(c) | | | | 63,304 | | | 830,548 |
| | | | | | | |
| | | | | | | 3,185,251 |
| | | | | | | |
| REITs – 1.0% | | | | | | | |
BioMed Realty Trust, Inc. | | | | 45,409 | | | 1,201,068 |
| | | | | | | |
| Road & Rail – 0.9% | | | | | | | |
Kansas City Southern(b)(c) | | | | 24,446 | | | 1,084,425 |
| | | | | | | |
| Semiconductors & Semiconductor Equipment – 2.5% | | | | | | | |
Cavium Network, Inc.(b)(c) | | | | 64,411 | | | 906,907 |
Netlogic Microsystems, Inc.(b)(c) | | | | 43,302 | | | 1,309,452 |
Varian Semiconductor Equipment Associates, Inc.(b)(c) | | | | 36,434 | | | 915,222 |
| | | | | | | |
| | | | | | | 3,131,581 |
| | | | | | | |
| Software – 7.8% | | | | | | | |
Advent Software, Inc.(b)(c) | | | | 32,973 | | | 1,161,639 |
Blackbaud, Inc. | | | | 49,142 | | | 906,670 |
16
PORTFOLIO OF INVESTMENTS – as of September 30, 2008
Loomis Sayles Small Cap Growth Fund – continued
| | | | | | | | |
| | | | | Shares | | Value (†) |
| | | | | | | | |
| | | |
| COMMON STOCKS – continued | | | | | | | | |
| | | |
| Software – continued | | | | | | | | |
Blackboard, Inc.(c) | | | | | 40,021 | | $ | 1,612,446 |
Concur Technologies, Inc.(c) | | | | | 22,305 | | | 853,389 |
Informatica Corp.(c) | | | | | 91,111 | | | 1,183,532 |
NetScout Systems, Inc.(c) | | | | | 81,175 | | | 863,702 |
Solera Holdings, Inc.(b)(c) | | | | | 52,824 | | | 1,517,105 |
Tyler Technologies, Inc.(b)(c) | | | | | 108,887 | | | 1,651,816 |
| | | | | | | | |
| | | | | | | | 9,750,299 |
| | | | | | | | |
| Specialty Retail – 3.3% | | | | | | | | |
Aeropostale, Inc.(b)(c) | | | | | 39,091 | | | 1,255,212 |
Buckle, Inc. (The)(b) | | | | | 20,272 | | | 1,125,907 |
Gymboree Corp.(c) | | | | | 28,430 | | | 1,009,265 |
Ulta Salon, Cosmetics & Fragrance, Inc.(c) | | | | | 49,347 | | | 655,328 |
| | | | | | | | |
| | | | | | | | 4,045,712 |
| | | | | | | | |
| Textiles, Apparel & Luxury Goods – 0.9% | | | | | | | | |
True Religion Apparel, Inc.(b)(c) | | | | | 41,962 | | | 1,084,718 |
| | | | | | | | |
| Trading Companies & Distributors – 0.7% | | | | | | | | |
DXP Enterprises, Inc.(c) | | | | | 16,675 | | | 888,944 |
| | | | | | | | |
| Wireless Telecommunication Services – 0.9% | | | | | | | | |
SBA Communications Corp., Class A(c) | | | | | 43,635 | | | 1,128,837 |
| | | | | | | | |
| | | |
| TOTAL COMMON STOCKS | | | | | | | | |
(Identified Cost $124,156,478) | | | | | | | | 121,616,396 |
| | | | | | | | |
| | | | | Shares/
Principal Amount | | |
| | | | | | | | |
| | | |
| SHORT-TERM INVESTMENTS – 21.1% | | | | | | | | |
State Street Navigator Securities Lending Prime Portfolio(d) | | | | | 22,691,148 | | | 22,691,148 |
| Tri-Party Repurchase Agreement with Fixed Income Clearing Corporation, dated 9/30/08 at 1.300% to be repurchased at $3,593,130 on 10/01/08 collateralized by $3,605,000 Federal National Mortgage Association, 4.330% due 7/28/11 valued at $3,668,088 including accrued interest (Note 2g of Notes to Financial Statements) | | | | $ | 3,593,000 | | | 3,593,000 |
| | | | | | | | |
| | | |
| TOTAL SHORT-TERM INVESTMENTS | | | | | | | | |
(Identified Cost $26,284,148) | | | | | | | | 26,284,148 |
| | | | | | | | |
| | | |
| TOTAL INVESTMENTS – 118.9% | | | | | | | | |
(Identified Cost $150,440,626)(a) | | | | | | | | 147,900,544 |
Other assets less liabilities—(18.9)% | | | | | | | | (23,463,444) |
| | | | | | | | |
| | | |
| NET ASSETS – 100.0% | | | | | | | $ | 124,437,100 |
| | | | | | | | |
| | | |
(†) See Note 2a of Notes to Financial Statements. | | | | | | | | |
(a) Federal Tax Information: | | | | | | | | |
At September 30, 2008, the net unrealized depreciation on investments based on a cost of $150,467,126 for federal income tax purposes was as follows: | | | |
Aggregate gross unrealized appreciation for all investments in which there is an excess of value over tax cost | | $ | 7,763,399 |
Aggregate gross unrealized depreciation for all investments in which there is an excess of tax cost over value | | | (10,329,981) |
| | | | | | | | |
Net unrealized depreciation | | $ | (2,566,582) |
| | | | | | | | |
| (b) | All or a portion of this security was on loan to brokers at September 30, 2008. |
| (c) | Non-income producing security. |
| (d) | Represents investments of security lending collateral. |
17
| ADR | An American Depositary Receipt (ADR) is a certificate issued by a custodian bank representing the right to receive securities of the foreign issuer described. The values of ADRs are significantly influenced by trading on exchanges not located in the United States. |
| REITs | Real Estate Investment Trusts |
NET ASSET SUMMARY AT SEPTEMBER 30, 2008 (Unaudited)
| | | |
Commercial Services & Supplies | | 9.4 | % |
Software | | 7.8 | |
Health Care Providers & Services | | 7.7 | |
Health Care Equipment & Supplies | | 6.7 | |
Internet Software & Services | | 6.2 | |
Oil, Gas & Consumable Fuels | | 4.2 | |
Machinery | | 3.6 | |
Energy Equipment & Services | | 3.4 | |
Life Sciences Tools & Services | | 3.3 | |
Specialty Retail | | 3.3 | |
Aerospace & Defense | | 3.1 | |
Communications Equipment | | 2.9 | |
Biotechnology | | 2.9 | |
Diversified Consumer Services | | 2.8 | |
Pharmaceuticals | | 2.6 | |
Semiconductors & Semiconductor Equipment | | 2.5 | |
Media | | 2.5 | |
Commercial Banks | | 2.3 | |
Food Products | | 2.1 | |
Other Investments, less than 2% each | | 18.5 | |
Short-Term Investments | | 21.1 | |
| | | |
Total Investments | | 118.9 | |
Other assets less liabilities | | (18.9 | ) |
| | | |
Net Assets | | 100.0 | % |
| | | |
See accompanying notes to financial statements.
18
PORTFOLIO OF INVESTMENTS – as of September 30, 2008
Loomis Sayles Small Cap Value Fund
| | | | | | | |
| | | | | Shares | | Value (†) |
| | | | | | | |
| | | |
| COMMON STOCKS – 96.7% of Net Assets | | | | | | | |
| | | |
| Aerospace & Defense – 2.5% | | | | | | | |
Ducommun, Inc. | | | | 199,540 | | $ | 4,765,015 |
Moog, Inc., Class A(c) | | | | 214,056 | | | 9,178,721 |
Teledyne Technologies, Inc.(c) | | | | 230,897 | | | 13,198,073 |
| | | | | | | |
| | | | | | | 27,141,809 |
| | | | | | | |
| Air Freight & Logistics – 1.1% | | | | | | | |
Atlas Air Worldwide Holdings, Inc.(c) | | | | 132,540 | | | 5,342,687 |
Hub Group, Inc., Class A(c) | | | | 182,489 | | | 6,870,711 |
| | | | | | | |
| | | | | | | 12,213,398 |
| | | | | | | |
| Auto Components – 0.8% | | | | | | | |
Federal Mogul Corp.(b)(c) | | | | 239,496 | | | 3,005,675 |
Gentex Corp.(b) | | | | 235,448 | | | 3,366,906 |
Stoneridge, Inc.(b)(c) | | | | 207,161 | | | 2,330,561 |
| | | | | | | |
| | | | | | | 8,703,142 |
| | | | | | | |
| Building Products – 0.6% | | | | | | | |
Armstrong World Industries, Inc.(b) | | | | 220,314 | | | 6,367,075 |
| | | | | | | |
| Capital Markets – 1.9% | | | | | | | |
Investment Technology Group, Inc.(c) | | | | 188,844 | | | 5,746,523 |
JMP Group, Inc.(b) | | | | 161,713 | | | 840,908 |
Stifel Financial Corp.(b)(c) | | | | 282,127 | | | 14,078,137 |
| | | | | | | |
| | | | | | | 20,665,568 |
| | | | | | | |
| Chemicals – 2.6% | | | | | | | |
Cytec Industries, Inc. | | | | 112,465 | | | 4,376,013 |
Koppers Holdings, Inc. | | | | 119,827 | | | 4,482,728 |
LSB Industries, Inc.(c) | | | | 91,485 | | | 1,267,067 |
Minerals Technologies, Inc. | | | | 66,995 | | | 3,976,823 |
Solutia, Inc.(c) | | | | 597,275 | | | 8,361,850 |
Zep, Inc.(b) | | | | 314,590 | | | 5,549,368 |
| | | | | | | |
| | | | | | | 28,013,849 |
| | | | | | | |
| Commercial Banks – 7.9% | | | | | | | |
Bank of the Ozarks, Inc.(b) | | | | 383,177 | | | 10,345,779 |
Citizens Republic Bancorp, Inc.(b) | | | | 903,218 | | | 2,781,912 |
Comerica, Inc.(b) | | | | 163,603 | | | 5,364,542 |
CVB Financial Corp.(b) | | | | 428,949 | | | 5,962,391 |
Hancock Holding Co.(b) | | | | 171,626 | | | 8,752,926 |
IBERIABANK Corp.(b) | | | | 118,691 | | | 6,272,819 |
Old National Bancorp(b) | | | | 199,052 | | | 3,985,021 |
Pennsylvania Commerce Bancorp, Inc.(b)(c) | | | | 117,448 | | | 3,501,125 |
Prosperity Bancshares, Inc.(b) | | | | 277,785 | | | 9,441,912 |
Signature Bank(c) | | | | 281,675 | | | 9,824,824 |
Sterling Bancshares, Inc. | | | | 899,189 | | | 9,396,525 |
SVB Financial Group(c) | | | | 191,082 | | | 11,067,470 |
| | | | | | | |
| | | | | | | 86,697,246 |
| | | | | | | |
| Commercial Services & Supplies – 6.9% | | | | | | | |
ABM Industries, Inc. | | | | 391,160 | | | 8,542,934 |
American Ecology Corp. | | | | 244,373 | | | 6,761,801 |
Geo Group, Inc. (The)(b)(c) | | | | 373,256 | | | 7,543,504 |
McGrath Rentcorp | | | | 302,358 | | | 8,713,958 |
Rollins, Inc. | | | | 1,005,262 | | | 19,079,873 |
Standard Parking Corp.(b)(c) | | | | 584,334 | | | 12,983,901 |
19
| | | | | | | |
| | | | | Shares | | Value (†) |
| | | | | | | |
| | | |
| COMMON STOCKS – continued | | | | | | | |
| | | |
| Commercial Services & Supplies – continued | | | | | | | |
Waste Connections, Inc.(c) | | | | 342,932 | | $ | 11,762,568 |
| | | | | | | |
| | | | | | | 75,388,539 |
| | | | | | | |
| Communications Equipment – 2.5% | | | | | | | |
ADC Telecommunications, Inc.(b)(c) | | | | 437,163 | | | 3,694,027 |
ADTRAN, Inc.(b) | | | | 282,340 | | | 5,502,807 |
Anaren, Inc.(c) | | | | 169,861 | | | 1,724,089 |
CommScope, Inc.(b)(c) | | | | 289,303 | | | 10,021,456 |
Tekelec(b)(c) | | | | 459,368 | | | 6,426,558 |
| | | | | | | |
| | | | | | | 27,368,937 |
| | | | | | | |
| Computers & Peripherals – 1.0% | | | | | | | |
Intevac, Inc.(b)(c) | | | | 313,197 | | | 3,332,416 |
NCR Corp.(c) | | | | 130,848 | | | 2,885,198 |
Teradata Corp.(c) | | | | 251,165 | | | 4,897,718 |
| | | | | | | |
| | | | | | | 11,115,332 |
| | | | | | | |
| Construction & Engineering – 0.6% | | | | | | | |
Granite Construction, Inc.(b) | | | | 153,697 | | | 5,505,427 |
Layne Christensen Co.(c) | | | | 41,568 | | | 1,472,754 |
| | | | | | | |
| | | | | | | 6,978,181 |
| | | | | | | |
| Consumer Finance – 1.0% | | | | | | | |
Dollar Financial Corp.(b)(c) | | | | 438,239 | | | 6,744,498 |
World Acceptance Corp.(b)(c) | | | | 114,051 | | | 4,105,836 |
| | | | | | | |
| | | | | | | 10,850,334 |
| | | | | | | |
| Containers & Packaging – 1.6% | | | | | | | |
Greif, Inc., Class A | | | | 53,583 | | | 3,516,117 |
Myers Industries, Inc.(b) | | | | 538,926 | | | 6,795,857 |
Rock-Tenn Co., Class A | | | | 191,835 | | | 7,669,563 |
| | | | | | | |
| | | | | | | 17,981,537 |
| | | | | | | |
| Distributors – 0.1% | | | | | | | |
Core-Mark Holding Co., Inc.(b)(c) | | | | 61,813 | | | 1,544,707 |
| | | | | | | |
| Diversified Consumer Services – 0.4% | | | | | | | |
Hillenbrand, Inc. | | | | 221,283 | | | 4,461,065 |
| | | | | | | |
| Diversified Financial Services – 0.7% | | | | | | | |
PHH Corp.(c) | | | | 590,822 | | | 7,852,024 |
| | | | | | | |
| Electric Utilities – 2.5% | | | | | | | |
ALLETE, Inc.(b) | | | | 228,675 | | | 10,176,038 |
ITC Holdings Corp.(b) | | | | 147,590 | | | 7,640,734 |
Portland General Electric Co.(b) | | | | 425,252 | | | 10,061,462 |
| | | | | | | |
| | | | | | | 27,878,234 |
| | | | | | | |
| Electrical Equipment – 1.8% | | | | | | | |
Acuity Brands, Inc.(b) | | | | 118,589 | | | 4,952,277 |
General Cable Corp.(b)(c) | | | | 115,652 | | | 4,120,681 |
II-VI, Inc.(b)(c) | | | | 112,325 | | | 4,342,484 |
Polypore International, Inc.(b)(c) | | | | 313,468 | | | 6,742,697 |
| | | | | | | |
| | | | | | | 20,158,139 |
| | | | | | | |
| Electronic Equipment & Instruments – 2.5% | | | | | | | |
Anixter International, Inc.(b)(c) | | | | 46,485 | | | 2,766,322 |
Daktronics, Inc.(b) | | | | 226,280 | | | 3,769,825 |
20
PORTFOLIO OF INVESTMENTS – as of September 30, 2008
Loomis Sayles Small Cap Value Fund – continued
| | | | | | | |
| | | | | Shares | | Value (†) |
| | | | | | | |
| | | |
| COMMON STOCKS – continued | | | | | | | |
| | | |
| Electronic Equipment & Instruments – continued | | | | | | | |
Littelfuse, Inc.(c) | | | | 325,708 | | $ | 9,683,299 |
Scansource, Inc.(b)(c) | | | | 255,453 | | | 7,354,492 |
Vishay Intertechnology, Inc.(c) | | | | 509,093 | | | 3,370,196 |
| | | | | | | |
| | | | | | | 26,944,134 |
| | | | | | | |
| Energy Equipment & Services – 2.7% | | | | | | | |
Dresser-Rand Group, Inc.(c) | | | | 234,984 | | | 7,394,946 |
Hornbeck Offshore Services, Inc.(b)(c) | | | | 180,436 | | | 6,968,438 |
Newpark Resources(c) | | | | 443,003 | | | 3,233,922 |
Oceaneering International, Inc.(c) | | | | 158,835 | | | 8,469,082 |
Superior Well Services, Inc.(b)(c) | | | | 149,034 | | | 3,772,051 |
| | | | | | | |
| | | | | | | 29,838,439 |
| | | | | | | |
| Food & Staples Retailing – 1.0% | | | | | | | |
Spartan Stores, Inc. | | | | 439,868 | | | 10,943,916 |
| | | | | | | |
| Food Products – 1.3% | | | | | | | |
J & J Snack Foods Corp. | | | | 161,455 | | | 5,474,939 |
Ralcorp Holdings, Inc.(b)(c) | | | | 131,864 | | | 8,888,952 |
| | | | | | | |
| | | | | | | 14,363,891 |
| | | | | | | |
| Gas Utilities – 1.8% | | | | | | | |
Energen Corp. | | | | 66,378 | | | 3,005,596 |
ONEOK, Inc. | | | | 32,345 | | | 1,112,668 |
UGI Corp. | | | | 613,180 | | | 15,807,780 |
| | | | | | | |
| | | | | | | 19,926,044 |
| | | | | | | |
| Health Care Equipment & Supplies – 1.9% | | | | | | | |
Hill-Rom Holdings, Inc.(b) | | | | 234,856 | | | 7,118,485 |
Medical Action Industries, Inc.(b)(c) | | | | 261,297 | | | 3,430,830 |
West Pharmaceutical Services, Inc.(b) | | | | 200,228 | | | 9,775,131 |
| | | | | | | |
| | | | | | | 20,324,446 |
| | | | | | | |
| Health Care Providers & Services – 3.6% | | | | | | | |
Amedisys, Inc.(b)(c) | | | | 150,106 | | | 7,305,659 |
CorVel Corp.(c) | | | | 199,528 | | | 5,708,496 |
Healthspring, Inc.(c) | | | | 206,960 | | | 4,379,274 |
inVentiv Health, Inc.(b)(c) | | | | 231,633 | | | 4,090,639 |
MWI Veterinary Supply, Inc.(b)(c) | | | | 109,983 | | | 4,321,232 |
Pediatrix Medical Group, Inc.(c) | | | | 96,907 | | | 5,225,225 |
Skilled Healthcare Group, Inc., Class A(c) | | | | 538,628 | | | 8,558,799 |
| | | | | | | |
| | | | | | | 39,589,324 |
| | | | | | | |
| Hotels, Restaurants & Leisure – 1.9% | | | | | | | |
Bob Evans Farms, Inc.(b) | | | | 241,742 | | | 6,597,139 |
Cosi, Inc.(b)(c) | | | | 1,371,708 | | | 2,702,265 |
Dover Downs Gaming & Entertainment, Inc.(b) | | | | 301,983 | | | 2,349,428 |
Penn National Gaming, Inc.(c) | | | | 208,457 | | | 5,538,702 |
Wyndham Worldwide Corp. | | | | 226,044 | | | 3,551,151 |
| | | | | | | |
| | | | | | | 20,738,685 |
| | | | | | | |
| Industrial Conglomerates – 0.8% | | | | | | | |
Teleflex, Inc. | | | | 142,341 | | | 9,037,230 |
| | | | | | | |
| Insurance – 4.3% | | | | | | | |
American Equity Investment Life Holding Co.(b) | | | | 106,407 | | | 798,053 |
American Physicians Capital, Inc. | | | | 109,698 | | | 4,643,516 |
Delphi Financial Group, Inc., Class A | | | | 162,971 | | | 4,569,707 |
21
| | | | | | | |
| | | | | Shares | | Value (†) |
| | | | | | | |
| | | |
| COMMON STOCKS – continued | | | | | | | |
| | | |
| Insurance – continued | | | | | | | |
Employers Holdings, Inc. | | | | 289,738 | | $ | 5,035,646 |
Fidelity National Financial, Inc., Class A(b) | | | | 217,876 | | | 3,202,777 |
HCC Insurance Holdings, Inc. | | | | 274,796 | | | 7,419,492 |
Navigators Group, Inc.(c) | | | | 116,894 | | | 6,779,852 |
ProAssurance Corp.(c) | | | | 109,522 | | | 6,133,232 |
RLI Corp.(b) | | | | 136,845 | | | 8,496,706 |
| | | | | | | |
| | | | | | | 47,078,981 |
| | | | | | | |
| Internet & Catalog Retail – 0.6% | | | | | | | |
HSN, Inc.(c) | | | | 550,266 | | | 6,058,429 |
| | | | | | | |
| Internet Software & Services – 0.5% | | | | | | | |
United Online, Inc.(b) | | | | 525,530 | | | 4,945,237 |
| | | | | | | |
| IT Services – 4.5% | | | | | | | |
Alliance Data Systems Corp.(c) | | | | 170,986 | | | 10,837,093 |
Broadridge Financial Solutions, Inc. | | | | 657,472 | | | 10,118,494 |
Lender Processing Services, Inc. | | | | 262,910 | | | 8,024,013 |
Perot Systems Corp., Class A(c) | | | | 465,246 | | | 8,072,018 |
Wright Express Corp.(b)(c) | | | | 405,536 | | | 12,105,250 |
| | | | | | | |
| | | | | | | 49,156,868 |
| | | | | | | |
| Leisure Equipment & Products – 0.4% | | | | | | | |
Steinway Musical Instruments, Inc.(b)(c) | | | | 171,934 | | | 4,869,171 |
| | | | | | | |
| Life Sciences Tools & Services – 1.0% | | | | | | | |
PerkinElmer, Inc. | | | | 273,638 | | | 6,832,741 |
Varian, Inc.(c) | | | | 103,764 | | | 4,451,475 |
| | | | | | | |
| | | | | | | 11,284,216 |
| | | | | | | |
| Machinery – 3.2% | | | | | | | |
Actuant Corp., Class A(b) | | | | 294,943 | | | 7,444,361 |
Altra Holdings, Inc.(c) | | | | 319,028 | | | 4,708,853 |
CLARCOR, Inc.(b) | | | | 115,232 | | | 4,373,055 |
Commercial Vehicle Group, Inc.(b)(c) | | | | 29,381 | | | 208,899 |
John Bean Technologies Corp.(c) | | | | 444,933 | | | 5,632,852 |
RBC Bearings, Inc.(c) | | | | 194,903 | | | 6,566,282 |
Wabtec Corp. | | | | 111,584 | | | 5,716,448 |
| | | | | | | |
| | | | | | | 34,650,750 |
| | | | | | | |
| Media – 2.4% | | | | | | | |
A H Belo Corp., Class A(b) | | | | 233,331 | | | 1,203,988 |
Alloy, Inc.(c) | | | | 244,628 | | | 1,890,975 |
Interactive Data Corp. | | | | 387,591 | | | 9,775,045 |
John Wiley & Sons, Inc. Class A | | | | 325,934 | | | 13,184,030 |
| | | | | | | |
| | | | | | | 26,054,038 |
| | | | | | | |
| Metals & Mining – 0.9% | | | | | | | |
Haynes International, Inc.(b)(c) | | | | 82,724 | | | 3,873,965 |
Reliance Steel & Aluminum Co.(b) | | | | 146,038 | | | 5,545,063 |
| | | | | | | |
| | | | | | | 9,419,028 |
| | | | | | | |
| Multi-Utilities & Unregulated Power – 0.4% | | | | | | | |
NorthWestern Corp. | | | | 193,268 | | | 4,856,825 |
| | | | | | | |
| Multiline Retail – 0.6% | | | | | | | |
Dollar Tree, Inc.(c) | | | | 178,125 | | | 6,476,625 |
| | | | | | | |
22
PORTFOLIO OF INVESTMENTS – as of September 30, 2008
Loomis Sayles Small Cap Value Fund – continued
| | | | | | | |
| | | | | Shares | | Value (†) |
| | | | | | | |
| | | |
| COMMON STOCKS – continued | | | | | | | |
| | | |
| Oil, Gas & Consumable Fuels – 2.3% | | | | | | | |
Mariner Energy, Inc.(c) | | | | 353,552 | | $ | 7,247,816 |
Penn Virginia Corp. | | | | 197,229 | | | 10,539,918 |
St. Mary Land & Exploration Co. | | | | 116,800 | | | 4,163,920 |
Venoco, Inc.(b)(c) | | | | 224,274 | | | 2,915,562 |
| | | | | | | |
| | | | | | | 24,867,216 |
| | | | | | | |
| Personal Products – 0.8% | | | | | | | |
Alberto-Culver Co. | | | | 338,097 | | | 9,209,762 |
| | | | | | | |
| Pharmaceuticals – 2.0% | | | | | | | |
Endo Pharmaceuticals Holdings, Inc.(c) | | | | 285,227 | | | 5,704,540 |
Obagi Medical Products, Inc.(c) | | | | 458,289 | | | 4,573,724 |
Perrigo Co.(b) | | | | 312,305 | | | 12,011,251 |
| | | | | | | |
| | | | | | | 22,289,515 |
| | | | | | | |
| Professional Services – 0.0% | | | | | | | |
Duff & Phelps Corp., Class A(c) | | | | 21,896 | | | 460,473 |
| | | | | | | |
| Real Estate Management & Development – 0.6% | | | | | | | |
Forestar Real Estate Group, Inc.(b)(c) | | | | 451,535 | | | 6,660,141 |
| | | | | | | |
| REITs – 4.5% | | | | | | | |
American Campus Communities, Inc. | | | | 192,347 | | | 6,516,716 |
Capstead Mortgage Corp. | | | | 673,066 | | | 7,370,073 |
Digital Realty Trust, Inc.(b) | | | | 168,396 | | | 7,956,711 |
Health Care REIT, Inc. | | | | 222,382 | | | 11,837,394 |
Kite Realty Group Trust(b) | | | | 262,801 | | | 2,890,811 |
Potlatch Corp. | | | | 273,634 | | | 12,693,881 |
| | | | | | | |
| | | | | | | 49,265,586 |
| | | | | | | |
| Road & Rail – 2.2% | | | | | | | |
Con-way, Inc.(b) | | | | 167,355 | | | 7,382,029 |
Genesee & Wyoming, Inc., Class A(c) | | | | 207,868 | | | 7,799,207 |
Ryder System, Inc.(b) | | | | 135,440 | | | 8,397,280 |
| | | | | | | |
| | | | | | | 23,578,516 |
| | | | | | | |
| Semiconductors & Semiconductor Equipment – 2.3% | | | | | | | |
Cohu, Inc.(b) | | | | 230,704 | | | 3,649,737 |
Diodes, Inc.(b)(c) | | | | 248,509 | | | 4,584,991 |
ON Semiconductor Corp.(c) | | | | 772,119 | | | 5,219,525 |
Semtech Corp.(c) | | | | 216,006 | | | 3,015,444 |
Verigy Ltd.(c) | | | | 518,047 | | | 8,433,805 |
| | | | | | | |
| | | | | | | 24,903,502 |
| | | | | | | |
| Software – 2.7% | | | | | | | |
Mentor Graphics Corp.(b)(c) | | | | 517,448 | | | 5,873,035 |
Progress Software Corp.(c) | | | | 330,751 | | | 8,596,218 |
Quest Software, Inc.(c) | | | | 420,079 | | | 5,330,803 |
Radiant Systems, Inc.(c) | | | | 296,779 | | | 2,579,010 |
Sybase, Inc.(c) | | | | 240,639 | | | 7,368,366 |
| | | | | | | |
| | | | | | | 29,747,432 |
| | | | | | | |
| Specialty Retail – 2.7% | | | | | | | |
Genesco, Inc.(b)(c) | | | | 315,877 | | | 10,575,562 |
Jo-Ann Stores, Inc.(b)(c) | | | | 200,926 | | | 4,215,427 |
RadioShack Corp. | | | | 316,154 | | | 5,463,141 |
Sally Beauty Holdings, Inc.(b)(c) | | | | 1,121,911 | | | 9,648,435 |
| | | | | | | |
| | | | | | | 29,902,565 |
| | | | | | | |
23
| | | | | | | | |
| | | | | Shares | | Value (†) |
| | | | | | | | |
| | | |
| COMMON STOCKS – continued | | | | | | | | |
| | | |
| Textiles, Apparel & Luxury Goods – 2.0% | | | | | | | | |
Carter’s, Inc.(c) | | | | | 297,508 | | $ | 5,869,833 |
FGX International Holdings Ltd.(b)(c) | | | | | 275,446 | | | 3,049,187 |
Fossil, Inc.(b)(c) | | | | | 220,980 | | | 6,238,265 |
Hanesbrands, Inc.(b)(c) | | | | | 300,501 | | | 6,535,897 |
| | | | | | | | |
| | | | | | | | 21,693,182 |
| | | | | | | | |
| Thrifts & Mortgage Finance – 0.9% | | | | | | | | |
Beneficial Mutual Bancorp, Inc.(b)(c) | | | | | 480,075 | | | 6,072,949 |
Westfield Financial, Inc.(b) | | | | | 384,086 | | | 3,956,086 |
| | | | | | | | |
| | | | | | | | 10,029,035 |
| | | | | | | | |
| Water Utilities – 0.9% | | | | | | | | |
American States Water Co.(b) | | | | | 122,345 | | | 4,710,282 |
Middlesex Water Co.(b) | | | | | 270,987 | | | 4,734,143 |
| | | | | | | | |
| | | | | | | | 9,444,425 |
| | | | | | | | |
| | | |
| TOTAL COMMON STOCKS | | | | | | | | |
(Identified Cost $1,034,835,389) | | | | | | | | 1,059,986,743 |
| | | | | | | | |
| | | |
| EXCHANGE TRADED FUND – 1.0% | | | | | | | | |
| | | |
| Diversified Financial Services – 1.0% | | | | | | | | |
iShares Russell 2000 Value Index Fund(b) | | | | | | | | |
(Identified Cost $10,504,021) | | | | | 166,444 | | | 11,191,695 |
| | | | | | | | |
| | | |
| | | | | Shares/
Principal Amount | | |
| | | | | | | | |
| | | |
| SHORT-TERM INVESTMENTS – 22.9% | | | | | | | | |
| State Street Navigator Securities Lending Prime Portfolio(d) | | | | | 195,864,078 | | | 195,864,078 |
| Tri-Party Repurchase Agreement with Fixed Income Clearing Corporation, dated 9/30/2008 at 1.300% to be repurchased at $54,488,968 on 10/01/2008 collateralized by $54,625,000 Federal National Mortgage Association, 4.330% due 7/28/2011 with a value of $55,580,938 including accrued interest (Note 2g of Notes to Financial Statements) | | | | $ | 54,487,000 | | | 54,487,000 |
| | | | | | | | |
| | | |
| TOTAL SHORT-TERM INVESTMENTS | | | | | | | | |
(Identified Cost $250,351,078) | | | | | | | | 250,351,078 |
| | | | | | | | |
| | | |
| TOTAL INVESTMENTS – 120.6% | | | | | | | | |
(Identified Cost $1,295,690,488)(a) | | | | | | | | 1,321,529,516 |
Other assets less liabilities—(20.6)% | | | | | | | | (225,880,689) |
| | | | | | | | |
| | | |
| NET ASSETS – 100.0% | | | | | | | $ | 1,095,648,827 |
| | | | | | | | |
| | | |
(†) See Note 2a of Notes to Financial Statements. | | | | | | | | |
(a) Federal Tax Information: | | | | | | | | |
At September 30, 2008, the net unrealized appreciation on investments based on a cost of $1,297,881,270 for federal income tax purposes was as follows: | | | |
Aggregate gross unrealized appreciation for all investments in which there is an excess of value over tax cost | | $ | 107,220,862 |
Aggregate gross unrealized depreciation for all investments in which there is an excess of tax cost over value | | | (83,572,616) |
| | | | | | | | |
Net unrealized appreciation | | $ | 23,648,246 |
| | | | | | | | |
| (b) | All or a portion of this security was on loan to brokers at September 30, 2008. |
| (c) | Non-income producing security. |
24
PORTFOLIO OF INVESTMENTS – as of September 30, 2008
Loomis Sayles Small Cap Value Fund – continued
| (d) | Represents investment of securities lending collateral. |
| REITs | Real Estate Investment Trusts |
NET ASSET SUMMARY AT SEPTEMBER 30, 2008 (Unaudited)
| | | |
Commercial Banks | | 7.9 | % |
Commercial Services & Supplies | | 6.9 | |
REITs | | 4.5 | |
IT Services | | 4.5 | |
Insurance | | 4.3 | |
Health Care Providers & Services | | 3.6 | |
Machinery | | 3.2 | |
Specialty Retail | | 2.7 | |
Energy Equipment & Services | | 2.7 | |
Software | | 2.7 | |
Chemicals | | 2.6 | |
Electric Utilities | | 2.5 | |
Communications Equipment | | 2.5 | |
Aerospace & Defense | | 2.5 | |
Electronic Equipment & Instruments | | 2.5 | |
Media | | 2.4 | |
Semiconductors & Semiconductor Equipment | | 2.3 | |
Oil, Gas & Consumable Fuels | | 2.3 | |
Road & Rail | | 2.2 | |
Pharmaceuticals | | 2.0 | |
Textiles, Apparel & Luxury Goods | | 2.0 | |
Other Investments, less than 2% each | | 28.9 | |
Short-Term Investments | | 22.9 | |
| | | |
Total Investments | | 120.6 | |
Other assets less liabilities | | (20.6 | ) |
| | | |
Net Assets | | 100.0 | % |
| | | |
See accompanying notes to financial statements.
25
STATEMENTS OF ASSETS AND LIABILITIES
September 30, 2008
| | | | | | | | | | | | |
| | | Mid Cap
Growth Fund | | | Small Cap
Growth Fund | | | Small Cap
Value Fund | |
| | | | | | | | | | | | |
| | | | | | | | | | | | |
Assets | | | | | | | | | | | | |
Investments at cost | | $ | 180,141,873 | | | $ | 150,440,626 | | | $ | 1,295,690,488 | |
Net unrealized appreciation (depreciation) | | | (11,322,426 | ) | | | (2,540,082 | ) | | | 25,839,028 | |
| | | | | | | | | | | | |
Investments at value | | | 168,819,447 | | | | 147,900,544 | | | | 1,321,529,516 | |
Cash | | | 182 | | | | 2,296 | | | | 105,664 | |
Receivable for Fund shares sold | | | 466,881 | | | | 328,689 | | | | 6,670,686 | |
Receivable for securities sold | | | 3,200,961 | | | | 1,225,292 | | | | 13,521,237 | |
Dividends and interest receivable | | | 56,298 | | | | 34,679 | | | | 1,128,754 | |
Receivable from investment adviser (Note 4) | | | 32,715 | | | | 36,159 | | | | 101,061 | |
Securities lending income receivable | | | 15,033 | | | | 24,412 | | | | 98,283 | |
| | | | | | | | | | | | |
Total Assets | | | 172,591,517 | | | | 149,552,071 | | | | 1,343,155,201 | |
| | | | | | | | | | | | |
| | | |
| Liabilities | | | | | | | | | | | | |
Collateral on securities loaned, at value (Note 2) | | | 22,705,247 | | | | 22,691,148 | | | | 195,864,078 | |
Payable for securities purchased | | | 1,109,286 | | | | 1,795,490 | | | | 32,928,331 | |
Payable for Fund shares redeemed | | | 2,267,241 | | | | 435,529 | | | | 17,697,226 | |
Management fees payable (Note 4) | | | 111,530 | | | | 81,329 | | | | 714,720 | |
Administrative fees payable (Note 4) | | | 7,000 | | | | 5,103 | | | | 44,860 | |
Deferred Trustees’ fees (Note 4) | | | 42,576 | | | | 40,103 | | | | 113,489 | |
Service and distribution fees payable (Note 4) | | | 820 | | | | 536 | | | | 4,225 | |
Other accounts payable and accrued expenses | | | 44,474 | | | | 65,733 | | | | 139,445 | |
| | | | | | | | | | | | |
Total Liabilities | | | 26,288,174 | | | | 25,114,971 | | | | 247,506,374 | |
| | | | | | | | | | | | |
Net Assets | | $ | 146,303,343 | | | $ | 124,437,100 | | | $ | 1,095,648,827 | |
| | | | | | | | | | | | |
Net Assets consist of: | | | | | | | | | | | | |
Paid-in capital | | $ | 262,590,406 | | | $ | 332,005,808 | | | $ | 1,117,571,112 | |
Accumulated net investment income (loss) | | | (42,576 | ) | | | (40,103 | ) | | | 1,842,018 | |
Accumulated net realized loss on investments and foreign currency transactions | | | (104,922,061 | ) | | | (204,988,523 | ) | | | (49,603,331 | ) |
Net unrealized appreciation (depreciation) on investments and foreign currency translations | | | (11,322,426 | ) | | | (2,540,082 | ) | | | 25,839,028 | |
| | | | | | | | | | | | |
Net Assets | | $ | 146,303,343 | | | $ | 124,437,100 | | | $ | 1,095,648,827 | |
| | | | | | | | | | | | |
| | | |
| Net Asset Value and Offering Price | | | | | | | | | | | | |
Institutional Class | | | | | | | | | | | | |
Net assets | | $ | 25,779,418 | | | $ | 44,540,086 | | | $ | 553,268,333 | |
| | | | | | | | | | | | |
Shares of beneficial interest | | | 1,188,171 | | | | 3,407,805 | | | | 25,132,292 | |
| | | | | | | | | | | | |
Net asset value, offering and redemption price per share | | $ | 21.70 | | | $ | 13.07 | | | $ | 22.01 | |
| | | | | | | | | | | | |
Retail Class | | | | | | | | | | | | |
Net assets | | $ | 120,523,925 | | | $ | 79,897,014 | | | $ | 464,525,207 | |
| | | | | | | | | | | | |
Shares of beneficial interest | | | 5,706,725 | | | | 6,296,278 | | | | 21,318,846 | |
| | | | | | | | | | | | |
Net asset value, offering and redemption price per share | | $ | 21.12 | | | $ | 12.69 | | | $ | 21.79 | |
| | | | | | | | | | | | |
Admin Class | | | | | | | | | | | | |
Net assets | | $ | — | | | $ | — | | | $ | 77,855,287 | |
| | | | | | | | | | | | |
Shares of beneficial interest | | | — | | | | — | | | | 3,638,028 | |
| | | | | | | | | | | | |
Net asset value, offering and redemption price per share | | $ | — | | | $ | — | | | $ | 21.40 | |
| | | | | | | | | | | | |
Value of securities on loan (Note 2) | | $ | 22,615,127 | | | $ | 22,689,377 | | | $ | 197,462,353 | |
| | | | | | | | | | | | |
See accompanying notes to financial statements.
26
STATEMENTS OF OPERATIONS
For the Year Ended September 30, 2008
| | | | | | | | | | | | |
| | | Mid Cap
Growth Fund | | | Small Cap
Growth Fund | | | Small Cap
Value Fund | |
| | | | | | | | | | | | |
Investment Income | | | | | | | | | | | | |
Dividends | | $ | 469,227 | | | $ | 221,760 | | | $ | 12,128,483 | * |
Interest | | | 160,344 | | | | 102,730 | | | | 980,421 | |
Securities lending income (Note 2) | | | 186,710 | | | | 199,641 | | | | 1,537,445 | |
Less net foreign taxes withheld | | | (12,805 | ) | | | — | | | | — | |
| | | | | | | | | | | | |
| | | 803,476 | | | | 524,131 | | | | 14,646,349 | |
| | | | | | | | | | | | |
| | | |
| Expenses | | | | | | | | | | | | |
Management fees (Note 4) | | | 909,027 | | | | 726,130 | | | | 8,053,932 | |
Distribution fees—Retail Class (Note 4) | | | 228,997 | | | | 140,202 | | | | 1,174,810 | |
Service and distribution fees—Admin Class (Note 4) | | | — | | | | — | | | | 395,796 | |
Trustees’ fees and expenses (Note 4) | | | 11,123 | | | | 10,806 | | | | 22,232 | |
Administrative fees (Note 4) | | | 61,279 | | | | 49,032 | | | | 546,547 | |
Custodian fees and expenses | | | 27,288 | | | | 32,363 | | | | 45,613 | |
Transfer agent fees and expenses—Institutional Class (Note 4) | | | 13,414 | | | | 17,715 | | | | 258,415 | |
Transfer agent fees and expenses—Retail Class (Note 4) | | | 102,699 | | | | 114,743 | | | | 812,511 | |
Transfer agent fees and expenses—Admin Class (Note 4) | | | — | | | | — | | | | 266,375 | |
Audit and tax services fees | | | 39,275 | | | | 36,021 | | | | 40,169 | |
Registration fees | | | 87,242 | | | | 44,426 | | | | 109,444 | |
Shareholder reporting expenses | | | 15,619 | | | | 23,916 | | | | 188,329 | |
Legal fees | | | 2,797 | | | | 2,341 | | | | 27,455 | |
Expense recapture—Institutional Class (Note 4) | | | 835 | | | | — | | | | — | |
Miscellaneous expenses | | | 8,185 | | | | 7,606 | | | | 45,736 | |
| | | | | | | | | | | | |
Total expenses | | | 1,507,780 | | | | 1,205,301 | | | | 11,987,364 | |
Less fee reduction and/or expense reimbursement (Note 4) | | | (66,565 | ) | | | (96,890 | ) | | | (788,326 | ) |
| | | | | | | | | | | | |
Net expenses | | | 1,441,215 | | | | 1,108,411 | | | | 11,199,038 | |
| | | | | | | | | | | | |
Net investment income (loss) | | | (637,739 | ) | | | (584,280 | ) | | | 3,447,311 | |
| | | | | | | | | | | | |
| | | |
| Net Realized and Unrealized Gain (Loss) on Investments and Foreign Currency Transactions | | | | | | | | | | | | |
Net Realized Gain (Loss) on: | | | | | | | | | | | | |
Investments | | | (16,802,159 | ) | | | (6,171,517 | ) | | | (37,271,375 | ) |
Foreign currency transactions | | | 166 | | | | — | | | | — | |
Payments by affiliates (Note 4) | | | 1,112 | | | | — | | | | — | |
| | | |
| Net Change in Unrealized Appreciation (Depreciation) on: | | | | | | | | | | | | |
Investments | | | (24,348,722 | ) | | | (10,322,096 | ) | | | (141,209,963 | ) |
Foreign currency translations | | | (109 | ) | | | — | | | | — | |
| | | | | | | | | | | | |
Net realized and unrealized loss on investments and foreign currency transactions | | | (41,149,712 | ) | | | (16,493,613 | ) | | | (178,481,338 | ) |
| | | | | | | | | | | | |
| | | |
| Net Decrease in Net Assets Resulting from Operations | | $ | (41,787,451 | ) | | $ | (17,077,893 | ) | | $ | (175,034,027 | ) |
| | | | | | | | | | | | |
| * | Amount includes a special dividend of $926,046 in which the source of the dividend has not been determined by the issuer. |
See accompanying notes to financial statements.
27
STATEMENTS OF CHANGES IN NET ASSETS
Mid Cap Growth Fund
| | | | | | | | |
| | | Year Ended
September 30, 2008 | | | Year Ended
September 30, 2007 | |
From Operations: | | | | | | | | |
Net investment loss | | $ | (637,739 | ) | | $ | (288,083 | ) |
Net realized gain (loss) on investments and foreign currency transactions | | | (16,800,881 | ) | | | 7,015,246 | |
Net change in net unrealized appreciation (depreciation) on investments and foreign currency translations | | | (24,348,831 | ) | | | 8,067,259 | |
| | | | | | | | |
Increase (decrease) in net assets from operations | | | (41,787,451 | ) | | | 14,794,422 | |
| | | | | | | | |
From Distributions to Shareholders: | | | | | | | | |
Net Investment Income: | | | | | | | | |
Institutional Class | | | — | | | | — | |
Retail Class | | | — | | | | — | |
Capital Gains: | | | | | | | | |
Institutional Class | | | — | | | | — | |
Retail Class | | | — | | | | — | |
| | | | | | | | |
Total distributions | | | — | | | | — | |
| | | | | | | | |
Increase (Decrease) in Net Assets Derived from Capital Shares Transactions (Note 8) | | | 133,294,170 | | | | (4,132,735 | ) |
| | | | | | | | |
Total increase in net assets | | | 91,506,719 | | | | 10,661,687 | |
Net Assets | | | | | | | | |
Beginning of year | | | 54,796,624 | | | | 44,134,937 | |
| | | | | | | | |
End of year | | $ | 146,303,343 | | | $ | 54,796,624 | |
| | | | | | | | |
Accumulated Net Investment Loss | | $ | (42,576 | ) | | $ | (38,169 | ) |
| | | | | | | | |
Small Cap Growth Fund
| | | | | | | | |
| | | Year Ended
September 30, 2008 | | | Year Ended
September 30, 2007 | |
From Operations: | | | | | | | | |
Net investment loss | | $ | (584,280 | ) | | $ | (143,375 | ) |
Net realized gain (loss) on investments | | | (6,171,517 | ) | | | 3,362,779 | |
Net change in net unrealized appreciation (depreciation) on investments | | | (10,322,096 | ) | | | 5,500,407 | |
| | | | | | | | |
Increase (decrease) in net assets from operations | | | (17,077,893 | ) | | | 8,719,811 | |
| | | | | | | | |
From Distributions to Shareholders: | | | | | | | | |
Net Investment Income: | | | | | | | | |
Institutional Class | | | — | | | | — | |
Retail Class | | | — | | | | — | |
Capital Gains: | | | | | | | | |
Institutional Class | | | — | | | | — | |
Retail Class | | | — | | | | — | |
| | | | | | | | |
Total distributions | | | — | | | | — | |
| | | | | | | | |
Increase in Net Assets Derived from Capital Shares Transactions (Note 8) | | | 92,473,941 | | | | 16,896,224 | |
| | | | | | | | |
Redemption Fees | | | | | | | | |
Institutional Class | | | 11,629 | | | | 346 | |
Retail Class | | | 17,229 | | | | 186 | |
| | | | | | | | |
Total increase in net assets | | | 75,424,906 | | | | 25,616,567 | |
Net Assets | | | | | | | | |
Beginning of year | | | 49,012,194 | | | | 23,395,627 | |
| | | | | | | | |
End of year | | $ | 124,437,100 | | | $ | 49,012,194 | |
| | | | | | | | |
Accumulated Net Investment Loss | | $ | (40,103 | ) | | $ | (35,571 | ) |
| | | | | | | | |
See accompanying notes to financial statements.
28
STATEMENTS OF CHANGES IN NET ASSETS – continued
Small Cap Value Fund
| | | | | | | | |
| | | Year Ended
September 30, 2008 | | | Year Ended
September 30, 2007 | |
From Operations: | | | | | | | | |
Net investment income | | $ | 3,447,311 | | | $ | 2,636,586 | |
Net realized gain (loss) on investments | | | (37,271,375 | ) | | | 100,922,002 | |
Net change in net unrealized appreciation (depreciation) on investments | | | (141,209,963 | ) | | | 34,456,656 | |
| | | | | | | | |
Increase (decrease) in net assets from operations | | | (175,034,027 | ) | | | 138,015,244 | |
| | | | | | | | |
From Distributions to Shareholders: | | | | | | | | |
Net Investment Income: | | | | | | | | |
Institutional Class | | | (1,132,960 | ) | | | (2,801,001 | ) |
Retail Class | | | — | | | | (1,058,622 | ) |
Admin Class | | | — | | | | (101,702 | ) |
Capital Gains: | | | | | | | | |
Institutional Class | | | (51,944,175 | ) | | | (50,563,842 | ) |
Retail Class | | | (47,065,282 | ) | | | (32,749,822 | ) |
Admin Class | | | (8,031,853 | ) | | | (7,983,100 | ) |
| | | | | | | | |
Total distributions | | | (108,174,270 | ) | | | (95,258,089 | ) |
| | | | | | | | |
Increase in Net Assets Derived from Capital Shares Transactions (Note 8) | | | 302,201,210 | | | | 235,053,214 | |
| | | | | | | | |
Redemption Fees | | | | | | | | |
Institutional Class | | | 20,568 | | | | 16,563 | |
Retail Class | | | 18,348 | | | | 13,201 | |
Admin Class | | | 3,084 | | | | 2,493 | |
| | | | | | | | |
Total increase in net assets | | | 19,034,913 | | | | 277,842,626 | |
Net Assets | | | | | | | | |
Beginning of year | | | 1,076,613,914 | | | | 798,771,288 | |
| | | | | | | | |
End of year | | $ | 1,095,648,827 | | | $ | 1,076,613,914 | |
| | | | | | | | |
Accumulated Net Investment Income | | $ | 1,842,018 | | | $ | 334,317 | |
| | | | | | | | |
See accompanying notes to financial statements.
29
THIS PAGE INTENTIONALLY LEFT BLANK
30
FINANCIAL HIGHLIGHTS
For a share outstanding throughout each period.
| | | | | | | | | | | | | | | | | | | | | | | | |
| | | | | Income (Loss) from Investment
Operations: | | | | | Less Distributions: |
| | | Net asset
value,
beginning
of
the period | | Net
investment
(loss)(c) | | | Net realized
and unrealized
gain (loss) | | | Total from
investment
operations | | | | | Dividends
from
net investment
income | | | Distributions
from net
realized
capital gains |
| Mid Cap Growth Fund | | | | | | | | | | | | | | | | | | | | | |
| | | | | | |
| Institutional Class | | | | | | | | | | | | | | | | | | | | | |
9/30/2008 | | $ | 27.51 | | $ | (0.10 | ) | | $ | (5.71 | ) | | $ | (5.81 | ) | | | | $ | — | | | $ | — |
9/30/2007 | | | 20.13 | | | (0.11 | )(d) | | | 7.49 | | | | 7.38 | | | | | | — | | | | — |
9/30/2006 | | | 19.00 | | | (0.10 | ) | | | 1.23 | | | | 1.13 | | | | | | — | | | | — |
9/30/2005 | | | 15.50 | | | (0.10 | ) | | | 3.78 | | | | 3.68 | | | | | | (0.18 | ) | | | — |
9/30/2004 | | | 13.69 | | | (0.13 | ) | | | 1.94 | | | | 1.81 | | | | | | — | | | | — |
| | | | | | | |
| Retail Class | | | | | | | | | | | | | | | | | | | | | | | | |
9/30/2008 | | $ | 26.84 | | $ | (0.15 | ) | | $ | (5.57 | ) | | $ | (5.72 | ) | | | | $ | — | | | $ | — |
9/30/2007 | | | 19.69 | | | (0.16 | )(d) | | | 7.31 | | | | 7.15 | | | | | | — | | | | — |
9/30/2006 | | | 18.63 | | | (0.15 | ) | | | 1.21 | | | | 1.06 | | | | | | — | | | | — |
9/30/2005 | | | 15.20 | | | (0.14 | ) | | | 3.70 | | | | 3.56 | | | | | | (0.13 | ) | | | — |
9/30/2004 | | | 13.46 | | | (0.16 | ) | | | 1.90 | | | | 1.74 | | | | | | — | | | | — |
(a) Had certain expenses not been reduced during the period, if applicable, total returns would have been lower. Periods less than one year, if applicable, are not annualized.
(b) The investment adviser and/or administrator agreed to reimburse a portion of the Fund’s expenses and/or reduce its fee during the period. Without this reimbursement/fee reduction, if applicable, expenses would have been higher.
(c) Per share net investment loss has been calculated using the average shares outstanding during the period.
(d) Includes a non-recurring payment of $0.02 per share.
(e) Computed on an annualized basis for periods less than one year, if applicable.
(f) Includes expense recapture of less than 0.01%.
See accompanying notes to financial statements.
31
| | | | | | | | | | | | | | | | | | | | | | |
| | | | | |
Ratios to Average Net Assets: |
| | | | | | | |
Total
distributions | | | Net asset
value,
end of
the period | | Total
return (%)(a) | | | Net assets,
end of
the period
(000’s) | | Net
expenses (%)(b)(e) | | | Gross
expenses (%)(e) | | | Net investment
income (loss) (%)(e) | | | Portfolio
turnover
rate (%) |
| | | | | | | | | | | | | | | | | | | | | | |
| | | | | | | |
| | | | | | | | | | | | | | | | | | | | | | |
| $ | — | | | $ | 21.70 | | (21.1 | ) | | $ | 25,779 | | 1.00 | (f) | | 1.00 | (f) | | (0.36 | ) | | 299 |
| | — | | | | 27.51 | | 36.7 | | | | 24,143 | | 1.00 | | | 1.10 | | | (0.47 | ) | | 194 |
| | — | | | | 20.13 | | 6.0 | | | | 17,467 | | 1.00 | | | 1.12 | | | (0.49 | ) | | 211 |
| | (0.18 | ) | | | 19.00 | | 23.9 | | | | 26,159 | | 1.00 | | | 1.21 | | | (0.60 | ) | | 280 |
| | — | | | | 15.50 | | 13.2 | | | | 25,191 | | 1.00 | | | 1.17 | | | (0.84 | ) | | 284 |
| | | | | | | |
| | | | | | | | | | | | | | | | | | | | | | |
| $ | — | | | $ | 21.12 | | (21.3 | ) | | $ | 120,524 | | 1.25 | | | 1.32 | | | (0.58 | ) | | 299 |
| | — | | | | 26.84 | | 36.3 | | | | 30,654 | | 1.25 | | | 1.43 | | | (0.71 | ) | | 194 |
| | — | | | | 19.69 | | 5.7 | | | | 26,668 | | 1.25 | | | 1.52 | | | (0.72 | ) | | 211 |
| | (0.13 | ) | | | 18.63 | | 23.6 | | | | 25,802 | | 1.25 | | | 1.50 | | | (0.85 | ) | | 280 |
| | — | | | | 15.20 | | 12.9 | | | | 25,382 | | 1.25 | | | 1.42 | | | (1.10 | ) | | 284 |
See accompanying notes to financial statements.
32
FINANCIAL HIGHLIGHTS – continued
For a share outstanding throughout each period.
| | | | | | | | | | | | | | | | | | | | | | | | | | | | | |
| | | | | Income (Loss) from Investment
Operations: | | | | | Less Distributions: | |
| | | Net asset
value,
beginning
of
the period | | Net
investment
income
(loss)(c)(d) | | | Net realized
and unrealized
gain (loss) | | | Total from
investment
operations | | | | | Dividends
from
net investment
income | | | Distributions
from net
realized
capital gains | | | Total
distributions | |
| Small Cap Growth Fund | | | | | | | | | | | | | | | | | | | | | | | |
| | | | | | | |
| Institutional Class | | | | | | | | | | | | | | | | | | | | | | | | | | |
9/30/2008 | | $ | 15.87 | | $ | (0.07 | ) | | $ | (2.73 | ) | | $ | (2.80 | ) | | | | $ | — | | | $ | — | | | $ | — | |
9/30/2007 | | | 12.00 | | | (0.06 | )(f) | | | 3.93 | | | | 3.87 | | | | | | — | | | | — | | | | — | |
9/30/2006 | | | 11.08 | | | (0.08 | ) | | | 0.99 | | | | 0.91 | | | | | | — | | | | — | | | | — | |
9/30/2005 | | | 8.96 | | | (0.08 | ) | | | 2.20 | | | | 2.12 | | | | | | — | | | | — | | | | — | |
9/30/2004 | | | 8.59 | | | (0.09 | ) | | | 0.46 | | | | 0.37 | | | | | | — | | | | — | | | | — | |
| | | | | | | |
| Retail Class | | | | | | | | | | | | | | | | | | | | | | | | | | |
9/30/2008 | | $ | 15.45 | | $ | (0.10 | ) | | $ | (2.66 | ) | | $ | (2.76 | ) | | | | $ | — | | | $ | — | | | $ | — | |
9/30/2007 | | | 11.71 | | | (0.09 | )(f) | | | 3.83 | | | | 3.74 | | | | | | — | | | | — | | | | — | |
9/30/2006 | | | 10.84 | | | (0.11 | ) | | | 0.97 | | | | 0.86 | | | | | | — | | | | — | | | | — | |
9/30/2005 | | | 8.78 | | | (0.11 | ) | | | 2.17 | | | | 2.06 | | | | | | — | | | | — | | | | — | |
9/30/2004 | | | 8.45 | | | (0.11 | ) | | | 0.44 | | | | 0.33 | | | | | | — | | | | — | | | | — | |
| | | | | | |
| Small Cap Value Fund | | | | | | | | | | | | | | | | | | | | | | | |
| | | | | | | |
| Institutional Class | | | | | | | | | | | | | | | | | | | | | | | | | | |
9/30/2008 | | $ | 28.77 | | $ | 0.11 | (i) | | $ | (4.03 | ) | | $ | (3.92 | ) | | | | $ | (0.06 | ) | | $ | (2.78 | ) | | $ | (2.84 | ) |
9/30/2007 | | | 27.69 | | | 0.12 | (f)(g) | | | 4.29 | | | | 4.41 | | | | | | (0.17 | ) | | | (3.16 | ) | | | (3.33 | ) |
9/30/2006 | | | 27.43 | | | 0.13 | | | | 2.70 | | | | 2.83 | | | | | | (0.15 | ) | | | (2.42 | ) | | | (2.57 | ) |
9/30/2005 | | | 25.75 | | | 0.13 | | | | 4.22 | | | | 4.35 | | | | | | (0.02 | ) | | | (2.65 | ) | | | (2.67 | ) |
9/30/2004 | | | 21.34 | | | 0.04 | | | | 4.97 | | | | 5.01 | | | | | | (0.05 | ) | | | (0.55 | ) | | | (0.60 | ) |
| | | | | | | |
| Retail Class | | | | | | | | | | | | | | | | | | | | | | | | | | |
9/30/2008 | | $ | 28.52 | | $ | 0.05 | (i) | | $ | (4.00 | ) | | $ | (3.95 | ) | | | | $ | — | | | $ | (2.78 | ) | | $ | (2.78 | ) |
9/30/2007 | | | 27.46 | | | 0.04 | (f)(g) | | | 4.28 | | | | 4.32 | | | | | | (0.10 | ) | | | (3.16 | ) | | | (3.26 | ) |
9/30/2006 | | | 27.23 | | | 0.06 | | | | 2.67 | | | | 2.73 | | | | | | (0.08 | ) | | | (2.42 | ) | | | (2.50 | ) |
9/30/2005 | | | 25.62 | | | 0.06 | | | | 4.20 | | | | 4.26 | | | | | | — | | | | (2.65 | ) | | | (2.65 | ) |
9/30/2004 | | | 21.25 | | | (0.02 | ) | | | 4.95 | | | | 4.93 | | | | | | (0.01 | ) | | | (0.55 | ) | | | (0.56 | ) |
| | | | | | | |
| Admin Class | | | | | | | | | | | | | | | | | | | | | | | | | | |
9/30/2008 | | $ | 28.13 | | $ | (0.01 | )(i) | | $ | (3.94 | ) | | $ | (3.95 | ) | | | | $ | — | | | $ | (2.78 | ) | | $ | (2.78 | ) |
9/30/2007 | | | 27.14 | | | (0.03 | )(f)(g) | | | 4.22 | | | | 4.19 | | | | | | (0.04 | ) | | | (3.16 | ) | | | (3.20 | ) |
9/30/2006 | | | 26.94 | | | (0.01 | ) | | | 2.65 | | | | 2.64 | | | | | | (0.02 | ) | | | (2.42 | ) | | | (2.44 | ) |
9/30/2005 | | | 25.43 | | | (0.00 | ) | | | 4.16 | | | | 4.16 | | | | | | — | | | | (2.65 | ) | | | (2.65 | ) |
9/30/2004 | | | 21.13 | | | (0.08 | ) | | | 4.93 | | | | 4.85 | | | | | | — | | | | (0.55 | ) | | | (0.55 | ) |
(a) Had certain expenses not been reduced during the period, if applicable, total returns would have been lower. Periods less than one year, if applicable, are not annualized.
(b) The investment adviser and/or administrator agreed to reimburse a portion of the Fund’s expenses and/or reduce its fees during the period. Without this reimbursement/fee reduction, if applicable, expenses would have been higher.
(c) Per share net investment income (loss) has been calculated using the average shares outstanding during the period.
(d) Amount rounds to less than $0.01 per share, if applicable.
(e) Includes expense recapture of 0.02%.
(f) Includes a non-recurring payment of $0.01 per share and $0.00 per share for Small Cap Growth Fund and Small Cap Value Fund, respectively.
(g) Includes a non-recurring dividend of $0.05 per share.
(h) Computed on an annualized basis for periods less than one year, if applicable.
(i) Includes a special dividend of $0.02 per share in which the source of the dividend has not been determined by the issuer.
See accompanying notes to financial statements.
33
| | | | | | | | | | | | | | | | | | | | | |
| | | | | |
| | | | | | | | | | Ratios to Average Net Assets: | | | |
| | | | | | | |
Redemption
fees(d) | | Net asset
value,
end of
the period | | Total
return (%)(a) | | | Net assets,
end of
the period
(000’s) | | Net
expenses (%)(b)(h) | | | Gross
expenses (%)(h) | | | Net investment
income (loss) (%)(h) | | | Portfolio
turnover
rate (%) |
| | | | | | | | | | | | | | | | | | | | | |
| | | | | | | |
| | | | | | | | | | | | | | | | | | | | | |
| $ | 0.00 | | $ | 13.07 | | (17.6 | ) | | $ | 44,540 | | 1.00 | | | 1.01 | | | (0.47 | ) | | 92 |
| | 0.00 | | | 15.87 | | 32.3 | | | | 28,088 | | 1.00 | | | 1.23 | | | (0.47 | ) | | 83 |
| | 0.01 | | | 12.00 | | 8.3 | | | | 20,414 | | 1.00 | | | 1.38 | | | (0.69 | ) | | 100 |
| | 0.00 | | | 11.08 | | 23.7 | | | | 15,785 | | 1.00 | | | 1.70 | | | (0.85 | ) | | 227 |
| | 0.00 | | | 8.96 | | 4.3 | | | | 15,867 | | 1.00 | | | 1.31 | | | (0.95 | ) | | 217 |
| | | | | | | |
| | | | | | | | | | | | | | | | | | | | | |
| $ | 0.00 | | $ | 12.69 | | (17.9 | ) | | $ | 79,897 | | 1.25 | | | 1.42 | | | (0.70 | ) | | 92 |
| | 0.00 | | | 15.45 | | 31.9 | | | | 20,924 | | 1.25 | | | 1.50 | | | (0.66 | ) | | 83 |
| | 0.01 | | | 11.71 | | 8.0 | | | | 2,981 | | 1.25 | | | 1.92 | | | (0.94 | ) | | 100 |
| | 0.00 | | | 10.84 | | 23.5 | | | | 3,592 | | 1.25 | | | 1.87 | | | (1.14 | ) | | 227 |
| | 0.00 | | | 8.78 | | 3.9 | | | | 14,589 | | 1.25 | | | 1.52 | | | (1.19 | ) | | 217 |
| | | | | | | |
| | | | | | | | | | | | | | | | | | | | | |
| | | | | | | |
| | | | | | | | | | | | | | | | | | | | | |
| $ | 0.00 | | $ | 22.01 | | (15.0 | ) | | $ | 553,268 | | 0.89 | | | 0.89 | | | 0.47 | | | 61 |
| | 0.00 | | | 28.77 | | 17.0 | | | | 534,776 | | 0.89 | | | 0.89 | | | 0.43 | | | 57 |
| | 0.00 | | | 27.69 | | 11.2 | | | | 442,714 | | 0.89 | (e) | | 0.89 | (e) | | 0.47 | | | 62 |
| | 0.00 | | | 27.43 | | 18.0 | | | | 403,110 | | 0.90 | | | 0.93 | | | 0.48 | | | 59 |
| | 0.00 | | | 25.75 | | 23.8 | | | | 346,356 | | 0.90 | | | 0.93 | | | 0.16 | | | 70 |
| | | | | | | |
| | | | | | | | | | | | | | | | | | | | | |
| $ | 0.00 | | $ | 21.79 | | (15.2 | ) | | $ | 464,525 | | 1.15 | | | 1.27 | | | 0.21 | | | 61 |
| | 0.00 | | | 28.52 | | 16.7 | | | | 465,055 | | 1.15 | | | 1.24 | | | 0.15 | | | 57 |
| | 0.00 | | | 27.46 | | 10.9 | | | | 291,690 | | 1.15 | | | 1.20 | | | 0.21 | | | 62 |
| | 0.00 | | | 27.23 | | 17.7 | | | | 235,948 | | 1.15 | | | 1.20 | | | 0.24 | | | 59 |
| | 0.00 | | | 25.62 | | 23.5 | | | | 173,411 | | 1.15 | | | 1.18 | | | (0.08 | ) | | 70 |
| | | | | | | |
| | | | | | | | | | | | | | | | | | | | | |
| $ | 0.00 | | $ | 21.40 | | (15.4 | ) | | $ | 77,855 | | 1.40 | | | 1.68 | | | (0.04 | ) | | 61 |
| | 0.00 | | | 28.13 | | 16.4 | | | | 76,783 | | 1.40 | | | 1.56 | | | (0.10 | ) | | 57 |
| | 0.00 | | | 27.14 | | 10.6 | | | | 64,367 | | 1.40 | | | 1.46 | | | (0.04 | ) | | 62 |
| | 0.00 | | | 26.94 | | 17.4 | | | | 67,505 | | 1.40 | | | 1.43 | | | (0.01 | ) | | 59 |
| | 0.00 | | | 25.43 | | 23.3 | | | | 62,680 | | 1.40 | | | 1.43 | | | (0.33 | ) | | 70 |
See accompanying notes to financial statements.
34
NOTES TO FINANCIAL STATEMENTS
September 30, 2008
1. Organization. Loomis Sayles Funds I and Loomis Sayles Funds II (the “Trusts” and each a “Trust”) are each organized as a Massachusetts business trust. Each Trust is registered under the Investment Company Act of 1940, as amended (the “1940 Act”), as an open-end management investment company. Each Declaration of Trust permits the Board of Trustees to authorize the issuance of an unlimited number of shares of the Trusts in multiple series. Information presented in these financial statements pertains to certain equity funds of the Trusts; the financial statements for the remaining equity funds and the fixed income funds of the Trusts are presented in separate reports. The following funds (individually, a “Fund” and collectively, the “Funds”) are included in this report:
Loomis Sayles Funds I:
Loomis Sayles Small Cap Value Fund (the “Small Cap Value Fund”)
Loomis Sayles Funds II:
Loomis Sayles Mid Cap Growth Fund (the “Mid Cap Growth Fund”)
Loomis Sayles Small Cap Growth Fund (the “Small Cap Growth Fund”)
Each Fund offers Institutional Class Shares and Retail Class Shares. In addition, Small Cap Value Fund offers Admin Class Shares.
Most expenses of the Trusts can be directly attributed to a fund. Expenses which cannot be directly attributed to a fund are generally apportioned based on the relative net assets of each of the funds in the Trusts. Expenses of a fund are borne pro rata by the holders of each class of shares, except that each class bears expenses unique to that class (including the Rule 12b-1 service and distribution fees and transfer agent fees applicable to such class). In addition, each class votes as a class only with respect to its own Rule 12b-1 Plan. Shares of each class would receive their pro rata share of the net assets of a fund if the fund were liquidated. The Trustees approve separate dividends from net investment income on each class of shares.
2. Significant Accounting Policies. The following is a summary of significant accounting policies consistently followed by each Fund in the preparation of its financial statements. The Funds’ financial statements are prepared in accordance with accounting principles generally accepted in the United States of America which require the use of management estimates that affect the reported amounts and disclosures in the financial statements. Actual results could differ from those estimates.
a. Security Valuation. Equity securities, including closed-end investment companies and exchange-traded funds, for which market quotations are readily available are valued at market value, as reported by pricing services recommended by the investment adviser and approved by the Board of Trustees. Such pricing services generally use the security’s last sale price on the exchange or market where the security is primarily traded or, if there is no reported sale during the day, the closing bid price. Securities traded on the NASDAQ Global Select Market, NASDAQ Global Market and NASDAQ Capital Market are valued at the NASDAQ Official Closing Price (“NOCP”), or if lacking a NOCP, at the most recent bid quotation on the applicable NASDAQ Market. Debt securities (other than short-term obligations purchased with an original or remaining maturity of sixty days or less) are generally valued on the basis of evaluated bids furnished to the Funds by a pricing service recommended by the investment adviser and approved by the Board of Trustees, which service determines valuations for normal, institutional-size trading units of such securities using market information, transactions for comparable securities and various relationships between securities which are generally recognized by institutional traders. Broker-dealer bid quotations may also be used to value debt and equity securities where a pricing service does not price a security or where a pricing service does not provide a reliable price for the security. In instances where broker-dealer bid quotations are not available, certain securities held by the Funds may be valued on the basis of a price provided by a principal market maker. Short-term obligations purchased with an original or remaining maturity of sixty days or less are valued at amortized cost, which approximates market value. Securities for which market quotations are not readily available are valued at fair value as determined in good faith by the Funds’ investment adviser using consistently applied procedures under the general supervision of the Board of Trustees. Investments in other open-end investment companies are valued at their net asset value each day.
The Funds may hold securities traded in foreign markets. Foreign securities are valued at the market price in the foreign market. However, if events occurring after the close of the foreign market (but before the close of regular trading on the New York Stock Exchange) are believed to materially affect the value of those securities, such securities are fair valued pursuant to procedures approved by the Board of Trustees. When fair valuing securities, the Funds may, among other things, use modeling tools or other processes that may take into account factors such as securities market activity and/or significant events that occur after the close of the foreign market and before the Funds calculate their net asset values.
b. Security Transactions and Related Investment Income. Security transactions are accounted for on trade date. Dividend income is recorded on ex-dividend date, or in the case of certain foreign securities, as soon as the Fund is notified, and interest income is
35
recorded on an accrual basis. Interest income is increased by the accretion of discount and decreased by the amortization of premium. Distributions received from investments in securities that represent a return of capital or capital gain are recorded as a reduction of cost of investments or as a realized gain, respectively. The calendar year-end amounts of ordinary income, capital gains, and return of capital included in distributions received from the Funds’ investments in real estate investment trusts (“REITs”) are reported to the Funds after the end of the fiscal year; accordingly, the Funds estimate these amounts for accounting purposes until the characterization of REIT distributions is reported to the Funds after the end of the fiscal year. Estimates are based on the most recent REIT distribution information available. Investment income is recorded net of foreign taxes withheld when applicable. In determining net gain or loss on securities sold, the cost of securities has been determined on an identified cost basis. Investment income, non-class specific expenses and realized and unrealized gains and losses are allocated on a pro rata basis to each class based on the relative net assets of each class to the total net assets of the Fund.
c. Foreign Currency Translation. The books and records of the Funds are maintained in U.S. dollars. The value of securities, currencies and other assets and liabilities denominated in currencies other than U.S. dollars are translated into U.S. dollars based upon foreign exchange rates prevailing at the end of the period. Purchases and sales of investment securities, income and expenses are translated on the respective dates of such transactions.
Since the values of investment securities are presented at the foreign exchange rates prevailing at the end of the period, it is not practical to isolate that portion of the results of operations arising from changes in exchange rates from fluctuations which arise due to changes in market prices of the investment securities. Such changes are included with the net realized and unrealized gain or loss on investments.
Net realized foreign exchange gains or losses arise from sales of foreign currency, currency gains or losses realized between the trade and settlement dates on securities transactions and the difference between the amounts of dividends, interest and foreign withholding taxes recorded on the Funds’ books and the U.S. dollar equivalent of the amounts actually received or paid. Net unrealized foreign exchange gains and losses arise from changes in the value of assets and liabilities, other than investment securities, at the end of the fiscal period, resulting from changes in exchange rates.
Each Fund may use foreign currency exchange contracts to facilitate transactions in foreign-denominated investments. Losses may arise from changes in the value of the foreign currency or if the counterparties do not perform under the contracts’ terms.
Each Fund may purchase investments of foreign issuers. Investing in securities of foreign issuers involves special risks and considerations not typically associated with investing in U.S. companies and securities of the U.S. government. These risks include revaluation of currencies and the risk of appropriation. Moreover, the markets for securities of many foreign issuers may be less liquid and the price of such securities may be more volatile than those of comparable U.S. companies and the U.S. government.
d. Forward Foreign Currency Contracts. Each Fund may enter into forward foreign currency contracts. Contracts to buy generally are used to acquire exposure to foreign currencies, while contracts to sell generally are used to hedge a Fund’s investments against currency fluctuation. Also, a contract to buy or sell can offset a previous contract. These contracts involve market risk in excess of the unrealized gain or loss reflected in the Fund’s Statement of Assets and Liabilities. The U.S. dollar value of the currencies a Fund has committed to buy or sell represents the aggregate exposure to each currency the Fund has acquired or hedged through currency contracts outstanding at period end.
All contracts are “marked-to-market” daily at the applicable exchange rates and any gains or losses are recorded for financial statement purposes as unrealized until settlement date. Risks may arise upon entering into these contracts from the potential inability of counterparties to meet the terms of their contracts and from unanticipated movements in the value of a foreign currency relative to the U.S. dollar. At September 30, 2008, there were no open forward currency contracts.
e. Federal and Foreign Income Taxes. Each Trust treats each Fund as a separate entity for federal income tax purposes. Each Fund intends to meet the requirements of the Internal Revenue Code applicable to regulated investment companies, and to distribute to its shareholders substantially all of its net investment income and any net realized capital gains at least annually. Management has performed an analysis of the Funds’ tax positions taken on federal and state tax returns that remain subject to examinations (tax years ended September 30, 2005-2008) and has concluded that no provisions for income tax are required. Fund management is not aware of any events that are reasonably possible to occur in the next twelve months that would result in the amounts of any unrecognized tax benefits significantly increasing or decreasing for the Funds. However, management’s conclusions regarding tax positions taken may be subject to review and adjustment at a later date based on factors including, but not limited to, new tax laws and accounting regulations and interpretations thereof.
A Fund may be subject to foreign taxes on income and gains on investments that are accrued based upon the Fund’s understanding of the tax rules and regulations that exist in the countries in which the Fund invests. Foreign governments may also impose taxes or other payments on investments with respect to foreign securities. Such taxes are accrued as applicable.
36
NOTES TO FINANCIAL STATEMENTS – continued
September 30, 2008
f. Dividends and Distributions to Shareholders. Dividends and distributions are recorded on ex-dividend date. The timing and characterization of certain income and capital gain distributions are determined annually in accordance with federal tax regulations, which may differ from accounting principles generally accepted in the United States of America. Permanent differences are primarily due to differing treatments for book and tax purposes for items such as distributions from REITs, foreign currency transactions and net operating losses. Permanent book and tax basis differences relating to shareholder distributions will result in reclassifications to capital accounts. Temporary differences between book and tax distributable earnings are primarily due to securities lending collateral gain/loss adjustment, deferred Trustees’ fees, REIT basis adjustments and wash sales. Distributions from net investment income and short-term capital gains are considered to be distributed from ordinary income for tax purposes.
The tax characterization of distributions is determined on an annual basis. The tax character of distributions paid to shareholders during the years ended September 30, 2008 and 2007 was as follows:
| | | | | | | | | | | | | | | | | | |
| | | 2008 Distributions Paid From: | | 2007 Distributions Paid From: |
Fund | | Ordinary
Income | | Long-Term
Capital Gains | | Total | | Ordinary
Income | | Long-Term
Capital Gains | | Total |
Mid Cap Growth Fund | | $ | — | | $ | — | | $ | — | | $ | — | | $ | — | | $ | — |
Small Cap Growth Fund | | | — | | | — | | | — | | | — | | | — | | | — |
Small Cap Value Fund | | | 16,873,484 | | | 91,300,786 | | | 108,174,270 | | | 19,298,487 | | | 75,959,602 | | | 95,258,089 |
Differences between these amounts and those reported in the Statements of Changes in Net Assets are primarily attributable to different book and tax treatment for short-term capital gains.
As of September 30, 2008, the components of distributable earnings on a tax basis were as follows:
| | | | | | | | | | | | |
| | | Mid Cap
Growth Fund | | | Small Cap
Growth Fund | | | Small Cap
Value Fund | |
Undistributed ordinary income | | $ | — | | | $ | — | | | $ | 1,955,507 | |
Undistributed long-term capital gains | | | — | | | | — | | | | 331,178 | |
| | | | | | | | | | | | |
Total undistributed earnings | | | — | | | | — | | | | 2,286,685 | |
Capital Loss Carryforward: | | | | | | | | | | | | |
Expires September 30, 2010 | | | (65,130,772 | ) | | | (138,314,515 | ) | | | — | |
Expires September 30, 2011 | | | (21,142,388 | ) | | | (59,283,040 | ) | | | — | |
Total capital loss carryforward | | | (86,273,160 | ) | | | (197,597,555 | ) | | | — | |
Deferred net capital losses
(post-October 2007) | | | (18,347,531 | ) | | | (7,364,469 | ) | | | (47,743,728 | ) |
Unrealized appreciation
(depreciation) | | | (11,623,796 | ) | | | (2,566,582 | ) | | | 23,648,246 | |
| | | | | | | | | | | | |
Total accumulated earnings
(losses) | | $ | (116,244,487 | ) | | $ | (207,528,606 | ) | | $ | (21,808,797 | ) |
| | | | | | | | | | | | |
Capital loss carryforward
utilized in the current year | | $ | 1,847,474 | | | $ | 1,209,729 | | | $ | — | |
| | | | | | | | | | | | |
g. Repurchase Agreements. Each Fund, through its custodian, receives delivery of the underlying securities collateralizing repurchase agreements. It is each Fund’s policy that the market value of the collateral be at least equal to 102% of the repurchase price, including interest. The repurchase agreements are tri-party arrangements whereby the collateral is held at the custodian bank in a segregated account for the benefit of the Fund and on behalf of the counterparty. Repurchase agreements could involve certain risks in the event of default or insolvency of the counterparty including possible delays or restrictions upon a Fund’s ability to dispose of the underlying securities.
h. Securities Lending. The Funds have entered into an agreement with State Street Bank and Trust Company (“State Street Bank”), as agent of the Funds, to lend securities to certain designated borrowers. The loans are collateralized with cash or securities in an amount equal to at least 105% or 102% of the market value of the loaned international or domestic securities, respectively, when the loan is initiated. Thereafter, the value of the collateral must remain at least 102% of the market value of loaned securities for U.S. equities and U.S. corporate debt; at least 105% of the market value of loaned securities for non-U.S. equities; and at least 100% of the market value of loaned securities for U.S. government securities, sovereign debt issued by non-U.S. governments and non-U.S. corporate debt. In the event that the market value of the collateral falls below the required percentages described above, the borrower will deliver additional collateral on the next business day. As with other extensions of credit, the Funds may bear the risk of loss with respect to the investment of the collateral. The Funds invest cash collateral in short-term investments, a portion of the income from which is remitted to the borrowers and the remainder allocated between the Funds and State Street Bank as
37
lending agent. The value of securities on loan to borrowers and the value of collateral held by the Funds with respect to such loans at September 30, 2008 were as follows:
| | | | | | |
| | | Value of
Securities on Loan | | Value of
Collateral |
Mid Cap Growth Fund | | $ | 22,615,127 | | $ | 22,705,247 |
Small Cap Growth Fund | | | 22,689,377 | | | 22,691,148 |
Small Cap Value Fund | | | 197,462,353 | | | 195,864,078 |
Subsequent to September 30, 2008, all open securities lending transactions were closed.
i. Indemnifications. Under the Trusts’ organizational documents, their officers and Trustees are indemnified against certain liabilities arising out of the performance of their duties to the Funds. Additionally, in the normal course of business, the Funds enter into contracts with service providers that contain general indemnification clauses. The Funds’ maximum exposure under these arrangements is unknown as this would involve future claims that may be made against the Funds that have not yet occurred. However, based on experience, the Funds expect the risk of loss to be remote.
j. New Accounting Pronouncement. In September 2006, Statement of Financial Accounting Standards No. 157, Fair Value Measurements (“FAS 157”), was issued and is effective for fiscal years beginning after November 15, 2007. FAS 157 defines fair value, establishes a framework for measuring fair value and expands disclosures about fair value measurements. Management has evaluated the impact the adoption of FAS 157 will have on the Funds’ financial statements and believes that such impact will be limited to expanded disclosure in the Funds’ financial statements regarding inputs used in determining the value of the Funds’ investments.
In March 2008, Statement of Financial Accounting Standards No. 161, Disclosures about Derivative Instruments and Hedging Activities (“FAS 161”), was issued and will be effective for fiscal years and interim periods beginning after November 15, 2008. FAS 161 requires enhanced disclosures about funds’ derivative and hedging activities. Management is currently evaluating the impact the adoption of FAS 161 will have on the Funds’ financial statement disclosures.
3. Purchases and Sales of Securities. For the year ended September 30, 2008, purchases and sales of securities (excluding short-term investments) were as follows:
| | | | | | |
Fund | | Purchases | | Sales |
Mid Cap Growth Fund | | $ | 461,496,904 | | $ | 336,296,687 |
Small Cap Growth Fund | | | 175,639,765 | | | 84,821,824 |
Small Cap Value Fund | | | 860,871,284 | | | 625,425,569 |
4. Management Fees and Other Transactions with Affiliates.
a. Management Fees. Loomis, Sayles & Company, L.P. (“Loomis Sayles”) serves as investment adviser to each Fund. Under the terms of the management agreements, each Fund pays a management fee at the following annual rates, calculated daily and payable monthly, based on each Fund’s average daily net assets:
| | |
Fund | | Percentage of
Average Daily
Net Assets |
Mid Cap Growth Fund | | 0.75% |
Small Cap Growth Fund | | 0.75% |
Small Cap Value Fund | | 0.75% |
Loomis Sayles has given binding undertakings to the Funds to reduce management fees and/or reimburse certain expenses associated with the Funds to limit their operating expenses. These undertakings are in effect until January 31, 2009 and will be reevaluated on an annual basis. For the year ended September 30, 2008, the expense limits as a percentage of average daily net assets under the expense limitation agreements were as follows:
| | | | | | | | | |
| | | Expense Limit as a Percentage of
Average Daily Net Assets | |
Fund | | Institutional Class | | | Retail Class | | | Admin Class | |
Mid Cap Growth Fund | | 1.00 | % | | 1.25 | % | | — | |
Small Cap Growth Fund | | 1.00 | % | | 1.25 | % | | — | |
Small Cap Value Fund | | 0.90 | % | | 1.15 | % | | 1.40 | % |
38
NOTES TO FINANCIAL STATEMENTS – continued
September 30, 2008
For the year ended September 30, 2008, the management fees for each Fund were as follows:
| | | | | |
Fund | | Management
Fee | | Percentage of
Average Daily
Net Assets |
Mid Cap Growth Fund | | $ | 909,027 | | 0.75% |
Small Cap Growth Fund | | | 726,130 | | 0.75% |
Small Cap Value Fund | | | 8,053,932 | | 0.75% |
For the year ended September 30, 2008, class specific expenses have been reimbursed as follows:
| | | |
Fund | | Reimbursement |
Mid Cap Growth Fund | | $ | 64,519 |
Small Cap Growth Fund | | | 95,181 |
Small Cap Value Fund | | | 767,446 |
Loomis Sayles shall be permitted to recover expenses it has borne under the expense limitation agreement (whether through reduction of its management fees or otherwise) on a class by class basis in later periods to the extent the expenses of a class fall below a class’ expense limits, provided, however, that a class is not obligated to pay such reduced fees/expenses more than one year after the end of the fiscal year in which the fee/expense was reduced. The amounts subject to possible reimbursement under the expense limitation agreements at September 30, 2008 were as follows:
| | | | | | | | | | | | |
| | | Expenses Subject to Possible Reimbursement Until
September 30, 2009 |
Fund | | Institutional Class | | Retail Class | | Admin Class | | Total |
Mid Cap Growth Fund | | $ | — | | $ | 64,519 | | $ | — | | $ | 64,519 |
Small Cap Growth Fund | | | 2,492 | | | 92,689 | | | — | | | 95,181 |
Small Cap Value Fund | | | — | | | 546,480 | | | 220,966 | | | 767,446 |
Certain officers and employees of Loomis Sayles are also officers or Trustees of the Trust. Loomis Sayles’ general partner is indirectly owned by Natixis Global Asset Management, L.P. (“Natixis US”), which is part of Natixis Global Asset Management, an international asset management group based in Paris, France.
For the year ended September 30, 2008, Loomis Sayles reimbursed the Mid Cap Growth Fund $1,112 for losses incurred in connection with a trading error.
b. Administrative Fees. Natixis Asset Management Advisors, L.P. (“Natixis Advisors”) provides certain administrative services for the Funds and subcontracts with State Street Bank to serve as sub-administrator. Natixis Advisors is a wholly-owned subsidiary of Natixis US. Pursuant to an agreement among Natixis Funds Trust I, Natixis Funds Trust II, Natixis Funds Trust III, Natixis Funds Trust IV, Natixis Cash Management Trust, Gateway Trust (“Natixis Funds Trusts”), Loomis Sayles Funds I, Loomis Sayles Funds II (“Loomis Sayles Funds Trusts”), Hansberger International Series and Natixis Advisors, each Fund pays Natixis Advisors monthly its pro rata portion of fees equal to an annual rate of 0.0575% of the first $15 billion of the average daily net assets of the Natixis Funds Trusts, Loomis Sayles Funds Trusts and the Hansberger International Series, 0.0500% of the next $15 billion, 0.0425% of the next $30 billion and 0.0375% of such assets in excess of $60 billion, subject to an annual aggregate minimum fee for the Natixis Funds Trusts , Loomis Sayles Funds Trusts and the Hansberger International Series of $10 million, which is reevaluated on an annual basis. New funds are subject to an annual fee of $75,000 plus $12,500 per class and an additional $75,000 if managed by multiple subadvisors in their first calendar year of operations.
Effective October 1, 2007, State Street Bank agreed to reduce the fees it receives from Natixis Advisors for serving as sub-administrator to the Funds. Also, effective October 1, 2007, Natixis Advisors gave a binding contractual undertaking to the Funds to waive the administrative fees paid by the Funds in an amount equal to the reduction in sub-administrative fees discussed above. The waiver was in effect through June 30, 2008.
Prior to July 1, 2008, the Funds paid Natixis Advisors monthly its pro rata portion of fees equal to an annual rate of 0.0675% of the first $5 billion of the average daily net assets of the Natixis Funds Trusts, Loomis Sayles Funds Trusts and the Hansberger International Series, 0.0625% of the next $5 billion, 0.0500% of the next $20 billion and 0.045% of such assets in excess of $30 billion, subject to an annual aggregate minimum fee for the Natixis Funds Trusts, Loomis Sayles Funds Trusts and the Hansberger International Series of $5 million, which was reevaluated on an annual basis. New funds were subject to an annual fee of $50,000 plus $12,500 per class and an additional $50,000 if managed by multiple subadvisors in their first calendar year of operations.
39
For the year ended September 30, 2008, amounts paid to Natixis Advisors for administrative fees were as follows:
| | | | | | | | | |
Fund | | Gross
Administrative
Fees | | Waiver of
Administrative
Fees | | Net
Administrative
Fees |
Mid Cap Growth Fund | | $ | 61,279 | | $ | 2,046 | | $ | 59,233 |
Small Cap Growth Fund | | | 49,032 | | | 1,709 | | | 47,323 |
Small Cap Value Fund | | | 546,547 | | | 20,880 | | | 525,667 |
c. Service and Distribution Fees. Natixis Distributors, L.P. (“Natixis Distributors”), a wholly owned subsidiary of Natixis US, has entered into a distribution agreement with the Trust. Pursuant to this agreement, Natixis Distributors serves as principal underwriter of each Fund.
Pursuant to Rule 12b-1 under the 1940 Act, the Mid Cap Growth Fund, the Small Cap Growth Fund and the Small Cap Value Fund have adopted a Distribution Plan relating to their Retail Class shares (the “Retail Class Plans”) and the Small Cap Value Fund has adopted a separate Distribution Plan relating to its Admin Class shares (the “Admin Class Plan”).
Under the respective Retail Class and Admin Class Plans, each Fund pays Natixis Distributors a monthly distribution fee at an annual rate not to exceed 0.25% of the average daily net assets attributable to the Fund’s Retail Class and Admin Class Shares, as reimbursement for expenses incurred by Natixis Distributors in providing personal services to investors in Retail Class and Admin Class Shares and/or maintenance of shareholder accounts. In addition, the Admin Class shares of the Small Cap Value Fund may pay an administrative service fee, at an annual rate not to exceed 0.25% of the average daily net assets attributable to Admin Class shares, to securities dealers or financial intermediaries for providing personal service and account maintenance for their customers who hold such shares.
For the year ended September 30, 2008, the Funds paid the following service and distribution fees:
| | | | | | | | | |
| | | Service Fees | | Distribution Fees |
Fund | | Admin
Class | | Retail
Class | | Admin
Class |
Mid Cap Growth Fund | | $ | — | | $ | 228,997 | | $ | — |
Small Cap Growth Fund | | | — | | | 140,202 | | | — |
Small Cap Value Fund | | | 197,898 | | | 1,174,810 | | | 197,898 |
d. Sub-Transfer Agent Fees. Natixis Distributors has entered into agreements with financial intermediaries to provide certain recordkeeping, processing, shareholder communications and other services to customers of the intermediaries and has agreed to compensate the intermediaries for providing those services. Certain services would be provided by the Funds if the shares of those customers were registered directly with the Funds’ transfer agent. Accordingly, the Funds agreed to pay a portion of the intermediary fees attributable to shares of the Fund held by the intermediary (which generally is a percentage of the value of shares held) not exceeding what the Funds would have paid its transfer agent had each customer’s shares been registered directly with the transfer agent instead of held through the intermediary. Natixis Distributors pays the remainder of the fees. Listed below are the fees incurred by the Funds which are included in the transfer agent fees and expenses in the Statements of Operations.
| | | | | | | | | |
| | | Sub-Transfer Agent Fees |
Fund | | Institutional
Class | | Retail
Class | | Admin
Class |
Mid Cap Growth Fund | | $ | 10,845 | | $ | 100,391 | | $ | — |
Small Cap Growth Fund | | | 16,844 | | | 51,624 | | | — |
Small Cap Value Fund | | | 247,244 | | | 758,261 | | | 262,375 |
e. Trustees Fees and Expenses. The Funds do not pay any compensation directly to their officers or Trustees who are directors, officers or employees of Natixis Advisors, Natixis Distributors, Natixis US, or their affiliates. The Chairperson of the Board receives a retainer fee at the annual rate of $200,000. The Chairperson does not receive any meeting attendance fees for Board of Trustees meetings or committee meetings that she attends. Each Independent Trustee (other than the Chairperson) receives, in the aggregate, a retainer fee at the annual rate of $65,000. Each Independent Trustee also receives a meeting attendance fee of $7,500 for each meeting of the Board of Trustees that he or she attends in person and $3,750 for each meeting of the Board of Trustees that he or she attends telephonically. In addition, each committee chair receives an additional retainer fee at the annual rate of $10,000. Each Contract Review and Governance Committee member is compensated $5,000 for each Committee meeting that
40
NOTES TO FINANCIAL STATEMENTS – continued
September 30, 2008
he or she attends in person and $2,500 for each meeting that he or she attends telephonically. Each Audit Committee member is compensated $6,250 for each Committee meeting that he or she attends in person and $3,125 for each meeting that he or she attends telephonically. These fees are allocated among the funds in the Natixis Funds Trusts, Loomis Sayles Funds Trusts and the Hansberger International Series based on a formula that takes into account, among other factors, the relative net assets of each Fund. Trustees are reimbursed for travel expenses in connection with attendance at meetings.
Prior to January 1, 2008, each Independent Trustee (other than the Chairperson) received, in the aggregate, a retainer fee at the annual rate of $55,000. Each Independent Trustee also received a meeting attendance fee of $6,000 for each meeting of the Board of Trustees that he or she attended in person and $3,000 for each meeting that he or she attended telephonically. In addition, each Contract Review and Governance Committee member received $4,000 for each committee meeting that he or she attended in person and $2,000 for each committee meeting that he or she attended telephonically. Each Audit Committee member received $5,000 for each committee meeting that he or she attended in person and $2,500 for each committee meeting that he or she attended telephonically. The Chairperson of the Board and committee chair retainers were $200,000 and $10,000, respectively.
A deferred compensation plan (the “Plan”) is available to the Trustees on a voluntary basis. Deferred amounts remain in the Funds until distributed in accordance with the provisions of the Plan. The value of a participating Trustee’s deferral account is based on theoretical investments of deferred amounts, on the normal payment dates, in certain funds of the Natixis Funds Trusts, Loomis Sayles Funds Trusts and Hansberger International Series as designated by the participating Trustees. Changes in the value of participants’ deferral accounts are allocated pro rata among the funds in the Natixis Funds Trusts, Loomis Sayles Funds Trusts, and Hansberger International Series, and are reflected as Trustees’ fees and expenses in the Statements of Operations. The portions of the accrued obligations allocated to the Funds under the Plan are reflected as Deferred Trustees’ fees in the Statements of Assets and Liabilities.
f. Redemption Fees. Shareholders of Small Cap Growth Fund and Small Cap Value Fund are charged a 2% redemption fee if they redeem, including redeeming by exchange, any class of shares of such Funds within 60 days of their acquisition (including acquisition by exchange). The redemption fee is intended to offset the costs to the Funds of short-term trading, such as portfolio transaction and market impact costs associated with redemption activity and administrative costs associated with processing redemptions. The redemption fee is deducted from the shareholder’s redemption or exchange proceeds and is paid to the Fund.
The “first-in, first-out” method is used to determine the holding period of redeemed or exchanged shares, which means that if a shareholder acquired shares on different days, the shares acquired first will be redeemed or exchanged first for purposes of determining whether the redemption fee applies. A new holding period begins with each purchase or exchange. These fees are accounted for as an addition to paid-in capital and are presented in the Statements of Changes in Net Assets.
5. Line of Credit. Each Fund, together with certain other funds of Natixis Funds Trusts, Loomis Sayles Funds Trusts and the Hansberger International Series, participates in a $200,000,000 committed line of credit provided by State Street Bank, with an individual limit of $125,000,000 for each Fund that participates in the line of credit. Interest is charged to each participating fund based on its borrowings at a rate per annum equal to the Federal Funds rate plus 0.50%. In addition, a commitment fee of 0.09% per annum, payable at the end of each calendar quarter, is accrued and apportioned among the participating funds based on their average daily unused portion of the line of credit.
Prior to March 12, 2008, each Fund, together with certain other funds of Natixis Funds Trusts, Loomis Sayles Funds Trusts and Hansberger International Series, participated in a $75,000,000 committed line of credit provided by State Street Bank.
For the year ended September 30, 2008, the Funds had no borrowings under these agreements.
6. Brokerage Commission Recapture. Each Fund has entered into agreements with certain brokers whereby the brokers will rebate a portion of brokerage commissions. All amounts rebated by the brokers are returned to the Funds under such agreements and are included in realized gains in the Statements of Operations. For the year ended September 30, 2008, amounts rebated under these agreements were as follows:
| | | |
Fund | | Rebates |
Mid Cap Growth Fund | | $ | 27,162 |
Small Cap Growth Fund | | | 13,724 |
Small Cap Value Fund | | | 117,277 |
7. Shareholders. At September 30, 2008, the Loomis Sayles Funded Pension Plan and the Loomis Sayles Employees’ Profit Sharing Retirement Plan held Institutional Class shares of beneficial interest in the Funds as follows:
| | | | |
Fund | | Pension Plan | | Profit Sharing
Retirement Plan |
Mid Cap Growth Fund | | 320,493 | | 370,439 |
Small Cap Growth Fund | | 375,466 | | 383,591 |
Small Cap Value Fund | | 366,402 | | 733,101 |
41
8. Capital Shares. Each Fund may issue an unlimited number of shares of beneficial interest, without par value. Transactions in capital shares were as follows:
| | | | | | | | | | | | | | |
| | | Mid Cap Growth Fund | |
| | |
| | | Year Ended September 30, 2008 | | | Year Ended September 30, 2007 | |
| | | | |
| Institutional Class | | Shares | | | Amount | | | Shares | | | Amount | |
Issued from the sale of shares | | 835,746 | | | $ | 23,099,020 | | | 122,987 | | | $ | 2,932,877 | |
Issued in connection with the
reinvestment of distributions | | — | | | | — | | | — | | | | — | |
Redeemed | | (525,115 | ) | | | (13,663,476 | ) | | (113,087 | ) | | | (2,616,811 | ) |
| | | | | | | | | | | | | | |
Net change | | 310,631 | | | $ | 9,435,544 | | | 9,900 | | | $ | 316,066 | |
| | | | | | | | | | | | | | |
| | | | |
| Retail Class | | Shares | | | Amount | | | Shares | | | Amount | |
Issued from the sale of shares | | 7,376,061 | | | $ | 191,485,150 | | | 404,396 | | | $ | 9,618,611 | |
Issued in connection with the
reinvestment of distributions | | — | | | | — | | | — | | | | — | |
Redeemed | | (2,811,222 | ) | | | (67,626,524 | ) | | (616,665 | ) | | | (14,067,412 | ) |
| | | | | | | | | | | | | | |
Net change | | 4,564,839 | | | $ | 123,858,626 | | | (212,269 | ) | | $ | (4,448,801 | ) |
| | | | | | | | | | | | | | |
Increase (decrease) from capital
share transactions | | 4,875,470 | | | $ | 133,294,170 | | | (202,369 | ) | | $ | (4,132,735 | ) |
| | | | | | | | | | | | | | |
| |
| | | Small Cap Growth Fund | |
| | |
| | | Year Ended September 30, 2008 | | | Year Ended September 30, 2007 | |
| | | | |
| Institutional Class | | Shares | | | Amount | | | Shares | | | Amount | |
Issued from the sale of shares | | 2,094,507 | | | $ | 30,602,699 | | | 227,764 | | | $ | 3,236,460 | |
Issued in connection with the
reinvestment of distributions | | — | | | | — | | | — | | | | — | |
Redeemed | | (456,742 | ) | | | (6,441,388 | ) | | (158,397 | ) | | | (2,160,742 | ) |
| | | | | | | | | | | | | | |
Net change | | 1,637,765 | | | $ | 24,161,311 | | | 69,367 | | | $ | 1,075,718 | |
| | | | | | | | | | | | | | |
| | | | |
| Retail Class | | Shares | | | Amount | | | Shares | | | Amount | |
Issued from the sale of shares | | 6,898,095 | | | $ | 94,809,730 | | | 1,247,066 | | | $ | 17,800,763 | |
Issued in connection with the
reinvestment of distributions | | — | | | | — | | | — | | | | — | |
Redeemed | | (1,956,386 | ) | | | (26,497,100 | ) | | (147,091 | ) | | | (1,980,257 | ) |
| | | | | | | | | | | | | | |
Net change | | 4,941,709 | | | $ | 68,312,630 | | | 1,099,975 | | | $ | 15,820,506 | |
| | | | | | | | | | | | | | |
Increase (decrease) from capital
share transactions | | 6,579,474 | | | $ | 92,473,941 | | | 1,169,342 | | | $ | 16,896,224 | |
| | | | | | | | | | | | | | |
42
NOTES TO FINANCIAL STATEMENTS – continued
September 30, 2008
| | | | | | | | | | | | | | |
| | | Small Cap Value Fund | |
| | |
| | | Year Ended September 30, 2008 | | | Year Ended September 30, 2007 | |
| | | | |
| Institutional Class | | Shares | | | Amount | | | Shares | | | Amount | |
Issued from the sale of shares | | 9,681,674 | | | $ | 228,728,526 | | | 3,665,690 | | | $ | 103,476,796 | |
Issued in connection with the
reinvestment of distributions | | 1,942,239 | | | | 49,352,283 | | | 1,908,336 | | | | 50,494,585 | |
Redeemed | | (5,076,716 | ) | | | (120,789,687 | ) | | (2,978,936 | ) | | | (83,598,708 | ) |
| | | | | | | | | | | | | | |
Net change | | 6,547,197 | | | $ | 157,291,122 | | | 2,595,090 | | | $ | 70,372,673 | |
| | | | | | | | | | | | | | |
| | | | |
| Retail Class | | Shares | | | Amount | | | Shares | | | Amount | |
Issued from the sale of shares | | 10,268,147 | | | $ | 242,357,595 | | | 9,567,844 | | | $ | 267,672,472 | |
Issued in connection with the
reinvestment of distributions | | 1,850,508 | | | | 46,632,804 | | | 1,279,692 | | | | 33,617,503 | |
Redeemed | | (7,108,230 | ) | | | (166,486,060 | ) | | (5,159,588 | ) | | | (145,568,951 | ) |
| | | | | | | | | | | | | | |
Net change | | 5,010,425 | | | $ | 122,504,339 | | | 5,687,948 | | | $ | 155,721,024 | |
| | | | | | | | | | | | | | |
| | | | |
| Admin Class | | Shares | | | Amount | | | Shares | | | Amount | |
Issued from the sale of shares | | 2,168,929 | | | $ | 51,105,918 | | | 1,317,587 | | | $ | 35,992,658 | |
Issued in connection with the
reinvestment of distributions | | 271,955 | | | | 6,747,215 | | | 292,721 | | | | 7,599,049 | |
Redeemed | | (1,532,487 | ) | | | (35,447,384 | ) | | (1,252,476 | ) | | | (34,632,190 | ) |
| | | | | | | | | | | | | | |
Net change | | 908,397 | | | $ | 22,405,749 | | | 357,832 | | | $ | 8,959,517 | |
| | | | | | | | | | | | | | |
Increase (decrease) from capital
share transactions | | 12,466,019 | | | $ | 302,201,210 | | | 8,640,870 | | | $ | 235,053,214 | |
| | | | | | | | | | | | | | |
43
REPORT OF INDEPENDENT REGISTERED PUBLIC ACCOUNTING FIRM
To the Trustees of Loomis Sayles Funds I and Loomis Sayles Funds II and Shareholders of Loomis Sayles Small Cap Value Fund, Loomis Sayles Mid Cap Growth Fund, Loomis Sayles Small Cap Growth Fund:
In our opinion, the accompanying statements of assets and liabilities, including the portfolios of investments, and the related statements of operations and of changes in net assets and the financial highlights present fairly, in all material respects, the financial position of the Loomis Sayles Small Cap Value Fund, a series of Loomis Sayles Funds I and the Loomis Sayles Mid Cap Growth Fund and Loomis Sayles Small Cap Growth Fund, each a series of Loomis Sayles Funds II (collectively, “the Funds”), at September 30, 2008, and the results of each of their operations, the changes in each of their net assets and the financial highlights for each of the periods indicated, in conformity with accounting principles generally accepted in the United States of America. These financial statements and financial highlights (hereafter referred to as “financial statements”) are the responsibility of the Funds’ management; our responsibility is to express an opinion on these financial statements based on our audits. We conducted our audits of these financial statements in accordance with the standards of the Public Company Accounting Oversight Board (United States). Those standards require that we plan and perform the audits to obtain reasonable assurance about whether the financial statements are free of material misstatement. An audit includes examining, on a test basis, evidence supporting the amounts and disclosures in the financial statements, assessing the accounting principles used and significant estimates made by management, and evaluating the overall financial statement presentation. We believe that our audits, which included confirmation of securities at September 30, 2008 by correspondence with the custodian and brokers, provide a reasonable basis for our opinion.
PricewaterhouseCoopers LLP
Boston, Massachusetts
November 21, 2008
44
2008 U.S. TAX DISTRIBUTION INFORMATION TO SHAREHOLDERS (Unaudited)
Corporate Dividends Received Deduction. For the fiscal year ended September 30, 2008, a percentage of dividends distributed by the Funds listed below qualify for the dividends received deduction for corporate shareholders. These percentages are as follows:
| | |
Fund | | Qualifying Percentage |
Small Cap Value Fund | | 34.45% |
Capital Gains Distributions. Pursuant to Internal Revenue Section 852(b), the following Funds paid distributions, which have been designated as capital gains distributions for the fiscal year ended September 30, 2008.
| | | |
Fund | | Amount |
Small Cap Value Fund | | $ | 91,300,786 |
Qualified Dividend Income. For the fiscal year ended September 30, 2008, the Funds below will designate up to the maximum amount allowable pursuant to the Internal Revenue Code as qualified dividend income eligible for reduced tax rates. These lower rates range from 5% to 15% depending on an individual’s tax bracket. If the Funds pay a distribution during calendar year 2008, complete information will be reported in conjunction with Form 1099-DIV.
| | |
Fund | | |
Mid Cap Growth Fund | | |
Small Cap Growth Fund | | |
Small Cap Value Fund | | |
45
TRUSTEE AND OFFICER INFORMATION
The tables below provide certain information regarding the Trustees and officers of Loomis Sayles Funds I and Loomis Sayles Funds II (the “Trusts”). Unless otherwise indicated, the address of all persons below is 399 Boylston Street, Boston, MA 02116. The Trusts’ Statements of Additional Information include additional information about the Trustees of the Trusts and are available by calling Loomis Sayles at 800-343-2029.
| | | | | | |
| Name and Year of Birth | | Position(s)
Held with
the Trust, Length
of Time Served and
Term of Office* | | Principal Occupation(s) During Past 5 Years** | | Number of Portfolios in Fund
Complex Overseen*** and Other Directorships Held |
| |
Independent Trustees | | |
| Graham T. Allison, Jr. (1940) | | Trustee Since 2003 Contract Review and Governance Committee Member | | Douglas Dillon Professor and Director of the Belfer Center for Science and International Affairs, John F. Kennedy School of Government, Harvard University | | 41 Director, Taubman Centers, Inc. (real estate investment trust) |
| | | |
Charles D. Baker (1956) | | Trustee Since 2005 Contract Review and Governance Committee Member | | President and Chief Executive Officer, Harvard Pilgrim Health Care (health plan) | | 41 None |
| | | |
| Edward A. Benjamin (1938) | | Trustee Since 2002 Chairman of the Contract Review and Governance Committee | | Retired | | 41 None |
| | | |
Daniel M. Cain (1945) | | Trustee Since 2003 Chairman of the Audit Committee | | President and Chief Executive Officer, Cain Brothers & Company, Incorporated (investment banking) | | 41 Director, Sheridan Healthcare Inc. (physician practice management) |
| | | |
Kenneth A. Drucker (1945) | | Trustee Since 2008 Contract Review and Governance Committee Member | | Formerly, Treasurer, Sequa Corp. (manufacturing) | | 41 Director, M Fund, Inc. (registered investment company) |
| | | |
Jonathan P. Mason (1958) | | Trustee Since 2007 Audit Committee Member | | Chief Financial Officer, Cabot Corp. (specialty chemicals); formerly, Vice President and Treasurer, International Paper Company; formerly, Chief Financial Officer, Carter Holt Harvey (forest products) | | 41 None |
| | | |
Sandra O. Moose (1942) | | Chairperson of the Board of Trustees since November 2005 Trustee since 2003 Ex officio member of the Audit Committee and Contract Review and Governance Committee | | President, Strategic Advisory Services (management consulting); formerly, Senior Vice President and Director, The Boston Consulting Group, Inc. (management consulting) | | 41 Director, Verizon Communications; Director, Rohm and Haas Company (specialty chemicals); Director, AES Corporation (international power company) |
46
| | | | | | |
| Name and Year of Birth | | Position(s)
Held with
the Trust, Length
of Time Served and
Term of Office* | | Principal Occupation(s) During Past 5 Years** | | Number of Portfolios in Fund
Complex Overseen*** and Other Directorships Held |
| | | |
Cynthia L. Walker (1956) | | Trustee Since 2005 Audit Committee Member | | Deputy Dean for Finance and Administration, Yale University School of Medicine; formerly, Executive Dean for Administration, Harvard Medical School; and formerly, Dean for Finance & Chief Financial Officer, Harvard Medical School | | 41 None |
| |
Interested Trustees | | |
Robert J. Blanding1 (1947) 555 California Street San Francisco, CA 94104 | | President and Chief Executive Officer of Loomis Sayles Funds I and Chief Executive Officer of Loomis Sayles Funds II; Trustee since 2002 | | President, Chairman, Director and Chief Executive Officer, Loomis, Sayles & Company, L.P. | | 41 None |
| | | |
John T. Hailer2 (1960) | | Trustee Since 2003 | | President and Chief Executive Officer-U.S. and Asia, Natixis Global Asset Management, L.P.; formerly, President and Chief Executive Officer, Natixis Distribution Corporation, Natixis Asset Management Advisors, L.P., Natixis Distributors, L.P. and Natixis Global Associates, Inc. | | 41 None |
| * | Each Trustee serves until retirement, resignation or removal from the Board of Trustees. The current retirement age is 72. The position of Chairperson of the Board is appointed for a two-year term. Ms. Moose was appointed to serve an additional two-year term as the Chairperson of the Board of Trustees on September 14, 2007. |
| ** | Each person listed above, except as noted, holds the same position(s) with the Natixis Funds Trust I, Natixis Funds Trust II, Natixis Funds Trust III, Natixis Funds Trust IV, Gateway Trust and the Natixis Cash Management Trust (collectively, the “Natixis Funds Trusts”), Loomis Sayles Funds I and Loomis Sayles Funds II (collectively, the “Loomis Sayles Funds Trusts”), and Hansberger International Series. Previous positions during the past five years with Natixis Distributors, L.P. (the “Distributor”), Natixis Asset Management Advisors, L.P. (“Natixis Advisors”), or Loomis, Sayles & Company, L.P. are omitted if not materially different from a Trustee’s or officer’s current position with such entity. |
| *** | The Trustees of the Trust serve as trustees of a fund complex that includes all series of the Natixis Funds Trusts, the Loomis Sayles Funds Trusts and Hansberger International Series (collectively, the “Fund Complex”). |
| 1 | Mr. Blanding is deemed an “interested person” of the Trust because he holds the following positions with affiliated persons of the Trust: President, Chairman, Director and Chief Executive Officer of Loomis, Sayles & Company, L.P. |
| 2 | Mr. Hailer is deemed an “interested person” of the Trust because he holds the following positions with affiliated persons of the Trust: President and Chief Executive Officer-U.S. and Asia, Natixis Global Asset Management, L.P. |
47
| | | | | | |
| Name and Year of Birth | | Position(s) Held with the Trust | | Term of Office* and Length of Time Served | | Principal Occupation During Past 5 Years** |
| | |
Officers of the Trust | | | | |
Coleen Downs Dinneen (1960) | | Secretary, Clerk and Chief Legal Officer | | Since September 2004 | | Executive Vice President,
General Counsel, Secretary
and Clerk (formerly,
Senior Vice President,
Deputy General Counsel,
Assistant Secretary and
Assistant Clerk), Natixis
Distribution Corporation,
Natixis Asset Management
Advisors, L.P. and Natixis
Distributors, L.P. |
| | | |
Daniel J. Fuss (1933) One Financial Center Boston, MA 02111 | | Executive Vice President | | Since June 2003 | | Vice Chairman and
Director, Loomis, Sayles &
Company, L.P. |
| | | |
David Giunta (1965) | | President of Loomis, Sayles Funds II and Executive Vice President of Loomis, Sayles Funds I | | Since March 2008 | | President and Chief
Executive Officer, Natixis
Distribution Corporation,
Natixis Asset Management
Advisors, L.P. and Natixis
Distributors, L.P.;
formerly, President,
Fidelity Charitable Gift
Fund; and formerly, Senior
Vice President, Fidelity
Brokerage Company |
| | | |
Russell L. Kane (1969) | | Chief Compliance Officer, Assistant Secretary and Anti-Money Laundering Officer | | Chief Compliance Officer
since May 2006; Assistant
Secretary since June 2004;
and Anti-Money
Laundering Officer since
April 2007 | | Chief Compliance Officer
for Mutual Funds, Senior
Vice President, Deputy
General Counsel, Assistant
Secretary and Assistant
Clerk, Natixis Distribution
Corporation, Natixis Asset
Management Advisors,
L.P. and Natixis
Distributors, L.P.; and
formerly, Senior Counsel,
Columbia Management
Group |
| | | |
Michael C. Kardok (1959) | | Treasurer, Principal Financial and Accounting Officer | | Since October 2004 | | Senior Vice President,
Natixis Asset Management
Advisors, L.P. and Natixis
Distributors, L.P.; and
formerly, Senior Director,
PFPC Inc. |
| | | |
Robert Krantz (1964) | | Executive Vice President | | Since September 2007 | | Executive Vice President,
Natixis Asset Management
Advisors, L.P. and Natixis
Distributors, L.P. |
| * | Each officer of the Trust serves for an indefinite term in accordance with the Trust’s current By-laws until the date his or her successor is elected and qualified, or until he or she sooner dies, retires, is removed or becomes disqualified. |
| ** | Each person listed above, except as noted, holds the same position(s) with the Natixis Funds Trusts, Loomis Sayles Funds Trusts and Hansberger International Series. Mr. Fuss is not an officer of the Natixis Funds Trusts or the Hansberger International Series. Previous positions during the past five years with the Distributor, Natixis Advisors or Loomis Sayles are omitted if not materially different from a Trustee’s or officer’s current position with such entity. |
48

Loomis Sayles Bond Fund
Loomis Sayles Fixed Income Fund
Loomis Sayles Global Bond Fund
Loomis Sayles Inflation Protected Securities Fund
Loomis Sayles Institutional High Income Fund
Loomis Sayles Intermediate Duration Fixed Income Fund
Loomis Sayles Investment Grade Fixed Income Fund
ANNUAL REPORT
SEPTEMBER 30, 2008
FUND AND MANAGER REVIEW
Loomis Sayles Bond Fund
| | |
 Daniel Fuss, CFA, CIC Manager since May 1991 | | 
Matthew Eagan, CFA Associate Manager since February 2007 |

Kathleen Gaffney, CFA Manager since October 1997 | | 
Elaine Stokes Associate Manager since February 2007 |
PORTFOLIO REVIEW
The Fund underperformed its Benchmark, the Lehman US Government/Credit Index, for the fiscal year ended September 30, 2008, primarily due to the unfolding credit crisis, which triggered systemic financial sector weakness, ongoing spread widening among investment grade and high yield credits, and a stronger US dollar.
A crisis of confidence engulfed the financial markets with the collapse of Bear Stearns, the government conservatorship of Fannie Mae and Freddie Mac, the bankruptcy of Lehman Brothers, the insurer AIG’s ceding control to the government in exchange for an $85 billion loan, and the seizure of Washington Mutual. These events severely and directly affected Fund performance. Investment grade financials were also indirectly impacted in this environment.
Investors fled risky assets, and US Treasurys outperformed all other sectors, as widespread risk aversion drained corporate markets of liquidity and risk capacity, driving investors to seek high quality assets.
As banks nursed capital, businesses had increasing difficulty borrowing, and issuers facing impaired access to capital generally were negative performers, including those in communications, technology and consumer-sensitive industries. Secular global growth and the boom in commodity prices early in the fiscal year helped support the currencies of Malaysia, Mexico and Thailand. However, an uncertain and dimming global growth outlook in the third quarter of 2008 sent most major currencies lower versus the US dollar near the end of the fiscal year, as risk-averse investors fled to the relative safety of US Treasurys. Exposure to the Icelandic krona, British pound and the euro, in particular, detracted from results.
OUTLOOK
With tight credit and slowing economic growth, we are taking a hard look at opportunities. We see potential value in stable industrials, such as telecommunications and cable, but we are less enthusiastic about “deep cyclicals,” firms that are heavily dependent on the economy, and anything levered to the consumer.
We believe specific high yield credits and industries are likely to experience higher default rates, which would put further downward pressure on valuations. However, as measured by the Lehman High Yield Index, price declines had driven yields up over 13%, on average, as of September 30, 2008. Such a generous income may help investors absorb default losses (up to a point) while waiting for prices to recover.
FUND FACTS
Symbol | Institutional: LSBDX;
Retail: LSBRX; Admin: LBFAX
Objective | High total investment return through a combination of current income and capital appreciation
Strategy | Invests primarily in investment-grade fixed-income securities, although it may invest up to 35% of assets in lower rated fixed-income securities and up to 20% of its assets in preferred stocks. The Fund may invest any portion of its assets in Canadian securities and up to 20% of assets in other foreign securities, including emerging markets securities.
Fund Inception Date | 5/16/91
Class Inception Date Institutional: 5/16/91; Retail: 12/31/96; Admin: 1/2/98
Total Net Assets | $14,690.7 million
1
We have a cautious view on sovereigns because we believe the global credit crunch may lead to slower growth and lower commodity prices. Yields in Europe may fall as the economy slows, boosting bond returns, but we think currency-adjusted returns are likely to remain weak.
Experience with past market cycles suggests to us that, once confidence and optimism are restored, markets may turn up quickly as investors realize good companies are attractively priced. We are working hard to ensure the Fund is in a prime position to capture this upside potential.
AVERAGE ANNUAL TOTAL RETURNS
Periods Ended September 30, 2008
| | | | | | | | | | |
| 1 Year | | | 5 Years | | | 10 Years | | | Since Fund
Inception(a) | |
| Loomis Sayles Bond: Institutional | |
| -13.14 | % | | 5.14 | % | | 7.62 | % | | 9.63 | % |
| Loomis Sayles Bond: Retail(c) | |
| -13.44 | | | 4.86 | | | 7.34 | | | 9.35 | |
| Loomis Sayles Bond: Admin(c) | |
| -13.69 | | | 4.58 | | | 7.06 | | | 8.87 | |
| Lehman US Government/Credit Index(d) | |
| 2.41 | | | 3.34 | | | 5.00 | | | 6.70 | |
| Lipper BBB-Rated Funds Index(d) | |
| -6.31 | | | 2.27 | | | 4.10 | | | 6.15 | |
| | | | | | | |
| Gross Expense Ratio (before reductions and reimbursements)* | |
| Institutional: 0.67 | % | | Retail: 0.97 | % | | Admin: 1.24 | % |
| Net Expense Ratio (after reductions and reimbursements)* | |
| Institutional: 0.67 | % | | Retail: 0.95 | % | | Admin: 1.20 | % |
* As stated in the most recent prospectus
CUMULATIVE PERFORMANCE(e)
Inception to September 30, 2008(b)
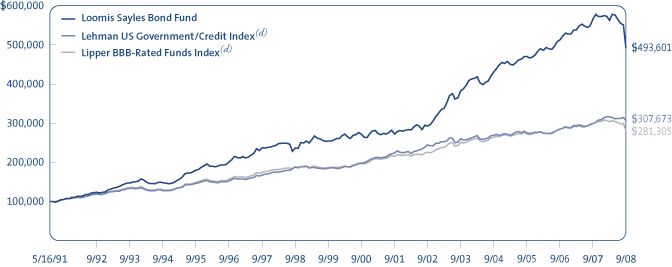
Data quoted reflects past performance and cannot guarantee future results. Average annual total returns assume reinvestment of dividends and capital gains distributions. Investment return and principal value will fluctuate so that shares, when redeemed, may be worth more or less than their original cost. For performance current to the most recent month-end, please visit the Loomis Sayles website. Current performance may be higher or lower than quoted.
Returns do not reflect the taxes that a shareholder would pay on Fund distributions or the redemption of shares. Periods of less than one year are not annualized. Performance data reflects certain fee reductions and reimbursements, if any, without which performance would be lower.
(a) Inception dates of the Institutional, Retail and Admin Classes of shares are May 16, 1991, December 31, 1996 and January 2, 1998, respectively. (b) The mountain chart is based on the initial minimum investment of $100,000 for the Institutional Class. (c) Performance shown for periods prior to the inception date of the Retail Class and the Admin Class represents the performance of the Institutional Class during the periods shown, adjusted to reflect the current levels of 12b-1 fees payable by the respective classes of shares. (d) See page 15 for a description of the indices. Index performance data is not available coincident with the Fund’s inception date; the beginning value of the index is the value as of the month end closest to the Fund’s inception date. (e) Cumulative performance is shown for the Institutional Class of shares. Performance of the Retail and Admin Classes would be lower, due to higher fees.
WHAT YOU SHOULD KNOW
The Fund can invest a significant percentage of assets in debt securities that are rated below investment grade and the value of fund shares can be adversely affected by changes in economic conditions or other circumstances. Lower rated debt securities have speculative characteristics and may be subject to greater price volatility than higher rated investments. In addition, the secondary market for these securities may lack liquidity. Fund shares should be viewed as a long-term investment. Securities issued by US government agencies are not insured by and may not be guaranteed by the US government. The Fund can invest a significant percentage of assets in foreign securities and the value of the fund shares can be adversely affected by changes in currency exchange rates, political, and economic developments. In emerging markets these risks can be significant. The Fund is subject to currency risk, which is the risk that fluctuations in exchange rates between the US dollar and foreign currencies may cause the value of a Fund’s investments to decline. Accordingly, the purchase of fund shares should be viewed as a long-term investment.
2
FUND AND MANAGER REVIEW
Loomis Sayles Fixed Income Fund
| | |
Daniel Fuss, CFA, CIC Manager since January 1995 | |
Matthew Eagan, CFA Associate Manager since
February 2007 |
Kathleen Gaffney, CFA Associate Manager since February 2007 | |
Elaine Stokes Associate Manager since February 2007 |
PORTFOLIO REVIEW
The Fund underperformed its Benchmark, the Lehman US Government/Credit Index, for the fiscal year ended September 30, 2008, primarily due to the unfolding credit crisis, which triggered systemic financial sector weakness, ongoing spread widening among investment grade and high yield credits, and a stronger US dollar.
A crisis of confidence engulfed the financial markets with the collapse of Bear Stearns, the government conservatorship of Fannie Mae and Freddie Mac, the bankruptcy of Lehman Brothers, insurer AIG’s ceding control to the government in exchange for an $85 billion loan, and the seizure of Washington Mutual. These events severely and directly affected Fund performance. Investment grade financials were also indirectly impacted in this environment.
Investors fled risky assets, and US Treasurys outperformed all other sectors. Agency mortgage pass-through securities also acted as a safe haven and were among the few shelters from the deteriorating credit markets. The government’s conservatorship of Fannie Mae and Freddie Mac made the guarantee on these securities explicit.
As banks nursed capital, businesses had difficulty borrowing. Issuers facing impaired access to capital were negative performers, including those in communications, technology and consumer-sensitive industries. Secular global growth and the boom in commodity prices early in the fiscal year helped the currencies of Mexico, Malaysia and Brazil. However, an uncertain and dimming global growth outlook in the third quarter of 2008 sent most major currencies lower versus the US dollar as risk-averse investors fled to the relative safety of US Treasurys. In particular, exposure to the Singapore dollar, Icelandic krona and the euro detracted from results.
OUTLOOK
With tight credit and slowing economic growth, we are taking a hard look at opportunities. We see potential value in stable industrials, such as telecommunications and cable, but we are less enthusiastic about “deep cyclicals,” firms heavily dependent on the economy, and anything levered to the consumer.
We believe specific high yield credits and industries are likely to experience higher default rates, which would put further downward pressure on valuations. However, as measured by the Lehman High Yield Index, price declines had driven yields up over 13%, on average, as of September 30, 2008. Such a generous income may help investors absorb default losses (up to a point) while waiting for prices to recover.
FUND FACTS
Symbol | LSFIX
Objective | High total investment return through a combination of current income and capital appreciation
Strategy | Invests primarily in fixed-income securities, may invest up to 35% of its assets in lower-rated fixed-income securities and up to 20% of its assets in preferred stocks. The Fund may invest any portion of its assets in Canadian securities and up to 20% of assets in other foreign securities, including emerging markets securities.
Fund Inception Date | 1/17/95
Fund Registration Date | 3/7/97
Total Net Assets | $624.5 million
3
We have a cautious view on sovereigns because we believe the global credit crunch may lead to slower growth and lower commodity prices. Yields in Europe may fall as the economy slows, boosting bond returns, but we think currency-adjusted returns are likely to remain weak.
Our experience with past market cycles suggests that, once confidence and optimism are restored, markets can recover quickly as investors realize good companies are attractively priced. We are working hard to ensure the Fund is in a prime position to capture this upside potential.
AVERAGE ANNUAL TOTAL RETURNS
Periods Ended September 30, 2008
| | | | | | | | | | | | | |
| 1 Year | | | 5 Years | | | 10 Years | | | Since
Registration(a) | | | Since Fund
Inception(a) | |
| Loomis Sayles Fixed Income: Institutional | |
| -9.42 | % | | 6.15 | % | | 7.98 | % | | 7.81 | % | | 9.35 | % |
| Lehman US Government/Credit Index(b) | |
| 2.41 | | | 3.34 | | | 5.00 | | | 5.93 | | | 6.46 | |
| Lipper BBB-Rated Funds Index(b) | |
| -6.31 | | | 2.27 | | | 4.10 | | | 4.78 | | | 5.71 | |
| | | | | |
| Gross Expense Ratio (before reductions and reimbursements)* |
| Institutional: 0.60 | % | | | | |
| Net Expense Ratio (after reductions and reimbursements)* |
| Institutional: 0.60 | % | | | | |
* As stated in the most recent prospectus
CUMULATIVE PERFORMANCE
Registration to September 30, 2008(c)
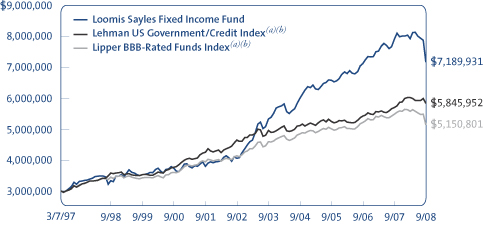
Inception to September 30, 2008(c)
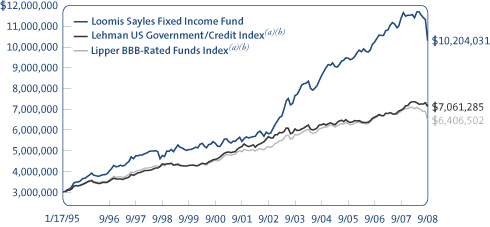
Data quoted reflects past performance and cannot guarantee future results. Average annual total returns assume reinvestment of dividends and capital gains distributions. Investment return and principal value will fluctuate so that shares, when redeemed, may be worth more or less than their original cost. For performance current to the most recent month end, please visit the Loomis Sayles website. Current performance may be higher or lower than quoted.
Returns do not reflect the taxes that a shareholder would pay on Fund distributions or the redemption of shares. Periods of less than one year are not annualized. Performance data reflects certain fee reductions and reimbursements, if any, without which performance would be lower.
(a) Shares of the Fund were registered for offer and sale under the Securities Act of 1933 on March 7, 1997. In accordance with regulations, performance information is provided for the period beginning on March 7, 1997 (“Registration”). Performance from inception is also provided for the convenience of our long-term shareholders. Since index performance data is not available coincident with the Fund’s inception and registration dates, comparative performance is presented from the month end closest to the Fund’s inception and registration dates. (b) See page 15 for a description of the indices. (c) The mountain chart is based on the Fund’s minimum initial investment of $3,000,000.
WHAT YOU SHOULD KNOW
The Fund can invest a significant percentage of assets in debt securities that are rated below investment grade and the value of fund shares can be adversely affected by changes in economic conditions or other circumstances. Lower rated debt securities have speculative characteristics and may be subject to greater price volatility than higher rated investments. In addition, the secondary market for these securities may lack liquidity. Fund shares should be viewed as a long-term investment. Securities issued by US government agencies are not insured by and may not be guaranteed by the US government. The Fund can invest a significant percentage of assets in foreign securities and the value of the fund shares can be adversely affected by changes in currency exchange rates, political, and economic developments. In emerging markets these risks can be significant. The Fund is subject to currency risk, which is the risk that fluctuations in exchange rates between the US dollar and foreign currencies may cause the value of a Fund’s investments to decline. Accordingly, the purchase of fund shares should be viewed as a long-term investment.
4
FUND AND MANAGER REVIEW
Loomis Sayles Global Bond Fund

Ken Buntrock, CFA, CIC
Manager since September 2000

David Rolley, CFA
Manager since September 2000

Lynda Schweitzer, CFA
Manager since February 2007
PORTFOLIO REVIEW
The Fund underperformed its Benchmark, the Lehman Global Aggregate Bond Index, for the fiscal year ended September 30, 2008, primarily due to an overweight in the corporate bond sector.
We gradually added to the Fund’s investment grade and high yield corporate bond holdings by lowering our exposure to high-quality government, quasi-government and securitized issuers. This hurt relative performance, as the credit markets significantly underperformed government bonds in the United States, United Kingdom and Europe. The Fund benefited from a brief rally following the rescue of Bear Stearns and the Federal Reserve’s actions to support liquidity. Nevertheless, the ongoing credit crisis and drama surrounding the global banking sector pushed credit spreads to their widest levels of the fiscal year in September. The Fund’s exposure to Freddie Mac and Fannie Mae preferred securities, as well as to Lehman Brothers and AIG, largely detracted from performance during the period. The worst-performing security was Lehman Brothers, which lost virtually all of its value after filing for bankruptcy in September.
Our country allocations had a slightly negative impact on performance. The Fund’s overweight in the Malaysian and Singapore bond markets detracted, while our underweight in euro-denominated issues aided relative performance. The Fund’s overall currency strategy generated excess returns for the period. Most notably, our underweight to the South Korean won and Canadian dollar performed well, as both currencies depreciated against the greenback. Our overweight positions in the Polish zloty, Uruguay peso, Singapore dollar and Malaysian ringgit also enhanced returns. The Fund’s overweight in the Icelandic krona detracted, as that currency weakened by more than 40% against the US dollar.
Our duration/yield curve positioning had a slightly positive influence on relative performance. Specifically, our longer-than-Benchmark duration in Europe enhanced returns, as deteriorating market conditions led to lower bond yields.
OUTLOOK
Credit spreads have widened to startling levels, and September was among the worst months of performance for investment grade and high yield debt. Credit remains extremely cheap, and greater risk aversion than we witnessed during the final three weeks of September seems difficult.
We are forecasting a global recession and a cut in the federal funds rate, possibly to 1.0% by year end. We believe the US dollar and euro markets will probably continue to trade within a defined range, as both regions struggle with
FUND FACTS
Symbol | Institutional: LSGBX;
Retail: LSGLX
Objective | High total investment return through a combination of high current income and capital appreciation
Strategy | Invests primarily in investment-grade fixed-income securities worldwide, although it may invest up to 20% of assets in lower-rated fixed-income securities.
Fund Inception Date | 5/10/91
Class Inception Date Institutional: 5/10/91; Retail: 12/31/96
Total Net Assets | $2,230.6 million
5
similar problems. We may reduce the Fund’s duration at some point because, if the needed bank capital support does not come from fiscal authorities, it will have to come from easy monetary policy for an extended period.
AVERAGE ANNUAL TOTAL RETURNS
Periods Ended September 30, 2008
| | | | | | | | | | |
| 1 Year | | | 5 Years | | | 10 Years | | | Since
Inception(a) | |
| Loomis Sayles Global Bond: Institutional | |
| -4.14 | % | | 4.00 | % | | 7.22 | % | | 7.72 | % |
| Loomis Sayles Global Bond: Retail(b) | |
| -4.45 | | | 3.72 | | | 6.94 | | | 7.53 | |
| Lehman Global Aggregate Bond Index(c) | |
| 2.80 | | | 4.76 | | | 4.91 | | | 6.81 | |
| Lipper Global Income Funds Index(c) | |
| -3.07 | | | 3.73 | | | 4.60 | | | 5.76 | |
| | | | | | |
| Gross Expense Ratio (before reductions and reimbursements)* |
| Institutional: 0.68 | % | | Retail: 1.04 | % | | |
| Net Expense Ratio (after reductions and reimbursements)* |
| Institutional: 0.68 | % | | Retail: 1.00 | % | | |
* As stated in the most recent prospectus
CUMULATIVE PERFORMANCE(d)
Inception to September 30, 2008(e)
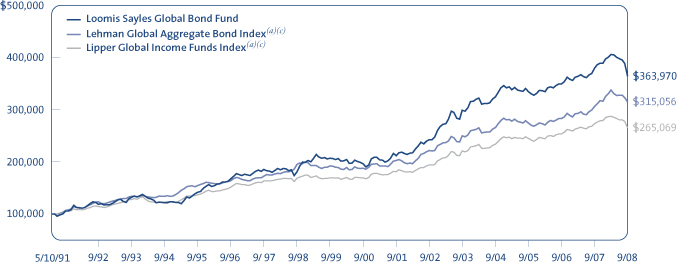
Data quoted reflects past performance and cannot guarantee future results. Average annual total returns assume reinvestment of dividends and capital gains distributions. Investment return and principal value will fluctuate so that shares, when redeemed, may be worth more or less than their original cost. For performance current to the most recent month-end, please visit the Loomis Sayles website. Current performance may be higher or lower than quoted.
Returns do not reflect the taxes that a shareholder would pay on Fund distributions or the redemption of shares. Periods of less than one year are not annualized. Performance data reflects certain fee reductions and reimbursements, if any, without which performance would be lower.
(a) Since index performance data is not available coincident with the Fund’s inception date, the beginning value of the index is the value as of the month end closest to the Fund’s inception date. (b) Performance shown for periods prior to the inception date of the Retail Class (12/31/96) represents the performance of the Institutional Class during the periods shown, adjusted to reflect the current levels of 12b-1 fees payable by the respective Classes of shares. (c) See page 15 for a description of the indices. (d) Cumulative performance is shown for the Institutional Class. Performance of the Retail Class would be lower due to higher fees. (e) The mountain chart is based on the Institutional Class minimum initial investment of $100,000.
WHAT YOU SHOULD KNOW
The Fund can invest a significant percentage of assets in debt securities that are rated below investment grade and the value of fund shares can be adversely affected by changes in economic conditions or other circumstances. Lower rated debt securities have speculative characteristics and may be subject to greater price volatility than higher rated investments. In addition, the secondary market for these securities may lack liquidity. Fund shares should be viewed as a long-term investment. Securities issued by US government agencies are not insured by and may not be guaranteed by the US government. The Fund can invest a significant percentage of assets in foreign securities and the value of the fund shares can be adversely affected by changes in currency exchange rates, political, and economic developments. In emerging markets these risks can be significant. The Fund is subject to currency risk, which is the risk that fluctuations in exchange rates between the US dollar and foreign currencies may cause the value of a Fund’s investments to decline. Accordingly, the purchase of fund shares should be viewed as a long-term investment.
6
FUND AND MANAGER REVIEW
Loomis Sayles Inflation Protected Securities Fund

John Hyll
Manager since January 2003

Cliff Rowe, CFA
Manager since January 2003
PORTFOLIO REVIEW
The Fund underperformed its Benchmark, the Lehman US Treasury Inflation Protected Securities Index, for the fiscal year ended September 30, 2008, primarily due to its out-of-Benchmark exposure to credit securities. In addition, the Fund held Fannie Mae and Freddie Mac preferred stock, and when the US government took conservatorship of these government-sponsored entities, it only guaranteed their senior and subordinated debt, not their preferred shares.
The period’s historic flight-to-quality led to outperformance for nominal US Treasurys and underperformance for all other sectors, including Treasury inflation-protected securities (TIPS). The Fund’s TIPS position (78% of the Fund) performed relatively well, especially in the short to intermediate maturity range. This segment benefited from a steepening of the yield curve prompted by the Federal Reserve’s rate cuts, which pushed the federal funds rate target to 2.00%, down from 4.75% at the beginning of the period. The Fund’s longer duration relative to the Benchmark was a neutral strategy at best, as most of the decline in yields occurred in the shorter end of the yield curve, and the Fund’s more laddered maturity structure, did not help offset the impact of the flight to quality. The Fund’s non-dollar exposure to Singapore and Mexico helped, as did its energy holdings, which contributed positively to performance early in the fiscal year.
During the period, the real yield of 10-year TIPS remained unchanged at 2.27%. Yields on 30-year TIPS rose to 2.58% on September 30, 2008, from 2.20% a year earlier, and yields on five-year TIPS fell to 1.94% from 2.16%. These relatively small yield changes do not reflect the volatility witnessed during the period. Yields on 10-year TIPS, for example, reached a low of 0.91% on March 10, 2008, as breakevens (the difference between yields on 10-year nominal US Treasurys and TIPS, which represents the market’s long-term inflation forecast) trended upward on soaring oil prices.
In the third quarter of 2008, TIPS posted their worst performance relative to nominal US Treasurys, and breakevens narrowed significantly (from 2.53% on June 30 to 1.56% on September 30). Credit also underperformed during the period, reflecting the ongoing difficulties in the housing market and how they may negatively affect employment, lending, corporate earnings and the overall health of the economy.
OUTLOOK
Due to poor performance in the TIPS sector, the market is certainly not pricing in fears of inflation. However, one might view the TIPS sector as fairly attractive, given that the 10-year TIPS breakeven was at 1.59% on September 30, 2008. This is the most attractive level for the year and it suggests that inflation expectations might be too low given all the monetary easing and liquidity infusion into the markets by the Federal Reserve in an effort to help jump start the financial sector. Low inflation expectations of 1.59% may be too optimistic given our anticipation of a recovery beginning sometime in mid-2009 and the possible recovery in oil prices that may accompany improving economic conditions within the next year. Pricing in the TIPS market marks one of the best valuations we have seen in a long time.
FUND FACTS
Symbol | LSGSX
Objective | High total investment return through a combination of current income and capital appreciation
Strategy | Invests primarily in inflation-protected securities with emphasis on debt securities issued by the US Treasury
Fund Inception Date | 5/20/91
Total Net Assets | $16.0 million
7
AVERAGE ANNUAL TOTAL RETURNS
Periods Ended September 30, 2008
| | | | | | | | | | |
| 1 Year | | | 5 Years | | | 10 Years | | | Since
Inception(a) | |
| Loomis Sayles Inflation Protected Securities: Institutional | |
| 2.64 | % | | 2.92 | % | | 4.87 | % | | 7.24 | % |
| Lehman US Treasury Inflation Protected Securities Index(b) | |
| 6.19 | | | 5.15 | | | 7.12 | | | N/A | |
| Lipper Treasury Inflation Protected Securities Index(b) | |
| 4.50 | | | 4.63 | | | N/A | | | N/A | |
| | | | | |
| Gross Expense Ratio (before reductions and reimbursements)* |
| Institutional: 1.28 | % | | | | |
| Net Expense Ratio (after reductions and reimbursements)* |
| Institutional: 0.40 | % | | | | |
* As stated in the most recent prospectus
CUMULATIVE PERFORMANCE
Inception to September 30, 2008(c)
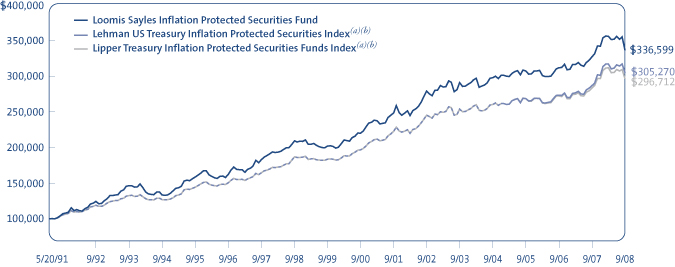
Data quoted reflects past performance and cannot guarantee future results. Average annual total returns assume reinvestment of dividends and capital gains distributions. Investment return and principal value will fluctuate so that shares, when redeemed, may be worth more or less than their original cost. For performance current to the most recent month end, please visit the Loomis Sayles website. Current performance may be higher or lower than quoted.
For illustrative purposes, the chart above reflects the growth of a hypothetical investment of $100,000 in the Fund, since its inception. The chart above also reflects the growth of a hypothetical investment in the former primary benchmark of the Fund, the Lehman US Government Bond Index (the “Former Benchmark”), compared to the performance of the Fund from the Fund’s inception date through December 31, 2004. On December 15, 2004, in connection with a change of the Fund’s investment objective, the Fund changed its primary benchmark to the Lehman US Treasury Inflation Protected Securities Index (the “New Benchmark”). Since index performance data is not available coincident with the date of the Fund’s strategy change, comparative data for the Fund’s New Benchmark begins on December 31, 2004. The chart above reflects the growth of a hypothetical investment in the New Benchmark, compared to the performance of the Fund, from December 31, 2004, through September 30, 2008. The chart above also compares the performance of the Fund to the Lipper Treasury Inflation Protected Securities Funds Index from December 31, 2004 through September 30, 2008. The performance of the New Benchmark and of the Lipper Treasury Inflation Protected Securities Funds Index was linked to the performance of the Former Benchmark as of December 31, 2004.
Returns do not reflect the taxes that a shareholder would pay on fund distributions or the redemption of shares. Periods of less than one year are not annualized. Performance data reflects certain fee reductions and reimbursements, if any, without which performance would be lower.
(a) Since index performance data is not available coincident with the Fund’s inception date, comparative performance is presented from the month end closest to the Fund’s inception date. (b) See page 15 for a description of the indices. Return data is not available for the Lehman US Treasury Inflation Protected Securities Index prior to March 1, 1997. Similarly, return data is not available for the Lipper Treasury Inflation Protected Securities Funds Index prior to July 1, 2003. (c) The mountain chart is based on the Fund’s minimum initial investment of $100,000.
WHAT YOU SHOULD KNOW
Securities issued by US government agencies are not insured by and may not be guaranteed by the US government. The Fund can invest a significant percentage of assets in foreign securities and the value of the fund shares can be adversely affected by changes in currency exchange rates, political, and economic developments. In emerging markets these risks can be significant. The Fund is subject to currency risk, which is the risk that fluctuations in exchange rates between the US dollar and foreign currencies may cause the value of a Fund’s investments to decline. Accordingly, the purchase of fund shares should be viewed as a long-term investment.
Effective December 15, 2004, the Fund’s name and investment strategy changed. The Fund’s strategy emphasizes inflation-protected debt securities issued by the US Treasury (TIPS). The principal value of the types of securities are periodically adjusted according to the rate of inflation and repayment of the original bonds is guaranteed by the US government.
8
FUND AND MANAGER REVIEW
Loomis Sayles Institutional High Income Fund
| | |
Daniel Fuss, CFA, CIC Manager since June 1996 | |
Matthew Eagan, CFA Associate Manager since
February 2007 |
Kathleen Gaffney, CFA Associate Manager since February 2007 | |
Elaine Stokes Associate Manager since February 2007 |
PORTFOLIO REVIEW
The Fund underperformed its Benchmark, the Lehman High Yield Index, for the fiscal year ended September 30, 2008, primarily due to poor price performance among investment grade and high yield bonds. On a relative basis, below investment grade industrials detracted the most from performance. This sector included many poorly performing “busted Leveraged Buy Out” names. These are highly leveraged companies—many in the technology and communication industries—now facing a grim outlook in the current credit environment.
Widespread risk aversion accelerated during the third quarter of 2008, draining liquidity from the credit markets as sellers vastly out-numbered buyers. The resulting crisis of confidence largely defined the Fund’s performance for the period. As spreads widened and liquidity dried up, frightened investors sold across the quality spectrum and sought safety in US Treasury securities. Our US Treasury holdings benefited, but performance among other sectors suffered.
In absolute terms, financial names generated the biggest losses for the period, particularly in the investment grade arena. Uncertainty regarding the magnitude of the financial crisis and the government rescue plan grew in the final weeks of September 2008, punishing financial credits across the board. In particular, preferred and equity holdings, composed mainly of government-sponsored and financial sector securities, hurt overall Fund performance. Auto and gaming credits also took a beating, as consumers pulled back.
Non-US-dollar investments, positive performers in earlier quarters, posted poor results for the trailing year, primarily due to the strengthening US dollar.
Our underweight allocation to below-investment grade financials contributed favorably to relative performance, despite posting a negative absolute return. Select convertible bonds also contributed positively to overall performance, and our small allocation to emerging market debt produced a meager gain.
OUTLOOK
With tight credit and slowing economic growth, we are taking a hard look at opportunities. We see potential value in stable industrials, such as telecommunications and cable, but we are less enthusiastic about “deep cyclicals,” firms heavily dependent on the economy, and anything levered to the consumer.
FUND FACTS
Symbol | LSHIX
Objective | High total investment return through a combination of current income and capital appreciation
Strategy | Invests in primarily lower-rated fixed-income securities and other securities that are expected to produce a relatively high level of income, (including income-producing preferred and common stocks).
The Fund may invest any portion of its assets in Canadian securities and up to 50% of assets in other foreign securities, including emerging markets securities.
Fund Inception Date | 6/5/96
Fund Registration Date | 3/7/97
Total Net Assets | $214.2 million
9
We believe specific high yield credits and industries are likely to experience higher defaults, which will put further downward pressure on valuations. However, as measured by the Lehman High Yield Index, price declines had driven yields up over 13%, on average, as of September 30, 2008. Such a generous income may help investors absorb default losses (up to a point) while waiting for prices to recover.
Experience with past market cycles suggests that once confidence and optimism are restored, markets can recover quickly as investors realize good companies are attractively priced. We are working hard to ensure the Fund is in a prime position to capture this upside potential.
AVERAGE ANNUAL TOTAL RETURNS
Periods Ended September 30, 2008
| | | | | | | | | | | | | |
| 1 Year | | | 5 Years | | | 10 Years | | | Since
Registration(a) | | | Since
Inception(a) | |
| Loomis Sayles Institutional High Income: Institutional | |
| -11.70 | % | | 7.81 | % | | 8.63 | % | | 6.66 | % | | 6.86 | % |
| Lehman High Yield Index(b) | |
| -11.24 | | | 4.38 | | | 4.42 | | | 4.63 | | | 5.26 | |
| Lipper High Current Yield Funds Index(b) | |
| -11.45 | | | 3.96 | | | 3.16 | | | 3.30 | | | 4.00 | |
| | | | | |
| Gross Expense Ratio (before reductions and reimbursements)* |
| Institutional: 0.76 | % | | | | |
| Net Expense Ratio (after reductions and reimbursements)* |
| Institutional: 0.76 | % | | | | |
* As stated in the most recent prospectus
CUMULATIVE PERFORMANCE
Registration to September 30, 2008(c)
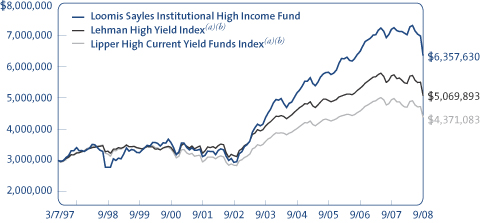
Inception to September 30, 2008(c)

Data quoted reflects past performance and cannot guarantee future results. Average annual total returns assume reinvestment of dividends and capital gains distributions. Investment return and principal value will fluctuate so that shares, when redeemed, may be worth more or less than their original cost. For performance current to the most recent month end, please visit the Loomis Sayles website. Current performance may be higher or lower than quoted.
Returns do not reflect the taxes that a shareholder would pay on Fund distributions or the redemption of shares. Periods of less than one year are not annualized. Performance data reflects certain fee reductions and reimbursements, if any, without which performance would be lower.
(a) Shares of the Fund were registered for offer and sale under the Securities Act of 1933 on March 7, 1997. In accordance with regulations, performance information is provided for the period beginning on March 7, 1997 (“Registration”). Performance from inception is also provided for the convenience of our long-term shareholders. Since index performance data is not available coincident with the Fund’s inception and registration dates, comparative performance is presented from the month end closest to the Fund’s inception and registration dates. (b) See page 15 for a description of the indices. (c) The mountain chart is based on the Fund’s minimum initial investment of $3,000,000.
WHAT YOU SHOULD KNOW
The Fund can invest a significant percentage of assets in debt securities that are rated below investment grade and the value of fund shares can be adversely affected by changes in economic conditions or other circumstances. Lower rated debt securities have speculative characteristics and may be subject to greater price volatility than higher rated investments. In addition, the secondary market for these securities may lack liquidity. Fund shares should be viewed as a long-term investment. Securities issued by US government agencies are not insured by and may not be guaranteed by the US government. The Fund can invest a significant percentage of assets in foreign securities and the value of the fund shares can be adversely affected by changes in currency exchange rates, political, and economic developments. In emerging markets these risks can be significant. The Fund is subject to currency risk, which is the risk that fluctuations in exchange rates between the US dollar and foreign currencies may cause the value of a Fund’s investments to decline. Accordingly, the purchase of fund shares should be viewed as a long-term investment.
10
FUND AND MANAGER REVIEW
Loomis Sayles Intermediate Duration Fixed Income Fund

Neil Burke
Manager since December 2005
Cliff Rowe, CFA
Manager since December 2005

Richard Raczkowski
Manager since December 2005
PORTFOLIO REVIEW
The Fund underperformed its Benchmark, the Lehman US Government/Credit Intermediate Index, for the fiscal year ended September 30, 2008, primarily due to security selection and sector allocation. The events of September dominated returns and ultimately dictated sector and industry performance throughout the year.
Battered by the historic events of September, the financial sector suffered the worst absolute returns for the period. The Fund’s holdings among brokerage and finance companies were impacted the most. In particular, Lehman Brothers, whose bankruptcy filing unleashed widespread risk-aversion and uncertainty, dragged down results. Exceptional volatility spurred a flight to quality that led to impaired access to capital for many businesses, including communications and consumer-sensitive firms. This also hampered Fund performance.
In the flight-to-quality environment characteristic of much of the year, US Treasurys and agencies provided the best relative performance. Although the Fund’s allocation to US Treasurys fared best on an absolute basis, its underweight to US Treasurys and agencies relative to the Benchmark detracted from results.
We shifted the Fund’s duration to a defensive posture, extending to 3.96 years at the end of September 2008, compared to the Benchmark’s duration of 3.69 years. This tactical positioning, concentrated largely in long-term US Treasurys and other bonds, helped overcome some of the effects of the steepening yield curve.
The Fund’s performance also benefited from an out-of-Benchmark allocation to the Singapore dollar. Structured products, particularly long-term mortgage-backed securities (MBS), fared well as investors preferred high-quality issues. MBS enjoyed greater liquidity than their counterparts in the credit market.
OUTLOOK
With tight credit and slowing economic growth, we are taking a hard look at opportunities. We see potential value in stable industrials, such as telecommunications and cable, but we are less enthusiastic about “deep cyclicals,” firms heavily dependent on the economy, and anything levered to the consumer.
We believe specific high yield credits and industries are likely to experience higher defaults, which will put further downward pressure on valuations. However, as measured by the Lehman High Yield Index, price declines had driven yields up over 13%, on average, as of September 30, 2008. Such a generous income may help investors absorb default losses (up to a point) while waiting for prices to recover.
We have a cautious view on sovereigns because we believe the global credit crunch may lead to slower growth and lower commodity prices. Yields in Europe may fall as the economy slows, boosting bond returns, but we believe currency-adjusted returns are likely to be weak.
Experience with past market cycles suggests that, once confidence and optimism are restored, markets can recover quickly as investors realize good companies are attractively priced. We are working hard to ensure the Fund is in a prime position to capture this upside potential.
FUND FACTS
Symbol | LSDIX
Objective | Above-average total return through a combination of current income and capital appreciation
Strategy | Invests only in investment-grade fixed-income securities. The Fund’s weighted average duration generally is two to five years
Fund Inception Date | 1/28/98
Total Net Assets | $32.7 million
11
AVERAGE ANNUAL TOTAL RETURNS
Periods Ended September 30, 2008
| | | | | | | | | | |
| 1 Year | | | 5 Years | | | 10 Years | | | Since
Inception(a) | |
| Loomis Sayles Intermediate Duration Fixed Income Fund: Institutional | |
| -0.46 | % | | 2.62 | % | | 4.77 | % | | 4.65 | % |
| Lehman US Gov’t/Credit Intermediate Index(b) | |
| 3.13 | | | 3.25 | | | 4.96 | | | 5.28 | |
| Lipper Intermediate Investment Grade Debt Funds Index(b) | |
| -2.43 | | | 2.46 | | | 4.28 | | | 4.61 | |
| | | | | | |
| Gross Expense Ratio (before reductions and reimbursements)* |
| Institutional: 0.61% | | | | | | |
| Net Expense Ratio (after reductions and reimbursements)* |
| Institutional 0.40% | | | | | | |
* As stated in the most recent prospectus
CUMULATIVE PERFORMANCE
Inception to September 30, 2008(c)
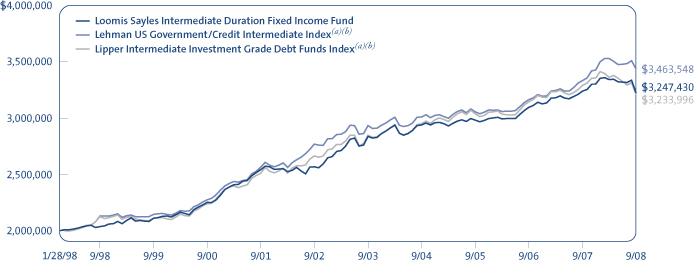
Data quoted reflects past performance and cannot guarantee future results. Average annual total returns assume reinvestment of dividends and capital gains distributions. Investment return and principal value will fluctuate so that shares, when redeemed, may be worth more or less than their original cost. For performance current to the most recent month-end, please visit the Loomis Sayles website. Current performance may be higher or lower than quoted.
Returns do not reflect the taxes that a shareholder would pay on fund distributions or the redemption of shares. Periods of less than one year are not annualized. Performance data reflects certain fee reductions and reimbursements, if any, without which performance would be lower.
(a) Since index performance data is not available coincident with the Fund’s inception date, comparative performance is presented from the month end closest to the Fund’s inception date. (b) See page 15 for a description of the indices. (c) The mountain chart is based on the Fund’s minimum initial investment of $2,000,000.
WHAT YOU SHOULD KNOW
If the credit rating of a security held by the Fund falls below investment grade, the Fund may continue to hold it if Loomis Sayles believes the investment is appropriate. The secondary market for securities that fall below investment grade may lack liquidity and such securities may incur greater risk of default, which may adversely affect the value of the Fund. Foreign countries may have different accounting standards than those of the US. Securities issued by US government agencies are not insured by and may not be guaranteed by the US government. The Fund can invest a significant percentage of assets in foreign securities and the value of the fund shares can be adversely affected by changes in currency exchange rates, political, and economic developments. In emerging markets these risks can be significant. The Fund is subject to currency risk, which is the risk that fluctuations in exchange rates between the US dollar and foreign currencies may cause the value of a Fund’s investments to decline. The Fund can invest a significant percentage of assets in debt securities that are rated below investment grade and the value of fund shares can be adversely affected by changes in economic conditions or other circumstances. Lower rated debt securities have speculative characteristics and may be subject to greater price volatility than higher rated investments. In addition, the secondary market for these securities may lack liquidity. Accordingly, the purchase of fund shares should be viewed as a long-term investment.
12
FUND AND MANAGER REVIEW
Loomis Sayles Investment Grade Fixed Income Fund
Daniel Fuss, CFA, CIC
Manager since July 1994

Steven Kaseta, CFA
Manager since February 2002
Kathleen Gaffney, CFA
Associate Manager since September 2006
Matthew Eagan, CFA
Associate Manager since September 2006
Elaine Stokes
Associate Manager since September 2006
PORTFOLIO REVIEW
The Fund underperformed its Benchmark, the Lehman US Government/Credit Index, for the fiscal year ended September 30, 2008, primarily due to widespread risk aversion, systemic weakness in the financial sector, a stronger US dollar and ongoing credit-spread widening among investment grade and high yield bonds.
The financial sector remained under significant downward pressure throughout the year, severely affecting investment grade and high yield financials. The massive flight-to-quality, along with concerns about the capital funding of banks and brokers, several high-profile bankruptcies, and the bailout of the government-sponsored entities (GSE), caused Treasury yields to plunge and the yield curve to steepen. As recession fears became more entrenched, our defensive duration position helped the Fund’s performance. Although the Fund was overweight in Treasurys, in terms of duration, it was significantly underweight in terms of market value.
Overall, our allocations to investment grade and high yield securities significantly hindered performance. Telecommunication holdings lagged across the board, and the Fund’s high yield auto and auto-related holdings detracted from performance. Our investments in preferred securities, primarily GSE, also hurt the Fund’s overall performance. However, on a positive note, the Fund’s investment grade financial holdings contributed positively due to a modest underweight and sound security selection.
Currencies of commodity-exporting countries like Australia, Canada and New Zealand, weakened late in the period, wiping out gains achieved earlier, when commodity prices reached record highs. An uncertain outlook for economic growth sent most currencies lower versus the US dollar.
OUTLOOK
With tight credit and slowing economic growth, we are taking a hard look at opportunities. We see potential value in stable industrials, such as telecommunications and cable, and we are less enthusiastic about “deep cyclicals,” firms heavily dependent on the economy, and anything levered to the consumer.
We believe specific high yield credits and industries are likely to experience higher defaults, which will put further downward pressure on valuations. However, as measured by the Lehman High Yield Index, price declines had driven yields up over 13%, on average, as of September 30, 2008.
FUND FACTS
Symbol | LSIGX
Objective | Above-average total investment return through a combination of current income and capital appreciation
Strategy | Invests in primarily investment-grade fixed-income securities, although it may invest up to 10% of its assets in lower rated fixed-income securities and up to 10% of its assets in preferred stocks. The Fund may invest any portion of its assets in securities of Canadian issuers and up to 20% of assets in securities of other foreign issuers, including emerging markets.
Fund Inception Date | 7/1/94
Fund Registration Date | 3/7/97
Total Net Assets | $277.9 million
13
Such a generous income may help investors absorb default losses (up to a point) while waiting for prices to recover.
We have a cautious view on sovereigns because we expect the global credit crunch may lead to slower growth and lower commodity prices. As the economy slows, yields in Europe may fall, boosting bond returns, but we believe currency-adjusted returns are likely to be weak.
Experience with past market cycles suggests that, once confidence and optimism are restored, markets can recover quickly as investors realize good companies are attractively priced. We’re working hard to ensure the Fund is in a prime position to capture this upside potential.
AVERAGE ANNUAL TOTAL RETURNS
Periods Ended September 30, 2008
| | | | | | | | | | | | | |
| 1 Year | | | 5 Years | | | 10 Years | | | Since
Registration(a) | | | Since
Inception(a) | |
| Loomis Sayles Investment Grade Fixed Income: Institutional | |
| -6.00 | % | | 5.53 | % | | 8.20 | % | | 7.90 | % | | 9.20 | % |
| Lehman US Government/Credit Index(b) | |
| 2.41 | | | 3.34 | | | 5.00 | | | 5.93 | | | 6.40 | |
| Lipper BBB-Rated Funds Index(b) | |
| -6.31 | | | 2.27 | | | 4.10 | | | 4.78 | | | 5.63 | |
| | | | | | |
| Gross Expense Ratio (before reductions and reimbursements)* |
| Institutional: 0.53% | | | | | | |
| Net Expense Ratio (after reductions and reimbursements)* |
| Institutional 0.53% | | | | | | |
* As stated in the most recent prospectus
CUMULATIVE PERFORMANCE
Registration to September 30, 2008(c)

Inception to September 30, 2008(c)
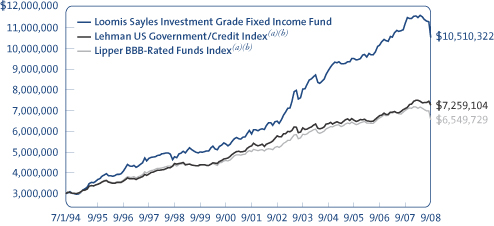
Data quoted reflects past performance and cannot guarantee future results. Average annual total returns assume reinvestment of dividends and capital gains distributions. Investment return and principal value will fluctuate so that shares, when redeemed, may be worth more or less than their original cost. For performance current to the most recent month end, please visit the Loomis Sayles website. Current performance may be higher or lower than quoted.
Returns do not reflect the taxes that a shareholder would pay on Fund distributions or the redemption of shares. Periods of less than one year are not annualized. Performance data reflects certain fee reductions and reimbursements, if any, without which performance would be lower.
(a) Shares of the Fund were registered for offer and sale under the Securities Act of 1933 on March 7, 1997. In accordance with regulations, performance information is provided for the period beginning on March 7, 1997 (“Registration”). Performance from inception is also provided for the convenience of our long-term shareholders. Since index performance data is not available coincident with the Fund’s inception and registration dates, comparative performance is presented from the month end closest to the Fund’s inception and registration dates. (b) See page 15 for a description of the indices. (c) The mountain chart is based on the Fund’s minimum initial investment of $3,000,000.
WHAT YOU SHOULD KNOW
The Fund can invest a significant percentage of assets in debt securities that are rated below investment grade and the value of fund shares can be adversely affected by changes in economic conditions or other circumstances. Lower rated debt securities have speculative characteristics and may be subject to greater price volatility than higher rated investments. In addition, the secondary market for these securities may lack liquidity. Fund shares should be viewed as a long-term investment. Securities issued by US government agencies are not insured by and may not be guaranteed by the US government. The Fund can invest a significant percentage of assets in foreign securities and the value of the fund shares can be adversely affected by changes in currency exchange rates, political, and economic developments. In emerging markets these risks can be significant. The Fund is subject to currency risk, which is the risk that fluctuations in exchange rates between the US dollar and foreign currencies may cause the value of a Fund’s investments to decline. The Fund can invest a significant percentage of assets in debt securities that are rated below investment grade and the value of fund shares can be adversely affected by changes in economic conditions or other circumstances. Lower rated debt securities have speculative characteristics and may be subject to greater price volatility than higher rated investments. In addition, the secondary market for these securities may lack liquidity. Accordingly, the purchase of fund shares should be viewed as a long-term investment.
14
ADDITIONAL INFORMATION
Index Definitions
Indexes are unmanaged and do not have expenses that affect results, unlike mutual funds. Index returns are adjusted for the reinvestment of capital gain distributions and income dividends. It is not possible to invest directly in an index.
Lipper BBB-Rated Funds Index is an equally weighted index of typically the 30 largest mutual funds within the corporate debt funds BBB-rated investment objective.
Lipper Global Income Funds Index is an equally weighted index of typically the 30 largest mutual funds within the global income funds investment objective.
Lipper High Current Yield Funds Index is an equally weighted unmanaged index of typically the 30 largest mutual funds within the high current yield funds investment objective.
Lipper Intermediate Investment Grade Debt Funds Index is an equally weighted unmanaged index of the 30 largest mutual funds within the intermediate investment grade debt funds investment objective.
Lipper Treasury Inflation Protected Securities Funds Index is an equally weighted index of typically the 30 largest mutual funds within the treasury inflation protected securities funds investment objective.
Source: Lipper, Inc.
Lehman US Government/Credit Index includes treasuries (public obligations of the U.S. Treasury that have remaining maturities of more than one year) and agencies (publicly issued debt of U.S. Government agencies, quasi-federal corporations, and corporate or foreign debt guaranteed by the U.S. Government) as well as other publicly issued investment grade corporate and foreign debentures that meet specified maturity, liquidity, and quality requirements.
Lehman US Government/Credit Intermediate Index includes securities which have a remaining maturity of 1-10 years and includes Treasuries (public obligations of the U.S. Treasury that have remaining maturities of more than one year) and agencies (publicly issued debt of U.S. Government agencies, quasi-federal corporations, and corporate or foreign debt guaranteed by the U.S. Government), as well as other publicly issued investment grade corporate and non-corporate debentures that meet specified maturity, liquidity, and quality requirements.
Lehman Global Aggregate Bond Index covers the most liquid portion of the global investment grade fixed-rate bond market, including government, credit and collateralized securities.
Lehman High Yield Index covers the universe of fixed rate, non-investment grade debt. Pay-in-kind bonds, Eurobonds, and debt issues from countries designated as emerging markets (e.g., Argentina, Brazil, Venezuela, etc.) are excluded, but Canadian and global bonds (SEC registered) of issuers in non-emerging market countries are included. Original issue zeroes, step-up coupon structures, and 144As are also included.
Lehman US Treasury Inflation Protected Securities Index measures the performance of the inflation protected securities issued by the U.S. Treasury.
Proxy Voting Information
A description of the Funds’ proxy voting policies and procedures is available without charge, upon request, (i) by calling Loomis Sayles at 800-633-3330; (ii) on the Funds’ website, www.loomissayles.com, and (iii) on the SEC’s website, www.sec.gov. Information about how the Funds voted proxies relating to portfolio securities during the 12 months ended June 30, 2008 is available on (i) the Funds’ website and (ii) the SEC’s website.
Quarterly Portfolio Schedules
The Funds file a complete schedule of portfolio holdings with the SEC for the first and third quarters of each fiscal year on Form N-Q. The Funds’ Forms N-Q are available on the SEC’s website at www.sec.gov and may be reviewed and copied at the SEC’s Public Reference Room in Washington, DC. Information on the operation of the Public Reference Room may be obtained by calling 1-800-SEC-0330.
UNDERSTANDING YOUR FUND’S EXPENSES
As a mutual fund shareholder you incur two types of costs: (1) transaction costs, including certain exchange fees; and (2) ongoing costs, including management fees, distribution and/or service fees (12b-1 fees), and other Fund expenses. These costs are described in more detail in each Fund’s prospectus. The examples below are intended to help you understand the ongoing costs of investing in the Funds and help you compare these with the ongoing costs of investing in other mutual funds.
The first line in the table for each Class of Fund shares shows the actual amount of Fund expenses you would have paid on a $1,000 investment in the Fund from April 1, 2008 through September 30, 2008. It also shows how much a $1,000 investment would be worth at the close of the period, assuming actual Fund returns and expenses. To estimate the expenses you paid over the period, simply divide your account value by $1,000 (for example $8,600 account value divided by $1,000 = 8.6) and multiply the result by the number in the Expenses Paid During Period column as shown below for your Class.
The second line in the table for each Class of Fund shares provides information about hypothetical account values and hypothetical expenses based on the Fund’s actual expense ratios and an assumed rate of return of 5% per year before expenses, which is not the Fund’s actual return. The hypothetical account values and expenses may not be used to estimate the actual ending account balance or expenses you paid on your investment for the period. You may use this information to compare the ongoing costs of investing in the Fund and other funds. To do so, compare this 5% hypothetical example with the 5% hypothetical examples that appear in the shareholder reports of the other funds.
15
Loomis Sayles Bond Fund
| | | | | | |
Institutional Class | | Beginning
Account Value
4/1/2008 | | Ending
Account Value
9/30/2008 | | Expenses Paid
During Period*
4/1/2008 – 9/30/2008 |
Actual | | $1,000.00 | | $873.80 | | $2.95 |
Hypothetical (5% return before expenses) | | $1,000.00 | | $1,021.85 | | $3.18 |
| | | |
Retail Class | | | | | | |
Actual | | $1,000.00 | | $872.10 | | $4.35 |
Hypothetical (5% return before expenses) | | $1,000.00 | | $1,020.35 | | $4.70 |
| | | |
Admin Class | | | | | | |
Actual | | $1,000.00 | | $870.70 | | $5.61 |
Hypothetical (5% return before expenses) | | $1,000.00 | | $1,019.00 | | $6.06 |
* Expenses are equal to the Fund’s annualized expense ratio (after fee reduction/reimbursement): 0.63%, 0.93%, and 1.20%, for Institutional, Retail and Admin Class, respectively, multiplied by the average account value over the period, multiplied by the number of days in the most recent fiscal half-year, divided by 366 (to reflect the half-year period). |
Loomis Sayles Fixed Income Fund
| | | | | | |
Institutional Class | | Beginning
Account Value
4/1/2008 | | Ending
Account Value
9/30/2008 | | Expenses Paid
During Period*
4/1/2008 – 9/30/2008 |
Actual | | $1,000.00 | | $904.70 | | $2.76 |
Hypothetical (5% return before expenses) | | $1,000.00 | | $1,022.10 | | $2.93 |
* Expenses are equal to the Fund’s annualized expense ratio (after fee reduction/reimbursement): 0.58%, multiplied by the average account value over the period, multiplied by the number of days in the most recent fiscal half-year, divided by 366 (to reflect the half-year period). |
Loomis Sayles Global Bond Fund
| | | | | | |
Institutional Class | | Beginning
Account Value
4/1/2008 | | Ending
Account Value
9/30/2008 | | Expenses Paid
During Period*
4/1/2008 – 9/30/2008 |
Actual | | $1,000.00 | | $897.10 | | $3.04 |
Hypothetical (5% return before expenses) | | $1,000.00 | | $1,021.80 | | $3.23 |
| | | |
Retail Class | | | | | | |
Actual | | $1,000.00 | | $895.90 | | $4.74 |
Hypothetical (5% return before expenses) | | $1,000.00 | | $1,020.00 | | $5.05 |
* Expenses are equal to the Fund’s annualized expense ratio (after fee reduction/reimbursement): 0.64% and 1.00% for the Institutional and Retail Class, respectively, multiplied by the average account value over the period, multiplied by the number of days in the most recent fiscal half-year, divided by 366 (to reflect the half-year period). |
Loomis Sayles Inflation Protected Securities Fund
| | | | | | |
Institutional Class | | Beginning
Account Value
4/1/2008 | | Ending
Account Value
9/30/2008 | | Expenses Paid
During Period*
4/1/2008 – 9/30/2008 |
Actual | | $1,000.00 | | $944.70 | | $1.94 |
Hypothetical (5% return before expenses) | | $1,000.00 | | $1,023.00 | | $2.02 |
* Expenses are equal to the Fund’s annualized expense ratio (after fee reduction/reimbursement): 0.40%, multiplied by the average account value over the period, multiplied by the number of days in the most recent fiscal half-year, divided by 366 (to reflect the half-year period). |
16
Loomis Sayles Institutional High Income Fund
| | | | | | |
Institutional Class | | Beginning
Account Value
4/1/2008 | | Ending
Account Value
9/30/2008 | | Expenses Paid
During Period*
4/1/2008 - 9/30/2008 |
Actual | | $1,000.00 | | $905.10 | | $3.43 |
Hypothetical (5% return before expenses) | | $1,000.00 | | $1,021.40 | | $3.64 |
| *Expensesare equal to the Fund’s annualized expense ratio (after fee reduction/reimbursement): 0.72%, multiplied by the average account value over the period, multiplied by the number of days in the most recent fiscal half-year, divided by 366 (to reflect the half-year period). |
Loomis Sayles Intermediate Duration Fixed Income Fund
| | | | | | |
Institutional Class | | Beginning
Account Value
4/1/2008 | | Ending
Account Value
9/30/2008 | | Expenses Paid
During Period*
4/1/2008 - 9/30/2008 |
Actual | | $1,000.00 | | $964.00 | | $1.96 |
Hypothetical (5% return before expenses) | | $1,000.00 | | $1,023.00 | | $2.02 |
| *Expensesare equal to the Fund’s annualized expense ratio (after fee reduction/reimbursement): 0.40%, multiplied by the average account value over the period, multiplied by the number of days in the most recent fiscal half-year, divided by 366 (to reflect the half-year period). |
Loomis Sayles Investment Grade Fixed Income Fund
| | | | | | |
Institutional Class | | Beginning
Account Value
4/1/2008 | | Ending
Account Value
9/30/2008 | | Expenses Paid
During Period*
4/1/2008 - 9/30/2008 |
Actual | | $1,000.00 | | $916.00 | | $2.35 |
Hypothetical (5% return before expenses) | | $1,000.00 | | $1,022.55 | | $2.48 |
| *Expensesare equal to the Fund’s annualized expense ratio (after fee reduction/reimbursement): 0.49%, multiplied by the average account value over the period, multiplied by the number of days in the most recent fiscal half-year, divided by 366 (to reflect the half-year period). |
17
BOARD APPROVAL OF THE EXISTING ADVISORY AGREEMENTS
The Board of Trustees, including the Independent Trustees, considers matters bearing on each Fund’s advisory agreements (collectively, the “Agreements”) at most of its meetings throughout the year. Each year, usually in the spring, the Contract Review and Governance Committee of the Board meets to review the Agreements to determine whether to recommend that the full Board approve the continuation of the Agreements, typically for an additional one-year period. After the Committee has made its recommendation, the full Board, including the Independent Trustees, determines whether to approve the continuation of the Agreements.
In connection with these meetings, the Trustees receive materials that the Funds’ investment adviser believes to be reasonably necessary for the Trustees to evaluate the Agreements. These materials generally include, among other items, (i) information on the investment performance of the Funds and the performance of peer groups of funds and the Funds’ performance benchmarks, (ii) information on the Funds’ advisory fees and other expenses, including information comparing the Funds’ expenses to those of peer groups of funds and information about any applicable expense caps and fee “breakpoints,” (iii) sales and redemption data in respect of the Funds, (iv) information about the profitability of the Agreements to the Funds’ adviser (the “Adviser”), and (v) information obtained through the completion of a questionnaire by the Adviser (the Trustees are consulted as to the information requested through that questionnaire). The Board of Trustees, including the Independent Trustees, also consider other matters such as (i) the Adviser’s financial results and financial condition, (ii) each Fund’s investment objective and strategies and the size, education and experience of the Adviser’s investment staffs and their use of technology, external research and trading cost measurement tools, (iii) arrangements in respect of the distribution of the Funds’ shares and the related costs, (iv) the procedures employed to determine the value of the Funds’ assets, (v) the allocation of the Funds’ brokerage, if any, including allocations to brokers affiliated with the Adviser and the use of “soft” commission dollars to pay Fund expenses and to pay for research and other similar services, (vi) the resources devoted to, and the record of compliance with, the Funds’ investment policies and restrictions, policies on personal securities transactions and other compliance policies, and (vii) the general economic outlook with particular emphasis on the mutual fund industry. Throughout the process, the Trustees are afforded the opportunity to ask questions of and request additional materials from the Adviser.
In addition to the materials requested by the Trustees in connection with the annual consideration of the continuation of the Agreements, the Trustees receive materials in advance of each regular quarterly meeting of the Board of Trustees that provide detailed information about each Fund’s investment performance and the fees charged to the Funds for advisory and other services. This information generally includes, among other things, an internal performance rating for each Fund based on agreed-upon criteria, graphs showing performance and fee differentials against each Fund’s peer group, performance ratings provided by a third-party, total return information for various periods, and third-party performance rankings for various periods comparing a Fund against its peer group. The portfolio management team for each Fund makes periodic presentations to the Contract Review and Governance Committee and/or the full Board of Trustees, and Funds identified as presenting possible performance concerns may be subject to more frequent board presentations and reviews. In addition, each quarter the Trustees are provided with detailed statistical information about each Fund’s portfolio.
The Board of Trustees most recently approved the continuation of the Agreements at their meeting held in June 2008. The Agreements were continued for a one-year period for all Funds. In considering whether to approve the continuation of the Agreements, the Board of Trustees, including the Independent Trustees, did not identify any single factor as determinative. Matters considered by the Trustees, including the Independent Trustees, in connection with their approval of the Agreements included the following:
The nature, extent and quality of the services provided to the Funds under the Agreements. The Trustees considered the nature, extent and quality of the services provided by the Adviser and its affiliates to the Funds and the resources dedicated to the Funds by the Adviser and its affiliates, including recent or planned investments by the Adviser in additional personnel or other resources. They also took note of the competitive market for talented personnel, in particular, for personnel who have contributed to the generation of strong investment performance. They considered the need for the Adviser to offer competitive compensation in order to attract and retain capable personnel. In the case of Loomis Sayles Bond Fund, which had experienced substantial net cash inflows, the Trustees considered factors including (1) the additional efforts required to manage the Fund’s portfolio in such circumstances (including the need to identify additional portfolio securities for investment as the Fund’s assets grow), (2) the additional personnel and other resources required to manage the portfolio in such circumstances, (3) the possible effects of such cash inflows on the Fund’s ability to achieve attractive investment returns and (4) the benefits to the Fund of such net cash inflows (including lower expense ratios).
The Trustees considered not only the advisory services provided by the Adviser to the Funds, but also considered the administrative services provided by Natixis Advisors and its affiliates to the Funds.
For each Fund, the Trustees also considered the benefits to shareholders of investing in a mutual fund that is part of a family of funds that offers shareholders the right to exchange shares of one type of fund for shares of another type of fund, and provides a variety of fund and shareholder services.
18
After reviewing these and related factors, the Trustees concluded, within the context of their overall conclusions regarding each of the Agreements, that the nature, extent and quality of services provided supported the renewal of the Agreements.
Investment performance of the Funds and the Adviser. As noted above, the Trustees received information about the performance of the Funds over various time periods, including information which compared the performance of the Funds to the performance of peer groups of funds and the Funds’ respective performance benchmarks. In addition, the Trustees also reviewed data prepared by an independent third party which analyzed the performance of the Funds using a variety of performance metrics, including metrics which also measured the performance of the Funds on a risk adjusted basis.
With respect to each Fund, the Board concluded that the Fund’s performance or other relevant factors supported the renewal of the Agreement relating to that Fund. In the case of each Fund that had performance that lagged that of a relevant peer group for certain (although not necessarily all) periods, the Board concluded that other factors relevant to performance supported renewal of the Funds’ Agreements. These factors varied from Fund to Fund, but included one or more of the following: (1) that the underperformance was attributable, to a significant extent, to investment decisions (such as security selection or sector allocation) by the Fund’s Adviser that were reasonable and consistent with the Funds’ investment objective and policies and (2) that reductions in the Funds’ expense levels resulting from decreased expenses and/or increased assets were not yet fully reflected in the Fund’s performance results.
The Trustees also considered the Adviser’s performance and reputation generally, the Funds’ performance as a fund family generally (as noted by certain financial publications), and the historical responsiveness of the Adviser to Trustee concerns about performance and the willingness of the Adviser to take steps intended to improve performance.
After reviewing these and related factors, the Trustees concluded, within the context of their overall conclusions regarding each of the Agreements, that the performance of the Funds and the Adviser supported the renewal of the Agreements.
The costs of the services to be provided and profits to be realized by the Adviser and its affiliates from their respective relationships with the Funds. The Trustees considered the fees charged to the Funds for advisory services as well as the total expense levels of the Funds. This information included comparisons (provided both by management and also by an independent third party) of the Funds’ advisory fees and total expense levels to those of their peer groups and information about the advisory fees charged by the Adviser to comparable accounts. In considering the fees charged to comparable accounts, the Trustees considered, among other things, management’s representations about the differences between managing mutual funds as compared to other types of accounts, including the additional resources required to effectively manage mutual fund assets. In evaluating each Fund’s advisory fees, the Trustees also took into account the demands, complexity and quality of the investment management of such Fund. The Trustees considered that over the past several years, management had made recommendations regarding reductions in advisory fee rates, implementation of advisory fee breakpoints and the institution of advisory fee waivers and expense caps for various Funds in the Fund family. They noted that all of the Loomis Sayles Funds in this report have expense caps in place, and they considered the amounts waived or reimbursed by the Adviser under these caps. The Trustees noted that the Loomis Sayles Global Bond Fund’s total expense ratio was below the median of a peer group of funds even though the advisory fee was above the median.
The Trustees also considered the compensation directly or indirectly received by the Adviser and its affiliates from their relationships with the Funds. The Trustees reviewed information provided by management as to the profitability of the Adviser and its affiliates’ relationships with the Funds, and information about the allocation of expenses used to calculate profitability. They also reviewed information provided by management about the effect of distribution costs and Fund growth on Adviser profitability, including information regarding resources spent on distribution activities and the increase in net sales for the family of funds. When reviewing profitability, the Trustees also considered information about court cases in which adviser profitability was an issue, the performance of the relevant Funds, the expense levels of the Funds, and whether the Adviser had implemented breakpoints and/or expense caps with respect to such Funds. The Trustees also noted management’s history of proposing additional advisory fee breakpoints as the Loomis Sayles Bond Fund grew to substantially larger scale.
After reviewing these and related factors, the Trustees concluded, within the context of their overall conclusions regarding each of the Agreements, that the advisory fees charged to each of the Funds were fair and reasonable, and that the costs of these services generally and the related profitability of the Adviser and its affiliates in respect of their relationships with the Funds supported the renewal of the Agreements.
Economies of Scale. The Trustees considered the existence of any economies of scale in the provision of services by the Adviser and whether those economies are shared with the Funds through breakpoints in their investment advisory fees or other means, such as expense waivers. The Trustees noted that two of the Loomis Sayles Funds in this report had breakpoints in their advisory fees and the remaining Funds were subject to expense caps. The Trustees also considered management’s representation that for certain Funds, the Funds’ Adviser did not benefit from economies of scale in providing services to the Funds (because of the investment style of the Fund, the small size of the Fund or for other reasons) or were capacity constrained with respect to the relevant investment strategy. For Loomis Sayles Bond Fund, the Trustees considered that the additional breakpoints implemented in December 2007 and
19
management’s representations that additional investments were being made to support the Fund’s investment team in response to the growth of assets in the Fund. In considering these issues, the Trustees also took note of the costs of the services provided (both on an absolute and a relative basis) and the profitability to the Adviser and its affiliates of their relationships with the Funds, as discussed above.
After reviewing these and related factors, the Trustees considered, within the context of their overall conclusions regarding each of the Agreements, that the extent to which economies of scale were shared with the Funds supported the renewal of the Agreements.
The Trustees also considered other factors, which included but were not limited to the following:
| • | | whether each Fund has operated in accordance with its investment objective and the Fund’s record of compliance with its investment restrictions, and the compliance programs of the Funds and the Adviser. They also considered the compliance-related resources the Adviser and its affiliates were providing to the Funds. |
| • | | the nature, quality, cost and extent of administrative and shareholder services performed by the Adviser and its affiliates, both under the Agreements and under separate agreements covering administrative services. |
| • | | so-called “fallout benefits” to the Adviser, such as the engagement of affiliates of the Adviser to provide distribution, administrative and brokerage services to the Funds, and the benefits of research made available to the Adviser by reason of brokerage commissions generated by the Funds’ securities transactions. The Trustees also considered the fact that Natixis Advisors’ parent company benefits from the retention of an affiliated Adviser. The Trustees considered the possible conflicts of interest associated with these fallout and other benefits, and the reporting, disclosure and other processes in place to disclose and monitor such possible conflicts of interest. |
Based on their evaluation of all factors that they deemed to be material, including those factors described above, and assisted by the advice of independent counsel, the Trustees, including the Independent Trustees, concluded that each of the existing advisory agreements should be continued through June 30, 2009.
20
PORTFOLIO OF INVESTMENTS – as of September 30, 2008
Loomis Sayles Bond Fund
| | | | | | | | |
| | | | | Principal Amount (‡) | | Value (†) |
| | | | | | | | |
| | |
| BONDS AND NOTES – 92.4% of Net Assets | | | | | | |
| | | |
| NON-CONVERTIBLE BONDS – 87.7% | | | | | | | | |
| | | |
| ABS Credit Card – 0.7% | | | | | | | | |
Citibank Credit Card Issuance Trust, Series 2008-C6, Class C6, 6.300%, 6/20/2014 | | | | $ | 113,710,000 | | $ | 98,805,382 |
MBNA Credit Card Master Note Trust, Series 03A5, 4.150%, 4/19/2010 | | EUR | | | 300,000 | | | 408,570 |
| | | | | | | | |
| | | | | | | | 99,213,952 |
| | | | | | | | |
| Aerospace & Defense – 0.1% | | | | | | | | |
Bombardier, Inc., 6.300%, 5/01/2014, 144A | | | | | 1,590,000 | | | 1,478,700 |
Bombardier, Inc., 7.350%, 12/22/2026 | | CAD | | | 6,785,000 | | | 5,662,295 |
Bombardier, Inc., 7.450%, 5/01/2034, 144A | | | | | 13,464,000 | | | 12,521,520 |
| | | | | | | | |
| | | | | | | | 19,662,515 |
| | | | | | | | |
| Airlines – 1.4% | | | | | | | | |
American Airlines, Inc., Series 1999-1,
7.324%, 4/15/2011 | | | | | 1,255,000 | | | 1,192,250 |
American Airlines, Inc., Series 93A6,
8.040%, 9/16/2011 | | | | | 1,522,568 | | | 1,149,539 |
Continental Airlines, Inc., Series 1997-4B,
6.900%, 7/02/2018 | | | | | 4,609,946 | | | 3,837,780 |
Continental Airlines, Inc., Series 1998-1, Class B, 6.748%, 9/15/2018 | | | | | 7,335,827 | | | 5,868,662 |
Continental Airlines, Inc., Series 1999-1B,
6.795%, 2/02/2020 | | | | | 4,220,894 | | | 3,186,775 |
Continental Airlines, Inc., Series 1999-1C,
6.954%, 2/02/2011 | | | | | 3,810,053 | | | 3,562,399 |
Continental Airlines, Inc., Series 1999-2, Class B, 7.566%, 9/15/2021 | | | | | 4,429,169 | | | 3,587,627 |
Continental Airlines, Inc., Series 2000-2, Class B, 8.307%, 10/02/2019 | | | | | 7,124,614 | | | 5,664,068 |
Continental Airlines, Inc., Series 2001-1, Class B, 7.373%, 6/15/2017 | | | | | 3,754,805 | | | 2,816,104 |
Continental Airlines, Inc., Series 96-A, Class B, 6.940%, 4/15/2015 | | | | | 335,683 | | | 313,025 |
Continental Airlines, Inc., Series 971A,
7.461%, 10/01/2016 | | | | | 7,632,142 | | | 6,639,964 |
Continental Airlines, Inc., Series A,
5.983%, 4/19/2022 | | | | | 26,671,000 | | | 20,536,670 |
Continental Airlines, Inc., Series B,
6.903%, 4/19/2022 | | | | | 23,877,000 | | | 16,952,670 |
Delta Air Lines, Inc., Series 2007-1, Class A, 6.821%, 8/10/2022 | | | | | 2,337,340 | | | 1,823,125 |
Delta Air Lines, Inc., Series 2007-1, Class B, 8.021%, 2/10/2024 | | | | | 5,753,706 | | | 3,912,520 |
Delta Air Lines, Inc., Series 2007-1, Class C, 8.954%, 8/10/2014 | | | | | 44,560,173 | | | 32,528,926 |
Northwest Airlines, Inc., Series 07-1, Class B, 8.028%, 11/01/2017 | | | | | 37,035,000 | | | 22,961,700 |
Qantas Airways Ltd., 5.125%, 6/20/2013, 144A | | | | | 2,000,000 | | | 1,878,858 |
Qantas Airways Ltd., 6.050%, 4/15/2016, 144A | | | | | 44,235,000 | | | 40,495,417 |
United Air Lines, Inc., 6.636%, 1/02/2024 | | | | | 26,136,569 | | | 19,341,061 |
| | | | | | | | |
| | | | | | | | 198,249,140 |
| | | | | | | | |
21
| | | | | | | | |
| | | | | Principal Amount (‡) | | Value (†) |
| | | | | | | | |
| | | |
| BONDS AND NOTES – continued | | | | | | | | |
| | | |
| Automotive – 1.7% | | | | | | | | |
Cummins, Inc., 6.750%, 2/15/2027 | | | | $ | 2,547,000 | | $ | 2,283,355 |
Cummins, Inc., 7.125%, 3/01/2028 | | | | | 3,000,000 | | | 2,870,907 |
FCE Bank PLC, EMTN, 7.125%, 1/16/2012 | | EUR | | | 9,800,000 | | | 9,243,617 |
FCE Bank PLC, EMTN, 7.125%, 1/15/2013 | | EUR | | | 6,550,000 | | | 5,993,710 |
Ford Motor Co., 6.375%, 2/01/2029 | | | | | 1,195,000 | | | 442,150 |
Ford Motor Co., 6.500%, 8/01/2018 | | | | | 2,240,000 | | | 918,400 |
Ford Motor Co., 6.625%, 2/15/2028 | | | | | 500,000 | | | 192,500 |
Ford Motor Co., 6.625%, 10/01/2028 | | | | | 62,410,000 | | | 23,715,800 |
Ford Motor Co., 7.125%, 11/15/2025(b) | | | | | 1,940,000 | | | 766,300 |
Ford Motor Co., 7.450%, 7/16/2031(b) | | | | | 114,720,000 | | | 49,329,600 |
Ford Motor Co., 7.500%, 8/01/2026 | | | | | 795,000 | | | 329,925 |
Ford Motor Credit Co. LLC, 5.700%, 1/15/2010 | | | | | 66,163,000 | | | 50,670,007 |
Ford Motor Credit Co. LLC, 7.000%, 10/01/2013 | | | | | 13,455,000 | | | 8,268,864 |
Ford Motor Credit Co. LLC, 7.250%, 10/25/2011 | | | | | 18,760,000 | | | 11,929,353 |
Ford Motor Credit Co. LLC, 7.375%, 10/28/2009 | | | | | 500,000 | | | 401,983 |
Ford Motor Credit Co. LLC, 7.875%, 6/15/2010 | | | | | 1,320,000 | | | 1,007,592 |
Ford Motor Credit Co. LLC,
8.000%, 12/15/2016(b) | | | | | 18,970,000 | | | 11,994,314 |
Ford Motor Credit Co. LLC, 8.625%, 11/01/2010 | | | | | 29,945,000 | | | 21,234,598 |
Ford Motor Credit Co. LLC, 9.750%, 9/15/2010 | | | | | 2,150,000 | | | 1,541,728 |
Ford Motor Credit Co. LLC, EMTN,
4.875%, 1/15/2010 | | EUR | | | 12,200,000 | | | 11,850,863 |
General Motors Corp., 7.250%, 7/03/2013(b) | | EUR | | | 2,805,000 | | | 1,619,041 |
General Motors Corp., 7.400%, 9/01/2025 | | | | | 9,790,000 | | | 3,524,400 |
General Motors Corp., 8.250%, 7/15/2023(b) | | | | | 73,625,000 | | | 28,897,813 |
General Motors Corp., 8.375%, 7/15/2033(b) | | | | | 3,445,000 | | | 1,378,000 |
Goodyear Tire & Rubber Co., 7.000%, 3/15/2028 | | | | | 6,041,000 | | | 4,470,340 |
| | | | | | | | |
| | | | | | | | 254,875,160 |
| | | | | | | | |
| Banking – 4.6% | | | | | | | | |
BAC Capital Trust VI, 5.625%, 3/08/2035 | | | | | 35,170,000 | | | 26,848,743 |
Barclays Financial LLC, 4.060%, 9/16/2010, 144A | | KRW | | | 38,370,000,000 | | | 32,350,397 |
Barclays Financial LLC, 4.160%, 2/22/2010, 144A | | THB | | | 2,816,000,000 | | | 82,234,519 |
Barclays Financial LLC, 4.460%, 9/23/2010, 144A | | KRW | | | 48,070,000,000 | | | 40,835,305 |
Barclays Financial LLC, EMTN,
4.100%, 3/22/2010, 144A | | THB | | | 247,000,000 | | | 7,207,206 |
BNP Paribas SA, EMTN, Zero Coupon Bond, 6/13/2011, 144A | | IDR | | | 273,109,870,000 | | | 20,907,531 |
ICICI Bank Ltd., (fixed rate to 4/30/2017, variable rate thereafter), 6.375%, 4/30/2022, 144A | | | | | 12,345,000 | | | 8,520,889 |
JPMorgan Chase & Co., Zero Coupon Bond, 5/17/2010, 144A | | BRL | | | 241,667,000 | | | 102,159,774 |
JPMorgan Chase & Co., Zero Coupon Bond, 3/28/2011, 144A | | IDR | | | 699,525,000,000 | | | 55,131,175 |
22
PORTFOLIO OF INVESTMENTS – as of September 30, 2008
Loomis Sayles Bond Fund – continued
| | | | | | | |
| | | | | Principal Amount (‡) | | Value (†) |
| | | | | | | |
| | | |
| BONDS AND NOTES – continued | | | | | | | |
| | | |
| Banking – continued | | | | | | | |
JPMorgan Chase & Co., Zero Coupon Bond, 3/28/2011, 144A | | IDR | | 248,433,920,000 | | $ | 19,553,304 |
JPMorgan Chase & Co., Zero Coupon Bond, 4/12/2012, 144A | | IDR | | 599,419,948,640 | | | 41,171,188 |
JPMorgan Chase London, Zero Coupon Bond, 10/21/2010, 144A | | IDR | | 152,206,784,000 | | | 12,697,887 |
Kaupthing Bank, 3.491%, 1/15/2010, 144A(b)(d) | | | | 3,635,000 | | | 2,835,300 |
Kaupthing Bank, Series D,
5.750%, 10/04/2011, 144A | | | | 52,942,000 | | | 33,882,880 |
Kaupthing Bank, Series E,
6.125%, 10/04/2016, 144A | | | | 13,245,000 | | | 7,019,850 |
Kreditanstalt fuer Wiederaufbau, EMTN,
10.750%, 2/01/2010 | | ISK | | 95,000,000 | | | 906,539 |
Rabobank Nederland, 10.250%, 9/10/2009, 144A | | ISK | | 4,660,000,000 | | | 43,317,691 |
Rabobank Nederland, EMTN,
12.500%, 2/17/2009 | | ISK | | 1,330,000,000 | | | 12,396,415 |
Rabobank Nederland, EMTN,
14.000%, 1/28/2009, 144A | | ISK | | 13,545,000,000 | | | 129,061,993 |
| | | | | | | |
| | | | | | | 679,038,586 |
| | | | | | | |
| Brokerage – 0.9% | | | | | | | |
Bear Stearns Cos., Inc. (The), 4.650%, 7/02/2018 | | | | 3,260,000 | | | 2,552,939 |
Bear Stearns Cos., Inc. (The), 5.300%, 10/30/2015 | | | | 1,445,000 | | | 1,281,159 |
Bear Stearns Cos., Inc. (The), 6.400%, 10/02/2017 | | | | 3,160,000 | | | 2,951,114 |
Bear Stearns Cos., Inc. (The), 7.250%, 2/01/2018 | | | | 22,055,000 | | | 21,225,181 |
Goldman Sachs Group LP, 5.000%, 10/01/2014 | | | | 7,620,000 | | | 6,355,590 |
Goldman Sachs Group, Inc. (The),
5.150%, 1/15/2014 | | | | 3,865,000 | | | 3,174,259 |
Lehman Brothers Holdings, Inc.,
6.875%, 7/17/2037(e) | | | | 117,630,000 | | | 147,037 |
Lehman Brothers Holdings, Inc., MTN, (fixed rate to 5/03/2027, variable rate thereafter),
6.000%, 5/03/2032(e) | | | | 8,005,000 | | | 10,006 |
Merrill Lynch & Co., Inc., 6.110%, 1/29/2037 | | | | 28,424,000 | | | 19,732,396 |
Merrill Lynch & Co., Inc., 10.710%, 3/08/2017 | | BRL | | 100,000,000 | | | 37,311,472 |
Merrill Lynch & Co., Inc., EMTN,
4.625%, 9/14/2018 | | EUR | | 4,887,000 | | | 3,768,201 |
Morgan Stanley, 3.875%, 1/15/2009 | | | | 840,000 | | | 772,815 |
Morgan Stanley, 5.375%, 10/15/2015 | | | | 800,000 | | | 495,836 |
Morgan Stanley, EMTN, 5.450%, 1/09/2017 | | | | 295,000 | | | 182,991 |
Morgan Stanley, Series F, MTN,
5.550%, 4/27/2017 | | | | 12,400,000 | | | 7,687,132 |
Morgan Stanley, Series F, MTN,
5.950%, 12/28/2017 | | | | 295,000 | | | 184,802 |
Morgan Stanley, Series F, MTN,
6.625%, 4/01/2018 | | | | 34,440,000 | | | 22,792,082 |
Morgan Stanley, MTN, 6.250%, 8/09/2026 | | | | 1,900,000 | | | 1,161,506 |
| | | | | | | |
| | | | | | | 131,786,518 |
| | | | | | | |
| Building Materials – 0.7% | | | | | | | |
Owens Corning, Inc., 6.500%, 12/01/2016 | | | | 24,725,000 | | | 21,879,474 |
Owens Corning, Inc., 7.000%, 12/01/2036 | | | | 50,335,000 | | | 40,463,098 |
23
| | | | | | | | |
| | | | | Principal Amount (‡) | | Value (†) |
| | | | | | | | |
| | | |
| BONDS AND NOTES – continued | | | | | | | | |
| | | |
| Building Materials – continued | | | | | | | | |
Ply Gem Industries, Inc., 9.000%, 2/15/2012(b) | | | | $ | 6,265,000 | | $ | 3,414,425 |
USG Corp., 6.300%, 11/15/2016 | | | | | 34,370,000 | | | 25,949,350 |
USG Corp., 8.000%, 1/15/2018 | | | | | 17,605,000 | | | 13,995,975 |
| | | | | | | | |
| | | | | | | | 105,702,322 |
| | | | | | | | |
| Chemicals – 0.4% | | | | | | | | |
Borden, Inc., 7.875%, 2/15/2023 | | | | | 29,454,000 | | | 13,548,840 |
Borden, Inc., 8.375%, 4/15/2016 | | | | | 2,886,000 | | | 981,240 |
Borden, Inc., 9.200%, 3/15/2021 | | | | | 11,255,000 | | | 5,627,500 |
Georgia Gulf Corp., 10.750%, 10/15/2016(b) | | | | | 1,000,000 | | | 450,000 |
Hercules, Inc., 6.500%, 6/30/2029(c) | | | | | 19,619,000 | | | 13,144,730 |
Methanex Corp., 6.000%, 8/15/2015 | | | | | 10,555,000 | | | 9,284,600 |
Mosaic Global Holdings, Inc., 7.300%, 1/15/2028 | | | | | 9,000,000 | | | 8,460,000 |
Mosaic Global Holdings, Inc., 7.375%, 8/01/2018 | | | | | 9,095,000 | | | 9,031,090 |
| | | | | | | | |
| | | | | | | | 60,528,000 |
| | | | | | | | |
| Construction Machinery – 0.4% | | | | | | | | |
Great Lakes Dredge & Dock Corp.,
7.750%, 12/15/2013 | | | | | 3,590,000 | | | 3,284,850 |
Joy Global, Inc., 6.625%, 11/15/2036 | | | | | 1,975,000 | | | 1,672,722 |
Toro Co., 6.625%, 5/01/2037 | | | | | 27,030,000 | | | 28,482,484 |
United Rentals North America, Inc., 7.000%, 2/15/2014 | | | | | 33,413,000 | | | 23,389,100 |
United Rentals North America, Inc.,
7.750%, 11/15/2013(b) | | | | | 3,895,000 | | | 2,969,938 |
| | | | | | | | |
| | | | | | | | 59,799,094 |
| | | | | | | | |
| Consumer Cyclical Services – 0.8% | | | | | | | | |
Western Union Co., 6.200%, 11/17/2036 | | | | | 154,180,000 | | | 120,481,340 |
| | | | | | | | |
| | | |
| Containers & Packaging – 0.0% | | | | | | | | |
Owens Brockway Glass Container, Inc.,
6.750%, 12/01/2014 | | EUR | | | 2,500,000 | | | 3,061,966 |
| | | | | | | | |
| Distributors – 0.0% | | | | | | | | |
ONEOK, Inc., 6.000%, 6/15/2035 | | | | | 3,805,000 | | | 2,715,777 |
| | | | | | | | |
| Electric – 4.1% | | | | | | | | |
AES Corp. (The), 8.375%, 3/01/2011 | | GBP | | | 1,990,000 | | | 3,497,236 |
AES Corp. (The), 7.750%, 3/01/2014 | | | | | 4,875,000 | | | 4,533,750 |
Bruce Mansfield Unit, 6.850%, 6/01/2034(c) | | | | | 95,735,000 | | | 95,466,942 |
Cleveland Electric Illuminating Co. (The),
5.950%, 12/15/2036 | | | | | 64,200,000 | | | 51,039,449 |
Commonwealth Edison Co.,
4.750%, 12/01/2011(c) | | | | | 268,000 | | | 254,871 |
Dominion Resources, Inc., 5.950%, 6/15/2035 | | | | | 13,040,000 | | | 10,787,862 |
Dynegy Holdings, Inc., 7.125%, 5/15/2018 | | | | | 5,295,000 | | | 3,997,725 |
Dynegy Holdings, Inc., 7.625%, 10/15/2026 | | | | | 11,835,000 | | | 8,639,550 |
Dynegy Holdings, Inc., 7.750%, 6/01/2019 | | | | | 1,504,000 | | | 1,203,200 |
Dynegy Holdings, Inc., 8.375%, 5/01/2016 | | | | | 2,000,000 | | | 1,740,000 |
Edison Mission Energy, 7.625%, 5/15/2027 | | | | | 23,200,000 | | | 18,792,000 |
Empresa Nacional de Electricidad SA (Endesa-Chile), 7.875%, 2/01/2027 | | | | | 11,581,000 | | | 12,128,665 |
24
PORTFOLIO OF INVESTMENTS – as of September 30, 2008
Loomis Sayles Bond Fund – continued
| | | | | | | | |
| | | | | Principal Amount (‡) | | Value (†) |
| | | | | | | | |
| | | |
| BONDS AND NOTES – continued | | | | | | | | |
| | | |
| Electric – continued | | | | | | | | |
Enersis SA, 7.400%, 12/01/2016 | | | | $ | 4,250,000 | | $ | 4,294,668 |
Illinois Power Co., 6.250%, 4/01/2018 | | | | | 3,105,000 | | | 2,859,534 |
ITC Holdings Corp., 5.875%, 9/30/2016, 144A | | | | | 25,460,000 | | | 23,988,692 |
ITC Holdings Corp., 6.375%, 9/30/2036, 144A | | | | | 37,955,000 | | | 32,797,599 |
MidAmerican Energy Holdings Co.,
6.125%, 4/01/2036 | | | | | 6,540,000 | | | 5,500,663 |
MidAmerican Energy Holdings Co.,
6.500%, 9/15/2037 | | | | | 54,485,000 | | | 47,802,960 |
NGC Corporation Capital Trust I, Series B,
8.316%, 6/01/2027(b) | | | | | 23,775,000 | | | 17,712,375 |
Nisource Finance Corp., 6.400%, 3/15/2018 | | | | | 63,435,000 | | | 56,849,749 |
Power Receivables Finance LLC,
6.290%, 1/01/2012, 144A | | | | | 1,887,259 | | | 1,952,785 |
Quezon Power Philippines Co., 8.860%, 6/15/2017 | | | | | 5,945,625 | | | 5,915,897 |
Salton Sea Funding Corp., Series E,
8.300%, 5/30/2011 | | | | | 1,468,160 | | | 1,567,510 |
Salton Sea Funding Corp., Series F,
7.475%, 11/30/2018 | | | | | 215,975 | | | 223,607 |
Southern California Edison Co.,
7.625%, 1/15/2010(b) | | | | | 2,000,000 | | | 2,077,300 |
SP Powerassets Ltd., EMTN, 3.730%, 10/22/2010 | | SGD | | | 1,000,000 | | | 710,462 |
Texas-New Mexico Power Co., 6.250%, 1/15/2009 | | | | | 1,000,000 | | | 999,100 |
Toledo Edison Co., 6.150%, 5/15/2037 | | | | | 13,195,000 | | | 10,742,868 |
TXU Corp., Series P, 5.550%, 11/15/2014 | | | | | 62,401,000 | | | 46,567,183 |
TXU Corp., Series Q, 6.500%, 11/15/2024 | | | | | 139,336,000 | | | 88,739,894 |
TXU Corp., Series R, 6.550%, 11/15/2034 | | | | | 8,266,000 | | | 5,078,986 |
White Pine Hydro LLC, 6.310%, 7/10/2017(c) | | | | | 9,175,000 | | | 8,807,477 |
White Pine Hydro LLC, 6.960%, 7/10/2037(c) | | | | | 14,695,000 | | | 14,184,128 |
White Pine Hydro Portfolio LLC,
7.260%, 7/20/2015(c) | | | | | 5,000,000 | | | 4,819,375 |
| | | | | | | | |
| | | | | | | | 596,274,062 |
| | | | | | | | |
| Entertainment – 0.6% | | | | | | | | |
Six Flags, Inc., 9.625%, 6/01/2014(b) | | | | | 11,190,000 | | | 6,266,400 |
Six Flags, Inc., 9.750%, 4/15/2013(b) | | | | | 3,875,000 | | | 2,247,500 |
Time Warner, Inc., 6.500%, 11/15/2036 | | | | | 9,510,000 | | | 7,221,979 |
Time Warner, Inc., 6.625%, 5/15/2029 | | | | | 21,780,000 | | | 17,396,121 |
Time Warner, Inc., 6.950%, 1/15/2028 | | | | | 8,805,000 | | | 7,340,905 |
Time Warner, Inc., 7.625%, 4/15/2031 | | | | | 5,885,000 | | | 5,110,299 |
Time Warner, Inc., 7.700%, 5/01/2032 | | | | | 3,785,000 | | | 3,307,106 |
Viacom, Inc., Class B, 6.875%, 4/30/2036 | | | | | 55,225,000 | | | 44,272,778 |
| | | | | | | | |
| | | | | | | | 93,163,088 |
| | | | | | | | |
| Food & Beverage – 1.0% | | | | | | | | |
Aramark Services, Inc., 5.000%, 6/01/2012 | | | | | 2,115,000 | | | 1,776,600 |
Corn Products International, Inc.,
6.625%, 4/15/2037 | | | | | 31,590,000 | | | 32,855,211 |
Dole Food Co., Inc., 8.625%, 5/01/2009 | | | | | 6,900,000 | | | 6,589,500 |
Kraft Foods, Inc., 6.500%, 8/11/2017 | | | | | 45,310,000 | | | 43,597,418 |
Kraft Foods, Inc., 6.500%, 11/01/2031 | | | | | 14,990,000 | | | 13,032,336 |
Kraft Foods, Inc., 7.000%, 8/11/2037 | | | | | 36,870,000 | | | 34,495,682 |
Sara Lee Corp., 6.125%, 11/01/2032 | | | | | 18,615,000 | | | 16,494,938 |
| | | | | | | | |
| | | | | | | | 148,841,685 |
| | | | | | | | |
25
| | | | | | | |
| | | | | Principal Amount (‡) | | Value (†) |
| | | | | | | |
| | | |
| BONDS AND NOTES – continued | | | | | | | |
| | | |
| Foreign Local Governments – 0.1% | | | | | | | |
Ontario Hydro, Zero Coupon Bond, 11/27/2020 | | CAD | | 1,507,000 | | $ | 782,748 |
Province of Alberta, 5.930%, 9/16/2016 | | CAD | | 18,123,482 | | | 18,448,572 |
| | | | | | | |
| | | | | | | 19,231,320 |
| | | | | | | |
| Government Guaranteed – 0.8% | | | | | | | |
Canada Housing Trust, 4.100%, 12/15/2008 | | CAD | | 130,265,000 | | | 122,852,411 |
| | | | | | | |
| Government Owned – No Guarantee – 0.1% | | | | | |
DP World Ltd., 6.850%, 7/02/2037, 144A | | | | 20,585,000 | | | 15,240,311 |
| | | | | | | |
| Government Sponsored – 1.2% | | | | | | | |
Federal Home Loan Mortgage Corp.,
4.625%, 10/25/2012(b) | | | | 32,925,000 | | | 33,844,431 |
Federal National Mortgage Association,
2.290%, 2/19/2009 | | SGD | | 145,900,000 | | | 101,719,264 |
Queensland Treasury Corp.,
7.125%, 9/18/2017, 144A | | NZD | | 60,170,000 | | | 42,255,124 |
| | | | | | | |
| | | | | | | 177,818,819 |
| | | | | | | |
| Health Insurance – 0.1% | | | | | | | |
CIGNA Corp., 6.150%, 11/15/2036 | | | | 20,530,000 | | | 17,296,114 |
| | | | | | | |
| Healthcare – 5.4% | | | | | | | |
Boston Scientific Corp., 5.450%, 6/15/2014 | | | | 3,710,000 | | | 3,468,850 |
Boston Scientific Corp., 6.400%, 6/15/2016 | | | | 14,305,000 | | | 13,589,750 |
Boston Scientific Corp., 7.000%, 11/15/2035 | | | | 22,132,000 | | | 19,697,480 |
Covidien International Finance SA,
6.000%, 10/15/2017 | | | | 24,890,000 | | | 24,591,146 |
Covidien International Finance SA,
6.550%, 10/15/2037 | | | | 25,070,000 | | | 24,102,173 |
HCA, Inc., 5.750%, 3/15/2014 | | | | 12,995,000 | | | 10,136,100 |
HCA, Inc., 6.250%, 2/15/2013 | | | | 7,795,000 | | | 6,508,825 |
HCA, Inc., 6.300%, 10/01/2012 | | | | 2,500,000 | | | 2,156,250 |
HCA, Inc., 6.375%, 1/15/2015 | | | | 17,365,000 | | | 13,674,937 |
HCA, Inc., 6.500%, 2/15/2016 | | | | 63,515,000 | | | 50,335,637 |
HCA, Inc., 6.750%, 7/15/2013 | | | | 3,040,000 | | | 2,553,600 |
HCA, Inc., 7.050%, 12/01/2027 | | | | 24,130,000 | | | 16,294,748 |
HCA, Inc., 7.190%, 11/15/2015 | | | | 19,290,000 | | | 15,399,824 |
HCA, Inc., 7.500%, 12/15/2023 | | | | 23,835,000 | | | 17,460,329 |
HCA, Inc., 7.500%, 11/06/2033 | | | | 19,830,000 | | | 14,079,300 |
HCA, Inc., 7.690%, 6/15/2025 | | | | 65,058,000 | | | 48,353,708 |
HCA, Inc., 8.360%, 4/15/2024 | | | | 38,139,000 | | | 29,560,776 |
HCA, Inc., MTN, 7.580%, 9/15/2025 | | | | 17,960,000 | | | 13,231,671 |
HCA, Inc., MTN, 7.750%, 7/15/2036 | | | | 11,516,000 | | | 8,175,208 |
Hospira, Inc., 6.050%, 3/30/2017 | | | | 15,175,000 | | | 14,468,513 |
Medco Health Solutions, Inc., 7.125%, 3/15/2018 | | | | 250,270,000 | | | 253,599,342 |
Owens & Minor, Inc., 6.350%, 4/15/2016(c) | | | | 4,710,000 | | | 4,586,273 |
Tenet Healthcare Corp., 6.500%, 6/01/2012 | | | | 3,660,000 | | | 3,385,500 |
Tenet Healthcare Corp., 6.875%, 11/15/2031 | | | | 30,578,000 | | | 20,793,040 |
Tenet Healthcare Corp., 7.375%, 2/01/2013 | | | | 2,236,000 | | | 2,034,760 |
Tenet Healthcare Corp., 9.250%, 2/01/2015(b) | | | | 560,000 | | | 529,200 |
WellPoint, Inc., 6.375%, 6/15/2037 | | | | 191,190,000 | | | 163,577,002 |
| | | | | | | |
| | | | | | | 796,343,942 |
| | | | | | | |
26
PORTFOLIO OF INVESTMENTS – as of September 30, 2008
Loomis Sayles Bond Fund – continued
| | | | | | | | |
| | | | | Principal Amount (‡) | | Value (†) |
| | | | | | | | |
| | | |
| BONDS AND NOTES – continued | | | | | | | | |
| | | |
| Home Construction – 1.6% | | | | | | | | |
Centex Corp., 5.250%, 6/15/2015 | | | | $ | 5,110,000 | | $ | 3,755,850 |
D.R. Horton, Inc., 5.250%, 2/15/2015 | | | | | 70,845,000 | | | 52,425,300 |
D.R. Horton, Inc., 5.625%, 9/15/2014 | | | | | 7,235,000 | | | 5,498,600 |
D.R. Horton, Inc., 5.625%, 1/15/2016 | | | | | 26,345,000 | | | 19,495,300 |
D.R. Horton, Inc., 6.500%, 4/15/2016 | | | | | 1,975,000 | | | 1,501,000 |
K. Hovnanian Enterprises, Inc., 6.250%, 1/15/2015 | | | | | 6,430,000 | | | 3,665,100 |
K. Hovnanian Enterprises, Inc., 6.250%, 1/15/2016 | | | | | 19,270,000 | | | 11,080,250 |
K. Hovnanian Enterprises, Inc.,
6.375%, 12/15/2014 | | | | | 6,249,000 | | | 3,624,420 |
K. Hovnanian Enterprises, Inc., 6.500%, 1/15/2014 | | | | | 4,050,000 | | | 2,389,500 |
K. Hovnanian Enterprises, Inc.,
7.500%, 5/15/2016(b) | | | | | 1,650,000 | | | 957,000 |
K. Hovnanian Enterprises, Inc.,
7.750%, 5/15/2013(b) | | | | | 2,865,000 | | | 1,618,725 |
K. Hovnanian Enterprises, Inc.,
8.875%, 4/01/2012(b) | | | | | 1,690,000 | | | 1,073,150 |
KB Home, 5.875%, 1/15/2015 | | | | | 895,000 | | | 711,525 |
Lennar Corp., 5.125%, 10/01/2010 | | | | | 3,495,000 | | | 2,935,800 |
Lennar Corp., 7.625%, 3/01/2009 | | | | | 5,245,000 | | | 5,061,425 |
Lennar Corp., Series B, 5.500%, 9/01/2014 | | | | | 22,935,000 | | | 14,907,750 |
Lennar Corp., Series B, 5.600%, 5/31/2015 | | | | | 9,112,000 | | | 5,922,800 |
Lennar Corp., Series B, 6.500%, 4/15/2016 | | | | | 40,810,000 | | | 27,546,750 |
Pulte Homes, Inc., 5.200%, 2/15/2015 | | | | | 6,790,000 | | | 5,432,000 |
Pulte Homes, Inc., 6.000%, 2/15/2035 | | | | | 63,520,000 | | | 45,416,800 |
Pulte Homes, Inc., 6.375%, 5/15/2033 | | | | | 17,205,000 | | | 12,559,650 |
Toll Brothers Finance Corp., 5.150%, 5/15/2015 | | | | | 7,935,000 | | | 6,710,749 |
Toll Corp., 8.250%, 12/01/2011 | | | | | 5,550,000 | | | 5,328,000 |
| | | | | | | | |
| | | | | | | | 239,617,444 |
| | | | | | | | |
| Independent Energy – 1.8% | | | | | | | | |
Anadarko Petroleum Corp., 5.950%, 9/15/2016 | | | | | 53,650,000 | | | 49,310,520 |
Anadarko Petroleum Corp., 6.450%, 9/15/2036 | | | | | 76,885,000 | | | 60,281,531 |
Chesapeake Energy Corp., 6.250%, 1/15/2017 | | EUR | | | 5,925,000 | | | 6,923,210 |
Chesapeake Energy Corp., 6.500%, 8/15/2017 | | | | | 3,820,000 | | | 3,342,500 |
Chesapeake Energy Corp., 6.875%, 11/15/2020 | | | | | 13,805,000 | | | 11,803,275 |
Connacher Oil and Gas Ltd.,
10.250%, 12/15/2015, 144A | | | | | 20,226,000 | | | 19,416,960 |
Pioneer Natural Resources Co., 5.875%, 7/15/2016 | | | | | 10,275,000 | | | 8,852,334 |
Pioneer Natural Resources Co., 6.875%, 5/01/2018 | | | | | 2,125,000 | | | 1,892,021 |
Pioneer Natural Resources Co., 7.200%, 1/15/2028 | | | | | 8,782,000 | | | 7,560,740 |
Questar Market Resources, Inc.,
6.800%, 4/01/2018 | | | | | 51,725,000 | | | 52,154,214 |
Talisman Energy, Inc., 5.850%, 2/01/2037 | | | | | 12,155,000 | | | 9,124,613 |
Talisman Energy, Inc., 6.250%, 2/01/2038 | | | | | 32,435,000 | | | 25,191,583 |
XTO Energy, Inc., 6.100%, 4/01/2036 | | | | | 2,165,000 | | | 1,792,646 |
XTO Energy, Inc., 6.750%, 8/01/2037 | | | | | 11,225,000 | | | 9,960,133 |
| | | | | | | | |
| | | | | | | | 267,606,280 |
| | | | | | | | |
27
| | | | | | | | |
| | | | | Principal Amount (‡) | | Value (†) |
| | | | | | | | |
| | | |
| BONDS AND NOTES – continued | | | | | | | | |
| | | |
| Industrial Other – 0.1% | | | | | | | | |
Ranhill Labuan Ltd., 12.500%, 10/26/2011, 144A | | | | $ | 26,410,000 | | $ | 12,676,800 |
| | | | | | | | |
| Integrated Energy – 0.0% | | | | | | | | |
PF Export Receivables Master Trust,
6.436%, 6/01/2015, 144A | | | | | 1,634,046 | | | 1,683,067 |
| | | | | | | | |
| Life Insurance – 0.5% | | | | | | | | |
ASIF Global Financing XXVII,
2.380%, 2/26/2009, 144A | | SGD | | | 38,400,000 | | | 13,579,037 |
Mutual of Omaha Insurance Co.,
6.800%, 6/15/2036, 144A | | | | | 57,985,000 | | | 54,549,969 |
| | | | | | | | |
| | | | | | | | 68,129,006 |
| | | | | | | | |
| Local Authorities – 1.6% | | | | | | | | |
Queensland Treasury Corp., Series 11G,
6.000%, 6/14/2011 | | AUD | | | 109,725,000 | | | 87,180,000 |
Virginia Tobacco Settlement Financing Corp., Series A-1, 6.706%, 6/01/2046(c) | | | | | 182,875,000 | | | 141,627,544 |
| | | | | | | | |
| | | | | | | | 228,807,544 |
| | | | | | | | |
| Media Cable – 2.4% | | | | | | | | |
Comcast Corp., 5.500%, 3/15/2011 | | | | | 3,000,000 | | | 2,945,778 |
Comcast Corp., 5.650%, 6/15/2035 | | | | | 70,675,000 | | | 52,535,060 |
Comcast Corp., 6.450%, 3/15/2037 | | | | | 59,810,000 | | | 48,240,533 |
Comcast Corp., 6.500%, 11/15/2035 | | | | | 37,670,000 | | | 31,451,587 |
Comcast Corp., 6.950%, 8/15/2037 | | | | | 195,555,000 | | | 166,799,224 |
CSC Holdings, Inc., 7.875%, 2/15/2018 | | | | | 1,550,000 | | | 1,364,000 |
Shaw Communications, Inc., 5.700%, 3/02/2017 | | CAD | | | 12,775,000 | | | 10,747,085 |
Time Warner Cable, Inc., 6.750%, 7/01/2018 | | | | | 29,500,000 | | | 27,550,935 |
Virgin Media Finance PLC, 9.125%, 8/15/2016 | | | | | 500,000 | | | 418,750 |
Virgin Media Finance PLC, 9.750%, 4/15/2014 | | GBP | | | 6,605,000 | | | 9,041,881 |
| | | | | | | | |
| | | | | | | | 351,094,833 |
| | | | | | | | |
| Media Non-Cable – 0.8% | | | | | | | | |
Clear Channel Communications, Inc.,
4.900%, 5/15/2015 | | | | | 20,075,000 | | | 5,972,313 |
Clear Channel Communications, Inc.,
5.500%, 9/15/2014 | | | | | 5,195,000 | | | 1,610,450 |
Clear Channel Communications, Inc.,
5.500%, 12/15/2016 | | | | | 17,050,000 | | | 4,944,500 |
Clear Channel Communications, Inc.,
5.750%, 1/15/2013 | | | | | 2,080,000 | | | 748,800 |
Clear Channel Communications, Inc.,
6.875%, 6/15/2018 | | | | | 1,095,000 | | | 333,975 |
News America, Inc., 6.150%, 3/01/2037 | | | | | 64,380,000 | | | 52,490,752 |
News America, Inc., 6.200%, 12/15/2034 | | | | | 17,665,000 | | | 14,084,110 |
News America, Inc., 6.400%, 12/15/2035 | | | | | 29,275,000 | | | 24,591,908 |
R.H. Donnelley Corp., Series A-1,
6.875%, 1/15/2013(b) | | | | | 4,713,000 | | | 1,838,070 |
R.H. Donnelley Corp., Series A-2,
6.875%, 1/15/2013(b) | | | | | 2,740,000 | | | 1,068,600 |
R.H. Donnelley Corp., Series A-3,
8.875%, 1/15/2016(b) | | | | | 927,000 | | | 315,180 |
R.H. Donnelley Corp., Series A-4,
8.875%, 10/15/2017(b) | | | | | 3,564,000 | | | 1,211,760 |
Tribune Co., 5.250%, 8/15/2015(b) | | | | | 42,705,000 | | | 12,811,500 |
| | | | | | | | |
| | | | | | | | 122,021,918 |
| | | | | | | | |
28
PORTFOLIO OF INVESTMENTS – as of September 30, 2008
Loomis Sayles Bond Fund – continued
| | | | | | | | |
| | | | | Principal Amount (‡) | | Value (†) |
| | | | | | | | |
| | | |
| BONDS AND NOTES – continued | | | | | | | | |
| | | |
| Metals & Mining – 0.4% | | | | | | | | |
Algoma Acquisition Corp.,
9.875%, 6/15/2015, 144A | | | | $ | 13,180,000 | | $ | 11,878,475 |
Newmont Mining Corp.,
5.875%, 4/01/2035 | | | | | 5,621,000 | | | 4,277,575 |
OI European Group BV,
6.875%, 3/31/2017, 144A | | EUR | | | 3,450,000 | | | 4,152,659 |
United States Steel Corp., 6.050%, 6/01/2017 | | | | | 9,420,000 | | | 8,185,519 |
United States Steel Corp., 6.650%, 6/01/2037 | | | | | 7,865,000 | | | 5,849,263 |
United States Steel Corp., 7.000%, 2/01/2018 | | | | | 22,600,000 | | | 20,402,376 |
| | | | | | | | |
| | | | | | | | 54,745,867 |
| | | �� | | | | | |
| Mortgage Related – 0.0% | | | | | | | | |
Federal Home Loan Mortgage Corp.,
5.000%, 12/01/2031 | | | | | 360,066 | | | 352,366 |
Federal Home Loan Mortgage Corp., MTN, 5.000%, 12/14/2018(b) | | | | | 3,795,000 | | | 3,567,133 |
| | | | | | | | |
| | | | | | | | 3,919,499 |
| | | | | | | | |
| Non-Captive Consumer – 3.4% | | | | | | | | |
American General Finance Corp., Series J, MTN, 6.900%, 12/15/2017 | | | | | 337,595,000 | | | 156,540,101 |
Countrywide Financial Corp., Series A, MTN, 3.333%, 12/19/2008(b)(d) | | | | | 5,670,000 | | | 5,605,804 |
Countrywide Home Loans, Inc., Series L, MTN, 4.000%, 3/22/2011 | | | | | 16,188,000 | | | 13,927,410 |
Hexion US Finance Corp/Hexion Nova Scotia Finance ULC, 9.750%, 11/15/2014 | | | | | 2,320,000 | | | 1,832,800 |
Residential Capital LLC, 8.125%, 11/21/2008(b) | | | | | 1,280,000 | | | 1,088,000 |
Residential Capital LLC, 8.375%, 6/30/2010(b) | | | | | 5,670,000 | | | 1,304,100 |
Residential Capital LLC, 8.500%, 6/01/2012 | | | | | 3,905,000 | | | 781,000 |
Residential Capital LLC, 8.500%, 4/17/2013(b) | | | | | 165,035,000 | | | 33,007,000 |
Residential Capital LLC, 8.875%, 6/30/2015(b) | | | | | 16,635,000 | | | 3,327,000 |
Residential Capital LLC,
9.625%, 5/15/2015, 144A | | | | | 64,723,000 | | | 15,533,520 |
SLM Corp., 6.000%, 12/15/2043 | | | | | 146,975(†††) | | | 1,517,884 |
SLM Corp., Series A, MTN, 4.000%, 1/15/2010 | | | | | 10,300,000 | | | 8,085,500 |
SLM Corp., Series A, MTN, 5.000%, 10/01/2013 | | | | | 72,710,000 | | | 45,080,200 |
SLM Corp., Series A, MTN, 5.000%, 4/15/2015 | | | | | 53,696,000 | | | 32,217,600 |
SLM Corp., Series A, MTN, 5.000%, 6/15/2018 | | | | | 22,293,000 | | | 12,261,150 |
SLM Corp., Series A, MTN, 5.375%, 1/15/2013 | | | | | 28,242,000 | | | 18,498,510 |
SLM Corp., Series A, MTN, 5.375%, 5/15/2014 | | | | | 31,370,000 | | | 19,449,400 |
SLM Corp., Series A, MTN,
5.400%, 10/25/2011(b) | | | | | 1,750,000 | | | 1,225,000 |
SLM Corp., Series A, MTN, 5.625%, 8/01/2033 | | | | | 38,535,000 | | | 19,267,500 |
SLM Corp., Series A, MTN, 6.500%, 6/15/2010 | | NZD | | | 8,020,000 | | | 4,454,265 |
SLM Corp., Series A, MTN, 8.450%, 6/15/2018 | | | | | 124,665,000 | | | 84,772,200 |
SLM Corp., EMTN, 4.750%, 3/17/2014 | | EUR | | | 9,200,000 | | | 7,123,470 |
SLM Corp., MTN, 5.050%, 11/14/2014 | | | | | 27,310,000 | | | 16,659,100 |
SLM Corp., MTN, 5.125%, 8/27/2012 | | | | | 1,925,000 | | | 1,251,250 |
| | | | | | | | |
| | | | | | | | 504,809,764 |
| | | | | | | | |
| Non-Captive Diversified – 6.6% | | | | | | | | |
CIT Group Funding Co. of Canada,
5.200%, 6/01/2015 | | | | | 8,278,000 | | | 4,065,235 |
CIT Group, Inc., 4.750%, 12/15/2010 | | | | | 125,000 | | | 81,406 |
29
| | | | | | | | |
| | | | | Principal Amount (‡) | | Value (†) |
| | | | | | | | |
| | | |
| BONDS AND NOTES – continued | | | | | | | | |
| | | |
| Non-Captive Diversified – continued | | | | | | | | |
CIT Group, Inc., 5.400%, 2/13/2012 | | | | $ | 2,155,000 | | $ | 1,238,853 |
CIT Group, Inc., 5.400%, 1/30/2016 | | | | | 1,558,000 | | | 754,074 |
CIT Group, Inc., 5.500%, 12/01/2014 | | GBP | | | 29,029,000 | | | 25,761,465 |
CIT Group, Inc., 5.600%, 4/27/2011 | | | | | 10,435,000 | | | 6,720,453 |
CIT Group, Inc., 5.650%, 2/13/2017 | | | | | 3,639,000 | | | 1,775,716 |
CIT Group, Inc., 5.800%, 10/01/2036 | | | | | 16,525,000 | | | 7,558,105 |
CIT Group, Inc., 5.850%, 9/15/2016 | | | | | 30,000 | | | 14,550 |
CIT Group, Inc., Series A, GMTN,
6.000%, 4/01/2036 | | | | | 545,000 | | | 223,450 |
CIT Group, Inc., Series A, MTN,
7.625%, 11/30/2012 | | | | | 342,170,000 | | | 217,061,014 |
CIT Group, Inc., EMTN, 3.800%, 11/14/2012 | | EUR | | | 21,220,000 | | | 16,121,695 |
CIT Group, Inc., EMTN, 4.650%, 9/19/2016 | | EUR | | | 21,200,000 | | | 14,627,155 |
CIT Group, Inc., EMTN, 5.000%, 5/13/2014 | | EUR | | | 6,450,000 | | | 4,644,825 |
CIT Group, Inc., EMTN, 5.500%, 12/20/2016 | | GBP | | | 16,050,000 | | | 14,231,668 |
CIT Group, Inc., GMTN, 4.250%, 2/01/2010 | | | | | 80,000 | | | 52,728 |
CIT Group, Inc., GMTN, 4.250%, 9/22/2011 | | EUR | | | 25,450,000 | | | 21,399,908 |
CIT Group, Inc., GMTN, 5.000%, 2/13/2014 | | | | | 8,485,000 | | | 4,799,701 |
CIT Group, Inc., GMTN, 5.000%, 2/01/2015 | | | | | 1,555,000 | | | 768,632 |
CIT Group, Inc., MTN, 4.250%, 3/17/2015 | | EUR | | | 29,270,000 | | | 20,197,935 |
CIT Group, Inc., MTN, 5.125%, 9/30/2014 | | | | | 13,445,000 | | | 6,630,496 |
General Electric Capital Corp., 6.500%, 9/28/2015 | | NZD | | | 266,148,000 | | | 158,663,554 |
General Electric Capital Corp., Series A, GMTN,
2.960%, 5/18/2012 | | SGD | | | 15,000,000 | | | 10,235,348 |
General Electric Capital Corp., Series A, GMTN, 3.485%, 3/08/2012 | | SGD | | | 150,000,000 | | | 104,355,152 |
General Electric Capital Corp., EMTN,
6.750%, 9/26/2016 | | NZD | | | 89,945,000 | | | 53,531,441 |
GMAC Canada Ltd., EMTN,
6.625%, 12/17/2010 | | GBP | | | 500,000 | | | 542,244 |
GMAC LLC, 4.750%, 9/14/2009 | | EUR | | | 11,775,000 | | | 10,609,183 |
GMAC LLC, 5.625%, 5/15/2009 | | | | | 1,085,000 | | | 775,256 |
GMAC LLC, 6.000%, 12/15/2011 | | | | | 82,530,000 | | | 36,696,057 |
GMAC LLC, 6.625%, 5/15/2012 | | | | | 32,245,000 | | | 13,651,501 |
GMAC LLC, 6.750%, 12/01/2014 | | | | | 49,101,000 | | | 18,845,651 |
GMAC LLC, 6.875%, 9/15/2011 | | | | | 8,945,000 | | | 3,991,143 |
GMAC LLC, 6.875%, 8/28/2012 | | | | | 6,680,000 | | | 2,655,153 |
GMAC LLC, 7.000%, 2/01/2012 | | | | | 16,765,000 | | | 6,833,582 |
GMAC LLC, 8.000%, 11/01/2031 | | | | | 57,598,000 | | | 21,730,401 |
GMAC LLC, EMTN, 5.375%, 6/06/2011 | | EUR | | | 69,910,000 | | | 41,336,115 |
GMAC LLC, EMTN, 5.750%, 9/27/2010 | | EUR | | | 8,215,000 | | | 5,204,286 |
iStar Financial, Inc., 5.150%, 3/01/2012 | | | | | 52,875,000 | | | 26,437,500 |
iStar Financial, Inc., 5.375%, 4/15/2010 | | | | | 6,905,000 | | | 4,143,000 |
iStar Financial, Inc., 5.500%, 6/15/2012 | | | | | 3,865,000 | | | 1,971,150 |
iStar Financial, Inc., 5.650%, 9/15/2011 | | | | | 30,335,000 | | | 15,774,200 |
iStar Financial, Inc., 5.800%, 3/15/2011 | | | | | 5,305,000 | | | 2,705,550 |
iStar Financial, Inc., 5.850%, 3/15/2017 | | | | | 6,565,000 | | | 3,216,850 |
iStar Financial, Inc., 5.875%, 3/15/2016 | | | | | 11,605,000 | | | 5,686,450 |
iStar Financial, Inc., 6.050%, 4/15/2015 | | | | | 5,655,000 | | | 2,770,950 |
iStar Financial, Inc., 8.625%, 6/01/2013 | | | | | 46,795,000 | | | 22,929,550 |
iStar Financial, Inc., Series B, 5.125%, 4/01/2011 | | | | | 2,330,000 | | | 1,188,300 |
iStar Financial, Inc., Series B, 5.700%, 3/01/2014 | | | | | 7,645,000 | | | 3,746,050 |
30
PORTFOLIO OF INVESTMENTS – as of September 30, 2008
Loomis Sayles Bond Fund – continued
| | | | | | | | |
| | | | | Principal Amount (‡) | | Value (†) |
| | | | | | | | |
| | | |
| BONDS AND NOTES – continued | | | | | | | | |
| | | |
| Non-Captive Diversified – continued | | | | | | | | |
iStar Financial, Inc., Series B, 5.950%, 10/15/2013 | | | | $ | 60,205,000 | | $ | 31,306,600 |
| | | | | | | | |
| | | | | | | | 980,261,281 |
| | | | | | | | |
| Oil Field Services – 0.2% | | | | | | | | |
North American Energy Partners, Inc.,
8.750%, 12/01/2011 | | | | | 12,530,000 | | | 11,527,600 |
Weatherford International Ltd.,
6.500%, 8/01/2036 | | | | | 20,375,000 | | | 17,564,085 |
| | | | | | | | |
| | | | | | | | 29,091,685 |
| | | | | | | | |
| Packaging – 0.1% | | | | | | | | |
Owens-Illinois, Inc., 7.800%, 5/15/2018 | | | | | 18,644,000 | | | 18,084,680 |
| | | | | | | | |
| Paper – 2.9% | | | | | | | | |
Abitibi-Consolidated, Inc., 7.400%, 4/01/2018 | | | | | 11,675,000 | | | 2,685,250 |
Abitibi-Consolidated, Inc., 7.500%, 4/01/2028 | | | | | 14,820,000 | | | 3,408,600 |
Abitibi-Consolidated, Inc., 8.500%, 8/01/2029(b) | | | | | 4,215,000 | | | 1,011,600 |
Abitibi-Consolidated, Inc., 8.850%, 8/01/2030 | | | | | 47,185,000 | | | 11,324,400 |
Avenor, Inc., 10.850%, 11/30/2014 | | CAD | | | 450,000 | | | 220,118 |
Bowater, Inc., 6.500%, 6/15/2013 | | | | | 3,880,000 | | | 1,493,800 |
Georgia-Pacific LLC, 7.250%, 6/01/2028 | | | | | 25,782,000 | | | 20,367,780 |
Georgia-Pacific LLC, 7.375%, 12/01/2025 | | | | | 31,207,000 | | | 25,199,653 |
Georgia-Pacific LLC, 7.700%, 6/15/2015 | | | | | 95,000 | | | 86,925 |
Georgia-Pacific LLC, 7.750%, 11/15/2029 | | | | | 80,700,000 | | | 66,577,500 |
Georgia-Pacific LLC, 8.000%, 1/15/2024 | | | | | 21,284,000 | | | 18,729,920 |
Georgia-Pacific LLC, 8.875%, 5/15/2031 | | | | | 27,237,000 | | | 23,696,190 |
International Paper Co., 4.250%, 1/15/2009 | | | | | 2,000,000 | | | 1,987,654 |
International Paper Co., 7.950%, 6/15/2018 | | | | | 211,360,000 | | | 207,684,661 |
Jefferson Smurfit Corp., 7.500%, 6/01/2013 | | | | | 5,520,000 | | | 4,471,200 |
Smurfit-Stone Container Enterprises, Inc.,
8.000%, 3/15/2017(b) | | | | | 1,000,000 | | | 780,000 |
Westvaco Corp., 7.950%, 2/15/2031 | | | | | 21,466,000 | | | 20,549,702 |
Westvaco Corp., 8.200%, 1/15/2030 | | | | | 17,890,000 | | | 16,791,644 |
| | | | | | | | |
| | | | | | | | 427,066,597 |
| | | | | | | | |
| Pharmaceuticals – 2.2% | | | | | | | | |
Astrazeneca PLC, 6.450%, 9/15/2037 | | | | | 214,650,000 | | | 205,237,812 |
Elan Financial PLC, 7.750%, 11/15/2011 | | | | | 71,241,000 | | | 64,473,105 |
Elan Financial PLC, 8.875%, 12/01/2013 | | | | | 57,880,000 | | | 48,619,200 |
| | | | | | | | |
| | | | | | | | 318,330,117 |
| | | | | | | | |
| Pipelines – 2.3% | | | | | | | | |
Colorado Interstate Gas Co., 5.950%, 3/15/2015 | | | | | 1,099,000 | | | 1,001,298 |
Colorado Interstate Gas Co., 6.800%, 11/15/2015 | | | | | 3,670,000 | | | 3,476,782 |
DCP Midstream LP, 6.450%, 11/03/2036, 144A | | | | | 27,200,000 | | | 21,757,552 |
El Paso Corp., 6.950%, 6/01/2028 | | | | | 11,959,000 | | | 9,442,755 |
El Paso Corp., 7.420%, 2/15/2037 | | | | | 2,045,000 | | | 1,629,423 |
El Paso Corp., 7.750%, 1/15/2032 | | | | | 1,500,000 | | | 1,255,429 |
El Paso Corp., 7.800%, 8/01/2031 | | | | | 1,000,000 | | | 842,517 |
Energy Transfer Partners LP, 6.125%, 2/15/2017 | | | | | 7,325,000 | | | 6,693,827 |
Energy Transfer Partners LP, 6.625%, 10/15/2036 | | | | | 14,235,000 | | | 12,128,647 |
Enterprise Products Operating LP,
6.300%, 9/15/2017 | | | | | 25,030,000 | | | 23,342,653 |
Kinder Morgan Energy Partners LP,
5.800%, 3/15/2035 | | | | | 778,000 | | | 579,417 |
31
| | | | | | | | |
| | | | | Principal Amount (‡) | | Value (†) |
| | | | | | | | |
| | | |
| BONDS AND NOTES – continued | | | | | | | | |
| | | |
| Pipelines – continued | | | | | | | | |
Kinder Morgan Finance, 5.700%, 1/05/2016 | | | | $ | 14,160,000 | | $ | 12,177,600 |
Kinder Morgan, Inc., Senior Note,
5.150%, 3/01/2015 | | | | | 16,530,000 | | | 14,009,175 |
NGPL Pipeco LLC, 7.119%, 12/15/2017, 144A | | | | | 117,630,000 | | | 111,646,044 |
ONEOK Partners LP, 6.650%, 10/01/2036 | | | | | 12,495,000 | | | 10,935,037 |
Plains All American Pipeline LP,
6.125%, 1/15/2017 | | | | | 28,845,000 | | | 26,211,221 |
Plains All American Pipeline LP,
6.650%, 1/15/2037 | | | | | 62,130,000 | | | 50,892,236 |
Southern Natural Gas Co., 7.350%, 2/15/2031 | | | | | 4,695,000 | | | 4,116,501 |
Tennessee Gas Pipeline Co.,
7.000%, 10/15/2028(b) | | | | | 7,900,000 | | | 6,769,921 |
Williams Cos., Inc., 7.500%, 1/15/2031 | | | | | 13,985,000 | | | 12,726,070 |
| | | | | | | | |
| | | | | | | | 331,634,105 |
| | | | | | | | |
| Property & Casualty Insurance – 1.3% | | | | | | | | |
Allstate Corp., 5.950%, 4/01/2036 | | | | | 7,745,000 | | | 6,313,724 |
Marsh & McLennan Cos., Inc., 5.375%, 7/15/2014 | | | | | 46,320,000 | | | 42,894,265 |
Marsh & McLennan Cos., Inc., 5.750%, 9/15/2015 | | | | | 34,729,000 | | | 32,554,617 |
Marsh & McLennan Cos., Inc., 5.875%, 8/01/2033 | | | | | 49,522,000 | | | 41,479,182 |
MBIA Insurance Corp., (fixed rate to 1/15/2013, variable rate thereafter), 14.000%, 1/15/2033, 144A | | | | | 9,760,000 | | | 5,172,800 |
St. Paul Travelers Co., Inc., 6.750%, 6/20/2036 | | | | | 6,850,000 | | | 6,331,804 |
Travelers Cos., Inc. (The), 6.250%, 6/15/2037 | | | | | 42,880,000 | | | 37,174,216 |
Travelers Property Casualty Corp.,
6.375%, 3/15/2033 | | | | | 1,000,000 | | | 877,759 |
Willis North America, Inc., 6.200%, 3/28/2017 | | | | | 12,000,000 | | | 10,433,496 |
| | | | | | | | |
| | | | | | | | 183,231,863 |
| | | | | | | | |
| Railroads – 0.5% | | | | | | | | |
Canadian Pacific Railway Co., 5.750%, 3/15/2033 | | | | | 3,830,000 | | | 2,972,057 |
Canadian Pacific Railway Co., 5.950%, 5/15/2037 | | | | | 26,475,000 | | | 21,671,535 |
CSX Corp., 6.000%, 10/01/2036(b) | | | | | 46,468,000 | | | 35,315,029 |
CSX Corp., 6.250%, 3/15/2018 | | | | | 5,000,000 | | | 4,525,470 |
Missouri Pacific Railroad Co.,
5.000%, 1/01/2045(c) | | | | | 7,804,000 | | | 4,682,400 |
| | | | | | | | |
| | | | | | | | 69,166,491 |
| | | | | | | | |
| REITs – 0.8% | | | | | | | | |
Camden Property Trust, 5.700%, 5/15/2017(b) | | | | | 39,980,000 | | | 35,341,440 |
Colonial Realty LP, 6.050%, 9/01/2016 | | | | | 3,980,000 | | | 3,356,995 |
Duke Realty LP, 5.950%, 2/15/2017 | | | | | 5,705,000 | | | 5,106,876 |
ERP Operating LP, 5.125%, 3/15/2016 | | | | | 4,675,000 | | | 3,915,794 |
First Industrial LP, 5.950%, 5/15/2017 | | | | | 7,750,000 | | | 6,194,250 |
Highwoods Properties, Inc., 5.850%, 3/15/2017 | | | | | 56,685,000 | | | 45,470,043 |
Highwoods Properties, Inc., 7.500%, 4/15/2018 | | | | | 5,640,000 | | | 4,998,224 |
Prologis, 5.625%, 11/15/2015 | | | | | 2,660,000 | | | 2,325,622 |
Prologis, 5.750%, 4/01/2016 | | | | | 2,170,000 | | | 1,890,825 |
Simon Property Group LP, 5.750%, 12/01/2015 | | | | | 3,450,000 | | | 3,260,516 |
| | | | | | | | |
| | | | | | | | 111,860,585 |
| | | | | | | | |
32
PORTFOLIO OF INVESTMENTS – as of September 30, 2008
Loomis Sayles Bond Fund – continued
| | | | | | | | |
| | | | | Principal Amount (‡) | | | Value (†) |
| | | | | | | | |
| | | |
| BONDS AND NOTES – continued | | | | | | | | |
| | | |
| Restaurants – 0.0% | | | | | | | | |
McDonald’s Corp., EMTN, 3.628%, 10/10/2010 | | SGD | | 3,750,000 | | | $ | 2,670,720 |
| | | | | | | | |
| Retailers – 3.8% | | | | | | | | |
Dillard’s, Inc., 6.625%, 1/15/2018 | | | | 1,920,000 | | | | 1,190,400 |
Dillard’s, Inc., 7.000%, 12/01/2028 | | | | 4,255,000 | | | | 2,170,050 |
Dillard’s, Inc., 7.130%, 8/01/2018 | | | | 1,740,000 | | | | 1,104,900 |
Dillard’s, Inc., 7.750%, 7/15/2026 | | | | 7,182,000 | | | | 4,093,740 |
Dillard’s, Inc., 7.750%, 5/15/2027 | | | | 1,000,000 | | | | 560,000 |
Foot Locker, Inc., 8.500%, 1/15/2022 | | | | 14,269,000 | | | | 12,913,445 |
Home Depot, Inc., 5.400%, 3/01/2016 | | | | 2,998,000 | | | | 2,549,253 |
Home Depot, Inc., 5.875%, 12/16/2036 | | | | 169,255,000 | | | | 118,981,695 |
J.C. Penney Corp., Inc., 5.750%, 2/15/2018 | | | | 5,145,000 | | | | 4,322,418 |
J.C. Penney Corp., Inc., 6.375%, 10/15/2036 | | | | 97,583,000 | | | | 74,222,020 |
J.C. Penney Corp., Inc., 7.125%, 11/15/2023(b) | | | | 1,933,000 | | | | 1,762,206 |
J.C. Penney Corp., Inc., 7.400%, 4/01/2037 | | | | 4,645,000 | | | | 3,886,393 |
J.C. Penney Corp., Inc., 7.625%, 3/01/2097 | | | | 5,565,000 | | | | 4,316,214 |
Lowes Cos., Inc., 6.650%, 9/15/2037 | | | | 55,705,000 | | | | 53,429,896 |
Macy’s Retail Holdings, Inc., 6.375%, 3/15/2037 | | | | 31,595,000 | | | | 22,884,195 |
Macy’s Retail Holdings, Inc., 6.790%, 7/15/2027 | | | | 11,098,000 | | | | 8,750,163 |
Macy’s Retail Holdings, Inc., 6.900%, 4/01/2029 | | | | 5,133,000 | | | | 4,013,903 |
Marks & Spencer PLC, 7.125%, 12/01/2037, 144A | | | | 9,245,000 | | | | 7,087,846 |
Target Corp., 6.500%, 10/15/2037 | | | | 10,959,000 | | | | 10,067,003 |
Target Corp., 7.000%, 1/15/2038 | | | | 199,051,000 | | | | 187,285,892 |
Toys R Us, Inc., 7.375%, 10/15/2018 | | | | 39,765,000 | | | | 25,847,250 |
Toys R Us, Inc., 7.875%, 4/15/2013 | | | | 11,255,000 | | | | 8,778,900 |
| | | | | | | | |
| | | | | | | | 560,217,782 |
| | | | | | | | |
| Sovereigns – 13.0% | | | | | | | | |
Canadian Government, 3.750%, 6/01/2012 | | CAD | | 108,410,000 | | | | 103,991,089 |
Canadian Government, 4.000%, 6/01/2016 | | CAD | | 35,000,000 | | | | 33,799,953 |
Canadian Government, 4.250%, 12/01/2008(b) | | CAD | | 474,235,000 | | | | 447,391,762 |
Canadian Government, 4.250%, 9/01/2009 | | CAD | | 73,725,000 | | | | 70,176,779 |
Canadian Government, 5.250%, 6/01/2012 | | CAD | | 286,105,000 | | | | 288,376,635 |
Canadian Government, 5.750%, 6/01/2033(b) | | CAD | | 48,845,000 | | | | 56,389,413 |
Indonesia Treasury Bond, 9.500%, 7/15/2023 | | IDR | | 10,000,000,000 | | | | 797,007 |
Indonesia Treasury Bond, 10.250%, 7/15/2027 | | IDR | | 25,000,000,000 | | | | 2,069,520 |
Indonesia Treasury Bond, Series FR43,
10.250%, 7/15/2022 | | IDR | | 145,156,000,000 | | | | 12,425,661 |
Indonesia Treasury Bond, Series ZC3,
Zero Coupon Bond, 11/20/2012 | | IDR | | 378,003,000,000 | | | | 24,190,228 |
Mexican Fixed Rate Bonds, Series M-10,
8.000%, 12/17/2015 | | MXN | | 4,585,000 | (††) | | | 40,988,932 |
Mexican Fixed Rate Bonds, Series M-20,
8.000%, 12/07/2023 | | MXN | | 42,372,800 | (††) | | | 371,857,013 |
Mexican Fixed Rate Bonds, Series MI-10,
9.000%, 12/20/2012 | | MXN | | 10,500,000 | (††) | | | 98,261,144 |
New South Wales Treasury Corp., Series 10RG, 7.000%, 12/01/2010 | | AUD | | 165,565,000 | | | | 133,898,987 |
New South Wales Treasury Corp., Series 12RG, 6.000%, 5/01/2012 | | AUD | | 87,640,000 | | | | 69,492,450 |
Republic of Brazil, 8.875%, 4/15/2024 | | | | 32,625,000 | | | | 38,986,875 |
Republic of Brazil, 10.250%, 1/10/2028 | | BRL | | 97,695,000 | | | | 45,102,243 |
Republic of Brazil, 12.500%, 1/05/2016(b) | | BRL | | 17,305,000 | | | | 9,435,040 |
Republic of Brazil, 12.500%, 1/05/2022 | | BRL | | 114,735,000 | | | | 61,802,183 |
| | | | | | | | |
| | | | | | | | 1,909,432,914 |
| | | | | | | | |
33
| | | | | | | | |
| | | | | Principal Amount (‡) | | Value (†) |
| | | | | | | | |
| | | |
| BONDS AND NOTES – continued | | | | | | | | |
| | | |
| Supermarkets – 0.9% | | | | | | | | |
Albertson’s, Inc., 7.450%, 8/01/2029 | | | | $ | 100,465,000 | | $ | 89,356,484 |
Albertson’s, Inc., 7.750%, 6/15/2026 | | | | | 20,515,000 | | | 18,856,731 |
Albertson’s, Inc., 8.000%, 5/01/2031 | | | | | 9,680,000 | | | 8,970,979 |
Albertson’s, Inc., 8.700%, 5/01/2030 | | | | | 2,995,000 | | | 2,966,473 |
Albertson’s, Inc., Series C, MTN,
6.625%, 6/01/2028 | | | | | 17,485,000 | | | 14,166,277 |
| | | | | | | | |
| | | | | | | | 134,316,944 |
| | | | | | | | |
| Supranational – 3.9% | | | | | | | | |
Eurofima, EMTN, 11.000%, 2/05/2010 | | ISK | | | 290,000,000 | | | 2,746,290 |
European Investment Bank, Zero Coupon Bond, 3/10/2021 | | AUD | | | 148,280,000 | | | 54,978,653 |
European Investment Bank,
4.600%, 1/30/2037, 144A | | CAD | | | 200,000,000 | | | 171,132,722 |
European Investment Bank, 11.250%, 2/14/2013 | | BRL | | | 11,505,000 | | | 6,038,780 |
European Investment Bank, EMTN,
Zero Coupon Bond, 4/24/2013, 144A | | IDR | | | 615,006,960,000 | | | 38,948,267 |
Inter-American Development Bank, EMTN,
Zero Coupon Bond, 5/11/2009 | | BRL | | | 297,000,000 | | | 138,909,033 |
Inter-American Development Bank, EMTN,
Zero Coupon Bond, 5/20/2013 | | IDR | | | 345,270,000,000 | | | 20,763,798 |
Inter-American Development Bank, EMTN, 6.000%, 12/15/2017(b) | | NZD | | | 184,525,000 | | | 119,318,634 |
International Bank for Reconstruction & Development, 9.500%, 5/27/2010 | | ISK | | | 2,126,200,000 | | | 19,998,802 |
Nordic Investment Bank, EMTN,
11.250%, 4/16/2009 | | ISK | | | 89,400,000 | | | 846,025 |
| | | | | | | | |
| | | | | | | | 573,681,004 |
| | | | | | | | |
| Technology – 2.8% | | | | | | | | |
Affiliated Computer Services, Inc.,
5.200%, 6/01/2015 | | | | | 115,000 | | | 92,862 |
Agilent Technologies, Inc., 6.500%, 11/01/2017 | | | | | 57,300,000 | | | 52,235,654 |
Alcatel-Lucent, EMTN, 6.375%, 4/07/2014 | | EUR | | | 500,000 | | | 566,640 |
Amkor Technology, Inc., 7.125%, 3/15/2011 | | | | | 8,785,000 | | | 7,906,500 |
Amkor Technology, Inc., 7.750%, 5/15/2013 | | | | | 11,745,000 | | | 10,041,975 |
Arrow Electronics, Inc., 6.875%, 7/01/2013 | | | | | 14,165,000 | | | 14,400,026 |
Arrow Electronics, Inc., 6.875%, 6/01/2018 | | | | | 5,000,000 | | | 4,901,180 |
Avnet, Inc., 5.875%, 3/15/2014 | | | | | 36,145,000 | | | 35,189,435 |
Avnet, Inc., 6.000%, 9/01/2015 | | | | | 50,685,000 | | | 48,830,639 |
Avnet, Inc., 6.625%, 9/15/2016 | | | | | 15,225,000 | | | 14,827,719 |
Corning, Inc., 5.900%, 3/15/2014 | | | | | 9,330,000 | | | 9,031,682 |
Corning, Inc., 6.200%, 3/15/2016 | | | | | 5,155,000 | | | 4,977,256 |
Corning, Inc., 6.850%, 3/01/2029 | | | | | 10,321,000 | | | 9,116,766 |
Corning, Inc., 7.250%, 8/15/2036 | | | | | 5,645,000 | | | 5,004,117 |
Equifax, Inc., 7.000%, 7/01/2037 | | | | | 19,270,000 | | | 16,252,684 |
Freescale Semiconductor, Inc.,
10.125%, 12/15/2016(b) | | | | | 30,004,000 | | | 19,202,560 |
Lucent Technologies, Inc., 6.450%, 3/15/2029 | | | | | 66,137,000 | | | 40,343,570 |
Lucent Technologies, Inc., 6.500%, 1/15/2028 | | | | | 2,216,000 | | | 1,351,760 |
Motorola, Inc., 5.220%, 10/01/2097 | | | | | 13,750,000 | | | 7,679,815 |
Motorola, Inc., 6.500%, 9/01/2025 | | | | | 12,730,000 | | | 9,765,998 |
Motorola, Inc., 6.500%, 11/15/2028(b) | | | | | 24,125,000 | | | 18,028,564 |
Motorola, Inc., 6.625%, 11/15/2037 | | | | | 26,570,000 | | | 19,368,069 |
Nortel Networks Corp., 1.750%, 4/15/2012 | | | | | 1,045,000 | | | 532,950 |
34
PORTFOLIO OF INVESTMENTS – as of September 30, 2008
Loomis Sayles Bond Fund – continued
| | | | | | | | |
| | | | | Principal Amount (‡) | | Value (†) |
| | | | | | | | |
| | | |
| BONDS AND NOTES – continued | | | | | | | | |
| | | |
| Technology – continued | | | | | | | | |
Nortel Networks Ltd., 6.875%, 9/01/2023 | | | | $ | 18,422,000 | | $ | 7,368,800 |
Nortel Networks Ltd., 10.125%, 7/15/2013 | | | | | 22,825,000 | | | 14,550,937 |
Northern Telecom Capital Corp.,
7.875%, 6/15/2026 | | | | | 12,035,000 | | | 5,295,400 |
Samsung Electronics Co. Ltd.,
7.700%, 10/01/2027, 144A | | | | | 5,060,000 | | | 5,353,217 |
Xerox Capital Trust I, 8.000%, 2/01/2027 | | | | | 25,440,000 | | | 23,133,381 |
Xerox Corp., MTN, 7.200%, 4/01/2016 | | | | | 615,000 | | | 596,882 |
| | | | | | | | |
| | | | | | | | 405,947,038 |
| | | | | | | | |
| Textile – 0.1% | | | | | | | | |
Kellwood Co., 7.625%, 10/15/2017(c) | | | | | 11,070,000 | | | 6,088,500 |
| | | | | | | | |
| Tobacco – 0.6% | | | | | | | | |
Reynolds American, Inc., 6.750%, 6/15/2017 | | | | | 71,085,000 | | | 66,422,535 |
Reynolds American, Inc., 7.250%, 6/15/2037 | | | | | 17,990,000 | | | 17,215,674 |
| | | | | | | | |
| | | | | | | | 83,638,209 |
| | | | | | | | |
| Transportation Services – 0.8% | | | | | | | | |
APL Ltd., 8.000%, 1/15/2024(c) | | | | | 20,144,000 | | | 15,108,000 |
Atlas Air, Inc., Series 1999-1, Class A-1,
7.200%, 7/02/2020 | | | | | 13,231,396 | | | 11,511,314 |
Atlas Air, Inc., Series 1999-1A, 6.880%, 1/02/2011 | | | | | 1,153,157 | | | 1,037,841 |
Atlas Air, Inc., Series 1999-1B,
7.630%, 7/02/2016(f) | | | | | 18,164,300 | | | 17,801,014 |
Atlas Air, Inc., Series 1999-1C,
8.770%, 7/02/2012(f) | | | | | 15,689,997 | | | 14,434,797 |
Atlas Air, Inc., Series 2000-1, Class B,
9.057%, 7/02/2017(f) | | | | | 9,260,147 | | | 9,630,553 |
Atlas Air, Inc., Series 2000-1, Class C,
9.702%, 7/02/2011(f) | | | | | 201,720 | | | 183,565 |
Atlas Air, Inc., Series B, 7.680%, 1/02/2014(f) | | | | | 39,925,752 | | | 39,925,752 |
Atlas Air, Inc., Series C, 8.010%, 1/02/2010(f) | | | | | 6,552,024 | | | 5,110,579 |
| | | | | | | | |
| | | | | | | | 114,743,415 |
| | | | | | | | |
| Wireless – 1.8% | | | | | | | | |
ALLTEL Corp., 6.800%, 5/01/2029 | | | | | 12,987,000 | | | 11,785,702 |
ALLTEL Corp., 7.875%, 7/01/2032 | | | | | 79,364,000 | | | 78,768,770 |
Nextel Communications, Inc., Series D,
7.375%, 8/01/2015 | | | | | 31,849,000 | | | 21,020,340 |
Nextel Communications, Inc., Series E,
6.875%, 10/31/2013 | | | | | 16,950,000 | | | 11,526,000 |
Nextel Communications, Inc., Series F,
5.950%, 3/15/2014 | | | | | 49,753,000 | | | 33,334,510 |
Rogers Wireless, Inc., 6.375%, 3/01/2014 | | | | | 1,895,000 | | | 1,812,344 |
Rogers Wireless, Inc., 7.625%, 12/15/2011(b) | | CAD | | | 6,990,000 | | | 6,976,142 |
Sprint Capital Corp., 6.875%, 11/15/2028 | | | | | 42,331,000 | | | 28,361,770 |
Sprint Capital Corp., 6.900%, 5/01/2019 | | | | | 31,405,000 | | | 24,338,875 |
Sprint Nextel Corp., 6.000%, 12/01/2016 | | | | | 15,184,000 | | | 11,691,680 |
True Move Co. Ltd., 10.750%, 12/16/2013, 144A | | | | | 36,610,000 | | | 24,894,800 |
Vodafone Group PLC, 6.150%, 2/27/2037 | | | | | 2,655,000 | | | 2,132,257 |
| | | | | | | | |
| | | | | | | | 256,643,190 |
| | | | | | | | |
35
| | | | | | | | |
| | | | | Principal Amount (‡) | | Value (†) |
| | | | | | | | |
| | | |
| BONDS AND NOTES – continued | | | | | | | | |
| | | |
| Wirelines – 5.4% | | | | | | | | |
AT&T Corp., 6.500%, 3/15/2029 | | | | $ | 27,859,000 | | $ | 23,322,997 |
AT&T, Inc., 6.150%, 9/15/2034 | | | | | 14,755,000 | | | 12,305,080 |
AT&T, Inc., 6.500%, 9/01/2037 | | | | | 152,250,000 | | | 129,516,030 |
Bell Canada, Series M-17, 6.100%, 3/16/2035 | | CAD | | | 45,750,000 | | | 31,291,409 |
Bell Canada, MTN, 5.000%, 2/15/2017 | | CAD | | | 7,738,000 | | | 5,742,807 |
Bell Canada, MTN, 6.550%, 5/01/2029, 144A | | CAD | | | 5,790,000 | | | 4,136,103 |
Bell Canada, MTN, 7.300%, 2/23/2032 | | CAD | | | 12,705,000 | | | 9,812,904 |
BellSouth Corp., 6.000%, 11/15/2034(b) | | | | | 25,445,000 | | | 20,610,450 |
BellSouth Corp., 6.550%, 6/15/2034 | | | | | 1,525,000 | | | 1,307,428 |
Embarq Corp., 7.995%, 6/01/2036 | | | | | 8,735,000 | | | 6,246,486 |
GTE Corp., 6.940%, 4/15/2028 | | | | | 11,700,000 | | | 9,927,602 |
Hawaiian Telcom Communications, Inc., Series B, 12.500%, 5/01/2015(b) | | | | | 640,000 | | | 89,600 |
Koninklijke (Royal) KPN NV,
8.375%, 10/01/2030 | | | | | 10,505,000 | | | 11,253,345 |
Koninklijke (Royal) KPN NV, EMTN,
5.750%, 3/18/2016 | | GBP | | | 1,600,000 | | | 2,640,122 |
Koninklijke (Royal) KPN NV, GMTN,
4.000%, 6/22/2015 | | EUR | | | 2,750,000 | | | 3,347,721 |
Level 3 Financing, Inc., 8.750%, 2/15/2017 | | | | | 43,605,000 | | | 31,613,625 |
Level 3 Financing, Inc., 9.250%, 11/01/2014 | | | | | 17,580,000 | | | 13,272,900 |
New England Telephone & Telegraph,
7.875%, 11/15/2029 | | | | | 2,740,000 | | | 2,474,686 |
Qwest Capital Funding, Inc., 6.500%, 11/15/2018 | | | | | 29,990,000 | | | 21,817,725 |
Qwest Capital Funding, Inc., 6.875%, 7/15/2028 | | | | | 66,907,000 | | | 46,500,365 |
Qwest Capital Funding, Inc.,
7.625%, 8/03/2021(b) | | | | | 15,025,000 | | | 11,419,000 |
Qwest Capital Funding, Inc., 7.750%, 2/15/2031 | | | | | 40,120,000 | | | 29,287,600 |
Qwest Corp., 6.875%, 9/15/2033 | | | | | 37,295,000 | | | 25,080,887 |
Qwest Corp., 7.200%, 11/10/2026 | | | | | 1,505,000 | | | 1,106,175 |
Qwest Corp., 7.250%, 9/15/2025 | | | | | 9,920,000 | | | 7,390,400 |
Qwest Corp., 7.500%, 6/15/2023 | | | | | 3,275,000 | | | 2,570,875 |
Telecom Italia Capital, 6.000%, 9/30/2034 | | | | | 30,915,000 | | | 21,659,667 |
Telecom Italia Capital, 6.375%, 11/15/2033 | | | | | 26,400,000 | | | 19,240,320 |
Telefonica Emisiones SAU, 7.045%, 6/20/2036 | | | | | 174,550,000 | | | 157,871,747 |
Telus Corp., 4.950%, 3/15/2017 | | CAD | | | 45,415,000 | | | 38,693,964 |
Verizon Communications, 5.850%, 9/15/2035 | | | | | 87,716,000 | | | 68,587,772 |
Verizon Maryland, Inc., 5.125%, 6/15/2033 | | | | | 10,290,000 | | | 6,961,710 |
Verizon New York, Inc., Series B, 7.375%, 4/01/2032 | | | | | 17,475,000 | | | 15,254,452 |
| | | | | | | | |
| | | | | | | | 792,353,954 |
| | | | | | | | |
| | | |
| TOTAL NON-CONVERTIBLE BONDS | | | | | | | | |
(Identified Cost $15,219,384,285) | | | | | | | | 12,885,749,218 |
| | | | | | | | |
| | | |
| CONVERTIBLE BONDS – 3.7% | | | | | | | | |
| | | |
| Healthcare – 0.2% | | | | | | | | |
Affymetrix, Inc., 3.500%, 1/15/2038 | | | | | 18,449,000 | | | 12,914,300 |
Invitrogen Corp., 1.500%, 2/15/2024 | | | | | 14,480,000 | | | 13,050,100 |
| | | | | | | | |
| | | | | | | | 25,964,400 |
| | | | | | | | |
| Industrial Other – 0.1% | | | | | | | | |
Incyte Corp., 3.500%, 2/15/2011(b) | | | | | 24,551,000 | | | 22,494,854 |
| | | | | | | | |
36
PORTFOLIO OF INVESTMENTS – as of September 30, 2008
Loomis Sayles Bond Fund – continued
| | | | | | | | |
| | | | | Principal Amount (‡) | | Value (†) |
| | | | | | | | |
| | | |
| BONDS AND NOTES – continued | | | | | | | | |
| | | |
| Media Non-Cable – 0.1% | | | | | | | | |
Liberty Media LLC, 3.500%, 1/15/2031 | | | | $ | 10,159,813 | | $ | 4,495,717 |
Sinclair Broadcast Group, Inc., (Step to 2.000% on 1/15/2011), 4.875%, 7/15/2018(g) | | | | | 4,048,000 | | | 3,673,560 |
| | | | | | | | |
| | | | | | | | 8,169,277 |
| | | | | | | | |
| Non-Captive Consumer – 0.3% | | | | | | | | |
Countrywide Financial Corp., Series A, Zero Coupon Bond, 4/15/2037(b) | | | | | 11,242,000 | | | 11,017,160 |
Countrywide Financial Corp., Series B, 0.554%, 5/15/2037(b)(d) | | | | | 33,004,000 | | | 30,033,640 |
| | | | | | | | |
| | | | | | | | 41,050,800 |
| | | | | | | | |
| Non-Captive Diversified – 0.2% | | | | | | | | |
iStar Financial, Inc., 3.291%, 10/01/2012(d) | | | | | 60,445,000 | | | 32,338,075 |
| | | | | | | | |
| Pharmaceuticals – 0.9% | | | | | | | | |
Epix Pharmaceuticals, Inc., 3.000%, 6/15/2024 | | | | | 7,122,000 | | | 3,561,000 |
Human Genome Sciences, Inc., 2.250%, 8/15/2012 | | | | | 50,150,000 | | | 33,475,125 |
Nektar Therapeutics, 3.250%, 9/28/2012 | | | | | 26,120,000 | | | 13,157,950 |
Valeant Pharmaceuticals International, 3.000%, 8/16/2010 | | | | | 34,125,000 | | | 32,248,125 |
Valeant Pharmaceuticals International, 4.000%, 11/15/2013 | | | | | 33,914,000 | | | 31,751,983 |
Vertex Pharmaceuticals, Inc., 4.750%, 2/15/2013 | | | | | 11,035,000 | | | 16,649,056 |
| | | | | | | | |
| | | | | | | | 130,843,239 |
| | | | | | | | |
| REITs – 0.2% | | | | | | | | |
Host Hotels & Resorts, Inc., 2.625%, 4/15/2027, 144A(b) | | | | | 29,380,000 | | | 22,769,500 |
| | | | | | | | |
| Technology – 0.5% | | | | | | | | |
Avnet, Inc., 2.000%, 3/15/2034 | | | | | 18,780,000 | | | 18,709,575 |
Kulicke & Soffa Industries, Inc., 0.500%, 11/30/2008 | | | | | 10,920,000 | | | 10,565,100 |
Kulicke & Soffa Industries, Inc., 0.875%, 6/01/2012 | | | | | 10,025,000 | | | 6,854,594 |
Kulicke & Soffa Industries, Inc., 1.000%, 6/30/2010 | | | | | 5,915,000 | | | 4,635,881 |
Maxtor Corp., 5.750%, 3/01/2012(c) | | | | | 9,467,000 | | | 8,709,640 |
Nortel Networks Corp., 2.125%, 4/15/2014 | | | | | 49,636,000 | | | 23,763,235 |
Richardson Electronics Ltd., 7.750%, 12/15/2011 | | | | | 395,000 | | | 296,250 |
| | | | | | | | |
| | | | | | | | 73,534,275 |
| | | | | | | | |
| Textile – 0.0% | | | | | | | | |
Dixie Yarns, Inc., 7.000%, 5/15/2012 | | | | | 144,000 | | | 128,160 |
| | | | | | | | |
| Transportation Services – 0.0% | | | | | | | | |
Builders Transportation, Inc., 8.000%, 8/15/2005(h) | | | | | 1,000,000 | | | — |
Preston Corp., 7.000%, 5/01/2011 | | | | | 602,000 | | | 535,780 |
| | | | | | | | |
| | | | | | | | 535,780 |
| | | | | | | | |
| Wireless – 0.1% | | | | | | | | |
Nextel Communications, Inc., 5.250%, 1/15/2010 | | | | | 3,505,000 | | | 3,285,937 |
NII Holdings, Inc., 3.125%, 6/15/2012 | | | | | 21,974,000 | | | 16,260,760 |
| | | | | | | | |
| | | | | | | | 19,546,697 |
| | | | | | | | |
37
| | | | | | | | |
| | | | | Principal Amount (‡) | | Value (†) |
| | | | | | | | |
| | | |
| BONDS AND NOTES – continued | | | | | | | | |
| | | |
| Wirelines – 1.1% | | | | | | | | |
Level 3 Communications, Inc., 2.875%, 7/15/2010 | | | | $ | 41,240,000 | | $ | 32,424,950 |
Level 3 Communications, Inc., 3.500%, 6/15/2012 | | | | | 46,770,000 | | | 33,031,313 |
Level 3 Communications, Inc., 5.250%, 12/15/2011 | | | | | 19,145,000 | | | 15,818,556 |
Level 3 Communications, Inc., 6.000%, 9/15/2009 | | | | | 39,230,000 | | | 36,876,200 |
Level 3 Communications, Inc., 6.000%, 3/15/2010(b) | | | | | 43,124,000 | | | 37,733,500 |
| | | | | | | | |
| | | | | | | | 155,884,519 |
| | | | | | | | |
| | | |
| TOTAL CONVERTIBLE BONDS | | | | | | | | |
(Identified Cost $618,940,165) | | | | | | | | 533,259,576 |
| | | | | | | | |
| | | |
| MUNICIPALS – 1.0% | | | | | | | | |
| | | |
| Alabama – 0.0% | | | | | | | | |
Alabama Public School & College Authority (Capital Improvement), 4.500%, 12/01/2026 | | | | | 4,640,000 | | | 4,046,544 |
| | | | | | | | |
| California – 0.4% | | | | | | | | |
San Diego Unified School District (Election 1998), 4.500%, 7/01/2029, Series F-1 (FSA insured) | | | | | 4,870,000 | | | 4,089,485 |
San Jose California Redevelpoment Agency Tax Allocation (Merged Area Redevelopment), 3.750%, 8/01/2028, Series C (MBIA insured) | | | | | 2,165,000 | | | 1,592,812 |
San Jose Redevelopment Agency Tax Allocation (Merged Area), 3.750%, 8/01/2028, Series C (MBIA insured) | | | | | 5,425,000 | | | 3,962,203 |
State of California, 4.500%, 8/01/2027 (AMBAC insured) | | | | | 7,340,000 | | | 6,182,849 |
State of California, 4.500%, 10/01/2029 | | | | | 20,455,000 | | | 16,970,491 |
State of California, 4.500%, 8/01/2030 (AMBAC insured) | | | | | 5,945,000 | | | 4,910,392 |
State of California, 4.500%, 8/01/2030 | | | | | 5,140,000 | | | 4,245,486 |
State of California (Various Purpose), 3.250%, 12/01/2027 (MBIA insured) | | | | | 3,805,000 | | | 2,653,417 |
State of California (Various Purpose), 4.500%, 12/01/2033 (AMBAC insured) | | | | | 17,945,000 | | | 14,415,218 |
University of California Regents Medical Center, 4.750%, 5/15/2031, Series A (MBIA insured) | | | | | 1,260,000 | | | 1,081,596 |
| | | | | | | | |
| | | | | | | | 60,103,949 |
| | | | | | | | |
| District Of Columbia – 0.0% | | | | | | | | |
District of Columbia, 4.750%, 6/01/2036, Series A (FGIC insured) | | | | | 4,640,000 | | | 3,793,432 |
| | | | | | | | |
| Florida – 0.1% | | | | | | | | |
Florida State Turnpike Authority (Department of Transportation), 3.500%, 7/01/2027, Series A (MBIA insured) | | | | | 4,640,000 | | | 3,401,074 |
Jacksonville Electric Authority, Florida Water & Sewer Systems Revenue, 4.750%, 10/01/2041, Series B (MBIA insured) | | | | | 7,355,000 | | | 6,204,089 |
| | | | | | | | |
| | | | | | | | 9,605,163 |
| | | | | | | | |
38
PORTFOLIO OF INVESTMENTS – as of September 30, 2008
Loomis Sayles Bond Fund – continued
| | | | | | | | |
| | | | | Principal Amount (‡) | | Value (†) |
| | | | | | | | |
| | | |
| BONDS AND NOTES – continued | | | | | | | | |
| | | |
| Illinois – 0.1% | | | | | | | | |
Chicago Board of Education, 4.750%, 12/01/2031, Series B (FSA insured) | | | | $ | 8,020,000 | | $ | 7,109,329 |
Chicago O’Hare International Airport, 4.500%, 1/01/2038, Series A (FSA insured) | | | | | 2,440,000 | | | 1,986,916 |
| | | | | | | | |
| | | | | | | | 9,096,245 |
| | | | | | | | |
| Louisiana – 0.0% | | | | | | | | |
State of Louisiana, 3.250%, 5/01/2026, Series C (FSA insured) | | | | | 4,640,000 | | | 3,310,779 |
| | | | | | | | |
| Massachusetts – 0.0% | | | | | | | | |
Massachusetts School Building Authority, 4.750%, 8/15/2032, Series A (AMBAC insured) | | | | | 4,645,000 | | | 3,951,827 |
| | | | | | | | |
| Michigan – 0.1% | | | | | | | | |
Grosse Pointe Public School System, 3.000%, 5/01/2027 (FGIC insured) | | | | | 2,800,000 | | | 1,866,956 |
Michigan Tobacco Settlement Finance Authority, 7.309%, 6/01/2034(c) | | | | | 21,455,000 | | | 18,477,046 |
| | | | | | | | |
| | | | | | | | 20,344,002 |
| | | | | | | | |
| Nebraska – 0.1% | | | | | | | | |
Omaha Public Power District, 4.500%, 2/01/2034, Series AA (FGIC insured) | | | | | 11,595,000 | | | 9,442,968 |
| | | | | | | | |
| Ohio – 0.1% | | | | | | | | |
Buckeye Tobacco Settlement Financing Authority, Series A-2, 5.875%, 6/01/2047(c) | | | | | 10,390,000 | | | 7,855,256 |
| | | | | | | | |
| Texas – 0.1% | | | | | | | | |
Harris County, TX, 4.500%, 10/01/2031, Series B | | | | | 13,125,000 | | | 11,302,594 |
| | | | | | | | |
| Wisconsin – 0.0% | | | | | | | | |
Green Bay Wisconsin Water System Revenue, 3.500%, 11/01/2026 (FSA insured) | | | | | 3,170,000 | | | 2,373,728 |
Green Bay Wisconsin Water System Revenue, 3.500%, 11/01/2029 (FSA insured) | | | | | 3,415,000 | | | 2,459,517 |
Wisconsin Housing & Economic Development Authority, 4.900%, 11/01/2035, Series E | | | | | 1,185,000 | | | 1,038,202 |
| | | | | | | | |
| | | | | | | | 5,871,447 |
| | | | | | | | |
| | | |
| TOTAL MUNICIPALS | | | | | | | | |
(Identified Cost $164,977,221) | | | | | | | | 148,724,206 |
| | | | | | | | |
| | | |
| TOTAL BONDS AND NOTES | | | | | | | | |
(Identified Cost $16,003,301,671) | | | | | | | | 13,567,733,000 |
| | | | | | | | |
| | | |
| BANK LOANS – 1.1% | | | | | | | | |
| | | |
| Automotive – 0.5% | | | | | | | | |
Chrysler LLC, First Lien Term Loan, 6.490%, 8/03/2013(i) | | | | | 162,996,784 | | | 67,100,886 |
| | | | | | | | |
| Consumer Products – 0.0% | | | | | | | | |
Mega Bloks, Inc., Term Loan B, 8.750%, 7/26/2012(i) | | | | | 8,473,162 | | | 6,609,066 |
| | | | | | | | |
39
| | | | | | | | |
| | | | | Principal Amount (‡) | | Value (†) |
| | | | | | | | |
| | | |
| BANK LOANS – continued | | | | | | | | |
| | | |
| Food & Beverage – 0.1% | | | | | | | | |
Dole Food Co., Inc., LOC, 4.788%, 4/12/2013(i) | | | | $ | 819,260 | | $ | 718,492 |
Dole Food Co., Inc., Term Loan, 4.738%, 4/12/2013(i) | | | | | 1,651,974 | | | 1,448,781 |
Dole Food Co., Inc., Tranche C Term Loan, 4.795%, 4/12/2013(i) | | | | | 6,156,743 | | | 5,399,463 |
| | | | | | | | |
| | | | | | | | 7,566,736 |
| | | | | | | | |
| Media Non-Cable – 0.2% | | | | | | | | |
Idearc, Inc., Term Loan B, 5.767%, 11/17/2014(i) | | | | | 43,798,015 | | | 26,114,567 |
Tribune Co., Tranche X, 5.541%, 6/04/2009(i) | | | | | 4,666,005 | | | 4,321,887 |
| | | | | | | | |
| | | | | | | | 30,436,454 |
| | | | | | | | |
| Oil Field Services – 0.0% | | | | | | | | |
Dresser, Inc., Second Lien Term Loan, 8.557%, 5/04/2015(i) | | | | | 3,515,000 | | | 3,022,900 |
Dresser, Inc., Term Loan B, 5.096%, 5/04/2014(i) | | | | | 1,734,381 | | | 1,565,279 |
| | | | | | | | |
| | | | | | | | 4,588,179 |
| | | | | | | | |
| Paper – 0.1% | | | | | | | | |
Georgia Pacific Corp., First Lien Term Loan, 4.689%, 12/20/2012(i) | | | | | 8,444,539 | | | 7,364,820 |
Georgia Pacific Corp., Term Loan B2, 4.299%, 12/20/2012(i) | | | | | 2,800,876 | | | 2,549,189 |
| | | | | | | | |
| | | | | | | | 9,914,009 |
| | | | | | | | |
| Technology – 0.1% | | | | | | | | |
Nuance Communications, Inc., Incremental Term Loan, 5.960%, 3/31/2013(i) | | | | | 16,375,628 | | | 14,246,797 |
| | | | | | | | |
| Wirelines – 0.1% | | | | | | | | |
Hawaiian Telcom Communications, Inc., Term Loan C, 6.262%, 6/01/2014(i) | | | | | 23,831,579 | | | 16,392,790 |
| | | | | | | | |
| | | |
| TOTAL BANK LOANS | | | | | | | | |
(Identified Cost $214,654,413) | | | | | | | | 156,854,917 |
| | | | | | | | |
| | | |
| | | | | Shares | | |
| | | |
| COMMON STOCKS – 0.7% | | | | | | | | |
| | | |
| Biotechnology – 0.2% | | | | | | | | |
Vertex Pharmaceuticals, Inc.(b)(f) | | | | | 879,080 | | | 29,220,619 |
| | | | | | | | |
| Communications Equipment – 0.1% | | | | | | | | |
Corning, Inc. | | | | | 630,490 | | | 9,860,864 |
| | | | | | | | |
| Containers & Packaging – 0.1% | | | | | | | | |
Owens-Illinois, Inc.(f) | | | | | 639,339 | | | 18,796,566 |
| | | | | | | | |
| Oil, Gas & Consumable Fuels – 0.2% | | | | | | | | |
Chesapeake Energy Corp.(b) | | | | | 1,026,780 | | | 36,820,331 |
| | | | | | | | |
| Thrifts & Mortgage Finance – 0.1% | | | | | | | | |
Federal Home Loan Mortgage Corp.(b)(k) | | | | | 6,751,988 | | | 11,545,899 |
| | | | | | | | |
| | | |
| TOTAL COMMON STOCKS | | | | | | | | |
(Identified Cost $170,032,706) | | | | | | | | 106,244,279 |
| | | | | | | | |
40
PORTFOLIO OF INVESTMENTS – as of September 30, 2008
Loomis Sayles Bond Fund – continued
| | | | | | | |
| | | | | Shares | | Value (†) |
| | | | | | | |
| | | |
| PREFERRED STOCKS – 1.2% | | | | | | | |
| | |
| CONVERTIBLE PREFERRED STOCKS – 0.8% | | | | | |
| | | |
| Automotive – 0.2% | | | | | | | |
Ford Motor Co., Capital Trust II, 6.500%(b) | | | | 1,957,035 | | $ | 30,138,339 |
General Motors Corp., 6.250% | | | | 104,656 | | | 837,248 |
| | | | | | | |
| | | | | | | 30,975,587 |
| | | | | | | |
| Capital Markets – 0.1% | | | | | | | |
Newell Financial Trust I, 5.250% | | | | 207,122 | | | 7,987,142 |
| | | | | | | |
| Commercial Banks – 0.0% | | | | | | | |
Wachovia Corp., 7.500% | | | | 8,193 | | | 3,154,305 |
| | | | | | | |
| Construction Materials – 0.0% | | | | | | | |
Williams Cos., Inc., 5.500% | | | | 25,000 | | | 2,729,687 |
| | | | | | | |
| Diversified Consumer Services – 0.0% | | | | | | | |
Six Flags, Inc., 7.250% | | | | 517,100 | | | 2,890,589 |
| | | | | | | |
| Diversified Financial Services – 0.0% | | | | | | | |
CIT Group, Inc., 8.750% | | | | 12,500 | | | 411,625 |
Sovereign Capital Trust, 4.375% | | | | 195,788 | | | 4,493,335 |
| | | | | | | |
| | | | | | | 4,904,960 |
| | | | | | | |
| Electric Utilities – 0.2% | | | | | | | |
AES Trust III, 6.750%(b) | | | | 346,577 | | | 13,291,228 |
CMS Energy Trust I, 7.750% | | | | 207,375 | | | 8,295,000 |
| | | | | | | |
| | | | | | | 21,586,228 |
| | | | | | | |
| Machinery – 0.0% | | | | | | | |
United Rentals Trust, 6.500% | | | | 206,396 | | | 4,540,712 |
| | | | | | | |
| Oil, Gas & Consumable Fuels – 0.1% | | | | | | | |
Chesapeake Energy Corp., 4.500%(b) | | | | 87,351 | | | 8,691,425 |
El Paso Energy Capital Trust I, 4.750% | | | | 189,879 | | | 6,325,344 |
| | | | | | | |
| | | | | | | 15,016,769 |
| | | | | | | |
| REITs – 0.0% | | | | | | | |
FelCor Lodging Trust, Inc., Series A, 7.800% | | | | 53,600 | | | 656,600 |
| | | | | | | |
| Semiconductors & Semiconductor Equipment – 0.2% | | | | | | | |
Lucent Technologies Capital Trust, 7.750% | | | | 44,211 | | | 20,542,641 |
| | | | | | | |
| | | |
| TOTAL CONVERTIBLE PREFERRED STOCKS | | | | | | | |
(Identified Cost $196,650,286) | | | | | | | 114,985,220 |
| | | | | | | |
| | | |
| NON-CONVERTIBLE PREFERRED STOCKS – 0.4% | | | | | | | |
| | | |
| Banking – 0.1% | | | | | | | |
Bank of America Corp., 7.250% | | | | 16,772 | | | 14,054,936 |
| | | | | | | |
| Capital Markets – 0.0% | | | | | | | |
Lehman Brothers Holdings Capital Trust I, 6.000%(e) | | | | 55,575 | | | 8,892 |
Lehman Brothers Holdings, Inc., 5.670%(e) | | | | 103,114 | | | 7,218 |
Lehman Brothers Holdings, Inc., 5.940%(e) | | | | 109,313 | | | 3,826 |
Lehman Brothers Holdings, Inc., 6.500%(e) | | | | 479,083 | | | 23,954 |
Lehman Brothers Holdings, Inc., 7.250%(e)(f) | | | | 40,860 | | | 40,860 |
Lehman Brothers Holdings, Inc., 7.950%(b)(e) | | | | 513,734 | | | 30,824 |
Merrill Lynch & Co., Inc., 6.375% | | | | 53,000 | | | 725,570 |
| | | | | | | |
| | | | | | | 841,144 |
| | | | | | | |
41
| | | | | | | |
| | | | | Shares | | Value (†) |
| | | | | | | |
| | | | | | | |
| | | |
| PREFERRED STOCKS – continued | | | | | | | |
| | | |
| Diversified Financial Services – 0.0% | | | | | | | |
CIT Group, Inc., 6.350%(b) | | | | 779,310 | | $ | 6,039,653 |
| | | | | | | |
| Electric Utilities – 0.0% | | | | | | | |
Connecticut Light & Power Co., 3.800% | | | | 2,925 | | | 107,311 |
Entergy Arkansas, Inc., 4.320% | | | | 100 | | | 8,122 |
Entergy Mississippi, Inc., 4.360% | | | | 5,000 | | | 420,625 |
Entergy New Orleans, Inc., 4.360% | | | | 665 | | | 49,335 |
Entergy New Orleans, Inc., 4.750% | | | | 200 | | | 15,262 |
MDU Resources Group, Inc., 5.100% | | | | 1,318 | | | 131,965 |
Public Service Company of Oklahoma, 4.000% | | | | 360 | | | 28,957 |
Southern California Edison Co., 4.780% | | | | 50,100 | | | 1,042,080 |
Xcel Energy, Inc., 3.600% | | | | 1,100 | | | 76,560 |
| | | | | | | |
| | | | | | | 1,880,217 |
| | | | | | | |
| Thrifts & Mortgage Finance – 0.4% | | | | | | | |
Countrywide Capital IV, 6.750% | | | | 534,725 | | | 4,759,053 |
Federal Home Loan Mortgage Corp., 5.000%(f)(k) | | | | 104,800 | | | 188,640 |
Federal Home Loan Mortgage Corp., 5.570%(f)(k) | | | | 2,451,457 | | | 2,426,942 |
Federal Home Loan Mortgage Corp., 5.660%(f)(k) | | | | 624,479 | | | 780,599 |
Federal Home Loan Mortgage Corp., 5.700%(f)(k) | | | | 171,050 | | | 319,864 |
Federal Home Loan Mortgage Corp., 5.790%(f)(k) | | | | 399,250 | | | 798,500 |
Federal Home Loan Mortgage Corp., 5.810%(f)(k) | | | | 115,450 | | | 202,038 |
Federal Home Loan Mortgage Corp., 5.900%(f)(k) | | | | 310,023 | | | 387,529 |
Federal Home Loan Mortgage Corp., 6.000%(f)(k) | | | | 134,800 | | | 242,640 |
Federal Home Loan Mortgage Corp., 6.420%(f)(k) | | | | 125,980 | | | 226,764 |
Federal Home Loan Mortgage Corp., 6.550%(f)(k) | | | | 541,540 | | | 584,863 |
Federal Home Loan Mortgage Corp., 8.375%(b)(f)(k) | | | | 5,365,743 | | | 8,746,161 |
Federal National Mortgage Association, 4.750%(k) | | | | 270,954 | | | 839,957 |
Federal National Mortgage Association, 5.125%(k) | | | | 204,700 | | | 716,450 |
Federal National Mortgage Association, 5.375%(k) | | | | 146,350 | | | 482,955 |
Federal National Mortgage Association, 5.810%(k) | | | | 79,850 | | | 287,460 |
Federal National Mortgage Association, 6.750%(k) | | | | 123,143 | | | 221,657 |
Federal National Mortgage Association, 8.250%(b)(k) | | | | 9,291,596 | | | 20,255,679 |
| | | | | | | |
| | | | | | | 42,467,751 |
| | | | | | | |
| | | |
| TOTAL NON-CONVERTIBLE PREFERRED STOCKS | | | | | | | |
(Identified Cost $487,997,634) | | | | | | | 65,283,701 |
| | | | | | | |
| | | |
| TOTAL PREFERRED STOCKS | | | | | | | |
(Identified Cost $684,647,920) | | | | | | | 180,268,921 |
| | | | | | | |
| | | |
| CLOSED END INVESTMENT COMPANIES – 0.2% | | | | | | | |
BlackRock Senior High Income Fund, Inc. | | | | 199,071 | | | 652,953 |
Dreyfus High Yield Strategies Fund | | | | 1,033,274 | | | 3,079,157 |
DWS High Income Trust | | | | 177,909 | | | 590,658 |
Highland Credit Strategies Fund | | | | 860,000 | | | 8,221,600 |
Morgan Stanley Emerging Markets Debt Fund, Inc. | | | | 356,954 | | | 2,580,777 |
Van Kampen High Income Trust II | | | | 141,611 | | | 324,289 |
Western Asset High Income Opportunity Fund, Inc. | | | | 2,217,450 | | | 9,623,733 |
Western Asset Managed High Income Fund, Inc.(b) | | | | 1,369,100 | | | 6,119,877 |
| | | | | | | |
| | | |
| TOTAL CLOSED END INVESTMENT COMPANIES | | | | | | | |
(Identified Cost $45,128,723) | | | | | | | 31,193,044 |
| | | | | | | |
42
PORTFOLIO OF INVESTMENTS – as of September 30, 2008
Loomis Sayles Bond Fund – continued
| | | | | | | | |
| | | | | Shares/Principal Amount (‡) | | Value (†) |
| | | | | | | | |
| | | |
| SHORT-TERM INVESTMENTS – 5.3% | | | | | | | | |
| State Street Navigator Securities Lending Prime Portfolio(j) | | | | | 387,498,967 | | $ | 387,498,967 |
| Repurchase Agreement with State Street Corp. dated 9/30/2008 at 1.300%, to be repurchased at $25,908,477 on 10/1/2008 collateralized by $25,405,000 Federal National Mortgage Association, 4.850% due 12/03/2012 valued at $25,908,641 including accrued interest (Note 2h of Notes to Financial Statements) | | | | $ | 25,907,541 | | | 25,907,541 |
| Tri-Party Repurchase Agreement with Fixed Income Clearing Corporation, dated 9/30/2008 at 1.300%, to be repurchased at $372,522,452 on 10/1/2008 collateralized by $1,475,000 Federal Home Loan Mortgage Corp., 5.250% due 4/3/2012 valued at $1,528,469; $94,635,000 Federal Home Loan Bank Discount Notes, due 11/21/2008 valued at $94,280,119; $140,000,000 Federal Home Loan Bank Discount Notes, due 11/26/2008 valued at $139,475,000; $95,620,000 Federal Home Loan Bank Discount Notes, due 12/05/2008 valued at $95,141,900; $48,565,000 Federal Home Loan Bank, 5.000% due 12/12/2008 valued at $49,536,300 including accrued interest (Note 2h of Notes to Financial Statements) | | | | | 372,509,000 | | | 372,509,000 |
| | | | | | | | |
| | | |
| TOTAL SHORT-TERM INVESTMENTS | | | | | | | | |
(Identified Cost $785,915,508) | | | | | | | | 785,915,508 |
| | | | | | | | |
| | | |
| TOTAL INVESTMENTS – 100.9% | | | | | | | | |
(Identified Cost $17,903,680,941)(a) | | | | | | | | 14,828,209,669 |
Other Assets Less Liabilities—(0.9)% | | | | | | | | (137,500,502) |
| | | | | | | | |
| | | |
| NET ASSETS – 100.0% | | | | | | | $ | 14,690,709,167 |
| | | | | | | | |
| | |
(‡) Principal amount stated in U.S. dollars unless otherwise noted. | | | | | | |
(†) See Note 2a of Notes to Financial Statements. | | | | | | | | |
(††) Amount shown represents units. One unit represents a principal amount of 100. | | | |
(†††)Amount shown represents units. One unit represents a principal amount of 25. | | | |
(a) Federal Tax Information: | | | | | | | | |
At September 30, 2008, the net unrealized depreciation on investments based on a cost of $17,913,715,806 for federal income tax purposes was as follows: | | | |
Aggregate gross unrealized appreciation for all investments in which there is an excess of value over tax cost | | $ | 268,167,819 |
Aggregate gross unrealized depreciation for all investments in which there is an excess of tax cost over value | | | (3,353,673,956) |
| | | | | | | | |
Net unrealized depreciation | | | | | | | $ | (3,085,506,137) |
| | | | | | | | |
| (b) | All or a portion of this security was on loan to brokers at September 30, 2008. |
| (c) | Illiquid security. At September 30, 2008, the value of these securities amounted to $343,812,182 or 2.3% of net assets. |
| (d) | Variable rate security. Rate as of September 30, 2008 is disclosed. |
| (e) | Issuer has filed for bankruptcy. |
| (f) | Non-income producing security. |
| (g) | Step Bond: Coupon is a fixed rate for an initial period then resets at a specified date and rate. |
| (h) | Bankrupt issuer. Security remains in the Portfolio of Investments pending final resolution of bankruptcy proceedings. |
| (i) | Variable rate security. Rate shown represents the weighted average rate at September 30, 2008. |
| (j) | Represents investment of securities lending collateral. |
| (k) | Future dividend payments have been eliminated as the issuer has been placed in conservatorship. |
| 144A | Securities exempt from registration under Rule 144A of the Securities Act of 1933. These securities may be resold in transactions exempt from registration, normally to qualified institutional buyers. At September 30, 2008, the total value of these securities amounted to $1,357,865,233 or 9.2% of net assets. |
43
| AMBAC | American Municipal Bond Assurance Corp. |
| EMTN | Euro Medium Term Note |
| FGIC | Financial Guaranty Insurance Company |
| FSA | Financial Security Assurance, Inc. |
| GMTN | Global Medium Term Note |
| MBIA | Municipal Bond Investor Assurance Corp. |
| REITs | Real Estate Investment Trusts |
Key to Abbreviations: AUD: Australian Dollar; BRL: Brazilian Real; CAD: Canadian Dollar; EUR: Euro; GBP: British Pound; IDR: Indonesian Rupiah; ISK: Icelandic Krona; KRW: South Korean Won; MXN: Mexican Peso; NZD: New Zealand Dollar; SGD: Singapore Dollar; THB: Thai Baht
NET ASSET SUMMARY AT SEPTEMBER 30, 2008 (Unaudited)
| | | |
Sovereigns | | 13.0 | % |
Non-Captive Diversified | | 6.8 | |
Wirelines | | 6.6 | |
Healthcare | | 5.6 | |
Banking | | 4.7 | |
Electric | | 4.1 | |
Supranational | | 3.9 | |
Retailers | | 3.8 | |
Non-Captive Consumer | | 3.7 | |
Technology | | 3.4 | |
Pharmaceuticals | | 3.1 | |
Paper | | 3.0 | |
Automotive | | 2.4 | |
Media Cable | | 2.4 | |
Pipelines | | 2.3 | |
Other Investments, less than 2% each | | 26.8 | |
Short-Term Investments | | 5.3 | |
| | | |
Total Investments | | 100.9 | |
Other assets less liabilities | | (0.9 | ) |
| | | |
Net Assets | | 100.0 | % |
| | | |
CURRENCY EXPOSURE AT SEPTEMBER 30, 2008 AS A PERCENTAGE OF NET ASSETS (Unaudited)
| | | |
United States Dollar | | 72.5 | % |
Canadian Dollar | | 9.7 | |
Mexican Peso | | 3.5 | |
Brazilian Real | | 2.7 | |
New Zealand Dollar | | 2.6 | |
Australian Dollar | | 2.4 | |
Other, less than 2% each | | 7.5 | |
| | | |
Total Investments | | 100.9 | |
Other assets less liabilities | | (0.9 | ) |
| | | |
Net Assets | | 100.0 | % |
| | | |
See accompanying notes to financial statements.
44
PORTFOLIO OF INVESTMENTS – as of September 30, 2008
Loomis Sayles Fixed Income Fund
| | | | | | | | |
| | | | | Principal Amount (‡) | | Value (†) |
| | | | | | | | |
| | |
| BONDS AND NOTES – 84.7% of Net Assets | | | | | | |
| | | |
| NON-CONVERTIBLE BONDS – 80.6% | | | | | | | | |
| | | |
| ABS Credit Card – 0.6% | | | | | | | | |
Citibank Credit Card Issuance Trust, Series 2008-C6, 6.300%, 6/20/2014 | | | | $ | 4,265,000 | | $ | 3,705,962 |
| | | | | | | | |
| Aerospace & Defense – 0.0% | | | | | | | | |
Bombardier, Inc., 7.450%, 5/01/2034, 144A | | | | | 175,000 | | | 162,750 |
| | | | | | | | |
| Airlines – 0.5% | | | | | | | | |
American Airlines, Inc., Series 1999-1, 7.324%, 4/15/2011 | | | | | 250,000 | | | 237,500 |
American Airlines, Inc., Series 93A6, 8.040%, 9/16/2011 | | | | | 23,424 | | | 17,685 |
Continental Airlines, Inc., Series 2000-2, Class B, 8.307%, 10/02/2019 | | | | | 123,157 | | | 97,909 |
Continental Airlines, Inc., Series 2001-1, Class B, 7.373%, 6/15/2017 | | | | | 203,816 | | | 152,862 |
Continental Airlines, Inc., Series 971A, 7.461%, 10/01/2016 | | | | | 458,014 | | | 398,472 |
Delta Air Lines, Inc., Series 2007-1, Class C, 8.954%, 8/10/2014 | | | | | 1,878,052 | | | 1,370,978 |
United Air Lines, Inc., 6.636%, 1/02/2024 | | | | | 1,232,139 | | | 911,783 |
| | | | | | | | |
| | | | | | | | 3,187,189 |
| | | | | | | | |
| Asset-Backed Securities – 0.1% | | | | | | | | |
Community Program Loan Trust, Series 1987-A, Class A5, 4.500%, 4/01/2029 | | | | | 725,000 | | | 643,945 |
Ford Credit Auto Owner Trust, 4.380%, 1/15/2010 | | | | | 28,106 | | | 28,072 |
| | | | | | | | |
| | | | | | | | 672,017 |
| | | | | | | | |
| Automotive – 1.6% | | | | | | | | |
Cummins, Inc., 7.125%, 3/01/2028 | | | | | 2,400,000 | | | 2,296,726 |
FCE Bank PLC, EMTN, 7.125%, 1/16/2012 | | EUR | | | 300,000 | | | 282,968 |
FCE Bank PLC, EMTN, 7.125%, 1/15/2013 | | EUR | | | 200,000 | | | 183,014 |
Ford Motor Co., 6.375%, 2/01/2029 | | | | | 730,000 | | | 270,100 |
Ford Motor Co., 6.500%, 8/01/2018 | | | | | 50,000 | | | 20,500 |
Ford Motor Co., 6.625%, 10/01/2028 | | | | | 2,435,000 | | | 925,300 |
Ford Motor Co., 7.125%, 11/15/2025(b) | | | | | 595,000 | | | 235,025 |
Ford Motor Co., 7.450%, 7/16/2031 | | | | | 5,065,000 | | | 2,177,950 |
Ford Motor Credit Co. LLC, 5.700%, 1/15/2010 | | | | | 750,000 | | | 574,377 |
Ford Motor Credit Co. LLC, 7.000%, 10/01/2013 | | | | | 230,000 | | | 141,348 |
Ford Motor Credit Co. LLC, 7.875%, 6/15/2010 | | | | | 500,000 | | | 381,664 |
Ford Motor Credit Co. LLC, 8.000%, 12/15/2016 | | | | | 565,000 | | | 357,237 |
General Motors Corp., 7.400%, 9/01/2025 | | | | | 250,000 | | | 90,000 |
General Motors Corp., 8.250%, 7/15/2023(b) | | | | | 4,435,000 | | | 1,740,737 |
General Motors Corp., 8.375%, 7/15/2033(b) | | | | | 275,000 | | | 110,000 |
Goodyear Tire & Rubber Co., 7.000%, 3/15/2028 | | | | | 375,000 | | | 277,500 |
| | | | | | | | |
| | | | | | | | 10,064,446 |
| | | | | | | | |
| Banking – 5.0% | | | | | | | | |
BAC Capital Trust VI, 5.625%, 3/08/2035 | | | | | 2,385,000 | | | 1,820,707 |
Bank of America Corp., 4.850%, 11/15/2014 | | | | | 500,000 | | | 426,776 |
Barclays Financial LLC, 4.060%, 9/16/2010, 144A | | KRW | | | 2,340,000,000 | | | 1,972,894 |
Barclays Financial LLC, 4.160%, 2/22/2010, 144A | | THB | | | 175,000,000 | | | 5,110,455 |
Barclays Financial LLC, EMTN, 4.100%, 3/22/2010, 144A | | THB | | | 45,000,000 | | | 1,313,054 |
45
| | | | | | | |
| | | | | Principal Amount (‡) | | Value (†) |
| | | | | | | |
| | | |
| BONDS AND NOTES – continued | | | | | | | |
| | | |
| Banking – continued | | | | | | | |
BNP Paribas SA, EMTN, Zero Coupon Bond, 6/13/2011, 144A | | IDR | | 18,710,000,000 | | $ | 1,432,317 |
JPMorgan Chase & Co., Zero Coupon Bond, 5/17/2010, 144A | | BRL | | 16,585,000 | | | 7,010,969 |
JPMorgan Chase & Co., Zero Coupon Bond, 3/28/2011, 144A | | IDR | | 13,692,036,000 | | | 1,079,101 |
JPMorgan Chase & Co., Zero Coupon Bond, 3/28/2011, 144A | | IDR | | 17,920,000,000 | | | 1,410,416 |
JPMorgan Chase & Co., Zero Coupon Bond, 4/12/2012, 144A | | IDR | | 21,194,634,240 | | | 1,455,754 |
JPMorgan Chase London, Zero Coupon Bond, 10/21/2010, 144A | | IDR | | 18,824,303,000 | | | 1,570,422 |
Kaupthing Bank, 3.491%, 1/15/2010, 144A(b)(c) | | | | 200,000 | | | 156,000 |
Kaupthing Bank, Series D, 5.750%, 10/04/2011, 144A | | | | 2,700,000 | | | 1,728,000 |
Kaupthing Bank, Series E, 6.125%, 10/04/2016, 144A | | | | 500,000 | | | 265,000 |
Rabobank Nederland, 10.250%, 9/10/2009, 144A | | ISK | | 360,000,000 | | | 3,346,431 |
Rabobank Nederland, EMTN, 12.500%, 2/17/2009 | | ISK | | 70,000,000 | | | 652,443 |
Rabobank Nederland, EMTN, 14.000%, 1/28/2009, 144A | | ISK | | 48,000,000 | | | 457,362 |
| | | | | | | |
| | | | | | | 31,208,101 |
| | | | | | | |
| Brokerage – 1.6% | | | | | | | |
Goldman Sachs Group LP, 5.000%, 10/01/2014 | | | | 3,855,000 | | | 3,215,328 |
Goldman Sachs Group, Inc. (The), 5.150%, 1/15/2014 | | | | 1,955,000 | | | 1,605,608 |
Lehman Brothers Holdings, Inc., 6.875%, 7/17/2037(d) | | | | 4,895,000 | | | 6,119 |
Lehman Brothers Holdings, Inc., MTN, (fixed rate to 5/03/2027, variable rate thereafter), 6.000%, 5/03/2032(d) | | | | 390,000 | | | 488 |
Merrill Lynch & Co., Inc., EMTN, 4.625%, 9/14/2018 | | EUR | | 1,000,000 | | | 771,066 |
Morgan Stanley, 3.875%, 1/15/2009 | | | | 1,870,000 | | | 1,720,434 |
Morgan Stanley, 5.375%, 10/15/2015 | | | | 1,700,000 | | | 1,053,651 |
Morgan Stanley, EMTN, 5.450%, 1/09/2017 | | | | 370,000 | | | 229,514 |
Morgan Stanley, Series F, MTN, 5.550%, 4/27/2017 | | | | 500,000 | | | 309,965 |
Morgan Stanley, Series F, MTN, 5.950%, 12/28/2017 | | | | 370,000 | | | 231,785 |
Morgan Stanley, Series F, MTN, 6.625%, 4/01/2018 | | | | 1,245,000 | | | 823,930 |
| | | | | | | |
| | | | | | | 9,967,888 |
| | | | | | | |
| Building Materials – 0.5% | | | | | | | |
Owens Corning, Inc., 6.500%, 12/01/2016 | | | | 805,000 | | | 712,355 |
Owens Corning, Inc., 7.000%, 12/01/2036 | | | | 1,205,000 | | | 968,671 |
Ply Gem Industries, Inc., 9.000%, 2/15/2012(b) | | | | 250,000 | | | 136,250 |
USG Corp., 6.300%, 11/15/2016 | | | | 1,680,000 | | | 1,268,400 |
| | | | | | | |
| | | | | | | 3,085,676 |
| | | | | | | |
46
PORTFOLIO OF INVESTMENTS – as of September 30, 2008
Loomis Sayles Fixed Income Fund – continued
| | | | | | | | |
| | | | | Principal Amount (‡) | | Value (†) |
| | | | | | | | |
| | | |
| BONDS AND NOTES – continued | | | | | | | | |
| | | |
| Chemicals – 0.9% | | | | | | | | |
Borden, Inc., 7.875%, 2/15/2023 | | | | $ | 5,240,000 | | $ | 2,410,400 |
Borden, Inc., 8.375%, 4/15/2016 | | | | | 55,000 | | | 18,700 |
Borden, Inc., 9.200%, 3/15/2021 | | | | | 905,000 | | | 452,500 |
ICI Wilmington, Inc., 5.625%, 12/01/2013 | | | | | 115,000 | | | 117,126 |
Lubrizol Corp., 5.500%, 10/01/2014 | | | | | 365,000 | | | 353,955 |
Lubrizol Corp., 6.500%, 10/01/2034 | | | | | 1,170,000 | | | 1,051,687 |
Methanex Corp., 6.000%, 8/15/2015 | | | | | 1,565,000 | | | 1,376,637 |
| | | | | | | | |
| | | | | | | | 5,781,005 |
| | | | | | | | |
| Construction Machinery – 0.2% | | | | | | | | |
Toro Co., 6.625%, 5/01/2037 | | | | | 965,000 | | | 1,016,855 |
| | | | | | | | |
| Distributors – 0.1% | | | | | | | | |
ONEOK, Inc., 6.000%, 6/15/2035 | | | | | 1,000,000 | | | 713,739 |
| | | | | | | | |
| Diversified Manufacturing – 0.1% | | | | | | | | |
General Electric Co., 5.000%, 2/01/2013 | | | | | 500,000 | | | 460,509 |
| | | | | | | | |
| Electric – 4.1% | | | | | | | | |
AES Corp. (The), 7.750%, 3/01/2014 | | | | | 730,000 | | | 678,900 |
Bruce Mansfield Unit, 6.850%, 6/01/2034(e) | | | | | 4,255,000 | | | 4,243,086 |
Duke Energy Carolinas, 4.200%, 10/01/2008 | | | | | 85,000 | | | 85,000 |
Dynegy Holdings, Inc., 7.125%, 5/15/2018 | | | | | 380,000 | | | 286,900 |
Dynegy Holdings, Inc., 7.625%, 10/15/2026 | | | | | 810,000 | | | 591,300 |
Empresa Nacional de Electricidad SA (Endesa-Chile), 7.875%, 2/01/2027 | | | | | 1,589,000 | | | 1,664,144 |
Enersis SA, 7.375%, 1/15/2014 | | | | | 275,000 | | | 277,687 |
Enersis SA, 7.400%, 12/01/2016 | | | | | 4,000,000 | | | 4,042,040 |
Mackinaw Power LLC, 6.296%, 10/31/2023, 144A | | | | | 4,046,326 | | | 4,036,655 |
NGC Corporation Capital Trust I, Series B, 8.316%, 6/01/2027(b) | | | | | 695,000 | | | 517,775 |
Nisource Finance Corp., 6.400%, 3/15/2018 | | | | | 2,855,000 | | | 2,558,620 |
Power Receivables Finance LLC, 6.290%, 1/01/2012, 144A | | | | | 791,857 | | | 819,350 |
Quezon Power Philippines Co., 8.860%, 6/15/2017 | | | | | 1,374,100 | | | 1,367,229 |
TXU Corp., Series P, 5.550%, 11/15/2014 | | | | | 765,000 | | | 570,887 |
TXU Corp., Series Q, 6.500%, 11/15/2024 | | | | | 1,515,000 | | | 964,869 |
TXU Corp., Series R, 6.550%, 11/15/2034 | | | | | 1,275,000 | | | 783,415 |
White Pine Hydro LLC, 6.310%, 7/10/2017(e) | | | | | 450,000 | | | 431,974 |
White Pine Hydro LLC, 6.960%, 7/10/2037(e) | | | | | 670,000 | | | 646,707 |
White Pine Hydro Portfolio LLC, 7.260%, 7/20/2015(e) | | | | | 1,280,000 | | | 1,233,760 |
| | | | | | | | |
| | | | | | | | 25,800,298 |
| | | | | | | | |
| Entertainment – 1.4% | | | | | | | | |
Six Flags, Inc., 9.625%, 6/01/2014(b) | | | | | 100,000 | | | 56,000 |
Time Warner, Inc., 6.500%, 11/15/2036 | | | | | 910,000 | | | 691,062 |
Time Warner, Inc., 6.625%, 5/15/2029 | | | | | 2,065,000 | | | 1,649,357 |
Time Warner, Inc., 6.950%, 1/15/2028 | | | | | 875,000 | | | 729,505 |
Time Warner, Inc., 7.625%, 4/15/2031 | | | | | 730,000 | | | 633,903 |
Time Warner, Inc., 7.700%, 5/01/2032 | | | | | 1,155,000 | | | 1,009,170 |
Viacom, Inc., Class B, 6.875%, 4/30/2036 | | | | | 4,880,000 | | | 3,912,198 |
| | | | | | | | |
| | | | | | | | 8,681,195 |
| | | | | | | | |
| Food & Beverage – 0.3% | | | | | | | | |
Corn Products International, Inc., 6.625%, 4/15/2037 | | | | | 1,540,000 | | | 1,601,679 |
47
| | | | | | | | |
| | | | | Principal Amount (‡) | | Value (†) |
| | | | | | | | |
| | | |
| BONDS AND NOTES – continued | | | | | | | | |
| | | |
| Food & Beverage – continued | | | | | | | | |
Dole Food Co., Inc., 8.625%, 5/01/2009 | | | | $ | 165,000 | | $ | 157,575 |
Sara Lee Corp., 6.125%, 11/01/2032 | | | | | 295,000 | | | 261,402 |
| | | | | | | | |
| | | | | | | | 2,020,656 |
| | | | | | | | |
| Foreign Local Governments – 4.4% | | | | | | | | |
Province of Alberta, 5.930%, 9/16/2016 | | CAD | | | 913,654 | | | 930,042 |
Province of British Columbia, Zero Coupon Bond, 8/23/2013 | | CAD | | | 11,700,000 | | | 9,092,414 |
Province of Ontario, 5.700%, 12/01/2008 | | CAD | | | 18,145,000 | | | 17,146,578 |
| | | | | | | | |
| | | | | | | | 27,169,034 |
| | | | | | | | |
| Government Owned – No Guarantee – 0.2% | | | | | | |
DP World Ltd., 6.850%, 7/02/2037, 144A | | | | | 1,500,000 | | | 1,110,540 |
| | | | | | | | |
| Healthcare – 2.7% | | | | | | | | |
Boston Scientific Corp., 5.450%, 6/15/2014 | | | | | 290,000 | | | 271,150 |
Boston Scientific Corp., 6.400%, 6/15/2016 | | | | | 860,000 | | | 817,000 |
Boston Scientific Corp., 7.000%, 11/15/2035 | | | | | 860,000 | | | 765,400 |
HCA, Inc., 5.750%, 3/15/2014 | | | | | 455,000 | | | 354,900 |
HCA, Inc., 6.250%, 2/15/2013 | | | | | 2,345,000 | | | 1,958,075 |
HCA, Inc., 6.375%, 1/15/2015 | | | | | 410,000 | | | 322,875 |
HCA, Inc., 6.500%, 2/15/2016 | | | | | 610,000 | | | 483,425 |
HCA, Inc., 6.750%, 7/15/2013 | | | | | 115,000 | | | 96,600 |
HCA, Inc., 7.050%, 12/01/2027 | | | | | 3,545,000 | | | 2,393,903 |
HCA, Inc., 7.190%, 11/15/2015 | | | | | 560,000 | | | 447,066 |
HCA, Inc., 7.500%, 12/15/2023 | | | | | 840,000 | | | 615,342 |
HCA, Inc., 7.500%, 11/06/2033 | | | | | 1,440,000 | | | 1,022,400 |
HCA, Inc., 7.690%, 6/15/2025 | | | | | 2,660,000 | | | 1,977,018 |
HCA, Inc., 8.360%, 4/15/2024 | | | | | 1,775,000 | | | 1,375,767 |
HCA, Inc., MTN, 7.580%, 9/15/2025 | | | | | 2,930,000 | | | 2,158,619 |
HCA, Inc., MTN, 7.750%, 7/15/2036 | | | | | 430,000 | | | 305,257 |
Owens & Minor, Inc., 6.350%, 4/15/2016(e) | | | | | 320,000 | | | 311,594 |
Tenet Healthcare Corp., 6.500%, 6/01/2012 | | | | | 105,000 | | | 97,125 |
Tenet Healthcare Corp., 6.875%, 11/15/2031 | | | | | 1,075,000 | | | 731,000 |
Tenet Healthcare Corp., 7.375%, 2/01/2013(b) | | | | | 85,000 | | | 77,350 |
| | | | | | | | |
| | | | | | | | 16,581,866 |
| | | | | | | | |
| Home Construction – 1.2% | | | | | | | | |
K. Hovnanian Enterprises, Inc., 6.250%, 1/15/2016 | | | | | 115,000 | | | 66,125 |
K. Hovnanian Enterprises, Inc., 6.375%, 12/15/2014 | | | | | 155,000 | | | 89,900 |
K. Hovnanian Enterprises, Inc., 6.500%, 1/15/2014 | | | | | 115,000 | | | 67,850 |
Lennar Corp., 7.625%, 3/01/2009 | | | | | 470,000 | | | 453,550 |
Lennar Corp., Series B, 5.600%, 5/31/2015 | | | | | 1,700,000 | | | 1,105,000 |
Pulte Homes, Inc., 5.200%, 2/15/2015 | | | | | 1,305,000 | | | 1,044,000 |
Pulte Homes, Inc., 6.000%, 2/15/2035 | | | | | 3,920,000 | | | 2,802,800 |
Pulte Homes, Inc., 6.375%, 5/15/2033 | | | | | 1,960,000 | | | 1,430,800 |
Toll Brothers Finance Corp., 5.150%, 5/15/2015 | | | | | 565,000 | | | 477,829 |
| | | | | | | | |
| | | | | | | | 7,537,854 |
| | | | | | | | |
| Independent Energy – 2.3% | | | | | | | | |
Anadarko Petroleum Corp., 5.950%, 9/15/2016 | | | | | 3,495,000 | | | 3,212,307 |
Anadarko Petroleum Corp., 6.450%, 9/15/2036 | | | | | 2,580,000 | | | 2,022,844 |
Chesapeake Energy Corp., 6.500%, 8/15/2017 | | | | | 380,000 | | | 332,500 |
48
PORTFOLIO OF INVESTMENTS – as of September 30, 2008
Loomis Sayles Fixed Income Fund – continued
| | | | | | | | |
| | | | | Principal Amount (‡) | | Value (†) |
| | | | | | | | |
| | | |
| BONDS AND NOTES – continued | | | | | | | | |
| | | |
| Independent Energy – continued | | | | | | | | |
Chesapeake Energy Corp., 6.875%, 1/15/2016 | | | | $ | 200,000 | | $ | 182,500 |
Chesapeake Energy Corp., 6.875%, 11/15/2020 | | | | | 900,000 | | | 769,500 |
Connacher Oil and Gas Ltd., 10.250%, 12/15/2015, 144A | | | | | 792,000 | | | 760,320 |
Pioneer Natural Resources Co., 5.875%, 7/15/2016 | | | | | 435,000 | | | 374,770 |
Pioneer Natural Resources Co., 7.200%, 1/15/2028 | | | | | 1,465,000 | | | 1,261,271 |
Questar Market Resources, Inc., 6.800%, 4/01/2018 | | | | | 3,820,000 | | | 3,851,698 |
Talisman Energy, Inc., 5.850%, 2/01/2037 | | | | | 550,000 | | | 412,879 |
Talisman Energy, Inc., 6.250%, 2/01/2038 | | | | | 1,485,000 | | | 1,153,368 |
XTO Energy, Inc., 6.100%, 4/01/2036 | | | | | 155,000 | | | 128,342 |
| | | | | | | | |
| | | | | | | | 14,462,299 |
| | | | | | | | |
| Industrial Other – 0.1% | | | | | | | | |
Ranhill Labuan Ltd., 12.500%, 10/26/2011, 144A | | | | | 1,575,000 | | | 756,000 |
| | | | | | | | |
| Integrated Energy – 0.2% | | | | | | | | |
PF Export Receivables Master Trust, 6.436%, 6/01/2015, 144A | | | | | 1,361,705 | | | 1,402,556 |
| | | | | | | | |
| | | |
| Life Insurance – 1.3% | | | | | | | | |
ASIF Global Financing XXVII, 2.380%, 2/26/2009, 144A | | SGD | | | 17,000,000 | | | 6,011,553 |
Hartford Life Insurance Co., 7.800%, 9/15/2011(c) | | | | | 500,000 | | | 487,284 |
John Hancock Insurance Co., 7.450%, 4/15/2009(c) | | | | | 500,000 | | | 485,655 |
Principal Life Income Funding Trust, 5.000%, 10/15/2014 | | | | | 500,000 | | | 478,268 |
Protective Life Secured Trust, 7.330%, 9/10/2014(c) | | | | | 1,000,000 | | | 896,460 |
| | | | | | | | |
| | | | | | | | 8,359,220 |
| | | | | | | | |
| Local Authorities – 1.3% | | | | | | | | |
Queensland Treasury Corp., Series 11G, 6.000%, 6/14/2011 | | AUD | | | 2,150,000 | | | 1,708,243 |
Virginia Tobacco Settlement Financing Corp., Series A-1, 6.706%, 6/01/2046(e) | | | | | 7,910,000 | | | 6,125,900 |
| | | | | | | | |
| | | | | | | | 7,834,143 |
| | | | | | | | |
| Lodging – 0.0% | | | | | | | | |
Host Marriott LP, Series O, 6.375%, 3/15/2015 | | | | | 150,000 | | | 121,875 |
| | | | | | | | |
| Media Cable – 3.6% | | | | | | | | |
Comcast Corp., 5.650%, 6/15/2035 | | | | | 2,660,000 | | | 1,977,266 |
Comcast Corp., 6.450%, 3/15/2037 | | | | | 2,645,000 | | | 2,133,359 |
Comcast Corp., 6.500%, 11/15/2035 | | | | | 3,240,000 | | | 2,705,154 |
Comcast Corp., 6.950%, 8/15/2037 | | | | | 7,695,000 | | | 6,563,473 |
CSC Holdings, Inc., 6.750%, 4/15/2012 | | | | | 200,000 | | | 183,250 |
CSC Holdings, Inc., 7.625%, 4/01/2011 | | | | | 50,000 | | | 48,000 |
CSC Holdings, Inc., 7.875%, 2/15/2018 | | | | | 170,000 | | | 149,600 |
Rogers Cable, Inc., 5.500%, 3/15/2014 | | | | | 150,000 | | | 138,569 |
TCI Communications, Inc., 7.875%, 2/15/2026 | | | | | 550,000 | | | 529,587 |
Time Warner Cable, Inc., 6.550%, 5/01/2037 | | | | | 1,500,000 | | | 1,214,832 |
Time Warner Cable, Inc., 6.750%, 7/01/2018 | | | | | 6,500,000 | | | 6,070,545 |
Virgin Media Finance PLC, 9.125%, 8/15/2016 | | | | | 400,000 | | | 335,000 |
Virgin Media Finance PLC, 9.750%, 4/15/2014 | | GBP | | | 250,000 | | | 342,236 |
| | | | | | | | |
| | | | | | | | 22,390,871 |
| | | | | | | | |
49
| | | | | | | | |
| | | | | Principal Amount (‡) | | Value (†) |
| | | | | | | | |
| | | |
| BONDS AND NOTES – continued | | | | | | | | |
| | | |
| Media Non-Cable – 0.5% | | | | | | | | |
Clear Channel Communications, Inc., 4.250%, 5/15/2009 | | | | $ | 85,000 | | $ | 79,900 |
Clear Channel Communications, Inc., 4.900%, 5/15/2015 | | | | | 785,000 | | | 233,537 |
Clear Channel Communications, Inc., 5.500%, 12/15/2016 | | | | | 50,000 | | | 14,500 |
News America, Inc., 6.150%, 3/01/2037 | | | | | 2,630,000 | | | 2,144,310 |
News America, Inc., 6.200%, 12/15/2034 | | | | | 795,000 | | | 633,845 |
| | | | | | | | |
| | | | | | | | 3,106,092 |
| | | | | | | | |
| Mortgage Related – 0.0% | | | | | | | | |
GS Mortgage Securities Corp. II, Series 2005-GG4, Class A4A, 4.751%, 7/10/2039 | | | | | 95,000 | | | 85,233 |
| | | | | | | | |
| Non-Captive Consumer – 1.9% | | | | | | | | |
Countrywide Home Loans, Inc., Series L, MTN, 4.000%, 3/22/2011 | | | | | 84,000 | | | 72,269 |
HSBC Finance Corp., 6.500%, 11/15/2008 | | | | | 60,000 | | | 59,787 |
Residential Capital LLC, 8.500%, 6/01/2012 | | | | | 180,000 | | | 36,000 |
Residential Capital LLC, 8.500%, 4/17/2013 | | | | | 6,335,000 | | | 1,267,000 |
Residential Capital LLC, 8.875%, 6/30/2015 | | | | | 730,000 | | | 146,000 |
Residential Capital LLC, 9.625%, 5/15/2015, 144A | | | | | 884,000 | | | 212,160 |
SLM Corp., 6.000%, 12/15/2043 | | | | | 31,725(†††) | | | 327,640 |
SLM Corp., Series A, MTN, 4.000%, 1/15/2010 | | | | | 930,000 | | | 730,050 |
SLM Corp., Series A, MTN, 5.000%, 10/01/2013 | | | | | 1,600,000 | | | 992,000 |
SLM Corp., Series A, MTN, 5.000%, 4/15/2015 | | | | | 200,000 | | | 120,000 |
SLM Corp., Series A, MTN, 5.375%, 1/15/2013 | | | | | 2,920,000 | | | 1,912,600 |
SLM Corp., Series A, MTN, 5.375%, 5/15/2014 | | | | | 235,000 | | | 145,700 |
SLM Corp., Series A, MTN, 5.400%, 10/25/2011(b) | | | | | 405,000 | | | 283,500 |
SLM Corp., Series A, MTN, 8.450%, 6/15/2018 | | | | | 7,511,000 | | | 5,107,480 |
SLM Corp., Series B, 7.750%, 9/15/2009(c) | | | | | 500,000 | | | 429,490 |
SLM Corp., MTN, 5.125%, 8/27/2012 | | | | | 420,000 | | | 273,000 |
| | | | | | | | |
| | | | | | | | 12,114,676 |
| | | | | | | | |
| Non-Captive Diversified – 3.6% | | | | | | | | |
CIT Group Funding Co. of Canada, 5.200%, 6/01/2015 | | | | | 845,000 | | | 414,970 |
CIT Group, Inc., 4.750%, 12/15/2010 | | | | | 135,000 | | | 87,918 |
CIT Group, Inc., 5.050%, 9/15/2014 | | | | | 500,000 | | | 169,569 |
CIT Group, Inc., 5.125%, 9/30/2014 | | | | | 2,520,000 | | | 1,242,756 |
CIT Group, Inc., 5.400%, 2/13/2012 | | | | | 30,000 | | | 17,246 |
CIT Group, Inc., 5.400%, 1/30/2016 | | | | | 355,000 | | | 171,820 |
CIT Group, Inc., 5.500%, 12/01/2014 | | GBP | | | 800,000 | | | 709,951 |
CIT Group, Inc., 5.600%, 4/27/2011 | | | | | 625,000 | | | 402,519 |
CIT Group, Inc., 5.650%, 2/13/2017 | | | | | 1,005,000 | | | 490,408 |
CIT Group, Inc., 5.800%, 10/01/2036 | | | | | 1,855,000 | | | 848,429 |
CIT Group, Inc., 5.850%, 9/15/2016 | | | | | 30,000 | | | 14,550 |
CIT Group, Inc., Series A, GMTN, 6.000%, 4/01/2036 | | | | | 875,000 | | | 358,750 |
CIT Group, Inc., EMTN, 3.800%, 11/14/2012 | | EUR | | | 750,000 | | | 569,805 |
CIT Group, Inc., EMTN, 4.650%, 9/19/2016 | | EUR | | | 1,150,000 | | | 793,454 |
CIT Group, Inc., EMTN, 5.000%, 5/13/2014 | | EUR | | | 550,000 | | | 396,070 |
CIT Group, Inc., EMTN, 5.500%, 12/20/2016 | | GBP | | | 600,000 | | | 532,025 |
CIT Group, Inc., GMTN, 4.250%, 2/01/2010 | | | | | 85,000 | | | 56,023 |
CIT Group, Inc., GMTN, 4.250%, 9/22/2011 | | EUR | | | 400,000 | | | 336,344 |
50
PORTFOLIO OF INVESTMENTS – as of September 30, 2008
Loomis Sayles Fixed Income Fund – continued
| | | | | | | | |
| | | | | Principal Amount (‡) | | Value (†) |
| | | | | | | | |
| | | |
| BONDS AND NOTES – continued | | | | | | | | |
| | | |
| Non-Captive Diversified – continued | | | | | | | | |
CIT Group, Inc., GMTN, 5.000%, 2/13/2014 | | | | $ | 1,585,000 | | $ | 896,585 |
CIT Group, Inc., GMTN, 5.000%, 2/01/2015 | | | | | 870,000 | | | 430,038 |
CIT Group, Inc., MTN, 4.250%, 3/17/2015 | | EUR | | | 1,000,000 | | | 690,056 |
General Electric Capital Corp., 6.500%, 9/28/2015 | | NZD | | | 9,210,000 | | | 5,490,522 |
General Electric Capital Corp., EMTN, 6.750%, 9/26/2016 | | NZD | | | 1,345,000 | | | 800,487 |
GMAC LLC, 4.750%, 9/14/2009 | | EUR | | | 960,000 | | | 864,953 |
GMAC LLC, 5.625%, 5/15/2009(b) | | | | | 800,000 | | | 571,618 |
GMAC LLC, 6.000%, 12/15/2011 | | | | | 2,062,000 | | | 916,846 |
GMAC LLC, 6.875%, 8/28/2012 | | | | | 355,000 | | | 141,105 |
GMAC LLC, 7.000%, 2/01/2012 | | | | | 400,000 | | | 163,044 |
GMAC LLC, 8.000%, 11/01/2031 | | | | | 295,000 | | | 111,297 |
GMAC LLC, EMTN, 5.375%, 6/06/2011 | | EUR | | | 2,565,000 | | | 1,516,623 |
GMAC LLC, EMTN, 5.750%, 9/27/2010 | | EUR | | | 350,000 | | | 221,729 |
iStar Financial, Inc., 5.500%, 6/15/2012 | | | | | 85,000 | | | 43,350 |
iStar Financial, Inc., 5.650%, 9/15/2011 | | | | | 135,000 | | | 70,200 |
iStar Financial, Inc., 5.875%, 3/15/2016 | | | | | 30,000 | | | 14,700 |
iStar Financial, Inc., 6.050%, 4/15/2015 | | | | | 30,000 | | | 14,700 |
iStar Financial, Inc., 8.625%, 6/01/2013 | | | | | 2,495,000 | | | 1,222,550 |
iStar Financial, Inc., Series B, 5.700%, 3/01/2014 | | | | | 95,000 | | | 46,550 |
iStar Financial, Inc., Series B, 5.950%, 10/15/2013 | | | | | 1,245,000 | | | 647,400 |
| | | | | | | | |
| | | | | | | | 22,486,960 |
| | | | | | | | |
| Oil Field Services – 0.1% | | | | | | | | |
North American Energy Partners, Inc., 8.750%, 12/01/2011 | | | | | 1,000,000 | | | 920,000 |
| | | | | | | | |
| Packaging – 0.3% | | | | | | | | |
Owens-Illinois, Inc., 7.800%, 5/15/2018 | | | | | 2,000,000 | | | 1,940,000 |
| | | | | | | | |
| Paper – 1.9% | | | | | | | | |
Abitibi-Consolidated, Inc., 7.500%, 4/01/2028 | | | | | 650,000 | | | 149,500 |
Georgia-Pacific LLC, 7.250%, 6/01/2028 | | | | | 2,000,000 | | | 1,580,000 |
Georgia-Pacific LLC, 7.375%, 12/01/2025 | | | | | 2,868,000 | | | 2,315,910 |
Georgia-Pacific LLC, 7.750%, 11/15/2029 | | | | | 6,005,000 | | | 4,954,125 |
Georgia-Pacific LLC, 8.000%, 1/15/2024 | | | | | 132,000 | | | 116,160 |
International Paper Co., 4.250%, 1/15/2009 | | | | | 700,000 | | | 695,679 |
Jefferson Smurfit Corp., 7.500%, 6/01/2013 | | | | | 335,000 | | | 271,350 |
Westvaco Corp., 7.950%, 2/15/2031 | | | | | 1,045,000 | | | 1,000,393 |
Westvaco Corp., 8.200%, 1/15/2030 | | | | | 1,080,000 | | | 1,013,693 |
| | | | | | | | |
| | | | | | | | 12,096,810 |
| | | | | | | | |
| Pharmaceuticals – 0.7% | | | | | | | | |
Elan Financial PLC, 7.750%, 11/15/2011 | | | | | 4,235,000 | | | 3,832,675 |
Elan Financial PLC, 8.875%, 12/01/2013 | | | | | 335,000 | | | 281,400 |
| | | | | | | | |
| | | | | | | | 4,114,075 |
| | | | | | | | |
| Pipelines – 1.6% | | | | | | | | |
DCP Midstream LP, 6.450%, 11/03/2036, 144A | | | | | 1,740,000 | | | 1,391,843 |
El Paso Corp., 6.950%, 6/01/2028 | | | | | 925,000 | | | 730,375 |
El Paso Corp., 7.800%, 8/01/2031 | | | | | 250,000 | | | 210,629 |
Enterprise Products Operating LP, 6.300%, 9/15/2017 | | | | | 1,550,000 | | | 1,445,510 |
Kinder Morgan, Inc., 6.500%, 9/01/2012 | | | | | 90,000 | | | 84,825 |
51
| | | | | | | | |
| | | | | Principal Amount (‡) | | Value (†) |
| | | | | | | | |
| | | |
| BONDS AND NOTES – continued | | | | | | | | |
| | | |
| Pipelines – continued | | | | | | | | |
Kinder Morgan, Inc., Senior Note, 5.150%, 3/01/2015 | | | | $ | 305,000 | | $ | 258,488 |
Plains All American Pipeline LP, 6.125%, 1/15/2017 | | | | | 1,785,000 | | | 1,622,015 |
Plains All American Pipeline LP, 6.650%, 1/15/2037 | | | | | 3,850,000 | | | 3,153,631 |
Williams Cos., Inc., 7.500%, 1/15/2031 | | | | | 1,000,000 | | | 909,980 |
| | | | | | | | |
| | | | | | | | 9,807,296 |
| | | | | | | | |
| Property & Casualty Insurance – 1.3% | | | | | | | | |
Allstate Corp., 5.950%, 4/01/2036 | | | | | 540,000 | | | 440,208 |
Axis Capital Holdings Ltd., 5.750%, 12/01/2014 | | | | | 80,000 | | | 73,498 |
Marsh & McLennan Cos., Inc., 5.375%, 7/15/2014 | | | | | 1,190,000 | | | 1,101,990 |
Marsh & McLennan Cos., Inc., 5.750%, 9/15/2015 | | | | | 775,000 | | | 726,477 |
Marsh & McLennan Cos., Inc., 5.875%, 8/01/2033 | | | | | 180,000 | | | 150,766 |
MBIA Insurance Corp., (fixed rate to 1/15/13, variable rate thereafter), 14.000%, 1/15/2033, 144A | | | | | 1,545,000 | | | 818,850 |
Travelers Cos., Inc. (The), 6.250%, 6/15/2037 | | | | | 1,925,000 | | | 1,668,852 |
Travelers Property Casualty Corp., 6.375%, 3/15/2033 | | | | | 1,400,000 | | | 1,228,863 |
White Mountains RE Group, 6.375%, 3/20/2017, 144A | | | | | 2,140,000 | | | 1,889,979 |
| | | | | | | | |
| | | | | | | | 8,099,483 |
| | | | | | | | |
| Railroads – 0.2% | | | | | | | | |
CSX Corp., 6.000%, 10/01/2036 | | | | | 1,575,000 | | | 1,196,978 |
Missouri Pacific Railroad Co., 5.000%, 1/01/2045(e) | | | | | 500,000 | | | 300,000 |
| | | | | | | | |
| | | | | | | | 1,496,978 |
| | | | | | | | |
| REITs – 0.8% | | | | | | | | |
Camden Property Trust, 5.700%, 5/15/2017 | | | | | 1,495,000 | | | 1,321,547 |
Colonial Realty LP, 4.750%, 2/01/2010 | | | | | 15,000 | | | 14,499 |
Duke Realty LP, 5.950%, 2/15/2017 | | | | | 210,000 | | | 187,983 |
ERP Operating LP, 5.125%, 3/15/2016 | | | | | 70,000 | | | 58,632 |
Highwoods Properties, Inc., 5.850%, 3/15/2017 | | | | | 2,560,000 | | | 2,053,512 |
Highwoods Properties, Inc., 7.500%, 4/15/2018 | | | | | 475,000 | | | 420,950 |
Prologis, 5.625%, 11/15/2015 | | | | | 100,000 | | | 87,429 |
Prologis, 5.750%, 4/01/2016 | | | | | 80,000 | | | 69,708 |
Realty Income Corp., 6.750%, 8/15/2019 | | | | | 1,000,000 | | | 902,194 |
| | | | | | | | |
| | | | | | | | 5,116,454 |
| | | | | | | | |
| Restaurants – 0.1% | | | | | | | | |
McDonald’s Corp., 3.628%, 10/10/2010 | | SGD | | | 1,000,000 | | | 712,192 |
| | | | | | | | |
| Retailers – 1.5% | | | | | | | | |
Dillard’s, Inc., 7.750%, 7/15/2026 | | | | | 1,025,000 | | | 584,250 |
Foot Locker, Inc., 8.500%, 1/15/2022 | | | | | 1,100,000 | | | 995,500 |
Home Depot, Inc., 5.875%, 12/16/2036 | | | | | 4,283,000 | | | 3,010,833 |
J.C. Penney Corp., Inc., 6.375%, 10/15/2036 | | | | | 2,110,000 | | | 1,604,875 |
J.C. Penney Corp., Inc., 7.125%, 11/15/2023(b) | | | | | 575,000 | | | 524,195 |
Toys R Us, Inc., 7.375%, 10/15/2018 | | | | | 3,240,000 | | | 2,106,000 |
Toys R Us, Inc., 7.875%, 4/15/2013 | | | | | 750,000 | | | 585,000 |
| | | | | | | | |
| | | | | | | | 9,410,653 |
| | | | | | | | |
52
PORTFOLIO OF INVESTMENTS – as of September 30, 2008
Loomis Sayles Fixed Income Fund – continued
| | | | | | | | |
| | | | | Principal Amount (‡) | | | Value (†) |
| | | | | | | | |
| | | |
| BONDS AND NOTES – continued | | | | | | | | |
| | | |
| Sovereigns – 14.3% | | | | | | | | |
Canadian Government, 2.750%, 12/01/2010 | | CAD | | 12,760,000 | | | $ | 11,946,262 |
Canadian Government, 3.750%, 6/01/2012 | | CAD | | 14,255,000 | | | | 13,673,950 |
Canadian Government, 4.250%, 9/01/2009 | | CAD | | 16,520,000 | | | | 15,724,929 |
Canadian Government, 5.250%, 6/01/2012 | | CAD | | 22,355,000 | | | | 22,532,496 |
Indonesia Treasury Bond, Series FR43, 10.250%, 7/15/2022 | | IDR | | 2,915,000,000 | | | | 249,530 |
Indonesia Treasury Bond, Series ZC3, Zero Coupon Bond, 11/20/2012 | | IDR | | 7,590,000,000 | | | | 485,721 |
Mexican Fixed Rate Bonds, Series M-10, 8.000%, 12/17/2015 | | MXN | | 125,000 | (††) | | | 1,117,474 |
Mexican Fixed Rate Bonds, Series M-20, 8.000%, 12/07/2023 | | MXN | | 305,000 | (††) | | | 2,676,632 |
Mexican Fixed Rate Bonds, Series MI-10, 9.000%, 12/20/2012 | | MXN | | 1,015,000 | (††) | | | 9,498,577 |
New South Wales Treasury Corp., Series 10RG, 7.000%, 12/01/2010 | | AUD | | 3,240,000 | | | | 2,620,317 |
New South Wales Treasury Corp., Series 12RG, 6.000%, 5/01/2012 | | AUD | | 1,675,000 | | | | 1,328,159 |
Republic of Brazil, 10.250%, 1/10/2028 | | BRL | | 14,885,000 | | | | 6,871,865 |
Republic of Brazil, 12.500%, 1/05/2022 | | BRL | | 625,000 | | | | 336,657 |
| | | | | | | | |
| | | | | | | | 89,062,569 |
| | | | | | | | |
| Supermarkets – 1.5% | | | | | | | | |
Albertson’s, Inc., 7.450%, 8/01/2029 | | | | 6,515,000 | | | | 5,794,630 |
Albertson’s, Inc., 7.750%, 6/15/2026 | | | | 1,470,000 | | | | 1,351,177 |
Albertson’s, Inc., 8.000%, 5/01/2031 | | | | 565,000 | | | | 523,616 |
Albertson’s, Inc., 8.700%, 5/01/2030 | | | | 5,000 | | | | 4,952 |
Albertson’s, Inc., Series C, MTN, 6.625%, 6/01/2028 | | | | 1,745,000 | | | | 1,413,792 |
American Stores Co., 8.000%, 6/01/2026 | | | | 25,000 | | | | 23,435 |
| | | | | | | | |
| | | | | | | | 9,111,602 |
| | | | | | | | |
| Supranational – 5.5% | | | | | | | | |
Eurofima, EMTN, 11.000%, 2/05/2010 | | ISK | | 20,000,000 | | | | 189,399 |
European Investment Bank, 4.600%, 1/30/2037, 144A | | CAD | | 6,000,000 | | | | 5,133,982 |
Inter-American Development Bank, EMTN, Zero Coupon Bond, 5/11/2009 | | BRL | | 30,000,000 | | | | 14,031,215 |
Inter-American Development Bank, EMTN, 6.000%, 12/15/2017 | | NZD | | 19,735,000 | | | | 12,761,161 |
International Bank for Reconstruction & Development, 9.500%, 5/27/2010 | | ISK | | 210,000,000 | | | | 1,975,237 |
Nordic Investment Bank, EMTN, 11.250%, 4/16/2009 | | ISK | | 4,800,000 | | | | 45,424 |
| | | | | | | | |
| | | | | | | | 34,136,418 |
| | | | | | | | |
| Technology – 2.3% | | | | | | | | |
Agilent Technologies, Inc., 6.500%, 11/01/2017 | | | | 2,365,000 | | | | 2,155,974 |
Amkor Technology, Inc., 7.125%, 3/15/2011 | | | | 725,000 | | | | 652,500 |
Amkor Technology, Inc., 7.750%, 5/15/2013 | | | | 470,000 | | | | 401,850 |
Arrow Electronics, Inc., 6.875%, 7/01/2013 | | | | 2,850,000 | | | | 2,897,287 |
Avnet, Inc., 6.000%, 9/01/2015 | | | | 1,645,000 | | | | 1,584,816 |
Avnet, Inc., 6.625%, 9/15/2016 | | | | 130,000 | | | | 126,608 |
Corning, Inc., 6.200%, 3/15/2016 | | | | 250,000 | | | | 241,380 |
Corning, Inc., 6.850%, 3/01/2029 | | | | 450,000 | | | | 397,495 |
53
| | | | | | | | |
| | | | | Principal Amount (‡) | | Value (†) |
| | | | | | | | |
| | | |
| BONDS AND NOTES – continued | | | | | | | | |
| | | |
| Technology – continued | | | | | | | | |
Corning, Inc., 7.250%, 8/15/2036 | | | | $ | 1,175,000 | | $ | 1,041,601 |
Lucent Technologies, Inc., 6.450%, 3/15/2029 | | | | | 250,000 | | | 152,500 |
Motorola, Inc., 5.220%, 10/01/2097 | | | | | 515,000 | | | 287,644 |
Motorola, Inc., 5.800%, 10/15/2008 | | | | | 500,000 | | | 500,245 |
Motorola, Inc., 6.500%, 11/15/2028(b) | | | | | 815,000 | | | 609,048 |
Motorola, Inc., 6.625%, 11/15/2037 | | | | | 995,000 | | | 725,300 |
Nortel Networks Ltd., 6.875%, 9/01/2023 | | | | | 1,325,000 | | | 530,000 |
Nortel Networks Ltd., 10.125%, 7/15/2013 | | | | | 1,000,000 | | | 637,500 |
Northern Telecom Capital Corp., 7.875%, 6/15/2026 | | | | | 150,000 | | | 66,000 |
Samsung Electronics Co. Ltd., 7.700%, 10/01/2027, 144A | | | | | 1,158,000 | | | 1,225,104 |
| | | | | | | | |
| | | | | | | | 14,232,852 |
| | | | | | | | |
| Textile – 0.3% | | | | | | | | |
Kellwood Co., 7.625%, 10/15/2017(e) | | | | | 3,250,000 | | | 1,787,500 |
| | | | | | | | |
| Tobacco – 0.6% | | | | | | | | |
Reynolds American, Inc., 6.750%, 6/15/2017 | | | | | 3,320,000 | | | 3,102,241 |
Reynolds American, Inc., 7.250%, 6/15/2037 | | | | | 810,000 | | | 775,136 |
| | | | | | | | |
| | | | | | | | 3,877,377 |
| | | | | | | | |
| Transportation Services – 0.8% | | | | | | | | |
APL Ltd., 8.000%, 1/15/2024(e) | | | | | 2,500,000 | | | 1,875,000 |
Atlas Air, Inc., Series 1999-1B, 7.630%, 7/02/2016(f) | | | | | 1,326,184 | | | 1,299,660 |
Atlas Air, Inc., Series 2000-1, Class B, 9.057%, 7/02/2017(f) | | | | | 394,351 | | | 410,125 |
Atlas Air, Inc., Series B, 7.680%, 1/02/2014(f) | | | | | 1,500,291 | | | 1,500,291 |
| | | | | | | | |
| | | | | | | | 5,085,076 |
| | | | | | | | |
| Wireless – 1.4% | | | | | | | | |
ALLTEL Corp., 6.800%, 5/01/2029 | | | | | 150,000 | | | 136,125 |
ALLTEL Corp., 7.875%, 7/01/2032 | | | | | 1,395,000 | | | 1,384,538 |
Nextel Communications, Inc., Series D, 7.375%, 8/01/2015 | | | | | 4,315,000 | | | 2,847,900 |
Nextel Communications, Inc., Series E, 6.875%, 10/31/2013 | | | | | 630,000 | | | 428,400 |
Nextel Communications, Inc., Series F, 5.950%, 3/15/2014 | | | | | 1,565,000 | | | 1,048,550 |
Sprint Capital Corp., 6.875%, 11/15/2028 | | | | | 1,827,000 | | | 1,224,090 |
Sprint Capital Corp., 6.900%, 5/01/2019 | | | | | 1,150,000 | | | 891,250 |
Sprint Nextel Corp., 6.000%, 12/01/2016 | | | | | 898,000 | | | 691,460 |
| | | | | | | | |
| | | | | | | | 8,652,313 |
| | | | | | | | |
| Wirelines – 5.1% | | | | | | | | |
AT&T Corp., 6.500%, 3/15/2029 | | | | | 355,000 | | | 297,199 |
AT&T, Inc., 6.500%, 9/01/2037 | | | | | 6,600,000 | | | 5,614,488 |
Bell Canada, 6.550%, 5/01/2029, 144A | | CAD | | | 195,000 | | | 139,299 |
Bell Canada, Series M-17, 6.100%, 3/16/2035 | | CAD | | | 600,000 | | | 410,379 |
Bell Canada, MTN, 5.000%, 2/15/2017 | | CAD | | | 155,000 | | | 115,034 |
Bell Canada, MTN, 7.300%, 2/23/2032 | | CAD | | | 690,000 | | | 532,932 |
Embarq Corp., 7.082%, 6/01/2016 | | | | | 235,000 | | | 190,453 |
Embarq Corp., 7.995%, 6/01/2036 | | | | | 200,000 | | | 143,022 |
Hawaiian Telcom Communications, Inc., Series B, 12.500%, 5/01/2015(b) | | | | | 75,000 | | | 10,500 |
54
PORTFOLIO OF INVESTMENTS – as of September 30, 2008
Loomis Sayles Fixed Income Fund – continued
| | | | | | | | |
| | | | | Principal Amount (‡) | | Value (†) |
| | | | | | | | |
| | | |
| BONDS AND NOTES – continued | | | | | | | | |
| | | |
| Wirelines – continued | | | | | | | | |
Level 3 Financing, Inc., 9.250%, 11/01/2014 | | | | $ | 500,000 | | $ | 377,500 |
Qwest Capital Funding, Inc., 6.500%, 11/15/2018 | | | | | 3,305,000 | | | 2,404,388 |
Qwest Capital Funding, Inc., 6.875%, 7/15/2028 | | | | | 7,575,000 | | | 5,264,625 |
Qwest Capital Funding, Inc., 7.625%, 8/03/2021 | | | | | 350,000 | | | 266,000 |
Qwest Capital Funding, Inc., 7.750%, 2/15/2031 | | | | | 775,000 | | | 565,750 |
Qwest Corp., 6.875%, 9/15/2033 | | | | | 420,000 | | | 282,450 |
Telecom Italia Capital, 6.000%, 9/30/2034 | | | | | 1,330,000 | | | 931,825 |
Telecom Italia Capital, 6.375%, 11/15/2033 | | | | | 1,320,000 | | | 962,016 |
Telefonica Emisiones SAU, 7.045%, 6/20/2036 | | | | | 11,330,000 | | | 10,247,418 |
Verizon Communications, 5.850%, 9/15/2035 | | | | | 3,975,000 | | | 3,108,172 |
| | | | | | | | |
| | | | | | | | 31,863,450 |
| | | | | | | | |
| | | |
| TOTAL NON-CONVERTIBLE BONDS | | | | | | | | |
(Identified Cost $572,945,819) | | | | | | | | 503,570,603 |
| | | | | | | | |
| | | |
| CONVERTIBLE BONDS – 3.7% | | | | | | | | |
| | | |
| Healthcare – 0.1% | | | | | | | | |
Affymetrix, Inc., 3.500%, 1/15/2038 | | | | | 604,000 | | | 422,800 |
| | | | | | | | |
| Industrial Other – 0.2% | | | | | | | | |
Incyte Corp., 3.500%, 2/15/2011 | | | | | 1,290,000 | | | 1,181,963 |
| | | | | | | | |
| Media Non-Cable – 0.1% | | | | | | | | |
Liberty Media LLC, 3.500%, 1/15/2031 | | | | | 455,783 | | | 201,684 |
Sinclair Broadcast Group, Inc., (Step to 2.000% on 1/15/2011), 4.875%, 7/15/2018(g) | | | | | 500,000 | | | 453,750 |
| | | | | | | | |
| | | | | | | | 655,434 |
| | | | | | | | |
| Non-Captive Consumer – 0.0% | | | | | | | | |
Countrywide Financial Corp., Series A, Zero Coupon Bond, 4/15/2037(b) | | | | | 78,000 | | | 76,440 |
Countrywide Financial Corp., Series B, 0.554%, 5/15/2037(c) | | | | | 213,000 | | | 193,830 |
| | | | | | | | |
| | | | | | | | 270,270 |
| | | | | | | | |
| Non-Captive Diversified – 0.0% | | | | | | | | |
iStar Financial, Inc., 3.291%, 10/01/2012(c) | | | | | 380,000 | | | 203,300 |
| | | | | | | | |
| Pharmaceuticals – 1.1% | | | | | | | | |
Epix Pharmaceuticals, Inc., 3.000%, 6/15/2024 | | | | | 250,000 | | | 125,000 |
Human Genome Sciences, Inc., 2.250%, 8/15/2012 | | | | | 100,000 | | | 66,750 |
Nektar Therapeutics, 3.250%, 9/28/2012 | | | | | 1,065,000 | | | 536,494 |
Valeant Pharmaceuticals International, 3.000%, 8/16/2010 | | | | | 1,035,000 | | | 978,075 |
Valeant Pharmaceuticals International, 4.000%, 11/15/2013 | | | | | 1,095,000 | | | 1,025,194 |
Vertex Pharmaceuticals, Inc., 4.750%, 2/15/2013 | | | | | 2,770,000 | | | 4,179,237 |
| | | | | | | | |
| | | | | | | | 6,910,750 |
| | | | | | | | |
| Pipelines – 0.3% | | | | | | | | |
CenterPoint Energy Resources Corp., 6.000%, 3/15/2012 | | | | | 1,676,000 | | | 1,575,440 |
| | | | | | | | |
55
| | | | | | | | |
| | | | | Principal Amount (‡) | | Value (†) |
| | | | | | | | |
| | | |
| BONDS AND NOTES – continued | | | | | | | | |
| | | |
| REITs – 0.2% | | | | | | | | |
Host Hotels & Resorts, Inc., 2.625%, 4/15/2027, 144A | | | | $ | 1,430,000 | | $ | 1,108,250 |
| | | | | | | | |
| Technology – 0.8% | | | | | | | | |
Avnet, Inc., 2.000%, 3/15/2034 | | | | | 1,270,000 | | | 1,265,237 |
Kulicke & Soffa Industries, Inc., 0.500%, 11/30/2008 | | | | | 425,000 | | | 411,188 |
Kulicke & Soffa Industries, Inc., 0.875%, 6/01/2012 | | | | | 3,585,000 | | | 2,451,244 |
Kulicke & Soffa Industries, Inc., 1.000%, 6/30/2010 | | | | | 380,000 | | | 297,825 |
Maxtor Corp., 5.750%, 3/01/2012(e) | | | | | 408,000 | | | 375,360 |
Nortel Networks Corp., 2.125%, 4/15/2014 | | | | | 248,000 | | | 118,730 |
Richardson Electronics Ltd., 7.750%, 12/15/2011 | | | | | 263,000 | | | 197,250 |
| | | | | | | | |
| | | | | | | | 5,116,834 |
| | | | | | | | |
| Textile – 0.0% | | | | | | | | |
Dixie Yarns, Inc., 7.000%, 5/15/2012 | | | | | 74,000 | | | 65,860 |
| | | | | | | | |
| Wirelines – 0.9% | | | | | | | | |
Level 3 Communications, Inc., 2.875%, 7/15/2010 | | | | | 3,870,000 | | | 3,042,787 |
Level 3 Communications, Inc., 6.000%, 9/15/2009 | | | | | 2,685,000 | | | 2,523,900 |
Level 3 Communications, Inc., 6.000%, 3/15/2010(b) | | | | | 125,000 | | | 109,375 |
| | | | | | | | |
| | | | | | | | 5,676,062 |
| | | | | | | | |
| | | |
| TOTAL CONVERTIBLE BONDS | | | | | | | | |
(Identified Cost $23,664,879) | | | | | | | | 23,186,963 |
| | | | | | | | |
| | | |
| MUNICIPALS – 0.4% | | | | | | | | |
| | | |
| Michigan – 0.4% | | | | | | | | |
Michigan Tobacco Settlement Finance Authority, 7.309%, 6/01/2034(e) | | | | | 2,480,000 | | | 2,135,776 |
| | | | | | | | |
| | | |
| TOTAL MUNICIPALS | | | | | | | | |
(Identified Cost $2,479,855) | | | | | | | | 2,135,776 |
| | | | | | | | |
| | | |
| TOTAL BONDS AND NOTES | | | | | | | | |
(Identified Cost $599,090,553) | | | | | | | | 528,893,342 |
| | | | | | | | |
| | | |
| BANK LOANS – 0.3% | | | | | | | | |
| | | |
| Consumer Products – 0.0% | | | | | | | | |
Mega Bloks, Inc., Term Loan B, 8.750%, 7/26/2012(h) | | | | | 334,139 | | | 260,628 |
| | | | | | | | |
| Food & Beverage – 0.0% | | | | | | | | |
Dole Food Co., Inc., LOC, 4.788%, 4/12/2013(h) | | | | | 17,547 | | | 15,389 |
Dole Food Co., Inc., Term Loan, 4.738%, 4/12/2013(h) | | | | | 11,779 | | | 10,330 |
Dole Food Co., Inc., Tranche C Term Loan, 4.795%, 4/12/2013(h) | | | | | 61,712 | | | 54,121 |
| | | | | | | | |
| | | | | | | | 79,840 |
| | | | | | | | |
56
PORTFOLIO OF INVESTMENTS – as of September 30, 2008
Loomis Sayles Fixed Income Fund – continued
| | | | | | | | |
| | | | | Principal Amount (‡) | | Value (†) |
| | | | | | | | |
| | | |
| BANK LOANS – continued | | | | | | | | |
| | | |
| Media Non-Cable – 0.2% | | | | | | | | |
Idearc, Inc., Term Loan B, 5.767%, 11/17/2014(h) | | $ | 1,662,693 | | $ | 991,381 |
Tribune Co., Tranche X, 5.541%, 6/04/2009(h) | | | | | 74,971 | | | 69,442 |
| | | | | | | | |
| | | | | | | | 1,060,823 |
| | | | | | | | |
| Wirelines – 0.1% | | | | | | | | |
Hawaiian Telcom Communications, Inc., Term Loan C, 6.262%, 6/01/2014(h) | | | | | 475,000 | | | 326,734 |
| | | | | | | | |
| | | |
| TOTAL BANK LOANS | | | | | | | | |
(Identified Cost $2,136,640) | | | | | | | | 1,728,025 |
| | | | | | | | |
| | | |
| | | | | Shares | | |
| | | |
| COMMON STOCKS – 1.0% | | | | | | | | |
| | | |
| Communications Equipment – 0.5% | | | | | | | | |
Corning, Inc. | | | | | 205,167 | | | 3,208,812 |
| | | | | | | | |
| Containers & Packaging – 0.2% | | | | | | | | |
Owens-Illinois, Inc.(f) | | | | | 35,353 | | | 1,039,378 |
| | | | | | | | |
| Oil, Gas & Consumable Fuels – 0.3% | | | | | | | | |
Chesapeake Energy Corp.(b) | | | | | 54,259 | | | 1,945,728 |
| | | | | | | | |
| | | |
| TOTAL COMMON STOCKS | | | | | | | | |
(Identified Cost $5,011,989) | | | | | | | | 6,193,918 |
| | | | | | | | |
| | | |
| PREFERRED STOCKS – 1.5% | | | | | | | | |
| | |
| CONVERTIBLE PREFERRED STOCKS – 1.0% | | | | | | |
| | | |
| Automotive – 0.2% | | | | | | | | |
Ford Motor Co., Capital Trust II, 6.500%(b) | | | | | 79,845 | | | 1,229,613 |
| | | | | | | | |
| Capital Markets – 0.1% | | | | | | | | |
Newell Financial Trust I, 5.250% | | | | | 25,075 | | | 966,955 |
| | | | | | | | |
| Diversified Financial Services – 0.1% | | | | | | | | |
Sovereign Capital Trust, 4.375% | | | | | 30,343 | | | 696,372 |
| | | | | | | | |
| Electric Utilities – 0.1% | | | | | | | | |
AES Trust III, 6.750%(b) | | | | | 10,000 | | | 383,500 |
| | | | | | | | |
| Machinery – 0.1% | | | | | | | | |
United Rentals Trust, 6.500% | | | | | 30,199 | | | 664,378 |
| | | | | | | | |
| Oil, Gas & Consumable Fuels – 0.1% | | | | | | | | |
Chesapeake Energy Corp., 4.500%(b) | | | | | 775 | | | 77,113 |
El Paso Energy Capital Trust I, 4.750% | | | | | 20,200 | | | 672,912 |
| | | | | | | | |
| | | | | | | | 750,025 |
| | | | | | | | |
| REITs – 0.0% | | | | | | | | |
FelCor Lodging Trust, Inc., Series A, 7.800% | | | | | 2,500 | | | 30,625 |
| | | | | | | | |
| Semiconductors & Semiconductor Equipment – 0.3% | | | |
Lucent Technologies Capital Trust, 7.750% | | | | | 3,715 | | | 1,726,175 |
| | | | | | | | |
| | | |
| TOTAL CONVERTIBLE PREFERRED STOCKS | | | | | | | | |
(Identified Cost $10,172,629) | | | | | | | | 6,447,643 |
| | | | | | | | |
57
| | | | | | | |
| | | | | Shares | | Value (†) |
| | | | | | | |
| | | |
| PREFERRED STOCKS – continued | | | | | | | |
| | | |
| NON-CONVERTIBLE PREFERRED STOCKS – 0.5% | | | | | | | |
| | | |
| Banking – 0.2% | | | | | | | |
Bank of America Corp., 7.250% | | | | 1,657 | | $ | 1,388,566 |
| | | | | | | |
| Capital Markets – 0.0% | | | | | | | |
Lehman Brothers Holdings Capital Trust I, 6.000%(d) | | | | 2,075 | | | 332 |
Lehman Brothers Holdings, Inc., 5.670%(d) | | | | 3,878 | | | 271 |
Lehman Brothers Holdings, Inc., 5.940%(d) | | | | 4,120 | | | 144 |
Lehman Brothers Holdings, Inc., 6.500%(d) | | | | 18,030 | | | 902 |
Lehman Brothers Holdings, Inc., 7.250%(d)(f) | | | | 2,025 | | | 2,025 |
Lehman Brothers Holdings, Inc., 7.950%(d) | | | | 18,522 | | | 1,111 |
Merrill Lynch & Co., Inc., 6.375% | | | | 5,000 | | | 68,450 |
| | | | | | | |
| | | | | | | 73,235 |
| | | | | | | |
| Electric Utilities – 0.1% | | | | | | | |
Entergy New Orleans, Inc., 4.360% | | | | 90 | | | 6,677 |
Entergy New Orleans, Inc., 4.750% | | | | 2,876 | | | 219,475 |
MDU Resources Group, Inc., 5.100% | | | | 307 | | | 30,738 |
Public Service Electric & Gas Co., 4.180%(b) | | | | 1,950 | | | 142,662 |
Union Electric Co., 4.500% | | | | 4,670 | | | 347,915 |
Xcel Energy, Inc., 4.110%(b) | | | | 100 | | | 7,824 |
| | | | | | | |
| | | | | | | 755,291 |
| | | | | | | |
| Thrifts & Mortgage Finance – 0.2% | | | | | | | |
Countrywide Capital IV, 6.750% | | | | 20,975 | | | 186,677 |
Federal Home Loan Mortgage Corp., 5.000%(f)(j) | | | | 4,150 | | | 7,470 |
Federal Home Loan Mortgage Corp., 5.790%(f)(j) | | | | 12,100 | | | 24,200 |
Federal Home Loan Mortgage Corp., 5.810%(f)(j) | | | | 4,250 | | | 7,438 |
Federal Home Loan Mortgage Corp., 6.000%(f)(j) | | | | 5,350 | | | 9,630 |
Federal Home Loan Mortgage Corp., 5.700%(f)(j) | | | | 6,550 | | | 12,249 |
Federal Home Loan Mortgage Corp., 6.420%(f)(j) | | | | 3,800 | | | 6,840 |
Federal Home Loan Mortgage Corp., 5.900%(f)(j) | | | | 9,400 | | | 11,750 |
Federal Home Loan Mortgage Corp., 5.570%(f)(j) | | | | 63,750 | | | 63,113 |
Federal Home Loan Mortgage Corp., 5.660%(f)(j) | | | | 18,900 | | | 23,625 |
Federal Home Loan Mortgage Corp., 6.550%(f)(j) | | | | 24,825 | | | 26,811 |
Federal Home Loan Mortgage Corp., 8.375%(b)(f)(j) | | | | 88,575 | | | 144,377 |
Federal National Mortgage Association, 5.810%(j) | | | | 2,400 | | | 8,640 |
Federal National Mortgage Association, 5.375%(j) | | | | 5,800 | | | 19,140 |
Federal National Mortgage Association, 5.125%(j) | | | | 2,900 | | | 10,150 |
Federal National Mortgage Association, 4.750%(j) | | | | 8,200 | | | 25,420 |
Federal National Mortgage Association, 6.750%(j) | | | | 3,750 | | | 6,750 |
Federal National Mortgage Association, 8.250%(b)(j) | | | | 119,675 | | | 260,891 |
| | | | | | | |
| | | | | | | 855,171 |
| | | | | | | |
| | | |
| TOTAL NON-CONVERTIBLE PREFERRED STOCKS | | | | | | | |
(Identified Cost $10,636,250) | | | | | | | 3,072,263 |
| | | | | | | |
| | | |
| TOTAL PREFERRED STOCKS | | | | | | | |
(Identified Cost $20,808,879) | | | | | | | 9,519,906 |
| | | | | | | |
58
PORTFOLIO OF INVESTMENTS – as of September 30, 2008
Loomis Sayles Fixed Income Fund – continued
| | | | | | | | |
| | | | | Shares/Principal Amount (‡) | | Value (†) |
| | | | | | | | |
| | | |
| SHORT-TERM INVESTMENTS – 11.2% | | | | | | | | |
| State Street Navigator Securities Lending Prime Portfolio(i) | | | | | 6,151,664 | | $ | 6,151,664 |
| Repurchase Agreement with State Street Corp. dated 9/30/2008 at 1.300%, to be repurchased at $27,383 on 10/1/2008 collateralized by $30,000 Federal Home Loan Bank, 5.300% due 10/3/2012 valued at $30,782 including accrued interest (Note 2h of Notes to Financial Statements) | | | | $ | 27,382 | | | 27,382 |
| Tri-Party Repurchase Agreement with Fixed Income Clearing Corporation, dated 9/30/2008 at 1.300% to be repurchased at $64,014,312 on 10/1/2008 collateralized by $65,295,000 Federal National Mortgage Association, 2.875% due 10/12/2010 valued at $65,295,000, including accrued interest (Note 2h of Notes to Financial Statements) | | | | | 64,012,000 | | | 64,012,000 |
| | | | | | | | |
| | | |
| TOTAL SHORT-TERM INVESTMENTS | | | | | | | | |
(Identified Cost $70,191,046) | | | | | | | | 70,191,046 |
| | | | | | | | |
| | | |
| TOTAL INVESTMENTS – 98.7% | | | | | | | | |
(Identified Cost $697,239,107)(a) | | | | | | | | 616,526,237 |
Other Assets Less Liabilities—1.3% | | | | | | | | 7,959,580 |
| | | | | | | | |
| | | |
| NET ASSETS – 100.0% | | | | | | | $ | 624,485,817 |
| | | | | | | | |
|
(‡) Principal amount stated in U.S. dollars unless otherwise noted. |
(†) See Note 2a of Notes to Financial Statements. |
(††) Amount shown represents units. One unit represents a principal amount of 100. |
(†††) Amount shown represents units. One unit represents a principal amount of 25. |
(a) Federal Tax Information: | | | |
At September 30, 2008, the net unrealized depreciation on investments based on a cost of $699,043,212 for federal income tax purposes was as follows: | | | |
Aggregate gross unrealized appreciation for all investments in which there is an excess of value over tax cost | | $ | 16,482,433 |
Aggregate gross unrealized depreciation for all investments in which there is an excess of tax cost over value | | | (98,999,408) |
| | | | | | | | |
Net unrealized depreciation | | | | | | | $ | (82,516,975) |
| | | | | | | | |
| (b) | All or a portion of this security was on loan to brokers at September 30, 2008. |
| (c) | Variable rate security. Rate as of September 30, 2008 is disclosed. |
| (d) | Issuer has filed for bankruptcy. |
| (e) | Illiquid security. At September 30, 2008, the value of these securities amounted to $19,466,657 or 3.1% of net assets. |
| (f) | Non-income producing security. |
| (g) | Step Bond: Coupon is a fixed rate for an initial period then resets at a specified date and rate. |
| (h) | Variable rate security. Rate shown represents the weighted average rate at September 30, 2008. |
| (i) | Represents investment of securities lending collateral. |
| (j) | Future dividend payments have been eliminated as the issuer has been placed in conservatorship. |
| 144A | Securities exempt from registration under Rule 144A of the Securities Act of 1933. These securities may be resold in transactions exempt from registration, normally to qualified institutional buyers. At September 30, 2008, the total value of these securities amounted to $55,287,366 or 8.9% of net assets. |
| EMTN | Euro Medium Term Note |
| GMTN | Global Medium Term Note |
| REITs | Real Estate Investment Trusts |
Key to Abbreviations: AUD: Australian Dollar; BRL: Brazilian Real; CAD: Canadian Dollar; EUR: Euro; GBP: British Pound; IDR: Indonesian Rupiah; ISK: Icelandic Krona; KRW: South Korean Won; MXN: Mexican Peso; NZD: New Zealand Dollar; SGD: Singapore Dollar; THB: Thai Baht
59
NET ASSET SUMMARY AT SEPTEMBER 30, 2008 (Unaudited)
| | | |
Sovereigns | | 14.3 | % |
Wirelines | | 6.1 | |
Supranational | | 5.5 | |
Banking | | 5.2 | |
Foreign Local Governments | | 4.4 | |
Electric | | 4.1 | |
Non-Captive Diversified | | 3.6 | |
Media Cable | | 3.6 | |
Technology | | 3.1 | |
Healthcare | | 2.8 | |
Independent Energy | | 2.3 | |
Other Investments, less than 2% each | | 32.5 | |
Short-Term Investments | | 11.2 | |
| | | |
Total Investments | | 98.7 | |
Other assets less liabilities | | 1.3 | |
| | | |
Net Assets | | 100.0 | % |
| | | |
CURRENCY EXPOSURE AT SEPTEMBER 30, 2008 AS A PERCENTAGE OF NET ASSETS (Unaudited)
| | | |
United States Dollar | | 66.4 | % |
Canadian Dollar | | 15.6 | |
Brazilian Real | | 4.5 | |
New Zealand Dollar | | 3.1 | |
Mexican Peso | | 2.1 | |
Other, less than 2% each | | 7.0 | |
| | | |
Total Investments | | 98.7 | |
Other assets less liabilities | | 1.3 | |
| | | |
Net Assets | | 100.0 | % |
| | | |
See accompanying notes to financial statements.
60
PORTFOLIO OF INVESTMENTS – as of September 30, 2008
Loomis Sayles Global Bond Fund
| | | | | | | | |
| | | | | Principal Amount (‡) | | Value (†) |
| | | | | | | | |
| | | |
| BONDS AND NOTES – 93.9% of Net Assets | | | | | | | | |
| | | |
| NON-CONVERTIBLE BONDS – 93.9% | | | | | | | | |
| | | |
| Argentina – 0.3% | | | | | | | | |
Transportadora de Gas del Sur SA, 7.875%, 5/14/2017, 144A | | | | $ | 8,050,000 | | $ | 5,715,500 |
| | | | | | | | |
| Austria – 2.2% | | | | | | | | |
Oesterreichische Kontrollbank AG, 1.800%, 3/22/2010(b) | | JPY | | | 4,647,000,000 | | | 44,235,875 |
Sappi Papier Holding AG, 7.500%, 6/15/2032, 144A | | | | | 7,350,000 | | | 5,190,739 |
| | | | | | | | |
| | | | | | | | 49,426,614 |
| | | | | | | | |
| Belgium – 1.7% | | | | | | | | |
Kingdom of Belgium, 5.500%, 9/28/2017 | | EUR | | | 25,555,000 | | | 38,490,364 |
| | | | | | | | |
| Bermuda – 0.4% | | | | | | | | |
Noble Group Ltd., 8.500%, 5/30/2013, 144A | | | | | 5,500,000 | | | 4,537,500 |
White Mountains RE Group, 6.375%, 3/20/2017, 144A | | | | | 5,000,000 | | | 4,415,840 |
| | | | | | | | |
| | | | | | | | 8,953,340 |
| | | | | | | | |
| Brazil – 0.3% | | | | | | | | |
ISA Capital Do Brasil SA, 7.875%, 1/30/2012, 144A | | | | | 1,100,000 | | | 1,056,000 |
Marfrig Overseas Ltd., 9.625%, 11/16/2016, 144A | | | | | 1,170,000 | | | 936,000 |
Republic of Brazil, 10.250%, 1/10/2028 | | BRL | | | 9,750,000 | | | 4,501,222 |
| | | | | | | | |
| | | | | | | | 6,493,222 |
| | | | | | | | |
| Canada – 2.2% | | | | | | | | |
Bell Aliant Regional Communications, 5.410%, 9/26/2016 | | CAD | | | 4,280,000 | | | 3,445,073 |
Bell Canada, Series M-17, 6.100%, 3/16/2035 | | CAD | | | 3,090,000 | | | 2,113,453 |
Bell Canada, MTN, 5.000%, 2/15/2017 | | CAD | | | 4,035,000 | | | 2,994,601 |
Bell Canada, MTN, 6.550%, 5/01/2029, 144A | | CAD | | | 160,000 | | | 114,297 |
Bell Canada, MTN, 7.300%, 2/23/2032 | | CAD | | | 385,000 | | | 297,361 |
Bombardier, Inc., 7.250%, 11/15/2016, 144A | | EUR | | | 1,000,000 | | | 1,267,020 |
Canadian Government, 4.250%, 9/01/2009 | | CAD | | | 600,000 | | | 571,123 |
Canadian Government, 4.500%, 6/01/2015 | | CAD | | | 3,813,000 | | | 3,802,216 |
Canadian Pacific Railway Co., 5.750%, 3/15/2033 | | | | | 810,000 | | | 628,555 |
Canadian Pacific Railway Co., 5.950%, 5/15/2037 | | | | | 1,745,000 | | | 1,428,398 |
Export Development Canada, 3.500%, 5/16/2013(b) | | | | | 15,500,000 | | | 15,609,275 |
Kinder Morgan Finance, 5.700%, 1/05/2016 | | | | | 5,705,000 | | | 4,906,300 |
Province of Quebec, 1.600%, 5/09/2013 | | JPY | | | 766,000,000 | | | 7,312,597 |
Shaw Communications, Inc., 5.700%, 3/02/2017 | | CAD | | | 4,215,000 | | | 3,545,907 |
| | | | | | | | |
| | | | | | | | 48,036,176 |
| | | | | | | | |
| Cayman Islands – 0.8% | | | | | | | | |
Embraer Overseas Ltd., 6.375%, 1/24/2017 | | | | | 5,580,000 | | | 5,161,500 |
LPG International, Inc., 7.250%, 12/20/2015 | | | | | 3,010,000 | | | 2,885,988 |
Odebrecht Finance Ltd., 7.500%, 10/18/2017, 144A | | | | | 4,650,000 | | | 4,231,500 |
Vale Overseas Ltd., 6.875%, 11/21/2036 | | | | | 6,578,000 | | | 5,855,124 |
| | | | | | | | |
| | | | | | | | 18,134,112 |
| | | | | | | | |
61
| | | | | | | |
| | | | | Principal Amount (‡) | | Value (†) |
| | | | | | | |
| | | |
| BONDS AND NOTES – continued | | | | | | | |
| | | |
| Colombia – 0.3% | | | | | | | |
Republic of Colombia, 9.850%, 6/28/2027(b) | | COP | | 3,195,000,000 | | $ | 1,301,616 |
Republic of Colombia, 11.750%, 3/01/2010 | | COP | | 3,090,000,000 | | | 1,427,804 |
Republic of Colombia, 12.000%, 10/22/2015 | | COP | | 9,545,000,000 | | | 4,565,449 |
| | | | | | | |
| | | | | | | 7,294,869 |
| | | | | | | |
| France – 7.4% | | | | | | | |
Alcatel-Lucent, EMTN, 6.375%, 4/07/2014 | | EUR | | 6,050,000 | | | 6,856,340 |
BNP Paribas, (fixed rate to 4/12/2016, variable rate thereafter), 4.730%, 4/29/2049 | | EUR | | 3,100,000 | | | 3,008,666 |
France Telecom SA, EMTN, 3.625%, 10/14/2015 | | EUR | | 3,085,000 | | | 3,704,625 |
France Telecom SA, EMTN, 4.750%, 2/21/2017 | | EUR | | 4,010,000 | | | 4,979,193 |
Government of France, 5.000%, 10/25/2016 | | EUR | | 63,070,000 | | | 93,260,542 |
Lafarge SA, EMTN, 4.750%, 3/23/2020 | | EUR | | 3,335,000 | | | 3,550,370 |
Lafarge SA, EMTN, 5.375%, 6/26/2017 | | EUR | | 2,950,000 | | | 3,464,325 |
PPR SA, EMTN, 4.000%, 1/29/2013 | | EUR | | 3,235,000 | | | 4,153,430 |
Veolia Environnement, 6.000%, 6/01/2018(b) | | | | 15,465,000 | | | 14,829,388 |
Veolia Environnement, EMTN, 4.000%, 2/12/2016 | | EUR | | 2,255,000 | | | 2,811,337 |
Veolia Environnement, EMTN, 5.125%, 5/24/2022 | | EUR | | 3,970,000 | | | 4,897,986 |
Vivendi, 3.875%, 2/15/2012 | | EUR | | 2,405,000 | | | 3,189,623 |
Wendel, 4.375%, 8/09/2017 | | EUR | | 4,550,000 | | | 4,155,467 |
Wendel, 4.875%, 5/26/2016 | | EUR | | 10,150,000 | | | 10,154,244 |
WPP Finance SA, 5.250%, 1/30/2015 | | EUR | | 2,400,000 | | | 3,074,339 |
| | | | | | | |
| | | | | | | 166,089,875 |
| | | | | | | |
| Germany – 13.6% | | | | | | | |
Bertelsmann AG, EMTN, 3.625%, 10/06/2015 | | EUR | | 9,620,000 | | | 11,324,960 |
Bundesrepublik Deutschland, Series 06, 3.750%, 1/04/2017 | | EUR | | 38,060,000 | | | 52,679,651 |
Bundesrepublik Deutschland, Series 97, 6.500%, 7/04/2027 | | EUR | | 5,040,000 | | | 8,728,300 |
Kreditanstalt fuer Wiederaufbau, 1.350%, 1/20/2014 | | JPY | | 1,494,000,000 | | | 14,091,473 |
Kreditanstalt fuer Wiederaufbau, 1.750%, 3/23/2010 | | JPY | | 1,100,000,000 | | | 10,474,476 |
Kreditanstalt fuer Wiederaufbau, 2.500%, 10/11/2010 | | EUR | | 15,925,000 | | | 21,739,268 |
Kreditanstalt fuer Wiederaufbau, 2.600%, 6/20/2037 | | JPY | | 1,140,000,000 | | | 10,836,844 |
Kreditanstalt fuer Wiederaufbau, Series INTL, 1.850%, 9/20/2010(b) | | JPY | | 3,739,000,000 | | | 35,748,714 |
Munchener Hypothekenbank eG, 5.000%, 1/16/2012 | | EUR | | 31,180,000 | | | 44,230,179 |
Republic of Germany, 3.250%, 4/17/2009 | | EUR | | 15,690,000 | | | 22,132,785 |
Republic of Germany, 3.750%, 7/04/2013 | | EUR | | 31,000,000 | | | 43,659,267 |
Republic of Germany, 4.000%, 1/04/2037 | | EUR | | 7,639,000 | | | 9,731,679 |
Republic of Germany, Series 150, 4.000%, 4/13/2012 | | EUR | | 12,730,000 | | | 18,080,440 |
| | | | | | | |
| | | | | | | 303,458,036 |
| | | | | | | |
| Hong Kong – 0.6% | | | | | | | |
HKCG Finance Ltd., 6.250%, 8/07/2018, 144A | | | | 14,000,000 | | | 13,771,814 |
| | | | | | | |
62
PORTFOLIO OF INVESTMENTS – as of September 30, 2008
Loomis Sayles Global Bond Fund – continued
| | | | | | | | |
| | | | | Principal Amount (‡) | | Value (†) |
| | | | | | | | |
| | | |
| BONDS AND NOTES – continued | | | | | | | | |
| | | |
| India – 0.9% | | | | | | | | |
Canara Bank Ltd., (fixed rate to 11/28/2016, variable rate thereafter), 6.365%, 11/28/2021(b) | | | | $ | 17,350,000 | | $ | 13,923,045 |
ICICI Bank Ltd., (fixed rate to 4/30/2017, variable rate thereafter), 6.375%, 4/30/2022, 144A | | | | | 7,800,000 | | | 5,383,794 |
| | | | | | | | |
| | | | | | | | 19,306,839 |
| | | | | | | | |
| Indonesia – 1.1% | | | | | | | | |
Indonesia Government International Bond, 7.750%, 1/17/2038, 144A | | | | | 13,125,000 | | | 11,812,500 |
Indonesia Treasury Bond, 11.000%, 12/15/2012 | | IDR | | | 122,434,000,000 | | | 12,208,137 |
| | | | | | | | |
| | | | | | | | 24,020,637 |
| | | | | | | | |
| Ireland – 2.1% | | | | | | | | |
Depfa ACS Bank, EMTN, 1.650%, 12/20/2016 | | JPY | | | 5,200,000,000 | | | 47,442,892 |
| | | | | | | | |
| Italy – 0.1% | | | | | | | | |
Telecom Italia SpA, EMTN, 5.375%, 1/29/2019 | | EUR | | | 1,500,000 | | | 1,726,632 |
| | | | | | | | |
| Japan – 4.5% | | | | | | | | |
Development Bank of Japan, 1.750%, 3/17/2017 | | JPY | | | 4,800,000,000 | | | 46,141,650 |
Japan Finance Corp. for Municipal Enterprises, 1.350%, 11/26/2013 | | JPY | | | 1,132,000,000 | | | 10,766,107 |
Japan Finance Corp. for Municipal Enterprises, 1.900%, 6/22/2018 | | JPY | | | 2,670,000,000 | | | 25,737,414 |
Japan Government, 0.900%, 9/15/2009 | | JPY | | | 1,996,300,000 | | | 18,811,057 |
| | | | | | | | |
| | | | | | | | 101,456,228 |
| | | | | | | | |
| Korea – 0.5% | | | | | | | | |
Hanarotelecom, Inc., 7.000%, 2/01/2012, 144A | | | | | 1,610,000 | | | 1,545,600 |
SK Telecom Co. Ltd., 6.625%, 7/20/2027, 144A | | | | | 11,225,000 | | | 10,136,164 |
| | | | | | | | |
| | | | | | | | 11,681,764 |
| | | | | | | | |
| Luxembourg – 0.3% | | | | | | | | |
Telecom Italia Capital, 5.250%, 10/01/2015 | | | | | 1,660,000 | | | 1,381,784 |
Telecom Italia Capital, 6.375%, 11/15/2033 | | | | | 1,910,000 | | | 1,392,008 |
Telecom Italia Capital SA, 4.950%, 9/30/2014 | | | | | 3,990,000 | | | 3,364,647 |
| | | | | | | | |
| | | | | | | | 6,138,439 |
| | | | | | | | |
| Mexico – 0.5% | | | | | | | | |
Axtel SAB de CV, 7.625%, 2/01/2017, 144A | | | | | 3,920,000 | | | 3,485,664 |
Desarrolladora Homex SAB de CV, 7.500%, 9/28/2015(b) | | | | | 8,210,000 | | | 7,224,800 |
| | | | | | | | |
| | | | | | | | 10,710,464 |
| | | | | | | | |
| Netherlands – 2.9% | | | | | | | | |
Bite Finance International, 8.458%, 3/15/2014, 144A(c) | | EUR | | | 2,820,000 | | | 2,977,498 |
Cemex Finance Europe BV, 4.750%, 3/05/2014 | | EUR | | | 12,717,000 | | | 13,741,571 |
Kingdom of Netherlands, 5.500%, 1/15/2028 | | EUR | | | 12,995,000 | | | 20,038,184 |
Koninklijke KPN NV, 6.500%, 1/15/2016 | | EUR | | | 400,000 | | | 552,156 |
Koninklijke KPN NV, GMTN, 4.750%, 1/17/2017 | | EUR | | | 13,445,000 | | | 16,406,683 |
Linde Finance BV, EMTN, 4.750%, 4/24/2017 | | EUR | | | 3,865,000 | | | 4,914,021 |
Majapahit Holding BV, 7.250%, 6/28/2017, 144A | | | | | 3,340,000 | | | 2,939,200 |
OI European Group BV, 6.875%, 3/31/2017, 144A | | EUR | | | 1,000,000 | | | 1,203,669 |
Wolters Kluwer NV, 5.125%, 1/27/2014 | | EUR | | | 1,635,000 | | | 2,164,569 |
| | | | | | | | |
| | | | | | | | 64,937,551 |
| | | | | | | | |
63
| | | | | | | |
| | | | | Principal Amount (‡) | | Value (†) |
| | | | | | | |
| | | |
| BONDS AND NOTES – continued | | | | | | | |
| | | |
| Poland – 0.5% | | | | | | | |
Republic of Poland, Series 2BR, 1.020%, 6/09/2009 | | JPY | | 1,200,000,000 | | $ | 11,271,899 |
| | | | | | | |
| Singapore – 0.1% | | | | | | | |
SP Powerassets Ltd., EMTN, 3.730%, 10/22/2010 | | SGD | | 2,340,000 | | | 1,662,482 |
| | | | | | | |
| South Africa – 0.8% | | | | | | | |
Edcon Proprietary Ltd., 8.208%, 6/15/2014, 144A(c) | | EUR | | 8,335,000 | | | 6,981,739 |
Republic of South Africa, EMTN, 4.500%, 4/05/2016 | | EUR | | 9,090,000 | | | 10,403,500 |
| | | | | | | |
| | | | | | | 17,385,239 |
| | | | | | | |
| Supranational – 4.7% | | | | | | | |
Asia Development Bank, 2.350%, 6/21/2027 | | JPY | | 1,700,000,000 | | | 16,339,645 |
European Investment Bank, 1.250%, 9/20/2012(b) | | JPY | | 2,124,000,000 | | | 20,091,756 |
European Investment Bank, 1.400%, 6/20/2017(b) | | JPY | | 6,650,000,000 | | | 62,088,509 |
European Investment Bank, EMTN, Zero Coupon Bond, 4/24/2013, 144A | | IDR | | 90,681,660,000 | | | 5,742,851 |
| | | | | | | |
| | | | | | | 104,262,761 |
| | | | | | | |
| Switzerland – 0.5% | | | | | | | |
Credit Suisse London, EMTN, 6.125%, 8/05/2013 | | EUR | | 8,065,000 | | | 11,435,556 |
| | | | | | | |
| United Arab Emirates – 1.5% | | | | | | | |
Abu Dhabi National Energy Co., 7.250%, 8/01/2018, 144A | | | | 15,445,000 | | | 15,057,500 |
DP World Ltd., 6.850%, 7/02/2037, 144A(d) | | | | 26,000,000 | | | 19,249,360 |
| | | | | | | |
| | | | | | | 34,306,860 |
| | | | | | | |
| United Kingdom – 4.6% | | | | | | | |
British Sky Broadcasting Group PLC, 6.100%, 2/15/2018, 144A | | | | 9,150,000 | | | 8,768,628 |
BSKYB Finance UK PLC, 5.750%, 10/20/2017 | | GBP | | 4,300,000 | | | 6,775,930 |
Imperial Tobacco Finance PLC, EMTN, 4.375%, 11/22/2013 | | EUR | | 3,300,000 | | | 4,058,580 |
JPMorgan Chase London, Zero Coupon Bond, 10/21/2010, 144A | | IDR | | 75,579,375,000 | | | 6,305,227 |
Lloyds TSB Bank PLC, (fixed rate to 5/12/2017, variable rate thereafter), 4.385%, 5/29/2049 | | EUR | | 5,225,000 | | | 4,687,574 |
Lloyds TSB Group PLC, 5.875%, 7/08/2014 | | EUR | | 1,235,000 | | | 1,720,559 |
Network Rail MTN Finance PLC, EMTN, 4.875%, 3/06/2009 | | GBP | | 6,200,000 | | | 11,039,306 |
Rexam PLC, 6.750%, 6/01/2013, 144A | | | | 13,775,000 | | | 13,737,532 |
Standard Chartered Bank, EMTN, 6.750%, 4/27/2009 | | GBP | | 800,000 | | | 1,426,261 |
United Kingdom Treasury, 4.750%, 3/07/2020 | | GBP | | 10,030,000 | | | 18,031,557 |
United Kingdom Treasury, 5.000%, 3/07/2025 | | GBP | | 11,045,000 | | | 20,267,078 |
United Kingdom Treasury, 5.250%, 6/07/2012 | | GBP | | 2,520,000 | | | 4,645,054 |
Vodafone Group PLC, 5.750%, 3/15/2016 | | | | 435,000 | | | 395,011 |
| | | | | | | |
| | | | | | | 101,858,297 |
| | | | | | | |
| United States – 37.6% | | | | | | | |
Ahold Finance USA, Inc., EMTN, 6.500%, 3/14/2017 | | GBP | | 5,960,000 | | | 10,051,567 |
Albertson’s, Inc., 7.450%, 8/01/2029 | | | | 5,544,000 | | | 4,930,994 |
Albertson’s, Inc., 7.750%, 6/15/2026 | | | | 50,000 | | | 45,958 |
64
PORTFOLIO OF INVESTMENTS – as of September 30, 2008
Loomis Sayles Global Bond Fund – continued
| | | | | | | | |
| | | | | Principal Amount (‡) | | Value (†) |
| | | | | | | | |
| | | |
| BONDS AND NOTES – continued | | | | | | | | |
| | | |
| United States – continued | | | | | | | | |
Albertson’s, Inc., 8.000%, 5/01/2031 | | | | $ | 1,000,000 | | $ | 926,754 |
Albertson’s, Inc., Series C, MTN, 6.625%, 6/01/2028 | | | | | 830,000 | | | 672,463 |
American Express Co., 6.150%, 8/28/2017 | | | | | 995,000 | | | 846,692 |
American Express Co., 7.000%, 3/19/2018 | | | | | 4,845,000 | | | 4,276,090 |
ASIF Global Financing XXVII, 2.380%, 2/26/2009, 144A | | SGD | | | 16,300,000 | | | 5,764,019 |
Biogen Idec, Inc., 6.000%, 3/01/2013 | | | | | 10,850,000 | | | 10,713,312 |
Bristol-Myers Squibb Co., 4.625%, 11/15/2021 | | EUR | | | 3,700,000 | | | 4,452,311 |
Cargill, Inc., 5.600%, 9/15/2012, 144A | | | | | 5,595,000 | | | 5,527,782 |
Chesapeake Energy Corp., 6.250%, 1/15/2017 | | EUR | | | 250,000 | | | 292,119 |
Chesapeake Energy Corp., 6.500%, 8/15/2017(b) | | | | | 1,990,000 | | | 1,741,250 |
Chesapeake Energy Corp., 6.875%, 11/15/2020 | | | | | 5,615,000 | | | 4,800,825 |
CHS/Community Health Systems, Inc., 8.875%, 7/15/2015 | | | | | 3,490,000 | | | 3,315,500 |
CIT Group, Inc., 5.500%, 12/01/2014 | | GBP | | | 11,655,000 | | | 10,343,101 |
CIT Group, Inc., EMTN, 3.800%, 11/14/2012 | | EUR | | | 1,100,000 | | | 835,715 |
CIT Group, Inc., EMTN, 4.650%, 9/19/2016 | | EUR | | | 1,000,000 | | | 689,960 |
CIT Group, Inc., EMTN, 5.000%, 5/13/2014 | | EUR | | | 450,000 | | | 324,058 |
CIT Group, Inc., EMTN, 5.500%, 12/20/2016 | | GBP | | | 4,150,000 | | | 3,679,839 |
CIT Group, Inc., GMTN, 4.250%, 9/22/2011 | | EUR | | | 2,100,000 | | | 1,765,808 |
CIT Group, Inc., MTN, 4.250%, 3/17/2015 | | EUR | | | 1,200,000 | | | 828,067 |
Citi Credit Card Issuance Trust, Series 2001-A4, 5.375%, 4/10/2013 | | EUR | | | 5,130,000 | | | 6,953,732 |
Citigroup, Inc., 5.000%, 9/15/2014(d) | | | | | 19,620,000 | | | 15,042,889 |
Comcast Corp., 4.950%, 6/15/2016 | | | | | 6,300,000 | | | 5,430,543 |
Comcast Corp., 5.900%, 3/15/2016 | | | | | 3,360,000 | | | 3,079,621 |
Comcast Corp., 6.950%, 8/15/2037 | | | | | 3,444,000 | | | 2,937,570 |
Corning, Inc., 5.900%, 3/15/2014 | | | | | 1,675,000 | | | 1,621,444 |
Corning, Inc., 6.200%, 3/15/2016 | | | | | 3,670,000 | | | 3,543,458 |
Couche-Tard US/Finance, 7.500%, 12/15/2013 | | | | | 3,775,000 | | | 3,473,000 |
CSX Corp., 5.600%, 5/01/2017 | | | | | 859,000 | | | 748,180 |
CSX Corp., 6.000%, 10/01/2036(b) | | | | | 5,358,000 | | | 4,072,005 |
CSX Corp., 6.250%, 3/15/2018(d) | | | | | 8,075,000 | | | 7,308,634 |
CVS Caremark Corp., 5.750%, 6/01/2017(d) | | | | | 20,796,000 | | | 19,433,696 |
Delta Air Lines, Inc., Series 2007-1, Class A, 6.821%, 8/10/2022 | | | | | 7,283,151 | | | 5,680,857 |
Delta Air Lines, Inc., Series 2007-1, Class B, 8.021%, 8/10/2022 | | | | | 2,023,387 | | | 1,375,903 |
Embarq Corp., 7.995%, 6/01/2036 | | | | | 3,605,000 | | | 2,577,972 |
Energy Transfer Partners LP, 6.700%, 7/01/2018 | | | | | 9,230,000 | | | 8,748,859 |
Erac USA Finance Co., 6.375%, 10/15/2017, 144A | | | | | 9,110,000 | | | 7,240,865 |
Erac USA Finance Co., 7.000%, 10/15/2037, 144A | | | | | 10,571,000 | | | 7,445,293 |
Federal Home Loan Mortgage Corp.,
4.000%, 12/01/2019 | | | | | 132,696 | | | 126,971 |
Federal Home Loan Mortgage Corp.,
4.000%, 9/01/2020 | | | | | 866,375 | | | 825,748 |
Federal Home Loan Mortgage Corp.,
4.500%, 9/01/2020 | | | | | 4,006,566 | | | 3,917,597 |
Federal Home Loan Mortgage Corp.,
5.000%, 4/01/2020 | | | | | 2,957,702 | | | 2,943,784 |
Federal Home Loan Mortgage Corp.,
5.000%, 7/01/2035(d) | | | | | 19,346,733 | | | 18,875,889 |
65
| | | | | | | | |
| | | | | Principal Amount (‡) | | Value (†) |
| | | | | | | | |
| | | |
| BONDS AND NOTES – continued | | | | | | | | |
| | | |
| United States – continued | | | | | | | | |
Federal Home Loan Mortgage Corp., 5.500%, 5/01/2020 | | | | $ | 1,621,159 | | $ | 1,636,119 |
Federal Home Loan Mortgage Corp., 5.500%, 1/01/2021 | | | | | 1,023,031 | | | 1,032,471 |
Federal Home Loan Mortgage Corp., 5.500%, 4/01/2037(d) | | | | | 51,255,132 | | | 51,031,619 |
Federal Home Loan Mortgage Corp., 6.000%, 5/01/2018 | | | | | 520,009 | | | 529,605 |
Federal Home Loan Mortgage Corp., 6.000%, 10/01/2020 | | | | | 1,005,589 | | | 1,024,256 |
Federal Home Loan Mortgage Corp., 6.500%, 8/01/2035 | | | | | 713,414 | | | 732,992 |
Federal Home Loan Mortgage Corp., 6.500%, 10/01/2035 | | | | | 845,889 | | | 869,103 |
Federal National Mortgage Association, 2.290%, 2/19/2009 | | SGD | | | 16,200,000 | | | 11,294,394 |
Federal National Mortgage Association, 4.500%, 6/01/2019(d) | | | | | 4,040,063 | | | 3,968,025 |
Federal National Mortgage Association, 5.000%, 10/01/2019 | | | | | 1,309,725 | | | 1,309,942 |
Federal National Mortgage Association, 5.000%, 10/01/2019 | | | | | 358,339 | | | 358,399 |
Federal National Mortgage Association, 5.000%, 4/01/2020 | | | | | 343,779 | | | 342,761 |
Federal National Mortgage Association, 5.000%, 6/01/2020 | | | | | 623,128 | | | 621,284 |
Federal National Mortgage Association, 5.000%, 9/01/2035(d) | | | | | 9,379,052 | | | 9,153,724 |
Federal National Mortgage Association, 5.000%, 5/01/2036 | | | | | 815,514 | | | 795,921 |
Federal National Mortgage Association, 5.500%, 11/01/2016 | | | | | 402,780 | | | 410,398 |
Federal National Mortgage Association, 5.500%, 5/01/2020 | | | | | 1,680,426 | | | 1,698,558 |
Federal National Mortgage Association, 5.500%, 9/01/2020 | | | | | 679,359 | | | 688,601 |
Federal National Mortgage Association, 5.500%, 11/01/2034 | | | | | 1,331,633 | | | 1,330,611 |
Federal National Mortgage Association, 5.500%, 6/01/2035(d) | | | | | 5,964,380 | | | 5,956,078 |
Federal National Mortgage Association, 5.500%, 9/01/2035 | | | | | 3,590,834 | | | 3,585,835 |
Federal National Mortgage Association, 5.500%, 12/01/2035(d) | | | | | 17,873,967 | | | 17,849,086 |
Federal National Mortgage Association, 5.500%, 4/01/2036(d) | | | | | 12,905,230 | | | 12,887,265 |
Federal National Mortgage Association, 5.500%, 6/01/2037(d) | | | | | 8,480,204 | | | 8,463,947 |
Federal National Mortgage Association, 6.000%, 6/01/2017 | | | | | 804,314 | | | 821,120 |
Federal National Mortgage Association, 6.000%, 11/01/2017 | | | | | 657,201 | | | 672,507 |
Federal National Mortgage Association, 6.000%, 9/01/2021 | | | | | 2,137,117 | | | 2,179,545 |
66
PORTFOLIO OF INVESTMENTS – as of September 30, 2008
Loomis Sayles Global Bond Fund – continued
| | | | | | | | |
| | | | | Principal Amount (‡) | | Value (†) |
| | | | | | | | |
| | | |
| BONDS AND NOTES – continued | | | | | | | | |
| | | |
| United States – continued | | | | | | | | |
Federal National Mortgage Association, 6.000%, 11/01/2034 | | | | $ | 2,234,250 | | $ | 2,270,134 |
Federal National Mortgage Association, 6.000%, 4/01/2035(d) | | | | | 2,690,928 | | | 2,734,146 |
Federal National Mortgage Association, 6.000%, 5/01/2035 | | | | | 2,818,888 | | | 2,859,316 |
Federal National Mortgage Association, 6.500%, 3/01/2033 | | | | | 1,412,673 | | | 1,461,408 |
Federal National Mortgage Association, 6.500%, 6/01/2035 | | | | | 434,115 | | | 445,971 |
Federal National Mortgage Association, 6.500%, 7/01/2035 | | | | | 168,838 | | | 173,450 |
Federal National Mortgage Association, 6.500%, 10/01/2035 | | | | | 1,257,428 | | | 1,294,519 |
Frontier Communications Corp., 6.250%, 1/15/2013 | | | | | 11,175,000 | | | 10,462,594 |
Frontier Communications Corp., 7.125%, 3/15/2019 | | | | | 1,205,000 | | | 957,975 |
Frontier Communications Corp., 9.000%, 8/15/2031 | | | | | 1,795,000 | | | 1,373,175 |
General Electric Capital Corp., 0.750%, 2/05/2009 | | JPY | | | 1,365,000,000 | | | 12,755,983 |
General Electric Capital Corp., Series A, GMTN, 2.960%, 5/18/2012 | | SGD | | | 800,000 | | | 545,885 |
General Electric Capital Corp., EMTN, 1.000%, 3/21/2012 | | JPY | | | 2,035,000,000 | | | 17,348,808 |
General Electric Capital Corp., EMTN, 1.500%, 4/26/2012 | | JPY | | | 276,000,000 | | | 2,181,364 |
Georgia-Pacific Corp., 7.125%, 1/15/2017, 144A | | | | | 1,860,000 | | | 1,660,050 |
Georgia-Pacific LLC, 7.250%, 6/01/2028 | | | | | 4,540,000 | | | 3,586,600 |
Georgia-Pacific LLC, 8.000%, 1/15/2024 | | | | | 180,000 | | | 158,400 |
Georgia-Pacific LLC, 8.875%, 5/15/2031 | | | | | 1,805,000 | | | 1,570,350 |
Goldman Sachs Group LP, 5.000%, 10/01/2014 | | | | | 1,705,000 | | | 1,422,084 |
Goldman Sachs Group, Inc. (The), 5.150%, 1/15/2014 | | | | | 910,000 | | | 747,368 |
Goldman Sachs Group, Inc. (The), 5.314%, 5/23/2016(c) | | EUR | | | 8,500,000 | | | 8,169,551 |
Goldman Sachs Group, Inc. (The), 6.875%, 1/18/2038 | | GBP | | | 4,555,000 | | | 6,299,357 |
Goldman Sachs Group, Inc. (The), 7.250%, 4/10/2028 | | GBP | | | 2,050,000 | | | 2,896,220 |
Government National Mortgage Association, 5.500%, 11/20/2034 | | | | | 472,621 | | | 472,208 |
Government National Mortgage Association, 5.500%, 2/20/2036 | | | | | 1,400,914 | | | 1,399,021 |
Government National Mortgage Association, 6.000%, 10/20/2035 | | | | | 866,087 | | | 878,282 |
Government National Mortgage Association, 6.000%, 5/15/2037 | | | | | 2,445,286 | | | 2,485,124 |
Government National Mortgage Association, 6.500%, 7/20/2037 | | | | | 3,508,779 | | | 3,595,607 |
Greenwich Capital Commercial Funding Corp., Series 2005-GG5, Class A2, 5.117%, 4/10/2037 | | | | | 11,075,000 | | | 10,846,973 |
Harley-Davidson Funding Corp., Series C, 6.800%, 6/15/2018, 144A | | | | | 13,795,000 | | | 12,916,865 |
67
| | | | | | | | |
| | | | | Principal Amount (‡) | | Value (†) |
| | | | | | | | |
| | | |
| BONDS AND NOTES – continued | | | | | | | | |
| | | |
| United States – continued | | | | | | | | |
HCA, Inc., 5.750%, 3/15/2014 | | | | $ | 765,000 | | $ | 596,700 |
HCA, Inc., 6.250%, 2/15/2013 | | | | | 500,000 | | | 417,500 |
HCA, Inc., 6.375%, 1/15/2015 | | | | | 1,170,000 | | | 921,375 |
HCA, Inc., 6.500%, 2/15/2016(b) | | | | | 2,360,000 | | | 1,870,300 |
HCA, Inc., 7.690%, 6/15/2025 | | | | | 625,000 | | | 464,525 |
HCA, Inc., MTN, 7.580%, 9/15/2025 | | | | | 614,000 | | | 452,352 |
Hilcorp Energy I LP, 7.750%, 11/01/2015, 144A | | | | | 5,680,000 | | | 4,884,800 |
Home Depot, Inc., 5.875%, 12/16/2036 | | | | | 7,900,000 | | | 5,553,487 |
Host Hotels & Resorts LP, 6.875%, 11/01/2014 | | | | | 4,255,000 | | | 3,680,575 |
Host Marriott LP, Series O, 6.375%, 3/15/2015 | | | | | 6,040,000 | | | 4,907,500 |
Host Marriott LP, Series Q, 6.750%, 6/01/2016 | | | | | 3,745,000 | | | 3,061,537 |
International Paper Co., 7.950%, 6/15/2018 | | | | | 7,630,000 | | | 7,497,322 |
JPMorgan Chase & Co., 5.125%, 9/15/2014 | | | | | 15,965,000 | | | 14,228,247 |
JPMorgan Chase & Co., 5.150%, 10/01/2015 | | | | | 6,000,000 | | | 5,397,234 |
JPMorgan Chase & Co., (fixed rate to 4/30/2018, variable rate thereafter), 7.900%, 4/29/2049 | | | | | 13,425,000 | | | 11,302,239 |
Kinder Morgan Energy Partners LP, 5.950%, 2/15/2018 | | | | | 10,800,000 | | | 9,620,003 |
KLA-Tencor Corp., 6.900%, 5/01/2018 | | | | | 9,750,000 | | | 9,065,550 |
Kraft Foods, Inc., 6.000%, 2/11/2013 | | | | | 4,831,000 | | | 4,801,410 |
Kraft Foods, Inc., 6.875%, 2/01/2038 | | | | | 8,065,000 | | | 7,424,841 |
L-3 Communications Corp., 5.875%, 1/15/2015 | | | | | 1,935,000 | | | 1,751,175 |
L-3 Communications Corp., 6.125%, 7/15/2013 | | | | | 300,000 | | | 279,000 |
L-3 Communications Corp., 6.125%, 1/15/2014 | | | | | 280,000 | | | 259,000 |
Lehman Brothers Holdings, Inc., 5.750%, 1/03/2017(e) | | | | | 5,610,000 | | | 7,012 |
Lehman Brothers Holdings, Inc., 6.500%, 7/19/2017(e) | | | | | 15,905,000 | | | 19,881 |
Level 3 Financing, Inc., 8.750%, 2/15/2017 | | | | | 570,000 | | | 413,250 |
Lucent Technologies, Inc., 6.450%, 3/15/2029 | | | | | 7,950,000 | | | 4,849,500 |
Medco Health Solutions, Inc., 7.125%, 3/15/2018 | | | | | 9,465,000 | | | 9,590,913 |
Merrill Auto Trust Securitization, Series 2008-1, Class A4A, 6.150%, 4/15/2015 | | | | | 8,155,000 | | | 7,923,559 |
Merrill Lynch & Co., Inc., MTN, 6.875%, 4/25/2018 | | | | | 16,910,000 | | | 14,961,122 |
Merrill Lynch/Countrywide Commercial Mortgage Trust, Series 2006-1, Class A2, 5.439%, 2/12/2039(c) | | | | | 5,755,000 | | | 5,574,496 |
Morgan Stanley, 4.750%, 4/01/2014 | | | | | 9,080,000 | | | 4,813,263 |
Morgan Stanley, 5.375%, 11/14/2013 | | GBP | | | 2,010,000 | | | 2,405,466 |
Motorola, Inc., 6.625%, 11/15/2037 | | | | | 6,000,000 | | | 4,373,670 |
Nabors Industries, Inc., 6.150%, 2/15/2018, 144A | | | | | 6,235,000 | | | 5,944,536 |
National Semiconductor Corp., 6.150%, 6/15/2012 | | | | | 9,275,000 | | | 9,059,458 |
News America, Inc., 6.150%, 3/01/2037 | | | | | 5,730,000 | | | 4,671,824 |
Nextel Communications, Inc., Series D, 7.375%, 8/01/2015 | | | | | 5,475,000 | | | 3,613,500 |
NGPL PipeCo LLC, 6.514%, 12/15/2012, 144A | | | | | 8,320,000 | | | 8,333,478 |
NGPL PipeCo LLC, 7.119%, 12/15/2017, 144A | | | | | 1,740,000 | | | 1,651,484 |
NGPL PipeCo LLC, 7.768%, 12/15/2037, 144A | | | | | 1,740,000 | | | 1,706,258 |
Nisource Finance Corp., 6.400%, 3/15/2018 | | | | | 5,925,000 | | | 5,309,920 |
Owens & Minor, Inc., 6.350%, 4/15/2016(f) | | | | | 5,630,000 | | | 5,482,106 |
Owens Brockway Glass Container, Inc., 6.750%, 12/01/2014 | | EUR | | | 2,170,000 | | | 2,657,786 |
68
PORTFOLIO OF INVESTMENTS – as of September 30, 2008
Loomis Sayles Global Bond Fund – continued
| | | | | | | | |
| | | | | Principal Amount (‡) | | Value (†) |
| | | | | | | | |
| | | |
| BONDS AND NOTES – continued | | | | | | | | |
| | | |
| United States – continued | | | | | | | | |
Petrobras International Finance Co., 5.875%, 3/01/2018 | | | | $ | 15,600,000 | | $ | 14,178,559 |
Philip Morris International, Inc. GMTN, 5.875%, 9/04/2015 | | EUR | | | 8,100,000 | | | 11,123,714 |
Prologis, 6.625%, 5/15/2018(b) | | | | | 15,685,000 | | | 13,471,313 |
Qwest Capital Funding, Inc., 6.500%, 11/15/2018 | | | | | 855,000 | | | 622,012 |
Qwest Capital Funding, Inc., 6.875%, 7/15/2028(b) | | | | | 250,000 | | | 173,750 |
Qwest Capital Funding, Inc., 7.250%, 2/15/2011 | | | | | 1,435,000 | | | 1,341,725 |
Qwest Capital Funding, Inc., 7.750%, 2/15/2031 | | | | | 1,845,000 | | | 1,346,850 |
Qwest Corp., 6.500%, 6/01/2017 | | | | | 734,000 | | | 587,200 |
Qwest Corp., 6.875%, 9/15/2033 | | | | | 1,815,000 | | | 1,220,587 |
Qwest Corp., 7.200%, 11/10/2026 | | | | | 100,000 | | | 73,500 |
Qwest Corp., 7.250%, 9/15/2025 | | | | | 1,656,000 | | | 1,233,720 |
Qwest Corp., 7.250%, 10/15/2035 | | | | | 5,165,000 | | | 3,667,150 |
Qwest Corp., 7.500%, 6/15/2023 | | | | | 5,285,000 | | | 4,148,725 |
RBS Capital Trust, (fixed rate to 1/12/2016, variable rate thereafter), 4.243%, 12/29/2049 | | EUR | | | 4,485,000 | | | 4,145,952 |
Reynolds American, Inc., 6.750%, 6/15/2017 | | | | | 9,755,000 | | | 9,115,170 |
Rogers Communications, Inc. , Class B, 7.500%, 8/15/2038 | | | | | 4,270,000 | | | 4,255,290 |
SLM Corp., Series A, MTN, 4.000%, 1/15/2010 | | | | | 2,815,000 | | | 2,209,775 |
SLM Corp., Series A, MTN, 5.000%, 10/01/2013 | | | | | 6,465,000 | | | 4,008,300 |
SLM Corp., Series A, MTN, 5.375%, 5/15/2014 | | | | | 325,000 | | | 201,500 |
SLM Corp., Series A, MTN, 5.400%, 10/25/2011(b) | | | | | 535,000 | | | 374,500 |
SLM Corp., Series A, MTN, 8.450%, 6/15/2018 | | | | | 5,825,000 | | | 3,961,000 |
Sprint Capital Corp., 6.900%, 5/01/2019 | | | | | 2,500,000 | | | 1,937,500 |
Sprint Nextel Corp., 6.000%, 12/01/2016 | | | | | 6,775,000 | | | 5,216,750 |
SUPERVALU, Inc., 7.500%, 11/15/2014 | | | | | 1,735,000 | | | 1,682,950 |
Textron, Inc., 3.875%, 3/11/2013 | | EUR | | | 11,350,000 | | | 14,301,794 |
Time Warner, Inc., 6.625%, 5/15/2029 | | | | | 7,255,000 | | | 5,794,714 |
Time Warner, Inc., 6.950%, 1/15/2028 | | | | | 2,055,000 | | | 1,713,295 |
TXU Corp., Series P, 5.550%, 11/15/2014 | | | | | 1,390,000 | | | 1,037,297 |
TXU Corp., Series Q, 6.500%, 11/15/2024 | | | | | 12,560,000 | | | 7,999,175 |
TXU Corp., Series R, 6.550%, 11/15/2034 | | | | | 2,700,000 | | | 1,658,996 |
U.S. Treasury Note, 4.750%, 2/28/2009(d) | | | | | 2,500,000 | | | 2,533,595 |
Union Pacific Corp., 5.375%, 6/01/2033 | | | | | 1,198,000 | | | 943,841 |
Union Pacific Corp., 5.650%, 5/01/2017 | | | | | 4,190,000 | | | 3,888,563 |
UnitedHealth Group, Inc., 5.800%, 3/15/2036 | | | | | 2,495,000 | | | 1,892,839 |
UnitedHealth Group, Inc., 6.000%, 2/15/2018 | | | | | 23,035,000 | | | 20,837,714 |
Wells Fargo & Co., 4.625%, 11/02/2035 | | GBP | | | 12,030,000 | | | 15,788,818 |
| | | | | | | | |
| | | | | | | | 837,928,935 |
| | | | | | | | |
| Uruguay – 0.9% | | | | | | | | |
Republic of Uruguay, 4.250%, 4/05/2027 | | UYU | | | 454,250,624 | | | 19,663,116 |
| | | | | | | | |
| | | |
| TOTAL NON-CONVERTIBLE BONDS | | | | | | | | |
(Identified Cost $2,248,053,578) | | | | | | | | 2,093,060,513 |
| | | | | | | | |
69
| | | | | | | | |
| | | | | Shares/Principal Amount (‡) | | Value (†) |
| | | | | | | | |
| | | |
| BONDS AND NOTES – continued | | | | | | | | |
| | | |
| CONVERTIBLE BONDS – 0.0% | | | | | | | | |
| | | |
| United States – 0.0% | | | | | | | | |
Level 3 Communications, Inc., 3.500%, 6/15/2012 | | | | $ | 700,000 | | $ | 494,375 |
| | | | | | | | |
| | | |
| TOTAL CONVERTIBLE BONDS | | | | | | | | |
(Identified Cost $580,334) | | | | | | | | 494,375 |
| | | | | | | | |
| | | |
| TOTAL BONDS AND NOTES | | | | | | | | |
(Identified Cost $2,248,633,912) | | | | | | | | 2,093,554,888 |
| | | | | | | | |
| | | |
| PREFERRED STOCKS – 1.4% | | | | | | | | |
| | | |
| NON-CONVERTIBLE PREFERRED STOCKS – 1.4% | | | | | | | | |
| | | |
| United States – 1.4% | | | | | | | | |
Bank of America Corp., 8.200%(b) | | | | | 1,091,125 | | | 24,823,094 |
Federal Home Loan Mortgage Corp., 8.375%,(b)(h)(i) | | | | | 505,450 | | | 823,884 |
Federal National Mortgage Association, 8.250%(b)(i) | | | | | 998,425 | | | 2,176,566 |
Merrill Lynch & Co., Inc., 8.625%,(b) | | | | | 179,000 | | | 3,399,210 |
| | | | | | | | |
| | | |
| TOTAL NON-CONVERTIBLE PREFERRED STOCKS | | | | | | | | |
(Identified Cost $69,406,582) | | | | | | | | 31,222,754 |
| | | | | | | | |
| | | |
| TOTAL PREFERRED STOCKS | | | | | | | | |
(Identified Cost $69,406,582) | | | | | | | | 31,222,754 |
| | | | | | | | |
| | | |
| SHORT-TERM INVESTMENTS – 3.5% | | | | | | | | |
| State Street Navigator Securities Lending Prime Portfolio(g) | | | | | 62,965,841 | | | 62,965,841 |
| Tri-Party Repurchase Agreement with Fixed Income Clearing Corporation dated 9/30/08 at 1.300% to be repurchased at $15,909,574 on 10/01/08 collateralized by $15,950,000 Federal National Mortgage Association, 4.330% due 7/28/2011 valued at $16,229,125 including accrued interest (Note 2h of Notes to Financial Statements) | | | | $ | 15,909,000 | | | 15,909,000 |
| | | | | | | | |
| | | |
| TOTAL SHORT-TERM INVESTMENTS | | | | | | | | |
(Identified Cost $78,874,841) | | | | | | | | 78,874,841 |
| | | | | | | | |
| | | |
| TOTAL INVESTMENTS – 98.8% | | | | | | | | |
(Identified Cost $2,396,915,335)(a) | | | | | | | | 2,203,652,483 |
Other Assets Less Liabilities—1.2% | | | | | | | | 26,988,321 |
| | | | | | | | |
| | | |
| NET ASSETS – 100.0% | | | | | | | $ | 2,230,640,804 |
| | | | | | | | |
| |
(‡) Principal amount stated in U.S. dollars unless otherwise noted. | | | |
(†) See Note 2a of Notes to Financial Statements. | | | |
(a) Federal Tax Information: At September 30, 2008, the net unrealized depreciation on investments based on a cost of $2,402,175,767 for federal income tax purposes was as follows: | | | |
Aggregate gross unrealized appreciation for all investments in which there is an excess of value over tax cost | | $ | 35,827,874 |
Aggregate gross unrealized depreciation for all investments in which there is an excess of tax cost over value | | | (234,351,158) |
| | | | | | | | |
Net unrealized depreciation | | $ | (198,523,284) |
| | | | | | | | |
| (b) | All or a portion of this security was on loan to brokers at September 30, 2008. |
| (c) | Variable rate security. Rate as of September 30, 2008 is disclosed. |
| (d) | All or a portion of this security is held as collateral for open futures contracts and open forward contracts. |
70
PORTFOLIO OF INVESTMENTS – as of September 30, 2008
Loomis Sayles Global Bond Fund – continued
| (e) | Issuer has filed for bankruptcy. |
| (f) | Illiquid security. At September 30, 2008, the value of this security amounted to $5,482,106 or 0.2% of net assets. |
| (g) | Represents investment of securities lending collateral. |
| (h) | Non-income producing security. |
| (i) | Future dividend payments have been eliminated as the issuer has been placed in conservatorship. |
| 144A | Securities exempt from registration under Rule 144A of the Securities Act of 1933. These securities may be resold in transactions exempt from registration, normally to qualified institutional buyers. At September 30, 2008, the total value of these securities amounted to $219,638,566 or 9.8% of net assets. |
| EMTN | Euro Medium Term Note |
| GMTN | Global Medium Term Note |
Key to Abbreviations: BRL: Brazilian Real; CAD: Canadian Dollar; COP: Colombian Peso; EUR: Euro; GBP: British Pound; IDR: Indonesian Rupiah; JPY: Japanese Yen; SGD: Singapore Dollar; UYU: Uruguayan Peso
At September 30, 2008, the Fund had the following open forward foreign currency contracts:
| | | | | | | | | | | | | |
Contract to
Buy/Sell | | Delivery
Date | | Currency | | Units | | Value | | Unrealized
Appreciation
(Depreciation) | |
Sell | | 12/17/2008 | | Canadian Dollar | | 19,500,000 | | $ | 18,367,596 | | $ | (121,470 | ) |
Buy | | 6/15/2009 | | Chinese Yuan
Renminbi | | 173,000,000 | | | 24,933,580 | | | (1,510,932 | ) |
Sell | | 6/15/2009 | | Chinese Yuan
Renminbi | | 173,000,000 | | | 24,933,580 | | | 1,064,112 | |
Buy | | 12/17/2008 | | Icelandic Krona | | 1,164,000,000 | | | 10,863,897 | | | (1,698,158 | ) |
| | | | | | | | | | | | | |
Total | | | | | | | | | | | $ | (2,266,448 | ) |
| | | | | | | | | | | | | |
At September 30, 2008, the Fund had the following open forward cross currency contracts:
| | | | | | | | | | | | |
| Settlement Date | | Deliver/Units of Currency | | Receive/In Exchange For | | Net Unrealized
Depreciation | |
12/17/2008 | | Euro | | 13,794,000 | | Icelandic Krona | | 1,735,133,466 | | $ | (3,287,521 | ) |
| | | | | | | | | | | | |
At September 30, 2008, open futures contracts sold were as follows:
| | | | | | | | | | |
| Futures | | Expiration
Date | | Contracts | | Notional
Value | | Unrealized
Appreciation |
U.S. Treasury Bond | | 12/19/2008 | | 800 | | $ | 93,737,500 | | $ | 235,349 |
NET ASSET SUMMARY AT SEPTEMBER 30, 2008 (Unaudited)
| | | |
Treasuries | | 11.1 | % |
Mortgage Related | | 10.6 | |
Sovereigns | | 10.0 | |
Banking | | 9.1 | |
Government Guaranteed | | 4.8 | |
Supranational | | 4.7 | |
Wirelines | | 3.5 | |
Non-Captive Diversified | | 3.4 | |
Government Sponsored | | 3.2 | |
Brokerage | | 2.5 | |
Government Owned – No Guarantee | | 2.2 | |
Healthcare | | 2.1 | |
Other Investments, less than 2% each | | 28.1 | |
Short-Term Investments | | 3.5 | |
| | | |
Total Investments | | 98.8 | |
Other assets less liabilities (including open Forward Foreign Currency Contracts and Futures Contracts) | | 1.2 | |
| | | |
Net Assets | | 100.0 | % |
| | | |
CURRENCY EXPOSURE AT SEPTEMBER 30, 2008 AS A PERCENTAGE OF NET ASSETS (Unaudited)
| | | |
United States Dollar | | 44.9 | % |
Euro | | 26.1 | |
Japanese Yen | | 18.5 | |
British Pound | | 5.1 | |
Other, less than 2% each | | 4.2 | |
| | | |
Total Investments | | 98.8 | |
Other assets less liabilities (including open Forward Foreign Currency Contracts and Futures Contracts) | | 1.2 | |
| | | |
Net Assets | | 100.0 | % |
| | | |
See accompanying notes to financial statements.
71
PORTFOLIO OF INVESTMENTS – as of September 30, 2008
Loomis Sayles Inflation Protected Securities Fund
| | | | | | | | |
| | | | | Principal Amount (‡) | | Value (†) |
| | | | | | | | |
| | |
| BONDS AND NOTES – 98.3% of Net Assets | | | | | | |
| | | |
| Automotive – 0.9% | | | | | | | | |
Ford Motor Co., 6.625%, 2/15/2028 | | | | $ | 20,000 | | $ | 7,700 |
Ford Motor Co., 6.625%, 10/01/2028 | | | | | 185,000 | | | 70,300 |
Ford Motor Co., 7.450%, 7/16/2031 | | | | | 140,000 | | | 60,200 |
Ford Motor Co., 7.500%, 8/01/2026 | | | | | 15,000 | | | 6,225 |
| | | | | | | | |
| | | | | | | | 144,425 |
| | | | | | | | |
| Brokerage – 0.4% | | | | | | | | |
Goldman Sachs Group, Inc., 6.750%, 10/01/2037 | | | | | 100,000 | | | 66,759 |
| | | | | | | | |
| Construction Machinery – 0.9% | | | | | | | | |
Joy Global, Inc., 6.625%, 11/15/2036 | | | | | 165,000 | | | 139,746 |
| | | | | | | | |
| Electric – 0.5% | | | | | | | | |
Texas Competitive Electric Holdings Co., 10.250%, 11/01/2015, 144A | | | | | 80,000 | | | 72,200 |
TXU Corp., Series Q, 6.500%, 11/15/2024 | | | | | 10,000 | | | 6,369 |
| | | | | | | | |
| | | | | | | | 78,569 |
| | | | | | | | |
| Food & Beverage – 0.4% | | | | | | | | |
Dean Foods Co., 6.900%, 10/15/2017 | | | | | 75,000 | | | 64,500 |
| | | | | | | | |
| Independent Energy – 0.2% | | | | | | | | |
Chesapeake Energy Corp., 6.500%, 8/15/2017 | | | | | 35,000 | | | 30,625 |
| | | | | | | | |
| Lodging – 0.3% | | | | | | | | |
Royal Caribbean Cruises Ltd., 7.500%, 10/15/2027 | | | | | 50,000 | | | 38,500 |
| | | | | | | | |
| Metals & Mining – 0.3% | | | | | | | | |
United States Steel Corp., 6.650%, 6/01/2037 | | | | | 55,000 | | | 40,904 |
| | | | | | | | |
| Non-Captive Consumer – 0.5% | | | | | | | | |
SLM Corp., Series A, MTN, 5.000%, 10/01/2013 | | | | | 30,000 | | | 18,600 |
SLM Corp., Series A, MTN, 5.000%, 4/15/2015 | | | | | 45,000 | | | 27,000 |
SLM Corp., Series A, MTN, 5.375%, 5/15/2014 | | | | | 5,000 | | | 3,100 |
SLM Corp., Series A, MTN, 5.625%, 8/01/2033 | | | | | 45,000 | | | 22,500 |
SLM Corp., MTN, 5.050%, 11/14/2014 | | | | | 25,000 | | | 15,250 |
| | | | | | | | |
| | | | | | | | 86,450 |
| | | | | | | | |
| Non-Captive Diversified – 2.7% | | | | | | | | |
General Electric Capital Corp., Series A, GMTN, 2.960%, 5/18/2012 | | SGD | | | 200,000 | | | 136,471 |
General Electric Capital Corp., Series A, GMTN, 3.485%, 3/08/2012 | | SGD | | | 300,000 | | | 208,710 |
iStar Financial, Inc., 5.150%, 3/01/2012 | | | | | 40,000 | | | 20,000 |
iStar Financial, Inc., 5.375%, 4/15/2010 | | | | | 5,000 | | | 3,000 |
iStar Financial, Inc., 5.500%, 6/15/2012 | | | | | 5,000 | | | 2,550 |
iStar Financial, Inc., 5.650%, 9/15/2011 | | | | | 20,000 | | | 10,400 |
iStar Financial, Inc., 5.850%, 3/15/2017 | | | | | 10,000 | | | 4,900 |
iStar Financial, Inc., 5.875%, 3/15/2016 | | | | | 20,000 | | | 9,800 |
iStar Financial, Inc., 6.050%, 4/15/2015 | | | | | 5,000 | | | 2,450 |
iStar Financial, Inc., Series B, 5.125%, 4/01/2011 | | | | | 5,000 | | | 2,550 |
iStar Financial, Inc., Series B, 5.700%, 3/01/2014 | | | | | 5,000 | | | 2,450 |
iStar Financial, Inc., Series B, 5.950%, 10/15/2013 | | | | | 55,000 | | | 28,600 |
| | | | | | | | |
| | | | | | | | 431,881 |
| | | | | | | | |
| Paper – 0.4% | | | | | | | | |
Georgia-Pacific LLC, 7.700%, 6/15/2015 | | | | | 70,000 | | | 64,050 |
| | | | | | | | |
72
PORTFOLIO OF INVESTMENTS – as of September 30, 2008
Loomis Sayles Inflation Protected Securities Fund – continued
| | | | | | | | | |
| | | | | Principal Amount (‡) | | | Value (†) |
| | | | | | | | | |
| | | |
| BONDS AND NOTES – continued | | | | | | | | | |
| | | |
| Pipelines – 0.2% | | | | | | | | | |
Colorado Interstate Gas Co., 5.950%, 3/15/2015 | | | | $ | 3,000 | | | $ | 2,733 |
Southern Natural Gas Co., 7.350%, 2/15/2031 | | | | | 30,000 | | | | 26,304 |
| | | | | | | | | |
| | | | | | | | | 29,037 |
| | | | | | | | | |
| Sovereigns – 0.8% | | | | | | | | | |
Mexican Fixed Rate Bonds, Series M-10, 8.000%, 12/17/2015 | | MXN | | | 15,000 | (††) | | | 134,097 |
| | | | | | | | | |
| Technology – 1.0% | | | | | | | | | |
Agilent Technologies, Inc., 6.500%, 11/01/2017 | | | | | 105,000 | | | | 95,720 |
Lucent Technologies, Inc., 6.450%, 3/15/2029 | | | | | 90,000 | | | | 54,900 |
Lucent Technologies, Inc., 6.500%, 1/15/2028 | | | | | 15,000 | | | | 9,150 |
| | | | | | | | | |
| | | | | | | | | 159,770 |
| | | | | | | | | |
| Textile – 0.0% | | | | | | | | | |
Jones Apparel Group, Inc., 6.125%, 11/15/2034 | | | | | 10,000 | | | | 6,250 |
| | | | | | | | | |
| Treasuries – 86.6% | | | | | | | | | |
U.S. Treasury Inflation Index Bonds, 1.375%, 7/15/2018(b) | | | | | 270,266 | | | | 249,637 |
U.S. Treasury Inflation Index Bonds, 1.625%, 1/15/2018 | | | | | 1,322,723 | | | | 1,252,867 |
U.S. Treasury Inflation Index Bonds, 1.750%, 1/15/2028 | | | | | 278,192 | | | | 242,700 |
U.S. Treasury Inflation Index Bonds, 2.000%, 1/15/2026(b) | | | | | 177,290 | | | | 161,874 |
U.S. Treasury Inflation Index Bonds, 2.375%, 1/15/2017(b) | | | | | 1,275,944 | | | | 1,286,710 |
U.S. Treasury Inflation Index Bonds, 2.375%, 1/15/2025(b) | | | | | 805,044 | | | | 780,012 |
U.S. Treasury Inflation Index Bonds, 2.500%, 7/15/2016 | | | | | 310,365 | | | | 317,663 |
U.S. Treasury Inflation Index Bonds, 3.375%, 4/15/2032(b) | | | | | 1,561,165 | | | | 1,789,729 |
U.S. Treasury Inflation Index Notes, 1.625%, 1/15/2015(b) | | | | | 639,232 | | | | 622,403 |
U.S. Treasury Inflation Index Notes, 1.875%, 7/15/2013 | | | | | 969,918 | | | | 967,038 |
U.S. Treasury Inflation Index Notes, 1.875%, 7/15/2015 | | | | | 627,522 | | | | 617,766 |
U.S. Treasury Inflation Index Notes, 2.000%, 4/15/2012 | | | | | 113,799 | | | | 114,075 |
U.S. Treasury Inflation Index Notes, 2.000%, 1/15/2014(b) | | | | | 743,900 | | | | 742,389 |
U.S. Treasury Inflation Index Notes, 2.000%, 7/15/2014(b) | | | | | 688,371 | | | | 686,650 |
U.S. Treasury Inflation Index Notes, 2.000%, 1/15/2016(b) | | | | | 1,063,738 | | | | 1,050,857 |
U.S. Treasury Inflation Index Notes, 2.375%, 4/15/2011 | | | | | 421,044 | | | | 425,846 |
U.S. Treasury Inflation Index Notes, 2.375%, 1/15/2027(b) | | | | | 430,767 | | | | 416,599 |
U.S. Treasury Inflation Index Notes, 2.625%, 7/15/2017 | | | | | 1,124,798 | | | | 1,158,366 |
73
| | | | | | | | |
| | | | | Principal Amount (‡) | | Value (†) |
| | | | | | | | |
| | | |
| BONDS AND NOTES – continued | | | | | | | | |
| | | |
| Treasuries – continued | | | | | | | | |
U.S. Treasury Inflation Index Notes, 3.000%, 7/15/2012(b) | | | | $ | 752,250 | | $ | 782,986 |
U.S. Treasury Inflation Index Notes, 3.375%, 1/15/2012(b) | | | | | 204,364 | | | 214,343 |
| | | | | | | | |
| | | | | | | | 13,880,510 |
| | | | | | | | |
| Wireless – 0.6% | | | | | | | | |
ALLTEL Corp., 7.875%, 7/01/2032 | | | | | 20,000 | | | 19,850 |
Sprint Capital Corp., 6.875%, 11/15/2028 | | | | | 120,000 | | | 80,400 |
| | | | | | | | |
| | | | | | | | 100,250 |
| | | | | | | | |
| Wirelines – 1.6% | | | | | | | | |
AT&T Corp., 8.000%, 11/15/2031 | | | | | 80,000 | | | 81,020 |
Bell Canada, Series M-17, 6.100%, 3/16/2035 | | CAD | | | 35,000 | | | 23,939 |
Bell Canada, MTN, 5.000%, 2/15/2017 | | CAD | | | 30,000 | | | 22,264 |
Bell Canada, MTN, 6.550%, 5/01/2029, 144A | | CAD | | | 5,000 | | | 3,572 |
Bell Canada, MTN, 7.300%, 2/23/2032 | | CAD | | | 15,000 | | | 11,586 |
Embarq Corp., 7.995%, 6/01/2036 | | | | | 165,000 | | | 117,993 |
| | | | | | | | |
| | | | | | | | 260,374 |
| | | | | | | | |
| | | |
| TOTAL BONDS AND NOTES | | | | | | | | |
(Identified Cost $16,772,556) | | | | | | | | 15,756,697 |
| | | | | | | | |
| | | |
| | | | | Shares | | |
| | | |
| PREFERRED STOCKS – 0.1% | | | | | | | | |
| | | |
| NON-CONVERTIBLE PREFERRED STOCKS – 0.1% | | | | | | | | |
| | | |
| Thrifts & Mortgage Finance – 0.1% | | | | | | | | |
Federal Home Loan Mortgage Corp., 8.375%(d)(e) | | | | | 1,160 | | | 1,891 |
Federal National Mortgage Association, 8.250%(e) | | | | | 3,500 | | | 7,630 |
| | | | | | | | |
| | | |
| TOTAL NON-CONVERTIBLE PREFERRED STOCKS | | | | | | | | |
(Identified Cost $116,500) | | | | | | | | 9,521 |
| | | | | | | | |
| | | |
| TOTAL PREFERRED STOCKS | | | | | | | | |
(Identified Cost $116,500) | | | | | | | | 9,521 |
| | | | | | | | |
74
PORTFOLIO OF INVESTMENTS – as of September 30, 2008
Loomis Sayles Inflation Protected Securities Fund – continued
| | | | | | | | |
| | | | | Shares/Principal Amount (‡) | | Value (†) |
| | | | | | | | |
| | | |
| SHORT-TERM INVESTMENTS – 10.3% | | | | | | | | |
| State Street Navigator Securities Lending Prime Portfolio(c) | | | | | 1,411,666 | | $ | 1,411,666 |
| Tri-Party Repurchase Agreement with Fixed Income Clearing Corporation, dated 9/30/2008 at 1.300% to be repurchased at $251,009 on 10/1/2008 collateralized by $255,000 Federal Home Loan Bank, 3.750% due 8/18/2009 valued at $257,550 including accrued interest (Note 2h of Notes to Financial Statements) | | | | $ | 251,000 | | | 251,000 |
| | | | | | | | |
| | | |
| TOTAL SHORT-TERM INVESTMENTS | | | | | | | | |
(Identified Cost $1,662,666) | | | | | | | | 1,662,666 |
| | | | | | | | |
| | | |
| TOTAL INVESTMENTS – 108.7% | | | | | | | | |
(Identified Cost $18,551,722)(a) | | | | | | | | 17,428,884 |
Other Assets Less Liabilities—(8.7)% | | | | | | | | (1,395,778) |
| | | | | | | | |
| | | |
| NET ASSETS – 100.0% | | | | | | | $ | 16,033,106 |
| | | | | | | | |
|
(‡) Principal amount stated in U.S. dollars unless otherwise noted. |
(†) See Note 2a of Notes to Financial Statements. |
(††) Amount shown represents units. One unit represents a principal amount of 100. |
(a) Federal Tax Information: |
At September 30, 2008, the net unrealized depreciation on investments based on a cost of $18,668,982 for federal income tax purposes was as follows: | | | |
Aggregate gross unrealized appreciation for all investments in which there is an excess of value over tax cost | | $ | 29,568 |
Aggregate gross unrealized depreciation for all investments in which there is an excess of tax cost over value | | | (1,269,666) |
| | | | | | | | |
Net unrealized depreciation | | | | | | | $ | (1,240,098) |
| | | | | | | | |
| (b) | All or a portion of this security was on loan to brokers at September 30, 2008. |
| (c) | Represents investment of securities lending collateral. |
| (d) | Non-income producing security. |
| (e) | Future dividend payments have been eliminated as the issuer has been placed in conservatorship. |
| 144A | Securities exempt from registration under Rule 144A of the Securities Act of 1933. These securities may be resold in transactions exempt from registration, normally to qualified institutional buyers. At September 30, 2008, the total value of these securities amounted to $75,772 or 0.5% of net assets. |
| GMTN | Global Medium Term Note |
Key to Abbreviations: CAD: Canadian Dollar, MXN: Mexican Peso, SGD: Singapore Dollar
NET ASSET SUMMARY AT SEPTEMBER 30, 2008 (Unaudited)
| | | |
Treasuries | | 86.6 | % |
Non-Captive Diversified | | 2.7 | |
Other Investments, less than 2% each | | 9.1 | |
Short-Term Investments | | 10.3 | |
| | | |
Total Investments | | 108.7 | |
Other assets less liabilities | | (8.7 | ) |
| | | |
Net Assets | | 100.0 | % |
| | | |
See accompanying notes to financial statements.
75
PORTFOLIO OF INVESTMENTS – as of September 30, 2008
Loomis Sayles Institutional High Income Fund
| | | | | | | |
| | | | | Principal Amount (‡) | | Value (†) |
| | | | | | | |
| | | |
| BONDS AND NOTES – 75.8% of Net Assets | | | | | | | |
| | | |
| NON-CONVERTIBLE BONDS – 68.1% | | | | | | | |
| | | |
| Aerospace & Defense – 0.7% | | | | | | | |
Bombardier, Inc., 7.350%, 12/22/2026 | | CAD | | 600,000 | | $ | 500,719 |
Bombardier, Inc., 7.450%, 5/01/2034, 144A | | | | 1,075,000 | | | 999,750 |
| | | | | | | |
| | | | | | | 1,500,469 |
| | | | | | | |
| Airlines – 0.5% | | | | | | | |
American Airlines, Inc., Series 93A6, 8.040%, 9/16/2011 | | | | 23,424 | | | 17,685 |
Continental Airlines, Inc., Series 2000-2, Class B, 8.307%, 10/02/2019 | | | | 332,523 | | | 264,356 |
Continental Airlines, Inc., Series 2001-1, Class B, 7.373%, 6/15/2017 | | | | 180,851 | | | 135,638 |
Delta Air Lines, Inc., Series 2007-1, Class B, 8.021%, 8/10/2022 | | | | 479,476 | | | 326,043 |
Delta Air Lines, Inc., Series 2007-1, Class C, 8.954%, 8/10/2014 | | | | 580,841 | | | 424,014 |
| | | | | | | |
| | | | | | | 1,167,736 |
| | | | | | | |
| Automotive – 4.0% | | | | | | | |
Cummins, Inc., 7.125%, 3/01/2028 | | | | 350,000 | | | 334,939 |
FCE Bank PLC, EMTN, 7.125%, 1/16/2012 | | EUR | | 150,000 | | | 141,484 |
Ford Motor Co., 6.500%, 8/01/2018 | | | | 20,000 | | | 8,200 |
Ford Motor Co., 6.625%, 2/15/2028 | | | | 30,000 | | | 11,550 |
Ford Motor Co., 6.625%, 10/01/2028 | | | | 1,510,000 | | | 573,800 |
Ford Motor Co., 7.125%, 11/15/2025(b) | | | | 190,000 | | | 75,050 |
Ford Motor Co., 7.450%, 7/16/2031(b) | | | | 1,685,000 | | | 724,550 |
Ford Motor Co., 7.500%, 8/01/2026 | | | | 30,000 | | | 12,450 |
Ford Motor Credit Co. LLC, 5.700%, 1/15/2010 | | | | 2,980,000 | | | 2,282,191 |
Ford Motor Credit Co. LLC, 8.000%, 12/15/2016 | | | | 940,000 | | | 594,341 |
Ford Motor Credit Co. LLC, 8.625%, 11/01/2010 | | | | 70,000 | | | 49,638 |
Ford Motor Credit Co. LLC, 9.750%, 9/15/2010 | | | | 155,000 | | | 111,148 |
Ford Motor Credit Co. LLC, EMTN, 4.875%, 1/15/2010 | | EUR | | 130,000 | | | 126,280 |
General Motors Corp., 7.400%, 9/01/2025 | | | | 5,110,000 | | | 1,839,600 |
General Motors Corp., 8.250%, 7/15/2023(b) | | | | 645,000 | | | 253,163 |
Goodyear Tire & Rubber Co., 7.000%, 3/15/2028 | | | | 2,090,000 | | | 1,546,600 |
| | | | | | | |
| | | | | | | 8,684,984 |
| | | | | | | |
| Banking – 3.5% | | | | | | | |
Barclays Financial LLC, 4.160%, 2/22/2010, 144A | | THB | | 50,000,000 | | | 1,460,130 |
Barclays Financial LLC, EMTN, 4.100%, 3/22/2010, 144A | | THB | | 11,000,000 | | | 320,969 |
BNP Paribas SA, EMTN, Zero Coupon Bond, 6/13/2011, 144A | | IDR | | 10,477,600,000 | | | 802,098 |
JPMorgan Chase & Co., Zero Coupon Bond, 5/17/2010, 144A | | BRL | | 2,200,000 | | | 930,005 |
JPMorgan Chase & Co., Zero Coupon Bond, 3/28/2011, 144A | | IDR | | 6,846,018,000 | | | 539,550 |
JPMorgan Chase & Co., Zero Coupon Bond, 3/28/2011, 144A | | IDR | | 5,376,000,000 | | | 423,125 |
JPMorgan Chase London, Zero Coupon Bond, 10/21/2010, 144A | | IDR | | 9,533,078,500 | | | 795,299 |
Kaupthing Bank, 3.491%, 1/15/2010, 144A(b)(c) | | | | 200,000 | | | 156,000 |
76
PORTFOLIO OF INVESTMENTS – as of September 30, 2008
Loomis Sayles Institutional High Income Fund – continued
| | | | | | | | |
| | | | | Principal Amount (‡) | | Value (†) |
| | | | | | | | |
| | | |
| BONDS AND NOTES – continued | | | | | | | | |
| | | |
| Banking – continued | | | | | | | | |
Kaupthing Bank, Series D, 5.750%, 10/04/2011, 144A | | | | $ | 1,600,000 | | $ | 1,024,000 |
Rabobank Nederland, 10.250%, 9/10/2009, 144A | | ISK | | | 71,000,000 | | | 659,991 |
Rabobank Nederland, EMTN, 14.000%, 1/28/2009, 144A | | ISK | | | 40,000,000 | | | 381,135 |
| | | | | | | | |
| | | | | | | | 7,492,302 |
| | | | | | | | |
| Brokerage – 1.3% | | | | | | | | |
Bear Stearns Cos., Inc. (The), 4.650%, 7/02/2018 | | | | | 20,000 | | | 15,662 |
Bear Stearns Cos., Inc. (The), 6.400%, 10/02/2017 | | | | | 5,000 | | | 4,669 |
Goldman Sachs Group LP, 5.000%, 10/01/2014 | | | | | 1,305,000 | | | 1,088,457 |
Goldman Sachs Group, Inc. (The), 5.150%, 1/15/2014 | | | | | 665,000 | | | 546,153 |
Morgan Stanley, 3.875%, 1/15/2009 | | | | | 1,045,000 | | | 961,419 |
Morgan Stanley, 5.375%, 10/15/2015 | | | | | 100,000 | | | 61,980 |
Morgan Stanley, EMTN, 5.450%, 1/09/2017 | | | | | 5,000 | | | 3,102 |
Morgan Stanley, Series F, MTN, 5.950%, 12/28/2017 | | | | | 10,000 | | | 6,264 |
Morgan Stanley, MTN, 6.250%, 8/09/2026 | | | | | 200,000 | | | 122,264 |
| | | | | | | | |
| | | | | | | | 2,809,970 |
| | | | | | | | |
| Building Materials – 1.0% | | | | | | | | |
Ply Gem Industries, Inc., 9.000%, 2/15/2012(b) | | | | | 125,000 | | | 68,125 |
USG Corp., 6.300%, 11/15/2016 | | | | | 2,680,000 | | | 2,023,400 |
| | | | | | | | |
| | | | | | | | 2,091,525 |
| | | | | | | | |
| Chemicals – 2.5% | | | | | | | | |
Borden, Inc., 7.875%, 2/15/2023 | | | | | 1,824,000 | | | 839,040 |
Borden, Inc., 9.200%, 3/15/2021 | | | | | 2,641,000 | | | 1,320,500 |
Georgia Gulf Corp., 10.750%, 10/15/2016(b) | | | | | 500,000 | | | 225,000 |
Hercules, Inc., 6.500%, 6/30/2029(d) | | | | | 1,743,000 | | | 1,167,810 |
Mosaic Global Holdings, Inc., 7.300%, 1/15/2028 | | | | | 1,405,000 | | | 1,320,700 |
Mosaic Global Holdings, Inc., 7.375%, 8/01/2018 | | | | | 400,000 | | | 397,189 |
| | | | | | | | |
| | | | | | | | 5,270,239 |
| | | | | | | | |
| Construction Machinery – 0.8% | | | | | | | | |
Great Lakes Dredge & Dock Corp., 7.750%, 12/15/2013 | | | | | 300,000 | | | 274,500 |
United Rentals North America, Inc., 7.000%, 2/15/2014 | | | | | 1,620,000 | | | 1,134,000 |
United Rentals North America, Inc., 7.750%, 11/15/2013(b) | | | | | 290,000 | | | 221,125 |
| | | | | | | | |
| | | | | | | | 1,629,625 |
| | | | | | | | |
| Electric – 4.3% | | | | | | | | |
AES Corp. (The), 7.750%, 3/01/2014 | | | | | 1,185,000 | | | 1,102,050 |
AES Corp. (The), 7.750%, 10/15/2015 | | | | | 645,000 | | | 585,337 |
Dynegy Holdings, Inc., 7.125%, 5/15/2018 | | | | | 100,000 | | | 75,500 |
Dynegy Holdings, Inc., 7.625%, 10/15/2026 | | | | | 490,000 | | | 357,700 |
Dynegy Holdings, Inc., 7.750%, 6/01/2019 | | | | | 1,250,000 | | | 1,000,000 |
Dynegy Holdings, Inc., 8.375%, 5/01/2016(b) | | | | | 250,000 | | | 217,500 |
NGC Corporation Capital Trust I, Series B, 8.316%, 6/01/2027(b) | | | | | 1,685,000 | | | 1,255,325 |
NRG Energy, Inc., 7.375%, 2/01/2016 | | | | | 575,000 | | | 517,500 |
Quezon Power Philippines Co., 8.860%, 6/15/2017 | | | | | 377,500 | | | 375,613 |
77
| | | | | | | | |
| | | | | Principal Amount (‡) | | Value (†) |
| | | | | | | | |
| | | |
| BONDS AND NOTES – continued | | | | | | | | |
| | | |
| Electric – continued | | | | | | | | |
Reliant Energy, Inc., 7.875%, 6/15/2017(b) | | | | $ | 1,025,000 | | $ | 758,500 |
TXU Corp., Series P, 5.550%, 11/15/2014 | | | | | 920,000 | | | 686,556 |
TXU Corp., Series Q, 6.500%, 11/15/2024 | | | | | 1,515,000 | | | 964,869 |
TXU Corp., Series R, 6.550%, 11/15/2034 | | | | | 420,000 | | | 258,066 |
White Pine Hydro Portfolio LLC, 7.260%, 7/20/2015(d) | | | | | 1,000,000 | | | 963,875 |
| | | | | | | | |
| | | | | | | | 9,118,391 |
| | | | | | | | |
| Entertainment – 0.0% | | | | | | | | |
Six Flags, Inc., 9.625%, 6/01/2014(b) | | | | | 140,000 | | | 78,400 |
| | | | | | | | |
| Food & Beverage – 0.9% | | | | | | | | |
Chiquita Brands International, Inc., 7.500%, 11/01/2014(b) | | | | | 940,000 | | | 723,800 |
Dean Foods Co., 7.000%, 6/01/2016(b) | | | | | 225,000 | | | 195,750 |
Dole Food Co., Inc., 7.250%, 6/15/2010 | | | | | 415,000 | | | 365,200 |
Dole Food Co., Inc., 8.625%, 5/01/2009 | | | | | 50,000 | | | 47,750 |
Sara Lee Corp., 6.125%, 11/01/2032 | | | | | 690,000 | | | 611,416 |
| | | | | | | | |
| | | | | | | | 1,943,916 |
| | | | | | | | |
| Healthcare – 3.3% | | | | | | | | |
HCA, Inc., 5.750%, 3/15/2014 | | | | | 10,000 | | | 7,800 |
HCA, Inc., 6.250%, 2/15/2013 | | | | | 10,000 | | | 8,350 |
HCA, Inc., 6.375%, 1/15/2015 | | | | | 545,000 | | | 429,188 |
HCA, Inc., 6.500%, 2/15/2016 | | | | | 550,000 | | | 435,875 |
HCA, Inc., 6.750%, 7/15/2013 | | | | | 20,000 | | | 16,800 |
HCA, Inc., 7.050%, 12/01/2027 | | | | | 1,000,000 | | | 675,290 |
HCA, Inc., 7.190%, 11/15/2015 | | | | | 185,000 | | | 147,691 |
HCA, Inc., 7.500%, 12/15/2023 | | | | | 395,000 | | | 289,357 |
HCA, Inc., 7.500%, 11/06/2033 | | | | | 2,120,000 | | | 1,505,200 |
HCA, Inc., 7.690%, 6/15/2025 | | | | | 800,000 | | | 594,592 |
HCA, Inc., 8.360%, 4/15/2024 | | | | | 170,000 | | | 131,764 |
HCA, Inc., MTN, 7.580%, 9/15/2025 | | | | | 560,000 | | | 412,569 |
HCA, Inc., MTN, 7.750%, 7/15/2036 | | | | | 180,000 | | | 127,782 |
Tenet Healthcare Corp., 6.875%, 11/15/2031 | | | | | 3,355,000 | | | 2,281,400 |
| | | | | | | | |
| | | | | | | | 7,063,658 |
| | | | | | | | |
| Home Construction – 2.8% | | | | | | | | |
K. Hovnanian Enterprises, Inc., 6.250%, 1/15/2015 | | | | | 185,000 | | | 105,450 |
K. Hovnanian Enterprises, Inc., 6.250%, 1/15/2016 | | | | | 1,068,000 | | | 614,100 |
K. Hovnanian Enterprises, Inc., 6.375%, 12/15/2014 | | | | | 425,000 | | | 246,500 |
K. Hovnanian Enterprises, Inc., 6.500%, 1/15/2014 | | | | | 272,000 | | | 160,480 |
K. Hovnanian Enterprises, Inc., 7.500%, 5/15/2016 | | | | | 755,000 | | | 437,900 |
K. Hovnanian Enterprises, Inc., 7.750%, 5/15/2013 | | | | | 10,000 | | | 5,650 |
KB Home, 7.250%, 6/15/2018 | | | | | 1,260,000 | | | 1,033,200 |
Lennar Corp., 7.625%, 3/01/2009 | | | | | 766,000 | | | 739,190 |
Lennar Corp., Series B, 5.125%, 10/01/2010 | | | | | 1,320,000 | | | 1,108,800 |
Lennar Corp., Series B, 5.500%, 9/01/2014 | | | | | 95,000 | | | 61,750 |
Lennar Corp., Series B, 5.600%, 5/31/2015 | | | | | 2,000,000 | | | 1,300,000 |
Pulte Homes, Inc., 6.000%, 2/15/2035 | | | | | 400,000 | | | 286,000 |
| | | | | | | | |
| | | | | | | | 6,099,020 |
| | | | | | | | |
78
PORTFOLIO OF INVESTMENTS – as of September 30, 2008
Loomis Sayles Institutional High Income Fund – continued
| | | | | | | | |
| | | | | Principal Amount (‡) | | Value (†) |
| | | | | | | | |
| | | |
| BONDS AND NOTES – continued | | | | | | | | |
| | | |
| Independent Energy – 1.5% | | | | | | | | |
Chesapeake Energy Corp., 6.500%, 8/15/2017 | | | | $ | 155,000 | | $ | 135,625 |
Chesapeake Energy Corp., 6.875%, 11/15/2020 | | | | | 515,000 | | | 440,325 |
Connacher Oil and Gas Ltd., 10.250%, 12/15/2015, 144A | | | | | 249,000 | | | 239,040 |
Hilcorp Energy I LP, 7.750%, 11/01/2015, 144A | | | | | 985,000 | | | 847,100 |
Pioneer Natural Resources Co., 6.875%, 5/01/2018 | | | | | 820,000 | | | 730,098 |
Pioneer Natural Resources Co., 7.200%, 1/15/2028 | | | | | 920,000 | | | 792,061 |
| | | | | | | | |
| | | | | | | | 3,184,249 |
| | | | | | | | |
| Media Cable – 0.3% | | | | | | | | |
Virgin Media Finance PLC, 9.125%, 8/15/2016 | | | | | 685,000 | | | 573,688 |
| | | | | | | | |
| Media Non-Cable – 1.1% | | | | | | | | |
Clear Channel Communications, Inc., 4.900%, 5/15/2015 | | | | | 805,000 | | | 239,488 |
Clear Channel Communications, Inc., 5.500%, 9/15/2014 | | | | | 500,000 | | | 155,000 |
Clear Channel Communications, Inc., 5.500%, 12/15/2016 | | | | | 1,285,000 | | | 372,650 |
Clear Channel Communications, Inc., 5.750%, 1/15/2013 | | | | | 225,000 | | | 81,000 |
Clear Channel Communications, Inc., 6.875%, 6/15/2018 | | | | | 790,000 | | | 240,950 |
Idearc, Inc., 8.000%, 11/15/2016(b) | | | | | 1,598,000 | | | 435,455 |
R.H. Donnelley Corp., Series A-2, 6.875%, 1/15/2013(b) | | | | | 510,000 | | | 198,900 |
R.H. Donnelley Corp., Series A-4, 8.875%, 10/15/2017 | | | | | 1,460,000 | | | 496,400 |
Tribune Co., 5.250%, 8/15/2015 | | | | | 160,000 | | | 48,000 |
| | | | | | | | |
| | | | | | | | 2,267,843 |
| | | | | | | | |
| Metals & Mining – 0.8% | | | | | | | | |
Algoma Acquisition Corp., 9.875%, 6/15/2015, 144A | | | | | 1,245,000 | | | 1,122,056 |
Ryerson, Inc., 12.000%, 11/01/2015, 144A | | | | | 775,000 | | | 658,750 |
| | | | | | | | |
| | | | | | | | 1,780,806 |
| | | | | | | | |
| Non-Captive Consumer – 2.9% | | | | | | | | |
American General Finance Corp., MTN, 5.750%, 9/15/2016 | | | | | 700,000 | | | 320,044 |
Countrywide Home Loans, Inc., Series L, MTN, 4.000%, 3/22/2011 | | | | | 120,000 | | | 103,242 |
Hexion US Finance Corp/Hexion Nova Scotia Finance ULC, 9.750%, 11/15/2014 | | | | | 1,600,000 | | | 1,264,000 |
Residential Capital LLC, 8.500%, 6/01/2012 | | | | | 90,000 | | | 18,000 |
Residential Capital LLC, 8.500%, 4/17/2013 | | | | | 1,990,000 | | | 398,000 |
Residential Capital LLC, 8.875%, 6/30/2015 | | | | | 255,000 | | | 51,000 |
Residential Capital LLC, 9.625%, 5/15/2015, 144A | | | | | 1,026,000 | | | 246,240 |
SLM Corp., Series A, MTN, 6.500%, 6/15/2010 | | NZD | | | 4,720,000 | | | 2,621,462 |
SLM Corp., Series A, MTN, 8.450%, 6/15/2018 | | | | | 1,620,000 | | | 1,101,600 |
| | | | | | | | |
| | | | | | | | 6,123,588 |
| | | | | | | | |
79
| | | | | | | | |
| | | | | Principal Amount (‡) | | Value (†) |
| | | | | | | | |
| | | |
| BONDS AND NOTES – continued | | | | | | | | |
| | | |
| Non-Captive Diversified – 4.6% | | | | | | | | |
CIT Group Funding Co. of Canada, 5.200%, 6/01/2015 | | | | $ | 115,000 | | $ | 56,475 |
CIT Group, Inc., 4.750%, 12/15/2010 | | | | | 205,000 | | | 133,506 |
CIT Group, Inc., 5.400%, 2/13/2012 | | | | | 50,000 | | | 28,744 |
CIT Group, Inc., 5.400%, 1/30/2016 | | | | | 290,000 | | | 140,360 |
CIT Group, Inc., 5.650%, 2/13/2017 | | | | | 565,000 | | | 275,702 |
CIT Group, Inc., 5.800%, 10/01/2036 | | | | | 660,000 | | | 301,867 |
CIT Group, Inc., 5.850%, 9/15/2016 | | | | | 50,000 | | | 24,250 |
CIT Group, Inc., Series A, GMTN, 6.000%, 4/01/2036 | | | | | 70,000 | | | 28,700 |
CIT Group, Inc., EMTN, 3.800%, 11/14/2012 | | EUR | | | 300,000 | | | 227,922 |
CIT Group, Inc., EMTN, 4.650%, 9/19/2016 | | EUR | | | 1,050,000 | | | 724,458 |
CIT Group, Inc., EMTN, 5.000%, 5/13/2014 | | EUR | | | 200,000 | | | 144,026 |
CIT Group, Inc., EMTN, 5.500%, 12/20/2016 | | GBP | | | 300,000 | | | 266,012 |
CIT Group, Inc., GMTN, 4.250%, 2/01/2010 | | | | | 130,000 | | | 85,683 |
CIT Group, Inc., GMTN, 4.250%, 9/22/2011 | | EUR | | | 1,750,000 | | | 1,471,506 |
CIT Group, Inc., GMTN, 5.000%, 2/13/2014 | | | | | 210,000 | | | 118,790 |
CIT Group, Inc., GMTN, 5.000%, 2/01/2015 | | | | | 427,000 | | | 211,065 |
CIT Group, Inc., MTN, 4.250%, 3/17/2015 | | EUR | | | 1,260,000 | | | 869,470 |
CIT Group, Inc., MTN, 5.125%, 9/30/2014 | | | | | 85,000 | | | 41,918 |
General Electric Capital Corp., Series A, EMTN, 6.750%, 9/26/2016 | | NZD | | | 250,000 | | | 148,789 |
General Electric Capital Corp., Series A, MTN, 6.500%, 9/28/2015 | | NZD | | | 3,035,000 | | | 1,809,309 |
GMAC Canada Ltd., EMTN, 6.625%, 12/17/2010 | | GBP | | | 25,000 | | | 27,112 |
GMAC LLC, 6.000%, 12/15/2011 | | | | | 1,480,000 | | | 658,066 |
GMAC LLC, 6.625%, 5/15/2012 | | | | | 75,000 | | | 31,753 |
GMAC LLC, 6.750%, 12/01/2014 | | | | | 244,000 | | | 93,651 |
GMAC LLC, 6.875%, 9/15/2011 | | | | | 85,000 | | | 37,926 |
GMAC LLC, 6.875%, 8/28/2012 | | | | | 150,000 | | | 59,622 |
GMAC LLC, 7.000%, 2/01/2012 | | | | | 175,000 | | | 71,332 |
GMAC LLC, 8.000%, 11/01/2031 | | | | | 340,000 | | | 128,274 |
GMAC LLC, EMTN, 5.375%, 6/06/2011 | | EUR | | | 500,000 | | | 295,638 |
iStar Financial, Inc., 5.500%, 6/15/2012 | | | | | 65,000 | | | 33,150 |
iStar Financial, Inc., 5.650%, 9/15/2011 | | | | | 100,000 | | | 52,000 |
iStar Financial, Inc., 5.875%, 3/15/2016 | | | | | 20,000 | | | 9,800 |
iStar Financial, Inc., 6.050%, 4/15/2015 | | | | | 20,000 | | | 9,800 |
iStar Financial, Inc., 8.625%, 6/01/2013 | | | | | 1,770,000 | | | 867,300 |
iStar Financial, Inc., Series B, 5.700%, 3/01/2014 | | | | | 70,000 | | | 34,300 |
iStar Financial, Inc., Series B, 5.950%, 10/15/2013 | | | | | 565,000 | | | 293,800 |
| | | | | | | | |
| | | | | | | | 9,812,076 |
| | | | | | | | |
| Packaging – 1.0% | | | | | | | | |
Owens-Illinois, Inc., 7.800%, 5/15/2018 | | | | | 1,555,000 | | | 1,508,350 |
Stone Container Finance, 7.375%, 7/15/2014(b) | | | | | 980,000 | | | 754,600 |
| | | | | | | | |
| | | | | | | | 2,262,950 |
| | | | | | | | |
| Paper – 2.9% | | | | | | | | |
Abitibi Consolidated Co. of Canada, 15.500%, 7/15/2010, 144A | | | | | 110,000 | | | 77,550 |
Abitibi-Consolidated, Inc., 6.000%, 6/20/2013(b) | | | | | 250,000 | | | 66,250 |
Abitibi-Consolidated, Inc., 7.400%, 4/01/2018 | | | | | 15,000 | | | 3,450 |
Abitibi-Consolidated, Inc., 7.500%, 4/01/2028 | | | | | 140,000 | | | 32,200 |
80
PORTFOLIO OF INVESTMENTS – as of September 30, 2008
Loomis Sayles Institutional High Income Fund – continued
| | | | | | | | |
| | | | | Principal Amount (‡) | | Value (†) |
| | | | | | | | |
| | | |
| BONDS AND NOTES – continued | | | | | | | | |
| | | |
| Paper – continued | | | | | | | | |
Abitibi-Consolidated, Inc., 8.500%, 8/01/2029 | | | | $ | 15,000 | | $ | 3,600 |
Abitibi-Consolidated, Inc., 8.850%, 8/01/2030 | | | | | 90,000 | | | 21,600 |
Georgia-Pacific LLC, 7.250%, 6/01/2028 | | | | | 1,240,000 | | | 979,600 |
Georgia-Pacific LLC, 7.750%, 11/15/2029 | | | | | 1,165,000 | | | 961,125 |
Georgia-Pacific LLC, 8.000%, 1/15/2024 | | | | | 250,000 | | | 220,000 |
Georgia-Pacific LLC, 8.875%, 5/15/2031 | | | | | 765,000 | | | 665,550 |
Jefferson Smurfit Corp., 7.500%, 6/01/2013(b) | | | | | 515,000 | | | 417,150 |
Smurfit-Stone Container Enterprises, Inc., 8.000%, 3/15/2017(b) | | | | | 2,800,000 | | | 2,184,000 |
Westvaco Corp., 7.950%, 2/15/2031 | | | | | 320,000 | | | 306,340 |
Westvaco Corp., 8.200%, 1/15/2030 | | | | | 330,000 | | | 309,740 |
| | | | | | | | |
| | | | | | | | 6,248,155 |
| | | | | | | | |
| Pharmaceuticals – 2.0% | | | | | | | | |
Elan Financial PLC, 7.750%, 11/15/2011 | | | | | 3,665,000 | | | 3,316,825 |
Elan Financial PLC, 8.875%, 12/01/2013 | | | | | 1,085,000 | | | 911,400 |
| | | | | | | | |
| | | | | | | | 4,228,225 |
| | | | | | | | |
| Pipelines – 2.4% | | | | | | | | |
Colorado Interstate Gas Co., 5.950%, 3/15/2015 | | | | | 22,000 | | | 20,044 |
El Paso Corp., 6.950%, 6/01/2028 | | | | | 15,000 | | | 11,844 |
El Paso Corp., 7.420%, 2/15/2037 | | | | | 1,055,000 | | | 840,607 |
El Paso Corp., 7.800%, 8/01/2031 | | | | | 500,000 | | | 421,259 |
Kinder Morgan, Inc., Senior Note, 5.150%, 3/01/2015 | | | | | 50,000 | | | 42,375 |
Southern Natural Gas Co., 7.350%, 2/15/2031 | | | | | 95,000 | | | 83,294 |
Tennessee Gas Pipeline Co., 7.000%, 10/15/2028(b) | | | | | 890,000 | | | 762,687 |
Williams Cos., Inc., 7.500%, 1/15/2031 | | | | | 3,375,000 | | | 3,071,183 |
| | | | | | | | |
| | | | | | | | 5,253,293 |
| | | | | | | | |
| Property & Casualty Insurance – 0.2% | | | | | | | | |
MBIA Insurance Corp., (fixed rate to 1/15/2013, variable rate thereafter), 14.000%, 1/15/2033, 144A(b) | | | | | 690,000 | | | 365,700 |
| | | | | | | | |
| Railroads – 0.1% | | | | | | | | |
Missouri Pacific Railroad Co., 4.750%, 1/01/2020(d) | | | | | 30,000 | | | 22,800 |
Missouri Pacific Railroad Co., 5.000%, 1/01/2045(d) | | | | | 314,000 | | | 188,400 |
| | | | | | | | |
| | | | | | | | 211,200 |
| | | | | | | | |
| Retailers – 3.2% | | | | | | | | |
Dillard’s, Inc., 6.625%, 1/15/2018 | | | | | 500,000 | | | 310,000 |
Dillard’s, Inc., 7.000%, 12/01/2028 | | | | | 450,000 | | | 229,500 |
Dillard’s, Inc., 7.130%, 8/01/2018 | | | | | 750,000 | | | 476,250 |
Dillard’s, Inc., 7.750%, 7/15/2026 | | | | | 1,500,000 | | | 855,000 |
Foot Locker, Inc., 8.500%, 1/15/2022 | | | | | 1,679,000 | | | 1,519,495 |
Toys R Us, Inc., 7.375%, 10/15/2018 | | | | | 5,185,000 | | | 3,370,250 |
Toys R Us, Inc., 7.875%, 4/15/2013 | | | | | 197,000 | | | 153,660 |
| | | | | | | | |
| | | | | | | | 6,914,155 |
| | | | | | | | |
81
| | | | | | | | |
| | | | | Principal Amount (‡) | | | Value (†) |
| | | | | | | | |
| | | |
| BONDS AND NOTES – continued | | | | | | | | |
| | | |
| Sovereigns – 3.1% | | | | | | | | |
Indonesia Treasury Bond, Series FR43, 10.250%, 7/15/2022 | | IDR | | 1,881,000,000 | | | $ | 161,018 |
Indonesia Treasury Bond, Series ZC3, Zero Coupon Bond, 11/20/2012 | | IDR | | 4,897,000,000 | | | | 313,383 |
Mexican Fixed Rate Bonds, Series M-20, 8.000%, 12/07/2023 | | MXN | | 9,500 | (††) | | | 833,705 |
Mexican Fixed Rate Bonds, Series MI-10, 9.000%, 12/20/2012 | | MXN | | 365,000( | ††) | | | 3,415,744 |
Republic of Brazil, 10.250%, 1/10/2028 | | BRL | | 4,170,000 | | | | 1,925,138 |
| | | | | | | | |
| | | | | | | | 6,648,988 |
| | | | | | | | |
| Supermarkets – 1.1% | | | | | | | | |
Albertson’s, Inc., 7.450%, 8/01/2029 | | | | 1,525,000 | | | | 1,356,379 |
Albertson’s, Inc., 8.000%, 5/01/2031 | | | | 480,000 | | | | 444,842 |
Albertson’s, Inc., 8.700%, 5/01/2030 | | | | 180,000 | | | | 178,285 |
Albertson’s, Inc., Series C, MTN, 6.625%, 6/01/2028 | | | | 240,000 | | | | 194,447 |
American Stores Co., 8.000%, 6/01/2026 | | | | 110,000 | | | | 103,115 |
| | | | | | | | |
| | | | | | | | 2,277,068 |
| | | | | | | | |
| Supranational – 2.8% | | | | | | | | |
Inter-American Development Bank, EMTN, Zero Coupon Bond, 5/11/2009 | | BRL | | 11,000,000 | | | | 5,144,779 |
Inter-American Development Bank, EMTN, Zero Coupon Bond, 5/20/2013 | | IDR | | 8,600,000,000 | | | | 517,186 |
International Bank for Reconstruction & Development, 9.500%, 5/27/2010 | | ISK | | 42,500,000 | | | | 399,750 |
| | | | | | | | |
| | | | | | | | 6,061,715 |
| | | | | | | | |
| Technology – 3.5% | | | | | | | | |
Affiliated Computer Services, Inc., 5.200%, 6/01/2015 | | | | 496,000 | | | | 400,520 |
Amkor Technology, Inc., 7.125%, 3/15/2011 | | | | 400,000 | | | | 360,000 |
Amkor Technology, Inc., 7.750%, 5/15/2013 | | | | 1,600,000 | | | | 1,368,000 |
Corning, Inc., 6.850%, 3/01/2029 | | | | 701,000 | | | | 619,209 |
Freescale Semiconductor, Inc., 10.125%, 12/15/2016(b) | | | | 1,047,000 | | | | 670,080 |
Lucent Technologies, Inc., 6.450%, 3/15/2029 | | | | 4,115,000 | | | | 2,510,150 |
Motorola, Inc., 5.220%, 10/01/2097 | | | | 80,000 | | | | 44,682 |
Motorola, Inc., 6.500%, 11/15/2028(b) | | | | 70,000 | | | | 52,311 |
Motorola, Inc., 6.625%, 11/15/2037 | | | | 70,000 | | | | 51,026 |
Nortel Networks Ltd., 6.875%, 9/01/2023 | | | | 1,000,000 | | | | 400,000 |
Northern Telecom Capital Corp., 7.875%, 6/15/2026 | | | | 2,280,000 | | | | 1,003,200 |
| | | | | | | | |
| | | | | | | | 7,479,178 |
| | | | | | | | |
| Textile – 0.4% | | | | | | | | |
Jones Apparel Group, Inc., 6.125%, 11/15/2034 | | | | 890,000 | | | | 556,250 |
Kellwood Co., 7.625%, 10/15/2017(d) | | | | 500,000 | | | | 275,000 |
| | | | | | | | |
| | | | | | | | 831,250 |
| | | | | | | | |
| Transportation Services – 2.4% | | | | | | | | |
APL Ltd., 8.000%, 1/15/2024(d) | | | | 2,685,000 | | | | 2,013,750 |
Atlas Air, Inc., Series 1999-1B, 7.630%, 7/02/2016(e) | | | | 397,855 | | | | 389,898 |
82
PORTFOLIO OF INVESTMENTS – as of September 30, 2008
Loomis Sayles Institutional High Income Fund – continued
| | | | | | | | |
| | | | | Principal Amount (‡) | | Value (†) |
| | | | | | | | |
| | | |
| BONDS AND NOTES – continued | | | | | | | | |
| | | |
| Transportation Services – continued | | | | | | | | |
Atlas Air, Inc., Series 1999-1C, 8.770%, 7/02/2012(e) | | | | $ | 399,542 | | $ | 367,578 |
Atlas Air, Inc., Series 2000-1, Class C, 9.702%, 7/02/2011(e) | | | | | 40,344 | | | 36,713 |
Atlas Air, Inc., Series B, 7.680%, 1/02/2014(e) | | | | | 2,207,572 | | | 2,207,572 |
Atlas Air, Inc., Series C, 8.010%, 1/02/2010(e) | | | | | 289,324 | | | 225,673 |
| | | | | | | | |
| | | | | | | | 5,241,184 |
| | | | | | | | |
| Wireless – 2.4% | | | | | | | | |
ALLTEL Corp., 7.875%, 7/01/2032 | | | | | 540,000 | | | 535,950 |
Fairpoint Communications, Inc., 13.125%, 4/01/2018, 144A | | | | | 720,000 | | | 655,200 |
Nextel Communications, Inc., Series D, 7.375%, 8/01/2015 | | | | | 1,835,000 | | | 1,211,100 |
Nextel Communications, Inc., Series E, 6.875%, 10/31/2013 | | | | | 700,000 | | | 476,000 |
Nextel Communications, Inc., Series F, 5.950%, 3/15/2014 | | | | | 705,000 | | | 472,350 |
Sprint Capital Corp., 6.875%, 11/15/2028 | | | | | 1,045,000 | | | 700,150 |
Sprint Capital Corp., 6.900%, 5/01/2019 | | | | | 815,000 | | | 631,625 |
True Move Co. Ltd., 10.750%, 12/16/2013, 144A | | | | | 600,000 | | | 408,000 |
| | | | | | | | |
| | | | | | | | 5,090,375 |
| | | | | | | | |
| Wirelines – 3.8% | | | | | | | | |
Bell Canada, Series M-17, 6.100%, 3/16/2035 | | CAD | | | 220,000 | | | 150,472 |
Bell Canada, MTN, 5.000%, 2/15/2017 | | CAD | | | 105,000 | | | 77,926 |
Bell Canada, MTN, 7.300%, 2/23/2032 | | CAD | | | 275,000 | | | 212,401 |
Frontier Communications Corp., 7.875%, 1/15/2027 | | | | | 860,000 | | | 645,000 |
Hawaiian Telcom Communications, Inc., Series B, 12.500%, 5/01/2015(b) | | | | | 50,000 | | | 7,000 |
Level 3 Financing, Inc., 8.750%, 2/15/2017 | | | | | 95,000 | | | 68,875 |
Level 3 Financing, Inc., 9.250%, 11/01/2014 | | | | | 290,000 | | | 218,950 |
Qwest Capital Funding, Inc., 6.500%, 11/15/2018 | | | | | 1,034,000 | | | 752,235 |
Qwest Capital Funding, Inc., 6.875%, 7/15/2028 | | | | | 800,000 | | | 556,000 |
Qwest Capital Funding, Inc., 7.625%, 8/03/2021 | | | | | 290,000 | | | 220,400 |
Qwest Capital Funding, Inc., 7.750%, 2/15/2031 | | | | | 1,550,000 | | | 1,131,500 |
Qwest Corp., 6.500%, 6/01/2017 | | | | | 210,000 | | | 168,000 |
Qwest Corp., 6.875%, 9/15/2033 | | | | | 1,936,000 | | | 1,301,960 |
Qwest Corp., 7.200%, 11/10/2026 | | | | | 500,000 | | | 367,500 |
Qwest Corp., 7.250%, 9/15/2025 | | | | | 515,000 | | | 383,675 |
Qwest Corp., 7.250%, 10/15/2035 | | | | | 1,407,000 | | | 998,970 |
Qwest Corp., 7.500%, 6/15/2023 | | | | | 1,115,000 | | | 875,275 |
| | | | | | | | |
| | | | | | | | 8,136,139 |
| | | | | | | | |
| | | |
| TOTAL NON-CONVERTIBLE BONDS | | | | | | | | |
(Identified Cost $176,813,108) | | | | | | | | 145,942,060 |
| | | | | | | | |
| | | |
| CONVERTIBLE BONDS – 7.7% | | | | | | | | |
| | | |
| Healthcare – 0.5% | | | | | | | | |
Advanced Medical Optics, Inc., 3.250%, 8/01/2026 | | | | | 285,000 | | | 185,962 |
Affymetrix, Inc., 3.500%, 1/15/2038 | | | | | 1,216,000 | | | 851,200 |
| | | | | | | | |
| | | | | | | | 1,037,162 |
| | | | | | | | |
83
| | | | | | | | |
| | | | | Principal Amount (‡) | | Value (†) |
| | | | | | | | |
| | | |
| BONDS AND NOTES – continued | | | | | | | | |
| | | |
| Industrial Other – 0.5% | | | | | | | | |
Incyte Corp., 3.500%, 2/15/2011 | | | | $ | 1,100,000 | | $ | 1,007,875 |
| | | | | | | | |
| Media Non-Cable – 0.1% | | | | | | | | |
Liberty Media LLC, 3.500%, 1/15/2031 | | | | | 62,152 | | | 27,502 |
Sinclair Broadcast Group, Inc., (Step to 2.000% on 1/15/2011), 4.875%, 7/15/2018(f) | | | | | 155,000 | | | 140,663 |
| | | | | | | | |
| | | | | | | | 168,165 |
| | | | | | | | |
| Non-Captive Consumer – 0.2% | | | | | | | | |
Countrywide Financial Corp., Series A, Zero Coupon Bond, 4/15/2037(b) | | | | | 108,000 | | | 105,840 |
Countrywide Financial Corp., Series B, 0.554%, 5/15/2037(b)(c) | | | | | 292,000 | | | 265,720 |
| | | | | | | | |
| | | | | | | | 371,560 |
| | | | | | | | |
| Pharmaceuticals – 2.9% | | | | | | | | |
Epix Pharmaceuticals, Inc., 3.000%, 6/15/2024 | | | | | 230,000 | | | 115,000 |
Human Genome Sciences, Inc., 2.250%, 8/15/2012 | | | | | 980,000 | | | 654,150 |
Nektar Therapeutics, 3.250%, 9/28/2012 | | | | | 1,180,000 | | | 594,425 |
Valeant Pharmaceuticals International, 3.000%, 8/16/2010 | | | | | 1,230,000 | | | 1,162,350 |
Valeant Pharmaceuticals International, 4.000%, 11/15/2013 | | | | | 980,000 | | | 917,525 |
Vertex Pharmaceuticals, Inc., 4.750%, 2/15/2013 | | | | | 1,805,000 | | | 2,723,294 |
| | | | | | | | |
| | | | | | | | 6,166,744 |
| | | | | | | | |
| REITs – 0.4% | | | | | | | | |
Host Hotels & Resorts, Inc., 2.625%, 4/15/2027, 144A | | | | | 1,170,000 | | | 906,750 |
| | | | | | | | |
| Technology – 1.3% | | | | | | | | |
Kulicke & Soffa Industries, Inc., 0.500%, 11/30/2008 | | | �� | | 595,000 | | | 575,662 |
Kulicke & Soffa Industries, Inc., 0.875%, 6/01/2012 | | | | | 230,000 | | | 157,263 |
Kulicke & Soffa Industries, Inc., 1.000%, 6/30/2010 | | | | | 350,000 | | | 274,313 |
Maxtor Corp., 5.750%, 3/01/2012(d) | | | | | 1,489,000 | | | 1,369,880 |
Nortel Networks Corp., 2.125%, 4/15/2014 | | | | | 795,000 | | | 380,606 |
Richardson Electronics Ltd., 7.750%, 12/15/2011 | | | | | 132,000 | | | 99,000 |
| | | | | | | | |
| | | | | | | | 2,856,724 |
| | | | | | | | |
| Textile – 0.0% | | | | | | | | |
Dixie Yarns, Inc., 7.000%, 5/15/2012 | | | | | 19,000 | | | 16,910 |
| | | | | | | | |
| Transportation Services – 0.0% | | | | | | | | |
Builders Transportation, Inc., 8.000%, 8/15/2005(g) | | | | | 75,000 | | | — |
| | | | | | | | |
| Wirelines – 1.8% | | | | | | | | |
Level 3 Communications, Inc., 2.875%, 7/15/2010 | | | | | 2,005,000 | | | 1,576,431 |
Level 3 Communications, Inc., 3.500%, 6/15/2012 | | | | | 155,000 | | | 109,469 |
Level 3 Communications, Inc., 6.000%, 9/15/2009 | | | | | 1,820,000 | | | 1,710,800 |
Level 3 Communications, Inc., 6.000%, 3/15/2010 | | | | | 575,000 | | | 503,125 |
| | | | | | | | |
| | | | | | | | 3,899,825 |
| | | | | | | | |
| | | |
| TOTAL CONVERTIBLE BONDS | | | | | | | | |
(Identified Cost $17,165,648) | | | | | | | | 16,431,715 |
| | | | | | | | |
| | | |
| TOTAL BONDS AND NOTES | | | | | | | | |
(Identified Cost $193,978,756) | | | | | | | | 162,373,775 |
| | | | | | | | |
84
PORTFOLIO OF INVESTMENTS – as of September 30, 2008
Loomis Sayles Institutional High Income Fund – continued
| | | | | | | | |
| | | | | Principal Amount (‡) | | Value (†) |
| | | | | | | | |
| | | |
| BANK LOANS – 0.2% | | | | | | | | |
| | | |
| Consumer Products – 0.0% | | | | | | | | |
Mega Bloks, Inc., Term Loan B, 8.750%, 7/26/2012(h) | | | | $ | 99,743 | | $ | 77,800 |
| | | | | | | | |
| Food & Beverage – 0.0% | | | | | | | | |
Dole Food Co., Inc., LOC, 4.788%, 4/12/2013(h) | | | | | 6,120 | | | 5,367 |
Dole Food Co., Inc., Term Loan, 4.738%, 4/12/2013(h) | | | | | 4,109 | | | 3,603 |
Dole Food Co., Inc., Tranche C Term Loan, 4.795%, 4/12/2013(h) | | | | | 21,561 | | | 18,909 |
| | | | | | | | |
| | | | | | | | 27,879 |
| | | | | | | | |
| Media Non-Cable – 0.2% | | | | | | | | |
Idearc, Inc., Term Loan B, 5.767%, 11/17/2014(h) | | | | | 527,695 | | | 314,638 |
Tribune Co., Tranche X, 5.541%, 6/04/2009(h) | | | | | 25,600 | | | 23,712 |
| | | | | | | | |
| | | | | | | | 338,350 |
| | | | | | | | |
| Wirelines – 0.0% | | | | | | | | |
Hawaiian Telcom Communications, Inc., Term Loan C, 6.262%, 6/01/2014(h) | | | | | 155,000 | | | 106,618 |
| | | | | | | | |
| | | |
| TOTAL BANK LOANS | | | | | | | | |
(Identified Cost $679,612) | | | | | | | | 550,647 |
| | | | | | | | |
| | | |
| | | | | Shares | | |
| | | |
| COMMON STOCKS – 3.3% | | | | | | | | |
| | | |
| Biotechnology – 1.3% | | | | | | | | |
Vertex Pharmaceuticals, Inc.(b)(e) | | | | | 82,587 | | | 2,745,192 |
| | | | | | | | |
| Communications Equipment – 0.5% | | | | | | | | |
Corning, Inc.(b) | | | | | 69,766 | | | 1,091,140 |
| | | | | | | | |
| Containers & Packaging – 0.6% | | | | | | | | |
Owens-Illinois, Inc.(e) | | | | | 40,621 | | | 1,194,257 |
| | | | | | | | |
| Food Products – 0.0% | | | | | | | | |
ConAgra Foods, Inc. | | | | | 3,100 | | | 60,326 |
| | | | | | | | |
| Household Durables – 0.1% | | | | | | | | |
KB Home(b) | | | | | 6,775 | | | 133,332 |
| | | | | | | | |
| Oil, Gas & Consumable Fuels – 0.0% | | | | | | | | |
Chesapeake Energy Corp. | | | | | 2,846 | | | 102,058 |
| | | | | | | | |
| Pharmaceuticals – 0.4% | | | | | | | | |
Bristol-Myers Squibb Co. | | | | | 43,200 | | | 900,720 |
| | | | | | | | |
| REITs-Apartments – 0.3% | | | | | | | | |
Apartment Investment & Management Co.(b) | | | | | 4,746 | | | 166,205 |
Associated Estates Realty Corp. | | | | | 32,565 | | | 424,322 |
| | | | | | | | |
| | | | | | | | 590,527 |
| | | | | | | | |
| REITs-Shopping Malls – 0.1% | | | | | | | | |
Developers Diversified Realty Corp.(b) | | | | | 7,125 | | | 225,791 |
| | | | | | | | |
| | | |
| TOTAL COMMON STOCKS | | | | | | | | |
(Identified Cost $5,170,771) | | | | | | | | 7,043,343 |
| | | | | | | | |
85
| | | | | | | |
| | | | | Shares | | Value (†) |
| | | | | | | |
| PREFERRED STOCKS – 1.6% | | | | | | | |
| | | |
| CONVERTIBLE PREFERRED STOCKS – 1.3% | | | | | | | |
| | | |
| Automotive – 0.2% | | | | | | | |
Ford Motor Co. Capital Trust II, 6.500%(b) | | | | 27,177 | | $ | 418,526 |
General Motors Corp., 6.250% | | | | 11,236 | | | 89,888 |
| | | | | | | |
| | | | | | | 508,414 |
| | | | | | | |
| Commercial Banks – 0.0% | | | | | | | |
Wachovia Corp., Series L, Class A, 7.500% | | | | 138 | | | 53,130 |
| | | | | | | |
| Diversified Consumer Services – 0.1% | | | | | | | |
Six Flags, Inc., 7.250%(b) | | | | 39,950 | | | 223,321 |
| | | | | | | |
| Diversified Financial Services – 0.1% | | | | | | | |
CIT Group, Inc., 8.750% | | | | 4,500 | | | 148,185 |
| | | | | | | |
| Electric Utilities – 0.4% | | | | | | | |
AES Trust III, 6.750% | | | | 17,119 | | | 656,514 |
CMS Energy Trust I, 7.750% | | | | 4,150 | | | 166,000 |
| | | | | | | |
| | | | | | | 822,514 |
| | | | | | | |
| Machinery – 0.1% | | | | | | | |
United Rentals Trust, 6.500% | | | | 14,328 | | | 315,216 |
| | | | | | | |
| Oil, Gas & Consumable Fuels – 0.1% | | | | | | | |
El Paso Energy Capital Trust I, 4.750% | | | | 5,700 | | | 189,881 |
| | | | | | | |
| REITs-Hotel – 0.0% | | | | | | | |
FelCor Lodging Trust, Inc., Series A, 7.800% | | | | 1,100 | | | 13,475 |
| | | | | | | |
| Semiconductors & Semiconductor Equipment – 0.3% | | | | | | | |
Lucent Technologies Capital Trust, 7.750% | | | | 1,150 | | | 534,347 |
| | | | | | | |
| | | |
| TOTAL CONVERTIBLE PREFERRED STOCKS | | | | | | | |
(Identified Cost $5,063,611) | | | | | | | 2,808,483 |
| | | | | | | |
| | | |
| NON-CONVERTIBLE PREFERRED STOCKS – 0.3% | | | | | | | |
| | | |
| Capital Markets – 0.1% | | | | | | | |
Lehman Brothers Holdings Capital Trust I, 6.000%(i) | | | | 725 | | | 116 |
Lehman Brothers Holdings, Inc., 5.670%,(i) | | | | 1,362 | | | 95 |
Lehman Brothers Holdings, Inc., 5.940%,(i) | | | | 1,535 | | | 54 |
Lehman Brothers Holdings, Inc., 6.500%,(i) | | | | 6,334 | | | 317 |
Lehman Brothers Holdings, Inc., 7.950%,(i) | | | | 14,011 | | | 840 |
Merrill Lynch & Co., Inc., 6.375%, | | | | 18,000 | | | 246,420 |
| | | | | | | |
| | | | | | | 247,842 |
| | | | | | | |
| Thrifts & Mortgage Finance – 0.2% | | | | | | | |
Countrywide Capital IV, 6.750%, 4/01/2033 | | | | 7,075 | | | 62,968 |
Federal Home Loan Mortgage Corp., 5.000%,(e)(k) | | | | 1,350 | | | 2,430 |
Federal Home Loan Mortgage Corp., 5.790%,(e)(k) | | | | 7,100 | | | 14,200 |
Federal Home Loan Mortgage Corp., 5.810%,(e)(k) | | | | 1,600 | | | 2,800 |
Federal Home Loan Mortgage Corp., 6.000%,(e)(k) | | | | 1,700 | | | 3,060 |
Federal Home Loan Mortgage Corp., 5.700%,(e)(k) | | | | 2,200 | | | 4,114 |
Federal Home Loan Mortgage Corp., 6.420%,(e)(k) | | | | 2,200 | | | 3,960 |
Federal Home Loan Mortgage Corp., 5.900%,(e)(k) | | | | 4,700 | | | 5,875 |
Federal Home Loan Mortgage Corp., 5.570%,(e)(k) | | | | 31,000 | | | 30,690 |
Federal Home Loan Mortgage Corp., 5.660%,(e)(k) | | | | 11,100 | | | 13,875 |
Federal Home Loan Mortgage Corp., 6.550%,(e)(k) | | | | 4,150 | | | 4,482 |
Federal Home Loan Mortgage Corp., 8.375%(e)(k) | | | | 28,100 | | | 45,803 |
86
PORTFOLIO OF INVESTMENTS – as of September 30, 2008
Loomis Sayles Institutional High Income Fund – continued
| | | | | | | | |
| | | | | Shares/Principal Amount (‡) | | Value (†) |
| | | | | | | | |
| |
| NON-CONVERTIBLE PREFERRED STOCKS – continued | | | |
| | |
| Thrifts & Mortgage Finance – continued | | | | | | |
Federal National Mortgage Association, 5.810%,(k) | | | | | 1,400 | | $ | 5,040 |
Federal National Mortgage Association, 5.375%,(k) | | | | | 1,850 | | | 6,105 |
Federal National Mortgage Association, 5.125%,(k) | | | | | 900 | | | 3,150 |
Federal National Mortgage Association, 4.750%,(k) | | | | | 4,850 | | | 15,035 |
Federal National Mortgage Association, 6.750%,(k) | | | | | 2,200 | | | 3,960 |
Federal National Mortgage Association, 8.250%,(b)(k) | | | | | 40,550 | | | 88,399 |
| | | | | | | | |
| | | | | | | | 315,946 |
| | | | | | | | |
| | | |
| TOTAL NON-CONVERTIBLE PREFERRED STOCKS | | | | | | | | |
(Identified Cost $2,955,610) | | | | | | | | 563,788 |
| | | | | | | | |
| | | |
| TOTAL PREFERRED STOCKS | | | | | | | | |
(Identified Cost $8,019,221) | | | | | | | | 3,372,271 |
| | | | | | | | |
| | | |
| CLOSED END INVESTMENT COMPANIES – 1.2% | | | | | | | | |
BlackRock Senior High Income Fund, Inc. | | | | | 15,920 | | | 52,218 |
DWS High Income Trust | | | | | 22,522 | | | 74,773 |
Dreyfus High Yield Strategies Fund | | | | | 78,008 | | | 232,464 |
Highland Credit Strategies Fund(b) | | | | | 31,505 | | | 301,188 |
Van Kampen High Income Trust II | | | | | 42,002 | | | 96,184 |
Western Asset High Income Opportunity Fund, Inc. | | | | | 176,050 | | | 764,057 |
Western Asset Managed High Income Fund, Inc.(b) | | | | | 222,550 | | | 994,798 |
| | | | | | | | |
| | | |
| TOTAL CLOSED END INVESTMENT COMPANIES | | | | | | | | |
(Identified Cost $3,511,223) | | | | | | | | 2,515,682 |
| | | | | | | | |
| | | |
| SHORT-TERM INVESTMENTS – 22.2% | | | | | | | | |
| State Street Navigator Securities Lending Prime Portfolio(j) | | | | | 12,836,133 | | | 12,836,133 |
| Repurchase Agreement with State Street Corp. dated 9/30/08 at 1.300% to be repurchased at $8,723 on 10/01/08 collateralized by $10,000 Federal Home Loan Bank, 5.300% due 10/03/12 with a value of $10,261, including accrued interest (Note 2h of Notes to Financial Statements) | | | | $ | 8,723 | | | 8,723 |
| Tri-Party Repurchase Agreement with Fixed Income Clearing Corporation, dated 9/30/08 at 1.300% to be repurchased at $34,683,252 on 10/01/08 collateralized by $34,770,000 Federal National Mortgage Association, 4.330% due 7/28/11 with a value of $35,378,475, including accrued interest (Note 2h of Notes to Financial Statements) | | | | | 34,682,000 | | | 34,682,000 |
| | | | | | | | |
87
| | | | | | | |
| | | | | | | Value (†) |
| | | |
| SHORT-TERM INVESTMENTS – continued | | | | | | | |
| | | |
| TOTAL SHORT-TERM INVESTMENTS | | | | | | | |
(Identified Cost $47,526,856) | | | | | | | 47,526,856 |
| | | | | | | |
| | | |
| TOTAL INVESTMENTS – 104.3% | | | | | | | |
(Identified Cost $258,886,439)(a) | | | | | | | 223,382,574 |
Other Assets Less Liabilities—(4.3)% | | | | | | | (9,181,623) |
| | | | | | | |
| | | |
| NET ASSETS – 100.0% | | | | | | $ | 214,200,951 |
| | | | | | | |
| | | |
(‡) Principal amount stated in U.S. dollars unless otherwise noted. | | | | | | | |
(†) See Note 2a of Notes to Financial Statements. | | | | | | | |
(††) Amount shown represents units. One unit represents a principal amount of 100. | | | |
(a) Federal Tax Information: | | | | | | | |
At September 30, 2008, the net unrealized depreciation on investments based on a cost of $258,932,731 for federal income tax purposes was as follows: | | | |
Aggregate gross unrealized appreciation for all investments in which there is an excess of value over tax cost | | $ | 7,279,669 |
Aggregate gross unrealized depreciation for all investments in which there is an excess of tax cost over value | | | (42,829,826) |
| | | | | | | |
Net unrealized depreciation | | | | | | $ | (35,550,157) |
| | | | | | | |
| (b) | All or a portion of this security was on loan to brokers at September 30, 2008. |
| (c) | Variable rate security. Rate as of September 30, 2008 is disclosed. |
| (d) | Illiquid security. At September 30, 2008, the value of these securities amounted to $6,001,515 or 2.8% of net assets. |
| (e) | Non-income producing security. |
| (f) | Step Bond: Coupon is a fixed rate for an initial period then resets at a specified date and rate. |
| (g) | Bankrupt issuer. Security remains in the Portfolio of Investments pending final resolution of bankruptcy proceedings. |
| (h) | Variable rate security. Rate shown represents the weighted average rate at September 30, 2008. |
| (i) | Issuer has filed for bankruptcy. |
| (j) | Represents investment of security lending collateral. |
| (k) | Future dividend payments have been eliminated as the issuer has been placed in conservatorship. |
| 144A | Securities exempt from registration under Rule 144A of the Securities Act of 1933. These securities may be resold in transactions exempt from registration, normally to qualified institutional buyers. At September 30, 2008, the total value of these securities amounted to $14,018,438 or 6.5% of net assets. |
| EMTN | Euro Medium Term Note |
| GMTN | Global Medium Term Note |
| REITs | Real Estate Investment Trusts |
Key to Abbreviations: BRL: Brazilian Real; CAD: Canadian Dollar; EUR: Euro; GBP: British Pound; IDR: Indonesian Rupiah; ISK: Icelandic Krona; MXN: Mexican Peso; NZD: New Zealand Dollar; THB: Thai Baht
88
PORTFOLIO OF INVESTMENTS – as of September 30, 2008
Loomis Sayles Institutional High Income Fund – continued
NET ASSET SUMMARY AT SEPTEMBER 30, 2008 (Unaudited)
| | | |
Wirelines | | 5.6 | % |
Pharmaceuticals | | 5.3 | |
Technology | | 4.8 | |
Non-Captive Diversified | | 4.6 | |
Electric | | 4.3 | |
Automotive | | 4.2 | |
Healthcare | | 3.8 | |
Banking | | 3.5 | |
Retailers | | 3.2 | |
Non-Captive Consumer | | 3.1 | |
Sovereigns | | 3.1 | |
Paper | | 2.9 | |
Home Construction | | 2.8 | |
Supranational | | 2.8 | |
Chemicals | | 2.5 | |
Pipelines | | 2.4 | |
Transportation Services | | 2.4 | |
Wireless | | 2.4 | |
Other Investments, less than 2% each | | 18.4 | |
Short-Term Investments | | 22.2 | |
| | | |
Total Investments | | 104.3 | |
Other assets less liabilities | | (4.3 | ) |
| | | |
Net Assets | | 100.0 | % |
| | | |
See accompanying notes to financial statements.
89
PORTFOLIO OF INVESTMENTS – as of September 30, 2008
Loomis Sayles Intermediate Duration Fixed Income Fund
| | | | | | | | |
| | | | | Principal Amount (‡) | | Value (†) |
| | | | | | | | |
| | | |
| BONDS AND NOTES – 93.3% of Net Assets | | | | | | | | |
| | | |
| ABS Credit Card – 2.2% | | | | | | | | |
BA Credit Card Trust, Series 2008-A5, Class A5, 3.688%, 12/16/2013(b) | | | | $ | 260,000 | | $ | 255,388 |
Citibank Credit Card Issuance Trust, Series 2008-C6, Class C6, 6.300%, 6/20/2014 | | | | | 255,000 | | | 221,576 |
Discover Card Master Trust I, 2.538%, 10/16/2014(b) | | | | | 150,000 | | | 138,695 |
MBNA Credit Card Master Note Trust, Series 2004-A3, Class A3, 2.748%, 8/16/2021(b) | | | | | 140,000 | | | 117,338 |
| | | | | | | | |
| | | | | | | | 732,997 |
| | | | | | | | |
| Aerospace & Defense – 0.0% | | | | | | | | |
Boeing Capital Corp., 6.100%, 3/01/2011 | | | | | 5,000 | | | 5,249 |
| | | | | | | | |
| Asset-Backed Securities – 2.3% | | | | | | | | |
Americredit Automobile Receivables Trust, Series 2004-DF, Class A4, 3.430%, 7/06/2011 | | | | | 69,376 | | | 67,191 |
Capital Auto Receivables Asset Trust, Series 2004-2, Class A4, 3.750%, 7/15/2009 | | | | | 6,351 | | | 6,344 |
Countrywide Asset Backed Certificates, Series 2004-S1, Class A2, 3.872%, 3/25/2020 | | | | | 44,006 | | | 42,302 |
Countrywide Asset-Backed Certificates, Series 2004-S1, Class A3, 4.615%, 2/25/2035 | | | | | 135,000 | | | 96,943 |
Countrywide Asset-Backed Certificates, Series 2006-S1, Class A2, 5.549%, 8/25/2021 | | | | | 282,101 | | | 256,327 |
Ford Credit Auto Owner Trust, 4.380%, 1/15/2010 | | | | | 95,023 | | | 94,911 |
Navistar Financial Corp. Owner Trust, Series 2004-B, Class A4, 3.530%, 10/15/2012 | | | | | 155,049 | | | 153,965 |
USAA Auto Owner Trust, Series 2006-1, Class A3, 5.010%, 9/15/2010 | | | | | 46,557 | | | 46,655 |
| | | | | | | | |
| | | | | | | | 764,638 |
| | | | | | | | |
| Automotive – 0.4% | | | | | | | | |
Ford Motor Credit Co. LLC, 7.000%, 10/01/2013 | | | | | 235,000 | | | 144,421 |
| | | | | | | | |
| Banking – 6.7% | | | | | | | | |
Bank of America Corp., 5.650%, 5/01/2018 | | | | | 345,000 | | | 290,591 |
Bank One Corp., 5.900%, 11/15/2011 | | | | | 5,000 | | | 4,881 |
Citigroup, Inc., 5.300%, 10/17/2012 | | | | | 425,000 | | | 378,345 |
Credit Suisse NY, 6.000%, 2/15/2018 | | | | | 110,000 | | | 95,832 |
HSBC Finance Corp., 4.750%, 4/15/2010 | | | | | 350,000 | | | 344,154 |
JPMorgan Chase & Co., 5.600%, 6/01/2011 | | | | | 475,000 | | | 468,822 |
Suntrust Banks, Inc., 5.250%, 11/05/2012 | | | | | 190,000 | | | 170,683 |
Wachovia Corp., 5.300%, 10/15/2011 | | | | | 175,000 | | | 145,928 |
Wells Fargo & Co., 5.250%, 10/23/2012 | | | | | 305,000 | | | 292,754 |
| | | | | | | | |
| | | | | | | | 2,191,990 |
| | | | | | | | |
| Brokerage – 3.5% | | | | | | | | |
Bear Stearns Cos., Inc., 5.350%, 2/01/2012 | | | | | 130,000 | | | 123,683 |
Goldman Sachs Group, Inc., 4.500%, 6/15/2010 | | | | | 300,000 | | | 278,484 |
Goldman Sachs Group, Inc., 5.300%, 2/14/2012 | | | | | 10,000 | | | 9,012 |
Goldman Sachs Group, Inc., 5.450%, 11/01/2012 | | | | | 155,000 | | | 131,392 |
Merrill Lynch & Co., Inc., 5.450%, 2/05/2013 | | | | | 350,000 | | | 315,287 |
Morgan Stanley, 5.300%, 3/01/2013 | | | | | 400,000 | | | 274,720 |
| | | | | | | | |
| | | | | | | | 1,132,578 |
| | | | | | | | |
90
PORTFOLIO OF INVESTMENTS – as of September 30, 2008
Loomis Sayles Intermediate Duration Fixed Income Fund – continued
| | | | | | | | |
| | | | | Principal Amount (‡) | | Value (†) |
| | | | | | | | |
| | | |
| BONDS AND NOTES – continued | | | | | | | | |
| | | |
| Chemicals – 0.5% | | | | | | | | |
Lubrizol Corp., 4.625%, 10/01/2009 | | | | $ | 5,000 | | $ | 4,976 |
PPG Industries, Inc., 5.750%, 3/15/2013 | | | | | 170,000 | | | 168,486 |
| | | | | | | | |
| | | | | | | | 173,462 |
| | | | | | | | |
| Construction Machinery – 0.7% | | | | | | | | |
Caterpillar Financial Services, MTN, 4.850%, 12/07/2012 | | | | | 160,000 | | | 155,735 |
John Deere Capital Corp., MTN, 4.500%, 4/03/2013 | | | | | 90,000 | | | 85,902 |
| | | | | | | | |
| | | | | | | | 241,637 |
| | | | | | | | |
| Consumer Products – 1.0% | | | | | | | | |
Koninklijke (Royal) Philips Electronics NV, 4.625%, 3/11/2013 | | | | | 175,000 | | | 170,538 |
Newell Rubberamid, Inc., 5.500%, 4/15/2013 | | | | | 170,000 | | | 161,812 |
| | | | | | | | |
| | | | | | | | 332,350 |
| | | | | | | | |
| Diversified Manufacturing – 0.5% | | | | | | | | |
Honeywell International, Inc., 4.250%, 3/01/2013 | | | | | 175,000 | | | 169,990 |
| | | | | | | | |
| Electric – 2.2% | | | | | | | | |
Carolina Power & Light Co., 6.500%, 7/15/2012 | | | | | 5,000 | | | 5,150 |
Duke Energy Corp., 5.625%, 11/30/2012 | | | | | 300,000 | | | 303,840 |
Nisource Finance Corp., 7.875%, 11/15/2010 | | | | | 145,000 | | | 149,134 |
Pacific Gas & Electric Co., 3.600%, 3/01/2009 | | | | | 5,000 | | | 4,960 |
Virginia Electric and Power Co., 5.100%, 11/30/2012 | | | | | 260,000 | | | 254,501 |
| | | | | | | | |
| | | | | | | | 717,585 |
| | | | | | | | |
| Entertainment – 1.7% | | | | | | | | |
Time Warner, Inc., 5.875%, 11/15/2016 | | | | | 225,000 | | | 197,748 |
Time Warner, Inc., 6.500%, 11/15/2036 | | | | | 45,000 | | | 34,173 |
Walt Disney Co., 5.700%, 7/15/2011 | | | | | 315,000 | | | 324,472 |
| | | | | | | | |
| | | | | | | | 556,393 |
| | | | | | | | |
| Food & Beverage – 1.6% | | | | | | | | |
General Mills, Inc., 5.650%, 9/10/2012 | | | | | 225,000 | | | 227,097 |
HJ Heinz Finance Co., 6.000%, 3/15/2012 | | | | | 100,000 | | | 102,182 |
Kellogg Co., 5.125%, 12/03/2012 | | | | | 175,000 | | | 174,501 |
Kraft Foods, Inc., 5.625%, 11/01/2011 | | | | | 5,000 | | | 5,018 |
| | | | | | | | |
| | | | | | | | 508,798 |
| | | | | | | | |
| Government Sponsored – 1.1% | | | | | | | | |
Federal National Mortgage Association, 2.290%, 2/19/2009 | | SGD | | | 500,000 | | | 348,592 |
| | | | | | | | |
| Healthcare – 2.1% | | | | | | | | |
Hospira, Inc., 5.550%, 3/30/2012 | | | | | 250,000 | | | 249,862 |
Medco Health Solutions, Inc., 6.125%, 3/15/2013 | | | | | 170,000 | | | 172,932 |
UnitedHealth Group, Inc., 4.875%, 2/15/2013 | | | | | 180,000 | | | 172,043 |
WellPoint, Inc., 5.250%, 1/15/2016 | | | | | 100,000 | | | 92,112 |
| | | | | | | | |
| | | | | | | | 686,949 |
| | | | | | | | |
| Healthcare Insurance – 0.6% | | | | | | | | |
Aetna, Inc., 7.875%, 3/01/2011 | | | | | 170,000 | | | 180,531 |
| | | | | | | | |
91
| | | | | | | | |
| | | | | Principal Amount (‡) | | Value (†) |
| | | | | | | | |
| | | |
| BONDS AND NOTES – continued | | | | | | | | |
| | | |
| Hybrid ARMs – 1.1% | | | | | | | | |
Indymac Index Mortgage Loan Trust, Series 2006-AR25, Class 3A1, 6.321%, 9/25/2036(b) | | | | $ | 556,242 | | $ | 372,658 |
| | | | | | | | |
| Independent Energy – 0.5% | | | | | | | | |
XTO Energy, Inc., 4.900%, 2/01/2014 | | | | | 5,000 | | | 4,670 |
XTO Energy, Inc., 5.750%, 12/15/2013 | | | | | 170,000 | | | 163,203 |
| | | | | | | | |
| | | | | | | | 167,873 |
| | | | | | | | |
| Media Cable – 2.2% | | | | | | | | |
Comcast Cable Communications, 7.125%, 6/15/2013 | | | | | 195,000 | | | 196,893 |
Comcast Corp., 4.950%, 6/15/2016 | | | | | 160,000 | | | 137,919 |
Cox Communications, Inc., 4.625%, 1/15/2010 | | | | | 5,000 | | | 4,927 |
Cox Communications, Inc., 5.450%, 12/15/2014 | | | | | 215,000 | | | 200,327 |
Time Warner Cable, Inc., 6.200%, 7/01/2013 | | | | | 170,000 | | | 164,925 |
| | | | | | | | |
| | | | | | | | 704,991 |
| | | | | | | | |
| Media Non-Cable – 0.5% | | | | | | | | |
Thomson Reuters Corp., 5.950%, 7/15/2013 | | | | | 175,000 | | | 174,793 |
| | | | | | | | |
| Metals & Mining – 0.9% | | | | | | | | |
United States Steel Corp., 6.050%, 6/01/2017 | | | | | 175,000 | | | 152,066 |
Vale Overseas Ltd., 6.250%, 1/23/2017 | | | | | 165,000 | | | 154,183 |
| | | | | | | | |
| | | | | | | | 306,249 |
| | | | | | | | |
| Mortgage Related – 27.9% | | | | | | | | |
Banc of America Commercial Mortgage, Inc., Series 2006-2, Class A4, 5.739%, 5/10/2045(b) | | | | | 205,000 | | | 185,517 |
Banc of America Commercial Mortgage, Inc., Series 2007-2, Class A2, 5.634%, 4/10/2049 | | | | | 490,000 | | | 457,575 |
Bear Stearns Commercial Mortgage Securities, Series 2007-PW16, Class A4, 5.712%, 6/11/2040(b) | | | | | 250,000 | | | 215,391 |
Citigroup/Deutsche Bank Commercial Mortgage Trust, Series 2006-CD2, Class A2, 5.408%, 1/15/2046 | | | | | 140,000 | | | 135,536 |
Countrywide Alternative Loan Trust, Series 2006-J5, Class 4A1, 6.014%, 7/25/2021(b) | | | | | 275,942 | | | 239,639 |
Federal Home Loan Mortgage Corp., 4.500%, 12/01/2019 | | | | | 15,351 | | | 15,058 |
Federal Home Loan Mortgage Corp., 5.000%, 5/01/2019 | | | | | 5,728 | | | 5,737 |
Federal Home Loan Mortgage Corp., 5.000%, 1/01/2020 | | | | | 6,936 | | | 6,925 |
Federal Home Loan Mortgage Corp., 5.000%, 7/01/2023 | | | | | 994,411 | | | 986,624 |
Federal Home Loan Mortgage Corp., 5.000%, 8/15/2024 | | | | | 496,348 | | | 499,959 |
Federal Home Loan Mortgage Corp., 5.500%, 3/01/2013 | | | | | 9,863 | | | 10,012 |
Federal Home Loan Mortgage Corp., 5.500%, 8/01/2022 | | | | | 191,459 | | | 192,886 |
Federal Home Loan Mortgage Corp., 6.000%, 11/01/2012 | | | | | 16,991 | | | 17,508 |
Federal Home Loan Mortgage Corp., 6.343%, 1/01/2035(b) | | | | | 252,415 | | | 258,742 |
92
PORTFOLIO OF INVESTMENTS – as of September 30, 2008
Loomis Sayles Intermediate Duration Fixed Income Fund – continued
| | | | | | | | |
| | | | | Principal Amount (‡) | | Value (†) |
| | | | | | | | |
| | | |
| BONDS AND NOTES – continued | | | | | | | | |
| | | |
| Mortgage Related – continued | | | | | | | | |
Federal Home Loan Mortgage Corp., 6.500%, 1/01/2024 | | | | $ | 4,378 | | $ | 4,545 |
Federal Home Loan Mortgage Corp., 7.000%, 2/01/2009 | | | | | 139 | | | 141 |
Federal Home Loan Mortgage Corp., 8.000%, 7/01/2025 | | | | | 466 | | | 506 |
Federal National Mortgage Association, 4.500%, 12/01/2019 | | | | | 19,248 | | | 18,905 |
Federal National Mortgage Association, 5.000%, 1/01/2019 | | | | | 312,094 | | | 313,121 |
Federal National Mortgage Association, 5.000%, 2/01/2019 | | | | | 452,096 | | | 452,170 |
Federal National Mortgage Association, 5.375%, 6/12/2017(c) | | | | | 680,000 | | | 712,960 |
Federal National Mortgage Association, 5.500%, 1/01/2017 | | | | | 49,078 | | | 50,006 |
Federal National Mortgage Association, 5.500%, 1/01/2017 | | | | | 56,542 | | | 57,559 |
Federal National Mortgage Association, 5.500%, 2/01/2017 | | | | | 29,765 | | | 30,328 |
Federal National Mortgage Association, 5.500%, 8/01/2017 | | | | | 681,547 | | | 693,800 |
Federal National Mortgage Association, 5.500%, 9/01/2017 | | | | | 150,547 | | | 153,254 |
Federal National Mortgage Association, 5.500%, 11/01/2017 | | | | | 998 | | | 1,016 |
Federal National Mortgage Association, 5.500%, 1/01/2020(d) | | | | | 664,042 | | | 673,075 |
Federal National Mortgage Association, 5.500%, 3/01/2020(d) | | | | | 554,034 | | | 560,012 |
Federal National Mortgage Association, 6.000%, 9/01/2021 | | | | | 9,757 | | | 9,950 |
Federal National Mortgage Association, 7.500%, 6/01/2016 | | | | | 2,661 | | | 2,792 |
Federal National Mortgage Association, 8.000%, 6/01/2015 | | | | | 3,738 | | | 3,964 |
Government National Mortgage Association, 6.500%, 12/15/2023 | | | | | 10,734 | | | 11,028 |
Government National Mortgage Association, 8.500%, 9/15/2022 | | | | | 3,247 | | | 3,588 |
Government National Mortgage Association, 9.500%, 1/15/2019 | | | | | 7,169 | | | 7,986 |
GS Mortgage Securities Corp. II, Series 2005-GG4, Class A4A, 4.751%, 7/10/2039 | | | | | 205,000 | | | 183,924 |
GS Mortgage Securities Corp. II, Series 2006-GG8, Class A2, 5.479%, 11/10/2039 | | | | | 410,000 | | | 393,172 |
JPMorgan Chase Commercial Mortgage Securities Corp., Series 2006-LDP7, Class A2, 5.861%, 4/15/2045(b) | | | | | 375,000 | | | 365,246 |
LB-UBS Commercial Mortgage Trust, Series 2005-C3, Class A3, 4.647%, 7/15/2030 | | | | | 230,000 | | | 218,751 |
93
| | | | | | | | |
| | | | | Principal Amount (‡) | | Value (†) |
| | | | | | | | |
| | | |
| BONDS AND NOTES – continued | | | | | | | | |
| | | |
| Mortgage Related – continued | | | | | | | | |
Merrill Lynch/Countrywide Commercial Mortgage Trust, Series 2006-1, Class A4, 5.424%, 2/12/2039(b) | | | | $ | 320,000 | | $ | 285,033 |
Merrill Lynch/Countrywide Commercial Mortgage Trust, Series 2006-2, Class A4, 5.909%, 6/12/2046(b) | | | | | 210,000 | | | 191,710 |
Morgan Stanley Capital I, Series 2005-T19, Class A4A, 4.890%, 6/12/2047 | | | | | 330,000 | | | 294,993 |
Morgan Stanley Capital I, Series 2006-T23, Series A2, 5.742%, 8/12/2041(b) | | | | | 205,000 | | | 199,535 |
| | | | | | | | |
| | | | | | | | 9,120,179 |
| | | | | | | | |
| Non-Captive Consumer – 0.6% | | | | | | | | |
American Express Co., 5.500%, 9/12/2016 | | | | | 85,000 | | | 72,542 |
American Express Co., 6.150%, 8/28/2017 | | | | | 45,000 | | | 38,293 |
American General Finance Corp., Series H, MTN, 5.375%, 10/01/2012 | | | | | 5,000 | | | 2,733 |
SLM Corp., Series A, MTN, 5.000%, 10/01/2013 | | | | | 10,000 | | | 6,200 |
SLM Corp., Series A, MTN, 5.375%, 5/15/2014 | | | | | 10,000 | | | 6,200 |
SLM Corp., Series A, MTN, 8.450%, 6/15/2018 | | | | | 80,000 | | | 54,400 |
| | | | | | | | |
| | | | | | | | 180,368 |
| | | | | | | | |
| Non-Captive Diversified – 3.2% | | | | | | | | |
CIT Group, Inc., 5.650%, 2/13/2017 | | | | | 255,000 | | | 124,432 |
CIT Group, Inc., 5.850%, 9/15/2016 | | | | | 20,000 | | | 9,700 |
General Electric Capital Corp., Series A, GMTN, 3.485%, 3/08/2012 | | SGD | | | 500,000 | | | 347,851 |
General Electric Capital Corp., Series A, GMTN, 5.250%, 10/19/2012 | | | | | 345,000 | | | 324,354 |
International Lease Finance Corp., Series Q, MTN, 5.750%, 6/15/2011 | | | | | 205,000 | | | 147,732 |
iStar Financial, Inc., 5.150%, 3/01/2012 | | | | | 170,000 | | | 85,000 |
| | | | | | | | |
| | | | | | | | 1,039,069 |
| | | | | | | | |
| Oil Field Services – 0.5% | | | | | | | | |
Weatherford International Ltd., 5.150%, 3/15/2013 | | | | | 175,000 | | | 168,534 |
| | | | | | | | |
| Pharmaceuticals – 0.8% | | | | | | | | |
Abbott Laboratories, 5.150%, 11/30/2012 | | | | | 240,000 | | | 242,756 |
Schering-Plough Corp., 5.550%, 12/01/2013 | | | | | 5,000 | | | 4,835 |
| | | | | | | | |
| | | | | | | | 247,591 |
| | | | | | | | |
| Pipelines – 1.5% | | | | | | | | |
Energy Transfer Partners LP, 6.000%, 7/01/2013 | | | | | 170,000 | | | 166,016 |
Kinder Morgan Energy Partners LP, 5.000%, 12/15/2013 | | | | | 185,000 | | | 171,344 |
Spectra Energy Capital LLC, 5.668%, 8/15/2014 | | | | | 175,000 | | | 167,258 |
| | | | | | | | |
| | | | | | | | 504,618 |
| | | | | | | | |
| Railroads – 1.6% | | | | | | | | |
Burlington Northern Santa Fe Corp., 6.125%, 3/15/2009 | | | | | 205,000 | | | 204,969 |
Canadian Pacific Railway Co., 5.750%, 5/15/2013 | | | | | 170,000 | | | 164,996 |
Union Pacific Corp., 5.750%, 11/15/2017 | | | | | 160,000 | | | 148,095 |
| | | | | | | | |
| | | | | | | | 518,060 |
| | | | | | | | |
94
PORTFOLIO OF INVESTMENTS – as of September 30, 2008
Loomis Sayles Intermediate Duration Fixed Income Fund – continued
| | | | | | | | |
| | | | | Principal Amount (‡) | | Value (†) |
| | | | | | | | |
| | | |
| BONDS AND NOTES – continued | | | | | | | | |
| | | |
| REITs – 3.4% | | | | | | | | |
Colonial Realty LP, 4.750%, 2/01/2010 | | | | $ | 55,000 | | $ | 53,163 |
Colonial Realty LP, 4.800%, 4/01/2011 | | | | | 125,000 | | | 118,750 |
Developers Diversified Realty Corp., 3.875%, 1/30/2009 | | | | | 10,000 | | | 9,840 |
ERP Operating LP, 6.625%, 3/15/2012 | | | | | 165,000 | | | 163,838 |
Federal Realty Investment Trust, 5.400%, 12/01/2013 | | | | | 215,000 | | | 200,581 |
First Industrial LP, 5.250%, 6/15/2009 | | | | | 10,000 | | | 9,829 |
ProLogis Trust, 5.500%, 4/01/2012 | | | | | 410,000 | | | 393,148 |
Simon Property Group LP, 5.300%, 5/30/2013 | | | | | 170,000 | | | 158,787 |
| | | | | | | | |
| | | | | | | | 1,107,936 |
| | | | | | | | |
| Retailers – 1.2% | | | | | | | | |
CVS Caremark Corp., 5.750%, 6/01/2017 | | | | | 160,000 | | | 149,519 |
J.C. Penney Corp., Inc., 5.750%, 2/15/2018 | | | | | 50,000 | | | 42,006 |
Macy’s Retail Holdings, Inc., 5.350%, 3/15/2012 | | | | | 205,000 | | | 188,782 |
| | | | | | | | |
| | | | | | | | 380,307 |
| | | | | | | | |
| Supermarkets – 0.6% | | | | | | | | |
Kroger Co., 6.200%, 6/15/2012 | | | | | 50,000 | | | 50,490 |
Kroger Co., 6.400%, 8/15/2017 | | | | | 35,000 | | | 33,559 |
Kroger Co., 6.750%, 4/15/2012 | | | | | 115,000 | | | 117,727 |
| | | | | | | | |
| | | | | | | | 201,776 |
| | | | | | | | |
| Technology – 4.2% | | | | | | | | |
Agilent Technologies, Inc., 6.500%, 11/01/2017 | | | | | 120,000 | | | 109,394 |
Corning, Inc., 6.200%, 3/15/2016 | | | | | 45,000 | | | 43,448 |
Equifax, Inc., 7.000%, 7/01/2037 | | | | | 85,000 | | | 71,691 |
IBM International Group Capital, 5.050%, 10/22/2012 | | | | | 230,000 | | | 231,920 |
Jabil Circuit, Inc., 5.875%, 7/15/2010 | | | | | 350,000 | | | 336,000 |
National Semiconductor Corp., 6.600%, 6/15/2017 | | | | | 175,000 | | | 164,193 |
Oracle Corp., 4.950%, 4/15/2013 | | | | | 170,000 | | | 169,451 |
Pitney Bowes, Inc., 5.250%, 1/15/2037 | | | | | 95,000 | | | 87,438 |
Xerox Corp., 6.400%, 3/15/2016 | | | | | 170,000 | | | 158,319 |
| | | | | | | | |
| | | | | | | | 1,371,854 |
| | | | | | | | |
| Treasuries – 12.3% | | | | | | | | |
U.S. Treasury STRIPS, Zero Coupon Bond, 2/15/2015 | | | | | 535,000 | | | 427,268 |
U.S. Treasury Notes, 2.750%, 2/28/2013(c) | | | | | 565,000 | | | 562,087 |
U.S. Treasury Notes, 3.375%, 11/30/2012(c) | | | | | 710,000 | | | 727,084 |
U.S. Treasury Notes, 4.000%, 2/15/2015(c)(d) | | | | | 775,000 | | | 813,871 |
U.S. Treasury Notes, 4.000%, 8/15/2018(c) | | | | | 120,000 | | | 121,706 |
U.S. Treasury Notes, 4.250%, 8/15/2014(c) | | | | | 65,000 | | | 69,210 |
U.S. Treasury Notes, 4.625%, 2/15/2017 | | | | | 170,000 | | | 180,904 |
U.S. Treasury Notes, 4.750%, 5/15/2014(c) | | | | | 175,000 | | | 191,133 |
U.S. Treasury Notes, 4.750%, 8/15/2017(c) | | | | | 670,000 | | | 718,208 |
U.S. Treasury Notes, 5.000%, 2/15/2011(c) | | | | | 200,000 | | | 213,875 |
| | | | | | | | |
| | | | | | | | 4,025,346 |
| | | | | | | | |
| Wireless – 0.9% | | | | | | | | |
Nextel Communications, Inc., Series F, 5.950%, 3/15/2014 | | | | | 5,000 | | | 3,350 |
Sprint Nextel Corp., 6.000%, 12/01/2016 | | | | | 170,000 | | | 130,900 |
Vodafone Group Plc, 5.350%, 2/27/2012 | | | | | 175,000 | | | 171,925 |
| | | | | | | | |
| | | | | | | | 306,175 |
| | | | | | | | |
95
| | | | | | | | |
| | | | | Shares/Principal Amount (‡) | | Value (†) |
| | | | | | | | |
| | | |
| BONDS AND NOTES – continued | | | | | | | | |
| | | |
| Wirelines – 2.3% | | | | | | | | |
AT&T, Inc., 5.100%, 9/15/2014 | | | | $ | 180,000 | | $ | 168,352 |
Embarq Corp., 7.995%, 6/01/2036 | | | | | 155,000 | | | 110,842 |
Qwest Corp., 5.625%, 11/15/2008 | | | | | 110,000 | | | 108,900 |
Telecom Italia Capital SA, 4.950%, 9/30/2014 | | | | | 185,000 | | | 156,005 |
Verizon New England, Inc., 6.500%, 9/15/2011 | | | | | 5,000 | | | 4,957 |
Verizon Virginia, Inc., Series A, 4.625%, 3/15/2013 | | | | | 230,000 | | | 211,672 |
| | | | | | | | |
| | | | | | | | 760,728 |
| | | | | | | | |
| | | |
| TOTAL BONDS AND NOTES | | | | | | | | |
(Identified Cost $32,432,073) | | | | | | | | 30,547,265 |
| | | | | | | | |
| | | |
| SHORT-TERM INVESTMENTS – 18.9% | | | | | | | | |
| State Street Navigator Securities Lending Prime Portfolio(e) | | | | | 4,238,526 | | | 4,238,526 |
| Federal Home Loan Mortgage Corp., Discount Notes, 2.050%, 11/04/08(f) | | | | | 200,000 | | | 199,613 |
| Federal National Mortgage Association, Discount Notes, 2.380%, 10/27/2008(f) | | | | | 445,000 | | | 444,839 |
| Federal National Mortgage Association, Discount Notes, 2.250%, 10/28/08(f) | | | | | 970,000 | | | 968,363 |
| Tri-Party Repurchase Agreement with Fixed Income Clearing Corporation, dated 9/30/08 at 1.300% to be repurchased at $352,013 on 10/01/08 collateralized by $360,000 Federal Home Loan Bank, 3.750% due 8/18/09 valued at $363,000 including accrued interest (Note 2h of Notes to Financial Statements) | | | | | 352,000 | | | 352,000 |
| | | | | | | | |
| | | |
| TOTAL SHORT-TERM INVESTMENTS | | | | | | | | |
(Identified Cost $6,202,737) | | | | | | | | 6,203,341 |
| | | | | | | | |
| | | |
| TOTAL INVESTMENTS – 112.2% | | | | | | | | |
(Identified Cost $38,634,810)(a) | | | | | | | | 36,750,606 |
Other Assets Less Liabilities—(12.2)% | | | | | | | | (4,002,762) |
| | | | | | | | |
| | | |
| NET ASSETS – 100.0% | | | | | | | $ | 32,747,844 |
| | | | | | | | |
| |
(‡) Principal amount stated in U.S. dollars unless otherwise noted. | | | |
(†) See Note 2a of Notes to Financial Statements. | | | |
(a) Federal Tax Information: | | | |
At September 30, 2008, the net unrealized depreciation on investments based on a cost of $38,698,411 for federal income tax purposes was as follows: | | | |
Aggregate gross unrealized appreciation for all investments in which there is an excess of value over tax cost | | $ | 113,836 |
Aggregate gross unrealized depreciation for all investments in which there is an excess of tax cost over value | | | (2,061,641) |
| | | | | | | | |
Net unrealized depreciation | | $ | (1,947,805) |
| | | | | | | | |
| (b) | Variable rate security. Rate as of September 30, 2008 is disclosed. |
| (c) | All or a portion of this security was on loan to brokers at September 30, 2008. |
| (d) | All or a portion of this security is held as collateral for open futures contracts. |
| (e) | Represents investment of securities lending collateral. |
| (f) | Rate represents discount rate at time of purchase. |
| GMTN | Global Medium Term Note |
| REITs | Real Estate Investment Trusts |
96
PORTFOLIO OF INVESTMENTS – as of September 30, 2008
Loomis Sayles Intermediate Duration Fixed Income Fund – continued
| STRIPS | Separate Trading of Registered Interest and Principal of Securities |
Key to Abbreviations: SGD Singapore Dollar
At September 30, 2008 open futures contracts purchased were as follows:
| | | | | | | | | | | |
| Futures | | Expiration
Date | | Contracts | | Notional
Value | | Unrealized
Depreciation | |
10 YearU.S. Treasury Note | | 12/19/2008 | | 9 | | $ | 1,031,625 | | $ | (8,735 | ) |
NET ASSET SUMMARY AT SEPTEMBER 30, 2008 (Unaudited)
| | | |
Mortgage Related | | 27.9 | % |
Treasuries | | 12.3 | |
Banking | | 6.7 | |
Technology | | 4.2 | |
Brokerage | | 3.5 | |
REITs | | 3.4 | |
Non-Captive Diversified | | 3.2 | |
Asset-Backed Securities | | 2.3 | |
Wirelines | | 2.3 | |
ABS Credit Card | | 2.2 | |
Electric | | 2.2 | |
Media Cable | | 2.2 | |
Healthcare | | 2.1 | |
Other Investments, less than 2% each | | 18.8 | |
Short-Term Investments | | 18.9 | |
| | | |
Total Investments | | 112.2 | |
Other assets less liabilities (including variation margin on open Futures Contracts) | | (12.2 | ) |
| | | |
Net Assets | | 100.0 | % |
| | | |
See accompanying notes to financial statements.
97
PORTFOLIO OF INVESTMENTS – as of September 30, 2008
Loomis Sayles Investment Grade Fixed Income Fund
| | | | | | | | |
| | | | | Principal Amount (‡) | | Value (†) |
| | | | | | | | |
| | |
| BONDS AND NOTES – 91.6% of Net Assets | | | | | | |
| | | |
| NON-CONVERTIBLE BONDS – 90.6% | | | | | | | | |
| | | |
| ABS Car Loan – 1.1% | | | | | | | | |
ARG Funding Corp., Series 2005-2A, Class A5, 3.348%, 5/20/2011, 144A(b) | | | | $ | 3,245,000 | | $ | 2,981,481 |
| | | | | | | | |
| ABS Credit Card – 0.3% | | | | | | | | |
World Financial Network Credit Card, Series 2008-B, Class M, 7.800%, 10/15/2013 | | | | | 732,000 | | | 727,464 |
| | | | | | | | |
| Aerospace & Defense – 0.1% | | | | | | | | |
Boeing Capital Corp., 6.500%, 2/15/2012 | | | | | 165,000 | | | 175,335 |
| | | | | | | | |
| Airlines – 1.7% | | | | | | | | |
Delta Air Lines, Inc., Series 2007-1, Class B, 8.021%, 8/10/2022 | | | | | 2,344,635 | | | 1,594,352 |
Qantas Airways Ltd., 6.050%, 4/15/2016, 144A | | | | | 3,455,000 | | | 3,162,918 |
| | | | | | | | |
| | | | | | | | 4,757,270 |
| | | | | | | | |
| Asset-Backed Securities – 1.1% | | | | | | | | |
Community Program Loan Trust, Series 1987-A, Class A5, 4.500%, 4/01/2029 | | | | | 2,500,000 | | | 2,220,500 |
Countrywide Asset-Backed Certificates, Series 2006-S1, Class A2, 5.549%, 8/25/2021 | | | | | 326,825 | | | 296,964 |
Countrywide Asset-Backed Certificates, Series 2006-S3, Class A3, 6.287%, 6/25/2021 | | | | | 455,000 | | | 182,000 |
Countrywide Asset-Backed Certificates, Series 2006-S4, Class A3, 5.804%, 7/25/2034 | | | | | 499,938 | | | 324,959 |
Navistar Financial Corp. Owner Trust, Series 2005-A, Class A3, 4.220%, 2/15/2010 | | | | | 21,841 | | | 21,843 |
| | | | | | | | |
| | | | | | | | 3,046,266 |
| | | | | | | | |
| Automotive – 0.4% | | | | | | | | |
Ford Motor Co., 6.375%, 2/01/2029 | | | | | 2,665,000 | | | 986,050 |
Ford Motor Credit Co. LLC, 7.375%, 10/28/2009 | | | | | 150,000 | | | 120,595 |
General Motors Corp., 8.250%, 7/15/2023 | | | | | 50,000 | | | 19,625 |
| | | | | | | | |
| | | | | | | | 1,126,270 |
| | | | | | | | |
| Banking – 6.1% | | | | | | | | |
BAC Capital Trust VI, 5.625%, 3/08/2035 | | | | | 1,045,000 | | | 797,752 |
Barclays Financial LLC, 4.060%, 9/16/2010, 144A | | KRW | | | 940,000,000 | | | 792,530 |
Barclays Financial LLC, 4.160%, 2/22/2010, 144A | | THB | | | 70,000,000 | | | 2,044,182 |
Barclays Financial LLC, 4.460%, 9/23/2010, 144A | | KRW | | | 1,950,000,000 | | | 1,656,518 |
Barclays Financial LLC, EMTN, 4.100%, 3/22/2010, 144A | | THB | | | 17,000,000 | | | 496,043 |
BNP Paribas SA, EMTN, Zero Coupon Bond, 6/13/2011, 144A | | IDR | | | 7,484,000,000 | | | 572,927 |
Citibank NA, 15.000%, 7/02/2010, 144A | | BRL | | | 4,000,000 | | | 2,143,759 |
Countrywide Financial Corp., 6.250%, 5/15/2016(c) | | | | | 230,000 | | | 163,742 |
JPMorgan Chase & Co., Zero Coupon Bond, 5/17/2010, 144A | | BRL | | | 8,035,000 | | | 3,396,632 |
JPMorgan Chase & Co., Zero Coupon Bond, 3/28/2011, 144A | | IDR | | | 8,972,574,000 | | | 707,149 |
JPMorgan Chase & Co., Zero Coupon Bond, 3/28/2011, 144A | | IDR | | | 5,376,000,000 | | | 423,125 |
JPMorgan Chase & Co., 4.750%, 5/01/2013 | | | | | 60,000 | | | 55,838 |
98
PORTFOLIO OF INVESTMENTS – as of September 30, 2008
Loomis Sayles Investment Grade Fixed Income Fund – continued
| | | | | | | |
| | | | | Principal Amount (‡) | | Value (†) |
| | | | | | | |
| | | |
| BONDS AND NOTES – continued | | | | | | | |
| | | |
| Banking – continued | | | | | | | |
JPMorgan Chase London, Zero Coupon Bond, 10/21/2010, 144A | | IDR | | 9,533,078,500 | | $ | 795,299 |
Rabobank Nederland, 10.250%, 9/10/2009, 144A | | ISK | | 65,000,000 | | | 604,217 |
Rabobank Nederland, EMTN, 14.000%, 1/28/2009, 144A | | ISK | | 220,000,000 | | | 2,096,245 |
Washington Mutual Finance Corp., 6.875%, 5/15/2011 | | | | 135,000 | | | 130,062 |
| | | | | | | |
| | | | | | | 16,876,020 |
| | | | | | | |
| Brokerage – 3.9% | | | | | | | |
Bear Stearns Co., Inc. (The), 5.550%, 1/22/2017 | | | | 230,000 | | | 197,510 |
Goldman Sachs Group LP, 5.000%, 10/01/2014 | | | | 1,725,000 | | | 1,438,766 |
Goldman Sachs Group, Inc. (The), 5.150%, 1/15/2014 | | | | 870,000 | | | 714,516 |
Lehman Brothers Holdings, Inc., 6.875%, 7/17/2037(d) | | | | 2,030,000 | | | 2,538 |
Lehman Brothers Holdings, Inc., MTN, (fixed rate to 5/03/2027, variable rate thereafter), 6.000%, 5/03/2032(d) | | | | 155,000 | | | 194 |
Merrill Lynch & Co., Inc., 6.110%, 1/29/2037 | | | | 3,770,000 | | | 2,617,194 |
Merrill Lynch & Co., Inc., Series C, MTN, 5.000%, 1/15/2015 | | | | 235,000 | | | 192,282 |
Morgan Stanley, 3.875%, 1/15/2009 | | | | 2,630,000 | | | 2,419,647 |
Morgan Stanley, 4.750%, 4/01/2014 | | | | 245,000 | | | 129,873 |
Morgan Stanley, 5.375%, 10/15/2015 | | | | 1,300,000 | | | 805,733 |
Morgan Stanley, EMTN, 5.450%, 1/09/2017 | | | | 260,000 | | | 161,280 |
Morgan Stanley, Series F, MTN, 5.550%, 4/27/2017 | | | | 800,000 | | | 495,944 |
Morgan Stanley, Series F, MTN, 5.950%, 12/28/2017 | | | | 260,000 | | | 162,876 |
Morgan Stanley, Series F, MTN, 6.625%, 4/01/2018 | | | | 2,245,000 | | | 1,485,721 |
| | | | | | | |
| | | | | | | 10,824,074 |
| | | | | | | |
| Building Materials – 0.2% | | | | | | | |
Masco Corp., 5.850%, 3/15/2017 | | | | 500,000 | | | 421,989 |
| | | | | | | |
| Chemicals – 1.8% | | | | | | | |
Lubrizol Corp., 6.500%, 10/01/2034 | | | | 2,005,000 | | | 1,802,250 |
Methanex Corp., 6.000%, 8/15/2015 | | | | 980,000 | | | 862,047 |
PPG Industries, Inc., 6.650%, 3/15/2018 | | | | 2,410,000 | | | 2,380,037 |
| | | | | | | |
| | | | | | | 5,044,334 |
| | | | | | | |
| Distributors – 0.7% | | | | | | | |
Equitable Resources, Inc., 6.500%, 4/01/2018(c) | | | | 2,150,000 | | | 2,051,293 |
| | | | | | | |
| Diversified Manufacturing – 0.1% | | | | | | | |
General Electric Co., 5.000%, 2/01/2013 | | | | 310,000 | | | 285,515 |
| | | | | | | |
| Electric – 5.1% | | | | | | | |
AmerenEnergy Generating Co., Series H, 7.000%, 4/15/2018 | | | | 2,800,000 | | | 2,611,162 |
Baltimore Gas & Electric Co., 5.200%, 6/15/2033 | | | | 500,000 | | | 340,262 |
Bruce Mansfield Unit, 6.850%, 6/01/2034(e) | | | | 1,550,000 | | | 1,545,660 |
Cleveland Electric Illuminating Co. (The), 5.950%, 12/15/2036 | | | | 960,000 | | | 763,207 |
Commonwealth Edison Co., 4.700%, 4/15/2015 | | | | 555,000 | | | 500,432 |
99
| | | | | | | | |
| | | | | Principal Amount (‡) | | Value (†) |
| | | | | | | | |
| | | |
| BONDS AND NOTES – continued | | | | | | | | |
| | | |
| Electric – continued | | | | | | | | |
Commonwealth Edison Co., 4.750%, 12/01/2011(e) | | | | $ | 41,000 | | $ | 38,991 |
Commonwealth Edison Co., 5.875%, 2/01/2033 | | | | | 1,180,000 | | | 967,045 |
Dominion Resources, Inc., 5.950%, 6/15/2035 | | | | | 385,000 | | | 318,507 |
Duke Energy Carolinas, 4.200%, 10/01/2008 | | | | | 460,000 | | | 460,000 |
Empresa Nacional de Electricidad SA (Endesa-Chile), 7.875%, 2/01/2027 | | | | | 1,000,000 | | | 1,047,290 |
Illinois Power Co., 6.250%, 4/01/2018 | | | | | 3,385,000 | | | 3,117,399 |
MidAmerican Energy Holdings Co., 6.125%, 4/01/2036 | | | | | 445,000 | | | 374,281 |
MidAmerican Energy Holdings Co., 6.500%, 9/15/2037 | | | | | 1,035,000 | | | 908,068 |
Nisource Finance Corp., 6.150%, 3/01/2013 | | | | | 195,000 | | | 188,745 |
Nisource Finance Corp., 6.400%, 3/15/2018 | | | | | 1,255,000 | | | 1,124,717 |
| | | | | | | | |
| | | | | | | | 14,305,766 |
| | | | | | | | |
| Entertainment – 1.0% | | | | | | | | |
Time Warner, Inc., 6.500%, 11/15/2036 | | | | | 410,000 | | | 311,358 |
Time Warner, Inc., 6.625%, 5/15/2029 | | | | | 870,000 | | | 694,887 |
Time Warner, Inc., 6.950%, 1/15/2028 | | | | | 375,000 | | | 312,645 |
Time Warner, Inc., 7.625%, 4/15/2031 | | | | | 245,000 | | | 212,748 |
Time Warner, Inc., 7.700%, 5/01/2032 | | | | | 160,000 | | | 139,798 |
Viacom, Inc., Class B, 6.875%, 4/30/2036 | | | | | 1,325,000 | | | 1,062,226 |
| | | | | | | | |
| | | | | | | | 2,733,662 |
| | | | | | | | |
| Food & Beverage – 1.4% | | | | | | | | |
Anheuser-Busch Cos., Inc., 5.950%, 1/15/2033 | | | | | 995,000 | | | 769,156 |
Anheuser-Busch Cos., Inc., 6.450%, 9/01/2037 | | | | | 1,270,000 | | | 1,028,917 |
Cia Brasileira de Bebidas, 8.750%, 9/15/2013 | | | | | 1,025,000 | | | 1,095,468 |
Kraft Foods, Inc., 6.250%, 6/01/2012 | | | | | 210,000 | | | 211,100 |
Kraft Foods, Inc., 6.500%, 11/01/2031 | | | | | 960,000 | | | 834,626 |
| | | | | | | | |
| | | | | | | | 3,939,267 |
| | | | | | | | |
| Foreign Local Governments – 0.8% | | | | | | | | |
Province of Alberta, 5.000%, 12/16/2008 | | CAD | | | 2,000,000 | | | 1,889,857 |
Province of Alberta, 5.930%, 9/16/2016 | | CAD | | | 411,524 | | | 418,906 |
| | | | | | | | |
| | | | | | | | 2,308,763 |
| | | | | | | | |
| Government Owned-No Guarantee – 1.8% | | | | | | |
Abu Dhabi National Energy Co., 7.250%, 8/01/2018, 144A | | | | | 2,565,000 | | | 2,500,647 |
DP World Ltd., 6.850%, 7/02/2037, 144A | | | | | 3,500,000 | | | 2,591,260 |
| | | | | | | | |
| | | | | | | | 5,091,907 |
| | | | | | | | |
| Healthcare – 1.3% | | | | | | | | |
Covidien International Finance SA, 6.000%, 10/15/2017 | | | | | 900,000 | | | 889,194 |
Covidien International Finance SA, 6.550%, 10/15/2037 | | | | | 900,000 | | | 865,255 |
HCA, Inc., 5.750%, 3/15/2014 | | | | | 1,020,000 | | | 795,600 |
HCA, Inc., 6.250%, 2/15/2013 | | | | | 195,000 | | | 162,825 |
HCA, Inc., 6.375%, 1/15/2015 | | | | | 95,000 | | | 74,813 |
HCA, Inc., 6.500%, 2/15/2016 | | | | | 55,000 | | | 43,588 |
HCA, Inc., 6.750%, 7/15/2013 | | | | | 30,000 | | | 25,200 |
HCA, Inc., 7.050%, 12/01/2027 | | | | | 100,000 | | | 67,529 |
HCA, Inc., 7.190%, 11/15/2015 | | | | | 190,000 | | | 151,683 |
100
PORTFOLIO OF INVESTMENTS – as of September 30, 2008
Loomis Sayles Investment Grade Fixed Income Fund – continued
| | | | | | | | |
| | | | | Principal Amount (‡) | | Value (†) |
| | | | | | | | |
| | | |
| BONDS AND NOTES – continued | | | | | | | | |
| | | |
| Healthcare – continued | | | | | | | | |
HCA, Inc., 7.500%, 12/15/2023 | | | | $ | 75,000 | | $ | 54,941 |
HCA, Inc., 7.690%, 6/15/2025 | | | | | 175,000 | | | 130,067 |
HCA, Inc., 8.360%, 4/15/2024 | | | | | 305,000 | | | 236,399 |
HCA, Inc., MTN, 7.580%, 9/15/2025 | | | | | 10,000 | | | 7,367 |
HCA, Inc., MTN, 7.750%, 7/15/2036 | | | | | 305,000 | | | 216,520 |
| | | | | | | | |
| | | | | | | | 3,720,981 |
| | | | | | | | |
| Home Construction – 2.7% | | | | | | | | |
Centex Corp., 5.250%, 6/15/2015 | | | | | 380,000 | | | 279,300 |
Lennar Corp., Series B, 5.600%, 5/31/2015 | | | | | 1,250,000 | | | 812,500 |
Lennar Corp., Series B, 6.500%, 4/15/2016 | | | | | 770,000 | | | 519,750 |
Pulte Homes, Inc., 5.200%, 2/15/2015 | | | | | 1,265,000 | | | 1,012,000 |
Pulte Homes, Inc., 6.000%, 2/15/2035(c) | | | | | 3,340,000 | | | 2,388,100 |
Pulte Homes, Inc., 6.375%, 5/15/2033 | | | | | 1,455,000 | | | 1,062,150 |
Toll Brothers Finance Corp., 5.150%, 5/15/2015 | | | | | 1,725,000 | | | 1,458,858 |
| | | | | | | | |
| | | | | | | | 7,532,658 |
| | | | | | | | |
| Hybrid ARMS – 0.5% | | | | | | | | |
Federal National Mortgage Association, 6.039%, 2/01/2037(b) | | | | | 412,210 | | | 415,010 |
Indymac Index Mortgage Loan Trust, Series 2006-AR25, Class 3A1, 6.321%, 9/25/2036(b) | | | | | 567,671 | | | 380,315 |
Morgan Stanley Mortgage Loan Trust, Series 2005-3AR, Class 5A, 5.588%, 7/25/2035(b) | | | | | 425,372 | | | 372,135 |
Wells Fargo Mortgage Backed Securities Trust, Series 2005-AR16, Class 3A2, 4.997%, 10/25/2035(b) | | | | | 323,046 | | | 280,375 |
| | | | | | | | |
| | | | | | | | 1,447,835 |
| | | | | | | | |
| Independent Energy – 2.8% | | | | | | | | |
Anadarko Petroleum Corp., 5.950%, 9/15/2016 | | | | | 1,365,000 | | | 1,254,592 |
Anadarko Petroleum Corp., 6.450%, 9/15/2036 | | | | | 1,215,000 | | | 952,618 |
Apache Corp., 6.000%, 1/15/2037 | | | | | 1,940,000 | | | 1,639,735 |
Questar Market Resources, Inc., 6.800%, 4/01/2018(c) | | | | | 3,365,000 | | | 3,392,923 |
Talisman Energy, Inc., 5.850%, 2/01/2037 | | | | | 15,000 | | | 11,260 |
XTO Energy, Inc., 6.100%, 4/01/2036 | | | | | 65,000 | | | 53,821 |
XTO Energy, Inc., 6.750%, 8/01/2037 | | | | | 435,000 | | | 385,983 |
| | | | | | | | |
| | | | | | | | 7,690,932 |
| | | | | | | | |
| Local Authorities – 2.7% | | | | | | | | |
Manitoba (Province of), GMTN, 6.375%, 9/01/2015 | | NZD | | | 4,635,000 | | | 3,035,926 |
Quebec Province, Series QC, 6.750%, 11/09/2015 | | NZD | | | 1,185,000 | | | 795,574 |
Queensland Treasury Corp., Series 11G, 6.000%, 6/14/2011 | | AUD | | | 1,735,000 | | | 1,378,513 |
Virginia Tobacco Settlement Financing Corp., Series A-1, 6.706%, 6/01/2046(e) | | | | | 2,880,000 | | | 2,230,416 |
| | | | | | | | |
| | | | | | | | 7,440,429 |
| | | | | | | | |
| Media Cable – 2.8% | | | | | | | | |
Comcast Corp., 5.650%, 6/15/2035 | | | | | 2,090,000 | | | 1,553,566 |
Comcast Corp., 6.450%, 3/15/2037 | | | | | 1,230,000 | | | 992,072 |
Comcast Corp., 6.500%, 11/15/2035 | | | | | 1,570,000 | | | 1,310,831 |
Comcast Corp., 6.950%, 8/15/2037 | | | | | 1,925,000 | | | 1,641,935 |
Time Warner Cable, Inc., 6.750%, 7/01/2018 | | | | | 2,500,000 | | | 2,334,825 |
| | | | | | | | |
| | | | | | | | 7,833,229 |
| | | | | | | | |
101
| | | | | | | | |
| | | | | Principal Amount (‡) | | Value (†) |
| | | | | | | | |
| | | |
| BONDS AND NOTES – continued | | | | | | | | |
| | | |
| Media Non-Cable – 0.9% | | | | | | | | |
Clear Channel Communications, Inc., 5.750%, 1/15/2013 | | | | $ | 250,000 | | $ | 90,000 |
News America, Inc., 6.200%, 12/15/2034 | | | | | 950,000 | | | 757,425 |
News America, Inc., 6.400%, 12/15/2035 | | | | | 1,980,000 | | | 1,663,261 |
| | | | | | | | |
| | | | | | | | 2,510,686 |
| | | | | | | | |
| Metals & Mining – 0.0% | | | | | | | | |
Teck Cominco Ltd., 7.000%, 9/15/2012 | | | | | 100,000 | | | 101,207 |
| | | | | | | | |
| Mortgage Related – 6.8% | | | | | | | | |
Banc of America Commercial Mortgage, Inc., Series 2005-6, Class A4, 5.1800%, 9/10/2047(b) | | | | | 160,000 | | | 145,218 |
Banc of America Commercial Mortgage, Inc., Series 2006-1, Class A2, 5.334%, 9/10/2045, Class A | | | | | 220,000 | | | 212,707 |
Bear Stearns Commercial Mortgage Securities, Series 2005-PW10, Class A2, 5.270%, 12/11/2040 | | | | | 280,000 | | | 274,158 |
Bear Stearns Commercial Mortgage Securities, Series 2006-T24, Class A4, 5.537%, 10/12/2041 | | | | | 360,000 | | | 320,419 |
Citigroup/Deutsche Bank Commercial Mortgage Trust, Series 2006-CD2, Class A2, 5.408%, 1/15/2046 | | | | | 155,000 | | | 150,058 |
Commercial Mortgage Pass Through Certificates, Series 2006-C7, Class A4, 5.7680%, 6/10/2046(b) | | | | | 480,000 | | | 433,844 |
CS First Boston Mortgage Securities Corp., Series 2005-7, Class 3A1, 5.000%, 8/25/2020 | | | | | 324,163 | | | 289,417 |
Federal Home Loan Mortgage Corp., 4.000%, 7/01/2019 | | | | | 326,653 | | | 312,560 |
Federal Home Loan Mortgage Corp., 4.500%, 4/01/2019 | | | | | 653,185 | | | 640,721 |
Federal Home Loan Mortgage Corp., 5.000%, 12/14/2018(c) | | | | | 281,000 | | | 264,128 |
Federal Home Loan Mortgage Corp., 5.000%, 5/01/2034 | | | | | 208,212 | | | 203,334 |
Federal Home Loan Mortgage Corp., 5.500%, 8/01/2033 | | | | | 527,216 | | | 525,988 |
Federal Home Loan Mortgage Corp., 5.500%, 2/01/2037 | | | | | 600,382 | | | 597,764 |
Federal Home Loan Mortgage Corp., 6.000%, 2/01/2020 | | | | | 225,748 | | | 229,932 |
Federal Home Loan Mortgage Corp., 6.000%, 6/01/2035 | | | | | 419,216 | | | 426,342 |
Federal Home Loan Mortgage Corp., 6.500%, 10/15/2008 | | | | | 2,032 | | | 2,030 |
Federal Home Loan Mortgage Corp., 10.000%, 8/01/2018 | | | | | 3,573 | | | 4,100 |
Federal Home Loan Mortgage Corp., 10.000%, 10/01/2018 | | | | | 2,326 | | | 2,663 |
Federal Home Loan Mortgage Corp., 10.250%, 12/01/2009 | | | | | 1,897 | | | 1,916 |
Federal Home Loan Mortgage Corp., Series 2912, Class EH, 5.500%, 1/15/2035 | | | | | 675,000 | | | 655,777 |
102
PORTFOLIO OF INVESTMENTS – as of September 30, 2008
Loomis Sayles Investment Grade Fixed Income Fund – continued
| | | | | | | | |
| | | | | Principal Amount (‡) | | Value (†) |
| | | | | | | | |
| | | |
| BONDS AND NOTES – continued | | | | | | | | |
| | | |
| Mortgage Related – continued | | | | | | | | |
Federal National Mortgage Association, 4.000%, 1/01/2020 | | | | $ | 176,410 | | $ | 168,799 |
Federal National Mortgage Association, 4.500%, 3/01/2035 | | | | | 268,501 | | | 254,876 |
Federal National Mortgage Association, 4.500%, 9/01/2035 | | | | | 372,293 | | | 352,712 |
Federal National Mortgage Association, 5.000%, 2/01/2018 | | | | | 109,152 | | | 109,648 |
Federal National Mortgage Association, 5.000%, 6/01/2020 | | | | | 314,857 | | | 313,925 |
Federal National Mortgage Association, 5.000%, 4/01/2034 | | | | | 200,359 | | | 195,671 |
Federal National Mortgage Association, 5.000%, 5/01/2034 | | | | | 203,103 | | | 198,350 |
Federal National Mortgage Association, 5.000%, 5/01/2035 | | | | | 368,162 | | | 359,317 |
Federal National Mortgage Association, 5.000%, 6/01/2035 | | | | | 259,583 | | | 253,347 |
Federal National Mortgage Association, 5.000%, 6/01/2035 | | | | | 149,886 | | | 146,285 |
Federal National Mortgage Association, 5.000%, 8/01/2035 | | | | | 365,977 | | | 357,184 |
Federal National Mortgage Association, 5.500%, 9/01/2016 | | | | | 73,161 | | | 74,545 |
Federal National Mortgage Association, 5.500%, 8/01/2019 | | | | | 47,785 | | | 48,435 |
Federal National Mortgage Association, 5.500%, 12/01/2032 | | | | | 118,995 | | | 119,090 |
Federal National Mortgage Association, 5.500%, 1/01/2033 | | | | | 256,362 | | | 256,566 |
Federal National Mortgage Association, 5.500%, 6/01/2033 | | | | | 383,498 | | | 384,071 |
Federal National Mortgage Association, 5.500%, 7/01/2033 | | | | | 567,992 | | | 568,089 |
Federal National Mortgage Association, 5.500%, 9/01/2034 | | | | | 225,384 | | | 225,211 |
Federal National Mortgage Association, 5.500%, 3/01/2035 | | | | | 76,747 | | | 76,688 |
Federal National Mortgage Association, 5.500%, 3/01/2035 | | | | | 64,570 | | | 64,480 |
Federal National Mortgage Association, 5.500%, 5/01/2035 | | | | | 76,926 | | | 76,819 |
Federal National Mortgage Association, 5.500%, 8/01/2035 | | | | | 146,994 | | | 146,789 |
Federal National Mortgage Association, 5.500%, 12/01/2035 | | | | | 322,818 | | | 322,368 |
Federal National Mortgage Association, 5.500%, 1/01/2036 | | | | | 17,425 | | | 17,401 |
Federal National Mortgage Association, 5.500%, 2/01/2036 | | | | | 7,358 | | | 7,348 |
Federal National Mortgage Association, 5.500%, 4/01/2036 | | | | | 406,887 | | | 406,321 |
Federal National Mortgage Association, 5.500%, 6/01/2036 | | | | | 95,794 | | | 95,616 |
103
| | | | | | | | |
| | | | | Principal Amount (‡) | | Value (†) |
| | | | | | | | |
| | | |
| BONDS AND NOTES – continued | | | | | | | | |
| | | |
| Mortgage Related – continued | | | | | | | | |
Federal National Mortgage Association, 5.736%, 9/01/2036(b) | | | | $ | 435,487 | | $ | 447,098 |
Federal National Mortgage Association, 6.000%, 12/01/2018 | | | | | 28,175 | | | 28,864 |
Federal National Mortgage Association, 6.000%, 12/01/2020 | | | | | 34,874 | | | 35,567 |
Federal National Mortgage Association, 6.000%, 3/01/2021 | | | | | 326,605 | | | 334,212 |
Federal National Mortgage Association, 6.000%, 10/01/2028 | | | | | 29,189 | | | 29,812 |
Federal National Mortgage Association, 6.000%, 10/01/2033 | | | | | 623,460 | | | 634,447 |
Federal National Mortgage Association, 6.500%, 2/01/2011 | | | | | 3,928 | | | 4,073 |
Federal National Mortgage Association, 6.500%, 10/01/2031 | | | | | 92,200 | | | 95,352 |
Federal National Mortgage Association, 6.500%, 10/01/2033 | | | | | 44,397 | | | 45,790 |
Federal National Mortgage Association, 6.500%, 10/01/2033 | | | | | 86,904 | | | 89,630 |
Federal National Mortgage Association, 6.500%, 10/01/2033 | | | | | 63,633 | | | 65,629 |
Federal National Mortgage Association, 6.500%, 11/01/2033 | | | | | 89,344 | | | 92,147 |
Federal National Mortgage Association, 7.000%, 4/25/2020 | | | | | 42,811 | | | 44,352 |
Government National Mortgage Association, 6.500%, 2/20/2028 | | | | | 144,071 | | | 148,185 |
Government National Mortgage Association, 7.000%, 11/20/2025 | | | | | 5,698 | | | 5,986 |
Government National Mortgage Association, 10.000%, 5/15/2018 | | | | | 15,321 | | | 17,363 |
Government National Mortgage Association, 10.000%, 8/15/2018 | | | | | 9,768 | | | 11,117 |
Government National Mortgage Association, 10.000%, 12/15/2018 | | | | | 47,908 | | | 54,529 |
Greenwich Capital Commercial Funding Corp., Series 2005-GG5, Class A2, 5.117%, 4/10/2037 | | | | | 485,000 | | | 475,014 |
GS Mortgage Securities Corp. II, Series 2005-GG4, Class A4A, 4.751%, 7/10/2039 | | | | | 805,000 | | | 722,237 |
GS Mortgage Securities Corp. II, Series 2006-GG8, Class A4, 5.560%, 11/10/2039 | | | | | 350,000 | | | 309,645 |
JP Morgan Chase Commercial Mortgage Securities Corp.,Series 2006-LDP7, Class A4, 5.8754%, 4/15/2045(b) | | | | | 600,000 | | | 542,544 |
LB-UBS Commercial Mortgage Trust, Series 2005-C3, Class A5, 4.739%, 7/15/2030 | | | | | 480,000 | | | 427,268 |
LB-UBS Commercial Mortgage Trust, Series 2006-C4, Class A4, 5.883%, 6/15/2038(b) | | | | | 180,000 | | | 164,417 |
LB-UBS Commercial Mortgage Trust, Series 2006-C6, Class A4, 5.372%, 9/15/2039 | | | | | 390,000 | | | 341,375 |
LB-UBS Commercial Mortgage Trust, Series 2007-C2, Class A2, 5.303%, 2/15/2040 | | | | | 915,000 | | | 851,582 |
104
PORTFOLIO OF INVESTMENTS – as of September 30, 2008
Loomis Sayles Investment Grade Fixed Income Fund – continued
| | | | | | | | |
| | | | | Principal Amount (‡) | | Value (†) |
| | | | | | | | |
| | | |
| BONDS AND NOTES – continued | | | | | | | | |
| | | |
| Mortgage Related – continued | | | | | | | | |
Merrill Lynch/Countrywide Commercial Mortgage Trust, Series 2006-1, Class A2, 5.439%, 2/12/2039(b) | | | | $ | 335,000 | | $ | 324,493 |
Merrill Lynch/Countrywide Commercial Mortgage Trust, Series 2006-2, Class A4, 5.9093%, 6/12/2046(b) | | | | | 235,000 | | | 214,533 |
Morgan Stanley Capital I, Series 2005-HQ6, Class A4A, 4.989%, 8/13/2042 | | | | | 350,000 | | | 315,113 |
Morgan Stanley Capital I, Series 2005-T19, Class A4A, 4.890%, 6/12/2047 | | | | | 425,000 | | | 379,915 |
Residential Accredit Loans, Inc., Series 2006-QS18, Class 3A3, 5.750%, 12/25/2021 | | | | | 332,240 | | | 272,176 |
| | | | | | | | |
| | | | | | | | 18,817,492 |
| | | | | | | | |
| Non-Captive Consumer – 1.6% | | | | | | | | |
American General Finance Corp., Series H, MTN, 5.375%, 10/01/2012 | | | | | 45,000 | | | 24,596 |
American General Finance Corp., Series J, MTN, 6.900%, 12/15/2017 | | | | | 2,815,000 | | | 1,305,293 |
Countrywide Financial Corp., Series A, MTN, 3.333%, 12/19/2008(b)(c) | | | | | 50,000 | | | 49,434 |
Countrywide Home Loans, Inc., Series L, MTN, 4.000%, 3/22/2011 | | | | | 144,000 | | | 123,891 |
HSBC Finance Corp., 8.000%, 7/15/2010 | | | | | 205,000 | | | 209,192 |
Residential Capital LLC, 8.500%, 6/01/2012 | | | | | 380,000 | | | 76,000 |
Residential Capital LLC, 8.875%, 6/30/2015(c) | | | | | 155,000 | | | 31,000 |
SLM Corp., Series A, MTN, 5.000%, 4/15/2015 | | | | | 70,000 | | | 42,000 |
SLM Corp., Series A, MTN, 5.375%, 1/15/2013 | | | | | 680,000 | | | 445,400 |
SLM Corp., Series A, MTN, 6.500%, 6/15/2010 | | NZD | | | 970,000 | | | 538,733 |
SLM Corp., Series A, MTN, 8.450%, 6/15/2018 | | | | | 2,385,000 | | | 1,621,800 |
| | | | | | | | |
| | | | | | | | 4,467,339 |
| | | | | | | | |
| Non-Captive Diversified – 3.1% | | | | | | | | |
CIT Group Funding Co. of Canada, 5.200%, 6/01/2015 | | | | | 255,000 | | | 125,228 |
CIT Group, Inc., 5.125%, 9/30/2014 | | | | | 510,000 | | | 251,510 |
CIT Group, Inc., 5.400%, 2/13/2012 | | | | | 30,000 | | | 17,246 |
CIT Group, Inc., 5.400%, 1/30/2016 | | | | | 60,000 | | | 29,040 |
CIT Group, Inc., 5.650%, 2/13/2017 | | | | | 215,000 | | | 104,913 |
CIT Group, Inc., 5.800%, 7/28/2011 | | | | | 240,000 | | | 155,958 |
CIT Group, Inc., 5.800%, 10/01/2036 | | | | | 610,000 | | | 278,998 |
CIT Group, Inc., 5.850%, 9/15/2016 | | | | | 15,000 | | | 7,275 |
CIT Group, Inc., Series A, GMTN, 6.000%, 4/01/2036 | | | | | 925,000 | | | 379,250 |
CIT Group, Inc., EMTN, 4.650%, 9/19/2016 | | EUR | | | 350,000 | | | 241,486 |
CIT Group, Inc., GMTN, 5.000%, 2/13/2014 | | | | | 335,000 | | | 189,499 |
CIT Group, Inc., GMTN, 5.000%, 2/01/2015 | | | | | 55,000 | | | 27,187 |
General Electric Capital Corp., 6.500%, 9/28/2015 | | NZD | | | 5,650,000 | | | 3,368,235 |
General Electric Capital Corp., Series A, MTN, 6.000%, 6/15/2012 | | | | | 735,000 | | | 709,403 |
General Electric Capital Corp., EMTN, 6.750%, 9/26/2016 | | NZD | | | 470,000 | | | 279,724 |
General Electric Capital Corp., GMTN, 7.625%, 12/10/2014 | | NZD | | | 405,000 | | | 263,818 |
105
| | | | | | | | |
| | | | | Principal Amount (‡) | | Value (†) |
| | | | | | | | |
| | | |
| BONDS AND NOTES – continued | | | | | | | | |
| | | |
| Non-Captive Diversified – continued | | | | | | | | |
GMAC LLC, 5.625%, 5/15/2009(c) | | | | $ | 1,330,000 | | $ | 950,314 |
GMAC LLC, 6.000%, 12/15/2011 | | | | | 1,205,000 | | | 535,790 |
International Lease Finance Corp., 6.375%, 3/15/2009 | | | | | 725,000 | | | 668,598 |
| | | | | | | | |
| | | | | | | | 8,583,472 |
| | | | | | | | |
| Oil Field Services – 0.1% | | | | | | | | |
Weatherford International Ltd., 6.500%, 8/01/2036 | | | | | 195,000 | | | 168,098 |
| | | | | | | | |
| Paper – 1.0% | | | | | | | | |
Georgia-Pacific LLC, 7.250%, 6/01/2028 | | | | | 1,500,000 | | | 1,185,000 |
International Paper Co., 4.000%, 4/01/2010 | | | | | 500,000 | | | 485,145 |
International Paper Co., 4.250%, 1/15/2009 | | | | | 1,000,000 | | | 993,827 |
| | | | | | | | |
| | | | | | | | 2,663,972 |
| | | | | | | | |
| Pharmaceuticals – 0.1% | | | | | | | | |
Elan Financial PLC, 7.750%, 11/15/2011 | | | | | 60,000 | | | 54,300 |
Elan Financial PLC, 8.875%, 12/01/2013 | | | | | 170,000 | | | 142,800 |
| | | | | | | | |
| | | | | | | | 197,100 |
| | | | | | | | |
| Pipelines – 2.9% | | | | | | | | |
DCP Midstream LP, 6.450%, 11/03/2036, 144A | | | | | 635,000 | | | 507,943 |
El Paso Corp., 6.950%, 6/01/2028 | | | | | 350,000 | | | 276,358 |
Enterprise Products Operating LP, 6.300%, 9/15/2017 | | | | | 680,000 | | | 634,159 |
Kinder Morgan Energy Partners LP, 5.125%, 11/15/2014 | | | | | 145,000 | | | 132,364 |
Kinder Morgan Energy Partners LP, 5.950%, 2/15/2018 | | | | | 5,300,000 | | | 4,720,927 |
NGPL Pipeco LLC, 7.119%, 12/15/2017, 144A | | | | | 965,000 | | | 915,910 |
Southern Natural Gas Co.,
5.900%, 4/01/2017, 144A | | | | | 810,000 | | | 716,844 |
Spectra Energy Capital LLC, 5.500%, 3/01/2014(c) | | | | | 230,000 | | | 219,247 |
| | | | | | | | |
| | | | | | | | 8,123,752 |
| | | | | | | | |
| Property & Casualty Insurance – 1.6% | | | | | | | | |
Allstate Corp., 5.950%, 4/01/2036 | | | | | 470,000 | | | 383,144 |
Marsh & McLennan Cos., Inc., 5.375%, 7/15/2014 | | | | | 65,000 | | | 60,193 |
Marsh & McLennan Cos., Inc., 5.750%, 9/15/2015 | | | | | 1,842,000 | | | 1,726,672 |
Marsh & McLennan Cos., Inc., 5.875%, 8/01/2033(c) | | | | | 2,360,000 | | | 1,976,715 |
MBIA Insurance Corp., (fixed rate to 1/15/2013, variable rate thereafter),
14.000%, 1/15/2033, 144A(b) | | | | | 60,000 | | | 31,800 |
Progressive Corp., 7.000%, 10/01/2013 | | | | | 150,000 | | | 157,902 |
Willis North America, Inc., 6.200%, 3/28/2017 | | | | | 225,000 | | | 195,628 |
| | | | | | | | |
| | | | | | | | 4,532,054 |
| | | | | | | | |
| Railroads – 0.9% | | | | | | | | |
Canadian Pacific Railway Co., 5.950%, 5/15/2037 | | | | | 115,000 | | | 94,135 |
Canadian Pacific Railway Ltd., MTN, 4.900%, 6/15/2010, 144A | | CAD | | | 1,000,000 | | | 933,822 |
CSX Corp., 6.000%, 10/01/2036(c) | | | | | 210,000 | | | 159,597 |
106
PORTFOLIO OF INVESTMENTS – as of September 30, 2008
Loomis Sayles Investment Grade Fixed Income Fund – continued
| | | | | | | | |
| | | | | Principal Amount (‡) | | Value (†) |
| | | | | | | | |
| | | |
| BONDS AND NOTES – continued | | | | | | | | |
| | | |
| Railroads – continued | | | | | | | | |
CSX Corp., 6.250%, 3/15/2018 | | | | $ | 670,000 | | $ | 606,413 |
Missouri Pacific Railroad Co., 5.000%, 1/01/2045(e) | | | | | 190,000 | | | 114,000 |
Union Pacific Corp., 3.875%, 2/15/2009 | | | | | 325,000 | | | 320,251 |
Union Pacific Corp., 5.375%, 6/01/2033 | | | | | 415,000 | | | 326,957 |
| | | | | | | | |
| | | | | | | | 2,555,175 |
| | | | | | | | |
| REITs – 1.8% | | | | | | | | |
Camden Property Trust, 5.700%, 5/15/2017 | | | | | 640,000 | | | 565,746 |
Colonial Realty LP, 4.800%, 4/01/2011 | | | | | 1,840,000 | | | 1,747,998 |
Colonial Realty LP, 5.500%, 10/01/2015 | | | | | 290,000 | | | 249,203 |
Duke Realty LP, 5.950%, 2/15/2017 | | | | | 90,000 | | | 80,564 |
Equity One, Inc., 6.000%, 9/15/2017 | | | | | 1,000,000 | | | 801,522 |
ERP Operating LP, 5.125%, 3/15/2016 | | | | | 30,000 | | | 25,128 |
ERP Operating LP, 5.750%, 6/15/2017 | | | | | 180,000 | | | 151,587 |
Highwoods Properties, Inc., 5.850%, 3/15/2017 | | | | | 80,000 | | | 64,172 |
Highwoods Properties, Inc., 7.500%, 4/15/2018 | | | | | 1,075,000 | | | 952,676 |
Prologis, 5.625%, 11/15/2015 | | | | | 40,000 | | | 34,972 |
Prologis, 5.750%, 4/01/2016 | | | | | 35,000 | | | 30,497 |
Realty Income Corp., 6.750%, 8/15/2019 | | | | | 500,000 | | | 451,097 |
Simon Property Group LP, 5.750%, 12/01/2015 | | | | | 55,000 | | | 51,979 |
| | | | | | | | |
| | | | | | | | 5,207,141 |
| | | | | | | | |
| Retailers – 1.1% | | | | | | | | |
J.C. Penney Corp., Inc., 6.375%, 10/15/2036 | | | | | 230,000 | | | 174,939 |
Lowe’s Cos., Inc., 6.650%, 9/15/2037 | | | | | 975,000 | | | 935,179 |
Macy’s Retail Holdings, Inc., 5.350%, 3/15/2012 | | | | | 355,000 | | | 326,916 |
Macy’s Retail Holdings, Inc., 6.375%, 3/15/2037 | | | | | 2,275,000 | | | 1,647,778 |
| | | | | | | | |
| | | | | | | | 3,084,812 |
| | | | | | | | |
| Sovereigns – 12.1% | | | | | | | | |
Canadian Government, 2.750%, 12/01/2010 | | CAD | | | 5,410,000 | | | 5,064,990 |
Canadian Government, 3.750%, 6/01/2012 | | CAD | | | 3,340,000 | | | 3,203,858 |
Canadian Government, 4.000%, 6/01/2016 | | CAD | | | 1,000,000 | | | 965,713 |
Canadian Government, 4.250%, 9/01/2009 | | CAD | | | 4,070,000 | | | 3,874,120 |
Canadian Government, 5.250%, 6/01/2012 | | CAD | | | 11,565,000 | | | 11,656,824 |
Mexican Fixed Rate Bonds, Series M-20, 8.000%, 12/07/2023 | | MXN | | | 140,000(††) | | | 1,228,618 |
Mexican Fixed Rate Bonds, Series MI-10, 9.000%, 12/20/2012 | | MXN | | | 460,000(††) | | | 4,304,774 |
New South Wales Treasury Corp., Series 10RG, 7.000%, 12/01/2010 | | AUD | | | 2,625,000 | | | 2,122,942 |
New South Wales Treasury Corp., Series 12RG, 6.000%, 5/01/2012 | | AUD | | | 1,355,000 | | | 1,074,421 |
| | | | | | | | |
| | | | | | | | 33,496,260 |
| | | | | | | | |
| Supranational – 4.1% | | | | | | | | |
European Investment Bank, 4.600%, 1/30/2037, 144A | | CAD | | | 1,900,000 | | | 1,625,761 |
Inter-American Development Bank, EMTN, Zero Coupon Bond, 5/11/2009 | | BRL | | | 9,000,000 | | | 4,209,365 |
Inter-American Development Bank, EMTN, Zero Coupon Bond, 9/23/2013 | | IDR | | | 45,300,000,000 | | | 2,741,058 |
Inter-American Development Bank, EMTN, 6.000%, 12/15/2017 | | NZD | | | 4,375,000 | | | 2,828,988 |
| | | | | | | | |
| | | | | | | | 11,405,172 |
| | | | | | | | |
107
| | | | | | | | |
| | | | | Principal Amount (‡) | | Value (†) |
| | | | | | | | |
| | | |
| BONDS AND NOTES – continued | | | | | | | | |
| | | |
| Technology – 4.4% | | | | | | | | |
Avnet, Inc., 6.000%, 9/01/2015 | | | | $ | 1,970,000 | | $ | 1,897,926 |
Avnet, Inc., 6.625%, 9/15/2016 | | | | | 270,000 | | | 262,955 |
Corning, Inc., 6.850%, 3/01/2029 | | | | | 10,000 | | | 8,833 |
Corning, Inc., 7.250%, 8/15/2036 | | | | | 1,565,000 | | | 1,387,324 |
Dun & Bradstreet Corp., 6.000%, 4/01/2013 | | | | | 1,970,000 | | | 1,956,257 |
International Business Machines Corp., 4.750%, 11/29/2012 | | | | | 795,000 | | | 795,843 |
Intuit, Inc., 5.750%, 3/15/2017 | | | | | 635,000 | | | 561,610 |
KLA-Tencor Corp., 6.900%, 5/01/2018 | | | | | 1,370,000 | | | 1,273,826 |
Koninklijke (Royal) Philips Electronics N.V., 6.875%, 3/11/2038 | | | | | 2,745,000 | | | 2,719,848 |
Motorola, Inc., 5.220%, 10/01/2097 | | | | | 1,000,000 | | | 558,532 |
Motorola, Inc., 6.500%, 9/01/2025 | | | | | 190,000 | | | 145,761 |
Samsung Electronics Co. Ltd.,
7.700%, 10/01/2027, 144A | | | | | 500,000 | | | 528,974 |
| | | | | | | | |
| | | | | | | | 12,097,689 |
| | | | | | | | |
| Textile – 0.2% | | | | | | | | |
Kellwood Co., 7.625%, 10/15/2017(e) | | | | | 1,000,000 | | | 550,000 |
| | | | | | | | |
| Tobacco – 0.3% | | | | | | | | |
Reynolds American, Inc., 6.750%, 6/15/2017 | | | | | 735,000 | | | 686,791 |
Reynolds American, Inc., 7.250%, 6/15/2037 | | | | | 195,000 | | | 186,607 |
| | | | | | | | |
| | | | | | | | 873,398 |
| | | | | | | | |
| Transportation Services – 1.3% | | | | | | | | |
APL Ltd., 8.000%, 1/15/2024(e) | | | | | 100,000 | | | 75,000 |
Atlas Air, Inc., Series B, 7.680%, 1/02/2014(f) | | | | | 3,429,237 | | | 3,429,237 |
| | | | | | | | |
| | | | | | | | 3,504,237 |
| | | | | | | | |
| Treasuries – 0.1% | | | | | | | | |
U.S. Treasury Notes, 4.250%, 11/15/2013(c) | | | | | 330,000 | | | 350,883 |
| | | | | | | | |
| Wireless – 1.1% | | | | | | | | |
America Movil SAB de CV, 4.125%, 3/01/2009 | | | | | 500,000 | | | 496,987 |
Nextel Communications, Inc., Series E, 6.875%, 10/31/2013 | | | | | 140,000 | | | 95,200 |
Nextel Communications, Inc., Series F, 5.950%, 3/15/2014 | | | | | 470,000 | | | 314,900 |
Sprint Capital Corp., 6.875%, 11/15/2028 | | | | | 359,000 | | | 240,530 |
Sprint Nextel Corp., 6.000%, 12/01/2016 | | | | | 366,000 | | | 281,820 |
Telefonica Emisones SAU, 6.421%, 6/20/2016 | | | | | 185,000 | | | 173,698 |
Vodafone Group PLC, 6.150%, 2/27/2037 | | | | | 1,725,000 | | | 1,385,365 |
| | | | | | | | |
| | | | | | | | 2,988,500 |
| | | | | | | | |
| Wirelines – 4.7% | | | | | | | | |
AT&T Corp., 6.500%, 3/15/2029 | | | | | 1,310,000 | | | 1,096,706 |
AT&T, Inc., 6.150%, 9/15/2034 | | | | | 545,000 | | | 454,508 |
AT&T, Inc., 6.500%, 9/01/2037 | | | | | 965,000 | | | 820,906 |
BellSouth Corp., 6.000%, 11/15/2034(c) | | | | | 1,770,000 | | | 1,433,700 |
BellSouth Corp., 6.550%, 6/15/2034 | | | | | 105,000 | | | 90,020 |
GTE Corp., 6.940%, 4/15/2028 | | | | | 50,000 | | | 42,426 |
New England Telephone & Telegraph, 7.875%, 11/15/2029 | | | | | 570,000 | | | 514,807 |
108
PORTFOLIO OF INVESTMENTS – as of September 30, 2008
Loomis Sayles Investment Grade Fixed Income Fund – continued
| | | | | | | | |
| | | | | Principal Amount (‡) | | Value (†) |
| | | | | | | | |
| | | |
| BONDS AND NOTES – continued | | | | | | | | |
| | | |
| Wirelines – continued | | | | | | | | |
Qwest Capital Funding, Inc., 6.500%, 11/15/2018 | | | | $ | 500,000 | | $ | 363,750 |
Telefonica Emisiones SAU, 7.045%, 6/20/2036 | | | | | 4,075,000 | | | 3,685,634 |
Verizon Communications, 5.850%, 9/15/2035 | | | | | 3,715,000 | | | 2,904,870 |
Verizon Maryland, Inc., 5.125%, 6/15/2033 | | | | | 290,000 | | | 196,200 |
Verizon New York, Inc., Series B, 7.375%, 4/01/2032 | | | | | 1,110,000 | | | 968,952 |
Verizon Virginia, Inc., Series A, 4.625%, 3/15/2013 | | | | | 505,000 | | | 464,756 |
| | | | | | | | |
| | | | | | | | 13,037,235 |
| | | | | | | | |
| | | |
| TOTAL NON-CONVERTIBLE BONDS | | | | | | | | |
(Identified Cost $279,157,747) | | | | | | | | 251,678,414 |
| | | | | | | | |
| | | |
| CONVERTIBLE BONDS – 0.5% | | | | | | | | |
| | | |
| Non-Captive Consumer – 0.1% | | | | | | | | |
Countrywide Financial Corp., Series A, Zero Coupon Bond, 4/15/2037(c) | | | | | 99,000 | | | 97,020 |
Countrywide Financial Corp., Series B, 0.554%, 5/15/2037(b) | | | | | 265,000 | | | 241,150 |
| | | | | | | | |
| | | | | | | | 338,170 |
| | | | | | | | |
| Pharmaceuticals – 0.2% | | | | | | | | |
Vertex Pharmaceuticals, Inc., 4.750%, 2/15/2013 | | | | | 298,000 | | | 449,607 |
Watson Pharmaceuticals, Inc., 1.750%, 3/15/2023(c) | | | | | 125,000 | | | 116,563 |
| | | | | | | | |
| | | | | | | | 566,170 |
| | | | | | | | |
| Technology – 0.2% | | | | | | | | |
Avnet, Inc., 2.000%, 3/15/2034 | | | | | 430,000 | | | 428,388 |
Maxtor Corp., 5.750%, 3/01/2012(e) | | | | | 54,000 | | | 49,680 |
Richardson Electronics Ltd., 7.750%, 12/15/2011 | | | | | 44,000 | | | 33,000 |
| | | | | | | | |
| | | | | | | | 511,068 |
| | | | | | | | |
| Transportation Services – 0.0% | | | | | | | | |
Builders Transportation, Inc., 6.500%, 5/01/2011(g) | | | | | 129,000 | | | — |
| | | | | | | | |
| | | |
| TOTAL CONVERTIBLE BONDS | | | | | | | | |
(Identified Cost $1,331,262) | | | | | | | | 1,415,408 |
| | | | | | | | |
| | | |
| MUNICIPALS – 0.5% | | | | | | | | |
| | | |
| Michigan – 0.3% | | | | | | | | |
Michigan Tobacco Settlement Finance Authority, 7.309%, 6/01/2034(e) | | | | | 1,085,000 | | | 934,402 |
| | | | | | | | |
| Ohio – 0.2% | | | | | | | | |
Buckeye Tobacco Settlement Financing Authority, Series A-2, 5.875%, 6/01/2047(e) | | | | | 750,000 | | | 567,030 |
| | | | | | | | |
| | | |
| TOTAL MUNICIPALS | | | | | | | | |
(Identified Cost $1,813,181) | | | | | | | | 1,501,432 |
| | | | | | | | |
| | | |
| TOTAL BONDS AND NOTES | | | | | | | | |
(Identified Cost $282,302,190) | | | | | | | | 254,595,254 |
| | | | | | | | |
109
| | | | | | | |
| | | | | Shares | | Value (†) |
| | | | | | | |
| PREFERRED STOCKS – 0.9% | | | | | | | |
| | |
| NON-CONVERTIBLE PREFERRED STOCKS – 0.4% | | | | | |
| | | |
| Banking – 0.2% | | | | | | | |
Bank of America Corp., 7.250% | | | | 640 | | $ | 536,320 |
| | | | | | | |
| Capital Markets – 0.0% | | | | | | | |
Lehman Brothers Holdings, Inc., 7.250%(d)(f) | | | | 860 | | | 860 |
Lehman Brothers Holdings, Inc., 7.950%(d) | | | | 570 | | | 34 |
| | | | | | | |
| | | | | | | 894 |
| | | | | | | |
| Diversified Financial Services – 0.0% | | | | | | | |
CIT Group, Inc., 6.350%(c) | | | | 12,023 | | | 93,178 |
| | | | | | | |
| Electric Utilities – 0.1% | | | | | | | |
Connecticut Light & Power Co., 4.400% | | | | 263 | | | 9,797 |
MDU Resources Group, Inc., 5.100% | | | | 307 | | | 30,738 |
Public Service Electric & Gas Co., 4.080%(c) | | | | 400 | | | 29,100 |
San Diego Gas & Electric Co., 4.500% | | | | 100 | | | 1,610 |
Union Electric Co., 4.500% | | | | 3,160 | | | 235,420 |
| | | | | | | |
| | | | | | | 306,665 |
| | | | | | | |
| Thrifts & Mortgage Finance – 0.1% | | | | | | | |
Federal Home Loan Mortgage Corp., 5.000%(f)(i) | | | | 1,850 | | | 3,330 |
Federal Home Loan Mortgage Corp., 5.570%(f)(i) | | | | 28,450 | | | 28,166 |
Federal Home Loan Mortgage Corp., 5.660%(f)(i) | | | | 8,500 | | | 10,625 |
Federal Home Loan Mortgage Corp., 5.700%(f)(i) | | | | 2,900 | | | 5,423 |
Federal Home Loan Mortgage Corp., 5.790%(f)(i) | | | | 5,400 | | | 10,800 |
Federal Home Loan Mortgage Corp., 5.810%(f)(i) | | | | 1,900 | | | 3,325 |
Federal Home Loan Mortgage Corp., 5.900%(f)(i) | | | | 4,200 | | | 5,250 |
Federal Home Loan Mortgage Corp., 6.000%(f)(i) | | | | 2,400 | | | 4,320 |
Federal Home Loan Mortgage Corp., 6.420%(f)(i) | | | | 1,700 | | | 3,060 |
Federal Home Loan Mortgage Corp., 6.550%(f)(i) | | | | 11,075 | | | 11,961 |
Federal Home Loan Mortgage Corp., 8.375%(c)(f)(i) | | | | 39,400 | | | 64,222 |
Federal National Mortgage Association, 4.750%(c)(i) | | | | 3,650 | | | 11,315 |
Federal National Mortgage Association, 5.125%(i) | | | | 1,300 | | | 4,550 |
Federal National Mortgage Association, 5.375%(i) | | | | 2,600 | | | 8,580 |
Federal National Mortgage Association, 5.810%(i) | | | | 1,050 | | | 3,780 |
Federal National Mortgage Association, 6.750%(i) | | | | 1,650 | | | 2,970 |
Federal National Mortgage Association, 8.250%(c)(i) | | | | 53,575 | | | 116,793 |
| | | | | | | |
| | | | | | | 298,470 |
| | | | | | | |
| | | |
| TOTAL NON-CONVERTIBLE PREFERRED STOCKS | | | | | | | |
(Identified Cost $4,163,108) | | | | | | | 1,235,527 |
| | | | | | | |
| | | |
| CONVERTIBLE PREFERRED STOCKS – 0.5% | | | | | | | |
| | | |
| Consumer Products – 0.5% | | | | | | | |
Newell Financial Trust I, 5.250%, 12/01/2027 | | | | | | | |
(Identified Cost $1,294,828) | | | | 33,050 | | | 1,274,491 |
| | | | | | | |
| | | |
| TOTAL PREFERRED STOCKS | | | | | | | |
(Identified Cost $5,457,936) | | | | | | | 2,510,018 |
| | | | | | | |
110
PORTFOLIO OF INVESTMENTS – as of September 30, 2008
Loomis Sayles Investment Grade Fixed Income Fund – continued
| | | | | | | | |
| | | | | Shares/Principal Amount (‡) | | Value (†) |
| | | | | | | | |
| | | |
| SHORT-TERM INVESTMENTS – 10.0% | | | | | | | | |
| State Street Navigator Securities Lending Prime Portfolio(h) | | | | | 10,190,325 | | $ | 10,190,325 |
| Tri-Party Repurchase Agreement with Fixed Income Clearing Corporation, dated 9/30/2008 at 1.300% to be repurchased at $17,525,633 on 10/01/2008 collateralized by $17,570,000 Federal National Mortgage Association, 4.330% due 7/28/2011 with a value of $17,877,475 including accrued interest (Note 2h of Notes to Financial Statements) | | | | $ | 17,525,000 | | | 17,525,000 |
| | | | | | | | |
| | | |
| TOTAL SHORT-TERM INVESTMENTS | | | | | | | | |
(Identified Cost $27,715,325) | | | | | | | | 27,715,325 |
| | | | | | | | |
| | | |
| TOTAL INVESTMENTS – 102.5% | | | | | | | | |
(Identified Cost $315,475,451)(a) | | | | | | | | 284,820,597 |
Other Assets Less Liabilities—(2.5)% | | | | | | | | (6,957,779) |
| | | | | | | | |
| | | |
| NET ASSETS – 100.0% | | | | | | | $ | 277,862,818 |
| | | | | | | | |
| | |
(‡) Principal amount stated in U.S. dollars unless otherwise noted. | | | | | | |
(†) See Note 2a of Notes to Financial Statements. | | | | | | | | |
(††) Amount shown represents units. One unit represents a principal amount of 100. | | | |
(a) Federal Tax Information: | | | | | | | | |
At September 30, 2008, the net unrealized depreciation on investments based on a cost of $315,654,322 for federal income tax purposes was as follows: | | | |
Aggregate gross unrealized appreciation for all investments in which there is an excess of value over tax cost | | $ | 4,831,513 |
Aggregate gross unrealized depreciation for all investments in which there is an excess of tax cost over value | | | (35,665,238) |
| | | | | | | | |
Net unrealized depreciation | | $ | (30,833,725) |
| | | | | | | | |
| (b) | Variable rate security. Rate as of September 30, 2008 is disclosed. |
| (c) | All or a portion of this security was on loan to brokers at September 30, 2008. |
| (d) | Issuer has filed for bankruptcy. |
| (e) | Illiquid security. At September 30, 2008, the value of these securities amounted to $6,105,179 or 2.2% of net assets. |
| (f) | Non-income producing security. |
| (g) | Bankrupt issuer. Security remains in the Portfolio of Investments pending final resolution of bankruptcy proceedings. |
| (h) | Represents investment of securities lending collateral. |
| (i) | Future dividend payments have been eliminated as the issuer has been placed in conservatorship. |
| 144A | Securities exempt from registration under Rule 144A of the Securities Act of 1933. These securities may be resold in transactions exempt from registration, normally to qualified institutional buyers. At September 30, 2008, the total value of these securities amounted to $32,225,986 or 11.6% of net assets. |
| EMTN | Euro Medium Term Note |
| GMTN | Global Medium Term Note |
| REITs | Real Estate Investments Trusts |
Key to Abbreviations: AUD: Australian Dollar; BRL: Brazilian Real; CAD: Canadian Dollar; EUR: Euro; IDR: Indonesian Rupiah; ISK: Icelandic Krona; KRW: South Korean Won; MXN: Mexican Peso; NZD: New Zealand Dollar; THB: Thai Baht
111
NET ASSET SUMMARY AT SEPTEMBER 30, 2008 (Unaudited)
| | | |
Sovereigns | | 12.1 | % |
Mortgage Related | | 6.8 | |
Banking | | 6.3 | |
Electric | | 5.1 | |
Wirelines | | 4.7 | |
Technology | | 4.6 | |
Supranational | | 4.1 | |
Brokerage | | 3.9 | |
Non-Captive Diversified | | 3.1 | |
Pipelines | | 2.9 | |
Media Cable | | 2.8 | |
Independent Energy | | 2.8 | |
Home Construction | | 2.7 | |
Local Authorities | | 2.7 | |
Other Investments, less than 2% each | | 27.9 | |
Short-Term Investments | | 10.0 | |
| | | |
Total Investments | | 102.5 | |
Other assets less liabilities | | (2.5 | ) |
| | | |
Net Assets | | 100.0 | % |
| | | |
CURRENCY EXPOSURE AT SEPTEMBER 30, 2008 AS A PERCENTAGE OF NET ASSETS (Unaudited)
| | | |
United States Dollar | | 76.0 | % |
Canadian Dollar | | 10.7 | |
New Zealand Dollar | | 4.0 | |
Brazilian Real | | 3.5 | |
Mexican Peso | | 2.0 | |
Other, less than 2% each | | 6.3 | |
| | | |
Total Investments | | 102.5 | |
Other assets less liabilities | | (2.5 | ) |
| | | |
Net Assets | | 100.0 | % |
| | | |
See accompanying notes to financial statements.
112
STATEMENTS OF ASSETS AND LIABILITIES
September 30, 2008
| | | | | | | | |
| | | Bond Fund | | | Fixed Income Fund | |
| | | | | | | | |
Assets | | | | | | | | |
Investments at cost | | $ | 17,505,264,400 | | | $ | 633,199,725 | |
Repurchase agreement(s) at cost | | | 398,416,541 | | | | 64,039,382 | |
Net unrealized depreciation | | | (3,075,471,272 | ) | | | (80,712,870 | ) |
| | | | | | | | |
Investments at value | | | 14,828,209,669 | | | | 616,526,237 | |
Cash | | | 3,141,193 | | | | 62,493 | |
Foreign currency at value (identified cost $8,922,297, $229,893, $57,421,660, $0, $72,474, $0 and $154,254) | | | 8,651,271 | | | | 228,679 | |
Receivable for Fund shares sold | | | 28,494,376 | | | | 6,557,071 | |
Receivable for securities sold | | | 15,994,919 | | | | 134,110 | |
Unrealized appreciation on forward foreign currency contracts (Note 2) | | | — | | | | — | |
Dividends and interest receivable | | | 286,351,419 | | | | 9,919,214 | |
Tax reclaims receivable | | | — | | | | 8,345 | |
Receivable from investment adviser (Note 4) | | | — | | | | — | |
Securities lending income receivable | | | 436,189 | | | | 17,084 | |
Receivable from broker - variation margin on open futures contracts | | | — | | | | — | |
| | | | | | | | |
Total Assets | | | 15,171,279,036 | | | | 633,453,233 | |
| | | | | | | | |
| | |
| Liabilities | | | | | | | | |
Collateral on securities loaned, at value (Note 2) | | | 387,498,967 | | | | 6,151,664 | |
Due to custodian | | | — | | | | — | |
Payable for securities purchased | | | 2,430,619 | | | | 1,045,134 | |
Payable for Fund shares redeemed | | | 80,797,255 | | | | 1,331,001 | |
Management fees payable (Note 4) | | | 7,167,358 | | | | 274,368 | |
Administrative fees payable (Note 4) | | | 631,377 | | | | 25,764 | |
Deferred Trustees’ fees (Note 4) | | | 612,198 | | | | 82,925 | |
Service and distribution fees payable (Note 4) | | | 51,494 | | | | — | |
Payable to broker - variation margin on open futures contracts | | | — | | | | — | |
Unrealized depreciation on forward foreign currency contracts (Note 2) | | | — | | | | — | |
Other accounts payable and accrued expenses | | | 1,380,601 | | | | 56,560 | |
| | | | | | | | |
Total Liabilities | | | 480,569,869 | | | | 8,967,416 | |
| | | | | | | | |
Net Assets | | $ | 14,690,709,167 | | | $ | 624,485,817 | |
| | | | | | | | |
Net Assets consist of: | | | | | | | | |
Paid-in capital | | $ | 17,502,369,606 | | | $ | 661,311,385 | |
Accumulated net investment income | | | 162,371,028 | | | | 33,192,023 | |
Accumulated net realized gain (loss) on investments, futures contracts and foreign currency transactions | | | 110,827,421 | | | | 10,892,549 | |
Net unrealized depreciation on investments, futures contracts and foreign currency translations | | | (3,084,858,888 | ) | | | (80,910,140 | ) |
| | | | | | | | |
Net Assets | | $ | 14,690,709,167 | | | $ | 624,485,817 | |
| | | | | | | | |
| | |
| Net Asset Value and Offering Price | | | | | | | | |
Institutional Class | | | | | | | | |
Net assets | | $ | 7,616,621,451 | | | $ | 624,485,817 | |
| | | | | | | | |
Shares of beneficial interest | | | 640,789,202 | | | | 51,383,949 | |
| | | | | | | | |
Net asset value, offering and redemption price per share | | $ | 11.89 | | | $ | 12.15 | |
| | | | | | | | |
Retail Class | | | | | | | | |
Net assets | | $ | 6,863,593,992 | | | $ | — | |
| | | | | | | | |
Shares of beneficial interest | | | 579,263,966 | | | | — | |
| | | | | | | | |
Net asset value, offering and redemption price per share | | $ | 11.85 | | | $ | — | |
| | | | | | | | |
Admin Class | | | | | | | | |
Net assets | | $ | 210,493,724 | | | $ | — | |
| | | | | | | | |
Shares of beneficial interest | | | 17,801,628 | | | | — | |
| | | | | | | | |
Net asset value, offering and redemption price per share | | $ | 11.82 | | | $ | — | |
| | | | | | | | |
Value of securities on loan (Note 2) | | $ | 369,800,620 | | | $ | 5,787,463 | |
| | | | | | | | |
See accompanying notes to financial statements.
113
| | | | | | | | | | | | | | | | | | |
Global Bond
Fund | | | Inflation Protected
Securities Fund | | | Institutional High
Income Fund | | | Intermediate Duration
Fixed Income Fund | | | Investment Grade
Fixed Income Fund | |
| | | | | | | | | | | | | | | | | | |
| | | | | | | | | | | | | | | | | | |
| $ | 2,381,006,335 | | | $ | 18,300,722 | | | $ | 224,195,716 | | | $ | 38,282,810 | | | $ | 297,950,451 | |
| | 15,909,000 | | | | 251,000 | | | | 34,690,723 | | | | 352,000 | | | | 17,525,000 | |
| | (193,262,852 | ) | | | (1,122,838 | ) | | | (35,503,865 | ) | | | (1,884,204 | ) | | | (30,654,854 | ) |
| | 2,203,652,483 | | | | 17,428,884 | | | | 223,382,574 | | | | 36,750,606 | | | | 284,820,597 | |
| | 867 | | | | 526 | | | | — | | | | 216 | | | | 509 | |
| | | | |
| | 55,711,422 | | | | — | | | | 71,649 | | | | — | | | | 152,170 | |
| | 3,640,805 | | | | 126,503 | | | | 28,258 | | | | — | | | | — | |
| | 5,398,499 | | | | — | | | | 5,435 | | | | 1,799 | | | | — | |
| | 1,064,112 | | | | — | | | | — | | | | — | | | | — | |
| | 36,479,772 | | | | 134,773 | | | | 3,904,456 | | | | 328,395 | | | | 4,080,429 | |
| | 63,107 | | | | — | | | | — | | | | — | | | | 1,006 | |
| | — | | | | 7,458 | | | | — | | | | 5,728 | | | | — | |
| | 52,402 | | | | 2,266 | | | | 12,831 | | | | 4,391 | | | | 5,809 | |
| | 2,125,000 | | | | — | | | | — | | | | — | | | | — | |
| | 2,308,188,469 | | | | 17,700,410 | | | | 227,405,203 | | | | 37,091,135 | | | | 289,060,520 | |
| | | | |
| | | | | | | | | | | | | | | | | | |
| | 62,965,841 | | | | 1,411,666 | | | | 12,836,133 | | | | 4,238,526 | | | | 10,190,325 | |
| | — | | | | — | | | | 13,464 | | | | — | | | | — | |
| | 3,138,001 | | | | — | | | | 61,478 | | | | — | | | | 799,259 | |
| | 3,108,112 | | | | 174,920 | | | | 71,861 | | | | — | | | | — | |
| | 1,286,643 | | | | 3,495 | | | | 111,879 | | | | 6,899 | | | | 96,744 | |
| | 90,951 | | | | 657 | | | | 8,761 | | | | 1,297 | | | | 11,362 | |
| | 148,965 | | | | 37,499 | | | | 49,329 | | | | 40,447 | | | | 56,444 | |
| | 7,604 | | | | — | | | | — | | | | — | | | | — | |
| | — | | | | — | | | | — | | | | 17,578 | | | | — | |
| | 6,618,081 | | | | — | | | | — | | | | — | | | | — | |
| | 183,467 | | | | 39,067 | | | | 51,347 | | | | 38,544 | | | | 43,568 | |
| | 77,547,665 | | | | 1,667,304 | | | | 13,204,252 | | | | 4,343,291 | | | | 11,197,702 | |
| $ | 2,230,640,804 | | | $ | 16,033,106 | | | $ | 214,200,951 | | | $ | 32,747,844 | | | $ | 277,862,818 | |
| | | | | | | | | | | | | | | | | | |
| $ | 2,413,305,216 | | | $ | 17,419,094 | | | $ | 234,732,109 | | | $ | 35,685,795 | | | $ | 301,292,827 | |
| | 43,914,862 | | | | 29,211 | | | | 11,730,719 | | | | 6,401 | | | | 4,075,614 | |
| | | | |
| | (24,566,327 | ) | | | (292,118 | ) | | | 3,289,220 | | | | (1,051,400 | ) | | | 3,277,958 | |
| | (202,012,947 | ) | | | (1,123,081 | ) | | | (35,551,097 | ) | | | (1,892,952 | ) | | | (30,783,581 | ) |
| $ | 2,230,640,804 | | | $ | 16,033,106 | | | $ | 214,200,951 | | | $ | 32,747,844 | | | $ | 277,862,818 | |
| | | | |
| | | | | | | | | | | | | | | | | | |
| | | | | | | | | | | | | | | | | | |
| $ | 1,157,175,061 | | | $ | 16,033,106 | | | $ | 214,200,951 | | | $ | 32,747,844 | | | $ | 277,862,818 | |
| | 80,240,376 | | | | 1,626,279 | | | | 31,168,434 | | | | 3,656,973 | | | | 24,455,843 | |
| $ | 14.42 | | | $ | 9.86 | | | $ | 6.87 | | | $ | 8.95 | | | $ | 11.36 | |
| | | | | | | | | | | | | | | | | | |
| $ | 1,073,465,743 | | | $ | — | | | $ | — | | | $ | — | | | $ | — | |
| | 75,038,963 | | | | — | | | | — | | | | — | | | | — | |
| $ | 14.31 | | | $ | — | | | $ | — | | | $ | — | | | $ | — | |
| | | | | | | | | | | | | | | | | | |
| $ | — | | | $ | — | | | $ | — | | | $ | — | | | $ | — | |
| | — | | | | — | | | | — | | | | — | | | | — | |
| $ | — | | | $ | — | | | $ | — | | | $ | — | | | $ | — | |
| $ | 62,005,117 | | | $ | 1,348,324 | | | $ | 12,606,239 | | | $ | 4,100,616 | | | $ | 9,806,034 | |
See accompanying notes to financial statements.
114
STATEMENTS OF OPERATIONS
For the Year Ended September 30, 2008
| | | | | | | | |
| | |
Bond Fund | | | Fixed Income Fund | |
| | | | | | | | |
Investment Income | | | | | | | | |
Dividends | | $ | 39,649,353 | | | $ | 1,085,683 | |
Interest | | | 1,192,161,628 | | | | 43,611,273 | |
Securities lending income (Note 2) | | | 9,506,084 | | | | 217,377 | |
Less net foreign taxes withheld | | | (141,984 | ) | | | (3,524 | ) |
| | | | | | | | |
| | | 1,241,175,081 | | | | 44,910,809 | |
| | | | | | | | |
| | |
| Expenses | | | | | | | | |
Management fees (Note 4) | | | 86,455,857 | | | | 3,205,797 | |
Distribution fees—Retail Class (Note 4) | | | 19,616,387 | | | | — | |
Service and distribution fees—Admin Class (Note 4) | | | 1,141,246 | | | | — | |
Trustees’ fees and expenses (Note 4) | | | 235,110 | | | | 17,219 | |
Administrative fees (Note 4) | | | 8,516,973 | | | | 326,354 | |
Custodian fees and expenses | | | 824,993 | | | | 55,541 | |
Transfer agent fees and expenses—Institutional Class (Note 4) | | | 3,959,763 | | | | 1,409 | |
Transfer agent fees and expenses—Retail Class (Note 4) | | | 7,202,782 | | | | — | |
Transfer agent fees and expenses—Admin Class (Note 4) | | | 326,862 | | | | — | |
Audit and tax services fees | | | 44,988 | | | | 44,752 | |
Registration fees | | | 786,947 | | | | 32,822 | |
Shareholder reporting expenses | | | 1,625,860 | | | | 2,752 | |
Legal fees | | | 448,044 | | | | 16,349 | |
Expense recapture—Retail Class (Note 4) | | | 215,069 | | | | — | |
Miscellaneous expenses | | | 478,435 | | | | 25,674 | |
| | | | | | | | |
Total expenses | | | 131,879,316 | | | | 3,728,669 | |
Less fee reduction and/or expense reimbursement (Note 4) | | | (411,748 | ) | | | (12,467 | ) |
| | | | | | | | |
Net expenses | | | 131,467,568 | | | | 3,716,202 | |
| | | | | | | | |
Net investment income | | | 1,109,707,513 | | | | 41,194,607 | |
| | | | | | | | |
| | |
| Net Realized And Unrealized Gain (Loss) On Investments, Futures Contracts and Foreign Currency Transactions | | | | | | | | |
Net Realized Gain (Loss) on: | | | | | | | | |
Investments | | | 297,027,441 | | | | 15,026,908 | |
Futures contracts | | | — | | | | — | |
Foreign currency transactions | | | 2,733,234 | | | | 54,807 | |
| | |
| Net Change in Unrealized Appreciation (Depreciation) on: | | | | | | | | |
Investments | | | (3,770,212,311 | ) | | | (122,868,672 | ) |
Futures contracts | | | — | | | | — | |
Foreign currency translations | | | (11,664,563 | ) | | | (252,927 | ) |
| | | | | | | | |
Net realized and unrealized gain (loss) on investments, futures contracts and foreign currency transactions | | | (3,482,116,199 | ) | | | (108,039,884 | ) |
| | | | | | | | |
| | |
| Net Increase (Decrease) in Net Assets Resulting from Operations | | $ | (2,372,408,686 | ) | | $ | (66,845,277 | ) |
| | | | | | | | |
See accompanying notes to financial statements.
115
| | | | | | | | | | | | | | | | | | |
Global Bond
Fund | | | Inflation Protected
Securities Fund | | | Institutional High
Income Fund | | | Intermediate Duration
Fixed Income Fund | | | Investment Grade
Fixed Income Fund | |
| | | | | | | | | | | | | | | | | | |
| | | | | | | | | | | | | | | | | | |
| $ | 2,670,207 | | | $ | 7,230 | | | $ | 791,752 | | | $ | — | | | $ | 167,634 | |
| | 113,511,843 | | | | 1,108,823 | | | | 16,928,190 | | | | 1,798,764 | | | | 17,651,087 | |
| | 1,272,026 | | | | 22,610 | | | | 218,407 | | | | 48,994 | | | | 114,588 | |
| | (113,226 | ) | | | — | | | | (1,227 | ) | | | — | | | | — | |
| | 117,340,850 | | | | 1,138,663 | | | | 17,937,122 | | | | 1,847,758 | | | | 17,933,309 | |
| | | | |
| | | | | | | | | | | | | | | | | | |
| | 12,638,603 | | | | 39,289 | | | | 1,278,890 | | | | 85,501 | | | | 1,106,947 | |
| | 2,780,722 | | | | — | | | | — | | | | — | | | | — | |
| | — | | | | — | | | | — | | | | — | | | | — | |
| | 39,661 | | | | 9,720 | | | | 12,191 | | | | 9,861 | | | | 12,983 | |
| | 1,191,798 | | | | 7,996 | | | | 108,472 | | | | 17,427 | | | | 140,839 | |
| | 229,209 | | | | 16,265 | | | | 31,977 | | | | 20,122 | | | | 34,430 | |
| | 243,299 | | | | 7,536 | | | | 7,005 | | | | 1,044 | | | | 989 | |
| | 1,176,640 | | | | — | | | | — | | | | — | | | | — | |
| | — | | | | — | | | | — | | | | — | | | | — | |
| | 46,938 | | | | 41,074 | | | | 43,212 | | | | 37,793 | | | | 39,091 | |
| | 154,344 | | | | 21,517 | | | | 28,772 | | | | 21,679 | | | | 25,356 | |
| | 187,023 | | | | 1,183 | | | | 8,601 | | | | 1,757 | | | | 1,689 | |
| | 62,437 | | | | 401 | | | | 5,418 | | | | 805 | | | | 7,129 | |
| | 240,828 | | | | — | | | | — | | | | — | | | | — | |
| | 72,105 | | | | 4,145 | | | | 10,405 | | | | 5,067 | | | | 12,698 | |
| | 19,063,607 | | | | 149,126 | | | | 1,534,943 | | | | 201,056 | | | | 1,382,151 | |
| | (45,880 | ) | | | (86,267 | ) | | | (4,126 | ) | | | (64,255 | ) | | | (5,357 | ) |
| | 19,017,727 | | | | 62,859 | | | | 1,530,817 | | | | 136,801 | | | | 1,376,794 | |
| | 98,323,123 | | | | 1,075,804 | | | | 16,406,305 | | | | 1,710,957 | | | | 16,556,515 | |
| | | | |
| | | | | | | | | | | | | | | | | | |
| | | | | | | | | | | | | | | | | | |
| | 39,040,311 | | | | 117,757 | | | | 3,309,293 | | | | (299,671 | ) | | | 8,203,200 | |
| | (1,375,468 | ) | | | — | | | | — | | | | 90,945 | | | | — | |
| | (532,270 | ) | | | 381 | | | | (3,911 | ) | | | (1,055 | ) | | | 12,532 | |
| | | | |
| | | | | | | | | | | | | | | | | | |
| | (245,009,680 | ) | | | (952,219 | ) | | | (48,353,364 | ) | | | (1,622,101 | ) | | | (43,260,764 | ) |
| | 224,761 | | | | — | | | | — | | | | (8,735 | ) | | | — | |
| | (10,573,520 | ) | | | (1,079 | ) | | | (57,192 | ) | | | (13 | ) | | | (160,758 | ) |
| | | | |
| | (218,225,866 | ) | | | (835,160 | ) | | | (45,105,174 | ) | | | (1,840,630 | ) | | | (35,205,790 | ) |
| | | | |
| $ | (119,902,743 | ) | | $ | 240,644 | | | $ | (28,698,869 | ) | | $ | (129,673 | ) | | $ | (18,649,275 | ) |
See accompanying notes to financial statements.
116
STATEMENTS OF CHANGES IN NET ASSETS
Bond Fund
| | | | | | | | |
| | | Year Ended
September 30, 2008 | | | Year Ended
September 30, 2007 | |
From Operations: | | | | | | | | |
Net investment income | | $ | 1,109,707,513 | | | $ | 602,981,854 | |
Net realized gain on investments and foreign currency transactions | | | 299,760,675 | | | | 141,128,552 | |
Net change in net unrealized appreciation (depreciation) on investments and foreign currency translations | | | (3,781,876,874 | ) | | | 288,741,579 | |
| | | | | | | | |
Increase (Decrease) in Net Assets From Operations | | | (2,372,408,686 | ) | | | 1,032,851,985 | |
| | | | | | | | |
From Distributions to Shareholders: | | | | | | | | |
Net Investment Income: | | | | | | | | |
Institutional Class | | | (618,954,427 | ) | | | (367,518,277 | ) |
Retail Class | | | (540,831,022 | ) | | | (254,215,109 | ) |
Admin Class | | | (15,164,699 | ) | | | (8,202,969 | ) |
Capital Gains: | | | | | | | | |
Institutional Class | | | — | | | | — | |
Retail Class | | | — | | | | — | |
Admin Class | | | — | | | | — | |
| | | | | | | | |
Total distributions | | | (1,174,950,148 | ) | | | (629,936,355 | ) |
| | | | | | | | |
Increase in Net Assets Derived from Capital Shares Transactions (Note 7) | | | 3,895,007,552 | | | | 6,856,379,181 | |
| | | | | | | | |
Redemption Fees | | | | | | | | |
Institutional Class | | | 423,395 | | | | 440,675 | |
Retail Class | | | 381,530 | | | | 303,180 | |
Admin Class | | | 11,120 | | | | 10,693 | |
| | | | | | | | |
Total increase in net assets | | | 348,464,763 | | | | 7,260,049,359 | |
Net Assets | | | | | | | | |
Beginning of year | | | 14,342,244,404 | | | | 7,082,195,045 | |
| | | | | | | | |
End of year | | $ | 14,690,709,167 | | | $ | 14,342,244,404 | |
| | | | | | | | |
Accumulated Net Investment Income | | $ | 162,371,028 | | | $ | 57,172,960 | |
| | | | | | | | |
Fixed Income Fund
| | | | | | | | |
| | | Year Ended
September 30, 2008 | | | Year Ended
September 30, 2007 | |
From Operations: | | | | | | | | |
Net investment income | | $ | 41,194,607 | | | $ | 30,944,356 | |
Net realized gain on investments and foreign currency transactions | | | 15,081,715 | | | | 18,051,055 | |
Net change in net unrealized appreciation (depreciation) on investments and foreign currency translations | | | (123,121,599 | ) | | | 6,460,609 | |
| | | | | | | | |
Increase (Decrease) in Net Assets From Operations | | | (66,845,277 | ) | | | 55,456,020 | |
| | | | | | | | |
From Distributions to Shareholders: | | | | | | | | |
Net Investment Income: | | | | | | | | |
Institutional Class | | | (43,626,372 | ) | | | (30,011,559 | ) |
Capital Gains: | | | | | | | | |
Institutional Class | | | (643,688 | ) | | | — | |
| | | | | | | | |
Total distributions | | | (44,270,060 | ) | | | (30,011,559 | ) |
| | | | | | | | |
Increase in Net Assets Derived from Capital Shares Transactions (Note 7) | | | 130,500,717 | | | | 123,644,710 | |
| | | | | | | | |
Total increase in net assets | | | 19,385,380 | | | | 149,089,171 | |
Net Assets | | | | | | | | |
Beginning of year | | | 605,100,437 | | | | 456,011,266 | |
| | | | | | | | |
End of year | | $ | 624,485,817 | | | $ | 605,100,437 | |
| | | | | | | | |
Accumulated Net Investment Income | | $ | 33,192,023 | | | $ | 32,919,117 | |
| | | | | | | | |
See accompanying notes to financial statements.
117
STATEMENTS OF CHANGES IN NET ASSETS
Global Bond Fund
| | | | | | | | |
| | | Year Ended
September 30, 2008 | | | Year Ended
September 30, 2007 | |
From Operations: | | | | | | | | |
Net investment income | | $ | 98,323,123 | | | $ | 55,241,500 | |
Net realized gain on investments, futures contracts and foreign currency transactions | | | 37,132,573 | | | | 14,783,271 | |
Net change in net unrealized appreciation (depreciation) on investments, futures contracts and foreign currency translations | | | (255,358,439 | ) | | | 56,531,746 | |
| | | | | | | | |
Increase (Decrease) in Net Assets From Operations | | | (119,902,743 | ) | | | 126,556,517 | |
| | | | | | | | |
From Distributions to Shareholders: | | | | | | | | |
Net Investment Income: | | | | | | | | |
Institutional Class | | | (61,946,579 | ) | | | (46,911,889 | ) |
Retail Class | | | (52,697,573 | ) | | | (37,021,466 | ) |
Capital Gains: | | | | | | | | |
Institutional Class | | | — | | | | — | |
Retail Class | | | — | | | | — | |
| | | | | | | | |
Total distributions | | | (114,644,152 | ) | | | (83,933,355 | ) |
| | | | | | | | |
Increase in Net Assets Derived from Capital Shares Transactions (Note 7) | | | 594,419,506 | | | | 643,198,818 | |
| | | | | | | | |
Redemption Fees | | | | | | | | |
Institutional Class | | | 77,878 | | | | 59,521 | |
Retail Class | | | 69,167 | | | | 51,588 | |
| | | | | | | | |
Total increase in net assets | | | 360,019,656 | | | | 685,933,089 | |
Net Assets | | | | | | | | |
Beginning of year | | | 1,870,621,148 | | | | 1,184,688,059 | |
| | | | | | | | |
End of year | | $ | 2,230,640,804 | | | $ | 1,870,621,148 | |
| | | | | | | | |
Accumulated Net Investment Income | | $ | 43,914,862 | | | $ | 12,750,956 | |
| | | | | | | | |
Inflation Protected Securities Fund
| | | | | | | | |
| | | Year Ended
September 30, 2008 | | | Year Ended
September 30, 2007 | |
From Operations: | | | | | | | | |
Net investment income | | $ | 1,075,804 | | | $ | 535,955 | |
Net realized gain (loss) on investments and foreign currency transactions | | | 118,138 | | | | (18,387 | ) |
Net change in net unrealized appreciation (depreciation) on investments and foreign currency translations | | | (953,298 | ) | | | 114,691 | |
| | | | | | | | |
Increase in net assets resulting from operations | | | 240,644 | | | | 632,259 | |
| | | | | | | | |
From Distributions to Shareholders: | | | | | | | | |
Net Investment Income: | | | | | | | | |
Institutional Class | | | (1,129,818 | ) | | | (595,612 | ) |
Capital Gains: | | | | | | | | |
Institutional Class | | | — | | | | — | |
| | | | | | | | |
Total distributions | | | (1,129,818 | ) | | | (595,612 | ) |
| | | | | | | | |
Increase in Net Assets Derived from Capital Shares Transactions (Note 7) | | | 3,454,672 | | | | 4,378,400 | |
| | | | | | | | |
Total increase in net assets | | | 2,565,498 | | | | 4,415,047 | |
Net Assets | | | | | | | | |
Beginning of year | | | 13,467,608 | | | | 9,052,561 | |
| | | | | | | | |
End of year | | $ | 16,033,106 | | | $ | 13,467,608 | |
| | | | | | | | |
Accumulated Net Investment Income | | $ | 29,211 | | | $ | 1,726 | |
| | | | | | | | |
See accompanying notes to financial statements.
118
STATEMENTS OF CHANGES IN NET ASSETS – continued
Institutional High Income Fund
| | | | | | | | |
| | | Year Ended
September 30, 2008 | | | Year Ended
September 30, 2007 | |
From Operations: | | | | | | | | |
Net investment income | | $ | 16,406,305 | | | $ | 10,809,328 | |
Net realized gain on investments and foreign currency transactions | | | 3,305,382 | | | | 8,148,235 | |
Net change in net unrealized appreciation (depreciation) on investments and foreign currency translations | | | (48,410,556 | ) | | | (3,394,602 | ) |
| | | | | | | | |
Increase (Decrease) in Net Assets From Operations | | | (28,698,869 | ) | | | 15,562,961 | |
| | | | | | | | |
From Distributions to Shareholders: | | | | | | | | |
Net Investment Income: | | | | | | | | |
Institutional Class | | | (12,543,920 | ) | | | (9,165,373 | ) |
Capital Gains: | | | | | | | | |
Institutional Class | | | (3,556,542 | ) | | | — | |
| | | | | | | | |
Total distributions | | | (16,100,462 | ) | | | (9,165,373 | ) |
| | | | | | | | |
Increase in Net Assets Derived from Capital Shares Transactions (Note 7) | | | 71,431,847 | | | | 39,853,081 | |
| | | | | | | | |
Total increase in net assets | | | 26,632,516 | | | | 46,250,669 | |
Net Assets | | | | | | | | |
Beginning of year | | | 187,568,435 | | | | 141,317,766 | |
| | | | | | | | |
End of year | | $ | 214,200,951 | | | $ | 187,568,435 | |
| | | | | | | | |
Accumulated Net Investment Income | | $ | 11,730,719 | | | $ | 8,165,766 | |
| | | | | | | | |
Intermediate Duration Fixed Income Fund
| | | | | | | | |
| | | Year Ended
September 30, 2008 | | | Year Ended
September 30, 2007 | |
From Operations: | | | | | | | | |
Net investment income | | $ | 1,710,957 | | | $ | 1,737,447 | |
Net realized loss on investments, futures contracts and foreign currency transactions | | | (209,781 | ) | | | (82,683 | ) |
Net change in net unrealized appreciation (depreciation) on investments, futures contracts and foreign currency translations | | | (1,630,849 | ) | | | 42,252 | |
| | | | | | | | |
Increase (Decrease) in Net Assets From Operations | | | (129,673 | ) | | | 1,697,016 | |
| | | | | | | | |
From Distributions to Shareholders: | | | | | | | | |
Net Investment Income: | | | | | | | | |
Institutional Class | | | (1,768,089 | ) | | | (1,835,942 | ) |
Capital Gains: | | | | | | | | |
Institutional Class | | | — | | | | — | |
| | | | | | | | |
Total distributions | | | (1,768,089 | ) | | | (1,835,942 | ) |
| | | | | | | | |
Increase (Decrease) in Net Assets Derived from Capital Shares Transactions (Note 7) | | | 3,200,454 | | | | (10,267,100 | ) |
| | | | | | | | |
Total increase (decrease) in net assets | | | 1,302,692 | | | | (10,406,026 | ) |
Net Assets | | | | | | | | |
Beginning of year | | | 31,445,152 | | | | 41,851,178 | |
| | | | | | | | |
End of year | | $ | 32,747,844 | | | $ | 31,445,152 | |
| | | | | | | | |
Accumulated Net Investment Income | | $ | 6,401 | | | $ | 4,913 | |
| | | | | | | | |
See accompanying notes to financial statements.
119
STATEMENTS OF CHANGES IN NET ASSETS
Investment Grade Fixed Income Fund
| | | | | | | | |
| | | Year Ended
September 30, 2008 | | | Year Ended
September 30, 2007 | |
From Operations: | | | | | | | | |
Net investment income | | $ | 16,556,515 | | | $ | 11,275,232 | |
Net realized gain on investments and foreign currency transactions | | | 8,215,732 | | | | 3,867,775 | |
Net change in net unrealized appreciation (depreciation) on investments and foreign currency translations | | | (43,421,522 | ) | | | 5,644,073 | |
| | | | | | | | |
Increase (Decrease) in Net Assets From Operations | | | (18,649,275 | ) | | | 20,787,080 | |
| | | | | | | | |
From Distributions to Shareholders: | | | | | | | | |
Net Investment Income: | | | | | | | | |
Institutional Class | | | (19,088,772 | ) | | | (14,190,258 | ) |
Capital Gains: | | | | | | | | |
Institutional Class | | | — | | | | — | |
| | | | | | | | |
Total distributions | | | (19,088,772 | ) | | | (14,190,258 | ) |
| | | | | | | | |
Increase in Net Assets Derived from Capital Shares Transactions (Note 7) | | | 53,860,153 | | | | 81,594,581 | |
| | | | | | | | |
Total increase in net assets | | | 16,122,106 | | | | 88,191,403 | |
Net Assets | | | | | | | | |
Beginning of year | | | 261,740,712 | | | | 173,549,309 | |
| | | | | | | | |
End of year | | $ | 277,862,818 | | | $ | 261,740,712 | |
| | | | | | | | |
Accumulated Net Investment Income | | $ | 4,075,614 | | | $ | 2,416,446 | |
| | | | | | | | |
See accompanying notes to financial statements.
120
FINANCIAL HIGHLIGHTS
For a share outstanding throughout each period.
| | | | | | | | | | | | | | | | | | | | | | | | | | | |
| | | | | Income (Loss) from Investment Operations: | | | | | Less Distributions: | |
| | | Net asset
value,
beginning
of the period | | Net
investment
income(c) | | Net realized
and unrealized
gain (loss) | | | Total from
investment
operations | | | | | Dividends
from
net investment
income | | | Distributions
from net
realized
capital gains | | Total
distributions | |
| Bond Fund | | | | | | | | | | | | | | | | | | | | | | | | |
| | | | | | | |
| Institutional Class | | | | | | | | | | | | | | | | | | | | | | | | |
9/30/2008 | | $ | 14.71 | | $ | 0.96 | | $ | (2.77 | ) | | $ | (1.81 | ) | | | | $ | (1.01 | ) | | $ | — | | $ | (1.01 | ) |
9/30/2007 | | | 14.13 | | | 0.83 | | | 0.58 | | | | 1.41 | | | | | | (0.83 | ) | | | — | | | (0.83 | ) |
9/30/2006 | | | 13.81 | | | 0.72 | | | 0.47 | | | | 1.19 | | | | | | (0.87 | ) | | | — | | | (0.87 | ) |
9/30/2005 | | | 13.46 | | | 0.67 | | | 0.57 | | | | 1.24 | | | | | | (0.89 | ) | | | — | | | (0.89 | ) |
9/30/2004 | | | 12.66 | | | 0.72 | | | 0.82 | | | | 1.54 | | | | | | (0.74 | ) | | | — | | | (0.74 | ) |
| | | | | | | |
| Retail Class | | | | | | | | | | | | | | | | | | | | | | | | |
9/30/2008 | | $ | 14.67 | | $ | 0.92 | | $ | (2.77 | ) | | $ | (1.85 | ) | | | | $ | (0.97 | ) | | $ | — | | $ | (0.97 | ) |
9/30/2007 | | | 14.10 | | | 0.79 | | | 0.57 | | | | 1.36 | | | | | | (0.79 | ) | | | — | | | (0.79 | ) |
9/30/2006 | | | 13.78 | | | 0.69 | | | 0.47 | | | | 1.16 | | | | | | (0.84 | ) | | | — | | | (0.84 | ) |
9/30/2005 | | | 13.44 | | | 0.64 | | | 0.57 | | | | 1.21 | | | | | | (0.87 | ) | | | — | | | (0.87 | ) |
9/30/2004 | | | 12.65 | | | 0.69 | | | 0.82 | | | | 1.51 | | | | | | (0.72 | ) | | | — | | | (0.72 | ) |
| | | | | | | |
| Admin Class | | | | | | | | | | | | | | | | | | | | | | | | |
9/30/2008 | | $ | 14.64 | | $ | 0.88 | | $ | (2.76 | ) | | $ | (1.88 | ) | | | | $ | (0.94 | ) | | $ | — | | $ | (0.94 | ) |
9/30/2007 | | | 14.07 | | | 0.75 | | | 0.58 | | | | 1.33 | | | | | | (0.76 | ) | | | — | | | (0.76 | ) |
9/30/2006 | | | 13.75 | | | 0.65 | | | 0.48 | | | | 1.13 | | | | | | (0.81 | ) | | | — | | | (0.81 | ) |
9/30/2005 | | | 13.42 | | | 0.60 | | | 0.56 | | | | 1.16 | | | | | | (0.83 | ) | | | — | | | (0.83 | ) |
9/30/2004 | | | 12.64 | | | 0.65 | | | 0.82 | | | | 1.47 | | | | | | (0.69 | ) | | | — | | | (0.69 | ) |
(a) Had certain expenses not been reduced during the period, if applicable, total returns would have been lower. Periods less than one year, if applicable, are not annualized.
(b) The investment adviser and/or administrator agreed to reimburse a portion of the Fund’s expenses and/or reduce its fees during the period. Without this reimbursement/fee reduction, if applicable, expenses would have been higher.
(c) Per share net investment income has been calculated using the average shares outstanding during the period.
(d) Amount rounds to less than $0.01 per share, if applicable.
(e) Includes expense recapture of 0.02%.
(f) Effective July 1, 2007, the Fund decreased its net expense limitations to 0.70%, 0.95% and 1.20% from 0.75%, 1.00% and 1.25% for the Institutional Class, Retail Class and Admin Class, respectively.
(g) Computed on an annualized basis for periods less than one year, if applicable.
(h) Includes expense recapture of less than 0.01%.
(i) Effective June 2, 2008, redemption fees were eliminated.
See accompanying notes to financial statements.
121
| | | | | | | | | | | | | | | | | | | | |
| | | | | | | | | | Ratios to Average Net Assets: | | |
Redemption
fees(d)(i) | | Net asset
value,
end of the
period | | Total
return (%)(a) | | | Net assets,
end of the
period
(000’s) | | Net
expenses (%)(b)(g) | | | Gross
expenses (%)(g) | | | Net
investment
income (loss) (%)(g) | | Portfolio
turnover
rate (%) |
| | | | | | | | | | | | | | | | | | | | |
| | | | | | | |
| | | | | | | | | | | | | | | | | | | | |
| $ | 0.00 | | $ | 11.89 | | (13.1 | ) | | $ | 7,616,621 | | 0.64 | | | 0.64 | | | 6.78 | | 26 |
| | 0.00 | | | 14.71 | | 10.3 | | | | 7,716,061 | | 0.67 | (f) | | 0.67 | | | 5.75 | | 20 |
| | 0.00 | | | 14.13 | | 9.0 | | | | 4,742,622 | | 0.75 | (e) | | 0.75 | (e) | | 5.20 | | 26 |
| | 0.00 | | | 13.81 | | 9.5 | | | | 3,303,997 | | 0.75 | | | 0.79 | | | 4.91 | | 22 |
| | — | | | 13.46 | | 12.5 | | | | 2,365,199 | | 0.75 | | | 0.79 | | | 5.48 | | 42 |
| | | | | | | |
| | | | | | | | | | | | | | | | | | | | |
| $ | 0.00 | | $ | 11.85 | | (13.4 | ) | | $ | 6,863,594 | | 0.94 | (h) | | 0.94 | (h) | | 6.49 | | 26 |
| | 0.00 | | | 14.67 | | 9.9 | | | | 6,432,333 | | 0.97 | (f) | | 0.97 | | | 5.49 | | 20 |
| | 0.00 | | | 14.10 | | 8.8 | | | | 2,232,632 | | 1.00 | | | 1.01 | | | 4.99 | | 26 |
| | 0.00 | | | 13.78 | | 9.2 | | | | 707,394 | | 1.00 | | | 1.05 | | | 4.64 | | 22 |
| | — | | | 13.44 | | 12.2 | | | | 275,349 | | 1.00 | | | 1.04 | | | 5.24 | | 42 |
| | | | | | | |
| | | | | | | | | | | | | | | | | | | | |
| $ | 0.00 | | $ | 11.82 | | (13.7 | ) | | $ | 210,494 | | 1.20 | | | 1.24 | | | 6.23 | | 26 |
| | 0.00 | | | 14.64 | | 9.7 | | | | 193,850 | | 1.23 | (f)(h) | | 1.23 | (h) | | 5.20 | | 20 |
| | 0.00 | | | 14.07 | | 8.5 | | | | 106,941 | | 1.25 | | | 1.29 | | | 4.71 | | 26 |
| | 0.00 | | | 13.75 | | 8.9 | | | | 64,263 | | 1.25 | | | 1.31 | | | 4.39 | | 22 |
| | — | | | 13.42 | | 11.9 | | | | 27,299 | | 1.25 | | | 1.29 | | | 4.99 | | 42 |
See accompanying notes to financial statements.
122
FINANCIAL HIGHLIGHTS – continued
For a share outstanding throughout each period.
| | | | | | | | | | | | | | | | | | | | | | | | | | | | |
| | | | | Income (Loss) from Investment Operations: | | | | | Less Distributions: | |
| | | Net asset
value,
beginning
of the period | | Net
investment
income(c) | | Net realized
and unrealized
gain (loss) | | | Total from
investment
operations | | | | | Dividends
from
net investment
income | | | Distributions
from net
realized
capital gains | | | Total
distributions | |
| Fixed Income Fund | | | | | | | | | | | | | | | | | | | | | | |
| | | | | | | |
| Institutional Class | | | | | | | | | | | | | | | | | | | | | | | | | |
9/30/2008 | | $ | 14.49 | | $ | 0.88 | | $ | (2.14 | ) | | $ | (1.26 | ) | | | | $ | (1.06 | ) | | $ | (0.02 | ) | | $ | (1.08 | ) |
9/30/2007 | | | 13.89 | | | 0.83 | | | 0.67 | | | | 1.50 | | | | | | (0.90 | ) | | | — | | | | (0.90 | ) |
9/30/2006 | | | 13.88 | | | 0.74 | | | 0.30 | | | | 1.04 | | | | | | (1.03 | ) | | | — | | | | (1.03 | ) |
9/30/2005 | | | 13.93 | | | 0.75 | | | 0.58 | | | | 1.33 | | | | | | (1.38 | ) | | | — | | | | (1.38 | ) |
9/30/2004 | | | 13.24 | | | 0.82 | | | 0.79 | | | | 1.61 | | | | | | (0.92 | ) | | | — | | | | (0.92 | ) |
| | | | | | |
| Global Bond Fund | | | | | | | | | | | | | | | | | | | | | | |
| | | | | | | |
| Institutional Class | | | | | | | | | | | | | | | | | | | | | | | | | |
9/30/2008 | | $ | 15.83 | | $ | 0.70 | | $ | (1.30 | ) | | $ | (0.60 | ) | | | | $ | (0.81 | ) | | $ | — | | | $ | (0.81 | ) |
9/30/2007 | | | 15.43 | | | 0.60 | | | 0.70 | | | | 1.30 | | | | | | (0.90 | ) | | | — | | | | (0.90 | ) |
9/30/2006 | | | 15.57 | | | 0.48 | | | 0.16 | | | | 0.64 | | | | | | (0.70 | ) | | | (0.08 | ) | | | (0.78 | ) |
9/30/2005 | | | 15.59 | | | 0.44 | | | 0.05 | | | | 0.49 | | | | | | (0.46 | ) | | | (0.05 | ) | | | (0.51 | ) |
9/30/2004 | | | 14.93 | | | 0.48 | | | 0.78 | | | | 1.26 | | | | | | (0.60 | ) | | | — | | | | (0.60 | ) |
| | | | | | | |
| Retail Class | | | | | | | | | | | | | | | | | | | | | | | | | |
9/30/2008 | | $ | 15.71 | | $ | 0.64 | | $ | (1.29 | ) | | $ | (0.65 | ) | | | | $ | (0.75 | ) | | $ | — | | | $ | (0.75 | ) |
9/30/2007 | | | 15.29 | | | 0.54 | | | 0.70 | | | | 1.24 | | | | | | (0.82 | ) | | | — | | | | (0.82 | ) |
9/30/2006 | | | 15.43 | | | 0.44 | | | 0.15 | | | | 0.59 | | | | | | (0.65 | ) | | | (0.08 | ) | | | (0.73 | ) |
9/30/2005 | | | 15.46 | | | 0.40 | | | 0.05 | | | | 0.45 | | | | | | (0.43 | ) | | | (0.05 | ) | | | (0.48 | ) |
9/30/2004 | | | 14.83 | | | 0.43 | | | 0.79 | | | | 1.22 | | | | | | (0.59 | ) | | | — | | | | (0.59 | ) |
(a) Had certain expenses not been reduced during the period, if applicable, total returns would have been lower. Periods less than one year, if applicable, are not annualized.
(b) The investment adviser and/or administrator agreed to reimburse a portion of the Fund’s expenses and/or reduce its fee during the period. Without this reimbursement/fee reduction, if applicable, expenses would have been higher.
(c) Per share net investment income has been calculated using the average shares outstanding during the period.
(d) Amount rounds to less than $0.01 per share, if applicable.
(e) Includes expense recapture of less than 0.01% and 0.03% for Fixed Income Fund and Global Bond Fund, respectively.
(f) Includes expense recapture of 0.02%.
(g) Computed on an annualized basis for periods less than one year, if applicable.
(h) Effective June 2, 2008, redemption fees were eliminated.
See accompanying notes to financial statements.
123
| | | | | | | | | | | | | | | | | | | | | |
| | | | | | | | | | | Ratios to Average Net Assets: | | |
Redemption
fees(d) | | | Net asset
value,
end of
the period | | Total
return (%)(a) | | | Net assets,
end of
the period
(000’s) | | Net
expenses (%)(b)(g) | | | Gross
expenses (%)(g) | | | Net
investment
income (loss) (%)(g) | | Portfolio
turnover
rate (%) |
| | | | | | | | | | | | | | | | | | | | | |
| | | | | | | |
| | | | | | | | | | | | | | | | | | | | | |
| $ | — | | | $ | 12.15 | | (9.4 | ) | | $ | 624,486 | | 0.58 | | | 0.58 | | | 6.43 | | 30 |
| | — | | | | 14.49 | | 11.3 | | | | 605,100 | | 0.60 | | | 0.60 | | | 5.96 | | 22 |
| | — | | | | 13.89 | | 8.1 | | | | 456,011 | | 0.60 | (e) | | 0.60 | (e) | | 5.48 | | 40 |
| | — | | | | 13.88 | | 9.9 | | | | 444,552 | | 0.65 | | | 0.65 | | | 5.47 | | 34 |
| | — | | | | 13.93 | | 12.6 | | | | 358,652 | | 0.65 | | | 0.66 | | | 6.17 | | 35 |
| | | | | | | |
| | | | | | | | | | | | | | | | | | | | | |
| | | | | | | |
| | | | | | | | | | | | | | | | | | | | | |
| $ | 0.00 | (h) | | $ | 14.42 | | (4.1 | ) | | $ | 1,157,175 | | 0.64 | | | 0.64 | | | 4.36 | | 60 |
| | 0.00 | | | | 15.83 | | 8.7 | | | | 996,046 | | 0.68 | | | 0.68 | | | 3.84 | | 95 |
| | 0.00 | | | | 15.43 | | 4.3 | | | | 643,991 | | 0.74 | (e) | | 0.74 | (e) | | 3.21 | | 77 |
| | 0.00 | | | | 15.57 | | 3.1 | | | | 553,704 | | 0.75 | | | 0.80 | | | 2.75 | | 63 |
| | 0.00 | | | | 15.59 | | 8.6 | | | | 287,830 | | 0.80 | | | 0.85 | | | 3.15 | | 61 |
| | | | | | | |
| | | | | | | | | | | | | | | | | | | | | |
| $ | 0.00 | (h) | | $ | 14.31 | | (4.5 | ) | | $ | 1,073,466 | | 1.00 | (f) | | 1.00 | (f) | | 4.02 | | 60 |
| | 0.00 | | | | 15.71 | | 8.4 | | | | 874,575 | | 1.00 | | | 1.04 | | | 3.53 | | 95 |
| | 0.00 | | | | 15.29 | | 4.0 | | | | 540,697 | | 1.00 | | | 1.09 | | | 2.93 | | 77 |
| | 0.00 | | | | 15.43 | | 2.8 | | | | 699,498 | | 1.00 | | | 1.09 | | | 2.57 | | 63 |
| | 0.00 | | | | 15.46 | | 8.4 | | | | 413,652 | | 1.04 | | | 1.10 | | | 2.88 | | 61 |
See accompanying notes to financial statements.
124
FINANCIAL HIGHLIGHTS – continued
For a share outstanding throughout each period.
| | | | | | | | | | | | | | | | | | | | | | | | | | | | |
| | | | | Income (Loss) from Investment Operations: | | | | | Less Distributions: | |
| | | Net asset
value,
beginning
of the period | | Net
investment
income(c) | | Net realized
and unrealized
gain (loss) | | | Total from
investment
operations | | | | | Dividends
from
net investment
income | | | Distributions
from
net realized
capital gains | | | Total
distributions | |
| Inflation Protected Securities Fund | | | | | | | | | | | | | | | |
| | | | | | |
| Institutional Class | | | | | | | | | | | | | | | | | | | | | | |
9/30/2008 | | $ | 10.31 | | $ | 0.73 | | $ | (0.43 | ) | | $ | 0.30 | | | | | $ | (0.75 | ) | | $ | — | | | $ | (0.75 | ) |
9/30/2007 | | | 10.30 | | | 0.47 | | | 0.03 | | | | 0.50 | | | | | | (0.49 | ) | | | — | | | | (0.49 | ) |
9/30/2006 | | | 10.84 | | | 0.52 | | | (0.38 | ) | | | 0.14 | | | | | | (0.63 | ) | | | (0.05 | ) | | | (0.68 | ) |
9/30/2005 | | | 11.02 | | | 0.42 | | | (0.08 | ) | | | 0.34 | | | | | | (0.52 | ) | | | — | | | | (0.52 | ) |
9/30/2004 | | | 11.60 | | | 0.37 | | | (0.12 | ) | | | 0.25 | | | | | | (0.54 | ) | | | (0.29 | ) | | | (0.83 | ) |
| | | | |
| Institutional High Income Fund | | | | | | | | | | | | | | | |
| | | | | | |
| Institutional Class | | | | | | | | | | | | | | | | | | | | | | |
9/30/2008 | | $ | 8.45 | | $ | 0.60 | | $ | (1.52 | ) | | $ | (0.92 | ) | | | | $ | (0.51 | ) | | $ | (0.15 | ) | | $ | (0.66 | ) |
9/30/2007 | | | 8.11 | | | 0.55 | | | 0.30 | | | | 0.85 | | | | | | (0.51 | ) | | | — | | | | (0.51 | ) |
9/30/2006 | | | 7.80 | | | 0.50 | | | 0.34 | | | | 0.84 | | | | | | (0.53 | ) | | | — | | | | (0.53 | ) |
9/30/2005 | | | 7.50 | | | 0.55 | | | 0.39 | | | | 0.94 | | | | | | (0.64 | ) | | | — | | | | (0.64 | ) |
9/30/2004 | | | 6.91 | | | 0.55 | | | 0.66 | | | | 1.21 | | | | | | (0.62 | ) | | | — | | | | (0.62 | ) |
| | | | |
| Intermediate Duration Fixed Income Fund | | | | | | | | | | | | | | | |
| | | | | | |
| Institutional Class | | | | | | | | | | | | | | | | | | | | | | |
9/30/2008 | | $ | 9.47 | | $ | 0.47 | | $ | (0.50 | ) | | $ | (0.03 | ) | | | | $ | (0.49 | ) | | $ | — | | | $ | (0.49 | ) |
9/30/2007 | | | 9.50 | | | 0.45 | | | (0.01 | ) | | | 0.44 | | | | | | (0.47 | ) | | | — | | | | (0.47 | ) |
9/30/2006 | | | 9.60 | | | 0.42 | | | (0.07 | ) | | | 0.35 | | | | | | (0.45 | ) | | | — | | | | (0.45 | ) |
9/30/2005 | | | 9.92 | | | 0.40 | | | (0.25 | ) | | | 0.15 | | | | | | (0.45 | ) | | | (0.02 | ) | | | (0.47 | ) |
9/30/2004 | | | 10.10 | | | 0.45 | | | (0.10 | ) | | | 0.35 | | | | | | (0.53 | ) | | | — | | | | (0.53 | ) |
| | | | |
| Investment Grade Fixed Income Fund | | | | | | | | | | | | | | | |
| | | | | | |
| Institutional Class | | | | | | | | | | | | | | | | | | | | | | |
9/30/2008 | | $ | 12.96 | | $ | 0.76 | | $ | (1.47 | ) | | $ | (0.71 | ) | | | | $ | (0.89 | ) | | $ | — | | | $ | (0.89 | ) |
9/30/2007 | | | 12.63 | | | 0.70 | | | 0.53 | | | | 1.23 | | | | | | (0.90 | ) | | | — | | | | (0.90 | ) |
9/30/2006 | | | 13.28 | | | 0.60 | | | 0.22 | | | | 0.82 | | | | | | (0.92 | ) | | | (0.55 | ) | | | (1.47 | ) |
9/30/2005 | | | 13.54 | | | 0.57 | | | 0.27 | | | | 0.84 | | | | | | (0.83 | ) | | | (0.27 | ) | | | (1.10 | ) |
9/30/2004 | | | 13.38 | | | 0.67 | | | 0.75 | | | | 1.42 | | | | | | (0.88 | ) | | | (0.38 | ) | | | (1.26 | ) |
(a) Had certain expenses not been reduced during the period, if applicable, total returns would have been lower. Periods less than one year, if applicable, are not annualized.
(b) The investment adviser and/or administrator agreed to reimburse a portion of the Fund’s expenses and/or reduce its fee during the period. Without this reimbursement/fee reduction, if applicable, expenses would have been higher.
(c) Per share net investment income has been calculated using the average shares outstanding during the period.
(d) Includes expense recapture of less than 0.01%.
(e) Includes expense recapture of 0.01%.
(f) Effective July 1, 2005, the Intermediate Duration Fixed Income Fund and the Inflation Protected Securities Fund decreased their net expense limitations to 0.40% and 0.45%, respectively, from 0.45% and 0.50%, respectively.
(g) Computed on an annualized basis for periods less than one year, if applicable.
See accompanying notes to financial statements.
125
| | | | | | | | | | | | | | | | | |
| | | | | | | | Ratios to Average Net Assets: | | |
Net asset
value,
end of
the period | | Total
return (%)(a) | | | Net assets,
end of
the period
(000’s) | | Net
expenses (%)(b)(g) | | | Gross
expenses (%)(g) | | | Net
investment
income (loss) (%)(g) | | Portfolio
turnover
rate (%) |
| | | | | | | | | | | | | | | | | |
| | | | | | |
| | | | | | | | | | | | | | | | | |
| $ | 9.86 | | 2.6 | | | $ | 16,033 | | 0.40 | | | 0.95 | | | 6.85 | | 22 |
| | 10.31 | | 5.1 | | | | 13,468 | | 0.40 | | | 1.28 | | | 4.60 | | 26 |
| | 10.30 | | 1.5 | | | | 9,053 | | 0.40 | | | 1.69 | | | 4.96 | | 41 |
| | 10.84 | | 3.1 | | | | 9,298 | | 0.49 | (f) | | 1.54 | | | 3.81 | | 141 |
| | 11.02 | | 2.3 | | | | 7,390 | | 0.50 | | | 1.73 | | | 3.33 | | 99 |
| | | | | | |
| | | | | | | | | | | | | | | | | |
| | | | | | |
| | | | | | | | | | | | | | | | | |
| $ | 6.87 | | (11.7 | ) | | $ | 214,201 | | 0.72 | | | 0.72 | | | 7.70 | | 35 |
| | 8.45 | | 10.8 | | | | 187,568 | | 0.75 | (e) | | 0.75 | (e) | | 6.60 | | 31 |
| | 8.11 | | 11.6 | | | | 141,318 | | 0.75 | | | 0.79 | | | 6.40 | | 23 |
| | 7.80 | | 13.0 | | | | 110,533 | | 0.75 | | | 0.82 | | | 7.24 | | 22 |
| | 7.50 | | 18.1 | | | | 97,109 | | 0.75 | | | 0.88 | | | 7.66 | | 59 |
| | | | | | |
| | | | | | | | | | | | | | | | | |
| | | | | | |
| | | | | | | | | | | | | | | | | |
| $ | 8.95 | | (0.5 | ) | | $ | 32,748 | | 0.40 | | | 0.59 | | | 5.00 | | 65 |
| | 9.47 | | 4.8 | | | | 31,445 | | 0.40 | | | 0.61 | | | 4.71 | | 87 |
| | 9.50 | | 3.8 | | | | 41,851 | | 0.40 | | | 0.62 | | | 4.48 | | 62 |
| | 9.60 | | 1.5 | | | | 40,628 | | 0.44 | (f) | | 0.68 | | | 4.10 | | 50 |
| | 9.92 | | 3.6 | | | | 31,051 | | 0.45 | | | 0.76 | | | 4.48 | | 48 |
| | | | | | |
| | | | | | | | | | | | | | | | | |
| | | | | | |
| | | | | | | | | | | | | | | | | |
| $ | 11.36 | | (6.0 | ) | | $ | 277,863 | | 0.50 | | | 0.50 | | | 5.98 | | 32 |
| | 12.96 | | 10.2 | | | | 261,741 | | 0.53 | | | 0.53 | | | 5.52 | | 23 |
| | 12.63 | | 6.8 | | | | 173,549 | | 0.55 | (d) | | 0.55 | (d) | | 4.79 | | 50 |
| | 13.28 | | 6.4 | | | | 186,749 | | 0.55 | | | 0.58 | | | 4.28 | | 42 |
| | 13.54 | | 11.1 | | | | 177,094 | | 0.55 | | | 0.60 | | | 5.03 | | 34 |
See accompanying notes to financial statements.
126
NOTES TO FINANCIAL STATEMENTS
September 30, 2008
1. Organization. Loomis Sayles Funds I (the “Trust”) is organized as a Massachusetts business trust. The Trust is registered under the Investment Company Act of 1940, as amended (the “1940 Act”) as an open-end management investment company. The Declaration of Trust permits the Board of Trustees to authorize the issuance of an unlimited number of shares of the Trust in multiple series. Shares of certain funds in the Trust were first registered under the Securities Act of 1933 (the “1933 Act”) effective March 7, 1997 (subsequent to their commencement of investment operations). Information presented in these financial statements pertains to the fixed income funds of the Trust; the financial statements for the equity funds of the Trust are presented in a separate report. The following funds (individually, a “Fund” and collectively, the “Funds”) are included in this report:
Loomis Sayles Bond Fund (the “Bond Fund”)
Loomis Sayles Fixed Income Fund (the “Fixed Income Fund”)
Loomis Sayles Global Bond Fund (the “Global Bond Fund”)
Loomis Sayles Inflation Protected Securities Fund (the “Inflation Protected Securities Fund”)
Loomis Sayles Institutional High Income Fund (the “Institutional High Income Fund”)
Loomis Sayles Intermediate Duration Fixed Income Fund (the “Intermediate Duration Fixed Income Fund”)
Loomis Sayles Investment Grade Fixed Income Fund (the “Investment Grade Fixed Income Fund”)
Each Fund offers Institutional Class Shares. Bond Fund and Global Bond Fund also offer Retail Class Shares. In addition, Bond Fund offers Admin Class Shares.
Most expenses of the Trust can be directly attributed to a fund. Expenses which cannot be directly attributed to a fund are generally apportioned based on the relative net assets of each of the funds in the Trust. Expenses of a fund are borne pro rata by the holders of each class of shares, except that each class bears expenses unique to that class (including the Rule 12b-1 service and distribution fees and transfer agent fees applicable to such class). In addition, each class votes as a class only with respect to its own Rule 12b-1 Plan. Shares of each class would receive their pro rata share of the net assets of a fund if the fund were liquidated. The Trustees approve separate dividends from net investment income on each class of shares.
2. Significant Accounting Policies. The following is a summary of significant accounting policies consistently followed by each Fund in the preparation of its financial statements. The Funds’ financial statements are prepared in accordance with accounting principles generally accepted in the United States of America which require the use of management estimates that affect the reported amounts and disclosures in the financial statements. Actual results could differ from those estimates.
a. Security Valuation. Debt securities (other than short-term obligations purchased with an original or remaining maturity of sixty days or less) are generally valued on the basis of evaluated bids furnished to the Funds by a pricing service recommended by the investment adviser and approved by the Board of Trustees, which service determines valuations for normal, institutional size-trading units of such securities using market information, transactions for comparable securities and various relationships between securities which are generally recognized by institutional traders. Equity securities, including closed-end investment companies and exchange traded funds, for which market quotations are readily available are valued at market value, as reported by pricing services recommended by the investment adviser and approved by the Board of Trustees. Such pricing services generally use the security’s last sale price on the exchange or market where the security is primarily traded or, if there is no reported sale during the day, the closing bid price. Securities traded on the NASDAQ Global Select Market, NASDAQ Global Market and NASDAQ Capital Market are valued at the NASDAQ Official Closing Price (“NOCP”), or if lacking a NOCP, at the most recent bid quotation on the applicable NASDAQ Market. Broker-dealer bid quotations may also be used to value debt and equity securities where a pricing service does not price a security or where a pricing service does not provide a reliable price for the security. In instances where broker-dealer bid quotations are not available, certain securities held by the Funds may be valued on the basis of a price provided by a principal market maker. Futures contracts are priced at their most recent settlement price. Short-term obligations purchased with an original or remaining maturity of sixty days or less are valued at amortized cost, which approximates market value. Securities for which market quotations are not readily available are valued at fair value as determined in good faith by the Funds’ investment adviser using consistently applied procedures under the general supervision of the Board of Trustees. Investments in other open-end investment companies are valued at their net asset value each day.
The Funds may hold securities traded in foreign markets. Foreign securities are valued at the market price in the foreign market. However, if events occurring after the close of the foreign market (but before the close of regular trading on the New York Stock Exchange) are believed to materially affect the value of those securities, such securities are fair valued pursuant to procedures approved by the Board of Trustees. When fair valuing securities, the Funds may, among other things, use modeling tools or other processes that may take into account factors such as securities market activity and/or significant events that occur after the close of the foreign market and before the Funds calculate their net asset values.
127
b. Security Transactions and Related Investment Income. Security transactions are accounted for on trade date. Dividend income is recorded on ex-dividend date, or in the case of certain foreign securities, as soon as the Fund is notified, and interest income is recorded on an accrual basis. Interest income is increased by the accretion of discount and decreased by the amortization of premium. Periodic principal adjustments for inflation-protected securities are recorded to interest income. Distributions received from investments in securities that represent a return of capital or capital gain are recorded as a reduction of cost of investments or as a realized gain, respectively. The calendar year-end amounts of ordinary income, capital gains, and return of capital included in distributions received from the Funds’ investments in real estate investment trusts (“REITs”) are reported to the Funds after the end of the fiscal year; accordingly, the Funds estimate these amounts for accounting purposes until the characterization of REIT distributions is reported to the Funds after the end of the fiscal year. Estimates are based on the most recent REIT distribution information available. Investment income is recorded net of foreign taxes withheld when applicable. In determining net gain or loss on securities sold, the cost of securities has been determined on an identified cost basis. Investment income, non-class specific expenses and realized and unrealized gains and losses are allocated on a pro rata basis to each class based on the relative net assets of each class to the total net assets of the Fund.
c. Foreign Currency Translation. The books and records of the Funds are maintained in U.S. dollars. The value of securities, currencies and other assets and liabilities denominated in currencies other than U.S. dollars are translated into U.S. dollars based upon foreign exchange rates prevailing at the end of the period. Purchases and sales of investment securities, income and expenses are translated on the respective dates of such transactions.
Since the values of investment securities are presented at the foreign exchange rates prevailing at the end of the period, it is not practical to isolate that portion of the results of operations arising from changes in exchange rates from fluctuations which arise due to changes in market prices of the investment securities. Such changes are included with the net realized and unrealized gain or loss on investments.
Net realized foreign exchange gains or losses arise from sales of foreign currency, currency gains or losses realized between the trade and settlement dates on securities transactions and the difference between the amounts of dividends, interest and foreign withholding taxes recorded on the Funds’ books and the U.S. dollar equivalent of the amounts actually received or paid. Net unrealized foreign exchange gains and losses arise from changes in the value of assets and liabilities, other than investment securities, at the end of the fiscal period, resulting from changes in exchange rates.
Certain Funds may use foreign currency exchange contracts to facilitate transactions in foreign-denominated investments. Losses may arise from changes in the value of the foreign currency or if the counterparties do not perform under the contracts’ terms.
Each Fund may purchase investments of foreign issuers. Investing in securities of foreign issuers involves special risks and considerations not typically associated with investing in U.S. companies and securities of the U.S. government. These risks include revaluation of currencies and the risk of appropriation. Moreover, the markets for securities of many foreign issuers may be less liquid and the prices of such securities may be more volatile than those of comparable U.S. companies and the U.S. government.
d. Forward Foreign Currency Contracts. Each Fund that may invest in foreign investments may enter into forward foreign currency contracts. Contracts to buy generally are used to acquire exposure to foreign currencies, while contracts to sell generally are used to hedge a Fund’s investments against currency fluctuation. Also, a contract to buy or sell may offset a previous contract. These contracts involve market risk in excess of the unrealized gain or loss reflected in the Fund’s Statement of Assets and Liabilities. The U.S. dollar value of the currencies a Fund has committed to buy or sell represents the aggregate exposure to each currency the Fund has acquired or hedged through currency contracts outstanding at period end.
All contracts are “marked-to-market” daily using interpolated prices determined by an independent pricing service and any gains or losses are recorded for financial statement purposes as unrealized until settlement date. Risks may arise upon entering into these contracts from the potential inability of counterparties to meet the terms of their contracts and from unanticipated movements in the value of a foreign currency relative to the U.S. dollar. At September 30, 2008, there were no open forward currency contracts.
e. Futures Contracts. The Funds may enter into futures contracts. A futures contract is an agreement between two parties to buy and sell a particular commodity, instrument or index (e.g., an interest-bearing security) for a specified price on a specified future date.
When a Fund enters into a futures contract, it is required to deposit with (or for the benefit of) its broker as “initial margin” an amount of cash or short-term high-quality securities. As the value of the contract changes, the value of the futures contract position increases or declines. At the end of each trading day, the amount of such increase or decline is received or paid, respectively, by and to the holders of these positions. The amount received or paid is known as “variation margin.” Realized gain
128
NOTES TO FINANCIAL STATEMENTS – continued
September 30, 2008
or loss on a futures position is equal to the net variation margin received or paid over the time the position is held, plus or minus the amount received or paid when the position is closed, minus brokerage commissions. When a Fund enters into a futures contract certain risks may arise such as illiquidity in the futures market, which may limit the Fund’s ability to close out a futures contract prior to settlement date, and unanticipated movements in the value of securities or interest rates.
f. Federal and Foreign Income Taxes. The Trust treats each Fund as a separate entity for federal income tax purposes. Each Fund intends to meet the requirements of the Internal Revenue Code applicable to regulated investment companies, and to distribute to its shareholders substantially all of its net investment income and any net realized capital gains at least annually. Management has performed an analysis of the Funds’ tax positions taken on federal and state tax returns that remain subject to examinations (tax years ended September 30, 2005-2008) and has concluded that no provisions for income tax are required. Fund management is not aware of any events that are reasonably possible to occur in the next twelve months that would result in the amounts of any unrecognized tax benefits significantly increasing or decreasing for the Funds. However, management’s conclusions regarding tax positions taken may be subject to review and adjustment at a later date based on factors including, but not limited to, new tax laws and accounting regulations and interpretations thereof.
A Fund may be subject to foreign taxes on income and gains on investments that are accrued based upon the Fund’s understanding of the tax rules and regulations that exist in the countries in which the Fund invests. Foreign governments may also impose taxes or other payments on investments with respect to foreign securities. Such taxes are accrued as applicable.
g. Dividends and Distributions to Shareholders. Dividends and distributions are recorded on ex-dividend date. The timing and characterization of certain income and capital gain distributions are determined annually in accordance with federal tax regulations, which may differ from accounting principles generally accepted in the United States of America. Permanent differences are primarily due to differing treatments for book and tax purposes for items such as foreign currency transactions, defaulted bond adjustments, discount adjustments on inflation-protected securities, paydown gains and losses and premium amortization accruals. Permanent book and tax basis differences relating to shareholder distributions will result in reclassifications to capital accounts. Temporary differences between book and tax distributable earnings are primarily due to deferred Trustees’ fees, wash sales, premium amortization accruals, securities lending collateral gain/loss adjustments, forward contracts mark to market, futures contracts mark to market, and defaulted bond interest. Distributions from net investment income and short-term capital gains are considered to be distributed from ordinary income for tax purposes.
The tax characterization of distributions is determined on an annual basis. The tax character of distributions paid to shareholders during the years ended September 30, 2008 and 2007 was as follows:
| | | | | | | | | | | | | | | | | |
| | | 2008 Distributions Paid From: | | 2007 Distributions Paid From: |
Fund | | Ordinary
Income | | Long-Term
Capital
Gains | | Total | | Ordinary
Income | | Long-Term
Capital
Gains | | Total |
Bond Fund | | $ | 1,174,950,148 | | $ | — | | $ | 1,174,950,148 | | $ | 629,936,355 | | $ — | | $ | 629,936,355 |
Fixed Income Fund | | | 43,626,372 | | | 643,688 | | | 44,270,060 | | | 30,011,559 | | — | | | 30,011,559 |
Global Bond Fund | | | 114,644,152 | | | — | | | 114,644,152 | | | 83,933,355 | | — | | | 83,933,355 |
Inflation Protected Securities Fund | | | 1,129,818 | | | — | | | 1,129,818 | | | 595,612 | | — | | | 595,612 |
Institutional High Income Fund | | | 12,782,158 | | | 3,318,304 | | | 16,100,462 | | | 9,165,373 | | — | | | 9,165,373 |
Intermediate Duration Fixed Income Fund | | | 1,768,089 | | | — | | | 1,768,089 | | | 1,835,942 | | — | | | 1,835,942 |
Investment Grade Fixed Income Fund | | | 19,088,772 | | | — | | | 19,088,772 | | | 14,190,258 | | — | | | 14,190,258 |
Differences between these amounts and those reported in the Statements of Changes in Net Assets are primarily attributable to different book and tax treatment for short-term capital gains.
129
As of September 30, 2008, the components of distributable earnings on a tax basis were as follows:
| | | | | | | | | | | | | | | | | | | | | | | | | | | | |
| | | Bond Fund | | | Fixed
Income Fund | | | Global
Bond Fund | | | Inflation
Protected
Securities
Fund | | | Institutional
High
Income Fund | | | Intermediate
Duration Fixed
Income Fund | | | Investment
Grade Fixed
Income Fund | |
Undistributed ordinary income | | $ | 184,626,437 | | | $ | 37,879,219 | | | $ | 44,111,703 | | | $ | 66,711 | | | $ | 14,533,583 | | | $ | 46,847 | | | $ | 5,511,330 | |
Undistributed long-term capital gains | | | 117,096,804 | | | | 8,757,966 | | | | — | | | | — | | | | 1,232,217 | | | | — | | | | 2,544,086 | |
| | | | | | | | | | | | | | | | | | | | | | | | | | | | |
Total undistributed earnings | | $ | 301,723,241 | | | $ | 46,637,185 | | | $ | 44,111,703 | | | $ | 66,711 | | | $ | 15,765,800 | | | $ | 46,847 | | | $ | 8,055,416 | |
Capital loss carryforward: | | | | | | | | | | | | | | | | | | | | | | | | | | | | |
Expires September 30, 2013 | | | — | | | | — | | | | — | | | | — | | | | — | | | | (3,797 | ) | | | — | |
Expires September 30, 2014 | | | — | | | | — | | | | (1,046,616 | ) | | | (19,853 | ) | | | — | | | | (186,919 | ) | | | | |
Expires September 30, 2015 | | | — | | | | — | | | | (5,497,643 | ) | | | (155,005 | ) | | | — | | | | (326,220 | ) | | | | |
Expires September 30, 2016 | | | — | | | | — | | | | (3,309,847 | ) | | | — | | | | — | | | | (222,423 | ) | | | | |
| | | | | | | | | | | | | | | | | | | | | | | | | | | | |
Total capital loss carryforward | | | — | | | | — | | | | (9,854,106 | ) | | | (174,858 | ) | | | — | | | | (739,359 | ) | | | — | |
Deferred net capital losses (post-October 2007) | | | — | | | | — | | | | (9,216,441 | ) | | | — | | | | — | | | | (257,177 | ) | | | — | |
Unrealized appreciation (depreciation) | | | (3,094,888,440 | ) | | | (82,714,245 | ) | | | (207,323,735 | ) | | | (1,240,343 | ) | | | (35,597,273 | ) | | | (1,947,815 | ) | | | (30,962,453 | ) |
| | | | | | | | | | | | | | | | | | | | | | | | | | | | |
Total accumulated earnings (losses) | | $ | (2,793,165,199 | ) | | $ | (36,077,060 | ) | | $ | (182,282,579 | ) | | $ | (1,348,490 | ) | | $ | (19,831,473 | ) | | $ | (2,897,504 | ) | | $ | (22,907,037 | ) |
| | | | | | | | | | | | | | | | | | | | | | | | | | | | |
Capital loss carryforward utilized in the current year | | $ | 4,753,778 | | | $ | — | | | $ | — | | | $ | 2,320 | | | $ | — | | | $ | — | | | $ | 332,729 | |
| | | | | | | | | | | | | | | | | | | | | | | | | | | | |
h. Repurchase Agreements. Each Fund, through its custodian, receives delivery of the underlying securities collateralizing repurchase agreements. It is each Fund’s policy that the market value of the collateral be at least equal to 100% of the repurchase price, including interest. Certain repurchase agreements are tri-party arrangements whereby the collateral is held at the custodian bank in a segregated account for the benefit of the Fund and on behalf of the counterparty. It is each Fund’s policy, regarding tri-party arrangements, that the market value of the collateral be at least equal to 102% of the repurchase price, including interest. Repurchase agreements could involve certain risks in the event of default or insolvency of the counterparty including possible delays or restrictions upon a Fund’s ability to dispose of the underlying securities.
130
NOTES TO FINANCIAL STATEMENTS – continued
September 30, 2008
i. Delayed Delivery Commitments. Each Fund may purchase or sell securities on a when issued or forward commitment basis. Payment and delivery may take place a month or more after the date of the transaction. The price of the underlying securities and the date when the securities will be delivered and paid for are fixed at the time the transaction is negotiated. Losses may arise due to changes in the market value of the underlying securities or if the counterparty does not perform under the contract. Collateral consisting of liquid securities or cash and cash equivalents is maintained in an amount at least equal to these commitments with the custodian. At September 30, 2008, there were no delayed delivery commitments.
j. Securities Lending. The Funds have entered into an agreement with State Street Bank and Trust Company (“State Street Bank”), as agent of the Funds, to lend securities to certain designated borrowers. The loans are collateralized with cash or securities in an amount equal to at least 105% or 102% of the market value of the loaned international or domestic securities, respectively, when the loan is initiated. Thereafter, the value of the collateral must remain at least 102% of the market value of loaned securities for U.S. equities and U.S. corporate debt; at least 105% of the market value of loaned securities for non-U.S. equities; and at least 100% of the market value of loaned securities for U.S. government securities, sovereign debt issued by non-U.S. governments and non-U.S. corporate debt. In the event that the market value of the collateral falls below the required percentages described above, the borrower will deliver additional collateral on the next business day. As with other extensions of credit, the Funds may bear the risk of loss with respect to the investment of the collateral. The Funds invest cash collateral in short-term investments, a portion of the income from which is remitted to the borrowers and the remainder allocated between the Funds and State Street Bank as lending agent. The value of securities on loan to borrowers and the value of collateral held by the Funds with respect to such loans at September 30, 2008 were as follows:
| | | | | | |
| | | Value of
Securities on Loan | | Value of
Collateral |
Bond Fund | | $ | 369,800,620 | | $ | 387,498,967 |
Fixed Income Fund | �� | | 5,787,463 | | | 6,151,664 |
Global Bond Fund | | | 62,005,117 | | | 62,965,841 |
Inflation Protected Securities Fund | | | 1,348,324 | | | 1,411,666 |
Institutional High Income Fund | | | 12,606,239 | | | 12,836,133 |
Intermediate Duration Fixed Income Fund | | | 4,100,616 | | | 4,238,526 |
Investment Grade Fixed Income Fund | | | 9,806,034 | | | 10,190,325 |
Subsequent to September 30, 2008, all securities on loan were called back.
k. Indemnifications. Under the Trust’s organizational documents, its officers and Trustees are indemnified against certain liabilities arising out of the performance of their duties to the Funds. Additionally, in the normal course of business, the Funds enter into contracts with service providers that contain general indemnification clauses. The Funds’ maximum exposure under these arrangements is unknown as this would involve future claims that may be made against the Funds that have not yet occurred. However, based on experience, the Funds expect the risk of loss to be remote.
l. New Accounting Pronouncements. In September 2006, Statement of Financial Accounting Standards No. 157, Fair Value Measurements (“FAS 157”), was issued and is effective for fiscal years beginning after November 15, 2007. FAS 157 defines fair value, establishes a framework for measuring fair value and expands disclosures about fair value measurements. Management has evaluated the impact the adoption of FAS 157 will have on the Funds’ financial statements and believes that such impact will be limited to expanded disclosure in the Funds’ financial statements regarding inputs used in determining the value of the Funds’ investments.
In March 2008, Statement of Financial Accounting Standards No. 161, Disclosures about Derivative Instruments and Hedging Activities (“FAS 161”), was issued and will be effective for fiscal years and interim periods beginning after November 15, 2008. FAS 161 requires enhanced disclosures about funds’ derivative and hedging activities. Management is currently evaluating the impact the adoption of FAS 161 will have on the Funds’ financial statement disclosures.
131
3. Purchases and Sales of Securities. For the year ended September 30, 2008, purchases and sales of securities (excluding short-term investments and including paydowns) were as follows:
| | | | | | | | | | | | |
| | | U.S. Government/Agency Securities | | Other Securities |
Fund | | Purchases | | Sales | | Purchases | | Sales |
Bond Fund | | $ | 238,449,095 | | $ | 1,771,881,510 | | $ | 7,441,017,238 | | $ | 2,259,013,261 |
Fixed Income Fund | | | 29,973,580 | | | 68,040,184 | | | 208,432,300 | | | 111,689,835 |
Global Bond Fund | | | 217,945,864 | | | 383,465,167 | | | 1,668,494,479 | | | 941,818,955 |
Inflation Protected Securities Fund | | | 5,644,680 | | | 2,814,430 | | | 584,270 | | | 568,926 |
Institutional High Income Fund | | | 14,986,790 | | | 53,204,242 | | | 89,111,647 | | | 15,318,286 |
Intermediate Duration Fixed Income Fund | | | 13,619,267 | | | 13,180,461 | | | 9,409,537 | | | 8,083,295 |
Investment Grade Fixed Income Fund | | | 1,064,092 | | | 32,424,656 | | | 113,593,854 | | | 48,060,864 |
4. Management Fees and Other Transactions with Affiliates.
a. Management Fees. Loomis, Sayles & Company, L.P. (“Loomis Sayles”) serves as investment adviser to each Fund. Separate management agreements for each Fund in effect for the year ended September 30, 2008, provided for fees at the following annual percentage rates of each Fund’s average daily net assets:
| | | | | | | | | | |
| | | Percentage of Average Daily Net Assets |
Fund | | First
$1 billion | | Next
$1 billion | | Next
$1 billion | | Next
$12 billion | | Over
$15 billion |
Bond Fund | | 0.60% | | 0.60% | | 0.60% | | 0.50% | | 0.49% |
Fixed Income Fund | | 0.50% | | 0.50% | | 0.50% | | 0.50% | | 0.50% |
Global Bond Fund | | 0.60% | | 0.50% | | 0.48% | | 0.48% | | 0.48% |
Inflation Protected Securities Fund | | 0.25% | | 0.25% | | 0.25% | | 0.25% | | 0.25% |
Institutional High Income Fund | | 0.60% | | 0.60% | | 0.60% | | 0.60% | | 0.60% |
Intermediate Duration Fixed Income Fund | | 0.25% | | 0.25% | | 0.25% | | 0.25% | | 0.25% |
Investment Grade Fixed Income Fund | | 0.40% | | 0.40% | | 0.40% | | 0.40% | | 0.40% |
Prior to December 1, 2007, the management fees for the Bond Fund were 0.60% for the first $3 billion of average daily net assets of the Fund and 0.50% of such assets thereafter.
Loomis Sayles has given binding undertakings to the Funds to reduce management fees and/or reimburse certain expenses associated with the Funds to limit their operating expenses. These undertakings are in effect until January 31, 2009 and will be reevaluated on an annual basis. For the year ended September 30, 2008, the expense limits as a percentage of average daily net assets under the expense limitation agreements were as follows:
| | | | | | |
| | | Expense Limit as a Percentage of
Average Daily Net Assets |
Fund | | Institutional Class | | Retail Class | | Admin Class |
Bond Fund | | 0.70% | | 0.95% | | 1.20% |
Fixed Income Fund | | 0.65% | | — | | — |
Global Bond Fund | | 0.75% | | 1.00% | | — |
Inflation Protected Securities Fund | | 0.40% | | — | | — |
Institutional High Income Fund | | 0.75% | | — | | — |
Intermediate Duration Fixed Income Fund | | 0.40% | | — | | — |
Investment Grade Fixed Income Fund | | 0.55% | | — | | — |
132
NOTES TO FINANCIAL STATEMENTS – continued
September 30, 2008
For the year ended September 30, 2008, the management fees for each Fund were as follows:
| | | | | |
Fund | | Management
Fee | | Percentage of
Average Daily Net Assets |
Bond Fund | | $ | 86,455,857 | | 0.52% |
Fixed Income Fund | | | 3,205,797 | | 0.50% |
Global Bond Fund | | | 12,638,603 | | 0.54% |
Inflation Protected Securities Fund | | | 39,289 | | 0.25% |
Institutional High Income Fund | | | 1,278,890 | | 0.60% |
Intermediate Duration Fixed Income Fund | | | 85,501 | | 0.25% |
Investment Grade Fixed Income Fund | | | 1,106,947 | | 0.40% |
For the year ended September 30, 2008, class specific expenses have been reimbursed as follows:
| | | |
Fund | | Reimbursement |
Bond Fund | | $ | 81,414 |
Fixed Income Fund | | | — |
Global Bond Fund | | | — |
Inflation Protected Securities Fund | | | 85,963 |
Institutional High Income Fund | | | — |
Intermediate Duration Fixed Income Fund | | | 63,574 |
Investment Grade Fixed Income Fund | | | — |
Loomis Sayles shall be permitted to recover expenses it has borne under the expense limitation agreement (whether through reduction of its management fees or otherwise) on a class by class basis in later periods to the extent the expenses of a class fall below a class’ expense limits, provided, however, that a class is not obligated to pay such reduced fees/expenses more than one year after the end of the fiscal year in which the fee/expense was reduced. The amounts subject to possible reimbursement under the expense limitation agreements at September 30, 2008 were as follows:
| | | | | | | | | | | | |
| | | Expenses Subject to Possible Reimbursement Until
September 30, 2009 |
Fund | | Institutional Class | | Retail Class | | Admin Class | | Total |
Bond Fund | | $ | — | | $ | — | | $ | 81,414 | | $ | 81,414 |
Fixed Income Fund | | | — | | | — | | | — | | | — |
Global Bond Fund | | | — | | | — | | | — | | | — |
Inflation Protected Securities Fund | | | 85,963 | | | — | | | — | | | 85,963 |
Institutional High Income Fund | | | — | | | — | | | — | | | — |
Intermediate Duration Fixed Income Fund | | | 63,574 | | | — | | | — | | | 63,574 |
Investment Grade Fixed Income Fund | | | — | | | — | | | — | | | — |
Certain officers and employees of Loomis Sayles are also officers or Trustees of the Trust. Loomis Sayles’ general partner is indirectly owned by Natixis Global Asset Management, L.P. (“Natixis US”), which is part of Natixis Global Asset Management, an international asset management group based in Paris, France.
b. Administrative Fees. Natixis Asset Management Advisors, L.P. (“Natixis Advisors”) provides certain administrative services for the Fund and subcontracts with State Street Bank to serve as sub-administrator. Natixis Advisors is a wholly-owned subsidiary of Natixis US. Pursuant to an agreement among Natixis Funds Trust I, Natixis Funds Trust II, Natixis Funds Trust III, Natixis Funds Trust IV, Natixis Cash Management Trust, Gateway Trust (“Natixis Funds Trusts”), Loomis Sayles Funds I, Loomis Sayles Funds II (“Loomis Sayles Funds Trusts”), Hansberger International Series and Natixis Advisors, each Fund pays Natixis Advisors monthly its pro rata portion of fees equal to an annual rate of 0.0575% of the first $15 billion of the average daily net assets of the Natixis Funds Trusts, Loomis Sayles Funds Trusts and the Hansberger International Series, 0.0500% of the next $15 billion, 0.0425% of the next $30 billion and 0.0375% of such assets in excess of $60 billion, subject to an annual aggregate minimum fee for the Natixis Funds Trusts, Loomis Sayles Funds Trusts and the Hansberger International Series of $10 million, which is reevaluated on an annual basis. New funds are subject to an annual fee of $75,000 plus $12,500 per class and an additional $75,000 if managed by multiple subadvisors in their first calendar year of operations.
133
Effective October 1, 2007, State Street Bank agreed to reduce the fees it receives from Natixis Advisors for serving as sub-administrator to the Funds. Also, effective October 1, 2007, Natixis Advisors gave a binding contractual undertaking to the Funds to waive the administrative fees paid by the Funds in an amount equal to the reduction in sub-administrative fees discussed above. The waiver was in effect through June 30, 2008.
Prior to July 1, 2008, each Fund paid Natixis Advisors monthly its pro rata portion of fees equal to an annual rate of 0.0675% of the first $5 billion of the average daily net assets of the Natixis Funds Trusts, Loomis Sayles Funds Trusts and the Hansberger International Series, 0.0625% of the next $5 billion, 0.0500% of the next $20 billion and 0.045% of such assets in excess of $30 billion, subject to an annual aggregate minimum fee for the Natixis Funds Trusts, Loomis Sayles Funds Trusts and the Hansberger International Series of $5 million, which was reevaluated on an annual basis. New funds were subject to an annual fee of $50,000 plus $12,500 per class and an additional $50,000 if managed by multiple subadvisors in their first calendar year of operations.
For the year ended September 30, 2008, each Fund paid the following for administrative fees to Natixis Advisors:
| | | | | | | | | |
Fund | | Gross
Administrative
Fees | | Waiver of
Administrative
Fees | | Net
Administrative
Fees |
Bond Fund | | $ | 8,516,973 | | $ | 330,334 | | $ | 8,186,639 |
Fixed Income Fund | | | 326,354 | | | 12,467 | | | 313,887 |
Global Bond Fund | | | 1,191,798 | | | 45,880 | | | 1,145,918 |
Inflation Protected Securities Fund | | | 7,996 | | | 304 | | | 7,692 |
Institutional High Income Fund | | | 108,472 | | | 4,126 | | | 104,346 |
Intermediate Duration Fixed Income Fund | | | 17,427 | | | 681 | | | 16,746 |
Investment Grade Fixed Income Fund | | | 140,839 | | | 5,357 | | | 135,482 |
c. Service and Distribution Fees. Natixis Distributors, L.P. (“Natixis Distributors”), a wholly owned subsidiary of Natixis US, has entered into a distribution agreement with the Trust. Pursuant to this agreement, Natixis Distributors serves as principal underwriter of each fund.
Pursuant to Rule 12b-1 under the 1940 Act, Bond Fund and Global Bond Fund have adopted a Distribution Plan relating to each Fund’s Retail Class shares (the “Retail Class Plans”) and Bond Fund has adopted a separate Distribution Plan relating to its Admin Class shares (the “Admin Class Plan”).
Under the respective Retail Class and Admin Class Plans, each Fund pays Natixis Distributors a monthly distribution fee at an annual rate not to exceed 0.25% of the average daily net assets attributable to the Fund’s Retail Class and Admin Class Shares, as reimbursement for expenses incurred by Natixis Distributors in providing personal services to investors in Retail Class and Admin Class Shares and/or maintenance of shareholder accounts. In addition, the Admin Class shares of the Bond Fund may pay an administrative service fee at an annual rate not to exceed 0.25% of the average daily net assets attributable to Admin Class shares to securities dealers or financial intermediaries for providing personal service and account maintenance for their customers who hold such shares.
For the year ended September 30, 2008, the Funds paid the following service and distribution fees:
| | | | | | | | | | | | |
| | | Service Fees | | Distribution Fees |
Fund | | Admin Class | | Retail Class | | Admin Class | | Retail Class |
Bond Fund | | $ | 570,623 | | $ | — | | $ | 570,623 | | $ | 19,616,387 |
Fixed Income Fund | | | — | | | — | | | — | | | — |
Global Bond Fund | | | — | | | — | | | — | | | 2,780,722 |
Inflation Protected Securities Fund | | | — | | | — | | | — | | | — |
Institutional High Income Fund | | | — | | | — | | | — | | | — |
Intermediate Duration Fixed Income Fund | | | — | | | — | | | — | | | — |
Investment Grade Fixed Income Fund | | | — | | | — | | | — | | | — |
d. Sub-Transfer Agent Fees. Natixis Distributors has entered into agreements with financial intermediaries to provide certain recordkeeping, processing, shareholder communications and other services to customers of the intermediaries and has agreed to compensate the intermediaries for providing those services. Certain services would be provided by the Funds if the shares of those
134
NOTES TO FINANCIAL STATEMENTS – continued
September 30, 2008
customers were registered directly with the Funds’ transfer agent. Accordingly, the Funds agreed to pay a portion of the intermediary fees attributable to shares of the Fund held by the intermediary (which generally is a percentage of the value of shares held) not exceeding what the Funds would have paid its transfer agent had each customer’s shares been registered directly with the transfer agent instead of held through the intermediary. Natixis Distributors pays the remainder of the fees. Listed below are the fees incurred by the Funds which are included in the transfer agent fees and expenses in the Statements of Operations.
| | | | | | | | | |
| | | Sub-Transfer Agent Fees |
Fund | | Institutional
Class | | Retail
Class | | Admin
Class |
Bond Fund | | $ | 3,645,546 | | $ | 5,978,079 | | $ | 306,150 |
Fixed Income Fund | | | — | | | — | | | — |
Global Bond Fund | | | 241,448 | | | 1,056,665 | | | — |
Inflation Protected Securities Fund | | | 6,113 | | | — | | | — |
Institutional High Income Fund | | | 5,053 | | | — | | | — |
Intermediate Duration Fixed Income Fund | | | 624 | | | — | | | — |
Investment Grade Fixed Income Fund | | | — | | | — | | | — |
e. Trustees Fees and Expenses. The Funds do not pay any compensation directly to their officers or Trustees who are directors, officers or employees of Natixis Advisors, Natixis Distributors, Natixis US, or their affiliates. The Chairperson of the Board receives a retainer fee at the annual rate of $200,000. The Chairperson does not receive any meeting attendance fees for Board of Trustees meetings or committee meetings that she attends. Each Independent Trustee (other than the Chairperson) receives, in the aggregate, a retainer fee at the annual rate of $65,000. Each Independent Trustee also receives a meeting attendance fee of $7,500 for each meeting of the Board of Trustees that he or she attends in person and $3,750 for each meeting of the Board of Trustees that he or she attends telephonically. In addition, each committee chair receives an additional retainer fee at the annual rate of $10,000. Each Contract Review and Governance Committee member is compensated $5,000 for each Committee meeting that he or she attends in person and $2,500 for each meeting that he or she attends telephonically. Each Audit Committee member is compensated $6,250 for each Committee meeting that he or she attends in person and $3,125 for each meeting that he or she attends telephonically. These fees are allocated among the funds in the Natixis Funds Trusts, Loomis Sayles Funds Trusts and the Hansberger International Series based on a formula that takes into account, among other factors, the relative net assets of each Fund. Trustees are reimbursed for travel expenses in connection with attendance at meetings.
Prior to January 1, 2008, each Independent Trustee (other than the Chairperson) received, in the aggregate, a retainer fee at the annual rate of $55,000. Each Independent Trustee also received a meeting attendance fee of $6,000 for each meeting of the Board of Trustees that he or she attended in person and $3,000 for each meeting that he or she attended telephonically. In addition, each Contract Review and Governance Committee member received $4,000 for each committee meeting that he or she attended in person and $2,000 for each committee meeting that he or she attended telephonically. Each Audit Committee member received $5,000 for each committee meeting that he or she attended in person and $2,500 for each committee meeting that he or she attended telephonically. The Chairperson of the Board and committee chair retainers were $200,000 and $10,000, respectively.
A deferred compensation plan (the “Plan”) is available to the Trustees on a voluntary basis. Deferred amounts remain in the Funds until distributed in accordance with the provisions of the Plan. The value of a participating Trustee’s deferral account is based on theoretical investments of deferred amounts, on the normal payment dates, in certain funds of the Natixis Funds Trusts, Loomis Sayles Funds Trusts and Hansberger International Series as designated by the participating Trustees. Changes in the value of participants’ deferral accounts are allocated pro rata among the funds in the Natixis Funds Trusts, Loomis Sayles Funds Trusts, and Hansberger International Series, and are reflected as Trustees’ fees and expenses in the Statements of Operations. The portions of the accrued obligations allocated to the Funds under the Plan are reflected as Deferred Trustees’ fees in the Statements of Assets and Liabilities.
f. Redemption Fees. Effective June 2, 2008, the redemption fee imposed on any class of shares of the Bond Fund and Global Bond Fund was eliminated. Prior to June 2, 2008, shareholders were charged a 2% redemption fee if they redeemed, including redeeming by exchange, such shares within 60 days of their acquisition (including acquisition by exchange). The redemption fee was deducted from the shareholder’s redemption or exchange proceeds and was paid to the Funds. The fees were accounted for as an addition to paid-in capital and are presented on the Statements of Changes in Net Assets.
5. Line of Credit. Each Fund, together with certain other funds of Natixis Funds Trusts, Loomis Sayles Funds Trusts and the Hansberger International Series, participates in a $200,000,000 committed line of credit provided by State Street Bank, with an individual limit of $125,000,000 for each fund that participates in the line of credit. Interest is charged to each participating fund
135
based on its borrowings at a rate per annum equal to the Federal Funds rate plus 0.50%. In addition, a commitment fee of 0.09% per annum, payable at the end of each calendar quarter, is accrued and apportioned among the participating funds based on their average daily unused portion of the line of credit.
Prior to March 12, 2008, each Fund, together with certain other funds of Natixis Funds Trusts, Loomis Sayles Funds Trusts and Hansberger International Series, participated in a $75,000,000 committed line of credit provided by State Street Bank.
For the year ended September 30, 2008, the Funds had no borrowings under these agreements.
6. Shareholders. At September 30, 2008, Loomis Sayles Distributors, L.P. and Loomis Sayles Trust Co. LLC owned 247,011 shares, equal to 15.2% of Inflation Protected Securities Fund’s shares outstanding. At September 30, 2008, the Loomis Sayles Funded Pension Plan and Trust (“Pension Plan”) and the Loomis Sayles Employees’ Profit Sharing Retirement Plan held shares of beneficial interest in the Funds as follows:
| | | | |
Fund | | Pension Plan | | Profit Sharing
Retirement Plan |
Bond Fund | | 1,183,415 | | 1,617,212 |
Fixed Income Fund | | — | | — |
Global Bond Fund | | 622,782 | | 421,420 |
Inflation Protected Securities Fund | | 186,042 | | 171,162 |
Institutional High Income Fund | | — | | 907,004 |
Intermediate Duration Fixed Income Fund | | — | | 56,833 |
Investment Grade Fixed Income Fund | | — | | — |
In addition, one shareholder affiliated with Institutional High Income Fund held approximately 5.6% of the Fund’s total outstanding shares.
At September 30, 2008, 4 shareholders individually owned more than 5% of the Fixed Income Fund’s total outstanding shares, representing, in aggregate, 23.3% of the Fund; 2 shareholders individually owned more than 5% of the Inflation Protected Securities Fund’s total outstanding shares, representing, in aggregate, 15.2% of the Fund; 3 shareholders individually owned more than 5% of the Institutional High Income Fund’s total outstanding shares, representing, in aggregate, 18.5% of the Fund; 3 shareholders individually owned more than 5% of the Intermediate Duration Fixed Income Fund’s total outstanding shares, representing, in aggregate, 83.4% of the Fund; and 4 shareholders individually owned more than 5% of the Investment Grade Fixed Income Fund’s total outstanding shares representing in aggregate, 40.7% of the Fund.
7. Capital Shares. Each Fund may issue an unlimited number of shares of beneficial interest, without par value. Transactions in capital shares were as follows:
| | | | | | | | | | | | | | |
| | | Bond Fund | |
| | |
| | | Year Ended September 30, 2008 | | | Year Ended September 30, 2007 | |
| | | | |
| Institutional Class | | Shares | | | Amount | | | Shares | | | Amount | |
Issued from the sale of shares | | 251,570,447 | | | $ | 3,582,639,853 | | | 225,302,977 | | | $ | 3,259,332,205 | |
Issued in connection with the reinvestment of distributions | | 38,067,200 | | | | 533,833,567 | | | 21,376,443 | | | | 307,439,341 | |
Redeemed | | (173,399,411 | ) | | | (2,388,845,785 | ) | | (57,759,551 | ) | | | (835,264,911 | ) |
| | | | | | | | | | | | | | |
Net change | | 116,238,236 | | | $ | 1,727,627,635 | | | 188,919,869 | | | $ | 2,731,506,635 | |
| | | | | | | | | | | | | | |
| | | | |
| Retail Class | | Shares | | | Amount | | | Shares | | | Amount | |
Issued from the sale of shares | | 289,365,734 | | | $ | 4,136,823,680 | | | 316,905,718 | | | $ | 4,574,277,582 | |
Issued in connection with the reinvestment of distributions | | 36,275,158 | | | | 506,995,862 | | | 16,459,304 | | | | 236,127,467 | |
Redeemed | | (184,939,337 | ) | | | (2,542,156,728 | ) | | (53,198,802 | ) | | | (766,662,779 | ) |
| | | | | | | | | | | | | | |
Net change | | 140,701,555 | | | $ | 2,101,662,814 | | | 280,166,220 | | | $ | 4,043,742,270 | |
| | | | | | | | | | | | | | |
136
NOTES TO FINANCIAL STATEMENTS – continued
September 30, 2008
| | | | | | | | | | | | | | |
| | | Bond Fund | |
| | |
| | | Year Ended September 30, 2008 | | | Year Ended September 30, 2007 | |
| | | | |
| Admin Class | | Shares | | | Amount | | | Shares | | | Amount | |
Issued from the sale of shares | | 9,933,305 | | | $ | 141,062,361 | | | 7,435,777 | | | $ | 106,930,369 | |
Issued in connection with the reinvestment of distributions | | 936,366 | | | | 13,050,988 | | | 484,814 | | | | 6,942,995 | |
Redeemed | | (6,310,368 | ) | | | (88,396,246 | ) | | (2,279,523 | ) | | | (32,743,088 | ) |
| | | | | | | | | | | | | | |
Net change | | 4,559,303 | | | $ | 65,717,103 | | | 5,641,068 | | | $ | 81,130,276 | |
| | | | | | | | | | | | | | |
Increase (decrease) from capital share transactions | | 261,499,094 | | | $ | 3,895,007,552 | | | 474,727,157 | | | $ | 6,856,379,181 | |
| | | | | | | | | | | | | | |
| |
| | | Fixed Income Fund | |
| | |
| | | Year Ended September 30, 2008 | | | Year Ended September 30, 2007 | |
| | | | |
| Institutional Class | | Shares | | | Amount | | | Shares | | | Amount | |
Issued from the sale of shares | | 20,684,018 | | | $ | 285,477,865 | | | 8,214,414 | | | $ | 114,350,567 | |
Issued in connection with the reinvestment of distributions | | 3,076,075 | | | | 41,096,367 | | | 2,112,444 | | | | 28,412,372 | |
Issued from subscriptions-in-kind* | | — | | | | — | | | 1,358,851 | | | | 18,602,665 | |
Redeemed | | (14,148,613 | ) | | | (196,073,515 | ) | | (2,736,152 | ) | | | (37,720,894 | ) |
| | | | | | | | | | | | | | |
Increase (decrease) from capital share transactions | | 9,611,480 | | | $ | 130,500,717 | | | 8,949,557 | | | $ | 123,644,710 | |
| | | | | | | | | | | | | | |
* Issued in exchange for portfolio securities contributed to the Fund in-kind by such shareholders on March, 1, 2007. Contributions included $18,407,166 of cash and securities and $195,499 in receivables. The securities contributed were part of a portfolio that was previously managed by Loomis Sayles. | |
| |
| | | Global Bond Fund | |
| | |
| | | Year Ended September 30, 2008 | | | Year Ended September 30, 2007 | |
| | | | |
| Institutional Class | | Shares | | | Amount | | | Shares | | | Amount | |
Issued from the sale of shares | | 35,619,497 | | | $ | 570,769,864 | | | 27,734,425 | | | $ | 431,703,225 | |
Issued in connection with the reinvestment of distributions | | 3,416,152 | | | | 54,204,619 | | | 2,446,517 | | | | 37,807,115 | |
Redeemed | | (21,704,761 | ) | | | (345,126,532 | ) | | (9,017,324 | ) | | | (139,876,702 | ) |
| | | | | | | | | | | | | | |
Net change | | 17,330,888 | | | $ | 279,847,951 | | | 21,163,618 | | | $ | 329,633,638 | |
| | | | | | | | | | | | | | |
| | | | |
| Retail Class | | Shares | | | Amount | | | Shares | | | Amount | |
Issued from the sale of shares | | 41,004,039 | | | $ | 653,696,591 | | | 30,549,761 | | | $ | 471,407,761 | |
Issued in connection with the reinvestment of distributions | | 3,149,153 | | | | 49,533,904 | | | 2,275,012 | | | | 34,895,516 | |
Redeemed | | (24,777,028 | ) | | | (388,658,940 | ) | | (12,534,751 | ) | | | (192,738,097 | ) |
| | | | | | | | | | | | | | |
Net change | | 19,376,164 | | | $ | 314,571,555 | | | 20,290,022 | | | $ | 313,565,180 | |
| | | | | | | | | | | | | | |
Increase (decrease) from capital share transactions | | 36,707,052 | | | $ | 594,419,506 | | | 41,453,640 | | | $ | 643,198,818 | |
| | | | | | | | | | | | | | |
137
| | | | | | | | | | | | | | |
| | | Inflation Protected Securities Fund | |
| | |
| | | Year Ended September 30, 2008 | | | Year Ended September 30, 2007 | |
| | | | |
| Institutional Class | | Shares | | | Amount | | | Shares | | | Amount | |
Issued from the sale of shares | | 644,995 | | | $ | 6,931,326 | | | 513,841 | | | $ | 5,272,640 | |
Issued in connection with the reinvestment of distributions | | 89,564 | | | | 936,772 | | | 52,702 | | | | 533,425 | |
Redeemed | | (414,633 | ) | | | (4,413,426 | ) | | (139,248 | ) | | | (1,427,665 | ) |
| | | | | | | | | | | | | | |
Increase (decrease) from capital share transactions | | 319,926 | | | $ | 3,454,672 | | | 427,295 | | | $ | 4,378,400 | |
| | | | | | | | | | | | | | |
| |
| | | Institutional High Income Fund | |
| | |
| | | Year Ended September 30, 2008 | | | Year Ended September 30, 2007 | |
| | | | |
| Institutional Class | | Shares | | | Amount | | | Shares | | | Amount | |
Issued from the sale of shares | | 13,115,043 | | | $ | 104,688,742 | | | 5,899,925 | | | $ | 49,270,705 | |
Issued in connection with the reinvestment of distributions | | 1,889,032 | | | | 14,526,657 | | | 912,481 | | | | 7,327,229 | |
Redeemed | | (6,046,047 | ) | | | (47,783,552 | ) | | (2,029,721 | ) | | | (16,744,853 | ) |
| | | | | | | | | | | | | | |
Increase (decrease) from capital share transactions | | 8,958,028 | | | $ | 71,431,847 | | | 4,782,685 | | | $ | 39,853,081 | |
| | | | | | | | | | | | | | |
| |
| | | Intermediate Duration Fixed Income Fund | |
| | |
| | | Year Ended September 30, 2008 | | | Year Ended September 30, 2007 | |
| | | | |
| Institutional Class | | Shares | | | Amount | | | Shares | | | Amount | |
Issued from the sale of shares | | 464,596 | | | $ | 4,429,364 | | | 288,140 | | | $ | 2,734,830 | |
Issued in connection with the reinvestment of distributions | | 128,620 | | | | 1,209,983 | | | 132,904 | | | | 1,257,767 | |
Issued from subscriptions-in-kind* | | | | | | | | | 112,853 | | | | 1,070,978 | |
Redeemed | | (257,694 | ) | | | (2,438,893 | ) | | (1,619,583 | ) | | | (15,330,675 | ) |
| | | | | | | | | | | | | | |
Increase (decrease) from capital share transactions | | 335,522 | | | $ | 3,200,454 | | | (1,085,686 | ) | | $ | (10,267,100 | ) |
| | | | | | | | | | | | | | |
* Issued in exchange for portfolio securities contributed to the Fund in-kind by such shareholders on October, 30, 2006. Contributions included $1,057,779 of securities and $13,199 in receivables. The securities contributed were part of a portfolio that was previously managed by Loomis Sayles. | |
| |
| | | Investment Grade Fixed Income Fund | |
| | |
| | | Year Ended September 30, 2008 | | | Year Ended September 30, 2007 | |
| | | | |
| Institutional Class | | Shares | | | Amount | | | Shares | | | Amount | |
Issued from the sale of shares | | 7,579,953 | | | $ | 95,580,515 | | | 3,430,409 | | | $ | 43,194,911 | |
Issued in connection with the reinvestment of distributions | | 1,021,690 | | | | 12,868,000 | | | 902,151 | | | | 11,398,175 | |
Issued from subscriptions-in-kind* | | — | | | | — | | | 3,389,172 | | | | 43,211,946 | |
Redeemed | | (4,336,110 | ) | | | (54,588,362 | ) | | (1,275,094 | ) | | | (16,210,451 | ) |
| | | | | | | | | | | | | | |
Increase (decrease) from capital share transactions | | 4,265,533 | | | $ | 53,860,153 | | | 6,446,638 | | | $ | 81,594,581 | |
| | | | | | | | | | | | | | |
* Issued in exchange for portfolio securities contributed to the Fund in-kind by such shareholders on July, 12, 2007. Contributions included $42,946,879 of cash and securities and $265,067 in receivables. The securities contributed were part of portfolios that were previously managed by Loomis Sayles. | |
138
REPORT OF INDEPENDENT REGISTERED PUBLIC ACCOUNTING FIRM
To the Trustees of Loomis Sayles Funds I and Shareholders of Loomis Sayles Bond Fund, Loomis Sayles Fixed Income Fund, Loomis Sayles Global Bond Fund, Loomis Sayles Inflation Protected Securities Fund, Loomis Sayles Institutional High Income Fund, Loomis Sayles Intermediate Duration Fixed Income Fund and Loomis Sayles Investment Grade Fixed Income Fund:
In our opinion, the accompanying statements of assets and liabilities, including the portfolios of investments, and the related statements of operations and of changes in net assets and the financial highlights present fairly, in all material respects, the financial position of the Loomis Sayles Bond Fund, Loomis Sayles Fixed Income Fund, Loomis Sayles Global Bond Fund, Loomis Sayles Inflation Protected Securities Fund, Loomis Sayles Institutional High Income Fund, Loomis Sayles Intermediate Duration Fixed Income Fund and Loomis Sayles Investment Grade Fixed Income Fund, each a series of Loomis Sayles Funds I (collectively, “the Funds”), at September 30, 2008, and the results of each of their operations, the changes in each of their net assets and the financial highlights for each of the periods indicated, in conformity with accounting principles generally accepted in the United States of America. These financial statements and financial highlights (hereafter referred to as “financial statements”) are the responsibility of the Funds’ management; our responsibility is to express an opinion on these financial statements based on our audits. We conducted our audits of these financial statements in accordance with the standards of the Public Company Accounting Oversight Board (United States). Those standards require that we plan and perform the audits to obtain reasonable assurance about whether the financial statements are free of material misstatement. An audit includes examining, on a test basis, evidence supporting the amounts and disclosures in the financial statements, assessing the accounting principles used and significant estimates made by management, and evaluating the overall financial statement presentation. We believe that our audits, which included confirmation of securities at September 30, 2008 by correspondence with the custodian and brokers, provide a reasonable basis for our opinion.
PricewaterhouseCoopers LLP
Boston, Massachusetts
November 21, 2008
139
2008 U.S. TAX DISTRIBUTION INFORMATION TO SHAREHOLDERS (Unaudited)
Corporate Dividends Received Deduction. For the fiscal year ended September 30, 2008, a percentage of dividends distributed by the Funds listed below qualify for the dividends received deduction for corporate shareholders. These percentages are as follows:
| | |
Fund | | Qualifying Percentage |
Bond Fund | | 2.42% |
Fixed Income Fund | | 1.59% |
Global Bond Fund | | 1.63% |
Inflation Protected Securities Fund | | 0.60% |
Institutional High Income Fund | | 3.33% |
Investment Grade Fixed Income Fund | | 0.66% |
Capital Gains Distributions. Pursuant to Internal Revenue Section 852(b), the following Funds paid distributions, which have been designated as capital gains distributions for the fiscal year ended September 30, 2008.
| | |
Fund | | Amount |
Fixed Income Fund | | 643,688 |
Institutional High Income Fund | | 3,318,304 |
Qualified Dividend Income. For the fiscal year ended September 30, 2008, the Funds below will designate up to the maximum amount allowable pursuant to the Internal Revenue Code as qualified dividend income eligible for reduced tax rates. These lower rates range from 5% to 15% depending on an individual’s tax bracket. If the Funds pay a distribution during calendar year 2008, complete information will be reported in conjunction with Form 1099-DIV.
Fund
Bond Fund
Fixed Income Fund
Global Bond Fund
Inflation Protected Securities Fund
Institutional High Income Fund
Investment Grade Fixed Income Fund
140
TRUSTEE AND OFFICER INFORMATION
The tables below provide certain information regarding the Trustees and officers of Loomis Sayles Funds I (the “Trust”). Unless otherwise indicated, the address of all persons below is 399 Boylston Street, Boston, MA 02116. The Trust’s Statements of Additional Information include additional information about the Trustees of the Trust and are available by calling Loomis Sayles at 800-343-2029.
| | | | | | |
| Name and Year of Birth | | Position(s)
Held with
the Trusts, Length
of Time Served and
Term of Office* | | Principal Occupation(s)
During Past 5 Years** | | Number of Portfolios in Fund
Complex Overseen*** and
Other Directorships Held |
| |
Independent Trustees | | |
Graham T. Allison, Jr.
(1940) | | Trustee since 2003 Contract Review and Governance Committee Member | | Douglas Dillon Professor and Director of the Belfer Center for Science and International Affairs, John F. Kennedy School of Government, Harvard University | | 41
Director, Taubman Centers, Inc. (real estate investment trust) |
| | | |
Charles D. Baker
(1956) | | Trustee Since 2005 Contract Review and Governance Committee Member | | President and Chief Executive Officer, Harvard Pilgrim Health Care (health plan) | | 41
None |
| | | |
Edward A. Benjamin
(1938) | | Trustee Since 2003 Chairman of the Contract Review and Governance Committee | | Retired | | 41
None |
| | | |
Daniel M. Cain
(1945) | | Trustee Since 2003 Chairman of the Audit Committee | | President and Chief Executive Officer, Cain Brothers & Company, Incorporated (investment banking) | | 41
Director, Sheridan Healthcare Inc. (physician practice management) |
| | | |
Kenneth A. Drucker
(1945) | | Trustee Since 2008 Contract Review and Governance Committee Member | | Formerly, Treasurer, Sequa Corp. (manufacturing) | | 41
Director, M Fund, Inc. (registered investment company) |
| | | |
Jonathan P. Mason
(1958) | | Trustee Since 2007 Audit Committee Member | | Chief Financial Officer, Cabot Corp. (specialty chemicals); formerly, Vice President and Treasurer, International Paper Company; formerly, Chief Financial Officer, Carter Holt Harvey (forest products) | | 41
None |
| | | |
Sandra O. Moose
(1942) | | Chairperson of the Board of Trustees since November 2005 Trustee Since 2003 Ex officio member of the Audit Committee and Contract Review and Governance Committee | | President, Strategic Advisory Services (management consulting); formerly, Senior Vice President and Director, The Boston Consulting Group, Inc. (management consulting) | | 41
Director, Verizon Communications; Director, Rohm and Haas Company (specialty chemicals); Director, AES Corporation (international power company) |
141
| | | | | | |
| Name and Year of Birth | | Position(s)
Held with
the Trusts, Length
of Time Served and
Term of Office* | | Principal Occupation(s)
During Past 5 Years** | | Number of Portfolios in Fund
Complex Overseen*** and
Other Directorships Held |
Cynthia L. Walker
(1956) | | Trustee Since 2005 Audit Committee Member | | Deputy Dean for Finance and Administration, Yale University School of Medicine; formerly, Executive Dean for Administration, Harvard Medical School; and formerly, Dean for Finance & Chief Financial Officer, Harvard Medical School | | 41
None |
| | |
Interested Trustees | | | | |
Robert J. Blanding1
(1947) 555 California Street San Francisco, CA 94104 | | Trustee Since 2002 President and Chief Executive Officer since 2002 | | President, Chairman, Director and Chief Executive Officer, Loomis, Sayles & Company, L.P. | | 41
None |
| | | |
John T. Hailer2 (1960) | | Trustee since 2003 | | President and Chief Executive Officer-U.S. and Asia, Natixis Global Asset Management, L.P.; formerly, President and Chief Executive Officer, Natixis Distribution Corporation, Natixis Asset Management Advisors, L.P., Natixis Distributors, L.P. and Natixis Global Associates, Inc. | | 41
None |
| * | Each Trustee serves until retirement, resignation or removal from the Board of Trustees. The current retirement age is 72. The position of Chairperson of the Board is appointed for a two-year term. Ms. Moose was appointed to serve an additional two-year term as the Chairperson of the Board of Trustees on September 14, 2007. |
| ** | Each person listed above, except as noted, holds the same position(s) with the Natixis Funds Trust I, Natixis Funds Trust II, Natixis Funds Trust III, Natixis Funds Trust IV, Gateway Trust and the Natixis Cash Management Trust (collectively, the “Natixis Funds Trusts”), Loomis Sayles Funds I and Loomis Sayles Funds II (collectively, the “Loomis Sayles Funds Trusts”), and Hansberger International Series. Previous positions during the past five years with Natixis Distributors, L.P. (the “Distributor”), Natixis Asset Management Advisors, L.P. (“Natixis Advisors”), or Loomis, Sayles & Company, L.P. are omitted if not materially different from a Trustee’s or officer’s current position with such entity. |
| *** | The Trustees of the Trusts serve as trustees of a fund complex that includes all series of the Natixis Funds Trusts, the Loomis Sayles Funds Trusts and Hansberger International Series (collectively, the “Fund Complex”). |
| 1 | Mr. Blanding is deemed an “interested person” of the Trusts because he holds the following positions with affiliated persons of the Trusts: President, Chairman, Director and Chief Executive Officer of Loomis, Sayles & Company, L.P. |
| 2 | Mr. Hailer is deemed an “interested person” of the Trusts because he holds the following positions with affiliated persons of the Trusts: President and Chief Executive Officer-U.S. and Asia, Natixis Global Asset Management, L.P. |
142
| | | | | | |
| Name and Year of Birth | | Position(s)
Held with the Trusts | | Term of Office* and
Length of Time Served | | Principal Occupation
During Past 5 Years** |
| |
Officers of the Trust | | |
Coleen Downs Dinneen
(1960) | | Secretary, Clerk and Chief Legal Officer | | Since September 2004 | | Executive Vice President, General Counsel, Secretary and Clerk (formerly, Senior Vice President, Deputy General Counsel, Assistant Secretary and Assistant Clerk), Natixis Distribution Corporation, Natixis Asset Management Advisors, L.P. and Natixis Distributors, L.P. |
| | | |
Daniel J. Fuss
(1933) One Financial Center Boston, MA 02111 | | Executive Vice President | | Since June 2003 | | Vice Chairman and Director, Loomis, Sayles & Company, L.P. |
| | | |
David Giunta
(1965) | | Executive Vice President | | Since March 2008 | | President and Chief Executive Officer, Natixis Distribution Corporation, Natixis Asset Management Advisors, L.P. and Natixis Distributors, L.P.; formerly, President, Fidelity Charitable Gift Fund; and formerly, Senior Vice President, Fidelity Brokerage Company |
| | | |
Russell L. Kane
(1969) | | Chief Compliance Officer, Assistant Secretary and Anti-Money Laundering Officer | | Chief Compliance Officer since May 2006; Assistant Secretary since June 2004; and Anti-Money Laundering Officer since April 2007 | | Chief Compliance Officer for Mutual Funds, Senior Vice President, Deputy General Counsel, Assistant Secretary and Assistant Clerk, Natixis Distribution Corporation, Natixis Asset Management Advisors, L.P. and Natixis Distributors, L.P.; and formerly, Senior Counsel, Columbia Management Group |
| | | |
Michael C. Kardok
(1959) | | Treasurer, Principal Financial and Accounting Officer | | Since October 2004 | | Senior Vice President, Natixis Asset Management Advisors, L.P. and Natixis Distributors, L.P.; and formerly, Senior Director, PFPC Inc. |
| | | |
Robert Krantz
(1964) | | Executive Vice President | | Since September 2007 | | Executive Vice President, Natixis Asset Management Advisors, L.P. and Natixis Distributors, L.P. |
| * | Each officer of the Trusts serves for an indefinite term in accordance with the Trusts’ current By-laws until the date his or her successor is elected and qualified, or until he or she sooner dies, retires, is removed or becomes disqualified. |
| ** | Each person listed above, except as noted, holds the same position(s) with the Natixis Funds Trusts, Loomis Sayles Funds Trusts and Hansberger International Series. Mr. Fuss is not an officer of the Natixis Funds Trusts or the Hansberger International Series. Previous positions during the past five years with the Distributor, Natixis Advisors or Loomis Sayles are omitted if not materially different from a Trustee’s or officer’s current position with such entity. |
143

Loomis Sayles High Income Opportunities Fund
Loomis Sayles Securitized Asset Fund
ANNUAL REPORT
SEPTEMBER 30, 2008
FUND AND MANAGER REVIEW
Loomis Sayles High Income Opportunities Fund

Matthew Eagan, CFA
Manager Since April 2004

Kathleen Gaffney, CFA
Manager Since April 2004

Dan Fuss, CFA, CIC
Manager Since April 2004

Elaine Stokes
Manager Since April 2004
KEY FUND FACTS
Symbol | LSIOX
Objective | High current income. Capital appreciation is the Fund’s secondary objective.
Strategy | Invests substantially all of its assets, and may invest up to 100% of its assets, in high income securities. High income securities are fixed-income securities that Loomis Sayles believes have the potential to generate relatively high levels of current income.
Fund Inception Date | 4/12/04
Total Net Assets | $65.0 million
PORTFOLIO REVIEW
The Fund underperformed its Benchmark, the Lehman High Yield Index, for the fiscal year ended September 30, 2008, primarily due to the ongoing credit crisis and drama surrounding the banking sector, which pushed credit spreads to their widest levels of the year.
Our out-of-Benchmark exposure to investment grade financials was a principal contributor to the Fund’s negative total return, as the market lost confidence in the credit quality of many big-name banks and financial companies. The government’s seizure of Washington Mutual and the restructuring of the broker/dealer industry have fundamentally altered the landscape of investment and commercial banks.
Among below-investment grade industrials, lower-quality names resulting from leveraged buyouts in the days of easy credit were dragged down, as investors remained concerned about the financial implications of high debt loads and illiquid credit markets. The bankruptcy of Lehman Brothers and the conservatorship of Fannie Mae and Freddie Mac also had a negative impact on performance. We held preferred shares of Fannie and Freddie, and the suspension of dividends decreased the valuation of those holdings.
On a positive note, the Fund’s underweight in below-investment grade financials buoyed relative performance. The credit crisis made investors in the banking and finance sectors more anxious. Specifically, the ratings downgrade and subsequent downfall of Washington Mutual helped drag down performance for the sector. In addition, select investment grade industrial and convertible issues contributed positively, while an underweight allocation to the consumer cyclical sector also provided a modest boost. Our commitment to security selection lifted relative returns, as asset-backed and quality industrial names proved able to weather the credit market storm.
OUTLOOK
With tight credit and slowing economic growth, we are taking a hard look at opportunities. The team sees potential value in stable industrials, such as telecommunications and cable, but we are less enthusiastic about deep cyclicals, firms heavily dependent on the economy, and anything levered to the consumer.
We believe specific high yield credits and industries are likely to experience higher default rates, which would put further downward pressure on valuations. However, as measured by the Lehman High Yield Index, price declines had driven yields up over 13%, on average, as of September 30, 2008.
1
Such generous income may help investors absorb default losses (up to a point) while waiting for prices to recover.
Our experience with past market cycles suggests that, once confidence and optimism are restored, markets can recover quickly as investors realize good companies are attractively priced. We are working hard to ensure the Fund is in a prime position to capture this upside potential.
AVERAGE ANNUAL TOTAL RETURNS
Periods Ended September 30, 2008
| | | | | | | |
| 1 Year | | | 3 years | | | Since Inception(a) | |
|
| Loomis Sayles High Income Opportunities Fund | |
| -13.24 | % | | -0.13 | % | | 3.27 | % |
|
| Lehman High Yield Index(b) | |
| -11.24 | | | 1.04 | | | 3.01 | |
|
| Lipper High Current Yield Funds Index(b) | |
| -11.45 | | | 0.61 | | | 2.67 | |
|
| Expense Ratio(c) | |
| Institutional: 0.00% | |
CUMULATIVE PERFORMANCE
Inception to September 30, 2008
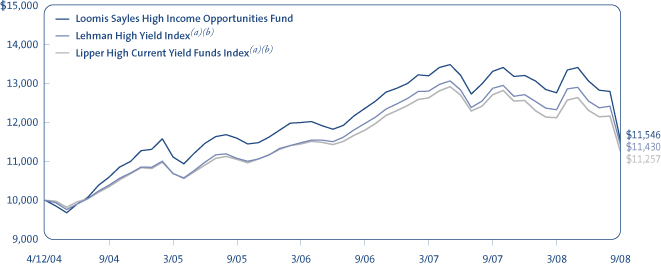
Data quoted reflects past performance and cannot guarantee future results. Total returns assume reinvestment of dividends and capital gains distributions. Investment return and principal value will fluctuate so that shares, when redeemed, may be worth more or less than their original cost. Current performance may be higher or lower than quoted.
Returns do not reflect the taxes that a shareholder would pay on fund distributions or the redemption of shares. Periods of less than one year are not annualized. Index performance data is not available coincident with the Fund’s inception date.
(a) Since Index performance data is not available coincident with the Fund’s inception date, the beginning value of the index is the value of the month-end closest to the Fund’s inception date. (b) See page 5 for a description of the Indices. (c) The amount shown under Expense Ratio is 0.00% to reflect the fact that the Fund does not pay any advisory, administration or distribution and service fees, and that Loomis Sayles has agreed to pay certain expenses of the Fund.
WHAT YOU SHOULD KNOW
High yield securities are subject to a high degree of market and credit risk. The secondary market for these securities may lack liquidity, which may adversely affect the value of the Fund. Securities issued by US government agencies are not insured by and may not be guaranteed by the US government.
2
FUND AND MANAGER REVIEW
Loomis Sayles Securitized Asset Fund

Clifton Rowe, CFA
Manager since March 2006

Fan Hu, CFA
Manager since April 2006
KEY FUND FACTS
Symbol | LSSAX
Objective | High current income consistent with capital preservation.
Strategy | Invest at least 80% of its net assets (plus any borrowings made for investment purposes) in a diversified portfolio of securitized assets, such as mortgage-backed and other asset-backed securities.
Fund Inception Date | 3/2/06
Total Net Assets | $382.1 million
PORTFOLIO REVIEW
The Fund lagged its Benchmark, the Lehman Securitized Index, for the fiscal year ended September 30, 2008, primarily due to its emphasis on mortgage-backed securities (MBS) and asset-backed securities (ABS) issued by entities other than government-sponsored entities (GSE). Relative to the Benchmark, the Fund was modestly overweight in ABS secured by consumer loans and mortgage loan receivables. The Fund also had an overweight position in commercial mortgage-backed securities (CMBS). The performance of these sectors did not keep pace with the performance of MBS issued by GSE.
As the financial crisis evolved, investors sought the safety of US Treasury securities. Other sectors with more yield and greater risk were unable to keep pace. Investor fear reached an extreme, such that even high-quality securities lagged significantly. This created opportunities across a wide range of sectors for us to add significant yield advantages at historically attractive levels.
Specifically, we increased the Fund’s holdings in high-quality ABS and CMBS. Certain areas of the ABS market, particularly the residential mortgage segment, faced serious problems, but valuations cheapened in the stronger sectors. This created an attractive combination of strong credit quality and a significant yield advantage.
We also increased our holdings in MBS issued by GSE. As mortgage troubles continued to mount, investors became concerned that GSE would be unable to function without government intervention, even though the underlying mortgages were of much higher quality than those in the subprime market. Eventually, the government did intervene with actions that supported the senior obligations of Fannie Mae and Freddie Mac. MBS issued by GSE reacted positively to the government’s intervention.
OUTLOOK
As a result of past Federal Reserve rate cuts and expectations for more cuts, the yield curve is steep by historical standards. Longer maturity securities now offer significant yield boosts versus shorter alternatives. We will look for opportunities to capitalize on this situation.
The Fund remains overweight in high-quality ABS backed by automobile loans and credit card receivables, which currently offer attractive yields and have strong credit quality due to their secured status and additional credit
3
enhancements. The Fund is also overweight relative to its Benchmark in CMBS, holding senior securities backed by first mortgages on commercial properties. We see little risk of any ratings downgrades among these holdings due to the strong credit enhancements on the senior securities. We are also maintaining the Fund’s overweight position in non-GSE residential MBS. Although market prices of these securities currently are depressed, our holdings are generally high in quality, and we anticipate a strong recovery in these securities.
AVERAGE ANNUAL TOTAL RETURNS
Periods Ended September 30, 2008
| | |
| 1 Year | | Since
Inception(a) |
|
| Loomis Sayles Securitized Asset Fund |
| 0.92% | | 3.40% |
|
| Lehman Securitized Index(b) |
| 5.17 | | 5.14 |
|
| Lipper US Mortgage Funds Index(b) |
| 2.68 | | 3.80 |
|
| Expense Ratio(c) |
| Institutional: 0.00% |
CUMULATIVE PERFORMANCE
Inception to September 30, 2008
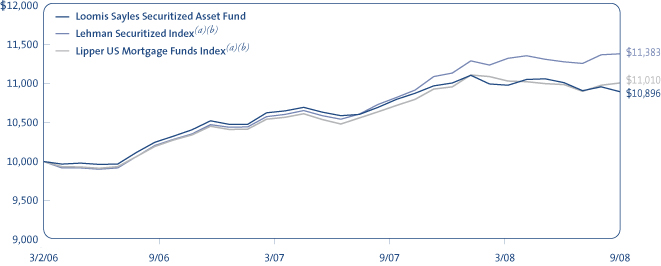
Data quoted reflects past performance and cannot guarantee future results. Total returns assume reinvestment of dividends and capital gains distributions. Investment return and principal value will fluctuate so that shares, when redeemed, may be worth more or less than their original cost. Current performance may be higher or lower than quoted.
Returns do not reflect the taxes that a shareholder would pay on fund distributions or the redemption of shares. Periods of less than one year are not annualized.
(a) Since Index performance data is not available coincident with the Fund’s inception date, the beginning value of the index is the value of the month-end closest to the Fund’s inception date. (b) See page 5 for a description of the Indices. (c) The amount shown under Expense Ratio is 0.00% to reflect the fact that the Fund does not pay any advisory, administration or distribution and service fees, and that Loomis Sayles has agreed to pay certain expenses of the Fund.
WHAT YOU SHOULD KNOW
High yield securities are subject to a high degree of market and credit risk. The secondary market for these securities may lack liquidity, which may adversely affect the value of the Fund. Securities issued by US government agencies are not insured by and may not be guaranteed by the US government.
4
ADDITIONAL INFORMATION
Index Definitions
Lipper High Current Yield Funds Index is an equally weighted, unmanaged index of typically the 30 largest mutual funds within the high current yield funds investment objective.
Lipper US Mortgage Funds Index is an equally weighted, unmanaged index of typically the 30 largest mutual funds within the US mortgage funds investment objective.
Source: Lipper, Inc.
Lehman High Yield Index covers the universe of fixed rate, non-investment grade debt. Pay-in-kind (PIK) bonds, Eurobonds, and debt issues from countries designated as emerging markets (e.g., Argentina, Brazil, Venezuela, etc.) are excluded, but Canadian and global bonds (SEC registered) of issuers in non-emerging market countries are included. Original issue zeroes, step-up coupon structures, and 144As are also included.
Lehman Securitized Index is an unmanaged index of asset-backed securities, collateralized mortgage-backed securities (ERISA eligible) and fixed rate mortgage-backed securities.
Returns are adjusted for the reinvestment of capital gains distributions and income dividends. Indices are unmanaged and do not have expenses that affect results, unlike most mutual funds. It is not possible to invest directly in an index.
Proxy Voting Information
A description of the Funds’ proxy voting policies and procedures is available without charge, upon request, (i) by calling Loomis Sayles at 800-633-3330; (ii) on the Funds’ website, www.loomissayles.com, and (iii) on the SEC’s website at www.sec.gov. Information about how the Funds voted proxies relating to portfolio securities during the 12-month period ended June 30, 2008 is available on (i) the Funds’ website and (ii) the SEC’s website.
Quarterly Portfolio Schedules
The Funds file a complete schedule of portfolio holdings with the SEC for the first and third quarters of each fiscal year on Form N-Q. The Funds’ Forms N-Q is available on the SEC’s website at www.sec.gov and may be reviewed and copied at the SEC’s Public Reference Room in Washington, DC. Information on the operation of the Public Reference Room may be obtained by calling 800-SEC-0330.
UNDERSTANDING FUND EXPENSES
Typically, mutual fund shareholders incur two types of costs: (1) transaction costs, including sales charges (loads) on purchases, redemption fees and certain exchange fees; and (2) ongoing costs, including management fees, distribution fees (12b-1 fees), and other fund expenses. However, the Funds are unlike other mutual funds; they do not charge any fees or expenses.
You should be aware that shares in the Funds are available only to institutional investment advisory clients of Loomis, Sayles & Company, L.P. (“Loomis Sayles”) and Natixis Asset Management Advisors, L.P. (“Natixis Advisors”) and to participants in “wrap-fee” programs sponsored by broker dealers and investment advisers that may be affiliated or unaffiliated with the Funds, Loomis Sayles or Natixis Advisors. The institutional investment advisory clients of Loomis Sayles and Natixis Advisors pay Loomis Sayles or Natixis Advisors a fee for their investment advisory services, while participants in “wrap fee” programs pay a “wrap” fee to the program’s sponsor. The “wrap fee” program sponsors, in turn, pay a fee to Natixis Advisors. “Wrap fee” program participants should read carefully the wrap fee brochure provided to them by their program’s sponsor and the fees paid by such sponsor to Natixis Advisors. Shareholders pay no additional fees or expenses to purchase shares of the Funds. However, shareholders will indirectly pay a proportionate share of those costs, such as brokerage commissions, taxes and extraordinary expenses, that are borne by the Funds through a reduction in each Fund’s net asset value.
The first line in each Fund’s table below shows the actual amount of Fund expenses ($0) you would have paid on a $1,000 investment in the Fund from April 1, 2008 through September 30, 2008. It also shows how much a $1,000 investment would be worth at the close of the period, assuming actual Fund returns and expenses.
The second line in each Fund’s table provides information about hypothetical account values and hypothetical expenses based on the Fund’s actual expense ratio (0%) and an assumed rate of return of 5% per year before expenses, which is not the Fund’s actual return. The hypothetical account values and expenses may not be used to estimate the actual ending account balance or expenses you paid on your investment for the period. You may use this information to compare the ongoing costs of investing in the Funds and other funds. To do so, compare this 5% hypothetical example with the 5% hypothetical examples that appear in the shareholder reports of the other funds.
Loomis Sayles High Income Opportunities Fund
| | | | | | |
Institutional Class | | Beginning
Account Value
4/1/2008 | | Ending
Account Value
9/30/2008 | | Expenses Paid
During Period*
4/1/2008 – 9/30/2008 |
Actual | | $1,000.00 | | $904.90 | | $0.00 |
Hypothetical (5% return before expenses) | | $1,000.00 | | $1,025.00 | | $0.00 |
* Expenses are equal to the Fund’s annualized expense ratio: 0.00%, multiplied by the average account value over the period, multiplied by the number of days in the most recent fiscal half-year, divided by 366 (to reflect the half-year period). |
Loomis Sayles Securitized Asset Fund
| | | | | | |
Institutional Class | | Beginning
Account Value
4/1/2008 | | Ending
Account Value
9/30/2008 | | Expenses Paid
During Period*
4/1/2008 – 9/30/2008 |
Actual | | $1,000.00 | | $992.30 | | $0.00 |
Hypothetical (5% return before expenses) | | $1,000.00 | | $1,025.00 | | $0.00 |
* Expenses are equal to the Fund’s annualized expense ratio: 0.00%, multiplied by the average account value over the period, multiplied by the number of days in the most recent fiscal half-year, divided by 366 (to reflect the half-year period). |
5
BOARD APPROVAL OF THE EXISTING ADVISORY AGREEMENTS
The Board of Trustees, including the Independent Trustees, considers matters bearing on each Fund’s advisory agreement (the “Agreements”) at most of its meetings throughout the year. Each year, usually in the spring, the Contract Review and Governance Committee of the Board meets to review the Agreements to determine whether to recommend that the full Board approve the continuation of the Agreements, typically for an additional one-year period. After the Committee has made its recommendation, the full Board, including the Independent Trustees, determines whether to approve the continuation of the Agreements.
In connection with these meetings, the Trustees receive materials that the Funds’ investment adviser believes to be reasonably necessary for the Trustees to evaluate the Agreements. These materials generally include, among other items, (i) information on the investment performance of the Funds and the performance of peer groups of funds and the Funds’ performance benchmarks, (ii) information on the Funds’ advisory fees, if any, and other expenses, including information comparing the Funds’ expenses to those of peer groups of funds and information about any applicable expense caps and fee “breakpoints,” (iii) sales and redemption data in respect of the Funds, (iv) information about the profitability of the Agreements to the Funds’ advisers (the “Adviser”), and (v) information obtained through the completion of a questionnaire by the Adviser (the Trustees are consulted as to the information requested through that questionnaire). The Board of Trustees, including the Independent Trustees, also consider other matters such as (i) the Adviser’s financial results and financial condition, (ii) each Fund’s investment objective and strategies and the size, education and experience of the Adviser’s respective investment staffs and their use of technology, external research and trading cost measurement tools, (iii) arrangements in respect of the distribution of the Funds’ shares and the related costs, (iv) the procedures employed to determine the value of the Funds’ assets, (v) the allocation of the Funds’ brokerage, if any, including allocations to brokers affiliated with the Adviser and the use of “soft” commission dollars to pay Fund expenses and to pay for research and other similar services, (vi) the resources devoted to, and the record of compliance with, the Funds’ investment policies and restrictions, policies on personal securities transactions and other compliance policies, and (vii) the general economic outlook with particular emphasis on the mutual fund industry. Throughout the process, the Trustees are afforded the opportunity to ask questions of and request additional materials from the Adviser.
In addition to the materials requested by the Trustees in connection with the annual consideration of the continuation of the Agreements, the Trustees receive materials in advance of each regular quarterly meeting of the Board of Trustees that provide detailed information about the Funds’ investment performance. This information generally includes an internal performance rating for each Fund based on agreed-upon criteria.
The Board of Trustees most recently approved the continuation of the Agreements at their meeting held in June 2008. The Agreements were continued for a one-year period for both Funds. In considering whether to approve the continuation of the Agreements, the Board of Trustees, including the Independent Trustees, did not identify any single factor as determinative. Matters considered by the Trustees, including the Independent Trustees, in connection with their approval of the Agreements included the following:
The nature, extent and quality of the services provided to the Funds under the Agreements. The Trustees considered the nature, extent and quality of the services provided by the Adviser and its affiliates to the Funds and the resources dedicated to the Funds by the Adviser and its affiliates, including recent or planned investments by the Adviser in additional personnel or other resources. They also took note of the competitive market for talented personnel, in particular, for personnel who have contributed to the generation of strong investment performance. They considered the need for the Adviser to offer competitive compensation in order to attract and retain capable personnel. They also considered the administrative services provided by Natixis Advisors and its affiliates to the Funds.
The Trustees also considered the benefits to shareholders of investing in a mutual fund that is part of a family of funds that offers shareholders the right to exchange shares of one type of fund for shares of another type of fund, and provides a variety of fund and shareholder services.
After reviewing these and related factors, the Trustees concluded, within the context of their overall conclusions regarding each of the Agreements, that the nature, extent and quality of services provided supported the renewal of the Agreements.
Investment performance of the Funds and the Adviser. As noted above, the Trustees received information about the performance of the Funds over various time periods, including information which compared the performance of the Funds to the performance of peer groups of funds and the Funds’ respective performance benchmarks. In addition, the Trustees also reviewed data prepared by an independent third party which analyzed the performance of the Funds using a variety of performance metrics, including metrics which also measured the performance of the Funds on a risk adjusted basis.
The Trustees also considered the Adviser’s performance and reputation generally, the Funds’ performance as a fund family generally (as noted by certain financial publications), and the historical responsiveness of the Adviser to Trustee concerns about performance and the willingness of the Adviser to take steps intended to improve performance.
6
After reviewing these and related factors, the Trustees concluded, within the context of their overall conclusions regarding each of the Agreements, that the performance of the Funds and the Adviser supported the renewal of the Agreements.
The costs of the services to be provided and profits to be realized by the Adviser and its affiliates from their respective relationships with the Funds. Under the terms of the Agreements, the Adviser does not charge the Funds an investment advisory fee or any other fee for services or for bearing expenses. The Trustees considered that, although the Funds do not compensate the Adviser directly for services under the Agreements, the Adviser will typically receive an advisory fee from its advisory clients who have invested in the Funds or from the sponsors of “wrap programs,” who in turn charge the programs’ participants. The Trustees also took into account the demands, complexity and quality of the investment management of the Funds. Because the Funds do not charge an advisory fee, the Trustees did not consider the profitability of the Adviser’s relationship to the Funds.
After reviewing these and related factors, the Trustees concluded, within the context of their overall conclusions regarding each of the Agreements, that the advisory fees, of 0%, charged to each of the Funds were fair and reasonable and supported the renewal of the Agreements.
Economies of Scale. The Trustees noted that because the Adviser bears most of the Funds’ expenses, economies of scale were not relevant to these Funds.
The Trustees also considered other factors, which included but were not limited to the following:
| • | | whether each Fund has operated in accordance with its investment objective and the Fund’s record of compliance with its investment restrictions, and the compliance programs of the Funds and the Adviser. They also considered the compliance-related resources the Adviser and its affiliates were providing to the Funds. |
| • | | the nature, quality, cost and extent of administrative and shareholder services performed by the Adviser and its affiliates, both under the Agreements and under separate agreements covering administrative services. |
| • | | so-called “fallout benefits” to the Adviser, such as the financial and other benefits to the Adviser from being able to offer the Funds to its advisory clients and investors in certain “wrap” programs and engagement of affiliates of the Adviser to provide distribution, administrative and brokerage services to the Funds, and the benefits of research made available to the Adviser by reason of brokerage commissions generated by the Funds’ securities transactions. The Trustees considered the possible conflicts of interest associated with these fallout and other benefits, and the reporting, disclosure and other processes in place to disclose and monitor such possible conflicts of interest. |
Based on their evaluation of all factors that they deemed to be material, including those factors described above, and assisted by the advice of independent counsel, the Trustees, including the Independent Trustees, concluded that each of the existing Agreements should be continued through June 30, 2009.
7
PORTFOLIO OF INVESTMENTS – as of September 30, 2008
Loomis Sayles High Income Opportunities Fund
| | | | | | | | |
| | | | | Principal Amount | | Value (†) |
| | | | | | | | |
| | | |
| BONDS AND NOTES – 98.4% of Net Assets | | | | | | | | |
| | | |
| NON-CONVERTIBLE BONDS – 92.8% | | | | | | | | |
| | | |
| ABS Car Loan – 1.2% | | | | | | | | |
Capital One Auto Finance Trust, Class A, 2.998%, 4/16/2012(b) | | | | $ | 500,000 | | $ | 458,857 |
Capital One Auto Finance Trust, Series 2006-C, Class A4, 2.518%, 5/15/2013(b) | | | | | 170,000 | | | 141,838 |
Capital One Auto Finance Trust, Series 2007-C, Class A4, 5.230%, 7/15/2014 | | | | | 185,000 | | | 155,553 |
| | | | | | | | |
| | | | | | | | 756,248 |
| | | | | | | | |
| Aerospace & Defense – 0.8% | | | | | | | | |
Bombardier, Inc., 7.450%, 5/01/2034, 144A | | | | | 585,000 | | | 544,050 |
| | | | | | | | |
| Airlines – 2.4% | | | | | | | | |
American Airlines, Inc., Series 93A6, 8.040%, 9/16/2011 | | | | | 76,128 | | | 57,477 |
Continental Airlines, Inc., Series 1997-4B, 6.900%, 7/02/2018 | | | | | 84,214 | | | 70,108 |
Continental Airlines, Inc., Series 1998-1, Class B, 6.748%, 9/15/2018 | | | | | 218,779 | | | 175,023 |
Continental Airlines, Inc., Series 2000-2, Class B, 8.307%, 10/02/2019 | | | | | 15,395 | | | 12,239 |
Continental Airlines, Inc., Series 2001-1, Class B, 7.373%, 6/15/2017 | | | | | 74,637 | | | 55,978 |
Continental Airlines, Inc., Series 971A, 7.461%, 10/01/2016 | | | | | 177,525 | | | 154,447 |
Delta Air Lines, Inc., Series 2007-1, Class A, 6.821%, 2/10/2024 | | | | | 233,734 | | | 182,312 |
Delta Air Lines, Inc., Series 2007-1, Class B, 8.021%, 2/10/2024 | | | | | 738,392 | | | 502,107 |
Northwest Airlines, Inc., Series 07-1, Class B, 8.028%, 11/01/2017 | | | | | 540,000 | | | 334,800 |
| | | | | | | | |
| | | | | | | | 1,544,491 |
| | | | | | | | |
| Automotive – 4.0% | | | | | | | | |
Cummins, Inc., 6.750%, 2/15/2027 | | | | | 139,000 | | | 124,612 |
Ford Motor Co., 6.625%, 2/15/2028 | | | | | 165,000 | | | 63,525 |
Ford Motor Co., 6.625%, 10/01/2028 | | | | | 1,470,000 | | | 558,600 |
Ford Motor Co., 7.125%, 11/15/2025 | | | | | 35,000 | | | 13,825 |
Ford Motor Co., 7.450%, 7/16/2031 | | | | | 695,000 | | | 298,850 |
Ford Motor Co., 7.500%, 8/01/2026 | | | | | 110,000 | | | 45,650 |
Ford Motor Credit Co. LLC, 7.000%, 10/01/2013 | | | | | 825,000 | | | 507,010 |
Ford Motor Credit Co. LLC, 7.250%, 10/25/2011 | | | | | 370,000 | | | 235,280 |
Ford Motor Credit Co. LLC, 8.000%, 12/15/2016 | | | | | 100,000 | | | 63,228 |
General Motors Corp., 7.400%, 9/01/2025 | | | | | 45,000 | | | 16,200 |
General Motors Corp., 8.250%, 7/15/2023(c) | | | | | 1,060,000 | | | 416,050 |
General Motors Corp., 8.375%, 7/15/2033 | | | | | 25,000 | | | 10,000 |
Goodyear Tire & Rubber Co., 7.000%, 3/15/2028 | | | | | 320,000 | | | 236,800 |
| | | | | | | | |
| | | | | | | | 2,589,630 |
| | | | | | | | |
| Brokerage – 0.7% | | | | | | | | |
Lehman Brothers Holdings, Inc., 6.875%, 7/17/2037(d) | | | | | 245,000 | | | 306 |
Lehman Brothers Holdings, Inc., (fixed rate to 5/03/2027, variable rate thereafter), 6.000%, 5/03/2032(d) | | | | | 60,000 | | | 75 |
Nuveen Investments, Inc., 10.500%, 11/15/2015, 144A | | | | | 550,000 | | | 423,500 |
| | | | | | | | |
| | | | | | | | 423,881 |
| | | | | | | | |
8
PORTFOLIO OF INVESTMENTS – as of September 30, 2008
Loomis Sayles High Income Opportunities Fund – continued
| | | | | | | | |
| | | | | Principal Amount | | Value (†) |
| | | | | | | | |
| | | |
| BONDS AND NOTES – continued | | | | | | | | |
| | | |
| Building Materials – 0.8% | | | | | | | | |
Owens Corning, Inc., 6.500%, 12/01/2016 | | | | $ | 85,000 | | $ | 75,217 |
Owens Corning, Inc., 7.000%, 12/01/2036 | | | | | 130,000 | | | 104,504 |
Texas Industries, Inc., 7.250%, 7/15/2013 | | | | | 70,000 | | | 60,900 |
USG Corp., 6.300%, 11/15/2016 | | | | | 365,000 | | | 275,575 |
| | | | | | | | |
| | | | | | | | 516,196 |
| | | | | | | | |
| Chemicals – 4.1% | | | | | | | | |
Borden, Inc., 7.875%, 2/15/2023 | | | | | 610,000 | | | 280,600 |
Borden, Inc., 8.375%, 4/15/2016 | | | | | 175,000 | | | 59,500 |
Borden, Inc., 9.200%, 3/15/2021 | | | | | 220,000 | | | 110,000 |
Chemtura Corp., 6.875%, 6/01/2016 | | | | | 924,000 | | | 739,200 |
Georgia Gulf Corp., 10.750%, 10/15/2016(c) | | | | | 335,000 | | | 150,750 |
Hercules, Inc., 6.500%, 6/30/2029(f) | | | | | 675,000 | | | 452,250 |
LyondellBasell Industries AF, 8.375%, 8/15/2015, 144A | | | | | 200,000 | | | 94,000 |
Methanex Corp., 6.000%, 8/15/2015 | | | | | 150,000 | | | 131,946 |
Montell Finance Co., 8.100%, 3/15/2027, 144A | | | | | 290,000 | | | 130,500 |
Mosaic Global Holdings, Inc., 7.300%, 1/15/2028 | | | | | 235,000 | | | 220,900 |
Mosaic Global Holdings, Inc., 7.375%, 8/01/2018 | | | | | 275,000 | | | 273,068 |
Nalco Finance Holdings, Inc.,
(step to 9.000% on 2/1/2009),
Zero Coupon, 2/01/2014(c)(e) | | | | | 43,000 | | | 38,162 |
| | | | | | | | |
| | | | | | | | 2,680,876 |
| | | | | | | | |
| Construction Machinery – 0.4% | | | | | | | | |
United Rentals North America, Inc., 7.000%, 2/15/2014 | | | | | 400,000 | | | 280,000 |
| | | | | | | | |
| Consumer Cyclical Services – 0.2% | | | | | | | | |
Kar Holdings, Inc., 10.000%, 5/01/2015(c) | | | | | 165,000 | | | 127,050 |
| | | | | | | | |
| Consumer Products – 0.0% | | | | | | | | |
Jostens IH Corp., 7.625%, 10/01/2012 | | | | | 25,000 | | | 22,938 |
| | | | | | | | |
| Electric – 8.0% | | | | | | | | |
AES Corp. (The), 7.750%, 3/01/2014 | | | | | 160,000 | | | 148,800 |
Allegheny Generating Co., 6.875%, 9/01/2023 | | | | | 100,000 | | | 99,750 |
Dynegy Holdings, Inc., 7.125%, 5/15/2018 | | | | | 195,000 | | | 147,225 |
Dynegy Holdings, Inc., 7.500%, 6/01/2015 | | | | | 100,000 | | | 84,500 |
Dynegy Holdings, Inc., 7.625%, 10/15/2026 | | | | | 325,000 | | | 237,250 |
Dynegy Holdings, Inc., 7.750%, 6/01/2019 | | | | | 350,000 | | | 280,000 |
Dynegy Holdings, Inc., 8.375%, 5/01/2016 | | | | | 280,000 | | | 243,600 |
Edison Mission Energy, 7.625%, 5/15/2027 | | | | | 525,000 | | | 425,250 |
Edison Mission Energy, 7.750%, 6/15/2016 | | | | | 515,000 | | | 484,100 |
NGC Corporation Capital Trust I, Series B, 8.316%, 6/01/2027 | | | | | 460,000 | | | 342,700 |
NRG Energy, Inc., 7.375%, 1/15/2017 | | | | | 435,000 | | | 395,850 |
NSG Holdings LLC, 7.750%, 12/15/2025, 144A | | | | | 355,000 | | | 337,250 |
Reliant Energy, Inc., 7.875%, 6/15/2017 | | | | | 410,000 | | | 303,400 |
TXU Corp., Series P, 5.550%, 11/15/2014 | | | | | 160,000 | | | 119,401 |
TXU Corp., Series Q, 6.500%, 11/15/2024 | | | | | 1,415,000 | | | 901,181 |
TXU Corp., Series R, 6.550%, 11/15/2034 | | | | | 515,000 | | | 316,438 |
White Pine Hydro Portfolio LLC, 7.260%, 7/20/2015(f) | | | | | 365,000 | | | 351,815 |
| | | | | | | | |
| | | | | | | | 5,218,510 |
| | | | | | | | |
| Food & Beverage – 2.0% | | | | | | | | |
Aramark Services, Inc., 5.000%, 6/01/2012 | | | | | 950,000 | | | 798,000 |
Dean Foods Co., 7.000%, 6/01/2016(c) | | | | | 470,000 | | | 408,900 |
Marfrig Overseas Ltd., 9.625%, 11/16/2016, 144A | | | | | 110,000 | | | 88,000 |
| | | | | | | | |
| | | | | | | | 1,294,900 |
| | | | | | | | |
9
| | | | | | | | |
| | | | | Principal Amount | | Value (†) |
| | | | | | | | |
| | | |
| BONDS AND NOTES – continued | | | | | | | | |
| | | |
| Gaming – 0.3% | | | | | | | | |
Harrah’s Operating Co., Inc., 5.750%, 10/01/2017 | | | | $ | 350,000 | | $ | 91,000 |
Harrah’s Operating Co., Inc., 10.750%, 2/01/2016, 144A | | | | | 220,000 | | | 112,200 |
| | | | | | | | |
| | | | | | | | 203,200 |
| | | | | | | | |
| Healthcare – 6.4% | | | | | | | | |
Alliance Imaging, Inc., 7.250%, 12/15/2012 | | | | | 320,000 | | | 291,200 |
Boston Scientific Corp., 5.450%, 6/15/2014 | | | | | 20,000 | | | 18,700 |
Boston Scientific Corp., 6.400%, 6/15/2016 | | | | | 135,000 | | | 128,250 |
Boston Scientific Corp., 7.000%, 11/15/2035 | | | | | 250,000 | | | 222,500 |
CHS/Community Health Systems, Inc., 8.875%, 7/15/2015 | | | | | 870,000 | | | 826,500 |
DASA Finance Corp., 8.750%, 5/29/2018, 144A | | | | | 200,000 | | | 168,000 |
HCA, Inc., 5.750%, 3/15/2014 | | | | | 15,000 | | | 11,700 |
HCA, Inc., 6.375%, 1/15/2015 | | | | | 510,000 | | | 401,625 |
HCA, Inc., 6.500%, 2/15/2016 | | | | | 720,000 | | | 570,600 |
HCA, Inc., 7.050%, 12/01/2027 | | | | | 430,000 | | | 290,375 |
HCA, Inc., 7.500%, 12/15/2023 | | | | | 30,000 | | | 21,977 |
HCA, Inc., 7.500%, 11/06/2033 | | | | | 840,000 | | | 596,400 |
HCA, Inc., 7.690%, 6/15/2025 | | | | | 160,000 | | | 118,918 |
HCA, Inc., 8.360%, 4/15/2024 | | | | | 40,000 | | | 31,003 |
HCA, Inc., MTN, 7.580%, 9/15/2025 | | | | | 200,000 | | | 147,346 |
HCA, Inc., MTN, 7.750%, 7/15/2036 | | | | | 20,000 | | | 14,198 |
Tenet Healthcare Corp., 6.875%, 11/15/2031 | | | | | 450,000 | | | 306,000 |
| | | | | | | | |
| | | | | | | | 4,165,292 |
| | | | | | | | |
| Home Construction – 4.7% | | | | | | | | |
Centex Corp., 5.250%, 6/15/2015 | | | | | 125,000 | | | 91,875 |
D.R. Horton, Inc., 5.625%, 9/15/2014 | | | | | 65,000 | | | 49,400 |
Desarrolladora Homex SAB de CV, 7.500%, 9/28/2015 | | | | | 1,030,000 | | | 906,400 |
K. Hovnanian Enterprises, Inc., 6.250%, 1/15/2015 | | | | | 15,000 | | | 8,550 |
K. Hovnanian Enterprises, Inc., 6.250%, 1/15/2016 | | | | | 690,000 | | | 396,750 |
K. Hovnanian Enterprises, Inc., 6.375%, 12/15/2014 | | | | | 145,000 | | | 84,100 |
K. Hovnanian Enterprises, Inc., 6.500%, 1/15/2014 | | | | | 130,000 | | | 76,700 |
K. Hovnanian Enterprises, Inc., 8.875%, 4/01/2012(c) | | | | | 10,000 | | | 6,350 |
KB Home, 5.750%, 2/01/2014 | | | | | 90,000 | | | 72,450 |
KB Home, 5.875%, 1/15/2015 | | | | | 390,000 | | | 310,050 |
KB Home, 6.250%, 6/15/2015 | | | | | 265,000 | | | 215,975 |
KB Home, 7.250%, 6/15/2018 | | | | | 290,000 | | | 237,800 |
Lennar Corp., Series B, 5.600%, 5/31/2015 | | | | | 250,000 | | | 162,500 |
Pulte Homes, Inc., 6.000%, 2/15/2035 | | | | | 475,000 | | | 339,625 |
Pulte Homes, Inc., 6.375%, 5/15/2033 | | | | | 100,000 | | | 73,000 |
Toll Brothers Finance Corp., 5.150%, 5/15/2015 | | | | | 40,000 | | | 33,829 |
| | | | | | | | |
| | | | | | | | 3,065,354 |
| | | | | | | | |
| Independent Energy – 7.3% | | | | | | | | |
Chesapeake Energy Corp., 6.500%, 8/15/2017 | | | | | 570,000 | | | 498,750 |
Chesapeake Energy Corp., 6.875%, 1/15/2016 | | | | | 100,000 | | | 91,250 |
Chesapeake Energy Corp., 6.875%, 11/15/2020 | | | | | 405,000 | | | 346,275 |
Encore Acquisition Co., 6.000%, 7/15/2015 | | | | | 275,000 | | | 218,625 |
Encore Acquisition Co., 7.250%, 12/01/2017 | | | | | 115,000 | | | 94,300 |
Forest Oil Corp., 7.250%, 6/15/2019 | | | | | 715,000 | | | 611,325 |
Hilcorp Energy I LP, 7.750%, 11/01/2015, 144A | | | | | 595,000 | | | 511,700 |
Hilcorp Energy I LP, 9.000%, 6/01/2016, 144A | | | | | 185,000 | | | 168,350 |
Pioneer Natural Resources Co., 5.875%, 7/15/2016 | | | | | 20,000 | | | 17,231 |
Pioneer Natural Resources Co., 6.875%, 5/01/2018 | | | | | 260,000 | | | 231,494 |
Pioneer Natural Resources Co., 7.200%, 1/15/2028 | | | | | 1,640,000 | | | 1,411,935 |
10
PORTFOLIO OF INVESTMENTS – as of September 30, 2008
Loomis Sayles High Income Opportunities Fund – continued
| | | | | | | | |
| | | | | Principal Amount | | Value (†) |
| | | | | | | | |
| | | |
| BONDS AND NOTES – continued | | | | | | | | |
| | | |
| Independent Energy – continued | | | | | | | | |
Swift Energy Co., 7.125%, 6/01/2017 | | | | $ | 600,000 | | $ | 510,000 |
Swift Energy Co., 7.625%, 7/15/2011 | | | | | 20,000 | | | 19,000 |
| | | | | | | | |
| | | | | | | | 4,730,235 |
| | | | | | | | |
| Industrial Other – 1.1% | | | | | | | | |
Baldor Electric Co., 8.625%, 2/15/2017 | | | | | 325,000 | | | 310,375 |
Chart Industries, Inc., 9.125%, 10/15/2015 | | | | | 305,000 | | | 312,625 |
Ranhill Labuan Ltd., 12.500%, 10/26/2011, 144A | | | | | 155,000 | | | 74,400 |
| | | | | | | | |
| | | | | | | | 697,400 |
| | | | | | | | |
| Lodging – 0.7% | | | | | | | | |
Host Marriott LP, Series M, 7.000%, 8/15/2012 | | | | | 175,000 | | | 156,187 |
Host Marriott LP, Series O, 6.375%, 3/15/2015 | | | | | 50,000 | | | 40,625 |
Royal Caribbean Cruises Ltd., 7.250%, 6/15/2016 | | | | | 315,000 | | | 261,450 |
| | | | | | | | |
| | | | | | | | 458,262 |
| | | | | | | | |
| Media Cable – 4.1% | | | | | | | | |
Charter Communications Operating LLC/CAP, 8.000%, 4/30/2012, 144A | | | | | 170,000 | | | 152,150 |
Comcast Corp., 5.650%, 6/15/2035 | | | | | 80,000 | | | 59,467 |
CSC Holdings, Inc., 6.750%, 4/15/2012 | | | | | 215,000 | | | 196,994 |
CSC Holdings, Inc., 7.625%, 7/15/2018 | | | | | 1,260,000 | | | 1,096,200 |
CSC Holdings, Inc., 7.875%, 2/15/2018 | | | | | 310,000 | | | 272,800 |
Virgin Media Finance PLC, 8.750%, 4/15/2014 | | | | | 870,000 | | | 730,800 |
Virgin Media Finance PLC, 9.125%, 8/15/2016 | | | | | 175,000 | | | 146,562 |
| | | | | | | | |
| | | | | | | | 2,654,973 |
| | | | | | | | |
| Media Non-Cable – 1.2% | | | | | | | | |
Clear Channel Communications, Inc., 4.900%, 5/15/2015 | | | | | 5,000 | | | 1,488 |
Clear Channel Communications, Inc., 5.500%, 12/15/2016 | | | | | 390,000 | | | 113,100 |
Clear Channel Communications, Inc., 5.750%, 1/15/2013 | | | | | 75,000 | | | 27,000 |
Idearc, Inc., 8.000%, 11/15/2016 | | | | | 455,000 | | | 123,987 |
Intelsat Corp., 6.875%, 1/15/2028 | | | | | 235,000 | | | 171,550 |
R.H. Donnelley Corp., Series A-1, 6.875%, 1/15/2013(c) | | | | | 405,000 | | | 157,950 |
R.H. Donnelley Corp., Series A-2, 6.875%, 1/15/2013 | | | | | 340,000 | | | 132,600 |
R.H. Donnelley Corp., Series A-4, 8.875%, 10/15/2017 | | | | | 160,000 | | | 54,400 |
Tribune Co., 5.250%, 8/15/2015 | | | | | 85,000 | | | 25,500 |
| | | | | | | | |
| | | | | | | | 807,575 |
| | | | | | | | |
| Metals & Mining – 0.6% | | | | | | | | |
International Steel Group, Inc., 6.500%, 4/15/2014 | | | | | 75,000 | | | 76,170 |
Novelis, Inc., 7.250%, 2/15/2015 | | | | | 70,000 | | | 60,900 |
United States Steel Corp., 6.050%, 6/01/2017 | | | | | 80,000 | | | 69,516 |
United States Steel Corp., 6.650%, 6/01/2037 | �� | | | | 275,000 | | | 204,520 |
| | | | | | | | |
| | | | | | | | 411,106 |
| | | | | | | | |
| Non-Captive Consumer – 2.6% | | | | | | | | |
SLM Corp., Series A, MTN, 5.000%, 10/01/2013 | | | | | 55,000 | | | 34,100 |
SLM Corp., Series A, MTN, 5.000%, 6/15/2018 | | | | | 65,000 | | | 35,750 |
SLM Corp., Series A, MTN, 5.375%, 1/15/2013 | | | | | 470,000 | | | 307,850 |
SLM Corp., Series A, MTN, 5.375%, 5/15/2014 | | | | | 70,000 | | | 43,400 |
SLM Corp., Series A, MTN, 5.625%, 8/01/2033 | | | | | 850,000 | | | 425,000 |
SLM Corp., Series A, MTN, 8.450%, 6/15/2018 | | | | | 1,135,000 | | | 771,800 |
SLM Corp., MTN, 5.050%, 11/14/2014 | | | | | 60,000 | | | 36,600 |
| | | | | | | | |
| | | | | | | | 1,654,500 |
| | | | | | | | |
11
| | | | | | | | |
| | | | | Principal Amount | | Value (†) |
| | | | | | | | |
| | | |
| BONDS AND NOTES – continued | | | | | | | | |
| | | |
| Non-Captive Diversified – 4.7% | | | | | | | | |
CIT Group Funding Co. of Canada, 5.200%, 6/01/2015 | | | | $ | 372,000 | | $ | 182,685 |
CIT Group, Inc., 4.750%, 12/15/2010 | | | | | 148,000 | | | 96,385 |
CIT Group, Inc., 5.400%, 2/13/2012 | | | | | 36,000 | | | 20,695 |
CIT Group, Inc., 5.400%, 1/30/2016 | | | | | 218,000 | | | 105,512 |
CIT Group, Inc., 5.650%, 2/13/2017 | | | | | 342,000 | | | 166,885 |
CIT Group, Inc., 5.800%, 10/01/2036 | | | | | 480,000 | | | 219,540 |
CIT Group, Inc., 5.850%, 9/15/2016 | | | | | 35,000 | | | 16,975 |
CIT Group, Inc., Series A, GMTN, 6.000%, 4/01/2036 | | | | | 32,000 | | | 13,120 |
CIT Group, Inc., GMTN, 4.250%, 2/01/2010 | | | | | 95,000 | | | 62,615 |
CIT Group, Inc., GMTN, 5.000%, 2/13/2014 | | | | | 42,000 | | | 23,758 |
CIT Group, Inc., GMTN, 5.000%, 2/01/2015 | | | | | 290,000 | | | 143,346 |
GMAC LLC, 6.000%, 12/15/2011 | | | | | 500,000 | | | 222,319 |
GMAC LLC, 6.625%, 5/15/2012 | | | | | 852,000 | | | 360,710 |
GMAC LLC, 6.750%, 12/01/2014 | | | | | 1,010,000 | | | 387,652 |
GMAC LLC, 6.875%, 9/15/2011 | | | | | 175,000 | | | 78,083 |
GMAC LLC, 6.875%, 8/28/2012 | | | | | 65,000 | | | 25,836 |
GMAC LLC, 7.000%, 2/01/2012 | | | | | 100,000 | | | 40,761 |
GMAC LLC, 7.250%, 3/02/2011 | | | | | 100,000 | | | 47,298 |
GMAC LLC, 8.000%, 11/01/2031 | | | | | 230,000 | | | 86,774 |
International Lease Finance Corp., Series Q, MTN, 5.250%, 1/10/2013 | | | | | 330,000 | | | 212,564 |
International Lease Finance Corp., Series R, MTN, 5.650%, 6/01/2014 | | | | | 185,000 | | | 109,007 |
International Lease Finance Corp., Series R, MTN, 6.625%, 11/15/2013 | | | | | 340,000 | | | 208,427 |
iStar Financial, Inc., 5.150%, 3/01/2012 | | | | | 130,000 | | | 65,000 |
iStar Financial, Inc., 5.650%, 9/15/2011 | | | | | 45,000 | | | 23,400 |
iStar Financial, Inc., 5.800%, 3/15/2011 | | | | | 20,000 | | | 10,200 |
iStar Financial, Inc., Series B, 5.950%, 10/15/2013 | | | | | 190,000 | | | 98,800 |
| | | | | | | | |
| | | | | | | | 3,028,347 |
| | | | | | | | |
| Oil Field Services – 1.6% | | | | | | | | |
Basic Energy Services, Inc., 7.125%, 4/15/2016 | | | | | 330,000 | | | 293,700 |
Grant Prideco, Inc., 6.125%, 8/15/2015 | | | | | 205,000 | | | 200,062 |
North American Energy Partners, Inc., 8.750%, 12/01/2011 | | | | | 620,000 | | | 570,400 |
| | | | | | | | |
| | | | | | | | 1,064,162 |
| | | | | | | | |
| Packaging – 0.6% | | | | | | | | |
Stone Container Finance, 7.375%, 7/15/2014 | | | | | 500,000 | | | 385,000 |
| | | | | | | | |
| Paper – 4.1% | | | | | | | | |
Abitibi-Consolidated, Inc., 6.000%, 6/20/2013 | | | | | 75,000 | | | 19,875 |
Abitibi-Consolidated, Inc., 7.400%, 4/01/2018 | | | | | 40,000 | | | 9,200 |
Abitibi-Consolidated, Inc., 7.500%, 4/01/2028 | | | | | 250,000 | | | 57,500 |
Abitibi-Consolidated, Inc., 8.500%, 8/01/2029 | | | | | 25,000 | | | 6,000 |
Abitibi-Consolidated, Inc., 8.850%, 8/01/2030 | | | | | 190,000 | | | 45,600 |
Bowater, Inc., 6.500%, 6/15/2013 | | | | | 435,000 | | | 167,475 |
Domtar Corp., 5.375%, 12/01/2013 | | | | | 250,000 | | | 211,250 |
Georgia-Pacific LLC, 7.250%, 6/01/2028 | | | | | 215,000 | | | 169,850 |
Georgia-Pacific LLC, 7.375%, 12/01/2025 | | | | | 495,000 | | | 399,712 |
Georgia-Pacific LLC, 7.700%, 6/15/2015 | | | | | 125,000 | | | 114,375 |
Georgia-Pacific LLC, 7.750%, 11/15/2029 | | | | | 525,000 | | | 433,125 |
Georgia-Pacific LLC, 8.000%, 1/15/2024 | | | | | 260,000 | | | 228,800 |
Georgia-Pacific LLC, 8.875%, 5/15/2031 | | | | | 225,000 | | | 195,750 |
Mercer International, Inc., 9.250%, 2/15/2013 | | | | | 140,000 | | | 116,550 |
12
PORTFOLIO OF INVESTMENTS – as of September 30, 2008
Loomis Sayles High Income Opportunities Fund – continued
| | | | | | | | |
| | | | | Principal Amount | | Value (†) |
| | | | | | | | |
| | | |
| BONDS AND NOTES – continued | | | | | | | | |
| | | |
| Paper – continued | | | | | | | | |
Sappi Papier Holding AG, 7.500%, 6/15/2032, 144A | | | | $ | 290,000 | | $ | 204,805 |
Westvaco Corp., 7.950%, 2/15/2031 | | | | | 140,000 | | | 134,024 |
Westvaco Corp., 8.200%, 1/15/2030 | | | | | 140,000 | | | 131,405 |
| | | | | | | | |
| | | | | | | | 2,645,296 |
| | | | | | | | |
| Pharmaceuticals – 2.1% | | | | | | | | |
Elan Financial PLC, 7.750%, 11/15/2011 | | | | | 800,000 | | | 724,000 |
Elan Financial PLC, 8.875%, 12/01/2013 | | | | | 770,000 | | | 646,800 |
| | | | | | | | |
| | | | | | | | 1,370,800 |
| | | | | | | | |
| Pipelines – 1.1% | | | | | | | | |
Kinder Morgan Finance, 5.700%, 1/05/2016 | | | | | 130,000 | | | 111,800 |
Kinder Morgan, Inc., Senior Note, 5.150%, 3/01/2015 | | | | | 225,000 | | | 190,688 |
Tennessee Gas Pipeline Co., 7.000%, 10/15/2028(c) | | | | | 150,000 | | | 128,543 |
Williams Cos., Inc., 7.500%, 1/15/2031 | | | | | 235,000 | | | 213,845 |
Williams Cos., Inc., 7.750%, 6/15/2031 | | | | | 85,000 | | | 79,438 |
| | | | | | | | |
| | | | | | | | 724,314 |
| | | | | | | | |
| Refining – 0.8% | | | | | | | | |
Petroplus Finance Ltd., 6.750%, 5/01/2014, 144A | | | | | 500,000 | | | 422,500 |
Petroplus Finance Ltd., 7.000%, 5/01/2017, 144A | | | | | 75,000 | | | 62,250 |
| | | | | | | | |
| | | | | | | | 484,750 |
| | | | | | | | |
| Retailers – 3.6% | | | | | | | | |
Dillard’s, Inc., 6.625%, 1/15/2018 | | | | | 155,000 | | | 96,100 |
Dillard’s, Inc., 7.000%, 12/01/2028 | | | | | 480,000 | | | 244,800 |
Dillard’s, Inc., 7.130%, 8/01/2018 | | | | | 175,000 | | | 111,125 |
Dillard’s, Inc., 7.875%, 1/01/2023 | | | | | 75,000 | | | 45,000 |
Foot Locker, Inc., 8.500%, 1/15/2022 | | | | | 280,000 | | | 253,400 |
Home Depot, Inc., 5.875%, 12/16/2036 | | | | | 785,000 | | | 551,834 |
Macy’s Retail Holdings, Inc., 6.790%, 7/15/2027 | | | | | 180,000 | | | 141,920 |
Macy’s Retail Holdings, Inc., 6.900%, 4/01/2029 | | | | | 300,000 | | | 234,594 |
Toys R Us, Inc., 7.375%, 10/15/2018 | | | | | 985,000 | | | 640,250 |
| | | | | | | | |
| | | | | | | | 2,319,023 |
| | | | | | | | |
| Supermarkets – 2.7% | | | | | | | | |
Albertson’s, Inc., 7.450%, 8/01/2029 | | | | | 1,075,000 | | | 956,136 |
Albertson’s, Inc., 7.750%, 6/15/2026 | | | | | 220,000 | | | 202,217 |
Albertson’s, Inc., 8.000%, 5/01/2031 | | | | | 30,000 | | | 27,803 |
Albertson’s, Inc., Series C, MTN, 6.625%, 6/01/2028 | | | | | 605,000 | | | 490,169 |
American Stores Co., 8.000%, 6/01/2026 | | | | | 70,000 | | | 65,618 |
Couche-Tard US/Finance, 7.500%, 12/15/2013 | | | | | 40,000 | | | 36,800 |
| | | | | | | | |
| | | | | | | | 1,778,743 |
| | | | | | | | |
| Technology – 7.0% | | | | | | | | |
Activant Solutions, Inc., 9.500%, 5/01/2016 | | | | | 90,000 | | | 66,600 |
Amkor Technology, Inc., 7.750%, 5/15/2013 | | | | | 440,000 | | | 376,200 |
Flextronics International Ltd., 6.250%, 11/15/2014 | | | | | 380,000 | | | 321,100 |
Freescale Semiconductor, Inc., 10.125%, 12/15/2016(c) | | | | | 480,000 | | | 307,200 |
Lucent Technologies, Inc., 6.450%, 3/15/2029 | | | | | 3,020,000 | | | 1,842,200 |
Lucent Technologies, Inc., 6.500%, 1/15/2028 | | | | | 290,000 | | | 176,900 |
Motorola, Inc., 6.500%, 9/01/2025 | | | | | 165,000 | | | 126,582 |
Nortel Networks Ltd., 6.875%, 9/01/2023 | | | | | 125,000 | | | 50,000 |
Nortel Networks Ltd., 10.125%, 7/15/2013 | | | | | 370,000 | | | 235,875 |
Northern Telecom Capital Corp., 7.875%, 6/15/2026 | | | | | 860,000 | | | 378,400 |
13
| | | | | | | | |
| | | | | Principal Amount | | Value (†) |
| | | | | | | | |
| | | |
| BONDS AND NOTES – continued | | | | | | | | |
| | | |
| Technology – continued | | | | | | | | |
Seagate Technology HDD Holdings, 6.800%, 10/01/2016 | | | | $ | 750,000 | | $ | 656,250 |
Unisys Corp, 8.000%, 10/15/2012 | | | | | 15,000 | | | 12,150 |
| | | | | | | | |
| | | | | | | | 4,549,457 |
| | | | | | | | |
| Textile – 0.4% | | | | | | | | |
Jones Apparel Group, Inc., 6.125%, 11/15/2034 | | | | | 425,000 | | | 265,625 |
| | | | | | | | |
| Transportation Services – 0.9% | | | | | | | | |
APL Ltd., 8.000%, 1/15/2024(f) | | | | | 185,000 | | | 138,750 |
Atlas Air, Inc., Series B, 7.680%, 1/02/2014(g) | | | | | 34,292 | | | 34,292 |
Atlas Air, Inc., Series C, 8.010%, 1/02/2010(g) | | | | | 347,188 | | | 270,807 |
Overseas Shipholding Group, 7.500%, 2/15/2024 | | | | | 155,000 | | | 137,175 |
| | | | | | | | |
| | | | | | | | 581,024 |
| | | | | | | | |
| Wireless – 1.5% | | | | | | | | |
ALLTEL Corp., 7.000%, 7/01/2012 | | | | | 5,000 | | | 4,887 |
ALLTEL Corp., 7.875%, 7/01/2032 | | | | | 170,000 | | | 168,725 |
Nextel Communications, Inc., Series D, 7.375%, 8/01/2015 | | | | | 85,000 | | | 56,100 |
Sprint Capital Corp., 6.875%, 11/15/2028 | | | | | 501,000 | | | 335,670 |
Sprint Nextel Corp., 6.000%, 12/01/2016 | | | | | 502,000 | | | 386,540 |
| | | | | | | | |
| | | | | | | | 951,922 |
| | | | | | | | |
| Wirelines – 8.1% | | | | | | | | |
Axtel SAB de CV, 7.625%, 2/01/2017, 144A | | | | | 765,000 | | | 680,238 |
Cincinnati Bell Telephone Co., 6.300%, 12/01/2028 | | | | | 185,000 | | | 131,350 |
Cincinnati Bell, Inc., 8.375%, 1/15/2014 | | | | | 800,000 | | | 696,000 |
Frontier Communications Corp., 7.000%, 11/01/2025 | | | | | 15,000 | | | 9,150 |
Frontier Communications Corp., 7.125%, 3/15/2019 | | | | | 325,000 | | | 258,375 |
Frontier Communications Corp., 7.450%, 7/01/2035 | | | | | 325,000 | | | 198,250 |
Frontier Communications Corp., 7.875%, 1/15/2027 | | | | | 540,000 | | | 405,000 |
L-3 Communications Corp., Series B, 6.375%, 10/15/2015 | | | | | 25,000 | | | 23,000 |
Level 3 Financing, Inc., 8.750%, 2/15/2017 | | | | | 790,000 | | | 572,750 |
Level 3 Financing, Inc., 9.250%, 11/01/2014 | | | | | 835,000 | | | 630,425 |
Qwest Capital Funding, Inc., 6.500%, 11/15/2018 | | | | | 1,030,000 | | | 749,325 |
Qwest Capital Funding, Inc., 6.875%, 7/15/2028 | | | | | 495,000 | | | 344,025 |
Qwest Capital Funding, Inc., 7.625%, 8/03/2021 | | | | | 315,000 | | | 239,400 |
Qwest Capital Funding, Inc., 7.750%, 2/15/2031 | | | | | 280,000 | | | 204,400 |
Qwest Corp., 6.875%, 9/15/2033 | | | | | 175,000 | | | 117,687 |
Qwest Corp., 7.250%, 9/15/2025 | | | | | 10,000 | | | 7,450 |
| | | | | | | | |
| | | | | | | | 5,266,825 |
| | | | | | | | |
| | | |
| TOTAL NON-CONVERTIBLE BONDS | | | | | | | | |
(Identified Cost $78,232,362) | | | | | | | | 60,261,955 |
| | | | | | | | |
| | | |
| CONVERTIBLE BONDS – 5.6% | | | | | | | | |
| | | |
| Healthcare – 0.7% | | | | | | | | |
Advanced Medical Optics, Inc., 3.250%, 8/01/2026 | | | | | 125,000 | | | 81,562 |
Affymetrix, Inc., 3.500%, 1/15/2038 | | | | | 480,000 | | | 336,000 |
Invitrogen Corp., 1.500%, 2/15/2024 | | | | | 50,000 | | | 45,063 |
| | | | | | | | |
| | | | | | | | 462,625 |
| | | | | | | | |
| Industrial Other – 0.2% | | | | | | | | |
Incyte Corp., 3.500%, 2/15/2011 | | | | | 165,000 | | | 151,181 |
| | | | | | | | |
14
PORTFOLIO OF INVESTMENTS – as of September 30, 2008
Loomis Sayles High Income Opportunities Fund – continued
| | | | | | | | |
| | | | | Principal Amount | | Value (†) |
| | | | | | | | |
| | | |
| BONDS AND NOTES – continued | | | | | | | | |
| | | |
| Media Non-Cable – 0.4% | | | | | | | | |
Liberty Media LLC, 3.500%, 1/15/2031 | | | | $ | 153,309 | | $ | 67,839 |
Sinclair Broadcast Group, Inc.,
(Step to 2.000% on 1/15/2011), 4.875%, 7/15/2018(e) | | | | | 190,000 | | | 172,425 |
| | | | | | | | |
| | | | | | | | 240,264 |
| | | | | | | | |
| Non-Captive Diversified – 0.0% | | | | | | | | |
iStar Financial, Inc., 3.291%, 10/01/2012(b) | | | | | 5,000 | | | 2,675 |
| | | | | | | | |
| Pharmaceuticals – 1.4% | | | | | | | | |
Epix Pharmaceuticals, Inc., 3.000%, 6/15/2024 | | | | | 45,000 | | | 22,500 |
Human Genome Sciences, Inc., 2.250%, 8/15/2012 | | | | | 325,000 | | | 216,938 |
Valeant Pharmaceuticals International, 3.000%, 8/16/2010 | | | | | 180,000 | | | 170,100 |
Valeant Pharmaceuticals International, 4.000%, 11/15/2013 | | | | | 510,000 | | | 477,487 |
| | | | | | | | |
| | | | | | | | 887,025 |
| | | | | | | | |
| REITs – 0.5% | | | | | | | | |
Host Hotels & Resorts, Inc., 2.625%, 4/15/2027, 144A | | | | | 435,000 | | | 337,125 |
| | | | | | | | |
| Technology – 0.5% | | | | | | | | |
JDS Uniphase Corp., 1.000%, 5/15/2026 | | | | | 200,000 | | | 132,250 |
Kulicke & Soffa Industries, Inc., 0.500%, 11/30/2008 | | | | | 50,000 | | | 48,375 |
Kulicke & Soffa Industries, Inc., 1.000%, 6/30/2010 | | | | | 45,000 | | | 35,269 |
Maxtor Corp., 5.750%, 3/01/2012(f) | | | | | 123,000 | | | 113,160 |
| | | | | | | | |
| | | | | | | | 329,054 |
| | | | | | | | |
| Wirelines – 1.9% | | | | | | | | |
Level 3 Communications, Inc., 2.875%, 7/15/2010 | | | | | 270,000 | | | 212,288 |
Level 3 Communications, Inc., 6.000%, 9/15/2009 | | | | | 105,000 | | | 98,700 |
Level 3 Communications, Inc., 6.000%, 3/15/2010 | | | | | 1,062,000 | | | 929,250 |
| | | | | | | | |
| | | | | | | | 1,240,238 |
| | | | | | | | |
| | | |
| TOTAL CONVERTIBLE BONDS | | | | | | | | |
(Identified Cost $4,075,798) | | | | | | | | 3,650,187 |
| | | | | | | | |
| | | |
| TOTAL BONDS AND NOTES | | | | | | | | |
(Identified Cost $82,308,160) | | | | | | | | 63,912,142 |
| | | | | | | | |
| | | |
| BANK LOANS – 1.2% | | | | | | | | |
| | | |
| Consumer Products – 0.1% | | | | | | | | |
Mega Bloks, Inc., Term Loan B, 8.750%, 7/26/2012(h) | | | | | 44,884 | | | 35,010 |
| | | | | | | | |
| Electric – 0.6% | | | | | | | | |
Calpine Corp., First Priority Term Loan, 3/29/2014(i) | | | | | 435,000 | | | 371,172 |
| | | | | | | | |
| Food & Beverage – 0.0% | | | | | | | | |
Dole Food Co., Inc., LOC, 4.788%, 4/12/2013(h) | | | | | 2,041 | | | 1,789 |
Dole Food Co., Inc., Term Loan, 4.738%, 4/12/2013(h) | | | | | 1,370 | | | 1,201 |
Dole Food Co., Inc., Tranche C Term Loan, 4.795%, 4/12/2013(h) | | | | | 7,237 | | | 6,347 |
| | | | | | | | |
| | | | | | | | 9,337 |
| | | | | | | | |
| Media Non-Cable – 0.4% | | | | | | | | |
Idearc, Inc., Term Loan B, 5.767%, 11/17/2014(h) | | | | | 204,088 | | | 121,688 |
Tribune Co., Tranche X, 5.541%, 6/04/2009(h) | | | | | 181,970 | | | 168,549 |
| | | | | | | | |
| | | | | | | | 290,237 |
| | | | | | | | |
15
| | | | | | | | |
| | | | | Principal Amount | | Value (†) |
| | | | | | | | |
| | | |
| BANK LOANS – continued | | | | | | | | |
| | | |
| Wirelines – 0.1% | | | | | | | | |
Hawaiian Telecom Communications, Inc., Term Loan C, 6.262%, 6/01/2014(h) | | | | $ | 60,000 | | $ | 41,272 |
| | | | | | | | |
| | | |
| TOTAL BANK LOANS | | | | | | | | |
(Identified Cost $822,396) | | | | | | | | 747,028 |
| | | | | | | | |
| | | |
| | | | | Shares | | |
| | | |
| COMMON STOCKS – 1.3% | | | | | | | | |
| | | |
| Chemicals – 0.6% | | | | | | | | |
Hercules, Inc. | | | | | 20,651 | | | 408,683 |
| | | | | | | | |
| Containers & Packaging – 0.2% | | | | | | | | |
Owens-Illinois, Inc.(c)(g) | | | | | 3,321 | | | 97,638 |
| | | | | | | | |
| Oil, Gas & Consumable Fuels – 0.5% | | | | | | | | |
Chesapeake Energy Corp.(c) | | | | | 9,278 | | | 332,709 |
| | | | | | | | |
| | | |
| TOTAL COMMON STOCKS | | | | | | | | |
(Identified Cost $846,012) | | | | | | | | 839,030 |
| | | | | | | | |
| | | |
| PREFERRED STOCKS – 1.3% | | | | | | | | |
| | | |
| Automotive – 0.2% | | | | | | | | |
Ford Motor Co. Capital Trust II, 6.500%(c) | | | | | 6,225 | | | 95,865 |
| | | | | | | | |
| Capital Markets – 0.1% | | | | | | | | |
Lehman Brothers Holdings Capital Trust I, 6.000%(d) | | | | | 250 | | | 40 |
Lehman Brothers Holdings, Inc., 5.670%(d) | | | | | 230 | | | 16 |
Lehman Brothers Holdings, Inc., 5.940%(d) | | | | | 201 | | | 7 |
Lehman Brothers Holdings, Inc., 6.500%(d) | | | | | 1,182 | | | 59 |
Lehman Brothers Holdings, Inc., 7.250%(d)(g) | | | | | 30 | | | 30 |
Lehman Brothers Holdings, Inc., 7.950%(d) | | | | | 1,819 | | | 109 |
Newell Financial Trust I, 5.250% | | | | | 1,675 | | | 64,593 |
| | | | | | | | |
| | | | | | | | 64,854 |
| | | | | | | | |
| Diversified Consumer Services – 0.0% | | | | | | | | |
Six Flags, Inc., 7.250% | | | | | 2,100 | | | 11,739 |
| | | | | | | | |
| Electric Utilities – 0.5% | | | | | | | | |
AES Trust III, 6.750%(c) | | | | | 7,975 | | | 305,841 |
| | | | | | | | |
| Oil, Gas & Consumable Fuels – 0.4% | | | | | | | | |
El Paso Energy Capital Trust I, 4.750% | | | | | 8,050 | | | 268,166 |
| | | | | | | | |
| Thrifts & Mortgage Finance – 0.1% | | | | | | | | |
Federal Home Loan Mortgage Corp., 5.000%(g)(k) | | | | | 500 | | | 900 |
Federal Home Loan Mortgage Corp., 5.570%(g)(k) | | | | | 7,750 | | | 7,672 |
Federal Home Loan Mortgage Corp., 5.660%(g)(k) | | | | | 2,300 | | | 2,875 |
Federal Home Loan Mortgage Corp., 5.700%(g)(k) | | | | | 800 | | | 1,496 |
Federal Home Loan Mortgage Corp., 5.790%(g)(k) | | | | | 1,450 | | | 2,900 |
Federal Home Loan Mortgage Corp., 5.810%(g)(k) | | | | | 550 | | | 963 |
Federal Home Loan Mortgage Corp., 5.900%(g)(k) | | | | | 1,100 | | | 1,375 |
Federal Home Loan Mortgage Corp., 6.000%(c)(g)(k) | | | | | 650 | | | 1,170 |
Federal Home Loan Mortgage Corp., 6.420%(g)(k) | | | | | 450 | | | 810 |
Federal Home Loan Mortgage Corp., 6.550%(g)(k) | | | | | 1,550 | | | 1,674 |
Federal Home Loan Mortgage Corp., 8.375%(g)(k) | | | | | 9,450 | | | 15,403 |
16
PORTFOLIO OF INVESTMENTS – as of September 30, 2008
Loomis Sayles High Income Opportunities Fund – continued
| | | | | | | | |
| | | | | Shares | | Value (†) |
| | | | | | | | |
| | | |
| PREFERRED STOCKS – continued | | | | | | | | |
| | | |
| Thrifts & Mortgage Finance – continued | | | | | | | | |
Federal National Mortgage Association, 4.750%(c)(k) | | | | | 1,000 | | $ | 3,100 |
Federal National Mortgage Association, 5.125%(k) | | | | | 350 | | | 1,225 |
Federal National Mortgage Association, 5.375%(k) | | | | | 700 | | | 2,310 |
Federal National Mortgage Association, 5.810%(k) | | | | | 300 | | | 1,080 |
Federal National Mortgage Association, 6.750%(k) | | | | | 450 | | | 810 |
Federal National Mortgage Association, 8.250%(c)(k) | | | | | 14,200 | | | 30,956 |
| | | | | | | | |
| | | | | | | | 76,719 |
| | | | | | | | |
| | | |
| TOTAL PREFERRED STOCKS | | | | | | | | |
(Identified Cost $1,698,929) | | | | | | | | 823,184 |
| | | | | | | | |
| | | |
| | | | | Shares/
Principal Amount | | |
| | | |
| SHORT-TERM INVESTMENTS – 14.9% | | | | | | | | |
| State Street Navigator Securities Lending Prime Portfolio(j) | | | | | 2,444,943 | | | 2,444,943 |
| Repurchase Agreement with State Street Corp. dated 9/30/2008 at 1.300%, to be repurchased at $3,433 on 10/1/2008 collateralized by $5,000 Federal Home Loan Bank, 5.300% due 10/3/2012 valued at $5,130 including accrued interest (Note 2h of Notes to Financial Statements) | | | | $ | 3,433 | | | 3,433 |
| Tri-Party Repurchase Agreement with Fixed Income Clearing Corporation, dated 9/30/2008 at 1.300% to be repurchased at $7,257,262 on 10/01/2008 collateralized by $7,330,000 Federal Home Loan Bank, 3.750% due 8/18/2009 valued at $7,403,300 including accrued interest (Note 2h of Notes to Financial Statements) | | | | | 7,257,000 | | | 7,257,000 |
| | | | | | | | |
| | | |
| TOTAL SHORT-TERM INVESTMENTS | | | | | | | | |
(Identified Cost $9,705,376) | | | | | | | | 9,705,376 |
| | | | | | | | |
| | | |
| TOTAL INVESTMENTS – 117.1% | | | | | | | | |
(Identified Cost $95,380,873)(a) | | | | | | | | 76,026,760 |
Other assets less liabilities—(17.1)% | | | | | | | | (11,076,464) |
| | | | | | | | |
| | | |
| NET ASSETS – 100.0% | | | | | | | $ | 64,950,296 |
| | | | | | | | |
(†) See Note 2a of Notes to Financial Statements. | | | | | | | | |
(a) Federal Tax Information: | | | |
At September 30, 2008, net unrealized depreciation on investments based on a cost of $95,484,822 for federal income tax purposes was as follows: | | | |
Aggregate gross unrealized appreciation for all investments in which there is an excess of value over tax cost | | $ | 159,659 |
Aggregate gross unrealized depreciation for all investments in which there is an excess of tax cost over value | | | (19,617,721) |
| | | | | | | | |
Net unrealized depreciation | | | | | $ | (19,458,062) |
| | | | | | | | |
| (b) | Variable rate security. Rate as of September 30, 2008 is disclosed. |
| (c) | All or a portion of this security was on loan to brokers at September 30, 2008. |
| (d) | Issuer has filed for bankruptcy. |
| (e) | Step Bond: Coupon is a fixed rate for an initial period then resets at a specified date and rate. |
| (f) | Illiquid Security. At September 30, 2008, the value of these securities amounted to $1,055,975 or 1.6% of net assets. |
| (g) | Non-income producing security. |
| (h) | Variable rate security. Rate shown represents the weighted average rate at September 30, 2008. |
| (i) | The security has not settled. Contract rates do not take effect until settlement date. |
| (j) | Represents investment of securities lending collateral. |
| (k) | Future dividend payments have been eliminated as the issuer has been placed in conservatorship. |
| 144A | Securities exempt from registration under Rule 144A of the Securities Act of 1933. These securities may be resold in transactions exempt from registration, normally to qualified institutional buyers. At September 30, 2008, the total value of these securities amounted to $4,511,018 or 6.9% of net assets. |
17
| GMTN | Global Medium Term Note |
| REITs | Real Estate Investment Trusts |
NET ASSET SUMMARY AT SEPTEMBER 30, 2008 (Unaudited)
| | | |
Wirelines | | 10.1 | % |
Electric | | 8.6 | |
Technology | | 7.5 | |
Independent Energy | | 7.3 | |
Healthcare | | 7.1 | |
Chemicals | | 4.7 | |
Home Construction | | 4.7 | |
Non-Captive Diversified | | 4.7 | |
Automotive | | 4.2 | |
Media Cable | | 4.1 | |
Paper | | 4.1 | |
Retailers | | 3.6 | |
Pharmaceuticals | | 3.5 | |
Supermarkets | | 2.7 | |
Non-Captive Consumer | | 2.6 | |
Airlines | | 2.4 | |
Media Non-Cable | | 2.0 | |
Food & Beverage | | 2.0 | |
Other Investments, less than 2% each | | 16.3 | |
Short-Term Investments | | 14.9 | |
| | | |
Total Investments | | 117.1 | |
Other assets less liabilities | | (17.1 | ) |
| | | |
Net Assets | | 100.0 | % |
| | | |
See accompanying notes to financial statements.
18
PORTFOLIO OF INVESTMENTS – as of September 30, 2008
Loomis Sayles Securitized Asset Fund
| | | | | | | | |
| | | | | Principal Amount | | Value (†) |
| | | | | | | | |
| | | |
| BONDS AND NOTES – 150.4% of Net Assets | | | | | | | | |
| | | |
| ABS Car Loan – 3.8% | | | | | | | | |
Americredit Prime Automobile Receivables, Series 2007-2M, Class A2B, 2.867%, 11/08/2010(b)(c) | | | | $ | 941,567 | | $ | 931,497 |
ARG Funding Corp., Series 2005-2A, Class A5,
3.348%, 5/20/2011(b)(c), 144A | | | | | 1,700,000 | | | 1,561,947 |
Capital Auto Receivables Asset Trust, Series 2008-1,
Class A2B, 3.188%, 9/15/2010(b)(c) | | | | | 3,000,000 | | | 2,996,618 |
Capital One Auto Finance Trust, Series 2006-C, Class A4,
2.518%, 5/15/2013(b)(c) | | | | | 845,000 | | | 705,017 |
Capital One Auto Finance Trust, Series 2007-C, Class A4,
5.230%, 7/15/2014(c) | | | | | 800,000 | | | 672,663 |
Daimler Chrysler Auto Trust, Series 2008-A, Class A2B,
3.337%, 10/08/2010(b)(c) | | | | | 5,000,000 | | | 4,995,279 |
Merrill Auto Trust Securitization Asset, Series 2008-1,
Class B, 6.750%, 4/15/2015(c) | | | | | 1,305,000 | | | 1,182,481 |
Nissan Auto Receivables Owner Trust, Series 2005-A,
Class A4, 3.820%, 7/15/2010(c) | | | | | 121,021 | | | 120,825 |
Nissan Auto Receivables Owner Trust, Series 2008-B,
Class A3, 4.460%, 4/16/2012(c) | | | | | 1,330,000 | | | 1,285,369 |
| | | | | | | | |
| | | | | | | | 14,451,696 |
| | | | | | | | |
| ABS Credit Card – 7.5% | | | | | | | | |
BA Credit Card Trust, Series 2006-C4, Class C4,
2.718%, 11/15/2011(b)(c) | | | | | 2,000,000 | | | 1,934,789 |
BA Credit Card Trust, Series 2008-A5, Class A5,
3.688%, 12/16/2013(b)(c) | | | | | 3,645,000 | | | 3,580,339 |
Bank One Issuance Trust, Series 2004-C2, Class C2, 3.288%, 2/15/2017(b)(c) | | | | | 2,310,000 | | | 1,574,048 |
Capital One Multi-Asset Execution Trust, Series 2007-A5, Class A5, 2.528%, 7/15/2020(b)(c) | | | | | 2,140,000 | | | 1,643,104 |
Chase Issuance Trust, Series 2005-A9, Class A9,
2.508%, 11/15/2011(b)(c) | | | | | 500,000 | | | 492,961 |
Chase Issuance Trust, Series 2007-B1, Class B1,
2.738%, 4/15/2019(b)(c) | | | | | 2,300,000 | | | 1,623,857 |
Citibank Credit Card Issuance Trust, Series 2005-C2,
Class C2, 3.646%, 3/24/2017(b)(c) | | | | | 1,150,000 | | | 801,205 |
Citibank Credit Card Issuance Trust, Series 2006-C4,
Class C4, 2.707%, 1/09/2012(b)(c) | | | | | 300,000 | | | 281,097 |
Citibank Credit Card Issuance Trust, Series 2007-A8,
Class A8, 5.650%, 9/20/2019(c) | | | | | 4,215,000 | | | 3,885,897 |
Citibank Credit Card Issuance Trust, Series 2008-C6,
Class C6, 6.300%, 6/20/2014(c) | | | | | 1,895,000 | | | 1,646,612 |
Discover Card Master Trust, Series 2007-A1, Class A1, 5.650%, 3/16/2020(c) | | | | | 3,305,000 | | | 2,864,585 |
Discover Card Master Trust, Series 2008-A3, Class A3, 5.100%, 10/15/2013(c) | | | | | 3,650,000 | | | 3,565,025 |
MBNA Credit Card Master Note Trust, Series 2002-C1, Class C1, 6.800%, 7/15/2014(c) | | | | | 1,000,000 | | | 899,157 |
MBNA Credit Card Master Note Trust, Series 2004-A3, Class A3, 2.748%, 8/16/2021(b)(c) | | | | | 1,490,000 | | | 1,248,813 |
World Financial Network Credit Card Master Trust, Series 2004-A, Class C, 3.488%, 3/15/2013(b)(c) | | | | | 2,000,000 | | | 1,919,524 |
World Financial Network Credit Card Master Trust, Series 2008-A, Class M, 7.487%, 6/15/2014(b)(c) | | | | | 706,000 | | | 703,231 |
| | | | | | | | |
| | | | | | | | 28,664,244 |
| | | | | | | | |
19
| | | | | | | | |
| | | | | Principal Amount | | Value (†) |
| | | | | | | | |
| | | |
| BONDS AND NOTES – continued | | | | | | | | |
| | | |
| ABS Home Equity – 0.7% | | | | | | | | |
Countrywide Asset-Backed Certificates, Series 2006-S3, Class A1, 3.317%, 6/25/2021(b)(c) | | | | $ | 3,193,567 | | $ | 2,556,421 |
| | | | | | | | |
| Asset-Backed Securities – 1.6% | | | | | | | | |
CIT Equipment Collateral, Series 2008-VT1, Class A3, 6.590%, 12/22/2014(c) | | | | | 3,020,000 | | | 2,925,868 |
CNH Equipment Trust, Series 2007-B, Class A2A,
5.460%, 6/15/2010(c) | | | | | 311,315 | | | 312,229 |
Countrywide Asset-Backed Certificates, Series 2004-S1,
Class A3, 4.615%, 2/25/2035(c) | | | | | 995,000 | | | 714,510 |
Countrywide Asset-Backed Certificates, Series 2006-S1,
Class A2, 5.549%, 8/25/2021(c) | | | | | 626,128 | | | 568,920 |
Countrywide Asset-Backed Certificates, Series 2006-S3,
Class A3, 6.287%, 6/25/2021(c) | | | | | 895,000 | | | 358,000 |
Countrywide Asset-Backed Certificates, Series 2006-S7,
Class A3, 5.712%, 11/25/2035(c) | | | | | 2,355,000 | | | 1,177,500 |
Residential Asset Mortgage Products, Inc., Series 2004-RZ1, Class AI5, 4.070%, 7/25/2032(c) | | | | | 231,530 | | | 226,918 |
| | | | | | | | |
| | | | | | | | 6,283,945 |
| | | | | | | | |
| Hybrid ARMS – 11.5% | | | | | | | | |
Countrywide Home Loans, Series 2004-HYB4, Class 6A2, 5.447%, 4/20/2035(b)(c) | | | | | 683,510 | | | 525,212 |
Federal Home Loan Mortgage Corp.,
5.949%, 11/01/2036(b)(c) | | | | | 6,890,922 | | | 6,943,975 |
Federal National Mortgage Association,
6.039%, 2/01/2037(b)(c) | | | | | 7,920,981 | | | 7,974,784 |
First Horizon Alternative Mortgage Securities,
Series 2006-AA3, Class A1, 6.306%, 6/25/2036(b)(c) | | | | | 5,977,133 | | | 4,124,748 |
Indymac Index Mortgage Loan Trust, Series 2006-AR25, Class 3A1, 6.321%, 9/25/2036(b)(c) | | | | | 6,850,156 | | | 4,589,305 |
JPMorgan Mortgage Trust, Series 2006-A7, Class 1A3, 5.924%, 1/25/2037(b)(c) | | | | | 902,768 | | | 880,363 |
Morgan Stanley Mortgage Loan Trust, Series 2005-3AR, Class 5A, 5.588%, 7/25/2035(b)(c) | | | | | 1,051,160 | | | 919,602 |
Washington Mutual Mortgage Pass Through Certificates, Series 2007-HY6, Class 2A1, 5.694%, 6/25/2037(b)(c) | | | | | 7,363,267 | | | 5,998,296 |
Washington Mutual Mortgage Pass-Through Certificates, Series 2007-HY2, Class 2A2, 6.412%, 11/25/2036(b)(c) | | | | | 12,043,997 | | | 11,102,165 |
Wells Fargo Mortgage Backed Securities Trust,
Series 2005-AR16, Class 3A2, 4.997%, 10/25/2035(b)(c) | | | | | 892,783 | | | 774,854 |
| | | | | | | | |
| | | | | | | | 43,833,304 |
| | | | | | | | |
| Mortgage Related – 125.3% | | | | | | | | |
Banc of America Commercial Mortgage, Inc., Series 2005-6, Class A2, 5.165%, 9/10/2047(c) | | | | | 120,000 | | | 117,226 |
Banc of America Commercial Mortgage, Inc., Series 2005-6, Class A4, 5.180%, 9/10/2047(b)(c) | | | | | 189,000 | | | 171,539 |
Banc of America Commercial Mortgage, Inc., Series 2006-2, Class A4, 5.739%, 5/10/2045(b)(c) | | | | | 350,000 | | | 316,736 |
Banc of America Commercial Mortgage, Inc., Series 2006-4, Class A2, 5.522%, 7/10/2046(c) | | | | | 460,000 | | | 442,618 |
Banc of America Commercial Mortgage, Inc., Series 2007-2, Class A2, 5.634%, 4/10/2049(c) | | | | | 5,375,000 | | | 5,019,314 |
20
PORTFOLIO OF INVESTMENTS – as of September 30, 2008
Loomis Sayles Securitized Asset Fund – continued
| | | | | | | | |
| | | | | Principal Amount | | Value (†) |
| | | | | | | | |
| | | |
| BONDS AND NOTES – continued | | | | | | | | |
| | | |
| Mortgage Related – continued | | | | | | | | |
Bank of America-First Union NB Commercial Mortgage, Series 2001-3, Class A2, 5.464%, 4/11/2037(c) | | | | $ | 430,000 | | $ | 420,792 |
Bear Stearns Commercial Mortgage Securities,
Series 2001-TOP2, Class A2, 6.480%, 2/15/2035(c) | | | | | 175,000 | | | 175,441 |
Bear Stearns Commercial Mortgage Securities,
Series 2005-PW10, Class A2, 5.270%, 12/11/2040(c) | | | | | 1,601,000 | | | 1,567,595 |
Bear Stearns Commercial Mortgage Securities,
Series 2005-T18, Class A2, 4.556%, 2/13/2042(c) | | | | | 171,000 | | | 167,868 |
Bear Stearns Commercial Mortgage Securities,
Series 2006-PW12, Class A2, 5.688%, 9/11/2038(c) | | | | | 1,000,000 | | | 970,255 |
Bear Stearns Commercial Mortgage Securities,
Series 2007-PW15, Class A4, 5.331%, 2/11/2044(c) | | | | | 225,000 | | | 188,606 |
Bear Stearns Commercial Mortgage Securities,
Series 2007-PW16, Class A4, 5.712%, 6/11/2040(b)(c) | | | | | 150,000 | | | 129,235 |
Citigroup/Deutsche Bank Commercial Mortgage Trust, Series 2006-CD2, Class A2, 5.408%, 1/15/2046(c) | | | | | 1,057,000 | | | 1,023,300 |
Citigroup/Deutsche Bank Commercial Mortgage Trust, Series 2006-CD3, Class A5, 5.617%, 10/15/2048(c) | | | | | 5,000,000 | | | 4,440,614 |
Commercial Mortgage Pass Through Certificates,
Series 2006-C7, Class A4, 5.768%, 6/10/2046(b)(c) | | | | | 250,000 | | | 225,961 |
Countrywide Alternative Loan Trust, Series 2006-15CB,
Class A1, 6.500%, 6/25/2036(c) | | | | | 1,297,426 | | | 788,835 |
Countrywide Alternative Loan Trust, Series 2006-J5,
Class 4A1, 6.014%, 7/25/2021(b)(c) | | | | | 1,389,451 | | | 1,206,652 |
Credit Suisse Mortgage Capital Certificates, Series 2007-C3, Class A4, 5.723%, 6/15/2039(b)(c) | | | | | 2,342,000 | | | 2,004,237 |
Credit Suisse Mortgage Capital Certificates, Series 2008-C1, Class A3, 6.219%, 2/15/2041(b)(c) | | | | | 1,508,000 | | | 1,326,395 |
CS First Boston Mortgage Securities Corp., Series 2005-7, Class 3A1, 5.000%, 8/25/2020(c) | | | | | 314,438 | | | 280,734 |
Federal Home Loan Mortgage Corp., 4.500%, 6/01/2021(c) | | | | | 3,719,947 | | | 3,637,342 |
Federal Home Loan Mortgage Corp., 5.000%, 7/01/2020(c) | | | | | 58,080 | | | 57,989 |
Federal Home Loan Mortgage Corp.,
5.000%, 10/01/2020(c) | | | | | 359,653 | | | 357,961 |
Federal Home Loan Mortgage Corp., 5.000%, 7/01/2035(c) | | | | | 610,026 | | | 595,180 |
Federal Home Loan Mortgage Corp., 5.000%, 9/01/2035(c) | | | | | 806,524 | | | 786,896 |
Federal Home Loan Mortgage Corp.,
5.000%, 12/01/2035(c) | | | | | 156,698 | | | 152,884 |
Federal Home Loan Mortgage Corp., 5.000%, 2/01/2036(c) | | | | | 312,396 | | | 304,793 |
Federal Home Loan Mortgage Corp., 5.000%, 2/01/2036(c) | | | | | 660,577 | | | 644,501 |
Federal Home Loan Mortgage Corp., 5.500%, 9/01/2021(c) | | | | | 7,849,659 | | | 7,912,283 |
Federal Home Loan Mortgage Corp.,
5.500%, 12/01/2021(c) | | | | | 3,588,263 | | | 3,616,890 |
Federal Home Loan Mortgage Corp., 5.500%, 5/01/2035(c) | | | | | 448,886 | | | 447,139 |
Federal Home Loan Mortgage Corp., 5.500%, 7/01/2037(c) | | | | | 3,946,678 | | | 3,928,850 |
Federal Home Loan Mortgage Corp., 5.500%, 7/01/2037(c) | | | | | 1,809,291 | | | 1,801,119 |
Federal Home Loan Mortgage Corp., 5.500%, 8/01/2037(c) | | | | | 4,608,372 | | | 4,587,556 |
Federal Home Loan Mortgage Corp.,
5.975%, 2/01/2037(b)(c) | | | | | 9,068,995 | | | 9,273,389 |
Federal Home Loan Mortgage Corp., 6.000%, 6/01/2037(c) | | | | | 4,467,033 | | | 4,526,213 |
Federal Home Loan Mortgage Corp., 6.000%, 6/01/2037(c) | | | | | 10,914,812 | | | 11,059,413 |
Federal Home Loan Mortgage Corp., 6.000%, 8/01/2037(c) | | | | | 4,580,541 | | | 4,641,224 |
Federal Home Loan Mortgage Corp.,
6.000%, 10/01/2037(c) | | | | | 4,353,639 | | | 4,411,317 |
21
| | | | | | | | |
| | | | | Principal Amount | | Value (†) |
| | | | | | | | |
| | | |
| BONDS AND NOTES – continued | | | | | | | | |
| | | |
| Mortgage Related – continued | | | | | | | | |
Federal Home Loan Mortgage Corp.,
6.000%, 11/01/2037(c) | | | | $ | 6,783,572 | | $ | 6,873,441 |
Federal Home Loan Mortgage Corp.,
6.000%, 12/01/2037(c) | | | | | 1,880,330 | | | 1,905,241 |
Federal Home Loan Mortgage Corp.,
6.3430%, 1/01/2035(b)(c) | | | | | 371,773 | | | 381,093 |
Federal Home Loan Mortgage Corp., 6.500%, 1/01/2038(c) | | | | | 194,558 | | | 199,714 |
Federal Home Loan Mortgage Corp. (TBA),
5.500%, 7/01/2035(d) | | | | | 24,910,000 | | | 24,777,678 |
Federal Home Loan Mortgage Corp. (TBA),
6.000%, 1/01/2036(d) | | | | | 17,000,000 | | | 17,207,196 |
Federal Home Loan Mortgage Corp., Series 2613, Class HI, 5.500%, 2/15/2033(c) | | | | | 1,025,293 | | | 229,289 |
Federal Home Loan Mortgage Corp., Series 2912, Class EH, 5.500%, 1/15/2035(c) | | | | | 2,797,000 | | | 2,717,344 |
Federal National Mortgage Association,
4.500%, 7/01/2020(c) | | | | | 940,618 | | | 923,846 |
Federal National Mortgage Association,
4.500%, 3/01/2021(c) | | | | | 593,932 | | | 579,444 |
Federal National Mortgage Association,
4.500%, 10/01/2035(c) | | | | | 844,990 | | | 800,548 |
Federal National Mortgage Association,
5.500%, 5/01/2035(c) | | | | | 153,638 | | | 153,424 |
Federal National Mortgage Association,
5.500%, 12/01/2035(c) | | | | | 229,169 | | | 228,850 |
Federal National Mortgage Association,
5.500%, 4/01/2036(c) | | | | | 156,109 | | | 155,818 |
Federal National Mortgage Association,
5.500%, 4/01/2036(c) | | | | | 369,523 | | | 368,836 |
Federal National Mortgage Association,
5.500%, 4/01/2036(c) | | | | | 77,815 | | | 77,671 |
Federal National Mortgage Association,
5.500%, 4/01/2036(c) | | | | | 2,383,744 | | | 2,380,426 |
Federal National Mortgage Association,
5.500%, 5/01/2036(c) | | | | | 391,109 | | | 390,381 |
Federal National Mortgage Association,
5.500%, 5/01/2036(c) | | | | | 625,121 | | | 623,957 |
Federal National Mortgage Association,
5.500%, 6/01/2036(c) | | | | | 798,754 | | | 797,268 |
Federal National Mortgage Association,
5.500%, 6/01/2036(c) | | | | | 1,406,317 | | | 1,403,701 |
Federal National Mortgage Association,
5.500%, 6/01/2036(c) | | | | | 571,470 | | | 570,407 |
Federal National Mortgage Association,
5.500%, 6/01/2036(c) | | | | | 3,944,216 | | | 3,936,877 |
Federal National Mortgage Association,
5.500%, 8/01/2036(c) | | | | | 620,938 | | | 619,783 |
Federal National Mortgage Association,
5.500%, 9/01/2036(c) | | | | | 1,383,889 | | | 1,381,314 |
Federal National Mortgage Association,
5.500%, 12/01/2036(c) | | | | | 8,213,288 | | | 8,198,005 |
Federal National Mortgage Association,
5.500%, 6/01/2037(c) | | | | | 3,184,314 | | | 3,178,210 |
Federal National Mortgage Association,
5.736%, 9/01/2036(b)(c) | | | | | 4,234,790 | | | 4,347,693 |
Federal National Mortgage Association,
6.000%, 5/01/2021(c) | | | | | 202,358 | | | 206,376 |
22
PORTFOLIO OF INVESTMENTS – as of September 30, 2008
Loomis Sayles Securitized Asset Fund – continued
| | | | | | | | |
| | | | | Principal Amount | | Value (†) |
| | | | | | | | |
| | | |
| BONDS AND NOTES – continued | | | | | | | | |
| | | |
| Mortgage Related – continued | | | | | | | | |
Federal National Mortgage Association,
6.000%, 10/01/2034(c) | | | | $ | 72,853 | | $ | 74,023 |
Federal National Mortgage Association,
6.000%, 4/01/2036(c) | | | | | 306,770 | | | 311,073 |
Federal National Mortgage Association,
6.000%, 6/01/2036(c) | | | | | 5,123,204 | | | 5,195,079 |
Federal National Mortgage Association,
6.000%, 6/01/2036(c) | | | | | 1,716,157 | | | 1,740,233 |
Federal National Mortgage Association,
6.000%, 9/01/2036(c) | | | | | 1,246,506 | | | 1,263,993 |
Federal National Mortgage Association,
6.000%, 10/01/2036(c) | | | | | 1,485,231 | | | 1,506,068 |
Federal National Mortgage Association,
6.000%, 11/01/2036(c) | | | | | 4,007,318 | | | 4,063,538 |
Federal National Mortgage Association,
6.000%, 1/01/2037(c) | | | | | 941,848 | | | 955,062 |
Federal National Mortgage Association,
6.000%, 10/01/2037(c) | | | | | 5,845,180 | | | 5,926,855 |
Federal National Mortgage Association,
7.000%, 12/01/2037(c) | | | | | 197,438 | | | 206,521 |
Federal National Mortgage Association (TBA),
5.000%, 5/01/2019(d) | | | | | 32,515,000 | | | 32,281,282 |
Federal National Mortgage Association (TBA),
5.000%, 10/01/2034(d) | | | | | 15,900,000 | | | 15,492,562 |
Federal National Mortgage Association (TBA),
5.500%, 5/01/2035(d) | | | | | 46,860,000 | | | 46,728,230 |
Federal National Mortgage Association (TBA),
6.000%, 1/01/2036(d) | | | | | 49,000,000 | | | 49,627,788 |
Federal National Mortgage Association (TBA),
6.500%, 4/01/2035(d) | | | | | 17,000,000 | | | 17,430,304 |
Federal National Mortgage Association, Series 2003-26,
Class 0I, 5.500%, 11/25/2032(c) | | | | | 22,905,676 | | | 4,020,688 |
Federal National Mortgage Association, Series 2004-2,
Class QK, 4.000%, 9/25/2017(c) | | | | | 10,000,000 | | | 9,850,752 |
Government National Mortgage Association (TBA),
5.500%, 11/01/2035(d) | | | | | 37,000,000 | | | 37,034,706 |
Government National Mortgage Association,
5.500%, 8/15/2033(c) | | | | | 78,302 | | | 78,599 |
Government National Mortgage Association,
5.500%, 12/15/2035(c) | | | | | 349,666 | | | 350,664 |
Government National Mortgage Association,
5.500%, 9/15/2036(c) | | | | | 2,304,084 | | | 2,309,940 |
Government National Mortgage Association,
6.000%, 6/15/2036(c) | | | | | 216,402 | | | 219,992 |
Government National Mortgage Association,
6.500%, 9/15/2036(c) | | | | | 925,950 | | | 949,627 |
Greenwich Capital Commercial Funding Corp.,
Series 2007-GG9, Class A2, 5.381%, 3/10/2039(c) | | | | | 2,005,000 | | | 1,870,050 |
Greenwich Capital Commercial Funding Corp.,
Series 2007-GG9, Class A4, 5.444%, 3/10/2039(c) | | | | | 5,000,000 | | | 4,225,555 |
GS Mortgage Securities Corp. II, Series 2004-GG2, Class A6, 5.396%, 8/10/2038(c) | | | | | 125,000 | | | 116,987 |
GS Mortgage Securities Corp. II, Series 2005-GG4, Class A2, 4.475%, 7/10/2039(c) | | | | | 1,130,000 | | | 1,102,357 |
GS Mortgage Securities Corp. II, Series 2005-GG4,
Class A4A, 4.751%, 7/10/2039(c) | | | | | 7,495,000 | | | 6,724,434 |
23
| | | | | | | | |
| | | | | Principal Amount | | Value (†) |
| | | | | | | | |
| | | |
| BONDS AND NOTES – continued | | | | | | | | |
| | | |
| Mortgage Related – continued | | | | | | | | |
GS Mortgage Securities Corp. II, Series 2006-GG6, Class A2, 5.506%, 4/10/2038(c) | | | | $ | 500,000 | | $ | 486,215 |
GS Mortgage Securities Corp. II, Series 2006-GG8, Class A2, 5.479%, 11/10/2039(c) | | | | | 4,449,000 | | | 4,266,392 |
JPMorgan Chase Commercial Mortgage Securities Corp., Series 2001-CIBC, Class A3, 6.260%, 3/15/2033(c) | | | | | 177,499 | | | 177,429 |
JPMorgan Chase Commercial Mortgage Securities Corp., Series 2005-LDP5, Class A4, 5.179%, 12/15/2044(b)(c) | | | | | 7,000,000 | | | 6,340,218 |
JPMorgan Chase Commercial Mortgage Securities Corp., Series 2006-LDP7, Class A2, 5.861%, 4/15/2045(b)(c) | | | | | 1,065,000 | | | 1,037,298 |
JPMorgan Chase Commercial Mortgage Securities Corp., Series 2007-LDPX, Class A3, 5.420%, 1/15/2049(c) | | | | | 4,085,000 | | | 3,394,320 |
LB-UBS Commercial Mortgage Trust, Series 2005-C3,
Class A3, 4.647%, 7/15/2030(c) | | | | | 275,000 | | | 261,550 |
LB-UBS Commercial Mortgage Trust, Series 2006-C3,
Class A4, 5.661%, 3/15/2039(c) | | | | | 2,440,000 | | | 2,198,254 |
LB-UBS Commercial Mortgage Trust, Series 2006-C7,
Class A2, 5.300%, 11/15/2038(c) | | | | | 2,460,000 | | | 2,340,770 |
LB-UBS Commercial Mortgage Trust, Series 2007-C2,
Class A2, 5.303%, 2/15/2040(c) | | | | | 11,060,000 | | | 10,293,435 |
Merrill Lynch Mortgage Trust, Series 2006-C1, Class A2, 5.612%, 5/12/2039(b)(c) | | | | | 1,000,000 | | | 971,032 |
Merrill Lynch/Countrywide Commercial Mortgage Trust, Series 2006-1, Class A2, 5.439%, 2/12/2039(c) | | | | | 4,895,000 | | | 4,741,469 |
Merrill Lynch/Countrywide Commercial Mortgage Trust, Series 2006-1, Class A4, 5.424%, 2/12/2039(b)(c) | | | | | 1,000,000 | | | 890,728 |
Merrill Lynch/Countrywide Commercial Mortgage Trust, Series 2006-2, Class A4, 5.909%, 6/12/2046(b)(c) | | | | | 250,000 | | | 228,227 |
Merrill Lynch/Countrywide Commercial Mortgage Trust, Series 2006-3, Class A4, 5.414%, 7/12/2046(c) | | | | | 1,000,000 | | | 876,945 |
Morgan Stanley Capital I, Class A, 5.328%, 11/12/2041(c) | | | | | 5,000,000 | | | 4,353,098 |
Morgan Stanley Capital I, Series 2005-HQ6, Class A4A, 4.989%, 8/13/2042(c) | | | | | 5,280,000 | | | 4,753,710 |
Morgan Stanley Capital I, Series 2005-HQ7, Class A4, 5.208%, 11/14/2042(b)(c) | | | | | 5,965,000 | | | 5,497,225 |
Morgan Stanley Capital I, Series 2005-T19, Class A4A, 4.890%, 6/12/2047(c) | | | | | 1,267,000 | | | 1,132,595 |
Morgan Stanley Capital I, Series 2006-T23, Class A2, 5.742%, 8/12/2041(b)(c) | | | | | 555,000 | | | 540,205 |
Residential Accredit Loans, Inc., Series 2006-QS13,
Class 2A1, 5.750%, 9/25/2021(c) | | | | | 690,003 | | | 550,924 |
Residential Accredit Loans, Inc., Series 2006-QS18,
Class 3A3, 5.750%, 12/25/2021(c) | | | | | 2,945,862 | | | 2,413,294 |
Residential Accredit Loans, Inc., Series 2006-QS6,
Class 2A1, 6.000%, 6/25/2021(c) | | | | | 154,782 | | | 134,419 |
Wachovia Bank Commercial Mortgage Trust,
Series 2005-C16, Class A2, 4.380%, 10/15/2041(c) | | | | | 78,222 | | | 76,679 |
| | | | | | | | |
| | | | | | | | 478,954,116 |
| | | | | | | | |
| | | |
| TOTAL BONDS AND NOTES | | | | | | | | |
(Identified Cost $593,285,288) | | | | | | | | 574,743,726 |
| | | | | | | | |
| | | |
| SHORT-TERM INVESTMENTS – 12.1% | | | | | | | | |
Federal Home Loan Bank, Discount Notes,
2.340%, 10/10/2008(c)(e) | | | | | 6,800,000 | | | 6,796,022 |
Federal Home Loan Bank, Discount Notes,
2.050%, 10/14/2008(c)(e) | | | | | 2,000,000 | | | 1,998,519 |
24
PORTFOLIO OF INVESTMENTS – as of September 30, 2008
Loomis Sayles Securitized Asset Fund – continued
| | | | | | | | |
| | | | | Principal Amount | | Value (†) |
| | | | | | | | |
| | | |
| SHORT-TERM INVESTMENTS – continued | | | | | | | | |
Federal Home Loan Bank, Discount Notes,
2.150%, 11/13/2008(c)(e) | | | | $ | 27,000,000 | | $ | 26,930,663 |
Federal National Mortgage Association, Discount Notes,
2.490%, 12/03/2008(c)(e) | | | | | 1,000,000 | | | 995,625 |
Federal National Mortgage Association, Discount Notes,
1.950%, 11/13/2008(c)(e) | | | | | 5,000,000 | | | 4,988,354 |
| Tri-Party Repurchase Agreement with Fixed Income Clearing Corporation dated 9/30/2008 at 1.300% to be repurchased at $4,478,162 on 10/01/2008 collateralized by $4,490,000 Federal National Mortgage Association, 4.330% due 7/28/2011 valued at $4,568,575 including accrued interest (Note 2h of Notes to Financial Statements) | | | | | 4,478,000 | | | 4,478,000 |
| | | | | | | | |
| | | |
| TOTAL SHORT-TERM INVESTMENTS | | | | | | | | |
(Identified Cost $46,187,200) | | | | | | | | 46,187,183 |
| | | | | | | | |
| | | |
| TOTAL INVESTMENTS – 162.5% | | | | | | | | |
(Identified Cost $639,472,488)(a) | | | | | | | | 620,930,909 |
Other Assets Less Liabilities—(62.5)% | | | | | | | | (238,876,966) |
| | | | | | | | |
| | | |
| NET ASSETS – 100.0% | | | | | | | $ | 382,053,943 |
| | | | | | | | |
| | | |
(†) See Note 2a of Notes to Financial Statements. | | | | | | | | |
(a) Federal Tax Information: | | | | | | | | |
At September 30, 2008, the net unrealized depreciation on investments based on a cost of $639,475,461 for federal income tax purposes was as follows: | | | |
Aggregate gross unrealized appreciation for all investments in which there is an excess of value over tax cost | | $ | 2,965,659 |
Aggregate gross unrealized depreciation for all investments in which there is an excess of tax cost over value | | | (21,510,211) |
| | | | | | | | |
Net unrealized depreciation | | | | | | | $ | (18,544,552) |
| | | | | | | | |
| (b) | Variable rate security. Rate as of September 30, 2008 is disclosed. |
| (c) | All or a portion of this security has been segregated to cover requirements on TBA obligations and futures contracts. |
| (d) | Delayed delivery. (See Note 2i of Notes to Financial Statements). |
| (e) | Rate represents discount rate at time of purchase. |
| 144A | Securities exempt from registration under Rule 144A of the Securities Act of 1933. These securities may be resold in transactions exempt from registration, normally to qualified institutional buyers. At September 30, 2008, the total value of these securities amounted to $1,561,947 or 0.4% of net assets. |
| | At September 30, 2008, open futures contracts sold were as follows: |
| | | | | | | | | | | |
| Futures | | Expiration
Date | | Contracts | | Notional
Value | | Unrealized
Appreciation/
(Depreciation) | |
10 Year U.S. Treasury Note | | 12/19/2008 | | 318 | | $ | 36,450,750 | | $ | 304,996 | |
5 Year U.S. Treasury Note | | 12/31/2008 | | 327 | | $ | 36,700,641 | | | (95,121 | ) |
| | | | | | | | | | | |
Total | | | | | | | | | $ | 209,875 | |
| | | | | | | | | | | |
NET ASSET SUMMARY AT SEPTEMBER 30, 2008 (Unaudited)
| | | |
Mortgage Related | | 125.3 | % |
Hybrid ARMS | | 11.5 | |
ABS Credit Card | | 7.5 | |
ABS Car Loan | | 3.8 | |
Asset-Backed Securities | | 1.6 | |
ABS Home Equity | | 0.7 | |
Short-Term Investments | | 12.1 | |
| | | |
Total Investments | | 162.5 | |
Other assets less liabilities (including open futures contracts) | | (62.5 | ) |
| | | |
Net Assets | | 100.0 | % |
| | | |
See accompanying notes to financial statements.
25
STATEMENTS OF ASSETS AND LIABILITIES
September 30, 2008
| | | | | | | | |
| | | High Income
Opportunities Fund | | | Securitized
Asset Fund | |
| | | | | | | | |
Assets | | | | | | | | |
Investments at cost | | $ | 88,120,440 | | | $ | 634,994,488 | |
Repurchase agreements at cost | | | 7,260,433 | | | | 4,478,000 | |
Net unrealized depreciation | | | (19,354,113 | ) | | | (18,541,579 | ) |
| | | | | | | | |
Investments at value | | | 76,026,760 | | | | 620,930,909 | |
Cash | | | — | | | | 345 | |
Receivable for Fund shares sold | | | — | | | | 38,541 | |
Receivable for securities sold | | | 522,933 | | | | — | |
Dividends and interest receivable | | | 1,716,064 | | | | 2,541,864 | |
Tax reclaims receivable | | | 7,020 | | | | — | |
Securities lending income receivable | | | 4,260 | | | | — | |
Receivable from broker—variation margin on open futures contracts | | | — | | | | 1,037,508 | |
| | | | | | | | |
Total Assets | | | 78,277,037 | | | | 624,549,167 | |
| | | | | | | | |
| | |
| Liabilities | | | | | | | | |
Due to custodian | | | 522,213 | | | | — | |
Collateral on securities loaned, at value (Note 2) | | | 2,444,943 | | | | — | |
Payable for securities purchased | | | 387,150 | | | | — | |
Payable for delayed delivery securities purchased (Note 2) | | | — | | | | 241,502,215 | |
Payable for Fund shares redeemed | | | 9,972,435 | | | | 993,009 | |
| | | | | | | | |
Total Liabilities | | | 13,326,741 | | | | 242,495,224 | |
| | | | | | | | |
Net Assets | | $ | 64,950,296 | | | $ | 382,053,943 | |
| | | | | | | | |
Net Assets consist of: | | | | | | | | |
Paid-in capital | | $ | 83,693,463 | | | $ | 400,955,919 | |
Accumulated net investment income | | | 629,102 | | | | 2,141,622 | |
Accumulated net realized loss on investments and futures contracts | | | (18,156 | ) | | | (2,711,894 | ) |
Net unrealized depreciation on investments and futures contracts | | | (19,354,113 | ) | | | (18,331,704 | ) |
| | | | | | | | |
Net Assets | | $ | 64,950,296 | | | $ | 382,053,943 | |
| | | | | | | | |
| | |
| Net Asset Value and Offering Price | | | | | | | | |
Institutional Class | | | | | | | | |
Net assets | | $ | 64,950,296 | | | $ | 382,053,943 | |
| | | | | | | | |
Shares of beneficial interest | | | 7,861,223 | | | | 39,804,809 | |
| | | | | | | | |
Net asset value, offering and redemption price per share | | $ | 8.26 | | | $ | 9.60 | |
| | | | | | | | |
Value of securities on loan (Note 2) | | $ | 2,331,061 | | | $ | — | |
| | | | | | | | |
See accompanying notes to financial statements.
26
STATEMENTS OF OPERATIONS
For the Year Ended September 30, 2008
| | | | | | | | |
| | | High Income
Opportunities Fund | | | Securitized
Asset Fund | |
| | | | | | | | |
Investment Income | | | | | | | | |
Dividends | | $ | 107,970 | | | $ | — | |
Interest | | | 6,712,888 | | | | 20,385,139 | |
Securities lending income (Note 2) | | | 60,490 | | | | — | |
Less net foreign taxes withheld | | | (328 | ) | | | — | |
| | | | | | | | |
Net investment income | | | 6,881,020 | | | | 20,385,139 | |
| | | | | | | | |
| | |
| Net Realized and Unrealized Gain (Loss) on Investments and Futures Contracts | | | | | | | | |
Net Realized Gain (Loss) on: | | | | | | | | |
Investments | | | 17,115 | | | | 6,894,683 | |
Futures contracts | | | — | | | | (6,749,353 | ) |
| | |
| Net Change in Unrealized Appreciation (Depreciation) on: | | | | | | | | |
Investments | | | (18,349,158 | ) | | | (17,955,641 | ) |
Futures contracts | | | — | | | | 280,500 | |
| | | | | | | | |
Net realized and unrealized loss on investments and futures contracts | | | (18,332,043 | ) | | | (17,529,811 | ) |
| | | | | | | | |
| | |
| Net Increase (Decrease) in Net Assets Resulting from Operations | | $ | (11,451,023 | ) | | $ | 2,855,328 | |
| | | | | | | | |
See accompanying notes to financial statements.
27
STATEMENTS OF CHANGES IN NET ASSETS
High Income Opportunities Fund
| | | | | | | | |
| | | Year Ended
September 30, 2008 | | | Year Ended
September 30, 2007 | |
From Operations: | | | | | | | | |
Net investment income | | $ | 6,881,020 | | | $ | 4,937,988 | |
Net realized gain on investments | | | 17,115 | | | | 548,692 | |
Net change in net unrealized appreciation (depreciation) on investments | | | (18,349,158 | ) | | | (1,332,208 | ) |
| | | | | | | | |
Increase (decrease) in net assets from operations | | | (11,451,023 | ) | | | 4,154,472 | |
| | | | | | | | |
From Distributions to Shareholders: | | | | | | | | |
Net Investment Income: | | | | | | | | |
Institutional Class | | | (6,813,880 | ) | | | (4,658,683 | ) |
Capital Gains: | | | | | | | | |
Institutional Class | | | (543,232 | ) | | | (10,790 | ) |
| | | | | | | | |
Total distributions | | | (7,357,112 | ) | | | (4,669,473 | ) |
| | | | | | | | |
Increase (Decrease) in Net Assets Derived from Capital Share Transactions (Note 7) | | | (314,836 | ) | | | 41,741,681 | |
| | | | | | | | |
Total increase (decrease) in net assets | | | (19,122,971 | ) | | | 41,226,680 | |
Net Assets | | | | | | | | |
Beginning of year | | | 84,073,267 | | | | 42,846,587 | |
| | | | | | | | |
End of year | | $ | 64,950,296 | | | $ | 84,073,267 | |
| | | | | | | | |
Accumulated Net Investment Income | | $ | 629,102 | | | $ | 548,629 | |
| | | | | | | | |
Securitized Asset Fund
| | | | | | | | |
| | | Year Ended
September 30, 2008 | | | Year Ended
September 30, 2007 | |
From Operations: | | | | | | | | |
Net investment income | | $ | 20,385,139 | | | $ | 13,048,141 | |
Net realized gain (loss) on investments and futures contracts | | | 145,330 | | | | (1,735,124 | ) |
Net change in net unrealized appreciation (depreciation) on investments and futures contracts | | | (17,675,141 | ) | | | (1,369,392 | ) |
| | | | | | | | |
Increase in net assets resulting from operations | | | 2,855,328 | | | | 9,943,625 | |
| | | | | | | | |
From Distributions to Shareholders: | | | | | | | | |
Net Investment Income: | | | | | | | | |
Institutional Class | | | (20,848,572 | ) | | | (11,831,185 | ) |
Capital Gains: | | | | | | | | |
Institutional Class | | | — | | | | (53,435 | ) |
| | | | | | | | |
Total distributions | | | (20,848,572 | ) | | | (11,884,620 | ) |
| | | | | | | | |
Increase in Net Assets Derived from Capital Share Transactions (Note 7) | | | 52,893,796 | | | | 278,101,365 | |
| | | | | | | | |
Total increase in net assets | | | 34,900,552 | | | | 276,160,370 | |
Net Assets | | | | | | | | |
Beginning of year | | | 347,153,391 | | | | 70,993,021 | |
| | | | | | | | |
End of year | | $ | 382,053,943 | | | $ | 347,153,391 | |
| | | | | | | | |
Accumulated Net Investment Income | | $ | 2,141,622 | | | $ | 1,776,301 | |
| | | | | | | | |
See accompanying notes to financial statements.
28
FINANCIAL HIGHLIGHTS
For a share outstanding throughout each period.
| | | | | | | | | | | | | | | | | | | | | | | | |
| | | | | Income (Loss) from Investment Operations: | | | | | Less Distributions: | |
| | | Net asset
value,
beginning
of the period | | Net
investment
income(e) | | Net realized
and unrealized
gain (loss) | | | Total from
investment
operations | | | | | Dividends
from
net investment
income | | | Distributions
from net
realized
capital gains(g) | |
| High Income Opportunities Fund | | | | | | | | | | | | | | | | | | |
| | | | | | | |
| Institutional Class | | | | | | | | | | | | | | | | | | | | | | | | |
9/30/2008 | | $ | 10.42 | | $ | 0.82 | | $ | (2.09 | ) | | $ | (1.27 | ) | | | | $ | (0.82 | ) | | $ | (0.07 | ) |
9/30/2007 | | | 10.39 | | | 0.77 | | | 0.01 | (h) | | | 0.78 | | | | | | (0.75 | ) | | | (0.00 | ) |
9/30/2006 | | | 10.50 | | | 0.76 | | | (0.10 | ) | | | 0.66 | | | | | | (0.73 | ) | | | (0.04 | ) |
9/30/2005 | | | 10.32 | | | 0.78 | | | 0.17 | | | | 0.95 | | | | | | (0.77 | ) | | | — | |
9/30/2004(a) | | | 10.00 | | | 0.33 | | | 0.25 | | | | 0.58 | | | | | | (0.26 | ) | | | — | |
| | | | | |
| Securitized Asset Fund | | | | | | | | | | | | | | | | | | |
| | | | | | | |
| Institutional Class | | | | | | | | | | | | | | | | | | | | | | | | |
9/30/2008 | | $ | 10.07 | | $ | 0.55 | | $ | (0.45 | ) | | $ | 0.10 | | | | | $ | (0.57 | ) | | $ | — | |
9/30/2007 | | | 10.13 | | | 0.55 | | | (0.10 | ) | | | 0.45 | | | | | | (0.51 | ) | | | (0.00 | ) |
9/30/2006(f) | | | 10.00 | | | 0.30 | | | 0.02 | | | | 0.32 | | | | | | (0.19 | ) | | | — | |
(a) For the period April 12, 2004 (commencement of operations) through September 30, 2004.
(b) Periods less than one year, if applicable, are not annualized.
(c) Loomis Sayles has agreed to pay, without reimbursement from the Fund, all expenses associated with the operations of the Fund.
(d) Computed on an annualized basis for periods less than one year, if applicable.
(e) Per share net investment income has been calculated using the average shares outstanding during the period.
(f) For the period March 2, 2006 (commencement of operations) through September 30, 2006.
(g) Amount rounds to less than $0.01 per share, if applicable.
(h) The amount shown for a share outstanding does not correspond with the aggregate realized and unrealized gain (loss) on investments for the period due to the timing of sales and redemptions of fund shares in relation to fluctuating market values of investments of the fund.
(i) Portfolio turnover rate has been recalculated to conform with current presentation.
See accompanying notes to financial statements.
29
| | | | | | | | | | | | | | | | | | | | |
| | | | | | | | | | | Ratios to Average Net Assets: | |
Total
distributions | | | Net asset
value,
end of
the period | | Total
return (%)(b) | | | Net assets,
end of
the period
(000’s) | | Net
expenses (%)(c) | | Gross
expenses (%)(c) | | Net
investment
income (%)(d) | | Portfolio
turnover
rate (%) | |
| | | | | | | | | | | | | | | | | | | | |
| | | | | | | |
| | | | | | | | | | | | | | | | | | | | |
| $ | (0.89 | ) | | $ | 8.26 | | (13.2 | ) | | $ | 64,950 | | — | | — | | 8.47 | | 24 | |
| | (0.75 | ) | | | 10.42 | | 7.7 | | | | 84,073 | | — | | — | | 7.35 | | 29 | |
| | (0.77 | ) | | | 10.39 | | 6.6 | | | | 42,847 | | — | | — | | 7.36 | | 26 | |
| | (0.77 | ) | | | 10.50 | | 9.5 | | | | 13,115 | | — | | — | | 7.40 | | 22 | |
| | (0.26 | ) | | | 10.32 | | 5.9 | | | | 9,079 | | — | | — | | 7.03 | | 45 | |
| | | | | | | |
| | | | | | | | | | | | | | | | | | | | |
| | | | | | | |
| | | | | | | | | | | | | | | | | | | | |
| $ | (0.57 | ) | | | 9.60 | | 0.9 | | | $ | 382,054 | | — | | — | | 5.55 | | 430 | |
| | (0.51 | ) | | | 10.07 | | 4.6 | | | | 347,153 | | — | | — | | 5.43 | | 73 | |
| | (0.19 | ) | | | 10.13 | | 3.3 | | | | 70,993 | | — | | — | | 3.02 | | 55 | (i) |
See accompanying notes to financial statements.
30
NOTES TO FINANCIAL STATEMENTS
September 30, 2008
1. Organization. Loomis Sayles Funds I (the “Trust”) is organized as a Massachusetts business trust. The Trust is registered under the Investment Company Act of 1940, as amended (the “1940 Act”), as an open-end management investment company. The Declaration of Trust permits the Board of Trustees to authorize the issuance of an unlimited number of shares of the Trust in multiple series. The following funds (individually, a “Fund” and collectively, the “Funds”) are included in this report:
Loomis Sayles High Income Opportunities Fund (the “High Income Opportunities Fund”)
Loomis Sayles Securitized Asset Fund (the “Securitized Asset Fund”)
Each Fund offers Institutional Class Shares. The Funds’ shares are offered exclusively to investors in “wrap fee” programs approved by Natixis Asset Management Advisors, L.P. (“Natixis Advisors”) and/or Loomis, Sayles & Company, L.P. (“Loomis Sayles”) and to institutional advisory clients of Natixis Advisors or Loomis Sayles that, in each case, meet the Funds’ policies as established by Loomis Sayles.
2. Significant Accounting Policies. The following is a summary of significant accounting policies consistently followed by each Fund in the preparation of its financial statements. Each Fund’s financial statements are prepared in accordance with accounting principles generally accepted in the United States of America which require the use of management estimates that affect the reported amounts and disclosures in the financial statements. Actual results could differ from those estimates.
a. Security Valuation. Debt securities (other than short-term obligations purchased with an original or remaining maturity of sixty days or less) are generally valued on the basis of evaluated bids furnished to the Funds by a pricing service recommended by the investment adviser and approved by the Board of Trustees, which service determines valuations for normal, institutional size-trading units of such securities using market information, transactions for comparable securities and various relationships between securities which are generally recognized by institutional traders. Equity securities, including closed-end investment companies and exchange traded funds, for which market quotations are readily available are valued at market value, as reported by pricing services recommended by the investment adviser and approved by the Board of Trustees. Such pricing services generally use the security’s last sale price on the exchange or market where the security is primarily traded or, if there is no reported sale during the day, the closing bid price. Securities traded on the NASDAQ Global Select Market, NASDAQ Global Market and NASDAQ Capital Markets are valued at the NASDAQ Official Closing Price (“NOCP”), or if lacking a NOCP, at the most recent bid quotation on the applicable NASDAQ Market. Broker-dealer bid quotations may also be used to value debt and equity securities where a pricing service does not price a security or where a pricing service does not provide a reliable price for the security. In instances where broker-dealer bid quotations are not available, certain securities held by the Funds may be valued on the basis of a price provided by a principal market maker. Futures contracts are priced at their most recent settlement price. Short-term obligations purchased with an original or remaining maturity of sixty days or less are valued at amortized cost, which approximates market value. Securities for which market quotations are not readily available are valued at fair value as determined in good faith by the Funds’ investment adviser using consistently applied procedures under the general supervision of the Board of Trustees. Investments in other open-end investment companies are valued at their net asset value each day.
The High Income Opportunities Fund may hold securities traded in foreign markets. Foreign securities are valued at the market price in the foreign market. However, if events occurring after the close of the foreign market (but before the close of regular trading on the New York Stock Exchange) are believed to materially affect the value of those securities, such securities are fair valued pursuant to procedures approved by the Board of Trustees. When fair valuing securities, the Fund may, among other things, use modeling tools or other processes that may take into account factors such as securities market activity and/or significant events that occur after the close of the foreign market and before the Fund calculates its net asset value.
b. Security Transactions and Related Investment Income. Security transactions are accounted for on trade date. Dividend income is recorded on ex-dividend date, or in the case of certain foreign securities, as soon as the Fund is notified, and interest income is recorded on an accrual basis. Interest income is increased by the accretion of discount and decreased by the amortization of premium. Distributions received from investments in securities that represent a return of capital or capital gain are recorded as a reduction of cost of investments or as a realized gain, respectively. The calendar year-end amounts of ordinary income, capital gains, and return of capital included in distributions received from the Funds’ investments in real estate investment trusts (“REITs”) are reported to the Funds after the end of the fiscal year; accordingly, the Funds estimate these amounts for accounting purposes until the characterization of REIT distributions is reported to the Funds after the end of the fiscal year. Estimates are based on the most recent REIT distribution information available. Investment income is recorded net of foreign taxes withheld when applicable. In determining net gain or loss on securities sold, the cost of securities has been determined on an identified cost basis.
31
c. Foreign Currency Translation. The books and records of the Funds are maintained in U.S. dollars. The value of securities, currencies and other assets and liabilities denominated in currencies other than U.S. dollars are translated into U.S. dollars based upon foreign exchange rates prevailing at the end of the period. Purchases and sales of investment securities, income and expenses are translated on the respective dates of such transactions.
Since the values of investment securities are presented at the foreign exchange rates prevailing at the end of the period, it is not practical to isolate that portion of the results of operations arising from changes in exchange rates from fluctuations which arise due to changes in market prices of the investment securities. Such changes are included with the net realized and unrealized gain or loss on investments.
Net realized foreign exchange gains or losses arise from sales of foreign currency, currency gains or losses realized between the trade and settlement dates on securities transactions and the difference between the amounts of dividends, interest and foreign withholding taxes recorded on the High Income Opportunities Fund’s books and the U.S. dollar equivalent of the amounts actually received or paid. Net unrealized foreign exchange gains and losses arise from changes in the value of assets and liabilities, other than investment securities, at the end of the fiscal period, resulting from changes in exchange rates.
The High Income Opportunities Fund may use foreign currency exchange contracts to facilitate transactions in foreign denominated investments. Losses may arise from changes in the value of the foreign currency or if the counterparties do not perform under the contracts’ terms.
The High Income Opportunities Fund may purchase investments of foreign issuers. Investing in securities of foreign issuers involves special risks and considerations not typically associated with investing in U.S. companies and securities of the U.S. government. These risks include revaluation of currencies and the risk of appropriation. Moreover, the markets for securities of many foreign issuers may be less liquid and the prices of such securities may be more volatile than those of comparable U.S. companies and the U.S. government.
d. Forward Foreign Currency Contracts. The High Income Opportunities Fund may enter into forward foreign currency exchange contracts. Contracts to buy generally are used to acquire exposure to foreign currencies, while contracts to sell generally are used to hedge the Fund’s investments against currency fluctuation. Also, a contract to buy or sell can offset a previous contract. These contracts involve market risk in excess of the unrealized gain or loss reflected in the Fund’s Statement of Assets and Liabilities. The U.S. dollar value of the currencies a Fund has committed to buy or sell represents the aggregate exposure to each currency the Fund has acquired or hedged through currency contracts outstanding at period end.
All contracts are “marked-to-market” daily utilizing interpolated prices determined by an independent pricing service and any gains or losses are recorded for financial statement purposes as unrealized until settlement date. Risks may arise upon entering into these contracts from the potential inability of counterparties to meet the terms of their contracts and from unanticipated movements in the value of a foreign currency relative to the U.S. dollar. At September 30, 2008, there were no open forward foreign currency contracts.
e. Futures Contracts. The Funds may enter into futures contracts. A futures contract is an agreement between two parties to buy and sell a particular commodity, instrument or index (e.g., an interest-bearing security) for a specified price on a specified future date.
When a Fund enters into a futures contract, it is required to deposit with (or for the benefit of) its broker as “initial margin” an amount of cash or short-term high-quality securities. As the value of the contract changes, the value of the futures contract position increases or declines. At the end of each trading day, the amount of such increase or decline is received or paid, respectively, by and to the holders of these positions. The amount received or paid is known as “variation margin.” Realized gain or loss on a futures position is equal to the net variation margin received or paid over the time the position is held, plus or minus the amount received or paid when the position is closed, minus brokerage commissions. When a Fund enters into a futures contract certain risks may arise such as illiquidity in the futures market, which may limit the Fund’s ability to close out a futures contract prior to settlement date, and unanticipated movements in the value of securities or interest rates.
f. Federal and Foreign Income Taxes. The Trust treats each Fund as a separate entity for federal income tax purposes. Each Fund intends to meet the requirements of the Internal Revenue Code applicable to regulated investment companies, and to distribute to its shareholders substantially all of its net investment income and any net realized capital gains at least annually. Management has performed an analysis of the Fund’s tax positions taken on federal and state tax returns that remain subject to examinations (tax years ended September 30, 2005—2008), where applicable and has concluded that no provisions for income tax are required. Fund management is not aware of any events that are reasonably possible to occur in the next twelve months that would result in the amounts of any unrecognized tax benefits significantly increasing or decreasing for the Fund. However, management’s
32
NOTES TO FINANCIAL STATEMENTS – continued
September 30, 2008
conclusions regarding tax positions taken may be subject to review and adjustment at a later date based on factors including, but not limited to, new tax laws and accounting regulations and interpretations thereof.
The High Income Opportunities Fund may be subject to foreign taxes on income and gains on investments that are accrued based upon the Fund’s understanding of the tax rules and regulations that exist in the countries in which the Fund invests. Foreign governments may also impose taxes or other payments on investments with respect to foreign securities. Such taxes are accrued as applicable.
g. Dividends and Distributions to Shareholders. Dividends and distributions are recorded on ex-dividend date. The timing and characterization of certain income and capital gain distributions are determined annually in accordance with federal tax regulations, which may differ from accounting principles generally accepted in the United States of America. Permanent differences are primarily due to differing treatments for book and tax purposes for items such as premium amortization and paydown gains and losses. Permanent book and tax basis differences relating to shareholder distributions will result in reclassifications to capital accounts. Temporary differences between book and tax distributable earnings are primarily due to defaulted bond income accruals, premium amortization accruals, securities lending collateral gain/loss adjustments, wash sales and futures contracts marked to market. Distributions from net investment income and short-term capital gains are considered to be distributed from ordinary income for tax purposes.
The tax characterization of distributions is determined on an annual basis. The tax character of distributions paid to shareholders during the years ended September 30, 2008 and 2007 was as follows:
| | | | | | | | | | | | | | | | | | |
| | | 2008 Distributions Paid From: | | 2007 Distributions Paid From: |
Fund | | Ordinary
Income | | Long-Term
Capital Gains | | Total | | Ordinary
Income | | Long-Term
Capital Gains | | Total |
High Income Opportunities Fund | | $ | 7,183,035 | | $ | 174,077 | | $ | 7,357,112 | | $ | 4,658,683 | | $ | 10,790 | | $ | 4,669,473 |
Securitized Asset Fund | | | 20,848,572 | | | — | | | 20,848,572 | | | 11,884,620 | | | — | | | 11,884,620 |
Differences between these amounts and those reported in the Statements of Changes in Net Assets are primarily attributable to different book and tax treatment for short-term capital gains.
As of September 30, 2008, the components of distributable earnings on a tax basis were as follows:
| | | | | | | | |
| | | High Income
Opportunities Fund | | | Securitized
Asset Fund | |
Undistributed ordinary income | | $ | 697,200 | | | $ | 3,177,200 | |
Undistributed long-term capital gains | | | 85,792 | | | | — | |
| | | | | | | | |
Total undistributed earnings | | | 782,992 | | | | 3,177,200 | |
Deferred net capital losses (post-October 2007) | | | — | | | | (3,534,625 | ) |
Unrealized appreciation (depreciation) | | | (19,458,062 | ) | | | (18,544,552 | ) |
| | | | | | | | |
Total accumulated earnings | | $ | (18,675,070 | ) | | $ | (18,901,977 | ) |
| | | | | | | | |
h. Repurchase Agreements. Each Fund, through its custodian, receives delivery of the underlying securities collateralizing repurchase agreements. It is each Fund’s policy that the market value of the collateral be at least equal to 100% of the repurchase price, including interest. Certain repurchase agreements are tri-party arrangements whereby the collateral is held at the custodian bank in a segregated account for the benefit of the Fund and on behalf of the counterparty. It is each Fund’s policy, regarding tri-party arrangements, that the market value of the collateral be at least equal to 102% of the repurchase price, including interest. Repurchase agreements could involve certain risks in the event of default or insolvency of the counterparty including possible delays or restrictions upon a Fund’s ability to dispose of the underlying securities.
i. Delayed Delivery Commitments. Each Fund may purchase or sell securities on a when issued or forward commitment basis. Payment and delivery may take place a month or more after the date of the transaction. The price of the underlying securities and the date when the securities will be delivered and paid for are fixed at the time the transaction is negotiated. Losses may arise due to changes in the market value of the underlying securities or if the counterparty does not perform under the contract. Collateral consisting of liquid securities or cash and cash equivalents is maintained in an amount at least equal to these commitments with the custodian.
j. Securities Lending. The Funds have entered into an agreement with State Street Bank and Trust Company (“State Street Bank”), as agent of the Funds, to lend securities to certain designated borrowers. The loans are collateralized with cash or securities
33
in an amount equal to at least 105% or 102% of the market value of the loaned international or domestic securities, respectively, when the loan is initiated. Thereafter, the value of the collateral must remain at least 102% of the market value of loaned securities for U.S. equities and U.S. corporate debt; at least 105% of the market value of loaned securities for non-U.S. equities; and at least 100% of the market value of loaned securities for U.S. government securities, sovereign debt issued by non-U.S. governments and non-U.S. corporate debt. In the event that the market value of the collateral falls below the required percentages described above, the borrower will deliver additional collateral on the next business day. As with other extensions of credit, the Funds may bear the risk of loss with respect to the investment of the collateral. The Funds invest cash collateral in short-term investments, a portion of the income from which is remitted to the borrowers and the remainder allocated between the Funds and State Street Bank as lending agent. The value of securities on loan to borrowers and the value of collateral held by the Funds with respect to such loans at September 30, 2008 were as follows:
| | | | | | |
| | | Value
of Securities
on Loan | | Value of
Collateral |
High Income Opportunities Fund | | $ | 2,331,061 | | $ | 2,444,943 |
Securitized Asset Fund | | | — | | | — |
Subsequent to September 30, 2008, all open securities lending transactions were closed.
k. Indemnifications. Under the Trust’s organizational documents, its officers and Trustees are indemnified against certain liabilities arising out of the performance of their duties to the Funds. Additionally, in the normal course of business, the Funds enter into contracts with service providers that contain general indemnification clauses. The Funds’ maximum exposure under these arrangements is unknown as this would involve future claims that may be made against the Funds that have not yet occurred. However, based on experience the Funds expect the risk of loss to be remote.
l. New Accounting Pronouncements. In September 2006, Statement of Financial Accounting Standards No. 157, Fair Value Measurements (“FAS 157”), was issued and is effective for fiscal years beginning after November 15, 2007. FAS 157 defines fair value, establishes a framework for measuring fair value and expands disclosures about fair value measurements. Management has evaluated the impact the adoption of FAS 157 will have on the Funds’ financial statements and believes that such impact will be limited to expanded disclosure in the Funds’ financial statements regarding inputs used in determining the value of the Funds’ investments.
In March 2008, Statement of Financial Accounting Standards No. 161, Disclosures about Derivative Instruments and Hedging Activities (“FAS 161”), was issued and will be effective for fiscal years and interim periods beginning after November 15, 2008. FAS 161 requires enhanced disclosures about funds’ derivative and hedging activities. Management is currently evaluating the impact the adoption of FAS 161 will have on the Funds’ financial statement disclosures.
3. Purchases and Sales of Securities. For the year ended September 30, 2008, purchases and sales of securities (excluding short-term investments and including paydowns) were as follows:
| | | | | | | | | | | | |
| | | U.S. Government/Agency Securities | | Other Securities |
Fund | | Purchases | | Sales | | Purchases | | Sales |
High Income Opportunities Fund | | $ | — | | $ | 1,384,083 | | $ | 23,841,786 | | $ | 17,379,364 |
Securitized Asset Fund | | | 2,365,950,887 | | | 2,308,615,608 | | | 76,662,959 | | | 6,245,006 |
4. Management Fees and Other Transactions with Affiliates.
a. Management Fees. Loomis Sayles has agreed to pay, without reimbursement from the Funds or the Trust, the following expenses of the Funds: compensation to Trustees of the Trust who are not “interested persons” (as defined in the 1940 Act) of the Trust; registration, filing and other fees in connection with requirements of regulatory authorities; the charges and expenses of any entity appointed by the Funds for custodial, paying agent, shareholder servicing and plan agent services; charges and expenses of the independent registered public accounting firm retained by the Funds; charges and expenses of any transfer agents and registrars appointed by the Funds; any cost of certificates representing shares of the Funds; legal fees and expenses in connection with the day-to-day affairs of the Funds, including registering and qualifying its shares with Federal and State regulatory authorities; expenses of meetings of shareholders and Trustees of the Trust; the costs of services, including services of counsel, required in connection with the preparation of the Funds’ registration statements and prospectuses, including amendments and revisions thereto, annual, semi-annual and other periodic reports of the Funds, and notices and proxy solicitation material furnished to shareholders of the Funds or regulatory authorities, and any costs of printing or mailing these items; and the Funds’ expenses of bookkeeping, accounting and financial reporting, including related clerical expenses.
34
NOTES TO FINANCIAL STATEMENTS – continued
September 30, 2008
Loomis Sayles serves as investment adviser to each Fund. Under the terms of each management agreement, Loomis Sayles does not charge the Funds an investment advisory fee, also known as a management fee, or any other fee for those services or for bearing those expenses. Although the Funds do not compensate Loomis Sayles directly for services under the advisory agreement, Loomis Sayles will typically receive an advisory fee from the sponsors of “wrap programs,” who in turn charge the programs’ participants.
Certain officers and employees of Loomis Sayles are also officers or Trustees of the Trust. Loomis Sayles’ general partner is indirectly owned by Natixis Global Asset Management, L.P. (“Natixis US”), which is part of Natixis Global Asset Management, an international asset management group based in Paris, France.
b. Administrative Fees. Natixis Advisors provides certain administrative services for the Funds and subcontracts with State Street Bank to serve as sub-administrator. Natixis Advisors is a wholly-owned subsidiary of Natixis US. Loomis Sayles has agreed to pay, without reimbursement from the Trust or Funds, fees to Natixis Advisors for services to the Funds under each agreement.
c. Service and Distribution Fees. The Trust has entered into a distribution agreement with Natixis Distributors, L.P. (“Natixis Distributors”), a wholly-owned subsidiary of Natixis US. Pursuant to this agreement, Natixis Distributors serves as principal underwriter of the Funds. Natixis Distributors currently is not paid a fee for serving as distributor for the Funds. Loomis Sayles has agreed to reimburse Natixis Distributors to the extent that Natixis Distributors incurs expenses in connection with any redemption of Fund shares.
d. Trustees Fees and Expenses. The Funds do not pay any compensation directly to their officers or Trustees who are directors, officers or employees of Natixis Advisors, Natixis Distributors, Natixis US, or their affiliates. The Chairperson of the Board receives a retainer fee at the annual rate of $200,000. The Chairperson does not receive any meeting attendance fees for Board of Trustees meetings or committee meetings that she attends. Each Independent Trustee (other than the Chairperson) receives, in the aggregate, a retainer fee at the annual rate of $65,000. Each Independent Trustee also receives a meeting attendance fee of $7,500 for each meeting of the Board of Trustees that he or she attends in person and $3,750 for each meeting of the Board of Trustees that he or she attends telephonically. In addition, each committee chair receives an additional retainer fee at the annual rate of $10,000. Each Contract Review and Governance Committee member is compensated $5,000 for each Committee meeting that he or she attends in person and $2,500 for each meeting that he or she attends telephonically. Each Audit Committee member is compensated $6,250 for each Committee meeting that he or she attends in person and $3,125 for each meeting that he or she attends telephonically. These fees are allocated among the funds in Natixis Funds Trust I, Natixis Funds Trust II, Natixis Funds Trust III, Natixis Funds Trust IV, Natixis Cash Management Trust, Gateway Trust (“Natixis Funds Trusts”), Loomis Sayles Funds I, Loomis Sayles Funds II (“Loomis Sayles Funds Trusts”) and the Hansberger International Series based on a formula that takes into account, among other factors, the relative net assets of each Fund. Trustees are reimbursed for travel expenses in connection with attendance at meetings. Loomis Sayles has agreed to pay the pro rata portion of Trustees fees and expenses for each Fund, without reimbursement from the Trust or Funds.
Prior to January 1, 2008, each Independent Trustee (other than the Chairperson) received, in the aggregate, a retainer fee at the annual rate of $55,000. Each Independent Trustee also received a meeting attendance fee of $6,000 for each meeting of the Board of Trustees that he or she attended in person and $3,000 for each meeting that he or she attended telephonically. In addition, each Contract Review and Governance Committee member received $4,000 for each committee meeting that he or she attended in person and $2,000 for each committee meeting that he or she attended telephonically. Each Audit Committee member received $5,000 for each committee meeting that he or she attended in person and $2,500 for each committee meeting that he or she attended telephonically. The Chairperson of the Board and committee chair retainers were $200,000 and $10,000, respectively.
5. Line of Credit. Each Fund, together with certain other funds of Natixis Funds Trusts, Loomis Sayles Funds Trusts and the Hansberger International Series, participates in a $200,000,000 committed line of credit provided by State Street Bank, with an individual limit of $125,000,000 for each fund that participates in the line of credit. Interest is charged to each participating fund based on its borrowings at a rate per annum equal to the Federal Funds rate plus 0.50%. In addition, a commitment fee of 0.09% per annum, payable at the end of each calendar quarter, is accrued and apportioned among the participating funds based on their average daily unused portion of the line of credit. Loomis Sayles has agreed to pay the pro rata portion of commitment fees for each Fund, without reimbursement from the Trust or Funds.
Prior to March 12, 2008, each fund, together with certain other funds of Natixis Funds Trusts, Loomis Sayles Funds Trusts and Hansberger International Series, participated in a $75,000,000 committed line of credit provided by State Street Bank.
For the year ended September 30, 2008, the Funds had no borrowings under these agreements.
35
6. Concentration of Risk. The Securitized Asset Fund is a non-diversified fund. Compared with diversified mutual funds, the Securitized Asset Fund may invest a greater percentage of its assets in a particular company. Therefore, the Securitized Asset Fund’s returns could be significantly affected by the performance of any one of the small number of bond issuers in its portfolio.
7. Capital Shares. Each Fund may issue an unlimited number of shares of beneficial interest, without par value. Transactions in capital shares were as follows:
| | | | | | | | | | | | | | |
| | | High Income Opportunities Fund | |
| | |
| | | Year Ended September 30, 2008 | | | Year Ended September 30, 2007 | |
| | | | |
| | | Shares | | | Amount | | | Shares | | | Amount | |
Issued from the sale of shares | | 1,980,419 | | | $ | 19,260,155 | | | 5,003,754 | | | $ | 52,835,635 | |
Issued in connection with the
reinvestment of distributions | | 380,809 | | | | 3,709,039 | | | 190,501 | | | | 1,995,422 | |
Redeemed | | (2,571,913 | ) | | | (23,284,030 | ) | | (1,244,842 | ) | | | (13,089,376 | ) |
| | | | | | | | | | | | | | |
Increase (decrease) from capital share transactions | | (210,685 | ) | | $ | (314,836 | ) | | 3,949,413 | | | $ | 41,741,681 | |
| | | | | | | | | | | | | | |
| |
| | | Securitized Asset Fund | |
| | |
| | | Year Ended September 30, 2008 | | | Year Ended September 30, 2007 | |
| | | | |
| | | Shares | | | Amount | | | Shares | | | Amount | |
Issued from the sale of shares | | 14,774,496 | | | $ | 146,455,592 | | | 34,557,748 | | | $ | 349,398,198 | |
Issued in connection with the
reinvestment of distributions | | 20,764 | | | | 205,641 | | | 12,259 | | | | 123,960 | |
Redeemed | | (9,456,660 | ) | | | (93,767,437 | ) | | (7,110,836 | ) | | | (71,420,793 | ) |
| | | | | | | | | | | | | | |
Increase (decrease) from capital share transactions | | 5,338,600 | | | $ | 52,893,796 | | | 27,459,171 | | | $ | 278,101,365 | |
| | | | | | | | | | | | | | |
36
REPORT OF INDEPENDENT REGISTERED PUBLIC ACCOUNTING FIRM
To the Trustees of Loomis Sayles Funds I and Shareholders of Loomis Sayles High Income Opportunities Fund and Loomis Sayles Securitized Asset Fund:
In our opinion, the accompanying statements of assets and liabilities, including the portfolios of investments, and the related statements of operations and of changes in net assets and the financial highlights present fairly, in all material respects, the financial position of the Loomis Sayles High Income Opportunities Fund and Loomis Sayles Securitized Asset Fund, each a series of Loomis Sayles Funds I (collectively, “the Funds”), at September 30, 2008, and the results of each of their operations, the changes in each of their net assets and the financial highlights for each of the periods indicated, in conformity with accounting principles generally accepted in the United States of America. These financial statements and financial highlights (hereafter referred to as “financial statements”) are the responsibility of the Funds’ management; our responsibility is to express an opinion on these financial statements based on our audits. We conducted our audits of these financial statements in accordance with the standards of the Public Company Accounting Oversight Board (United States). Those standards require that we plan and perform the audits to obtain reasonable assurance about whether the financial statements are free of material misstatement. An audit includes examining, on a test basis, evidence supporting the amounts and disclosures in the financial statements, assessing the accounting principles used and significant estimates made by management, and evaluating the overall financial statement presentation. We believe that our audits, which included confirmation of securities at September 30, 2008 by correspondence with the custodian and brokers, provide a reasonable basis for our opinion.
PricewaterhouseCoopers LLP
Boston, Massachusetts
November 21, 2008
37
2008 U.S. TAX DISTRIBUTION INFORMATION TO SHAREHOLDERS (Unaudited)
Corporate Dividends Received Deduction. For the fiscal year ended September 30, 2008, a percentage of dividends distributed by the Fund listed below qualify for the dividends received deduction for corporate shareholders. These percentages are as follows:
| | |
Fund | | Qualifying Percentage |
High Income Opportunities Fund | | 0.90% |
Capital Gains Distributions. Pursuant to Internal Revenue Section 852(b), the following Fund paid distributions, which have been designated as capital gains distributions for the fiscal year ended September 30, 2008.
| | | |
Fund | | Amount |
High Income Opportunities Fund | | $ | 174,077 |
Qualified Dividend Income. For the fiscal year ended September 30, 2008, the Fund below will designate up to the maximum amount allowable pursuant to the Internal Revenue Code as qualified dividend income eligible for reduced tax rates. These lower rates range from 5% to 15% depending on an individual’s tax bracket. If the Fund pays a distribution during calendar year 2008, complete information will be reported in conjunction with Form 1099-DIV.
| | |
Fund | | |
High Income Opportunities Fund | | |
38
TRUSTEE AND OFFICER INFORMATION
The tables below provide certain information regarding the Trustees and officers of Loomis Sayles Funds I (the “Trust”). Unless otherwise indicated, the address of all persons below is 399 Boylston Street, Boston, MA 02116. The Trust’s Statement of Additional Information includes additional information about the Trustees of the Trust and is available by calling Loomis Sayles at 800-343-2029.
| | | | | | |
| Name and Year of Birth | | Position(s) Held with the Trusts, Length of Time Served and
Term of Office* | | Principal Occupation(s) During Past 5 Years** | | Number of Portfolios in Fund
Complex Overseen*** and Other Directorships Held |
| | |
INDEPENDENT TRUSTEES | | | | |
Graham T. Allison, Jr. (1940) | | Trustee Since 2003 Contract Review and Governance Committee Member | | Douglas Dillon Professor and Director of the Belfer Center for Science and International Affairs, John F. Kennedy School of Government, Harvard University | | 41 Director, Taubman Centers, Inc. (real estate investment trust) |
| | | |
Charles D. Baker (1956) | | Trustee Since 2005 Contract Review and Governance Committee Member | | President and Chief Executive Officer, Harvard Pilgrim Health Care (health plan) | | 41 None |
| | | |
Edward A. Benjamin (1938) | | Trustee Since 2002 Chairman of the Contract Review and Governance Committee | | Retired | | 41 None |
| | | |
Daniel M. Cain (1945) | | Trustee Since 2003 Chairman of the Audit Committee | | President and Chief Executive Officer, Cain Brothers & Company, Incorporated (investment banking) | | 41 Director, Sheridan Healthcare Inc. (physician practice management) |
| | | |
Kenneth A. Drucker (1945) | | Trustee Since 2008 Contract Review and Governance Committee Member | | Formerly, Treasurer, Sequa Corp. (manufacturing) | | 41 Director, M Fund, Inc. (registered investment company) |
| | | |
Jonathan P. Mason (1958) | | Trustee Since 2007 Audit Committee Member | | Chief Financial Officer, Cabot Corp. (specialty chemicals); formerly, Vice President and Treasurer, International Paper Company; formerly, Chief Financial Officer, Carter Holt Harvey (forest products) | | 41 None |
| | | |
Sandra O. Moose (1942) | | Chairperson of the Board of Trustees since November 2005 Trustee since 2003 Ex officio member of the Audit Committee and Contract Review and Governance Committee | | President, Strategic Advisory Services (management consulting); formerly, Senior Vice President and Director, The Boston Consulting Group, Inc. (management consulting) | | 41 Director, Verizon Communications; Director, Rohm and Haas Company (specialty chemicals); Director, AES Corporation (international power company) |
39
| | | | | | |
| Name and Year of Birth | | Position(s) Held with the Trusts, Length of Time Served and
Term of Office* | | Principal Occupation(s) During Past 5 Years** | | Number of Portfolios in Fund
Complex Overseen*** and Other Directorships Held |
| | | |
Cynthia L. Walker (1956) | | Trustee Since 2005 Audit Committee Member | | Deputy Dean for Finance and Administration, Yale University School of Medicine; formerly, Executive Dean for Administration, Harvard Medical School; and formerly, Dean for Finance & Chief Financial Officer, Harvard Medical School | | 41 None |
| | | |
INTERESTED TRUSTEES | | | | | | |
Robert J. Blanding1 (1947) 555 California Street San Francisco, CA 94104 | | Trustee Since 2002 President and Chief Executive Officer since 2002 | | President, Chairman, Director and Chief Executive Officer, Loomis, Sayles & Company, L.P. | | 41 None |
| | | |
John T. Hailer2 (1960) | | Trustee Since 2003 | | President and Chief Executive Officer-U.S. and Asia, Natixis Global Asset Management, L.P.; formerly, President and Chief Executive Officer, Natixis Distribution Corporation, Natixis Asset Management Advisors, L.P., Natixis Distributors, L.P. and Natixis Global Associates, Inc. | | 41 None |
| * | Each Trustee serves until retirement, resignation or removal from the Board of Trustees. The current retirement age is 72. The position of Chairperson of the Board is appointed for a two-year term. Ms. Moose was appointed to serve an additional two-year term as the Chairperson of the Board of Trustees on September 14, 2007. |
| ** | Each person listed above, except as noted, holds the same position(s) with the Natixis Funds Trust I, Natixis Funds Trust II, Natixis Funds Trust III, Natixis Funds Trust IV, Gateway Trust and the Natixis Cash Management Trust (collectively, the “Natixis Funds Trusts”), Loomis Sayles Funds I and Loomis Sayles Funds II (collectively, the “Loomis Sayles Funds Trusts”), and Hansberger International Series. Previous positions during the past five years with Natixis Distributors, L.P. (the “Distributor”), Natixis Asset Management Advisors, L.P. (“Natixis Advisors”), or Loomis, Sayles & Company, L.P. are omitted if not materially different from a Trustee’s or officer’s current position with such entity. |
| *** | The Trustees of the Trusts serve as trustees of a fund complex that includes all series of the Natixis Funds Trusts, the Loomis Sayles Funds Trusts and Hansberger International Series (collectively, the “Fund Complex”). |
| 1 | Mr. Blanding is deemed an “interested person” of the Trusts because he holds the following positions with affiliated persons of the Trusts: President, Chairman, Director and Chief Executive Officer of Loomis, Sayles & Company, L.P. |
| 2 | Mr. Hailer is deemed an “interested person” of the Trusts because he holds the following positions with affiliated persons of the Trusts: President and Chief Executive Officer-U.S. and Asia, Natixis Global Asset Management, L.P. |
40
| | | | | | |
| Name and Year of Birth | | Position(s) Held with the Trusts | | Term of Office* and Length of Time Served | | Principal Occupation During Past 5 Years** |
|
OFFICERS OF THE TRUST |
Coleen Downs Dinneen (1960) | | Secretary, Clerk and Chief Legal Officer | | Since September 2004 | | Executive Vice President, General Counsel, Secretary and Clerk (formerly, Senior Vice President, Deputy General Counsel, Assistant Secretary and Assistant Clerk), Natixis Distribution Corporation, Natixis Asset Management Advisors, L.P. and Natixis Distributors, L.P. |
| | | |
Daniel J. Fuss (1933) One Financial Center Boston, MA 02111 | | Executive Vice President | | Since June 2003 | | Vice Chairman and Director, Loomis, Sayles & Company, L.P. |
| | | |
David Giunta (1965) | | Executive Vice President | | Since March 2008 | | President and Chief Executive Officer, Natixis Distribution Corporation, Natixis Asset Management Advisors, L.P. and Natixis Distributors, L.P.; formerly, President, Fidelity Charitable Gift Fund; and formerly, Senior Vice President, Fidelity Brokerage Company |
| | | |
Russell L. Kane (1969) | | Chief Compliance Officer, Assistant Secretary and Anti-Money Laundering Officer | | Chief Compliance Officer since May 2006; Assistant Secretary since June 2004; and Anti-Money Laundering Officer since April 2007 | | Chief Compliance Officer for Mutual Funds, Senior Vice President, Deputy General Counsel, Assistant Secretary and Assistant Clerk, Natixis Distribution Corporation, Natixis Asset Management Advisors, L.P. and Natixis Distributors, L.P.; and formerly, Senior Counsel, Columbia Management Group |
| | | |
Michael C. Kardok (1959) | | Treasurer, Principal Financial and Accounting Officer | | Since October 2004 | | Senior Vice President, Natixis Asset Management Advisors, L.P. and Natixis Distributors, L.P.; and formerly, Senior Director, PFPC Inc. |
| | | |
Robert Krantz (1964) | | Executive Vice President | | Since September 2007 | | Executive Vice President, Natixis Asset Management Advisors, L.P. and Natixis Distributors, L.P. |
| * | Each officer of the Trusts serves for an indefinite term in accordance with the Trusts’ current By-laws until the date his or her successor is elected and qualified, or until he or she sooner dies, retires, is removed or becomes disqualified. |
| ** | Each person listed above, except as noted, holds the same position(s) with the Natixis Funds Trusts, Loomis Sayles Funds Trusts and Hansberger International Series. Mr. Fuss is not an officer of the Natixis Funds Trusts or the Hansberger International Series. Previous positions during the past five years with the Distributor, Natixis Advisors or Loomis Sayles are omitted if not materially different from a Trustee’s or officer’s current position with such entity. |
41
Item 2. Code of Ethics.
The Registrant has adopted a code of ethics that applies to the Registrant’s principal executive officer, principal financial officer and persons performing similar functions.
Item 3. Audit Committee Financial Expert.
The Board of Trustees of the Registrant has established an audit committee. Ms. Cynthia L. Walker, Mr. Daniel M. Cain and Mr. Jonathan P. Mason are members of the audit committee and have been designated as “audit committee financial experts” by the Board of Trustees. Each of these individuals is also an Independent Trustee of the Registrant.
Item 4. Principal Accountant Fees and Services.
Fees billed by the Principal Accountant for services rendered to the Registrant.
The table below sets forth fees billed by the principal accountant, PricewaterhouseCoopers LLP, for the past two fiscal years for professional services rendered in connection with a) the audit of the Registrant’s annual financial statements and services provided in connection with regulatory filings; b) audit-related services (including services that are reasonably related to the performance of the audit of the Registrant’s financial statements and but not reported under “Audit Fees”); c) tax compliance, tax advice and tax planning and d) all other fees billed for professional services rendered by the principal accountant to the Registrant, other than the services reported as a part of (a) through (c) of this Item.
| | | | | | | | | | | | | | | | | | | | | | | | |
| | | Audit fees | | Audit-related fees1 | | Tax fees2 | | All other fees |
| | | 2007 | | 2008 | | 2007 | | 2008 | | 2007 | | 2008 | | 2007 | | 2008 |
Loomis Sayles Funds I | | $ | 372,586 | | $ | 352,741 | | $ | — | | $ | 17,960 | | $ | 86,274 | | $ | 112,821 | | $ | — | | $ | — |
| 1. | Audit-related fees consist of the performance of agreed-upon procedures related to the Registrant’s deferred compensation plan and services related to the implementation of a new accounting standard. |
| 2. | The tax fees consist of a review of year-end shareholder reporting and a review of the Registrant’s tax returns (2007 and 2008). |
Aggregate fees billed to the Registrant for non-audit services during 2007 and 2008 were $86,274 and $130,781, respectively.
Fees billed by the Principal Accountant for services rendered to the Adviser and Control Affiliates.
The following table sets forth the non-audit services provided by the Registrant’s principal accountant to Loomis, Sayles & Company, L.P. and entities controlling, controlled by or under common control with Loomis, Sayles & Company, L.P. that provide ongoing services to the Registrant (“Control Affiliates”) for the last two fiscal years.
| | | | | | | | | | | | | | | | | | |
| | | Audit-related fees | | Tax fees | | All other fees |
| | | 2007 | | 2008 | | 2007 | | 2008 | | 2007 | | 2008 |
Control Affiliates | | $ | 12,000 | | $ | 12,000 | | $ | — | | $ | — | | $ | — | | $ | — |
Aggregate fees billed to Control Affiliates for non-audit services during 2007 and 2008 were $12,000 and $12,000, respectively.
None of the audit-related, tax and other services provided by the Registrant’s principal accountant were approved by the Audit Committee pursuant to paragraph (c)(7)(i)(C) of Rule 2-01 of Regulation S-X.
Audit Committee Pre Approval Policies.
Annually, the Registrant’s Audit Committee reviews the audit, audit-related, tax and other non-audit services together with the projected fees, for services proposed to be rendered to the Trust and/or other entities for which pre-approval is required during the upcoming year. Any subsequent revisions to already pre-approved services or fees (including fee increases) and requests for pre-approval of new services would be presented for consideration quarterly as needed.
If, in the opinion of management, a proposed engagement by the Registrant’s independent accountants needs to commence before the next regularly scheduled Audit Committee meeting, any member of the Audit Committee who is an independent Board member is authorized to pre-approve the engagement, but only for engagements to provide audit, audit related and tax services. This approval is subject to review of the full Audit Committee at its next quarterly meeting. All other engagements require the approval of all the members of the Audit Committee.
Item 5. Audit Committee of Listed Registrants.
Not applicable.
Item 6. Schedule of Investments.
Included as part of the Report to Shareholders filed as Item 1 herewith.
Item 7. Disclosure of Proxy Voting Policies and Procedures for Closed-End Management Investment Companies.
Not applicable.
Item 8. Portfolio Managers of Closed-End Management Investment Companies
Not applicable.
Item 9. Purchases of Equity Securities by Closed-End Management Investment Companies and Affiliated Purchasers.
Not applicable.
Item 10. Submission of Matters to a Vote of Securities Holders.
There were no material changes to the procedures by which shareholders may recommend nominees to the Registrant’s Board of Trustees.
Item 11. Controls and Procedures.
The Registrant’s principal executive officer and principal financial officer have concluded that the Registrant’s disclosure controls and procedures are sufficient to ensure that information required to be disclosed by the Registrant in this Form N-CSR was recorded, processed, summarized and reported within the time periods specified in the Securities and Exchange Commission’s rules and forms, based upon such officers’ evaluation of these controls and procedures as of a date within 90 days of the filing date of the report.
There were no changes in the Registrant’s internal control over financial reporting that occurred during the Registrant’s last fiscal quarter of the period covered by the report that has materially affected, or is reasonably likely to materially affect, the Registrant’s internal control over financial reporting.
Item 12. Exhibits.
| | | | |
| (a) | | (1) | | Code of Ethics required by Item 2 hereof, filed herewith as exhibit (a)(1). |
| | |
| (a) | | (2) | | Certifications of Principal Executive Officer and Principal Financial Officer pursuant to Rule 30a-2(a) under the Investment Company Act of 1940 (17 CFR 270.30a-2(a)), filed herewith as Exhibits (a)(2)(1) and (a)(2)(2), respectively. |
| | |
| (a) | | (3) | | Not applicable. |
| | |
| (b) | | | | Certification of Principal Executive Officer and Principal Financial Officer pursuant to Section 906 of Sarbanes-Oxley Act of 2002 are filed herewith as Exhibit (b). |
SIGNATURES
Pursuant to the requirements of the Securities Exchange Act of 1934 and the Investment Company Act of 1940, the Registrant has duly caused this report to be signed on its behalf by the undersigned, thereunto duly authorized.
| | |
| Loomis Sayles Funds I |
| |
| By: | | /s/ Robert J. Blanding |
| Name: | | Robert J. Blanding |
| Title: | | President and Chief Executive Officer |
| Date: | | November 19, 2008 |
Pursuant to the requirements of the Securities Exchange Act of 1934 and the Investment Company Act of 1940, this report has been signed by the following persons on behalf of the Registrant and in the capacities and on the dates indicated.
| | |
| By: | | /s/ Robert J. Blanding |
| Name: | | Robert J. Blanding |
| Title: | | President and Chief Executive Officer |
| Date: | | November 19, 2008 |
| |
| By: | | /s/ Michael C. Kardok |
| Name: | | Michael C. Kardok |
| Title: | | Treasurer |
| Date: | | November 19, 2008 |